UNITED STATES
SECURITIES AND EXCHANGE COMMISSION
Washington, D.C. 20549
FORM N-CSR
CERTIFIED SHAREHOLDER REPORT OF REGISTERED
MANAGEMENT INVESTMENT COMPANIES
Investment Company Act file number: 811-09997
Baird Funds, Inc.
(Exact name of registrant as specified in charter)
777 East Wisconsin Avenue
Milwaukee, WI 53202
(Address of principal executive offices) (Zip code)
Charles M. Weber
Robert W. Baird & Co. Incorporated
777 East Wisconsin Avenue
Milwaukee, WI 53202
(Name and address of agent for service)
1-866-442-2473
Registrant's telephone number, including area code
Date of fiscal year end: December 31, 2008
Date of reporting period: December 31, 2008
Item 1. Reports to Stockholders.
Annual Report - Baird Funds
Baird Intermediate Bond Fund
Baird Aggregate Bond Fund
Baird Intermediate Municipal Bond Fund
Baird Core Plus Bond Fund
Baird Short-Term Bond Fund
TABLE OF CONTENTS
| Page | |
| Letter to Shareholders | 1 |
| 2008 Bond Market Overview | 2 |
| Baird Intermediate Bond Fund | 6 |
| Baird Aggregate Bond Fund | 23 |
| Baird Intermediate Municipal Bond Fund | 45 |
| Baird Core Plus Bond Fund | 57 |
| Baird Short-Term Bond Fund | 74 |
| Additional Information on Fund Expenses | 87 |
| Statements of Assets and Liabilities | 89 |
| Statements of Operations | 90 |
| Statements of Changes in Net Assets | 91 |
| Financial Highlights | 96 |
| Notes to the Financial Statements | 105 |
| Report of Independent Registered Public Accounting Firm | 118 |
| Directors and Officers | 119 |
| Disclosure Regarding the Board of Directors’ Approval | |
| of the Investment Advisory Agreement for Baird Bond Funds | 121 |
| Additional Information | 124 |
This report has been prepared for shareholders and may be distributed to others only if preceded or accompanied by a current prospectus.
Cautionary Note on Analyses, Opinions and Outlooks: In this report we offer analyses and opinions on the performance of individual securities, companies, industries, sectors, markets, interest rates and governmental policies, including predictions, forecasts and outlooks regarding possible future events. These can generally be identified as such because the context of the statements may include such words as “believe,” “should,” “will,” “expects,” “anticipates,” “hopes” and words of similar effect. These statements reflect the portfolio managers’ good faith beliefs and judgments and involve risks and uncertainties, including the risk that the portfolio managers’ analyses, opinions and outlooks are or will prove to be inaccurate. It is inherently difficult to correctly assess and explain the performance of particular securities, sectors, markets, interest rate movements, governmental actions or general economic trends and conditions, and many unforeseen factors contribute to the performance of Baird Funds. Investors are, therefore, cautioned not to place undue reliance on subjective judgments contained in this report.
Baird Funds
1-866-442-2473
www.bairdfunds.com
February 28, 2009
Dear Shareholder,
We appreciate the trust you have placed in us to help you achieve your financial goals. We are pleased to report that, despite a very difficult year, the aggregate net assets of the eight mutual funds in our family have grown to more than $1.9 billion as of the end of 2008, an increase of 19% over the prior year.
In this Annual Report we review the bond market in 2008 and the performance and composition of each of the Baird Bond Funds. Though the year was extremely challenging, we believe that patience will eventually be rewarded for bond investors as unprecedented volatility and market dislocation begin to subside. Thank you again for choosing Baird Funds.
Sincerely,

Mary Ellen Stanek, CFA
President
Baird Funds
Page 1
2008 Bond Market Overview
2008 – A Year to Remember (or Forget)
2008 was a year that will be remembered for a long time by investors, but also a year that many would prefer to forget. The “uptick” in volatility in 2007 was merely a preview of the tumultuous chaos that became daily life for investors in 2008 as monumental deleveraging led to unprecedented volatility (see market volatility charts below) and illiquidity that shook the very foundations of the financial markets and eventually stalled the engines of the world economies. Shock waves emanating from Wall Street swiftly spread to Main Street leaving virtually no one unscathed.
| Bond Market Volatility – MOVE Index | CBOE S&P 500 Volatility Index (VIX) |
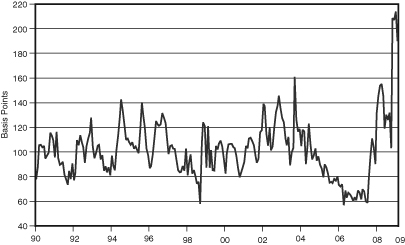 | 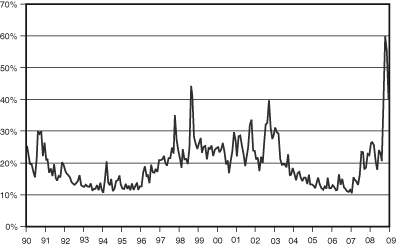 |
| Source: Bloomberg, Merrill Lynch | Source: Bloomberg/CBOE |
Deleveraging and Concerns of Deflation
Deleveraging proved to be most painful for the highly-leveraged, and corporate obituaries of 2008 included several household names that were unable to raise the precious liquidity needed to survive (e.g. Bear Stearns, Lehman Brothers, Countrywide, Washington Mutual, National City). Deleveraging also rendered tremendous destruction of wealth in 2008 (e.g. S&P 500 -37%; S&P/Case-Shiller Home Price Index -18% thru 10/31/08) which severely damaged consumer sentiment, raising concerns that reduced consumer spending could trigger general deflation (while year-over-year CPI was still positive 0.1% through December, forecasts looking forward are slightly negative).
Unprecedented Policy Response
To counter the powerful forces of deleveraging, the U.S. Government pulled out all the stops in efforts to stabilize the markets and the economy: bailouts of FNMA and FHLMC, money market guarantees, purchases of commercial paper, TAF, TSLF, PDCF, TARP, TARF, bridge loans to the Big 3 automakers and reducing the Fed Funds rate to a range of 0-0.25%. Essentially, the Government leveraged its balance sheet to facilitate a more orderly deleveraging of everything else. While the jury is still out on whether these unprecedented efforts will ultimately succeed, one key measure suggests the medicine is beginning to work. The TED Spread (3 mo. LIBOR minus 3 mo. T-bill yield), a
TED Spread
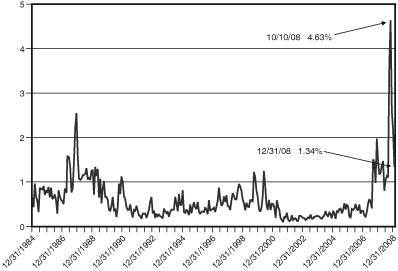
Source: Bloomberg
Page 2
2008 Bond Market Overview
common measure of confidence in the banking system, retreated sharply to 1.34% at year end after spiking to 4.63% at the peak of the financial crisis in mid-October (see chart on prior page). Confidence in the banking system is key to the orderly functioning of the financial markets, and while not back to “normal” levels, improvement in the TED Spread is very encouraging. Possibly the most effective move on the Fed’s part to improve market liquidity was to reduce its target for the Fed Funds rate to 0-0.25% in mid-December. This move pushed money market rates painfully close to zero and effectively flushed money out of money market funds and into other sectors of the bond market as investors began looking for more attractive opportunities for their cash (see positive excess returns of non-Treasury sectors in December on next page).
Flight to Quality, Disparity in Returns
As confidence in the financial markets unraveled over the course of 2008, a full-fledged flight to quality developed and U.S. Treasury yields plunged nearly 300 bps to all-time lows near the end of the year (see chart and table below). Treasuries were
Treasury Yields (Source: Bloomberg)

| Dec 31, | Sep 30, | Dec 31, | Q4 | 2008 | |
| Maturity | 2007 | 2008 | 2008 | Change | Change |
| 1 | 3.30% | 1.79% | 0.34% | -1.45 | -2.96 |
| 2 | 3.05% | 1.96% | 0.76% | -1.20 | -2.29 |
| 3 | 3.03% | 2.28% | 0.97% | -1.31 | -2.06 |
| 5 | 3.44% | 2.98% | 1.55% | -1.43 | -1.89 |
| 10 | 4.02% | 3.82% | 2.21% | -1.61 | -1.81 |
| 30 | 4.45% | 4.31% | 2.68% | -1.63 | -1.77 |
the primary beneficiary of the flight to quality and posted impressive returns of 8.75% for the fourth quarter and 13.74% for the year (see table below). Government Agencies (Q4: +6.10%, 2008: + 9.08%) and Agency-guaranteed MBS (Q4: +4.34%, 2008: +8.34%) were secondary beneficiaries of the flight to quality as investors became confident that the U.S. Government would stand firm behind the debt of FNMA and FHLMC. All other sectors produced negative returns in 2008 as shattered confidence, forced selling and severe illiquidity led to broad price declines. Despite a sharp rebound in December (+7.68%), the High Yield sector was decimated in the fourth quarter (-17.9%) and suffered one of its worst years ever (-26.16%). Forced sales of Asset-Backed Securities (ABS) weighed on this sector throughout the year (2008: -12.72%), while downgrades and rising concern about consumer finance receivables also depressed prices in December (-0.59%). Forced liquidations of leveraged municipal strategies overwhelmed tepid demand resulting in negative returns (2008: -2.47%) for a sector that usually correlates more closely with Treasuries. TIPS rebounded in December (+4.96%) but had a weak fourth quarter (-3.48%) and year (-2.35%) as investors feared deflation over inflation. Annual and fourth quarter returns of various sectors and indices appear in the table below.
Page 3
2008 Bond Market Overview
Total Returns of Selected Barclays Capital (BC) Indices and Subsectors
| Index/Sector | Q4 2008 | Year 2008 | |||||||
| BC Aggregate Index | 4.58 | % | 5.24 | % | |||||
| BC Gov’t/Credit Index | 6.42 | % | 5.70 | % | |||||
| BC Int. Gov’t/Credit Index | 4.84 | % | 5.08 | % | |||||
| BC 1-3 yr. Gov’t/Credit Index | 2.68 | % | 4.97 | % | |||||
| US Treasury Sector | 8.75 | % | 13.74 | % | |||||
| Gov’t Agency Sector | 6.10 | % | 9.08 | % | |||||
| Corporate Sector | 3.98 | % | -4.94 | % | |||||
| MBS Sector | 4.34 | % | 8.34 | % | |||||
| ABS Sector | -6.82 | % | -12.72 | % | |||||
| Municipal Sector | 0.74 | % | -2.47 | % | |||||
| TIPS | -3.48 | % | -2.35 | % | |||||
| High Yield Sector | -17.88 | % | -26.16 | % | |||||
Price Dislocation
Deleveraging caused dramatic widening in yield spreads of most non-Treasury sectors and as liquidity all but vanished late in the year with investors struggling to reduce exposure to risk, price dislocations developed in several sectors. The chart below shows option-adjusted yield spreads (versus similar duration Treasuries) at the end of the second, third and fourth quarters and “excess” returns (versus Treasuries) for the last three months and the entire year of 2008. Yields spreads on Asset-Backed Securities widened sharply throughout the year to 955 bps resulting in 2223 bps of underperformance relative to Treasuries. Spreads in the Finance sector, which came under intense pressure in September, doubled in the second half of the year (from 315 bps to 629 bps) leading to underperformance of 2209 bps versus Treasuries for the year.
| OAS and Excess Returns (in bps) | |||||||||||||
| Option Adjusted Spreads | Excess Returns vs U.S. Treasuries | ||||||||||||
| 6/30/08 | 9/30/08 | 12/31/08 | October | November | December | 2008 | |||||||
| U.S. Aggregate Index | 129 | 176 | 213 | -252 | -163 | 136 | -710 | ||||||
| U.S. Agency | |||||||||||||
| (non-mortgage) Sector | 67 | 115 | 93 | -123 | -9 | 179 | -110 | ||||||
| Mortgage and ABS Sectors | |||||||||||||
| Mortgage-Backed Securities | 127 | 135 | 145 | -152 | -68 | 33 | -232 | ||||||
| Asset-Backed Securities | 353 | 584 | 955 | -665 | -316 | -190 | -2223 | ||||||
| CMBS | 288 | 480 | 1010 | -1020 | -2259 | 1514 | -3274 | ||||||
| Credit Sectors | |||||||||||||
| U.S. Investment Grade | 238 | 385 | 493 | -580 | -183 | 276 | -1786 | ||||||
| Industrial | 226 | 325 | 500 | -884 | -218 | 337 | -1756 | ||||||
| Utility | 232 | 335 | 537 | -992 | -157 | 126 | -2039 | ||||||
| Financial Institutions | 315 | 613 | 629 | -243 | -131 | 349 | -2209 | ||||||
| U.S. High Yield | 708 | 1020 | 1669 | -1650 | -1362 | 568 | -3832 | ||||||
| Source: Barclays Capital | |||||||||||||
Page 4
2008 Bond Market Overview
Industrials and Utilities fell hard in October and finished the year with excess returns of - -1756 bps and -2039 bps, respectively, while the entire investment grade credit sector underperformed Treasuries by 1786 bps. Commercial Mortgage Backed Securities (CMBS) and High Yield got crushed in October and November and finished 2008 with excess returns of -3274 bps and -3832 bps, respectively. Benefiting from government guarantees, Government Agencies and Agency Mortgage-Backed Securities (ABS) saw only modest widening of spreads in 2008 and underperformed Treasuries by just 110 bps and 232 bps respectively. While the positive excess returns of several sectors in December were encouraging, the underperformance of most non-Treasury sectors in 2008 was unprecedented.
Summary
The powerful forces of deleveraging brought the bond market to its knees in 2008. Weakness centered in the financial sector swiftly spread to all corners of the economy and market liquidity all but vanished. Asset prices tumbled and inflation concerns gave way to new worries of deflation. Investor confidence was shattered as several stalwart institutions collapsed and a monumental flight to quality brought Treasury yields to all-time lows while forced liquidations in other areas of the market left huge disparities in sector returns. Pricing services and rating agencies struggled to reflect the changes that were occurring and mark-to-market accounting put additional stress on already dysfunctional and dislocated markets.
Outlook
We believe patience will be rewarded for unleveraged investors in 2009 as severely dislocated prices of bonds in several sectors do not reflect sound credit fundamentals and “quality is on sale”. We believe that deleveraging presents a significant headwind to the economy and the stock market but see great value in investment grade bonds after the price declines of last year. While market and credit risks cannot be ignored, we see exceptional value in well-structured non-Agency MBS and ABS with fixed-rate collateral and believe well-diversified investment grade corporate exposure will excel as liquidity improves. We think Treasuries are poised to underperform in 2009 given increases in supply that are coming and remain cautious of risks in high yield bonds.
A Note on Securities Prices
The unprecedented financial market volatility and lack of liquidity in certain sectors of the bond markets may cause the prices of some of the securities held by the Funds to fluctuate significantly from day to day and from period to period. Nearly all of the securities held by the Funds are priced by Interactive Data Corporation (IDC), an independent pricing service, using evaluation methodologies that integrate information from various market sources, such as observed market data, credit quality information, perceived market movements, news and other relevant information into analytical pricing models to derive market prices for bonds on a daily basis. Although many other mutual fund companies and institutions use IDC to price their securities, the pricing of certain securities – particularly under current conditions – is subject to some extent to the price evaluator’s judgment and IDC’s prices may vary significantly on any given day from prices obtained from other sources and from prices that may be obtained from an actual sale of securities. In addition, certain securities held by the Funds are priced at fair value by the Valuation Committee as delegated by the Funds’ Board of Directors.
Page 5
Baird Intermediate Bond Fund
The Baird Intermediate Bond Fund seeks an annual rate of total return, before Fund expenses, greater than the annual rate of total return of the Barclays Capital Intermediate Government/Credit Bond Index. The Barclays Capital Intermediate Government/Credit Bond Index is an unmanaged, market value weighted index of investment grade, fixed-rate debt issues, including government and corporate securities, with maturities between one and ten years.
Extreme volatility in the financial markets led to severely dislocated prices of bonds in several sectors that we believe do not reflect sound credit fundamentals. The Fund underperformed its benchmark index in 2008. The primary factors for the underperformance were:
| • | The Fund’s underweight to U.S. Treasuries which outperformed all other market sectors due to a flight to quality by investors; |
| • | Exposure to non-Agency mortgage-backed and asset-backed securities; and |
| • | The Fund’s overweighting to the finance sector relative to the benchmark. |
The Fund maintained its duration-neutral strategy, holding a broadly diversified portfolio of over 270 securities at year end.
The Fund ended 2008 with a yield advantage versus its benchmark index. Despite the unprecedented market volatility, we are confident of the integrity of the issues we hold and the structure of the Fund overall. We feel very strongly that the Fund will realize its sizeable yield advantage over time and outperform its benchmark through the completion of this historic and severe credit cycle.
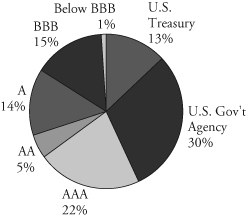
Portfolio Characteristics
| Quality Distribution* | Sector Weightings* | ||||
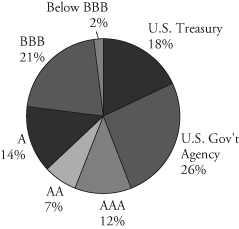 | 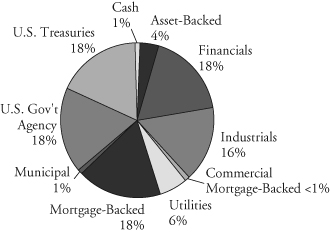 | ||||
| Net Assets: | $405,932,700 | Annualized Expense Ratio: | |||
SEC 30-Day Yield:** | Institutional Class: | 0.30% | |||
| Institutional Class: | 6.18% | Investor Class: | 0.55% | *** | |
| Investor Class: | 5.99% | Portfolio Turnover Rate: | 32.9% | ||
| Average Effective Duration: | 3.82 years | Total Number of Holdings: | 276 | ||
| Average Effective Maturity: | 4.74 years | ||||
| * | Percentages shown are based on the Fund’s total net assets. |
| ** | SEC yields are based on SEC guidelines and are calculated for the 30 days ended December 31, 2008. |
| *** | Includes 0.25% 12b-1 fee. |
Page 6
Baird Intermediate Bond Fund
| Institutional Class |
| Value of a $25,000 Investment |
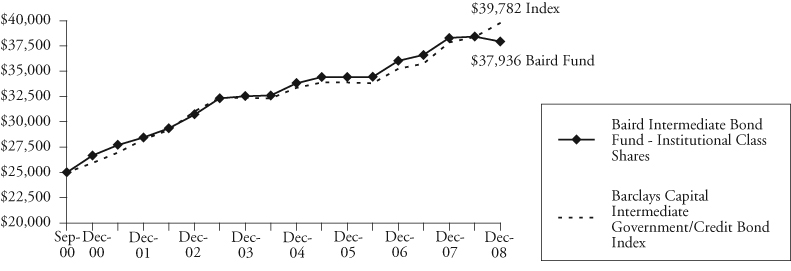 |
Growth of a hypothetical investment of $25,000 made on the Fund’s inception date (9/29/00), assuming reinvestment of all distributions.
| Investor Class |
| Value of a $10,000 Investment |
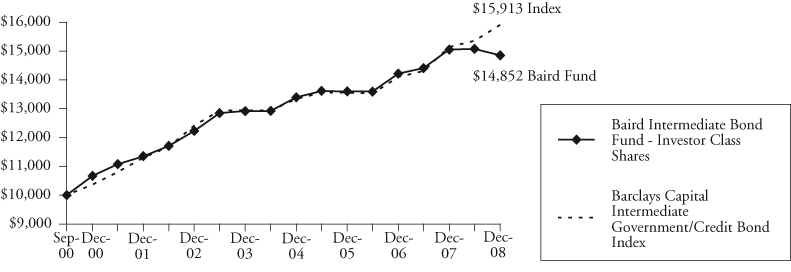 |
Growth of a hypothetical investment of $10,000 made on the Fund’s inception date (9/29/00), assuming reinvestment of all distributions.
Page 7
Baird Intermediate Bond Fund
Average Annual Total Returns
| Since | |||
| For the Periods Ended December 31, 2008 | One Year | Five Years | Inception(1) |
| Institutional Class Shares | -0.91% | 3.11% | 5.18% |
| Investor Class Shares | -1.31% | 2.82% | 4.91% |
Barclays Capital Intermediate Government/Credit Bond Index(2) | 5.08% | 4.21% | 5.79% |
| (1) | For the period from September 29, 2000 (commencement of operations) through December 31, 2008. |
| (2) | The Barclays Capital Intermediate Government/Credit Bond Index is an unmanaged, market value weighted index of investment grade, fixed-rate debt including government and corporate securities with maturities between one and 10 years. This index does not reflect any deduction for fees, expenses or taxes. A direct investment in an index is not possible. |
The returns shown in the table above and line graphs on the previous page reflect reinvestment of dividends and/or capital gains distributions in additional shares. The returns do not reflect the deduction of taxes that a shareholder would pay on Fund distributions or the redemption of Fund shares.
Past performance does not guarantee future results. Investment return and principal value will fluctuate so that an investor’s shares, when redeemed, may be worth more or less than their original cost.
For information about the performance of the Fund as of the most recent month-end, please call 1-866-44BAIRD or visit www.bairdfunds.com. Mutual fund performance changes over time and current performance may be lower or higher than that stated.
Page 8
Baird Intermediate Bond Fund
Schedule of Investments December 31, 2008 |
| Principal | |||||||
| Amount | Value | ||||||
| LONG-TERM INVESTMENTS – 97.1% | |||||||
| Asset Backed Securities – 3.3% | |||||||
| $ | 925,000 | American Express Credit | |||||
| Account Master Trust, | |||||||
| Series 2005-5, Class A, | |||||||
| 1.235%, 02/15/2013 | $ | 848,518 | |||||
| 184,464 | Amresco Residential | ||||||
| Securities Mortgage | |||||||
| Loan Trust, | |||||||
| Series 1998-1, Class A6, | |||||||
| 6.51%, 08/25/2027 | 183,814 | ||||||
| 1,144,305 | CitiFinancial Mortgage | ||||||
| Securities, Inc., | |||||||
| Series 2004-1, Class AF2, | |||||||
| 2.645%, 04/25/2034 | 1,039,898 | ||||||
| 70 | Contimortgage Home | ||||||
| Equity Trust, | |||||||
| Series 1999-1, Class A7, | |||||||
| 6.97%, 12/25/2013 | 69 | ||||||
| Countrywide Asset-Backed | |||||||
| Certificates: | |||||||
| 2,215,000 | Series 2006-S3, Class A2, | ||||||
| 6.085%, 06/25/2021 | 950,475 | ||||||
| 2,024,513 | Series 2005-12, Class 1A2, | ||||||
| 4.847%, 02/25/2036 | 1,990,175 | ||||||
| 4,000,000 | Series 2006-13, Class 1AF2, | ||||||
| 5.884%, 01/25/2037 | 3,756,080 | ||||||
| 375,000 | Series 2006-13, Class 1AF3, | ||||||
| 5.944%, 01/25/2037 | 272,963 | ||||||
| 1,380,000 | Series 2006-9, Class 1AF3, | ||||||
| 5.859%, 10/25/2046 | 803,458 | ||||||
| Delta Funding Home | |||||||
| Equity Loan Trust: | |||||||
| 77,421 | Series 1997-2, Class A6, | ||||||
| 7.04%, 06/25/2027 | 77,495 | ||||||
| 49,386 | Series 1999-1, Class A6F, | ||||||
| 6.34%, 12/15/2028 | 47,342 | ||||||
| 538,268 | Series 1999-2, Class A7F, | ||||||
| 7.03%, 08/15/2030 | 537,459 | ||||||
| 175,000 | Discover Card | ||||||
| Master Trust I, | |||||||
| Series 2005-2, Class A, | |||||||
| 1.23%, 04/17/2012 | 167,594 | ||||||
| 31,479 | Equivantage Home | ||||||
| Equity Loan Trust, | |||||||
| Series 1996-3, Class A3, | |||||||
| 7.70%, 09/25/2027 | 24,814 | ||||||
| GMAC Mortgage | |||||||
| Corporation Loan Trust: | |||||||
| 490,447 | Series 2004-GH1, | ||||||
| Class A2, 4.39%, | |||||||
| 12/25/2025 | 476,383 | ||||||
| 238,615 | Series 2005-HE3, | ||||||
| Class A2, 1.12%, | |||||||
| 02/25/2036 | 101,922 | ||||||
| Green Tree Financial | |||||||
| Corporation: | |||||||
| 61,657 | Series 1993-4, Class A5, | ||||||
| 7.05%, 01/15/2019 | 53,355 | ||||||
| 933,992 | Series 1998-2, Class A5, | ||||||
| 6.24%, 12/01/2028 | 708,160 | ||||||
| 1,216,032 | Series 1998-3, Class A5, | ||||||
| 6.22%, 03/01/2030 | 883,919 | ||||||
| 453,908 | Series 1998-4, Class A5, | ||||||
| 6.18%, 04/01/2030 | 290,983 | ||||||
| 65,966 | IMC Home Equity | ||||||
| Loan Trust, | |||||||
| Series 1998-1, Class A6, | |||||||
| 7.02%, 06/20/2029 | 58,671 | ||||||
| 194,957 | Oakwood Mortgage | ||||||
| Investors, Inc., | |||||||
| Series 1999-B, Class A3, | |||||||
| 6.45%, 11/15/2017 | 129,626 | ||||||
The accompanying notes are an integral part of these financial statements.
Page 9
Baird Intermediate Bond Fund
Schedule of Investments December 31, 2008 |
| Principal | |||||||
| Amount | Value | ||||||
| LONG-TERM INVESTMENTS – 97.1% (cont.) | |||||||
| Asset Backed Securities – 3.3% (cont.) | |||||||
| $ | 21,280 | Residential Asset | |||||
| Mortgage Products, Inc., | |||||||
| Series 2003-RS7, | |||||||
| Class AI6, 5.34%, | |||||||
| 08/25/2033 | $ | 19,931 | |||||
| 163,503 | Structured Asset | ||||||
| Securities Corporation, | |||||||
| Series 2005-2XS, | |||||||
| Class 1A2A, 4.51%, | |||||||
| 02/25/2035 | 143,483 | ||||||
| 13,566,587 | |||||||
| Financial – 18.4% | |||||||
| 875,000 | Allfirst Financial, Inc. | ||||||
| Subordinated Notes, | |||||||
| 6.875%, 06/01/2009 | 890,245 | ||||||
| American General Finance | |||||||
| Corporation Notes: | |||||||
| 25,000 | 4.625%, 09/01/2010 | 12,665 | |||||
| 550,000 | 4.00%, 03/15/2011 | 266,729 | |||||
| 630,000 | AmSouth Bancorporation | ||||||
| Subordinated Debentures, | |||||||
| 6.75%, 11/01/2025 | 556,881 | ||||||
| 1,335,000 | Anthem, Inc., | ||||||
| 6.80%, 08/01/2012 | 1,319,646 | ||||||
| 525,000 | Banco Santander Chile, | ||||||
7.375%, 07/18/2012 f | 537,669 | ||||||
| 760,000 | Bank of America | ||||||
| Corporation | |||||||
| Subordinated Notes, | |||||||
| 10.20%, 07/15/2015 | 833,600 | ||||||
| 1,450,000 | Bank of Tokyo- | ||||||
| Mitsubishi UFJ NY, | |||||||
7.40%, 06/15/2011 f | 1,403,790 | ||||||
| Bank One Corporation | |||||||
| Subordinated Notes: | |||||||
| 180,000 | 6.00%, 02/17/2009 | 180,009 | |||||
| 1,043,000 | 10.00%, 08/15/2010 | 1,099,070 | |||||
| 125,000 | Bank United | ||||||
| Subordinated Notes, | |||||||
| 8.00%, 03/15/2009 @ | 13 | ||||||
| 2,695,000 | BankAmerica Institutional, | ||||||
| 8.07%, 12/31/2026 | |||||||
| (Acquired 01/04/2006 – | |||||||
| 11/06/2007, Aggregate | |||||||
| Cost $2,781,965)* | 2,210,296 | ||||||
| 2,500,000 | Banponce Trust I, Series A, | ||||||
| 8.327%, 02/01/2027 | |||||||
| (Callable 03/02/2009) | 2,063,025 | ||||||
| 1,000,000 | Bear Stearns Cos., Inc., | ||||||
| 6.40%, 10/02/2017 | 1,039,178 | ||||||
| 1,000,000 | BOI Capital | ||||||
| Funding No. 2, | |||||||
| 5.571%, 02/01/2049 | |||||||
| (Acquired 01/20/2006; | |||||||
| Cost $1,000,000) | |||||||
(Callable 02/01/2016)* f | 219,807 | ||||||
| 520,000 | CIT Group Company | ||||||
| of Canada, | |||||||
5.20%, 06/01/2015 f | 365,068 | ||||||
| CIT Group, Inc.: | |||||||
| 200,000 | 5.40%, 01/30/2016 | 139,258 | |||||
| 1,500,000 | 6.10%, 03/15/2067 | ||||||
| (Callable 03/15/2017) | 463,190 | ||||||
| 1,000,000 | Citigroup, Inc., | ||||||
| 5.50%, 04/11/2013 | 973,684 | ||||||
| 1,000,000 | Compass Bank | ||||||
| Subordinated Notes, | |||||||
| 8.10%, 08/15/2009 | 976,425 | ||||||
The accompanying notes are an integral part of these financial statements.
Page 10
Baird Intermediate Bond Fund
Schedule of Investments December 31, 2008 |
| Principal | |||||||
| Amount | Value | ||||||
| LONG-TERM INVESTMENTS – 97.1% (cont.) | |||||||
| Financial – 18.4% (cont.) | |||||||
| $ | 1,760,000 | Corestates Capital Trust I, | |||||
| 8.00%, 12/15/2026 | |||||||
| (Acquired 11/29/2005 | |||||||
| and 10/10/2007; | |||||||
| Cost $268,040 | |||||||
| and $1,546,382)* | $ | 1,445,523 | |||||
| 275,000 | Corp Andina De | ||||||
| Fomento Notes, | |||||||
7.375%, 01/18/2011 f | 276,995 | ||||||
| 1,900,000 | Countrywide | ||||||
| Financial Corporation | |||||||
| Subordinated Notes, | |||||||
| 6.25%, 05/15/2016 | 1,804,065 | ||||||
| 1,000,000 | Export Import | ||||||
| Bank Korea, | |||||||
| 5.125%, 02/14/2011 | 965,610 | ||||||
| 416,065 | First National | ||||||
| Bank of Chicago | |||||||
| Pass-Thru Certificates, | |||||||
| Series 1993-A, | |||||||
| 8.08%, 01/05/2018 | 541,655 | ||||||
| 2,600,000 | First National | ||||||
| Bank of Omaha | |||||||
| Subordinated Notes, | |||||||
| 7.32%, 12/01/2010 | 2,619,679 | ||||||
| 2,025,000 | First Union | ||||||
| Capital I, Series A, | |||||||
| 7.935%, 01/15/2027 | |||||||
| (Callable 03/27/2009) | 1,680,659 | ||||||
| 775,000 | FMR LLC Notes, | ||||||
| 4.75%, 03/01/2013 | |||||||
| (Acquired 02/26/2003; | |||||||
| Cost $776,147)* | 712,588 | ||||||
| 2,300,000 | GE Global Insurance | ||||||
| Holding Corp., | |||||||
| 7.50%, 06/15/2010 | 2,282,870 | ||||||
| 800,000 | General Electric Capital | ||||||
| Corporation Notes, | |||||||
| 6.00%, 06/15/2012 | 820,838 | ||||||
| 2,000,000 | Genworth Financial, Inc., | ||||||
| 4.75%, 06/15/2009 | 1,964,938 | ||||||
| 1,100,000 | Genworth Financial Inc. | ||||||
| Notes, 5.75%, 06/15/2014 | 422,490 | ||||||
| 1,975,000 | Glencore Funding LLC, | ||||||
| 6.00%, 04/15/2014 | |||||||
| (Acquired 03/31/2004, | |||||||
| 02/02/2005, 04/26/2006 | |||||||
| and 12/04/2006; | |||||||
| Cost $794,280, $146,738, | |||||||
| $287,643 and $720,432, | |||||||
| respectively)* | 799,476 | ||||||
| GMAC LLC: | |||||||
| 1,025,000 | 7.75%, 01/19/2010 | 914,181 | |||||
| 80,000 | 7.50%, 12/31/2013 | ||||||
| (Acquired 12/31/2008, | |||||||
| Cost $344,425)* # | 58,365 | ||||||
| 200,000 | 6.75%, 12/01/2014 | 136,729 | |||||
| 96,000 | 8.00%, 12/31/2018 | ||||||
| (Acquired 12/31/2008, | |||||||
| Cost $413,311)* # | 50,336 | ||||||
| 1,125,000 | Goldman Sachs | ||||||
| Group, Inc., | |||||||
| 5.15%, 01/15/2014 | 1,013,208 | ||||||
| 1,800,000 | Great West Life & | ||||||
| Annuity Insurance, | |||||||
| 7.153%, 05/16/2046 | |||||||
| (Acquired 05/16/2006 | |||||||
| and 11/08/2007; | |||||||
| Cost $1,000,000 | |||||||
| and $792,736)* | 983,729 | ||||||
The accompanying notes are an integral part of these financial statements.
Page 11
Baird Intermediate Bond Fund
Schedule of Investments December 31, 2008 |
| Principal | |||||||
| Amount | Value | ||||||
| LONG-TERM INVESTMENTS – 97.1% (cont.) | |||||||
| Financial – 18.4% (cont.) | |||||||
| HSBC Finance | |||||||
| Corporation Notes: | |||||||
| $ | 2,000,000 | 8.00%, 07/15/2010 | $ | 2,033,262 | |||
| 25,000 | 5.00%, 06/30/2015 | 22,191 | |||||
| 2,000,000 | Huntington National | ||||||
| Bank Notes, | |||||||
| 8.00%, 04/01/2010 | 1,833,640 | ||||||
| 500,000 | Invesco Ltd., | ||||||
5.375%, 02/27/2013 f | 444,095 | ||||||
| Istar Financial, Inc.: | |||||||
| 2,300,000 | 4.875%, Series B, | ||||||
| 01/15/2009 | 2,087,250 | ||||||
| 1,050,000 | 5.95%, 10/15/2013 | 330,750 | |||||
| 500,000 | J.P. Morgan | ||||||
| Chase & Company | |||||||
| Subordinated Notes, | |||||||
| 6.625%, 03/15/2012 | 512,199 | ||||||
| 2,000,000 | Key Bank NA, | ||||||
| 7.413%, 05/06/2015 | 1,716,804 | ||||||
| Korea Development | |||||||
Bank Notes: f | |||||||
| 1,275,000 | 3.875%, 03/02/2009 | 1,268,559 | |||||
| 350,000 | 4.625%, 09/16/2010 | 339,629 | |||||
| 846,000 | Lehman Brothers | ||||||
| Holdings, Inc. Notes, | |||||||
| 8.50%, 08/01/2015 @ | 80,370 | ||||||
| 1,735,000 | Lehman Brothers | ||||||
| Holdings Senior Notes, | |||||||
| 8.80%, 03/01/2015 @ | 164,825 | ||||||
| 546,000 | Liberty Mutual Group, | ||||||
| 7.25%, 09/01/2012 | |||||||
| (Acquired 08/03/2004, | |||||||
| Cost $583,994)* | 477,750 | ||||||
| Marsh & McLennan | |||||||
| Companies, Inc.: | |||||||
| 1,000,000 | 7.125%, 06/15/2009 | 997,341 | |||||
| 700,000 | 5.375%, 07/15/2014 | 621,025 | |||||
| 500,000 | MBIA Insurance Corp., | ||||||
| 14.00%, 01/15/2033 | |||||||
| (Callable 01/15/2013) | |||||||
| (Acquired 01/11/2008; | |||||||
| Cost $500,000)* | 255,000 | ||||||
| Merrill Lynch & Co, Inc.: | |||||||
| 1,000,000 | 5.70%, 05/02/2017 | 885,956 | |||||
| 1,000,000 | 6.875%, 04/25/2018 | 1,046,026 | |||||
| 375,000 | Met Life Global | ||||||
| Funding Senior Notes, | |||||||
| 4.50%, 05/05/2010 | |||||||
| (Acquired 08/04/2005 and | |||||||
| 03/22/2007; Cost $123,925 | |||||||
| and $248,188)* | 359,749 | ||||||
| 1,075,000 | The Mony Group, Inc., | ||||||
| 8.35%, 03/15/2010 | 1,063,069 | ||||||
| Morgan Stanley Senior | |||||||
| Unsecured Notes: | |||||||
| 1,000,000 | 5.625%, 01/09/2012 | 948,307 | |||||
| 1,400,000 | 6.625%, 04/01/2018 | 1,228,206 | |||||
| 25,000 | Morgan Stanley | ||||||
| Subordinated Notes, | |||||||
| 4.75%, 04/01/2014 | 19,047 | ||||||
| 1,530,000 | National Australia Bank Ltd. | ||||||
| Subordinated Notes, Series A, | |||||||
8.60%, 05/19/2010 f | 1,560,949 | ||||||
| 350,000 | National Bank of Hungary | ||||||
| Yankee Debentures, | |||||||
8.875%, 11/01/2013 f | 369,867 | ||||||
| 2,725,000 | National City | ||||||
| Bank of Cleveland, | |||||||
| 4.50%, 03/15/2010 | 2,623,695 | ||||||
| 534,000 | National City | ||||||
| Bank of Kentucky | |||||||
| Subordinated Notes, | |||||||
| 6.30%, 02/15/2011 | 514,436 | ||||||
The accompanying notes are an integral part of these financial statements.
Page 12
Baird Intermediate Bond Fund
Schedule of Investments December 31, 2008 |
| Principal | |||||||
| Amount | Value | ||||||
| LONG-TERM INVESTMENTS – 97.1% (cont.) | |||||||
| Financial – 18.4% (cont.) | |||||||
| $ | 2,300,000 | Navigators Group Inc. | |||||
| Senior Unsecured Notes, | |||||||
| 7.00%, 05/01/2016 | $ | 1,463,205 | |||||
| 1,260,000 | NB Capital Trust IV, | ||||||
| 8.25%, 04/15/2027 | |||||||
| (Callable 03/27/2009) | 1,042,331 | ||||||
| 1,000,000 | North Fork | ||||||
| Capital Trust II, | |||||||
| 8.00%, 12/15/2027 | |||||||
| (Callable 03/27/2009) | 459,690 | ||||||
| 1,319,000 | PNC Funding | ||||||
| Corporation, | |||||||
| 7.50%, 11/01/2009 | 1,317,131 | ||||||
| 1,500,000 | Premium Asset Senior | ||||||
| Notes, 4.125%, 03/12/2009 | |||||||
| (Acquired 12/20/2006 and | |||||||
| 05/10/2007; Cost $993,963 | |||||||
| and $497,795)* | 181,875 | ||||||
| 75,000 | Protective Life | ||||||
| Corporation Senior Notes, | |||||||
| 4.30%, 06/01/2013 | 61,145 | ||||||
| 1,650,000 | Regions Bank, | ||||||
| 7.50%, 05/15/2018 | 1,418,063 | ||||||
| 800,000 | Santander | ||||||
| Financial Issuances, | |||||||
6.375%, 02/15/2011 f | 832,539 | ||||||
| 1,300,000 | Schwab Capital Trust I, | ||||||
| 7.50%, 11/15/2037 | |||||||
| (Callable 11/15/2017) | 650,143 | ||||||
| SLM Corporation Notes: | |||||||
| 1,516,000 | 4.50%, 07/26/2010 | 1,315,686 | |||||
| 200,000 | 5.375%, 05/15/2014 | 134,975 | |||||
| 1,000,000 | Sovereign Bank, Inc., | ||||||
| 8.75%, 05/30/2018 | 987,935 | ||||||
| 1,000,000 | St. Paul Travelers, Inc., | ||||||
| 6.25%, 06/20/2016 | 1,000,251 | ||||||
| 1,046,000 | Toll Road Inv. | ||||||
| Partnership II, | |||||||
| 0.00%, 02/15/2011 | |||||||
| (Acquired 09/28/2004; | |||||||
| Cost $946,449)* ^ | 935,812 | ||||||
| 1,320,000 | Transamerica Finance | ||||||
| Corporation Debentures, | |||||||
| 0.00%, 03/01/2010 ^ | 1,154,215 | ||||||
| 850,000 | UFJ Finance Aruba AEC, | ||||||
6.75%, 07/15/2013 f | 830,788 | ||||||
| 500,000 | Washington Mutual Bank | ||||||
| Subordinated Notes, | |||||||
| 6.875%, 06/15/2011 | 50 | ||||||
| Westdeutsche Landesbank | |||||||
| Subordinated Notes: | |||||||
| 246,000 | 6.05%, 01/15/2009 | 246,308 | |||||
| 1,495,000 | 4.796%, 07/15/2015 | 1,686,933 | |||||
| 74,567,254 | |||||||
| Industrial – 16.8% | |||||||
| 450,000 | Alcan, Inc., Notes, | ||||||
5.00%, 06/01/2015 f | 333,212 | ||||||
| 2,000,000 | American Standard Inc., | ||||||
| 8.25%, 06/01/2009 | 2,012,138 | ||||||
| Ameritech Capital | |||||||
| Funding Debentures: | |||||||
| 1,158,879 | 9.10%, 06/01/2016 | 1,224,826 | |||||
| 1,008,000 | 6.45%, 01/15/2018 | 996,898 | |||||
| 2,250,000 | British Sky | ||||||
| Broadcasting Group, | |||||||
8.20%, 07/15/2009 f | 2,287,222 | ||||||
| 2,000,000 | British | ||||||
| Telecommunications PLC, | |||||||
5.95%, 01/15/2018 f | 1,739,934 | ||||||
The accompanying notes are an integral part of these financial statements.
Page 13
Baird Intermediate Bond Fund
Schedule of Investments December 31, 2008 |
| Principal | |||||||
| Amount | Value | ||||||
| LONG-TERM INVESTMENTS – 97.1% (cont.) | |||||||
| Industrial – 16.8% (cont.) | |||||||
| Bunge Ltd. Finance | |||||||
| Corporation Notes: | |||||||
| $ | 800,000 | 5.35%, 04/15/2014 | $ | 573,932 | |||
| 1,085,000 | 5.10%, 07/15/2015 | 789,259 | |||||
| 1,650,000 | CBS Corporation, | ||||||
| 7.70%, 07/30/2010 | 1,612,847 | ||||||
| 1,250,000 | Clear Channel | ||||||
| Communications Senior | |||||||
| Unsubordinated Notes, | |||||||
| 5.50%, 12/15/2016 | 143,750 | ||||||
| Comcast Cable Holdings, | |||||||
| 550,000 | 7.875%, 08/01/2013 | 565,519 | |||||
| 125,000 | Comcast Cable | ||||||
| Communication Holdings, | |||||||
| 8.375%, 03/15/2013 | 129,316 | ||||||
| 525,000 | Comcast Corporation, | ||||||
| 6.50%, 01/15/2017 | 518,550 | ||||||
| 50,000 | Comcast Holdings | ||||||
| Corporation, | |||||||
| 10.625%, 07/15/2012 | 53,103 | ||||||
| 1,062,000 | Computer Sciences | ||||||
| Corporation Notes, | |||||||
| 6.25%, 03/15/2009 | 1,058,504 | ||||||
| 1,281,000 | COX Communications Inc., | ||||||
| 7.125%, 10/01/2012 | 1,225,939 | ||||||
| 750,000 | COX Communications | ||||||
| Inc. Notes, | |||||||
| 7.875%, 08/15/2009 | 737,242 | ||||||
| CSX Corporation: | |||||||
| 1,700,000 | 5.75%, 03/15/2013 | 1,597,356 | |||||
| 450,000 | 6.25%, 04/01/2015 | 441,725 | |||||
| 1,250,000 | Deutsche Telekom | ||||||
| International Finance BV, | |||||||
8.50%, 06/15/2010 f | 1,287,593 | ||||||
| Donnelley (R.R.) | |||||||
| & Sons Co.: | |||||||
| 1,500,000 | 3.75%, 04/01/2009 | 1,471,599 | |||||
| 875,000 | 6.125%, 01/15/2017 | 622,557 | |||||
| 1,000,000 | D.R. Horton Inc. | ||||||
| Unsubordinated Notes, | |||||||
| 6.50%, 04/15/2016 | 630,000 | ||||||
| 2,225,000 | Fiserv, Inc., | ||||||
| 6.125%, 11/20/2012 | 2,090,465 | ||||||
| 623,000 | Ford Capital BV | ||||||
| Debentures, | |||||||
| 9.50%, 06/01/2010 | 271,005 | ||||||
| 300,000 | Ford Motor Company | ||||||
| Debentures, | |||||||
| 9.215%, 09/15/2021 | 69,000 | ||||||
| 1,260,000 | GTE Corporation, | ||||||
| 6.84%, 04/15/2018 | 1,276,201 | ||||||
| 675,000 | Halliburton Company Notes, | ||||||
| 5.50%, 10/15/2010 | 689,432 | ||||||
| 1,325,000 | Hanson Australia Funding, | ||||||
5.25%, 03/15/2013 f | 450,521 | ||||||
| 650,000 | Hanson PLC Notes, | ||||||
6.125%, 08/15/2016 f | 226,360 | ||||||
| 1,195,000 | Health Care Service | ||||||
| Corporation Notes, | |||||||
| 7.75%, 06/15/2011 | |||||||
| (Acquired 06/20/2001, | |||||||
| 01/26/2005, and | |||||||
| 10/19/2006; Cost | |||||||
| $497,765, $350,953, and | |||||||
| $383,154, respectively)* | 1,274,844 | ||||||
| 420,000 | Highmark, Inc. Notes, | ||||||
| 6.80%, 08/15/2013 | |||||||
| (Acquired 08/14/2003 and | |||||||
| 03/13/2008; Cost $399,088 | |||||||
| and $20,744)* | 400,151 | ||||||
The accompanying notes are an integral part of these financial statements.
Page 14
Baird Intermediate Bond Fund
Schedule of Investments December 31, 2008 |
| Principal | |||||||
| Amount | Value | ||||||
| LONG-TERM INVESTMENTS – 97.1% (cont.) | |||||||
| Industrial – 16.8% (cont.) | |||||||
| $ | 2,000,000 | Humana Inc., | |||||
| 7.20%, 06/15/2018 | $ | 1,608,376 | |||||
| 975,000 | Hutchison Whampoa | ||||||
| International Limited, | |||||||
| 6.25%, 01/24/2014 | |||||||
| (Acquired 11/19/2003 | |||||||
| and 02/08/2005; | |||||||
| Cost $749,228 | |||||||
and $237,149)* f | 932,468 | ||||||
| 1,000,000 | Ingersoll-Rand | ||||||
| Company Debentures, | |||||||
6.391%, 11/15/2027 f | 1,006,247 | ||||||
| 1,850,000 | International Paper | ||||||
| Company Notes, | |||||||
| 4.25%, 01/15/2009 | 1,849,362 | ||||||
| 1,100,000 | Johnson Controls Inc. | ||||||
| Senior Notes, | |||||||
| 5.50%, 01/15/2016 | 852,431 | ||||||
| 1,000,000 | Kraft Foods, Inc., | ||||||
| 6.125%, 08/23/2018 | 985,874 | ||||||
| 675,000 | Laboratory Corporation | ||||||
| of America Holdings, | |||||||
| 5.50%, 02/01/2013 | 647,681 | ||||||
| 550,000 | Lafarge S.A. Notes, | ||||||
6.50%, 07/15/2016 f | 371,098 | ||||||
| 500,000 | Limited Brands, Inc., | ||||||
| 5.25%, 11/01/2014 | 288,435 | ||||||
| 400,000 | Marathon Global | ||||||
| Funding Corp, | |||||||
| 6.00%, 07/01/2012 | 404,376 | ||||||
| 1,550,000 | Masco Corporation, | ||||||
| 6.125%, 10/03/2016 | 1,063,844 | ||||||
| 650,000 | Nabors Industrials, Inc., | ||||||
| 6.15%, 02/15/2018 | |||||||
| (Acquired 02/14/2008; | |||||||
| Cost $649,480)* | 559,223 | ||||||
| 650,000 | New York Telephone | ||||||
| Company Debentures, | |||||||
| 8.625%, 11/15/2010 | 675,867 | ||||||
| 2,307,000 | Nextel Communications | ||||||
| Senior Notes, | |||||||
| 6.875%, 10/31/2013 | 980,475 | ||||||
| 700,000 | PCCW Capital II Ltd., | ||||||
| 6.00%, 07/15/2013 | |||||||
| (Acquired 07/10/2003; | |||||||
Cost $696,731)* f | 598,955 | ||||||
| 925,000 | Pearson Dollar Finance PLC, | ||||||
| 5.70%, 06/01/2014 | |||||||
| (Acquired 09/28/2005 and | |||||||
| 12/14/2007; Cost $612,344 | |||||||
and $321,181)* f | 814,547 | ||||||
| 1,850,000 | PEMEX Project | ||||||
| Funding Master Trust, | |||||||
| 9.125%, 10/13/2010 | 1,947,125 | ||||||
| 1,770,000 | Plum Creek Timberlands, | ||||||
| 5.875%, 11/15/2015 | 1,445,663 | ||||||
| Qwest Capital | |||||||
| Funding, Inc.: | |||||||
| 350,000 | 7.00%, 08/03/2009 | 343,000 | |||||
| 100,000 | 7.25%, 02/15/2011 | 84,000 | |||||
| 1,000,000 | Reed Elsevier Capital Notes, | ||||||
| 4.625%, 06/15/2012 | 879,814 | ||||||
| 1,800,000 | Rio Tinto Financial | ||||||
| USA Ltd., | |||||||
6.50%, 07/15/2018 f | 1,319,708 | ||||||
| 500,000 | Sprint Nextel Corporation, | ||||||
| 6.00%, 12/01/2016 | 352,500 | ||||||
| 1,100,000 | Sunoco, Inc. Senior | ||||||
| Unsecured Notes, | |||||||
| 5.75%, 01/15/2017 | 914,180 | ||||||
| TCI Communications, | |||||||
| Inc. Debentures: | |||||||
| 583,000 | 8.75%, 08/01/2015 | 620,579 | |||||
The accompanying notes are an integral part of these financial statements.
Page 15
Baird Intermediate Bond Fund
Schedule of Investments December 31, 2008 |
| Principal | |||||||
| Amount | Value | ||||||
| LONG-TERM INVESTMENTS – 97.1% (cont.) | |||||||
| Industrial – 16.8% (cont.) | |||||||
Telecom Italia Capital: f | |||||||
| $ | 1,360,000 | 4.95%, 09/30/2014 | $ | 1,035,300 | |||
| 650,000 | 5.25%, 10/01/2015 | 494,812 | |||||
| 906,000 | Tele-Communications, | ||||||
| Inc. Debentures, | |||||||
| 9.80%, 02/01/2012 | 955,110 | ||||||
| 1,650,000 | Telefonica | ||||||
| Emisiones, S.A.U., | |||||||
6.421%, 06/20/2016 f | 1,647,136 | ||||||
| 1,000,000 | Time Warner Cable, Inc., | ||||||
| 5.85%, 05/01/2017 | 913,553 | ||||||
| 250,000 | Time Warner | ||||||
| Companies, Inc., | |||||||
| 6.875%, 06/15/2018 | 223,222 | ||||||
| 1,747,000 | Time Warner Companies | ||||||
| Inc. Debentures, | |||||||
| 9.125%, 01/15/2013 | 1,731,287 | ||||||
| 1,470,000 | Transocean, Inc., | ||||||
6.625%, 04/15/2011 f | 1,501,110 | ||||||
| 500,000 | Tyco Electronics | ||||||
| Group S. A., | |||||||
| 6.55%, 10/01/2017 | |||||||
| (Acquired 09/26/2007; | |||||||
Cost $504,926)* f | 420,201 | ||||||
| Tyco International | |||||||
Finance: f | |||||||
| 1,525,000 | 6.375%, 10/15/2011 | 1,498,990 | |||||
| 650,000 | 6.00%, 11/15/2013 | 609,905 | |||||
| United AirLines, Inc. | |||||||
| Pass-Thru Certificates: | |||||||
| 207,039 | Series 1991-A, Class A-2, | ||||||
| 10.02%, 03/22/2014 | 85,403 | ||||||
| 188,541 | Series 2001-1, Class A-2, | ||||||
| 6.201%, 12/31/2049 | 175,343 | ||||||
| 245,275 | Series 2000-2, Class C, | ||||||
| 7.762%, 12/31/2049 | 206,644 | ||||||
| 1,500,000 | Vale Overseas Limited, | ||||||
6.25%, 01/23/2017 f | 1,414,200 | ||||||
| 250,000 | Verizon Communications | ||||||
| Senior Unsecured Notes, | |||||||
| 5.55%, 02/15/2016 | 244,254 | ||||||
| 2,000,000 | Vulcan Materials Co., | ||||||
| 7.00%, 06/15/2018 | 1,564,806 | ||||||
| Waste Management, Inc.: | |||||||
| 2,510,000 | 6.875%, 05/15/2009 | 2,498,346 | |||||
| 25,000 | 5.00%, 03/15/2014 | 21,451 | |||||
| 500,000 | Willamette Industries, | ||||||
| Inc. Notes, | |||||||
| 6.60%, 06/05/2012 | 421,592 | ||||||
| 68,009,493 | |||||||
| Mortgage Backed Securities – 18.4% | |||||||
| Bank of America | |||||||
| Alternative Loan Trust: | |||||||
| 442,579 | Series 2003-11, Class 4A1, | ||||||
| 4.75%, 01/25/2019 | 423,217 | ||||||
| 1,280,243 | Series 2004-2, Class 5A1, | ||||||
| 5.50%, 03/25/2019 | 1,191,116 | ||||||
| 1,470,321 | Series 2004-11, Class 4A1, | ||||||
| 5.50%, 12/25/2019 | 1,396,346 | ||||||
| 827,056 | Series 2006-2, Class 7A1, | ||||||
| 6.00%, 03/25/2021 | 693,492 | ||||||
| 1,292,339 | Series 2006-3, Class 6A1, | ||||||
| 6.00%, 04/25/2036 | 936,945 | ||||||
| 1,252,258 | Series 2006-4, Class 3CB4, | ||||||
| 6.00%, 05/25/2046 | 855,086 | ||||||
| 941,584 | Bank of America | ||||||
| Funding Corporation, | |||||||
| Series 2003-3, Class 1A41, | |||||||
| 5.50%, 10/25/2033 | 884,366 | ||||||
The accompanying notes are an integral part of these financial statements.
Page 16
Baird Intermediate Bond Fund
Schedule of Investments December 31, 2008 |
| Principal | |||||||
| Amount | Value | ||||||
| LONG-TERM INVESTMENTS – 97.1% (cont.) | |||||||
| Mortgage Backed Securities – 18.4% (cont.) | |||||||
| Citicorp Mortgage | |||||||
| Securities, Inc.: | |||||||
| $ | 1,369,050 | Series 2004-5, Class 1A25, | |||||
| 5.50%, 10/25/2014 | $ | 1,292,261 | |||||
| 1,246,317 | Series 2004-4, Class A5, | ||||||
| 5.50%, 06/25/2034 | 1,148,953 | ||||||
| Countrywide Alternative | |||||||
| Loan Trust: | |||||||
| 359,863 | Series 2005-5R, Class A2, | ||||||
| 4.75%, 12/25/2018 | 323,024 | ||||||
| 1,301,983 | Series 2005-50CB, | ||||||
| Class 4A1, 5.00%, | |||||||
| 11/25/2020 | 1,095,080 | ||||||
| 1,374,576 | Series 2005-85CB, Class | ||||||
| 3A1, 5.25%, 02/25/2021 | |||||||
| (Acquired 09/26/2007, | |||||||
| 10/11/2007 and 06/19/2008; | |||||||
| Cost $273,511, $42,626 | |||||||
| and $957,934)* | 1,234,182 | ||||||
| 2,202,610 | Series 2006-7CB, | ||||||
| Class 3A1, 5.25%, | |||||||
| 05/25/2021 | 1,497,087 | ||||||
| 50,000 | Series 2005-10CB, | ||||||
| Class 1A6, 5.50%, | |||||||
| 05/25/2035 | 39,028 | ||||||
| 175,675 | Series 2005-11CB, | ||||||
| Class 2A1, 5.50%, | |||||||
| 06/25/2035 | 143,342 | ||||||
| 1,515,520 | Series 2005-34CB, | ||||||
| Class 1A6, 5.50%, | |||||||
| 09/25/2035 | 1,333,092 | ||||||
| 1,340,478 | Countrywide Home | ||||||
| Loans, Inc., | |||||||
| Series 2003-18, Class A3, | |||||||
| 5.25%, 07/25/2033 | 1,231,190 | ||||||
| 126,312 | Credit Suisse First Boston | ||||||
| Mortgage Securities Corp., | |||||||
| Series 2005-3, Class 3A27, | |||||||
| 5.50%, 07/25/2035 | 101,255 | ||||||
| Federal Gold | |||||||
| Loan Mortgage | |||||||
| Corporation (FGLMC) | |||||||
| Pass-Thru Certificates: | |||||||
| 1,319,023 | 6.00%, 06/01/2021 | 1,367,856 | |||||
| 49,146 | 6.00%, 07/01/2028 | 50,983 | |||||
| Federal Home | |||||||
| Loan Mortgage | |||||||
| Corporation (FHLMC): | |||||||
| 1,259,494 | Series 3033, Class LU, | ||||||
| 5.50%, 03/15/2013 | 1,294,696 | ||||||
| 1,364,124 | Series 2695, Class UA, | ||||||
| 5.50%, 09/15/2014 | 1,407,805 | ||||||
| 7,907,888 | Series R014, Class AL, | ||||||
| 5.50%, 10/15/2014 | 8,015,224 | ||||||
| 545,700 | Series R001, Class AE, | ||||||
| 4.375%, 04/15/2015 | 551,470 | ||||||
| 1,929,468 | Series R003, Class VA, | ||||||
| 5.50%, 08/15/2016 | 2,009,864 | ||||||
| 2,189,810 | Series 3122, Class VA, | ||||||
| 6.00%, 01/15/2017 | 2,271,177 | ||||||
| 1,714,239 | Series R010, Class VA, | ||||||
| 5.50%, 04/15/2017 | 1,785,807 | ||||||
| 4,089,752 | Series R009, Class AJ, | ||||||
| 5.75%, 12/15/2018 | 4,176,181 | ||||||
| 41,540 | Series 1395, Class G, | ||||||
| 6.00%, 10/15/2022 | 41,490 | ||||||
| 462,742 | Series 2970, Class DA, | ||||||
| 5.50%, 01/15/2023 | 472,359 | ||||||
| Federal National Mortgage | |||||||
| Association (FNMA): | |||||||
| 955,138 | Series 2006-B2, Class AB, | ||||||
| 5.50%, 05/25/2014 | 977,866 | ||||||
The accompanying notes are an integral part of these financial statements.
Page 17
Baird Intermediate Bond Fund
Schedule of Investments December 31, 2008 |
| Principal | |||||||
| Amount | Value | ||||||
| LONG-TERM INVESTMENTS – 97.1% (cont.) | |||||||
| Mortgage Backed Securities – 18.4% (cont.) | |||||||
| $ | 975,598 | Series 2003-24, Class PC, | |||||
| 5.00%, 11/25/2015 | $ | 988,272 | |||||
| 1,773,427 | Series 2006-B1, Class AB, | ||||||
| 6.00%, 06/25/2016 | 1,812,256 | ||||||
| 50,000 | Series 2003-35, Class TD, | ||||||
| 5.00%, 12/25/2016 | 50,667 | ||||||
| 148,980 | Series 1991-137, Class H, | ||||||
| 7.00%, 10/25/2021 | 159,403 | ||||||
| 134,276 | Series 1992-136, Class PK, | ||||||
| 6.00%, 08/25/2022 | 139,781 | ||||||
| 72,379 | Series 1993-32, Class H, | ||||||
| 6.00%, 03/25/2023 | 74,373 | ||||||
| 6,500,000 | Series 2002-85, Class PD, | ||||||
| 5.50%, 05/25/2031 | 6,632,129 | ||||||
| 2,457,185 | Series 2004-W6, Class 1A6, | ||||||
| 5.50%, 07/25/2034 | 2,284,120 | ||||||
| 4,050,000 | Series 2004-W10, Class A24, | ||||||
| 5.00%, 08/25/2034 | 3,993,016 | ||||||
| GMAC Mortgage | |||||||
| Corporation Loan Trust: | |||||||
| 154,933 | Series 2003-J1, Class A2, | ||||||
| 5.25%, 03/25/2018 | 157,421 | ||||||
| 1,418,314 | Series 2004-J4, Class A2, | ||||||
| 5.50%, 09/25/2034 | 1,332,141 | ||||||
| 389,314 | Government National | ||||||
| Mortgage Association | |||||||
| (GNMA), | |||||||
| Series 1999-4, Class ZB, | |||||||
| 6.00%, 02/20/2029 | 401,390 | ||||||
| J.P. Morgan Alternative | |||||||
| Loan Trust: | |||||||
| 3,363,682 | Series 2005-S1, Class 3A1, | ||||||
| 5.50%, 10/25/2020 | 2,622,623 | ||||||
| 1,299,269 | Series 2006-A1, Class 2A1, | ||||||
| 5.80%, 03/25/2036 | 650,997 | ||||||
| 2,691,777 | Series 2006-S2, Class A2, | ||||||
| 5.81%, 05/25/2036 | 2,151,578 | ||||||
| 746,443 | Lehman Mortgage Trust, | ||||||
| Series 2006-4, Class 3A1, | |||||||
| 5.00%, 08/25/2021 @ | 542,104 | ||||||
| Master Alternative | |||||||
| Loans Trust: | |||||||
| 2,105,726 | Series 2004-1, Class 1A1, | ||||||
| 5.00%, 01/25/2019 | 1,845,143 | ||||||
| 468,934 | Series 2004-3, Class 1A1, | ||||||
| 5.00%, 03/25/2019 | 410,903 | ||||||
| 268,825 | Series 2005-3, Class 4A1, | ||||||
| 5.50%, 03/25/2020 | 233,110 | ||||||
| 346,724 | Salomon Brothers | ||||||
| Mortgage Securities VII, | |||||||
| Series 2003-UP2, Class A2, | |||||||
| 4.00%, 06/25/2033 | 320,202 | ||||||
| Washington Mutual, Inc. | |||||||
| Pass-Thru Certificates: | |||||||
| 2,157,163 | Series 2004-CB1, | ||||||
| Class 5A, 5.00%, | |||||||
| 06/25/2019 | 2,105,930 | ||||||
| 3,057,898 | Series 2004-CB3, | ||||||
| Class 3A, 5.50%, | |||||||
| 10/25/2019 | 2,995,786 | ||||||
| 1,166,356 | Series 2004-CB3, | ||||||
| Class 4A, 6.00%, | |||||||
| 10/25/2019 | 1,000,151 | ||||||
| 745,649 | Series 2004-CB4, | ||||||
| Class 21A, 5.50%, | |||||||
| 12/25/2019 | 677,829 | ||||||
| 955,675 | Series 2004-CB4, | ||||||
| Class 22A, 6.00%, | |||||||
| 12/25/2019 | 880,054 | ||||||
| 74,703,219 | |||||||
The accompanying notes are an integral part of these financial statements.
Page 18
Baird Intermediate Bond Fund
Schedule of Investments December 31, 2008 |
| Principal | |||||||
| Amount | Value | ||||||
| LONG-TERM INVESTMENTS – 97.1% (cont.) | |||||||
| Taxable Municipal Bonds – 0.5% | |||||||
| $ | 1,595,000 | Tobacco Settlement | |||||
| Authority Iowa, | |||||||
| 6.50%, 06/01/2023 | $ | 1,152,292 | |||||
| 708,752 | Tobacco Settlement | ||||||
| Financing Corporation, | |||||||
| Series 2001-A, Class A, | |||||||
| 6.36%, 05/15/2025 | 688,829 | ||||||
| 1,841,121 | |||||||
| Utilities – 5.6% | |||||||
| 2,415,000 | Baltimore Gas | ||||||
| & Electic Co., | |||||||
| 6.125%, 07/01/2013 | 2,234,493 | ||||||
| 1,715,000 | Cilcorp Inc. Senior Notes, | ||||||
| 8.70%, 10/15/2009 | 1,577,800 | ||||||
| 50,000 | Commonwealth Edison, | ||||||
| 5.95%, 08/15/2016 | 46,660 | ||||||
| Dominion Resources Inc.: | |||||||
| 450,000 | 6.25%, 06/30/2012 | 451,427 | |||||
| 1,000,000 | 5.15%, 07/15/2015 | 929,110 | |||||
| 600,000 | Energy Transfer Partners, | ||||||
| 5.65%, 08/01/2012 | 535,670 | ||||||
| 600,000 | Exelon Corporation | ||||||
| Senior Notes, | |||||||
| 6.75%, 05/01/2011 | 585,580 | ||||||
| 2,500,000 | Kinder Morgan Finance, | ||||||
5.70%, 01/05/2016 f | 1,862,500 | ||||||
| 315,054 | Kiowa Power Partners LLC, | ||||||
| 4.811%, 12/30/2013 | |||||||
| (Acquired 11/19/2004; | |||||||
| Cost $327,791)* | 294,575 | ||||||
| 300,000 | Korea Electric Power | ||||||
| Corporation, | |||||||
6.75%, 08/01/2027 f | 224,716 | ||||||
| 1,400,000 | National Grid PLC | ||||||
| Senior Unsecured Notes, | |||||||
6.30%, 08/01/2016 f | 1,219,896 | ||||||
| 25,000 | National Rural Utilities, | ||||||
| 4.375%, 10/01/2010 | 24,818 | ||||||
| 100,000 | NiSource Finance | ||||||
| Corporation, | |||||||
| 7.875%, 11/15/2010 | 91,509 | ||||||
| 400,000 | ONEOK, Inc. | ||||||
| Senior Notes, | |||||||
| 7.125%, 04/15/2011 | 376,435 | ||||||
| 1,800,000 | ONEOK Partners | ||||||
| LP Notes, | |||||||
| 5.90%, 04/01/2012 | 1,742,377 | ||||||
| 1,700,000 | PPL Energy Supply, LLC | ||||||
| Bonds, Series A, | |||||||
| 5.70%, 10/15/2015 | 1,400,866 | ||||||
| 388,000 | PPL Energy Supply, LLC | ||||||
| Senior Notes, | |||||||
| 6.40%, 11/01/2011 | 381,631 | ||||||
| 900,000 | Progress Energy, Inc. | ||||||
| Senior Notes, | |||||||
| 6.85%, 04/15/2012 | 902,557 | ||||||
| 175,000 | PSE&G Energy Holdings | ||||||
| LLC Senior Notes, | |||||||
| 8.50%, 06/15/2011 | 164,958 | ||||||
| PSE&G Power LLC: | |||||||
| 275,000 | 7.75%, 04/15/2011 | 274,684 | |||||
| 425,000 | 5.00%, 04/01/2014 | 381,331 | |||||
| 806,208 | RGS (I&M) Funding | ||||||
| Corporation Debentures, | |||||||
| 9.82%, 12/07/2022 | 952,518 | ||||||
| 1,500,000 | Rockies Express | ||||||
| Pipeline LLC, | |||||||
| 5.10%, 08/20/2009 | |||||||
| (Acquired 09/17/2007; | |||||||
| Cost $1,498,364)* | 1,500,744 | ||||||
| 1,400,000 | Spectra Energy Capital, | ||||||
| 5.668%, 08/15/2014 | 1,227,957 | ||||||
The accompanying notes are an integral part of these financial statements.
Page 19
Baird Intermediate Bond Fund
Schedule of Investments December 31, 2008 |
| Principal | |||||||
| Amount | Value | ||||||
| LONG-TERM INVESTMENTS – 97.1% (cont.) | |||||||
| Utilities – 5.6% (cont.) | |||||||
| $ | 1,340,000 | Transcontinental Gas | |||||
| Pipe Line Corporation | |||||||
| Senior Notes, | |||||||
| 8.875%, 07/15/2012 | $ | 1,307,697 | |||||
| Vectren Utility Holdings: | |||||||
| 900,000 | 6.625%, 12/01/2011 | 901,754 | |||||
| 525,000 | 5.250%, 08/01/2013 | 501,437 | |||||
| 600,000 | Williams Companies, Inc. | ||||||
| Notes, 8.125%, 03/15/2012 | 552,750 | ||||||
| 251,896 | Yosemite Securities Trust I, | ||||||
| 8.25%, 11/15/2004 | |||||||
| (Acquired 04/26/2001; | |||||||
| Cost $251,896) f @ | 630 | ||||||
| 22,649,080 | |||||||
| U.S. Government Agency Issues – 16.2% | |||||||
| Federal National Mortgage | |||||||
| Association (FNMA): | |||||||
| 17,950,000 | 6.00%, 05/15/2011 | 19,839,830 | |||||
| 43,500,000 | 3.625%, 02/12/2013 | 46,036,876 | |||||
| 65,876,706 | |||||||
| U.S. Treasury Obligations – 17.9% | |||||||
| 47,075,000 | U.S. Treasury Bonds, | ||||||
| 9.125%, 05/15/2018 | 72,800,734 | ||||||
| Total Long-Term | |||||||
| Investments | |||||||
| (Cost $422,868,516) | 394,014,194 | ||||||
| Shares | |||||||
| SHORT-TERM INVESTMENTS – 2.8% | |||||||
| Money Market Fund – 2.8% | |||||||
| 11,392,906 | Short-Term Investment | ||||||
| Company Liquid Assets | |||||||
| Portfolio - AIM Fund | 11,392,906 | ||||||
| Total Short-Term | |||||||
| Investments | |||||||
| (Cost $11,392,906) | 11,392,906 | ||||||
| Principal | |||||||
| Amount | |||||||
| INVESTMENTS PURCHASED | |||||||
| WITH CASH PROCEEDS FROM | |||||||
| SECURITIES LENDING – 34.7% | |||||||
| Certificates of Deposit – 6.3% | |||||||
| $ | 5,704,752 | Abbey National Treasury | |||||
| Service, Series YCD1, | |||||||
| 1.09%, 02/20/09 | 5,704,296 | ||||||
| 5,704,752 | Barclays Bank, | ||||||
| 3.3615%, 03/16/09 | 5,700,245 | ||||||
| Natixis Bank of New York, | |||||||
| Series YCD1: | |||||||
| 4,026,884 | 0.89%, 02/18/09 | 4,026,642 | |||||
| 3,355,737 | 0.89%, 06/30/09 | 3,361,240 | |||||
| 5,033,606 | Royal Bank of | ||||||
| Scotland Group PLC, | |||||||
| 2.9944%, 05/06/09 | 5,033,506 | ||||||
| 1,677,868 | Societe Generale of | ||||||
| New York, Series YCD1, | |||||||
| 2.0625%, 02/20/09 | 1,677,767 | ||||||
| 25,503,696 | |||||||
| Commercial Paper – 0.8% | |||||||
| 3,381,314 | Atlantic East | ||||||
| Funding, LLC, | |||||||
| 3.0588%, 03/25/09 # | 3,381,314 | ||||||
| 3,381,314 | |||||||
The accompanying notes are an integral part of these financial statements.
Page 20
Baird Intermediate Bond Fund
Schedule of Investments December 31, 2008 |
| Principal | |||||||
| Amount | Value | ||||||
| INVESTMENTS PURCHASED | |||||||
| WITH CASH PROCEEDS FROM | |||||||
| SECURITIES LENDING – 34.7% (cont.) | |||||||
| Corporate Bonds and Notes – 3.4% | |||||||
| Allstate Life GL: | |||||||
| $ | 3,691,310 | 3.0575%, 03/20/09 | $ | 3,667,059 | |||
| 1,677,868 | 1.775%, 07/21/09 | 1,646,308 | |||||
| 3,355,737 | Svenska Handelsbanken, | ||||||
| 4.410%, 08/06/09 | 3,354,024 | ||||||
| 5,033,606 | Wachovia Bank NA, | ||||||
| 3.0013%, 05/01/09 | 4,978,184 | ||||||
| 13,645,575 | |||||||
| Government Agencies – 2.3% | |||||||
| 9,396,063 | Federal Home Loan Banks, | ||||||
| 0.645%, 03/02/09 | 9,390,707 | ||||||
| 9,390,707 | |||||||
| Shares | |||||||
| Investment Companies – 21.9% | |||||||
| 86,621,880 | Mount Vernon Securities | ||||||
| Lending Trust - | |||||||
| Prime Portfolio | 86,621,880 | ||||||
| 2,263,281 | Reserve Primary Fund # | 2,263,281 | |||||
| 88,885,161 | |||||||
| Total Investments | |||||||
| Purchased With Cash | |||||||
| Proceeds From | |||||||
| Securities Lending | |||||||
| (Cost $140,806,453) | 140,806,453 | ||||||
| Total Investments | |||||||
| (Cost $575,067,875) – | |||||||
| 134.6% | 546,213,553 | ||||||
| Other Liabilities in Excess | |||||||
| of Assets - (34.6)% | (140,280,853 | ) | |||||
| TOTAL NET | |||||||
| ASSETS - 100.0% | $ | 405,932,700 | |||||
| * | Restricted Security Deemed Liquid |
| f | Foreign Security |
| ^ | Non-Income Producing |
| # | Priced at Fair Value by the Valuation Committee as delegated by the Baird Funds’ Board of Directors |
| @ | Security in Default |
The accompanying notes are an integral part of these financial statements.
Page 21
Baird Intermediate Bond Fund
Schedule of Investments December 31, 2008 |
SFAS 157 – Summary of Fair Value Exposure at December 31, 2008
In September 2006, the Financial Accounting Standards Board issued Statement of Financial Accounting Standards No. 157, “Fair Value Measurements” (“SFAS 157”) effective for fiscal years beginning after November 15, 2007. SFAS 157 defines fair value, establishes a framework for measuring fair value in generally accepted accounting principles (GAAP), and expands disclosures about fair value measurements. The Fund adopted SFAS 157 as of January 1, 2008. Under SFAS 157, various inputs are used in determining the value of the Fund’s investments. These inputs are summarized into three broad levels and described below:
| Level 1 – | Quoted prices in active markets for identical securities |
| Level 2 – | Other significant observable inputs (including quoted prices for similar securities, interest rates, prepayment speeds, credit risk, etc.) |
| Level 3 – | Significant unobservable inputs (including the Fund’s own assumptions in determining the fair value of investments) |
The following is a summary of the inputs used to value the Fund’s investments as of December 31, 2008:
| Description | Investments, at Value | |||
| Level 1 - Quoted prices | $ | 98,014,786 | ||
| Level 2 - Other significant observable inputs | 445,826,785 | |||
| Level 3 - Significant unobservable inputs | 2,371,982 | |||
| Total | $ | 546,213,553 | ||
Following is a reconciliation of Level 3 investments for which significant unobservable inputs were used to determine fair value.
| Investments, at Value | ||||
| Balance as of 12/31/07 | $ | 4,002,071 | ||
| Accrued discounts / premiums | — | |||
| Realized gain (loss) | — | |||
| Change in unrealized appreciation (depreciation) | — | |||
| Net purchases (sales/paydowns) | — | |||
| Transfers in and / or out of Level 3* | (1,630,089 | ) | ||
| Balance as of 12/31/08 | $ | 2,371,982 | ||
| * | The information used in the above reconciliation represents fiscal year to date activity for any investments identified as using Level 3 inputs at either the beginning or end of the current fiscal period. Transfers in or out of Level 3 represents either the beginning value (for transfers in) or ending value (for transfers out) of any security or instrument where a change in the pricing level occurred from the beginning to the end of the period. |
Page 22
Baird Aggregate Bond Fund
The Baird Aggregate Bond Fund seeks an annual rate of total return, before Fund expenses, greater than the annual rate of total return of the Barclays Capital Aggregate Bond Index. The Barclays Capital Aggregate Bond Index is an unmanaged, market value weighted index of investment grade, fixed-rate debt issues, including government, corporate, asset-backed and mortgage-backed securities, with maturities of at least one year.
Extreme volatility in the financial markets led to severely dislocated prices of bonds in several sectors that we believe do not reflect sound credit fundamentals. The Fund underperformed its benchmark index in 2008. The primary factors for the underperformance were:
| • | The Fund’s underweight to U.S. Treasuries which outperformed all other market sectors due to a flight to quality by investors; |
| • | Exposure to non-Agency mortgage-backed and asset-backed securities; and |
| • | The Fund’s overweighting to the finance sector relative to the benchmark. |
The Fund maintained its duration-neutral strategy, holding a broadly diversified portfolio of over 390 securities at year end.
The Fund ended 2008 with a yield advantage versus its benchmark index. Despite the unprecedented market volatility, we are confident of the integrity of the issues we hold and the structure of the Fund overall. We feel very strongly that the Fund will realize its sizeable yield advantage over time and outperform its benchmark through the completion of this historic and severe credit cycle.
Portfolio Characteristics
| Quality Distribution* | Sector Weightings* | ||||
 | 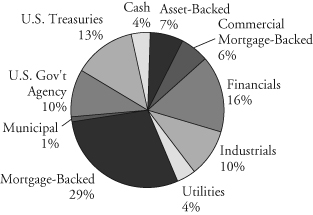 | ||||
| Net Assets: | $871,870,881 | Annualized Expense Ratio: | |||
SEC 30-Day Yield:** | Institutional Class: | 0.30% | |||
| Institutional Class: | 6.16% | Investor Class: | 0.55% | *** | |
| Investor Class: | 5.92% | Portfolio Turnover Rate: | 21.91% | ||
| Average Effective Duration: | 3.71 years | Total Number of Holdings: | 392 | ||
| Average Effective Maturity: | 5.80 years | ||||
| * | Percentages shown are based on the Fund’s total net assets. |
| ** | SEC yields are based on SEC guidelines and are calculated for the 30 days ended December 31, 2008. |
| *** | Includes 0.25% 12b-1 fee. |
Page 23
Baird Aggregate Bond Fund
| Institutional Class |
| Value of a $25,000 Investment |
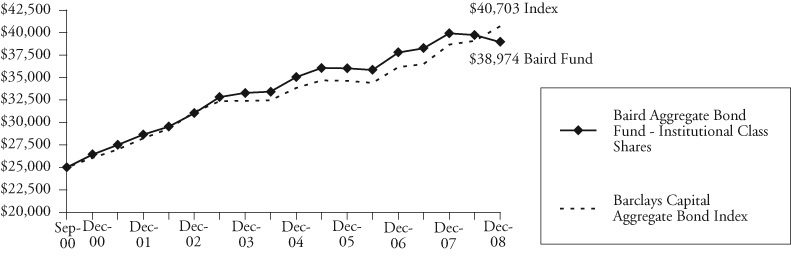 |
Growth of a hypothetical investment of $25,000 made on the Fund’s inception date (9/29/00), assuming reinvestment of all distributions.
| Investor Class |
| Value of a $10,000 Investment |
 |
Growth of a hypothetical investment of $10,000 made on the Fund’s inception date (9/29/00), assuming reinvestment of all distributions.
Page 24
Baird Aggregate Bond Fund
Average Annual Total Returns
| Since | |||
| For the Periods Ended December 31, 2008 | One Year | Five Years | Inception(1) |
| Institutional Class Shares | -2.36% | 3.21% | 5.53% |
| Investor Class Shares | -2.63% | 2.99% | 5.29% |
Barclays Capital Aggregate Bond Index(2) | 5.24% | 4.65% | 6.08% |
| (1) | For the period from September 29, 2000 (commencement of operations) through December 31, 2008. |
| (2) | The Barclays Capital Aggregate Bond Index is an unmanaged, market value weighted index of investment grade, fixed-rate debt issues, including government, corporate, asset-backed, and mortgage-backed securities, with maturities of at least one year. This index does not reflect any deduction for fees, expenses or taxes. A direct investment in an index is not possible. |
The returns shown in the table above and line graphs on the previous page reflect reinvestment of dividends and/or capital gains distributions in additional shares. The returns do not reflect the deduction of taxes that a shareholder would pay on Fund distributions or the redemption of Fund shares.
Past performance does not guarantee future results. Investment return and principal value will fluctuate so that an investor’s shares, when redeemed, may be worth more or less than their original cost.
For information about the performance of the Fund as of the most recent month-end, please call 1-866-44BAIRD or visit www.bairdfunds.com. Mutual fund performance changes over time and current performance may be lower or higher than that stated.
Page 25
Baird Aggregate Bond Fund
Schedule of Investments December 31, 2008 |
| Principal | |||||||
| Amount | Value | ||||||
| LONG-TERM INVESTMENTS – 94.8% | |||||||
| Asset Backed Securities – 6.2% | |||||||
| $ | 8,000,000 | American Express Credit | |||||
| Account Master Trust, | |||||||
| Series 2005-5, Class A, | |||||||
| 1.235%, 02/15/2013 | $ | 7,338,534 | |||||
| 2,000,000 | Bayview Financial | ||||||
| Acquisition Trust, | |||||||
| Series 2006-A, Class 1A2, | |||||||
| 5.483%, 02/28/2041 | 1,556,628 | ||||||
| Contimortgage Home | |||||||
| Equity Trust: | |||||||
| 95 | Series 1999-1, Class A7, | ||||||
| 6.97%, 12/25/2013 | 94 | ||||||
| 1,073 | Series 1997-2, Class A9, | ||||||
| 7.09%, 04/15/2028 | 1,072 | ||||||
| 12,440 | Series 1999-3, Class A8, | ||||||
| 1.03%, 05/25/2029 | 12,138 | ||||||
| Countrywide | |||||||
| Asset-Backed Certificates: | |||||||
| 4,100,000 | Series 2006-S2, Class A2, | ||||||
| 5.627%, 07/25/2027 | 3,165,909 | ||||||
| 1,865,261 | Series 2005-17, | ||||||
| Class 1AF2, 5.363%, | |||||||
| 05/25/2036 | 1,604,655 | ||||||
| 1,448,560 | Series 2004-15, | ||||||
| Class AF6, 4.613%, | |||||||
| 04/25/2035 | 1,367,016 | ||||||
| 4,889,002 | Series 2005-1, Class AF6, | ||||||
| 5.03%, 07/25/2035 | 3,478,210 | ||||||
| 4,999,048 | Series 2005-10, | ||||||
| Class AF6, 4.915%, | |||||||
| 02/25/2036 | 4,367,824 | ||||||
| 2,000,000 | Series 2005-17, | ||||||
| Class 1AF5, 5.564%, | |||||||
| 05/25/2036 | 1,261,275 | ||||||
| 2,923,601 | Series 2007-S1, Class A6, | ||||||
| 5.693%, 11/25/2036 | 1,256,254 | ||||||
| 7,000,000 | Series 2006-13, | ||||||
| Class 1AF2, 5.884%, | |||||||
| 01/25/2037 | 6,573,139 | ||||||
| 1,500,000 | Series 2006-10, | ||||||
| Class 1AF3, 5.971%, | |||||||
| 09/25/2046 | 1,339,083 | ||||||
| 1,124,263 | Credit-Based Asset | ||||||
| Servicing and Securities, | |||||||
| Series 2005-CB8, | |||||||
| Class AF2, 5.303%, | |||||||
| 12/25/2035 | 1,015,580 | ||||||
| Discover Card | |||||||
| Master Trust I: | |||||||
| 2,000,000 | Series 2004-2, Class A2, | ||||||
| 1.26%, 05/15/2012 | 1,619,084 | ||||||
| 1,700,000 | Series 2003-4,Class A2, | ||||||
| 1.38%, 05/15/2013 | 1,778,561 | ||||||
| 257,385 | Equivantage Home | ||||||
| Equity Loan Trust, | |||||||
| Series 1996-3, Class A3, | |||||||
| 7.70%, 09/25/2027 | 202,888 | ||||||
| GE Capital Mortgage | |||||||
| Services, Inc.: | |||||||
| 2,777 | Series 1997-HE4, Class A7, | ||||||
| 6.735%, 12/25/2028 | 2,773 | ||||||
| 36,788 | Series 1999-HE1, Class A7, | ||||||
| 6.265%, 04/25/2029 | 36,721 | ||||||
| 193,597 | GMAC Mortgage | ||||||
| Corporation Loan Trust, | |||||||
| Series 2004-GH1, | |||||||
| Class A2, 4.39%, | |||||||
| 12/25/2025 | 188,046 | ||||||
| Green Tree Financial | |||||||
| Corporation: | |||||||
| 833,912 | Series 1993-3, Class A7, | ||||||
| 6.40%, 10/15/2018 | 746,689 | ||||||
The accompanying notes are an integral part of these financial statements.
Page 26
Baird Aggregate Bond Fund
Schedule of Investments December 31, 2008 |
| Principal | |||||||
| Amount | Value | ||||||
| LONG-TERM INVESTMENTS – 94.8% (cont.) | |||||||
| Asset Backed Securities – 6.2% (cont.) | |||||||
| $ | 857,029 | Series 1993-4, Class A5, | |||||
| 7.05%, 01/15/2019 | $ | 741,629 | |||||
| 2,091,712 | Series 1998-2, Class A5, | ||||||
| 6.24%, 12/01/2028 | 1,585,953 | ||||||
| 149,313 | Series 1997-6, Class A8, | ||||||
| 7.07%, 01/15/2029 | 126,717 | ||||||
| 1,702,000 | Series 1998-3, Class A5, | ||||||
| 6.22%, 03/01/2030 | 1,237,163 | ||||||
| 1,022,427 | Series 1998-4, Class A5, | ||||||
| 6.18%, 04/01/2030 | 655,439 | ||||||
| 1,377,024 | GSAA Home Equity Trust, | ||||||
| Series 2005-1, Class AF2, | |||||||
| 4.316%, 11/25/2034 | 1,254,476 | ||||||
| 132,762 | IMC Home Equity | ||||||
| Loan Trust, | |||||||
| Series 1997-5, Class A10, | |||||||
| 5.749%, 11/20/2028 | 132,459 | ||||||
| 229,735 | Impac CMB Trust, | ||||||
| Series 2004-4, Class 2A2, | |||||||
| 5.75%, 09/25/2034 | 202,984 | ||||||
| 3,200,000 | MBNA Master | ||||||
| Credit Card Trust, | |||||||
| Series 2005 A4, Class A4, | |||||||
| 1.24%, 11/15/2012 | 2,949,889 | ||||||
| 97,478 | Oakwood Mortgage | ||||||
| Investors, Inc., | |||||||
| Series 1999-B, Class A3, | |||||||
| 6.45%, 11/15/2017 | 64,813 | ||||||
| RAAC Series: | |||||||
| 10,443 | Series 2004-SP1, | ||||||
| Class AI2, 4.38%, | |||||||
| 01/25/2022 | 10,358 | ||||||
| 1,156,267 | Series 2004-SP1, | ||||||
| Class AI4, 5.285%, | |||||||
| 08/25/2027 | 931,261 | ||||||
| 3,000,000 | Renaissance Home Equity | ||||||
| Loan Trust, Series 2007-1, | |||||||
| Class AF3, 5.612%, | |||||||
| 04/25/2037 | 1,593,374 | ||||||
| Residential Asset | |||||||
| Mortgage Products, Inc.: | |||||||
| 1,387,455 | Series 2003-RS7, Class | ||||||
| AI6, 5.34%, 08/25/2033 | 1,299,483 | ||||||
| 928,669 | Series 2005-RS1, | ||||||
| Class AI6, 4.713%, | |||||||
| 01/25/2035 | 693,704 | ||||||
| Residential Asset | |||||||
| Securities Corporation: | |||||||
| 270,613 | Series 2003-KS5, | ||||||
| Class AI6, 3.62%, | |||||||
| 07/25/2033 | 164,680 | ||||||
| 267,676 | Series 2004-KS2, | ||||||
| Class AI6, 4.30%, | |||||||
| 03/25/2034 | 193,209 | ||||||
| 2,600,000 | Stingray | ||||||
| Pass-Thru Certificates, | |||||||
| Series 2005, 5.902%, | |||||||
| 01/12/2015 (Acquired | |||||||
| 05/10/2007 and | |||||||
| 09/19/2007; Cost | |||||||
| $1,533,934 and $803,343, | |||||||
| respectively)* # | 390,000 | ||||||
| Structured Asset | |||||||
| Securities Corporation: | |||||||
| 109,917 | Series 2004-11XS, | ||||||
| Class 1A3A, 4.76%, | |||||||
| 06/25/2034 | 109,606 | ||||||
| 1,445,095 | Series 2005-7XS, | ||||||
| Class 1A4B, 5.44%, | |||||||
| 04/25/2035 | 1,090,627 | ||||||
| 54,339,997 | |||||||
The accompanying notes are an integral part of these financial statements.
Page 27
Baird Aggregate Bond Fund
Schedule of Investments December 31, 2008 |
| Principal | |||||||
| Amount | Value | ||||||
| LONG-TERM INVESTMENTS – 94.8% (cont.) | |||||||
| Financial – 15.5% | |||||||
| $ | 2,450,000 | American Express Credit | |||||
| Corporation, Series C, | |||||||
| 7.30%, 08/20/2013 | $ | 2,507,800 | |||||
| American General | |||||||
| Finance Corporation | |||||||
| Senior Notes: | |||||||
| 1,250,000 | 8.45%, 10/15/2009 | 900,012 | |||||
| 1,150,000 | 4.875%, 05/15/2010 | 684,426 | |||||
| 1,000,000 | 5.85%, 06/01/2013 | 379,814 | |||||
| 500,000 | 6.90%, 12/15/2017 | 216,386 | |||||
| 1,000,000 | American International | ||||||
| Group, 8.175%, | |||||||
| 05/15/2058 (Callable | |||||||
| 05/15/2038) (Acquired | |||||||
| 05/13/2008; | |||||||
| Cost $1,000,000)* | 389,025 | ||||||
| 250,000 | AmSouth Bancorporation | ||||||
| Subordinated Debentures, | |||||||
| 6.75%, 11/01/2025 | 220,984 | ||||||
| 300,000 | BAC Capital Trust VI, | ||||||
| 5.625%, 03/08/2035 | 252,026 | ||||||
| 1,065,000 | Bank of America | ||||||
| Corporation | |||||||
| Subordinated Notes, | |||||||
| 10.20%, 07/15/2015 | 1,168,137 | ||||||
| 1,435,000 | Bank of Tokyo- | ||||||
| Mitsubishi UFJ NY, | |||||||
7.40%, 06/15/2011 f | 1,389,268 | ||||||
| 929,000 | Bank One Corporation | ||||||
| Subordinated Notes, | |||||||
| 10.00%, 08/15/2010 | 978,941 | ||||||
| 2,175,000 | Banponce Trust I, | ||||||
| Series A, 8.327%, | |||||||
| 02/01/2027 (Callable | |||||||
| 03/02/2009) | 1,794,832 | ||||||
| 2,400,000 | Bear Stearns Cos., | ||||||
| Inc., Series B, | |||||||
| 6.95%, 08/10/2012 | 2,492,575 | ||||||
| 1,500,000 | BOI Capital | ||||||
| Funding No. 2, | |||||||
| 5.571%, 02/01/2016 | |||||||
| (Acquired 09/03/2008; | |||||||
Cost $966,760)* f | 329,710 | ||||||
| 2,000,000 | BOI Capital | ||||||
| Funding No. 3, | |||||||
| 6.107%, 02/04/2016 | |||||||
| (Acquired 08/25/2008 | |||||||
| and 08/26/2008; | |||||||
| Cost $686,250 | |||||||
and $676,250)* f | 439,576 | ||||||
| 2,000,000 | Capmark Financial | ||||||
| Group, Inc., | |||||||
| 6.30%, 05/10/2017 | 550,134 | ||||||
| 2,967,000 | CIT Group Company | ||||||
| of Canada, | |||||||
5.20%, 06/01/2015 f | 2,082,991 | ||||||
| CIT Group, Inc.: | |||||||
| 500,000 | 5.40%, 01/30/2016 | 348,144 | |||||
| 1,670,000 | 6.10%, 03/15/2067 | ||||||
| (Callable 03/15/2017) | 515,684 | ||||||
| 1,000,000 | Citigroup, Inc., | ||||||
| 5.50%, 04/11/2013 | 973,684 | ||||||
| 2,000,000 | Citigroup Capital XXI, | ||||||
| 8.30%, 12/21/2057 | |||||||
| (Callable 12/21/2037) | 1,542,474 | ||||||
| 1,281,000 | Compass Bank | ||||||
| Subordinated Notes, | |||||||
| 8.10%, 08/15/2009 | 1,250,800 | ||||||
The accompanying notes are an integral part of these financial statements.
Page 28
Baird Aggregate Bond Fund
Schedule of Investments December 31, 2008 |
| Principal | |||||||
| Amount | Value | ||||||
| LONG-TERM INVESTMENTS – 94.8% (cont.) | |||||||
| Financial – 15.5% (cont.) | |||||||
| Corp Andina De | |||||||
Fomento Notes: f | |||||||
| $ | 675,000 | 7.375%, 01/18/2011 | $ | 679,896 | |||
| 340,000 | 5.75%, 01/12/2017 | 284,339 | |||||
| 3,575,000 | Countrywide | ||||||
| Financial Corporation | |||||||
| Subordinated Notes, | |||||||
| 6.25%, 05/15/2016 | 3,394,491 | ||||||
| 1,000,000 | Credit Agricole S.A., | ||||||
| 6.637%, 05/29/2049 | |||||||
| (Acquired 05/23/2007; | |||||||
Cost $1,000,000)* f | 447,843 | ||||||
| 330,000 | Deutsche Bank Trust | ||||||
| Corporation Subordinated | |||||||
| Notes, 7.25%, 10/15/2011 | 332,816 | ||||||
| 3,135,000 | First Empire | ||||||
| Capital Trust I, | |||||||
| 8.234%, 02/01/2027 | |||||||
| (Callable 03/27/2009) | 2,263,899 | ||||||
| 1,575,000 | First Empire | ||||||
| Capital Trust II, | |||||||
| 8.277%, 06/01/2027 | |||||||
| (Callable 03/27/2009) | 1,139,969 | ||||||
| 3,500,000 | First Hawaiian | ||||||
| Capital Trust I, Series B, | |||||||
| 8.343%, 07/01/2027 | |||||||
| (Callable 03/27/2009) | 3,092,555 | ||||||
| 686,508 | First National | ||||||
| Bank of Chicago | |||||||
| Pass-Thru Certificates, | |||||||
| Series 1993-A, | |||||||
| 8.08%, 01/05/2018 | 893,730 | ||||||
| 3,975,000 | First National | ||||||
| Bank of Omaha | |||||||
| Subordinated Notes, | |||||||
| 7.32%, 12/01/2010 | 4,005,087 | ||||||
| First Tennessee Bank | |||||||
| Senior Unsecured Notes: | |||||||
| 2,232,000 | 3.874%, 01/23/2009 | 2,231,574 | |||||
| 1,000,000 | 2.30%, 05/18/2009 | 972,427 | |||||
| 1,748,000 | First Union Capital I, | ||||||
| Series A, | |||||||
| 7.935%, 01/15/2027 | |||||||
| (Callable 03/27/2009) | 1,450,761 | ||||||
| 5,107,000 | First Union Institutional | ||||||
| Capital I, Series A, | |||||||
| 8.04%, 12/01/2026 | |||||||
| (Callable 03/02/2009) | 4,061,102 | ||||||
| 1,460,000 | First Union Institutional | ||||||
| Capital II, | |||||||
| 7.85%, 01/01/2027 | |||||||
| (Callable 03/02/2009) | 1,196,490 | ||||||
| 2,500,000 | Fleet Capital Trust II, | ||||||
| 7.92%, 12/11/2026 | |||||||
| (Callable 03/02/2009) | 2,183,093 | ||||||
| 2,300,000 | FMR LLC Notes, | ||||||
| 4.75%, 03/01/2013 | |||||||
| (Acquired 02/26/2003 – | |||||||
| 12/21/2007; Aggregate | |||||||
| Cost $2,228,905)* | 2,114,779 | ||||||
| 2,175,000 | Glencore Funding LLC, | ||||||
| 6.00%, 04/15/2014 | |||||||
| (Acquired 03/31/2004 – | |||||||
| 06/19/2008; Aggregate | |||||||
| Cost $2,120,184)* | 880,436 | ||||||
| GMAC LLC: | |||||||
| 100,000 | 7.25%, 03/02/2011 | 84,984 | |||||
| 336,000 | 7.50%, 12/31/2013 | ||||||
| (Acquired 12/31/2008; | |||||||
| Cost $1,297,884)* # | 245,132 | ||||||
| 150,000 | 6.75%, 12/01/2014 | 102,547 | |||||
The accompanying notes are an integral part of these financial statements.
Page 29
Baird Aggregate Bond Fund
Schedule of Investments December 31, 2008 |
| Principal | |||||||
| Amount | Value | ||||||
| LONG-TERM INVESTMENTS – 94.8% (cont.) | |||||||
| Financial – 15.5% (cont.) | |||||||
| $ | 403,000 | 8.00%, 12/31/2018 | |||||
| (Acquired 12/31/2008, | |||||||
| Cost $1,556,688)* # | $ | 211,305 | |||||
| 1,180,000 | Goldman Sachs Capital I, | ||||||
| 6.345%, 02/15/2034 | 856,272 | ||||||
| 2,800,000 | Great West Life & | ||||||
| Annuity Insurance, | |||||||
| 7.153%, 05/16/2046 | |||||||
| (Acquired 05/16/2006 | |||||||
| and 11/08/2007; | |||||||
| Cost $1,000,000 | |||||||
| and $1,783,656, | |||||||
| respectively)* | 1,530,245 | ||||||
| 2,200,000 | Hartford Financial | ||||||
| Services Group Inc., | |||||||
| 8.125%, 06/15/2068 | |||||||
| (Callable 06/15/2018) | 1,158,298 | ||||||
| 950,000 | HSBC Bank PLC | ||||||
| Subordinated Notes, | |||||||
6.95%, 03/15/2011 f | 950,940 | ||||||
| 2,100,000 | HSBC Holdings PLC | ||||||
| Subordinated Notes, | |||||||
6.50%, 09/15/2037 f | 2,132,728 | ||||||
| 400,000 | HSBC USA | ||||||
| Capital Trust I, | |||||||
| 7.808%, 12/15/2026 | |||||||
| (Callable 03/02/2009) | |||||||
| (Acquired 03/08/2007; | |||||||
| Cost $412,808)* | 402,816 | ||||||
| 500,000 | HSBC USA | ||||||
| Capital Trust II, | |||||||
| 8.38%, 05/15/2027 | |||||||
| (Acquired 11/06/2007; | |||||||
| Cost $517,886)* | 496,953 | ||||||
| 3,150,000 | Huntington National | ||||||
| Bank Notes, | |||||||
| 8.00%, 04/01/2010 | 2,887,983 | ||||||
Invesco Ltd.: f | |||||||
| 775,000 | 5.375%, 02/27/2013 | 688,347 | |||||
| 921,000 | 5.375%, 12/15/2014 | 779,979 | |||||
| 6,000,000 | Istar Financial, Inc., | ||||||
| Series B, | |||||||
| 4.875%, 01/15/2009 | 5,445,000 | ||||||
| 900,000 | J.P. Morgan Chase | ||||||
| & Company Notes, | |||||||
| 5.875%, 03/15/2035 | 696,506 | ||||||
| 1,255,000 | Jefferies Group Inc., | ||||||
| 6.25%, 01/15/2036 | 745,092 | ||||||
| 1,250,000 | Kaupthing Bank, | ||||||
| 5.75%, 10/04/2011 | |||||||
| (Acquired 06/06/2008 | |||||||
| and 07/22/2008; | |||||||
| Cost $199,243 and | |||||||
$769,804, respectively )* f | 75,000 | ||||||
| 3,400,000 | Key Bank NA, | ||||||
| 7.413%, 05/06/2015 | 2,918,567 | ||||||
| Lehman Brothers | |||||||
| Holdings, Inc. Notes: @ | |||||||
| 750,000 | 8.50%, 08/01/2015 | 71,250 | |||||
| 1,425,000 | 6.50%, 07/19/2017 | 143 | |||||
| Liberty Mutual Group, | |||||||
| 2,500,000 | 10.75%, 06/15/2088 | ||||||
| (Callable 06/15/2038) | |||||||
| (Acquired 05/21/2008; | |||||||
| Cost $2,445,125)* | 1,375,000 | ||||||
| Liberty Mutual | |||||||
| Insurance Company, | |||||||
| 565,000 | 7.697%, 10/15/2097 | ||||||
| (Acquired 03/26/2003; | |||||||
| Cost $361,716)* | 375,402 | ||||||
The accompanying notes are an integral part of these financial statements.
Page 30
Baird Aggregate Bond Fund
Schedule of Investments December 31, 2008 |
| Principal | |||||||
| Amount | Value | ||||||
| LONG-TERM INVESTMENTS – 94.8% (cont.) | |||||||
| Financial – 15.5% (cont.) | |||||||
| $ | 1,125,000 | Lincoln National | |||||
| Corporation, | |||||||
| 6.05%, 04/20/2067 | |||||||
| (Callable 04/20/2017) | $ | 450,000 | |||||
| Marsh & McLennan | |||||||
| Companies, Inc.: | |||||||
| 4,200,000 | 7.125%, 06/15/2009 | 4,188,832 | |||||
| 300,000 | 5.375%, 07/15/2014 | 266,153 | |||||
| 390,909 | Marshall & Ilsley | ||||||
| Bank Notes, | |||||||
| 2.90%, 08/18/2009 | 387,200 | ||||||
| 800,000 | MBIA Insurance Corp., | ||||||
| 14.00%, 01/15/2033 | |||||||
| (Callable 01/15/2013) | |||||||
| (Acquired 01/11/2008; | |||||||
| Cost $800,000)* | 408,000 | ||||||
| Merrill Lynch & Co., Inc: | |||||||
| 1,000,000 | 6.40%, 08/28/2017 | 1,001,867 | |||||
| 1,750,000 | 6.875%, 04/25/2018 | 1,830,546 | |||||
| 1,275,000 | 7.75%, 05/14/2038 | 1,404,643 | |||||
| 1,550,000 | Metropolitan Life | ||||||
| Global Funding I, | |||||||
| 2.189%, 05/17/2010 | |||||||
| (Acquired 12/31/2008; | |||||||
| Cost $1,441,577)* | 1,465,215 | ||||||
| 2,444,000 | The Mony Group, Inc., | ||||||
| 8.35%, 03/15/2010 | 2,416,874 | ||||||
| Morgan Stanley | |||||||
| Senior Unsecured Notes: | |||||||
| 2,000,000 | 3.875%, 01/15/2009 | 1,999,422 | |||||
| 2,000,000 | 5.625%, 01/09/2012 | 1,896,614 | |||||
| 475,000 | Morgan Stanley | ||||||
| Subordinated Notes, | |||||||
| 4.75%, 04/01/2014 | 361,897 | ||||||
| 510,000 | National Bank of Hungary | ||||||
| Yankee Debentures, | |||||||
8.875%, 11/01/2013 f | 538,949 | ||||||
| 2,500,000 | National City Bank | ||||||
| of Kentucky | |||||||
| Subordinated Notes, | |||||||
| 6.30%, 02/15/2011 | 2,408,410 | ||||||
| 1,750,000 | National Westminster | ||||||
| Bank Subordinated Notes, | |||||||
7.375%, 10/01/2009 f | 1,715,851 | ||||||
| 2,000,000 | Nationwide | ||||||
| Building Society, | |||||||
| 4.25%, 02/01/2010 | |||||||
| (Acquired 12/02/2008; | |||||||
Cost $1,945,202)* f | 1,979,350 | ||||||
| 3,721,000 | Navigators Group Inc. | ||||||
| Senior Unsecured Notes, | |||||||
| 7.00%, 05/01/2016 | 2,367,211 | ||||||
| 4,334,000 | NB Capital Trust IV, | ||||||
| 8.25%, 04/15/2027 | |||||||
| (Callable 03/27/2009) | 3,585,289 | ||||||
| 2,500,000 | North Fork | ||||||
| Capital Trust II, | |||||||
| 8.00%, 12/15/2027 | |||||||
| (Callable 03/27/2009) | 1,149,225 | ||||||
| Popular North | |||||||
| American Inc.: | |||||||
| 1,975,000 | 5.65%, 04/15/2009 | 1,956,658 | |||||
| 2,000,000 | 4.70%, 06/30/2009 | 1,954,726 | |||||
| 1,000,000 | Premium Asset | ||||||
| Senior Notes, | |||||||
| 4.125%, 03/12/2009 | |||||||
| (Acquired 12/20/2006; | |||||||
| Cost $993,963)* | 121,250 | ||||||
The accompanying notes are an integral part of these financial statements.
Page 31
Baird Aggregate Bond Fund
Schedule of Investments December 31, 2008 |
| Principal | |||||||
| Amount | Value | ||||||
| LONG-TERM INVESTMENTS – 94.8% (cont.) | |||||||
| Financial – 15.5% (cont.) | |||||||
| $ | 4,750,000 | Regions Financing | |||||
| Trust II, | |||||||
| 6.625%, 05/15/2047 | |||||||
| (Callable 05/15/2027) | $ | 2,585,762 | |||||
| 1,000,000 | Republic New York | ||||||
| Capital I, | |||||||
| 7.75%, 11/15/2026 | 1,019,880 | ||||||
| 700,000 | Republic | ||||||
| New York Corporation | |||||||
| Debentures, | |||||||
| 9.125%, 05/15/2021 | 782,319 | ||||||
| 1,000,000 | Santander | ||||||
| Financial Issuances, | |||||||
6.375%, 02/15/2011 f | 1,040,674 | ||||||
| 7,760,000 | Schwab Capital Trust I, | ||||||
| 7.50%, 11/15/2067 | |||||||
| (Callable 11/15/2017) | 3,880,854 | ||||||
| 500,000 | SLM Corporation Notes, | ||||||
| 5.625%, 08/01/2033 | 303,323 | ||||||
| Sovereign Bank: | |||||||
| 1,500,000 | 1.73%, 03/23/2010 | 1,331,901 | |||||
| 750,000 | 4.80%, 09/01/2010 | 672,742 | |||||
| 1,500,000 | 8.75%, 05/30/2018 | 1,481,903 | |||||
| 1,000,000 | Symetra Financial | ||||||
| Corporation Senior Notes, | |||||||
| 6.125%, 04/01/2016 | |||||||
| (Acquired 03/23/2006; | |||||||
| Cost $995,570)* | 823,325 | ||||||
| 2,400,000 | Toll Road Inv. | ||||||
| Partnership II, | |||||||
| 0.00%, 02/15/2011 | |||||||
| (Acquired 06/19/2008, | |||||||
| Cost $2,033,157)* ^ | 2,147,179 | ||||||
| 1,000,000 | Travelers Companies, Inc., | ||||||
| 6.75%, 06/20/2036 | 1,041,050 | ||||||
| 560,000 | UFJ Finance Aruba AEC, | ||||||
6.75%, 07/15/2013 f | 547,343 | ||||||
| 301,000 | United Mexican | ||||||
| States Notes, | |||||||
6.75%, 09/27/2034 f | 317,555 | ||||||
| 650,000 | Washington Mutual | ||||||
| Preferred Funding Trust I, | |||||||
| 6.534%, 03/29/2049 | |||||||
| (Callable 03/15/2011) | |||||||
| (Acquired 07/31/2007; | |||||||
| Cost $606,756)* @ | �� | 65 | |||||
| 2,671,000 | Westdeutsche | ||||||
| Landesbank | |||||||
| Subordinated Notes, | |||||||
| 4.796%, 07/15/2015 | 3,013,911 | ||||||
| 750,000 | Willis North | ||||||
| America, Inc., | |||||||
| 5.625%, 07/15/2015 | 549,005 | ||||||
| 134,656,172 | |||||||
| Industrial – 10.4% | |||||||
| 3,500,000 | American Standard Inc., | ||||||
| 8.25%, 06/01/2009 | 3,521,241 | ||||||
| Ameritech Capital | |||||||
| Funding Debentures: | |||||||
| 2,480,009 | 9.10%, 06/01/2016 | 2,621,136 | |||||
| 1,500,000 | 6.45%, 01/15/2018 | 1,483,479 | |||||
| British Telecom | |||||||
PLC Notes: f | |||||||
| 1,050,000 | 8.625%, 12/15/2010 | 1,080,134 | |||||
| 600,000 | 9.125%, 12/15/2030 | 637,765 | |||||
| 600,000 | Bunge Limited Finance | ||||||
| Corporation Notes, | |||||||
| 5.35%, 04/15/2014 | 430,449 | ||||||
| 1,000,000 | Canadian | ||||||
| National Resources, | |||||||
6.25%, 03/15/2038 f | 785,995 | ||||||
The accompanying notes are an integral part of these financial statements.
Page 32
Baird Aggregate Bond Fund
Schedule of Investments December 31, 2008 |
| Principal | |||||||
| Amount | Value | ||||||
| LONG-TERM INVESTMENTS – 94.8% (cont.) | |||||||
| Industrial – 10.4% (cont.) | |||||||
| $ | 825,000 | CBS Corporation | |||||
| Senior Notes, | |||||||
| 7.70%, 07/30/2010 | $ | 806,423 | |||||
| 800,000 | Clear Channel | ||||||
| Communications Senior | |||||||
| Unsubordinated Notes, | |||||||
| 5.50%, 12/15/2016 | 92,000 | ||||||
| 680,000 | Comcast - Cable | ||||||
| Holdings Debentures, | |||||||
| 7.875%, 08/01/2013 | 699,187 | ||||||
| 1,000,000 | Comcast Corporation, | ||||||
| 6.95%, 08/15/2037 | 1,053,052 | ||||||
| 825,000 | Comcast Holdings | ||||||
| Corporation, | |||||||
| 10.625%, 07/15/2012 | 876,201 | ||||||
| 5,000,000 | Computer Sciences | ||||||
| Corporation Senior Notes, | |||||||
| 7.375%, 06/15/2011 | 4,951,615 | ||||||
| Conagra Foods, Inc.: | |||||||
| 580,000 | 5.819%, 06/15/2017 | 543,172 | |||||
| 120,000 | 9.75%, 03/01/2021 | 144,814 | |||||
| Continental Airlines, Inc. | |||||||
| Pass-Thru Certificates: | |||||||
| 91,670 | Series 2000-2, | ||||||
| 8.312%, 04/02/2011 | 74,253 | ||||||
| 386,132 | Series 1997-4, | ||||||
| 6.90%, 01/02/2018 | 308,905 | ||||||
| COX Communications Inc.: | |||||||
| 1,000,000 | 7.75%, 11/01/2010 | 981,515 | |||||
| 1,775,000 | 7.125%, 10/01/2012 | 1,698,705 | |||||
| 2,000,000 | CVS Caremark Corp., | ||||||
| 5.75%, 06/01/2017 | 1,882,938 | ||||||
| 1,000,000 | D.R. Horton Inc. | ||||||
| Unsubordinated Notes, | |||||||
| 6.50%, 04/15/2016 | 630,000 | ||||||
| 300,000 | Deutsche Telekom | ||||||
| International Finance BV, | |||||||
8.50%, 06/15/2010 f | 369,943 | ||||||
| 1,500,000 | Donnelley (R.R.) & Sons | ||||||
| Co., 6.125%, 01/15/2017 | 1,067,241 | ||||||
| 635,000 | FedEx Corporation, | ||||||
| 9.65%, 06/15/2012 | 666,747 | ||||||
| 1,059,375 | FedEx Corporation | ||||||
| Pass-Thru Certificates, | |||||||
| Series 1998-1, | |||||||
| 6.845%, 01/15/2019 | 953,437 | ||||||
| 3,725,000 | Fiserv, Inc., | ||||||
| 6.125%, 11/20/2012 | 3,499,768 | ||||||
| 475,000 | Ford Capital | ||||||
| BV Debentures, | |||||||
| 9.50%, 06/01/2010 | 206,625 | ||||||
| 403,000 | Ford Motor | ||||||
| Company Debentures, | |||||||
| 9.215%, 09/15/2021 | 92,690 | ||||||
| 835,182 | GGIC Funding Corporation, | ||||||
| 5.129%, 01/15/2014 | |||||||
| (Acquired 06/27/2006; | |||||||
| Cost $806,615)* | 793,073 | ||||||
| 1,200,000 | GTE Corporation | ||||||
| Debentures, | |||||||
| 6.84%, 04/15/2018 | 1,215,430 | ||||||
| 500,000 | Health Care Service | ||||||
| Corporation Notes, | |||||||
| 7.75%, 06/15/2011 | |||||||
| (Acquired 06/20/2001 | |||||||
| and 01/26/2005; Cost | |||||||
| $199,106 and $319,050, | |||||||
| respectively)* | 533,408 | ||||||
| 650,000 | Health Management | ||||||
| Association, | |||||||
| 6.125%, 04/15/2016 | 403,000 | ||||||
The accompanying notes are an integral part of these financial statements.
Page 33
Baird Aggregate Bond Fund
Schedule of Investments December 31, 2008 |
| Principal | |||||||
| Amount | Value | ||||||
| LONG-TERM INVESTMENTS – 94.8% (cont.) | |||||||
| Industrial – 10.4% (cont.) | |||||||
| $ | 1,950,000 | Highmark, Inc. Notes, | |||||
| 6.80%, 08/15/2013 | |||||||
| (Acquired 08/14/2003, | |||||||
| 09/05/2007 and | |||||||
| 12/17/2007; Cost | |||||||
| $274,373, $749,293 and | |||||||
| $956,858, respectively)* | $ | 1,857,843 | |||||
| 2,000,000 | Humana Inc., | ||||||
| 7.20%, 06/15/2018 | 1,608,376 | ||||||
| 625,000 | Hutchison Whampoa | ||||||
| International Limited, | |||||||
| 6.25%, 01/24/2014 | |||||||
| (Acquired 06/02/2004 | |||||||
| and 02/08/2005; Cost | |||||||
| $340,229 and $289,849, | |||||||
respectively)* f | 597,736 | ||||||
| 6,000,000 | International | ||||||
| Paper Company Notes, | |||||||
| 4.25%, 01/15/2009 | 5,997,930 | ||||||
| 850,000 | Johnson Controls Inc., | ||||||
| Senior Notes, | |||||||
| 6.00%, 01/15/2036 | 538,079 | ||||||
| 1,700,000 | Kraft Foods, Inc., | ||||||
| 6.125%, 08/23/2018 | 1,675,986 | ||||||
| 400,000 | Laboratory Corporation | ||||||
| of America, | |||||||
| 5.625%, 12/15/2015 | 336,650 | ||||||
| 900,000 | Lafarge S.A. Notes, | ||||||
7.125%, 07/15/2036 f | 511,296 | ||||||
| 1,000,000 | Masco Corporation, | ||||||
| 6.125%, 10/03/2016 | 686,351 | ||||||
| 650,000 | McClatchy Company, | ||||||
| 5.75%, 09/01/2017 | 104,000 | ||||||
| 1,100,000 | Nabors Industries, Inc., | ||||||
| 6.15%, 02/15/2018 | |||||||
| (Acquired 02/14/2008; | |||||||
| Cost $1,099,120)* | 946,377 | ||||||
| 1,050,000 | New Cingular Wireless | ||||||
| Services, Inc. Senior Notes, | |||||||
| 8.75%, 03/01/2031 | 1,312,590 | ||||||
| 1,500,000 | Nextel Communications, | ||||||
| 7.375%, 08/01/2015 | 630,000 | ||||||
| 320,000 | Pactiv Corporation Senior | ||||||
| Unsecured Notes, | |||||||
| 7.95%, 12/15/2025 | 299,296 | ||||||
| 400,000 | PCCW Capital II Ltd., | ||||||
| 6.00%, 07/15/2013 | |||||||
| (Acquired 07/10/2003; | |||||||
Cost $398,132)* f | 342,260 | ||||||
| 2,800,000 | PEMEX Project Funding | ||||||
| Master Trust, | |||||||
| 5.75%, 03/01/2018 | |||||||
| (Acquired 10/17/2007; | |||||||
| Cost $2,780,848)* | 2,471,000 | ||||||
| 1,145,000 | Plum Creek | ||||||
| Timberlands, | |||||||
| 5.875%, 11/15/2015 | 935,189 | ||||||
| 2,500,000 | Premcor Refining Group, | ||||||
| 7.50%, 06/15/2015 | 2,251,040 | ||||||
| Qwest Capital | |||||||
| Funding, Inc.: | |||||||
| 300,000 | 7.00%, 08/03/2009 | 294,000 | |||||
| 200,000 | 7.25%, 02/15/2011 | 168,000 | |||||
| 500,000 | Rio Tinto Alcan, Inc., | ||||||
5.75%, 06/01/2035 f | 299,368 | ||||||
| 3,700,000 | Rio Tinto Financial | ||||||
| USA Ltd., | |||||||
6.50%, 07/15/2018 f | 2,712,733 | ||||||
The accompanying notes are an integral part of these financial statements.
Page 34
Baird Aggregate Bond Fund
Schedule of Investments December 31, 2008 |
| Principal | |||||||
| Amount | Value | ||||||
| LONG-TERM INVESTMENTS – 94.8% (cont.) | |||||||
| Industrial – 10.4% (cont.) | |||||||
| $ | 2,000,000 | Santander Perpetual, | |||||
| 6.671%, 10/29/2049 | |||||||
(Callable 10/24/2017) f | $ | 1,272,078 | |||||
| 1,500,000 | SK Telecom, | ||||||
| 6.625%, 07/20/2027 | |||||||
| (Acquired 07/13/2007; | |||||||
Cost $1,482,015)* f | 1,248,609 | ||||||
| Sprint Capital | |||||||
| Corporation: | |||||||
| 2,800,000 | 6.90%, 05/01/2019 | 1,988,000 | |||||
| 358,000 | 8.75%, 03/15/2032 | 241,650 | |||||
| 1,000,000 | Target Corporation, | ||||||
| 6.50%, 10/15/2037 | 858,671 | ||||||
| Telecom Italia | |||||||
Capital: f | |||||||
| 1,400,000 | 6.20%, 07/18/2011 | 1,242,500 | |||||
| 2,100,000 | 7.20%, 07/18/2036 | 1,617,000 | |||||
| 2,075,000 | Telefonica Emisones S.A., | ||||||
6.221%, 07/03/2017 f | 2,044,284 | ||||||
| 1,000,000 | Teva Pharmaceutical | ||||||
| Finance LLC, | |||||||
| 5.55%, 02/01/2016 | 985,621 | ||||||
| Time Warner Cable, Inc., | |||||||
| 1,000,000 | 6.55%, 05/01/2037 | 958,131 | |||||
| 1,100,000 | 7.625%, 04/15/2031 | 1,081,091 | |||||
| 250,000 | 7.70%, 05/01/2032 | 250,308 | |||||
| 3,000,000 | Tyco Electronics | ||||||
| Group S.A., | |||||||
6.55%, 10/01/2017 * f | 2,521,206 | ||||||
| Tyco International | |||||||
Finance: f | |||||||
| 1,468,000 | 6.125%, 01/15/2009 | 1,466,068 | |||||
| 1,775,000 | 6.375%, 10/15/2011 | 1,744,726 | |||||
| 300,000 | 6.00%, 11/15/2013 | 281,494 | |||||
| United AirLines, Inc. | |||||||
| Pass-Thru Certificates: | |||||||
| 207,395 | Series 2001-1, Class A-2, | ||||||
| 6.201%, 12/31/2049 | 192,877 | ||||||
| 269,803 | Series 2000-2, Class C, | ||||||
| 7.762%, 12/31/2049 | 227,309 | ||||||
| 471,011 | U.S. Airways | ||||||
| Pass-Thru Certificate, | |||||||
| Series 1998-1, | |||||||
| 6.85%, 01/30/2018 # | 320,947 | ||||||
Vale Overseas Limited: f | |||||||
| 350,000 | 8.25%, 01/17/2034 | 371,945 | |||||
| 1,450,000 | 6.875%, 11/21/2036 | 1,316,165 | |||||
| 2,000,000 | Verizon Wireless, | ||||||
| 8.50%, 11/15/2018 | |||||||
| (Acquired 11/18/2008; | |||||||
| Cost $1,978,700)* | 2,343,354 | ||||||
| 1,875,000 | Vodafone Group PLC, | ||||||
6.15%, 02/27/2037 f | 1,853,310 | ||||||
| Vulcan Materials Co.: | |||||||
| 2,000,000 | 7.00%, 06/15/2018 | 1,564,806 | |||||
| 500,000 | 7.15%, 11/30/2037 | 359,580 | |||||
| 1,000,000 | Wal-Mart Stores, | ||||||
| 5.25%, 09/01/2035 | 995,662 | ||||||
| 91,027,833 | |||||||
| Mortgage Backed Securities – 34.9% | |||||||
| Bank of America | |||||||
| Alternative Loan Trust: | |||||||
| 498,563 | Series 2003-4, Class 2A1, | ||||||
| 5.00%, 06/25/2018 | 476,216 | ||||||
| 872,865 | Series 2003-11, | ||||||
| Class 4A1, 4.75%, | |||||||
| 01/25/2019 | 834,677 | ||||||
| 565,384 | Series 2004-6, Class 4A1, | ||||||
| 5.00%, 07/25/2019 | 467,148 | ||||||
The accompanying notes are an integral part of these financial statements.
Page 35
Baird Aggregate Bond Fund
Schedule of Investments December 31, 2008 |
| Principal | |||||||
| Amount | Value | ||||||
| LONG-TERM INVESTMENTS – 94.8% (cont.) | |||||||
| Mortgage Backed Securities – 34.9% (cont.) | |||||||
| $ | 580,035 | Series 2004-11, | |||||
| Class 4A1, 5.50%, | |||||||
| 12/25/2019 | $ | 550,852 | |||||
| 922,914 | Series 2005-2, Class 4A1, | ||||||
| 5.50%, 03/25/2020 | 789,717 | ||||||
| 4,177,680 | Series 2005-4, Class 3A1, | ||||||
| 5.50%, 05/25/2020 | 3,652,616 | ||||||
| 3,282,705 | Series 2005-10, | ||||||
| Class 5A1, 5.25%, | |||||||
| 11/25/2020 | 2,985,989 | ||||||
| 4,129,880 | Series 2007-1, | ||||||
| Class 1A1, 6.10%, | |||||||
| 04/25/2022 | 2,839,293 | ||||||
| 1,651,644 | Series 2003-11, | ||||||
| Class 2A1, 6.00%, | |||||||
| 01/25/2034 | 1,452,415 | ||||||
| 918,531 | Series 2005-2, | ||||||
| Class 1CB2, 5.50%, | |||||||
| 03/25/2035 | 792,153 | ||||||
| 1,243,679 | Series 2005-9, | ||||||
| Class 1CB3, 5.50%, | |||||||
| 10/25/2035 | 1,054,829 | ||||||
| 705,156 | Series 2005-11, | ||||||
| Class 1CB4, 5.50%, | |||||||
| 12/25/2035 | 579,758 | ||||||
| 2,325,750 | Series 2006-5, Class CB7, | ||||||
| 6.00%, 06/25/2036 | 1,592,197 | ||||||
| 5,000,000 | Bayview Financial | ||||||
| Acquisition Trust, | |||||||
| Series 2007-B, Class 1A2, | |||||||
| 6.831%, 08/28/2047 | 4,884,256 | ||||||
| 3,282,506 | Chase Commercial | ||||||
| Mortgage Securities | |||||||
| Corporation, | |||||||
| Series 1999-2, Class A2, | |||||||
| 7.198%, 01/15/2032 | 3,271,446 | ||||||
| Chase Mortgage | |||||||
| Finance Corporation: | |||||||
| 1,329,275 | Series 2003-S13, | ||||||
| Class A11, 5.50%, | |||||||
| 11/25/2033 | 1,274,586 | ||||||
| 6,000,000 | Series 2006-A1, | ||||||
| Class 2A3, 6.00%, | |||||||
| 09/25/2036 | 2,575,534 | ||||||
| 646,756 | Citicorp Mortgage | ||||||
| Securities, Inc., | |||||||
| Series 2004-3, Class A2, | |||||||
| 5.25%, 05/25/2034 | 602,780 | ||||||
| 1,517,189 | Citigroup Mortgage | ||||||
| Loan Trust, Inc., Series | |||||||
| 2005-9, Class 2A2, | |||||||
| 5.50%, 11/25/2035 | 1,154,298 | ||||||
| Countrywide | |||||||
| Alternative Loan Trust: | |||||||
| 1,415,199 | Series 2005-50CB, | ||||||
| Class 4A1, 5.00%, | |||||||
| 11/25/2020 | 1,190,304 | ||||||
| 7,039,109 | Series 2006-7CB, | ||||||
| Class 3A1, 5.25%, | |||||||
| 05/25/2021 | 4,784,398 | ||||||
| 1,414,256 | Series 2006-J5, Class 3A1, | ||||||
| 6.161%, 07/25/2021 | 1,085,442 | ||||||
| 1,870,686 | Series 2006-43CB, | ||||||
| Class 2A1, 6.00%, | |||||||
| 02/25/2022 | 1,379,631 | ||||||
| 3,206,258 | Series 2002-11, Class A4, | ||||||
| 6.25%, 10/25/2032 | 3,141,272 | ||||||
| 3,000,000 | Series 2005-10CB, | ||||||
| Class 1A6, 5.50%, | |||||||
| 05/25/2035 | 2,341,700 | ||||||
| 2,828,971 | Series 2005-34CB, | ||||||
| Class 1A6, 5.50%, | |||||||
| 09/25/2035 | 2,488,439 | ||||||
The accompanying notes are an integral part of these financial statements.
Page 36
Baird Aggregate Bond Fund
Schedule of Investments December 31, 2008 |
| Principal | |||||||
| Amount | Value | ||||||
| LONG-TERM INVESTMENTS – 94.8% (cont.) | |||||||
| Mortgage Backed Securities – 34.9% (cont.) | |||||||
| $ | 3,459,658 | Series 2006-28CB, | |||||
| Class A17, 6.00%, | |||||||
| 10/25/2036 | $ | 2,413,523 | |||||
| 659,669 | Countrywide Home | ||||||
| Loans, Inc., | |||||||
| Series 2003-39, Class A5, | |||||||
| 5.00%, 05/25/2012 | 644,825 | ||||||
| 1,326,317 | CS First Boston Mortgage | ||||||
| Securities Corp., | |||||||
| Series 2004-4, | |||||||
| Class 2A5, 5.50%, | |||||||
| 06/25/2015 | 1,243,062 | ||||||
| 2,025,959 | Deutsche Securities | ||||||
| Inc. Mortgage, | |||||||
| Series 2006-AR5, | |||||||
| Class 21A, 6.00%, | |||||||
| 10/25/2021 | 1,775,018 | ||||||
| 6,696,856 | DLJ Commercial | ||||||
| Mortgage Corporation, | |||||||
| Series 1999-CG3, | |||||||
| Class A1B, 7.34%, | |||||||
| 10/10/2032 | 6,684,770 | ||||||
| Federal Gold Loan | |||||||
| Mortgage Corporation | |||||||
| (FGLMC): | |||||||
| 162,399 | 6.50%, 07/01/2014 | 168,721 | |||||
| 1,291,504 | 6.00%, 06/01/2020 | 1,339,208 | |||||
| 712,116 | 5.50%, 11/01/2022 | 733,553 | |||||
| 791,596 | 5.00%, 06/01/2023 | 813,569 | |||||
| 599,875 | 5.50%, 07/01/2023 | 617,268 | |||||
| 1,568,023 | 6.50%, 06/01/2029 | 1,641,034 | |||||
| 6,421,764 | 5.50%, 01/01/2036 | 6,581,578 | |||||
| 4,494,921 | 6.00%, 12/01/2036 | 4,635,579 | |||||
| 6,267,244 | 5.50%, 04/01/2037 | 6,421,881 | |||||
| Federal Home Loan | |||||||
| Mortgage Corporation | |||||||
| (FHLMC): | |||||||
| 956,586 | Series 3124, Class VP, | ||||||
| 6.00%, 06/15/2014 | 994,514 | ||||||
| 434,721 | Series 2695, Class UA, | ||||||
| 5.50%, 09/15/2014 | 448,641 | ||||||
| 2,600,471 | Series R007, Class AC, | ||||||
| 5.875%, 05/15/2016 | 2,675,038 | ||||||
| 3,591,485 | Series R003, Class VA, | ||||||
| 5.50%, 08/15/2016 | 3,741,132 | ||||||
| 2,239,575 | Series 3097, Class MC, | ||||||
| 6.00%, 11/15/2016 | 2,323,129 | ||||||
| 547,612 | Series 2391, Class QR, | ||||||
| 5.50%, 12/15/2016 | 566,223 | ||||||
| 5,471,472 | Series R009, Class AJ, | ||||||
| 5.75%, 12/15/2018 | 5,587,100 | ||||||
| 156,409 | Series 206, Class E, | ||||||
| 0.00%, 07/15/2019 ^ | 138,642 | ||||||
| 1,861,283 | Series R010, Class AB, | ||||||
| 5.50%, 12/15/2019 | 1,900,300 | ||||||
| 98,892 | Series 141, Class D, | ||||||
| 5.00%, 05/15/2021 | 101,869 | ||||||
| 79,574 | Series 1074, Class I, | ||||||
| 6.75%, 05/15/2021 | 79,477 | ||||||
| 509,035 | Series 1081, Class K, | ||||||
| 7.00%, 05/15/2021 | 545,332 | ||||||
| 68,458 | Series 163, Class F, | ||||||
| 6.00%, 07/15/2021 | 71,685 | ||||||
| 148,304 | Series 188, Class H, | ||||||
| 7.00%, 09/15/2021 | 154,368 | ||||||
| 71,276 | Series 1286, Class A, | ||||||
| 6.00%, 05/15/2022 | 71,191 | ||||||
| 2,600,000 | Series 1694, Class PK, | ||||||
| 6.50%, 03/15/2024 | 2,733,055 | ||||||
| 1,450,000 | Series 2664, Class LG, | ||||||
| 5.50%, 07/15/2028 | 1,472,459 | ||||||
The accompanying notes are an integral part of these financial statements.
Page 37
Baird Aggregate Bond Fund
Schedule of Investments December 31, 2008 |
| Principal | |||||||
| Amount | Value | ||||||
| LONG-TERM INVESTMENTS – 94.8% (cont.) | |||||||
| Mortgage Backed Securities – 34.9% (cont.) | |||||||
| $ | 3,300,000 | Series 2552, Class ND, | |||||
| 5.50%, 10/15/2031 | $ | 3,374,869 | |||||
| Federal National Mortgage | |||||||
| Association (FNMA): | |||||||
| 1,034,077 | 5.50%, 07/01/2015 | 1,079,789 | |||||
| 1,850,579 | 5.00%, 02/01/2018 | 1,916,176 | |||||
| 2,321,124 | 5.00%, 12/01/2019 | 2,396,147 | |||||
| 1,414,752 | 5.50%, 01/01/2023 | 1,457,216 | |||||
| 2,309,706 | 5.50%, 07/01/2023 | 2,376,184 | |||||
| 4,728,345 | 5.00%, 11/01/2023 | 4,849,092 | |||||
| 2,606,811 | 6.00%, 03/01/2026 | 2,689,574 | |||||
| 6,263,814 | 6.00%, 05/01/2026 | 6,462,684 | |||||
| 7,772,532 | 5.00%, 05/01/2028 | 7,958,636 | |||||
| 579,170 | 6.00%, 03/01/2033 | 598,471 | |||||
| 474,504 | 5.00%, 11/01/2033 | 485,719 | |||||
| 1,929,021 | 5.50%, 09/01/2034 | 1,980,945 | |||||
| 790,928 | 6.00%, 11/01/2034 | 816,172 | |||||
| 4,868,810 | 5.50%, 02/01/2035 | 4,999,867 | |||||
| 12,906,494 | 5.50%, 02/01/2035 | 13,253,906 | |||||
| 3,567,835 | 5.00%, 11/01/2035 | 3,647,706 | |||||
| 24,880,193 | 5.50%, 04/01/2036 | 25,534,358 | |||||
| 8,649,425 | 5.50%, 11/01/2036 | 8,876,841 | |||||
| 1,841,194 | 6.00%, 08/01/2037 | 1,868,648 | |||||
| 5,346,121 | Series 2006-B2, Class AB, | ||||||
| 5.50%, 05/25/2014 | 5,473,332 | ||||||
| 672,446 | Series 2003-27, Class OJ, | ||||||
| 5.00%, 07/25/2015 | 679,309 | ||||||
| 487,799 | Series 2003-24, Class PC, | ||||||
| 5.00%, 11/25/2015 | 494,136 | ||||||
| 75,168 | Series 2002-56, Class MC, | ||||||
| 5.50%, 09/25/2017 | 77,621 | ||||||
| 409,320 | Series 1989-37, Class G, | ||||||
| 8.00%, 07/25/2019 | 447,572 | ||||||
| 70,087 | Series 1989-94, Class G, | ||||||
| 7.50%, 12/25/2019 | 75,795 | ||||||
| 18,677 | Series 1990-58, Class J, | ||||||
| 7.00%, 05/25/2020 | 19,953 | ||||||
| 181,295 | Series 1990-76, Class G, | ||||||
| 7.00%, 07/25/2020 | 191,478 | ||||||
| 78,404 | Series 1990-105, Class J, | ||||||
| 6.50%, 09/25/2020 | 82,362 | ||||||
| 30,505 | Series 1990-108, Class G, | ||||||
| 7.00%, 09/25/2020 | 32,140 | ||||||
| 53,282 | Series 1991-1, Class G, | ||||||
| 7.00%, 01/25/2021 | 56,769 | ||||||
| 63,155 | Series 1991-86, Class Z, | ||||||
| 6.50%, 07/25/2021 | 66,376 | ||||||
| 254,399 | Series 2003-28, | ||||||
| Class KA, 4.25%, | |||||||
| 03/25/2022 | 255,773 | ||||||
| 29,282 | Series G92-30, Class Z, | ||||||
| 7.00%, 06/25/2022 | 31,072 | ||||||
| 2,843,975 | Series 2003-33, Class LD, | ||||||
| 4.25%, 09/25/2022 | 2,869,886 | ||||||
| 780,483 | Series 1993-58, Class H, | ||||||
| 5.50%, 04/25/2023 | 813,880 | ||||||
| 83,475 | Series 2003-17, Class QR, | ||||||
| 4.50%, 11/25/2025 | 83,328 | ||||||
| 507,355 | Series 1998-66, Class C, | ||||||
| 6.00%, 12/25/2028 | 526,413 | ||||||
| 2,000,000 | Series 2002-85, Class PD, | ||||||
| 5.50%, 05/25/2031 | 2,040,655 | ||||||
| 80,981 | Series 2003-44, Class AB, | ||||||
| 3.75%, 05/25/2033 | 80,197 | ||||||
| 2,698,137 | Series 2004-W6, | ||||||
| Class 1A4, 5.50%, | |||||||
| 07/25/2034 | 2,557,713 | ||||||
| 4,860,953 | Series 2004-W6, | ||||||
| Class 1A6, 5.50%, | |||||||
| 07/25/2034 | 4,518,585 | ||||||
The accompanying notes are an integral part of these financial statements.
Page 38
Baird Aggregate Bond Fund
Schedule of Investments December 31, 2008 |
| Principal | |||||||
| Amount | Value | ||||||
| LONG-TERM INVESTMENTS – 94.8% (cont.) | |||||||
| Mortgage Backed Securities – 34.9% (cont.) | |||||||
| $ | 7,750,000 | Series 2004-W10, | |||||
| Class A24, 5.00%, | |||||||
| 08/25/2034 | $ | 7,640,956 | |||||
| 4,000,000 | Series 2004-W10, | ||||||
| Class A4, 5.75%, | |||||||
| 08/25/2034 | 3,650,599 | ||||||
| First Horizon Alternative | |||||||
| Mortgage Securities: | |||||||
| 1,081,015 | Series 2005-FA7, | ||||||
| Class 2A1, 5.00%, | |||||||
| 09/25/2020 | 839,138 | ||||||
| 1,478,578 | Series 2006-FA6, | ||||||
| Class 3A1, 5.75%, | |||||||
| 11/25/2021 | 1,353,454 | ||||||
| 4,352,255 | Series 2006-FA8, | ||||||
| Class 2A1, 5.75%, | |||||||
| 02/25/2037 | 3,020,180 | ||||||
| 2,950,000 | First Union National | ||||||
| Bank Commercial | |||||||
| Mortgage Securities Inc., | |||||||
| Series 2001-C4, Class A2, | |||||||
| 6.223%, 12/12/2033 | 2,841,316 | ||||||
| GE Capital Commercial | |||||||
| Mortgage Corporation: | |||||||
| 6,345,394 | Series 2000-1, Class A2, | ||||||
| 6.496%, 01/15/2033 | 6,230,533 | ||||||
| 2,865,000 | Series 2002-3A, Class AZ, | ||||||
| 4.996%, 12/10/2037 | 2,598,073 | ||||||
| 6,200,000 | Series 2004-C3, Class A4, | ||||||
| 5.189%, 07/10/2039 | 5,287,309 | ||||||
| 10,100,000 | GMAC Commercial | ||||||
| Mortgage Securities, Inc., | |||||||
| Series 2003-C1, Class A2, | |||||||
| 4.079%, 05/10/2036 | 8,771,072 | ||||||
| Government National | |||||||
| Mortgage Association | |||||||
| (GNMA): | |||||||
| 459,414 | 6.00%, 11/20/2033 | 474,238 | |||||
| 800,000 | Series 2004-78, Class C, | ||||||
| 4.658%, 04/16/2029 | 810,664 | ||||||
| 1,285,000 | Series 2004-100, Class B, | ||||||
| 4.603%, 02/16/2043 | 1,297,233 | ||||||
| 1,299,269 | J.P. Morgan Alternative | ||||||
| Loan Trust, | |||||||
| Series 2006-A1, Class 2A1, | |||||||
| 5.80%, 03/25/2036 | 650,997 | ||||||
| J.P. Morgan | |||||||
| Mortgage Trust: | |||||||
| 3,100,000 | Series 2006-A7, | ||||||
| Class 2A4R, 5.43%, | |||||||
| 01/25/2037 | 1,553,952 | ||||||
| 1,941,755 | Series 2006-A7, | ||||||
| Class 2A2, 5.80%, | |||||||
| 01/25/2037 | 1,424,371 | ||||||
| 6,100,000 | Series 2007-A2, | ||||||
| Class 2A3, 5.69%, | |||||||
| 04/25/2037 | 3,410,392 | ||||||
| Master Alternative | |||||||
| Loans Trust: | |||||||
| 2,948,017 | Series 2004-1, Class 1A1, | ||||||
| 5.00%, 01/25/2019 | 2,583,200 | ||||||
| 2,139,227 | Series 2004-4, Class 4A1, | ||||||
| 5.00%, 04/25/2019 | 1,981,459 | ||||||
| 850,200 | Series 2003-5, Class 6A1, | ||||||
| 6.00%, 08/25/2033 | 790,155 | ||||||
| 665,743 | Residential Accredit | ||||||
| Loans, Inc., | |||||||
| Series 2004-QS6, | |||||||
| Class A1, 5.00%, | |||||||
| 05/25/2019 | 563,385 | ||||||
The accompanying notes are an integral part of these financial statements.
Page 39
Baird Aggregate Bond Fund
Schedule of Investments December 31, 2008 |
| Principal | |||||||
| Amount | Value | ||||||
| LONG-TERM INVESTMENTS – 94.8% (cont.) | |||||||
| Mortgage Backed Securities – 34.9% (cont.) | |||||||
| $ | 800,000 | Residential Funding | |||||
| Mortgage Security I, | |||||||
| Series 2003-S11, | |||||||
| Class A2, 4.00%, | |||||||
| 06/25/2018 | $ | 797,226 | |||||
| Salomon Brothers | |||||||
| Mortgage Securities VII: | |||||||
| 6,251,093 | Series 2000-C1, Class A2, | ||||||
| 7.52%, 12/18/2009 | 6,238,094 | ||||||
| 3,092,091 | Series 2001-C2, Class A3, | ||||||
| 6.50%, 10/13/2011 | 3,003,580 | ||||||
| 1,343,556 | Series 2003-UP2, | ||||||
| Class A2, 4.00%, | |||||||
| 06/25/2033 | 1,240,784 | ||||||
| 1,850,000 | Wachovia Bank | ||||||
| Commercial Mortgage | |||||||
| Trust, Series 2003-C3, | |||||||
| Class A2, 4.867%, | |||||||
| 02/15/2035 | 1,647,009 | ||||||
| Washington Mutual, Inc. | |||||||
| Pass-Thru Certificates: | |||||||
| 2,258,003 | Series 2004-CB1, Class 5A, | ||||||
| 5.00%, 06/25/2019 | 2,204,376 | ||||||
| 4,112,637 | Series 2004-CB2, | ||||||
| Class 7A, 5.50%, | |||||||
| 08/25/2019 | 3,823,469 | ||||||
| 1,434,618 | Series 2004-CB3, | ||||||
| Class 4A, 6.00%, | |||||||
| 10/25/2019 | 1,230,185 | ||||||
| 910,477 | Series 2004-CB4, | ||||||
| Class 21A, 5.50%, | |||||||
| 12/25/2019 | 827,664 | ||||||
| 304,442,098 | |||||||
| Taxable Municipal Bonds – 0.8% | |||||||
| 1,000,000 | Cuyahoga County | ||||||
| Ohio Industrial | |||||||
| Development Revenue, | |||||||
| 9.125%, 10/01/2023 | 1,058,660 | ||||||
| 5,235,000 | Tobacco Settlement | ||||||
| Authority Iowa, | |||||||
| 6.50%, 06/01/2023 | 3,781,974 | ||||||
| 2,429,827 | Tobacco Settlement | ||||||
| Financing Corporation, | |||||||
| Series 2001-A, Class A, | |||||||
| 6.36%, 05/15/2025 | 2,361,524 | ||||||
| 7,202,158 | |||||||
| Utilities – 4.5% | |||||||
| 431,000 | Beaver Valley | ||||||
| Funding Corporation | |||||||
| Debentures, | |||||||
| 9.00%, 06/01/2017 | 404,058 | ||||||
| 1,900,000 | Enel Finance International, | ||||||
| 6.80%, 09/15/2037 | |||||||
| (Acquired 09/13/2007; | |||||||
Cost $1,894,965)* f | 1,458,820 | ||||||
| 750,000 | Energy Transfer Partners, | ||||||
| 5.65%, 08/01/2012 | 669,588 | ||||||
| 300,000 | Exelon Corporation | ||||||
| Senior Notes, | |||||||
| 6.75%, 05/01/2011 | 292,790 | ||||||
| 2,500,000 | FPL Group Capital, Inc., | ||||||
| 7.30%, 09/01/2067 | |||||||
| (Callable 09/01/2017) | 1,400,000 | ||||||
| 3,750,000 | Illinois Power Company, | ||||||
| 7.50%, 06/15/2009 | 3,764,603 | ||||||
| Kinder Morgan Energy | |||||||
| Partners Senior Notes: | |||||||
| 600,000 | 6.30%, 02/01/2009 | 599,422 | |||||
| 1,000,000 | 9.00%, 02/01/2019 | 1,043,335 | |||||
| 2,250,000 | 6.95%, 01/15/2038 | 1,819,681 | |||||
The accompanying notes are an integral part of these financial statements.
Page 40
Baird Aggregate Bond Fund
Schedule of Investments December 31, 2008 |
| Principal | |||||||
| Amount | Value | ||||||
| LONG-TERM INVESTMENTS – 94.8% (cont.) | |||||||
| Utilities – 4.5% (cont.) | |||||||
| $ | 900,000 | Kinder Morgan Finance, | |||||
5.70%, 01/05/2016 f | $ | 670,500 | |||||
| 189,032 | Kiowa Power | ||||||
| Partners LLC, | |||||||
| 4.811%, 12/30/2013 | |||||||
| (Acquired 11/19/2004; | |||||||
| Cost $196,674)* | 176,735 | ||||||
| Korea Electric Power | |||||||
Corporation: f | |||||||
| 100,000 | 7.75%, 04/01/2013 | 97,059 | |||||
| 2,165,000 | 6.75%, 08/01/2027 | 1,621,700 | |||||
| 1,325,000 | National Grid PLC | ||||||
| Senior Unsecured Notes, | |||||||
6.30%, 08/01/2016 f | 1,154,544 | ||||||
| 1,500,000 | National Rural | ||||||
| Utilities Senior | |||||||
| Unsecured Notes, | |||||||
| 10.375%, 11/01/2018 | 1,755,612 | ||||||
| NiSource Finance | |||||||
| Corporation: | |||||||
| 2,025,000 | 7.875%, 11/15/2010 | 1,853,057 | |||||
| 2,948,000 | 6.15%, 03/01/2013 | 2,271,555 | |||||
| 625,000 | ONEOK, Inc. | ||||||
| Senior Notes, | |||||||
| 7.125%, 04/15/2011 | 604,992 | ||||||
| 875,000 | Pacific Gas & Electric | ||||||
| Company 1st Mortgage, | |||||||
| 6.05%, 03/01/2034 | 929,302 | ||||||
| 1,000,000 | Plains All American | ||||||
| Pipeline Senior Notes, | |||||||
| 5.625%, 12/15/2013 | 843,942 | ||||||
| 300,000 | PPL Energy Supply, | ||||||
| LLC Senior Notes, | |||||||
| 6.40%, 11/01/2011 | 295,076 | ||||||
| 175,000 | PSE&G Energy Holdings | ||||||
| LLC Senior Notes, | |||||||
| 8.50%, 06/15/2011 | 164,958 | ||||||
| PSE&G Power LLC: | |||||||
| 250,000 | 7.75%, 04/15/2011 | 249,712 | |||||
| 350,000 | 5.00%, 04/01/2014 | 314,037 | |||||
| 1,564,992 | RGS (I&M) Funding | ||||||
| Corporation Debentures, | |||||||
| 9.82%, 12/07/2022 | 1,849,006 | ||||||
| 2,900,000 | Rockies Express | ||||||
| Pipeline LLC, | |||||||
| 5.10%, 08/20/2009 | |||||||
| (Acquired 09/17/2007 | |||||||
| and 02/21/2008; | |||||||
| Cost $2,197,600 | |||||||
| and $691,123, | |||||||
| respectively)* | 2,901,438 | ||||||
| 1,400,000 | Southern Natural Gas, | ||||||
| 5.90%, 04/01/2017 | |||||||
| (Acquired 03/14/2007; | |||||||
| Cost $1,397,676)* | 1,109,441 | ||||||
| 1,500,000 | Spectra Energy Capital, | ||||||
| 5.668%, 08/15/2014 | 1,315,668 | ||||||
| 2,000,000 | Trans-Canada Pipelines, | ||||||
6.50%, 08/15/2018 f | 1,962,122 | ||||||
| 700,000 | Transcontinental Gas | ||||||
| Pipe Line Corporation | |||||||
| Senior Notes, | |||||||
| 8.875%, 07/15/2012 | 683,125 | ||||||
| Vectren Utility Holdings: | |||||||
| 875,000 | 6.625%, 12/01/2011 | 876,705 | |||||
| 1,100,000 | 5.25%, 08/01/2013 | 1,050,630 | |||||
The accompanying notes are an integral part of these financial statements.
Page 41
Baird Aggregate Bond Fund
Schedule of Investments December 31, 2008 |
| Principal | |||||||
| Amount | Value | ||||||
| LONG-TERM INVESTMENTS – 94.8% (cont.) | |||||||
| Utilities – 4.5% (cont.) | |||||||
| Williams Companies, | |||||||
| Inc. Notes: | |||||||
| $ | 2,475,000 | 6.375%, 10/01/2010 | |||||
| (Acquired 07/09/2008; | |||||||
| Cost $2,495,051)* | $ | 2,307,274 | |||||
| 550,000 | 8.125%, 03/15/2012 | 506,688 | |||||
| 39,017,175 | |||||||
| U.S. Government Agency Issues – 9.6% | |||||||
| 75,475,000 | Federal National | ||||||
| Mortgage Association | |||||||
| (FNMA), | |||||||
| 6.00%, 05/15/2011 | 83,421,235 | ||||||
| 83,421,235 | |||||||
| U.S. Treasury Obligations – 12.9% | |||||||
| 82,475,000 | U.S. Treasury Bonds, | ||||||
| 6.25%, 08/15/2023 | 112,488,147 | ||||||
| Total Long-Term | |||||||
| Investments | |||||||
| (Cost $890,917,707) | 826,594,815 | ||||||
| Shares | |||||||
| SHORT-TERM INVESTMENTS – 4.2% | |||||||
| Money Market Fund – 4.2% | |||||||
| 36,553,040 | Short-Term Investment | ||||||
| Company Liquid Assets | |||||||
| Portfolio – AIM Fund | 36,553,040 | ||||||
| Total Short-Term | |||||||
| Investments | |||||||
| (Cost $36,553,040) | 36,553,040 | ||||||
| Principal | |||||||
| Amount | |||||||
| INVESTMENTS PURCHASED | |||||||
| WITH CASH PROCEEDS FROM | |||||||
| SECURITIES LENDING – 24.3% | |||||||
| Certificates of Deposit – 4.4% | |||||||
| $ | 8,602,856 | Abbey National Treasury | |||||
| Service, Series YCD1, | |||||||
| 1.09%, 02/20/09 | 8,602,168 | ||||||
| 8,602,856 | Barclays Bank, | ||||||
| 3.3615%, 03/16/09 | 8,596,060 | ||||||
| Natixis Bank of New | |||||||
| York, Series YCD1: | |||||||
| 6,072,604 | 0.89%, 02/18/09 | 6,072,240 | |||||
| 5,060,503 | 0.89%, 06/30/09 | 5,068,803 | |||||
| 7,590,755 | Royal Bank of Scotland | ||||||
| Group PLC, | |||||||
| 2.9944%, 05/06/09 | 7,590,603 | ||||||
| 2,530,252 | Societe Generale of | ||||||
| New York, Series YCD1, | |||||||
| 2.0625%, 02/20/09 | 2,530,100 | ||||||
| 38,459,974 | |||||||
| Commercial Paper – 0.5% | |||||||
| 4,781,791 | Atlantic East | ||||||
| Funding, LLC, | |||||||
| 3.0588%, 03/25/09 # | 4,781,791 | ||||||
| 4,781,791 | |||||||
| Corporate Bonds and Notes – 2.4% | |||||||
| Allstate Life GL: | |||||||
| 5,566,554 | 3.0575%, 03/20/09 | 5,529,982 | |||||
| 2,530,251 | 1.775%, 07/21/09 | 2,482,657 | |||||
| 5,060,503 | Svenska Handelsbanken, | ||||||
| 4.410%, 08/06/09 | 5,057,923 | ||||||
| 7,590,755 | Wachovia Bank NA, | ||||||
| 3.0013%, 05/01/09 | 7,507,181 | ||||||
| 20,577,743 | |||||||
The accompanying notes are an integral part of these financial statements.
Page 42
Baird Aggregate Bond Fund
Schedule of Investments December 31, 2008 |
| Principal | |||||||
| Amount | Value | ||||||
| INVESTMENTS PURCHASED | |||||||
| WITH CASH PROCEEDS FROM | |||||||
| SECURITIES LENDING – 24.3% (cont.) | |||||||
| Government Agencies – 1.6% | |||||||
| $ | 14,169,409 | Federal Home | |||||
| Loan Banks, | |||||||
| 0.645%, 03/02/09 | $ | 14,161,333 | |||||
| 14,161,333 | |||||||
| Shares | |||||||
| Investment Companies – 15.4% | |||||||
| 130,627,150 | Mount Vernon Securities | ||||||
| Lending Trust – | |||||||
| Prime Portfolio | 130,627,150 | ||||||
| 3,413,063 | Reserve Primary Fund # | 3,413,063 | |||||
| 134,040,213 | |||||||
| Total Investments | |||||||
| Purchased With Cash | |||||||
| Proceeds From | |||||||
| Securities Lending | |||||||
| (Cost $212,021,054) | 212,021,054 | ||||||
| Total Investments | |||||||
| (Cost $1,139,491,801) – | |||||||
| 123.3% | 1,075,168,909 | ||||||
| Liabilities in Excess of | |||||||
| Other Assets – (23.3)% | (203,298,028 | ) | |||||
| TOTAL NET | |||||||
| ASSETS – 100.0% | $ | 871,870,881 | |||||
| ^ | Non Income Producing |
| * | Restricted Security Deemed Liquid |
| f | Foreign Security |
| # | Priced at Fair Value by the Valuation Committee as delegated by the Baird Funds’ Board of Directors |
| @ | Security in Default |
The accompanying notes are an integral part of these financial statements.
Page 43
Baird Aggregate Bond Fund
Schedule of Investments December 31, 2008 |
SFAS 157 – Summary of Fair Value Exposure at December 31, 2008
In September 2006, the Financial Accounting Standards Board issued Statement of Financial Accounting Standards No. 157, “Fair Value Measurements” (“SFAS 157”) effective for fiscal years beginning after November 15, 2007. SFAS 157 defines fair value, establishes a framework for measuring fair value in generally accepted accounting principles (GAAP), and expands disclosures about fair value measurements. The Fund adopted SFAS 157 as of January 1, 2008. Under SFAS 157, various inputs are used in determining the value of the Fund’s investments. These inputs are summarized into three broad levels and described below:
| Level 1 – | Quoted prices in active markets for identical securities |
| Level 2 – | Other significant observable inputs (including quoted prices for similar securities, interest rates, prepayment speeds, credit risk, etc.) |
| Level 3 – | Significant unobservable inputs (including the Fund’s own assumptions in determining the fair value of investments) |
The following is a summary of the inputs used to value the Fund’s investments as of December 31, 2008:
| Description | Investments, at Value | |||
| Level 1 – Quoted prices | $ | 167,180,190 | ||
| Level 2 – Other significant observable inputs | 903,408,272 | |||
| Level 3 – Significant unobservable inputs | 4,580,447 | |||
| Total | $ | 1,075,168,909 | ||
Following is a reconciliation of Level 3 investments for which significant unobservable inputs were used to determine fair value.
| Investments, at Value | ||||
| Balance as of 12/31/07 | $ | 5,659,655 | ||
| Accrued discounts / premiums | — | |||
| Realized gain (loss) | — | |||
| Change in unrealized appreciation (depreciation) | — | |||
| Net purchases (sales/paydowns) | — | |||
| Transfers in and / or out of Level 3* | (1,079,208 | ) | ||
| Balance as of 12/31/2008 | $ | 4,580,447 | ||
| * | The information used in the above reconciliation represents fiscal year to date activity for any investments identified as using Level 3 inputs at either the beginning or end of the current fiscal period. Transfers in or out of Level 3 represents either the beginning value (for transfers in) or ending value (for transfers out) of any security or instrument where a change in the pricing level occurred from the beginning to the end of the period. |
Page 44
Baird Intermediate Municipal Bond Fund
The Baird Intermediate Municipal Bond Fund seeks current income that is substantially exempt from federal income tax. A secondary objective is to provide total return with relatively low volatility of principal. The Fund strives to achieve an annual rate of return, before Fund expenses, greater than the annual rate of the total return of the Barclays Capital 7-Year General Obligation Bond Index. The Barclays Capital 7-Year General Obligation Bond Index is an unmanaged, market value weighted index consisting of investment grade state and local general obligation bonds that have been issued as part of an offering of at least $50 million; have a minimum amount outstanding of at least $5 million; have been issued within the last five years; and have a maturity of six to eight years.
The Fund generated strong positive investment returns in 2008 and outperformed its benchmark index. The Fund’s focus on high quality issues helped the Fund’s relative performance as there was a flight to quality by investors in 2008 that resulted in high quality issues significantly outperforming low quality issues. The Fund had more than 70% of its investments in pre-refunded bonds. We continue to emphasize high quality, intermediate holdings for the Fund and are optimistic regarding the Fund’s relative performance prospects for the coming year.
Portfolio Characteristics
| Quality Distribution* | Sector Weightings* | ||||
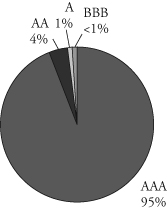 | 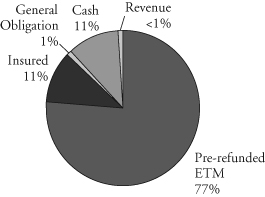 | ||||
| Net Assets: | $243,563,582 | Annualized Expense Ratio: | |||
SEC 30-Day Yield:** | Institutional Class: | 0.30% | |||
| Institutional Class: | 2.99% | Investor Class: | 0.55% | *** | |
| Investor Class: | 2.74% | Portfolio Turnover Rate: | 0.9% | ||
| Average Effective Duration: | 4.39 years | Total Number of Holdings: | 106 | ||
| Average Effective Maturity: | 5.12 years | ||||
| * | Percentages shown are based on the Fund’s total net assets. |
| ** | SEC yields are based on SEC guidelines and are calculated for the 30 days ended December 31, 2008. |
| *** | Includes 0.25% 12b-1 fee. |
Page 45
Baird Intermediate Municipal Bond Fund
| Institutional Class |
| Value of a $25,000 Investment |
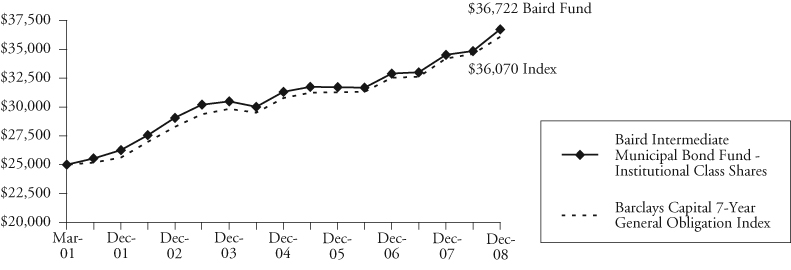 |
Growth of a hypothetical investment of $25,000 made on the Fund’s inception date (3/30/01), assuming reinvestment of all distributions.
| Investor Class |
| Value of a $10,000 Investment |
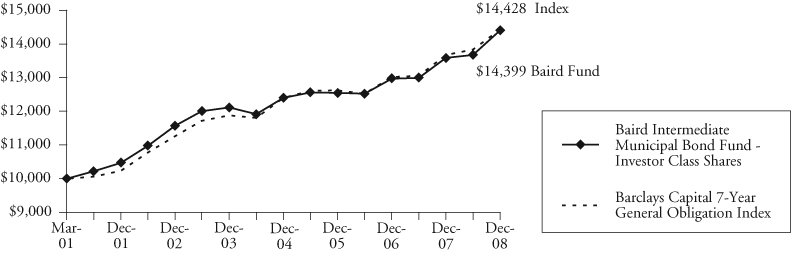 |
Growth of a hypothetical investment of $10,000 made on the Fund’s inception date (3/30/01), assuming reinvestment of all distributions.
Page 46
Baird Intermediate Municipal Bond Fund
Average Annual Total Returns
| Since | |||
| For the Periods Ended December 31, 2008 | One Year | Five Years | Inception(1) |
| Institutional Class Shares | 6.37% | 3.78% | 5.08% |
| Investor Class Shares | 6.02% | 3.52% | 4.81% |
Barclays Capital 7-Year General Obligation Bond Index(2) | 5.35% | 3.95% | 4.84% |
| (1) | For the period from March 30, 2001 (commencement of operations) through December 31, 2008. |
| (2) | The Barclays Capital 7-Year General Obligation Bond Index is an unmanaged, market value weighted index comprised of investment grade state and local general obligation bonds that have been issued as part of an offering of at least $50 million, have a minimum amount outstanding of at least $5 million, have been issued within the last five years and have a maturity of six to eight years. This index does not reflect any deduction for fees, expenses or taxes. A direct investment in an index is not possible. |
The returns shown in the table above and line graphs on the previous page reflect reinvestment of dividends and/or capital gains distributions in additional shares. The returns do not reflect the deduction of taxes that a shareholder would pay on Fund distributions or the redemption of Fund shares.
Past performance does not guarantee future results. Investment return and principal value will fluctuate so that an investor’s shares, when redeemed, may be worth more or less than their original cost.
For information about the performance of the Fund as of the most recent month-end, please call 1-866-44BAIRD or visit www.bairdfunds.com. Mutual fund performance changes over time and current performance may be lower or higher than that stated.
Page 47
Baird Intermediate Municipal Bond Fund
Schedule of Investments December 31, 2008 |
| Principal | |||||||
| Amount | Value | ||||||
| MUNICIPAL BONDS – 85.5% | |||||||
| Alabama – 5.2% | |||||||
| $ | 11,385,000 | Montgomery Alabama | |||||
| Special Care Facility Revenue | |||||||
| Bonds, 5.00%, 11/15/2021 | |||||||
| (Pre-refunded to | |||||||
| 11/15/2014) | $ | 12,644,750 | |||||
| Arizona – 3.9% | |||||||
| 1,415,000 | Arizona Health Facilities | ||||||
| Authority Hospital | |||||||
| Revenue, 6.375%, | |||||||
| 12/01/2037 (Pre-refunded | |||||||
| to 12/01/2012) | 1,633,349 | ||||||
| 2,375,000 | �� | Arizona School Facilities | |||||
| Board Revenue, | |||||||
| (Pre-refunded to | |||||||
| 07/01/2014) 5.75%, | |||||||
| 07/01/2018 (Pre-refunded | |||||||
| to 07/01/2014) | 2,804,447 | ||||||
| 1,540,000 | Phoenix Arizona Civic | ||||||
| Corporation of Wastewater | |||||||
| Systems Revenue Bonds, | |||||||
| 5.00%, 07/01/2015 | |||||||
| (Partially Pre-refunded, | |||||||
| MBIA Insured) | 1,697,727 | ||||||
| 1,000,000 | Pima County Arizona | ||||||
| Independent Development | |||||||
| Authority, 7.125%, | |||||||
| 07/01/2024 (Pre-refunded | |||||||
| to 07/01/2014) | 1,225,370 | ||||||
| 1,845,000 | Pima County Arizona | ||||||
| Industrial Development | |||||||
| Authority Revenue Bonds, | |||||||
| 7.50%, 07/01/2034 | |||||||
| (Pre-refunded to | |||||||
| 07/01/2014) | 2,182,192 | ||||||
| 9,543,085 | |||||||
| Arkansas – 0.1% | |||||||
| 290,000 | Springdale Arkansas | ||||||
| Sales & Use Tax Revenue, | |||||||
| 4.00%, 07/01/2016 | |||||||
| (Pre-refunded to | |||||||
| various dates) | 295,356 | ||||||
| California – 0.6% | |||||||
| Golden State Tobacco | |||||||
| Securitization Corporation | |||||||
| Revenue Bonds: | |||||||
| 465,000 | 6.25%, 06/01/2033 | ||||||
| (Pre-refunded to | |||||||
| various dates) | 504,590 | ||||||
| 700,000 | 6.75%, 06/01/2039 | ||||||
| (Pre-refunded to | |||||||
| 07/01/2014) | 813,197 | ||||||
| 230,000 | Santa Rosa California | ||||||
| Hospital Revenue, 10.30%, | |||||||
| 03/01/2011 (ETM) | 252,053 | ||||||
| 1,569,840 | |||||||
| Colorado – 8.4% | |||||||
| 2,000,000 | Adams County Colorado | ||||||
| Single Family Mortgage | |||||||
| Revenue, 8.875%, | |||||||
| 08/01/2012 (ETM) | 2,486,240 | ||||||
| 50,000 | Colorado Springs Colorado | ||||||
| Utilities Revenue, 5.80%, | |||||||
| 11/15/2010 (ETM) | 51,630 | ||||||
| Denver Colorado | |||||||
| Convention Center | |||||||
| & Hotel Authority | |||||||
| Revenue Bonds: | |||||||
| 1,000,000 | 5.00%, 12/01/2021 | ||||||
| (Pre-refunded to | |||||||
| 12/01/2013) | 1,103,000 | ||||||
The accompanying notes are an integral part of these financial statements.
Page 48
Baird Intermediate Municipal Bond Fund
Schedule of Investments December 31, 2008 |
| Principal | |||||||
| Amount | Value | ||||||
| MUNICIPAL BONDS – 85.5% (cont.) | |||||||
| Colorado – 8.4% (cont.) | |||||||
| $ | 1,500,000 | 5.00%, 12/01/2023 | |||||
| (Pre-refunded to | |||||||
| 12/01/2013) | $ | 1,654,500 | |||||
| 5,065,000 | 5.00%, 12/01/2024 | ||||||
| (Pre-refunded to | |||||||
| 12/01/2013) | 5,586,695 | ||||||
| 7,975,000 | Denver Colorado Health | ||||||
| & Hospital Authority | |||||||
| Healthcare Revenue, 6.25%, | |||||||
| 12/01/2033 (Pre-refunded | |||||||
| to 12/01/2014) | 9,592,011 | ||||||
| 20,474,076 | |||||||
| Delaware – 0.7% | |||||||
| 1,500,000 | Delaware State Economic | ||||||
| Development Authority | |||||||
| Revenue, 6.75%, | |||||||
| 01/01/2013 (ETM) | 1,630,380 | ||||||
| Florida – 13.0% | |||||||
| 4,240,000 | Bartram Springs Community | ||||||
| Development District Special | |||||||
| Assessment Bonds, 6.65%, | |||||||
| 05/01/2034 (Pre-refunded | |||||||
| to 06/01/2013) | 4,822,618 | ||||||
| 5,000,000 | Coral Gables Florida | ||||||
| Health Facility Authority | |||||||
| Hospital Revenue, 5.00%, | |||||||
| 08/15/2029 (Pre-refunded | |||||||
| to 08/15/2014) | 5,726,250 | ||||||
| 2,355,000 | Dade County Florida | ||||||
| Health Facility Authority | |||||||
| Hospital Revenue, 5.75%, | |||||||
| 05/01/2021 (ETM) | 2,652,719 | ||||||
| 4,675,000 | Florida State Mid-Bay Bridge | ||||||
| Authority Revenue Bonds, | |||||||
| 6.875%, 10/01/2022 (ETM) | 5,836,130 | ||||||
| 2,000,000 | Highlands County | ||||||
| Florida Health Facilities | |||||||
| Revenue Bonds, 5.375%, | |||||||
| 11/15/2035 (Pre-refunded | |||||||
| to 11/15/2013) | 2,257,540 | ||||||
| 2,100,000 | Islands At Doral (SW) | ||||||
| Community Development | |||||||
| District, 6.375%, | |||||||
| 05/01/2035 (Pre-refunded | |||||||
| to 05/01/2013) | 2,365,398 | ||||||
| 300,000 | Jacksonville Florida | ||||||
| Health Facility Authority | |||||||
| Hospital Revenue, 11.50%, | |||||||
| 10/01/2012 (ETM) | 401,442 | ||||||
| 1,470,000 | Miami Beach Florida | ||||||
| Resort Tax Revenue | |||||||
| Bonds, 6.25%, | |||||||
| 10/01/2022 (ETM) | 1,729,808 | ||||||
| 55,000 | Orange County Florida | ||||||
| Health Revenue, 8.75%, | |||||||
| 10/01/2009 (ETM) | 55,971 | ||||||
| 1,000,000 | Orlando Florida Utilities | ||||||
| Commission Water & | |||||||
| Electric Revenue, 6.75%, | |||||||
| 10/01/2017 (ETM) | 1,173,410 | ||||||
| 4,000,000 | Seminole County | ||||||
| Florida Water & | |||||||
| Sewer Revenue, 6.00%, | |||||||
| 10/01/2019 (ETM) | 4,601,880 | ||||||
| 31,623,166 | |||||||
| Georgia – 0.5% | |||||||
| 1,020,000 | Fulton County Georgia | ||||||
| Hospital Authority | |||||||
| Revenue, 7.875%, | |||||||
| 10/01/2013 (ETM) | 1,169,858 | ||||||
The accompanying notes are an integral part of these financial statements.
Page 49
Baird Intermediate Municipal Bond Fund
Schedule of Investments December 31, 2008 |
| Principal | |||||||
| Amount | Value | ||||||
| MUNICIPAL BONDS – 85.5% (cont.) | |||||||
| Illinois – 5.1% | |||||||
| $ | 1,000,000 | Chicago Illinois General | |||||
| Obligation Project | |||||||
| and Refunding, | |||||||
| 5.00%, 01/01/2017 | |||||||
| (FSA Insured) | $ | 1,054,810 | |||||
| 1,440,000 | Chicago Illinois | ||||||
| Metropolitan Water | |||||||
| Reclamation District | |||||||
| General Obligation, 7.00%, | |||||||
| 12/01/2010 (ETM) | 1,579,983 | ||||||
| 1,000,000 | Chicago Illinois Public | ||||||
| Building Community | |||||||
| Building Revenue, 7.00%, | |||||||
| 01/01/2020 (ETM) | 1,241,130 | ||||||
| �� | 1,430,000 | Cook County Illinois | |||||
| School District No. 100, | |||||||
| 8.10%, 12/01/2016 (ETM) | 1,966,364 | ||||||
| 1,025,000 | Lake County Illinois | ||||||
| Community High School | |||||||
| District No.124 Grant, | |||||||
| 5.00%, 12/01/2017 | 1,138,396 | ||||||
| 1,000,000 | Lake County Illinois | ||||||
| Community High School | |||||||
| District No. 128, | |||||||
| 5.00%, 01/01/2013 | 1,095,080 | ||||||
| 1,805,000 | Metropolitan Pier & | ||||||
| Exposition Authority | |||||||
| Illinois, 5.50%, | |||||||
| 06/15/2016 (ETM) | 2,126,326 | ||||||
| 2,000,000 | Northwest Suburban Illinois | ||||||
| Municipal Joint Action | |||||||
| Revenue Bonds, 5.00%, | |||||||
| 05/01/2014 (ETM) | 2,281,760 | ||||||
| 12,483,849 | |||||||
| Indiana – 1.7% | |||||||
| Hammond Indiana | |||||||
| Multi-School Building | |||||||
| Corporation Revenue Bonds: | |||||||
| 1,000,000 | 6.00% | ||||||
| 01/15/2018 (ETM) | 1,149,760 | ||||||
| 1,330,000 | 5.00%, 07/15/2018 | 1,462,122 | |||||
| 285,000 | Indiana Toll Road | ||||||
| Commission, 9.00%, | |||||||
| 01/01/2015 (ETM) | 351,209 | ||||||
| 1,000,000 | South Bend Indiana | ||||||
| Community School | |||||||
| Building Corporation, | |||||||
| 5.00%, 07/15/2017 | 1,077,620 | ||||||
| 4,040,711 | |||||||
| Iowa – 0.6% | |||||||
| 1,010,000 | Des Moines Iowa | ||||||
| Metropolitan Wastewater | |||||||
| Reclamation Authority, | |||||||
| 5.00%, 06/01/2015 | |||||||
| (MBIA Insured) | 1,107,394 | ||||||
| 405,000 | Muscatine Iowa Electric | ||||||
| Revenue, 6.70%, | |||||||
| 01/01/2013 (ETM) | 441,430 | ||||||
| 1,548,824 | |||||||
| Louisiana – 1.3% | |||||||
| 400,000 | Houma-Terrebonne | ||||||
| Public Trust Financing | |||||||
| Authority, 7.30%, | |||||||
| 04/01/2010 (ETM) | 429,168 | ||||||
| 1,000,000 | Houma-Terrebonne | ||||||
| Public Trust Financing | |||||||
| Authority Single Family | |||||||
| Mortgage Revenue, 7.30%, | |||||||
| 04/01/2011 (ETM) | 1,120,210 | ||||||
The accompanying notes are an integral part of these financial statements.
Page 50
Baird Intermediate Municipal Bond Fund
Schedule of Investments December 31, 2008 |
| Principal | |||||||
| Amount | Value | ||||||
| MUNICIPAL BONDS – 85.5% (cont.) | |||||||
| Louisiana – 1.3% (cont.) | |||||||
| $ | 1,450,000 | Jefferson Parish Louisiana | |||||
| Home Mortgage | |||||||
| Authority, 7.10%, | |||||||
| 08/01/2010 (ETM) | $ | 1,580,688 | |||||
| 3,130,066 | |||||||
| Massachusetts – 3.8% | |||||||
| 5,745,000 | Massachusetts State, 5.00%, | ||||||
| 08/01/2020 (Pre-refunded | |||||||
| to 08/01/2016) | 6,673,909 | ||||||
| 2,200,000 | Massachusetts State Water | ||||||
| Resources Authority, 6.50%, | |||||||
| 07/15/2019 (ETM) | 2,670,536 | ||||||
| 9,344,445 | |||||||
| Michigan – 1.5% | |||||||
| 1,000,000 | Cornell Twp Michigan | ||||||
| Economic Development | |||||||
| Revenue, 5.875%, | |||||||
| 05/01/2018 | 1,132,090 | ||||||
| 2,185,000 | Detroit Michigan Sewer | ||||||
| Disposal Revenue Bonds, | |||||||
| 5.00%, 07/01/2030 | |||||||
| (Pre-refunded to | |||||||
| 07/01/2015) | 2,500,339 | ||||||
| 3,632,429 | |||||||
| Minnesota – 2.1% | |||||||
| 1,040,000 | Centennial Independent | ||||||
| School District No. 12 | |||||||
| Minnesota, 5.00%, | |||||||
| 02/01/2014 (Pre-refunded | |||||||
| 02/01/2012, FSA Insured) | 1,110,938 | ||||||
| 1,215,000 | Robbinsdale Independent | ||||||
| School District No. 281, | |||||||
| 5.00%, 07/01/2020 | |||||||
| (Pre-refunded 02/01/2012, | |||||||
| FSA Insured) | 1,297,875 | ||||||
| 2,470,000 | Western Minnesota | ||||||
| Municipal Power Agency, | |||||||
| 6.375%, 01/01/2016 | |||||||
| (ETM) | 2,761,164 | ||||||
| 5,169,977 | |||||||
| Mississippi – 0.7% | |||||||
| 1,110,000 | Mississippi Development | ||||||
| Bank Special Obligations, | |||||||
| 5.25%, 10/01/2030 | |||||||
| (Pre-refunded to | |||||||
| 10/01/2015) | 1,278,054 | ||||||
| 600,000 | Mississippi Housing | ||||||
| Financial Corporation, | |||||||
| 0.00%, 06/01/2015 | |||||||
| (ETM) ^ | 487,482 | ||||||
| 1,765,536 | |||||||
| Missouri – 1.0% | |||||||
| 2,000,000 | St. Louis County Industrial | ||||||
| Development Authority, | |||||||
| 6.625%, 11/15/2035 | |||||||
| (Pre-refunded to | |||||||
| 11/15/2013) | 2,396,420 | ||||||
| Nebraska – 0.7% | |||||||
| 1,640,000 | Nebraska Public Power | ||||||
| District Revenue, | |||||||
| 5.00%, 01/01/2015 | |||||||
| (MBIA Insured) | 1,780,105 | ||||||
| Nevada – 0.9% | |||||||
| 1,965,000 | Reno Nevada Capital | ||||||
| Improvement Revenue, | |||||||
| 5.50%, 06/01/2019 | |||||||
| (Pre-refunded to | |||||||
| 06/01/2012) | 2,196,300 | ||||||
The accompanying notes are an integral part of these financial statements.
Page 51
Baird Intermediate Municipal Bond Fund
Schedule of Investments December 31, 2008 |
| Principal | |||||||
| Amount | Value | ||||||
| MUNICIPAL BONDS – 85.5% (cont.) | |||||||
| New Jersey – 2.3% | |||||||
| $ | 1,000,000 | New Jersey State | |||||
| Transportation Trust | |||||||
| Fund Authority, 6.00%, | |||||||
| 12/15/2017 (Pre-refunded | |||||||
| to 12/15/2011) | $ | 1,120,410 | |||||
| New Jersey State Turnpike | |||||||
| Authority: (ETM) | |||||||
| 177,000 | 6.75%, 01/01/2009 | 177,000 | |||||
| 1,500,000 | 6.50%, 01/01/2016 | 1,736,520 | |||||
| 130,000 | 6.50%, 01/01/2016 | 150,471 | |||||
| 2,000,000 | Tobacco Settlement | ||||||
| Financing Corporation, | |||||||
| 6.25%, 06/01/2043 | |||||||
| (Pre-refunded to | |||||||
| 06/01/2013) | 2,334,420 | ||||||
| 5,518,821 | |||||||
| New Mexico – 0.5% | |||||||
| 1,000,000 | New Mexico State | ||||||
| Hospital Equipment Loan | |||||||
| Council Hospital Revenue, | |||||||
| 5.25%, 07/01/2025 | |||||||
| (Pre-refunded to | |||||||
| 07/01/2015) | 1,146,310 | ||||||
| New York – 0.5% | |||||||
| 1,000,000 | New York, New York, | ||||||
| 5.00%, 03/01/2016 | |||||||
| (FGIC Insured) | 1,052,340 | ||||||
| 210,000 | TSASC Inc. New York, | ||||||
| 4.75%, 06/01/2022 | 155,230 | ||||||
| 1,207,570 | |||||||
| North Carolina – 3.1% | |||||||
| 225,000 | North Carolina Eastern | ||||||
| Municipal Power Agency | |||||||
| Power Systems Revenue, | |||||||
| 6.40%, 01/01/2021 (ETM) | 271,710 | ||||||
| 6,495,000 | North Carolina Medical | ||||||
| Care Community Hospital | |||||||
| Revenue Bonds, 5.25%, | |||||||
| 11/01/2029 (Pre-refunded | |||||||
| to 11/01/2014) | 7,240,366 | ||||||
| 7,512,076 | |||||||
| Ohio – 0.1% | |||||||
| 125,000 | Miamisburg Ohio Water | ||||||
| Revenue, 7.00%, | |||||||
| 11/15/2016 (ETM) | 146,129 | ||||||
| Oklahoma – 1.1% | |||||||
| 2,360,000 | Tulsa County Oklahoma | ||||||
| Home Financing Authority | |||||||
| Single Family Mortgage | |||||||
| Revenue, 6.90%, | |||||||
| 08/01/2011 (ETM) | 2,664,676 | ||||||
| Pennsylvania – 3.7% | |||||||
| 1,275,000 | Central Dauphin | ||||||
| Pennsylvania School | |||||||
| District, 6.75%, | |||||||
| 02/01/2024 (Pre-refunded | |||||||
| to 02/01/2016) | 1,611,830 | ||||||
| 3,000,000 | Pennsylvania State Public | ||||||
| School Building Authority | |||||||
| Lease Revenue, 5.00%, | |||||||
| 11/15/2034 (Pre-refunded | |||||||
| to 11/15/2014) | 3,392,310 | ||||||
| 1,790,000 | Philadelphia Pennsylvania | ||||||
| Authority For Industrial | |||||||
| Development Revenue, | |||||||
| 5.25%, 01/01/2027 | |||||||
| (Pre-refunded to | |||||||
| 01/01/2017) | 2,059,037 | ||||||
| 740,000 | Philadelphia Pennsylvania | ||||||
| Gas Works, 7.00%, | |||||||
| 05/15/2020 (ETM) | 893,513 | ||||||
The accompanying notes are an integral part of these financial statements.
Page 52
Baird Intermediate Municipal Bond Fund
Schedule of Investments December 31, 2008 |
| Principal | |||||||
| Amount | Value | ||||||
| MUNICIPAL BONDS – 85.5% (cont.) | |||||||
| Pennsylvania – 3.7% (cont.) | |||||||
| $ | 1,025,000 | Pittsburgh Pennsylvania | |||||
| Water & Sewer | |||||||
| Authority, 7.25%, | |||||||
| 09/01/2014 (ETM) | $ | 1,153,904 | |||||
| 9,110,594 | |||||||
| South Carolina – 2.2% | |||||||
| 285,000 | Greenville South | ||||||
| Carolina Waterworks | |||||||
| Revenue, 7.00%, | |||||||
| 02/01/2010 (ETM) | 302,730 | ||||||
| 4,500,000 | Lexington County South | ||||||
| Carolina Health Services | |||||||
| District Hospital Revenue, | |||||||
| 5.50%, 11/01/2032 | |||||||
| (Pre-refunded to | |||||||
| 11/01/2013) | 5,078,655 | ||||||
| 5,381,385 | |||||||
| South Dakota – 0.3% | |||||||
| 610,000 | Heartland Consumers | ||||||
| Power District, 7.00%, | |||||||
| 01/01/2016 (ETM) | 698,060 | ||||||
| Tennessee – 0.9% | |||||||
| 230,000 | Metropolitan | ||||||
| Government Nashville & | |||||||
| Davidson County | |||||||
| Tennessee H&E, 6.10%, | |||||||
| 07/01/2010 (ETM) | 238,616 | ||||||
| 1,545,000 | Metropolitan Government | ||||||
| Nashville & Davidson | |||||||
| County Tennessee Water | |||||||
| & Sewer Revenue, 6.50%, | |||||||
| 12/01/2014 (ETM) | 1,898,341 | ||||||
| 2,136,957 | |||||||
| Texas – 16.3% | |||||||
| 1,125,000 | Barbers Hill Texas | ||||||
| Independent School | |||||||
| District General Obligation, | |||||||
| 5.00%, 02/15/2017 | |||||||
| (PSF Guaranteed) | 1,219,612 | ||||||
| 1,000,000 | Copperas Cove Texas | ||||||
| Independent School District, | |||||||
| 5.00%, 08/15/2016 | |||||||
| (PSF Guaranteed) | 1,105,160 | ||||||
| 1,500,000 | Cypress-Fairbanks Texas | ||||||
| Independent School District, | |||||||
| 5.00%, 02/15/2017 | |||||||
| (PSF Guaranteed) | 1,639,470 | ||||||
| 1,625,000 | Frisco Texas Independent | ||||||
| School District, | |||||||
| 6.00%, 08/15/2018 | |||||||
| (PSF Guaranteed) | 1,866,166 | ||||||
| 1,000,000 | Georgetown Texas | ||||||
| Independent School District, | |||||||
| 5.00%, 02/15/2016 | |||||||
| (PSF Guaranteed) | 1,097,960 | ||||||
| 2,000,000 | Harris County Texas, | ||||||
| 5.25%, 10/01/2017 | |||||||
| (Pre-refunded to | |||||||
| 10/01/2013) | 2,269,020 | ||||||
| 1,720,000 | Harris County Texas | ||||||
| Health Facilities | |||||||
| Development Corporation | |||||||
| Hospital Revenue, 5.50%, | |||||||
| 10/01/2019 (ETM) | 1,969,916 | ||||||
| 7,250,000 | Houston Texas Health | ||||||
| Facilities Corporate | |||||||
| Facilities Revenue, | |||||||
| 7.125%, 02/15/2034 | |||||||
| (Pre-refunded to | |||||||
| 02/15/2014) | 8,803,167 | ||||||
The accompanying notes are an integral part of these financial statements.
Page 53
Baird Intermediate Municipal Bond Fund
Schedule of Investments December 31, 2008 |
| Principal | |||||||
| Amount | Value | ||||||
| MUNICIPAL BONDS – 85.5% (cont.) | |||||||
| Texas – 16.3% (cont.) | |||||||
| $ | 1,920,000 | Houston Texas Sewer | |||||
| System Revenue, 9.375%, | |||||||
| 10/01/2013 (ETM) | $ | 2,279,251 | |||||
| 1,315,000 | La Porte Texas | ||||||
| Independent | |||||||
| School District, | |||||||
| 5.00%, 02/15/2018 | |||||||
| (MBIA Insured) | 1,397,306 | ||||||
| 1,735,000 | Lufkin Texas Independent | ||||||
| School District, | |||||||
| 5.00%, 08/15/2015 | |||||||
| (PSF Guaranteed) | 1,911,901 | ||||||
| 1,050,000 | Magnolia Texas | ||||||
| Independent School District, | |||||||
| 5.00%, 08/15/2016 | |||||||
| (PSF Guaranteed) | 1,171,443 | ||||||
| 1,265,000 | Mission Consolidation | ||||||
| Independent School District, | |||||||
| 5.00%, 02/15/2019 | |||||||
| (PSF Guaranteed) | 1,337,826 | ||||||
| 1,210,000 | Pearland Texas Waterworks | ||||||
| & Sewage, 5.25%, | |||||||
| 03/01/2023 (Pre-refunded | |||||||
| to 03/01/2014) | 1,386,914 | ||||||
| 1,295,000 | Rockwall Texas | ||||||
| Independent School | |||||||
| District, 5.00%, | |||||||
| 02/15/2015 | |||||||
| (PSF Guaranteed) | 1,437,010 | ||||||
| 775,000 | Sam Rayburn Texas | ||||||
| Municipal Power Agency, | |||||||
| 6.00%, 09/01/2010 (ETM) | 806,605 | ||||||
| 1,565,000 | San Antonio Texas Electric | ||||||
| & Gas Revenue, 5.65%, | |||||||
| 02/01/2019 (ETM) | 1,779,875 | ||||||
| 2,000,000 | San Antonio Texas | ||||||
| Independent School District, | |||||||
| 5.00%, 08/15/2017 | |||||||
| (PSF Guaranteed) | 2,180,480 | ||||||
| 575,000 | Socorro Texas Independent | ||||||
| School District, 5.25%, | |||||||
| 08/15/2012 | |||||||
| (PSF Guaranteed) | 630,890 | ||||||
| 265,000 | Texas Public Building | ||||||
| Authority Revenue, 7.125%, | |||||||
| 08/01/2011 (ETM) | 284,652 | ||||||
| 1,900,000 | Trinity River Authority | ||||||
| Texas Revenue, | |||||||
| 5.50%, 02/01/2021 | |||||||
| (Pre-refunded 02/01/2013, | |||||||
| MBIA Insured) | 2,155,436 | ||||||
| 1,000,000 | University of Houston | ||||||
| Texas, 5.25%, 02/15/2012 | |||||||
| (FSA Insured) | 1,089,550 | ||||||
| 39,819,610 | |||||||
| Utah – 0.3% | |||||||
| 540,000 | Salt Lake City Utah | ||||||
| Hospital Revenue, 8.125%, | |||||||
| 05/15/2015 (ETM) | 629,354 | ||||||
| Virginia – 1.9% | |||||||
| 1,095,000 | Bristol Virginia Utility | ||||||
| Systems General | |||||||
| Obligation, 5.50%, | |||||||
| 11/01/2018 (ETM) | 1,205,967 | ||||||
| 2,915,000 | Tobacco Settlement | ||||||
| Financing Corporation | |||||||
| Revenue Bonds, | |||||||
| 5.625%, 06/01/2037 | |||||||
| (Pre-refunded to | |||||||
| 06/01/2015) | 3,335,751 | ||||||
| 4,541,718 | |||||||
The accompanying notes are an integral part of these financial statements.
Page 54
Baird Intermediate Municipal Bond Fund
Schedule of Investments December 31, 2008 |
| Principal | |||||||
| Amount | Value | ||||||
| MUNICIPAL BONDS – 85.5% (cont.) | |||||||
| Washington – 0.5% | |||||||
| $ | 1,000,000 | Snohomish County | |||||
| Washington Public | |||||||
| Utilities Revenue Bonds, | |||||||
| 6.80%, 01/01/2020 | |||||||
| (ETM, MBIA Insured) | $ | 1,202,740 | |||||
| Total Municipal Bonds | |||||||
| (Cost $200,773,283) | 208,155,173 | ||||||
| Shares | |||||||
| SHORT-TERM INVESTMENTS – 11.8% | |||||||
| Money Market Fund – 11.8% | |||||||
| 28,770,399 | Fidelity Institutional | ||||||
| Tax-Exempt Portfolio | 28,770,399 | ||||||
| Total Short-Term | |||||||
| Investments | |||||||
| (Cost $28,770,399) | 28,770,399 | ||||||
| Total Investments | |||||||
| (Cost $229,543,682) – | |||||||
| 97.3% | 236,925,572 | ||||||
| Other Assets in Excess | |||||||
| of Liabilities – 2.7% | 6,638,010 | ||||||
| TOTAL NET | |||||||
| ASSETS – 100.0% | $ | 243,563,582 | |||||
ETM – Escrowed to Maturity
| ^ | Non-Income Producing |
The accompanying notes are an integral part of these financial statements.
Page 55
Baird Intermediate Municipal Bond Fund
Schedule of Investments December 31, 2008 |
SFAS 157 – Summary of Fair Value Exposure at December 31, 2008
In September 2006, the Financial Accounting Standards Board issued Statement of Financial Accounting Standards No. 157, “Fair Value Measurements” (“SFAS 157”) effective for fiscal years beginning after November 15, 2007. SFAS 157 defines fair value, establishes a framework for measuring fair value in generally accepted accounting principles (GAAP), and expands disclosures about fair value measurements. The Fund adopted SFAS 157 as of January 1, 2008. Under SFAS 157, various inputs are used in determining the value of the Fund’s investments. These inputs are summarized into three broad levels and described below:
| Level 1 – | Quoted prices in active markets for identical securities |
| Level 2 – | Other significant observable inputs (including quoted prices for similar securities, interest rates, prepayment speeds, credit risk, etc.) |
| Level 3 – | Significant unobservable inputs (including the Fund’s own assumptions in determining the fair value of investments) |
The following is a summary of the inputs used to value the Fund’s investments as of December 31, 2008:
| Description | Investments, at Value | |||
| Level 1 – Quoted prices | $ | 28,770,399 | ||
| Level 2 – Other significant observable inputs | 208,155,173 | |||
| Level 3 – Significant unobservable inputs | — | |||
| Total | $ | 236,925,572 | ||
Page 56
Baird Core Plus Bond Fund
The Baird Core Plus Bond Fund seeks an annual rate of total return, before Fund expenses, greater than the annual rate of total return of the Barclays Capital U.S. Universal Bond Index. The Barclays Capital U.S. Universal Bond Index is an unmanaged, market value weighted index of fixed income securities issued in U.S. dollars, including U.S. government and investment grade debt, non-investment grade debt, asset-backed and mortgage-backed securities, Eurobonds, 144A securities and emerging market debt, with maturities of at least one year.
Extreme volatility in the financial markets led to severely dislocated prices of bonds in several sectors that we believe do not reflect sound credit fundamentals. The Fund underperformed its benchmark index in 2008. The primary factors for the underperformance were:
| • | The Fund’s underweight to U.S. Treasuries which outperformed all other market sectors due to a flight to quality by investors; |
| • | The Fund’s overweighting to the finance sector relative to the benchmark and exposure to non-Agency mortgage-backed and asset-backed securities; and |
| • | An underweight to the high yield sector was positive for performance relative to the benchmark. |
The Fund maintained its duration-neutral strategy, holding a broadly diversified portfolio of over 300 securities at year end.
The Fund ended 2008 with a yield advantage versus its benchmark index. Despite the unprecedented market volatility, we are confident of the integrity of the issues we hold and the structure of the Fund overall. We feel very strongly that the Fund will realize its sizeable yield advantage over time and outperform its benchmark through the completion of this historic and severe credit cycle.
Portfolio Characteristics
| Quality Distribution* | Sector Weightings* | ||||
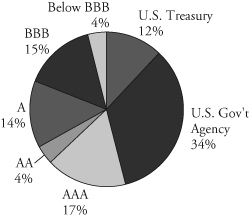 | 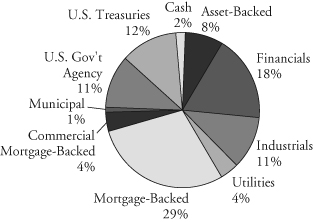 | ||||
| Net Assets: | $188,566,913 | Annualized Expense Ratio: | |||
SEC 30-Day Yield:** | Institutional Class: | 0.30% | |||
| Institutional Class: | 6.43% | Investor Class: | 0.55% | *** | |
| Investor Class: | 6.19% | Portfolio Turnover Rate: | 27.7% | ||
| Average Effective Duration: | 3.77 years | Total Number of Holdings: | 301 | ||
| Average Effective Maturity: | 5.74 years | ||||
| * | Percentages shown are based on the Fund’s total net assets. |
| ** | SEC yields are based on SEC guidelines and are calculated for the 30 days ended December 31, 2008. |
| *** | Includes 0.25% 12b-1 fee. |
Page 57
Baird Core Plus Bond Fund
| Institutional Class |
| Value of a $25,000 Investment |
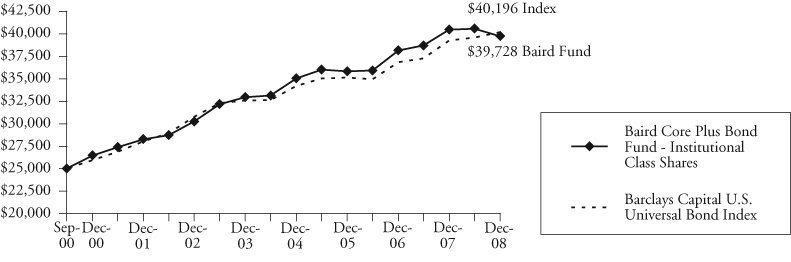 |
Growth of a hypothetical investment of $25,000 made on the Fund’s inception date (9/29/00), assuming reinvestment of all distributions.
| Investor Class |
| Value of a $10,000 Investment |
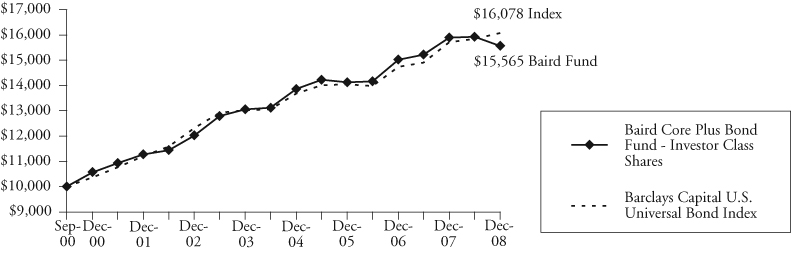 |
Growth of a hypothetical investment of $10,000 made on the Fund’s inception date (9/29/00), assuming reinvestment of all distributions.
Page 58
Baird Core Plus Bond Fund
Average Annual Total Returns
| Since | |||
| For the Periods Ended December 31, 2008 | One Year | Five Years | Inception(1) |
| Institutional Class Shares | -1.79% | 3.81% | 5.77% |
| Investor Class Shares | -2.07% | 3.57% | 5.51% |
Barclays Capital U.S. Universal Bond Index(2) | 2.38% | 4.29% | 5.92% |
| (1) | For the period from September 29, 2000 (commencement of operations) through December 31, 2008. |
| (2) | The Barclays Capital U.S. Universal Bond Index is an unmanaged, market value weighted index of fixed income securities issued in U.S. dollars, including U.S. government and investment grade debt, non-investment grade debt, asset-backed and mortgage-backed securities, Eurobonds, 144A securities and emerging market debt, with maturities of at least one year. This index does not reflect any deduction for fees, expenses or taxes. A direct investment in an index is not possible. |
The returns shown in the table above and line graphs on the previous page reflect reinvestment of dividends and/or capital gains distributions in additional shares. The returns do not reflect the deduction of taxes that a shareholder would pay on Fund distributions or the redemption of Fund shares.
Past performance does not guarantee future results. Investment return and principal value will fluctuate so that an investor’s shares, when redeemed, may be worth more or less than their original cost.
For information about the performance of the Fund as of the most recent month-end, please call 1-866-44BAIRD or visit www.bairdfunds.com. Mutual fund performance changes over time and current performance may be lower or higher than that stated.
Page 59
Baird Core Plus Bond Fund
Schedule of Investments December 31, 2008 |
| Principal | |||||||
| Amount | Value | ||||||
| LONG-TERM INVESTMENTS – 97.0% | |||||||
| Asset Backed Securities – 7.6% | |||||||
| $ | 900,000 | American Express Credit | |||||
| Account Master Trust, | |||||||
| Series 2005-5, Class A, | |||||||
| 1.235%, 02/15/2013 | $ | 825,585 | |||||
| 169,809 | Amresco Residential | ||||||
| Securities Mortgage | |||||||
| Loan Trust, | |||||||
| Series 1998-2, Class A6, | |||||||
| 6.41%, 12/25/2027 | 153,866 | ||||||
| 600,000 | Bayview Financial | ||||||
| Acquisition Trust, | |||||||
| Series 2007-A, | |||||||
| 6.205%, 05/28/2037 | 507,468 | ||||||
| 175,000 | Capital One Multi-Asset | ||||||
| Execution Trust, | |||||||
| Series 2006-9A, Class A9, | |||||||
| 1.21%, 05/15/2013 | 159,861 | ||||||
| 5,795 | Contimortgage Home | ||||||
| Equity Loan Trust, | |||||||
| Series 1997-5, Class A6, | |||||||
| 6.87%, 03/15/2024 | 5,763 | ||||||
| Countrywide Asset-Backed | |||||||
| Certificates: | |||||||
| 200,000 | Series 2006-S2, Class A2, | ||||||
| 5.627%, 07/25/2027 | 154,434 | ||||||
| 1,500,000 | Series 2006-S7, Class A2, | ||||||
| 5.571%, 11/25/2035 | 536,598 | ||||||
| 595,125 | Series 2005-10, Class AF6, | ||||||
| 4.915%, 02/25/2036 | 519,979 | ||||||
| 94,944 | Series 2005-13, Class AF2, | ||||||
| 5.294%, 04/25/2036 | 93,073 | ||||||
| 1,000,000 | Series 2005-13, Class AF3, | ||||||
| 5.43%, 04/25/2036 | 803,965 | ||||||
| 392,884 | Series 2006-S9, Class A3, | ||||||
| 5.728%, 08/25/2036 | 126,690 | ||||||
| 1,000,000 | Series 2006-13, | ||||||
| Class 1AF2, 5.884%, | |||||||
| 01/25/2037 | 939,020 | ||||||
| 1,300,000 | Series 2006-10, | ||||||
| Class 1AF3, 5.971%, | |||||||
| 09/25/2046 | 1,160,538 | ||||||
| 616,000 | Series 2006-9, Class 1AF3, | ||||||
| 5.859%, 10/25/2046 | 358,645 | ||||||
| 846,038 | Credit-Based Asset | ||||||
| Servicing and Security, | |||||||
| Series 2005-CB3, Class AF4 | |||||||
| 4.725%, 02/25/2035 | 738,516 | ||||||
| Discover Card | |||||||
| Master Trust I: | |||||||
| 825,000 | Series 2005-2, Class A, | ||||||
| 1.23%, 04/17/2012 | 790,086 | ||||||
| 500,000 | Series 2003-3, Class A, | ||||||
| 1.39%, 09/15/2012 | 462,866 | ||||||
| 477,230 | GMAC Mortgage | ||||||
| Corporation Loan Trust, | |||||||
| Series 2005-HE3, Class A2, | |||||||
| 1.12%, 02/25/2036 | 203,843 | ||||||
| Green Tree Financial | |||||||
| Corporation: | |||||||
| 28,229 | Series 1997-1, Class A5, | ||||||
| 6.86%, 03/15/2028 | 23,162 | ||||||
| 84,506 | Series 1997-4, Class A5, | ||||||
| 6.88%, 02/15/2029 | 68,721 | ||||||
| 943,534 | Series 1998-3, Class A5, | ||||||
| 6.22%, 03/01/2030 | 685,843 | ||||||
| 391,495 | Series 1998-4, Class A5, | ||||||
| 6.18%, 04/01/2030 | 250,973 | ||||||
| 55,702 | Oakwood Mortgage | ||||||
| Investors, Inc., | |||||||
| Series 1999-B, Class A3, | |||||||
| 6.45%, 11/15/2017 | 37,036 | ||||||
The accompanying notes are an integral part of these financial statements.
Page 60
Baird Core Plus Bond Fund
Schedule of Investments December 31, 2008 |
| Principal | |||||||
| Amount | Value | ||||||
| LONG-TERM INVESTMENTS – 97.0% (cont.) | |||||||
| Asset Backed Securities – 7.6% (cont.) | |||||||
| Renaissance Home | |||||||
| Equity Loan Trust: | |||||||
| $ | 169,450 | Series 2006-1, Class AF2, | |||||
| 5.533%, 05/25/2036 | $ | 168,519 | |||||
| 519,000 | Series 2006-2, Class AF3, | ||||||
| 5.797%, 08/25/2036 | 424,117 | ||||||
| 886,580 | Series 2006-3, Class AF2, | ||||||
| 5.58%, 11/25/2036 | 848,591 | ||||||
| 500,000 | Series 2007-1, Class AF2, | ||||||
| 5.512%, 04/25/2037 | 378,273 | ||||||
| 1,500,000 | Series 2007-2, Class AF2, | ||||||
| 5.675%, 06/25/2037 | 1,136,788 | ||||||
| 260,491 | Residential Asset | ||||||
| Mortgage Products, Inc., | |||||||
| Series 2003-RS10, | |||||||
| Class AI7, 4.85%, | |||||||
| 11/25/2033 | 193,468 | ||||||
| 347,931 | Residential Asset | ||||||
| Securities Corporation, | |||||||
| Series 2003-KS5, Class AI6, | |||||||
| 3.62%, 07/25/2033 | 211,731 | ||||||
| 400,000 | Stingray Pass-Thru | ||||||
| Certificates, Series 2005, | |||||||
| 5.902%, 01/12/2015 | |||||||
| (Acquired 05/10/2007, | |||||||
| Cost $383,484)* # | 60,000 | ||||||
| Structured Asset | |||||||
| Securities Corporation: | |||||||
| 12,824 | Series 2004-11XS, | ||||||
| Class 1A3A, 4.76%, | |||||||
| 06/25/2034 | 12,787 | ||||||
| 1,541,435 | Series 2005-7XS, | ||||||
| Class 1A4B, 5.44%, | |||||||
| 04/25/2035 | 1,163,335 | ||||||
| 14,204,140 | |||||||
| Financial – 16.9% | |||||||
| 825,000 | American Express Credit | ||||||
| Corporation, Series C, | |||||||
| 7.30%, 08/20/2013 | 844,463 | ||||||
| 1,000,000 | American General Finance | ||||||
| Corporation Senior Notes, | |||||||
| 6.90%, 12/15/2017 | 432,773 | ||||||
| 155,000 | Associates Corporation | ||||||
| North America | |||||||
| Subordinated Debentures, | |||||||
| 8.15%, 08/01/2009 | 154,415 | ||||||
| 500,000 | Bancwest Corporation, | ||||||
| 8.30%, 01/15/2011 | 522,585 | ||||||
| 300,000 | Bank of | ||||||
| America Corporation | |||||||
| Subordinated Notes, | |||||||
| 10.20%, 07/15/2015 | 329,053 | ||||||
| 200,000 | Banponce Trust I, Series A, | ||||||
| 8.327%, 02/01/2027 | |||||||
| (Callable 03/02/2009) | 165,042 | ||||||
| 400,000 | Bear Stearns Cos., | ||||||
| Inc., Series B, | |||||||
| 6.95%, 08/10/2012 | 415,429 | ||||||
| 1,000,000 | BOI Capital Funding No.3, | ||||||
6.107%, 02/04/2016 * f | 219,788 | ||||||
| 170,000 | Capmark Financial | ||||||
| Group, Inc., | |||||||
| 5.875%, 05/10/2012 | 57,969 | ||||||
| 600,000 | CIT Group Funding | ||||||
| Company of Canada, | |||||||
5.20%, 06/01/2015 f | 421,232 | ||||||
| CIT Group, Inc.: | |||||||
| 75,000 | 4.75%, 12/15/2010 | 66,020 | |||||
| 250,000 | 7.625%, 11/30/2012 | 211,042 | |||||
| 400,000 | 6.10%, 03/15/2067 | ||||||
| (Callable 03/15/2017) | 123,517 | ||||||
The accompanying notes are an integral part of these financial statements.
Page 61
Baird Core Plus Bond Fund
Schedule of Investments December 31, 2008 |
| Principal | |||||||
| Amount | Value | ||||||
| LONG-TERM INVESTMENTS – 97.0% (cont.) | |||||||
| Financial – 16.9% (cont.) | |||||||
| $ | 700,000 | Citigroup Capital XXI, | |||||
| 8.30%, 12/21/2077 | |||||||
| (Callable 12/21/2037) | $ | 539,866 | |||||
| 825,000 | Countrywide Financial | ||||||
| Corporation | |||||||
| Subordinated Notes, | |||||||
| 6.25%, 05/15/2016 | 783,344 | ||||||
| 500,000 | Export-Import | ||||||
| Bank Korea Notes, | |||||||
4.625%, 03/16/2010 f | 486,050 | ||||||
| 500,000 | First Empire | ||||||
| Capital Trust I, | |||||||
| 8.234%, 02/01/2027 | |||||||
| (Callable 03/27/2009) | 361,068 | ||||||
| 1,000,000 | First Empire | ||||||
| Capital Trust II, | |||||||
| 8.277%, 06/01/2027 | |||||||
| (Callable 03/27/2009) | 723,790 | ||||||
| 1,100,000 | First National | ||||||
| Bank of Omaha | |||||||
| Subordinated Notes, | |||||||
| 7.32%, 12/01/2010 | 1,108,326 | ||||||
| 1,300,000 | First Tennessee Capital I, | ||||||
| 8.07%, 01/06/2027 | 802,481 | ||||||
| 250,000 | First Union Capital I, | ||||||
| Series A, | |||||||
| 7.935%, 01/15/2027 | |||||||
| (Callable 03/27/2009) | 207,489 | ||||||
| 150,000 | General Electric Capital | ||||||
| Corporation Notes, | |||||||
| 6.00%, 06/15/2012 | 153,907 | ||||||
| General Motors Acceptance | |||||||
| Corporation Notes: | |||||||
| 75,000 | 7.75%, 01/19/2010 | 66,891 | |||||
| 450,000 | 6.875%, 09/15/2011 | 364,338 | |||||
| 250,000 | 6.75%, 12/01/2014 | 170,912 | |||||
| 1,627,000 | Genworth Global | ||||||
| Funding Trust, | |||||||
| 5.125%, 03/15/2011 | 1,143,115 | ||||||
| 425,000 | Glencore Funding LLC, | ||||||
| 6.00%, 04/15/2014 | |||||||
| (Acquired 03/31/2004, | |||||||
| 12/04/2006 and | |||||||
| 09/29/2008; | |||||||
| $148,928, $198,740 and | |||||||
| $71,779, respectively)* | 172,039 | ||||||
| GMAC LLC: | |||||||
| 49,000 | 7.50%, 12/31/2013 | ||||||
| (Acquired 12/31/2008, | |||||||
| Cost $176,953)* # | 35,748 | ||||||
| 59,000 | 8.00%, 12/31/2018 | ||||||
| (Acquired 12/31/2008, | |||||||
| Cost $213,066)* # | 30,935 | ||||||
| Goldman Sachs Group, Inc.: | |||||||
| 100,000 | 5.15%, 01/15/2014 | 90,063 | |||||
| 1,000,000 | 5.95%, 01/18/2018 | 948,172 | |||||
| 530,000 | Goldman Sachs Group LP, | ||||||
| 8.00%, 03/01/2013 | |||||||
| (Acquired 05/19/2006 and | |||||||
| 12/23/2008; Cost $32,014 | |||||||
| and $500,000)* | 505,436 | ||||||
| 800,000 | Hartford Financial | ||||||
| Services Group, | |||||||
| 8.125%, 06/15/2068 | |||||||
| (Callable 06/15/2018) | 421,199 | ||||||
| 175,000 | HSBC Bank PLC | ||||||
| Subordinated Notes, | |||||||
6.95%, 03/15/2011 f | 175,173 | ||||||
| 700,000 | Huntington National | ||||||
| Bank Notes, | |||||||
| 8.00%, 04/01/2010 | 641,774 | ||||||
| 1,110,000 | Invesco Ltd., | ||||||
5.375%, 12/15/2014 f | 940,040 | ||||||
The accompanying notes are an integral part of these financial statements.
Page 62
Baird Core Plus Bond Fund
Schedule of Investments December 31, 2008 |
| Principal | |||||||
| Amount | Value | ||||||
| LONG-TERM INVESTMENTS – 97.0% (cont.) | |||||||
| Financial – 16.9% (cont.) | |||||||
| Istar Financial, Inc.: | |||||||
| $ | 500,000 | Series B, | |||||
| 4.875%, 01/15/2009 | $ | 453,750 | |||||
| 400,000 | 5.85%, 03/15/2017 | 120,000 | |||||
| 100,000 | J.P. Morgan Chase | ||||||
| Capital XV, | |||||||
| 5.875%, 03/15/2035 | 77,390 | ||||||
| 400,000 | Jefferies Group, Inc., | ||||||
| 6.45%, 06/08/2027 | 233,851 | ||||||
| 600,000 | Key Bank NA, | ||||||
| 7.413%, 05/06/2015 | 515,041 | ||||||
| 400,000 | Lehman Brothers | ||||||
| Holdings Senior Notes, | |||||||
| 8.80%, 03/01/2015 @ | 38,000 | ||||||
| Liberty Mutual Group: | |||||||
| 50,000 | 6.50%, 03/15/2035 | ||||||
| (Acquired 09/29/2008, | |||||||
| Cost $36,910)* | 28,671 | ||||||
| 625,000 | 10.75%, 06/15/2058 | ||||||
| (Callable 06/15/2038) | |||||||
| (Acquired 05/21/2008 | |||||||
| and 08/28/2008; | |||||||
| Cost $489,025 | |||||||
| and $113,750, | |||||||
| respectively)* | 343,750 | ||||||
| Liberty Mutual Insurance, | |||||||
| 375,000 | 7.697%, 10/15/2097 | ||||||
| (Acquired 03/26/2003, | |||||||
| Cost $240,077)* | 249,161 | ||||||
| 825,000 | Lincoln National | ||||||
| Corporation, | |||||||
| 6.05%, 04/20/2067 | |||||||
| (Callable 04/20/2017) | 330,000 | ||||||
| 500,000 | Manufacturer And | ||||||
| Traders Trust Co., | |||||||
| 6.625%, 12/04/2017 | 465,212 | ||||||
| 700,000 | Marsh & McLennan | ||||||
| Companies, Inc., | |||||||
| 5.375%, 07/15/2014 | 621,025 | ||||||
| 700,000 | MBIA Insurance Company, | ||||||
| 14.00%, 01/15/2033 | |||||||
| (Callable 01/15/2013) | |||||||
| (Acquired 01/11/2008, | |||||||
| Cost $700,000)* | 357,000 | ||||||
| Merrill Lynch | |||||||
| & Co., Inc.: | |||||||
| 100,000 | 5.00%, 02/03/2014 | 96,952 | |||||
| 500,000 | 6.875%, 04/25/2018 | 550,840 | |||||
| 600,000 | 7.75%, 05/14/2038 | 627,616 | |||||
| Morgan Stanley | |||||||
| Senior Unsecured Notes: | |||||||
| 800,000 | 5.625%, 01/09/2012 | 758,646 | |||||
| 125,000 | 6.625%, 04/01/2018 | 109,661 | |||||
| 400,000 | National Australia Bank | ||||||
| Ltd. Subordinated Notes, | |||||||
| Series A, 8.60%, | |||||||
05/19/2010 f | 408,091 | ||||||
| 75,000 | National Bank of Hungary | ||||||
| Yankee Debentures, | |||||||
8.875%, 11/01/2013 f | 79,257 | ||||||
| 871,000 | National City Bank, | ||||||
| 6.20%, 12/15/2011 | 817,658 | ||||||
| 500,000 | National City | ||||||
| Bank of Kentucky | |||||||
| Subordinated Notes, | |||||||
| 6.30%, 02/15/2011 | 481,682 | ||||||
| 859,000 | Navigators Group Inc. | ||||||
| Senior Unsecured Notes, | |||||||
| 7.00%, 05/01/2016 | 546,475 | ||||||
| Popular North | |||||||
| American, Inc.: | |||||||
| 475,000 | 5.65%, 04/15/2009 | 470,589 | |||||
| 1,000,000 | 4.70%, 06/30/2009 | 977,363 | |||||
The accompanying notes are an integral part of these financial statements.
Page 63
Baird Core Plus Bond Fund
Schedule of Investments December 31, 2008 |
| Principal | |||||||
| Amount | Value | ||||||
| LONG-TERM INVESTMENTS – 97.0% (cont.) | |||||||
| Financial – 16.9% (cont.) | |||||||
| $ | 300,000 | Principal Financial | |||||
| Group (AU) Senior Notes, | |||||||
| 8.20%, 08/15/2009 | |||||||
| (Acquired 09/16/2005 | |||||||
| and 12/23/2008; | |||||||
| Cost $102,072 | |||||||
and $198,848)* f | $ | 302,395 | |||||
| 550,000 | Principal Life | ||||||
| Income Funding, | |||||||
| 5.10%, 04/15/2014 | 513,491 | ||||||
| 950,000 | Protective Life Corporation | ||||||
| Senior Notes, | |||||||
| 4.30%, 06/01/2013 | 774,509 | ||||||
| 1,400,000 | Regions Financing Trust II, | ||||||
| 6.625%, 05/15/2047 | |||||||
| (Callable 05/15/2027) | 762,119 | ||||||
| 200,000 | Santander | ||||||
| Financial Issuances, | |||||||
6.375%, 02/15/2011 f | 208,135 | ||||||
| 1,775,000 | Schwab Capital Trust I, | ||||||
| 7.50%, 11/15/2037 | |||||||
| (Callable 11/15/2017) | 887,695 | ||||||
| Sovereign Bank: | |||||||
| 1,100,000 | 1.73%, 03/23/2010 | 976,727 | |||||
| 643,000 | 8.75%, 05/30/2018 | 635,242 | |||||
| 1,200,000 | Toll Road Inv. | ||||||
| Partnership II, | |||||||
| Series 1999B, | |||||||
| 0.00%, 02/15/2009 | |||||||
| (Acquired 02/04/2008, | |||||||
| Cost $1,192,733)* ^ | 1,196,364 | ||||||
| 775,000 | Travelers Companies, Inc., | ||||||
| 6.25%, 03/15/2067 | 507,654 | ||||||
| 100,000 | UFJ Finance Aruba AEC, | ||||||
6.75%, 07/15/2013 f | 97,740 | ||||||
| 100,000 | Unitrin, Inc. | ||||||
| Senior Unsecured Notes, | |||||||
| 6.00%, 05/15/2017 | 71,571 | ||||||
| 1,400,000 | Washington Mutual | ||||||
| Prefered Funding Trust III, | |||||||
| 6.895%, 12/31/2049 | |||||||
| (Callable 06/15/2012) | |||||||
| (Acquired 12/12/2007 | |||||||
| and 02/05/2008; | |||||||
| Cost $761,027 and | |||||||
| $141,087)* @ | 140 | ||||||
| 375,000 | Western Financial Bank | ||||||
| Subordinated Debentures, | |||||||
| 9.625%, 05/15/2012 | |||||||
| (Callable 05/15/2009) | 369,454 | ||||||
| 31,896,401 | |||||||
| Industrial – 11.7% | |||||||
| 1,000,000 | American Standard Inc., | ||||||
| 8.25%, 06/01/2009 | 1,006,069 | ||||||
| 420,590 | Atlas Air, Inc. | ||||||
| Pass-Thru Certificates, | |||||||
| Series 2000-1, | |||||||
| 8.707%, 01/02/2019 | 336,472 | ||||||
| Bunge Ltd. Finance | |||||||
| Corporation Notes: | |||||||
| 150,000 | 5.35%, 04/15/2014 | 107,612 | |||||
| 200,000 | 5.10%, 07/15/2015 | 145,486 | |||||
| 150,000 | CBS Corporation, | ||||||
| 7.70%, 07/30/2010 | 146,622 | ||||||
| 375,000 | Clear Channel | ||||||
| Communications, | |||||||
| 4.50%, 01/15/2010 | 225,000 | ||||||
| 275,000 | Comcast-Cable Holdings, | ||||||
| 7.875%, 08/01/2013 | 282,759 | ||||||
| 500,000 | Comcast Holdings | ||||||
| Corporation, | |||||||
| 10.625%, 07/15/2012 | 531,031 | ||||||
The accompanying notes are an integral part of these financial statements.
Page 64
Baird Core Plus Bond Fund
Schedule of Investments December 31, 2008 |
| Principal | |||||||
| Amount | Value | ||||||
| LONG-TERM INVESTMENTS – 97.0% (cont.) | |||||||
| Industrial – 11.7% (cont.) | |||||||
| Continental Airlines, Inc. | |||||||
| Pass-Thru Certificates: | |||||||
| $ | 157,149 | Series 2000-2, | |||||
| Class C, 8.312% | $ | 127,290 | |||||
| 59,165 | Series 1997-4, | ||||||
| 6.90%, 01/02/2018 | 47,332 | ||||||
| 100,000 | COX Communications | ||||||
| Inc. Notes, | |||||||
| 7.875%, 08/15/2009 | 98,299 | ||||||
| 750,000 | CSX Corporation, | ||||||
| 6.25%, 04/01/2015 | 736,207 | ||||||
| 200,000 | Deutsche Telekom | ||||||
| International Finance BV, | |||||||
8.25%, 06/15/2030 f | 246,628 | ||||||
| 250,000 | Donnelley (R.R.) | ||||||
| & Sons Co., | |||||||
| 6.125%, 01/15/2017 | 177,874 | ||||||
| 430,419 | Federal Express | ||||||
| Corporation 1995 Pass-Thru | |||||||
| Certificates, Series B2, | |||||||
| 7.11%, 01/02/2014 | 406,746 | ||||||
| 500,000 | First Data Corporation, | ||||||
| 9.875%, 09/24/2015 | |||||||
| (Callable 09/30/2011) | 302,500 | ||||||
| 600,000 | Fiserv, Inc., | ||||||
| 6.125%, 11/20/2012 | 563,721 | ||||||
| 575,000 | Ford Motor | ||||||
| Company Debentures, | |||||||
| 9.215%, 09/15/2021 | 132,250 | ||||||
| 150,000 | Georgia Pacific LLC, | ||||||
| 9.50%, 12/01/2011 | 141,750 | ||||||
| 642,448 | GGIC Funding Corporation, | ||||||
| 5.129%, 01/15/2014 | |||||||
| (Acquired 11/21/2008, | |||||||
| Cost $612,749)* | 610,056 | ||||||
| 500,000 | GTE Corporation, | ||||||
| 8.75%, 11/01/2021 | 540,630 | ||||||
| 1,025,000 | Hanson Australia | ||||||
| Funding, | |||||||
5.25%, 03/15/2013 f | 348,516 | ||||||
Hanson PLC Notes: f | |||||||
| 1,150,000 | 7.875%, 09/27/2010 | 464,441 | |||||
| 350,000 | 6.125%, 08/15/2016 | 121,886 | |||||
| 100,000 | Health Care Service | ||||||
| Corporation Notes, | |||||||
| 7.75%, 06/15/2011 | |||||||
| (Acquired 01/26/2005, | |||||||
| Cost $106,350)* | 106,682 | ||||||
| 350,000 | Health Management | ||||||
| Association, | |||||||
| 6.125%, 04/15/2016 | 217,000 | ||||||
| Historic TW, Inc.: | |||||||
| 600,000 | 9.125%, 01/15/2013 | 594,604 | |||||
| 92,000 | 6.875%, 06/15/2018 | 82,146 | |||||
| 800,000 | Humana Inc., | ||||||
| 7.20%, 06/15/2018 | 643,350 | ||||||
| 225,000 | Hutchison Whampoa | ||||||
| International Limited, | |||||||
| 6.25%, 01/24/2014 | |||||||
| (Acquired 06/23/2005 | |||||||
| and 09/29/2008; | |||||||
| Cost $157,374 | |||||||
and $73,452)* f | 215,185 | ||||||
| International | |||||||
| Paper Company Notes: | |||||||
| 1,000,000 | 4.25%, 01/15/2009 | 999,655 | |||||
| 825,000 | 7.40%, 06/15/2014 | 676,260 | |||||
| 300,000 | Kraft Foods, Inc., | ||||||
| 6.125%, 08/23/2018 | 295,762 | ||||||
| 300,000 | Martin Marietta | ||||||
| Materials, Inc., | |||||||
| 6.25%, 05/01/2037 | 169,821 | ||||||
The accompanying notes are an integral part of these financial statements.
Page 65
Baird Core Plus Bond Fund
Schedule of Investments December 31, 2008 |
| Principal | |||||||
| Amount | Value | ||||||
| LONG-TERM INVESTMENTS – 97.0% (cont.) | |||||||
| Industrial – 11.7% (cont.) | |||||||
| $ | 250,000 | Nabors Industries, Inc., | |||||
| 6.15%, 02/15/2018* | $ | 215,086 | |||||
| 275,000 | New Cingular Wireless | ||||||
| Services, Inc. Senior Notes, | |||||||
| 8.75%, 03/01/2031 | 343,774 | ||||||
| 50,000 | Pactiv Corporation | ||||||
| Senior Unsecured Notes, | |||||||
| 7.95%, 12/15/2025 | 46,765 | ||||||
| 200,000 | PCCW-HWT Capital II Ltd., | ||||||
| 6.00%, 07/15/2013 | |||||||
| (Acquired 07/10/2003, | |||||||
Cost $199,066)* f | 171,130 | ||||||
| 100,000 | PCCW -HKT | ||||||
| Capital III Ltd., | |||||||
| 5.25%, 07/20/2015 | |||||||
| (Acquired 09/29/2008, | |||||||
Cost $83,608)* f | 73,675 | ||||||
| 75,000 | Pearson Dollar Finance PLC, | ||||||
| 5.70%, 06/01/2014 | |||||||
| (Acquired 09/29/2008, | |||||||
Cost $73,216)* f | 66,044 | ||||||
| 575,000 | PEMEX Project | ||||||
| Funding Master Trust, | |||||||
| 9.125%, 10/13/2010 | 605,188 | ||||||
| 300,000 | Plum Creek Timberlands, | ||||||
| 5.875%, 11/15/2015 | 245,028 | ||||||
| 925,000 | Rio Tinto Financial | ||||||
| USA Ltd., | |||||||
6.50%, 07/15/2018 f | 678,183 | ||||||
| 300,000 | SK Telecom, | ||||||
| 6.625%, 07/20/2027 | |||||||
| (Acquired 07/13/2007 | |||||||
| and 09/29/2008; Cost | |||||||
| $197,602 and | |||||||
$100,544, respectively)* f | 249,722 | ||||||
| Sprint Capital | |||||||
| Corporation: | |||||||
| 550,000 | 6.90%, 05/01/2019 | 390,500 | |||||
| 300,000 | 8.75%, 03/15/2032 | 202,500 | |||||
| 250,000 | Sungard Data Systems | ||||||
| Inc. Notes, | |||||||
| 3.75%, 01/15/2009 | 249,375 | ||||||
| 100,000 | Sunoco, Inc. Senior | ||||||
| Unsecured Notes, | |||||||
| 5.75%, 01/15/2017 | 83,107 | ||||||
Telecom Italia Capital: f | |||||||
| 340,000 | 4.95%, 09/30/2014 | 258,825 | |||||
| 850,000 | 7.20%, 07/18/2036 | 654,500 | |||||
| 300,000 | Telefonica | ||||||
| Emisiones, S.A.U., | |||||||
6.421%, 06/20/2016 f | 299,479 | ||||||
| Time Warner, Inc.: | |||||||
| 300,000 | 7.625%, 04/15/2031 | 294,843 | |||||
| 95,000 | 7.70%, 05/01/2032 | 95,117 | |||||
| 25,000 | Time Warner | ||||||
| Entertainment | |||||||
| Senior Notes, | |||||||
| 8.875%, 10/01/2012 | 25,212 | ||||||
| 500,000 | Transocean, Ltd., | ||||||
6.80%, 03/15/2038 f | 445,974 | ||||||
| 500,000 | Tyco Electronics | ||||||
| Group S.A., | |||||||
7.125%, 10/01/2037 f | 378,283 | ||||||
| Tyco International | |||||||
Finance: f | |||||||
| 150,000 | 6.125%, 01/15/2009 | 149,803 | |||||
| 50,000 | 6.00%, 11/15/2013 | 46,916 | |||||
| United AirLines, Inc. | |||||||
| Pass-Thru Certificates: | |||||||
| 172,532 | Series 1991-A, | ||||||
| 10.02%, 03/22/2014 | 71,170 | ||||||
The accompanying notes are an integral part of these financial statements.
Page 66
Baird Core Plus Bond Fund
Schedule of Investments December 31, 2008 |
| Principal | |||||||
| Amount | Value | ||||||
| LONG-TERM INVESTMENTS – 97.0% (cont.) | |||||||
| Industrial – 11.7% (cont.) | |||||||
| $ | 106,054 | Series 2001-1, Class A-2, | |||||
| 6.201%, 12/31/2049 | $ | 98,630 | |||||
| 73,583 | Series 2000-2, Class C, | ||||||
| 7.762%, 12/31/2049 | 61,993 | ||||||
| 1,000,000 | Unitedhealth Group, Inc. | ||||||
| Senior Unsecured Notes, | |||||||
| 6.00%, 02/15/2018 | 922,633 | ||||||
| 651,149 | U.S. Airways | ||||||
| Pass-Thru Trust, | |||||||
| Series 1998-1, Class B, | |||||||
| 7.35%, 07/30/2019 # | 383,331 | ||||||
| 322,000 | USX Corporation, | ||||||
| 9.125%, 01/15/2013 | 343,318 | ||||||
Vale Overseas Limited: f | |||||||
| 100,000 | 8.25%, 01/17/2034 | 106,270 | |||||
| 125,000 | 6.875%, 11/21/2036 | 113,463 | |||||
| 350,000 | Verizon New York, Inc. | ||||||
| Senior Unsecured Notes, | |||||||
| 8.625%, 11/15/2010 | 363,928 | ||||||
| 150,000 | Viacom, Inc. Senior Notes, | ||||||
| 6.25%, 04/30/2016 | 124,334 | ||||||
Vodafone Group PLC: f | |||||||
| 400,000 | 5.50%, 06/15/2011 | 398,660 | |||||
| 500,000 | 6.15%, 02/27/2037 | 494,216 | |||||
| 500,000 | Vulcan Materials, | ||||||
| 7.15%, 11/30/2037 | 359,580 | ||||||
| 75,000 | Wellpoint, Inc. | ||||||
| Senior Unsecured Notes, | |||||||
| 5.95%, 12/15/2034 | 62,308 | ||||||
| 22,020,505 | |||||||
| Mortgage Backed Securities – 33.9% | |||||||
| Bank of America | |||||||
| Alternative Loan Trust: | |||||||
| 162,867 | Series 2005-2, Class 4A1, | ||||||
| 5.50%, 03/25/2020 | 139,362 | ||||||
| 328,479 | Series 2006-2, Class 6A1, | ||||||
| 5.50%, 03/25/2021 | 272,192 | ||||||
| 129,234 | Series 2006-3, Class 6A1, | ||||||
| 6.00%, 04/25/2036 | 93,695 | ||||||
| Chase Mortgage | |||||||
| Finance Corporation: | |||||||
| 90,632 | Series 2003-S13, Class A11, | ||||||
| 5.50%, 11/25/2033 | 86,904 | ||||||
| 700,000 | Series 2006-A1, Class 2A3, | ||||||
| 6.00%, 09/25/2036 | 300,479 | ||||||
| 114,792 | Citicorp Mortgage | ||||||
| Securities, Inc., | |||||||
| Series 2004-4, Class A5, | |||||||
| 5.50%, 06/25/2034 | 105,825 | ||||||
| Citigroup Mortgage | |||||||
| Loan Trust, Inc.: | |||||||
| 214,552 | Series 2005-9, Class 2A2, | ||||||
| 5.50%, 11/25/2035 | 163,234 | ||||||
| 322,875 | Series 2005-9, Class 22A2, | ||||||
| 6.00%, 11/25/2035 | 201,396 | ||||||
| Countrywide Alternative | |||||||
| Loan Trust: | |||||||
| 1,047,395 | Series 2006-7CB, | ||||||
| Class 3A1, 5.25%, | |||||||
| 05/25/2021 | 711,902 | ||||||
| 249,425 | Series 2006-43CB, | ||||||
| Class 2A1, 6.00%, | |||||||
| 02/25/2022 | 183,951 | ||||||
| 1,210,880 | Series 2006-28CB, | ||||||
| Class A17, 6.00%, | |||||||
| 02/25/2022 | 844,733 | ||||||
| 1,000,000 | Series 2005-10CB, | ||||||
| Class 1A6, 5.50%, | |||||||
| 05/25/2035 | 780,567 | ||||||
The accompanying notes are an integral part of these financial statements.
Page 67
Baird Core Plus Bond Fund
Schedule of Investments December 31, 2008 |
| Principal | |||||||
| Amount | Value | ||||||
| LONG-TERM INVESTMENTS – 97.0% (cont.) | |||||||
| Mortgage Backed Securities – 33.9% (cont.) | |||||||
| $ | 132,350 | CS First Boston Mortgage | |||||
| Securities Corporation, | |||||||
| Series 2005-11, Class 5A1, | |||||||
| 5.25%, 12/25/2020 | $ | 116,815 | |||||
| 379,535 | Deutsche Securities Inc. | ||||||
| Mortgage, Series 2006-AR5, | |||||||
| Class 21A, 6.00%, | |||||||
| 10/25/2021 | 332,525 | ||||||
| 889,357 | DLJ Commercial | ||||||
| Mortgage Corporation, | |||||||
| Series 1999-CG3, | |||||||
| Class A1B, 7.34%, | |||||||
| 10/10/2032 | 887,752 | ||||||
| Federal Gold Loan Mortgage | |||||||
| Corporation (FGLMC): | |||||||
| 499,200 | 5.50%, 11/01/2017 | 515,990 | |||||
| 515,812 | 5.00%, 12/01/2020 | 530,872 | |||||
| 911,797 | 5.00%, 05/01/2021 | 938,418 | |||||
| 229,395 | 6.00%, 06/01/2021 | 237,888 | |||||
| 143,017 | 6.50%, 12/01/2028 | 149,766 | |||||
| 69,217 | 6.50%, 06/01/2029 | 72,439 | |||||
| 3,774,434 | 5.50%, 04/01/2037 | 3,867,564 | |||||
| Federal Home Loan Mortgage | |||||||
| Corporation (FHLMC): | |||||||
| 321,440 | Series 3122, Class VA, | ||||||
| 6.00%, 01/15/2017 | 333,384 | ||||||
| 2,828,494 | Series R010, Class VA, | ||||||
| 5.50%, 04/15/2017 | 2,946,582 | ||||||
| 1,880,471 | Series R010, Class AB, | ||||||
| 5.50%, 12/15/2019 | 1,919,891 | ||||||
| 14,177 | Series 1053, Class G, | ||||||
| 7.00%, 03/15/2021 | 14,831 | ||||||
| 31,985 | Series 136, Class E, | ||||||
| 6.00%, 04/15/2021 | 31,945 | ||||||
| 300,000 | Series 2673, Class NC, | ||||||
| 5.50%, 05/15/2021 | 308,397 | ||||||
| 243,458 | Series 2804, Class VC, | ||||||
| 5.00%, 07/15/2021 | 250,441 | ||||||
| 27,426 | Series 1122, Class G, | ||||||
| 7.00%, 08/15/2021 | 28,094 | ||||||
| 68,207 | Series 1186, Class I, | ||||||
| 7.00%, 12/15/2021 | 72,088 | ||||||
| 167,150 | Series 3132, Class MA, | ||||||
| 5.50%, 12/15/2023 | 170,484 | ||||||
| 120,991 | Series 2598, Class QC, | ||||||
| 4.50%, 06/15/2027 | 121,284 | ||||||
| Federal National Mortgage | |||||||
| Association (FNMA): | |||||||
| 211,889 | 5.00%, 02/01/2018 | 219,400 | |||||
| 150,382 | 5.00%, 10/01/2018 | 155,242 | |||||
| 148,493 | 5.00%, 11/01/2018 | 153,292 | |||||
| 1,938,385 | 5.50%, 03/01/2023 | 1,994,176 | |||||
| 749,010 | 5.50%, 07/01/2023 | 770,567 | |||||
| 1,023,957 | 5.50%, 12/01/2023 | 1,053,429 | |||||
| 260,681 | 6.00%, 03/01/2026 | 268,957 | |||||
| 1,457,350 | 5.00%, 05/01/2028 | 1,492,244 | |||||
| 112,209 | 6.50%, 09/01/2028 | 117,433 | |||||
| 220,514 | 6.50%, 02/01/2029 | 230,782 | |||||
| 185,685 | 5.50%, 01/01/2032 | 191,235 | |||||
| 1,914,133 | 5.50%, 04/01/2034 | 1,966,853 | |||||
| 190,015 | 5.50%, 02/01/2035 | 195,130 | |||||
| 3,211,590 | 5.50%, 02/01/2035 | 3,298,039 | |||||
| 8,809,147 | 5.50%, 04/01/2036 | 9,040,762 | |||||
| 1,841,194 | 6.00%, 08/01/2037 | 1,868,648 | |||||
| 13,478 | Series 1989-94, Class G, | ||||||
| 7.50%, 12/25/2019 | 14,576 | ||||||
| 55,988 | Series 1990-15, Class J, | ||||||
| 7.00%, 02/25/2020 | 59,702 | ||||||
| 11,666 | Series 1991-21, Class J, | ||||||
| 7.00%, 03/25/2021 | 12,415 | ||||||
| 218,690 | Series 1991-43, Class J, | ||||||
| 7.00%, 05/25/2021 | 233,537 | ||||||
The accompanying notes are an integral part of these financial statements.
Page 68
Baird Core Plus Bond Fund
Schedule of Investments December 31, 2008 |
| Principal | |||||||
| Amount | Value | ||||||
| LONG-TERM INVESTMENTS – 97.0% (cont.) | |||||||
| Mortgage Backed Securities – 33.9% (cont.) | |||||||
| $ | 276,538 | Series 1991-65, Class Z, | |||||
| 6.50%, 06/25/2021 | $ | 287,301 | |||||
| 430,105 | Series 1992-129, Class L, | ||||||
| 6.00%, 07/25/2022 | 439,514 | ||||||
| 1,260,876 | Series 2003-33, Class LD, | ||||||
| 4.25%, 09/25/2022 | 1,272,363 | ||||||
| 83,689 | Series 1993-32, Class H, | ||||||
| 6.00%, 03/25/2023 | 85,994 | ||||||
| 440,900 | Series 1993-58, Class H, | ||||||
| 5.50%, 04/25/2023 | 459,766 | ||||||
| 182,296 | Series 2003-31, Class KG, | ||||||
| 4.50%, 12/25/2028 | 183,306 | ||||||
| 2,300,000 | Series 2002-85, Class PD, | ||||||
| 5.50%, 05/25/2031 | 2,346,753 | ||||||
| 38,856 | Series 2003-44, Class AB, | ||||||
| 3.75%, 05/25/2033 | 38,480 | ||||||
| 895,486 | Series 2004-W6, Class 1A4, | ||||||
| 5.50%, 07/25/2034 | 848,880 | ||||||
| 758,522 | Series 2004-W6, Class 1A6, | ||||||
| 5.50%, 07/25/2034 | 705,098 | ||||||
| 1,500,000 | Series 2004-W10, | ||||||
| Class A4, 5.75%, | |||||||
| 08/25/2034 | 1,368,975 | ||||||
| First Horizon Alternative | |||||||
| Mortgage Securities: | |||||||
| 239,931 | Series 2006-FA6, | ||||||
| Class 3A1, 5.75%, | |||||||
| 11/25/2021 | 219,627 | ||||||
| 2,075,691 | Series 2006-FA8, | ||||||
| Class 2A1, 5.75%, | |||||||
| 02/25/2037 | 1,440,393 | ||||||
| 825,000 | First Union National | ||||||
| Bank Commercial | |||||||
| Mortgage Securities Inc., | |||||||
| Series 2001-C4, Class A2, | |||||||
| 6.223%, 12/12/2033 | 794,605 | ||||||
| GE Capital Commercial | |||||||
| Mortgage Corporation: | |||||||
| 877,304 | Series 2000-1, Class A2, | ||||||
| 6.496%, 01/15/2033 | 861,423 | ||||||
| 1,300,000 | Series 2003-C2, Class A4, | ||||||
| 5.145%, 07/10/2037 | 1,159,200 | ||||||
| 600,000 | Series 2004-C3, Class A4, | ||||||
| 5.189%, 07/10/2039 | 511,675 | ||||||
| 1,500,000 | GMAC Commercial | ||||||
| Mortgage Securities, Inc., | |||||||
| Series 2003-C1, Class A2, | |||||||
| 4.079%, 05/10/2036 | 1,302,635 | ||||||
| Government National | |||||||
| Mortgage Association | |||||||
| (GNMA): | |||||||
| 127,224 | 6.00%, 12/20/2028 | 131,799 | |||||
| 47,022 | 6.50%, 01/20/2029 | 49,505 | |||||
| 122,510 | 6.00%, 11/20/2033 | 126,464 | |||||
| 675,495 | Series 2003-2, Class PB, | ||||||
| 5.50%, 03/20/2032 | 691,288 | ||||||
| 1,681,841 | J.P. Morgan | ||||||
| Alternative Loan Trust, | |||||||
| Series 2005-S1, Class 3A1, | |||||||
| 5.50%, 10/25/2020 | 1,311,311 | ||||||
| J.P. Morgan Mortgage Trust: | |||||||
| 600,000 | Series 2006-A7, Class 2A4R, | ||||||
| 5.43%, 01/25/2037 | 300,765 | ||||||
| 700,000 | Series 2007-A2, Class 2A3, | ||||||
| 5.69%, 04/25/2037 | 391,356 | ||||||
| Master Alternative | |||||||
| Loans Trust: | |||||||
| 842,291 | Series 2004-1, Class 1A1, | ||||||
| 5.00%, 01/25/2019 | 738,057 | ||||||
| 509,354 | Series 2005-3, Class 4A1, | ||||||
| 5.50%, 03/25/2020 | 441,681 | ||||||
| 167,464 | Series 2003-5, Class 6A1, | ||||||
| 6.00%, 08/25/2033 | 155,636 | ||||||
The accompanying notes are an integral part of these financial statements.
Page 69
Baird Core Plus Bond Fund
Schedule of Investments December 31, 2008 |
| Principal | |||||||
| Amount | Value | ||||||
| LONG-TERM INVESTMENTS – 97.0% (cont.) | |||||||
| Mortgage Backed Securities – 33.9% (cont.) | |||||||
| Salomon Brothers Mortgage | |||||||
| Securities VII: | |||||||
| $ | 696,044 | Series 2000-C1, Class A2, | |||||
| 7.52%, 12/18/2009 | $ | 694,596 | |||||
| 1,244,746 | Series 2000-C2, Class A2, | ||||||
| 7.455%, 07/18/2033 | 1,241,379 | ||||||
| 1,250,000 | Wachovia Bank | ||||||
| Commercial Mortgage Trust, | |||||||
| Series 2003-C3, Class A2, | |||||||
| 4.867%, 02/15/2035 | 1,112,844 | ||||||
| Washington Mutual, Inc. | |||||||
| Pass-Thru Certificates: | |||||||
| 315,375 | Series 2004-CB1, Class 5A, | ||||||
| 5.00%, 06/25/2019 | 307,885 | ||||||
| 576,772 | Series 2004-CB2, Class 7A, | ||||||
| 5.50%, 08/25/2019 | 536,218 | ||||||
| 186,617 | Series 2004-CB3, Class 4A, | ||||||
| 6.00%, 10/25/2019 | 160,024 | ||||||
| 119,459 | Series 2004-CB4, | ||||||
| Class 22A, 6.00%, | |||||||
| 12/25/2019 | 110,007 | ||||||
| 63,894,912 | |||||||
| Taxable Municipal Bonds – 0.6% | |||||||
| 1,400,000 | Tobacco Settlement | ||||||
| Authority Iowa, | |||||||
| 6.50%, 06/01/2023 | 1,011,416 | ||||||
| 177,823 | Tobacco Settlement | ||||||
| Financing Corporation, | |||||||
| Series 2001-A, Class A, | |||||||
| 6.36%, 05/15/2025 | 172,825 | ||||||
| 1,184,241 | |||||||
| Utilities – 3.8% | |||||||
| 300,000 | Appalachian Power | ||||||
| Company Senior | |||||||
| Unsecured Notes, | |||||||
| 6.70%, 08/15/2037 | 278,921 | ||||||
| 165,000 | Cilcorp Inc. Senior Notes, | ||||||
| 8.70%, 10/15/2009 | 151,800 | ||||||
| 200,000 | Commonwealth Edison, | ||||||
| 5.40%, 12/15/2011 | 194,721 | ||||||
| 500,000 | Enel Finance International, | ||||||
| 6.80%, 09/15/2037 | |||||||
| (Acquired 09/13/2007 | |||||||
| and 09/29/2008; Cost | |||||||
| $398,940 and $99,957, | |||||||
respectively)* f | 383,900 | ||||||
| 150,000 | Energy Transfer Partners, | ||||||
| 5.65%, 08/01/2012 | 133,918 | ||||||
| 75,000 | Exelon Corporation | ||||||
| Senior Unsecured Notes, | |||||||
| 5.625%, 06/15/2035 | 47,345 | ||||||
| 1,000,000 | FPL Group Capital, Inc., | ||||||
| 7.30%, 09/01/2067 | |||||||
| (Callable 09/01/2017) | 560,000 | ||||||
| Kinder Morgan Energy | |||||||
| Partners Senior Notes: | |||||||
| 100,000 | 6.50%, 02/01/2037 | 76,351 | |||||
| 250,000 | 6.95%, 01/15/2038 | 202,187 | |||||
| 300,000 | Kinder Morgan Finance, | ||||||
5.70%, 01/05/2016 f | 223,500 | ||||||
| 63,011 | Kiowa Power Partners LLC, | ||||||
| 4.811%, 12/30/2013 | |||||||
| (Acquired 11/19/2004, | |||||||
| Cost $65,558)* | 58,915 | ||||||
| 65,000 | Korea Electric Power | ||||||
| Corporation, | |||||||
6.75%, 08/01/2027 f | 48,688 | ||||||
| 100,000 | National Grid PLC | ||||||
| Senior Unsecured Notes, | |||||||
6.30%, 08/01/2016 f | 87,135 | ||||||
The accompanying notes are an integral part of these financial statements.
Page 70
Baird Core Plus Bond Fund
Schedule of Investments December 31, 2008 |
| Principal | |||||||
| Amount | Value | ||||||
| LONG-TERM INVESTMENTS – 97.0% (cont.) | |||||||
| Utilities – 3.8% (cont.) | |||||||
| National Rural Utilities | |||||||
| Senior Unsecured Notes: | |||||||
| $ | 200,000 | 7.25%, 03/01/2012 | $ | 205,925 | |||
| 600,000 | 10.375%, 11/01/2018 | 702,245 | |||||
| Nisource Finance | |||||||
| Corporation: | |||||||
| 536,000 | 6.15%, 03/01/2013 | 413,010 | |||||
| 900,000 | 5.40%, 07/15/2014 | 615,832 | |||||
| 625,000 | ONEOK, Inc. | ||||||
| Senior Notes, | |||||||
| 7.125%, 04/15/2011 | 604,992 | ||||||
| 50,000 | Pacific Gas & Electric | ||||||
| Company 1st Mortgage, | |||||||
| 6.05%, 03/01/2034 | 53,103 | ||||||
| 475,000 | Pepco Holdings, Inc. | ||||||
| Senior Notes, | |||||||
| 6.125%, 06/01/2017 | 396,862 | ||||||
| 100,000 | PPL Energy Supply, LLC | ||||||
| Bonds, Series A | |||||||
| 5.70%, 10/15/2015 | 82,404 | ||||||
| 200,000 | PPL Energy Supply LLC | ||||||
| Senior Unsecured Notes, | |||||||
| 6.20%, 05/15/2016 | 165,590 | ||||||
| 200,000 | PSE&G Energy Holdings | ||||||
| LLC Senior Notes, | |||||||
| 8.50%, 06/15/2011 | 188,523 | ||||||
| 500,000 | Public Service Company | ||||||
| Of New Mexico, | |||||||
| 7.95%, 05/15/2018 | 406,879 | ||||||
| 284,544 | RGS (I&M) Funding | ||||||
| Corporation Debentures, | |||||||
| 9.82%, 12/07/2022 | 336,183 | ||||||
| 300,000 | Southern Natural Gas, | ||||||
| 5.90%, 04/01/2017 | |||||||
| (Acquired 03/14/2007, | |||||||
| Cost $299,502)* | 237,737 | ||||||
| Williams Cos. Inc. Notes: | |||||||
| 175,000 | 7.125%, 09/01/2011 | 161,000 | |||||
| 200,000 | 7.875%, 09/01/2021 | 153,000 | |||||
| 7,170,666 | |||||||
| U.S. Government Agency Issues – 10.4% | |||||||
| 17,800,000 | Federal National Mortgage | ||||||
| Association (FNMA), | |||||||
| 6.00%, 05/15/2011 | 19,674,037 | ||||||
| 19,674,037 | |||||||
| U.S. Treasury Obligations – 12.1% | |||||||
| 16,725,000 | U.S. Treasury Bonds, | ||||||
| 6.25%, 08/15/2023 | 22,811,329 | ||||||
| Total Long-Term | |||||||
| Investments | |||||||
| (Cost $196,533,391) | 182,856,231 | ||||||
| Shares | |||||||
| SHORT-TERM INVESTMENTS – 2.7% | |||||||
| Money Market Fund – 2.7% | |||||||
| 5,132,178 | Short-Term Investment | ||||||
| Company Liquid Assets | |||||||
| Portfolio – AIM Fund | 5,132,178 | ||||||
| Total Short-Term | |||||||
| Investments | |||||||
| (Cost $5,132,178) | 5,132,178 | ||||||
| Principal | |||||||
| Amount | |||||||
| INVESTMENTS PURCHASED | |||||||
| WITH CASH PROCEEDS FROM | |||||||
| SECURITIES LENDING – 23.1% | |||||||
| Certificates of Deposit – 4.2% | |||||||
| $ | 1,766,996 | Abbey National Treasury | |||||
| Service, Series YCD1, | |||||||
| 1.09%, 02/20/09 | 1,766,855 | ||||||
The accompanying notes are an integral part of these financial statements.
Page 71
Baird Core Plus Bond Fund
Schedule of Investments December 31, 2008 |
| Principal | |||||||
| Amount | Value | ||||||
| INVESTMENTS PURCHASED | |||||||
| WITH CASH PROCEEDS FROM | |||||||
| SECURITIES LENDING – 23.1% (cont.) | |||||||
| Certificates of Deposit – 4.2% (cont.) | |||||||
| $ | 1,766,996 | Barclays Bank, | |||||
| 3.3615%, 03/16/09 | $ | 1,765,600 | |||||
| Natixis Bank of New | |||||||
| York, Series YCD1: | |||||||
| 1,247,292 | 0.89%, 02/18/09 | 1,247,217 | |||||
| 1,039,410 | 0.89%, 06/30/09 | 1,041,114 | |||||
| 1,559,114 | Royal Bank of | ||||||
| Scotland Group PLC, | |||||||
| 2.9944%, 05/06/09 | 1,559,083 | ||||||
| 519,705 | Societe Generale of | ||||||
| New York, Series YCD1, | |||||||
| 2.0625%, 02/20/09 | 519,674 | ||||||
| 7,899,543 | |||||||
| Commercial Paper – 0.5% | |||||||
| 936,072 | Atlantic East | ||||||
| Funding, LLC, | |||||||
| 3.0588%, 03/25/09 # | 936,072 | ||||||
| 936,072 | |||||||
| Corporate Bonds and Notes – 2.2% | |||||||
| Allstate Life GL: | |||||||
| 1,143,351 | 3.0575%, 03/20/09 | 1,135,839 | |||||
| 519,705 | 1.775%, 07/21/09 | 509,929 | |||||
| 1,039,410 | Svenska Handelsbanken, | ||||||
| 4.410%, 08/06/09 | 1,038,880 | ||||||
| 1,559,114 | Wachovia Bank NA, | ||||||
| 3.0013%, 05/01/09 | 1,541,949 | ||||||
| 4,226,597 | |||||||
| Government Agencies – 1.6% | |||||||
| 2,910,347 | Federal Home Loan Banks, | ||||||
| 0.645%, 03/02/09 | 2,908,688 | ||||||
| 2,908,688 | |||||||
| Shares | |||||||
| Investment Companies – 14.6% | |||||||
| 26,830,358 | Mount Vernon Securities | ||||||
| Lending Trust – Prime | |||||||
| Portfolio | 26,830,358 | ||||||
| 701,031 | Reserve Primary Fund # | 701,031 | |||||
| 27,531,389 | |||||||
| Total Investments | |||||||
| Purchased With Cash | |||||||
| Proceeds From | |||||||
| Securities Lending | |||||||
| (Cost $43,502,289) | 43,502,289 | ||||||
| Total Investments | |||||||
| (Cost $245,167,858) – | |||||||
| 122.8% | 231,490,698 | ||||||
| Other Liabilities in Excess | |||||||
| of Assets – (22.8)% | (42,923,785 | ) | |||||
| TOTAL NET | |||||||
| ASSETS – 100.0% | $ | 188,566,913 | |||||
| * | Restricted Security Deemed Liquid |
| f | Foreign Security |
| ^ | Non-Income Producing |
| # | Priced at Fair Value by the Valuation Committee as delegated by the Baird Funds’ Board of Directors |
| @ | Security in Default |
The accompanying notes are an integral part of these financial statements.
Page 72
Baird Core Plus Bond Fund
Schedule of Investments December 31, 2008 |
SFAS 157 – Summary of Fair Value Exposure at December 31, 2008
In September 2006, the Financial Accounting Standards Board issued Statement of Financial Accounting Standards No. 157, “Fair Value Measurements” (“SFAS 157”) effective for fiscal years beginning after November 15, 2007. SFAS 157 defines fair value, establishes a framework for measuring fair value in generally accepted accounting principles (GAAP), and expands disclosures about fair value measurements. The Fund adopted SFAS 157 as of January 1, 2008. Under SFAS 157, various inputs are used in determining the value of the Fund’s investments. These inputs are summarized into three broad levels and described below:
| Level 1 – | Quoted prices in active markets for identical securities |
| Level 2 – | Other significant observable inputs (including quoted prices for similar securities, interest rates, prepayment speeds, credit risk, etc.) |
| Level 3 – | Significant unobservable inputs (including the Fund’s own assumptions in determining the fair value of investments) |
The following is a summary of the inputs used to value the Fund’s investments as of December 31, 2008:
| Description | Investments, at Value | |||
| Level 1 – Quoted prices | $ | 31,962,536 | ||
| Level 2 – Other significant observable inputs | 198,317,117 | |||
| Level 3 – Significant unobservable inputs | 1,211,045 | |||
| Total | $ | 231,490,698 | ||
Following is a reconciliation of Level 3 investments for which significant unobservable inputs were used to determine fair value.
| Investments, at Value | ||||
| Balance as of 12/31/07 | $ | 1,107,921 | ||
| Accrued discounts / premiums | — | |||
| Realized gain (loss) | — | |||
| Change in unrealized appreciation (depreciation) | — | |||
| Net purchases (sales/paydowns) | — | |||
| Transfers in and / or out of Level 3* | 103,124 | |||
| Balance as of 12/31/08 | $ | 1,211,045 | ||
| * | The information used in the above reconciliation represents fiscal year to date activity for any investments identified as using Level 3 inputs at either the beginning or end of the current fiscal period. Transfers in or out of Level 3 represents either the beginning value (for transfers in) or ending value (for transfers out) of any security or instrument where a change in the pricing level occurred from the beginning to the end of the period. |
Page 73
Baird Short-Term Bond Fund
The Baird Short-Term Bond Fund seeks an annual rate of total return, before Fund expenses, greater than the annual rate of total return of the Barclays Capital 1-3 Year Government/Credit Bond Index. The Barclays Capital 1-3 Year Government/Credit Bond Index is an unmanaged, market value weighted index of investment grade, fixed-rate debt issues, including government and corporate securities, with maturities between one and three years.
Extreme volatility in the financial markets led to severely dislocated prices of bonds in several sectors that we believe do not reflect sound credit fundamentals. The Fund underperformed its benchmark index in 2008. The primary factors for the underperformance were:
| • | The Fund’s underweight to U.S. Treasuries which outperformed all other market sectors due to a flight to quality by investors; |
| • | Exposure to non-Agency mortgage-backed and asset-backed securities; and |
| • | The Fund’s overweighting to the finance sector relative to the benchmark. |
The Fund maintained its duration-neutral strategy, holding a broadly diversified portfolio of over 170 securities at year end.
The Fund ended 2008 with a yield advantage versus its benchmark index. Despite the unprecedented market volatility, we are confident of the integrity of the issues we hold and the structure of the Fund overall. We feel very strongly that the Fund will realize its sizeable yield advantage over time and outperform its benchmark through the completion of this historic and severe credit cycle.
Portfolio Characteristics
| Quality Distribution* | Sector Weightings* | ||||
 | 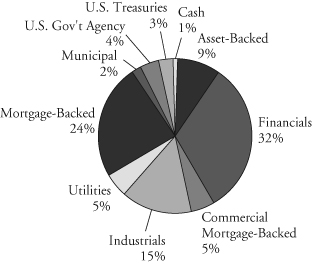 | ||||
| Net Assets: | $214,999,406 | Annualized Expense Ratio: | |||
SEC 30-Day Yield:** | Institutional Class: | 0.30% | |||
| Institutional Class: | 7.51% | Portfolio Turnover Rate: | 98.5% | ||
| Average Effective Duration: | 1.78 years | Total Number of Holdings: | 179 | ||
| Average Effective Maturity: | 2.00 years | ||||
| * | Percentages shown are based on the Fund’s total net assets. |
| ** | SEC yields are based on SEC guidelines and are calculated for the 30 days ended December 31, 2008. |
Page 74
Baird Short-Term Bond Fund
| Institutional Class* |
| Value of a $25,000 Investment |
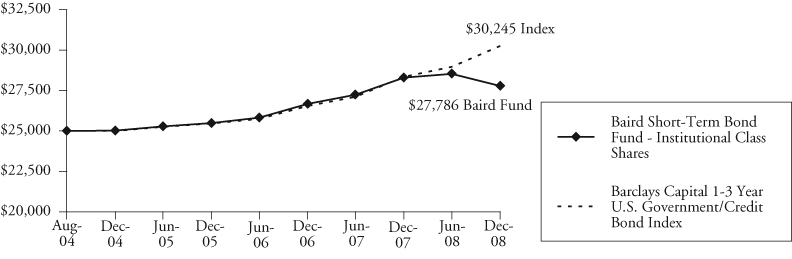 |
Growth of a hypothetical investment of $25,000 made on the Fund’s inception date (8/31/04), assuming reinvestment of all distributions.
| * | The Baird Short-Term Bond Fund is currently offering only the Institutional Class shares to investors. |
Page 75
Baird Short-Term Bond Fund
Average Annual Total Returns
| For the Periods Ended December 31, 2008 | One Year | Since Inception(1) |
| Institutional Class | -1.79% | 2.47% |
Barclays Capital 1-3 Year Government/Credit Bond Index(2) | 4.97% | 4.10% |
| (1) | For the period from August 31, 2004 (commencement of operations) to December 31, 2008. |
| (2) | The Barclays Capital 1-3 Year Government/Credit Bond Index is an unmanaged, market value weighted index of investment grade, fixed-rate debt including government and corporate securities with maturities between one and three years. This index does not reflect any deduction for fees, expenses or taxes. A direct investment in an index is not possible. |
The returns shown in the table above and the line graph on the previous page reflect reinvestment of dividends and/or capital gains distributions in additional shares. Returns do not reflect the deduction of taxes that a shareholder would pay on Fund distributions or the redemption of Fund shares.
Past performance does not guarantee future results. Investment returns and principal value will fluctuate so that an investor’s shares, when redeemed, may be worth more or less than their original cost.
For information about the performance of the Fund as of the most recent month-end, please call 1-866-44BAIRD or visit www.bairdfunds.com. Mutual fund performance changes over time and current performance may be lower or higher than that stated.
Page 76
Baird Short-Term Bond Fund
Schedule of Investments December 31, 2008 |
| Principal | |||||||
| Amount | Value | ||||||
| LONG-TERM INVESTMENTS – 98.1% | |||||||
| Asset Backed Securities – 8.7% | |||||||
| American Express Credit | |||||||
| Account Master Trust: | |||||||
| $ | 1,050,000 | Series 2004-5, Class A, | |||||
| 1.24%, 04/16/2012 | $ | 963,182 | |||||
| 1,400,000 | Series 2005-5, Class A, | ||||||
| 1.235%, 02/15/2013 | 1,350,226 | ||||||
| 52,035 | Bombardier Capital | ||||||
| Mortgage Securitization, | |||||||
| Series 1998-A, Class A3, | |||||||
| 6.23%, 04/15/2028 | 42,280 | ||||||
| 2,442,232 | Capital Auto Receivables | ||||||
| Asset Trust, Series | |||||||
| 2006-SN1A, Class A4B, | |||||||
| 0.62%, 03/20/2010 | |||||||
| (Acquired 09/29/2008 and | |||||||
| 11/28/2008; Cost $632,161 | |||||||
| and $1,787,094)* | 2,390,841 | ||||||
| 449,587 | CitiFinancial Mortgage | ||||||
| Securities, Inc., | |||||||
| Series 2004-1, Class AF2, | |||||||
| 2.645%, 04/25/2034 | 408,566 | ||||||
| Countrywide Asset-Backed | |||||||
| Certificates: | |||||||
| 1,500,000 | Series 2006-S7, Class A2, | ||||||
| 5.571%, 11/25/2035 | 536,598 | ||||||
| 1,061,029 | Series 2005-12, Class 1A2, | ||||||
| 4.847%, 02/25/2036 | 1,043,033 | ||||||
| 961,304 | Series 2005-13, Class AF2, | ||||||
| 5.294%, 04/25/2036 | 942,362 | ||||||
| 2,000,000 | Series 2006-13, Class 1AF2, | ||||||
| 5.884%, 01/25/2037 | 1,878,040 | ||||||
| 2,495,000 | Series 2006-13, Class 1AF3, | ||||||
| 5.944%, 01/25/2037 | 1,816,112 | ||||||
| 1,500,000 | Series 2006-9, Class 1AF3, | ||||||
| 5.859%, 10/25/2046 | 873,324 | ||||||
| 1,011,836 | Credit Based Asset | ||||||
| Servicing and Securities, | |||||||
| Series 2005-CB8, | |||||||
| Class AF2, 5.303%, | |||||||
| 12/25/2035 | 914,022 | ||||||
| 1,225,000 | Discover Card | ||||||
| Master Trust I, | |||||||
| Series 2005-2, Class A, | |||||||
| 1.225%, 04/17/2012 | 1,173,158 | ||||||
| 3,340,612 | GMAC Mortgage | ||||||
| Corporation Loan Trust, | |||||||
| Series 2005-HE3, Class A2, | |||||||
| 1.121%, 02/25/2036 | 1,426,903 | ||||||
| Green Tree Financial | |||||||
| Corporation: | |||||||
| 141,752 | Series 1996-3, Class A5, | ||||||
| 7.35%, 05/15/2027 | 128,226 | ||||||
| 59,975 | Series 1998-2, Class A5, | ||||||
| 6.24%, 12/01/2028 | 45,474 | ||||||
| 665,711 | Series 1998-3, Class A5, | ||||||
| 6.22%, 03/01/2030 | 483,897 | ||||||
| 529,878 | Merrill Lynch Mortgage | ||||||
| Investors Inc., Series | |||||||
| 2005-A8, Class A1C1, | |||||||
| 5.25%, 08/25/2036 | 483,844 | ||||||
| 2,000,000 | Renaissance Home | ||||||
| Equity Loan Trust, | |||||||
| Series 2007-2, Class AF2, | |||||||
| 5.675%, 06/25/2037 | 1,515,717 | ||||||
| 348,992 | Residential Asset Mortgage | ||||||
| Products, Inc., | |||||||
| Series 2003-RS7, | |||||||
| Class AI6, 5.34%, | |||||||
| 08/25/2033 | 326,864 | ||||||
| 18,742,669 | |||||||
The accompanying notes are an integral part of these financial statements.
Page 77
Baird Short-Term Bond Fund
Schedule of Investments December 31, 2008 |
| Principal | |||||||
| Amount | Value | ||||||
| LONG-TERM INVESTMENTS – 98.1% (cont.) | |||||||
| Financial – 32.1% | |||||||
| American General Finance | |||||||
| Corporation Notes: | |||||||
| $ | 1,099,000 | 8.45%, 10/15/2009 | $ | 791,291 | |||
| 1,000,000 | 4.00%, 03/15/2011 | 484,962 | |||||
| 1,000,000 | Ameriprise Financial, Inc., | ||||||
| 5.35%, 11/15/2010 | 901,143 | ||||||
| 400,000 | Amsouth Bancorporation, | ||||||
| 6.125%, 03/01/2009 | 398,623 | ||||||
| 1,130,000 | Associates Corporation | ||||||
| North America | |||||||
| Subordinated Debentures, | |||||||
| 8.15%, 08/01/2009 | 1,125,739 | ||||||
| 820,000 | Axa Financial, Inc., | ||||||
| 7.75%, 08/01/2010 | 816,626 | ||||||
| 2,000,000 | Bank of Hawaii, | ||||||
| 6.875%, 03/01/2009 | 2,013,574 | ||||||
| 500,000 | Bank of Ireland, | ||||||
1.898%, 12/18/2009 f | 496,800 | ||||||
| Bank Tokyo – | |||||||
Mitsubishi UFJ Ltd.: f | |||||||
| 250,000 | 8.40%, 04/15/2010 | 259,419 | |||||
| 1,500,000 | 7.40%, 06/15/2011 | 1,452,197 | |||||
| 251,000 | Bank United | ||||||
| Subordinated Notes, | |||||||
| 8.00%, 03/15/2009 @ | 25 | ||||||
| 383,000 | Bayerische Landesbank | ||||||
| Yankee Deposit Notes, | |||||||
5.65%, 02/01/2009 f | 384,144 | ||||||
| 1,000,000 | Bear Stearns Cos., Inc., | ||||||
| 7.625%, 12/07/2009 | 1,020,008 | ||||||
| 500,000 | Charles Schwab | ||||||
| Corporation Senior Notes, | |||||||
| 8.05%, 03/01/2010 | 503,320 | ||||||
| CIT Group, Inc. | |||||||
| 2,000,000 | 4.25%, 02/01/2010 | 1,833,550 | |||||
| 700,000 | 4.75%, 12/15/2010 | 616,185 | |||||
| 375,000 | Citifinancial Debentures, | ||||||
| 10.00%, 05/15/2009 | 374,759 | ||||||
| Compass Bank | |||||||
| Subordinated Notes: | |||||||
| 1,000,000 | 6.45%, 05/01/2009 | 983,150 | |||||
| 850,000 | 8.10%, 08/15/2009 | 829,961 | |||||
| 388,000 | Corestates Capital Trust I, | ||||||
| 8.00%, 12/15/2026 | |||||||
| (Acquired 01/26/2006 | |||||||
| and 05/31/2006; Cost | |||||||
| $206,184 and $193,813)* | 318,672 | ||||||
| 1,000,000 | Countrywide Home | ||||||
| Loans Notes, | |||||||
| 4.125%, 09/15/2009 | 988,281 | ||||||
| 1,000,000 | Daimler Finance NA | ||||||
| LLC, Series E, | |||||||
| 5.75%, 05/18/2009 | 970,484 | ||||||
| 397,000 | Deutsche Bank | ||||||
| Trust Corporation | |||||||
| Subordinated Notes, | |||||||
| 7.25%, 10/15/2011 | 400,387 | ||||||
| 175,000 | Export-Import | ||||||
| Bank Korea Notes, | |||||||
4.625%, 03/16/2010 f | 170,117 | ||||||
| 1,000,000 | First Empire | ||||||
| Capital Trust I, | |||||||
| 8.234%, 02/01/2027 | |||||||
| (Callable 2/27/2009) | 722,137 | ||||||
| 1,500,000 | First Hawaiian Capital | ||||||
| Trust I, Series B, | |||||||
| 8.343%, 07/01/2027 | |||||||
| (Callable 03/27/2009) | 1,325,380 | ||||||
The accompanying notes are an integral part of these financial statements.
Page 78
Baird Short-Term Bond Fund
Schedule of Investments December 31, 2008 |
| Principal | |||||||
| Amount | Value | ||||||
| LONG-TERM INVESTMENTS – 98.1% (cont.) | |||||||
| Financial – 32.1% (cont.) | |||||||
| $ | 1,500,000 | First National | |||||
| Bank of Omaha | |||||||
| Subordinated Notes, | |||||||
| 7.32%, 12/01/2010 | $ | 1,511,353 | |||||
| 800,000 | First Union Capital, | ||||||
| Series A, 7.935%, | |||||||
| 01/15/2027 | |||||||
| (Callable 3/27/2009) | 663,964 | ||||||
| 1,475,000 | GE Global Insurance | ||||||
| Holding Corp., | |||||||
| 7.50%, 06/15/2010 | 1,464,014 | ||||||
| 315,000 | Genworth Financial, Inc., | ||||||
| 4.75%, 06/15/2009 | 309,478 | ||||||
| Genworth Global | |||||||
| Funding Trust: | |||||||
| 400,000 | 2.06%, 02/10/2009 | 385,403 | |||||
| 250,000 | 5.125%, 03/15/2011 | 175,648 | |||||
| 787,000 | GMAC LLC, | ||||||
| 7.50%, 12/31/2013 | |||||||
| (Acquired 12/31/2008; | |||||||
| Cost $1,009,390)* # | 574,164 | ||||||
| 1,440,000 | Goldman Sachs | ||||||
| Group, Inc., | |||||||
| 6.875%, 01/15/2011 | 1,450,519 | ||||||
| 273,000 | Goldman Sachs | ||||||
| Group, Inc. Senior | |||||||
| Unsubordinated Notes, | |||||||
| 7.80%, 01/28/2010 | 269,947 | ||||||
| 1,500,000 | HSBC USA | ||||||
| Capital Trust II, | |||||||
| 8.38%, 05/15/2027 | |||||||
| (Callable 2/27/2009) | |||||||
| (Acquired 11/06/2007; | |||||||
| Cost $1,553,661)* | 1,490,859 | ||||||
| 1,300,000 | Huntington National | ||||||
| Bank Notes, | |||||||
| 8.00%, 04/01/2010 | 1,191,866 | ||||||
| 1,300,000 | Invesco Ltd., | ||||||
5.625%, 04/17/2012 f | 1,189,467 | ||||||
| 2,000,000 | Istar Financial, | ||||||
| Inc., Series B, | |||||||
| 4.875%, 01/15/2009 | 1,815,000 | ||||||
| 600,000 | Korea Development | ||||||
| Bank Notes, | |||||||
3.875%, 03/02/2009 f | 596,969 | ||||||
| 2,500,000 | M&I Marshall | ||||||
| & Ilsley Bank, | |||||||
| 2.05%, 06/16/2010 | 2,289,587 | ||||||
| 2,000,000 | Marsh & McLennan | ||||||
| Companies, Inc., | |||||||
| 7.125%, 06/15/2009 | 1,994,682 | ||||||
| 2,671,000 | MBNA Capital, Series A, | ||||||
| 8.278%, 12/01/2026 | |||||||
| (Callable 2/27/2009) | 2,216,738 | ||||||
| 1,500,000 | Merrill Lynch & Co., | ||||||
| 4.485%, 05/12/2010 | 1,445,323 | ||||||
| 1,000,000 | Monumental Global | ||||||
| Funding II, | |||||||
| 4.375%, 07/30/2009 | |||||||
| (Acquired 12/15/2008; | |||||||
| Cost $975,601)* | 992,091 | ||||||
| 1,020,000 | The Mony Group, Inc., | ||||||
| 8.35%, 03/15/2010 | 1,008,679 | ||||||
| Morgan Stanley: | |||||||
| 886,000 | 8.00%, 06/15/2010 | 889,219 | |||||
| 170,000 | 6.60%, 04/01/2012 | 164,354 | |||||
| 2,560,000 | National Australia Bank | ||||||
| Ltd. Subordinated | |||||||
| Notes, Series A, | |||||||
8.60%, 05/19/2010 f | 2,611,784 | ||||||
The accompanying notes are an integral part of these financial statements.
Page 79
Baird Short-Term Bond Fund
Schedule of Investments December 31, 2008 |
| Principal | |||||||
| Amount | Value | ||||||
| LONG-TERM INVESTMENTS – 98.1% (cont.) | |||||||
| Financial – 32.1% (cont.) | |||||||
| $ | 245,000 | National City Corporation, | |||||
| 5.75%, 02/01/2009 | $ | 243,778 | |||||
| 2,273,000 | NB Capital Trust IV, | ||||||
| 8.25%, 04/15/2027 | |||||||
| (Callable 3/27/2009) | 1,880,332 | ||||||
| 1,000,000 | North Fork | ||||||
| Capital Trust II, | |||||||
| 8.00%, 12/15/2027 | |||||||
| (Callable 3/27/2009) | 459,690 | ||||||
| 500,000 | Pacific Life | ||||||
| Global Funding, | |||||||
| 3.75%, 01/15/2009 | |||||||
| (Acquired 10/16/2008, | |||||||
| Cost $499,186)* | 500,077 | ||||||
| 1,433,000 | PNC Financial Services | ||||||
| Subordinated Notes, | |||||||
| 9.65%, 06/15/2009 | 1,450,821 | ||||||
| PNC Funding Corporation: | |||||||
| 1,050,000 | 6.125%, 02/15/2009 | 1,052,894 | |||||
| 1,000,000 | 7.50%, 11/01/2009 | 998,583 | |||||
| 2,965,000 | Popular North American, | ||||||
| Inc., 4.70%, 06/30/2009 | 2,897,881 | ||||||
| 1,500,000 | Premium Asset | ||||||
| Senior Notes, | |||||||
| 4.125%, 03/12/2009 | |||||||
| (Acquired 05/10/2007; | |||||||
| Cost $1,493,386)* | 181,875 | ||||||
| 1,800,000 | Principal Financial | ||||||
| Group (AU) Senior | |||||||
| Notes, 8.20%, 08/15/2009 | |||||||
| (Acquired 05/14/2008 and | |||||||
| 11/28/2008; Cost $511,731 | |||||||
and $1,305,564)* f | 1,814,368 | ||||||
| 455,000 | Republic New York | ||||||
| Corporation Subordinated | |||||||
| Notes, 9.70%, 02/01/2009 | 455,745 | ||||||
| 1,130,000 | Santander Central | ||||||
| Hispano Issuances, | |||||||
7.625%, 11/03/2009 f | 1,108,527 | ||||||
| 550,000 | Santander | ||||||
| Financial Issuances, | |||||||
6.375%, 02/15/2011 f | 572,371 | ||||||
| 1,724,000 | Sovereign Bancorp, Inc., | ||||||
| 4.80%, 09/01/2010 | 1,546,409 | ||||||
| 2,400,000 | Toll Road Inv. | ||||||
| Partnership II, | |||||||
| Series 1999B, | |||||||
| 0.00%, 02/15/2009 | |||||||
| (Acquired 02/04/2008; | |||||||
| Cost $2,385,468)* ^ | 2,392,728 | ||||||
| 1,075,000 | Union Planters | ||||||
| Corporation | |||||||
| Subordinated Notes, | |||||||
| 7.75%, 03/01/2011 | 1,029,477 | ||||||
| 850,000 | Unum Group, | ||||||
| 5.859%, 05/15/2009 | 810,940 | ||||||
| 2,675,000 | Western Financial Bank | ||||||
| Subordinated Debentures, | |||||||
| 9.625%, 05/15/2012 | |||||||
| (Callable 05/15/2009) | 2,635,437 | ||||||
| 68,913,975 | |||||||
| Industrial – 15.9% | |||||||
| 1,500,000 | American Standard Inc., | ||||||
| 8.25%, 06/01/2009 | 1,509,103 | ||||||
| 610,000 | Anadarko Petroleum Corp., | ||||||
| 2.40%, 09/15/2009 | |||||||
| (Callable 2/27/2009) | 583,662 | ||||||
| 1,000,000 | AOL Time Warner, Inc., | ||||||
| 6.75%, 04/15/2011 | 976,374 | ||||||
| 150,000 | BellSouth | ||||||
| Telecommunication | |||||||
| Debentures, | |||||||
| 5.875%, 01/15/2009 | 150,056 | ||||||
The accompanying notes are an integral part of these financial statements.
Page 80
Baird Short-Term Bond Fund
Schedule of Investments December 31, 2008 |
| Principal | |||||||
| Amount | Value | ||||||
| LONG-TERM INVESTMENTS – 98.1% (cont.) | |||||||
| Industrial – 15.9% (cont.) | |||||||
| $ | 605,000 | British Sky | |||||
| Broadcasting PLC, | |||||||
8.20%, 07/15/2009 f | $ | 615,009 | |||||
| 2,225,000 | British Telecom | ||||||
| PLC Notes, | |||||||
8.625%, 12/15/2010 f | 2,288,855 | ||||||
| 1,825,000 | CBS Corporation, | ||||||
| 7.70%, 07/30/2010 | 1,783,906 | ||||||
| 500,000 | Clear Channel | ||||||
| Communications | |||||||
| Senior Notes, | |||||||
| 7.65%, 09/15/2010 | 290,000 | ||||||
| 500,000 | Comcast Holdings | ||||||
| Corporation, | |||||||
| 10.625%, 07/15/2012 | 531,031 | ||||||
| 725,000 | Computer Sciences | ||||||
| Corporation Senior Notes, | |||||||
| 7.375%, 06/15/2011 | 717,984 | ||||||
| 1,581,000 | COX Communications | ||||||
| Inc. Notes, | |||||||
| 7.875%, 08/15/2009 | 1,554,106 | ||||||
| 2,105,000 | Deutsche Telekom | ||||||
| International Finance BV, | |||||||
8.50%, 06/15/2010 f | 2,168,306 | ||||||
| 1,625,000 | Developers Diversified | ||||||
| Realty Corp., | |||||||
| 3.875%, 01/30/2009 | 1,588,364 | ||||||
| 662,000 | Devon Energy | ||||||
| Corporation Debentures, | |||||||
| 10.125%, 11/15/2009 | 674,473 | ||||||
| 1,500,000 | Donnelley (R.R.) | ||||||
| & Sons Co., | |||||||
| 3.75%, 04/01/2009 | 1,471,599 | ||||||
| 500,000 | Fiserv, Inc., | ||||||
| 6.125%, 11/20/2012 | 469,767 | ||||||
| 1,500,000 | France Telecom S.A., | ||||||
7.75%, 03/01/2011 f | 1,578,456 | ||||||
| 2,000,000 | Home Depot, Inc., | ||||||
| 3.75%, 09/15/2009 | 1,981,048 | ||||||
| 675,000 | International Paper | ||||||
| Company Notes, | |||||||
| 4.00%, 04/01/2010 | 649,558 | ||||||
| 1,000,000 | New York | ||||||
| Telephone Company, | |||||||
| 6.125%, 01/15/2010 | 998,130 | ||||||
| 1,400,000 | PEMEX Project | ||||||
| Funding Master Trust, | |||||||
| 9.125%, 10/13/2010 | 1,473,500 | ||||||
| 1,770,000 | Republic Services, Inc., | ||||||
| 7.125%, 05/15/2009 | 1,791,403 | ||||||
| 1,500,000 | Sprint Capital | ||||||
| Corporation Notes, | |||||||
| 6.375%, 05/01/2009 | 1,490,625 | ||||||
| 1,000,000 | Telecom Italia Capital, | ||||||
4.00%, 01/15/2010 f | 920,000 | ||||||
| 157,117 | United AirLines, Inc. | ||||||
| Pass-Thru Certificates, | |||||||
| Series 2001-1, Class A-2, | |||||||
| 6.201%, 12/31/2049 | 146,119 | ||||||
| 1,000,000 | Unitedhealth Group, Inc., | ||||||
| 1.705%, 06/21/2010 | |||||||
| (Callable 03/21/2009) | 900,890 | ||||||
| 1,500,000 | Verizon Communications, | ||||||
| 7.25%, 12/01/2010 | 1,572,542 | ||||||
Vodafone Group PLC: f | |||||||
| 1,105,000 | 7.75%, 02/15/2010 | 1,129,327 | |||||
| 1,000,000 | 5.50%, 06/15/2011 | 996,651 | |||||
| Waste Management, Inc.: | |||||||
| 200,000 | 6.875%, 05/15/2009 | 199,071 | |||||
| 910,000 | 7.65%, 03/15/2011 | 908,224 | |||||
| 34,108,139 | |||||||
The accompanying notes are an integral part of these financial statements.
Page 81
Baird Short-Term Bond Fund
Schedule of Investments December 31, 2008 |
| Principal | |||||||
| Amount | Value | ||||||
| LONG-TERM INVESTMENTS – 98.1% (cont.) | |||||||
| Mortgage Backed Securities – 27.6% | |||||||
| $ | 764,463 | Bank of America | |||||
| Alternative Loan Trust, | |||||||
| Series 2003-4, Class 2A1, | |||||||
| 5.00%, 06/25/2018 | $ | 730,198 | |||||
| 555,572 | Chase Commercial | ||||||
| Mortgage Securities | |||||||
| Corporation, | |||||||
| Series 1999-2, Class A2, | |||||||
| 7.198%, 01/15/2032 | 553,700 | ||||||
| 1,598,756 | Chase Mortgage | ||||||
| Finance Corporation, | |||||||
| Series 2005-A1, Class 2A2, | |||||||
| 5.237%, 12/25/2035 | 1,328,797 | ||||||
| Citicorp Mortgage | |||||||
| Securities, Inc.: | |||||||
| 219,062 | Series 2003-11, Class 2A8, | ||||||
| 5.50%, 12/25/2033 | 206,042 | ||||||
| 646,756 | Series 2004-3, Class A2, | ||||||
| 5.25%, 05/25/2034 | 602,780 | ||||||
| 376,355 | Series 2004-4, Class A2, | ||||||
| 5.25%, 06/25/2034 | 346,679 | ||||||
| Countrywide Alternative | |||||||
| Loan Trust: | |||||||
| 1,132,159 | Series 2005-50CB, | ||||||
| Class 4A1, 5.00%, | |||||||
| 11/25/2020 | 952,243 | ||||||
| 3,068,929 | Series 2005-34CB, | ||||||
| Class 1A6, 5.50%, | |||||||
| 09/25/2035 | 2,699,512 | ||||||
| 745,821 | Series 2005-73CB, | ||||||
| Class 1A7, 5.50%, | |||||||
| 01/25/2036 | 669,361 | ||||||
| 3,075,252 | Series 2006-28CB, | ||||||
| Class A17, 6.00%, | |||||||
| 10/25/2036 | 2,145,353 | ||||||
| Deutsche Alternative | |||||||
| Securities Inc. Mortgage: | |||||||
| 512,854 | Series 2003-3, Class 2A5, | ||||||
| 5.00%, 10/25/2033 | 509,603 | ||||||
| 1,241,659 | Series 2005-4, Class A2, | ||||||
| 5.05%, 09/25/2035 | 1,131,338 | ||||||
| 4,526,825 | DLJ Commercial | ||||||
| Mortgage Corporation, | |||||||
| Series 1999-CG3, | |||||||
| Class A1B, 7.34%, | |||||||
| 10/10/2032 | 4,518,656 | ||||||
| 3,061,751 | Federal Home Loan Bank, | ||||||
| Series 00-0582, Class H, | |||||||
| 4.75%, 10/25/2010 | 3,107,677 | ||||||
| Federal Home Loan | |||||||
| Mortgage Corporation | |||||||
| (FHLMC): | |||||||
| 159,499 | Series 2548, Class HA, | ||||||
| 4.50%, 01/15/2010 | 160,951 | ||||||
| 460,495 | Series 2835, Class VK, | ||||||
| 5.50%, 11/15/2012 | 468,811 | ||||||
| 722,337 | Series 3033, Class LU, | ||||||
| 5.50%, 03/15/2013 | 742,526 | ||||||
| 2,084,223 | Series 3124, Class VP, | ||||||
| 6.00%, 06/15/2014 | 2,166,859 | ||||||
| 2,640,786 | Series R014, Class AL, | ||||||
| 5.50%, 10/15/2014 | 2,676,630 | ||||||
| 1,427,217 | Series R001, Class AE, | ||||||
| 4.375%, 04/15/2015 | 1,442,306 | ||||||
| 260,130 | Series 2789, Class VM, | ||||||
| 5.50%, 04/15/2015 | 268,838 | ||||||
| 765,794 | Series 2390, Class PW, | ||||||
| 6.00%, 04/15/2015 | 771,670 | ||||||
| 1,386,379 | Series 2857, Class VA, | ||||||
| 5.00%, 09/15/2015 | 1,427,916 | ||||||
| 126,344 | Series 2541, Class JB, | ||||||
| 5.00%, 02/15/2016 | 128,020 | ||||||
The accompanying notes are an integral part of these financial statements.
Page 82
Baird Short-Term Bond Fund
Schedule of Investments December 31, 2008 |
| Principal | |||||||
| Amount | Value | ||||||
| LONG-TERM INVESTMENTS – 98.1% (cont.) | |||||||
| Mortgage Backed Securities – 27.6% (cont.) | |||||||
| $ | 6,920,394 | Series R007, Class AC, | |||||
| 5.875%, 05/15/2016 | $ | 7,118,832 | |||||
| 42,487 | Series 5, Class B, | ||||||
| 2.14%, 05/15/2019 | 40,151 | ||||||
| 462,742 | Series 2970, Class DA, | ||||||
| 5.50%, 01/15/2023 | 472,359 | ||||||
| Federal National Mortgage | |||||||
| Association (FNMA): | |||||||
| 444,684 | 5.50%, 07/01/2015 | 464,220 | |||||
| 672,446 | Series 2003-27, Class OJ, | ||||||
| 5.00%, 07/25/2015 | 679,309 | ||||||
| 2,150,000 | Series 2002-74, Class TD, | ||||||
| 5.00%, 12/25/2015 | 2,176,000 | ||||||
| 776,341 | Series 2003-24, Class LC, | ||||||
| 5.00%, 12/25/2015 | 786,391 | ||||||
| 639,073 | Series 2006-B1, Class AB, | ||||||
| 6.00%, 06/25/2016 | 653,065 | ||||||
| 3,504,074 | Series 2004-W6, Class 1A4, | ||||||
| 5.50%, 07/25/2034 | 3,321,705 | ||||||
| 1,388,844 | Series 2004-W6, Class 1A6, | ||||||
| 5.50%, 07/25/2034 | 1,291,024 | ||||||
| 4,200,000 | Series 2004-W10, | ||||||
| Class A24, 5.00%, | |||||||
| 08/25/2034 | 4,140,905 | ||||||
| 1,794,518 | J.P. Morgan Alternative | ||||||
| Loan Trust, | |||||||
| Series 2006-S2, Class A2, | |||||||
| 5.81%, 05/25/2036 | 1,434,385 | ||||||
| 839,158 | Residential Accredit Loans | ||||||
| Inc., Series 2003-QS17, | |||||||
| Class CB3, 5.50%, | |||||||
| 09/25/2033 | 836,546 | ||||||
| Salomon Brothers Mortgage | |||||||
| Securities VII: | |||||||
| 3,236,381 | Series 2000-C1, Class A2, | ||||||
| 7.52%, 12/18/2009 | 3,229,652 | ||||||
| 1,120,272 | Series 2000-C2, Class A2, | ||||||
| 7.455%, 07/18/2033 | 1,117,242 | ||||||
| 934,167 | Series 2001-C2, Class A3, | ||||||
| 6.50%, 11/13/2036 | 907,426 | ||||||
| Washington Mutual, Inc. | |||||||
| Pass-Thru Certificates: | |||||||
| 523,262 | Series 2004-CB4, | ||||||
| Class 21A, 5.50%, | |||||||
| 12/25/2019 | 475,669 | ||||||
| 477,837 | Series 2004-CB4, | ||||||
| Class 22A, 6.00%, | |||||||
| 12/25/2019 | 440,027 | ||||||
| 59,341,374 | |||||||
| Taxable Municipal Bonds – 1.6% | |||||||
| 452,813 | Educational Enhancement | ||||||
| Funding Corporation, | |||||||
| 6.72%, 06/01/2025 | 425,458 | ||||||
| 470,000 | Missouri State Housing | ||||||
| Development Revenue | |||||||
| Bond, 5.74%, 03/01/2037 | 469,436 | ||||||
| 1,500,000 | Pennsylvania State | ||||||
| Turnpike Commission, | |||||||
| 5.29%, 10/15/2009 | 1,505,775 | ||||||
| 265,000 | Redding California | ||||||
| Redevelopment Agency | |||||||
| Tax Allocation, | |||||||
| 6.00%, 09/01/2010 | 265,387 | ||||||
| 255,000 | Richmond Joint Powers | ||||||
| Financing Authority | |||||||
| Tax Allocation, | |||||||
| 7.35%, 09/01/2010 | 257,004 | ||||||
| 571,574 | Tobacco Settlement | ||||||
| Financing Corporation, | |||||||
| Series 2001-A, Class A, | |||||||
| 6.36%, 05/15/2025 | 555,508 | ||||||
| 3,478,568 | |||||||
The accompanying notes are an integral part of these financial statements.
Page 83
Baird Short-Term Bond Fund
Schedule of Investments December 31, 2008 |
| Principal | |||||||
| Amount | Value | ||||||
| LONG-TERM INVESTMENTS – 98.1% (cont.) | |||||||
| Utilities – 5.2% | |||||||
| $ | 940,000 | Cilcorp Inc. Senior Notes, | |||||
| 8.70%, 10/15/2009 | $ | 864,800 | |||||
| 1,000,000 | Constellation Energy | ||||||
| Group Inc. Senior Notes, | |||||||
| 6.125%, 09/01/2009 | 989,636 | ||||||
| 1,000,000 | Energy Transfer | ||||||
| Partners L.P., | |||||||
| 9.70%, 03/15/2019 | 1,030,411 | ||||||
| 1,000,000 | Kinder Morgan Energy | ||||||
| Partners Senior Notes, | |||||||
| 6.30%, 02/01/2009 | 999,036 | ||||||
| 1,000,000 | NiSource Finance | ||||||
| Corporation, | |||||||
| 7.875%, 11/15/2010 | 915,090 | ||||||
| 1,500,000 | Northern Border | ||||||
| Pipeline Co., | |||||||
| 7.75%, 09/01/2009 | 1,509,086 | ||||||
| 1,000,000 | Pepco Holdings, Inc. | ||||||
| Senior Notes, | |||||||
| 2.83%, 06/01/2010 | |||||||
| (Callable 2/27/2009) | 990,560 | ||||||
| 2,350,000 | PPL Capital Funding | ||||||
| Trust I, Series A, | |||||||
| 4.33%, 03/01/2009 | 2,357,207 | ||||||
| 389,000 | PSE&G Power LLC, | ||||||
| 3.75%, 04/01/2009 | 388,035 | ||||||
| 1,300,000 | Williams Companies, | ||||||
| Inc. Notes, | |||||||
| 6.375%, 10/01/2010 | |||||||
| (Acquired 07/09/2008; | |||||||
| Cost $1,310,531)* | 1,211,902 | ||||||
| 11,255,763 | |||||||
| U.S. Government Agency Issues – 3.4% | |||||||
| Federal National Mortgage | |||||||
| Association (FNMA), | |||||||
| 7,000,000 | 3.625%, 02/12/2013 | 7,408,233 | |||||
| 7,408,233 | |||||||
| U.S. Treasury Obligations – 3.6% | |||||||
| 7,000,000 | U.S. Treasury Notes, | ||||||
| 3.375%, 06/30/2013 | 7,632,184 | ||||||
| Total Long-Term | |||||||
| Investments | |||||||
| (Cost $224,298,761) | 210,880,905 | ||||||
| Shares | |||||||
| SHORT-TERM INVESTMENTS – 4.5% | |||||||
| Money Market Fund – 4.5% | |||||||
| 9,602,812 | Short-Term Investment | ||||||
| Company Liquid Assets | |||||||
| Portfolio – AIM Fund | 9,602,812 | ||||||
| Total Short-Term | |||||||
| Investments | |||||||
| (Cost $9,602,812) | 9,602,812 | ||||||
| Principal | |||||||
| Amount | |||||||
| INVESTMENTS PURCHASED | |||||||
| WITH CASH PROCEEDS FROM | |||||||
| SECURITIES LENDING – 4.8% | |||||||
| Certificates of Deposit – 0.8% | |||||||
| $ | 381,810 | Abbey National Treasury | |||||
| Service, Series YCD1, | |||||||
| 1.09%, 02/20/09 | 381,779 | ||||||
| 381,810 | Barclays Bank, | ||||||
| 3.3615%, 03/16/09 | 381,508 | ||||||
| Natixis Bank of | |||||||
| New York, Series YCD1: | |||||||
| 269,513 | 0.89%, 02/18/09 | 269,497 | |||||
The accompanying notes are an integral part of these financial statements.
Page 84
Baird Short-Term Bond Fund
Schedule of Investments December 31, 2008 |
| Principal | |||||||
| Amount | Value | ||||||
| INVESTMENTS PURCHASED | |||||||
| WITH CASH PROCEEDS FROM | |||||||
| SECURITIES LENDING – 4.8% (cont.) | |||||||
| Certificates of Deposit – 0.8% (cont.) | |||||||
| $ | 224,594 | 0.89%, 06/30/09 | $ | 224,962 | |||
| 336,891 | Royal Bank of | ||||||
| Scotland Group PLC, | |||||||
| 2.9944%, 05/06/09 | 336,884 | ||||||
| 112,297 | Societe Generale of | ||||||
| New York, Series YCD1, | |||||||
| 2.0625%, 02/20/09 | 112,290 | ||||||
| 1,706,920 | |||||||
| Commercial Paper – 0.5% | |||||||
| 1,195,663 | Atlantic East | ||||||
| Funding, LLC, | |||||||
| 3.0588%, 03/25/09 # | 1,195,663 | ||||||
| 1,195,663 | |||||||
| Corporate Bonds and Notes – 0.4% | |||||||
| Allstate Life GL: | |||||||
| 247,053 | 3.0575%, 03/20/09 | 245,430 | |||||
| 112,297 | 1.775%, 07/21/09 | 110,185 | |||||
| 224,594 | Svenska Handelsbanken, | ||||||
| 4.410%, 08/06/09 | 224,480 | ||||||
| 336,891 | Wachovia Bank NA, | ||||||
| 3.0013%, 05/01/09 | 333,182 | ||||||
| 913,277 | |||||||
| Government Agencies – 0.3% | |||||||
| 628,863 | Federal Home Loan Banks, | ||||||
| 0.645%, 03/02/09 | 628,505 | ||||||
| 628,505 | |||||||
| Shares | |||||||
| Investment Companies – 2.8% | |||||||
| 5,797,463 | Mount Vernon Securities | ||||||
| Lending Trust – Prime | |||||||
| Portfolio | 5,797,463 | ||||||
| 151,478 | Reserve Primary Fund # | 151,478 | |||||
| 5,948,941 | |||||||
| Total Investments | |||||||
| Purchased With Cash | |||||||
| Proceeds From | |||||||
| Securities Lending | |||||||
| (Cost $10,393,306) | 10,393,306 | ||||||
| Total Investments | |||||||
| (Cost $244,294,879) – | |||||||
| 107.4% | 230,877,023 | ||||||
| Liabilities in Excess of | |||||||
| Other Assets – (7.4)% | (15,877,617 | ) | |||||
| TOTAL NET | |||||||
| ASSETS – 100.0% | $ | 214,999,406 | |||||
| * | Restricted Security Deemed Liquid |
| f | Foreign Security |
| ^ | Non-Income Producing |
| # | Priced at Fair Value by the Valuation Committee as delegated by the Baird Funds’ Board of Directors |
| @ | Security in default |
The accompanying notes are an integral part of these financial statements.
Page 85
Baird Short-Term Bond Fund
Schedule of Investments December 31, 2008 |
SFAS 157 – Summary of Fair Value Exposure at December 31, 2008
In September 2006, the Financial Accounting Standards Board issued Statement of Financial Accounting Standards No. 157, “Fair Value Measurements” (“SFAS 157”) effective for fiscal years beginning after November 15, 2007. SFAS 157 defines fair value, establishes a framework for measuring fair value in generally accepted accounting principles (GAAP), and expands disclosures about fair value measurements. The Fund adopted SFAS 157 as of January 1, 2008. Under SFAS 157, various inputs are used in determining the value of the Fund’s investments. These inputs are summarized into three broad levels and described below:
| Level 1 – | Quoted prices in active markets for identical securities. |
| Level 2 – | Other significant observable inputs (including quoted prices for similar securities, interest rates, prepayment speeds, credit risk, etc.) |
| Level 3 – | Significant unobservable inputs (including the Fund’s own assumptions in determining the fair value of investments) |
The following is a summary of the inputs used to value the Fund’s investments as of December 31, 2008:
| Description | Investments, at Value | |||
| Level 1 – Quoted prices | $ | 15,400,275 | ||
| Level 2 – Other significant observable inputs | 214,751,106 | |||
| Level 3 – Significant unobservable inputs | 725,642 | |||
| Total | $ | 230,877,023 | ||
Following is a reconciliation of Level 3 investments for which significant unobservable inputs were used to determine fair value.
| Investments, at Value | ||||
| Balance as of 12/31/07 | $ | 1,415,168 | ||
| Accrued discounts / premiums | — | |||
| Realized gain (loss) | — | |||
| Change in unrealized appreciation (depreciation) | — | |||
| Net purchases (sales/paydowns) | — | |||
| Transfers in and / or out of Level 3 * | (689,526 | ) | ||
| Balance as of 12/31/08 | $ | 725,642 | ||
| * | The information used in the above reconciliation represents fiscal year to date activity for any investments identified as using Level 3 inputs at either the beginning or end of the current fiscal period. Transfers in or out of Level 3 represents either the beginning value (for transfers in) or ending value (for transfers out) of any security or instrument where a change in the pricing level occurred from the beginning to the end of the period. |
Page 86
Baird Funds, Inc.
Additional Information on Fund Expenses December 31, 2008 |
Example
As a shareholder of a mutual fund, you incur two types of costs: (1) transaction costs, which may include sales charges (loads) on purchase payments, reinvested dividends, or other distributions; redemption fees; and exchange fees; and (2) ongoing costs, such as management fees; distribution and/or service (12b-1) fees; and other fund expenses. Although the Funds do not charge any sales loads, redemption fees, or other transaction fees, you will be assessed fees for outgoing wire transfers, returned checks and stop payment orders at prevailing rates charged by U.S. Bancorp Fund Services, LLC, the Funds’ transfer agent. If you request that a redemption be made by wire transfer, currently the Funds’ transfer agent charges a $15.00 fee.
This Example is intended to help you understand your ongoing costs (in dollars) of investing in each Fund and to compare these costs with the ongoing costs of investing in other mutual funds. The Example is based on an investment of $1,000 invested at the beginning of the period and held for the entire period (7/1/08 – 12/31/08).
Actual Expenses
The third and fourth columns of the following table provide information about account values based on actual returns and actual expenses. You may use the information in these columns, together with the amount you invested, to estimate the expenses that you paid over the period. Simply divide your account value by $1,000 (for example, an $8,600 account value divided by $1,000 = 8.6), then multiply the result by the number in the fourth column entitled “Expenses Paid During Period’’ to estimate the expenses you paid on your account during this period.
Hypothetical Example for Comparison Purposes
The fifth and sixth columns of the following table provide information about hypothetical account values and hypothetical expenses based on the Funds’ actual expense ratios and an assumed rate of return of 5% per year before expenses, which is not the Funds’ actual return. The hypothetical account values and expenses may not be used to estimate the actual ending account balance or expenses you paid for the period. You may use this information to compare the ongoing costs of investing in the Funds and other mutual funds. To do so, compare this 5% hypothetical example with the 5% hypothetical examples that appear in the shareholder reports of the other mutual funds. Please note that the expenses shown in the table are meant to highlight your ongoing costs only and do not reflect any transactional costs. Therefore, the sixth column of the table (entitled “Expenses Paid During Period”) is useful in comparing ongoing costs only, and will not help you determine the relative total costs of owning different mutual funds. In addition, if these transactional costs were included, your costs could have been higher.
Page 87
Baird Funds, Inc.
Additional Information on Fund Expenses December 31, 2008 |
Actual vs. Hypothetical Returns
For the Six Months Ended December 31, 2008
| Hypothetical (5% return | |||||||
| Actual | before expenses) | ||||||
| Fund’s | Beginning | Ending | Expenses | Ending | Expenses | ||
| Annualized | Account | Account | Paid | Account | Paid | ||
| Expense | Value | Value | During | Value | During | ||
Ratio(1) | 7/1/08 | 12/31/08 | Period(1) | 12/31/08 | Period(1) | ||
| Baird Intermediate Bond Fund | |||||||
| Institutional Class | 0.30% | $1,000.00 | $ 987.30 | $1.50 | $1,023.63 | $1.53 | |
| Investor Class | 0.55% | $1,000.00 | $ 985.50 | $2.74 | $1,022.37 | $2.80 | |
| Baird Aggregate Bond Fund | |||||||
| Institutional Class | 0.30% | $1,000.00 | $ 981.00 | $1.49 | $1,023.63 | $1.53 | |
| Investor Class | 0.55% | $1,000.00 | $ 979.20 | $2.74 | $1,022.37 | $2.80 | |
| Baird Intermediate Municipal | |||||||
| Bond Fund | |||||||
| Institutional Class | 0.30% | $1,000.00 | $1,054.00 | $1.55 | $1,023.63 | $1.53 | |
| Investor Class | 0.55% | $1,000.00 | $1,052.90 | $2.84 | $1,022.37 | $2.80 | |
| Baird Core Plus Bond Fund | |||||||
| Institutional Class | 0.30% | $1,000.00 | $ 979.30 | $1.49 | $1,023.63 | $1.53 | |
| Investor Class | 0.55% | $1,000.00 | $ 977.70 | $2.73 | $1,022.37 | $2.80 | |
| Baird Short-Term Bond Fund | |||||||
| Institutional Class | 0.30% | $1,000.00 | $ 973.60 | $1.49 | $1,023.63 | $1.53 | |
| (1) | Expenses are equal to the Fund’s annualized expense ratio multiplied by the average account value over the period, multiplied by 184 days and divided by 366 to reflect the one-half year period. |
Page 88
Baird Funds, Inc.
Statements of Assets and Liabilities December 31, 2008 |
| Baird | |||||||||||||||||||||
| Baird | Baird | Intermediate | Baird | Baird | |||||||||||||||||
| Intermediate | Aggregate | Municipal | Core Plus | Short-Term | |||||||||||||||||
| Bond Fund | Bond Fund | Bond Fund | Bond Fund | Bond Fund | |||||||||||||||||
| ASSETS: | |||||||||||||||||||||
| Investments, at value | $ | 546,213,553 | $ | 1,075,168,909 | $ | 236,925,572 | $ | 231,490,698 | $ | 230,877,023 | |||||||||||
| (cost $575,067,875; $1,139,491,801; | |||||||||||||||||||||
| $229,543,682; $245,167,858; | |||||||||||||||||||||
| & $244,294,879, respectively) | |||||||||||||||||||||
| Uninvested Cash | — | — | — | — | 5,946 | ||||||||||||||||
| Interest receivable | 4,978,979 | 9,589,036 | 2,978,657 | 2,283,034 | 2,403,102 | ||||||||||||||||
| Receivable for investments sold or exchanged | 86,708 | 315,833 | — | 47,957 | 157,985 | ||||||||||||||||
| Receivable for Fund shares sold | 3,010,775 | 2,598,976 | 6,911,441 | 662,299 | 96,030 | ||||||||||||||||
| Total assets | 554,290,015 | 1,087,672,754 | 246,815,670 | 234,483,988 | 233,540,086 | ||||||||||||||||
| LIABILITIES: | |||||||||||||||||||||
| Payable for collateral received | |||||||||||||||||||||
| for securities loaned (See Note 6) | 140,806,453 | 212,021,054 | — | 43,502,289 | 10,393,306 | ||||||||||||||||
| Payable for securities purchased | 7,117,997 | 2,153,286 | 2,092,691 | 1,669,522 | 7,668,560 | ||||||||||||||||
| Payable for Fund shares redeemed | 39,964 | 750,282 | 1,102,000 | 576,306 | 425,565 | ||||||||||||||||
| Payable to Advisor and Distributor | 102,694 | 226,644 | 57,397 | 62,272 | 53,249 | ||||||||||||||||
| Payable to the custodian | 290,207 | 650,607 | — | 106,686 | — | ||||||||||||||||
| Total liabilities | 148,357,315 | 215,801,873 | 3,252,088 | 45,917,075 | 18,540,680 | ||||||||||||||||
| NET ASSETS | $ | 405,932,700 | $ | 871,870,881 | $ | 243,563,582 | $ | 188,566,913 | $ | 214,999,406 | |||||||||||
| NET ASSETS CONSIST OF: | |||||||||||||||||||||
| Capital stock | $ | 433,763,534 | $ | 936,584,087 | $ | 236,797,656 | $ | 201,797,145 | $ | 228,407,441 | |||||||||||
| Accumulated undistributed | |||||||||||||||||||||
| net investment income | 87,193 | — | — | — | 32,582 | ||||||||||||||||
| Accumulated net realized | |||||||||||||||||||||
| gain (loss) on investments sold | 936,295 | (390,314 | ) | (615,964 | ) | 446,928 | (22,761 | ) | |||||||||||||
| Net unrealized appreciation (depreciation) | |||||||||||||||||||||
| on investments | (28,854,322 | ) | (64,322,892 | ) | 7,381,890 | (13,677,160 | ) | (13,417,856 | ) | ||||||||||||
| NET ASSETS | $ | 405,932,700 | $ | 871,870,881 | $ | 243,563,582 | $ | 188,566,913 | $ | 214,999,406 | |||||||||||
| INSTITUTIONAL CLASS SHARES | |||||||||||||||||||||
| Net Assets | $ | 401,914,872 | $ | 842,724,670 | $ | 226,148,164 | $ | 158,983,325 | $ | 214,999,406 | |||||||||||
| Shares outstanding ($0.01 par value, | |||||||||||||||||||||
| unlimited shares authorized) | 40,203,656 | 86,482,977 | 20,594,998 | 16,814,148 | 23,247,321 | ||||||||||||||||
| Net asset value, offering and | |||||||||||||||||||||
| redemption price per share | $ | 10.00 | $ | 9.74 | $ | 10.98 | $ | 9.46 | $ | 9.25 | |||||||||||
| INVESTOR CLASS SHARES | |||||||||||||||||||||
| Net Assets | $ | 4,017,828 | $ | 29,146,211 | $ | 17,415,418 | $ | 29,583,588 | |||||||||||||
| Shares outstanding ($0.01 par value, | |||||||||||||||||||||
| unlimited shares authorized) | 389,348 | 2,922,530 | 1,556,188 | 3,042,325 | |||||||||||||||||
| Net asset value, offering and | |||||||||||||||||||||
| redemption price per share | $ | 10.32 | $ | 9.97 | $ | 11.19 | $ | 9.72 | |||||||||||||
The accompanying notes are an integral part of these financial statements.
Page 89
Baird Funds, Inc.
Statements of Operations Year Ended December 31, 2008 |
| Baird | ||||||||||||||||||||
| Baird | Baird | Intermediate | Baird | Baird | ||||||||||||||||
| Intermediate | Aggregate | Municipal | Core Plus | Short-Term | ||||||||||||||||
| Bond Fund | Bond Fund | Bond Fund | Bond Fund | Bond Fund | ||||||||||||||||
| INVESTMENT INCOME: | ||||||||||||||||||||
| Interest income | $ | 23,337,409 | $ | 46,679,997 | $ | 5,576,187 | $ | 9,567,004 | $ | 11,796,470 | ||||||||||
| Income from securities lending (Note 6) | 320,308 | 391,035 | — | 85,533 | 120,718 | |||||||||||||||
| Other income | 76,132 | 281,767 | 3,096 | 79,981 | 69,584 | |||||||||||||||
| Total investment income | 23,733,849 | 47,352,799 | 5,579,283 | 9,732,518 | 11,986,772 | |||||||||||||||
| EXPENSES: | ||||||||||||||||||||
| Investment advisory fee | 1,091,957 | 2,048,386 | 359,479 | 409,894 | 562,946 | |||||||||||||||
| Administration fee | 218,391 | 409,677 | 71,896 | 81,979 | 112,589 | |||||||||||||||
| Distribution expense – | ||||||||||||||||||||
| Investor Class Shares (Note 8) | 9,116 | 65,731 | 5,990 | 54,989 | — | |||||||||||||||
| Interest Expense (Note 7) | 1,474 | — | — | — | 5,502 | |||||||||||||||
| Total expenses | 1,320,938 | 2,523,794 | 437,365 | 546,862 | 681,037 | |||||||||||||||
| NET INVESTMENT INCOME | 22,412,911 | 44,829,005 | 5,141,918 | 9,185,656 | 11,305,735 | |||||||||||||||
| REALIZED AND UNREALIZED | ||||||||||||||||||||
| GAIN (LOSS) ON INVESTMENTS: | ||||||||||||||||||||
| Net realized gain (loss) on investments | 3,440,473 | 1,031,139 | (274,006 | ) | 1,160,853 | 217,036 | ||||||||||||||
| Change in unrealized | ||||||||||||||||||||
| appreciation/depreciation on investments | (30,956,520 | ) | (67,458,374 | ) | 5,662,406 | (14,240,961 | ) | (14,687,311 | ) | |||||||||||
| Net realized and unrealized | ||||||||||||||||||||
| gain (loss) on investments | (27,516,047 | ) | (66,427,235 | ) | 5,388,400 | (13,080,108 | ) | (14,470,275 | ) | |||||||||||
| NET INCREASE (DECREASE) IN NET ASSETS | ||||||||||||||||||||
| RESULTING FROM OPERATIONS | $ | (5,103,136 | ) | $ | (21,598,230 | ) | $ | 10,530,318 | $ | (3,894,452 | ) | $ | (3,164,540 | ) | ||||||
The accompanying notes are an integral part of these financial statements.
Page 90
Baird Funds, Inc.
| Statements of Changes in Net Assets |
| Baird Intermediate Bond Fund | ||||||||
| Year Ended | Year Ended | |||||||
| December 31, 2008 | December 31, 2007 | |||||||
| OPERATIONS: | ||||||||
| Net investment income | $ | 22,412,911 | $ | 17,878,115 | ||||
| Net realized gain on investments | 3,440,473 | 834,207 | ||||||
| Change in unrealized appreciation/depreciation on investments | (30,956,520 | ) | 2,719,097 | |||||
| Net increase (decrease) in net assets resulting from operations | (5,103,136 | ) | 21,431,419 | |||||
| CAPITAL SHARE TRANSACTIONS: | ||||||||
| Proceeds from shares sold | 142,640,099 | 136,300,912 | ||||||
| Shares issued to holders in reinvestment of dividends | 19,625,331 | 15,901,882 | ||||||
| Cost of shares redeemed | (130,271,025 | ) | (82,165,056 | ) | ||||
| Net increase in net assets resulting | ||||||||
| from capital share transactions | 31,994,405 | 70,037,738 | ||||||
| DISTRIBUTIONS TO | ||||||||
| INSTITUTIONAL CLASS SHAREHOLDERS: | ||||||||
| From net investment income | (22,354,849 | ) | (17,835,145 | ) | ||||
| From net realized gains | (26,596 | ) | — | |||||
| Total Distributions | (22,381,445 | ) | (17,835,145 | ) | ||||
| DISTRIBUTIONS TO | ||||||||
| INVESTOR CLASS SHAREHOLDERS: | ||||||||
| From net investment income | (174,810 | ) | (78,708 | ) | ||||
| From net realized gains | (231 | ) | — | |||||
| Total Distributions | (175,041 | ) | (78,708 | ) | ||||
| TOTAL INCREASE IN NET ASSETS | 4,334,783 | 73,555,304 | ||||||
| NET ASSETS: | ||||||||
| Beginning of year | 401,597,917 | 328,042,613 | ||||||
| End of year (including undistributed net investment | ||||||||
| income of $87,193 and $196,255, respectively) | $ | 405,932,700 | $ | 401,597,917 | ||||
The accompanying notes are an integral part of these financial statements.
Page 91
Baird Funds, Inc.
| Statements of Changes in Net Assets |
| Baird Aggregate Bond Fund | ||||||||
| Year Ended | Year Ended | |||||||
| December 31, 2008 | December 31, 2007 | |||||||
| OPERATIONS: | ||||||||
| Net investment income | $ | 44,829,005 | $ | 27,527,327 | ||||
| Net realized gain (loss) on investments | 1,031,139 | (304,693 | ) | |||||
| Change in unrealized appreciation/depreciation on investments | (67,458,374 | ) | 3,082,857 | |||||
| Net increase (decrease) in net assets resulting from operations | (21,598,230 | ) | 30,305,491 | |||||
| CAPITAL SHARE TRANSACTIONS: | ||||||||
| Proceeds from shares sold | 380,122,590 | 448,144,815 | ||||||
| Shares issued to holders in reinvestment of dividends | 36,137,185 | 21,538,963 | ||||||
| Cost of shares redeemed | (217,594,354 | ) | (69,473,413 | ) | ||||
| Net increase in net assets resulting | ||||||||
| from capital share transactions | 198,665,421 | 400,210,365 | ||||||
| DISTRIBUTIONS TO | ||||||||
| INSTITUTIONAL CLASS SHAREHOLDERS: | ||||||||
| From net investment income | (43,763,255 | ) | (27,032,183 | ) | ||||
| DISTRIBUTIONS TO | ||||||||
| INVESTOR CLASS SHAREHOLDERS: | ||||||||
| From net investment income | (1,376,855 | ) | (296,350 | ) | ||||
| TOTAL INCREASE IN NET ASSETS | 131,927,081 | 403,187,323 | ||||||
| NET ASSETS: | ||||||||
| Beginning of year | 739,943,800 | 336,756,477 | ||||||
| End of year (including undistributed net investment | ||||||||
| income of $0 and $317,945, respectively) | $ | 871,870,881 | $ | 739,943,800 | ||||
The accompanying notes are an integral part of these financial statements.
Page 92
Baird Funds, Inc.
| Statements of Changes in Net Assets |
| Baird Intermediate Municipal Bond Fund | ||||||||
| Year Ended | Year Ended | |||||||
| December 31, 2008 | December 31, 2007 | |||||||
| OPERATIONS: | ||||||||
| Net investment income | $ | 5,141,918 | $ | 2,719,253 | ||||
| Net realized gain (loss) on investments | (274,006 | ) | 159 | |||||
| Change in unrealized appreciation/depreciation on investments | 5,662,406 | 1,596,614 | ||||||
| Net increase in net assets resulting from operations | 10,530,318 | 4,316,026 | ||||||
| CAPITAL SHARE TRANSACTIONS: | ||||||||
| Proceeds from shares sold | 160,219,164 | 53,013,622 | ||||||
| Shares issued to holders in reinvestment of dividends | 4,513,442 | 2,233,256 | ||||||
| Cost of shares redeemed | (33,490,109 | ) | (15,363,447 | ) | ||||
| Net increase in net assets resulting | ||||||||
| from capital share transactions | 131,242,497 | 39,883,431 | ||||||
| DISTRIBUTIONS TO | ||||||||
| INSTITUTIONAL CLASS SHAREHOLDERS: | ||||||||
| From net investment income | (5,091,785 | ) | (2,682,064 | ) | ||||
| DISTRIBUTIONS TO | ||||||||
| INVESTOR CLASS SHAREHOLDERS: | ||||||||
| From net investment income | (97,675 | ) | (14,673 | ) | ||||
| TOTAL INCREASE IN NET ASSETS | 136,583,355 | 41,502,720 | ||||||
| NET ASSETS: | ||||||||
| Beginning of year | 106,980,227 | 65,477,507 | ||||||
| End of year (including undistributed net investment | ||||||||
| income of $0 and $31,987, respectively) | $ | 243,563,582 | $ | 106,980,227 | ||||
The accompanying notes are an integral part of these financial statements.
Page 93
Baird Funds, Inc.
| Statements of Changes in Net Assets |
| Baird Core Plus Bond Fund | ||||||||
| Year Ended | Year Ended | |||||||
| December 31, 2008 | December 31, 2007 | |||||||
| OPERATIONS: | ||||||||
| Net investment income | $ | 9,185,656 | $ | 3,735,215 | ||||
| Net realized gain on investments | 1,160,853 | 197,335 | ||||||
| Change in unrealized appreciation/depreciation on investments | (14,240,961 | ) | 426,220 | |||||
| Net increase (decrease) in net assets resulting from operations | (3,894,452 | ) | 4,358,770 | |||||
| CAPITAL SHARE TRANSACTIONS: | ||||||||
| Proceeds from shares sold | 134,885,428 | 67,804,431 | ||||||
| Shares issued to holders in reinvestment of dividends | 8,307,982 | 3,528,244 | ||||||
| Cost of shares redeemed | (57,613,955 | ) | (6,913,616 | ) | ||||
| Net increase in net assets resulting | ||||||||
| from capital share transactions | 85,579,455 | 64,419,059 | ||||||
| DISTRIBUTIONS TO | ||||||||
| INSTITUTIONAL CLASS SHAREHOLDERS: | ||||||||
| From net investment income | (7,991,266 | ) | (3,684,505 | ) | ||||
| From net realized gains | (689,704 | ) | — | |||||
| Total Distributions | (8,680,970 | ) | (3,684,505 | ) | ||||
| DISTRIBUTIONS TO | ||||||||
| INVESTOR CLASS SHAREHOLDERS: | ||||||||
| From net investment income | (1,208,915 | ) | (37,714 | ) | ||||
| From net realized gains | (123,760 | ) | — | |||||
| Total Distributions | (1,332,675 | ) | (37,714 | ) | ||||
| TOTAL INCREASE IN NET ASSETS | 71,671,358 | 65,055,610 | ||||||
| NET ASSETS: | ||||||||
| Beginning of year | 116,895,555 | 51,839,945 | ||||||
| End of year (including undistributed net investment | ||||||||
| income of $0 and $47,200, respectively) | $ | 188,566,913 | $ | 116,895,555 | ||||
The accompanying notes are an integral part of these financial statements.
Page 94
Baird Funds, Inc.
| Statements of Changes in Net Assets |
| Baird Short-Term Bond Fund | ||||||||
| Year Ended | Year Ended | |||||||
| December 31, 2008 | December 31, 2007 | |||||||
| OPERATIONS: | ||||||||
| Net investment income | $ | 11,305,735 | $ | 8,559,164 | ||||
| Net realized gain on investments | 217,036 | 12,120 | ||||||
| Change in unrealized appreciation/depreciation on investments | (14,687,311 | ) | 1,756,196 | |||||
| Net increase (decrease) in net assets resulting from operations | (3,164,540 | ) | 10,327,480 | |||||
| CAPITAL SHARE TRANSACTIONS: | ||||||||
| Proceeds from shares sold | 178,053,687 | 66,497,728 | ||||||
| Shares issued to holders in reinvestment of dividends | 10,505,667 | 8,380,412 | ||||||
| Cost of shares redeemed | (158,184,075 | ) | (26,222,181 | ) | ||||
| Other capital contributions | — | 6,289 | ||||||
| Net increase in net assets resulting | ||||||||
| from capital share transactions | 30,375,279 | 48,662,248 | ||||||
| DISTRIBUTIONS TO | ||||||||
| INSTITUTIONAL CLASS SHAREHOLDERS: | ||||||||
| From net investment income | (11,301,816 | ) | (8,503,956 | ) | ||||
| TOTAL INCREASE IN NET ASSETS | 15,908,923 | 50,485,772 | ||||||
| NET ASSETS: | ||||||||
| Beginning of period | 199,090,483 | 148,604,711 | ||||||
| End of period (including undistributed net investment | ||||||||
| income of $32,582 and $87,188, respectively) | $ | 214,999,406 | $ | 199,090,483 | ||||
The accompanying notes are an integral part of these financial statements.
Page 95
Baird Funds, Inc.
| Financial Highlights |
| Baird Intermediate Bond Fund – Institutional Class | ||||||||||||||||||||
| Year Ended December 31, | ||||||||||||||||||||
| 2008 | 2007 | 2006 | 2005 | 2004 | ||||||||||||||||
| Per Share Data: | ||||||||||||||||||||
| Net asset value, beginning of period | $ | 10.62 | $ | 10.52 | $ | 10.55 | $ | 10.83 | $ | 10.88 | ||||||||||
| Income from investment operations: | ||||||||||||||||||||
| Net investment income | 0.55 | 0.54 | 0.51 | 0.46 | 0.47 | (1) | ||||||||||||||
| Net realized and unrealized | ||||||||||||||||||||
| gains (losses) on investments | (0.64 | ) | 0.10 | (0.03 | ) | (0.27 | ) | (0.05 | ) | |||||||||||
| Total from investment operations | (0.09 | ) | 0.64 | 0.48 | 0.19 | 0.42 | ||||||||||||||
| Less distributions: | ||||||||||||||||||||
| Dividends from net investment income | (0.53 | ) | (0.54 | ) | (0.51 | ) | (0.47 | ) | (0.47 | ) | ||||||||||
| Distributions from net realized gains | — | — | — | — | (0.00 | )(2) | ||||||||||||||
| Total distributions | (0.53 | ) | (0.54 | ) | (0.51 | ) | (0.47 | ) | (0.47 | ) | ||||||||||
| Net asset value, end of period | $ | 10.00 | $ | 10.62 | $ | 10.52 | $ | 10.55 | $ | 10.83 | ||||||||||
| Total return | (0.91 | )% | 6.24 | % | 4.70 | % | 1.77 | % | 3.91 | % | ||||||||||
| Supplemental data and ratios: | ||||||||||||||||||||
| Net assets, end of period | $ | 401,914,872 | $ | 398,321,566 | $ | 326,835,399 | $ | 231,800,807 | $ | 191,563,699 | ||||||||||
| Ratio of expenses to average net assets | 0.30 | % | 0.30 | % | 0.30 | % | 0.30 | % | 0.30 | % | ||||||||||
| Ratio of net investment income | ||||||||||||||||||||
| to average net assets | 5.14 | % | 5.13 | % | 4.90 | % | 4.34 | % | 4.32 | % | ||||||||||
Portfolio turnover rate(3) | 32.9 | % | 42.5 | % | 44.8 | % | 42.1 | % | 44.8 | % | ||||||||||
| (1) | Calculated using average shares outstanding during the period. |
| (2) | Amount is less than $0.01. |
| (3) | Portfolio turnover is calculated on the basis of the Fund as a whole without distinguishing between the classes of shares issued. |
The accompanying notes are an integral part of these financial statements.
Page 96
Baird Funds, Inc.
| Financial Highlights |
| Baird Intermediate Bond Fund – Investor Class | ||||||||||||||||||||
| Year Ended December 31, | ||||||||||||||||||||
| 2008 | 2007 | 2006 | 2005 | 2004 | ||||||||||||||||
| Per Share Data: | ||||||||||||||||||||
| Net asset value, beginning of period | $ | 10.96 | $ | 10.85 | $ | 10.86 | $ | 11.13 | $ | 11.17 | ||||||||||
| Income from investment operations: | ||||||||||||||||||||
| Net investment income | 0.52 | 0.52 | 0.50 | (1) | 0.45 | 0.45 | (1) | |||||||||||||
| Net realized and unrealized | ||||||||||||||||||||
| gains (losses) on investments | (0.65 | ) | 0.10 | (0.03 | ) | (0.28 | ) | (0.05 | ) | |||||||||||
| Total from investment operations | (0.13 | ) | 0.62 | 0.47 | 0.17 | 0.40 | ||||||||||||||
| Less distributions: | ||||||||||||||||||||
| Dividends from net investment income | (0.51 | ) | (0.51 | ) | (0.48 | ) | (0.44 | ) | (0.44 | ) | ||||||||||
| Distributions from net realized gains | — | — | — | — | (0.00 | )(2) | ||||||||||||||
| Total distributions | (0.51 | ) | (0.51 | ) | (0.48 | ) | (0.44 | ) | (0.44 | ) | ||||||||||
| Net asset value, end of period | $ | 10.32 | $ | 10.96 | $ | 10.85 | $ | 10.86 | $ | 11.13 | ||||||||||
| Total return | (1.31 | )% | 5.89 | % | 4.47 | % | 1.56 | % | 3.65 | % | ||||||||||
| Supplemental data and ratios: | ||||||||||||||||||||
| Net assets, end of period | $ | 4,017,828 | $ | 3,276,351 | $ | 1,207,214 | $ | 2,829,659 | $ | 3,012,328 | ||||||||||
| Ratio of expenses to average net assets | 0.55 | % | 0.55 | % | 0.55 | % | 0.55 | % | 0.55 | % | ||||||||||
| Ratio of net investment income | ||||||||||||||||||||
| to average net assets | 4.89 | % | 4.88 | % | 4.65 | % | 4.09 | % | 4.07 | % | ||||||||||
Portfolio turnover rate(3) | 32.9 | % | 42.5 | % | 44.8 | % | 42.1 | % | 44.8 | % | ||||||||||
| (1) | Calculated using average shares outstanding during the period. |
| (2) | Amount is less than $0.01. |
| (3) | Portfolio turnover is calculated on the basis of the Fund as a whole without distinguishing between the classes of shares issued. |
The accompanying notes are an integral part of these financial statements.
Page 97
Baird Funds, Inc.
| Financial Highlights |
| Baird Aggregate Bond Fund – Institutional Class | ||||||||||||||||||||
| Year Ended December 31, | ||||||||||||||||||||
| 2008 | 2007 | 2006 | 2005 | 2004 | ||||||||||||||||
| Per Share Data: | ||||||||||||||||||||
| Net asset value, beginning of period | $ | 10.54 | $ | 10.51 | $ | 10.54 | $ | 10.74 | $ | 10.71 | ||||||||||
| Income from investment operations: | ||||||||||||||||||||
| Net investment income | 0.56 | 0.54 | 0.52 | 0.49 | (1) | 0.49 | (1) | |||||||||||||
| Net realized and unrealized | ||||||||||||||||||||
| gains (losses) on investments | (0.81 | ) | 0.03 | (0.03 | ) | (0.19 | ) | 0.07 | ||||||||||||
| Total from investment operations | (0.25 | ) | 0.57 | 0.49 | 0.30 | 0.56 | ||||||||||||||
| Less distributions: | ||||||||||||||||||||
| Dividends from net investment income | (0.55 | ) | (0.54 | ) | (0.52 | ) | (0.49 | ) | (0.50 | ) | ||||||||||
| Distributions from net realized gains | — | — | (0.00 | )(2) | (0.01 | ) | (0.03 | ) | ||||||||||||
| Total distributions | (0.55 | ) | (0.54 | ) | (0.52 | ) | (0.50 | ) | (0.53 | ) | ||||||||||
| Net asset value, end of period | $ | 9.74 | $ | 10.54 | $ | 10.51 | $ | 10.54 | $ | 10.74 | ||||||||||
| Total return | (2.36 | )% | 5.61 | % | 4.88 | % | 2.85 | % | 5.30 | % | ||||||||||
| Supplemental data and ratios: | ||||||||||||||||||||
| Net assets, end of period | $ | 842,724,670 | $ | 725,580,384 | $ | 334,907,855 | $ | 227,132,399 | $ | 115,382,862 | ||||||||||
| Ratio of expenses to average net assets | 0.30 | % | 0.30 | % | 0.30 | % | 0.30 | % | 0.30 | % | ||||||||||
| Ratio of net investment income | ||||||||||||||||||||
| to average net assets | 5.46 | % | 5.37 | % | 5.11 | % | 4.56 | % | 4.58 | % | ||||||||||
Portfolio turnover rate(3) | 21.9 | % | 33.6 | % | 52.4 | % | 46.0 | % | 72.6 | % | ||||||||||
| (1) | Calculated using average shares outstanding during the period. |
| (2) | Amount is less than $0.01. |
| (3) | Portfolio turnover is calculated on the basis of the Fund as a whole without distinguishing between the classes of shares issued. |
The accompanying notes are an integral part of these financial statements.
Page 98
Baird Funds, Inc.
| Financial Highlights |
| Baird Aggregate Bond Fund – Investor Class | ||||||||||||||||||||
| Year Ended December 31, | ||||||||||||||||||||
| 2008 | 2007 | 2006 | 2005 | 2004 | ||||||||||||||||
| Per Share Data: | ||||||||||||||||||||
| Net asset value, beginning of period | $ | 10.78 | $ | 10.73 | $ | 10.75 | $ | 10.95 | $ | 10.88 | ||||||||||
| Income from investment operations: | ||||||||||||||||||||
| Net investment income | 0.52 | 0.53 | 0.50 | 0.47 | (1) | 0.48 | (1) | |||||||||||||
| Net realized and unrealized | ||||||||||||||||||||
| gains (losses) on investments | (0.81 | ) | 0.04 | (0.02 | ) | (0.19 | ) | 0.07 | ||||||||||||
| Total from investment operations | (0.29 | ) | 0.57 | 0.48 | 0.28 | 0.55 | ||||||||||||||
| Less distributions: | ||||||||||||||||||||
| Dividends from net investment income | (0.52 | ) | (0.52 | ) | (0.50 | ) | (0.47 | ) | (0.45 | ) | ||||||||||
| Distributions from net realized gains | — | — | (0.00 | )(2) | (0.01 | ) | (0.03 | ) | ||||||||||||
| Total distributions | (0.52 | ) | (0.52 | ) | (0.50 | ) | (0.48 | ) | (0.48 | ) | ||||||||||
| Net asset value, end of period | $ | 9.97 | $ | 10.78 | $ | 10.73 | $ | 10.75 | $ | 10.95 | ||||||||||
| Total return | (2.63 | )% | 5.45 | % | 4.61 | % | 2.54 | % | 5.20 | % | ||||||||||
| Supplemental data and ratios: | ||||||||||||||||||||
| Net assets, end of period | $ | 29,146,211 | $ | 14,363,416 | $ | 1,848,622 | $ | 1,289,926 | $ | 708,858 | ||||||||||
| Ratio of expenses to average net assets | 0.55 | % | 0.55 | % | 0.55 | % | 0.55 | % | 0.55 | % | ||||||||||
| Ratio of net investment income | ||||||||||||||||||||
| to average net assets | 5.21 | % | 5.12 | % | 4.86 | % | 4.31 | % | 4.33 | % | ||||||||||
Portfolio turnover rate(3) | 21.9 | % | 33.6 | % | 52.4 | % | 46.0 | % | 72.6 | % | ||||||||||
| (1) | Calculated using average shares outstanding during the period. |
| (2) | Amount is less than $0.01. |
| (3) | Portfolio turnover is calculated on the basis of the Fund as a whole without distinguishing between the classes of shares issued. |
The accompanying notes are an integral part of these financial statements.
Page 99
Baird Funds, Inc.
| Financial Highlights |
| Baird Intermediate Municipal Bond Fund – Institutional Class | ||||||||||||||||||||
| Year Ended December 31, | ||||||||||||||||||||
| 2008 | 2007 | 2006 | 2005 | 2004 | ||||||||||||||||
| Per Share Data: | ||||||||||||||||||||
| Net asset value, beginning of period | $ | 10.69 | $ | 10.55 | $ | 10.56 | $ | 10.81 | $ | 10.91 | ||||||||||
| Income from investment operations: | ||||||||||||||||||||
Net investment income(1) | 0.39 | 0.37 | 0.39 | 0.39 | 0.40 | |||||||||||||||
| Net realized and unrealized | ||||||||||||||||||||
| gains (losses) on investments | 0.28 | 0.14 | (0.01 | ) | (0.25 | ) | (0.11 | ) | ||||||||||||
| Total from investment operations | 0.67 | 0.51 | 0.38 | 0.14 | 0.29 | |||||||||||||||
| Less distributions: | ||||||||||||||||||||
| Dividends from net investment income | (0.38 | ) | (0.37 | ) | (0.39 | ) | (0.39 | ) | (0.39 | ) | ||||||||||
| Net asset value, end of period | $ | 10.98 | $ | 10.69 | $ | 10.55 | $ | 10.56 | $ | 10.81 | ||||||||||
| Total return | 6.37 | % | 4.93 | % | 3.69 | % | 1.33 | % | 2.69 | % | ||||||||||
| Supplemental data and ratios: | ||||||||||||||||||||
| Net assets, end of period | $ | 226,148,164 | $ | 106,583,763 | $ | 64,932,629 | $ | 53,831,848 | $ | 36,889,211 | ||||||||||
| Ratio of expenses to average net assets | 0.30 | % | 0.30 | % | 0.30 | % | 0.30 | % | 0.30 | % | ||||||||||
| Ratio of net investment income | ||||||||||||||||||||
| to average net assets | 3.58 | % | 3.44 | % | 3.72 | % | 3.64 | % | 3.70 | % | ||||||||||
Portfolio turnover rate(2) | 0.9 | % | 5.6 | % | 25.1 | % | 13.7 | % | 4.2 | % | ||||||||||
| (1) | Calculated using average shares outstanding during the period. |
| (2) | Portfolio turnover is calculated on the basis of the Fund as a whole without distinguishing between the classes of shares issued. |
The accompanying notes are an integral part of these financial statements.
Page 100
Baird Funds, Inc.
| Financial Highlights |
| Baird Intermediate Municipal Bond Fund – Investor Class | ||||||||||||||||||||
| Year Ended December 31, | ||||||||||||||||||||
| 2008 | 2007 | 2006 | 2005 | 2004 | ||||||||||||||||
| Per Share Data: | ||||||||||||||||||||
| Net asset value, beginning of period | $ | 10.90 | $ | 10.75 | $ | 10.75 | $ | 10.99 | $ | 11.09 | ||||||||||
| Income from investment operations: | ||||||||||||||||||||
Net investment income(1) | 0.36 | 0.35 | 0.37 | 0.37 | 0.38 | |||||||||||||||
| Net realized and unrealized | ||||||||||||||||||||
| gains (losses) on investments | 0.28 | 0.14 | (0.01 | ) | (0.25 | ) | (0.12 | ) | ||||||||||||
| Total from investment operations | 0.64 | 0.49 | 0.36 | 0.12 | 0.26 | |||||||||||||||
| Less distributions: | ||||||||||||||||||||
| Dividends from net investment income | (0.35 | ) | (0.34 | ) | (0.36 | ) | (0.36 | ) | (0.36 | ) | ||||||||||
| Net asset value, end of period | $ | 11.19 | $ | 10.90 | $ | 10.75 | $ | 10.75 | $ | 10.99 | ||||||||||
| Total return | 6.02 | % | 4.68 | % | 3.44 | % | 1.13 | % | 2.40 | % | ||||||||||
| Supplemental data and ratios: | ||||||||||||||||||||
| Net assets, end of period | $ | 17,415,418 | $ | 396,464 | $ | 544,878 | $ | 1,491,666 | $ | 4,611,766 | ||||||||||
| Ratio of expenses to average net assets | 0.55 | % | 0.55 | % | 0.55 | % | 0.55 | % | 0.55 | % | ||||||||||
| Ratio of net investment income | ||||||||||||||||||||
| to average net assets | 3.33 | % | 3.19 | % | 3.47 | % | 3.39 | % | 3.45 | % | ||||||||||
Portfolio turnover rate(2) | 0.9 | % | 5.6 | % | 25.1 | % | 13.7 | % | 4.2 | % | ||||||||||
| (1) | Calculated using average shares outstanding during the period. |
| (2) | Portfolio turnover is calculated on the basis of the Fund as a whole without distinguishing between the classes of shares issued. |
The accompanying notes are an integral part of these financial statements.
Page 101
Baird Funds, Inc.
| Financial Highlights |
| Baird Core Plus Bond Fund – Institutional Class | ||||||||||||||||||||
| Year Ended December 31, | ||||||||||||||||||||
| 2008 | 2007 | 2006 | 2005 | 2004 | ||||||||||||||||
| Per Share Data: | ||||||||||||||||||||
| Net asset value, beginning of period | $ | 10.22 | $ | 10.16 | $ | 10.06 | $ | 10.38 | $ | 10.45 | ||||||||||
| Income from investment operations: | ||||||||||||||||||||
| Net investment income | 0.56 | (1) | 0.54 | (1) | 0.55 | (1) | 0.51 | (1) | 0.54 | |||||||||||
| Net realized and unrealized | ||||||||||||||||||||
| gains (losses) on investments | (0.73 | ) | 0.05 | 0.09 | (0.28 | ) | 0.10 | |||||||||||||
| Total from investment operations | (0.17 | ) | 0.59 | 0.64 | 0.23 | 0.64 | ||||||||||||||
| Less distributions: | ||||||||||||||||||||
| Dividends from net investment income | (0.55 | ) | (0.53 | ) | (0.54 | ) | (0.54 | ) | (0.53 | ) | ||||||||||
| Distributions from net realized gains | (0.04 | ) | — | — | (0.01 | ) | (0.18 | ) | ||||||||||||
| Total distributions | (0.59 | ) | (0.53 | ) | (0.54 | ) | (0.55 | ) | (0.71 | ) | ||||||||||
| Net asset value, end of period | $ | 9.46 | $ | 10.22 | $ | 10.16 | $ | 10.06 | $ | 10.38 | ||||||||||
| Total return | (1.79 | )% | 5.99 | % | 6.58 | % | 2.23 | % | 6.29 | % | ||||||||||
| Supplemental data and ratios: | ||||||||||||||||||||
| Net assets, end of period | $ | 158,983,325 | $ | 114,421,895 | $ | 51,551,017 | $ | 32,173,459 | $ | 32,495,641 | ||||||||||
| Ratio of expenses to average net assets | 0.30 | % | 0.30 | % | 0.30 | % | 0.30 | % | 0.30 | % | ||||||||||
| Ratio of net investment income | ||||||||||||||||||||
| to average net assets | 5.61 | % | 5.41 | % | 5.49 | % | 4.92 | % | 4.85 | % | ||||||||||
Portfolio turnover rate(2) | 27.7 | % | 47.4 | % | 62.0 | % | 37.6 | % | 52.5 | % | ||||||||||
| (1) | Calculated using average shares outstanding during the period. |
| (2) | Portfolio turnover is calculated on the basis of the Fund as a whole without distinguishing between the classes of shares issued. |
The accompanying notes are an integral part of these financial statements.
Page 102
Baird Funds, Inc.
| Financial Highlights |
| Baird Core Plus Bond Fund – Investor Class | ||||||||||||||||||||
| Year Ended December 31, | ||||||||||||||||||||
| 2008 | 2007 | 2006 | 2005 | 2004 | ||||||||||||||||
| Per Share Data: | ||||||||||||||||||||
| Net asset value, beginning of period | $ | 10.50 | $ | 10.42 | $ | 10.30 | $ | 10.62 | $ | 10.67 | ||||||||||
| Income from investment operations: | ||||||||||||||||||||
| Net investment income | 0.53 | (1) | 0.53 | (1) | 0.54 | (1) | 0.49 | (1) | 0.53 | |||||||||||
| Net realized and unrealized | ||||||||||||||||||||
| gains (losses) on investments | (0.74 | ) | 0.06 | 0.09 | (0.29 | ) | 0.10 | |||||||||||||
| Total from investment operations | (0.21 | ) | 0.59 | 0.63 | 0.20 | 0.63 | ||||||||||||||
| Less distributions: | ||||||||||||||||||||
| Dividends from net investment income | (0.53 | ) | (0.51 | ) | (0.51 | ) | (0.51 | ) | (0.50 | ) | ||||||||||
| Distributions from net realized gains | (0.04 | ) | — | — | (0.01 | ) | (0.18 | ) | ||||||||||||
| Total distributions | (0.57 | ) | (0.51 | ) | (0.51 | ) | (0.52 | ) | (0.68 | ) | ||||||||||
| Net asset value, end of period | $ | 9.72 | $ | 10.50 | $ | 10.42 | $ | 10.30 | $ | 10.62 | ||||||||||
| Total return | (2.07 | )% | 5.80 | % | 6.34 | % | 1.93 | % | 6.09 | % | ||||||||||
| Supplemental data and ratios: | ||||||||||||||||||||
| Net assets, end of period | $ | 29,583,588 | $ | 2,473,660 | $ | 288,928 | $ | 449,709 | $ | 125,847 | ||||||||||
| Ratio of expenses to average net assets | 0.55 | % | 0.55 | % | 0.55 | % | 0.55 | % | 0.55 | % | ||||||||||
| Ratio of net investment income | ||||||||||||||||||||
| to average net assets | 5.36 | % | 5.16 | % | 5.24 | % | 4.67 | % | 4.60 | % | ||||||||||
Portfolio turnover rate(2) | 27.7 | % | 47.4 | % | 62.0 | % | 37.6 | % | 52.5 | % | ||||||||||
| (1) | Calculated using average shares outstanding during the period. |
| (2) | Portfolio turnover is calculated on the basis of the Fund as a whole without distinguishing between the classes of shares issued. |
The accompanying notes are an integral part of these financial statements.
Page 103
Baird Funds, Inc.
| Financial Highlights |
| Baird Short-Term Bond Fund – Institutional Class | ||||||||||||||||||||
August 31, 2004(1) | ||||||||||||||||||||
| Year Ended December 31, | through | |||||||||||||||||||
| 2008 | 2007 | 2006 | 2005 | December 31, 2004 | ||||||||||||||||
| Per Share Data: | ||||||||||||||||||||
| Net asset value, beginning of period | $ | 9.91 | $ | 9.81 | $ | 9.79 | $ | 9.93 | $ | 10.00 | ||||||||||
| Income from investment operations: | ||||||||||||||||||||
| Net investment income | 0.52 | 0.48 | 0.43 | 0.33 | 0.08 | |||||||||||||||
| Net realized and unrealized | ||||||||||||||||||||
| gains (losses) on investments | (0.67 | ) | 0.10 | 0.02 | (0.15 | ) | (0.07 | ) | ||||||||||||
| Total from investment operations | (0.15 | ) | 0.58 | 0.45 | 0.18 | 0.01 | ||||||||||||||
| Less distributions: | ||||||||||||||||||||
| Dividends from net investment income | (0.51 | ) | (0.48 | ) | (0.43 | ) | (0.32 | ) | (0.08 | ) | ||||||||||
| Net asset value, end of period | $ | 9.25 | $ | 9.91 | $ | 9.81 | $ | 9.79 | $ | 9.93 | ||||||||||
| Total return | (1.79 | )% | 6.08 | % | 4.65 | % | 1.85 | % | 0.10 | %(2) | ||||||||||
| Supplemental data and ratios: | ||||||||||||||||||||
| Net assets, end of period | $ | 214,999,406 | $ | 199,090,483 | $ | 148,604,711 | $ | 97,057,968 | $ | 31,973,000 | ||||||||||
| Ratio of expenses to average net assets | 0.30 | % | 0.30 | % | 0.30 | % | 0.30 | % | 0.30 | %(3) | ||||||||||
| Ratio of net investment income | ||||||||||||||||||||
| to average net assets | 5.01 | % | 5.00 | % | 4.48 | % | 3.52 | % | 2.60 | %(3) | ||||||||||
| Portfolio turnover rate | 98.5 | % | 36.6 | % | 41.1 | % | 31.8 | % | 16.7 | %(2) | ||||||||||
| (1) | Commencement of operations. |
| (2) | Not annualized. |
| (3) | Annualized. |
The accompanying notes are an integral part of these financial statements.
Page 104
Baird Funds, Inc.
Notes to the Financial Statements December 31, 2008 |
| 1. | ORGANIZATION |
Baird Funds, Inc. (the “Corporation”) was incorporated on June 9, 2000 as a Wisconsin corporation and is registered as an open-end investment management company under the Investment Company Act of 1940, as amended (the “1940 Act”). The accompanying financial statements include the Baird Intermediate Bond Fund, Baird Aggregate Bond Fund, Baird Intermediate Municipal Bond Fund, Baird Core Plus Bond Fund and Baird Short-Term Bond Fund (each, a “Fund” and collectively, the “Funds”), five of the eight portfolios comprising the Corporation, each of which is diversified within the meaning of the 1940 Act. Robert W. Baird & Co. Incorporated (“Baird” or the “Advisor”) serves as investment advisor to the Funds.
The Baird Intermediate Bond Fund, Baird Aggregate Bond Fund and Baird Core Plus Bond Fund commenced operations with the sale of both Institutional and Investor class shares on September 29, 2000. The Baird Intermediate Municipal Bond Fund commenced operations with the sale of both Institutional and Investor class shares on March 30, 2001. The Baird Short-Term Bond Fund commenced operations with the sale of Institutional Class Shares on August 31, 2004. The Institutional Class Shares are not subject to a distribution and service (12b-1) fee, while the Investor Class Shares are subject to a distribution and service (12b-1) fee up to 0.25%.
The investment objective of the Baird Intermediate Bond Fund is to provide an annual rate of total return, before Fund expenses, greater than the annual rate of total return of the Barclays Capital Intermediate Government/Credit Bond Index. The Barclays Capital Intermediate Government/Credit Bond Index is an unmanaged, market value weighted index of investment grade, fixed-rate debt, including government and corporate securities, with maturities between one and ten years.
The investment objective of the Baird Aggregate Bond Fund is to provide an annual rate of total return, before Fund expenses, greater than the annual rate of total return of the Barclays Capital Aggregate Bond Index. The Barclays Capital Aggregate Bond Index is an unmanaged, market value weighted index of investment grade, fixed-rate debt issues, including government, corporate, asset-backed, and mortgage-backed securities, with maturities of at least one year.
The primary investment objective of the Baird Intermediate Municipal Bond Fund is to provide current income that is substantially exempt from federal income tax. A secondary objective is to provide total return with relatively low volatility of principal.
The investment objective of the Baird Core Plus Bond Fund is to provide an annual rate of total return, before Fund expenses, greater than the annual rate of total return of the Barclays Capital U.S. Universal Bond Index. The Barclays Capital U.S. Universal Bond Index is an unmanaged, market value weighted index of fixed income securities issued in U.S. dollars, including U.S. government and investment grade debt, non-investment grade debt, asset-backed and mortgage-backed securities, Eurobonds, 144A securities and emerging market debt, with maturities of at least one year.
The investment objective of the Baird Short-Term Bond Fund is to provide an annual rate of total return, before Fund expenses, greater than the annual rate of total return of the Barclays Capital 1-3 Year Government/Credit Bond Index. The Barclays Capital 1-3 Year Government/Credit Bond Index is an unmanaged, market value weighted index of investment grade, fixed-rate debt including government and corporate securities with maturities between one and three years.
Page 105
Baird Funds, Inc.
Notes to the Financial Statements December 31, 2008 |
| 2. | SIGNIFICANT ACCOUNTING POLICIES |
The following is a summary of significant accounting policies consistently followed by the Funds in the preparation of their financial statements. These policies are in conformity with accounting principles generally accepted in the United States of America.
| a) | Investment Valuation – Section 2(a)(41) of the 1940 Act, together with the rules and interpretations of the SEC, require the Funds, in computing NAV, to value their portfolio securities using market quotations when they are “readily available.” When market quotations are not readily available (e.g., because there is no regular market quotation for such securities, the market for such security is limited, the validity of quotations is questionable or, for debt securities, IDC does not provide a price), the Board of Directors of the Corporation must value the securities at “fair value determined in good faith.” The Board has delegated such responsibility to the Advisor pursuant to pricing policies and procedures that the Board has adopted and regularly reviews. |
| In general, the “fair value” of a security means the amount that the Funds might reasonably expect to receive for the security upon its current sale. Pursuant to Statement of Financial Accounting Standards No. 157 (“SFAS 157), “fair value” means “the price that would be received to sell [a security] in an orderly transaction between market participants at the measurement date.” |
| Consistent with Section 2(a)(41) of the 1940 Act and SFAS 157, the Funds price their securities as follows: Debt securities are valued by an independent pricing service using valuation methods that are designed to represent fair value, such as matrix pricing and other analytical pricing models, market transactions and dealer quotations. Debt securities purchased with a remaining maturity of 60 days or less are valued at acquisition cost, plus or minus any amortized discount or premium. Investments in mutual funds are valued at their stated net asset value. Common stocks that are listed on a securities exchange (other than NASDAQ) are valued at the last quoted sales price. Securities traded on NASDAQ are valued at the NASDAQ Official Closing Price. Price information on listed stocks is taken from the exchange where the security is primarily traded. Securities that were not traded on the valuation date, as well as stocks that are not listed on an exchange, including NASDAQ, are valued at the average of the current bid and asked price. Other assets and securities for which no quotations are readily available are valued at fair value as determined in good faith by the Advisor in accordance with procedures approved by the Corporation’s Board of Directors. In accordance with such procedures, the Advisor may use broker quotes or, if the broker quotes are unavailable or deemed to be unreliable, fair value will be determined by a valuation committee of the Advisor. In determining fair value, the valuation committee takes into account all relevant factors and available information. Consequently, the price of the security used by a Fund to calculate its NAV may differ from quoted or published prices for the same security. Fair value pricing involves subjective judgments and there is no single standard for determining a security’s fair value. As a result, different mutual funds could reasonably arrive at a different fair value for the same security. It is possible that the fair value determined for a security is materially different from the value that could be realized upon the sale of that security or from the values that other mutual funds may determine. In addition, given the volatility and periodic illiquidity experienced in current markets, the prices determined for any individual security on any given day may vary significantly from the amount that can be obtained in an actual sale of that security, and the Funds’ NAVs may fluctuate significantly from day to day or from period to period. |
Page 106
Baird Funds, Inc.
Notes to the Financial Statements December 31, 2008 |
| 2. | SIGNIFICANT ACCOUNTING POLICIES (cont.) |
| In September 2006, the Financial Accounting Standards Board (FASB) issued SFAS 157, “Fair Value Measurements.” SFAS 157 defines fair value, establishes a framework for measuring fair value in accordance with GAAP, and expands disclosure about fair value measurements. SFAS 157 is effective for financial statements issued for fiscal years beginning after November 15, 2007. Management has determined that SFAS 157 had no material impact on the Funds’ financial statements. |
| In March 2008, Statement of Financial Accounting Standards No. 161, “Disclosures about Derivative Instruments and Hedging Activities” (“SFAS 161”) was issued and is effective for fiscal years beginning after November 15, 2008. SFAS 161 is intended to improve financial reporting for derivative instruments by requiring enhanced disclosure that enables investors to understand how and why an entity uses derivatives, how derivatives are accounted for, and how derivative instruments affect an entity’s results of operations and financial position. Management is currently evaluating the implications of SFAS 161, but does not believe it will have any impact on the Funds’ financial statement disclosures because the Funds generally do not maintain any positions in derivative instruments or engage in hedging activities. |
| b) | Unregistered Securities – Four of the Funds own certain investment securities which are unregistered and thus restricted with respect to resale. These securities are valued by the Advisor after giving due consideration to pertinent factors including recent private sales, market conditions and the issuer’s financial performance. The value of such securities for the Baird Intermediate Bond, Baird Aggregate Bond, Baird Core Plus Bond and Baird Short-Term Bond Funds were $16,720,826 (4.12% of net assets), $33,830,183 (3.88% of net assets), $5,457,066 (2.89% of net assets) and $11,867,577 (5.51% of net assets), respectively, at December 31, 2008. Restricted securities may be deemed to be liquid as determined by the Advisor based on several factors. All of the restricted securities held by the Funds as of December 31, 2008 consist of securities issued pursuant to Rule 144A under the Securities Act of 1933 and have been deemed to be liquid. |
| c) | Foreign Securities – Foreign securities are defined as securities of issuers that are organized outside the United States. The Funds may invest in U.S. dollar-denominated debt obligations of foreign companies and foreign governments. Investing in securities of foreign companies and foreign governments involves special risks and considerations not typically associated with investing in U.S. companies and the U.S. government. These risks include currency rate fluctuations, political and economic instability and differences in financial reporting standards and less strict regulation of securities markets. Moreover, securities of many foreign companies and foreign governments and their markets may be less liquid and their prices more volatile than those of securities of comparable U.S. companies and the U.S. government. Occasionally, events that affect these values and exchange rates may occur after the close of the exchange on which such securities are traded. If such events materially affect the value of a Funds’ securities, these securities may be valued at their fair value pursuant to procedures adopted by the Board of Directors. |
| d) | Federal Income Taxes – The Funds intend to continue to qualify as regulated investment companies as provided in subchapter M of the Internal Revenue Code and to distribute substantially all of their taxable income to their shareholders in a manner which results in no tax cost to the Funds. Therefore, no federal income or excise tax provision is recorded. |
Page 107
Baird Funds, Inc.
Notes to the Financial Statements December 31, 2008 |
| 2. | SIGNIFICANT ACCOUNTING POLICIES (cont.) |
| Effective June 29, 2007, the Funds adopted Financial Accounting Standards Board (FASB) Interpretation No. 48 (FIN 48), “Accounting for Uncertainty in Income Taxes,” a clarification of FASB Statement No. 109, “Accounting for Income Taxes.” FIN 48 establishes financial reporting rules regarding recognition and measurement of tax positions taken or expected to be taken on a tax return. Management has determined that FIN 48 did not result in any liability to the Funds. |
| e) | Allocation of Income and Expenses – Each Fund is charged for those expenses directly attributable to it. Expenses directly attributable to a class of shares, such as Rule 12b-1 distribution fees, are charged to that class of shares. Income, expenses and realized and unrealized gains and losses are allocated to the classes based on their respective net assets. Expenses that are not directly attributable to a Fund are allocated among the Funds in the series in proportion to their assets. |
| f) | Distributions to Shareholders – Dividends from net investment income are declared and paid monthly. Distributions of net realized capital gains, if any, are declared and paid at least annually. |
| g) | Use of Estimates – The preparation of financial statements in conformity with accounting principles generally accepted in the United States of America requires management to make estimates and assumptions that affect the reported amounts of assets and liabilities and disclosure of contingent assets and liabilities at the date of the financial statements and the reported amounts of revenues and expenses during the reporting period. Actual results could differ from those estimates. |
| h) | Other – Investment and shareholder transactions are recorded on trade date. The Funds determine the gain or loss realized from investment transactions by comparing the original cost of the security lot sold with the net sales proceeds. Dividend income is recognized on the ex-dividend date and interest income is recognized on an accrual basis. Premiums and discounts on the purchase of securities are amortized/accreted using the effective interest method. Accounting principles generally accepted in the United States of America require that permanent financial reporting and tax differences be reclassified in the capital accounts. |
| i) | Guarantees and Indemnifications – In the normal course of business, the Funds enter into contracts with service providers that contain general indemnification clauses. The Funds’ maximum exposure under these arrangements is unknown and would involve future claims against the Funds that have not yet occurred. Based on experience, the Funds would expect the risk of loss to be remote. |
Page 108
Baird Funds, Inc.
Notes to the Financial Statements December 31, 2008 |
| 3. | CAPITAL SHARE TRANSACTIONS |
The following table summarizes the capital share transactions of each Fund for the past two fiscal periods:
| BAIRD INTERMEDIATE BOND FUND | |||||||||||||||||
| Year Ended | Year Ended | ||||||||||||||||
| December 31, 2008 | December 31, 2008 | ||||||||||||||||
| Institutional Class Shares | Shares | Amount | Investor Class Shares | Shares | Amount | ||||||||||||
| Shares sold | 13,284,667 | $ | 139,033,374 | Shares sold | 344,090 | $ | 3,606,725 | ||||||||||
| Shares issued to | Shares issued to | ||||||||||||||||
| shareholders in | shareholders in | ||||||||||||||||
| reinvestment of dividends | 1,893,754 | 19,500,448 | reinvestment of dividends | 11,882 | 124,883 | ||||||||||||
| Shares redeemed | (12,483,629 | ) | (127,498,417 | ) | Shares redeemed | (265,688 | ) | (2,772,608 | ) | ||||||||
| Net increase | 2,694,792 | $ | 31,035,405 | Net increase | 90,284 | $ | 959,000 | ||||||||||
| Shares Outstanding: | Shares Outstanding: | ||||||||||||||||
| Beginning of period | 37,508,864 | Beginning of period | 299,064 | ||||||||||||||
| End of period | 40,203,656 | End of period | 389,348 | ||||||||||||||
| BAIRD INTERMEDIATE BOND FUND | |||||||||||||||||
| Year Ended | Year Ended | ||||||||||||||||
| December 31, 2007 | December 31, 2007 | ||||||||||||||||
| Institutional Class Shares | Shares | Amount | Investor Class Shares | Shares | Amount | ||||||||||||
| Shares sold | 12,492,799 | $ | 131,741,260 | Shares sold | 418,169 | $ | 4,559,652 | ||||||||||
| Shares issued to | Shares issued to | ||||||||||||||||
| shareholders in | shareholders in | ||||||||||||||||
| reinvestment of dividends | 1,507,264 | 15,863,327 | reinvestment of dividends | 3,551 | 38,555 | ||||||||||||
| Shares redeemed | (7,553,800 | ) | (79,615,418 | ) | Shares redeemed | (233,940 | ) | (2,549,638 | ) | ||||||||
| Net increase | 6,446,263 | $ | 67,989,169 | Net increase | 187,780 | $ | 2,048,569 | ||||||||||
| Shares Outstanding: | Shares Outstanding: | ||||||||||||||||
| Beginning of period | 31,062,601 | Beginning of period | 111,284 | ||||||||||||||
| End of period | 37,508,864 | End of period | 299,064 | ||||||||||||||
Page 109
Baird Funds, Inc.
Notes to the Financial Statements December 31, 2008 |
| 3. | CAPITAL SHARE TRANSACTIONS (cont.) |
| BAIRD AGGREGATE BOND FUND | |||||||||||||||||
| Year Ended | Year Ended | ||||||||||||||||
| December 31, 2008 | December 31, 2008 | ||||||||||||||||
| Institutional Class Shares | Shares | Amount | Investor Class Shares | Shares | Amount | ||||||||||||
| Shares sold | 35,060,168 | $ | 355,079,855 | Shares sold | 2,373,145 | $ | 25,042,735 | ||||||||||
| Shares issued to | Shares issued to | ||||||||||||||||
| shareholders in | shareholders in | ||||||||||||||||
| reinvestment of dividends | 3,467,389 | 34,858,275 | reinvestment of dividends | 124,786 | 1,278,910 | ||||||||||||
| Shares redeemed | (20,869,352 | ) | (208,295,492 | ) | Shares redeemed | (908,136 | ) | (9,298,862 | ) | ||||||||
| Net increase | 17,658,205 | $ | 181,642,638 | Net increase | 1,589,795 | $ | 17,022,783 | ||||||||||
| Shares Outstanding: | Shares Outstanding: | ||||||||||||||||
| Beginning of period | 68,824,772 | Beginning of period | 1,332,735 | ||||||||||||||
| End of period | 86,482,977 | End of period | 2,922,530 | ||||||||||||||
| BAIRD AGGREGATE BOND FUND | |||||||||||||||||
| Year Ended | Year Ended | ||||||||||||||||
| December 31, 2007 | December 31, 2007 | ||||||||||||||||
| Institutional Class Shares | Shares | Amount | Investor Class Shares | Shares | Amount | ||||||||||||
| Shares sold | 41,427,251 | $ | 434,719,171 | Shares sold | 1,252,836 | $ | 13,425,644 | ||||||||||
| Shares issued to | Shares issued to | ||||||||||||||||
| shareholders in | shareholders in | ||||||||||||||||
| reinvestment of dividends | 2,027,863 | 21,251,571 | reinvestment of dividends | 26,802 | 287,392 | ||||||||||||
| Shares redeemed | (6,509,144 | ) | (68,196,197 | ) | Shares redeemed | (119,156 | ) | (1,277,216 | ) | ||||||||
| Net increase | 36,945,970 | $ | 387,774,545 | Net increase | 1,160,482 | $ | 12,435,820 | ||||||||||
| Shares Outstanding: | Shares Outstanding: | ||||||||||||||||
| Beginning of period | 31,878,802 | Beginning of period | 172,253 | ||||||||||||||
| End of period | 68,824,772 | End of period | 1,332,735 | ||||||||||||||
Page 110
Baird Funds, Inc.
Notes to the Financial Statements December 31, 2008 |
| 3. | CAPITAL SHARE TRANSACTIONS (cont.) |
| BAIRD INTERMEDIATE MUNICIPAL BOND FUND | |||||||||||||||||
| Year Ended | Year Ended | ||||||||||||||||
| December 31, 2008 | December 31, 2008 | ||||||||||||||||
| Institutional Class Shares | Shares | Amount | Investor Class Shares | Shares | Amount | ||||||||||||
| Shares sold | 13,276,639 | $ | 142,984,847 | Shares sold | 1,565,048 | $ | 17,234,317 | ||||||||||
| Shares issued to | Shares issued to | ||||||||||||||||
| shareholders in | shareholders in | ||||||||||||||||
| reinvestment of dividends | 411,841 | 4,420,800 | reinvestment of dividends | 8,443 | 92,642 | ||||||||||||
| Shares redeemed | (3,060,912 | ) | (32,903,382 | ) | Shares redeemed | (53,682 | ) | (586,727 | ) | ||||||||
| Net increase | 10,627,568 | $ | 114,502,265 | Net increase | 1,519,809 | $ | 16,740,232 | ||||||||||
| Shares Outstanding: | Shares Outstanding: | ||||||||||||||||
| Beginning of period | 9,967,430 | Beginning of period | 36,379 | ||||||||||||||
| End of period | 20,594,998 | End of period | 1,556,188 | ||||||||||||||
| BAIRD INTERMEDIATE MUNICIPAL BOND FUND | |||||||||||||||||
| Year Ended | Year Ended | ||||||||||||||||
| December 31, 2007 | December 31, 2007 | ||||||||||||||||
| Institutional Class Shares | Shares | Amount | Investor Class Shares | Shares | Amount | ||||||||||||
| Shares sold | 5,030,032 | $ | 52,803,596 | Shares sold | 19,670 | $ | 210,026 | ||||||||||
| Shares issued to | Shares issued to | ||||||||||||||||
| shareholders in | shareholders in | ||||||||||||||||
| reinvestment of dividends | 210,783 | 2,218,657 | reinvestment of dividends | 1,362 | 14,599 | ||||||||||||
| Shares redeemed | (1,425,472 | ) | (14,983,722 | ) | Shares redeemed | (35,316 | ) | (379,725 | ) | ||||||||
| Net increase | 3,815,343 | $ | 40,038,531 | Net decrease | (14,284 | ) | $ | (155,100 | ) | ||||||||
| Shares Outstanding: | Shares Outstanding: | ||||||||||||||||
| Beginning of period | 6,152,087 | Beginning of period | 50,663 | ||||||||||||||
| End of period | 9,967,430 | End of period | 36,379 | ||||||||||||||
Page 111
Baird Funds, Inc.
Notes to the Financial Statements December 31, 2008 |
| 3. | CAPITAL SHARE TRANSACTIONS (cont.) |
| BAIRD CORE PLUS BOND FUND | |||||||||||||||||
| Year Ended | Year Ended | ||||||||||||||||
| December 31, 2008 | December 31, 2008 | ||||||||||||||||
| Institutional Class Shares | Shares | Amount | Investor Class Shares | Shares | Amount | ||||||||||||
| Shares sold | 9,503,375 | $ | 94,092,004 | Shares sold | 3,970,650 | $ | 40,793,424 | ||||||||||
| Shares issued to | Shares issued to | ||||||||||||||||
| shareholders in | shareholders in | ||||||||||||||||
| reinvestment of dividends | 808,307 | 7,891,717 | reinvestment of dividends | 41,410 | 416,265 | ||||||||||||
| Shares redeemed | (4,691,588 | ) | (45,526,757 | ) | Shares redeemed | (1,205,342 | ) | (12,087,198 | ) | ||||||||
| Net increase | 5,620,094 | $ | 56,456,964 | Net increase | 2,806,718 | $ | 29,122,491 | ||||||||||
| Shares Outstanding: | Shares Outstanding: | ||||||||||||||||
| Beginning of period | 11,194,054 | Beginning of period | 235,607 | ||||||||||||||
| End of period | 16,814,148 | End of period | 3,042,325 | ||||||||||||||
| BAIRD CORE PLUS BOND FUND | |||||||||||||||||
| Year Ended | Year Ended | ||||||||||||||||
| December 31, 2007 | December 31, 2007 | ||||||||||||||||
| Institutional Class Shares | Shares | Amount | Investor Class Shares | Shares | Amount | ||||||||||||
| Shares sold | 6,443,996 | $ | 65,545,679 | Shares sold | 216,335 | $ | 2,258,752 | ||||||||||
| Shares issued to | Shares issued to | ||||||||||||||||
| shareholders in | shareholders in | ||||||||||||||||
| reinvestment of dividends | 345,048 | 3,498,155 | reinvestment of dividends | 2,890 | 30,089 | ||||||||||||
| Shares redeemed | (670,165 | ) | (6,795,048 | ) | Shares redeemed | (11,342 | ) | (118,568 | ) | ||||||||
| Net increase | 6,118,879 | $ | 62,248,786 | Net increase | 207,883 | $ | 2,170,273 | ||||||||||
| Shares Outstanding: | Shares Outstanding: | ||||||||||||||||
| Beginning of period | 5,075,175 | Beginning of period | 27,724 | ||||||||||||||
| End of period | 11,194,054 | End of period | 235,607 | ||||||||||||||
Page 112
Baird Funds, Inc.
Notes to the Financial Statements December 31, 2008 |
| 3. | CAPITAL SHARE TRANSACTIONS (cont.) |
| BAIRD SHORT-TERM BOND FUND | |||||||||||||||||
| Year Ended | Year Ended | ||||||||||||||||
| December 31, 2008 | December 31, 2007 | ||||||||||||||||
| Institutional Class Shares | Shares | Amount | Institutional Class Shares | Shares | Amount | ||||||||||||
| Shares sold | 18,494,988 | $ | 178,053,687 | Shares sold | 6,742,388 | $ | 66,497,728 | ||||||||||
| Shares issued to | Shares issued to | ||||||||||||||||
| shareholders in | shareholders in | ||||||||||||||||
| reinvestment of dividends | 1,090,024 | 10,505,667 | reinvestment of dividends | 851,838 | 8,380,412 | ||||||||||||
| Shares redeemed | (16,418,698 | ) | (158,184,075 | ) | Shares redeemed | (2,660,382 | ) | (26,222,181 | ) | ||||||||
| Net increase | 3,166,314 | $ | 30,375,279 | Other capital | |||||||||||||
| Shares Outstanding: | contributions(1) | — | 6,289 | ||||||||||||||
| Beginning of period | 20,081,007 | Net increase | 4,933,844 | $ | 48,662,248 | ||||||||||||
| Shares Outstanding: | |||||||||||||||||
| End of period | 23,247,321 | Beginning of period | 15,147,163 | ||||||||||||||
| End of period | 20,081,007 | ||||||||||||||||
| (1) | Reimbursement by Advisor for misallocation of ALIGN Program trades. |
| 4. | INVESTMENT TRANSACTIONS AND INCOME TAX INFORMATION |
During the year ended December 31, 2008, purchases and sales of investment securities (excluding short-term investments) were as follows:
| Baird | ||||||||||||||||||||
| Baird | Baird | Intermediate | Baird | Baird | ||||||||||||||||
| Intermediate | Aggregate | Municipal | Core Plus | Short-Term | ||||||||||||||||
| Bond Fund | Bond Fund | Bond Fund | Bond Fund | Bond Fund | ||||||||||||||||
| Purchases: | ||||||||||||||||||||
| U.S. Government | $ | 92,142,243 | $ | 143,110,887 | $ | — | $ | 62,127,585 | $ | 133,184,266 | ||||||||||
| Other | $ | 66,113,467 | $ | 161,344,274 | $ | 133,249,738 | $ | 65,478,606 | $ | 149,625,670 | ||||||||||
| Sales: | ||||||||||||||||||||
| U.S. Government | $ | 93,534,802 | $ | 91,022,622 | $ | — | $ | 37,408,623 | $ | 127,446,908 | ||||||||||
| Other | $ | 48,013,718 | $ | 82,245,292 | $ | 1,527,598 | $ | 6,226,990 | $ | 65,243,385 | ||||||||||
At December 31, 2008, gross unrealized appreciation and depreciation of investments and distributable ordinary income and long-term capital gains for federal tax purposes were as follows:
Page 113
Baird Funds, Inc.
Notes to the Financial Statements December 31, 2008 |
| 4. | INVESTMENT TRANSACTIONS AND INCOME TAX INFORMATION (cont.) |
| Intermediate | ||||||||||||||||||||
| Intermediate | Aggregate | Municipal | Core Plus | Short-Term | ||||||||||||||||
| Bond Fund | Bond Fund | Bond Fund | Bond Fund | Bond Fund | ||||||||||||||||
| Cost of Investments | $ | 575,074,182 | $ | 1,140,078,561 | $ | 229,549,081 | $ | 245,167,858 | $ | 244,300,776 | ||||||||||
| Gross unrealized appreciation | $ | 12,832,844 | $ | 29,227,106 | $ | 7,639,290 | $ | 5,965,601 | $ | 1,463,970 | ||||||||||
| Gross unrealized depreciation | (42,009,321 | ) | (94,778,688 | ) | (262,799 | ) | (19,749,447 | ) | (14,923,827 | ) | ||||||||||
| Net unrealized | ||||||||||||||||||||
| appreciation/(depreciation) | $ | (29,176,477 | ) | $ | (65,551,582 | ) | $ | 7,376,491 | $ | (13,783,846 | ) | $ | (13,459,857 | ) | ||||||
| Undistributed ordinary income | $ | 403,041 | $ | 838,376 | $ | — | $ | 279,375 | $ | 68,686 | ||||||||||
| Undistributed long-term capital gain | 942,602 | — | — | 274,239 | — | |||||||||||||||
| Total distributable earnings | $ | 1,345,643 | $ | 838,376 | $ | — | $ | 553,614 | $ | 68,686 | ||||||||||
| Other accumulated losses | $ | — | $ | — | $ | (610,565 | ) | $ | — | $ | (16,864 | ) | ||||||||
| Total accumulated earnings (losses) | $ | (27,830,834 | ) | $ | (64,713,206 | ) | $ | 6,765,926 | $ | (13,230,232 | ) | $ | (13,408,035 | ) | ||||||
On the Statements of Asset and Liabilities, the following adjustments were made for permanent tax adjustments:
| Undistributed Net | Accumulated Net | Paid In | ||||||||||
| Investment Income (Loss) | Realized Gain (Loss) | Capital | ||||||||||
| Baird Intermediate Bond Fund | $ | 7,685 | $ | (7,684 | ) | $ | (1 | ) | ||||
| Baird Aggregate Bond Fund | (6,840 | ) | 6,840 | — | ||||||||
| Baird Intermediate Municipal Bond Fund | 15,555 | — | (15,555 | ) | ||||||||
| Baird Core Plus Bond Fund | (32,675 | ) | 32,674 | 1 | ||||||||
| Baird Short-Term Bond Fund | (58,525 | ) | 58,525 | — | ||||||||
The permanent differences primarily relate to reclasses from paydown gains and losses from asset backed securities.
The tax components of dividends paid during the periods ended December 31, 2008 and December 31, 2007 were:
| 2008 | 2007 | |||||||||||||||
| Ordinary | Long-Term | Ordinary | Long-Term | |||||||||||||
| Income | Capital Gains | Income | Capital Gains | |||||||||||||
| Distributions | Distributions | Distributions | Distributions | |||||||||||||
| Baird Intermediate Bond Fund | $ | 22,529,659 | $ | 26,827 | $ | 17,913,853 | $ | — | ||||||||
| Baird Aggregate Bond Fund | $ | 45,140,110 | $ | — | $ | 27,328,533 | $ | — | ||||||||
| Baird Intermediate Municipal Bond Fund | $ | — | $ | — | $ | — | $ | — | ||||||||
| Baird Core Plus Bond Fund | $ | 9,954,603 | $ | 59,042 | $ | 3,722,219 | $ | — | ||||||||
| Baird Short-Term Bond Fund | $ | 11,301,816 | $ | — | $ | 8,503,956 | $ | — | ||||||||
Page 114
Baird Funds, Inc.
Notes to the Financial Statements December 31, 2008 |
| 4. | INVESTMENT TRANSACTIONS AND INCOME TAX INFORMATION (cont.) |
For the years ended December 31, 2008 and December 31, 2007, distributions of $5,189,460 ($15,555 of which was return of capital) and $2,696,737, respectively, from the Baird Intermediate Municipal Bond Fund were tax-exempt.
Under the current tax law, capital losses realized after October 31 may be deferred and treated as occurring on the first day of the following fiscal year. For the year ended December 31, 2008, Baird Intermediate Municipal Bond Fund elected to defer capital losses occurring between November 1, 2008 and December 31, 2008 in the amount of $869.
At December 31, 2008, accumulated net realized capital loss carryovers, if any, and the year(s) in which the capital loss carryovers expire were:
| Capital Loss Carryover | Year of Expiration | ||||
| Baird Intermediate Municipal Bond Fund | $ 6,626 | 2012 | |||
| 184,660 | 2013 | ||||
| 51,283 | 2014 | ||||
| 76,723 | 2015 | ||||
| 290,404 | 2016 | ||||
| Baird Short-Term Bond Fund | 16,864 | 2014 | |||
To the extent these Funds realize future net capital gains, those gains will be offset by any unused capital loss carryovers. During the year ended December 31, 2008, the Baird Intermediate Bond Fund, the Baird Aggregate Bond Fund and the Baird Short-Term Bond Fund utilized capital loss carryovers of $2,424,499, $661,654, and $281,458, respectively.
| 5. | INVESTMENT ADVISORY AND OTHER AGREEMENTS |
The Funds have entered into an Investment Advisory Agreement with Baird for the provision of investment advisory services. Pursuant to the Investment Advisory Agreement, the Advisor is entitled to receive a fee, calculated daily and payable monthly, at the annual rate of 0.25% for the Funds as applied to the respective Fund’s average daily net assets. Certain officers of the Advisor are also officers of the Funds.
The Funds have entered into an Administration Agreement with Baird. Under the Administration Agreement, the Advisor assumes and pays all expenses of the applicable Fund other than the investment advisory fees, fees under the 12b-1 plan, costs related to portfolio securities transactions and extraordinary or non-recurring expenses. Pursuant to the Administration Agreement, the Advisor is entitled to receive a fee, calculated daily and payable monthly, at the annual rate of 0.05% for the Funds as applied to the respective Fund’s average daily net assets.
U.S. Bancorp Fund Services, LLC serves as transfer agent, administrator, and accounting services agent for the Funds. U.S. Bank, N.A. serves as custodian for the Funds.
Baird (the “Distributor”) is the distributor of the Funds pursuant to a distribution agreement.
Page 115
Baird Funds, Inc.
Notes to the Financial Statements December 31, 2008 |
| 6. | SECURITIES LENDING |
Each Fund may lend up to one-third of its total assets (including such loans) to borrowers under terms of participation in a securities lending program administered by FAF Advisors, Inc., an affiliate of the Funds’ custodian, transfer agent and administrator. The securities lending agreement requires that loans are collateralized at all times in an amount equal to at least 102% of the market value of any loaned securities at the time of the loan, plus accrued interest.
The Funds receive compensation in the form of fees and earn interest on the cash collateral. The amount of fees depends on a number of factors including the type of security and length of the loan. Each Fund continues to receive interest payments or dividends on the securities loaned during the borrowing period. Each Fund has the right under the terms of the securities lending agreement to recall the securities from the borrower on demand.
As of December 31, 2008, the Baird Intermediate Bond Fund, Baird Aggregate Bond Fund, Baird Core Plus Bond Fund and Baird Short-Term Bond Fund had loaned securities that were collateralized by cash equivalents. The cash collateral is invested by the custodian in accordance with approved investment guidelines. Those guidelines require the cash collateral to be invested in readily marketable, high quality, short-term obligations; however, such investments are subject to risk of payment delays or default on the part of the issuer or counterparty or otherwise may not generate sufficient interest to support the costs associated with securities lending. A Fund could also experience delays in recovering its securities and possible loss of income or value if the borrower fails to return the borrowed securities, although the Funds are indemnified from this risk by contract with the securities lending agent.
As of December 31, 2008, the market value of the securities on loan and payable on collateral due to broker were as follows:
| Market Value of | Payable on Collateral | |||||||
| Securities on Loan | due to Broker | |||||||
| Baird Intermediate Bond Fund | $137,492,769 | $140,806,453 | ||||||
| Baird Aggregate Bond Fund | 206,118,782 | 212,021,054 | ||||||
| Baird Core Plus Bond Fund | 42,384,700 | 43,502,289 | ||||||
| Baird Short-Term Bond Fund | 9,250,707 | 10,393,306 | ||||||
The Funds receive cash as collateral in return for securities lent as part of a securities lending program. The collateral is invested in short-term securities including the Mount Vernon Prime Portfolio (a securities lending trust subject to Rule 2a-7 under the 1940 Act), other money market funds, certificates of deposit, commercial paper, corporate notes, government agency securities and repurchase agreements. The schedules of investments for the Funds include the particular cash collateral holdings as of December 31, 2008. The Funds intend to invest all of the collateral in the Mount Vernon Prime Portfolio once their existing cash collateral holdings mature or are liquidated or otherwise paid down. Currently, the Funds hold two cash collateral investments that are priced at fair value by the Valuation Committee of the Advisor: an interest in Atlantic East Funding Trust, LLC and shares of the Reserve Primary Fund. The interest in Atlantic East Funding Trust, LLC is priced at par based on the underlying market value of the securities owned by the Atlantic East Funding Trust, LLC, amounts payable under an agreement from the Funds’ transfer agent and administrator to cover losses realized by the Funds on this investment (up to a certain amount), and a securities lending income reserve. The Funds have been depositing their
Page 116
Baird Funds, Inc.
Notes to the Financial Statements December 31, 2008 |
| 6. | SECURITIES LENDING (cont.) |
securities lending income into a reserve account since July 2008, which reserve may be used to cover additional losses by the Funds on their interest in Atlantic East Funding Trust, LLC after applying amounts payable from the Funds’ transfer agent and administrator. Additional reserves of securities lending income are expected to continue in 2009. As a result of these securities lending income reserves, the Funds are not recognizing income from their securities lending activity. Upon the liquidation of the Funds’ interest in Atlantic East Funding Trust, LLC, any excess securities lending income reserves (after applying the reserves and amounts payable from the Funds’ transfer agent and administrator to cover losses) will then be recognized as income to the Funds. Shares of the Reserve Primary Fund are priced at $1.00 per share based on the fair value of the shares of that fund plus an agreement to contribute additional amounts by the Funds’ transfer agent and administrator. Interest income earned on collateral investments during the year ended December 31, 2008 for the Baird Intermediate Bond Fund, Baird Aggregate Bond Fund, Baird Core Plus Bond Fund, and Baird Short-Term Bond Fund were $320,308, $391,035, $85,533, and $120,718, respectively.
| 7. | LINE OF CREDIT |
The Corporation maintains an uncommitted, senior secured line of credit (“LOC”) with U.S. Bank, N.A. (the “Bank”) to provide the Funds a temporary liquidity source to meet unanticipated redemptions. Under the terms of the LOC, borrowings for each Fund are limited to one-third of the total assets (including the amount borrowed) of the respective Fund, or as otherwise indicated within the Funds’ agreement with the Bank. The Bank charges interest at the Bank’s Prime Rate less 1% (weighted average rate of 4.21% during 2008). For the year ended December 31, 2008, the Baird Intermediate Bond Fund and the Baird Short-Term Bond Fund incurred $1,474 and $5,502 in interest charges, respectively, on average daily loan balances of $165,156 and $221,369, respectively. The Baird Aggregate Bond Fund, Baird Intermediate Municipal Bond Fund and Baird Core Plus Bond Fund did not borrow on the LOC during the period.
| 8. | DISTRIBUTION AND SHAREHOLDER SERVICE PLAN |
The Funds have adopted a distribution and shareholder service plan (the “Plan”) pursuant to Rule 12b-1 under the 1940 Act. The Plan allows the Funds to compensate the Distributor for the costs incurred in distributing the Funds’ Investor Class Shares, including amounts paid to brokers or dealers, at an annual rate not to exceed 0.25% of the average daily net assets of the Funds’ Investor Class Shares. The Baird Intermediate Bond, Baird Aggregate Bond, Baird Intermediate Municipal Bond and Baird Core Plus Bond Funds incurred $9,116, $65,731, $5,990 and $54,989, respectively, in fees pursuant to the Plan during the year ending December 31, 2008.
Page 117
Report of Independent Registered Public Accounting Firm
To the Shareholders and
Board of Directors of
Baird Funds, Inc.:
We have audited the accompanying statements of assets and liabilities of Baird Intermediate Bond Fund, Baird Aggregate Bond Fund, Baird Intermediate Municipal Bond Fund, Baird Core Plus Bond Fund and Baird Short-Term Bond Fund (five of the portfolios constituting Baird Funds, Inc.) (collectively, the “Funds”), including the schedules of investments, as of December 31, 2008, and the related statements of operations for the year then ended, the statements of changes in net assets for each of the two years in the period then ended, and the financial highlights for each of the four years in the period then ended. These financial statements and financial highlights are the responsibility of the Funds’ management. Our responsibility is to express an opinion on these financial statements and financial highlights based on our audits. The financial highlights for the year ended December 31, 2004 were audited by other auditors. Those auditors expressed an unqualified opinion on those financial highlights in their report dated February 22, 2005.
We conducted our audits in accordance with the standards of the Public Company Accounting Oversight Board (United States). Those standards require that we plan and perform the audit to obtain reasonable assurance about whether the financial statements and financial highlights are free of material misstatement. The Funds are not required to have, nor were we engaged to perform, an audit of their internal control over financial reporting. Our audits included consideration of internal control over financial reporting as a basis for designing audit procedures that are appropriate in the circumstances, but not for the purpose of expressing an opinion on the effectiveness of the Funds’ internal control over financial reporting. Accordingly, we express no such opinion. An audit also includes examining, on a test basis, evidence supporting the amounts and disclosures in the financial statements, assessing the accounting principles used and significant estimates made by management, as well as evaluating the overall financial statement presentation. Our procedures included confirmation of securities owned as of December 31, 2008, by correspondence with the custodian and brokers. We believe that our audits provide a reasonable basis for our opinion.
In our opinion, the financial statements and financial highlights referred to above present fairly, in all material respects, the financial position of each of the aforementioned funds of Baird Funds, Inc. as of December 31, 2008, and the results of their operations for the year then ended, the changes in their net assets for each of the two years in the period then ended and the financial highlights for each of the four years in the period then ended, in conformity with accounting principles generally accepted in the United States of America.
 |
Chicago, Illinois
February 26, 2009
Page 118
Baird Funds, Inc.
| Directors & Officers as of December 31, 2008 |
| Number of | |||||
| Portfolios | Other | ||||
| Positions | Term of Office | Principal | in Complex | Directorships | |
| Held with | and Length of | Occupation(s) | Overseen | Held | |
| Name, Address and Age | the Funds | Time Served | During Past 5 Years | by Director | by Director |
| G. Frederick Kasten, Jr. | Independent | Indefinite; | Retired; Chairman, the Advisor (January 2000-December | 8 | Director of Regal-Beloit |
| 777 East Wisconsin Avenue | Director and | Since September | 2005); Chairman and CEO, the Advisor (January 1998- | Corporation, a | |
| Milwaukee, WI 53202 | Chairman | 2000 | January 2000); President, Chairman and CEO, the | manufacturing | |
| Age: 69 | Advisor (June 1983-January 1998); President, the Advisor | company | |||
| (January 1979-January 1983) | |||||
| John W. Feldt | Independent | Indefinite; | Retired; Senior Vice President-Finance, University of | 8 | Director of Thompson |
| c/o University of | Director | Since September | Wisconsin Foundation (1985-2006); Vice President- | Plumb Funds, Inc., a | |
| Wisconsin Foundation | 2000 | Finance, University of Wisconsin Foundation (1980- | mutual fund complex | ||
| 1848 University Avenue | 1985); Associate Director, University of Wisconsin | (3 portfolios); Director | |||
| Madison, WI 53705 | Foundation (1967-1980) | of Nakoma Mutual | |||
| Age: 66 | Funds, a mutual fund | ||||
| complex (1 portfolio) | |||||
| Frederick P. Stratton, Jr. | Independent | Indefinite; | Retired; Chairman Emeritus, Briggs & Stratton | 8 | Director of Weyco |
| 10134 N. Port Washington | Director | Since May | Corporation, a manufacturing company, since 2003; | Group, Inc., a men’s | |
| Road, #2B | 2004 | Chairman of the Board, Briggs & Stratton Corporation | footwear distributor; | ||
| Mequon, WI 53092 | (2001-2002); Chairman and CEO, Briggs & Stratton | Wisconsin Energy | |||
| Age: 69 | Corporation (1986-2001) | Corporation and its | |||
| subsidiaries Wisconsin | |||||
| Electric Power | |||||
| Company and | |||||
| Wisconsin Gas LLC | |||||
| Marlyn J. Spear | Independent | Indefinite; | Chief Investment Officer, Building Trades United | 8 | Management Trustee of |
| P.O. Box 530 | Director | Since January | Pension Trust Fund since July 1989; Investment Officer, | AFL-CIO Housing | |
| 500 Elm Grove Road | 2008 | Northwestern Mutual Financial Network (1988-1989); | Investment Trust | ||
| Elm Grove, WI 53122 | Assistant Vice-President, Firstar Trust Company | ||||
| Age: 55 | (1978-1987); Financial Analyst, Harco Holdings, Inc. | ||||
| (1976-1978) | |||||
| Cory L. Nettles* | Interested | Indefinite; | Managing Director, Generation Growth Capital, Inc. | 8 | Director of Weyco |
| Generation Growth Capital, Inc. | Director | Since January | (since March 2007); Of Counsel, Quarles & Brady LLP | Group, Inc., a men’s | |
| 411 East Wisconsin Avenue | 2008 | (since January 2005); Secretary, Wisconsin Department | footwear distributor; | ||
| Suite 1710 | of Commerce (January 2003 – January 2005); Associate, | Director of The Private | |||
| Milwaukee, WI 53202 | Quarles & Brady LLP (July 1996 – December 2002) | Bank, a financial | |||
| Age: 38 | institution |
| * | Mr. Nettles is an “interested person” of the Corporation (as defined in the 1940 Act) because of his employment with the law firm, Quarles & Brady LLP, which provides legal services to the Advisor. The legal services that Quarles & Brady LLP has provided to the Advisor include litigation, real estate and miscellaneous securities related matters that did not relate to the Corporation or the Funds. |
Additional information about the Funds’ directors is available in the Statement of Additional Information which may be obtained without charge, upon request, by calling 1-866-44BAIRD, or at www.bairdfunds.com.
Page 119
Baird Funds, Inc.
| Directors & Officers as of December 31, 2008 |
| Position(s) | Term of Office | Principal | ||||
| Held with | and Length of | Occupation(s) | ||||
| Name, Address, and Age | the Funds | Time Served | During Past 5 Years | |||
| Mary Ellen Stanek | President | Re-elected by | Managing Director, the Advisor, and Chief Investment Officer, Baird Advisors, a department of | |||
| 777 East Wisconsin Avenue | Board annually; | the Advisor, since March 2000; President and CEO, Firstar Investment Research & Management | ||||
| Milwaukee, WI 53202 | Since | Company, LLC (“FIRMCO”) (November 1998-February 2000); President, Firstar Funds, Inc. | ||||
| Age: 52 | September 2000 | (December 1998-February 2000); President and Chief Operating Officer, FIRMCO | ||||
| (March 1994-November 1998) | ||||||
| J. Bary Morgan | Senior | Re-elected by | Chief Investment Officer, Baird Investment Management, a department of the Advisor, since | |||
| 777 East Wisconsin Avenue | Vice President | Board annually; | January 2004; Managing Director, the Advisor since January 2001; Director, Baird Investment | |||
| Milwaukee, WI 53202 | Since | Management (January 2001-January 2004); Senior Vice President, the Advisor (January 2000- | ||||
| Age: 43 | February 2003 | January 2001); First Vice President, the Advisor (January 1996-January 2000) | ||||
| Todd S. Nichol | Vice President | Re-elected by | Chief Compliance Officer, the Advisor since October 2004; Assistant Compliance Director, the | |||
| 777 East Wisconsin Avenue | and Chief | Board annually; | Advisor since August 2002; Senior Vice President, the Advisor since January 2005; First Vice | |||
| Milwaukee, WI 53202 | Compliance | Since | President, the Advisor (January 2004-January 2005); Vice President, the Advisor (August 2002- | |||
| Age: 46 | Officer | August 2004 | January 2004); Vice President – Risk Management, BNY Clearing Services, LLC, a division of | |||
| The Bank of New York (August 1995-August 2002) | ||||||
| Russell P. Schwei | Vice President | Re-elected by | Operations Director, the Advisor since July 1992; Managing Director, the Advisor since January | |||
| 777 East Wisconsin Avenue | Board annually; | 1997; Chief Financial Officer and Managing Director, the Advisor (February 1999-December | ||||
| Milwaukee, WI 53202 | Since | 1999) | ||||
| Age: 49 | September 2000 | |||||
| Leonard M. Rush | Treasurer | Re-elected by | Chief Financial Officer, the Advisor since January 2000 | |||
| 777 East Wisconsin Avenue | Board annually; | |||||
| Milwaukee, WI 53202 | Since | |||||
| Age: 62 | September 2000 | |||||
| Charles M. Weber | Secretary | Re-elected by | Senior Vice President and Associate General Counsel, the Advisor since July 2005; Partner, | |||
| 777 East Wisconsin Avenue | Board annually; | Quarles & Brady LLP, a law firm (October 1998-June 2005) | ||||
| Milwaukee, WI 53202 | Since | |||||
| Age: 45 | September 2005 | |||||
| Laura E. Piotrowski | Assistant | Re-elected by | Managing Director, the Advisor since January 2008; Senior Vice President, the Advisor (January | |||
| 777 East Wisconsin Avenue | Treasurer | Board annually; | 2003-December 2007); Controller, the Advisor since January 2003; First Vice President, the | |||
| Milwaukee, WI 53202 | Since | Advisor (January 2001-January 2003); Vice President, the Advisor (January 1999-January 2001) | ||||
| Age: 38 | August 2007 | |||||
| Robert A. Johnson | AML | Re-elected by | Compliance Officer, the Advisor since 1998, and AML Compliance Officer, the Advisor since | |||
| 777 East Wisconsin Avenue | Compliance | Board annually; | January 2004 | |||
| Milwaukee, WI 53202 | Officer | Since | ||||
| Age 45 | August 2004 | |||||
| Bret T. Reese | Assistant | Re-elected by | Vice President and Associate General Counsel, the Advisor since June 2005; Senior Financial | |||
| 777 East Wisconsin Avenue | Secretary | Board annually; | Analyst, the Advisor (August 2004-June 2005); Financial Analyst, Stark & Roth, Inc., a hedge | |||
| Milwaukee, WI 53202 | Since | fund (June 2001-August 2002) | ||||
| Age: 39 | August 2006 |
Page 120
Baird Funds, Inc.
DISCLOSURE REGARDING THE BOARD OF DIRECTORS’ APPROVAL OF THE INVESTMENT ADVISORY AGREEMENT FOR BAIRD BOND FUNDS
The Board of Directors (the “Board”) of Baird Funds, Inc. (the “Corporation”) met on August 12, 2008 to consider the annual renewal of the investment advisory agreement with Robert W. Baird & Co. Incorporated (“Baird” or the “Advisor”) for management of the Baird Intermediate Bond, Aggregate Bond, Intermediate Municipal Bond, Core Plus Bond and Short-Term Bond Funds, which are mutual fund series or portfolios of the Corporation (the “Funds”). The Board reviewed and discussed various information that had been provided prior to the meeting, including the investment advisory agreement, memoranda provided by outside legal counsel and the Secretary of the Funds discussing the Board’s fiduciary obligations and factors the Board should assess in considering the renewal of the investment advisory agreement, information from the Advisor in response to a request from the Board, including the directors who are not “interested persons” of the Corporation or the Advisor (“Independent Directors”) within the meaning of the Investment Company Act of 1940 (the “1940 Act”) (including the Advisor’s Form ADV, Annual Report and statement of financial condition), a profitability analysis, comparative information about the Funds’ performance for periods ended June 30, 2008, management fees and expense ratios, and other pertinent information. The Board also discussed relevant case law, including the recent Seventh Circuit decision in Jones v. Harris Associates, L.P. The Independent Directors met separately in executive session with outside legal counsel to consider the investment advisory agreement. The Board also received information periodically throughout the year that was relevant to its consideration of the investment advisory agreement, including performance, management fee and other expense information. Based on its evaluation of this information, the Board, including a majority of the Independent Directors, approved the continuation of the investment advisory agreement for an additional one-year period.
In considering the investment advisory agreement and reaching its conclusions, the Board reviewed and analyzed various factors that it determined were relevant, including the factors below.
Nature, Extent and Quality of Services Provided to the Funds
The Board analyzed the nature, extent and quality of the services provided by the Advisor to the Funds. The Board reviewed and considered the Advisor’s significant role in establishing the Funds and the construction of their investment objectives, principal strategies, investment limitations and fee structures. The Board noted the Advisor’s overall reputation and positive name recognition, the depth of the Advisor’s personnel, resources and commitment to the Funds, and the experience, credentials and continuity of the portfolio management teams employed to manage the Funds’ investments. The Board further noted that the Advisor has approximately $15.1 billion of assets under discretionary management and has strong relationships with numerous institutional accounts. The Funds provide an opportunity for smaller institutional and retail accounts to receive the same professional advice from the Advisor that it offers to its larger institutional clients. The Board considered the Advisor’s disciplined investment decision-making process used for the Funds. The Board also considered other services that the Advisor provided for the Funds in its capacity as their investment advisor, such as providing some of its key personnel available to serve as officers of the Funds, selecting broker-dealers for execution of portfolio transactions, ensuring adherence to the Fund’s investment policies and restrictions, providing support services to the Board and the Audit Committee of the Board and overseeing the Funds’ other service providers. In addition, the Board considered that the Advisor provides administrative services to each of the fixed income funds at an annual rate of 0.05% of the Fund’s average daily net assets, and is responsible for paying each Fund’s custody, transfer agency, accounting, printing, auditing, legal and director fees and other ordinary expenses (except for advisory and 12b-1 fees), which has the
Page 121
Baird Funds, Inc.
DISCLOSURE REGARDING THE BOARD OF DIRECTORS’ APPROVAL OF THE INVESTMENT ADVISORY AGREEMENT FOR BAIRD BOND FUNDS (cont.)
effect of capping the Funds’ expense ratios at 0.55% and 0.30% for Investor and Institutional Class shares, respectively. The Board further noted that the Advisor, in its capacity as a registered broker-dealer, also serves as distributor and principal underwriter of shares of the Funds and spends time and effort marketing the Funds. The Board also considered the strength of the Advisor’s compliance department, including the Funds’ Chief Compliance Officer, and the fact that the Advisor has not experienced any significant legal, compliance or regulatory difficulties since the Funds were launched. The Board concluded that the nature, extent and quality of the services provided by the Advisor to the Funds were appropriate and that each Fund was likely to continue to benefit from services provided under the investment advisory agreement.
Investment Performance of the Advisor and the Funds
In considering the investment performance of each of the Funds, the Board reviewed information as of June 30, 2008 regarding the Fund’s performance in comparison to its benchmark index and its peer groups as determined by Lipper. The Board concluded that the Funds had performed extremely well over most time periods and had achieved consistent performance results. While certain Funds had underperformed their benchmark indices in recent time periods, the Board noted the challenging environment for bond funds in recent periods due to the credit market and other factors and referred to the Advisor’s commentary in this regard. The Board also noted that each of the Funds (both Institutional and Investor Class shares) had outperformed its Lipper peer group average over the past one year, three year, five year and since inception periods, as applicable.
The Board also considered the Advisor’s quarterly portfolio commentaries and reviews explaining the Funds’ performance, the Advisor’s consistent and disciplined investment decision process and the investment strategies it employs for the Funds. After considering all of the information, the Board concluded that, although past performance is not a guarantee of future results, each Fund and its shareholders were likely to benefit from the Advisor’s continued management.
Costs of Services Provided and Profits Realized by the Advisor
The Board examined the fee and expense information for each of the Funds, including a comparison of such information to other similarly situated mutual funds as determined by Lipper. The Board noted that each Fund’s advisory fee and total expense ratio (for both its Investor Class and Institutional Class shares) were significantly lower than the average and median advisory fees and expense ratios for all mutual funds in its Lipper category.
The Board also reviewed and considered investment management fees charged by the Advisor to other investment advisory clients and found that the fee paid by the Funds (0.25%) was less than the fee that the Advisor charges on the first $25 million (0.30%) of a separately managed account and the same as the fee that the Advisor charges on the next $25 million. The Board noted and discussed the extent of the significant additional services provided to the Funds that the Advisor did not provide in the other advisory relationships. Those services included certain administrative services, oversight of the Funds’ other service providers, director support, risk management, regulatory compliance and various other services.
Page 122
Baird Funds, Inc.
DISCLOSURE REGARDING THE BOARD OF DIRECTORS’ APPROVAL OF THE INVESTMENT ADVISORY AGREEMENT FOR BAIRD BOND FUNDS (cont.)
The Board considered the fees realized, and the costs incurred, by the Advisor in providing investment management services to the Funds and a profitability analysis with respect to each Fund. The Board noted the unique expense structure of the Funds whereby the Institutional Class shareholders were charged only a management fee and an administration fee and the Advisor incurred all of the other expenses on behalf of each Fund and that Investor Class shareholders incurred the same expenses as the Institutional Class shareholders plus a 0.25% 12b-1 fee. This structure means that the annual expense ratio for each Fund (as a percentage of average daily net assets) is 0.55% for Investor Class shares and 0.30% for Institutional Class shares. The Advisor informed the Board that the profits realized by the Advisor (as a percentage of revenue) from its relationship with the Funds were less than those realized by the Advisor on its investment advisory business as a whole, particularly since the 0.05% administration fee payable to the Advisor by each Fund was considerably less than the Fund’s expenses that the Advisor is required to pay.
The Board concluded that the profits realized by the Advisor from its relationship with the Funds were appropriate. The Board also reviewed and considered the general financial condition of the Advisor and determined it to be sound. In light of all of the information that it received and considered, the Board concluded that the management fee and total expense ratio of each Fund were reasonable.
Economies of Scale and Fee Levels Reflecting Those Economies
The Board noted that the Funds’ advisory fee structure does not contain any breakpoint reductions as the Funds grow in size. However, the Board recognized that the Advisor essentially bears all of the Funds’ expenses other than management, 12b-1 and administration fees. The Board also recognized that the advisory fee rates paid by the Funds were designed to be lower than the fees otherwise charged by the Advisor to its separately managed account clients and to be comparable to the second or third breakpoint advisory fee levels paid by other comparable mutual funds.
The directors concluded that the current fee structure of each Fund was reasonable and reflects a sharing of economies of scale between the Advisor and the Fund at the Fund’s current asset level.
Benefits Derived from the Relationship with the Funds
The Board noted that the Advisor does not have any soft dollar arrangements and does not realize any other tangible benefits in connection with its management of the Funds. The Board believed that the Funds generally benefit from their association with the Advisor and the use of the “Baird” name. The Board concluded that the other benefits realized by the Advisor from its relationship with the Funds were appropriate.
Based on its evaluation of the above factors, as well as other factors relevant to their consideration of the investment advisory agreement, the directors, including all of the Independent Directors, concluded that the continuation of the investment advisory agreement was in the best interest of each Fund and its shareholders.
Page 123
Additional Information
Proxy Voting
A description of the policies and procedures that the Funds use to determine how to vote proxies relating to portfolio securities is available without charge, upon request, by calling toll free, 1-866-44BAIRD, or by accessing the Funds’ website at www.bairdfunds.com; and by accessing the SEC’s website at www.sec.gov.
Each Fund’s proxy voting record for the most recent 12-month period ended June 30, if applicable, is available without charge, upon request, by calling toll free, 1-866-44BAIRD, or by accessing the Funds’ website at www.bairdfunds.com; and by accessing the SEC’s website at www.sec.gov. The Funds generally do not vote proxies because the securities held in their portfolios, consisting of bonds and other fixed-income securities, are not entitled to vote.
Portfolio Holdings Disclosure
The Funds file a complete schedule of portfolio holdings with the SEC for the first and third quarters of each fiscal year on Form N-Q. The Funds’ Forms N-Q are available on the SEC website at www.sec.gov and may be reviewed and copied at the SEC’s Public Reference Room in Washington, D.C. Information on the operation of the Public Reference Room may be obtained by calling 1-800-732-0330. The Funds’ Forms N-Q may also be obtained by calling toll-free 1-866-44BAIRD.
Tax Information
The percentage of taxable ordinary income distributions that are designated as short-term capital gain distributions under Internal Revenue Section 871(k)(2)(c) for the Baird Core Plus Bond Fund was 7.60%.
Page 124
(This Page Intentionally Left Blank.)
Baird Funds, Inc.
c/o U.S. Bancorp Fund Services, LLC
P.O. Box 701
Milwaukee, WI 53201-0701
1-866-44BAIRD
Board of Directors
G. Frederick Kasten, Jr. (Chairman)
John W. Feldt
Frederick P. Stratton, Jr.
Cory L. Nettles
Marlyn J. Spear
Investment Advisor and Distributor
Robert W. Baird & Co. Incorporated
777 East Wisconsin Avenue
Milwaukee, WI 53202
Administrator and Transfer Agent
U.S. Bancorp Fund Services, LLC
P.O. Box 701
615 East Michigan Street
Milwaukee, WI 53202
Custodian
U.S. Bank, N.A.
1555 N. RiverCenter Drive, Suite 302
Milwaukee, WI 53212
Legal Counsel
Godfrey & Kahn, S.C.
780 North Water Street
Milwaukee, WI 53202
Independent Registered Public Accounting Firm
Grant Thornton LLP
175 West Jackson Boulevard, 13th Floor
Chicago, IL 60604
Annual Report - Baird Funds
Baird LargeCap Fund
Baird MidCap Fund
TABLE OF CONTENTS
| Page | |
| Letter to Shareholders | 1 |
| 2008 Economic and Stock Market Commentary | 2 |
| Baird LargeCap Fund | 4 |
| Baird MidCap Fund | 13 |
| Additional Information on Fund Expenses | 22 |
| Statements of Assets and Liabilities | 24 |
| Statements of Operations | 25 |
| Statements of Changes in Net Assets | 26 |
| Financial Highlights | 28 |
| Notes to the Financial Statements | 32 |
| Report of Independent Registered Public Accounting Firm | 41 |
| Directors and Officers | 42 |
| Disclosure Regarding the Board of Directors’ Approval | |
| of the Investment Advisory Agreement for Baird Equity Funds | 44 |
| Additional Information | 47 |
This report has been prepared for shareholders and may be distributed to others only if preceded or accompanied by a current prospectus.
Cautionary Note on Analyses, Opinions and Outlooks: In this report we offer analyses and opinions on the performance of individual securities, companies, industries, sectors, markets, interest rates and governmental policies, including predictions, forecasts and outlooks regarding possible future events. These can generally be identified as such because the context of the statements may include such words as “believe,” “should,” “will,” “expects,” “anticipates,” “hopes” and words of similar effect. These statements reflect the portfolio managers’ good faith beliefs and judgments and involve risks and uncertainties, including the risk that the portfolio managers’ analyses, opinions and outlooks are or will prove to be inaccurate. It is inherently difficult to correctly assess and explain the performance of particular securities, sectors, markets, interest rate movements, governmental actions or general economic trends and conditions, and many unforeseen factors contribute to the performance of Baird Funds. Investors are, therefore, cautioned not to place undue reliance on subjective judgments contained in this report.
Baird Funds, Inc.
1-866-442-2473
www.bairdfunds.com
February 28, 2009
Dear Shareholder,
Thank you for investing in the Baird Funds. We appreciate your patience during these challenging times. We are pleased to report that, despite a very difficult year, the aggregate net assets of the eight mutual funds in our family have grown to more than $1.9 billion as of the end of 2008, an increase of 19% over the prior year.
In this Annual Report we review the markets in 2008 and the performance and composition of each of the Baird LargeCap and MidCap Funds. We hope you find this report both informative and helpful in evaluating your investments.
Thank you again for choosing Baird Funds.
Sincerely,
Mary Ellen Stanek, CFA
President
Baird Funds
2008 Economic and Stock Market Commentary
U.S. equities experienced significant losses in 2008, ending one of the market’s most volatile years in generations. The Dow Jones Industrial Average ended the year down 33.8%. The S&P 500® declined 38.5% and the NASDAQ composite was down 40.5% in 2008. For the year the Russell 1000® Index declined 38.4% versus declines of 34.8% and 41.5% for the Russell 2000® Index and the Russell Midcap® Index, respectively. Large cap stock performance lagged small cap stocks in 2008, due primarily to large financial institutions reporting historic losses and write-offs amid a breakdown of the U.S. financial system. Value stocks fell less than growth stocks across all market capitalizations, although the difference was modest within large and mid cap stocks. To underscore the dramatic reduction in domestic equity values, the average domestic equity mutual fund declined by 37.6% and many well-regarded funds declined by over 50%.
The performance of the equities markets during 2008 was significantly impacted by frozen credit markets, the collapse or sale of numerous banks, insurance companies, hedge funds and financial services firms, government bailouts and other intervention, significant declines in housing prices, high mortgage default rates, a worsening recession, increased unemployment, lack of consumer confidence, and investor fear and uncertainty. The precipitous decline in the equities markets mostly occurred during the last three and a half months of the year following the collapse of Lehman Brothers and the realization that the financial markets were malfunctioning. Investors’ flight from stocks to U.S. Treasuries toward year-end worsened matters for the equity markets.
Losses in 2008 were broad-based, with all S&P 500 sectors showing double digit percentage declines. The financials were the weakest sector in the S&P 500 Index for the year, declining a staggering 58%. Financials primarily suffered from banks writing off significant loans and other assets and reporting lower-than-expected earnings during the ongoing credit crisis. The approval of the $700 billion TARP provided financial support to a select group of banks, but investors tended to apply selling pressure to those that announced capital inflows from the government. Financial services companies underperformed due to continued risk of credit downgrades from ratings agencies and potential need to raise capital. Consumer finance companies underperformed with expectations that the overleveraged consumer will be unable to continue payment of monthly debts such as credit cards. Money management firms were among the hardest hit due to the sizable decline in the equity markets.
Energy and materials stocks were among the best performers during the first half of 2008, but the trend reversed in the third quarter with the negative momentum carrying over to the fourth quarter. Commodity prices fell substantially as the global economy weakened and fear of energy and materials shortages subsided with a decline in growth of emerging market economies. Oil prices fell approximately 55% to $45 per barrel from $100 per barrel at the end of September. Other commodities, such as natural gas and coal, also declined significantly. The weak economy and falling commodity prices forced many oil and gas producers to cut production forecasts and delay exploration projects planned for 2009.
Health care, consumer staples, and utilities stocks proved to be a safe-haven for investors due to the counter-cyclical characteristics of these companies. Health care companies provided consistent earnings growth in the face of an economic downturn and health care stocks declined less than most other sectors. Further reductions in consumer spending increased concerns about many consumer-related companies, but sales of low-cost necessities remained strong, which was beneficial for consumer staples companies.
Page 2
2008 Economic and Stock Market Commentary
Economic Outlook
Much of the macro data continues to signal that economic hardship is still to come. For example, the ISM Index in December 2008 reported a cyclical low of 32.4 (a score of less than 50 indicates manufacturing contraction); unemployment continues to rise, and banks continue to see credit deterioration in their loan portfolios. Yet other reports, like the ISM Non-Manufacturing Composite Index, signaled a meaningful uptick in activity at the end of December, improving from November’s report of 36.5 to 40.6. We also continue to see anecdotal evidence that the credit markets – frozen since early September – are beginning to thaw. One key observation is the Libor-OIS spread. It has fallen from an early October high of 364 basis points to 97 basis points as of early February, signaling that general market conditions are beginning to return to normal.
At this juncture, the reports appear mixed in message. And that may be the bigger picture observation today. Does a mixed message from economic reports portend an eventual market recovery? In other words, are we in the bottoming phase of this bear market and can a new bull market eventually emerge?
We would like to think so, but in the meantime, we will closely watch the upcoming economic reports. We will also pay close attention to key market signals coming from the early cyclical industries like the retail, industrial and transportation stocks. Keep in mind that stocks begin to bottom well in advance of the bad news coming to an end. History has shown us, for example, that the unemployment report will continue to rise months after the stock market has already turned. In the financial crises of the early 1990s, news of bank credit deterioration continued to be reported a year after the stocks began to recover. The jury is still out, but if history is a guide, markets do reach bottom and the recovery may not be too far out.
Page 3
Baird LargeCap Fund
Portfolio Managers’ Commentary
For the year ended December 31, 2008, the Baird LargeCap Fund Institutional Class posted a total return of -39.88% (-39.94% for the Investor Class), as compared to a return of -38.44% for the Russell 1000® Growth Index, the LargeCap Fund’s primary benchmark.
At this time last year we wrote, “Although recent economic news has been disappointing and increases the odds of a recession in 2008, we still do not anticipate a recession this year given solid global growth, monetary stimulus from an accommodative Fed and potential fiscal stimulus. As always, our goal is to be fully invested in high quality growth companies that typically demonstrate the ability to expand earnings, not only during economic upturns, but also when economic activity slows.”
The key word in the preceding paragraph is “typically.” We were simply wrong about the degree of the economic downturn. We did not anticipate an abrupt halt to economic activity, but all came to a fast stop and we found ourselves in a recession nevertheless. In spite of the mis-calculated macro-assessment, we believed the Baird LargeCap Fund was structured to weather the coming economic storm due to our reduction in energy stocks in mid-summer from overweight to underweight, our technology weighting that was under-weight semiconductors and more biased to business services, and a reduction in our industrial positions with European market exposure – a geographical region that we believed was trailing the U.S. economically. The LargeCap Fund was well positioned through the end of the third quarter, with year-to-date performance results ahead of the Russell 1000® Growth Index by approximately 250 basis points, and the S&P 500® Index by approximately 150 basis points. This out-performance was driven by the portfolio structure just mentioned and our health care stocks which continued to post more predictable earnings in a slowing economic environment. However, with the close of the third quarter and the news regarding Lehman Brother’s bankruptcy, investors’ perceptions shifted from that of concern about economic slowing and financial liquidity in the credit markets to concern about economic collapse and individual company solvency. The general market, gripped with fear, plunged 33% during the 52-day period ending November 21. This sudden market plunge – not exactly “typical” – resulted in a plunge in the LargeCap Fund’s relative performance. The month of December proved especially difficult with a 200 basis point relative loss to the target index. The year-end result is that the Fund trailed the Russell 1000® Growth Index by 100 basis points.
The trailing performance was especially disappointing given that the LargeCap Fund was well ahead of its target index and within sight of the year-end finish line, only to collapse at the tape. Our attribution work indicates that the effects of both stock selection and sector allocation were relatively equal contributors to fourth quarter under performance.
Attribution analysis regarding the stock selection effect points to three stocks of noteworthy concern. Examination of those specific stocks suggests that management comments regarding future earnings guidance was a catalyst of catastrophic consequence for the stocks’ values, at least in the short run. For example, Western Union reported third quarter results in line with analyst expectations, but temporarily withdrew forward guidance in light of current economic conditions. The stock sold off considerably, ending the fourth quarter down 42%. Fear of the unknown was simply too much for many investors, and proved to be an impactful emotion for Western Union, Agilent (-47%) and Research in Motion (-41%).
Regarding the sector allocation effect, the month of December was a critical time period. Investors fled uncertainty in stocks like those just mentioned and re-positioned their portfolios to more economically stable and liquid stocks (i.e., higher capitalization). For example, the consumer staples sector was down 15% in the fourth quarter. A close look at this sector
Page 4
Baird LargeCap Fund
reveals that the top five stocks by market capitalization comprise approximately 10% of the entire Russell 1000® Growth Index weight, and the top two stocks, Wal-Mart (a market capitalization of $220 billion) and Philip Morris (with a market capitalization of $90 billion), comprise almost 5% of the Index’s weight. In total, fourth quarter attribution indicates that the LargeCap Fund’s performance relative to consumer staples lagged by approximately 100 basis points given that we under-weight staples and especially since we were not exposed to the larger cap stocks. The LargeCap Fund’s weighted average market capitalization was approximately $29 billion at year-end and trailed in relative performance during the last month of the year, and in this last minute flight to liquidity. Any market condition involving a flight to liquidity is likely to be one where the LargeCap Fund can trail the target index due to the Fund’s focus in lower market capitalization stocks within the large-cap space.
Much of the data continues to signal that economic hardship is still to come, yet there is some evidence that the credit markets are beginning to thaw and additional federal governmental intervention may improve the credit markets and economic conditions generally. At this juncture, it is difficult to predict whether we are in the bottoming phase of the current bear market and whether a new bull market will emerge in 2009.
In the meantime, we will closely watch the upcoming economic reports. We will also pay close attention to key market signals coming from the early cyclical industries like the retail, industrial and transportation stocks. Keep in mind that stocks begin to bottom well in advance of the bad news coming to an end. History has shown us, for example, that unemployment will continue to rise for months after the stock market has already turned. The jury is still out, but if history is a guide, markets do reach bottom and the recovery may not be too far out.
Portfolio Managers:
Douglas E. Guffy
Ken Hemauer, CFA
J. Bary Morgan, CFA
Page 5
Baird LargeCap Fund
A December 31, 2008 summary of the Fund’s top 10 holdings and equity sector analysis compared to the Russell 1000® Growth Index is shown below.
| Top 10 Holdings* | Equity Sector Analysis** | ||
| Gilead Sciences, Inc. | 3.7% | 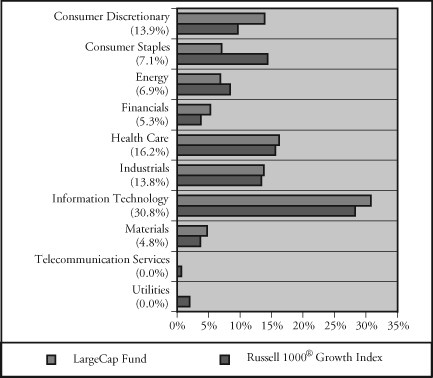 | |
| Abbott Laboratories | 3.3% | ||
| Iron Mountain Incorporated | 3.1% | ||
| Harris Corporation | 2.9% | ||
| Microsoft Corporation | 2.8% | ||
| Apple Computer, Inc. | 2.7% | ||
| Safeway Inc. | 2.6% | ||
| ITT Industries, Inc. | 2.6% | ||
| Kohl’s Corporation | 2.5% | ||
| Danaher Corporation | 2.5% | ||
| Net Assets: | $16,610,223 | ||
| Portfolio Turnover Rate: | 43.0% | ||
| Number of Equity Holdings: | 51 | ||
| Annualized Portfolio Expense Ratio:*** | |||
| INSTITUTIONAL CLASS: | 0.75% | ||
| INVESTOR CLASS: | 1.00% | **** | |
| * | The Fund’s portfolio composition is subject to change and there is no assurance that the Fund will continue to hold any particular security. Percentages shown relate to the Fund’s total net assets as of December 31, 2008. |
| ** | Percentages shown in parentheses relate to the Fund’s total equity investments as of December 31, 2008, and may not add up to 100% due to rounding. |
| *** | The Advisor has contractually agreed to limit the Fund’s total annual fund operating expenses to 0.75% of average daily net assets for the Institutional Class shares and 1.00% of average daily net assets for the Investor Class shares, at least through April 30, 2010. |
| **** | Includes 0.25% 12b-1 fee. |
Page 6
Baird LargeCap Fund
| Institutional Class |
| Value of a $25,000 Investment |
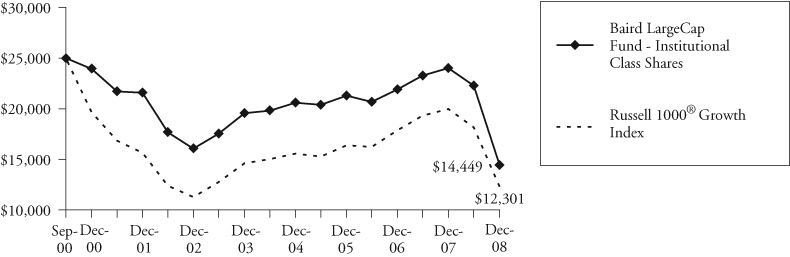 |
Growth of a hypothetical investment of $25,000 made on the Fund’s inception date (9/29/00), assuming reinvestment of all distributions.
| Investor Class |
| Value of a $10,000 Investment |
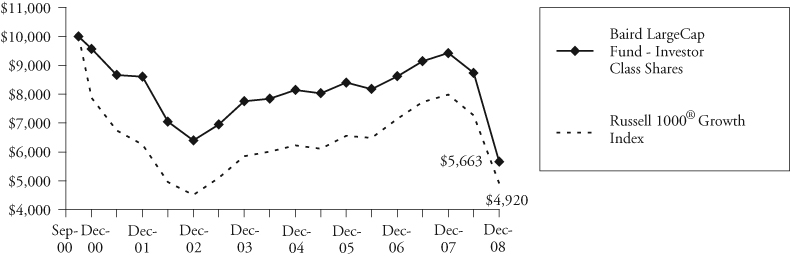 |
Growth of a hypothetical investment of $10,000 made on the Fund’s inception date (9/29/00), assuming reinvestment of all distributions.
Page 7
Baird LargeCap Fund
Average Annual Total Returns
| For the Periods Ended December 31, 2008 | One Year | Five Years | Since Inception(1) |
| Institutional Class Shares | -39.88% | -5.90% | -6.43% |
| Investor Class Shares | -39.94% | -6.11% | -6.66% |
Russell 1000® Growth Index(2) | -38.44% | -3.43% | -8.24% |
| (1) | For the period from September 29, 2000 (commencement of operations) through December 31, 2008. |
| (2) | The Russell 1000® Growth Index measures the performance of those Russell 1000® companies with higher price-to-book ratios and higher forecasted growth rates. The Russell 1000® Index consists of the 1,000 largest companies in the Russell 3000® Index, which represents approximately 92% of the total market capitalization of the Russell 3000® Index, which in turn is comprised of the 3,000 largest U.S. domiciled publicly traded common stocks by market capitalization. These indices do not reflect any deduction for fees, expenses or taxes. A direct investment in an index is not possible. |
The returns shown in the table above and line graphs on the previous page reflect reinvestment of dividends and/or capital gains distributions in additional shares. The returns do not reflect the deduction of taxes that a shareholder would pay on Fund distributions or the redemption of Fund shares.
Past performance does not guarantee future results. Investment return and principal value will fluctuate so that an investor’s shares, when redeemed, may be worth more or less than their original cost.
For information about the performance of the Fund as of the most recent month-end, please call 1-866-44BAIRD or visit www.bairdfunds.com. Mutual fund performance changes over time and current performance may be lower or higher than that stated.
Page 8
Baird LargeCap Fund
Schedule of Investments December 31, 2008 |
| Shares | Value | ||||||
| COMMON STOCKS – 96.8% | |||||||
| Air Freight & Logistics – 2.4% | |||||||
| 7,275 | C.H. Robinson | ||||||
| Worldwide, Inc. | $ | 400,343 | |||||
| Auto Components – 1.1% | |||||||
| 10,027 | Johnson Controls, Inc. | 182,090 | |||||
| Biotechnology – 5.6% | |||||||
| 5,800 | Celgene Corp.* | 320,624 | |||||
| 12,002 | Gilead Sciences, Inc.* | 613,782 | |||||
| 934,406 | |||||||
| Capital Markets – 5.1% | |||||||
| 5,934 | Northern Trust Corporation | 309,399 | |||||
| 8,364 | State Street Corporation | 328,956 | |||||
| 5,852 | T. Rowe Price Group, Inc. | 207,395 | |||||
| 845,750 | |||||||
| Chemicals – 4.6% | |||||||
| 11,560 | Ecolab, Inc. | 406,334 | |||||
| 6,107 | Praxair, Inc. | 362,512 | |||||
| 768,846 | |||||||
| Communications Equipment – 7.0% | |||||||
| 20,634 | Cisco Systems, Inc.* | 336,334 | |||||
| 18,373 | Corning Incorporated* | 175,095 | |||||
| 12,675 | Harris Corporation | 482,284 | |||||
| 4,050 | Research In | ||||||
Motion Limited* f | 164,349 | ||||||
| 1,158,062 | |||||||
| Computers & Peripherals – 4.8% | |||||||
| 5,299 | Apple Computer, Inc.* | 452,269 | |||||
| 32,525 | EMC Corporation* | 340,537 | |||||
| 792,806 | |||||||
| Diversified Consumer Services – 1.7% | |||||||
| 3,600 | Apollo Group | ||||||
| Incorporated – Class A* | 275,832 | ||||||
| Diversified Financial Services – 1.2% | |||||||
| 6,400 | JPMorgan Chase & Co. | 201,792 | |||||
| Electrical Equipment – 3.4% | |||||||
| 11,342 | Emerson Electric | ||||||
| Company | 415,231 | ||||||
| 1,103 | First Solar, Inc.* | 152,170 | |||||
| 567,401 | |||||||
| Electronic Equipment & Instruments – 1.7% | |||||||
| 18,077 | Agilent Technologies, Inc.* | 282,544 | |||||
| Energy Equipment & Services – 5.2% | |||||||
| 11,708 | Cameron International | ||||||
| Corporation* | 240,014 | ||||||
| 5,953 | Schlumberger Limited f | 251,990 | |||||
| 3,579 | Transocean Inc.* f | 169,108 | |||||
| 18,538 | Weatherford | ||||||
International Ltd.* f | 200,581 | ||||||
| 861,693 | |||||||
| Food & Staples Retailing – 6.1% | |||||||
| 6,228 | Costco Wholesale Corp. | 326,970 | |||||
| 18,100 | Safeway Inc. | 430,237 | |||||
| 11,496 | Sysco Corporation | 263,718 | |||||
| 1,020,925 | |||||||
| Health Care Equipment & Supplies – 2.2% | |||||||
| 6,725 | Baxter International, Inc. | 360,393 | |||||
| Health Care Providers & Services – 2.8% | |||||||
| 4,500 | Express Scripts, Inc.* | 247,410 | |||||
| 5,000 | Medco Health | ||||||
| Solutions, Inc.* | 209,550 | ||||||
| 456,960 | |||||||
| Internet Software & Services – 1.7% | |||||||
| 936 | Google Inc. – Class A* | 287,960 | |||||
| IT Services – 5.4% | |||||||
| 20,495 | Iron Mountain | ||||||
| Incorporated* | 506,842 | ||||||
| 26,715 | Western Union Company | 383,093 | |||||
| 889,935 | |||||||
The accompanying notes are an integral part of these financial statements.
Page 9
Baird LargeCap Fund
Schedule of Investments December 31, 2008 |
| Shares | Value | ||||||
| COMMON STOCKS – 96.8% (cont.) | |||||||
| Life Science Tools & Services – 1.8% | |||||||
| 8,625 | Thermo Fisher | ||||||
| Scientific, Inc.* | $ | 293,854 | |||||
| Machinery – 6.1% | |||||||
| 7,355 | Danaher Corporation | 416,366 | |||||
| 4,995 | Illinois Tool Works, Inc. | 175,075 | |||||
| 9,289 | ITT Industries, Inc. | 427,201 | |||||
| 1,018,642 | |||||||
| Media – 2.0% | |||||||
| 14,730 | The Walt Disney Co. | 334,224 | |||||
| Multiline Retail – 4.5% | |||||||
| 11,609 | Kohl’s Corporation* | 420,246 | |||||
| 9,597 | Target Corporation | 331,384 | |||||
| 751,630 | |||||||
| Oil & Gas – 1.5% | |||||||
| 8,424 | Southwestern | ||||||
| Energy Company* | 244,043 | ||||||
| Personal Products – 0.7% | |||||||
| 5,172 | Avon Products, Inc. | 124,283 | |||||
| Pharmaceuticals – 3.3% | |||||||
| 10,356 | Abbott Laboratories | 552,700 | |||||
| Semiconductor & Semiconductor Equipment – 3.2% | |||||||
| 31,125 | Applied Materials, Inc. | 315,296 | |||||
| 14,188 | Texas Instruments | ||||||
| Incorporated* | 220,198 | ||||||
| 535,494 | |||||||
| Software – 5.2% | |||||||
| 11,169 | Adobe Systems, | ||||||
| Incorporated* | 237,788 | ||||||
| 6,950 | Citrix Systems, Inc.* | 163,811 | |||||
| 23,654 | Microsoft Corporation | 459,834 | |||||
| 861,433 | |||||||
| Specialty Retail – 4.1% | |||||||
| 16,950 | Lowe’s Companies, Inc. | 364,764 | |||||
| 17,800 | Staples, Inc. | 318,976 | |||||
| 683,740 | |||||||
| Trading Companies & Distributors – 2.4% | |||||||
| 11,253 | Fastenal Company | 392,167 | |||||
| Total Common Stocks | |||||||
| (Cost $19,787,242) | 16,079,948 | ||||||
| SHORT-TERM INVESTMENTS – 3.2% | |||||||
| Money Market Fund – 3.2% | |||||||
| 524,240 | Short-Term Investment | ||||||
| Company Liquid Assets | |||||||
| Portfolio – AIM Fund | 524,240 | ||||||
| Total Short-Term | |||||||
| Investments | |||||||
| (Cost $524,240) | 524,240 | ||||||
| Principal | |||||||
| Amount | |||||||
| INVESTMENTS PURCHASED | |||||||
| WITH CASH PROCEEDS FROM | |||||||
| SECURITIES LENDING – 41.3% | |||||||
| Certificates of Deposit – 7.4% | |||||||
| $ | 275,177 | Abbey National Treasury | |||||
| Service, Series YCD1, | |||||||
| 1.09%, 02/20/09 | 275,155 | ||||||
| 275,177 | Barclays Bank, | ||||||
| 3.3615%, 03/16/09 | 274,959 | ||||||
| Natixis Bank of New York, | |||||||
| Series YCD1: | |||||||
| 194,242 | 0.89%, 02/18/09 | 194,231 | |||||
| 161,869 | 0.89%, 06/30/09 | 162,134 | |||||
| 242,803 | Royal Bank of | ||||||
| Scotland Group PLC, | |||||||
| 2.9944%, 05/06/09 | 242,798 | ||||||
The accompanying notes are an integral part of these financial statements.
Page 10
Baird LargeCap Fund
Schedule of Investments December 31, 2008 |
| Principal | |||||||
| Amount | Value | ||||||
| INVESTMENTS PURCHASED | |||||||
| WITH CASH PROCEEDS FROM | |||||||
| SECURITIES LENDING – 41.3% (cont.) | |||||||
| Certificates of Deposit – 7.4% (cont.) | |||||||
| $ | 80,934 | Societe Generale of | |||||
| New York, Series YCD1, | |||||||
| 2.0625%, 02/20/09 | $ | 80,929 | |||||
| 1,230,206 | |||||||
| Commercial Paper – 1.4% | |||||||
| 238,130 | Atlantic East | ||||||
| Funding LLC, | |||||||
| 3.0588%, 03/25/09 # | 238,130 | ||||||
| 238,130 | |||||||
| Corporate Bonds and Notes – 4.0% | |||||||
| Allstate Life GL: | |||||||
| 178,056 | 3.0575%, 03/20/09 | 176,886 | |||||
| 80,934 | 1.775%, 07/21/09 | 79,412 | |||||
| 161,869 | Svenska Handelsbanken, | ||||||
| 4.41%, 08/06/09 | 161,786 | ||||||
| 242,803 | Wachovia Bank NA, | ||||||
| 3.0013%, 05/01/09 | 240,130 | ||||||
| 658,214 | |||||||
| Government Agencies – 2.7% | |||||||
| 453,232 | Federal Home Loan Banks, | ||||||
| 0.645%, 03/02/09 | 452,974 | ||||||
| 452,974 | |||||||
| Shares | |||||||
| Investment Companies – 25.8% | |||||||
| 4,178,329 | Mount Vernon | ||||||
| Securities Lending Trust – | |||||||
| Prime Portfolio | 4,178,329 | ||||||
| 109,173 | Reserve Primary Fund # | 109,173 | |||||
| 4,287,502 | |||||||
| Total Investments Purchased | |||||||
| With Cash Proceeds From | |||||||
| Securities Lending | |||||||
| (Cost $6,867,026) | 6,867,026 | ||||||
| Total Investments | |||||||
| (Cost $27,178,508) – | |||||||
| 141.3% | 23,471,214 | ||||||
| Liabilities in Excess of | |||||||
| Other Assets – (41.3)% | (6,860,991 | ) | |||||
| TOTAL NET | |||||||
| ASSETS – 100.0% | $ | 16,610,223 | |||||
| * | Non-Income Producing |
| f | Foreign Security |
| # | Priced at Fair Value by the Valuation Committee as delegated by the Baird Funds’ Board of Directors |
The accompanying notes are an integral part of these financial statements.
Page 11
Baird LargeCap Fund
Schedule of Investments December 31, 2008 |
SFAS 157 – Summary of Fair Value Exposure at December 31, 2008
In September 2006, the Financial Accounting Standards Board issued Statement of Financial Accounting Standards No. 157, “Fair Value Measurements” (“SFAS 157”) effective for fiscal years beginning after November 15, 2007. SFAS 157 defines fair value, establishes a framework for measuring fair value in generally accepted accounting principles (GAAP), and expands disclosures about fair value measurements. The Fund adopted SFAS 157 as of January 1, 2008. Under SFAS 157, various inputs are used in determining the value of the Fund’s investments. These inputs are summarized into three broad levels and described below:
| Level 1 – | Quoted prices in active markets for identical securities. |
| Level 2 – | Other significant observable inputs (including quoted prices for similar securities, interest rates, prepayment speeds, credit risk, etc.) |
| Level 3 – | Significant unobservable inputs (including the Fund’s own assumptions in determining the fair value of investments) |
The following is a summary of the inputs used to value the Fund’s investments as of December 31, 2008:
| Description | Investments, at Value | |||
| Level 1 – Quoted prices | $ | 20,782,517 | ||
| Level 2 – Other significant observable inputs | 2,579,524 | |||
| Level 3 – Significant unobservable inputs | 109,173 | |||
| Total | $ | 23,471,214 | ||
Following is a reconciliation of Level 3 investments for which significant unobservable inputs were used to determine fair value.
| Investments, at Value | ||||
| Balance as of 12/31/07 | $ | 281,847 | ||
| Accrued discounts / premiums | — | |||
| Realized gain (loss) | — | |||
| Change in unrealized appreciation (depreciation) | — | |||
| Net purchases (sales/paydowns) | — | |||
| Transfers in and / or out of Level 3* | (172,674 | ) | ||
| Balance as of 12/31/08 | $ | 109,173 | ||
| * | The information used in the above reconciliation represents fiscal year to date activity for any investments identified as using Level 3 inputs at either the beginning or end of the current fiscal period. Transfers in or out of Level 3 represents either the beginning value (for transfers in) or ending value (for transfers out) of any security or instrument where a change in the pricing level occurred from the beginning to the end of the period. |
Page 12
Baird MidCap Fund
Portfolio Managers’ Commentary
Our investment theme is to search for growth in a risk-controlled manner, by remaining invested in businesses across the broad economy and not making a large bet in any one sector or stock position. We did not stray from this approach amid the turmoil of the most challenging markets in more than a generation. Given the unprecedented volatility and revaluation of all equity classes, our strategy performed relatively well during 2008 against its primary benchmark, although the Baird MidCap Fund, our benchmark and the stock markets generally suffered significant losses in 2008, particularly during the final three and a half months of the year.
Specifically, the MidCap Fund’s Institutional Class shares posted a total return in 2008 of - -41.53% (-41.70% for the Investor Class shares), which was 2.79% better than the - -44.32% return for the Russell Midcap® Growth Index, which is the Fund’s primary benchmark. However, the MidCap Fund’s performance lagged the -35.90% return of the S&P 400 Mid Cap® Index. In short, it was a dismal year for investing in equities and the MidCap Fund was no exception.
Overall the performance of mid-cap stocks in 2008 was a year of two halves. During the first half of the year, performance was dominated by commodity oriented cyclicals such as energy, industrials and basic materials. Oil prices, which peaked at $147 per barrel, drove share prices higher in that volatile sector through June. Additionally, companies with significant international exposure continued to exhibit strong relative revenue and earnings growth as foreign economies had yet to follow the U.S. economic deterioration. Additionally, a weak U.S. dollar in the first half of the year caused foreign earnings to be favorable as compared to the results of U.S.-domiciled companies. Traditional growth sectors, such as consumer discretionary and healthcare, were not in favor with many investors due to the building strains on consumer spending and fears over the potential for onerous regulation and government intervention in healthcare markets. The MidCap Fund’s performance lagged during the first half as our more balanced approach continued to focus on long-term investment in growth companies that meet our parameters. We remained invested in the financial sector in the first half, while the benchmark weighting was much lower than normal. In the second half of the year, the overall benchmark became extremely over-weight in commodities and deep cyclicals. We chose not to be overweight in those two sectors which helped our performance in the second half.
As it became clearer that the economic deterioration was indeed a global phenomenon, coupled with significant stimulus from the U.S. Treasury and Federal Reserve, investment results and investor sentiment changed during the second half of 2008. Commodity prices fell, earnings estimates for international companies were slashed and share prices for those companies came under significant pressure. That environment led to a change in mid-cap leadership, with companies exhibiting more consistent revenue and earnings and generally appearing to be of higher quality, becoming more valuable. This rotation to higher quality companies benefitted shareholders during the second half of 2008, and resulted in superior investment returns relative to the primary benchmark for both the second half and the year as a whole.
Several sectors had positive relative performance against the benchmark index during 2008. Generally speaking, we maintained overweight positions in financial services and consumer discretionary throughout 2008. We were equal weight in producer durables and energy in the first half, and moved to underweight in the second half. And we maintained an underweight position in materials and processors for the entire year. Specifically, our technology holdings helped performance, with microcontroller maker Microchip Tech, asset positioning technology maker Trimble, and defense contractor Harris Corp. showing positive variances. Consumer discretionary companies also helped performance with
Page 13
Baird MidCap Fund
Strayer Education, industrial distributor Fastenal and retailer Petsmart leading that segment. Those names more than offset disappointing results from outdoor advertising company Lamar and video entertainment retailer Gamestop. Finally, our holdings of Airgas, an industrial gas distributor, Aptar Group, a specialty packaging company, and Ecolab, a cleaning supplies distributor, resulted in the MidCap Fund’s holdings in the materials sector outperforming that sector’s performance in the benchmark index.
The MidCap Fund’s holdings in consumer staples, auto and transportation and healthcare lagged the benchmark during the year. Whole Foods and United Natural Foods were both underperformers during 2008 in the staples area. Oshkosh, a manufacturer of military vehicles and mobile lift platforms, declined as a result of a slowdown in commercial construction, leading to underperformance in the auto/transport sector, and Hologic, a healthcare company focused on women’s health products, faced the headwinds of assimilating a large acquisition and delays in approval of a major new product initiative. One particular bright spot in healthcare was our holding of specialty pharmaceutical companies Cephalon and United Therapeutics, which enjoyed positive absolute returns for the year.
The financials sector, obviously under great pressure due to the financial crisis, had mixed results during the year. Bank holdings East West Bank, investment manager Eaton Vance and payroll processor Paychex lagged for the year and were offset by better than benchmark segment returns in processors Alliance Data and Global Payments, and timely sales of mutual fund company Janus and M&I Marshall and Ilsley Bank.
Much of the data continues to signal that economic hardship is still to come, yet there is some evidence that the credit markets are beginning to thaw and additional federal governmental intervention may improve the credit markets and economic conditions generally. At this juncture, it is difficult to predict whether we are in the bottoming phase of the current bear market and whether a new bull market will emerge in 2009.
In the meantime, we will closely watch the upcoming economic reports. We will also pay close attention to key market signals coming from the early cyclical industries like the retail, industrial and transportation stocks. Keep in mind that stocks begin to bottom well in advance of the bad news coming to an end. History has shown us, for example, that unemployment will continue to rise for months after the stock market has already turned. The jury is still out, but if history is a guide, markets do reach bottom and the recovery may not be too far out.
Portfolio Managers:
Carla N. Cooper, CFA
J. Bary Morgan, CFA
Chuck Severson, CFA
Page 14
Baird MidCap Fund
A December 31, 2008 summary of the Fund’s top 10 holdings and equity sector analysis compared to the Russell Midcap® Growth Index is shown below.
| Top 10 Holdings* | Equity Sector Analysis** | ||
| Cephalon, Inc. | 3.4% | 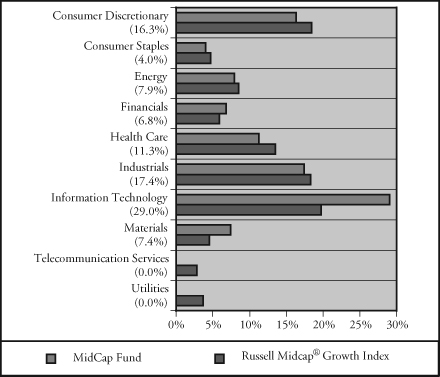 | |
| Iron Mountain Incorporated | 2.9% | ||
| Roper Industries, Inc. | 2.7% | ||
| Petsmart, Inc. | 2.7% | ||
| Fiserv, Inc. | 2.6% | ||
| Harris Corporation | 2.6% | ||
| Aptar Group, Inc. | 2.5% | ||
| Dolby Laboratories, Inc. | 2.4% | ||
| Stericycle, Inc. | 2.4% | ||
| Airgas, Inc. | 2.4% | ||
| Net Assets: | $19,726,820 | ||
| Portfolio Turnover Rate: | 74.0% | ||
| Number of Equity Holdings: | 55 | ||
| Annualized Portfolio Expense Ratio:*** | |||
| INSTITUTIONAL CLASS: | 0.85% | ||
| INVESTOR CLASS: | 1.10% | **** | |
| * | The Fund’s portfolio composition is subject to change and there is no assurance that the Fund will continue to hold any particular security. Percentages shown relate to the Fund’s total net assets as of December 31, 2008. |
| ** | Percentages shown in parentheses relate to the Fund’s total equity investments as of December 31, 2008, and may not add up to 100% due to rounding. |
| *** | The Advisor has contractually agreed to limit the Fund’s total annual fund operating expenses to 0.85% of average daily net assets for the Institutional Class shares and 1.10% of average daily net assets for the Investor Class shares, at least through April 30, 2010. |
| **** | Includes 0.25% 12b-1 fee. |
Page 15
Baird MidCap Fund
| Institutional Class |
| Value of a $25,000 Investment |
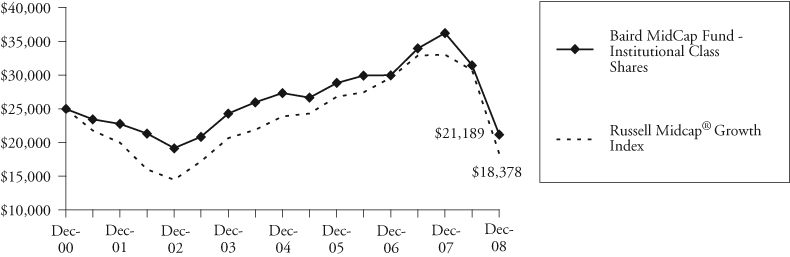 |
Growth of a hypothetical investment of $25,000 made on the Fund’s inception date (12/29/00), assuming reinvestment of all distributions.
| Investor Class |
| Value of a $10,000 Investment |
 |
Growth of a hypothetical investment of $10,000 made on the Fund’s inception date (12/29/00), assuming reinvestment of all distributions.
Page 16
Baird MidCap Fund
Average Annual Total Returns
| For the Periods Ended December 31, 2008 | One Year | Five Years | Since Inception(1) |
| Institutional Class Shares | -41.53% | -2.70% | -2.05% |
| Investor Class Shares | -41.70% | -2.92% | -2.27% |
Russell Midcap® Growth Index(2) | -44.32% | -2.33% | -4.08% |
| (1) | For the period from December 29, 2000 (commencement of operations) through December 31, 2008. |
| (2) | The Russell Midcap® Growth Index measures the performance of those Russell Midcap® Index companies with higher price-to-book ratios and higher forecasted growth rates. The Russell Midcap® Index consists of the 800 smallest companies in the Russell 1000® Index, which represent approximately 31% of the total market capitalization of the Russell 1000® Index. The Russell 1000® Index consists of the largest companies in the Russell 3000® Index, which in turn is comprised of the 3,000 largest U.S. domiciled publicly traded common stocks by market capitalization. These indices do not reflect any deduction for fees, expenses or taxes. A direct investment in an index is not possible. |
The returns shown in the table above and line graphs on the previous page reflect reinvestment of dividends and/or capital gains distributions in additional shares. The returns do not reflect the deduction of taxes that a shareholder would pay on Fund distributions or the redemption of Fund shares.
Past performance does not guarantee future results. Investment return and principal value will fluctuate so that an investor’s shares, when redeemed, may be worth more or less than their original cost.
For information about the performance of the Fund as of the most recent month-end, please call 1-866-44BAIRD or visit www.bairdfunds.com. Mutual fund performance changes over time and current performance may be lower or higher than that stated.
Page 17
Baird MidCap Fund
Schedule of Investments December 31, 2008 |
| Shares | Value | ||||||
| COMMON STOCKS – 96.8% | |||||||
| Air Freight & Logistics – 1.7% | |||||||
| 10,354 | Expeditors International | ||||||
| of Washington, Inc. | $ | 344,478 | |||||
| Biotechnology – 5.3% | |||||||
| 8,807 | Cephalon, Inc.* | 678,491 | |||||
| 5,725 | United Therapeutics | ||||||
| Corporation* | 358,099 | ||||||
| 1,036,590 | |||||||
| Capital Markets – 4.1% | |||||||
| 16,156 | Eaton Vance Corporation | 339,437 | |||||
| 3,588 | Greenhill & Co., Inc. | 250,335 | |||||
| 5,970 | T. Rowe Price Group Inc. | 211,577 | |||||
| 801,349 | |||||||
| Chemicals – 4.7% | |||||||
| 12,033 | Airgas, Inc. | 469,167 | |||||
| 12,807 | Ecolab, Inc. | 450,166 | |||||
| 919,333 | |||||||
| Commercial Banks – 2.5% | |||||||
| 5,688 | PrivateBancorp, Inc. | 184,632 | |||||
| 12,782 | Zions Bancorporation | 313,287 | |||||
| 497,919 | |||||||
| Commercial Services & Supplies – 2.4% | |||||||
| 9,097 | Stericycle, Inc.* | 473,772 | |||||
| Communications Equipment – 6.8% | |||||||
| 14,745 | Dolby Laboratories, Inc.* | 483,046 | |||||
| 15,205 | F5 Networks, Inc.* | 347,586 | |||||
| 13,493 | Harris Corporation | 513,409 | |||||
| 1,344,041 | |||||||
| Computers & Peripherals – 1.3% | |||||||
| 17,849 | NetApp, Inc.* | 249,351 | |||||
| Construction & Engineering – 1.0% | |||||||
| 8,848 | Foster Wheeler Ltd* f | 206,866 | |||||
| Containers & Packaging – 2.5% | |||||||
| 13,795 | AptarGroup, Inc. | 486,136 | |||||
| Distributors – 2.1% | |||||||
| 35,733 | LKQ Corporation* | 416,647 | |||||
| Diversified Consumer Services – 1.6% | |||||||
| 1,454 | Strayer Education, Inc. | 311,752 | |||||
| Electrical Equipment – 2.7% | |||||||
| 12,152 | Roper Industries, Inc. | 527,518 | |||||
| Electronic Equipment & Instruments – 1.5% | |||||||
| 13,939 | Trimble | ||||||
| Navigation Limited* | 301,222 | ||||||
| Energy Equipment & Services – 5.5% | |||||||
| 17,999 | Cameron International | ||||||
| Corporation* | 368,979 | ||||||
| 4,250 | CARBO Ceramics Inc. | 151,002 | |||||
| 14,455 | Oceaneering | ||||||
| International, Inc.* | 421,219 | ||||||
| 6,430 | Smith International, Inc. | 147,183 | |||||
| 1,088,383 | |||||||
| Food Products – 3.8% | |||||||
| 17,925 | Hain Celestial Group Inc.* | 342,188 | |||||
| 12,992 | McCormick & Co, | ||||||
| Incorporated | 413,925 | ||||||
| 756,113 | |||||||
| Health Care Equipment & Supplies – 1.0% | |||||||
| 6,200 | Thoratec Corporation* | 201,438 | |||||
| Health Care Providers & Services – 1.9% | |||||||
| 18,850 | VCA Antech, Inc.* | 374,738 | |||||
| Hotels Restaurants & Leisure – 1.7% | |||||||
| 13,950 | Burger King Holdings Inc. | 333,126 | |||||
| Internet Software & Services – 1.3% | |||||||
| 17,417 | Akamai Technologies, Inc.* | 262,823 | |||||
| IT Services – 10.4% | |||||||
| 9,644 | Alliance Data | ||||||
| Systems Corporation* | 448,735 | ||||||
| 14,399 | Fiserv, Inc.* | 523,692 | |||||
| 10,321 | Hewitt Associates, | ||||||
| Inc. – Class A* | 292,910 | ||||||
The accompanying notes are an integral part of these financial statements.
Page 18
Baird MidCap Fund
Schedule of Investments December 31, 2008 |
| Shares | Value | ||||||
| COMMON STOCKS – 96.8% (cont.) | |||||||
| IT Services – 10.4% (cont.) | |||||||
| 23,408 | Iron Mountain | ||||||
| Incorporated* | $ | 578,880 | |||||
| 7,585 | Paychex, Inc. | 199,334 | |||||
| 2,043,551 | |||||||
| Life Sciences Tools & Services – 2.8% | |||||||
| 7,150 | Illumina, Inc.* | 186,258 | |||||
| 15,525 | Life Technologies | ||||||
| Corporation* | 361,888 | ||||||
| 548,146 | |||||||
| Machinery – 5.8% | |||||||
| 11,870 | Bucyrus International, | ||||||
| Inc. – Class A | 219,832 | ||||||
| 10,278 | Harsco Corporation | 284,495 | |||||
| 13,200 | IDEX Corporation | 318,780 | |||||
| 7,874 | Wabtec Corporation | 312,992 | |||||
| 1,136,099 | |||||||
| Media – 1.1% | |||||||
| 16,620 | Lamar Advertising | ||||||
| Co. – Class A* | 208,747 | ||||||
| Oil & Gas – 2.1% | |||||||
| 14,384 | Southwestern | ||||||
| Energy Company* | 416,704 | ||||||
| Road & Rail – 1.1% | |||||||
| 7,995 | J.B. Hunt Transport | ||||||
| Services, Inc. | 210,029 | ||||||
| Semiconductor & Semiconductor Equipment – 3.5% | |||||||
| 19,188 | Microchip Technology | ||||||
| Incorporated | 374,742 | ||||||
| 17,900 | Varian Semiconductor | ||||||
| Equipment | |||||||
| Associates, Inc.* | 324,348 | ||||||
| 699,090 | |||||||
| Software – 3.2% | |||||||
| 18,614 | Citrix Systems, Inc.* | 438,732 | |||||
| 14,175 | Cogent Inc.* | 192,355 | |||||
| 631,087 | |||||||
| Specialty Retail – 8.3% | |||||||
| 11,879 | Advance Auto Parts, Inc. | 399,728 | |||||
| 28,656 | Dick’s Sporting Goods, Inc.* | 404,336 | |||||
| 14,020 | Gamestop Corporation – | ||||||
| Class A* | 303,673 | ||||||
| 28,495 | Petsmart, Inc. | 525,733 | |||||
| 1,633,470 | |||||||
| Textiles, Apparel & Luxury Goods – 1.0% | |||||||
| 10,202 | Phillips-Van Heusen | ||||||
| Corporation | 205,366 | ||||||
| Trading Companies & Distributors – 2.1% | |||||||
| 12,151 | Fastenal Company | 423,462 | |||||
| Total Common Stocks | |||||||
| (Cost $22,998,632) | 19,089,346 | ||||||
| SHORT-TERM INVESTMENTS – 1.7% | |||||||
| Money Market Mutual Funds – 1.7% | |||||||
| 342,271 | Short-Term Investment | ||||||
| Company Liquid Assets | |||||||
| Portfolio – AIM Fund | 342,271 | ||||||
| Total Short-Term | |||||||
| Investments | |||||||
| (Cost $342,271) | 342,271 | ||||||
| Principal | |||||||
| Amount | |||||||
| INVESTMENTS PURCHASED | |||||||
| WITH CASH PROCEEDS FROM | |||||||
| SECURITIES LENDING – 34.5% | |||||||
| Certificates of Deposit – 6.1% | |||||||
| $ | 268,409 | Abbey National Treasury | |||||
| Service, Series YCD1, | |||||||
| 1.09%, 02/20/09 | 268,387 | ||||||
| 268,409 | Barclays Bank, | ||||||
| 3.3615%, 03/16/09 | 268,198 | ||||||
The accompanying notes are an integral part of these financial statements.
Page 19
Baird MidCap Fund
Schedule of Investments December 31, 2008 |
| Principal | ||||||||
| Amount | Value | |||||||
| INVESTMENTS PURCHASED | ||||||||
| WITH CASH PROCEEDS FROM | ||||||||
| SECURITIES LENDING – 34.5% (cont.) | ||||||||
| Certificates of Deposit – 6.1% (cont.) | ||||||||
| Natixis Bank of New York, | ||||||||
| Series YCD1: | ||||||||
| $ | 189,465 | 0.89%, 02/18/09 | $ | 189,453 | ||||
| 157,887 | 0.89%, 06/30/09 | 158,147 | ||||||
| 236,831 | Royal Bank of | |||||||
| Scotland Group PLC, | ||||||||
| 2.9944%, 05/06/09 | 236,826 | |||||||
| 78,944 | Societe Generale of | |||||||
| New York, Series YCD1, | ||||||||
| 2.0625%, 02/20/09 | 78,939 | |||||||
| 1,199,950 | ||||||||
| Commercial Paper – 1.7% | ||||||||
| 339,756 | Atlantic East | |||||||
| Funding LLC, | ||||||||
| 3.0588%, 03/25/09 # | 339,756 | |||||||
| 339,756 | ||||||||
| Corporate Bonds and Notes – 3.3% | ||||||||
| Allstate Life GL: | ||||||||
| 173,676 | 3.0575%, 03/20/09 | 172,535 | ||||||
| 78,944 | 1.775%, 07/21/09 | 77,459 | ||||||
| 157,887 | Svenska Handelsbanken, | |||||||
| 4.41%, 08/06/09 | 157,807 | |||||||
| 236,831 | Wachovia Bank NA, | |||||||
| 3.0013%, 05/01/09 | 234,224 | |||||||
| 642,025 | ||||||||
| Government Agencies – 2.2% | ||||||||
| 442,085 | Federal Home Loan Banks, | |||||||
| 0.645%, 03/02/09 | 441,833 | |||||||
| 441,833 | ||||||||
| Shares | ||||||||
| Investment Companies – 21.2% | ||||||||
| 4,075,559 | Mount Vernon | |||||||
| Securities Lending Trust – | ||||||||
| Prime Portfolio | 4,075,559 | |||||||
| 106,487 | Reserve Primary Fund # | 106,487 | ||||||
| 4,182,046 | ||||||||
| Total Investments Purchased | ||||||||
| With Cash Proceeds From | ||||||||
| Securities Lending | ||||||||
| (Cost $6,805,610) | 6,805,610 | |||||||
| Total Investments | ||||||||
| (Cost $30,146,513) – | ||||||||
| 133.0% | 26,237,227 | |||||||
| Liabilities in Excess of | ||||||||
| Other Assets – (33.0)% | (6,510,407 | ) | ||||||
| TOTAL NET | ||||||||
| ASSETS – 100.0% | $ | 19,726,820 | ||||||
| * | Non-Income Producing |
| f | Foreign Security |
| # | Priced at Fair Value by the Valuation Committee as delegated by the Baird Funds’ Board of Directors |
The accompanying notes are an integral part of these financial statements.
Page 20
Baird MidCap Fund
Schedule of Investments December 31, 2008 |
SFAS 157 – Summary of Fair Value Exposure at December 31, 2008
In September 2006, the Financial Accounting Standards Board issued Statement of Financial Accounting Standards No. 157, “Fair Value Measurements” (“SFAS 157”) effective for fiscal years beginning after November 15, 2007. SFAS 157 defines fair value, establishes a framework for measuring fair value in generally accepted accounting principles (GAAP), and expands disclosures about fair value measurements. The Fund adopted SFAS 157 as of January 1, 2008. Under SFAS 157, various inputs are used in determining the value of the Fund’s investments. These inputs are summarized into three broad levels and described below:
| Level 1 – | Quoted prices in active markets for identical securities. |
| Level 2 – | Other significant observable inputs (including quoted prices for similar securities, interest rates, prepayment speeds, credit risk, etc.) |
| Level 3 – | Significant unobservable inputs (including the Fund’s own assumptions in determining the fair value of investments) |
The following is a summary of the inputs used to value the Fund’s investments as of December 31, 2008:
| Description | Investments, at Value | |||
| Level 1 – Quoted prices | $ | 23,507,176 | ||
| Level 2 – Other significant observable inputs | 2,623,564 | |||
| Level 3 – Significant unobservable inputs | 106,487 | |||
| Total | $ | 26,237,227 | ||
Following is a reconciliation of Level 3 investments for which significant unobservable inputs were used to determine fair value.
| Investments, at Value | ||||
| Balance as of 12/31/07 | $ | 402,130 | ||
| Accrued discounts / premiums | — | |||
| Realized gain (loss) | — | |||
| Change in unrealized appreciation (depreciation) | — | |||
| Net purchases (sales/paydowns) | — | |||
| Transfers in and / or out of Level 3* | (295,643 | ) | ||
| Balance as of 12/31/08 | $ | 106,487 | ||
| * | The information used in the above reconciliation represents fiscal year to date activity for any investments identified as using Level 3 inputs at either the beginning or end of the current fiscal period. Transfers in or out of Level 3 represents either the beginning value (for transfers in) or ending value (for transfers out) of any security or instrument where a change in the pricing level occurred from the beginning to the end of the period. |
Page 21
Baird Funds, Inc.
Additional Information on Fund Expenses December 31, 2008 |
Example
As a shareholder of a mutual fund, you incur two types of costs: (1) transaction costs, which may include sales charges (loads) on purchase payments, reinvested dividends, or other distributions; redemption fees; and exchange fees; and (2) ongoing costs, such as management fees; distribution and/or service (12b-1) fees; and other fund expenses. Although the Funds do not charge any sales loads, redemption fees, or other transaction fees, you will be assessed fees for outgoing wire transfers, returned checks and stop payment orders at prevailing rates charged by U.S. Bancorp Fund Services, LLC, the Fund’s transfer agent. If you request that a redemption be made by wire transfer, currently the Fund’s transfer agent charges a $15.00 fee.
This Example is intended to help you understand your ongoing costs (in dollars) of investing in each Fund and to compare these costs with the ongoing costs of investing in other mutual funds. The Example is based on an investment of $1,000 invested at the beginning of the period and held for the entire period (7/1/08 – 12/31/08).
Actual Expenses
The third and fourth columns of the following table provide information about account values based on actual returns and actual expenses. You may use the information in these columns, together with the amount you invested, to estimate the expenses that you paid over the period. Simply divide your account value by $1,000 (for example, an $8,600 account value divided by $1,000 – 8.6), then multiply the result by the number in the fourth column entitled “Expenses Paid During Period’’ to estimate the expenses you paid on your account during this period.
Hypothetical Example for Comparison Purposes
The fifth and sixth columns of the following table provide information about hypothetical account values and hypothetical expenses based on the Funds’ actual expense ratios and an assumed rate of return of 5% per year before expenses, which is not the Funds’ actual return. The hypothetical account values and expenses may not be used to estimate the actual ending account balance or expenses you paid for the period. You may use this information to compare the ongoing costs of investing in the Funds and other mutual funds. To do so, compare this 5% hypothetical example with the 5% hypothetical examples that appear in the shareholder reports of the other mutual funds. Please note that the expenses shown in the table are meant to highlight your ongoing costs only and do not reflect any transactional costs. Therefore, the sixth column of the table (entitled “Expenses Paid During Period”) is useful in comparing ongoing costs only, and will not help you determine the relative total costs of owning different mutual funds. In addition, if these transactional costs were included, your costs could have been higher.
Page 22
Baird Funds, Inc.
Additional Information on Fund Expenses December 31, 2008 |
Actual vs. Hypothetical Returns
For the Six Months Ended December 31, 2008
| Hypothetical (5% return | |||||||
| Actual | before expenses) | ||||||
| Fund’s | Beginning | Ending | Expenses | Ending | Expenses | ||
| Annualized | Account | Account | Paid | Account | Paid | ||
| Expense | Value | Value | During | Value | During | ||
Ratio(1) | 7/1/08 | 12/31/08 | Period(1) | 12/31/08 | Period(1) | ||
| Baird LargeCap Fund | |||||||
| Institutional Class | 0.75% | $1,000.00 | $648.40 | $3.11 | $1,021.37 | $3.81 | |
| Investor Class | 1.00% | $1,000.00 | $648.10 | $4.14 | $1,020.11 | $5.08 | |
| Baird MidCap Fund | |||||||
| Institutional Class | 0.85% | $1,000.00 | $673.60 | $3.58 | $1,020.86 | $4.32 | |
| Investor Class | 1.10% | $1,000.00 | $672.40 | $4.62 | $1,019.61 | $5.58 | |
| (1) | Expenses are equal to the Fund’s annualized expense ratio multiplied by the average account value over the period, multiplied by 184 days and divided by 366 to reflect the one-half year period. |
Page 23
Baird Funds, Inc.
Statements of Assets and Liabilities December 31, 2008 |
| Baird LargeCap | Baird MidCap | |||||||
| Fund | Fund | |||||||
| ASSETS: | ||||||||
| Investments, at value | $ | 23,471,214 | $ | 26,237,227 | ||||
| (cost $27,178,508 and $30,146,513, respectively) | ||||||||
| Dividends receivable | 24,816 | 6,551 | ||||||
| Interest receivable | 1,106 | 1,017 | ||||||
| Receivable for investments sold | 86,504 | 777,173 | ||||||
| Receivable for fund shares sold | — | 2,700 | ||||||
| Other assets | 7,699 | 5,481 | ||||||
| Total assets | 23,591,339 | 27,030,149 | ||||||
| LIABILITIES: | ||||||||
| Payable for collateral received for securities loaned | 6,867,026 | 6,805,610 | ||||||
| Payable to Advisor and Distributor | 1,493 | 3,470 | ||||||
| Payable to custodian | 9,431 | 26,460 | ||||||
| Payable for securities purchased | 76,711 | 309,599 | ||||||
| Payable for fund shares redeemed | — | 126,677 | ||||||
| Accrued expenses and other liabilities | 26,455 | 31,513 | ||||||
| Total liabilities | 6,981,116 | 7,303,329 | ||||||
| NET ASSETS | $ | 16,610,223 | $ | 19,726,820 | ||||
| NET ASSETS CONSIST OF: | ||||||||
| Capital stock | $ | 24,464,353 | $ | 26,904,953 | ||||
| Accumulated undistributed net investment income | 198 | — | ||||||
| Accumulated net realized loss on investments sold | (4,147,034 | ) | (3,268,847 | ) | ||||
| Net unrealized depreciation on investments | (3,707,294 | ) | (3,909,286 | ) | ||||
| NET ASSETS | $ | 16,610,223 | $ | 19,726,820 | ||||
| INSTITUTIONAL CLASS SHARES | ||||||||
| Net Assets | $ | 16,349,025 | $ | 18,163,034 | ||||
| Shares outstanding | ||||||||
| ($0.01 par value, unlimited shares authorized) | 2,924,270 | 3,228,019 | ||||||
| Net asset value, offering and redemption price per share | $ | 5.59 | $ | 5.63 | ||||
| INVESTOR CLASS SHARES | ||||||||
| Net Assets | $ | 261,198 | $ | 1,563,786 | ||||
| Shares outstanding | ||||||||
| ($0.01 par value, unlimited shares authorized) | 46,755 | 284,906 | ||||||
| Net asset value, offering and redemption price per share | $ | 5.59 | $ | 5.49 | ||||
The accompanying notes are an integral part of these financial statements.
Page 24
Baird Funds, Inc.
Statements of Operations Year Ended December 31, 2008 |
| Baird | Baird | |||||||
| LargeCap Fund | MidCap Fund | |||||||
| INVESTMENT INCOME: | ||||||||
| Dividends | $ | 225,999 | $ | 217,585 | ||||
| Interest | 18,796 | 30,408 | ||||||
| Income from securities lending (Note 6) | 12,824 | 22,317 | ||||||
| Total investment income | 257,619 | 270,310 | ||||||
| EXPENSES: | ||||||||
| Investment advisory fees | 155,998 | 221,704 | ||||||
| Administration fees | 7,023 | 8,689 | ||||||
| Shareholder servicing fees | 15,603 | 15,145 | ||||||
| Fund accounting fees | 8,801 | 9,829 | ||||||
| Professional fees | 30,324 | 30,321 | ||||||
| Federal and state registration | 27,414 | 27,355 | ||||||
| Directors fees | 26,336 | 26,236 | ||||||
| Custody fees | 4,483 | 6,335 | ||||||
| Reports to shareholders | 3,014 | 5,236 | ||||||
| Distribution fees – Investor Class Shares (Note 8) | 1,391 | 8,617 | ||||||
| Interest expense (Note 7) | — | 106 | ||||||
| Miscellaneous expenses | 1,683 | 2,352 | ||||||
| Total expenses | 282,070 | 361,925 | ||||||
| Expense reimbursement by Advisor (Note 5) | (99,829 | ) | (101,968 | ) | ||||
| Total expenses | 182,241 | 259,957 | ||||||
| NET INVESTMENT INCOME | 75,378 | 10,353 | ||||||
| REALIZED AND UNREALIZED | ||||||||
| LOSS ON INVESTMENTS: | ||||||||
| Net realized loss on investments | (2,680,501 | ) | (2,859,632 | ) | ||||
| Change in unrealized appreciation/depreciation on investments | (8,322,225 | ) | (12,378,757 | ) | ||||
| Net realized and unrealized loss on investments | (11,002,726 | ) | (15,238,389 | ) | ||||
| NET DECREASE IN NET ASSETS | ||||||||
| RESULTING FROM OPERATIONS | $ | (10,927,348 | ) | $ | (15,228,036 | ) | ||
The accompanying notes are an integral part of these financial statements.
Page 25
Baird Funds, Inc.
| Statements of Changes in Net Assets |
| Baird LargeCap Fund | ||||||||
| Year Ended | Year Ended | |||||||
| December 31, 2008 | December 31, 2007 | |||||||
| OPERATIONS: | ||||||||
| Net investment income | $ | 75,378 | $ | 69,718 | ||||
| Net realized gain (loss) on investments | (2,680,501 | ) | 1,295,539 | |||||
| Change in unrealized appreciation/depreciation on investments | (8,322,225 | ) | 1,311,455 | |||||
| Net increase (decrease) in net assets resulting from operations | (10,927,348 | ) | 2,676,712 | |||||
| CAPITAL SHARE TRANSACTIONS: | ||||||||
| Proceeds from shares sold | 2,906,588 | 6,164,640 | ||||||
| Shares issued to holders in reinvestment of dividends | 80,523 | 62,978 | ||||||
| Cost of shares redeemed | (3,752,903 | ) | (8,986,143 | ) | ||||
| Net decrease in net assets resulting | ||||||||
| from capital share transactions | (765,792 | ) | (2,758,525 | ) | ||||
| DISTRIBUTIONS TO | ||||||||
| INSTITUTIONAL CLASS SHAREHOLDERS: | ||||||||
| From net investment income | (81,425 | ) | (63,676 | ) | ||||
| TOTAL DECREASE IN NET ASSETS | (11,774,565 | ) | (145,489 | ) | ||||
| NET ASSETS: | ||||||||
| Beginning of year | 28,384,788 | 28,530,277 | ||||||
| End of year (including undistributed net investment income | ||||||||
| of $198 and $6,245, respectively) | $ | 16,610,223 | $ | 28,384,788 | ||||
The accompanying notes are an integral part of these financial statements.
Page 26
Baird Funds, Inc.
| Statements of Changes in Net Assets |
| Baird MidCap Fund | ||||||||
| Year Ended | Year Ended | |||||||
| December 31, 2008 | December 31, 2007 | |||||||
| OPERATIONS: | ||||||||
| Net investment income (loss) | $ | 10,353 | $ | (34,555 | ) | |||
| Net realized gain (loss) on investments | (2,859,632 | ) | 6,233,273 | |||||
| Change in unrealized appreciation/depreciation on investments | (12,378,757 | ) | 1,141,357 | |||||
| Net increase (decrease) in net assets resulting from operations | (15,228,036 | ) | 7,340,075 | |||||
| CAPITAL SHARE TRANSACTIONS: | ||||||||
| Proceeds from shares sold | 3,082,022 | 10,258,071 | ||||||
| Shares issued to holders in reinvestment of dividends | 14,311 | 5,849,724 | ||||||
| Cost of shares redeemed | (9,527,280 | ) | (13,209,733 | ) | ||||
| Net increase (decrease) in net assets resulting | ||||||||
| from capital share transactions | (6,430,947 | ) | 2,898,062 | |||||
| DISTRIBUTIONS TO | ||||||||
| INSTITUTIONAL CLASS SHAREHOLDERS: | ||||||||
| From net investment income | (14,588 | ) | — | |||||
| From net realized gains | — | (5,482,243 | ) | |||||
| (14,588 | ) | (5,482,243 | ) | |||||
| DISTRIBUTIONS TO | ||||||||
| INVESTOR CLASS SHAREHOLDERS: | ||||||||
| From net realized gains | — | (436,338 | ) | |||||
| TOTAL INCREASE (DECREASE) IN NET ASSETS | (21,673,571 | ) | 4,319,556 | |||||
| NET ASSETS: | ||||||||
| Beginning of year | 41,400,391 | 37,080,835 | ||||||
| End of year | $ | 19,726,820 | $ | 41,400,391 | ||||
The accompanying notes are an integral part of these financial statements.
Page 27
Baird Funds, Inc.
| Financial Highlights |
| Baird LargeCap Fund – Institutional Class | ||||||||||||||||||||
| Year Ended December 31, | ||||||||||||||||||||
| 2008 | 2007 | 2006 | 2005 | 2004 | ||||||||||||||||
| Per Share Data: | ||||||||||||||||||||
| Net asset value, beginning of period | $ | 9.33 | $ | 8.53 | $ | 8.33 | $ | 8.13 | $ | 7.78 | ||||||||||
| Income from investment operations: | ||||||||||||||||||||
| Net investment income | 0.03 | 0.02 | 0.04 | 0.04 | (1) | 0.06 | (1) | |||||||||||||
| Net realized and unrealized | ||||||||||||||||||||
| gains (losses) on investments | (3.74 | ) | 0.80 | 0.20 | 0.24 | 0.35 | ||||||||||||||
| Total from investment operations | (3.71 | ) | 0.82 | 0.24 | 0.28 | 0.41 | ||||||||||||||
| Less distributions: | ||||||||||||||||||||
| Dividends from net investment income | (0.03 | ) | (0.02 | ) | (0.04 | ) | (0.08 | ) | (0.06 | ) | ||||||||||
| Net asset value, end of period | $ | 5.59 | $ | 9.33 | $ | 8.53 | $ | 8.33 | $ | 8.13 | ||||||||||
| Total return | (39.88 | %) | 9.63 | % | 2.89 | % | 3.39 | % | 5.21 | % | ||||||||||
| Supplemental data and ratios: | ||||||||||||||||||||
| Net assets, end of period | $ | 16,349,025 | $ | 27,644,009 | $ | 27,442,329 | $ | 27,375,626 | $ | 64,754,140 | ||||||||||
| Ratio of expenses to average net assets | 0.75 | % | 0.75 | % | 0.75 | % | 0.75 | % | 0.75 | % | ||||||||||
| Ratio of expenses to average | ||||||||||||||||||||
| net assets (before waivers) | 1.17 | % | 1.10 | % | 1.12 | % | 0.93 | % | 0.93 | % | ||||||||||
| Ratio of net investment income | ||||||||||||||||||||
| to average net assets | 0.32 | % | 0.25 | % | 0.44 | % | 0.46 | % | 0.72 | % | ||||||||||
| Ratio of net investment income (loss) | ||||||||||||||||||||
| to average net assets (before waivers) | (0.10 | %) | (0.10 | %) | 0.07 | % | 0.28 | % | 0.54 | % | ||||||||||
Portfolio turnover rate(2) | 43.0 | % | 72.2 | % | 63.9 | % | 28.6 | % | 23.2 | % | ||||||||||
| (1) | Calculated using average shares outstanding during the period. |
| (2) | Portfolio turnover is calculated on the basis of the Fund as a whole without distinguishing between the classes of shares issued. |
The accompanying notes are an integral part of these financial statements.
Page 28
Baird Funds, Inc.
| Financial Highlights |
| Baird LargeCap Fund – Investor Class | ||||||||||||||||||||
| Year Ended December 31, | ||||||||||||||||||||
| 2008 | 2007 | 2006 | 2005 | 2004 | ||||||||||||||||
| Per Share Data: | ||||||||||||||||||||
| Net asset value, beginning of period | $ | 9.29 | $ | 8.50 | $ | 8.29 | $ | 8.09 | $ | 7.75 | ||||||||||
| Income from investment operations: | ||||||||||||||||||||
| Net investment income | 0.00 | (1) | 0.00 | (1) | 0.01 | 0.02 | (2) | 0.04 | (2) | |||||||||||
| Net realized and unrealized | ||||||||||||||||||||
| gains (losses) on investments | (3.70 | ) | 0.79 | 0.21 | 0.23 | 0.35 | ||||||||||||||
| Total from investment operations | (3.70 | ) | 0.79 | 0.22 | 0.25 | 0.39 | ||||||||||||||
| Less distributions: | ||||||||||||||||||||
| Dividends from net investment income | — | — | (0.01 | ) | (0.05 | ) | (0.05 | ) | ||||||||||||
| Net asset value, end of period | $ | 5.59 | $ | 9.29 | $ | 8.50 | $ | 8.29 | $ | 8.09 | ||||||||||
| Total return | (39.94 | %) | 9.29 | % | 2.64 | % | 3.15 | % | 5.00 | % | ||||||||||
| Supplemental data and ratios: | ||||||||||||||||||||
| Net assets, end of period | $ | 261,198 | $ | 740,779 | $ | 1,087,948 | $ | 2,400,525 | $ | 1,900,053 | ||||||||||
| Ratio of expenses to average net assets | 1.00 | % | 1.00 | % | 1.00 | % | 1.00 | % | 1.00 | % | ||||||||||
| Ratio of expenses to average | ||||||||||||||||||||
| net assets (before waivers) | 1.42 | % | 1.35 | % | 1.37 | % | 1.18 | % | 1.18 | % | ||||||||||
| Ratio of net investment income | ||||||||||||||||||||
| to average net assets | 0.07 | % | 0.00 | % | 0.19 | % | 0.21 | % | 0.47 | % | ||||||||||
| Ratio of net investment income (loss) | ||||||||||||||||||||
| to average net assets (before waivers) | (0.35 | %) | (0.35 | %) | (0.18 | %) | 0.03 | % | 0.29 | % | ||||||||||
Portfolio turnover rate(3) | 43.0 | % | 72.2 | % | 63.9 | % | 28.6 | % | 23.2 | % | ||||||||||
| (1) | Amount is less than $0.01. |
| (2) | Calculated using average shares outstanding during the period. |
| (3) | Portfolio turnover is calculated on the basis of the Fund as a whole without distinguishing between the classes of shares issued. |
The accompanying notes are an integral part of these financial statements.
Page 29
Baird Funds, Inc.
| Financial Highlights |
| Baird MidCap Fund – Institutional Class | ||||||||||||||||||||
| Year Ended December 31, | ||||||||||||||||||||
| 2008 | 2007 | 2006 | 2005 | 2004 | ||||||||||||||||
| Per Share Data: | ||||||||||||||||||||
| Net asset value, beginning of period | $ | 9.62 | $ | 9.33 | $ | 11.12 | $ | 10.91 | $ | 9.72 | ||||||||||
| Income from investment operations: | ||||||||||||||||||||
Net investment income (loss)(1) | 0.01 | (0.01 | ) | (0.02 | ) | (0.02 | ) | (0.04 | ) | |||||||||||
| Net realized and unrealized | ||||||||||||||||||||
| gains (losses) on investments | (3.99 | ) | 1.99 | 0.46 | 0.63 | 1.25 | ||||||||||||||
| Total from investment operations | (3.98 | ) | 1.98 | 0.44 | 0.61 | 1.21 | ||||||||||||||
| Less distributions: | ||||||||||||||||||||
| Distributions from net realized gains | — | (1.69 | ) | (2.23 | ) | (0.40 | ) | (0.02 | ) | |||||||||||
| Distributions from net investment income | (0.01 | ) | — | — | — | — | ||||||||||||||
| Total distributions | (0.01 | ) | (1.69 | ) | (2.23 | ) | (0.40 | ) | (0.02 | ) | ||||||||||
| Net asset value, end of period | $ | 5.63 | $ | 9.62 | $ | 9.33 | $ | 11.12 | $ | 10.91 | ||||||||||
| Total return | (41.53 | %) | 20.89 | % | 3.93 | % | 5.56 | % | 12.44 | % | ||||||||||
| Supplemental data and ratios: | ||||||||||||||||||||
| Net assets, end of period | $ | 18,163,034 | $ | 36,616,547 | $ | 32,057,214 | $ | 85,670,669 | $ | 86,476,869 | ||||||||||
| Ratio of expenses to average net assets | 0.85 | % | 0.85 | % | 0.85 | % | 0.85 | % | 0.85 | % | ||||||||||
| Ratio of expenses to average | ||||||||||||||||||||
| net assets (before waivers) | 1.19 | % | 1.11 | % | 1.01 | % | 0.98 | % | 1.05 | % | ||||||||||
| Ratio of net investment income (loss) | ||||||||||||||||||||
| to average net assets | 0.06 | % | (0.06 | %) | (0.17 | %) | (0.21 | %) | (0.43 | %) | ||||||||||
| Ratio of net investment loss | ||||||||||||||||||||
| to average net assets (before waivers) | (0.28 | %) | (0.32 | %) | (0.33 | %) | (0.34 | %) | (0.63 | %) | ||||||||||
Portfolio turnover rate(2) | 74.0 | % | 72.3 | % | 78.6 | % | 77.4 | % | 77.9 | % | ||||||||||
| (1) | Calculated using average shares outstanding during the period. |
| (2) | Portfolio turnover is calculated on the basis of the Fund as a whole without distinguishing between the classes of shares issued. |
The accompanying notes are an integral part of these financial statements.
Page 30
Baird Funds, Inc.
| Financial Highlights |
| Baird MidCap Fund – Investor Class | ||||||||||||||||||||
| Year Ended December 31, | ||||||||||||||||||||
| 2008 | 2007 | 2006 | 2005 | 2004 | ||||||||||||||||
| Per Share Data: | ||||||||||||||||||||
| Net asset value, beginning of period | $ | 9.40 | $ | 9.17 | $ | 10.99 | $ | 10.82 | $ | 9.65 | ||||||||||
| Income from investment operations: | ||||||||||||||||||||
Net investment loss(1) | (0.02 | ) | (0.04 | ) | (0.04 | ) | (0.05 | ) | (0.07 | ) | ||||||||||
| Net realized and unrealized | ||||||||||||||||||||
| gains (losses) on investments | (3.89 | ) | 1.96 | 0.45 | 0.62 | 1.26 | ||||||||||||||
| Total from investment operations | (3.91 | ) | 1.92 | 0.41 | 0.57 | 1.19 | ||||||||||||||
| Less distributions: | ||||||||||||||||||||
| Distributions from net realized gains | — | (1.69 | ) | (2.23 | ) | (0.40 | ) | (0.02 | ) | |||||||||||
| Net asset value, end of period | $ | 5.49 | $ | 9.40 | $ | 9.17 | $ | 10.99 | $ | 10.82 | ||||||||||
| Total return | (41.70 | %) | 20.61 | % | 3.73 | % | 5.24 | % | 12.32 | % | ||||||||||
| Supplemental data and ratios: | ||||||||||||||||||||
| Net assets, end of period | $ | 1,563,786 | $ | 4,783,844 | $ | 5,023,621 | $ | 4,506,947 | $ | 3,944,857 | ||||||||||
| Ratio of expenses to average net assets | 1.10 | % | 1.10 | % | 1.10 | % | 1.10 | % | 1.10 | % | ||||||||||
| Ratio of expenses to average | ||||||||||||||||||||
| net assets (before waivers) | 1.44 | % | 1.36 | % | 1.26 | % | 1.23 | % | 1.30 | % | ||||||||||
| Ratio of net investment loss | ||||||||||||||||||||
| to average net assets | (0.19 | %) | (0.31 | %) | (0.42 | %) | (0.46 | %) | (0.68 | %) | ||||||||||
| Ratio of net investment loss | ||||||||||||||||||||
| to average net assets (before waivers) | (0.53 | %) | (0.57 | %) | (0.58 | %) | (0.59 | %) | (0.88 | %) | ||||||||||
Portfolio turnover rate(2) | 74.0 | % | 72.3 | % | 78.6 | % | 77.4 | % | 77.9 | % | ||||||||||
| (1) | Calculated using average shares outstanding during the period. |
| (2) | Portfolio turnover is calculated on the basis of the Fund as a whole without distinguishing between the classes of shares issued. |
The accompanying notes are an integral part of these financial statements.
Page 31
Baird Funds, Inc.
Notes to the Financial Statements December 31, 2008 |
| 1. | ORGANIZATION |
Baird Funds, Inc. (the “Corporation”) was incorporated on June 9, 2000 as a Wisconsin corporation and is registered as an open-end management investment company under the Investment Company Act of 1940, as amended (the “1940 Act”). The accompanying financial statements include the Baird LargeCap Fund and the Baird MidCap Fund (each a “Fund” and collectively the “Funds”), two of the eight portfolios comprising the Corporation. Pursuant to the 1940 Act, the Funds are “diversified” series of the Corporation. The investment advisor to the Funds is Robert W. Baird & Co. Incorporated (“Baird” or the “Advisor”).
The Baird LargeCap Fund commenced operations with the sale of both Institutional and Investor Class Shares on September 29, 2000. The Baird MidCap Fund commenced operations with the sale of both Institutional and Investor Class Shares on December 29, 2000. The Institutional Class Shares are not subject to a distribution and service (12b-1) fee, while the Investor Class Shares are subject to a distribution and service (12b-1) fee up to 0.25%.
The Baird LargeCap Fund seeks long-term growth of capital through investments in equity securities of large-capitalization companies. Dividend income is a secondary consideration.
The Baird MidCap Fund seeks long-term growth of capital through investments in equity securities of mid-capitalization companies.
On December 31, 2008, shareholders affiliated with the Advisor held 81.4% of the Baird LargeCap Fund and 33.2% of the Baird MidCap Fund. These shareholders included the Advisor’s participant-directed retirement and deferred compensation plans and the Baird Foundation.
| 2. | SIGNIFICANT ACCOUNTING POLICIES |
The following is a summary of significant accounting policies consistently followed by the Funds in the preparation of their financial statements. These policies are in conformity with accounting principles generally accepted in the United States of America.
| a) | Investment Valuation – Section 2(a)(41) of the 1940 Act, together with the rules and interpretations of the SEC, require the Funds, in computing NAV, to value their portfolio securities using market quotations when they are “readily available.” When market quotations are not readily available (e.g., because there is no regular market quotation for such securities, the market for such security is limited, the validity of quotations is questionable or, for debt securities, IDC does not provide a price), the Board of Directors of the Corporation must value the securities at “fair value determined in good faith.” The Board has delegated such responsibility to the Advisor pursuant to pricing policies and procedures that the Board has adopted and regularly reviews. |
| In general, the “fair value” of a security means the amount that the Funds might reasonably expect to receive for the security upon its current sale. Pursuant to Statement of Financial Accounting Standards No. 157 (“SFAS 157), “fair value” means “the price that would be received to sell [a security] in an orderly transaction between market participants at the measurement date.” |
Page 32
Baird Funds, Inc.
Notes to the Financial Statements December 31, 2008 |
| 2. | SIGNIFICANT ACCOUNTING POLICIES (cont.) |
| Consistent with Section 2(a)(41) of the 1940 Act and SFAS 157, the Funds price their securities as follows: Common stocks that are listed on a securities exchange (other than NASDAQ) are valued at the last quoted sales price. Securities traded on NASDAQ are valued at the NASDAQ Official Closing Price. Price information on listed stocks is taken from the exchange where the security is primarily traded. Securities that were not traded on the valuation date, as well as stocks that are not listed on an exchange, including NASDAQ, are valued at the average of the current bid and asked price. Debt securities are valued by an independent pricing service using valuation methods that are designed to represent fair value, such as matrix pricing and other analytical pricing models, market transactions and dealer quotations. Debt securities purchased with a remaining maturity of 60 days or less are valued at acquisition cost plus or minus any amortized discount or premium. Investments in mutual funds are valued at their stated net asset value. Other assets and securities for which no quotations are readily available are valued at fair value as determined in good faith by the Advisor in accordance with procedures approved by the Corporation’s Board of Directors. In accordance with such procedures, the Advisor may use broker quotes or, if the broker quotes are unavailable or deemed to be unreliable, fair value will be determined by a valuation committee of the Advisor. In determining fair value, the valuation committee takes into account all relevant factors and available information. Consequently, the price of the security used by a Fund to calculate its NAV may differ from quoted or published prices for the same security. Fair value pricing involves subjective judgments and there is no single standard for determining a security’s fair value. As a result, different mutual funds could reasonably arrive at a different fair value for the same security. It is possible that the fair value determined for a security is materially different from the value that could be realized upon the sale of that security or from the values that other mutual funds may determine. In addition, given the volatility and periodic illiquidity experienced in current markets, the prices determined for any individual security on any given day may vary significantly from the amount that can be obtained in an actual sale of that security, and the Funds’ NAV may fluctuate significantly from day to day or from period to period. |
| In September 2006, the Financial Accounting Standards Board (FASB) issued SFAS 157, “Fair Value Measurements.” SFAS 157 defines fair value, establishes a framework for measuring fair value in accordance with GAAP, and expands disclosure about fair value measurements. SFAS No. 157 is effective for financial statements issued for fiscal years beginning after November 15, 2007. Management has determined that SFAS 157 had no material impact on the Funds’ financial statements. |
| In March 2008, Statement of Financial Accounting Standards No. 161, “Disclosures about Derivative Instruments and Hedging Activities” (“SFAS 161”) was issued and is effective for fiscal years beginning after November 15, 2008. SFAS 161 is intended to improve financial reporting for derivative instruments by requiring enhanced disclosure that enables investors to understand how and why an entity uses derivatives, how derivatives are accounted for, and how derivative instruments affect an entity’s results of operations and financial position. Management is currently evaluating the implications of SFAS 161, but does not believe it will have any impact on the Funds’ financial statement disclosures because the Funds generally do not maintain any positions in derivative instruments or engage in hedging activities. |
| b) | Foreign Securities – Foreign securities are defined as securities issued by companies that are organized outside the United States. Investing in securities of foreign companies and foreign governments involves special risks and considerations not typically associated with investing in U.S. companies and the U.S. government. These risks include |
Page 33
Baird Funds, Inc.
Notes to the Financial Statements December 31, 2008 |
| 2. | SIGNIFICANT ACCOUNTING POLICIES (cont.) |
| considerations not typically associated with investing in U.S. companies and the U.S. government. These risks include revaluation of currencies and future adverse political and economic developments. Moreover, securities of many foreign companies and foreign governments and their markets may be less liquid and their prices more volatile than those of securities of comparable U.S. companies and the U.S. government. Occasionally, events that affect those values and exchange rates may occur after the close of the exchange on which such securities are traded. If such events materially affect the value of a Funds’ securities, these securities may be valued at their fair value pursuant to procedures adopted by the Board of Directors. All the foreign securities owned by the Funds as of December 31, 2008 are traded on the New York Stock Exchange or NASDAQ. |
| c) | Federal Income Taxes – The Funds intend to continue to qualify as regulated investment companies as provided in subchapter M of the Internal Revenue Code and to distribute substantially all of their taxable income to their shareholders in a manner which results in no tax cost to the Funds. Therefore, no federal income or excise tax provision is recorded. |
| Effective June 29, 2007, the Funds adopted Financial Accounting Standards Board (FASB) Interpretation No. 48 (FIN 48), “Accounting for Uncertainty in Income Taxes,” a clarification of FASB Statement No. 109, “Accounting for Income Taxes.” FIN 48 establishes financial reporting rules regarding recognition and measurement of tax positions taken or expected to be taken on a tax return. Management has determined that FIN 48 has not resulted in any liability to the Funds. |
| d) | Distributions to Shareholders – Dividends from net investment income, if any, are declared and paid annually. Distributions of net realized gains, if any, are declared and paid at least annually. |
| e) | Allocation of Income and Expenses – Each Fund is charged for those expenses directly attributable to it. Expenses directly attributable to a class of shares, such as Rule 12b-1 distribution fees, are charged to that class of shares. Income, expenses, and realized and unrealized gains and losses are allocated to the classes based on their respective net assets. Expenses that are not directly attributable to a Fund are allocated among the series of the Corporation in proportion to their assets. |
| f) | Use of Estimates – The preparation of financial statements in conformity with accounting principles generally accepted in the United States requires management to make estimates and assumptions that affect the reported amounts of assets and liabilities and disclosure of contingent assets and liabilities at the date of the financial statements and the reported amounts of revenues and expenses during the reporting period. Actual results could differ from those estimates. |
| g) | Other – Investment and shareholder transactions are recorded on trade date. The Funds determine the gain or loss realized from investment transactions by comparing the original cost of the security lot sold with the net sales proceeds. Dividend income is recognized on the ex-dividend date and interest income is recognized on an accrual basis. Accounting principles generally accepted in the United States require that permanent financial reporting and tax differences be reclassified in the capital accounts. |
| h) | Guarantees and Indemnifications – In the normal course of business, the Funds enter into contracts with service providers that contain general indemnification clauses. The Funds’ maximum exposure under these arrangements is unknown and this would involve future claims against the Funds that have not yet occurred. Based on experience, the Funds would expect the risk of loss to be remote. |
Page 34
Baird Funds, Inc.
Notes to the Financial Statements December 31, 2008 |
| 3. | CAPITAL SHARE TRANSACTIONS |
The following table summarizes the capital share transactions of each Fund for the past two fiscal periods:
| BAIRD LARGECAP FUND | |||||||||||||||||
| Year Ended | Year Ended | ||||||||||||||||
| December 31, 2008 | December 31, 2008 | ||||||||||||||||
| Institutional Class Shares | Shares | Amount | Investor Class Shares | Shares | Amount | ||||||||||||
| Shares sold | 395,392 | $ | 2,875,596 | Shares sold | 3,893 | $ | 30,992 | ||||||||||
| Shares issued to | Shares issued to | ||||||||||||||||
| shareholders in | shareholders in | ||||||||||||||||
| reinvestment of dividends | 14,995 | 80,523 | reinvestment of dividends | — | — | ||||||||||||
| Shares redeemed | (449,499 | ) | (3,446,338 | ) | Shares redeemed | (36,862 | ) | (306,565 | ) | ||||||||
| Net decrease | (39,112 | ) | $ | (490,219 | ) | Net decrease | (32,969 | ) | $ | (275,573 | ) | ||||||
| Shares Outstanding: | Shares Outstanding: | ||||||||||||||||
| Beginning of period | 2,963,382 | Beginning of period | 79,724 | ||||||||||||||
| End of period | 2,924,270 | End of period | 46,755 | ||||||||||||||
| Year Ended | Year Ended | ||||||||||||||||
| December 31, 2007 | December 31, 2007 | ||||||||||||||||
| Institutional Class Shares | Shares | Amount | Investor Class Shares | Shares | Amount | ||||||||||||
| Shares sold | 688,671 | $ | 6,011,411 | Shares sold | 16,768 | $ | 153,229 | ||||||||||
| Shares issued to | Shares issued to | ||||||||||||||||
| shareholders in | shareholders in | ||||||||||||||||
| reinvestment of dividends | 6,609 | 62,978 | reinvestment of dividends | — | — | ||||||||||||
| Shares redeemed | (948,994 | ) | (8,396,303 | ) | Shares redeemed | (65,062 | ) | (589,840 | ) | ||||||||
| Net decrease | (253,714 | ) | $ | (2,321,914 | ) | Net decrease | (48,294 | ) | $ | (436,611 | ) | ||||||
| Shares Outstanding: | Shares Outstanding: | ||||||||||||||||
| Beginning of period | 3,217,096 | Beginning of period | 128,018 | ||||||||||||||
| End of period | 2,963,382 | End of period | 79,724 | ||||||||||||||
Page 35
Baird Funds, Inc.
Notes to the Financial Statements December 31, 2008 |
| 3. | CAPITAL SHARE TRANSACTIONS (cont.) |
| BAIRD MIDCAP FUND | |||||||||||||||||
| Year Ended | Year Ended | ||||||||||||||||
| December 31, 2008 | December 31, 2008 | ||||||||||||||||
| Institutional Class Shares | Shares | Amount | Investor Class Shares | Shares | Amount | ||||||||||||
| Shares sold | 376,048 | $ | 2,765,434 | Shares sold | 41,456 | $ | 316,588 | ||||||||||
| Shares issued to | Shares issued to | ||||||||||||||||
| shareholders in | shareholders in | ||||||||||||||||
| reinvestment of | reinvestment of | ||||||||||||||||
| dividends | 2,660 | 14,311 | dividends | — | — | ||||||||||||
| Shares redeemed | (955,817 | ) | (7,643,087 | ) | Shares redeemed | (265,423 | ) | (1,884,193 | ) | ||||||||
| Net decrease | (577,109 | ) | $ | (4,863,342 | ) | Net decrease | (223,967 | ) | $ | (1,567,605 | ) | ||||||
| Shares Outstanding: | Shares Outstanding: | ||||||||||||||||
| Beginning of period | 3,805,128 | Beginning of period | 508,873 | ||||||||||||||
| End of period | 3,228,019 | End of period | 284,906 | ||||||||||||||
| Year Ended | Year Ended | ||||||||||||||||
| December 31, 2007 | December 31, 2007 | ||||||||||||||||
| Institutional Class Shares | Shares | Amount | Investor Class Shares | Shares | Amount | ||||||||||||
| Shares sold | 489,977 | $ | 4,956,364 | Shares sold | 541,128 | $ | 5,301,707 | ||||||||||
| Shares issued to | Shares issued to | ||||||||||||||||
| shareholders in | shareholders in | ||||||||||||||||
| reinvestment of | reinvestment of | ||||||||||||||||
| distributions | 552,386 | 5,413,386 | distributions | 45,594 | 436,338 | ||||||||||||
| Shares redeemed | (673,826 | ) | (6,830,431 | ) | Shares redeemed | (625,959 | ) | (6,379,302 | ) | ||||||||
| Net increase | 368,537 | $ | 3,539,319 | Net decrease | (39,237 | ) | $ | (641,257 | ) | ||||||||
| Shares Outstanding: | Shares Outstanding: | ||||||||||||||||
| Beginning of period | 3,436,591 | Beginning of period | 548,110 | ||||||||||||||
| End of period | 3,805,128 | End of period | 508,873 | ||||||||||||||
Page 36
Baird Funds, Inc.
Notes to the Financial Statements December 31, 2008 |
| 4. | INVESTMENT TRANSACTIONS AND INCOME TAX INFORMATION |
During the year ended December 31, 2008, purchases and sales of investment securities (excluding short-term investments) were as follows:
| Baird | Baird | |||||||
| LargeCap Fund | MidCap Fund | |||||||
| Purchases: | $ | 10,136,218 | $ | 21,388,234 | ||||
| Sales: | $ | 10,404,590 | $ | 26,335,988 | ||||
At December 31, 2008, accumulated earnings/losses on a tax basis were as follows:
| LargeCap | MidCap | |||||||
| Fund | Fund | |||||||
| Cost of Investments | $ | 27,362,405 | $ | 30,288,972 | ||||
| Gross unrealized appreciation | $ | 913,224 | $ | 1,571,476 | ||||
| Gross unrealized depreciation | (4,813,846 | ) | (5,645,446 | ) | ||||
| Net unrealized depreciation | $ | (3,900,622 | ) | $ | (4,073,970 | ) | ||
| Undistributed ordinary income | $ | 9,629 | $ | 22,225 | ||||
| Undistributed long-term capital gain | — | — | ||||||
| Total distributable earnings | $ | 9,629 | $ | 22,225 | ||||
| Other accumulated losses | $ | (3,963,137 | ) | $ | (3,126,388 | ) | ||
| Total accumulated losses | $ | (7,854,130 | ) | $ | (7,178,133 | ) | ||
Undistributed income or net realized gains for financial statement purposes may differ from amounts recognized for federal income tax purposes due to differences in the recognition and characterization of income, expense and capital gain items.
Under the current tax law, capital losses realized after October 31 may be deferred and treated as occurring on the first day of the following fiscal year. For the year ended December 31, 2008, the Baird LargeCap Fund and the Baird MidCap Fund elected to defer capital losses occurring between November 1, 2008 and December 31, 2008 in the amount of $1,651,089 and $2,034,254, respectively.
At December 31, 2008, the Baird LargeCap Fund had accumulated net realized capital loss carryovers of $929,167 that expire in 2016, $1,167,011 that expire in 2012 and $215,870 that expire in 2011. At December 31, 2008, the Baird MidCap Fund had accumulated net realized capital loss carryovers of $1,092,134 that expire in 2016. To the extent the Funds realize future net capital gains, taxable distributions to shareholders will be offset by any unused capital loss carryovers. During the year ended December 31, 2008, the Funds did not utilize any capital loss carryovers from previous years.
Page 37
Baird Funds, Inc.
Notes to the Financial Statements December 31, 2008 |
| 4. | INVESTMENT TRANSACTIONS AND INCOME TAX INFORMATION (cont.) |
During the year ended December 31, 2008, the Funds paid the following dividends:
| Ordinary Income Dividends | Net Long-Term Capital Gains | |
| Baird LargeCap Fund | $81,425 | — |
| Baird MidCap Fund | $14,588 | — |
During the year ended December 31, 2007, the Funds paid the following dividends:
| Ordinary Income Dividends | Net Long-Term Capital Gains | |
| Baird LargeCap Fund | $ 63,676 | — |
| Baird MidCap Fund | $970,880 | $4,947,701 |
| 5. | INVESTMENT ADVISORY AND OTHER AGREEMENTS |
The Funds have entered into an Investment Advisory Agreement with Baird for the provision of investment advisory services. Pursuant to the Investment Advisory Agreement, the Advisor is entitled to receive a fee, calculated daily and payable monthly, at the annual rate of 0.65% for the Baird LargeCap Fund and 0.75% for the Baird MidCap Fund as applied to the respective Fund’s average daily net assets. Certain officers of the Advisor are also officers of the Funds.
For the years ended December 31, 2008 and 2009 and through April 30, 2010, the Advisor has contractually agreed to waive its investment advisory fee and/or reimburse the Funds’ operating expenses (exclusive of brokerage, taxes, and extraordinary expenses) to the extent necessary to ensure that each Fund’s annual operating expenses do not exceed the following percentages of average daily net assets:
| Institutional Class Shares | Investor Class Shares | |
| Baird LargeCap Fund | 0.75% | 1.00% |
| Baird MidCap Fund | 0.85% | 1.10% |
To the extent that the Advisor reimburses or absorbs fees and expenses, it may seek payment of such amounts for three years after the year in which expenses were reimbursed or absorbed. A Fund will make no such payment, however, if its total annual operating expenses exceed the expense limits in effect at the time the expenses were reimbursed or at the time these payments are proposed.
| Fiscal Year Ended December 31, | |||
| 2008 | 2007 | 2006 | |
| Reimbursed / Absorbed Expenses Subject | |||
| to Recovery by Advisor Until: | 2011 | 2010 | 2009 |
| Baird LargeCap Fund | $ 99,829 | $100,379 | $ 98,794 |
| Baird MidCap Fund | $101,968 | $103,600 | $117,213 |
Page 38
Baird Funds, Inc.
Notes to the Financial Statements December 31, 2008 |
| 5. | INVESTMENT ADVISORY AND OTHER AGREEMENTS (cont.) |
U.S. Bancorp Fund Services, LLC serves as transfer agent, administrator, and accounting services agent for the Funds. U.S. Bank, N.A. serves as custodian for the Funds.
Robert W. Baird & Co. Incorporated (the “Distributor”) is the sole distributor of the Funds pursuant to a distribution agreement.
No commissions were earned by the Distributor for services rendered as a registered broker-dealer in securities transactions for the Baird LargeCap Fund and Baird MidCap Fund for the year ended December 31, 2008.
| 6. | SECURITIES LENDING |
Each Fund may lend up to one-third of its total assets (including such loans) to borrowers under terms of participation in a securities lending program administered by FAF Advisors, Inc., an affiliate of the Funds’ custodian, transfer agent and administrator. The securities lending agreement requires that loans are collateralized at all times in an amount equal to at least 102% of the market value of any loaned securities at the time of the loan, plus accrued interest.
The Funds receive compensation in the form of fees and earn interest on the cash collateral. The amount of fees depends on a number of factors including the type of security and length of the loan. Each Fund continues to receive interest payments or dividends on the securities loaned during the borrowing period. Each Fund has the right under the terms of the securities lending agreement to recall the securities from the borrower on demand.
As of December 31, 2008, the Baird LargeCap and Baird MidCap Funds had loaned securities that were collateralized by cash equivalents. The cash collateral is invested by the custodian in accordance with approved investment guidelines. Those guidelines require the cash collateral to be invested in readily marketable, high quality, short-term obligations; however, such investments are subject to risk of payment delays or default on the part of the issuer or counterparty or otherwise may not generate sufficient interest to support the costs associated with securities lending. A Fund could also experience delays in recovering its securities and possible loss of income or value if the borrower fails to return the borrowed securities, although the Funds are indemnified from this risk by contract with the securities lending agent.
As of December 31, 2008, the market value of the securities on loan and payable on collateral due to broker were as follows:
| Market Value of | Payable on Collateral | |
| Securities on Loan | due to Broker | |
| Baird LargeCap Fund | $6,724,968 | $6,867,026 |
| Baird MidCap Fund | $6,633,362 | $6,805,610 |
The Funds receive cash as collateral in return for securities lent as part of a securities lending program. The collateral is invested in short-term securities including the Mount Vernon Prime Portfolio (a securities lending trust subject to Rule 2a-7 under the 1940 Act), other money market funds, certificates of deposit, commercial paper, corporate notes, government agency securities and repurchase agreements. The schedules of investments for the Funds include the particular cash collateral holdings as of December 31, 2008. The Funds intend to invest all of the collateral in the Mount Vernon Prime
Page 39
Notes to the Financial Statements December 31, 2008 |
| 6. | SECURITIES LENDING (cont.) |
Portfolio once their existing cash collateral holdings mature or are liquidated or otherwise paid down. Currently, the Funds hold two cash collateral investments that are priced at fair value by the Valuation Committee of the Advisor: an interest in Atlantic East Funding Trust, LLC and shares of the Reserve Primary Fund. The interest in Atlantic East Funding Trust, LLC is priced at par based on the underlying market value of the securities owned by the Atlantic East Funding Trust, LLC, amounts payable under an agreement from the Funds’ transfer agent and administrator to cover losses realized by the Funds on this investment (up to a certain amount), and a securities lending income reserve. The Funds have been depositing their securities lending income into a reserve account since July 2008, which reserve may be used to cover additional losses by the Funds on their interest in Atlantic East Funding Trust, LLC after applying amounts payable from the Funds’ transfer agent and administrator. Additional reserves of securities lending income are expected to continue in 2009. As a result of these securities lending income reserves, the Funds are not recognizing income from their securities lending activity. Upon the liquidation of the Funds’ interest in Atlantic East Funding Trust, LLC, any excess securities lending income reserves (after applying the reserves and amounts payable from the Funds’ transfer agent and administrator to cover losses) will then be recognized as income to the Funds. Shares of the Reserve Primary Fund are priced at $1.00 per share based on the fair value of the shares of that fund plus an agreement to contribute additional amounts by the Funds’ transfer agent and administrator. Interest income earned on collateral investments during the year ended December 31, 2008 for the Baird LargeCap Fund and Baird MidCap Fund were $12,824 and $22,317, respectively.
| 7. | LINE OF CREDIT |
The Corporation maintains an uncommitted, senior secured line of credit (“LOC”) with U.S. Bank, N.A. (the “Bank”) to provide the Funds a temporary liquidity source to meet unanticipated redemptions. Under the terms of the LOC, borrowings for each Fund are limited to one-third of the total assets (including the amount borrowed) of the respective Fund, or as otherwise indicated within the Funds’ agreement with the Bank. The Bank charges interest at the Bank’s Prime Rate less 1% (weighted average rate of 4.21% during 2008). For the year ended December 31, 2008, the Baird LargeCap Fund and Baird MidCap Fund incurred $0 and $106 in interest charges, respectively, on average daily loan balances of $0 and $1,730, respectively.
| 8. | DISTRIBUTION AND SHAREHOLDER SERVICE PLAN |
The Funds have adopted a distribution and shareholder service plan (the “Plan”) pursuant to Rule 12b-1 under the 1940 Act. The Plan allows the Funds to compensate the Distributor for the costs incurred in distributing the Funds’ Investor Class Shares, including amounts paid to brokers or dealers, at an annual rate not to exceed 0.25% of the average daily net assets of the Funds’ Investor Class Shares. The Baird LargeCap Fund and Baird MidCap Fund incurred $1,391 and $8,617, respectively, in fees pursuant to the Plan during the year ended December 31, 2008.
Page 40
Report of Independent Registered Public Accounting Firm
To the Shareholders and
Board of Directors of
Baird Funds, Inc.:
We have audited the accompanying statements of assets and liabilities of Baird LargeCap Fund and Baird MidCap Fund (two of the portfolios constituting Baird Funds, Inc.) (collectively, the “Funds”), including the schedules of investments, as of December 31, 2008, and the related statements of operations for the year then ended, the statements of changes in net assets for each of the two years in the period then ended, and the financial highlights for each of the four years in the period then ended. These financial statements and financial highlights are the responsibility of the Funds’ management. Our responsibility is to express an opinion on these financial statements and financial highlights based on our audits. The financial highlights for the year ended December 31, 2004 were audited by other auditors. Those auditors expressed an unqualified opinion on those financial highlights in their report dated February 22, 2005.
We conducted our audits in accordance with the standards of the Public Company Accounting Oversight Board (United States). Those standards require that we plan and perform the audit to obtain reasonable assurance about whether the financial statements and financial highlights are free of material misstatement. The Funds are not required to have, nor were we engaged to perform, an audit of their internal control over financial reporting. Our audits included consideration of internal control over financial reporting as a basis for designing audit procedures that are appropriate in the circumstances, but not for the purpose of expressing an opinion on the effectiveness of the Funds’ internal control over financial reporting. Accordingly, we express no such opinion. An audit also includes examining, on a test basis, evidence supporting the amounts and disclosures in the financial statements, assessing the accounting principles used and significant estimates made by management, as well as evaluating the overall financial statement presentation. Our procedures included confirmation of securities owned as of December 31, 2008, by correspondence with the custodian and brokers. We believe that our audits provide a reasonable basis for our opinion.
In our opinion, the financial statements and financial highlights referred to above present fairly, in all material respects, the financial position of each of the aforementioned funds of Baird Funds, Inc. as of December 31, 2008, and the results of their operations for the year then ended, the changes in their net assets for each of the two years in the period then ended and the financial highlights for each of the four years in the period then ended, in conformity with accounting principles generally accepted in the United States of America.
| |
Chicago, Illinois
February 26, 2009
Page 41
Baird Funds, Inc.
| Directors & Officers as of December 31, 2008 |
| Number of | |||||
| Portfolios | Other | ||||
| Positions | Term of Office | Principal | in Complex | Directorships | |
| Held with | and Length of | Occupation(s) | Overseen | Held | |
| Name, Address and Age | the Funds | Time Served | During Past 5 Years | by Director | by Director |
| G. Frederick Kasten, Jr. | Independent | Indefinite; | Retired; Chairman, the Advisor (January 2000-December | 8 | Director of Regal-Beloit |
| 777 East Wisconsin Avenue | Director and | Since September | 2005); Chairman and CEO, the Advisor (January 1998- | Corporation, a | |
| Milwaukee, WI 53202 | Chairman | 2000 | January 2000); President, Chairman and CEO, the | manufacturing | |
| Age: 69 | Advisor (June 1983-January 1998); President, the Advisor | company | |||
| (January 1979-January 1983) | |||||
| John W. Feldt | Independent | Indefinite; | Retired; Senior Vice President-Finance, University of | 8 | Director of Thompson |
| c/o University of | Director | Since September | Wisconsin Foundation (1985-2006); Vice President- | Plumb Funds, Inc., a | |
| Wisconsin Foundation | 2000 | Finance, University of Wisconsin Foundation (1980- | mutual fund complex | ||
| 1848 University Avenue | 1985); Associate Director, University of Wisconsin | (3 portfolios); Director | |||
| Madison, WI 53705 | Foundation (1967-1980) | of Nakoma Mutual | |||
| Age: 66 | Funds, a mutual fund | ||||
| complex (1 portfolio) | |||||
| Frederick P. Stratton, Jr. | Independent | Indefinite; | Retired; Chairman Emeritus, Briggs & Stratton | 8 | Director of Weyco |
| 10134 N. Port Washington | Director | Since May | Corporation, a manufacturing company, since 2003; | Group, Inc., a men’s | |
| Road, #2B | 2004 | Chairman of the Board, Briggs & Stratton Corporation | footwear distributor; | ||
| Mequon, WI 53092 | (2001-2002); Chairman and CEO, Briggs & Stratton | Wisconsin Energy | |||
| Age: 69 | Corporation (1986-2001) | Corporation and its | |||
| subsidiaries Wisconsin | |||||
| Electric Power | |||||
| Company and | |||||
| Wisconsin Gas LLC | |||||
| Marlyn J. Spear | Independent | Indefinite; | Chief Investment Officer, Building Trades United | 8 | Management Trustee of |
| P.O. Box 530 | Director | Since January | Pension Trust Fund since July 1989; Investment Officer, | AFL-CIO Housing | |
| 500 Elm Grove Road | 2008 | Northwestern Mutual Financial Network (1988-1989); | Investment Trust | ||
| Elm Grove, WI 53122 | Assistant Vice-President, Firstar Trust Company | ||||
| Age: 55 | (1978-1987); Financial Analyst, Harco Holdings, Inc. | ||||
| (1976-1978) | |||||
| Cory L. Nettles* | Interested | Indefinite; | Managing Director, Generation Growth Capital, Inc. | 8 | Director of Weyco |
| Generation Growth Capital, Inc. | Director | Since January | (since March 2007); Of Counsel, Quarles & Brady LLP | Group, Inc., a men’s | |
| 411 East Wisconsin Avenue, | 2008 | (since January 2005); Secretary, Wisconsin Department | footwear distributor; | ||
| Suite 1710, | of Commerce (January 2003 – January 2005); Associate, | Director of The Private | |||
| Milwaukee, WI 53202 | Quarles & Brady LLP (July 1996 – December 2002) | Bank, a financial | |||
| Age: 38 | institution |
| * | Mr. Nettles is an “interested person” of the Corporation (as defined in the 1940 Act) because of his employment with the law firm, Quarles & Brady LLP, which provides legal services to the Advisor. The legal services that Quarles & Brady LLP has provided to the Advisor include litigation, real estate and miscellaneous securities related matters that did not relate to the Corporation or the Funds. |
Additional information about the Funds’ directors is available in the Statement of Additional Information which may be obtained without charge, upon request, by calling 1-866-44BAIRD, or at www.bairdfunds.com.
Page 42
| Directors & Officers as of December 31, 2008 |
| Position(s) | Term of Office | Principal | |
| Held with | and Length of | Occupation(s) | |
| Name, Address, and Age | the Funds | Time Served | During Past 5 Years |
| Mary Ellen Stanek | President | Re-elected by | Managing Director, the Advisor, and Chief Investment Officer, Baird Advisors, a department of |
| 777 East Wisconsin Avenue | Board annually; | the Advisor, since March 2000; President and CEO, Firstar Investment Research & Management | |
| Milwaukee, WI 53202 | Since | Company, LLC (“FIRMCO”) (November 1998-February 2000); President, Firstar Funds, Inc. | |
| Age: 52 | September 2000 | (December 1998-February 2000); President and Chief Operating Officer, FIRMCO | |
| (March 1994-November 1998) | |||
| J. Bary Morgan | Senior | Re-elected by | Chief Investment Officer, Baird Investment Management, a department of the Advisor, since |
| 777 East Wisconsin Avenue | Vice President | Board annually; | January 2004; Managing Director, the Advisor since January 2001; Director, Baird Investment |
| Milwaukee, WI 53202 | Since | Management (January 2001-January 2004); Senior Vice President, the Advisor (January 2000- | |
| Age: 43 | February 2003 | January 2001); First Vice President, the Advisor (January 1996-January 2000) | |
| Todd S. Nichol | Vice President | Re-elected by | Chief Compliance Officer, the Advisor since October 2004; Assistant Compliance Director, the |
| 777 East Wisconsin Avenue | and Chief | Board annually; | Advisor since August 2002; Senior Vice President, the Advisor since January 2005; First Vice |
| Milwaukee, WI 53202 | Compliance | Since | President, the Advisor (January 2004-January 2005); Vice President, the Advisor (August 2002- |
| Age: 46 | Officer | August 2004 | January 2004); Vice President – Risk Management, BNY Clearing Services, LLC, a division of |
| The Bank of New York (August 1995-August 2002) | |||
| Russell P. Schwei | Vice President | Re-elected by | Operations Director, the Advisor since July 1992; Managing Director, the Advisor since January |
| 777 East Wisconsin Avenue | Board annually; | 1997; Chief Financial Officer and Managing Director, the Advisor (February 1999-December | |
| Milwaukee, WI 53202 | Since | 1999) | |
| Age: 49 | September 2000 | ||
| Leonard M. Rush | Treasurer | Re-elected by | Chief Financial Officer, the Advisor since January 2000 |
| 777 East Wisconsin Avenue | Board annually; | ||
| Milwaukee, WI 53202 | Since | ||
| Age: 62 | September 2000 | ||
| Charles M. Weber | Secretary | Re-elected by | Senior Vice President and Associate General Counsel, the Advisor since July 2005; Partner, |
| 777 East Wisconsin Avenue | Board annually; | Quarles & Brady LLP, a law firm (October 1998-June 2005) | |
| Milwaukee, WI 53202 | Since | ||
| Age: 45 | September 2005 | ||
| Laura E. Piotrowski | Assistant | Re-elected by | Managing Director, the Advisor since January 2008; Senior Vice President, the Advisor (January |
| 777 East Wisconsin Avenue | Treasurer | Board annually; | 2003-December 2007); Controller, the Advisor since January 2003; First Vice President, the |
| Milwaukee, WI 53202 | Since | Advisor (January 2001-January 2003); Vice President, the Advisor (January 1999-January 2001) | |
| Age: 38 | August 2007 | ||
| Robert A. Johnson | AML | Re-elected by | Compliance Officer, the Advisor since 1998, and AML Compliance Officer, the Advisor since |
| 777 East Wisconsin Avenue | Compliance | Board annually; | January 2004 |
| Milwaukee, WI 53202 | Officer | Since | |
| Age 45 | August 2004 | ||
| Bret T. Reese | Assistant | Re-elected by | Vice President and Associate General Counsel, the Advisor since June 2005; Senior Financial |
| 777 East Wisconsin Avenue | Secretary | Board annually; | Analyst, the Advisor (August 2004-June 2005); Financial Analyst, Stark & Roth, Inc., a hedge |
| Milwaukee, WI 53202 | Since | fund (June 2001-August 2002) | |
| Age: 39 | August 2006 |
Page 43
Baird Funds, Inc.
DISCLOSURE REGARDING THE BOARD OF DIRECTORS’ APPROVAL OF THE INVESTMENT ADVISORY AGREEMENT FOR BAIRD LARGECAP AND MIDCAP FUNDS
The Board of Directors (the “Board”) of Baird Funds, Inc. (the “Corporation”) met on August 12, 2008 to consider the annual renewal of the investment advisory agreement with Robert W. Baird & Co. Incorporated (“Baird” or the “Advisor”) for management of the Baird LargeCap and Baird MidCap Funds, which are mutual fund series or portfolios of the Corporation (the “Funds”). The Board reviewed and discussed various information that had been provided prior to the meeting, including the investment advisory agreement, memoranda provided by outside legal counsel and the Secretary of the Funds discussing the Board’s fiduciary obligations and factors the Board should assess in considering the renewal of the investment advisory agreement, information from the Advisor in response to a request from the Board, including the directors who are not “interested persons” of the Corporation or the Advisor within the meaning of the Investment Company Act of 1940 (the “1940 Act”) (“Independent Directors”) (including the Advisor’s Form ADV, Annual Report and statement of financial condition), a profitability analysis, comparative information about the Funds’ performance for periods ended June 30, 2008, management fees and expense ratios, and other pertinent information. The Board also discussed relevant case law, including the recent decision by the U.S. Court of Appeals (Seventh Circuit) in Jones v. Harris Associates, L.P. The Independent Directors met separately in executive session with outside legal counsel to consider the investment advisory agreement. The Board also received information periodically throughout the year that was relevant to its consideration of the investment advisory agreement, including performance, management fee and other expense information. Based on its evaluation of this information, the Board, including a majority of the Independent Directors, approved the continuation of the investment advisory agreement for an additional one-year period.
In considering the investment advisory agreement and reaching its conclusions, the Board reviewed and analyzed various factors that it determined were relevant, including the factors below.
Nature, Extent and Quality of Services Provided to the Funds
The Board analyzed the nature, extent and quality of the services provided by the Advisor to the Funds. The Board reviewed and considered the Advisor’s significant role in establishing the Funds and the construction of their investment objectives, principal strategies, investment limitations and fee structures. The Board noted the Advisor’s overall reputation and positive name recognition, the depth of the Advisor’s personnel, resources and commitment to the Funds, and the experience, credentials and continuity of the portfolio management teams employed to manage the Funds’ investments. The Board further noted that the Advisor has approximately $15.1 billion of assets under discretionary management and has strong relationships with numerous institutional accounts. The Funds provide an opportunity for smaller institutional and retail accounts to receive the same professional advice from the Advisor that it offers to its larger institutional clients. The Board considered the Advisor’s disciplined investment decision-making process used for the Funds. The Board also considered other services that the Advisor provided for the Funds in its capacity as their investment advisor, such as providing some of its key personnel to serve as officers of the Funds, selecting broker-dealers for execution of portfolio transactions, ensuring adherence to the Fund’s investment policies and restrictions, providing support services to the Board and the Audit Committee of the Board and overseeing the Funds’ other service providers. The Board further noted that the Advisor, in its capacity as a registered broker-dealer, also serves as distributor and principal underwriter of shares of the Funds and spends time and effort marketing the Funds. The Board also considered the strength of the Advisor’s compliance department, including the Funds’ Chief Compliance Officer, and the fact that the Advisor has not experienced
Page 44
Baird Funds, Inc.
DISCLOSURE REGARDING THE BOARD OF DIRECTORS’ APPROVAL OF THE INVESTMENT ADVISORY AGREEMENT FOR BAIRD LARGECAP AND MIDCAP FUNDS (cont.)
any significant legal, compliance or regulatory difficulties since the Funds were launched. The Board concluded that the nature, extent and quality of the services provided by the Advisor to the Funds were appropriate and that each Fund was likely to continue to benefit from services provided under the investment advisory agreement.
Investment Performance of the Advisor and the Funds
In considering the investment performance of each of the Funds, the Board reviewed information as of June 30, 2008 regarding the Funds’ performance in comparison to various benchmark indices and their peer groups as determined by Lipper.
The Board noted that the Baird LargeCap Fund (both Institutional and Investor Class shares) had outperformed its benchmark index and the Lipper peer group average for the one year and since inception periods, but lagged the index and peer group average for the three year and five year periods. The Board noted that the performance of the Baird Midcap Fund had exceeded its benchmark and Lipper peer group average for the since inception period, but had underperformed both the benchmark index and peer group average for the one year, three year and five year periods. The Board also considered the Advisor’s quarterly commentary and discussion of the reasons for these Funds’ underperformance during such periods.
The Board also considered the Advisor’s quarterly portfolio commentaries and reviews explaining the Funds’ performance, the Advisor’s consistent and disciplined investment decision process and the investment strategies it employs for the Funds. After considering all of the information, the Board concluded that, although past performance is not a guarantee of future results, each Fund and its shareholders were likely to benefit from the Advisor’s continued management.
Costs of Services Provided and Profits Realized by the Advisor
The Board examined the fee and expense information for each of the Funds, including a comparison of such information to other similarly situated mutual funds as determined by Lipper. The Board noted that each Fund’s advisory fee was competitive with the average and median for the universe of all mutual funds in its Lipper category. The Board also reviewed and considered management fees charged by the Advisor to other investment advisory clients and found that the investment management fee paid by the Funds was 10 basis points (or 0.10%) less than what the Advisor charges on the first $5 million of a separately managed account. The Board recognized the extent of the significant additional services provided to each Fund that the Advisor did not provide to its other clients, such as certain administrative services, oversight of the Fund’s other service providers, director support, risk management, regulatory compliance and various other services.
The Board also examined the total expense ratio of each Fund relative to all other mutual funds in its Lipper category. The Board noted that each Fund’s total expense ratio (both for its Institutional and Investor Class shares), after fee waivers and expense reimbursements by the Advisor, was not only lower than the average and median expense ratios for all funds in its Lipper category, but in the lowest or second lowest quartile and that the Institutional Class’ expense ratio compared favorably to the average and median expense ratios for institutional class shares of other similarly sized funds in each Fund’s Lipper category.
Page 45
Baird Funds, Inc.
DISCLOSURE REGARDING THE BOARD OF DIRECTORS’ APPROVAL OF THE INVESTMENT ADVISORY AGREEMENT FOR BAIRD LARGECAP AND MIDCAP FUNDS (cont.)
The Board considered the fees realized, and the costs incurred, by the Advisor in providing investment management services to the Funds and the profitability to the Advisor of having a relationship with the Funds. The Board noted that the Adviser had waived significant fees and/or reimbursed expenses for the Funds since their respective inception dates. The Advisor informed the Board that the profits realized by the Advisor (as a percentage of revenue) from its relationship with the equity Funds have generally been less than those realized by the Advisor on its investment advisory business as a whole.
The Board concluded that the profits realized by the Advisor from its relationship with the Funds were appropriate. The Board also reviewed and considered the general financial condition of the Advisor and determined it to be sound. In light of all of the information that it received and considered, the Board concluded that the management fee and total expense ratio of each Fund were reasonable.
Economies of Scale and Fee Levels Reflecting Those Economies
The Board noted that the Funds’ advisory fee structure does not contain any breakpoint reductions as the Funds grow in size. However, the Board recognized that the Advisor has been waiving fees and/or reimbursing expenses for the Funds since their inception. The Board also recognized that the advisory fee rates paid by the Funds were designed to be lower than the fees otherwise charged by the Advisor to its separately managed account clients and to be comparable to the second or third breakpoint advisory fee levels paid by other comparable mutual funds.
The directors concluded that the current fee structure of each Fund was reasonable and reflects a sharing of economies of scale between the Advisor and the Fund at the Fund’s current asset level.
Benefits Derived from the Relationship with the Funds
The Board noted that the Advisor derives ancillary benefits from its association with the Funds in the form of research products and services received from unaffiliated broker dealers who execute portfolio trades for the Funds. However, the Board determined such products and services have been used for legitimate purposes relating to the Funds by providing assistance in the Advisor’s investment decision-making process. The Board believed that the Funds generally benefit from their association with the Advisor and the use of the “Baird” name. The Board concluded that the other benefits realized by the Advisor from its relationship with the Funds were appropriate.
Based on its evaluation of the above factors, as well as other factors relevant to their consideration of the investment advisory agreement, the directors, including all of the Independent Directors, concluded that the continuation of the investment advisory agreement was in the best interest of each Fund and its shareholders.
Page 46
Additional Information
Proxy Voting
A description of the policies and procedures that the Funds use to determine how to vote proxies relating to portfolio securities is available without charge, upon request, by calling toll free, 1-866-44BAIRD, or by accessing the Funds’ website at www.bairdfunds.com; and by accessing the SEC’s website at www.sec.gov.
Each Fund’s proxy voting record for the most recent 12-month period ended June 30 is available without charge, upon request, by calling toll free, 1-866-44BAIRD, or by accessing the Funds’ website at www.bairdfunds.com; and by accessing the SEC’s website at www.sec.gov.
Portfolio Holdings Disclosure
The Funds file a complete schedule of portfolio holdings with the SEC for the first and third quarters of each fiscal year on Form N-Q. The Funds’ Forms N-Q are available on the SEC website at www.sec.gov and may be reviewed and copied at the SEC’s Public Reference Room in Washington, D.C. Information on the operation of the Public Reference Room may be obtained by calling 1-800-732-0330. The Funds’ Forms N-Q may also be obtained by calling toll-free 1-866-44BAIRD.
Qualified Dividend Income/Dividends Received Deduction
For the fiscal year ended December 31, 2008, certain dividends paid by the Funds may be subject to a maximum tax rate of 15%, as provided for by the Jobs and Growth Tax Relief Reconciliation Act of 2003. The percentage of dividends declared from ordinary income designated as qualified dividend income was as follows:
| LargeCap | 100% |
| MidCap | 100% |
For corporate shareholders, the percent of ordinary income distributions qualifying for the corporate dividends received deduction for the fiscal year ended December 31, 2008 was as follows:
| LargeCap | 100% |
| MidCap | 100% |
Page 47
(This Page Intentionally Left Blank.)
Baird Funds, Inc.
c/o U.S. Bancorp Fund Services, LLC
P.O. Box 701
Milwaukee, WI 53201-0701
1-866-44BAIRD
Board of Directors
G. Frederick Kasten, Jr. (Chairman)
John W. Feldt
Frederick P. Stratton, Jr.
Cory L. Nettles
Marlyn J. Spear
Investment Advisor and Distributor
Robert W. Baird & Co. Incorporated
777 East Wisconsin Avenue
Milwaukee, WI 53202
Administrator and Transfer Agent
U.S. Bancorp Fund Services, LLC
P.O. Box 701
615 East Michigan Street
Milwaukee, WI 53202
Custodian
U.S. Bank, N.A.
1555 N. RiverCenter Drive, Suite 302
Milwaukee, WI 53212
Legal Counsel
Godfrey & Kahn, S.C.
780 North Water Street
Milwaukee, WI 53202
Independent Registered Public Accounting Firm
Grant Thornton LLP
175 West Jackson Boulevard, 13th Floor
Chicago, IL 60604
| |
Annual Report - Baird Funds
Riverfront Long-Term Growth Fund
TABLE OF CONTENTS
| Page | |
| Letter to Shareholders | 1 |
| Portfolio Managers’ Commentary | 2 |
| Additional Information on Fund Expenses | 12 |
| Statement of Assets and Liabilities | 14 |
| Statement of Operations | 15 |
| Statement of Changes in Net Assets | 16 |
| Financial Highlights | 17 |
| Notes to the Financial Statements | 18 |
| Report of Independent Registered Public Accounting Firm | 24 |
| Directors and Officers | 25 |
| Disclosure Regarding Board of Directors’ Approval | |
| of Investment Advisory and Sub-Advisory Agreements | 27 |
| Additional Information | 30 |
This report has been prepared for shareholders and may be distributed to others only if preceded or accompanied by a current prospectus.
Cautionary Note on Analyses, Opinions and Outlooks: In this report we offer analyses and opinions on the performance of individual securities, companies, industries, sectors, markets, interest rates and governmental policies, including predictions, forecasts and outlooks regarding possible future events. These can generally be identified as such because the context of the statements may include such words as “believe,” “should,” “will,” “expects,” “anticipates,” “hopes” and words of similar effect. These statements reflect the portfolio managers’ good faith beliefs and judgments and involve risks and uncertainties, including the risk that the portfolio managers’ analyses, opinions and outlooks are or will prove to be inaccurate. It is inherently difficult to correctly assess and explain the performance of particular securities, sectors, markets, interest rate movements, governmental actions or general economic trends and conditions, and many unforeseen factors contribute to the performance of Baird Funds. Investors are, therefore, cautioned not to place undue reliance on subjective judgments contained in this report.
| |
Baird Funds, Inc.
1-866-442-2473
www.bairdfunds.com
February 28, 2009
Dear Shareholder,
Thank you for investing in the Riverfront Long-Term Growth Fund. We are pleased to report that, despite a very difficult year, we successfully launched this new fund in late October, with assets growing to nearly $8 million by year-end. In addition, the aggregate net assets of the eight series in the Baird Funds family have grown to more than $1.9 billion as of the end of 2008, an increase of 19% over the prior year.
In this Annual Report we review the brief performance and composition of Riverfront Long-Term Growth Fund. We hope you find this report both informative and helpful in evaluating your investments.
Thank you again for choosing Baird Funds.
Sincerely,
Mary Ellen Stanek, CFA
President
Baird Funds, Inc.
Riverfront Long-Term Growth Fund
Portfolio Managers’ Commentary
During the fourth quarter of 2008, the financial crisis that has gripped the global economy since mid-2007 took a decided turn for the worse. We believe that allowing Lehman Brothers to fail combined with the Congressional delay in passing bank bailout legislation helped to create a near collapse in the already weakened global banking system. In this crisis atmosphere, banks, life insurance companies, hedge funds and other financial institutions frantically scrambled to raise cash, dumping assets onto fragile markets and causing steep drops in almost every financial market. Banks went even further in their efforts to conserve cash, significantly curtailing lending commitments and trade financing arrangements. This withdrawal of credit quickly transmitted the financial crisis to the real economy, and virtually every economy in the world suffered steep declines in the last three months of 2008.
The Riverfront Long-Term Growth Fund commenced operations on October 28, 2008. During the two-month period ended December 31, 2008, we maintained a defensive posture in light of the financial crisis then taking place. The Fund had a strong quality bias that helped provide protection from the market turmoil, as did our relatively large cash reserves. As a result, despite the losses posted by virtually every asset class except cash and treasuries during the last part of 2008, the Riverfront Long Term Growth Fund Institutional Class has a total return of 5.81% (5.68% for the Investor Class) as compared to a loss in the S&P 500 of 3.96%. We believe that consistent, incremental outperformance in both bull and bear markets is the key to long-term investment success.
Outlook
As we enter 2009, we believe that the global economy will continue to struggle with the lingering impact of the financial crisis and the necessary pull-back in spending by the American consumer. Aggressive monetary policy and government stimulus packages should help support economic growth in the short run, effectively building a bridge across this difficult period of economic adjustment. We believe that these government actions will prevent the kind of downward spiral witnessed in the U.S. in the 1930s or more recently in Japan. It is too early to gauge the long-term impact of this massive monetary and fiscal stimulus, but by the second half of 2009 we think its short-term impact, when combined with the decline in commodity prices, will slow the pace of economic contraction — things will become ‘less bad.’
We see a bottoming process for stocks, followed by a new cyclical bull market. We expect volatility to remain high and think the S&P 500 will range between 750 and 1010 in the first half of 2009, with the opportunity of a breakout to 1140 in the second half if the economy begins to turn around. In other words, we think the lows were made in November 2008. A purely technical evaluation of the S&P 500 is less optimistic, but pervasive investor pessimism, combined with coordinated and determined policy makers, makes us more hopeful. If we are overly optimistic and 750 does not hold, then we see the 600 to 650 as the next zone of technical support.
Total return for risky assets (such as stocks, high yield bonds and commodities) were below their long-term averages over the last 10 years — an environment of strong global growth. We expect the opposite over the next 10 years. Capital is scarce and risk capital even more so, suggesting to us that returns will be above average.
If we are correct, then “risky” assets such as equities and corporate bonds are priced to potentially provide attractive returns over the long-term. Our investors can expect increasing allocations to these asset classes as our momentum disciplines signal that prices are stabilizing.
Page 2
Riverfront Long-Term Growth Fund
Riverfront’s theme for 2009 is ‘Get Paid to Wait.’ We think assets offering sustainable income flows will deliver better total returns in a difficult economy than those that do not. For stocks, we prefer companies with low debt, stable earnings and sustainable dividend growth. From a demographic perspective, we expect this theme to be supported by baby boomers’ need for income.
From an asset allocation perspective we are seeking to maintain a high quality bias. We are overweight large caps relative to small, and the US relative to international. We have a small overweight in emerging markets, reflecting their attractive valuations and longer term potential. Small- and mid-cap companies may be hindered as a result of limited resources or less diverse products or services and have therefore historically been more volatile than the stocks of larger, more established companies.
Riverfront Investment Group, LLC
Portfolio Managers:
Michael Jones, CFA
Rod Smyth
Doug Sandler, CFA
Tim Anderson, CFA
Page 3
Riverfront Long-Term Growth Fund
A December 31, 2008 summary of the Fund’s top 10 holdings and asset allocation is shown below.
| Top 10 Holdings* | Asset Allocation** | ||
| Fidelity Institutional | |||
| Government Portfolio | 12.69% | 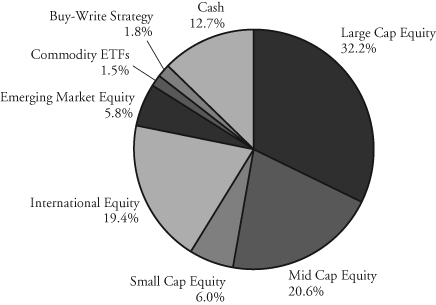 | |
| Vanguard Europe Pacific ETF | 9.70% | ||
| iShares MSCI EAFE Index Fund | 7.59% | ||
| SPDR Trust Series 1 | 3.72% | ||
| iShares Morningstar | |||
| Mid Growth Index Fund | 3.11% | ||
| Vanguard Emerging Markets ETF | 2.66% | ||
| Exxon Mobil Corporation | 2.09% | ||
| iShares S&P SmallCap 600 Index Fund | 1.94% | ||
| Rydex Russell Top 50 ETF | 1.84% | ||
| iShares MSCI Emerging Markets Index | 1.81% | ||
| Net Assets: | $7,864,705 | ||
| Portfolio Turnover Rate | |||
| (not annualized): | 13.3% | ||
| Number of Equity Holdings: | 87 | ||
| Annualized Portfolio Expense Ratio:*** | |||
| INSTITUTIONAL CLASS: | 0.90% | ||
| INVESTOR CLASS: | 1.15% | **** | |
| * | The Fund’s portfolio composition is subject to change and there is no assurance that the Fund will continue to hold any particular security. Percentages shown relate to the Fund’s total net assets as of December 31, 2008. |
| ** | Percentages shown in parentheses may not add up to 100% due to rounding. |
| *** | The Advisor has contractually agreed to limit the Fund’s total annual fund operating expenses to 0.90% of average daily net assets for the Institutional Class shares and 1.15% of average daily net assets for the Investor Class shares, at least through December 31, 2011. |
| **** | Includes 0.25% 12b-1 fee. |
Page 4
Riverfront Long-Term Growth Fund
| Institutional Class |
| Value of a $25,000 Investment |
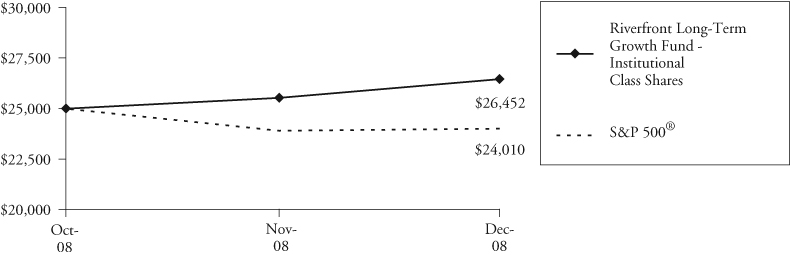 |
Growth of a hypothetical investment of $25,000 made on the Fund’s inception date (10/28/08), assuming reinvestment of all distributions.
| Investor Class |
| Value of a $10,000 Investment |
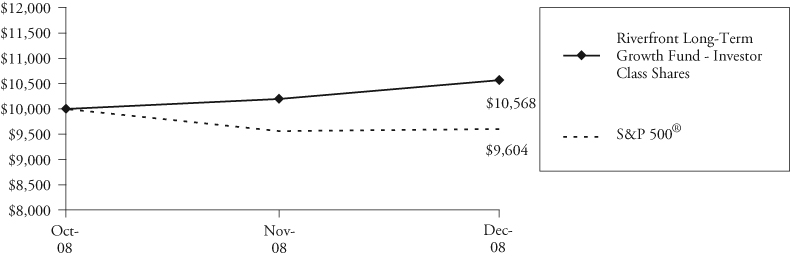 |
Growth of a hypothetical investment of $10,000 made on the Fund’s inception date (10/28/08), assuming reinvestment of all distributions.
Page 5
Riverfront Long-Term Growth Fund
Average Annual Total Returns
| For the Period Ended December 31, 2008 | Since Inception(1) |
| Institutional Class Shares | 5.81% |
| Investor Class Shares | 5.68% |
S&P 500® Index(2) | -3.96% |
| (1) | For the period from October 28, 2008 (commencement of operations) through December 31, 2008. |
| (2) | The S&P 500® is an index of 500 stocks chosen for market size, liquidity and industry grouping, among other factors. The S&P 500® is designed to be a leading indicator of U.S. equities and is meant to reflect the risk/return characteristics of the large cap universe. Companies included in the index are selected by the S&P Index Committee, a team of analysts and economists at Standard & Poor’s. The S&P 500® is a market value weighted index – each stock’s weight in the index is proportionate to its market value. A direct investment in an index is not possible. |
The returns shown in the table above and line graphs on the previous page reflect reinvestment of dividends and/or capital gains distributions in additional shares. The returns do not reflect the deduction of taxes that a shareholder would pay on Fund distributions or the redemption of Fund shares.
Past performance does not guarantee future results. Investment return and principal value will fluctuate so that an investor’s shares, when redeemed, may be worth more or less than their original cost.
For information about the performance of the Fund as of the most recent month-end, please call 1-866-44BAIRD or visit www.bairdfunds.com. Mutual fund performance changes over time and current performance may be lower or higher than that stated.
Page 6
Riverfront Long-Term Growth Fund
Schedule of Investments December 31, 2008 |
| Shares | Value | ||||||
| COMMON STOCKS – 41.0% | |||||||
| Aerospace & Defense – 1.8% | |||||||
| 686 | L-3 Communications | ||||||
| Holdings, Inc. | $ | 50,613 | |||||
| 375 | Lockheed Martin | ||||||
| Corporation | 31,530 | ||||||
| 1,112 | United Technologies | ||||||
| Corporation | 59,603 | ||||||
| 141,746 | |||||||
| Beverages – 0.9% | |||||||
| 1,493 | The Coca-Cola Company | 67,588 | |||||
| Capital Markets – 0.6% | |||||||
| 3,291 | Invesco Limited f | 47,522 | |||||
| Chemicals – 0.4% | |||||||
| 583 | Praxair, Inc. | 34,607 | |||||
| Commercial Banks – 0.6% | |||||||
| 899 | Cullen/Frost Bankers, Inc. | 45,561 | |||||
| Commercial Services & Supplies – 0.4% | |||||||
| 852 | Manpower Inc. | 28,959 | |||||
| Communications Equipment – 1.7% | |||||||
| 3,713 | Cisco Systems, Inc.* | 60,522 | |||||
| 1,539 | Harris Corporation | 58,559 | |||||
| 1,356 | Polycom, Inc.* | 18,319 | |||||
| 137,400 | |||||||
| Computers & Peripherals – 2.4% | |||||||
| 747 | Apple Inc.* | 63,756 | |||||
| 1,761 | Hewlett-Packard Company | 63,907 | |||||
| 692 | International | ||||||
| Business Machines | |||||||
| Corporation (IBM) | 58,239 | ||||||
| 185,902 | |||||||
| Construction & Engineering – 0.4% | |||||||
| 679 | Fluor Corporation | 30,467 | |||||
| Containers & Packaging – 0.8% | |||||||
| 1,584 | Ball Corporation | 65,878 | |||||
| Distributors – 0.8% | |||||||
| 3,551 | Ingram Micro | ||||||
| Inc. – Class A* | 47,548 | ||||||
| 890 | WESCO | ||||||
| International, Inc.* | 17,115 | ||||||
| 64,663 | |||||||
| Diversified Financial Services – 0.7% | |||||||
| 2,379 | NASDAQ OMX | ||||||
| Group, Inc.* | 58,785 | ||||||
| Diversified Telecommunication Services – 0.4% | |||||||
| 844 | Verizon | ||||||
| Communications Inc. | 28,612 | ||||||
| Electric Utilities – 0.4% | |||||||
| 2,283 | TECO Energy, Inc. | 28,195 | |||||
| Energy Equipment & Services – 0.9% | |||||||
| 2,014 | BJ Services Company | 23,504 | |||||
| 1,864 | Hornbeck Offshore | ||||||
| Services, Inc.* | 30,458 | ||||||
| 1,297 | Superior Energy | ||||||
| Services, Inc.* | 20,661 | ||||||
| 74,623 | |||||||
| Food & Staples Retailing – 2.4% | |||||||
| 1,058 | Costco Wholesale | ||||||
| Corporation | 55,545 | ||||||
| 1,169 | CVS Caremark Corporation | 33,597 | |||||
| 1,807 | Wal-Mart Stores, Inc. | 101,300 | |||||
| 190,442 | |||||||
| Food Products – 1.1% | |||||||
| 1,840 | The Hain Celestial | ||||||
| Group Inc.* | 35,126 | ||||||
| 1,409 | H.J. Heinz Company | 52,978 | |||||
| 88,104 | |||||||
| Health Care Providers & Services – 3.3% | |||||||
| 1,241 | DaVita, Inc.* | 61,516 | |||||
| 1,003 | Express Scripts, Inc.* | 55,145 | |||||
| 1,163 | Henry Schein, Inc.* | 42,671 | |||||
The accompanying notes are an integral part of these financial statements.
Page 7
Riverfront Long-Term Growth Fund
Schedule of Investments December 31, 2008 |
| Shares | Value | ||||||
| COMMON STOCKS – 41.0% (cont.) | |||||||
| Health Care Providers & Services – 3.3% (cont.) | |||||||
| 480 | Johnson & Johnson | $ | 28,718 | ||||
| 1,073 | Laboratory Corporation | ||||||
| of America Holdings* | 69,112 | ||||||
| 257,162 | |||||||
| Hotels, Restaurants & Leisure – 1.1% | |||||||
| 2,010 | Jack in the Box Inc.* | 44,401 | |||||
| 1,836 | Penn National | ||||||
| Gaming, Inc.* | 39,254 | ||||||
| �� | 83,655 | ||||||
| Household Products – 2.0% | |||||||
| 1,159 | Church & Dwight Co., Inc. | 65,043 | |||||
| 1,496 | Procter & Gamble Company | 92,483 | |||||
| 157,526 | |||||||
| Industrial Conglomerates – 0.4% | |||||||
| 481 | 3M Co. | 27,677 | |||||
| Insurance – 2.6% | |||||||
| 1,974 | Aflac, Inc. | 90,488 | |||||
| 3,058 | HCC Insurance | ||||||
| Holdings, Inc. | 81,802 | ||||||
| 2,293 | The Progressive Corporation | 33,959 | |||||
| 206,249 | |||||||
| IT Services – 0.7% | |||||||
| 1,475 | Fiserv, Inc.* | 53,646 | |||||
| Machinery – 1.5% | |||||||
| 1,952 | Actuant | ||||||
| Corporation – Class A | 37,127 | ||||||
| 1,528 | Dover Corporation | 50,302 | |||||
| 859 | Illinois Tool Works Inc. | 30,108 | |||||
| 117,537 | |||||||
| Multiline Retail – 0.8% | |||||||
| 1,480 | Dollar Tree, Inc.* | 61,864 | |||||
| Multimedia – 0.7% | |||||||
| 1,284 | Factset Research | ||||||
| Systems Inc. | 56,804 | ||||||
| Multi-Utilities & Unregulated Power – 1.3% | |||||||
| 1,546 | Dominion Resources, Inc. | 55,408 | |||||
| 2,110 | MDU Resources Group, Inc. | 45,534 | |||||
| 100,942 | |||||||
| Oil & Gas – 4.7% | |||||||
| 1,226 | Chevron Corporation | 90,687 | |||||
| 1,026 | Cimarex Energy Co. | 27,476 | |||||
| 2,060 | Exxon Mobil Corporation | 164,450 | |||||
| 1,016 | Forest Oil Corporation* | 16,754 | |||||
| 1,867 | ONEOK, Inc. | 54,367 | |||||
| 1,436 | Patterson-UTI Energy, Inc. | 16,528 | |||||
| 370,262 | |||||||
| Pharmaceuticals – 2.3% | |||||||
| 1,619 | Bristol-Myers | ||||||
| Squibb Company | 37,642 | ||||||
| 2,815 | Endo Pharmaceuticals | ||||||
| Holdings Inc.* | 72,852 | ||||||
| 1,926 | Wyeth | 72,244 | |||||
| 182,738 | |||||||
| Specialty Retail – 1.8% | |||||||
| 1,746 | Best Buy Co., Inc. | 49,080 | |||||
| 1,481 | Lowe’s Companies, Inc. | 31,871 | |||||
| 3,166 | PetSmart, Inc. | 58,413 | |||||
| 139,364 | |||||||
| Telecommunication Services – 0.5% | |||||||
| 2,298 | Amdocs Limited* f | 42,031 | |||||
| Tobacco – 0.6% | |||||||
| 1,072 | Philip Morris | ||||||
| International Inc. | 46,643 | ||||||
| Total Common Stocks | |||||||
| (Cost $3,148,948) | 3,223,154 | ||||||
The accompanying notes are an integral part of these financial statements.
Page 8
Riverfront Long-Term Growth Fund
Schedule of Investments December 31, 2008 |
| Shares | Value | ||||||
| EXCHANGE-TRADED FUNDS – 47.6% | |||||||
| Buy-Write Strategy – 1.8% | |||||||
| 8,062 | Powershares S&P 500 | ||||||
| BuyWrite Portfolio | $ | 142,294 | |||||
| Commodity – 0.5% | |||||||
| 435 | SPDR Gold Trust* | 37,649 | |||||
| Energy – 1.0% | |||||||
| 1,222 | Vanguard Energy ETF | 82,766 | |||||
| Financial Services – 1.8% | |||||||
| 4,140 | Financial Select Sector | ||||||
| SPDR Fund | 52,247 | ||||||
| 5,655 | PowerShares Dynamic | ||||||
| Banking Portfolio | 91,724 | ||||||
| 143,971 | |||||||
| Health & Biotechnology – 3.0% | |||||||
| 957 | iShares Dow Jones US | ||||||
| Pharmaceuticals Index Fund | 43,123 | ||||||
| 1,486 | iShares Nasdaq | ||||||
| Biotechnology Index Fund | 105,580 | ||||||
| 1,661 | PowerShares Dynamic | ||||||
| Healthcare Sector Portfolio* | 32,589 | ||||||
| 1,000 | SPDR S&P Biotech ETF | 53,720 | |||||
| 235,012 | |||||||
| International Equity – 25.5% | |||||||
| 3,410 | iShares MSCI | ||||||
| Canada Index Fund | 59,436 | ||||||
| 13,307 | iShares MSCI | ||||||
| EAFE Index Fund | 597,085 | ||||||
| 5,700 | iShares MSCI | ||||||
| Emerging Markets Index | 142,329 | ||||||
| 13,054 | iShares MSCI | ||||||
| Japan Index Fund | 125,318 | ||||||
| 4,352 | iShares S&P Latin | ||||||
| American 40 Index Fund | 110,846 | ||||||
| 8,821 | Vanguard Emerging | ||||||
| Markets ETF | 209,058 | ||||||
| 27,774 | Vanguard Europe | ||||||
| Pacific ETF | 762,952 | ||||||
| 2,007,024 | |||||||
| Large Cap – 5.6% | |||||||
| 2,023 | Rydex Russell Top 50 ETF | 144,382 | |||||
| 3,240 | SPDR Trust Series 1 | 292,377 | |||||
| 436,759 | |||||||
| Mid Cap – 3.1% | |||||||
| 4,587 | iShares Morningstar | ||||||
| Mid Growth Index Fund | 244,671 | ||||||
| Small Cap – 3.6% | |||||||
| 3,476 | iShares S&P | ||||||
| SmallCap 600 Index Fund | 152,944 | ||||||
| 3,042 | Vanguard Small-Cap | ||||||
| Growth ETF | 128,068 | ||||||
| 281,012 | |||||||
| Technology – 0.8% | |||||||
| 2,009 | iShares S&P | ||||||
| North American | |||||||
| Technology-Software | |||||||
| Index Fund* | 63,826 | ||||||
| Value – 0.9% | |||||||
| 6,291 | PowerShares Dividend | ||||||
| Achievers Portfolio | 72,724 | ||||||
| Total Exchange- | |||||||
| Traded Funds | |||||||
| (Cost $3,686,707) | 3,747,708 | ||||||
The accompanying notes are an integral part of these financial statements.
Page 9
Riverfront Long-Term Growth Fund
Schedule of Investments December 31, 2008 |
| Shares | Value | ||||||
| SHORT-TERM INVESTMENTS – 12.7% | |||||||
| Money Market Fund – 12.7% | |||||||
| 998,023 | Fidelity Institutional | ||||||
| Government Portfolio | $ | 998,023 | |||||
| Total Short-Term | |||||||
| Investments | |||||||
| (Cost $998,023) | 998,023 | ||||||
| Total Investments | |||||||
| (Cost $7,833,678) – | |||||||
| 101.3% | 7,968,885 | ||||||
| Liabilities in Excess | |||||||
| of Other Assets – (1.3)% | (104,180 | ) | |||||
| TOTAL NET | |||||||
| ASSETS – 100.0% | $ | 7,864,705 | |||||
| * | Non-Income Producing |
| f | Foreign Security |
The accompanying notes are an integral part of these financial statements.
Page 10
Riverfront Long-Term Growth Fund
Schedule of Investments December 31, 2008 |
SFAS 157 – Summary of Fair Value Exposure at December 31, 2008
In September 2006, the Financial Accounting Standards Board issued Statement of Financial Accounting Standards No. 157, “Fair Value Measurements” (“SFAS 157”) effective for fiscal years beginning after November 15, 2007. SFAS 157 defines fair value, establishes a framework for measuring fair value in generally accepted accounting principles (GAAP), and expands disclosures about fair value measurements. Under SFAS 157, various inputs are used in determining the value of the Fund’s investments. These inputs are summarized into three broad levels and described below:
| Level 1 – | Quoted prices in active markets for identical securities. |
| Level 2 – | Other significant observable inputs (including quoted prices for similar securities, interest rates, prepayment speeds, credit risk, etc.) |
| Level 3 – | Significant unobservable inputs (including the Fund’s own assumptions in determining the fair value of investments) |
The following is a summary of the inputs used to value the Fund’s investments as of December 31, 2008:
| Description | Investments, at Value | |||
| Level 1 – Quoted prices | $ | 7,968,885 | ||
| Level 2 – Other significant observable inputs | — | |||
| Level 3 – Significant unobservable inputs | — | |||
| Total | $ | 7,968,885 | ||
Page 11
Riverfront Long-Term Growth Fund
Additional Information on Fund Expenses December 31, 2008 |
Example
As a shareholder of a mutual fund, you incur two types of costs: (1) transaction costs, which may include sales charges (loads) on purchase payments, reinvested dividends, or other distributions; redemption fees; and exchange fees; and (2) ongoing costs, such as management fees; distribution and/or service (12b-1) fees; and other fund expenses. Although the Fund does not charge any sales loads, redemption fees, or other transaction fees, you will be assessed fees for outgoing wire transfers, returned checks and stop payment orders at prevailing rates charged by U.S. Bancorp Fund Services, LLC, the Fund’s transfer agent. If you request that a redemption be made by wire transfer, currently the Fund’s transfer agent charges a $15.00 fee.
This Example is intended to help you understand your ongoing costs (in dollars) of investing in the Fund and to compare these costs with the ongoing costs of investing in other mutual funds. The Example is based on an investment of $1,000 invested at the beginning of the period and held for the entire period (10/28/08 – 12/31/08).
Actual Expenses
The third and fourth columns of the following table provide information about account values based on actual returns and actual expenses. You may use the information in these columns, together with the amount you invested, to estimate the expenses that you paid over the period. Simply divide your account value by $1,000 (for example, an $8,600 account value divided by $1,000 – 8.6), then multiply the result by the number in the fourth column entitled “Expenses Paid During Period’’ to estimate the expenses you paid on your account during this period.
Hypothetical Example for Comparison Purposes
The fifth and sixth columns of the following table provide information about hypothetical account values and hypothetical expenses based on the Fund’s actual expense ratios and an assumed rate of return of 5% per year before expenses, which is not the Fund’s actual return. The hypothetical account values and expenses may not be used to estimate the actual ending account balance or expenses you paid for the period. You may use this information to compare the ongoing costs of investing in the Fund and other mutual funds. To do so, compare this 5% hypothetical example with the 5% hypothetical examples that appear in the shareholder reports of the other mutual funds. Please note that the expenses shown in the table are meant to highlight your ongoing costs only and do not reflect any transactional costs. Therefore, the sixth column of the table (entitled “Expenses Paid During Period”) is useful in comparing ongoing costs only, and will not help you determine the relative total costs of owning different mutual funds. In addition, if these transactional costs were included, your costs could have been higher.
Page 12
Riverfront Long-Term Growth Fund
Additional Information on Fund Expenses December 31, 2008 |
Actual vs. Hypothetical Returns
For the Period from October 28, 2008 (Fund’s inception date) through December 31, 2008
| Hypothetical (5% return | |||||||
| Actual | before expenses) | ||||||
| Fund’s | Beginning | Ending | Expenses | Ending | Expenses | ||
| Annualized | Account | Account | Paid | Account | Paid | ||
| Expense | Value | Value | During | Value | During | ||
Ratio(1) | 10/28/08 | 12/31/08 | Period(1) | 12/31/08 | Period(1) | ||
| Riverfront Long-Term | |||||||
| Growth Fund | |||||||
| Institutional Class | 0.90% | $1,000.00 | $1,058.10 | $1.62 | $1,007.17 | $1.58 | |
| Investor Class | 1.15% | $1,000.00 | $1,056.80 | $2.07 | $1,006.73 | $2.02 | |
| (1) | Expenses are equal to the Fund’s annualized expense ratio multiplied by the average account value over the period, multiplied by 64 days and divided by 366 to reflect the period since the Fund’s inception on October 28, 2008. |
Page 13
Riverfront Long-Term Growth Fund
Statement of Assets and Liabilities December 31, 2008 |
| ASSETS: | ||||
| Investments, at value | $ | 7,968,885 | ||
| (cost $7,833,678) | ||||
| Dividends receivable | 5,941 | |||
| Interest receivable | 736 | |||
| Receivable for fund shares sold | 203,231 | |||
| Receivable from Advisor | 29,332 | |||
| Other assets | 2,016 | |||
| Total assets | 8,210,141 | |||
| LIABILITIES: | ||||
| Payable to custodian | 953 | |||
| Payable for securities purchased | 313,692 | |||
| Accrued expenses and other liabilities | 30,791 | |||
| Total liabilities | 345,436 | |||
| NET ASSETS | $ | 7,864,705 | ||
| NET ASSETS CONSIST OF: | ||||
| Capital stock | $ | 7,821,694 | ||
| Accumulated undistributed net investment income | 2,682 | |||
| Accumulated net realized loss on investments sold | (94,878 | ) | ||
| Net unrealized appreciation on investments | 135,207 | |||
| NET ASSETS | $ | 7,864,705 | ||
| INSTITUTIONAL CLASS SHARES | ||||
| Net assets | $ | 7,438,725 | ||
| Shares outstanding | ||||
| ($0.01 par value, unlimited shares authorized) | 709,014 | |||
| Net asset value, offering and redemption price per share | $ | 10.49 | ||
| INVESTOR CLASS SHARES | ||||
| Net assets | $ | 425,980 | ||
| Shares outstanding | ||||
| ($0.01 par value, unlimited shares authorized) | 40,622 | |||
| Net asset value, offering and redemption price per share | $ | 10.49 | ||
The accompanying notes are an integral part of these financial statements.
Page 14
Riverfront Long-Term Growth Fund
Statement of Operations October 28, 2008(1) through December 31, 2008 |
| INVESTMENT INCOME: | ||||
| Dividends | $ | 71,545 | ||
| Interest | 1,466 | |||
| Total investment income | 73,011 | |||
| EXPENSES: | ||||
| Investment advisory fees | 5,681 | |||
| Administration fees | 576 | |||
| Shareholder servicing fees | 4,164 | |||
| Fund accounting fees | 468 | |||
| Professional fees | 19,826 | |||
| Federal and state registration | 5,340 | |||
| Directors fees | 4,160 | |||
| Custody fees | 1,162 | |||
| Reports to shareholders | 1,266 | |||
| Distribution fees - Investor Class Shares (Note 7) | 86 | |||
| Miscellaneous expenses | 256 | |||
| Total expenses | 42,985 | |||
| Expense reimbursement by Advisor (Note 5) | (35,032 | ) | ||
| Total expenses | 7,953 | |||
| NET INVESTMENT INCOME | 65,058 | |||
| REALIZED AND UNREALIZED GAIN/(LOSS) ON INVESTMENTS: | ||||
| Net realized loss on investments | (94,878 | ) | ||
| Change in unrealized appreciation/depreciation on investments | 135,207 | |||
| Net realized and unrealized gain on investments | 40,329 | |||
| NET INCREASE IN NET ASSETS RESULTING FROM OPERATIONS | $ | 105,387 | ||
| (1) | Commencement of operations. |
The accompanying notes are an integral part of these financial statements.
Page 15
Riverfront Long-Term Growth Fund
| Statement of Changes in Net Assets |
October 28, 2008(1) | ||||
| through | ||||
| December 31, 2008 | ||||
| OPERATIONS: | ||||
| Net investment income | $ | 65,058 | ||
| Net realized loss on investments | (94,878 | ) | ||
| Change in unrealized appreciation/depreciation on investments | 135,207 | |||
| Net increase in net assets resulting from operations | 105,387 | |||
| CAPITAL SHARE TRANSACTIONS: | ||||
| Proceeds from shares sold | 7,978,984 | |||
| Shares issued to holders in reinvestments of dividends | 56,642 | |||
| Cost of shares redeemed | (213,933 | ) | ||
| Net increase in net assets resulting from capital share transactions | 7,821,693 | |||
| DISTRIBUTIONS TO INSTITUTIONAL CLASS SHAREHOLDERS: | ||||
| From net investment income | (59,302 | ) | ||
| DISTRIBUTIONS TO INVESTOR CLASS SHAREHOLDERS: | ||||
| From net investment income | (3,073 | ) | ||
| TOTAL INCREASE IN NET ASSETS | 7,864,705 | |||
| NET ASSETS: | ||||
| Beginning of period | — | |||
| End of period (including undistributed net investment income of $2,682) | $ | 7,864,705 | ||
| (1) | Commencement of operations. |
The accompanying notes are an integral part of these financial statements.
Page 16
Riverfront Long-Term Growth Fund
| Financial Highlights |
| Institutional Class | Investor Class | |||||||
October 28, 2008(1) | October 28, 2008(1) | |||||||
| through | through | |||||||
| December 31, 2008 | December 31, 2008 | |||||||
| Per Share Data: | ||||||||
| Net asset value, beginning of period | $ | 10.00 | $ | 10.00 | ||||
| Income from investment operations: | ||||||||
Net investment income(2) | 0.12 | 0.12 | ||||||
| Net realized and unrealized gains on investments | 0.46 | 0.46 | ||||||
| Total from investment operations | 0.58 | 0.58 | ||||||
| Less distributions: | ||||||||
| Distributions from net investment income | (0.09 | ) | (0.09 | ) | ||||
| Net asset value, end of period | $ | 10.49 | $ | 10.49 | ||||
| Total return | 5.81 | %(3) | 5.68 | %(3) | ||||
| Supplemental data and ratios: | ||||||||
| Net assets, end of period | $ | 7,438,725 | $ | 425,980 | ||||
| Ratio of expenses to average net assets | 0.90 | %(4) | 1.15 | %(4) | ||||
| Ratio of expenses to average net assets (before waivers) | 4.97 | %(4) | 5.22 | %(4) | ||||
| Ratio of net investment income to average net assets | 7.55 | %(4) | 7.30 | %(4) | ||||
| Ratio of net investment income to average net assets (before waivers) | 3.48 | %(4) | 3.23 | %(4) | ||||
Portfolio turnover rate(5) | 13.3 | %(3) | 13.3 | %(3) | ||||
| (1) | Commencement of operations. |
| (2) | Calculated using average shares outstanding during the period. |
| (3) | Not annualized. |
| (4) | Annualized. |
| (5) | Portfolio turnover is calculated on the basis of the Fund as a whole without distinguishing between the classes of shares issued. |
The accompanying notes are an integral part of these financial statements.
Page 17
Riverfront Long-Term Growth Fund
Notes to the Financial Statements December 31, 2008 |
| 1. | ORGANIZATION |
Baird Funds, Inc. (the “Corporation”) was incorporated on June 9, 2000 as a Wisconsin corporation and is registered as an open-end management investment company under the Investment Company Act of 1940, as amended (the “1940 Act”). The accompanying financial statements include the Riverfront Long-Term Growth Fund (“Fund”), one of the eight portfolios comprising the Corporation. Pursuant to the 1940 Act, the Fund is a “diversified” series of the Corporation. The investment advisor to the Fund is Robert W. Baird & Co. Incorporated (“Baird” or the “Advisor”). The sub-advisor to the Fund is Riverfront Investment Group, LLC (“Riverfront”).
The Fund commenced operations with the sale of both Institutional and Investor Class Shares on October 28, 2008. The Institutional Class Shares are not subject to a distribution and service (12b-1) fee, while the Investor Class Shares are subject to a distribution and service (12b-1) fee up to 0.25%.
The Fund seeks long-term capital appreciation through investments primarily in equity securities of domestic and foreign companies across varying market capitalization ranges, styles and economic sectors.
On December 31, 2008, the Advisor held 61.2% of the Fund through the Advisor’s participant-directed retirement and deferred compensation plans.
| 2. | SIGNIFICANT ACCOUNTING POLICIES |
The following is a summary of significant accounting policies consistently followed by the Fund in the preparation of its financial statements. These policies are in conformity with accounting principles generally accepted in the United States of America.
| a) | Investment Valuation – Section 2(a)(41) of the 1940 Act, together with the rules and interpretations of the SEC, requires the Fund, in computing NAV, to value its portfolio securities using market quotations when they are “readily available.” When market quotations are not readily available (e.g., because there is no regular market quotation for such securities, the market for such security is limited, the validity of quotations is questionable or, for debt securities, IDC does not provide a price), the Board of Directors of the Corporation must value the securities at “fair value determined in good faith.” The Board has delegated such responsibility to the Advisor pursuant to pricing policies and procedures that the Board has adopted and regularly reviews. |
| In general, the “fair value” of a security means the amount that the Fund might reasonably expect to receive for the security upon its current sale. Pursuant to Statement of Financial Accounting Standards No. 157 (“SFAS 157), “fair value” means “the price that would be received to sell [a security] in an orderly transaction between market participants at the measurement date.” |
| Consistent with Section 2(a)(41) of the 1940 Act and SFAS 157, the Fund prices its securities as follows: Common stocks that are listed on a securities exchange (other than NASDAQ) are valued at the last quoted sales price. Securities traded on NASDAQ are valued at the NASDAQ Official Closing Price. Price information on listed stocks is taken from the exchange where the security is primarily traded. Securities that were not traded on the valuation date, |
Page 18
Riverfront Long-Term Growth Fund
Notes to the Financial Statements December 31, 2008 |
| 2. | SIGNIFICANT ACCOUNTING POLICIES (cont.) |
| as well as stocks that are not listed on an exchange, including NASDAQ, are valued at the average of the current bid and asked price. Debt securities are valued by an independent pricing service using valuation methods that are designed to represent fair value, such as matrix pricing and other analytical pricing models, market transactions and dealer quotations. Debt securities purchased with a remaining maturity of 60 days or less are valued at acquisition cost plus or minus any amortized discount or premium. Investments in mutual funds are valued at their stated net asset value. Other assets and securities for which no quotations are readily available are valued at fair value as determined in good faith by the Advisor in accordance with procedures approved by the Corporation’s Board of Directors. In accordance with such procedures, the Advisor may use broker quotes or, if the broker quotes are unavailable or deemed to be unreliable, fair value will be determined by a valuation committee of the Advisor. In determining fair value, the valuation committee takes into account all relevant factors and available information. Consequently, the price of the security used by the Fund to calculate its NAV may differ from quoted or published prices for the same security. Fair value pricing involves subjective judgments and there is no single standard for determining a security’s fair value. As a result, different mutual funds could reasonably arrive at a different fair value for the same security. It is possible that the fair value determined for a security is materially different from the value that could be realized upon the sale of that security or from the values that other mutual funds may determine. In addition, given the volatility and periodic illiquidity experienced in current markets, the prices determined for any individual security on any given day may vary significantly from the amount that can be obtained in an actual sale of that security. |
| In September 2006, the Financial Accounting Standards Board (FASB) issued SFAS 157, “Fair Value Measurements.” SFAS 157 defines fair value, establishes a framework for measuring fair value in accordance with GAAP, and expands disclosure about fair value measurements. SFAS 157 is effective for financial statements issued for fiscal years beginning after November 15, 2007. Management has determined that SFAS 157 had no material impact on the Fund’s financial statements. |
| In March 2008, Statement of Financial Accounting Standards No. 161, “Disclosures about Derivative Instruments and Hedging Activities” (“SFAS 161”) was issued and is effective for fiscal years beginning after November 15, 2008. SFAS 161 is intended to improve financial reporting for derivative instruments by requiring enhanced disclosure that enables investors to understand how and why an entity uses derivatives, how derivatives are accounted for, and how derivative instruments affect an entity’s results of operations and financial position. Management is currently evaluating the implications of SFAS 161, but does not believe it will have any impact on the Fund’s financial statement disclosures because the Fund generally does not maintain any positions in derivative instruments or engage in hedging activities. |
| b) | Foreign Securities – Foreign securities are defined as securities issued by companies that are organized outside the United States. Investing in securities of foreign companies and foreign governments involves special risks and considerations not typically associated with investing in U.S. companies and the U.S. government. These risks include revaluation of currencies and future adverse political and economic developments. Moreover, securities of many foreign companies and foreign governments and their markets may be less liquid and their prices more volatile than those of securities of comparable U.S. companies and the U.S. government. Occasionally, events that affect those values and exchange rates may occur after the close of the exchange on which such securities are traded. If such events |
Page 19
Riverfront Long-Term Growth Fund
Notes to the Financial Statements December 31, 2008 |
| 2. | SIGNIFICANT ACCOUNTING POLICIES (cont.) |
| materially affect the value of a Fund’s securities, these securities may be valued at their fair value pursuant to procedures adopted by the Board of Directors. All the foreign securities owned by the Fund as of December 31, 2008 are traded on the New York Stock Exchange or NASDAQ. |
| c) | Federal Income Taxes – The Fund intends to continue to qualify as a regulated investment company as provided in subchapter M of the Internal Revenue Code and to distribute substantially all of its taxable income to its shareholders in a manner which results in no tax cost to the Fund. Therefore, no federal income or excise tax provision is recorded. |
| The Fund adopted Financial Accounting Standards Board (FASB) Interpretation No. 48 (FIN 48), “Accounting for Uncertainty in Income Taxes,” a clarification of FASB Statement No. 109, “Accounting for Income Taxes.” FIN 48 establishes financial reporting rules regarding recognition and measurement of tax positions taken or expected to be taken on a tax return. Management has determined that FIN 48 has not resulted in any liability to the Fund. |
| d) | Distributions to Shareholders – Dividends from net investment income, if any, are declared and paid annually. Distributions of net realized gains, if any, are declared and paid at least annually. |
| e) | Allocation of Income and Expenses – The Fund is charged for those expenses directly attributable to it. Expenses directly attributable to a class of shares, such as Rule 12b-1 distribution fees, are charged to that class of shares. Income, expenses, and realized and unrealized gains and losses are allocated to the classes based on their respective net assets. Expenses that are not directly attributable to the Fund are allocated among the series of the Corporation in proportion to their assets. |
| f) | Use of Estimates – The preparation of financial statements in conformity with accounting principles generally accepted in the United States requires management to make estimates and assumptions that affect the reported amounts of assets and liabilities and disclosure of contingent assets and liabilities at the date of the financial statements and the reported amounts of revenues and expenses during the reporting period. Actual results could differ from those estimates. |
| g) | Other – Investment and shareholder transactions are recorded on trade date. The Fund determines the gain or loss realized from investment transactions by comparing the original cost of the security lot sold with the net sales proceeds. Dividend income is recognized on the ex-dividend date and interest income is recognized on an accrual basis. Accounting principles generally accepted in the United States require that permanent financial reporting and tax differences be reclassified in the capital accounts. |
| h) | Guarantees and Indemnifications – In the normal course of business, the Fund enters into contracts with service providers that contain general indemnification clauses. The Fund’s maximum exposure under these arrangements is unknown and this would involve future claims against the Fund that have not yet occurred. Based on experience, the Fund would expect the risk of loss to be remote. |
Page 20
Riverfront Long-Term Growth Fund
Notes to the Financial Statements December 31, 2008 |
| 3. | CAPITAL SHARE TRANSACTIONS |
The following table summarizes the capital share transactions of the Fund for the period from October 28, 2008 through December 31, 2008 (commencement of operations):
October 28, 2008(1) | October 28, 2008(1) | ||||||||||||||||
| through | through | ||||||||||||||||
| December 31, 2008 | December 31, 2008 | ||||||||||||||||
| Institutional Class Shares | Shares | Amount | Investor Class Shares | Shares | Amount | ||||||||||||
| Shares sold | 727,917 | $ | 7,567,640 | Shares sold | 40,368 | $ | 411,344 | ||||||||||
| Shares issued to | Shares issued to | ||||||||||||||||
| shareholders in | shareholders in | ||||||||||||||||
| reinvestment of | reinvestment of | ||||||||||||||||
| distributions | 5,326 | 54,064 | distributions | 254 | 2,578 | ||||||||||||
| Shares redeemed | (24,229 | ) | (213,933 | ) | Shares redeemed | — | — | ||||||||||
| Net increase | 709,014 | $ | 7,407,771 | Net increase | 40,622 | $ | 413,922 | ||||||||||
| Shares Outstanding: | Shares Outstanding: | ||||||||||||||||
| Beginning of period | — | Beginning of period | — | ||||||||||||||
| End of period | 709,014 | End of period | 40,622 | ||||||||||||||
| (1) | Commencement of operations. |
| 4. | INVESTMENT TRANSACTIONS AND INCOME TAX INFORMATION |
During the period from October 28, 2008 through December 31, 2008 (commencement of operations), the Fund’s purchases and sales of investment securities (excluding short-term investments) were $7,228,943 and $612,103, respectively.
Page 21
Riverfront Long-Term Growth Fund
Notes to the Financial Statements December 31, 2008 |
| 4. | INVESTMENT TRANSACTIONS AND INCOME TAX INFORMATION (cont.) |
At December 31, 2008, the Fund’s accumulated earnings/losses on a tax basis were as follows:
| Riverfront | ||||
| Long-Term | ||||
| Growth Fund | ||||
| Cost of Investments | $ | 7,847,116 | ||
| Gross unrealized appreciation | $ | 291,488 | ||
| Gross unrealized depreciation | (169,719 | ) | ||
| Net unrealized appreciation | $ | 121,769 | ||
| Undistributed ordinary income | $ | 2,683 | ||
| Undistributed long-term capital gain | — | |||
| Total distributable earnings | $ | 2,683 | ||
| Other accumulated losses | $ | (81,440 | ) | |
| Total accumulated earnings | $ | 43,012 | ||
Undistributed income or net realized gains for financial statement purposes may differ from amounts recognized for federal income tax purposes due to differences in the recognition and characterization of income, expense and capital gain items.
Under the current tax law, capital losses realized after October 31 may be deferred and treated as occurring on the first day of the following fiscal year. For the period October 28, 2008 through December 31, 2008, the Fund elected to defer capital losses occurring between November 1, 2008 and December 31, 2008 in the amount of $81,440.
At December 31, 2008, the Fund had not accumulated net realized capital loss carryovers. To the extent the Fund realizes future net capital gains, taxable distributions to shareholders will be offset by any unused capital loss carryovers.
During the period October 28, 2008 through December 31, 2008, the Fund paid ordinary income dividends of $62,375. The Fund did not distribute net realized capital gains.
| 5. | INVESTMENT ADVISORY AND OTHER AGREEMENTS |
The Fund has entered into an Investment Advisory Agreement with Baird for the provision of investment advisory services. Pursuant to the Investment Advisory Agreement, the Advisor is entitled to receive a fee, calculated daily and payable monthly, at the annual rate of 0.65% for the Fund as applied to the Fund’s average daily net assets. Certain officers of the Advisor are also officers of the Fund. The Fund has also entered into a Sub-Advisory Agreement with Baird and Riverfront under which Riverfront in its capacity as investment sub-advisor is responsible for the management of the Fund’s assets subject to the Advisor’s oversight. Pursuant to the Sub-Advisory Agreement, the Advisor (not the Fund) is responsible for paying Riverfront a sub-advisory fee at an annual rate of 0.45% of the Fund’s average daily net assets.
Page 22
Riverfront Long-Term Growth Fund
Notes to the Financial Statements December 31, 2008 |
| 5. | INVESTMENT ADVISORY AND OTHER AGREEMENTS (cont.) |
For the period from October 28, 2008 through December 31, 2008 (commencement of operations), and years ending 2009, 2010 and 2011, the Advisor has contractually agreed to waive its investment advisory fee and/or reimburse the Fund’s operating expenses (exclusive of brokerage commissions, taxes, and extraordinary expenses, but including the fees and expenses incurred by the Fund in connection with its investments in ETFs and other investment companies) to the extent necessary to ensure that the Fund’s annual operating expenses do not exceed 0.90% of the average daily net assets of the Fund’s Institutional Class Shares and 1.15% of the average daily net assets of the Fund’s Investor Class Shares.
To the extent that the Advisor reimburses or absorbs fees and expenses, it may seek payment of such amounts for three years after the year in which expenses were reimbursed or absorbed. The Fund will make no such payment, however, if its total annual operating expenses exceed the expense limits in effect at the time the expenses were reimbursed or at the time these payments are proposed. Reimbursed expenses totaled $35,032 for the period from October 28, 2008 through December 31, 2008 (commencement of operations) and are eligible for recoupment by the Advisor until 2011.
U.S. Bancorp Fund Services, LLC serves as transfer agent, administrator, and accounting services agent for the Fund. U.S. Bank, N.A. serves as custodian for the Fund.
Robert W. Baird & Co. Incorporated (the “Distributor”) is the sole distributor of the Fund pursuant to a distribution agreement.
No commissions were earned by the Distributor for services rendered as a registered broker-dealer in securities transactions for the Fund for the period from October 28, 2008 through December 31, 2008 (commencement of operations).
| 6. | LINE OF CREDIT |
The Corporation maintains an uncommitted, senior secured line of credit (“LOC”) with U.S. Bank, N.A. (the “Bank”) to provide the Fund a temporary liquidity source to meet unanticipated redemptions. Under the terms of the LOC, borrowings for the Fund are limited to one-third of the total assets (including the amount borrowed), or as otherwise indicated within the Fund’s agreement with the Bank. The Bank charges interest at the Bank’s Prime Rate less 1%. For the period October 28, 2008 through December 31, 2008 the Fund did not borrow from the LOC.
| 7. | DISTRIBUTION AND SHAREHOLDER SERVICE PLAN |
The Fund has adopted a distribution and shareholder service plan (the “Plan”) pursuant to Rule 12b-1 under the 1940 Act. The Plan allows the Fund to compensate the Distributor for the cost incurred in distributing the Fund’s Investor Class Shares, including amounts paid to brokers or dealers, at an annual rate not to exceed 0.25% of the average daily net assets of the Fund’s Investor Class Shares. The Fund incurred $86 in fees pursuant to the Plan during the period October 28, 2008 through December 31, 2008.
Page 23
Report of Independent Registered Public Accounting Firm
To the Shareholders and
Board of Directors of
Baird Funds, Inc.:
We have audited the accompanying statement of assets and liabilities of the Riverfront Long-Term Growth Fund (one of the portfolios constituting the Baird Funds, Inc.) (the “Fund”), including the schedule of investments, as of December 31, 2008, and the related statement of operations, statement of changes in net assets and the financial highlights for period from October 28, 2008 (initial date of inception) through December 31, 2008. These financial statements and financial highlights are the responsibility of the Fund’s management. Our responsibility is to express an opinion on these financial statements and financial highlights based on our audit.
We conducted our audit in accordance with the standards of the Public Company Accounting Oversight Board (United States). Those standards require that we plan and perform the audit to obtain reasonable assurance about whether the financial statements and financial highlights are free of material misstatement. The Fund is not required to have, nor were we engaged to perform, an audit of its internal control over financial reporting. Our audit included consideration of internal control over financial reporting as a basis for designing audit procedures that are appropriate in the circumstances, but not for the purpose of expressing an opinion on the effectiveness of the Fund’s internal control over financial reporting. Accordingly, we express no such opinion. An audit also includes examining, on a test basis, evidence supporting the amounts and disclosures in the financial statements, assessing the accounting principles used and significant estimates made by management, as well as evaluating the overall financial statement presentation. Our procedures included confirmation of securities owned as of December 31, 2008, by correspondence with the custodian and brokers. We believe that our audit provides a reasonable basis for our opinion.
In our opinion, the financial statements and financial highlights referred to above present fairly, in all material respects, the financial position of the Riverfront Long-Term Growth Fund of Baird Funds, Inc. as of December 31, 2008, and the results of its operations, the changes in its net assets and the financial highlights for the period from October 28, 2008 through December 31, 2008, in conformity with accounting principles generally accepted in the United States of America.
| |
Chicago, Illinois
February 26, 2009
Page 24
Riverfront Long-Term Growth Fund
| Directors & Officers as of December 31, 2008 |
| Number of | |||||
| Portfolios | Other | ||||
| Positions | Term of Office | Principal | in Complex | Directorships | |
| Held with | and Length of | Occupation(s) | Overseen | Held | |
| Name, Address and Age | the Funds | Time Served | During Past 5 Years | by Director | by Director |
| G. Frederick Kasten, Jr. | Independent | Indefinite; | Retired; Chairman, the Advisor (January 2000-December | 8 | Director of Regal-Beloit |
| 777 East Wisconsin Avenue | Director and | Since September | 2005); Chairman and CEO, the Advisor (January 1998- | Corporation, a | |
| Milwaukee, WI 53202 | Chairman | 2000 | January 2000); President, Chairman and CEO, the | manufacturing | |
| Age: 69 | Advisor (June 1983-January 1998); President, the Advisor | company | |||
| (January 1979-January 1983) | |||||
| John W. Feldt | Independent | Indefinite; | Retired; Senior Vice President-Finance, University of | 8 | Director of Thompson |
| c/o University of | Director | Since September | Wisconsin Foundation (1985-2006); Vice President- | Plumb Funds, Inc., a | |
| Wisconsin Foundation | 2000 | Finance, University of Wisconsin Foundation (1980- | mutual fund complex | ||
| 1848 University Avenue | 1985); Associate Director, University of Wisconsin | (3 portfolios); Director | |||
| Madison, WI 53705 | Foundation (1967-1980) | of Nakoma Mutual | |||
| Age: 66 | Funds, a mutual fund | ||||
| complex (1 portfolio) | |||||
| Frederick P. Stratton, Jr. | Independent | Indefinite; | Retired; Chairman Emeritus, Briggs & Stratton | 8 | Director of Weyco |
| 10134 N. Port Washington | Director | Since May | Corporation, a manufacturing company, since 2003; | Group, Inc., a men’s | |
| Road, #2B | 2004 | Chairman of the Board, Briggs & Stratton Corporation | footwear distributor; | ||
| Mequon, WI 53092 | (2001-2002); Chairman and CEO, Briggs & Stratton | Wisconsin Energy | |||
| Age: 69 | Corporation (1986-2001) | Corporation and its | |||
| subsidiaries Wisconsin | |||||
| Electric Power | |||||
| Company and | |||||
| Wisconsin Gas LLC | |||||
| Marlyn J. Spear | Independent | Indefinite; | Chief Investment Officer, Building Trades United | 8 | Management Trustee of |
| P.O. Box 530 | Director | Since January | Pension Trust Fund since July 1989; Investment Officer, | AFL-CIO Housing | |
| 500 Elm Grove Road | 2008 | Northwestern Mutual Financial Network (1988-1989); | Investment Trust | ||
| Elm Grove, WI 53122 | Assistant Vice-President, Firstar Trust Company | ||||
| Age: 55 | (1978-1987); Financial Analyst, Harco Holdings, Inc. | ||||
| (1976-1978) | |||||
| Cory L. Nettles* | Interested | Indefinite; | Managing Director, Generation Growth Capital, Inc. | 8 | Director of Weyco |
| Generation Growth Capital, Inc. | Director | Since January | (since March 2007); Of Counsel, Quarles & Brady LLP | Group, Inc., a men’s | |
| 411 East Wisconsin Avenue, | 2008 | (since January 2005); Secretary, Wisconsin Department | footwear distributor; | ||
| Suite 1710, | of Commerce (January 2003 – January 2005); Associate, | Director of The Private | |||
| Milwaukee, WI 53202 | Quarles & Brady LLP (July 1996 – December 2002) | Bank, a financial | |||
| Age: 38 | institution |
| * | Mr. Nettles is an “interested person” of the Corporation (as defined in the 1940 Act) because of his employment with the law firm, Quarles & Brady LLP, which provides legal services to the Advisor. The legal services that Quarles & Brady LLP has provided to the Advisor include litigation, real estate and miscellaneous securities related matters that did not relate to the Corporation or the Fund. |
Additional information about the Fund’s directors is available in the Statement of Additional Information which may be obtained without charge, upon request, by calling 1-866-44BAIRD, or at www.bairdfunds.com.
Page 25
Riverfront Long-Term Growth Fund
| Directors & Officers as of December 31, 2008 |
| Position(s) | Term of Office | Principal | |
| Held with | and Length of | Occupation(s) | |
| Name, Address, and Age | the Funds | Time Served | During Past 5 Years |
| Mary Ellen Stanek | President | Re-elected by | Managing Director, the Advisor, and Chief Investment Officer, Baird Advisors, a department of |
| 777 East Wisconsin Avenue | Board annually; | the Advisor, since March 2000; President and CEO, Firstar Investment Research & Management | |
| Milwaukee, WI 53202 | Since | Company, LLC (“FIRMCO”) (November 1998-February 2000); President, Firstar Funds, Inc. | |
| Age: 52 | September 2000 | (December 1998-February 2000); President and Chief Operating Officer, FIRMCO | |
| (March 1994-November 1998) | |||
| J. Bary Morgan | Senior | Re-elected by | Chief Investment Officer, Baird Investment Management, a department of the Advisor, since |
| 777 East Wisconsin Avenue | Vice President | Board annually; | January 2004; Managing Director, the Advisor since January 2001; Director, Baird Investment |
| Milwaukee, WI 53202 | Since | Management (January 2001-January 2004); Senior Vice President, the Advisor (January 2000- | |
| Age: 43 | February 2003 | January 2001); First Vice President, the Advisor (January 1996-January 2000) | |
| Todd S. Nichol | Vice President | Re-elected by | Chief Compliance Officer, the Advisor since October 2004; Assistant Compliance Director, the |
| 777 East Wisconsin Avenue | and Chief | Board annually; | Advisor since August 2002; Senior Vice President, the Advisor since January 2005; First Vice |
| Milwaukee, WI 53202 | Compliance | Since | President, the Advisor (January 2004-January 2005); Vice President, the Advisor (August 2002- |
| Age: 46 | Officer | August 2004 | January 2004); Vice President – Risk Management, BNY Clearing Services, LLC, a division of |
| The Bank of New York (August 1995-August 2002) | |||
| Russell P. Schwei | Vice President | Re-elected by | Operations Director, the Advisor since July 1992; Managing Director, the Advisor since January |
| 777 East Wisconsin Avenue | Board annually; | 1997; Chief Financial Officer and Managing Director, the Advisor (February 1999-December | |
| Milwaukee, WI 53202 | Since | 1999) | |
| Age: 49 | September 2000 | ||
| Leonard M. Rush | Treasurer | Re-elected by | Chief Financial Officer, the Advisor since January 2000 |
| 777 East Wisconsin Avenue | Board annually; | ||
| Milwaukee, WI 53202 | Since | ||
| Age: 62 | September 2000 | ||
| Charles M. Weber | Secretary | Re-elected by | Senior Vice President and Associate General Counsel, the Advisor since July 2005; Partner, |
| 777 East Wisconsin Avenue | Board annually; | Quarles & Brady LLP, a law firm (October 1998-June 2005) | |
| Milwaukee, WI 53202 | Since | ||
| Age: 45 | September 2005 | ||
| Laura E. Piotrowski | Assistant | Re-elected by | Managing Director, the Advisor since January 2008; Senior Vice President, the Advisor (January |
| 777 East Wisconsin Avenue | Treasurer | Board annually; | 2003-December 2007); Controller, the Advisor since January 2003; First Vice President, the |
| Milwaukee, WI 53202 | Since | Advisor (January 2001-January 2003); Vice President, the Advisor (January 1999-January 2001) | |
| Age: 38 | August 2007 | ||
| Robert A. Johnson | AML | Re-elected by | Compliance Officer, the Advisor since 1998, and AML Compliance Officer, the Advisor since |
| 777 East Wisconsin Avenue | Compliance | Board annually; | January 2004 |
| Milwaukee, WI 53202 | Officer | Since | |
| Age 45 | August 2004 | ||
| Bret T. Reese | Assistant | Re-elected by | Vice President and Associate General Counsel, the Advisor since June 2005; Senior Financial |
| 777 East Wisconsin Avenue | Secretary | Board annually; | Analyst, the Advisor (August 2004-June 2005); Financial Analyst, Stark & Roth, Inc., a hedge |
| Milwaukee, WI 53202 | Since | fund (June 2001-August 2002) | |
| Age: 39 | August 2006 |
Page 26
Riverfront Long-Term Growth Fund
DISCLOSURE REGARDING THE BOARD OF DIRECTORS’ APPROVAL OF THE INVESTMENT ADVISORY AND SUBADVISORY AGREEMENTS FOR THE RIVERFRONT LONG-TERM GROWTH FUND
The Board of Directors (the “Board”) of Baird Funds, Inc. (the “Corporation”) met on August 12, 2008 to consider the approval of a new advisory and subadvisory agreement with the Advisor for management of a new portfolio of the Corporation, the Riverfront Long-Term Growth Fund (the “Riverfront Fund”). Riverfront Investment Group, LLC (“Riverfront”), the proposed subadviser to the Riverfront Fund, had been introduced to the Board at its May 5, 2008 quarterly meeting, at which Riverfront’s Chief Investment Officer made a presentation regarding the firm, the prior experience of the firm’s principals and Riverfront’s investment philosophy. At the May 5 meeting, the Advisor also discussed its strategy in partnering with Riverfront, and noted that Baird is a minority owner of the firm.
At the August 12, 2008 meeting, the Board reviewed and discussed various information that had been provided prior to the meeting, including the proposed investment advisory and subadvisory agreements, a memorandum provided by outside legal counsel discussing the Board’s fiduciary obligations and factors the Board should assess in considering the approval of the investment advisory and subadvisory agreements, information from the Advisor in response to a request from the Board, including the directors who are not “interested persons” of the Corporation or the Advisor (the “Independent Directors”) within the meaning of the Investment Company Act of 1940 (the “1940 Act”) (including the Advisor’s Form ADV, Annual Report and statement of financial condition), proposed management fees and expense ratios, and other pertinent information. The Board also discussed relevant case law. The Independent Directors met separately in executive session with outside legal counsel to consider the investment advisory and subadvisory agreements. The Board also met with Riverfront, as described below. Based on its evaluation of this information, the Board, including a majority of the Independent Directors, approved the investment advisory and subadvisory agreements.
The Board of Directors also reviewed the proposed subadvisory agreement between the Advisor and Riverfront on behalf of the Riverfront Fund on August 12, 2008. At that time, the Board was provided materials relevant to its consideration of the subadvisory agreement, such as Riverfront’s Form ADV and Code of Ethics, information regarding Riverfront’s compliance program and its performance track record. Representatives of Riverfront, including its Chief Investment Officer and Chief Operating Officer, made a presentation regarding the Fund’s proposed investment strategy as a long-term growth asset-allocation portfolio, Riverfront’s personnel and the firm’s business development strategy. They also responded to questions from the Board.
In approving each of the investment advisory and subadvisory agreements, the Board reviewed and analyzed various factors that it determined were relevant, including the factors below.
Nature, Extent and Quality of Services to be Provided to the Fund
The Board analyzed the nature, extent and quality of the services to be provided by the Advisor to the Riverfront Fund. The Board discussed the fact that the Advisor had selected Riverfront to make the day-to day investment decisions for the Fund and that the Fund’s proposed investment strategy as a long-term growth asset allocation fund would complement the other
Page 27
Riverfront Long-Term Growth Fund
DISCLOSURE REGARDING THE BOARD OF DIRECTORS’ APPROVAL OF THE INVESTMENT ADVISORY AND SUBADVISORY AGREEMENTS FOR THE RIVERFRONT LONG-TERM GROWTH FUND (cont.)
Baird Fund offerings. The Board discussed the Advisor’s responsibilities for overseeing Riverfront as subadviser to the Fund and for monitoring the Fund’s compliance with applicable requirements under the securities laws. The Board further noted that the Advisor, in its capacity as a registered broker-dealer, was proposed to serve as distributor and principal underwriter of shares of the Fund and would assist Riverfront in marketing the Fund. The Board also considered other services the Advisor would provide the Fund, such as providing compliance support and overseeing the Fund’s other service providers. The Board concluded that the nature, extent and quality of the services to be provided by the Advisor to the Riverfront Fund were appropriate and that the Fund was likely to benefit from services provided under the investment advisory agreement.
The Board also considered Riverfront’s background as the former investment strategy team at another firm, and its core service of providing turn-key asset allocation products to financial advisors and their clients. The Board referred to the presentation from Riverfront’s management regarding the firm’s investment philosophy, process, investment management team and marketing plan. The Board concluded that the nature, extent and quality of the services to be provided by Riverfront to the Fund were appropriate and that the Fund was likely to benefit from services provided under the subadvisory agreement.
Investment Performance
Because the Fund had not yet commenced operations, the Board did not consider any performance information with respect to the Fund. However, the Board reviewed performance information for Riverfront’s long-term growth composite for the 1-year, 3-year and since inception (9/3/03) periods ending March 31, 2008, noting that performance history prior to March 31, 2008 was achieved at a predecessor firm. The Board concluded that, although past performance is not a guarantee of future results, the Fund and its shareholders were likely to benefit from Riverfront’s management.
Costs of Services Provided and Profitability
The Board examined the proposed fee and expense information for the Riverfront Fund, including a comparison of such information to other similarly situated mutual funds as determined by Lipper. The Board noted that the Fund’s advisory fee was slightly above the industry average and equal to the Lipper category median and that the Fund’s total expense ratio (for both its Investor Class and Institutional Class shares), after giving effect to the proposed expense cap agreement, was lower than the average and median expense ratio for all mutual funds in the Fund’s Lipper category. The Board reviewed and considered the general financial condition of the Advisor and determined it to be sound. The Board did not consider any information regarding the costs of services to be provided or the profits the Advisor might realize because the Fund had not yet commenced operations.
Page 28
Riverfront Long-Term Growth Fund
DISCLOSURE REGARDING THE BOARD OF DIRECTORS’ APPROVAL OF THE INVESTMENT ADVISORY AND SUBADVISORY AGREEMENTS FOR THE RIVERFRONT LONG-TERM GROWTH FUND (cont.)
In light of all of the information that it received and considered, the Board concluded that the proposed management fee and total expense ratio of the Riverfront Fund were reasonable.
The Board determined that the proposed subadvisory fee paid to Riverfront was appropriate in light of the Fund’s investment style and proposed expense structure. In evaluating the subadvisory fee, the Board noted that the fee is paid by the Advisor and therefore the overall advisory fee to be paid by the Fund is not directly affected by the subadvisory fee. The Board did not consider any information regarding the costs of services to be provided or the profits Riverfront might realize because the Fund had not yet commenced operations.
Economies of Scale and Fee Levels Reflecting Those Economies
Because the Fund had not yet commenced operations, the Board did not consider whether any alternative fee structures, such as breakpoint fees, would be appropriate to reflect any economies of scale that may result from increases in the Fund’s assets.
Benefits to be Derived from the Relationship with the Fund
The Board considered other potential benefits to the Advisor from serving as advisor to the Fund (in addition to the advisory fee). The Board noted that, as a minority owner of Riverfront, the Advisor would benefit from Riverfront’s financial performance. The Board concluded that other benefits that may be realized by the Advisor from its relationship with the Fund were appropriate.
The Board considered other potential benefits to Riverfront from serving as subadvisor to the Fund (in addition to the subadvisory fee). The Board noted that Riverfront would benefit from Baird’s distribution activities on behalf of the Fund. Riverfront provided information regarding its policies for the use of soft dollar commissions. The Board concluded that other benefits that may be realized by Riverfront from its relationship with the Fund were appropriate.
Based on its evaluation of the above factors, as well as other factors relevant to their consideration of the investment advisory agreement and subadvisory agreement, the Directors, including all of the Independent Directors, concluded that the approval of each of the investment advisory agreement and subadvisory agreement was in the best interest of the Riverfront Fund.
Page 29
Additional Information
Proxy Voting
A description of the policies and procedures that the Fund uses to determine how to vote proxies relating to portfolio securities is available without charge, upon request, by calling toll free, 1-866-44BAIRD, or by accessing the Fund’s website at www.bairdfunds.com; and by accessing the SEC’s website at www.sec.gov.
The Fund’s proxy voting record for the most recent 12-month period ended June 30 will be available in August 2009 without charge, upon request, by calling toll free, 1-866-44BAIRD, or by accessing the Fund’s website at www.bairdfunds.com; and by accessing the SEC’s website at www.sec.gov.
Portfolio Holdings Disclosure
The Fund files a complete schedule of portfolio holdings with the SEC for the first and third quarters of each fiscal year on Form N-Q. The Fund’s Forms N-Q are available on the SEC website at www.sec.gov and may be reviewed and copied at the SEC’s Public Reference Room in Washington, D.C. Information on the operation of the Public Reference Room may be obtained by calling 1-800-732-0330. The Fund’s Forms N-Q may also be obtained by calling toll-free 1-866-44BAIRD.
Qualified Dividend Income/Dividends Received Deduction
For the period October 28, 2008 through December 31, 2008, certain dividends paid by the Fund may be subject to a maximum tax rate of 15%, as provided for by the Jobs and Growth Tax Relief Reconciliation Act of 2003. The percentage of dividends declared from ordinary income designated as qualified dividend income was 94.48%.
For corporate shareholders, the percent of ordinary income distributions qualifying for the corporate dividends received deduction for the period October 28, 2008 through December 31, 2008 was 94.60%.
Page 30
(This Page Intentionally Left Blank.)
Baird Funds, Inc.
Riverfront Long-Term Growth Fund
c/o U.S. Bancorp Fund Services, LLC
P.O. Box 701
Milwaukee, WI 53201-0701
1-866-44BAIRD
Board of Directors
G. Frederick Kasten, Jr. (Chairman)
John W. Feldt
Frederick P. Stratton, Jr.
Cory L. Nettles
Marlyn J. Spear
Investment Advisor and Distributor
Robert W. Baird & Co. Incorporated
777 East Wisconsin Avenue
Milwaukee, WI 53202
Sub-Advisor
Riverfront Investment Group, LLC
9011 Arboretum Parkway
Suite 110
Richmond, VA 23236
Administrator and Transfer Agent
U.S. Bancorp Fund Services, LLC
P.O. Box 701
615 East Michigan Street
Milwaukee, WI 53202
Custodian
U.S. Bank, N.A.
1555 N. RiverCenter Drive, Suite 302
Milwaukee, WI 53212
Legal Counsel
Godfrey & Kahn, S.C.
780 North Water Street
Milwaukee, WI 53202
Independent Registered Public Accounting Firm
Grant Thornton LLP
175 West Jackson Boulevard, 13th Floor
Chicago, IL 60604
Item 2. Code of Ethics.
As of the end of the period covered by this report, the Registrant has adopted a code of ethics that applies to the President, Treasurer and Assistant Treasurer of the Registrant. The Registrant has not made any amendments to its code of ethics during the period covered by this report. The Registrant has not granted any waivers from any provisions of the code of ethics during the period covered by this report.
Item 3. Audit Committee Financial Expert.
The Registrant’s board of directors has determined that John W. Feldt, Frederick P. Stratton, Jr., and Marlyn J. Spear, members of the audit committee, each qualify as an “audit committee financial expert” as such term is defined in paragraph (b) of Item 3 of Form N-CSR. Mr. Feldt, Mr. Stratton, and Ms. Spear are each “independent” as such term is defined in paragraph (a)(2) of Item 3 of Form N-CSR.
Item 4. Principal Accountant Fees and Services.
Fees Billed by Grant Thornton LLP. The aggregate fees billed for professional services by Grant Thornton LLP (“GT”) during the last two fiscal years were as follows:
| FYE 12/31/2008 | FYE 12/31/2007 | |
| Audit Fees | $103,194 | $109,200 |
| Audit-Related Fees | - | - |
| Tax Fees | $26,730 | $26,400 |
| All Other Fees | - | - |
In the above table, “audit fees” are fees billed for professional services for the audit of the Registrant’s annual financial statements or for services that are normally provided by the accountant in connection with statutory and regulatory filings or engagements. “Tax fees” are fees billed for professional services rendered for tax compliance, tax advice and tax planning, and specifically relate to GT’s review of the Registrant’s federal and state tax returns.
The audit committee has adopted pre-approval policies and procedures that require the audit committee to pre-approve all audit and non-audit services rendered to the Registrant, as well as all non-audit services provided to the Registrant’s investment adviser and any entity affiliated with the Registrant’s investment adviser with respect to any engagement that relates directly to the operations and financial reporting of the Registrant. In accordance with its policies and procedures, the audit committee pre-approved all audit and tax services provided by GT during fiscal 2008. During the past two fiscal years, the Registrant did not receive any non-audit services from GT pursuant to any waivers of the pre-approval requirement under paragraph (c)(7)(i)(C) of Rule 2-01 of Regulation S-X. All of GT’s hours spent on auditing the Registrant’s financial statements were attributed to work performed by full-time permanent employees of GT.
During the last two fiscal years, GT has served as the auditor to Robert W. Baird & Co. Incorporated (“RWB”), the Registrant’s investment adviser, and has rendered non-audit services to RWB and its affiliates. The non-audit services consisted of review of state and federal tax returns for investment partnerships, tax services for Asian expatriates, and advice provided to RWB’s foreign affiliates about foreign tax and repatriation matters None of the RWB affiliates provides ongoing services to the Registrant. GT charged the following amounts for such non-audit services to RWB and its affiliates: $276,200 for 2008 and $280,108 for 2007. The Audit Committee has concluded that the provision of these audit services to RWB and non-audit services to RWB-affiliates is compatible with GT’s independence.
Item 5. Audit Committee of Listed Registrants.
Not applicable because the Registrant is not a "listed issuer" within the meaning of Rule 10A-3 under the Securities Exchange Act of 1934.
Item 6. Schedule of Investments.
The Schedules of Investments are included as part of the reports to shareholders filed under Item 1 of this Form N-CSR.
Item 7. Disclosure of Proxy Voting Policies and Procedures for Closed-End Management Investment Companies.
Not applicable because the Registrant is not a closed-end management investment company.
Item 8. Portfolio Managers of Closed-End Management Investment Companies.
Not applicable because the Registrant is not a closed-end management investment company.
Item 9. Purchases of Equity Securities by Closed-End Management Investment Company and Affiliated Purchasers.
Not applicable because the Registrant is not a closed-end management investment company.
Item 10. Submission of Matters to a Vote of Security Holders.
There have been no material changes to the procedures by which shareholders may recommend nominees to the Registrant’s board of directors.
Item 11. Controls and Procedures.
| (a) | The Registrant’s management, with the participation of its principal executive and principal financial officers, has evaluated the effectiveness of the Registrant's disclosure controls and procedures (as defined in Rule 30a-3(c) under the Investment Company Act of 1940 (the “Act”)), as of a date within 90 days prior to the filing date of this Form N-CSR. Based on such evaluation, the Registrant's principal executive and principal financial officers have concluded that the design and operation of the Registrant's disclosure controls and procedures are effective in providing reasonable assurance that the information required to be disclosed on Form N-CSR is recorded, processed, summarized and reported within the applicable time periods. |
| (b) | There were no changes in the Registrant's internal control over financial reporting (as defined in Rule 30a-3(d) under the Act) that occurred during the second fiscal quarter of the period covered by this report that has materially affected, or is reasonably likely to materially affect, the Registrant's internal control over financial reporting. |
Item 12. Exhibits.
| (a) | (1) Code of ethics. |
Incorporated by reference to the Registrant’s Form N-CSR filed on March 9, 2004.
(2) Certifications pursuant to Section 302 of the Sarbanes-Oxley Act of 2002. Filed herewith.
(3) Any written solicitation to purchase securities under Rule 23c-1 under the Act sent or given during the period covered by the report by or on behalf of the registrant to 10 or more persons. Not applicable because the Registrant is not a closed-end management investment company.
(b) Certification pursuant to Section 906 of the Sarbanes-Oxley Act of 2002. Furnished herewith.
SIGNATURES
Pursuant to the requirements of the Securities Exchange Act of 1934 and the Investment Company Act of 1940, the registrant has duly caused this report to be signed on its behalf by the undersigned, thereunto duly authorized.
BAIRD FUNDS, INC.
By: /s/Mary Ellen Stanek
Mary Ellen Stanek, President
Date: March 12, 2009
Pursuant to the requirements of the Securities Exchange Act of 1934 and the Investment Company Act of 1940, this report has been signed below by the following persons on behalf of the registrant and in the capacities and on the dates indicated.
By: /s/Mary Ellen Stanek
Mary Ellen Stanek, President
Date: March 12, 2009
By: /s/Leonard M. Rush
Leonard M. Rush, Treasurer
Date: March 12, 2009