UNITED STATES
SECURITIES AND EXCHANGE COMMISSION
Washington, D.C. 20549
FORM N-CSR
CERTIFIED SHAREHOLDER REPORT OF REGISTERED
MANAGEMENT INVESTMENT COMPANIES
Investment Company Act file number 811-09997
Baird Funds, Inc.
(Exact name of registrant as specified in charter)
777 East Wisconsin Avenue
Milwaukee, WI 53202
(Address of principal executive offices) (Zip code)
Andrew D. Ketter
Robert W. Baird & Co. Incorporated
777 East Wisconsin Avenue
Milwaukee, WI 53202
(Name and address of agent for service)
1-866-442-2473
Registrant's telephone number, including area code
Date of fiscal year end December 31, 2012
Date of reporting period: June 30, 2012
Item 1. Reports to Stockholders.
Semi-Annual Report –
Baird Funds
June 30, 2012
Baird Short-Term Bond Fund
Baird Intermediate Bond Fund
Baird Intermediate Municipal Bond Fund
Baird Aggregate Bond Fund
Baird Core Plus Bond Fund
| Go Green. |  | Go Paperless. |
Sign up to receive your Baird Funds’ prospectuses and reports online.
Table of Contents
| Baird Short-Term Bond Fund | 1 |
| Baird Intermediate Bond Fund | 10 |
| Baird Intermediate Municipal Bond Fund | 19 |
| Baird Aggregate Bond Fund | 30 |
| Baird Core Plus Bond Fund | 39 |
| Additional Information on Fund Expenses | 48 |
| Statements of Assets and Liabilities | 50 |
| Statements of Operations | 52 |
| Statements of Changes in Net Assets | 53 |
| Financial Highlights | 58 |
| Notes to the Financial Statements | 67 |
| Additional Information | 77 |
This report has been prepared for shareholders and may be distributed to others only if preceded or accompanied by a current prospectus.
Cautionary Note on Analyses, Opinions and Outlooks: In this report we offer analyses and opinions on the performance of individual securities, companies, industries, sectors, markets, interest rates and governmental policies, including predictions, forecasts and outlooks regarding possible future events. These can generally be identified as such because the context of the statements may include such words as “believe,” “should,” “will,” “expects,” “anticipates,” “hopes” and words of similar effect. These statements reflect the portfolio managers’ good faith beliefs and judgments and involve risks and uncertainties, including the risk that the portfolio managers’ analyses, opinions and outlooks are or will prove to be inaccurate. It is inherently difficult to correctly assess and explain the performance of particular securities, sectors, markets, interest rate movements, governmental actions or general economic trends and conditions, and many unforeseen factors contribute to the performance of Baird Funds. Investors are, therefore, cautioned not to place undue reliance on subjective judgments contained in this report.
Baird Short-Term Bond Fund
June 30, 2012 (Unaudited)
The Baird Short-Term Bond Fund seeks an annual rate of total return, before Fund expenses, greater than the annual rate of total return of the Barclays Capital 1-3 Year U.S. Government/Credit Bond Index. The Barclays Capital 1-3 Year U.S. Government/Credit Bond Index is an unmanaged, market value weighted index of investment grade, fixed-rate debt issues, including government and corporate securities, with maturities between one and three years.
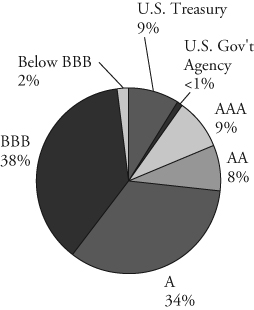
Portfolio Characteristics
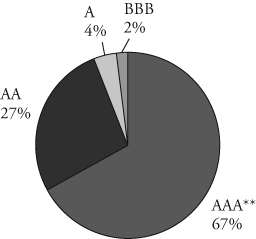
Quality Distribution*
 | Net Assets: | $1,103,277,261 | ||
| SEC 30-Day | ||||
Yield:** | ||||
| Institutional Class: | 2.04% | |||
| Average | ||||
| Effective | ||||
| Duration: | 1.89 years | |||
| Average | ||||
| Effective | ||||
| Maturity: | 2.02 years | |||
| Annualized | ||||
| Expense | ||||
| Ratio: | ||||
| Institutional Class: | 0.30% | |||
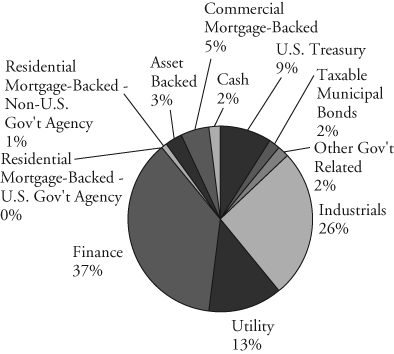
| Sector Weightings* | Portfolio | |||
| Turnover | ||||
 | Rate: | 21.5%# | ||
| Total | ||||
| Number of | ||||
Holdings: | 357 | |||
| * | Percentages shown are based on the Fund’s total investments (less investments purchased with cash proceeds from securities lending). |
| ** | SEC yields are based on SEC guidelines and are calculated for the 30 days ended June 30, 2012. |
| # | Not annualized. |
Page 1
Baird Short-Term Bond Fund
June 30, 2012 (Unaudited)
Total Returns
| Average Annual | ||||
| Six | One | Five | Since | |
| For the Periods Ended June 30, 2012 | Months | Year | Years | Inception(1) |
| Institutional Class | 2.08% | 2.47% | 3.71% | 3.48% |
| Barclays Capital 1-3 Year | ||||
U.S. Government/Credit Bond Index(2) | 0.58% | 1.12% | 3.67% | 3.39% |
| (1) | For the period from August 31, 2004 (commencement of operations) to June 30, 2012. |
| (2) | The Barclays Capital 1-3 Year U.S. Government/Credit Bond Index is an unmanaged, market value weighted index of investment grade, fixed-rate debt issues including government and corporate securities with maturities between one and three years. This index does not reflect any deduction for fees, expenses or taxes. A direct investment in an index is not possible. |
The returns shown in the table above reflect reinvestment of dividends and/or capital gains distributions in additional shares. Returns do not reflect the deduction of taxes that a shareholder would pay on Fund distributions or the redemption of Fund shares. The returns reflect the actual performance for each period and does not include the impact of trades executed on the last business day of the period that were recorded on the first business day of the next period.
Past performance does not guarantee future results. Investment returns and principal value will fluctuate so that an investor’s shares, when redeemed, may be worth more or less than their original cost.
For information about the performance of the Fund as of the most recent month-end, please call 1-866-44BAIRD or visit www.bairdfunds.com. Mutual fund performance changes over time and current performance may be lower or higher than that stated.
Page 2
Baird Short-Term Bond Fund
Summary Schedule of Investments, June 30, 2012 (Unaudited)
This schedule summarizes the Fund’s holdings by asset type. Details are reported for each of the Fund’s 50 largest individual holdings and for investments that, in total for any issuer, represent more than 1% of the Fund’s net assets. The total value of smaller holdings is reported as a single amount within each category.
The Fund reports a complete list of its holdings in regulatory filings following the end of each fiscal quarter. For the second and fourth fiscal quarters, the complete listing of the Fund’s holdings is available electronically at http://www.rwbaird.com/baird-funds/prospectus-applications/prospectus-applications.aspx under the column “Form N-CSR” and on the Securities and Exchange Commission’s website (www.sec.gov) or you can have it mailed to you without charge by calling 1-866-44BAIRD. For the first and third fiscal quarters, the Fund files its holdings with the SEC on Form N-Q. Shareholders can look up the Fund’s Forms N-Q on the SEC’s website (www.sec.gov).
Long-Term Investments
| Principal | Market | % of | ||||||||||
| Amount | Value | Net Assets | ||||||||||
| U.S. Treasury Securities | ||||||||||||
| U.S. Treasury Bonds | ||||||||||||
| 2.375%, 03/31/2016@ | $ | 86,700,000 | $ | 92,559,013 | 8.4 | % | ||||||
| Total U.S. Treasury Securities | ||||||||||||
| (Cost $91,999,563) | 92,559,013 | 8.4 | % | |||||||||
| Taxable Municipal Bonds | ||||||||||||
| Government Development Bank for Puerto Rico | ||||||||||||
| 3.670%, 05/01/2014 | 6,450,000 | 6,563,778 | 0.6 | % | ||||||||
Other Municipal Bonds# | 18,773,206 | 1.7 | % | |||||||||
| Total Municipal Bonds | ||||||||||||
| (Cost $24,980,636) | 25,336,984 | 2.3 | % | |||||||||
| Other Government Related Securities | ||||||||||||
Total Other Government Related Securities#~ | ||||||||||||
| (Cost $16,930,021) | 17,002,883 | 1.6 | % | |||||||||
| Corporate Bonds | ||||||||||||
| Industrials | ||||||||||||
| Anglo American Capital PLC | ||||||||||||
| 2.150%, 09/27/2013 (Acquired 09/20/2010 | ||||||||||||
through 03/21/2012, Cost $6,909,261)* f | 6,900,000 | 6,951,260 | 0.6 | % | ||||||||
| Cadbury Schweppes U.S. Finance LLC | ||||||||||||
| 5.125%, 10/01/2013 (Acquired 09/03/2010 | ||||||||||||
| through 02/07/2012, Cost $5,575,884)* | 5,324,000 | 5,577,002 | 0.5 | % | ||||||||
| CBS Corporation | ||||||||||||
| 8.200%, 05/15/2014 | 5,175,000 | 5,858,768 | 0.5 | % | ||||||||
| Computer Sciences Corporation | ||||||||||||
| 5.500%, 03/15/2013@ | 7,367,000 | 7,551,175 | 0.7 | % | ||||||||
| Express Scripts, Inc. | ||||||||||||
| 6.250%, 06/15/2014 | 5,000,000 | 5,466,960 | 0.5 | % | ||||||||
| Georgia-Pacific LLC | ||||||||||||
| 8.250%, 05/01/2016 (Acquired 04/27/2011 | ||||||||||||
| through 06/19/2012, Cost $7,054,091)* | 6,500,000 | 7,160,224 | 0.7 | % | ||||||||
The accompanying notes are in integral part of these financial statements.
Page 3
Baird Short-Term Bond Fund
Summary Schedule of Investments, June 30, 2012 (Unaudited)
Long-Term Investments (cont.)
| Principal | Market | % of | ||||||||||
| Amount | Value | Net Assets | ||||||||||
| Glencore Funding LLC | ||||||||||||
| 6.000%, 04/15/2014 (Acquired 01/12/2010 | ||||||||||||
| through 02/27/2012, Cost $7,353,121)* | $ | 7,120,000 | $ | 7,484,694 | 0.7 | % | ||||||
| HP Enterprise Services LLC, Series B | ||||||||||||
| 6.000%, 08/01/2013 | 5,639,000 | 5,917,995 | 0.5 | % | ||||||||
| Hutchison Whampoa International Ltd. | ||||||||||||
| 6.500%, 02/13/2013 (Acquired 01/20/2010 | ||||||||||||
through 01/19/2012, Cost $6,859,820)* f | 6,699,000 | 6,905,704 | 0.6 | % | ||||||||
| Laboratory Corporation of America Holdings | ||||||||||||
| 5.500%, 02/01/2013 | 6,025,000 | 6,171,679 | 0.6 | % | ||||||||
| POSCO | ||||||||||||
| 8.750%, 03/26/2014 (Acquired 03/19/2009 | ||||||||||||
through 04/28/2011, Cost $7,824,706)* f | 7,300,000 | 8,076,158 | 0.7 | % | ||||||||
| Union Pacific Railroad Co. 2004 Pass Through Trust | ||||||||||||
| 5.214%, 09/30/2014 (Acquired 10/22/2010 | ||||||||||||
| through 03/29/2012, Cost $6,312,848)* | 5,924,000 | 6,365,693 | 0.6 | % | ||||||||
| Xerox Corporation | ||||||||||||
| 8.250%, 05/15/2014 | 6,100,000 | 6,801,677 | 0.6 | % | ||||||||
Other Industrials#~ | 200,976,196 | 18.2 | % | |||||||||
| Total Industrials | ||||||||||||
| (Cost $285,624,479) | 287,265,185 | 26.0 | % | |||||||||
| Utility | ||||||||||||
| Consolidated Natural Gas, Series A | ||||||||||||
| 5.000%, 03/01/2014 | 5,923,000 | 6,284,108 | 0.6 | % | ||||||||
| El Paso Pipeline Partners Operating Co LLC | ||||||||||||
| 4.100%, 11/15/2015@ | 5,286,000 | 5,530,092 | 0.5 | % | ||||||||
| Gulf South Pipeline Company, L.P. | ||||||||||||
| 5.750%, 08/15/2012 (Acquired 03/25/2011 | ||||||||||||
| through 04/12/2011, Cost $6,635,752)* | 6,600,000 | 6,629,594 | 0.6 | % | ||||||||
| National Grid PLC | ||||||||||||
6.300%, 08/01/2016 f | 7,461,000 | 8,608,054 | 0.8 | % | ||||||||
| Nisource Finance Corp. | ||||||||||||
| 5.400%, 07/15/2014 | 5,775,000 | 6,223,631 | 0.6 | % | ||||||||
| Spectra Energy Capital LLC | ||||||||||||
| 5.668%, 08/15/2014 | 5,814,000 | 6,290,794 | 0.6 | % | ||||||||
| Williams Partners L.P. | ||||||||||||
| 3.800%, 02/15/2015 | 6,000,000 | 6,311,892 | 0.6 | % | ||||||||
Other Utility#~ | 100,663,982 | 9.0 | % | |||||||||
| Total Utility | ||||||||||||
| (Cost $145,033,519) | 146,542,147 | 13.3 | % | |||||||||
The accompanying notes are in integral part of these financial statements.
Page 4
Baird Short-Term Bond Fund
Summary Schedule of Investments, June 30, 2012 (Unaudited)
Long-Term Investments (cont.)
| Principal | Market | % of | ||||||||||
| Amount | Value | Net Assets | ||||||||||
| Finance | ||||||||||||
| ABN AMRO Bank N.V. | ||||||||||||
| 3.000%, 01/31/2014 (Acquired 01/27/2011 | ||||||||||||
through 04/28/2011, Cost $5,652,611)* f | $ | 5,650,000 | $ | 5,674,425 | 0.5 | % | ||||||
| AEGON N.V. | ||||||||||||
4.750%, 06/01/2013 f | 6,722,000 | 6,922,544 | 0.6 | % | ||||||||
| ANZ National (Int’l) LTD | ||||||||||||
| 6.200%, 07/19/2013 (Acquired 05/25/2010 | ||||||||||||
through 06/09/2011, Cost $7,984,207)* f | 7,678,000 | 8,044,010 | 0.7 | % | ||||||||
| Cie de Financement Foncier | ||||||||||||
| 2.250%, 03/07/2014 (Acquired 03/01/2011 | ||||||||||||
through 12/14/2011, Cost $5,493,438)* f | 5,500,000 | 5,533,550 | 0.5 | % | ||||||||
| Citigroup, Inc. | ||||||||||||
| 6.010%, 01/15/2015 | 7,000,000 | 7,520,961 | 0.7 | % | ||||||||
| Credit Suisse New York | ||||||||||||
5.000%, 05/15/2013 f | 6,221,000 | 6,415,245 | 0.6 | % | ||||||||
| FMR LLC | ||||||||||||
| 4.750%, 03/01/2013 (Acquired 10/04/2010 | ||||||||||||
| through 05/30/2012, Cost $8,781,143)* | 8,615,000 | 8,812,085 | 0.8 | % | ||||||||
| General Electric Capital Corporation: | ||||||||||||
| 4.875%, 03/04/2015 | 5,000,000 | 5,428,830 | 0.5 | % | ||||||||
| 2.300%-5.900%, 05/13/2014-04/27/2017@ | 8,900,000 | 9,256,016 | 0.9 | % | ||||||||
| Genworth Life Institutional Funding Trust | ||||||||||||
| 5.875%, 05/03/2013 (Acquired 04/07/2010 | ||||||||||||
| through 01/17/2012, Cost $6,111,121)* | 5,980,000 | 6,080,643 | 0.6 | % | ||||||||
| Goldman Sachs Group LP | ||||||||||||
| 8.000%, 03/01/2013 (Acquired 04/16/2009 | ||||||||||||
| through 06/15/2012, Cost $5,879,764)* | 5,720,000 | 5,907,502 | 0.5 | % | ||||||||
| Invesco Ltd. | ||||||||||||
5.375%, 02/27/2013 f | 6,785,000 | 6,962,278 | 0.6 | % | ||||||||
| Irish Life & Permanent Group Holdings PLC | ||||||||||||
| 3.600%, 01/14/2013 (Acquired 01/07/2010 | ||||||||||||
through 02/28/2012, Cost $6,028,131)* f | 6,050,000 | 5,863,019 | 0.5 | % | ||||||||
| J.P. Morgan Chase & Co. | ||||||||||||
| 3.450%, 03/01/2016@ | 5,550,000 | 5,752,469 | 0.5 | % | ||||||||
| Key Bank NA | ||||||||||||
| 5.800%, 07/01/2014 | 5,100,000 | 5,467,129 | 0.5 | % | ||||||||
| Kookmin Bank | ||||||||||||
| 7.250%, 05/14/2014 (Acquired 05/26/2009 | ||||||||||||
through 12/15/2011, Cost $5,270,974)* f | 5,000,000 | 5,475,090 | 0.5 | % | ||||||||
| M&I Marshall & Ilsley Bank | ||||||||||||
| 4.850%, 06/16/2015 | 5,532,000 | 5,898,434 | 0.5 | % | ||||||||
| UFJ Finance Aruba A.E.C. | ||||||||||||
6.750%, 07/15/2013 f | 6,175,000 | 6,511,624 | 0.6 | % | ||||||||
The accompanying notes are in integral part of these financial statements.
Page 5
Baird Short-Term Bond Fund
Summary Schedule of Investments, June 30, 2012 (Unaudited)
Long-Term Investments (cont.)
| Principal | Market | % of | ||||||||||
| Amount | Value | Net Assets | ||||||||||
| WEA Finance LLC | ||||||||||||
| 7.500%, 06/02/2014 (Acquired 12/14/2011 | ||||||||||||
| through 06/26/2012, Cost $8,562,239)* | $ | 7,865,000 | $ | 8,581,399 | 0.8 | % | ||||||
| Wells Fargo Bank NA | ||||||||||||
| 4.750%, 02/09/2015 | 5,250,000 | 5,626,394 | 0.5 | % | ||||||||
| Willis North America, Inc. | ||||||||||||
| 5.625%, 07/15/2015 | 6,100,000 | 6,618,311 | 0.6 | % | ||||||||
Other Finance#~ | 272,208,156 | 24.7 | % | |||||||||
| Total Finance | ||||||||||||
| (Cost $406,777,662) | 410,560,114 | 37.2 | % | |||||||||
| Residential Mortgage-Backed Securities | ||||||||||||
| U.S. Government Agency Issues | ||||||||||||
| Total U.S. Government Agency Issues# | ||||||||||||
| (Cost $3,628,312) | 3,804,621 | 0.3 | % | |||||||||
| Non-U.S. Government Agency Issues | ||||||||||||
Total Non-U.S. Government Agency Issues# | ||||||||||||
| (Cost $11,639,762) | 11,093,760 | 1.0 | % | |||||||||
| Asset Backed Securities | ||||||||||||
| Specialty Underwriting & Residential Finance | ||||||||||||
| Series 2006-BC1, Class A2C, 0.439%, 12/25/2036 | 8,494,721 | 8,202,104 | 0.7 | % | ||||||||
Other Asset Backed Securities#~ | 19,510,448 | 1.8 | % | |||||||||
| Total Asset Backed Securities | ||||||||||||
| (Cost $30,044,274) | 27,712,552 | 2.5 | % | |||||||||
| Commercial Mortgage-Backed Securities | ||||||||||||
| Bear Stearns Commercial Mortgage Securities | ||||||||||||
| Series 2005-PWR9, Class A4A, 4.871%, 09/11/2042 | 10,000,000 | 11,018,010 | 1.0 | % | ||||||||
| Credit Suisse First Boston | ||||||||||||
| Mortgage Securities Corporation | ||||||||||||
| Series 2005-C5, Class A4, 5.100%, 08/15/2038 | 5,808,250 | 6,404,089 | 0.6 | % | ||||||||
| GE Capital Commercial Mortgage Corporation | ||||||||||||
| Series 2004-C3, Class A4, 5.189%, 07/10/2039 | 7,180,000 | 7,650,154 | 0.7 | % | ||||||||
| J.P. Morgan Chase Commercial | ||||||||||||
| Mortgage Securities Corp. | ||||||||||||
| Series 2003-CB7, Class A4, 4.879%, 01/12/2038 | 11,161,414 | 11,575,302 | 1.0 | % | ||||||||
| J.P. Morgan Chase Commercial Mortgage Trust | ||||||||||||
| Series 2005-CB12, Class A4, 4.895%, 09/12/2037 | 8,774,000 | 9,623,551 | 0.9 | % | ||||||||
| Wachovia Bank Commercial Mortgage Trust | ||||||||||||
| Series 2003-C3, Class A2, 4.867%, 02/15/2035 | 7,506,485 | 7,603,363 | 0.7 | % | ||||||||
Other Commercial Mortgage Backed Securities#~ | 2,980,260 | 0.3 | % | |||||||||
| Total Commercial Mortgage Backed Securities | ||||||||||||
| (Cost $56,503,335) | 56,854,729 | 5.2 | % | |||||||||
| Total Long-Term Investments | ||||||||||||
| (Cost $1,073,161,563) | 1,078,731,988 | 97.8 | % | |||||||||
The accompanying notes are in integral part of these financial statements.
Page 6
Baird Short-Term Bond Fund
Summary Schedule of Investments, June 30, 2012 (Unaudited)
Short-Term Investments
| Market | % of | |||||||||||
| Shares | Value | Net Assets | ||||||||||
| Money Market Mutual Fund | ||||||||||||
| Short-Term Investments Trust – | ||||||||||||
| Liquid Assets Portfolio, 0.16%« | 20,518,668 | $ | 20,518,668 | 1.9 | % | |||||||
| Total Short-Term Investments | ||||||||||||
| (Cost $20,518,668) | 20,518,668 | 1.9 | % | |||||||||
| Investments Purchased with Cash | ||||||||||||
| Proceeds from Securities Lending | ||||||||||||
| Principal | ||||||||||||
| Amount | ||||||||||||
| Commercial Paper | ||||||||||||
| Atlantic East Funding LLC, | ||||||||||||
| 0.595%, 03/25/2013†** | $ | 817,950 | 539,642 | 0.0 | % | |||||||
| Total Commercial Paper | ||||||||||||
| (Cost $817,950) | 539,642 | 0.0 | % | |||||||||
| Shares | ||||||||||||
| Investment Companies | ||||||||||||
| Mount Vernon Securities Lending | ||||||||||||
| Trust Prime Portfolio, 0.31%« | 125,762,756 | 125,762,756 | 11.4 | % | ||||||||
| Total Investment Companies | ||||||||||||
| (Cost $125,762,756) | 125,762,756 | 11.4 | % | |||||||||
| Total Investments Purchased With | ||||||||||||
| Cash Proceeds From Securities Lending | ||||||||||||
| (Cost $126,580,706) | 126,302,398 | 11.4 | % | |||||||||
| Total Investments | ||||||||||||
| (Cost $1,220,260,937) | 1,225,553,054 | 111.1 | % | |||||||||
| Asset Relating to Securities Lending Investments | ||||||||||||
Support Agreement**^a† | 278,308 | 0.0 | % | |||||||||
| Total | ||||||||||||
| (Cost $0) | 278,308 | 0.0 | % | |||||||||
| Liabilities in Excess of Other Assets | (122,554,101 | ) | (11.1 | %) | ||||||||
| TOTAL NET ASSETS | $ | 1,103,277,261 | 100.0 | % | ||||||||
The accompanying notes are in integral part of these financial statements.
Page 7
Baird Short-Term Bond Fund
Summary Schedule of Investments, June 30, 2012 (Unaudited)
Notes to Summary Schedule of Investments
| * | Restricted Security Deemed Liquid | |
| ** | Illiquid Security | |
| @ | This security or portion of this security is out on loan at June 30, 2012. | |
| f | Foreign Security | |
| ^ | Non-Income Producing | |
| « | 7-Day Yield | |
| † | Priced at Fair Value by the Valuation Committee as delegated by the Baird Funds’ Board of Directors. | |
| # | Represents the aggregate value, by category, securities that are not among the 50 largest holdings and, in total for any issuer, represent 1% or less of net assets. | |
| ~ | Groupings contain, in aggregate, restricted securities totaling $167,755,204 representing 15.21% of net assets. | |
| a | The Fund’s transfer agent and administrator and securities lending agent entered into a support agreement with the Fund to cover losses realized by the Fund on its investment in Atlantic East Funding, LLC (up to a certain amount), which investment was made by the Fund’s securities lending agent. |
Summary of Fair Value Exposure at June 30, 2012 (Unaudited)
The Fund has adopted authoritative fair valuation accounting standards which establish a definition of fair value and set out a hierarchy for measuring fair value. These standards require additional disclosures about the various inputs and valuation techniques used to develop the measurements of fair value and a discussion on changes in valuation techniques and related inputs during the period. These standards define fair value as the price that would be received to sell an asset or paid to transfer a liability in an orderly transaction between market participants at the measurement date. The fair value hierarchy is organized into three levels based upon the assumptions (referred to as “inputs”) used in pricing the asset or liability. These standards state that “observable inputs” reflect the assumptions market participants would use in pricing the asset or liability based on market data obtained from independent sources and “unobservable inputs” reflect an entity’s own assumptions about the assumptions market participants would use in pricing the asset or liability. These inputs are summarized into three broad levels and described below:
Level 1 – | Unadjusted quoted prices in active markets for identical unrestricted securities. |
Level 2 – | Other significant observable inputs (including quoted prices for similar securities, quoted prices in inactive markets, dealer indications, interest rates, yield curves, prepayment speeds, credit risk, default rates, inputs corroborated by observable market data, etc.). |
Level 3 – | Significant unobservable inputs (including the Fund’s own assumptions about the factors that market participants would use in valuing the security) based on the best information available. |
The inputs or methodology used for valuing securities are not necessarily an indication of the risk associated with investing in those securities.
The accompanying notes are in integral part of these financial statements.
Page 8
Baird Short-Term Bond Fund
Summary Schedule of Investments, June 30, 2012 (Unaudited)
The following is a summary of the inputs used to value the Fund’s investments as of June 30, 2012:
| Level 1 | Level 2 | Level 3 | Total | |||||||||||||
| Fixed Income | ||||||||||||||||
| U.S. Treasury Obligations | $ | — | $ | 92,559,013 | $ | — | $ | 92,559,013 | ||||||||
| Municipal Bonds | — | 25,336,984 | — | 25,336,984 | ||||||||||||
| Other Government Related Securities | — | 17,002,883 | — | 17,002,883 | ||||||||||||
| Corporate Debt Securities | — | 844,367,446 | — | 844,367,446 | ||||||||||||
| Residential Mortgage-Backed Securities – | ||||||||||||||||
| U.S. Government Agency Issues | — | 3,804,621 | — | 3,804,621 | ||||||||||||
| Residential Mortgage-Backed Securities – | ||||||||||||||||
| Non-U.S. Government Agency Issues | — | 11,093,760 | — | 11,093,760 | ||||||||||||
| Asset Backed Securities | — | 27,712,552 | — | 27,712,552 | ||||||||||||
| Commercial Mortgage Backed Securities | — | 56,854,729 | — | 56,854,729 | ||||||||||||
| Total Fixed Income | — | 1,078,731,988 | — | 1,078,731,988 | ||||||||||||
| Short-Term Investments | ||||||||||||||||
| Money Market Mutual Fund | 20,518,668 | — | — | 20,518,668 | ||||||||||||
| Total Short-Term Investments | 20,518,668 | — | — | 20,518,668 | ||||||||||||
| Investments Purchased with Cash | ||||||||||||||||
| Proceeds from Securities Lending | ||||||||||||||||
| Commercial Paper | — | 539,642 | — | 539,642 | ||||||||||||
| Money Market Mutual Fund | 125,762,756 | — | — | 125,762,756 | ||||||||||||
| Total Investments Purchased | ||||||||||||||||
| with Cash Proceeds | ||||||||||||||||
| from Securities Lending | 125,762,756 | 539,642 | — | 126,302,398 | ||||||||||||
| Total Investments | $ | 146,281,424 | $ | 1,079,271,630 | $ | — | $ | 1,225,553,054 | ||||||||
| Asset Relating to | ||||||||||||||||
| Securities Lending Investments | $ | — | $ | 278,308 | $ | — | $ | 278,308 | ||||||||
Changes in valuation techniques may result in transfers into or out of current assigned levels within the hierarchy. There were no significant transfers between Level 1, Level 2 and Level 3 fair value measurements during the reporting period, as compared to their classification from the prior year’s annual report.
Page 9
Baird Intermediate Bond Fund
June 30, 2012 (Unaudited)
The Baird Intermediate Bond Fund seeks an annual rate of total return, before Fund expenses, greater than the annual rate of total return of the Barclays Capital Intermediate U.S. Government/Credit Bond Index. The Barclays Capital Intermediate U.S. Government/Credit Bond Index is an unmanaged, market value weighted index of investment grade, fixed-rate debt issues, including government and corporate securities, with maturities between one and ten years.
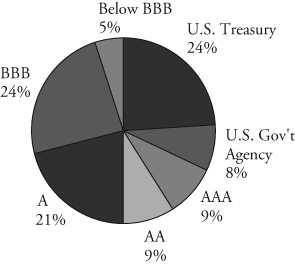
Portfolio Characteristics
Quality Distribution*
| Net Assets: | $773,406,773 | |||
 | ||||
| SEC 30-Day | ||||
Yield:** | ||||
| Institutional Class: | 2.30% | |||
| Investor Class: | 2.05% | |||
| Average | ||||
| Effective | ||||
| Duration: | 3.93 years | |||
| Average | ||||
| Effective | ||||
| Maturity: | 4.54 years | |||
| Annualized | ||||
| Expense | ||||
| Ratio: | ||||
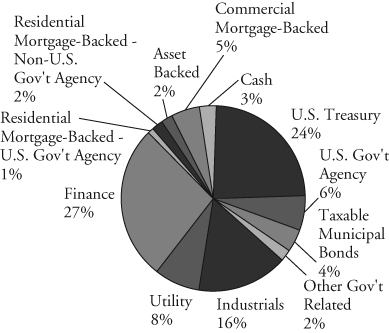
| Sector Weightings* | Institutional Class: | 0.30% | ||
| Investor Class: | 0.55%*** | |||
 | ||||
| Portfolio | ||||
| Turnover | ||||
| Rate: | 24.3%# | |||
| Total | ||||
| Number of | ||||
| Holdings: | 347 | |||
| * | Percentages shown are based on the Fund’s total investments (less investments purchased with cash proceeds from securities lending). | |
| ** | SEC yields are based on SEC guidelines and are calculated for the 30 days ended June 30, 2012. | |
| *** | Includes 0.25% 12b-1 fee. | |
| # | Not annualized. |
Page 10
Baird Intermediate Bond Fund
June 30, 2012 (Unaudited)
Total Returns
| Average Annual | |||||
| Six | One | Five | Ten | Since | |
| For the Periods Ended June 30, 2012 | Months | Year | Years | Years | Inception(1) |
| Institutional Class Shares | 3.25% | 6.11% | 6.42% | 5.46% | 6.07% |
| Investor Class Shares | 3.10% | 5.91% | 6.12% | 5.17% | 5.80% |
| Barclays Capital Intermediate | |||||
| U.S. Government/Credit | |||||
Bond Index(2) | 2.10% | 5.42% | 6.01% | 5.08% | 5.69% |
| (1) | For the period from September 29, 2000 (commencement of operations) through June 30, 2012. |
| (2) | The Barclays Capital Intermediate U.S. Government/Credit Bond Index is an unmanaged, market value weighted index of investment grade, fixed-rate debt issues, including government and corporate securities, with maturities between one and ten years. This index does not reflect any deduction for fees, expenses or taxes. A direct investment in an index is not possible. |
The returns shown in the table above reflect reinvestment of dividends and/or capital gains distributions in additional shares. The returns do not reflect the deduction of taxes that a shareholder would pay on Fund distributions or the redemption of Fund shares. The returns reflect the actual performance for each period and does not include the impact of trades executed on the last business day of the period that were recorded on the first business day of the next period.
Past performance does not guarantee future results. Investment return and principal value will fluctuate so that an investor’s shares, when redeemed, may be worth more or less than their original cost.
For information about the performance of the Fund as of the most recent month-end, please call 1-866-44BAIRD or visit www.bairdfunds.com. Mutual fund performance changes over time and current performance may be lower or higher than that stated.
Page 11
Baird Intermediate Bond Fund
Summary Schedule of Investments, June 30, 2012 (Unaudited)
This schedule summarizes the Fund’s holdings by asset type. Details are reported for each of the Fund’s 50 largest individual holdings and for investments that, in total for any issuer, represent more than 1% of the Fund’s net assets. The total value of smaller holdings is reported as a single amount within each category.
The Fund reports a complete list of its holdings in regulatory filings following the end of each fiscal quarter. For the second and fourth fiscal quarters, the complete listing of the Fund’s holdings is available electronically at http://www.rwbaird.com/baird-funds/prospectus-applications/prospectus-applications.aspx under the column “Form N-CSR” and on the Securities and Exchange Commission’s website (www.sec.gov) or you can have it mailed to you without charge by calling 1-866-44BAIRD. For the first and third fiscal quarters, the Fund files its holdings with the SEC on Form N-Q. Shareholders can look up the Fund’s Forms N-Q on the SEC’s website (www.sec.gov).
Long-Term Investments
| Principal | Market | % of | ||||||||||
| Amount | Value | Net Assets | ||||||||||
| U.S. Treasury Securities | ||||||||||||
| U.S. Treasury Bonds: | ||||||||||||
| 2.375%, 03/31/2016 | $ | 17,850,000 | $ | 19,056,267 | 2.5 | % | ||||||
| 2.375%, 07/31/2017@ | 72,100,000 | 77,856,753 | 10.1 | % | ||||||||
| 3.875%, 05/15/2018@ | 30,400,000 | 35,589,371 | 4.6 | % | ||||||||
| 9.125%, 05/15/2018@ | 12,375,000 | 18,206,719 | 2.3 | % | ||||||||
| 2.625%, 08/15/2020@ | 5,000,000 | 5,502,735 | 0.7 | % | ||||||||
| 7.875%, 02/15/2021 | 10,000,000 | 15,296,880 | 2.0 | % | ||||||||
| 6.250%, 08/15/2023@ | 10,000,000 | 14,525,000 | 1.9 | % | ||||||||
| Total U.S. Treasury Securities | ||||||||||||
| (Cost $176,176,872) | 186,033,725 | 24.1 | % | |||||||||
| U.S. Government Agency Securities | ||||||||||||
| Federal Farm Credit Bank | ||||||||||||
| 3.000%, 09/22/2014 | 7,000,000 | 7,406,028 | 1.0 | % | ||||||||
| Federal Home Loan Mortgage Corporation (FHLMC) | ||||||||||||
| 1.250%, 05/12/2017 | 5,050,000 | 5,116,741 | 0.7 | % | ||||||||
| 1.000%, 06/29/2017 | 8,900,000 | 8,921,654 | 1.1 | % | ||||||||
| 1.000%, 07/28/2017 | 5,500,000 | 5,497,145 | 0.7 | % | ||||||||
| Federal National Mortgage Association (FNMA) | ||||||||||||
| 2.375%, 04/11/2016 | 3,325,000 | 3,531,805 | 0.4 | % | ||||||||
| 1.375%, 11/15/2016@ | 6,700,000 | 6,857,483 | 0.9 | % | ||||||||
| 1.250%, 01/30/2017@ | 7,000,000 | 7,110,341 | 0.9 | % | ||||||||
| Total U.S. Government Agency Securities | ||||||||||||
| (Cost $43,343,243) | 44,441,197 | 5.7 | % | |||||||||
| Taxable Municipal Bonds | ||||||||||||
| California Qualified School Construction Bonds | ||||||||||||
| 5.955%, 03/01/2019 | 3,375,000 | 3,797,719 | 0.5 | % | ||||||||
The accompanying notes are in integral part of these financial statements.
Page 12
Baird Intermediate Bond Fund
Summary Schedule of Investments, June 30, 2012 (Unaudited)
Long-Term Investments (cont.)
| Principal | Market | % of | ||||||||||
| Amount | Value | Net Assets | ||||||||||
| Illinois State | ||||||||||||
| 3.636%, 02/01/2014 | $ | 5,000,000 | $ | 5,125,950 | 0.7 | % | ||||||
Other Municipal Bonds# | 24,072,869 | 3.1 | % | |||||||||
| Total Municipal Bonds | ||||||||||||
| (Cost $30,475,818) | 32,996,538 | 4.3 | % | |||||||||
| Other Government Related Securities | ||||||||||||
| KFW | ||||||||||||
4.875%, 06/17/2019 f | 3,000,000 | 3,608,469 | 0.5 | % | ||||||||
Other Government Related Securities#~ | 11,158,903 | 1.4 | % | |||||||||
| Total Other Government Related Securities | ||||||||||||
| (Cost $13,216,141) | 14,767,372 | 1.9 | % | |||||||||
| Corporate Bonds | ||||||||||||
| Industrials | ||||||||||||
| Computer Sciences Corporation | ||||||||||||
| 5.500%, 03/15/2013@ | 4,136,000 | 4,239,400 | 0.5 | % | ||||||||
| ConAgra Foods, Inc. | ||||||||||||
| 5.875%, 04/15/2014 | 3,650,000 | 3,941,361 | 0.5 | % | ||||||||
| Glencore Funding LLC | ||||||||||||
| 6.000%, 04/15/2014 (Acquired 03/31/2004 | ||||||||||||
| through 02/02/2010, Cost $3,469,207)* | 3,456,000 | 3,633,020 | 0.5 | % | ||||||||
| Hewlett-Packard Co. | ||||||||||||
| 3.300%, 12/09/2016 | 3,500,000 | 3,658,382 | 0.5 | % | ||||||||
| Hutchison Whampoa International Ltd. | ||||||||||||
| 7.625%, 04/09/2019 (Acquired 10/16/2009 | ||||||||||||
through 09/19/2011, Cost $3,138,591)* f | 2,800,000 | 3,459,408 | 0.4 | % | ||||||||
| POSCO | ||||||||||||
| 5.250%, 04/14/2021 (Acquired 04/08/2011 | ||||||||||||
through 09/22/2011, Cost $2,978,212)* f @ | 3,000,000 | 3,285,939 | 0.4 | % | ||||||||
| TCI Communications, Inc. | ||||||||||||
| 8.750%, 08/01/2015 | 3,498,000 | 4,267,955 | 0.5 | % | ||||||||
| Xerox Corporation | ||||||||||||
| 8.250%, 05/15/2014 | 3,000,000 | 3,345,087 | 0.4 | % | ||||||||
Other Industrials#~ | 93,066,446 | 12.2 | % | |||||||||
| Total Industrials | ||||||||||||
| (Cost $117,015,963) | 122,896,998 | 15.9 | % | |||||||||
| Utility | ||||||||||||
| Ameren Corporation | ||||||||||||
| 8.875%, 05/15/2014 | 3,000,000 | 3,341,667 | 0.4 | % | ||||||||
| Enterprise Products Operating LLC | ||||||||||||
| 9.750%, 01/31/2014 | 3,824,000 | 4,314,283 | 0.6 | % | ||||||||
| National Grid PLC | ||||||||||||
6.300%, 08/01/2016 f | 3,800,000 | 4,384,212 | 0.5 | % | ||||||||
The accompanying notes are in integral part of these financial statements.
Page 13
Baird Intermediate Bond Fund
Summary Schedule of Investments, June 30, 2012 (Unaudited)
Long-Term Investments (cont.)
| Principal | Market | % of | ||||||||||
| Amount | Value | Net Assets | ||||||||||
| NuStar Logistics, L.P. | ||||||||||||
| 6.875%, 07/15/2012 | $ | 4,000,000 | $ | 4,004,544 | 0.5 | % | ||||||
Other Utility#~ | 49,981,450 | 6.5 | % | |||||||||
| Total Utility | ||||||||||||
| (Cost $63,642,751) | 66,026,156 | 8.5 | % | |||||||||
| Finance | ||||||||||||
| American Express Credit Corporation | ||||||||||||
| Series C, 7.300%, 08/20/2013 | 3,257,000 | 3,482,254 | 0.5 | % | ||||||||
| Berkshire Hathaway Finance Corporation | ||||||||||||
| 1.600%, 05/15/2017@ | 3,800,000 | 3,826,459 | 0.5 | % | ||||||||
| Cie de Financement Foncier | ||||||||||||
| 2.250%, 03/07/2014 | ||||||||||||
(Acquired 07/26/2011, Cost $3,524,338)* f | 3,500,000 | 3,521,350 | 0.5 | % | ||||||||
| Commonwealth Bank of Australia | ||||||||||||
| 5.000%, 10/15/2019 | ||||||||||||
(Acquired 03/02/2012, Cost $4,324,519)* f @ | 4,000,000 | 4,394,516 | 0.6 | % | ||||||||
| Deutsche Bank Aktiengesellschaft | ||||||||||||
3.250%, 01/11/2016 f | 3,850,000 | 3,962,212 | 0.5 | % | ||||||||
| J.P. Morgan Chase & Co. | ||||||||||||
| 4.500%, 01/24/2022@ | 3,000,000 | 3,231,654 | 0.4 | % | ||||||||
| MassMutual Global Funding II | ||||||||||||
| 2.000%, 04/05/2017 | ||||||||||||
| (Acquired 03/29/2012, Cost $3,783,470)* | 3,800,000 | 3,822,135 | 0.5 | % | ||||||||
| Susa Partnership LP | ||||||||||||
| 8.200%, 06/01/2017 | 2,800,000 | 3,365,804 | 0.4 | % | ||||||||
| Talent Yield Investments Ltd | ||||||||||||
| 4.500%, 04/25/2022 | ||||||||||||
(Acquired 04/18/2012, Cost $3,774,008)* f | 3,800,000 | 3,887,575 | 0.5 | % | ||||||||
| The Royal Bank of Scotland Group PLC | ||||||||||||
5.625%, 08/24/2020 f | 3,100,000 | 3,289,680 | 0.4 | % | ||||||||
| Willis Group Holdings Limited | ||||||||||||
5.750%, 03/15/2021 f | 3,000,000 | 3,269,400 | 0.4 | % | ||||||||
Other Finance#~ | 166,916,548 | 21.6 | % | |||||||||
| Total Finance | ||||||||||||
| (Cost $200,940,415) | 206,969,587 | 26.8 | % | |||||||||
| Residential Mortgage-Backed Securities | ||||||||||||
| U.S. Government Agency Issues | ||||||||||||
| Federal Home Loan Mortgage Corporation (FHLMC) | ||||||||||||
| 5.500%-6.000%, 08/15/2016-01/15/2023 | 3,327,707 | 3,407,029 | 0.4 | % | ||||||||
| Federal National Mortgage Association (FNMA) | ||||||||||||
| 4.000%-8.800%, 01/25/2019-07/25/2034 | 1,422,936 | 1,488,982 | 0.2 | % | ||||||||
Other U.S. Government Agency Issues# | 616,255 | 0.1 | % | |||||||||
| Total U.S. Government Agency Issues | ||||||||||||
| (Cost $5,304,854) | 5,512,266 | 0.7 | % | |||||||||
The accompanying notes are in integral part of these financial statements.
Page 14
Baird Intermediate Bond Fund
Summary Schedule of Investments, June 30, 2012 (Unaudited)
Long-Term Investments (cont.)
| Principal | Market | % of | ||||||||||
| Amount | Value | Net Assets | ||||||||||
| Non-U.S. Government Agency Issues | ||||||||||||
| Total Non-U.S. Government Agency Issues#~ | ||||||||||||
| (Cost $16,367,407) | $ | 15,842,726 | 2.1 | % | ||||||||
| Asset Backed Securities | ||||||||||||
| Countrywide Asset-Backed Certificates | ||||||||||||
| Series 2005-1, Class AF6, 5.030%, 07/25/2035 | $ | 3,455,758 | 3,438,465 | 0.5 | % | |||||||
| Springleaf Mortgage Loan Trust | ||||||||||||
| Series 2012-1, 2.667%, 09/25/2057 | ||||||||||||
| (Acquired 04/11/2012, Cost $4,622,501)* | 4,622,555 | 4,619,606 | 0.6 | % | ||||||||
Other Asset Backed Securities# | 5,451,792 | 0.6 | % | |||||||||
| Total Asset Backed Securities | ||||||||||||
| (Cost $14,117,341) | 13,509,863 | 1.7 | % | |||||||||
| Commercial Mortgage-Backed Securities | ||||||||||||
| Bear Stearns Commercial Mortgage Securities | ||||||||||||
| Series 2005-PWR9, Class A4A, | ||||||||||||
| 4.871%, 09/11/2042 | 4,250,000 | 4,682,654 | 0.6 | % | ||||||||
| Citigroup Deutsche Bank | ||||||||||||
| Series 2005-CD1, Class A4, | ||||||||||||
| 5.394%, 07/15/2044 | 5,600,000 | 6,231,820 | 0.8 | % | ||||||||
| Credit Suisse First Boston | ||||||||||||
| Mortgage Securities Corporation | ||||||||||||
| Series 2005-C5, Class A4, | ||||||||||||
| 5.100%, 08/15/2038 | 4,000,000 | 4,410,340 | 0.6 | % | ||||||||
| Federal Home Loan Mortgage | ||||||||||||
| Corporation (FHLMC) Multifamily | ||||||||||||
| Structured Pass Through Certificates, | ||||||||||||
| Series K708, 2.130%, 01/25/2019 | 8,000,000 | 8,159,816 | 1.1 | % | ||||||||
| J.P. Morgan Chase Commercial Mortgage Trust | ||||||||||||
| Series 2005-CB12, Class A4, | ||||||||||||
| 4.895%, 09/12/2037 | 5,000,000 | 5,484,130 | 0.7 | % | ||||||||
| Wachovia Bank Commercial Mortgage Trust | ||||||||||||
| Series 2005-C22, Class A4, | ||||||||||||
| 5.441%, 12/15/2044 | 5,000,000 | 5,549,490 | 0.7 | % | ||||||||
Other Commercial Mortgage Backed Securities# | 8,200,358 | 1.0 | % | |||||||||
| Total Commercial Mortgage Backed Securities | ||||||||||||
| (Cost $41,176,706) | 42,718,608 | 5.5 | % | |||||||||
| Total Long-Term Investments | ||||||||||||
| (Cost $721,777,511) | 751,715,036 | 97.2 | % | |||||||||
The accompanying notes are in integral part of these financial statements.
Page 15
Baird Intermediate Bond Fund
Summary Schedule of Investments, June 30, 2012 (Unaudited)
Short-Term Investments
| Market | % of | |||||||||||
| Shares | Value | Net Assets | ||||||||||
| Money Market Mutual Funds | ||||||||||||
| Dreyfus Institutional Cash Advantage Fund, 0.15%« | 9,815,302 | $ | 9,815,302 | 1.3 | % | |||||||
| Short-Term Investments Trust – | ||||||||||||
| Liquid Assets Portfolio, 0.16%« | 15,000,000 | 15,000,000 | 1.9 | % | ||||||||
| Total Short-Term Investments | ||||||||||||
| (Cost $24,815,302) | 24,815,302 | 3.2 | % | |||||||||
| Investments Purchased with Cash | ||||||||||||
| Proceeds from Securities Lending | ||||||||||||
| Principal | ||||||||||||
| Amount | ||||||||||||
| Commercial Paper | ||||||||||||
| Atlantic East Funding LLC, | ||||||||||||
| 0.595%, 03/25/2013†** | $ | 2,066,837 | 1,363,594 | 0.2 | % | |||||||
| Total Commercial Paper | ||||||||||||
| (Cost $2,066,837) | 1,363,594 | 0.2 | % | |||||||||
| Shares | ||||||||||||
| Investment Companies | ||||||||||||
| Mount Vernon Securities Lending | ||||||||||||
| Trust Prime Portfolio, 0.31%« | 111,372,677 | 111,372,677 | 14.4 | % | ||||||||
| Total Investment Companies | ||||||||||||
| (Cost $111,372,677) | 111,372,677 | 14.4 | % | |||||||||
| Total Investments Purchased With | ||||||||||||
| Cash Proceeds From Securities Lending | ||||||||||||
| (Cost $113,439,514) | 112,736,271 | 14.6 | % | |||||||||
| Total Investments | ||||||||||||
| (Cost $860,032,327) | 889,266,609 | 115.0 | % | |||||||||
| Asset Relating to Securities Lending Investments | ||||||||||||
Support Agreement**^a† | 703,243 | 0.1 | % | |||||||||
| Total | ||||||||||||
| (Cost $0) | 703,243 | 0.1 | % | |||||||||
| Liabilities in Excess of Other Assets | (116,563,079 | ) | (15.1 | %) | ||||||||
| TOTAL NET ASSETS | $ | 773,406,773 | 100.0 | % | ||||||||
The accompanying notes are in integral part of these financial statements.
Page 16
Baird Intermediate Bond Fund
Summary Schedule of Investments, June 30, 2012 (Unaudited)
Notes to Summary Schedule of Investments
| * | Restricted Security Deemed Liquid | |
| ** | Illiquid Security | |
| @ | This security or portion of this security is out on loan at June 30, 2012. | |
| f | Foreign Security | |
| ^ | Non-Income Producing | |
| « | 7-Day Yield | |
| † | Priced at Fair Value by the Valuation Committee as delegated by the Baird Funds’ Board of Directors. | |
| # | Represents the aggregate value, by category, securities that are not among the 50 largest holdings and, in total for any issuer, represent 1% or less of net assets. | |
| ~ | Groupings contain, in aggregate, restricted securities totaling $66,776,454 representing 8.63% of net assets. | |
| a | The Fund’s transfer agent and administrator and securities lending agent entered into a support agreement with the Fund to cover losses realized by the Fund on its investment in Atlantic East Funding, LLC (up to a certain amount), which investment was made by the Fund’s securities lending agent. |
Summary of Fair Value Exposure at June 30, 2012 (Unaudited)
The Fund has adopted authoritative fair valuation accounting standards which establish a definition of fair value and set out a hierarchy for measuring fair value. These standards require additional disclosures about the various inputs and valuation techniques used to develop the measurements of fair value and a discussion on changes in valuation techniques and related inputs during the period. These standards define fair value as the price that would be received to sell an asset or paid to transfer a liability in an orderly transaction between market participants at the measurement date. The fair value hierarchy is organized into three levels based upon the assumptions (referred to as “inputs”) used in pricing the asset or liability. These standards state that “observable inputs” reflect the assumptions market participants would use in pricing the asset or liability based on market data obtained from independent sources and “unobservable inputs” reflect an entity’s own assumptions about the assumptions market participants would use in pricing the asset or liability. These inputs are summarized into three broad levels and described below:
Level 1 – | Unadjusted quoted prices in active markets for identical unrestricted securities. |
Level 2 – | Other significant observable inputs (including quoted prices for similar securities, quoted prices in inactive markets, dealer indications, interest rates, yield curves, prepayment speeds, credit risk, default rates, inputs corroborated by observable market data, etc.). |
Level 3 – | Significant unobservable inputs (including the Fund’s own assumptions about the factors that market participants would use in valuing the security) based on the best information available. |
The inputs or methodology used for valuing securities are not necessarily an indication of the risk associated with investing in those securities.
The accompanying notes are in integral part of these financial statements.
Page 17
Baird Intermediate Bond Fund
Summary Schedule of Investments, June 30, 2012 (Unaudited)
Summary of Fair Value Exposure at June 30, 2012 (Unaudited) (cont.)
The following is a summary of the inputs used to value the Fund’s investments as of June 30, 2012:
| Level 1 | Level 2 | Level 3 | Total | |||||||||||||
| Fixed Income | ||||||||||||||||
| U.S. Treasury Securities | $ | — | $ | 186,033,725 | $ | — | $ | 186,033,725 | ||||||||
| U.S. Government Agency Securities | — | 44,441,197 | — | 44,441,197 | ||||||||||||
| Taxable Municipal Bonds | — | 32,996,538 | — | 32,996,538 | ||||||||||||
| Other Government Related Securities | — | 14,767,372 | — | 14,767,372 | ||||||||||||
| Corporate Bonds | — | 395,891,280 | 1,461 | 395,892,741 | ||||||||||||
| Residential Mortgage-Backed Securities – | ||||||||||||||||
| U.S. Government Agency Issues | — | 5,512,266 | — | 5,512,266 | ||||||||||||
| Residential Mortgage-Backed Securities – | ||||||||||||||||
| Non-U.S. Government Agency Issues | — | 15,842,726 | — | 15,842,726 | ||||||||||||
| Asset Backed Securities | — | 13,509,863 | — | 13,509,863 | ||||||||||||
| Commercial Mortgage Backed Securities | — | 42,718,608 | — | 42,718,608 | ||||||||||||
| Total Fixed Income | — | 751,713,575 | 1,461 | 751,715,036 | ||||||||||||
| Short-Term Investments | ||||||||||||||||
| Money Market Mutual Funds | 24,815,302 | — | — | 24,815,302 | ||||||||||||
| Total Short-Term Investments | 24,815,302 | — | — | 24,815,302 | ||||||||||||
| Investments Purchased with Cash | ||||||||||||||||
| Proceeds from Securities Lending | ||||||||||||||||
| Commercial Paper | — | 1,363,594 | — | 1,363,594 | ||||||||||||
| Money Market Mutual Fund | 111,372,677 | — | — | 111,372,677 | ||||||||||||
| Total Investments Purchased with | ||||||||||||||||
| Cash Proceeds from Securities Lending | 111,372,677 | 1,363,594 | — | 112,736,271 | ||||||||||||
| Total Investments | $ | 136,187,979 | $ | 753,077,169 | $ | 1,461 | $ | 889,266,609 | ||||||||
| Asset Relating to | ||||||||||||||||
| Securities Lending Investments | $ | — | $ | 703,243 | $ | — | $ | 703,243 | ||||||||
Changes in valuation techniques may result in transfers into or out of current assigned levels within the hierarchy. There were no significant transfers between Level 1, Level 2 and Level 3 fair value measurements during the reporting period, as compared to their classification from the prior year’s annual report. One security that is priced at fair value by the Valuation Committee instead of the Fund’s pricing vendor is valued using level 3 inputs.
Level 3 Reconciliation Disclosure
Following is a reconciliation of Level 3 assets for which significant unobservable inputs were used to determine fair value.
| Description | Investments in Securities | |||
| Balance as of December 31, 2011 | $ | 1,461 | ||
| Accrued discounts/premiums | — | |||
| Realized gain (loss) | — | |||
| Change in unrealized appreciation (depreciation) | — | |||
| Purchases | — | |||
| Sales | — | |||
| Transfers in and/or out of Level 3* | — | |||
| Balance as of June 30, 2012 | $ | 1,461 | ||
* Transfers between levels are recognized at the end of the reporting period.
Page 18
Baird Intermediate Municipal Bond Fund
June 30, 2012 (Unaudited)
The Baird Intermediate Municipal Bond Fund seeks current income that is substantially exempt from federal income tax. A secondary objective is to provide total return with relatively low volatility of principal. The Fund strives to achieve an annual rate of return, before Fund expenses, greater than the annual rate of the total return of the Barclays Capital 7-Year General Obligation Bond Index. The Barclays Capital 7-Year General Obligation Bond Index is an unmanaged, market value weighted index comprised of investment grade state and local general obligation bonds that have been issued as part of an offering of at least $50 million, have a minimum amount outstanding of at least $5 million, have been issued within the last five years and have a maturity of six to eight years.
Portfolio Characteristics
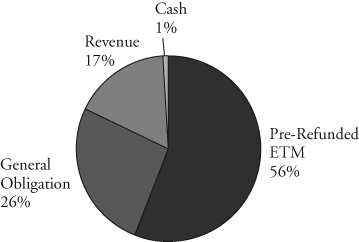
Quality Distribution*
 | Net Assets: | $1,189,195,782 | ||
| SEC 30-Day | ||||
Yield:*** | ||||
| Institutional Class: | 1.55% | |||
| Investor Class: | 1.31% | |||
| Average | ||||
| Effective | ||||
| Duration: | 5.04 years | |||
| Average | ||||
| Effective | ||||
| Maturity: | 6.05 years | |||
| Sector Weightings* | Annualized | |||
| Expense | ||||
 | Ratio: | |||
| Institutional Class: | 0.30% | |||
| Investor Class: | 0.55%**** | |||
| Portfolio | ||||
| Turnover | ||||
| Rate: | 2.9%# | |||
| Total | ||||
| Number of | ||||
| Holdings: | 309 | |||
| * | Percentages shown are based on the Fund’s total investments. | |
| ** | Includes pre-refunded and escrowed-to-maturity (ETM) bonds. | |
| *** | SEC yields are based on SEC guidelines and are calculated for the 30 days ended June 30, 2012. | |
| **** | Includes 0.25% 12b-1 fee. | |
| # | Not annualized. |
Page 19
Baird Intermediate Municipal Bond Fund
June 30, 2012 (Unaudited)
Total Returns
| Average Annual | |||||
| Six | One | Five | Ten | Since | |
| For the Periods Ended June 30, 2012 | Months | Year | Years | Years | Inception(1) |
| Institutional Class Shares | 1.49% | 6.19% | 5.93% | 4.79% | 5.16% |
| Investor Class Shares | 1.34% | 5.80% | 5.64% | 4.53% | 4.88% |
| Barclays Capital 7-Year | |||||
General Obligation Bond Index(2) | 1.32% | 7.55% | 6.67% | 5.29% | 5.38% |
| (1) | For the period from March 30, 2001 (commencement of operations) through June 30, 2012. |
| (2) | The Barclays Capital 7-Year General Obligation Bond Index is an unmanaged, market value weighted index comprised of investment grade state and local general obligation bonds that have been issued as part of an offering of at least $50 million, have a minimum amount outstanding of at least $5 million, have been issued within the last five years and have a maturity of six to eight years. This index does not reflect any deduction for fees, expenses or taxes. A direct investment in an index is not possible. |
The returns shown in the table above reflect reinvestment of dividends and/or capital gains distributions in additional shares. The returns do not reflect the deduction of taxes that a shareholder would pay on Fund distributions or the redemption of Fund shares. The returns reflect the actual performance for each period and does not include the impact of trades executed on the last business day of the period that were recorded on the first business day of the next period.
Past performance does not guarantee future results. Investment return and principal value will fluctuate so that an investor’s shares, when redeemed, may be worth more or less than their original cost.
For information about the performance of the Fund as of the most recent month-end, please call 1-866-44BAIRD or visit www.bairdfunds.com. Mutual fund performance changes over time and current performance may be lower or higher than that stated.
Page 20
Baird Intermediate Municipal Bond Fund
Summary Schedule of Investments, June 30, 2012 (Unaudited)
This schedule summarizes the Fund’s holdings by asset type. Details are reported for each of the Fund’s 50 largest individual holdings and for investments that, in total for any issuer, represent more than 1% of the Fund’s net assets. The total value of smaller holdings is reported as a single amount within each category.
The Fund reports a complete list of its holdings in regulatory filings following the end of each fiscal quarter. For the second and fourth fiscal quarters, the complete listing of the Fund’s holdings is available electronically at http://www.rwbaird.com/baird-funds/prospectus-applications/prospectus-applications.aspx under the column “Form N-CSR” and on the Securities and Exchange Commission’s website (www.sec.gov) or you can have it mailed to you without charge by calling 1-866-44BAIRD. For the first and third fiscal quarters, the Fund files its holdings with the SEC on Form N-Q. Shareholders can look up the Fund’s Forms N-Q on the SEC’s website (www.sec.gov).
Long-Term Investments
| Principal | Market | % of | ||||||||||
| Amount | Value | Net Assets | ||||||||||
| Municipal Bonds | ||||||||||||
| Alabama | ||||||||||||
| Montgomery Alabama Special Care Facility Revenue: | ||||||||||||
| 5.000%, 11/15/2021 | ||||||||||||
| (Pre-refunded to 11/15/2014) | $ | 11,385,000 | $ | 12,623,005 | 1.1 | % | ||||||
| 5.000%-5.250%, 11/15/2015-11/15/2029 | ||||||||||||
| (Pre-refunded to 11/15/2014) | 5,525,000 | 6,145,330 | 0.5 | % | ||||||||
Other Alabama# | 3,509,294 | 0.3 | % | |||||||||
| Total Alabama | ||||||||||||
| (Cost $21,339,873) | 22,277,629 | 1.9 | % | |||||||||
| Alaska | ||||||||||||
Total Alaska# | ||||||||||||
| (Cost $1,026,170) | 1,086,320 | 0.1 | % | |||||||||
| Arizona | ||||||||||||
Total Arizona# | ||||||||||||
| (Cost $15,103,740) | 15,709,451 | 1.3 | % | |||||||||
| California | ||||||||||||
| Golden State Tobacco Securitization | ||||||||||||
| Corporation Revenue Bonds: | ||||||||||||
| 5.625%, 06/01/2038 | ||||||||||||
| (Pre-refunded to 06/01/2013) | 6,950,000 | 7,287,701 | 0.6 | % | ||||||||
| 5.000%-6.250%, 06/01/2033-06/01/2038 | ||||||||||||
| (Pre-refunded to 06/01/2013) | 6,790,000 | 7,145,562 | 0.6 | % | ||||||||
| San Joaquin Hills California Transportation | ||||||||||||
| Corridor Agency Toll Road Revenue^: | ||||||||||||
| 0.000%, 01/01/2023 (ETM) | 14,000,000 | 10,951,220 | 0.9 | % | ||||||||
| 0.000%, 01/01/2020 (ETM) | 6,865,000 | 5,989,850 | 0.5 | % | ||||||||
| San Marcos California Public | ||||||||||||
| Facilities Authority Revenue | ||||||||||||
| 0.000%, 09/01/2019 (ETM)^ | 17,295,000 | 15,192,101 | 1.3 | % | ||||||||
Other California# | 23,724,622 | 2.0 | % | |||||||||
| Total California | ||||||||||||
| (Cost $64,324,087) | 70,291,056 | 5.9 | % | |||||||||
The accompanying notes are in integral part of these financial statements.
Page 21
Baird Intermediate Municipal Bond Fund
Summary Schedule of Investments, June 30, 2012 (Unaudited)
Long-Term Investments (cont.)
| Principal | Market | % of | ||||||||||
| Amount | Value | Net Assets | ||||||||||
| Colorado | ||||||||||||
| Colorado Springs Colorado Utilities Revenue Bonds | ||||||||||||
| 5.875%, 11/15/2017 (ETM) | $ | 8,640,000 | $ | 9,475,834 | 0.8 | % | ||||||
| Dawson Ridge Metropolitan District No. 1 Colorado^: | ||||||||||||
| 0.000%, 10/01/2022 (ETM) | 15,030,000 | 11,748,801 | 1.0 | % | ||||||||
| 0.000%, 10/01/2022 (ETM) | 12,745,000 | 9,962,639 | 0.8 | % | ||||||||
| Denver Colorado Health & Hospital | ||||||||||||
| Authority Healthcare Revenue | ||||||||||||
| 6.250%, 12/01/2033 | ||||||||||||
| (Pre-refunded to 12/01/2014) | 7,975,000 | 9,072,121 | 0.8 | % | ||||||||
| Regional Transportation District | ||||||||||||
| Colorado Sales Tax Revenue | ||||||||||||
| 5.000%, 11/01/2036 | ||||||||||||
| (Pre-refunded to 11/01/2016) | 6,750,000 | 8,008,942 | 0.7 | % | ||||||||
Other Colorado# | 14,393,732 | 1.2 | % | |||||||||
| Total Colorado | ||||||||||||
| (Cost $59,034,071) | 62,662,069 | 5.3 | % | |||||||||
| Delaware | ||||||||||||
Total Delaware# | ||||||||||||
| (Cost $334,289) | 340,524 | 0.0 | % | |||||||||
| Florida | ||||||||||||
| Broward County Florida School Board: | ||||||||||||
| 5.250%, 07/01/2022 (Callable 07/01/2021) | 8,300,000 | 9,783,293 | 0.8 | % | ||||||||
| 5.250%, 07/01/2023 (Callable 07/01/2021) | 4,865,000 | 5,671,812 | 0.5 | % | ||||||||
| Florida State Board of Education | ||||||||||||
| 5.000%, 06/01/2022 (Callable 06/01/2019) | 13,800,000 | 16,595,742 | 1.4 | % | ||||||||
| Highlands County Florida Health Facilities Revenue: | ||||||||||||
| 5.875%, 11/15/2029 | ||||||||||||
| (Pre-refunded to 11/15/2013) | 9,650,000 | 10,345,765 | 0.9 | % | ||||||||
| 5.375%, 11/15/2035 | ||||||||||||
| (Pre-refunded to 11/15/2013) | 5,010,000 | 5,337,303 | 0.4 | % | ||||||||
| Miami-Dade County Florida | ||||||||||||
| 4.500%, 10/01/2020 | 7,100,000 | 8,168,266 | 0.7 | % | ||||||||
| St. Lucie County Florida | ||||||||||||
| 6.000%, 10/01/2020 (ETM) | 5,940,000 | 7,731,682 | 0.7 | % | ||||||||
Other Florida# | 72,169,782 | 6.0 | % | |||||||||
| Total Florida | ||||||||||||
| (Cost $126,844,685) | 135,803,645 | 11.4 | % | |||||||||
| Georgia | ||||||||||||
| Atlanta Georgia Water & Wastewater Revenue | ||||||||||||
| 5.500%, 11/01/2017 (Insured by AGM) | 8,445,000 | 10,229,175 | 0.9 | % | ||||||||
The accompanying notes are in integral part of these financial statements.
Page 22
Baird Intermediate Municipal Bond Fund
Summary Schedule of Investments, June 30, 2012 (Unaudited)
Long-Term Investments (cont.)
| Principal | Market | % of | ||||||||||
| Amount | Value | Net Assets | ||||||||||
| Forsyth County Georgia Hospital | ||||||||||||
| Authority Revenue Anticipation Certificates | ||||||||||||
| 6.375%, 10/01/2028 | ||||||||||||
| (Callable 08/02/2012)(ETM) | $ | 7,745,000 | $ | 10,246,480 | 0.9 | % | ||||||
| Georgia Municipal Electric Authority Power Revenue | ||||||||||||
| 6.500%, 01/01/2017 (Insured by AGM) | 7,470,000 | 8,976,173 | 0.7 | % | ||||||||
| Gwinnett County Georgia School District | ||||||||||||
| 5.000%, 02/01/2026 | ||||||||||||
| (Pre-refunded to 02/01/2018) | 7,400,000 | 8,960,068 | 0.8 | % | ||||||||
| State of Georgia | ||||||||||||
| 5.000%, 07/01/2020 (Callable 07/01/2017) | 12,570,000 | 14,883,006 | 1.3 | % | ||||||||
Other Georgia# | 3,342,393 | 0.2 | % | |||||||||
| Total Georgia | ||||||||||||
| (Cost $54,317,648) | 56,637,295 | 4.8 | % | |||||||||
| Illinois | ||||||||||||
| Illinois Development Financial Authority | ||||||||||||
| 0.000%, 07/15/2023 (ETM)^ | 16,380,000 | 12,252,731 | 1.0 | % | ||||||||
| Kane Cook & Dupage Counties Illinois | ||||||||||||
| Community United School District No. 303 | ||||||||||||
| 5.000%, 01/01/2014 (Insured by AGM) | 6,750,000 | 7,184,362 | 0.6 | % | ||||||||
| Kane McHenry Cook & De Kalb | ||||||||||||
| Counties Illinois School District No. 300 | ||||||||||||
| 7.000%, 01/01/2018 (Insured by AMBAC) | 6,140,000 | 7,573,751 | 0.6 | % | ||||||||
| Kendall Kane & Will Counties Community | ||||||||||||
| Unit School District No. 308 | ||||||||||||
| 0.000%, 02/01/2021^ | 13,625,000 | 10,257,036 | 0.9 | % | ||||||||
Other Illinois# | 85,552,209 | 7.2 | % | |||||||||
| Total Illinois | ||||||||||||
| (Cost $116,251,752) | 122,820,089 | 10.3 | % | |||||||||
| Indiana | ||||||||||||
Total Indiana# | ||||||||||||
| (Cost $15,440,970) | 16,787,662 | 1.4 | % | |||||||||
| Iowa | ||||||||||||
Total Iowa# | ||||||||||||
| (Cost $1,123,231) | 1,191,781 | 0.1 | % | |||||||||
| Kansas | ||||||||||||
Total Kansas# | ||||||||||||
| (Cost $2,010,622) | 2,228,675 | 0.2 | % | |||||||||
The accompanying notes are in integral part of these financial statements.
Page 23
Baird Intermediate Municipal Bond Fund
Summary Schedule of Investments, June 30, 2012 (Unaudited)
Long-Term Investments (cont.)
| Principal | Market | % of | ||||||||||
| Amount | Value | Net Assets | ||||||||||
| Kentucky | ||||||||||||
| Louisville & Jefferson County | ||||||||||||
| Metropolitan Government | ||||||||||||
| 6.125%, 02/01/2037 (Callable 02/01/2018) | $ | 7,345,000 | $ | 9,361,864 | 0.8 | % | ||||||
Other Kentucky# | 5,157,662 | 0.4 | % | |||||||||
| Total Kentucky | ||||||||||||
| (Cost $14,219,050) | 14,519,526 | 1.2 | % | |||||||||
| Louisiana | ||||||||||||
| Louisiana Public Facilities Authority Revenue: | ||||||||||||
| 5.500%, 05/15/2032 | ||||||||||||
| (Pre-refunded to 05/15/2026) | 13,905,000 | 18,211,657 | 1.5 | % | ||||||||
| 5.500%, 05/15/2027 | ||||||||||||
| (Pre-refunded to 05/15/2026) | 1,500,000 | 1,906,965 | 0.2 | % | ||||||||
| State of Louisiana: | ||||||||||||
| 5.000%, 11/15/2020 (Callable 05/15/2020) | 10,000,000 | 12,335,700 | 1.0 | % | ||||||||
| 5.000%, 11/15/2018 | 1,750,000 | 2,129,732 | 0.2 | % | ||||||||
| Total Louisiana | ||||||||||||
| (Cost $30,025,415) | 34,584,054 | 2.9 | % | |||||||||
| Maine | ||||||||||||
Total Maine# | ||||||||||||
| (Cost $4,693,546) | 4,915,918 | 0.4 | % | |||||||||
| Maryland | ||||||||||||
Total Maryland# | ||||||||||||
| (Cost $1,458,614) | 1,488,135 | 0.1 | % | |||||||||
| Massachusetts | ||||||||||||
| Massachusetts State: | ||||||||||||
| 4.00%, 12/01/2022 (Callable 12/01/2019) | 15,000,000 | 16,857,450 | 1.4 | % | ||||||||
| 5.00%, 08/01/2020 | ||||||||||||
| (Pre-refunded to 08/01/2016) | 5,820,000 | 6,843,505 | 0.6 | % | ||||||||
Other Massachusetts# | 13,366,158 | 1.1 | % | |||||||||
| Total Massachusetts | ||||||||||||
| (Cost $35,881,365) | 37,067,113 | 3.1 | % | |||||||||
| Michigan | ||||||||||||
| Michigan Finance Authority | ||||||||||||
| 5.000%, 01/01/2019 | 7,000,000 | 8,456,560 | 0.7 | % | ||||||||
Other Michigan# | 22,969,343 | 1.9 | % | |||||||||
| Total Michigan | ||||||||||||
| (Cost $30,246,713) | 31,425,903 | 2.6 | % | |||||||||
The accompanying notes are in integral part of these financial statements.
Page 24
Baird Intermediate Municipal Bond Fund
Summary Schedule of Investments, June 30, 2012 (Unaudited)
Long-Term Investments (cont.)
| Principal | Market | % of | ||||||||||
| Amount | Value | Net Assets | ||||||||||
| Minnesota | ||||||||||||
| University of Minnesota | ||||||||||||
| 5.500%, 07/01/2021 (ETM) | $ | 7,655,000 | $ | 9,430,654 | 0.8 | % | ||||||
Other Minnesota# | 5,044,800 | 0.4 | % | |||||||||
| Total Minnesota | ||||||||||||
| (Cost $14,235,451) | 14,475,454 | 1.2 | % | |||||||||
| Mississippi | ||||||||||||
Total Mississippi# | ||||||||||||
| (Cost $2,126,719) | 2,298,969 | 0.2 | % | |||||||||
| Missouri | ||||||||||||
Total Missouri# | ||||||||||||
| (Cost $3,184,672) | 3,342,400 | 0.3 | % | |||||||||
| Nebraska | ||||||||||||
| Omaha Nebraska Public Electric Power District Revenue | ||||||||||||
| 6.200%, 02/01/2017 (ETM) | 9,150,000 | 10,314,887 | 0.9 | % | ||||||||
Other Nebraska# | 1,815,414 | 0.1 | % | |||||||||
| Total Nebraska | ||||||||||||
| (Cost $11,713,077) | 12,130,301 | 1.0 | % | |||||||||
| Nevada | ||||||||||||
Total Nevada# | ||||||||||||
| (Cost $2,104,859) | 2,351,398 | 0.2 | % | |||||||||
| New Hampshire | ||||||||||||
Total New Hampshire# | ||||||||||||
| (Cost $6,677,130) | 6,898,816 | 0.6 | % | |||||||||
| New Jersey | ||||||||||||
| New Jersey State Housing & | ||||||||||||
| Mortgage Finance Agency Bonds | ||||||||||||
| 4.500%, 10/01/2029 (Callable 04/01/2021) | 9,610,000 | 10,062,631 | 0.9 | % | ||||||||
Other New Jersey# | 23,901,405 | 2.0 | % | |||||||||
| Total New Jersey | ||||||||||||
| (Cost $32,910,183) | 33,964,036 | 2.9 | % | |||||||||
| New Mexico | ||||||||||||
Total New Mexico# | ||||||||||||
| (Cost $3,768,401) | 3,840,730 | 0.3 | % | |||||||||
| New York | ||||||||||||
| Metropolitan Transit Authority New York | ||||||||||||
| 6.000%, 04/01/2020 (ETM) | 13,330,000 | 17,022,943 | 1.4 | % | ||||||||
The accompanying notes are in integral part of these financial statements.
Page 25
Baird Intermediate Municipal Bond Fund
Summary Schedule of Investments, June 30, 2012 (Unaudited)
Long-Term Investments (cont.)
| Principal | Market | % of | ||||||||||
| Amount | Value | Net Assets | ||||||||||
| Westchester Tobacco Asset | ||||||||||||
| Securitization Corp. New York | ||||||||||||
| 6.950%, 07/15/2039 | ||||||||||||
| (Pre-refunded to 07/15/2017) | $ | 13,075,000 | $ | 17,042,347 | 1.5 | % | ||||||
Other New York# | 43,014,393 | 3.6 | % | |||||||||
| Total New York | ||||||||||||
| (Cost $71,908,134) | 77,079,683 | 6.5 | % | |||||||||
| North Carolina | ||||||||||||
| North Carolina Eastern Municipal | ||||||||||||
| Power Agency Power Systems Revenue: | ||||||||||||
| 4.500%, 01/01/2024 | ||||||||||||
| (Pre-refunded to 01/01/2022) | 6,425,000 | 7,929,864 | 0.7 | % | ||||||||
| 6.400%, 01/01/2021 (ETM) | 5,750,000 | 7,137,647 | 0.6 | % | ||||||||
| 5.000%-6.000%, 01/01/2017-01/01/2026 | 5,145,000 | 6,279,030 | 0.5 | % | ||||||||
| North Carolina Medical Care | ||||||||||||
| Community Hospital Revenue | ||||||||||||
| 5.250%, 11/01/2029 | ||||||||||||
| (Pre-refunded to 11/01/2014) | 6,495,000 | 7,195,161 | 0.6 | % | ||||||||
Other North Carolina# | 6,900,905 | 0.6 | % | |||||||||
| Total North Carolina | ||||||||||||
| (Cost $33,276,809) | 35,442,607 | 3.0 | % | |||||||||
| Ohio | ||||||||||||
Total Ohio# | ||||||||||||
| (Cost $14,572,397) | 14,820,890 | 1.3 | % | |||||||||
| Pennsylvania | ||||||||||||
| Pennsylvania Convention | ||||||||||||
| Center Authority Revenue Bonds | ||||||||||||
| 6.000%, 09/01/2019 (ETM) | 6,830,000 | 8,735,228 | 0.7 | % | ||||||||
Other Pennsylvania# | 26,468,965 | 2.3 | % | |||||||||
| Total Pennsylvania | ||||||||||||
| (Cost $32,805,350) | 35,204,193 | 3.0 | % | |||||||||
| Puerto Rico | ||||||||||||
Total Puerto Rico# | ||||||||||||
| (Cost $9,316,011) | 9,799,599 | 0.8 | % | |||||||||
| South Carolina | ||||||||||||
| Piedmont Municipal Power Agency | ||||||||||||
| South Carolina Electric Revenue | ||||||||||||
| 6.750%, 01/01/2020 (ETM) | 6,375,000 | 8,672,678 | 0.7 | % | ||||||||
Other South Carolina# | 5,341,820 | 0.5 | % | |||||||||
| Total South Carolina | ||||||||||||
| (Cost $13,146,830) | 14,014,498 | 1.2 | % | |||||||||
The accompanying notes are in integral part of these financial statements.
Page 26
Baird Intermediate Municipal Bond Fund
Summary Schedule of Investments, June 30, 2012 (Unaudited)
Long-Term Investments (cont.)
| Principal | Market | % of | ||||||||||
| Amount | Value | Net Assets | ||||||||||
| South Dakota | ||||||||||||
Total South Dakota# | ||||||||||||
| (Cost $923,249) | $ | 956,020 | 0.1 | % | ||||||||
| Tennessee | ||||||||||||
Total Tennessee# | ||||||||||||
| (Cost $11,301,235) | 11,767,540 | 1.0 | % | |||||||||
| Texas | ||||||||||||
| Houston Texas Health Facilities | ||||||||||||
| Corporate Facilities Revenue | ||||||||||||
| 7.125%, 02/15/2034 | ||||||||||||
| (Pre-refunded to 02/15/2014) | $ | 10,960,000 | 12,234,210 | 1.0 | % | |||||||
| Houston Texas Water & Sewer System Revenue Bonds | ||||||||||||
| 5.500%, 12/01/2029 (ETM) | 16,050,000 | 21,850,630 | 1.8 | % | ||||||||
| Lamar Consolidated Independent School District | ||||||||||||
| 5.000%, 02/15/2021 (Insured by PSF) | 6,760,000 | 8,399,097 | 0.7 | % | ||||||||
| San Antonio Texas Electric & Gas Revenue | ||||||||||||
| 5.650%, 02/01/2019 (ETM) | 11,565,000 | 14,101,436 | 1.2 | % | ||||||||
| Tarrant County Texas Health Facilities Revenue | ||||||||||||
| 6.000%, 09/01/2024 (ETM) | 7,990,000 | 10,265,312 | 0.9 | % | ||||||||
| Texas State | ||||||||||||
| 5.000%, 10/01/2018 | 6,285,000 | 7,686,744 | 0.6 | % | ||||||||
Other Texas# | 88,542,673 | 7.5 | % | |||||||||
| Total Texas | ||||||||||||
| (Cost $153,237,719) | 163,080,102 | 13.7 | % | |||||||||
| Utah | ||||||||||||
Total Utah# | ||||||||||||
| (Cost $6,755,035) | 7,283,349 | 0.6 | % | |||||||||
| Virginia | ||||||||||||
| Tobacco Settlement Financing Corporation Revenue | ||||||||||||
| 5.625%, 06/01/2037 | ||||||||||||
| (Pre-refunded to 06/01/2015) | 7,650,000 | 8,762,692 | 0.8 | % | ||||||||
Other Virginia# | 1,321,720 | 0.1 | % | |||||||||
| Total Virginia | ||||||||||||
| (Cost $9,668,395) | 10,084,412 | 0.9 | % | |||||||||
| Washington | ||||||||||||
| University of Washington | ||||||||||||
| 5.000%, 07/01/2022 | 6,505,000 | 8,216,921 | 0.7 | % | ||||||||
| Washington State: | ||||||||||||
| 5.000%, 01/01/2021 | 10,000,000 | 12,349,100 | 1.0 | % | ||||||||
| 5.000%-5.500%, 07/01/2018-07/01/2023 | 5,470,000 | 6,653,890 | 0.6 | % | ||||||||
Other Washington# | 14,495,696 | 1.2 | % | |||||||||
| Total Washington | ||||||||||||
| (Cost $40,003,785) | 41,715,607 | 3.5 | % | |||||||||
The accompanying notes are in integral part of these financial statements.
Page 27
Baird Intermediate Municipal Bond Fund
Summary Schedule of Investments, June 30, 2012 (Unaudited)
Long-Term Investments (cont.)
| Principal | Market | % of | ||||||||||
| Amount | Value | Net Assets | ||||||||||
| West Virginia | ||||||||||||
| Berkeley Brooke Fayette Counties West Virginia | ||||||||||||
| Single Family Mortgage Revenue | ||||||||||||
| 0.000%, 12/01/2014 (ETM) ^ | $ | 7,365,000 | $ | 7,252,684 | 0.6 | % | ||||||
Other West Virginia# | 1,395,233 | 0.1 | % | |||||||||
| Total West Virginia | ||||||||||||
| (Cost $8,291,684) | 8,647,917 | 0.7 | % | |||||||||
| Wisconsin | ||||||||||||
| State of Wisconsin | ||||||||||||
| 5.000%, 05/01/2022 | 10,000,000 | 12,491,000 | 1.0 | % | ||||||||
Other Wisconsin# | 6,729,858 | 0.6 | % | |||||||||
| Total Wisconsin | ||||||||||||
| (Cost $18,747,526) | 19,220,858 | 1.6 | % | |||||||||
| Total Long-Term Investments | ||||||||||||
| (Cost $1,094,350,492) | 1,160,256,224 | 97.6 | % | |||||||||
| Short-Term Investments | ||||||||||||
| Shares | ||||||||||||
| Money Market Mutual Fund | ||||||||||||
| Goldman Sachs Financial Square Funds, 0.02%« | 17,877,536 | 17,877,536 | 1.5 | % | ||||||||
| Total Short-Term Investments | ||||||||||||
| (Cost $17,877,536) | 17,877,536 | 1.5 | % | |||||||||
| Total Investments | ||||||||||||
| (Cost $1,112,228,028) | 1,178,133,760 | 99.1 | % | |||||||||
| Other Assets in Excess of Liabilities | 11,062,022 | 0.9 | % | |||||||||
| TOTAL NET ASSETS | $ | 1,189,195,782 | 100.0 | % | ||||||||
Notes to Summary Schedule of Investments
AGM – Assured Guaranty Municipal
| AMBAC – | Ambac Assurance Corporation. Ambac Assurance’s plan of rehabilitation transferring certain troubled insurance policies and assets (mostly relating to insurance coverage and credit default swaps on residential mortgage-backed securities) to a segregated account has obtained court approval but has not yet been implemented. |
ETM – Escrowed to Maturity
PSF – Texas Permanent School Fund
| ^ | Non-Income Producing | |
| « | 7-Day Yield | |
| # | Represents the aggregate value, by category, securities that are not among the 50 largest holdings and, in total for any issuer, represent 1% or less of net assets. |
The accompanying notes are in integral part of these financial statements.
Page 28
Baird Intermediate Municipal Bond Fund
Summary Schedule of Investments, June 30, 2012 (Unaudited)
Summary of Fair Value Exposure at June 30, 2012 (Unaudited)
The Fund has adopted authoritative fair valuation accounting standards which establish a definition of fair value and set out a hierarchy for measuring fair value. These standards require additional disclosures about the various inputs and valuation techniques used to develop the measurements of fair value and a discussion on changes in valuation techniques and related inputs during the period. These standards define fair value as the price that would be received to sell an asset or paid to transfer a liability in an orderly transaction between market participants at the measurement date. The fair value hierarchy is organized into three levels based upon the assumptions (referred to as “inputs”) used in pricing the asset or liability. These standards state that “observable inputs” reflect the assumptions market participants would use in pricing the asset or liability based on market data obtained from independent sources and “unobservable inputs” reflect an entity’s own assumptions about the assumptions market participants would use in pricing the asset or liability. These inputs are summarized into three broad levels and described below:
Level 1 – | Unadjusted quoted prices in active markets for identical unrestricted securities. |
Level 2 – | Other significant observable inputs (including quoted prices for similar securities, quoted prices in inactive markets, dealer indications, interest rates, yield curves, prepayment speeds, credit risk, default rates, inputs corroborated by observable market data, etc.). |
Level 3 – | Significant unobservable inputs (including the Fund’s own assumptions about the factors that market participants would use in valuing the security) based on the best information available. |
The inputs or methodology used for valuing securities are not necessarily an indication of the risk associated with investing in those securities.
The following is a summary of the inputs used to value the Fund’s investments as of June 30, 2012:
| Level 1 | Level 2 | Level 3 | Total | |||||||||||||
| Fixed Income | ||||||||||||||||
| Municipal Bonds | $ | — | $ | 1,160,256,224 | $ | — | $ | 1,160,256,224 | ||||||||
| Total Fixed Income | — | 1,160,256,224 | — | 1,160,256,224 | ||||||||||||
| Short-Term Investments | ||||||||||||||||
| Money Market Mutual Fund | 17,877,536 | — | — | 17,877,536 | ||||||||||||
| Total Short-Term Investments | 17,877,536 | — | — | 17,877,536 | ||||||||||||
| Total Investments | $ | 17,877,536 | $ | 1,160,256,224 | $ | — | $ | 1,178,133,760 | ||||||||
Changes in valuation techniques may result in transfers into or out of current assigned levels within the hierarchy. There were no significant transfers between Level 1, Level 2 and Level 3 fair value measurements during the reporting period, as compared to their classification from the prior year’s annual report.
Page 29
Baird Aggregate Bond Fund
June 30, 2012 (Unaudited)
The Baird Aggregate Bond Fund seeks an annual rate of total return, before Fund expenses, greater than the annual rate of total return of the Barclays Capital U.S. Aggregate Bond Index. The Barclays Capital U.S. Aggregate Bond Index is an unmanaged, market value weighted index of investment grade, fixed-rate debt issues, including government, corporate, asset-backed and mortgage-backed securities, with maturities of at least one year.
Portfolio Characteristics
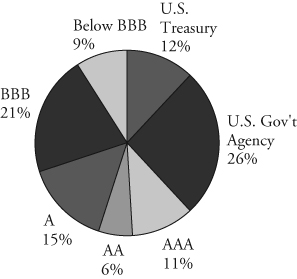
Quality Distribution*
 | Net Assets: | $1,258,981,269 | ||
| SEC 30-Day | ||||
Yield:** | ||||
| Institutional Class: | 3.57% | |||
| Investor Class: | 3.20% | |||
| Average | ||||
| Effective | ||||
| Duration: | 5.07 years | |||
| Average | ||||
| Effective | ||||
| Maturity: | 7.01 years | |||
| Annualized | ||||
| Expense | ||||
| Ratio: | ||||
| Sector Weightings* | Institutional Class: | 0.30% | ||
| Investor Class: | 0.55%*** | |||
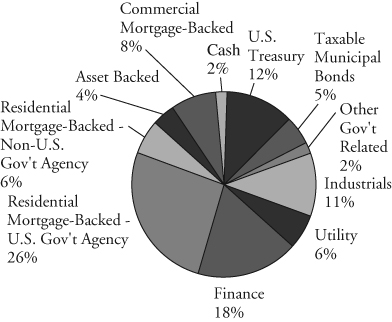 | ||||
| Portfolio | ||||
| Turnover | ||||
| Rate: | 30.1%# | |||
| Total | ||||
| Number of | ||||
| Holdings: | 377 | |||
| * | Percentages shown are based on the Fund’s total investments (less investments purchased with cash proceeds from securities lending). | |
| ** | SEC yields are based on SEC guidelines and are calculated for the 30 days ended June 30, 2012. | |
| *** | Includes 0.25% 12b-1 fee. | |
| # | Not annualized. |
Page 30
Baird Aggregate Bond Fund
June 30, 2012 (Unaudited)
Total Returns
| Average Annual | |||||
| Six | One | Five | Ten | Since | |
| For the Periods Ended June 30, 2012 | Months | Year | Years | Years | Inception(1) |
| Institutional Class Shares | 3.98% | 8.52% | 6.53% | 5.93% | 6.52% |
| Investor Class Shares | 3.84% | 8.21% | 6.25% | 5.68% | 6.26% |
| Barclays Capital | |||||
U.S. Aggregate Bond Index(2) | 2.37% | 7.47% | 6.79% | 5.63% | 6.20% |
| (1) | For the period from September 29, 2000 (commencement of operations) through June 30, 2012. |
| (2) | The Barclays Capital U.S. Aggregate Bond Index is an unmanaged, market value weighted index of investment grade, fixed-rate debt issues, including government, corporate, asset-backed and mortgage-backed securities, with maturities of at least one year. This index does not reflect any deduction for fees, expenses or taxes. A direct investment in an index is not possible. |
The returns shown in the table above reflect reinvestment of dividends and/or capital gains distributions in additional shares. The returns do not reflect the deduction of taxes that a shareholder would pay on Fund distributions or the redemption of Fund shares. The returns reflect the actual performance for each period and does not include the impact of trades executed on the last business day of the period that were recorded on the first business day of the next period.
Past performance does not guarantee future results. Investment return and principal value will fluctuate so that an investor’s shares, when redeemed, may be worth more or less than their original cost.
For information about the performance of the Fund as of the most recent month-end, please call 1-866-44BAIRD or visit www.bairdfunds.com. Mutual fund performance changes over time and current performance may be lower or higher than that stated.
Page 31
Baird Aggregate Bond Fund
Summary Schedule of Investments, June 30, 2012 (Unaudited)
This schedule summarizes the Fund’s holdings by asset type. Details are reported for each of the Fund’s 50 largest individual holdings and for investments that, in total for any issuer, represent more than 1% of the Fund’s net assets. The total value of smaller holdings is reported as a single amount within each category.
The Fund reports a complete list of its holdings in regulatory filings following the end of each fiscal quarter. For the second and fourth fiscal quarters, the complete listing of the Fund’s holdings is available electronically at http://www.rwbaird.com/baird-funds/prospectus-applications/prospectus-applications.aspx under the column “Form N-CSR” and on the Securities and Exchange Commission’s website (www.sec.gov) or you can have it mailed to you without charge by calling 1-866-44BAIRD. For the first and third fiscal quarters, the Fund files its holdings with the SEC on Form N-Q. Shareholders can look up the Fund’s Forms N-Q on the SEC’s website (www.sec.gov).
Long-Term Investments
| Principal | Market | % of | ||||||||||
| Amount | Value | Net Assets | ||||||||||
| U.S. Treasury Securities | ||||||||||||
| U.S. Treasury Bonds: | ||||||||||||
| 2.375%, 07/31/2017@ | $ | 57,300,000 | $ | 61,875,061 | 4.9 | % | ||||||
| 5.250%, 11/15/2028@ | 33,825,000 | 47,603,411 | 3.8 | % | ||||||||
| 4.375%, 02/15/2038@ | 31,850,000 | 42,260,969 | 3.4 | % | ||||||||
| 6.250%, 08/15/2023 | 1,000,000 | 1,452,500 | 0.1 | % | ||||||||
| Total U.S. Treasury Securities | ||||||||||||
| (Cost $143,419,647) | 153,191,941 | 12.2 | % | |||||||||
| Taxable Municipal Bonds | ||||||||||||
| California Qualified School Construction Bonds | ||||||||||||
| 7.155%, 03/01/2027 | 7,500,000 | 8,691,375 | 0.7 | % | ||||||||
| Contra Costa County California Pension Obligation | ||||||||||||
| 5.140%, 06/01/2017 | 5,975,000 | 6,657,763 | 0.5 | % | ||||||||
| San Dieguito California Public Facilities | ||||||||||||
| 6.459%, 05/01/2027 | 6,500,000 | 7,627,295 | 0.6 | % | ||||||||
| Tobacco Settlement Authority Iowa | ||||||||||||
| 6.500%, 06/01/2023 (Callable 06/01/2015) | 6,960,000 | 6,697,051 | 0.5 | % | ||||||||
Other Municipal Bonds# | 34,561,734 | 2.8 | % | |||||||||
| Total Municipal Bonds | ||||||||||||
| (Cost $58,026,061) | 64,235,218 | 5.1 | % | |||||||||
| Other Government Related Securities | ||||||||||||
| Corp Andina de Fomento | ||||||||||||
4.375%, 06/15/2022 f | 6,242,000 | 6,375,779 | 0.5 | % | ||||||||
Other Government Related Securities#~ | 24,046,365 | 1.9 | % | |||||||||
| Total Other Government Related Securities | ||||||||||||
| (Cost $28,256,137) | 30,422,144 | 2.4 | % | |||||||||
| Corporate Bonds | ||||||||||||
| Industrials | ||||||||||||
| Anadarko Petroleum Corporation | ||||||||||||
| 6.375%, 09/15/2017 | 6,000,000 | 6,969,804 | 0.5 | % | ||||||||
| Glencore Funding LLC | ||||||||||||
| 6.000%, 04/15/2014 (Acquired 03/31/2004 | ||||||||||||
| through 06/20/2011, Cost $8,145,793)* | 8,092,000 | 8,506,480 | 0.7 | % | ||||||||
The accompanying notes are in integral part of these financial statements.
Page 32
Baird Aggregate Bond Fund
Summary Schedule of Investments, June 30, 2012 (Unaudited)
Long-Term Investments (cont.)
| Principal | Market | % of | ||||||||||
| Amount | Value | Net Assets | ||||||||||
| Hutchison Whampoa International Ltd. | ||||||||||||
| 7.625%, 04/09/2019 (Acquired 10/22/2009 | ||||||||||||
through 10/29/2009, Cost $6,265,355)* f | $ | 5,700,000 | $ | 7,042,367 | 0.6 | % | ||||||
| National Oilwell Varco Inc. | ||||||||||||
| Series B, 6.125%, 08/15/2015 | 7,045,000 | 7,153,866 | 0.6 | % | ||||||||
Other Industrials#~ | 113,662,123 | 9.0 | % | |||||||||
| Total Industrials | ||||||||||||
| (Cost $134,112,297) | 143,334,640 | 11.4 | % | |||||||||
| Utility | ||||||||||||
| Ameren Corporation | ||||||||||||
| 8.875%, 05/15/2014 | 6,900,000 | 7,685,834 | 0.6 | % | ||||||||
| Constellation Energy Group Inc. | ||||||||||||
| 4.550%, 06/15/2015 | 5,862,000 | 6,295,313 | 0.5 | % | ||||||||
| Mega Advance Investments Ltd | ||||||||||||
| 5.000%, 05/12/2021 | ||||||||||||
(Acquired 05/09/2011, Cost $5,443,790)* f @ | 5,500,000 | 5,838,937 | 0.4 | % | ||||||||
Other Utility#~ | 52,546,328 | 4.2 | % | |||||||||
| Total Utility | ||||||||||||
| (Cost $68,467,471) | 72,366,412 | 5.7 | % | |||||||||
| Finance | ||||||||||||
| Associates Corporation of North America | ||||||||||||
| 6.950%, 11/01/2018 | 5,125,000 | 5,778,489 | 0.5 | % | ||||||||
| General Electric Capital Corporation | ||||||||||||
| 4.650%, 10/17/2021 | 6,000,000 | 6,663,156 | 0.5 | % | ||||||||
| Genworth Life Institutional Funding Trust | ||||||||||||
| 5.875%, 05/03/2013 | ||||||||||||
| (Acquired 04/14/2011, Cost $6,668,639)* | 6,500,000 | 6,609,395 | 0.5 | % | ||||||||
| Irish Life & Permanent Group Holdings PLC | ||||||||||||
| 3.600%, 01/14/2013 (Acquired 01/07/2010 | ||||||||||||
through 03/09/2012, Cost $7,509,051)* f | 7,525,000 | 7,292,432 | 0.6 | % | ||||||||
| John Hancock Mutual Life Insurance Company | ||||||||||||
| 7.375%, 02/15/2024 | ||||||||||||
| (Acquired 08/26/2010, Cost $7,635,127)* | 6,800,000 | 8,269,568 | 0.7 | % | ||||||||
| Schwab Capital Trust I | ||||||||||||
| 7.500%, 11/15/2037 | 8,760,000 | 9,018,858 | 0.7 | % | ||||||||
Other Finance#~ | 183,139,237 | 14.5 | % | |||||||||
| Total Finance | ||||||||||||
| (Cost $217,352,935) | 226,771,135 | 18.0 | % | |||||||||
The accompanying notes are in integral part of these financial statements.
Page 33
Baird Aggregate Bond Fund
Summary Schedule of Investments, June 30, 2012 (Unaudited)
Long-Term Investments (cont.)
| Principal | Market | % of | ||||||||||
| Amount | Value | Net Assets | ||||||||||
| Residential Mortgage-Backed Securities | ||||||||||||
| U.S. Government Agency Issues | ||||||||||||
| Federal Gold Loan Mortgage | ||||||||||||
| Corporation (FGLMC) Pass-Through Certificates: | ||||||||||||
| 5.000%, 03/01/2038 | $ | 14,800,242 | $ | 15,928,203 | 1.3 | % | ||||||
| 4.500%, 11/01/2039 | 19,239,963 | 20,556,802 | 1.6 | % | ||||||||
| 5.000%-6.500%, 07/01/2014-12/01/2036 | 5,225,414 | 5,738,416 | 0.5 | % | ||||||||
| Federal Home Loan Mortgage | ||||||||||||
| Corporation (FHLMC) Pass-Through Certificates: | ||||||||||||
| 5.500%, 05/01/2038 | 6,568,626 | 7,141,364 | 0.6 | % | ||||||||
| 4.500%, 11/01/2039 | 6,608,927 | 7,061,261 | 0.6 | % | ||||||||
| 4.500%, 09/01/2040 | 18,029,488 | 19,286,016 | 1.5 | % | ||||||||
| 0.000%-7.000%, 07/15/2019-05/15/2022 | 490,946 | 539,394 | 0.0 | % | ||||||||
| Federal National Mortgage Association (FNMA) | ||||||||||||
| Pass-Through Certificates: | ||||||||||||
| 5.000%, 11/01/2021 | 7,943,864 | 8,601,116 | 0.7 | % | ||||||||
| 5.500%, 04/01/2034 | 6,396,715 | 7,027,349 | 0.6 | % | ||||||||
| 5.000%, 10/01/2035 | 20,805,818 | 22,626,678 | 1.8 | % | ||||||||
| 5.000%, 11/01/2035 | 10,337,656 | 11,216,802 | 0.9 | % | ||||||||
| 5.500%, 04/01/2037 | 9,680,752 | 10,648,879 | 0.8 | % | ||||||||
| 4.000%, 08/01/2040 | 10,371,201 | 11,055,556 | 0.9 | % | ||||||||
| 3.500%, 02/01/2041 | 31,853,237 | 33,514,721 | 2.7 | % | ||||||||
| 4.000%, 02/01/2041 | 41,924,265 | 44,690,682 | 3.5 | % | ||||||||
| 4.000%, 09/01/2041 | 14,599,445 | 15,567,367 | 1.2 | % | ||||||||
| 3.500%-8.000%, 09/25/2017-12/01/2040 | 32,260,929 | 34,720,753 | 2.8 | % | ||||||||
| Government National Mortgage | ||||||||||||
| Association (GNMA) Pass-Through Certificates: | ||||||||||||
| 6.000%, 11/20/2033 | 203,556 | 230,207 | 0.0 | % | ||||||||
| 5.000%, 07/20/2040 | 11,828,250 | 13,115,913 | 1.0 | % | ||||||||
| 4.500%, 01/20/2041 | 32,914,234 | 36,350,719 | 2.9 | % | ||||||||
| Total U.S. Government Agency Issues | ||||||||||||
| (Cost $312,777,821) | 325,618,198 | 25.9 | % | |||||||||
| Non-U.S. Government Agency Issues | ||||||||||||
| Bank of America Alternative Loan Trust: | ||||||||||||
| Series 2004-7, Class 4A1, 5.000%, 08/25/2019 | 6,538,571 | 6,749,146 | 0.5 | % | ||||||||
| 4.750%-6.000%, 06/25/2018-06/25/2046 | 14,973,965 | 14,377,576 | 1.2 | % | ||||||||
| Countrywide Alternative Loan Trust: | ||||||||||||
| Series 2003-20CB, Class 1A1, | ||||||||||||
| 5.500%, 10/25/2033 | 10,093,585 | 10,610,043 | 0.8 | % | ||||||||
| 5.000%-6.250%, 11/25/2020-10/25/2036 | 11,071,431 | 9,700,944 | 0.8 | % | ||||||||
Other Non-U.S. Government Agency Issues# | 29,440,081 | 2.3 | % | |||||||||
| Total Non-U.S. Government Agency Issues | ||||||||||||
| (Cost $75,672,591) | 70,877,790 | 5.6 | % | |||||||||
The accompanying notes are in integral part of these financial statements.
Page 34
Baird Aggregate Bond Fund
Summary Schedule of Investments, June 30, 2012 (Unaudited)
Long-Term Investments (cont.)
| Principal | Market | % of | ||||||||||
| Amount | Value | Net Assets | ||||||||||
| Asset Backed Securities | ||||||||||||
| Countrywide Asset-Backed Certificates: | ||||||||||||
| Series 2005-1, Class AF6, 5.030%, 07/25/2035 | $ | 8,328,376 | $ | 8,286,701 | 0.7 | % | ||||||
| Series 2005-11, Class AF3, 4.778%, 02/25/2036 | 9,964,966 | 8,005,605 | 0.6 | % | ||||||||
| 4.583%-5.884%, 03/25/2030-09/25/2046 | 27,930,796 | 23,778,658 | 1.9 | % | ||||||||
Other Asset Backed Securities# | 11,473,923 | 0.9 | % | |||||||||
| Total Asset Backed Securities | ||||||||||||
| (Cost $56,934,326) | 51,544,887 | 4.1 | % | |||||||||
| Commercial Mortgage-Backed Securities | ||||||||||||
| Bear Stearns Commercial Mortgage Securities | ||||||||||||
| Series 2005-PWR9, Class A4A, | ||||||||||||
| 4.871%, 09/11/2042 | 11,139,000 | 12,272,962 | 1.0 | % | ||||||||
| Commercial Mortgage Pass-Through Certificates | ||||||||||||
| Series 2005-C6, Class A5A, | ||||||||||||
| 5.116%, 06/10/2044 | 11,248,000 | 12,420,638 | 1.0 | % | ||||||||
| Credit Suisse First Boston | ||||||||||||
| Mortgage Securities Corporation | ||||||||||||
| Series 2005-C5, Class A4, 5.10%, 08/15/2038 | 10,149,000 | 11,190,135 | 0.9 | % | ||||||||
| GE Capital Commercial Mortgage Corporation | ||||||||||||
| Series 2005-C4, Class A4, 5.305%, 11/10/2045 | 10,750,000 | 12,018,059 | 0.9 | % | ||||||||
| J.P. Morgan Chase Commercial Mortgage Trust | ||||||||||||
| Series 2005-CB12, Class A4, | ||||||||||||
| 4.895%, 09/12/2037 | 11,355,000 | 12,454,459 | 1.0 | % | ||||||||
| Morgan Stanley Capital I | ||||||||||||
| Series 2005-HQ7, Class A4, | ||||||||||||
| 5.201%, 11/14/2042 | 10,825,000 | 12,015,144 | 0.9 | % | ||||||||
| Wachovia Bank Commercial Mortgage Trust | ||||||||||||
| Series 2005-C22, Class A4, | ||||||||||||
| 5.441%, 12/15/2044 | 10,000,000 | 11,098,980 | 0.9 | % | ||||||||
| WF-RBS Commercial Mortgage Trust | ||||||||||||
| Series 2012-C6, Class A4, 3.44%, 04/15/2045 | 12,000,000 | 12,321,408 | 1.0 | % | ||||||||
Other Commercial Mortgage Backed Securities# | 5,031,380 | 0.4 | % | |||||||||
| Total Commercial Mortgage Backed Securities | ||||||||||||
| (Cost $96,821,649) | 100,823,165 | 8.0 | % | |||||||||
| Total Long-Term Investments | ||||||||||||
| (Cost $1,191,840,935) | 1,239,185,530 | 98.4 | % | |||||||||
The accompanying notes are in integral part of these financial statements.
Page 35
Baird Aggregate Bond Fund
Summary Schedule of Investments, June 30, 2012 (Unaudited)
Short-Term Investments
| Market | % of | |||||||||||
| Shares | Value | Net Assets | ||||||||||
| Money Market Mutual Funds | ||||||||||||
| Dreyfus Institutional Cash Advantage Fund, 0.15%« | 4,797,194 | $ | 4,797,194 | 0.4 | % | |||||||
| Short-Term Investments Trust – | ||||||||||||
| Liquid Assets Portfolio, 0.16%« | 23,288,773 | 23,288,773 | 1.8 | % | ||||||||
| Total Short-Term Investments | ||||||||||||
| (Cost $28,085,967) | 28,085,967 | 2.2 | % | |||||||||
| Investments Purchased with Cash | ||||||||||||
| Proceeds from Securities Lending | ||||||||||||
| Principal | ||||||||||||
| Amount | ||||||||||||
| Commercial Paper | ||||||||||||
| Atlantic East Funding LLC, | ||||||||||||
| 0.595%, 03/25/2013†** | $ | 2,837,710 | 1,872,176 | 0.2 | % | |||||||
| Total Commercial Paper | ||||||||||||
| (Cost $2,837,710) | 1,872,176 | 0.2 | % | |||||||||
| Shares | ||||||||||||
| Investment Companies | ||||||||||||
| Mount Vernon Securities Lending | ||||||||||||
| Trust Prime Portfolio, 0.31%« | 135,218,513 | 135,218,513 | 10.7 | % | ||||||||
| Total Investment Companies | ||||||||||||
| (Cost $135,218,513) | 135,218,513 | 10.7 | % | |||||||||
| Total Investments Purchased With | ||||||||||||
| Cash Proceeds From Securities Lending | ||||||||||||
| (Cost $138,056,223) | 137,090,689 | 10.9 | % | |||||||||
| Total Investments | ||||||||||||
| (Cost $1,357,983,125) | 1,404,362,186 | 111.5 | % | |||||||||
| Asset Relating to Securities Lending Investments | ||||||||||||
Support Agreement**^a† | 965,534 | 0.1 | % | |||||||||
| Total | ||||||||||||
| (Cost $0) | 965,534 | 0.1 | % | |||||||||
| Liabilities in Excess of Other Assets | (146,346,451 | ) | (11.6 | %) | ||||||||
| TOTAL NET ASSETS | $ | 1,258,981,269 | 100.0 | % | ||||||||
The accompanying notes are in integral part of these financial statements.
Page 36
Baird Aggregate Bond Fund
Summary Schedule of Investments, June 30, 2012 (Unaudited)
Notes to Summary Schedule of Investments
| * | Restricted Security Deemed Liquid | |
| ** | Illiquid Security | |
| @ | This security or portion of this security is out on loan at June 30, 2012. | |
| f | Foreign Security | |
| ^ | Non-Income Producing | |
| « | 7-Day Yield | |
| † | Priced at Fair Value by the Valuation Committee as delegated by the Baird Funds’ Board of Directors. | |
| # | Represents the aggregate value, by category, securities that are not among the 50 largest holdings and, in total for any issuer, represent 1% or less of net assets. | |
| ~ | Groupings contain, in aggregate, restricted securities totaling $64,562,555 representing 5.13% of net assets. | |
| a | The Fund’s transfer agent and administrator and securities lending agent entered into a support agreement with the Fund to cover losses realized by the Fund on its investment in Atlantic East Funding, LLC (up to a certain amount), which investment was made by the Fund’s securities lending agent. |
Summary of Fair Value Exposure at June 30, 2012 (Unaudited)
The Fund has adopted authoritative fair valuation accounting standards which establish a definition of fair value and set out a hierarchy for measuring fair value. These standards require additional disclosures about the various inputs and valuation techniques used to develop the measurements of fair value and a discussion on changes in valuation techniques and related inputs during the period. These standards define fair value as the price that would be received to sell an asset or paid to transfer a liability in an orderly transaction between market participants at the measurement date. The fair value hierarchy is organized into three levels based upon the assumptions (referred to as “inputs”) used in pricing the asset or liability. These standards state that “observable inputs” reflect the assumptions market participants would use in pricing the asset or liability based on market data obtained from independent sources and “unobservable inputs” reflect an entity’s own assumptions about the assumptions market participants would use in pricing the asset or liability. These inputs are summarized into three broad levels and described below:
Level 1 – | Unadjusted quoted prices in active markets for identical unrestricted securities. |
Level 2 – | Other significant observable inputs (including quoted prices for similar securities, quoted prices in inactive markets, dealer indications, interest rates, yield curves, prepayment speeds, credit risk, default rates, inputs corroborated by observable market data, etc.). |
Level 3 – | Significant unobservable inputs (including the Fund’s own assumptions about the factors that market participants would use in valuing the security) based on the best information available. |
The inputs or methodology used for valuing securities are not necessarily an indication of the risk associated with investing in those securities.
The accompanying notes are in integral part of these financial statements.
Page 37
Baird Aggregate Bond Fund
Summary Schedule of Investments, June 30, 2012 (Unaudited)
The following is a summary of the inputs used to value the Fund’s investments as of June 30, 2012:
| Level 1 | Level 2 | Level 3 | Total | |||||||||||||
| Fixed Income | ||||||||||||||||
| U.S. Treasury Securities | $ | — | $ | 153,191,941 | $ | — | $ | 153,191,941 | ||||||||
| Taxable Municipal Bonds | — | 64,235,218 | — | 64,235,218 | ||||||||||||
| Other Government Related Securities | — | 30,422,144 | — | 30,422,144 | ||||||||||||
| Corporate Debt Securities | — | 442,470,580 | 1,607 | 442,472,187 | ||||||||||||
| Residential Mortgage-Backed Securities – | ||||||||||||||||
| U.S. Government Agency Issues | — | 325,618,198 | — | 325,618,198 | ||||||||||||
| Residential Mortgage-Backed Securities – | ||||||||||||||||
| Non-U.S. Government Agency Issues | — | 70,877,790 | — | 70,877,790 | ||||||||||||
| Asset Backed Securities | — | 51,544,887 | — | 51,544,887 | ||||||||||||
| Commercial Mortgage-Backed Securities | — | 100,823,165 | — | 100,823,165 | ||||||||||||
| Total Fixed Income | — | 1,239,183,923 | 1,607 | 1,239,185,530 | ||||||||||||
| Short-Term Investments | ||||||||||||||||
| Money Market Mutual Funds | 28,085,967 | — | — | 28,085,967 | ||||||||||||
| Total Short-Term Investments | 28,085,967 | — | — | 28,085,967 | ||||||||||||
| Investments Purchased with Cash | ||||||||||||||||
| Proceeds from Securities Lending | ||||||||||||||||
| Commercial Paper | — | 1,872,176 | — | 1,872,176 | ||||||||||||
| Money Market Mutual Fund | 135,218,513 | — | — | 135,218,513 | ||||||||||||
| Total Investments Purchased | ||||||||||||||||
| with Cash Proceeds | ||||||||||||||||
| from Securities Lending | 135,218,513 | 1,872,176 | — | 137,090,689 | ||||||||||||
| Total Investments | $ | 163,304,480 | $ | 1,241,056,099 | $ | 1,607 | $ | 1,404,362,186 | ||||||||
| Asset Relating to | ||||||||||||||||
| Securities Lending Investments | $ | — | $ | 965,534 | $ | — | $ | 965,534 | ||||||||
Changes in valuation techniques may result in transfers into or out of current assigned levels within the hierarchy. There were no significant transfers between Level 1, Level 2 and Level 3 fair value measurements during the reporting period, as compared to their classification from the prior year’s annual report. One security that is priced at fair value by the Valuation Committee instead of the Fund’s pricing vendor is valued using level 3 inputs.
Level 3 Reconciliation Disclosure
Following is a reconciliation of Level 3 assets for which significant unobservable inputs were used to determine fair value.
| Description | Investments in Securities | |||
| Balance as of December 31, 2011 | $ | 1,607 | ||
| Accrued discounts/premiums | — | |||
| Realized gain (loss) | — | |||
| Change in unrealized appreciation (depreciation) | — | |||
| Purchases | — | |||
| Sales | — | |||
| Transfers in and/or out of Level 3* | — | |||
| Balance as of June 30, 2012 | $ | 1,607 | ||
* Transfers between levels are recognized at the end of the reporting period.
Page 38
Baird Core Plus Bond Fund
June 30, 2012 (Unaudited)
The Baird Core Plus Bond Fund seeks an annual rate of total return, before Fund expenses, greater than the annual rate of total return of the Barclays Capital U.S. Universal Bond Index. The Barclays Capital U.S. Universal Bond Index is an unmanaged, market value weighted index of fixed income securities issued in U.S. dollars, including U.S. government and investment grade debt, non-investment grade debt, asset-backed and mortgage-backed securities, Eurobonds, 144A securities and emerging market debt, with maturities of at least one year.
Portfolio Characteristics
Quality Distribution*
 | Net Assets: | $1,776,836,267 | ||
| SEC 30-Day | ||||
Yield:** | ||||
| Institutional Class: | 3.20% | |||
| Investor Class: | 2.94% | |||
| Average | ||||
| Effective | ||||
| Duration: | 5.02 years | |||
| Average | ||||
| Effective | ||||
| Maturity: | 6.64 years | |||
| Annualized | ||||
| Expense | ||||
| Sector Weightings* | Ratio: | |||
| Institutional Class: | 0.30% | |||
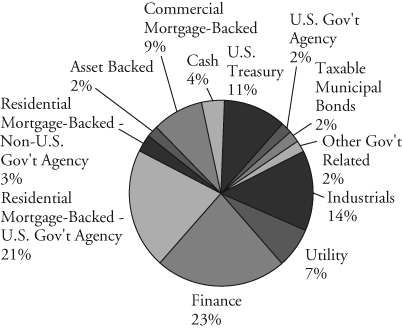 | Investor Class: | 0.55%*** | ||
| Portfolio | ||||
| Turnover | ||||
| Rate: | 17.1%# | |||
| Total | ||||
| Number of | ||||
| Holdings: | 585 | |||
| * | Percentages shown are based on the Fund’s total investments (less investments purchased with cash proceeds from securities lending). | |
| ** | SEC yields are based on SEC guidelines and are calculated for the 30 days ended June 30, 2012. | |
| *** | Includes 0.25% 12b-1 fee. | |
| # | Not annualized. |
Page 39
Baird Core Plus Bond Fund
June 30, 2012 (Unaudited)
Total Returns
| Average Annual | |||||
| Six | One | Five | Ten | Since | |
| For the Periods Ended June 30, 2012 | Months | Year | Years | Years | Inception(1) |
| Institutional Class Shares | 3.85% | 8.08% | 7.83% | 6.98% | 7.17% |
| Investor Class Shares | 3.79% | 7.85% | 7.55% | 6.70% | 6.90% |
| Barclays Capital | |||||
U.S. Universal Bond Index(2) | 2.87% | 7.36% | 6.76% | 5.96% | 6.38% |
| (1) | For the period from September 29, 2000 (commencement of operations) through June 30, 2012. |
| (2) | The Barclays Capital U.S. Universal Bond Index is an unmanaged, market value weighted index of fixed income securities issued in U.S. dollars, including U.S. government and investment grade debt, non-investment grade debt, asset-backed and mortgage-backed securities, Eurobonds, 144A securities and emerging market debt, with maturities of at least one year. This index does not reflect any deduction for fees, expenses or taxes. A direct investment in an index is not possible. |
The returns shown in the table above reflect reinvestment of dividends and/or capital gains distributions in additional shares. The returns do not reflect the deduction of taxes that a shareholder would pay on Fund distributions or the redemption of Fund shares. The returns reflect the actual performance for each period and does not include the impact of trades executed on the last business day of the period that were recorded on the first business day of the next period.
Past performance does not guarantee future results. Investment return and principal value will fluctuate so that an investor’s shares, when redeemed, may be worth more or less than their original cost.
For information about the performance of the Fund as of the most recent month-end, please call 1-866-44BAIRD or visit www.bairdfunds.com. Mutual fund performance changes over time and current performance may be lower or higher than that stated.
Page 40
Baird Core Plus Bond Fund
Summary Schedule of Investments, June 30, 2012 (Unaudited)
This schedule summarizes the Fund’s holdings by asset type. Details are reported for each of the Fund’s 50 largest individual holdings and for investments that, in total for any issuer, represent more than 1% of the Fund’s net assets. The total value of smaller holdings is reported as a single amount within each category.
The Fund reports a complete list of its holdings in regulatory filings following the end of each fiscal quarter. For the second and fourth fiscal quarters, the complete listing of the Fund’s holdings is available electronically at http://www.rwbaird.com/baird-funds/prospectus-applications/prospectus-applications.aspx under the column “Form N-CSR” and on the Securities and Exchange Commission’s website (www.sec.gov) or you can have it mailed to you without charge by calling 1-866-44BAIRD. For the first and third fiscal quarters, the Fund files its holdings with the SEC on Form N-Q. Shareholders can look up the Fund’s Forms N-Q on the SEC’s website (www.sec.gov).
Long-Term Investments
| Principal | Market | % of | ||||||||||
| Amount | Value | Net Assets | ||||||||||
| U.S. Treasury Securities | ||||||||||||
| U.S. Treasury Bonds@: | ||||||||||||
| 2.375%, 07/31/2017 | $ | 63,150,000 | $ | 68,192,149 | 3.9 | % | ||||||
| 6.250%, 08/15/2023 | 12,675,000 | 18,410,437 | 1.0 | % | ||||||||
| 5.250%, 11/15/2028 | 35,775,000 | 50,347,732 | 2.8 | % | ||||||||
| 4.375%, 02/15/2038 | 43,525,000 | 57,752,234 | 3.3 | % | ||||||||
| Total U.S. Treasury Securities | ||||||||||||
| (Cost $183,930,092) | 194,702,552 | 11.0 | % | |||||||||
| U.S. Government Agency Securities | ||||||||||||
| Federal National Mortgage Association (FNMA): | ||||||||||||
| 1.000%, 07/28/2017 | 15,075,000 | 15,067,176 | 0.9 | % | ||||||||
| 1.250%, 01/30/2017 | 10,975,000 | 11,147,999 | 0.6 | % | ||||||||
| Total U.S. Government Agency Securities | ||||||||||||
| (Cost $25,994,341) | 26,215,175 | 1.5 | % | |||||||||
| Taxable Municipal Bonds | ||||||||||||
Total Municipal Bonds# | ||||||||||||
| (Cost $39,925,668) | 43,473,520 | 2.4 | % | |||||||||
| Other Government Related Securities | ||||||||||||
| Eksportfinans ASA | ||||||||||||
2.000%, 09/15/2015 f | 9,000,000 | 8,054,514 | 0.5 | % | ||||||||
Other Government Related Securities#~ | 26,598,890 | 1.5 | % | |||||||||
| Total Other Government Related Securities | ||||||||||||
| (Cost $32,822,311) | 34,653,404 | 2.0 | % | |||||||||
| Corporate Bonds | ||||||||||||
| Industrials | ||||||||||||
Total Industrials#~ | ||||||||||||
| (Cost $244,260,973) | 251,732,023 | 14.2 | % | |||||||||
The accompanying notes are in integral part of these financial statements.
Page 41
Baird Core Plus Bond Fund
Summary Schedule of Investments, June 30, 2012 (Unaudited)
Long-Term Investments (cont.)
| Principal | Market | % of | ||||||||||
| Amount | Value | Net Assets | ||||||||||
| Utility | ||||||||||||
| National Rural Utilities Corporation | ||||||||||||
| 10.375%, 11/01/2018 | $ | 6,498,000 | $ | 9,415,505 | 0.5 | % | ||||||
Other Utility#~ | 109,637,030 | 6.2 | % | |||||||||
| Total Utility | ||||||||||||
| (Cost $113,726,234) | 119,052,535 | 6.7 | % | |||||||||
| Finance | ||||||||||||
| Barclays Bank PLC | ||||||||||||
6.750%, 05/22/2019 f | 6,850,000 | 7,990,840 | 0.5 | % | ||||||||
| Credit Suisse New York | ||||||||||||
5.300%, 08/13/2019 f | 6,966,000 | 7,837,105 | 0.4 | % | ||||||||
| Dresdner Bank AG | ||||||||||||
7.250%, 09/15/2015 f | 7,850,000 | 7,956,854 | 0.4 | % | ||||||||
| General Electric Capital Corporation | ||||||||||||
| 4.650%, 10/17/2021 | 8,450,000 | 9,383,945 | 0.5 | % | ||||||||
| Irish Life & Permanent Group Holdings PLC | ||||||||||||
| 3.600%, 01/14/2013 (Acquired 12/01/2010 | ||||||||||||
through 02/28/2012, Cost $10,037,601)* f | 10,400,000 | 10,078,578 | 0.6 | % | ||||||||
| Nordea Bank AB | ||||||||||||
| 3.125%, 03/20/2017 (Acquired 03/14/2012 | ||||||||||||
through 05/09/2012, Cost $8,050,179)* f @ | 8,000,000 | 8,034,152 | 0.5 | % | ||||||||
| Regions Bank | ||||||||||||
| 7.500%, 05/15/2018 | 7,475,000 | 8,409,375 | 0.5 | % | ||||||||
| Wachovia Bank, NA | ||||||||||||
| 6.000%, 11/15/2017 | 8,322,000 | 9,696,944 | 0.5 | % | ||||||||
Other Finance#~ | 336,307,422 | 18.9 | % | |||||||||
| Total Finance | ||||||||||||
| (Cost $392,639,557) | 405,695,215 | 22.8 | % | |||||||||
| Residential Mortgage-Backed Securities | ||||||||||||
| U.S. Government Agency Issues | ||||||||||||
| Federal Gold Loan Mortgage Corporation | ||||||||||||
| (FGLMC) Pass-Through Certificates: | ||||||||||||
| 3.000%, 05/01/2027 | 18,670,065 | 19,562,225 | 1.1 | % | ||||||||
| 4.500%, 11/01/2039 | 10,154,425 | 10,849,423 | 0.6 | % | ||||||||
| 4.500%, 08/01/2040 | 20,356,034 | 21,774,706 | 1.2 | % | ||||||||
| 4.500%, 08/01/2040 | 12,045,525 | 12,885,013 | 0.7 | % | ||||||||
| 4.500%-6.500%, 12/01/2020-11/01/2039 | 8,398,409 | 9,046,252 | 0.5 | % | ||||||||
The accompanying notes are in integral part of these financial statements.
Page 42
Baird Core Plus Bond Fund
Summary Schedule of Investments, June 30, 2012 (Unaudited)
Long-Term Investments (cont.)
| Principal | Market | % of | ||||||||||
| Amount | Value | Net Assets | ||||||||||
| Federal National Mortgage Association (FNMA) | ||||||||||||
| Series 2004-90, Class LH, 5.000%, 04/25/2034 | $ | 10,543,849 | $ | 11,229,117 | 0.6 | % | ||||||
| Pass-Through Certificates: | ||||||||||||
| 5.000%, 04/01/2035 | 8,891,701 | 9,670,108 | 0.6 | % | ||||||||
| 5.000%, 07/01/2035 | 25,841,704 | 28,184,091 | 1.6 | % | ||||||||
| 5.000%, 02/01/2036 | 15,020,927 | 16,335,451 | 0.9 | % | ||||||||
| 5.500%, 04/01/2036 | 15,571,093 | 17,079,626 | 1.0 | % | ||||||||
| 4.000%, 12/01/2040 | 9,282,268 | 10,063,009 | 0.6 | % | ||||||||
| 3.500%, 01/01/2041 | 7,338,623 | 7,721,410 | 0.4 | % | ||||||||
| 4.000%, 01/01/2041 | 16,633,771 | 17,731,368 | 1.0 | % | ||||||||
| 3.500%, 02/01/2041 | 19,045,355 | 20,038,772 | 1.1 | % | ||||||||
| 4.000%, 02/01/2041 | 28,764,635 | 30,662,700 | 1.7 | % | ||||||||
| 4.500%, 07/01/2041 | 7,720,853 | 8,324,085 | 0.5 | % | ||||||||
| 4.000%, 09/01/2041 | 17,012,696 | 18,140,613 | 1.0 | % | ||||||||
| 4.000%, 12/01/2041 | 14,102,134 | 15,037,085 | 0.9 | % | ||||||||
| 3.500%, 06/01/2042 | 17,650,000 | 18,614,760 | 1.1 | % | ||||||||
| 3.500%-7.500%, 12/25/2019-03/01/2041 | 35,854,275 | 38,548,604 | 2.2 | % | ||||||||
| Government National Mortgage | ||||||||||||
| Association (GNMA) Pass-Through Certificates: | ||||||||||||
| 4.500%, 05/20/2040 | 7,799,133 | 8,617,582 | 0.5 | % | ||||||||
| 4.500%, 01/20/2041 | 20,500,433 | 22,640,828 | 1.3 | % | ||||||||
| 5.000%-6.500%, 12/20/2028-07/20/2040 | 3,879,285 | 4,293,692 | 0.2 | % | ||||||||
Other U.S. Government Agency Issues# | 2,516,710 | 0.0 | % | |||||||||
| Total U.S. Government Agency Issues | ||||||||||||
| (Cost $370,569,513) | 379,567,230 | 21.3 | % | |||||||||
| Non-U.S. Government Agency Issues | ||||||||||||
| Bank of America Mortgage Securities Inc | ||||||||||||
| Series 2003-L, Class 2A1, 2.928%, 01/25/2034 | 8,601,800 | 8,029,763 | 0.5 | % | ||||||||
| J.P. Morgan Mortgage Trust | ||||||||||||
| Series 2007-A2, Class 2A3, 2.857%, 04/25/2037 | 14,307,108 | 10,430,196 | 0.6 | % | ||||||||
Other Non-U.S. Government Agency Issues# | 39,514,951 | 2.2 | % | |||||||||
| Total Non-U.S. Government Agency Issues | ||||||||||||
| (Cost $59,106,023) | 57,974,910 | 3.3 | % | |||||||||
| Asset Backed Securities | ||||||||||||
| J.P. Morgan Mortgage Acquisition Corp | ||||||||||||
| Series 2007-CH1, 0.479%, 11/25/2036 | 10,000,000 | 7,499,230 | 0.4 | % | ||||||||
Other Asset Backed Securities# | 21,931,234 | 1.3 | % | |||||||||
| Total Asset Backed Securities | ||||||||||||
| (Cost $32,354,936) | 29,430,464 | 1.7 | % | |||||||||
The accompanying notes are in integral part of these financial statements.
Page 43
Baird Core Plus Bond Fund
Summary Schedule of Investments, June 30, 2012 (Unaudited)
Long-Term Investments (cont.)
| Principal | Market | % of | ||||||||||
| Amount | Value | Net Assets | ||||||||||
| Commercial Mortgage-Backed Securities | ||||||||||||
| Bear Stearns Commercial Mortgage Securities | ||||||||||||
| Series 2005-PWR9, Class A4A, 4.871%, 09/11/2042 | $ | 16,160,000 | $ | 17,805,104 | 1.0 | % | ||||||
| Citigroup Deutsche Bank | ||||||||||||
| Series 2005-CD1, Class A4, 5.394%, 07/15/2044 | 13,222,000 | 14,713,772 | 0.8 | % | ||||||||
| Commercial Mortgage Pass-Through Certificates: | ||||||||||||
| Series 2005-C6, Class A5A, 5.116%, 06/10/2044 | 5,987,000 | 6,611,163 | 0.4 | % | ||||||||
| Series 2012-CR1, Class A3, 3.391%, 05/15/2045 | 16,923,000 | 17,207,323 | 1.0 | % | ||||||||
| Credit Suisse First Boston | ||||||||||||
| Mortgage Securities Corporation | ||||||||||||
| Series 2005-C5, Class A4, 5.100%, 08/15/2038 | 16,925,000 | 18,661,251 | 1.0 | % | ||||||||
| GE Capital Commercial Mortgage Corporation | ||||||||||||
| Series 2005-C4, Class A4, 5.305%, 11/10/2045 | 12,795,000 | 14,304,285 | 0.8 | % | ||||||||
| J.P. Morgan Chase Commercial | ||||||||||||
| Mortgage Securities Corporation | ||||||||||||
| Series 2011-C5, Class A3, 4.171%, 08/15/2046 | 17,145,000 | 18,651,463 | 1.0 | % | ||||||||
| J.P. Morgan Chase Commercial Mortgage Trust | ||||||||||||
| Series 2005-CB12, Class A4, 4.895%, 09/12/2037 | 15,505,000 | 17,006,287 | 1.0 | % | ||||||||
| Morgan Stanley Capital I | ||||||||||||
| Series 2005-HQ7, Class A4, 5.201%, 11/14/2042 | 11,275,000 | 12,514,619 | 0.7 | % | ||||||||
| WF-RBS Commercial Mortgage Trust | ||||||||||||
| Series 2012-C6, Class A4, 3.440%, 04/15/2045 | 9,000,000 | 9,241,056 | 0.5 | % | ||||||||
Other Commercial Mortgage Backed Securities# | 19,075,534 | 1.1 | % | |||||||||
| Total Commercial Mortgage Backed Securities | ||||||||||||
| (Cost $163,182,211) | 165,791,857 | 9.3 | % | |||||||||
| Total Long-Term Investments | ||||||||||||
| (Cost $1,658,511,859) | 1,708,288,885 | 96.2 | % | |||||||||
| Short-Term Investments | ||||||||||||
| Shares | ||||||||||||
| Money Market Mutual Funds | ||||||||||||
| Dreyfus Institutional Cash Advantage Fund, 0.15%« | 30,548,601 | 30,548,601 | 1.7 | % | ||||||||
| Short-Term Investments Trust – | ||||||||||||
| Liquid Assets Portfolio, 0.16%« | 30,000,000 | 30,000,000 | 1.7 | % | ||||||||
| Total Short-Term Investments | ||||||||||||
| (Cost $60,548,601) | 60,548,601 | 3.4 | % | |||||||||
The accompanying notes are in integral part of these financial statements.
Page 44
Baird Core Plus Bond Fund
Summary Schedule of Investments, June 30, 2012 (Unaudited)
Investments Purchased with Cash
Proceeds from Securities Lending – 9.5%
| Principal | Market | % of | ||||||||||
| Amount | Value | Net Assets | ||||||||||
| Commercial Paper - 0.0% | ||||||||||||
| Atlantic East Funding LLC, | ||||||||||||
| 0.595%, 03/25/2013†** | $ | 257,951 | $ | 170,183 | 0.0 | % | ||||||
| Total Commercial Paper | ||||||||||||
| (Cost $257,951) | 170,183 | 0.0 | % | |||||||||
| Shares | ||||||||||||
| Investment Companies – 9.5% | ||||||||||||
| Mount Vernon Securities Lending | ||||||||||||
| Trust Prime Portfolio, 0.31%« | 168,741,412 | 168,741,412 | 9.5 | % | ||||||||
| Total Investment Companies | ||||||||||||
| (Cost $168,741,412) | 168,741,412 | 9.5 | % | |||||||||
| Total Investments Purchased With | ||||||||||||
| Cash Proceeds From Securities Lending | ||||||||||||
| (Cost $168,999,363) | 168,911,595 | 9.5 | % | |||||||||
| Total Investments | ||||||||||||
| (Cost $1,888,059,823) – 109.1% | 1,937,749,081 | 109.1 | % | |||||||||
| Asset Relating to Securities | ||||||||||||
| Lending Investments – 0.0% | ||||||||||||
Support Agreement**^a† | 87,768 | 0.0 | % | |||||||||
| Total | ||||||||||||
| (Cost $0) | 87,768 | 0.0 | % | |||||||||
| Liabilities in Excess of Other Assets – (9.1)% | (161,000,582 | ) | (9.1 | %) | ||||||||
| TOTAL NET ASSETS | $ | 1,776,836,267 | 100.0 | % | ||||||||
Notes to Summary Schedule of Investments
| * | Restricted Security Deemed Liquid | |
| ** | Illiquid Security | |
| @ | This security or portion of this security is out on loan at June 30, 2012. | |
| f | Foreign Security | |
| ^ | Non-Income Producing | |
| « | 7-Day Yield | |
| † | Priced at Fair Value by the Valuation Committee as delegated by the Baird Funds’ Board of Directors. | |
| # | Represents the aggregate value, by category, securities that are not among the 50 largest holdings and, in total for any issuer, represent 1% or less of net assets. | |
| ~ | Groupings contain, in aggregate, restricted securities totaling $220,881,636 representing 12.43% of net assets. | |
| a | The Fund’s transfer agent and administrator and securities lending agent entered into a support agreement with the Fund to cover losses realized by the Fund on its investment in Atlantic East Funding, LLC (up to a certain amount), which investment was made by the Fund’s securities lending agent. |
The accompanying notes are in integral part of these financial statements.
Page 45
Baird Core Plus Bond Fund
Summary Schedule of Investments, June 30, 2012 (Unaudited)
Summary of Fair Value Exposure at June 30, 2012 (Unaudited)
The Fund has adopted authoritative fair valuation accounting standards which establish a definition of fair value and set out a hierarchy for measuring fair value. These standards require additional disclosures about the various inputs and valuation techniques used to develop the measurements of fair value and a discussion on changes in valuation techniques and related inputs during the period. These standards define fair value as the price that would be received to sell an asset or paid to transfer a liability in an orderly transaction between market participants at the measurement date. The fair value hierarchy is organized into three levels based upon the assumptions (referred to as “inputs”) used in pricing the asset or liability. These standards state that “observable inputs” reflect the assumptions market participants would use in pricing the asset or liability based on market data obtained from independent sources and “unobservable inputs” reflect an entity’s own assumptions about the assumptions market participants would use in pricing the asset or liability. These inputs are summarized into three broad levels and described below:
Level 1 – | Unadjusted quoted prices in active markets for identical unrestricted securities. |
Level 2 – | Other significant observable inputs (including quoted prices for similar securities, quoted prices in inactive markets, dealer indications, interest rates, yield curves, prepayment speeds, credit risk, default rates, inputs corroborated by observable market data, etc.). |
Level 3 – | Significant unobservable inputs (including the Fund’s own assumptions about the factors that market participants would use in valuing the security) based on the best information available. |
The inputs or methodology used for valuing securities are not necessarily an indication of the risk associated with investing in those securities.
Page 46
Baird Core Plus Bond Fund
Summary Schedule of Investments, June 30, 2012 (Unaudited)
The following is a summary of the inputs used to value the Fund’s investments as of June 30, 2012:
| Level 1 | Level 2 | Level 3 | Total | |||||||||||||
| Fixed Income | ||||||||||||||||
| U.S. Treasury Securities | $ | — | $ | 194,702,552 | $ | — | $ | 194,702,552 | ||||||||
| U.S. Government Agency Securities | — | 26,215,175 | — | 26,215,175 | ||||||||||||
| Taxable Municipal Bonds | — | 43,473,520 | — | 43,473,520 | ||||||||||||
| Other Government Related Securities | — | 34,653,404 | — | 34,653,404 | ||||||||||||
| Corporate Bonds | — | 776,475,098 | 4,675 | 776,479,773 | ||||||||||||
| Residential Mortgage-Backed Securities – | ||||||||||||||||
| U.S. Government Agency Issues | — | 379,567,230 | — | 379,567,230 | ||||||||||||
| Residential Mortgage-Backed Securities – | ||||||||||||||||
| Non-U.S. Government Agency Issues | — | 57,974,910 | — | 57,974,910 | ||||||||||||
| Asset Backed Securities | — | 29,430,464 | — | 29,430,464 | ||||||||||||
| Commercial Mortgage-Backed Securities | — | 165,791,857 | — | 165,791,857 | ||||||||||||
| Total Fixed Income | — | 1,708,284,210 | 4,675 | 1,708,288,885 | ||||||||||||
| Short-Term Investments | ||||||||||||||||
| Money Market Mutual Funds | 60,548,601 | — | — | 60,548,601 | ||||||||||||
| Total Short-Term Investments | 60,548,601 | — | — | 60,548,601 | ||||||||||||
| Investments Purchased with Cash | ||||||||||||||||
| Proceeds from Securities Lending | ||||||||||||||||
| Commercial Paper | — | 170,183 | — | 170,183 | ||||||||||||
| Money Market Mutual Fund | 168,741,412 | — | — | 168,741,412 | ||||||||||||
| Total Investments Purchased | ||||||||||||||||
| with Cash Proceeds | ||||||||||||||||
| from Securities Lending | 168,741,412 | 170,183 | — | 168,911,595 | ||||||||||||
| Total Investments | $ | 229,290,013 | $ | 1,708,454,393 | $ | 4,675 | $ | 1,937,749,081 | ||||||||
| Asset Relating to | ||||||||||||||||
| Securities Lending Investments | $ | — | $ | 87,768 | $ | — | $ | 87,768 | ||||||||
Changes in valuation techniques may result in transfers into or out of current assigned levels within the hierarchy. There were no significant transfers between Level 1, Level 2 and Level 3 fair value measurements during the reporting period, as compared to their classification from the prior year’s annual report. One security that is priced at fair value by the Valuation Committee instead of the Fund’s pricing vendor is valued using level 3 inputs.
Level 3 Reconciliation Disclosure
Following is a reconciliation of Level 3 assets for which significant unobservable inputs were used to determine fair value.
| Description | Investments in Securities | |||
| Balance as of December 31, 2011 | $ | 4,675 | ||
| Accrued discounts/premiums | — | |||
| Realized gain (loss) | — | |||
| Change in unrealized appreciation (depreciation) | — | |||
| Purchases | — | |||
| Sales | — | |||
| Transfers in and/or out of Level 3* | — | |||
| Balance as of June 30, 2012 | $ | 4,675 | ||
* Transfers between levels are recognized at the end of the reporting period.
Page 47
Additional Information on Fund Expenses
June 30, 2012 (Unaudited)
As a shareholder of a mutual fund, you incur two types of costs: (1) transaction costs, which may include sales charges (loads) on purchase payments, reinvested dividends, or other distributions; redemption fees; and exchange fees; and (2) ongoing costs, such as management fees; distribution and/or service (12b-1) fees; and other fund expenses. Although the Funds do not charge any sales loads, redemption fees, or other transaction fees, you will be assessed fees for outgoing wire transfers, returned checks and stop payment orders at prevailing rates charged by U.S. Bancorp Fund Services, LLC, the Funds’ transfer agent. If you request that a redemption be made by wire transfer, currently the Funds’ transfer agent charges a $15.00 fee.
This Example is intended to help you understand your ongoing costs (in dollars) of investing in each Fund and to compare these costs with the ongoing costs of investing in other mutual funds. The Example is based on an investment of $1,000 invested at the beginning of the period and held for the entire period (1/1/12 – 6/30/12).
Actual Expenses
The third and fourth columns of the following table provide information about account values based on actual returns and actual expenses. You may use the information in these columns, together with the amount you invested, to estimate the expenses that you paid over the period. Simply divide your account value by $1,000 (for example, an $8,600 account value divided by $1,000 = 8.6), then multiply the result by the number in the fourth column entitled “Expenses Paid During Period’’ to estimate the expenses you paid on your account during this period.
Hypothetical Example for Comparison Purposes
The fifth and sixth columns of the following table provide information about hypothetical account values and hypothetical expenses based on the Funds’ actual expense ratios and an assumed rate of return of 5% per year before expenses, which is not the Funds’ actual return. The hypothetical account values and expenses may not be used to estimate the actual ending account balance or expenses you paid for the period. You may use this information to compare the ongoing costs of investing in the Funds and other mutual funds. To do so, compare this 5% hypothetical example with the 5% hypothetical examples that appear in the shareholder reports of the other mutual funds. Please note that the expenses shown in the table are meant to highlight your ongoing costs only and do not reflect any transactional costs. Therefore, the sixth column of the table (entitled “Expenses Paid During Period”) is useful in comparing ongoing costs only, and will not help you determine the relative total costs of owning different mutual funds. In addition, if these transactional costs were included, your costs could have been higher.
Page 48
Additional Information on Fund Expenses
June 30, 2012 (Unaudited)
Actual vs. Hypothetical Returns
| Hypothetical | |||||||
| (5% return | |||||||
| Actual | before expenses) | ||||||
| Fund’s | Beginning | Ending | Expenses | Ending | Expenses | ||
| Annualized | Account | Account | Paid | Account | Paid | ||
| Expense | Value | Value | During | Value | During | ||
Ratio(1) | 1/1/12 | 6/30/12 | Period(1) | 6/30/12 | Period(1) | ||
| Baird Short-Term | |||||||
| Bond Fund | |||||||
| Institutional Class | 0.30% | $1,000.00 | $1,020.80 | $1.51 | $1,023.37 | $1.51 | |
| Baird Intermediate | |||||||
| Bond Fund | |||||||
| Institutional Class | 0.30% | $1,000.00 | $1,032.50 | $1.52 | $1,023.37 | $1.51 | |
| Investor Class | 0.55% | $1,000.00 | $1,031.00 | $2.78 | $1,022.13 | $2.77 | |
| Baird Intermediate | |||||||
| Municipal Bond Fund | |||||||
| Institutional Class | 0.30% | $1,000.00 | $1,014.90 | $1.50 | $1,023.37 | $1.51 | |
| Investor Class | 0.55% | $1,000.00 | $1,013.40 | $2.75 | $1,022.13 | $2.77 | |
| Baird Aggregate | |||||||
| Bond Fund | |||||||
| Institutional Class | 0.30% | $1,000.00 | $1,039.80 | $1.52 | $1,023.37 | $1.51 | |
| Investor Class | 0.55% | $1,000.00 | $1,038.40 | $2.79 | $1,022.13 | $2.77 | |
| Baird Core Plus | |||||||
| Bond Fund | |||||||
| Institutional Class | 0.30% | $1,000.00 | $1,038.50 | $1.52 | $1,023.37 | $1.51 | |
| Investor Class | 0.55% | $1,000.00 | $1,037.90 | $2.79 | $1,022.13 | $2.77 | |
| (1) | Expenses are equal to the Fund’s annualized net expense ratio multiplied by the average account value over the period, multiplied by 182 days and divided by 366 to reflect the one-half year period. |
Page 49
Statement of Assets and Liabilities
June 30, 2012 (Unaudited)
| Baird | ||||||||||||
| Baird | Baird | Intermediate | ||||||||||
| Short-Term | Intermediate | Municipal | ||||||||||
| Bond Fund | Bond Fund | Bond Fund | ||||||||||
| ASSETS: | ||||||||||||
| Investments, at value (cost $1,220,260,937, | $ | 1,225,553,054 | $ | 889,266,609 | $ | 1,178,133,760 | ||||||
| $860,032,327 and $1,112,228,028, respectively)* | ||||||||||||
| Support Agreement (Note 6) | 278,308 | 703,243 | — | |||||||||
| Interest receivable | 12,390,727 | 8,437,946 | 13,633,685 | |||||||||
| Receivable for investments sold or paid down | 228,382 | 17,622 | — | |||||||||
| Receivable for Fund shares sold | 2,326,732 | 872,428 | 2,286,608 | |||||||||
| Uninvested cash | 24,188 | 10,295 | — | |||||||||
| Total assets | 1,240,801,391 | 899,308,143 | 1,194,054,053 | |||||||||
| LIABILITIES: | ||||||||||||
| Payable for collateral received | ||||||||||||
| for securities loaned (Note 6) | 126,604,894 | 113,460,934 | — | |||||||||
| Payable for securities purchased | 10,175,173 | 11,363,927 | 3,984,804 | |||||||||
| Payable for Fund shares repurchased | 462,935 | 804,194 | 482,303 | |||||||||
| Payable to Advisor and Distributor | 270,153 | 194,413 | 391,164 | |||||||||
| Other liabilities | 10,975 | 77,902 | — | |||||||||
| Total liabilities | 137,524,130 | 125,901,370 | 4,858,271 | |||||||||
| NET ASSETS | $ | 1,103,277,261 | $ | 773,406,773 | $ | 1,189,195,782 | ||||||
| NET ASSETS CONSIST OF: | ||||||||||||
| Capital stock | 1,095,906,748 | $ | 735,621,072 | $ | 1,123,050,095 | |||||||
| Undistributed net investment income | 441,964 | 477,297 | 652,211 | |||||||||
| Accumulated net realized gain (loss) | ||||||||||||
| on investments sold | 1,358,124 | 7,370,879 | (412,256 | ) | ||||||||
| Net unrealized appreciation on | ||||||||||||
| investments and support agreement | 5,570,425 | 29,937,525 | 65,905,732 | |||||||||
| NET ASSETS | $ | 1,103,277,261 | $ | 773,406,773 | $ | 1,189,195,782 | ||||||
| INSTITUTIONAL CLASS SHARES | ||||||||||||
| Net Assets | $ | 1,103,277,261 | $ | 755,880,107 | $ | 926,871,671 | ||||||
| Shares outstanding ($0.01 par value, | ||||||||||||
| unlimited shares authorized) | 113,933,043 | 67,186,199 | 77,453,086 | |||||||||
| Net asset value, offering and | ||||||||||||
| redemption price per share | $ | 9.68 | $ | 11.25 | $ | 11.97 | ||||||
| INVESTOR CLASS SHARES | ||||||||||||
| Net Assets | $ | 17,526,666 | $ | 262,324,111 | ||||||||
| Shares outstanding ($0.01 par value, | ||||||||||||
| unlimited shares authorized) | 1,501,475 | 21,476,802 | ||||||||||
| Net asset value, offering and | ||||||||||||
| redemption price per share | $ | 11.67 | $ | 12.21 | ||||||||
*Includes securities out on loan to brokers with a market value of $123,824,195, $110,962,820 and $0, respectively.
The accompanying notes are in integral part of these financial statements.
Page 50
Statement of Assets and Liabilities
June 30, 2012 (Unaudited)
| Baird | Baird | |||||||
| Aggregate | Core Plus | |||||||
| Bond Fund | Bond Fund | |||||||
| ASSETS: | ||||||||
| Investments, at value (cost $1,357,983,125 | $ | 1,404,362,186 | $ | 1,937,749,081 | ||||
| and $1,888,059,823, respectively)* | ||||||||
| Support Agreement (Note 6) | 965,534 | 87,768 | ||||||
| Interest receivable | 10,721,326 | 15,754,559 | ||||||
| Receivable for investments sold or paid down | 44,082 | 257,135 | ||||||
| Receivable for Fund shares sold | 2,082,181 | 14,108,131 | ||||||
| Uninvested cash | 26,007 | 32,454 | ||||||
| Total assets | 1,418,201,316 | 1,967,989,128 | ||||||
| LIABILITIES: | ||||||||
| Payable for collateral received | ||||||||
| for securities loaned (Note 6) | 138,082,230 | 169,031,817 | ||||||
| Payable for securities purchased | 20,012,689 | 19,359,480 | ||||||
| Payable for Fund shares repurchased | 592,566 | 2,012,876 | ||||||
| Payable to Advisor and Distributor | 387,059 | 717,375 | ||||||
| Other liabilities | 145,503 | 31,313 | ||||||
| Total liabilities | 159,220,047 | 191,152,861 | ||||||
| NET ASSETS | $ | 1,258,981,269 | $ | 1,776,836,267 | ||||
| NET ASSETS CONSIST OF: | ||||||||
| Capital stock | $ | 1,181,593,341 | $ | 1,723,002,910 | ||||
| Distributions in excess of net investment income | (954,476 | ) | (323,486 | ) | ||||
| Accumulated net realized gain | ||||||||
| on investments sold | 30,997,809 | 4,379,817 | ||||||
| Net unrealized appreciation on | ||||||||
| investments and support agreement | 47,344,595 | 49,777,026 | ||||||
| NET ASSETS | $ | 1,258,981,269 | $ | 1,776,836,267 | ||||
| INSTITUTIONAL CLASS SHARES | ||||||||
| Net Assets | $ | 1,225,078,262 | $ | 1,127,718,313 | ||||
| Shares outstanding ($0.01 par value, | ||||||||
| unlimited shares authorized) | 112,846,915 | 102,038,885 | ||||||
| Net asset value, offering and | ||||||||
| redemption price per share | $ | 10.86 | $ | 11.05 | ||||
| INVESTOR CLASS SHARES | ||||||||
| Net Assets | $ | 33,903,007 | $ | 649,117,954 | ||||
| Shares outstanding ($0.01 par value, | ||||||||
| unlimited shares authorized) | 3,036,889 | 56,786,116 | ||||||
| Net asset value, offering and | ||||||||
| redemption price per share | $ | 11.16 | $ | 11.43 | ||||
*Includes securities out on loan to brokers with a market value of $134,255,481 and $164,776,666, respectively.
The accompanying notes are in integral part of these financial statements.
Page 51
Statement of Operations
Six Months Ended June 30, 2012 (Unaudited)
| Baird | ||||||||||||||||||||
| Baird | Baird | Intermediate | Baird | Baird | ||||||||||||||||
| Short-Term | Intermediate | Municipal | Aggregate | Core Plus | ||||||||||||||||
| Bond Fund | Bond Fund | Bond Fund | Bond Fund | Bond Fund | ||||||||||||||||
| INVESTMENT INCOME: | ||||||||||||||||||||
| Interest income, | ||||||||||||||||||||
| net of paydowns | $ | 14,155,779 | $ | 12,690,039 | $ | 16,536,798 | $ | 30,683,635 | $ | 26,762,907 | ||||||||||
| Income from securities | ||||||||||||||||||||
| lending (Note 6) | 81,083 | 72,957 | — | 125,995 | 120,873 | |||||||||||||||
| Other income | 29 | 232 | — | — | — | |||||||||||||||
| Total investment income | 14,236,891 | 12,763,228 | 16,536,798 | 30,809,630 | 26,883,780 | |||||||||||||||
| EXPENSES: | ||||||||||||||||||||
| Investment advisory fee | 1,345,039 | 937,643 | 1,429,903 | 1,932,458 | 1,821,254 | |||||||||||||||
| Administration fee | 269,008 | 187,529 | 285,981 | 386,492 | 364,251 | |||||||||||||||
| Distribution expense – | ||||||||||||||||||||
| Investor Class Shares (Note 8) | — | 19,729 | 321,249 | 36,611 | 613,088 | |||||||||||||||
| Interest expense (Note 7) | — | 72 | — | — | — | |||||||||||||||
| Total expenses | 1,614,047 | 1,144,973 | 2,037,133 | 2,355,561 | 2,798,593 | |||||||||||||||
| NET INVESTMENT | ||||||||||||||||||||
| INCOME | 12,622,844 | 11,618,255 | 14,499,665 | 28,454,069 | 24,085,187 | |||||||||||||||
| REALIZED AND | ||||||||||||||||||||
| UNREALIZED GAIN (LOSS) | ||||||||||||||||||||
| ON INVESTMENTS: | ||||||||||||||||||||
| Net realized gain (loss) | ||||||||||||||||||||
| on investments | 817,104 | 6,716,896 | (225,363 | ) | 32,848,038 | 4,568,828 | ||||||||||||||
| Change in unrealized | ||||||||||||||||||||
| appreciation/depreciation | ||||||||||||||||||||
| on investments and | ||||||||||||||||||||
| support agreement | 9,062,084 | 5,936,181 | 2,404,676 | (1,466,749 | ) | 25,939,564 | ||||||||||||||
| Net realized and unrealized | ||||||||||||||||||||
| gain on investments | 9,879,188 | 12,653,077 | 2,179,313 | 31,381,289 | 30,508,392 | |||||||||||||||
| NET INCREASE IN | ||||||||||||||||||||
| NET ASSETS RESULTING | ||||||||||||||||||||
| FROM OPERATIONS | $ | 22,502,032 | $ | 24,271,332 | $ | 16,678,978 | $ | 59,835,358 | $ | 54,593,579 | ||||||||||
The accompanying notes are in integral part of these financial statements.
Page 52
Statement of Changes in Net Assets
Baird Short-Term Bond Fund
| Six Months Ended | ||||||||
| June 30, 2012 | Year Ended | |||||||
| (Unaudited) | December 31, 2011 | |||||||
| OPERATIONS: | ||||||||
| Net investment income | $ | 12,622,844 | $ | 24,101,938 | ||||
| Net realized gain on investments | 817,104 | 6,055,269 | ||||||
| Change in unrealized appreciation/depreciation | ||||||||
| on investments and support agreement | 9,062,084 | (9,257,746 | ) | |||||
| Net increase in net assets resulting from operations | 22,502,032 | 20,849,461 | ||||||
| CAPITAL SHARE TRANSACTIONS: | ||||||||
| Proceeds from shares sold | 250,176,983 | 514,984,905 | ||||||
| Shares issued to holders in reinvestment of dividends | 11,083,881 | 27,443,430 | ||||||
| Cost of shares redeemed | (185,522,272 | ) | (434,651,786 | ) | ||||
| Net increase in net assets resulting | ||||||||
| from capital share transactions | 75,738,592 | 107,776,549 | ||||||
| DISTRIBUTIONS TO | ||||||||
| INSTITUTIONAL CLASS SHAREHOLDERS: | ||||||||
| From net investment income | (12,193,450 | ) | (24,321,455 | ) | ||||
| From net realized gains | — | (6,100,633 | ) | |||||
| Total Distributions | (12,193,450 | ) | (30,422,088 | ) | ||||
| TOTAL INCREASE IN NET ASSETS | 86,047,174 | 98,203,922 | ||||||
| NET ASSETS: | ||||||||
| Beginning of period | 1,017,230,087 | 919,026,165 | ||||||
| End of period (including undistributed net | ||||||||
| investment income of $441,964 and $12,570, respectively) | $ | 1,103,277,261 | $ | 1,017,230,087 | ||||
The accompanying notes are in integral part of these financial statements.
Page 53
Statement of Changes in Net Assets
Baird Intermediate Bond Fund
| Six Months Ended | ||||||||
| June 30, 2012 | Year Ended | |||||||
| (Unaudited) | December 31, 2011 | |||||||
| OPERATIONS: | ||||||||
| Net investment income | $ | 11,618,255 | $ | 23,725,726 | ||||
| Net realized gain on investments | 6,716,896 | 3,633,559 | ||||||
| Change in unrealized appreciation | ||||||||
| on investments and support agreement | 5,936,181 | 12,455,100 | ||||||
| Net increase in net assets resulting from operations | 24,271,332 | 39,814,385 | ||||||
| CAPITAL SHARE TRANSACTIONS: | ||||||||
| Proceeds from shares sold | 113,360,286 | 215,597,625 | ||||||
| Shares issued to holders in reinvestment of dividends | 9,070,539 | 24,186,576 | ||||||
| Cost of shares redeemed | (79,968,739 | ) | (136,560,126 | ) | ||||
| Net increase in net assets resulting | ||||||||
| from capital share transactions | 42,462,086 | 103,224,075 | ||||||
| DISTRIBUTIONS TO | ||||||||
| INSTITUTIONAL CLASS SHAREHOLDERS: | ||||||||
| From net investment income | (11,058,205 | ) | (23,416,880 | ) | ||||
| From net realized gains | — | (5,067,500 | ) | |||||
| Total Distributions | (11,058,205 | ) | (28,484,380 | ) | ||||
| DISTRIBUTIONS TO | ||||||||
| INVESTOR CLASS SHAREHOLDERS: | ||||||||
| From net investment income | (213,583 | ) | (411,556 | ) | ||||
| From net realized gains | — | (101,027 | ) | |||||
| Total Distributions | (213,583 | ) | (512,583 | ) | ||||
| TOTAL INCREASE IN NET ASSETS | 55,461,630 | 114,041,497 | ||||||
| NET ASSETS: | ||||||||
| Beginning of period | 717,945,143 | 603,903,646 | ||||||
| End of period (including undistributed net | ||||||||
| investment income of $477,297 and $130,830, respectively) | $ | 773,406,773 | $ | 717,945,143 | ||||
The accompanying notes are in integral part of these financial statements.
Page 54
Statement of Changes in Net Assets
Baird Intermediate Municipal Bond Fund
| Six Months Ended | ||||||||
| June 30, 2012 | Year Ended | |||||||
| (Unaudited) | December 31, 2011 | |||||||
| OPERATIONS: | ||||||||
| Net investment income | $ | 14,499,665 | $ | 26,026,096 | ||||
| Net realized gain (loss) on investments | (225,363 | ) | 1,184,801 | |||||
| Change in unrealized appreciation on investments | 2,404,676 | 51,360,206 | ||||||
| Net increase in net assets resulting from operations | 16,678,978 | 78,571,103 | ||||||
| CAPITAL SHARE TRANSACTIONS: | ||||||||
| Proceeds from shares sold | 237,934,230 | 434,046,253 | ||||||
| Shares issued to holders in reinvestment of dividends | 11,708,973 | 22,891,902 | ||||||
| Cost of shares redeemed | (157,327,329 | ) | (356,580,147 | ) | ||||
| Net increase in net assets resulting | ||||||||
| from capital share transactions | 92,315,874 | 100,358,008 | ||||||
| DISTRIBUTIONS TO | ||||||||
| INSTITUTIONAL CLASS SHAREHOLDERS: | ||||||||
| From net investment income | (11,054,697 | ) | (20,603,834 | ) | ||||
| From net realized gains | — | (467,874 | ) | |||||
| Total Distributions | (11,054,697 | ) | (21,071,708 | ) | ||||
| DISTRIBUTIONS TO | ||||||||
| INVESTOR CLASS SHAREHOLDERS: | ||||||||
| From net investment income | (2,812,275 | ) | (5,402,244 | ) | ||||
| From net realized gains | — | (141,151 | ) | |||||
| Total Distributions | (2,812,275 | ) | (5,543,395 | ) | ||||
| TOTAL INCREASE IN NET ASSETS | 95,127,880 | 152,314,008 | ||||||
| NET ASSETS: | ||||||||
| Beginning of period | 1,094,067,902 | 941,753,894 | ||||||
| End of period (including undistributed net | ||||||||
| investment income of $652,211 and $19,518, respectively) | $ | 1,189,195,782 | $ | 1,094,067,902 | ||||
The accompanying notes are in integral part of these financial statements.
Page 55
Statement of Changes in Net Assets
Baird Aggregate Bond Fund
| Six Months Ended | ||||||||
| June 30, 2012 | Year Ended | |||||||
| (Unaudited) | December 31, 2011 | |||||||
| OPERATIONS: | ||||||||
| Net investment income | $ | 28,454,069 | $ | 66,027,410 | ||||
| Net realized gain on investments | 32,848,038 | 29,334,806 | ||||||
| Change in unrealized appreciation/depreciation | ||||||||
| on investments and support agreement | (1,466,749 | ) | 27,081,217 | |||||
| Net increase in net assets resulting from operations | 59,835,358 | 122,443,433 | ||||||
| CAPITAL SHARE TRANSACTIONS: | ||||||||
| Proceeds from shares sold | 247,015,726 | 605,032,019 | ||||||
| Shares issued to holders in reinvestment of dividends | 25,297,871 | 87,989,277 | ||||||
| Cost of shares redeemed | (550,070,208 | ) | (908,429,486 | ) | ||||
| Net decrease in net assets resulting | ||||||||
| from capital share transactions | (277,756,611 | ) | (215,408,190 | ) | ||||
| DISTRIBUTIONS TO | ||||||||
| INSTITUTIONAL CLASS SHAREHOLDERS: | ||||||||
| From net investment income | (28,956,599 | ) | (67,922,305 | ) | ||||
| From net realized gains | — | (28,455,915 | ) | |||||
| Total Distributions | (28,956,599 | ) | (96,378,220 | ) | ||||
| DISTRIBUTIONS TO | ||||||||
| INVESTOR CLASS SHAREHOLDERS: | ||||||||
| From net investment income | (534,419 | ) | (1,101,319 | ) | ||||
| From net realized gains | — | (496,921 | ) | |||||
| Total Distributions | (534,419 | ) | (1,598,240 | ) | ||||
| TOTAL DECREASE IN NET ASSETS | (247,412,271 | ) | (190,941,217 | ) | ||||
| NET ASSETS: | ||||||||
| Beginning of period | 1,506,393,540 | 1,697,334,757 | ||||||
| End of period (including distributions in excess of | ||||||||
| net investment income and undistributed net investment | ||||||||
| income of $(954,476) and $82,473, respectively) | $ | 1,258,981,269 | $ | 1,506,393,540 | ||||
The accompanying notes are in integral part of these financial statements.
Page 56
Statement of Changes in Net Assets
Baird Core Plus Bond Fund
| Six Months Ended | ||||||||
| June 30, 2012 | Year Ended | |||||||
| (Unaudited) | December 31, 2011 | |||||||
| OPERATIONS: | ||||||||
| Net investment income | $ | 24,085,187 | $ | 28,180,121 | ||||
| Net realized gain on investments | 4,568,828 | 5,311,546 | ||||||
| Change in unrealized appreciation on | ||||||||
| investments and support agreement | 25,939,564 | 15,339,832 | ||||||
| Net increase in net assets resulting from operations | 54,593,579 | 48,831,499 | ||||||
| CAPITAL SHARE TRANSACTIONS: | ||||||||
| Proceeds from shares sold | 766,053,125 | 687,143,111 | ||||||
| Shares issued to holders in reinvestment of dividends | 22,935,446 | 30,879,432 | ||||||
| Cost of shares redeemed | (142,978,818 | ) | (143,951,115 | ) | ||||
| Net increase in net assets resulting | ||||||||
| from capital share transactions | 646,009,753 | 574,071,428 | ||||||
| DISTRIBUTIONS TO | ||||||||
| INSTITUTIONAL CLASS SHAREHOLDERS: | ||||||||
| From net investment income | (16,731,437 | ) | (24,400,094 | ) | ||||
| From net realized gains | — | (2,509,064 | ) | |||||
| Total Distributions | (16,731,437 | ) | (26,909,158 | ) | ||||
| DISTRIBUTIONS TO | ||||||||
| INVESTOR CLASS SHAREHOLDERS: | ||||||||
| From net investment income | (7,805,071 | ) | (4,960,208 | ) | ||||
| From net realized gains | — | (1,035,923 | ) | |||||
| Total Distributions | (7,805,071 | ) | (5,996,131 | ) | ||||
| TOTAL INCREASE IN NET ASSETS | 676,066,824 | 589,997,638 | ||||||
| NET ASSETS: | ||||||||
| Beginning of period | 1,100,769,443 | 510,771,805 | ||||||
| End of period (including distributions in excess of | ||||||||
| net investment income and undistributed net investment | ||||||||
| income of $(323,486) and $127,835, respectively) | $ | 1,776,836,267 | $ | 1,100,769,443 | ||||
The accompanying notes are in integral part of these financial statements.
Page 57
Financial Highlights
Baird Short-Term Bond Fund – Institutional Class
| Six Months | ||||||||||||||||||||||||
| Ended | ||||||||||||||||||||||||
| June 30, 2012 | Year Ended December 31, | |||||||||||||||||||||||
| (Unaudited) | 2011 | 2010 | 2009 | 2008 | 2007 | |||||||||||||||||||
| Per Share Data: | ||||||||||||||||||||||||
| Net asset value, | ||||||||||||||||||||||||
| beginning of period | $ | 9.59 | $ | 9.68 | $ | 9.57 | $ | 9.25 | $ | 9.91 | $ | 9.81 | ||||||||||||
| Income from | ||||||||||||||||||||||||
| investment operations: | ||||||||||||||||||||||||
| Net investment income | 0.11 | 0.23 | 0.29 | 0.41 | 0.52 | 0.48 | ||||||||||||||||||
| Net realized and unrealized | ||||||||||||||||||||||||
| gains (losses) on investments | 0.09 | (0.03 | ) | 0.13 | 0.32 | (0.67 | ) | 0.10 | ||||||||||||||||
| Total from | ||||||||||||||||||||||||
| investment operations | 0.20 | 0.20 | 0.42 | 0.73 | (0.15 | ) | 0.58 | |||||||||||||||||
| Less distributions: | ||||||||||||||||||||||||
| Dividends from net | ||||||||||||||||||||||||
| investment income | (0.11 | ) | (0.23 | ) | (0.29 | ) | (0.41 | ) | (0.51 | ) | (0.48 | ) | ||||||||||||
| Distributions from | ||||||||||||||||||||||||
| net realized gains | — | (0.06 | ) | (0.02 | ) | — | — | — | ||||||||||||||||
| Total distributions | (0.11 | ) | (0.29 | ) | (0.31 | ) | (0.41 | ) | (0.51 | ) | (0.48 | ) | ||||||||||||
| Net asset value, end of period | $ | 9.68 | $ | 9.59 | $ | 9.68 | $ | 9.57 | $ | 9.25 | $ | 9.91 | ||||||||||||
| Total return | 2.08 | %(1) | 2.08 | % | 4.39 | % | 8.14 | % | (1.79 | )% | 6.08 | % | ||||||||||||
| Supplemental data and ratios: | ||||||||||||||||||||||||
| Net assets, | ||||||||||||||||||||||||
| end of period (millions) | $ | 1,103.3 | $ | 1,017.2 | $ | 919.0 | $ | 606.2 | $ | 215.0 | $ | 199.1 | ||||||||||||
| Ratio of expenses | ||||||||||||||||||||||||
| to average net assets | 0.30 | %(2) | 0.30 | % | 0.30 | % | 0.30 | % | 0.30 | % | 0.30 | % | ||||||||||||
| Ratio of net | ||||||||||||||||||||||||
| investment income | ||||||||||||||||||||||||
| to average net assets | 2.35 | %(2) | 2.40 | % | 2.92 | % | 4.28 | % | 5.01 | % | 5.00 | % | ||||||||||||
| Portfolio turnover rate | 21.5 | %(1) | 61.1 | % | 58.7 | % | 55.5 | % | 98.5 | % | 36.6 | % | ||||||||||||
(1)Not annualized.
(2)Annualized.
The accompanying notes are in integral part of these financial statements.
Page 58
Financial Highlights
Baird Intermediate Bond Fund – Institutional Class
| Six Months | ||||||||||||||||||||||||
| Ended | ||||||||||||||||||||||||
| June 30, 2012 | Year Ended December 31, | |||||||||||||||||||||||
| (Unaudited) | 2011 | 2010 | 2009 | 2008 | 2007 | |||||||||||||||||||
| Per Share Data: | ||||||||||||||||||||||||
| Net asset value, | ||||||||||||||||||||||||
| beginning of period | $ | 11.06 | $ | 10.87 | $ | 10.61 | $ | 10.00 | $ | 10.62 | $ | 10.52 | ||||||||||||
| Income from | ||||||||||||||||||||||||
| investment operations: | ||||||||||||||||||||||||
| Net investment income | 0.17 | 0.39 | 0.44 | (1) | 0.51 | (1) | 0.55 | 0.54 | ||||||||||||||||
| Net realized and unrealized | ||||||||||||||||||||||||
| gains (losses) on investments | 0.19 | 0.27 | 0.35 | 0.63 | (0.64 | ) | 0.10 | |||||||||||||||||
| Total from | ||||||||||||||||||||||||
| investment operations | 0.36 | 0.66 | 0.79 | 1.14 | (0.09 | ) | 0.64 | |||||||||||||||||
| Less distributions: | ||||||||||||||||||||||||
| Distributions from net | ||||||||||||||||||||||||
| investment income | (0.17 | ) | (0.39 | ) | (0.44 | ) | (0.51 | ) | (0.53 | ) | (0.54 | ) | ||||||||||||
| Distributions from | ||||||||||||||||||||||||
| net realized gains | — | (0.08 | ) | (0.09 | ) | (0.02 | ) | — | — | |||||||||||||||
| Total distributions | (0.17 | ) | (0.47 | ) | (0.53 | ) | (0.53 | ) | (0.53 | ) | (0.54 | ) | ||||||||||||
| Net asset value, end of period | $ | 11.25 | $ | 11.06 | $ | 10.87 | $ | 10.61 | $ | 10.00 | $ | 10.62 | ||||||||||||
| Total return | 3.25 | %(2) | 6.14 | % | 7.54 | % | 11.76 | % | (0.91 | )% | 6.24 | % | ||||||||||||
| Supplemental data and ratios: | ||||||||||||||||||||||||
| Net assets, | ||||||||||||||||||||||||
| end of period (millions) | $ | 755.9 | $ | 703.2 | $ | 591.2 | $ | 527.8 | $ | 401.9 | $ | 398.3 | ||||||||||||
| Ratio of expenses | ||||||||||||||||||||||||
| to average net assets | 0.30 | %(3) | 0.30 | % | 0.30 | % | 0.30 | % | 0.30 | % | 0.30 | % | ||||||||||||
| Ratio of net | ||||||||||||||||||||||||
| investment income | ||||||||||||||||||||||||
| to average net assets | 3.10 | %(3) | 3.49 | % | 4.05 | % | 4.92 | % | 5.14 | % | 5.13 | % | ||||||||||||
Portfolio turnover rate(4) | 24.3 | %(2) | 24.1 | % | 38.7 | % | 38.6 | % | 32.9 | % | 42.5 | % | ||||||||||||
(1)Calculated using average shares outstanding during the year.
(2)Not annualized.
(3)Annualized.
(4)Portfolio turnover is calculated on the basis of the Fund as a whole without distinguishing between the classes of shares issued.
The accompanying notes are in integral part of these financial statements.
Page 59
Financial Highlights
Baird Intermediate Bond Fund – Investor Class
| Six Months | ||||||||||||||||||||||||
| Ended | ||||||||||||||||||||||||
| June 30, 2012 | Year Ended December 31, | |||||||||||||||||||||||
| (Unaudited) | 2011 | 2010 | 2009 | 2008 | 2007 | |||||||||||||||||||
| Per Share Data: | ||||||||||||||||||||||||
| Net asset value, | ||||||||||||||||||||||||
| beginning of period | $ | 11.47 | $ | 11.26 | $ | 10.97 | $ | 10.32 | $ | 10.96 | $ | 10.85 | ||||||||||||
| Income from | ||||||||||||||||||||||||
| investment operations: | ||||||||||||||||||||||||
| Net investment income | 0.16 | 0.37 | 0.43 | (1) | 0.50 | (1) | 0.52 | 0.52 | ||||||||||||||||
| Net realized and unrealized | ||||||||||||||||||||||||
| gains (losses) on investments | 0.19 | 0.28 | 0.36 | 0.65 | (0.65 | ) | 0.10 | |||||||||||||||||
| Total from | ||||||||||||||||||||||||
| investment operations | 0.35 | 0.65 | 0.79 | 1.15 | (0.13 | ) | 0.62 | |||||||||||||||||
| Less distributions: | ||||||||||||||||||||||||
| Distributions from net | ||||||||||||||||||||||||
| investment income | (0.15 | ) | (0.36 | ) | (0.41 | ) | (0.48 | ) | (0.51 | ) | (0.51 | ) | ||||||||||||
| Distributions from | ||||||||||||||||||||||||
| net realized gains | — | (0.08 | ) | (0.09 | ) | (0.02 | ) | — | — | |||||||||||||||
| Total distributions | (0.15 | ) | (0.44 | ) | (0.50 | ) | (0.50 | ) | (0.51 | ) | (0.51 | ) | ||||||||||||
| Net asset value, end of period | $ | 11.67 | $ | 11.47 | $ | 11.26 | $ | 10.97 | $ | 10.32 | $ | 10.96 | ||||||||||||
| Total return | 3.10 | %(2) | 5.84 | % | 7.30 | % | 11.51 | % | (1.31 | )% | 5.89 | % | ||||||||||||
| Supplemental data and ratios: | ||||||||||||||||||||||||
| Net assets, | ||||||||||||||||||||||||
| end of period (millions) | $ | 17.5 | $ | 14.7 | $ | 12.7 | $ | 6.7 | $ | 4.0 | $ | 3.3 | ||||||||||||
| Ratio of expenses | ||||||||||||||||||||||||
| to average net assets | 0.55 | %(3) | 0.55 | % | 0.55 | % | 0.55 | % | 0.55 | % | 0.55 | % | ||||||||||||
| Ratio of net | ||||||||||||||||||||||||
| investment income | ||||||||||||||||||||||||
| to average net assets | 2.85 | %(3) | 3.24 | % | 3.80 | % | 4.67 | % | 4.89 | % | 4.88 | % | ||||||||||||
Portfolio turnover rate(4) | 24.3 | %(2) | 24.1 | % | 38.7 | % | 38.6 | % | 32.9 | % | 42.5 | % | ||||||||||||
(1)Calculated using average shares outstanding during the year.
(2)Not annualized.
(3)Annualized.
(4)Portfolio turnover is calculated on the basis of the Fund as a whole without distinguishing between the classes of shares issued.
The accompanying notes are in integral part of these financial statements.
Page 60
Financial Highlights
Baird Intermediate Municipal Bond Fund – Institutional Class
| Six Months | ||||||||||||||||||||||||
| Ended | ||||||||||||||||||||||||
| June 30, 2012 | Year Ended December 31, | |||||||||||||||||||||||
| (Unaudited) | 2011 | 2010 | 2009 | 2008 | 2007 | |||||||||||||||||||
| Per Share Data: | ||||||||||||||||||||||||
| Net asset value, | ||||||||||||||||||||||||
| beginning of period | $ | 11.94 | $ | 11.31 | $ | 11.35 | $ | 10.98 | $ | 10.69 | $ | 10.55 | ||||||||||||
| Income from | ||||||||||||||||||||||||
| investment operations: | ||||||||||||||||||||||||
| Net investment income | 0.15 | 0.32 | 0.32 | 0.32 | (1) | 0.39 | (1) | 0.37 | (1) | |||||||||||||||
| Net realized and unrealized | ||||||||||||||||||||||||
| gains (losses) on investments | 0.02 | 0.64 | (0.04 | ) | 0.36 | 0.28 | 0.14 | |||||||||||||||||
| Total from | ||||||||||||||||||||||||
| investment operations | 0.17 | 0.96 | 0.28 | 0.68 | 0.67 | 0.51 | ||||||||||||||||||
| Less distributions: | ||||||||||||||||||||||||
| Distributions from net | ||||||||||||||||||||||||
| investment income | (0.14 | ) | (0.32 | ) | (0.32 | ) | (0.31 | ) | (0.38 | ) | (0.37 | ) | ||||||||||||
| Distributions from | ||||||||||||||||||||||||
| net realized gains | — | (0.01 | ) | — | — | — | — | |||||||||||||||||
| Total distributions | (0.14 | ) | (0.33 | ) | (0.32 | ) | (0.31 | ) | (0.38 | ) | (0.37 | ) | ||||||||||||
| Net asset value, end of period | $ | 11.97 | $ | 11.94 | $ | 11.31 | $ | 11.35 | $ | 10.98 | $ | 10.69 | ||||||||||||
| Total return | 1.49 | %(2) | 8.55 | % | 2.42 | % | 6.22 | % | 6.37 | % | 4.93 | % | ||||||||||||
| Supplemental data and ratios: | ||||||||||||||||||||||||
| Net assets, | ||||||||||||||||||||||||
| end of period (millions) | $ | 926.9 | $ | 836.1 | $ | 739.0 | $ | 533.3 | $ | 226.1 | $ | 106.6 | ||||||||||||
| Ratio of expenses | ||||||||||||||||||||||||
| to average net assets | 0.30 | %(3) | 0.30 | % | 0.30 | % | 0.30 | % | 0.30 | % | 0.30 | % | ||||||||||||
| Ratio of net | ||||||||||||||||||||||||
| investment income | ||||||||||||||||||||||||
| to average net assets | 2.59 | %(3) | 2.74 | % | 2.74 | % | 2.83 | % | 3.58 | % | 3.44 | % | ||||||||||||
Portfolio turnover rate(4) | 2.9 | %(2) | 8.0 | % | 8.7 | % | 0.7 | % | 0.9 | % | 5.6 | % | ||||||||||||
(1)Calculated using average shares outstanding during the year.
(2)Not annualized.
(3)Annualized.
(4)Portfolio turnover is calculated on the basis of the Fund as a whole without distinguishing between the classes of shares issued.
The accompanying notes are in integral part of these financial statements.
Page 61
Financial Highlights
Baird Intermediate Municipal Bond Fund – Investor Class
| Six Months | ||||||||||||||||||||||||
| Ended | ||||||||||||||||||||||||
| June 30, 2012 | Year Ended December 31, | |||||||||||||||||||||||
| (Unaudited) | 2011 | 2010 | 2009 | 2008 | 2007 | |||||||||||||||||||
| Per Share Data: | ||||||||||||||||||||||||
| Net asset value, | ||||||||||||||||||||||||
| beginning of period | $ | 12.18 | $ | 11.53 | $ | 11.57 | $ | 11.19 | $ | 10.90 | $ | 10.75 | ||||||||||||
| Income from | ||||||||||||||||||||||||
| investment operations: | ||||||||||||||||||||||||
| Net investment income | 0.14 | 0.29 | 0.29 | 0.29 | (1) | 0.36 | (1) | 0.35 | (1) | |||||||||||||||
| Net realized and unrealized | ||||||||||||||||||||||||
| gains (losses) on investments | 0.02 | 0.66 | (0.04 | ) | 0.37 | 0.28 | 0.14 | |||||||||||||||||
| Total from | ||||||||||||||||||||||||
| investment operations | 0.16 | 0.95 | 0.25 | 0.66 | 0.64 | 0.49 | ||||||||||||||||||
| Less distributions: | �� | |||||||||||||||||||||||
| Distributions from net | ||||||||||||||||||||||||
| investment income | (0.13 | ) | (0.29 | ) | (0.29 | ) | (0.28 | ) | (0.35 | ) | (0.34 | ) | ||||||||||||
| Distributions from | ||||||||||||||||||||||||
| net realized gains | — | (0.01 | ) | — | — | — | — | |||||||||||||||||
| Total distributions | (0.13 | ) | (0.30 | ) | (0.29 | ) | (0.28 | ) | (0.35 | ) | (0.34 | ) | ||||||||||||
| Net asset value, end of period | $ | 12.21 | $ | 12.18 | $ | 11.53 | $ | 11.57 | $ | 11.19 | $ | 10.90 | ||||||||||||
| Total return | 1.34 | %(2) | 8.30 | % | 2.11 | % | 5.95 | % | 6.02 | % | 4.68 | % | ||||||||||||
| Supplemental data and ratios: | ||||||||||||||||||||||||
| Net assets, | ||||||||||||||||||||||||
| end of period (millions) | $ | 262.3 | $ | 257.9 | $ | 202.8 | $ | 196.7 | $ | 17.4 | $ | 0.4 | ||||||||||||
| Ratio of expenses | ||||||||||||||||||||||||
| to average net assets | 0.55 | %(3) | 0.55 | % | 0.55 | % | 0.55 | % | 0.55 | % | 0.55 | % | ||||||||||||
| Ratio of net | ||||||||||||||||||||||||
| investment income | ||||||||||||||||||||||||
| to average net assets | 2.34 | %(3) | 2.49 | % | 2.49 | % | 2.58 | % | 3.33 | % | 3.19 | % | ||||||||||||
Portfolio turnover rate(4) | 2.9 | %(2) | 8.0 | % | 8.7 | % | 0.7 | % | 0.9 | % | 5.6 | % | ||||||||||||
(1)Calculated using average shares outstanding during the year.
(2)Not annualized.
(3)Annualized.
(4)Portfolio turnover is calculated on the basis of the Fund as a whole without distinguishing between the classes of shares issued.
The accompanying notes are in integral part of these financial statements.
Page 62
Financial Highlights
Baird Aggregate Bond Fund – Institutional Class
| Six Months | ||||||||||||||||||||||||
| Ended | ||||||||||||||||||||||||
| June 30, 2012 | Year Ended December 31, | |||||||||||||||||||||||
| (Unaudited) | 2011 | 2010 | 2009 | 2008 | 2007 | |||||||||||||||||||
| Per Share Data: | ||||||||||||||||||||||||
| Net asset value, | ||||||||||||||||||||||||
| beginning of period | $ | 10.65 | $ | 10.52 | $ | 10.23 | $ | 9.74 | $ | 10.54 | $ | 10.51 | ||||||||||||
| Income from | ||||||||||||||||||||||||
| investment operations: | ||||||||||||||||||||||||
| Net investment income | 0.20 | (1) | 0.44 | (1) | 0.47 | (2) | 0.54 | 0.56 | 0.54 | |||||||||||||||
| Net realized and unrealized | ||||||||||||||||||||||||
| gains (losses) on investments | 0.22 | 0.36 | 0.37 | 0.49 | (0.81 | ) | 0.03 | |||||||||||||||||
| Total from | ||||||||||||||||||||||||
| investment operations | 0.42 | 0.80 | 0.84 | 1.03 | (0.25 | ) | 0.57 | |||||||||||||||||
| Less distributions: | ||||||||||||||||||||||||
| Distributions from net | ||||||||||||||||||||||||
| investment income | (0.21 | ) | (0.46 | ) | (0.49 | ) | (0.54 | ) | (0.55 | ) | (0.54 | ) | ||||||||||||
| Distributions from | ||||||||||||||||||||||||
| net realized gains | — | (0.21 | ) | (0.06 | ) | (0.00 | )(3) | — | — | |||||||||||||||
| Total distributions | (0.21 | ) | (0.67 | ) | (0.55 | ) | (0.54 | ) | (0.55 | ) | (0.54 | ) | ||||||||||||
| Net asset value, end of period | $ | 10.86 | $ | 10.65 | $ | 10.52 | $ | 10.23 | $ | 9.74 | $ | 10.54 | ||||||||||||
| Total return | 3.98 | %(4) | 7.85 | % | 8.34 | % | 10.88 | % | (2.36 | )% | 5.61 | % | ||||||||||||
| Supplemental data and ratios: | ||||||||||||||||||||||||
| Net assets, | ||||||||||||||||||||||||
| end of period (millions) | $ | 1,225.1 | $ | 1,480.3 | $ | 1,658.4 | $ | 1,362.2 | $ | 842.7 | $ | 725.6 | ||||||||||||
| Ratio of expenses | ||||||||||||||||||||||||
| to average net assets | 0.30 | %(5) | 0.30 | % | 0.30 | % | 0.30 | % | 0.30 | % | 0.30 | % | ||||||||||||
| Ratio of net | ||||||||||||||||||||||||
| investment income | ||||||||||||||||||||||||
| to average net assets | 3.69 | %(5) | 4.10 | % | 4.44 | % | 5.37 | % | 5.46 | % | 5.37 | % | ||||||||||||
Portfolio turnover rate(6) | 30.1 | %(4) | 45.9 | % | 41.4 | % | 37.7 | % | 21.9 | % | 33.6 | % | ||||||||||||
(1)Calculated using average shares outstanding during the year.
(2)Net investment income per share is calculated using ending balances prior to consideration of adjustments for permanent book and tax differences.
(3)Amount is less than ($0.005).
(4)Not annualized.
(5)Annualized.
(6)Portfolio turnover is calculated on the basis of the Fund as a whole without distinguishing between the classes of shares issued.
The accompanying notes are in integral part of these financial statements.
Page 63
Financial Highlights
Baird Aggregate Bond Fund – Investor Class
| Six Months | ||||||||||||||||||||||||
| Ended | ||||||||||||||||||||||||
| June 30, 2012 | Year Ended December 31, | |||||||||||||||||||||||
| (Unaudited) | 2011 | 2010 | 2009 | 2008 | 2007 | |||||||||||||||||||
| Per Share Data: | ||||||||||||||||||||||||
| Net asset value, | ||||||||||||||||||||||||
| beginning of period | $ | 10.94 | $ | 10.80 | $ | 10.48 | $ | 9.97 | $ | 10.78 | $ | 10.73 | ||||||||||||
| Income from | ||||||||||||||||||||||||
| investment operations: | ||||||||||||||||||||||||
| Net investment income | 0.18 | (1) | 0.42 | (1) | 0.46 | (2) | 0.52 | 0.52 | 0.53 | |||||||||||||||
| Net realized and unrealized | ||||||||||||||||||||||||
| gains (losses) on investments | 0.24 | 0.37 | 0.38 | 0.50 | (0.81 | ) | 0.04 | |||||||||||||||||
| Total from | ||||||||||||||||||||||||
| investment operations | 0.42 | 0.79 | 0.84 | 1.02 | (0.29 | ) | 0.57 | |||||||||||||||||
| Less distributions: | ||||||||||||||||||||||||
| Distributions from net | ||||||||||||||||||||||||
| investment income | (0.20 | ) | (0.44 | ) | (0.46 | ) | (0.51 | ) | (0.52 | ) | (0.52 | ) | ||||||||||||
| Distributions from | ||||||||||||||||||||||||
| net realized gains | — | (0.21 | ) | (0.06 | ) | (0.00 | )(3) | — | — | |||||||||||||||
| Total distributions | (0.20 | ) | (0.65 | ) | (0.52 | ) | (0.51 | ) | (0.52 | ) | (0.52 | ) | ||||||||||||
| Net asset value, end of period | $ | 11.16 | $ | 10.94 | $ | 10.80 | $ | 10.48 | $ | 9.97 | $ | 10.78 | ||||||||||||
| Total return | 3.84 | %(4) | 7.46 | % | 8.16 | % | 10.55 | % | (2.63 | )% | 5.45 | % | ||||||||||||
| Supplemental data and ratios: | ||||||||||||||||||||||||
| Net assets, | ||||||||||||||||||||||||
| end of period (millions) | $ | 33.9 | $ | 26.1 | $ | 38.9 | $ | 35.1 | $ | 29.1 | $ | 14.4 | ||||||||||||
| Ratio of expenses | ||||||||||||||||||||||||
| to average net assets | 0.55 | %(5) | 0.55 | % | 0.55 | % | 0.55 | % | 0.55 | % | 0.55 | % | ||||||||||||
| Ratio of net | ||||||||||||||||||||||||
| investment income | ||||||||||||||||||||||||
| to average net assets | 3.44 | %(5) | 3.85 | % | 4.19 | % | 5.12 | % | 5.21 | % | 5.12 | % | ||||||||||||
Portfolio turnover rate(6) | 30.1 | %(4) | 45.9 | % | 41.4 | % | 37.7 | % | 21.9 | % | 33.6 | % | ||||||||||||
(1)Calculated using average shares outstanding during the year.
(2)Net investment income per share is calculated using ending balances prior to consideration of adjustments for permanent book and tax differences.
(3)Amount is less than ($0.005).
(4)Not annualized.
(5)Annualized.
(6)Portfolio turnover is calculated on the basis of the Fund as a whole without distinguishing between the classes of shares issued.
The accompanying notes are in integral part of these financial statements.
Page 64
Financial Highlights
Baird Core Plus Bond Fund – Institutional Class
| Six Months | ||||||||||||||||||||||||
| Ended | ||||||||||||||||||||||||
| June 30, 2012 | Year Ended December 31, | |||||||||||||||||||||||
| (Unaudited) | 2011 | 2010 | 2009 | 2008 | 2007 | |||||||||||||||||||
| Per Share Data: | ||||||||||||||||||||||||
| Net asset value, | ||||||||||||||||||||||||
| beginning of period | $ | 10.82 | $ | 10.51 | $ | 10.18 | $ | 9.46 | $ | 10.22 | $ | 10.16 | ||||||||||||
| Income from | ||||||||||||||||||||||||
| investment operations: | ||||||||||||||||||||||||
| Net investment income | 0.18 | 0.45 | (1) | 0.59 | (2) | 0.65 | (1) | 0.56 | (1) | 0.54 | (1) | |||||||||||||
| Net realized and unrealized | ||||||||||||||||||||||||
| gains (losses) on investments | 0.23 | 0.36 | 0.39 | 0.74 | (0.73 | ) | 0.05 | |||||||||||||||||
| Total from | ||||||||||||||||||||||||
| investment operations | 0.41 | 0.81 | 0.98 | 1.39 | (0.17 | ) | 0.59 | |||||||||||||||||
| Less distributions: | ||||||||||||||||||||||||
| Distributions from net | ||||||||||||||||||||||||
| investment income | (0.18 | ) | (0.46 | ) | (0.60 | ) | (0.65 | ) | (0.55 | ) | (0.53 | ) | ||||||||||||
| Distributions from | ||||||||||||||||||||||||
| net realized gains | — | (0.04 | ) | (0.05 | ) | (0.02 | ) | (0.04 | ) | — | ||||||||||||||
| Total distributions | (0.18 | ) | (0.50 | ) | (0.65 | ) | (0.67 | ) | (0.59 | ) | (0.53 | ) | ||||||||||||
| Net asset value, end of period | $ | 11.05 | $ | 10.82 | $ | 10.51 | $ | 10.18 | $ | 9.46 | $ | 10.22 | ||||||||||||
| Total return | 3.85 | %(3) | 7.89 | % | 9.81 | % | 15.36 | % | (1.79 | )% | 5.99 | % | ||||||||||||
| Supplemental data and ratios: | ||||||||||||||||||||||||
| Net assets, | ||||||||||||||||||||||||
| end of period (millions) | $ | 1,127.7 | $ | 768.9 | $ | 452.4 | $ | 215.2 | $ | 159.0 | $ | 114.4 | ||||||||||||
| Ratio of expenses | ||||||||||||||||||||||||
| to average net assets | 0.30 | %(4) | 0.30 | % | 0.30 | % | 0.30 | % | 0.30 | % | 0.30 | % | ||||||||||||
| Ratio of net | ||||||||||||||||||||||||
| investment income | ||||||||||||||||||||||||
| to average net assets | 3.39 | %(4) | 4.22 | % | 5.56 | % | 6.67 | % | 5.61 | % | 5.41 | % | ||||||||||||
Portfolio turnover rate(5) | 17.1 | %(3) | 34.6 | % | 61.5 | % | 33.2 | % | 27.7 | % | 47.4 | % | ||||||||||||
(1)Calculated using average shares outstanding during the period.
(2)Net investment income per share is calculated using ending balances prior to consideration of adjustments for permanent book and tax differences.
(3)Not annualized.
(4)Annualized.
(5)Portfolio turnover is calculated on the basis of the Fund as a whole without distinguishing between the classes of shares issued.
The accompanying notes are in integral part of these financial statements.
Page 65
Financial Highlights
Baird Core Plus Bond Fund – Investor Class
| Six Months | ||||||||||||||||||||||||
| Ended | ||||||||||||||||||||||||
| June 30, 2012 | Year Ended December 31, | |||||||||||||||||||||||
| (Unaudited) | 2011 | 2010 | 2009 | 2008 | 2007 | |||||||||||||||||||
| Per Share Data: | ||||||||||||||||||||||||
| Net asset value, | ||||||||||||||||||||||||
| beginning of period | $ | 11.18 | $ | 10.85 | $ | 10.49 | $ | 9.72 | $ | 10.50 | $ | 10.42 | ||||||||||||
| Income from | ||||||||||||||||||||||||
| investment operations: | ||||||||||||||||||||||||
| Net investment income | 0.17 | 0.44 | (1) | 0.57 | (2) | 0.64 | (1) | 0.53 | (1) | 0.53 | (1) | |||||||||||||
| Net realized and unrealized | ||||||||||||||||||||||||
| gains (losses) on investments | 0.25 | 0.37 | 0.41 | 0.78 | (0.74 | ) | 0.06 | |||||||||||||||||
| Total from | ||||||||||||||||||||||||
| investment operations | 0.42 | 0.81 | 0.98 | 1.42 | (0.21 | ) | 0.59 | |||||||||||||||||
| Less distributions: | ||||||||||||||||||||||||
| Distributions from net | ||||||||||||||||||||||||
| investment income | (0.17 | ) | (0.44 | ) | (0.57 | ) | (0.63 | ) | (0.53 | ) | (0.51 | ) | ||||||||||||
| Distributions from | ||||||||||||||||||||||||
| net realized gains | — | (0.04 | ) | (0.05 | ) | (0.02 | ) | (0.04 | ) | — | ||||||||||||||
| Total distributions | (0.17 | ) | (0.48 | ) | �� | (0.62 | ) | (0.65 | ) | (0.57 | ) | (0.51 | ) | |||||||||||
| Net asset value, end of period | $ | 11.43 | $ | 11.18 | $ | 10.85 | $ | 10.49 | $ | 9.72 | $ | 10.50 | ||||||||||||
| Total return | 3.79 | %(3) | 7.57 | % | 9.53 | % | 15.06 | % | (2.07 | )% | 5.80 | % | ||||||||||||
| Supplemental data and ratios: | ||||||||||||||||||||||||
| Net assets, | ||||||||||||||||||||||||
| end of period (millions) | $ | 649.1 | $ | 331.9 | $ | 58.4 | $ | 45.5 | $ | 29.6 | $ | 2.5 | ||||||||||||
| Ratio of expenses | ||||||||||||||||||||||||
| to average net assets | 0.55 | %(4) | 0.55 | % | 0.55 | % | 0.55 | % | 0.55 | % | 0.55 | % | ||||||||||||
| Ratio of net | ||||||||||||||||||||||||
| investment income | ||||||||||||||||||||||||
| to average net assets | 3.14 | %(4) | 3.97 | % | 5.31 | % | 6.42 | % | 5.36 | % | 5.16 | % | ||||||||||||
Portfolio turnover rate(5) | 17.1 | %(3) | 34.6 | % | 61.5 | % | 33.2 | % | 27.7 | % | 47.4 | % | ||||||||||||
(1)Calculated using average shares outstanding during the period.
(2)Net investment income per share is calculated using ending balances prior to consideration of adjustments for permanent book and tax differences.
(3)Not annualized.
(4)Annualized.
(5)Portfolio turnover is calculated on the basis of the Fund as a whole without distinguishing between the classes of shares issued.
The accompanying notes are in integral part of these financial statements.
Page 66
Notes to the Financial Statements
June 30, 2012 (Unaudited)
1.Organization
Baird Funds, Inc. (the “Corporation”) was incorporated on June 9, 2000 as a Wisconsin corporation and is registered as an open-end investment management company under the Investment Company Act of 1940, as amended (the “1940 Act”). The accompanying financial statements include the Baird Short-Term Bond Fund, Baird Intermediate Bond Fund, Baird Intermediate Municipal Bond Fund, Baird Aggregate Bond Fund and Baird Core Plus Bond Fund (each, a “Fund” and collectively, the “Funds”), five of the eight series comprising the Corporation, each of which is diversified within the meaning of the 1940 Act. Robert W. Baird & Co. Incorporated (“Baird” or the “Advisor”) serves as investment advisor to the Funds.
The Baird Short-Term Bond Fund commenced operations with the sale of Institutional Class shares on August 31, 2004. The Baird Intermediate Municipal Bond Fund commenced operations with the sale of both Institutional and Investor Class shares on March 30, 2001. The Baird Intermediate Bond Fund, Baird Aggregate Bond Fund and Baird Core Plus Bond Fund commenced operations with the sale of both Institutional and Investor Class shares on September 29, 2000. The Institutional Class Shares are not subject to a distribution and service (12b-1) fee, while the Investor Class Shares are subject to a distribution and service (12b-1) fee of 0.25%.
The investment objective of the Baird Short-Term Bond Fund is to provide an annual rate of total return, before Fund expenses, greater than the annual rate of total return of the Barclays Capital 1-3 Year U.S. Government/Credit Bond Index. The Barclays Capital 1-3 Year U.S. Government/Credit Bond Index is an unmanaged, market value weighted index of investment grade, fixed-rate debt including government and corporate securities with maturities between one and three years.
The investment objective of the Baird Intermediate Bond Fund is to provide an annual rate of total return, before Fund expenses, greater than the annual rate of total return of the Barclays Capital Intermediate U.S. Government/Credit Bond Index. The Barclays Capital Intermediate U.S. Government/Credit Bond Index is an unmanaged, market value weighted index of investment grade, fixed-rate debt issues, including government and corporate securities, with maturities between one and ten years.
The primary investment objective of the Baird Intermediate Municipal Bond Fund is to provide current income that is substantially exempt from federal income tax. A secondary objective is to provide total return with relatively low volatility of principal.
The investment objective of the Baird Aggregate Bond Fund is to provide an annual rate of total return, before Fund expenses, greater than the annual rate of total return of the Barclays Capital U.S. Aggregate Bond Index. The Barclays Capital U.S. Aggregate Bond Index is an unmanaged, market value weighted index of investment grade, fixed-rate debt issues, including government, corporate, asset-backed and mortgage-backed securities, with maturities of at least one year.
The investment objective of the Baird Core Plus Bond Fund is to provide an annual rate of total return, before Fund expenses, greater than the annual rate of total return of the Barclays Capital U.S. Universal Bond Index. The Barclays Capital U.S. Universal Bond Index is an unmanaged, market value weighted index of fixed income securities issued in U.S. dollars, including U.S. government and investment grade debt, non-investment grade debt, asset-backed and mortgage-backed securities, Eurobonds, 144A securities and emerging market debt, with maturities of at least one year.
2.Significant Accounting Policies
The following is a summary of significant accounting policies consistently followed by the Funds in the preparation of their financial statements. These policies are in conformity with accounting principles generally accepted in the United States of America.
| a) | Investment Valuation – Section 2(a)(41) of the 1940 Act, together with the rules and interpretations of the SEC, require the Funds, in computing net asset value, to value their portfolio securities using market quotations when they are “readily available.” When market quotations are not readily available (e.g., because |
Page 67
Notes to the Financial Statements
June 30, 2012 (Unaudited)
2.Significant Accounting Policies (cont.)
| there is no regular market quotation for such securities, the market for such security is limited, the validity of quotations is questionable or, for debt securities, Interactive Data Corporation (IDC), the Funds’ independent pricing service, does not provide a price), the Board of Directors of the Corporation must value the securities at “fair value determined in good faith.” The Board has delegated such responsibility to the Advisor pursuant to pricing policies and procedures that the Board has adopted and regularly reviews. In general, the “fair value” of a security means the price that would be received to sell a security in an orderly transaction between market participants at the measurement date. |
| The Funds determine the fair value of their investments and compute their net asset value per share as of the close of regular trading of the New York Stock Exchange (4:00 p.m. EST). |
| Consistent with Section 2(a)(41) of the 1940 Act, the Funds price their securities as follows: debt securities are valued at their bid prices by an independent pricing service using valuation methods that are designed to represent fair value, such as matrix pricing and other analytical pricing models, market transactions and dealer quotations. Debt securities purchased with a remaining maturity of 60 days or less are valued at acquisition cost, plus or minus any amortized discount or premium which approximates fair value. Investments in mutual funds are valued at their stated net asset value. Common stocks that are listed on a securities exchange (other than NASDAQ) are valued at the last quoted sales price. Securities traded on Nasdaq are valued at the Nasdaq Official Closing Price. Price information on listed stocks is taken from the exchange where the security is primarily traded. Securities that were not traded on the valuation date, as well as stocks that are not listed on an exchange, including NASDAQ, are valued at the average of the current bid and asked price. Other assets and securities for which market quotations are not readily available are valued at fair value as determined in good faith by the Advisor in accordance with procedures approved by the Corporation’s Board of Directors. In accordance with such procedures, the Advisor may use broker quotes or prices obtained from alternative independent pricing services or, if the broker quotes or prices from alternative pricing services are unavailable or deemed to be unreliable, fair value will be determined by a valuation committee of the Advisor. In determining fair value, the valuation committee takes into account all relevant factors and available information. Consequently, the price of the security used by a Fund to calculate its NAV may differ from quoted or published prices for the same security. Fair value pricing involves subjective judgments and there is no single standard for determining a security’s fair value. As a result, different mutual funds could reasonably arrive at a different fair value for the same security. It is possible that the fair value determined for a security is materially different from the value that could be realized upon the sale of that security or from the values that other mutual funds may determine. In addition, given the volatility and periodic illiquidity experienced in recent years, the prices determined for any individual security on any given day may vary significantly from the amount that can be obtained in an actual sale of that security, and the Funds’ NAVs may fluctuate significantly from day to day or from period to period. |
| In May 2011, the FASB issued ASU No. 2011-04 “Amendments to Achieve Common Fair Value Measurement and Disclosure Requirements in GAAP and the International Financial Reporting Standards (“IFRS”)” (ASU 2011-04). ASU 2011-04 amends FASB ASC Topic 820, Fair Value Measurements and Disclosures, to establish common requirements for measuring fair value and for disclosing information about fair value measurements in accordance with GAAP and IFRS. ASU No. 2011-04 is effective for fiscal years beginning after December 15, 2011 and for interim periods within those fiscal years. The Funds have disclosed the applicable requirements of this accounting standard in their financial statements. |
| b) | Unregistered Securities – Four of the Funds own certain investment securities which are unregistered and thus restricted with respect to resale. The value of such securities for the Baird Short-Term Bond, Baird Intermediate Bond, Baird Aggregate Bond and Baird Core Plus Bond Funds were $282,877,256 (25.64% of net assets), $97,400,003 (12.59% of net assets), $108,121,761 (8.59% of net assets), and $238,994,366 (13.45% of net assets), respectively, at June 30, 2012. Restricted securities may be deemed to be liquid as |
Page 68
Notes to the Financial Statements
June 30, 2012 (Unaudited)
2.Significant Accounting Policies (cont.)
| determined by the Advisor based on several factors. All of the restricted securities held by the Funds as of June 30, 2012 consist of securities issued pursuant to Rule 144A under the Securities Act of 1933 and nearly all have been deemed to be liquid. |
| c) | Foreign Securities – Foreign securities are defined as securities of issuers that are organized outside the United States. The Funds may invest in U.S. dollar-denominated debt obligations of foreign companies and foreign governments. Investing in securities of foreign companies and foreign governments involves special risks and considerations not typically associated with investing in U.S. companies and the U.S. government. These risks include foreign currency fluctuations, political and economic instability and differences in financial reporting standards and less strict regulation of securities markets. Moreover, securities of many foreign companies and foreign governments and their markets may be less liquid and their prices more volatile than those of securities of comparable U.S. companies and the U.S. government. Occasionally, events that affect these values and exchange rates may occur after the close of the exchange on which such securities are traded. If such events materially affect the value of a Fund’s securities, these securities may be valued at their fair value pursuant to procedures adopted by the Board of Directors. |
| d) | Income Tax Status – The Funds intend to continue to qualify as regulated investment companies as provided in subchapter M of the Internal Revenue Code and to distribute substantially all of their taxable income to their shareholders in a manner which results in no tax cost to the Funds. Therefore, no federal income or excise tax provision is recorded. |
| There is no tax liability resulting from unrecognized tax benefits relating to uncertain income tax positions taken or expected to be taken on the tax return for the fiscal year ended December 31, 2011, or for any other tax years which are open for exam. As of June 30, 2012, open tax years include the tax years ended December 31, 2008 through 2011. The Funds are not aware of any tax positions for which it is reasonably possible that the total amounts of unrecognized tax benefits will significantly change in the next 12 months. The Funds recognize interest and penalties, if any, related to unrecognized tax benefits as income tax expense and other expense, respectively, in the Statement of Operations. During the year, the Funds did not incur any interest or penalties. |
| e) | Allocation of Income and Expenses – Each Fund is charged for those expenses directly attributable to it. Expenses directly attributable to a class of shares, such as Rule 12b-1 distribution fees, are charged to that class of shares. Income, expenses and realized and unrealized gains and losses are allocated to the classes based on their respective net assets. Expenses that are not directly attributable to a Fund are allocated among the Funds in the series in proportion to their assets. |
| f) | Distributions to Shareholders – Dividends from net investment income are declared and paid monthly. Distributions of net realized capital gains, if any, are declared and paid at least annually. The book basis character of distributions may differ from their ultimate characterization for Federal income tax purposes. |
| g) | Use of Estimates – The preparation of financial statements in conformity with accounting principles generally accepted in the United States of America requires management to make estimates and assumptions that affect the reported amounts of assets and liabilities and disclosure of contingent assets and liabilities at the date of the financial statements and the reported amounts of revenues and expenses during the reporting period. Actual results could differ from those estimates. |
| h) | Securities Transactions and Investment Income – Investment and shareholder transactions are recorded on the trade date. The Funds determine the gain or loss realized from investment transactions by comparing the original cost of the security lot sold with the net sales proceeds. Dividend income is recognized on the ex-dividend date and interest income is recognized on an accrual basis. Premiums and discounts on the purchase of securities are amortized/accreted using the effective interest method. Paydown gains and losses are netted and recorded as interest income on the Statement of Operations for financial reporting purposes. |
Page 69
Notes to the Financial Statements
June 30, 2012 (Unaudited)
2.Significant Accounting Policies (cont.)
| Accounting principles generally accepted in the United States of America require that permanent financial reporting and tax differences be reclassified in the capital accounts. |
| i) | Guarantees and Indemnifications – In the normal course of business, the Funds enter into contracts with service providers that contain general indemnification clauses. The Funds’ maximum exposure under these arrangements is unknown and would involve future claims against the Funds that have not yet occurred. Based on experience, the Funds would expect the risk of loss to be remote. |
3.Capital Share Transactions
The following table summarizes the capital share transactions of each Fund for the past two fiscal periods:
| Baird Short-Term Bond Fund | |||||||||||||||||
| Institutional Class Shares | Institutional Class Shares | ||||||||||||||||
| Six Months Ended | Year Ended | ||||||||||||||||
| June 30, 2012 | December 31, 2011 | ||||||||||||||||
| Shares | Amount | Shares | Amount | ||||||||||||||
| Shares sold | 25,850,384 | $ | 250,176,983 | Shares sold | 53,122,196 | $ | 514,984,905 | ||||||||||
| Shares issued to | Shares issued to | ||||||||||||||||
| shareholders in | shareholders in | ||||||||||||||||
| reinvestment | reinvestment | ||||||||||||||||
| of dividends | 1,145,656 | 11,083,881 | of dividends | 2,841,238 | 27,443,430 | ||||||||||||
| Shares redeemed | (19,160,857 | ) | (185,522,272 | ) | Shares redeemed | (44,833,884 | ) | (434,651,786 | ) | ||||||||
| Net increase | 7,835,183 | $ | 75,738,592 | Net increase | 11,129,550 | $ | 107,776,549 | ||||||||||
| Shares Outstanding: | Shares Outstanding: | ||||||||||||||||
| Beginning of period | 106,097,860 | Beginning of year | 94,968,310 | ||||||||||||||
| End of period | 113,933,043 | End of year | 106,097,860 | ||||||||||||||
| Baird Intermediate Bond Fund | |||||||||||||||||
| Institutional Class Shares | Investor Class Shares | ||||||||||||||||
| Six Months Ended | Six Months Ended | ||||||||||||||||
| June 30, 2012 | June 30, 2012 | ||||||||||||||||
| Shares | Amount | Shares | Amount | ||||||||||||||
| Shares sold | 9,753,961 | $ | 109,190,434 | Shares sold | 359,073 | $ | 4,169,852 | ||||||||||
| Shares issued to | Shares issued to | ||||||||||||||||
| shareholders in | shareholders in | ||||||||||||||||
| reinvestment | reinvestment | ||||||||||||||||
| of dividends | 793,388 | 8,876,819 | of dividends | 16,688 | 193,720 | ||||||||||||
| Shares redeemed | (6,968,597 | ) | (78,139,166 | ) | Shares redeemed | (157,764 | ) | (1,829,573 | ) | ||||||||
| Net increase | 3,578,752 | $ | 39,928,087 | Net increase | 217,997 | $ | 2,533,999 | ||||||||||
| Shares Outstanding: | Shares Outstanding: | ||||||||||||||||
| Beginning of period | 63,607,447 | Beginning of period | 1,283,478 | ||||||||||||||
| End of period | 67,186,199 | End of period | 1,501,475 | ||||||||||||||
Page 70
Notes to the Financial Statements
June 30, 2012 (Unaudited)
3.Capital Share Transactions (cont.)
| Baird Intermediate Bond Fund (cont.) | |||||||||||||||||
| Institutional Class Shares | Investor Class Shares | ||||||||||||||||
| Year Ended | Year Ended | ||||||||||||||||
| December 31, 2011 | December 31, 2011 | ||||||||||||||||
| Shares | Amount | Shares | Amount | ||||||||||||||
| Shares sold | 18,638,168 | $ | 205,507,343 | Shares sold | 883,474 | $ | 10,090,282 | ||||||||||
| Shares issued to | Shares issued to | ||||||||||||||||
| shareholders in | shareholders in | ||||||||||||||||
| reinvestment | reinvestment | ||||||||||||||||
| of dividends | 2,149,990 | 23,704,272 | of dividends | 42,204 | 482,304 | ||||||||||||
| Shares redeemed | (11,543,624 | ) | (127,767,983 | ) | Shares redeemed | (773,902 | ) | (8,792,143 | ) | ||||||||
| Net increase | 9,244,534 | $ | 101,443,632 | Net increase | 151,776 | $ | 1,780,443 | ||||||||||
| Shares Outstanding: | Shares Outstanding: | ||||||||||||||||
| Beginning of year | 54,362,913 | Beginning of year | 1,131,702 | ||||||||||||||
| End of year | 63,607,447 | End of year | 1,283,478 | ||||||||||||||
| Baird Intermediate Municipal Bond Fund | |||||||||||||||||
| Institutional Class Shares | Investor Class Shares | ||||||||||||||||
| Six Months Ended | Six Months Ended | ||||||||||||||||
| June 30, 2012 | June 30, 2012 | ||||||||||||||||
| Shares | Amount | Shares | Amount | ||||||||||||||
| Shares sold | 16,316,614 | $ | 195,437,013 | Shares sold | 3,477,298 | $ | 42,497,217 | ||||||||||
| Shares issued to | Shares issued to | ||||||||||||||||
| shareholders in | shareholders in | ||||||||||||||||
| reinvestment | reinvestment | ||||||||||||||||
| of dividends | 757,858 | 9,063,104 | of dividends | 216,713 | 2,645,869 | ||||||||||||
| Shares redeemed | (9,678,529 | ) | (115,797,350 | ) | Shares redeemed | (3,394,859 | ) | (41,529,979 | ) | ||||||||
| Net increase | 7,395,943 | $ | 88,702,767 | Net increase | 299,152 | $ | 3,613,107 | ||||||||||
| Shares Outstanding: | Shares Outstanding: | ||||||||||||||||
| Beginning of period | 70,057,143 | Beginning of period | 21,177,650 | ||||||||||||||
| End of period | 77,453,086 | End of period | 21,476,802 | ||||||||||||||
| Institutional Class Shares | Investor Class Shares | ||||||||||||||||
| Year Ended | Year Ended | ||||||||||||||||
| December 31, 2011 | December 31, 2011 | ||||||||||||||||
| Shares | Amount | Shares | Amount | ||||||||||||||
| Shares sold | 28,247,024 | $ | 327,854,380 | Shares sold | 8,949,573 | $ | 106,191,873 | ||||||||||
| Shares issued to | Shares issued to | ||||||||||||||||
| shareholders in | shareholders in | ||||||||||||||||
| reinvestment | reinvestment | ||||||||||||||||
| of dividends | 1,511,354 | 17,575,486 | of dividends | 447,538 | 5,316,416 | ||||||||||||
| Shares redeemed | (25,043,108 | ) | (288,447,567 | ) | Shares redeemed | (5,800,868 | ) | (68,132,580 | ) | ||||||||
| Net increase | 4,715,270 | $ | 56,982,299 | Net increase | 3,596,243 | $ | 43,375,709 | ||||||||||
| Shares Outstanding: | Shares Outstanding: | ||||||||||||||||
| Beginning of year | 65,341,873 | Beginning of year | 17,581,407 | ||||||||||||||
| End of year | 70,057,143 | End of year | 21,177,650 | ||||||||||||||
Page 71
Notes to the Financial Statements
June 30, 2012 (Unaudited)
3.Capital Share Transactions (cont.)
| Baird Aggregate Bond Fund | |||||||||||||||||
| Institutional Class Shares | Investor Class Shares | ||||||||||||||||
| Six Months Ended | Six Months Ended | ||||||||||||||||
| June 30, 2012 | June 30, 2012 | ||||||||||||||||
| Shares | Amount | Shares | Amount | ||||||||||||||
| Shares sold | 22,035,869 | $ | 237,531,080 | Shares sold | 854,731 | $ | 9,484,646 | ||||||||||
| Shares issued to | Shares issued to | ||||||||||||||||
| shareholders in | shareholders in | ||||||||||||||||
| reinvestment | reinvestment | ||||||||||||||||
| of dividends | 2,303,651 | 24,800,780 | of dividends | 44,864 | 497,091 | ||||||||||||
| Shares redeemed | (50,523,592 | ) | (547,304,117 | ) | Shares redeemed | (249,327 | ) | (2,766,091 | ) | ||||||||
| Net decrease | (26,184,072 | ) | $ | (284,972,257 | ) | Net increase | 650,268 | $ | 7,215,646 | ||||||||
| Shares Outstanding: | Shares Outstanding: | ||||||||||||||||
| Beginning of period | 139,030,987 | Beginning of period | 2,386,621 | ||||||||||||||
| End of period | 112,846,915 | End of period | 3,036,889 | ||||||||||||||
| Institutional Class Shares | Investor Class Shares | ||||||||||||||||
| Year Ended | Year Ended | ||||||||||||||||
| December 31, 2011 | December 31, 2011 | ||||||||||||||||
| Shares | Amount | Shares | Amount | ||||||||||||||
| Shares sold | 55,839,863 | $ | 597,699,924 | Shares sold | 667,679 | $ | 7,332,095 | ||||||||||
| Shares issued to | Shares issued to | ||||||||||||||||
| shareholders in | shareholders in | ||||||||||||||||
| reinvestment | reinvestment | ||||||||||||||||
| of dividends | 8,120,694 | 86,467,957 | of dividends | 139,163 | 1,521,320 | ||||||||||||
| Shares redeemed | (82,507,416 | ) | (886,351,800 | ) | Shares redeemed | (2,025,333 | ) | (22,077,686 | ) | ||||||||
| Net decrease | (18,546,859 | ) | $ | (202,183,919 | ) | Net decrease | (1,218,491 | ) | $ | (13,224,271 | ) | ||||||
| Shares Outstanding: | Shares Outstanding: | ||||||||||||||||
| Beginning of year | 157,577,846 | Beginning of year | 3,605,112 | ||||||||||||||
| End of year | 139,030,987 | End of year | 2,386,621 | ||||||||||||||
| Baird Core Plus Bond Fund | |||||||||||||||||
| Institutional Class Shares | Investor Class Shares | ||||||||||||||||
| Six Months Ended | Six Months Ended | ||||||||||||||||
| June 30, 2012 | June 30, 2012 | ||||||||||||||||
| Shares | Amount | Shares | Amount | ||||||||||||||
| Shares sold | 37,717,172 | $ | 413,100,063 | Shares sold | 31,134,304 | $ | 352,953,062 | ||||||||||
| Shares issued to | Shares issued to | ||||||||||||||||
| shareholders in | shareholders in | ||||||||||||||||
| reinvestment | reinvestment | ||||||||||||||||
| of dividends | 1,388,869 | 15,229,972 | of dividends | 679,228 | 7,705,474 | ||||||||||||
| Shares redeemed | (8,160,252 | ) | (89,554,540 | ) | Shares redeemed | (4,708,257 | ) | (53,424,278 | ) | ||||||||
| Net increase | 30,945,789 | $ | 338,775,495 | Net increase | 27,105,275 | $ | 307,234,258 | ||||||||||
| Shares Outstanding: | Shares Outstanding: | ||||||||||||||||
| Beginning of period | 71,093,096 | Beginning of period | 29,680,841 | ||||||||||||||
| End of period | 102,038,885 | End of period | 56,786,116 | ||||||||||||||
Page 72
Notes to the Financial Statements
June 30, 2012 (Unaudited)
3.Capital Share Transactions (cont.)
| Baird Core Plus Bond Fund (cont.) | |||||||||||||||||
| Institutional Class Shares | Investor Class Shares | ||||||||||||||||
| Year Ended | Year Ended | ||||||||||||||||
| December 31, 2011 | December 31, 2011 | ||||||||||||||||
| Shares | Amount | Shares | Amount | ||||||||||||||
| Shares sold | 36,047,590 | $ | 388,252,142 | Shares sold | 26,760,168 | $ | 298,890,969 | ||||||||||
| Shares issued to | Shares issued to | ||||||||||||||||
| shareholders in | shareholders in | ||||||||||||||||
| reinvestment | reinvestment | ||||||||||||||||
| of dividends | 2,340,028 | 25,063,056 | of dividends | 524,142 | 5,816,376 | ||||||||||||
| Shares redeemed | (10,328,750 | ) | (110,911,182 | ) | Shares redeemed | (2,980,242 | ) | (33,039,933 | ) | ||||||||
| Net increase | 28,058,868 | $ | 302,404,016 | Net increase | 24,304,068 | $ | 271,667,412 | ||||||||||
| Shares Outstanding: | Shares Outstanding: | ||||||||||||||||
| Beginning of year | 43,034,228 | Beginning of year | 5,376,773 | ||||||||||||||
| End of year | 71,093,096 | End of year | 29,680,841 | ||||||||||||||
4.Investment Transactions and Income Tax Information
During the six months ended June 30, 2012, purchases and sales of investment securities (excluding short-term investments) were as follows:
| Baird | ||||||||||||||||||||
| Baird | Baird | Intermediate | Baird | Baird | ||||||||||||||||
| Short-Term | Intermediate | Municipal | Aggregate | Core Plus | ||||||||||||||||
| Bond Fund | Bond Fund | Bond Fund | Bond Fund | Bond Fund | ||||||||||||||||
| Purchases: | ||||||||||||||||||||
| U.S. Government | $ | 27,842,274 | $ | 106,663,484 | $ | — | $ | 365,815,377 | $ | 369,105,652 | ||||||||||
| Other | $ | 267,058,648 | $ | 86,698,830 | $ | 139,516,058 | $ | 74,716,665 | $ | 482,017,607 | ||||||||||
| Sales: | ||||||||||||||||||||
| U.S. Government | $ | 18,394,808 | $ | 140,506,727 | $ | — | $ | 541,246,588 | $ | 185,781,080 | ||||||||||
| Other | $ | 207,438,640 | $ | 35,564,866 | $ | 32,394,017 | $ | 148,344,365 | $ | 54,016,867 | ||||||||||
Page 73
Notes to the Financial Statements
June 30, 2012 (Unaudited)
4.Investment Transactions and Income Tax Information (cont.)
At December 31, 2011, gross unrealized appreciation and depreciation of investments and distributable ordinary income and long-term capital gains for federal tax purposes were as follows:
| Baird | ||||||||||||||||||||
| Baird | Baird | Intermediate | Baird | Baird | ||||||||||||||||
| Short-Term | Intermediate | Municipal | Aggregate | Core Plus | ||||||||||||||||
| Bond Fund | Bond Fund | Bond Fund | Bond Fund | Bond Fund | ||||||||||||||||
| Cost of investments | $ | 1,107,663,428 | $ | 833,995,621 | $ | 1,038,274,202 | $ | 1,748,288,036 | $ | 1,273,564,118 | ||||||||||
| Gross unrealized | ||||||||||||||||||||
| appreciation | 7,284,356 | 32,040,424 | 63,679,571 | 79,018,370 | 36,284,483 | |||||||||||||||
| Gross unrealized | ||||||||||||||||||||
| depreciation | (10,794,486 | ) | (8,039,080 | ) | (227,982 | ) | (31,641,193 | ) | (12,565,870 | ) | ||||||||||
| Net unrealized | ||||||||||||||||||||
| appreciation | ||||||||||||||||||||
| (depreciation) | (3,510,130 | ) | 24,001,344 | 63,451,589 | 47,377,177 | 23,718,613 | ||||||||||||||
| Undistributed | ||||||||||||||||||||
| ordinary income | 84,035 | 424,194 | — | 82,473 | 127,835 | |||||||||||||||
| Undistributed | ||||||||||||||||||||
| long-term | ||||||||||||||||||||
| capital gain | 488,026 | 360,619 | — | — | — | |||||||||||||||
| Undistributed | ||||||||||||||||||||
| tax-exempt income | — | — | 19,518 | — | — | |||||||||||||||
| Total distributable | ||||||||||||||||||||
| earnings | 572,061 | 784,813 | 19,518 | 82,473 | 127,835 | |||||||||||||||
| Other accumulated | ||||||||||||||||||||
| losses | — | — | (137,429 | ) | (416,062 | ) | (70,162 | ) | ||||||||||||
| Total accumulated | ||||||||||||||||||||
| earnings/(losses) | $ | (2,938,069 | ) | $ | 24,786,157 | $ | 63,333,678 | $ | 47,043,588 | $ | 23,776,286 | |||||||||
Undistributed income or net realized gains for financial statement purposes may differ from amounts recognized for federal income tax purposes due to differences in the recognition and characterization of income, expense and capital gain items. The difference between book-basis and tax-basis unrealized appreciation is attributed primarily to the tax deferral of losses on wash sales.
Additionally, U.S. generally accepted accounting principles require that certain components of net assets relating to permanent differences be reclassified between financial and tax reporting. These reclassifications have no effect on net assets or net asset value per share.
The tax components of dividends paid during the periods shown below were as follows:
| Six Months Ended | Year Ended | |||||||||||
| June 30, 2012 | December 31, 2011 | |||||||||||
| Ordinary Income | Ordinary Income | Long-Term Capital | ||||||||||
| Distributions | Distributions | Gains Distributions | ||||||||||
| Baird Short-Term Bond Fund | $ | 12,193,450 | $ | 26,304,269 | $ | 4,117,819 | ||||||
| Baird Intermediate Bond Fund | $ | 11,271,788 | $ | 24,939,410 | $ | 4,057,553 | ||||||
| Baird Intermediate Municipal Bond Fund | $ | — | $ | 407,181 | $ | 608,525 | ||||||
| Baird Aggregate Bond Fund | $ | 29,491,018 | $ | 75,902,247 | $ | 22,074,213 | ||||||
| Baird Core Plus Bond Fund | $ | 24,536,508 | $ | 30,406,429 | $ | 2,498,860 | ||||||
Page 74
Notes to the Financial Statements
June 30, 2012 (Unaudited)
4.Investment Transactions and Income Tax Information (cont.)
For the six months ended June 30, 2012 and the year ended December 31, 2011, distributions of $13,866,972 and $25,599,397, respectively, from the Baird Intermediate Municipal Bond Fund were tax-exempt.
Under the current tax law, capital losses realized after October 31 may be deferred and treated as occurring on the first day of the following fiscal year. For the year ended December 31, 2011, Baird Intermediate Municipal Bond Fund, Baird Aggregate Bond Fund and Baird Core Plus Bond Fund elected to defer capital losses occurring between November 1, 2011 and December 31, 2011 in the amount of $137,429, $416,062 and $70,162, respectively.
At December 31, 2011, there were no accumulated net realized capital loss carryovers.
During the year ended December 31, 2011, Baird Intermediate Municipal Bond Fund utilized capital loss carryovers of $713,705.
On December 22, 2010, the Regulated Investment Company Modernization Act of 2010 (the “RIC Act”) was enacted, and the provisions within the RIC Act are effective for the Funds for the year ended December 31, 2011. The RIC Act modernized several of the federal income and excise tax provisions related to regulated investments companies (“RICs”). Under the RIC Act, new capital losses may be carried forward indefinitely with the character of the original loss retained. Prior to the RIC Act, capital losses could be carried forward for eight years, and were carried forward as short-term capital losses regardless of the character of the original loss. The RIC Act also contains simplification provisions, which are aimed at preventing disqualification of a RIC for inadvertent failures to comply with asset diversification and/or qualifying income tests. The RIC Act exempts RICs from the preferential dividend rule and repeals the 60-day designation requirement for certain types of pay-through income and gains. In addition, the RIC Act contains provisions aimed at preserving the character of distributions made by a RIC during the portion of its taxable year ending after October 31 or December 31.
5.Investment Advisory and Other Agreements
The Funds have entered into an Investment Advisory Agreement with Baird for the provision of investment advisory services. Pursuant to the Investment Advisory Agreement, the Advisor is entitled to receive a fee, calculated daily and payable monthly, at the annual rate of 0.25% for the Funds as applied to the respective Fund’s average daily net assets. Certain officers of the Advisor are also officers of the Funds.
The Funds have entered into an Administration Agreement with Baird. Under the Administration Agreement, the Advisor assumes and pays all expenses of the applicable Fund other than the investment advisory fees, fees under the 12b-1 plan, costs related to portfolio securities transactions and extraordinary or non-recurring expenses. Pursuant to the Administration Agreement, the Advisor is entitled to receive a fee, calculated daily and payable monthly, at the annual rate of 0.05% for the Funds as applied to the respective Fund’s average daily net assets.
U.S. Bancorp Fund Services, LLC serves as transfer agent, administrator, and accounting services agent for the Funds. U.S. Bank, N.A. serves as custodian for the Funds.
Baird (the “Distributor”) is the distributor of the Funds pursuant to a distribution agreement.
6.Securities Lending
Each Fund (other than the Intermediate Municipal Bond Fund) may lend up to one-third of its total assets (including such loans) to borrowers under terms of participation in a securities lending program administered by U.S. Bank, N.A., the Fund’s custodian and an affiliate of the Funds’ transfer agent and administrator. The securities lending agreement requires that loans are collateralized at all times in an amount equal to at least 102% of the market value of any loaned securities at the time of the loan, plus accrued interest.
The Funds receive compensation in the form of fees and earn interest on the cash collateral. The amount of fees depends on a number of factors including the type of security and length of the loan. Each Fund continues to
Page 75
Notes to the Financial Statements
June 30, 2012 (Unaudited)
6.Securities Lending (cont.)
receive interest payments or dividends on the securities loaned during the borrowing period. Each Fund has the right under the terms of the securities lending agreement to recall the securities from the borrower on demand.
As of June 30, 2012, the Baird Short-Term Bond Fund, Baird Intermediate Bond Fund, Baird Aggregate Bond Fund and Baird Core Plus Bond Fund had loaned securities that were collateralized by cash equivalents. The cash collateral is invested by the custodian in accordance with approved investment guidelines. Those guidelines require the cash collateral to be invested in readily marketable, high quality, short-term obligations; however, such investments are subject to risk of payment delays or default on the part of the issuer or counterparty or otherwise may not generate sufficient interest to support the costs associated with securities lending. A Fund could also experience delays in recovering its securities and possible loss of income or value if the borrower fails to return the borrowed securities, although the Funds are indemnified from this risk by contract with the securities lending agent.
As of June 30, 2012, the market value of the securities on loan and payable on collateral due to broker were as follows:
| Market Value of | Payable on Collateral | |||||||
| Securities on Loan | due to Broker | |||||||
| Baird Short-Term Bond Fund | $ | 123,824,195 | $ | 126,604,894 | ||||
| Baird Intermediate Bond Fund | 110,962,820 | 113,460,934 | ||||||
| Baird Aggregate Bond Fund | 134,255,481 | 138,082,230 | ||||||
| Baird Core Plus Bond Fund | 164,776,666 | 169,031,817 | ||||||
The Funds receive cash as collateral in return for securities lent as part of the securities lending program. The collateral is invested in the Mount Vernon Securities Lending Prime Portfolio (a securities lending trust subject to Rule 2a-7 under the 1940 Act) and a legacy interest in Atlantic East Funding LLC. The schedules of investments for the Funds include the particular cash collateral holdings as of June 30, 2012.
The Funds’ interest in Atlantic East Funding LLC is priced at fair value by the Valuation Committee of the Advisor. The fair value of the Funds’ interest in Atlantic East Funding LLC is based on the underlying market values of the securities owned by Atlantic East Funding LLC, which are determined by independent pricing sources. In addition, the Funds’ transfer agent and administrator and securities lending agent entered into a support agreement with the Funds to cover potential losses realized by the Funds on their investment in Atlantic East Funding LLC (up to a certain amount). The amounts agreed to be provided to the Funds under the support agreement are shown in the Funds’ schedules of investments and statements of assets and liabilities. At June 30, 2012, the fair value of the Funds’ interest in Atlantic East Funding LLC, plus the amounts payable under the support agreement, amounted to 100% of the outstanding par value of the Funds’ interest in Atlantic East Funding LLC.
The interest income earned by the Funds on investments of cash collateral received from borrowers for the securities loaned to them (“securities lending income”) is reflected in the Funds’ statements of operations. Interest income earned on collateral investments and recognized by the Funds during the six months ended June 30, 2012 for the Baird Short-Term Bond Fund, Baird Intermediate Bond Fund, Baird Aggregate Bond Fund, and Baird Core Plus Bond Fund were $81,083, $72,957, $125,995, and $120,873, respectively.
7.Line of Credit
The Corporation maintains an uncommitted, senior secured line of credit (“LOC”) with U.S. Bank, N.A. (the “Bank”) to provide the Funds a temporary liquidity source to meet unanticipated redemptions. Under the terms of the LOC, borrowings for each Fund are limited to one-third of the total assets (including the amount borrowed) of the respective Fund, or as otherwise indicated within the Funds’ agreement with the Bank. The Bank charged interest at the Bank’s Prime Rate less 1% for the period January 1 through May 17 and the Bank’s Prime Rate
Page 76
Notes to the Financial Statements
June 30, 2012 (Unaudited)
7.Line of Credit (cont.)
less 2% since May 18 (weighted average rate of 2.01% for the six months of 2012). For the six months ended June 30, 2012, the Baird Intermediate Bond Fund incurred $72 in interest charges on average daily loan balances of $6,352. The Baird Short-Term Bond Fund, Baird Intermediate Municipal Bond Fund, Baird Aggregate Bond Fund and Baird Core Plus Bond Fund did not borrow from the LOC during the period.
8.Distribution and Shareholder Service Plan
The Funds have adopted a distribution and shareholder service plan (the “Plan”) pursuant to Rule 12b-1 under the 1940 Act. The Plan allows the Funds to compensate the Distributor for the costs incurred in distributing the Funds’ Investor Class Shares, including amounts paid to brokers or dealers, at an annual rate of 0.25% of the average daily net assets of the Funds’ Investor Class Shares. The Baird Intermediate Bond, Baird Intermediate Municipal Bond, Baird Aggregate Bond and Baird Core Plus Bond Funds incurred $19,729, $321,249, $36,611 and $613,088, respectively, in fees pursuant to the Plan during the six months ended June 30, 2012.
9.Subsequent Event
In preparing these financial statements, the Corporation has evaluated events after June 30, 2012. There were no subsequent events since June 30, 2012 that would require adjustment to or additional disclosure in these financial statements.
Additional Information
Proxy Voting
A description of the policies and procedures that the Funds use to determine how to vote proxies relating to portfolio securities is available without charge, upon request, by calling toll free, 1-866-44BAIRD, or by accessing the Funds’ website at www.bairdfunds.com; and by accessing the SEC’s website at www.sec.gov.
Each Fund’s proxy voting record for the most recent 12-month period ended June 30, if applicable, is available without charge, upon request, by calling toll free, 1-866-44BAIRD, or by accessing the Funds’ website at www.bairdfunds.com; and by accessing the SEC’s website at www.sec.gov. The Funds generally do not vote proxies because the securities held in their portfolios, consisting of bonds and other fixed-income securities, are not entitled to vote.
Portfolio Holdings Disclosure
The Funds file a complete schedule of portfolio holdings with the SEC for the first and third quarters of each fiscal year on Form N-Q. The Funds’ Forms N-Q are available on the SEC’s website at www.sec.gov and may be reviewed and copied at the SEC’s Public Reference Room in Washington, D.C. Information on the operation of the Public Reference Room may be obtained by calling 1-800-732-0330. The Funds’ Forms N-Q may also be obtained by calling toll-free 1-866-44BAIRD.
Page 77
Baird Funds, Inc.
c/o U.S. Bancorp Fund Services, LLC
P.O. Box 701
Milwaukee, WI 53201-0701
1-866-44BAIRD
Board of Directors
G. Frederick Kasten, Jr. (Chairman)
John W. Feldt
Cory L. Nettles
Marlyn J. Spear
Frederick P. Stratton, Jr.
Investment Advisor and Distributor
Robert W. Baird & Co. Incorporated
777 East Wisconsin Avenue
Milwaukee, WI 53202
Administrator and Transfer Agent
U.S. Bancorp Fund Services, LLC
P.O. Box 701
615 East Michigan Street
Milwaukee, WI 53202
Custodian
U.S. Bank, N.A.
1555 N. RiverCenter Drive, Suite 302
Milwaukee, WI 53212
Legal Counsel
Godfrey & Kahn, S.C.
780 North Water Street
Milwaukee, WI 53202
Independent Registered Public
Accounting Firm
Grant Thornton LLP
175 West Jackson Boulevard, 13th Floor
Chicago, IL 60604
Semi-Annual Report - Baird Funds
Baird LargeCap Fund
Baird MidCap Fund
Baird SmallCap Value Fund
TABLE OF CONTENTS
| Page | |
| Baird LargeCap Fund | 1 |
| Baird MidCap Fund | 7 |
| Baird SmallCap Value Fund | 13 |
| Additional Information on Fund Expenses | 18 |
| Statements of Assets and Liabilities | 20 |
| Statements of Operations | 21 |
| Statements of Changes in Net Assets | 22 |
| Financial Highlights | 25 |
| Notes to the Financial Statements | 31 |
| Additional Information | 41 |
This report has been prepared for shareholders and may be distributed to others only if preceded or accompanied by a current prospectus.
Cautionary Note on Analyses, Opinions and Outlooks: In this report we offer analyses and opinions on the performance of individual securities, companies, industries, sectors, markets, interest rates and governmental policies, including predictions, forecasts and outlooks regarding possible future events. These can generally be identified as such because the context of the statements may include such words as “believe,” “should,” “will,” “expects,” “anticipates,” “hopes” and words of similar effect. These statements reflect the portfolio managers’ good faith beliefs and judgments and involve risks and uncertainties, including the risk that the portfolio managers’ analyses, opinions and outlooks are or will prove to be inaccurate. It is inherently difficult to correctly assess and explain the performance of particular securities, sectors, markets, interest rate movements, governmental actions or general economic trends and conditions, and many unforeseen factors contribute to the performance of Baird Funds. Investors are, therefore, cautioned not to place undue reliance on subjective judgments contained in this report.
Baird LargeCap Fund
A June 30, 2012 summary of the Fund’s top 10 holdings and equity sector analysis compared to the Russell 1000® Growth Index is shown below.
| Top 10 Holdings* | Equity Sector Analysis** | ||
 | |||
| Apple Inc. | 7.4% | ||
| The Coca-Cola Company | 3.8% | ||
| Microsoft Corporation | 3.4% | ||
| Praxair, Inc. | 3.4% | ||
| Danaher Corporation | 3.3% | ||
| Whole Foods Market, Inc. | 3.1% | ||
| Allergan, Inc. | 2.9% | ||
| O’Reilly Automotive, Inc. | 2.8% | ||
| Salesforce.com. Inc. | 2.6% | ||
| Intuitive Surgical, Inc. | 2.5% | ||
| Net Assets: | $23,420,211 | ||
| Portfolio Turnover Rate: | 25.4% | † | |
| Number of Equity Holdings: | 57 | ||
| Annualized Portfolio Expense Ratio:*** | |||
| INSTITUTIONAL CLASS: | 0.75% | ||
| INVESTOR CLASS: | 1.00% | **** | |
| * | The Fund’s portfolio composition is subject to change and there is no assurance that the Fund will continue to hold any particular security. Percentages shown relate to the Fund’s total net assets as of June 30, 2012. | |
| ** | Percentages shown in parentheses relate to the Fund’s total market value of investments as of June 30, 2012, and may not add up to 100% due to rounding. | |
| *** | The Advisor has contractually agreed to limit the Fund’s total annual fund operating expenses to 0.75% of average daily net assets for the Institutional Class shares and 1.00% of average daily net assets for the Investor Class shares, at least through April 30, 2013. | |
| **** | Includes 0.25% 12b-1 fee. | |
| † | Not annualized. |
Page 1
Baird LargeCap Fund
Total Returns
| Average Annual | |||||
| For the Periods Ended June 30, 2012 | Six Months | One Year | Five Years | Ten Years | Since Inception(1) |
| Institutional Class Shares | 9.87% | 2.38% | 1.39% | 3.49% | -0.02% |
| Investor Class Shares | 9.79% | 2.14% | 1.17% | 3.23% | -0.26% |
Russell 1000® Growth Index(2) | 10.08% | 5.76% | 2.87% | 6.03% | -0.98% |
| (1) | For the period from September 29, 2000 (commencement of operations) through June 30, 2012. |
| (2) | The Russell 1000® Growth Index measures the performance of the large-cap growth segment of the U.S. equity universe. It includes those Russell 1000® companies with higher price-to-book ratios and higher forecasted growth values. This index does not reflect any deduction for fees, expenses or taxes. A direct investment in the index is not possible. |
The returns shown in the table above reflect reinvestment of dividends and/or capital gains distributions in additional shares. The returns do not reflect the deduction of taxes that a shareholder would pay on Fund distributions or the redemption of Fund shares. The returns reflect the actual performance for each period and does not include the impact of trades executed on the last business day of the period that were recorded on the first business day of the next period.
Past performance does not guarantee future results. Investment return and principal value will fluctuate so that an investor’s shares, when redeemed, may be worth more or less than their original cost.
For information about the performance of the Fund as of the most recent month-end, please call 1-866-44BAIRD or visit www.bairdfunds.com. Mutual fund performance changes over time and current performance may be lower or higher than that stated.
Page 2
Baird LargeCap Fund
Schedule of Investments June 30, 2012 (Unaudited) |
| Shares | Value | ||||||
| COMMON STOCKS – 96.1% | |||||||
| Aerospace & Defense – 2.0% | |||||||
| 2,793 | Precision Castparts Corp. | $ | 459,421 | ||||
| Beverages – 3.8% | |||||||
| 11,300 | The Coca-Cola | ||||||
| Company@ | 883,547 | ||||||
| Biotechnology – 1.3% | |||||||
| 6,000 | Gilead Sciences, Inc.*@ | 307,680 | |||||
| Capital Markets – 2.1% | |||||||
| 4,816 | State Street Corporation | 214,986 | |||||
| 4,489 | T. Rowe Price Group, Inc. | 282,628 | |||||
| 497,614 | |||||||
| Chemicals – 3.4% | |||||||
| 7,250 | Praxair, Inc. | 788,293 | |||||
| Commercial Services & Supplies – 2.4% | |||||||
| 6,175 | Stericycle, Inc.* | 566,062 | |||||
| Communications Equipment – 2.5% | |||||||
| 800 | F5 Networks, Inc.* | 79,648 | |||||
| 9,225 | QUALCOMM | ||||||
| Incorporated | 513,648 | ||||||
| 593,296 | |||||||
| Computers & Peripherals – 10.0% | |||||||
| 2,985 | Apple Inc. | 1,743,240 | |||||
| 22,950 | EMC Corporation* | 588,208 | |||||
| 2,331,448 | |||||||
| Construction & Engineering – 0.9% | |||||||
| 4,050 | Fluor Corporation | 199,827 | |||||
| Electrical Equipment – 0.7% | |||||||
| 3,675 | Emerson Electric Company | 171,181 | |||||
| Energy Equipment & Services – 3.7% | |||||||
| 2,423 | Core Laboratories N.V. f | 280,826 | |||||
| 7,775 | Oceaneering | ||||||
| International, Inc. | 372,111 | ||||||
| 3,412 | Schlumberger Limited f | 221,473 | |||||
| 874,410 | |||||||
| Food & Staples Retailing – 3.1% | |||||||
| 7,725 | Whole Foods Market, Inc. | 736,347 | |||||
| Health Care Equipment & Supplies – 2.5% | |||||||
| 1,065 | Intuitive Surgical, Inc.* | 589,786 | |||||
| Health Care Providers & Services – 1.7% | |||||||
| 7,025 | Express Scripts, Inc.* | 392,206 | |||||
| Health Care Technology – 0.9% | |||||||
| 2,550 | Cerner Corporation* | 210,783 | |||||
| Hotels, Restaurants & Leisure – 2.6% | |||||||
| 4,350 | Las Vegas Sands Corp. | 189,182 | |||||
| 7,800 | Starbucks Corporation@ | 415,896 | |||||
| 605,078 | |||||||
| Industrial Conglomerates – 3.3% | |||||||
| 14,734 | Danaher Corporation | 767,347 | |||||
| Insurance – 0.5% | |||||||
| 2,850 | Aflac, Inc. | 121,382 | |||||
| Internet & Catalog Retail – 1.8% | |||||||
| 1,273 | Amazon.com, Inc.* | 290,689 | |||||
| 207 | priceline.com | ||||||
| Incorporated* | 137,556 | ||||||
| 428,245 | |||||||
| Internet Software & Services – 2.8% | |||||||
| 3,850 | Akamai Technologies, Inc.* | 122,237 | |||||
| 718 | Baidu, Inc. ADR* f | 82,556 | |||||
| 783 | Google, Inc. – Class A* | 454,195 | |||||
| 658,988 | |||||||
| IT Services – 4.4% | |||||||
| 9,100 | Cognizant Technology | ||||||
| Solutions Corporation – | |||||||
| Class A* | 546,000 | ||||||
| 833 | MasterCard, Inc. – Class A | 358,282 | |||||
| 1,825 | Teradata Corporation* | 131,418 | |||||
| 1,035,700 | |||||||
| Life Sciences Tools & Services – 1.0% | |||||||
| 5,975 | Illumina, Inc.* | 241,330 | |||||
The accompanying notes are an integral part of these financial statements.
Page 3
Baird LargeCap Fund
Schedule of Investments June 30, 2012 (Unaudited) |
| Shares | Value | ||||||
| COMMON STOCKS – 96.1% (cont.) | |||||||
| Machinery – 2.6% | |||||||
| 4,371 | Caterpillar Inc. | $ | 371,142 | ||||
| 5,750 | Eaton Corporation@ | 227,872 | |||||
| 599,014 | |||||||
| Media – 2.4% | |||||||
| 11,350 | DIRECTV* | 554,107 | |||||
| Multiline Retail – 2.5% | |||||||
| 10,765 | Dollar General | ||||||
| Corporation* | 585,508 | ||||||
| Oil, Gas & Consumable Fuels – 3.6% | |||||||
| 3,725 | Cabot Oil & Gas | ||||||
| Corporation | 146,765 | ||||||
| 4,000 | Continental | ||||||
| Resources, Inc.* | 266,480 | ||||||
| 2,276 | Noble Energy, Inc. | 193,050 | |||||
| 7,300 | Southwestern | ||||||
| Energy Company* | 233,089 | ||||||
| 839,384 | |||||||
| Pharmaceuticals – 4.3% | |||||||
| 7,275 | Allergan, Inc. | 673,447 | |||||
| 2,850 | Perrigo Company | 336,100 | |||||
| 1,009,547 | |||||||
| Real Estate Investment Trusts (REITs) – 1.9% | |||||||
| 4,775 | American Tower Corp. | 333,820 | |||||
| 745 | Simon Property | ||||||
| Group, Inc.* | 115,967 | ||||||
| 449,787 | |||||||
| Semiconductors & Semiconductor Equipment – 1.5% | |||||||
| 13,100 | Intel Corporation@ | 349,115 | |||||
| Software – 10.0% | |||||||
| 5,225 | Citrix Systems, Inc.* | 438,587 | |||||
| 26,075 | Microsoft Corporation | 797,634 | |||||
| 16,175 | Oracle Corporation | 480,397 | |||||
| 4,460 | Salesforce.com, Inc.* | 616,640 | |||||
| 2,333,258 | |||||||
| Specialty Retail – 7.5% | |||||||
| 10,600 | Dick’s Sporting | ||||||
| Goods, Inc. | 508,800 | ||||||
| 7,950 | O’Reilly Automotive, Inc.* | 665,972 | |||||
| 3,700 | Tiffany & Co. | 195,915 | |||||
| 2,225 | Tractor Supply Company | 184,808 | |||||
| 7,200 | Urban Outfitters, Inc.* | 198,648 | |||||
| 1,754,143 | |||||||
| Textiles, Apparel & Luxury Goods – 0.8% | |||||||
| 2,232 | NIKE, Inc. | 195,925 | |||||
| Trading Companies & Distributors – 1.6% | |||||||
| 9,144 | Fastenal Company | 368,595 | |||||
| Total Common Stocks | |||||||
| (Cost $16,824,921) | 22,498,354 | ||||||
| SHORT-TERM INVESTMENTS – 4.7% | |||||||
| Money Market Mutual Funds – 4.7% | |||||||
| 701,713 | Dreyfus Institutional Cash | ||||||
| Advantage Fund, 0.15%« | 701,713 | ||||||
| 400,000 | Short-Term Investments | ||||||
| Trust – Liquid Assets | |||||||
| Portfolio, 0.16%« | 400,000 | ||||||
| Total Short-Term | |||||||
| Investments | |||||||
| (Cost $1,101,713) | 1,101,713 | ||||||
| Principal | |||||||
| Amount | |||||||
| INVESTMENTS PURCHASED | |||||||
| WITH CASH PROCEEDS FROM | |||||||
| SECURITIES LENDING – 1.8% | |||||||
| Commercial Paper – 0.4% | |||||||
| $ | 149,484 | Atlantic East Funding LLC, | |||||
| 0.595%, 03/25/2013†** | 98,622 | ||||||
| Total Commercial Paper | |||||||
| (Cost $149,484) | 98,622 | ||||||
The accompanying notes are an integral part of these financial statements.
Page 4
Baird LargeCap Fund
Schedule of Investments June 30, 2012 (Unaudited) |
| Shares | Value | |||||||
| INVESTMENTS PURCHASED | ||||||||
| WITH CASH PROCEEDS FROM | ||||||||
| SECURITIES LENDING – 1.8% | ||||||||
| Investment Companies – 1.4% | ||||||||
| 321,424 | Mount Vernon Securities | |||||||
| Lending Trust Prime | ||||||||
| Portfolio, 0.31%« | $ | 321,424 | ||||||
| Total Investment | ||||||||
| Companies | ||||||||
| (Cost $321,424) | 321,424 | |||||||
| Total Investments Purchased | ||||||||
| With Cash Proceeds From | ||||||||
| Securities Lending | ||||||||
| (Cost $470,908) | 420,046 | |||||||
| Total Investments | ||||||||
| (Cost $18,397,542) – | ||||||||
| 102.6% | 24,020,113 | |||||||
| Asset Relating to Securities | ||||||||
| Lending Investments – 0.2% | ||||||||
Support Agreement*a **† | 50,862 | |||||||
| Total (Cost $0) | 50,862 | |||||||
| Liabilities in Excess of | ||||||||
| Other Assets – (2.8)% | (650,764 | ) | ||||||
| TOTAL NET | ||||||||
| ASSETS – 100.0% | $ | 23,420,211 | ||||||
Notes to Schedule of Investments
ADR American Depository Receipt
| * | Non-Income Producing | |
| ** | Illiquid Security | |
| @ | This security or portion of this security is out on loan at June 30, 2012. | |
| f | Foreign Security | |
| « | 7-Day Yield | |
| † | Priced at Fair Value by the Valuation Committee as delegated by the Baird Funds’ Board of Directors. | |
| a | The Fund’s transfer agent and administrator and securities lending agent entered into a support agreement with the Fund to cover losses realized by the Fund on its investment in Atlantic East Funding, LLC (up to a certain amount), which investment was made by the Fund’s securities lending agent. |
Industry classifications shown in the Schedule of Investments are based off of the Global Industry Classification Standard (GICS®). GICS was developed by and/or is the exclusive property of MSCI, Inc. and Standard & Poor Financial Services LLC (“S&P”). GICS is a service mark of MSCI and S&P and has been licensed for use by U.S. Bancorp Fund Services, LLC.
The accompanying notes are an integral part of these financial statements.
Page 5
Baird LargeCap Fund
| Summary of Fair Value Exposure at June 30, 2012 (Unaudited) |
The Fund has adopted authoritative fair valuation accounting standards which establish a definition of fair value and set out a hierarchy for measuring fair value. These standards require additional disclosures about the various inputs and valuation techniques used to develop the measurements of fair value and a discussion on changes in valuation techniques and related inputs during the period. These standards define fair value as the price that would be received to sell an asset or paid to transfer a liability in an orderly transaction between market participants at the measurement date. Management has determined that these standards have no material impact on the Funds’ financial statements. The fair value hierarchy is organized into three levels based upon the assumptions (referred to as “inputs”) used in pricing the asset or liability. These standards state that “observable inputs” reflect the assumptions market participants would use in pricing the asset or liability based on market data obtained from independent sources and “unobservable inputs” reflect an entity’s own assumptions about the assumptions market participants would use in pricing the asset or liability. These inputs are summarized into three broad levels and described below:
| Level 1 – | Unadjusted quoted prices in active markets for identical unrestricted securities. |
| Level 2 – | Other significant observable inputs (including quoted prices for similar securities, quoted prices in inactive markets, dealer indications, interest rates, yield curves, prepayment speeds, credit risk, default rates, inputs corroborated by observable market data, etc.). |
| Level 3 – | Significant unobservable inputs (including the Fund’s own assumptions about the factors that market participants would use in valuing the security) based on the best information available. |
The inputs or methodology used for valuing securities are not necessarily an indication of the risk associated with investing in those securities.
The following is a summary of the inputs used to value the Fund’s investments as of June 30, 2012:
| Level 1 | Level 2 | Level 3 | Total | |||||||||||||
| Equity | ||||||||||||||||
| Common Stocks | $ | 22,498,354 | $ | — | $ | — | $ | 22,498,354 | ||||||||
| Total Equity | 22,498,354 | — | — | 22,498,354 | ||||||||||||
| Short-Term Investments | ||||||||||||||||
| Money Market Mutual Funds | 1,101,713 | — | — | 1,101,713 | ||||||||||||
| Total Short-Term Investments | 1,101,713 | — | — | 1,101,713 | ||||||||||||
| Investments Purchased with Cash | ||||||||||||||||
| Proceeds from Securities Lending | ||||||||||||||||
| Commercial Paper | — | 98,622 | — | 98,622 | ||||||||||||
| Money Market Mutual Fund | 321,424 | — | — | 321,424 | ||||||||||||
| Total Investments Purchased with | ||||||||||||||||
| Cash Proceeds from Securities Lending | 321,424 | 98,622 | — | 420,046 | ||||||||||||
Total Investments* | $ | 23,921,491 | $ | 98,622 | $ | — | $ | 24,020,113 | ||||||||
| Asset Relating to Securities Lending Investments | $ | — | $ | 50,862 | $ | — | $ | 50,862 | ||||||||
*Additional information regarding the industry classifications of these investments is disclosed in the Schedule of Investments.
Changes in valuation techniques may result in transfers into or out of current assigned levels within the hierarchy. There were no significant transfers between Level 1, Level 2 and Level 3 fair value measurements during the reporting period, as compared to their classification from the prior year’s annual report.
Page 6
Baird MidCap Fund
A June 30, 2012 summary of the Fund’s top 10 holdings and equity sector analysis compared to the Russell Midcap® Growth Index is shown below.
| Top 10 Holdings* | Equity Sector Analysis** | ||
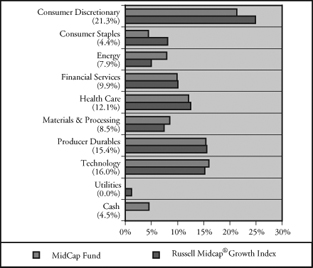 | |||
| Perrigo Company | 2.4% | ||
| Stericycle, Inc. | 2.4% | ||
| Dick’s Sporting Goods, Inc. | 2.4% | ||
| Catalyst Health Solutions, Inc. | 2.3% | ||
| Church & Dwight Co., Inc. | 2.3% | ||
| Teradata Corporation | 2.3% | ||
| ANSYS, Inc. | 2.3% | ||
| Alliance Data Systems Corporation | 2.3% | ||
| Citrix Systems, Inc. | 2.3% | ||
| J.B. Hunt Transport Services, Inc. | 2.1% | ||
| Net Assets: | $106,903,574 | ||
| Portfolio Turnover Rate: | 17.0% | † | |
| Number of Equity Holdings: | 58 | ||
| Annualized Portfolio Expense Ratio:*** | |||
| INSTITUTIONAL CLASS: | 0.85% | ||
| INVESTOR CLASS: | 1.10% | **** | |
| * | The Fund’s portfolio composition is subject to change and there is no assurance that the Fund will continue to hold any particular security. Percentages shown relate to the Fund’s total net assets as of June 30, 2012. | |
| ** | Percentages shown in parentheses relate to the Fund’s total market value of investments as of June 30, 2012, and may not add up to 100% due to rounding. | |
| *** | The Advisor has contractually agreed to limit the Fund’s total annual fund operating expenses to 0.85% of average daily net assets for the Institutional Class shares and 1.10% of average daily net assets for the Investor Class shares, at least through April 30, 2013. | |
| **** | Includes 0.25% 12b-1 fee. | |
| † | Not annualized. |
Page 7
Baird MidCap Fund
Total Returns
| Average Annual | |||||
| For the Periods Ended June 30, 2012 | Six Months | One Year | Five Years | Ten Years | Since Inception(1) |
| Institutional Class Shares | 11.12% | 5.91% | 5.48% | 7.60% | 5.11% |
| Investor Class Shares | 10.97% | 5.62% | 5.24% | 7.34% | 4.87% |
Russell Midcap® Growth Index(2) | 8.10% | -2.99% | 1.90% | 8.47% | 3.02% |
| (1) | For the period from December 29, 2000 (commencement of operations) through June 30, 2012. |
| (2) | The Russell Midcap® Growth Index measures the performance of the mid-cap growth segment of the U.S. equity universe. It includes those Russell Midcap® Index companies with higher price-to-book ratios and higher forecasted growth values. This index does not reflect any deduction for fees, expenses or taxes. A direct investment in the index is not possible. |
The returns shown in the table above reflect reinvestment of dividends and/or capital gains distributions in additional shares. The returns do not reflect the deduction of taxes that a shareholder would pay on Fund distributions or the redemption of Fund shares. The returns reflect the actual performance for each period and does not include the impact of trades executed on the last business day of the period that were recorded on the first business day of the next period.
Past performance does not guarantee future results. Investment return and principal value will fluctuate so that an investor’s shares, when redeemed, may be worth more or less than their original cost.
For information about the performance of the Fund as of the most recent month-end, please call 1-866-44BAIRD or visit www.bairdfunds.com. Mutual fund performance changes over time and current performance may be lower or higher than that stated.
Page 8
Baird MidCap Fund
Schedule of Investments June 30, 2012 (Unaudited) |
| Shares | Value | ||||||
| COMMON STOCKS – 95.7% | |||||||
| Auto Components – 3.1% | |||||||
| 81,705 | Gentex Corporation | $ | 1,705,183 | ||||
| 29,685 | WABCO Holdings Inc. | 1,571,227 | |||||
| 3,276,410 | |||||||
| Automobiles – 1.8% | |||||||
| 42,995 | Harley-Davidson, Inc. | 1,966,161 | |||||
| Biotechnology – 1.1% | |||||||
| 12,373 | Alexion | ||||||
| Pharmaceuticals, Inc.*@ | 1,228,639 | ||||||
| Capital Markets – 4.5% | |||||||
| 15,706 | Affiliated Managers | ||||||
| Group, Inc.* | 1,719,022 | ||||||
| 30,768 | Greenhill & Co., Inc.@ | 1,096,879 | |||||
| 86,755 | Invesco Limited f | 1,960,663 | |||||
| 4,776,564 | |||||||
| Chemicals – 1.9% | |||||||
| 23,920 | Airgas, Inc. | 2,009,519 | |||||
| Commercial Banks – 1.1% | |||||||
| 49,700 | East West Bancorp, Inc. | 1,165,962 | |||||
| Commercial Services & Supplies – 2.4% | |||||||
| 27,735 | Stericycle, Inc.* | 2,542,467 | |||||
| Communications Equipment – 3.2% | |||||||
| 8,365 | F5 Networks, Inc.* | 832,819 | |||||
| 53,565 | Plantronics, Inc. | 1,789,071 | |||||
| 51,365 | Riverbed Technology, Inc.* | 829,545 | |||||
| 3,451,435 | |||||||
| Computers & Peripherals – 1.0% | |||||||
| 34,850 | NetApp, Inc.* | 1,108,927 | |||||
| Construction & Engineering – 0.9% | |||||||
| 18,950 | Fluor Corporation | 934,993 | |||||
| Containers & Packaging – 1.6% | |||||||
| 33,357 | AptarGroup, Inc. | 1,702,875 | |||||
| Electrical Equipment – 4.8% | |||||||
| 26,700 | Acuity Brands, Inc. | 1,359,297 | |||||
| 26,145 | Rockwell Automation, Inc. | 1,727,139 | |||||
| 20,662 | Roper Industries, Inc. | 2,036,860 | |||||
| 5,123,296 | |||||||
| Electronic Equipment, Instruments | |||||||
| & Components – 2.8% | |||||||
| 52,310 | Plexus Corp.* | 1,475,142 | |||||
| 33,900 | Trimble Navigation | ||||||
| Limited* | 1,559,739 | ||||||
| 3,034,881 | |||||||
| Energy Equipment & Services – 5.1% | |||||||
| 15,130 | Core Laboratories N.V. f | 1,753,567 | |||||
| 37,895 | Dresser-Rand | ||||||
| Group, Inc.* | 1,687,843 | ||||||
| 41,311 | Oceaneering | ||||||
| International, Inc. | 1,977,145 | ||||||
| 5,418,555 | |||||||
| Food Products – 2.1% | |||||||
| 37,112 | McCormick & Co, | ||||||
| Incorporated | 2,250,843 | ||||||
| Health Care Providers & Services – 3.5% | |||||||
| 26,740 | Catalyst Health | ||||||
| Solutions, Inc.* | 2,498,585 | ||||||
| 37,525 | HMS Holdings Corp.*@ | 1,249,958 | |||||
| 3,748,543 | |||||||
| Health Care Technology – 1.6% | |||||||
| 21,275 | Cerner Corporation*@ | 1,758,591 | |||||
| Hotels Restaurants & Leisure – 3.4% | |||||||
| 23,633 | Buffalo Wild | ||||||
| Wings Inc.*@ | 2,047,563 | ||||||
| 65,675 | InterContinental Hotels | ||||||
Group PLC ADR f @ | 1,582,768 | ||||||
| 3,630,331 | |||||||
| Household Products – 2.3% | |||||||
| 44,801 | Church & | ||||||
| Dwight Co., Inc. | 2,485,111 | ||||||
The accompanying notes are an integral part of these financial statements.
Page 9
Baird MidCap Fund
Schedule of Investments June 30, 2012 (Unaudited) |
| Shares | Value | ||||||
| COMMON STOCKS – 95.7% (cont.) | |||||||
| IT Services – 4.6% | |||||||
| 18,110 | Alliance Data Systems | ||||||
| Corporation*@ | $ | 2,444,850 | |||||
| 34,385 | Teradata Corporation* | 2,476,064 | |||||
| 4,920,914 | |||||||
| Life Sciences Tools & Services – 3.4% | |||||||
| 74,306 | ICON PLC ADR* f | 1,674,114 | |||||
| 48,175 | Illumina, Inc.*@ | 1,945,788 | |||||
| 3,619,902 | |||||||
| Machinery – 2.9% | |||||||
| 63,510 | Actuant Corporation@ | 1,724,932 | |||||
| 24,655 | Joy Global Inc. | 1,398,678 | |||||
| 3,123,610 | |||||||
| Multiline Retail – 2.1% | |||||||
| 42,070 | Dollar General | ||||||
| Corporation* | 2,288,187 | ||||||
| Office Electronics – 1.1% | |||||||
| 34,310 | Zebra Technologies | ||||||
| Corporation* | 1,178,892 | ||||||
| Oil, Gas & Consumable Fuels – 2.9% | |||||||
| 53,180 | Cabot Oil & Gas | ||||||
| Corporation | 2,095,292 | ||||||
| 23,335 | Whiting Petroleum | ||||||
| Corporation* | 959,535 | ||||||
| 3,054,827 | |||||||
| Pharmaceuticals – 2.4% | |||||||
| 22,085 | Perrigo Company@ | 2,604,484 | |||||
| Professional Services – 1.0% | |||||||
| 29,635 | Manpower Inc. | 1,086,123 | |||||
| Real Estate Investment Trusts (REITs) – 2.1% | |||||||
| 29,465 | Digital Realty | ||||||
| Trust, Inc.@ | 2,211,938 | ||||||
| Road & Rail – 2.1% | |||||||
| 38,595 | J.B. Hunt Transport | ||||||
| Services, Inc.@ | 2,300,262 | ||||||
| Semiconductors & Semiconductor Equipment – 3.6% | |||||||
| 48,175 | Altera Corporation | 1,630,242 | |||||
| 65,663 | Microchip Technology | ||||||
| Incorporated | 2,172,132 | ||||||
| 3,802,374 | |||||||
| Software – 4.6% | |||||||
| 39,075 | ANSYS, Inc.* | 2,466,023 | |||||
| 28,810 | Citrix Systems, Inc.* | 2,418,312 | |||||
| 4,884,335 | |||||||
| Specialty Retail – 9.9% | |||||||
| 52,711 | Dick’s Sporting | ||||||
| Goods, Inc.@ | 2,530,128 | ||||||
| 24,615 | O’Reilly | ||||||
| Automotive, Inc.* | 2,061,999 | ||||||
| 26,050 | Tiffany & Co. | 1,379,348 | |||||
| 17,421 | Tractor Supply Company | 1,446,988 | |||||
| 16,225 | Ulta Salon, Cosmetics | ||||||
| & Fragrance, Inc.@ | 1,515,090 | ||||||
| 58,569 | Urban Outfitters, Inc.* | 1,615,919 | |||||
| 10,549,472 | |||||||
| Textiles, Apparel & Luxury Goods – 1.1% | |||||||
| 11,995 | Under Armour, | ||||||
| Inc. – Class A* | 1,133,288 | ||||||
| Trading Companies & Distributors – 3.7% | |||||||
| 41,992 | Fastenal Company | 1,692,697 | |||||
| 31,090 | Watsco, Inc.@ | 2,294,442 | |||||
| 3,987,139 | |||||||
| Total Common Stocks | |||||||
| (Cost $90,905,070) | 102,359,850 | ||||||
The accompanying notes are an integral part of these financial statements.
Page 10
Baird MidCap Fund
Schedule of Investments June 30, 2012 (Unaudited) |
| Shares | Value | ||||||
| SHORT-TERM INVESTMENTS – 4.3% | |||||||
| Money Market Mutual Funds – 4.3% | |||||||
| 2,750,257 | Dreyfus Institutional Cash | ||||||
| Advantage Fund, 0.15%« | $ | 2,750,257 | |||||
| 1,800,000 | Short-Term Investments | ||||||
| Trust – Liquid Assets | |||||||
| Portfolio, 0.16%« | 1,800,000 | ||||||
| Total Short-Term | |||||||
| Investments | |||||||
| (Cost $4,550,257) | 4,550,257 | ||||||
| Principal | |||||||
| Amount | |||||||
| INVESTMENTS PURCHASED | |||||||
| WITH CASH PROCEEDS FROM | |||||||
| SECURITIES LENDING – 6.8% | |||||||
| Commercial Paper – 0.1% | |||||||
| $ | 210,429 | Atlantic East | |||||
| Funding LLC, | |||||||
| 0.595%, 03/25/2013†** | 138,830 | ||||||
| Total Commercial Paper | |||||||
| (Cost $210,429) | 138,830 | ||||||
| Shares | |||||||
| Investment Companies – 6.7% | |||||||
| 7,144,522 | Mount Vernon Securities | ||||||
| Lending Trust Prime | |||||||
| Portfolio, 0.31%« | 7,144,522 | ||||||
| Total Investment | |||||||
| Companies | |||||||
| (Cost $7,144,522) | 7,144,522 | ||||||
| Total Investments | |||||||
| Purchased With Cash | |||||||
| Proceeds From | |||||||
| Securities Lending | |||||||
| (Cost $7,354,951) | 7,283,352 | ||||||
| Total Investments | |||||||
| (Cost $102,810,278) – | |||||||
| 106.8% | 114,193,459 | ||||||
| Asset Relating to Securities | |||||||
| Lending Investments – 0.1% | |||||||
Support Agreement*a **† | 71,599 | ||||||
| Total (Cost $0) | 71,599 | ||||||
| Liabilities in Excess of | |||||||
| Other Assets – (6.9)% | (7,361,484 | ) | |||||
| TOTAL NET | |||||||
| ASSETS – 100.0% | $ | 106,903,574 | |||||
Notes to Schedule of Investments
ADR American Depository Receipt
| * | Non-Income Producing | |
| ** | Illiquid Security | |
| @ | This security or portion of this security is out on loan at June 30, 2012. | |
| f | Foreign Security | |
| « | 7-Day Yield | |
| † | Priced at Fair Value by the Valuation Committee as delegated by the Baird Funds’ Board of Directors. | |
| a | The Fund’s transfer agent and administrator and securities lending agent entered into a support agreement with the Fund to cover losses realized by the Fund on its investment in Atlantic East Funding, LLC (up to a certain amount), which investment was made by the Fund’s securities lending agent. |
Industry classifications shown in the Schedule of Investments are based off of the Global Industry Classification Standard (GICS®). GICS was developed by and/or is the exclusive property of MSCI, Inc. and Standard & Poor Financial Services LLC (“S&P”). GICS is a service mark of MSCI and S&P and has been licensed for use by U.S. Bancorp Fund Services, LLC.
The accompanying notes are an integral part of these financial statements.
Page 11
Baird MidCap Fund
| Summary of Fair Value Exposure at June 30, 2012 (Unaudited) |
The Fund has adopted authoritative fair valuation accounting standards which establish a definition of fair value and set out a hierarchy for measuring fair value. These standards require additional disclosures about the various inputs and valuation techniques used to develop the measurements of fair value and a discussion on changes in valuation techniques and related inputs during the period. These standards define fair value as the price that would be received to sell an asset or paid to transfer a liability in an orderly transaction between market participants at the measurement date. Management has determined that these standards have no material impact on the Funds’ financial statements. The fair value hierarchy is organized into three levels based upon the assumptions (referred to as “inputs”) used in pricing the asset or liability. These standards state that “observable inputs” reflect the assumptions market participants would use in pricing the asset or liability based on market data obtained from independent sources and “unobservable inputs” reflect an entity’s own assumptions about the assumptions market participants would use in pricing the asset or liability. These inputs are summarized into three broad levels and described below:
| Level 1 – | Unadjusted quoted prices in active markets for identical unrestricted securities. |
| Level 2 – | Other significant observable inputs (including quoted prices for similar securities, quoted prices in inactive markets, dealer indications, interest rates, yield curves, prepayment speeds, credit risk, default rates, inputs corroborated by observable market data, etc.). |
| Level 3 – | Significant unobservable inputs (including the Fund’s own assumptions about the factors that market participants would use in valuing the security) based on the best information available. |
The inputs or methodology used for valuing securities are not necessarily an indication of the risk associated with investing in those securities.
The following is a summary of the inputs used to value the Fund’s investments as of June 30, 2012:
| Level 1 | Level 2 | Level 3 | Total | |||||||||||||
| Equity | ||||||||||||||||
| Common Stocks | $ | 102,359,850 | $ | — | $ | — | $ | 102,359,850 | ||||||||
| Total Equity | 102,359,850 | — | — | 102,359,850 | ||||||||||||
| Short-Term Investments | ||||||||||||||||
| Money Market Mutual Funds | 4,550,257 | — | — | 4,550,257 | ||||||||||||
| Total Short-Term Investments | 4,550,257 | — | — | 4,550,257 | ||||||||||||
| Investments Purchased with Cash | ||||||||||||||||
| Proceeds from Securities Lending | ||||||||||||||||
| Commercial Paper | — | 138,830 | — | 138,830 | ||||||||||||
| Money Market Mutual Fund | 7,144,522 | — | — | 7,144,522 | ||||||||||||
| Total Investments Purchased with | ||||||||||||||||
| Cash Proceeds from Securities Lending | 7,144,522 | 138,830 | — | 7,283,352 | ||||||||||||
Total Investments* | $ | 114,054,629 | $ | 138,830 | $ | — | $ | 114,193,459 | ||||||||
| Asset Relating to Securities Lending Investments | $ | — | $ | 71,599 | $ | — | $ | 71,599 | ||||||||
*Additional information regarding the industry classifications of these investments is disclosed in the Schedule of Investments.
Changes in valuation techniques may result in transfers into or out of current assigned levels within the hierarchy. There were no significant transfers between Level 1, Level 2 and Level 3 fair value measurements during the reporting period, as compared to their classification from the prior year’s annual report.
Page 12
Baird SmallCap Value Fund
A June 30, 2012 summary of the Fund’s top 10 holdings and equity sector analysis compared to the Russell 2000® Value Index is shown below.
| Top 10 Holdings* | Equity Sector Analysis** | ||
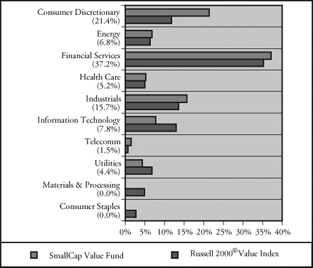 | |||
| Omega Healthcare Investors, Inc. | 3.9% | ||
| Jarden Corporation | 3.8% | ||
| VeriSign, Inc. | 3.8% | ||
| EZCORP, Inc. | 3.8% | ||
| ICU Medical, Inc. | 3.5% | ||
| First Cash Financial Services, Inc. | 3.4% | ||
| LTC Properties, Inc. | 3.3% | ||
| Valmont Industries, Inc. | 2.9% | ||
| Portfolio Recovery Associates, Inc. | 2.6% | ||
| Quanta Services, Inc. | 2.6% | ||
| Net Assets: | $5,617,999 | ||
| Portfolio Turnover Rate: | 0.6% | † | |
| Number of Equity Holdings: | 43 | ||
| Annualized Portfolio Expense Ratio:*** | |||
| INSTITUTIONAL CLASS: | 1.00% | ||
| INVESTOR CLASS: | 1.25% | **** | |
| * | The Fund’s portfolio composition is subject to change and there is no assurance that the Fund will continue to hold any particular security. Percentages shown relate to the Fund’s total net assets as of June 30, 2012. | |
| ** | Percentages shown in parentheses relate to the Fund’s total market value of investments as of June 30, 2012, and may not add up to 100% due to rounding. | |
| *** | The Advisor has contractually agreed to limit the Fund’s total annual fund operating expenses to 1.00% of average daily net assets for the Institutional Class shares and 1.25% of average daily net assets for the Investor Class shares, at least through April 30, 2013. | |
| **** | Includes 0.25% 12b-1 fee. | |
| † | Not annualized. |
Page 13
Baird SmallCap Value Fund
Total Returns
| For the Period Ended June 30, 2012 | Since Inception(1) |
| Institutional Class Shares | -2.10% |
| Investor Class Shares | -2.20% |
Russell 2000® Value Index(2) | -1.58% |
| (1) | For the period from May 1, 2012 (commencement of operations) through June 30, 2012. |
| (2) | The Russell 2000® Value Index measures the performance of the small-cap value segment of the U.S. equity universe and includes Russell 2000® Index companies with lower price-to-book ratios and lower forecasted growth values. This index does not reflect any deduction for fees, expenses or taxes. A direct investment in the index is not possible. |
The returns shown in the table above reflect reinvestment of dividends and/or capital gains distributions in additional shares. The returns do not reflect the deduction of taxes that a shareholder would pay on Fund distributions or the redemption of Fund shares. The returns reflect the actual performance for each period and does not include the impact of trades executed on the last business day of the period that were recorded on the first business day of the next period.
Past performance does not guarantee future results. Investment return and principal value will fluctuate so that an investor’s shares, when redeemed, may be worth more or less than their original cost.
For information about the performance of the Fund as of the most recent month-end, please call 1-866-44BAIRD or visit www.bairdfunds.com. Mutual fund performance changes over time and current performance may be lower or higher than that stated.
Page 14
Baird SmallCap Value Fund
Schedule of Investments June 30, 2012 (Unaudited) |
| Shares | Value | ||||||
| COMMON STOCKS – 95.0% | |||||||
| Aerospace & Defense – 2.2% | |||||||
| 2,175 | Triumph Group, Inc. | $ | 122,387 | ||||
| Capital Markets – 2.5% | |||||||
| 1,820 | Diamond Hill Investment | ||||||
| Group, Inc. | 142,488 | ||||||
| Commercial Services & Supplies – 2.6% | |||||||
| 1,619 | Portfolio Recovery | ||||||
| Associates, Inc.* | 147,750 | ||||||
| Construction & Engineering – 4.6% | |||||||
| 6,671 | MYR Group Inc.* | 113,807 | |||||
| 6,069 | Quanta Services, Inc.* | 146,081 | |||||
| 259,888 | |||||||
| Consumer Finance – 7.2% | |||||||
| 9,003 | EZCORP, Inc.* | 211,211 | |||||
| 4,754 | First Cash Financial | ||||||
| Services, Inc.* | 190,968 | ||||||
| 402,179 | |||||||
| Diversified Telecommunication Services – 1.5% | |||||||
| 8,445 | Windstream Corporation | 81,579 | |||||
| Electric Utilities – 1.8% | |||||||
| 2,782 | UIL Holdings Corporation | 99,762 | |||||
| Energy Equipment & Services – 5.0% | |||||||
| 4,906 | Mitcham Industries, Inc.* | 83,255 | |||||
| 4,756 | Superior Energy | ||||||
| Services, Inc.* | 96,214 | ||||||
| 67,720 | Vantage Drilling Co* f | 101,580 | |||||
| 281,049 | |||||||
| Health Care Equipment & Supplies – 3.5% | |||||||
| 3,692 | ICU Medical, Inc.* | 197,079 | |||||
| Hotels, Restaurants & Leisure – 2.0% | |||||||
| 8,242 | Shuffle Master, Inc.* | 113,740 | |||||
| Household Durables – 5.8% | |||||||
| 3,337 | Helen of Troy Limited* f | 113,091 | |||||
| 5,107 | Jarden Corporation | 214,596 | |||||
| 327,687 | |||||||
| Insurance – 4.3% | |||||||
| 5,462 | American Safety Insurance | ||||||
Holdings, Ltd.* f | 102,412 | ||||||
| 4,502 | HCC Insurance | ||||||
| Holdings, Inc | 141,363 | ||||||
| 243,775 | |||||||
| Internet Software & Services – 3.8% | |||||||
| 4,906 | VeriSign, Inc.* | 213,754 | |||||
| IT Services – 3.6% | |||||||
| 2,428 | Lender Processing | ||||||
| Services, Inc. | 61,380 | ||||||
| 2,290 | Wright Express Corporation* | 141,339 | |||||
| 202,719 | |||||||
| Machinery – 2.9% | |||||||
| 1,366 | Valmont Industries, Inc. | 165,245 | |||||
| Media – 1.8% | |||||||
| 2,074 | John Wiley & Sons, Inc. | 101,605 | |||||
| Multiline Retail – 4.2% | |||||||
| 2,580 | Big Lots, Inc.* | 105,238 | |||||
| 2,428 | Dollar Tree Inc* | 130,627 | |||||
| 235,865 | |||||||
| Multi-Utilities – 2.3% | |||||||
| 5,613 | CMS Energy Corporation | 131,905 | |||||
| Oil, Gas & Consumable Fuels – 1.5% | |||||||
| 12,290 | Sandridge Energy, Inc.* | 82,220 | |||||
| Pharmaceuticals – 1.5% | |||||||
| 4,605 | Warner Chilcott PLC* f | 82,522 | |||||
| Professional Services – 2.6% | |||||||
| 7,329 | CBIZ, Inc.* | 43,534 | |||||
| 3,490 | FTI Consulting, Inc.* | 100,338 | |||||
| 143,872 | |||||||
The accompanying notes are an integral part of these financial statements.
Page 15
Baird SmallCap Value Fund
Schedule of Investments June 30, 2012 (Unaudited) |
| Shares | Value | ||||||
| COMMON STOCKS – 95.0% (cont.) | |||||||
| Real Estate Investment Trusts (REITs) – 14.9% | |||||||
| 5,766 | BioMed Realty Trust, Inc. | $ | 107,709 | ||||
| 7,485 | Capstead Mortgage | ||||||
| Corporation | 104,116 | ||||||
| 7,585 | CYS Investments, Inc. | 104,445 | |||||
| 5,058 | LTC Properties, Inc. | 183,504 | |||||
| 1,719 | Mid-America Apartment | ||||||
| Communities, Inc. | 117,305 | ||||||
| 9,660 | Omega Healthcare | ||||||
| Investors, Inc. | 217,350 | ||||||
| 834,429 | |||||||
| Specialty Retail – 4.1% | |||||||
| 5,360 | Ascena Retail Group, Inc.* | 99,803 | |||||
| 3,895 | Rent-A-Center, Inc. | 131,417 | |||||
| 231,220 | |||||||
| Textiles, Apparel & Luxury Goods – 2.4% | |||||||
| 4,855 | Hanesbrands, Inc.* | 134,629 | |||||
| Thrifts & Mortgage Finance – 6.4% | |||||||
| 11,680 | Beneficial Mutual | ||||||
| Bancorp, Inc.* | 100,798 | ||||||
| 6,775 | Capitol Federal | ||||||
| Financial, Inc. | 80,487 | ||||||
| 7,433 | Chicopee Bancorp, Inc.* | 107,630 | |||||
| 9,913 | Westfield Financial, Inc. | 72,365 | |||||
| 361,280 | |||||||
| Total Common Stocks | |||||||
| (Cost $5,421,887) | 5,340,628 | ||||||
| SHORT-TERM INVESTMENTS – 2.3% | |||||||
| Money Market Mutual Funds – 2.3% | |||||||
| 38,414 | Dreyfus Institutional Cash | ||||||
| Advantage Fund, 0.15%« | 38,414 | ||||||
| 90,000 | Short-Term Investments | ||||||
| Trust – Liquid Assets | |||||||
| Portfolio, 0.16%« | 90,000 | ||||||
| Total Short-Term | |||||||
| Investments | |||||||
| (Cost $128,414) | 128,414 | ||||||
| Total Investments | |||||||
| (Cost $5,550,301) – 97.3% | 5,469,042 | ||||||
| Other Assets in Excess | |||||||
| of Liabilities – 2.7% | 148,957 | ||||||
| TOTAL NET | |||||||
| ASSETS – 100.0% | $ | 5,617,999 | |||||
Notes to Schedule of Investments
| * | Non-Income Producing |
| f | Foreign Security |
| « | 7-Day Yield |
Industry classifications shown in the Schedule of Investments are based off of the Global Industry Classification Standard (GICS®). GICS was developed by and/or is the exclusive property of MSCI, Inc. and Standard & Poor Financial Services LLC (“S&P”). GICS is a service mark of MSCI and S&P and has been licensed for use by U.S. Bancorp Fund Services, LLC.
The accompanying notes are an integral part of these financial statements.
Page 16
Baird SmallCap Value Fund
| Summary of Fair Value Exposure at June 30, 2012 (Unaudited) |
The Fund has adopted authoritative fair valuation accounting standards which establish a definition of fair value and set out a hierarchy for measuring fair value. These standards require additional disclosures about the various inputs and valuation techniques used to develop the measurements of fair value and a discussion on changes in valuation techniques and related inputs during the period. These standards define fair value as the price that would be received to sell an asset or paid to transfer a liability in an orderly transaction between market participants at the measurement date. Management has determined that these standards have no material impact on the Funds’ financial statements. The fair value hierarchy is organized into three levels based upon the assumptions (referred to as “inputs”) used in pricing the asset or liability. These standards state that “observable inputs” reflect the assumptions market participants would use in pricing the asset or liability based on market data obtained from independent sources and “unobservable inputs” reflect an entity’s own assumptions about the assumptions market participants would use in pricing the asset or liability. These inputs are summarized into three broad levels and described below:
| Level 1 – | Unadjusted quoted prices in active markets for identical unrestricted securities. |
| Level 2 – | Other significant observable inputs (including quoted prices for similar securities, quoted prices in inactive markets, dealer indications, interest rates, yield curves, prepayment speeds, credit risk, default rates, inputs corroborated by observable market data, etc.). |
| Level 3 – | Significant unobservable inputs (including the Fund’s own assumptions about the factors that market participants would use in valuing the security) based on the best information available. |
The inputs or methodology used for valuing securities are not necessarily an indication of the risk associated with investing in those securities.
The following is a summary of the inputs used to value the Fund’s investments as of June 30, 2012:
| Level 1 | Level 2 | Level 3 | Total | |||||||||||||
| Equity | ||||||||||||||||
| Common Stocks | $ | 5,340,628 | $ | — | $ | — | $ | 5,340,628 | ||||||||
| Total Equity | 5,340,628 | — | — | 5,340,628 | ||||||||||||
| Short-Term Investments | ||||||||||||||||
| Money Market Mutual Funds | 128,414 | — | — | 128,414 | ||||||||||||
| Total Short-Term Investments | 128,414 | — | — | 128,414 | ||||||||||||
Total Investments* | $ | 5,469,042 | $ | — | $ | — | $ | 5,469,042 | ||||||||
*Additional information regarding the industry classifications of these investments is disclosed in the Schedule of Investments.
Changes in valuation techniques may result in transfers into or out of current assigned levels within the hierarchy.
Page 17
Baird Funds, Inc.
Additional Information on Fund Expenses June 30, 2012 (Unaudited) |
Example
As a shareholder of a mutual fund, you incur two types of costs: (1) transaction costs, which may include sales charges (loads) on purchase payments, reinvested dividends, or other distributions; redemption fees; and exchange fees; and (2) ongoing costs, such as management fees; distribution and/or service (12b-1) fees; and other fund expenses. Although the Funds do not charge any sales loads, redemption fees, or other transaction fees, you will be assessed fees for outgoing wire transfers, returned checks and stop payment orders at prevailing rates charged by U.S. Bancorp Fund Services, LLC, the Fund’s transfer agent. If you request that a redemption be made by wire transfer, currently the Fund’s transfer agent charges a $15.00 fee.
This Example is intended to help you understand your ongoing costs (in dollars) of investing in each Fund and to compare these costs with the ongoing costs of investing in other mutual funds. The Example is based on an investment of $1,000 invested at the beginning of the period and held for the entire period (1/1/12 – 6/30/12 except for the SmallCap Value Fund, which is based on the period since its inception on 5/1/12 – 6/30/12).
Actual Expenses
The third and fourth columns of the following table provide information about account values based on actual returns and actual expenses. You may use the information in these columns, together with the amount you invested, to estimate the expenses that you paid over the period. Simply divide your account value by $1,000 (for example, an $8,600 account value divided by $1,000 = 8.6), then multiply the result by the number in the fourth column entitled “Expenses Paid During Period’’ to estimate the expenses you paid on your account during this period.
Hypothetical Example for Comparison Purposes
The fifth and sixth columns of the following table provide information about hypothetical account values and hypothetical expenses based on the Funds’ actual expense ratios and an assumed rate of return of 5% per year before expenses, which is not the Funds’ actual return. The hypothetical account values and expenses may not be used to estimate the actual ending account balance or expenses you paid for the period. You may use this information to compare the ongoing costs of investing in the Funds and other mutual funds. To do so, compare this 5% hypothetical example with the 5% hypothetical examples that appear in the shareholder reports of the other mutual funds. Please note that the expenses shown in the table are meant to highlight your ongoing costs only and do not reflect any transactional costs. Therefore, the sixth column of the table (entitled “Expenses Paid During Period”) is useful in comparing ongoing costs only, and will not help you determine the relative total costs of owning different mutual funds. In addition, if these transactional costs were included, your costs could have been higher.
Page 18
Baird Funds, Inc.
Additional Information on Fund Expenses June 30, 2012 (Unaudited) |
Actual vs. Hypothetical Returns
For the Six Months Ended June 30, 2012
| Hypothetical (5% return | |||||||
| Actual | before expenses) | ||||||
| Fund’s | Beginning | Ending | Expenses | Ending | Expenses | ||
| Annualized | Account | Account | Paid | Account | Paid | ||
| Expense | Value | Value | During | Value | During | ||
Ratio(1)(2) | 1/1/12 | 6/30/12 | Period(1)(2) | 6/30/12 | Period(1)(2) | ||
| Baird LargeCap Fund | |||||||
| Institutional Class | 0.75% | $1,000.00 | $1,098.70 | $3.91 | $1,021.13 | $3.77 | |
| Investor Class | 1.00% | $1,000.00 | $1,097.90 | $5.22 | $1,019.89 | $5.02 | |
| Baird MidCap Fund | |||||||
| Institutional Class | 0.85% | $1,000.00 | $1,111.20 | $4.46 | $1,020.64 | $4.27 | |
| Investor Class | 1.10% | $1,000.00 | $1,109.70 | $5.77 | $1,019.39 | $5.52 | |
| Baird SmallCap Value Fund | |||||||
| Institutional Class | 1.00% | $1,000.00 | $979.00 | $1.65 | $1,006.67 | $1.67 | |
| Investor Class | 1.25% | $1,000.00 | $978.00 | $2.06 | $1,006.25 | $2.09 | |
| (1) | Expenses are equal to the Baird LargeCap and Baird MidCap Fund’s annualized net expense ratio multiplied by the average account value over the period, multiplied by 182 days and divided by 366 to reflect the one-half year period. |
| (2) | Expenses are equal to the Baird SmallCap Value Fund’s annualized net expense ratio multiplied by the average account value over the period, multiplied by 61 days and divided by 366 to reflect the period since the Fund’s inception on May 1, 2012. |
Page 19
Baird Funds, Inc.
Statements of Assets and Liabilities June 30, 2012 (Unaudited) |
| Baird LargeCap | Baird MidCap | Baird SmallCap | ||||||||||
| Fund | Fund | Value Fund | ||||||||||
| ASSETS: | ||||||||||||
| Investments, at value (cost $18,397,542, | $ | 24,020,113 | $ | 114,193,459 | $ | 5,469,042 | ||||||
| $102,810,278 and $5,550,301, respectively)* | ||||||||||||
| Support Agreement (Note 6) | 50,862 | 71,599 | — | |||||||||
| Dividends receivable | 12,595 | 12,603 | 12,942 | |||||||||
| Interest receivable | 142 | 693 | 40 | |||||||||
| Receivable for investments sold | 185,568 | 608,637 | 118,206 | |||||||||
| Receivable for fund shares sold | — | 370,720 | — | |||||||||
| Uninvested cash | 62 | 1,375 | — | |||||||||
| Receivable from Advisor and Distributor | 557 | — | 8,510 | |||||||||
| Prepaid expenses and other assets | 18,616 | 25,205 | 29,929 | |||||||||
| Total assets | 24,288,515 | 115,284,291 | 5,638,669 | |||||||||
| LIABILITIES: | ||||||||||||
| Payable for collateral received for securities loaned (Note 6) | 470,970 | 7,356,326 | — | |||||||||
| Payable for securities purchased | 360,784 | 507,086 | — | |||||||||
| Payable for fund shares repurchased | 3,453 | 433,941 | 28 | |||||||||
| Payable to Advisor and Distributor | — | 49,827 | — | |||||||||
| Accrued expenses and other liabilities | 33,097 | 33,537 | 20,642 | |||||||||
| Total liabilities | 868,304 | 8,380,717 | 20,670 | |||||||||
| NET ASSETS | $ | 23,420,211 | $ | 106,903,574 | $ | 5,617,999 | ||||||
| NET ASSETS CONSIST OF: | ||||||||||||
| Capital stock | $ | 20,469,833 | $ | 95,280,105 | $ | 5,694,954 | ||||||
| Accumulated undistributed net investment income | 4,064 | 22,808 | 8,526 | |||||||||
| Accumulated net realized gain (loss) on investments sold | (2,727,119 | ) | 145,881 | (4,222 | ) | |||||||
| Net unrealized appreciation (depreciation) | ||||||||||||
| on investments and support agreement | 5,673,433 | 11,454,780 | (81,259 | ) | ||||||||
| NET ASSETS | $ | 23,420,211 | $ | 106,903,574 | $ | 5,617,999 | ||||||
| INSTITUTIONAL CLASS SHARES | ||||||||||||
| Net Assets | $ | 23,097,905 | $ | 80,854,672 | $ | 5,564,614 | ||||||
| Shares outstanding ($0.01 par value, unlimited shares authorized) | 2,412,284 | 7,293,142 | 568,963 | |||||||||
| Net asset value, offering and redemption price per share | $ | 9.58 | $ | 11.09 | $ | 9.78 | ||||||
| INVESTOR CLASS SHARES | ||||||||||||
| Net Assets | $ | 322,306 | $ | 26,048,902 | $ | 53,385 | ||||||
| Shares outstanding ($0.01 par value, unlimited shares authorized) | 33,830 | 2,430,750 | 5,461 | |||||||||
| Net asset value, offering and redemption price per share | $ | 9.53 | $ | 10.72 | $ | 9.78 | ||||||
*Includes securities out on loan to brokers with a market value of $469,376, $7,384,899, and $0, respectively.
The accompanying notes are an integral part of these financial statements.
Page 20
Baird Funds, Inc.
Statements of Operations Six Months Ended June 30, 2012^ (Unaudited) |
| Baird LargeCap | Baird MidCap | Baird SmallCap | ||||||||||
| Fund | Fund | Value Fund | ||||||||||
| INVESTMENT INCOME: | ||||||||||||
| Dividends (net of foreign taxes and issuance fees | ||||||||||||
| withheld of $355, $1,723 and $0, respectively) | $ | 89,122 | $ | 354,958 | $ | 16,656 | ||||||
| Income from securities lending (Note 6) | 1,897 | 6,938 | — | |||||||||
| Interest | 936 | 3,174 | 112 | |||||||||
| Other income | — | 549 | — | |||||||||
| Total investment income | 91,955 | 365,619 | 16,768 | |||||||||
| EXPENSES: | ||||||||||||
| Investment advisory fees | 75,992 | 287,126 | 6,998 | |||||||||
| Administration fees | 1,824 | 5,378 | 549 | |||||||||
| Shareholder servicing fees | 7,694 | 8,726 | 3,568 | |||||||||
| Fund accounting fees | 10,922 | 12,740 | 3,660 | |||||||||
| Professional fees | 14,730 | 14,730 | 6,283 | |||||||||
| Federal and state registration | 20,350 | 23,006 | 6,466 | |||||||||
| Directors fees | 27,108 | 26,708 | 4,856 | |||||||||
| Custody fees | 832 | 14,594 | 727 | |||||||||
| Reports to shareholders | 2,428 | 3,420 | 671 | |||||||||
| Distribution fees – Investor Class Shares (Note 8) | 261 | 17,402 | 9 | |||||||||
| Miscellaneous expenses | 414 | 544 | 92 | |||||||||
| Total expenses | 162,555 | 414,374 | 33,879 | |||||||||
| Expense reimbursement by Advisor (Note 5) | (74,611 | ) | (71,563 | ) | (25,637 | ) | ||||||
| Total expenses | 87,944 | 342,811 | 8,242 | |||||||||
| NET INVESTMENT INCOME | 4,011 | 22,808 | 8,526 | |||||||||
| REALIZED AND UNREALIZED | ||||||||||||
| GAIN (LOSS) ON INVESTMENTS: | ||||||||||||
| Net realized gain (loss) on investments | 709,305 | 109,298 | (4,222 | ) | ||||||||
| Change in unrealized appreciation/depreciation | ||||||||||||
| on investments and support agreement | 1,372,322 | 3,852,603 | (81,259 | ) | ||||||||
| Net realized and unrealized gain (loss) on investments | 2,081,627 | 3,961,901 | (85,481 | ) | ||||||||
| NET INCREASE (DECREASE) IN NET ASSETS | ||||||||||||
| RESULTING FROM OPERATIONS | $ | 2,085,638 | $ | 3,984,709 | $ | (76,955 | ) | |||||
^The Baird SmallCap Value Fund commenced operations on May 1, 2012.
The accompanying notes are an integral part of these financial statements.
Page 21
Baird Funds, Inc.
| Statements of Changes in Net Assets |
| Baird LargeCap Fund | ||||||||
| Six Months Ended | ||||||||
| June 30, 2012 | Year Ended | |||||||
| (Unaudited) | December 31, 2011 | |||||||
| OPERATIONS: | ||||||||
| Net investment income | $ | 4,011 | $ | 26,870 | ||||
| Net realized gain on investments | 709,305 | 1,579,463 | ||||||
| Change in unrealized appreciation/depreciation | ||||||||
| on investments and support agreement | 1,372,322 | (2,097,553 | ) | |||||
| Net increase (decrease) in net assets from operations | 2,085,638 | (491,220 | ) | |||||
| CAPITAL SHARE TRANSACTIONS: | ||||||||
| Proceeds from shares sold | 2,876,933 | 2,788,450 | ||||||
| Shares issued to holders in reinvestment of dividends | — | 26,756 | ||||||
| Cost of shares redeemed | (2,183,546 | ) | (5,196,123 | ) | ||||
| Net increase (decrease) in net assets resulting | ||||||||
| from capital share transactions | 693,387 | (2,380,917 | ) | |||||
| DISTRIBUTIONS TO | ||||||||
| INSTITUTIONAL CLASS SHAREHOLDERS: | ||||||||
| From net investment income | — | (26,841 | ) | |||||
| TOTAL INCREASE (DECREASE) IN NET ASSETS | 2,779,025 | (2,898,978 | ) | |||||
| NET ASSETS: | ||||||||
| Beginning of period | 20,641,186 | 23,540,164 | ||||||
| End of period (including undistributed net | ||||||||
| investment income of $4,064 and $53, respectively) | $ | 23,420,211 | $ | 20,641,186 | ||||
The accompanying notes are an integral part of these financial statements.
Page 22
Baird Funds, Inc.
| Statements of Changes in Net Assets |
| Baird MidCap Fund | ||||||||
| Six Months Ended | ||||||||
| June 30, 2012 | Year Ended | |||||||
| (Unaudited) | December 31, 2011 | |||||||
| OPERATIONS: | ||||||||
| Net investment income (loss) | $ | 22,808 | $ | (40,774 | ) | |||
| Net realized gain on investments | 109,298 | 3,717,798 | ||||||
| Change in unrealized appreciation/depreciation | ||||||||
| on investments and support agreement | 3,852,603 | (1,766,260 | ) | |||||
| Net increase in net assets from operations | 3,984,709 | 1,910,764 | ||||||
| CAPITAL SHARE TRANSACTIONS: | ||||||||
| Proceeds from shares sold | 65,624,329 | 11,352,599 | ||||||
| Shares issued to holders in reinvestment of dividends | — | 2,310,237 | ||||||
| Cost of shares redeemed | (6,166,515 | ) | (4,282,939 | ) | ||||
| Net increase in net assets resulting from capital share transactions | 59,457,814 | 9,379,897 | ||||||
| DISTRIBUTIONS TO | ||||||||
| INSTITUTIONAL CLASS SHAREHOLDERS: | ||||||||
| From net realized gains | — | (2,240,606 | ) | |||||
| DISTRIBUTIONS TO | ||||||||
| INVESTOR CLASS SHAREHOLDERS: | ||||||||
| From net realized gains | — | (140,127 | ) | |||||
| TOTAL INCREASE IN NET ASSETS | 63,442,523 | 8,909,928 | ||||||
| NET ASSETS: | ||||||||
| Beginning of period | 43,461,051 | 34,551,123 | ||||||
| End of period (including distributions in excess of net | ||||||||
| investment income of $22,808 and $0, respectively) | $ | 106,903,574 | $ | 43,461,051 | ||||
The accompanying notes are an integral part of these financial statements.
Page 23
Baird Funds, Inc.
| Statements of Changes in Net Assets |
| Baird SmallCap Value Fund | ||||
| May 1, 2012^ through | ||||
| June 30, 2012 | ||||
| (Unaudited) | ||||
| OPERATIONS: | ||||
| Net investment income | $ | 8,526 | ||
| Net realized loss on investments | (4,222 | ) | ||
| Change in unrealized depreciation on investments | (81,259 | ) | ||
| Net decrease in net assets from operations | (76,955 | ) | ||
| CAPITAL SHARE TRANSACTIONS: | ||||
| Proceeds from shares sold | 5,695,326 | |||
| Cost of shares redeemed | (372 | ) | ||
| Net increase in net assets resulting from capital share transactions | 5,694,954 | |||
| TOTAL INCREASE IN NET ASSETS | 5,617,999 | |||
| NET ASSETS: | ||||
| Beginning of period | — | |||
| End of period (including undistributed net | ||||
| investment income of $8,526) | $ | 5,617,999 | ||
^Commencement of operations.
The accompanying notes are an integral part of these financial statements.
Page 24
Baird Funds, Inc.
| Financial Highlights |
| Baird LargeCap Fund – Institutional Class | ||||||||||||||||||||||||
| Six Months | ||||||||||||||||||||||||
| Ended | ||||||||||||||||||||||||
| June 30, 2012 | Year Ended December 31, | |||||||||||||||||||||||
| (Unaudited) | 2011 | 2010 | 2009 | 2008 | 2007 | |||||||||||||||||||
| Per Share Data: | ||||||||||||||||||||||||
| Net asset value, beginning of period | $ | 8.71 | $ | 8.93 | $ | 7.57 | $ | 5.59 | $ | 9.33 | $ | 8.53 | ||||||||||||
| Income from investment operations: | ||||||||||||||||||||||||
| Net investment income | 0.00 | (1)(2) | 0.01 | 0.01 | 0.03 | 0.03 | 0.02 | |||||||||||||||||
| Net realized and unrealized | ||||||||||||||||||||||||
| gains (losses) on investments | 0.87 | (0.22 | ) | 1.36 | 1.98 | (3.74 | ) | 0.80 | ||||||||||||||||
| Total from investment operations | 0.87 | (0.21 | ) | 1.37 | 2.01 | (3.71 | ) | 0.82 | ||||||||||||||||
| Less distributions: | ||||||||||||||||||||||||
| Distributions from net investment income | — | (0.01 | ) | (0.01 | ) | (0.03 | ) | (0.03 | ) | (0.02 | ) | |||||||||||||
| Net asset value, end of period | $ | 9.58 | $ | 8.71 | $ | 8.93 | $ | 7.57 | $ | 5.59 | $ | 9.33 | ||||||||||||
| Total return | 9.87 | %(3) | (2.34 | %) | 18.06 | % | 36.27 | % | (39.88 | %) | 9.63 | % | ||||||||||||
| Supplemental data and ratios: | ||||||||||||||||||||||||
| Net assets, end of period | $ | 23,097,905 | $ | 20,485,829 | $ | 23,399,325 | $ | 20,741,302 | $ | 16,349,025 | $ | 27,644,009 | ||||||||||||
| Ratio of expenses to average net assets | 0.75 | %(4) | 0.75 | % | 0.75 | % | 0.75 | % | 0.75 | % | 0.75 | % | ||||||||||||
| Ratio of expenses to average | ||||||||||||||||||||||||
| net assets (before waivers) | 1.39 | %(4) | 1.35 | % | 1.40 | % | 1.39 | % | 1.17 | % | 1.10 | % | ||||||||||||
| Ratio of net investment income | ||||||||||||||||||||||||
| to average net assets | 0.04 | %(4) | 0.12 | % | 0.14 | % | 0.46 | % | 0.32 | % | 0.25 | % | ||||||||||||
| Ratio of net investment loss | ||||||||||||||||||||||||
| to average net assets (before waivers) | (0.60 | %)(4) | (0.48 | %) | (0.51 | %) | (0.18 | %) | (0.10 | %) | (0.10 | %) | ||||||||||||
Portfolio turnover rate(5) | 25.4 | %(3) | 38.2 | % | 52.0 | % | 58.7 | % | 43.0 | % | 72.2 | % | ||||||||||||
| (1) | Calculated using average shares outstanding during the period. | |
| (2) | Amount is less than $0.005. | |
| (3) | Not annualized. | |
| (4) | Annualized. | |
| (5) | Portfolio turnover is calculated on the basis of the Fund as a whole without distinguishing between the classes of shares issued. |
The accompanying notes are an integral part of these financial statements.
Page 25
Baird Funds, Inc.
| Financial Highlights |
| Baird LargeCap Fund – Investor Class | ||||||||||||||||||||||||
| Six Months | ||||||||||||||||||||||||
| Ended | ||||||||||||||||||||||||
| June 30, 2012 | Year Ended December 31, | |||||||||||||||||||||||
| (Unaudited) | 2011 | 2010 | 2009 | 2008 | 2007 | |||||||||||||||||||
| Per Share Data: | ||||||||||||||||||||||||
| Net asset value, beginning of period | $ | 8.68 | $ | 8.91 | $ | 7.56 | $ | 5.59 | $ | 9.29 | $ | 8.50 | ||||||||||||
| Income from investment operations: | ||||||||||||||||||||||||
| Net investment income (loss) | (0.01 | )(1) | (0.01 | ) | (0.02 | ) | 0.02 | 0.00 | (2) | 0.00 | (2) | |||||||||||||
| Net realized and unrealized | ||||||||||||||||||||||||
| gains (losses) on investments | 0.86 | (0.22 | ) | 1.37 | 1.97 | (3.70 | ) | 0.79 | ||||||||||||||||
| Total from investment operations | 0.85 | (0.23 | ) | 1.35 | 1.99 | (3.70 | ) | 0.79 | ||||||||||||||||
| Less distributions: | ||||||||||||||||||||||||
| Distributions from net investment income | — | — | — | (0.02 | ) | — | — | |||||||||||||||||
| Net asset value, end of period | $ | 9.53 | $ | 8.68 | $ | 8.91 | $ | 7.56 | $ | 5.59 | $ | 9.29 | ||||||||||||
| Total return | 9.79 | %(3) | (2.58 | %) | 17.86 | % | 35.79 | % | (39.94 | %) | 9.29 | % | ||||||||||||
| Supplemental data and ratios: | ||||||||||||||||||||||||
| Net assets, end of period | $ | 322,306 | $ | 155,357 | $ | 140,839 | $ | 347,385 | $ | 261,198 | $ | 740,779 | ||||||||||||
| Ratio of expenses to average net assets | 1.00 | %(4) | 1.00 | % | 1.00 | % | 1.00 | % | 1.00 | % | 1.00 | % | ||||||||||||
| Ratio of expenses to average | ||||||||||||||||||||||||
| net assets (before waivers) | 1.64 | %(4) | 1.60 | % | 1.65 | % | 1.64 | % | 1.42 | % | 1.35 | % | ||||||||||||
| Ratio of net investment income (loss) | ||||||||||||||||||||||||
| to average net assets | (0.21 | %)(4) | (0.13 | %) | (0.11 | %) | 0.21 | % | 0.07 | % | 0.00 | % | ||||||||||||
| Ratio of net investment loss | ||||||||||||||||||||||||
| to average net assets (before waivers) | (0.85 | %)(4) | (0.73 | %) | (0.76 | %) | (0.43 | %) | (0.35 | %) | (0.35 | %) | ||||||||||||
Portfolio turnover rate(5) | 25.4 | %(3) | 38.2 | % | 52.0 | % | 58.7 | % | 43.0 | % | 72.2 | % | ||||||||||||
| (1) | Calculated using average shares outstanding during the period. | |
| (2) | Amount is less than $0.005. | |
| (3) | Not annualized. | |
| (4) | Annualized. | |
| (5) | Portfolio turnover is calculated on the basis of the Fund as a whole without distinguishing between the classes of shares issued. |
The accompanying notes are an integral part of these financial statements.
Page 26
Baird Funds, Inc.
| Financial Highlights |
| Baird MidCap Fund – Institutional Class | |||||||||||||||||||||||||
| Six Months | |||||||||||||||||||||||||
| Ended | |||||||||||||||||||||||||
| June 30, 2012 | Year Ended December 31, | ||||||||||||||||||||||||
| (Unaudited) | 2011 | 2010 | 2009 | 2008 | 2007 | ||||||||||||||||||||
| Per Share Data: | |||||||||||||||||||||||||
| Net asset value, beginning of period | $ | 9.98 | $ | 10.04 | $ | 7.90 | $ | 5.63 | $ | 9.62 | $ | 9.33 | |||||||||||||
| Income from investment operations: | |||||||||||||||||||||||||
Net investment income (loss)(1) | 0.01 | (0.01 | ) | (0.01 | ) | 0.02 | 0.01 | (0.01 | ) | ||||||||||||||||
| Net realized and unrealized | |||||||||||||||||||||||||
| gains (losses) on investments | 1.10 | 0.54 | 2.15 | 2.27 | (3.99 | ) | 1.99 | ||||||||||||||||||
| Total from investment operations | 1.11 | 0.53 | 2.14 | 2.29 | (3.98 | ) | 1.98 | ||||||||||||||||||
| Less distributions: | |||||||||||||||||||||||||
| Distributions from net investment income | — | — | — | (0.02 | ) | (0.01 | ) | — | |||||||||||||||||
| Distributions from net realized gains | — | (0.59 | ) | — | — | — | (1.69 | ) | |||||||||||||||||
| Total distributions | — | (0.59 | ) | — | (0.02 | ) | (0.01 | ) | (1.69 | ) | |||||||||||||||
| Net asset value, end of period | $ | 11.09 | $ | 9.98 | $ | 10.04 | $ | 7.90 | $ | 5.63 | $ | 9.62 | |||||||||||||
| Total return | 11.12 | %(2) | 5.19 | % | 27.09 | % | 40.90 | % | (41.53 | %) | 20.89 | % | |||||||||||||
| Supplemental data and ratios: | |||||||||||||||||||||||||
| Net assets, end of period | $ | 80,854,672 | $ | 40,880,008 | $ | 33,432,268 | $ | 25,513,554 | $ | 18,163,034 | $ | 36,616,547 | |||||||||||||
| Ratio of expenses to average net assets | 0.85 | %(3) | 0.85 | % | 0.85 | % | 0.85 | % | 0.85 | % | 0.85 | % | |||||||||||||
| Ratio of expenses to average | |||||||||||||||||||||||||
| net assets (before waivers) | 1.04 | %(3) | 1.21 | % | 1.30 | % | 1.34 | % | 1.19 | % | 1.11 | % | |||||||||||||
| Ratio of net investment income (loss) | |||||||||||||||||||||||||
| to average net assets | 0.11 | %(3) | (0.10 | %) | (0.10 | %) | 0.25 | % | 0.06 | % | (0.06 | %) | |||||||||||||
| Ratio of net investment loss | |||||||||||||||||||||||||
| to average net assets (before waivers) | (0.08 | %)(3) | (0.46 | %) | (0.55 | %) | (0.24 | %) | (0.28 | %) | (0.32 | %) | |||||||||||||
Portfolio turnover rate(4) | 17.0 | %(2) | 44.8 | % | 62.7 | % | 61.3 | % | 74.0 | % | 72.3 | % | |||||||||||||
| (1) | Calculated using average shares outstanding during the period. | |
| (2) | Not annualized. | |
| (3) | Annualized. | |
| (4) | Portfolio turnover is calculated on the basis of the Fund as a whole without distinguishing between the classes of shares issued. |
The accompanying notes are an integral part of these financial statements.
Page 27
Baird Funds, Inc.
| Financial Highlights |
| Baird MidCap Fund – Investor Class | ||||||||||||||||||||||||
| Six Months | ||||||||||||||||||||||||
| Ended | ||||||||||||||||||||||||
| June 30, 2012 | Year Ended December 31, | |||||||||||||||||||||||
| (Unaudited) | 2011 | 2010 | 2009 | 2008 | 2007 | |||||||||||||||||||
| Per Share Data: | ||||||||||||||||||||||||
| Net asset value, beginning of period | $ | 9.66 | $ | 9.76 | $ | 7.69 | $ | 5.49 | $ | 9.40 | $ | 9.17 | ||||||||||||
| Income from investment operations: | ||||||||||||||||||||||||
Net investment income (loss)(1) | (0.01 | ) | (0.03 | ) | (0.03 | ) | 0.00 | (2) | (0.02 | ) | (0.04 | ) | ||||||||||||
| Net realized and unrealized | ||||||||||||||||||||||||
| gains (losses) on investments | 1.07 | 0.52 | 2.10 | 2.21 | (3.89 | ) | 1.96 | |||||||||||||||||
| Total from investment operations | 1.06 | 0.49 | 2.07 | 2.21 | (3.91 | ) | 1.92 | |||||||||||||||||
| Less distributions: | ||||||||||||||||||||||||
| Distributions from net investment income | — | — | — | (0.01 | ) | — | — | |||||||||||||||||
| Distributions from net realized gains | — | (0.59 | ) | — | — | — | (1.69 | ) | ||||||||||||||||
| Total distributions | — | (0.59 | ) | — | (0.01 | ) | — | (1.69 | ) | |||||||||||||||
| Net asset value, end of period | $ | 10.72 | $ | 9.66 | $ | 9.76 | $ | 7.69 | $ | 5.49 | $ | 9.40 | ||||||||||||
| Total return | 10.97 | %(3) | 4.93 | % | 26.92 | % | 40.52 | % | (41.70 | %) | 20.61 | % | ||||||||||||
| Supplemental data and ratios: | ||||||||||||||||||||||||
| Net assets, end of period | $ | 26,048,902 | $ | 2,581,043 | $ | 1,118,855 | $ | 1,576,880 | $ | 1,563,786 | $ | 4,783,844 | ||||||||||||
| Ratio of expenses to average net assets | 1.10 | %(4) | 1.10 | % | 1.10 | % | 1.10 | % | 1.10 | % | 1.10 | % | ||||||||||||
| Ratio of expenses to average | ||||||||||||||||||||||||
| net assets (before waivers) | 1.29 | %(4) | 1.46 | % | 1.55 | % | 1.59 | % | 1.44 | % | 1.36 | % | ||||||||||||
| Ratio of net investment income (loss) | ||||||||||||||||||||||||
| to average net assets | (0.14 | %)(4) | (0.35 | %) | (0.35 | %) | 0.00 | % | (0.19 | %) | (0.31 | %) | ||||||||||||
| Ratio of net investment loss | ||||||||||||||||||||||||
| to average net assets (before waivers) | (0.33 | %)(4) | (0.71 | %) | (0.80 | %) | (0.49 | %) | (0.53 | %) | (0.57 | %) | ||||||||||||
Portfolio turnover rate(5) | 17.0 | %(3) | 44.8 | % | 62.7 | % | 61.3 | % | 74.0 | % | 72.3 | % | ||||||||||||
| (1) | Calculated using average shares outstanding during the period. | |
| (2) | Amount is less than $0.005. | |
| (3) | Not annualized. | |
| (4) | Annualized. | |
| (5) | Portfolio turnover is calculated on the basis of the Fund as a whole without distinguishing between the classes of shares issued. |
The accompanying notes are an integral part of these financial statements.
Page 28
Baird Funds, Inc.
| Financial Highlights |
| Baird SmallCap Value Fund – | ||||
| Institutional Class | ||||
| May 1, 2012^ | ||||
| through | ||||
| June 30, 2012 | ||||
| (Unaudited) | ||||
| Per Share Data: | ||||
| Net asset value, beginning of period | $ | 10.00 | ||
| Income from investment operations: | ||||
| Net investment income | 0.01 | |||
| Net realized and unrealized losses on investments | (0.23 | ) | ||
| Total from investment operations | (0.22 | ) | ||
| Net asset value, end of period | $ | 9.78 | ||
| Total return | (2.10 | %)(1) | ||
| Supplemental data and ratios: | ||||
| Net assets, end of period | $ | 5,564,614 | ||
| Ratio of expenses to average net assets | 1.00 | %(2) | ||
| Ratio of expenses to average net assets (before waivers) | 4.11 | %(2) | ||
| Ratio of net investment income to average net assets | 1.04 | %(2) | ||
| Ratio of net investment loss to average net assets (before waivers) | (2.07 | %)(2) | ||
Portfolio turnover rate(3) | 0.6 | %(1) | ||
| ^ | Commenced of operations. | |
| (1) | Not annualized. | |
| (2) | Annualized. | |
| (3) | Portfolio turnover is calculated on the basis of the Fund as a whole without distinguishing between the classes of shares issued. |
The accompanying notes are an integral part of these financial statements.
Page 29
Baird Funds, Inc.
| Financial Highlights |
| Baird SmallCap Value Fund – | ||||
| Investor Class | ||||
| May 1, 2012^ | ||||
| through | ||||
| June 30, 2012 | ||||
| (Unaudited) | ||||
| Per Share Data: | ||||
| Net asset value, beginning of period | $ | 10.00 | ||
| Income from investment operations: | ||||
| Net investment income | 0.01 | |||
| Net realized and unrealized losses on investments | (0.23 | ) | ||
| Total from investment operations | (0.22 | ) | ||
| Net asset value, end of period | $ | 9.78 | ||
| Total return | (2.20 | %)(1) | ||
| Supplemental data and ratios: | ||||
| Net assets, end of period | $ | 53,385 | ||
| Ratio of expenses to average net assets | 1.25 | %(2) | ||
| Ratio of expenses to average net assets (before waivers) | 4.36 | %(2) | ||
| Ratio of net investment income to average net assets | 0.79 | %(2) | ||
| Ratio of net investment loss to average net assets (before waivers) | (2.32 | %)(2) | ||
Portfolio turnover rate(3) | 0.6 | %(1) | ||
| ^ | Commenced of operations. | |
| (1) | Not annualized. | |
| (2) | Annualized. | |
| (3) | Portfolio turnover is calculated on the basis of the Fund as a whole without distinguishing between the classes of shares issued. |
The accompanying notes are an integral part of these financial statements.
Page 30
Baird Funds, Inc.
Notes to the Financial Statements June 30, 2012 (Unaudited) |
1.ORGANIZATION
Baird Funds, Inc. (the “Corporation”) was incorporated on June 9, 2000 as a Wisconsin corporation and is registered as an open-end management investment company under the Investment Company Act of 1940, as amended (the “1940 Act”). The accompanying financial statements include the Baird LargeCap Fund, Baird MidCap Fund and Baird SmallCap Value Fund (each a “Fund” and collectively the “Funds”), three of the eight series comprising the Corporation. Pursuant to the 1940 Act, the Funds are “diversified” series of the Corporation. The investment advisor to the Funds is Robert W. Baird & Co. Incorporated (“Baird” or the “Advisor”).
The Baird LargeCap Fund commenced operations with the sale of both Institutional and Investor Class Shares on September 29, 2000. The Baird MidCap Fund commenced operations with the sale of both Institutional and Investor Class Shares on December 29, 2000. The Baird SmallCap Value Fund commenced operations with the sale of both Institutional and Investor Class Shares on May 1, 2012. The Institutional Class Shares are not subject to a distribution and service (12b-1) fee, while the Investor Class Shares are subject to a distribution and service (12b-1) fee of 0.25%.
The Baird LargeCap Fund seeks long-term growth of capital through investments in equity securities of large-capitalization companies. Dividend income is a secondary consideration.
The Baird MidCap Fund seeks long-term growth of capital through investments in equity securities of mid-capitalization companies.
The Baird SmallCap Value Fund seeks long-term growth of capital through investments in equity securities of small-capitalization companies.
On June 30, 2012, shareholders affiliated with the Advisor held 85% of the Institutional Class shares of the Baird LargeCap Fund, 26% of the Institutional Class shares of the Baird MidCap Fund and 62% of the Institutional Class shares of the Baird SmallCap Value Fund. These shareholders included the Advisor’s participant-directed retirement and deferred compensation plans and the Baird Foundation.
2.SIGNIFICANT ACCOUNTING POLICIES
The following is a summary of significant accounting policies consistently followed by the Funds in the preparation of their financial statements. These policies are in conformity with accounting principles generally accepted in the United States of America.
| a) | Investment Valuation – Section 2(a)(41) of the 1940 Act, together with the rules and interpretations of the SEC, require the Funds, in computing net asset value, to value their portfolio securities using market quotations when they are “readily available.” When market quotations are not readily available (e.g., because there is no regular market quotation for such securities, the market for such security is limited, the validity of quotations is questionable or, for debt securities, Interactive Data Corporation (IDC), the Funds’ independent pricing service, does not provide a price), the Board of Directors of the Corporation must value the securities at “fair value determined in good faith.” The Board |
Page 31
Baird Funds, Inc.
Notes to the Financial Statements June 30, 2012 (Unaudited) |
2. SIGNIFICANT ACCOUNTING POLICIES (cont.)
| has delegated such responsibility to the Advisor pursuant to pricing policies and procedures that the Board has adopted and regularly reviews. In general, the “fair value” of a security means the price that would be received to sell a security in an orderly transaction between market participants at the measurement date. |
| The Funds determine the fair value of their investments and compute their net asset value per share as of the close of regular trading of the New York Stock Exchange (4:00 p.m. EST). |
| Consistent with Section 2(a)(41) of the 1940 Act, the Funds price their securities as follows: common stocks that are listed on a securities exchange (other than NASDAQ) are valued at the last quoted sale price. Securities traded on NASDAQ are valued at the NASDAQ Official Closing Price. Price information on listed stocks is taken from the exchange where the security is primarily traded. Securities that were not traded on the valuation date, as well as stocks that are not listed on an exchange, including NASDAQ, are valued at the average of the current bid and asked price. Debt securities are valued at their bid prices by an independent pricing service using valuation methods that are designed to represent fair value, such as matrix pricing and other analytical pricing models, market transactions and dealer quotations. Debt securities purchased with a remaining maturity of 60 days or less are valued at acquisition cost plus or minus any amortized discount or premium. Investments in mutual funds are valued at their stated net asset value. Other assets and securities for which market quotations are not readily available are valued at fair value as determined in good faith by the Advisor in accordance with procedures approved by the Corporation’s Board of Directors. In accordance with such procedures, the Advisor may use broker quotes or prices obtained from alternative independent pricing services or, if the broker quotes or prices from alternative pricing services are unavailable or deemed to be unreliable, fair value will be determined by a valuation committee of the Advisor. In determining fair value, the valuation committee takes into account all relevant factors and available information. Consequently, the price of the security used by a Fund to calculate its NAV may differ from quoted or published prices for the same security. Fair value pricing involves subjective judgments and there is no single standard for determining a security’s fair value. As a result, different mutual funds could reasonably arrive at a different fair value for the same security. It is possible that the fair value determined for a security is materially different from the value that could be realized upon the sale of that security or from the values that other mutual funds may determine. In addition, given the volatility and periodic illiquidity experienced in recent years, the prices determined for an individual security on any given day may vary significantly from the amount that can be obtained in an actual sale of that security, and the Funds’ NAVs may fluctuate significantly from day to day or from period to period. |
| In May 2011, the FASB issued ASU No. 2011-04 “Amendments to Achieve Common Fair Value Measurement and Disclosure Requirements in GAAP and the International Financial Reporting Standards (“IFRS”) (ASU 2011-04).” ASU 2011-04 amends FASB ASC Topic 820, Fair Value Measurements and Disclosures, to establish common requirements for measuring fair value and for disclosing information about fair value measurements in accordance with GAAP and IFRS. ASU No. 2011-04 is effective for fiscal years beginning after December 15, 2011 and for interim periods within those fiscal years. The Funds have disclosed the applicable requirements of this accounting standard in their financial statements. |
Page 32
Baird Funds, Inc.
Notes to the Financial Statements June 30, 2012 (Unaudited) |
2. SIGNIFICANT ACCOUNTING POLICIES (cont.)
| b) | Foreign Securities – Foreign securities are defined as securities issued by companies that are organized outside the United States. Investing in securities of foreign companies and foreign governments involves special risks and considerations not typically associated with investing in U.S. companies and the U.S. government. These risks include foreign currency fluctuations and adverse political and economic developments. Moreover, securities of many foreign companies and foreign governments and their markets may be less liquid and their prices more volatile than those of securities of comparable U.S. companies and the U.S. government. Occasionally, events that affect those values and exchange rates may occur after the close of the exchange on which such securities are traded. If such events materially affect the value of a Fund’s securities, these securities may be valued at their fair value pursuant to procedures adopted by the Board of Directors. All of the foreign securities owned by the Funds as of June 30, 2012 are traded directly on the New York Stock Exchange or NASDAQ or through an American Depository Receipt (ADR). |
| c) | Income Tax Status –The Funds intend to continue to qualify as regulated investment companies as provided in subchapter M of the Internal Revenue Code and to distribute substantially all of their taxable income to their shareholders in a manner which results in no tax cost to the Funds. Therefore, no federal income or excise tax provision is recorded. |
| There is no tax liability resulting from unrecognized tax benefits relating to uncertain income tax positions taken or expected to be taken on the tax return for the fiscal year ended December 31, 2011, or for any other tax years which are open for exam. As of June 30, 2012, open tax years include the tax years ended December 31, 2008 through 2011. The Funds are not aware of any tax positions for which it is reasonably possible that the total amounts of unrecognized tax benefits will significantly change in the next 12 months. The Funds recognize interest and penalties, if any, related to unrecognized tax benefits as income tax expense and other expense, respectively, in the Statement of Operations. During the year, the Funds did not incur any interest or penalties. |
| d) | Distributions to Shareholders – Distributions from net investment income, if any, are declared and paid annually. Distributions of net realized gains, if any, are declared and paid at least annually. The book basis character of distributions may differ from their ultimate characterization for Federal income tax purposes. |
| e) | Allocation of Income and Expenses – Each Fund is charged for those expenses directly attributable to it. Expenses directly attributable to a class of shares, such as Rule 12b-1 distribution fees, are charged to that class of shares. Income, expenses, and realized and unrealized gains and losses are allocated to the classes based on their respective net assets. Expenses that are not directly attributable to a Fund are allocated among the series of the Corporation in proportion to their assets. |
| f) | Use of Estimates – The preparation of financial statements in conformity with accounting principles generally accepted in the United States requires management to make estimates and assumptions that affect the reported amounts of assets and liabilities and disclosure of contingent assets and liabilities at the date of the financial statements and the reported amounts of revenues and expenses during the reporting period. Actual results could differ from those estimates. |
Page 33
Baird Funds, Inc.
Notes to the Financial Statements June 30, 2012 (Unaudited) |
2. SIGNIFICANT ACCOUNTING POLICIES (cont.)
| g) | Securities Transactions and Investment Income – Investment and shareholder transactions are recorded on the trade date. The Funds determine the gain or loss realized from investment transactions by comparing the original cost of the security lot sold with the net sales proceeds. Dividend income is recognized on the ex-dividend date and interest income is recognized on an accrual basis. Accounting principles generally accepted in the United States require that permanent financial reporting and tax differences be reclassified in the capital accounts. |
| h) | Guarantees and Indemnifications – In the normal course of business, the Funds enter into contracts with service providers that contain general indemnification clauses. The Funds’ maximum exposure under these arrangements is unknown and this would involve future claims against the Funds that have not yet occurred. Based on experience, the Funds would expect the risk of loss to be remote. |
3. CAPITAL SHARE TRANSACTIONS
The following table summarizes the capital share transactions of each Fund for the past two fiscal periods:
| BAIRD LARGECAP FUND | |||||||||||||||||
| Six Months Ended | Six Months Ended | ||||||||||||||||
| June 30, 2012 | June 30, 2012 | ||||||||||||||||
| Institutional Class Shares | Shares | Amount | Investor Class Shares | Shares | Amount | ||||||||||||
| Shares sold | 288,389 | $ | 2,722,149 | Shares sold | 15,990 | $ | 154,784 | ||||||||||
| Shares redeemed | (227,507 | ) | (2,182,976 | ) | Shares redeemed | (56 | ) | (570 | ) | ||||||||
| Net increase | 60,882 | $ | 539,173 | Net increase | 15,934 | $ | 154,214 | ||||||||||
| Shares Outstanding: | Shares Outstanding: | ||||||||||||||||
| Beginning of period | 2,351,402 | Beginning of period | 17,896 | ||||||||||||||
| End of period | 2,412,284 | End of period | 33,830 | ||||||||||||||
| Year Ended | Year Ended | ||||||||||||||||
| December 31, 2011 | December 31, 2011 | ||||||||||||||||
| Institutional Class Shares | Shares | Amount | Investor Class Shares | Shares | Amount | ||||||||||||
| Shares sold | 310,586 | $ | 2,768,012 | Shares sold | 2,275 | $ | 20,438 | ||||||||||
| Shares issued to | |||||||||||||||||
| shareholders in | |||||||||||||||||
| reinvestment of dividends | 3,047 | 26,756 | |||||||||||||||
| Shares redeemed | (581,336 | ) | (5,194,653 | ) | Shares redeemed | (180 | ) | (1,470 | ) | ||||||||
| Net decrease | (267,703 | ) | $ | (2,399,885 | ) | Net increase | 2,095 | $ | 18,968 | ||||||||
| Shares Outstanding: | Shares Outstanding: | ||||||||||||||||
| Beginning of year | 2,619,105 | Beginning of year | 15,801 | ||||||||||||||
| End of year | 2,351,402 | End of year | 17,896 | ||||||||||||||
Page 34
Baird Funds, Inc.
Notes to the Financial Statements June 30, 2012 (Unaudited) |
3.CAPITAL SHARE TRANSACTIONS (cont.)
| BAIRD MIDCAP FUND | |||||||||||||||||
| Six Months Ended | Six Months Ended | ||||||||||||||||
| June 30, 2012 | June 30, 2012 | ||||||||||||||||
| Institutional Class Shares | Shares | Amount | Investor Class Shares | Shares | Amount | ||||||||||||
| Shares sold | 3,575,504 | $ | 40,078,405 | Shares sold | 2,349,515 | $ | 25,545,924 | ||||||||||
| Shares redeemed | (379,409 | ) | (4,184,567 | ) | Shares redeemed | (186,079 | ) | (1,981,948 | ) | ||||||||
| Net increase | 3,196,095 | $ | 35,893,838 | Net increase | 2,163,436 | $ | 23,563,976 | ||||||||||
| Shares Outstanding: | Shares Outstanding: | ||||||||||||||||
| Beginning of period | 4,097,047 | Beginning of period | 267,314 | ||||||||||||||
| End of period | 7,293,142 | End of period | 2,430,750 | ||||||||||||||
| Year Ended | Year Ended | ||||||||||||||||
| December 31, 2011 | December 31, 2011 | ||||||||||||||||
| Institutional Class Shares | Shares | Amount | Investor Class Shares | Shares | Amount | ||||||||||||
| Shares sold | 918,529 | $ | 9,487,425 | Shares sold | 187,694 | $ | 1,865,174 | ||||||||||
| Shares issued to | Shares issued to | ||||||||||||||||
| shareholders in | shareholders in | ||||||||||||||||
| reinvestment of dividends | 214,890 | 2,170,393 | reinvestment of dividends | 14,314 | 139,844 | ||||||||||||
| Shares redeemed | (364,653 | ) | (3,784,255 | ) | Shares redeemed | (49,311 | ) | (498,684 | ) | ||||||||
| Net increase | 768,766 | $ | 7,873,563 | Net increase | 152,697 | $ | 1,506,334 | ||||||||||
| Shares Outstanding: | Shares Outstanding: | ||||||||||||||||
| Beginning of year | 3,328,281 | Beginning of year | 114,617 | ||||||||||||||
| End of year | 4,097,047 | End of year | 267,314 | ||||||||||||||
| BAIRD SMALLCAP VALUE FUND | |||||||||||||||||
| May 1, 2012^ through | May 1, 2012^ through | ||||||||||||||||
| June 30, 2012 | June 30, 2012 | ||||||||||||||||
| Institutional Class Shares | Shares | Amount | Investor Class Shares | Shares | Amount | ||||||||||||
| Shares sold | 569,003 | $ | 5,643,090 | Shares sold | 5,461 | $ | 52,236 | ||||||||||
| Shares redeemed | (40 | ) | (372 | ) | Shares redeemed | — | — | ||||||||||
| Net increase | 568,963 | $ | 5,642,718 | Net increase | 5,461 | $ | 52,236 | ||||||||||
| Shares Outstanding: | Shares Outstanding: | ||||||||||||||||
| Beginning of period | — | Beginning of period | — | ||||||||||||||
| End of period | 568,963 | End of period | 5,461 | ||||||||||||||
^ Commencement of operations.
Page 35
Baird Funds, Inc.
Notes to the Financial Statements June 30, 2012 (Unaudited) |
4.INVESTMENT TRANSACTIONS AND INCOME TAX INFORMATION
During the six months ended June 30, 2012, purchases and sales of investment securities (excluding short-term investments) were as follows:
| Baird | Baird | Baird | |
| LargeCap Fund | MidCap Fund | SmallCap Value Fund^ | |
| Purchases: | $5,651,001 | $70,291,579 | $3,540,023 |
| Sales: | $5,794,115 | $12,445,943 | $ 20,427 |
^ Commenced operations on May 1, 2012.
The Baird LargeCap Fund and Baird MidCap Fund did not purchase or sell U.S. Government securities during the six months ended June 30, 2012. The Baird SmallCap Value Fund did not purchase or sell U.S. Government securities during the period May 1, 2012 through June 30, 2012.
At December 31, 2011, accumulated earnings/losses on a tax basis were as follows:
| Baird | Baird | |||||||
| LargeCap | MidCap | |||||||
| Fund | Fund | |||||||
| Cost of Investments | $ | 20,098,494 | $ | 43,364,740 | ||||
| Gross unrealized appreciation | $ | 5,071,705 | $ | 9,447,340 | ||||
| Gross unrealized depreciation | (782,501 | ) | (1,977,831 | ) | ||||
| Net unrealized appreciation | $ | 4,289,204 | $ | 7,469,509 | ||||
| Undistributed ordinary income | $ | 53 | $ | — | ||||
| Undistributed long-term capital gain | — | 169,251 | ||||||
| Total distributable earnings | $ | 53 | $ | 169,251 | ||||
| Other accumulated losses | $ | (3,424,517 | ) | $ | — | |||
| Total accumulated earnings | $ | 864,740 | $ | 7,638,760 | ||||
Undistributed income or net realized gains for financial statement purposes may differ from amounts recognized for federal income tax purposes due to differences in the recognition and characterization of income, expense and capital gain items. The difference between book-basis and tax-basis unrealized appreciation is attributable primarily to the tax deferral of losses on wash sales.
Additionally, U.S. generally accepted accounting principles require that certain components of net assets relating to permanent differences be reclassified between financial and tax reporting. These reclassifications have no effect on net assets or net asset value per share.
Page 36
Baird Funds, Inc.
Notes to the Financial Statements June 30, 2012 (Unaudited) |
4.INVESTMENT TRANSACTIONS AND INCOME TAX INFORMATION (cont.)
Under the current tax law, capital losses realized after October 31 may be deferred and treated as occurring on the first day of the following fiscal year. For the year ended December 31, 2011, the Baird LargeCap Fund and Baird MidCap Fund did not defer any capital losses occurring between November 1, 2011 and December 31, 2011.
At December 31, 2011, accumulated net realized capital loss carryovers, if any, and the year(s) in which the capital loss carryovers expire were:
| Capital Loss Carryover | Year of Expiration | |
| Baird LargeCap Fund | $ 407,235 | 2016 |
| 3,017,282 | 2017 |
To the extent the Fund realizes future net capital gains, those gains will be offset by any unused capital loss carryovers. During the year ended December 31, 2011, the Baird LargeCap Fund and the Baird MidCap Fund utilized capital loss carryovers of $1,538,929 and $1,264,942, respectively.
RIC Modernization Act
On December 22, 2010, the Regulated Investment Company Modernization Act of 2010 (the “RIC Act”) was enacted, and the provisions within the RIC Act are effective for the Funds. The RIC Act modernized several of the federal income and excise tax provisions related to regulated investments companies (“RICs”). Under the RIC Act, new capital losses may be carried forward indefinitely with the character of the original loss retained. Prior to the RIC Act, capital losses could be carried forward for eight years, and were carried forward as short-term capital losses regardless of the character of the original loss. The RIC Act also contains simplification provisions, which are aimed at preventing disqualification of a RIC for inadvertent failures to comply with asset diversification and/or qualifying income tests. The RIC Act exempts RICs from the preferential dividend rule and repeals the 60-day designation requirement for certain types of pay-through income and gains. In addition, the RIC Act contains provisions aimed at preserving the character of distributions made by a RIC during the portion of its taxable year ending after October 31 or December 31.
During the six months ended June 30, 2012, the Funds did not pay any dividends.
During the year ended December 31, 2011, the Funds paid the following dividends:
| Ordinary Income Dividends | Net Capital Gain | |
| Baird LargeCap Fund | $26,841 | $ — |
| Baird MidCap Fund | — | 2,380,733 |
Page 37
Baird Funds, Inc.
Notes to the Financial Statements June 30, 2012 (Unaudited) |
5.INVESTMENT ADVISORY AND OTHER AGREEMENTS
The Funds have entered into an Investment Advisory Agreement with Baird for the provision of investment advisory services. Pursuant to the Investment Advisory Agreement, the Advisor is entitled to receive a fee, calculated daily and payable monthly, at the annual rate of 0.65% for the Baird LargeCap Fund, 0.75% for the Baird MidCap Fund and 0.85% for the Baird SmallCap Value Fund as applied to the respective Fund’s average daily net assets. Certain officers of the Advisor are also officers of the Funds.
For the six months ended June 30, 2012 and through April 30, 2013, the Advisor has contractually agreed to waive its investment advisory fee and/or reimburse the Funds’ operating expenses (exclusive of brokerage, taxes, and extraordinary expenses) to the extent necessary to ensure that each Fund’s annual operating expenses do not exceed the following percentages of average daily net assets:
| Institutional Class Shares | Investor Class Shares | |
| Baird LargeCap Fund | 0.75% | 1.00% |
| Baird MidCap Fund | 0.85% | 1.10% |
| Baird SmallCap Value Fund | 1.00% | 1.25% |
To the extent that the Advisor reimburses or absorbs fees and expenses, it may seek payment of such amounts for three years after the year in which expenses were reimbursed or absorbed. A Fund will make no such payment, however, if its total annual operating expenses exceed the expense limits in effect at the time the expenses were reimbursed or at the time these payments are proposed.
| Six Months Ended | ||||
| June 30, | Fiscal Year Ended December 31, | |||
| 2012 | 2011 | 2010 | 2009 | |
| Reimbursed/Absorbed Expenses Subject | ||||
| to Recovery by Advisor Until: | 2015 | 2014 | 2013 | 2012 |
| Baird LargeCap Fund | $74,611 | $136,264 | $136,939 | $118,040 |
| Baird MidCap Fund | $71,563 | $136,295 | $133,302 | $110,382 |
Baird SmallCap Value Fund(1) | $25,637 | N/A | N/A | N/A |
(1)Amount shown reflects expense reimbursements made by the Advisor from May 1, 2012 (commencement of operations) through June 30, 2012.
U.S. Bancorp Fund Services, LLC serves as transfer agent, administrator, and accounting services agent for the Funds. U.S. Bank, N.A. serves as custodian for the Funds.
Robert W. Baird & Co. Incorporated (the “Distributor”) is the sole distributor of the Funds pursuant to a distribution agreement.
Page 38
Baird Funds, Inc.
Notes to the Financial Statements June 30, 2012 (Unaudited) |
5.INVESTMENT ADVISORY AND OTHER AGREEMENTS (cont.)
No commissions were earned by the Distributor for services rendered as a registered broker-dealer in securities transactions for the Baird LargeCap Fund and Baird MidCap Fund for the six months ended June 30, 2012 and the Baird SmallCap Value Fund from May 1, 2012 through June 30, 2012.
6.SECURITIES LENDING
Each Fund may lend up to one-third of its total assets (including such loans) to borrowers under terms of participation in a securities lending program administered by U.S. Bank N.A., the Funds’ custodian and an affiliate of the Funds’ transfer agent and administrator. The securities lending agreement requires that loans are collateralized at all times in an amount equal to at least 102% of the market value of any loaned securities at the time of the loan, plus accrued interest.
The Funds receive compensation in the form of fees and earn interest on the cash collateral. The amount of fees depends on a number of factors including the type of security and length of the loan. Each Fund continues to receive interest payments or dividends on the securities loaned during the borrowing period. Each Fund has the right under the terms of the securities lending agreement to recall the securities from the borrower on demand.
As of June 30, 2012, the Baird LargeCap and Baird MidCap Funds had loaned securities that were collateralized by cash equivalents. The cash collateral is invested by the custodian in accordance with approved investment guidelines. Those guidelines require the cash collateral to be invested in readily marketable, high quality, short-term obligations; however, such investments are subject to risk of payment delays or default on the part of the issuer or counterparty or otherwise may not generate sufficient interest to support the costs associated with securities lending. A Fund could also experience delays in recovering its securities and possible loss of income or value if the borrower fails to return the borrowed securities, although the Funds are indemnified from this risk by contract with the securities lending agent.
As of June 30, 2012, the market value of the securities on loan and payable on collateral due to broker were as follows:
| Market Value of | Payable on Collateral | |||||||||
| Securities on Loan | due to Broker | |||||||||
| Baird LargeCap Fund | $ | 469,376 | $ | 470,970 | ||||||
| Baird MidCap Fund | $ | 7,384,899 | $ | 7,356,326 | ||||||
| Baird SmallCap Value Fund | $ | — | $ | — | ||||||
The Funds receive cash as collateral in return for securities lent as part of the securities lending program. The collateral is invested in the Mount Vernon Securities Lending Prime Portfolio (a securities lending trust subject to Rule 2a-7 under the 1940 Act), other than a legacy interest in Atlantic East Funding LLC. The schedules of investments for the Funds include the particular cash collateral holdings as of June 30, 2012.
Page 39
Baird Funds, Inc.
Notes to the Financial Statements June 30, 2012 (Unaudited) |
6.SECURITIES LENDING (cont.)
The Funds’ interest in Atlantic East Funding LLC is priced at fair value by the Valuation Committee of the Advisor. The fair value of the Funds’ interest in Atlantic East Funding LLC is based on the underlying market values of the securities owned by Atlantic East Funding LLC, which are determined by independent pricing sources. In addition, the Funds’ transfer agent and administrator and securities lending agent entered into a support agreement with the Funds to cover potential losses realized by the Funds on their investment in Atlantic East Funding LLC (up to a certain amount). The amounts agreed to be provided to the Funds under the support agreement are shown in the Funds’ schedules of investments and statements of assets and liabilities. At June 30, 2012, the fair value of the Funds’ interest in Atlantic East Funding LLC, plus the amounts payable under the support agreement, amounted to 100% of the outstanding par value of the Funds’ interest in Atlantic East Funding LLC.
The interest income earned by the Funds on investments of cash collateral received from borrowers for the securities loaned to them (“securities lending income”) is reflected in the Funds’ statements of operations. Interest income earned on collateral investments and recognized by the Funds during the six months ended June 30, 2012 for the Baird LargeCap Fund and Baird MidCap Fund was $1,897 and $6,938. The SmallCap Value Fund has not participated in the securities lending program since the Fund’s inception on May 1, 2012.
7.LINE OF CREDIT
The Corporation maintains an uncommitted, senior secured line of credit (“LOC”) with U.S. Bank, N.A. (the “Bank”) to provide the Funds a temporary liquidity source to meet unanticipated redemptions. Under the terms of the LOC, borrowings for each Fund are limited to one-third of the total assets (including the amount borrowed) of the respective Fund, or as otherwise indicated within the Funds’ agreement with the Bank. The Bank charged interest at the Bank’s Prime Rate less 1% for the period January 1 through May 17 and the Bank’s Prime Rate less 2% since May 18 (weighted average rate of 2.01% for the first six months of 2012). For the six months ended June 30, 2012, the Baird LargeCap Fund, Baird MidCap Fund and Baird SmallCap Value Fund did not borrow on the LOC.
8.DISTRIBUTION AND SHAREHOLDER SERVICE PLAN
The Funds have adopted a distribution and shareholder service plan (the “Plan”) pursuant to Rule 12b-1 under the 1940 Act. The Plan allows the Funds to compensate the Distributor for the costs incurred in distributing the Funds’ Investor Class Shares, including amounts paid to brokers or dealers, at an annual rate of 0.25% of the average daily net assets of the Funds’ Investor Class Shares. The Baird LargeCap Fund, Baird MidCap Fund and Baird SmallCap Value Fund incurred $261, $17,402 and $9, respectively, in fees pursuant to the Plan during the six months ended June 30, 2012.
9.SUBSEQUENT EVENT
In preparing these financial statements, the Corporation has evaluated subsequent events after June 30, 2012. There were no subsequent events since June 30, 2012 that would require adjustment to or additional disclosure in these financial statements.
Page 40
Additional Information
Proxy Voting
A description of the policies and procedures that the Funds use to determine how to vote proxies relating to portfolio securities is available without charge, upon request, by calling toll free, 1-866-44BAIRD, or by accessing the Funds’ website at www.bairdfunds.com; and by accessing the SEC’s website at www.sec.gov.
Each Fund’s proxy voting record for the most recent 12-month period ended June 30 is available without charge, upon request, by calling toll free, 1-866-44BAIRD, or by accessing the Funds’ website at www.bairdfunds.com; and by accessing the SEC’s website at www.sec.gov.
Portfolio Holdings Disclosure
The Funds file a complete schedule of portfolio holdings with the SEC for the first and third quarters of each fiscal year on Form N-Q. The Funds’ Forms N-Q are available on the SEC’s website at www.sec.gov and may be reviewed and copied at the SEC’s Public Reference Room in Washington, D.C. Information on the operation of the Public Reference Room may be obtained by calling 1-800-732-0330. The Funds’ Forms N-Q may also be obtained by calling toll-free 1-866-44BAIRD.
Page 41
Baird Funds, Inc.
c/o U.S. Bancorp Fund Services, LLC
P.O. Box 701
Milwaukee, WI 53201-0701
1-866-44BAIRD
Board of Directors
G. Frederick Kasten, Jr. (Chairman)
John W. Feldt
Cory L. Nettles
Marlyn J. Spear
Frederick P. Stratton, Jr.
Investment Advisor and Distributor
Robert W. Baird & Co. Incorporated
777 East Wisconsin Avenue
Milwaukee, WI 53202
Administrator and Transfer Agent
U.S. Bancorp Fund Services, LLC
P.O. Box 701
615 East Michigan Street
Milwaukee, WI 53202
Custodian
U.S. Bank, N.A.
1555 N. RiverCenter Drive, Suite 302
Milwaukee, WI 53212
Legal Counsel
Godfrey & Kahn, S.C.
780 North Water Street
Milwaukee, WI 53202
Independent Registered Public Accounting Firm
Grant Thornton LLP
175 West Jackson Boulevard, 10th Floor
Chicago, IL 60604
Item 2. Code of Ethics.
Not applicable – only required for annual reports on Form N-CSR.
Item 3. Audit Committee Financial Expert.
Not applicable – only required for annual reports on Form N-CSR.
Item 4. Principal Accountant Fees and Services.
Not applicable – only required for annual reports on Form N-CSR.
Item 5. Audit Committee of Listed Registrants.
Not applicable because the Registrant is not a “listed issuer” within the meaning of Rule 10A-3 under the Securities Exchange Act of 1934.
Item 6. Investments.
| Baird Short-Term Bond Fund | |||||||
| Schedule of Investments | |||||||
| June 30, 2012 (Unaudited) | |||||||
| Principal Amount | Value | ||||||
| LONG-TERM INVESTMENTS - 97.8% | |||||||
| U.S. Treasury Securities - 8.4% | |||||||
| $ | 86,700,000 | U.S. Treasury Bonds, | |||||
| 2.375%, 03/31/2016 @ | $ | 92,559,013 | |||||
| 92,559,013 | |||||||
| Taxable Municipal Bonds - 2.3% | |||||||
| Alaska Municipal Bond Bank Authority: | |||||||
| 1,000,000 | 1.422%, 08/01/2012 | 1,000,460 | |||||
| 1,000,000 | 1.918%, 08/01/2013 | 1,011,160 | |||||
| 1,170,000 | City of Arlington TX, | ||||||
| 4.680%, 08/15/2013 | 1,213,208 | ||||||
| 1,240,000 | City of Des Moines IA, | ||||||
| 2.587%, 06/01/2013 | 1,250,602 | ||||||
| 3,000,000 | City of Frederick MD, | ||||||
| 4.520%, 03/01/2013 | 3,070,380 | ||||||
| 231,544 | Educational Enhancement Funding Corporation, | ||||||
| 6.720%, 06/01/2025 | 229,754 | ||||||
| 6,450,000 | Government Development Bank for Puerto Rico, | ||||||
| 3.670%, 05/01/2014 | 6,563,778 | ||||||
| Illinois State: | |||||||
| 545,000 | 4.071%, 01/01/2014 | 562,407 | |||||
| 2,030,000 | 4.422%, 04/01/2015 | 2,138,118 | |||||
| 1,110,000 | 4.961%, 03/01/2016 | 1,194,360 | |||||
| 5,000,000 | Michigan Strategic Fund, | ||||||
| 4.500%, 12/01/2013 | 5,248,650 | ||||||
| 1,690,000 | Puerto Rico Public Finance Corp., | ||||||
| 6.100%, 08/01/2017 | 1,695,341 | ||||||
| 165,000 | Tobacco Settlement Authority Iowa, | ||||||
| 6.500%, 06/01/2023 | 158,766 | ||||||
| 25,336,984 | |||||||
| Other Government Related Securities - 1.6% | |||||||
| 2,500,000 | Corp Andina de Fomento, | ||||||
| 5.200%, 05/21/2013 f | 2,586,730 | ||||||
| 2,000,000 | Export-Import Bank of Korea Notes, | ||||||
| 5.500%, 10/17/2012 f | 2,021,530 | ||||||
| 350,000 | Korea Development Bank, | ||||||
| 5.300%, 01/17/2013 f | 356,634 | ||||||
| 1,887,000 | Korea Electric Power Corporation, | ||||||
| 7.750%, 04/01/2013 f | 1,964,484 | ||||||
| 3,805,000 | Korea Southern Power Co., Ltd., | ||||||
5.375%, 04/18/2013 (Acquired 02/22/2011, Cost $3,895,272) * f | 3,896,305 | ||||||
Petrobras International Finance Company: f | |||||||
| 1,000,000 | 2.875%, 02/06/2015 | 1,015,000 | |||||
| 5,000,000 | 3.875%, 01/27/2016 | 5,162,200 | |||||
| 17,002,883 | |||||||
| Corporate Bonds - 76.5% | |||||||
| Industrials - 26.0% | |||||||
| 1,400,000 | The ADT Corporation, | ||||||
| 2.250%, 07/15/2017 (Acquired 06/27/2012, Cost $1,398,544) * | 1,406,566 | ||||||
| 2,000,000 | American Honda Finance Corporation, | ||||||
| 1.450%, 02/27/2015 (Acquired 02/21/2012, Cost $1,998,940) * @ | 2,007,556 | ||||||
| 2,775,000 | Amgen Inc., | ||||||
| 1.875%, 11/15/2014 @ | 2,818,071 | ||||||
| 5,000,000 | Anadarko Petroleum Corporation, | ||||||
| 5.750%, 06/15/2014 | 5,374,070 | ||||||
Anglo American Capital PLC: f | |||||||
| 6,900,000 | 2.150%, 09/27/2013 (Acquired 09/20/2010 through 03/21/2012, Cost $6,909,261) * | 6,951,260 | |||||
| 900,000 | 9.375%, 04/08/2014 (Acquired 03/23/2012 through 06/19/2012, Cost $1,017,778) * | 1,012,126 | |||||
ArcelorMittal: f | |||||||
| 2,500,000 | 5.375%, 06/01/2013 | 2,571,160 | |||||
| 341,000 | 9.000%, 02/15/2015 | 383,232 | |||||
| 1,000,000 | 3.750%, 02/25/2015 @ | 1,013,683 | |||||
| 1,275,000 | 3.750%, 08/05/2015 @ | 1,282,066 | |||||
| 1,000,000 | AT&T Inc., | ||||||
| 0.875%, 02/13/2015 @ | 999,253 | ||||||
| 3,000,000 | Barrick Gold Corporation, | ||||||
1.750%, 05/30/2014 f | 3,036,834 | ||||||
| 600,000 | The Black & Decker Corporation, | ||||||
| 8.950%, 04/15/2014 | 677,352 | ||||||
BP Capital Markets PLC: f | |||||||
| 5,000,000 | 5.250%, 11/07/2013 @ | 5,298,025 | |||||
| 550,000 | 3.200%, 03/11/2016 @ | 584,984 | |||||
British Telecommunications PLC: f | |||||||
| 5,000,000 | 5.150%, 01/15/2013 | 5,112,135 | |||||
| 1,000,000 | 1.593%, 12/20/2013 | 1,005,736 | |||||
| Bunge Limited Finance Corporation: | |||||||
| 3,938,000 | 5.875%, 05/15/2013 | 4,086,884 | |||||
| 3,000,000 | 5.350%, 04/15/2014 | 3,165,600 | |||||
| 1,520,000 | 5.100%, 07/15/2015 | 1,624,267 | |||||
| 5,324,000 | Cadbury Schweppes U.S. Finance LLC, | ||||||
| 5.125%, 10/01/2013 (Acquired 09/03/2010 through 02/07/2012, Cost $5,575,884) * | 5,577,002 | ||||||
| 5,175,000 | CBS Corporation, | ||||||
| 8.200%, 05/15/2014 | 5,858,768 | ||||||
| 2,191,000 | Comcast Holdings Corporation, | ||||||
| 10.625%, 07/15/2012 | 2,196,651 | ||||||
| 7,367,000 | Computer Sciences Corporation, | ||||||
| 5.500%, 03/15/2013 @ | 7,551,175 | ||||||
| COX Communications Inc.: | |||||||
| 1,224,000 | 5.450%, 12/15/2014 @ | 1,346,875 | |||||
| 2,000,000 | 7.250%, 11/15/2015 | 2,276,332 | |||||
| 1,535,000 | CRH America, Inc., | ||||||
| 6.000%, 09/30/2016 | 1,680,279 | ||||||
| Daimler Finance North America LLC: | |||||||
| 1,750,000 | 6.500%, 11/15/2013 | 1,875,902 | |||||
| 3,600,000 | 2.300%, 01/09/2015 (Acquired 01/04/2012, Cost $3,595,464) * | 3,673,037 | |||||
Deutsche Telekom International Finance B.V.: f | |||||||
| 550,000 | 5.250%, 07/22/2013 | 574,057 | |||||
| 200,000 | 5.750%, 03/23/2016 | 224,278 | |||||
| 4,000,000 | 3.125%, 04/11/2016 (Acquired 03/14/2012, Cost $4,123,146) * | 4,137,220 | |||||
| 2,525,000 | EnCana Holdings Finance Corp., | ||||||
| 5.800%, 05/01/2014 f | 2,717,488 | ||||||
| Express Scripts, Inc.: | |||||||
| 5,000,000 | 6.250%, 06/15/2014 | 5,466,960 | |||||
| 3,000,000 | 3.125%, 05/15/2016 | 3,123,513 | |||||
| 515,000 | FBG Finance Limited, | ||||||
5.125%, 06/15/2015 (Acquired 03/12/2012, Cost $565,784) * f | 564,601 | ||||||
| 3,291,000 | FedEx Corporation, | ||||||
| 7.375%, 01/15/2014 | 3,602,681 | ||||||
| 2,355,000 | FedEx Corporation 2012 Pass-Through Trust, | ||||||
| 2.625%, 01/15/2018 | 2,350,646 | ||||||
| 282,894 | FedEx Corporation Pass-Through Certificates, | ||||||
| Series 1998-1, Class B, 6.845%, 01/15/2019 | 318,256 | ||||||
| 4,000,000 | Ford Motor Credit Company LLC, | ||||||
| 2.750%, 05/15/2015 @ | 4,032,456 | ||||||
| 3,500,000 | Freeport-McMoRan Copper & Gold Inc., | ||||||
| 1.400%, 02/13/2015 @ | 3,488,051 | ||||||
| 6,500,000 | Georgia-Pacific LLC, | ||||||
| 8.250%, 05/01/2016 (Acquired 04/27/2011 through 06/19/2012, Cost $7,054,091) * | 7,160,224 | ||||||
| 1,000,000 | Gilead Sciences, Inc., | ||||||
| 2.400%, 12/01/2014 | 1,030,629 | ||||||
| 7,120,000 | Glencore Funding LLC, | ||||||
| 6.000%, 04/15/2014 (Acquired 01/12/2010 through 02/27/2012, Cost $7,353,121) * | 7,484,694 | ||||||
| 2,300,000 | Highmark Inc., | ||||||
| 6.800%, 08/15/2013 (Acquired 05/08/2012 through 05/30/2012, Cost $2,426,256) * | 2,399,454 | ||||||
| 5,639,000 | HP Enterprise Services LLC, Series B, | ||||||
| 6.000%, 08/01/2013 | 5,917,995 | ||||||
| 6,699,000 | Hutchison Whampoa International Ltd., | ||||||
6.500%, 02/13/2013 (Acquired 01/20/2010 through 01/19/2012, Cost $6,859,820) * f | 6,905,704 | ||||||
| 3,000,000 | Hyundai Capital Services Inc., | ||||||
4.375%, 07/27/2016 (Acquired 05/11/2012, Cost $3,156,239) * f | 3,152,928 | ||||||
| 3,000,000 | International Business Machines Corporation, | ||||||
| 0.750%, 05/11/2015 @ | 2,995,440 | ||||||
| 1,400,000 | The Interpublic Group of Companies, Inc., | ||||||
| 10.000%, 07/15/2017 | 1,582,000 | ||||||
| Laboratory Corporation of America Holdings: | |||||||
| 6,025,000 | 5.500%, 02/01/2013 | 6,171,679 | |||||
| 400,000 | 5.625%, 12/15/2015 | 451,674 | |||||
| 5,000,000 | Lafarge North America Inc., | ||||||
| 6.875%, 07/15/2013 | 5,225,000 | ||||||
| 2,813,000 | Nabisco, Inc., | ||||||
| 7.550%, 06/15/2015 | 3,301,905 | ||||||
| 4,325,000 | Nabors Industries, Inc., | ||||||
| 5.375%, 08/15/2012 | 4,342,408 | ||||||
| 4,700,000 | National Oilwell Varco Inc., | ||||||
| Series B, 6.125%, 08/15/2015 | 4,772,629 | ||||||
Noble Holding International Limited: f | |||||||
| 4,500,000 | 3.450%, 08/01/2015 | 4,736,929 | |||||
| 1,000,000 | 2.500%, 03/15/2017 | 1,015,478 | |||||
| 400,000 | PCCW-HKT Capital No. 2 Limited, | ||||||
6.000%, 07/15/2013 (Acquired 06/18/2012, Cost $415,786) * f | 415,098 | ||||||
| 482,000 | Pearson Dollar Finance PLC, | ||||||
5.700%, 06/01/2014 (Acquired 06/20/2011, Cost $513,264) * f | 516,428 | ||||||
| 4,426,000 | Pearson Dollar Finance Two PLC, f | ||||||
5.500%, 05/06/2013 (Acquired 05/31/2011 through 06/15/2011, Cost $4,570,058) * f | 4,584,199 | ||||||
| 5,000,000 | Petrohawk Energy Corporation, | ||||||
| 7.875%, 06/01/2015 | 5,197,820 | ||||||
| 2,075,000 | Plum Creek Timberlands, L.P., | ||||||
| 5.875%, 11/15/2015 | 2,299,065 | ||||||
| 7,300,000 | POSCO, | ||||||
8.750%, 03/26/2014 (Acquired 03/19/2009 through 04/28/2011, Cost $7,824,706) * f | 8,076,158 | ||||||
| 1,452,000 | PPG Industries, Inc., | ||||||
| 1.900%, 01/15/2016 | 1,485,432 | ||||||
| 4,000,000 | Reed Elsevier Capital Inc., | ||||||
| 7.750%, 01/15/2014 | 4,371,956 | ||||||
| 2,332,000 | Rio Tinto Alcan, Inc., | ||||||
5.200%, 01/15/2014 f | 2,468,541 | ||||||
| 2,000,000 | SABMiller Holdings Inc, | ||||||
| 1.850%, 01/15/2015 (Acquired 01/10/2012, Cost $1,999,880) * @ | 2,028,564 | ||||||
| 1,214,000 | SABMiller PLC, | ||||||
6.500%, 07/01/2016 (Acquired 03/01/2012 through 03/20/2012, Cost $1,402,777) * f | 1,417,313 | ||||||
| 425,000 | Southwestern Bell Telephone, L.P., | ||||||
| 7.000%, 07/01/2015 | 492,747 | ||||||
| 2,249,000 | TCI Communications, Inc., | ||||||
| 8.750%, 08/01/2015 | 2,744,034 | ||||||
Telecom Italia Capital, SA: f | |||||||
| 120,000 | 5.250%, 11/15/2013 | 120,300 | |||||
| 4,875,000 | 4.950%, 09/30/2014 | 4,838,437 | |||||
| 175,000 | 5.250%, 10/01/2015 | 173,250 | |||||
Telefonica Emisiones S.A.U.: f | |||||||
| 2,000,000 | 2.582%, 04/26/2013 | 1,970,108 | |||||
| 3,620,000 | 6.421%, 06/20/2016 | 3,473,766 | |||||
| 1,020,000 | Telefonica Moviles Chile SA, | ||||||
2.875%, 11/09/2015 (Acquired 11/03/2010 through 04/04/2012, Cost $1,016,329) * f | 1,025,227 | ||||||
| 500,000 | Teva Pharmaceutical Finance Company, LLC, | ||||||
5.550%, 02/01/2016 f | 567,183 | ||||||
| 4,500,000 | Teva Pharmaceutical Finance III BV, | ||||||
0.968%, 03/21/2014 f | 4,507,726 | ||||||
| 3,600,000 | Time Warner, Inc., | ||||||
| 3.150%, 07/15/2015 | 3,796,657 | ||||||
| 4,000,000 | Transocean Inc., | ||||||
| 5.050%, 12/15/2016 f @ | 4,338,576 | ||||||
Tyco Electronics Group S.A.: f | |||||||
| 1,655,000 | 5.950%, 01/15/2014 | 1,764,101 | |||||
| 1,000,000 | 1.600%, 02/03/2015 | 1,004,183 | |||||
| 265,000 | Tyco International Finance S.A., | ||||||
6.000%, 11/15/2013 f | 284,733 | ||||||
| 5,924,000 | Union Pacific Railroad Co. 2004 Pass Through Trust, | ||||||
| 5.214%, 09/30/2014 (Acquired 10/22/2010 through 03/29/2012, Cost $6,312,848) * | 6,365,693 | ||||||
| 700,000 | United Technologies Corporation, | ||||||
| 1.200%, 06/01/2015 | 708,146 | ||||||
| 1,500,000 | USX Corporation, | ||||||
| 9.125%, 01/15/2013 | 1,557,963 | ||||||
| 3,100,000 | Valero Energy Corporation, | ||||||
| 4.750%, 04/01/2014 | 3,255,459 | ||||||
| 1,000,000 | Viacom Inc., | ||||||
| 1.250%, 02/27/2015 @ | 1,002,490 | ||||||
| 3,000,000 | Vivendi SA, | ||||||
2.400%, 04/10/2015 (Acquired 04/03/2012, Cost $2,999,820) * f @ | 2,970,288 | ||||||
Volkswagen International Finance N.V.: f | |||||||
| 3,000,000 | 1.625%, 08/12/2013 (Acquired 08/05/2010, Cost $2,991,000) * | 3,024,291 | |||||
| 2,260,000 | 0.982%, 04/01/2014 (Acquired 03/23/2011 through 12/15/2011, Cost $2,255,755) * | 2,255,331 | |||||
| 341,000 | Vulcan Materials Co., | ||||||
| 5.600%, 11/30/2012 | 343,558 | ||||||
| 3,700,000 | Waste Management, Inc., | ||||||
| 5.000%, 03/15/2014 | 3,937,263 | ||||||
| 2,000,000 | Weyerhaeuser Company, | ||||||
| 7.250%, 07/01/2013 | 2,114,470 | ||||||
| 3,631,000 | Wm. Wrigley Jr. Company, | ||||||
| 3.700%, 06/30/2014 (Acquired 03/15/2012 through 05/16/2012, Cost $3,756,906) * @ | 3,751,604 | ||||||
| 6,100,000 | Xerox Corporation, | ||||||
| 8.250%, 05/15/2014 | 6,801,677 | ||||||
| 3,515,000 | Xstrata Canada Corp., | ||||||
| 7.250%, 07/15/2012 f | 3,521,492 | ||||||
| 287,265,185 | |||||||
| Utility - 13.3% | |||||||
| 4,739,000 | Ameren Corporation, | ||||||
| 8.875%, 05/15/2014 | 5,278,720 | ||||||
| 2,200,000 | Appalachian Power Co., Series O, | ||||||
| 5.650%, 08/15/2012 | 2,211,902 | ||||||
| 2,137,000 | Beaver Valley Funding Corporation Debentures, | ||||||
| 9.000%, 06/01/2017 | 2,210,513 | ||||||
| 5,923,000 | Consolidated Natural Gas, Series A, | ||||||
| 5.000%, 03/01/2014 | 6,284,108 | ||||||
| DCP Midstream, LLC: | |||||||
| 3,640,000 | 9.700%, 12/01/2013 (Acquired 07/29/2010 through 03/14/2012, Cost $4,015,848) * | 4,001,416 | |||||
| 1,708,000 | 5.375%, 10/15/2015 (Acquired 01/13/2012, Cost $1,860,654) * | 1,838,971 | |||||
| 500,000 | Duke Energy Corp., | ||||||
| 6.300%, 02/01/2014 | 541,099 | ||||||
| 5,286,000 | El Paso Pipeline Partners Operating Co LLC, | ||||||
| 4.100%, 11/15/2015 @ | 5,530,092 | ||||||
| 4,000,000 | Enel Finance International, | ||||||
5.700%, 01/15/2013 (Acquired 03/10/2010 through 03/31/2010, Cost $4,066,923) * f @ | 4,054,984 | ||||||
| Energy Transfer Partners: | |||||||
| 2,668,000 | 8.500%, 04/15/2014 | 2,953,580 | |||||
| 2,500,000 | 5.950%, 02/01/2015 | 2,723,055 | |||||
| 1,000,000 | 9.700%, 03/15/2019 | 1,282,222 | |||||
| Enterprise Products Operating LLC: | |||||||
| 2,630,000 | 6.125%, 02/01/2013 | 2,702,293 | |||||
| 1,701,000 | Series O, 9.750%, 01/31/2014 | 1,919,089 | |||||
| 575,000 | 3.700%, 06/01/2015 | 613,471 | |||||
| 1,130,000 | Exelon Corporation, | ||||||
| 4.900%, 06/15/2015 | 1,228,176 | ||||||
| 4,750,000 | Exelon Generation Company, LLC, | ||||||
| 5.350%, 01/15/2014 | 5,031,414 | ||||||
| 3,276,108 | GG1C Funding Corporation, | ||||||
| 5.129%, 01/15/2014 (Acquired 04/02/2009 through 07/28/2011, Cost $3,272,969) * | 3,344,513 | ||||||
| 6,600,000 | Gulf South Pipeline Company, L.P., | ||||||
| 5.750%, 08/15/2012 (Acquired 03/25/2011 through 04/12/2011, Cost $6,635,752) * | 6,629,594 | ||||||
| 2,895,000 | Kinder Morgan Energy Partners, L.P., | ||||||
| 5.850%, 09/15/2012 | 2,923,131 | ||||||
| 1,286,785 | Kiowa Power Partners LLC, | ||||||
| 4.811%, 12/30/2013 (Acquired 05/31/2011 through 05/29/2012, Cost $1,307,210) * | 1,300,837 | ||||||
| 7,461,000 | National Grid PLC, | ||||||
| 6.300%, 08/01/2016 f | 8,608,054 | ||||||
| 2,750,000 | Nevada Power Company, | ||||||
| 7.375%, 01/15/2014 | 3,012,212 | ||||||
| Nisource Finance Corp.: | |||||||
| 80,000 | 6.150%, 03/01/2013 | 82,725 | |||||
| 5,775,000 | 5.400%, 07/15/2014 | 6,223,631 | |||||
| 2,000,000 | Northeast Utilities, | ||||||
| 1.218%, 09/20/2013 | 2,008,002 | ||||||
| 2,000,000 | ONEOK, Inc., | ||||||
| 5.200%, 06/15/2015 @ | 2,171,684 | ||||||
| 3,745,000 | Pacific Gas and Electric Company, | ||||||
| 6.250%, 12/01/2013 | 4,028,789 | ||||||
| 1,100,000 | Pennsylvania Electric Co., | ||||||
| 5.125%, 04/01/2014 | 1,171,774 | ||||||
| 2,745,000 | PG&E Corporation, | ||||||
| 5.750%, 04/01/2014 | 2,953,499 | ||||||
| Plains All American Pipeline: | |||||||
| 525,000 | 4.250%, 09/01/2012 | 527,392 | |||||
| 4,635,000 | 5.625%, 12/15/2013 | 4,935,672 | |||||
| PPL Energy Supply, LLC: | |||||||
| 738,000 | 6.300%, 07/15/2013 | 777,587 | |||||
| 4,437,000 | Series A, 5.700%, 10/15/2015 | 4,814,757 | |||||
| 350,000 | 6.200%, 05/15/2016 | 392,282 | |||||
| Rockies Express Pipeline LLC: | |||||||
| 4,000,000 | 6.250%, 07/15/2013 (Acquired 05/06/2011 through 05/13/2011, Cost $4,175,738) * @ | 4,110,000 | |||||
| 2,000,000 | 3.900%, 04/15/2015 (Acquired 02/17/2011, Cost $2,000,214) * | 1,925,000 | |||||
| 2,100,000 | Sempra Energy, | ||||||
| 2.000%, 03/15/2014 | 2,132,836 | ||||||
| 3,000,000 | Southwestern Public Service Company, | ||||||
| 5.600%, 10/01/2016 | 3,388,353 | ||||||
| Spectra Energy Capital LLC: | |||||||
| 1,000,000 | 5.500%, 03/01/2014 | 1,051,390 | |||||
| 5,814,000 | 5.668%, 08/15/2014 | 6,290,794 | |||||
| 5,000,000 | System Energy Resources, Inc., | ||||||
| 6.200%, 10/01/2012 | 5,059,895 | ||||||
| 5,090,000 | Trans-Allegheny Interstate Line Company, | ||||||
| 4.000%, 01/15/2015 (Acquired 01/19/2010 through 06/19/2012, Cost $5,212,044) * | 5,345,610 | ||||||
| 500,000 | Union Electric Company, | ||||||
| 4.750%, 04/01/2015 | 530,895 | ||||||
| 650,000 | Vectren Utility Holdings, Inc., | ||||||
| 5.250%, 08/01/2013 | 678,912 | ||||||
| 3,299,000 | Veolia Environnement, | ||||||
| 5.250%, 06/03/2013 f | 3,405,330 | ||||||
| 6,000,000 | Williams Partners L.P., | ||||||
| 3.800%, 02/15/2015 | 6,311,892 | ||||||
| 146,542,147 | |||||||
| Finance - 37.2% | |||||||
| 2,722,000 | Abbey National Treasury Services PLC, | ||||||
| 3.875%, 11/10/2014 (Acquired 12/29/2011 through 03/19/2012, Cost $2,686,071) * | 2,681,644 | ||||||
| 5,650,000 | ABN AMRO Bank N.V., | ||||||
3.000%, 01/31/2014 (Acquired 01/27/2011 through 04/28/2011, Cost $5,652,611) * f | 5,674,425 | ||||||
| 6,722,000 | AEGON N.V., | ||||||
4.750%, 06/01/2013 f | 6,922,544 | ||||||
| Allstate Corporation: | |||||||
| 3,920,000 | 7.500%, 06/15/2013 | 4,178,402 | |||||
| 1,080,000 | 5.000%, 08/15/2014 | 1,168,448 | |||||
| American Express Credit Corporation: | |||||||
| 4,400,000 | Series C, 7.30%, 08/20/2013 | 4,704,304 | |||||
| 1,200,000 | 2.750%, 09/15/2015 | 1,252,187 | |||||
| 2,700,000 | Ameriprise Financial, Inc., | ||||||
| 5.650%, 11/15/2015 | 3,056,951 | ||||||
| 4,275,000 | AmSouth Bank, | ||||||
| 4.850%, 04/01/2013 | 4,328,437 | ||||||
| 7,678,000 | ANZ National International, | ||||||
6.200%, 07/19/2013 (Acquired 05/25/2010 through 06/09/2011, Cost $7,984,207) * f | 8,044,010 | ||||||
| AON Corporation: | |||||||
| 3,600,000 | 7.375%, 12/14/2012 @ | 3,697,859 | |||||
| 750,000 | 3.500%, 09/30/2015 | 783,770 | |||||
| 1,708,000 | Arden Realty Limited Partnership, | ||||||
| 5.250%, 03/01/2015 (Callable, 12/01/2014) | 1,841,760 | ||||||
| 5,165,000 | ASIF Global Financing XIX, | ||||||
| 4.900%, 01/17/2013 (Acquired 05/26/2011 through 09/28/2011, Cost $5,247,757) * | 5,212,291 | ||||||
| 1,500,000 | Banco Santander-Chile, | ||||||
2.506%, 02/14/2014 (Acquired 02/09/2012, Cost $1,500,000) * f | 1,476,637 | ||||||
| 2,277,000 | BankAmerica Institutional, | ||||||
| 8.070%, 12/31/2026 (Acquired 07/22/2010, Cost $2,254,230) * | 2,326,525 | ||||||
Barclays Bank PLC, f | |||||||
| 2,605,000 | 5.200%, 07/10/2014 | 2,744,607 | |||||
| 2,000,000 | 5.000%, 09/22/2016 | 2,171,920 | |||||
| 2,000,000 | BB&T Corporation, | ||||||
| 2.050%, 04/28/2014 @ | 2,040,930 | ||||||
| 3,000,000 | The Bear Stearns Companies LLC, | ||||||
| 5.300%, 10/30/2015 | 3,255,492 | ||||||
| 850,000 | Canadian Imperial Bank of Commerce, | ||||||
2.350%, 12/11/2015 f | 879,464 | ||||||
| 1,354,000 | Capital One Bank USA NA, | ||||||
| 6.500%, 06/13/2013 | 1,419,071 | ||||||
| 4,900,000 | Capital One Financial Corporation, | ||||||
| 7.375%, 05/23/2014 | 5,382,728 | ||||||
| 2,790,000 | CDP Financial Inc., | ||||||
3.000%, 11/25/2014 (Acquired 11/20/2009 through 06/25/2010, Cost $2,790,482) * f @ | 2,933,850 | ||||||
Cie de Financement Foncier: f | |||||||
| 5,500,000 | 2.250%, 03/07/2014 (Acquired 03/01/2011 through 12/14/2011, Cost $5,493,438) * | 5,533,550 | |||||
| 1,000,000 | 2.500%, 09/16/2015 (Acquired 06/19/2012, Cost $1,006,951) * | 1,003,530 | |||||
| CIT Group, Inc.: | |||||||
| 478,000 | 7.000%, 05/02/2016 (Acquired 04/29/2008 through 06/09/2008, Cost $478,978) * | 479,195 | |||||
| 256,836 | 7.000%, 05/02/2017 (Acquired 06/09/2008, Cost $257,177) * | 257,318 | |||||
| Citigroup, Inc.: | |||||||
| 2,900,000 | 6.500%, 08/19/2013 @ | 3,038,513 | |||||
| 7,000,000 | 6.010%, 01/15/2015 | 7,520,961 | |||||
| CNA Financial Corporation: | |||||||
| 2,125,000 | 5.850%, 12/15/2014 | 2,279,877 | |||||
| 525,000 | 6.500%, 08/15/2016 | 590,768 | |||||
| Comerica Bank: | |||||||
| 4,100,000 | 5.700%, 06/01/2014 | 4,368,964 | |||||
| 825,000 | 5.750%, 11/21/2016 | 932,177 | |||||
Commonwealth Bank of Australia: f | |||||||
| 1,500,000 | 1.198%, 03/17/2014 (Acquired 03/20/2012, Cost $1,499,505) * | 1,502,320 | |||||
| 4,000,000 | 3.500%, 03/19/2015 (Acquired 08/30/2010, Cost $4,103,477) * @ | 4,175,384 | |||||
| 800,000 | Countrywide Financial Corporation, | ||||||
| 6.250%, 05/15/2016 | 832,638 | ||||||
Credit Suisse New York, f | |||||||
| 6,221,000 | 5.000%, 05/15/2013 | 6,415,245 | |||||
| 1,000,000 | 5.500%, 05/01/2014 | 1,060,145 | |||||
| 5,000,000 | Deutsche Bank Aktiengesellschaft, | ||||||
4.875%, 05/20/2013 f | 5,147,960 | ||||||
| 3,177,000 | Dresdner Bank AG, | ||||||
7.250%, 09/15/2015 f | 3,220,245 | ||||||
| Fifth Third Bancorp: | |||||||
| 3,752,000 | 6.250%, 05/01/2013 | 3,907,824 | |||||
| 4,955,000 | 0.479%, 05/17/2013 | 4,937,108 | |||||
| 550,000 | 3.625%, 01/25/2016 | 580,115 | |||||
| 1,000,000 | First Empire Capital Trust I, | ||||||
| 8.234%, 02/01/2027 | 1,058,823 | ||||||
| 1,500,000 | First Hawaiian Capital Trust I, | ||||||
| Series B, 8.343%, 07/01/2027 | 1,500,000 | ||||||
| 8,615,000 | FMR LLC, | ||||||
| 4.750%, 03/01/2013 (Acquired 10/04/2010 through 05/30/2012, Cost $8,781,143) * | 8,812,085 | ||||||
| General Electric Capital Corporation: | |||||||
| 2,000,000 | 5.900%, 05/13/2014 | 2,172,490 | |||||
| 800,000 | 4.750%, 09/15/2014 | 857,955 | |||||
| 5,000,000 | 4.875%, 03/04/2015 | 5,428,830 | |||||
| 1,100,000 | 4.375%, 09/21/2015 | 1,191,766 | |||||
| 5,000,000 | 2.300%, 04/27/2017 @ | 5,033,805 | |||||
| 5,980,000 | Genworth Life Institutional Funding Trust, | ||||||
| 5.875%, 05/03/2013 (Acquired 04/07/2010 through 01/17/2012, Cost $6,111,121) * | 6,080,643 | ||||||
| 787,000 | GMAC Inc., | ||||||
| 7.500%, 12/31/2013 | 834,220 | ||||||
| 5,720,000 | Goldman Sachs Group LP, | ||||||
| 8.000%, 03/01/2013 (Acquired 04/16/2009 through 06/15/2012, Cost $5,879,764) * | 5,907,502 | ||||||
| HSBC Finance Corporation: | |||||||
| 2,200,000 | 6.375%, 11/27/2012 | 2,246,552 | |||||
| 1,451,000 | 4.750%, 07/15/2013 | 1,497,718 | |||||
| 1,950,000 | 5.000%, 06/30/2015 | 2,077,027 | |||||
| 221,000 | 6.676%, 01/15/2021 | 239,280 | |||||
| 1,500,000 | HSBC USA Capital Trust II, | ||||||
| 8.380%, 05/15/2027 (Acquired 11/06/2007, Cost $1,535,299) * | 1,515,999 | ||||||
ING Bank N.V.: f | |||||||
| 205,000 | 2.650%, 01/14/2013 (Acquired 04/12/2011, Cost $205,806) * | 206,039 | |||||
| 3,000,000 | 2.000%, 10/18/2013 (Acquired 10/13/2010 through 10/28/2010, Cost $2,996,795) * | 2,978,886 | |||||
| 1,200,000 | 2.375%, 06/09/2014 (Acquired 02/24/2012, Cost $1,190,801) * | 1,190,813 | |||||
| 1,085,000 | 4.000%, 03/15/2016 (Acquired 03/08/2012, Cost $1,107,254) * | 1,092,376 | |||||
| 6,785,000 | Invesco Ltd., | ||||||
5.375%, 02/27/2013 f | 6,962,278 | ||||||
| 6,050,000 | Irish Life & Permanent Group Holdings PLC, | ||||||
3.600%, 01/14/2013 (Acquired 01/07/2010 through 02/28/2012, Cost $6,028,131) * f | 5,863,019 | ||||||
| J.P. Morgan Chase & Co.: | |||||||
| 723,000 | 5.125%, 09/15/2014 | 768,104 | |||||
| 5,550,000 | 3.450%, 03/01/2016 @ | 5,752,469 | |||||
| 1,446,000 | Jefferson-Pilot Corp., | ||||||
| 4.750%, 01/30/2014 @ | 1,502,646 | ||||||
| 2,500,000 | Kemper Corporation, | ||||||
| 6.000%, 11/30/2015 | 2,620,665 | ||||||
| Key Bank NA: | |||||||
| 5,100,000 | 5.800%, 07/01/2014 | 5,467,129 | |||||
| 3,800,000 | 7.413%, 05/06/2015 | 4,268,369 | |||||
| 374,000 | KeyCorp, | ||||||
| 6.500%, 05/14/2013 | 391,743 | ||||||
| 5,000,000 | Kookmin Bank, | ||||||
7.250%, 05/14/2014 (Acquired 05/26/2009 through 12/15/2011, Cost $5,270,974) * f | 5,475,090 | ||||||
| Liberty Mutual Group Inc.: | |||||||
| 3,992,000 | 7.250%, 09/01/2012 (Acquired 03/31/2010 through 09/21/2011, Cost $4,019,744) * | 4,027,457 | |||||
| 3,188,000 | 5.750%, 03/15/2014 (Acquired 09/03/2009 through 10/05/2010, Cost $3,071,073) * | 3,366,024 | |||||
| 1,700,000 | Lincoln National Corporation, | ||||||
| 5.650%, 08/27/2012 | 1,711,681 | ||||||
| 5,110,000 | Lloyds TSB Bank PLC, | ||||||
4.375%, 01/12/2015 (Acquired 01/05/2010 through 02/24/2012, Cost $5,191,811) * f | 5,277,240 | ||||||
| M&I Marshall & Ilsley Bank: | |||||||
| 787,000 | 5.250%, 09/04/2012 | 792,120 | |||||
| 5,532,000 | 4.850%, 06/16/2015 | 5,898,434 | |||||
| 620,000 | Manufacturers and Traders Trust Co., | ||||||
| 1.751%, 04/01/2013 | 620,000 | ||||||
| 5,035,000 | Manulife Financial Corp., | ||||||
3.400%, 09/17/2015 f | 5,174,339 | ||||||
| Marsh & McLennan Companies, Inc.: | |||||||
| 4,640,000 | 4.850%, 02/15/2013 | 4,739,217 | |||||
| 1,010,000 | 5.750%, 09/15/2015 @ | 1,120,182 | |||||
| Massmutual Global Funding II: | |||||||
| 2,550,000 | 2.875%, 04/21/2014 (Acquired 10/24/2011, Cost $2,602,011) * | 2,624,840 | |||||
| 3,000,000 | 2.300%, 09/28/2015 (Acquired 11/22/2011, Cost $2,996,460) * @ | 3,079,782 | |||||
| 2,000,000 | 3.125%, 04/14/2016 (Acquired 01/19/2012, Cost $2,083,587) * | 2,098,430 | |||||
| 2,671,000 | MBNA Capital, Series A, | ||||||
| 8.278%, 12/01/2026 | 2,736,440 | ||||||
| 3,166,000 | Mercantile Bankshares Corporation Subordinated Notes, Series B, | ||||||
| 4.625%, 04/15/2013 | 3,248,968 | ||||||
| 300,000 | Merrill Lynch & Company, | ||||||
| 6.050%, 08/15/2012 | 301,650 | ||||||
| Metropolitan Life Global Funding I: | |||||||
| 3,242,000 | 5.125%, 04/10/2013 (Acquired 10/25/2010 through 03/17/2011, Cost $3,332,883) * | 3,349,213 | |||||
| 3,173,000 | 5.200%, 09/18/2013 (Acquired 10/21/2010 through 09/23/2011, Cost $3,309,958) * @ | 3,325,380 | |||||
| 2,300,000 | 3.125%, 01/11/2016 (Acquired 01/04/2011 through 03/05/2012, Cost $2,318,175) * | 2,409,731 | |||||
| Monumental Global Funding III: | |||||||
| 350,000 | 0.473%, 01/25/2013 (Acquired 07/28/2009, Cost $341,996) * | 348,990 | |||||
| 1,265,000 | 5.500%, 04/22/2013 (Acquired 09/23/2009 through 03/16/2010, Cost $1,282,146) * | 1,309,428 | |||||
| Morgan Stanley: | |||||||
| 2,600,000 | 2.875%, 01/24/2014 @ | 2,570,742 | |||||
| 1,000,000 | 4.000%, 07/24/2015 | 994,193 | |||||
| 3,516,000 | Morgan Stanley Dean Witter & Co., | ||||||
| 6.750%, 10/15/2013 | 3,653,029 | ||||||
National Australia Bank Limited: f | |||||||
| 800,000 | 5.350%, 06/12/2013 (Acquired 01/31/2012, Cost $826,044) * | 833,544 | |||||
| 500,000 | 3.750%, 03/02/2015 (Acquired 03/14/2012, Cost $521,977) * | 522,479 | |||||
| 2,000,000 | 2.000%, 03/09/2015 | 2,005,076 | |||||
| 475,000 | National City Bank of Cleveland Subordinated Notes, | ||||||
| 4.625%, 05/01/2013 | 488,937 | ||||||
| 350,000 | Nationwide Financial Services Inc., | ||||||
| 5.900%, 07/01/2012 | 350,000 | ||||||
| 2,273,000 | NB Capital Trust IV, | ||||||
| 8.250%, 04/15/2027 | 2,323,915 | ||||||
| 1,000,000 | Nomura Holdings Inc., | ||||||
5.000%, 03/04/2015 f | 1,038,203 | ||||||
| 3,000,000 | Nordea Bank AB, | ||||||
2.250%, 03/20/2015 (Acquired 03/14/2012, Cost $2,993,610) * f | 3,010,821 | ||||||
| 1,000,000 | North Fork Capital Trust II, | ||||||
| 8.000%, 12/15/2027 | 1,007,500 | ||||||
| 925,000 | PNC Funding Corp., | ||||||
| 5.500%, 09/28/2012 | 935,781 | ||||||
| Principal Life Income Funding Trusts: | |||||||
| 1,180,000 | 5.300%, 12/14/2012 | 1,203,881 | |||||
| 2,000,000 | 5.100%, 04/15/2014 | 2,138,368 | |||||
| 221,000 | Protective Life Secured Trust, | ||||||
| 5.450%, 09/28/2012 | 223,488 | ||||||
| Prudential Financial Inc.: | |||||||
| 2,428,000 | 5.150%, 01/15/2013 | 2,484,378 | |||||
| 1,370,000 | 4.500%, 07/15/2013 | 1,417,817 | |||||
| 3,799,000 | 6.200%, 01/15/2015 | 4,170,223 | |||||
| 1,000,000 | Rabobank Nederland Global Senior Unsecured Notes, | ||||||
| 4.200%, 05/13/2014 (Acquired 05/06/2009, Cost $998,170) * f | 1,044,800 | ||||||
The Royal Bank of Scotland Group PLC: f | |||||||
| 1,000,000 | 3.400%, 08/23/2013 | 1,010,355 | |||||
| 3,000,000 | 4.875%, 08/25/2014 (Acquired 08/18/2009 through 01/27/2011, Cost $3,010,640) * | 3,084,423 | |||||
| 1,756,000 | 4.875%, 03/16/2015 | 1,817,017 | |||||
| 1,600,000 | Santander U.S. Debt S.A. Unipersonal, | ||||||
2.991%, 10/07/2013 (Acquired 09/27/2010 through 12/14/2010, Cost $1,596,999) * f | 1,538,498 | ||||||
| 1,500,000 | Scotland International Finance No. 2 B.V., | ||||||
4.250%, 05/23/2013 (Acquired 03/16/2012, Cost $1,503,238) * f | 1,499,437 | ||||||
| SLM Corporation: | |||||||
| 135,000 | 5.125%, 08/27/2012 | 135,506 | |||||
| 2,000,000 | 5.375%, 01/15/2013 | 2,037,468 | |||||
| 4,765,000 | 5.000%, 10/01/2013 | 4,907,950 | |||||
| 5,000,000 | Societe Generale SA, | ||||||
2.200%, 09/14/2013 (Acquired 09/07/2010, Cost $4,994,350) * f @ | 4,929,480 | ||||||
| 1,875,000 | SouthTrust Corporation, | ||||||
| 5.800%, 06/15/2014 | 2,009,599 | ||||||
| 3,000,000 | Sovereign Bank, | ||||||
| 5.125%, 03/15/2013 | 2,998,899 | ||||||
| 4,000,000 | Sumitomo Mitsui Banking Corporation, | ||||||
2.150%, 07/22/2013 (Acquired 07/14/2010, Cost $3,998,480) * f | 4,031,372 | ||||||
| SunTrust Bank: | |||||||
| 5,000,000 | 0.768%, 04/01/2015 | 4,759,875 | |||||
| 2,396,000 | 5.000%, 09/01/2015 | 2,531,458 | |||||
| 4,850,000 | Svenska Handelsbanken AB, | ||||||
4.875%, 06/10/2014 (Acquired 09/20/2011 through 12/13/2011, Cost $5,069,287) * f @ | 5,119,374 | ||||||
| 4,050,000 | The Dai-ichi Mutual Life Insurance Company, | ||||||
5.730%, 03/17/2014 (Acquired 03/02/2011, Cost $4,208,034) * f | 4,197,157 | ||||||
| The Goldman Sachs Group, Inc.: | |||||||
| 2,000,000 | 5.125%, 01/15/2015 | 2,088,102 | |||||
| 225,000 | 3.700%, 08/01/2015 @ | 226,988 | |||||
| The Hartford Financial Services Group, Inc.: | |||||||
| 3,000,000 | 4.000%, 03/30/2015 | 3,146,304 | |||||
| 3,000,000 | 5.500%, 10/15/2016 | 3,248,562 | |||||
UBS AG: f | |||||||
| 1,000,000 | 2.250%, 08/12/2013 | 1,003,074 | |||||
| 5,250,000 | 2.250%, 01/28/2014 | 5,276,859 | |||||
| 6,175,000 | UFJ Finance Aruba A.E.C., | ||||||
| 6.750%, 07/15/2013 f | 6,511,624 | ||||||
| 3,150,000 | Union Bank NA, | ||||||
| 2.125%, 06/16/2017 | 3,150,576 | ||||||
| 750,000 | UnitedHealth Group, Inc., | ||||||
| 4.750%, 02/10/2014 | 795,114 | ||||||
| 7,865,000 | WEA Finance LLC, | ||||||
| 7.500%, 06/02/2014 (Acquired 12/14/2011 through 06/26/2012, Cost $8,562,239) * | 8,581,399 | ||||||
| 5,250,000 | Wells Fargo Bank NA, | ||||||
| 4.750%, 02/09/2015 | 5,626,394 | ||||||
| 720,000 | Westpac Banking Corporation, | ||||||
| 3.000%, 08/04/2015 f | 745,804 | ||||||
| 6,100,000 | Willis North America, Inc., | ||||||
| 5.625%, 07/15/2015 | 6,618,311 | ||||||
| 410,560,114 | |||||||
| Residential Mortgage-Backed Securities - 1.3% | |||||||
| U.S. Government Agency Issues - 0.3% | |||||||
| Federal Home Loan Mortgage Corporation (FHLMC): | |||||||
| 831,550 | Series 3124, Class VP, 6.000%, 06/15/2014 | 847,860 | |||||
| 381,143 | Series 2857, Class VA, 5.000%, 09/15/2015 | 381,746 | |||||
| 166,190 | Series 2910, Class BD, 4.500%, 11/15/2018 | 169,167 | |||||
| 18,576 | Series 5, Class B, 1.013%, 05/15/2019 | 18,712 | |||||
| 18,952 | Series 2970, Class DA, 5.500%, 01/15/2023 | 19,014 | |||||
| Federal National Mortgage Association (FNMA): | |||||||
| 116,468 | 5.500%, 07/01/2015 | 126,613 | |||||
| 1,474,919 | Series 2004-W6, Class 1A4, 5.500%, 07/25/2034 | 1,513,646 | |||||
| 701,685 | Series 2004-W6, Class 1A6, 5.500%, 07/25/2034 | 727,863 | |||||
| 3,804,621 | |||||||
| Non-U.S. Government Agency Issues - 1.0% | |||||||
| 2,259,883 | Banc of America Mortgage Securities Inc, | ||||||
| Series 2003-10, Class 3A1, 5.000%, 01/25/2019 | 2,361,264 | ||||||
| Bank of America Alternative Loan Trust: | |||||||
| 329,811 | Series 2003-4, Class 2A1, 5.000%, 06/25/2018 | 341,628 | |||||
| 1,388,621 | Series 2004-2, Class 5A1, 5.500%, 03/25/2019 | 1,432,733 | |||||
| Countrywide Alternative Loan Trust: | |||||||
| 593,575 | Series 2005-50CB, Class 4A1, 5.000%, 11/25/2020 § | 521,163 | |||||
| 230,739 | Series 2005-73CB, Class 1A7, 5.500%, 01/25/2036 § | 176,467 | |||||
| 1,567,757 | Series 2006-28CB, Class A17, 6.000%, 10/25/2036 § | 963,647 | |||||
| 27,885 | Credit Suisse First Boston Mortgage Securities Corporation, | ||||||
| Series 2005-11, Class 5A1, 5.250%, 12/25/2020 | 27,967 | ||||||
| 4,506,659 | HSI Asset Securitization Corp Trust, | ||||||
| Series 2005-NC1, 0.605%, 07/25/2035 | 4,444,571 | ||||||
| 149,200 | J.P. Morgan Alternative Loan Trust, | ||||||
| Series 2006-S2, Class A2, 5.810%, 05/25/2036 | 148,153 | ||||||
| 162,904 | Merrill Lynch Mortgage Investors Trust, | ||||||
| Series 2005-A8, Class A1C1, 5.250%, 08/25/2036 | 164,364 | ||||||
| Washington Mutual, Inc. Pass-Through Certificates: | |||||||
| 258,081 | Series 2004-CB4, Class 21A, 5.500%, 12/25/2019 | 265,628 | |||||
| 236,176 | Series 2004-CB4, Class 22A, 6.000%, 12/25/2019 | 246,175 | |||||
| 11,093,760 | |||||||
| Asset Backed Securities - 2.5% | |||||||
| 22,457 | Bombardier Capital Mortgage Securitization, | ||||||
| Series 1998-A, Class A3, 6.230%, 04/15/2028 | 22,229 | ||||||
| 1,239,130 | Citigroup Mortgage Loan Trust Inc., | ||||||
| Series 2006-WFH3, Class A3, 0.396%, 10/25/2036 | 1,171,411 | ||||||
| Countrywide Asset-Backed Certificates: | |||||||
| 570,653 | Series 2006-13, Class 1AF2, 5.884%, 01/25/2037 § | 542,121 | |||||
| 2,291,013 | Series 2006-13, Class 1AF3, 5.944%, 01/25/2037 § | 1,494,886 | |||||
| 1,500,000 | Series 2006-9, Class 1AF3, 5.859%, 10/25/2046 | 840,492 | |||||
| 361,033 | Credit Based Asset Servicing and Securitization LLC, | ||||||
| Series 2005-CB8, Class AF2, 5.303%, 12/25/2035 | 325,733 | ||||||
| Green Tree Financial Corporation: | |||||||
| 43,737 | Series 1996-3, Class A5, 7.350%, 05/15/2027 | 45,398 | |||||
| 34,320 | Series 1998-2, Class A5, 6.240%, 12/01/2028 | 35,497 | |||||
| 768,523 | Series 1997-5, Class A6, 6.820%, 05/15/2029 | 804,972 | |||||
| 412,941 | Series 1998-3, Class A5, 6.220%, 03/01/2030 | 450,931 | |||||
| 2,000,000 | Renaissance Home Equity Loan Trust, | ||||||
| Series 2007-2, Class AF2, 5.675%, 06/25/2037 | 811,238 | ||||||
| Residential Asset Mortgage Products, Inc.: | |||||||
| 1,237,361 | Series 2003-RS11, Class AI7, 4.828%, 12/25/2033 | 1,223,054 | |||||
| 111,431 | Series 2003-RS7, Class AI6, 5.340%, 08/25/2033 | 109,517 | |||||
| Soundview Home Equity Loan Trust: | |||||||
| 836,936 | Series 2005-OPT2, Class A5, 0.616%, 08/25/2035 | 830,793 | |||||
| 3,244,289 | Series 2005-OPT4, Class 2A3, 0.505%, 12/25/2035 | 2,954,382 | |||||
| 8,494,721 | Specialty Underwriting & Residential Finance, | ||||||
| Series 2006-BC1, Class A2C, 0.439%, 12/25/2036 | 8,202,104 | ||||||
| 4,622,555 | Springleaf Mortgage Loan Trust, | ||||||
| Series 2012-1A, Class A, 2.667%, 09/25/2057 (Acquired 04/11/2012, Cost $4,622,502) * | 4,619,606 | ||||||
| 3,251,167 | Wells Fargo Home Equity Trust, | ||||||
| Series 2005-2, Class AI1B, 0.536%, 08/25/2035 | 3,228,188 | ||||||
| 27,712,552 | |||||||
| Commercial Mortgage-Backed Securities - 5.2% | |||||||
| 10,000,000 | Bear Stearns Commercial Mortgage Securities, | ||||||
| Series 2005-PWR9, Class A4A, 4.871%, 09/11/2042 | 11,018,010 | ||||||
| 5,808,250 | Credit Suisse First Boston Mortgage Securities Corporation, | ||||||
| Series 2005-C5, Class A4, 5.100%, 08/15/2038 | 6,404,089 | ||||||
| GE Capital Commercial Mortgage Corporation: | |||||||
| 64,431 | Series 2004-C3, Class A3, 4.865%, 07/10/2039 | 64,836 | |||||
| 7,180,000 | Series 2004-C3, Class A4, 5.189%, 07/10/2039 | 7,650,154 | |||||
| 11,161,414 | J.P. Morgan Chase Commercial Mortgage Securities Corp., | ||||||
| Series 2003-CB7, Class A4, 4.879%, 01/12/2038 | 11,575,302 | ||||||
| 8,774,000 | J.P. Morgan Chase Commercial Mortgage Trust, | ||||||
| Series 2005-CB12, Class A4, 4.895%, 09/12/2037 | 9,623,551 | ||||||
| 2,863,090 | RBSCF Trust, | ||||||
| Series 2010-MB1, Class A1, 2.367%, 04/15/2024 (Acquired 04/09/2010, Cost $2,863,029) * | 2,915,424 | ||||||
| 7,506,485 | Wachovia Bank Commercial Mortgage Trust, | ||||||
| Series 2003-C3, Class A2, 4.867%, 02/15/2035 | 7,603,363 | ||||||
| 56,854,729 | |||||||
| Total Long-Term Investments (Cost $1,073,161,563) | 1,078,731,988 | ||||||
| Shares | |||||||
| SHORT-TERM INVESTMENTS - 1.9% | |||||||
| Money Market Mutual Fund - 1.9% | |||||||
| 20,518,668 | Short-Term Investments Trust - Liquid Assets Portfolio, 0.16% « | 20,518,668 | |||||
| Total Short-Term Investments (Cost $20,518,668) | 20,518,668 | ||||||
| Principal Amount | |||||||
| INVESTMENTS PURCHASED WITH CASH PROCEEDS FROM | |||||||
| SECURITIES LENDING - 11.4% | |||||||
| Commercial Paper - 0.0% | |||||||
| $ | 817,950 | Atlantic East Funding LLC, 0.595%, 03/25/2013 † ** | 539,642 | ||||
| Total Commercial Paper (Cost $817,950) | 539,642 | ||||||
| Shares | |||||||
| Investment Companies - 11.4% | |||||||
| 125,762,756 | Mount Vernon Securities Lending Trust Prime Portfolio, 0.31% « | 125,762,756 | |||||
| Total Investment Companies (Cost $125,762,756) | 125,762,756 | ||||||
| Total Investments Purchased With Cash Proceeds From | |||||||
| Securities Lending (Cost $126,580,706) | 126,302,398 | ||||||
| Total Investments (Cost $1,220,260,937) - 111.1% | 1,225,553,054 | ||||||
| Asset Relating to Securities Lending Investments - 0.0% | |||||||
Support Agreement ** ^ α † | 278,308 | ||||||
| Total (Cost $0) | 278,308 | ||||||
| Liabilities in Excess of Other Assets - (11.1)% | (122,554,101 | ) | |||||
| TOTAL NET ASSETS - 100.0% | $ | 1,103,277,261 | |||||
| Notes to Schedule of Investments | |||||||
| * | Restricted Security Deemed Liquid | ||||||
| ** | Illiquid Security | ||||||
| @ | This security or portion of this security is out on loan at June 30, 2012. | ||||||
| f | Foreign Security | ||||||
| ^ | Non-Income Producing | ||||||
| « | 7-Day Yield | ||||||
| § | Security in Default | ||||||
| † | Priced at Fair Value by the Valuation Committee as delegated by the Baird Funds' Board of Directors. | ||||||
| α | The Fund's transfer agent and administrator and securities lending agent entered into a support agreement with | ||||||
| the Fund to cover losses realized by the Fund on its investment in Atlantic East Funding, LLC (up to a certain amount), | |||||||
| which investment was made by the Fund's securities lending agent. | |||||||
Summary of Fair Value Exposure at June 30, 2012 (Unaudited) |
The Fund has adopted authoritative fair valuation accounting standards which establish a definition of fair value and set out a hierarchy for measuring fair value. These standards require additional disclosures about the various inputs and valuation techniques used to develop the measurements of fair value and a discussion on changes in valuation techniques and related inputs during the period. These standards define fair value as the price that would be received to sell an asset or paid to transfer a liability in an orderly transaction between market participants at the measurement date. The fair value hierarchy is organized into three levels based upon the assumptions (referred to as "inputs") used in pricing the asset or liability. These standards state that "observable inputs" reflect the assumptions market participants would use in pricing the asset or liability based on market data obtained from independent sources and "unobservable inputs" reflect an entity's own assumptions about the assumptions market participants would use in pricing the asset or liability. These inputs are summarized into three broad levels and described below: |
| Level 1 - | Unadjusted quoted prices in active markets for identical unrestricted securities. |
| Level 2 - | Other significant observable inputs (including quoted prices for similar securities, quoted prices in inactive markets, dealer indications, interest rates, yield curves, prepayment speeds,credit risk, default rates, inputs corroborated by observable market data, etc.). |
| Level 3 - | Significant unobservable inputs (including the Fund's own assumptions about the factors that market participants would use in valuing the security) based on the best information available. |
The inputs or methodology used for valuing securities are not necessarily an indication of the risk associated with investing in those securities.
The following is a summary of the inputs used to value the Fund's investments as of June 30, 2012:
| Level 1 | Level 2 | Level 3 | Total | |||||||||||||
| Fixed Income | ||||||||||||||||
| U.S. Treasury Obligations | $ | - | $ | 92,559,013 | $ | - | $ | 92,559,013 | ||||||||
| Municipal Bonds | - | 25,336,984 | - | 25,336,984 | ||||||||||||
| Other Government Related Securities | - | 17,002,883 | - | 17,002,883 | ||||||||||||
| Corporate Debt Securities | - | 844,367,446 | - | 844,367,446 | ||||||||||||
| Residential Mortgage-Backed Securities - U.S. Government Agency Issues | - | 3,804,621 | - | 3,804,621 | ||||||||||||
| Residential Mortgage-Backed Securities - Non - U.S. Government Agency Issues | 11,093,760 | - | 11,093,760 | |||||||||||||
| Asset Backed Securities | - | 27,712,552 | - | 27,712,552 | ||||||||||||
| Commercial Mortgage Backed Securities | - | 56,854,729 | - | 56,854,729 | ||||||||||||
| Total Fixed Income | - | 1,078,731,988 | - | 1,078,731,988 | ||||||||||||
| Short-Term Investments | ||||||||||||||||
| Money Market Mutual Fund | 20,518,668 | - | - | 20,518,668 | ||||||||||||
| Total Short-Term Investments | 20,518,668 | - | - | 20,518,668 | ||||||||||||
| Investments Purchased with Cash | ||||||||||||||||
| Proceeds from Securities Lending | ||||||||||||||||
| Commercial Paper | - | 539,642 | - | 539,642 | ||||||||||||
| Money Market Mutual Fund | 125,762,756 | - | - | 125,762,756 | ||||||||||||
| Total Investments Purchased with | ||||||||||||||||
| Cash Proceeds from Securities Lending | 125,762,756 | 539,642 | - | 126,302,398 | ||||||||||||
| Total Investments | $ | 146,281,424 | $ | 1,079,271,630 | $ | - | $ | 1,225,553,054 | ||||||||
| Asset Relating to Securities Lending Investments | $ | - | $ | 278,308 | $ | - | $ | 278,308 | ||||||||
| Baird Intermediate Bond Fund | |||||||
| Schedule of Investments | |||||||
| June 30, 2012 (Unaudited) | |||||||
| Principal Amount | Value | ||||||
| LONG-TERM INVESTMENTS - 97.2% | |||||||
| U.S. Treasury Securities - 24.1% | |||||||
| U.S. Treasury Bonds: | |||||||
| $ | 17,850,000 | 2.375%, 03/31/2016 | $ | 19,056,267 | |||
| 72,100,000 | 2.375%, 07/31/2017 @ | 77,856,753 | |||||
| 30,400,000 | 3.875%, 05/15/2018 @ | 35,589,371 | |||||
| 12,375,000 | 9.125%, 05/15/2018 @ | 18,206,719 | |||||
| 5,000,000 | 2.625%, 08/15/2020 @ | 5,502,735 | |||||
| 10,000,000 | 7.875%, 02/15/2021 | 15,296,880 | |||||
| 10,000,000 | 6.250%, 08/15/2023 @ | 14,525,000 | |||||
| 186,033,725 | |||||||
| U.S. Government Agency Securities - 5.7% | |||||||
| 7,000,000 | Federal Farm Credit Bank, | ||||||
| 3.000%, 09/22/2014 | 7,406,028 | ||||||
| Federal Home Loan Mortgage Corporation (FHLMC): | |||||||
| 5,050,000 | 1.250%, 05/12/2017 | 5,116,741 | |||||
| 8,900,000 | 1.000%, 06/29/2017 | 8,921,654 | |||||
| 5,500,000 | 1.000%, 07/28/2017 | 5,497,145 | |||||
| Federal National Mortgage Association (FNMA): | |||||||
| 3,325,000 | 2.375%, 04/11/2016 | 3,531,805 | |||||
| 6,700,000 | 1.375%, 11/15/2016 @ | 6,857,483 | |||||
| 7,000,000 | 1.250%, 01/30/2017 @ | 7,110,341 | |||||
| 44,441,197 | |||||||
| Taxable Municipal Bonds - 4.3% | |||||||
| Alaska Municipal Bond Bank Authority: | |||||||
| 1,000,000 | 4.309%, 08/01/2018 | 1,118,850 | |||||
| 1,340,000 | 4.459%, 08/01/2019 | 1,505,986 | |||||
| 3,375,000 | California Qualified School Construction Bonds, | ||||||
| 5.955%, 03/01/2019 | 3,797,719 | ||||||
| 2,500,000 | California School Finance Authority, | ||||||
| 4.426%, 07/01/2020 | 2,756,550 | ||||||
| California State: | |||||||
| 900,000 | 5.450%, 04/01/2015 | 995,535 | |||||
| 500,000 | 5.500%, 03/01/2016 | 564,585 | |||||
| 2,000,000 | Central Valley Support Joint Power Agency, | ||||||
| 5.326%, 09/01/2022 | 2,189,440 | ||||||
| 2,500,000 | Contra Costa County California Pension Obligation, | ||||||
| 5.140%, 06/01/2017 | 2,785,675 | ||||||
| 1,465,000 | Dallas Independent School District, | ||||||
| 4.950%, 02/15/2022 (Callable 02/15/2021) | 1,731,308 | ||||||
| 1,000,000 | Davie Florida Water & Sewer Revenue, | ||||||
| 6.062%, 10/01/2025 (Callable 10/01/2020) | 1,124,510 | ||||||
| 3,000,000 | Government Development Bank for Puerto Rico, | ||||||
| 4.704%, 05/01/2016 | 3,116,070 | ||||||
| 5,000,000 | Illinois State, | ||||||
| 3.636%, 02/01/2014 | 5,125,950 | ||||||
| 2,500,000 | Michigan State Housing Development Authority, | ||||||
| 4.625%, 12/01/2015 | 2,601,725 | ||||||
| 2,100,000 | North East Independent School District Texas, | ||||||
| 5.240%, 08/01/2027 | 2,442,405 | ||||||
| 1,185,000 | Tobacco Settlement Authority Iowa, | ||||||
| 6.500%, 06/01/2023 (Callable 06/01/2015) | 1,140,230 | ||||||
| 32,996,538 | |||||||
| Other Government Related Securities - 1.9% | |||||||
| 3,000,000 | KFW, | ||||||
4.875%, 06/17/2019 f | 3,608,469 | ||||||
| 2,000,000 | Korea Development Bank, | ||||||
3.875%, 05/04/2017 f | 2,126,318 | ||||||
| 300,000 | Korea Electric Power Corporation, | ||||||
6.750%, 08/01/2027 f | 371,093 | ||||||
| 1,000,000 | Korea Hydro & Nuclear Power Co., Ltd., | ||||||
6.250%, 06/17/2014 (Acquired 06/10/2009, Cost $989,350) * f | 1,075,622 | ||||||
| 350,000 | National Bank of Hungary Yankee Debentures, | ||||||
8.875%, 11/01/2013 f | 361,095 | ||||||
| 2,500,000 | Petrobras International Finance Company, | ||||||
3.875%, 01/27/2016 f | 2,581,100 | ||||||
| 2,650,000 | United Mexican States, | ||||||
5.125%, 01/15/2020 f @ | 3,107,125 | ||||||
| 1,495,000 | Westdeutsche Landesbank Subordinated Notes, | ||||||
4.796%, 07/15/2015 f | 1,536,550 | ||||||
| 14,767,372 | |||||||
| Corporate Bonds - 51.2% | |||||||
| Industrials - 15.9% | |||||||
| Ameritech Capital Funding Debentures: | |||||||
| 704,100 | 9.100%, 06/01/2016 | 825,726 | |||||
| 2,508,000 | 6.450%, 01/15/2018 | 2,882,191 | |||||
| Anadarko Petroleum Corporation: | |||||||
| 2,000,000 | 6.375%, 09/15/2017 | 2,323,268 | |||||
| 1,000,000 | 6.950%, 06/15/2019 | 1,225,547 | |||||
| 2,000,000 | Aristotle Holding, Inc., | ||||||
| 2.650%, 02/15/2017 (Acquired 02/06/2012, Cost $1,980,500) * | 2,034,738 | ||||||
BP Capital Markets PLC: f | |||||||
| 2,500,000 | 4.750%, 03/10/2019 | 2,829,228 | |||||
| 1,000,000 | 3.245%, 05/06/2022 | 1,035,390 | |||||
| 2,000,000 | British Telecommunications PLC, | ||||||
5.950%, 01/15/2018 f | 2,342,776 | ||||||
| Bunge Limited Finance Corporation: | |||||||
| 1,925,000 | 5.350%, 04/15/2014 | 2,031,260 | |||||
| 1,085,000 | 5.100%, 07/15/2015 | 1,159,428 | |||||
| 1,300,000 | 3.200%, 06/15/2017 | 1,302,879 | |||||
| 1,250,000 | Clear Channel Communications, | ||||||
| 5.500%, 12/15/2016 @ | 621,875 | ||||||
| 550,000 | Comcast Cable Holdings, LLC, | ||||||
| 7.875%, 08/01/2013 | 587,232 | ||||||
| 525,000 | Comcast Corporation, | ||||||
| 6.500%, 01/15/2017 | 624,998 | ||||||
| 75,000 | Comcast Holdings Corporation, | ||||||
| 10.625%, 07/15/2012 | 75,193 | ||||||
| 4,136,000 | Computer Sciences Corporation, | ||||||
| 5.500%, 03/15/2013 @ | 4,239,400 | ||||||
| 3,650,000 | ConAgra Foods, Inc., | ||||||
| 5.875%, 04/15/2014 | 3,941,361 | ||||||
Deutsche Telekom International Finance B.V.: f | |||||||
| 2,200,000 | 3.125%, 04/11/2016 (Acquired 04/04/2011, Cost $2,197,778) * | 2,275,471 | |||||
| 1,300,000 | 6.000%, 07/08/2019 @ | 1,534,949 | |||||
| Donnelley (R.R.) & Sons Co.: | |||||||
| 1,000,000 | 8.600%, 08/15/2016 | 1,060,000 | |||||
| 875,000 | 6.125%, 01/15/2017 @ | 826,875 | |||||
| 1,000,000 | 7.625%, 06/15/2020 | 935,000 | |||||
| 1,000,000 | D.R. Horton, Inc., | ||||||
| 6.500%, 04/15/2016 | 1,082,500 | ||||||
| 453,415 | Federal Express Corporation 1995 Pass-Through Certificates, | ||||||
| Series B2, 7.110%, 01/02/2014 | 476,086 | ||||||
| 2,250,000 | FedEx Corporation, | ||||||
| 7.375%, 01/15/2014 | 2,463,091 | ||||||
| 2,000,000 | Freeport-McMoRan Copper & Gold Inc., | ||||||
| 2.150%, 03/01/2017 | 1,971,894 | ||||||
| 2,000,000 | Georgia-Pacific LLC, | ||||||
| 8.250%, 05/01/2016 (Acquired 10/13/2011, Cost $2,152,595) * | 2,203,146 | ||||||
| 3,456,000 | Glencore Funding LLC, | ||||||
| 6.000%, 04/15/2014 (Acquired 03/31/2004 through 02/02/2010, Cost $3,469,207) * | 3,633,020 | ||||||
| 1,460,000 | GTE Corporation, | ||||||
| 6.840%, 04/15/2018 | 1,788,190 | ||||||
| 1,375,000 | Hanson Australia Funding, | ||||||
5.250%, 03/15/2013 f | 1,405,937 | ||||||
| 650,000 | Hanson PLC Notes, | ||||||
6.125%, 08/15/2016 f | 692,250 | ||||||
| 3,500,000 | Hewlett-Packard Co., | ||||||
| 3.300%, 12/09/2016 | 3,658,382 | ||||||
| 795,000 | Highmark Inc. Notes, | ||||||
| 6.800%, 08/15/2013 (Acquired 08/14/2003 through 05/23/2012, Cost $809,947) * | 829,377 | ||||||
| 250,000 | Historic Time Warner Inc., | ||||||
| 6.875%, 06/15/2018 | 308,028 | ||||||
| 2,800,000 | Hutchison Whampoa International Ltd., | ||||||
7.625%, 04/09/2019 (Acquired 10/16/2009 through 09/19/2011, Cost $3,138,591) * f | 3,459,408 | ||||||
| 1,000,000 | Ingersoll-Rand Company Debentures, | ||||||
6.391%, 11/15/2027 f | 1,199,352 | ||||||
| 1,625,000 | Johnson Controls Inc., | ||||||
| 5.500%, 01/15/2016 @ | 1,826,588 | ||||||
| 2,000,000 | Kraft Foods Group Inc, | ||||||
| 3.500%, 06/06/2022 (Acquired 05/30/2012, Cost $1,982,000) * | 2,052,324 | ||||||
| 1,675,000 | Laboratory Corporation of America Holdings, | ||||||
| 5.500%, 02/01/2013 | 1,715,778 | ||||||
Lafarge SA: f | |||||||
| 1,000,000 | 6.200%, 07/09/2015 (Acquired 07/06/2010, Cost $999,140) * | 1,065,570 | |||||
| 625,000 | 6.500%, 07/15/2016 | 675,000 | |||||
| 180,000 | Limited Brands, Inc., | ||||||
| 5.250%, 11/01/2014 | 189,000 | ||||||
| 75,000 | Martin Marietta Materials, Inc., | ||||||
| 6.600%, 04/15/2018 | 82,715 | ||||||
| 1,625,000 | Masco Corporation, | ||||||
| 6.125%, 10/03/2016 @ | 1,734,200 | ||||||
| 215,000 | Medco Health Solutions, Inc., | ||||||
| 2.750%, 09/15/2015 | 221,080 | ||||||
| 825,000 | Nabors Industries, Inc., | ||||||
| 6.150%, 02/15/2018 | 946,735 | ||||||
| 2,291,000 | Nextel Communications Senior Notes, Series E, | ||||||
| 6.875%, 10/31/2013 | 2,299,591 | ||||||
| 700,000 | PCCW-HKT Capital II Ltd., | ||||||
6.000%, 07/15/2013 (Acquired 07/10/2003, Cost $696,731) * f | 726,422 | ||||||
| 925,000 | Pearson Dollar Finance PLC, | ||||||
5.700%, 06/01/2014 (Acquired 09/28/2005 through 12/14/2007, Cost $925,954) * f | 991,071 | ||||||
| 2,045,000 | Plum Creek Timberlands, L.P., | ||||||
| 5.875%, 11/15/2015 | 2,265,825 | ||||||
| 3,000,000 | POSCO, | ||||||
5.250%, 04/14/2021 (Acquired 04/08/2011 through 09/22/2011, Cost $2,978,212) * f @ | 3,285,939 | ||||||
| 450,000 | Rio Tinto Alcan, Inc., | ||||||
5.000%, 06/01/2015 f | 495,908 | ||||||
Rio Tinto Financial USA Ltd.: f | |||||||
| 1,800,000 | 6.500%, 07/15/2018 | 2,218,565 | |||||
| 1,000,000 | 9.000%, 05/01/2019 | 1,367,275 | |||||
| 500,000 | 3.500%, 11/02/2020 | 531,935 | |||||
| 500,000 | Sprint Nextel Corporation, | ||||||
| 6.000%, 12/01/2016 @ | 478,750 | ||||||
| 1,175,000 | Sunoco, Inc. Senior Unsecured Notes, | ||||||
| 5.750%, 01/15/2017 | 1,248,326 | ||||||
| 3,498,000 | TCI Communications, Inc., | ||||||
| 8.750%, 08/01/2015 | 4,267,955 | ||||||
Teck Resources Limited: f | |||||||
| 1,045,000 | 10.250%, 05/15/2016 | 1,166,481 | |||||
| 1,000,000 | 3.150%, 01/15/2017 | 1,031,514 | |||||
Telecom Italia Capital, SA: f | |||||||
| 1,360,000 | 4.950%, 09/30/2014 | 1,349,800 | |||||
| 2,225,000 | 5.250%, 10/01/2015 | 2,202,750 | |||||
Telefonica Emisiones S.A.U.: f | |||||||
| 2,725,000 | 6.421%, 06/20/2016 f | 2,614,921 | |||||
| 1,000,000 | 6.221%, 07/03/2017 f | 938,793 | |||||
| 1,000,000 | Time Warner Cable, Inc., | ||||||
| 5.850%, 05/01/2017 | 1,175,056 | ||||||
| Time Warner, Inc.: | |||||||
| 1,000,000 | 4.700%, 01/15/2021 | 1,114,326 | |||||
| 2,000,000 | 4.750%, 03/29/2021 | 2,237,712 | |||||
| 2,375,000 | Toyota Motor Credit Corporation, | ||||||
| 2.050%, 01/12/2017 @ | 2,427,575 | ||||||
| 500,000 | Tyco Electronics Group S.A., | ||||||
6.550%, 10/01/2017 f | 596,906 | ||||||
| 650,000 | Tyco International Finance S.A., | ||||||
6.000%, 11/15/2013 f | 698,402 | ||||||
| United AirLines, Inc. Pass-Through Certificates: | |||||||
| 139,615 | Series 1991-A, Class A-2, 10.020%, 03/22/2014 | 72,949 | |||||
| 48,704 | Series 2000-2, Class C, 7.762%, 04/29/2049 § † ** | 1,461 | |||||
Vale Overseas Limited: f | |||||||
| 1,500,000 | 6.250%, 01/23/2017 | 1,705,940 | |||||
| 2,425,000 | 4.375%, 01/11/2022 | 2,469,433 | |||||
| Verizon Communications, Inc.: | |||||||
| 1,000,000 | 5.550%, 02/15/2016 | 1,147,871 | |||||
| 375,000 | 5.500%, 04/01/2017 | 439,215 | |||||
| 500,000 | Viacom Inc., | ||||||
| 6.250%, 04/30/2016 | 582,944 | ||||||
| Vulcan Materials Co.: | |||||||
| 69,000 | 5.600%, 11/30/2012 | 69,518 | |||||
| 2,000,000 | 7.000%, 06/15/2018 | 2,130,000 | |||||
| 125,000 | Waste Management, Inc., | ||||||
| 5.000%, 03/15/2014 | 133,016 | ||||||
| 3,000,000 | Xerox Corporation, | ||||||
| 8.250%, 05/15/2014 | 3,345,087 | ||||||
| 611,000 | Xstrata Canada Corp., | ||||||
6.000%, 10/15/2015 f | 673,330 | ||||||
| 122,896,998 | |||||||
| Utility - 8.5% | |||||||
| 3,000,000 | Ameren Corporation, | ||||||
| 8.875%, 05/15/2014 | 3,341,667 | ||||||
| 2,065,000 | Baltimore Gas & Electric Co. Senior Unsecured Notes, | ||||||
| 6.125%, 07/01/2013 | 2,174,592 | ||||||
| 1,150,000 | Centrais Eletricas Brasileiras SA, | ||||||
5.750%, 10/27/2021 (Acquired 10/20/2011 through 10/25/2011, Cost $1,152,347) * f @ | 1,256,950 | ||||||
| 660,000 | DCP Midstream, LLC, | ||||||
| 9.700%, 12/01/2013 (Acquired 04/03/2012, Cost $729,673) * | 725,531 | ||||||
| Dominion Resources, Inc.: | |||||||
| 1,000,000 | Series C, 5.150%, 07/15/2015 | 1,113,812 | |||||
| 800,000 | 6.000%, 11/30/2017 @ | 956,248 | |||||
| 1,411,000 | DTE Energy Company, | ||||||
| 7.625%, 05/15/2014 | 1,574,099 | ||||||
| 3,000,000 | El Paso Pipeline Partners Operating Co LLC, | ||||||
| 4.100%, 11/15/2015 | 3,138,531 | ||||||
| 2,000,000 | Enel Finance International, | ||||||
5.700%, 01/15/2013 (Acquired 03/31/2010, Cost $2,033,218) * f | 2,027,492 | ||||||
| Energy Transfer Partners: | |||||||
| 1,336,000 | 5.950%, 02/01/2015 | 1,455,200 | |||||
| 778,000 | 9.700%, 03/15/2019 | 997,569 | |||||
| 3,824,000 | Enterprise Products Operating LLC, | ||||||
| 9.750%, 01/31/2014 | 4,314,283 | ||||||
| 1,000,000 | Exelon Corporation, | ||||||
| 4.900%, 06/15/2015 | 1,086,881 | ||||||
| 2,585,000 | Exelon Generation Company, LLC, | ||||||
| 5.350%, 01/15/2014 | 2,738,148 | ||||||
| 2,500,000 | Kinder Morgan Finance, | ||||||
5.700%, 01/05/2016 f @ | 2,631,250 | ||||||
| 99,146 | Kiowa Power Partners LLC, | ||||||
| 4.811%, 12/30/2013 (Acquired 11/19/2004, Cost $99,146) * | 100,229 | ||||||
| 3,800,000 | National Grid PLC, | ||||||
6.300%, 08/01/2016 f | 4,384,212 | ||||||
| 2,000,000 | National Rural Utilities Corporation, | ||||||
| 10.375%, 11/01/2018 | 2,897,970 | ||||||
| 2,000,000 | Nisource Finance Corp., | ||||||
| 4.450%, 12/01/2021 | 2,098,166 | ||||||
| 4,000,000 | NuStar Logistics, L.P., | ||||||
| 6.875%, 07/15/2012 | 4,004,544 | ||||||
| 1,775,000 | PPL Energy Supply, LLC, | ||||||
| Series A, 5.700%, 10/15/2015 | 1,926,120 | ||||||
| PSE&G Power LLC: | |||||||
| 1,000,000 | 5.000%, 04/01/2014 | 1,062,216 | |||||
| 144,000 | 5.320%, 09/15/2016 | 162,389 | |||||
| 220,000 | 5.125%, 04/15/2020 | 243,989 | |||||
| 1,575,000 | Public Service Company of New Mexico, | ||||||
| 7.950%, 05/15/2018 | 1,886,064 | ||||||
| 626,033 | RGS (I&M) Funding Corporation Debentures, | ||||||
| 9.820%, 12/07/2022 | 782,334 | ||||||
| Rockies Express Pipeline LLC: | |||||||
| 3,000,000 | 3.900%, 04/15/2015 (Acquired 02/17/2011, Cost $3,000,321) * | 2,887,500 | |||||
| 1,000,000 | 5.625%, 04/15/2020 (Acquired 03/17/2010, Cost $999,110) * @ | 910,000 | |||||
| 2,000,000 | Sempra Energy, | ||||||
| 2.000%, 03/15/2014 | 2,031,272 | ||||||
| Spectra Energy Capital LLC: | |||||||
| 1,500,000 | 5.500%, 03/01/2014 | 1,577,085 | |||||
| 2,700,000 | 5.668%, 08/15/2014 | 2,921,422 | |||||
| 2,500,000 | Trans-Allegheny Interstate Line Company, | ||||||
| 4.000%, 01/15/2015 (Acquired 01/19/2010, Cost $2,490,650) * | 2,625,545 | ||||||
| 575,000 | Vectren Utility Holdings, Inc., | ||||||
| 5.250%, 08/01/2013 | 600,576 | ||||||
| 2,000,000 | West Penn Power Company, | ||||||
| 5.875%, 08/15/2016 (Acquired 10/25/2010, Cost $2,212,843) * | 2,268,714 | ||||||
| 1,000,000 | Williams Partners L.P., | ||||||
| 5.250%, 03/15/2020 | 1,123,556 | ||||||
| 66,026,156 | |||||||
| Finance - 26.8% | |||||||
| 1,725,000 | AEGON N.V., | ||||||
4.750%, 06/01/2013 f | 1,776,464 | ||||||
| 200,000 | Ally Financial Inc., | ||||||
| 6.750%, 12/01/2014 @ | 210,986 | ||||||
| 3,257,000 | American Express Credit Corporation, | ||||||
| Series C, 7.300%, 08/20/2013 | 3,482,254 | ||||||
| 3,000,000 | American International Group, Inc., | ||||||
| 4.875%, 06/01/2022 @ | 3,069,666 | ||||||
| 630,000 | AmSouth Bancorp, | ||||||
| 6.750%, 11/01/2025 | 599,854 | ||||||
| 2,239,000 | ANZ National (Int'l) LTD, | ||||||
3.125%, 08/10/2015 (Acquired 02/28/2012, Cost $2,279,172) * f | 2,298,831 | ||||||
| 425,000 | AON Corporation, | ||||||
| 3.500%, 09/30/2015 | 444,136 | ||||||
| 2,000,000 | ASIF Global Financing XIX, | ||||||
| 4.900%, 01/17/2013 (Acquired 05/02/2012, Cost $2,040,771) * | 2,018,312 | ||||||
| 1,000,000 | Associates Corporation of North America, | ||||||
| 6.950%, 11/01/2018 | 1,127,510 | ||||||
| 1,700,000 | Australia and New Zealand Banking Group Limited, | ||||||
3.250%, 03/01/2016 (Acquired 02/22/2011, Cost $1,693,081) * f | 1,762,881 | ||||||
| 600,000 | Banco Santander-Chile, | ||||||
7.375%, 07/18/2012 f | 600,944 | ||||||
| 2,695,000 | BankAmerica Institutional, | ||||||
| 8.070%, 12/31/2026 (Acquired 01/04/2006 through 11/06/2007, Cost $2,744,005) * | 2,753,616 | ||||||
| 835,000 | Bank of America Corporation Subordinated Notes, | ||||||
| 10.200%, 07/15/2015 | 945,206 | ||||||
| 2,500,000 | Banponce Trust I, | ||||||
| Series A, 8.327%, 02/01/2027 | 1,808,225 | ||||||
| 2,390,000 | Barclays Bank PLC, | ||||||
5.000%, 09/22/2016 f @ | 2,595,444 | ||||||
| 2,322,000 | BB&T Corporation, | ||||||
| 6.850%, 04/30/2019 @ | 2,928,314 | ||||||
| 3,800,000 | Berkshire Hathaway Finance Corporation, | ||||||
| 1.600%, 05/15/2017 @ | 3,826,459 | ||||||
| Capital One Financial Corporation: | |||||||
| 1,000,000 | 7.375%, 05/23/2014 | 1,098,516 | |||||
| 2,000,000 | 3.150%, 07/15/2016 @ | 2,071,200 | |||||
| 1,000,000 | CDP Financial Inc., | ||||||
4.400%, 11/25/2019 (Acquired 11/20/2009, Cost $997,520) * f | 1,130,319 | ||||||
| 3,500,000 | Cie de Financement Foncier, | ||||||
2.250%, 03/07/2014 (Acquired 07/26/2011, Cost $3,524,338) * f | 3,521,350 | ||||||
| CIT Group, Inc.: | |||||||
| 48,000 | 7.000%, 05/02/2016 (Acquired 01/23/2009 through 01/28/2009, Cost $48,176) * | 48,120 | |||||
| 26,106 | 7.000%, 05/02/2017 (Acquired 01/23/2009 through 01/28/2009, Cost $26,136) * | 26,155 | |||||
| Citigroup, Inc.: | |||||||
| 200,000 | 5.500%, 10/15/2014 | 211,754 | |||||
| 2,100,000 | 6.010%, 01/15/2015 | 2,256,288 | |||||
| 1,800,000 | 4.450%, 01/10/2017 | 1,886,838 | |||||
| 2,000,000 | CNA Financial Corporation, | ||||||
| 6.500%, 08/15/2016 | 2,250,546 | ||||||
| 4,000,000 | Commonwealth Bank of Australia, | ||||||
5.000%, 10/15/2019 (Acquired 03/02/2012, Cost $4,324,519) * f @ | 4,394,516 | ||||||
| 1,900,000 | Countrywide Financial Corporation, | ||||||
| 6.250%, 05/15/2016 | 1,977,516 | ||||||
| 2,425,000 | Credit Suisse New York, | ||||||
5.300%, 08/13/2019 f @ | 2,728,249 | ||||||
| 3,850,000 | Deutsche Bank Aktiengesellschaft, | ||||||
3.250%, 01/11/2016 f | 3,962,212 | ||||||
| 2,577,000 | Dresdner Bank AG, | ||||||
7.250%, 09/15/2015 f | 2,612,078 | ||||||
| 1,495,000 | Fifth Third Bancorp, | ||||||
| 6.250%, 05/01/2013 | 1,557,089 | ||||||
| 1,800,000 | Fifth Third Bank, | ||||||
| 4.750%, 02/01/2015 | 1,914,892 | ||||||
| 327,948 | First National Bank of Chicago Pass-Through Certificates, | ||||||
| Series 1993-A, 8.080%, 01/05/2018 | 368,168 | ||||||
| 1,546,000 | FMR LLC, | ||||||
| 4.750%, 03/01/2013 (Acquired 02/26/2003 through 12/01/2009, Cost $1,550,303) * | 1,581,368 | ||||||
| General Electric Capital Corporation: | |||||||
| 2,000,000 | 5.625%, 09/15/2017 | 2,295,148 | |||||
| 1,600,000 | 6.000%, 08/07/2019 | 1,872,122 | |||||
| 2,300,000 | 5.500%, 01/08/2020 | 2,632,437 | |||||
| 1,150,000 | Genworth Financial, Inc., | ||||||
| 5.750%, 06/15/2014 @ | 1,168,623 | ||||||
| 2,620,000 | Genworth Life Institutional Funding Trust, | ||||||
| 5.875%, 05/03/2013 (Acquired 03/22/2011 through 03/22/2011, Cost $2,689,493) * | 2,664,095 | ||||||
| GMAC Inc.: | |||||||
| 80,000 | 7.500%, 12/31/2013 | 84,800 | |||||
| 96,000 | 8.000%, 12/31/2018 | 106,320 | |||||
| 1,800,000 | Great West Life & Annuity Insurance, | ||||||
| 7.153%, 05/16/2046 (Acquired 05/16/2006 through 11/08/2007, Cost $1,792,736) * | 1,791,000 | ||||||
| 1,758,000 | HSBC Finance Corporation, | ||||||
| 6.676%, 01/15/2021 | 1,903,411 | ||||||
| 1,000,000 | HSBC Holdings PLC, | ||||||
5.250%, 12/12/2012 f | 1,018,027 | ||||||
| 1,000,000 | HSBC USA Inc., | ||||||
| 2.375%, 02/13/2015 | 1,011,398 | ||||||
| 2,000,000 | Humana Inc., | ||||||
| 7.200%, 06/15/2018 | 2,403,380 | ||||||
ING Bank N.V.: f | |||||||
| 2,000,000 | 2.000%, 10/18/2013 (Acquired 10/28/2010, Cost $2,000,991) * | 1,985,924 | |||||
| 1,000,000 | 3.000%, 09/01/2015 (Acquired 08/17/2010, Cost $997,320) * | 987,982 | |||||
| 1,567,000 | Invesco Ltd., | ||||||
5.375%, 02/27/2013 f | 1,607,943 | ||||||
| 2,075,000 | Irish Life & Permanent Group Holdings PLC, | ||||||
3.600%, 01/14/2013 (Acquired 01/07/2010, Cost $2,073,879) * f | 2,010,870 | ||||||
| Istar Financial, Inc.: | |||||||
| 1,050,000 | 5.950%, 10/15/2013 | 1,014,563 | |||||
| 75,000 | 5.850%, 03/15/2017 | 66,187 | |||||
| 2,000,000 | Jefferies Group, Inc., | ||||||
| 6.875%, 04/15/2021 | 2,011,214 | ||||||
| J.P. Morgan Chase & Co.: | |||||||
| 1,725,000 | 3.450%, 03/01/2016 | 1,787,930 | |||||
| 3,000,000 | 4.500%, 01/24/2022 @ | 3,231,654 | |||||
| Key Bank NA: | |||||||
| 2,000,000 | 5.800%, 07/01/2014 | 2,143,972 | |||||
| 2,000,000 | 7.413%, 05/06/2015 | 2,246,510 | |||||
| 2,600,000 | Kookmin Bank, | ||||||
7.250%, 05/14/2014 (Acquired 06/12/2009, Cost $2,618,484) * f | 2,847,047 | ||||||
| Liberty Mutual Group Inc.: | |||||||
| 1,550,000 | 7.250%, 09/01/2012 (Acquired 08/03/2004 through 08/24/2011, Cost $1,557,557) * | 1,563,767 | |||||
| 1,000,000 | 5.750%, 03/15/2014 (Acquired 09/03/2009 through 10/15/2010, Cost $988,036) * | 1,055,842 | |||||
| 2,900,000 | Lloyds TSB Bank PLC, | ||||||
5.800%, 01/13/2020 (Acquired 02/09/2010 through 03/16/2012, Cost $2,905,997) * f | 3,100,132 | ||||||
| M&I Marshall & Ilsley Bank: | |||||||
| 1,925,000 | 4.850%, 06/16/2015 | 2,052,510 | |||||
| 1,000,000 | 5.000%, 01/17/2017 | 1,077,969 | |||||
| 1,650,000 | Manulife Financial Corp., | ||||||
4.900%, 09/17/2020 f | 1,732,830 | ||||||
| Marsh & McLennan Companies, Inc.: | |||||||
| 3,000,000 | 4.850%, 02/15/2013 | 3,064,149 | |||||
| 1,197,000 | 5.750%, 09/15/2015 @ | 1,327,582 | |||||
| 3,800,000 | MassMutual Global Funding II, | ||||||
| 2.000%, 04/05/2017 (Acquired 03/29/2012, Cost $3,783,470) * | 3,822,135 | ||||||
| 500,000 | MBIA Insurance Corp., | ||||||
| 14.000%, 01/15/2033 (Acquired 01/11/2008, Cost $500,000) * @ | 270,000 | ||||||
| Merrill Lynch & Company: | |||||||
| 1,000,000 | 5.700%, 05/02/2017 | 1,029,128 | |||||
| 1,000,000 | 6.875%, 04/25/2018 | 1,118,936 | |||||
| 3,000,000 | MetLife Institutional Funding II, | ||||||
| 1.368%, 04/04/2014 (Acquired 03/29/2011, Cost $3,000,000) * | 3,014,547 | ||||||
| 1,735,000 | Monumental Global Funding III, | ||||||
| 5.250%, 01/15/2014 (Acquired 04/05/2011 through 12/05/2011, Cost $1,804,209) * | 1,840,616 | ||||||
| Morgan Stanley: | |||||||
| 100,000 | 4.750%, 04/01/2014 @ | 100,880 | |||||
| 1,400,000 | 6.625%, 04/01/2018 | 1,463,795 | |||||
| 2,400,000 | Morgan Stanley Dean Witter & Co., | ||||||
| 6.750%, 10/15/2013 | 2,493,535 | ||||||
| 1,725,000 | National Australia Bank Ltd, | ||||||
3.000%, 07/27/2016 (Acquired 07/20/2011, Cost $1,720,239) * f | 1,767,432 | ||||||
| 2,320,000 | Navigators Group Inc. Senior Unsecured Notes, | ||||||
| 7.000%, 05/01/2016 | 2,437,357 | ||||||
| 1,260,000 | NB Capital Trust IV, | ||||||
| 8.250%, 04/15/2027 | 1,288,224 | ||||||
| 2,500,000 | Nomura Holdings Inc., | ||||||
5.000%, 03/04/2015 f | 2,595,508 | ||||||
| 1,000,000 | North Fork Capital Trust II, | ||||||
| 8.000%, 12/15/2027 | 1,007,500 | ||||||
| 1,085,000 | Principal Life Income Funding Trusts, | ||||||
| 5.550%, 04/27/2015 | 1,197,460 | ||||||
| Protective Life Secured Trust: | |||||||
| 3,091,000 | 5.450%, 09/28/2012 | 3,125,805 | |||||
| 1,225,000 | 4.300%, 06/01/2013 | 1,260,106 | |||||
| 3,125,000 | Prudential Financial Inc., | ||||||
| 5.150%, 01/15/2013 | 3,197,562 | ||||||
| 2,000,000 | Rabobank Nederland Global Senior Unsecured Notes, | ||||||
4.200%, 05/13/2014 (Acquired 05/06/2009, Cost $1,996,340) * f | 2,089,600 | ||||||
| 1,650,000 | Regions Bank, | ||||||
| 7.500%, 05/15/2018 @ | 1,856,250 | ||||||
| 1,300,000 | Schwab Capital Trust I, | ||||||
| 7.500%, 11/15/2037 | 1,338,415 | ||||||
| SLM Corporation: | |||||||
| 3,000,000 | 5.000%, 10/01/2013 | 3,090,000 | |||||
| 250,000 | 5.375%, 05/15/2014 | 258,741 | |||||
| 2,880,000 | Sovereign Bank, | ||||||
| 8.750%, 05/30/2018 | 3,122,358 | ||||||
| 2,000,000 | St. Paul Travelers, Inc., | ||||||
| 6.250%, 06/20/2016 | 2,353,548 | ||||||
| 2,200,000 | SunTrust Banks, Inc., | ||||||
| 3.600%, 04/15/2016 | 2,284,421 | ||||||
| 2,800,000 | Susa Partnership LP, | ||||||
| 8.200%, 06/01/2017 | 3,365,804 | ||||||
| 1,500,000 | Svenska Handelsbanken AB, | ||||||
2.875%, 04/04/2017 f | 1,520,596 | ||||||
| 1,000,000 | Symetra Financial Corporation, | ||||||
| 6.125%, 04/01/2016 (Acquired 08/12/2011, Cost $1,063,262) * | 1,022,420 | ||||||
| 3,800,000 | Talent Yield Investments Ltd, | ||||||
4.500%, 04/25/2022 (Acquired 04/18/2012, Cost $3,774,008) * f | 3,887,575 | ||||||
| The Bear Stearns Companies LLC: | |||||||
| 1,150,000 | 6.400%, 10/02/2017 | 1,326,159 | |||||
| 600,000 | 7.250%, 02/01/2018 | 717,317 | |||||
| The Goldman Sachs Group, Inc.: | |||||||
| 2,125,000 | 5.150%, 01/15/2014 | 2,208,360 | |||||
| 2,700,000 | 6.150%, 04/01/2018 | 2,927,016 | |||||
| 1,000,000 | The Hartford Financial Services Group, Inc., | ||||||
| 4.000%, 03/30/2015 | 1,048,768 | ||||||
| 3,100,000 | The Royal Bank of Scotland Group PLC, | ||||||
5.625%, 08/24/2020 f | 3,289,680 | ||||||
| 850,000 | UFJ Finance Aruba A.E.C., | ||||||
6.750%, 07/15/2013 f | 896,337 | ||||||
| Union Bank NA: | |||||||
| 665,000 | 2.125%, 12/16/2013 | 675,085 | |||||
| 1,800,000 | 2.125%, 06/16/2017 | 1,800,330 | |||||
| 650,000 | Unionbancal Corporation, | ||||||
| 5.250%, 12/16/2013 | 683,168 | ||||||
| 389,000 | Wachovia Bank, NA, | ||||||
| 6.000%, 11/15/2017 | 453,270 | ||||||
| 500,000 | WEA Finance LLC, | ||||||
| 7.500%, 06/02/2014 (Acquired 04/05/2012, Cost $546,255) * | 545,543 | ||||||
| 1,015,000 | Wells Fargo Bank NA, | ||||||
| 4.750%, 02/09/2015 | 1,087,769 | ||||||
| 3,000,000 | Westpac Banking Corporation, | ||||||
3.000%, 08/04/2015 f | 3,107,517 | ||||||
| 3,000,000 | Willis Group Holdings Limited, | ||||||
5.750%, 03/15/2021 f | 3,269,400 | ||||||
| 206,969,587 | |||||||
| Residential Mortgage-Backed Securities - 2.8% | |||||||
| U.S. Government Agency Issues - 0.7% | |||||||
| Federal Gold Loan Mortgage Corporation (FGLMC) Pass-Through Certificates: | |||||||
| 332,929 | 6.000%, 06/01/2021 | 365,788 | |||||
| 19,691 | 6.000%, 07/01/2028 | 22,078 | |||||
| Federal Home Loan Mortgage Corporation (FHLMC): | |||||||
| 1,138,916 | Series R003, Class VA, 5.500%, 08/15/2016 | 1,165,164 | |||||
| 661,065 | Series 3122, Class VA, 6.000%, 01/15/2017 | 664,204 | |||||
| 1,082,023 | Series R010, Class VA, 5.500%, 04/15/2017 | 1,126,022 | |||||
| 275,961 | Series R009, Class AJ, 5.750%, 12/15/2018 | 278,894 | |||||
| 2,811 | Series 74, Class F, 6.000%, 10/15/2020 | 3,064 | |||||
| 20,053 | Series 1395, Class G, 6.000%, 10/15/2022 | 22,322 | |||||
| 146,878 | Series 2970, Class DA, 5.500%, 01/15/2023 | 147,359 | |||||
| Federal National Mortgage Association (FNMA): | |||||||
| 12,329 | Series 1989-2, Class D, 8.800%, 01/25/2019 | 14,006 | |||||
| 1,026 | Series G-29, Class O, 8.500%, 09/25/2021 | 1,168 | |||||
| 66,346 | Series 1991-137, Class H, 7.000%, 10/25/2021 | 75,143 | |||||
| 55,064 | Series 1992-136, Class PK, 6.000%, 08/25/2022 | 60,748 | |||||
| 36,291 | Series 1993-32, Class H, 6.000%, 03/25/2023 | 39,658 | |||||
| 10,437 | Series 2004-90, Class YB, 4.000%, 07/25/2032 | 10,502 | |||||
| 1,241,443 | Series 2004-W6, Class 1A6, 5.500%, 07/25/2034 | 1,287,757 | |||||
| 200,406 | Government National Mortgage Association (GNMA), | ||||||
| Series 1999-4, Class ZB, 6.000%, 02/20/2029 | 228,389 | ||||||
| 5,512,266 | |||||||
| Non-U.S. Government Agency Issues - 2.1% | |||||||
| Bank of America Alternative Loan Trust: | |||||||
| 217,794 | Series 2003-11, Class 4A1, 4.750%, 01/25/2019 | 222,263 | |||||
| 688,004 | Series 2004-2, Class 5A1, 5.500%, 03/25/2019 | 709,860 | |||||
| 797,525 | Series 2004-11, Class 4A1, 5.500%, 12/25/2019 | 831,035 | |||||
| 36,992 | Series 2005-6, Class 7A1, 5.500%, 07/25/2020 | 36,870 | |||||
| 471,397 | Series 2006-2, Class 7A1, 6.000%, 03/25/2021 | 462,086 | |||||
| 624,268 | Series 2006-3, Class 6A1, 6.000%, 04/25/2036 | 618,294 | |||||
| 747,598 | Series 2006-4, Class 3CB4, 6.000%, 05/25/2046 | 580,493 | |||||
| 469,199 | Bank of America Funding Corporation, | ||||||
| Series 2003-3, Class 1A41, 5.500%, 10/25/2033 | 478,572 | ||||||
| 587,839 | Citicorp Mortgage Securities, Inc., | ||||||
| Series 2004-5, Class 1A25, 5.500%, 10/25/2014 | 592,557 | ||||||
| Countrywide Alternative Loan Trust: | |||||||
| 109,532 | Series 2005-5R, Class A2, 4.750%, 12/25/2018 | 110,102 | |||||
| 682,611 | Series 2005-50CB, Class 4A1, 5.000%, 11/25/2020 § | 599,337 | |||||
| 584,562 | Series 2005-85CB, Class 3A1, 5.250%, 02/25/2021 (Acquired 09/26/2007 through 01/28/2009, Cost $568,766) * § | 544,333 | |||||
| 1,006,418 | Series 2006-7CB, Class 3A1, 5.250%, 05/25/2021 § | 886,921 | |||||
| 72,732 | Series 2005-10CB, Class 1A6, 5.500%, 05/25/2035 | 71,620 | |||||
| 102,594 | Series 2005-11CB, Class 2A1, 5.500%, 06/25/2035 | 86,005 | |||||
| Credit Suisse First Boston Mortgage Securities Corporation: | |||||||
| 13,013 | Series 2005-11, Class 5A1, 5.250%, 12/25/2020 | 13,052 | |||||
| 70,100 | Series 2005-3, Class 3A27, 5.500%, 07/25/2035 | 72,991 | |||||
| J.P. Morgan Alternative Loan Trust: | |||||||
| 1,772,538 | Series 2005-S1, Class 3A1, 5.500%, 10/25/2020 | 1,673,092 | |||||
| 922,052 | Series 2006-A1, Class 2A1, 2.789%, 03/25/2036 § | 532,209 | |||||
| 223,800 | Series 2006-S2, Class A2, 5.810%, 05/25/2036 | 222,229 | |||||
| 293,502 | Lehman Mortgage Trust, | ||||||
| Series 2006-4, Class 3A1, 5.000%, 08/25/2021 § | 270,503 | ||||||
| Master Alternative Loans Trust: | |||||||
| 929,893 | Series 2004-1, Class 1A1, 5.000%, 01/25/2019 | 955,249 | |||||
| 219,850 | Series 2004-3, Class 1A1, 5.000%, 03/25/2019 | 228,616 | |||||
| 191,222 | Series 2005-3, Class 4A1, 5.500%, 03/25/2020 | 192,412 | |||||
| 24,436 | Merrill Lynch Mortgage Investors Trust, | ||||||
| Series 2005-A8, Class A1C1, 5.250%, 08/25/2036 | 24,655 | ||||||
| 87,367 | Residential Accredit Loans, Inc., | ||||||
| Series 2004-QS6, Class A1, 5.000%, 05/25/2019 | 88,615 | ||||||
| 177,239 | Salomon Brothers Mortgage Securities VII, | ||||||
| Series 2003-UP2, Class A2, 4.000%, 06/25/2033 | 186,057 | ||||||
| 23,392 | Structured Asset Securities Corporation, | ||||||
| Series 2005-2XS, Class 1A2A, 4.510%, 02/25/2035 | 23,423 | ||||||
| Washington Mutual, Inc. Pass-Through Certificates: | |||||||
| 1,200,897 | Series 2004-CB1, Class 5A, 5.000%, 06/25/2019 | 1,246,454 | |||||
| 1,563,766 | Series 2004-CB3, Class 3A, 5.500%, 10/25/2019 | 1,607,279 | |||||
| 523,005 | Series 2004-CB3, Class 4A, 6.000%, 10/25/2019 | 545,684 | |||||
| 619,394 | Series 2004-CB4, Class 21A, 5.500%, 12/25/2019 | 637,507 | |||||
| 472,352 | Series 2004-CB4, Class 22A, 6.000%, 12/25/2019 | 492,351 | |||||
| 15,842,726 | |||||||
| Asset Backed Securities - 1.7% | |||||||
| 40,380 | Amresco Residential Securities Mortgage Loan Trust, | ||||||
| Series 1998-1, Class A6, 6.510%, 08/25/2027 | 40,667 | ||||||
| 3,923 | Cityscape Home Equity Loan Trust, | ||||||
| Series 1997-C, Class A4, 7.000%, 07/25/2028 | 3,896 | ||||||
| Countrywide Asset-Backed Certificates: | |||||||
| 1,150,381 | Series 2006-S3, Class A2, 6.085%, 06/25/2021 § | 806,331 | |||||
| 83,140 | Series 2004-12, Class AF6, 4.634%, 03/25/2035 | 81,332 | |||||
| 3,455,758 | Series 2005-1, Class AF6, 5.030%, 07/25/2035 | 3,438,465 | |||||
| 1,141,307 | Series 2006-13, Class 1AF2, 5.884%, 01/25/2037 § | 1,084,241 | |||||
| 344,341 | Series 2006-13, Class 1AF3, 5.944%, 01/25/2037 § | 224,682 | |||||
| 1,380,000 | Series 2006-9, Class 1AF3, 5.859%, 10/25/2046 | 773,253 | |||||
| Delta Funding Home Equity Loan Trust: | |||||||
| 14,721 | Series 1997-2, Class A6, 7.040%, 06/25/2027 | 15,613 | |||||
| 2,369 | Series 1999-1, Class A6F, 6.340%, 12/15/2028 | 2,343 | |||||
| 538,268 | Series 1999-2, Class A7F, 7.030%, 08/15/2030 | 523,061 | |||||
| 6,239 | Equivantage Home Equity Loan Trust, | ||||||
| Series 1996-3, Class A3, 7.700%, 09/25/2027 | 6,187 | ||||||
| Green Tree Financial Corporation: | |||||||
| 44,970 | Series 1993-4, Class A5, 7.050%, 01/15/2019 | 45,440 | |||||
| 534,474 | Series 1998-2, Class A5, 6.240%, 12/01/2028 | 552,795 | |||||
| 754,305 | Series 1998-3, Class A5, 6.220%, 03/01/2030 | 823,700 | |||||
| 291,045 | Series 1998-4, Class A5, 6.180%, 04/01/2030 | 300,597 | |||||
| 15,782 | IMC Home Equity Loan Trust, | ||||||
| Series 1998-1, Class A6, 7.020%, 06/20/2029 | 15,704 | ||||||
| 127,950 | Oakwood Mortgage Investors, Inc., | ||||||
| Series 1999-B, Class A3, 6.450%, 11/15/2017 | 118,561 | ||||||
| 33,973 | Residential Asset Mortgage Products, Inc., | ||||||
| Series 2003-RS7, Class AI6, 5.340%, 08/25/2033 | 33,389 | ||||||
| 4,622,555 | Springleaf Mortgage Loan Trust, | ||||||
| Series 2012-1, 2.667%, 09/25/2057 (Acquired 04/11/2012, Cost $4,622,501) * | 4,619,606 | ||||||
| 13,509,863 | |||||||
| Commercial Mortgage-Backed Securities - 5.5% | |||||||
| 4,250,000 | Bear Stearns Commercial Mortgage Securities, | ||||||
| Series 2005-PWR9, Class A4A, 4.871%, 09/11/2042 | 4,682,654 | ||||||
| 5,600,000 | Citigroup Deutsche Bank, | ||||||
| Series 2005-CD1, Class A4, 5.394%, 07/15/2044 | 6,231,820 | ||||||
| 4,000,000 | Credit Suisse First Boston Mortgage Securities Corporation, | ||||||
| Series 2005-C5, Class A4, 5.100%, 08/15/2038 | 4,410,340 | ||||||
| 8,000,000 | Federal Home Loan Mortgage Corporation (FHLMC) Multifamily Structured Pass Through Certificates, | ||||||
| Series K708, 2.130%, 01/25/2019 | 8,159,816 | ||||||
| Federal Home Loan Mortgage Corporation (FHLMC) Pass-Through Certificates: | |||||||
| 3,000,000 | Series K705, Class A2, 2.303%, 09/25/2018 | 3,095,877 | |||||
| 3,075,000 | Series K706, Class A2, 2.323%, 10/25/2018 | 3,175,264 | |||||
| 1,860,236 | J.P. Morgan Chase Commercial Mortgage Securities Corp., | ||||||
| Series 2003-CB7, Class A4, 4.879%, 01/12/2038 | 1,929,217 | ||||||
| 5,000,000 | J.P. Morgan Chase Commercial Mortgage Trust, | ||||||
| Series 2005-CB12, Class A4, 4.895%, 09/12/2037 | 5,484,130 | ||||||
| 5,000,000 | Wachovia Bank Commercial Mortgage Trust, | ||||||
| Series 2005-C22, Class A4, 5.441%, 12/15/2044 | 5,549,490 | ||||||
| 42,718,608 | |||||||
| Total Long-Term Investments (Cost $721,777,511) | 751,715,036 | ||||||
| Shares | |||||||
| SHORT-TERM INVESTMENTS - 3.2% | |||||||
| Money Market Mutual Funds - 3.2% | |||||||
| 9,815,302 | Dreyfus Institutional Cash Advantage Fund, 0.15% « | 9,815,302 | |||||
| 15,000,000 | Short-Term Investments Trust - Liquid Assets Portfolio, 0.16% « | 15,000,000 | |||||
| Total Short-Term Investments (Cost $24,815,302) | 24,815,302 | ||||||
| Principal Amount | |||||||
| INVESTMENTS PURCHASED WITH CASH PROCEEDS FROM | |||||||
| SECURITIES LENDING - 14.6% | |||||||
| Commercial Paper - 0.2% | |||||||
| $ | 2,066,837 | Atlantic East Funding LLC, 0.595%, 03/25/2013 † ** | 1,363,594 | ||||
| Total Commercial Paper (Cost $2,066,837) | 1,363,594 | ||||||
| Shares | |||||||
| Investment Companies - 14.4% | |||||||
| 111,372,677 | Mount Vernon Securities Lending Trust Prime Portfolio, 0.31% « | 111,372,677 | |||||
| Total Investment Companies (Cost $111,372,677) | 111,372,677 | ||||||
| Total Investments Purchased With Cash Proceeds From | |||||||
| Securities Lending (Cost $113,439,514) | 112,736,271 | ||||||
| Total Investments (Cost $860,032,327) - 115.0% | 889,266,609 | ||||||
| Asset Relating to Securities Lending Investments - 0.1% | |||||||
Support Agreement ** ^ α † | 703,243 | ||||||
| Total (Cost $0) | 703,243 | ||||||
| Liabilities in Excess of Other Assets - (15.1)% | (116,563,079 | ) | |||||
| TOTAL NET ASSETS - 100.0% | $ | 773,406,773 | |||||
| Notes to Schedule of Investments | |||||||
| * | Restricted Security Deemed Liquid | ||||||
| ** | Illiquid Security | ||||||
| @ | This security or portion of this security is out on loan at June 30, 2012. | ||||||
| f | Foreign Security | ||||||
| ^ | Non-Income Producing | ||||||
| « | 7-Day Yield | ||||||
| § | Security in Default | ||||||
| † | Priced at Fair Value by the Valuation Committee as delegated by the Baird Funds' Board of Directors. | ||||||
| α | The Fund's transfer agent and administrator and securities lending agent entered into a support agreement with | ||||||
| the Fund to cover losses realized by the Fund on its investment in Atlantic East Funding, LLC (up to a certain amount), | |||||||
| which investment was made by the Fund's securities lending agent. | |||||||
Summary of Fair Value Exposure at June 30, 2012 (Unaudited) |
The Fund has adopted authoritative fair valuation accounting standards which establish a definition of fair value and set out a hierarchy for measuring fair value. These standards require additional disclosures about the various inputs and valuation techniques used to develop the measurements of fair value and a discussion on changes in valuation techniques and related inputs during the period. These standards define fair value as the price that would be received to sell an asset or paid to transfer a liability in an orderly transaction between market participants at the measurement date. The fair value hierarchy is organized into three levels based upon the assumptions (referred to as “inputs”) used in pricing the asset or liability. These standards state that “observable inputs” reflect the assumptions market participants would use in pricing the asset or liability based on market data obtained from independent sources and “unobservable inputs” reflect an entity’s own assumptions about the assumptions market participants would use in pricing the asset or liability. These inputs are summarized into three broad levels and described below:
| Level 1 - | Unadjusted quoted prices in active markets for identical unrestricted securities. |
| Level 2 - | Other significant observable inputs (including quoted prices for similar securities, quoted prices in inactive markets, dealer indications, interest rates, yield curves, prepayment speeds, credit risk, default rates, inputs corroborated by observable market data, etc.). |
| Level 3 - | Significant unobservable inputs (including the Fund’s own assumptions about the factors that market participants would use in valuing the security) based on the best information available. |
The inputs or methodology used for valuing securities are not necessarily an indication of the risk associated with investing in those securities.
The following is a summary of the inputs used to value the Fund’s investments as of June 30, 2012:
| Level 1 | Level 2 | Level 3 | Total | |||||||||||||
| Fixed Income | ||||||||||||||||
| U.S. Treasury Securities | $ | - | $ | 186,033,725 | $ | - | $ | 186,033,725 | ||||||||
| U.S. Government Agency Securities | - | 44,441,197 | - | 44,441,197 | ||||||||||||
| Taxable Municipal Bonds | - | 32,996,538 | - | 32,996,538 | ||||||||||||
| Other Government Related Securities | - | 14,767,372 | - | 14,767,372 | ||||||||||||
| Corporate Bonds | - | 395,891,280 | 1,461 | 395,892,741 | ||||||||||||
| Residential Mortgage-Backed Securities - U.S. Government Agency Issues | - | 5,512,266 | - | 5,512,266 | ||||||||||||
| Residential Mortgage-Backed Securities - Non - U.S. Government Agency Issues | - | 15,842,726 | - | 15,842,726 | ||||||||||||
| Asset Backed Securities | - | 13,509,863 | - | 13,509,863 | ||||||||||||
| Commercial Mortgage Backed Securities | - | 42,718,608 | - | 42,718,608 | ||||||||||||
| Total Fixed Income | - | 751,713,575 | 1,461 | 751,715,036 | ||||||||||||
| Short-Term Investments | ||||||||||||||||
| Money Market Mutual Funds | 24,815,302 | - | - | 24,815,302 | ||||||||||||
| Total Short-Term Investments | 24,815,302 | - | - | 24,815,302 | ||||||||||||
| Investments Purchased with Cash | ||||||||||||||||
| Proceeds from Securities Lending | ||||||||||||||||
| Commercial Paper | - | 1,363,594 | - | 1,363,594 | ||||||||||||
| Money Market Mutual Fund | 111,372,677 | - | - | 111,372,677 | ||||||||||||
| Total Investments Purchased with | ||||||||||||||||
| Cash Proceeds from Securities Lending | 111,372,677 | 1,363,594 | - | 112,736,271 | ||||||||||||
| Total Investments | $ | 136,187,979 | $ | 753,077,169 | $ | 1,461 | $ | 889,266,609 | ||||||||
| Asset Relating to Securities Lending Investments | $ | - | $ | 703,243 | $ | - | $ | 703,243 | ||||||||
Changes in valuation techniques may result in transfers into or out of current assigned levels within the hierarchy. There were no significant transfers between Level 1, Level 2 and Level 3 fair value measurements during the reporting period, as compared to their classification from the prior year’s annual report. One security that is priced at fair value by the Valuation Committee instead of the Fund’s pricing vendor is valued using level 3 inputs.
Level 3 Reconciliation Disclosure
Following is a reconciliation of Level 3 assets for which significant unobservable inputs were used to determine fair value.
Description | Investments in Securities | |||
| Balance as of December 31, 2011 | $ | 1,461 | ||
| Accrued discounts/premiums | - | |||
| Realized gain (loss) | - | |||
| Change in unrealized appreciation (depreciation) | - | |||
| Purchases | - | |||
| Sales | - | |||
| Transfers in and/or out of Level 3 * | - | |||
| Balance as of June 30, 2012 | $ | 1,461 | ||
* Transfers between levels are recognized at the end of the reporting period.
| Baird Intermediate Municipal Bond Fund | |||||||
| Schedule of Investments | |||||||
| June 30, 2012 (Unaudited) | |||||||
| Principal Amount | Value | ||||||
| Municipal Bonds - 97.6% | |||||||
| Alabama - 1.9% | |||||||
| $ | 1,000,000 | Alabama State Public School & College Authority, | |||||
| 5.00%, 05/01/2019 | $ | 1,216,010 | |||||
| 1,000,000 | Camden Alabama Industrial Development Board Revenue, | ||||||
| 6.125%, 12/01/2024 (Pre-refunded to 12/01/2013) | 1,081,340 | ||||||
| 1,080,000 | Gulf Shores Alabama, | ||||||
| 5.00%, 12/15/2018 (Callable 12/15/2017) | 1,211,944 | ||||||
| Montgomery Alabama Special Care Facility Revenue: | |||||||
| 1,540,000 | 5.00%, 11/15/2015 (Pre-refunded to 11/15/2014) | 1,703,609 | |||||
| 11,385,000 | 5.00%, 11/15/2021 (Pre-refunded to 11/15/2014) | 12,623,005 | |||||
| 3,985,000 | 5.25%, 11/15/2029 (Pre-refunded to 11/15/2014) | 4,441,721 | |||||
| 22,277,629 | |||||||
| Alaska - 0.1% | |||||||
| 1,000,000 | Alaska State Housing Finance Corporation, | ||||||
| 5.00%, 06/01/2017 (Callable 06/01/2015)(Insured by NPFGC) | 1,086,320 | ||||||
| Arizona - 1.3% | |||||||
| 2,375,000 | Arizona School Facilities Board Revenue, | ||||||
| 5.75%, 07/01/2018 (Pre-refunded to 07/01/2014) | 2,625,468 | ||||||
| 1,000,000 | Gila County Arizona Unified School District Bonds, | ||||||
| 5.25%, 07/01/2027 (Callable 07/01/2017) | 1,102,070 | ||||||
| 1,860,000 | Maricopa County Arizona University School District No. 48 Scottsdale, | ||||||
| 4.00%, 07/01/2026 (Pre-refunded to 07/01/2016) | 2,107,324 | ||||||
| 1,540,000 | Phoenix Arizona Civic Corporation of Wastewater Systems Revenue, | ||||||
| 5.00%, 07/01/2015 (Callable 07/01/2014)(Partially Pre-refunded)(Insured by NPFGC) | 1,672,810 | ||||||
| Pima County Arizona Industrial Development Authority: | |||||||
| 1,000,000 | 7.125%, 07/01/2024 (Pre-refunded to 07/01/2014) | 1,127,320 | |||||
| 2,870,000 | 7.50%, 07/01/2034 (Pre-refunded to 07/01/2014) | 3,131,342 | |||||
| 3,475,000 | 7.50%, 07/01/2034 (Pre-refunded to 07/01/2014) | 3,943,117 | |||||
| 15,709,451 | |||||||
| California - 5.9% | |||||||
| 5,110,000 | Bakersfield California Certificates Participation, | ||||||
| 0.00%, 04/15/2021 (ETM) ^ | 4,202,464 | ||||||
| 2,465,000 | Coalinga California Regional Medical Center, | ||||||
| 5.125%, 03/01/2032 (Pre-refunded to 03/01/2015) | 2,713,940 | ||||||
| 1,310,000 | Commerce Community Development Commission, | ||||||
| 0.00%, 08/01/2021 ^ | 808,925 | ||||||
| 3,000,000 | Contra Costa County California Certificate Participation, | ||||||
| 0.00%, 11/01/2014 (ETM) ^ | 2,959,230 | ||||||
| 3,695,000 | Golden State Tobacco Securitization Corporation Asset Backed Bonds, | ||||||
| 5.50%, 06/01/2043 (Pre-refunded to 06/01/2013) | 3,870,365 | ||||||
| Golden State Tobacco Securitization Corporation Revenue Bonds: | |||||||
| 5,915,000 | 6.25%, 06/01/2033 (Pre-refunded 06/01/2013) | 6,232,990 | |||||
| 875,000 | 5.00%, 06/01/2038 (Pre-refunded to 06/01/2013) | 912,572 | |||||
| 6,950,000 | 5.625%, 06/01/2038 (Pre-refunded to 06/01/2013) | 7,287,701 | |||||
| 820,000 | Mount Diablo California Hospital District Revenue, | ||||||
| 5.00%, 12/01/2013 (ETM) | 849,545 | ||||||
| 3,725,000 | Pittsburg California Redevelopment Agency Residential Mortgage Revenue, | ||||||
| 9.60%, 06/01/2016 (ETM) | 4,959,130 | ||||||
| 1,800,000 | Port Oakland California Revenue, | ||||||
| 5.00%, 11/01/2017 (Insured by NPFGC) | 2,045,952 | ||||||
| San Joaquin Hills California Transportation Corridor Agency Toll Road Revenue: (ETM) ^ | |||||||
| 6,865,000 | 0.00%, 01/01/2020 | 5,989,850 | |||||
| 14,000,000 | 0.00%, 01/01/2023 | 10,951,220 | |||||
| 17,295,000 | San Marcos California Public Facilities Authority Revenue, | ||||||
| 0.00%, 09/01/2019 (ETM) ^ | 15,192,101 | ||||||
| 1,130,000 | Woodside California Elementary School District Government School Bonds, | ||||||
| 5.00%, 10/01/2023 (Pre-refunded to 10/01/2016) | 1,315,071 | ||||||
| 70,291,056 | |||||||
| Colorado - 5.3% | |||||||
| 780,000 | Colorado Educational & Cultural Facilities Authority, | ||||||
| 7.625%, 03/15/2032 (Pre-refunded to 03/15/2013) | 813,992 | ||||||
| 8,640,000 | Colorado Springs Colorado Utilities Revenue Bonds, | ||||||
| 5.875%, 11/15/2017 (ETM) | 9,475,834 | ||||||
| 1,000,000 | Conservatory Metropolitan District Colorado, | ||||||
| 6.75%, 12/01/2034 (Pre-refunded to 12/01/2013) | 1,092,490 | ||||||
| 1,330,000 | County of El Paso Colorado Mortgage Revenue Bonds, | ||||||
| 0.00%, 09/01/2015 (ETM) ^ | 1,298,133 | ||||||
| Dawson Ridge Metropolitan District No. 1 Colorado: (ETM) ^ | |||||||
| 15,030,000 | 0.00%, 10/01/2022 | 11,748,801 | |||||
| 12,745,000 | 0.00%, 10/01/2022 | 9,962,639 | |||||
| Denver Colorado Convention Center & Hotel Authority Revenue Bonds: | |||||||
| 1,000,000 | 5.00%, 12/01/2021 (Pre-refunded to 12/01/2013) | 1,064,110 | |||||
| 2,950,000 | 5.00%, 12/01/2022 (Pre-refunded to 12/01/2013) | 3,139,125 | |||||
| 1,500,000 | 5.00%, 12/01/2023 (Pre-refunded to 12/01/2013) | 1,596,165 | |||||
| 5,065,000 | 5.00%, 12/01/2024 (Pre-refunded to 12/01/2013) | 5,389,717 | |||||
| 7,975,000 | Denver Colorado Health & Hospital Authority Healthcare Revenue, | ||||||
| 6.25%, 12/01/2033 (Pre-refunded to 12/01/2014) | 9,072,121 | ||||||
| 6,750,000 | Regional Transportation District Colorado Sales Tax Revenue, | ||||||
| 5.00%, 11/01/2036 (Pre-refunded to 11/01/2016) | 8,008,942 | ||||||
| 62,662,069 | |||||||
| Delaware - 0.0% | |||||||
| 330,000 | Delaware State Economic Development Authority Revenue, | ||||||
| 6.75%, 01/01/2013 (ETM) | 340,524 | ||||||
| Florida - 11.4% | |||||||
| 4,040,000 | Bartram Springs Community Development District Special Assessment, | ||||||
| 6.65%, 05/01/2034 (Pre-refunded to 05/01/2013) | 4,328,618 | ||||||
| 1,925,000 | Brevard County Florida School Board, | ||||||
| 5.00%, 07/01/2020 (Callable 07/01/2017)(Insured by AMBAC) | 2,134,151 | ||||||
| Broward County Florida School Board: | |||||||
| 8,300,000 | 5.25%, 07/01/2022 (Callable 07/01/2021) | 9,783,293 | |||||
| 4,865,000 | 5.25%, 07/01/2023 (Callable 07/01/2021) | 5,671,812 | |||||
| 5,940,000 | County of St. Lucie County Florida, | ||||||
| 6.00%, 10/01/2020 (ETM) | 7,731,682 | ||||||
| 1,825,000 | Dade County Florida Health Facility Authority Hospital Revenue, | ||||||
| 5.75%, 05/01/2021 (ETM) | 2,185,529 | ||||||
| 3,200,000 | Escambia County Florida Housing Finance Authority Multifamily Housing Revenue, | ||||||
| 0.00%, 10/15/2018 (ETM) ^ | 2,872,000 | ||||||
| 13,800,000 | Florida State Board of Education, | ||||||
| 5.00%, 06/01/2022 (Callable 06/01/2019) | 16,595,742 | ||||||
| 2,500,000 | Florida State Department of Management Services, | ||||||
| 5.00%, 08/01/2018 | 2,926,800 | ||||||
| Florida State Mid-Bay Bridge Authority Revenue: (ETM) | |||||||
| 4,675,000 | 6.875%, 10/01/2022 | 6,398,766 | |||||
| 3,175,000 | 6.875%, 10/01/2022 | 4,345,686 | |||||
| 1,585,000 | Florida State Municipal Power Agency Revenue, | ||||||
| 5.00%, 10/01/2017 (Callable 08/02/2012)(ETM) | 1,923,128 | ||||||
| 1,500,000 | Gulf Environmental Services Inc. Florida Revenue Bonds, | ||||||
| 5.00%, 10/01/2018 (ETM) | 1,700,685 | ||||||
| Highlands County Florida Health Facilities Revenue: | |||||||
| 9,650,000 | 5.875%, 11/15/2029 (Pre-refunded to 11/15/2013) | 10,345,765 | |||||
| 5,010,000 | 5.375%, 11/15/2035 (Pre-refunded to 11/15/2013) | 5,337,303 | |||||
| 2,000,000 | Hillsborough County Florida School Board Master Lease Program, | ||||||
| 5.50%, 07/01/2018 (Insured by NPFGC) | 2,389,500 | ||||||
| Hillsborough County Industrial Development Authority: | |||||||
| 2,060,000 | 5.625%, 08/15/2029 (Pre-refunded to 08/15/2018) | 2,605,262 | |||||
| 1,550,000 | 8.00%, 08/15/2032 (Pre-refunded to 08/15/2019) | 2,202,364 | |||||
| 2,000,000 | Islands At Doral (SW) Community Development District, | ||||||
| 6.375%, 05/01/2035 (Pre-refunded to 05/01/2013) | 2,113,500 | ||||||
| 300,000 | Jacksonville Florida Health Facility Authority Hospital Revenue, | ||||||
| 11.50%, 10/01/2012 (Callable 08/02/2012)(ETM) | 308,076 | ||||||
| 2,145,000 | Laguna Lakes Community Development District Special Assessment Revenue Bonds, | ||||||
| 6.40%, 05/01/2033 (Pre-refunded to 05/01/2013) | 2,250,320 | ||||||
| 1,470,000 | Miami Beach Florida Resort Tax Revenue, | ||||||
| 6.25%, 10/01/2022 (ETM) | 1,911,529 | ||||||
| 7,100,000 | Miami-Dade County Florida, | ||||||
| 4.50%, 10/01/2020 | 8,168,266 | ||||||
| 3,000,000 | Miami Dade County Florida Entitlement Revenue Bonds, | ||||||
| 5.00%, 08/01/2015 (Insured by NPFGC) | 3,314,070 | ||||||
| 3,000,000 | Miami-Dade County Florida School Board, | ||||||
| 5.00%, 05/01/2016 (Insured by NPFGC) | 3,345,930 | ||||||
| 2,420,000 | Miami-Dade County Florida Water & Sewer Revenue, | ||||||
| 5.00%, 10/01/2013 (Insured by NPFGC) | 2,559,610 | ||||||
| 4,220,000 | Orange County Florida Health Facilities Authority Revenue Bond, | ||||||
| 6.25%, 10/01/2013 (ETM) | 4,527,511 | ||||||
| 990,000 | Orlando Florida Utilities Commission Water & Electric Revenue, | ||||||
| 6.75%, 10/01/2017 (ETM) | 1,149,459 | ||||||
| 1,000,000 | Palm Beach County Florida Revenue, | ||||||
| 5.00%, 11/01/2018 (Callable 11/01/2017) | 1,183,430 | ||||||
| 2,390,000 | Pinellas County Housing Finance Authority, | ||||||
| 4.25%, 03/01/2027 (Callable 09/01/2019) | 2,543,820 | ||||||
| 1,000,000 | Sarasota County Florida School Board, | ||||||
| 5.00%, 07/01/2015 (Insured by NPFGC) | 1,101,620 | ||||||
| 5,200,000 | Seminole County Florida Water & Sewage Revenue, | ||||||
| 6.00%, 10/01/2019 (ETM) | 6,296,628 | ||||||
| 3,000,000 | Sunrise Florida Utility System Revenue, | ||||||
| 5.50%, 10/01/2018 (ETM) | 3,551,790 | ||||||
| 135,803,645 | |||||||
| Georgia - 4.8% | |||||||
| 8,445,000 | Atlanta Georgia Water & Wastewater Revenue, | ||||||
| 5.50%, 11/01/2017 (Insured by AGM) | 10,229,175 | ||||||
| 7,745,000 | Forsyth County Georgia Hospital Authority Revenue Anticipation Certificates, | ||||||
| 6.375%, 10/01/2028 (Callable 08/02/2012)(ETM) | 10,246,480 | ||||||
| 470,000 | Fulton County Georgia Hospital Authority Revenue, | ||||||
| 7.875%, 10/01/2013 (Callable 08/02/2012)(ETM) | 494,398 | ||||||
| Georgia Municipal Electric Authority Power Revenue, | |||||||
| 7,470,000 | 6.50%, 01/01/2017 (Insured by AGM) | 8,976,173 | |||||
| Gwinnett County Georgia School District, | |||||||
| 7,400,000 | 5.00%, 02/01/2026 (Pre-refunded to 02/01/2018) | 8,960,068 | |||||
| 2,310,000 | Northwestern Gwinnett County Georgia Facilities Corporation I Certificate Participation, | ||||||
| 5.75%, 06/15/2019 (Callable 06/15/2014)(Pre-refunded to 06/15/2015) | 2,506,835 | ||||||
| 425,000 | Richmond County Development Authority, | ||||||
| 0.00%, 12/01/2021 (ETM) ^ | 341,160 | ||||||
| 12,570,000 | State of Georgia, | ||||||
| 5.00%, 07/01/2020 (Callable 07/01/2017) | 14,883,006 | ||||||
| 56,637,295 | |||||||
| Illinois - 10.3% | |||||||
| 2,360,000 | Chicago Illinois, | ||||||
| 5.00%, 01/01/2017 (Callable 01/01/2016)(Insured by AGM) | 2,669,844 | ||||||
| Chicago Illinois Board of Education: | |||||||
| 4,345,000 | 5.00%, 12/01/2017 (Callable 12/01/2016)(Insured by AGM) | 5,013,001 | |||||
| 2,100,000 | 5.00%, 12/01/2017 (Insured by AMBAC) | 2,449,335 | |||||
| 1,625,000 | 6.00%, 01/01/2020 (Insured by NPFGC) | 1,879,751 | |||||
| Chicago Illinois Public Building Community Building Revenue: (ETM) | |||||||
| 2,885,000 | 7.00%, 01/01/2015 | 3,143,092 | |||||
| 1,555,000 | 7.00%, 01/01/2020 | 2,055,119 | |||||
| 2,605,000 | Cook County Illinois School District No. 097, | ||||||
| 9.00%, 12/01/2015 (Insured by NPFGC) | 3,240,386 | ||||||
| 1,430,000 | Cook County Illinois School District No. 100, | ||||||
| 8.10%, 12/01/2016 (ETM) | 1,884,626 | ||||||
| 2,000,000 | Cook County Illinois School District No. 159, | ||||||
| 0.00%, 12/01/2022 (ETM) ^ | 1,533,300 | ||||||
| 1,095,000 | Dupage County Illinois Stormwater Project, | ||||||
| 5.60%, 01/01/2021 | 1,320,504 | ||||||
| 16,380,000 | Illinois Development Financial Authority, | ||||||
| 0.00%, 07/15/2023 (ETM) ^ | 12,252,731 | ||||||
| 9,310,000 | Illinois Finance Authority, | ||||||
| 0.00%, 07/15/2025 (ETM) ^ | 6,332,662 | ||||||
| 2,330,000 | Illinois Finance Authority Revenue, | ||||||
| 5.50%, 08/15/2043 (Pre-refunded to 08/15/2014) | 2,575,885 | ||||||
| 1,000,000 | Illinois Municipal Electric Agency Power Supply Revenue Bonds, | ||||||
| 5.25%, 02/01/2016 (Insured by NPFGC) | 1,139,690 | ||||||
| Illinois State: | |||||||
| 1,000,000 | 5.00%, 01/01/2019 (Insured by AGM) | 1,128,440 | |||||
| 5,000,000 | 4.00%, 09/01/2019 (Callable 09/01/2018)(Insured by AGM) | 5,383,850 | |||||
| 3,000,000 | 6.00%, 11/01/2026 (Insured by NPFGC) | 3,593,430 | |||||
| 2,100,000 | Illinois State Toll Highway Authority Priority Revenue Bonds, | ||||||
| 5.50%, 01/01/2016 (Insured by AGM) | 2,369,199 | ||||||
| Illinois State Toll Highway Authority Revenue Bonds: | |||||||
| 1,065,000 | 5.00%, 01/01/2026 (Pre-refunded to 07/01/2016) | 1,250,810 | |||||
| 2,055,000 | 5.00%, 01/01/2031 (Pre-refunded to 07/01/2016) | 2,413,536 | |||||
| 6,750,000 | Kane Cook & Dupage Counties Illinois Community United School District No. 303, | ||||||
| 5.00%, 01/01/2014 (Insured by AGM) | 7,184,363 | ||||||
| 2,130,000 | Kane Cook & Dupage Counties Illinois School District No. 46 Elgin, | ||||||
| 0.00%, 01/01/2013 (Insured by AGM) ^ | 2,118,605 | ||||||
| Kane McHenry Cook & De Kalb Counties Illinois School District No. 300: (Insured by AMBAC) | |||||||
| 1,000,000 | 9.00%, 01/01/2015 | 1,169,130 | |||||
| 6,140,000 | 7.00%, 01/01/2018 | 7,573,751 | |||||
| 13,625,000 | Kendall Kane & Will Counties Community Unit School District No. 308, | ||||||
| 0.00%, 02/01/2021 ^ | 10,257,036 | ||||||
| Lake County Illinois Community Consolidated School District: (Insured by NPFGC) ^ | |||||||
| 1,755,000 | 0.00%, 12/01/2012 | 1,737,239 | |||||
| 1,920,000 | 0.00%, 12/01/2013 | 1,856,160 | |||||
| 1,875,000 | 0.00%, 12/01/2014 | 1,758,694 | |||||
| 1,025,000 | Lake County Illinois Community High School District No. 124 Grant, | ||||||
| 5.00%, 12/01/2017 | 1,227,663 | ||||||
| McHenry & Kane Counties Illinois Community School District No. 158: (Insured by NPFGC) ^ | |||||||
| 1,870,000 | 0.00%, 01/01/2013 | 1,849,206 | |||||
| 1,970,000 | 0.00%, 01/01/2016 | 1,775,009 | |||||
| Metropolitan Pier & Exposition Authority Illinois (ETM): | |||||||
| 1,805,000 | 5.50%, 06/15/2016 | 2,136,055 | |||||
| 2,000,000 | 5.50%, 12/15/2023 | 2,518,120 | |||||
| 2,000,000 | Northwest Suburban Illinois Municipal Joint Action Revenue, | ||||||
| 5.00%, 05/01/2014 (ETM) | 2,169,160 | ||||||
| 4,705,000 | Regional Transportation Authority Illinois, | ||||||
| 6.00%, 07/01/2022 (Insured by NPFGC) | 6,008,991 | ||||||
| 2,734,000 | Round Lake Illinois, | ||||||
| 6.70%, 03/01/2033 (Pre-refunded to 03/01/2013) | 2,900,801 | ||||||
| Southern Illinois University Revenue: (Insured by NPFGC) | |||||||
| 1,000,000 | 5.25%, 04/01/2018 | 1,165,910 | |||||
| 1,390,000 | 5.25%, 04/01/2019 | 1,636,030 | |||||
| 950,000 | Winnebago & Boone Counties Illinois School District No. 205, | ||||||
| 5.00%, 02/01/2013 (Insured by AMBAC) | 972,173 | ||||||
| Winnebago County Illinois School District No. 122 Harlam-Loves Park: ^ | |||||||
| 155,000 | 0.00%, 01/01/2018 (ETM) | 144,045 | |||||
| 1,205,000 | 0.00%, 01/01/2018 (Insured by AGM) | 1,032,757 | |||||
| 122,820,089 | |||||||
| Indiana - 1.4% | |||||||
| 1,990,000 | Franklin Community Multi-School Building Corp, | ||||||
| 5.00%, 07/15/2020 | 2,349,812 | ||||||
| Hammond Indiana Multi-School Building Corporation Revenue Bonds: | |||||||
| 1,000,000 | 6.00%, 01/15/2018 (ETM) | 1,163,670 | |||||
| 1,330,000 | 5.00%, 07/15/2018 (Insured by NPFGC) | 1,556,326 | |||||
| 1,115,000 | Indiana State Office Building Commisions Facilities Revenue Bonds, | ||||||
| 5.25%, 07/01/2017 | 1,310,560 | ||||||
| 645,000 | Indiana Toll Road Commission, | ||||||
| 9.00%, 01/01/2015 (ETM) | 726,657 | ||||||
| 1,155,000 | Indianapolis Local Public Improvement Bond Bank, | ||||||
| 5.50%, 01/01/2019 (Insured by NPFGC) | 1,388,945 | ||||||
| 3,460,000 | Indianapolis Local Public Improvement Bond Waterworks Project, | ||||||
| 5.50%, 07/01/2018 (Insured by NPFGC) | 4,168,470 | ||||||
| 1,000,000 | Perry Township Multi School Building Corporation, | ||||||
| 5.00%, 07/10/2018 (Callable 07/10/2015) | 1,113,720 | ||||||
| 1,650,000 | Purdue University Indiana Revenue, | ||||||
| 5.00%, 07/01/2015 | 1,853,742 | ||||||
| 1,000,000 | South Bend Indiana Community School Building Corporation, | ||||||
| 5.00%, 07/15/2017 (Insured by NPFGC) | 1,155,760 | ||||||
| 16,787,662 | |||||||
| Iowa - 0.1% | |||||||
| 1,010,000 | Des Moines Iowa Metropolitan Wastewater Reclamation Authority, | ||||||
| 5.00%, 06/01/2015 (Callable 06/01/2014)(Insured by NPFGC) | 1,098,910 | ||||||
| 90,000 | Muscatine Iowa Electric Revenue, | ||||||
| 6.70%, 01/01/2013 (ETM) | 92,871 | ||||||
| 1,191,781 | |||||||
| Kansas - 0.2% | |||||||
| 1,865,000 | Wyandotte County Kansas Revenue, | ||||||
| 5.00%, 09/01/2019 (Callable 03/01/2019)(Insured by BHAC) | 2,228,675 | ||||||
| Kentucky - 1.2% | |||||||
| 3,340,000 | Jefferson County Kentucky School District Financial School Building Revenue Bonds, | ||||||
| 5.50%, 01/01/2018 (Insured by AGM) | 4,043,371 | ||||||
| 1,035,000 | Kentucky Economic Development Finance Authority Health System Revenue, | ||||||
| 5.80%, 10/01/2014 (Pre-refunded to 10/01/2013) | 1,114,291 | ||||||
| 7,345,000 | Louisville & Jefferson County Metropolitan Government, | ||||||
| 6.125%, 02/01/2037 (Callcable 02/01/2018) | 9,361,864 | ||||||
| 14,519,526 | |||||||
| Louisiana - 2.9% | |||||||
| Louisiana Public Facilities Authority Revenue: | |||||||
| 1,500,000 | 5.50%, 05/15/2027 (Pre-refunded to 05/15/2026) | 1,906,965 | |||||
| 13,905,000 | 5.50%, 05/15/2032 (Pre-refunded to 05/15/2026) | 18,211,657 | |||||
| State of Louisiana: | |||||||
| 1,750,000 | 5.00%, 11/15/2018 | 2,129,732 | |||||
| 10,000,000 | 5.00%, 11/15/2020 (Callable 05/15/2020) | 12,335,700 | |||||
| 34,584,054 | |||||||
| Maine - 0.4% | |||||||
| 4,340,000 | Maine Health & Higher Education Facilities Authority, | ||||||
| 5.00%, 07/01/2035 (Pre-refunded to 07/01/2015) | 4,915,918 | ||||||
| Maryland - 0.1% | |||||||
| 1,150,000 | Baltimore Maryland Project Revenue, | ||||||
| 5.00%, 07/01/2024 | 1,488,135 | ||||||
| Massachusetts - 3.1% | |||||||
| 1,565,000 | Massachusetts Department of Transportation, | ||||||
| 5.00%, 01/01/2020 (ETM) | 1,846,387 | ||||||
| Massachusetts State: | |||||||
| 5,820,000 | 5.00%, 08/01/2020 (Pre-refunded to 08/01/2016) | 6,843,505 | |||||
| 15,000,000 | 4.00%, 12/01/2022 (Callable 12/01/2019) | 16,857,450 | |||||
| Massachusetts State Obligations Tax Revenue: | |||||||
| 1,000,000 | 5.25%, 01/01/2026 (Pre-refunded to 01/01/2014) | 1,072,080 | |||||
| 1,845,000 | 5.75%, 01/01/2032 (Pre-refunded to 01/01/2014) | 1,991,678 | |||||
| Massachusetts State Water Resources Authority: (ETM) | |||||||
| 4,105,000 | 5.25%, 12/01/2015 | 4,457,004 | |||||
| 3,295,000 | 6.50%, 07/15/2019 | 3,999,009 | |||||
| 37,067,113 | |||||||
| Michigan - 2.6% | |||||||
| 1,000,000 | Detroit Michigan City School District, | ||||||
| 5.00%, 05/01/2016 (Callable 05/01/2015)(Insured by AGM) | 1,093,430 | ||||||
| 2,185,000 | Detroit Michigan Sewer Disposal Revenue, | ||||||
| 5.00%, 07/01/2030 (Pre-refunded to 07/01/2015) | 2,474,949 | ||||||
| 1,550,000 | Harper Creek Michigan Community School District, | ||||||
| 5.00%, 05/01/2016 (Callable 05/01/2015)(Insured by AGM) | 1,702,040 | ||||||
| 1,390,000 | Jenison Michigan Public Schools, | ||||||
| 5.25%, 05/01/2015 (Insured by NPFGC) | 1,511,722 | ||||||
| 2,275,000 | Lakeview Public School District, | ||||||
| 5.00%, 05/01/2017 (Insured by NPFGC) | 2,588,313 | ||||||
| Livonia Michigan Public Schools School District: | |||||||
| 4,295,000 | 5.00%, 05/01/2017 (Callable 05/01/2014)(Insured by NPFGC) | 4,608,449 | |||||
| 3,000,000 | 5.00%, 05/01/2022 (Callable 05/01/2014)(Insured by NPFGC) | 3,170,700 | |||||
| 7,000,000 | Michigan Finance Authority, | ||||||
| 5.00%, 01/01/2019 | 8,456,560 | ||||||
| 4,000,000 | Michigan State Housing Development Authority, | ||||||
| 4.75%, 06/01/2016 | 4,266,720 | ||||||
| 2,000,000 | State of Michigan, | ||||||
| 0.00%, 06/01/2022 (ETM) ^ | 1,553,020 | ||||||
| 31,425,903 | |||||||
| Minnesota - 1.2% | |||||||
| Minnesota State Housing Finance Agency Homeownership Finance Bond: | |||||||
| 1,085,000 | 4.25%, 07/01/2028 (Callable 01/01/2020) | 1,153,648 | |||||
| 1,990,000 | 4.50%, 07/01/2034 (Callable 07/01/2021) | 2,157,996 | |||||
| 7,655,000 | University of Minnesota, | ||||||
| 5.50%, 07/01/2021 (ETM) | 9,430,654 | ||||||
| 1,555,000 | Western Minnesota Municipal Power Agency, | ||||||
| 6.375%, 01/01/2016 (ETM) | 1,733,156 | ||||||
| 14,475,454 | |||||||
| Mississippi - 0.2% | |||||||
| 1,110,000 | Mississippi Development Bank Special Obligations, | ||||||
| 5.25%, 10/01/2030 (Pre-refunded to 10/01/2015) | 1,270,673 | ||||||
| 1,050,000 | Mississippi Housing Financial Corporation, | ||||||
| 0.00%, 06/01/2015 (ETM) ^ | 1,028,296 | ||||||
| 2,298,969 | |||||||
| Missouri - 0.3% | |||||||
| 1,000,000 | St. Charles County Missouri Francis Howell School District, | ||||||
| 4.50%, 03/01/2018 | 1,172,140 | ||||||
| 2,000,000 | St. Louis County Industrial Development Authority, | ||||||
| 6.625%, 11/15/2035 (Pre-refunded to 11/15/2013) | 2,170,260 | ||||||
| 3,342,400 | |||||||
| Nebraska - 1.0% | |||||||
| 1,640,000 | Nebraska Public Power District Revenue, | ||||||
| 5.00%, 01/01/2015 (Insured by NPFGC) | 1,815,414 | ||||||
| 9,150,000 | Omaha Nebraska Public Electric Power District Revenue, | ||||||
| 6.20%, 02/01/2017 (ETM) | 10,314,887 | ||||||
| 12,130,301 | |||||||
| Nevada - 0.2% | |||||||
| 2,080,000 | Las Vegas Clark County Nevada Library District, | ||||||
| 5.00%, 01/01/2017 | 2,351,398 | ||||||
| New Hampshire - 0.6% | |||||||
| 5,190,000 | New Hampshire Housing Finance Authority Revenue Bonds, | ||||||
| 5.25%, 07/01/2028 (Callable 01/01/2021) | 5,659,176 | ||||||
| 1,000,000 | State of New Hampshire, | ||||||
| 5.00%, 07/01/2021 (Callable 07/01/2020) | 1,239,640 | ||||||
| 6,898,816 | |||||||
| New Jersey - 2.9% | |||||||
| 1,140,000 | County of Hudson NJ, | ||||||
| 3.00%, 03/15/2021 | 1,178,851 | ||||||
| New Jersey Economic Development Authority Revenue Bonds: | |||||||
| 2,250,000 | 6.375%, 04/01/2018 (Pre-refunded to 05/15/2014) | 2,495,002 | |||||
| 6,000,000 | 6.375%, 04/01/2031 (Pre-refunded to 05/15/2014) | 6,653,340 | |||||
| 460,000 | New Jersey Sports & Exposition Authority State Contract Bonds, | ||||||
| 6.50%, 03/01/2013 (ETM) | 478,911 | ||||||
| 9,610,000 | New Jersey State Housing & Mortgage Finance Agency Bonds, | ||||||
| 4.50%, 10/01/2029 (Callable 04/01/2021) | 10,062,631 | ||||||
| New Jersey State Transportation Trust Fund Authority: | |||||||
| 2,595,000 | 5.50%, 12/15/2015 (Insured by AMBAC) | 2,975,115 | |||||
| 5,000,000 | 5.25%, 12/15/2020 | 6,083,300 | |||||
| New Jersey State Turnpike Authority: | |||||||
| 1,180,000 | 6.50%, 01/01/2016 (ETM) | 1,328,999 | |||||
| 100,000 | 6.50%, 01/01/2016 (ETM) | 112,627 | |||||
| 2,000,000 | 5.50%, 01/01/2025 | 2,595,260 | |||||
| 33,964,036 | |||||||
| New Mexico - 0.3% | |||||||
| New Mexico Mortgage Financial Authority: | |||||||
| 1,445,000 | 4.625%, 09/01/2025 (Callable 03/01/2020) | 1,523,189 | |||||
| 1,105,000 | 4.50%, 09/01/2028 (Callable 03/01/2020) | 1,183,831 | |||||
| 1,000,000 | New Mexico State Hospital Equipment Loan Council Hospital Revenue, | ||||||
| 5.25%, 07/01/2025 (Pre-refunded to 07/01/2015) | 1,133,710 | ||||||
| 3,840,730 | |||||||
| New York - 6.5% | |||||||
| Cattaraugus-Little Valley Central School District: | |||||||
| 1,520,000 | 3.125%, 06/15/2016 | 1,621,475 | |||||
| 1,000,000 | 3.125%, 06/15/2017 | 1,064,850 | |||||
| Churchville-Chili Central School District: | |||||||
| 1,045,000 | 3.00%, 06/15/2017 | 1,118,391 | |||||
| 1,070,000 | 3.00%, 06/15/2018 | 1,142,075 | |||||
| 2,000,000 | Long Island Power Authority and Electric System Revenue, | ||||||
| 5.00%, 12/01/2017 (Callable 12/01/2016)(Insured by NPFGC) | 2,325,160 | ||||||
| 13,330,000 | Metropolitan Transit Authority New York, | ||||||
| 6.00%, 04/01/2020 (ETM) | 17,022,943 | ||||||
| New York, New York: | |||||||
| 1,000,000 | 5.00%, 03/01/2016 (Callable 03/01/2015)(Insured by FGIC-TCRS) | 1,113,490 | |||||
| 5,000,000 | 5.00%, 08/01/2017 | 5,932,200 | |||||
| 1,125,000 | 5.25%, 08/15/2021 (Callable 08/15/2018) | 1,339,301 | |||||
| 4,730,000 | New York City, New York Transitional Financial Authority Building Aid Revenue Bonds, | ||||||
| 5.00%, 01/15/2015 (Insured by AGM) | 5,239,989 | ||||||
| 2,000,000 | New York State Dormitory Authority and Personal Income Tax Revenue, | ||||||
| 5.00%, 12/15/2017 | 2,412,260 | ||||||
| 4,040,000 | New York State Thruway Authority, | ||||||
| 5.00%, 03/15/2022 (Callable 03/15/2019) | 4,809,701 | ||||||
| New York State University Dormitory Authority Revenues: | |||||||
| 695,000 | 5.50%, 05/15/2013 (Insured by NPFGC) | 724,572 | |||||
| 5,290,000 | 5.25%, 05/15/2015 | 5,769,486 | |||||
| 4,715,000 | Suffolk County Water Authority, | ||||||
| 6.00%, 06/01/2017 (ETM) | 5,550,309 | ||||||
| Susquehanna Valley Central School District: | |||||||
| 1,155,000 | 3.125%, 06/15/2017 | 1,227,084 | |||||
| 1,375,000 | 3.125%, 06/15/2019 | 1,448,315 | |||||
| 175,000 | TSASC Inc. New York, | ||||||
| 4.75%, 06/01/2022 (Callable 06/01/2016) | 175,735 | ||||||
| 13,075,000 | Westchester Tobacco Asset Securitization Corp. New York, | ||||||
| 6.95%, 07/15/2039 (Pre-refunded to 07/15/2017) | 17,042,347 | ||||||
| 77,079,683 | |||||||
| North Carolina - 3.0% | |||||||
| 5,500,000 | North Carolina Eastern Municipal Power Agency, | ||||||
| 5.00%, 01/01/2021 (ETM) | 6,900,905 | ||||||
| North Carolina Eastern Municipal Power Agency Power Systems Revenue: | |||||||
| 3,310,000 | 5.00%, 01/01/2017 (ETM) | 3,778,365 | |||||
| 5,750,000 | 6.40%, 01/01/2021 (ETM) | 7,137,647 | |||||
| 6,425,000 | 4.50%, 01/01/2024 (Pre-refunded to 01/01/2022) | 7,929,864 | |||||
| 1,835,000 | 6.00%, 01/01/2026 (Pre-refunded to 01/01/2022) | 2,500,665 | |||||
| 6,495,000 | North Carolina Medical Care Community Hospital Revenue, | ||||||
| 5.25%, 11/01/2029 (Pre-refunded to 11/01/2014) | 7,195,161 | ||||||
| 35,442,607 | |||||||
| Ohio - 1.3% | |||||||
| 1,000,000 | Akron Ohio Community Learning Center Income Tax Revenue, | ||||||
| 5.25%, 12/01/2016 (Callable 12/01/2013)(Insured by NPFGC) | 1,063,520 | ||||||
| 2,000,000 | Cincinnati Ohio City School District, | ||||||
| 5.00%, 12/01/2016 (Insured by AGM) | 2,343,940 | ||||||
| Cleveland Municipal School District: | |||||||
| 1,790,000 | 4.00%, 12/01/2017 | 1,962,914 | |||||
| 1,865,000 | 4.00%, 12/01/2018 | 2,040,012 | |||||
| 1,940,000 | 4.00%, 12/01/2019 | 2,105,501 | |||||
| 2,015,000 | 5.00%, 12/01/2020 | 2,309,170 | |||||
| 90,000 | Miamisburg Ohio Water Revenue, | ||||||
| 7.00%, 11/15/2016 (Callable 08/02/2012)(ETM) | 93,956 | ||||||
| 2,680,000 | Ohio Housing Finance Agency, | ||||||
| 5.00%, 11/01/2028 (Callable 05/01/2020) | 2,901,877 | ||||||
| 14,820,890 | |||||||
| Pennsylvania - 3.0% | |||||||
| 1,275,000 | Central Dauphin Pennsylvania School District, | ||||||
| 6.75%, 02/01/2024 (Pre-refunded to 02/01/2016) | 1,552,211 | ||||||
| 1,380,000 | Erie Pennsylvania Sewer Authority Revenue, | ||||||
| 5.125%, 06/01/2020 (ETM) | 1,660,678 | ||||||
| 6,830,000 | Pennsylvania Convention Center Authority Revenue Bonds, | ||||||
| 6.00%, 09/01/2019 (ETM) | 8,735,228 | ||||||
| Pennsylvania Housing Finance Agency: | |||||||
| 2,130,000 | 3.70%, 04/01/2018 | 2,200,034 | |||||
| 1,760,000 | 3.75%, 10/01/2018 | 1,827,426 | |||||
| 1,025,000 | 3.90%, 04/01/2019 | 1,066,881 | |||||
| 1,675,000 | 3.90%, 10/01/2019 (Callable 04/01/2019) | 1,750,677 | |||||
| 3,000,000 | Pennsylvania State Public School Building Authority Lease Revenue, | ||||||
| 5.00%, 11/15/2034 (Pre-refunded to 11/15/2014) | 3,326,220 | ||||||
| 1,790,000 | Philadelphia Pennsylvania Authority For Industrial Development Revenue, | ||||||
| 5.25%, 01/01/2027 (Pre-refunded to 01/01/2017) | 2,131,801 | ||||||
| 2,660,000 | Philadelphia Pennsylvania Gas Works, | ||||||
| 7.00%, 05/15/2020 (ETM) | 3,237,858 | ||||||
| Pittsburgh Pennsylvania Water & Sewer Authority Revenue Bonds: | |||||||
| 870,000 | 7.25%, 09/01/2014 (Callable 07/18/2012)(ETM) | 935,224 | |||||
| 4,500,000 | 5.00%, 09/01/2029 (Pre-refunded to 09/01/2015) | 5,114,925 | |||||
| 1,500,000 | St. Mary Hospital Authority Pennsylvania Health Revenue, | ||||||
| 5.375%, 11/15/2034 (Pre-refunded to 11/15/2014) | 1,665,030 | ||||||
| 35,204,193 | |||||||
| Puerto Rico - 0.8% | |||||||
| 6,000,000 | Commonwealth of Puerto Rico, | ||||||
| 5.00%, 07/01/2021 | 6,529,620 | ||||||
| 1,625,000 | Puerto Rico Public Building Authority, | ||||||
| 5.50%, 07/01/2022 (Pre-refunded to 07/01/2014) | 1,784,234 | ||||||
| 1,080,000 | Puerto Rico Public Finance Corp., | ||||||
| 6.00%, 08/01/2026 (ETM) | 1,485,745 | ||||||
| 9,799,599 | |||||||
| South Carolina - 1.2% | |||||||
| 6,375,000 | Piedmont Municipal Power Agency South Carolina Electric Revenue, | ||||||
| 6.75%, 01/01/2020 (ETM) | 8,672,678 | ||||||
| South Carolina Jobs Economic Development Authority Hospital Facilities Revenue: | |||||||
| 2,575,000 | 7.00%, 08/01/2030 (Pre-refunded to 08/01/2013) | 2,756,640 | |||||
| 2,430,000 | 6.375%, 08/01/2034 (Pre-refunded to 08/01/2013) | 2,585,180 | |||||
| 14,014,498 | |||||||
| South Dakota - 0.1% | |||||||
| 850,000 | Heartland Consumers Power District, | ||||||
| 7.00%, 01/01/2016 (ETM) | 956,020 | ||||||
| Tennessee - 1.0% | |||||||
| 1,000,000 | Metropolitan Government Nashville & Davidson County Tennessee H&E, | ||||||
| 0.00%, 06/01/2021 (ETM) ^ | 828,050 | ||||||
| 5,000,000 | Shelby County Tennessee Health Educational & Housing Facilities Revenue, | ||||||
| 5.50%, 08/15/2019 (ETM) | 5,742,300 | ||||||
| 4,835,000 | Tennessee Housing Development Agency, | ||||||
| 4.50%, 07/01/2028 (Callable 01/01/2020) | 5,197,190 | ||||||
| 11,767,540 | |||||||
| Texas - 13.7% | |||||||
| 2,010,000 | Barbers Hill Independent School District, | ||||||
| 5.00%, 02/15/2019 | 2,456,843 | ||||||
| 2,125,000 | Barbers Hill Texas Independent School District General Obligation, | ||||||
| 5.00%, 02/15/2017 (Callable 02/15/2015)(PSF Guaranteed) | 2,366,868 | ||||||
| 6,060,000 | Capital Area Housing Finance Corporation Texas, | ||||||
| 0.00%, 01/01/2016 (ETM) ^ | 5,864,929 | ||||||
| 1,500,000 | Central Texas Housing Finance Corporation, | ||||||
| 0.00%, 09/01/2016 (ETM) ^ | 1,440,885 | ||||||
| Conroe Independent School District: | |||||||
| 1,000,000 | 5.00%, 02/15/2022 (Callable 02/15/2021) | 1,230,880 | |||||
| 2,680,000 | 5.00%, 02/15/2023 (Callable 02/15/2021) | 3,253,949 | |||||
| 1,500,000 | Cypress-Fairbanks Texas Independent School District, | ||||||
| 5.00%, 02/15/2017 (Callable 02/15/2016)(PSF Guaranteed) | 1,723,785 | ||||||
| 2,410,000 | Dallas Texas Independent School District, | ||||||
| 5.00%, 02/15/2020 (PSF Guaranteed) | 2,967,770 | ||||||
| 1,355,000 | El Paso Texas Waterworks & Sewer Revenue, | ||||||
| 5.00%, 08/15/2018 | 1,639,726 | ||||||
| 1,625,000 | Frisco Texas Independent School District, | ||||||
| 6.00%, 08/15/2018 (Callable 08/15/2016)(PSF Guaranteed) | 1,950,715 | ||||||
| 1,000,000 | Georgetown Texas Independent School District, | ||||||
| 5.00%, 02/15/2016 (Callable 02/15/2015)(PSF Guaranteed) | 1,111,880 | ||||||
| Harris County Texas: | |||||||
| 1,525,000 | 5.00%, 10/01/2019 | 1,889,811 | |||||
| 140,000 | 5.75%, 10/01/2020 (Pre-refunded to 10/01/2018) | 178,854 | |||||
| 4,840,000 | 5.75%, 10/01/2028 (Pre-refunded to 10/01/2018) | 6,183,245 | |||||
| Harris County Texas Health Facilities Development Corporation Hospital Revenue: (ETM) | |||||||
| 5,475,000 | 5.50%, 10/01/2013 | 5,649,707 | |||||
| 4,280,000 | 5.50%, 10/01/2019 | 5,171,225 | |||||
| 10,960,000 | Houston Texas Health Facilities Corporate Facilities Revenue, | ||||||
| 7.125%, 02/15/2034 (Pre-refunded to 02/15/2014) | 12,234,210 | ||||||
| 825,000 | Houston Texas Sewer System Revenue, | ||||||
| 9.375%, 10/01/2013 (Callable 10/01/2012)(ETM) | 878,295 | ||||||
| 3,000,000 | Houston Texas Utility System Revenue, | ||||||
| 5.25%, 05/15/2015 (Callable 05/15/2014)(Insured by NPFGC) | 3,255,420 | ||||||
| 16,050,000 | Houston Texas Water & Sewer System Revenue Bonds, | ||||||
| 5.50%, 12/01/2029 (ETM) | 21,850,630 | ||||||
| 1,500,000 | Humble Texas Independent School District, | ||||||
| 5.00%, 02/15/2021 | 1,866,390 | ||||||
| 1,000,000 | Killeen Independent School District, | ||||||
| 4.00%, 02/15/2024 (Callable 02/15/2021) | 1,114,720 | ||||||
| 1,315,000 | La Porte Texas Independent School District, | ||||||
| 5.00%, 02/15/2018 (Callable 02/15/2015)(Insured by NPFGC) | 1,453,101 | ||||||
| 6,760,000 | Lamar Consolidated Independent School District, | ||||||
| 5.00%, 02/15/2021 (Insured by PSF) | 8,399,097 | ||||||
| 3,425,000 | Lubbock Texas, | ||||||
| 5.00%, 02/15/2021 (Callable 02/15/2018)(Insured by AGM) | 3,973,651 | ||||||
| 1,730,000 | Lubbock Texas Housing Finance Corp., | ||||||
| 8.00%, 10/01/2021 (ETM) | 2,541,024 | ||||||
| 1,000,000 | Lubbock Texas Independent School District, | ||||||
| 4.00%, 02/15/2022 (Callable 02/15/2020) | 1,134,490 | ||||||
| 1,735,000 | Lufkin Texas Independent School District, | ||||||
| 5.00%, 08/15/2015 (Callable 08/15/2014)(PSF Guaranteed) | 1,900,675 | ||||||
| 1,050,000 | Magnolia Texas Independent School District, | ||||||
| 5.00%, 08/15/2016 (PSF Guaranteed) | 1,228,458 | ||||||
| 1,265,000 | Mission Consolidation Independent School District, | ||||||
| 5.00%, 02/15/2019 (Callable 02/15/2015)(PSF Guaranteed) | 1,400,962 | ||||||
| 1,125,000 | North Central Texas Health Facilities Revenue, | ||||||
| 5.75%, 02/15/2015 (ETM) | 1,258,346 | ||||||
| 1,210,000 | Pearland Texas Waterworks & Sewage, | ||||||
| 5.25%, 03/01/2023 (Pre-refunded to 03/01/2014) | 1,307,998 | ||||||
| 2,035,000 | Retama Texas Development Corporation Special Facilites Revenue, | ||||||
| 8.75%, 12/15/2018 (ETM) | 2,952,052 | ||||||
| 1,295,000 | Rockwall Texas Independent School District, | ||||||
| 5.00%, 02/15/2015 (PSF Guaranteed) | 1,441,322 | ||||||
| 11,565,000 | San Antonio Texas Electric & Gas Revenue, | ||||||
| 5.65%, 02/01/2019 (ETM) | 14,101,436 | ||||||
| 2,100,000 | San Antonio Texas Hotel Occupancy Tax Revenue Bonds, | ||||||
| 0.00%, 08/15/2015 (ETM) ^ | 2,047,206 | ||||||
| 2,000,000 | San Antonio Texas Independent School District, | ||||||
| 5.00%, 08/15/2017 (Callable 08/15/2015)(PSF Guaranteed) | 2,270,820 | ||||||
| 1,020,000 | Spring Texas Independent School District, | ||||||
| 5.00%, 08/15/2019 (Callable 08/15/2018)(PSF Guaranteed) | 1,243,686 | ||||||
| 7,990,000 | Tarrant County Texas Health Facilities Revenue, | ||||||
| 6.00%, 09/01/2024 (ETM) | 10,265,312 | ||||||
| 1,800,000 | Tarrant County Texas Housing Finance Corporation Revenue Bonds, | ||||||
| 0.00%, 09/15/2016 (ETM) ^ | 1,724,796 | ||||||
| Texas State: | |||||||
| 6,285,000 | 5.00%, 10/01/2018 | 7,686,744 | |||||
| 3,965,000 | 5.00%, 04/01/2020 (Callable 04/01/2016) | 4,539,251 | |||||
| 2,200,000 | Tomball Hospital Authority, | ||||||
| 5.00%, 07/01/2020 (Pre-refunded to 07/01/2015) | 2,491,940 | ||||||
| 1,225,000 | University of Texas Revenue Bonds, | ||||||
| 5.00%, 08/15/2018 (Pre-refunded to 08/15/2016) | 1,436,998 | ||||||
| 163,080,102 | |||||||
| Utah - 0.6% | |||||||
| Granite School District Board of Education: | |||||||
| 3,900,000 | 5.00%, 06/01/2022 (Callable 06/01/2021) | 4,824,924 | |||||
| 1,750,000 | 5.00%, 06/01/2023 (Callable 06/01/2021) | 2,139,533 | |||||
| 285,000 | Salt Lake City Utah Hospital Revenue, | ||||||
| 8.125%, 05/15/2015 (Callable 08/02/2012)(ETM) | 318,892 | ||||||
| 7,283,349 | |||||||
| Virginia - 0.9% | |||||||
| 1,095,000 | Bristol Virginia Utility Systems General Obligations, | ||||||
| 5.50%, 11/01/2018 (ETM) | 1,321,720 | ||||||
| 7,650,000 | Tobacco Settlement Financing Corporation Revenue, | ||||||
| 5.625%, 06/01/2037 (Pre-refunded to 06/01/2015) | 8,762,692 | ||||||
| 10,084,412 | |||||||
| Washington - 3.5% | |||||||
| 4,500,000 | Snohomish County School District No. 201, | ||||||
| 4.00%, 12/01/2021 (Callable 12/01/2020) | 5,144,400 | ||||||
| 3,605,000 | Snohomish County Washington Public Utilities Revenue, | ||||||
| 6.80%, 01/01/2020 (Callable 08/02/2012)(ETM) | 4,622,691 | ||||||
| 2,755,000 | Thurston & Pierce Counties Washington Community Schools, | ||||||
| 4.25%, 12/01/2021 (Callable 12/01/2020) | 3,156,624 | ||||||
| 6,505,000 | University of Washington, | ||||||
| 5.00%, 07/01/2022 | 8,216,921 | ||||||
| 1,290,000 | Walla Walla County School District No 250 College Place, | ||||||
| 5.00%, 12/01/2019 | 1,571,981 | ||||||
| Washington State: | |||||||
| 1,500,000 | 5.00%, 07/01/2018 (Callable 07/01/2013) | 1,568,955 | |||||
| 10,000,000 | 5.00%, 01/01/2021 | 12,349,100 | |||||
| 3,970,000 | 5.50%, 07/01/2023 | 5,084,935 | |||||
| 41,715,607 | |||||||
| West Virginia - 0.7% | |||||||
| 7,365,000 | Berkeley Brooke Fayette Counties West Virginia Single Family Mortgage Revenue, | ||||||
| 0.00%, 12/01/2014 (ETM) ^ | 7,252,684 | ||||||
| 1,130,000 | Ohio County Board of Education, | ||||||
| 5.25%, 06/01/2018 (ETM) | 1,395,233 | ||||||
| 8,647,917 | |||||||
| Wisconsin - 1.6% | |||||||
| 3,000,000 | Ladysmith-Hawkins Wisconsin School District General Obligation, | ||||||
| 5.20%, 04/01/2018 (Callable 04/01/2016)(Insured by NPFGC) | 3,183,600 | ||||||
| 10,000,000 | State of Wisconsin, | ||||||
| 5.00%, 05/01/2022 | 12,491,000 | ||||||
| 3,320,000 | Wisconsin State Health & Educational Facilities Revenue, | ||||||
| 5.00%, 12/01/2019 (Callable 12/01/2014)(Insured by NPFGC) | 3,546,258 | ||||||
| 19,220,858 | |||||||
| Total Municipal Bonds (Cost $1,094,350,492) | 1,160,256,224 | ||||||
| Shares | |||||||
| SHORT-TERM INVESTMENTS - 1.5% | |||||||
| Money Market Mutual Fund - 1.5% | |||||||
| 17,877,536 | Goldman Sachs Financial Square Funds, 0.03% « | 17,877,536 | |||||
| Total Short-Term Investments (Cost $17,877,536) | 17,877,536 | ||||||
| Total Investments (Cost $1,112,228,028) - 99.1% | 1,178,133,760 | ||||||
| Other Assets in Excess of Liabilities - 0.9% | 11,062,022 | ||||||
| TOTAL NET ASSETS - 100.0% | $ | 1,189,195,782 | |||||
| Notes to Summary Schedule of Investments | ||||||
| AGM - Assured Guaranty Municipal | ||||||
| AMBAC - Ambac Assurance Corporation. Ambac Assurance's plan of rehabilitation transferring certain troubled insurance policies and assets | ||||||
| (mostly relating to insurance coverage and credit default swaps on residential mortgage-backed securities) to a segregated account has | ||||||
| obtained court approval but has not yet been implemented. | ||||||
| BHAC - Berkshire Hathaway Assurance Corp. | ||||||
| FGIC-TCRS - Financial Guaranty Insurance Company | ||||||
| NPFGC - National Public Finance Guarantee Corp. | ||||||
| PSF - Texas Permanent School Fund | ||||||
| ETM - Escrowed to Maturity | ||||||
| ^ Non-Income Producing | ||||||
| « 7-Day Yield | ||||||
Summary of Fair Value Exposure at June 30, 2012 (Unaudited) |
The Fund has adopted authoritative fair valuation accounting standards which establish a definition of fair value and set out a hierarchy for measuring fair value. These standards require additional disclosures about the various inputs and valuation techniques used to develop the measurements of fair value and a discussion on changes in valuation techniques and related inputs during the period. These standards define fair value as the price that would be received to sell an asset or paid to transfer a liability in an orderly transaction between market participants at the measurement date. The fair value hierarchy is organized into three levels based upon the assumptions (referred to as “inputs”) used in pricing the asset or liability. These standards state that “observable inputs” reflect the assumptions market participants would use in pricing the asset or liability based on market data obtained from independent sources and “unobservable inputs” reflect an entity’s own assumptions about the assumptions market participants would use in pricing the asset or liability. These inputs are summarized into three broad levels and described below:
| Level 1 - | Unadjusted quoted prices in active markets for identical unrestricted securities. |
| Level 2 - | Other significant observable inputs (including quoted prices for similar securities, quoted prices in inactive markets, dealer indications, interest rates, yield curves, prepayment speeds, credit risk, default rates, inputs corroborated by observable market data, etc.). |
| Level 3 - | Significant unobservable inputs (including the Fund’s own assumptions about the factors that market participants would use in valuing the security) based on the best information available. |
The inputs or methodology used for valuing securities are not necessarily an indication of the risk associated with investing in those securities.
The following is a summary of the inputs used to value the Fund’s investments as of June 30, 2012:
| Level 1 | Level 2 | Level 3 | Total | |||||||||||||
| Fixed Income | ||||||||||||||||
| Municipal Bonds | $ | - | $ | 1,160,256,224 | $ | - | $ | 1,160,256,224 | ||||||||
| Total Fixed Income | - | 1,160,256,224 | - | 1,160,256,224 | ||||||||||||
| Short-Term Investments | ||||||||||||||||
| Money Market Mutual Fund | 17,877,536 | - | - | 17,877,536 | ||||||||||||
| Total Short-Term Investments | 17,877,536 | - | - | 17,877,536 | ||||||||||||
| Total Investments | $ | 17,877,536 | $ | 1,160,256,224 | $ | - | $ | 1,178,133,760 | ||||||||
Changes in valuation techniques may result in transfers into or out of current assigned levels within the hierarchy. There were no significant transfers between Level 1, Level 2 and Level 3 fair value measurements during the reporting period, as compared to their classification from the prior year’s annual report.
| Baird Aggregate Bond Fund | |||||||
| Schedule of Investments | |||||||
| June 30, 2012 (Unaudited) | |||||||
| Principal Amount | Value | ||||||
| LONG-TERM INVESTMENTS - 98.4% | |||||||
| U.S. Treasury Securities - 12.2% | |||||||
| U.S. Treasury Bonds: | |||||||
| $ | 57,300,000 | 2.375%, 07/31/2017 @ | $ | 61,875,061 | |||
| 1,000,000 | 6.25%, 08/15/2023 | 1,452,500 | |||||
| 33,825,000 | 5.25%, 11/15/2028 @ | 47,603,411 | |||||
| 31,850,000 | 4.375%, 02/15/2038 @ | 42,260,969 | |||||
| 153,191,941 | |||||||
| Taxable Municipal Bonds - 5.1% | |||||||
| 5,000,000 | Atlanta Independent School System, | ||||||
| 5.557%, 03/01/2026 | 5,705,600 | ||||||
| California Qualified School Construction Bonds: | |||||||
| 2,500,000 | 5.041%, 07/01/2020 | 2,819,675 | |||||
| 7,500,000 | 7.155%, 03/01/2027 | 8,691,375 | |||||
| 2,000,000 | California School Finance Authority, | ||||||
| 5.043%, 01/01/2021 (Callable 12/31/2015) | 2,103,880 | ||||||
| 5,975,000 | Contra Costa County California Pension Obligation, | ||||||
| 5.14%, 06/01/2017 | 6,657,763 | ||||||
| 1,000,000 | Cuyahoga County Ohio Industrial Development Revenue, | ||||||
| 9.125%, 10/01/2023 | 775,720 | ||||||
| 2,580,000 | Eaton Ohio Community City Schools, | ||||||
| 5.39%, 08/25/2027 (Callable 06/01/2020) | 2,796,488 | ||||||
| 4,975,000 | Elgin Ohio LOC School District, | ||||||
| 5.499%, 08/31/2027 (Callable 12/01/2019) | 5,312,156 | ||||||
| 6,500,000 | San Dieguito California Public Facilities, | ||||||
| 6.459%, 05/01/2027 | 7,627,295 | ||||||
| 5,000,000 | State Public School Building Authorities Revenue, | ||||||
| 5.00%, 09/15/2027 | 5,570,150 | ||||||
| 2,650,000 | Three Rivers Ohio LOC School District, | ||||||
| 5.209%, 09/15/2027 (Callable 12/01/2020) | 2,850,525 | ||||||
| 6,960,000 | Tobacco Settlement Authority Iowa, | ||||||
| 6.50%, 06/01/2023 (Callable 06/01/2015) | 6,697,051 | ||||||
| 2,000,000 | West Contra Costa Unified School District, | ||||||
| 6.25%, 08/01/2030 | 2,175,540 | ||||||
| 4,000,000 | Westlake Ohio City School District, | ||||||
| 5.227%, 12/01/2026 (Callable 12/01/2020) | 4,452,000 | ||||||
| 64,235,218 | |||||||
| Other Government Related Securities - 2.4% | |||||||
| 6,242,000 | Corp Andina de Fomento, | ||||||
4.375%, 06/15/2022 f | 6,375,779 | ||||||
| 500,000 | Industrial Bank of Korea, | ||||||
3.75%, 09/29/2016 (Acquired 03/22/2011, Cost $496,855) * f | 521,885 | ||||||
| 2,165,000 | Korea Electric Power Corporation, | ||||||
6.75%, 08/01/2027 f | 2,678,052 | ||||||
| 2,600,000 | Korea Gas Corp., | ||||||
4.25%, 11/02/2020 (Acquired 10/26/2010, Cost $2,587,026) * f | 2,737,745 | ||||||
| 510,000 | National Bank of Hungary Yankee Debentures, | ||||||
8.875%, 11/01/2013 f | 526,166 | ||||||
| 3,000,000 | PEMEX Finance Ltd., | ||||||
10.61%, 08/15/2017 f | 3,619,826 | ||||||
| 2,800,000 | PEMEX Project Funding Master Trust, | ||||||
| 5.75%, 03/01/2018 | 3,164,000 | ||||||
Petrobras International Finance Company: f | |||||||
| 5,000,000 | 3.50%, 02/06/2017 | 5,132,420 | |||||
| 1,000,000 | 5.75%, 01/20/2020 | 1,093,878 | |||||
| 1,600,000 | The Export-Import Bank of Korea, | ||||||
4.00%, 01/11/2017 f | 1,706,906 | ||||||
| 2,788,000 | Westdeutsche Landesbank Subordinated Notes, | ||||||
4.796%, 07/15/2015 f | 2,865,487 | ||||||
| 30,422,144 | |||||||
| Corporate Bonds - 35.1% | |||||||
| Industrials - 11.4% | |||||||
| 4,200,000 | Acuity Brands Lighting Inc., | ||||||
| 6.00%, 12/15/2019 | 4,747,651 | ||||||
| Ameritech Capital Funding Corporation, | |||||||
| 1,506,774 | 9.10%, 06/01/2016 | 1,767,053 | |||||
| 2,989,000 | 6.45%, 01/15/2018 | 3,434,956 | |||||
| 6,000,000 | Anadarko Petroleum Corporation, | ||||||
| 6.375%, 09/15/2017 | 6,969,804 | ||||||
| 2,000,000 | Anglo American Capital PLC, | ||||||
9.375%, 04/08/2019 (Acquired 04/02/2009, Cost $2,000,000) * f | 2,650,440 | ||||||
| 3,000,000 | Aristotle Holding, Inc., | ||||||
| 2.65%, 02/15/2017 (Acquired 02/06/2012, Cost $2,970,750) * | 3,052,107 | ||||||
| Bunge Limited Finance Corporation: | |||||||
| 600,000 | 5.35%, 04/15/2014 | 633,120 | |||||
| 1,289,000 | 5.10%, 07/15/2015 | 1,377,422 | |||||
| 3,800,000 | Bunge NA Finance LP, | ||||||
| 5.90%, 04/01/2017 | 4,250,976 | ||||||
| 3,000,000 | CenturyLink Inc., | ||||||
| 5.15%, 06/15/2017 | 3,069,351 | ||||||
| 800,000 | Clear Channel Communications, | ||||||
| 5.50%, 12/15/2016 @ | 398,000 | ||||||
| 1,000,000 | Comcast Corporation, | ||||||
| 6.95%, 08/15/2037 | 1,284,416 | ||||||
| ConAgra Foods, Inc.: | |||||||
| 1,687,000 | 5.819%, 06/15/2017 | 1,933,109 | |||||
| 120,000 | 9.75%, 03/01/2021 | 163,807 | |||||
| 295,676 | Continental Airlines, Inc. Pass-Through Certificates, | ||||||
| Series 1997-4, Class A, 6.90%, 01/02/2018 | 311,198 | ||||||
| 410,000 | Deutsche Telekom International Finance B.V., | ||||||
8.75%, 06/15/2030 f | 569,094 | ||||||
| Donnelley (R.R.) & Sons Co.: | |||||||
| 2,500,000 | 8.60%, 08/15/2016 @ | 2,650,000 | |||||
| 2,000,000 | 6.125%, 01/15/2017 @ | 1,890,000 | |||||
| 1,000,000 | 7.625%, 06/15/2020 @ | 935,000 | |||||
| 1,000,000 | D.R. Horton, Inc., | ||||||
| 6.50%, 04/15/2016 @ | 1,082,500 | ||||||
| 2,762,667 | FedEx Corporation Pass-Through Certificates, | ||||||
| Series 1998-1, Class B, 6.845%, 01/15/2019 | 3,108,000 | ||||||
| 8,092,000 | Glencore Funding LLC, | ||||||
| 6.00%, 04/15/2014 (Acquired 03/31/2004 through 06/20/2011, Cost $8,145,793) * | 8,506,480 | ||||||
| GTE Corporation: | |||||||
| 2,400,000 | 6.84%, 04/15/2018 | 2,939,491 | |||||
| 100,000 | 8.75%, 11/01/2021 | 140,372 | |||||
| 650,000 | Health Management Association, | ||||||
| 6.125%, 04/15/2016 | 689,000 | ||||||
| 3,000,000 | Highmark Inc. Notes, | ||||||
| 4.75%, 05/15/2021 (Acquired 05/03/2011, Cost $2,987,880) * | 3,069,573 | ||||||
| 1,105,000 | Holcim U.S. Finance, | ||||||
6.00%, 12/30/2019 (Acquired 09/24/2009 through 06/26/2012, Cost $1,096,616) * f | 1,158,534 | ||||||
| 5,700,000 | Hutchison Whampoa International Ltd., | ||||||
7.625%, 04/09/2019 (Acquired 10/22/2009 through 10/29/2009, Cost $6,265,355) * f | 7,042,367 | ||||||
| 1,800,000 | Hyundai Capital Services Inc., | ||||||
3.50%, 09/13/2017 (Acquired 03/07/2012, Cost $1,809,201) * f | 1,815,181 | ||||||
| 950,000 | Johnson Controls Inc., | ||||||
| 6.00%, 01/15/2036 | 1,135,789 | ||||||
| 1,000,000 | Lafarge SA, | ||||||
7.125%, 07/15/2036 f @ | 990,000 | ||||||
| 1,000,000 | Martin Marietta Materials, Inc., | ||||||
| 6.25%, 05/01/2037 | 982,942 | ||||||
| 1,000,000 | Masco Corporation, | ||||||
| 6.125%, 10/03/2016 | 1,067,200 | ||||||
| 1,100,000 | Nabors Industries, Inc., | ||||||
| 6.15%, 02/15/2018 | 1,262,314 | ||||||
| 7,045,000 | National Oilwell Varco Inc., | ||||||
| Series B, 6.125%, 08/15/2015 | 7,153,866 | ||||||
| 1,300,000 | New Cingular Wireless Services, Inc., | ||||||
| 8.75%, 03/01/2031 | 1,979,934 | ||||||
| 1,500,000 | Nextel Communications, | ||||||
| Series D, 7.375%, 08/01/2015 | 1,501,875 | ||||||
| 320,000 | Pactiv Corporation, | ||||||
| 7.95%, 12/15/2025 @ | 256,000 | ||||||
| 4,355,000 | Plum Creek Timberlands, L.P., | ||||||
| 5.875%, 11/15/2015 | 4,825,266 | ||||||
| 1,000,000 | Questar Market Resources Inc., | ||||||
| 6.80%, 03/01/2020 | 1,097,500 | ||||||
| 2,000,000 | Ralcorp Holdings, Inc., | ||||||
| 4.95%, 08/15/2020 | 2,093,718 | ||||||
| 500,000 | Rio Tinto Alcan, Inc., | ||||||
5.75%, 06/01/2035 f | 590,581 | ||||||
| 1,500,000 | SK Telecom, | ||||||
6.625%, 07/20/2027 (Acquired 07/13/2007, Cost $1,482,015) * f | 1,853,067 | ||||||
| Sprint Capital Corporation: | |||||||
| 2,800,000 | 6.90%, 05/01/2019 @ | 2,632,000 | |||||
| 358,000 | 8.75%, 03/15/2032 | 325,780 | |||||
| 1,000,000 | Talisman Energy Inc., | ||||||
7.75%, 06/01/2019 f | 1,226,980 | ||||||
Telecom Italia Capital, SA: f | |||||||
| 2,000,000 | 7.175%, 06/18/2019 @ | 1,990,000 | |||||
| 5,519,000 | 7.20%, 07/18/2036 | 4,677,353 | |||||
Telefonica Emisiones S.A.U.: f | |||||||
| 1,950,000 | 6.421%, 06/20/2016 | 1,871,228 | |||||
| 5,075,000 | 6.221%, 07/03/2017 | 4,764,374 | |||||
| Time Warner, Inc.: | |||||||
| 1,050,000 | 4.70%, 01/15/2021 | 1,170,042 | |||||
| 1,100,000 | 7.625%, 04/15/2031 | 1,420,805 | |||||
| 500,000 | 7.70%, 05/01/2032 @ | 652,918 | |||||
| 1,000,000 | 6.55%, 05/01/2037 | 1,185,823 | |||||
| 3,100,000 | 6.75%, 06/15/2039 | 3,778,209 | |||||
| 3,000,000 | Tyco Electronics Group S.A., | ||||||
6.55%, 10/01/2017 f | 3,581,439 | ||||||
| 53,574 | United AirLines, Inc. Pass-Through Certificates, | ||||||
| Series 2000-2, Class C, 7.762%, 04/29/2049 ** § † | 1,607 | ||||||
| 296,734 | U.S. Airways Pass-Through Certificate, | ||||||
| Series 1998-1, 6.85%, 01/30/2018 | 293,767 | ||||||
Vale Overseas Limited: f | |||||||
| 3,850,000 | 8.25%, 01/17/2034 | 4,913,135 | |||||
| 1,550,000 | 6.875%, 11/21/2036 @ | 1,797,929 | |||||
| 1,000,000 | 6.875%, 11/10/2039 @ | 1,168,377 | |||||
| Vulcan Materials Co.: | |||||||
| 2,000,000 | 7.00%, 06/15/2018 | 2,130,000 | |||||
| 500,000 | 7.15%, 11/30/2037 | 473,750 | |||||
| 100,000 | Westvaco Corporation, | ||||||
| 9.75%, 06/15/2020 | 126,241 | ||||||
| 3,600,000 | Woodside Finance Ltd., | ||||||
8.125%, 03/01/2014 (Acquired 02/24/2009, Cost $3,598,884) * f | 3,953,059 | ||||||
| 690,000 | Xstrata Finance Canada Ltd, | ||||||
5.80%, 11/15/2016 (Acquired 12/06/2011, Cost $740,994) * f | 770,770 | ||||||
| 143,334,640 | |||||||
| Utility - 5.7% | |||||||
| 1,900,000 | Allegheny Energy Supply Co. Senior Unsecured Notes, | ||||||
| 5.75%, 10/15/2019 (Acquired 09/22/2009 through 06/30/2010, Cost $1,891,569) * | 2,044,641 | ||||||
| 6,900,000 | Ameren Corporation, | ||||||
| 8.875%, 05/15/2014 | 7,685,834 | ||||||
| 850,000 | Arizona Public Service Senior Unsecured Notes, | ||||||
| 8.75%, 03/01/2019 | 1,124,124 | ||||||
| 1,220,000 | Beaver Valley Funding Corporation Debentures, | ||||||
| 9.00%, 06/01/2017 | 1,261,968 | ||||||
| 5,862,000 | Constellation Energy Group Inc., | ||||||
| 4.55%, 06/15/2015 | 6,295,313 | ||||||
| 2,800,000 | DCP Midstream, LLC, | ||||||
| 9.75%, 03/15/2019 (Acquired 02/29/2012, Cost $3,647,661) * | 3,629,942 | ||||||
| 4,500,000 | El Paso Pipeline Partners Operating Co LLC, | ||||||
| 7.50%, 11/15/2040 | 5,702,189 | ||||||
Enel Finance International: f | |||||||
| 2,475,000 | 5.125%, 10/07/2019 (Acquired 09/30/2009, Cost $2,464,110) *@ | 2,364,276 | |||||
| 1,900,000 | 6.80%, 09/15/2037 (Acquired 09/13/2007, Cost $1,894,965) * | 1,643,787 | |||||
| 2,200,000 | Exelon Generation Company, LLC, | ||||||
| 6.20%, 10/01/2017 | 2,536,406 | ||||||
| 2,500,000 | FPL Group Capital, Inc., | ||||||
| Series D, 7.30%, 09/01/2067 | 2,653,125 | ||||||
| 322,769 | GG1C Funding Corporation, | ||||||
| 5.129%, 01/15/2014 (Acquired 06/27/2006, Cost $319,048) * | 329,509 | ||||||
| Kinder Morgan Energy Partners Senior, L.P.: | |||||||
| 1,000,000 | 9.00%, 02/01/2019 | 1,291,775 | |||||
| 2,250,000 | 6.95%, 01/15/2038 @ | 2,660,949 | |||||
| 1,000,000 | 6.50%, 09/01/2039 | 1,142,073 | |||||
| 900,000 | Kinder Morgan Finance, | ||||||
5.70%, 01/05/2016 f @ | 947,250 | ||||||
| 187,385 | Kiowa Power Partners LLC, | ||||||
| 4.811%, 12/30/2013 (Acquired 11/19/2004 through 12/23/2011, Cost $190,210) * | 189,432 | ||||||
| 5,500,000 | Mega Advance Investments Ltd, | ||||||
5.00%, 05/12/2021 (Acquired 05/09/2011, Cost $5,443,790) *f @ | 5,838,938 | ||||||
| 100,000 | National Rural Utilities Corporation, | ||||||
| 8.00%, 03/01/2032 | 146,910 | ||||||
| 3,401,000 | ONEOK Partners L.P., | ||||||
| 6.15%, 10/01/2016 | 3,953,560 | ||||||
| 2,060,000 | PPL Energy Supply, LLC, | ||||||
| Series A, 5.70%, 10/15/2015 | 2,235,384 | ||||||
| PSE&G Power LLC: | |||||||
| 3,223,000 | 5.32%, 09/15/2016 @ | 3,634,593 | |||||
| 4,005,000 | 5.125%, 04/15/2020 | 4,441,701 | |||||
| 1,215,240 | RGS (I&M) Funding Corporation Debentures, | ||||||
| 9.82%, 12/07/2022 | 1,518,649 | ||||||
| 2,000,000 | Rockies Express Pipeline LLC, | ||||||
| 5.625%, 04/15/2020 (Acquired 03/17/2010, Cost $1,998,220) *@ | 1,820,000 | ||||||
| 1,400,000 | Southern Natural Gas, | ||||||
| 5.90%, 04/01/2017 (Acquired 03/14/2007, Cost $1,397,676) * | 1,602,723 | ||||||
| 3,100,000 | Williams Partners L.P., | ||||||
| 6.30%, 04/15/2040 | 3,671,361 | ||||||
| 72,366,412 | |||||||
| Finance - 18.0% | |||||||
| 150,000 | Ally Financial Inc., | ||||||
| 6.75%, 12/01/2014 @ | 158,239 | ||||||
| American General Finance Corporation: | |||||||
| 1,000,000 | 5.85%, 06/01/2013 @ | 960,000 | |||||
| 500,000 | 6.90%, 12/15/2017 | 399,060 | |||||
| 1,000,000 | American International Group, Inc., | ||||||
| 8.175%, 05/15/2058 @ | 1,085,000 | ||||||
| 2,000,000 | Ameriprise Financial, Inc., | ||||||
| 7.30%, 06/28/2019 @ | 2,497,064 | ||||||
| 250,000 | AmSouth Bancorp, | ||||||
| 6.75%, 11/01/2025 | 238,038 | ||||||
| 5,125,000 | Associates Corporation of North America, | ||||||
| 6.95%, 11/01/2018 | 5,778,489 | ||||||
| 400,000 | BAC Capital Trust VI, | ||||||
| 5.625%, 03/08/2035 | 381,719 | ||||||
| 100,000 | BankAmerica Capital II, | ||||||
| Series 2, 8.00%, 12/15/2026 | 102,280 | ||||||
| 1,715,000 | Bank of America Corporation Subordinated Notes, | ||||||
| 10.20%, 07/15/2015 | 1,941,351 | ||||||
| 2,175,000 | Banponce Trust I, | ||||||
| Series A, 8.327%, 02/01/2027 | 1,573,156 | ||||||
| 4,000,000 | Barclays Bank PLC, | ||||||
6.75%, 05/22/2019 f | 4,666,184 | ||||||
| 100,000 | Capital One Financial Corporation, | ||||||
| 6.15%, 09/01/2016 | 111,797 | ||||||
| CIT Group, Inc.: | |||||||
| 88,000 | 7.00%, 05/02/2016 (Acquired 01/23/2006, Cost $88,366) * | 88,220 | |||||
| 47,605 | 7.00%, 05/02/2017 (Acquired 01/23/2006, Cost $47,672) * | 47,694 | |||||
| 2,000,000 | Citigroup Capital XXI, | ||||||
| 8.30%, 12/21/2057 | 2,005,000 | ||||||
| Citigroup, Inc.: | |||||||
| 1,000,000 | 4.45%, 01/10/2017 | 1,048,243 | |||||
| 2,675,000 | 6.125%, 11/21/2017 @ | 2,963,694 | |||||
| 5,000,000 | CNA Financial Corporation, | ||||||
| 6.50%, 08/15/2016 | 5,626,365 | ||||||
| 5,330,000 | Countrywide Financial Corporation, | ||||||
| 6.25%, 05/15/2016 | 5,547,453 | ||||||
| 1,000,000 | Credit Agricole S.A., | ||||||
6.637%, 05/29/2049 (Acquired 05/23/2007, Cost $1,000,000) *f @ | 704,100 | ||||||
| 1,575,000 | Credit Suisse New York, | ||||||
5.30%, 08/13/2019 f @ | 1,771,955 | ||||||
| 2,410,000 | Dresdner Bank AG, | ||||||
7.25%, 09/15/2015 f | 2,442,805 | ||||||
| 3,135,000 | First Empire Capital Trust I, | ||||||
| 8.234%, 02/01/2027 | 3,319,410 | ||||||
| 1,575,000 | First Empire Capital Trust II, | ||||||
| 8.277%, 06/01/2027 | 1,606,500 | ||||||
| 3,749,000 | First Hawaiian Capital Trust I, | ||||||
| Series B, 8.343%, 07/01/2027 | 3,749,000 | ||||||
| 541,115 | First National Bank of Chicago Pass-Through Certificates, | ||||||
| Series 1993-A, 8.08%, 01/05/2018 | 607,477 | ||||||
| 2,500,000 | Fleet Capital Trust II, | ||||||
| 7.92%, 12/11/2026 | 2,556,250 | ||||||
| General Electric Capital Corporation: | |||||||
| 1,500,000 | 5.625%, 09/15/2017 | 1,721,361 | |||||
| 4,700,000 | 5.625%, 05/01/2018 @ | 5,402,838 | |||||
| 6,000,000 | 4.65%, 10/17/2021 | 6,663,156 | |||||
| 1,416,000 | Genworth Financial, Inc., | ||||||
| 5.75%, 06/15/2014 @ | 1,438,931 | ||||||
| 6,500,000 | Genworth Life Institutional Funding Trust, | ||||||
| 5.875%, 05/03/2013 (Acquired 04/14/2011, Cost $6,668,639) * | 6,609,395 | ||||||
| GMAC Inc.: | |||||||
| 336,000 | 7.50%, 12/31/2013 | 356,160 | |||||
| 403,000 | 8.00%, 12/31/2018 | 446,322 | |||||
| 1,180,000 | Goldman Sachs Capital I, | ||||||
| 6.345%, 02/15/2034 @ | 1,116,108 | ||||||
| 2,800,000 | Great West Life & Annuity Insurance, | ||||||
| 7.153%, 05/16/2046 (Acquired 05/16/2006 through 11/08/2007, Cost $2,783,656) * | 2,786,000 | ||||||
| 2,100,000 | HSBC Holdings PLC, | ||||||
6.50%, 09/15/2037 f | 2,329,912 | ||||||
| 400,000 | HSBC USA Capital Trust I, | ||||||
| 7.808%, 12/15/2026 (Acquired 03/08/2007, Cost $406,965) * | 403,000 | ||||||
| 500,000 | HSBC USA Capital Trust II, | ||||||
| 8.38%, 05/15/2027 (Acquired 11/06/2007, Cost $511,766) * | 505,333 | ||||||
| 2,000,000 | Humana Inc., | ||||||
| 7.20%, 06/15/2018 | 2,403,380 | ||||||
ING Bank N.V.: f | |||||||
| 3,650,000 | 4.00%, 03/15/2016 (Acquired 03/08/2011, Cost $3,648,029) * | 3,674,813 | |||||
| 2,150,000 | 3.75%, 03/07/2017 (Acquired 03/28/2012, Cost $2,132,950) *@ | 2,139,914 | |||||
| 7,525,000 | Irish Life & Permanent Group Holdings PLC, | ||||||
3.60%, 01/14/2013 (Acquired 01/07/2010 through 03/09/2012, Cost $7,509,051) * f | 7,292,432 | ||||||
| Jefferies Group, Inc.: | |||||||
| 4,000,000 | 6.875%, 04/15/2021 | 4,022,428 | |||||
| 1,395,000 | 6.25%, 01/15/2036 | 1,255,500 | |||||
| 6,800,000 | John Hancock Mutual Life Insurance Company, | ||||||
| 7.375%, 02/15/2024 (Acquired 08/26/2010, Cost $7,635,127) * | 8,269,568 | ||||||
| 3,000,000 | J.P. Morgan Chase Bank NA, | ||||||
| 5.875%, 06/13/2016 | 3,289,929 | ||||||
| 4,600,000 | J.P. Morgan Chase & Co., | ||||||
| 5.60%, 07/15/2041 | 5,214,744 | ||||||
| 1,250,000 | Kaupthing Bank, | ||||||
5.75%, 10/04/2011 (Acquired 06/06/2008 through 07/22/2008, Cost $969,046) ** f § | 318,750 | ||||||
| 5,000,000 | Kookmin Bank, | ||||||
7.25%, 05/14/2014 (Acquired 08/24/2009 through 03/10/2010, Cost $5,226,463) * f @ | 5,475,090 | ||||||
| 2,500,000 | Liberty Mutual Group Inc., | ||||||
| 10.75%, 06/15/2058 (Acquired 05/21/2008, Cost $2,445,125) * | 3,400,000 | ||||||
| 565,000 | Liberty Mutual Insurance Company, | ||||||
| 7.697%, 10/15/2097 (Acquired 03/26/2003, Cost $361,719) * | 554,112 | ||||||
| 1,125,000 | Lincoln National Corporation, | ||||||
| 6.05%, 04/20/2067 | 1,029,375 | ||||||
| 1,600,000 | Lloyds TSB Bank PLC, | ||||||
5.80%, 01/13/2020 (Acquired 02/10/2010, Cost $1,561,386) * f | 1,710,418 | ||||||
| 100,000 | Manulife Financial Corp., | ||||||
4.90%, 09/17/2020 f | 105,020 | ||||||
| Marsh & McLennan Companies, Inc.: | |||||||
| 2,500,000 | 2.30%, 04/01/2017 | 2,486,473 | |||||
| 1,000,000 | 9.25%, 04/15/2019 | 1,325,683 | |||||
| 1,000,000 | Massachusetts Mutual Life Insurance Company, | ||||||
| 8.875%, 06/01/2039 (Acquired 05/27/2009, Cost $987,100) * | 1,432,873 | ||||||
| 800,000 | MBIA Insurance Corp., | ||||||
| 14.00%, 01/15/2033 (Acquired 01/11/2008, Cost $800,000) *@ | 432,000 | ||||||
| Merrill Lynch & Company: | |||||||
| 1,000,000 | 6.40%, 08/28/2017 | 1,087,750 | |||||
| 1,750,000 | 6.875%, 04/25/2018 | 1,958,138 | |||||
| 1,275,000 | 7.75%, 05/14/2038 | 1,454,336 | |||||
| 422,000 | Metlife, Inc., | ||||||
| 6.50%, 12/15/2032 | 533,570 | ||||||
| Morgan Stanley: | |||||||
| 1,075,000 | 4.75%, 04/01/2014 @ | 1,084,462 | |||||
| 1,000,000 | 4.00%, 07/24/2015 | 994,193 | |||||
| 150,000 | 6.625%, 04/01/2018 | 156,835 | |||||
| 3,644,000 | Morgan Stanley Dean Witter & Co., | ||||||
| 6.75%, 10/15/2013 | 3,786,018 | ||||||
| 2,000,000 | National City Bank of Cleveland Subordinated Notes, | ||||||
| 5.80%, 06/07/2017 | 2,276,908 | ||||||
| 4,921,000 | Navigators Group Inc. Senior Unsecured Notes, | ||||||
| 7.00%, 05/01/2016 | 5,169,929 | ||||||
| 4,389,000 | NB Capital Trust IV, | ||||||
| 8.25%, 04/15/2027 | 4,487,314 | ||||||
| 2,500,000 | North Fork Capital Trust II, | ||||||
| 8.00%, 12/15/2027 | 2,518,750 | ||||||
| 2,750,000 | Protective Life Corp., | ||||||
| 7.375%, 10/15/2019 | 3,178,543 | ||||||
| 1,000,000 | Regions Financial Corp., | ||||||
| 7.75%, 11/10/2014 @ | 1,080,000 | ||||||
| 4,750,000 | Regions Financing Trust II, | ||||||
| 6.625%, 05/15/2047 | 4,512,500 | ||||||
| 1,000,000 | Republic New York Capital I, | ||||||
| 7.75%, 11/15/2026 | 1,007,500 | ||||||
| 700,000 | Republic New York Corporation Debentures, | ||||||
| 9.125%, 05/15/2021 | 869,326 | ||||||
| 1,800,000 | Santander Issuances, | ||||||
6.50%, 08/11/2019 (Acquired 10/18/2007 through 03/19/2012, Cost $1,925,491) * f | 1,557,364 | ||||||
| 1,100,000 | Santander U.S. Debt S.A. Unipersonal, | ||||||
2.991%, 10/07/2013 (Acquired 09/27/2010, Cost $1,100,000) * f | 1,057,717 | ||||||
| 8,760,000 | Schwab Capital Trust I, | ||||||
| 7.50%, 11/15/2037 | 9,018,858 | ||||||
| SLM Corporation: | |||||||
| 1,137,000 | 5.375%, 05/15/2014 | 1,176,753 | |||||
| 500,000 | 5.625%, 08/01/2033 | 422,500 | |||||
| 4,900,000 | Sovereign Bank, | ||||||
| 8.75%, 05/30/2018 | 5,312,345 | ||||||
| 1,032,000 | Susa Partnership LP, | ||||||
| 8.20%, 06/01/2017 | 1,240,539 | ||||||
| 1,000,000 | Symetra Financial Corporation, | ||||||
| 6.125%, 04/01/2016 (Acquired 03/23/2006, Cost $995,570) * | 1,022,420 | ||||||
| 2,000,000 | Talent Yield Investments Ltd., | ||||||
4.50%, 04/25/2022 (Acquired 04/18/2012, Cost $1,986,320) * f | 2,046,092 | ||||||
| 3,000,000 | TD Ameritrade Holding Corporation, | ||||||
| 5.60%, 12/01/2019 | 3,409,854 | ||||||
| 2,400,000 | The Bear Stearns Companies LLC, | ||||||
| 5.30%, 10/30/2015 | 2,604,394 | ||||||
| The Goldman Sachs Group, Inc.: | |||||||
| 2,200,000 | 3.70%, 08/01/2015 @ | 2,219,441 | |||||
| 1,000,000 | 6.25%, 09/01/2017 | 1,087,269 | |||||
| 4,500,000 | 6.15%, 04/01/2018 | 4,878,360 | |||||
| The Hartford Financial Services Group, Inc.: | |||||||
| 5,000,000 | 4.00%, 10/15/2017 | 5,020,740 | |||||
| 2,200,000 | 8.125%, 06/15/2038 @ | 2,304,500 | |||||
| 1,000,000 | The NASDAQ OMX Group Inc., | ||||||
| 4.00%, 01/15/2015 | 1,033,931 | ||||||
| 4,120,000 | Wachovia Bank, NA, | ||||||
| 6.00%, 11/15/2017 | 4,800,698 | ||||||
| 750,000 | Willis North America Inc., | ||||||
| 5.625%, 07/15/2015 | 813,727 | ||||||
| 226,771,135 | |||||||
| Residential Mortgage-Backed Securities - 31.5% | |||||||
| U.S. Government Agency Issues - 25.9% | |||||||
| Federal Gold Loan Mortgage Corporation (FGLMC) Pass-Through Certificates: | |||||||
| 22,616 | 6.50%, 07/01/2014 | 23,184 | |||||
| 391,741 | 6.00%, 06/01/2020 | 416,327 | |||||
| 211,553 | 5.50%, 11/01/2022 | 231,850 | |||||
| 244,956 | 5.00%, 06/01/2023 | 263,319 | |||||
| 241,362 | 5.50%, 07/01/2023 | 264,519 | |||||
| 675,285 | 6.50%, 06/01/2029 | 772,597 | |||||
| 2,100,481 | 5.50%, 01/01/2036 | 2,296,757 | |||||
| 1,337,418 | 6.00%, 12/01/2036 | 1,469,863 | |||||
| 14,800,242 | 5.00%, 03/01/2038 | 15,928,203 | |||||
| 19,239,963 | 4.50%, 11/01/2039 | 20,556,803 | |||||
| Federal Home Loan Mortgage Corporation (FHLMC) Pass-Through Certificates: | |||||||
| 64,202 | Series 206, Class E, 0.00%, 07/15/2019 ^ | 63,193 | |||||
| 36,328 | Series 141, Class D, 5.00%, 05/15/2021 | 38,960 | |||||
| 41,134 | Series 1074, Class I, 6.75%, 05/15/2021 | 45,363 | |||||
| 206,152 | Series 1081, Class K, 7.00%, 05/15/2021 | 232,562 | |||||
| 39,050 | Series 163, Class F, 6.00%, 07/15/2021 | 43,530 | |||||
| 73,203 | Series 188, Class H, 7.00%, 09/15/2021 | 82,075 | |||||
| 30,878 | Series 1286, Class A, 6.00%, 05/15/2022 | 33,709 | |||||
| 6,568,626 | 5.50%, 05/01/2038 | 7,141,364 | |||||
| 6,608,927 | 4.50%, 11/01/2039 | 7,061,261 | |||||
| 18,029,488 | 4.50%, 09/01/2040 | 19,286,016 | |||||
| Federal National Mortgage Association (FNMA) Pass-Through Certificates: | |||||||
| 22,261 | Series 2002-56, Class MC, 5.50%, 09/25/2017 | 24,027 | |||||
| 247,702 | Series 1989-37, Class G, 8.00%, 07/25/2019 | 279,046 | |||||
| 915,307 | 5.00%, 12/01/2019 | 991,037 | |||||
| 62,808 | Series 1989-94, Class G, 7.50%, 12/25/2019 | 70,927 | |||||
| 9,543 | Series 1990-58, Class J, 7.00%, 05/25/2020 | 10,717 | |||||
| 84,501 | Series 1990-76, Class G, 7.00%, 07/25/2020 | 94,929 | |||||
| 40,012 | Series 1990-105, Class J, 6.50%, 09/25/2020 | 43,827 | |||||
| 13,139 | Series 1990-108, Class G, 7.00%, 09/25/2020 | 14,767 | |||||
| 24,500 | Series 1991-1, Class G, 7.00%, 01/25/2021 | 27,646 | |||||
| 30,524 | Series 1991-86, Class Z, 6.50%, 07/25/2021 | 33,715 | |||||
| 7,943,864 | 5.00%, 11/01/2021 | 8,601,116 | |||||
| 516,322 | 5.50%, 01/01/2023 | 567,957 | |||||
| 385,810 | Series 1993-58, Class H, 5.50%, 04/25/2023 | 423,639 | |||||
| 908,911 | 5.50%, 07/01/2023 | 999,807 | |||||
| 2,193,979 | 5.00%, 11/01/2023 | 2,412,100 | |||||
| 899,722 | 6.00%, 03/01/2026 | 992,054 | |||||
| 2,042,962 | 6.00%, 05/01/2026 | 2,252,619 | |||||
| 1,982,875 | 5.00%, 05/01/2028 | 2,151,505 | |||||
| 244,743 | Series 1998-66, Class C, 6.00%, 12/25/2028 | 269,985 | |||||
| 266,496 | 6.00%, 03/01/2033 | 300,238 | |||||
| 287,173 | 5.00%, 11/01/2033 | 312,492 | |||||
| 6,396,715 | 5.50%, 04/01/2034 | 7,027,349 | |||||
| 1,135,687 | Series 2004-W6, Class 1A4, 5.50%, 07/25/2034 | 1,165,507 | |||||
| 2,455,898 | Series 2004-W6, Class 1A6, 5.50%, 07/25/2034 | 2,547,518 | |||||
| 3,515,583 | Series 2004-W10, Class A4, 5.75%, 08/25/2034 | 3,601,288 | |||||
| 1,204,264 | 5.50%, 09/01/2034 | 1,323,191 | |||||
| 302,818 | 6.00%, 11/01/2034 | 337,964 | |||||
| 4,328,422 | 5.50%, 02/01/2035 | 4,755,877 | |||||
| 20,805,818 | 5.00%, 10/01/2035 | 22,626,678 | |||||
| 10,337,656 | 5.00%, 11/01/2035 | 11,216,802 | |||||
| 2,423,753 | 5.50%, 11/01/2036 | 2,647,963 | |||||
| 9,680,752 | 5.50%, 04/01/2037 | 10,648,879 | |||||
| 521,737 | 6.00%, 08/01/2037 | 570,715 | |||||
| 1,589,193 | 4.50%, 11/01/2039 | 1,705,411 | |||||
| 10,371,201 | 4.00%, 08/01/2040 | 11,055,556 | |||||
| 3,604,284 | 3.50%, 12/01/2040 | 3,792,285 | |||||
| 31,853,237 | 3.50%, 02/01/2041 | 33,514,721 | |||||
| 41,924,265 | 4.00%, 02/01/2041 | 44,690,682 | |||||
| 14,599,445 | 4.00%, 09/01/2041 | 15,567,367 | |||||
| Government National Mortgage Association (GNMA) Pass-Through Certificates: | |||||||
| 203,556 | 6.00%, 11/20/2033 | 230,208 | |||||
| 11,828,250 | 5.00%, 07/20/2040 | 13,115,913 | |||||
| 32,914,234 | 4.50%, 01/20/2041 | 36,350,719 | |||||
| 325,618,198 | |||||||
| Non-U.S. Government Agency Issues - 5.6% | |||||||
| Bank of America Alternative Loan Trust: | |||||||
| 250,943 | Series 2003-4, Class 2A1, 5.00%, 06/25/2018 | 259,934 | |||||
| 3,276,980 | Series 2003-5, Class 2A1, 5.00%, 07/25/2018 | 3,402,269 | |||||
| 429,539 | Series 2003-11, Class 4A1, 4.75%, 01/25/2019 | 438,352 | |||||
| 289,702 | Series 2004-6, Class 4A1, 5.00%, 07/25/2019 | 296,584 | |||||
| 6,538,571 | Series 2004-7, Class 4A1, 5.00%, 08/25/2019 | 6,749,146 | |||||
| 312,075 | Series 2004-11, Class 4A1, 5.50%, 12/25/2019 | 325,188 | |||||
| 465,741 | Series 2005-2, Class 4A1, 5.50%, 03/25/2020 | 471,119 | |||||
| 2,122,748 | Series 2005-4, Class 3A1, 5.50%, 05/25/2020 | 2,075,186 | |||||
| 1,425,417 | Series 2005-10, Class 5A1, 5.25%, 11/25/2020 | 1,396,862 | |||||
| 2,473,098 | Series 2007-1, Class 1A1, 5.966%, 04/25/2022 | 2,420,804 | |||||
| 1,029,068 | Series 2003-11, Class 2A1, 6.00%, 01/25/2034 | 1,075,707 | |||||
| 441,768 | Series 2005-2, Class 1CB2, 5.50%, 03/25/2035 | 410,648 | |||||
| 644,564 | Series 2005-9, Class 1CB3, 5.50%, 10/25/2035 | 502,968 | |||||
| 379,311 | Series 2005-11, Class 1CB4, 5.50%, 12/25/2035 | 294,499 | |||||
| 1,433,012 | Series 2006-5, Class CB7, 6.00%, 06/25/2046 § | 1,007,456 | |||||
| 2,430,963 | Bear Stearns Asset Backed Securities Trust, | ||||||
| Series 2004-AC2, Class 2A, 5.00%, 05/25/2034 | 2,446,932 | ||||||
| Chase Mortgage Finance Corporation: | |||||||
| 571,853 | Series 2003-S13, Class A11, 5.50%, 11/25/2033 | 582,417 | |||||
| 14,901 | Series 2003-S14, Class 3A6, 5.50%, 01/25/2034 | 14,887 | |||||
| 5,031,543 | Series 2006-A1, Class 2A3, 5.593%, 09/25/2036 § | 3,907,582 | |||||
| 677,273 | Citigroup Mortgage Loan Trust, Inc., | ||||||
| Series 2005-9, Class 2A2, 5.50%, 11/25/2035 | 651,550 | ||||||
| Countrywide Alternative Loan Trust: | |||||||
| 741,969 | Series 2005-50CB, Class 4A1, 5.00%, 11/25/2020 § | 651,454 | |||||
| 3,216,315 | Series 2006-7CB, Class 3A1, 5.25%, 05/25/2021 § | 2,834,425 | |||||
| 679,525 | Series 2006-J5, Class 3A1, 6.041%, 07/25/2021 § | 593,886 | |||||
| 829,065 | Series 2006-43CB, Class 2A1, 6.00%, 02/25/2022 § | 750,597 | |||||
| 116,944 | Series 2002-11, Class A4, 6.25%, 10/25/2032 | 119,539 | |||||
| 10,093,585 | Series 2003-20CB, Class 1A1, 5.50%, 10/25/2033 | 10,610,043 | |||||
| 3,723,888 | Series 2005-10CB, Class 1A6, 5.50%, 05/25/2035 | 3,666,939 | |||||
| 1,763,727 | Series 2006-28CB, Class A17, 6.00%, 10/25/2036 § | 1,084,103 | |||||
| Deutsche Mortgage Securities Inc.: | |||||||
| 1,160,622 | Series 2006-AR5, Class 21A, 6.00%, 10/25/2021 § | 916,040 | |||||
| 162,525 | Series 2004-4, Class 1A6, 5.65%, 04/25/2034 | 162,477 | |||||
| First Horizon Alternative Mortgage Securities: | |||||||
| 502,407 | Series 2005-FA7, Class 2A1, 5.00%, 09/25/2020 | 484,370 | |||||
| 705,808 | Series 2006-FA6, Class 3A1, 5.75%, 11/25/2021 | 679,031 | |||||
| 2,090,390 | Series 2006-FA8, Class 2A1, 5.75%, 02/25/2037 | 1,975,356 | |||||
| 222,113 | Impac CMB Trust, | ||||||
| Series 2004-4, Class 2A2, 4.933%, 09/25/2034 | 217,287 | ||||||
| 922,052 | J.P. Morgan Alternative Loan Trust, | ||||||
| Series 2006-A1, Class 2A1, 2.789%, 03/25/2036 § | 532,209 | ||||||
| J.P. Morgan Mortgage Trust: | |||||||
| 539,920 | Series 2006-A7, Class 2A2, 2.72%, 01/25/2037 § | 380,319 | |||||
| 2,306,777 | Series 2006-A7, Class 2A4R, 2.72%, 01/25/2037 § | 1,624,661 | |||||
| 5,800,821 | Series 2007-A2, Class 2A3, 2.857%, 04/25/2037 | 4,228,926 | |||||
| Master Alternative Loans Trust: | |||||||
| 1,301,850 | Series 2004-1, Class 1A1, 5.00%, 01/25/2019 | 1,337,349 | |||||
| 79,046 | Series 2004-2, Class 4A1, 5.00%, 02/25/2019 | 82,197 | |||||
| 965,174 | Series 2004-4, Class 4A1, 5.00%, 04/25/2019 | 997,600 | |||||
| 557,456 | Series 2003-5, Class 6A1, 6.00%, 08/25/2033 | 593,902 | |||||
| 415,237 | RAAC Series, | ||||||
| Series 2004-SP1, Class AI4, 5.285%, 08/25/2027 | 416,833 | ||||||
| 508,784 | Residential Accredit Loans, Inc., | ||||||
| Series 2004-QS6, Class A1, 5.00%, 05/25/2019 | 516,051 | ||||||
| 105,831 | Residential Funding Mortgage Security I, | ||||||
| Series 2003-S11, Class A2, 4.00%, 06/25/2018 | 107,433 | ||||||
| 686,801 | Salomon Brothers Mortgage Securities VII, | ||||||
| Series 2003-UP2, Class A2, 4.00%, 06/25/2033 | 720,971 | ||||||
| 1,076,058 | Structured Asset Securities Corporation, | ||||||
| Series 2005-7XS, Class 1A4B, 5.44%, 04/25/2035 | 1,092,000 | ||||||
| Washington Mutual, Inc. Pass-Through Certificates: | |||||||
| 1,207,601 | Series 2004-CB1, Class 5A, 5.00%, 06/25/2019 | 1,253,413 | |||||
| 2,198,539 | Series 2004-CB2, Class 7A, 5.50%, 08/25/2019 | 2,300,046 | |||||
| 69,641 | Series 2004-CB3, Class 3A, 5.50%, 10/25/2019 | 71,579 | |||||
| 643,297 | Series 2004-CB3, Class 4A, 6.00%, 10/25/2019 | 671,191 | |||||
| 461,965 | Series 2004-CB4, Class 21A, 5.50%, 12/25/2019 | 475,473 | |||||
| 70,877,790 | |||||||
| Asset Backed Securities - 4.1% | |||||||
| 506 | Amresco Residential Securities Mortgage Loan Trust, | ||||||
| Series 1997-3, Class A9, 6.96%, 03/25/2027 | 508 | ||||||
| Bayview Financial Acquisition Trust: | |||||||
| 930,200 | Series 2006-A, Class 1A2, 5.483%, 02/28/2041 | 933,291 | |||||
| 2,500,000 | Series 2007-B, Class 1A2, 6.831%, 08/28/2047 | 1,133,142 | |||||
| 139 | Contimortgage Home Equity Trust, | ||||||
| Series 1997-2, Class A9, 7.09%, 04/15/2028 | 139 | ||||||
| Countrywide Asset-Backed Certificates: | |||||||
| 860,518 | Series 2005-17, Class 1AF2, 5.363%, 03/25/2030 § | 743,881 | |||||
| 3,769,439 | Series 2004-13, Class AF4, 4.583%, 01/25/2033 | 3,672,225 | |||||
| 2,388,003 | Series 2004-S1, Class A3, 4.615%, 02/25/2035 | 2,273,040 | |||||
| 5,593,957 | Series 2004-15, Class AF6, 4.613%, 04/25/2035 | 5,263,684 | |||||
| 8,328,376 | Series 2005-1, Class AF6, 5.03%, 07/25/2035 | 8,286,701 | |||||
| 9,964,966 | Series 2005-11, Class AF3, 4.778%, 02/25/2036 | 8,005,605 | |||||
| 4,246,775 | Series 2005-10, Class AF6, 4.915%, 02/25/2036 | 3,595,380 | |||||
| 4,370,246 | Series 2005-13, Class AF3, 5.43%, 04/25/2036 | 3,211,606 | |||||
| 1,706,867 | Series 2005-17, Class 1AF5, 5.521%, 05/25/2036 § | 1,065,136 | |||||
| 1,497,705 | Series 2007-S1, Class A6, 5.693%, 11/25/2036 | 1,210,358 | |||||
| 1,997,287 | Series 2006-13, Class 1AF2, 5.884%, 01/25/2037 § | 1,897,422 | |||||
| 1,500,000 | Series 2006-10, Class 1AF3, 5.767%, 09/25/2046 | 845,927 | |||||
| 385,102 | Credit Based Asset Servicing and Securitization LLC, | ||||||
| Series 2005-CB8, Class AF2, 5.303%, 12/25/2035 | 347,449 | ||||||
| 51,016 | Equivantage Home Equity Loan Trust, | ||||||
| Series 1996-3, Class A3, 7.70%, 09/25/2027 | 50,591 | ||||||
| GE Capital Mortgage Services, Inc.: | |||||||
| 446 | Series 1997-HE4, Class A7, 6.735%, 12/25/2028 | 443 | |||||
| 11,104 | Series 1999-HE1, Class A7, 6.265%, 04/25/2029 | 10,854 | |||||
| Green Tree Financial Corporation: | |||||||
| 329,408 | Series 1993-3, Class A7, 6.40%, 10/15/2018 | 339,196 | |||||
| 240,419 | Series 1993-4, Class A5, 7.05%, 01/15/2019 | 242,927 | |||||
| 25,373 | Series 1997-1, Class A5, 6.86%, 03/15/2028 | 26,563 | |||||
| 1,196,975 | Series 1998-2, Class A5, 6.24%, 12/01/2028 | 1,238,005 | |||||
| 41,236 | Series 1997-6, Class A8, 7.07%, 01/15/2029 | 44,383 | |||||
| 1,055,752 | Series 1998-3, Class A5, 6.22%, 03/01/2030 | 1,152,880 | |||||
| 655,578 | Series 1998-4, Class A5, 6.18%, 04/01/2030 | 677,095 | |||||
| 24,248 | IMC Home Equity Loan Trust, | ||||||
| Series 1997-5, Class A10, 6.88%, 11/20/2028 | 24,248 | ||||||
| 63,975 | Oakwood Mortgage Investors, Inc., | ||||||
| Series 1999-B, Class A3, 6.45%, 11/15/2017 | 59,280 | ||||||
| 3,000,000 | Renaissance Home Equity Loan Trust, | ||||||
| Series 2007-1, Class AF3, 5.612%, 04/25/2037 | 1,240,113 | ||||||
| Residential Asset Mortgage Products, Inc.: | |||||||
| 1,792,410 | Series 2003-RS7, Class AI6, 5.34%, 08/25/2033 | 1,761,615 | |||||
| 569,676 | Series 2005-RS1, Class AI6, 4.713%, 01/25/2035 | 517,868 | |||||
| Residential Asset Securities Corporation: | |||||||
| 1,499,985 | Series 2003-KS2, Class AI6, 3.99%, 04/25/2033 | 1,431,346 | |||||
| 110,468 | Series 2003-KS5, Class AI6, 3.62%, 07/25/2033 | 96,703 | |||||
| 151,214 | Series 2004-KS2, Class AI6, 4.30%, 03/25/2034 | 145,283 | |||||
| 51,544,887 | |||||||
| Commercial Mortgage-Backed Securities - 8.0% | |||||||
| 11,139,000 | Bear Stearns Commercial Mortgage Securities, | ||||||
| Series 2005-PWR9, Class A4A, 4.871%, 09/11/2042 | 12,272,962 | ||||||
| 11,248,000 | Commercial Mortgage Pass-Through Certificates, | ||||||
| Series 2005-C6, Class A5A, 5.116%, 06/10/2044 | 12,420,638 | ||||||
| 10,149,000 | Credit Suisse First Boston Mortgage Securities Corporation, | ||||||
| Series 2005-C5, Class A4, 5.10%, 08/15/2038 | 11,190,135 | ||||||
| 10,750,000 | GE Capital Commercial Mortgage Corporation, | ||||||
| Series 2005-C4, Class A4, 5.305%, 11/10/2045 | 12,018,059 | ||||||
| 4,625,000 | J.P. Morgan Chase Commercial Mortgage Securities Corporation, | ||||||
| Series 2011-C5, Class A3, 4.171%, 08/15/2046 | 5,031,380 | ||||||
| 11,355,000 | J.P. Morgan Chase Commercial Mortgage Trust, | ||||||
| Series 2005-CB12, Class A4, 4.895%, 09/12/2037 | 12,454,459 | ||||||
| 10,825,000 | Morgan Stanley Capital I, | ||||||
| Series 2005-HQ7, Class A4, 5.201%, 11/14/2042 | 12,015,144 | ||||||
| 10,000,000 | Wachovia Bank Commercial Mortgage Trust, | ||||||
| Series 2005-C22, Class A4, 5.441%, 12/15/2044 | 11,098,980 | ||||||
| 12,000,000 | WF-RBS Commercial Mortgage Trust, | ||||||
| Series 2012-C6, Class A4, 3.44%, 04/15/2045 | 12,321,408 | ||||||
| 100,823,165 | |||||||
| Total Long-Term Investments (Cost $1,191,840,935) | 1,239,185,530 | ||||||
| Shares | |||||||
| SHORT-TERM INVESTMENTs - 2.2% | |||||||
| Money Market Mutual Funds - 2.2% | |||||||
| 4,797,194 | Dreyfus Institutional Cash Advantage Fund, 0.15% « | 4,797,194 | |||||
| 23,288,773 | Short-Term Investments Trust - Liquid Assets Portfolio, 0.16% « | 23,288,773 | |||||
| Total Short-Term Investments (Cost $28,085,967) | 28,085,967 | ||||||
| Principal Amount | |||||||
| INVESTMENTS PURCHASED WITH CASH PROCEEDS FROM | |||||||
| SECURITIES LENDING - 10.9% | |||||||
| Commercial Paper - 0.2% | |||||||
| $ | 2,837,710 | Atlantic East Funding LLC, 0.595%, 03/25/2013 † ** | 1,872,176 | ||||
| Total Commercial Paper (Cost $2,837,710) | 1,872,176 | ||||||
| Shares | |||||||
| Investment Companies - 10.7% | |||||||
| 135,218,513 | Mount Vernon Securities Lending Trust Prime Portfolio, 0.31% « | 135,218,513 | |||||
| Total Investment Companies (Cost $135,218,513) | 135,218,513 | ||||||
| Total Investments Purchased With Cash Proceeds From | |||||||
| Securities Lending (Cost $138,056,223) | 137,090,689 | ||||||
| Total Investments (Cost $1,357,983,125) - 111.5% | 1,404,362,186 | ||||||
| Asset Relating to Securities Lending Investments - 0.1% | |||||||
Support Agreement ** ^ α † | 965,534 | ||||||
| Total (Cost $0) | 965,534 | ||||||
| Liabilities in Excess of Other Assets - (11.6)% | (146,346,451 | ) | |||||
| TOTAL NET ASSETS - 100.0% | $ | 1,258,981,269 | |||||
| Notes to Schedule of Investments | |||||||
| * | Restricted Security Deemed Liquid | ||||||
| ** | Illiquid Security | ||||||
| @ | This security or portion of this security is out on loan at June 30, 2012. | ||||||
| f | Foreign Security | ||||||
| ^ | Non-Income Producing | ||||||
| « | 7-Day Yield | ||||||
| § | Security in Default | ||||||
| † | Priced at Fair Value by the Valuation Committee as delegated by the Baird Funds' Board of Directors. | ||||||
| α | The Fund's transfer agent and administrator and securities lending agent entered into a support agreement with | ||||||
| the Fund to cover losses realized by the Fund on its investment in Atlantic East Funding, LLC (up to a certain amount), | |||||||
| which investment was made by the Fund's securities lending agent. | |||||||
Summary of Fair Value Exposure at June 30, 2012 (Unaudited) |
The Fund has adopted authoritative fair valuation accounting standards which establish a definition of fair value and set out a hierarchy for measuring fair value. These standards require additional disclosures about the various inputs and valuation techniques used to develop the measurements of fair value and a discussion on changes in valuation techniques and related inputs during the period. These standards define fair value as the price that would be received to sell an asset or paid to transfer a liability in an orderly transaction between market participants at the measurement date. The fair value hierarchy is organized into three levels based upon the assumptions (referred to as “inputs”) used in pricing the asset or liability. These standards state that “observable inputs” reflect the assumptions market participants would use in pricing the asset or liability based on market data obtained from independent sources and “unobservable inputs” reflect an entity’s own assumptions about the assumptions market participants would use in pricing the asset or liability. These inputs are summarized into three broad levels and described below:
| Level 1 - | Unadjusted quoted prices in active markets for identical unrestricted securities. |
| Level 2 - | Other significant observable inputs (including quoted prices for similar securities, quoted prices in inactive markets, dealer indications, interest rates, yield curves, prepayment speeds, credit risk, default rates, inputs corroborated by observable market data, etc.). |
| Level 3 - | Significant unobservable inputs (including the Fund’s own assumptions about the factors that market participants would use in valuing the security) based on the best information available. |
The inputs or methodology used for valuing securities are not necessarily an indication of the risk associated with investing in those securities.
The following is a summary of the inputs used to value the Fund’s investments as of June 30, 2012:
| Level 1 | Level 2 | Level 3 | Total | |||||||||||||
| Fixed Income | ||||||||||||||||
| U.S. Treasury Securities | $ | - | $ | 153,191,941 | $ | - | $ | 153,191,941 | ||||||||
| Taxable Municipal Bonds | - | 64,235,218 | - | 64,235,218 | ||||||||||||
| Other Government Related Securities | - | 30,422,144 | - | 30,422,144 | ||||||||||||
| Corporate Debt Securities | - | 442,470,580 | 1,607 | 442,472,187 | ||||||||||||
| Residential Mortgage-Backed Securities - U.S. Government Agency Issues | - | 325,618,198 | - | 325,618,198 | ||||||||||||
| Residential Mortgage-Backed Securities - Non - U.S. Government Agency Issues | - | 70,877,790 | - | 70,877,790 | ||||||||||||
| Asset Backed Securities | - | 51,544,887 | - | 51,544,887 | ||||||||||||
| Commercial Mortgage-Backed Securities | - | 100,823,165 | - | 100,823,165 | ||||||||||||
| Total Fixed Income | - | 1,239,183,923 | 1,607 | 1,239,185,530 | ||||||||||||
| Short-Term Investments | ||||||||||||||||
| Money Market Mutual Funds | 28,085,967 | - | - | 28,085,967 | ||||||||||||
| Total Short-Term Investments | 28,085,967 | - | - | 28,085,967 | ||||||||||||
| Investments Purchased with Cash | ||||||||||||||||
| Proceeds from Securities Lending | ||||||||||||||||
| Commercial Paper | - | 1,872,176 | - | 1,872,176 | ||||||||||||
| Money Market Mutual Fund | 135,218,513 | - | - | 135,218,513 | ||||||||||||
| Total Investments Purchased with | ||||||||||||||||
| Cash Proceeds from Securities Lending | 135,218,513 | 1,872,176 | - | 137,090,689 | ||||||||||||
| Total Investments | $ | 163,304,480 | $ | 1,241,056,099 | $ | 1,607 | $ | 1,404,362,186 | ||||||||
| Asset Relating to Securities Lending Investments | $ | - | $ | 965,534 | $ | - | $ | 965,534 | ||||||||
Changes in valuation techniques may result in transfers into or out of current assigned levels within the hierarchy. There were no significant transfers between Level 1, Level 2 and Level 3 fair value measurements during the reporting period, as compared to their classification from the prior year’s annual report. One security that is priced at fair value by the Valuation Committee instead of the Fund’s pricing vendor is valued using level 3 inputs.
Level 3 Reconciliation Disclosure
Following is a reconciliation of Level 3 assets for which significant unobservable inputs were used to determine fair value.
| Description | Investments in Securities | |||
| Balance as of December 31, 2011 | $ | 1,607 | ||
| Accrued discounts/premiums | - | |||
| Realized gain (loss) | - | |||
| Change in unrealized appreciation (depreciation) | - | |||
| Purchases | - | |||
| Sales | - | |||
| Transfers in and/or out of Level 3 * | - | |||
| Balance as of June 30, 2012 | $ | 1,607 | ||
* Transfers between levels are recognized at the end of the reporting period.
| Baird Core Plus Bond Fund | |||||||
| Schedule of Investments | |||||||
| June 30, 2012 (Unaudited) | |||||||
| Principal Amount | Value | ||||||
| LONG-TERM INVESTMENTS - 96.2% | |||||||
| U.S. Treasury Securities - 11.0% | |||||||
| U.S. Treasury Bonds: @ | |||||||
| $ | 63,150,000 | 2.375%, 07/31/2017 | $ | 68,192,149 | |||
| 12,675,000 | 6.250%, 08/15/2023 | 18,410,437 | |||||
| 35,775,000 | 5.250%, 11/15/2028 | 50,347,732 | |||||
| 43,525,000 | 4.375%, 02/15/2038 | 57,752,234 | |||||
| 194,702,552 | |||||||
| U.S. Government Agency Securities - 1.5% | |||||||
| Federal National Mortgage Association (FNMA): | |||||||
| 15,075,000 | 1.000%, 07/28/2017 | 15,067,176 | |||||
| 10,975,000 | 1.250%, 01/30/2017 @ | 11,147,999 | |||||
| 26,215,175 | |||||||
| Taxable Municipal Bonds - 2.4% | |||||||
| 625,000 | Bellevue California Union School District, | ||||||
| 5.000%, 08/01/2028 | 649,644 | ||||||
| California Qualified School Construction Bonds: | |||||||
| 1,500,000 | 5.041%, 07/01/2020 | 1,691,805 | |||||
| 1,700,000 | 7.155%, 03/01/2027 | 1,970,045 | |||||
| 2,000,000 | California State, | ||||||
| 5.500%, 03/01/2016 | 2,258,340 | ||||||
| 1,500,000 | Central Valley Support Joint Powers Agency, | ||||||
| 5.676%, 09/01/2024 | 1,660,695 | ||||||
| 1,250,000 | Colton Joint Unified School District, | ||||||
| 6.008%, 08/01/2026 | 1,380,263 | ||||||
| 1,300,000 | Contra Costa County California Pension Obligation, | ||||||
| 5.140%, 06/01/2017 | 1,448,551 | ||||||
| 1,000,000 | Davie Florida Water & Sewer Revenue, | ||||||
| 6.599%, 10/01/2030 (Callable 10/01/2020) | 1,149,510 | ||||||
| 1,000,000 | Elgin Ohio LOC School District, | ||||||
| 5.499%, 08/31/2027 (Callable 12/01/2019) | 1,067,770 | ||||||
| Illinois State: | |||||||
| 2,000,000 | 4.026%, 03/01/2014 | 2,068,280 | |||||
| 1,600,000 | 4.421%, 01/01/2015 | 1,682,032 | |||||
| 2,000,000 | 4.961%, 03/01/2016 | 2,152,000 | |||||
| 3,000,000 | 5.163%, 02/01/2018 | 3,250,680 | |||||
| 3,000,000 | North East Independent School District Texas, | ||||||
| 5.240%, 08/01/2027 | 3,489,150 | ||||||
| 2,900,000 | Port of Oakland, | ||||||
| 5.000%, 11/01/2020 | 3,163,842 | ||||||
| 1,515,000 | San Dieguito California Public Facilities, | ||||||
| 6.459%, 05/01/2027 | 1,777,746 | ||||||
| 2,000,000 | State Public School Building Authorities Revenue, | ||||||
| 5.000%, 09/15/2027 | 2,228,060 | ||||||
| 1,350,000 | Three Rivers Ohio LOC School District, | ||||||
| 5.209%, 09/15/2027 (Callable 12/01/2020) | 1,452,155 | ||||||
| 3,420,000 | Tobacco Settlement Authority Iowa, | ||||||
| 6.500%, 06/01/2023 (Callable 06/01/2015) | 3,290,792 | ||||||
| 4,000,000 | West Contra Costa Unified School District, | ||||||
| 6.250%, 08/01/2030 | 4,351,080 | ||||||
| 1,160,000 | Westlake Ohio City School District, | ||||||
| 5.227%, 12/01/2026 (Callable 12/01/2020) | 1,291,080 | ||||||
| 43,473,520 | |||||||
| Other Government Related Securities - 2.0% | |||||||
| 2,556,000 | Corp Andina de Fomento, | ||||||
4.375%, 06/15/2022 f | 2,610,780 | ||||||
| 9,000,000 | Eksportfinans ASA, | ||||||
2.000%, 09/15/2015 f | 8,054,514 | ||||||
Export-Import Bank of Korea Notes: f | |||||||
| 3,500,000 | 5.875%, 01/14/2015 | 3,826,599 | |||||
| 1,000,000 | 4.000%, 01/29/2021 | 1,032,223 | |||||
| 100,000 | Korea Development Bank, | ||||||
5.300%, 01/17/2013 f | 101,896 | ||||||
| 240,000 | Korea Electric Power Corporation, | ||||||
6.750%, 08/01/2027 f | 296,874 | ||||||
Korea Hydro & Nuclear Power Co., Ltd.: f | |||||||
| 1,000,000 | 6.250%, 06/17/2014 (Acquired 03/21/2011, Cost $1,062,700) * | 1,075,622 | |||||
| 500,000 | 3.125%, 09/16/2015 (Acquired 09/09/2010, Cost $493,770) * | 510,880 | |||||
| 150,000 | National Bank of Hungary Yankee Debentures, | ||||||
8.875%, 11/01/2013 f | 154,755 | ||||||
Petrobras International Finance Company: f | |||||||
| 4,100,000 | 3.875%, 01/27/2016 | 4,233,004 | |||||
| 3,200,000 | 5.375%, 01/27/2021 | 3,448,867 | |||||
Petroleos Mexicanos: f | |||||||
| 2,500,000 | 4.875%, 01/24/2022 (Acquired 01/17/2012, Cost $2,477,975) * | 2,700,000 | |||||
| 4,000,000 | 6.500%, 06/02/2041 (Acquired 10/12/2011 through 10/13/2011, Cost $4,129,885) * | 4,670,000 | |||||
| 1,885,000 | Westdeutsche Landesbank Subordinated Notes, | ||||||
4.796%, 07/15/2015 f | 1,937,390 | ||||||
| 34,653,404 | |||||||
| Corporate Bonds - 43.7% | |||||||
| Industrials - 14.2% | |||||||
| 700,000 | Acuity Brands Lighting Inc., | ||||||
| 6.000%, 12/15/2019 | 791,275 | ||||||
| 3,000,000 | Ameritech Capital Funding Corporation, | ||||||
| 6.450%, 01/15/2018 | 3,447,597 | ||||||
| Anadarko Petroleum Corporation: | |||||||
| 2,225,000 | 5.950%, 09/15/2016 @ | 2,524,881 | |||||
| 968,000 | 6.375%, 09/15/2017 | 1,124,462 | |||||
| 3,700,000 | 8.700%, 03/15/2019 | 4,836,510 | |||||
| 2,500,000 | Anglo American Capital PLC, | ||||||
9.375%, 04/08/2019 (Acquired 09/20/2011, Cost $3,205,933) * f | 3,313,050 | ||||||
| 2,000,000 | ArcelorMittal, | ||||||
6.250%, 02/25/2022 f | 1,958,816 | ||||||
| 5,000,000 | Aristotle Holding, Inc., | ||||||
| 3.500%, 11/15/2016 (Acquired 11/14/2011 through 03/28/2012, Cost $5,041,148) * | 5,264,320 | ||||||
| 1,000,000 | AT&T Inc., | ||||||
| 5.550%, 08/15/2041 | 1,191,957 | ||||||
| 284,020 | Atlas Air, Inc. Pass-Through Certificates, | ||||||
| Series 2000-1, 8.707%, 07/02/2021 | 284,020 | ||||||
| 2,000,000 | Beam, Inc., | ||||||
| 3.250%, 05/15/2022 @ | 2,011,524 | ||||||
| 1,000,000 | Bemis Company, Inc., | ||||||
| 4.500%, 10/15/2021 | 1,079,234 | ||||||
| 1,500,000 | BP Capital Markets PLC, | ||||||
4.750%, 03/10/2019 f | 1,697,536 | ||||||
| 1,500,000 | Browning-Ferris Industries Inc., | ||||||
| 9.250%, 05/01/2021 | 1,968,984 | ||||||
| Bunge Limited Finance Corporation: | |||||||
| 625,000 | 5.350%, 04/15/2014 | 659,500 | |||||
| 2,527,000 | 5.100%, 07/15/2015 | 2,700,345 | |||||
| 3,000,000 | 3.200%, 06/15/2017 | 3,006,645 | |||||
| 1,105,000 | 8.500%, 06/15/2019 | 1,379,530 | |||||
| 1,950,000 | Bunge NA Finance LP, | ||||||
| 5.900%, 04/01/2017 | 2,181,422 | ||||||
| 2,000,000 | CenturyLink Inc., | ||||||
| 5.150%, 06/15/2017 | 2,046,234 | ||||||
| 3,544,000 | Chesapeake Energy Corporation, | ||||||
| 6.500%, 08/15/2017 @ | 3,526,280 | ||||||
| 50,000 | Clear Channel Communications, | ||||||
| 5.500%, 12/15/2016 @ | 24,875 | ||||||
| 1,000,000 | CNPC HK Overseas Capital Ltd, | ||||||
5.950%, 04/28/2041 (Acquired 04/20/2011, Cost $978,120) * f @ | 1,215,918 | ||||||
| 1,025,000 | Comcast Cable Holdings, LLC, | ||||||
| 7.875%, 08/01/2013 | 1,094,386 | ||||||
| Comcast Corporation: | |||||||
| 350,000 | 6.500%, 01/15/2017 | 416,665 | |||||
| 2,000,000 | 4.650%, 07/15/2042 | 2,000,916 | |||||
| 875,000 | Comcast Holdings Corporation, | ||||||
| 10.625%, 07/15/2012 | 877,257 | ||||||
| Computer Sciences Corporation: @ | |||||||
| 3,500,000 | 5.000%, 02/15/2013 | 3,587,500 | |||||
| 3,375,000 | 5.500%, 03/15/2013 | 3,459,375 | |||||
| 845,000 | ConocoPhillips Canada Funding Company I, | ||||||
5.950%, 10/15/2036 f | 1,061,623 | ||||||
| 45,305 | Continental Airlines, Inc. Pass-Through Certificates, | ||||||
| Series 1997-4, Class A, 6.900%, 01/02/2018 | 47,684 | ||||||
| 175,000 | CSX Corporation, | ||||||
| 6.220%, 04/30/2040 | 215,819 | ||||||
| 1,000,000 | D.R. Horton, Inc., | ||||||
| 4.750%, 05/15/2017 @ | 1,030,625 | ||||||
| 5,000,000 | Daimler Finance North America LLC, | ||||||
| 1.071%, 03/28/2014 (Acquired 04/23/2012, Cost $4,971,144) * | 4,988,160 | ||||||
| 3,500,000 | Danone, | ||||||
3.000%, 06/15/2022 (Acquired 05/29/2012, Cost $3,489,465) * f | 3,511,911 | ||||||
Deutsche Telekom International Finance B.V.: f | |||||||
| 2,450,000 | 3.125%, 04/11/2016 (Acquired 11/09/2011, Cost $2,484,947) * | 2,534,047 | |||||
| 825,000 | 8.750%, 06/15/2030 | 1,145,127 | |||||
| Donnelley (R.R.) & Sons Co.: | |||||||
| 1,250,000 | 8.600%, 08/15/2016 | 1,325,000 | |||||
| 1,200,000 | 6.125%, 01/15/2017 @ | 1,134,000 | |||||
| 500,000 | Encana Corporation, | ||||||
6.500%, 05/15/2019 f | 595,466 | ||||||
| 198,369 | FedEx Corporation Pass-Through Certificates, | ||||||
| Series B2, 7.110%, 01/02/2014 | 208,287 | ||||||
| 500,000 | First Data Corporation, | ||||||
| 9.875%, 09/24/2015 @ | 506,250 | ||||||
| 2,325,000 | Fiserv, Inc., | ||||||
| 3.125%, 06/15/2016 | 2,396,826 | ||||||
| Ford Motor Credit Company LLC: | |||||||
| 2,000,000 | 3.875%, 01/15/2015 | 2,059,628 | |||||
| 3,000,000 | 3.000%, 06/12/2017 @ | 2,983,473 | |||||
| 1,050,000 | France Telecom SA, | ||||||
2.750%, 09/14/2016 f @ | 1,069,983 | ||||||
| Georgia-Pacific LLC: | |||||||
| 3,500,000 | 8.250%, 05/01/2016 (Acquired 10/13/2011 through 05/15/2012, Cost $3,821,101) * | 3,855,505 | |||||
| 1,000,000 | 5.400%, 11/01/2020 (Acquired 10/27/2010, Cost $994,130) * | 1,160,369 | |||||
| 7,115,000 | Glencore Funding LLC, | ||||||
| 6.000%, 04/15/2014 (Acquired 03/31/2004 through 06/19/2012, Cost $7,356,247) * | 7,479,437 | ||||||
| 975,000 | GTE Corporation, | ||||||
| 8.750%, 11/01/2021 | 1,368,628 | ||||||
| 2,200,000 | Hanson Australia Funding, | ||||||
5.250%, 03/15/2013 f | 2,249,500 | ||||||
| 2,375,000 | Hanson PLC Notes, | ||||||
6.125%, 08/15/2016 f | 2,529,375 | ||||||
| 4,100,000 | Health Management Association, | ||||||
| 6.125%, 04/15/2016 | 4,346,000 | ||||||
| 4,000,000 | Hewlett-Packard Co., | ||||||
| 4.650%, 12/09/2021 | 4,192,816 | ||||||
| 425,000 | Highmark Inc. Notes, | ||||||
| 6.800%, 08/15/2013 (Acquired 10/28/2010 through 11/24/2010, Cost $445,520) * | 443,377 | ||||||
| 92,000 | Historic Time Warner Inc., | ||||||
| 6.875%, 06/15/2018 | 113,354 | ||||||
| 3,563,000 | Hutchison Whampoa International Ltd., | ||||||
4.625%, 09/11/2015 (Acquired 08/19/2010 through 12/28/2011, Cost $3,717,178) * f | 3,808,640 | ||||||
| 2,000,000 | Hyundai Capital Services Inc., | ||||||
3.500%, 09/13/2017 (Acquired 03/06/2012, Cost $1,992,580) * f | 2,016,868 | ||||||
| 1,114,000 | International Paper Company, | ||||||
| 7.400%, 06/15/2014 | 1,234,565 | ||||||
| 1,150,000 | Johnson Controls Inc., | ||||||
| 5.250%, 12/01/2041 | 1,275,307 | ||||||
| 5,100,000 | Kinross Gold Corporation, | ||||||
6.875%, 09/01/2041 f | 5,175,607 | ||||||
| 1,000,000 | Kraft Foods Group Inc, | ||||||
| 5.000%, 06/04/2042 (Acquired 05/30/2012, Cost $992,930) * | 1,058,376 | ||||||
Lafarge SA: f | |||||||
| 1,375,000 | 6.500%, 07/15/2016 | 1,485,000 | |||||
| 875,000 | 7.125%, 07/15/2036 | 866,250 | |||||
| Martin Marietta Materials, Inc.: | |||||||
| 475,000 | 6.600%, 04/15/2018 | 523,861 | |||||
| 450,000 | 6.250%, 05/01/2037 | 442,324 | |||||
| Masco Corporation: @ | |||||||
| 2,150,000 | 6.125%, 10/03/2016 | 2,294,480 | |||||
| 1,000,000 | 7.125%, 03/15/2020 | 1,103,360 | |||||
| 250,000 | Nabors Industries, Inc., | ||||||
| 6.150%, 02/15/2018 | 286,890 | ||||||
| 2,655,000 | National Oilwell Varco Inc., | ||||||
| Series B, 6.125%, 08/15/2015 | 2,696,028 | ||||||
| 2,675,000 | New Cingular Wireless Services, Inc., | ||||||
| 8.750%, 03/01/2031 | 4,074,095 | ||||||
| 244,000 | Nextel Communications, Series E, | ||||||
| 6.875%, 10/31/2013 | 244,915 | ||||||
| 3,000,000 | Oi S.A., | ||||||
5.750%, 02/10/2022 (Acquired 02/06/2012, Cost $3,000,000) * f @ | 3,057,000 | ||||||
| 50,000 | Pactiv Corporation, | ||||||
| 7.950%, 12/15/2025 @ | 40,000 | ||||||
| 200,000 | PCCW-HKT Capital II Ltd., | ||||||
6.000%, 07/15/2013 (Acquired 07/10/2003, Cost $199,066) * f | 207,549 | ||||||
| 775,000 | PCCW-HKT Capital III Ltd., | ||||||
5.250%, 07/20/2015 (Acquired 09/29/2008 through 12/20/2010, Cost $785,445) * f | 827,345 | ||||||
| 75,000 | Pearson Dollar Finance PLC, | ||||||
5.700%, 06/01/2014 (Acquired 09/29/2008, Cost $74,300) * f | 80,357 | ||||||
| 3,000,000 | Petrohawk Energy Corporation, | ||||||
| 7.875%, 06/01/2015 | 3,118,692 | ||||||
| 3,000,000 | Phillips 66, | ||||||
| 2.950%, 05/01/2017 (Acquired 03/07/2012, Cost $2,999,460) * | 3,082,704 | ||||||
| Plum Creek Timberlands, L.P.: | |||||||
| 1,200,000 | 5.875%, 11/15/2015 | 1,329,580 | |||||
| 1,200,000 | 4.700%, 03/15/2021 | 1,246,803 | |||||
POSCO: f | |||||||
| 3,725,000 | 8.750%, 03/26/2014 (Acquired 09/23/2011 through 01/11/2012, Cost $4,074,754) * | 4,121,053 | |||||
| 2,175,000 | 4.250%, 10/28/2020 (Acquired 10/21/2010, Cost $2,165,365) * | 2,228,005 | |||||
| 2,000,000 | Reliance Holdings USA Inc., | ||||||
| 4.500%, 10/19/2020 (Acquired 10/14/2010 through 10/18/2010, Cost $1,988,700) * | 1,879,568 | ||||||
| 4,000,000 | Republic Services, Inc., | ||||||
| 3.550%, 06/01/2022 | 4,043,236 | ||||||
| 1,077,000 | Rio Tinto Alcan, Inc., | ||||||
5.200%, 01/15/2014 f | 1,140,059 | ||||||
| 4,825,000 | Rio Tinto Financial USA Ltd., | ||||||
6.500%, 07/15/2018 f | 5,946,986 | ||||||
| 2,250,000 | Sealed Air Corp., | ||||||
| 8.375%, 09/15/2021 (Acquired 09/16/2011 through 09/19/2011, Cost $2,290,204) * | 2,542,500 | ||||||
| 610,000 | SK Telecom, | ||||||
6.625%, 07/20/2027 (Acquired 07/13/2007 through 04/08/2009, Cost $545,581) * f | 753,581 | ||||||
| 1,000,000 | Sonoco Products Co., | ||||||
| 4.375%, 11/01/2021 | 1,054,765 | ||||||
| Sprint Capital Corporation: | |||||||
| 675,000 | 6.900%, 05/01/2019 @ | 634,500 | |||||
| 300,000 | 8.750%, 03/15/2032 | 273,000 | |||||
| 200,000 | Sprint Nextel Corporation, | ||||||
| 6.000%, 12/01/2016 @ | 191,500 | ||||||
| 1,031,000 | SunGard Data Systems Inc., | ||||||
| 4.875%, 01/15/2014 | 1,061,930 | ||||||
| 701,000 | Sunoco, Inc. Senior Unsecured Notes, | ||||||
| 5.750%, 01/15/2017 | 744,746 | ||||||
| 1,000,000 | Sunoco Logistics Partners Operations LP, | ||||||
| 6.100%, 02/15/2042 | 1,031,040 | ||||||
| 2,635,000 | TCI Communications, Inc., | ||||||
| 8.750%, 08/01/2015 | 3,214,998 | ||||||
| 3,629,000 | Teck Resources Limited, | ||||||
10.250%, 05/15/2016 f | 4,050,871 | ||||||
Telecom Italia Capital, SA: f | |||||||
| 340,000 | 4.950%, 09/30/2014 | 337,450 | |||||
| 4,100,000 | 5.250%, 10/01/2015 | 4,059,000 | |||||
| 2,375,000 | 7.200%, 07/18/2036 | 2,012,813 | |||||
Telefonica Emisiones S.A.U.: f | |||||||
| 3,950,000 | 6.421%, 06/20/2016 | 3,790,436 | |||||
| 4,942,000 | 6.221%, 07/03/2017 | 4,639,515 | |||||
| 1,000,000 | 5.462%, 02/16/2021 | 870,793 | |||||
| 100,000 | 7.045%, 06/20/2036 | 87,429 | |||||
| 1,200,000 | The ADT Corp, | ||||||
| 3.500%, 07/15/0202 (Acquired 06/27/2012, Cost $1,197,168) * | 1,204,027 | ||||||
| 835,000 | The Dow Chemical Co., | ||||||
| 4.125%, 11/15/2021 | 895,624 | ||||||
| Time Warner, Inc.: | |||||||
| 2,300,000 | 7.250%, 10/15/2017 | 2,866,442 | |||||
| 2,875,000 | 7.625%, 04/15/2031 | 3,713,468 | |||||
| 358,000 | 7.700%, 05/01/2032 @ | 467,489 | |||||
| 2,000,000 | Toyota Motor Credit Corporation, | ||||||
| 2.050%, 01/12/2017 | 2,044,274 | ||||||
Transocean Inc.: f | |||||||
| 2,000,000 | 6.375%, 12/15/2021 @ | 2,287,538 | |||||
| 675,000 | 6.800%, 03/15/2038 | 758,942 | |||||
| 500,000 | Tyco Electronics Group S.A., | ||||||
7.125%, 10/01/2037 f | 677,418 | ||||||
| United AirLines, Inc. Pass-Through Certificates: | |||||||
| 116,346 | Series 1991-A, Class A-2, 10.020%, 03/22/2014 | 60,791 | |||||
| 155,852 | Series 2000-2, Class C, 7.762%, 04/29/2049 § † ** | 4,675 | |||||
| 480,107 | U.S. Airways Pass-Through Trust, | ||||||
| Series 1998-1, Class B, 7.350%, 07/30/2019 | 470,505 | ||||||
| 322,000 | USX Corporation, | ||||||
| 9.125%, 01/15/2013 | 334,443 | ||||||
Vale Overseas Limited: f | |||||||
| 3,850,000 | 6.250%, 01/23/2017 | 4,378,578 | |||||
| 2,700,000 | 4.375%, 01/11/2022 | 2,749,472 | |||||
| 300,000 | 8.250%, 01/17/2034 | 382,842 | |||||
| 250,000 | 6.875%, 11/21/2036 @ | 289,988 | |||||
| 500,000 | Vodafone Group PLC, | ||||||
6.150%, 02/27/2037 f | 639,063 | ||||||
| Vulcan Materials Co.: | |||||||
| 200,000 | 6.400%, 11/30/2017 | 209,500 | |||||
| 1,000,000 | 7.000%, 06/15/2018 | 1,065,000 | |||||
| 500,000 | 7.150%, 11/30/2037 | 473,750 | |||||
| 1,250,000 | Weatherford International Ltd., | ||||||
6.750%, 09/15/2040 f | 1,403,010 | ||||||
| 505,000 | Westvaco Corporation, | ||||||
| 9.750%, 06/15/2020 | 637,516 | ||||||
| 1,000,000 | Weyerhaeuser Company, | ||||||
| 7.250%, 07/01/2013 | 1,057,235 | ||||||
| 1,034,000 | Williams Companies Inc., | ||||||
| 7.875%, 09/01/2021 | 1,305,868 | ||||||
Woodside Finance Ltd.: f | |||||||
| 400,000 | 5.000%, 11/15/2013 (Acquired 11/26/2010, Cost $414,016) * | 417,037 | |||||
| 1,000,000 | 8.125%, 03/01/2014 (Acquired 02/24/2009, Cost $999,690) * | 1,098,072 | |||||
| 4,000,000 | WPX Energy Inc., | ||||||
| 6.000%, 01/15/2022 (Acquired 11/07/2011 through 11/16/2011, Cost $3,985,000) * | 3,980,000 | ||||||
| 4,587,000 | Xerox Corporation, | ||||||
| 8.250%, 05/15/2014 | 5,114,638 | ||||||
| 2,000,000 | Xstrata Canada Corp., | ||||||
5.375%, 06/01/2015 f | 2,168,678 | ||||||
| 2,000,000 | Xstrata Canada Financial Corp., | ||||||
4.950%, 11/15/2021 (Acquired 11/03/2011, Cost $1,997,480) * f | 2,066,486 | ||||||
| 251,732,023 | |||||||
| Utility - 6.7% | |||||||
| 500,000 | Allegheny Energy Supply Co. Senior Unsecured Notes, | ||||||
| 5.750%, 10/15/2019 (Acquired 09/22/2009, Cost $498,175) * | 538,064 | ||||||
| 1,816,000 | Ameren Corporation, | ||||||
| 8.875%, 05/15/2014 | 2,022,822 | ||||||
| 1,025,000 | Appalachian Power Company Senior Unsecured Notes, | ||||||
| 6.700%, 08/15/2037 | 1,306,123 | ||||||
| 1,150,000 | Arizona Public Service Senior Unsecured Notes, | ||||||
| 8.750%, 03/01/2019 | 1,520,874 | ||||||
| 4,000,000 | Centrais Eletricas Brasileiras SA, | ||||||
5.750%, 10/27/2021 (Acquired 10/20/2011, Cost $4,000,000) * f @ | 4,372,000 | ||||||
| 300,000 | Chesapeake Midstream Partners LP / CHKM Finance Corp, | ||||||
| 6.125%, 07/15/2022 @ | 294,000 | ||||||
| CMS Energy Corporation: | |||||||
| 3,000,000 | 4.250%, 09/30/2015 | 3,119,040 | |||||
| 1,000,000 | 5.050%, 03/15/2022 | 1,037,238 | |||||
| 5,200,000 | Comision Federal de Electricidad, | ||||||
5.750%, 02/14/2042 (Acquired 02/08/2012, Cost $5,116,800) * f | 5,460,000 | ||||||
| 750,000 | Constellation Energy Group Inc., | ||||||
| 4.550%, 06/15/2015 | 805,439 | ||||||
| DCP Midstream, LLC: | |||||||
| 4,835,000 | 9.750%, 03/15/2019 (Acquired 02/29/2012 through 03/30/2012, Cost $6,278,881) * | 6,268,133 | |||||
| 2,245,000 | 4.750%, 09/30/2021 (Acquired 09/14/2011 through 11/18/2011, Cost $2,252,453) * | 2,372,049 | |||||
| 1,880,000 | Dominion Resources, Inc., | ||||||
| 5.950%, 06/15/2035 | 2,327,335 | ||||||
| 2,500,000 | El Paso Pipeline Partners Operating Co LLC, | ||||||
| 7.500%, 11/15/2040 | 3,167,882 | ||||||
| 500,000 | Enel Finance International, | ||||||
6.800%, 09/15/2037 (Acquired 09/13/2007 through 09/29/2008, Cost $498,897) * f | 432,576 | ||||||
| Energy Transfer Partners: | |||||||
| 125,000 | 6.125%, 02/15/2017 | 140,491 | |||||
| 1,189,000 | 9.700%, 03/15/2019 | 1,524,562 | |||||
| 1,000,000 | 5.200%, 02/01/2022 | 1,070,912 | |||||
| 223,000 | Entergy Arkansas, Inc., | ||||||
| 5.000%, 07/01/2018 | 222,504 | ||||||
| 500,000 | Exelon Corporation, | ||||||
| 4.900%, 06/15/2015 | 543,441 | ||||||
| Exelon Generation Company, LLC: | |||||||
| 4,350,000 | 6.200%, 10/01/2017 | 5,015,167 | |||||
| 5,800,000 | 5.600%, 06/15/2042 (Acquired 06/13/2012, Cost $5,789,154) * | 5,904,273 | |||||
| 3,000,000 | Florida Gas Transmission Company, LLC, | ||||||
| 3.875%, 07/15/2022 (Acquired 06/12/2012, Cost $2,996,190) * @ | 3,015,756 | ||||||
| 2,500,000 | FPL Group Capital, Inc., | ||||||
| Series D, 7.300%, 09/01/2067 @ | 2,653,125 | ||||||
| 248,284 | GG1C Funding Corporation, | ||||||
| 5.129%, 01/15/2014 (Acquired 11/21/2008, Cost $244,400) * | 253,468 | ||||||
| 3,000,000 | Gulf South Pipeline Company, L.P., | ||||||
| 4.000%, 06/15/2022 (Acquired 06/07/2012, Cost $2,989,230) * | 2,985,315 | ||||||
| 1,000,000 | IPALCO Enterprises Inc., | ||||||
| 5.000%, 05/01/2018 @ | 1,012,500 | ||||||
| 1,875,000 | KeySpan Corp., | ||||||
| 8.000%, 11/15/2030 | 2,585,454 | ||||||
| Kinder Morgan Energy Partners, L.P.: | |||||||
| 1,658,000 | 9.000%, 02/01/2019 | 2,141,763 | |||||
| 400,000 | 6.500%, 02/01/2037 | 450,204 | |||||
| 350,000 | 6.950%, 01/15/2038 @ | 413,925 | |||||
| Kinder Morgan Finance: @ | |||||||
| 1,685,000 | 5.700%, 01/05/2016 f | 1,773,463 | |||||
| 1,000,000 | 6.000%, 01/15/2018 (Acquired 12/06/2010, Cost $999,930) * | 1,040,000 | |||||
| 19,829 | Kiowa Power Partners LLC, | ||||||
| 4.811%, 12/30/2013 (Acquired 11/19/2004, Cost $19,829) * | 20,046 | ||||||
| 2,800,000 | Mega Advance Investments Ltd, | ||||||
5.000%, 05/12/2021 (Acquired 05/09/2011 through 05/23/2012, Cost $2,820,998) * f @ | 2,972,550 | ||||||
| 3,375,000 | National Grid PLC, | ||||||
6.300%, 08/01/2016 f | 3,893,872 | ||||||
| National Rural Utilities Corporation: | |||||||
| 6,498,000 | 10.375%, 11/01/2018 | 9,415,505 | |||||
| 125,000 | 8.000%, 03/01/2032 | 183,637 | |||||
| 1,583,000 | Nisource Finance Corp., | ||||||
| 5.400%, 07/15/2014 | 1,705,975 | ||||||
| 1,000,000 | NuStar Logistics L.P., | ||||||
| 4.800%, 09/01/2020 | 1,018,866 | ||||||
| 5,250,000 | ONEOK, Inc., | ||||||
| 4.250%, 02/01/2022 | 5,498,104 | ||||||
| PPL Energy Supply, LLC: | |||||||
| 1,350,000 | Series A, 5.700%, 10/15/2015 | 1,464,936 | |||||
| 1,950,000 | 6.200%, 05/15/2016 @ | 2,185,572 | |||||
| 3,077,000 | PSE&G Power LLC, | ||||||
| 5.320%, 09/15/2016 @ | 3,469,948 | ||||||
| 3,500,000 | Public Service Company Of New Mexico, | ||||||
| 7.950%, 05/15/2018 | 4,191,253 | ||||||
| 220,953 | RGS (I&M) Funding Corporation Debentures, | ||||||
| 9.820%, 12/07/2022 | 276,118 | ||||||
| Rockies Express Pipeline LLC: | |||||||
| 850,000 | 3.900%, 04/15/2015 (Acquired 09/15/2011, Cost $861,288) * | 818,125 | |||||
| 2,000,000 | 6.850%, 07/15/2018 (Acquired 12/21/2011, Cost $2,038,091) * @ | 1,960,000 | |||||
| 2,695,000 | 5.625%, 04/15/2020 (Acquired 12/10/2010 through 12/29/2011, Cost $2,702,471) * @ | 2,452,450 | |||||
| 300,000 | Southern Natural Gas, | ||||||
| 5.900%, 04/01/2017 (Acquired 03/14/2007, Cost $299,502) * | 343,441 | ||||||
| 4,395,000 | Spectra Energy Capital LLC, | ||||||
| 5.668%, 08/15/2014 | 4,755,425 | ||||||
| 1,489,000 | Veolia Environnement SA, | ||||||
6.000%, 06/01/2018 f | 1,648,241 | ||||||
| Williams Partners L.P.: | |||||||
| 2,000,000 | 7.250%, 02/01/2017 @ | 2,396,418 | |||||
| 500,000 | 6.300%, 04/15/2040 | 592,155 | |||||
| 119,052,535 | |||||||
| Finance - 22.8% | |||||||
| 1,045,000 | Abbey National Treasury Services PLC, | ||||||
| 3.875%, 11/10/2014 (Acquired 02/25/2010 through 12/29/2011, Cost $1,027,471) * | 1,029,507 | ||||||
| 5,000,000 | ABN AMRO Bank N.V., | ||||||
4.250%, 02/02/2017 (Acquired 01/30/2012, Cost $4,995,100) * f | 5,090,750 | ||||||
| 2,000,000 | AIG SunAmerica Global Financing X, | ||||||
| 6.900%, 03/15/2032 (Acquired 11/10/2011, Cost $2,136,722) * | 2,413,784 | ||||||
| 175,000 | Allstate Corporation, | ||||||
| 5.350%, 06/01/2033 @ | 196,871 | ||||||
| Ally Financial Inc.: | |||||||
| 250,000 | 6.750%, 12/01/2014 @ | 263,732 | |||||
| 1,065,000 | 8.300%, 02/12/2015 | 1,160,850 | |||||
| 3,000,000 | 5.500%, 02/15/2017 @ | 3,047,223 | |||||
| American Express Credit Corporation: | |||||||
| 935,000 | Series C, 7.300%, 08/20/2013 | 999,665 | |||||
| 1,040,000 | 2.750%, 09/15/2015 | 1,085,228 | |||||
| American General Finance Corporation: | |||||||
| 325,000 | 5.850%, 06/01/2013 @ | 312,000 | |||||
| 1,000,000 | 6.900%, 12/15/2017 | 798,120 | |||||
| American International Group, Inc.: @ | |||||||
| 2,500,000 | 3.800%, 03/22/2017 | 2,548,475 | |||||
| 3,000,000 | 4.875%, 06/01/2022 | 3,069,666 | |||||
| 225,000 | AmSouth Bancorp, | ||||||
| 6.750%, 11/01/2025 | 214,234 | ||||||
| 620,000 | ANZ National (Int'l) LTD, | ||||||
6.200%, 07/19/2013 (Acquired 01/31/2012, Cost $647,114) * f | 649,555 | ||||||
| 2,500,000 | AON Corporation, | ||||||
| 3.500%, 09/30/2015 | 2,612,567 | ||||||
| 975,000 | Arden Realty LP, | ||||||
| 5.250%, 03/01/2015 | 1,051,356 | ||||||
| 2,464,000 | ASIF Global Financing XIX, | ||||||
| 4.900%, 01/17/2013 (Acquired 09/28/2011 through 12/06/2011, Cost $2,493,141) * | 2,486,560 | ||||||
| 4,325,000 | Associates Corporation of North America, | ||||||
| 6.950%, 11/01/2018 | 4,876,481 | ||||||
| 2,250,000 | Australia and New Zealand Banking Group Limited, | ||||||
3.250%, 03/01/2016 (Acquired 02/22/2011 through 09/14/2011, Cost $2,242,204) * f | 2,333,225 | ||||||
| 1,000,000 | Banco Santander (Brasil) S.A., | ||||||
4.625%, 02/13/2017 (Acquired 02/06/2012, Cost $994,140) * f | 985,000 | ||||||
| 200,000 | BankAmerica Capital II, | ||||||
| Series 2, 8.000%, 12/15/2026 | 204,560 | ||||||
| 1,400,000 | BankAmerica Institutional, | ||||||
| 8.070%, 12/31/2026 (Acquired 07/22/2010 through 08/16/2011, Cost $1,363,048) * | 1,430,450 | ||||||
| 2,675,000 | Bank of America Corporation Subordinated Notes, | ||||||
| 10.200%, 07/15/2015 | 3,028,055 | ||||||
| 2,060,000 | Banponce Trust I, | ||||||
| Series A, 8.327%, 02/01/2027 | 1,489,977 | ||||||
| 6,850,000 | Barclays Bank PLC, | ||||||
6.750%, 05/22/2019 f | 7,990,840 | ||||||
| 3,500,000 | Berkshire Hathaway Finance Corporation, | ||||||
| 4.400%, 05/15/2042 | 3,589,978 | ||||||
| Capital One Financial Corporation: | |||||||
| 2,500,000 | 7.375%, 05/23/2014 | 2,746,290 | |||||
| 1,015,000 | 3.150%, 07/15/2016 @ | 1,051,134 | |||||
| 125,000 | 6.150%, 09/01/2016 | 139,747 | |||||
| CIT Group, Inc.: | |||||||
| 571,000 | 7.000%, 05/02/2016 (Acquired 11/27/2007 through 08/02/2010, Cost $571,000) * | 572,427 | |||||
| 1,574,035 | 7.000%, 05/02/2017 (Acquired 09/15/2011 through 12/20/2011, Cost $1,572,785) * | 1,576,986 | |||||
| 500,000 | 5.500%, 02/15/2019 (Acquired 02/02/2012, Cost $500,000) * @ | 513,750 | |||||
| 700,000 | Citigroup Capital XXI, | ||||||
| 8.300%, 12/21/2057 | 701,750 | ||||||
| Citigroup, Inc.: | |||||||
| 1,954,000 | 6.010%, 01/15/2015 | 2,099,423 | |||||
| 1,800,000 | 4.450%, 01/10/2017 | 1,886,837 | |||||
| CNA Financial Corporation: | |||||||
| 1,000,000 | 6.500%, 08/15/2016 | 1,125,273 | |||||
| 3,500,000 | 5.875%, 08/15/2020 @ | 3,848,789 | |||||
| Comerica Bank: | |||||||
| 3,200,000 | 5.750%, 11/21/2016 | 3,615,719 | |||||
| 2,855,000 | 5.200%, 08/22/2017 | 3,196,038 | |||||
| 5,000,000 | Commonwealth Bank of Australia, | ||||||
5.000%, 10/15/2019 (Acquired 03/02/2012, Cost $5,405,649) * f | 5,493,145 | ||||||
Cooperatieve Centrale Raiffeisen-Boerenleenbank BA/Utrect: f | |||||||
| 2,000,000 | 3.375%, 01/19/2017 | 2,058,374 | |||||
| 4,150,000 | 3.875%, 02/08/2022 | 4,221,517 | |||||
| 2,100,000 | Countrywide Financial Corporation, | ||||||
| 6.250%, 05/15/2016 | 2,185,676 | ||||||
| 6,966,000 | Credit Suisse New York, | ||||||
5.300%, 08/13/2019 f | 7,837,105 | ||||||
| 7,850,000 | Dresdner Bank AG, | ||||||
7.250%, 09/15/2015 f | 7,956,854 | ||||||
| 500,000 | First Empire Capital Trust I, | ||||||
| 8.234%, 02/01/2027 | 529,412 | ||||||
| 2,300,000 | First Empire Capital Trust II, | ||||||
| 8.277%, 06/01/2027 | 2,346,000 | ||||||
| 2,420,000 | First Horizon National Corporation, | ||||||
| 5.375%, 12/15/2015 | 2,553,594 | ||||||
| 311,551 | First National Bank of Chicago Pass-Through Certificates, | ||||||
| Series 1993-A, 8.080%, 01/05/2018 | 349,760 | ||||||
| 1,148,000 | FMR LLC, | ||||||
| 4.750%, 03/01/2013 (Acquired 11/28/2011 through 12/15/2011, Cost $1,167,128) * | 1,174,263 | ||||||
| General Electric Capital Corporation: | |||||||
| 1,000,000 | 2.300%, 04/27/2017 @ | 1,006,761 | |||||
| 1,150,000 | 5.625%, 09/15/2017 | 1,319,710 | |||||
| 2,000,000 | 5.625%, 05/01/2018 @ | 2,299,080 | |||||
| 1,875,000 | 5.500%, 01/08/2020 | 2,146,009 | |||||
| 8,450,000 | 4.650%, 10/17/2021 | 9,383,945 | |||||
| 1,000,000 | Genworth Financial, Inc., | ||||||
| 7.625%, 09/24/2021 @ | 944,834 | ||||||
| 3,300,000 | Genworth Life Institutional Funding Trust, | ||||||
| 5.875%, 05/03/2013 (Acquired 08/24/2011 through 01/12/2012, Cost $3,298,402) * | 3,355,539 | ||||||
| GMAC Inc.: | |||||||
| 1,305,000 | 7.500%, 12/31/2013 | 1,383,300 | |||||
| 984,000 | 8.000%, 12/31/2018 | 1,089,780 | |||||
| 125,000 | Goldman Sachs Capital I, | ||||||
| 6.345%, 02/15/2034 | 118,232 | ||||||
| 1,805,000 | Goldman Sachs Group LP, | ||||||
| 8.000%, 03/01/2013 (Acquired 05/19/2006 through 10/28/2010, Cost $1,852,448) * | 1,864,168 | ||||||
| 3,000,000 | HSBC Bank USA NA, | ||||||
| 4.625%, 04/01/2014 | 3,127,230 | ||||||
| 1,120,000 | HSBC Finance Corporation, | ||||||
| 5.500%, 01/19/2016 @ | 1,212,901 | ||||||
| 1,000,000 | HSBC Holdings PLC, | ||||||
5.250%, 12/12/2012 f | 1,018,027 | ||||||
| 800,000 | Humana Inc., | ||||||
| 7.200%, 06/15/2018 | 961,352 | ||||||
| 2,000,000 | Hutchison Whampoa International Ltd., | ||||||
3.500%, 01/13/2017 (Acquired 01/10/2012, Cost $1,990,380) * f @ | 2,073,808 | ||||||
ING Bank N.V.: f | |||||||
| 1,600,000 | 4.000%, 03/15/2016 (Acquired 03/08/2011 through 09/20/2011, Cost $1,601,109) * | 1,610,877 | |||||
| 4,800,000 | 3.750%, 03/07/2017 (Acquired 02/29/2012, Cost $4,775,328) * @ | 4,777,483 | |||||
| 2,500,000 | 5.000%, 06/09/2021 (Acquired 10/12/2011, Cost $2,468,800) * | 2,598,445 | |||||
Invesco Ltd.: f | |||||||
| 1,380,000 | 5.375%, 02/27/2013 | 1,416,057 | |||||
| 5,781,000 | 5.375%, 12/15/2014 | 6,231,762 | |||||
| 10,400,000 | Irish Life & Permanent Group Holdings PLC, | ||||||
3.600%, 01/14/2013 (Acquired 12/01/2010 through 02/28/2012, Cost $10,037,601) * f | 10,078,578 | ||||||
| 400,000 | Istar Financial, Inc., | ||||||
| 5.850%, 03/15/2017 | 353,000 | ||||||
| 875,000 | Jefferies Group, Inc., | ||||||
| 6.450%, 06/08/2027 | 831,250 | ||||||
| 1,000,000 | Jefferson-Pilot Corp., | ||||||
| 4.750%, 01/30/2014 | 1,039,174 | ||||||
| 1,500,000 | John Hancock Mutual Life Insurance Company, | ||||||
| 7.375%, 02/15/2024 (Acquired 08/26/2010, Cost $1,684,219) * | 1,824,170 | ||||||
| J.P. Morgan Chase & Co.: | |||||||
| 3,100,000 | 4.250%, 10/15/2020 | 3,256,594 | |||||
| 2,400,000 | 4.350%, 08/15/2021 | 2,532,955 | |||||
| 4,400,000 | 4.500%, 01/24/2022 @ | 4,739,759 | |||||
| 2,500,000 | Kemper Corporation, | ||||||
| 6.000%, 11/30/2015 | 2,620,665 | ||||||
| Key Bank NA: | |||||||
| 2,000,000 | 5.800%, 07/01/2014 | 2,143,972 | |||||
| 2,600,000 | 7.413%, 05/06/2015 | 2,920,463 | |||||
| 820,000 | 4.950%, 09/15/2015 | 880,134 | |||||
| 1,279,000 | 5.450%, 03/03/2016 | 1,420,079 | |||||
| 2,670,000 | 4.625%, 06/15/2018 | 2,789,058 | |||||
| 3,900,000 | Kookmin Bank, | ||||||
7.250%, 05/14/2014 (Acquired 03/10/2010 through 01/18/2012, Cost $4,167,379) * f | 4,270,570 | ||||||
| Liberty Mutual Group Inc.: | |||||||
| 980,000 | 5.750%, 03/15/2014 (Acquired 12/21/2010 through 04/24/2012, Cost $1,013,380) * | 1,034,725 | |||||
| 500,000 | 6.500%, 03/15/2035 (Acquired 09/29/2008 through 03/22/2012, Cost $469,391) * | 511,502 | |||||
| 900,000 | 10.750%, 06/15/2058 (Acquired 05/21/2008 through 05/06/2009, Cost $750,551) * | 1,224,000 | |||||
| 375,000 | Liberty Mutual Insurance Company, | ||||||
| 7.697%, 10/15/2097 (Acquired 03/26/2003, Cost $240,079) * | 367,773 | ||||||
| 825,000 | Lincoln National Corporation, | ||||||
| 6.050%, 04/20/2067 | 754,875 | ||||||
Lloyds TSB Bank PLC: f | |||||||
| 2,000,000 | 4.200%, 03/28/2017 @ | 2,063,014 | |||||
| 6,350,000 | 5.800%, 01/13/2020 (Acquired 01/05/2010 through 01/19/2012, Cost $6,419,186) * | 6,788,220 | |||||
| 2,189,000 | M&I Marshall & Ilsley Bank, | ||||||
| 4.850%, 06/16/2015 | 2,333,997 | ||||||
| Manufacturer and Traders Trust Co.: | |||||||
| 500,000 | 6.625%, 12/04/2017 | 584,192 | |||||
| 265,000 | 5.585%, 12/28/2020 | 261,824 | |||||
Manulife Financial Corp.: f | |||||||
| 2,285,000 | 3.400%, 09/17/2015 | 2,348,235 | |||||
| 1,590,000 | 4.900%, 09/17/2020 | 1,669,818 | |||||
| Marsh & McLennan Companies, Inc.: | |||||||
| 2,400,000 | 4.850%, 02/15/2013 | 2,451,319 | |||||
| 1,000,000 | 4.800%, 07/15/2021 @ | 1,088,872 | |||||
| 700,000 | MBIA Insurance Corp., | ||||||
| 14.000%, 01/15/2033 (Acquired 01/11/2008, Cost $700,000) * @ | 378,000 | ||||||
| 2,335,000 | MBNA Capital, Series A, | ||||||
| 8.278%, 12/01/2026 | 2,392,207 | ||||||
| Merrill Lynch & Company: | |||||||
| 100,000 | 5.000%, 02/03/2014 | 103,424 | |||||
| 800,000 | 6.875%, 04/25/2018 | 895,149 | |||||
| 725,000 | 7.750%, 05/14/2038 | 826,975 | |||||
| 500,000 | Metlife Capital Trust IV, | ||||||
| 7.875%, 12/15/2037 (Acquired 03/26/2012, Cost $551,146) * | 555,000 | ||||||
| MetLife, Inc.: | |||||||
| 300,000 | Series A, 6.817%, 08/15/2018 | 365,908 | |||||
| 360,000 | 7.717%, 02/15/2019 | 455,940 | |||||
| Metropolitan Life Global Funding I: | |||||||
| 1,800,000 | 2.500%, 09/29/2015 (Acquired 01/19/2012, Cost $1,830,691) * | 1,844,865 | |||||
| 2,415,000 | 3.125%, 01/11/2016 (Acquired 09/27/2011 through 06/01/2012, Cost $2,441,807) * | 2,530,217 | |||||
| Morgan Stanley: | |||||||
| 2,505,000 | 4.750%, 04/01/2014 @ | 2,527,049 | |||||
| 650,000 | 6.000%, 04/28/2015 | 671,909 | |||||
| 300,000 | 5.375%, 10/15/2015 | 306,666 | |||||
| 2,000,000 | 4.750%, 03/22/2017 @ | 1,995,604 | |||||
| 1,125,000 | 6.625%, 04/01/2018 | 1,176,264 | |||||
| 3,000,000 | National Australia Bank Ltd, | ||||||
3.000%, 07/27/2016 (Acquired 07/20/2011, Cost $2,991,720) * f | 3,073,794 | ||||||
| 3,000,000 | National Australia Bank/New York, | ||||||
2.750%, 03/09/2017 f @ | 3,018,189 | ||||||
| 2,000,000 | National City Bank of Cleveland Subordinated Notes, | ||||||
| 5.800%, 06/07/2017 | 2,276,908 | ||||||
| 800,000 | Nationwide Financial Services Inc., | ||||||
| 5.900%, 07/01/2012 | 800,000 | ||||||
| 100,000 | Nationwide Mutual Insurance Company, | ||||||
| 7.875%, 04/01/2033 (Acquired 10/13/2009, Cost $90,349) * | 111,758 | ||||||
| 3,709,000 | Navigators Group Inc. Senior Unsecured Notes, | ||||||
| 7.000%, 05/01/2016 | 3,896,620 | ||||||
| 575,000 | NB Capital Trust IV, | ||||||
| 8.250%, 04/15/2027 | 587,880 | ||||||
| 325,000 | Nomura Holdings Inc., | ||||||
6.700%, 03/04/2020 f | 360,086 | ||||||
| 8,000,000 | Nordea Bank AB, | ||||||
3.125%, 03/20/2017 (Acquired 03/14/2012 through 05/09/2012, Cost $8,050,179) * f @ | 8,034,152 | ||||||
| 775,000 | PHH Corporation, | ||||||
| 7.125%, 03/01/2013 | 790,500 | ||||||
| 1,550,000 | Principal Life Income Funding Trusts, | ||||||
| 5.100%, 04/15/2014 | 1,657,235 | ||||||
| 1,450,000 | Protective Life Secured Trust, | ||||||
| 4.300%, 06/01/2013 @ | 1,491,554 | ||||||
| Prudential Financial Inc.: | |||||||
| 2,297,000 | 6.200%, 01/15/2015 | 2,521,454 | |||||
| 2,000,000 | 6.000%, 12/01/2017 | 2,300,406 | |||||
| 2,551,000 | Prudential Holdings LLC, | ||||||
| 8.695%, 12/18/2023 (Acquired 11/29/2011 through 06/20/2012, Cost $3,135,400) * | 3,149,694 | ||||||
| 7,475,000 | Regions Bank, | ||||||
| 7.500%, 05/15/2018 | 8,409,375 | ||||||
| 1,400,000 | Regions Financing Trust II, | ||||||
| 6.625%, 05/15/2047 | 1,330,000 | ||||||
| 3,500,000 | Reliance Holdings USA Inc, | ||||||
| 5.400%, 02/14/2022 (Acquired 02/09/2012 through 02/23/2012, Cost $3,519,633) * | 3,499,787 | ||||||
| 300,000 | Santander Financial Issuances, | ||||||
7.250%, 11/01/2015 f @ | 292,194 | ||||||
| 2,500,000 | Santander U.S. Debt S.A. Unipersonal, | ||||||
2.991%, 10/07/2013 (Acquired 08/25/2011, Cost $2,427,330) * f | 2,403,902 | ||||||
| 2,378,000 | Schwab Capital Trust I, | ||||||
| 7.500%, 11/15/2037 | 2,448,270 | ||||||
| SLM Corporation: | |||||||
| 425,000 | 5.125%, 08/27/2012 | 426,592 | |||||
| 7,100,000 | 5.375%, 05/15/2014 | 7,348,237 | |||||
| 50,000 | 5.625%, 08/01/2033 | 42,250 | |||||
| 5,500,000 | Societe Generale SA, | ||||||
5.200%, 04/15/2021 (Acquired 09/20/2011 through 12/09/2011, Cost $4,768,899) * f @ | 5,256,141 | ||||||
| 6,156,000 | Sovereign Bank, | ||||||
| 8.750%, 05/30/2018 | 6,674,040 | ||||||
| 1,500,000 | Sumitomo Mitsui Banking Corporation, | ||||||
3.150%, 07/22/2015 (Acquired 09/23/2011, Cost $1,550,181) * f | 1,575,358 | ||||||
| SunTrust Banks, Inc.: | |||||||
| 1,500,000 | 3.600%, 04/15/2016 | 1,557,559 | |||||
| 4,250,000 | 3.500%, 01/20/2017 @ | 4,399,715 | |||||
| 3,697,000 | 7.250%, 03/15/2018 | 4,278,520 | |||||
| 1,000,000 | Susa Partnership LP, | ||||||
| 8.200%, 06/01/2017 | 1,202,073 | ||||||
| 2,425,000 | Svenska Handelsbanken AB, | ||||||
2.875%, 04/04/2017 f | 2,458,298 | ||||||
| 3,590,000 | Symetra Financial Corporation, | ||||||
| 6.125%, 04/01/2016 (Acquired 10/12/2010 through 11/07/2011, Cost $3,792,210) * | 3,670,488 | ||||||
| 6,000,000 | Talent Yield Investments Ltd, | ||||||
4.500%, 04/25/2022 (Acquired 04/18/2012, Cost $5,958,960) * f | 6,138,276 | ||||||
| 1,000,000 | TD Ameritrade Holding Corporation, | ||||||
| 5.600%, 12/01/2019 | 1,136,618 | ||||||
| 6,000,000 | The Bank of Tokyo-Mitsubishi UFJ, Ltd., | ||||||
2.350%, 02/23/2017 (Acquired 02/14/2012, Cost $5,996,640) * f | 6,132,288 | ||||||
| 600,000 | The Bear Stearns Companies LLC, | ||||||
| 5.300%, 10/30/2015 | 651,098 | ||||||
| 1,320,000 | The Chubb Corp., | ||||||
| 6.375%, 03/29/2067 | 1,362,900 | ||||||
| The Goldman Sachs Group, Inc.: | |||||||
| 6,500,000 | 6.150%, 04/01/2018 | 7,046,520 | |||||
| 1,000,000 | 5.250%, 07/27/2021 | 1,015,818 | |||||
| 300,000 | 6.750%, 10/01/2037 | 294,016 | |||||
| The Hartford Financial Services Group, Inc.: | |||||||
| 1,000,000 | 7.300%, 11/01/2015 | 1,112,689 | |||||
| 2,913,000 | 5.375%, 03/15/2017 @ | 3,097,961 | |||||
| 3,000,000 | 4.000%, 10/15/2017 | 3,012,444 | |||||
| 800,000 | 8.125%, 06/15/2038 @ | 838,000 | |||||
The Royal Bank of Scotland Group PLC: f | |||||||
| 705,000 | 5.000%, 11/12/2013 | 705,423 | |||||
| 350,000 | 4.875%, 08/25/2014 (Acquired 08/24/2011, Cost $350,969) * | 359,849 | |||||
| 1,528,000 | 5.050%, 01/08/2015 @ | 1,525,645 | |||||
| 3,300,000 | 4.875%, 03/16/2015 | 3,414,669 | |||||
| 2,850,000 | 6.125%, 01/11/2021 @ | 3,166,108 | |||||
| 4,800,000 | UBS AG, | ||||||
5.750%, 04/25/2018 f @ | 5,317,229 | ||||||
| 1,220,000 | UFJ Finance Aruba A.E.C., | ||||||
6.750%, 07/15/2013 f | 1,286,507 | ||||||
| 1,100,000 | UnionBanCal Corp., | ||||||
| 3.500%, 06/18/2022 | 1,111,064 | ||||||
| 1,000,000 | UnitedHealth Group, Inc., | ||||||
| 6.000%, 02/15/2018 @ | 1,210,045 | ||||||
| 1,000,000 | Unitrin, Inc. Senior Unsecured Notes, | ||||||
| 6.000%, 05/15/2017 | 1,059,360 | ||||||
| 8,322,000 | Wachovia Bank, NA, | ||||||
| 6.000%, 11/15/2017 | 9,696,944 | ||||||
| 3,475,000 | WEA Finance LLC, | ||||||
| 7.500%, 06/02/2014 (Acquired 12/28/2011 through 02/24/2012, Cost $3,771,381) * | 3,791,527 | ||||||
| 150,000 | Westpac Banking Corporation, | ||||||
4.875%, 11/19/2019 f @ | 162,433 | ||||||
| 2,600,000 | Willis North America Inc., | ||||||
| 5.625%, 07/15/2015 | 2,820,919 | ||||||
| 405,695,215 | |||||||
| Residential Mortgage-Backed Securities - 24.6% | |||||||
| U.S. Government Agency Issues - 21.3% | |||||||
| Federal Gold Loan Mortgage Corporation (FGLMC) Pass-Through Certificates: | |||||||
| 157,683 | 5.000%, 12/01/2020 | 169,503 | |||||
| 293,129 | 5.000%, 05/01/2021 | 315,103 | |||||
| 57,901 | 6.000%, 06/01/2021 | 63,615 | |||||
| 18,670,065 | 3.000%, 05/01/2027 | 19,562,225 | |||||
| 64,970 | 6.500%, 12/01/2028 | 74,333 | |||||
| 29,809 | 6.500%, 06/01/2029 | 34,104 | |||||
| 1,232,341 | 5.500%, 04/01/2037 | 1,340,948 | |||||
| 713,843 | 5.500%, 04/01/2038 | 776,754 | |||||
| 1,218,920 | 5.500%, 05/01/2038 | 1,325,201 | |||||
| 4,629,813 | 4.500%, 11/01/2039 | 4,946,691 | |||||
| 10,154,425 | 4.500%, 11/01/2039 | 10,849,424 | |||||
| 20,356,034 | 4.500%, 08/01/2040 | 21,774,706 | |||||
| 12,045,525 | 4.500%, 08/01/2040 | 12,885,013 | |||||
| Federal Home Loan Mortgage Corporation (FHLMC) Pass-Through Certificates: | |||||||
| 87,414 | Series 3122, Class VA, 6.000%, 01/15/2017 | 87,829 | |||||
| 1,785,339 | Series R010, Class VA, 5.500%, 04/15/2017 | 1,857,937 | |||||
| 267,150 | Series R010, Class AB, 5.500%, 12/15/2019 | 271,305 | |||||
| 8,775 | Series 1053, Class G, 7.000%, 03/15/2021 | 10,282 | |||||
| 16,213 | Series 136, Class E, 6.000%, 04/15/2021 | 17,725 | |||||
| 189,811 | Series 2804, Class VC, 5.000%, 07/15/2021 | 211,641 | |||||
| 13,742 | Series 1122, Class G, 7.000%, 08/15/2021 | 16,069 | |||||
| 31,377 | Series 1186, Class I, 7.000%, 12/15/2021 | 35,585 | |||||
| 8,291 | Series 3132, Class MA, 5.500%, 12/15/2023 | 8,337 | |||||
| Federal National Mortgage Association (FNMA) Pass-Through Certificates: | |||||||
| 8,052 | Series 1989-94, Class G, 7.500%, 12/25/2019 | 9,093 | |||||
| 28,134 | Series 1990-15, Class J, 7.000%, 02/25/2020 | 31,333 | |||||
| 4,978 | Series 1991-21, Class J, 7.000%, 03/25/2021 | 5,601 | |||||
| 97,708 | Series 1991-43, Class J, 7.000%, 05/25/2021 | 110,675 | |||||
| 122,198 | Series 1991-65, Class Z, 6.500%, 06/25/2021 | 133,208 | |||||
| 1,150,628 | 5.000%, 11/01/2021 | 1,245,827 | |||||
| 196,221 | Series 1992-129, Class L, 6.000%, 07/25/2022 | 218,593 | |||||
| 178,284 | Series 2003-33, Class LD, 4.250%, 09/25/2022 | 180,940 | |||||
| 602,011 | 5.500%, 03/01/2023 | 662,215 | |||||
| 41,961 | Series 1993-32, Class H, 6.000%, 03/25/2023 | 45,855 | |||||
| 217,947 | Series 1993-58, Class H, 5.500%, 04/25/2023 | 239,317 | |||||
| 276,749 | 5.500%, 07/01/2023 | 304,425 | |||||
| 400,006 | 5.500%, 12/01/2023 | 440,759 | |||||
| 89,972 | 6.000%, 03/01/2026 | 99,205 | |||||
| 371,789 | 5.000%, 05/01/2028 | 403,407 | |||||
| 48,985 | 6.500%, 09/01/2028 | 56,316 | |||||
| 105,688 | 6.500%, 02/01/2029 | 121,505 | |||||
| 56,773 | 5.500%, 01/01/2032 | 62,451 | |||||
| 4,678,892 | 5.500%, 04/01/2034 | 5,140,171 | |||||
| 4,743,478 | 5.500%, 04/01/2034 | 5,214,887 | |||||
| 10,543,849 | Series 2004-90, Class LH, 5.000%, 04/25/2034 | 11,229,117 | |||||
| 376,924 | Series 2004-W6, Class 1A4, 5.500%, 07/25/2034 | 386,821 | |||||
| 421,011 | Series 2004-W6, Class 1A6, 5.500%, 07/25/2034 | 436,717 | |||||
| 1,286,189 | Series 2004-W10, Class A4, 5.750%, 08/25/2034 | 1,317,544 | |||||
| 145,959 | 5.500%, 09/01/2034 | 160,373 | |||||
| 75,144 | 5.500%, 02/01/2035 | 82,564 | |||||
| 8,891,701 | 5.000%, 04/01/2035 | 9,670,108 | |||||
| 25,841,704 | 5.000%, 07/01/2035 | 28,184,091 | |||||
| 15,020,927 | 5.000%, 02/01/2036 | 16,335,451 | |||||
| 2,953,986 | 5.000%, 03/01/2036 | 3,212,508 | |||||
| 15,571,093 | 5.500%, 04/01/2036 | 17,079,626 | |||||
| 521,737 | 6.000%, 08/01/2037 | 570,715 | |||||
| 6,018,101 | 4.000%, 08/01/2040 | 6,415,212 | |||||
| 3,680,228 | 4.000%, 10/01/2040 | 3,923,072 | |||||
| 9,282,268 | 4.000%, 12/01/2040 | 10,063,009 | |||||
| 7,338,623 | 3.500%, 01/01/2041 | 7,721,410 | |||||
| 16,633,771 | 4.000%, 01/01/2041 | 17,731,368 | |||||
| 19,045,355 | 3.500%, 02/01/2041 | 20,038,772 | |||||
| 28,764,635 | 4.000%, 02/01/2041 | 30,662,700 | |||||
| 6,954,543 | 3.500%, 03/01/2041 | 7,317,296 | |||||
| 7,720,853 | 4.500%, 07/01/2041 | 8,324,085 | |||||
| 17,012,696 | 4.000%, 09/01/2041 | 18,140,613 | |||||
| 14,102,134 | 4.000%, 12/01/2041 | 15,037,084 | |||||
| 17,650,000 | 3.500%, 06/01/2042 | 18,614,760 | |||||
| Government National Mortgage Association (GNMA) Pass-Through Certificates: | |||||||
| 66,073 | 6.000%, 12/20/2028 | 74,538 | |||||
| 27,446 | 6.500%, 01/20/2029 | 31,830 | |||||
| 162,774 | Series 2003-2, Class PB, 5.500%, 03/20/2032 | 168,723 | |||||
| 54,281 | 6.000%, 11/20/2033 | 61,389 | |||||
| 7,799,133 | 4.500%, 05/20/2040 | 8,617,582 | |||||
| 3,568,710 | 5.000%, 07/20/2040 | 3,957,212 | |||||
| 20,500,433 | 4.500%, 01/20/2041 | 22,640,827 | |||||
| 379,567,230 | |||||||
| Non-U.S. Government Agency Issues - 3.3% | |||||||
| 8,601,800 | Banc of America Mortgage Securities Inc, | ||||||
| Series 2003-L, Class 2A1, 2.928%, 01/25/2034 | 8,029,763 | ||||||
| Bank of America Alternative Loan Trust: | |||||||
| 2,440,816 | Series 2004-1, Class 5A2, 5.500%, 02/25/2019 | 2,496,740 | |||||
| 389,869 | Series 2004-2, Class 5A1, 5.500%, 03/25/2019 | 402,254 | |||||
| 2,798,994 | Series 2004-8, Class 3A1, 5.500%, 09/25/2019 | 2,837,233 | |||||
| 82,190 | Series 2005-2, Class 4A1, 5.500%, 03/25/2020 | 83,139 | |||||
| 1,281,511 | Series 2005-4, Class 3A1, 5.500%, 05/25/2020 | 1,252,797 | |||||
| 150,782 | Series 2005-8, Class 5A1, 5.500%, 09/25/2020 | 147,122 | |||||
| 315,306 | Series 2006-2, Class 6A1, 5.500%, 03/25/2021 | 308,158 | |||||
| 1,409,666 | Series 2007-1, Class 1A1, 5.966%, 04/25/2022 | 1,379,859 | |||||
| 5,080,333 | Series 2005-2, Class 1CB2, 5.500%, 03/25/2035 | 4,722,454 | |||||
| 312,134 | Series 2006-3, Class 6A1, 6.000%, 04/25/2036 | 309,147 | |||||
| 406,020 | Series 2006-5, Class CB7, 6.000%, 06/25/2046 § | 285,446 | |||||
| Chase Mortgage Finance Corporation: | |||||||
| 38,990 | Series 2003-S13, Class A11, 5.500%, 11/25/2033 | 39,710 | |||||
| 922,450 | Series 2006-A1, Class 2A3, 5.593%, 09/25/2036 § | 716,390 | |||||
| Citigroup Mortgage Loan Trust, Inc.: | |||||||
| 95,776 | Series 2005-9, Class 2A2, 5.500%, 11/25/2035 | 92,138 | |||||
| 349,193 | Series 2005-9, Class 22A2, 6.000%, 11/25/2035 | 291,633 | |||||
| Countrywide Alternative Loan Trust: | |||||||
| 764,228 | Series 2005-50CB, Class 4A1, 5.000%, 11/25/2020 § | 670,997 | |||||
| 907,887 | Series 2006-7CB, Class 3A1, 5.250%, 05/25/2021 § | 800,089 | |||||
| 527,285 | Series 2006-43CB, Class 2A1, 6.000%, 02/25/2022 § | 477,380 | |||||
| 887,333 | Series 2005-10CB, Class 1A6, 5.500%, 05/25/2035 | 873,763 | |||||
| 248,042 | Series 2006-J2, Class A3, 6.000%, 04/25/2036 § | 182,301 | |||||
| 1,342,392 | Series 2006-28CB, Class A17, 6.000%, 10/25/2036 § | 825,123 | |||||
| 2,266,198 | Countrywide Home Loan Mortgage Pass Through Trust, | ||||||
| Series 2005-6, Class 2A1, 5.500%, 04/25/2035 | 2,057,692 | ||||||
| 24,167 | Credit Suisse First Boston Mortgage Securities Corporation, | ||||||
| Series 2005-11, Class 5A1, 5.250%, 12/25/2020 | 24,238 | ||||||
| 1,403,320 | Deutsche ALT-A Securities Inc. Alternate Loan Trust, | ||||||
| Series 2005-3, Class 4A5, 5.250%, 06/25/2035 | 1,287,750 | ||||||
| 217,426 | Deutsche Mortgage Securities Inc., | ||||||
| Series 2006-AR5, Class 21A, 6.000%, 10/25/2021 § | 171,607 | ||||||
| First Horizon Alternative Mortgage Securities: | |||||||
| 458,131 | Series 2006-FA6, Class 3A1, 5.750%, 11/25/2021 | 440,751 | |||||
| 1,318,553 | Series 2006-FA8, Class 2A1, 5.750%, 02/25/2037 | 1,245,993 | |||||
| 3,493,186 | GSR Mortgage Loan Trust, | ||||||
| Series 2004-15F, Class 5A1, 5.500%, 01/25/2020 | 3,610,162 | ||||||
| J.P. Morgan Alternative Loan Trust: | |||||||
| 1,949,792 | Series 2005-S1, Class 3A1, 5.500%, 10/25/2020 | 1,840,401 | |||||
| 184,410 | Series 2006-A1, Class 2A1, 2.789%, 03/25/2036 § | 106,442 | |||||
| 1,753,845 | Series 2006-S2, Class A2, 5.810%, 05/25/2036 | 1,741,535 | |||||
| 300,000 | Series 2006-S3, Class A3A, 6.000%, 08/25/2036 | 252,932 | |||||
| J.P. Morgan Mortgage Trust: | |||||||
| 632,503 | Series 2006-A7, Class 2A4R, 2.720%, 01/25/2037 § | 445,472 | |||||
| 14,307,108 | Series 2007-A2, Class 2A3, 2.857%, 04/25/2037 | 10,430,196 | |||||
| Master Alternative Loans Trust: | |||||||
| 371,957 | Series 2004-1, Class 1A1, 5.000%, 01/25/2019 | 382,100 | |||||
| 1,096,585 | Series 2004-5, Class 4A1, 5.500%, 07/25/2019 | 1,162,121 | |||||
| 1,778,522 | Series 2005-3, Class 4A1, 5.500%, 03/25/2020 | 1,789,590 | |||||
| 109,802 | Series 2003-5, Class 6A1, 6.000%, 08/25/2033 | 116,980 | |||||
| 533,991 | Master Asset Securitization Trust, | ||||||
| Series 2005-2, Class 1A1, 5.250%, 11/25/2035 | 532,579 | ||||||
| 89,597 | Merrill Lynch Mortgage Investors Trust, | ||||||
| Series 2005-A8, Class A1C1, 5.250%, 08/25/2036 | 90,400 | ||||||
| 867,176 | Residential Accredit Loans, Inc., | ||||||
| Series 2005-QS2, Class A-1, 5.500%, 02/25/2035 | 779,199 | ||||||
| 1,202,653 | Structured Asset Securities Corporation, | ||||||
| Series 2005-7XS, Class 1A4B, 5.440%, 04/25/2035 | 1,220,471 | ||||||
| Washington Mutual, Inc. Pass-Through Certificates: | |||||||
| 168,665 | Series 2004-CB1, Class 5A, 5.000%, 06/25/2019 | 175,064 | |||||
| 149,610 | Series 2004-CB2, Class 5A, 5.000%, 07/25/2019 | 154,524 | |||||
| 308,332 | Series 2004-CB2, Class 7A, 5.500%, 08/25/2019 | 322,567 | |||||
| 83,681 | Series 2004-CB3, Class 4A, 6.000%, 10/25/2019 | 87,309 | |||||
| 147,610 | Series 2004-CB4, Class 22A, 6.000%, 12/25/2019 | 153,860 | |||||
| 182,159 | Wells Fargo Alternative Loan Trust, | ||||||
| Series 2007-PA1, Class A4, 6.000%, 03/25/2037 § | 129,339 | ||||||
| 57,974,910 | |||||||
| Asset Backed Securities - 1.7% | |||||||
| 25,615 | Amresco Residential Securities Mortgage Loan Trust, | ||||||
| Series 1998-2, Class A6, 6.450%, 12/25/2027 | 25,046 | ||||||
| Bayview Financial Acquisition Trust: | |||||||
| 655,993 | Series 2007-A, Class 1A2, 6.205%, 05/28/2037 | 663,047 | |||||
| 150,000 | Series 2007-B, Class 1A2, 6.831%, 08/28/2047 | 67,989 | |||||
| Countrywide Asset-Backed Certificates: | |||||||
| 166,279 | Series 2004-12, Class AF6, 4.634%, 03/25/2035 | 162,664 | |||||
| 1,038,321 | Series 2004-15, Class AF6, 4.613%, 04/25/2035 | 977,018 | |||||
| 3,129,358 | Series 2005-7, Class AF6, 4.693%, 08/25/2035 | 2,779,969 | |||||
| 1,826,200 | Series 2005-11, Class AF3, 4.778%, 02/25/2036 | 1,467,124 | |||||
| 486,272 | Series 2005-10, Class AF6, 4.915%, 02/25/2036 | 411,685 | |||||
| 1,684,896 | Series 2005-13, Class AF3, 5.430%, 04/25/2036 | 1,238,196 | |||||
| 237,358 | Series 2006-S9, Class A3, 5.728%, 08/25/2036 | 207,614 | |||||
| 144,939 | Series 2007-S1, Class A6, 5.693%, 11/25/2036 | 117,132 | |||||
| 285,327 | Series 2006-13, Class 1AF2, 5.884%, 01/25/2037 § | 271,060 | |||||
| 229,560 | Series 2006-13, Class 1AF3, 5.944%, 01/25/2037 § | 149,788 | |||||
| 183,102 | Series 2007-S2, Class A2, 5.649%, 05/25/2037 | 164,178 | |||||
| 300,000 | Series 2007-4, Class A3, 5.714%, 09/25/2037 | 126,539 | |||||
| 1,300,000 | Series 2006-10, Class 1AF3, 5.767%, 09/25/2046 | 733,136 | |||||
| 616,000 | Series 2006-9, Class 1AF3, 5.859%, 10/25/2046 | 345,162 | |||||
| 1,536,557 | Credit Based Asset Servicing and Securitization LLC, | ||||||
| Series 2005-CB8, Class AF2, 5.303%, 12/25/2035 | 1,386,322 | ||||||
| 2,989 | GE Capital Mortgage Services, Inc., | ||||||
| Series 1999-HE1, Class A7, 6.265%, 04/25/2029 | 2,922 | ||||||
| Green Tree Financial Corporation: | |||||||
| 24,215 | Series 1993-4, Class A5, 7.050%, 01/15/2019 | 24,468 | |||||
| 10,149 | Series 1997-1, Class A5, 6.860%, 03/15/2028 | 10,625 | |||||
| 37,555 | Series 1997-4, Class A5, 6.880%, 02/15/2029 | 39,320 | |||||
| 505,029 | Series 1997-5, Class A6, 6.820%, 05/15/2029 | 528,982 | |||||
| 585,275 | Series 1998-3, Class A5, 6.220%, 03/01/2030 | 639,119 | |||||
| 251,026 | Series 1998-4, Class A5, 6.180%, 04/01/2030 | 259,265 | |||||
| 1,927,760 | Home Equity Asset Trust, | ||||||
| Series 2006-4, Class 2A3, 0.415%, 08/25/2036 | 1,757,938 | ||||||
| J.P. Morgan Mortgage Acquisition Corp: | |||||||
| 3,293,162 | Series 2007-CH4, Class A2, 0.305%, 05/25/2037 | 3,179,176 | |||||
| 10,000,000 | Series 2007-CH1, 0.479%, 11/25/2036 | 7,499,230 | |||||
| 36,557 | Oakwood Mortgage Investors, Inc., | ||||||
| Series 1999-B, Class A3, 6.450%, 11/15/2017 | 33,874 | ||||||
| 1,038,866 | Option One Mortgage Loan Trust, | ||||||
| Series 2005-4, Class A3, 0.505%, 11/25/2035 | 993,750 | ||||||
| Renaissance Home Equity Loan Trust: | |||||||
| 221,877 | Series 2005-1, Class AF6, 4.970%, 05/25/2035 | 198,651 | |||||
| 819,000 | Series 2006-2, Class AF3, 5.797%, 08/25/2036 | 345,186 | |||||
| 712,467 | Series 2006-3, Class AF2, 5.580%, 11/25/2036 | 377,654 | |||||
| 500,000 | Series 2007-1, Class AF2, 5.512%, 04/25/2037 | 196,966 | |||||
| 300,000 | Series 2007-1, Class AF3, 5.612%, 04/25/2037 | 124,011 | |||||
| 1,500,000 | Series 2007-2, Class AF2, 5.675%, 06/25/2037 | 608,429 | |||||
| 107,613 | Residential Asset Mortgage Products, Inc., | ||||||
| Series 2003-RS10, Class AI7, 4.850%, 11/25/2033 | 106,123 | ||||||
| Residential Asset Securities Corporation: | |||||||
| 142,030 | Series 2003-KS5, Class AI6, 3.620%, 07/25/2033 | 124,333 | |||||
| 108,212 | Series 2003-KS9, Class AI6, 4.710%, 11/25/2033 | 94,297 | |||||
| 1,050,013 | Series 2006-EMX8, Class 1A2, 0.365%, 10/25/2036 | 992,476 | |||||
| 29,430,464 | |||||||
| Commercial Mortgage-Backed Securities - 9.3% | |||||||
| 16,160,000 | Bear Stearns Commercial Mortgage Securities, | ||||||
| Series 2005-PWR9, Class A4A, 4.871%, 09/11/2042 | 17,805,104 | ||||||
| 13,222,000 | Citigroup Deutsche Bank, | ||||||
| Series 2005-CD1, Class A4, 5.394%, 07/15/2044 | 14,713,772 | ||||||
| Commercial Mortgage Pass-Through Certificates: | |||||||
| 5,987,000 | Series 2005-C6, Class A5A, 5.116%, 06/10/2044 | 6,611,163 | |||||
| 16,923,000 | Series 2012-CR1, Class A3, 3.391%, 05/15/2045 | 17,207,323 | |||||
| 16,925,000 | Credit Suisse First Boston Mortgage Securities Corporation, | ||||||
| Series 2005-C5, Class A4, 5.100%, 08/15/2038 | 18,661,251 | ||||||
| GE Capital Commercial Mortgage Corporation: | |||||||
| 1,593,960 | Series 2003-C2, Class A4, 5.145%, 07/10/2037 | 1,637,219 | |||||
| 1,600,000 | Series 2004-C3, Class A4, 5.189%, 07/10/2039 | 1,704,770 | |||||
| 12,795,000 | Series 2005-C4, Class A4, 5.305%, 11/10/2045 | 14,304,285 | |||||
| GMAC Commercial Mortgage Securities, Inc.: | |||||||
| 1,654,457 | Series 2003-C1, Class A2, 4.079%, 05/10/2036 | 1,672,333 | |||||
| 6,727,000 | Series 2004-C2, Class A4, 5.301%, 08/10/2038 | 7,094,146 | |||||
| 17,145,000 | J.P. Morgan Chase Commercial Mortgage Securities Corporation, | ||||||
| Series 2011-C5, Class A3, 4.171%, 08/15/2046 | 18,651,463 | ||||||
| 15,505,000 | J.P. Morgan Chase Commercial Mortgage Trust, | ||||||
| Series 2005-CB12, Class A4, 4.895%, 09/12/2037 | 17,006,287 | ||||||
| 11,275,000 | Morgan Stanley Capital I, | ||||||
| Series 2005-HQ7, Class A4, 5.201%, 11/14/2042 | 12,514,619 | ||||||
| Wachovia Bank Commercial Mortgage Trust: | |||||||
| 1,399,514 | Series 2003-C3, Class A2, 4.867%, 02/15/2035 | 1,417,576 | |||||
| 5,000,000 | Series 2005-C22, Class A4, 5.441%, 12/15/2044 | 5,549,490 | |||||
| 9,000,000 | WF-RBS Commercial Mortgage Trust, | ||||||
| Series 2012-C6, Class A4, 3.440%, 04/15/2045 | 9,241,056 | ||||||
| 165,791,857 | |||||||
| Total Long-Term Investments (Cost $1,658,511,859) | 1,708,288,885 | ||||||
| Shares | |||||||
| SHORT-TERM INVESTMENTS - 3.4% | |||||||
| Money Market Mutual Funds - 3.4% | |||||||
| 30,548,601 | Dreyfus Institutional Cash Advantage Fund, 0.15% « | 30,548,601 | |||||
| 30,000,000 | Short-Term Investments Trust - Liquid Assets Portfolio, 0.16% « | 30,000,000 | |||||
| Total Short-Term Investments (Cost $60,548,601) | 60,548,601 | ||||||
| Principal Amount | |||||||
| INVESTMENTS PURCHASED WITH CASH PROCEEDS FROM | |||||||
| SECURITIES LENDING - 9.5% | |||||||
| Commercial Paper - 0.0% | |||||||
| $ | 257,951 | Atlantic East Funding LLC, 0.595%, 03/25/2013 † ** | 170,183 | ||||
| Total Commercial Paper (Cost $257,951) | 170,183 | ||||||
| Shares | |||||||
| Investment Companies - 9.5% | |||||||
| 168,741,412 | Mount Vernon Securities Lending Trust Prime Portfolio, 0.31% « | 168,741,412 | |||||
| Total Investment Companies (Cost $168,741,412) | 168,741,412 | ||||||
| Total Investments Purchased With Cash Proceeds From | |||||||
| Securities Lending (Cost $168,999,363) | 168,911,595 | ||||||
| Total Investments (Cost $1,888,059,823) - 109.1% | 1,937,749,081 | ||||||
| Asset Relating to Securities Lending Investments - 0.0% | |||||||
Support Agreement ** ^ α † | 87,768 | ||||||
| Total (Cost $0) | 87,768 | ||||||
| Liabilities in Excess of Other Assets - (9.1)% | (161,000,582 | ) | |||||
| TOTAL NET ASSETS - 100.0% | $ | 1,776,836,267 | |||||
| Notes to Schedule of Investments | |||||||
| * | Restricted Security Deemed Liquid | ||||||
| ** | Illiquid Security | ||||||
| @ | This security or portion of this security is out on loan at June 30, 2012. | ||||||
| f | Foreign Security | ||||||
| ^ | Non-Income Producing | ||||||
| « | 7-Day Yield | ||||||
| § | Security in Default | ||||||
| † | Priced at Fair Value by the Valuation Committee as delegated by the Baird Funds' Board of Directors. | ||||||
| α | The Fund's transfer agent and administrator and securities lending agent entered into a support agreement with | ||||||
| the Fund to cover losses realized by the Fund on its investment in Atlantic East Funding, LLC (up to a certain amount), | |||||||
| which investment was made by the Fund's securities lending agent. | |||||||
Summary of Fair Value Exposure at June 30, 2012 (Unaudited) |
The Fund has adopted authoritative fair valuation accounting standards which establish a definition of fair value and set out a hierarchy for measuring fair value. These standards require additional disclosures about the various inputs and valuation techniques used to develop the measurements of fair value and a discussion on changes in valuation techniques and related inputs during the period. These standards define fair value as the price that would be received to sell an asset or paid to transfer a liability in an orderly transaction between market participants at the measurement date. The fair value hierarchy is organized into three levels based upon the assumptions (referred to as “inputs”) used in pricing the asset or liability. These standards state that “observable inputs” reflect the assumptions market participants would use in pricing the asset or liability based on market data obtained from independent sources and “unobservable inputs” reflect an entity’s own assumptions about the assumptions market participants would use in pricing the asset or liability. These inputs are summarized into three broad levels and described below:
| Level 1 - | Unadjusted quoted prices in active markets for identical unrestricted securities. |
| Level 2 - | Other significant observable inputs (including quoted prices for similar securities, quoted prices in inactive markets, dealer indications, interest rates, yield curves, prepayment speeds, credit risk, default rates, inputs corroborated by observable market data, etc.). |
| Level 3 - | Significant unobservable inputs (including the Fund’s own assumptions about the factors that market participants would use in valuing the security) based on the best information available. |
The inputs or methodology used for valuing securities are not necessarily an indication of the risk associated with investing in those securities.
The following is a summary of the inputs used to value the Fund’s investments as of June 30, 2012:
| Level 1 | Level 2 | Level 3 | Total | |||||||||||||
| Fixed Income | ||||||||||||||||
| U.S. Treasury Securities | $ | - | $ | 194,702,552 | $ | - | $ | 194,702,552 | ||||||||
| U.S. Government Agency Securities | - | 26,215,175 | - | 26,215,175 | ||||||||||||
| Taxable Municipal Bonds | - | 43,473,520 | - | 43,473,520 | ||||||||||||
| Other Government Related Securities | - | 34,653,404 | - | 34,653,404 | ||||||||||||
| Corporate Bonds | - | 776,475,098 | 4,675 | 776,479,773 | ||||||||||||
| Residential Mortgage-Backed Securities - U.S. Government Agency Issues | - | 379,567,230 | - | 379,567,230 | ||||||||||||
| Residential Mortgage-Backed Securities - Non - U.S. Government Agency Issues | - | 57,974,910 | - | 57,974,910 | ||||||||||||
| Asset Backed Securities | - | 29,430,464 | - | 29,430,464 | ||||||||||||
| Commercial Mortgage-Backed Securities | - | 165,791,857 | - | 165,791,857 | ||||||||||||
| Total Fixed Income | - | 1,708,284,210 | 4,675 | 1,708,288,885 | ||||||||||||
| Short-Term Investments | ||||||||||||||||
| Money Market Mutual Funds | 60,548,601 | - | - | 60,548,601 | ||||||||||||
| Total Short-Term Investments | 60,548,601 | - | - | 60,548,601 | ||||||||||||
| Investments Purchased with Cash | ||||||||||||||||
| Proceeds from Securities Lending | ||||||||||||||||
| Commercial Paper | - | 170,183 | - | 170,183 | ||||||||||||
| Money Market Mutual Fund | 168,741,412 | - | - | 168,741,412 | ||||||||||||
| Total Investments Purchased with | ||||||||||||||||
| Cash Proceeds from Securities Lending | 168,741,412 | 170,183 | - | 168,911,595 | ||||||||||||
| Total Investments | $ | 229,290,013 | $ | 1,708,454,393 | $ | 4,675 | $ | 1,937,749,081 | ||||||||
| Asset Relating to Securities Lending Investments | $ | - | $ | 87,768 | $ | - | $ | 87,768 | ||||||||
Changes in valuation techniques may result in transfers into or out of current assigned levels within the hierarchy. There were no significant transfers between Level 1, Level 2 and Level 3 fair value measurements during the reporting period, as compared to their classification from the prior year’s annual report. One security that is priced at fair value by the Valuation Committee instead of the Fund’s pricing vendor is valued using level 3 inputs.
Level 3 Reconciliation Disclosure
Following is a reconciliation of Level 3 assets for which significant unobservable inputs were used to determine fair value.
| Description | Investments in Securities | |||
| Balance as of December 31, 2011 | $ | 4,675 | ||
| Accrued discounts/premiums | - | |||
| Realized gain (loss) | - | |||
| Change in unrealized appreciation (depreciation) | - | |||
| Purchases | - | |||
| Sales | - | |||
| Transfers in and/or out of Level 3 * | - | |||
| Balance as of June 30, 2012 | $ | 4,675 | ||
* Transfers between levels are recognized at the end of the reporting period.
Item 7. Disclosure of Proxy Voting Policies and Procedures for Closed-End Management Investment Companies.
Not applicable because the Registrant is not a closed-end management investment company.
Item 8. Portfolio Managers of Closed-End Management Investment Companies.
Not applicable because the Registrant is not a closed-end management investment company.
Item 9. Purchases of Equity Securities by Closed-End Management Investment Company and Affiliated Purchasers.
Not applicable because the Registrant is not a closed-end management investment company.
Item 10. Submission of Matters to a Vote of Security Holders.
There have been no material changes to the procedures by which shareholders may recommend nominees to the Registrant’s board of directors.
Item 11. Controls and Procedures.
| (a) | The Registrant’s management, with the participation of its principal executive and principal financial officers, has evaluated the effectiveness of the Registrant's disclosure controls and procedures (as defined in Rule 30a-3(c) under the Investment Company Act of 1940 (the “Act”)), as of a date within 90 days prior to the filing date of this Form N-CSR, as required by Rule 30a-3(b) under the Act and Rules 13a-15(b) or 15d-15(b) under the Securities Exchange Act of 1934. Based on such evaluation, the Registrant's principal executive and principal financial officers have concluded that the design and operation of the Registrant's disclosure controls and procedures are effective in providing reasonable assurance that the information required to be disclosed on Form N-CSR is recorded, processed, summarized and reported within the applicable time periods. |
| (b) | There were no changes in the Registrant's internal control over financial reporting (as defined in Rule 30a-3(d) under the Act) that occurred during the second fiscal quarter of the period covered by this report that has materially affected, or is reasonably likely to materially affect, the Registrant's internal control over financial reporting. |
Item 12. Exhibits.
| (a) | (1) Code of ethics. |
Incorporated by reference to the Registrant’s Form N-CSR filed on March 9, 2004.
(2) Certifications pursuant to Section 302 of the Sarbanes-Oxley Act of 2002. Filed herewith.
(3) Any written solicitation to purchase securities under Rule 23c-1 under the Act sent or given during the period covered by the report by or on behalf of the registrant to 10 or more persons. Not applicable because the Registrant is not a closed-end management investment company.
| (b) | Certification pursuant to Section 906 of the Sarbanes-Oxley Act of 2002. Furnished herewith. |
SIGNATURES
Pursuant to the requirements of the Securities Exchange Act of 1934 and the Investment Company Act of 1940, the registrant has duly caused this report to be signed on its behalf by the undersigned, thereunto duly authorized.
BAIRD FUNDS, INC.
By: /s/Mary Ellen Stanek
Mary Ellen Stanek, President
Date: September 6, 2012
Pursuant to the requirements of the Securities Exchange Act of 1934 and the Investment Company Act of 1940, this report has been signed below by the following persons on behalf of the registrant and in the capacities and on the dates indicated.
By: /s/Mary Ellen Stanek
Mary Ellen Stanek, President
Date: September 6, 2012
By: /s/Dominick Zarcone
Dominick Zarcone, Treasurer
Date: September 6, 2012