UNITED STATES
SECURITIES AND EXCHANGE COMMISSION
Washington, D.C. 20549
FORM N-CSR
CERTIFIED SHAREHOLDER REPORT OF REGISTERED MANAGEMENT INVESTMENT
COMPANIES
Investment Company Act file number: 811-09997
Baird Funds, Inc.
(Exact name of Registrant as specified in charter)
777 East Wisconsin Avenue
Milwaukee, WI 53202
(Address of principal executive offices) (Zip code)
Andrew D. Ketter
Robert W. Baird & Co. Incorporated
777 East Wisconsin Avenue
Milwaukee, WI 53202
(Name and address of agent for service)
1-866-442-2473
Registrant's telephone number, including area code
Date of fiscal year end: December 31, 2014
Date of reporting period: June 30, 2014
Item 1. Reports to Stockholders.
Semi-Annual Report –
Baird Funds
June 30, 2014
Baird Ultra Short Bond Fund
Baird Short-Term Bond Fund
Baird Intermediate Bond Fund
Baird Intermediate Municipal Bond Fund
Baird Aggregate Bond Fund
Baird Core Plus Bond Fund
| Go Green. |  | Go Paperless. |
Sign up to receive your Baird Funds’ prospectuses and reports online.
Table of Contents
| Baird Ultra Short Bond Fund | 3 |
| Baird Short-Term Bond Fund | 11 |
| Baird Intermediate Bond Fund | 19 |
| Baird Intermediate Municipal Bond Fund | 27 |
| Baird Aggregate Bond Fund | 38 |
| Baird Core Plus Bond Fund | 46 |
| Additional Information on Fund Expenses | 54 |
| Statements of Assets and Liabilities | 56 |
| Statements of Operations | 58 |
| Statements of Changes in Net Assets | 60 |
| Financial Highlights | 66 |
| Notes to the Financial Statements | 78 |
| Additional Information | 91 |
This report has been prepared for shareholders and may be distributed to others only if preceded or accompanied by a current prospectus.
Cautionary Note on Analyses, Opinions and Outlooks: In this report we offer analyses and opinions on the performance of individual securities, companies, industries, sectors, markets, interest rates and governmental policies, including predictions, forecasts and outlooks regarding possible future events. These can generally be identified as such because the context of the statements may include such words as “believe,” “should,” “will,” “expects,” “anticipates,” “hopes” and words of similar effect. These statements reflect the portfolio managers’ good faith beliefs and judgments and involve risks and uncertainties, including the risk that the portfolio managers’ analyses, opinions and outlooks are or will prove to be inaccurate. It is inherently difficult to correctly assess and explain the performance of particular securities, sectors, markets, interest rate movements, governmental actions or general economic trends and conditions, and many unforeseen factors contribute to the performance of Baird Funds. Investors are, therefore, cautioned not to place undue reliance on subjective judgments contained in this report.
Baird Ultra Short Bond Fund
June 30, 2014 (Unaudited)
Portfolio Characteristics
| Quality Distribution(1)(2) | ||||
 | Net Assets | $14,151,178 | ||
| SEC 30-Day | ||||
Yield(3) | ||||
| Institutional Class (Subsidized) | 1.17% | |||
| Institutional Class | ||||
| (Unsubsidized) | 1.02% | |||
| Investor Class (Subsidized) | 0.92% | |||
| Investor Class (Unsubsidized) | 0.77% | |||
| Average | ||||
| Effective | ||||
| Duration | 0.58 years | |||
| Average | ||||
| Effective | ||||
| Maturity | 0.59 years | |||
| Annualized Portfolio | ||||
| Sector Weightings(1) | Expense Ratio:(4) | |||
| Gross | ||||
 | Institutional Class | 0.30% | ||
| Investor Class | 0.55%(5) | |||
| Net | ||||
| Institutional Class | 0.15% | |||
| Investor Class | 0.40%(5) | |||
| Portfolio | ||||
| Turnover | ||||
| Rate | 31.8%(6) | |||
| Number of | ||||
| Holdings | 79 | |||
| (1) | Percentages shown are based on the Fund’s total investments. |
| (2) | The quality profile is calculated on a market value-weighted basis using the highest credit quality rating for each security held by the Fund given by S&P, Moody’s or Fitch, each of which is a Nationally Recognized Statistical Rating Organization (NRSRO). NRSROs rate the credit quality of securities using a scale that generally ranges from AAA (highest) to D (lowest). |
| (3) | SEC yields are based on SEC guidelines and are calculated for the 30 days ended June 30, 2014. |
| (4) | Reflects expense ratios as stated in the Fund’s current prospectus. The Advisor has contractually agreed to waive management fees in an amount equal to an annual rate of 0.15% of average daily net assets for the Fund, at least through April 30, 2015. The agreement may only be terminated prior to the end of this term by or with the consent of the Board of Directors of Baird Funds, Inc. |
| (5) | Includes 0.25% 12b-1 fee. |
| (6) | Not annualized. |
Page 3
Baird Ultra Short Bond Fund
June 30, 2014 (Unaudited)
Total Returns
| Six | Since | |
| For the Periods Ended June 30, 2014 | Months | Inception(1) |
| Institutional Class Shares | 1.14% | 1.14% |
| Investor Class Shares | 1.03% | 1.03% |
Barclays U.S. Short-Term Government/Corporate Index(2) | 0.12% | 0.12% |
| (1) | For the period from December 31, 2013 (commencement of operations) through June 30, 2014. |
| (2) | The Barclays U.S. Short-Term Government/Corporate Index is an unmanaged, market value weighted index of investment grade, fixed debt including government and corporate securities with maturities less than one year. This index does not reflect any deduction for fees, expenses or taxes. A direct investment in an index is not possible. |
The returns shown in the table above reflect reinvestment of dividends and/or capital gains distributions in additional shares. Returns do not reflect the deduction of taxes that a shareholder would pay on Fund distributions or the redemption of Fund shares. The returns reflect the actual performance for each period and do not include the impact of trades executed on the last business day of the period that were recorded on the first business day of the next period.
The Fund’s gross expense ratio for each Class, as reflected in the Fund’s current prospectus, is set forth under “Portfolio Characteristics”.
The Fund may invest up to 10% of its net assets in non-investment grade debt securities (commonly referred to as junk bonds). While these types of securities typically offer higher yields than investment grade securities, they also include greater risks including increased credit risk and the increased risk of default or bankruptcy. The Fund may also invest in U.S. dollar denominated foreign securities which involve additional risks such as currency rate fluctuations, political and economic instability, and different and sometimes less strict financial reporting standards and regulation. The Fund may also invest in mortgage- and asset-backed securities, which include interest rate and prepayment risks more pronounced than those of other fixed income securities.
Past performance does not guarantee future results. Investment returns and principal value will fluctuate so that an investor’s shares, when redeemed, may be worth more or less than their original cost.
For information about the performance of the Fund as of the most recent month-end, please call 1-866-44BAIRD or visit www.bairdfunds.com. Mutual fund performance changes over time and current performance may be lower or higher than that stated.
Page 4
Baird Ultra Short Bond Fund
Summary Schedule of Investments, June 30, 2014 (Unaudited)
This schedule summarizes the Fund’s holdings by asset type. Details are reported for each of the Fund’s 50 largest individual holdings and for investments that, in total for any issuer, represent more than 1% of the Fund’s net assets. The total value of smaller holdings is reported as a single amount within each category.
The Fund reports a complete list of its holdings in regulatory filings four times in each fiscal year, at the quarter end. For the second and fourth fiscal quarters, the complete listing of the Fund’s holdings is available electronically in the Fund’s Form N-CSR at http://www.rwbaird.com/baird-funds/prospectus-applications/prospectus-applications.aspx and on the Securities and Exchange Commission’s website (www.sec.gov) or you can have it mailed to you without charge by calling 1-866-44BAIRD. For the first and third fiscal quarters, the Fund files the lists with the SEC on Form N-Q. Shareholders can look up the Fund’s Forms N-CSR and N-Q on the SEC’s website (www.sec.gov).
Long-Term Investments
| Principal | % of | |||||||||||
| Amount | Value | Net Assets | ||||||||||
| U.S. Treasury Securities | ||||||||||||
| United States Treasury Note/Bond | ||||||||||||
| 0.500%, 06/30/2016 | $ | 250,000 | $ | 250,215 | 1.8 | % | ||||||
| Total U.S. Treasury Securities | ||||||||||||
| (Cost $249,991) | 250,215 | 1.8 | % | |||||||||
| Taxable Municipal Bonds | ||||||||||||
| Cook County School District No 144 Prairie Hills | ||||||||||||
| 1.500%, 12/01/2016 | 250,000 | 249,410 | 1.8 | % | ||||||||
| Louisiana Local Government Environmental | ||||||||||||
| Facilities & Community Development Auth. | ||||||||||||
| 1.520%, 02/01/2018 | 249,463 | 251,249 | 1.8 | % | ||||||||
| Madison County Community | ||||||||||||
| Unit School District No 12 Madison | ||||||||||||
| 1.950%, 01/01/2017 | 200,000 | 199,710 | 1.4 | % | ||||||||
| Other Taxable Municipal Bonds# | 330,598 | 2.3 | % | |||||||||
| Total Taxable Municipal Bonds | ||||||||||||
| (Cost $1,029,358) | 1,030,967 | 7.3 | % | |||||||||
| Other Government Related Securities | ||||||||||||
| CNPC General Capital Ltd | ||||||||||||
| 1.125%, 05/14/2017 (Acquired 05/07/2014, | ||||||||||||
Cost $250,000)* f | 250,000 | 250,700 | 1.7 | % | ||||||||
| EDF | ||||||||||||
| 0.688%, 01/20/2017 (Acquired 01/13/2014, | ||||||||||||
Cost $250,000) * f | 250,000 | 251,014 | 1.8 | % | ||||||||
| Petrobras Global Finance B.V. | ||||||||||||
2.592%, 03/17/2017 f | 250,000 | 252,975 | 1.8 | % | ||||||||
| The Export-Import Bank of Korea | ||||||||||||
0.977%, 01/14/2017 f | 250,000 | 251,692 | 1.8 | % | ||||||||
| Total Other Government Related Securities | ||||||||||||
| (Cost $1,000,000) | 1,006,381 | 7.1 | % | |||||||||
The accompanying notes are an integral part of these financial statements.
Page 5
Baird Ultra Short Bond Fund
Summary Schedule of Investments, June 30, 2014 (Unaudited)
Long-Term Investments (cont.)
| Principal | % of | |||||||||||
| Amount | Value | Net Assets | ||||||||||
| Corporate Bonds | ||||||||||||
| Industrials | ||||||||||||
| Amgen Inc. | ||||||||||||
| 0.608%, 05/22/2017 | $ | 250,000 | $ | 250,141 | 1.8 | % | ||||||
| Anglo American Capital PLC | ||||||||||||
| 1.176%, 04/15/2016 (Acquired 04/08/2014, | ||||||||||||
Cost $200,000)* f | 200,000 | 200,635 | 1.4 | % | ||||||||
| Bunge Limited Finance Corp. | ||||||||||||
| 5.100%, 07/15/2015 | 250,000 | 260,394 | 1.8 | % | ||||||||
| Fiserv, Inc.: | ||||||||||||
| 3.125%, 10/01/2015 | 75,000 | 77,155 | 0.5 | % | ||||||||
| 3.125%, 06/15/2016 | 175,000 | 181,795 | 1.3 | % | ||||||||
| Glencore Canada Corporation | ||||||||||||
5.375%, 06/01/2015 f | 200,000 | 208,034 | 1.5 | % | ||||||||
| Total Capital International | ||||||||||||
0.580%, 06/19/2019 f | 250,000 | 249,998 | 1.8 | % | ||||||||
| Verizon Communications, Inc. | ||||||||||||
| 1.981%, 09/14/2018 | 250,000 | 263,764 | 1.9 | % | ||||||||
| Volkswagen Group of America Finance, LLC | ||||||||||||
| 0.595%, 05/23/2017 (Acquired 05/15/2014, | ||||||||||||
| Cost $250,000)* | 250,000 | 250,282 | 1.8 | % | ||||||||
| Other Industrials#~ | 265,114 | 1.8 | % | |||||||||
| Total Industrials (Cost $2,204,169) | 2,207,312 | 15.6 | % | |||||||||
| Utility | ||||||||||||
| Enbridge Inc. | ||||||||||||
0.678%, 06/02/2017 f | 250,000 | 250,503 | 1.8 | % | ||||||||
| Midcontinent Express Pipeline LLC | ||||||||||||
| 5.450%, 09/15/2014 (Acquired 01/09/2014, | ||||||||||||
| Cost $201,710)* | 200,000 | 201,209 | 1.4 | % | ||||||||
| Spectra Energy Capital LLC | ||||||||||||
| 5.668%, 08/15/2014 | 250,000 | 251,665 | 1.8 | % | ||||||||
| Trans-Allegheny Interstate Line Company | ||||||||||||
| 4.000%, 01/15/2015 (Acquired 01/07/2014 | ||||||||||||
| through 06/16/2014, Cost $354,877)* | 350,000 | 355,747 | 2.5 | % | ||||||||
| Other Utility#~ | 246,641 | 1.7 | % | |||||||||
| Total Utility (Cost $1,304,809) | 1,305,765 | 9.2 | % | |||||||||
| Finance | ||||||||||||
| ABN AMRO Bank N.V. | ||||||||||||
| 1.028%, 10/28/2016 (Acquired 01/03/2014, | ||||||||||||
Cost $225,747)* f | 225,000 | 226,953 | 1.6 | % | ||||||||
| AmSouth Bank | ||||||||||||
| Series AI, 5.200%, 04/01/2015 | 150,000 | 154,739 | 1.1 | % | ||||||||
The accompanying notes are an integral part of these financial statements.
Page 6
Baird Ultra Short Bond Fund
Summary Schedule of Investments, June 30, 2014 (Unaudited)
Long-Term Investments (cont.)
| Principal | % of | |||||||||||
| Amount | Value | Net Assets | ||||||||||
| Banco Santander-Chile | ||||||||||||
| 1.126%, 04/11/2017 (Acquired 04/08/2014, | ||||||||||||
Cost $200,000)* f | $ | 200,000 | $ | 200,000 | 1.4 | % | ||||||
| BPCE | ||||||||||||
1.073%, 02/10/2017 f | 250,000 | 252,123 | 1.8 | % | ||||||||
| Commonwealth Bank of Australia | ||||||||||||
| 0.830%, 10/08/2015 (Acquired 01/03/2014, | ||||||||||||
Cost $199,800)* f | 200,000 | 199,928 | 1.4 | % | ||||||||
| Credit Agricole S.A. | ||||||||||||
| 1.078%, 10/03/2016 (Acquired 01/03/2014, | ||||||||||||
Cost $250,528)* f | 250,000 | 251,392 | 1.8 | % | ||||||||
| Deutsche Bank Aktiengesellschaft | ||||||||||||
0.834%, 02/13/2017 f | 150,000 | 150,698 | 1.1 | % | ||||||||
| Dresdner Bank AG | ||||||||||||
7.250%, 09/15/2015 f | 150,000 | 159,180 | 1.1 | % | ||||||||
| First Tennessee Bank, National Association | ||||||||||||
| 5.050%, 01/15/2015 | 250,000 | 255,559 | 1.8 | % | ||||||||
| General Electric Capital Corporation | ||||||||||||
| 0.737%, 01/14/2019 | 250,000 | 252,349 | 1.8 | % | ||||||||
| J.P. Morgan Chase & Co. | ||||||||||||
| Series 1, 0.858%, 01/28/2019 | 250,000 | 251,122 | 1.8 | % | ||||||||
| Kookmin Bank | ||||||||||||
| 1.103%, 01/27/2017 (Acquired 01/21/2014, | ||||||||||||
Cost $250,000)* f | 250,000 | 251,364 | 1.8 | % | ||||||||
| Macquarie Bank Limited | ||||||||||||
| 1.021%, 03/24/2017 (Acquired 03/18/2014, | ||||||||||||
Cost $200,000)* f | 200,000 | 200,643 | 1.4 | % | ||||||||
| Marsh & McLennan Companies, Inc. | ||||||||||||
| 5.375%, 07/15/2014 | 165,000 | 165,298 | 1.2 | % | ||||||||
| Mizuho Bank, Ltd. | ||||||||||||
| 0.659%, 04/16/2017 (Acquired 04/09/2014, | ||||||||||||
Cost $200,000)* f | 200,000 | 200,165 | 1.4 | % | ||||||||
| Morgan Stanley | ||||||||||||
| 1.079%, 01/24/2019 | 250,000 | 251,672 | 1.8 | % | ||||||||
| National Australia Bank Limited | ||||||||||||
| 0.730%, 10/08/2015 (Acquired 01/03/2014, | ||||||||||||
Cost $199,860)* f | 200,000 | 199,953 | 1.4 | % | ||||||||
| Nomura Holdings, Inc. | ||||||||||||
5.000%, 03/04/2015 f | 250,000 | 257,007 | 1.8 | % | ||||||||
| Rabobank Nederland | ||||||||||||
| 0.481%, 03/07/2016 (Acquired 01/03/2014, | ||||||||||||
Cost $249,625)* f | 250,000 | 250,524 | 1.8 | % | ||||||||
| SunTrust Bank | ||||||||||||
| 0.533%, 04/01/2015 | 150,000 | 149,967 | 1.0 | % | ||||||||
The accompanying notes are an integral part of these financial statements.
Page 7
Baird Ultra Short Bond Fund
Summary Schedule of Investments, June 30, 2014 (Unaudited)
Long-Term Investments (cont.)
| Principal | % of | |||||||||||
| Amount | Value | Net Assets | ||||||||||
| The Goldman Sachs Group, Inc. | ||||||||||||
| 1.324%, 11/15/2018 | $ | 250,000 | $ | 253,414 | 1.8 | % | ||||||
| Willis North America, Inc. | ||||||||||||
| 5.625%, 07/15/2015 | 237,000 | 248,334 | 1.7 | % | ||||||||
| Other Finance#~ | 153,637 | 1.1 | % | |||||||||
| Total Finance | ||||||||||||
| (Cost $4,921,424) | 4,936,021 | 34.9 | % | |||||||||
| Residential Mortgage-Backed Securities | ||||||||||||
| U.S. Government Agency Issues | ||||||||||||
| Fannie Mae Pool | ||||||||||||
| 5.500%, 11/01/2017 | 296,448 | 314,847 | 2.2 | % | ||||||||
| Federal Gold Loan Mortgage Corporation (FGLMC) | ||||||||||||
| 5.000%, 12/01/2017 | 174,468 | 185,197 | 1.3 | % | ||||||||
| Federal National Mortgage Association (FNMA): | ||||||||||||
| 5.000%, 10/01/2017 | 179,665 | 190,592 | 1.4 | % | ||||||||
| 5.000%, 11/01/2017 | 145,169 | 153,989 | 1.1 | % | ||||||||
| 5.000%, 12/01/2017 | 125,502 | 133,125 | 0.9 | % | ||||||||
| Total U.S. Government Agency Issues | ||||||||||||
| (Cost $650,932) | 977,750 | 6.9 | % | |||||||||
| Residential Mortgage-Backed Securities | ||||||||||||
| Non-U.S. Government Agency Issues | ||||||||||||
| Bank of America Alternative Loan Trust: | ||||||||||||
| 5.000%-5.500%, 06/25/2018-02/25/2019 | 183,771 | 189,671 | 1.3 | % | ||||||||
| Other Non-U.S. Government Agency Issues# | 393,199 | 2.8 | % | |||||||||
| Total Non-U.S. Government Agency Issues | ||||||||||||
| (Cost $577,606) | 582,870 | 4.1 | % | |||||||||
| Asset Backed Securities | ||||||||||||
| Accredited Mortgage Loan Trust | ||||||||||||
| Series 2005-3, Class A1, 0.390%, 09/25/2035 | 192,959 | 191,834 | 1.4 | % | ||||||||
| Capital Auto Receivables Asset Trust | ||||||||||||
| Series 2014-1, Class A1B, 0.503%, 05/20/2016 | 200,000 | 200,140 | 1.4 | % | ||||||||
| First Franklin Mortgage Loan Trust | ||||||||||||
| Series 2004-FF7, Class A1, 0.792%, 09/25/2034 | 225,333 | 224,807 | 1.6 | % | ||||||||
| JP Morgan Mortgage Acquisition Trust | ||||||||||||
| Series 2007-CH3, Class A3, 0.302%, 03/25/2037 | 236,238 | 232,129 | 1.6 | % | ||||||||
| Morgan Stanley Home Equity Loan Trust | ||||||||||||
| Series 2006-2, Class A3, 0.322%, 02/25/2036 | 164,381 | 162,390 | 1.1 | % | ||||||||
| Specialty Underwriting & Residential Finance Trust | ||||||||||||
| Series 2006-BC1, Class A2C, 0.352%, 12/25/2036 | 196,709 | 194,312 | 1.4 | % | ||||||||
| Other Asset Backed Securities# | 356,269 | 2.5 | % | |||||||||
| Total Asset Backed Securities | ||||||||||||
| (Cost $1,559,730) | 1,561,881 | 11.0 | % | |||||||||
The accompanying notes are an integral part of these financial statements.
Page 8
Baird Ultra Short Bond Fund
Summary Schedule of Investments, June 30, 2014 (Unaudited)
Long-Term Investments (cont.)
| Principal | % of | |||||||||||
| Amount | Value | Net Assets | ||||||||||
| Commercial Mortgage-Backed Securities | ||||||||||||
| Other Commercial Mortgage Backed Securities# | $ | 20,585 | 0.2 | % | ||||||||
| Total Commercial Mortgage Backed Securities | ||||||||||||
| (Cost $333,484) | 20,585 | 0.2 | % | |||||||||
| Total Long-Term Investments | ||||||||||||
| (Cost $13,831,503) | 13,879,747 | 98.1 | % | |||||||||
| Short-Term Investments | ||||||||||||
| Shares | ||||||||||||
| Money Market Mutual Fund | ||||||||||||
| Dreyfus Institutional Cash Advantage Fund, 0.06%« | 202,229 | 202,229 | 1.4 | % | ||||||||
| Total Short-Term Investment | ||||||||||||
| (Cost $202,229) | 202,229 | 1.4 | % | |||||||||
| Total Investments | ||||||||||||
| (Cost $14,033,732) | 14,081,976 | 99.5 | % | |||||||||
| Other Assets in Excess of Liabilities | 69,202 | 0.5 | % | |||||||||
| TOTAL NET ASSETS | $ | 14,151,178 | 100.0 | % | ||||||||
Notes to Summary Schedule of Investments
| * | Restricted Security Deemed Liquid |
| f | Foreign Security |
| « | 7-Day Yield |
| # | Represents the aggregate value, by category, securities that are not among the 50 largest holdings and, in total for any issuer, represent 1% or less of net assets. |
| ~ | Groupings contain, in aggregate, restricted securities totaling $269,895 representing 1.91% of net assets. |
Summary of Fair Value Exposure at June 30, 2014 (Unaudited)
The Fund has adopted authoritative fair valuation accounting standards which establish a definition of fair value and set out a hierarchy for measuring fair value. These standards require additional disclosures about the various inputs and valuation techniques used to develop the measurements of fair value and a discussion on changes in valuation techniques and related inputs during the period. These standards define fair value as the price that would be received to sell an asset or paid to transfer a liability in an orderly transaction between market participants at the measurement date.
The fair value hierarchy is organized into three levels based upon the assumptions (referred to as “inputs”) used in pricing the asset or liability. These standards state that “observable inputs” reflect the assumptions market participants would use in pricing the asset or liability based on market data obtained from independent sources and “unobservable inputs” reflect an entity’s own assumptions about the assumptions market participants would use in pricing the asset or liability. These inputs are summarized into three broad levels and described below:
Level 1 – | Unadjusted quoted prices in active markets for identical unrestricted securities. |
The accompanying notes are an integral part of these financial statements.
Page 9
Baird Ultra Short Bond Fund
Summary Schedule of Investments, June 30, 2014 (Unaudited)
Summary of Fair Value Exposure at June 30, 2014 (Unaudited) (cont.)
Level 2 – | Other significant observable inputs (including quoted prices for similar securities, quoted prices in inactive markets, dealer indications, interest rates, yield curves, prepayment speeds, credit risk, default rates, inputs corroborated by observable market data, etc.). |
Level 3 – | Significant unobservable inputs (including the Fund’s own assumptions about the factors that market participants would use in valuing the security) based on the best information available. |
The inputs or methodology used for valuing securities are not necessarily an indication of the risk associated with investing in those securities.
The following is a summary of the inputs used to value the Fund’s investments as of June 30, 2014:
| Level 1 | Level 2 | Level 3 | Total | |||||||||||||
| Fixed Income | ||||||||||||||||
| U.S. Treasury Securities | $ | — | $ | 250,215 | $ | — | $ | 250,215 | ||||||||
| Taxable Municipal Bonds | — | 1,030,967 | — | 1,030,967 | ||||||||||||
| Other Government Related Securities | — | 1,006,381 | — | 1,006,381 | ||||||||||||
| Corporate Bonds | — | 8,449,098 | — | 8,449,098 | ||||||||||||
| Residential Mortgage-Backed Securities – | ||||||||||||||||
| U.S. Government Agency Issues | — | 977,750 | — | 977,750 | ||||||||||||
| Residential Mortgage-Backed Securities – | ||||||||||||||||
| Non-U.S. Government Agency Issues | — | 582,870 | — | 582,870 | ||||||||||||
| Asset Backed Securities | — | 1,561,881 | — | 1,561,881 | ||||||||||||
| Commercial Mortgage-Backed Securities | — | 20,585 | — | 20,585 | ||||||||||||
| Total Fixed Income | — | 13,879,747 | — | 13,879,747 | ||||||||||||
| Short-Term Investment | ||||||||||||||||
| Money Market Mutual Fund | 202,229 | — | — | 202,229 | ||||||||||||
| Total Short-Term Investment | 202,229 | — | — | 202,229 | ||||||||||||
| Total Investments | $ | 202,229 | $ | 13,879,747 | $ | — | $ | 14,081,976 | ||||||||
Changes in valuation techniques may result in transfers into or out of assigned levels within the fair value hierarchy. There were no transfers between Level 1, Level 2 and Level 3 fair value measurements during the reporting period.
The accompanying notes are an integral part of these financial statements.
Page 10
Baird Short-Term Bond Fund
June 30, 2014 (Unaudited)
Portfolio Characteristics
| Quality Distribution(1)(2) | ||||
 | Net Assets | $2,190,675,149 | ||
| SEC 30-Day | ||||
Yield(3) | ||||
| Institutional Class | 1.29% | |||
| Investor Class | 1.04% | |||
| Average | ||||
| Effective | ||||
| Duration | 1.95 years | |||
| Average | ||||
| Effective | ||||
| Maturity | 1.97 years | |||
| Annualized | ||||
| Expense | ||||
| Ratio | ||||
| Sector Weightings(1) | Institutional Class | 0.30% | ||
| Investor Class | 0.55%(4) | |||
 | ||||
| Portfolio | ||||
| Turnover | ||||
| Rate | 26.5%(5) | |||
| Number of | ||||
| Holdings | 489 | |||
| (1) | Percentages shown are based on the Fund’s total investments (less investments purchased with cash proceeds from securities lending). |
| (2) | The quality profile is calculated on a market value-weighted basis using the highest credit quality rating for each security held by the Fund given by S&P, Moody’s or Fitch, each of which is a Nationally Recognized Statistical Rating Organization (NRSRO). NRSROs rate the credit quality of securities using a scale that generally ranges from AAA (highest) to D (lowest). |
| (3) | SEC yields are based on SEC guidelines and are calculated for the 30 days ended June 30, 2014. |
| (4) | Includes 0.25% 12b-1 fee. |
| (5) | Not annualized. |
Page 11
Baird Short-Term Bond Fund
June 30, 2014 (Unaudited)
Total Returns
| Average Annual | |||||
| Since | Since | ||||
| Six | One | Five | Inception | Inception | |
| For the Periods Ended June 30, 2014 | Months | Year | Years | (8/31/04) | (9/19/12) |
| Institutional Class Shares | 1.32% | 2.49% | 3.48% | 3.25% | N/A |
| Investor Class Shares | 1.20% | 2.25% | N/A | N/A | 1.68% |
| Barclays 1-3 Year U.S. Government/ | |||||
Credit Bond Index(1) | 0.56% | 1.14% | 1.73% | 2.89% | 0.80% |
| (1) | The Barclays 1-3 Year U.S. Government/Credit Bond Index is an unmanaged, market value weighted index of investment grade, fixed-rate debt issues, including government and corporate securities, with maturities between one and three years. This index does not reflect any deduction for fees, expenses or taxes. A direct investment in an index is not possible. |
The returns shown in the table above reflect reinvestment of dividends and/or capital gains distributions in additional shares. Returns do not reflect the deduction of taxes that a shareholder would pay on Fund distributions or the redemption of Fund shares. The returns reflect the actual performance for each period and do not include the impact of trades executed on the last business day of the period that were recorded on the first business day of the next period.
The Fund’s gross expense ratio for each Class, as reflected in the Fund’s current prospectus, is set forth under “Portfolio Characteristics”.
The Fund may invest in U.S. dollar denominated foreign securities which involve additional risks such as currency rate fluctuations, political and economic instability, and different and sometimes less strict financial reporting standards and regulation. The Fund may also invest in mortgage- and asset-backed securities, which include interest rate and prepayment risks more pronounced than those of other fixed income securities.
Past performance does not guarantee future results. Investment returns and principal value will fluctuate so that an investor’s shares, when redeemed, may be worth more or less than their original cost.
For information about the performance of the Fund as of the most recent month-end, please call 1-866-44BAIRD or visit www.bairdfunds.com. Mutual fund performance changes over time and current performance may be lower or higher than that stated.
Page 12
Baird Short-Term Bond Fund
Summary Schedule of Investments, June 30, 2014 (Unaudited)
This schedule summarizes the Fund’s holdings by asset type. Details are reported for each of the Fund’s 50 largest individual holdings and for investments that, in total for any issuer, represent more than 1% of the Fund’s net assets. The total value of smaller holdings is reported as a single amount within each category.
The Fund reports a complete list of its holdings in regulatory filings four times in each fiscal year, at the quarter end. For the second and fourth fiscal quarters, the complete listing of the Fund’s holdings is available electronically in the Fund’s Form N-CSR at http://www.rwbaird.com/baird-funds/prospectus-applications/prospectus-applications.aspx and on the Securities and Exchange Commission’s website (www.sec.gov) or you can have it mailed to you without charge by calling 1-866-44BAIRD. For the first and third fiscal quarters, the Fund files the lists with the SEC on Form N-Q. Shareholders can look up the Fund’s Forms N-CSR and N-Q on the SEC’s website (www.sec.gov).
Long-Term Investments
| Principal | % of | |||||||||||
| Amount | Value | Net Assets | ||||||||||
| U.S. Treasury Securities | ||||||||||||
| U.S. Treasury Bonds: | ||||||||||||
| 0.500%, 06/30/2016 | $ | 9,750,000 | $ | 9,758,375 | 0.4 | % | ||||||
| 2.375%, 07/31/2017@ | 17,850,000 | 18,633,722 | 0.9 | % | ||||||||
| 2.250%, 07/31/2018@ | 225,000,000 | 233,226,450 | 10.7 | % | ||||||||
| Total U.S. Treasury Securities | ||||||||||||
| (Cost $260,877,726) | 261,618,547 | 12.0 | % | |||||||||
| Taxable Municipal Bonds | ||||||||||||
| New Jersey Economic Development Authority | ||||||||||||
| 2.421%, 06/15/2018 | 10,000,000 | 10,083,100 | 0.5 | % | ||||||||
| Rhode Island Housing & Mortgage Finance Corp/RI | ||||||||||||
| 3.000%, 10/01/2034 (Callable 10/01/2022) | 12,500,000 | 12,666,125 | 0.6 | % | ||||||||
| Other Taxable Municipal Bonds# | 41,754,784 | 1.9 | % | |||||||||
| Total Taxable Municipal Bonds | ||||||||||||
| (Cost $64,139,765) | 64,504,009 | 3.0 | % | |||||||||
| Other Government Related Securities | ||||||||||||
| Electricite de France Societe anonyme | ||||||||||||
| 0.688%, 01/20/2017 (Acquired 01/13/2014, | ||||||||||||
Cost $9,750,000)* f | 9,750,000 | 9,789,527 | 0.4 | % | ||||||||
| Other Government Related Securities#~ | 64,810,415 | 3.0 | % | |||||||||
| Total Other Government Related Securities | ||||||||||||
| (Cost $74,002,011) | 74,599,942 | 3.4 | % | |||||||||
| Corporate Bonds | ||||||||||||
| Industrials | ||||||||||||
| AbbVie Inc. | ||||||||||||
| 1.750%, 11/06/2017 | 9,949,000 | 10,003,262 | 0.5 | % | ||||||||
| Dollar General Corporation | ||||||||||||
| 4.125%, 07/15/2017 | 17,221,000 | 18,433,789 | 0.8 | % | ||||||||
| Ford Motor Credit Company LLC | ||||||||||||
| 6.625%, 08/15/2017 | 9,000,000 | 10,360,026 | 0.5 | % | ||||||||
| Murphy Oil Corporation | ||||||||||||
| 2.500%, 12/01/2017 | 10,281,000 | 10,522,603 | 0.5 | % | ||||||||
The accompanying notes are an integral part of these financial statements.
Page 13
Baird Short-Term Bond Fund
Summary Schedule of Investments, June 30, 2014 (Unaudited)
Long-Term Investments (cont.)
| Principal | % of | |||||||||||
| Amount | Value | Net Assets | ||||||||||
| Pioneer Natural Resources Company | ||||||||||||
| 5.875%, 07/15/2016 | $ | 10,000,000 | $ | 10,942,750 | 0.5 | % | ||||||
| Plum Creek Timberlands, L.P. | ||||||||||||
| 5.875%, 11/15/2015 | 9,700,000 | 10,298,267 | 0.5 | % | ||||||||
| Seagate HDD Cayman | ||||||||||||
6.875%, 05/01/2020 f | 9,653,000 | 10,437,306 | 0.5 | % | ||||||||
| Telecom Italia Capital | ||||||||||||
5.250%, 10/01/2015 f | 10,960,000 | 11,453,200 | 0.5 | % | ||||||||
| The Valspar Corporation | ||||||||||||
| 5.100%, 08/01/2015 | 10,450,000 | 10,843,066 | 0.5 | % | ||||||||
| Warner Chilcott Co LLC / | ||||||||||||
| Warner Chilcott Finance LLC | ||||||||||||
7.750%, 09/15/2018 f | 10,585,000 | 11,127,905 | 0.5 | % | ||||||||
| Other Industrials#~ | 482,651,573 | 22.0 | % | |||||||||
| Total Industrials | ||||||||||||
| (Cost $591,024,080) | 597,073,747 | 27.3 | % | |||||||||
| Utility | ||||||||||||
| Boardwalk Pipelines, LP | ||||||||||||
| 5.500%, 02/01/2017 | 13,384,000 | 14,579,138 | 0.6 | % | ||||||||
| National Grid PLC | ||||||||||||
6.300%, 08/01/2016 f | 9,431,000 | 10,444,248 | 0.5 | % | ||||||||
| Other Utility#~ | 142,308,098 | 6.5 | % | |||||||||
| Total Utility | ||||||||||||
| (Cost $165,533,271) | 167,331,484 | 7.6 | % | |||||||||
| Finance | ||||||||||||
| ABN AMRO Bank N.V. | ||||||||||||
| 1.028%, 10/28/2016 (Acquired 10/23/2013 | ||||||||||||
through 05/19/2014, Cost $11,060,905)* f | 11,050,000 | 11,145,914 | 0.5 | % | ||||||||
| BPCE | ||||||||||||
1.073%, 02/10/2017 f | 9,650,000 | 9,731,957 | 0.4 | % | ||||||||
| Credit Agricole S.A. | ||||||||||||
| 1.082%, 10/03/2016 (Acquired 09/26/2013, | ||||||||||||
Cost $10,000,000)* f | 10,000,000 | 10,055,670 | 0.4 | % | ||||||||
| Dresdner Bank AG | ||||||||||||
7.250%, 09/15/2015 f | 10,522,000 | 11,165,915 | 0.5 | % | ||||||||
| General Electric Capital Corporation: | ||||||||||||
| 0.877%, 07/12/2016 | 10,000,000 | 10,090,770 | 0.5 | % | ||||||||
| 5.625%, 09/15/2017 | 9,080,000 | 10,278,796 | 0.5 | % | ||||||||
| 0.737%-5.625%, 05/09/2016-01/14/2019 | 6,325,000 | 6,587,500 | 0.3 | % | ||||||||
| LeasePlan Corporation N.V. | ||||||||||||
| 2.500%, 05/16/2018 (Acquired 05/07/2013 | ||||||||||||
through 02/20/2014, Cost $11,668,719)* f | 11,785,000 | 11,882,533 | 0.5 | % | ||||||||
The accompanying notes are an integral part of these financial statements.
Page 14
Baird Short-Term Bond Fund
Summary Schedule of Investments, June 30, 2014 (Unaudited)
Long-Term Investments (cont.)
| Principal | % of | |||||||||||
| Amount | Value | Net Assets | ||||||||||
| Macquarie Bank Limited | ||||||||||||
| 2.000%, 08/15/2016 (Acquired 08/07/2013 | ||||||||||||
through 09/27/2013, Cost $10,020,038)* f | $ | 10,000,000 | $ | 10,181,620 | 0.5 | % | ||||||
| Manulife Financial Corporation | ||||||||||||
3.400%, 09/17/2015 f | 9,761,000 | 10,086,568 | 0.5 | % | ||||||||
| Nomura Holdings, Inc. | ||||||||||||
2.000%, 09/13/2016 f | 10,105,000 | 10,269,914 | 0.5 | % | ||||||||
| Other Finance#~ | 483,943,773 | 22.1 | % | |||||||||
| Total Finance | ||||||||||||
| (Cost $588,504,498) | 595,420,930 | 27.2 | % | |||||||||
| Residential Mortgage-Backed Securities | ||||||||||||
| U.S. Government Agency Issues | ||||||||||||
| Other U.S. Government Agency Issues# | 886,828 | 0.0 | % | |||||||||
| Total U.S. Government Agency Issues | ||||||||||||
| (Cost $838,269) | 886,828 | 0.0 | % | |||||||||
| Residential Mortgage-Backed Securities | ||||||||||||
| Non-U.S. Government Agency Issues | ||||||||||||
| MASTR Alternative Loan Trust: | ||||||||||||
| Series 2003-5, Class 7A1, 5.000%, 07/25/2018 | 10,147,529 | 10,537,702 | 0.5 | % | ||||||||
| 4.750%-5.500%, 11/25/2018-07/25/2033 | 13,673,629 | 14,338,435 | 0.6 | % | ||||||||
| Structured Asset Securities Corp. | ||||||||||||
| Mortgage Pass-Through Certificates | ||||||||||||
| Series 2004-22, Class A2, 5.175%, 01/25/2035 | 13,066,038 | 13,566,049 | 0.6 | % | ||||||||
| Washington Mutual Mortgage Pass Through Certificates | ||||||||||||
| Series 2004-AR3, Class A1, 2.377%, 06/25/2034 | 12,100,270 | 12,328,252 | 0.6 | % | ||||||||
| Other Non-U.S. Government Agency Issues# | 24,516,448 | 1.1 | % | |||||||||
| Total Non-U.S. Government Agency Issues | ||||||||||||
| (Cost $75,137,989) | 75,286,886 | 3.4 | % | |||||||||
| Asset Backed Securities | ||||||||||||
| Accredited Mortgage Loan Trust | ||||||||||||
| Series 2006-2, Class A3, 0.302%, 09/25/2036 | 10,342,164 | 10,025,714 | 0.5 | % | ||||||||
| Argent Securities Inc Asset-Backed | ||||||||||||
| Pass-Through Certificates | ||||||||||||
| Series 2005-W3, Class A2D, 0.492%, 11/25/2035 | 12,870,162 | 12,156,023 | 0.5 | % | ||||||||
| First Franklin Mortgage Loan Trust | ||||||||||||
| Series 2004-FF7, Class A1, 0.792%, 09/25/2034 | 9,897,122 | 9,874,022 | 0.4 | % | ||||||||
| Ford Credit Auto Owner Trust | ||||||||||||
| Series A, 2.260%, 11/15/2025 (Acquired 05/06/2014, | ||||||||||||
| Cost $9,997,505)* | 10,000,000 | 10,089,660 | 0.5 | % | ||||||||
| GSAA Trust | ||||||||||||
| Series 2005-8, Class A4, 0.422%, 06/25/2035 | 13,067,907 | 12,329,349 | 0.6 | % | ||||||||
| J.P. Morgan Mortgage Acquisition Trust | ||||||||||||
| Series 2006-CH1, Class A1, 0.280%, 07/25/2036 | 11,210,786 | 10,773,150 | 0.5 | % | ||||||||
The accompanying notes are an integral part of these financial statements.
Page 15
Baird Short-Term Bond Fund
Summary Schedule of Investments, June 30, 2014 (Unaudited)
Long-Term Investments (cont.)
| Principal | % of | |||||||||||
| Amount | Value | Net Assets | ||||||||||
| Nationstar Home Equity Loan Trust | ||||||||||||
| Series 2006-B, Class AV3, 0.320%, 09/25/2036 | $ | 10,413,559 | $ | 10,377,955 | 0.5 | % | ||||||
| RASC Series Trust | ||||||||||||
| Series 2005-AHL2, Class A3, 0.502%, 10/25/2035 | 12,150,000 | 11,680,621 | 0.5 | % | ||||||||
| Securitized Asset Backed Receivables LLC Trust | ||||||||||||
| Series 2005-OP2, Class A1, 0.477%, 10/25/2035 | ||||||||||||
| (Acquired 03/13/2014, Cost $16,134,734)* | 16,333,802 | 16,102,434 | 0.7 | % | ||||||||
| Springleaf Funding Trust | ||||||||||||
| Series 2013-AA, Class A, 2.580%, 09/15/2021 | ||||||||||||
| (Acquired 01/09/2014 through 06/05/2014, | ||||||||||||
| Cost $13,253,852)* | 13,200,000 | 13,296,730 | 0.6 | % | ||||||||
| Other Asset Backed Securities#~ | 68,108,587 | 3.1 | % | |||||||||
| Total Asset Backed Securities | ||||||||||||
| (Cost $184,986,212) | 184,814,245 | 8.4 | % | |||||||||
| Commercial Mortgage-Backed Securities | ||||||||||||
| Bear Stearns Commercial Mortgage Securities Trust | ||||||||||||
| Series 2005-PWR9, Class A4A, 4.871%, 09/11/2042 | 15,739,236 | 16,297,900 | 0.7 | % | ||||||||
| CD Commercial Mortgage Trust | ||||||||||||
| Series 2005-CD1, Class A4, 5.401%, 07/15/2044 | 19,390,988 | 20,162,517 | 0.9 | % | ||||||||
| COMM Mortgage Trust | ||||||||||||
| Series 2005-C6, Class A5A, 5.116%, 06/10/2044 | 15,968,173 | 16,510,340 | 0.7 | % | ||||||||
| Credit Suisse First Boston Mortgage Securities Corp. | ||||||||||||
| Series 2005-C5, Class A4, 5.100%, 08/15/2038 | 19,822,454 | 20,400,933 | 0.9 | % | ||||||||
| FHLMC Multifamily Structured | ||||||||||||
| Pass Through Certificates | ||||||||||||
| Series K-701, Class A2, 3.882%, 11/25/2017 | 10,015,000 | 10,805,223 | 0.5 | % | ||||||||
| J.P. Morgan Chase Commercial | ||||||||||||
| Mortgage Securities Trust | ||||||||||||
| Series 2005-CB12, Class A4, 4.895%, 09/12/2037 | 19,435,000 | 20,003,376 | 0.9 | % | ||||||||
| Morgan Stanley Capital I Trust | ||||||||||||
| Series 2005-HQ7, Class A4, 5.376%, 11/14/2042 | 13,524,689 | 14,025,806 | 0.6 | % | ||||||||
| Wachovia Bank Commercial Mortgage Trust | ||||||||||||
| Series 2005-C22, Class A4, 5.455%, 12/15/2044 | 9,912,000 | 10,394,437 | 0.5 | % | ||||||||
| Other Commercial Mortgage Backed Securities# | 11,202,239 | 0.5 | % | |||||||||
| Total Commercial Mortgage Backed Securities | ||||||||||||
| (Cost $143,460,416) | 139,802,771 | 6.4 | % | |||||||||
| Total Long-Term Investments | ||||||||||||
| (Cost $2,148,504,237) | 2,161,339,389 | 98.7 | % | |||||||||
The accompanying notes are an integral part of these financial statements.
Page 16
Baird Short-Term Bond Fund
Summary Schedule of Investments, June 30, 2014 (Unaudited)
Short-Term Investments
| % of | ||||||||||||
| Shares | Value | Net Assets | ||||||||||
| Money Market Mutual Fund | ||||||||||||
| Short-Term Investments Trust – | ||||||||||||
| Liquid Assets Portfolio, 0.06%« | 20,999,321 | $ | 20,999,321 | 1.0 | % | |||||||
| Total Short-Term Investment | ||||||||||||
| (Cost $20,999,321) | 20,999,321 | 1.0 | % | |||||||||
| Investments Purchased with Cash | ||||||||||||
| Proceeds from Securities Lending | ||||||||||||
| Investment Companies | ||||||||||||
| Mount Vernon Securities Lending | ||||||||||||
| Trust Prime Portfolio, 0.20%« | 132,338,001 | 132,338,001 | 6.0 | % | ||||||||
| Total Investment Companies | ||||||||||||
| (Cost $132,338,001) | 132,338,001 | 6.0 | % | |||||||||
| Total Investments Purchased With | ||||||||||||
| Cash Proceeds From Securities Lending | ||||||||||||
| (Cost $132,338,001) | 132,338,001 | 6.0 | % | |||||||||
| Total Investments | ||||||||||||
| (Cost $2,301,841,559) | 2,314,676,711 | 105.7 | % | |||||||||
| Liabilities in Excess of Other Assets | (124,001,562 | ) | (5.7 | )% | ||||||||
| TOTAL NET ASSETS | $ | 2,190,675,149 | 100.0 | % | ||||||||
Notes to Summary Schedule of Investments
| * | Restricted Security Deemed Liquid |
| @ | This security or portion of this security is out on loan at June 30, 2014. |
| f | Foreign Security |
| « | 7-Day Yield |
| # | Represents the aggregate value, by category, securities that are not among the 50 largest holdings and, in total for any issuer, represent 1% or less of net assets. |
| ~ | Groupings contain, in aggregate, restricted securities totaling $286,678,126 representing 13.09% of net assets. |
Summary of Fair Value Exposure at June 30, 2014 (Unaudited)
The Fund has adopted authoritative fair valuation accounting standards which establish a definition of fair value and set out a hierarchy for measuring fair value. These standards require additional disclosures about the various inputs and valuation techniques used to develop the measurements of fair value and a discussion on changes in valuation techniques and related inputs during the period. These standards define fair value as the price that would be received to sell an asset or paid to transfer a liability in an orderly transaction between market participants at the measurement date.
The fair value hierarchy is organized into three levels based upon the assumptions (referred to as “inputs”) used in pricing the asset or liability. These standards state that “observable inputs” reflect the assumptions market participants would use in pricing the asset or liability based on market data obtained from independent sources and “unobservable inputs” reflect an entity’s own assumptions about the assumptions market participants would use in pricing the asset or liability. These inputs are summarized into three broad levels and described below:
The accompanying notes are an integral part of these financial statements.
Page 17
Baird Short-Term Bond Fund
Summary Schedule of Investments, June 30, 2014 (Unaudited)
Summary of Fair Value Exposure at June 30, 2014 (Unaudited) (cont.)
Level 1 – | Unadjusted quoted prices in active markets for identical unrestricted securities. |
Level 2 – | Other significant observable inputs (including quoted prices for similar securities, quoted prices in inactive markets, dealer indications, interest rates, yield curves, prepayment speeds, credit risk, default rates, inputs corroborated by observable market data, etc.). |
Level 3 – | Significant unobservable inputs (including the Fund’s own assumptions about the factors that market participants would use in valuing the security) based on the best information available. |
The inputs or methodology used for valuing securities are not necessarily an indication of the risk associated with investing in those securities.
The following is a summary of the inputs used to value the Fund’s investments as of June 30, 2014:
| Level 1 | Level 2 | Level 3 | Total | |||||||||||||
| Fixed Income | ||||||||||||||||
| U.S. Treasury Securities | $ | — | $ | 261,618,547 | $ | — | $ | 261,618,547 | ||||||||
| Taxable Municipal Bonds | — | 64,504,009 | — | 64,504,009 | ||||||||||||
| Other Government Related Securities | — | 74,599,942 | — | 74,599,942 | ||||||||||||
| Corporate Bonds | — | 1,359,826,161 | — | 1,359,826,161 | ||||||||||||
| Residential Mortgage-Backed Securities – | ||||||||||||||||
| U.S. Government Agency Issues | — | 886,828 | — | 886,828 | ||||||||||||
| Residential Mortgage-Backed Securities – | ||||||||||||||||
| Non-U.S. Government Agency Issues | — | 75,286,886 | — | 75,286,886 | ||||||||||||
| Asset Backed Securities | — | 184,814,245 | — | 184,814,245 | ||||||||||||
| Commercial Mortgage-Backed Securities | — | 139,802,771 | — | 139,802,771 | ||||||||||||
| Total Fixed Income | — | 2,161,339,389 | — | 2,161,339,389 | ||||||||||||
| Short-Term Investments | ||||||||||||||||
| Money Market Mutual Fund | 20,999,321 | — | — | 20,999,321 | ||||||||||||
| Total Short-Term Investments | 20,999,321 | — | — | 20,999,321 | ||||||||||||
| Investments Purchased with Cash | ||||||||||||||||
| Proceeds from Securities Lending | ||||||||||||||||
| Investment Companies | 132,338,001 | — | — | 132,338,001 | ||||||||||||
| Total Investments Purchased with | ||||||||||||||||
| Cash Proceeds from Securities Lending | 132,338,001 | — | — | 132,338,001 | ||||||||||||
| Total Investments | $ | 153,337,322 | $ | 2,161,339,389 | $ | — | $ | 2,314,676,711 | ||||||||
Changes in valuation techniques may result in transfers into or out of assigned levels within the fair value hierarchy. There were no transfers between Level 1, Level 2 and Level 3 fair value measurements during the reporting period, as compared to their classification from the prior year’s annual report.
The accompanying notes are an integral part of these financial statements.
Page 18
Baird Intermediate Bond Fund
June 30, 2014 (Unaudited)
Portfolio Characteristics
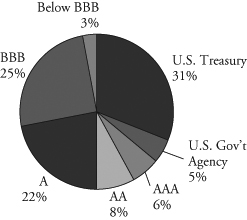
| Quality Distribution(1)(2) | ||||
 | Net Assets | $1,265,895,885 | ||
| SEC 30-Day | ||||
Yield(3) | ||||
| Institutional Class | 1.92% | |||
| Investor Class | 1.67% | |||
| Average | ||||
| Effective | ||||
| Duration | 3.89 years | |||
| Average | ||||
| Effective | ||||
| Maturity | 4.39 years | |||
| Annualized | ||||
| Sector Weightings(1) | Expense | |||
| Ratio | ||||
 | Institutional Class | 0.30% | ||
| Investor Class | 0.55%(4) | |||
| Portfolio | ||||
| Turnover | ||||
| Rate | 14.0%(5) | |||
| Number of | ||||
| Holdings | 403 | |||
| (1) | Percentages shown are based on the Fund’s total investments (less investments purchased with cash proceeds from securities lending). |
| (2) | The quality profile is calculated on a market value-weighted basis using the highest credit quality rating for each security held by the Fund given by S&P, Moody’s or Fitch, each of which is a Nationally Recognized Statistical Rating Organization (NRSRO). NRSROs rate the credit quality of securities using a scale that generally ranges from AAA (highest) to D (lowest). |
| (3) | SEC yields are based on SEC guidelines and are calculated for the 30 days ended June 30, 2014. |
| (4) | Includes 0.25% 12b-1 fee. |
| (5) | Not annualized. |
Page 19
Baird Intermediate Bond Fund
June 30, 2014 (Unaudited)
Total Returns
| Average Annual | |||||
| Six | One | Five | Ten | Since | |
| For the Periods Ended June 30, 2014 | Months | Year | Years | Years | Inception(1) |
| Institutional Class Shares | 2.76% | 3.95% | 5.77% | 4.96% | 5.60% |
| Investor Class Shares | 2.71% | 3.72% | 5.53% | 4.69% | 5.33% |
| Barclays Intermediate U.S. Government/ | |||||
Credit Bond Index(2) | 2.25% | 2.86% | 4.09% | 4.33% | 5.08% |
| (1) | For the period from September 29, 2000 (commencement of operations) through June 30, 2014. |
| (2) | The Barclays Intermediate U.S. Government/Credit Bond Index is an unmanaged, market value weighted index of investment grade, fixed-rate debt issues, including government and corporate securities, with maturities between one and ten years. This index does not reflect any deduction for fees, expenses or taxes. A direct investment in an index is not possible. |
The returns shown in the table above reflect reinvestment of dividends and/or capital gains distributions in additional shares. The returns do not reflect the deduction of taxes that a shareholder would pay on Fund distributions or the redemption of Fund shares. The returns reflect the actual performance for each period and do not include the impact of trades executed on the last business day of the period that were recorded on the first business day of the next period.
The Fund’s gross expense ratio for each Class, as reflected in the Fund’s current prospectus, is set forth under “Portfolio Characteristics”.
The Fund may invest in U.S. dollar denominated foreign securities which involve additional risks such as currency rate fluctuations, political and economic instability, and different and sometimes less strict financial reporting standards and regulation. The Fund may also invest in mortgage- and asset-backed securities, which include interest rate and prepayment risks more pronounced than those of other fixed income securities.
Past performance does not guarantee future results. Investment return and principal value will fluctuate so that an investor’s shares, when redeemed, may be worth more or less than their original cost.
For information about the performance of the Fund as of the most recent month-end, please call 1-866-44BAIRD or visit www.bairdfunds.com. Mutual fund performance changes over time and current performance may be lower or higher than that stated.
Page 20
Baird Intermediate Bond Fund
Summary Schedule of Investments, June 30, 2014 (Unaudited)
This schedule summarizes the Fund’s holdings by asset type. Details are reported for each of the Fund’s 50 largest individual holdings and for investments that, that, in total for any issuer, represent more than 1% of the Fund’s net assets. The total value of smaller holdings is reported as a single amount within each category.
The Fund reports a complete list of its holdings in regulatory filings four times in each fiscal year, at the quarter end. For the second and fourth fiscal quarters, the complete listing of the Fund’s holdings is available electronically in the Fund’s Form N-CSR at http://www.rwbaird.com/baird-funds/prospectus-applications/prospectus-applications.aspx and on the Securities and Exchange Commission’s website (www.sec.gov) or you can have it mailed to you without charge by calling 1-866-44BAIRD. For the first and third fiscal quarters, the fund files the lists with the SEC on Form N-Q. Shareholders can look up the fund’s Forms N-CSR and N-Q on the SEC’s website (www.sec.gov).
Long-Term Investments
| Principal | % of | |||||||||||
| Amount | Value | Net Assets | ||||||||||
| U.S. Treasury Securities | ||||||||||||
| U.S. Treasury Bonds: | ||||||||||||
| 9.125%, 05/15/2018@ | $ | 12,950,000 | $ | 16,842,084 | 1.3 | % | ||||||
| 1.250%, 04/30/2019@ | 275,625,000 | 271,490,625 | 21.5 | % | ||||||||
| 2.625%, 08/15/2020 | 12,000,000 | 12,491,256 | 1.0 | % | ||||||||
| 7.875%, 02/15/2021@ | 67,000,000 | 91,601,596 | 7.2 | % | ||||||||
| Total U.S. Treasury Securities | ||||||||||||
| (Cost $389,665,644) | 392,425,561 | 31.0 | % | |||||||||
| U.S. Government Agency Issues | ||||||||||||
| Federal Home Loan Mortgage Corporation (FHLMC) | ||||||||||||
| 1.375%, 05/01/2020@ | 10,000,000 | 9,727,060 | 0.8 | % | ||||||||
| Other U.S. Government Agency Issue# | 299,410 | 0.0 | % | |||||||||
| Total U.S. Government Agency Issue | ||||||||||||
| (Cost $9,736,766) | 10,026,470 | 0.8 | % | |||||||||
| Taxable Municipal Bonds | ||||||||||||
| New Jersey Economic Development Authority | ||||||||||||
| 1.802%, 06/15/2017 | 5,000,000 | 5,037,050 | 0.4 | % | ||||||||
| Other Taxable Municipal Bonds# | 26,464,064 | 2.1 | % | |||||||||
| Total Taxable Municipal Bonds | ||||||||||||
| (Cost $30,376,589) | 31,501,114 | 2.5 | % | |||||||||
| Other Government Related Securities | ||||||||||||
| CNOOC Nexen Finance (2014) ULC | ||||||||||||
4.250%, 04/30/2024 f | 5,150,000 | 5,280,470 | 0.4 | % | ||||||||
| Petrobras International Finance Company | ||||||||||||
3.875%, 01/27/2016 f | 4,175,000 | 4,304,634 | 0.4 | % | ||||||||
| Other Government Related Securities#~ | 19,105,358 | 1.5 | % | |||||||||
| Total Other Government Related Securities | ||||||||||||
| (Cost $27,032,647) | 28,690,462 | 2.3 | % | |||||||||
| Corporate Bonds | ||||||||||||
| Industrials | ||||||||||||
| Computer Sciences Corporation | ||||||||||||
| 2.500%, 09/15/2015 | 4,500,000 | 4,580,460 | 0.4 | % | ||||||||
The accompanying notes are an integral part of these financial statements.
Page 21
Baird Intermediate Bond Fund
Summary Schedule of Investments, June 30, 2014 (Unaudited)
Long-Term Investments (cont.)
| Principal | % of | |||||||||||
| Amount | Value | Net Assets | ||||||||||
| CVS Caremark Corporation | ||||||||||||
| 4.000%, 12/05/2023 | $ | 4,425,000 | $ | 4,630,612 | 0.4 | % | ||||||
| Fidelity National Information Services, Inc. | ||||||||||||
| 7.875%, 07/15/2020 | 4,800,000 | 5,083,488 | 0.4 | % | ||||||||
| Glencore Funding LLC | ||||||||||||
| 2.500%, 01/15/2019 (Acquired 05/22/2013 | ||||||||||||
| through 10/29/2013, Cost $4,301,850)* | 4,400,000 | 4,388,802 | 0.3 | % | ||||||||
| Hutchison Whampoa International (09) Limited | ||||||||||||
| 7.625%, 04/09/2019 (Acquired 10/16/2009 | ||||||||||||
through 04/16/2014, Cost $6,215,960)* f | 5,400,000 | 6,593,843 | 0.5 | % | ||||||||
| Hyundai Capital Services, Inc. | ||||||||||||
| 6.000%, 05/05/2015 (Acquired 03/27/2013 | ||||||||||||
through 05/30/2013, Cost $5,760,366)* f | 5,549,000 | 5,785,177 | 0.4 | % | ||||||||
| Murphy Oil Corporation | ||||||||||||
| 3.700%, 12/01/2022 | 5,000,000 | 4,976,270 | 0.4 | % | ||||||||
| Telecom Italia Capital | ||||||||||||
5.250%, 10/01/2015 f | 4,425,000 | 4,624,125 | 0.4 | % | ||||||||
| Waste Management, Inc. | ||||||||||||
| 7.375%, 03/11/2019 | 5,000,000 | 6,109,795 | 0.5 | % | ||||||||
| Other Industrials#~ | 206,151,960 | 16.3 | % | |||||||||
| Total Industrials | ||||||||||||
| (Cost $244,486,739) | 252,924,532 | 20.0 | % | |||||||||
| Utility | ||||||||||||
| National Grid PLC | ||||||||||||
6.300%, 08/01/2016 f | 3,925,000 | 4,346,694 | 0.3 | % | ||||||||
| Other Utility#~ | 52,851,873 | 4.2 | % | |||||||||
| Total Utility | ||||||||||||
| (Cost $54,734,588) | 57,198,567 | 4.5 | % | |||||||||
| Finance | ||||||||||||
| ABN AMRO Bank N.V. | ||||||||||||
| 4.250%, 02/02/2017 (Acquired 11/22/2013, | ||||||||||||
Cost $4,797,617)* f | 4,500,000 | 4,828,365 | 0.4 | % | ||||||||
| BPCE | ||||||||||||
4.000%, 04/15/2024 f | 7,000,000 | 7,145,950 | 0.6 | % | ||||||||
| Comerica Bank | ||||||||||||
| 5.200%, 08/22/2017 | 4,095,000 | 4,542,547 | 0.4 | % | ||||||||
| Commonwealth Bank of Australia | ||||||||||||
| 5.000%, 10/15/2019 (Acquired 03/02/2012, | ||||||||||||
Cost $4,243,961)* f | 4,000,000 | 4,519,720 | 0.3 | % | ||||||||
| Deutsche Bank Aktiengesellschaft | ||||||||||||
3.250%, 01/11/2016 f | 4,250,000 | 4,409,851 | 0.3 | % | ||||||||
| First Tennessee Bank National Association | ||||||||||||
| 5.650%, 04/01/2016 | 4,263,000 | 4,532,392 | 0.4 | % | ||||||||
The accompanying notes are an integral part of these financial statements.
Page 22
Baird Intermediate Bond Fund
Summary Schedule of Investments, June 30, 2014 (Unaudited)
Long-Term Investments (cont.)
| Principal | % of | |||||||||||
| Amount | Value | Net Assets | ||||||||||
| Macquarie Bank Limited | ||||||||||||
| 2.000%, 08/15/2016 (Acquired 08/07/2013, | ||||||||||||
Cost $4,998,250)* f | $ | 5,000,000 | $ | 5,090,810 | 0.4 | % | ||||||
| The Goldman Sachs Group, Inc. | ||||||||||||
| 6.150%, 04/01/2018 | 3,900,000 | 4,472,598 | 0.3 | % | ||||||||
| The Huntington National Bank | ||||||||||||
| 1.300%, 11/20/2016 | 4,850,000 | 4,871,098 | 0.4 | % | ||||||||
| WEA Finance LLC / WT Finance Aust Pty Ltd | ||||||||||||
| 6.750%, 09/02/2019 (Acquired 11/21/2013, | ||||||||||||
| Cost $4,741,244)* | 4,000,000 | 4,985,368 | 0.4 | % | ||||||||
| Other Finance#~ | 232,944,742 | 18.4 | % | |||||||||
| Total Finance | ||||||||||||
| (Cost $270,965,359) | 282,343,441 | 22.3 | % | |||||||||
| Residential Mortgage-Backed Securities | ||||||||||||
| U.S. Government Agency Issues | ||||||||||||
| Other U.S. Government Agency Issues# | 1,155,990 | 0.1 | % | |||||||||
| Total U.S. Government Agency Issues | ||||||||||||
| (Cost $1,087,833) | 1,155,990 | 0.1 | % | |||||||||
| Residential Mortgage-Backed Securities | ||||||||||||
| Non-U.S. Government Agency Issues | ||||||||||||
| Banc of America Funding Trust | ||||||||||||
| Series 2004-2, Class 1CB1, 5.750%, 09/20/2034 | 5,339,457 | 5,759,758 | 0.5 | % | ||||||||
| Structured Asset Securities Corp. Mortgage | ||||||||||||
| Pass-Through Certificates | ||||||||||||
| Series 2004-22, Class A2, 5.175%, 01/25/2035 | 8,710,692 | 9,044,033 | 0.7 | % | ||||||||
| Washington Mutual Mortgage | ||||||||||||
| Pass Through Certificates: | ||||||||||||
| Series 2004-AR3, Class A1, 2.377%, 06/25/2034 | 7,098,825 | 7,232,574 | 0.6 | % | ||||||||
| Series 2004-CB2, Class 3A, 6.000%, 08/25/2034 | 5,338,086 | 5,713,941 | 0.4 | % | ||||||||
| 5.000%-6.000%, 06/25/2019-12/25/2019 | 2,551,104 | 2,655,547 | 0.2 | % | ||||||||
| Other Non-U.S. Government Agency Issues#~ | 14,447,710 | 1.1 | % | |||||||||
| Total Non-U.S. Government Agency Issues | ||||||||||||
| (Cost $44,715,956) | 44,853,563 | 3.5 | % | |||||||||
| Asset Backed Securities | ||||||||||||
| First Franklin Mortgage Loan Trust | ||||||||||||
| Series 2004-FF7, Class A1, 0.792%, 09/25/2034 | 6,160,958 | 6,146,579 | 0.5 | % | ||||||||
| J.P. Morgan Mortgage Acquisition Trust | ||||||||||||
| Series 2006-CH1, Class A1, 0.280%, 07/25/2036 | 5,381,177 | 5,171,112 | 0.4 | % | ||||||||
| Securitized Asset Backed Receivables LLC Trust | ||||||||||||
| Series 2005-OP2, Class A1, 0.477%, 10/25/2035 | ||||||||||||
| (Acquired 03/13/2014, Cost $8,936,160)* | 9,046,413 | 8,918,271 | 0.7 | % | ||||||||
| Soundview Home Loan Trust | ||||||||||||
| Series 2003-2, Class A2, 1.452%, 11/25/2033 | 4,321,857 | 4,282,662 | 0.4 | % | ||||||||
The accompanying notes are an integral part of these financial statements.
Page 23
Baird Intermediate Bond Fund
Summary Schedule of Investments, June 30, 2014 (Unaudited)
Long-Term Investments (cont.)
| Principal | % of | |||||||||||
| Amount | Value | Net Assets | ||||||||||
| Specialty Underwriting & Residential Finance Trust | ||||||||||||
| Series 2006-BC1, Class A2D, 0.452%, 12/25/2036 | $ | 5,607,100 | $ | 5,318,312 | 0.4 | % | ||||||
| Springleaf Funding Trust | ||||||||||||
| Series 2013-AA, Class A, 2.580%, 09/15/2021 | ||||||||||||
| (Acquired 02/14/2014, Cost $5,024,363)* | 5,000,000 | 5,036,640 | 0.4 | % | ||||||||
| Other Asset Backed Securities#~ | 15,572,525 | 1.2 | % | |||||||||
| Total Asset Backed Securities | ||||||||||||
| (Cost $50,415,037) | 50,446,101 | 4.0 | % | |||||||||
| Commercial Mortgage-Backed Securities | ||||||||||||
| Bear Stearns Commercial Mortgage Securities Trust | ||||||||||||
| Series 2005-PWR9, Class A4A, 4.871%, 09/11/2042 | 5,773,604 | 5,978,538 | 0.5 | % | ||||||||
| CD Commercial Mortgage Trust | ||||||||||||
| Series 2005-CD1, Class A4, 5.401%, 07/15/2044 | 6,731,363 | 6,999,191 | 0.6 | % | ||||||||
| Credit Suisse First Boston Mortgage Securities Corp. | ||||||||||||
| Series 2005-C5, Class A4, 5.100%, 08/15/2038 | 5,885,454 | 6,057,209 | 0.5 | % | ||||||||
| DBUBS Mortgage Trust | ||||||||||||
| Series 2011-LC3A, Class A2, 3.642%, 08/10/2044 | 5,150,000 | 5,407,969 | 0.4 | % | ||||||||
| FHLMC Multifamily Structured | ||||||||||||
| Pass Through Certificates: | ||||||||||||
| Series K-708, Class A2, 2.130%, 01/25/2019 | 8,300,000 | 8,427,148 | 0.7 | % | ||||||||
| Series K-003, Class A4, 5.053%, 01/25/2019 | 9,000,000 | 10,211,193 | 0.8 | % | ||||||||
| Series K-004, Class A2, 4.186%, 08/25/2019 | 5,875,000 | 6,489,319 | 0.5 | % | ||||||||
| Series K-005, Class A2, 4.317%, 11/25/2019 | 4,975,000 | 5,533,658 | 0.4 | % | ||||||||
| Series K-F02, Class A3, 0.782%, 07/25/2020 | 9,051,773 | 9,063,405 | 0.7 | % | ||||||||
| 1.655%-4.251%, 11/25/2016-01/25/2020 | 7,783,000 | 8,125,227 | 0.6 | % | ||||||||
| J.P. Morgan Chase Commercial Mortgage Securities Trust | ||||||||||||
| Series 2005-CB12, Class A4, 4.895%, 09/12/2037 | 5,000,000 | 5,146,225 | 0.4 | % | ||||||||
| Wachovia Bank Commercial Mortgage Trust | ||||||||||||
| Series 2005-C22, Class A4, 5.455%, 12/15/2044 | 5,000,000 | 5,243,360 | 0.4 | % | ||||||||
| Other Commercial Mortgage Backed Securities# | 6,615,186 | 0.5 | % | |||||||||
| Total Commercial Mortgage Backed Securities | ||||||||||||
| (Cost $88,876,615) | 89,297,628 | 7.0 | % | |||||||||
| Total Long-Term Investments | ||||||||||||
| (Cost $1,212,093,773) | 1,240,863,429 | 98.0 | % | |||||||||
| Short-Term Investments | ||||||||||||
| Shares | ||||||||||||
| Money Market Mutual Funds | ||||||||||||
| Short-Term Investments Trust – | ||||||||||||
| Liquid Assets Portfolio, 0.06%« | 24,000,000 | 24,000,000 | 1.9 | % | ||||||||
| Other Short-Term Invesments# | 3,872,934 | 3,872,934 | 0.3 | % | ||||||||
| Total Short-Term Investments | ||||||||||||
| (Cost $27,872,934) | 27,872,934 | 2.2 | % | |||||||||
The accompanying notes are an integral part of these financial statements.
Page 24
Baird Intermediate Bond Fund
Summary Schedule of Investments, June 30, 2014 (Unaudited)
Investments Purchased with Cash
Proceeds from Securities Lending
| % of | ||||||||||||
| Shares | Value | Net Assets | ||||||||||
| Investment Companies | ||||||||||||
| Mount Vernon Securities Lending | ||||||||||||
| Trust Prime Portfolio, 0.20%« | $ | 231,817,863 | $ | 231,817,863 | 18.3 | % | ||||||
| Total Investment Companies | ||||||||||||
| (Cost $231,817,863) | 231,817,863 | 18.3 | % | |||||||||
| Total Investments Purchased With | ||||||||||||
| Cash Proceeds From Securities Lending | ||||||||||||
| (Cost $231,817,863) | 231,817,863 | 18.3 | % | |||||||||
| Total Investments | ||||||||||||
| (Cost $1,471,784,570) | 1,500,554,226 | 118.5 | % | |||||||||
| Liabilities in Excess of Other Assets | (234,658,341 | ) | (18.5 | )% | ||||||||
| TOTAL NET ASSETS | $ | 1,265,895,885 | 100.0 | % | ||||||||
Notes to Summary Schedule of Investments
| * | Restricted Security Deemed Liquid |
| @ | This security or portion of this security is out on loan at June 30, 2014. |
| f | Foreign Security |
| « | 7-Day Yield |
| # | Represents the aggregate value, by category, securities that are not among the 50 largest holdings and, in total for any issuer, represent 1% or less of net assets. |
| ~ | Groupings contain, in aggregate, restricted securities totaling $135,411,174 representing 10.70% of net assets. |
Summary of Fair Value Exposure at June 30, 2014 (Unaudited)
The Fund has adopted authoritative fair valuation accounting standards which establish a definition of fair value and set out a hierarchy for measuring fair value. These standards require additional disclosures about the various inputs and valuation techniques used to develop the measurements of fair value and a discussion on changes in valuation techniques and related inputs during the period. These standards define fair value as the price that would be received to sell an asset or paid to transfer a liability in an orderly transaction between market participants at the measurement date.
The fair value hierarchy is organized into three levels based upon the assumptions (referred to as “inputs”) used in pricing the asset or liability. These standards state that “observable inputs” reflect the assumptions market participants would use in pricing the asset or liability based on market data obtained from independent sources and “unobservable inputs” reflect an entity’s own assumptions about the assumptions market participants would use in pricing the asset or liability. These inputs are summarized into three broad levels and described below:
Level 1 – | Unadjusted quoted prices in active markets for identical unrestricted securities. |
Level 2 – | Other significant observable inputs (including quoted prices for similar securities, quoted prices in inactive markets, dealer indications, interest rates, yield curves, prepayment speeds, credit risk, default rates, inputs corroborated by observable market data, etc.). |
Level 3 – | Significant unobservable inputs (including the Fund’s own assumptions about the factors that market participants would use in valuing the security) based on the best information available. |
The accompanying notes are an integral part of these financial statements.
Page 25
Baird Intermediate Bond Fund
Summary Schedule of Investments, June 30, 2014 (Unaudited)
Summary of Fair Value Exposure at June 30, 2014 (Unaudited) (cont.)
The inputs or methodology used for valuing securities are not necessarily an indication of the risk associated with investing in those securities.
The following is a summary of the inputs used to value the Fund’s investments as of June 30, 2014:
| Level 1 | Level 2 | Level 3 | Total | |||||||||||||
| Fixed Income | ||||||||||||||||
| U.S. Treasury Securities | $ | — | $ | 392,425,561 | $ | — | $ | 392,425,561 | ||||||||
| U.S. Government Agency Issues | — | 10,026,470 | — | 10,026,470 | ||||||||||||
| Taxable Municipal Bonds | — | 31,501,114 | — | 31,501,114 | ||||||||||||
| Other Government Related Securities | — | 28,690,462 | — | 28,690,462 | ||||||||||||
| Corporate Bonds | — | 592,444,643 | 21,897 | 592,466,540 | ||||||||||||
| Residential Mortgage-Backed Securities – | ||||||||||||||||
| U.S. Government Agency Issues | — | 1,155,990 | — | 1,155,990 | ||||||||||||
| Residential Mortgage-Backed Securities – | ||||||||||||||||
| Non-U.S. Government Agency Issues | — | 44,853,563 | — | 44,853,563 | ||||||||||||
| Asset Backed Securities | — | 50,445,709 | 392 | 50,446,101 | ||||||||||||
| Commercial Mortgage-Backed Securities | — | 89,297,628 | — | 89,297,628 | ||||||||||||
| Total Fixed Income | — | 1,240,841,140 | 22,289 | 1,240,863,429 | ||||||||||||
| Short-Term Investments | ||||||||||||||||
| Money Market Mutual Funds | 27,872,934 | — | — | 27,872,934 | ||||||||||||
| Total Short-Term Investments | 27,872,934 | — | — | 27,872,934 | ||||||||||||
| Investments Purchased with Cash | ||||||||||||||||
| Proceeds from Securities Lending | ||||||||||||||||
| Investment Companies | 231,817,863 | — | — | 231,817,863 | ||||||||||||
| Total Investments Purchased with | ||||||||||||||||
| Cash Proceeds from Securities Lending | 231,817,863 | — | — | 231,817,863 | ||||||||||||
| Total Investments | $ | 259,690,797 | $ | 1,240,841,140 | $ | 22,289 | $ | 1,500,554,226 | ||||||||
Changes in valuation techniques may result in transfers into or out of assigned levels within the fair value hierarchy. There was one transfer between Level 2 and Level 3 fair value measurements during the reporting period, as compared to their classification from the prior year’s annual report. Two securities were priced at fair value by the Valuation Committee instead of the Fund’s pricing vendor is valued using Level 3 inputs.
Level 3 Reconciliation Disclosure
Following is a reconciliation of Level 3 assets for which significant unobservable inputs were used to determine fair value.
| Description | Investments in Securities | |||
| Balance as of December 31, 2013 | $ | 392 | ||
| Accrued discounts/premiums | — | |||
| Realized gain (loss) | — | |||
| Change in unrealized appreciation (depreciation) | — | |||
| Purchases | — | |||
| Sales | — | |||
| Transfers in and/or out of Level 3* | 21,897 | |||
| Balance as of June 30, 2014 | $ | 22,289 | ||
* Transfers between levels are recognized at the end of the reporting period.
The accompanying notes are an integral part of these financial statements.
Page 26
Baird Intermediate Municipal Bond Fund
June 30, 2014 (Unaudited)
Portfolio Characteristics
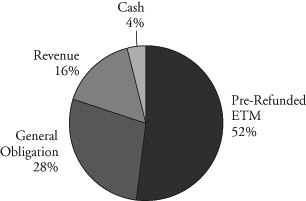
| Quality Distribution(1)(2) | ||||
 | Net Assets | $1,081,098,526 | ||
| SEC 30-Day | ||||
Yield(4) | ||||
| Institutional Class | 1.57% | |||
| Investor Class | 1.32% | |||
| Average | ||||
| Effective | ||||
| Duration | 4.62 years | |||
| Average | ||||
| Effective | ||||
| Maturity | 5.51 years | |||
| Sector Weightings(1) | Annualized | |||
| Expense | ||||
 | Ratio | |||
| Institutional Class | 0.30% | |||
| Investor Class | 0.55%(5) | |||
| Portfolio | ||||
| Turnover | ||||
| Rate | 3.2%(6) | |||
| Number of | ||||
| Holdings | 277 | |||
| (1) | Percentages shown are based on the Fund’s total investments. |
| (2) | The quality profile is calculated on a market value-weighted basis using the highest credit quality rating for each security held by the Fund given by S&P, Moody’s or Fitch, each of which is a Nationally Recognized Statistical Rating Organization (NRSRO). NRSROs rate the credit quality of securities using a scale that generally ranges from AAA (highest) to D (lowest). |
| (3) | Includes pre-refunded and escrowed-to-maturity (ETM) bonds. |
| (4) | SEC yields are based on SEC guidelines and are calculated for the 30 days ended June 30, 2014. |
| (5) | Includes 0.25% 12b-1 fee. |
| (6) | Not annualized. |
Page 27
Baird Intermediate Municipal Bond Fund
June 30, 2014 (Unaudited)
Total Returns
| Average Annual | |||||
| Six | One | Five | Ten | Since | |
| For the Periods Ended June 30, 2014 | Months | Year | Years | Years | Inception(1) |
| Institutional Class Shares | 3.27% | 4.31% | 3.90% | 4.28% | 4.65% |
| Investor Class Shares | 3.08% | 4.04% | 3.64% | 4.00% | 4.37% |
| Barclays 7-Year General Obligation | |||||
Bond Index(2) | 4.13% | 5.23% | 5.13% | 4.87% | 4.96% |
| (1) | For the period from March 30, 2001 (commencement of operations) through June 30, 2014. |
| (2) | The Barclays 7-Year General Obligation Bond Index is an unmanaged, market value weighted index comprised of investment grade state and local general obligation bonds that have been issued as part of an offering of at least $50 million, have a minimum amount outstanding of at least $5 million, have been issued within the last five years and have a maturity of six to eight years. This index does not reflect any deduction for fees, expenses or taxes. A direct investment in an index is not possible. |
The returns shown in the table above reflect reinvestment of dividends and/or capital gains distributions in additional shares. The returns do not reflect the deduction of taxes that a shareholder would pay on Fund distributions or the redemption of Fund shares. The returns reflect the actual performance for each period and do not include the impact of trades executed on the last business day of the period that were recorded on the first business day of the next period.
The Fund’s gross expense ratio for each Class, as reflected in the Fund’s current prospectus, is set forth under “Portfolio Characteristics”.
The Fund may invest up to 25% of its total assets in municipal obligations issued by persons in the same state. As a result, changes in economic, business or political conditions of a particular state may have a disproportionate impact on the Fund’s share price. Municipal securities investments are not appropriate for all investors, especially those taxed at lower rates. The Fund may also invest in U.S. dollar denominated foreign securities which involve additional risks such as currency rate fluctuations, political and economic instability, and different and sometimes less strict financial reporting standards and regulation.
Past performance does not guarantee future results. Investment return and principal value will fluctuate so that an investor’s shares, when redeemed, may be worth more or less than their original cost.
For information about the performance of the Fund as of the most recent month-end, please call 1-866-44BAIRD or visit www.bairdfunds.com. Mutual fund performance changes over time and current performance may be lower or higher than that stated.
Page 28
Baird Intermediate Municipal Bond Fund
Summary Schedule of Investments, June 30, 2014 (Unaudited)
This schedule summarizes the Fund’s holdings by asset type. Details are reported for each of the Fund’s 50 largest individual holdings and for investments that, in total for any issuer, represent more than 1% of the Fund’s net assets. The total value of smaller holdings is reported as a single amount within each category.
The Fund reports a complete list of its holdings in regulatory filings four times in each fiscal year, at the quarter end. For the second and fourth fiscal quarters, the complete listing of the Fund’s holdings is available electronically in the Fund’s Form N-CSR at http://www.rwbaird.com/baird-funds/prospectus-applications/prospectus-applications.aspx and on the Securities and Exchange Commission’s website (www.sec.gov) or you can have it mailed to you without charge by calling 1-866-44BAIRD. For the first and third fiscal quarters, the Fund files the lists with the SEC on Form N-Q. Shareholders can look up the Fund’s Forms N-CSR and N-Q on the SEC’s website (www.sec.gov).
Long-Term Investments
| Principal | % of | |||||||||||
| Amount | Value | Net Assets | ||||||||||
| Municipal Bonds | ||||||||||||
| Alabama | ||||||||||||
| Other Alabama# | $ | 3,959,700 | 0.4 | % | ||||||||
| Total Alabama | ||||||||||||
| (Cost $3,752,013) | 3,959,700 | 0.4 | % | |||||||||
| Alaska | ||||||||||||
| Other Alaska# | 1,042,820 | 0.1 | % | |||||||||
| Total Alaska | ||||||||||||
| (Cost $1,008,561) | 1,042,820 | 0.1 | % | |||||||||
| Arizona | ||||||||||||
| Other Arizona# | 4,647,546 | 0.4 | % | |||||||||
| Total Arizona | ||||||||||||
| (Cost $4,481,851) | 4,647,546 | 0.4 | % | |||||||||
| Arkansas | ||||||||||||
| Other Arkansas# | 1,151,980 | 0.1 | % | |||||||||
| Total Arkansas | ||||||||||||
| (Cost $1,154,819) | 1,151,980 | 0.1 | % | |||||||||
| California | ||||||||||||
| Bakersfield California Certificates Participation | ||||||||||||
| 0.000%, 04/15/2021 (ETM)^ | $ | 12,380,000 | 10,816,654 | 1.0 | % | |||||||
| San Joaquin Hills California Transportation | ||||||||||||
| Corridor Agency Toll Road Revenue: | ||||||||||||
| 0.000%, 01/01/2020 (ETM)^ | 6,865,000 | 6,327,265 | 0.6 | % | ||||||||
| 0.000%, 01/01/2023 (ETM)^ | 14,000,000 | 11,460,680 | 1.0 | % | ||||||||
| San Marcos California Public | ||||||||||||
| Facilities Authority Revenue | ||||||||||||
| 0.000%, 09/01/2019 (ETM)^ | 17,295,000 | 16,093,516 | 1.5 | % | ||||||||
| Other California# | 10,821,991 | 1.0 | % | |||||||||
| Total California | ||||||||||||
| (Cost $50,624,944) | 55,520,106 | 5.1 | % | |||||||||
The accompanying notes are an integral part of these financial statements.
Page 29
Baird Intermediate Municipal Bond Fund
Summary Schedule of Investments, June 30, 2014 (Unaudited)
Long-Term Investments (cont.)
| Principal | % of | |||||||||||
| Amount | Value | Net Assets | ||||||||||
| Colorado | ||||||||||||
| Colorado Springs Colorado Utilities Revenue Bonds | ||||||||||||
| 5.875%, 11/15/2017 (ETM) | $ | 6,105,000 | $ | 6,699,017 | 0.6 | % | ||||||
| Dawson Ridge Metropolitan District No. 1 Colorado: | ||||||||||||
| 0.000%, 10/01/2022 (ETM)^ | 21,595,000 | 17,884,331 | 1.7 | % | ||||||||
| 0.000%, 10/01/2022 (ETM)^ | 17,540,000 | 14,585,387 | 1.3 | % | ||||||||
| Regional Transportation District | ||||||||||||
| Colorado Sales Tax Revenue | ||||||||||||
| 5.000%, 11/01/2036 (Pre-refunded to 11/01/2016) | 6,785,000 | 7,520,765 | 0.7 | % | ||||||||
| Other Colorado# | 2,847,596 | 0.3 | % | |||||||||
| Total Colorado | ||||||||||||
| (Cost $47,143,069) | 49,537,096 | 4.6 | % | |||||||||
| Connecticut | ||||||||||||
| Other Connecticut# | 5,220,939 | 0.5 | % | |||||||||
| Total Connecticut | ||||||||||||
| (Cost $5,071,924) | 5,220,939 | 0.5 | % | |||||||||
| Florida | ||||||||||||
| Broward County Florida School Board | ||||||||||||
| 5.250%, 07/01/2022 (Callable 07/01/2021) | 8,390,000 | 9,968,746 | 0.9 | % | ||||||||
| 5.250%, 07/01/2023 (Callable 07/01/2021) | 4,915,000 | 5,746,471 | 0.5 | % | ||||||||
| County of St. Lucie Florida | ||||||||||||
| 6.000%, 10/01/2020 (ETM) | 6,420,000 | 7,819,945 | 0.7 | % | ||||||||
| Florida State Board of Education | ||||||||||||
| 5.000%, 06/01/2022 (Callable 06/01/2019) | 13,800,000 | 16,078,380 | 1.5 | % | ||||||||
| Miami-Dade County Florida | ||||||||||||
| 4.500%, 10/01/2020 | 7,100,000 | 8,163,864 | 0.8 | % | ||||||||
| Other Florida# | 56,464,050 | 5.2 | % | |||||||||
| Total Florida | ||||||||||||
| (Cost $96,674,254) | 104,241,456 | 9.6 | % | |||||||||
| Georgia | ||||||||||||
| Atlanta Georgia Water & Wastewater Revenue | ||||||||||||
| 5.500%, 11/01/2017 (Insured by AGM) | 8,445,000 | 9,739,703 | 0.9 | % | ||||||||
| Forsyth County Georgia Hospital Authority | ||||||||||||
| Revenue Anticipation Certificates | ||||||||||||
| 6.375%, 10/01/2028 (Callable 08/01/2014)(ETM) | 8,050,000 | 10,152,821 | 0.9 | % | ||||||||
| Gwinnett County Georgia School District | ||||||||||||
| 5.000%, 02/01/2026 (Pre-refunded to 02/01/2018) | 7,400,000 | 8,488,318 | 0.8 | % | ||||||||
| State of Georgia | ||||||||||||
| 5.000%, 07/01/2020 (Callable 07/01/2017) | 12,570,000 | 14,192,913 | 1.3 | % | ||||||||
| Other Georgia# | 10,575,116 | 1.0 | % | |||||||||
| Total Georgia | ||||||||||||
| (Cost $51,600,205) | 53,148,871 | 4.9 | % | |||||||||
The accompanying notes are an integral part of these financial statements.
Page 30
Baird Intermediate Municipal Bond Fund
Summary Schedule of Investments, June 30, 2014 (Unaudited)
Long-Term Investments (cont.)
| Principal | % of | |||||||||||
| Amount | Value | Net Assets | ||||||||||
| Illinois | ||||||||||||
| Illinois Finance Authority: | ||||||||||||
| 0.000%, 07/15/2023 (ETM)^ | $ | 16,860,000 | $ | 13,494,744 | 1.2 | % | ||||||
| 0.000%, 07/15/2025 (ETM)^ | 9,560,000 | 7,165,698 | 0.7 | % | ||||||||
| Kane McHenry Cook & De Kalb Counties | ||||||||||||
| Illinois School District No. 300 | ||||||||||||
| 7.000%, 01/01/2018 (ETM) (Insured by AMBAC) | 5,775,000 | 7,013,102 | 0.7 | % | ||||||||
| Kendall Kane & Will Counties Community | ||||||||||||
| Unit School District No. 308 | ||||||||||||
| 0.000%, 02/01/2021^ | 13,625,000 | 11,274,279 | 1.0 | % | ||||||||
| Village of Schaumburg IL | ||||||||||||
| 4.000%, 12/01/2024 (Callable 12/01/2022) | 5,750,000 | 6,192,233 | 0.6 | % | ||||||||
| Other Illinois# | 67,302,395 | 6.2 | % | |||||||||
| Total Illinois | ||||||||||||
| (Cost $106,989,454) | 112,442,451 | 10.4 | % | |||||||||
| Indiana | ||||||||||||
| Other Indiana# | 15,329,370 | 1.4 | % | |||||||||
| Total Indiana | ||||||||||||
| (Cost $14,440,670) | 15,329,370 | 1.4 | % | |||||||||
| Kansas | ||||||||||||
| Other Kansas# | 3,320,606 | 0.3 | % | |||||||||
| Total Kansas | ||||||||||||
| (Cost $3,136,528) | 3,320,606 | 0.3 | % | |||||||||
| Kentucky | ||||||||||||
| Louisville & Jefferson County Metropolitan Government | ||||||||||||
| 6.125%, 02/01/2037 (Pre-refunded to 02/01/2018) | 13,665,000 | 16,215,709 | 1.5 | % | ||||||||
| Other Kentucky# | 3,811,575 | 0.4 | % | |||||||||
| Total Kentucky | ||||||||||||
| (Cost $19,749,813) | 20,027,284 | 1.9 | % | |||||||||
| Louisiana | ||||||||||||
| Louisiana Public Facilities Authority Revenue: | ||||||||||||
| 5.500%, 05/15/2027 (Pre-refunded to 05/15/2026) | 9,860,000 | 12,441,348 | 1.1 | % | ||||||||
| 5.500%, 05/15/2032 (Pre-refunded to 05/15/2026) | 19,975,000 | 25,691,246 | 2.4 | % | ||||||||
| State of Louisiana: | ||||||||||||
| 5.000%, 11/15/2018 | 1,775,000 | 2,073,466 | 0.2 | % | ||||||||
| 5.000%, 11/15/2020 (Callable 05/15/2020) | 10,000,000 | 11,792,100 | 1.1 | % | ||||||||
| Total Louisiana | ||||||||||||
| (Cost $47,445,942) | 51,998,160 | 4.8 | % | |||||||||
| Maryland | ||||||||||||
| Other Maryland# | 3,902,411 | 0.4 | % | |||||||||
| Total Maryland | ||||||||||||
| (Cost $3,894,769) | 3,902,411 | 0.4 | % | |||||||||
The accompanying notes are an integral part of these financial statements.
Page 31
Baird Intermediate Municipal Bond Fund
Summary Schedule of Investments, June 30, 2014 (Unaudited)
Long-Term Investments (cont.)
| Principal | % of | |||||||||||
| Amount | Value | Net Assets | ||||||||||
| Massachusetts | ||||||||||||
| Massachusetts State: | ||||||||||||
| 5.000%, 08/01/2020 (Pre-refunded to 08/01/2016) | $ | 5,820,000 | $ | 6,390,011 | 0.6 | % | ||||||
| 4.000%, 12/01/2022 (Callable 12/01/2019) | 15,000,000 | 16,579,800 | 1.5 | % | ||||||||
| Other Massachusetts# | 7,726,125 | 0.7 | % | |||||||||
| Total Massachusetts | ||||||||||||
| (Cost $29,930,766) | 30,695,936 | 2.8 | % | |||||||||
| Michigan | ||||||||||||
| Michigan Finance Authority | ||||||||||||
| 5.000%, 01/01/2019 | 7,000,000 | 8,157,100 | 0.8 | % | ||||||||
| Other Michigan# | 25,167,560 | 2.3 | % | |||||||||
| Total Michigan | ||||||||||||
| (Cost $32,693,978) | 33,324,660 | 3.1 | % | |||||||||
| Minnesota | ||||||||||||
| University of Minnesota | ||||||||||||
| 5.500%, 07/01/2021 (ETM) | 8,980,000 | 10,977,960 | 1.0 | % | ||||||||
| Other Minnesota# | 3,164,595 | 0.3 | % | |||||||||
| Total Minnesota | ||||||||||||
| (Cost $13,734,565) | 14,142,555 | 1.3 | % | |||||||||
| Mississippi | ||||||||||||
| Other Mississippi# | 2,676,342 | 0.2 | % | |||||||||
| Total Mississippi | ||||||||||||
| (Cost $2,602,844) | 2,676,342 | 0.2 | % | |||||||||
| Missouri | ||||||||||||
| Other Missouri# | 1,127,810 | 0.1 | % | |||||||||
| Total Missouri | ||||||||||||
| (Cost $1,077,688) | 1,127,810 | 0.1 | % | |||||||||
| Nebraska | ||||||||||||
| Omaha Nebraska Public Electric Power District Revenue | ||||||||||||
| 6.200%, 02/01/2017 (ETM) | 5,630,000 | 6,108,325 | 0.6 | % | ||||||||
| Total Nebraska | ||||||||||||
| (Cost $5,945,997) | 6,108,325 | 0.6 | % | |||||||||
| Nevada | ||||||||||||
| Other Nevada# | 2,278,515 | 0.2 | % | |||||||||
| Total Nevada | ||||||||||||
| (Cost $2,094,450) | 2,278,515 | 0.2 | % | |||||||||
The accompanying notes are an integral part of these financial statements.
Page 32
Baird Intermediate Municipal Bond Fund
Summary Schedule of Investments, June 30, 2014 (Unaudited)
Long-Term Investments (cont.)
| Principal | % of | |||||||||||
| Amount | Value | Net Assets | ||||||||||
| New Hampshire | ||||||||||||
| Other New Hampshire# | $ | 4,760,685 | 0.4 | % | ||||||||
| Total New Hampshire | ||||||||||||
| (Cost $4,679,707) | 4,760,685 | 0.4 | % | |||||||||
| New Jersey | ||||||||||||
| New Jersey State Housing & | ||||||||||||
| Mortgage Finance Agency Bonds | ||||||||||||
| 4.500%, 10/01/2029 (Callable 04/01/2021) | $ | 7,625,000 | 8,014,256 | 0.8 | % | |||||||
| Other New Jersey# | 18,709,841 | 1.7 | % | |||||||||
| Total New Jersey | ||||||||||||
| (Cost $25,992,543) | 26,724,097 | 2.5 | % | |||||||||
| New Mexico | ||||||||||||
| Other New Mexico# | 2,954,883 | 0.3 | % | |||||||||
| Total New Mexico | ||||||||||||
| (Cost $2,936,045) | 2,954,883 | 0.3 | % | |||||||||
| New York | ||||||||||||
| Metropolitan Transit Authority New York | ||||||||||||
| 6.000%, 04/01/2020 (ETM) | 13,430,000 | 16,060,534 | 1.5 | % | ||||||||
| Westchester Tobacco Asset | ||||||||||||
| Securitization Corp. New York | ||||||||||||
| 6.950%, 07/15/2039 (Pre-refunded to 07/15/2017) | 13,075,000 | 15,682,155 | 1.5 | % | ||||||||
| Other New York# | 30,454,981 | 2.8 | % | |||||||||
| Total New York | ||||||||||||
| (Cost $59,140,265) | 62,197,670 | 5.8 | % | |||||||||
| North Carolina | ||||||||||||
| North Carolina Eastern Municipal Power Agency | ||||||||||||
| 5.000%, 01/01/2021 (ETM) | 7,945,000 | 9,407,834 | 0.9 | % | ||||||||
| North Carolina Eastern Municipal | ||||||||||||
| Power Agency Power Systems Revenue: | ||||||||||||
| 5.000%, 01/01/2017 (ETM) | 6,630,000 | 7,082,232 | 0.7 | % | ||||||||
| 4.500%, 01/01/2024 (Pre-refunded to 01/01/2022) | 7,665,000 | 8,960,845 | 0.8 | % | ||||||||
| 6.000%-6.400%, 01/01/2021-01/01/2026 | 7,255,000 | 8,770,210 | 0.8 | % | ||||||||
| Total North Carolina | ||||||||||||
| (Cost $33,400,789) | 34,221,121 | 3.2 | % | |||||||||
| Ohio | ||||||||||||
| State of Ohio: | ||||||||||||
| 5.000%-5.500%, 03/01/2019-06/15/2021 | 9,155,000 | 10,989,756 | 1.0 | % | ||||||||
| Other Ohio# | 12,608,653 | 1.2 | % | |||||||||
| Total Ohio | ||||||||||||
| (Cost $23,025,009) | 23,598,409 | 2.2 | % | |||||||||
The accompanying notes are an integral part of these financial statements.
Page 33
Baird Intermediate Municipal Bond Fund
Summary Schedule of Investments, June 30, 2014 (Unaudited)
Long-Term Investments (cont.)
| Principal | % of | |||||||||||
| Amount | Value | Net Assets | ||||||||||
| Pennsylvania | ||||||||||||
| Pennsylvania Convention Center | ||||||||||||
| Authority Revenue Bonds | ||||||||||||
| 6.000%, 09/01/2019 (ETM) | $ | 10,900,000 | $ | 13,017,979 | 1.2 | % | ||||||
| Other Pennsylvania# | 16,737,198 | 1.6 | % | |||||||||
| Total Pennsylvania | ||||||||||||
| (Cost $28,458,253) | 29,755,177 | 2.8 | % | |||||||||
| Puerto Rico | ||||||||||||
| Other Puerto Rico# | 13,424,738 | 1.2 | % | |||||||||
| Total Puerto Rico | ||||||||||||
| (Cost $14,936,288) | 13,424,738 | 1.2 | % | |||||||||
| South Carolina | ||||||||||||
| Piedmont Municipal Power Agency | ||||||||||||
| South Carolina Electric Revenue | ||||||||||||
| 6.750%, 01/01/2020 (ETM) | 6,450,000 | 8,194,402 | 0.8 | % | ||||||||
| Other South Carolina# | 5,379,439 | 0.5 | % | |||||||||
| Total South Carolina | ||||||||||||
| (Cost $12,977,288) | 13,573,841 | 1.3 | % | |||||||||
| South Dakota | ||||||||||||
| Other South Dakota# | 470,183 | 0.0 | % | |||||||||
| Total South Dakota | ||||||||||||
| (Cost $473,246) | 470,183 | 0.0 | % | |||||||||
| Tennessee | ||||||||||||
| Other Tennessee# | 11,639,306 | 1.1 | % | |||||||||
| Total Tennessee | ||||||||||||
| (Cost $11,450,896) | 11,639,306 | 1.1 | % | |||||||||
| Texas | ||||||||||||
| Harris County Texas | ||||||||||||
| 5.750%, 10/01/2028 (Pre-refunded to 10/01/2018) | 6,830,000 | 8,177,901 | 0.8 | % | ||||||||
| Houston Texas Water & Sewer System Revenue Bonds | ||||||||||||
| 5.500%, 12/01/2029 (ETM) | 16,050,000 | 21,043,316 | 1.9 | % | ||||||||
| North East Independent School District/TX | ||||||||||||
| 5.000%, 08/01/2021 | 6,095,000 | 7,372,085 | 0.7 | % | ||||||||
| San Antonio Texas Electric & Gas Revenue | ||||||||||||
| 5.650%, 02/01/2019 (ETM) | 11,665,000 | 13,514,836 | 1.2 | % | ||||||||
| Tarrant County Texas Health Facilities Revenue | ||||||||||||
| 6.000%, 09/01/2024 (ETM) | 7,990,000 | 9,710,247 | 0.9 | % | ||||||||
| Texas State: | ||||||||||||
| 5.000%, 10/01/2018 | 6,285,000 | 7,321,397 | 0.7 | % | ||||||||
| 5.000%-5.000%, 04/01/2020-08/01/2021 | 5,170,000 | 5,751,948 | 0.5 | % | ||||||||
The accompanying notes are an integral part of these financial statements.
Page 34
Baird Intermediate Municipal Bond Fund
Summary Schedule of Investments, June 30, 2014 (Unaudited)
Long-Term Investments (cont.)
| Principal | % of | |||||||||||
| Amount | Value | Net Assets | ||||||||||
| Texas (cont.) | ||||||||||||
| University of Texas System/The: | ||||||||||||
| 5.000%, 08/15/2018 (Pre-refunded to 08/15/2016) | $ | 1,225,000 | $ | 1,345,834 | 0.1 | % | ||||||
| 5.000%, 08/15/2022 | 9,530,000 | 11,653,951 | 1.1 | % | ||||||||
| Other Texas# | 72,160,049 | 6.7 | % | |||||||||
| Total Texas | ||||||||||||
| (Cost $151,602,933) | 158,051,564 | 14.6 | % | |||||||||
| Utah | ||||||||||||
| Other Utah# | 6,728,811 | 0.6 | % | |||||||||
| Total Utah | ||||||||||||
| (Cost $6,374,173) | 6,728,811 | 0.6 | % | |||||||||
| Virginia | ||||||||||||
| Other Virginia# | 4,648,431 | 0.4 | % | |||||||||
| Total Virginia | ||||||||||||
| (Cost $4,551,917) | 4,648,431 | 0.4 | % | |||||||||
| Washington | ||||||||||||
| Washington Health Care Facilities Authority: | ||||||||||||
| 6.250%, 08/01/2036 (Pre-refunded to 08/01/2018) | 7,850,000 | 9,478,640 | 0.9 | % | ||||||||
| 6.125%-6.250%, 08/01/2028-11/15/2041 | 5,925,000 | 7,531,926 | 0.7 | % | ||||||||
| Washington State: | ||||||||||||
| 5.000%, 01/01/2021 | 10,000,000 | 11,932,800 | 1.1 | % | ||||||||
| 5.500%, 07/01/2023 | 5,000,000 | 6,137,900 | 0.5 | % | ||||||||
| Other Washington# | 14,017,826 | 1.3 | % | |||||||||
| Total Washington | ||||||||||||
| (Cost $47,572,594) | 49,099,092 | 4.5 | % | |||||||||
| West Virginia | ||||||||||||
| Other West Virginia# | 1,314,213 | 0.1 | % | |||||||||
| Total West Virginia | ||||||||||||
| (Cost $1,288,329) | 1,314,213 | 0.1 | % | |||||||||
| Wisconsin | ||||||||||||
| Other Wisconsin# | 6,153,272 | 0.6 | % | |||||||||
| Total Wisconsin | ||||||||||||
| (Cost $5,952,006) | 6,153,272 | 0.6 | % | |||||||||
| Total Long-Term Investments | ||||||||||||
| (Cost $980,061,385) | 1,025,160,432 | 94.8 | % | |||||||||
The accompanying notes are an integral part of these financial statements.
Page 35
Baird Intermediate Municipal Bond Fund
Summary Schedule of Investments, June 30, 2014 (Unaudited)
Short-Term Investments
| % of | ||||||||||||
| Shares | Value | Net Assets | ||||||||||
| Money Market Mutual Fund | ||||||||||||
| Goldman Sachs Financial Square Fund, 0.01%« | 48,412,392 | $ | 48,412,392 | 4.5 | % | |||||||
| Total Short-Term Investment | ||||||||||||
| (Cost $48,412,392) | 48,412,392 | 4.5 | % | |||||||||
| Total Investments | ||||||||||||
| (Cost $1,028,473,777) | 1,073,572,824 | 99.3 | % | |||||||||
| Other Assets in Excess of Liabilities | 7,525,702 | 0.7 | % | |||||||||
| TOTAL NET ASSETS | $ | 1,081,098,526 | 100.0 | % | ||||||||
Notes to Summary Schedule of Investments
AGM – Assured Guaranty Municipal
AMBAC – Ambac Assurance Corporation
ETM – Escrowed to Maturity
| ^ | Non-Income Producing |
| « | 7-Day Yield |
| # | Represents the aggregate value, by category, securities that are not among the 50 largest holdings and, in total for any issuer, represent 1% or less of net assets. |
Summary of Fair Value Exposure at June 30, 2014 (Unaudited)
The Fund has adopted authoritative fair valuation accounting standards which establish a definition of fair value and set out a hierarchy for measuring fair value. These standards require additional disclosures about the various inputs and valuation techniques used to develop the measurements of fair value and a discussion on changes in valuation techniques and related inputs during the period. These standards define fair value as the price that would be received to sell an asset or paid to transfer a liability in an orderly transaction between market participants at the measurement date.
The fair value hierarchy is organized into three levels based upon the assumptions (referred to as “inputs”) used in pricing the asset or liability. These standards state that “observable inputs” reflect the assumptions market participants would use in pricing the asset or liability based on market data obtained from independent sources and “unobservable inputs” reflect an entity’s own assumptions about the assumptions market participants would use in pricing the asset or liability. These inputs are summarized into three broad levels and described below:
Level 1 – | Unadjusted quoted prices in active markets for identical unrestricted securities. |
Level 2 – | Other significant observable inputs (including quoted prices for similar securities, quoted prices in inactive markets, dealer indications, interest rates, yield curves, prepayment speeds, credit risk, default rates, inputs corroborated by observable market data, etc.). |
Level 3 – | Significant unobservable inputs (including the Fund’s own assumptions about the factors that market participants would use in valuing the security) based on the best information available. |
The inputs or methodology used for valuing securities are not necessarily an indication of the risk associated with investing in those securities.
The accompanying notes are an integral part of these financial statements.
Page 36
Baird Intermediate Municipal Bond Fund
Summary Schedule of Investments, June 30, 2014 (Unaudited)
Summary of Fair Value Exposure at June 30, 2014 (Unaudited) (cont.)
The following is a summary of the inputs used to value the Fund’s investments as of June 30, 2014:
| Level 1 | Level 2 | Level 3 | Total | |||||||||||||
| Fixed Income | ||||||||||||||||
| Municipal Bonds | $ | — | $ | 1,025,160,432 | $ | — | $ | 1,025,160,432 | ||||||||
| Total Fixed Income | — | 1,025,160,432 | — | 1,025,160,432 | ||||||||||||
| Short-Term Investment | ||||||||||||||||
| Money Market Mutual Fund | 48,412,392 | — | — | 48,412,392 | ||||||||||||
| Total Short-Term Investment | 48,412,392 | — | — | 48,412,392 | ||||||||||||
| Total Investments | $ | 48,412,392 | $ | 1,025,160,432 | $ | — | $ | 1,073,572,824 | ||||||||
Changes in valuation techniques may result in transfers into or out of assigned levels within the fair value hierarchy. There were no transfers between Level 1, Level 2 and Level 3 fair value measurements during the reporting period, as compared to their classification from the prior year’s annual report.
The accompanying notes are an integral part of these financial statements.
Page 37
Baird Aggregate Bond Fund
June 30, 2014 (Unaudited)
Portfolio Characteristics
| Quality Distribution(1)(2) | ||||
 | Net Assets | $2,247,587,406 | ||
| SEC 30-Day | ||||
Yield(3) | ||||
| Institutional Class | 2.71% | |||
| Investor Class | 2.46% | |||
| Average | ||||
| Effective | ||||
| Duration | 5.60 years | |||
| Average | ||||
| Effective | ||||
| Maturity | 7.25 years | |||
| Annualized | ||||
| Expense | ||||
| Sector Weightings(1) | Ratio | |||
| Institutional Class | 0.30% | |||
 | Investor Class | 0.55%(4) | ||
| Portfolio | ||||
| Turnover | ||||
| Rate | 13.3%(5) | |||
| Number of | ||||
| Holdings | 506 | |||
| (1) | Percentages shown are based on the Fund’s total investments (less investments purchased with cash proceeds from securities lending). |
| (2) | The quality profile is calculated on a market value-weighted basis using the highest credit quality rating for each security held by the Fund given by S&P, Moody’s or Fitch, each of which is a Nationally Recognized Statistical Rating Organization (NRSRO). NRSROs rate the credit quality of securities using a scale that generally ranges from AAA (highest) to D (lowest). |
| (3) | SEC yields are based on SEC guidelines and are calculated for the 30 days ended June 30, 2014. |
| (4) | Includes 0.25% 12b-1 fee. |
| (5) | Not annualized. |
Page 38
Baird Aggregate Bond Fund
June 30, 2014 (Unaudited)
Total Returns
| Average Annual | |||||
| Six | One | Five | Ten | Since | |
| For the Periods Ended June 30, 2014 | Months | Year | Years | Years | Inception(1) |
| Institutional Class Shares | 4.79% | 5.67% | 6.85% | 5.37% | 6.09% |
| Investor Class Shares | 4.72% | 5.43% | 6.60% | 5.10% | 5.84% |
Barclays U.S. Aggregate Bond Index(2) | 3.93% | 4.37% | 4.85% | 4.93% | 5.55% |
| (1) | For the period from September 29, 2000 (commencement of operations) through June 30, 2014. |
| (2) | The Barclays U.S. Aggregate Bond Index is an unmanaged, market value weighted index of investment grade, fixed-rate debt issues, including government, corporate, asset-backed and mortgage-backed securities, with maturities of at least one year. This index does not reflect any deduction for fees, expenses or taxes. A direct investment in an index is not possible. |
The returns shown in the table above reflect reinvestment of dividends and/or capital gains distributions in additional shares. The returns do not reflect the deduction of taxes that a shareholder would pay on Fund distributions or the redemption of Fund shares. The returns reflect the actual performance for each period and do not include the impact of trades executed on the last business day of the period that were recorded on the first business day of the next period.
The Fund’s gross expense ratio for each Class, as reflected in the Fund’s current prospectus, is set forth under “Portfolio Characteristics”.
The Fund maintains securities with longer maturities in order to provide a greater potential for return. Generally, the longer a bond’s maturity, the greater the interest rate risk. The Fund may also invest in U.S. dollar denominated foreign securities which involve additional risks such as currency rate fluctuations, political and economic instability, and different and sometimes less strict financial reporting standards and regulation. The Fund may also invest in mortgage- and asset-backed securities, which include interest rate and prepayment risks more pronounced than those of other fixed income securities.
Past performance does not guarantee future results. Investment return and principal value will fluctuate so that an investor’s shares, when redeemed, may be worth more or less than their original cost.
For information about the performance of the Fund as of the most recent month-end, please call 1-866-44BAIRD or visit www.bairdfunds.com. Mutual fund performance changes over time and current performance may be lower or higher than that stated.
Page 39
Baird Aggregate Bond Fund
Summary Schedule of Investments, June 30, 2014 (Unaudited)
This schedule summarizes the Fund’s holdings by asset type. Details are reported for each of the Fund’s 50 largest individual holdings and for investments that, in total for any issuer, represent more than 1% of the Fund’s net assets. The total value of smaller holdings is reported as a single amount within each category.
The Fund reports a complete list of its holdings in regulatory filings four times in each fiscal year, at the quarter end. For the second and fourth fiscal quarters, the complete listing of the Fund’s holdings is available electronically in the Fund’s Form N-CSR at http://www.rwbaird.com/baird-funds/prospectus-applications/prospectus-applications.aspx and on the Securities and Exchange Commission’s website (www.sec.gov) or you can have it mailed to you without charge by calling 1-866-44BAIRD. For the first and third fiscal quarters, the Fund files the lists with the SEC on Form N-Q. Shareholders can look up the Fund’s Forms N-CSR and N-Q on the SEC’s website (www.sec.gov).
Long-Term Investments
| Principal | % of | |||||||||||
| Amount | Value | Net Assets | ||||||||||
| U.S. Treasury Securities | ||||||||||||
| U.S. Treasury Bonds: | ||||||||||||
| 1.250%, 04/30/2019@ | $ | 162,424,400 | $ | 159,988,034 | 7.1 | % | ||||||
| 6.250%, 08/15/2023@ | 30,200,000 | 39,835,673 | 1.8 | % | ||||||||
| 5.250%, 11/15/2028@ | 53,426,500 | 68,436,034 | 3.0 | % | ||||||||
| 4.375%, 02/15/2038@ | 19,587,400 | 23,385,514 | 1.0 | % | ||||||||
| 3.500%, 02/15/2039@ | 91,630,900 | 95,611,163 | 4.3 | % | ||||||||
| Total U.S. Treasury Securities | ||||||||||||
| (Cost $381,591,002) | 387,256,418 | 17.2 | % | |||||||||
| Taxable Municipal Bonds | ||||||||||||
| Other Taxable Municipal Bonds# | 71,819,097 | 3.2 | % | |||||||||
| Total Taxable Municipal Bonds | ||||||||||||
| (Cost $67,487,701) | 71,819,097 | 3.2 | % | |||||||||
| Other Government Related Securities | ||||||||||||
| Other Government Related Securities#~ | 49,362,916 | 2.2 | % | |||||||||
| Total Other Government Related Securities | ||||||||||||
| (Cost $46,703,444) | 49,362,916 | 2.2 | % | |||||||||
| Corporate Bonds | ||||||||||||
| Industrials | ||||||||||||
| Hutchison Whampoa International (09) Limited | ||||||||||||
| 7.625%, 04/09/2019 (Acquired 10/22/2009 | ||||||||||||
through 04/16/2014, Cost $9,347,624)* f | 8,288,000 | 10,120,328 | 0.5 | % | ||||||||
| Petrofac Limited | ||||||||||||
| 3.400%, 10/10/2018 (Acquired 10/03/2013, | ||||||||||||
Cost $8,514,123)* f | 8,546,000 | 8,871,235 | 0.4 | % | ||||||||
| Warner Chilcott Co LLC / | ||||||||||||
| Warner Chilcott Finance LLC | ||||||||||||
7.750%, 09/15/2018 f | 8,500,000 | 8,935,965 | 0.4 | % | ||||||||
| Other Industrials#~ | 292,494,986 | 13.0 | % | |||||||||
| Total Industrials | ||||||||||||
| (Cost $303,875,545) | 320,422,514 | 14.3 | % | |||||||||
The accompanying notes are an integral part of these financial statements.
Page 40
Baird Aggregate Bond Fund
Summary Schedule of Investments, June 30, 2014 (Unaudited)
Long-Term Investments (cont.)
| Principal | % of | |||||||||||
| Amount | Value | Net Assets | ||||||||||
| Utility | ||||||||||||
| Other Utility#~ | $ | 84,761,099 | 3.8 | % | ||||||||
| Total Utility | ||||||||||||
| (Cost $79,328,171) | 84,761,099 | 3.8 | % | |||||||||
| Finance | ||||||||||||
| ABN AMRO Bank N.V. | ||||||||||||
| 2.500%, 10/30/2018 (Acquired 10/23/2013 | ||||||||||||
through 01/13/2014, Cost $11,028,182)* f | $ | 11,033,000 | 11,194,854 | 0.5 | % | |||||||
| Deutsche Bank Aktiengesellschaft | ||||||||||||
3.700%, 05/30/2024@ f | 10,000,000 | 10,003,040 | 0.4 | % | ||||||||
| Massachusetts Mutual Life Insurance Company | ||||||||||||
| 8.875%, 06/01/2039 (Acquired 05/27/2009 | ||||||||||||
| through 03/10/2014, Cost $8,496,656)* | 6,111,000 | 9,732,214 | 0.4 | % | ||||||||
| Other Finance#~ | 406,052,298 | 18.1 | % | |||||||||
| Total Finance | ||||||||||||
| (Cost $415,890,095) | 436,982,406 | 19.4 | % | |||||||||
| Residential Mortgage-Backed Securities | ||||||||||||
| U.S. Government Agency Issues | ||||||||||||
| Federal Gold Loan Mortgage Corporation (FGLMC): | ||||||||||||
| 3.500%, 11/01/2025 | 8,380,241 | 8,883,063 | 0.4 | % | ||||||||
| 5.000%, 03/01/2036 | 15,377,651 | 17,065,366 | 0.8 | % | ||||||||
| 4.500%, 11/01/2039 | 11,404,586 | 12,348,858 | 0.5 | % | ||||||||
| 4.500%, 09/01/2040 | 9,091,055 | 9,847,946 | 0.4 | % | ||||||||
| 3.500%, 06/01/2042 | 10,080,172 | 10,374,658 | 0.5 | % | ||||||||
| 3.500%, 07/01/2042 | 26,203,332 | 26,968,846 | 1.2 | % | ||||||||
| 3.000%, 08/01/2042 | 30,764,951 | 30,385,219 | 1.3 | % | ||||||||
| 3.000%, 10/01/2042 | 11,258,296 | 11,119,171 | 0.5 | % | ||||||||
| 3.000%, 06/01/2043 | 30,154,134 | 29,780,877 | 1.3 | % | ||||||||
| 3.000%, 08/01/2043 | 9,613,077 | 9,494,084 | 0.4 | % | ||||||||
| 4.000%, 03/01/2044 | 19,237,040 | 20,407,105 | 0.9 | % | ||||||||
| 2.500%-6.500%, 07/01/2014-02/01/2043 | 33,412,585 | 35,469,239 | 1.6 | % | ||||||||
| Federal National Mortgage Association (FNMA): | ||||||||||||
| 3.000%, 04/01/2027 | 12,519,126 | 13,020,396 | 0.6 | % | ||||||||
| 2.500%, 12/01/2027 | 13,361,835 | 13,591,796 | 0.6 | % | ||||||||
| 5.000%, 07/01/2035 | 14,201,225 | 15,811,463 | 0.7 | % | ||||||||
| 3.500%, 02/01/2041 | 32,107,114 | 33,101,937 | 1.5 | % | ||||||||
| 4.000%, 02/01/2041 | 22,535,308 | 23,949,766 | 1.1 | % | ||||||||
| 4.000%, 12/01/2041 | 22,489,238 | 23,919,474 | 1.1 | % | ||||||||
| 3.000%, 05/01/2042 | 9,064,573 | 8,965,304 | 0.4 | % | ||||||||
| 3.000%, 05/01/2043 | 10,553,323 | 10,437,750 | 0.5 | % | ||||||||
| 3.500%-8.000%, 07/25/2019-09/01/2041 | 58,207,945 | 63,618,427 | 2.8 | % | ||||||||
The accompanying notes are an integral part of these financial statements.
Page 41
Baird Aggregate Bond Fund
Summary Schedule of Investments, June 30, 2014 (Unaudited)
Long-Term Investments (cont.)
| Principal | % of | |||||||||||
| Amount | Value | Net Assets | ||||||||||
| Government National Mortgage Association (GNMA): | ||||||||||||
| 4.500%, 01/20/2041 | $ | 18,840,763 | $ | 20,643,160 | 0.9 | % | ||||||
| 4.000%, 06/20/2042 | 16,864,661 | 18,078,612 | 0.8 | % | ||||||||
| 3.500%, 09/20/2042 | 10,992,458 | 11,471,899 | 0.5 | % | ||||||||
| 5.000%-6.000%, 11/20/2033-07/20/2040 | 6,356,899 | 7,068,931 | 0.3 | % | ||||||||
| Other U.S. Government Agency Issues# | 292,952 | 0.0 | % | |||||||||
| Total U.S. Government Agency Issues | ||||||||||||
| (Cost $476,695,955) | 486,116,299 | 21.6 | % | |||||||||
| Residential Mortgage-Backed Securities | ||||||||||||
| Non-U.S. Government Agency Issues | ||||||||||||
| Washington Mutual Mortgage Pass Through Certificates: | ||||||||||||
| Series 2004-CB2, Class 3A, 6.000%, 08/25/2034 | 13,198,274 | 14,127,565 | 0.6 | % | ||||||||
| 5.000%-6.500%, 06/25/2019-10/25/2034 | 9,857,761 | 10,609,238 | 0.5 | % | ||||||||
| Other Non-U.S. Government Agency Issues# | 44,035,917 | 2.0 | % | |||||||||
| Total Non-U.S. Government Agency Issues | ||||||||||||
| (Cost $69,104,046) | 68,772,720 | 3.1 | % | |||||||||
| Asset Backed Securities | ||||||||||||
| J.P. Morgan Mortgage Acquisition Trust | ||||||||||||
| Series 2006-CH1, Class A1, 0.280%, 07/25/2036 | 10,297,107 | 9,895,139 | 0.4 | % | ||||||||
| Other Asset Backed Securities#~ | 66,929,102 | 3.0 | % | |||||||||
| Total Asset Backed Securities | ||||||||||||
| (Cost $76,768,525) | 76,824,241 | 3.4 | % | |||||||||
| Commercial Mortgage-Backed Securities | ||||||||||||
| Bear Stearns Commercial Mortgage Securities Trust | ||||||||||||
| Series 2005-PWR9, Class A4A, 4.871%, 09/11/2042 | 9,543,271 | 9,882,009 | 0.4 | % | ||||||||
| CD Commercial Mortgage Trust | ||||||||||||
| Series 2005-CD1, Class A4, 5.401%, 07/15/2044 | 11,539,480 | 11,998,613 | 0.5 | % | ||||||||
| COMM Mortgage Trust: | ||||||||||||
| Series 2005-C6, Class A5A, 5.116%, 06/10/2044 | 12,579,159 | 13,006,259 | 0.6 | % | ||||||||
| Series 2012-CR1, Class A3, 3.391%, 05/15/2045 | 7,813,462 | 8,035,310 | 0.4 | % | ||||||||
| Series 2012-CR2, Class A4, 3.147%, 08/15/2045 | 14,880,536 | 15,038,671 | 0.7 | % | ||||||||
| Credit Suisse First Boston Mortgage Securities Corp. | ||||||||||||
| Series 2005-C5, Class A4, 5.100%, 08/15/2038 | 14,236,850 | 14,652,324 | 0.7 | % | ||||||||
| FHLMC Multifamily Structured Pass Through Certificates | ||||||||||||
| Series K-003, Class A4, 5.053%, 01/25/2019 | 12,525,000 | 14,210,577 | 0.6 | % | ||||||||
| GE Capital Commercial Mortgage Corp. | ||||||||||||
| Series 2005-C4, Class A4, 5.489%, 11/10/2045 | 9,751,208 | 10,211,026 | 0.5 | % | ||||||||
| GS Mortgage Securities Corp II | ||||||||||||
| Series 2012-GCJ9, Class A3, 2.773%, 11/10/2045 | 20,412,320 | 19,981,722 | 0.9 | % | ||||||||
| J.P. Morgan Chase Commercial Mortgage Securities Trust | ||||||||||||
| Series 2005-CB12, Class A4, 4.895%, 09/12/2037 | 10,399,264 | 10,703,391 | 0.5 | % | ||||||||
| Series 2013-LC11, Class A5, 2.960%, 04/15/2046 | 9,452,913 | 9,328,106 | 0.4 | % | ||||||||
The accompanying notes are an integral part of these financial statements.
Page 42
Baird Aggregate Bond Fund
Summary Schedule of Investments, June 30, 2014 (Unaudited)
Long-Term Investments (cont.)
| Principal | % of | |||||||||||
| Amount | Value | Net Assets | ||||||||||
| Morgan Stanley Bank of America Merrill Lynch Trust | ||||||||||||
| Series 2012-C6, Class A4, 2.858%, 11/15/2045 | $ | 17,180,945 | $ | 16,897,391 | 0.7 | % | ||||||
| Wachovia Bank Commercial Mortgage Trust | ||||||||||||
| Series 2005-C22, Class A4, 5.455%, 12/15/2044 | 9,010,591 | 9,449,155 | 0.4 | % | ||||||||
| WFRBS Commercial Mortgage Trust | ||||||||||||
| Series 2012-C6, Class A4, 3.440%, 04/15/2045 | 10,964,220 | 11,349,053 | 0.5 | % | ||||||||
| Total Commercial Mortgage Backed Securities | ||||||||||||
| (Cost $175,760,863) | 174,743,607 | 7.8 | % | |||||||||
| Total Long-Term Investments | ||||||||||||
| (Cost $2,093,205,347) | 2,157,061,317 | 96.0 | % | |||||||||
| Short-Term Investments | ||||||||||||
| Shares | ||||||||||||
| Money Market Mutual Funds | ||||||||||||
| Dreyfus Institutional Cash Advantage Fund, 0.06%« | 53,651,768 | 53,651,768 | 2.4 | % | ||||||||
| Short-Term Investments Trust – | ||||||||||||
| Liquid Assets Portfolio, 0.06%« | 43,000,000 | 43,000,000 | 1.9 | % | ||||||||
| Total Short-Term Investments | ||||||||||||
| (Cost $96,651,768) | 96,651,768 | 4.3 | % | |||||||||
| Investments Purchased with Cash | ||||||||||||
| Proceeds from Securities Lending | ||||||||||||
| Investment Companies | ||||||||||||
| Mount Vernon Securities Lending | ||||||||||||
| Trust Prime Portfolio, 0.20%« | 230,827,698 | 230,827,698 | 10.2 | % | ||||||||
| Total Investment Companies | ||||||||||||
| (Cost $230,827,698) | 230,827,698 | 10.2 | % | |||||||||
| Total Investments Purchased With | ||||||||||||
| Cash Proceeds From Securities Lending | ||||||||||||
| (Cost $230,827,698) | 230,827,698 | 10.2 | % | |||||||||
| Total Investments | ||||||||||||
| (Cost $2,420,684,813) | 2,484,540,783 | 110.5 | % | |||||||||
| Liabilities in Excess of Other Assets | (236,953,377 | ) | (10.5 | )% | ||||||||
| TOTAL NET ASSETS | $ | 2,247,587,406 | 100.0 | % | ||||||||
Notes to Summary Schedule of Investments
| * | Restricted Security Deemed Liquid |
| @ | This security or portion of this security is out on loan at June 30, 2014. |
| f | Foreign Security |
| « | 7-Day Yield |
| # | Represents the aggregate value, by category, securities that are not among the 50 largest holdings and, in total for any issuer, represent 1% or less of net assets. |
| ~ | Groupings contain, in aggregate, restricted securities totaling $239,004,687 representing 10.63% of net assets. |
The accompanying notes are an integral part of these financial statements.
Page 43
Baird Aggregate Bond Fund
Summary Schedule of Investments, June 30, 2014 (Unaudited)
Summary of Fair Value Exposure at June 30, 2014 (Unaudited)
The Fund has adopted authoritative fair valuation accounting standards which establish a definition of fair value and set out a hierarchy for measuring fair value. These standards require additional disclosures about the various inputs and valuation techniques used to develop the measurements of fair value and a discussion on changes in valuation techniques and related inputs during the period. These standards define fair value as the price that would be received to sell an asset or paid to transfer a liability in an orderly transaction between market participants at the measurement date.
The fair value hierarchy is organized into three levels based upon the assumptions (referred to as “inputs”) used in pricing the asset or liability. These standards state that “observable inputs” reflect the assumptions market participants would use in pricing the asset or liability based on market data obtained from independent sources and “unobservable inputs” reflect an entity’s own assumptions about the assumptions market participants would use in pricing the asset or liability. These inputs are summarized into three broad levels and described below:
Level 1 – | Unadjusted quoted prices in active markets for identical unrestricted securities. |
Level 2 – | Other significant observable inputs (including quoted prices for similar securities, quoted prices in inactive markets, dealer indications, interest rates, yield curves, prepayment speeds, credit risk, default rates, inputs corroborated by observable market data, etc.). |
Level 3 – | Significant unobservable inputs (including the Fund’s own assumptions about the factors that market participants would use in valuing the security) based on the best information available. |
The inputs or methodology used for valuing securities are not necessarily an indication of the risk associated with investing in those securities.
The following is a summary of the inputs used to value the Fund’s investments as of June 30, 2014:
| �� | Level 1 | Level 2 | Level 3 | Total | ||||||||||||
| Fixed Income | ||||||||||||||||
| U.S. Treasury Securities | $ | — | $ | 387,256,418 | $ | — | $ | 387,256,418 | ||||||||
| Taxable Municipal Bonds | — | 71,819,097 | — | 71,819,097 | ||||||||||||
| Other Government Related Securities | — | 49,362,916 | — | 49,362,916 | ||||||||||||
| Corporate Bonds | — | 842,166,019 | — | 842,166,019 | ||||||||||||
| Residential Mortgage-Backed Securities – | ||||||||||||||||
| U.S. Government Agency Issues | — | 486,116,299 | — | 486,116,299 | ||||||||||||
| Residential Mortgage-Backed Securities – | ||||||||||||||||
| Non-U.S. Government Agency Issues | — | 68,772,720 | — | 68,772,720 | ||||||||||||
| Asset Backed Securities | — | 76,824,241 | — | 76,824,241 | ||||||||||||
| Commercial Mortgage-Backed Securities | — | 174,743,607 | — | 174,743,607 | ||||||||||||
| Total Fixed Income | — | 2,157,061,317 | — | 2,157,061,317 | ||||||||||||
| Short-Term Investments | ||||||||||||||||
| Money Market Mutual Funds | 96,651,768 | — | — | 96,651,768 | ||||||||||||
| Total Short-Term Investments | 96,651,768 | — | — | 96,651,768 | ||||||||||||
| Investments Purchased with Cash | ||||||||||||||||
| Proceeds from Securities Lending | ||||||||||||||||
| Investment Companies | 230,827,698 | — | — | 230,827,698 | ||||||||||||
| Total Investments Purchased with | ||||||||||||||||
| Cash Proceeds from Securities Lending | 230,827,698 | — | — | 230,827,698 | ||||||||||||
| Total Investments | $ | 327,479,466 | $ | 2,157,061,317 | $ | — | $ | 2,484,540,783 | ||||||||
The accompanying notes are an integral part of these financial statements.
Page 44
Baird Aggregate Bond Fund
Summary Schedule of Investments, June 30, 2014 (Unaudited)
Summary of Fair Value Exposure at June 30, 2014 (Unaudited) (cont.)
Changes in valuation techniques may result in transfers into or out of assigned levels within the fair value hierarchy. There were no transfers between Level 1, Level 2 and Level 3 fair value measurements during the reporting period, as compared to their classification from the prior year’s annual report.
The accompanying notes are an integral part of these financial statements.
Page 45
Baird Core Plus Bond Fund
June 30, 2014 (Unaudited)
Portfolio Characteristics
| Quality Distribution(1)(2) | ||||
 | Net Assets | $3,419,952,020 | ||
| SEC 30-Day | ||||
Yield(3) | ||||
| Institutional Class | 2.74% | |||
| Investor Class | 2.49% | |||
| Average | ||||
| Effective | ||||
| Duration | 5.44 years | |||
| Average | ||||
| Effective | ||||
| Maturity | 7.00 years | |||
| Annualized | ||||
| Sector Weightings(1) | Expense | |||
| Ratio | ||||
 | Institutional Class | 0.30% | ||
| Investor Class | 0.55%(4) | |||
| Portfolio | ||||
| Turnover | ||||
| Rate | 9.8%(5) | |||
| Number of | ||||
| Holdings | 693 | |||
| (1) | Percentages shown are based on the Fund’s total investments (less investments purchased with cash proceeds from securities lending). |
| (2) | The quality profile is calculated on a market value-weighted basis using the highest credit quality rating for each security held by the Fund given by S&P, Moody’s or Fitch, each of which is a Nationally Recognized Statistical Rating Organization (NRSRO). NRSROs rate the credit quality of securities using a scale that generally ranges from AAA (highest) to D (lowest). |
| (3) | SEC yields are based on SEC guidelines and are calculated for the 30 days ended June 30, 2014. |
| (4) | Includes 0.25% 12b-1 fee. |
| (5) | Not annualized. |
Page 46
Baird Core Plus Bond Fund
June 30, 2014 (Unaudited)
Total Returns
| Average Annual | |||||
| Six | One | Five | Ten | Since | |
| For the Periods Ended June 30, 2014 | Months | Year | Years | Years | Inception(1) |
| Institutional Class Shares | 4.81% | 6.19% | 7.59% | 6.23% | 6.65% |
| Investor Class Shares | 4.61% | 5.80% | 7.30% | 5.96% | 6.38% |
Barclays U.S. Universal Bond Index(2) | 4.19% | 5.20% | 5.58% | 5.27% | 5.83% |
| (1) | For the period from September 29, 2000 (commencement of operations) through June 30, 2014. |
| (2) | The Barclays U.S. Universal Bond Index is an unmanaged, market value weighted index of fixed income securities issued in U.S. dollars, including U.S. government and investment grade debt, non-investment grade debt, asset-backed and mortgage-backed securities, Eurobonds, 144A securities and emerging market debt, with maturities of at least one year. This index does not reflect any deduction for fees, expenses or taxes. A direct investment in an index is not possible. |
The returns shown in the table above reflect reinvestment of dividends and/or capital gains distributions in additional shares. The returns do not reflect the deduction of taxes that a shareholder would pay on Fund distributions or the redemption of Fund shares. The returns reflect the actual performance for each period and do not include the impact of trades executed on the last business day of the period that were recorded on the first business day of the next period.
The Fund’s gross expense ratio for each Class, as reflected in the Fund’s current prospectus, is set forth under “Portfolio Characteristics”.
The Fund may invest up to 20% of its net assets in non-investment grade debt securities (commonly referred to as junk bonds). While these types of debt securities typically offer higher yields than investment grade securities, they also include greater risks including increased credit risk and the increased risk of default or bankruptcy. The Fund maintains securities with longer maturities in order to provide a greater potential for return. Generally, the longer a bond’s maturity, the greater the interest rate risk. The Fund may also invest in U.S. dollar denominated foreign securities which involve additional risks such as currency rate fluctuations, political and economic instability, and different and sometimes less strict financial reporting standards and regulation. The Fund may also invest in mortgage- and asset-backed securities, which include interest rate and prepayment risks more pronounced than those of other fixed income securities.
Past performance does not guarantee future results. Investment return and principal value will fluctuate so that an investor’s shares, when redeemed, may be worth more or less than their original cost.
For information about the performance of the Fund as of the most recent month-end, please call 1-866-44BAIRD or visit www.bairdfunds.com. Mutual fund performance changes over time and current performance may be lower or higher than that stated.
Page 47
Baird Core Plus Bond Fund
Summary Schedule of Investments, June 30, 2014 (Unaudited)
This schedule summarizes the Fund’s holdings by asset type. Details are reported for each of the Fund’s 50 largest individual holdings and for investments that, in total for any issuer, represent more than 1% of the Fund’s net assets. The total value of smaller holdings is reported as a single amount within each category.
The Fund reports a complete list of its holdings in regulatory filings four times in each fiscal year, at the quarter end. For the second and fourth fiscal quarters, the complete listing of the Fund’s holdings is available electronically in the Fund’s Form N-CSR at http://www.rwbaird.com/baird-funds/prospectus-applications/prospectus-applications.aspx and on the Securities and Exchange Commission’s website (www.sec.gov) or you can have it mailed to you without charge by calling 1-866-44BAIRD. For the first and third fiscal quarters, the Fund files the lists with the SEC on Form N-Q. Shareholders can look up the Fund’s Forms N-CSR and N-Q on the SEC’s website (www.sec.gov).
Long-Term Investments
| Principal | % of | |||||||||||
| Amount | Value | Net Assets | ||||||||||
| U.S. Treasury Securities | ||||||||||||
| U.S. Treasury Bonds: | ||||||||||||
| 1.250%, 04/30/2019@ | $ | 238,400,000 | $ | 234,824,000 | 6.9 | % | ||||||
| 5.250%, 11/15/2028@ | 58,975,000 | 75,543,319 | 2.2 | % | ||||||||
| 4.375%, 02/15/2038@ | 21,475,000 | 25,639,131 | 0.8 | % | ||||||||
| 3.500%, 02/15/2039@ | 122,475,000 | 127,795,069 | 3.7 | % | ||||||||
| Total U.S. Treasury Securities | ||||||||||||
| (Cost $460,273,664) | 463,801,519 | 13.6 | % | |||||||||
| Taxable Municipal Bonds | ||||||||||||
| New Jersey Economic Development Authority | ||||||||||||
| 1.802%, 06/15/2017 | 15,000,000 | 15,111,150 | 0.5 | % | ||||||||
| Other Taxable Municipal Bonds# | 71,832,434 | 2.1 | % | |||||||||
| Total Taxable Municipal Bonds | ||||||||||||
| (Cost $83,737,379) | 86,943,584 | 2.6 | % | |||||||||
| Other Government Related Securities | ||||||||||||
| Other Government Related Securities#~ | 107,139,021 | 3.1 | % | |||||||||
| Total Other Government Related Securities | ||||||||||||
| (Cost $103,862,577) | 107,139,021 | 3.1 | % | |||||||||
| Corporate Bonds | ||||||||||||
| Industrials | ||||||||||||
| Fidelity National Information Services, Inc. | ||||||||||||
| 7.875%, 07/15/2020 | 11,884,000 | 12,585,869 | 0.4 | % | ||||||||
| Glencore Funding LLC | ||||||||||||
| 4.125%, 05/30/2023 (Acquired 05/22/2013 | ||||||||||||
| through 04/03/2014, Cost $12,189,608)*@ | 12,300,000 | 12,353,394 | 0.3 | % | ||||||||
| Murphy Oil Corporation | ||||||||||||
| 4.000%, 06/01/2022 | 12,600,000 | 12,752,851 | 0.4 | % | ||||||||
| Rio Tinto Finance (USA) Limited | ||||||||||||
| 9.000%, 05/01/2019 f | 11,000,000 | 14,421,550 | 0.4 | % | ||||||||
| Other Industrials#~ | 568,545,233 | 16.6 | % | |||||||||
| Total Industrials | ||||||||||||
| (Cost $603,931,067) | 620,658,897 | 18.1 | % | |||||||||
The accompanying notes are an integral part of these financial statements.
Page 48
Baird Core Plus Bond Fund
Summary Schedule of Investments, June 30, 2014 (Unaudited)
Long-Term Investments (cont.)
| Principal | % of | |||||||||||
| Amount | Value | Net Assets | ||||||||||
| Utility | ||||||||||||
| Other Utility#~ | $ | 187,679,228 | 5.5 | % | ||||||||
| Total Utility | ||||||||||||
| (Cost $180,193,786) | 187,679,228 | 5.5 | % | |||||||||
| Finance | ||||||||||||
| Associates Corporation of North America | ||||||||||||
| 6.950%, 11/01/2018 | $ | 12,038,000 | 14,376,309 | 0.4 | % | |||||||
| Regions Bank | ||||||||||||
| 7.500%, 05/15/2018 | 14,034,000 | 16,703,435 | 0.5 | % | ||||||||
| Standard Chartered PLC | ||||||||||||
| 5.700%, 03/26/2044 (Acquired 03/21/2014 | ||||||||||||
| through 05/01/2014, Cost $14,105,128)*@ f | 14,000,000 | 14,674,268 | 0.4 | % | ||||||||
| Other Finance#~ | 626,985,559 | 18.4 | % | |||||||||
| Total Finance | ||||||||||||
| (Cost $641,614,373) | 672,739,571 | 19.7 | % | |||||||||
| Residential Mortgage-Backed Securities | ||||||||||||
| U.S. Government Agency Issues | ||||||||||||
| Federal Gold Loan Mortgage Corporation (FGLMC): | ||||||||||||
| 3.000%, 05/01/2027 | 12,688,731 | 13,168,226 | 0.4 | % | ||||||||
| 5.000%, 03/01/2036 | 11,899,931 | 13,205,961 | 0.4 | % | ||||||||
| 3.500%, 06/01/2042 | 13,225,452 | 13,611,825 | 0.4 | % | ||||||||
| 3.500%, 07/01/2042 | 46,483,484 | 47,841,470 | 1.4 | % | ||||||||
| 3.000%, 08/01/2042 | 36,785,238 | 36,331,198 | 1.1 | % | ||||||||
| 3.000%, 06/01/2043 | 19,163,600 | 18,926,388 | 0.5 | % | ||||||||
| 3.000%, 08/01/2043 | 28,984,153 | 28,625,378 | 0.8 | % | ||||||||
| 3.000%-6.500%, 12/01/2020-02/01/2043 | 38,294,292 | 40,402,864 | 1.2 | % | ||||||||
| Federal National Mortgage Association (FNMA): | ||||||||||||
| 3.000%, 04/01/2027 | 23,817,912 | 24,771,589 | 0.7 | % | ||||||||
| 2.500%, 12/01/2027 | 24,257,493 | 24,674,971 | 0.7 | % | ||||||||
| 4.500%, 07/01/2030 | 12,849,960 | 14,051,593 | 0.4 | % | ||||||||
| 4.000%, 11/01/2031 | 12,190,033 | 13,118,331 | 0.4 | % | ||||||||
| 5.500%, 04/01/2036 | 11,024,870 | 12,341,912 | 0.4 | % | ||||||||
| 5.000%, 06/01/2040 | 15,416,569 | 17,147,565 | 0.5 | % | ||||||||
| 4.500%, 08/01/2040 | 14,375,825 | 15,575,422 | 0.4 | % | ||||||||
| 4.000%, 12/01/2041 | 37,383,089 | 39,760,521 | 1.2 | % | ||||||||
| 3.500%, 06/01/2042 | 13,656,309 | 14,079,443 | 0.4 | % | ||||||||
| 3.000%-7.500%, 12/25/2019-05/01/2042 | 100,010,640 | 107,065,009 | 3.1 | % | ||||||||
| Government National Mortgage Association (GNMA): | ||||||||||||
| 4.500%, 07/20/2040 | 26,701,095 | 29,256,436 | 0.9 | % | ||||||||
| 4.500%, 01/20/2041 | 18,569,158 | 20,345,572 | 0.6 | % | ||||||||
| 4.000%, 06/20/2042 | 37,560,959 | 40,264,669 | 1.2 | % | ||||||||
The accompanying notes are an integral part of these financial statements.
Page 49
Baird Core Plus Bond Fund
Summary Schedule of Investments, June 30, 2014 (Unaudited)
Long-Term Investments (cont.)
| Principal | % of | |||||||||||
| Amount | Value | Net Assets | ||||||||||
| Government National Mortgage | ||||||||||||
| Association (GNMA): (cont.) | ||||||||||||
| 3.500%, 09/20/2042 | $ | 20,046,410 | $ | 20,920,744 | 0.6 | % | ||||||
| 4.500%-6.500%, 12/20/2028-07/20/2040 | 6,947,396 | 7,648,160 | 0.2 | % | ||||||||
| Other U.S. Government Agency Issues# | 210,867 | 0.0 | % | |||||||||
| Total U.S. Government Agency Issues | ||||||||||||
| (Cost $606,049,362) | 613,346,114 | 17.9 | % | |||||||||
| Residential Mortgage-Backed Securities | ||||||||||||
| Non-U.S. Government Agency Issues | ||||||||||||
| Sequoia Mortgage Trust | ||||||||||||
| Series 2013-6, Class A2, 3.000%, 05/25/2043 | 19,002,766 | 17,664,762 | 0.5 | % | ||||||||
| Other Non-U.S. Government Agency Issues# | 126,422,430 | 3.7 | % | |||||||||
| Total Non-U.S. Government Agency Issues | ||||||||||||
| (Cost $144,411,967) | 144,087,192 | 4.2 | % | |||||||||
| Asset Backed Securities | ||||||||||||
| ABFC Trust | ||||||||||||
| Series 2006-OPT1, Class A3C2, 0.302%, 09/25/2036 | 14,510,819 | 12,511,780 | 0.4 | % | ||||||||
| ACE Securities Corp Home Equity Loan Trust | ||||||||||||
| Series 2006-OP1, Class A2C, 0.302%, 04/25/2036 | 20,120,352 | 18,952,084 | 0.5 | % | ||||||||
| Bank of America Funding Trust | ||||||||||||
| Series 2005-C, Class A1, 0.393%, 05/20/2035 | 19,869,928 | 18,473,072 | 0.5 | % | ||||||||
| J.P. Morgan Mortgage Acquisition Trust | ||||||||||||
| Series 2007-CH3, Class A3, 0.302%, 03/25/2037 | 16,845,622 | 16,552,592 | 0.5 | % | ||||||||
| Soundview Home Equity Loan Trust | ||||||||||||
| Series 2005-OPT4, Class 2A3, 0.672%, 12/25/2035 | 14,216,648 | 13,768,639 | 0.4 | % | ||||||||
| Other Asset Backed Securities#~ | 139,656,893 | 4.1 | % | |||||||||
| Total Asset Backed Securities | ||||||||||||
| (Cost $218,590,530) | 219,915,060 | 6.4 | % | |||||||||
| Commercial Mortgage-Backed Securities | ||||||||||||
| CD Commercial Mortgage Trust | ||||||||||||
| Series 2005-CD1, Class A4, 5.401%, 07/15/2044 | 18,103,731 | 18,824,043 | 0.6 | % | ||||||||
| COMM Mortgage Trust: | ||||||||||||
| Series 2005-C6, Class A5A, 5.116%, 06/10/2044 | 19,637,853 | 20,304,617 | 0.6 | % | ||||||||
| Series 2012-CR1, Class A3, 3.391%, 05/15/2045 | 25,842,000 | 26,575,732 | 0.8 | % | ||||||||
| Series 2012-CR2, Class A4, 3.147%, 08/15/2045 | 28,450,000 | 28,752,338 | 0.8 | % | ||||||||
| GE Capital Commercial Mortgage Corp. | ||||||||||||
| Series 2005-C4, Class A4, 5.489%, 11/10/2045 | 12,795,000 | 13,398,348 | 0.4 | % | ||||||||
| GS Mortgage Securities Corp II | ||||||||||||
| Series 2012-GCJ9, Class A3, 2.773%, 11/10/2045 | 28,185,000 | 27,590,437 | 0.8 | % | ||||||||
| J.P. Morgan Chase Commercial | ||||||||||||
| Mortgage Securities Trust | ||||||||||||
| Series 2005-CB12, Class A4, 4.895%, 09/12/2037 | 24,965,000 | 25,695,101 | 0.8 | % | ||||||||
| Morgan Stanley Bank of America Merrill Lynch Trust | ||||||||||||
| Series 2012-C6, Class A4, 2.858%, 11/15/2045 | 25,410,000 | 24,990,633 | 0.7 | % | ||||||||
The accompanying notes are an integral part of these financial statements.
Page 50
Baird Core Plus Bond Fund
Summary Schedule of Investments, June 30, 2014 (Unaudited)
Long-Term Investments (cont.)
| Principal | % of | |||||||||||
| Amount | Value | Net Assets | ||||||||||
| Morgan Stanley Capital I Trust | ||||||||||||
| Series 2005-HQ7, Class A4, 5.376%, 11/14/2042 | $ | 19,362,227 | $ | 20,079,636 | 0.6 | % | ||||||
| WFRBS Commercial Mortgage Trust | ||||||||||||
| Series 2012-C6, Class A4, 3.440%, 04/15/2045 | 14,000,000 | 14,491,386 | 0.4 | % | ||||||||
| Other Commercial Mortgage Backed Securities# | 47,400,081 | 1.4 | % | |||||||||
| Total Commercial Mortgage Backed Securities | ||||||||||||
| (Cost $273,703,836) | 268,102,352 | 7.9 | % | |||||||||
| Total Long-Term Investments | ||||||||||||
| (Cost $3,316,368,541) | 3,384,412,538 | 99.0 | % | |||||||||
| Short-Term Investments | ||||||||||||
| Shares | ||||||||||||
| Money Market Mutual Funds | ||||||||||||
| Dreyfus Institutional Cash Advantage Fund, 0.06%« | 47,543,180 | 47,543,180 | 1.4 | % | ||||||||
| Short-Term Investments Trust - | ||||||||||||
| Liquid Assets Portfolio, 0.06%« | 66,000,000 | 66,000,000 | 1.9 | % | ||||||||
| Total Short-Term Investments | ||||||||||||
| (Cost $113,543,180) | 113,543,180 | 3.3 | % | |||||||||
| Investments Purchased with Cash | ||||||||||||
| Proceeds from Securities Lending | ||||||||||||
| Investment Companies | ||||||||||||
| Mount Vernon Securities Lending | ||||||||||||
| Trust Prime Portfolio, 0.20%« | 229,724,869 | 229,724,869 | 6.7 | % | ||||||||
| Total Investment Companies | ||||||||||||
| (Cost $229,724,869) | 229,724,869 | 6.7 | % | |||||||||
| Total Investments Purchased With | ||||||||||||
| Cash Proceeds From Securities Lending | ||||||||||||
| (Cost $229,724,869) | 229,724,869 | 6.7 | % | |||||||||
| Total Investments | ||||||||||||
| (Cost $3,659,636,590) | 3,727,680,587 | 109.0 | % | |||||||||
| Liabilities in Excess of Other Assets | (307,728,567 | ) | (9.0 | )% | ||||||||
| TOTAL NET ASSETS | $ | 3,419,952,020 | 100.0 | % | ||||||||
Notes to Summary Schedule of Investments
| # | Represents the aggregate value, by category, securities that are not among the 50 largest holdings and, in total for any issuer, represent 1% or less of net assets. |
| * | Restricted Security Deemed Liquid |
| @ | This security or portion of this security is out on loan at June 30, 2014. |
| f | Foreign Security |
| « | 7-Day Yield |
| ~ | Groupings contain, in aggregate, restricted securities totaling $411,947,816 representing 12.05% of net assets. |
The accompanying notes are an integral part of these financial statements.
Page 51
Baird Core Plus Bond Fund
Summary Schedule of Investments, June 30, 2014 (Unaudited)
Summary of Fair Value Exposure at June 30, 2014 (Unaudited)
The Fund has adopted authoritative fair valuation accounting standards which establish a definition of fair value and set out a hierarchy for measuring fair value. These standards require additional disclosures about the various inputs and valuation techniques used to develop the measurements of fair value and a discussion on changes in valuation techniques and related inputs during the period. These standards define fair value as the price that would be received to sell an asset or paid to transfer a liability in an orderly transaction between market participants at the measurement date.
The fair value hierarchy is organized into three levels based upon the assumptions (referred to as “inputs”) used in pricing the asset or liability. These standards state that “observable inputs” reflect the assumptions market participants would use in pricing the asset or liability based on market data obtained from independent sources and “unobservable inputs” reflect an entity’s own assumptions about the assumptions market participants would use in pricing the asset or liability. These inputs are summarized into three broad levels and described below:
Level 1 – | Unadjusted quoted prices in active markets for identical unrestricted securities. |
Level 2 – | Other significant observable inputs (including quoted prices for similar securities, quoted prices in inactive markets, dealer indications, interest rates, yield curves, prepayment speeds, credit risk, default rates, inputs corroborated by observable market data, etc.). |
Level 3 – | Significant unobservable inputs (including the Fund’s own assumptions about the factors that market participants would use in valuing the security) based on the best information available. |
The inputs or methodology used for valuing securities are not necessarily an indication of the risk associated with investing in those securities.
The accompanying notes are an integral part of these financial statements.
Page 52
Baird Core Plus Bond Fund
Summary Schedule of Investments, June 30, 2014 (Unaudited)
Summary of Fair Value Exposure at June 30, 2014 (Unaudited) (cont.)
The following is a summary of the inputs used to value the Fund’s investments as of June 30, 2014:
| Level 1 | Level 2 | Level 3 | Total | |||||||||||||
| Fixed Income | ||||||||||||||||
| U.S. Treasury Securities | $ | — | $ | 463,801,519 | $ | — | $ | 463,801,519 | ||||||||
| Taxable Municipal Bonds | — | 86,943,584 | — | 86,943,584 | ||||||||||||
| Other Government Related Securities | — | 107,139,021 | — | 107,139,021 | ||||||||||||
| Corporate Bonds | — | 1,481,059,448 | 18,248 | 1,481,077,696 | ||||||||||||
| Residential Mortgage-Backed Securities – | ||||||||||||||||
| U.S. Government Agency Issues | — | 613,346,114 | — | 613,346,114 | ||||||||||||
| Residential Mortgage-Backed Securities – | ||||||||||||||||
| Non-U.S. Government Agency Issues | — | 144,087,192 | — | 144,087,192 | ||||||||||||
| Asset Backed Securities | — | 219,915,060 | — | 219,915,060 | ||||||||||||
| Commercial Mortgage-Backed Securities | — | 268,102,352 | — | 268,102,352 | ||||||||||||
| Total Fixed Income | — | 3,384,394,290 | 18,248 | 3,384,412,538 | ||||||||||||
| Short-Term Investments | ||||||||||||||||
| Money Market Mutual Funds | 113,543,180 | — | — | 113,543,180 | ||||||||||||
| Total Short-Term Investments | 113,543,180 | — | — | 113,543,180 | ||||||||||||
| Investments Purchased with Cash | ||||||||||||||||
| Proceeds from Securities Lending | ||||||||||||||||
| Investment Companies | 229,724,869 | — | — | 229,724,869 | ||||||||||||
| Total Investments Purchased with | ||||||||||||||||
| Cash Proceeds from Securities Lending | 229,724,869 | — | — | 229,724,869 | ||||||||||||
| Total Investments | $ | 343,268,049 | $ | 3,384,394,290 | $ | 18,248 | $ | 3,727,680,587 | ||||||||
Changes in valuation techniques may result in transfers into or out of current assigned levels within the hierarchy. There was one transfer between Level 2 and Level 3 fair value measurements during the reporting period, as compared to their classification from the prior year’s annual report. One security that is priced at fair value by the Valuation Committee instead of the Fund’s pricing vendor is valued using level 3 inputs.
Level 3 Reconciliation Disclosure
Following is a reconciliation of Level 3 assets for which significant unobservable inputs were used to determine fair value.
| Description | Investments in Securities | |||
| Balance as of December 31, 2013 | $ | — | ||
| Accrued discounts/premiums | — | |||
| Realized gain (loss) | — | |||
| Change in unrealized appreciation (depreciation) | — | |||
| Purchases | — | |||
| Sales | — | |||
| Transfers in and/or out of Level 3* | 18,248 | |||
| Balance as of June 30, 2014 | $ | 18,248 | ||
* Transfers between levels are recognized at the end of the reporting period.
The accompanying notes are an integral part of these financial statements.
Page 53
Additional Information on Fund Expenses
June 30, 2014 (Unaudited)
As a shareholder of a mutual fund, you incur two types of costs: (1) transaction costs, which may include sales charges (loads) on purchase payments, reinvested dividends, or other distributions; redemption fees; and exchange fees; and (2) ongoing costs, such as management fees; distribution and/or service (12b-1) fees; and other fund expenses. Although the Funds do not charge any sales loads, redemption fees, or other transaction fees, you will be assessed fees for outgoing wire transfers, returned checks and stop payment orders at prevailing rates charged by U.S. Bancorp Fund Services, LLC, the Funds’ transfer agent. If you request that a redemption be made by wire transfer, currently the Funds’ transfer agent charges a $15.00 fee.
This Example is intended to help you understand your ongoing costs (in dollars) of investing in each Fund and to compare these costs with the ongoing costs of investing in other mutual funds. The Example is based on an investment of $1,000 invested at the beginning of the period and held for the entire period (1/1/14 – 6/30/14).
Actual Expenses
The third and fourth columns of the following table provide information about account values based on actual returns and actual expenses. You may use the information in these columns, together with the amount you invested, to estimate the expenses that you paid over the period. Simply divide your account value by $1,000 (for example, an $8,600 account value divided by $1,000 = 8.6), then multiply the result by the number in the fourth column entitled “Expenses Paid During Period’’ to estimate the expenses you paid on your account during this period.
Hypothetical Example for Comparison Purposes
The fifth and sixth columns of the following table provide information about hypothetical account values and hypothetical expenses based on the Funds’ actual expense ratios and an assumed rate of return of 5% per year before expenses, which is not the Funds’ actual return. The hypothetical account values and expenses may not be used to estimate the actual ending account balance or expenses you paid for the period. You may use this information to compare the ongoing costs of investing in the Funds and other mutual funds. To do so, compare this 5% hypothetical example with the 5% hypothetical examples that appear in the shareholder reports of the other mutual funds. Please note that the expenses shown in the table are meant to highlight your ongoing costs only and do not reflect any transactional costs. Therefore, the sixth column of the table (entitled “Expenses Paid During Period”) is useful in comparing ongoing costs only, and will not help you determine the relative total costs of owning different mutual funds. In addition, if these transactional costs were included, your costs could have been higher.
Page 54
Additional Information on Fund Expenses
June 30, 2014 (Unaudited)
Actual vs. Hypothetical Returns
| Hypothetical | ||||||
| (5% return | ||||||
| Actual | before expenses) | |||||
| Fund’s | Beginning | Ending | Expenses | Ending | Expenses | |
| Annualized | Account | Account | Paid | Account | Paid | |
| Expense | Value | Value | During | Value | During | |
Ratio(1) | 1/1/14 | 6/30/14 | Period(1) | 6/30/14 | Period(1) | |
| Baird Ultra Short | ||||||
| Bond Fund | ||||||
| Institutional Class | 0.15% | $1,000.00 | $1,011.40 | $0.75 | $1,024.05 | $0.75 |
| Investor Class | 0.40% | $1,000.00 | $1,010.30 | $1.99 | $1,022.81 | $2.01 |
| Baird Short-Term | ||||||
| Bond Fund | ||||||
| Institutional Class | 0.30% | $1,000.00 | $1,013.20 | $1.50 | $1,023.31 | $1.51 |
| Investor Class | 0.55% | $1,000.00 | $1,012.00 | $2.74 | $1,022.07 | $2.76 |
| Baird Intermediate | ||||||
| Bond Fund | ||||||
| Institutional Class | 0.30% | $1,000.00 | $1,027.60 | $1.51 | $1,023.31 | $1.51 |
| Investor Class | 0.55% | $1,000.00 | $1,027.10 | $2.76 | $1,022.07 | $2.76 |
| Baird Intermediate | ||||||
| Municipal Bond Fund | ||||||
| Institutional Class | 0.30% | $1,000.00 | $1,032.70 | $1.51 | $1,023.31 | $1.51 |
| Investor Class | 0.55% | $1,000.00 | $1,030.80 | $2.77 | $1,022.07 | $2.76 |
| Baird Aggregate | ||||||
| Bond Fund | ||||||
| Institutional Class | 0.30% | $1,000.00 | $1,047.90 | $1.52 | $1,023.31 | $1.51 |
| Investor Class | 0.55% | $1,000.00 | $1,047.20 | $2.79 | $1,022.07 | $2.76 |
| Baird Core Plus | ||||||
| Bond Fund | ||||||
| Institutional Class | 0.30% | $1,000.00 | $1,048.10 | $1.52 | $1,023.31 | $1.51 |
| Investor Class | 0.55% | $1,000.00 | $1,046.10 | $2.79 | $1,022.07 | $2.76 |
| (1) | Expenses are equal to the Fund’s annualized net expense ratio multiplied by the average account value over the period, multiplied by 181 days and divided by 365 to reflect the one-half year period. |
Page 55
Statements of Assets and Liabilities
June 30, 2014 (Unaudited)
| Baird | Baird | Baird | ||||||||||
| Ultra Short | Short-Term | Intermediate | ||||||||||
| Bond Fund | Bond Fund | Bond Fund | ||||||||||
| ASSETS: | ||||||||||||
| Investments, at value (cost $14,033,732, | ||||||||||||
| $2,301,841,559 and $1,471,784,570, respectively)* | $ | 14,081,976 | $ | 2,314,676,711 | $ | 1,500,554,226 | ||||||
| Interest receivable | 70,959 | 17,067,599 | 10,909,310 | |||||||||
| Receivable for investments sold or paid down | — | — | 163 | |||||||||
| Receivable for Fund shares sold | — | 5,205,457 | 3,257,455 | |||||||||
| Uninvested cash | — | 11,953 | 2,972 | |||||||||
| Receivable for securities lending | — | 8,270 | 19,370 | |||||||||
| Total assets | 14,152,935 | 2,336,969,990 | 1,514,743,496 | |||||||||
| LIABILITIES: | ||||||||||||
| Payable for collateral received | ||||||||||||
| for securities loaned (Note 6) | — | 132,338,001 | 231,817,863 | |||||||||
| Payable for securities purchased | — | 10,824,898 | 16,204,683 | |||||||||
| Payable for Fund shares repurchased | — | 2,575,471 | 505,726 | |||||||||
| Payable to Advisor and Distributor | 1,757 | 556,471 | 319,339 | |||||||||
| Total liabilities | 1,757 | 146,294,841 | 248,847,611 | |||||||||
| NET ASSETS | $ | 14,151,178 | $ | 2,190,675,149 | $ | 1,265,895,885 | ||||||
| NET ASSETS CONSIST OF: | ||||||||||||
| Capital stock | $ | 14,100,657 | $ | 2,175,286,997 | $ | 1,235,243,816 | ||||||
| Undistributed (distributions in excess of) | ||||||||||||
| net investment income | (2,161 | ) | (138,031 | ) | 434,697 | |||||||
| Accumulated net realized | ||||||||||||
| gain on investments sold | 4,438 | 2,691,031 | 1,447,716 | |||||||||
| Net unrealized appreciation | ||||||||||||
| on investments | 48,244 | 12,835,152 | 28,769,656 | |||||||||
| NET ASSETS | $ | 14,151,178 | $ | 2,190,675,149 | $ | 1,265,895,885 | ||||||
| INSTITUTIONAL CLASS SHARES | ||||||||||||
| Net Assets | $ | 14,053,862 | $ | 2,163,819,864 | $ | 1,213,224,035 | ||||||
| Shares outstanding ($0.01 par value, | ||||||||||||
| unlimited shares authorized) | 1,395,593 | 222,198,887 | 108,598,937 | |||||||||
| Net asset value, offering and | ||||||||||||
| redemption price per share | $ | 10.07 | $ | 9.74 | $ | 11.17 | ||||||
| INVESTOR CLASS SHARES | ||||||||||||
| Net Assets | $ | 97,316 | $ | 26,855,285 | $ | 52,671,850 | ||||||
| Shares outstanding ($0.01 par value, | ||||||||||||
| unlimited shares authorized) | 9,667 | 2,757,935 | 4,533,995 | |||||||||
| Net asset value, offering and | ||||||||||||
| redemption price per share | $ | 10.07 | $ | 9.74 | $ | 11.62 | ||||||
| * | Includes securities out on loan to brokers with a market value of $0, $129,636,231 and $227,302,513, respectively. |
The accompanying notes are an integral part of these financial statements.
Page 56
Statements of Assets and Liabilities
June 30, 2014 (Unaudited)
| Baird | ||||||||||||
| Intermediate | Baird | Baird | ||||||||||
| Municipal | Aggregate | Core Plus | ||||||||||
| Bond Fund | Bond Fund | Bond Fund | ||||||||||
| ASSETS: | ||||||||||||
| Investments, at value (cost $1,028,473,777, | ||||||||||||
| $2,420,684,813 and | ||||||||||||
| $3,659,636,590, respectively)* | $ | 1,073,572,824 | $ | 2,484,540,783 | $ | 3,727,680,587 | ||||||
| Interest receivable | 11,941,919 | 16,753,987 | 26,789,653 | |||||||||
| Receivable for investments sold or paid down | — | 5,247 | 1,954,896 | |||||||||
| Receivable for Fund shares sold | 2,112,967 | 9,700,208 | 17,817,512 | |||||||||
| Receivable for securities lending | — | 10,690 | 44,113 | |||||||||
| Uninvested cash | 125 | — | 2,533,982 | |||||||||
| Total assets | 1,087,627,835 | 2,511,010,915 | 3,776,820,743 | |||||||||
| LIABILITIES: | ||||||||||||
| Payable for collateral received | ||||||||||||
| for securities loaned (Note 6) | — | 230,827,699 | 229,724,869 | |||||||||
| Payable for securities purchased | 5,642,672 | 25,580,476 | 124,696,546 | |||||||||
| Payable for Fund shares repurchased | 563,104 | 6,180,050 | 1,348,657 | |||||||||
| Payable to Advisor and Distributor | 323,533 | 586,709 | 1,098,651 | |||||||||
| Other liabilities | — | 248,575 | — | |||||||||
| Total liabilities | 6,529,309 | 263,423,509 | 356,868,723 | |||||||||
| NET ASSETS | $ | 1,081,098,526 | $ | 2,247,587,406 | $ | 3,419,952,020 | ||||||
| NET ASSETS CONSIST OF: | ||||||||||||
| Capital stock | $ | 1,036,095,097 | $ | 2,195,371,827 | $ | 3,365,932,683 | ||||||
| Undistributed (distributions in excess of) | ||||||||||||
| net investment income | 441,605 | (104,186 | ) | 346,328 | ||||||||
| Accumulated net realized | ||||||||||||
| loss on investments sold | (537,223 | ) | (11,536,205 | ) | (14,370,988 | ) | ||||||
| Net unrealized appreciation | ||||||||||||
| on investments | 45,099,047 | 63,855,970 | 68,043,997 | |||||||||
| NET ASSETS | $ | 1,081,098,526 | $ | 2,247,587,406 | $ | 3,419,952,020 | ||||||
| INSTITUTIONAL CLASS SHARES | ||||||||||||
| Net Assets | $ | 872,668,510 | $ | 2,057,774,150 | $ | 2,254,243,169 | ||||||
| Shares outstanding ($0.01 par value, | ||||||||||||
| unlimited shares authorized) | 74,110,041 | 191,474,521 | 202,809,447 | |||||||||
| Net asset value, offering and | ||||||||||||
| redemption price per share | $ | 11.78 | $ | 10.75 | $ | 11.12 | ||||||
| INVESTOR CLASS SHARES | ||||||||||||
| Net Assets | $ | 208,430,016 | $ | 189,813,256 | $ | 1,165,708,851 | ||||||
| Shares outstanding ($0.01 par value, | ||||||||||||
| unlimited shares authorized) | 17,322,467 | 17,138,335 | 101,174,394 | |||||||||
| Net asset value, offering and | ||||||||||||
| redemption price per share | $ | 12.03 | $ | 11.08 | $ | 11.52 | ||||||
| * | Includes securities out on loan to brokers with a market value of $0, $226,586,682 and $225,481,186, respectively. |
The accompanying notes are an integral part of these financial statements.
Page 57
Statements of Operations
Six Months Ended June 30, 2014 (Unaudited)
| Baird | Baird | Baird | ||||||||||
| Ultra Short | Short-Term | Intermediate | ||||||||||
| Bond Fund | Bond Fund | Bond Fund | ||||||||||
| INVESTMENT INCOME: | ||||||||||||
| Interest income, net of paydowns | $ | 61,969 | $ | 19,816,528 | $ | 16,395,442 | ||||||
| Income from securities lending (Note 6) | — | 112,402 | 156,025 | |||||||||
| Other income | — | 7,905 | 3,000 | |||||||||
| Total investment income | 61,969 | 19,936,835 | 16,554,467 | |||||||||
| EXPENSES: | ||||||||||||
| Investment advisory fees | 14,445 | 2,641,165 | 1,490,476 | |||||||||
| Administration fees | 2,889 | 528,233 | 298,095 | |||||||||
| Distribution expense – | ||||||||||||
| Investor Class Shares (Note 8) | 50 | 32,893 | 59,059 | |||||||||
| Total expenses | 17,384 | 3,202,291 | 1,847,630 | |||||||||
| Expense reimbursement by Advisor (Note 5) | (8,646 | ) | — | — | ||||||||
| Net expenses | 8,738 | 3,202,291 | 1,847,630 | |||||||||
| NET INVESTMENT INCOME | 53,231 | 16,734,544 | 14,706,837 | |||||||||
| REALIZED AND UNREALIZED GAIN | ||||||||||||
| ON INVESTMENTS: | ||||||||||||
| Net realized gain on investments | 4,438 | 2,363,783 | 1,469,372 | |||||||||
| Change in unrealized appreciation/ | ||||||||||||
| depreciation on investments | 48,244 | 8,074,280 | 16,662,026 | |||||||||
| Net realized and unrealized gain on investments | 52,682 | 10,438,063 | 18,131,398 | |||||||||
| NET INCREASE IN NET ASSETS | ||||||||||||
| RESULTING FROM OPERATIONS | $ | 105,913 | $ | 27,172,607 | $ | 32,838,235 | ||||||
The accompanying notes are an integral part of these financial statements.
Page 58
Statements of Operations
Six Months Ended June 30, 2014 (Unaudited)
| Baird | ||||||||||||
| Intermediate | Baird | Baird | ||||||||||
| Municipal | Aggregate | Core Plus | ||||||||||
| Bond Fund | Bond Fund | Bond Fund | ||||||||||
| INVESTMENT INCOME: | ||||||||||||
| Interest income, net of paydowns | $ | 14,903,209 | $ | 32,302,508 | $ | 50,088,190 | ||||||
| Income from securities lending (Note 6) | — | 119,773 | 292,724 | |||||||||
| Other income | — | 10,602 | 16,964 | |||||||||
| Total investment income | 14,903,209 | 32,432,883 | 50,397,878 | |||||||||
| EXPENSES: | ||||||||||||
| Investment advisory fees | 1,281,491 | 2,477,095 | 3,772,975 | |||||||||
| Administration fees | 256,298 | 495,419 | 754,595 | |||||||||
| Distribution expense – | ||||||||||||
| Investor Class Shares (Note 8) | 254,394 | 211,379 | 1,357,620 | |||||||||
| Total expenses | 1,792,183 | 3,183,893 | 5,885,190 | |||||||||
| NET INVESTMENT INCOME | 13,111,026 | 29,248,990 | 44,512,688 | |||||||||
| REALIZED AND UNREALIZED GAIN | ||||||||||||
| (LOSS) ON INVESTMENTS: | ||||||||||||
| Net realized loss on investments | (166,587 | ) | (1,034,409 | ) | (928,867 | ) | ||||||
| Change in unrealized appreciation/ | ||||||||||||
| depreciation on investments | 19,591,910 | 63,563,259 | 95,778,423 | |||||||||
| Net realized and unrealized gain on investments | 19,425,323 | 62,528,850 | 94,849,556 | |||||||||
| NET INCREASE IN NET ASSETS | ||||||||||||
| RESULTING FROM OPERATIONS | $ | 32,536,349 | $ | 91,777,840 | $ | 139,362,244 | ||||||
The accompanying notes are an integral part of these financial statements.
Page 59
Statement of Changes in Net Assets
Baird Ultra Short Bond Fund
| Six Months Ended | ||||
| June 30, 2014^ | ||||
| (Unaudited) | ||||
| OPERATIONS: | ||||
| Net investment income | $ | 53,231 | ||
| Net realized gain on investments | 4,438 | |||
| Change in unrealized appreciation/depreciation on investments | 48,244 | |||
| Net increase in net assets resulting from operations | 105,913 | |||
| CAPITAL SHARE TRANSACTIONS: | ||||
| Proceeds from shares sold | 14,104,669 | |||
| Shares issued to holders in reinvestment of distributions | 41,019 | |||
| Cost of shares redeemed | (45,031 | ) | ||
| Net increase in net assets resulting from capital share transactions | 14,100,657 | |||
| DISTRIBUTIONS TO INSTITUTIONAL CLASS SHAREHOLDERS: | ||||
| From net investment income | (55,228 | ) | ||
| Total Distributions | (55,228 | ) | ||
| DISTRIBUTIONS TO INVESTOR CLASS SHAREHOLDERS: | ||||
| From net investment income | (164 | ) | ||
| Total Distributions | (164 | ) | ||
| TOTAL INCREASE IN NET ASSETS | 14,151,178 | |||
| NET ASSETS: | ||||
| Beginning of period | — | |||
| End of period (including distributions in excess of net investment | ||||
| income of $(2,161)) | $ | 14,151,178 | ||
^ Commencement of operations was December 31, 2013.
The accompanying notes are an integral part of these financial statements.
Page 60
Statement of Changes in Net Assets
Baird Short-Term Bond Fund
| Six Months Ended | ||||||||
| June 30, 2014 | Year Ended | |||||||
| (Unaudited) | December 31, 2013 | |||||||
| OPERATIONS: | ||||||||
| Net investment income | $ | 16,734,544 | $ | 27,854,126 | ||||
| Net realized gain on investments | 2,363,783 | 4,483,161 | ||||||
| Change in unrealized appreciation/depreciation | ||||||||
| on investments | 8,074,280 | (9,991,149 | ) | |||||
| Net increase in net assets | ||||||||
| resulting from operations | 27,172,607 | 22,346,138 | ||||||
| CAPITAL SHARE TRANSACTIONS: | ||||||||
| Proceeds from shares sold | 491,439,513 | 1,321,429,969 | ||||||
| Shares issued to holders in reinvestment of distributions | 14,598,636 | 28,803,751 | ||||||
| Cost of shares redeemed | (334,540,024 | ) | (628,082,008 | ) | ||||
| Net increase in net assets resulting | ||||||||
| from capital share transactions | 171,498,125 | 722,151,712 | ||||||
| DISTRIBUTIONS TO | ||||||||
| INSTITUTIONAL CLASS SHAREHOLDERS: | ||||||||
| From net investment income | (16,778,953 | ) | (28,830,295 | ) | ||||
| From net realized gains | — | (3,715,930 | ) | |||||
| Total Distributions | (16,778,953 | ) | (32,546,225 | ) | ||||
| DISTRIBUTIONS TO | ||||||||
| INVESTOR CLASS SHAREHOLDERS: | ||||||||
| From net investment income | (181,219 | ) | (101,725 | ) | ||||
| From net realized gains | — | (43,827 | ) | |||||
| Total Distributions | (181,219 | ) | (145,552 | ) | ||||
| TOTAL INCREASE IN NET ASSETS | 181,710,560 | 711,806,073 | ||||||
| NET ASSETS: | ||||||||
| Beginning of period | 2,008,964,589 | 1,297,158,516 | ||||||
| End of period (including distributions in excess | ||||||||
| of net investment income and undistributed | ||||||||
| net investment income of $(138,031) and | ||||||||
| $87,597, respectively) | $ | 2,190,675,149 | $ | 2,008,964,589 | ||||
The accompanying notes are an integral part of these financial statements.
Page 61
Statement of Changes in Net Assets
Baird Intermediate Bond Fund
| Six Months Ended | ||||||||
| June 30, 2014 | Year Ended | |||||||
| (Unaudited) | December 31, 2013 | |||||||
| OPERATIONS: | ||||||||
| Net investment income | $ | 14,706,837 | $ | 24,284,984 | ||||
| Net realized gain on investments | 1,469,372 | 280,244 | ||||||
| Change in unrealized appreciation/depreciation | ||||||||
| on investments | 16,662,026 | (25,956,146 | ) | |||||
| Net increase (decrease) in net assets | ||||||||
| resulting from operations | 32,838,235 | (1,390,918 | ) | |||||
| CAPITAL SHARE TRANSACTIONS: | ||||||||
| Proceeds from shares sold | 154,105,090 | 446,423,832 | ||||||
| Shares issued to holders in reinvestment of distributions | 12,163,826 | 22,280,498 | ||||||
| Cost of shares redeemed | (74,610,871 | ) | (179,390,475 | ) | ||||
| Net increase in net assets resulting | ||||||||
| from capital share transactions | 91,658,045 | 289,313,855 | ||||||
| DISTRIBUTIONS TO | ||||||||
| INSTITUTIONAL CLASS SHAREHOLDERS: | ||||||||
| From net investment income | (13,808,824 | ) | (23,931,138 | ) | ||||
| From net realized gains | — | (1,670,359 | ) | |||||
| Total Distributions | (13,808,824 | ) | (25,601,497 | ) | ||||
| DISTRIBUTIONS TO | ||||||||
| INVESTOR CLASS SHAREHOLDERS: | ||||||||
| From net investment income | (497,496 | ) | (763,548 | ) | ||||
| From net realized gains | — | (60,340 | ) | |||||
| Total Distributions | (497,496 | ) | (823,888 | ) | ||||
| TOTAL INCREASE IN NET ASSETS | 110,189,960 | 261,497,552 | ||||||
| NET ASSETS: | ||||||||
| Beginning of period | 1,155,705,925 | 894,208,373 | ||||||
| End of period (including undistributed net investment | ||||||||
| income of $434,697 and $34,180, respectively) | $ | 1,265,895,885 | $ | 1,155,705,925 | ||||
The accompanying notes are an integral part of these financial statements.
Page 62
Statement of Changes in Net Assets
Baird Intermediate Municipal Bond Fund
| Six Months Ended | ||||||||
| June 30, 2014 | Year Ended | |||||||
| (Unaudited) | December 31, 2013 | |||||||
| OPERATIONS: | ||||||||
| Net investment income | $ | 13,111,026 | $ | 29,327,292 | ||||
| Net realized gain (loss) on investments | (166,587 | ) | 393,206 | |||||
| Change in unrealized | ||||||||
| appreciation/depreciation on investments | 19,591,910 | (45,857,361 | ) | |||||
| Net increase (decrease) in net assets | ||||||||
| resulting from operations | 32,536,349 | (16,136,863 | ) | |||||
| CAPITAL SHARE TRANSACTIONS: | ||||||||
| Proceeds from shares sold | 178,642,429 | 375,180,193 | ||||||
| Shares issued to holders in reinvestment of distributions | 10,980,204 | 24,773,117 | ||||||
| Cost of shares redeemed | (135,385,633 | ) | (569,130,806 | ) | ||||
| Net increase (decrease) in net assets | ||||||||
| resulting from capital share transactions | 54,237,000 | (169,177,496 | ) | |||||
| DISTRIBUTIONS TO | ||||||||
| INSTITUTIONAL CLASS SHAREHOLDERS: | ||||||||
| From net investment income | (10,408,391 | ) | (23,787,845 | ) | ||||
| Total Distributions | (10,408,391 | ) | (23,787,845 | ) | ||||
| DISTRIBUTIONS TO | ||||||||
| INVESTOR CLASS SHAREHOLDERS: | ||||||||
| From net investment income | (2,261,030 | ) | (5,549,463 | ) | ||||
| Total Distributions | (2,261,030 | ) | (5,549,463 | ) | ||||
| TOTAL INCREASE (DECREASE) IN NET ASSETS | 74,103,928 | (214,651,667 | ) | |||||
| NET ASSETS: | ||||||||
| Beginning of period | 1,006,994,598 | 1,221,646,265 | ||||||
| End of period (including undistributed net investment | ||||||||
| income of $441,605 and $0, respectively) | $ | 1,081,098,526 | $ | 1,006,994,598 | ||||
The accompanying notes are an integral part of these financial statements.
Page 63
Statement of Changes in Net Assets
Baird Aggregate Bond Fund
| Six Months Ended | ||||||||
| June 30, 2014 | Year Ended | |||||||
| (Unaudited) | December 31, 2013 | |||||||
| OPERATIONS: | ||||||||
| Net investment income | $ | 29,248,990 | $ | 51,332,825 | ||||
| Net realized gain (loss) on investments | (1,034,409 | ) | 378,075 | |||||
| Change in unrealized appreciation/depreciation | ||||||||
| on investments | 63,563,259 | (72,138,203 | ) | |||||
| Net increase (decrease) in net assets | ||||||||
| resulting from operations | 91,777,840 | (20,427,303 | ) | |||||
| CAPITAL SHARE TRANSACTIONS: | ||||||||
| Proceeds from shares sold | 566,818,534 | 1,010,876,966 | ||||||
| Shares issued to holders in reinvestment of distributions | 24,751,670 | 44,941,674 | ||||||
| Cost of shares redeemed | (213,269,308 | ) | (717,490,386 | ) | ||||
| Net increase in net assets resulting | ||||||||
| from capital share transactions | 378,300,896 | 338,328,254 | ||||||
| DISTRIBUTIONS TO | ||||||||
| INSTITUTIONAL CLASS SHAREHOLDERS: | ||||||||
| From net investment income | (27,150,491 | ) | (52,544,503 | ) | ||||
| Total Distributions | (27,150,491 | ) | (52,544,503 | ) | ||||
| DISTRIBUTIONS TO | ||||||||
| INVESTOR CLASS SHAREHOLDERS: | ||||||||
| From net investment income | (2,266,008 | ) | (3,280,448 | ) | ||||
| Total Distributions | (2,266,008 | ) | (3,280,448 | ) | ||||
| TOTAL INCREASE IN NET ASSETS | 440,662,237 | 262,076,000 | ||||||
| NET ASSETS: | ||||||||
| Beginning of period | 1,806,925,169 | 1,544,849,169 | ||||||
| End of period (including distributions in excess of net | ||||||||
| investment income and undistributed net investment | ||||||||
| income of $(104,186) and $63,323, respectively) | $ | 2,247,587,406 | $ | 1,806,925,169 | ||||
The accompanying notes are an integral part of these financial statements.
Page 64
Statement of Changes in Net Assets
Baird Core Plus Bond Fund
| Six Months Ended | ||||||||
| June 30, 2014 | Year Ended | |||||||
| (Unaudited) | December 31, 2013 | |||||||
| OPERATIONS: | ||||||||
| Net investment income | $ | 44,512,688 | $ | 76,999,110 | ||||
| Net realized loss on investments | (928,867 | ) | (5,595,901 | ) | ||||
| Change in unrealized appreciation/depreciation | ||||||||
| on investments | 95,778,423 | (116,074,581 | ) | |||||
| Net increase (decrease) in net assets | ||||||||
| resulting from operations | 139,362,244 | (44,671,372 | ) | |||||
| CAPITAL SHARE TRANSACTIONS: | ||||||||
| Proceeds from shares sold | 770,873,725 | 1,377,196,811 | ||||||
| Shares issued to holders in reinvestment of distributions | 42,746,446 | 81,644,399 | ||||||
| Cost of shares redeemed | (322,408,694 | ) | (1,103,175,773 | ) | ||||
| Net increase in net assets resulting | ||||||||
| from capital share transactions | 491,211,477 | 355,665,437 | ||||||
| DISTRIBUTIONS TO | ||||||||
| INSTITUTIONAL CLASS SHAREHOLDERS: | ||||||||
| From net investment income | (29,756,278 | ) | (54,209,559 | ) | ||||
| From net realized gains | — | (1,221,572 | ) | |||||
| Total Distributions | (29,756,278 | ) | (55,431,131 | ) | ||||
| DISTRIBUTIONS TO | ||||||||
| INVESTOR CLASS SHAREHOLDERS: | ||||||||
| From net investment income | (14,679,726 | ) | (30,443,741 | ) | ||||
| From net realized gains | — | (694,353 | ) | |||||
| Total Distributions | (14,679,726 | ) | (31,138,094 | ) | ||||
| TOTAL INCREASE IN NET ASSETS | 586,137,717 | 224,424,840 | ||||||
| NET ASSETS: | ||||||||
| Beginning of period | 2,833,814,303 | 2,609,389,463 | ||||||
| End of period (including undistributed net investment | ||||||||
| income of $346,328 and $269,644, respectively) | $ | 3,419,952,020 | $ | 2,833,814,303 | ||||
The accompanying notes are an integral part of these financial statements.
Page 65
Financial Highlights
Baird Ultra Short Bond Fund – Institutional Class^
| Six Months Ended | ||||
| June 30, 2014 | ||||
| (Unaudited) | ||||
| Per Share Data: | ||||
| Net asset value, beginning of period | $ | 10.00 | ||
| Income from investment operations: | ||||
| Net investment income | 0.04 | |||
| Net realized and unrealized gains on investments | 0.07 | |||
| Total from investment operations | 0.11 | |||
| Less distributions: | ||||
| Distributions from net investment income | (0.04 | ) | ||
| Total distributions | (0.04 | ) | ||
| Net asset value, end of period | $ | 10.07 | ||
| Total return | 1.14 | %(1) | ||
| Supplemental data and ratios: | ||||
| Net assets, end of period (millions) | $ | 14.1 | ||
| Ratio of expenses to average net assets | 0.15 | %(2) | ||
| Ratio of expenses to average net assets (before waivers) | 0.30 | %(2) | ||
| Ratio of net investment income to average net assets | 0.92 | %(2) | ||
| Ratio of net investment income to average net assets (before waivers) | 0.77 | %(2) | ||
Portfolio turnover rate(3) | 31.8 | %(1) | ||
| ^ | Commencement of operations was December 31, 2013. |
| (1) | Not annualized. |
| (2) | Annualized. |
| (3) | Portfolio turnover is calculated on the basis of the Fund as a whole without distinguishing between the classes of shares issued. |
The accompanying notes are an integral part of these financial statements.
Page 66
Financial Highlights
Baird Ultra Short Bond Fund – Investor Class^
| Six Months Ended | ||||
| June 30, 2014 | ||||
| (Unaudited) | ||||
| Per Share Data: | ||||
| Net asset value, beginning of period | $ | 10.00 | ||
| Income from investment operations: | ||||
| Net investment income | 0.03 | |||
| Net realized and unrealized gains on investments | 0.07 | |||
| Total from investment operations | 0.10 | |||
| Less distributions: | ||||
| Distributions from net investment income | (0.03 | ) | ||
| Total distributions | (0.03 | ) | ||
| Net asset value, end of period | $ | 10.07 | ||
| Total return | 1.03 | %(1) | ||
| Supplemental data and ratios: | ||||
| Net assets, end of period (thousands) | $ | 97.3 | ||
| Ratio of expenses to average net assets | 0.40 | %(2) | ||
| Ratio of expenses to average net assets (before waivers) | 0.55 | %(2) | ||
| Ratio of net investment income to average net assets | 0.68 | %(2) | ||
| Ratio of net investment income to average net assets (before waivers) | 0.53 | %(2) | ||
Portfolio turnover rate(3) | 31.8 | %(1) | ||
| ^ | Commencement of operations was December 31, 2013. |
| (1) | Not annualized. |
| (2) | Annualized. |
| (3) | Portfolio turnover is calculated on the basis of the Fund as a whole without distinguishing between the classes of shares issued. |
The accompanying notes are an integral part of these financial statements.
Page 67
Financial Highlights
Baird Short-Term Bond Fund – Institutional Class
| Six Months | ||||||||||||||||||||||||
| Ended | ||||||||||||||||||||||||
| June 30, 2014 | Year Ended December 31, | |||||||||||||||||||||||
| (Unaudited) | 2013 | 2012 | 2011 | 2010 | 2009 | |||||||||||||||||||
| Per Share Data: | ||||||||||||||||||||||||
| Net asset value, | ||||||||||||||||||||||||
| beginning of period | $ | 9.69 | $ | 9.75 | $ | 9.59 | $ | 9.68 | $ | 9.57 | $ | 9.25 | ||||||||||||
| Income from | ||||||||||||||||||||||||
| investment operations: | ||||||||||||||||||||||||
| Net investment income | 0.08 | 0.17 | (1) | 0.22 | 0.23 | 0.29 | 0.41 | |||||||||||||||||
| Net realized and unrealized | ||||||||||||||||||||||||
| gains (losses) on investments | 0.05 | (0.04 | ) | 0.17 | (0.03 | ) | 0.13 | 0.32 | ||||||||||||||||
| Total from | ||||||||||||||||||||||||
| investment operations | 0.13 | 0.13 | 0.39 | 0.20 | 0.42 | 0.73 | ||||||||||||||||||
| Less distributions: | ||||||||||||||||||||||||
| Distributions from net | ||||||||||||||||||||||||
| investment income | (0.08 | ) | (0.17 | ) | (0.22 | ) | (0.23 | ) | (0.29 | ) | (0.41 | ) | ||||||||||||
| Distributions from | ||||||||||||||||||||||||
| net realized gains | — | (0.02 | ) | (0.01 | ) | (0.06 | ) | (0.02 | ) | — | ||||||||||||||
| Total distributions | (0.08 | ) | (0.19 | ) | (0.23 | ) | (0.29 | ) | (0.31 | ) | (0.41 | ) | ||||||||||||
| Net asset value, end of period | $ | 9.74 | $ | 9.69 | $ | 9.75 | $ | 9.59 | $ | 9.68 | $ | 9.57 | ||||||||||||
| Total return | 1.32 | %(2) | 1.33 | % | 4.16 | % | 2.08 | % | 4.39 | % | 8.14 | % | ||||||||||||
| Supplemental data and ratios: | ||||||||||||||||||||||||
| Net assets, | ||||||||||||||||||||||||
| end of period (millions) | $ | 2,163.8 | $ | 1,985.0 | $ | 1,295.7 | $ | 1,017.2 | $ | 919.0 | $ | 606.2 | ||||||||||||
| Ratio of expenses | ||||||||||||||||||||||||
| to average net assets | 0.30 | %(3) | 0.30 | % | 0.30 | % | 0.30 | % | 0.30 | % | 0.30 | % | ||||||||||||
| Ratio of net | ||||||||||||||||||||||||
| investment income | ||||||||||||||||||||||||
| to average net assets | 1.59 | %(3) | 1.71 | % | 2.23 | % | 2.40 | % | 2.92 | % | 4.28 | % | ||||||||||||
Portfolio turnover rate(4) | 26.5 | %(2) | 45.1 | % | 40.1 | % | 61.1 | % | 58.7 | % | 55.5 | % | ||||||||||||
| (1) | Calculated using average shares outstanding during the year. |
| (2) | Not annualized. |
| (3) | Annualized. |
| (4) | Portfolio turnover is calculated on the basis of the Fund as a whole without distinguishing between the classes of shares issued. |
The accompanying notes are an integral part of these financial statements.
Page 68
Financial Highlights
Baird Short-Term Bond Fund – Investor Class
| September 19, 2012^ | ||||||||||||
| Six Months Ended | Year Ended | through | ||||||||||
| June 30, 2014 | December 31, | December 31, | ||||||||||
| (Unaudited) | 2013 | 2012 | ||||||||||
| Per Share Data: | ||||||||||||
| Net asset value, beginning of period | $ | 9.69 | $ | 9.75 | $ | 9.77 | ||||||
| Income from investment operations: | ||||||||||||
| Net investment income | 0.06 | 0.15 | (1) | 0.06 | ||||||||
| Net realized and unrealized | ||||||||||||
| gains (losses) on investments | 0.06 | (0.04 | ) | 0.00 | (2) | |||||||
| Total from investment operations | 0.12 | 0.11 | 0.06 | |||||||||
| Less distributions: | ||||||||||||
| Distributions from net investment income | (0.07 | ) | (0.15 | ) | (0.07 | ) | ||||||
| Distributions from net realized gains | — | (0.02 | ) | (0.01 | ) | |||||||
| Total distributions | (0.07 | ) | (0.17 | ) | (0.08 | ) | ||||||
| Net asset value, end of period | $ | 9.74 | $ | 9.69 | $ | 9.75 | ||||||
| Total return | 1.20 | %(3) | 1.11 | % | 0.68 | %(3) | ||||||
| Supplemental data and ratios: | ||||||||||||
| Net assets, end of period (millions) | $ | 26.9 | $ | 2.5 | $ | 1.5 | ||||||
| Ratio of expenses to average net assets | 0.55 | %(4) | 0.55 | % | 0.55 | %(4) | ||||||
| Ratio of net investment income | ||||||||||||
| to average net assets | 1.34 | %(4) | 1.46 | % | 1.98 | %(4) | ||||||
Portfolio turnover rate(5) | 26.5 | %(3) | 45.1 | % | 40.1 | %(3) | ||||||
| ^ | Commencement of Operations. |
| (1) | Calculated using average shares outstanding during the year. |
| (2) | Amount is less than $0.005. |
| (3) | Not annualized. |
| (4) | Annualized. |
| (5) | Portfolio turnover is calculated on the basis of the Fund as a whole without distinguishing between the classes of shares issued. |
The accompanying notes are an integral part of these financial statements.
Page 69
Financial Highlights
Baird Intermediate Bond Fund – Institutional Class
| Six Months | ||||||||||||||||||||||||
| Ended | ||||||||||||||||||||||||
| June 30, 2014 | Year Ended December 31, | |||||||||||||||||||||||
| (Unaudited) | 2013 | 2012 | 2011 | 2010 | 2009 | |||||||||||||||||||
| Per Share Data: | ||||||||||||||||||||||||
| Net asset value, | ||||||||||||||||||||||||
| beginning of period | $ | 11.00 | $ | 11.31 | $ | 11.06 | $ | 10.87 | $ | 10.61 | $ | 10.00 | ||||||||||||
| Income from | ||||||||||||||||||||||||
| investment operations: | ||||||||||||||||||||||||
| Net investment income | 0.14 | 0.27 | 0.33 | (1) | 0.39 | 0.44 | (1) | 0.51 | (1) | |||||||||||||||
| Net realized and unrealized | ||||||||||||||||||||||||
| gains (losses) on investments | 0.16 | (0.29 | ) | 0.38 | 0.27 | 0.35 | 0.63 | |||||||||||||||||
| Total from | ||||||||||||||||||||||||
| investment operations | 0.30 | (0.02 | ) | 0.71 | 0.66 | 0.79 | 1.14 | |||||||||||||||||
| Less distributions: | ||||||||||||||||||||||||
| Distributions from net | ||||||||||||||||||||||||
| investment income | (0.13 | ) | (0.27 | ) | (0.33 | ) | (0.39 | ) | (0.44 | ) | (0.51 | ) | ||||||||||||
| Distributions from | ||||||||||||||||||||||||
| net realized gains | — | (0.02 | ) | (0.13 | ) | (0.08 | ) | (0.09 | ) | (0.02 | ) | |||||||||||||
| Total distributions | (0.13 | ) | (0.29 | ) | (0.46 | ) | (0.47 | ) | (0.53 | ) | (0.53 | ) | ||||||||||||
| Net asset value, end of period | $ | 11.17 | $ | 11.00 | $ | 11.31 | $ | 11.06 | $ | 10.87 | $ | 10.61 | ||||||||||||
| Total return | 2.76 | %(2) | (0.17 | )% | 6.52 | % | 6.14 | % | 7.54 | % | 11.76 | % | ||||||||||||
| Supplemental data and ratios: | ||||||||||||||||||||||||
| Net assets, | ||||||||||||||||||||||||
| end of period (millions) | $ | 1,213.2 | $ | 1,113.7 | $ | 867.5 | $ | 703.2 | $ | 591.2 | $ | 527.8 | ||||||||||||
| Ratio of expenses | ||||||||||||||||||||||||
| to average net assets | 0.30 | %(3) | 0.30 | % | 0.30 | % | 0.30 | % | 0.30 | % | 0.30 | % | ||||||||||||
| Ratio of net | ||||||||||||||||||||||||
| investment income | ||||||||||||||||||||||||
| to average net assets | 2.48 | %(3) | 2.45 | % | 2.95 | % | 3.49 | % | 4.05 | % | 4.92 | % | ||||||||||||
Portfolio turnover rate(4) | 14.0 | %(2) | 45.1 | % | 45.1 | % | 24.1 | % | 38.7 | % | 38.6 | % | ||||||||||||
| (1) | Calculated using average shares outstanding during the year. |
| (2) | Not annualized. |
| (3) | Annualized. |
| (4) | Portfolio turnover is calculated on the basis of the Fund as a whole without distinguishing between the classes of shares issued. |
The accompanying notes are an integral part of these financial statements.
Page 70
Financial Highlights
Baird Intermediate Bond Fund – Investor Class
| Six Months | ||||||||||||||||||||||||
| Ended | ||||||||||||||||||||||||
| June 30, 2014 | Year Ended December 31, | |||||||||||||||||||||||
| (Unaudited) | 2013 | 2012 | 2011 | 2010 | 2009 | |||||||||||||||||||
| Per Share Data: | ||||||||||||||||||||||||
| Net asset value, | ||||||||||||||||||||||||
| beginning of period | $ | 11.43 | $ | 11.74 | $ | 11.47 | $ | 11.26 | $ | 10.97 | $ | 10.32 | ||||||||||||
| Income from | ||||||||||||||||||||||||
| investment operations: | ||||||||||||||||||||||||
| Net investment income | 0.13 | 0.25 | 0.32 | (1) | 0.37 | 0.43 | (1) | 0.50 | (1) | |||||||||||||||
| Net realized and unrealized | ||||||||||||||||||||||||
| gains (losses) on investments | 0.18 | (0.29 | ) | 0.39 | 0.28 | 0.36 | 0.65 | |||||||||||||||||
| Total from | ||||||||||||||||||||||||
| investment operations | 0.31 | (0.04 | ) | 0.71 | 0.65 | 0.79 | 1.15 | |||||||||||||||||
| Less distributions: | ||||||||||||||||||||||||
| Distributions from net | ||||||||||||||||||||||||
| investment income | (0.12 | ) | (0.25 | ) | (0.31 | ) | (0.36 | ) | (0.41 | ) | (0.48 | ) | ||||||||||||
| Distributions from | ||||||||||||||||||||||||
| net realized gains | — | (0.02 | ) | (0.13 | ) | (0.08 | ) | (0.09 | ) | (0.02 | ) | |||||||||||||
| Total distributions | (0.12 | ) | (0.27 | ) | (0.44 | ) | (0.44 | ) | (0.50 | ) | (0.50 | ) | ||||||||||||
| Net asset value, end of period | $ | 11.62 | $ | 11.43 | $ | 11.74 | $ | 11.47 | $ | 11.26 | $ | 10.97 | ||||||||||||
| Total return | 2.71 | %(2) | (0.41 | )% | 6.20 | % | 5.84 | % | 7.30 | % | 11.51 | % | ||||||||||||
| Supplemental data and ratios: | ||||||||||||||||||||||||
| Net assets, | ||||||||||||||||||||||||
| end of period (millions) | $ | 52.7 | $ | 42.1 | $ | 26.7 | $ | 14.7 | $ | 12.7 | $ | 6.7 | ||||||||||||
| Ratio of expenses | ||||||||||||||||||||||||
| to average net assets | 0.55 | %(3) | 0.55 | % | 0.55 | % | 0.55 | % | 0.55 | % | 0.55 | % | ||||||||||||
| Ratio of net | ||||||||||||||||||||||||
| investment income | ||||||||||||||||||||||||
| to average net assets | 2.23 | %(3) | 2.20 | % | 2.70 | % | 3.24 | % | 3.80 | % | 4.67 | % | ||||||||||||
Portfolio turnover rate(4) | 14.0 | %(2) | 45.1 | % | 45.1 | % | 24.1 | % | 38.7 | % | 38.6 | % | ||||||||||||
| (1) | Calculated using average shares outstanding during the year. |
| (2) | Not annualized. |
| (3) | Annualized. |
| (4) | Portfolio turnover is calculated on the basis of the Fund as a whole without distinguishing between the classes of shares issued. |
The accompanying notes are an integral part of these financial statements.
Page 71
Financial Highlights
Baird Intermediate Municipal Bond Fund – Institutional Class
| Six Months | ||||||||||||||||||||||||
| Ended | ||||||||||||||||||||||||
| June 30, 2014 | Year Ended December 31, | |||||||||||||||||||||||
| (Unaudited) | 2013 | 2012 | 2011 | 2010 | 2009 | |||||||||||||||||||
| Per Share Data: | ||||||||||||||||||||||||
| Net asset value, | ||||||||||||||||||||||||
| beginning of period | $ | 11.55 | $ | 12.01 | $ | 11.94 | $ | 11.31 | $ | 11.35 | $ | 10.98 | ||||||||||||
| Income from | ||||||||||||||||||||||||
| investment operations: | ||||||||||||||||||||||||
| Net investment income | 0.15 | 0.32 | (1) | 0.30 | 0.32 | 0.32 | 0.32 | (1) | ||||||||||||||||
| Net realized and unrealized | ||||||||||||||||||||||||
| gains (losses) on investments | 0.23 | (0.46 | ) | 0.07 | 0.64 | (0.04 | ) | 0.36 | ||||||||||||||||
| Total from | ||||||||||||||||||||||||
| investment operations | 0.38 | (0.14 | ) | 0.37 | 0.96 | 0.28 | 0.68 | |||||||||||||||||
| Less distributions: | ||||||||||||||||||||||||
| Distributions from net | ||||||||||||||||||||||||
| investment income | (0.15 | ) | (0.32 | ) | (0.30 | ) | (0.32 | ) | (0.32 | ) | (0.31 | ) | ||||||||||||
| Distributions from | ||||||||||||||||||||||||
| net realized gains | — | — | — | (0.01 | ) | — | — | |||||||||||||||||
| Total distributions | (0.15 | ) | (0.32 | ) | (0.30 | ) | (0.33 | ) | (0.32 | ) | (0.31 | ) | ||||||||||||
| Net asset value, end of period | $ | 11.78 | $ | 11.55 | $ | 12.01 | $ | 11.94 | $ | 11.31 | $ | 11.35 | ||||||||||||
| Total return | 3.27 | %(2) | (1.19 | )% | 3.12 | % | 8.55 | % | 2.42 | % | 6.22 | % | ||||||||||||
| Supplemental data and ratios: | ||||||||||||||||||||||||
| Net assets, | ||||||||||||||||||||||||
| end of period (millions) | $ | 872.7 | $ | 801.4 | $ | 963.1 | $ | 836.1 | $ | 739.0 | $ | 533.3 | ||||||||||||
| Ratio of expenses | ||||||||||||||||||||||||
| to average net assets | 0.30 | %(3) | 0.30 | % | 0.30 | % | 0.30 | % | 0.30 | % | 0.30 | % | ||||||||||||
| Ratio of net | ||||||||||||||||||||||||
| investment income | ||||||||||||||||||||||||
| to average net assets | 2.61 | %(3) | 2.65 | % | 2.48 | % | 2.74 | % | 2.74 | % | 2.83 | % | ||||||||||||
Portfolio turnover rate(4) | 3.2 | %(2) | 9.0 | % | 5.1 | % | 8.0 | % | 8.7 | % | 0.7 | % | ||||||||||||
| (1) | Calculated using average shares outstanding during the year. |
| (2) | Not annualized. |
| (3) | Annualized. |
| (4) | Portfolio turnover is calculated on the basis of the Fund as a whole without distinguishing between the classes of shares issued. |
The accompanying notes are an integral part of these financial statements.
Page 72
Financial Highlights
Baird Intermediate Municipal Bond Fund – Investor Class
| Six Months | ||||||||||||||||||||||||
| Ended | ||||||||||||||||||||||||
| June 30, 2014 | Year Ended December 31, | |||||||||||||||||||||||
| (Unaudited) | 2013 | 2012 | 2011 | 2010 | 2009 | |||||||||||||||||||
| Per Share Data: | ||||||||||||||||||||||||
| Net asset value, | ||||||||||||||||||||||||
| beginning of period | $ | 11.80 | $ | 12.26 | $ | 12.18 | $ | 11.53 | $ | 11.57 | $ | 11.19 | ||||||||||||
| Income from | ||||||||||||||||||||||||
| investment operations: | ||||||||||||||||||||||||
| Net investment income | 0.14 | 0.29 | (1) | 0.27 | 0.29 | 0.29 | 0.29 | (1) | ||||||||||||||||
| Net realized and unrealized | ||||||||||||||||||||||||
| gains (losses) on investments | 0.22 | (0.46 | ) | 0.08 | 0.66 | (0.04 | ) | 0.37 | ||||||||||||||||
| Total from | ||||||||||||||||||||||||
| investment operations | 0.36 | (0.17 | ) | 0.35 | 0.95 | 0.25 | 0.66 | |||||||||||||||||
| Less distributions: | ||||||||||||||||||||||||
| Distributions from net | ||||||||||||||||||||||||
| investment income | (0.13 | ) | (0.29 | ) | (0.27 | ) | (0.29 | ) | (0.29 | ) | (0.28 | ) | ||||||||||||
| Distributions from | ||||||||||||||||||||||||
| net realized gains | — | — | — | (0.01 | ) | — | — | |||||||||||||||||
| Total distributions | (0.13 | ) | (0.29 | ) | (0.27 | ) | (0.30 | ) | (0.29 | ) | (0.28 | ) | ||||||||||||
| Net asset value, end of period | $ | 12.03 | $ | 11.80 | $ | 12.26 | $ | 12.18 | $ | 11.53 | $ | 11.57 | ||||||||||||
| Total return | 3.08 | %(2) | (1.42 | )% | 2.88 | % | 8.30 | % | 2.11 | % | 5.95 | % | ||||||||||||
| Supplemental data and ratios: | ||||||||||||||||||||||||
| Net assets, | ||||||||||||||||||||||||
| end of period (millions) | $ | 208.4 | $ | 205.6 | $ | 258.5 | $ | 257.9 | $ | 202.8 | $ | 196.7 | ||||||||||||
| Ratio of expenses | ||||||||||||||||||||||||
| to average net assets | 0.55 | %(3) | 0.55 | % | 0.55 | % | 0.55 | % | 0.55 | % | 0.55 | % | ||||||||||||
| Ratio of net | ||||||||||||||||||||||||
| investment income | ||||||||||||||||||||||||
| to average net assets | 2.36 | %(3) | 2.40 | % | 2.23 | % | 2.49 | % | 2.49 | % | 2.58 | % | ||||||||||||
Portfolio turnover rate(4) | 3.2 | %(2) | 9.0 | % | 5.1 | % | 8.0 | % | 8.7 | % | 0.7 | % | ||||||||||||
| (1) | Calculated using average shares outstanding during the year. |
| (2) | Not annualized. |
| (3) | Annualized. |
| (4) | Portfolio turnover is calculated on the basis of the Fund as a whole without distinguishing between the classes of shares issued. |
The accompanying notes are an integral part of these financial statements.
Page 73
Financial Highlights
Baird Aggregate Bond Fund – Institutional Class
| Six Months | ||||||||||||||||||||||||
| Ended | ||||||||||||||||||||||||
| June 30, 2014 | Year Ended December 31, | |||||||||||||||||||||||
| (Unaudited) | 2013 | 2012 | 2011 | 2010 | 2009 | |||||||||||||||||||
| Per Share Data: | ||||||||||||||||||||||||
| Net asset value, | ||||||||||||||||||||||||
| beginning of period | $ | 10.41 | $ | 10.89 | $ | 10.65 | $ | 10.52 | $ | 10.23 | $ | 9.74 | ||||||||||||
| Income from | ||||||||||||||||||||||||
| investment operations: | ||||||||||||||||||||||||
| Net investment income | 0.16 | 0.32 | (1) | 0.38 | (1) | 0.44 | (1) | 0.47 | (2) | 0.54 | ||||||||||||||
| Net realized and unrealized | ||||||||||||||||||||||||
| gains (losses) on investments | 0.34 | (0.45 | ) | 0.45 | 0.36 | 0.37 | 0.49 | |||||||||||||||||
| Total from | ||||||||||||||||||||||||
| investment operations | 0.50 | (0.13 | ) | 0.83 | 0.80 | 0.84 | 1.03 | |||||||||||||||||
| Less distributions: | ||||||||||||||||||||||||
| Distributions from net | ||||||||||||||||||||||||
| investment income | (0.16 | ) | (0.35 | ) | (0.43 | ) | (0.46 | ) | (0.49 | ) | (0.54 | ) | ||||||||||||
| Distributions from | ||||||||||||||||||||||||
| net realized gains | — | — | (0.16 | ) | (0.21 | ) | (0.06 | ) | (0.00 | )(3) | ||||||||||||||
| Total distributions | (0.16 | ) | (0.35 | ) | (0.59 | ) | (0.67 | ) | (0.55 | ) | (0.54 | ) | ||||||||||||
| Net asset value, end of period | $ | 10.75 | $ | 10.41 | $ | 10.89 | $ | 10.65 | $ | 10.52 | $ | 10.23 | ||||||||||||
| Total return | 4.79 | %(4) | (1.25 | )% | 7.92 | % | 7.85 | % | 8.34 | % | 10.88 | % | ||||||||||||
| Supplemental data and ratios: | ||||||||||||||||||||||||
| Net assets, | ||||||||||||||||||||||||
| end of period (millions) | $ | 2,057.8 | $ | 1,665.0 | $ | 1,495.4 | $ | 1,480.3 | $ | 1,658.4 | $ | 1,362.2 | ||||||||||||
| Ratio of expenses | ||||||||||||||||||||||||
| to average net assets | 0.30 | %(5) | 0.30 | % | 0.30 | % | 0.30 | % | 0.30 | % | 0.30 | % | ||||||||||||
| Ratio of net | ||||||||||||||||||||||||
| investment income | ||||||||||||||||||||||||
| to average net assets | 2.97 | %(5) | 3.01 | % | 3.51 | % | 4.10 | % | 4.44 | % | 5.37 | % | ||||||||||||
Portfolio turnover rate(6) | 13.3 | %(4) | 28.4 | % | 64.4 | % | 45.9 | % | 41.4 | % | 37.7 | % | ||||||||||||
| (1) | Calculated using average shares outstanding during the year. |
| (2) | Net investment income per share is calculated using ending balances prior to consideration of adjustments for permanent book and tax differences. |
| (3) | Amount is less than ($0.005). |
| (4) | Not annualized. |
| (5) | Annualized. |
| (6) | Portfolio turnover is calculated on the basis of the Fund as a whole without distinguishing between the classes of shares issued. |
The accompanying notes are an integral part of these financial statements.
Page 74
Financial Highlights
Baird Aggregate Bond Fund – Investor Class
| Six Months | ||||||||||||||||||||||||
| Ended | ||||||||||||||||||||||||
| June 30, 2014 | Year Ended December 31, | |||||||||||||||||||||||
| (Unaudited) | 2013 | 2012 | 2011 | 2010 | 2009 | |||||||||||||||||||
| Per Share Data: | ||||||||||||||||||||||||
| Net asset value, | ||||||||||||||||||||||||
| beginning of period | $ | 10.72 | $ | 11.21 | $ | 10.94 | $ | 10.80 | $ | 10.48 | $ | 9.97 | ||||||||||||
| Income from | ||||||||||||||||||||||||
| investment operations: | ||||||||||||||||||||||||
| Net investment income | 0.15 | 0.29 | (1) | 0.37 | (1) | 0.42 | (1) | 0.46 | (2) | 0.52 | ||||||||||||||
| Net realized and unrealized | ||||||||||||||||||||||||
| gains (losses) on investments | 0.35 | (0.46 | ) | 0.46 | 0.37 | 0.38 | 0.50 | |||||||||||||||||
| Total from | ||||||||||||||||||||||||
| investment operations | 0.50 | (0.17 | ) | 0.83 | 0.79 | 0.84 | 1.02 | |||||||||||||||||
| Less distributions: | ||||||||||||||||||||||||
| Distributions from net | ||||||||||||||||||||||||
| investment income | (0.14 | ) | (0.32 | ) | (0.40 | ) | (0.44 | ) | (0.46 | ) | (0.51 | ) | ||||||||||||
| Distributions from | ||||||||||||||||||||||||
| net realized gains | — | — | (0.16 | ) | (0.21 | ) | (0.06 | ) | (0.00 | )(3) | ||||||||||||||
| Total distributions | (0.14 | ) | (0.32 | ) | (0.56 | ) | (0.65 | ) | (0.52 | ) | (0.51 | ) | ||||||||||||
| Net asset value, end of period | $ | 11.08 | $ | 10.72 | $ | 11.21 | $ | 10.94 | $ | 10.80 | $ | 10.48 | ||||||||||||
| Total return | 4.72 | %(4) | (1.54 | )% | 7.72 | % | 7.46 | % | 8.16 | % | 10.55 | % | ||||||||||||
| Supplemental data and ratios: | ||||||||||||||||||||||||
| Net assets, | ||||||||||||||||||||||||
| end of period (millions) | $ | 189.8 | $ | 141.9 | $ | 49.4 | $ | 26.1 | $ | 38.9 | $ | 35.1 | ||||||||||||
| Ratio of expenses | ||||||||||||||||||||||||
| to average net assets | 0.55 | %(5) | 0.55 | % | 0.55 | % | 0.55 | % | 0.55 | % | 0.55 | % | ||||||||||||
| Ratio of net | ||||||||||||||||||||||||
| investment income | ||||||||||||||||||||||||
| to average net assets | 2.72 | %(5) | 2.76 | % | 3.26 | % | 3.85 | % | 4.19 | % | 5.12 | % | ||||||||||||
Portfolio turnover rate(6) | 13.3 | %(4) | 28.4 | % | 64.4 | % | 45.9 | % | 41.4 | % | 37.7 | % | ||||||||||||
| (1) | Calculated using average shares outstanding during the year. |
| (2) | Net investment income per share is calculated using ending balances prior to consideration of adjustments for permanent book and tax differences. |
| (3) | Amount is less than ($0.005). |
| (4) | Not annualized. |
| (5) | Annualized. |
| (6) | Portfolio turnover is calculated on the basis of the Fund as a whole without distinguishing between the classes of shares issued. |
The accompanying notes are an integral part of these financial statements.
Page 75
Financial Highlights
Baird Core Plus Bond Fund – Institutional Class
| Six Months | ||||||||||||||||||||||||
| Ended | ||||||||||||||||||||||||
| June 30, 2014 | Year Ended December 31, | |||||||||||||||||||||||
| (Unaudited) | 2013 | 2012 | 2011 | 2010 | 2009 | |||||||||||||||||||
| Per Share Data: | ||||||||||||||||||||||||
| Net asset value, | ||||||||||||||||||||||||
| beginning of period | $ | 10.77 | $ | 11.27 | $ | 10.82 | $ | 10.51 | $ | 10.18 | $ | 9.46 | ||||||||||||
| Income from | ||||||||||||||||||||||||
| investment operations: | ||||||||||||||||||||||||
| Net investment income | 0.17 | 0.31 | (1) | 0.35 | (2) | 0.45 | (2) | 0.59 | (1) | 0.65 | (2) | |||||||||||||
| Net realized and unrealized | ||||||||||||||||||||||||
| gains (losses) on investments | 0.35 | (0.46 | ) | 0.50 | 0.36 | 0.39 | 0.74 | |||||||||||||||||
| Total from | ||||||||||||||||||||||||
| investment operations | 0.52 | (0.15 | ) | 0.85 | 0.81 | 0.98 | 1.39 | |||||||||||||||||
| Less distributions: | ||||||||||||||||||||||||
| Distributions from net | ||||||||||||||||||||||||
| investment income | (0.17 | ) | (0.34 | ) | (0.38 | ) | (0.46 | ) | (0.60 | ) | (0.65 | ) | ||||||||||||
| Distributions from | ||||||||||||||||||||||||
| net realized gains | — | (0.01 | ) | (0.02 | ) | (0.04 | ) | (0.05 | ) | (0.02 | ) | |||||||||||||
| Total distributions | (0.17 | ) | (0.35 | ) | (0.40 | ) | (0.50 | ) | (0.65 | ) | (0.67 | ) | ||||||||||||
| Net asset value, end of period | $ | 11.12 | $ | 10.77 | $ | 11.27 | $ | 10.82 | $ | 10.51 | $ | 10.18 | ||||||||||||
| Total return | 4.81 | %(3) | (1.32 | )% | 7.95 | % | 7.89 | % | 9.81 | % | 15.36 | % | ||||||||||||
| Supplemental data and ratios: | ||||||||||||||||||||||||
| Net assets, | ||||||||||||||||||||||||
| end of period (millions) | $ | 2,254.2 | $ | 1,789.7 | $ | 1,573.4 | $ | 768.9 | $ | 452.4 | $ | 215.2 | ||||||||||||
| Ratio of expenses | ||||||||||||||||||||||||
| to average net assets | 0.30 | %(4) | 0.30 | % | 0.30 | % | 0.30 | % | 0.30 | % | 0.30 | % | ||||||||||||
| Ratio of net | ||||||||||||||||||||||||
| investment income | ||||||||||||||||||||||||
| to average net assets | 3.04 | %(4) | 2.83 | % | 3.12 | % | 4.22 | % | 5.56 | % | 6.67 | % | ||||||||||||
Portfolio turnover rate(5) | 9.8 | %(3) | 35.5 | % | 36.7 | % | 34.6 | % | 61.5 | % | 33.2 | % | ||||||||||||
| (1) | Net investment income per share is calculated using ending balance prior to consideration of adjustments for performance book to tax differences. |
| (2) | Calculated using average shares outstanding during the year. |
| (3) | Not annualized. |
| (4) | Annualized. |
| (5) | Portfolio turnover is calculated on the basis of the Fund as a whole without distinguishing between the classes of shares issued. |
The accompanying notes are an integral part of these financial statements.
Page 76
Financial Highlights
Baird Core Plus Bond Fund – Investor Class
| Six Months | ||||||||||||||||||||||||
| Ended | ||||||||||||||||||||||||
| June 30, 2014 | Year Ended December 31, | |||||||||||||||||||||||
| (Unaudited) | 2013 | 2012 | 2011 | 2010 | 2009 | |||||||||||||||||||
| Per Share Data: | ||||||||||||||||||||||||
| Net asset value, | ||||||||||||||||||||||||
| beginning of period | $ | 11.16 | $ | 11.67 | $ | 11.18 | $ | 10.85 | $ | 10.49 | $ | 9.72 | ||||||||||||
| Income from | ||||||||||||||||||||||||
| investment operations: | ||||||||||||||||||||||||
| Net investment income | 0.16 | 0.29 | (1) | 0.33 | (2) | 0.44 | (2) | 0.57 | (1) | 0.64 | (2) | |||||||||||||
| Net realized and unrealized | ||||||||||||||||||||||||
| gains (losses) on investments | 0.35 | (0.48 | ) | 0.53 | 0.37 | 0.41 | 0.78 | |||||||||||||||||
| Total from | ||||||||||||||||||||||||
| investment operations | 0.51 | (0.19 | ) | 0.86 | 0.81 | 0.98 | 1.42 | |||||||||||||||||
| Less distributions: | ||||||||||||||||||||||||
| Distributions from net | ||||||||||||||||||||||||
| investment income | (0.15 | ) | (0.31 | ) | (0.35 | ) | (0.44 | ) | (0.57 | ) | (0.63 | ) | ||||||||||||
| Distributions from | ||||||||||||||||||||||||
| net realized gains | — | (0.01 | ) | (0.02 | ) | (0.04 | ) | (0.05 | ) | (0.02 | ) | |||||||||||||
| Total distributions | (0.15 | ) | (0.32 | ) | (0.37 | ) | (0.48 | ) | (0.62 | ) | (0.65 | ) | ||||||||||||
| Net asset value, end of period | $ | 11.52 | $ | 11.16 | $ | 11.67 | $ | 11.18 | $ | 10.85 | $ | 10.49 | ||||||||||||
| Total return | 4.61 | %(3) | (1.61 | )% | 7.80 | % | 7.57 | % | 9.53 | % | 15.06 | % | ||||||||||||
| Supplemental data and ratios: | ||||||||||||||||||||||||
| Net assets, | ||||||||||||||||||||||||
| end of period (millions) | $ | 1,165.7 | $ | 1,044.1 | $ | 1,036.0 | $ | 331.9 | $ | 58.4 | $ | 45.5 | ||||||||||||
| Ratio of expenses | ||||||||||||||||||||||||
| to average net assets | 0.55 | %(4) | 0.55 | % | 0.55 | % | 0.55 | % | 0.55 | % | 0.55 | % | ||||||||||||
| Ratio of net | ||||||||||||||||||||||||
| investment income | ||||||||||||||||||||||||
| to average net assets | 2.79 | %(4) | 2.58 | % | 2.87 | % | 3.97 | % | 5.31 | % | 6.42 | % | ||||||||||||
Portfolio turnover rate(5) | 9.8 | %(3) | 35.5 | % | 36.7 | % | 34.6 | % | 61.5 | % | 33.2 | % | ||||||||||||
| (1) | Net investment income per share is calculated using ending balance prior to consideration of adjustments for performance book to tax differences. |
| (2) | Calculated using average shares outstanding during the year. |
| (3) | Not annualized. |
| (4) | Annualized. |
| (5) | Portfolio turnover is calculated on the basis of the Fund as a whole without distinguishing between the classes of shares issued. |
The accompanying notes are an integral part of these financial statements.
Page 77
Notes to the Financial Statements
June 30, 2014 (Unaudited)
| 1. | Organization |
Baird Funds, Inc. (the “Corporation”) was incorporated on June 9, 2000 as a Wisconsin corporation and is registered as an open-end investment management company under the Investment Company Act of 1940, as amended (the “1940 Act”). The accompanying financial statements include the Baird Ultra Short Bond Fund, Baird Short-Term Bond Fund, Baird Intermediate Bond Fund, Baird Intermediate Municipal Bond Fund, Baird Aggregate Bond Fund and Baird Core Plus Bond Fund (each, a “Fund” and collectively, the “Funds”), six of the nine series comprising the Corporation, each of which is diversified within the meaning of the 1940 Act. Robert W. Baird & Co. Incorporated (“Baird” or the “Advisor”) serves as investment advisor to the Funds.
The Baird Ultra Short Bond Fund commenced operations with the sale of both Institutional and Investor Class shares on December 31, 2013. The Baird Short-Term Bond Fund commenced operations with the sale of Institutional Class shares on August 31, 2004 while the Investor Class shares commenced operations on September 19, 2012. The Baird Intermediate Municipal Bond Fund commenced operations with the sale of both Institutional and Investor Class shares on March 30, 2001. The Baird Intermediate Bond Fund, Baird Aggregate Bond Fund and Baird Core Plus Bond Fund commenced operations with the sale of both Institutional and Investor Class shares on September 29, 2000. The Institutional Class Shares are not subject to a distribution and service (12b-1) fee, while the Investor Class Shares are subject to a distribution and service (12b-1) fee of 0.25%. See Note 8.
The investment objective of the Baird Ultra Short Bond Fund is to seek current income consistent with preservation of capital. The Fund’s benchmark index, the Barclays U.S. Short-Term Government/Corporate Index, is an unmanaged, market value weighted index of investment grade, fixed debt including government and corporate securities with maturities less than one year.
The investment objective of the Baird Short-Term Bond Fund is to provide an annual rate of total return, before Fund expenses, greater than the annual rate of total return of the Barclays 1-3 Year U.S. Government/Credit Bond Index. The Barclays 1-3 Year U.S. Government/Credit Bond Index is an unmanaged, market value weighted index of investment grade, fixed-rate debt including government and corporate securities with maturities between one and three years.
The investment objective of the Baird Intermediate Bond Fund is to provide an annual rate of total return, before Fund expenses, greater than the annual rate of total return of the Barclays Intermediate U.S. Government/Credit Bond Index. The Barclays Intermediate U.S. Government/Credit Bond Index is an unmanaged, market value weighted index of investment grade, fixed-rate debt issues, including government and corporate securities, with maturities between one and ten years.
The primary investment objective of the Baird Intermediate Municipal Bond Fund is to provide current income that is substantially exempt from federal income tax. A secondary objective is to provide total return with relatively low volatility of principal.
The investment objective of the Baird Aggregate Bond Fund is to provide an annual rate of total return, before Fund expenses, greater than the annual rate of total return of the Barclays U.S. Aggregate Bond Index. The Barclays U.S. Aggregate Bond Index is an unmanaged, market value weighted index of investment grade, fixed-rate debt issues, including government, corporate, asset-backed and mortgage-backed securities, with maturities of at least one year.
The investment objective of the Baird Core Plus Bond Fund is to provide an annual rate of total return, before Fund expenses, greater than the annual rate of total return of the Barclays U.S. Universal Bond Index. The Barclays U.S. Universal Bond Index is an unmanaged, market value weighted index of fixed income securities issued in U.S. dollars, including U.S. government and investment grade debt, non-investment grade debt, asset-backed and mortgage-backed securities, Eurobonds, 144A securities and emerging market debt, with maturities of at least one year.
Page 78
Notes to the Financial Statements
June 30, 2014 (Unaudited)
| 2. | Significant Accounting Policies |
The following is a summary of significant accounting policies consistently followed by the Funds in the preparation of their financial statements. These policies are in conformity with accounting principles generally accepted in the United States of America.
| a) | Investment Valuation – Section 2(a)(41) of the 1940 Act, together with the rules and interpretations of the SEC, require the Funds, in computing net asset value, to value their portfolio securities using market quotations when they are “readily available.” When market quotations are not readily available (e.g., because there is no regular market quotation for such securities, the market for such security is limited, the validity of quotations is questionable or the Funds’ independent pricing service does not provide a price), the Board of Directors of the Corporation must value the securities at “fair value determined in good faith.” The Board has delegated such responsibility to the Advisor pursuant to pricing policies and procedures that the Board has adopted and regularly reviews. In general, the “fair value” of a security means the price that would be received to sell a security in an orderly transaction between market participants at the measurement date. |
The Funds determine the fair value of their investments and compute their net asset value per share as of the close of regular trading of the New York Stock Exchange (4:00 p.m. EST). | |
Consistent with Section 2(a)(41) of the 1940 Act, the Funds price their securities as follows: debt securities are valued at their bid prices by an independent pricing service using valuation methods that are designed to represent fair value, such as matrix pricing and other analytical pricing models, market transactions and dealer quotations. Debt securities purchased with a remaining maturity of 60 days or less are valued at acquisition cost, plus or minus any amortized discount or premium which approximates fair value. Investments in mutual funds are valued at their stated net asset value. Common stocks that are listed on a securities exchange (other than NASDAQ) are valued at the last quoted sales price. Securities traded on Nasdaq are valued at the Nasdaq Official Closing Price. Price information on listed stocks is taken from the exchange where the security is primarily traded. Securities that were not traded on the valuation date, as well as stocks that are not listed on an exchange, including NASDAQ, are valued at the average of the current bid and asked price. Other assets and securities for which market quotations are not readily available are valued at fair value as determined in good faith by the Advisor in accordance with procedures approved by the Corporation’s Board of Directors. In accordance with such procedures, the Advisor may use broker quotes or prices obtained from alternative independent pricing services or, if the broker quotes or prices from alternative pricing services are unavailable or deemed to be unreliable, fair value will be determined by a valuation committee of the Advisor. In determining fair value, the valuation committee takes into account all relevant factors and available information. Consequently, the price of the security used by a Fund to calculate its NAV may differ from quoted or published prices for the same security. Fair value pricing involves subjective judgments and there is no single standard for determining a security’s fair value. As a result, different mutual funds could reasonably arrive at a different fair value for the same security. It is possible that the fair value determined for a security is materially different from the value that could be realized upon the sale of that security or from the values that other mutual funds may determine. In addition, given the volatility and periodic illiquidity experienced in recent years, the prices determined for any individual security on any given day may vary significantly from the amount that can be obtained in an actual sale of that security, and the Funds’ NAVs may fluctuate significantly from day to day or from period to period. | |
| b) | Unregistered Securities – Five of the Funds own certain investment securities which are unregistered and thus restricted with respect to resale. The value of such securities for the Baird Ultra Short Bond, Baird Short-Term Bond, Baird Intermediate Bond, Baird Aggregate Bond and Baird Core Plus Bond Funds were $3,760,404 (26.57% of net assets), $379,222,214 (17.31% of net assets), $185,558,170 (14.66% of net assets), $278,923,318 (12.41% of net assets), and $438,975,478 (12.84% of net assets), respectively, at June 30, 2014. Restricted securities may be deemed to be liquid as determined by the |
Page 79
Notes to the Financial Statements
June 30, 2014 (Unaudited)
| 2. | Significant Accounting Policies (cont.) |
Advisor based on several factors. All of the restricted securities held by the Funds as of June 30, 2014 consist of securities issued pursuant to Rule 144A under the Securities Act of 1933 and nearly all have been deemed to be liquid. | |
| c) | Foreign Securities – Foreign securities are defined as securities of issuers that are organized outside the United States. The Funds may invest in U.S. dollar-denominated debt obligations of foreign companies and foreign governments. Investing in securities of foreign companies and foreign governments involves special risks and considerations not typically associated with investing in U.S. companies and the U.S. government. These risks include foreign currency fluctuations, political and economic instability and differences in financial reporting standards and less strict regulation of securities markets. Moreover, securities of many foreign companies and foreign governments and their markets may be less liquid and their prices more volatile than those of securities of comparable U.S. companies and the U.S. government. Occasionally, events that affect these values and exchange rates may occur after the close of the exchange on which such securities are traded. If such events materially affect the value of a Fund’s securities, these securities may be valued at their fair value pursuant to procedures adopted by the Board of Directors. |
| d) | Income Tax Status – The Funds intend to continue to qualify as regulated investment companies as provided in subchapter M of the Internal Revenue Code and to distribute substantially all of their taxable income to their shareholders in a manner which results in no tax expense to the Funds. Therefore, no federal income or excise tax provision is recorded. |
There is no tax liability resulting from unrecognized tax benefits relating to uncertain income tax positions taken or expected to be taken on the tax return for the fiscal year ended December 31, 2013, or for any other tax years which are open for exam. As of June 30, 2014, open tax years include the tax years ended December 31, 2010 through 2013. The Funds are not aware of any tax positions for which it is reasonably possible that the total amounts of unrecognized tax benefits will significantly change in the next 12 months. The Funds recognize interest and penalties, if any, related to unrecognized tax benefits as interest and other expense, respectively, in the Statement of Operations. During the period, the Funds did not incur any interest or penalties. | |
| e) | Allocation of Income and Expenses – Each Fund is charged for those expenses directly attributable to it. Expenses directly attributable to a class of shares, such as Rule 12b-1 distribution fees, are charged to that class of shares. Income, expenses and realized and unrealized gains and losses are allocated to the classes based on their respective net assets. Expenses that are not directly attributable to a Fund are allocated among the Funds in the series in proportion to their assets or are divided equally amongst the Funds. |
| f) | Distributions to Shareholders – Dividends from net investment income are declared and paid monthly. Distributions of net realized capital gains, if any, are declared and paid at least annually. The book basis character of distributions may differ from their ultimate characterization for Federal income tax purposes. |
| g) | Use of Estimates – The preparation of financial statements in conformity with accounting principles generally accepted in the United States of America requires management to make estimates and assumptions that affect the reported amounts of assets and liabilities and disclosure of contingent assets and liabilities at the date of the financial statements and the reported amounts of revenues and expenses during the reporting period. Actual results could differ from those estimates. |
| h) | Securities Transactions and Investment Income – Investment and shareholder transactions are recorded on the trade date. The Funds determine the gain or loss realized from investment transactions by comparing the original cost of the security lot sold with the net sales proceeds. Dividend income is recognized on the ex-dividend date and interest income is recognized on an accrual basis. Premiums and discounts on the purchase of securities are amortized/accreted using the effective interest method. |
Page 80
Notes to the Financial Statements
June 30, 2014 (Unaudited)
| 2. | Significant Accounting Policies (cont.) |
Paydown gains and losses are netted and recorded as interest income on the Statement of Operations for financial reporting purposes. Accounting principles generally accepted in the United States of America require that permanent financial reporting and tax differences be reclassified in the capital accounts. | |
| i) | Guarantees and Indemnifications – In the normal course of business, the Funds enter into contracts with service providers that contain general indemnification clauses. The Funds’ maximum exposure under these arrangements is unknown and would involve future claims against the Funds that have not yet occurred. Based on experience, the Funds would expect the risk of loss to be remote. |
| j) | Recent Accounting Pronouncements – In January 2013, the FASB issued ASU No. 2013-01 “Clarifying the Scope of Disclosures about Offsetting Assets and Liabilities” in GAAP and International Financial Reporting Standards (“IFRS”). ASU No. 2013-01 clarifies ASU No. 2011-11 to increase comparability and reduce presentation differences between financial statements prepared in accordance with GAAP and financial statements prepared in accordance with IFRS. This requires increased disclosure for both gross and net information for derivatives and other financial instruments that are offset in a reporting entity’s Statement of Assets and Liabilities and derivative instruments that are subject to a master netting agreement (“MNA”). Specifically, the ASU requires reporting entities to present separately for assets and liabilities, a) the gross amounts of those recognized assets and recognized liabilities, b) the amounts offset to determine the net amounts presented in the Statement of Assets and Liabilities, c) the net amount presented in the Statement of Assets and Liabilities, d) the amounts subject to an enforceable MNA not included in (b), and e) the net amount after deducting the amounts from (d) and (c). The effective date of each ASU is for interim and annual periods beginning on or after January 1, 2013. The Funds are not required to disclose the applicable requirements of this accounting standard in their Statement of Assets & Liabilities due to the absence of a master netting agreement relating to the Funds’ participation in securities lending. As such, no additional disclosures have been made on behalf of the Funds. |
| In June 2014, the FASB issued ASU No. 2014-11 “Repurchase-to-Maturity Transactions, Repurchase Financings, and Disclosures.” ASU No. 2014-11 makes limited changes to the accounting for repurchase agreements, clarifies when repurchase agreements and securities lending transactions should be accounted for as secured borrowings, and requires additional disclosures regarding these types of transactions. The effective date of this ASU is for fiscal years beginning on or after December 15, 2014, and for interim periods within those fiscal years. Management is currently evaluating the impact these changes will have on the Fund’s financial statement disclosures. |
Page 81
Notes to the Financial Statements
June 30, 2014 (Unaudited)
| 3. | Capital Share Transactions |
The following table summarizes the capital share transactions of each Fund for the past two fiscal periods:
| Baird Ultra Short Bond Fund^ | ||||||||||||||||||
| Institutional Class Shares | Investor Class Shares | |||||||||||||||||
| Six Months Ended | Six Months Ended | |||||||||||||||||
| June 30, 2014 | June 30, 2014 | |||||||||||||||||
| Shares | Amount | Shares | Amount | |||||||||||||||
| Shares sold | 1,396,004 | $ | 14,007,669 | Shares sold | 9,651 | $ | 97,000 | |||||||||||
| Shares issued to | Shares issued to | |||||||||||||||||
| shareholders in | shareholders in | |||||||||||||||||
| reinvestment | reinvestment | |||||||||||||||||
| of dividends | 4,061 | 40,855 | of dividends | 16 | 164 | |||||||||||||
| Shares redeemed | (4,472 | ) | (45,031 | ) | Shares redeemed | — | — | |||||||||||
| Net increase | 1,395,593 | $ | 14,003,493 | Net increase | 9,667 | $ | 97,164 | |||||||||||
| Shares Outstanding: | Shares Outstanding: | |||||||||||||||||
| Beginning of period | — | Beginning of period | — | |||||||||||||||
| End of period | 1,395,593 | End of period | 9,667 | |||||||||||||||
^ Commencement of operations was December 31, 2013.
Baird Short-Term Bond Fund
| Institutional Class Shares | Investor Class Shares | |||||||||||||||||
| Six Months Ended | Six Months Ended | |||||||||||||||||
| June 30, 2014 | June 30, 2014 | |||||||||||||||||
| Shares | Amount | Shares | Amount | |||||||||||||||
| Shares sold | 49,025,620 | $ | 476,802,830 | Shares sold | 1,505,101 | $ | 14,636,683 | |||||||||||
| Shares issued to | Shares issued to | |||||||||||||||||
| shareholders in | shareholders in | |||||||||||||||||
| reinvestment | reinvestment | |||||||||||||||||
| of dividends | 1,489,079 | 14,477,129 | of dividends | 12,499 | 121,507 | |||||||||||||
| Shares redeemed | (33,148,375 | ) | (322,496,813 | ) | Shares redeemed | (1,237,998 | ) | (12,043,211 | ) | |||||||||
| Net increase | 17,366,324 | $ | 168,783,146 | Net increase | 279,602 | $ | 2,714,979 | |||||||||||
| Shares Outstanding: | Shares Outstanding: | |||||||||||||||||
| Beginning of period | 204,832,563 | Beginning of period | 2,478,333 | |||||||||||||||
| End of period | 222,198,887 | End of period | 2,757,935 | |||||||||||||||
Page 82
Notes to the Financial Statements
June 30, 2014 (Unaudited)
| 3. | Capital Share Transactions (cont.) |
Baird Short-Term Bond Fund (cont.)
| Institutional Class Shares | Investor Class Shares | |||||||||||||||||
| Year Ended | Year Ended | |||||||||||||||||
| December 31, 2013 | December 31, 2013 | |||||||||||||||||
| Shares | Amount | Shares | Amount | |||||||||||||||
| Shares sold | 133,023,716 | $ | 1,293,669,284 | Shares sold | 2,851,595 | $ | 27,760,685 | |||||||||||
| Shares issued to | Shares issued to | |||||||||||||||||
| shareholders in | shareholders in | |||||||||||||||||
| reinvestment | reinvestment | |||||||||||||||||
| of dividends | 2,957,005 | 28,726,556 | of dividends | 7,956 | 77,195 | |||||||||||||
| Shares redeemed | (63,981,180 | ) | (622,888,419 | ) | Shares redeemed | (533,574 | ) | (5,193,589 | ) | |||||||||
| Net increase | 71,999,541 | $ | 699,507,421 | Net increase | 2,325,977 | $ | 22,644,291 | |||||||||||
| Shares Outstanding: | Shares Outstanding: | |||||||||||||||||
| Beginning of year | 132,833,022 | Beginning of year | 152,356 | |||||||||||||||
| End of year | 204,832,563 | End of year | 2,478,333 | |||||||||||||||
| Baird Intermediate Bond Fund | ||||||||||||||||||
| Institutional Class Shares | Investor Class Shares | |||||||||||||||||
| Six Months Ended | Six Months Ended | |||||||||||||||||
| June 30, 2014 | June 30, 2014 | |||||||||||||||||
| Shares | Amount | Shares | Amount | |||||||||||||||
| Shares sold | 12,390,405 | $ | 137,803,672 | Shares sold | 1,410,951 | $ | 16,301,418 | |||||||||||
| Shares issued to | Shares issued to | |||||||||||||||||
| shareholders in | shareholders in | |||||||||||||||||
| reinvestment | reinvestment | |||||||||||||||||
| of dividends | 1,050,442 | 11,672,608 | of dividends | 42,518 | 491,218 | |||||||||||||
| Shares redeemed | (6,095,168 | ) | (67,706,050 | ) | Shares redeemed | (597,975 | ) | (6,904,821 | ) | |||||||||
| Net increase | 7,345,679 | $ | 81,770,230 | Net increase | 855,494 | $ | 9,887,815 | |||||||||||
| Shares Outstanding: | Shares Outstanding: | |||||||||||||||||
| Beginning of period | 101,253,258 | Beginning of period | 3,678,501 | |||||||||||||||
| End of period | 108,598,937 | End of period | 4,533,995 | |||||||||||||||
| Institutional Class Shares | Investor Class Shares | |||||||||||||||||
| Year Ended | Year Ended | |||||||||||||||||
| December 31, 2013 | December 31, 2013 | |||||||||||||||||
| Shares | Amount | Shares | Amount | |||||||||||||||
| Shares sold | 37,134,677 | $ | 412,939,370 | Shares sold | 2,881,540 | $ | 33,484,462 | |||||||||||
| Shares issued to | Shares issued to | |||||||||||||||||
| shareholders in | shareholders in | |||||||||||||||||
| reinvestment | reinvestment | |||||||||||||||||
| of dividends | 1,931,633 | 21,480,431 | of dividends | 69,261 | 800,067 | |||||||||||||
| Shares redeemed | (14,537,572 | ) | (161,463,957 | ) | Shares redeemed | (1,548,764 | ) | (17,926,518 | ) | |||||||||
| Net increase | 24,528,738 | $ | 272,955,844 | Net increase | 1,402,037 | $ | 16,358,011 | |||||||||||
| Shares Outstanding: | Shares Outstanding: | |||||||||||||||||
| Beginning of year | 76,724,520 | Beginning of year | 2,276,464 | |||||||||||||||
| End of year | 101,253,258 | End of year | 3,678,501 | |||||||||||||||
Page 83
Notes to the Financial Statements
June 30, 2014 (Unaudited)
| 3. | Capital Share Transactions (cont.) |
Baird Intermediate Municipal Bond Fund
| Institutional Class Shares | Investor Class Shares | |||||||||||||||||
| Six Months Ended | Six Months Ended | |||||||||||||||||
| June 30, 2014 | June 30, 2014 | |||||||||||||||||
| Shares | Amount | Shares | Amount | |||||||||||||||
| Shares sold | 13,298,080 | $ | 155,939,687 | Shares sold | 1,894,839 | $ | 22,702,742 | |||||||||||
| Shares issued to | Shares issued to | |||||||||||||||||
| shareholders in | shareholders in | |||||||||||||||||
| reinvestment | reinvestment | |||||||||||||||||
| of dividends | 749,398 | 8,788,201 | of dividends | 182,921 | 2,192,003 | |||||||||||||
| Shares redeemed | (9,330,628 | ) | (109,233,921 | ) | Shares redeemed | (2,185,943 | ) | (26,151,712 | ) | |||||||||
| Net increase | 4,716,850 | $ | 55,493,967 | Net decrease | (108,183 | ) | $ | (1,256,967 | ) | |||||||||
| Shares Outstanding: | Shares Outstanding: | |||||||||||||||||
| Beginning of period | 69,393,191 | Beginning of period | 17,430,650 | |||||||||||||||
| End of period | 74,110,041 | End of period | 17,322,467 | |||||||||||||||
| Institutional Class Shares | Investor Class Shares | |||||||||||||||||
| Year Ended | Year Ended | |||||||||||||||||
| December 31, 2013 | December 31, 2013 | |||||||||||||||||
| Shares | Amount | Shares | Amount | |||||||||||||||
| Shares sold | 26,493,640 | $ | 312,051,832 | Shares sold | 5,238,276 | $ | 63,128,361 | |||||||||||
| Shares issued to | Shares issued to | |||||||||||||||||
| shareholders in | shareholders in | |||||||||||||||||
| reinvestment | reinvestment | |||||||||||||||||
| of dividends | 1,665,529 | 19,521,896 | of dividends | 438,678 | 5,251,221 | |||||||||||||
| Shares redeemed | (38,953,053 | ) | (457,319,983 | ) | Shares redeemed | (9,327,884 | ) | (111,810,823 | ) | |||||||||
| Net decrease | (10,793,884 | ) | $ | (125,746,255 | ) | Net decrease | (3,650,930 | ) | $ | (43,431,241 | ) | |||||||
| Shares Outstanding: | Shares Outstanding: | |||||||||||||||||
| Beginning of year | 80,187,075 | Beginning of year | 21,081,580 | |||||||||||||||
| End of year | 69,393,191 | End of year | 17,430,650 | |||||||||||||||
| Baird Aggregate Bond Fund | ||||||||||||||||||
| Institutional Class Shares | Investor Class Shares | |||||||||||||||||
| Six Months Ended | Six Months Ended | |||||||||||||||||
| June 30, 2014 | June 30, 2014 | |||||||||||||||||
| Shares | Amount | Shares | Amount | |||||||||||||||
| Shares sold | 47,272,873 | $ | 503,188,004 | Shares sold | 5,829,746 | $ | 63,630,530 | |||||||||||
| Shares issued to | Shares issued to | |||||||||||||||||
| shareholders in | shareholders in | |||||||||||||||||
| reinvestment | reinvestment | |||||||||||||||||
| of dividends | 2,118,582 | 22,527,491 | of dividends | 203,048 | 2,224,179 | |||||||||||||
| Shares redeemed | (17,869,209 | ) | (190,024,738 | ) | Shares redeemed | (2,124,075 | ) | (23,244,570 | ) | |||||||||
| Net increase | 31,522,246 | $ | 335,690,757 | Net increase | 3,908,719 | $ | 42,610,139 | |||||||||||
| Shares Outstanding: | Shares Outstanding: | |||||||||||||||||
| Beginning of period | 159,952,275 | Beginning of period | 13,229,616 | |||||||||||||||
| End of period | 191,474,521 | End of period | 17,138,335 | |||||||||||||||
Page 84
Notes to the Financial Statements
June 30, 2014 (Unaudited)
| 3. | Capital Share Transactions (cont.) |
Baird Aggregate Bond Fund (cont.)
| Institutional Class Shares | Investor Class Shares | |||||||||||||||||
| Year Ended | Year Ended | |||||||||||||||||
| December 31, 2013 | December 31, 2013 | |||||||||||||||||
| Shares | Amount | Shares | Amount | |||||||||||||||
| Shares sold | 81,532,396 | $ | 864,177,608 | Shares sold | 13,314,778 | $ | 146,699,358 | |||||||||||
| Shares issued to | Shares issued to | |||||||||||||||||
| shareholders in | shareholders in | |||||||||||||||||
| reinvestment | reinvestment | |||||||||||||||||
| of dividends | 3,939,511 | 41,769,235 | of dividends | 291,300 | 3,172,439 | |||||||||||||
Shares redeemed(1) | (62,786,649 | ) | (665,296,456 | ) | Shares redeemed | (4,783,014 | ) | (52,193,930 | ) | |||||||||
| Net increase | 22,685,258 | $ | 240,650,387 | Net increase | 8,823,064 | $ | 97,677,867 | |||||||||||
| Shares Outstanding: | Shares Outstanding: | |||||||||||||||||
| Beginning of year | 137,267,017 | Beginning of year | 4,406,552 | |||||||||||||||
| End of year | 159,952,275 | End of year | 13,229,616 | |||||||||||||||
| (1) | In the fourth quarter of 2013, the Baird Aggregate Bond Fund satisfied a redemption request made by a large shareholder by distributing the Fund’s portfolio securities in kind to the redeeming shareholder. The redemption was effected in accordance with policies and procedures approved by the Board of Directors of the Funds. |
Baird Core Plus Bond Fund
| Institutional Class Shares | Investor Class Shares | |||||||||||||||||
| Six Months Ended | Six Months Ended | |||||||||||||||||
| June 30, 2014 | June 30, 2014 | |||||||||||||||||
| Shares | Amount | Shares | Amount | |||||||||||||||
| Shares sold | 50,515,971 | $ | 556,092,596 | Shares sold | 18,864,158 | $ | 214,781,129 | |||||||||||
| Shares issued to | Shares issued to | |||||||||||||||||
| shareholders in | shareholders in | |||||||||||||||||
| reinvestment | reinvestment | |||||||||||||||||
| of dividends | 2,565,914 | 28,213,154 | of dividends | 1,275,587 | 14,533,292 | |||||||||||||
| Shares redeemed | (16,439,074 | ) | (180,046,262 | ) | Shares redeemed | (12,526,917 | ) | (142,362,432 | ) | |||||||||
| Net increase | 36,642,811 | $ | 404,259,488 | Net increase | 7,612,828 | $ | 86,951,989 | |||||||||||
| Shares Outstanding: | Shares Outstanding: | |||||||||||||||||
| Beginning of period | 166,166,636 | Beginning of period | 93,561,566 | |||||||||||||||
| End of period | 202,809,447 | End of period | 101,174,394 | |||||||||||||||
Page 85
Notes to the Financial Statements
June 30, 2014 (Unaudited)
| 3. | Capital Share Transactions (cont.) |
Baird Core Plus Bond Fund (cont.)
| Institutional Class Shares | Investor Class Shares | |||||||||||||||||
| Year Ended | Year Ended | |||||||||||||||||
| December 31, 2013 | December 31, 2013 | |||||||||||||||||
| Shares | Amount | Shares | Amount | |||||||||||||||
| Shares sold | 74,068,429 | $ | 816,081,945 | Shares sold | 48,901,785 | $ | 561,114,866 | |||||||||||
| Shares issued to | Shares issued to | |||||||||||||||||
| shareholders in | shareholders in | |||||||||||||||||
| reinvestment | reinvestment | |||||||||||||||||
| of dividends | 4,648,511 | 50,888,369 | of dividends | 2,710,437 | 30,756,030 | |||||||||||||
| Shares redeemed | (52,145,086 | ) | (570,782,143 | ) | Shares redeemed | (46,866,443 | ) | (532,393,630 | ) | |||||||||
| Net increase | 26,571,854 | $ | 296,188,171 | Net increase | 4,745,779 | $ | 59,477,266 | |||||||||||
| Shares Outstanding: | Shares Outstanding: | |||||||||||||||||
| Beginning of year | 139,594,782 | Beginning of year | 88,815,787 | |||||||||||||||
| End of year | 166,166,636 | End of year | 93,561,566 | |||||||||||||||
| 4. | Investment Transactions and Income Tax Information |
During the six months ended June 30, 2014, purchases and sales of investment securities (excluding short-term investments) were as follows:
| Baird | Baird | Baird | ||||||||||
| Ultra Short | Short-Term | Intermediate | ||||||||||
| Bond Fund | Bond Fund | Bond Fund | ||||||||||
| Purchases: | ||||||||||||
| U.S. Government | $ | — | $ | — | $ | — | ||||||
| Other | $ | 15,403,381 | $ | 767,133,620 | $ | 250,918,720 | ||||||
| Sales: | ||||||||||||
| U.S. Government | $ | — | $ | — | $ | — | ||||||
| Other | $ | 2,837,159 | $ | 547,650,530 | $ | 163,614,410 | ||||||
| Baird | ||||||||||||
| Intermediate | Baird | Baird | ||||||||||
| Municipal | Aggregate | Core Plus | ||||||||||
| Bond Fund | Bond Fund | Bond Fund | ||||||||||
| Purchases: | ||||||||||||
| U.S. Government | $ | — | $ | 268,319 | $ | 29,493,320 | ||||||
| Other | $ | 73,857,906 | $ | 574,317,400 | $ | 687,605,850 | ||||||
| Sales: | ||||||||||||
| U.S. Government | $ | 9,225,137 | $ | 4,332,956 | $ | 7,041,642 | ||||||
| Other | $ | 22,168,040 | $ | 250,543,438 | $ | 286,220,879 | ||||||
Page 86
Notes to the Financial Statements
June 30, 2014 (Unaudited)
| 4. | Investment Transactions and Income Tax Information (cont.) |
At December 31, 2013, gross unrealized appreciation and depreciation of investments and distributable ordinary income and long-term capital gains for federal tax purposes were as follows:
| Baird | ||||||||||||||||||||
| Baird | Baird | Intermediate | Baird | Baird | ||||||||||||||||
| Short-Term | Intermediate | Municipal | Aggregate | Core Plus | ||||||||||||||||
| Bond Fund | Bond Fund | Bond Fund | Bond Fund | Bond Fund | ||||||||||||||||
| Cost of investments | $ | 2,212,265,085 | $ | 1,368,699,239 | $ | 945,496,398 | $ | 2,026,445,143 | $ | 3,094,265,952 | ||||||||||
| Gross unrealized | ||||||||||||||||||||
| appreciation | $ | 13,265,398 | $ | 23,781,743 | $ | 34,838,976 | $ | 40,732,991 | $ | 52,227,554 | ||||||||||
| Gross unrealized | ||||||||||||||||||||
| depreciation | (8,844,501 | ) | (11,691,355 | ) | (9,337,348 | ) | (40,486,803 | ) | (80,251,380 | ) | ||||||||||
| Net unrealized | ||||||||||||||||||||
| appreciation | ||||||||||||||||||||
| (depreciation) | $ | 4,420,897 | $ | 12,090,388 | $ | 25,501,628 | $ | 246,188 | $ | (28,023,826 | ) | |||||||||
| Undistributed | ||||||||||||||||||||
| ordinary income | $ | 518,513 | $ | 34,180 | $ | — | $ | 63,323 | $ | 269,644 | ||||||||||
| Undistributed | ||||||||||||||||||||
| long-term | ||||||||||||||||||||
| capital gain | 236,307 | — | — | — | — | |||||||||||||||
| Total distributable | ||||||||||||||||||||
| earnings | $ | 754,820 | $ | 34,180 | $ | — | $ | 63,323 | $ | 269,644 | ||||||||||
| Other accumulated | ||||||||||||||||||||
| losses | — | (4,414 | ) | (365,127 | ) | (10,455,273 | ) | (13,152,721 | ) | |||||||||||
| Total accumulated | ||||||||||||||||||||
| earnings/(losses) | $ | 5,175,717 | $ | 12,120,154 | $ | 25,136,501 | $ | (10,145,762 | ) | $ | (40,906,903 | ) | ||||||||
Undistributed income or net realized gains for financial statement purposes may differ from amounts recognized for federal income tax purposes due to differences in the recognition and characterization of income, expense and capital gain items. The difference between book-basis and tax-basis unrealized appreciation is attributed primarily to the tax deferral of losses on wash sales.
Additionally, U.S. generally accepted accounting principles require that certain components of net assets relating to permanent differences be reclassified between financial and tax reporting. These reclassifications are primarily due to differing treatments for losses deferred due to wash sales, equalization accounting for tax purposes, and non-deductible expenses. These reclassifications have no effect on net assets or net asset value per share.
Page 87
Notes to the Financial Statements
June 30, 2014 (Unaudited)
| 4. | Investment Transactions and Income Tax Information (cont.) |
The tax components of dividends paid during the periods shown below were as follows:
| Six Months Ended | Year Ended | |||||||||||||||
| June 30, 2014 | December 31, 2013 | |||||||||||||||
| Ordinary | Long-Term | Ordinary | Long-Term | |||||||||||||
| Income | Capital Gains | Income | Capital Gains | |||||||||||||
| Distributions | Distributions | Distributions | Distributions | |||||||||||||
| Baird Ultra Short Bond Fund | $ | 55,392 | $ | — | $ | N/A | $ | N/A | ||||||||
| Baird Short-Term Bond Fund | $ | 16,960,172 | $ | — | $ | 29,397,102 | $ | 3,294,675 | ||||||||
| Baird Intermediate Bond Fund | $ | 14,306,320 | $ | — | $ | 25,175,900 | $ | 1,249,485 | ||||||||
| Baird Intermediate Municipal Bond Fund | $ | — | $ | — | $ | 209,368 | $ | — | ||||||||
| Baird Aggregate Bond Fund | $ | 29,416,499 | $ | — | $ | 55,824,951 | $ | — | ||||||||
| Baird Core Plus Bond Fund | $ | 44,436,004 | $ | — | $ | 84,668,834 | $ | 1,900,391 | ||||||||
For the six months ended June 30, 2014 and the year ended December 31, 2013, distributions of $12,669,421 and $29,127,940, respectively, from the Baird Intermediate Municipal Bond Fund were tax-exempt.
The Fund designated as long-term capital gain dividend, pursuant to Internal Revenue Code Section 852(b)(3), the amount necessary to reduce the earnings and profits of the Fund related to net capital gain to zero for the tax year ended December 31, 2013. To the extent necessary to fully distribute such capital gains, the Funds also designate earnings and profits distributed to shareholders on the redemption of shares.
Under the current tax law, capital losses realized after October 31 may be deferred and treated as occurring on the first day of the following fiscal year. For the year ended December 31, 2013, Baird Aggregate Bond Fund elected to defer capital losses occurring between November 1, 2013 and December 31, 2013 in the amount of $4,706,969.
At December 31, 2013, accumulated net realized capital loss carryovers, if any, and the year(s) in which the capital loss carryovers expire were:
| Capital Loss | Year of | |||||
| Carryover | Character | Expiration | ||||
| Baird Intermediate Bond Fund | $ | 4,414 | Short-Term | Indefinitely | ||
| Baird Intermediate Municipal Bond Fund | 365,127 | Short-Term | Indefinitely | |||
| Baird Aggregate Bond Fund | 5,748,122 | Short-Term | Indefinitely | |||
| 4,707,151 | Long-Term | Indefinitely | ||||
| Baird Core Plus Bond Fund | 8,445,752 | Short-Term | Indefinitely | |||
To the extent a Fund realizes future net capital gains, those gains will be offset by any unused capital loss carryovers. During the year ended December 31, 2013, the Baird Intermediate Municipal Bond Fund utilized capital loss carryover of $717,460.
| 5. | Investment Advisory and Other Agreements |
The Funds have entered into an Investment Advisory Agreement with Baird for the provision of investment advisory services. Pursuant to the Investment Advisory Agreement, the Advisor is entitled to receive a fee, calculated daily and payable monthly, at the annual rate of 0.25% for the Funds as applied to the respective Fund’s average daily net assets. Certain officers of the Advisor are also officers of the Funds.
For the six months ended June 30, 2014, the Advisor waived the following amount:
| Fund | Waived Amount |
| Baird Ultra Short Bond Fund | $8,646 |
Page 88
Notes to the Financial Statements
June 30, 2014 (Unaudited)
| 5. | Investment Advisory and Other Agreements (cont.) |
The Funds have entered into an Administration Agreement with Baird. Under the Administration Agreement, the Advisor assumes and pays all expenses of the applicable Fund other than the investment advisory fees, fees under the 12b-1 plan, costs related to portfolio securities transactions and extraordinary or non-recurring expenses. Pursuant to the Administration Agreement, the Advisor is entitled to receive a fee, calculated daily and payable monthly, at the annual rate of 0.05% for the Funds as applied to the respective Fund’s average daily net assets.
U.S. Bancorp Fund Services, LLC (“USBFS”) serves as transfer agent, administrator, and accounting services agent for the Funds. U.S. Bank, N.A. (“U.S. Bank”) serves as custodian for the Funds. Effective June 20, 2014, U.S. Bank is considered an “affiliated person” of the Funds for purposes of the 1940 Act, as a result of U.S. Bank’s fiduciary accounts for which it has investment authority and/or voting authority collectively acquiring 5% or more of the shares of the Baird Aggregate Bond Fund, a separate series of the Company. As a result, USBFS is an affiliated person of an affiliated person (or a “second tier” affiliate) of the Funds.
Baird (the “Distributor”) is the distributor of the Funds pursuant to a distribution agreement.
| 6. | Securities Lending |
Each Fund (other than the Intermediate Municipal Bond Fund) may lend up to one-third of its total assets (including such loans) to borrowers under terms of participation in a securities lending program administered by U.S. Bank, N.A., the Funds’ custodian and an affiliated person of the Funds, and an affiliate of USBFS, the Funds’ transfer agent and administrator and a second-tier affiliate of the Funds. The securities lending agreement requires that loans are collateralized at all times in an amount equal to at least 102% of the market value of any loaned securities at the time of the loan, plus accrued interest.
The Funds receive compensation in the form of fees and earn interest on the cash collateral. The amount of fees depends on a number of factors including the type of security and length of the loan. Each Fund continues to receive interest payments or dividends on the securities loaned during the borrowing period. Each Fund has the right under the terms of the securities lending agreement to recall the securities from the borrower on demand.
As of June 30, 2014, the Baird Short-Term Bond Fund, Baird Intermediate Bond Fund, Baird Aggregate Bond Fund and Baird Core Plus Bond Fund had loaned securities that were collateralized by cash equivalents. The cash collateral is invested by the custodian in accordance with approved investment guidelines. Those guidelines require the cash collateral to be invested in readily marketable, high quality, short-term obligations; however, such investments are subject to risk of payment delays or default on the part of the issuer or counterparty or otherwise may not generate sufficient interest to support the costs associated with securities lending. A Fund could also experience delays in recovering its securities and possible loss of income or value if the borrower fails to return the borrowed securities, although the Funds are indemnified from this risk by contract with the securities lending agent.
As of June 30, 2014, the market value of the securities on loan and payable on collateral due to broker were as follows:
| Market Value of | Payable on Collateral | |||||||
| Securities on Loan | due to Broker | |||||||
| Baird Short-Term Bond Fund | $ | 129,636,231 | $ | 132,338,001 | ||||
| Baird Intermediate Bond Fund | 227,302,513 | 231,817,863 | ||||||
| Baird Aggregate Bond Fund | 226,586,682 | 230,827,699 | ||||||
| Baird Core Plus Bond Fund | 225,481,186 | 229,724,869 | ||||||
Page 89
Notes to the Financial Statements
June 30, 2014 (Unaudited)
| 6. | Securities Lending (cont.) |
The Funds receive cash as collateral in return for securities lent as part of the securities lending program. The collateral is invested in the Mount Vernon Securities Lending Prime Portfolio (a securities lending trust subject to Rule 2a-7 under the 1940 Act). The schedules of investments for the Funds include the particular cash collateral holdings as of June 30, 2014.
The interest income earned by the Funds on investments of cash collateral received from borrowers for the securities loaned to them (“securities lending income”) is reflected in the Funds’ statements of operations. Interest income earned on collateral investments and recognized by the Funds during the six months ended June 30, 2014 for the Baird Short-Term Bond Fund, Baird Intermediate Bond Fund, Baird Aggregate Bond Fund, and Baird Core Plus Bond Fund were $112,402, $156,025, $119,773, and $292,724, respectively.
| 7. | Line of Credit |
The Corporation maintains an uncommitted, senior secured and unsecured line of credit (“LOC”) with U.S. Bank, N.A. (the “Bank”) to provide the Funds a temporary liquidity source to meet unanticipated redemptions. The unsecured line of credit is available to the Funds for any period during which U.S. Bank is an affiliate of the Funds. Under the terms of the LOC, borrowings for each Fund are limited to one-third of the total assets (including the amount borrowed) of the respective Fund, or as otherwise indicated within the Funds’ agreement with the Bank. The Bank charges interest at the Bank’s Prime Rate less 2% (weighted average rate of 1.25% for the first half of 2014). For the six months ended June 30, 2014, the Funds did not have any borrowings.
| 8. | Distribution and Shareholder Service Plan |
The Funds have adopted a distribution and shareholder service plan (the “Plan”) pursuant to Rule 12b-1 under the 1940 Act. The Plan allows the Funds to compensate the Distributor for the costs incurred in distributing the Funds’ Investor Class Shares, including amounts paid to brokers or dealers, at an annual rate of 0.25% of the average daily net assets of the Funds’ Investor Class Shares. The Baird Ultra Short Bond, Baird Short-Term Bond, Baird Intermediate Bond, Baird Intermediate Municipal Bond, Baird Aggregate Bond and Baird Core Plus Bond Funds incurred $50, $32,893, $59,059, $254,394, $211,379 and $1,357,620, respectively, in fees pursuant to the Plan during the six months ended June 30, 2014.
| 9. | Subsequent Event: |
In preparing these financial statements, the Corporation has evaluated events after June 30, 2014. There were no subsequent events since June 30, 2014 through the date the financial statements were issued that would require adjustment to or additional disclosure in these financial statements.
Page 90
Additional Information
Proxy Voting
A description of the policies and procedures that the Funds use to determine how to vote proxies relating to portfolio securities is available without charge, upon request, by calling toll free, 1-866-44BAIRD, or by accessing the Funds’ website at www.bairdfunds.com; and by accessing the SEC’s website at www.sec.gov.
Each Fund’s proxy voting record for the most recent 12-month period ended June 30, if applicable, is available without charge, upon request, by calling toll free, 1-866-44BAIRD, or by accessing the Funds’ website at www.bairdfunds.com; and by accessing the SEC’s website at www.sec.gov. The Funds generally do not vote proxies because the securities held in their portfolios, consisting of bonds and other fixed-income securities, are not entitled to vote.
Portfolio Holdings Disclosure
The Funds file a complete schedule of portfolio holdings with the SEC for the first and third quarters of each fiscal year on Form N-Q. The Funds’ Forms N-Q are available on the SEC’s website at www.sec.gov and may be reviewed and copied at the SEC’s Public Reference Room in Washington, D.C. Information on the operation of the Public Reference Room may be obtained by calling 1-800-732-0330. The Funds’ Forms N-Q may also be obtained by calling toll-free 1-866-44BAIRD.
Page 91
Baird Funds, Inc.
c/o U.S. Bancorp Fund Services, LLC
P.O. Box 701
Milwaukee, WI 53201-0701
1-866-44BAIRD
Board of Directors
G. Frederick Kasten, Jr. (Chairman)
John W. Feldt
Cory L. Nettles
Marlyn J. Spear
Frederick P. Stratton, Jr.
Investment Advisor and Distributor
Robert W. Baird & Co. Incorporated
777 East Wisconsin Avenue
Milwaukee, WI 53202
Administrator and Transfer Agent
U.S. Bancorp Fund Services, LLC
P.O. Box 701
615 East Michigan Street
Milwaukee, WI 53202
Custodian
U.S. Bank, N.A.
1555 N. RiverCenter Drive, Suite 302
Milwaukee, WI 53212
Legal Counsel
Godfrey & Kahn, S.C.
780 North Water Street
Milwaukee, WI 53202
Independent Registered Public
Accounting Firm
Grant Thornton LLP
175 West Jackson Boulevard, 20th Floor
Chicago, IL 60604
Semi-Annual Report –
Baird Funds
June 30, 2014
Baird LargeCap Fund
Baird MidCap Fund
Baird SmallCap Value Fund
| Go Green. | | Go Paperless. |
Sign up to receive your Baird Funds’ prospectuses and reports online.
Table of Contents
| Baird LargeCap Fund | 1 |
| Baird MidCap Fund | 10 |
| Baird SmallCap Value Fund | 17 |
| Additional Information on Fund Expenses | 23 |
| Statements of Assets and Liabilities | 25 |
| Statements of Operations | 26 |
| Statements of Changes in Net Assets | 27 |
| Financial Highlights | 30 |
| Notes to the Financial Statements | 36 |
| Additional Information | 46 |
This report has been prepared for shareholders and may be distributed to others only if preceded or accompanied by a current prospectus.
Cautionary Note on Analyses, Opinions and Outlooks: In this report we offer analyses and opinions on the performance of individual securities, companies, industries, sectors, markets, interest rates and governmental policies, including predictions, forecasts and outlooks regarding possible future events. These can generally be identified as such because the context of the statements may include such words as “believe,” “should,” “will,” “expects,” “anticipates,” “hopes” and words of similar effect. These statements reflect the portfolio managers’ good faith beliefs and judgments and involve risks and uncertainties, including the risk that the portfolio managers’ analyses, opinions and outlooks are or will prove to be inaccurate. It is inherently difficult to correctly assess and explain the performance of particular securities, sectors, markets, interest rate movements, governmental actions or general economic trends and conditions, and many unforeseen factors contribute to the performance of Baird Funds. Investors are, therefore, cautioned not to place undue reliance on subjective judgments contained in this report.
Baird LargeCap Fund
June 30, 2014 (Unaudited)
A June 30, 2014 summary of the Fund’s top 10 holdings and equity sector analysis compared to the S&P 500® Index is shown below.
| Top 10 Holdings* | Equity Sector Analysis** | ||
| Seagate Technology |  | ||
| Public Limited Company | 3.0% | ||
| DISH Network Corporation | 2.9% | ||
| Moody’s Corporation | 2.8% | ||
| Medtronic, Inc. | 2.7% | ||
| Wells Fargo & Company | 2.6% | ||
| Phillips 66 | 2.6% | ||
| Intel Corporation | 2.5% | ||
| Northrop Grumman Corporation | 2.2% | ||
| PepsiCo, Inc. | 2.1% | ||
| Alliance Data Systems Corporation | 2.0% | ||
| Net Assets: | $34,707,872 | ||
| Portfolio Turnover Rate: | 44.4% | † | |
| Number of Equity Holdings: | 112 | ||
| Annualized Portfolio Expense Ratio:*** | |||
| Gross | |||
| Institutional Class: | 1.24% | ||
| Investor Class: | 1.49% | **** | |
| Net | |||
| Institutional Class: | 0.75% | ||
| Investor Class: | 1.00% | **** |
| * | The Fund’s portfolio composition is subject to change and there is no assurance that the Fund will continue to hold any particular security. Percentages shown relate to the Fund’s total net assets as of June 30, 2014. | |
| ** | Percentages shown in parentheses relate to the Fund’s total market value of investments as of June 30, 2014, and may not add up to 100% due to rounding. | |
| *** | Reflects expense ratios as stated in the Fund’s current prospectus. The Advisor has contractually agreed to limit the Fund’s total annual fund operating expenses to 0.75% of average daily net assets for the Institutional Class shares and 1.00% of average daily net assets for the Investor Class shares, at least through April 30, 2015. | |
| **** | Includes 0.25% 12b-1 fee. | |
| † | Not annualized. |
Page 1
Baird LargeCap Fund
June 30, 2014 (Unaudited)
Total Returns
| Average Annual | |||||
| Since | |||||
| For the Periods Ended June 30, 2014 | Six Months | One Year | Five Years | Ten Years | Inception(1) |
| Institutional Class Shares | 7.83% | 31.95% | 17.62% | 6.40% | 2.87% |
| Investor Class Shares | 7.62% | 31.58% | 17.31% | 6.14% | 2.61% |
Russell 1000® Growth Index(2) | 6.31% | 26.92% | 19.24% | 8.20% | 2.05% |
S&P 500® Index(3) | 7.14% | 24.61% | 18.83% | 7.78% | 4.29% |
| (1) | For the period from September 29, 2000 (commencement of operations) through June 30, 2014. |
| (2) | The Russell 1000® Growth Index measures the performance of the large-cap growth segment of the U.S. equity universe. It includes those Russell 1000® companies with higher price-to-book ratios and higher forecasted growth values. This Index does not reflect any deduction for fees, expenses or taxes. A direct investment in the index is not possible. |
| (3) | The S&P 500® Index measures the performance of 500 common stocks chosen for market size, liquidity and industry group representation of U.S. equity performance. This index does not reflect any deduction for fees, expenses or taxes. A direct investment in the index is not possible. |
Effective December 23, 2013, Baird Kailash Group, LLC became the Fund’s subadviser. The returns shown in the table above reflect reinvestment of dividends and/or capital gains distributions in additional shares. The returns do not reflect the deduction of taxes that a shareholder would pay on Fund distributions or the redemption of Fund shares. The returns reflect the actual performance for each period and do not include the impact of trades executed on the last business day of the period that were recorded on the first business day of the next period.
The gross expense ratio for each Class, as reflected in the Fund’s current prospectus, is set forth under “Portfolio Characteristics”.
The Fund’s subadviser makes investment decisions for the Fund primarily using quantitative investment models which rank securities based on fundamental measures of value, past performance and indicators of recent positive changes. The success of the quantitative investment methodologies and processes employed by the subadviser depends on the analyses and assessments that were used in developing such methodologies and processes, as well as on the accuracy and reliability of models and data provided by third parties. Incorrect analyses and assessments or inaccurate or incomplete models and data would adversely affect performance. Certain low-probability events or factors that are assigned little weight may occur or prove to be more likely or may have more relevance than expected, for short or extended periods of time. It is also possible that prices of securities may move in directions that were not predicted by the subadviser’s quantitative methodologies. The Fund may invest in stocks (or ADRs representing stocks) of foreign companies that are traded on U.S. exchanges. Foreign investments involve additional risk such as currency rate fluctuations, political and economic instability, and different and sometimes less strict financial reporting standards and regulation.
Past performance does not guarantee future results. Investment return and principal value will fluctuate so that an investor’s shares, when redeemed, may be worth more or less than their original cost.
For information about the performance of the Fund as of the most recent month-end, please call 1-866-44BAIRD or visit www.bairdfunds.com. Mutual fund performance changes over time and current performance may be lower or higher than that stated.
Page 2
Baird LargeCap Fund
Schedule of Investments, June 30, 2014 (Unaudited)
| Common Stocks | ||||||||||||
| % of | ||||||||||||
| Shares | Value | Net Assets | ||||||||||
| Aerospace & Defense | ||||||||||||
| The Boeing Company | 2,515 | $ | 319,983 | 0.9 | % | |||||||
| Lockheed Martin Corporation | 466 | 74,900 | 0.2 | % | ||||||||
| Northrop Grumman Corporation | 6,466 | 773,528 | 2.2 | % | ||||||||
| Raytheon Company | 6,702 | 618,260 | 1.8 | % | ||||||||
| 1,786,671 | 5.1 | % | ||||||||||
| Airlines | ||||||||||||
| Delta Air Lines, Inc. | 9,284 | 359,476 | 1.1 | % | ||||||||
| Southwest Airlines Co. | 11,986 | 321,944 | 0.9 | % | ||||||||
| 681,420 | 2.0 | % | ||||||||||
| Auto Components | ||||||||||||
Delphi Automotive PLC f | 4,543 | 312,286 | 0.9 | % | ||||||||
| TRW Automotive Holdings Corp.* | 846 | 75,734 | 0.2 | % | ||||||||
| 388,020 | 1.1 | % | ||||||||||
| Automobiles | ||||||||||||
| Ford Motor Company | 35,354 | 609,503 | 1.7 | % | ||||||||
| General Motors Company | 3,494 | 126,832 | 0.4 | % | ||||||||
| Harley-Davidson, Inc. | 1,020 | 71,247 | 0.2 | % | ||||||||
| 807,582 | 2.3 | % | ||||||||||
| Banks | ||||||||||||
| Bank of America Corp. | 13,484 | 207,249 | 0.6 | % | ||||||||
| Fifth Third Bancorp | 10,155 | 216,809 | 0.6 | % | ||||||||
| Huntington Bancshares Incorporated | 65,479 | 624,670 | 1.8 | % | ||||||||
| J.P. Morgan Chase & Co. | 1,307 | 75,309 | 0.2 | % | ||||||||
| KeyCorp | 11,097 | 159,020 | 0.5 | % | ||||||||
| Regions Financial Corporation | 13,936 | 148,000 | 0.4 | % | ||||||||
| U.S. Bancorp | 12,602 | 545,919 | 1.6 | % | ||||||||
| Wells Fargo & Company | 17,364 | 912,652 | 2.6 | % | ||||||||
| 2,889,628 | 8.3 | % | ||||||||||
| Beverages | ||||||||||||
| The Coca-Cola Company | 3,390 | 143,600 | 0.4 | % | ||||||||
| Coca-Cola Enterprises, Inc. | 3,398 | 162,357 | 0.5 | % | ||||||||
| PepsiCo, Inc. | 8,076 | 721,510 | 2.1 | % | ||||||||
| 1,027,467 | 3.0 | % | ||||||||||
| Biotechnology | ||||||||||||
| Amgen Inc. | 3,102 | 367,184 | 1.1 | % | ||||||||
| Building Products | ||||||||||||
| Masco Corporation | 6,512 | 144,566 | 0.4 | % | ||||||||
The accompanying notes are an integral part of these financial statements.
Page 3
Baird LargeCap Fund
Schedule of Investments, June 30, 2014 (Unaudited)
| Common Stocks (cont.) | ||||||||||||
| % of | ||||||||||||
| Shares | Value | Net Assets | ||||||||||
| Capital Markets | ||||||||||||
| Ameriprise Financial, Inc. | 2,522 | $ | 302,640 | 0.9 | % | |||||||
| The Blackstone Group L.P. | 11,582 | 387,302 | 1.1 | % | ||||||||
UBS AG* f | 3,275 | 59,998 | 0.2 | % | ||||||||
| 749,940 | 2.2 | % | ||||||||||
| Chemicals | ||||||||||||
| Celanese Corporation | 1,170 | 75,208 | 0.2 | % | ||||||||
| The Dow Chemical Company | 4,309 | 221,741 | 0.6 | % | ||||||||
| International Flavors & Fragrances Inc. | 1,491 | 155,482 | 0.5 | % | ||||||||
LyondellBasell Industries N.V. – Class A f | 3,980 | 388,647 | 1.1 | % | ||||||||
| Sigma-Aldrich Corporation | 728 | 73,877 | 0.2 | % | ||||||||
| W. R. Grace & Co* | 717 | 67,778 | 0.2 | % | ||||||||
| 982,733 | 2.8 | % | ||||||||||
| Communications Equipment | ||||||||||||
| Harris Corporation | 2,921 | 221,266 | 0.7 | % | ||||||||
| QUALCOMM Incorporated | 1,888 | 149,529 | 0.4 | % | ||||||||
| 370,795 | 1.1 | % | ||||||||||
| Consumer Finance | ||||||||||||
| American Express Company | 4,872 | 462,207 | 1.3 | % | ||||||||
| Capital One Financial Corporation | 921 | 76,074 | 0.2 | % | ||||||||
| Discover Financial Services | 7,719 | 478,424 | 1.4 | % | ||||||||
| 1,016,705 | 2.9 | % | ||||||||||
| Containers & Packaging | ||||||||||||
| Ball Corporation | 6,401 | 401,215 | 1.2 | % | ||||||||
| Diversified Consumer Services | ||||||||||||
| H&R Block, Inc. | 6,432 | 215,601 | 0.6 | % | ||||||||
| Diversified Financial Services | ||||||||||||
| McGraw Hill Financial, Inc. | 906 | 75,225 | 0.2 | % | ||||||||
| Moody’s Corporation | 10,928 | 957,949 | 2.8 | % | ||||||||
| 1,033,174 | 3.0 | % | ||||||||||
| Diversified Telecommunication Services | ||||||||||||
| AT&T Inc. | 2,078 | 73,478 | 0.2 | % | ||||||||
| Electrical Equipment | ||||||||||||
| Rockwell Automation, Inc. | 1,964 | 245,814 | 0.7 | % | ||||||||
| Energy Equipment & Services | ||||||||||||
| Halliburton Company | 2,248 | 159,631 | 0.5 | % | ||||||||
Seadrill Limited f | 1,316 | 52,574 | 0.1 | % | ||||||||
| 212,205 | 0.6 | % | ||||||||||
The accompanying notes are an integral part of these financial statements.
Page 4
Baird LargeCap Fund
Schedule of Investments, June 30, 2014 (Unaudited)
| Common Stocks (cont.) | ||||||||||||
| % of | ||||||||||||
| Shares | Value | Net Assets | ||||||||||
| Food & Staples Retailing | ||||||||||||
| The Kroger Co. | 5,188 | $ | 256,443 | 0.7 | % | |||||||
| Safeway Inc. | 2,116 | 72,663 | 0.2 | % | ||||||||
| 329,106 | 0.9 | % | ||||||||||
| Food Products | ||||||||||||
| Archer-Daniels-Midland Company | 6,985 | 308,108 | 0.9 | % | ||||||||
| Campbell Soup Company | 5,684 | 260,384 | 0.7 | % | ||||||||
| General Mills, Inc. | 1,197 | 62,890 | 0.2 | % | ||||||||
| Tyson Foods, Inc. | 1,649 | 61,904 | 0.2 | % | ||||||||
| 693,286 | 2.0 | % | ||||||||||
| Health Care Equipment & Supplies | ||||||||||||
| Abbott Laboratories | 1,568 | 64,131 | 0.2 | % | ||||||||
| Baxter International Inc. | 940 | 67,962 | 0.2 | % | ||||||||
| Becton, Dickson and Company | 3,163 | 374,183 | 1.1 | % | ||||||||
| C.R. Bard, Inc. | 3,840 | 549,158 | 1.6 | % | ||||||||
| Edwards Lifesciences Corporation* | 3,945 | 338,639 | 1.0 | % | ||||||||
| Medtronic, Inc. | 14,827 | 945,370 | 2.7 | % | ||||||||
| St. Jude Medical, Inc. | 7,073 | 489,805 | 1.4 | % | ||||||||
| Varian Medical Systems, Inc.* | 881 | 73,246 | 0.2 | % | ||||||||
| 2,902,494 | 8.4 | % | ||||||||||
| Health Care Providers & Services | ||||||||||||
| AmerisourceBergen Corporation | 3,024 | 219,724 | 0.6 | % | ||||||||
| Hotels, Restaurants & Leisure | ||||||||||||
| Wyndham Worldwide Corporation | 4,958 | 375,420 | 1.1 | % | ||||||||
| Household Durables | ||||||||||||
| PulteGroup, Inc. | 14,182 | 285,909 | 0.8 | % | ||||||||
| Household Products | ||||||||||||
| The Clorox Company | 1,400 | 127,960 | 0.4 | % | ||||||||
| Energizer Holdings, Inc. | 584 | 71,266 | 0.2 | % | ||||||||
| Kimberly-Clark Corporation | 1,911 | 212,541 | 0.6 | % | ||||||||
| 411,767 | 1.2 | % | ||||||||||
| Independent Power Producers & Energy Traders | ||||||||||||
| The AES Corporation | 39,348 | 611,861 | 1.8 | % | ||||||||
| Insurance | ||||||||||||
| Aflac, Inc. | 4,306 | 268,048 | 0.8 | % | ||||||||
| Principal Financial Group, Inc. | 1,553 | 78,395 | 0.2 | % | ||||||||
| Prudential Financial, Inc. | 788 | 69,951 | 0.2 | % | ||||||||
| Unum Group | 4,181 | 145,332 | 0.4 | % | ||||||||
| 561,726 | 1.6 | % | ||||||||||
The accompanying notes are an integral part of these financial statements.
Page 5
Baird LargeCap Fund
Schedule of Investments, June 30, 2014 (Unaudited)
| Common Stocks (cont.) | ||||||||||||
| % of | ||||||||||||
| Shares | Value | Net Assets | ||||||||||
| Internet & Catalog Retail | ||||||||||||
| Expedia, Inc. | 3,920 | $ | 308,739 | 0.9 | % | |||||||
| IT Services | ||||||||||||
| Alliance Data Systems Corporation* | 2,476 | 696,375 | 2.0 | % | ||||||||
| Blackhawk Network Holdings, Inc.* | 317 | 8,512 | 0.0 | % | ||||||||
| The Western Union Company | 21,853 | 378,931 | 1.1 | % | ||||||||
| 1,083,818 | 3.1 | % | ||||||||||
| Leisure Equipment Products | ||||||||||||
| Hasbro, Inc. | 2,583 | 137,028 | 0.4 | % | ||||||||
| Life Sciences Tools & Services | ||||||||||||
| Agilent Technologies, Inc. | 2,457 | 141,130 | 0.4 | % | ||||||||
| Machinery | ||||||||||||
| Caterpillar Inc. | 2,778 | 301,885 | 0.9 | % | ||||||||
| Deere & Company | 3,188 | 288,674 | 0.8 | % | ||||||||
| 590,559 | 1.7 | % | ||||||||||
| Media | ||||||||||||
| DISH Network Corporation – Class A* | 15,538 | 1,011,213 | 2.9 | % | ||||||||
| Omnicom Group Inc. | 1,928 | 137,312 | 0.4 | % | ||||||||
| Time Warner Cable Inc. | 1,765 | 259,985 | 0.8 | % | ||||||||
| Viacom Inc. – Class B | 817 | 70,858 | 0.2 | % | ||||||||
| 1,479,368 | 4.3 | % | ||||||||||
| Multiline Retail | ||||||||||||
| Macys, Inc. | 2,457 | 142,555 | 0.4 | % | ||||||||
| Nordstrom, Inc. | 4,416 | 299,979 | 0.9 | % | ||||||||
| 442,534 | 1.3 | % | ||||||||||
| Multi-Utilities | ||||||||||||
| CenterPoint Energy, Inc. | 4,925 | 125,785 | 0.4 | % | ||||||||
| CMS Energy Corporation | 2,442 | 76,068 | 0.2 | % | ||||||||
| 201,853 | 0.6 | % | ||||||||||
| Oil, Gas & Consumable Fuels | ||||||||||||
| Marathon Petroleum Corporation | 7,352 | 573,971 | 1.6 | % | ||||||||
| Phillips 66 | 11,061 | 889,636 | 2.6 | % | ||||||||
| Tesoro Corporation | 1,998 | 117,223 | 0.3 | % | ||||||||
| Valero Energy Corporation | 1,296 | 64,929 | 0.2 | % | ||||||||
| Whiting Petroleum Corporation* | 5,148 | 413,127 | 1.2 | % | ||||||||
| 2,058,886 | 5.9 | % | ||||||||||
| Pharmaceuticals | ||||||||||||
| AbbVie Inc. | 10,880 | 614,067 | 1.8 | % | ||||||||
| Allergan, Inc. | 570 | 96,456 | 0.3 | % | ||||||||
The accompanying notes are an integral part of these financial statements.
Page 6
Baird LargeCap Fund
Schedule of Investments, June 30, 2014 (Unaudited)
| Common Stocks (cont.) | ||||||||||||
| % of | ||||||||||||
| Shares | Value | Net Assets | ||||||||||
| Pharmaceuticals (cont.) | ||||||||||||
| Eli Lilly and Company | 3,665 | $ | 227,853 | 0.6 | % | |||||||
| Pfizer Inc. | 2,246 | 66,661 | 0.2 | % | ||||||||
| 1,005,037 | 2.9 | % | ||||||||||
| Road & Rail | ||||||||||||
| Hertz Global Holdings, Inc.* | 8,838 | 247,729 | 0.7 | % | ||||||||
| Semiconductors & Semiconductor Equipment | ||||||||||||
| Intel Corporation | 27,319 | 844,157 | 2.5 | % | ||||||||
| Maxim Integrated Products, Inc. | 4,339 | 146,702 | 0.4 | % | ||||||||
| Micron Technology, Inc.* | 13,515 | 445,319 | 1.3 | % | ||||||||
| NVIDIA Corporation | 8,047 | 149,191 | 0.4 | % | ||||||||
| 1,585,369 | 4.6 | % | ||||||||||
| Software | ||||||||||||
Check Point Software Technologies Ltd.*f | 4,508 | 302,171 | 0.9 | % | ||||||||
| Microsoft Corporation | 13,471 | 561,741 | 1.6 | % | ||||||||
| Oracle Corporation | 14,932 | 605,194 | 1.7 | % | ||||||||
| 1,469,106 | 4.2 | % | ||||||||||
| Technology Hardware, Storage & Peripherals | ||||||||||||
| Hewlett-Packard Company | 8,872 | 298,809 | 0.9 | % | ||||||||
| NetApp, Inc. | 4,283 | 156,415 | 0.5 | % | ||||||||
| SanDisk Corporation | 5,468 | 571,023 | 1.6 | % | ||||||||
Seagate Technology Public Limited Company f | 18,439 | 1,047,704 | 3.0 | % | ||||||||
| Western Digital Corporation | 4,210 | 388,583 | 1.1 | % | ||||||||
| 2,462,534 | 7.1 | % | ||||||||||
| Thrifts & Mortgage Finance | ||||||||||||
| New York Community Bancorp, Inc. | 13,184 | 210,680 | 0.6 | % | ||||||||
| Tobacco | ||||||||||||
| Reynolds American, Inc. | 1,227 | 74,050 | 0.2 | % | ||||||||
| Total Common Stocks | ||||||||||||
| (Cost $30,444,980) | 33,283,911 | 95.9 | % | |||||||||
| Exchange Traded Fund | ||||||||||||
| SPDR Consumer Staples Select Sector Fund | 7,273 | 324,521 | 0.9 | % | ||||||||
| Total Exchange Traded Fund | ||||||||||||
| (Cost $321,909) | 324,521 | 0.9 | % | |||||||||
The accompanying notes are an integral part of these financial statements.
Page 7
Baird LargeCap Fund
Schedule of Investments, June 30, 2014 (Unaudited)
| Short-Term Investments | ||||||||||||
| % of | ||||||||||||
| Shares | Value | Net Assets | ||||||||||
| Money Market Mutual Funds | ||||||||||||
| Dreyfus Institutional Cash Advantage Fund, 0.06%« | 490,124 | $ | 490,124 | 1.4 | % | |||||||
| Short-Term Investments Trust – | ||||||||||||
| Liquid Assets Portfolio, 0.06%« | 600,000 | 600,000 | 1.8 | % | ||||||||
| Total Short-Term Investments | ||||||||||||
| (Cost $1,090,124) | 1,090,124 | 3.2 | % | |||||||||
| Total Investments | ||||||||||||
| (Cost $31,857,013) | 34,698,556 | 100.0 | % | |||||||||
| Other Assets in Excess of Liabilities | 9,316 | 0.0 | % | |||||||||
| TOTAL NET ASSETS | $ | 34,707,872 | 100.0 | % | ||||||||
Notes to Schedule of Investments
| * | Non-Income Producing |
| f | Foreign Security |
| « | 7-Day Yield |
Industry classifications shown in the Schedule of Investments are based off of the Global Industry Classification Standard (GICS®). GICS was developed by and/or is the exclusive property of MSCI, Inc. and Standard & Poor Financial Services LLC (“S&P”). GICS is a service mark of MSCI and S&P and has been licensed for use by U.S. Bancorp Fund Services, LLC.
The accompanying notes are an integral part of these financial statements.
Page 8
Baird LargeCap Fund
Schedule of Investments, June 30, 2014 (Unaudited)
Summary of Fair Value Exposure at June 30, 2014
The Fund has adopted authoritative fair valuation accounting standards which establish a definition of fair value and set out a hierarchy for measuring fair value. These standards require additional disclosures about the various inputs and valuation techniques used to develop the measurements of fair value and a discussion on changes in valuation techniques and related inputs during the period. These standards define fair value as the price that would be received to sell an asset or paid to transfer a liability in an orderly transaction between market participants at the measurement date. The fair value hierarchy is organized into three levels based upon the assumptions (referred to as “inputs”) used in pricing the asset or liability. These standards state that “observable inputs” reflect the assumptions market participants would use in pricing the asset or liability based on market data obtained from independent sources and “unobservable inputs” reflect an entity’s own assumptions about the assumptions market participants would use in pricing the asset or liability. These inputs are summarized into three broad levels and described below:
Level 1 – | Unadjusted quoted prices in active markets for identical unrestricted securities. |
Level 2 – | Other significant observable inputs (including quoted prices for similar securities, quoted prices in inactive markets, dealer indications, interest rates, yield curves, prepayment speeds, credit risk, default rates, inputs corroborated by observable market data, etc.). |
Level 3 – | Significant unobservable inputs (including the Fund’s own assumptions about the factors that market participants would use in valuing the security) based on the best information available. |
The inputs or methodology used for valuing securities are not necessarily an indication of the risk associated with investing in those securities.
The following is a summary of the inputs used to value the Fund’s investments as of June 30, 2014:
| Level 1 | Level 2 | Level 3 | Total | |||||||||||||
| Equity | ||||||||||||||||
| Common Stocks | $ | 33,283,911 | $ | — | $ | — | $ | 33,283,911 | ||||||||
| Total Equity | 33,283,911 | — | — | 33,283,911 | ||||||||||||
| Exchange Traded Fund | 324,521 | — | — | 324,521 | ||||||||||||
| Short-Term Investments | ||||||||||||||||
| Money Market Mutual Funds | 1,090,124 | — | — | 1,090,124 | ||||||||||||
| Total Short-Term Investments | 1,090,124 | — | — | 1,090,124 | ||||||||||||
| Total Investments* | $ | 34,698,556 | $ | — | $ | — | $ | 34,698,556 | ||||||||
| * | Additional information regarding the industry classifications of these investments is disclosed in the Schedule of Investments. |
Changes in valuation techniques may result in transfers into or out of assigned levels within the fair value hierarchy. There were no transfers between Level 1, Level 2 and Level 3 fair value measurements during the reporting period, as compared to their classification from the prior year’s annual report.
Page 9
Baird MidCap Fund
June 30, 2014 (Unaudited)
A June 30, 2014 summary of the Fund’s top 10 holdings and equity sector analysis compared to the Russell MidCap® Growth Index is shown below.
| Top 10 Holdings* | Equity Sector Analysis** | ||
| Whiting Petroleum Corporation | 2.5% |  | |
| Affiliated Managers Group, Inc. | 2.4% | ||
| O’Reilly Automotive, Inc. | 2.3% | ||
| Alliance Data Systems Corporation | 2.3% | ||
| ICON Public Limited Company | 2.3% | ||
| Illumina, Inc. | 2.3% | ||
| Southwestern Energy Company | 2.1% | ||
| Rockwell Automation, Inc. | 2.1% | ||
| McCormick & Co, Incorporated | 2.1% | ||
| Skyworks Solutions, Inc. | 2.1% | ||
| Net Assets: | $959,083,055 | ||
| Portfolio Turnover Rate: | 13.5% | † | |
| Number of Equity Holdings: | 60 | ||
| Annualized Portfolio Expense Ratio:*** | |||
| Gross | |||
| Institutional Class: | 0.88% | ||
| Investor Class: | 1.13% | **** | |
| Net | |||
| Institutional Class: | 0.85% | ||
| Investor Class: | 1.10% | **** |
| * | The Fund’s portfolio composition is subject to change and there is no assurance that the Fund will continue to hold any particular security. Percentages shown relate to the Fund’s total net assets as of June 30, 2014. | |
| ** | Percentages shown in parentheses relate to the Fund’s total market value of investments as of June 30, 2014, and may not add up to 100% due to rounding. | |
| *** | Reflects expense ratios as stated in the Fund’s current prospectus. The Advisor has contractually agreed to limit the Fund’s total annual fund operating expenses to 0.85% of average daily net assets for the Institutional Class shares and 1.10% of average daily net assets for the Investor Class shares, at least through April 30, 2015. | |
| **** | Includes 0.25% 12b-1 fee. | |
| † | Not annualized. |
Page 10
Baird MidCap Fund
June 30, 2014 (Unaudited)
Total Returns
| Average Annual | |||||
| Since | |||||
| For the Periods Ended June 30, 2014 | Six Months | One Year | Five Years | Ten Years | Inception(1) |
| Institutional Class Shares | 2.87% | 22.85% | 21.53% | 9.37% | 7.16% |
| Investor Class Shares | 2.77% | 22.63% | 21.23% | 9.12% | 6.91% |
Russell MidCap® Growth Index(2) | 6.51% | 26.04% | 21.16% | 9.83% | 5.94% |
| (1) | For the period from December 29, 2000 (commencement of operations) through June 30, 2014. |
| (2) | The Russell MidCap® Growth Index measures the performance of the mid-cap growth segment of the U.S. equity universe. It includes those Russell MidCap® index companies with higher price-to-book ratios and higher forecasted growth values. This index does not reflect any deduction for fees, expenses or taxes. A direct investment in the index is not possible. |
The returns shown in the table above reflect reinvestment of dividends and/or capital gains distributions in additional shares. The returns do not reflect the deduction of taxes that a shareholder would pay on Fund distributions or the redemption of Fund shares. The returns reflect the actual performance for each period and do not include the impact of trades executed on the last business day of the period that were recorded on the first business day of the next period.
The gross expense ratio for each Class, as reflected in the Fund’s current prospectus, is set forth under “Portfolio Characteristics”.
The Fund focuses on growth-style stocks and therefore the performance of the Fund will typically be more volatile than the performance of funds that focus on types of stocks that have a broader investment style. The Fund may invest up to 15% of its total assets in U.S. dollar denominated foreign securities and ADRs. Foreign investments involve additional risks such as currency rate fluctuations, political and economic instability, and different and sometimes less strict financial reporting standards and regulation. The Fund invests a substantial portion of its assets in the stocks of mid-capitalization companies. Mid-capitalization companies often are more volatile and face greater risks than larger, more established companies.
Past performance does not guarantee future results. Investment return and principal value will fluctuate so that an investor’s shares, when redeemed, may be worth more or less than their original cost.
For information about the performance of the Fund as of the most recent month-end, please call 1-866-44BAIRD or visit www.bairdfunds.com. Mutual fund performance changes over time and current performance may be lower or higher than that stated.
Page 11
Baird MidCap Fund
Schedule of Investments, June 30, 2014 (Unaudited)
| Common Stocks | ||||||||||||
| % of | ||||||||||||
| Shares | Value | Net Assets | ||||||||||
| Banks | ||||||||||||
| East West Bancorp, Inc. | 562,321 | $ | 19,675,612 | 2.0 | % | |||||||
| Building Products | ||||||||||||
| Fortune Brands Home & Security, Inc. | 447,036 | 17,850,148 | 1.9 | % | ||||||||
| Capital Markets | ||||||||||||
| Affiliated Managers Group, Inc.* | 113,280 | 23,267,712 | 2.4 | % | ||||||||
| Greenhill & Co., Inc. | 381,638 | 18,795,671 | 2.0 | % | ||||||||
Invesco Limited f | 210,954 | 7,963,514 | 0.8 | % | ||||||||
| 50,026,897 | 5.2 | % | ||||||||||
| Chemicals | ||||||||||||
| Airgas, Inc. | 111,938 | 12,191,168 | 1.3 | % | ||||||||
| Commercial Services & Supplies | ||||||||||||
| Stericycle, Inc.* | 139,707 | 16,544,103 | 1.7 | % | ||||||||
| Construction & Engineering | ||||||||||||
| Fluor Corporation | 186,056 | 14,307,706 | 1.5 | % | ||||||||
| Containers & Packaging | ||||||||||||
| AptarGroup, Inc. | 210,318 | 14,093,409 | 1.5 | % | ||||||||
| Distributors | ||||||||||||
| LKQ Corporation* | 668,997 | 17,855,530 | 1.9 | % | ||||||||
| Electrical Equipment | ||||||||||||
| Acuity Brands, Inc. | 131,082 | 18,122,086 | 1.9 | % | ||||||||
| Regal-Beloit Corporation | 94,703 | 7,439,868 | 0.8 | % | ||||||||
| Rockwell Automation, Inc. | 164,157 | 20,545,890 | 2.1 | % | ||||||||
| 46,107,844 | 4.8 | % | ||||||||||
| Electronic Equipment, Instruments & Components | ||||||||||||
| Trimble Navigation Limited* | 530,454 | 19,600,275 | 2.0 | % | ||||||||
| Energy Equipment & Services | ||||||||||||
Core Laboratories N.V. f | 46,857 | 7,827,930 | 0.8 | % | ||||||||
| Oceaneering International, Inc. | 188,427 | 14,721,802 | 1.5 | % | ||||||||
| 22,549,732 | 2.3 | % | ||||||||||
| Food & Staples Retailing | ||||||||||||
| The Fresh Market, Inc.* | 340,804 | 11,406,710 | 1.2 | % | ||||||||
| Food Products | ||||||||||||
| McCormick & Co, Incorporated | 285,491 | 20,438,301 | 2.1 | % | ||||||||
| Mead Johnson Nutrition Company | 152,880 | 14,243,829 | 1.5 | % | ||||||||
| 34,682,130 | 3.6 | % | ||||||||||
| Health Care Equipment & Supplies | ||||||||||||
| Globus Medical, Inc.* | 387,890 | 9,278,329 | 1.0 | % | ||||||||
The accompanying notes are an integral part of these financial statements.
Page 12
Baird MidCap Fund
Schedule of Investments, June 30, 2014 (Unaudited)
| Common Stocks (cont.) | ||||||||||||
| % of | ||||||||||||
| Shares | Value | Net Assets | ||||||||||
| Health Care Providers & Services | ||||||||||||
| Acadia Healthcare Company, Inc.* | 356,562 | $ | 16,223,571 | 1.7 | % | |||||||
| Envision Healthcare Holdings, Inc.* | 142,921 | 5,132,293 | 0.5 | % | ||||||||
| 21,355,864 | 2.2 | % | ||||||||||
| Health Care Technology | ||||||||||||
| Cerner Corporation* | 154,449 | 7,966,479 | 0.8 | % | ||||||||
| Hotels Restaurants & Leisure | ||||||||||||
| Buffalo Wild Wings Inc.* | 84,782 | 14,049,225 | 1.5 | % | ||||||||
| Household Products | ||||||||||||
| Church & Dwight Co., Inc. | 240,267 | 16,806,677 | 1.7 | % | ||||||||
| Internet & Catalog Retail | ||||||||||||
| HomeAway, Inc.* | 282,000 | 9,819,240 | 1.0 | % | ||||||||
| Internet Software & Services | ||||||||||||
| Envestnet, Inc.* | 80,907 | 3,957,971 | 0.4 | % | ||||||||
| Pandora Media, Inc.* | 190,330 | 5,614,735 | 0.6 | % | ||||||||
| 9,572,706 | 1.0 | % | ||||||||||
| IT Services | ||||||||||||
| Alliance Data Systems Corporation* | 78,101 | 21,965,906 | 2.3 | % | ||||||||
| Leisure Equipment Products | ||||||||||||
| Polaris Industries Inc. | 106,615 | 13,885,538 | 1.4 | % | ||||||||
| Life Sciences Tools & Services | ||||||||||||
ICON Public Limited Company*f | 465,554 | 21,932,249 | 2.3 | % | ||||||||
| Illumina, Inc.* | 122,493 | 21,869,900 | 2.3 | % | ||||||||
| 43,802,149 | 4.6 | % | ||||||||||
| Machinery | ||||||||||||
| Actuant Corporation – Class A | 398,882 | 13,789,351 | 1.4 | % | ||||||||
| The Middleby Corporation* | 202,920 | 16,785,542 | 1.8 | % | ||||||||
| Trinity Industries, Inc. | 221,465 | 9,682,450 | 1.0 | % | ||||||||
| WABCO Holdings Inc.* | 188,885 | 20,176,696 | 2.1 | % | ||||||||
| 60,434,039 | 6.3 | % | ||||||||||
| Multiline Retail | ||||||||||||
| Dollar Tree, Inc.* | 361,133 | 19,667,303 | 2.1 | % | ||||||||
| Oil, Gas & Consumable Fuels | ||||||||||||
| Southwestern Energy Company* | 453,654 | 20,636,721 | 2.1 | % | ||||||||
| Whiting Petroleum Corporation* | 295,765 | 23,735,141 | 2.5 | % | ||||||||
| 44,371,862 | 4.6 | % | ||||||||||
| Pharmaceuticals | ||||||||||||
Perrigo Company PLC f | 126,828 | 18,486,449 | 1.9 | % | ||||||||
The accompanying notes are an integral part of these financial statements.
Page 13
Baird MidCap Fund
Schedule of Investments, June 30, 2014 (Unaudited)
| Common Stocks (cont.) | ||||||||||||
| % of | ||||||||||||
| Shares | Value | Net Assets | ||||||||||
| Professional Services | ||||||||||||
| Manpower Inc. | 212,650 | $ | 18,043,353 | 1.9 | % | |||||||
| Road & Rail | ||||||||||||
| J.B. Hunt Transport Services, Inc. | 243,685 | 17,979,079 | 1.9 | % | ||||||||
| Semiconductors & Semiconductor Equipment | ||||||||||||
| Altera Corporation | 302,530 | 10,515,943 | 1.1 | % | ||||||||
| Microchip Technology Incorporated | 317,075 | 15,476,431 | 1.6 | % | ||||||||
| Skyworks Solutions, Inc. | 434,734 | 20,415,108 | 2.1 | % | ||||||||
| 46,407,482 | 4.8 | % | ||||||||||
| Software | ||||||||||||
| ANSYS, Inc.* | 202,009 | 15,316,322 | 1.6 | % | ||||||||
| Citrix Systems, Inc.* | 183,389 | 11,470,982 | 1.2 | % | ||||||||
| Concur Technologies, Inc.* | 157,811 | 14,730,079 | 1.5 | % | ||||||||
| Fortinet, Inc.* | 614,010 | 15,430,071 | 1.6 | % | ||||||||
| Qlik Technologies Inc.* | 271,061 | 6,131,400 | 0.7 | % | ||||||||
| The Ultimate Software Group, Inc.* | 112,610 | 15,559,324 | 1.6 | % | ||||||||
| 78,638,178 | 8.2 | % | ||||||||||
| Specialty Retail | ||||||||||||
| Dick’s Sporting Goods, Inc. | 329,862 | 15,358,375 | 1.6 | % | ||||||||
| O’Reilly Automotive, Inc.* | 148,044 | 22,295,426 | 2.3 | % | ||||||||
| Tiffany & Co. | 163,349 | 16,375,737 | 1.7 | % | ||||||||
| Tractor Supply Company | 238,531 | 14,407,272 | 1.5 | % | ||||||||
| Urban Outfitters, Inc.* | 493,753 | 16,718,477 | 1.8 | % | ||||||||
| 85,155,287 | 8.9 | % | ||||||||||
| Textiles, Apparel & Luxury Goods | ||||||||||||
| PVH Corp. | 173,686 | 20,251,788 | 2.1 | % | ||||||||
| Under Armour, Inc. – Class A* | 201,168 | 11,967,484 | 1.3 | % | ||||||||
| 32,219,272 | 3.4 | % | ||||||||||
| Trading Companies & Distributors | ||||||||||||
| Fastenal Company | 342,675 | 16,958,986 | 1.8 | % | ||||||||
| Watsco, Inc. | 139,778 | 14,363,587 | 1.5 | % | ||||||||
| 31,322,573 | 3.3 | % | ||||||||||
| Total Common Stocks | ||||||||||||
| (Cost $808,230,043) | 918,118,254 | 95.7 | % | |||||||||
The accompanying notes are an integral part of these financial statements.
Page 14
Baird MidCap Fund
Schedule of Investments, June 30, 2014 (Unaudited)
| Short-Term Investments | ||||||||||||
| % of | ||||||||||||
| Shares | Value | Net Assets | ||||||||||
| Money Market Mutual Funds | ||||||||||||
| Dreyfus Institutional Cash Advantage Fund, 0.06%« | 25,491,954 | $ | 25,491,954 | 2.6 | % | |||||||
| Short-Term Investments Trust – | ||||||||||||
| Liquid Assets Portfolio, 0.06%« | 18,000,000 | 18,000,000 | 1.9 | % | ||||||||
| Total Short-Term Investments | ||||||||||||
| (Cost $43,491,954) | 43,491,954 | 4.5 | % | |||||||||
| Total Investments | ||||||||||||
| (Cost $851,721,997) | 961,610,208 | 100.2 | % | |||||||||
| Liabilities in Excess of Other Assets | (2,527,153 | ) | (0.2 | )% | ||||||||
| TOTAL NET ASSETS | $ | 959,083,055 | 100.0 | % | ||||||||
Notes to Schedule of Investments
| * | Non-Income Producing |
| f | Foreign Security |
| « | 7-Day Yield |
Industry classifications shown in the Schedule of Investments are based off of the Global Industry Classification Standard (GICS®). GICS was developed by and/or is the exclusive property of MSCI, Inc. and Standard & Poor Financial Services LLC (“S&P”). GICS is a service mark of MSCI and S&P and has been licensed for use by U.S. Bancorp Fund Services, LLC.
The accompanying notes are an integral part of these financial statements.
Page 15
Baird MidCap Fund
Schedule of Investments, June 30, 2014 (Unaudited)
The Fund has adopted authoritative fair valuation accounting standards which establish a definition of fair value and set out a hierarchy for measuring fair value. These standards require additional disclosures about the various inputs and valuation techniques used to develop the measurements of fair value and a discussion on changes in valuation techniques and related inputs during the period. These standards define fair value as the price that would be received to sell an asset or paid to transfer a liability in an orderly transaction between market participants at the measurement date. The fair value hierarchy is organized into three levels based upon the assumptions (referred to as “inputs”) used in pricing the asset or liability. These standards state that “observable inputs” reflect the assumptions market participants would use in pricing the asset or liability based on market data obtained from independent sources and “unobservable inputs” reflect an entity’s own assumptions about the assumptions market participants would use in pricing the asset or liability. These inputs are summarized into three broad levels and described below:
Level 1 – | Unadjusted quoted prices in active markets for identical unrestricted securities. |
Level 2 – | Other significant observable inputs (including quoted prices for similar securities, quoted prices in inactive markets, dealer indications, interest rates, yield curves, prepayment speeds, credit risk, default rates, inputs corroborated by observable market data, etc.). |
Level 3 – | Significant unobservable inputs (including the Fund’s own assumptions about the factors that market participants would use in valuing the security) based on the best information available. |
The inputs or methodology used for valuing securities are not necessarily an indication of the risk associated with investing in those securities.
The following is a summary of the inputs used to value the Fund’s investments as of June 30, 2014:
| Level 1 | Level 2 | Level 3 | Total | |||||||||||||
| Equity | ||||||||||||||||
| Common Stocks | $ | 918,118,254 | $ | — | $ | — | $ | 918,118,254 | ||||||||
| Total Equity | 918,118,254 | — | — | 918,118,254 | ||||||||||||
| Short-Term Investments | ||||||||||||||||
| Money Market Mutual Funds | 43,491,954 | — | — | 43,491,954 | ||||||||||||
| Total Short-Term Investments | 43,491,954 | — | — | 43,491,954 | ||||||||||||
| Total Investments* | $ | 961,610,208 | $ | — | $ | — | $ | 961,610,208 | ||||||||
| * | Additional information regarding the industry classifications of these investments is disclosed in the Schedule of Investments. |
Changes in valuation techniques may result in transfers into or out of assigned levels within the fair value hierarchy. There were no transfers between Level 1, Level 2 and Level 3 fair value measurements during the reporting period, as compared to their classification from the prior year’s annual report.
Page 16
Baird SmallCap Value Fund
June 30, 2014 (Unaudited)
A June 30, 2014 summary of the Fund’s top 10 holdings and equity sector analysis compared to the Russell 2000® Value Index is shown below.
| Top 10 Holdings* | Equity Sector Analysis** | ||
| Portfolio Recovery Associates, Inc. | 3.8% |  | |
| Targa Resources Corp. | 3.7% | ||
| Pinnacle Foods Inc. | 3.4% | ||
| Integrated Device Technology, Inc. | 3.4% | ||
| Motorcar Parts of America, Inc. | 3.3% | ||
| LTC Properties, Inc. | 3.0% | ||
| Generac Holdings Inc. | 2.9% | ||
| Encore Capital Group, Inc. | 2.7% | ||
| Hexcel Corporation | 2.7% | ||
| Hilltop Holdings, Inc. | 2.7% | ||
| Net Assets: | $25,485,263 | ||
| Portfolio Turnover Rate: | 27.4% | † | |
| Number of Equity Holdings: | 43 | ||
| Annualized Portfolio Expense Ratio:*** | |||
| Gross | |||
| Institutional Class: | 2.03% | ||
| Investor Class: | 2.28% | **** | |
| Net | |||
| Institutional Class: | 1.00% | ||
| Investor Class: | 1.25% | **** |
| * | The Fund’s portfolio composition is subject to change and there is no assurance that the Fund will continue to hold any particular security. Percentages shown relate to the Fund’s total net assets as of June 30, 2014. | |
| ** | Percentages shown in parentheses relate to the Fund’s total market value of investments as of June 30, 2014, and may not add up to 100% due to rounding. | |
| *** | Reflects expense ratios as stated in the Fund’s current prospectus. The Advisor has contractually agreed to limit the Fund’s total annual fund operating expenses to 1.00% of average daily net assets for the Institutional Class shares and 1.25% of average daily net assets for the Investor Class shares, at least through April 30, 2015. | |
| **** | Includes 0.25% 12b-1 fee. | |
| † | Not annualized. |
Page 17
Baird SmallCap Value Fund
June 30, 2014 (Unaudited)
Total Returns
| Average | |||
| Annual | |||
| Since | |||
| For the Periods Ended June 30, 2014 | Six Months | One Year | Inception(1) |
| Institutional Class Shares | 3.07% | 24.71% | 20.29% |
| Investor Class Shares | 2.93% | 24.39% | 19.99% |
Russell 2000® Value Index(2) | 4.20% | 22.54% | 20.75% |
| (1) | For the period from May 1, 2012 (commencement of operations) through June 30, 2014. |
| (2) | The Russell 2000® Value Index measures the performance of the small-cap value segment of the U.S. equity universe. It includes those Russell 2000® Index companies with lower price-to-book ratios and lower forecasted growth values. This index does not reflect any deduction for fees, expenses or taxes. A direct investment in the index is not possible. |
The returns shown in the table above reflect reinvestment of dividends and/or capital gains distributions in additional shares. The returns do not reflect the deduction of taxes that a shareholder would pay on Fund distributions or the redemption of Fund shares. The returns reflect the actual performance for each period and do not include the impact of trades executed on the last business day of the period that were recorded on the first business day of the next period.
The gross expense ratio for each Class, as reflected in the Fund’s current prospectus, is set forth under “Portfolio Characteristics”.
The Fund focuses on small cap value style stocks and therefore the performance of the Fund may be more volatile than the performance of funds that focus on types of stocks that have a broader investment style. The Fund may invest up to 15% of its total assets in U.S. dollar denominated foreign securities and ADRs. Foreign investments involve additional risks such as currency rate fluctuations and the potential for political and economic instability, and different and sometimes less strict financial reporting standards and regulation.
Past performance does not guarantee future results. Investment return and principal value will fluctuate so that an investor’s shares, when redeemed, may be worth more or less than their original cost.
For information about the performance of the Fund as of the most recent month-end, please call 1-866-44BAIRD or visit www.bairdfunds.com. Mutual fund performance changes over time and current performance may be lower or higher than that stated.
Page 18
Baird SmallCap Value Fund
Schedule of Investments, June 30, 2014 (Unaudited)
| Common Stocks | ||||||||||||
| % of | ||||||||||||
| Shares | Value | Net Assets | ||||||||||
| Aerospace & Defense | ||||||||||||
| Hexcel Corporation* | 16,699 | $ | 682,989 | 2.7 | % | |||||||
| Auto Components | ||||||||||||
| Motorcar Parts of America, Inc.* | 34,773 | 846,723 | 3.3 | % | ||||||||
| Banks | ||||||||||||
| PrivateBancorp, Inc. | 16,661 | 484,169 | 1.9 | % | ||||||||
| Texas Capital Bancshares, Inc.* | 7,728 | 416,925 | 1.6 | % | ||||||||
| TriState Capital Holdings, Inc.* | 36,161 | 510,955 | 2.0 | % | ||||||||
| 1,412,049 | 5.5 | % | ||||||||||
| Capital Markets | ||||||||||||
| Diamond Hill Investment Group, Inc. | 5,279 | 674,234 | 2.6 | % | ||||||||
| Communications Equipment | ||||||||||||
| Applied Optoelectronics, Inc.* | 16,894 | 391,941 | 1.5 | % | ||||||||
| Construction & Engineering | ||||||||||||
| MasTec, Inc.* | 20,619 | 635,478 | 2.5 | % | ||||||||
| Quanta Services, Inc.* | 17,633 | 609,749 | 2.4 | % | ||||||||
| 1,245,227 | 4.9 | % | ||||||||||
| Consumer Finance | ||||||||||||
| Encore Capital Group, Inc.* | 15,261 | 693,155 | 2.7 | % | ||||||||
| Portfolio Recovery Associates, Inc.* | 16,346 | 973,077 | 3.8 | % | ||||||||
| 1,666,232 | 6.5 | % | ||||||||||
| Diversified Consumer Services | ||||||||||||
Steiner Leisure Limited*f | 8,314 | 359,913 | 1.4 | % | ||||||||
| Electric Utilities | ||||||||||||
| UIL Holdings Corporation | 13,311 | 515,269 | 2.0 | % | ||||||||
| Electrical Equipment | ||||||||||||
| Generac Holdings Inc.* | 15,089 | 735,438 | 2.9 | % | ||||||||
| Electronic Equipment, Instruments & Components | ||||||||||||
| Methode Electronics, Inc. | 16,209 | 619,346 | 2.4 | % | ||||||||
| Energy Equipment & Services | ||||||||||||
Pacific Drilling SA*f | 53,960 | 539,600 | 2.1 | % | ||||||||
Vantage Drilling Co.*f | 198,334 | 380,801 | 1.5 | % | ||||||||
| Willbros Group, Inc.* | 42,672 | 526,999 | 2.1 | % | ||||||||
| 1,447,400 | 5.7 | % | ||||||||||
| Food Products | ||||||||||||
| Pinnacle Foods Inc. | 26,294 | 865,073 | 3.4 | % | ||||||||
| Gas Utilities | ||||||||||||
| South Jersey Industries, Inc. | 8,341 | 503,880 | 2.0 | % | ||||||||
The accompanying notes are an integral part of these financial statements.
Page 19
Baird SmallCap Value Fund
Schedule of Investments, June 30, 2014 (Unaudited)
| Common Stocks (cont.) | ||||||||||||
| % of | ||||||||||||
| Shares | Value | Net Assets | ||||||||||
| Health Care Equipment & Supplies | ||||||||||||
| ICU Medical, Inc.* | 6,946 | $ | 422,386 | 1.7 | % | |||||||
| Insurance | ||||||||||||
| HCC Insurance Holdings, Inc. | 13,073 | 639,792 | 2.5 | % | ||||||||
| Hilltop Holdings, Inc.* | 31,991 | 680,129 | 2.7 | % | ||||||||
| 1,319,921 | 5.2 | % | ||||||||||
| Internet & Catalog Retail | ||||||||||||
| Lands’ End, Inc.* | 15,298 | 513,707 | 2.0 | % | ||||||||
| Internet Software & Services | ||||||||||||
| j2 Global, Inc. | 10,828 | 550,712 | 2.2 | % | ||||||||
| IT Services | ||||||||||||
| WEX Inc.* | 5,153 | 540,910 | 2.1 | % | ||||||||
| Oil, Gas & Consumable Fuels | ||||||||||||
| Dorian LPG Limited* | 21,639 | 497,481 | 2.0 | % | ||||||||
Navigator Holdings Limited*f | 19,975 | 586,865 | 2.3 | % | ||||||||
| PDC Energy, Inc.* | 8,853 | 559,067 | 2.2 | % | ||||||||
| Targa Resources Corp. | 6,747 | 941,679 | 3.7 | % | ||||||||
| 2,585,092 | 10.2 | % | ||||||||||
| Real Estate Investment Trusts (REITs) | ||||||||||||
| BioMed Realty Trust, Inc. | 22,429 | 489,625 | 1.9 | % | ||||||||
| Blackstone Mortgage Trust, Inc. | 17,493 | 507,297 | 2.0 | % | ||||||||
| DiamondRock Hospitality Company | 42,538 | 545,337 | 2.1 | % | ||||||||
| Hersha Hospitality Trust | 56,941 | 382,074 | 1.5 | % | ||||||||
| LTC Properties, Inc. | 19,544 | 762,998 | 3.0 | % | ||||||||
| 2,687,331 | 10.5 | % | ||||||||||
| Road & Rail | ||||||||||||
| Quality Distribution, Inc.* | 33,435 | 496,844 | 1.9 | % | ||||||||
| Universal Truckload Services, Inc. | 25,095 | 636,409 | 2.5 | % | ||||||||
| 1,133,253 | 4.4 | % | ||||||||||
| Semiconductors & Semiconductor Equipment | ||||||||||||
| Integrated Device Technology, Inc.* | 55,445 | 857,180 | 3.4 | % | ||||||||
| TriQuint Semiconductor, Inc.* | 33,782 | 534,093 | 2.1 | % | ||||||||
| 1,391,273 | 5.5 | % | ||||||||||
| Specialty Retail | ||||||||||||
| Conn’s Inc.* | 12,286 | 606,805 | 2.4 | % | ||||||||
The accompanying notes are an integral part of these financial statements.
Page 20
Baird SmallCap Value Fund
Schedule of Investments, June 30, 2014 (Unaudited)
| Common Stocks (cont.) | ||||||||||||
| % of | ||||||||||||
| Shares | Value | Net Assets | ||||||||||
| Thrifts & Mortgage Finance | ||||||||||||
| Bofi Holding, Inc.* | 9,198 | $ | 675,777 | 2.7 | % | |||||||
| Capitol Federal Financial, Inc. | 19,387 | 235,746 | 0.9 | % | ||||||||
| Chicopee Bancorp, Inc. | 15,976 | 269,835 | 1.1 | % | ||||||||
| 1,181,358 | 4.7 | % | ||||||||||
| Total Common Stocks | ||||||||||||
| (Cost $21,097,581) | 24,898,462 | 97.7 | % | |||||||||
| Short-Term Investments | ||||||||||||
| Money Market Mutual Funds | ||||||||||||
| Dreyfus Institutional Cash Advantage Fund, 0.06%« | 995,915 | 995,915 | 3.9 | % | ||||||||
| Short-Term Investments Trust – | ||||||||||||
| Liquid Assets Portfolio, 0.06%« | 450,000 | 450,000 | 1.8 | % | ||||||||
| Total Short-Term Investments | ||||||||||||
| (Cost $1,445,915) | 1,445,915 | 5.7 | % | |||||||||
| Total Investments | ||||||||||||
| (Cost $22,543,496) | 26,344,377 | 103.4 | % | |||||||||
| Liabilities in Excess of Other Assets | (859,114 | ) | (3.4 | )% | ||||||||
| TOTAL NET ASSETS | $ | 25,485,263 | 100.0 | % | ||||||||
Notes to Schedule of Investments
| * | Non-Income Producing |
| f | Foreign Security |
| « | 7-Day Yield |
Industry classifications shown in the Schedule of Investments are based off of the Global Industry Classification Standard (GICS®). GICS was developed by and/or is the exclusive property of MSCI, Inc. and Standard & Poor Financial Services LLC (“S&P”). GICS is a service mark of MSCI and S&P and has been licensed for use by U.S. Bancorp Fund Services, LLC.
The accompanying notes are an integral part of these financial statements.
Page 21
Baird SmallCap Value Fund
Schedule of Investments, June 30, 2014 (Unaudited)
Summary of Fair Value Exposure at June 30, 2014
The Fund has adopted authoritative fair valuation accounting standards which establish a definition of fair value and set out a hierarchy for measuring fair value. These standards require additional disclosures about the various inputs and valuation techniques used to develop the measurements of fair value and a discussion on changes in valuation techniques and related inputs during the period. These standards define fair value as the price that would be received to sell an asset or paid to transfer a liability in an orderly transaction between market participants at the measurement date. The fair value hierarchy is organized into three levels based upon the assumptions (referred to as “inputs”) used in pricing the asset or liability. These standards state that “observable inputs” reflect the assumptions market participants would use in pricing the asset or liability based on market data obtained from independent sources and “unobservable inputs” reflect an entity’s own assumptions about the assumptions market participants would use in pricing the asset or liability. These inputs are summarized into three broad levels and described below:
Level 1 – | Unadjusted quoted prices in active markets for identical unrestricted securities. |
Level 2 – | Other significant observable inputs (including quoted prices for similar securities, quoted prices in inactive markets, dealer indications, interest rates, yield curves, prepayment speeds, credit risk, default rates, inputs corroborated by observable market data, etc.). |
Level 3 – | Significant unobservable inputs (including the Fund’s own assumptions about the factors that market participants would use in valuing the security) based on the best information available. |
The inputs or methodology used for valuing securities are not necessarily an indication of the risk associated with investing in those securities.
The following is a summary of the inputs used to value the Fund’s investments as of June 30, 2014:
| Level 1 | Level 2 | Level 3 | Total | |||||||||||||
| Equity | ||||||||||||||||
| Common Stocks | $ | 24,898,462 | $ | — | $ | — | $ | 24,898,462 | ||||||||
| Total Equity | 24,898,462 | — | — | 24,898,462 | ||||||||||||
| Short-Term Investments | ||||||||||||||||
| Money Market Mutual Funds | 1,445,915 | — | — | 1,445,915 | ||||||||||||
| Total Short-Term Investments | 1,445,915 | — | — | 1,445,915 | ||||||||||||
| Total Investments* | $ | 26,344,377 | $ | — | $ | — | $ | 26,344,377 | ||||||||
| * | Additional information regarding the industry classifications of these investments is disclosed in the Schedule of Investments. |
Changes in valuation techniques may result in transfers into or out of assigned levels within the fair value hierarchy. There were no transfers between Level 1, Level 2 and Level 3 fair value measurements during the reporting period, as compared to their classification from the prior year’s annual report.
Page 22
Additional Information on Fund Expenses
June 30, 2014 (Unaudited)
Example
As a shareholder of a mutual fund, you incur two types of costs: (1) transaction costs, which may include sales charges (loads) on purchase payments, reinvested dividends, or other distributions; redemption fees; and exchange fees; and (2) ongoing costs, such as management fees; distribution and/or service (12b-1) fees; and other fund expenses. Although the Funds do not charge any sales loads, redemption fees, or other transaction fees, you will be assessed fees for outgoing wire transfers, returned checks and stop payment orders at prevailing rates charged by U.S. Bancorp Fund Services, LLC, the Fund’s transfer agent. If you request that a redemption be made by wire transfer, currently the Fund’s transfer agent charges a $15.00 fee.
This Example is intended to help you understand your ongoing costs (in dollars) of investing in each Fund and to compare these costs with the ongoing costs of investing in other mutual funds. The Example is based on an investment of $1,000 invested at the beginning of the period and held for the entire period (1/1/14 – 6/30/14).
Actual Expenses
The third and fourth columns of the following table provide information about account values based on actual returns and actual expenses. You may use the information in these columns, together with the amount you invested, to estimate the expenses that you paid over the period. Simply divide your account value by $1,000 (for example, an $8,600 account value divided by $1,000 = 8.6), then multiply the result by the number in the fourth column entitled “Expenses Paid During Period��� to estimate the expenses you paid on your account during this period.
Hypothetical Example for Comparison Purposes
The fifth and sixth columns of the following table provide information about hypothetical account values and hypothetical expenses based on the Funds’ actual expense ratios and an assumed rate of return of 5% per year before expenses, which is not the Funds’ actual return. The hypothetical account values and expenses may not be used to estimate the actual ending account balance or expenses you paid for the period. You may use this information to compare the ongoing costs of investing in the Funds and other mutual funds. To do so, compare this 5% hypothetical example with the 5% hypothetical examples that appear in the shareholder reports of the other mutual funds. Please note that the expenses shown in the table are meant to highlight your ongoing costs only and do not reflect any transactional costs. Therefore, the sixth column of the table (entitled “Expenses Paid During Period”) is useful in comparing ongoing costs only, and will not help you determine the relative total costs of owning different mutual funds. In addition, if these transactional costs were included, your costs could have been higher.
Page 23
Additional Information on Fund Expenses
June 30, 2014 (Unaudited)
Actual vs. Hypothetical Returns
For the Six Months Ended June 30, 2014
| Hypothetical | ||||||||
| (5% return | ||||||||
| Actual | before expenses) | |||||||
| Fund’s | Beginning | Ending | Expenses | Ending | Expenses | |||
| Annualized | Account | Account | Paid | Account | Paid | |||
| Expense | Value | Value | During | Value | During | |||
Ratio(1) | 1/1/14 | 6/30/14 | Period(1) | 6/30/14 | Period(1) | |||
| Baird LargeCap Fund | ||||||||
| Institutional Class | 0.75% | $1,000.00 | $1,078.30 | $3.86 | $1,021.08 | $3.76 | ||
| Investor Class | 1.00% | $1,000.00 | $1,076.20 | $5.15 | $1,019.84 | $5.01 | ||
| Baird MidCap Fund | ||||||||
| Institutional Class | 0.85% | $1,000.00 | $1,028.70 | $4.28 | $1,020.58 | $4.26 | ||
| Investor Class | 1.10% | $1,000.00 | $1,027.70 | $5.53 | $1,019.34 | $5.51 | ||
| Baird SmallCap Value Fund | ||||||||
| Institutional Class | 1.00% | $1,000.00 | $1,030.70 | $5.04 | $1,019.84 | $5.01 | ||
| Investor Class | 1.25% | $1,000.00 | $1,029.30 | $6.29 | $1,018.60 | $6.26 | ||
| (1) | Expenses are equal to the Fund’s annualized net expense ratio multiplied by the average account value over the period, multiplied by 181 days and divided by 365 to reflect the one-half year period. |
Page 24
Statements of Assets and Liabilities
June 30, 2014 (Unaudited)
| Baird | Baird | Baird | ||||||||||
| LargeCap | MidCap | SmallCap | ||||||||||
| Fund | Fund | Value Fund | ||||||||||
| ASSETS: | ||||||||||||
| Investments, at value (cost $31,857,013, | ||||||||||||
| $851,721,997 and $22,543,496, respectively) | $ | 34,698,556 | $ | 961,610,208 | $ | 26,344,377 | ||||||
| Dividends receivable | 30,879 | 159,518 | 38,925 | |||||||||
| Interest receivable | 47 | 2,151 | 36 | |||||||||
| Receivable for investments sold | — | — | 1,035 | |||||||||
| Receivable for Fund shares sold | — | 2,711,535 | 23,500 | |||||||||
| Prepaid expenses and other assets | 15,287 | 40,978 | 19,086 | |||||||||
| Total assets | 34,744,769 | 964,524,390 | 26,426,959 | |||||||||
| LIABILITIES: | ||||||||||||
| Payable for securities purchased | — | 3,530,340 | 892,480 | |||||||||
| Payable for Fund shares repurchased | 3,155 | 1,148,884 | 26,688 | |||||||||
| Payable to Advisor and Distributor | 6,529 | 755,780 | 7,116 | |||||||||
| Accrued expenses and other liabilities | 27,213 | 6,331 | 15,412 | |||||||||
| Total liabilities | 36,897 | 5,441,335 | 941,696 | |||||||||
| NET ASSETS | $ | 34,707,872 | $ | 959,083,055 | $ | 25,485,263 | ||||||
| NET ASSETS CONSIST OF: | ||||||||||||
| Capital stock | $ | 31,732,356 | $ | 839,078,243 | $ | 20,517,252 | ||||||
| Accumulated undistributed net investment income (loss) | 169,745 | (959,522 | ) | 55,167 | ||||||||
| Accumulated net realized gain (loss) on investments sold | (35,772 | ) | 11,076,123 | 1,111,963 | ||||||||
| Net unrealized appreciation on investments | 2,841,543 | 109,888,211 | 3,800,881 | |||||||||
| NET ASSETS | $ | 34,707,872 | $ | 959,083,055 | $ | 25,485,263 | ||||||
| INSTITUTIONAL CLASS SHARES | ||||||||||||
| Net Assets | $ | 33,301,947 | $ | 639,437,553 | $ | 23,578,226 | ||||||
| Shares outstanding ($0.01 par value, | ||||||||||||
| unlimited shares authorized) | 3,900,710 | 41,429,919 | 1,632,658 | |||||||||
| Net asset value, offering and redemption price per share | $ | 8.54 | $ | 15.43 | $ | 14.44 | ||||||
| INVESTOR CLASS SHARES | ||||||||||||
| Net Assets | $ | 1,405,925 | $ | 319,645,502 | $ | 1,907,037 | ||||||
| Shares outstanding ($0.01 par value, | ||||||||||||
| unlimited shares authorized) | 165,904 | 21,523,796 | 132,539 | |||||||||
| Net asset value, offering and redemption price per share | $ | 8.47 | $ | 14.85 | $ | 14.39 | ||||||
The accompanying notes are an integral part of these financial statements.
Page 25
Statements of Operations
Six Months Ended June 30, 2014 (Unaudited)
| Baird | Baird | Baird | ||||||||||
| LargeCap | MidCap | SmallCap | ||||||||||
| Fund | Fund | Value Fund | ||||||||||
| INVESTMENT INCOME: | ||||||||||||
| Dividends (of foreign taxes withheld | ||||||||||||
| of $0, $4,816 and $0, respectively) | $ | 285,516 | $ | 2,417,613 | $ | 170,334 | ||||||
| Interest | 349 | 10,848 | 231 | |||||||||
| Other income | — | 2,427 | 92 | |||||||||
| Total investment income | 285,865 | 2,430,888 | 170,657 | |||||||||
| EXPENSES: | ||||||||||||
| Investment advisory fees | 100,491 | 2,712,652 | 96,427 | |||||||||
| Administration fees | 4,977 | 28,423 | 1,972 | |||||||||
| Shareholder servicing fees | 8,540 | 109,696 | 5,867 | |||||||||
| Fund accounting fees | 7,773 | 23,004 | 7,261 | |||||||||
| Professional fees | 16,963 | 16,563 | 13,021 | |||||||||
| Federal and state registration | 19,929 | 49,038 | 20,002 | |||||||||
| Directors fees | 25,169 | 25,169 | 25,169 | |||||||||
| Custody fees | 3,037 | 17,970 | 3,796 | |||||||||
| Reports to shareholders | 1,448 | 12,809 | 860 | |||||||||
| Distribution expense – Investor Class Shares (Note 8) | 466 | 316,071 | 2,047 | |||||||||
| Miscellaneous expenses | 66 | 765 | 36 | |||||||||
| Total expenses | 188,859 | 3,312,160 | 176,458 | |||||||||
| Expense reimbursement/recoupment | ||||||||||||
| by Advisor (Note 5) | (72,442 | ) | 78,250 | (60,968 | ) | |||||||
| Net expenses | 116,417 | 3,390,410 | 115,490 | |||||||||
| NET INVESTMENT INCOME (LOSS) | 169,448 | (959,522 | ) | 55,167 | ||||||||
| REALIZED AND UNREALIZED | ||||||||||||
| GAIN (LOSS) ON INVESTMENTS: | ||||||||||||
| Net realized gain (loss) on investments | (25,472 | ) | 8,498,781 | 1,058,870 | ||||||||
| Change in unrealized appreciation/depreciation | ||||||||||||
| on investments | 2,318,398 | 12,966,179 | (316,693 | ) | ||||||||
| Net realized and unrealized gain on investments | 2,292,926 | 21,464,960 | 742,177 | |||||||||
| NET INCREASE IN NET ASSETS | ||||||||||||
| RESULTING FROM OPERATIONS | $ | 2,462,374 | $ | 20,505,438 | $ | 797,344 | ||||||
The accompanying notes are an integral part of these financial statements.
Page 26
Statement of Changes in Net Assets
Baird LargeCap Fund
| Six Months Ended | ||||||||
| June 30, 2014 | Year Ended | |||||||
| (Unaudited) | December 31, 2013 | |||||||
| OPERATIONS: | ||||||||
| Net investment income | $ | 169,448 | $ | 76,503 | ||||
| Net realized gain (loss) on investments | (25,472 | ) | 13,127,622 | |||||
| Change in unrealized appreciation/depreciation | ||||||||
| on investments | 2,318,398 | (5,351,781 | ) | |||||
| Net increase in net assets resulting from operations | 2,462,374 | 7,852,344 | ||||||
| CAPITAL SHARE TRANSACTIONS: | ||||||||
| Proceeds from shares sold | 5,944,929 | 4,465,469 | ||||||
| Shares issued to holders in reinvestment of dividends | — | 11,004,303 | ||||||
| Cost of shares redeemed | (1,899,640 | ) | (8,523,677 | ) | ||||
| Net increase in net assets resulting | ||||||||
| from capital share transactions | 4,045,289 | 6,946,095 | ||||||
| DISTRIBUTIONS TO | ||||||||
| INSTITUTIONAL CLASS SHAREHOLDERS: | ||||||||
| From net investment income | — | (76,300 | ) | |||||
| From net realized gains | — | (10,867,055 | ) | |||||
| Total Distributions | — | (10,943,355 | ) | |||||
| DISTRIBUTIONS TO | ||||||||
| INVESTOR CLASS SHAREHOLDERS: | ||||||||
| From net investment income | — | — | ||||||
| From net realized gains | — | (60,948 | ) | |||||
| Total Distributions | — | (60,948 | ) | |||||
| TOTAL INCREASE IN NET ASSETS | 6,507,663 | 3,794,136 | ||||||
| NET ASSETS: | ||||||||
| Beginning of period | 28,200,209 | 24,406,073 | ||||||
| End of period (including undistributed net investment | ||||||||
| income of $169,745 and $297, respectively) | $ | 34,707,872 | $ | 28,200,209 | ||||
The accompanying notes are an integral part of these financial statements.
Page 27
Statement of Changes in Net Assets
Baird MidCap Fund
| Six Months Ended | ||||||||
| June 30, 2014 | Year Ended | |||||||
| (Unaudited) | December 31, 2013 | |||||||
| OPERATIONS: | ||||||||
| Net investment loss | $ | (959,522 | ) | $ | (441,675 | ) | ||
| Net realized gain on investments | 8,498,781 | 12,919,158 | ||||||
| Change in unrealized appreciation/depreciation | ||||||||
| on investments | 12,966,179 | 78,465,897 | ||||||
| Net increase in net assets resulting from operations | 20,505,438 | 90,943,380 | ||||||
| CAPITAL SHARE TRANSACTIONS: | ||||||||
| Proceeds from shares sold | 567,030,199 | 184,044,271 | ||||||
| Shares issued to holders in reinvestment of dividends | — | 8,466,032 | ||||||
| Cost of shares redeemed | (57,605,194 | ) | (66,916,146 | ) | ||||
| Other capital contribution (Note 3) | — | 118 | ||||||
| Net increase in net assets resulting | ||||||||
| from capital share transactions | 509,425,005 | 125,594,275 | ||||||
| DISTRIBUTIONS TO | ||||||||
| INSTITUTIONAL CLASS SHAREHOLDERS: | ||||||||
| From net realized gains | — | (5,756,644 | ) | |||||
| Total Distributions | — | (5,756,644 | ) | |||||
| �� | ||||||||
| DISTRIBUTIONS TO | ||||||||
| INVESTOR CLASS SHAREHOLDERS: | ||||||||
| From net realized gains | — | (2,987,660 | ) | |||||
| Total Distributions | — | (2,987,660 | ) | |||||
| TOTAL INCREASE IN NET ASSETS | 529,930,443 | 207,793,351 | ||||||
| NET ASSETS: | ||||||||
| Beginning of period | 429,152,612 | 221,359,261 | ||||||
| End of period (including accumulated net investment | ||||||||
| loss of $(959,522) and $0, respectively) | $ | 959,083,055 | $ | 429,152,612 | ||||
The accompanying notes are an integral part of these financial statements.
Page 28
Statement of Changes in Net Assets
Baird SmallCap Value Fund
| Six Months Ended | ||||||||
| June 30, 2014 | Year Ended | |||||||
| (Unaudited) | December 31, 2013 | |||||||
| OPERATIONS: | ||||||||
| Net investment income | $ | 55,167 | $ | 76,633 | ||||
| Net realized gain on investments | 1,058,870 | 345,941 | ||||||
| Change in unrealized appreciation/depreciation | ||||||||
| on investments | (316,693 | ) | 3,905,459 | |||||
| Net increase in net assets resulting from operations | 797,344 | 4,328,033 | ||||||
| CAPITAL SHARE TRANSACTIONS: | ||||||||
| Proceeds from shares sold | 6,033,257 | 9,409,735 | ||||||
| Shares issued to holders in reinvestment of dividends | — | 325,192 | ||||||
| Cost of shares redeemed | (1,461,315 | ) | (1,934,888 | ) | ||||
| Net increase in net assets resulting | ||||||||
| from capital share transactions | 4,571,942 | 7,800,039 | ||||||
| DISTRIBUTIONS TO | ||||||||
| INSTITUTIONAL CLASS SHAREHOLDERS: | ||||||||
| From net investment income | — | (70,596 | ) | |||||
| From net realized gains | — | (265,202 | ) | |||||
| Total Distributions | — | (335,798 | ) | |||||
| DISTRIBUTIONS TO | ||||||||
| INVESTOR CLASS SHAREHOLDERS: | ||||||||
| From net investment income | — | (3,119 | ) | |||||
| From net realized gains | — | (15,228 | ) | |||||
| Total Distributions | — | (18,347 | ) | |||||
| TOTAL INCREASE IN NET ASSETS | 5,369,286 | 11,773,927 | ||||||
| NET ASSETS: | ||||||||
| Beginning of period | 20,115,977 | 8,342,050 | ||||||
| End of period (including undistributed net investment | ||||||||
| income of $55,167 and $0, respectively) | $ | 25,485,263 | $ | 20,115,977 | ||||
The accompanying notes are an integral part of these financial statements.
Page 29
Financial Highlights
Baird LargeCap Fund – Institutional Class
| Six Months | ||||||||||||||||||||||||
| Ended | ||||||||||||||||||||||||
| June 30, 2014 | Year Ended December 31, | |||||||||||||||||||||||
| (Unaudited) | 2013(1) | 2012 | 2011 | 2010 | 2009 | |||||||||||||||||||
| Per Share Data: | ||||||||||||||||||||||||
| Net asset value, | ||||||||||||||||||||||||
| beginning of period | $ | 7.92 | $ | 9.86 | $ | 8.71 | $ | 8.93 | $ | 7.57 | $ | 5.59 | ||||||||||||
| Income from | ||||||||||||||||||||||||
| investment operations: | ||||||||||||||||||||||||
| Net investment income | 0.04 | 0.03 | (2) | 0.04 | (2) | 0.01 | 0.01 | 0.03 | ||||||||||||||||
| Net realized and unrealized | ||||||||||||||||||||||||
| gains (losses) on investments | 0.58 | 3.16 | 1.15 | (0.22 | ) | 1.36 | 1.98 | |||||||||||||||||
| Total from | ||||||||||||||||||||||||
| investment operations | 0.62 | 3.19 | 1.19 | (0.21 | ) | 1.37 | 2.01 | |||||||||||||||||
| Less distributions: | ||||||||||||||||||||||||
| Distributions from net | ||||||||||||||||||||||||
| investment income | — | (0.04 | ) | (0.04 | ) | (0.01 | ) | (0.01 | ) | (0.03 | ) | |||||||||||||
| Distributions from net | ||||||||||||||||||||||||
| realized gains | — | (5.09 | ) | — | — | — | — | |||||||||||||||||
| Total distributions | — | (5.13 | ) | (0.04 | ) | (0.01 | ) | (0.01 | ) | (0.03 | ) | |||||||||||||
| Net asset value, end of period | $ | 8.54 | $ | 7.92 | $ | 9.86 | $ | 8.71 | $ | 8.93 | $ | 7.57 | ||||||||||||
| Total return | 7.83 | %(3) | 32.68 | % | 13.62 | % | (2.34 | )% | 18.06 | % | 36.27 | % | ||||||||||||
| Supplemental data and ratios: | ||||||||||||||||||||||||
| Net assets, | ||||||||||||||||||||||||
| end of period (millions) | $ | 33.3 | $ | 28.0 | $ | 24.0 | $ | 20.5 | $ | 23.4 | $ | 20.7 | ||||||||||||
| Ratio of expenses | ||||||||||||||||||||||||
| to average net assets | 0.75 | %(4) | 0.75 | % | 0.75 | % | 0.75 | % | 0.75 | % | 0.75 | % | ||||||||||||
| Ratio of expenses | ||||||||||||||||||||||||
| to average net assets | ||||||||||||||||||||||||
| (before waivers) | 1.22 | %(4) | 1.24 | % | 1.34 | % | 1.35 | % | 1.40 | % | 1.39 | % | ||||||||||||
| Ratio of net | ||||||||||||||||||||||||
| investment income | ||||||||||||||||||||||||
| to average net assets | 1.10 | %(4) | 0.28 | % | 0.37 | % | 0.12 | % | 0.14 | % | 0.46 | % | ||||||||||||
| Ratio of net | ||||||||||||||||||||||||
| investment income (loss) | ||||||||||||||||||||||||
| to average net assets | ||||||||||||||||||||||||
| (before waivers) | 0.63 | %(4) | (0.21 | )% | (0.22 | )% | (0.48 | )% | (0.51 | )% | (0.18 | )% | ||||||||||||
Portfolio turnover rate(5) | 44.4 | %(3) | 127.7 | % | 39.2 | % | 38.2 | % | 52.0 | % | 58.7 | % | ||||||||||||
| (1) | Effective December 23, 2013, Baird Kailash Group, LLC became the Fund’s subadviser. |
| (2) | Calculated using average shares outstanding during the period. |
| (3) | Not annualized. |
| (4) | Annualized. |
| (5) | Portfolio turnover is calculated on the basis of the Fund as a whole without distinguishing between the classes of shares issued. The Baird LargeCap Fund’s portfolio turnover rate in 2013 was higher than previous years primarily due to the implementation of a new investment strategy for the Fund by Baird Kailash Group, LLC, the Fund’s subadviser. |
The accompanying notes are an integral part of these financial statements.
Page 30
Financial Highlights
Baird LargeCap Fund – Investor Class
| Six Months | ||||||||||||||||||||||||
| Ended | ||||||||||||||||||||||||
| June 30, 2014 | Year Ended December 31, | |||||||||||||||||||||||
| (Unaudited) | 2013(1) | 2012 | 2011 | 2010 | 2009 | |||||||||||||||||||
| Per Share Data: | ||||||||||||||||||||||||
| Net asset value, | ||||||||||||||||||||||||
| beginning of period | $ | 7.87 | $ | 9.82 | $ | 8.68 | $ | 8.91 | $ | 7.56 | $ | 5.59 | ||||||||||||
| Income from | ||||||||||||||||||||||||
| investment operations: | ||||||||||||||||||||||||
| Net investment income (loss) | 0.04 | 0.00 | (2)(3) | 0.01 | (2) | (0.01 | ) | (0.02 | ) | 0.02 | ||||||||||||||
| Net realized and unrealized | ||||||||||||||||||||||||
| gains (losses) on investments | 0.56 | 3.14 | 1.15 | (0.22 | ) | 1.37 | 1.97 | |||||||||||||||||
| Total from | ||||||||||||||||||||||||
| investment operations | 0.60 | 3.14 | 1.16 | (0.23 | ) | 1.35 | 1.99 | |||||||||||||||||
| Less distributions: | ||||||||||||||||||||||||
| Distributions from net | ||||||||||||||||||||||||
| investment income | — | — | (0.02 | ) | — | — | (0.02 | ) | ||||||||||||||||
| Distributions from net | ||||||||||||||||||||||||
| realized gains | — | (5.09 | ) | — | — | — | — | |||||||||||||||||
| Total distributions | — | (5.09 | ) | (0.02 | ) | — | — | (0.02 | ) | |||||||||||||||
| Net asset value, end of period | $ | 8.47 | $ | 7.87 | $ | 9.82 | $ | 8.68 | $ | 8.91 | $ | 7.56 | ||||||||||||
| Total return | 7.62 | %(4) | 32.34 | % | 13.32 | % | (2.58 | )% | 17.86 | % | 35.79 | % | ||||||||||||
| Supplemental data and ratios: | ||||||||||||||||||||||||
| Net assets, | ||||||||||||||||||||||||
| end of period (millions) | $ | 1.4 | $ | 0.2 | $ | 0.4 | $ | 0.2 | $ | 0.1 | $ | 0.3 | ||||||||||||
| Ratio of expenses | ||||||||||||||||||||||||
| to average net assets | 1.00 | %(5) | 1.00 | % | 1.00 | % | 1.00 | % | 1.00 | % | 1.00 | % | ||||||||||||
| Ratio of expenses | ||||||||||||||||||||||||
| to average net assets | ||||||||||||||||||||||||
| (before waivers) | 1.47 | %(5) | 1.49 | % | 1.59 | % | 1.60 | % | 1.65 | % | 1.64 | % | ||||||||||||
| Ratio of net | ||||||||||||||||||||||||
| investment income (loss) | ||||||||||||||||||||||||
| to average net assets | 0.85 | %(5) | 0.03 | % | 0.12 | % | (0.13 | )% | (0.11 | )% | 0.21 | % | ||||||||||||
| Ratio of net | ||||||||||||||||||||||||
| investment income (loss) | ||||||||||||||||||||||||
| to average net assets | ||||||||||||||||||||||||
| (before waivers) | 0.38 | %(5) | (0.46 | )% | (0.47 | )% | (0.73 | )% | (0.76 | )% | (0.43 | )% | ||||||||||||
Portfolio turnover rate(6) | 44.4 | %(4) | 127.7 | % | 39.2 | % | 38.2 | % | 52.0 | % | 58.7 | % | ||||||||||||
| (1) | Effective December 23, 2013, Baird Kailash Group, LLC became the Fund’s subadviser. |
| (2) | Calculated using average shares outstanding during the period. |
| (3) | Amount is less than $0.005. |
| (4) | Not annualized. |
| (5) | Annualized. |
| (6) | Portfolio turnover is calculated on the basis of the Fund as a whole without distinguishing between the classes of shares issued. The Baird LargeCap Fund’s portfolio turnover rate in 2013 was higher than previous years primarily due to the implementation of a new investment strategy for the Fund by Baird Kailash Group, LLC, the Fund’s subadviser. |
The accompanying notes are an integral part of these financial statements.
Page 31
Financial Highlights
Baird MidCap Fund – Institutional Class
| Six Months | ||||||||||||||||||||||||
| Ended | ||||||||||||||||||||||||
| June 30, 2014 | Year Ended December 31, | |||||||||||||||||||||||
| (Unaudited) | 2013 | 2012 | 2011 | 2010 | 2009 | |||||||||||||||||||
| Per Share Data: | ||||||||||||||||||||||||
| Net asset value, | ||||||||||||||||||||||||
| beginning of period | $ | 15.00 | $ | 11.52 | $ | 9.98 | $ | 10.04 | $ | 7.90 | $ | 5.63 | ||||||||||||
| Income from | ||||||||||||||||||||||||
| investment operations: | ||||||||||||||||||||||||
| Net investment income (loss) | (0.01 | ) | (0.01 | ) | 0.07 | (1) | (0.01 | )(1) | (0.01 | )(1) | 0.02 | (1) | ||||||||||||
| Net realized and unrealized | ||||||||||||||||||||||||
| gain on investments | 0.44 | 3.80 | 1.57 | 0.54 | 2.15 | 2.27 | ||||||||||||||||||
| Total from | ||||||||||||||||||||||||
| investment operations | 0.43 | 3.79 | 1.64 | 0.53 | 2.14 | 2.29 | ||||||||||||||||||
| Less distributions: | ||||||||||||||||||||||||
| Distributions from net | ||||||||||||||||||||||||
| investment income | — | — | (0.04 | ) | — | — | (0.02 | ) | ||||||||||||||||
| Distributions from net | ||||||||||||||||||||||||
| realized gains | — | (0.31 | ) | (0.06 | ) | (0.59 | ) | — | — | |||||||||||||||
| Total distributions | — | (0.31 | ) | (0.10 | ) | (0.59 | ) | — | (0.02 | ) | ||||||||||||||
| Net asset value, end of period | $ | 15.43 | $ | 15.00 | $ | 11.52 | $ | 9.98 | $ | 10.04 | $ | 7.90 | ||||||||||||
| Total return | 2.87 | %(2) | 32.90 | % | 16.49 | % | 5.19 | % | 27.09 | % | 40.90 | % | ||||||||||||
| Supplemental data and ratios: | ||||||||||||||||||||||||
| Net assets, | ||||||||||||||||||||||||
| end of period (millions) | $ | 639.4 | $ | 286.1 | $ | 137.2 | $ | 40.9 | $ | 33.4 | $ | 25.5 | ||||||||||||
| Ratio of expenses | ||||||||||||||||||||||||
| to average net assets | 0.85 | %(3) | 0.85 | % | 0.85 | % | 0.85 | % | 0.85 | % | 0.85 | % | ||||||||||||
| Ratio of expenses | �� | |||||||||||||||||||||||
| to average net assets | ||||||||||||||||||||||||
| (before recoupment) | 0.83 | %(3) | 0.87 | % | 0.97 | % | 1.21 | % | 1.30 | % | 1.34 | % | ||||||||||||
| Ratio of net | ||||||||||||||||||||||||
| investment income (loss) | ||||||||||||||||||||||||
| to average net assets | (0.18 | )%(3) | (0.04 | )% | 0.65 | % | (0.10 | )% | (0.10 | )% | 0.25 | % | ||||||||||||
| Ratio of net | ||||||||||||||||||||||||
| investment income (loss) | ||||||||||||||||||||||||
| to average net assets | ||||||||||||||||||||||||
| (before recoupment) | (0.16 | )%(3) | (0.06 | )% | 0.53 | % | (0.46 | )% | (0.55 | )% | (0.24 | )% | ||||||||||||
Portfolio turnover rate(4) | 13.5 | %(2) | 36.3 | % | 29.5 | % | 44.8 | % | 62.7 | % | 61.3 | % | ||||||||||||
| (1) | Calculated using average shares outstanding during the period. |
| (2) | Not annualized. |
| (3) | Annualized. |
| (4) | Portfolio turnover is calculated on the basis of the Fund as a whole without distinguishing between the classes of shares issued. |
The accompanying notes are an integral part of these financial statements.
Page 32
Financial Highlights
Baird MidCap Fund – Investor Class
| Six Months | ||||||||||||||||||||||||
| Ended | ||||||||||||||||||||||||
| June 30, 2014 | Year Ended December 31, | |||||||||||||||||||||||
| (Unaudited) | 2013 | 2012 | 2011 | 2010 | 2009 | |||||||||||||||||||
| Per Share Data: | ||||||||||||||||||||||||
| Net asset value, | ||||||||||||||||||||||||
| beginning of period | $ | 14.45 | $ | 11.13 | $ | 9.66 | $ | 9.76 | $ | 7.69 | $ | 5.49 | ||||||||||||
| Income from | ||||||||||||||||||||||||
| investment operations: | ||||||||||||||||||||||||
| Net investment | ||||||||||||||||||||||||
| income (loss) | (0.03 | ) | (0.03 | ) | 0.04 | (1) | (0.03 | )(1) | (0.03 | )(1) | 0.00 | (1)(2) | ||||||||||||
| Net realized and unrealized | ||||||||||||||||||||||||
| gain on investments | 0.43 | 3.66 | 1.52 | 0.52 | 2.10 | 2.21 | ||||||||||||||||||
| Total from | ||||||||||||||||||||||||
| investment operations | 0.40 | 3.63 | 1.56 | 0.49 | 2.07 | 2.21 | ||||||||||||||||||
| Less distributions: | ||||||||||||||||||||||||
| Distributions from net | ||||||||||||||||||||||||
| investment income | — | — | (0.03 | ) | — | — | (0.01 | ) | ||||||||||||||||
| Distributions from net | ||||||||||||||||||||||||
| realized gains | — | (0.31 | ) | (0.06 | ) | (0.59 | ) | — | — | |||||||||||||||
| Total distributions | — | (0.31 | ) | (0.09 | ) | (0.59 | ) | — | (0.01 | ) | ||||||||||||||
| Net asset value, end of period | $ | 14.85 | $ | 14.45 | $ | 11.13 | $ | 9.66 | $ | 9.76 | $ | 7.69 | ||||||||||||
| Total return | 2.77 | %(3) | 32.62 | % | 16.16 | % | 4.93 | % | 26.92 | % | 40.52 | % | ||||||||||||
| Supplemental data and ratios: | ||||||||||||||||||||||||
| Net assets, | ||||||||||||||||||||||||
| end of period (millions) | $ | 319.6 | $ | 143.1 | $ | 84.1 | $ | 2.6 | $ | 1.1 | $ | 1.6 | ||||||||||||
| Ratio of expenses | ||||||||||||||||||||||||
| to average net assets | 1.10 | %(4) | 1.10 | % | 1.10 | % | 1.10 | % | 1.10 | % | 1.10 | % | ||||||||||||
| Ratio of expenses to | ||||||||||||||||||||||||
| average net assets | ||||||||||||||||||||||||
| (before recoupment) | 1.08 | %(4) | 1.12 | % | 1.22 | % | 1.46 | % | 1.55 | % | 1.59 | % | ||||||||||||
| Ratio of net | ||||||||||||||||||||||||
| investment income (loss) | ||||||||||||||||||||||||
| to average net assets | (0.43 | )%(4) | (0.29 | )% | 0.40 | % | (0.35 | )% | (0.35 | )% | 0.00 | % | ||||||||||||
| Ratio of net | ||||||||||||||||||||||||
| investment income (loss) | ||||||||||||||||||||||||
| to average net assets | ||||||||||||||||||||||||
| (before recoupment) | (0.41 | )%(4) | (0.31 | )% | 0.28 | % | (0.71 | )% | (0.80 | )% | (0.49 | )% | ||||||||||||
Portfolio turnover rate(5) | 13.5 | %(3) | 36.3 | % | 29.5 | % | 44.8 | % | 62.7 | % | 61.3 | % | ||||||||||||
| (1) | Calculated using average shares outstanding during the period. |
| (2) | Amount is less than $0.005. |
| (3) | Not annualized. |
| (4) | Annualized. |
| (5) | Portfolio turnover is calculated on the basis of the Fund as a whole without distinguishing between the classes of shares issued. |
The accompanying notes are an integral part of these financial statements.
Page 33
Financial Highlights
Baird SmallCap Value Fund – Institutional Class
| Six Months | ||||||||||||
| Ended | May 1, 2012^ | |||||||||||
| June 30, 2014 | Year Ended | through | ||||||||||
| (Unaudited) | December 31, 2013 | December 31, 2012 | ||||||||||
| Per Share Data: | ||||||||||||
| Net asset value, beginning of period | $ | 14.01 | $ | 10.20 | $ | 10.00 | ||||||
| Income from investment operations: | ||||||||||||
| Net investment income | 0.03 | 0.07 | (1) | 0.15 | (1) | |||||||
| Net realized and unrealized | ||||||||||||
| gain on investments | 0.40 | 3.99 | 0.20 | |||||||||
| Total from investment operations | 0.43 | 4.06 | 0.35 | |||||||||
| Less distributions: | ||||||||||||
| Distributions from net investment income | — | (0.05 | ) | (0.12 | ) | |||||||
| Distributions from net realized gains | — | (0.20 | ) | (0.03 | ) | |||||||
| Total distributions | — | (0.25 | ) | (0.15 | ) | |||||||
| Net asset value, end of period | $ | 14.44 | $ | 14.01 | $ | 10.20 | ||||||
| Total return | 3.07 | %(2) | 39.85 | % | 3.52 | %(2) | ||||||
| Supplemental data and ratios: | ||||||||||||
| Net assets, end of period (millions) | $ | 23.6 | $ | 19.0 | $ | 8.1 | ||||||
| Ratio of expenses to average net assets | 1.00 | %(3) | 1.00 | % | 1.00 | %(3) | ||||||
| Ratio of expenses to | ||||||||||||
| average net assets (before waivers) | 1.54 | %(3) | 2.02 | % | 3.06 | %(3) | ||||||
| Ratio of net investment income to | ||||||||||||
| average net assets | 0.50 | %(3) | 0.71 | % | 2.32 | %(3) | ||||||
| Ratio of net investment income (loss) to | ||||||||||||
| average net assets (before waivers) | (0.04 | )%(3) | (0.31 | )% | 0.26 | %(3) | ||||||
Portfolio turnover rate(4) | 27.4 | %(2) | 36.9 | % | 24.6 | %(2) | ||||||
| ^ | Commencement of operations. |
| (1) | Calculated using average shares outstanding during the period. |
| (2) | Not annualized. |
| (3) | Annualized. |
| (4) | Portfolio turnover is calculated on the basis of the Fund as a whole without distinguishing between the classes of shares issued. |
The accompanying notes are an integral part of these financial statements.
Page 34
Financial Highlights
Baird SmallCap Value Fund – Investor Class
| Six Months | ||||||||||||
| Ended | May 1, 2012^ | |||||||||||
| June 30, 2014 | Year Ended | through | ||||||||||
| (Unaudited) | December 31, 2013 | December 31, 2012 | ||||||||||
| Per Share Data: | ||||||||||||
| Net asset value, beginning of period | $ | 13.98 | $ | 10.19 | $ | 10.00 | ||||||
| Income from investment operations: | ||||||||||||
| Net investment income | 0.02 | 0.04 | (1) | 0.14 | (1) | |||||||
| Net realized and unrealized | ||||||||||||
| gain on investments | 0.39 | 3.99 | 0.19 | |||||||||
| Total from investment operations | 0.41 | 4.03 | 0.33 | |||||||||
| Less distributions: | ||||||||||||
| Distributions from net investment income | — | (0.04 | ) | (0.11 | ) | |||||||
| Distributions from net realized gains | — | (0.20 | ) | (0.03 | ) | |||||||
| Total distributions | — | (0.24 | ) | (0.14 | ) | |||||||
| Net asset value, end of period | $ | 14.39 | $ | 13.98 | $ | 10.19 | ||||||
| Total return | 2.93 | %(2) | 39.58 | % | 3.32 | %(2) | ||||||
| Supplemental data and ratios: | ||||||||||||
| Net assets, end of period (millions) | $ | 1.9 | $ | 1.1 | $ | 0.2 | ||||||
| Ratio of expenses to average net assets | 1.25 | %(3) | 1.25 | % | 1.25 | %(3) | ||||||
| Ratio of expenses to | ||||||||||||
| average net assets (before waivers) | 1.79 | %(3) | 2.27 | % | 3.31 | %(3) | ||||||
| Ratio of net investment income to | ||||||||||||
| average net assets | 0.25 | %(3) | 0.46 | % | 2.07 | %(3) | ||||||
| Ratio of net investment income (loss) to | ||||||||||||
| average net assets (before waivers) | (0.29 | )%(3) | (0.56 | )% | 0.01 | %(3) | ||||||
Portfolio turnover rate(4) | 27.4 | %(2) | 36.9 | % | 24.6 | %(2) | ||||||
| ^ | Commencement of operations. |
| (1) | Calculated using average shares outstanding during the period. |
| (2) | Not annualized. |
| (3) | Annualized. |
| (4) | Portfolio turnover is calculated on the basis of the Fund as a whole without distinguishing between the classes of shares issued. |
The accompanying notes are an integral part of these financial statements.
Page 35
Notes to the Financial Statements
June 30, 2014 (Unaudited)
| 1. | Organization |
Baird Funds, Inc. (the “Corporation”) was incorporated on June 9, 2000 as a Wisconsin corporation and is registered as an open-end management investment company under the Investment Company Act of 1940, as amended (the “1940 Act”). The accompanying financial statements include the Baird LargeCap Fund, the Baird MidCap Fund and the Baird SmallCap Value Fund (each a “Fund” and collectively the “Funds”), three of the nine series comprising the Corporation. Pursuant to the 1940 Act, the Funds are “diversified” series of the Corporation. The investment advisor to the Funds is Robert W. Baird & Co. Incorporated (“Baird” or the “Advisor”).
The Baird LargeCap Fund commenced operations with the sale of both Institutional and Investor Class Shares on September 29, 2000. The Baird MidCap Fund commenced operations with the sale of both Institutional and Investor Class Shares on December 29, 2000. The Baird SmallCap Value Fund commenced operations with the sale of both Institutional and Investor Class Shares on May 1, 2012. The Institutional Class Shares are not subject to a distribution and service (12b-1) fee, while the Investor Class Shares are subject to a distribution and service (12b-1) fee up to 0.25%. See Note 8.
The Baird LargeCap Fund seeks long-term growth of capital through investments in equity securities of large-capitalization companies.
The Baird MidCap Fund seeks long-term growth of capital through investments in equity securities of mid-capitalization companies.
The Baird SmallCap Value Fund seeks long-term growth of capital through investments in equity securities of small-capitalization companies.
On June 30, 2014, shareholders affiliated with the Advisor held 92% of the Institutional Class shares of the Baird LargeCap Fund, 6% of the Institutional Class shares of the Baird MidCap Fund and 52% of the Institutional Class shares of the Baird SmallCap Value Fund. These shareholders included the Advisor’s participant-directed retirement and deferred compensation plans and the Baird Foundation.
| 2. | Significant Accounting Policies |
The following is a summary of significant accounting policies consistently followed by the Funds in the preparation of their financial statements. These policies are in conformity with accounting principles generally accepted in the United States of America.
| a) | Investment Valuation – Section 2(a)(41) of the 1940 Act, together with the rules and interpretations of the SEC, require the Funds, in computing net asset value, to value their portfolio securities using market quotations when they are “readily available.” When market quotations are not readily available (e.g., because there is no regular market quotation for such securities, the market for such security is limited, the validity of quotations is questionable or, for debt securities, the Funds’ independent pricing service, does not provide a price), the Board of Directors of the Corporation must value the securities at “fair value determined in good faith.” The Board has delegated such responsibility to the Advisor pursuant to pricing policies and procedures that the Board has adopted and regularly reviews. In general, the “fair value” of a security means the price that would be received to sell a security in an orderly transaction between market participants at the measurement date. |
The Funds determine the fair value of their investments and compute their net asset value per share as of the close of regular trading of the New York Stock Exchange (4:00 p.m. EST). | |
| Consistent with Section 2(a)(41) of the 1940 Act, the Funds price their securities as follows: common stocks that are listed on a securities exchange (other than NASDAQ) are valued at the last quoted sale price. Securities traded on NASDAQ are valued at the NASDAQ Official Closing Price. Price information on listed stocks is taken from the exchange where the security is primarily traded. Securities that were not traded on the valuation date, as well as stocks that are not listed on an exchange, including |
Page 36
Notes to the Financial Statements
June 30, 2014 (Unaudited)
| 2. | Significant Accounting Policies (cont.) |
NASDAQ, are valued at the average of the current bid and asked price. Debt securities are valued at their bid prices by an independent pricing service using valuation methods that are designed to represent fair value, such as matrix pricing and other analytical pricing models, market transactions and dealer quotations. Debt securities purchased with a remaining maturity of 60 days or less are valued at acquisition cost plus or minus any amortized discount or premium. Investments in mutual funds are valued at their stated net asset value. Other assets and securities for which market quotations are not readily available are valued at fair value as determined in good faith by the Advisor in accordance with procedures approved by the Corporation’s Board of Directors. In accordance with such procedures, the Advisor may use broker quotes or prices obtained from alternative independent pricing services or, if the broker quotes or prices from alternative pricing services are unavailable or deemed to be unreliable, fair value will be determined by a valuation committee of the Advisor. In determining fair value, the valuation committee takes into account all relevant factors and available information. Consequently, the price of the security used by a Fund to calculate its NAV may differ from quoted or published prices for the same security. Fair value pricing involves subjective judgments and there is no single standard for determining a security’s fair value. As a result, different mutual funds could reasonably arrive at a different fair value for the same security. It is possible that the fair value determined for a security is materially different from the value that could be realized upon the sale of that security or from the values that other mutual funds may determine. In addition, given the volatility and periodic illiquidity experienced in recent years, the prices determined for any individual security on any given day may vary significantly from the amount that can be obtained in an actual sale of that security, and the Funds’ NAV may fluctuate significantly from day to day or from period to period. | |
| b) | Foreign Securities – Foreign securities are defined as securities issued by companies that are organized outside the United States. Investing in securities of foreign companies and foreign governments involves special risks and considerations not typically associated with investing in U.S. companies and the U.S. government. These risks include foreign currency fluctuations and adverse political and economic developments. Moreover, securities of many foreign companies and foreign governments and their markets may be less liquid and their prices more volatile than those of securities of comparable U.S. companies and the U.S. government. Occasionally, events that affect these values and exchange rates may occur after the close of the exchange on which such securities are traded. If such events materially affect the value of a Fund’s securities, these securities may be valued at their fair value pursuant to procedures adopted by the Board of Directors. All of the foreign securities owned by the Funds as of June 30, 2014 are traded directly on the New York Stock Exchange or NASDAQ or through an American Depository Receipt (ADR). |
| c) | Income Tax Status – The Funds intend to continue to qualify as regulated investment companies as provided in subchapter M of the Internal Revenue Code and to distribute substantially all of their taxable income to their shareholders in a manner which results in no tax expense to the Funds. Therefore, no federal income or excise tax provision is recorded. |
| There is no tax liability resulting from unrecognized tax benefits relating to uncertain income tax positions taken or expected to be taken on the tax return for the fiscal year ended December 31, 2013, or for any other tax years which are open for exam. As of June 30, 2014, open tax years include the tax years ended December 31, 2010 through 2013. The Funds are not aware of any tax positions for which it is reasonably possible that the total amounts of unrecognized tax benefits will significantly change in the next 12 months. The Funds recognize interest and penalties, if any, related to unrecognized tax benefits as interest expense and other expense, respectively, in the Statement of Operations. During the year, the Funds did not incur any interest or penalties. |
Page 37
Notes to the Financial Statements
June 30, 2014 (Unaudited)
| 2. | Significant Accounting Policies (cont.) |
| d) | Distributions to Shareholders – Dividends from net investment income, if any, are declared and paid annually. Distributions of net realized capital gains, if any, are declared and paid at least annually. The book basis character of distributions may differ from their ultimate characterization for Federal income tax purposes. |
| e) | Allocation of Income and Expenses – Each Fund is charged for those expenses directly attributable to it. Expenses directly attributable to a class of shares, such as Rule 12b-1 distribution fees, are charged to that class of shares. Income, expenses and realized and unrealized gains and losses are allocated to the classes based on their respective net assets. Expenses that are not directly attributable to a Fund are allocated among the Funds in the series of the Corporation in proportion to their assets. |
| f) | Use of Estimates – The preparation of financial statements in conformity with accounting principles generally accepted in the United States requires management to make estimates and assumptions that affect the reported amounts of assets and liabilities and disclosure of contingent assets and liabilities at the date of the financial statements and the reported amounts of revenues and expenses during the reporting period. Actual results could differ from those estimates. |
| g) | Securities Transactions and Investment Income – Investment and shareholder transactions are recorded on trade date. The Funds determine the gain or loss realized from investment transactions by comparing the original cost of the security lot sold with the net sales proceeds. Dividend income is recognized on the ex-dividend date net of withholding taxes, if any, and interest income is recognized on an accrual basis. |
| h) | Guarantees and Indemnifications – In the normal course of business, the Funds enter into contracts with service providers that contain general indemnification clauses. The Funds’ maximum exposure under these arrangements is unknown and would involve future claims against the Funds that have not yet occurred. Based on experience, the Funds would expect the risk of loss to be remote. |
| i) | Recent Accounting Pronouncements – In January, 2013, the FASB issued ASU No. 2013-01 “Clarifying the Scope of Disclosures about Offsetting Assets and Liabilities” in GAAP and International Financial Reporting Standards (“IFRS”). ASU No. 2013-01 clarifies ASU No. 2011-11, to increase comparability and reduce presentation differences between financial statements prepared in accordance with GAAP and financial statements prepared in accordance with IFRS. This requires increased disclosure for both gross and net information for derivatives and other financial instruments that are offset in a reporting entity’s Statement of Assets and Liabilities and derivative instruments that are subject to a master netting agreement (“MNA”). Specifically, the ASU requires reporting entities to present separately for assets and liabilities, a) the gross amounts of those recognized assets and recognized liabilities, b) the amounts offset to determine the net amounts presented in the Statement of Assets and Liabilities, c) the net amount presented in the Statement of Assets and Liabilities, d) the amounts subject to an enforceable MNA not included in (b), and (e) the net amount after deducting the amounts from (d) and (c). The effective date of each ASU is for interim and annual periods beginning on or after January 1, 2013. The Funds are not required to disclose the applicable requirements of this accounting standard in their Statement of Assets & Liabilities due to the absence of a master netting agreement relating to the Funds’ participation in securities lending. As such, no additional disclosures have been made on behalf of the Funds. |
| In June 2014, the FASB issued ASU No. 2014-11 “Repurchase-to-Maturity Transactions, Repurchase Financings, and Disclosures.” ASU No. 2014-11 makes limited changes to the accounting for repurchase agreements, clarifies when repurchase agreements and securities lending transactions should be accounted for as secured borrowings, and requires additional disclosures regarding these types of transactions. The effective date of this ASU is for fiscal years beginning on or after December 15, 2014, and for interim periods within those fiscal years. Management is currently evaluating the impact these changes will have on the Fund’s financial statement disclosures. |
Page 38
Notes to the Financial Statements
June 30, 2014 (Unaudited)
| 3. | Capital Share Transactions |
The following table summarizes the capital share transactions of each Fund for the past two fiscal periods:
Baird LargeCap Fund
| Institutional Class Shares | Investor Class Shares | |||||||||||||||||
| Six Months Ended | Six Months Ended | |||||||||||||||||
| June 30, 2014 | June 30, 2014 | |||||||||||||||||
| Shares | Amount | Shares | Amount | |||||||||||||||
| Shares sold | 587,732 | $ | 4,688,154 | Shares sold | 153,075 | $ | 1,256,775 | |||||||||||
| Shares redeemed | (228,806 | ) | (1,846,389 | ) | Shares redeemed | (6,788 | ) | (53,251 | ) | |||||||||
| Net increase | 358,926 | $ | 2,841,765 | Net increase | 146,287 | $ | 1,203,524 | |||||||||||
| Shares Outstanding: | Shares Outstanding: | |||||||||||||||||
| Beginning of period | 3,541,784 | Beginning of period | 19,617 | |||||||||||||||
| End of period | 3,900,710 | End of period | 165,904 | |||||||||||||||
| Institutional Class Shares | Investor Class Shares | |||||||||||||||||
| Year Ended | Year Ended | |||||||||||||||||
| December 31, 2013 | December 31, 2013 | |||||||||||||||||
| Shares | Amount | Shares | Amount | |||||||||||||||
| Shares sold | 412,836 | $ | 4,388,931 | Shares sold | 7,175 | $ | 76,538 | |||||||||||
| Shares issued to | Shares issued to | |||||||||||||||||
| shareholders in | shareholders in | |||||||||||||||||
| reinvestment | reinvestment | |||||||||||||||||
| of dividends | 1,390,515 | 10,943,355 | of dividends | 7,794 | 60,948 | |||||||||||||
| Shares redeemed | (700,194 | ) | (8,160,107 | ) | Shares redeemed | (31,739 | ) | (363,570 | ) | |||||||||
| Net increase | 1,103,157 | $ | 7,172,179 | Net decrease | (16,770 | ) | $ | (226,084 | ) | |||||||||
| Shares Outstanding: | Shares Outstanding: | |||||||||||||||||
| Beginning of year | 2,438,627 | Beginning of year | 36,387 | |||||||||||||||
| End of year | 3,541,784 | End of year | 19,617 | |||||||||||||||
Page 39
Notes to the Financial Statements
June 30, 2014 (Unaudited)
| 3. | Capital Share Transactions (cont.) |
Baird MidCap Fund
| Institutional Class Shares | Investor Class Shares | |||||||||||||||||
| Six Months Ended | Six Months Ended | |||||||||||||||||
| June 30, 2014 | June 30, 2014 | |||||||||||||||||
| Shares | Amount | Shares | Amount | |||||||||||||||
| Shares sold | 24,565,439 | $ | 371,881,495 | Shares sold | 13,286,989 | $ | 195,148,704 | |||||||||||
| Shares redeemed | (2,209,172 | ) | (33,390,027 | ) | Shares redeemed | (1,666,050 | ) | (24,215,167 | ) | |||||||||
| Net increase | 22,356,267 | $ | 338,491,468 | Net increase | 11,620,939 | $ | 170,933,537 | |||||||||||
| Shares Outstanding: | Shares Outstanding: | |||||||||||||||||
| Beginning of period | 19,073,652 | Beginning of period | 9,902,857 | |||||||||||||||
| End of period | 41,429,919 | End of period | 21,523,796 | |||||||||||||||
| Institutional Class Shares | Investor Class Shares | |||||||||||||||||
| Year Ended | Year Ended | |||||||||||||||||
| December 31, 2013 | December 31, 2013 | |||||||||||||||||
| Shares | Amount | Shares | Amount | |||||||||||||||
| Shares sold | 9,558,656 | $ | 126,368,466 | Shares sold | 4,440,509 | $ | 57,675,805 | |||||||||||
| Shares issued to | Shares issued to | |||||||||||||||||
| shareholders in | shareholders in | |||||||||||||||||
| reinvestment | reinvestment | |||||||||||||||||
| of dividends | 374,122 | 5,585,636 | of dividends | 200,305 | 2,880,396 | |||||||||||||
| Shares redeemed | (2,772,115 | ) | (37,423,433 | ) | Shares redeemed | (2,295,565 | ) | (29,492,713 | ) | |||||||||
| Other capital | Other capital | |||||||||||||||||
contribution(1) | — | 75 | contribution(1) | — | 43 | |||||||||||||
| Net increase | 7,160,663 | $ | 94,530,744 | Net increase | 2,345,249 | $ | 31,063,531 | |||||||||||
| Shares Outstanding: | Shares Outstanding: | |||||||||||||||||
| Beginning of year | 11,912,989 | Beginning of year | 7,557,608 | |||||||||||||||
| End of year | 19,073,652 | End of year | 9,902,857 | |||||||||||||||
(1) Reimbursement from Advisor for trade error.
Page 40
Notes to the Financial Statements
June 30, 2014 (Unaudited)
| 3. | Capital Share Transactions (cont.) |
Baird SmallCap Value Fund
| Institutional Class Shares | Investor Class Shares | |||||||||||||||||
| Six Months Ended | Six Months Ended | |||||||||||||||||
| June 30, 2014 | June 30, 2014 | |||||||||||||||||
| Shares | Amount | Shares | Amount | |||||||||||||||
| Shares sold | 371,288 | $ | 5,171,262 | Shares sold | 62,775 | $ | 861,995 | |||||||||||
| Shares redeemed | (97,354 | ) | (1,362,747 | ) | Shares redeemed | (7,109 | ) | (98,568 | ) | |||||||||
| Net increase | 273,934 | $ | 3,808,515 | Net increase | 55,666 | $ | 763,427 | |||||||||||
| Shares Outstanding: | Shares Outstanding: | |||||||||||||||||
| Beginning of period | 1,358,724 | Beginning of period | 76,873 | |||||||||||||||
| End of period | 1,632,658 | End of period | 132,539 | |||||||||||||||
| Institutional Class Shares | Investor Class Shares | |||||||||||||||||
| Year Ended | Year Ended | |||||||||||||||||
| December 31, 2013 | December 31, 2013 | |||||||||||||||||
| Shares | Amount | Shares | Amount | |||||||||||||||
| Shares sold | 686,823 | $ | 8,629,742 | Shares sold | 58,124 | $ | 779,993 | |||||||||||
| Shares issued to | Shares issued to | |||||||||||||||||
| shareholders in | shareholders in | |||||||||||||||||
| reinvestment | reinvestment | |||||||||||||||||
| of dividends | 22,607 | 314,468 | of dividends | 773 | 10,724 | |||||||||||||
| Shares redeemed | (149,451 | ) | (1,918,409 | ) | Shares redeemed | (1,298 | ) | (16,479 | ) | |||||||||
| Net increase | 559,979 | $ | 7,025,801 | Net increase | 57,599 | $ | 774,238 | |||||||||||
| Shares Outstanding: | Shares Outstanding: | |||||||||||||||||
| Beginning of year | 798,745 | Beginning of year | 19,274 | |||||||||||||||
| End of year | 1,358,724 | End of year | 76,873 | |||||||||||||||
Page 41
Notes to the Financial Statements
June 30, 2014 (Unaudited)
| 4. | Investment Transactions and Income Tax Information |
During the six months ended June 30, 2014, purchases and sales of investment securities (excluding short-term investments) were as follows:
| Baird | Baird | Baird | |
| LargeCap Fund | MidCap Fund | SmallCap Value Fund | |
| Purchases: | $17,405,014 | $579,969,515 | $10,654,808 |
| Sales: | $13,314,735 | $94,177,368 | $6,076,992 |
The Baird LargeCap Fund, Baird MidCap Fund and Baird SmallCap Value Fund did not purchase or sell U.S. Government securities during the six months ended June 30, 2014.
At December 31, 2013, accumulated earnings/losses on a tax basis were as follows:
| Baird | Baird | Baird | ||||||||||
| LargeCap | MidCap | SmallCap | ||||||||||
| Fund | Fund | Value Fund | ||||||||||
| Cost of Investments | $ | 27,493,646 | $ | 332,454,069 | $ | 16,021,197 | ||||||
| Gross unrealized appreciation | 561,125 | 102,894,237 | 4,473,127 | |||||||||
| Gross unrealized depreciation | (66,647 | ) | (6,923,646 | ) | (404,085 | ) | ||||||
| Net unrealized appreciation | $ | 494,478 | $ | 95,970,591 | $ | 4,069,042 | ||||||
| Undistributed ordinary income | 297 | 1,023,078 | 30,444 | |||||||||
| Undistributed long-term capital gain | 18,367 | 2,505,705 | 71,181 | |||||||||
| Total distributable earnings | $ | 18,664 | $ | 3,528,783 | $ | 101,625 | ||||||
| Other accumulated losses | — | — | — | |||||||||
| Total accumulated earnings | $ | 513,142 | $ | 99,499,374 | $ | 4,170,667 | ||||||
Undistributed income or net realized gains for financial statement purposes may differ from amounts recognized for federal income tax purposes due to differences in the recognition and characterization of income, expense and capital gain items. The difference between book-basis and tax-basis unrealized appreciation is attributable primarily to the tax deferral of losses on wash sales.
Additionally, U.S. generally accepted accounting principles require that certain components of net assets relating to permanent differences be reclassified between financial and tax reporting. These reclassifications are primarily due to differing treatments for losses deferred due to wash sales, equalization accounting for tax purposes, and non-deductible expenses. These reclassifications have no effect on net assets or net asset value per share.
Under the current tax law, capital losses realized after October 31 may be deferred and treated as occurring on the first day of the following fiscal year. For the year ended, December 31, 2013, the Baird LargeCap Fund, Baird MidCap Fund and Baird SmallCap Value Fund did not defer any capital losses occurring between November 1, 2013 and December 31, 2013.
To the extent the Fund realizes future net capital gains, those gains will be offset by any unused capital loss carryovers. During the year ended December 31, 2013, the Baird LargeCap Fund utilized capital loss carryovers of $2,199,210.
During the six months ended June 30, 2014, the Funds did not pay any dividends.
Page 42
Notes to the Financial Statements
June 30, 2014 (Unaudited)
| 4. | Investment Transactions and Income Tax Information (cont.) |
During the year ended December 31, 2013, the Funds paid the following dividends:
| Ordinary Income Dividends | Long-Term Capital Gain | |||||||||
| Baird LargeCap Fund | $ | 76,300 | $ | 10,928,003 | ||||||
| Baird MidCap Fund | 5,304,795 | 3,439,509 | ||||||||
| Baird SmallCap Value Fund | 98,898 | 255,247 | ||||||||
A significant portion of the long-term capital gain realized by the Baird LargeCap Fund was attributable to the implementation of a new investment strategy for the Fund by Baird Kailash Group LLC (“BKG”), the Fund’s subadviser. The implementation of the new strategy resulted in the sale of nearly all of the Fund’s holdings.
The Funds designated as long-term capital gain dividend, pursuant to Internal Revenue Code Section 852(b)(3), the amount necessary to reduce the earnings and profits of the Funds related to net capital gain to zero for the tax year ended December 31, 2013. To the extent necessary to fully distribute such capital gains, the Baird MidCap Fund also designated earnings and profits distributed to shareholders on the redemption of shares.
| 5. | Investment Advisory and Other Agreements |
The Funds have entered into Investment Advisory Agreements with Baird for the provision of investment advisory services. Pursuant to the Investment Advisory Agreements, the Advisor is entitled to receive a fee, calculated daily and payable monthly, at the annual rate of 0.65% for the Baird LargeCap Fund, 0.75% for the Baird MidCap Fund and 0.85% for the Baird SmallCap Value Fund as applied to the respective Fund’s average daily net assets. Certain officers of the Advisor are also officers of the Funds.
Baird has entered into a Sub-Advisory Agreement with BKG, pursuant to which BKG acts as subadviser to the Baird LargeCap Fund (the “Sub-Advisory Agreement”). Baird is responsible for paying BKG a subadvisory fee, which is calculated daily and paid monthly at the annual rate of 0.45% of the average daily net assets of the Baird LargeCap Fund, out of the advisory fee that the Baird LargeCap Fund pays to Baird. Certain officers of BKG are also officers of the Funds.
For the six months ended June 30, 2014 and through April 30, 2015, the Advisor has contractually agreed to waive its investment advisory fee and/or reimburse the Funds’ operating expenses (exclusive of brokerage, taxes, and extraordinary expenses) to the extent necessary to ensure that each Fund’s annual operating expenses do not exceed the following percentages of average daily net assets:
| Institutional Class Shares | Investor Class Shares | |
| Baird LargeCap Fund | 0.75% | 1.00% |
| Baird MidCap Fund | 0.85% | 1.10% |
| Baird SmallCap Value Fund | 1.00% | 1.25% |
To the extent that the Advisor reimburses or absorbs fees and expenses, it may seek payment of such amounts for three years after the year in which expenses were reimbursed or absorbed. A Fund will make no such payment, however, if its total annual operating expenses exceed the expense limits in effect at the time the expenses were reimbursed or at the time these payments are proposed.
For the six months ended June 30, 2014, the Advisor recouped the following amounts:
| Fund | Recoupment Amount | |
| Baird MidCap Fund | $78,250 |
Page 43
Notes to the Financial Statements
June 30, 2014 (Unaudited)
| 5. | Investment Advisory and Other Agreements (cont.) |
| Six Months | |||||||||||||||||
| Ended | |||||||||||||||||
| June 30, | Fiscal Year Ended December 31, | ||||||||||||||||
| 2014 | 2013 | 2012 | 2011 | ||||||||||||||
| Reimbursed/Absorbed Expenses Subject | |||||||||||||||||
| to Recovery by Advisor Until: | 2017 | 2016 | 2015 | 2014 | |||||||||||||
| Baird LargeCap Fund | $ | 72,442 | $ | 136,777 | $ | 141,680 | $ | 136,264 | |||||||||
| Baird MidCap Fund | $ | — | $ | 73,919 | $ | 153,676 | $ | 58,045 | |||||||||
| Baird SmallCap Value Fund | $ | 60,968 | $ | 133,527 | $ | 91,176 | (1) | N/A | |||||||||
| (1) | Amount shown reflects expense reimbursements made by the Advisor from May 1, 2012 (Commencement of operations) through December 31, 2012. |
U.S. Bancorp Fund Services, LLC (“USBFS”) serves as transfer agent, administrator, and accounting services agent for the Funds. U.S. Bank, N.A. (“U.S. Bank”) serves as custodian for the Funds. Effective June 20, 2014, U.S. Bank is considered an “affiliated person” of the Funds for purposes of the 1940 Act, as a result of U.S. Bank’s fiduciary accounts for which it has investment authority and/or voting authority collectively acquiring 5% or more of the shares of the Baird Aggregate Bond Fund, a separate series of the Company. As a result, USBFS is an affiliated person of an affiliated person (or a “second tier” affiliate) of the Funds.
Robert W. Baird & Co. Incorporated (the “Distributor”) is the sole distributor of the Funds pursuant to a distribution agreement.
No commissions were earned by the Distributor for services rendered as a registered broker-dealer in securities transactions for the Baird LargeCap Fund, Baird MidCap Fund and Baird SmallCap Value Fund for the six months ended June 30, 2014.
| 6. | Securities Lending |
Each Fund may lend up to one-third of its total assets (including such loans) to borrowers under terms of participation in a securities lending program administered by U.S. Bank N.A., the Funds’ custodian and an affiliated person of the Funds, and an affiliate of USBFS, the Funds’ transfer agent and administrator, and a second-tier affiliate of the Funds. The securities lending agreement requires that loans are collateralized at all times in an amount equal to at least 102% of the market value of any loaned securities at the time of the loan, plus accrued interest.
The Funds receive compensation in the form of fees and earn interest on the cash collateral. The amount of fees depends on a number of factors including the type of security and length of the loan. Each Fund continues to receive interest payments or dividends on the securities loaned during the borrowing period. Each Fund has the right under the terms of the securities lending agreement to recall the securities from the borrower on demand.
As of June 30, 2014, none of the Funds had securities on loan. When a Fund engages in securities lending, loaned securities are collateralized by cash equivalents. The cash collateral is invested by the custodian in accordance with approved investment guidelines. Those guidelines require the cash collateral to be invested in readily marketable, high quality, short-term obligations; however, such investments are subject to risk of payment delays or default on the part of the issuer or counterparty or otherwise may not generate sufficient interest to support the costs associated with securities lending. A Fund could also experience delays in recovering its securities and possible loss of income or value if the borrower fails to return the borrowed securities, although the Funds are indemnified from this risk by contract with the securities lending agent.
The Funds receive cash as collateral in return for securities lent as part of a securities lending program. The collateral is invested in the Mount Vernon Securities Lending Prime Portfolio (a securities lending trust subject to Rule 2a-7 under the 1940 Act).
Page 44
Notes to the Financial Statements
June 30, 2014 (Unaudited)
The interest income earned by the Funds, if any, on investments of cash collateral received from borrowers for the securities loaned to them (“securities lending income”) is reflected in the Funds’ statements of operations. The Funds did not participate in the securities lending program during the six months ended June 30, 2014.
| 7. | Line of Credit |
The Corporation maintains an uncommitted, senior secured and unsecured line of credit (“LOC”) with U.S. Bank, N.A. (the “Bank”) to provide the Funds a temporary liquidity source to meet unanticipated redemptions. The unsecured line of credit is available to the Funds for any period during which U.S. Bank is an affiliate of the Funds. Under the terms of the LOC, borrowings for each Fund are limited to one-third of the total assets (including the amount borrowed) of the respective Fund, or as otherwise indicated within the Funds’ agreement with the Bank. The Bank charged interest at the Bank’s Prime Rate less 2% (weighted average rate of 1.25% for the first six months of 2014). For the six months ended June 30, 2014, the Funds did not borrow on the LOC.
| 8. | Distribution and Shareholder Service Plan |
The Funds have adopted a distribution and shareholder service plan (the “Plan”) pursuant to Rule 12b-1 under the 1940 Act. The Plan allows the Funds to compensate the Distributor for the costs incurred in distributing the Funds’ Investor Class Shares, including amounts paid to brokers or dealers, at an annual rate of 0.25% of the average daily net assets of the Funds’ Investor Class Shares. The Baird LargeCap Fund, Baird MidCap Fund and Baird SmallCap Value Fund incurred $466, $316,071 and $2,047, respectively, in fees pursuant to the Plan during the six months ended June 30, 2014.
| 9. | Subsequent Event |
In preparing these financial statements, the Corporation has evaluated subsequent events after June 30, 2014 through the date the financial statements were issued. There were no subsequent events since June 30, 2014 that would require adjustment to or additional disclosure in these financial statements.
Page 45
Additional Information
Proxy Voting
A description of the policies and procedures that the Funds use to determine how to vote proxies relating to portfolio securities is available without charge, upon request, by calling toll free, 1-866-44BAIRD, or by accessing the Funds’ website at www.bairdfunds.com; and by accessing the SEC’s website at www.sec.gov.
Each Fund’s proxy voting record for the most recent 12-month period ended June 30 is available without charge, upon request, by calling toll free, 1-866-44BAIRD, or by accessing the Funds’ website at www.bairdfunds.com; and by accessing the SEC’s website at www.sec.gov.
Portfolio Holdings Disclosure
The Funds file a complete schedule of portfolio holdings with the SEC for the first and third quarters of each fiscal year on Form N-Q. The Funds’ Forms N-Q are available on the SEC’s website at www.sec.gov and may be reviewed and copied at the SEC’s Public Reference Room in Washington, D.C. Information on the operation of the Public Reference Room may be obtained by calling 1-800-732-0330. The Funds’ Forms N-Q may also be obtained by calling toll-free 1-866-44BAIRD.
Page 46
(This Page Intentionally Left Blank.)
Baird Funds, Inc.
c/o U.S. Bancorp Fund Services, LLC
P.O. Box 701
Milwaukee, WI 53201-0701
1-866-44BAIRD
Board of Directors
G. Frederick Kasten, Jr. (Chairman)
John W. Feldt
Cory L. Nettles
Marlyn J. Spear
Frederick P. Stratton, Jr.
Investment Advisor and Distributor
Robert W. Baird & Co. Incorporated
777 East Wisconsin Avenue
Milwaukee, WI 53202
Administrator and Transfer Agent
U.S. Bancorp Fund Services, LLC
P.O. Box 701
615 East Michigan Street
Milwaukee, WI 53202
Custodian
U.S. Bank, N.A.
1555 N. RiverCenter Drive, Suite 302
Milwaukee, WI 53212
Legal Counsel
Godfrey & Kahn, S.C.
780 North Water Street
Milwaukee, WI 53202
Independent Registered Public
Accounting Firm
Grant Thornton LLP
175 West Jackson Boulevard, 20th Floor
Chicago, IL 60604
Item 2. Code of Ethics.
Not applicable – only required for annual reports on Form N-CSR.
Item 3. Audit Committee Financial Expert.
Not applicable – only required for annual reports on Form N-CSR.
Item 4. Principal Accountant Fees and Services.
Not applicable – only required for annual reports on Form N-CSR.
Item 5. Audit Committee of Listed Registrants.
Not applicable because the Registrant is not a “listed issuer” within the meaning of Rule 10A-3 under the Securities Exchange Act of 1934.
Item 6. Schedule of Investments.
| Baird Ultra Short Bond Fund | |||||||||||||
| Schedule of Investments | |||||||||||||
| June 30, 2014 (Unaudited) | |||||||||||||
| Principal | % of | ||||||||||||
| Amount | Value | Net Assets | |||||||||||
| LONG-TERM INVESTMENTS | |||||||||||||
| U.S. Treasury Securities | |||||||||||||
| United States Treasury Note/Bond, | |||||||||||||
| 0.500%, 06/30/2016 | $ | 250,000 | $ | 250,215 | |||||||||
| 250,215 | 1.8 | % | |||||||||||
| Taxable Municipal Bonds | |||||||||||||
| City of Passaic NJ, | |||||||||||||
| 1.630%, 02/01/2015 | 125,000 | 125,489 | |||||||||||
| Colorado State Board of Governors, | |||||||||||||
| 0.963%, 03/01/2015 | 105,000 | 105,118 | |||||||||||
| Cook County School District No 144 Prairie Hills, | |||||||||||||
| 1.500%, 12/01/2016 | 250,000 | 249,410 | |||||||||||
| Louisiana Local Government Environmental Facilities & Community Development Auth., | |||||||||||||
| 1.520%, 02/01/2018 | 249,463 | 251,249 | |||||||||||
| Madison County Community Unit School District No 12 Madison, | |||||||||||||
| 1.950%, 01/01/2017 | 200,000 | 199,710 | |||||||||||
| Tulsa Airports Improvement Trust, | |||||||||||||
| 1.389%, 06/01/2015 | 100,000 | 99,991 | |||||||||||
| 1,030,967 | 7.3 | % | |||||||||||
| Other Government Related Securities | |||||||||||||
| CNPC General Capital Ltd, | |||||||||||||
| 1.125%, 05/14/2017 (Acquired 05/07/2014, Cost $250,000) * f | 250,000 | 250,700 | |||||||||||
| EDF, | |||||||||||||
| 0.688%, 01/20/2017 (Acquired 01/13/2014, Cost $250,000) * f | 250,000 | 251,014 | |||||||||||
| Petrobras Global Finance B.V., | |||||||||||||
| 2.592%, 03/17/2017 f | 250,000 | 252,975 | |||||||||||
| The Export-Import Bank of Korea, | |||||||||||||
| 0.977%, 01/14/2017 f | 250,000 | 251,692 | |||||||||||
| 1,006,381 | 7.1 | % | |||||||||||
| Corporate Bonds | |||||||||||||
| Industrials | |||||||||||||
| Amgen Inc., | |||||||||||||
| 0.608%, 05/22/2017 | 250,000 | 250,141 | |||||||||||
| Anglo American Capital PLC, | |||||||||||||
| 1.176%, 04/15/2016 (Acquired 04/08/2014, Cost $200,000) * f | 200,000 | 200,635 | |||||||||||
| Bunge Limited Finance Corp., | |||||||||||||
| 5.100%, 07/15/2015 | 250,000 | 260,394 | |||||||||||
| Devon Energy Corporation, | |||||||||||||
| 0.771%, 12/15/2016 | 125,000 | 125,579 | |||||||||||
| Fiserv, Inc.: | |||||||||||||
| 3.125%, 10/01/2015 | 75,000 | 77,155 | |||||||||||
| 3.125%, 06/15/2016 | 175,000 | 181,795 | |||||||||||
| Glencore Canada Corporation, | |||||||||||||
| 5.375%, 06/01/2015 f | 200,000 | 208,034 | |||||||||||
| Hewlett-Packard Company, | |||||||||||||
| 1.167%, 01/14/2019 | 35,000 | 35,279 | |||||||||||
| Hyundai Capital Services, Inc., | |||||||||||||
| 6.000%, 05/05/2015 (Acquired 01/09/2014, Cost $103,920) * f | 100,000 | 104,256 | |||||||||||
| Total Capital International, | |||||||||||||
| 0.580%, 06/19/2019 f | 250,000 | 249,998 | |||||||||||
| Verizon Communications, Inc., | |||||||||||||
| 1.981%, 09/14/2018 | 250,000 | 263,764 | |||||||||||
| Volkswagen Group of America Finance, LLC, | |||||||||||||
| 0.595%, 05/23/2017 (Acquired 05/15/2014, Cost $250,000) * | 250,000 | 250,282 | |||||||||||
| 2,207,312 | 15.6 | % | |||||||||||
| Utility | |||||||||||||
| Enbridge Inc., | |||||||||||||
| 0.678%, 06/02/2017 f | 250,000 | 250,503 | |||||||||||
| Exelon Corporation, | |||||||||||||
| 4.900%, 06/15/2015 | 103,000 | 107,073 | |||||||||||
| Midcontinent Express Pipeline LLC, | |||||||||||||
| 5.450%, 09/15/2014 (Acquired 01/09/2014, Cost $201,710) * | 200,000 | 201,209 | |||||||||||
| Orange and Rockland Utilities, Inc., | |||||||||||||
| 2.500%, 08/15/2015 (Acquired 03/19/2014, Cost $101,280) * | 100,000 | 101,245 | |||||||||||
| Spectra Energy Capital LLC, | |||||||||||||
| 5.668%, 08/15/2014 | 250,000 | 251,665 | |||||||||||
| Trans-Allegheny Interstate Line Company, | |||||||||||||
| 4.000%, 01/15/2015 (Acquired 01/07/2014 through 06/16/2014, Cost $354,877) * | 350,000 | 355,747 | |||||||||||
| W3A Funding Corporation, | |||||||||||||
| 8.090%, 01/02/2017 | 38,329 | 38,323 | |||||||||||
| 1,305,765 | 9.2 | % | |||||||||||
| Finance | |||||||||||||
| ABN AMRO Bank N.V., | |||||||||||||
| 1.028%, 10/28/2016 (Acquired 01/03/2014, Cost $225,747) * f | 225,000 | 226,953 | |||||||||||
| AmSouth Bank, | |||||||||||||
| Series AI, 5.200%, 04/01/2015 | 150,000 | 154,739 | |||||||||||
| Banco Santander-Chile, | |||||||||||||
| 1.126%, 04/11/2017 (Acquired 04/08/2014, Cost $200,000) * f | 200,000 | 200,000 | |||||||||||
| BB&T Corporation, | |||||||||||||
| 5.200%, 12/23/2015 | 41,000 | 43,593 | |||||||||||
| BPCE, | |||||||||||||
| 1.073%, 02/10/2017 f | 250,000 | 252,123 | |||||||||||
| Citigroup Inc., | |||||||||||||
| 5.500%, 10/15/2014 | 45,000 | 45,650 | |||||||||||
| Commonwealth Bank of Australia, | |||||||||||||
| 0.830%, 10/08/2015 (Acquired 01/03/2014, Cost $199,800) * f | 200,000 | 199,928 | |||||||||||
| Credit Agricole S.A., | |||||||||||||
| 1.078%, 10/03/2016 (Acquired 01/03/2014, Cost $250,528) * f | 250,000 | 251,392 | |||||||||||
| Deutsche Bank Aktiengesellschaft, | |||||||||||||
| 0.834%, 02/13/2017 f | 150,000 | 150,698 | |||||||||||
| Dresdner Bank AG, | |||||||||||||
| 7.250%, 09/15/2015 f | 150,000 | 159,180 | |||||||||||
| First Tennessee Bank, National Association, | |||||||||||||
| 5.050%, 01/15/2015 | 250,000 | 255,559 | |||||||||||
| General Electric Capital Corporation, | |||||||||||||
| 0.737%, 01/14/2019 | 250,000 | 252,349 | |||||||||||
| J.P. Morgan Chase & Co., | |||||||||||||
| Series 1, 0.858%, 01/28/2019 | 250,000 | 251,122 | |||||||||||
| Kookmin Bank, | |||||||||||||
| 1.103%, 01/27/2017 (Acquired 01/21/2014, Cost $250,000) * f | 250,000 | 251,364 | |||||||||||
| Macquarie Bank Limited, | |||||||||||||
| 1.021%, 03/24/2017 (Acquired 03/18/2014, Cost $200,000) * f | 200,000 | 200,643 | |||||||||||
| Marsh & McLennan Companies, Inc., | |||||||||||||
| 5.375%, 07/15/2014 | 165,000 | 165,298 | |||||||||||
| Mizuho Bank, Ltd., | |||||||||||||
| 0.659%, 04/16/2017 (Acquired 04/09/2014, Cost $200,000) * f | 200,000 | 200,165 | |||||||||||
| Morgan Stanley, | |||||||||||||
| 1.079%, 01/24/2019 | 250,000 | 251,672 | |||||||||||
| National Australia Bank Limited, | |||||||||||||
| 0.730%, 10/08/2015 (Acquired 01/03/2014, Cost $199,860) * f | 200,000 | 199,953 | |||||||||||
| Nomura Holdings, Inc., | |||||||||||||
| 5.000%, 03/04/2015 f | 250,000 | 257,007 | |||||||||||
| Rabobank Nederland, | |||||||||||||
| 0.481%, 03/07/2016 (Acquired 01/03/2014, Cost $249,625) * f | 250,000 | 250,524 | |||||||||||
| SunTrust Bank, | |||||||||||||
| 0.533%, 04/01/2015 | 150,000 | 149,967 | |||||||||||
| Symetra Financial Corporation, | |||||||||||||
| 6.125%, 04/01/2016 (Acquired 04/23/2014, Cost $64,036) * | 60,000 | 64,394 | |||||||||||
| The Goldman Sachs Group, Inc., | |||||||||||||
| 1.324%, 11/15/2018 | 250,000 | 253,414 | |||||||||||
| Willis North America, Inc., | |||||||||||||
| 5.625%, 07/15/2015 | 237,000 | 248,334 | |||||||||||
| 4,936,021 | 34.9 | % | |||||||||||
| Total Corporate Bonds | 8,449,098 | 59.7 | % | ||||||||||
| Residential Mortgage-Backed Securities | |||||||||||||
| U.S. Government Agency Issues | |||||||||||||
| Fannie Mae Pool, | |||||||||||||
| 5.500%, 11/01/2017 | 296,448 | 314,847 | |||||||||||
| Federal Gold Loan Mortgage Corporation (FGLMC), | |||||||||||||
| 5.000%, 12/01/2017 | 174,468 | 185,197 | |||||||||||
| Federal National Mortgage Association (FNMA): | |||||||||||||
| 5.000%, 10/01/2017 | 179,665 | 190,592 | |||||||||||
| 5.000%, 11/01/2017 | 145,169 | 153,989 | |||||||||||
| 5.000%, 12/01/2017 | 125,502 | 133,125 | |||||||||||
| 977,750 | 6.9 | % | |||||||||||
| Non-U.S. Government Agency Issues | |||||||||||||
| Bank of America Alternative Loan Trust: | |||||||||||||
| Series 2003-4, Class 2A1, 5.000%, 06/25/2018 | 103,708 | 106,709 | |||||||||||
| Series 2004-1, Class 5A2, 5.500%, 02/25/2019 | 80,063 | 82,962 | |||||||||||
| Countrywide Alternative Loan Trust, | |||||||||||||
| Series 2004-18CB, Class 2A5, 0.602%, 09/25/2034 | 74,900 | 75,179 | |||||||||||
| J.P. Morgan Mortgage Trust, | |||||||||||||
| Series 2006-S1, Class 2A2, 6.000%, 04/25/2036 | 56,899 | 56,791 | |||||||||||
| MASTR Alternative Loan Trust, | |||||||||||||
| Series 2004-13, Class 8A1, 5.500%, 01/25/2025 | 120,064 | 120,952 | |||||||||||
| Morgan Stanley Mortgage Loan Trust, | |||||||||||||
| Series 2004-4, Class 1A10, 5.000%, 08/25/2034 | 135,930 | 140,277 | |||||||||||
| 582,870 | 4.1 | % | |||||||||||
| Asset Backed Securities | |||||||||||||
| Accredited Mortgage Loan Trust, | |||||||||||||
| Series 2005-3, Class A1, 0.390%, 09/25/2035 | 192,959 | 191,834 | |||||||||||
| Capital Auto Receivables Asset Trust, | |||||||||||||
| Series 2014-1, Class A1B, 0.503%, 05/20/2016 | 200,000 | 200,140 | |||||||||||
| Carrington Mortgage Loan Trust, | |||||||||||||
| Series 2007-HE1, Class A1, 0.252%, 06/25/2037 | 93,861 | 92,021 | |||||||||||
| First Franklin Mortgage Loan Trust, | |||||||||||||
| Series 2004-FF7, Class A1, 0.792%, 09/25/2034 | 225,333 | 224,807 | |||||||||||
| JP Morgan Mortgage Acquisition Trust, | |||||||||||||
| Series 2007-CH3, Class A3, 0.302%, 03/25/2037 | 236,238 | 232,129 | |||||||||||
| Long Beach Mortgage Loan Trust, | |||||||||||||
| Series 2006-WL2, Class 2A3, 0.352%, 01/25/2036 | 54,895 | 51,802 | |||||||||||
| Morgan Stanley Home Equity Loan Trust, | |||||||||||||
| Series 2006-2, Class A3, 0.322%, 02/25/2036 | 164,381 | 162,390 | |||||||||||
| RAMP Series Trust, | |||||||||||||
| Series 2003-RS7, Class AI6, 5.340%, 08/25/2033 | 131,778 | 132,224 | |||||||||||
| RASC Series Trust, | |||||||||||||
| Series 2003-KS2, Class AI6, 3.990%, 04/25/2033 | 72,854 | 72,800 | |||||||||||
| Santander Drive Auto Receivables Trust, | |||||||||||||
| Series 2013-2, Class A2, 0.470%, 03/15/2016 | 7,422 | 7,422 | |||||||||||
| Specialty Underwriting & Residential Finance Trust, | |||||||||||||
| Series 2006-BC1, Class A2C, 0.352%, 12/25/2036 | 196,709 | 194,312 | |||||||||||
| 1,561,881 | 11.0 | % | |||||||||||
| Commercial Mortgage-Backed Securities | |||||||||||||
| JP Morgan Chase Commercial Mortgage Securities Trust, | |||||||||||||
| Series 2005-CB12, Class A4, 4.895%, 09/12/2037 | 20,000 | 20,585 | |||||||||||
| 20,585 | 0.2 | % | |||||||||||
| Total Long-Term Investments (Cost $13,831,503) | 13,879,747 | 98.1 | % | ||||||||||
| Shares | |||||||||||||
| SHORT-TERM INVESTMENTS | |||||||||||||
| Money Market Mutual Funds | |||||||||||||
| Dreyfus Institutional Cash Advantage Fund, 0.06% « | 202,229 | 202,229 | |||||||||||
| Total Short-Term Investments (Cost $202,229) | 202,229 | 1.4 | % | ||||||||||
| Total Investments (Cost $14,033,732) | 14,081,976 | 99.5 | % | ||||||||||
| Other Assets in Excess of Liabilities | 69,202 | 0.5 | % | ||||||||||
| TOTAL NET ASSETS | $ | 14,151,178 | 100.0 | % | |||||||||
| Notes to Schedule of Investments | |||||||||||||
| * | Restricted Security Deemed Liquid | ||||||||||||
| f | Foreign Security | ||||||||||||
| « | 7-Day Yield |
| Baird Short-Term Bond Fund | |||||||||||||
| Schedule of Investments | |||||||||||||
| June 30, 2014 (Unaudited) | |||||||||||||
| Principal | % of | ||||||||||||
| Amount | Value | Net Assets | |||||||||||
| LONG-TERM INVESTMENTS | |||||||||||||
| U.S. Treasury Securities | |||||||||||||
| U.S. Treasury Bonds: | |||||||||||||
| 0.500%, 06/30/2016 | $ | 9,750,000 | $ | 9,758,375 | |||||||||
| 2.375%, 07/31/2017 @ | 17,850,000 | 18,633,722 | |||||||||||
| 2.250%, 07/31/2018 @ | 225,000,000 | 233,226,450 | |||||||||||
| 261,618,547 | 12.0 | % | |||||||||||
| Taxable Municipal Bonds | |||||||||||||
| City of Passaic NJ, | |||||||||||||
| 1.882%, 02/01/2016 | 1,020,000 | 1,025,651 | |||||||||||
| City of Trenton NJ: | |||||||||||||
| 1.430%, 04/01/2015 | 1,440,000 | 1,440,418 | |||||||||||
| 1.722%, 04/01/2016 | 1,470,000 | 1,463,091 | |||||||||||
| Cook County School District No 144 Prairie Hills: | |||||||||||||
| 2.000%, 12/01/2017 | 930,000 | 928,772 | |||||||||||
| 2.500%, 12/01/2018 | 745,000 | 746,103 | |||||||||||
| County of Dauphin PA, | |||||||||||||
| 1.194%, 03/01/2016 | 1,200,000 | 1,194,288 | |||||||||||
| County of Miami-Dade FL Aviation Revenue, | |||||||||||||
| 5.000%, 10/01/2016 | 6,200,000 | 6,792,596 | |||||||||||
| Government Development Bank for Puerto Rico, | |||||||||||||
| 4.704%, 05/01/2016 | 725,000 | 607,340 | |||||||||||
| Indiana Bond Bank, | |||||||||||||
| 1.689%, 01/15/2017 | 1,000,000 | 1,009,040 | |||||||||||
| Iowa Tobacco Settlement Authority, | |||||||||||||
| 6.500%, 06/01/2023 (Callable 06/01/2015) | 135,000 | 134,270 | |||||||||||
| IPS Multi-School Building Corp., | |||||||||||||
| 3.790%, 01/15/2017 | 2,085,000 | 2,093,152 | |||||||||||
| New Hampshire Housing Finance Authority: | |||||||||||||
| 1.250%, 07/01/2016 | 965,000 | 962,066 | |||||||||||
| 1.500%, 01/01/2017 | 930,000 | 933,525 | |||||||||||
| 1.650%, 07/01/2017 | 875,000 | 875,892 | |||||||||||
| New Jersey Economic Development Authority: | |||||||||||||
| 0.000%, 02/15/2016 ^ | 2,500,000 | 2,441,500 | |||||||||||
| 2.421%, 06/15/2018 | 10,000,000 | 10,083,100 | |||||||||||
| Ohio Air Quality Development Authority, | |||||||||||||
| 5.750%, 06/01/2033 | 3,000,000 | 3,231,600 | |||||||||||
| Rhode Island Housing & Mortgage Finance Corp/RI: | |||||||||||||
| 1.150%, 04/01/2016 | 1,175,000 | 1,171,052 | |||||||||||
| 1.930%, 04/01/2017 | 600,000 | 606,372 | |||||||||||
| 3.000%, 10/01/2034 (Callable 10/01/2022) | 12,500,000 | 12,666,125 | |||||||||||
| Schenectady Metroplex Development Authority/NY: | |||||||||||||
| 0.979%, 08/01/2015 | 375,000 | 374,985 | |||||||||||
| 2.232%, 08/01/2017 | 200,000 | 201,706 | |||||||||||
| South Carolina State Public Service Authority, | |||||||||||||
| 1.252%, 06/01/2016 (Callable 12/01/2015) | 6,800,000 | 6,839,304 | |||||||||||
| State of Illinois: | |||||||||||||
| 4.422%, 04/01/2015 | 2,210,000 | 2,269,604 | |||||||||||
| 4.961%, 03/01/2016 | 1,110,000 | 1,180,740 | |||||||||||
| 5.090%, 04/01/2017 | 2,785,000 | 3,015,932 | |||||||||||
| Tulsa Airports Improvement Trust: | |||||||||||||
| 2.592%, 06/01/2017 | 115,000 | 115,207 | |||||||||||
| 3.042%, 06/01/2018 | 100,000 | 100,578 | |||||||||||
| 64,504,009 | 3.0 | % | |||||||||||
| Other Government Related Securities | |||||||||||||
| Centrais Eletricas Brasileiras SA, | |||||||||||||
| 7.750%, 11/30/2015 (Acquired 12/06/2012, Cost $3,234,975) * f | 3,000,000 | 3,255,000 | |||||||||||
| CNOOC Finance 2013 Ltd: | |||||||||||||
| 1.125%, 05/09/2016 f | 2,500,000 | 2,505,513 | |||||||||||
| 1.750%, 05/09/2018 f | 1,000,000 | 992,247 | |||||||||||
| CNOOC Nexen Finance (2014) ULC, | |||||||||||||
| 1.625%, 04/30/2017 f | 5,000,000 | 5,012,835 | |||||||||||
| CNPC General Capital Ltd, | |||||||||||||
| 1.125%, 05/14/2017 (Acquired 05/07/2014, Cost $4,750,000) * f | 4,750,000 | 4,763,309 | |||||||||||
| CNPC HK Overseas Capital Ltd, | |||||||||||||
| 3.125%, 04/28/2016 (Acquired 12/18/2012, Cost $2,355,518) * f | 2,300,000 | 2,370,891 | |||||||||||
| Corp Andina de Fomento, | |||||||||||||
| 5.750%, 01/12/2017 f | 250,000 | 276,927 | |||||||||||
| Electricite de France Societe anonyme, | |||||||||||||
| 0.688%, 01/20/2017 (Acquired 01/13/2014, Cost $9,750,000) * f | 9,750,000 | 9,789,527 | |||||||||||
| Korea Expressway Corporation, | |||||||||||||
| 1.625%, 04/28/2017 (Acquired 06/23/2014, Cost $3,989,480) * f | 4,000,000 | 3,995,832 | |||||||||||
| Korea Hydro & Nuclear Power Co., Ltd., | |||||||||||||
| 2.875%, 10/02/2018 (Acquired 09/25/2013, Cost $2,982,150) * f | 3,000,000 | 3,068,781 | |||||||||||
| Petrobras Global Finance B.V., | |||||||||||||
| 2.592%, 03/17/2017 f | 4,000,000 | 4,047,600 | |||||||||||
| Petrobras International Finance Company, | |||||||||||||
| 3.875%, 01/27/2016 f | 6,825,000 | 7,036,916 | |||||||||||
| Petroleos Mexicanos, | |||||||||||||
| 4.875%, 03/15/2015 f | 5,270,000 | 5,417,560 | |||||||||||
| Sinopec Capital (2013) Limited, | |||||||||||||
| 1.250%, 04/24/2016 (Acquired 01/10/2014, Cost $4,250,152) * f | 4,250,000 | 4,251,445 | |||||||||||
| Sinopec Group Overseas Development (2014) Limited, | |||||||||||||
| 1.750%, 04/10/2017 (Acquired 04/02/2014, Cost $6,984,110) * f | 7,000,000 | 7,003,192 | |||||||||||
| The Export-Import Bank of Korea, | |||||||||||||
| 0.977%, 01/14/2017 f | 750,000 | 755,075 | |||||||||||
| The Korea Development Bank: | |||||||||||||
| 0.853%, 01/22/2017 f | 5,000,000 | 5,005,705 | |||||||||||
| 3.875%, 05/04/2017 f | 2,350,000 | 2,498,268 | |||||||||||
| 3.000%, 03/17/2019 f | 2,475,000 | 2,553,319 | |||||||||||
| 74,599,942 | 3.4 | % | |||||||||||
| Corporate Bonds | |||||||||||||
| Industrials | |||||||||||||
| AbbVie Inc., | |||||||||||||
| 1.750%, 11/06/2017 | 9,949,000 | 10,003,262 | |||||||||||
| Actavis Funding SCS, | |||||||||||||
| 2.450%, 06/15/2019 (Acquired 06/10/2014, Cost $2,991,480) * f | 3,000,000 | 3,008,400 | |||||||||||
| ACTAVIS, INC., | |||||||||||||
| 1.875%, 10/01/2017 | 1,392,000 | 1,404,415 | |||||||||||
| ADT Corp., | |||||||||||||
| 2.250%, 07/15/2017 @ | 6,700,000 | 6,616,250 | |||||||||||
| Agrium Inc., | |||||||||||||
| 7.700%, 02/01/2017 f | 5,000,000 | 5,717,685 | |||||||||||
| Altera Corporation, | |||||||||||||
| 2.500%, 11/15/2018 | 3,000,000 | 3,046,083 | |||||||||||
| America Movil, S.A.B. de C.V., | |||||||||||||
| 1.230%, 09/12/2016 f | 9,000,000 | 9,107,856 | |||||||||||
| American Honda Finance Corporation, | |||||||||||||
| 0.602%, 05/26/2016 (Acquired 05/22/2013, Cost $800,000) * | 800,000 | 803,447 | |||||||||||
| Amgen Inc., | |||||||||||||
| 0.608%, 05/22/2017 | 2,750,000 | 2,751,556 | |||||||||||
| Anadarko Petroleum Corporation: | |||||||||||||
| 5.950%, 09/15/2016 | 5,255,000 | 5,820,212 | |||||||||||
| 6.375%, 09/15/2017 | 2,400,000 | 2,763,216 | |||||||||||
| Anglo American Capital PLC, | |||||||||||||
| 1.176%, 04/15/2016 (Acquired 04/08/2014, Cost $1,800,000) * f | 1,800,000 | 1,805,717 | |||||||||||
| ArcelorMittal S.A.: | |||||||||||||
| 9.500%, 02/15/2015 f | 341,000 | 357,624 | |||||||||||
| 4.250%, 02/25/2015 f | 1,000,000 | 1,016,250 | |||||||||||
| 4.250%, 08/05/2015 f | 1,525,000 | 1,565,031 | |||||||||||
| AT&T Inc., | |||||||||||||
| 0.608%, 02/12/2016 | 4,113,000 | 4,124,800 | |||||||||||
| Avon Products, Inc., | |||||||||||||
| 2.375%, 03/15/2016 | 2,000,000 | 2,026,438 | |||||||||||
| Beam Suntory Inc.: | |||||||||||||
| 5.375%, 01/15/2016 | 1,269,000 | 1,350,911 | |||||||||||
| 1.875%, 05/15/2017 | 8,000,000 | 8,022,216 | |||||||||||
| Boston Scientific Corporation, | |||||||||||||
| 5.125%, 01/12/2017 | 3,000,000 | 3,274,611 | |||||||||||
| BP Capital Markets, | |||||||||||||
| 0.864%, 09/26/2018 f | 7,000,000 | 7,064,477 | |||||||||||
| Bunge Limited Finance Corp.: | |||||||||||||
| 5.100%, 07/15/2015 | 1,635,000 | 1,702,975 | |||||||||||
| 3.200%, 06/15/2017 | 425,000 | 443,120 | |||||||||||
| Bunge N.A. Finance L.P., | |||||||||||||
| 5.900%, 04/01/2017 | 1,820,000 | 2,019,594 | |||||||||||
| CareFusion Corporation, | |||||||||||||
| 1.450%, 05/15/2017 | 5,315,000 | 5,311,030 | |||||||||||
| CF Industries, Inc., | |||||||||||||
| 6.875%, 05/01/2018 | 4,857,000 | 5,710,433 | |||||||||||
| Coca-Cola FEMSA, S.A.B. de C.V., | |||||||||||||
| 2.375%, 11/26/2018 f | 4,000,000 | 4,048,216 | |||||||||||
| Computer Sciences Corporation, | |||||||||||||
| 2.500%, 09/15/2015 | 9,550,000 | 9,720,754 | |||||||||||
| ConAgra Foods, Inc.: | |||||||||||||
| 1.350%, 09/10/2015 | 3,840,000 | 3,868,374 | |||||||||||
| 5.819%, 06/15/2017 | 6,234,000 | 7,005,838 | |||||||||||
| Cox Communications, Inc.: | |||||||||||||
| 5.500%, 10/01/2015 | 200,000 | 211,706 | |||||||||||
| 7.250%, 11/15/2015 | 2,000,000 | 2,172,884 | |||||||||||
| 5.875%, 12/01/2016 (Acquired 02/26/2014, Cost $1,105,217) * | 1,000,000 | 1,104,972 | |||||||||||
| CRH America, Inc., | |||||||||||||
| 6.000%, 09/30/2016 | 5,865,000 | 6,507,288 | |||||||||||
| CSX Corporation, | |||||||||||||
| 7.900%, 05/01/2017 | 2,221,000 | 2,583,441 | |||||||||||
| Daimler Finance North America LLC: | |||||||||||||
| 1.250%, 01/11/2016 (Acquired 01/07/2013, Cost $2,846,495) * | 2,850,000 | 2,874,846 | |||||||||||
| 0.905%, 08/01/2016 (Acquired 07/24/2013 through 04/30/2014, Cost $2,131,047) * | 2,130,000 | 2,149,426 | |||||||||||
| 0.580%, 03/10/2017 (Acquired 03/03/2014, Cost $2,000,000) * | 2,000,000 | 2,002,116 | |||||||||||
| Deutsche Telekom International Finance B.V.: | |||||||||||||
| 5.750%, 03/23/2016 f | 400,000 | 432,666 | |||||||||||
| 3.125%, 04/11/2016 (Acquired 03/14/2012 through 06/25/2013, Cost $5,876,917) * @ f | 5,775,000 | 5,998,169 | |||||||||||
| Devon Energy Corporation: | |||||||||||||
| 2.400%, 07/15/2016 | 375,000 | 386,793 | |||||||||||
| 1.875%, 05/15/2017 | 3,100,000 | 3,153,552 | |||||||||||
| DIRECTV Holdings LLC / DIRECTV Financing Co., Inc., | |||||||||||||
| 3.500%, 03/01/2016 @ | 400,000 | 417,398 | |||||||||||
| Dollar General Corporation, | |||||||||||||
| 4.125%, 07/15/2017 | 17,221,000 | 18,433,789 | |||||||||||
| Eaton Corporation, | |||||||||||||
| 1.500%, 11/02/2017 @ | 5,000,000 | 5,006,195 | |||||||||||
| Express Scripts Holding Company: | |||||||||||||
| 3.125%, 05/15/2016 | 3,000,000 | 3,125,475 | |||||||||||
| 3.500%, 11/15/2016 | 525,000 | 557,439 | |||||||||||
| 2.650%, 02/15/2017 | 200,000 | 207,781 | |||||||||||
| FBG Finance Pty Ltd, | |||||||||||||
| 5.125%, 06/15/2015 (Acquired 03/12/2012, Cost $531,703) * f | 515,000 | 536,276 | |||||||||||
| Federal Express Corp 1998 Pass Through Trust, | |||||||||||||
| Series 981B, 6.845%, 01/15/2019 | 3,429,592 | 3,835,199 | |||||||||||
| Federal Express Corp 2012 Pass Through Trust, | |||||||||||||
| 2.625%, 01/15/2018 (Acquired 01/20/2012 through 05/07/2012, Cost $1,473,009) * | 1,471,588 | 1,495,146 | |||||||||||
| Fidelity National Information Services, Inc.: | |||||||||||||
| 1.450%, 06/05/2017 | 3,000,000 | 2,996,436 | |||||||||||
| 7.875%, 07/15/2020 | 8,520,000 | 9,023,191 | |||||||||||
| Fiserv, Inc.: | |||||||||||||
| 3.125%, 10/01/2015 | 2,486,000 | 2,557,430 | |||||||||||
| 3.125%, 06/15/2016 | 3,295,000 | 3,422,935 | |||||||||||
| Ford Motor Credit Company LLC: | |||||||||||||
| 8.700%, 10/01/2014 | 429,000 | 437,873 | |||||||||||
| 2.500%, 01/15/2016 | 500,000 | 512,684 | |||||||||||
| 6.625%, 08/15/2017 | 9,000,000 | 10,360,026 | |||||||||||
| 1.724%, 12/06/2017 | 1,250,000 | 1,250,509 | |||||||||||
| Freeport-McMoRan Copper & Gold Inc.: | |||||||||||||
| 1.400%, 02/13/2015 | 3,500,000 | 3,513,853 | |||||||||||
| 2.150%, 03/01/2017 | 2,000,000 | 2,041,322 | |||||||||||
| Georgia-Pacific LLC, | |||||||||||||
| 7.700%, 06/15/2015 | 5,300,000 | 5,653,722 | |||||||||||
| Glencore Canada Corporation, | |||||||||||||
| 6.000%, 10/15/2015 f | 525,000 | 557,512 | |||||||||||
| Glencore Finance (Canada) Limited, | |||||||||||||
| 2.050%, 10/23/2015 (Acquired 10/18/2012, Cost $2,999,040) * f | 3,000,000 | 3,033,984 | |||||||||||
| Glencore Funding LLC: | |||||||||||||
| 1.700%, 05/27/2016 (Acquired 05/22/2013, Cost $2,998,770) * | 3,000,000 | 3,027,306 | |||||||||||
| 1.586%, 01/15/2019 (Acquired 06/17/2014, Cost $5,047,060) * | 5,000,000 | 5,024,110 | |||||||||||
| 2.500%, 01/15/2019 (Acquired 05/22/2013, Cost $597,012) * | 600,000 | 598,473 | |||||||||||
| Heineken N.V., | |||||||||||||
| 1.400%, 10/01/2017 (Acquired 10/02/2012, Cost $1,993,400) * f | 2,000,000 | 1,999,038 | |||||||||||
| Hewlett-Packard Company: | |||||||||||||
| 3.000%, 09/15/2016 | 450,000 | 468,609 | |||||||||||
| 1.167%, 01/14/2019 @ | 5,000,000 | 5,039,830 | |||||||||||
| Hospira, Inc., | |||||||||||||
| 6.050%, 03/30/2017 | 2,654,000 | 2,927,933 | |||||||||||
| Husky Energy Inc., | |||||||||||||
| 6.200%, 09/15/2017 f | 1,000,000 | 1,142,859 | |||||||||||
| Husky Oil Limited, | |||||||||||||
| 7.550%, 11/15/2016 f | 2,500,000 | 2,872,602 | |||||||||||
| Hutchison Whampoa International (09/16) Limited, | |||||||||||||
| 4.625%, 09/11/2015 (Acquired 09/24/2012 through 06/25/2013, Cost $9,415,014) * f | 9,090,000 | 9,498,214 | |||||||||||
| Hyundai Capital Services, Inc.: | |||||||||||||
| 6.000%, 05/05/2015 (Acquired 11/01/2012 through 04/30/2013, Cost $6,148,043) * @ f | 5,924,000 | 6,176,137 | |||||||||||
| 4.375%, 07/27/2016 (Acquired 05/11/2012 through 12/05/2013, Cost $6,475,292) * f | 6,230,000 | 6,623,238 | |||||||||||
| 3.500%, 09/13/2017 (Acquired 06/04/2014, Cost $2,107,571) * f | 2,000,000 | 2,104,120 | |||||||||||
| Ingersoll-Rand Global Holding Company Limited, | |||||||||||||
| 6.875%, 08/15/2018 | 1,000,000 | 1,191,401 | |||||||||||
| Ingredion Incorporated, | |||||||||||||
| 1.800%, 09/25/2017 | 8,974,000 | 8,980,928 | |||||||||||
| Johnson Controls, Inc., | |||||||||||||
| 5.500%, 01/15/2016 @ | 7,270,000 | 7,777,337 | |||||||||||
| KIA Motors Corporation, | |||||||||||||
| 3.625%, 06/14/2016 (Acquired 02/18/2014, Cost $1,455,733) * f | 1,400,000 | 1,465,943 | |||||||||||
| L-3 Communications Corporation, | |||||||||||||
| 1.500%, 05/28/2017 | 2,000,000 | 2,002,736 | |||||||||||
| Laboratory Corporation of America Holdings: | |||||||||||||
| 5.625%, 12/15/2015 | 650,000 | 694,819 | |||||||||||
| 3.125%, 05/15/2016 | 2,000,000 | 2,083,080 | |||||||||||
| Marathon Oil Corporation, | |||||||||||||
| 6.000%, 10/01/2017 | 7,805,000 | 8,923,238 | |||||||||||
| Marathon Petroleum Corporation, | |||||||||||||
| 3.500%, 03/01/2016 | 1,503,000 | 1,569,563 | |||||||||||
| Masco Corporation, | |||||||||||||
| 6.125%, 10/03/2016 | 3,475,000 | 3,826,844 | |||||||||||
| Medco Health Solutions, Inc., | |||||||||||||
| 2.750%, 09/15/2015 | 250,000 | 255,977 | |||||||||||
| Murphy Oil Corporation, | |||||||||||||
| 2.500%, 12/01/2017 | 10,281,000 | 10,522,603 | |||||||||||
| Mylan Inc.: | |||||||||||||
| 1.800%, 06/24/2016 @ | 1,000,000 | 1,014,161 | |||||||||||
| 6.000%, 11/15/2018 (Acquired 02/01/2013, Cost $2,615,083) * | 2,500,000 | 2,614,847 | |||||||||||
| 7.875%, 07/15/2020 (Acquired 07/16/2013 through 09/16/2013, Cost $6,605,077) * | 6,000,000 | 6,641,154 | |||||||||||
| Nabors Industries, Inc., | |||||||||||||
| 2.350%, 09/15/2016 | 2,000,000 | 2,041,736 | |||||||||||
| National Oilwell Varco, Inc., | |||||||||||||
| Series B, 6.125%, 08/15/2015 | 4,700,000 | 4,705,067 | |||||||||||
| NBCUniversal Enterprise, Inc., | |||||||||||||
| 0.763%, 04/15/2016 (Acquired 07/03/2013 through 10/21/2013, Cost $3,107,873) * | 3,100,000 | 3,116,690 | |||||||||||
| Nissan Motor Acceptance Corporation: | |||||||||||||
| 0.934%, 09/26/2016 (Acquired 09/19/2013, Cost $5,000,000) * | 5,000,000 | 5,033,150 | |||||||||||
| 0.777%, 03/03/2017 (Acquired 02/25/2014, Cost $3,000,000) * | 3,000,000 | 3,008,742 | |||||||||||
| Noble Holding International Limited: | |||||||||||||
| 3.450%, 08/01/2015 f | 4,552,000 | 4,681,782 | |||||||||||
| 2.500%, 03/15/2017 f | 5,510,000 | 5,636,912 | |||||||||||
| Pentair Finance S.A., | |||||||||||||
| 1.875%, 09/15/2017 f | 4,000,000 | 4,043,564 | |||||||||||
| Petrofac Limited, | |||||||||||||
| 3.400%, 10/10/2018 (Acquired 10/03/2013 through 03/27/2014, Cost $4,749,271) * f | 4,750,000 | 4,930,771 | |||||||||||
| Petrohawk Energy Corporation, | |||||||||||||
| 7.250%, 08/15/2018 | 4,175,000 | 4,362,875 | |||||||||||
| Phillips 66, | |||||||||||||
| 2.950%, 05/01/2017 | 3,000,000 | 3,144,093 | |||||||||||
| Pioneer Natural Resources Company: | |||||||||||||
| 5.875%, 07/15/2016 | 10,000,000 | 10,942,750 | |||||||||||
| 6.650%, 03/15/2017 @ | 1,260,000 | 1,434,220 | |||||||||||
| Plains Exploration & Production Company, | |||||||||||||
| 7.625%, 04/01/2020 | 6,850,000 | 7,483,625 | |||||||||||
| Plum Creek Timberlands, L.P., | |||||||||||||
| 5.875%, 11/15/2015 | 9,700,000 | 10,298,267 | |||||||||||
| PPG Industries, Inc., | |||||||||||||
| 1.900%, 01/15/2016 | 1,452,000 | 1,476,235 | |||||||||||
| Quest Diagnostics Inc, | |||||||||||||
| 3.200%, 04/01/2016 | 5,050,000 | 5,240,617 | |||||||||||
| Rohm and Haas Company, | |||||||||||||
| 6.000%, 09/15/2017 | 646,000 | 730,160 | |||||||||||
| RPM United Kingdom G.P., | |||||||||||||
| 6.700%, 11/01/2015 (Acquired 03/04/2013 through 01/10/2014, Cost $8,121,696) * f | 7,600,000 | 8,076,338 | |||||||||||
| SABMiller Holdings Inc., | |||||||||||||
| 0.915%, 08/01/2018 (Acquired 08/06/2013 through 06/05/2014, Cost $3,003,288) * | 3,000,000 | 3,016,926 | |||||||||||
| SABMiller PLC, | |||||||||||||
| 6.500%, 07/01/2016 (Acquired 03/01/2012 through 03/20/2012, Cost $1,310,640) * f | 1,214,000 | 1,342,019 | |||||||||||
| Seagate HDD Cayman, | |||||||||||||
| 6.875%, 05/01/2020 f | 9,653,000 | 10,437,306 | |||||||||||
| Southwestern Bell Telephone, L.P., | |||||||||||||
| 7.000%, 07/01/2015 | 875,000 | 929,820 | |||||||||||
| Talisman Energy Inc., | |||||||||||||
| 5.125%, 05/15/2015 f | 3,557,000 | 3,696,634 | |||||||||||
| Telecom Italia Capital, | |||||||||||||
| 5.250%, 10/01/2015 f | 10,960,000 | 11,453,200 | |||||||||||
| Telefonica Emisiones S.A.U.: | |||||||||||||
| 6.421%, 06/20/2016 f | 7,290,000 | 8,025,502 | |||||||||||
| 6.221%, 07/03/2017 f | 1,344,000 | 1,520,919 | |||||||||||
| Telefonica Moviles Chile S.A., | |||||||||||||
| 2.875%, 11/09/2015 (Acquired 11/03/2010 through 04/04/2012, Cost $1,016,874) * f | 1,020,000 | 1,040,274 | |||||||||||
| Temple-Inland Inc., | |||||||||||||
| 6.625%, 01/15/2018 | 4,676,000 | 5,422,944 | |||||||||||
| The Clorox Company, | |||||||||||||
| 5.000%, 01/15/2015 | 2,000,000 | 2,048,328 | |||||||||||
| The Valspar Corporation, | |||||||||||||
| 5.100%, 08/01/2015 | 10,450,000 | 10,843,066 | |||||||||||
| Thomson Reuters Corporation, | |||||||||||||
| 0.875%, 05/23/2016 f | 4,550,000 | 4,548,144 | |||||||||||
| Time Warner Cable Inc., | |||||||||||||
| 5.850%, 05/01/2017 | 2,355,000 | 2,648,595 | |||||||||||
| Time Warner Companies, Inc., | |||||||||||||
| 7.250%, 10/15/2017 | 7,831,000 | 9,160,563 | |||||||||||
| Total Capital International: | |||||||||||||
| 0.793%, 08/10/2018 f | 4,350,000 | 4,390,707 | |||||||||||
| 0.580%, 06/19/2019 f | 7,700,000 | 7,699,946 | |||||||||||
| Transocean Inc.: | |||||||||||||
| 5.050%, 12/15/2016 f | 400,000 | 434,529 | |||||||||||
| 2.500%, 10/15/2017 f | 7,400,000 | 7,556,821 | |||||||||||
| TSMC Global Ltd, | |||||||||||||
| 0.950%, 04/03/2016 (Acquired 03/27/2013, Cost $1,999,760) * f | 2,000,000 | 1,996,302 | |||||||||||
| Tyco Electronics Group S.A., | |||||||||||||
| 6.550%, 10/01/2017 f | 860,000 | 995,180 | |||||||||||
| Vale Canada Limited, | |||||||||||||
| 5.700%, 10/15/2015 f | 8,000,000 | 8,477,616 | |||||||||||
| Vale Overseas Limited, | |||||||||||||
| 6.250%, 01/23/2017 f | 915,000 | 1,023,885 | |||||||||||
| Valero Energy Corporation, | |||||||||||||
| 6.125%, 06/15/2017 | 1,120,000 | 1,275,664 | |||||||||||
| Verizon Communications Inc.: | |||||||||||||
| 2.500%, 09/15/2016 @ | 3,000,000 | 3,092,229 | |||||||||||
| 3.650%, 09/14/2018 @ | 9,000,000 | 9,625,329 | |||||||||||
| Viacom Inc., | |||||||||||||
| 6.250%, 04/30/2016 | 2,125,000 | 2,333,694 | |||||||||||
| Vodafone Group Public Limited Company: | |||||||||||||
| 0.611%, 02/19/2016 f | 5,000,000 | 5,012,950 | |||||||||||
| 5.625%, 02/27/2017 @ f | 2,000,000 | 2,225,590 | |||||||||||
| Volkswagen Group of America Finance, LLC, | |||||||||||||
| 0.597%, 05/23/2017 (Acquired 05/15/2014, Cost $2,750,000) * | 2,750,000 | 2,753,097 | |||||||||||
| Warner Chilcott Co LLC / Warner Chilcott Finance LLC, | |||||||||||||
| 7.750%, 09/15/2018 f | 10,585,000 | 11,127,905 | |||||||||||
| Woodside Finance Limited, | |||||||||||||
| 4.500%, 11/10/2014 (Acquired 11/15/2012 through 07/30/2013, Cost $2,772,390) * f | 2,740,000 | 2,777,848 | |||||||||||
| Xerox Corporation, | |||||||||||||
| 6.400%, 03/15/2016 | 2,583,000 | 2,821,584 | |||||||||||
| Yara International ASA, | |||||||||||||
| 5.250%, 12/15/2014 (Acquired 09/25/2012 through 02/13/2013, Cost $7,907,754) * f | 7,775,000 | 7,937,381 | |||||||||||
| Yum! Brands, Inc.: | |||||||||||||
| 4.250%, 09/15/2015 | 6,425,000 | 6,702,856 | |||||||||||
| 6.250%, 04/15/2016 | 2,000,000 | 2,182,594 | |||||||||||
| Zoetis Inc., | |||||||||||||
| 1.150%, 02/01/2016 | 1,000,000 | 1,006,281 | |||||||||||
| 597,073,747 | 27.3 | % | |||||||||||
| Utility | |||||||||||||
| Beaver Valley II Funding Corporation, | |||||||||||||
| 9.000%, 06/01/2017 | 434,000 | 457,910 | |||||||||||
| Boardwalk Pipelines, LP, | |||||||||||||
| 5.500%, 02/01/2017 | 13,384,000 | 14,579,138 | |||||||||||
| Colorado Interstate Gas Company, L.L.C., | |||||||||||||
| 6.800%, 11/15/2015 | 2,000,000 | 2,159,802 | |||||||||||
| Commonwealth Edison Company: | |||||||||||||
| Series 104, 5.950%, 08/15/2016 | 550,000 | 607,015 | |||||||||||
| 6.150%, 09/15/2017 | 100,000 | 114,909 | |||||||||||
| Constellation Energy Group, Inc., | |||||||||||||
| 4.550%, 06/15/2015 | 3,069,000 | 3,181,844 | |||||||||||
| DCP Midstream, LLC, | |||||||||||||
| 5.375%, 10/15/2015 (Acquired 01/13/2012, Cost $1,769,329) * | 1,708,000 | 1,785,808 | |||||||||||
| Dominion Resources, Inc., | |||||||||||||
| 6.400%, 06/15/2018 | 2,000,000 | 2,344,498 | |||||||||||
| El Paso Pipeline Partners Operating Company, L.L.C., | |||||||||||||
| 4.100%, 11/15/2015 | 5,286,000 | 5,499,094 | |||||||||||
| Enable Midstream Partners, LP, | |||||||||||||
| 2.400%, 05/15/2019 (Acquired 05/19/2014, Cost $2,997,780) * | 3,000,000 | 3,002,769 | |||||||||||
| Enbridge Inc.: | |||||||||||||
| 0.885%, 10/01/2016 f | 2,000,000 | 2,011,134 | |||||||||||
| 5.600%, 04/01/2017 f | 5,125,000 | 5,702,203 | |||||||||||
| Energy Transfer Partners, L.P.: | |||||||||||||
| 5.950%, 02/01/2015 | 5,570,000 | 5,720,512 | |||||||||||
| 6.125%, 02/15/2017 | 600,000 | 668,461 | |||||||||||
| 9.700%, 03/15/2019 | 1,000,000 | 1,310,773 | |||||||||||
| Entergy Corporation, | |||||||||||||
| 4.700%, 01/15/2017 | 8,750,000 | 9,440,804 | |||||||||||
| Enterprise Products Operating LLC: | |||||||||||||
| 3.700%, 06/01/2015 | 1,075,000 | 1,106,017 | |||||||||||
| 1.250%, 08/13/2015 | 3,000,000 | 3,021,129 | |||||||||||
| Exelon Corporation, | |||||||||||||
| 4.900%, 06/15/2015 | 2,159,000 | 2,244,365 | |||||||||||
| Florida Gas Transmission Company, LLC, | |||||||||||||
| 4.000%, 07/15/2015 (Acquired 09/12/2012 through 10/15/2013, Cost $3,545,231) * | 3,450,000 | 3,550,447 | |||||||||||
| Gulfstream Natural Gas System, L.L.C., | |||||||||||||
| 6.950%, 06/01/2016 (Acquired 07/22/2013 through 08/27/2013, Cost $8,439,907) * | 7,646,000 | 8,385,743 | |||||||||||
| Kinder Morgan Energy Partners, L.P.: | |||||||||||||
| 6.000%, 02/01/2017 | 250,000 | 278,874 | |||||||||||
| 5.950%, 02/15/2018 | 1,665,000 | 1,899,768 | |||||||||||
| Midcontinent Express Pipeline LLC, | |||||||||||||
| 5.450%, 09/15/2014 (Acquired 07/05/2013 through 02/12/2014, Cost $2,348,623) * | 2,332,000 | 2,346,099 | |||||||||||
| National Grid PLC, | |||||||||||||
| 6.300%, 08/01/2016 f | 9,431,000 | 10,444,248 | |||||||||||
| NextEra Energy Capital Holdings, Inc., | |||||||||||||
| 1.339%, 09/01/2015 | 5,000,000 | 5,036,700 | |||||||||||
| NiSource Finance Corp.: | |||||||||||||
| 5.400%, 07/15/2014 | 4,751,000 | 4,759,547 | |||||||||||
| 5.250%, 09/15/2017 | 5,300,000 | 5,907,746 | |||||||||||
| ONEOK Partners, L.P.: | |||||||||||||
| 6.150%, 10/01/2016 | 4,695,000 | 5,230,399 | |||||||||||
| 2.000%, 10/01/2017 | 2,858,000 | 2,897,009 | |||||||||||
| Pepco Holdings, Inc., | |||||||||||||
| 2.700%, 10/01/2015 | 1,395,000 | 1,422,483 | |||||||||||
| PPL Energy Supply, LLC: | |||||||||||||
| Series A, 5.700%, 10/15/2015 | 6,127,000 | 6,441,713 | |||||||||||
| 6.200%, 05/15/2016 | 4,041,000 | 4,342,475 | |||||||||||
| PSEG Power LLC, | |||||||||||||
| 5.320%, 09/15/2016 | 4,905,000 | 5,362,685 | |||||||||||
| Rockies Express Pipeline LLC, | |||||||||||||
| 3.900%, 04/15/2015 (Acquired 02/17/2011, Cost $2,000,063) * | 2,000,000 | 2,020,000 | |||||||||||
| Sempra Energy, | |||||||||||||
| 2.300%, 04/01/2017 | 1,300,000 | 1,334,515 | |||||||||||
| Southwestern Public Service Company, | |||||||||||||
| 5.600%, 10/01/2016 | 3,000,000 | 3,246,114 | |||||||||||
| Spectra Energy Capital LLC, | |||||||||||||
| 5.668%, 08/15/2014 | 6,414,000 | 6,456,724 | |||||||||||
| Sunoco, Inc., | |||||||||||||
| 5.750%, 01/15/2017 | 600,000 | 660,771 | |||||||||||
| Tennessee Gas Pipeline Company, L.L.C., | |||||||||||||
| 8.000%, 02/01/2016 | 1,000,000 | 1,111,595 | |||||||||||
| Trans-Allegheny Interstate Line Company, | |||||||||||||
| 4.000%, 01/15/2015 (Acquired 01/19/2010 through 04/21/2014, Cost $5,819,626) * | 5,790,000 | 5,885,072 | |||||||||||
| TransCanada PipeLines Ltd, | |||||||||||||
| 0.914%, 06/30/2016 f | 2,575,000 | 2,595,909 | |||||||||||
| Union Electric Company, | |||||||||||||
| 4.750%, 04/01/2015 | 500,000 | 514,901 | |||||||||||
| Williams Partners L.P., | |||||||||||||
| 3.800%, 02/15/2015 | 9,000,000 | 9,173,115 | |||||||||||
| Williams Partners LP / Williams Partners Finance Corp., | |||||||||||||
| 7.250%, 02/01/2017 | 935,000 | 1,068,647 | |||||||||||
| 167,331,484 | 7.6 | % | |||||||||||
| Finance | |||||||||||||
| ABN AMRO Bank N.V.: | |||||||||||||
| 1.028%, 10/28/2016 (Acquired 10/23/2013 through 05/19/2014, Cost $11,060,906) * f | 11,050,000 | 11,145,914 | |||||||||||
| 4.250%, 02/02/2017 (Acquired 08/23/2013 through 11/22/2013, Cost $3,383,447) * f | 3,200,000 | 3,433,504 | |||||||||||
| 2.500%, 10/30/2018 (Acquired 03/04/2014, Cost $957,280) * f | 950,000 | 963,937 | |||||||||||
| Aegon N.V., | |||||||||||||
| 4.625%, 12/01/2015 f | 1,275,000 | 1,343,617 | |||||||||||
| American Express Bank, FSB, | |||||||||||||
| 0.452%, 06/12/2017 | 250,000 | 249,419 | |||||||||||
| American Express Company: | |||||||||||||
| 5.500%, 09/12/2016 | 1,213,000 | 1,331,880 | |||||||||||
| 7.000%, 03/19/2018 | 2,661,000 | 3,164,334 | |||||||||||
| American Express Credit Corporation, | |||||||||||||
| 0.737%, 07/29/2016 | 5,000,000 | 5,032,050 | |||||||||||
| American International Group, Inc.: | |||||||||||||
| 2.375%, 08/24/2015 | 1,100,000 | 1,119,764 | |||||||||||
| 5.600%, 10/18/2016 | 5,120,000 | 5,628,923 | |||||||||||
| 5.450%, 05/18/2017 | 3,575,000 | 3,988,348 | |||||||||||
| Ameriprise Financial, Inc., | |||||||||||||
| 5.650%, 11/15/2015 | 1,350,000 | 1,440,050 | |||||||||||
| AmSouth Bank, | |||||||||||||
| Series AI, 5.200%, 04/01/2015 | 6,140,000 | 6,334,006 | |||||||||||
| ANZ New Zealand (Int'l) Limited: | |||||||||||||
| 3.125%, 08/10/2015 (Acquired 07/23/2013, Cost $3,015,847) * f | 2,950,000 | 3,034,680 | |||||||||||
| 1.125%, 03/24/2016 (Acquired 03/20/2013 through 01/16/2014, Cost $5,323,032) * f | 5,324,000 | 5,354,128 | |||||||||||
| Aon Corporation: | |||||||||||||
| 3.500%, 09/30/2015 f | 3,778,000 | 3,907,646 | |||||||||||
| 3.125%, 05/27/2016 f | 1,582,000 | 1,646,893 | |||||||||||
| Arden Realty Limited Partnership, | |||||||||||||
| 5.250%, 03/01/2015 | 1,708,000 | 1,738,049 | |||||||||||
| Australia and New Zealand Banking Group Limited: | |||||||||||||
| 0.607%, 01/10/2017 (Acquired 01/06/2014, Cost $750,000) * f | 750,000 | 752,065 | |||||||||||
| 1.875%, 10/06/2017 (Acquired 07/17/2013 through 11/21/2013, Cost $749,558) * f | 750,000 | 763,912 | |||||||||||
| 2.250%, 06/13/2019 f | 1,000,000 | 1,003,960 | |||||||||||
| Banco Santander-Chile: | |||||||||||||
| 3.750%, 09/22/2015 (Acquired 11/21/2013 through 03/28/2014, Cost $1,616,725) * f | 1,575,000 | 1,622,175 | |||||||||||
| 1.126%, 04/11/2017 (Acquired 04/08/2014, Cost $1,800,000) * f | 1,800,000 | 1,799,996 | |||||||||||
| Bank of America Corporation: | |||||||||||||
| 10.200%, 07/15/2015 | 3,920,000 | 4,295,340 | |||||||||||
| 5.750%, 12/01/2017 | 5,000,000 | 5,639,600 | |||||||||||
| Barclays Bank PLC: | |||||||||||||
| Series 1, 5.000%, 09/22/2016 f | 5,180,000 | 5,630,406 | |||||||||||
| 0.806%, 02/17/2017 f | 4,000,000 | 4,012,492 | |||||||||||
| BB&T Corporation, | |||||||||||||
| 1.091%, 06/15/2018 | 3,750,000 | 3,814,556 | |||||||||||
| BBVA U.S. Senior, S.A. Unipersonal, | |||||||||||||
| 4.664%, 10/09/2015 f | 2,800,000 | 2,927,436 | |||||||||||
| BNP Paribas: | |||||||||||||
| 0.820%, 12/12/2016 f | 4,540,000 | 4,554,415 | |||||||||||
| 2.375%, 09/14/2017 f | 3,000,000 | 3,072,003 | |||||||||||
| BPCE: | |||||||||||||
| 1.073%, 02/10/2017 f | 9,650,000 | 9,731,957 | |||||||||||
| 2.500%, 12/10/2018 f | 3,275,000 | 3,319,753 | |||||||||||
| Branch Banking and Trust Company, | |||||||||||||
| 0.527%, 05/23/2017 | 8,645,000 | 8,580,318 | |||||||||||
| Canadian Imperial Bank of Commerce: | |||||||||||||
| 0.748%, 07/18/2016 f | 3,000,000 | 3,017,712 | |||||||||||
| 1.350%, 07/18/2016 @ f | 5,000,000 | 5,064,380 | |||||||||||
| Capital One Financial Corporation: | |||||||||||||
| 6.150%, 09/01/2016 | 450,000 | 497,999 | |||||||||||
| 5.250%, 02/21/2017 | 1,000,000 | 1,100,503 | |||||||||||
| CIGNA Corporation: | |||||||||||||
| 2.750%, 11/15/2016 | 5,331,000 | 5,536,313 | |||||||||||
| 5.375%, 03/15/2017 | 2,300,000 | 2,549,672 | |||||||||||
| Citigroup Inc.: | |||||||||||||
| 5.300%, 01/07/2016 | 2,000,000 | 2,133,136 | |||||||||||
| 0.904%, 11/15/2016 | 2,000,000 | 2,010,310 | |||||||||||
| 6.125%, 05/15/2018 | 3,920,000 | 4,516,314 | |||||||||||
| CNA Financial Corporation, | |||||||||||||
| 6.500%, 08/15/2016 | 4,995,000 | 5,563,551 | |||||||||||
| Comerica Bank: | |||||||||||||
| 5.750%, 11/21/2016 | 1,425,000 | 1,581,169 | |||||||||||
| 5.200%, 08/22/2017 | 4,125,000 | 4,575,825 | |||||||||||
| Commonwealth Bank of Australia: | |||||||||||||
| 0.830%, 10/08/2015 (Acquired 12/05/2013, Cost $1,198,800) * f | 1,200,000 | 1,199,568 | |||||||||||
| 0.731%, 09/20/2016 (Acquired 09/16/2013 through 12/20/2013, Cost $6,103,060) * f | 6,100,000 | 6,136,466 | |||||||||||
| Cooperatieve Centrale Raiffeisen-Boerenleenbank BA, | |||||||||||||
| 0.711%, 03/18/2016 f | 3,000,000 | 3,016,962 | |||||||||||
| Countrywide Financial Corporation, | |||||||||||||
| 6.250%, 05/15/2016 | 4,050,000 | 4,419,437 | |||||||||||
| Coventry Health Care, Inc., | |||||||||||||
| 6.125%, 01/15/2015 | 1,125,000 | 1,158,436 | |||||||||||
| Credit Agricole S.A., | |||||||||||||
| 1.082%, 10/03/2016 (Acquired 09/26/2013, Cost $10,000,000) * f | 10,000,000 | 10,055,670 | |||||||||||
| Credit Suisse: | |||||||||||||
| 0.719%, 05/26/2017 f | 2,000,000 | 2,004,576 | |||||||||||
| 6.000%, 02/15/2018 f | 2,935,000 | 3,344,004 | |||||||||||
| Deutsche Bank Aktiengesellschaft: | |||||||||||||
| 0.834%, 02/13/2017 f | 3,850,000 | 3,867,907 | |||||||||||
| Series 3FXD, 1.400%, 02/13/2017 f | 3,000,000 | 3,015,246 | |||||||||||
| 0.698%, 05/30/2017 f | 2,640,000 | 2,641,502 | |||||||||||
| 6.000%, 09/01/2017 f | 3,467,000 | 3,940,807 | |||||||||||
| Dresdner Bank AG, | |||||||||||||
| 7.250%, 09/15/2015 f | 10,522,000 | 11,165,915 | |||||||||||
| Fifth Third Bancorp: | |||||||||||||
| 3.625%, 01/25/2016 | 1,305,000 | 1,362,398 | |||||||||||
| 0.651%, 12/20/2016 | 2,900,000 | 2,879,508 | |||||||||||
| 5.450%, 01/15/2017 | 619,000 | 678,554 | |||||||||||
| Fifth Third Bank, | |||||||||||||
| 0.637%, 02/26/2016 | 5,000,000 | 5,010,920 | |||||||||||
| First Hawaiian Capital I, | |||||||||||||
| Series B, 8.343%, 07/01/2027 | 1,500,000 | 1,520,465 | |||||||||||
| First Horizon National Corporation, | |||||||||||||
| 5.375%, 12/15/2015 | 1,984,000 | 2,098,798 | |||||||||||
| First Tennessee Bank National Association: | |||||||||||||
| 5.050%, 01/15/2015 | 1,000,000 | 1,022,238 | |||||||||||
| 5.650%, 04/01/2016 | 7,170,000 | 7,623,094 | |||||||||||
| General Electric Capital Corporation: | |||||||||||||
| 2.950%, 05/09/2016 | 5,400,000 | 5,629,932 | |||||||||||
| 0.877%, 07/12/2016 | 10,000,000 | 10,090,770 | |||||||||||
| 5.625%, 09/15/2017 | 9,080,000 | 10,278,796 | |||||||||||
| 5.625%, 05/01/2018 | 175,000 | 200,521 | |||||||||||
| 0.737%, 01/14/2019 | 750,000 | 757,047 | |||||||||||
| Genworth Holdings, Inc., | |||||||||||||
| 8.625%, 12/15/2016 | 1,000,000 | 1,169,104 | |||||||||||
| Hana Bank, | |||||||||||||
| 1.349%, 11/09/2016 (Acquired 11/05/2013, Cost $7,005,979) * f | 7,000,000 | 7,049,560 | |||||||||||
| HSBC Bank USA, National Association, | |||||||||||||
| 6.000%, 08/09/2017 | 925,000 | 1,042,155 | |||||||||||
| HSBC Finance Corporation: | |||||||||||||
| 5.500%, 01/19/2016 | 556,000 | 595,436 | |||||||||||
| 6.676%, 01/15/2021 | 221,000 | 264,294 | |||||||||||
| HSBC USA Capital Trust III, | |||||||||||||
| 8.380%, 05/15/2027 (Acquired 11/06/2007, Cost $1,518,111) * | 1,500,000 | 1,520,670 | |||||||||||
| HSBC USA Inc., | |||||||||||||
| 1.111%, 09/24/2018 | 1,000,000 | 1,012,065 | |||||||||||
| Huntington Bancshares Incorporated, | |||||||||||||
| 2.600%, 08/02/2018 | 3,250,000 | 3,305,104 | |||||||||||
| ING Bank N.V.: | |||||||||||||
| 4.000%, 03/15/2016 (Acquired 03/08/2012 through 07/15/2013, Cost $5,966,416) * @ f | 5,783,000 | 6,078,702 | |||||||||||
| 3.750%, 03/07/2017 (Acquired 05/30/2013 through 01/13/2014, Cost $3,352,925) * f | 3,200,000 | 3,403,744 | |||||||||||
| J.P. Morgan Chase & Co., | |||||||||||||
| Series 1, 0.858%, 01/28/2019 | 750,000 | 753,368 | |||||||||||
| Kemper Corporation: | |||||||||||||
| 6.000%, 11/30/2015 | 8,500,000 | 9,074,744 | |||||||||||
| 6.000%, 05/15/2017 | 4,565,000 | 5,044,001 | |||||||||||
| KeyBank National Association, | |||||||||||||
| 4.950%, 09/15/2015 | 920,000 | 965,095 | |||||||||||
| Kookmin Bank, | |||||||||||||
| 1.103%, 01/27/2017 (Acquired 01/21/2014 through 02/20/2014, Cost $4,753,106) * f | 4,750,000 | 4,775,916 | |||||||||||
| LeasePlan Corporation N.V., | |||||||||||||
| 2.500%, 05/16/2018 (Acquired 05/07/2013 through 02/20/2014, Cost $11,668,719) * f | 11,785,000 | 11,882,533 | |||||||||||
| Lloyds Bank plc, | |||||||||||||
| 4.875%, 01/21/2016 f | 1,775,000 | 1,889,972 | |||||||||||
| M&I Marshall & Ilsley Bank: | |||||||||||||
| 4.850%, 06/16/2015 | 6,682,000 | 6,947,737 | |||||||||||
| 5.000%, 01/17/2017 | 2,488,000 | 2,692,339 | |||||||||||
| M&T Capital Trust I, | |||||||||||||
| 8.234%, 02/01/2027 | 1,000,000 | 1,017,638 | |||||||||||
| Macquarie Bank Limited, | |||||||||||||
| 2.000%, 08/15/2016 (Acquired 08/07/2013 through 09/27/2013, Cost $10,020,038) * f | 10,000,000 | 10,181,620 | |||||||||||
| Manufacturers And Traders Trust Company: | |||||||||||||
| 0.531%, 03/07/2016 | 6,300,000 | 6,289,895 | |||||||||||
| 6.625%, 12/04/2017 | 1,000,000 | 1,163,584 | |||||||||||
| Manulife Financial Corporation, | |||||||||||||
| 3.400%, 09/17/2015 f | 9,761,000 | 10,086,568 | |||||||||||
| Marsh & McLennan Companies, Inc.: | |||||||||||||
| 5.750%, 09/15/2015 | 758,000 | 802,772 | |||||||||||
| 2.300%, 04/01/2017 | 1,197,000 | 1,225,622 | |||||||||||
| MassMutual Global Funding II, | |||||||||||||
| 3.125%, 04/14/2016 (Acquired 01/19/2012, Cost $2,040,210) * | 2,000,000 | 2,084,176 | |||||||||||
| Metropolitan Life Global Funding I: | |||||||||||||
| 3.125%, 01/11/2016 (Acquired 01/04/2011 through 03/05/2012, Cost $2,306,592) * | 2,300,000 | 2,385,369 | |||||||||||
| 0.607%, 04/10/2017 (Acquired 04/07/2014, Cost $8,500,000) * | 8,500,000 | 8,518,675 | |||||||||||
| Mizuho Bank, Ltd.: | |||||||||||||
| 2.550%, 03/17/2017 (Acquired 05/30/2013, Cost $7,043,993) * f | 6,900,000 | 7,133,392 | |||||||||||
| 0.659%, 04/16/2017 (Acquired 04/09/2014, Cost $2,800,000) * f | 2,800,000 | 2,802,313 | |||||||||||
| Morgan Stanley: | |||||||||||||
| 1.750%, 02/25/2016 | 2,000,000 | 2,028,404 | |||||||||||
| 5.450%, 01/09/2017 | 2,950,000 | 3,249,705 | |||||||||||
| 6.625%, 04/01/2018 | 2,000,000 | 2,337,946 | |||||||||||
| 1.079%, 01/24/2019 | 4,750,000 | 4,781,773 | |||||||||||
| MUFG Union Bank, National Association: | |||||||||||||
| 3.000%, 06/06/2016 | 6,200,000 | 6,462,843 | |||||||||||
| 2.125%, 06/16/2017 | 3,500,000 | 3,577,808 | |||||||||||
| National Australia Bank Limited: | |||||||||||||
| 0.730%, 10/08/2015 (Acquired 03/26/2013, Cost $1,098,900) * f | 1,100,000 | 1,099,739 | |||||||||||
| 0.657%, 12/02/2016 (Acquired 11/21/2013, Cost $6,000,000) * f | 6,000,000 | 6,021,636 | |||||||||||
| National City Bank, | |||||||||||||
| 5.800%, 06/07/2017 | 1,675,000 | 1,887,670 | |||||||||||
| Nomura Holdings, Inc.: | |||||||||||||
| 5.000%, 03/04/2015 f | 1,000,000 | 1,028,027 | |||||||||||
| 2.000%, 09/13/2016 f | 10,105,000 | 10,269,914 | |||||||||||
| Nordea Bank AB: | |||||||||||||
| 3.125%, 03/20/2017 (Acquired 10/03/2012 through 08/21/2013, Cost $5,301,696) * f | 5,140,000 | 5,414,445 | |||||||||||
| 1.250%, 04/04/2017 (Acquired 03/31/2014, Cost $3,988,880) * @ f | 4,000,000 | 3,998,732 | |||||||||||
| Paine Webber Group Inc., | |||||||||||||
| 7.990%, 06/09/2017 | 300,000 | 339,921 | |||||||||||
| PNC Bank, National Association, | |||||||||||||
| 0.547%, 04/29/2016 | 4,000,000 | 4,001,580 | |||||||||||
| PNC Funding Corp, | |||||||||||||
| 4.250%, 09/21/2015 | 450,000 | 469,842 | |||||||||||
| Principal Financial Group, Inc., | |||||||||||||
| 1.850%, 11/15/2017 @ | 3,500,000 | 3,517,668 | |||||||||||
| Prudential Covered Trust 2012-1, | |||||||||||||
| 2.997%, 09/30/2015 (Acquired 10/16/2012 through 07/15/2013, Cost $2,627,253) * | 2,580,000 | 2,642,748 | |||||||||||
| Prudential Financial, Inc., | |||||||||||||
| 6.100%, 06/15/2017 | 4,720,000 | 5,352,768 | |||||||||||
| Rabobank Nederland, | |||||||||||||
| 3.375%, 01/19/2017 f | 1,092,000 | 1,156,382 | |||||||||||
| Raymond James Financial, Inc., | |||||||||||||
| 4.250%, 04/15/2016 | 5,000,000 | 5,280,995 | |||||||||||
| Regions Bank, | |||||||||||||
| 7.500%, 05/15/2018 | 1,165,000 | 1,386,597 | |||||||||||
| Regions Financial Corporation, | |||||||||||||
| 5.750%, 06/15/2015 | 3,549,000 | 3,709,308 | |||||||||||
| Santander Bank, N.A., | |||||||||||||
| 8.750%, 05/30/2018 | 243,000 | 295,800 | |||||||||||
| Santander Holdings USA, Inc., | |||||||||||||
| 3.000%, 09/24/2015 | 2,975,000 | 3,055,730 | |||||||||||
| Societe Generale: | |||||||||||||
| 3.100%, 09/14/2015 (Acquired 02/06/2013 through 06/19/2013, Cost $3,543,101) * @ f | 3,475,000 | 3,570,896 | |||||||||||
| 2.625%, 10/01/2018 (Acquired 03/04/2014, Cost $1,015,401) * f | 1,000,000 | 1,019,810 | |||||||||||
| Sumitomo Mitsui Banking Corporation: | |||||||||||||
| 1.350%, 07/18/2015 f | 2,000,000 | 2,016,338 | |||||||||||
| 3.150%, 07/22/2015 (Acquired 02/06/2013 through 08/06/2013, Cost $2,147,969) * f | 2,100,000 | 2,157,960 | |||||||||||
| 1.450%, 07/19/2016 @ f | 4,000,000 | 4,040,904 | |||||||||||
| 0.657%, 01/10/2017 f | 2,075,000 | 2,079,671 | |||||||||||
| SunTrust Bank: | |||||||||||||
| 0.535%, 04/01/2015 | 7,080,000 | 7,078,421 | |||||||||||
| 0.517%, 08/24/2015 | 1,000,000 | 998,806 | |||||||||||
| 5.000%, 09/01/2015 | 2,396,000 | 2,508,471 | |||||||||||
| 7.250%, 03/15/2018 | 154,000 | 182,349 | |||||||||||
| SunTrust Banks, Inc., | |||||||||||||
| 6.000%, 09/11/2017 | 780,000 | 883,353 | |||||||||||
| SUSA Partnership, L.P., | |||||||||||||
| 8.200%, 06/01/2017 | 714,000 | 838,123 | |||||||||||
| Svenska Handelsbanken AB: | |||||||||||||
| 0.680%, 03/21/2016 f | 2,000,000 | 2,010,118 | |||||||||||
| 3.125%, 07/12/2016 f | 175,000 | 183,270 | |||||||||||
| 0.700%, 09/23/2016 f | 5,000,000 | 5,028,865 | |||||||||||
| 2.875%, 04/04/2017 f | 275,000 | 287,726 | |||||||||||
| 1.625%, 03/21/2018 f | 1,100,000 | 1,097,437 | |||||||||||
| 0.722%, 06/17/2019 f | 2,000,000 | 2,003,040 | |||||||||||
| The Bank of Nova Scotia: | |||||||||||||
| 0.631%, 03/15/2016 f | 7,000,000 | 7,023,156 | |||||||||||
| 0.650%, 12/13/2016 f | 2,575,000 | 2,584,406 | |||||||||||
| The Bear Stearns Companies LLC: | |||||||||||||
| 5.300%, 10/30/2015 | 4,152,000 | 4,401,116 | |||||||||||
| 6.400%, 10/02/2017 | 7,700,000 | 8,877,569 | |||||||||||
| 7.250%, 02/01/2018 | 275,000 | 327,270 | |||||||||||
| The Goldman Sachs Group, Inc.: | |||||||||||||
| 6.250%, 09/01/2017 | 4,583,000 | 5,217,544 | |||||||||||
| 1.330%, 12/10/2017 | 1,000,000 | 994,994 | |||||||||||
| 6.150%, 04/01/2018 | 4,500,000 | 5,160,690 | |||||||||||
| 2.900%, 07/19/2018 | 1,000,000 | 1,030,270 | |||||||||||
| The Hartford Financial Services Group, Inc.: | |||||||||||||
| 7.300%, 11/01/2015 | 233,000 | 251,177 | |||||||||||
| 5.500%, 10/15/2016 | 3,050,000 | 3,348,131 | |||||||||||
| 5.375%, 03/15/2017 | 3,145,000 | 3,475,779 | |||||||||||
| 6.300%, 03/15/2018 | 140,000 | 161,922 | |||||||||||
| The Huntington National Bank, | |||||||||||||
| 1.350%, 08/02/2016 | 5,000,000 | 5,035,120 | |||||||||||
| The Retail Property Trust, | |||||||||||||
| 7.875%, 03/15/2016 (Acquired 05/21/2013, Cost $1,112,541) * | 1,000,000 | 1,115,322 | |||||||||||
| The Royal Bank of Scotland Group Public Limited Company, | |||||||||||||
| 2.550%, 09/18/2015 f | 4,430,000 | 4,521,364 | |||||||||||
| The Royal Bank of Scotland plc, | |||||||||||||
| 4.875%, 08/25/2014 (Acquired 08/18/2009 through 01/27/2011, Cost $2,995,252) * f | 3,000,000 | 3,017,718 | |||||||||||
| UBS AG: | |||||||||||||
| 5.875%, 12/20/2017 f | 1,000,000 | 1,142,158 | |||||||||||
| 5.750%, 04/25/2018 f | 3,201,000 | 3,670,078 | |||||||||||
| Voya Financial, Inc., | |||||||||||||
| 2.900%, 02/15/2018 | 6,963,000 | 7,215,339 | |||||||||||
| Wells Fargo Bank, National Association: | |||||||||||||
| 0.435%, 05/16/2016 | 7,000,000 | 6,983,725 | |||||||||||
| 6.000%, 11/15/2017 | 610,000 | 698,879 | |||||||||||
| Westpac Banking Corporation, | |||||||||||||
| 2.000%, 08/14/2017 f | 2,000,000 | 2,043,538 | |||||||||||
| Willis North America, Inc., | |||||||||||||
| 5.625%, 07/15/2015 | 6,650,000 | 6,968,016 | |||||||||||
| 595,420,930 | 27.2 | % | |||||||||||
| Total Corporate Bonds | 1,359,826,161 | 62.1 | % | ||||||||||
| Residential Mortgage-Backed Securities | |||||||||||||
| U.S. Government Agency Issues | |||||||||||||
| Federal Home Loan Mortgage Corporation (FHLMC), | |||||||||||||
| Series 5, Class B, 0.852%, 05/15/2019 | 8,677 | 8,733 | |||||||||||
| Federal National Mortgage Association (FNMA): | |||||||||||||
| 5.500%, 07/01/2015 | 22,958 | 24,382 | |||||||||||
| Series 2004-W6, Class 1A4, 5.500%, 07/25/2034 | 472,118 | 478,099 | |||||||||||
| Series 2004-W6, Class 1A6, 5.500%, 07/25/2034 | 362,094 | 375,614 | |||||||||||
| 886,828 | 0.0 | % | |||||||||||
| Non-U.S. Government Agency Issues | |||||||||||||
| Banc of America Mortgage Trust, | |||||||||||||
| Series 2003-10, Class 3A1, 5.000%, 01/25/2019 | 1,153,508 | 1,192,645 | |||||||||||
| Bank of America Alternative Loan Trust: | |||||||||||||
| Series 2003-4, Class 2A1, 5.000%, 06/25/2018 | 159,019 | 163,621 | |||||||||||
| Series 2004-2, Class 5A1, 5.500%, 03/25/2019 | 782,135 | 800,730 | |||||||||||
| Series 2003-3, Class A1, 5.500%, 05/25/2033 | 1,801,758 | 1,884,837 | |||||||||||
| Series 2004-B, Class 2A2, 2.638%, 03/25/2034 | 2,050,464 | 2,083,974 | |||||||||||
| Countrywide Alternative Loan Trust: | |||||||||||||
| Series 2004-12CB, Class 1A1, 5.000%, 07/25/2019 | 1,783,308 | 1,845,697 | |||||||||||
| Series 2005-50CB, Class 4A1, 5.000%, 11/25/2020 § | 350,875 | 348,941 | |||||||||||
| Series 2004-2CB, Class 1A8, 5.750%, 03/25/2034 | 7,247,618 | 7,327,262 | |||||||||||
| Series 2004-J2, Class 3A3, 5.500%, 04/25/2034 | 351,971 | 356,171 | |||||||||||
| Series 2004-18CB, Class 2A5, 0.602%, 09/25/2034 | 200,627 | 201,373 | |||||||||||
| Series 2005-73CB, Class 1A7, 5.500%, 01/25/2036 § | 158,055 | 147,453 | |||||||||||
| Series 2006-28CB, Class A17, 6.000%, 10/25/2036 § | 1,161,932 | 950,015 | |||||||||||
| HSI Asset Securitization Corp. Trust, | |||||||||||||
| Series 2005-NC1, Class 2A3, 0.512%, 07/25/2035 | 1,296,630 | 1,292,715 | |||||||||||
| J.P. Morgan Mortgage Trust, | |||||||||||||
| Series 2005-A4, Class 1A1, 5.240%, 07/25/2035 | 2,179,283 | 2,222,801 | |||||||||||
| MASTR Alternative Loan Trust: | |||||||||||||
| Series 2003-5, Class 7A1, 5.000%, 07/25/2018 | 10,147,529 | 10,537,702 | |||||||||||
| Series 2003-9, Class 3A1, 4.750%, 11/25/2018 | 5,073,970 | 5,191,356 | |||||||||||
| Series 2003-5, Class 4A1, 5.500%, 07/25/2033 | 8,599,659 | 9,147,079 | |||||||||||
| Morgan Stanley Mortgage Loan Trust, | |||||||||||||
| Series 2004-4, Class 1A10, 5.000%, 08/25/2034 | 2,437,672 | 2,515,638 | |||||||||||
| Structured Asset Securities Corp Mortgage Pass-Through Certificates, | |||||||||||||
| Series 2004-22, Class A2, 5.175%, 01/25/2035 | 13,066,038 | 13,566,049 | |||||||||||
| Structured Asset Securities Corp., | |||||||||||||
| Series 2004-4XS, Class 1A6, 4.550%, 02/25/2034 | 783,402 | 799,166 | |||||||||||
| Washington Mutual Mortgage Pass Through Certificates: | |||||||||||||
| Series 2004-CB4, Class 21A, 5.500%, 12/25/2019 | 141,562 | 147,195 | |||||||||||
| Series 2004-CB4, Class 22A, 6.000%, 12/25/2019 | 225,190 | 236,214 | |||||||||||
| Series 2004-AR3, Class A1, 2.377%, 06/25/2034 | 12,100,270 | 12,328,252 | |||||||||||
| 75,286,886 | 3.4 | % | |||||||||||
| Asset Backed Securities | |||||||||||||
| Accredited Mortgage Loan Trust: | |||||||||||||
| Series 2005-3, Class A1, 0.390%, 09/25/2035 | 243,128 | 241,711 | |||||||||||
| Series 2006-2, Class A3, 0.302%, 09/25/2036 | 10,342,164 | 10,025,714 | |||||||||||
| Argent Securities Inc Asset-Backed Pass-Through Certificates: | |||||||||||||
| Series 2005-W2, Class A2B1, 0.352%, 10/25/2035 | 1,691,497 | 1,683,982 | |||||||||||
| Series 2005-W3, Class A2D, 0.492%, 11/25/2035 | 12,870,162 | 12,156,023 | |||||||||||
| BCMSC Trust, | |||||||||||||
| Series 1998-A, Class A3, 6.230%, 04/15/2028 | 6,513 | 6,572 | |||||||||||
| Carrington Mortgage Loan Trust, | |||||||||||||
| Series 2006-OPT1, Class A3, 0.332%, 02/25/2036 | 6,955,168 | 6,574,345 | |||||||||||
| Citifinancial Mortgage Securities Inc, | |||||||||||||
| Series 2003-4, Class AF6, 4.493%, 10/25/2033 | 1,138,858 | 1,163,851 | |||||||||||
| Citigroup Mortgage Loan Trust. Inc., | |||||||||||||
| Series 2006-WFH3, Class A3, 0.302%, 10/25/2036 | 1,543,346 | 1,535,550 | |||||||||||
| Conseco Financial Corp.: | |||||||||||||
| Series 1996-3, Class A5, 7.350%, 05/15/2027 | 8,449 | 8,488 | |||||||||||
| Series 1998-2, Class A5, 6.240%, 12/01/2028 | 23,660 | 24,299 | |||||||||||
| Series 1997-5, Class A6, 6.820%, 05/15/2029 | 185,859 | 188,760 | |||||||||||
| Series 1998-3, Class A5, 6.220%, 03/01/2030 | 301,894 | 320,682 | |||||||||||
| Countrywide Asset-Backed Certificates: | |||||||||||||
| Series 2006-13, Class 1AF3, 5.011%, 01/25/2037 § | 1,684,411 | 1,970,578 | |||||||||||
| Series 2006-9, Class 1AF3, 5.319%, 10/25/2046 § | 1,365,388 | 1,056,477 | |||||||||||
| Credit-Based Asset Servicing and Securitization LLC, | |||||||||||||
| Series 2005-CB8, Class AF2, 4.296%, 12/25/2035 | 314,767 | 296,162 | |||||||||||
| First Franklin Mortgage Loan Trust, | |||||||||||||
| Series 2004-FF7, Class A1, 0.792%, 09/25/2034 | 9,897,122 | 9,874,022 | |||||||||||
| Ford Credit Auto Owner Trust, | |||||||||||||
| Series 2014-1, Class A, 2.260%, 11/15/2025 (Acquired 05/06/2014, Cost $9,997,505) * | 10,000,000 | 10,089,660 | |||||||||||
| GE-WMC Asset-Backed Pass Through Certificates, | |||||||||||||
| Series 2005-1, Class A2C, 0.512%, 10/25/2035 | 5,275,427 | 5,243,775 | |||||||||||
| GSAA Trust, | |||||||||||||
| Series 2005-8, Class A4, 0.422%, 06/25/2035 | 13,067,907 | 12,329,349 | |||||||||||
| Home Equity Asset Trust, | |||||||||||||
| Series 2006-4, Class 2A3, 0.322%, 08/25/2036 | 4,818,637 | 4,710,107 | |||||||||||
| J.P. Morgan Mortgage Acquisition Trust: | |||||||||||||
| Series 2006-CH1, Class A1, 0.280%, 07/25/2036 | 11,210,786 | 10,773,150 | |||||||||||
| Series 2007-CH1, Class AV4, 0.280%, 11/25/2036 | 2,961,930 | 2,943,709 | |||||||||||
| Master Credit Card Trust II, | |||||||||||||
| Series 2013-3A, Class A, 0.583%, 01/22/2018 (Acquired 07/25/2013, Cost $8,000,000) * f | 8,000,000 | 8,016,624 | |||||||||||
| MASTR Asset Backed Securities Trust, | |||||||||||||
| Series 2006-AB1, Class A2, 0.382%, 02/25/2036 | 1,407,646 | 1,397,503 | |||||||||||
| Morgan Stanley ABS Capital I Inc Trust, | |||||||||||||
| Series 2005-HE2, Class A3B, 0.372%, 01/25/2035 | 8,206,362 | 7,995,007 | |||||||||||
| Nationstar Home Equity Loan Trust, | |||||||||||||
| Series 2006-B, Class AV3, 0.320%, 09/25/2036 | 10,413,559 | 10,377,955 | |||||||||||
| RAMP Series Trust: | |||||||||||||
| Series 2003-RS7, Class AI6, 5.340%, 08/25/2033 | 80,482 | 80,754 | |||||||||||
| Series 2003-RS11, Class AI7, 4.828%, 12/25/2033 | 491,904 | 500,175 | |||||||||||
| RASC Series Trust: | |||||||||||||
| Series 2005-AHL2, Class A3, 0.502%, 10/25/2035 | 12,150,000 | 11,680,621 | |||||||||||
| Series 2006-KS1, Class A4, 0.452%, 02/25/2036 | 5,139,000 | 4,971,484 | |||||||||||
| Renaissance Home Equity Loan Trust, | |||||||||||||
| Series 2007-2, Class AF2, 5.675%, 06/25/2037 | 1,978,467 | 1,081,027 | |||||||||||
| Securitized Asset Backed Receivables LLC Trust, | |||||||||||||
| Series 2005-OP2, Class A1, 0.477%, 10/25/2035 (Acquired 03/13/2014, Cost $16,134,734) * | 16,333,802 | 16,102,434 | |||||||||||
| Soundview Home Equity Loan Trust, | |||||||||||||
| Series 2005-OPT4, Class 2A3, 0.672%, 12/25/2035 | 3,202,931 | 3,101,997 | |||||||||||
| Specialty Underwriting & Residential Finance Trust, | |||||||||||||
| Series 2006-BC1, Class A2C, 0.352%, 12/25/2036 | 4,993,055 | 4,932,224 | |||||||||||
| Springleaf Funding Trust, | |||||||||||||
| Series 2013-AA, Class A, 2.580%, 09/15/2021 (Acquired 01/09/2014 through 06/05/2014, Cost $13,253,852) * | 13,200,000 | 13,296,730 | |||||||||||
| Springleaf Mortgage Loan Trust: | |||||||||||||
| Series 2012-1A, Class A, 2.667%, 09/25/2057 (Acquired 04/11/2012 through 03/28/2014, Cost $3,597,463) * | 3,582,340 | 3,648,459 | |||||||||||
| Series 2012-2A, Class A, 2.220%, 10/25/2057 (Acquired 07/31/2012 through 03/28/2014, Cost $2,810,237) * | 2,806,370 | 2,842,084 | |||||||||||
| Structured Asset Securities Corp Mortgage Loan Trust, | |||||||||||||
| Series 2007-BC2, Class A3, 0.282%, 03/25/2037 | 1,581,534 | 1,572,201 | |||||||||||
| 184,814,245 | 8.4 | % | |||||||||||
| Commercial Mortgage Backed Securities | |||||||||||||
| Bear Stearns Commercial Mortgage Securities Trust, | |||||||||||||
| Series 2005-PWR9, Class A4A, 4.871%, 09/11/2042 | 15,739,236 | 16,297,900 | |||||||||||
| CD Commercial Mortgage Trust, | |||||||||||||
| Series 2005-CD1, Class A4, 5.401%, 07/15/2044 | 19,390,988 | 20,162,517 | |||||||||||
| Citigroup Commercial Mortgage Trust, | |||||||||||||
| Series 2006-C4, Class A3, 5.975%, 03/15/2049 | 2,642,524 | 2,827,763 | |||||||||||
| COMM Mortgage Trust, | |||||||||||||
| Series 2005-C6, Class A5A, 5.116%, 06/10/2044 | 15,968,173 | 16,510,340 | |||||||||||
| Credit Suisse First Boston Mortgage Securities Corp., | |||||||||||||
| Series 2005-C5, Class A4, 5.100%, 08/15/2038 | 19,822,454 | 20,400,933 | |||||||||||
| DBUBS Mortgage Trust, | |||||||||||||
| Series 2011-LC3A, Class A2, 3.642%, 08/10/2044 | 7,975,000 | 8,374,476 | |||||||||||
| FHLMC Multifamily Structured Pass Through Certificates, | |||||||||||||
| Series K-701, Class A2, 3.882%, 11/25/2017 | 10,015,000 | 10,805,223 | |||||||||||
| J.P. Morgan Chase Commercial Mortgage Securities Trust, | |||||||||||||
| Series 2005-CB12, Class A4, 4.895%, 09/12/2037 | 19,435,000 | 20,003,376 | |||||||||||
| Morgan Stanley Capital I Trust, | |||||||||||||
| Series 2005-HQ7, Class A4, 5.376%, 11/14/2042 | 13,524,689 | 14,025,806 | |||||||||||
| Wachovia Bank Commercial Mortgage Trust, | |||||||||||||
| Series 2005-C22, Class A4, 5.455%, 12/15/2044 | 9,912,000 | 10,394,437 | |||||||||||
| 139,802,771 | 6.4 | % | |||||||||||
| Total Long-Term Investments (Cost $2,148,504,237) | 2,161,339,389 | 98.7 | % | ||||||||||
| Shares | |||||||||||||
| SHORT-TERM INVESTMENTS | |||||||||||||
| Money Market Mutual Funds | |||||||||||||
| Short-Term Investments Trust - Liquid Assets Portfolio, 0.06% « | 20,999,321 | 20,999,321 | |||||||||||
| Total Short-Term Investments (Cost $20,999,321) | 20,999,321 | 1.0 | % | ||||||||||
| INVESTMENTS PURCHASED WITH CASH PROCEEDS FROM | |||||||||||||
| SECURITIES LENDING | |||||||||||||
| Investment Companies | |||||||||||||
| Mount Vernon Securities Lending Trust Prime Portfolio, 0.20% « | 132,338,001 | 132,338,001 | |||||||||||
| Total Investment Companies (Cost $132,338,001) | 132,338,001 | 6.0 | % | ||||||||||
| Total Investments Purchased With Cash Proceeds From | |||||||||||||
| Securities Lending (Cost $132,338,001) | 132,338,001 | 6.0 | % | ||||||||||
| Total Investments (Cost $2,301,841,559) | 2,314,676,711 | 105.7 | % | ||||||||||
| Liabilities in Excess of Other Assets | (124,001,562 | ) | (5.7 | )% | |||||||||
| TOTAL NET ASSETS | $ | 2,190,675,149 | 100.0 | % | |||||||||
| Notes to Schedule of Investments | |||||||||||||
| * | Restricted Security Deemed Liquid | ||||||||||||
| @ | This security or portion of this security is out on loan at June 30, 2014. | ||||||||||||
| f | Foreign Security | ||||||||||||
| « | 7-Day Yield | ||||||||||||
| § | Security in Default | ||||||||||||
| ^ | Non-Income Producing |
| Baird Intermediate Bond Fund | |||||||||||||
| Schedule of Investments | |||||||||||||
| June 30, 2014 (Unaudited) | |||||||||||||
| Principal | % of | ||||||||||||
| Amount | Value | Net Assets | |||||||||||
| LONG-TERM INVESTMENTS | |||||||||||||
| U.S. Treasury Securities | |||||||||||||
| U.S. Treasury Bonds: | |||||||||||||
| 9.125%, 05/15/2018 @ | $ | 12,950,000 | $ | 16,842,084 | |||||||||
| 1.250%, 04/30/2019 @ | 275,625,000 | 271,490,625 | |||||||||||
| 2.625%, 08/15/2020 | 12,000,000 | 12,491,256 | |||||||||||
| 7.875%, 02/15/2021 @ | 67,000,000 | 91,601,596 | |||||||||||
| 392,425,561 | 31.0 | % | |||||||||||
| U.S. Government Agency Issues | |||||||||||||
| Federal Home Loan Mortgage Corporation (FHLMC): | |||||||||||||
| 1.375%, 05/01/2020 @ | 10,000,000 | 9,727,060 | |||||||||||
| 2.375%, 01/13/2022 | 300,000 | 299,410 | |||||||||||
| 10,026,470 | 0.8 | % | |||||||||||
| Taxable Municipal Bonds | |||||||||||||
| Alaska Municipal Bond Bank Authority: | |||||||||||||
| 4.309%, 08/01/2018 | 1,000,000 | 1,075,440 | |||||||||||
| 4.459%, 08/01/2019 | 1,340,000 | 1,447,964 | |||||||||||
| California Qualified School Bond Joint Powers Authority, | |||||||||||||
| 5.955%, 03/01/2019 | 3,375,000 | 3,649,826 | |||||||||||
| California School Finance Authority, | |||||||||||||
| 4.426%, 07/01/2020 | 2,500,000 | 2,676,525 | |||||||||||
| California State, | |||||||||||||
| 5.500%, 03/01/2016 | 500,000 | 539,300 | |||||||||||
| Central Valley Support Joint Power Agency, | |||||||||||||
| 5.326%, 09/01/2022 | 2,000,000 | 2,118,500 | |||||||||||
| County of Contra Costa CA, | |||||||||||||
| 5.140%, 06/01/2017 | 2,500,000 | 2,684,500 | |||||||||||
| Dallas Independent School District, | |||||||||||||
| 4.950%, 02/15/2022 (Callable 02/15/2021) | 1,965,000 | 2,236,642 | |||||||||||
| Davie Florida Water & Sewer Revenue, | |||||||||||||
| 6.062%, 10/01/2025 (Callable 10/01/2020) | 1,000,000 | 1,152,130 | |||||||||||
| Government Development Bank for Puerto Rico, | |||||||||||||
| 4.704%, 05/01/2016 | 3,525,000 | 2,952,928 | |||||||||||
| Iowa Tobacco Settlement Authority, | |||||||||||||
| 6.500%, 06/01/2023 (Callable 06/01/2015) | 970,000 | 964,752 | |||||||||||
| New Hampshire Housing Finance Authority, | |||||||||||||
| 2.600%, 01/01/2020 | 2,035,000 | 2,058,260 | |||||||||||
| New Jersey Economic Development Authority, | |||||||||||||
| 1.802%, 06/15/2017 | 5,000,000 | 5,037,050 | |||||||||||
| North Carolina Housing Finance Agency, | |||||||||||||
| 4.000%, 01/01/2030 (Callable 07/01/2021) | 445,000 | 453,468 | |||||||||||
| North East Independent School District Texas, | |||||||||||||
| 5.240%, 08/01/2027 | 2,100,000 | 2,453,829 | |||||||||||
| 31,501,114 | 2.5 | % | |||||||||||
| Other Government Related Securities | |||||||||||||
| CDP Financial Inc., | |||||||||||||
| 4.400%, 11/25/2019 (Acquired 11/20/2009, Cost $997,520) * f | 1,000,000 | 1,112,211 | |||||||||||
| Centrais Eletricas Brasileiras SA, | |||||||||||||
| 5.750%, 10/27/2021 (Acquired 10/20/2011 through 10/25/2011, Cost $1,151,939) * @ f | 1,150,000 | 1,179,762 | |||||||||||
| CNOOC Nexen Finance (2014) ULC, | |||||||||||||
| 4.250%, 04/30/2024 f | 5,150,000 | 5,280,470 | |||||||||||
| Corp Andina de Fomento, | |||||||||||||
| 4.375%, 06/15/2022 f | 680,000 | 721,189 | |||||||||||
| KFW, | |||||||||||||
| 4.875%, 06/17/2019 f | 3,250,000 | 3,734,610 | |||||||||||
| Korea Electric Power Corporation, | |||||||||||||
| 6.750%, 08/01/2027 f | 300,000 | 365,799 | |||||||||||
| Korea Gas Corporation, | |||||||||||||
| 2.875%, 07/29/2018 (Acquired 07/22/2013, Cost $994,790) * f | 1,000,000 | 1,025,564 | |||||||||||
| Mexico Government International Bond, | |||||||||||||
| 5.125%, 01/15/2020 f | 2,650,000 | 3,002,450 | |||||||||||
| Petrobras Global Finance B.V., | |||||||||||||
| 2.592%, 03/17/2017 f | 1,700,000 | 1,720,230 | |||||||||||
| Petrobras International Finance Company, | |||||||||||||
| 3.875%, 01/27/2016 f | 4,175,000 | 4,304,634 | |||||||||||
| Petroleos Mexicanos, | |||||||||||||
| 3.125%, 01/23/2019 (Acquired 01/15/2014, Cost $2,000,000) * @ f | 2,000,000 | 2,069,000 | |||||||||||
| Portigon AG, | |||||||||||||
| 4.796%, 07/15/2015 f | 1,811,000 | 1,888,893 | |||||||||||
| The Korea Development Bank, | |||||||||||||
| 3.875%, 05/04/2017 f | 2,150,000 | 2,285,650 | |||||||||||
| 28,690,462 | 2.3 | % | |||||||||||
| Corporate Bonds | |||||||||||||
| Industrials | |||||||||||||
| Altera Corporation, | |||||||||||||
| 2.500%, 11/15/2018 | 2,000,000 | 2,030,722 | |||||||||||
| America Movil, S.A.B. de C.V., | |||||||||||||
| 1.230%, 09/12/2016 f | 3,200,000 | 3,238,349 | |||||||||||
| Ameritech Capital Funding Corporation: | |||||||||||||
| 9.100%, 06/01/2016 | 476,700 | 527,790 | |||||||||||
| 6.450%, 01/15/2018 | 2,758,000 | 3,133,518 | |||||||||||
| Anadarko Petroleum Corporation: | |||||||||||||
| 5.950%, 09/15/2016 | 2,270,000 | 2,514,154 | |||||||||||
| 6.375%, 09/15/2017 | 2,000,000 | 2,302,680 | |||||||||||
| 6.950%, 06/15/2019 | 1,000,000 | 1,223,848 | |||||||||||
| Anglo American Capital PLC, | |||||||||||||
| 9.375%, 04/08/2019 (Acquired 07/11/2012, Cost $2,497,857) * f | 2,000,000 | 2,574,586 | |||||||||||
| Apple Inc., | |||||||||||||
| 2.400%, 05/03/2023 @ | 2,000,000 | 1,889,378 | |||||||||||
| Boston Scientific Corporation, | |||||||||||||
| 4.125%, 10/01/2023 @ | 3,000,000 | 3,117,489 | |||||||||||
| BP Capital Markets: | |||||||||||||
| 4.750%, 03/10/2019 f | 2,500,000 | 2,803,840 | |||||||||||
| 3.245%, 05/06/2022 f | 1,000,000 | 1,012,366 | |||||||||||
| British Telecommunications plc, | |||||||||||||
| 5.950%, 01/15/2018 f | 2,000,000 | 2,287,562 | |||||||||||
| Bunge Limited Finance Corp.: | |||||||||||||
| 5.100%, 07/15/2015 | 1,085,000 | 1,130,109 | |||||||||||
| 4.100%, 03/15/2016 | 2,805,000 | 2,945,343 | |||||||||||
| 3.200%, 06/15/2017 | 1,300,000 | 1,355,425 | |||||||||||
| Bunge N.A. Finance L.P., | |||||||||||||
| 5.900%, 04/01/2017 | 425,000 | 471,608 | |||||||||||
| Celgene Corporation, | |||||||||||||
| 4.000%, 08/15/2023 @ | 2,000,000 | 2,082,812 | |||||||||||
| Coca-Cola FEMSA, S.A.B. de C.V., | |||||||||||||
| 2.375%, 11/26/2018 f | 3,425,000 | 3,466,285 | |||||||||||
| Comcast Cable Communications, LLC, | |||||||||||||
| 8.875%, 05/01/2017 | 550,000 | 668,752 | |||||||||||
| Comcast Corporation: | |||||||||||||
| 6.500%, 01/15/2017 | 175,000 | 199,057 | |||||||||||
| 2.850%, 01/15/2023 @ | 1,475,000 | 1,463,824 | |||||||||||
| Computer Sciences Corporation, | |||||||||||||
| 2.500%, 09/15/2015 | 4,500,000 | 4,580,460 | |||||||||||
| ConAgra Foods, Inc., | |||||||||||||
| 7.000%, 04/15/2019 | 1,000,000 | 1,202,268 | |||||||||||
| Cox Communications, Inc., | |||||||||||||
| 3.250%, 12/15/2022 (Acquired 11/26/2012, Cost $3,594,456) * | 3,600,000 | 3,525,311 | |||||||||||
| CVS Caremark Corporation, | |||||||||||||
| 4.000%, 12/05/2023 | 4,425,000 | 4,630,612 | |||||||||||
| D.R. Horton, Inc., | |||||||||||||
| 6.500%, 04/15/2016 | 1,000,000 | 1,082,500 | |||||||||||
| Daimler Finance North America LLC, | |||||||||||||
| 2.250%, 07/31/2019 (Acquired 07/25/2012, Cost $2,285,234) * @ | 2,300,000 | 2,318,770 | |||||||||||
| Deutsche Telekom International Finance B.V.: | |||||||||||||
| 6.750%, 08/20/2018 f | 2,850,000 | 3,379,453 | |||||||||||
| 6.000%, 07/08/2019 f | 1,300,000 | 1,525,540 | |||||||||||
| Devon Energy Corporation, | |||||||||||||
| 6.300%, 01/15/2019 | 760,000 | 892,390 | |||||||||||
| DIRECTV Holdings LLC / DIRECTV Financing Co., Inc., | |||||||||||||
| 3.500%, 03/01/2016 @ | 250,000 | 260,874 | |||||||||||
| Ecolab Inc., | |||||||||||||
| 1.450%, 12/08/2017 | 4,000,000 | 4,005,120 | |||||||||||
| ERAC USA Finance LLC, | |||||||||||||
| 2.350%, 10/15/2019 (Acquired 06/30/2014, Cost $3,594,708) * | 3,600,000 | 3,594,708 | |||||||||||
| Express Scripts Holding Company: | |||||||||||||
| 2.650%, 02/15/2017 @ | 2,000,000 | 2,077,806 | |||||||||||
| 7.250%, 06/15/2019 | 1,000,000 | 1,225,736 | |||||||||||
| Federal Express Corp 1998 Pass Through Trust, | |||||||||||||
| Series 981B, 6.845%, 01/15/2019 | 2,130,878 | 2,382,890 | |||||||||||
| Fidelity National Information Services, Inc.: | |||||||||||||
| 7.875%, 07/15/2020 | 4,800,000 | 5,083,488 | |||||||||||
| 3.875%, 06/05/2024 | 2,300,000 | 2,310,900 | |||||||||||
| Fiserv, Inc.: | |||||||||||||
| 4.750%, 06/15/2021 | 1,630,000 | 1,773,220 | |||||||||||
| 3.500%, 10/01/2022 | 300,000 | 301,747 | |||||||||||
| FMC Corporation, | |||||||||||||
| 4.100%, 02/01/2024 | 2,000,000 | 2,088,980 | |||||||||||
| Ford Motor Credit Company LLC: | |||||||||||||
| 2.500%, 01/15/2016 | 3,000,000 | 3,076,104 | |||||||||||
| 1.724%, 12/06/2017 | 3,300,000 | 3,301,343 | |||||||||||
| Freeport-McMoRan Copper & Gold Inc.: | |||||||||||||
| 3.100%, 03/15/2020 @ | 2,000,000 | 2,019,774 | |||||||||||
| 3.875%, 03/15/2023 @ | 1,100,000 | 1,096,652 | |||||||||||
| Glencore Canada Corporation, | |||||||||||||
| 6.000%, 10/15/2015 f | 1,024,000 | 1,087,414 | |||||||||||
| Glencore Funding LLC: | |||||||||||||
| 2.500%, 01/15/2019 (Acquired 05/22/2013 through 10/29/2013, Cost $4,301,850) * | 4,400,000 | 4,388,802 | |||||||||||
| 4.125%, 05/30/2023 (Acquired 04/03/2014, Cost $1,450,685) * @ | 1,500,000 | 1,506,511 | |||||||||||
| Grupo Bimbo, S.A.B. de C.V., | |||||||||||||
| 3.875%, 06/27/2024 (Acquired 06/24/2014, Cost $2,987,700) * f | 3,000,000 | 2,994,060 | |||||||||||
| GTE Corporation, | |||||||||||||
| 8.750%, 11/01/2021 | 2,150,000 | 2,849,496 | |||||||||||
| Hanson Limited, | |||||||||||||
| 6.125%, 08/15/2016 f | 650,000 | 708,500 | |||||||||||
| Hess Corporation, | |||||||||||||
| 8.125%, 02/15/2019 | 1,200,000 | 1,509,557 | |||||||||||
| Hewlett-Packard Company: | |||||||||||||
| 3.300%, 12/09/2016 | 3,500,000 | 3,683,323 | |||||||||||
| 2.750%, 01/14/2019 | 2,550,000 | 2,614,665 | |||||||||||
| Historic TW Inc., | |||||||||||||
| 6.875%, 06/15/2018 @ | 392,000 | 467,412 | |||||||||||
| Hutchison Whampoa International (09) Limited, | |||||||||||||
| 7.625%, 04/09/2019 (Acquired 10/16/2009 through 04/16/2014, Cost $6,215,960) * f | 5,400,000 | 6,593,843 | |||||||||||
| Hyundai Capital Services, Inc., | |||||||||||||
| 6.000%, 05/05/2015 (Acquired 03/27/2013 through 05/30/2013, Cost $5,760,366) * f | 5,549,000 | 5,785,177 | |||||||||||
| Ingersoll-Rand Company, | |||||||||||||
| 6.391%, 11/15/2027 f | 1,195,000 | 1,421,922 | |||||||||||
| Ingersoll-Rand Global Holding Company Limited, | |||||||||||||
| 2.875%, 01/15/2019 | 3,000,000 | 3,075,234 | |||||||||||
| Ingredion Incorporated, | |||||||||||||
| 1.800%, 09/25/2017 | 1,275,000 | 1,275,984 | |||||||||||
| Johnson Controls, Inc.: | |||||||||||||
| 5.500%, 01/15/2016 @ | 1,625,000 | 1,738,401 | |||||||||||
| 4.250%, 03/01/2021 | 2,000,000 | 2,157,256 | |||||||||||
| Kraft Foods Group, Inc., | |||||||||||||
| 3.500%, 06/06/2022 | 2,000,000 | 2,053,530 | |||||||||||
| L Brands, Inc., | |||||||||||||
| 5.250%, 11/01/2014 | 180,000 | 182,340 | |||||||||||
| Laboratory Corporation of America Holdings, | |||||||||||||
| 4.625%, 11/15/2020 | 400,000 | 432,604 | |||||||||||
| Lafarge S.A.: | |||||||||||||
| 6.200%, 07/09/2015 (Acquired 07/06/2010, Cost $999,140) * f | 1,000,000 | 1,047,500 | |||||||||||
| 6.500%, 07/15/2016 f | 625,000 | 684,375 | |||||||||||
| Martin Marietta Materials, Inc., | |||||||||||||
| 6.600%, 04/15/2018 | 75,000 | 85,923 | |||||||||||
| Masco Corporation, | |||||||||||||
| 6.125%, 10/03/2016 | 2,200,000 | 2,422,750 | |||||||||||
| MeadWestvaco Corporation, | |||||||||||||
| 7.375%, 09/01/2019 | 2,033,000 | 2,460,351 | |||||||||||
| Medco Health Solutions, Inc.: | |||||||||||||
| 2.750%, 09/15/2015 | 215,000 | 220,140 | |||||||||||
| 7.125%, 03/15/2018 | 1,850,000 | 2,185,259 | |||||||||||
| Merey Sweeny, L.P., | |||||||||||||
| 8.850%, 12/18/2019 (Acquired 06/11/2013, Cost $1,813,195) * | 1,568,333 | 1,775,712 | |||||||||||
| Murphy Oil Corporation, | |||||||||||||
| 3.700%, 12/01/2022 | 5,000,000 | 4,976,270 | |||||||||||
| Mylan Inc.: | |||||||||||||
| 6.000%, 11/15/2018 (Acquired 01/15/2013 through 02/12/2013, Cost $4,183,905) * | 4,000,000 | 4,183,756 | |||||||||||
| 7.875%, 07/15/2020 (Acquired 07/22/2013, Cost $1,100,779) * | 1,000,000 | 1,106,859 | |||||||||||
| Nabors Industries, Inc., | |||||||||||||
| 6.150%, 02/15/2018 | 825,000 | 939,927 | |||||||||||
| Noble Energy, Inc.: | |||||||||||||
| 8.250%, 03/01/2019 | 1,000,000 | 1,260,667 | |||||||||||
| 4.150%, 12/15/2021 | 450,000 | 483,816 | |||||||||||
| Petrofac Limited, | |||||||||||||
| 3.400%, 10/10/2018 (Acquired 10/03/2013, Cost $3,486,945) * f | 3,500,000 | 3,633,199 | |||||||||||
| Petrohawk Energy Corporation, | |||||||||||||
| 7.250%, 08/15/2018 | 4,000,000 | 4,180,000 | |||||||||||
| Plains Exploration & Production Company: | |||||||||||||
| 7.625%, 04/01/2020 | 2,000,000 | 2,185,000 | |||||||||||
| 6.750%, 02/01/2022 | 1,000,000 | 1,136,250 | |||||||||||
| Plum Creek Timberlands, L.P., | |||||||||||||
| 5.875%, 11/15/2015 | 2,445,000 | 2,595,800 | |||||||||||
| POSCO, | |||||||||||||
| 5.250%, 04/14/2021 (Acquired 04/08/2011 through 09/22/2011, Cost $2,977,831) * f | 3,000,000 | 3,367,353 | |||||||||||
| R.R. Donnelley & Sons Company: | |||||||||||||
| 8.600%, 08/15/2016 | 1,000,000 | 1,147,500 | |||||||||||
| 6.125%, 01/15/2017 | 43,000 | 46,977 | |||||||||||
| 7.625%, 06/15/2020 @ | 1,000,000 | 1,135,000 | |||||||||||
| Rio Tinto Alcan Inc., | |||||||||||||
| 5.000%, 06/01/2015 f | 450,000 | 467,891 | |||||||||||
| Rio Tinto Finance (USA) Limited: | |||||||||||||
| 9.000%, 05/01/2019 f | 2,975,000 | 3,900,374 | |||||||||||
| 3.500%, 11/02/2020 f | 500,000 | 523,140 | |||||||||||
| RPM United Kingdom G.P., | |||||||||||||
| 6.700%, 11/01/2015 (Acquired 03/06/2013, Cost $3,525,765) * f | 3,300,000 | 3,506,831 | |||||||||||
| Schneider Electric SE, | |||||||||||||
| 2.950%, 09/27/2022 (Acquired 09/20/2012, Cost $1,994,680) * f | 2,000,000 | 1,967,420 | |||||||||||
| Southwestern Bell Telephone, L.P., | |||||||||||||
| 7.000%, 07/01/2015 | 125,000 | 132,832 | |||||||||||
| Sprint Communications, Inc., | |||||||||||||
| 6.000%, 12/01/2016 @ | 500,000 | 544,375 | |||||||||||
| Sysco Corporation, | |||||||||||||
| 2.600%, 06/12/2022 | 150,000 | 145,517 | |||||||||||
| Teck Resources Limited, | |||||||||||||
| 3.150%, 01/15/2017 f | 1,000,000 | 1,042,092 | |||||||||||
| Telecom Italia Capital, | |||||||||||||
| 5.250%, 10/01/2015 f | 4,425,000 | 4,624,125 | |||||||||||
| Telefonica Emisiones S.A.U.: | |||||||||||||
| 6.421%, 06/20/2016 f | 3,450,000 | 3,798,077 | |||||||||||
| 6.221%, 07/03/2017 f | 1,000,000 | 1,131,636 | |||||||||||
| 3.192%, 04/27/2018 @ f | 1,000,000 | 1,045,075 | |||||||||||
| Teva Pharmaceutical Finance IV, LLC, | |||||||||||||
| 2.250%, 03/18/2020 | 1,250,000 | 1,222,361 | |||||||||||
| The Mosaic Company, | |||||||||||||
| 4.250%, 11/15/2023 @ | 2,000,000 | 2,111,314 | |||||||||||
| Time Warner Cable Inc., | |||||||||||||
| 5.850%, 05/01/2017 | 1,000,000 | 1,124,669 | |||||||||||
| Time Warner Inc.: | |||||||||||||
| 4.700%, 01/15/2021 | 1,325,000 | 1,467,171 | |||||||||||
| 4.750%, 03/29/2021 | 2,000,000 | 2,217,692 | |||||||||||
| TSMC Global Ltd, | |||||||||||||
| 1.625%, 04/03/2018 (Acquired 03/27/2013, Cost $3,297,789) * f | 3,300,000 | 3,251,949 | |||||||||||
| Tyco Electronics Group S.A., | |||||||||||||
| 6.550%, 10/01/2017 f | 1,245,000 | 1,440,697 | |||||||||||
| United AirLines, Inc. Pass Through Trust, | |||||||||||||
| Series 91A2, 10.020%, 03/22/2014 ** § † | 75,509 | 21,897 | |||||||||||
| Vale Overseas Limited: | |||||||||||||
| 6.250%, 01/23/2017 f | 1,650,000 | 1,846,350 | |||||||||||
| 4.375%, 01/11/2022 @ f | 2,425,000 | 2,489,748 | |||||||||||
| Valero Energy Corporation, | |||||||||||||
| 9.375%, 03/15/2019 | 1,898,000 | 2,491,243 | |||||||||||
| Verizon Communications Inc., | |||||||||||||
| 4.150%, 03/15/2024 | 2,000,000 | 2,088,304 | |||||||||||
| Viacom Inc., | |||||||||||||
| 6.250%, 04/30/2016 | 500,000 | 549,105 | |||||||||||
| Vulcan Materials Company, | |||||||||||||
| 7.000%, 06/15/2018 | 2,000,000 | 2,302,500 | |||||||||||
| Wabtec Corporation, | |||||||||||||
| 4.375%, 08/15/2023 | 3,000,000 | 3,118,278 | |||||||||||
| Walgreen Co., | |||||||||||||
| 5.250%, 01/15/2019 @ | 637,000 | 722,801 | |||||||||||
| Waste Management, Inc., | |||||||||||||
| 7.375%, 03/11/2019 | 5,000,000 | 6,109,795 | |||||||||||
| Wesfarmers Limited, | |||||||||||||
| 1.874%, 03/20/2018 (Acquired 03/13/2013, Cost $3,900,000) * f | 3,900,000 | 3,897,777 | |||||||||||
| Yara International ASA, | |||||||||||||
| 5.250%, 12/15/2014 (Acquired 01/15/2013 through 05/03/2013, Cost $1,655,573) * f | 1,625,000 | 1,658,938 | |||||||||||
| 252,924,532 | 20.0 | % | |||||||||||
| Utility | |||||||||||||
| Commonwealth Edison Company, | |||||||||||||
| Series 104, 5.950%, 08/15/2016 | 375,000 | 413,874 | |||||||||||
| DCP Midstream, LLC, | |||||||||||||
| 9.750%, 03/15/2019 (Acquired 10/15/2012, Cost $1,984,455) * | 1,600,000 | 2,062,987 | |||||||||||
| Dominion Resources, Inc., | |||||||||||||
| Series 07-A, 6.000%, 11/30/2017 | 966,000 | 1,105,670 | |||||||||||
| El Paso Pipeline Partners Operating Company, L.L.C., | |||||||||||||
| 4.100%, 11/15/2015 | 3,000,000 | 3,120,939 | |||||||||||
| Energy Transfer Partners, L.P.: | |||||||||||||
| 5.950%, 02/01/2015 | 1,336,000 | 1,372,102 | |||||||||||
| 9.700%, 03/15/2019 | 2,457,000 | 3,220,569 | |||||||||||
| Exelon Corporation, | |||||||||||||
| 4.900%, 06/15/2015 | 1,000,000 | 1,039,539 | |||||||||||
| Kinder Morgan Finance Company LLC, | |||||||||||||
| 5.700%, 01/05/2016 f | 2,500,000 | 2,625,000 | |||||||||||
| National Grid PLC, | |||||||||||||
| 6.300%, 08/01/2016 f | 3,925,000 | 4,346,694 | |||||||||||
| National Rural Utilities Cooperative Finance Corporation, | |||||||||||||
| 10.375%, 11/01/2018 | 3,144,000 | 4,235,641 | |||||||||||
| NiSource Finance Corp., | |||||||||||||
| 4.450%, 12/01/2021 | 2,000,000 | 2,152,784 | |||||||||||
| PPL Capital Funding, Inc., | |||||||||||||
| 3.400%, 06/01/2023 | 2,475,000 | 2,478,539 | |||||||||||
| PPL Energy Supply, LLC, | |||||||||||||
| Series A, 5.700%, 10/15/2015 | 1,950,000 | 2,050,162 | |||||||||||
| PSEG Power LLC: | |||||||||||||
| 5.320%, 09/15/2016 | 994,000 | 1,086,750 | |||||||||||
| 5.125%, 04/15/2020 | 220,000 | 246,394 | |||||||||||
| Public Service Company of New Mexico, | |||||||||||||
| 7.950%, 05/15/2018 | 2,820,000 | 3,385,703 | |||||||||||
| RGS I&M Funding Corp, | |||||||||||||
| Series F*, 9.820%, 06/07/2022 | 471,253 | 564,507 | |||||||||||
| Rockies Express Pipeline LLC: | |||||||||||||
| 3.900%, 04/15/2015 (Acquired 02/17/2011, Cost $3,000,094) * | 3,000,000 | 3,030,000 | |||||||||||
| 5.625%, 04/15/2020 (Acquired 03/17/2010, Cost $999,110) * | 1,000,000 | 1,030,000 | |||||||||||
| Sunoco, Inc., | |||||||||||||
| 5.750%, 01/15/2017 | 1,175,000 | 1,294,010 | |||||||||||
| Talent Yield Investments Ltd., | |||||||||||||
| 4.500%, 04/25/2022 (Acquired 04/18/2012, Cost $3,774,008) * f | 3,800,000 | 3,929,808 | |||||||||||
| Texas Eastern Transmission, LP, | |||||||||||||
| 6.000%, 09/15/2017 (Acquired 11/07/2013 through 11/22/2013, Cost $2,188,643) * | 1,948,000 | 2,174,675 | |||||||||||
| Trans-Allegheny Interstate Line Company, | |||||||||||||
| 4.000%, 01/15/2015 (Acquired 01/19/2010 through 02/22/2013, Cost $3,681,101) * | 3,673,000 | 3,733,311 | |||||||||||
| TransCanada PipeLines Ltd, | |||||||||||||
| 9.875%, 01/01/2021 f | 150,000 | 209,731 | |||||||||||
| West Penn Power Company, | |||||||||||||
| 5.875%, 08/15/2016 (Acquired 10/25/2010, Cost $2,113,003) * | 2,000,000 | 2,180,752 | |||||||||||
| Williams Partners L.P.: | |||||||||||||
| 5.250%, 03/15/2020 @ | 1,000,000 | 1,128,002 | |||||||||||
| 4.125%, 11/15/2020 | 350,000 | 373,179 | |||||||||||
| 4.300%, 03/04/2024 | 2,500,000 | 2,607,245 | |||||||||||
| 57,198,567 | 4.5 | % | |||||||||||
| Finance | |||||||||||||
| Abbey National Treasury Services plc, | |||||||||||||
| 3.050%, 08/23/2018 f | 1,050,000 | 1,099,585 | |||||||||||
| ABN AMRO Bank N.V.: | |||||||||||||
| 4.250%, 02/02/2017 (Acquired 11/22/2013, Cost $4,797,617) * f | 4,500,000 | 4,828,365 | |||||||||||
| 2.500%, 10/30/2018 (Acquired 10/23/2013 through 04/17/2014, Cost $1,200,841) * f | 1,200,000 | 1,217,604 | |||||||||||
| AgriBank, FCB, | |||||||||||||
| Series AI, 9.125%, 07/15/2019 (Acquired 02/24/2014, Cost $3,648,996) * | 2,850,000 | 3,666,462 | |||||||||||
| Ally Financial Inc.: | |||||||||||||
| 6.750%, 12/01/2014 | 200,000 | 204,750 | |||||||||||
| 8.000%, 12/31/2018 | 96,000 | 114,000 | |||||||||||
| American International Group, Inc.: | |||||||||||||
| 8.250%, 08/15/2018 | 1,000,000 | 1,242,409 | |||||||||||
| 4.875%, 06/01/2022 | 3,000,000 | 3,340,689 | |||||||||||
| AmSouth Bancorporation, | |||||||||||||
| 6.750%, 11/01/2025 | 630,000 | 729,386 | |||||||||||
| ANZ New Zealand (Int'l) Limited, | |||||||||||||
| 1.850%, 10/15/2015 (Acquired 08/29/2013, Cost $1,008,998) * f | 1,000,000 | 1,015,050 | |||||||||||
| Associates Corporation of North America, | |||||||||||||
| 6.950%, 11/01/2018 | 2,579,000 | 3,079,955 | |||||||||||
| Australia and New Zealand Banking Group Limited, | |||||||||||||
| 3.250%, 03/01/2016 (Acquired 02/22/2011, Cost $1,693,081) * f | 1,700,000 | 1,767,128 | |||||||||||
| Bank of America Corporation: | |||||||||||||
| 10.200%, 07/15/2015 | 1,035,000 | 1,134,101 | |||||||||||
| 5.700%, 05/02/2017 | 1,100,000 | 1,220,691 | |||||||||||
| 6.875%, 04/25/2018 | 1,000,000 | 1,178,131 | |||||||||||
| 3.300%, 01/11/2023 | 3,350,000 | 3,301,948 | |||||||||||
| 4.000%, 04/01/2024 | 2,750,000 | 2,806,460 | |||||||||||
| BanPonce Trust I, | |||||||||||||
| Series A, 8.327%, 02/01/2027 | 2,500,000 | 1,996,275 | |||||||||||
| Barclays Bank PLC: | |||||||||||||
| Series 1, 5.000%, 09/22/2016 f | 2,565,000 | 2,788,029 | |||||||||||
| 6.750%, 05/22/2019 f | 2,000,000 | 2,408,520 | |||||||||||
| BB&T Corporation, | |||||||||||||
| 6.850%, 04/30/2019 | 2,322,000 | 2,821,023 | |||||||||||
| Berkshire Hathaway Finance Corporation, | |||||||||||||
| 1.600%, 05/15/2017 | 3,800,000 | 3,859,766 | |||||||||||
| BPCE, | |||||||||||||
| 4.000%, 04/15/2024 f | 7,000,000 | 7,145,950 | |||||||||||
| Capital One Financial Corporation, | |||||||||||||
| 3.150%, 07/15/2016 | 2,596,000 | 2,709,038 | |||||||||||
| Capital One N.A., | |||||||||||||
| 0.680%, 03/22/2016 | 2,100,000 | 2,104,880 | |||||||||||
| CIGNA Corporation, | |||||||||||||
| 2.750%, 11/15/2016 | 3,781,000 | 3,926,618 | |||||||||||
| Citigroup Inc.: | �� | ||||||||||||
| 4.450%, 01/10/2017 | 1,800,000 | 1,938,616 | |||||||||||
| 6.125%, 11/21/2017 | 435,000 | 497,530 | |||||||||||
| 3.750%, 06/16/2024 | 500,000 | 501,396 | |||||||||||
| CNA Financial Corporation: | |||||||||||||
| 6.500%, 08/15/2016 | 2,000,000 | 2,227,648 | |||||||||||
| 7.350%, 11/15/2019 | 2,395,000 | 2,954,297 | |||||||||||
| 5.750%, 08/15/2021 | 435,000 | 506,104 | |||||||||||
| Comerica Bank, | |||||||||||||
| 5.200%, 08/22/2017 | 4,095,000 | 4,542,547 | |||||||||||
| Commonwealth Bank of Australia, | |||||||||||||
| 5.000%, 10/15/2019 (Acquired 03/02/2012, Cost $4,243,961) * f | 4,000,000 | 4,519,720 | |||||||||||
| Countrywide Financial Corporation, | |||||||||||||
| 6.250%, 05/15/2016 | 2,200,000 | 2,400,682 | |||||||||||
| Credit Suisse: | |||||||||||||
| 2.300%, 05/28/2019 f | 2,450,000 | 2,453,935 | |||||||||||
| 5.300%, 08/13/2019 f | 3,220,000 | 3,683,519 | |||||||||||
| Deutsche Bank Aktiengesellschaft, | |||||||||||||
| 3.250%, 01/11/2016 f | 4,250,000 | 4,409,851 | |||||||||||
| Dresdner Bank AG, | |||||||||||||
| 7.250%, 09/15/2015 f | 2,652,000 | 2,814,294 | |||||||||||
| First Tennessee Bank National Association, | |||||||||||||
| 5.650%, 04/01/2016 | 4,263,000 | 4,532,392 | |||||||||||
| General Electric Capital Corporation: | |||||||||||||
| 6.000%, 08/07/2019 | 1,600,000 | 1,895,277 | |||||||||||
| 5.500%, 01/08/2020 @ | 2,550,000 | 2,955,980 | |||||||||||
| 5.550%, 05/04/2020 | 2,850,000 | 3,316,682 | |||||||||||
| Genworth Holdings, Inc., | |||||||||||||
| 4.900%, 08/15/2023 | 1,500,000 | 1,605,652 | |||||||||||
| Great-West Life & Annuity Insurance Capital LP II, | |||||||||||||
| 7.153%, 05/16/2046 (Acquired 05/16/2006 through 11/08/2007, Cost $1,792,736) * | 1,800,000 | 1,863,000 | |||||||||||
| HSBC Finance Corporation, | |||||||||||||
| 6.676%, 01/15/2021 | 2,059,000 | 2,462,360 | |||||||||||
| Humana Inc., | |||||||||||||
| 7.200%, 06/15/2018 | 2,000,000 | 2,375,760 | |||||||||||
| ING Bank N.V.: | |||||||||||||
| 3.000%, 09/01/2015 (Acquired 08/17/2010 through 09/14/2012, Cost $2,313,218) * f | 2,300,000 | 2,358,337 | |||||||||||
| 5.000%, 06/09/2021 (Acquired 06/12/2013, Cost $2,171,474) * f | 2,000,000 | 2,258,366 | |||||||||||
| Invesco Finance PLC, | |||||||||||||
| 3.125%, 11/30/2022 f | 4,225,000 | 4,190,638 | |||||||||||
| iStar Financial Inc., | |||||||||||||
| 5.850%, 03/15/2017 | 75,000 | 79,875 | |||||||||||
| J.P. Morgan Chase & Co., | |||||||||||||
| 4.500%, 01/24/2022 | 3,000,000 | 3,287,217 | |||||||||||
| Jefferies Group LLC, | |||||||||||||
| 6.875%, 04/15/2021 | 2,000,000 | 2,338,260 | |||||||||||
| John Hancock Life Insurance Company, | |||||||||||||
| 7.375%, 02/15/2024 (Acquired 04/10/2013 through 04/11/2013, Cost $2,958,843) * | 2,325,000 | 2,879,794 | |||||||||||
| Kemper Corporation, | |||||||||||||
| 6.000%, 05/15/2017 | 600,000 | 662,957 | |||||||||||
| KeyBank National Association, | |||||||||||||
| 7.413%, 05/06/2015 | 4,000,000 | 4,226,552 | |||||||||||
| Korea Housing Finance Corporation, | |||||||||||||
| 1.625%, 09/15/2018 (Acquired 02/26/2013 through 04/18/2013, Cost $842,747) * f | 850,000 | 827,597 | |||||||||||
| LeasePlan Corporation N.V.: | |||||||||||||
| 3.000%, 10/23/2017 (Acquired 02/07/2013, Cost $4,041,062) * f | 4,000,000 | 4,164,884 | |||||||||||
| 2.500%, 05/16/2018 (Acquired 05/29/2013, Cost $988,420) * f | 1,000,000 | 1,008,276 | |||||||||||
| Liberty Mutual Group Inc., | |||||||||||||
| 4.250%, 06/15/2023 (Acquired 06/13/2013, Cost $1,987,300) * | 2,000,000 | 2,072,934 | |||||||||||
| Lloyds Bank plc: | |||||||||||||
| 4.875%, 01/21/2016 f | 225,000 | 239,574 | |||||||||||
| 5.800%, 01/13/2020 (Acquired 02/09/2010 through 03/16/2012, Cost $2,904,435) * f | 2,900,000 | 3,366,613 | |||||||||||
| M&I Marshall & Ilsley Bank: | |||||||||||||
| 4.850%, 06/16/2015 | 3,075,000 | 3,197,290 | |||||||||||
| 5.000%, 01/17/2017 | 1,000,000 | 1,082,130 | |||||||||||
| Macquarie Bank Limited, | |||||||||||||
| 2.000%, 08/15/2016 (Acquired 08/07/2013, Cost $4,998,250) * f | 5,000,000 | 5,090,810 | |||||||||||
| Manulife Financial Corporation, | |||||||||||||
| 4.900%, 09/17/2020 f | 2,300,000 | 2,538,954 | |||||||||||
| Marsh & McLennan Companies, Inc.: | |||||||||||||
| 5.750%, 09/15/2015 | 574,000 | 607,904 | |||||||||||
| 2.550%, 10/15/2018 | 1,000,000 | 1,022,071 | |||||||||||
| MassMutual Global Funding II, | |||||||||||||
| 2.000%, 04/05/2017 (Acquired 03/29/2012, Cost $3,783,470) * | 3,800,000 | 3,884,812 | |||||||||||
| MBIA Insurance Corporation, | |||||||||||||
| 11.486%, 01/15/2033 (Acquired 01/11/2008, Cost $500,000) * | 500,000 | 390,000 | |||||||||||
| Metropolitan Life Global Funding I, | |||||||||||||
| 3.000%, 01/10/2023 (Acquired 01/03/2013, Cost $1,299,337) * | 1,300,000 | 1,289,748 | |||||||||||
| Metropolitan Life Insurance Company, | |||||||||||||
| 7.700%, 11/01/2015 (Acquired 11/21/2013, Cost $2,169,672) * | 2,000,000 | 2,174,548 | |||||||||||
| Morgan Stanley: | |||||||||||||
| 3.800%, 04/29/2016 | 125,000 | 131,241 | |||||||||||
| 6.625%, 04/01/2018 | 1,600,000 | 1,870,357 | |||||||||||
| 7.300%, 05/13/2019 | 2,700,000 | 3,301,417 | |||||||||||
| MUFG Union Bank, National Association, | |||||||||||||
| 2.125%, 06/16/2017 | 1,800,000 | 1,840,016 | |||||||||||
| National Australia Bank Limited: | |||||||||||||
| 0.730%, 10/08/2015 (Acquired 02/19/2013, Cost $3,100,940) * f | 3,100,000 | 3,099,265 | |||||||||||
| 0.657%, 12/02/2016 (Acquired 11/21/2013, Cost $1,175,000) * f | 1,175,000 | 1,179,237 | |||||||||||
| Nationwide Financial Services, Inc., | |||||||||||||
| 5.375%, 03/25/2021 (Acquired 10/07/2013, Cost $888,959) * | 828,000 | 922,084 | |||||||||||
| Nomura Holdings, Inc.: | |||||||||||||
| 5.000%, 03/04/2015 f | 2,500,000 | 2,570,068 | |||||||||||
| 2.000%, 09/13/2016 f | 2,450,000 | 2,489,984 | |||||||||||
| 6.700%, 03/04/2020 f | 1,000,000 | 1,202,219 | |||||||||||
| NYSE Euronext, | |||||||||||||
| 2.000%, 10/05/2017 | 800,000 | 815,177 | |||||||||||
| PNC Bank, National Association, | |||||||||||||
| 2.950%, 01/30/2023 | 4,000,000 | 3,914,868 | |||||||||||
| Protective Life Corporation, | |||||||||||||
| 7.375%, 10/15/2019 | 1,925,000 | 2,381,818 | |||||||||||
| Prudential Covered Trust 2012-1, | |||||||||||||
| 2.997%, 09/30/2015 (Acquired 11/06/2012 through 07/23/2013, Cost $2,444,790) * | 2,400,000 | 2,458,370 | |||||||||||
| Prudential Financial, Inc.: | |||||||||||||
| 3.875%, 01/14/2015 | 200,000 | 203,706 | |||||||||||
| 7.375%, 06/15/2019 | 850,000 | 1,052,641 | |||||||||||
| Prudential Holdings, LLC, | |||||||||||||
| 8.695%, 12/18/2023 (Acquired 03/26/2013 through 12/12/2013, Cost $1,739,783) * | 1,387,857 | 1,751,488 | |||||||||||
| Regions Bank, | |||||||||||||
| 7.500%, 05/15/2018 | 2,475,000 | 2,945,775 | |||||||||||
| Regions Financial Corporation, | |||||||||||||
| 5.750%, 06/15/2015 | 1,500,000 | 1,567,755 | |||||||||||
| Santander Bank, N.A., | |||||||||||||
| 8.750%, 05/30/2018 | 3,080,000 | 3,749,238 | |||||||||||
| Santander UK PLC, | |||||||||||||
| 5.000%, 11/07/2023 (Acquired 10/31/2013, Cost $996,810) * f | 1,000,000 | 1,080,031 | |||||||||||
| Societe Generale: | |||||||||||||
| 2.625%, 10/01/2018 (Acquired 09/24/2013, Cost $998,330) * @ f | 1,000,000 | 1,019,810 | |||||||||||
| 5.200%, 04/15/2021 (Acquired 01/28/2013, Cost $1,382,904) * f | 1,250,000 | 1,411,306 | |||||||||||
| 5.000%, 01/17/2024 (Acquired 01/14/2014 through 02/18/2014, Cost $3,128,104) * @ f | 3,150,000 | 3,294,384 | |||||||||||
| Sumitomo Mitsui Banking Corporation, | |||||||||||||
| 2.500%, 07/19/2018 f | 3,000,000 | 3,067,470 | |||||||||||
| SunTrust Bank: | |||||||||||||
| 5.450%, 12/01/2017 | 500,000 | 554,283 | |||||||||||
| 7.250%, 03/15/2018 | 1,506,000 | 1,783,232 | |||||||||||
| SunTrust Banks, Inc., | |||||||||||||
| 3.600%, 04/15/2016 | 2,450,000 | 2,568,511 | |||||||||||
| SUSA Partnership, L.P., | |||||||||||||
| 8.200%, 06/01/2017 | 2,800,000 | 3,286,758 | |||||||||||
| Svenska Handelsbanken AB: | |||||||||||||
| 3.125%, 07/12/2016 f | 275,000 | 287,995 | |||||||||||
| 2.875%, 04/04/2017 f | 1,500,000 | 1,569,417 | |||||||||||
| 2.500%, 01/25/2019 f | 1,000,000 | 1,022,785 | |||||||||||
| Swedbank AB: | |||||||||||||
| 1.750%, 03/12/2018 (Acquired 03/05/2013, Cost $3,236,383) * f | 3,250,000 | 3,245,502 | |||||||||||
| 2.375%, 02/27/2019 (Acquired 02/20/2014, Cost $2,595,606) * f | 2,600,000 | 2,629,624 | |||||||||||
| Symetra Financial Corporation, | |||||||||||||
| 6.125%, 04/01/2016 (Acquired 08/12/2011 through 12/02/2013, Cost $1,317,053) * | 1,269,000 | 1,361,931 | |||||||||||
| The Bank of Nova Scotia, | |||||||||||||
| 2.550%, 01/12/2017 f | 150,000 | 155,662 | |||||||||||
| The Bank of Tokyo-Mitsubishi UFJ, Ltd.: | |||||||||||||
| 2.700%, 09/09/2018 (Acquired 09/03/2013, Cost $2,547,756) * f | 2,550,000 | 2,627,992 | |||||||||||
| 2.300%, 03/10/2019 (Acquired 03/04/2014, Cost $998,400) * f | 1,000,000 | 1,009,781 | |||||||||||
| The Bear Stearns Companies LLC: | |||||||||||||
| 6.400%, 10/02/2017 | 1,450,000 | 1,671,750 | |||||||||||
| 7.250%, 02/01/2018 | 2,275,000 | 2,707,421 | |||||||||||
| The Charles Schwab Corporation, | |||||||||||||
| 6.375%, 09/01/2017 | 325,000 | 374,692 | |||||||||||
| The Goldman Sachs Group, Inc.: | |||||||||||||
| 6.150%, 04/01/2018 | 3,900,000 | 4,472,598 | |||||||||||
| 2.900%, 07/19/2018 | 1,000,000 | 1,030,270 | |||||||||||
| 7.500%, 02/15/2019 | 865,000 | 1,055,608 | |||||||||||
| The Hartford Financial Services Group, Inc., | |||||||||||||
| 5.500%, 10/15/2016 | 1,500,000 | 1,646,622 | |||||||||||
| The Huntington National Bank, | |||||||||||||
| 1.300%, 11/20/2016 | 4,850,000 | 4,871,098 | |||||||||||
| The Royal Bank of Scotland Group Public Limited Company, | |||||||||||||
| 2.550%, 09/18/2015 f | 200,000 | 204,125 | |||||||||||
| The Royal Bank of Scotland plc, | |||||||||||||
| 5.625%, 08/24/2020 f | 3,300,000 | 3,781,463 | |||||||||||
| 6.125%, 01/11/2021 @ f | 1,300,000 | 1,529,255 | |||||||||||
| UBS AG, | |||||||||||||
| 5.875%, 12/20/2017 f | 2,000,000 | 2,284,316 | |||||||||||
| UnionBanCal Corporation, | |||||||||||||
| 3.500%, 06/18/2022 | 225,000 | 232,008 | |||||||||||
| Voya Financial, Inc., | |||||||||||||
| 2.900%, 02/15/2018 | 2,000,000 | 2,072,480 | |||||||||||
| WEA Finance LLC / WT Finance Aust Pty Ltd, | |||||||||||||
| 6.750%, 09/02/2019 (Acquired 11/21/2013, Cost $4,741,244) * | 4,000,000 | 4,985,368 | |||||||||||
| Wells Fargo Bank, National Association, | |||||||||||||
| 6.000%, 11/15/2017 | 1,479,000 | 1,694,495 | |||||||||||
| Westpac Banking Corporation, | |||||||||||||
| 1.600%, 01/12/2018 f | 1,250,000 | 1,251,493 | |||||||||||
| Willis Group Holdings Public Limited Company, | |||||||||||||
| 5.750%, 03/15/2021 f | 3,250,000 | 3,650,985 | |||||||||||
| 282,343,441 | 22.3 | % | |||||||||||
| Total Corporate Bonds | 592,466,540 | 46.8 | % | ||||||||||
| Residential Mortgage-Backed Securities | |||||||||||||
| U.S. Government Agency Issues | |||||||||||||
| Federal Gold Loan Mortgage Corporation (FGLMC): | |||||||||||||
| 6.000%, 06/01/2021 | 152,976 | 166,365 | |||||||||||
| 6.000%, 07/01/2028 | 10,768 | 12,253 | |||||||||||
| Federal Home Loan Mortgage Corporation (FHLMC): | |||||||||||||
| Series 74, Class F, 6.000%, 10/15/2020 | 1,567 | 1,679 | |||||||||||
| Series 1395, Class G, 6.000%, 10/15/2022 | 13,405 | 14,407 | |||||||||||
| Federal National Mortgage Association (FNMA): | |||||||||||||
| Series 1989-2, Class D, 8.800%, 01/25/2019 | 7,122 | 7,843 | |||||||||||
| Series 1990-108, Class G, 7.000%, 09/25/2020 | 6,468 | 7,153 | |||||||||||
| Series G-29, Class O, 8.500%, 09/25/2021 | 711 | 808 | |||||||||||
| Series 1991-137, Class H, 7.000%, 10/25/2021 | 45,013 | 50,349 | |||||||||||
| Series 1993-32, Class H, 6.000%, 03/25/2023 | 23,242 | 25,429 | |||||||||||
| Series 2004-W6, Class 1A6, 5.500%, 07/25/2034 | 699,120 | 725,223 | |||||||||||
| Government National Mortgage Association (GNMA), | |||||||||||||
| Series 1999-4, Class ZB, 6.000%, 02/20/2029 | 128,698 | 144,481 | |||||||||||
| 1,155,990 | 0.1 | % | |||||||||||
| Non-U.S. Government Agency Issues | |||||||||||||
| Banc of America Funding Trust, | |||||||||||||
| Series 2004-2, Class 1CB1, 5.750%, 09/20/2034 | 5,339,457 | 5,759,758 | |||||||||||
| Bank of America Alternative Loan Trust: | |||||||||||||
| Series 2003-11, Class 4A1, 4.750%, 01/25/2019 | 114,308 | 115,563 | |||||||||||
| Series 2004-2, Class 5A1, 5.500%, 03/25/2019 | 387,515 | 396,728 | |||||||||||
| Series 2004-11, Class 4A1, 5.500%, 12/25/2019 | 475,141 | 490,207 | |||||||||||
| Series 2005-6, Class 7A1, 5.500%, 07/25/2020 | 23,999 | 24,475 | |||||||||||
| Series 2006-2, Class 7A1, 6.000%, 03/25/2021 | 332,187 | 339,550 | |||||||||||
| Series 2003-9, Class 1CB2, 5.500%, 11/25/2033 | 912,197 | 931,688 | |||||||||||
| Series 2006-3, Class 6A1, 6.000%, 04/25/2036 | 392,135 | 404,389 | |||||||||||
| Series 2006-4, Class 3CB4, 6.000%, 05/25/2046 § | 528,382 | 442,260 | |||||||||||
| Bear Stearns ARM Trust, | |||||||||||||
| Series 2004-5, Class 2A, 2.957%, 07/25/2034 | 3,322,923 | 3,333,141 | |||||||||||
| Countrywide Alternative Loan Trust: | |||||||||||||
| Series 2005-5R, Class A2, 4.750%, 12/25/2018 | 5,382 | 5,377 | |||||||||||
| Series 2005-50CB, Class 4A1, 5.000%, 11/25/2020 § | 403,507 | 401,282 | |||||||||||
| Series 2005-85CB, Class 3A1, 5.250%, 02/25/2021 (Acquired 09/26/2007 through 01/28/2009, Cost $330,554) * | 335,484 | 322,061 | |||||||||||
| Series 2006-7CB, Class 3A1, 5.250%, 05/25/2021 § | 580,819 | 527,723 | |||||||||||
| Series 2004-2CB, Class 1A8, 5.750%, 03/25/2034 | 4,161,737 | 4,207,471 | |||||||||||
| Series 2005-11CB, Class 2A1, 5.500%, 06/25/2035 § | 87,961 | 84,818 | |||||||||||
| Credit Suisse First Boston Mortgage Securities Corp., | |||||||||||||
| Series 2005-3, Class 3A27, 5.500%, 07/25/2035 | 33,043 | 33,915 | |||||||||||
| J.P. Morgan Alternative Loan Trust: | |||||||||||||
| Series 2005-S1, Class 3A1, 5.500%, 10/25/2020 § | 852,308 | 864,773 | |||||||||||
| Series 2006-A1, Class 2A1, 2.523%, 03/25/2036 § | 653,938 | 522,184 | |||||||||||
| Lehman Mortgage Trust, | |||||||||||||
| Series 2006-4, Class 3A1, 5.000%, 08/25/2021 § | 146,241 | 142,646 | |||||||||||
| MASTR Alternative Loan Trust: | |||||||||||||
| Series 2004-1, Class 1A1, 5.000%, 01/25/2019 | 448,234 | 456,565 | |||||||||||
| Series 2004-3, Class 1A1, 5.000%, 03/25/2019 | 119,449 | 122,685 | |||||||||||
| Series 2005-3, Class 4A1, 5.500%, 03/25/2020 | 111,039 | 115,609 | |||||||||||
| RALI Series Trust, | |||||||||||||
| Series 2004-QS6, Class A1, 5.000%, 05/25/2019 | 44,361 | 45,085 | |||||||||||
| Salomon Brothers Mortgage Securities VII, Inc., | |||||||||||||
| Series 2003-UP2, Class A2, 7.000%, 06/25/2033 | 108,898 | 117,515 | |||||||||||
| Structured Asset Securities Corp Mortgage Pass-Through Certificates, | |||||||||||||
| Series 2004-22, Class A2, 5.175%, 01/25/2035 | 8,710,692 | 9,044,033 | |||||||||||
| Washington Mutual Mortgage Pass Through Certificates: | |||||||||||||
| Series 2004-CB1, Class 5A, 5.000%, 06/25/2019 | 609,310 | 626,837 | |||||||||||
| Series 2004-CB3, Class 3A, 5.500%, 10/25/2019 | 1,028,757 | 1,075,050 | |||||||||||
| Series 2004-CB3, Class 4A, 6.000%, 10/25/2019 | 329,839 | 345,025 | |||||||||||
| Series 2004-CB4, Class 21A, 5.500%, 12/25/2019 | 339,750 | 353,269 | |||||||||||
| Series 2004-CB4, Class 22A, 6.000%, 12/25/2019 | 243,449 | 255,366 | |||||||||||
| Series 2004-AR3, Class A1, 2.377%, 06/25/2034 | 7,098,825 | 7,232,574 | |||||||||||
| Series 2004-CB2, Class 3A, 6.000%, 08/25/2034 | 5,338,086 | 5,713,941 | |||||||||||
| 44,853,563 | 3.5 | % | |||||||||||
| Asset Backed Securities | |||||||||||||
| Amresco Residential Securities Mortgage Loan Trust, | |||||||||||||
| Series 1998-1, Class A6, 6.510%, 08/25/2027 | 21,448 | 21,559 | |||||||||||
| Citigroup Mortgage Loan Trust. Inc., | |||||||||||||
| Series 2006-WFH3, Class A3, 0.302%, 10/25/2036 | 1,240,059 | 1,233,795 | |||||||||||
| Cityscape Home Equity Loan Trust, | |||||||||||||
| Series 1997-C, Class A4, 7.000%, 07/25/2028 ** § † | 3,921 | 392 | |||||||||||
| Conseco Financial Corp.: | |||||||||||||
| Series 1993-4, Class A5, 7.050%, 01/15/2019 | 7,797 | 8,035 | |||||||||||
| Series 1998-2, Class A5, 6.240%, 12/01/2028 | 368,462 | 378,406 | |||||||||||
| Series 1998-3, Class A5, 6.220%, 03/01/2030 | 551,460 | 585,780 | |||||||||||
| Series 1998-4, Class A5, 6.180%, 04/01/2030 | 217,159 | 223,038 | |||||||||||
| Countrywide Asset-Backed Certificates: | |||||||||||||
| Series 2006-S3, Class A2, 6.085%, 06/25/2021 | 425,901 | 423,163 | |||||||||||
| Series 2004-12, Class AF6, 4.634%, 03/25/2035 | 31,658 | 32,151 | |||||||||||
| Series 2005-1, Class AF6, 5.030%, 07/25/2035 | 1,580,995 | 1,611,203 | |||||||||||
| Series 2006-13, Class 1AF3, 5.011%, 01/25/2037 § | 253,168 | 296,179 | |||||||||||
| Series 2006-9, Class 1AF3, 5.319%, 10/25/2046 § | 1,256,157 | 971,959 | |||||||||||
| Delta Funding Home Equity Loan Trust: | |||||||||||||
| Series 1997-2, Class A6, 7.040%, 06/25/2027 | 5,395 | 5,521 | |||||||||||
| Series 1999-1, Class A6F, 6.340%, 12/15/2028 | 72 | 72 | |||||||||||
| Series 1999-2, Class A7F, 7.030%, 08/15/2030 | 457,601 | 471,555 | |||||||||||
| First Franklin Mortgage Loan Trust, | |||||||||||||
| Series 2004-FF7, Class A1, 0.792%, 09/25/2034 | 6,160,958 | 6,146,579 | |||||||||||
| IMC Home Equity Loan Trust, | |||||||||||||
| Series 1998-1, Class A6, 7.020%, 06/20/2029 | 6,585 | 6,592 | |||||||||||
| J.P. Morgan Mortgage Acquisition Trust, | |||||||||||||
| Series 2006-CH1, Class A1, 0.280%, 07/25/2036 | 5,381,177 | 5,171,112 | |||||||||||
| Oakwood Mortgage Investors, Inc., | |||||||||||||
| Series 1999-B, Class A3, 6.450%, 11/15/2017 | 95,567 | 99,620 | |||||||||||
| RAAC Series Trust, | |||||||||||||
| Series 2004-SP1, Class AI4, 5.285%, 08/25/2027 | 24,253 | 24,243 | |||||||||||
| RAMP Series Trust, | |||||||||||||
| Series 2005-RS1, Class AI6, 4.713%, 01/25/2035 | 167,964 | 164,900 | |||||||||||
| Saxon Asset Securities Trust, | |||||||||||||
| Series 2005-4, Class A1B, 0.532%, 11/25/2037 | 2,970,909 | 2,749,104 | |||||||||||
| Securitized Asset Backed Receivables LLC Trust, | |||||||||||||
| Series 2005-OP2, Class A1, 0.477%, 10/25/2035 (Acquired 03/13/2014, Cost $8,936,160) * | 9,046,413 | 8,918,271 | |||||||||||
| Soundview Home Loan Trust, | |||||||||||||
| Series 2003-2, Class A2, 1.452%, 11/25/2033 | 4,321,857 | 4,282,662 | |||||||||||
| Specialty Underwriting & Residential Finance Trust: | |||||||||||||
| Series 2004-BC4, Class A1A, 0.822%, 10/25/2035 | 4,025,119 | 3,911,413 | |||||||||||
| Series 2006-BC1, Class A2D, 0.452%, 12/25/2036 | 5,607,100 | 5,318,312 | |||||||||||
| Springleaf Funding Trust, | |||||||||||||
| Series 2013-AA, Class A, 2.580%, 09/15/2021 (Acquired 02/14/2014, Cost $5,024,363) * | 5,000,000 | 5,036,640 | |||||||||||
| Springleaf Mortgage Loan Trust, | |||||||||||||
| Series 2012-1A, Class A, 2.667%, 09/25/2057 (Acquired 04/11/2012, Cost $2,311,161) * | 2,311,187 | 2,353,845 | |||||||||||
| 50,446,101 | 4.0 | % | |||||||||||
| Commercial Mortgage-Backed Securities | |||||||||||||
| Bear Stearns Commercial Mortgage Securities Trust, | |||||||||||||
| Series 2005-PWR9, Class A4A, 4.871%, 09/11/2042 | 5,773,604 | 5,978,538 | |||||||||||
| CD Commercial Mortgage Trust, | |||||||||||||
| Series 2005-CD1, Class A4, 5.401%, 07/15/2044 | 6,731,363 | 6,999,191 | |||||||||||
| Credit Suisse First Boston Mortgage Securities Corp., | |||||||||||||
| Series 2005-C5, Class A4, 5.100%, 08/15/2038 | 5,885,454 | 6,057,209 | |||||||||||
| DBUBS Mortgage Trust, | |||||||||||||
| Series 2011-LC3A, Class A2, 3.642%, 08/10/2044 | 5,150,000 | 5,407,969 | |||||||||||
| Federal National Mortgage Association (FNMA): | |||||||||||||
| Series 2013-M1, Class ASQ2, 1.074%, 11/25/2016 | 3,228,886 | 3,251,675 | |||||||||||
| Series 2012-M9, Class ASQ2, 1.513%, 12/25/2017 | 1,125,000 | 1,132,189 | |||||||||||
| FHLMC Multifamily Structured Pass Through Certificates: | |||||||||||||
| Series K-501, Class A2, 1.655%, 11/25/2016 | 2,345,000 | 2,384,159 | |||||||||||
| Series K-702, Class A2, 3.154%, 02/25/2018 | 275,000 | 291,050 | |||||||||||
| Series K-704, Class A2, 2.412%, 08/25/2018 | 300,000 | 309,159 | |||||||||||
| Series K-705, Class A2, 2.303%, 09/25/2018 | 3,000,000 | 3,075,489 | |||||||||||
| Series K-708, Class A2, 2.130%, 01/25/2019 | 8,300,000 | 8,427,148 | |||||||||||
| Series K-003, Class A4, 5.053%, 01/25/2019 | 9,000,000 | 10,211,193 | |||||||||||
| Series K-004, Class A2, 4.186%, 08/25/2019 | 5,875,000 | 6,489,319 | |||||||||||
| Series K-005, Class A2, 4.317%, 11/25/2019 | 4,975,000 | 5,533,658 | |||||||||||
| Series K-006, Class A2, 4.251%, 01/25/2020 | 1,863,000 | 2,065,370 | |||||||||||
| Series K-F02, Class A3, 0.782%, 07/25/2020 | 9,051,773 | 9,063,405 | |||||||||||
| J.P. Morgan Chase Commercial Mortgage Securities Trust, | |||||||||||||
| Series 2005-CB12, Class A4, 4.895%, 09/12/2037 | 5,000,000 | 5,146,225 | |||||||||||
| NCUA Guaranteed Notes Trust, | |||||||||||||
| Series 2010-C1, Class A2, 2.900%, 10/29/2020 | 2,150,000 | 2,231,322 | |||||||||||
| Wachovia Bank Commercial Mortgage Trust, | |||||||||||||
| Series 2005-C22, Class A4, 5.455%, 12/15/2044 | 5,000,000 | 5,243,360 | |||||||||||
| 89,297,628 | 7.0 | % | |||||||||||
| Total Long-Term Investments (Cost $1,212,093,773) | 1,240,863,429 | 98.0 | % | ||||||||||
| Shares | |||||||||||||
| SHORT-TERM INVESTMENTS | |||||||||||||
| Money Market Mutual Funds | |||||||||||||
| Dreyfus Institutional Cash Advantage Fund, 0.06% « | 3,872,934 | 3,872,934 | |||||||||||
| Short-Term Investments Trust - Liquid Assets Portfolio, 0.06% « | 24,000,000 | 24,000,000 | |||||||||||
| Total Short-Term Investments (Cost $27,872,934) | 27,872,934 | 2.2 | % | ||||||||||
| INVESTMENTS PURCHASED WITH CASH PROCEEDS FROM | |||||||||||||
| SECURITIES LENDING | |||||||||||||
| Invesmtment Companies | |||||||||||||
| Mount Vernon Securities Lending Trust Prime Portfolio, 0.20% « | 231,817,863 | 231,817,863 | |||||||||||
| Total Invesment Companies (Cost $231,817,863) | 231,817,863 | 18.3 | % | ||||||||||
| Total Invesments Purchased With Cash Proceeds From | |||||||||||||
| Securities Lending (Cost $231,817,863) | 231,817,863 | 18.3 | % | ||||||||||
| Total Investments (Cost $1,471,784,570) | 1,500,554,226 | 118.5 | % | ||||||||||
| Liabilities in Excess of Other Assets | (234,658,341 | ) | (18.5 | )% | |||||||||
| TOTAL NET ASSETS | $ | 1,265,895,885 | 100.0 | % | |||||||||
| Notes to Schedule of Investments | |||||||||||||
| * | Restricted Security Deemed Liquid | ||||||||||||
| ** | Illiquid Security | ||||||||||||
| @ | This security or portion of this security is out on loan at June 30, 2014. | ||||||||||||
| f | Foreign Security | ||||||||||||
| « | 7-Day Yield | ||||||||||||
| § | Security in Default | ||||||||||||
| † | Priced at Fair Value by the Valuation Committee as delegated by the Baird Funds' Board of Directors. |
| Baird Intermediate Municipal Bond Fund | ||||||||||||
| Schedule of Investments | ||||||||||||
| June 30, 2014 (Unaudited) | ||||||||||||
| Principal | % of | |||||||||||
| Amount | Value | Net Assets | ||||||||||
| Municipal Bonds | ||||||||||||
| Alabama | ||||||||||||
| Alabama State Public School & College Authority, | ||||||||||||
| 5.000%, 05/01/2019 | 1,000,000 | $ | 1,170,530 | |||||||||
| Gulf Shores Alabama, | ||||||||||||
| 5.000%, 12/15/2018 (Callable 12/15/2017) | 1,080,000 | 1,221,804 | ||||||||||
| Montgomery Alabama Special Care Facility Revenue, | ||||||||||||
| 5.000%, 11/15/2015 (Pre-refunded to 11/15/2014) | 1,540,000 | 1,567,366 | ||||||||||
| 3,959,700 | 0.4 | % | ||||||||||
| Alaska | ||||||||||||
| Alaska State Housing Finance Corporation, | ||||||||||||
| 5.000%, 06/01/2017 (Callable 06/01/2015)(Insured by NPFGC) | 1,000,000 | 1,042,820 | 0.1 | % | ||||||||
| Arizona | ||||||||||||
| Gila County Arizona Unified School District Bonds, | ||||||||||||
| 5.250%, 07/01/2027 (Callable 07/01/2017) | 1,000,000 | 1,111,580 | ||||||||||
| Maricopa County Arizona University School District No. 48 Scottsdale, | ||||||||||||
| 4.000%, 07/01/2026 (Pre-refunded to 07/01/2016) | 1,860,000 | 1,995,966 | ||||||||||
| Phoenix Arizona Civic Corporation of Wastewater Systems Revenue, | ||||||||||||
| 5.000%, 07/01/2015 (Callable 07/01/2014)(Pre-refunded)(Insured by NPFGC) | 1,540,000 | 1,540,000 | ||||||||||
| 4,647,546 | 0.4 | % | ||||||||||
| Arkansas | ||||||||||||
| Arkansas Development Finance Authority, | ||||||||||||
| 5.500%, 12/01/2018 (ETM) | 1,000,000 | 1,151,980 | 0.1 | % | ||||||||
| California | ||||||||||||
| Bakersfield California Certificates Participation, | ||||||||||||
| 0.000%, 04/15/2021 (ETM) ^ | 12,380,000 | 10,816,654 | ||||||||||
| Coalinga California Regional Medical Center, | ||||||||||||
| 5.125%, 03/01/2032 (Pre-refunded to 03/01/2015) | 2,395,000 | 2,483,759 | ||||||||||
| Commerce Community Development Commission, | ||||||||||||
| 0.000%, 08/01/2021 (ETM) ^ | 965,000 | 687,205 | ||||||||||
| Pittsburg California Redevelopment Agency Residential Mortgage Revenue, | ||||||||||||
| 9.600%, 06/01/2016 (ETM) | 3,725,000 | 4,359,479 | ||||||||||
| Port Oakland California Revenue, | ||||||||||||
| 5.000%, 11/01/2017 (Insured by NPFGC) | 1,800,000 | 2,042,028 | ||||||||||
| San Joaquin Hills California Transportation Corridor Agency Toll Road Revenue: | ||||||||||||
| 0.000%, 01/01/2020 (ETM) ^ | 6,865,000 | 6,327,265 | ||||||||||
| 0.000%, 01/01/2023 (ETM) ^ | 14,000,000 | 11,460,680 | ||||||||||
| San Marcos California Public Facilities Authority Revenue, | ||||||||||||
| 0.000%, 09/01/2019 (ETM) ^ | 17,295,000 | 16,093,516 | ||||||||||
| Woodside California Elementary School District Government School Bonds, | ||||||||||||
| 5.000%, 10/01/2023 (Pre-refunded to 10/01/2016) | 1,130,000 | 1,249,520 | ||||||||||
| 55,520,106 | 5.1 | % | ||||||||||
| Colorado | ||||||||||||
| Colorado Springs Colorado Hospital Revenue Bonds, | ||||||||||||
| 5.000%, 12/15/2032 (Pre-refunded to 12/15/2018) | 1,300,000 | 1,523,288 | ||||||||||
| Colorado Springs Colorado Utilities Revenue Bonds, | ||||||||||||
| 5.875%, 11/15/2017 (ETM) | 6,105,000 | 6,699,017 | ||||||||||
| County of El Paso Colorado Mortgage Revenue Bonds, | ||||||||||||
| 0.000%, 09/01/2015 (ETM) ^ | 1,330,000 | 1,324,308 | ||||||||||
| Dawson Ridge Metropolitan District No. 1 Colorado: | ||||||||||||
| 0.000%, 10/01/2022 (ETM) ^ | 21,595,000 | 17,884,331 | ||||||||||
| 0.000%, 10/01/2022 (ETM) ^ | 17,540,000 | 14,585,387 | ||||||||||
| Regional Transportation District Colorado Sales Tax Revenue, | ||||||||||||
| 5.000%, 11/01/2036 (Pre-refunded to 11/01/2016) | 6,785,000 | 7,520,765 | ||||||||||
| 49,537,096 | 4.6 | % | ||||||||||
| Connecticut | ||||||||||||
| State of Connecticut, | ||||||||||||
| 5.000%, 10/15/2020 | 4,390,000 | 5,220,939 | 0.5 | % | ||||||||
| Florida | ||||||||||||
| Brevard County Florida School Board, | ||||||||||||
| 5.000%, 07/01/2020 (Callable 07/01/2017)(Insured by AMBAC) | 1,925,000 | 2,123,352 | ||||||||||
| Broward County Florida School Board: | ||||||||||||
| 5.250%, 07/01/2022 (Callable 07/01/2021) | 8,390,000 | 9,968,746 | ||||||||||
| 5.250%, 07/01/2023 (Callable 07/01/2021) | 4,915,000 | 5,746,471 | ||||||||||
| County of St. Lucie Florida, | ||||||||||||
| 6.000%, 10/01/2020 (ETM) | 6,420,000 | 7,819,945 | ||||||||||
| Dade County Florida Health Facility Authority Hospital Revenue, | ||||||||||||
| 5.750%, 05/01/2021 (ETM) | 1,570,000 | 1,807,776 | ||||||||||
| Escambia County Florida Housing Finance Authority Multifamily Housing Revenue, | ||||||||||||
| 0.000%, 10/15/2018 (ETM) ^ | 4,130,000 | 3,883,811 | ||||||||||
| Florida State Board of Education, | ||||||||||||
| 5.000%, 06/01/2022 (Callable 06/01/2019) | 13,800,000 | 16,078,380 | ||||||||||
| Florida State Department of Management Services, | ||||||||||||
| 5.000%, 08/01/2018 | 2,500,000 | 2,844,825 | ||||||||||
| Florida State Mid-Bay Bridge Authority Revenue: | ||||||||||||
| 6.875%, 10/01/2022 (ETM) | 4,675,000 | 5,969,788 | ||||||||||
| 6.875%, 10/01/2022 (ETM) | 3,175,000 | 4,054,348 | ||||||||||
| Florida State Municipal Power Agency Revenue, | ||||||||||||
| 5.000%, 10/01/2017 (Callable 08/01/2014)(ETM) | 1,590,000 | 1,813,888 | ||||||||||
| Gulf Environmental Services Inc. Florida Revenue Bonds, | ||||||||||||
| 5.000%, 10/01/2018 (ETM) | 1,285,000 | 1,407,743 | ||||||||||
| Hillsborough County Florida School Board Master Lease Program, | ||||||||||||
| 5.500%, 07/01/2018 (Insured by NPFGC) | 2,000,000 | 2,315,780 | ||||||||||
| Hillsborough County Industrial Development Authority: | ||||||||||||
| 5.625%, 08/15/2029 (Pre-refunded to 08/15/2018) | 2,285,000 | 2,716,271 | ||||||||||
| 8.000%, 08/15/2032 (Pre-refunded to 08/15/2019) | 1,940,000 | 2,588,115 | ||||||||||
| Miami Beach Florida Resort Tax Revenue, | ||||||||||||
| 6.250%, 10/01/2022 (ETM) | 1,470,000 | 1,801,941 | ||||||||||
| Miami Dade County Florida Entitlement Revenue Bonds, | ||||||||||||
| 5.000%, 08/01/2015 (Insured by NPFGC) | 3,000,000 | 3,136,920 | ||||||||||
| Miami-Dade County Florida, | ||||||||||||
| 4.500%, 10/01/2020 | 7,100,000 | 8,163,864 | ||||||||||
| Miami-Dade County Florida School Board, | ||||||||||||
| 5.000%, 05/01/2016 (Insured by NPFGC) | 3,000,000 | 3,249,330 | ||||||||||
| Miami-Dade County Florida Water & Sewer Revenue, | ||||||||||||
| 5.250%, 10/01/2022 | 1,125,000 | 1,349,528 | ||||||||||
| Orlando Florida Utilities Commission Water & Electric Revenue, | ||||||||||||
| 6.750%, 10/01/2017 (ETM) | 1,960,000 | 2,172,738 | ||||||||||
| Palm Beach County Florida Revenue, | ||||||||||||
| 5.000%, 11/01/2018 (Callable 11/01/2017) | 1,000,000 | 1,130,940 | ||||||||||
| Pinellas County Housing Finance Authority, | ||||||||||||
| 4.250%, 03/01/2027 (Callable 09/01/2019) | 1,640,000 | 1,693,218 | ||||||||||
| Sarasota County Florida School Board, | ||||||||||||
| 5.000%, 07/01/2015 (Insured by NPFGC) | 1,000,000 | 1,048,280 | ||||||||||
| Seminole County Florida Water & Sewage Revenue, | ||||||||||||
| 6.000%, 10/01/2019 (ETM) | 5,200,000 | 5,958,108 | ||||||||||
| Sunrise Florida Utility System Revenue, | ||||||||||||
| 5.500%, 10/01/2018 (ETM) | 3,000,000 | 3,397,350 | ||||||||||
| 104,241,456 | 9.6 | % | ||||||||||
| Georgia | ||||||||||||
| Atlanta Georgia Water & Wastewater Revenue, | ||||||||||||
| 5.500%, 11/01/2017 (Insured by AGM) | 8,445,000 | 9,739,703 | ||||||||||
| Forsyth County Georgia Hospital Authority Revenue Anticipation Certificates, | ||||||||||||
| 6.375%, 10/01/2028 (Callable 08/01/2014)(ETM) | 8,050,000 | 10,152,821 | ||||||||||
| Georgia Municipal Electric Authority Power Revenue, | ||||||||||||
| 6.500%, 01/01/2017 (Insured by AGM) | 4,700,000 | 5,082,439 | ||||||||||
| Gwinnett County Georgia School District, | ||||||||||||
| 5.000%, 02/01/2026 (Pre-refunded to 02/01/2018) | 7,400,000 | 8,488,318 | ||||||||||
| Northwestern Gwinnett County Georgia Facilities Corporation I Certificate Participation, | ||||||||||||
| 5.750%, 06/15/2019 (Callable 09/22/2014)(Pre-refunded to 06/15/2015) | 1,735,000 | 1,834,658 | ||||||||||
| Richmond County Development Authority: | ||||||||||||
| 0.000%, 12/01/2021 (ETM) ^ | 720,000 | 622,641 | ||||||||||
| 0.000%, 12/01/2021 (ETM) ^ | 3,510,000 | 3,035,378 | ||||||||||
| State of Georgia, | ||||||||||||
| 5.000%, 07/01/2020 (Callable 07/01/2017) | 12,570,000 | 14,192,913 | ||||||||||
| 53,148,871 | 4.9 | % | ||||||||||
| Illinois | ||||||||||||
| Chicago Illinois, | ||||||||||||
| 5.000%, 01/01/2017 (Callable 01/01/2016)(Insured by AGM) | 2,360,000 | 2,500,396 | ||||||||||
| Chicago Illinois Board of Education: | ||||||||||||
| 5.000%, 12/01/2017 (Callable 12/01/2016)(Insured by AGM) | 4,345,000 | 4,719,930 | ||||||||||
| 5.000%, 12/01/2017 (Insured by AMBAC) | 2,100,000 | 2,347,212 | ||||||||||
| 6.000%, 01/01/2020 (Insured by NPFGC) | 1,745,000 | 1,959,862 | ||||||||||
| Chicago Illinois Public Building Community Building Revenue: | ||||||||||||
| 7.000%, 01/01/2015 (ETM) | 1,025,000 | 1,059,686 | ||||||||||
| 7.000%, 01/01/2020 (ETM) | 1,555,000 | 1,919,352 | ||||||||||
| Cook County Community High School District No. 233, | ||||||||||||
| 4.000%, 12/01/2026 (Callable 06/01/2022) | 3,695,000 | 4,046,062 | ||||||||||
| Cook County Illinois School District No. 097, | ||||||||||||
| 9.000%, 12/01/2015 (Insured by NPFGC) | 2,605,000 | 2,919,111 | ||||||||||
| Cook County Illinois School District No. 100, | ||||||||||||
| 8.100%, 12/01/2016 (ETM) | 1,430,000 | 1,690,889 | ||||||||||
| Cook County Illinois School District No. 159, | ||||||||||||
| 0.000%, 12/01/2022 (ETM) ^ | 2,000,000 | 1,612,080 | ||||||||||
| Dupage County Illinois Stormwater Project, | ||||||||||||
| 5.600%, 01/01/2021 | 980,000 | 1,127,617 | ||||||||||
| Illinois Development Financial Authority, | ||||||||||||
| 0.000%, 07/15/2023 (ETM) ^ | 16,860,000 | 13,494,744 | ||||||||||
| Illinois Finance Authority, | ||||||||||||
| 0.000%, 07/15/2025 (ETM) ^ | 9,560,000 | 7,165,698 | ||||||||||
| Illinois Municipal Electric Agency Power Supply Revenue Bonds, | ||||||||||||
| 5.250%, 02/01/2016 (Insured by NPFGC) | 1,000,000 | 1,074,220 | ||||||||||
| Illinois State: | ||||||||||||
| 5.000%, 01/01/2019 (Insured by AGM) | 1,000,000 | 1,123,300 | ||||||||||
| 4.000%, 09/01/2019 (Callable 09/01/2018)(Insured by AGM) | 5,000,000 | 5,399,350 | ||||||||||
| 6.000%, 11/01/2026 (Insured by NPFGC) | 3,000,000 | 3,618,450 | ||||||||||
| Illinois State Toll Highway Authority Priority Revenue Bonds, | ||||||||||||
| 5.500%, 01/01/2016 (Insured by AGM) | 2,100,000 | 2,259,411 | ||||||||||
| Illinois State Toll Highway Authority Revenue Bonds: | ||||||||||||
| 5.000%, 01/01/2026 (Pre-refunded to 07/01/2016) | 1,065,000 | 1,164,013 | ||||||||||
| 5.000%, 01/01/2031 (Pre-refunded to 07/01/2016) | 2,055,000 | 2,246,053 | ||||||||||
| Kane County Community Unit School District No 304 Geneva, | ||||||||||||
| 9.000%, 01/01/2023 (Insured by AGM) | 1,500,000 | 2,167,650 | ||||||||||
| Kane McHenry Cook & De Kalb Counties Illinois School District No. 300: | ||||||||||||
| 9.000%, 01/01/2015 (Insured by AMBAC) | 1,000,000 | 1,042,950 | ||||||||||
| 7.000%, 01/01/2018 (ETM) | 5,775,000 | 7,013,102 | ||||||||||
| 7.000%, 01/01/2018 (ETM) | 365,000 | 442,548 | ||||||||||
| Kendall Kane & Will Counties Community Unit School District No. 308, | ||||||||||||
| 0.000%, 02/01/2021 ^ | 13,625,000 | 11,274,279 | ||||||||||
| Lake County Illinois Community Consolidated School District, | ||||||||||||
| 0.000%, 12/01/2014 (Insured by NPFGC) ^ | 1,875,000 | 1,862,362 | ||||||||||
| Lake County Illinois Community High School District No. 124 Grant, | ||||||||||||
| 5.000%, 12/01/2017 | 1,050,000 | 1,186,343 | ||||||||||
| McHenry & Kane Counties Illinois Community School District No. 158: | ||||||||||||
| 0.000%, 01/01/2016 (ETM) ^ | 1,245,000 | 1,238,513 | ||||||||||
| 0.000%, 01/01/2016 ^ | 725,000 | 709,623 | ||||||||||
| Metropolitan Pier & Exposition Authority Illinois: | ||||||||||||
| 5.500%, 06/15/2016 (ETM) | 1,805,000 | 1,984,742 | ||||||||||
| 5.500%, 12/15/2023 (ETM) | 2,250,000 | 2,707,065 | ||||||||||
| Regional Transportation Authority Illinois: | ||||||||||||
| 7.750%, 06/01/2020 | 1,000,000 | 1,213,600 | ||||||||||
| 6.000%, 07/01/2022 (Insured by NPFGC) | 4,705,000 | 5,918,749 | ||||||||||
| Southern Illinois University Revenue: | ||||||||||||
| 5.250%, 04/01/2018 (Insured by NPFGC) | 1,075,000 | 1,211,181 | ||||||||||
| 5.250%, 04/01/2019 (Insured by NPFGC) | 1,390,000 | 1,582,654 | ||||||||||
| Village of Schaumburg IL, | ||||||||||||
| 4.000%, 12/01/2024 (Callable 12/01/2022) | 5,750,000 | 6,192,233 | ||||||||||
| Winnebago County Illinois School District No. 122 Harlam-Loves Park: | ||||||||||||
| 0.000%, 01/01/2018 (ETM) ^ | 155,000 | 149,847 | ||||||||||
| 0.000%, 01/01/2018 (Insured by AGM) ^ | 1,205,000 | 1,097,574 | ||||||||||
| 112,442,451 | 10.4 | % | ||||||||||
| Indiana | ||||||||||||
| Franklin Community Multi-School Building Corp, | ||||||||||||
| 5.000%, 07/15/2020 | 1,990,000 | 2,232,641 | ||||||||||
| Hammond Indiana Multi-School Building Corporation Revenue Bonds: | ||||||||||||
| 6.000%, 01/15/2018 (ETM) | 825,000 | 890,431 | ||||||||||
| 5.000%, 07/15/2018 (Insured by NPFGC) | 1,330,000 | 1,516,000 | ||||||||||
| Indiana State Office Building Commissions Facilities Revenue Bonds, | ||||||||||||
| 5.250%, 07/01/2017 | 1,115,000 | 1,250,584 | ||||||||||
| Indiana Toll Road Commission, | ||||||||||||
| 9.000%, 01/01/2015 (ETM) | 255,000 | 266,085 | ||||||||||
| Indianapolis Local Public Improvement Bond Bank, | ||||||||||||
| 5.500%, 01/01/2019 (Insured by NPFGC) | 1,155,000 | 1,318,317 | ||||||||||
| Indianapolis Local Public Improvement Bond Waterworks Project, | ||||||||||||
| 5.500%, 07/01/2018 (Insured by NPFGC) | 3,460,000 | 3,970,004 | ||||||||||
| Perry Township Multi School Building Corporation, | ||||||||||||
| 5.000%, 07/10/2018 (Callable 07/10/2015) | 1,000,000 | 1,044,340 | ||||||||||
| Purdue University Indiana Revenue, | ||||||||||||
| 5.000%, 07/01/2015 | 1,650,000 | 1,730,008 | ||||||||||
| South Bend Indiana Community School Building Corporation, | ||||||||||||
| 5.000%, 07/15/2017 (Insured by NPFGC) | 1,000,000 | 1,110,960 | ||||||||||
| 15,329,370 | 1.4 | % | ||||||||||
| Kansas | ||||||||||||
| City of Wichita KS, | ||||||||||||
| 5.000%, 11/15/2034 (Pre-refunded to 11/15/2019) | 1,005,000 | 1,197,136 | ||||||||||
| Wyandotte County Kansas Revenue, | ||||||||||||
| 5.000%, 09/01/2019 (Callable 03/01/2019)(Insured by BHAC) | 1,865,000 | 2,123,470 | ||||||||||
| 3,320,606 | 0.3 | % | ||||||||||
| Kentucky | ||||||||||||
| Jefferson County Kentucky School District Financial School Building Revenue Bonds, | ||||||||||||
| 5.500%, 01/01/2018 (Insured by AGM) | 3,340,000 | 3,811,575 | ||||||||||
| Louisville & Jefferson County Metropolitan Government, | ||||||||||||
| 6.125%, 02/01/2037 (Pre-refunded to 02/01/2018) | 13,665,000 | 16,215,709 | ||||||||||
| 20,027,284 | 1.9 | % | ||||||||||
| Louisiana | ||||||||||||
| Louisiana Public Facilities Authority Revenue: | ||||||||||||
| 5.500%, 05/15/2027 (Pre-refunded to 05/15/2026) | 9,860,000 | 12,441,348 | ||||||||||
| 5.500%, 05/15/2032 (Pre-refunded to 05/15/2026) | 19,975,000 | 25,691,246 | ||||||||||
| State of Louisiana: | ||||||||||||
| 5.000%, 11/15/2018 | 1,775,000 | 2,073,466 | ||||||||||
| 5.000%, 11/15/2020 (Callable 05/15/2020) | 10,000,000 | 11,792,100 | ||||||||||
| 51,998,160 | 4.8 | % | ||||||||||
| Maryland | ||||||||||||
| City of Baltimore MD, | ||||||||||||
| 5.000%, 07/01/2024 (ETM) | 1,195,000 | 1,444,767 | ||||||||||
| State of Maryland: | ||||||||||||
| 5.000%, 03/15/2019 (Pre-refunded to 03/15/2017) | 1,135,000 | 1,273,754 | ||||||||||
| 5.000%, 03/01/2021 (Callable 03/01/2020) | 1,000,000 | 1,183,890 | ||||||||||
| 3,902,411 | 0.4 | % | ||||||||||
| Massachusetts | ||||||||||||
| Massachusetts Department of Transportation, | ||||||||||||
| 5.000%, 01/01/2020 (ETM) | 1,990,000 | 2,238,213 | ||||||||||
| Massachusetts State: | ||||||||||||
| 5.000%, 08/01/2020 (Pre-refunded to 08/01/2016) | 5,820,000 | 6,390,011 | ||||||||||
| 4.000%, 12/01/2022 (Callable 12/01/2019) | 15,000,000 | 16,579,800 | ||||||||||
| Massachusetts State Water Resources Authority: | ||||||||||||
| 5.250%, 12/01/2015 (ETM) | 2,165,000 | 2,255,995 | ||||||||||
| 6.500%, 07/15/2019 (ETM) | 2,855,000 | 3,231,917 | ||||||||||
| 30,695,936 | 2.8 | % | ||||||||||
| Michigan | ||||||||||||
| Brighton Area School District/MI: | ||||||||||||
| 5.000%, 05/01/2020 | 1,300,000 | 1,501,110 | ||||||||||
| 5.000%, 05/01/2021 | 500,000 | 578,335 | ||||||||||
| Detroit Michigan City School District, | ||||||||||||
| 5.000%, 05/01/2016 (Callable 05/01/2015)(Insured by AGM) | 1,000,000 | 1,027,160 | ||||||||||
| Harper Creek Michigan Community School District, | ||||||||||||
| 5.000%, 05/01/2016 (Callable 05/01/2015)(Insured by AGM) | 1,550,000 | 1,607,660 | ||||||||||
| Jenison Michigan Public Schools, | ||||||||||||
| 5.250%, 05/01/2015 (Insured by NPFGC) | 1,390,000 | 1,447,908 | ||||||||||
| Lakeview Public School District, | ||||||||||||
| 5.000%, 05/01/2017 (Insured by NPFGC) | 2,275,000 | 2,517,310 | ||||||||||
| Michigan Finance Authority, | ||||||||||||
| 5.000%, 01/01/2019 | 7,000,000 | 8,157,100 | ||||||||||
| Michigan State Housing Development Authority, | ||||||||||||
| 4.750%, 06/01/2016 | 4,000,000 | 4,156,200 | ||||||||||
| Pinckney Community Schools: | ||||||||||||
| 5.000%, 05/01/2022 | 1,935,000 | 2,242,626 | ||||||||||
| 5.000%, 05/01/2023 | 2,200,000 | 2,537,084 | ||||||||||
| St Johns Public Schools, | ||||||||||||
| 5.000%, 05/01/2021 | 5,040,000 | 5,909,047 | ||||||||||
| State of Michigan, | ||||||||||||
| 0.000%, 06/01/2022 (ETM) ^ | 2,000,000 | 1,643,120 | ||||||||||
| 33,324,660 | 3.1 | % | ||||||||||
| Minnesota | ||||||||||||
| Minnesota State Housing Finance Agency Homeownership Finance Bond: | ||||||||||||
| 4.250%, 07/01/2028 (Callable 01/01/2020) | 720,000 | 757,325 | ||||||||||
| 4.500%, 07/01/2034 (Callable 07/01/2021) | 1,485,000 | 1,563,170 | ||||||||||
| University of Minnesota, | ||||||||||||
| 5.500%, 07/01/2021 (ETM) | 8,980,000 | 10,977,960 | ||||||||||
| Western Minnesota Municipal Power Agency, | ||||||||||||
| 6.375%, 01/01/2016 (ETM) | 820,000 | 844,100 | ||||||||||
| 14,142,555 | 1.3 | % | ||||||||||
| Mississippi | ||||||||||||
| Mississippi Development Bank Special Obligations, | ||||||||||||
| 5.250%, 10/01/2030 (Pre-refunded to 10/01/2015) | 1,110,000 | 1,179,342 | ||||||||||
| Mississippi Housing Financial Corporation, | ||||||||||||
| 0.000%, 06/01/2015 (ETM) ^ | 1,500,000 | 1,497,000 | ||||||||||
| 2,676,342 | 0.2 | % | ||||||||||
| Missouri | ||||||||||||
| St. Charles County Missouri Francis Howell School District, | ||||||||||||
| 4.500%, 03/01/2018 | 1,000,000 | 1,127,810 | 0.1 | % | ||||||||
| Nebraska | ||||||||||||
| Omaha Nebraska Public Electric Power District Revenue, | ||||||||||||
| 6.200%, 02/01/2017 (ETM) | 5,630,000 | 6,108,325 | 0.6 | % | ||||||||
| Nevada | ||||||||||||
| Las Vegas Clark County Nevada Library District, | ||||||||||||
| 5.000%, 01/01/2017 | 2,080,000 | 2,278,515 | 0.2 | % | ||||||||
| New Hampshire | ||||||||||||
| New Hampshire Housing Finance Authority Revenue Bonds, | ||||||||||||
| 5.250%, 07/01/2028 (Callable 01/01/2021) | 3,385,000 | 3,573,375 | ||||||||||
| State of New Hampshire, | ||||||||||||
| 5.000%, 07/01/2021 (Callable 07/01/2020) | 1,000,000 | 1,187,310 | ||||||||||
| 4,760,685 | 0.4 | % | ||||||||||
| New Jersey | ||||||||||||
| County of Hudson NJ, | ||||||||||||
| 3.000%, 03/15/2021 | 1,140,000 | 1,206,724 | ||||||||||
| New Jersey Educational Facilities Authority, | ||||||||||||
| 7.500%, 12/01/2032 (Pre-refunded to 06/01/2019) | 3,575,000 | 4,636,060 | ||||||||||
| New Jersey Health Care Facilities Financing Authority, | ||||||||||||
| 5.750%, 07/01/2039 (Pre-refunded to 07/01/2019) | 870,000 | 1,056,632 | ||||||||||
| New Jersey State Housing & Mortgage Finance Agency Bonds, | ||||||||||||
| 4.500%, 10/01/2029 (Callable 04/01/2021) | 7,625,000 | 8,014,256 | ||||||||||
| New Jersey State Transportation Trust Fund Authority: | ||||||||||||
| 5.500%, 12/15/2015 (Insured by AMBAC) | 2,595,000 | 2,785,759 | ||||||||||
| 5.250%, 12/15/2020 | 5,000,000 | 5,866,350 | ||||||||||
| New Jersey State Turnpike Authority: | ||||||||||||
| 6.500%, 01/01/2016 (ETM) | 585,000 | 606,984 | ||||||||||
| 6.500%, 01/01/2016 (ETM) | 45,000 | 46,692 | ||||||||||
| 5.500%, 01/01/2025 | 2,000,000 | 2,504,640 | ||||||||||
| 26,724,097 | 2.5 | % | ||||||||||
| New Mexico | ||||||||||||
| New Mexico Mortgage Financial Authority: | ||||||||||||
| 4.625%, 09/01/2025 (Callable 03/01/2020) | 1,005,000 | 1,074,958 | ||||||||||
| 4.500%, 09/01/2028 (Callable 03/01/2020) | 785,000 | 831,535 | ||||||||||
| New Mexico State Hospital Equipment Loan Council Hospital Revenue, | ||||||||||||
| 5.250%, 07/01/2025 (Pre-refunded to 07/01/2015) | 1,000,000 | 1,048,390 | ||||||||||
| 2,954,883 | 0.3 | % | ||||||||||
| New York | ||||||||||||
| Cattaraugus-Little Valley Central School District: | ||||||||||||
| 3.125%, 06/15/2016 (Insured by AGM) | 1,520,000 | 1,587,944 | ||||||||||
| 3.125%, 06/15/2017 (Insured by AGM) | 1,000,000 | 1,061,020 | ||||||||||
| Churchville-Chili Central School District: | ||||||||||||
| 3.000%, 06/15/2017 | 1,045,000 | 1,112,841 | ||||||||||
| 3.000%, 06/15/2018 | 1,070,000 | 1,148,367 | ||||||||||
| City of New York NY, | ||||||||||||
| 5.000%, 08/01/2022 | 5,000,000 | 5,949,350 | ||||||||||
| Long Island Power Authority and Electric System Revenue, | ||||||||||||
| 5.000%, 12/01/2017 (Callable 12/01/2016)(Insured by NPFGC) | 2,000,000 | 2,204,240 | ||||||||||
| Metropolitan Transit Authority New York, | ||||||||||||
| 6.000%, 04/01/2020 (ETM) | 13,430,000 | 16,060,534 | ||||||||||
| New York State Thruway Authority, | ||||||||||||
| 5.000%, 03/15/2022 (Callable 03/15/2019) | 4,040,000 | 4,667,372 | ||||||||||
| New York State Urban Development Corp, | ||||||||||||
| 5.000%, 03/15/2022 | 2,000,000 | 2,400,880 | ||||||||||
| New York, New York: | ||||||||||||
| 5.000%, 03/01/2016 (Callable 03/01/2015)(Partially Pre-refunded)(Insured by FGIC-TCRS) | 1,000,000 | 1,032,030 | ||||||||||
| 5.250%, 08/15/2021 (Callable 08/15/2018) | 1,125,000 | 1,303,526 | ||||||||||
| Suffolk County Water Authority, | ||||||||||||
| 6.000%, 06/01/2017 (ETM) | 4,715,000 | 5,173,864 | ||||||||||
| Susquehanna Valley Central School District: | ||||||||||||
| 3.125%, 06/15/2017 (Insured by AGM) | 1,155,000 | 1,225,478 | ||||||||||
| 3.125%, 06/15/2019 (Insured by AGM) | 1,375,000 | 1,436,958 | ||||||||||
| TSASC Inc. New York, | ||||||||||||
| 4.750%, 06/01/2022 (Callable 06/01/2016) | 150,000 | 151,111 | ||||||||||
| Westchester Tobacco Asset Securitization Corp. New York, | ||||||||||||
| 6.950%, 07/15/2039 (Pre-refunded to 07/15/2017) | 13,075,000 | 15,682,155 | ||||||||||
| 62,197,670 | 5.8 | % | ||||||||||
| North Carolina | ||||||||||||
| North Carolina Eastern Municipal Power Agency, | ||||||||||||
| 5.000%, 01/01/2021 (ETM) | 7,945,000 | 9,407,834 | ||||||||||
| North Carolina Eastern Municipal Power Agency Power Systems Revenue: | ||||||||||||
| 5.000%, 01/01/2017 (ETM) | 6,630,000 | 7,082,232 | ||||||||||
| 6.400%, 01/01/2021 (ETM) | 5,180,000 | 6,101,885 | ||||||||||
| 4.500%, 01/01/2024 (Pre-refunded to 01/01/2022) | 7,665,000 | 8,960,845 | ||||||||||
| 6.000%, 01/01/2026 (Pre-refunded to 01/01/2022) | 2,075,000 | 2,668,325 | ||||||||||
| 34,221,121 | 3.2 | % | ||||||||||
| Ohio | ||||||||||||
| Cincinnati Ohio City School District, | ||||||||||||
| 5.000%, 12/01/2016 (Insured by AGM) | 2,000,000 | 2,216,960 | ||||||||||
| Cleveland Municipal School District: | ||||||||||||
| 4.000%, 12/01/2017 | 1,790,000 | 1,943,850 | ||||||||||
| 4.000%, 12/01/2018 | 1,865,000 | 2,033,242 | ||||||||||
| 4.000%, 12/01/2019 | 1,940,000 | 2,120,304 | ||||||||||
| 5.000%, 12/01/2020 | 2,015,000 | 2,325,854 | ||||||||||
| Miamisburg Ohio Water Revenue, | ||||||||||||
| 7.000%, 11/15/2016 (Callable 05/02/2014)(ETM) | 60,000 | 63,252 | ||||||||||
| Ohio Housing Finance Agency, | ||||||||||||
| 5.000%, 11/01/2028 (Callable 05/01/2020) | 1,840,000 | 1,905,191 | ||||||||||
| State of Ohio: | ||||||||||||
| 5.000%, 03/01/2019 | 1,220,000 | 1,428,315 | ||||||||||
| 5.500%, 02/01/2020 | 1,195,000 | 1,447,694 | ||||||||||
| 5.000%, 06/15/2021 | 6,740,000 | 8,113,747 | ||||||||||
| 23,598,409 | 2.2 | % | ||||||||||
| Pennsylvania | ||||||||||||
| Central Dauphin Pennsylvania School District, | ||||||||||||
| 6.750%, 02/01/2024 (Pre-refunded to 02/01/2016) | 1,275,000 | 1,405,420 | ||||||||||
| Erie Pennsylvania Sewer Authority Revenue, | ||||||||||||
| 5.125%, 06/01/2020 (ETM) | 1,380,000 | 1,581,535 | ||||||||||
| Lampeter Strasburg School District, | ||||||||||||
| 4.000%, 06/01/2019 | 1,715,000 | 1,877,187 | ||||||||||
| Pennsylvania Convention Center Authority Revenue Bonds, | ||||||||||||
| 6.000%, 09/01/2019 (ETM) | 10,900,000 | 13,017,979 | ||||||||||
| Pennsylvania Housing Finance Agency: | ||||||||||||
| 3.700%, 04/01/2018 | 2,130,000 | 2,263,934 | ||||||||||
| 3.750%, 10/01/2018 | 1,760,000 | 1,888,410 | ||||||||||
| 3.900%, 04/01/2019 | 1,025,000 | 1,104,991 | ||||||||||
| 3.900%, 10/01/2019 (Callable 04/01/2019) | 1,675,000 | 1,805,717 | ||||||||||
| Philadelphia Pennsylvania Authority For Industrial Development Revenue, | ||||||||||||
| 5.250%, 01/01/2027 (Pre-refunded to 01/01/2017) | 1,790,000 | 1,996,244 | ||||||||||
| Philadelphia Pennsylvania Gas Works, | ||||||||||||
| 7.000%, 05/15/2020 (ETM) | 2,120,000 | 2,495,134 | ||||||||||
| Pittsburgh Pennsylvania Water & Sewer Authority Revenue Bonds, | ||||||||||||
| 7.250%, 09/01/2014 (Callable 07/17/2014)(ETM) | 315,000 | 318,626 | ||||||||||
| 29,755,177 | 2.8 | % | ||||||||||
| Puerto Rico | ||||||||||||
| Commonwealth of Puerto Rico, | ||||||||||||
| 5.000%, 07/01/2021 | 6,000,000 | 4,736,760 | ||||||||||
| Puerto Rico Electric Power Authority: | ||||||||||||
| 0.000%, 07/01/2017 (ETM) ^ | 5,010,000 | 4,600,132 | ||||||||||
| 0.000%, 07/01/2017 (Pre-refunded to various dates) ^ | 3,000,000 | 2,686,740 | ||||||||||
| Puerto Rico Public Finance Corp., | ||||||||||||
| 6.000%, 08/01/2026 (ETM) | 1,080,000 | 1,401,106 | ||||||||||
| 13,424,738 | 1.2 | % | ||||||||||
| South Carolina | ||||||||||||
| Charleston Educational Excellence Finance Corp, | ||||||||||||
| 5.000%, 12/01/2026 (Callable 12/01/2023) | 4,580,000 | 5,379,439 | ||||||||||
| Piedmont Municipal Power Agency South Carolina Electric Revenue, | ||||||||||||
| 6.750%, 01/01/2020 (ETM) | 6,450,000 | 8,194,402 | ||||||||||
| 13,573,841 | 1.3 | % | ||||||||||
| South Dakota | ||||||||||||
| Heartland Consumers Power District, | ||||||||||||
| 7.000%, 01/01/2016 (ETM) | 455,000 | 470,183 | 0.0 | % | ||||||||
| Tennessee | ||||||||||||
| County of Rutherford TN, | ||||||||||||
| 5.000%, 04/01/2021 | 1,955,000 | 2,354,739 | ||||||||||
| Metropolitan Government Nashville & Davidson County Tennessee H&E, | ||||||||||||
| 0.000%, 06/01/2021 (ETM) ^ | 1,050,000 | 916,955 | ||||||||||
| Shelby County Tennessee Health Educational & Housing Facilities Revenue, | ||||||||||||
| 5.500%, 08/15/2019 (ETM) | 4,395,000 | 4,777,936 | ||||||||||
| Tennessee Housing Development Agency, | ||||||||||||
| 4.500%, 07/01/2028 (Callable 01/01/2020) | 3,455,000 | 3,589,676 | ||||||||||
| 11,639,306 | 1.1 | % | ||||||||||
| Texas | ||||||||||||
| Barbers Hill Texas Independent School District General Obligation, | ||||||||||||
| 5.000%, 02/15/2017 (Callable 02/15/2015)(PSF Guaranteed) | 2,125,000 | 2,185,945 | ||||||||||
| Capital Area Housing Finance Corporation Texas, | ||||||||||||
| 0.000%, 01/01/2016 (ETM) ^ | 6,060,000 | 6,019,459 | ||||||||||
| Central Texas Housing Finance Corporation, | ||||||||||||
| 0.000%, 09/01/2016 (ETM) ^ | 1,500,000 | 1,483,260 | ||||||||||
| City of Austin TX Water & Wastewater System Revenue, | ||||||||||||
| 5.000%, 11/15/2024 (Callable 11/15/2022) | 3,000,000 | 3,553,020 | ||||||||||
| City of Houston TX Utility System Revenue, | ||||||||||||
| 5.500%, 12/01/2024 (ETM) | 1,735,000 | 2,188,425 | ||||||||||
| Conroe Independent School District: | ||||||||||||
| 5.000%, 02/15/2022 (Callable 02/15/2021)(PSF Guaranteed) | 1,000,000 | 1,195,990 | ||||||||||
| 5.000%, 02/15/2023 (Callable 02/15/2021)(PSF Guaranteed) | 2,680,000 | 3,199,732 | ||||||||||
| Cypress-Fairbanks Independent School District: | ||||||||||||
| 5.000%, 02/15/2017 (Pre-refunded to 02/15/2016) | 1,085,000 | 1,169,011 | ||||||||||
| 5.000%, 02/15/2017 (Callable 02/15/2016) | 415,000 | 445,312 | ||||||||||
| Dallas Texas Independent School District, | ||||||||||||
| 5.000%, 02/15/2020 (PSF Guaranteed) | 2,410,000 | 2,865,562 | ||||||||||
| El Paso Texas, | ||||||||||||
| 5.000%, 08/15/2018 | 1,355,000 | 1,554,727 | ||||||||||
| Frisco Texas Independent School District, | ||||||||||||
| 6.000%, 08/15/2018 (Callable 08/15/2016)(PSF Guaranteed) | 1,625,000 | 1,813,305 | ||||||||||
| Georgetown Independent School District, | ||||||||||||
| 4.000%, 02/15/2020 (PSF Guaranteed) | 1,900,000 | 2,158,210 | ||||||||||
| Georgetown Texas Independent School District, | ||||||||||||
| 5.000%, 02/15/2016 (Callable 02/15/2015)(PSF Guaranteed) | 1,000,000 | 1,030,070 | ||||||||||
| Goose Creek Consolidated Independent School District, | ||||||||||||
| 5.000%, 02/15/2021 (PSF Guaranteed) | 1,050,000 | 1,259,412 | ||||||||||
| Harris County Texas: | ||||||||||||
| 5.000%, 10/01/2019 | 1,525,000 | 1,803,328 | ||||||||||
| 5.750%, 10/01/2020 (Pre-refunded to 10/01/2018) | 175,000 | 209,536 | ||||||||||
| 5.750%, 10/01/2028 (Pre-refunded to 10/01/2018) | 6,830,000 | 8,177,901 | ||||||||||
| Harris County Texas Health Facilities Development Corporation Hospital Revenue, | ||||||||||||
| 5.500%, 10/01/2019 (ETM) | 4,780,000 | 5,496,044 | ||||||||||
| Houston Texas Water & Sewer System Revenue Bonds, | ||||||||||||
| 5.500%, 12/01/2029 (ETM) | 16,050,000 | 21,043,316 | ||||||||||
| Humble Texas Independent School District, | ||||||||||||
| 5.000%, 02/15/2021 (PSF Guaranteed) | 1,500,000 | 1,802,265 | ||||||||||
| Killeen Independent School District, | ||||||||||||
| 4.000%, 02/15/2024 (Callable 02/15/2021)(PSF Guaranteed) | 1,145,000 | 1,244,020 | ||||||||||
| La Porte Independent School District/TX, | ||||||||||||
| 5.000%, 02/15/2018 (Callable 02/15/2015)(Insured by NPFGC) | 85,000 | 87,266 | ||||||||||
| Lower Colorado River Authority, | ||||||||||||
| 4.750%, 01/01/2028 (ETM) | 1,200,000 | 1,421,556 | ||||||||||
| Lubbock Texas, | ||||||||||||
| 5.000%, 02/15/2021 (Callable 02/15/2018)(Insured by AGM) | 3,425,000 | 3,860,900 | ||||||||||
| Lubbock Texas Housing Finance Corp., | ||||||||||||
| 8.000%, 10/01/2021 (ETM) | 1,780,000 | 2,457,699 | ||||||||||
| Lubbock Texas Independent School District, | ||||||||||||
| 4.000%, 02/15/2022 (Callable 02/15/2020)(PSF Guaranteed) | 1,000,000 | 1,094,600 | ||||||||||
| Lufkin Texas Independent School District, | ||||||||||||
| 5.000%, 08/15/2015 (Callable 08/15/2014)(PSF Guaranteed) | 1,735,000 | 1,744,907 | ||||||||||
| Magnolia Texas Independent School District, | ||||||||||||
| 5.000%, 08/15/2016 (PSF Guaranteed) | 1,475,000 | 1,616,880 | ||||||||||
| Mission Consolidation Independent School District, | ||||||||||||
| 5.000%, 02/15/2019 (Callable 02/15/2015)(PSF Guaranteed) | 1,265,000 | 1,299,117 | ||||||||||
| North East Independent School District/TX, | ||||||||||||
| 5.000%, 08/01/2021 | 6,095,000 | 7,372,085 | ||||||||||
| Pasadena Independent School District, | ||||||||||||
| 5.000%, 02/15/2022 (Callable 02/15/2021)(PSF Guaranteed) | 1,115,000 | 1,312,244 | ||||||||||
| Retama Texas Development Corporation Special Facilites Revenue, | ||||||||||||
| 8.750%, 12/15/2018 (ETM) | 2,035,000 | 2,673,949 | ||||||||||
| San Antonio Texas Electric & Gas Revenue, | ||||||||||||
| 5.650%, 02/01/2019 (ETM) | 11,665,000 | 13,514,836 | ||||||||||
| San Antonio Texas Hotel Occupancy Tax Revenue Bonds, | ||||||||||||
| 0.000%, 08/15/2015 (ETM) ^ | 2,100,000 | 2,093,679 | ||||||||||
| San Antonio Texas Independent School District, | ||||||||||||
| 5.000%, 08/15/2017 (Callable 08/15/2015)(PSF Guaranteed) | 2,000,000 | 2,110,740 | ||||||||||
| Spring Texas Independent School District, | ||||||||||||
| 5.000%, 08/15/2019 (Callable 08/15/2018)(PSF Guaranteed) | 1,020,000 | 1,180,109 | ||||||||||
| Tarrant County Texas Health Facilities Revenue, | ||||||||||||
| 6.000%, 09/01/2024 (ETM) | 7,990,000 | 9,710,247 | ||||||||||
| Tarrant County Texas Housing Finance Corporation Revenue Bonds, | ||||||||||||
| 0.000%, 09/15/2016 (ETM) ^ | 1,800,000 | 1,783,458 | ||||||||||
| Temple Independent School District, | ||||||||||||
| 4.000%, 02/01/2022 (Callable 02/01/2021)(PSF Guaranteed) | 1,120,000 | 1,242,819 | ||||||||||
| Texas State: | ||||||||||||
| 5.000%, 10/01/2018 | 6,285,000 | 7,321,397 | ||||||||||
| 5.000%, 04/01/2020 (Pre-refunded to 04/01/2016) | 3,965,000 | 4,296,236 | ||||||||||
| 5.000%, 08/01/2021 | 1,205,000 | 1,455,712 | ||||||||||
| Tomball Hospital Authority, | ||||||||||||
| 5.000%, 07/01/2020 (Pre-refunded to 07/01/2015) | 2,200,000 | 2,304,412 | ||||||||||
| University of Texas Revenue Bonds, | ||||||||||||
| 5.000%, 08/15/2018 (Pre-refunded to 08/15/2016) | 1,225,000 | 1,345,834 | ||||||||||
| University of Texas System/The, | ||||||||||||
| 5.000%, 08/15/2022 | 9,530,000 | 11,653,951 | ||||||||||
| Ysleta Independent School District, | ||||||||||||
| 5.000%, 08/15/2023 (Callable 08/15/2021)(PSF Guaranteed) | 1,020,000 | 1,199,081 | ||||||||||
| 158,051,564 | 14.6 | % | ||||||||||
| Utah | ||||||||||||
| Granite School District Board of Education: | ||||||||||||
| 5.000%, 06/01/2022 (Callable 06/01/2021) | 3,900,000 | 4,593,771 | ||||||||||
| 5.000%, 06/01/2023 (Callable 06/01/2021) | 1,750,000 | 2,044,210 | ||||||||||
| Salt Lake City Utah Hospital Revenue, | ||||||||||||
| 8.125%, 05/15/2015 (Callable 08/01/2014)(ETM) | 85,000 | 90,830 | ||||||||||
| 6,728,811 | 0.6 | % | ||||||||||
| Virginia | ||||||||||||
| Bristol Virginia Utility Systems General Obligations, | ||||||||||||
| 5.500%, 11/01/2018 (ETM) | 1,095,000 | 1,256,447 | ||||||||||
| Danville Industrial Development Authority, | ||||||||||||
| 5.250%, 10/01/2028 (ETM) | 1,500,000 | 1,819,080 | ||||||||||
| Virginia Public School Authority, | ||||||||||||
| 6.250%, 12/01/2028 (Pre-refunded to 12/01/2018) | 1,285,000 | 1,572,904 | ||||||||||
| 4,648,431 | 0.4 | % | ||||||||||
| Washington | ||||||||||||
| Snohomish County School District No. 201, | ||||||||||||
| 4.000%, 12/01/2021 (Callable 12/01/2020) | 4,500,000 | 5,131,980 | ||||||||||
| Snohomish County Washington Public Utilities Revenue, | ||||||||||||
| 6.800%, 01/01/2020 (Callable 08/01/2014)(ETM) | 3,605,000 | 4,328,884 | ||||||||||
| Thurston & Pierce Counties Washington Community Schools, | ||||||||||||
| 4.250%, 12/01/2021 (Callable 12/01/2020) | 2,755,000 | 3,078,712 | ||||||||||
| Walla Walla County School District No 250 College Place, | ||||||||||||
| 5.000%, 12/01/2019 | 1,290,000 | 1,478,250 | ||||||||||
| Washington Health Care Facilities Authority: | ||||||||||||
| 6.250%, 08/01/2028 (Pre-refunded to 08/01/2018) | 1,305,000 | 1,575,748 | ||||||||||
| 6.125%, 11/15/2031 (Pre-refunded to 05/15/2021) | 415,000 | 531,980 | ||||||||||
| 6.250%, 08/01/2036 (Pre-refunded to 08/01/2018) | 7,850,000 | 9,478,640 | ||||||||||
| 6.250%, 11/15/2041 (Pre-refunded to 05/15/2021) | 4,205,000 | 5,424,198 | ||||||||||
| Washington State: | ||||||||||||
| 5.000%, 01/01/2021 | 10,000,000 | 11,932,800 | ||||||||||
| 5.500%, 07/01/2023 | 5,000,000 | 6,137,900 | ||||||||||
| 49,099,092 | 4.5 | % | ||||||||||
| West Virginia | ||||||||||||
| Ohio County Board of Education, | ||||||||||||
| 5.250%, 06/01/2018 (ETM) | 1,130,000 | 1,314,213 | 0.1 | % | ||||||||
| Wisconsin | ||||||||||||
| Ladysmith-Hawkins Wisconsin School District General Obligation, | ||||||||||||
| 5.200%, 04/01/2018 (Callable 04/01/2016)(Insured by NPFGC) | 2,685,000 | 2,797,582 | ||||||||||
| Wisconsin State Health & Educational Facilities Revenue, | ||||||||||||
| 5.000%, 12/01/2019 (Callable 12/01/2014)(Insured by NPFGC) | 3,320,000 | 3,355,690 | ||||||||||
| 6,153,272 | 0.6 | % | ||||||||||
| Total Municipal Bonds (Cost $980,061,385) | 1,025,160,432 | 94.8 | % | |||||||||
| Shares | ||||||||||||
| SHORT-TERM INVESTMENTS | ||||||||||||
| Money Market Mutual Fund | ||||||||||||
| Goldman Sachs Financial Square Funds, 0.01% « | 48,412,392 | 48,412,392 | ||||||||||
| Total Short-Term Investments (Cost $48,412,392) | 48,412,392 | 4.5 | % | |||||||||
| Total Investments (Cost $1,028,473,777) | 1,073,572,824 | 99.3 | % | |||||||||
| Other Assets in Excess of Liabilities | 7,525,702 | 0.7 | % | |||||||||
| TOTAL NET ASSETS | $ | 1,081,098,526 | 100.0 | % | ||||||||
| Notes to Schedule of Investments | ||||||||||||
| AGM - Assured Guaranty Municipal | ||||||||||||
| AMBAC - Ambac Assurance Corporation. | ||||||||||||
| BHAC - Berkshire Hathaway Assurance Corp. | ||||||||||||
| FGIC-TCRS - Financial Guaranty Insurance Company | ||||||||||||
| NPFGC - National Public Finance Guarantee Corp. | ||||||||||||
| PSF - Texas Permanent School Fund | ||||||||||||
| ETM - Escrowed to Maturity | ||||||||||||
| ^ Non-Income Producing | ||||||||||||
| « 7-Day Yield | ||||||||||||
| Baird Aggregate Bond Fund | |||||||||||||
| Schedule of Investments | |||||||||||||
| June 30, 2014 (Unaudited) | |||||||||||||
| Principal | % of | ||||||||||||
| Amount | Value | Net Assets | |||||||||||
| LONG-TERM INVESTMENTS | |||||||||||||
| U.S. Treasury Securities | |||||||||||||
| U.S. Treasury Bonds: | |||||||||||||
| 1.250%, 04/30/2019 @ | $ | 162,424,400 | $ | 159,988,034 | |||||||||
| 6.250%, 08/15/2023 @ | 30,200,000 | 39,835,673 | |||||||||||
| 5.250%, 11/15/2028 @ | 53,426,500 | 68,436,034 | |||||||||||
| 4.375%, 02/15/2038 @ | 19,587,400 | 23,385,514 | |||||||||||
| 3.500%, 02/15/2039 @ | 91,630,900 | 95,611,163 | |||||||||||
| 387,256,418 | 17.2 | % | |||||||||||
| Taxable Municipal Bonds | |||||||||||||
| Atlanta Independent School System, | |||||||||||||
| 5.557%, 03/01/2026 | 4,465,000 | 5,096,396 | |||||||||||
| California Qualified School Bond Joint Powers Authority, | |||||||||||||
| 7.155%, 03/01/2027 | 6,695,000 | 7,481,395 | |||||||||||
| California School Finance Authority: | |||||||||||||
| 5.041%, 07/01/2020 | 2,230,000 | 2,431,347 | |||||||||||
| 5.043%, 01/01/2021 (Callable 12/31/2015) | 1,785,000 | 1,822,235 | |||||||||||
| County of Contra Costa CA, | |||||||||||||
| 5.140%, 06/01/2017 | 5,335,000 | 5,728,723 | |||||||||||
| County of Cuyahoga OH, | |||||||||||||
| 9.125%, 10/01/2023 | 895,000 | 834,668 | |||||||||||
| Eaton Community City School District, | |||||||||||||
| 5.390%, 08/25/2027 (Callable 06/01/2020) | 2,305,000 | 2,429,447 | |||||||||||
| Elgin Local School District, | |||||||||||||
| 5.499%, 08/31/2027 (Callable 12/01/2019) | 4,440,000 | 4,623,594 | |||||||||||
| Iowa Tobacco Settlement Authority, | |||||||||||||
| 6.500%, 06/01/2023 (Callable 06/01/2015) | 5,105,000 | 5,077,382 | |||||||||||
| New Hampshire Housing Finance Authority: | |||||||||||||
| 3.050%, 01/01/2021 | 1,090,000 | 1,113,664 | |||||||||||
| 3.750%, 07/01/2034 (Callable 07/01/2023) | 3,010,000 | 3,127,932 | |||||||||||
| New Jersey Economic Development Authority, | |||||||||||||
| 2.421%, 06/15/2018 | 7,000,000 | 7,058,170 | |||||||||||
| North Carolina Housing Finance Agency, | |||||||||||||
| 2.812%, 07/01/2035 (Callable 01/01/2024) | 5,270,000 | 5,333,451 | |||||||||||
| San Dieguito Public Facilities, | |||||||||||||
| 6.459%, 05/01/2027 | 5,675,000 | 6,411,331 | |||||||||||
| State Public School Building Authority, | |||||||||||||
| 5.000%, 09/15/2027 | 4,458,000 | 4,985,693 | |||||||||||
| Three Rivers Ohio LOC School District, | |||||||||||||
| 5.209%, 09/15/2027 (Callable 12/01/2020) | 2,365,000 | 2,478,520 | |||||||||||
| West Contra Costa Unified School District, | |||||||||||||
| 6.250%, 08/01/2030 | 1,785,000 | 1,938,760 | |||||||||||
| Westlake City School District, | |||||||||||||
| 5.227%, 12/01/2026 (Callable 12/01/2020) | 3,570,000 | 3,846,389 | |||||||||||
| 71,819,097 | 3.2 | % | |||||||||||
| Other Government Related Securities | |||||||||||||
| CNPC General Capital Ltd, | |||||||||||||
| 2.750%, 05/14/2019 (Acquired 05/07/2014, Cost $1,983,740) * @ f | 2,000,000 | 1,999,548 | |||||||||||
| Comision Federal de Electricidad, | |||||||||||||
| 4.875%, 01/15/2024 (Acquired 10/17/2013, Cost $2,662,655) * @ f | 2,678,000 | 2,858,765 | |||||||||||
| Corp Andina de Fomento, | |||||||||||||
| 4.375%, 06/15/2022 f | 6,107,000 | 6,476,913 | |||||||||||
| Korea Electric Power Corporation, | |||||||||||||
| 6.750%, 08/01/2027 f | 1,932,000 | 2,355,745 | |||||||||||
| Korea Gas Corporation, | |||||||||||||
| 4.250%, 11/02/2020 (Acquired 10/26/2010, Cost $2,309,418) * f | 2,321,000 | 2,514,244 | |||||||||||
| Nexen Energy ULC: | |||||||||||||
| 6.400%, 05/15/2037 f | 3,392,000 | 4,081,733 | |||||||||||
| 7.500%, 07/30/2039 f | 4,000,000 | 5,413,132 | |||||||||||
| Petrobras Global Finance B.V.: | |||||||||||||
| 2.592%, 03/17/2017 @ f | 3,000,000 | 3,035,700 | |||||||||||
| 4.375%, 05/20/2023 f | 1,785,000 | 1,719,044 | |||||||||||
| Petrobras International Finance Company: | |||||||||||||
| 3.500%, 02/06/2017 f | 4,463,000 | 4,581,270 | |||||||||||
| 5.750%, 01/20/2020 f | 893,000 | 954,438 | |||||||||||
| Petroleos Mexicanos: | |||||||||||||
| 5.750%, 03/01/2018 f | 2,499,000 | 2,817,623 | |||||||||||
| 8.000%, 05/03/2019 f | 1,500,000 | 1,858,500 | |||||||||||
| 6.625%, 06/15/2035 f | 893,000 | 1,051,507 | |||||||||||
| Portigon AG, | |||||||||||||
| 4.796%, 07/15/2015 f | 2,488,000 | 2,595,011 | |||||||||||
| Sinopec Group Overseas Development (2014) Limited, | |||||||||||||
| 4.375%, 04/10/2024 (Acquired 04/02/2014, Cost $1,496,505) * @ f | 1,500,000 | 1,552,904 | |||||||||||
| The Export-Import Bank of Korea, | |||||||||||||
| 4.000%, 01/11/2017 f | 1,400,000 | 1,494,557 | |||||||||||
| The Korea Development Bank, | |||||||||||||
| 0.853%, 01/22/2017 f | 2,000,000 | 2,002,282 | |||||||||||
| 49,362,916 | 2.2 | % | |||||||||||
| Corporate Bonds | |||||||||||||
| Industrials | |||||||||||||
| Actavis Funding SCS, | |||||||||||||
| 3.850%, 06/15/2024 (Acquired 06/10/2014, Cost $2,988,690) * f | 3,000,000 | 3,032,556 | |||||||||||
| Acuity Brands Lighting, Inc., | |||||||||||||
| 6.000%, 12/15/2019 | 3,749,000 | 4,246,365 | |||||||||||
| Altera Corporation, | |||||||||||||
| 4.100%, 11/15/2023 | 2,000,000 | 2,068,216 | |||||||||||
| Ameritech Capital Funding Corporation: | |||||||||||||
| 9.100%, 06/01/2016 | 910,497 | 1,008,078 | |||||||||||
| 6.450%, 01/15/2018 | 2,668,000 | 3,031,264 | |||||||||||
| Anadarko Petroleum Corporation: | |||||||||||||
| 6.375%, 09/15/2017 | 5,355,000 | 6,165,426 | |||||||||||
| 8.700%, 03/15/2019 | 2,432,000 | 3,133,233 | |||||||||||
| Anglo American Capital PLC, | |||||||||||||
| 9.375%, 04/08/2019 (Acquired 04/02/2009, Cost $1,785,000) * f | 1,785,000 | 2,297,818 | |||||||||||
| Apple Inc., | |||||||||||||
| 2.400%, 05/03/2023 @ | 2,678,000 | 2,529,877 | |||||||||||
| Beam Suntory Inc., | |||||||||||||
| 1.875%, 05/15/2017 | 2,000,000 | 2,005,554 | |||||||||||
| Bunge Limited Finance Corp.: | |||||||||||||
| 5.100%, 07/15/2015 | 1,251,000 | 1,303,010 | |||||||||||
| 8.500%, 06/15/2019 | 2,500,000 | 3,141,558 | |||||||||||
| Bunge N.A. Finance L.P., | |||||||||||||
| 5.900%, 04/01/2017 | 3,392,000 | 3,763,990 | |||||||||||
| Canadian Natural Resources Limited: | |||||||||||||
| 5.700%, 05/15/2017 f | 50,000 | 56,002 | |||||||||||
| 6.500%, 02/15/2037 f | 982,000 | 1,249,073 | |||||||||||
| Celgene Corporation, | |||||||||||||
| 4.000%, 08/15/2023 | 2,477,000 | 2,579,563 | |||||||||||
| CenturyLink, Inc., | |||||||||||||
| Series R, 5.150%, 06/15/2017 | 2,678,000 | 2,892,240 | |||||||||||
| CF Industries, Inc., | |||||||||||||
| 5.150%, 03/15/2034 | 3,000,000 | 3,196,050 | |||||||||||
| Comcast Corporation: | |||||||||||||
| 4.250%, 01/15/2033 | 5,712,000 | 5,867,566 | |||||||||||
| 6.950%, 08/15/2037 | 893,000 | 1,203,801 | |||||||||||
| Computer Sciences Corporation, | |||||||||||||
| 2.500%, 09/15/2015 | 4,686,000 | 4,769,786 | |||||||||||
| ConAgra Foods, Inc.: | |||||||||||||
| 5.819%, 06/15/2017 | 1,506,000 | 1,692,459 | |||||||||||
| 4.950%, 08/15/2020 | 1,785,000 | 1,978,253 | |||||||||||
| 9.750%, 03/01/2021 | 107,000 | 139,564 | |||||||||||
| Continental Airlines, Inc. Pass Through Trust, | |||||||||||||
| Series 974A, 6.900%, 01/02/2018 | 187,863 | 201,013 | |||||||||||
| D.R. Horton, Inc., | |||||||||||||
| 6.500%, 04/15/2016 | 893,000 | 966,672 | |||||||||||
| Deutsche Telekom International Finance B.V., | |||||||||||||
| 8.750%, 06/15/2030 f | 411,000 | 601,085 | |||||||||||
| Express Scripts Holding Company, | |||||||||||||
| 2.650%, 02/15/2017 | 2,678,000 | 2,782,182 | |||||||||||
| Federal Express Corp 1998 Pass Through Trust, | |||||||||||||
| Series 981B, 6.845%, 01/15/2019 | 2,052,822 | 2,295,602 | |||||||||||
| Fidelity National Information Services, Inc.: | |||||||||||||
| 7.875%, 07/15/2020 | 3,994,000 | 4,229,886 | |||||||||||
| 3.500%, 04/15/2023 @ | 3,570,000 | 3,512,519 | |||||||||||
| 3.875%, 06/05/2024 | 2,000,000 | 2,009,478 | |||||||||||
| Fiserv, Inc., | |||||||||||||
| 4.625%, 10/01/2020 | 1,785,000 | 1,945,898 | |||||||||||
| FMC Corporation, | |||||||||||||
| 4.100%, 02/01/2024 | 3,000,000 | 3,133,470 | |||||||||||
| Fomento Economico Mexicano SAB de CV, | |||||||||||||
| 4.375%, 05/10/2043 f | 4,374,000 | 4,066,814 | |||||||||||
| Ford Motor Credit Company LLC: | |||||||||||||
| 7.000%, 04/15/2015 | 1,160,000 | 1,218,139 | |||||||||||
| 2.875%, 10/01/2018 @ | 6,806,000 | 7,044,496 | |||||||||||
| Glencore Finance (Canada) Limited, | |||||||||||||
| 5.800%, 11/15/2016 (Acquired 12/06/2011, Cost $641,658) * f | 616,000 | 677,809 | |||||||||||
| Glencore Funding LLC: | |||||||||||||
| 2.500%, 01/15/2019 (Acquired 05/22/2013, Cost $4,440,774) * | 4,463,000 | 4,451,642 | |||||||||||
| 4.125%, 05/30/2023 (Acquired 07/22/2013 through 04/03/2014, Cost $3,599,049) * | 3,746,000 | 3,762,261 | |||||||||||
| 4.625%, 04/29/2024 (Acquired 04/22/2014, Cost $1,668,233) * | 1,675,000 | 1,726,758 | |||||||||||
| GTE Corporation, | |||||||||||||
| 8.750%, 11/01/2021 | 89,000 | 117,956 | |||||||||||
| Holcim US Finance S. a r.l. & Cie S.C.S., | |||||||||||||
| 6.000%, 12/30/2019 (Acquired 09/24/2009 through 09/04/2013, Cost $1,250,762) * f | 1,232,000 | 1,427,426 | |||||||||||
| Hospira, Inc., | |||||||||||||
| 6.050%, 03/30/2017 | 4,463,000 | 4,923,649 | |||||||||||
| Hutchison Whampoa International (09) Limited, | |||||||||||||
| 7.625%, 04/09/2019 (Acquired 10/22/2009 through 04/16/2014, Cost $9,347,624) * f | 8,288,000 | 10,120,328 | |||||||||||
| Hyundai Capital Services, Inc.: | |||||||||||||
| 6.000%, 05/05/2015 (Acquired 05/20/2013, Cost $1,853,125) * f | 1,785,000 | 1,860,973 | |||||||||||
| 4.375%, 07/27/2016 (Acquired 04/23/2013, Cost $2,111,459) * f | 2,008,000 | 2,134,745 | |||||||||||
| 1.031%, 03/18/2017 (Acquired 03/11/2014, Cost $2,000,000) * f | 2,000,000 | 2,005,860 | |||||||||||
| 3.500%, 09/13/2017 (Acquired 03/07/2012 through 06/04/2014, Cost $3,853,334) * f | 3,734,000 | 3,928,392 | |||||||||||
| Johnson Controls, Inc.: | |||||||||||||
| 6.000%, 01/15/2036 | 893,000 | 1,070,970 | |||||||||||
| 4.950%, 07/02/2064 | 2,400,000 | 2,431,236 | |||||||||||
| Lafarge S.A., | |||||||||||||
| 7.125%, 07/15/2036 f | 893,000 | 1,035,880 | |||||||||||
| Martin Marietta Materials, Inc., | |||||||||||||
| 6.250%, 05/01/2037 | 893,000 | 957,608 | |||||||||||
| Masco Corporation, | |||||||||||||
| 6.125%, 10/03/2016 | 1,450,000 | 1,596,812 | |||||||||||
| Murphy Oil Corporation, | |||||||||||||
| 4.000%, 06/01/2022 | 4,463,000 | 4,517,141 | |||||||||||
| Mylan Inc.: | |||||||||||||
| 6.000%, 11/15/2018 (Acquired 02/01/2013 through 02/12/2013, Cost $5,746,780) * | 5,496,000 | 5,748,481 | |||||||||||
| 7.875%, 07/15/2020 (Acquired 04/25/2014, Cost $3,329,424) * | 3,000,000 | 3,320,577 | |||||||||||
| Nabors Industries, Inc., | |||||||||||||
| 6.150%, 02/15/2018 | 982,000 | 1,118,798 | |||||||||||
| National Oilwell Varco, Inc., | |||||||||||||
| Series B, 6.125%, 08/15/2015 | 6,288,000 | 6,294,778 | |||||||||||
| New Cingular Wireless Services, Inc., | |||||||||||||
| 8.750%, 03/01/2031 | 1,260,000 | 1,877,202 | |||||||||||
| Noble Energy, Inc., | |||||||||||||
| 8.250%, 03/01/2019 | 2,684,000 | 3,383,630 | |||||||||||
| Oracle Corporation, | |||||||||||||
| 3.400%, 07/08/2024 | 3,000,000 | 2,993,190 | |||||||||||
| Pactiv LLC, | |||||||||||||
| 7.950%, 12/15/2025 | 286,000 | 306,020 | |||||||||||
| Petrofac Limited, | |||||||||||||
| 3.400%, 10/10/2018 (Acquired 10/03/2013, Cost $8,514,123) * f | 8,546,000 | 8,871,235 | |||||||||||
| Petrohawk Energy Corporation, | |||||||||||||
| 7.250%, 08/15/2018 | 6,166,000 | 6,443,470 | |||||||||||
| Plains Exploration & Production Company: | |||||||||||||
| 7.625%, 04/01/2020 | 7,627,000 | 8,332,498 | |||||||||||
| 6.500%, 11/15/2020 | 2,000,000 | 2,232,500 | |||||||||||
| 6.750%, 02/01/2022 | 1,000,000 | 1,136,250 | |||||||||||
| Plum Creek Timberlands, L.P., | |||||||||||||
| 5.875%, 11/15/2015 | 3,887,000 | 4,126,739 | |||||||||||
| QEP Resources, Inc., | |||||||||||||
| 6.800%, 03/01/2020 | 893,000 | 975,603 | |||||||||||
| R.R. Donnelley & Sons Company: | |||||||||||||
| 8.600%, 08/15/2016 | 2,231,000 | 2,560,072 | |||||||||||
| 6.125%, 01/15/2017 | 88,000 | 96,140 | |||||||||||
| 7.625%, 06/15/2020 @ | 893,000 | 1,013,555 | |||||||||||
| Rio Tinto Alcan Inc., | |||||||||||||
| 5.750%, 06/01/2035 f | 446,000 | 505,990 | |||||||||||
| Rio Tinto Finance (USA) Limited, | |||||||||||||
| 9.000%, 05/01/2019 f | 4,909,000 | 6,435,944 | |||||||||||
| Samarco Mineracao S.A., | |||||||||||||
| 5.750%, 10/24/2023 (Acquired 10/22/2013, Cost $4,477,817) * f | 4,463,000 | 4,684,811 | |||||||||||
| Seagate HDD Cayman, | |||||||||||||
| 6.875%, 05/01/2020 f | 7,321,000 | 7,915,831 | |||||||||||
| SK Telecom Co., Ltd, | |||||||||||||
| 6.625%, 07/20/2027 (Acquired 07/13/2007, Cost $1,322,945) * f | 1,339,000 | 1,683,676 | |||||||||||
| Sprint Capital Corporation: | |||||||||||||
| 6.900%, 05/01/2019 | 2,499,000 | 2,755,148 | |||||||||||
| 8.750%, 03/15/2032 | 320,000 | 369,600 | |||||||||||
| Talisman Energy Inc., | |||||||||||||
| 7.750%, 06/01/2019 f | 1,071,000 | 1,326,668 | |||||||||||
| Telecom Italia Capital: | |||||||||||||
| 7.175%, 06/18/2019 f | 1,785,000 | 2,063,906 | |||||||||||
| 7.200%, 07/18/2036 @ f | 5,350,000 | 5,925,125 | |||||||||||
| Telefonica Emisiones S.A.U.: | |||||||||||||
| 6.421%, 06/20/2016 f | 1,830,000 | 2,014,632 | |||||||||||
| 6.221%, 07/03/2017 f | 4,530,000 | 5,126,311 | |||||||||||
| The Mosaic Company, | |||||||||||||
| 5.450%, 11/15/2033 | 2,000,000 | 2,241,072 | |||||||||||
| Time Warner Cable Inc.: | |||||||||||||
| 6.550%, 05/01/2037 | 893,000 | 1,111,152 | |||||||||||
| 6.750%, 06/15/2039 | 2,767,000 | 3,566,126 | |||||||||||
| Time Warner Inc.: | |||||||||||||
| 7.625%, 04/15/2031 | 1,082,000 | 1,486,677 | |||||||||||
| 7.700%, 05/01/2032 | 5,918,000 | 8,217,995 | |||||||||||
| TSMC Global Ltd, | |||||||||||||
| 1.625%, 04/03/2018 (Acquired 12/03/2013, Cost $1,142,971) * f | 1,175,000 | 1,157,891 | |||||||||||
| Tyco Electronics Group S.A., | |||||||||||||
| 6.550%, 10/01/2017 f | 6,248,000 | 7,230,098 | |||||||||||
| U.S. Airways Pass Through Trust, | |||||||||||||
| Series 981A, 6.850%, 01/30/2018 | 213,355 | 232,023 | |||||||||||
| Vale Overseas Limited: | |||||||||||||
| 8.250%, 01/17/2034 f | 3,526,000 | 4,391,690 | |||||||||||
| 6.875%, 11/21/2036 f | 1,383,000 | 1,531,036 | |||||||||||
| 6.875%, 11/10/2039 f | 893,000 | 991,719 | |||||||||||
| Valero Energy Corporation, | |||||||||||||
| 9.375%, 03/15/2019 | 2,000,000 | 2,625,124 | |||||||||||
| Verizon Communications Inc.: | |||||||||||||
| 4.150%, 03/15/2024 | 3,000,000 | 3,132,456 | |||||||||||
| 6.400%, 09/15/2033 @ | 7,140,000 | 8,746,057 | |||||||||||
| Vulcan Materials Company: | |||||||||||||
| 7.000%, 06/15/2018 | 1,785,000 | 2,054,981 | |||||||||||
| 7.150%, 11/30/2037 | 446,000 | 463,840 | |||||||||||
| Wabtec Corporation, | |||||||||||||
| 4.375%, 08/15/2023 | 2,678,000 | 2,783,583 | |||||||||||
| Warner Chilcott Co LLC / Warner Chilcott Finance LLC, | |||||||||||||
| 7.750%, 09/15/2018 f | 8,500,000 | 8,935,965 | |||||||||||
| Westvaco Corporation: | |||||||||||||
| 9.750%, 06/15/2020 | 143,000 | 186,525 | |||||||||||
| 8.200%, 01/15/2030 | 4,463,000 | 5,860,874 | |||||||||||
| Yara International ASA, | |||||||||||||
| 5.250%, 12/15/2014 (Acquired 10/02/2012 through 11/09/2012, Cost $5,710,612) * f | 5,614,000 | 5,731,248 | |||||||||||
| 320,422,514 | 14.3 | % | |||||||||||
| Utility | |||||||||||||
| Arizona Public Service Company, | |||||||||||||
| 8.750%, 03/01/2019 | 759,000 | 978,585 | |||||||||||
| Beaver Valley II Funding Corporation, | |||||||||||||
| 9.000%, 06/01/2017 | 219,000 | 231,065 | |||||||||||
| Constellation Energy Group, Inc., | |||||||||||||
| 4.550%, 06/15/2015 | 5,232,000 | 5,424,375 | |||||||||||
| DCP Midstream, LLC, | |||||||||||||
| 9.750%, 03/15/2019 (Acquired 02/29/2012 through 10/15/2012, Cost $6,221,763) * | 5,065,000 | 6,530,644 | |||||||||||
| El Paso Pipeline Partners Operating Company, LLC., | |||||||||||||
| 7.500%, 11/15/2040 | 4,017,000 | 5,175,250 | |||||||||||
| Enable Midstream Partners, LP, | |||||||||||||
| 3.900%, 05/15/2024 (Acquired 05/19/2014, Cost $4,994,350) * | 5,000,000 | 4,989,355 | |||||||||||
| ENEL Finance International N.V.: | |||||||||||||
| 5.125%, 10/07/2019 (Acquired 09/30/2009, Cost $2,199,280) * f | 2,209,000 | 2,487,049 | |||||||||||
| 6.800%, 09/15/2037 (Acquired 09/13/2007, Cost $1,691,506) * f | 1,696,000 | 2,069,622 | |||||||||||
| Energy Transfer Partners, LP, | |||||||||||||
| 9.700%, 03/15/2019 | 893,000 | 1,170,520 | |||||||||||
| Exelon Generation Company, LLC, | |||||||||||||
| 6.200%, 10/01/2017 | 1,964,000 | 2,237,654 | |||||||||||
| Gulf South Pipeline Company, LP, | |||||||||||||
| 4.000%, 06/15/2022 | 3,633,000 | 3,665,221 | |||||||||||
| Kinder Morgan Energy Partners, LP: | |||||||||||||
| 9.000%, 02/01/2019 | 893,000 | 1,144,517 | |||||||||||
| 6.950%, 01/15/2038 | 2,008,000 | 2,475,605 | |||||||||||
| 6.500%, 09/01/2039 | 893,000 | 1,053,451 | |||||||||||
| Kinder Morgan Finance Company LLC, | |||||||||||||
| 5.700%, 01/05/2016 f | 803,000 | 843,150 | |||||||||||
| Mega Advance Investments Ltd, | |||||||||||||
| 5.000%, 05/12/2021 (Acquired 05/09/2011, Cost $4,858,830) * @ f | 4,909,000 | 5,271,922 | |||||||||||
| National Rural Utilities Cooperative Finance Corporation: | |||||||||||||
| 10.375%, 11/01/2018 | 547,000 | 736,926 | |||||||||||
| 8.000%, 03/01/2032 | 2,834,000 | 4,095,295 | |||||||||||
| NextEra Energy Capital Holdings, Inc., | |||||||||||||
| Series D, 7.300%, 09/01/2067 | 2,455,000 | 2,706,638 | |||||||||||
| ONEOK Partners, L.P.: | |||||||||||||
| 6.150%, 10/01/2016 | 3,036,000 | 3,382,213 | |||||||||||
| 8.625%, 03/01/2019 | 2,937,000 | 3,707,901 | |||||||||||
| PPL Energy Supply, LLC, | |||||||||||||
| Series A, 5.700%, 10/15/2015 | 1,839,000 | 1,933,460 | |||||||||||
| PSEG Power LLC: | |||||||||||||
| 5.320%, 09/15/2016 | 2,877,000 | 3,145,453 | |||||||||||
| 5.125%, 04/15/2020 | 3,575,000 | 4,003,907 | |||||||||||
| RGS I&M Funding Corp, | |||||||||||||
| Series F, 9.820%, 06/07/2022 * | 816,656 | 978,260 | |||||||||||
| Rockies Express Pipeline LLC, | |||||||||||||
| 5.625%, 04/15/2020 (Acquired 03/17/2010, Cost $1,783,411) * | 1,785,000 | 1,838,550 | |||||||||||
| Southern Natural Gas Company, LLC., | |||||||||||||
| 5.900%, 04/01/2017 (Acquired 03/14/2007, Cost $1,247,925) * | 1,250,000 | 1,405,166 | |||||||||||
| Spectra Energy Capital LLC, | |||||||||||||
| 5.668%, 08/15/2014 | 893,000 | 898,948 | |||||||||||
| Talent Yield Investments Ltd., | |||||||||||||
| 4.500%, 04/25/2022 (Acquired 04/18/2012, Cost $1,772,791) * f | 1,785,000 | 1,845,976 | |||||||||||
| The Williams Companies, Inc., | |||||||||||||
| 4.550%, 06/24/2024 | 5,000,000 | 5,049,505 | |||||||||||
| Williams Partners LP, | |||||||||||||
| 6.300%, 04/15/2040 | 2,767,000 | 3,284,916 | |||||||||||
| 84,761,099 | 3.8 | % | |||||||||||
| Finance | |||||||||||||
| ABN AMRO Bank N.V., | |||||||||||||
| 2.500%, 10/30/2018 (Acquired 10/23/2013 through 01/13/2014, Cost $11,028,182) * f | 11,033,000 | 11,194,854 | |||||||||||
| Ally Financial Inc.: | |||||||||||||
| 6.750%, 12/01/2014 | 134,000 | 137,182 | |||||||||||
| 8.000%, 12/31/2018 | 360,000 | 427,500 | |||||||||||
| American International Group, Inc.: | |||||||||||||
| 5.450%, 05/18/2017 | 2,678,000 | 2,987,636 | |||||||||||
| 8.250%, 08/15/2018 | 1,785,000 | 2,217,700 | |||||||||||
| 6.400%, 12/15/2020 | 830,000 | 1,002,014 | |||||||||||
| 4.125%, 02/15/2024 @ | 893,000 | 940,003 | |||||||||||
| 8.175%, 05/15/2058 | 893,000 | 1,230,108 | |||||||||||
| Ameriprise Financial, Inc., | |||||||||||||
| 7.300%, 06/28/2019 | 1,785,000 | 2,205,319 | |||||||||||
| AmSouth Bancorporation, | |||||||||||||
| 6.750%, 11/01/2025 | 223,000 | 258,179 | |||||||||||
| Associates Corporation of North America, | |||||||||||||
| 6.950%, 11/01/2018 | 4,764,000 | 5,689,378 | |||||||||||
| Australia and New Zealand Banking Group Limited, | |||||||||||||
| 4.500%, 03/19/2024 (Acquired 03/12/2014, Cost $5,991,840) * f | 6,000,000 | 6,158,376 | |||||||||||
| BAC Capital Trust VI, | |||||||||||||
| 5.625%, 03/08/2035 ^ | 357,000 | 353,144 | |||||||||||
| Bank of America Corporation: | |||||||||||||
| 10.200%, 07/15/2015 | 1,531,000 | 1,677,593 | |||||||||||
| 6.400%, 08/28/2017 | 893,000 | 1,020,055 | |||||||||||
| 6.875%, 04/25/2018 | 1,562,000 | 1,840,241 | |||||||||||
| 7.750%, 05/14/2038 | 1,138,000 | 1,563,291 | |||||||||||
| BanPonce Trust I, | |||||||||||||
| Series A, 8.327%, 02/01/2027 | 1,941,000 | 1,549,908 | |||||||||||
| Barclays Bank PLC: | |||||||||||||
| 2.500%, 02/20/2019 @ f | 2,000,000 | 2,025,810 | |||||||||||
| 6.750%, 05/22/2019 f | 3,570,000 | 4,299,208 | |||||||||||
| 3.750%, 05/15/2024 f | 1,450,000 | 1,455,183 | |||||||||||
| BNP Paribas, | |||||||||||||
| 3.250%, 03/03/2023 f | 3,570,000 | 3,525,757 | |||||||||||
| BPCE: | |||||||||||||
| 1.073%, 02/10/2017 f | 2,544,000 | 2,565,606 | |||||||||||
| 5.700%, 10/22/2023 (Acquired 10/15/2013, Cost $5,346,111) * f | 5,355,000 | 5,896,444 | |||||||||||
| 4.000%, 04/15/2024 f | 2,500,000 | 2,552,125 | |||||||||||
| Citigroup Inc.: | |||||||||||||
| 4.450%, 01/10/2017 | 893,000 | 961,769 | |||||||||||
| 6.125%, 11/21/2017 | 2,477,000 | 2,833,061 | |||||||||||
| 3.750%, 06/16/2024 | 1,000,000 | 1,002,792 | |||||||||||
| CNA Financial Corporation: | |||||||||||||
| 6.500%, 08/15/2016 | 4,463,000 | 4,970,997 | |||||||||||
| 7.250%, 11/15/2023 | 4,000,000 | 5,001,316 | |||||||||||
| Commonwealth Bank of Australia, | |||||||||||||
| 0.830%, 10/08/2015 (Acquired 01/09/2013, Cost $4,264,246) * f | 4,263,000 | 4,261,465 | |||||||||||
| Compagnie de Financement Foncier, | |||||||||||||
| 2.500%, 09/16/2015 (Acquired 08/13/2012 through 08/14/2012, Cost $1,315,645) * f | 1,300,000 | 1,330,458 | |||||||||||
| Countrywide Financial Corporation, | |||||||||||||
| 6.250%, 05/15/2016 | 4,757,000 | 5,190,929 | |||||||||||
| Credit Agricole S.A.: | |||||||||||||
| 1.082%, 10/03/2016 (Acquired 09/26/2013, Cost $1,500,000) * f | 1,500,000 | 1,508,351 | |||||||||||
| 6.637%, 05/29/2049 (Acquired 05/23/2007, Cost $893,000) * f | 893,000 | 947,696 | |||||||||||
| Credit Suisse: | |||||||||||||
| 5.300%, 08/13/2019 f | 1,406,000 | 1,608,394 | |||||||||||
| 5.400%, 01/14/2020 f | 5,000,000 | 5,618,510 | |||||||||||
| Deutsche Bank Aktiengesellschaft, | |||||||||||||
| 3.700%, 05/30/2024 @ f | 10,000,000 | 10,003,040 | |||||||||||
| Dresdner Bank AG, | |||||||||||||
| 7.250%, 09/15/2015 f | 3,651,000 | 3,874,430 | |||||||||||
| First Hawaiian Capital I, | |||||||||||||
| Series B, 8.343%, 07/01/2027 | 3,346,000 | 3,391,650 | |||||||||||
| First Tennessee Bank National Association, | |||||||||||||
| 5.050%, 01/15/2015 | 8,503,000 | 8,692,090 | |||||||||||
| FMR LLC, | |||||||||||||
| 4.950%, 02/01/2033 (Acquired 01/29/2013, Cost $1,747,795) * | 1,750,000 | 1,887,520 | |||||||||||
| General Electric Capital Corporation: | |||||||||||||
| 5.550%, 05/04/2020 | 5,534,000 | 6,440,182 | |||||||||||
| 4.650%, 10/17/2021 | 5,355,000 | 5,954,974 | |||||||||||
| Genworth Holdings, Inc., | |||||||||||||
| 4.900%, 08/15/2023 | 1,339,000 | 1,433,312 | |||||||||||
| Goldman Sachs Capital I, | |||||||||||||
| 6.345%, 02/15/2034 | 1,053,000 | 1,202,943 | |||||||||||
| Great-West Life & Annuity Insurance Capital LP II, | |||||||||||||
| 7.153%, 05/16/2046 (Acquired 05/16/2006 through 11/08/2007, Cost $2,482,656) * | 2,499,000 | 2,586,465 | |||||||||||
| Highmark Inc, | |||||||||||||
| 4.750%, 05/15/2021 (Acquired 05/03/2011, Cost $2,667,181) * | 2,678,000 | 2,698,771 | |||||||||||
| HSBC Holdings PLC, | |||||||||||||
| 6.500%, 09/15/2037 f | 1,874,000 | 2,310,745 | |||||||||||
| HSBC USA Capital Trust I, | |||||||||||||
| 7.808%, 12/15/2026 (Acquired 03/08/2007, Cost $302,886) * | 300,000 | 303,831 | |||||||||||
| HSBC USA Capital Trust III: | |||||||||||||
| 7.750%, 11/15/2026 | 893,000 | 903,903 | |||||||||||
| 8.380%, 05/15/2027 (Acquired 11/06/2007, Cost $451,385) * | 446,000 | 452,146 | |||||||||||
| HSBC USA Inc., | |||||||||||||
| 9.125%, 05/15/2021 | 625,000 | 812,735 | |||||||||||
| Humana Inc., | |||||||||||||
| 7.200%, 06/15/2018 | 1,870,000 | 2,221,336 | |||||||||||
| ING Bank N.V.: | |||||||||||||
| 4.000%, 03/15/2016 (Acquired 03/08/2011, Cost $3,256,241) * f | 3,258,000 | 3,424,591 | |||||||||||
| 3.750%, 03/07/2017 (Acquired 03/28/2012, Cost $1,903,782) * f | 1,919,000 | 2,041,183 | |||||||||||
| 5.800%, 09/25/2023 (Acquired 01/14/2014 through 04/07/2014, Cost $2,592,091) * f | 2,450,000 | 2,759,925 | |||||||||||
| Invesco Finance PLC, | |||||||||||||
| 3.125%, 11/30/2022 f | 5,902,000 | 5,853,999 | |||||||||||
| J.P. Morgan Chase & Co.: | |||||||||||||
| 4.250%, 10/15/2020 | 636,000 | 689,954 | |||||||||||
| 5.600%, 07/15/2041 | 4,106,000 | 4,815,570 | |||||||||||
| Jefferies Group LLC: | |||||||||||||
| 6.875%, 04/15/2021 | 3,570,000 | 4,173,794 | |||||||||||
| 6.250%, 01/15/2036 | 1,290,000 | 1,349,946 | |||||||||||
| John Hancock Life Insurance Company, | |||||||||||||
| 7.375%, 02/15/2024 (Acquired 08/26/2010, Cost $6,719,189) * | 6,069,000 | 7,517,191 | |||||||||||
| JPMorgan Chase Bank, National Association, | |||||||||||||
| 5.875%, 06/13/2016 | 2,678,000 | 2,929,968 | |||||||||||
| LeasePlan Corporation N.V.: | |||||||||||||
| 3.000%, 10/23/2017 (Acquired 12/03/2013 through 04/04/2014, Cost $766,286) * f | 750,000 | 780,916 | |||||||||||
| 2.500%, 05/16/2018 (Acquired 08/02/2013 through 09/24/2013, Cost $7,995,946) * f | 8,158,000 | 8,225,515 | |||||||||||
| Liberty Mutual Group Inc.: | |||||||||||||
| 4.250%, 06/15/2023 (Acquired 06/13/2013, Cost $2,660,995) * | 2,678,000 | 2,775,659 | |||||||||||
| 10.750%, 06/15/2058 (Acquired 05/21/2008, Cost $2,182,029) * | 2,231,000 | 3,407,852 | |||||||||||
| Liberty Mutual Insurance Company, | |||||||||||||
| 7.697%, 10/15/2097 (Acquired 03/26/2003, Cost $297,700) * | 465,000 | 523,755 | |||||||||||
| Lincoln National Corporation: | |||||||||||||
| 8.750%, 07/01/2019 | 5,218,000 | 6,765,419 | |||||||||||
| 6.050%, 04/20/2067 | 1,004,000 | 1,015,295 | |||||||||||
| Lloyds Bank plc, | |||||||||||||
| 5.800%, 01/13/2020 (Acquired 02/10/2010, Cost $1,401,209) * f | 1,428,000 | 1,657,767 | |||||||||||
| M&I Marshall & Ilsley Bank, | |||||||||||||
| 4.850%, 06/16/2015 | 5,355,000 | 5,567,963 | |||||||||||
| M&T Capital Trust I, | |||||||||||||
| 8.234%, 02/01/2027 | 2,798,000 | 2,847,351 | |||||||||||
| M&T Capital Trust II, | |||||||||||||
| 8.277%, 06/01/2027 | 1,406,000 | 1,429,369 | |||||||||||
| Macquarie Group Limited: | |||||||||||||
| 3.000%, 12/03/2018 (Acquired 11/25/2013, Cost $8,490,900) * f | 8,525,000 | 8,745,030 | |||||||||||
| 7.625%, 08/13/2019 (Acquired 02/12/2014 through 04/09/2014, Cost $1,956,534) * f | 1,630,000 | 1,976,284 | |||||||||||
| Marsh & McLennan Companies, Inc.: | |||||||||||||
| 2.300%, 04/01/2017 | 2,231,000 | 2,284,345 | |||||||||||
| 9.250%, 04/15/2019 | 1,473,000 | 1,922,691 | |||||||||||
| Massachusetts Mutual Life Insurance Company, | |||||||||||||
| 8.875%, 06/01/2039 (Acquired 05/27/2009 through 03/10/2014, Cost $8,496,656) * | 6,111,000 | 9,732,214 | |||||||||||
| MBIA Insurance Corporation, | |||||||||||||
| 11.486%, 01/15/2033 (Acquired 01/11/2008, Cost $714,000) * @ § | 714,000 | 556,920 | |||||||||||
| MetLife, Inc.: | |||||||||||||
| 7.717%, 02/15/2019 | 982,000 | 1,221,649 | |||||||||||
| 6.500%, 12/15/2032 | 466,000 | 604,083 | |||||||||||
| Mizuho Bank, Ltd.: | |||||||||||||
| 1.850%, 03/21/2018 (Acquired 03/14/2013, Cost $3,119,689) * f | 3,124,000 | 3,136,334 | |||||||||||
| 2.450%, 04/16/2019 (Acquired 04/09/2014, Cost $2,096,262) * f | 2,100,000 | 2,120,351 | |||||||||||
| Morgan Stanley: | |||||||||||||
| 7.300%, 05/13/2019 | 5,110,000 | 6,248,237 | |||||||||||
| 5.625%, 09/23/2019 | 1,941,000 | 2,232,556 | |||||||||||
| 3.875%, 04/29/2024 @ | 1,650,000 | 1,669,998 | |||||||||||
| National Australia Bank Limited, | |||||||||||||
| 0.730%, 10/08/2015 (Acquired 01/16/2013, Cost $8,705,097) * f | 8,700,000 | 8,697,938 | |||||||||||
| National City Bank, | |||||||||||||
| 5.800%, 06/07/2017 | 1,750,000 | 1,972,192 | |||||||||||
| Navient Corporation, | |||||||||||||
| 5.625%, 08/01/2033 | 446,000 | 385,233 | |||||||||||
| Nomura Holdings, Inc.: | |||||||||||||
| 2.000%, 09/13/2016 f | 6,248,000 | 6,349,968 | |||||||||||
| 2.750%, 03/19/2019 f | 1,400,000 | 1,424,217 | |||||||||||
| 6.700%, 03/04/2020 f | 1,667,000 | 2,004,099 | |||||||||||
| PNC Bank, National Association, | |||||||||||||
| 4.200%, 11/01/2025 | 2,678,000 | 2,832,810 | |||||||||||
| Protective Life Corporation, | |||||||||||||
| 7.375%, 10/15/2019 | 7,096,000 | 8,779,938 | |||||||||||
| Prudential Covered Trust 2012-1, | |||||||||||||
| 2.997%, 09/30/2015 (Acquired 12/19/2012 through 07/23/2013, Cost $6,491,477) * | 6,372,800 | 6,527,793 | |||||||||||
| Prudential Holdings, LLC, | |||||||||||||
| 8.695%, 12/18/2023 (Acquired 08/13/2013 through 05/13/2014, Cost $3,772,790) * | 2,994,900 | 3,779,590 | |||||||||||
| Rabobank Nederland, | |||||||||||||
| 0.481%, 03/07/2016 (Acquired 05/21/2013, Cost $8,636,486) * f | 8,676,000 | 8,694,202 | |||||||||||
| Regions Bank, | |||||||||||||
| 7.500%, 05/15/2018 | 4,463,000 | 5,311,916 | |||||||||||
| Regions Financial Corporation: | |||||||||||||
| 7.750%, 11/10/2014 | 252,000 | 258,295 | |||||||||||
| 5.750%, 06/15/2015 | 1,785,000 | 1,865,628 | |||||||||||
| Santander Bank, N.A., | |||||||||||||
| 8.750%, 05/30/2018 | 6,327,000 | 7,701,762 | |||||||||||
| Santander Issuances, S.A., | |||||||||||||
| 6.500%, 08/11/2019 (Acquired 10/18/2007 through 03/19/2012, Cost $1,605,887) * @ f | 1,600,000 | 1,608,000 | |||||||||||
| Santander UK PLC, | |||||||||||||
| 5.000%, 11/07/2023 (Acquired 10/31/2013, Cost $1,993,620) * f | 2,000,000 | 2,160,062 | |||||||||||
| Skandinaviska Enskilda Banken AB: | |||||||||||||
| 2.375%, 11/20/2018 (Acquired 11/13/2013, Cost $4,995,550) * f | 5,000,000 | 5,074,050 | |||||||||||
| 2.375%, 03/25/2019 (Acquired 03/18/2014, Cost $1,498,875) * f | 1,500,000 | 1,513,050 | |||||||||||
| SpareBank 1 Boligkreditt AS, | |||||||||||||
| 1.750%, 11/15/2019 (Acquired 11/07/2012, Cost $4,428,323) * f | 4,463,000 | 4,364,564 | |||||||||||
| Springleaf Finance Corp, | |||||||||||||
| 6.900%, 12/15/2017 | 400,000 | 444,000 | |||||||||||
| Standard Chartered PLC, | |||||||||||||
| 5.700%, 03/26/2044 (Acquired 03/21/2014, Cost $5,988,000) * @ f | 6,000,000 | 6,288,972 | |||||||||||
| Sumitomo Mitsui Banking Corporation, | |||||||||||||
| 3.950%, 07/19/2023 f | 1,850,000 | 1,940,983 | |||||||||||
| SunTrust Bank, | |||||||||||||
| 7.250%, 03/15/2018 | 1,874,000 | 2,218,975 | |||||||||||
| SUSA Partnership, L.P., | |||||||||||||
| 8.200%, 06/01/2017 | 921,000 | 1,081,108 | |||||||||||
| Swedbank AB: | |||||||||||||
| 2.125%, 09/29/2017 (Acquired 09/24/2012, Cost $1,782,305) * f | 1,785,000 | 1,817,969 | |||||||||||
| 2.375%, 02/27/2019 (Acquired 02/20/2014, Cost $7,287,663) * f | 7,300,000 | 7,383,176 | |||||||||||
| Symetra Financial Corporation, | |||||||||||||
| 6.125%, 04/01/2016 (Acquired 03/23/2006, Cost $889,044) * | 893,000 | 958,396 | |||||||||||
| TD Ameritrade Holding Corporation, | |||||||||||||
| 5.600%, 12/01/2019 | 2,945,000 | 3,431,337 | |||||||||||
| The Bank of Tokyo-Mitsubishi UFJ, Ltd.: | |||||||||||||
| 4.100%, 09/09/2023 (Acquired 09/03/2013 through 03/26/2014, Cost $2,942,175) * f | 2,911,000 | 3,104,555 | |||||||||||
| 3.750%, 03/10/2024 (Acquired 03/04/2014, Cost $2,594,410) * f | 2,600,000 | 2,691,424 | |||||||||||
| The Bear Stearns Companies LLC, | |||||||||||||
| 5.300%, 10/30/2015 | 2,276,000 | 2,412,558 | |||||||||||
| The Goldman Sachs Group, Inc.: | |||||||||||||
| 6.250%, 09/01/2017 | 893,000 | 1,016,641 | |||||||||||
| 6.150%, 04/01/2018 | 5,634,000 | 6,461,184 | |||||||||||
| 7.500%, 02/15/2019 | 1,964,000 | 2,396,779 | |||||||||||
| 3.850%, 07/08/2024 | 3,000,000 | 2,996,040 | |||||||||||
| The Guardian Life Insurance Company of America, | |||||||||||||
| 4.875%, 06/19/2064 (Acquired 06/16/2014, Cost $1,993,300) * | 2,000,000 | 2,010,574 | |||||||||||
| The Hartford Financial Services Group, Inc.: | |||||||||||||
| 4.000%, 10/15/2017 | 4,463,000 | 4,815,863 | |||||||||||
| 8.125%, 06/15/2038 | 1,964,000 | 2,322,430 | |||||||||||
| The Royal Bank of Scotland PLC, | |||||||||||||
| 6.125%, 01/11/2021 f | 2,812,000 | 3,307,896 | |||||||||||
| UBS AG, | |||||||||||||
| 5.750%, 04/25/2018 f | 2,678,000 | 3,070,437 | |||||||||||
| WEA Finance LLC / WT Finance Aust Pty Ltd, | |||||||||||||
| 6.750%, 09/02/2019 (Acquired 11/06/2013 through 04/03/2014, Cost $5,950,862) * | 5,000,000 | 6,231,710 | |||||||||||
| WellPoint, Inc., | |||||||||||||
| 5.100%, 01/15/2044 | 1,584,000 | 1,724,814 | |||||||||||
| Wells Fargo Bank, National Association, | |||||||||||||
| 6.000%, 11/15/2017 | 3,789,000 | 4,341,069 | |||||||||||
| Westpac Banking Corporation, | |||||||||||||
| 1.600%, 01/12/2018 f | 7,079,000 | 7,087,452 | |||||||||||
| Willis North America, Inc.: | |||||||||||||
| 5.625%, 07/15/2015 | 669,000 | 700,993 | |||||||||||
| 7.000%, 09/29/2019 | 4,463,000 | 5,237,665 | |||||||||||
| 436,982,406 | 19.4 | % | |||||||||||
| Total Corporate Bonds | 842,166,019 | 37.5 | % | ||||||||||
| Residential Mortgage-Backed Securities | |||||||||||||
| U.S. Government Agency Issues | |||||||||||||
| Federal Gold Loan Mortgage Corporation (FGLMC): | |||||||||||||
| 6.500%, 07/01/2014 | 22 | 22 | |||||||||||
| 6.000%, 06/01/2020 | 162,343 | 172,675 | |||||||||||
| 5.500%, 11/01/2022 | 100,844 | 112,435 | |||||||||||
| 5.000%, 06/01/2023 | 101,769 | 112,623 | |||||||||||
| 5.500%, 07/01/2023 | 114,454 | 127,615 | |||||||||||
| 3.500%, 11/01/2025 | 8,380,241 | 8,883,063 | |||||||||||
| 2.500%, 04/01/2028 | 5,573,128 | 5,662,908 | |||||||||||
| 6.500%, 06/01/2029 | 329,038 | 370,771 | |||||||||||
| 5.500%, 01/01/2036 | 659,533 | 737,373 | |||||||||||
| 5.000%, 03/01/2036 | 15,377,651 | 17,065,366 | |||||||||||
| 6.000%, 12/01/2036 | 492,054 | 553,843 | |||||||||||
| 5.000%, 03/01/2038 | 4,910,187 | 5,433,857 | |||||||||||
| 5.500%, 05/01/2038 | 2,202,679 | 2,455,237 | |||||||||||
| 4.500%, 11/01/2039 | 3,700,694 | 4,006,870 | |||||||||||
| 4.500%, 11/01/2039 | 11,404,586 | 12,348,858 | |||||||||||
| 4.500%, 08/01/2040 | 2,168,144 | 2,348,675 | |||||||||||
| 4.500%, 09/01/2040 | 9,091,055 | 9,847,946 | |||||||||||
| 4.500%, 03/01/2041 | 6,671,024 | 7,224,686 | |||||||||||
| 3.500%, 06/01/2042 | 10,080,172 | 10,374,658 | |||||||||||
| 3.500%, 07/01/2042 | 26,203,332 | 26,968,846 | |||||||||||
| 3.000%, 08/01/2042 | 30,764,951 | 30,385,219 | |||||||||||
| 3.000%, 10/01/2042 | 11,258,296 | 11,119,171 | |||||||||||
| 3.000%, 02/01/2043 | 6,226,672 | 6,149,649 | |||||||||||
| 3.000%, 06/01/2043 | 30,154,134 | 29,780,877 | |||||||||||
| 3.000%, 08/01/2043 | 9,613,077 | 9,494,084 | |||||||||||
| 4.000%, 03/01/2044 | 19,237,040 | 20,407,105 | |||||||||||
| Federal Home Loan Mortgage Corporation (FHLMC): | |||||||||||||
| Series 206, Class E, 0.000%, 07/15/2019 | 36,285 | 36,116 | |||||||||||
| Series 141, Class D, 5.000%, 05/15/2021 | 20,861 | 21,968 | |||||||||||
| Series 1074, Class I, 6.750%, 05/15/2021 | 19,801 | 21,395 | |||||||||||
| Series 1081, Class K, 7.000%, 05/15/2021 | 116,428 | 129,537 | |||||||||||
| Series 163, Class F, 6.000%, 07/15/2021 | 18,755 | 20,437 | |||||||||||
| Series 188, Class H, 7.000%, 09/15/2021 | 43,015 | 47,440 | |||||||||||
| Series 1286, Class A, 6.000%, 05/15/2022 | 14,912 | 16,059 | |||||||||||
| Federal National Mortgage Association (FNMA): | |||||||||||||
| Series 1989-37, Class G, 8.000%, 07/25/2019 | 120,449 | 131,940 | |||||||||||
| 5.000%, 12/01/2019 | 387,156 | 410,892 | |||||||||||
| Series 1989-94, Class G, 7.500%, 12/25/2019 | 34,883 | 38,230 | |||||||||||
| Series 1990-58, Class J, 7.000%, 05/25/2020 | 4,690 | 5,160 | |||||||||||
| Series 1990-76, Class G, 7.000%, 07/25/2020 | 37,483 | 41,292 | |||||||||||
| Series 1990-105, Class J, 6.500%, 09/25/2020 | 21,794 | 23,511 | |||||||||||
| Series 1990-108, Class G, 7.000%, 09/25/2020 | 7,459 | 8,249 | |||||||||||
| Series 1991-1, Class G, 7.000%, 01/25/2021 | 9,599 | 10,643 | |||||||||||
| Series 1991-86, Class Z, 6.500%, 07/25/2021 | 16,437 | 17,907 | |||||||||||
| 5.000%, 11/01/2021 | 3,285,376 | 3,496,955 | |||||||||||
| 5.500%, 01/01/2023 | 5,010,996 | 5,606,235 | |||||||||||
| Series 1993-58, Class H, 5.500%, 04/25/2023 | 211,378 | 229,154 | |||||||||||
| 5.500%, 07/01/2023 | 403,544 | 451,480 | |||||||||||
| 5.000%, 11/01/2023 | 972,541 | 1,080,689 | |||||||||||
| 6.000%, 03/01/2026 | 391,483 | 443,593 | |||||||||||
| 6.000%, 05/01/2026 | 836,475 | 947,549 | |||||||||||
| 3.000%, 04/01/2027 | 12,519,126 | 13,020,396 | |||||||||||
| 2.500%, 12/01/2027 | 13,361,835 | 13,591,796 | |||||||||||
| 5.000%, 05/01/2028 | 616,982 | 685,592 | |||||||||||
| Series 1998-66, Class C, 6.000%, 12/25/2028 | 130,929 | 141,837 | |||||||||||
| 4.500%, 08/01/2029 | 4,555,825 | 4,961,913 | |||||||||||
| 4.500%, 09/01/2029 | 4,994,492 | 5,443,026 | |||||||||||
| 6.000%, 03/01/2033 | 118,520 | 134,589 | |||||||||||
| 5.000%, 11/01/2033 | 125,272 | 139,702 | |||||||||||
| 5.500%, 04/01/2034 | 2,492,507 | 2,802,004 | |||||||||||
| Series 2004-W6, Class 1A4, 5.500%, 07/25/2034 | 324,473 | 328,583 | |||||||||||
| Series 2004-W6, Class 1A6, 5.500%, 07/25/2034 | 1,322,593 | 1,371,976 | |||||||||||
| 5.500%, 09/01/2034 | 476,478 | 535,683 | |||||||||||
| 6.000%, 11/01/2034 | 124,598 | 141,212 | |||||||||||
| 5.500%, 02/01/2035 | 1,681,510 | 1,889,633 | |||||||||||
| 5.000%, 07/01/2035 | 14,201,225 | 15,811,463 | |||||||||||
| 5.000%, 10/01/2035 | 7,599,089 | 8,455,730 | |||||||||||
| 5.000%, 11/01/2035 | 3,022,215 | 3,360,736 | |||||||||||
| 5.500%, 11/01/2036 | 771,119 | 864,280 | |||||||||||
| 5.500%, 04/01/2037 | 3,765,873 | 4,232,978 | |||||||||||
| 6.000%, 08/01/2037 | 150,273 | 164,744 | |||||||||||
| 4.500%, 11/01/2039 | 686,995 | 744,471 | |||||||||||
| 4.000%, 08/01/2040 | 4,367,841 | 4,641,994 | |||||||||||
| 3.500%, 12/01/2040 | 2,161,020 | 2,227,978 | |||||||||||
| 3.500%, 02/01/2041 | 32,107,114 | 33,101,937 | |||||||||||
| 4.000%, 02/01/2041 | 22,535,308 | 23,949,766 | |||||||||||
| 4.000%, 09/01/2041 | 6,967,599 | 7,406,287 | |||||||||||
| 4.000%, 12/01/2041 | 22,489,238 | 23,919,474 | |||||||||||
| 3.000%, 05/01/2042 | 9,064,573 | 8,965,304 | |||||||||||
| 3.000%, 05/01/2043 | 10,553,323 | 10,437,750 | |||||||||||
| Government National Mortgage Association (GNMA): | |||||||||||||
| 6.000%, 11/20/2033 | 105,032 | 121,472 | |||||||||||
| 5.000%, 07/20/2040 | 6,251,868 | 6,947,459 | |||||||||||
| 4.500%, 01/20/2041 | 18,840,763 | 20,643,160 | |||||||||||
| 4.000%, 06/20/2042 | 16,864,661 | 18,078,612 | |||||||||||
| 3.500%, 09/20/2042 | 10,992,458 | 11,471,899 | |||||||||||
| 486,116,299 | 21.6 | % | |||||||||||
| Non-U.S. Government Agency Issues | |||||||||||||
| Bank of America Alternative Loan Trust: | |||||||||||||
| Series 2003-4, Class 2A1, 5.000%, 06/25/2018 | 107,993 | 111,119 | |||||||||||
| Series 2003-5, Class 2A1, 5.000%, 07/25/2018 | 1,334,149 | 1,369,683 | |||||||||||
| Series 2003-11, Class 4A1, 4.750%, 01/25/2019 | 201,219 | 203,428 | |||||||||||
| Series 2004-6, Class 4A1, 5.000%, 07/25/2019 | 150,524 | 153,118 | |||||||||||
| Series 2004-7, Class 4A1, 5.000%, 08/25/2019 | 2,816,702 | 2,908,814 | |||||||||||
| Series 2004-11, Class 4A1, 5.500%, 12/25/2019 | 150,269 | 155,033 | |||||||||||
| Series 2005-2, Class 4A1, 5.500%, 03/25/2020 | 234,939 | 244,296 | |||||||||||
| Series 2005-4, Class 3A1, 5.500%, 05/25/2020 | 1,146,413 | 1,177,176 | |||||||||||
| Series 2005-10, Class 5A1, 5.250%, 11/25/2020 § | 623,769 | 637,661 | |||||||||||
| Series 2007-1, Class 1A1, 5.829%, 04/25/2022 | 1,098,231 | 1,117,389 | |||||||||||
| Series 2003-11, Class 2A1, 6.000%, 01/25/2034 | 625,479 | 651,721 | |||||||||||
| Series 2005-2, Class 1CB2, 5.500%, 03/25/2035 | 187,807 | 176,594 | |||||||||||
| Series 2005-9, Class 1CB3, 5.500%, 10/25/2035 § | 412,363 | 375,169 | |||||||||||
| Series 2005-11, Class 1CB4, 5.500%, 12/25/2035 § | 239,993 | 217,858 | |||||||||||
| Series 2006-5, Class CB7, 6.000%, 06/25/2046 § | 903,671 | 767,189 | |||||||||||
| Bear Stearns Asset Backed Securities I Trust, | |||||||||||||
| Series 2004-AC2, Class 2A, 5.000%, 05/25/2034 | 1,150,503 | 1,158,410 | |||||||||||
| Chase Mortgage Finance Trust, | |||||||||||||
| Series 2006-A1, Class 2A3, 2.639%, 09/25/2036 § | 3,167,171 | 2,821,946 | |||||||||||
| Citigroup Mortgage Loan Trust. Inc., | |||||||||||||
| Series 2005-9, Class 2A2, 5.500%, 11/25/2035 § | 355,474 | 350,484 | |||||||||||
| Countrywide Alternative Loan Trust: | |||||||||||||
| Series 2005-50CB, Class 4A1, 5.000%, 11/25/2020 | 391,402 | 389,244 | |||||||||||
| Series 2006-7CB, Class 3A1, 5.250%, 05/25/2021 § | 1,656,674 | 1,505,229 | |||||||||||
| Series 2006-J5, Class 3A1, 5.268%, 07/25/2021 | 320,097 | 314,369 | |||||||||||
| Series 2006-43CB, Class 2A1, 6.000%, 02/25/2022 | 431,993 | 455,481 | |||||||||||
| Series 2002-11, Class A4, 6.250%, 10/25/2032 | 57,507 | 58,777 | |||||||||||
| Series 2003-20CB, Class 1A1, 5.500%, 10/25/2033 | 6,231,233 | 6,678,960 | |||||||||||
| Series 2006-28CB, Class A17, 6.000%, 10/25/2036 § | 1,166,730 | 953,937 | |||||||||||
| Deutsche Alt-A Securities Mortgage Loan Trust, | |||||||||||||
| Series 2006-AR5, Class 21A, 6.000%, 10/25/2021 § | 584,029 | 499,653 | |||||||||||
| First Horizon Alternative Mortgage Securities Trust: | |||||||||||||
| Series 2005-FA7, Class 2A1, 5.000%, 09/25/2020 | 237,623 | 242,891 | |||||||||||
| Series 2006-FA6, Class 3A1, 5.750%, 11/25/2021 | 368,743 | 365,951 | |||||||||||
| Series 2006-FA8, Class 2A1, 5.750%, 02/25/2037 § | 1,285,473 | 1,135,916 | |||||||||||
| J.P. Morgan Alternative Loan Trust, | |||||||||||||
| Series 2006-A1, Class 2A1, 2.523%, 03/25/2036 § | 583,678 | 466,080 | |||||||||||
| J.P. Morgan Mortgage Trust: | |||||||||||||
| Series 2005-A4, Class 1A1, 5.240%, 07/25/2035 | 3,933,433 | 4,011,980 | |||||||||||
| Series 2006-A7, Class 2A2, 2.626%, 01/25/2037 | 348,489 | 311,480 | |||||||||||
| Series 2006-A7, Class 2A4R, 2.626%, 01/25/2037 | 1,488,901 | 1,340,331 | |||||||||||
| Series 2007-A2, Class 2A3, 2.575%, 04/25/2037 | 3,834,914 | 3,316,916 | |||||||||||
| MASTR Alternative Loan Trust: | |||||||||||||
| Series 2004-2, Class 6A1, 5.250%, 12/25/2018 | 4,458,721 | 4,653,634 | |||||||||||
| Series 2004-1, Class 1A1, 5.000%, 01/25/2019 | 560,105 | 570,516 | |||||||||||
| Series 2004-2, Class 4A1, 5.000%, 02/25/2019 | 35,040 | 36,060 | |||||||||||
| Series 2004-4, Class 4A1, 5.000%, 04/25/2019 | 454,336 | 465,099 | |||||||||||
| Series 2003-5, Class 6A1, 6.000%, 08/25/2033 | 492,516 | 525,141 | |||||||||||
| RALI Series Trust, | |||||||||||||
| Series 2004-QS6, Class A1, 5.000%, 05/25/2019 | 230,582 | 234,346 | |||||||||||
| RFMSI Series Trust, | |||||||||||||
| Series 2003-S11, Class A2, 4.000%, 06/25/2018 | 20,869 | 21,039 | |||||||||||
| Salomon Brothers Mortgage Securities VII, Inc., | |||||||||||||
| Series 2003-UP2, Class A2, 7.000%, 06/25/2033 | 392,031 | 423,052 | |||||||||||
| Structured Asset Securities Corp. Mortgage Loan Trust, | |||||||||||||
| Series 2005-7XS, Class 1A4B, 5.440%, 04/25/2035 | 438,548 | 462,747 | |||||||||||
| Washington Mutual Mortgage Pass Through Certificates: | |||||||||||||
| Series 2004-CB1, Class 5A, 5.000%, 06/25/2019 | 574,266 | 590,784 | |||||||||||
| Series 2004-CB2, Class 7A, 5.500%, 08/25/2019 | 1,079,745 | 1,115,506 | |||||||||||
| Series 2004-CB3, Class 3A, 5.500%, 10/25/2019 | 85,622 | 89,475 | |||||||||||
| Series 2004-CB3, Class 4A, 6.000%, 10/25/2019 | 336,536 | 352,030 | |||||||||||
| Series 2004-CB4, Class 21A, 5.500%, 12/25/2019 | 254,484 | 264,611 | |||||||||||
| Series 2004-CB2, Class 3A, 6.000%, 08/25/2034 | 13,198,274 | 14,127,565 | |||||||||||
| Series 2004-CB3, Class 2A, 6.500%, 10/25/2034 | 7,527,108 | 8,196,832 | |||||||||||
| 68,772,720 | 3.1 | % | |||||||||||
| Asset Backed Securities | |||||||||||||
| AMRESCO Residential Securities Corp Mortgage Loan Trust, | |||||||||||||
| Series 1997-3, Class A9, 6.960%, 03/25/2027 | 2 | 2 | |||||||||||
| Bayview Financial Mortgage Pass-Through Trust: | |||||||||||||
| Series 2006-A, Class 1A2, 5.483%, 02/28/2041 | 480,692 | 489,607 | |||||||||||
| Series 2007-B, Class 1A2, 6.831%, 08/28/2047 | 2,231,398 | 1,863,548 | |||||||||||
| Citibank Credit Card Issuance Trust, | |||||||||||||
| Series 2007-A3, Class A3, 6.150%, 06/15/2039 | 4,166,000 | 5,209,604 | |||||||||||
| Conseco Financial Corp.: | |||||||||||||
| Series 1993-3, Class A7, 6.400%, 10/15/2018 | 75,881 | 77,802 | |||||||||||
| Series 1993-4, Class A5, 7.050%, 01/15/2019 | 37,208 | 38,349 | |||||||||||
| Series 1997-1, Class A5, 6.860%, 03/15/2028 | 5,022 | 5,076 | |||||||||||
| Series 1998-2, Class A5, 6.240%, 12/01/2028 | 736,552 | 756,430 | |||||||||||
| Series 1997-6, Class A8, 7.070%, 01/15/2029 | 15,189 | 15,570 | |||||||||||
| Series 1998-3, Class A5, 6.220%, 03/01/2030 | 742,760 | 788,986 | |||||||||||
| Series 1998-4, Class A5, 6.180%, 04/01/2030 | 436,598 | 448,417 | |||||||||||
| Contimortgage Home Equity Loan Trust, | |||||||||||||
| Series 1997-2, Class A9, 7.090%, 04/15/2028 | 28 | 28 | |||||||||||
| Countrywide Asset-Backed Certificates: | |||||||||||||
| Series 2004-13, Class AF4, 4.583%, 01/25/2033 | 1,853,765 | 1,881,401 | |||||||||||
| Series 2004-S1, Class A3, 5.115%, 02/25/2035 | 1,256,720 | 1,282,716 | |||||||||||
| Series 2004-15, Class AF6, 4.613%, 04/25/2035 | 2,090,487 | 2,030,912 | |||||||||||
| Series 2005-1, Class AF6, 5.030%, 07/25/2035 | 3,400,720 | 3,465,698 | |||||||||||
| Series 2005-11, Class AF3, 4.778%, 02/25/2036 | 7,165,575 | 7,215,046 | |||||||||||
| Series 2005-10, Class AF6, 4.915%, 02/25/2036 | 2,127,628 | 2,115,720 | |||||||||||
| Series 2005-13, Class AF3, 5.046%, 04/25/2036 | 3,258,629 | 2,789,638 | |||||||||||
| Series 2005-17, Class 1AF5, 5.084%, 05/25/2036 § | 963,476 | 1,022,310 | |||||||||||
| Series 2005-17, Class 1AF2, 5.084%, 05/25/2036 § | 375,471 | 425,923 | |||||||||||
| Series 2006-10, Class 1AF3, 5.020%, 09/25/2046 § | 1,325,227 | 844,265 | |||||||||||
| Credit-Based Asset Servicing and Securitization LLC, | |||||||||||||
| Series 2005-CB8, Class AF2, 4.296%, 12/25/2035 | 299,678 | 281,965 | |||||||||||
| CWHEQ Home Equity Loan Trust, | |||||||||||||
| Series 2007-S1, Class A6, 5.693%, 11/25/2036 | 821,654 | 789,593 | |||||||||||
| Deutsche Mortgage Securities Inc Mortgage Loan Trust, | |||||||||||||
| Series 2004-4, Class 1A6, 6.000%, 04/25/2034 | 56,921 | 58,320 | |||||||||||
| GE Capital Mortgage Services Inc. Trust, | |||||||||||||
| Series 1999-HE1, Class A7, 6.265%, 04/25/2029 | 3,236 | 3,220 | |||||||||||
| GE Mortgage Services LLC, | |||||||||||||
| Series 1997-HE4, Class A7, 6.735%, 12/25/2028 | 114 | 114 | |||||||||||
| GSAA Home Equity Trust, | |||||||||||||
| Series 2004-6, Class A1, 0.952%, 06/25/2034 | 4,027,834 | 3,892,829 | |||||||||||
| Imc Home Equity Loan Trust, | |||||||||||||
| Series 1997-5, Class A10, 6.880%, 11/20/2028 | 7,938 | 7,926 | |||||||||||
| Impac CMB Trust, | |||||||||||||
| Series 2004-4, Class 2A2, 4.658%, 09/25/2034 | 156,819 | 158,965 | |||||||||||
| J.P. Morgan Mortgage Acquisition Trust: | |||||||||||||
| Series 2006-CH1, Class A1, 0.280%, 07/25/2036 | 10,297,107 | 9,895,139 | |||||||||||
| Series 2007-CH1, Class AV4, 0.280%, 11/25/2036 | 2,742,176 | 2,725,306 | |||||||||||
| MortgageIT Trust, | |||||||||||||
| Series 2005-2, Class 1A1, 0.412%, 05/25/2035 | 5,044,257 | 4,836,954 | |||||||||||
| Nationstar Home Equity Loan Trust, | |||||||||||||
| Series 2006-B, Class AV3, 0.320%, 09/25/2036 | 8,298,614 | 8,270,242 | |||||||||||
| Oakwood Mortgage Investors, Inc., | |||||||||||||
| Series 1999-B, Class A3, 6.450%, 11/15/2017 | 42,650 | 44,458 | |||||||||||
| Pemex Finance Ltd., | |||||||||||||
| 10.610%, 08/15/2017 f | 2,175,875 | 2,452,012 | |||||||||||
| RAAC Series Trust, | |||||||||||||
| Series 2004-SP1, Class AI4, 5.285%, 08/25/2027 | 68,188 | 68,160 | |||||||||||
| RAMP Series Trust: | |||||||||||||
| Series 2003-RS7, Class AI6, 5.340%, 08/25/2033 | 520,604 | 522,366 | |||||||||||
| Series 2005-RS1, Class AI6, 4.713%, 01/25/2035 | 214,169 | 210,261 | |||||||||||
| RASC Series Trust: | |||||||||||||
| Series 2003-KS2, Class AI6, 3.990%, 04/25/2033 | 688,199 | 687,692 | |||||||||||
| Series 2003-KS5, Class AI6, 3.620%, 07/25/2033 | 39,945 | 38,468 | |||||||||||
| Series 2004-KS2, Class AI6, 4.300%, 03/25/2034 | 79,448 | 80,348 | |||||||||||
| Renaissance Home Equity Loan Trust, | |||||||||||||
| Series 2007-1, Class AF3, 5.612%, 04/25/2037 | 2,613,255 | 1,483,004 | |||||||||||
| Securitized Asset Backed Receivables LLC Trust, | |||||||||||||
| Series 2005-OP2, Class A1, 0.477%, 10/25/2035 (Acquired 03/13/2014, Cost $3,428,060) * | 3,470,355 | 3,421,197 | |||||||||||
| Specialty Underwriting & Residential Finance Trust, | |||||||||||||
| Series 2004-BC4, Class A1A, 0.822%, 10/25/2035 | 4,248,675 | 4,128,654 | |||||||||||
| 76,824,241 | 3.4 | % | |||||||||||
| Commercial Mortgage-Backed Securities | |||||||||||||
| Bear Stearns Commercial Mortgage Securities Trust, | |||||||||||||
| Series 2005-PWR9, Class A4A, 4.871%, 09/11/2042 | 9,543,271 | 9,882,009 | |||||||||||
| CD Commercial Mortgage Trust, | |||||||||||||
| Series 2005-CD1, Class A4, 5.401%, 07/15/2044 | 11,539,480 | 11,998,613 | |||||||||||
| COMM Mortgage Trust: | |||||||||||||
| Series 2005-C6, Class A5A, 5.116%, 06/10/2044 | 12,579,159 | 13,006,259 | |||||||||||
| Series 2012-CR1, Class A3, 3.391%, 05/15/2045 | 7,813,462 | 8,035,310 | |||||||||||
| Series 2012-CR2, Class A4, 3.147%, 08/15/2045 | 14,880,536 | 15,038,671 | |||||||||||
| Credit Suisse First Boston Mortgage Securities Corp., | |||||||||||||
| Series 2005-C5, Class A4, 5.100%, 08/15/2038 | 14,236,850 | 14,652,324 | |||||||||||
| FHLMC Multifamily Structured Pass Through Certificates, | |||||||||||||
| Series K-003, Class A4, 5.053%, 01/25/2019 | 12,525,000 | 14,210,577 | |||||||||||
| GE Capital Commercial Mortgage Corp., | |||||||||||||
| Series 2005-C4, Class A4, 5.489%, 11/10/2045 | 9,751,208 | 10,211,026 | |||||||||||
| GS Mortgage Securities Corp II, | |||||||||||||
| Series 2012-GCJ9, Class A3, 2.773%, 11/10/2045 | 20,412,320 | 19,981,722 | |||||||||||
| J.P. Morgan Chase Commercial Mortgage Securities Trust, | |||||||||||||
| Series 2005-CB12, Class A4, 4.895%, 09/12/2037 | 10,399,264 | 10,703,391 | |||||||||||
| J.P. Morgan Chase Commercial Mortgage Trust, | |||||||||||||
| Series 2013-LC11, Class A5, 2.960%, 04/15/2046 | 9,452,913 | 9,328,106 | |||||||||||
| Morgan Stanley Bank of America Merrill Lynch Trust, | |||||||||||||
| Series 2012-C6, Class A4, 2.858%, 11/15/2045 | 17,180,945 | 16,897,391 | |||||||||||
| Wachovia Bank Commercial Mortgage Trust, | |||||||||||||
| Series 2005-C22, Class A4, 5.455%, 12/15/2044 | 9,010,591 | 9,449,155 | |||||||||||
| WFRBS Commercial Mortgage Trust, | |||||||||||||
| Series 2012-C6, Class A4, 3.440%, 04/15/2045 | 10,964,220 | 11,349,053 | |||||||||||
| 174,743,607 | 7.8 | % | |||||||||||
| Total Long-Term Investments (Cost $2,093,205,347) | 2,157,061,317 | 96.0 | % | ||||||||||
| Shares | |||||||||||||
| SHORT-TERM INVESTMENTS | |||||||||||||
| Money Market Mutual Funds | |||||||||||||
| Dreyfus Institutional Cash Advantage Fund, 0.06% « | 53,651,768 | 53,651,768 | |||||||||||
| Short-Term Investments Trust - Liquid Assets Portfolio, 0.06% « | 43,000,000 | 43,000,000 | |||||||||||
| Total Short-Term Investments (Cost $96,651,768) | 96,651,768 | 4.3 | % | ||||||||||
| INVESTMENTS PURCHASED WITH CASH PROCEEDS FROM | |||||||||||||
| SECURITIES LENDING | |||||||||||||
| Investment Companies | |||||||||||||
| Mount Vernon Securities Lending Trust Prime Portfolio, 0.20% « | 230,827,698 | 230,827,698 | |||||||||||
| Total Investment Companies (Cost $230,827,698) | 230,827,698 | 10.2 | % | ||||||||||
| Total Investments Purchased With Cash Proceeds From | |||||||||||||
| Securities Lending (Cost $230,827,698) | 230,827,698 | 10.2 | % | ||||||||||
| Total Investments (Cost $2,420,684,813) | 2,484,540,783 | 110.5 | % | ||||||||||
| Liabilities in Excess of Other Assets | (236,953,378 | ) | (10.5 | )% | |||||||||
| TOTAL NET ASSETS | $ | 2,247,587,405 | 100.0 | % | |||||||||
| Notes to Schedule of Investments | |||||||||||||
| * | Restricted Security Deemed Liquid | ||||||||||||
| @ | This security or portion of this security is out on loan at June 30, 2014. | ||||||||||||
| f | Foreign Security | ||||||||||||
| ^ | Non-Income Producing | ||||||||||||
| « | 7-Day Yield | ||||||||||||
| § | Security in Default |
| Baird Core Plus Bond Fund | |||||||||||||
| Schedule of Investments | |||||||||||||
| June 30, 2014 (Unaudited) | |||||||||||||
| Principal | % of | ||||||||||||
| Amount | Value | Net Assets | |||||||||||
| LONG-TERM INVESTMENTS | |||||||||||||
| U.S. Treasury Securities | |||||||||||||
| U.S. Treasury Bonds: | |||||||||||||
| 1.250%, 04/30/2019 @ | $ | 238,400,000 | $ | 234,824,000 | |||||||||
| 5.250%, 11/15/2028 @ | 58,975,000 | 75,543,319 | |||||||||||
| 4.375%, 02/15/2038 @ | 21,475,000 | 25,639,131 | |||||||||||
| 3.500%, 02/15/2039 @ | 122,475,000 | 127,795,069 | |||||||||||
| 463,801,519 | 13.6 | % | |||||||||||
| Taxable Municipal Bonds | |||||||||||||
| Bellevue Union School District, | |||||||||||||
| 5.000%, 08/01/2028 | 625,000 | 629,387 | |||||||||||
| California Qualified School Bond Joint Powers Authority: | |||||||||||||
| 6.739%, 09/01/2026 | 2,415,000 | 2,636,963 | |||||||||||
| 7.155%, 03/01/2027 | 1,700,000 | 1,899,682 | |||||||||||
| California School Finance Authority, | |||||||||||||
| 5.041%, 07/01/2020 | 1,500,000 | 1,635,435 | |||||||||||
| California State, | |||||||||||||
| 5.500%, 03/01/2016 | 2,000,000 | 2,157,200 | |||||||||||
| Central Valley Support Joint Powers Agency, | |||||||||||||
| 5.676%, 09/01/2024 | 1,500,000 | 1,584,525 | |||||||||||
| Colton Joint Unified School District, | |||||||||||||
| 6.008%, 08/01/2026 | 1,250,000 | 1,410,400 | |||||||||||
| County of Contra Costa CA, | |||||||||||||
| 5.140%, 06/01/2017 | 1,300,000 | 1,395,940 | |||||||||||
| Elgin Local School District, | |||||||||||||
| 5.499%, 08/31/2027 (Callable 12/01/2019) | 1,000,000 | 1,041,350 | |||||||||||
| Government Development Bank for Puerto Rico, | |||||||||||||
| 4.704%, 05/01/2016 | 875,000 | 732,996 | |||||||||||
| Iowa Tobacco Settlement Authority, | |||||||||||||
| 6.500%, 06/01/2023 (Callable 06/01/2015) | 2,810,000 | 2,794,798 | |||||||||||
| New Hampshire Housing Finance Authority: | |||||||||||||
| 3.100%, 07/01/2021 | 2,045,000 | 2,084,714 | |||||||||||
| 3.750%, 07/01/2034 (Callable 07/01/2023) | 8,400,000 | 8,729,112 | |||||||||||
| New Jersey Economic Development Authority, | |||||||||||||
| 1.802%, 06/15/2017 | 15,000,000 | 15,111,150 | |||||||||||
| North Carolina Housing Finance Agency: | |||||||||||||
| 2.870%, 07/01/2032 (Callable 01/01/2024) | 7,000,000 | 7,066,640 | |||||||||||
| 2.812%, 07/01/2035 (Callable 01/01/2024) | 9,430,000 | 9,543,537 | |||||||||||
| North East Independent School District Texas, | |||||||||||||
| 5.240%, 08/01/2027 | 3,000,000 | 3,505,470 | |||||||||||
| Port of Oakland, | |||||||||||||
| 5.000%, 11/01/2020 (Callable 11/01/2017) | 2,900,000 | 3,137,742 | |||||||||||
| San Dieguito Public Facilities Authority, | |||||||||||||
| 6.459%, 05/01/2027 | 1,825,000 | 2,061,794 | |||||||||||
| State of Illinois: | |||||||||||||
| 4.421%, 01/01/2015 | 1,600,000 | 1,630,224 | |||||||||||
| 4.961%, 03/01/2016 | 2,000,000 | 2,127,460 | |||||||||||
| 5.163%, 02/01/2018 | 3,000,000 | 3,271,740 | |||||||||||
| State Public School Building Authority, | |||||||||||||
| 5.000%, 09/15/2027 | 1,998,000 | 2,234,503 | |||||||||||
| Three Rivers Local School District, | |||||||||||||
| 5.209%, 09/15/2027 (Callable 12/01/2020) | 1,350,000 | 1,414,800 | |||||||||||
| Town of Davie FL Water & Sewer Revenue, | |||||||||||||
| 6.599%, 10/01/2030 (Callable 10/01/2020) | 1,000,000 | 1,164,090 | |||||||||||
| West Contra Costa Unified School District, | |||||||||||||
| 6.250%, 08/01/2030 | 4,320,000 | 4,692,125 | |||||||||||
| Westlake City School District, | |||||||||||||
| 5.227%, 12/01/2026 (Callable 12/01/2020) | 1,160,000 | 1,249,807 | |||||||||||
| 86,943,584 | 2.6 | % | |||||||||||
| Other Government Related Securities | |||||||||||||
| Centrais Eletricas Brasileiras SA: | |||||||||||||
| 6.875%, 07/30/2019 (Acquired 12/06/2012, Cost $3,403,250) * f | 3,000,000 | 3,330,000 | |||||||||||
| 5.750%, 10/27/2021 (Acquired 10/20/2011, Cost $4,000,000) * @ f | 4,000,000 | 4,103,520 | |||||||||||
| CNOOC Curtis Funding No.1 Pty Ltd, | |||||||||||||
| 4.500%, 10/03/2023 (Acquired 02/26/2014, Cost $5,040,707) * f | 5,000,000 | 5,245,370 | |||||||||||
| CNOOC Finance 2013 Ltd, | |||||||||||||
| 3.000%, 05/09/2023 f | 1,000,000 | 944,217 | |||||||||||
| CNOOC Nexen Finance (2014) ULC, | |||||||||||||
| 4.250%, 04/30/2024 f | 2,000,000 | 2,050,668 | |||||||||||
| CNPC General Capital Ltd, | |||||||||||||
| 2.750%, 05/14/2019 (Acquired 05/07/2014, Cost $1,983,740) * f | 2,000,000 | 1,999,548 | |||||||||||
| CNPC HK Overseas Capital Ltd, | |||||||||||||
| 5.950%, 04/28/2041 (Acquired 04/20/2011, Cost $978,120) * f | 1,000,000 | 1,176,226 | |||||||||||
| Comision Federal de Electricidad, | |||||||||||||
| 5.750%, 02/14/2042 (Acquired 02/08/2012, Cost $5,116,800) * f | 5,200,000 | 5,525,000 | |||||||||||
| Corp Andina de Fomento, | |||||||||||||
| 4.375%, 06/15/2022 f | 3,956,000 | 4,195,623 | |||||||||||
| Eksportfinans ASA, | |||||||||||||
| 2.000%, 09/15/2015 f | 10,000,000 | 9,990,000 | |||||||||||
| Korea Electric Power Corporation, | |||||||||||||
| 6.750%, 08/01/2027 f | 490,000 | 597,472 | |||||||||||
| Korea Expressway Corporation, | |||||||||||||
| 1.625%, 04/28/2017 (Acquired 04/22/2014, Cost $2,643,057) * f | 2,650,000 | 2,647,239 | |||||||||||
| Korea Hydro & Nuclear Power Co., Ltd., | |||||||||||||
| 3.125%, 09/16/2015 (Acquired 09/09/2010, Cost $493,770) * f | 500,000 | 512,649 | |||||||||||
| Nexen Energy ULC, | |||||||||||||
| 7.500%, 07/30/2039 f | 6,175,000 | 8,356,522 | |||||||||||
| Petrobras Global Finance B.V., | |||||||||||||
| 3.000%, 01/15/2019 @ f | 3,000,000 | 2,944,950 | |||||||||||
| Petrobras International Finance Company: | |||||||||||||
| 3.875%, 01/27/2016 f | 5,800,000 | 5,980,090 | |||||||||||
| 7.875%, 03/15/2019 f | 5,000,000 | 5,829,200 | |||||||||||
| 5.375%, 01/27/2021 f | 3,200,000 | 3,335,136 | |||||||||||
| Petroleos Mexicanos: | |||||||||||||
| 4.875%, 03/15/2015 f | 4,809,000 | 4,943,652 | |||||||||||
| 4.875%, 01/24/2022 f | 2,500,000 | 2,704,500 | |||||||||||
| 6.500%, 06/02/2041 f | 4,000,000 | 4,650,000 | |||||||||||
| Portigon AG, | |||||||||||||
| 4.796%, 07/15/2015 f | 1,885,000 | 1,966,076 | |||||||||||
| PTT Public Company Limited, | |||||||||||||
| 3.375%, 10/25/2022 (Acquired 10/19/2012, Cost $4,958,500) * f | 5,000,000 | 4,756,075 | |||||||||||
| Sinopec Group Overseas Development (2014) Limited, | |||||||||||||
| 4.375%, 04/10/2024 (Acquired 04/02/2014, Cost $1,496,505) * f | 1,500,000 | 1,552,903 | |||||||||||
| State Bank of India, | |||||||||||||
| 4.125%, 08/01/2017 (Acquired 07/25/2012, Cost $6,939,800) * f | 7,000,000 | 7,287,756 | |||||||||||
| The Export-Import Bank of Korea: | |||||||||||||
| 5.875%, 01/14/2015 f | 3,500,000 | 3,595,694 | |||||||||||
| 4.000%, 01/29/2021 f | 2,400,000 | 2,549,990 | |||||||||||
| The Korea Development Bank, | |||||||||||||
| 3.000%, 09/14/2022 @ f | 4,400,000 | 4,368,945 | |||||||||||
| 107,139,021 | 3.1 | % | |||||||||||
| Corporate Bonds | |||||||||||||
| Industrials | |||||||||||||
| AbbVie Inc., | |||||||||||||
| 1.750%, 11/06/2017 | 7,450,000 | 7,490,632 | |||||||||||
| Acuity Brands Lighting, Inc., | |||||||||||||
| 6.000%, 12/15/2019 | 700,000 | 792,866 | |||||||||||
| ADT Corp.: | |||||||||||||
| 2.250%, 07/15/2017 | 2,810,000 | 2,774,875 | |||||||||||
| 3.500%, 07/15/2022 | 1,200,000 | 1,092,000 | |||||||||||
| Altera Corporation, | |||||||||||||
| 4.100%, 11/15/2023 | 3,000,000 | 3,102,324 | |||||||||||
| Ameritech Capital Funding Corporation, | |||||||||||||
| 6.450%, 01/15/2018 | 3,000,000 | 3,408,468 | |||||||||||
| Anadarko Petroleum Corporation: | |||||||||||||
| 5.950%, 09/15/2016 | 2,225,000 | 2,464,315 | |||||||||||
| 6.375%, 09/15/2017 | 968,000 | 1,114,497 | |||||||||||
| 8.700%, 03/15/2019 | 3,700,000 | 4,766,843 | |||||||||||
| Anglo American Capital PLC, | |||||||||||||
| 9.375%, 04/08/2019 (Acquired 09/20/2011 through 07/11/2012, Cost $6,765,748) * f | 5,500,000 | 7,080,111 | |||||||||||
| ArcelorMittal S.A.: | |||||||||||||
| 5.000%, 02/25/2017 f | 5,000,000 | 5,287,500 | |||||||||||
| 6.750%, 02/25/2022 @ f | 2,000,000 | 2,240,000 | |||||||||||
| AT&T Inc., | |||||||||||||
| 5.550%, 08/15/2041 | 1,000,000 | 1,121,252 | |||||||||||
| Atlas Air, Inc. Pass Through Trust, | |||||||||||||
| Series 00-1, 8.707%, 01/02/2019 @ | 173,992 | 183,561 | |||||||||||
| Beam Suntory Inc., | |||||||||||||
| 3.250%, 05/15/2022 | 2,000,000 | 1,977,212 | |||||||||||
| Bemis Company, Inc., | |||||||||||||
| 4.500%, 10/15/2021 | 1,000,000 | 1,065,326 | |||||||||||
| BP Capital Markets: | |||||||||||||
| 0.864%, 09/26/2018 f | 5,000,000 | 5,046,055 | |||||||||||
| 4.750%, 03/10/2019 f | 1,500,000 | 1,682,304 | |||||||||||
| Browning-Ferris Industries, Inc., | |||||||||||||
| 9.250%, 05/01/2021 | 1,600,000 | 1,992,632 | |||||||||||
| Bunge Limited Finance Corp.: | |||||||||||||
| 5.100%, 07/15/2015 | 2,527,000 | 2,632,060 | |||||||||||
| 8.500%, 06/15/2019 | 9,490,000 | 11,925,352 | |||||||||||
| Bunge N.A. Finance L.P., | |||||||||||||
| 5.900%, 04/01/2017 | 2,424,000 | 2,689,833 | |||||||||||
| CareFusion Corporation, | |||||||||||||
| 3.875%, 05/15/2024 | 3,000,000 | 3,031,029 | |||||||||||
| CenturyLink, Inc., | |||||||||||||
| Series R, 5.150%, 06/15/2017 | 2,000,000 | 2,160,000 | |||||||||||
| CF Industries, Inc.: | |||||||||||||
| 3.450%, 06/01/2023 | 2,000,000 | 1,982,376 | |||||||||||
| 5.375%, 03/15/2044 | 5,000,000 | 5,361,215 | |||||||||||
| Chesapeake Energy Corporation, | |||||||||||||
| 6.500%, 08/15/2017 @ | 3,544,000 | 3,969,280 | |||||||||||
| Cliffs Natural Resources Inc., | |||||||||||||
| 3.950%, 01/15/2018 @ | 11,579,000 | 11,733,336 | |||||||||||
| Comcast Cable Communications Holdings, Inc., | |||||||||||||
| 9.455%, 11/15/2022 | 2,030,000 | 2,950,599 | |||||||||||
| Comcast Corporation: | |||||||||||||
| 4.250%, 01/15/2033 | 5,900,000 | 6,060,686 | |||||||||||
| 4.650%, 07/15/2042 | 2,000,000 | 2,073,578 | |||||||||||
| Computer Sciences Corporation, | |||||||||||||
| 4.450%, 09/15/2022 | 2,000,000 | 2,097,080 | |||||||||||
| ConocoPhillips Canada Funding Company I, | |||||||||||||
| 5.950%, 10/15/2036 f | 845,000 | 1,070,476 | |||||||||||
| Continental Airlines, Inc. Pass Through Trust, | |||||||||||||
| Series 974A, 6.900%, 01/02/2018 | 32,273 | 34,532 | |||||||||||
| Cox Communications, Inc.: | |||||||||||||
| 2.950%, 06/30/2023 (Acquired 04/24/2013, Cost $5,226,900) * | 5,250,000 | 4,983,620 | |||||||||||
| 4.700%, 12/15/2042 (Acquired 11/26/2012, Cost $4,999,050) * | 5,000,000 | 4,862,440 | |||||||||||
| CSX Corporation, | |||||||||||||
| 6.220%, 04/30/2040 | 175,000 | 219,750 | |||||||||||
| D.R. Horton, Inc., | |||||||||||||
| 4.750%, 05/15/2017 | 1,000,000 | 1,060,000 | |||||||||||
| Daimler Finance North America LLC, | |||||||||||||
| 1.875%, 01/11/2018 (Acquired 01/07/2013, Cost $2,116,139) * | 2,125,000 | 2,144,244 | |||||||||||
| Danone, | |||||||||||||
| 3.000%, 06/15/2022 (Acquired 05/29/2012, Cost $3,489,465) * f | 3,500,000 | 3,449,716 | |||||||||||
| Deutsche Telekom International Finance B.V.: | |||||||||||||
| 6.750%, 08/20/2018 f | 1,250,000 | 1,482,216 | |||||||||||
| 8.750%, 06/15/2030 f | 825,000 | 1,206,558 | |||||||||||
| Devon Financing Corporation, L.L.C., | |||||||||||||
| 7.875%, 09/30/2031 | 5,000,000 | 7,023,615 | |||||||||||
| DISH DBS Corporation, | |||||||||||||
| 5.000%, 03/15/2023 | 2,500,000 | 2,546,875 | |||||||||||
| Dollar General Corporation, | |||||||||||||
| 1.875%, 04/15/2018 | 2,100,000 | 2,082,511 | |||||||||||
| Eaton Corporation: | |||||||||||||
| 2.750%, 11/02/2022 | 2,500,000 | 2,420,735 | |||||||||||
| 4.000%, 11/02/2032 | 3,660,000 | 3,662,331 | |||||||||||
| Ecolab Inc., | |||||||||||||
| 1.450%, 12/08/2017 | 5,200,000 | 5,206,656 | |||||||||||
| Encana Corporation, | |||||||||||||
| 6.500%, 05/15/2019 f | 500,000 | 595,193 | |||||||||||
| Express Scripts Holding Company: | |||||||||||||
| 3.500%, 11/15/2016 | 5,000,000 | 5,308,945 | |||||||||||
| 7.250%, 06/15/2019 | 4,600,000 | 5,638,385 | |||||||||||
| 4.750%, 11/15/2021 | 4,700,000 | 5,201,871 | |||||||||||
| Fidelity National Information Services, Inc.: | |||||||||||||
| 7.875%, 07/15/2020 | 11,884,000 | 12,585,869 | |||||||||||
| 3.500%, 04/15/2023 | 4,100,000 | 4,033,986 | |||||||||||
| 3.875%, 06/05/2024 | 7,000,000 | 7,033,173 | |||||||||||
| Fiserv, Inc.: | |||||||||||||
| 3.125%, 06/15/2016 | 2,475,000 | 2,571,097 | |||||||||||
| 4.625%, 10/01/2020 | 3,000,000 | 3,270,417 | |||||||||||
| 3.500%, 10/01/2022 | 6,650,000 | 6,688,729 | |||||||||||
| Fomento Economico Mexicano SAB de CV: | |||||||||||||
| 2.875%, 05/10/2023 f | 6,000,000 | 5,716,140 | |||||||||||
| 4.375%, 05/10/2043 f | 4,000,000 | 3,719,080 | |||||||||||
| Ford Motor Credit Company LLC: | |||||||||||||
| 3.875%, 01/15/2015 | 2,000,000 | 2,035,830 | |||||||||||
| 2.500%, 01/15/2016 | 2,000,000 | 2,050,736 | |||||||||||
| 4.207%, 04/15/2016 | 2,680,000 | 2,828,483 | |||||||||||
| 3.000%, 06/12/2017 | 3,000,000 | 3,129,750 | |||||||||||
| Freeport-McMoRan Copper & Gold Inc.: | |||||||||||||
| 3.100%, 03/15/2020 | 3,800,000 | 3,837,571 | |||||||||||
| 3.550%, 03/01/2022 @ | 5,000,000 | 4,951,500 | |||||||||||
| Georgia-Pacific LLC, | |||||||||||||
| 5.400%, 11/01/2020 (Acquired 10/27/2010, Cost $994,130) * | 1,000,000 | 1,154,245 | |||||||||||
| Glencore Canada Corporation, | |||||||||||||
| 5.375%, 06/01/2015 f | 2,000,000 | 2,080,340 | |||||||||||
| Glencore Finance (Canada) Limited: | |||||||||||||
| 4.950%, 11/15/2021 (Acquired 11/03/2011, Cost $1,997,480) * f | 2,000,000 | 2,157,688 | |||||||||||
| 4.250%, 10/25/2022 (Acquired 10/18/2012 through 05/22/2013, Cost $7,126,972) * f | 7,000,000 | 7,089,712 | |||||||||||
| Glencore Funding LLC, | |||||||||||||
| 4.125%, 05/30/2023 (Acquired 05/22/2013 through 04/03/2014, Cost $12,189,608) * @ | 12,300,000 | 12,353,394 | |||||||||||
| Grupo Bimbo, S.A.B. de C.V., | |||||||||||||
| 3.875%, 06/27/2024 (Acquired 06/27/2014, Cost $7,011,480) * f | 7,000,000 | 6,986,140 | |||||||||||
| GTE Corporation, | |||||||||||||
| 8.750%, 11/01/2021 | 975,000 | 1,292,213 | |||||||||||
| H. J. Heinz Finance Company, | |||||||||||||
| 6.750%, 03/15/2032 | 10,000,000 | 10,775,000 | |||||||||||
| Hanson Limited, | |||||||||||||
| 6.125%, 08/15/2016 f | 8,877,000 | 9,675,930 | |||||||||||
| Hewlett-Packard Company, | |||||||||||||
| 4.650%, 12/09/2021 @ | 4,000,000 | 4,364,048 | |||||||||||
| Hospira, Inc., | |||||||||||||
| 6.050%, 03/30/2017 | 5,000,000 | 5,516,075 | |||||||||||
| Hutchison Whampoa International (09/16) Limited, | |||||||||||||
| 4.625%, 09/11/2015 (Acquired 08/19/2010 through 12/28/2011, Cost $3,622,479) * f | 3,563,000 | 3,723,007 | |||||||||||
| Hutchison Whampoa International (11) Limited, | |||||||||||||
| 3.500%, 01/13/2017 (Acquired 01/10/2012, Cost $1,990,380) * f | 2,000,000 | 2,102,900 | |||||||||||
| Hutchison Whampoa International (12) (II) Limited, | |||||||||||||
| 3.250%, 11/08/2022 (Acquired 11/05/2012, Cost $3,581,424) * f | 3,600,000 | 3,534,192 | |||||||||||
| Hyundai Capital Services, Inc.: | |||||||||||||
| 4.375%, 07/27/2016 (Acquired 04/05/2013, Cost $1,159,275) * f | 1,100,000 | 1,169,432 | |||||||||||
| 1.031%, 03/18/2017 (Acquired 03/11/2014, Cost $2,400,000) * f | 2,400,000 | 2,407,032 | |||||||||||
| 3.500%, 09/13/2017 (Acquired 03/06/2012 through 04/24/2013, Cost $5,286,226) * f | 5,140,000 | 5,407,588 | |||||||||||
| Ingredion Incorporated, | |||||||||||||
| 1.800%, 09/25/2017 | 5,650,000 | 5,654,362 | |||||||||||
| Johnson Controls, Inc., | |||||||||||||
| 5.250%, 12/01/2041 | 1,150,000 | 1,270,398 | |||||||||||
| Kinross Gold Corporation, | �� | ||||||||||||
| 6.875%, 09/01/2041 f | 5,500,000 | 5,646,113 | |||||||||||
| Kraft Foods Group Inc, | |||||||||||||
| 5.000%, 06/04/2042 | 1,000,000 | 1,069,097 | |||||||||||
| Lafarge S.A.: | |||||||||||||
| 6.200%, 07/09/2015 (Acquired 10/01/2013, Cost $519,371) * f | 500,000 | 523,750 | |||||||||||
| 6.500%, 07/15/2016 f | 3,993,000 | 4,372,335 | |||||||||||
| 7.125%, 07/15/2036 f | 1,225,000 | 1,421,000 | |||||||||||
| Martin Marietta Materials, Inc.: | |||||||||||||
| 6.600%, 04/15/2018 | 475,000 | 544,179 | |||||||||||
| 6.250%, 05/01/2037 | 450,000 | 482,557 | |||||||||||
| Masco Corporation: | |||||||||||||
| 6.125%, 10/03/2016 | 2,150,000 | 2,367,688 | |||||||||||
| 7.125%, 03/15/2020 | 1,000,000 | 1,176,720 | |||||||||||
| Murphy Oil Corporation, | |||||||||||||
| 4.000%, 06/01/2022 | 12,600,000 | 12,752,851 | |||||||||||
| Mylan Inc.: | |||||||||||||
| 6.000%, 11/15/2018 (Acquired 02/06/2013, Cost $4,183,046) * | 4,000,000 | 4,183,756 | |||||||||||
| 7.875%, 07/15/2020 (Acquired 07/16/2013, Cost $5,501,415) * | 5,000,000 | 5,534,295 | |||||||||||
| 4.200%, 11/29/2023 | 4,525,000 | 4,670,601 | |||||||||||
| Nabors Industries, Inc., | |||||||||||||
| 6.150%, 02/15/2018 | 250,000 | 284,826 | |||||||||||
| National Oilwell Varco, Inc., | |||||||||||||
| Series B, 6.125%, 08/15/2015 | 2,655,000 | 2,657,862 | |||||||||||
| New Cingular Wireless Services, Inc., | |||||||||||||
| 8.750%, 03/01/2031 | 3,050,000 | 4,544,021 | |||||||||||
| Northern Tier Energy LLC / Northern Tier Finance Corp, | |||||||||||||
| 7.125%, 11/15/2020 | 250,000 | 270,938 | |||||||||||
| Oi S.A., | |||||||||||||
| 5.750%, 02/10/2022 (Acquired 02/06/2012, Cost $3,000,000) * f | 3,000,000 | 2,994,000 | |||||||||||
| Oracle Corporation, | |||||||||||||
| 3.400%, 07/08/2024 | 8,850,000 | 8,829,911 | |||||||||||
| Orange, | |||||||||||||
| 2.750%, 09/14/2016 f | 1,050,000 | 1,089,307 | |||||||||||
| Pactiv LLC, | |||||||||||||
| 7.950%, 12/15/2025 | 475,000 | 508,250 | |||||||||||
| PCCW-HKT Capital No. 3 Limited, | |||||||||||||
| 5.250%, 07/20/2015 (Acquired 09/29/2008 through 12/20/2010, Cost $778,630) * f | 775,000 | 807,559 | |||||||||||
| Pearson Funding Two plc, | |||||||||||||
| 4.000%, 05/17/2016 (Acquired 07/17/2012, Cost $9,051,092) * f | 8,700,000 | 9,154,471 | |||||||||||
| Pentair Finance S.A., | |||||||||||||
| 2.650%, 12/01/2019 f | 5,000,000 | 5,010,060 | |||||||||||
| Petrofac Limited, | |||||||||||||
| 3.400%, 10/10/2018 (Acquired 10/03/2013, Cost $8,966,430) * f | 9,000,000 | 9,342,513 | |||||||||||
| Petrohawk Energy Corporation, | |||||||||||||
| 7.250%, 08/15/2018 | 8,510,000 | 8,892,950 | |||||||||||
| Plains Exploration & Production Company: | |||||||||||||
| 6.500%, 11/15/2020 | 6,800,000 | 7,590,500 | |||||||||||
| 6.750%, 02/01/2022 | 1,000,000 | 1,136,250 | |||||||||||
| Plum Creek Timberlands, L.P.: | |||||||||||||
| 5.875%, 11/15/2015 | 1,200,000 | 1,274,012 | |||||||||||
| 4.700%, 03/15/2021 | 1,200,000 | 1,304,252 | |||||||||||
| 3.250%, 03/15/2023 | 8,375,000 | 8,002,581 | |||||||||||
| POSCO, | |||||||||||||
| 4.250%, 10/28/2020 (Acquired 10/21/2010, Cost $2,165,365) * f | 2,175,000 | 2,300,206 | |||||||||||
| Qwest Capital Funding, Inc., | |||||||||||||
| 7.625%, 08/03/2021 | 200,000 | 226,000 | |||||||||||
| R.R. Donnelley & Sons Company: | |||||||||||||
| 8.600%, 08/15/2016 | 1,250,000 | 1,434,375 | |||||||||||
| 6.125%, 01/15/2017 | 76,000 | 83,030 | |||||||||||
| Reliance Holding USA, Inc.: | |||||||||||||
| 4.500%, 10/19/2020 (Acquired 10/14/2010 through 10/18/2010, Cost $1,988,700) * | 2,000,000 | 2,087,946 | |||||||||||
| 5.400%, 02/14/2022 (Acquired 02/09/2012 through 02/23/2012, Cost $3,515,456) * | 3,500,000 | 3,779,157 | |||||||||||
| Republic Services, Inc., | |||||||||||||
| 3.550%, 06/01/2022 | 4,000,000 | 4,135,008 | |||||||||||
| Rio Tinto Finance (USA) Limited, | |||||||||||||
| 9.000%, 05/01/2019 f | 11,000,000 | 14,421,550 | |||||||||||
| Samarco Mineracao S.A., | |||||||||||||
| 5.750%, 10/24/2023 (Acquired 10/21/2013, Cost $2,447,255) * f | 2,475,000 | 2,598,008 | |||||||||||
| Schneider Electric SE, | |||||||||||||
| 2.950%, 09/27/2022 (Acquired 09/20/2012, Cost $4,986,700) * f | 5,000,000 | 4,918,550 | |||||||||||
| Seagate HDD Cayman, | |||||||||||||
| 6.875%, 05/01/2020 f | 5,000,000 | 5,406,250 | |||||||||||
| Sealed Air Corporation, | |||||||||||||
| 8.375%, 09/15/2021 (Acquired 09/16/2011 through 09/19/2011, Cost $2,288,360) * @ | 2,250,000 | 2,576,250 | |||||||||||
| SK Telecom Co., Ltd, | |||||||||||||
| 6.625%, 07/20/2027 (Acquired 07/13/2007 through 04/30/2013, Cost $997,860) * f | 960,000 | 1,207,116 | |||||||||||
| Sonoco Products Company, | |||||||||||||
| 4.375%, 11/01/2021 | 1,000,000 | 1,053,405 | |||||||||||
| Sprint Capital Corporation: | |||||||||||||
| 6.900%, 05/01/2019 | 675,000 | 744,188 | |||||||||||
| 8.750%, 03/15/2032 | 300,000 | 346,500 | |||||||||||
| Sprint Communications, Inc., | |||||||||||||
| 6.000%, 12/01/2016 | 200,000 | 217,750 | |||||||||||
| Telecom Italia Capital: | |||||||||||||
| 5.250%, 10/01/2015 f | 4,100,000 | 4,284,500 | |||||||||||
| 7.200%, 07/18/2036 f | 2,500,000 | 2,768,750 | |||||||||||
| Telecom Italia S.p.A., | |||||||||||||
| 5.303%, 05/30/2024 (Acquired 05/22/2014, Cost $5,000,000) * @ f | 5,000,000 | 5,018,750 | |||||||||||
| Telefonica Emisiones S.A.U.: | |||||||||||||
| 6.421%, 06/20/2016 f | 3,950,000 | 4,348,524 | |||||||||||
| 6.221%, 07/03/2017 f | 8,942,000 | 10,119,089 | |||||||||||
| 5.462%, 02/16/2021 f | 1,000,000 | 1,135,469 | |||||||||||
| 4.570%, 04/27/2023 @ f | 1,000,000 | 1,062,110 | |||||||||||
| 7.045%, 06/20/2036 f | 200,000 | 255,098 | |||||||||||
| The Dow Chemical Company, | |||||||||||||
| 4.125%, 11/15/2021 @ | 835,000 | 896,126 | |||||||||||
| Time Warner Cable Inc., | |||||||||||||
| 8.750%, 02/14/2019 | 1,132,000 | 1,451,759 | |||||||||||
| Time Warner Companies, Inc., | |||||||||||||
| 7.250%, 10/15/2017 | 2,300,000 | 2,690,499 | |||||||||||
| Time Warner Inc.: | |||||||||||||
| 7.625%, 04/15/2031 | 3,050,000 | 4,190,724 | |||||||||||
| 7.700%, 05/01/2032 | 408,000 | 566,567 | |||||||||||
| Transocean Inc.: | |||||||||||||
| 6.375%, 12/15/2021 f | 5,500,000 | 6,362,626 | |||||||||||
| 3.800%, 10/15/2022 @ f | 5,000,000 | 4,948,615 | |||||||||||
| 6.800%, 03/15/2038 @ f | 878,000 | 1,001,401 | |||||||||||
| TSMC Global Ltd, | |||||||||||||
| 1.625%, 04/03/2018 (Acquired 03/27/2013, Cost $2,997,990) * f | 3,000,000 | 2,956,317 | |||||||||||
| Tyco Electronics Group S.A.: | |||||||||||||
| 6.550%, 10/01/2017 f | 5,243,000 | 6,067,126 | |||||||||||
| 7.125%, 10/01/2037 f | 500,000 | 656,672 | |||||||||||
| U.S. Airways Pass Through Trust, | |||||||||||||
| Series 981B, 7.350%, 01/30/2018 | 328,109 | 352,307 | |||||||||||
| United AirLines, Inc. Pass Through Trust, | |||||||||||||
| Series 91A2, 10.020%, 03/22/2014 § † ** | 62,924 | 18,248 | |||||||||||
| Vale Overseas Limited: | |||||||||||||
| 6.250%, 01/23/2017 f | 3,850,000 | 4,308,150 | |||||||||||
| 4.375%, 01/11/2022 @ f | 2,700,000 | 2,772,090 | |||||||||||
| 8.250%, 01/17/2034 f | 425,000 | 529,344 | |||||||||||
| 6.875%, 11/10/2039 f | 5,625,000 | 6,246,833 | |||||||||||
| Verizon Communications Inc.: | |||||||||||||
| 5.150%, 09/15/2023 | 10,000,000 | 11,190,930 | |||||||||||
| 6.400%, 09/15/2033 | 5,725,000 | 7,012,770 | |||||||||||
| Vodafone Group Public Limited Company, | |||||||||||||
| 6.150%, 02/27/2037 f | 500,000 | 594,131 | |||||||||||
| Vulcan Materials Company: | |||||||||||||
| 7.000%, 06/15/2018 | 1,900,000 | 2,187,375 | |||||||||||
| 7.150%, 11/30/2037 | 500,000 | 520,000 | |||||||||||
| Walgreen Co., | |||||||||||||
| 5.250%, 01/15/2019 | 10,000,000 | 11,346,950 | |||||||||||
| Weatherford International LTD., | |||||||||||||
| 6.750%, 09/15/2040 f | 1,250,000 | 1,533,719 | |||||||||||
| Westvaco Corporation: | |||||||||||||
| 9.750%, 06/15/2020 | 930,000 | 1,213,065 | |||||||||||
| 8.200%, 01/15/2030 | 1,540,000 | 2,022,350 | |||||||||||
| WPX Energy, Inc., | |||||||||||||
| 6.000%, 01/15/2022 | 4,000,000 | 4,270,000 | |||||||||||
| Wynn Las Vegas LLC / Wynn Las Vegas Capital Corp., | |||||||||||||
| 4.250%, 05/30/2023 (Acquired 05/15/2013, Cost $4,000,000) * | 4,000,000 | 3,870,000 | |||||||||||
| Yara International ASA, | |||||||||||||
| 7.875%, 06/11/2019 (Acquired 12/03/2012 through 10/31/2013, Cost $7,232,038) * f | 5,880,000 | 7,199,496 | |||||||||||
| 620,658,897 | 18.1 | % | |||||||||||
| Utility | |||||||||||||
| Access Midstream Partners LP / ACMP Finance Corp, | |||||||||||||
| 6.125%, 07/15/2022 | 300,000 | 331,500 | |||||||||||
| Appalachian Power Company, | |||||||||||||
| Series P, 6.700%, 08/15/2037 | 1,150,000 | 1,509,238 | |||||||||||
| Arizona Public Service Company, | |||||||||||||
| 8.750%, 03/01/2019 | 1,150,000 | 1,482,704 | |||||||||||
| CMS Energy Corporation: | |||||||||||||
| 4.250%, 09/30/2015 | 3,000,000 | 3,125,031 | |||||||||||
| 5.050%, 03/15/2022 @ | 1,000,000 | 1,136,581 | |||||||||||
| Constellation Energy Group, Inc., | |||||||||||||
| 4.550%, 06/15/2015 | 750,000 | 777,577 | |||||||||||
| DCP Midstream, LLC: | |||||||||||||
| 9.750%, 03/15/2019 (Acquired 02/29/2012 through 12/12/2012, Cost $11,204,382) * | 9,155,000 | 11,804,155 | |||||||||||
| 4.750%, 09/30/2021 (Acquired 09/14/2011 through 11/18/2011, Cost $2,250,899) * | 2,245,000 | 2,369,187 | |||||||||||
| Dominion Resources, Inc., | |||||||||||||
| Series B, 5.950%, 06/15/2035 | 1,880,000 | 2,273,292 | |||||||||||
| El Paso Pipeline Partners Operating Company, L.L.C., | |||||||||||||
| 7.500%, 11/15/2040 | 2,500,000 | 3,220,842 | |||||||||||
| ENEL Finance International N.V., | |||||||||||||
| 6.800%, 09/15/2037 (Acquired 09/13/2007 through 09/29/2008, Cost $498,897) * f | 500,000 | 610,148 | |||||||||||
| Energy Transfer Partners, L.P.: | |||||||||||||
| 9.700%, 03/15/2019 | 1,189,000 | 1,558,509 | |||||||||||
| 5.200%, 02/01/2022 | 1,000,000 | 1,106,608 | |||||||||||
| 3.600%, 02/01/2023 @ | 5,000,000 | 4,953,995 | |||||||||||
| Enogex LLC, | |||||||||||||
| 6.250%, 03/15/2020 (Acquired 10/25/2012 through 05/10/2013, Cost $3,591,350) * | 3,190,000 | 3,513,303 | |||||||||||
| Enterprise Products Operating LLC, | |||||||||||||
| 3.350%, 03/15/2023 @ | 10,000,000 | 10,017,480 | |||||||||||
| Exelon Corporation, | |||||||||||||
| 4.900%, 06/15/2015 | 500,000 | 519,769 | |||||||||||
| Exelon Generation Company, LLC: | |||||||||||||
| 6.200%, 10/01/2017 | 4,350,000 | 4,956,107 | |||||||||||
| 5.600%, 06/15/2042 | 6,100,000 | 6,609,247 | |||||||||||
| Florida Gas Transmission Company, LLC, | |||||||||||||
| 3.875%, 07/15/2022 (Acquired 06/12/2012, Cost $2,996,190) * | 3,000,000 | 3,064,635 | |||||||||||
| Gulf South Pipeline Company, LP, | |||||||||||||
| 4.000%, 06/15/2022 | 3,000,000 | 3,026,607 | |||||||||||
| IPALCO Enterprises, Inc., | |||||||||||||
| 5.000%, 05/01/2018 | 1,000,000 | 1,067,500 | |||||||||||
| KeySpan Corporation, | |||||||||||||
| 8.000%, 11/15/2030 | 1,875,000 | 2,573,291 | |||||||||||
| Kinder Morgan Energy Partners, L.P.: | |||||||||||||
| 9.000%, 02/01/2019 | 1,658,000 | 2,124,982 | |||||||||||
| 6.850%, 02/15/2020 | 4,645,000 | 5,574,000 | |||||||||||
| 6.500%, 02/01/2037 | 400,000 | 469,800 | |||||||||||
| 6.950%, 01/15/2038 | 350,000 | 431,505 | |||||||||||
| Kinder Morgan Finance Company LLC: | |||||||||||||
| 5.700%, 01/05/2016 f | 1,886,000 | 1,980,300 | |||||||||||
| 6.000%, 01/15/2018 (Acquired 12/06/2010, Cost $999,930) * | 1,000,000 | 1,092,500 | |||||||||||
| Mega Advance Investments Ltd, | |||||||||||||
| 5.000%, 05/12/2021 (Acquired 05/09/2011 through 05/23/2012, Cost $2,814,054) * f | 2,800,000 | 3,007,004 | |||||||||||
| National Grid PLC, | |||||||||||||
| 6.300%, 08/01/2016 f | 4,790,000 | 5,304,628 | |||||||||||
| National Rural Utilities Cooperative Finance Corporation, | |||||||||||||
| 10.375%, 11/01/2018 | 6,673,000 | 8,989,959 | |||||||||||
| NextEra Energy Capital Holdings, Inc., | |||||||||||||
| Series D, 7.300%, 09/01/2067 | 2,600,000 | 2,866,500 | |||||||||||
| NuStar Logistics, L.P.: | |||||||||||||
| 4.800%, 09/01/2020 | 4,275,000 | 4,339,125 | |||||||||||
| 6.750%, 02/01/2021 | 3,000,000 | 3,330,000 | |||||||||||
| ONEOK Partners, L.P.: | |||||||||||||
| 3.375%, 10/01/2022 | 3,000,000 | 2,980,458 | |||||||||||
| 5.000%, 09/15/2023 | 5,800,000 | 6,404,058 | |||||||||||
| ONEOK, Inc., | |||||||||||||
| 4.250%, 02/01/2022 | 6,150,000 | 6,151,396 | |||||||||||
| PPL Energy Supply, LLC: | |||||||||||||
| Series A, 5.700%, 10/15/2015 | 1,600,000 | 1,682,184 | |||||||||||
| 6.200%, 05/15/2016 | 2,025,000 | 2,176,073 | |||||||||||
| PSEG Power LLC, | |||||||||||||
| 5.320%, 09/15/2016 | 3,077,000 | 3,364,115 | |||||||||||
| Public Service Company of New Mexico, | |||||||||||||
| 7.950%, 05/15/2018 | 6,553,000 | 7,867,558 | |||||||||||
| RGS I&M Funding Corp, | |||||||||||||
| Series F*, 9.820%, 06/07/2022 | 166,325 | 199,238 | |||||||||||
| Rockies Express Pipeline LLC: | |||||||||||||
| 3.900%, 04/15/2015 (Acquired 09/15/2011 through 01/08/2013, Cost $2,854,230) * | 2,850,000 | 2,878,500 | |||||||||||
| 6.850%, 07/15/2018 (Acquired 12/21/2011, Cost $2,027,056) * | 2,000,000 | 2,160,000 | |||||||||||
| 5.625%, 04/15/2020 (Acquired 12/10/2010 through 12/29/2011, Cost $2,700,606) * @ | 2,695,000 | 2,775,850 | |||||||||||
| Spectra Energy Capital LLC, | |||||||||||||
| 5.668%, 08/15/2014 | 5,030,000 | 5,063,505 | |||||||||||
| Sunoco Logistics Partners Operations L.P.: | |||||||||||||
| 3.450%, 01/15/2023 | 2,000,000 | 1,972,898 | |||||||||||
| 6.100%, 02/15/2042 | 1,000,000 | 1,153,805 | |||||||||||
| Sunoco, Inc., | |||||||||||||
| 5.750%, 01/15/2017 | 701,000 | 772,001 | |||||||||||
| Talent Yield Investments Ltd., | |||||||||||||
| 4.500%, 04/25/2022 (Acquired 04/18/2012, Cost $5,958,960) * f | 6,000,000 | 6,204,960 | |||||||||||
| The Williams Companies, Inc.: | |||||||||||||
| 7.875%, 09/01/2021 | 1,335,000 | 1,657,452 | |||||||||||
| 3.700%, 01/15/2023 @ | 3,000,000 | 2,885,811 | |||||||||||
| Series A, 7.500%, 01/15/2031 | 120,000 | 141,931 | |||||||||||
| 7.750%, 06/15/2031 | 3,500,000 | 4,217,420 | |||||||||||
| 5.750%, 06/24/2044 | 2,500,000 | 2,521,510 | |||||||||||
| Trans-Allegheny Interstate Line Company, | |||||||||||||
| 4.000%, 01/15/2015 (Acquired 08/03/2012, Cost $2,885,656) * | 2,850,000 | 2,896,797 | |||||||||||
| Transcontinental Gas Pipe Line Company, LLC, | |||||||||||||
| 4.450%, 08/01/2042 | 2,600,000 | 2,608,341 | |||||||||||
| Veolia Environnement SA, | |||||||||||||
| 6.000%, 06/01/2018 f | 1,489,000 | 1,682,144 | |||||||||||
| Williams Partners L.P.: | |||||||||||||
| 5.250%, 03/15/2020 | 2,000,000 | 2,256,004 | |||||||||||
| 6.300%, 04/15/2040 | 1,590,000 | 1,887,610 | |||||||||||
| 187,679,228 | 5.5 | % | |||||||||||
| Finance | |||||||||||||
| Abbey National Treasury Services PLC, | |||||||||||||
| 4.000%, 03/13/2024 f | 2,700,000 | 2,786,268 | |||||||||||
| ABN AMRO Bank N.V.: | |||||||||||||
| 4.250%, 02/02/2017 (Acquired 01/30/2012, Cost $4,995,100) * f | 5,000,000 | 5,364,850 | |||||||||||
| 2.500%, 10/30/2018 (Acquired 10/23/2013, Cost $1,996,820) * f | 2,000,000 | 2,029,340 | |||||||||||
| AIG SunAmerica Global Financing X, | |||||||||||||
| 6.900%, 03/15/2032 (Acquired 11/10/2011, Cost $2,129,174) * | 2,000,000 | 2,665,490 | |||||||||||
| Ally Financial Inc.: | |||||||||||||
| 6.750%, 12/01/2014 | 250,000 | 255,938 | |||||||||||
| 8.300%, 02/12/2015 | 1,065,000 | 1,109,597 | |||||||||||
| 4.625%, 06/26/2015 | 5,000,000 | 5,162,500 | |||||||||||
| 5.500%, 02/15/2017 | 7,275,000 | 7,884,281 | |||||||||||
| 8.000%, 12/31/2018 | 1,176,000 | 1,396,500 | |||||||||||
| American International Group, Inc.: | |||||||||||||
| 3.800%, 03/22/2017 | 2,500,000 | 2,671,520 | |||||||||||
| 8.250%, 08/15/2018 | 4,525,000 | 5,621,901 | |||||||||||
| 6.400%, 12/15/2020 | 3,500,000 | 4,225,361 | |||||||||||
| 4.875%, 06/01/2022 | 3,625,000 | 4,036,666 | |||||||||||
| AmSouth Bancorporation, | |||||||||||||
| 6.750%, 11/01/2025 | 710,000 | 822,006 | |||||||||||
| Aon Corporation, | |||||||||||||
| 3.500%, 09/30/2015 f | 2,500,000 | 2,585,790 | |||||||||||
| Arden Realty Limited Partnership, | |||||||||||||
| 5.250%, 03/01/2015 | 1,090,000 | 1,109,176 | |||||||||||
| Associates Corporation of North America, | |||||||||||||
| 6.950%, 11/01/2018 | 12,038,000 | 14,376,309 | |||||||||||
| Australia and New Zealand Banking Group Limited, | |||||||||||||
| 4.500%, 03/19/2024 (Acquired 03/12/2014, Cost $8,987,760) * f | 9,000,000 | 9,237,564 | |||||||||||
| Banco Santander (Brasil) S.A., | |||||||||||||
| 4.625%, 02/13/2017 (Acquired 02/06/2012, Cost $994,140) * f | 1,000,000 | 1,063,750 | |||||||||||
| Bank of America Corporation: | |||||||||||||
| 10.200%, 07/15/2015 | 2,675,000 | 2,931,131 | |||||||||||
| 6.875%, 04/25/2018 | 800,000 | 942,505 | |||||||||||
| 7.625%, 06/01/2019 | 6,000,000 | 7,411,086 | |||||||||||
| 3.300%, 01/11/2023 | 4,450,000 | 4,386,169 | |||||||||||
| 7.750%, 05/14/2038 | 725,000 | 995,946 | |||||||||||
| BanPonce Trust I, | |||||||||||||
| Series A, 8.327%, 02/01/2027 | 2,185,000 | 1,744,744 | |||||||||||
| Barclays Bank PLC: | |||||||||||||
| 6.750%, 05/22/2019 f | 9,850,000 | 11,861,961 | |||||||||||
| 3.750%, 05/15/2024 f | 1,450,000 | 1,455,182 | |||||||||||
| Berkshire Hathaway Finance Corporation, | |||||||||||||
| 4.400%, 05/15/2042 | 3,500,000 | 3,539,431 | |||||||||||
| BNP Paribas: | |||||||||||||
| 2.375%, 09/14/2017 f | 3,000,000 | 3,072,003 | |||||||||||
| 5.000%, 01/15/2021 f | 5,000,000 | 5,568,530 | |||||||||||
| 3.250%, 03/03/2023 @ f | 4,000,000 | 3,950,428 | |||||||||||
| BPCE: | |||||||||||||
| 2.500%, 12/10/2018 f | 5,500,000 | 5,575,157 | |||||||||||
| 5.700%, 10/22/2023 (Acquired 10/15/2013, Cost $5,990,040) * @ f | 6,000,000 | 6,606,660 | |||||||||||
| 4.000%, 04/15/2024 f | 6,500,000 | 6,635,525 | |||||||||||
| Capital One Financial Corporation: | |||||||||||||
| 3.150%, 07/15/2016 | 1,015,000 | 1,059,196 | |||||||||||
| 6.150%, 09/01/2016 | 4,425,000 | 4,896,993 | |||||||||||
| 2.450%, 04/24/2019 | 2,000,000 | 2,018,758 | |||||||||||
| CIT Group Inc.: | |||||||||||||
| 4.250%, 08/15/2017 | 1,000,000 | 1,043,125 | |||||||||||
| 5.500%, 02/15/2019 (Acquired 02/02/2012, Cost $500,000) * | 500,000 | 541,875 | |||||||||||
| 5.000%, 08/01/2023 @ | 5,000,000 | 5,118,750 | |||||||||||
| Citigroup Inc.: | |||||||||||||
| 4.450%, 01/10/2017 | 1,800,000 | 1,938,616 | |||||||||||
| 8.500%, 05/22/2019 | 1,389,000 | 1,775,407 | |||||||||||
| CNA Financial Corporation: | |||||||||||||
| 6.500%, 08/15/2016 | 1,000,000 | 1,113,824 | |||||||||||
| 7.350%, 11/15/2019 | 1,175,000 | 1,449,394 | |||||||||||
| 5.875%, 08/15/2020 | 4,839,000 | 5,662,569 | |||||||||||
| 7.250%, 11/15/2023 | 5,300,000 | 6,626,744 | |||||||||||
| Comerica Bank: | |||||||||||||
| 5.750%, 11/21/2016 | 3,200,000 | 3,550,694 | |||||||||||
| 5.200%, 08/22/2017 | 2,855,000 | 3,167,026 | |||||||||||
| Commonwealth Bank of Australia, | |||||||||||||
| 5.000%, 10/15/2019 (Acquired 03/02/2012 through 08/16/2012, Cost $6,288,143) * f | 5,900,000 | 6,666,587 | |||||||||||
| Cooperatieve Centrale Raiffeisen-Boerenleenbank BA, | |||||||||||||
| 1.700%, 03/19/2018 @ f | 5,250,000 | 5,266,989 | |||||||||||
| Countrywide Financial Corporation, | |||||||||||||
| 6.250%, 05/15/2016 | 2,100,000 | 2,291,560 | |||||||||||
| Credit Mutuel-CIC Home Loan SFH, | |||||||||||||
| 1.500%, 11/16/2017 (Acquired 11/08/2012, Cost $4,981,300) * f | 5,000,000 | 5,016,450 | |||||||||||
| Credit Suisse, | |||||||||||||
| 5.300%, 08/13/2019 f | 6,966,000 | 7,968,756 | |||||||||||
| Dresdner Bank AG, | |||||||||||||
| 7.250%, 09/15/2015 f | 10,425,000 | 11,062,979 | |||||||||||
| First Horizon National Corporation, | |||||||||||||
| 5.375%, 12/15/2015 | 2,420,000 | 2,560,026 | |||||||||||
| First Tennessee Bank National Association, | |||||||||||||
| 5.050%, 01/15/2015 | 4,672,000 | 4,775,896 | |||||||||||
| FMR LLC: | |||||||||||||
| 4.950%, 02/01/2033 (Acquired 01/29/2013, Cost $2,696,598) * | 2,700,000 | 2,912,174 | |||||||||||
| 6.500%, 12/14/2040 (Acquired 04/04/2013 through 10/28/2013, Cost $2,283,018) * | 1,820,000 | 2,292,434 | |||||||||||
| General Electric Capital Corporation: | |||||||||||||
| 5.500%, 01/08/2020 | 1,875,000 | 2,173,515 | |||||||||||
| 5.550%, 05/04/2020 | 4,185,000 | 4,870,286 | |||||||||||
| 4.375%, 09/16/2020 | 2,925,000 | 3,230,437 | |||||||||||
| 5.300%, 02/11/2021 @ | 3,000,000 | 3,411,357 | |||||||||||
| 4.650%, 10/17/2021 | 8,450,000 | 9,396,738 | |||||||||||
| Genworth Holdings, Inc., | |||||||||||||
| 7.625%, 09/24/2021 | 1,000,000 | 1,252,856 | |||||||||||
| Goldman Sachs Capital I, | |||||||||||||
| 6.345%, 02/15/2034 | 125,000 | 142,799 | |||||||||||
| HSBC Bank USA, National Association, | |||||||||||||
| 6.000%, 08/09/2017 | 2,720,000 | 3,064,499 | |||||||||||
| HSBC Finance Corporation, | |||||||||||||
| 5.500%, 01/19/2016 | 1,120,000 | 1,199,438 | |||||||||||
| Humana Inc., | |||||||||||||
| 7.200%, 06/15/2018 | 800,000 | 950,304 | |||||||||||
| ING Bank N.V.: | |||||||||||||
| 4.000%, 03/15/2016 (Acquired 03/08/2011 through 09/20/2011, Cost $1,600,103) * f | 1,600,000 | 1,681,813 | |||||||||||
| 3.750%, 03/07/2017 (Acquired 02/29/2012 through 04/24/2013, Cost $4,986,096) * f | 5,000,000 | 5,318,350 | |||||||||||
| 5.000%, 06/09/2021 (Acquired 10/12/2011, Cost $2,468,800) * f | 2,500,000 | 2,822,957 | |||||||||||
| 5.800%, 09/25/2023 (Acquired 01/14/2014, Cost $2,951,756) * f | 2,800,000 | 3,154,200 | |||||||||||
| Invesco Finance PLC, | |||||||||||||
| 3.125%, 11/30/2022 f | 5,500,000 | 5,455,268 | |||||||||||
| iStar Financial Inc., | |||||||||||||
| 5.850%, 03/15/2017 | 500,000 | 532,500 | |||||||||||
| J.P. Morgan Chase & Co.: | |||||||||||||
| 4.250%, 10/15/2020 | 3,100,000 | 3,362,982 | |||||||||||
| 4.350%, 08/15/2021 | 2,400,000 | 2,598,811 | |||||||||||
| 4.500%, 01/24/2022 | 4,400,000 | 4,821,252 | |||||||||||
| 3.200%, 01/25/2023 | 5,350,000 | 5,311,881 | |||||||||||
| Jefferies Group LLC, | |||||||||||||
| 6.450%, 06/08/2027 | 1,000,000 | 1,134,700 | |||||||||||
| John Hancock Life Insurance Company, | |||||||||||||
| 7.375%, 02/15/2024 (Acquired 08/26/2010 through 04/11/2013, Cost $12,025,917) * | 9,765,000 | 12,095,134 | |||||||||||
| Kemper Corporation: | |||||||||||||
| 6.000%, 11/30/2015 | 2,500,000 | 2,669,043 | |||||||||||
| 6.000%, 05/15/2017 | 1,000,000 | 1,104,929 | |||||||||||
| KeyBank National Association: | |||||||||||||
| 7.413%, 05/06/2015 | 5,100,000 | 5,388,854 | |||||||||||
| 5.450%, 03/03/2016 | 1,279,000 | 1,375,544 | |||||||||||
| 4.625%, 06/15/2018 | 2,670,000 | 2,878,113 | |||||||||||
| LeasePlan Corporation N.V.: | |||||||||||||
| 3.000%, 10/23/2017 (Acquired 10/15/2012 through 02/07/2013, Cost $10,048,078) * f | 10,000,000 | 10,412,210 | |||||||||||
| 2.500%, 05/16/2018 (Acquired 05/07/2013, Cost $4,976,700) * f | 5,000,000 | 5,041,380 | |||||||||||
| Liberty Mutual Group Inc.: | |||||||||||||
| 6.500%, 03/15/2035 (Acquired 09/29/2008 through 04/16/2013, Cost $700,311) * | 700,000 | 857,443 | |||||||||||
| 10.750%, 06/15/2058 (Acquired 05/21/2008 through 05/06/2009, Cost $751,029) * | 900,000 | 1,374,750 | |||||||||||
| Liberty Mutual Insurance Company, | |||||||||||||
| 7.697%, 10/15/2097 (Acquired 03/26/2003, Cost $240,081) * | 375,000 | 422,383 | |||||||||||
| Lincoln National Corporation: | |||||||||||||
| 8.750%, 07/01/2019 | 7,801,000 | 10,114,418 | |||||||||||
| 6.050%, 04/20/2067 | 930,000 | 940,462 | |||||||||||
| Lloyds Bank plc: | |||||||||||||
| 4.200%, 03/28/2017 f | 2,000,000 | 2,163,238 | |||||||||||
| 5.800%, 01/13/2020 (Acquired 01/05/2010 through 01/19/2012, Cost $6,402,547) * f | 6,350,000 | 7,371,721 | |||||||||||
| M&I Marshall & Ilsley Bank, | |||||||||||||
| 4.850%, 06/16/2015 | 2,189,000 | 2,276,054 | |||||||||||
| M&T Capital Trust I, | |||||||||||||
| 8.234%, 02/01/2027 | 500,000 | 508,819 | |||||||||||
| M&T Capital Trust II, | |||||||||||||
| 8.277%, 06/01/2027 | 2,300,000 | 2,338,228 | |||||||||||
| Macquarie Bank Limited, | |||||||||||||
| 2.000%, 08/15/2016 (Acquired 09/27/2013, Cost $3,515,252) * f | 3,500,000 | 3,563,567 | |||||||||||
| Manufacturers And Traders Trust Company: | |||||||||||||
| 6.625%, 12/04/2017 | 1,120,000 | 1,303,214 | |||||||||||
| 5.585%, 12/28/2020 | 265,000 | 276,266 | |||||||||||
| Manulife Financial Corporation, | |||||||||||||
| 4.900%, 09/17/2020 f | 1,909,000 | 2,107,332 | |||||||||||
| Marsh & McLennan Companies, Inc., | |||||||||||||
| 4.800%, 07/15/2021 | 1,000,000 | 1,110,670 | |||||||||||
| Massachusetts Mutual Life Insurance Company: | |||||||||||||
| 7.625%, 11/15/2023 (Acquired 10/10/2012, Cost $4,202,933) * | 3,184,000 | 4,080,974 | |||||||||||
| 8.875%, 06/01/2039 (Acquired 10/03/2012 through 05/19/2014, Cost $5,766,462) * | 3,825,000 | 6,091,592 | |||||||||||
| MBIA Insurance Corporation, | |||||||||||||
| 11.486%, 01/15/2033 (Acquired 01/11/2008, Cost $700,000) * § | 700,000 | 546,000 | |||||||||||
| METLIFE CAPITAL TRUST IV, | |||||||||||||
| 7.875%, 12/15/2037 (Acquired 03/26/2012 through 04/05/2013, Cost $1,048,291) * | 900,000 | 1,118,250 | |||||||||||
| MetLife, Inc., | |||||||||||||
| 7.717%, 02/15/2019 | 1,157,000 | 1,439,357 | |||||||||||
| Metropolitan Life Global Funding I, | |||||||||||||
| 3.875%, 04/11/2022 (Acquired 12/18/2012, Cost $1,611,572) * | 1,500,000 | 1,588,628 | |||||||||||
| Mizuho Bank, Ltd., | |||||||||||||
| 1.850%, 03/21/2018 (Acquired 03/14/2013, Cost $1,847,447) * f | 1,850,000 | 1,857,304 | |||||||||||
| Morgan Stanley: | |||||||||||||
| 6.000%, 04/28/2015 | 650,000 | 680,229 | |||||||||||
| 5.450%, 01/09/2017 | 2,000,000 | 2,203,190 | |||||||||||
| 6.625%, 04/01/2018 | 1,275,000 | 1,490,441 | |||||||||||
| 7.300%, 05/13/2019 | 4,675,000 | 5,716,342 | |||||||||||
| 5.625%, 09/23/2019 | 3,100,000 | 3,565,648 | |||||||||||
| 3.750%, 02/25/2023 | 1,000,000 | 1,017,279 | |||||||||||
| National Australia Bank Ltd/New York, | |||||||||||||
| 2.750%, 03/09/2017 f | 6,000,000 | 6,255,888 | |||||||||||
| National City Bank, | |||||||||||||
| 5.800%, 06/07/2017 | 6,170,000 | 6,953,386 | |||||||||||
| Nationwide Mutual Insurance Company, | |||||||||||||
| 7.875%, 04/01/2033 (Acquired 10/13/2009, Cost $90,719) * | 100,000 | 133,526 | |||||||||||
| Navient Corporation, | |||||||||||||
| 5.625%, 08/01/2033 | 50,000 | 43,188 | |||||||||||
| New England Mutual Life Insurance Company, | |||||||||||||
| 7.875%, 02/15/2024 (Acquired 11/07/2012, Cost $4,249,860) * | 3,200,000 | 4,117,638 | |||||||||||
| Nippon Life Insurance Company, | |||||||||||||
| 5.000%, 10/18/2042 (Acquired 10/11/2012, Cost $2,000,000) * f | 2,000,000 | 2,150,000 | |||||||||||
| Nomura Holdings, Inc.: | |||||||||||||
| 2.000%, 09/13/2016 f | 3,000,000 | 3,048,960 | |||||||||||
| 2.750%, 03/19/2019 f | 6,600,000 | 6,714,167 | |||||||||||
| 6.700%, 03/04/2020 f | 2,525,000 | 3,035,603 | |||||||||||
| Nordea Bank AB, | |||||||||||||
| 3.125%, 03/20/2017 (Acquired 03/14/2012 through 05/09/2012, Cost $8,028,547) * f | 8,000,000 | 8,427,152 | |||||||||||
| Principal Financial Group, Inc.: | |||||||||||||
| 3.300%, 09/15/2022 | 1,000,000 | 995,271 | |||||||||||
| 3.125%, 05/15/2023 | 3,550,000 | 3,471,453 | |||||||||||
| Prudential Financial, Inc., | |||||||||||||
| 6.000%, 12/01/2017 | 2,000,000 | 2,290,120 | |||||||||||
| Prudential Holdings, LLC, | |||||||||||||
| 8.695%, 12/18/2023 (Acquired 11/29/2011 through 05/13/2014, Cost $12,112,521) * | 9,658,529 | 12,189,150 | |||||||||||
| Rabobank Nederland: | |||||||||||||
| 3.375%, 01/19/2017 f | 2,000,000 | 2,117,916 | |||||||||||
| 3.875%, 02/08/2022 @ f | 4,150,000 | 4,396,124 | |||||||||||
| Raymond James Financial, Inc., | |||||||||||||
| 8.600%, 08/15/2019 | 1,427,000 | 1,802,026 | |||||||||||
| Regions Bank, | |||||||||||||
| 7.500%, 05/15/2018 | 14,034,000 | 16,703,435 | |||||||||||
| Santander Bank, N.A., | |||||||||||||
| 8.750%, 05/30/2018 | 7,034,000 | 8,562,383 | |||||||||||
| Santander Financial Issuances Limited, | |||||||||||||
| 7.250%, 11/01/2015 f | 300,000 | 320,877 | |||||||||||
| Santander UK PLC, | |||||||||||||
| 5.000%, 11/07/2023 (Acquired 10/31/2013, Cost $996,810) * f | 1,000,000 | 1,080,031 | |||||||||||
| Simon Property Group LP, | |||||||||||||
| 1.500%, 02/01/2018 (Acquired 12/10/2012, Cost $11,962,200) * | 12,000,000 | 11,917,056 | |||||||||||
| Societe Generale: | |||||||||||||
| 5.200%, 04/15/2021 (Acquired 09/20/2011 through 02/13/2013, Cost $9,987,490) * f | 10,100,000 | 11,403,355 | |||||||||||
| 5.000%, 01/17/2024 (Acquired 01/14/2014, Cost $2,972,790) * f | 3,000,000 | 3,137,508 | |||||||||||
| SpareBank 1 Boligkreditt AS, | |||||||||||||
| 1.750%, 11/15/2019 (Acquired 11/07/2012, Cost $4,961,150) * f | 5,000,000 | 4,889,720 | |||||||||||
| Springleaf Finance Corp, | |||||||||||||
| 6.900%, 12/15/2017 | 1,000,000 | 1,110,000 | |||||||||||
| Standard Chartered PLC, | |||||||||||||
| 5.700%, 03/26/2044 (Acquired 03/21/2014 through 05/01/2014, Cost $14,105,128) * @ f | 14,000,000 | 14,674,268 | |||||||||||
| Sumitomo Mitsui Banking Corporation, | |||||||||||||
| 3.000%, 01/18/2023 f | 2,500,000 | 2,450,755 | |||||||||||
| SunTrust Bank, | |||||||||||||
| 7.250%, 03/15/2018 | 5,682,000 | �� | 6,727,971 | ||||||||||
| SunTrust Banks, Inc., | |||||||||||||
| 3.500%, 01/20/2017 | 4,250,000 | 4,499,815 | |||||||||||
| SUSA Partnership, L.P., | |||||||||||||
| 8.200%, 06/01/2017 | 1,000,000 | 1,173,842 | |||||||||||
| Svenska Handelsbanken AB, | |||||||||||||
| 2.875%, 04/04/2017 f | 2,425,000 | 2,537,224 | |||||||||||
| Swedbank AB, | |||||||||||||
| 2.125%, 09/29/2017 (Acquired 09/24/2012, Cost $2,995,470) * f | 3,000,000 | 3,055,410 | |||||||||||
| Symetra Financial Corporation, | |||||||||||||
| 6.125%, 04/01/2016 (Acquired 10/12/2010 through 10/16/2012, Cost $3,720,038) * | 3,620,000 | 3,885,100 | |||||||||||
| TD Ameritrade Holding Corporation, | |||||||||||||
| 5.600%, 12/01/2019 | 1,000,000 | 1,165,140 | |||||||||||
| The Bank of Tokyo-Mitsubishi UFJ, Ltd., | |||||||||||||
| 2.350%, 02/23/2017 (Acquired 02/14/2012, Cost $5,996,640) * f | 6,000,000 | 6,174,882 | |||||||||||
| The Bear Stearns Companies LLC, | |||||||||||||
| 7.250%, 02/01/2018 | 2,250,000 | 2,677,669 | |||||||||||
| The Chubb Corporation, | |||||||||||||
| 6.375%, 03/29/2067 | 1,320,000 | 1,466,850 | |||||||||||
| The Goldman Sachs Group, Inc.: | |||||||||||||
| 5.950%, 01/18/2018 | 3,000,000 | 3,408,150 | |||||||||||
| 6.150%, 04/01/2018 | 6,500,000 | 7,454,330 | |||||||||||
| 7.500%, 02/15/2019 | 1,825,000 | 2,227,150 | |||||||||||
| 5.250%, 07/27/2021 | 1,000,000 | 1,122,933 | |||||||||||
| 5.750%, 01/24/2022 | 3,100,000 | 3,587,270 | |||||||||||
| 6.750%, 10/01/2037 | 300,000 | 360,910 | |||||||||||
| The Guardian Life Insurance Company of America, | |||||||||||||
| 4.875%, 06/19/2064 (Acquired 06/16/2014, Cost $2,989,950) * | 3,000,000 | 3,015,861 | |||||||||||
| The Hartford Financial Services Group, Inc.: | |||||||||||||
| 7.300%, 11/01/2015 | 465,000 | 501,277 | |||||||||||
| 5.375%, 03/15/2017 | 2,913,000 | 3,219,378 | |||||||||||
| 4.000%, 10/15/2017 | 3,000,000 | 3,237,192 | |||||||||||
| 8.125%, 06/15/2038 | 1,365,000 | 1,614,112 | |||||||||||
| The Royal Bank of Scotland Group Public Limited Company: | |||||||||||||
| 5.050%, 01/08/2015 f | 1,528,000 | 1,556,209 | |||||||||||
| 2.550%, 09/18/2015 f | 4,225,000 | 4,312,136 | |||||||||||
| The Royal Bank of Scotland plc, | |||||||||||||
| 6.125%, 01/11/2021 f | 7,850,000 | 9,234,348 | |||||||||||
| Torchmark Corporation, | |||||||||||||
| 3.800%, 09/15/2022 | 1,275,000 | 1,305,483 | |||||||||||
| UnionBanCal Corporation, | |||||||||||||
| 3.500%, 06/18/2022 | 1,150,000 | 1,185,818 | |||||||||||
| UnitedHealth Group Incorporated, | |||||||||||||
| 6.000%, 02/15/2018 | 1,000,000 | 1,153,744 | |||||||||||
| WEA Finance LLC / WT Finance Aust Pty Ltd, | |||||||||||||
| 6.750%, 09/02/2019 (Acquired 04/02/2014 through 04/03/2014, Cost $8,961,899) * | 7,500,000 | 9,347,565 | |||||||||||
| Wells Fargo Bank, National Association, | |||||||||||||
| 6.000%, 11/15/2017 | 8,322,000 | 9,534,540 | |||||||||||
| Westpac Banking Corporation: | |||||||||||||
| 2.000%, 08/14/2017 f | 8,000,000 | 8,174,152 | |||||||||||
| 4.875%, 11/19/2019 f | 636,000 | 716,375 | |||||||||||
| Willis North America, Inc.: | |||||||||||||
| 5.625%, 07/15/2015 | 2,600,000 | 2,724,337 | |||||||||||
| 7.000%, 09/29/2019 | 7,803,000 | 9,157,406 | |||||||||||
| 672,739,571 | 19.7 | % | |||||||||||
| Total Corporate Bonds | 1,481,077,696 | 43.3 | % | ||||||||||
| Residential Mortgage-Backed Securities | |||||||||||||
| U.S. Government Agency Issues | |||||||||||||
| Federal Gold Loan Mortgage Corporation (FGLMC): | |||||||||||||
| 5.000%, 12/01/2020 | 73,861 | 79,791 | |||||||||||
| 5.000%, 05/01/2021 | 138,040 | 149,117 | |||||||||||
| 6.000%, 06/01/2021 | 26,605 | 28,933 | |||||||||||
| 3.000%, 05/01/2027 | 12,688,731 | 13,168,226 | |||||||||||
| 6.500%, 12/01/2028 | 38,141 | 43,542 | |||||||||||
| 6.500%, 06/01/2029 | 16,273 | 18,337 | |||||||||||
| 5.000%, 03/01/2036 | 11,899,931 | 13,205,961 | |||||||||||
| 5.500%, 04/01/2037 | 381,543 | 425,291 | |||||||||||
| 5.500%, 04/01/2038 | 224,941 | 250,733 | |||||||||||
| 5.500%, 05/01/2038 | 457,947 | 510,455 | |||||||||||
| 4.500%, 11/01/2039 | 2,168,055 | 2,347,428 | |||||||||||
| 4.500%, 11/01/2039 | 6,617,827 | 7,165,767 | |||||||||||
| 4.500%, 08/01/2040 | 9,632,500 | 10,434,551 | |||||||||||
| 4.500%, 08/01/2040 | 6,891,558 | 7,465,741 | |||||||||||
| 3.500%, 06/01/2042 | 13,225,452 | 13,611,825 | |||||||||||
| 3.500%, 07/01/2042 | 46,483,484 | 47,841,470 | |||||||||||
| 3.000%, 08/01/2042 | 36,785,238 | 36,331,198 | |||||||||||
| 3.000%, 02/01/2043 | 11,627,002 | 11,483,178 | |||||||||||
| 3.000%, 06/01/2043 | 19,163,600 | 18,926,388 | |||||||||||
| 3.000%, 08/01/2043 | 28,984,153 | 28,625,378 | |||||||||||
| Federal Home Loan Mortgage Corporation (FHLMC): | |||||||||||||
| Series 1053, Class G, 7.000%, 03/15/2021 | 4,513 | 5,171 | |||||||||||
| Series 136, Class E, 6.000%, 04/15/2021 | 8,035 | 8,617 | |||||||||||
| Series 2804, Class VC, 5.000%, 07/15/2021 | 154,678 | 165,595 | |||||||||||
| Series 1122, Class G, 7.000%, 08/15/2021 | 9,383 | 10,299 | |||||||||||
| Series 1186, Class I, 7.000%, 12/15/2021 | 18,673 | 21,185 | |||||||||||
| Federal National Mortgage Association (FNMA): | |||||||||||||
| Series 1989-94, Class G, 7.500%, 12/25/2019 | 5,011 | 5,491 | |||||||||||
| Series 1990-15, Class J, 7.000%, 02/25/2020 | 16,424 | 17,768 | |||||||||||
| Series 1991-21, Class J, 7.000%, 03/25/2021 | 3,262 | 3,610 | |||||||||||
| Series 1991-43, Class J, 7.000%, 05/25/2021 | 63,918 | 71,286 | |||||||||||
| Series 1991-65, Class Z, 6.500%, 06/25/2021 | 67,379 | 72,249 | |||||||||||
| 5.000%, 11/01/2021 | 533,152 | 567,487 | |||||||||||
| Series 1992-129, Class L, 6.000%, 07/25/2022 | 117,563 | 128,321 | |||||||||||
| 5.500%, 03/01/2023 | 288,673 | 322,964 | |||||||||||
| Series 1993-32, Class H, 6.000%, 03/25/2023 | 26,874 | 29,402 | |||||||||||
| Series 1993-58, Class H, 5.500%, 04/25/2023 | 133,783 | 145,033 | |||||||||||
| 5.500%, 07/01/2023 | 137,663 | 154,016 | |||||||||||
| 5.500%, 12/01/2023 | 199,701 | 223,950 | |||||||||||
| 6.000%, 03/01/2026 | 43,861 | 49,699 | |||||||||||
| 5.000%, 06/01/2026 | 11,178,565 | 12,072,841 | |||||||||||
| 3.000%, 04/01/2027 | 23,817,912 | 24,771,589 | |||||||||||
| 2.500%, 12/01/2027 | 24,257,493 | 24,674,971 | |||||||||||
| 5.000%, 05/01/2028 | 124,876 | 138,762 | |||||||||||
| 6.500%, 09/01/2028 | 29,465 | 33,651 | |||||||||||
| 6.500%, 02/01/2029 | 63,369 | 71,451 | |||||||||||
| 4.500%, 07/01/2030 | 12,849,960 | 14,051,593 | |||||||||||
| 4.000%, 11/01/2031 | 12,190,033 | 13,118,331 | |||||||||||
| 5.500%, 01/01/2032 | 26,037 | 29,285 | |||||||||||
| 5.500%, 04/01/2034 | 2,071,468 | 2,328,873 | |||||||||||
| 5.500%, 04/01/2034 | 1,988,791 | 2,235,741 | |||||||||||
| Series 2004-90, Class LH, 5.000%, 04/25/2034 | 3,610,975 | 3,769,862 | |||||||||||
| Series 2004-W6, Class 1A6, 5.500%, 07/25/2034 | 217,256 | 225,368 | |||||||||||
| Series 2004-W6, Class 1A4, 5.500%, 07/25/2034 | 120,652 | 122,181 | |||||||||||
| 5.500%, 09/01/2034 | 64,702 | 72,741 | |||||||||||
| 5.500%, 02/01/2035 | 32,232 | 36,222 | |||||||||||
| 5.000%, 04/01/2035 | 3,746,613 | 4,171,290 | |||||||||||
| 5.000%, 07/01/2035 | 11,020,151 | 12,269,695 | |||||||||||
| 5.000%, 02/01/2036 | 5,912,494 | 6,576,586 | |||||||||||
| 5.000%, 03/01/2036 | 2,322,303 | 2,583,084 | |||||||||||
| 5.500%, 04/01/2036 | 11,024,870 | 12,341,912 | |||||||||||
| 6.000%, 08/01/2037 | 168,362 | 184,575 | |||||||||||
| 5.000%, 06/01/2040 | 15,416,569 | 17,147,565 | |||||||||||
| 4.000%, 08/01/2040 | 2,789,024 | 2,964,080 | |||||||||||
| 4.500%, 08/01/2040 | 14,375,825 | 15,575,422 | |||||||||||
| 4.000%, 10/01/2040 | 1,936,310 | 2,057,845 | |||||||||||
| 4.000%, 12/01/2040 | 7,229,417 | 7,702,228 | |||||||||||
| 3.500%, 01/01/2041 | 4,319,640 | 4,453,482 | |||||||||||
| 4.000%, 01/01/2041 | 10,003,752 | 10,631,650 | |||||||||||
| 3.500%, 02/01/2041 | 4,701,651 | 4,847,329 | |||||||||||
| 3.500%, 03/01/2041 | 5,763,707 | 5,942,293 | |||||||||||
| 4.500%, 07/01/2041 | 3,863,663 | 4,186,068 | |||||||||||
| 4.000%, 09/01/2041 | 8,978,970 | 9,544,297 | |||||||||||
| 4.000%, 12/01/2041 | 37,383,089 | 39,760,521 | |||||||||||
| 3.000%, 05/01/2042 | 6,088,935 | 6,022,253 | |||||||||||
| 3.500%, 06/01/2042 | 13,656,309 | 14,079,443 | |||||||||||
| Government National Mortgage Association (GNMA): | |||||||||||||
| 6.000%, 12/20/2028 | 40,717 | 45,877 | |||||||||||
| 6.500%, 01/20/2029 | 19,119 | 22,182 | |||||||||||
| 6.000%, 11/20/2033 | 31,380 | 36,291 | |||||||||||
| 4.500%, 05/20/2040 | 4,773,193 | 5,229,067 | |||||||||||
| 4.500%, 07/20/2040 | 26,701,095 | 29,256,436 | |||||||||||
| 5.000%, 07/20/2040 | 2,082,987 | 2,314,743 | |||||||||||
| 4.500%, 01/20/2041 | 18,569,158 | 20,345,572 | |||||||||||
| 4.000%, 06/20/2042 | 37,560,959 | 40,264,669 | |||||||||||
| 3.500%, 09/20/2042 | 20,046,410 | 20,920,744 | |||||||||||
| 613,346,114 | 17.9 | % | |||||||||||
| Non-U.S. Government Agency Issues | |||||||||||||
| Bank of America Alternative Loan Trust: | |||||||||||||
| Series 2004-1, Class 5A2, 5.500%, 02/25/2019 | 1,144,436 | 1,185,864 | |||||||||||
| Series 2004-2, Class 5A1, 5.500%, 03/25/2019 | 268,031 | 274,404 | |||||||||||
| Series 2004-8, Class 3A1, 5.500%, 09/25/2019 | 1,500,315 | 1,567,478 | |||||||||||
| Series 2005-2, Class 4A1, 5.500%, 03/25/2020 | 46,450 | 48,301 | |||||||||||
| Series 2005-4, Class 3A1, 5.500%, 05/25/2020 | 775,404 | 796,211 | |||||||||||
| Series 2005-8, Class 5A1, 5.500%, 09/25/2020 | 191,673 | 196,060 | |||||||||||
| Series 2006-2, Class 6A1, 5.500%, 03/25/2021 | 194,542 | 199,916 | |||||||||||
| Series 2007-1, Class 1A1, 5.829%, 04/25/2022 | 799,779 | 813,731 | |||||||||||
| Series 2005-2, Class 1CB2, 5.500%, 03/25/2035 | 2,419,757 | 2,275,293 | |||||||||||
| Series 2006-3, Class 6A1, 6.000%, 04/25/2036 | 276,455 | 285,094 | |||||||||||
| Series 2006-5, Class CB7, 6.000%, 06/25/2046 § | 455,603 | 386,792 | |||||||||||
| Bank of America Mortgage Trust, | |||||||||||||
| Series 2003-L, Class 2A1, 2.836%, 01/25/2034 | 5,914,339 | 5,939,741 | |||||||||||
| Chase Mortgage Finance Trust, | |||||||||||||
| Series 2006-A1, Class 2A3, 2.639%, 09/25/2036 § | 650,586 | 579,672 | |||||||||||
| Citicorp Mortgage Securities Trust, | |||||||||||||
| Series 2007-2, Class 1A3, 6.000%, 02/25/2037 | 2,974,231 | 3,117,657 | |||||||||||
| Citigroup Mortgage Loan Trust. Inc.: | |||||||||||||
| Series 2005-9, Class 2A2, 5.500%, 11/25/2035 § | 185,052 | 182,454 | |||||||||||
| Series 2005-9, Class 22A2, 6.000%, 11/25/2035 § | 8,528,962 | 8,013,659 | |||||||||||
| Countrywide Alternative Loan Trust: | |||||||||||||
| Series 2005-3CB, Class 2A1, 5.000%, 03/25/2020 | 2,806,735 | 2,851,780 | |||||||||||
| Series 2005-50CB, Class 4A1, 5.000%, 11/25/2020 § | 688,593 | 684,797 | |||||||||||
| Series 2006-7CB, Class 3A1, 5.250%, 05/25/2021 § | 735,162 | 667,957 | |||||||||||
| Series 2006-43CB, Class 2A1, 6.000%, 02/25/2022 | 307,820 | 324,557 | |||||||||||
| Series 2005-73CB, Class 1A7, 5.500%, 01/25/2036 § | 857,290 | 799,787 | |||||||||||
| Series 2006-J2, Class A3, 6.000%, 04/25/2036 § | 160,210 | 143,111 | |||||||||||
| Series 2006-28CB, Class A17, 6.000%, 10/25/2036 § | 994,904 | 813,450 | |||||||||||
| Countrywide Home Loan Mortgage Pass Through Trust, | |||||||||||||
| Series 2005-6, Class 2A1, 5.500%, 04/25/2035 | 1,483,135 | 1,393,665 | |||||||||||
| Credit Suisse First Boston Mortgage Securities Corp., | |||||||||||||
| Series 2005-7, Class 3A1, 5.000%, 08/25/2020 | 689,502 | 688,998 | |||||||||||
| Deutsche Alt-A Securities Inc Mortgage Loan Trust, | |||||||||||||
| Series 2005-3, Class 4A5, 5.250%, 06/25/2035 | 1,110,920 | 1,089,856 | |||||||||||
| Deutsche Alt-A Securities Mortgage Loan Trust, | |||||||||||||
| Series 2006-AR5, Class 21A, 6.000%, 10/25/2021 § | 539,351 | 461,430 | |||||||||||
| First Frankin Mortgage Loan Trust, | |||||||||||||
| Series 2006-FF3, Class A2B, 0.552%, 02/25/2036 | 1,600,946 | 1,539,079 | |||||||||||
| First Horizon Alternative Mortgage Securities Trust: | |||||||||||||
| Series 2006-FA6, Class 3A1, 5.750%, 11/25/2021 | 268,177 | 266,146 | |||||||||||
| Series 2006-FA8, Class 2A1, 5.750%, 02/25/2037 § | 908,383 | 802,698 | |||||||||||
| GSR Mortgage Loan Trust: | |||||||||||||
| Series 2004-15F, Class 5A1, 5.500%, 01/25/2020 | 1,724,441 | 1,771,724 | |||||||||||
| Series 2005-3F, Class 2A4, 6.000%, 03/25/2035 | 9,351,314 | 9,707,309 | |||||||||||
| J.P. Morgan Alternative Loan Trust: | |||||||||||||
| Series 2005-S1, Class 3A1, 5.500%, 10/25/2020 | 2,301,232 | 2,334,888 | |||||||||||
| Series 2006-A1, Class 2A1, 2.523%, 03/25/2036 § | 179,833 | 143,601 | |||||||||||
| Series 2006-S3, Class A3A, 6.000%, 08/25/2036 | 224,145 | 214,204 | |||||||||||
| J.P. Morgan Mortgage Trust: | |||||||||||||
| Series 2006-S3, Class 2A3, 5.000%, 08/25/2021 | 577,178 | 574,520 | |||||||||||
| Series 2006-S1, Class 2A2, 6.000%, 04/25/2036 | 376,039 | 375,326 | |||||||||||
| Series 2006-A7, Class 2A2, 2.626%, 01/25/2037 | 5,570,763 | 4,979,159 | |||||||||||
| Series 2006-A7, Class 2A4R, 2.626%, 01/25/2037 § | 2,332,685 | 2,099,918 | |||||||||||
| Series 2007-A2, Class 2A3, 2.575%, 04/25/2037 | 10,949,128 | 9,470,185 | |||||||||||
| MASTR Alternative Loan Trust: | |||||||||||||
| Series 2004-1, Class 1A1, 5.000%, 01/25/2019 | 179,294 | 182,626 | |||||||||||
| Series 2004-5, Class 4A1, 5.500%, 07/25/2019 | 544,063 | 568,251 | |||||||||||
| Series 2005-3, Class 4A1, 5.500%, 03/25/2020 | 1,063,839 | 1,107,625 | |||||||||||
| Series 2003-5, Class 6A1, 6.000%, 08/25/2033 | 74,723 | 79,673 | |||||||||||
| Series 2004-2, Class 2A1, 6.000%, 02/25/2034 | 6,516,308 | 7,120,083 | |||||||||||
| Series 2004-8, Class 2A1, 6.000%, 09/25/2034 | 5,713,749 | 5,852,531 | |||||||||||
| Series 2005-6, Class 1A5, 5.500%, 12/25/2035 | 6,574,847 | 6,012,816 | |||||||||||
| RALI Series Trust: | |||||||||||||
| Series 2004-QS3, Class CB, 5.000%, 03/25/2019 | 2,009,332 | 2,057,941 | |||||||||||
| Series 2004-QS13, Class CB, 5.000%, 09/25/2019 | 1,733,835 | 1,774,764 | |||||||||||
| Series 2004-QS5, Class A5, 4.750%, 04/25/2034 | 8,956 | 9,218 | |||||||||||
| Series 2005-QS2, Class A1, 5.500%, 02/25/2035 | 595,743 | 589,719 | |||||||||||
| Series 2005-QS5, Class A1, 0.552%, 04/25/2035 | 5,457,159 | 4,401,679 | |||||||||||
| Sequoia Mortgage Trust, | |||||||||||||
| Series 2013-6, Class A2, 3.000%, 05/25/2043 | 19,002,766 | 17,664,762 | |||||||||||
| Structured Asset Securities Corp., | |||||||||||||
| Series 2003-31A, Class 2A7, 2.428%, 10/25/2033 | 3,977,593 | 3,987,704 | |||||||||||
| Structured Asset Securities Corp. Mortgage Loan Trust, | |||||||||||||
| Series 2005-7XS, Class 1A4B, 5.440%, 04/25/2035 | 717,088 | 756,656 | |||||||||||
| Washington Mutual Mortgage Pass Through Certificates: | |||||||||||||
| Series 2004-CB1, Class 5A, 5.000%, 06/25/2019 | 85,577 | 88,039 | |||||||||||
| Series 2004-CB2, Class 5A, 5.000%, 07/25/2019 | 78,291 | 80,165 | |||||||||||
| Series 2004-CB2, Class 7A, 5.500%, 08/25/2019 | 169,656 | 175,275 | |||||||||||
| Series 2004-CB3, Class 4A, 6.000%, 10/25/2019 | 49,047 | 51,305 | |||||||||||
| Series 2004-CB4, Class 22A, 6.000%, 12/25/2019 | 243,449 | 255,366 | |||||||||||
| Series 2004-CB3, Class 1A, 6.000%, 10/25/2034 | 11,111,159 | 11,912,785 | |||||||||||
| Series 2004-CB3, Class 2A, 6.500%, 10/25/2034 | 8,433,018 | 9,183,345 | |||||||||||
| Wells Fargo Alternative Loan Trust, | |||||||||||||
| Series 2007-PA1, Class A4, 6.000%, 03/25/2037 § | 127,439 | 114,392 | |||||||||||
| 144,087,192 | 4.2 | % | |||||||||||
| Asset Backed Securities | |||||||||||||
| ABFC Trust, | |||||||||||||
| Series 2006-OPT1, Class A3C2, 0.302%, 09/25/2036 | 14,510,819 | 12,511,780 | |||||||||||
| ACE Securities Corp Home Equity Loan Trust, | |||||||||||||
| Series 2006-OP1, Class A2C, 0.302%, 04/25/2036 | 20,120,352 | 18,952,084 | |||||||||||
| AMRESCO Residential Securities Corp Mortgage Loan Trust, | |||||||||||||
| Series 1998-2, Class A6, 6.405%, 12/25/2027 | 7,862 | 7,671 | |||||||||||
| Bank of America Funding Trust, | |||||||||||||
| Series 2005-C, Class A1, 0.393%, 05/20/2035 | 19,869,928 | 18,473,072 | |||||||||||
| Bayview Financial Acquisition Trust, | |||||||||||||
| Series 2007-A, Class 1A2, 6.205%, 05/28/2037 | 864,190 | 918,242 | |||||||||||
| Bayview Financial Mortgage Pass-Through Trust, | |||||||||||||
| Series 2007-B, Class 1A2, 6.831%, 08/28/2047 | 150,000 | 125,272 | |||||||||||
| Bear Stearns Asset Backed Securities I Trust, | |||||||||||||
| Series 2007-HE4, Class 1A1, 0.272%, 05/25/2037 § | 3,976,110 | 4,047,303 | |||||||||||
| Carrington Mortgage Loan Trust: | |||||||||||||
| Series 2006-NC1, Class A3, 0.362%, 01/25/2036 | 10,518,015 | 10,019,345 | |||||||||||
| Series 2006-OPT1, Class A3, 0.332%, 02/25/2036 | 2,983,081 | 2,819,746 | |||||||||||
| Series 2006-NC2, Class A2, 0.242%, 06/25/2036 | 3,256,789 | 3,183,475 | |||||||||||
| Series 2007-HE1, Class A1, 0.252%, 06/25/2037 | 1,445,456 | 1,417,132 | |||||||||||
| Citibank Credit Card Issuance Trust, | |||||||||||||
| Series 2007-A3, Class A3, 6.150%, 06/15/2039 | 6,100,000 | 7,628,080 | |||||||||||
| Citigroup Mortgage Loan Trust, Inc., | |||||||||||||
| Series 2007-WFH1, Class A3, 0.302%, 01/25/2037 | 8,294,778 | 8,105,516 | |||||||||||
| Citigroup Mortgage Loan Trust. Inc., | |||||||||||||
| Series 2006-WFH3, Class A3, 0.302%, 10/25/2036 | 2,271,811 | 2,260,336 | |||||||||||
| Conseco Financial Corp.: | |||||||||||||
| Series 1993-4, Class A5, 7.050%, 01/15/2019 | 4,198 | 4,327 | |||||||||||
| Series 1997-1, Class A5, 6.860%, 03/15/2028 | 2,252 | 2,276 | |||||||||||
| Series 1997-4, Class A5, 6.880%, 02/15/2029 | 15,442 | 15,976 | |||||||||||
| Series 1997-5, Class A6, 6.820%, 05/15/2029 | 122,136 | 124,042 | |||||||||||
| Series 1998-3, Class A5, 6.220%, 03/01/2030 | 427,884 | 454,514 | |||||||||||
| Series 1998-4, Class A5, 6.180%, 04/01/2030 | 187,300 | 192,370 | |||||||||||
| Countrywide Asset-Backed Certificates: | |||||||||||||
| Series 2005-1, Class AF4, 5.147%, 02/25/2033 | 819,588 | 826,448 | |||||||||||
| Series 2004-12, Class AF6, 4.634%, 03/25/2035 | 569,848 | 578,721 | |||||||||||
| Series 2004-15, Class AF6, 4.613%, 04/25/2035 | 526,018 | 511,027 | |||||||||||
| Series 2005-7, Class AF6, 4.693%, 10/25/2035 | 1,530,010 | 1,523,118 | |||||||||||
| Series 2005-11, Class AF3, 4.778%, 02/25/2036 | 1,471,270 | 1,481,428 | |||||||||||
| Series 2005-10, Class AF6, 4.915%, 02/25/2036 | 3,389,556 | 3,370,585 | |||||||||||
| Series 2005-13, Class AF3, 5.046%, 04/25/2036 | 1,501,384 | 1,285,300 | |||||||||||
| Series 2006-S9, Class A3, 5.728%, 08/25/2036 | 165,370 | 161,695 | |||||||||||
| Series 2006-13, Class 1AF3, 5.011%, 01/25/2037 § | 168,779 | 197,453 | |||||||||||
| Series 2006-10, Class 1AF3, 5.020%, 09/25/2046 § | 1,286,783 | 819,774 | |||||||||||
| Series 2006-9, Class 1AF3, 5.319%, 10/25/2046 § | 560,719 | 433,860 | |||||||||||
| Series 2007-4, Class A3, 5.714%, 04/25/2047 § | 547,589 | 424,108 | |||||||||||
| Series 2006-24, Class 2A2, 0.272%, 06/25/2047 | 3,753,472 | 3,735,774 | |||||||||||
| Credit-Based Asset Servicing and Securitization LLC, | |||||||||||||
| Series 2005-CB8, Class AF2, 4.296%, 12/25/2035 | 1,625,372 | 1,529,303 | |||||||||||
| CWHEQ Home Equity Loan Trust: | |||||||||||||
| Series 2007-S1, Class A6, 5.693%, 11/25/2036 | 89,086 | 85,610 | |||||||||||
| Series 2007-S2, Class A2, 5.649%, 05/25/2037 | 14,972 | 14,985 | |||||||||||
| GE Capital Mortgage Services Inc. Trust, | |||||||||||||
| Series 1999-HE1, Class A7, 6.265%, 04/25/2029 | 1,953 | 1,943 | |||||||||||
| GSAA Home Equity Trust, | |||||||||||||
| Series 2004-6, Class A1, 0.952%, 06/25/2034 | 5,912,124 | 5,713,962 | |||||||||||
| Home Equity Asset Trust, | |||||||||||||
| Series 2006-4, Class 2A3, 0.322%, 08/25/2036 | 1,205,649 | 1,178,494 | |||||||||||
| J.P. Morgan Mortgage Acquisition Corp, | |||||||||||||
| Series 2007-CH1, Class AV5, 0.390%, 11/25/2036 | 10,000,000 | 9,278,250 | |||||||||||
| J.P. Morgan Mortgage Acquisition Trust, | |||||||||||||
| Series 2007-CH3, Class A3, 0.302%, 03/25/2037 | 16,845,622 | 16,552,592 | |||||||||||
| Long Beach Mortgage Loan Trust, | |||||||||||||
| Series 2006-WL2, Class 2A3, 0.352%, 01/25/2036 | 3,123,495 | 2,947,489 | |||||||||||
| Luminent Mortgage Trust, | |||||||||||||
| Series 2005-1, Class A1, 0.412%, 11/25/2035 | 2,596,643 | 2,339,812 | |||||||||||
| Morgan Stanley Capital I Inc. Trust, | |||||||||||||
| Series 2006-HE1, Class A3, 0.332%, 01/25/2036 | 5,217,867 | 5,159,103 | |||||||||||
| Morgan Stanley Home Equity Loan Trust, | |||||||||||||
| Series 2006-2, Class A3, 0.322%, 02/25/2036 | 8,435,507 | 8,333,319 | |||||||||||
| MortgageIT Trust, | |||||||||||||
| Series 2005-5, Class A1, 0.412%, 12/25/2035 | 11,859,691 | 11,096,342 | |||||||||||
| Nationstar Home Equity Loan Trust, | |||||||||||||
| Series 2006-B, Class AV3, 0.320%, 09/25/2036 | 5,073,511 | 5,056,164 | |||||||||||
| Oakwood Mortgage Investors, Inc., | |||||||||||||
| Series 1999-B, Class A3, 6.450%, 11/15/2017 | 27,305 | 28,463 | |||||||||||
| Option One Mortgage Loan Trust, | |||||||||||||
| Series 2005-4, Class A3, 0.412%, 11/25/2035 | 594,246 | 583,890 | |||||||||||
| RAMP Series Trust: | |||||||||||||
| Series 2002-RS3, Class AI5, 5.572%, 06/25/2032 | 3,231,063 | 3,212,368 | |||||||||||
| Series 2003-RS10, Class AI7, 4.850%, 11/25/2033 | 38,262 | 38,478 | |||||||||||
| Series 2004-RS4, Class AI6, 5.072%, 04/25/2034 | 2,333,642 | 2,386,847 | |||||||||||
| RASC Series Trust: | |||||||||||||
| Series 2003-KS5, Class AI6, 3.620%, 07/25/2033 | 57,539 | �� | 55,413 | ||||||||||
| Series 2003-KS9, Class AI6, 4.710%, 11/25/2033 | 95,005 | 91,157 | |||||||||||
| Renaissance Home Equity Loan Trust: | |||||||||||||
| Series 2005-1, Class AF6, 4.970%, 05/25/2035 | 138,996 | 135,373 | |||||||||||
| Series 2006-2, Class AF3, 5.797%, 08/25/2036 | 16,730,307 | 11,068,001 | |||||||||||
| Series 2006-3, Class AF2, 5.580%, 11/25/2036 | 5,222,116 | 3,362,134 | |||||||||||
| Series 2007-1, Class AF2, 5.512%, 04/25/2037 | 487,971 | 272,020 | |||||||||||
| Series 2007-1, Class AF3, 5.612%, 04/25/2037 | 292,782 | 166,152 | |||||||||||
| Series 2007-2, Class AF2, 5.675%, 06/25/2037 | 1,483,850 | 810,770 | |||||||||||
| Soundview Home Equity Loan Trust, | |||||||||||||
| Series 2005-OPT4, Class 2A3, 0.672%, 12/25/2035 | 14,216,648 | 13,768,639 | |||||||||||
| Specialty Underwriting & Residential Finance Trust, | |||||||||||||
| Series 2004-BC4, Class A1A, 0.822%, 10/25/2035 | 4,760,105 | 4,625,637 | |||||||||||
| Springleaf Mortgage Loan Trust, | |||||||||||||
| Series 2012-2A, Class A, 2.220%, 10/25/2057 (Acquired 07/31/2012, Cost $3,367,262) * | 3,367,644 | 3,410,500 | |||||||||||
| 219,915,060 | 6.4 | % | |||||||||||
| Commercial Mortgage-Backed Securities | |||||||||||||
| Bear Stearns Commercial Mortgage Securities Trust, | |||||||||||||
| Series 2005-PWR9, Class A4A, 4.871%, 09/11/2042 | 10,756,420 | 11,138,219 | |||||||||||
| CD Commercial Mortgage Trust, | |||||||||||||
| Series 2005-CD1, Class A4, 5.401%, 07/15/2044 | 18,103,731 | 18,824,043 | |||||||||||
| COMM Mortgage Trust: | |||||||||||||
| Series 2005-C6, Class A5A, 5.116%, 06/10/2044 | 19,637,853 | 20,304,617 | |||||||||||
| Series 2012-CR1, Class A3, 3.391%, 05/15/2045 | 25,842,000 | 26,575,732 | |||||||||||
| Series 2012-CR2, Class A4, 3.147%, 08/15/2045 | 28,450,000 | 28,752,338 | |||||||||||
| Credit Suisse First Boston Mortgage Securities Corp., | |||||||||||||
| Series 2005-C5, Class A4, 5.100%, 08/15/2038 | 11,721,863 | 12,063,942 | |||||||||||
| DBUBS Mortgage Trust, | |||||||||||||
| Series 2011-LC3A, Class A4, 4.551%, 08/10/2044 | 2,000,000 | 2,215,614 | |||||||||||
| GE Capital Commercial Mortgage Corp., | |||||||||||||
| Series 2005-C4, Class A4, 5.489%, 11/10/2045 | 12,795,000 | 13,398,348 | |||||||||||
| GMAC Commercial Mortgage Securities, Inc., | |||||||||||||
| Series 2004-C2, Class A4, 5.301%, 08/10/2038 | 1,674,719 | 1,677,356 | |||||||||||
| GS Mortgage Securities Corp II, | |||||||||||||
| Series 2012-GCJ9, Class A3, 2.773%, 11/10/2045 | 28,185,000 | 27,590,437 | |||||||||||
| J.P. Morgan Chase Commercial Mortgage Securities Trust, | |||||||||||||
| Series 2005-CB12, Class A4, 4.895%, 09/12/2037 | 24,965,000 | 25,695,101 | |||||||||||
| J.P. Morgan Chase Commercial Mortgage Trust, | |||||||||||||
| Series 2013-LC11, Class A5, 2.960%, 04/15/2046 | 12,075,000 | 11,915,574 | |||||||||||
| Morgan Stanley Bank of America Merrill Lynch Trust, | |||||||||||||
| Series 2012-C6, Class A4, 2.858%, 11/15/2045 | 25,410,000 | 24,990,633 | |||||||||||
| Morgan Stanley Capital I Trust, | |||||||||||||
| Series 2005-HQ7, Class A4, 5.376%, 11/14/2042 | 19,362,227 | 20,079,636 | |||||||||||
| Wachovia Bank Commercial Mortgage Trust, | |||||||||||||
| Series 2005-C22, Class A4, 5.455%, 12/15/2044 | 8,000,000 | 8,389,376 | |||||||||||
| WFRBS Commercial Mortgage Trust, | |||||||||||||
| Series 2012-C6, Class A4, 3.440%, 04/15/2045 | 14,000,000 | 14,491,386 | |||||||||||
| 268,102,352 | 7.9 | % | |||||||||||
| Total Long-Term Investments (Cost $3,316,368,541) | 3,384,412,538 | 99.0 | % | ||||||||||
| Shares | |||||||||||||
| SHORT-TERM INVESTMENTS | |||||||||||||
| Money Market Mutual Funds | |||||||||||||
| Dreyfus Institutional Cash Advantage Fund, 0.06% « | 47,543,180 | 47,543,180 | |||||||||||
| Short-Term Investments Trust - Liquid Assets Portfolio, 0.06% « | 66,000,000 | 66,000,000 | |||||||||||
| Total Short-Term Investments (Cost $113,543,180) | 113,543,180 | 3.3 | % | ||||||||||
| INVESTMENTS PURCHASED WITH CASH PROCEEDS FROM | |||||||||||||
| SECURITIES LENDING | |||||||||||||
| Investment Companies | |||||||||||||
| Mount Vernon Securities Lending Trust Prime Portfolio, 0.20% « | 229,724,869 | 229,724,869 | |||||||||||
| Total Investment Companies (Cost $229,724,869) | 229,724,869 | 6.7 | % | ||||||||||
| Total Investments Purchased With Cash Proceeds From | |||||||||||||
| Securities Lending (Cost $229,724,869) | 229,724,869 | 6.7 | % | ||||||||||
| Total Investments (Cost $3,659,636,590) | 3,727,680,587 | 109.0 | % | ||||||||||
| Liabilities in Excess of Other Assets | (307,728,567 | ) | (9.0 | )% | |||||||||
| TOTAL NET ASSETS | $ | 3,419,952,020 | 100.0 | % | |||||||||
| Notes to Schedule of Investments | |||||||||||||
| * | Restricted Security Deemed Liquid | ||||||||||||
| ** | Illiquid Security | ||||||||||||
| @ | This security or portion of this security is out on loan at June 30, 2014. | ||||||||||||
| f | Foreign Security | ||||||||||||
| « | 7-Day Yield | ||||||||||||
| § | Security in Default | ||||||||||||
| † | Priced at Fair Value by the Valuation Committee as delegated by the Baird Funds' Board of Directors. | ||||||||||||
Item 7. Disclosure of Proxy Voting Policies and Procedures for Closed-End Management Investment Companies.
Not applicable because the Registrant is not a closed-end management investment company.
Item 8. Portfolio Managers of Closed-End Management Investment Companies.
Not applicable because the Registrant is not a closed-end management investment company.
Item 9. Purchases of Equity Securities by Closed-End Management Investment Company and Affiliated Purchasers.
Not applicable because the Registrant is not a closed-end management investment company.
Item 10. Submission of Matters to a Vote of Security Holders.
There have been no material changes to the procedures by which shareholders may recommend nominees to the Registrant’s board of directors.
Item 11. Controls and Procedures.
| (a) | The Registrant’s management, with the participation of its principal executive and principal financial officers, has evaluated the effectiveness of the Registrant's disclosure controls and procedures (as defined in Rule 30a-3(c) under the Investment Company Act of 1940 (the “Act”)), as of a date within 90 days prior to the filing date of this Form N-CSR, as required by Rule 30a-3(b) under the Act and Rules 13a-15(b) or 15d-15(b) under the Securities Exchange Act of 1934. Based on such evaluation, the Registrant's principal executive and principal financial officers have concluded that the design and operation of the Registrant's disclosure controls and procedures are effective in providing reasonable assurance that the information required to be disclosed on Form N-CSR is recorded, processed, summarized and reported within the applicable time periods. |
| (b) | There were no changes in the Registrant's internal control over financial reporting (as defined in Rule 30a-3(d) under the Act) that occurred during the second fiscal quarter of the period covered by this report that have materially affected, or are reasonably likely to materially affect, the Registrant's internal control over financial reporting. |
Item 12. Exhibits.
| (a) | (1) Code of ethics. |
Incorporated by reference to the Registrant’s Form N-CSR filed on March 9, 2004.
(2) Certifications pursuant to Section 302 of the Sarbanes-Oxley Act of 2002. Filed herewith.
(3) Any written solicitation to purchase securities under Rule 23c-1 under the Act sent or given during the period covered by the report by or on behalf of the Registrant to 10 or more persons. Not applicable because the Registrant is not a closed-end management investment company.
(b) Certification pursuant to Section 906 of the Sarbanes-Oxley Act of 2002. Furnished herewith.
SIGNATURES
Pursuant to the requirements of the Securities Exchange Act of 1934 and the Investment Company Act of 1940, the Registrant has duly caused this report to be signed on its behalf by the undersigned, thereunto duly authorized.
BAIRD FUNDS, INC.
By: /s/Mary Ellen Stanek
Mary Ellen Stanek, President
Date: September 8, 2014
Pursuant to the requirements of the Securities Exchange Act of 1934 and the Investment Company Act of 1940, this report has been signed below by the following persons on behalf of the Registrant and in the capacities and on the dates indicated.
By: /s/Mary Ellen Stanek
Mary Ellen Stanek, President
Date: September 8, 2014
By: /s/Dominick Zarcone
Dominick Zarcone, Treasurer
Date: September 8, 2014