UNITED STATES
SECURITIES AND EXCHANGE COMMISSION
Washington, D.C. 20549
SECURITIES AND EXCHANGE COMMISSION
Washington, D.C. 20549
FORM N-CSR
CERTIFIED SHAREHOLDER REPORT OF REGISTERED MANAGEMENT INVESTMENT
COMPANIES
Investment Company Act file number: 811-09997
Baird Funds, Inc.
(Exact name of Registrant as specified in charter)
(Exact name of Registrant as specified in charter)
777 East Wisconsin Avenue
Milwaukee, WI 53202
(Address of principal executive offices) (Zip code)
(Address of principal executive offices) (Zip code)
Andrew D. Ketter
Robert W. Baird & Co. Incorporated
777 East Wisconsin Avenue
Milwaukee, WI 53202
(Name and address of agent for service)
(Name and address of agent for service)
1-866-442-2473
Registrant's telephone number, including area code
Date of fiscal year end: December 31, 2017
Date of reporting period: June 30, 2017
Item 1. Reports to Stockholders.
Semi-Annual Report –
Baird Funds
June 30, 2017
Taxable Bond Funds
Baird Ultra Short Bond Fund
Baird Short-Term Bond Fund
Baird Intermediate Bond Fund
Baird Aggregate Bond Fund
Baird Core Plus Bond Fund
Municipal Bond Funds
Baird Short-Term Municipal Bond Fund
Baird Quality Intermediate Municipal Bond Fund
Baird Core Intermediate Municipal Bond Fund
| Go Green. |  | Go Paperless. |
Sign up to receive your Baird Funds’ prospectuses and reports online.
Table of Contents
| Baird Ultra Short Bond Fund | 1 |
| Baird Short-Term Bond Fund | 9 |
| Baird Intermediate Bond Fund | 17 |
| Baird Aggregate Bond Fund | 25 |
| Baird Core Plus Bond Fund | 33 |
| Baird Short-Term Municipal Bond Fund | 41 |
| Baird Quality Intermediate Municipal Bond Fund | 52 |
| Baird Core Intermediate Municipal Bond Fund | 62 |
| Additional Information on Fund Expenses | 74 |
| Statements of Assets and Liabilities | 76 |
| Statements of Operations | 79 |
| Statements of Changes in Net Assets | 82 |
| Financial Highlights | 90 |
| Notes to the Financial Statements | 106 |
| Additional Information | 120 |
This report has been prepared for shareholders and may be distributed to others only if preceded or accompanied by a current prospectus.
Cautionary Note on Analyses, Opinions and Outlooks: In this report we offer analyses and opinions on the performance of individual securities, companies, industries, sectors, markets, interest rates and governmental policies, including predictions, forecasts and outlooks regarding possible future events. These can generally be identified as such because the context of the statements may include such words as “believe,” “should,” “will,” “expects,” “anticipates,” “hopes” and words of similar effect. These statements reflect the portfolio managers’ good faith beliefs and judgments and involve risks and uncertainties, including the risk that the portfolio managers’ analyses, opinions and outlooks are or will prove to be inaccurate. It is inherently difficult to correctly assess and explain the performance of particular securities, sectors, markets, interest rate movements, governmental actions or general economic trends and conditions, and many unforeseen factors contribute to the performance of Baird Funds. Investors are, therefore, cautioned not to place undue reliance on subjective judgments contained in this report.
Baird Ultra Short Bond Fund
June 30, 2017 (Unaudited)
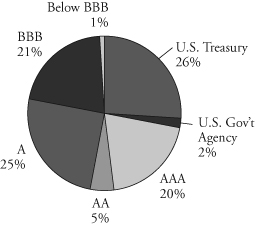
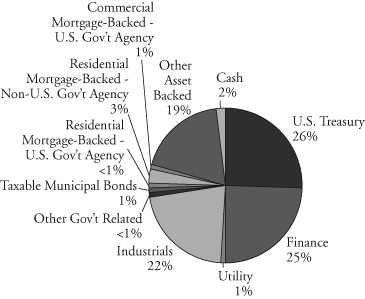
Portfolio Characteristics
Quality Distribution(1)(2)
 | Net Assets | $567,765,550 | |||
| SEC 30-Day | |||||
Yield(3) | |||||
| Institutional Class | |||||
| (Subsidized) | 1.38% | ||||
| Institutional Class | |||||
| (Unsubsidized) | 1.23% | ||||
| Investor Class | |||||
| (Subsidized) | 1.13% | ||||
| Investor Class | |||||
| (Unsubsidized) | 0.99% | ||||
| Average | |||||
| Effective | |||||
| Duration | 0.44 years | ||||
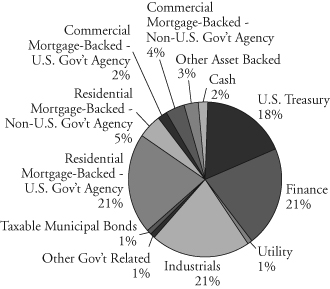
Sector Weightings(1) | Average | ||||
| Effective | |||||
 | Maturity | 0.78 years | |||
| Annualized | |||||
Expense Ratio(4) | |||||
Gross | |||||
| Institutional Class | 0.30% | ||||
| Investor Class | 0.55% | (5) | |||
Net | |||||
| Institutional Class | 0.15% | ||||
| Investor Class | 0.40% | ||||
| Portfolio | |||||
| Turnover Rate | 40.5% | † | |||
| Number of | |||||
| Holdings | 269 | ||||
(1) | Percentages shown are based on the Fund’s total investments. | |
(2) | The quality profile is calculated on a market value-weighted basis using the highest credit quality rating for each security held by the Fund given by S&P, Moody’s or Fitch, each of which is a Nationally Recognized Statistical Rating Organization (NRSRO). NRSROs rate the credit quality of securities using a scale that generally ranges from AAA (highest) to D (lowest). | |
(3) | SEC yields are based on SEC guidelines and are calculated for the 30 days ended June 30, 2017. | |
(4) | Reflects expense ratios as stated in the Fund’s current prospectus. The Advisor has contractually agreed to waive management fees in an amount equal to an annual rate of 0.15% of average daily net assets for the Fund, at least through April 30, 2018. The agreement may only be terminated prior to the end of this term by or with the consent of the Board of Directors of Baird Funds, Inc. | |
(5) | Includes 0.25% 12b-1 fee. | |
| † | Not annualized. |
Page 1
Baird Ultra Short Bond Fund
June 30, 2017 (Unaudited)
Total Returns
| Average Annual | ||||
| Six | One | Three | Since | |
| For the Periods Ended June 30, 2017 | Months | Year | Years | Inception(1) |
| Institutional Class Shares | 0.63% | 1.27% | 0.85% | 1.06% |
| Investor Class Shares | 0.52% | 1.04% | 0.61% | 0.82% |
| Bloomberg Barclays U.S. Short-Term | ||||
Government/Corporate Index(2) | 0.43% | 0.72% | 0.51% | 0.48% |
| (1) | For the period from December 31, 2013 (inception date) through June 30, 2017. |
| (2) | The Bloomberg Barclays U.S. Short-Term Government/Corporate Index is an unmanaged, market value weighted index of investment grade, fixed debt including government and corporate securities with maturities less than one year. This Index does not reflect any deduction for fees, expenses or taxes. A direct investment in an index is not possible. |
The returns shown in the table above reflect reinvestment of dividends and/or capital gains distributions in additional shares. The returns do not reflect the deduction of taxes that a shareholder would pay on Fund distributions or the redemption of Fund shares. The returns reflect the actual performance for each period and do not include the impact of trades executed on the last business day of the period that were recorded on the first business day of the next period.
The Fund’s gross expense ratio for each Class, as reflected in the Fund’s current prospectus, is set forth under “Portfolio Characteristics”.
The Fund may invest up to 10% of its net assets in non-investment grade debt securities (commonly referred to as “high yield” bonds). While these types of securities typically offer higher yields than investment grade securities, they also include greater risks including increased credit risk and the increased risk of default or bankruptcy. The Fund may also invest in U.S. dollar denominated foreign securities which involve additional risks such as political and economic instability, and different and sometimes less strict financial reporting standards and regulation. The Fund may also invest in mortgage- and asset-backed securities, which include interest rate and prepayment risks more pronounced than those of other fixed income securities.
Past performance does not guarantee future results. Investment return and principal value will fluctuate so that an investor’s shares, when redeemed, may be worth more or less than their original cost.
For information about the performance of the Fund as of the most recent month-end, please call 1-866-44BAIRD or visit www.bairdfunds.com. Mutual fund performance changes over time and current performance may be lower or higher than that stated.
Page 2
Baird Ultra Short Bond Fund
Summary Schedule of Investments, June 30, 2017 (Unaudited)
This schedule summarizes the Fund’s holdings by asset type. Details are reported for each of the Fund’s 50 largest individual holdings and for investments that, in total for any issuer, represent more than 1% of the Fund’s net assets. The total value of smaller holdings is reported as a single amount within each category.
The Fund reports a complete list of its holdings in regulatory filings four times in each fiscal year, at the quarter end. For the second and fourth fiscal quarters, the complete listing of the Fund’s holdings is available electronically in the Fund’s Form N-CSR at http://www.bairdassetmanagement.com/baird-funds/funds-and-performance#Literature and on the Securities and Exchange Commission’s website (www.sec.gov) or you can have it mailed to you without charge by calling 1-866-44BAIRD. For the first and third fiscal quarters, the Fund files the lists with the SEC on Form N-Q. Shareholders can look up the Fund’s Forms N-CSR and N-Q on the SEC’s website (www.sec.gov).
Long-Term Investments
| Principal | % of | |||||||||||
| Amount | Value | Net Assets | ||||||||||
| U.S. Treasury Securities | ||||||||||||
| United States Treasury Note/Bond: | ||||||||||||
| 1.000%, 09/15/2017 | $ | 34,100,000 | $ | 34,094,987 | 6.0 | % | ||||||
| 0.875%, 01/15/2018 | 77,300,000 | 77,179,103 | 13.6 | % | ||||||||
| 1.000%, 05/15/2018 | 34,200,000 | 34,117,168 | 6.0 | % | ||||||||
| Total U.S. Treasury Securities | ||||||||||||
| (Cost $145,528,664) | 145,391,258 | 25.6 | % | |||||||||
| Other Government Related Security | ||||||||||||
| Other Government Related Security# | 1,502,719 | 0.3 | % | |||||||||
| Total Other Government Related Security | ||||||||||||
| (Cost $1,503,879) | 1,502,719 | 0.3 | % | |||||||||
| Corporate Bonds | ||||||||||||
| Industrials | ||||||||||||
| AbbVie, Inc., | ||||||||||||
| 1.800%, 05/14/2018 | 3,500,000 | 3,504,417 | 0.6 | % | ||||||||
| Anheuser-Busch InBev Worldwide, Inc., | ||||||||||||
| 6.500%, 07/15/2018 | 2,880,000 | 3,019,761 | 0.5 | % | ||||||||
| EI du Pont de Nemours & Co., | ||||||||||||
1.700%, 05/01/2020∞ | 5,000,000 | 5,030,055 | 0.9 | % | ||||||||
| Enbridge Energy Partners LP, | ||||||||||||
| Class B, 6.500%, 04/15/2018 | 4,000,000 | 4,141,884 | 0.7 | % | ||||||||
| Enterprise Products Operating LLC, | ||||||||||||
| Class L, 6.300%, 09/15/2017 | 3,500,000 | 3,530,499 | 0.6 | % | ||||||||
| Harris Corp., | ||||||||||||
| 1.999%, 04/27/2018 | 4,000,000 | 4,005,464 | 0.7 | % | ||||||||
| Hyundai Capital America, | ||||||||||||
| 2.099%, 04/03/2020 | ||||||||||||
(Acquired 03/29/2017, Cost $3,000,000)∞* | 3,000,000 | 3,008,529 | 0.5 | % | ||||||||
| Kinder Morgan Finance Co. LLC, | ||||||||||||
| 6.000%, 01/15/2018 (Acquired 01/30/2017 | ||||||||||||
| through 03/17/2017, Cost $3,807,216)* | 3,725,000 | 3,802,350 | 0.7 | % | ||||||||
The accompanying notes are an integral part of these financial statements.
Page 3
Baird Ultra Short Bond Fund
Summary Schedule of Investments, June 30, 2017 (Unaudited)
Long-Term Investments (cont.)
| Principal | % of | |||||||||||
| Amount | Value | Net Assets | ||||||||||
| Medco Health Solutions, Inc., | ||||||||||||
| 7.125%, 03/15/2018 | $ | 3,308,000 | $ | 3,430,227 | 0.6 | % | ||||||
| Mylan, Inc., | ||||||||||||
| 2.600%, 06/24/2018 | 4,000,000 | 4,028,732 | 0.7 | % | ||||||||
| Phillips 66, | ||||||||||||
| 1.886%, 04/15/2020 | ||||||||||||
(Acquired 04/11/2017, Cost $3,000,000)∞* | 3,000,000 | 3,006,033 | 0.5 | % | ||||||||
| Potash Corp of Saskatchewan, Inc., | ||||||||||||
3.250%, 12/01/2017 f | 3,609,000 | 3,631,242 | 0.6 | % | ||||||||
| Republic Services, Inc., | ||||||||||||
| 3.800%, 05/15/2018 | 4,000,000 | 4,070,688 | 0.7 | % | ||||||||
| RPM International, Inc., | ||||||||||||
| 6.500%, 02/15/2018 | 2,750,000 | 2,829,720 | 0.5 | % | ||||||||
| Teva Pharmaceutical Finance Netherlands III BV, | ||||||||||||
1.400%, 07/20/2018 f | 3,500,000 | 3,491,758 | 0.6 | % | ||||||||
| Zoetis, Inc., | ||||||||||||
| 1.875%, 02/01/2018 | 2,750,000 | 2,751,669 | 0.5 | % | ||||||||
| Other Industrials# | 70,355,169 | 12.5 | % | |||||||||
| Total Industrials | ||||||||||||
| (Cost $127,506,170) | 127,638,197 | 22.4 | % | |||||||||
| Utilities | ||||||||||||
| Other Utilities# | 7,874,366 | 1.4 | % | |||||||||
| Total Utilities | ||||||||||||
| (Cost $7,880,377) | 7,874,366 | 1.4 | % | |||||||||
| Financials | ||||||||||||
| ABN AMRO Bank NV, | ||||||||||||
| 1.798%, 01/18/2019 (Acquired 01/11/2017 | ||||||||||||
through 04/04/2017, Cost $4,503,162)∞* f | 4,500,000 | 4,516,735 | 0.8 | % | ||||||||
| Bank of America Corp., | ||||||||||||
| 6.875%, 04/25/2018 | 3,000,000 | 3,121,887 | 0.5 | % | ||||||||
| Barclays PLC, | ||||||||||||
2.000%, 03/16/2018 f | 3,900,000 | 3,903,966 | 0.7 | % | ||||||||
| BPCE SA, | ||||||||||||
1.625%, 01/26/2018 f | 3,000,000 | 2,995,026 | 0.5 | % | ||||||||
| Citigroup, Inc., | ||||||||||||
| 1.700%, 04/27/2018 | 3,000,000 | 2,996,994 | 0.5 | % | ||||||||
| Compass Bank, | ||||||||||||
| 1.850%, 09/29/2017 | 3,015,000 | 3,015,730 | 0.5 | % | ||||||||
| Jefferies Group LLC, | ||||||||||||
| 5.125%, 04/13/2018 | 3,250,000 | 3,333,574 | 0.6 | % | ||||||||
| KEB Hana Bank, | ||||||||||||
| 2.021%, 04/05/2020 | ||||||||||||
(Acquired 03/27/2017, Cost $3,000,000)∞* f | 3,000,000 | 2,999,595 | 0.5 | % | ||||||||
The accompanying notes are an integral part of these financial statements.
Page 4
Baird Ultra Short Bond Fund
Summary Schedule of Investments, June 30, 2017 (Unaudited)
Long-Term Investments (cont.)
| Principal | % of | |||||||||||
| Amount | Value | Net Assets | ||||||||||
| Manufacturers & Traders Trust Co., | ||||||||||||
| 6.625%, 12/04/2017 | $ | 2,810,000 | $ | 2,867,172 | 0.5 | % | ||||||
| National Bank of Canada, | ||||||||||||
1.788%, 06/12/2020∞ f | 4,000,000 | 4,012,988 | 0.7 | % | ||||||||
| Royal Bank of Canada, | ||||||||||||
1.415%, 10/13/2017∞ f | 3,000,000 | 3,001,938 | 0.5 | % | ||||||||
| Voya Financial, Inc., | ||||||||||||
| 2.900%, 02/15/2018 | 3,834,000 | 3,859,933 | 0.7 | % | ||||||||
| Other Financials# | 99,519,028 | 17.7 | % | |||||||||
| Total Financials | ||||||||||||
| (Cost $139,946,376) | 140,144,566 | 24.7 | % | |||||||||
| Total Corporate Bonds | ||||||||||||
| (Cost $275,332,923) | 275,657,129 | 48.5 | % | |||||||||
| Taxable Municipal Bonds | ||||||||||||
| Other Taxable Municipal Bonds# | 4,002,740 | 0.7 | % | |||||||||
| Total Taxable Municipal Bonds | ||||||||||||
| (Cost $4,004,481) | 4,002,740 | 0.7 | % | |||||||||
| Residential Mortgage-Backed Securities | ||||||||||||
| U.S. Government Agency Issues | ||||||||||||
| Other U.S. Government Agency Issues# | 968,245 | 0.2 | % | |||||||||
| Total U.S. Government Agency Issues | ||||||||||||
| (Cost $957,809) | 968,245 | 0.2 | % | |||||||||
| Non-U.S. Government Agency Issues | ||||||||||||
| Other Non-U.S. Government Agency Issues# | 14,581,556 | 2.6 | % | |||||||||
| Total Non-U.S. Government Agency Issues | ||||||||||||
| (Cost $14,475,262) | 14,581,556 | 2.6 | % | |||||||||
| Commercial Mortgage-Backed Securities | ||||||||||||
| U.S. Government Agency Issues | ||||||||||||
| Other U.S. Government Agency Issues# | 7,649,650 | 1.3 | % | |||||||||
| Total U.S. Government Agency Issues | ||||||||||||
| (Cost $7,636,454) | 7,649,650 | 1.3 | % | |||||||||
| Other Asset Backed Securities | ||||||||||||
| American Express Credit Account Master Trust, | ||||||||||||
| Series 2014-4, Class A, 1.430%, 06/15/2020 | 3,100,000 | 3,100,611 | 0.5 | % | ||||||||
| Bank of The West Auto Trust, | ||||||||||||
| Series 2014-1, Class A4, 1.650%, 03/16/2020 | ||||||||||||
| (Acquired 02/16/2017, Cost $2,782,417)* | 2,780,000 | 2,781,518 | 0.5 | % | ||||||||
| Barclays Dryrock Issuance Trust, | ||||||||||||
| Series 2014-5, Class A, 1.480%, 09/15/2020 | 3,000,000 | 3,000,585 | 0.5 | % | ||||||||
| Capital Auto Receivables Asset Trust, | ||||||||||||
| Series 2015-3, Class A2, 1.720%, 01/22/2019 | 3,310,580 | 3,312,315 | 0.6 | % | ||||||||
The accompanying notes are an integral part of these financial statements.
Page 5
Baird Ultra Short Bond Fund
Summary Schedule of Investments, June 30, 2017 (Unaudited)
Long-Term Investments (cont.)
| Principal | % of | |||||||||||
| Amount | Value | Net Assets | ||||||||||
| Capital One Multi-Asset Execution Trust, | ||||||||||||
| Series 2007-A7, Class A7, 5.750%, 07/15/2020 | $ | 3,000,000 | $ | 3,026,594 | 0.5 | % | ||||||
| Chase Issuance Trust: | ||||||||||||
| Series 2014-A6, Class A6, 1.260%, 07/15/2019 | 4,100,000 | 4,099,768 | 0.7 | % | ||||||||
| Series 2013-A1, Class A1, 1.300%, 02/18/2020 | 2,500,000 | 2,497,581 | 0.4 | % | ||||||||
| Chrysler Capital Auto Receivables Trust, | ||||||||||||
| Series 2016-BA, Class A2, 1.360%, 01/15/2020 | ||||||||||||
| (Acquired 02/22/2017, Cost $3,265,076)* | 3,266,990 | 3,263,073 | 0.6 | % | ||||||||
| Citibank Credit Card Issuance Trust, | ||||||||||||
| Series 2008-A1, Class A1, 5.350%, 02/07/2020 | 4,500,000 | 4,601,427 | 0.8 | % | ||||||||
| Discover Card Execution Note Trust, | ||||||||||||
| Series 2007-A1, Class A1, 5.650%, 03/16/2020 | 3,120,000 | 3,147,658 | 0.6 | % | ||||||||
| Enterprise Fleet Financing LLC, | ||||||||||||
| Series 2015-2, Class A2, 1.590%, 02/22/2021 | ||||||||||||
| (Acquired 08/23/2016 through 01/18/2017, | ||||||||||||
| Cost $2,706,628)* | 2,706,872 | 2,706,980 | 0.5 | % | ||||||||
| First National Master Note Trust 2017-1, | ||||||||||||
Series 2017-1, Class A, 1.559%, 04/18/2022∞ | 4,150,000 | 4,153,615 | 0.7 | % | ||||||||
| Ford Credit Auto Owner Trust 2015-B, | ||||||||||||
| Series 2015-B, Class A3, 1.160%, 11/15/2019 | 3,132,619 | 3,128,297 | 0.6 | % | ||||||||
| Hyundai Auto Lease Securitization Trust, | ||||||||||||
| Series 2016-A, Class A3, 1.600%, 07/15/2019 | ||||||||||||
| (Acquired 02/23/2017 through 06/20/2017, | ||||||||||||
| Cost $3,713,345)* | 3,710,000 | 3,710,867 | 0.7 | % | ||||||||
| Mercedes Benz Auto Lease Trust, | ||||||||||||
| Series 2015-B, Class A4, 1.530%, 05/17/2021 | 3,600,000 | 3,600,660 | 0.6 | % | ||||||||
| Mercedes-Benz Auto Receivables Trust, | ||||||||||||
| Series 2015-1, Class A3, 1.340%, 12/16/2019 | 3,275,560 | 3,272,362 | 0.6 | % | ||||||||
| MMAF Equipment Finance LLC, | ||||||||||||
| Series 2016-AA, Class A2, 1.390%, 12/17/2018 | ||||||||||||
| (Acquired 10/26/2016 through 02/27/2017, | ||||||||||||
| Cost $3,746,051)* | 3,745,143 | 3,744,710 | 0.7 | % | ||||||||
| Nissan Auto Lease Trust 2017-A, | ||||||||||||
| Series 2017-A, Class A2A, 1.640%, 09/16/2019 | 3,625,000 | 3,623,916 | 0.6 | % | ||||||||
| Synchrony Credit Card Master Note Trust: | ||||||||||||
| Series 2012-6, Class A, 1.360%, 08/17/2020 | 3,150,000 | 3,149,702 | 0.6 | % | ||||||||
| Series 2014-1, Class A, 1.610%, 11/15/2020 | 5,000,000 | 5,002,847 | 0.9 | % | ||||||||
| Other Asset Backed Securities# | 39,712,349 | 6.9 | % | |||||||||
| Total Other Asset Backed Securities | ||||||||||||
| (Cost $108,672,879) | 108,637,435 | 19.1 | % | |||||||||
| Total Long-Term Investments | ||||||||||||
| (Cost $558,112,351) | 558,390,732 | 98.3 | % | |||||||||
The accompanying notes are an integral part of these financial statements.
Page 6
Baird Ultra Short Bond Fund
Summary Schedule of Investments, June 30, 2017 (Unaudited)
| Short-Term Investments | ||||||||||||
| % of | ||||||||||||
| Shares | Value | Net Assets | ||||||||||
| Short-Term Investments | ||||||||||||
| Fidelity Institutional Money Market Fund – | ||||||||||||
| Government Portfolio, Institutional Class, 0.85%« | 8,941,015 | $ | 8,941,015 | 1.6 | % | |||||||
| Total Short-Term Investments | ||||||||||||
| (Cost $8,941,015) | 8,941,015 | 1.6 | % | |||||||||
| Total Investments | ||||||||||||
| (Cost $567,053,366) | 567,331,747 | 99.9 | % | |||||||||
| Other Assets in Excess of Liabilities | 433,803 | 0.1 | % | |||||||||
| TOTAL NET ASSETS | $ | 567,765,550 | 100.0 | % | ||||||||
Notes to Summary Schedule of Investments
| ∞ | Variable or floating rate security. Floating rate securities are securities whose yields vary with a designated index rate. These securities’ rates are as of June 30, 2017. | |
| * | Restricted security as defined in Rule 144(a) under the Securities Act of 1933 and determined to be liquid. Purchased in a private placement transaction; resale to the public may require registration or may extend only to qualified institutional buyers. At June 30, 2017, the value of these securities total $33,540,390, which represents 5.91% of total net assets. | |
| f | Foreign Security. | |
| # | Represents the aggregate value, by category, securities that are not among the 50 largest holdings and, in total for any issuer, represent 1% or less of net assets. | |
| ~ | Groupings contain, in aggregate, restricted securities totaling $42,562,803 representing 7.49% of net assets. | |
| « | 7-Day Yield. |
Summary of Fair Value Exposure at June 30, 2017 (Unaudited)
The Fund has adopted authoritative fair valuation accounting standards which establish a definition of fair value and set out a hierarchy for measuring fair value. These standards require additional disclosures about the various inputs and valuation techniques used to develop the measurements of fair value and a discussion on changes in valuation techniques and related inputs during the period. These standards define fair value as the price that would be received to sell an asset or paid to transfer a liability in an orderly transaction between market participants at the measurement date.
The fair value hierarchy is organized into three levels based upon the assumptions (referred to as “inputs”) used in pricing the asset or liability. These standards state that “observable inputs” reflect the assumptions market participants would use in pricing the asset or liability based on market data obtained from independent sources and “unobservable inputs” reflect an entity’s own assumptions about the assumptions market participants would use in pricing the asset or liability. These inputs are summarized into three broad levels and described below:
Level 1 – | Unadjusted quoted prices in active markets for identical unrestricted securities. |
Level 2 – | Other significant observable inputs (including quoted prices for similar securities, quoted prices in inactive markets, dealer indications, interest rates, yield curves, prepayment speeds, credit risk, default rates, inputs corroborated by observable market data, etc.). |
Level 3 – | Significant unobservable inputs (including the Fund’s own assumptions about the factors that market participants would use in valuing the security) based on the best information available. |
The accompanying notes are an integral part of these financial statements.
Page 7
Baird Ultra Short Bond Fund
Summary Schedule of Investments, June 30, 2017 (Unaudited)
Summary of Fair Value Exposure at June 30, 2017 (Unaudited) (cont.)
The inputs or methodology used for valuing securities are not necessarily an indication of the risk associated with investing in those securities.
The following is a summary of the inputs used to value the Fund’s investments as of June 30, 2017:
| Level 1 | Level 2 | Level 3 | Total | |||||||||||||
| Long-Term Investments | ||||||||||||||||
| U.S. Treasury Securities | $ | — | $ | 145,391,258 | $ | — | $ | 145,391,258 | ||||||||
| Other Government Related Security | — | 1,502,719 | — | 1,502,719 | ||||||||||||
| Corporate Bonds | — | 275,657,129 | — | 275,657,129 | ||||||||||||
| Taxable Municipal Bonds | — | 4,002,740 | — | 4,002,740 | ||||||||||||
| Residential Mortgage-Backed Securities – | ||||||||||||||||
| U.S. Government Agency Issues | — | 968,245 | — | 968,245 | ||||||||||||
| Residential Mortgage-Backed Securities – | ||||||||||||||||
| Non-U.S. Government Agency Issues | — | 14,581,556 | — | 14,581,556 | ||||||||||||
| Commercial Mortgage-Backed Securities – | ||||||||||||||||
| U.S. Government Agency Issues | — | 7,649,650 | — | 7,649,650 | ||||||||||||
| Other Asset Backed Securities | — | 108,637,435 | — | 108,637,435 | ||||||||||||
| Total Long-Term Investments | — | 558,390,732 | — | 558,390,732 | ||||||||||||
| Short-Term Investment | ||||||||||||||||
| Money Market Mutual Fund | 8,941,015 | — | — | 8,941,015 | ||||||||||||
| Total Short-Term Investment | 8,941,015 | — | — | 8,941,015 | ||||||||||||
| Total Investments | $ | 8,941,015 | $ | 558,390,732 | $ | — | $ | 567,331,747 | ||||||||
Changes in valuation techniques may result in transfers into or out of assigned levels within the fair value hierarchy. There were no transfers between Level 1, Level 2, and Level 3 fair value measurements during the reporting period. See the Fund’s valuation policy in Note 2a to the financial statements.
The accompanying notes are an integral part of these financial statements.
Page 8
Baird Short-Term Bond Fund
June 30, 2017 (Unaudited)
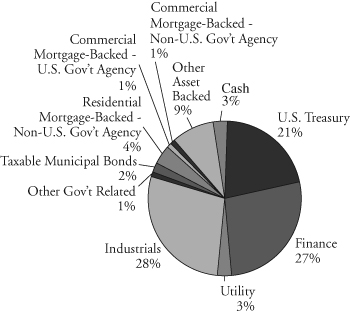
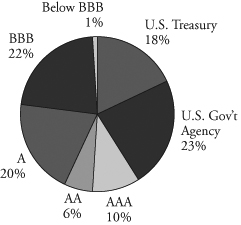
Portfolio Characteristics
Quality Distribution(1)(2)
 | Net Assets | $4,588,541,420 | |||
| SEC 30-Day | |||||
Yield(3) | |||||
| Institutional Class | 1.71% | ||||
| Investor Class | 1.45% | ||||
| Average | |||||
| Effective | |||||
| Duration | 1.94 years | ||||
| Average | |||||
| Effective | |||||
| Maturity | 2.11 years | ||||
| Annualized | |||||
Sector Weightings(1) | Expense | ||||
Ratio(4) | |||||
 | Institutional Class | 0.30% | |||
| Investor Class | 0.55% | (5) | |||
| Portfolio | |||||
| Turnover Rate | 24.3% | † | |||
| Number of | |||||
| Holdings | 566 | ||||
(1) | Percentages shown are based on the Fund’s total investments. | |
(2) | The quality profile is calculated on a market value-weighted basis using the highest credit quality rating for each security held by the Fund given by S&P, Moody’s or Fitch, each of which is a Nationally Recognized Statistical Rating Organization (NRSRO). NRSROs rate the credit quality of securities using a scale that generally ranges from AAA (highest) to D (lowest). | |
(3) | SEC yields are based on SEC guidelines and are calculated for the 30 days ended June 30, 2017. | |
(4) | Reflects expense ratios as stated in the Fund’s current prospectus. | |
(5) | Includes 0.25% 12b-1 fee. | |
| † | Not annualized. |
Page 9
Baird Short-Term Bond Fund
June 30, 2017 (Unaudited)
Total Returns
| Average Annual | ||||||
| Since | Since | |||||
| Six | One | Five | Ten | Inception | Inception | |
| For the Periods Ended June 30, 2017 | Months | Year | Years | Years | (8/31/04) | (9/19/12) |
| Institutional Class Shares | 1.10% | 1.02% | 1.82% | 2.76% | 2.83% | N/A |
| Investor Class Shares | 0.98% | 0.77% | N/A | N/A | N/A | 1.39% |
| Bloomberg Barclays 1-3 Year U.S. | ||||||
Government/Credit Bond Index(1) | 0.72% | 0.35% | 0.95% | 2.30% | 2.43% | 0.90% |
| (1) | The Bloomberg Barclays 1-3 Year U.S. Government/Credit Bond Index is an unmanaged, market value weighted index of investment grade, fixed-rate debt issues, including government and corporate securities, with maturities between one and three years. This Index does not reflect any deduction for fees, expenses or taxes. A direct investment in an index is not possible. |
The returns shown in the table above reflect reinvestment of dividends and/or capital gains distributions in additional shares. Returns do not reflect the deduction of taxes that a shareholder would pay on Fund distributions or the redemption of Fund shares. The returns reflect the actual performance for each period and do not include the impact of trades executed on the last business day of the period that were recorded on the first business day of the next period.
The Fund’s gross expense ratio for each Class, as reflected in the Fund’s current prospectus, is set forth under “Portfolio Characteristics”.
The Fund may invest in U.S. dollar denominated foreign securities which involve additional risks such as political and economic instability, and different and sometimes less strict financial reporting standards and regulation. The Fund may also invest in mortgage- and asset-backed securities, which include interest rate and prepayment risks more pronounced than those of other fixed income securities.
Past performance does not guarantee future results. Investment returns and principal value will fluctuate so that an investor’s shares, when redeemed, may be worth more or less than their original cost.
For information about the performance of the Fund as of the most recent month-end, please call 1-866-44BAIRD or visit www.bairdfunds.com. Mutual fund performance changes over time and current performance may be lower or higher than that stated.
Page 10
Baird Short-Term Bond Fund
Summary Schedule of Investments, June 30, 2017 (Unaudited)
This schedule summarizes the Fund’s holdings by asset type. Details are reported for each of the Fund’s 50 largest individual holdings and for investments that, in total for any issuer, represent more than 1% of the Fund’s net assets. The total value of smaller holdings is reported as a single amount within each category.
The Fund reports a complete list of its holdings in regulatory filings four times in each fiscal year, at the quarter end. For the second and fourth fiscal quarters, the complete listing of the Fund’s holdings is available electronically in the Fund’s Form N-CSR at http://www.bairdassetmanagement.com/baird-funds/funds-and-performance#Literature and on the Securities and Exchange Commission’s website (www.sec.gov) or you can have it mailed to you without charge by calling 1-866-44BAIRD. For the first and third fiscal quarters, the Fund files the lists with the SEC on Form N-Q. Shareholders can look up the Fund’s Forms N-CSR and N-Q on the SEC’s website (www.sec.gov).
Long-Term Investments
| Principal | % of | |||||||||||
| Amount | Value | Net Assets | ||||||||||
| U.S. Treasury Securities | ||||||||||||
| U.S. Treasury Bonds: | ||||||||||||
| 1.625%, 08/31/2019 | $ | 163,225,000 | $ | 163,970,938 | 3.6 | % | ||||||
| 2.625%, 08/15/2020 | 77,900,000 | 80,343,490 | 1.8 | % | ||||||||
| 1.375%, 08/31/2020 | 736,225,000 | 731,048,602 | 15.9 | % | ||||||||
| Total U.S. Treasury Securities | ||||||||||||
| (Cost $977,822,389) | 975,363,030 | 21.3 | % | |||||||||
| Other Government Related Securities | ||||||||||||
| Other Government Related Securities# | 50,557,344 | 1.1 | % | |||||||||
| Total Other Government Related Securities | ||||||||||||
| (Cost $50,250,310) | 50,557,344 | 1.1 | % | |||||||||
| Corporate Bonds | ||||||||||||
| Industrials | ||||||||||||
| Broadcom Corp. / Broadcom Cayman Finance Ltd., | ||||||||||||
| 2.375%, 01/15/2020 | ||||||||||||
| (Acquired 01/11/2017, Cost $21,950,280)* | 22,000,000 | 22,031,966 | 0.5 | % | ||||||||
| Cenovus Energy, Inc., | ||||||||||||
5.700%, 10/15/2019 f | 20,000,000 | 21,107,800 | 0.5 | % | ||||||||
| CF Industries, Inc., | ||||||||||||
| 6.875%, 05/01/2018 | 19,412,000 | 20,164,215 | 0.4 | % | ||||||||
| Diamond 1 Finance Corp. / Diamond 2 Finance Corp., | ||||||||||||
| 3.480%, 06/01/2019 (Acquired 05/17/2016 | ||||||||||||
| through 01/03/2017, Cost $19,163,165)* | 19,135,000 | 19,582,300 | 0.4 | % | ||||||||
| DXC Technology Co., | ||||||||||||
| 2.875%, 03/27/2020 (Acquired 03/13/2017 | ||||||||||||
| through 06/21/2017, Cost $22,467,797)* | 22,344,000 | 22,624,931 | 0.5 | % | ||||||||
| ERAC USA Finance LLC, | ||||||||||||
| 2.350%, 10/15/2019 (Acquired 01/21/2015 | ||||||||||||
| through 10/26/2016, Cost $19,118,635)* | 19,000,000 | 19,029,526 | 0.4 | % | ||||||||
| Harris Corp., | ||||||||||||
| 1.999%, 04/27/2018 | 17,030,000 | 17,053,263 | 0.4 | % | ||||||||
The accompanying notes are an integral part of these financial statements.
Page 11
Baird Short-Term Bond Fund
Summary Schedule of Investments, June 30, 2017 (Unaudited)
Long-Term Investments (cont.)
| Principal | % of | |||||||||||
| Amount | Value | Net Assets | ||||||||||
| Keysight Technologies, Inc., | ||||||||||||
| 3.300%, 10/30/2019 | $ | 20,625,000 | $ | 21,008,625 | 0.5 | % | ||||||
| Petrofac Ltd., | ||||||||||||
| 3.400%, 10/10/2018 (Acquired 02/15/2017 | ||||||||||||
through 04/29/2015, Cost $20,190,090)* f | 20,050,000 | 18,849,967 | 0.4 | % | ||||||||
| Republic Services, Inc., | ||||||||||||
| 3.800%, 05/15/2018 | 15,490,000 | 15,763,739 | 0.3 | % | ||||||||
| Teva Pharmaceutical Finance Netherlands III BV, | ||||||||||||
2.200%, 07/21/2021 f | 15,654,000 | 15,366,890 | 0.3 | % | ||||||||
| The Dow Chemical Co., | ||||||||||||
| 8.550%, 05/15/2019 | 14,777,000 | 16,550,787 | 0.4 | % | ||||||||
| TSMC Global Ltd., | ||||||||||||
| 1.625%, 04/03/2018 | ||||||||||||
| (Acquired 08/05/2014 through 11/03/2015, | ||||||||||||
Cost $15,871,380)* f | 15,919,000 | 15,886,888 | 0.3 | % | ||||||||
| Verisk Analytics, Inc., | ||||||||||||
| 4.875%, 01/15/2019 | 19,150,000 | 19,940,838 | 0.4 | % | ||||||||
| Other Industrials# | 1,033,412,063 | 22.6 | % | |||||||||
| Total Industrials | ||||||||||||
| (Cost $1,294,938,000) | 1,298,373,798 | 28.3 | % | |||||||||
| Utilities | ||||||||||||
| Other Utilities# | 123,476,703 | 2.7 | % | |||||||||
| Total Utilities | ||||||||||||
| (Cost $123,136,805) | 123,476,703 | 2.7 | % | |||||||||
| Financials | ||||||||||||
| ABN AMRO Bank NV, | ||||||||||||
| 2.100%, 01/18/2019 | ||||||||||||
(Acquired 04/04/2017, Cost $18,001,080)* f | 18,000,000 | 18,028,134 | 0.4 | % | ||||||||
| Banque Federative du Credit Mutuel SA, | ||||||||||||
| 2.000%, 04/12/2019 (Acquired 04/06/2016 | ||||||||||||
through 10/21/2016, Cost $18,595,831)* f | 18,600,000 | 18,597,954 | 0.4 | % | ||||||||
| Canadian Imperial Bank of Commerce/Canada, | ||||||||||||
1.600%, 09/06/2019 f | 20,000,000 | 19,810,780 | 0.4 | % | ||||||||
| CNA Financial Corp., | ||||||||||||
| 7.350%, 11/15/2019 | 14,915,000 | 16,667,319 | 0.4 | % | ||||||||
| Commonwealth Bank of Australia/New York NY, | ||||||||||||
1.750%, 11/02/2018 f | 15,000,000 | 15,012,045 | 0.3 | % | ||||||||
| First Tennessee Bank NA, | ||||||||||||
| 2.950%, 12/01/2019 | 15,286,000 | 15,452,786 | 0.3 | % | ||||||||
| Jackson National Life Global Funding, | ||||||||||||
| 2.200%, 01/30/2020 | ||||||||||||
| (Acquired 01/24/2017, Cost $24,098,463)* | 24,125,000 | 24,131,972 | 0.5 | % | ||||||||
| KEB Hana Bank, | ||||||||||||
| 1.750%, 10/18/2019 | ||||||||||||
(Acquired 10/11/2016, Cost $17,942,040)* f | 18,000,000 | 17,722,620 | 0.4 | % | ||||||||
The accompanying notes are an integral part of these financial statements.
Page 12
Baird Short-Term Bond Fund
Summary Schedule of Investments, June 30, 2017 (Unaudited)
Long-Term Investments (cont.)
| Principal | % of | |||||||||||
| Amount | Value | Net Assets | ||||||||||
| LeasePlan Corp. NV, | ||||||||||||
| 2.500%, 05/16/2018 (Acquired 05/07/2013 | ||||||||||||
through 02/17/2016, Cost $16,370,178)* f | $ | 16,435,000 | $ | 16,478,849 | 0.4 | % | ||||||
| Morgan Stanley, | ||||||||||||
| 7.300%, 05/13/2019 | 15,125,000 | 16,535,633 | 0.4 | % | ||||||||
| National Australia Bank Ltd/New York, | ||||||||||||
2.250%, 01/10/2020 f | 24,600,000 | 24,675,473 | 0.5 | % | ||||||||
| National Bank of Canada, | ||||||||||||
2.150%, 06/12/2020 f | 23,525,000 | 23,476,186 | 0.5 | % | ||||||||
| Principal Life Global Funding II, | ||||||||||||
| 2.150%, 01/10/2020 | ||||||||||||
| (Acquired 01/03/2017, Cost $19,073,451)* | 19,100,000 | 19,121,640 | 0.4 | % | ||||||||
| Protective Life Global Funding, | ||||||||||||
| 1.555%, 09/13/2019 | ||||||||||||
| (Acquired 09/07/2016, Cost $18,000,000)* | 18,000,000 | 17,735,886 | 0.4 | % | ||||||||
| Sumitomo Mitsui Trust Bank Ltd, | ||||||||||||
| 2.050%, 03/06/2019 | ||||||||||||
(Acquired 02/27/2017, Cost $22,387,232)* f | 22,400,000 | 22,399,843 | 0.5 | % | ||||||||
| Voya Financial, Inc., | ||||||||||||
| 2.900%, 02/15/2018 | 17,494,000 | 17,612,329 | 0.4 | % | ||||||||
| Other Financials# | 943,919,597 | 20.6 | % | |||||||||
| Total Financials | ||||||||||||
| (Cost $1,244,594,986) | 1,247,379,046 | 27.2 | % | |||||||||
| Total Corporate Bonds | ||||||||||||
| (Cost $2,672,771,504) | 2,669,229,547 | 58.2 | % | |||||||||
| Taxable Municipal Bonds | ||||||||||||
| Other Taxable Municipal Bonds# | 99,322,965 | 2.2 | % | |||||||||
| Total Taxable Municipal Bonds | ||||||||||||
| (Cost $99,602,257) | 99,322,965 | 2.2 | % | |||||||||
| Residential Mortgage-Backed Securities | ||||||||||||
| Non-U.S. Government Agency Issues | ||||||||||||
| Towd Point Mortgage Trust, | ||||||||||||
| Series 2017-1, Class A1, 2.750%, 10/25/2056 | ||||||||||||
(Acquired 02/07/2017, Cost $15,416,144)∞* | 15,396,393 | 15,515,069 | 0.3 | % | ||||||||
| Other Non-U.S. Government Agency Issues# | 187,826,877 | 4.1 | % | |||||||||
| Total Non-U.S. Government Agency Issues | ||||||||||||
| (Cost $201,775,720) | 203,341,946 | 4.4 | % | |||||||||
The accompanying notes are an integral part of these financial statements.
Page 13
Baird Short-Term Bond Fund
Summary Schedule of Investments, June 30, 2017 (Unaudited)
Long-Term Investments (cont.)
| Principal | % of | |||||||||||
| Amount | Value | Net Assets | ||||||||||
| Commercial Mortgage-Backed Securities | ||||||||||||
| U.S. Government Agency Issues | ||||||||||||
| Freddie Mac Multifamily Structured | ||||||||||||
| Pass Through Certificates, | ||||||||||||
| Series K006, Class A2, 4.251%, 01/25/2020 | $ | 15,000,000 | $ | 15,824,216 | 0.3 | % | ||||||
| Other U.S. Government Agency Issues# | 22,615,819 | 0.5 | % | |||||||||
| Total U.S. Government Agency Issues | ||||||||||||
| (Cost $38,230,383) | 38,440,035 | 0.8 | % | |||||||||
| Non-U.S. Government Agency Issues | ||||||||||||
| J.P. Morgan Chase Commercial Mortgage Securities Trust, | ||||||||||||
| Series 2012-C8, Class ASB, 2.379%, 10/15/2045 | 16,100,000 | 16,214,767 | 0.4 | % | ||||||||
| Other Non-U.S. Government Agency Issues# | 13,139,571 | 0.2 | % | |||||||||
| Total Non-U.S. Government Agency Issues | ||||||||||||
| (Cost $29,544,853) | 29,354,338 | 0.6 | % | |||||||||
| Other Asset Backed Securities | ||||||||||||
| American Express Credit Account Master Trust, | ||||||||||||
| Series 2017-1, Class A, 1.930%, 09/15/2022 | 18,450,000 | 18,509,686 | 0.4 | % | ||||||||
| Chesapeake Funding II LLC, | ||||||||||||
| Series 2017-2A, Class A1, 1.990%, 05/15/2029 | ||||||||||||
| (Acquired 05/23/2017, Cost $16,324,136)* | 16,325,000 | 16,300,610 | 0.4 | % | ||||||||
| Citibank Credit Card Issuance Trust, | ||||||||||||
| Series 2017-A3, Class A3, 1.920%, 04/07/2022 | 23,225,000 | 23,250,668 | 0.5 | % | ||||||||
| Discover Card Execution Note Trust, | ||||||||||||
| Series 2016-A4, Class A4, 1.390%, 03/15/2022 | 19,075,000 | 18,914,844 | 0.4 | % | ||||||||
| Ford Credit Auto Owner Trust: | ||||||||||||
| Series 2014-1, Class A, 2.260%, 11/15/2025 | ||||||||||||
| (Acquired 05/06/2014 through 11/18/2014, | ||||||||||||
| Cost $17,928,558)* | 17,894,000 | 18,058,201 | 0.4 | % | ||||||||
| Series 2014-2, Class A, 2.310%, 04/15/2026 | ||||||||||||
| (Acquired 01/06/2016 through 05/26/2017, | ||||||||||||
| Cost $16,549,229)* | 16,392,000 | 16,550,638 | 0.4 | % | ||||||||
| GM Financial Automobile Leasing Trust, | ||||||||||||
| Series 2016-3, Class A3, 1.610%, 12/20/2019 | 22,000,000 | 21,961,720 | 0.5 | % | ||||||||
| GM Financial Automobile Leasing Trust 2017-2, | ||||||||||||
| Series 2017-2, Class A3, 2.020%, 09/21/2020 | 19,425,000 | 19,400,490 | 0.4 | % | ||||||||
| Hyundai Auto Lease Securitization Trust 2017-A, | ||||||||||||
| Series 2017-A, Class A3, 1.880%, 08/17/2020 | ||||||||||||
| (Acquired 01/10/2017, Cost $16,674,461)* | 16,675,000 | 16,688,445 | 0.4 | % | ||||||||
| Mercedes-Benz Auto Lease Trust, | ||||||||||||
| Series 2016-B, Class A3, 1.350%, 08/15/2019 | 18,800,000 | 18,751,998 | 0.4 | % | ||||||||
| PFS Financing Corp., | ||||||||||||
| Series 2016-BA, Class A, 1.870%, 10/15/2021 | ||||||||||||
| (Acquired 02/10/2017 through 03/31/2017, | ||||||||||||
| Cost $15,601,791)* | 15,734,000 | 15,661,402 | 0.3 | % | ||||||||
The accompanying notes are an integral part of these financial statements.
Page 14
Baird Short-Term Bond Fund
Summary Schedule of Investments, June 30, 2017 (Unaudited)
| Long-Term Investments (cont.) | ||||||||||||
| Principal | % of | |||||||||||
| Amount | Value | Net Assets | ||||||||||
| Synchrony Credit Card Master Note Trust, | ||||||||||||
| Series 2016-3, Class A, 1.580%, 09/15/2022 | $ | 15,670,000 | $ | 15,562,624 | 0.3 | % | ||||||
| Verizon Owner Trust: | ||||||||||||
| Series 2016-1A, Class A, 1.420%, 01/20/2021 | ||||||||||||
| (Acquired 07/12/2016, Cost $16,247,263)* | 16,250,000 | 16,169,613 | 0.4 | % | ||||||||
| Series 2016-2A, Class A, 1.680%, 05/20/2021 | ||||||||||||
| (Acquired 11/16/2016 through 02/02/2017, | ||||||||||||
| Cost $22,701,803)* | 22,750,000 | 22,687,861 | 0.5 | % | ||||||||
| Other Asset Backed Securities# | 177,564,187 | 3.8 | % | |||||||||
| Total Other Asset Backed Securities | ||||||||||||
| (Cost $435,795,862) | 436,032,987 | 9.5 | % | |||||||||
| Total Long-Term Investments | ||||||||||||
| (Cost $4,495,691,565) | 4,501,642,192 | 98.1 | % | |||||||||
| Short-Term Investment | ||||||||||||
| Shares | ||||||||||||
| Money Market Mutual Fund | ||||||||||||
| Fidelity Institutional Money Market Fund – | ||||||||||||
| Government Portfolio, Institutional Class, 0.85%« | 162,214,090 | 162,214,090 | 3.5 | % | ||||||||
| Total Short-Term Investment | ||||||||||||
| (Cost $162,214,090) | 162,214,090 | 3.5 | % | |||||||||
| Total Investments | ||||||||||||
| (Cost $4,657,905,655) | 4,663,856,282 | 101.6 | % | |||||||||
| Liabilities in Excess of Other Assets | (75,314,862 | ) | (1.6 | )% | ||||||||
| TOTAL NET ASSETS | $ | 4,588,541,420 | 100.0 | % | ||||||||
Notes to Summary Schedule of Investments
| ∞ | Variable or Floating rate security. Floating rate securities are securities whose yields vary with a designated index rate. These securities’ rates are as of June 30, 2017. | |
| * | Restricted security as defined in Rule 144(a) under the Securities Act of 1933 and determined to be liquid. Purchased in a private placement transaction; resale to the public may require registration or may extend only to qualified institutional buyers. At June 30, 2017, the value of these securities total $409,854,315, which represents 8.93% of total net assets. | |
| f | Foreign Security. | |
| # | Represents the aggregate value, by category, securities that are not among the 50 largest holdings and, in total for any issuer, represent 1% or less of net assets. | |
| ~ | Groupings contain, in aggregate, restricted securities totaling $591,045,042 representing 12.88% of net assets. | |
| « | 7-Day Yield. |
The accompanying notes are an integral part of these financial statements.
Page 15
Baird Short-Term Bond Fund
Summary Schedule of Investments, June 30, 2017 (Unaudited)
Summary of Fair Value Exposure at June 30, 2017 (Unaudited)
The Fund has adopted authoritative fair valuation accounting standards which establish a definition of fair value and set out a hierarchy for measuring fair value. These standards require additional disclosures about the various inputs and valuation techniques used to develop the measurements of fair value and a discussion on changes in valuation techniques and related inputs during the period. These standards define fair value as the price that would be received to sell an asset or paid to transfer a liability in an orderly transaction between market participants at the measurement date.
The fair value hierarchy is organized into three levels based upon the assumptions (referred to as “inputs”) used in pricing the asset or liability. These standards state that “observable inputs” reflect the assumptions market participants would use in pricing the asset or liability based on market data obtained from independent sources and “unobservable inputs” reflect an entity’s own assumptions about the assumptions market participants would use in pricing the asset or liability. These inputs are summarized into three broad levels and described below:
Level 1 – | Unadjusted quoted prices in active markets for identical unrestricted securities. |
Level 2 – | Other significant observable inputs (including quoted prices for similar securities, quoted prices in inactive markets, dealer indications, interest rates, yield curves, prepayment speeds, credit risk, default rates, inputs corroborated by observable market data, etc.). |
Level 3 – | Significant unobservable inputs (including the Fund’s own assumptions about the factors that market participants would use in valuing the security) based on the best information available. |
The inputs or methodology used for valuing securities are not necessarily an indication of the risk associated with investing in those securities.
The following is a summary of the inputs used to value the Fund’s investments as of June 30, 2017:
| Level 1 | Level 2 | Level 3 | Total | |||||||||||||
| Long-Term Investments | ||||||||||||||||
| U.S. Treasury Securities | $ | — | $ | 975,363,030 | $ | — | $ | 975,363,030 | ||||||||
| Other Government Related Securities | — | 50,557,344 | — | 50,557,344 | ||||||||||||
| Corporate Bonds | — | 2,669,229,547 | — | 2,669,229,547 | ||||||||||||
| Taxable Municipal Bonds | — | 99,322,965 | — | 99,322,965 | ||||||||||||
| Residential Mortgage-Backed Securities – | ||||||||||||||||
| Non-U.S. Government Agency Issues | — | 203,341,946 | — | 203,341,946 | ||||||||||||
| Commercial Mortgage-Backed Securities – | ||||||||||||||||
| U.S. Government Agency Issues | — | 38,440,035 | — | 38,440,035 | ||||||||||||
| Commercial Mortgage-Backed Securities – | ||||||||||||||||
| Non-U.S. Government Agency Issues | — | 29,354,338 | — | 29,354,338 | ||||||||||||
| Other Asset Backed Securities | — | 436,032,987 | — | 436,032,987 | ||||||||||||
| Total Long-Term Investments | — | 4,501,642,192 | — | 4,501,642,192 | ||||||||||||
| Short-Term Investment | ||||||||||||||||
| Money Market Mutual Fund | 162,214,090 | — | — | 162,214,090 | ||||||||||||
| Total Short-Term Investment | 162,214,090 | — | — | 162,214,090 | ||||||||||||
| Total Investments | $ | 162,214,090 | $ | 4,501,642,192 | $ | — | $ | 4,663,856,282 | ||||||||
Changes in valuation techniques may result in transfers into or out of assigned levels within the fair value hierarchy. There were no transfers between Level 1, Level 2 and Level 3 fair value measurements during the reporting period, as compared to their classification from the prior year’s annual report. See the Fund’s valuation policy in Note 2a to the financial statements.
The accompanying notes are an integral part of these financial statements.
Page 16
Baird Intermediate Bond Fund
June 30, 2017 (Unaudited)
Portfolio Characteristics
Quality Distribution(1)(2)
 | Net Assets | $2,676,792,907 | |||
| SEC 30-Day | |||||
Yield(3) | |||||
| Institutional Class | 2.07% | ||||
| Investor Class | 1.83% | ||||
| Average | |||||
| Effective | |||||
| Duration | 4.07 years | ||||
| Average | |||||
| Effective | |||||
| Maturity | 4.59 years | ||||
| Annualized | |||||
Sector Weightings(1) | Expense | ||||
Ratio(4) | |||||
 | Institutional Class | 0.30% | |||
| Investor Class | 0.55% | (5) | |||
| Portfolio | |||||
| Turnover Rate | 18.3% | † | |||
| Number of | |||||
| Holdings | 490 | ||||
(1) | Percentages shown are based on the Fund’s total investments. | |
(2) | The quality profile is calculated on a market value-weighted basis using the highest credit quality rating for each security held by the Fund given by S&P, Moody’s or Fitch, each of which is a Nationally Recognized Statistical Rating Organization (NRSRO). NRSROs rate the credit quality of securities using a scale that generally ranges from AAA (highest) to D (lowest). | |
(3) | SEC yields are based on SEC guidelines and are calculated for the 30 days ended June 30, 2017. | |
(4) | Reflects expense ratios as stated in the Fund’s current prospectus. | |
(5) | Includes 0.25% 12b-1 fee. | |
| † | Not annualized. |
Page 17
Baird Intermediate Bond Fund
June 30, 2017 (Unaudited)
Total Returns
| Average Annual | |||||
| Six | One | Five | Ten | Since | |
| For the Periods Ended June 30, 2017 | Months | Year | Years | Years | Inception(1) |
| Institutional Class Shares | 2.02% | 0.38% | 2.46% | 4.42% | 4.98% |
| Investor Class Shares | 1.90% | 0.20% | 2.22% | 4.15% | 4.72% |
| Bloomberg Barclays Intermediate | |||||
U.S. Government/Credit Bond Index(2) | 1.73% | -0.21% | 1.77% | 3.87% | 4.50% |
| (1) | For the period from September 29, 2000 (inception date) through June 30, 2017. |
| (2) | The Bloomberg Barclays Intermediate U.S. Government/Credit Bond Index is an unmanaged, market value weighted index of investment grade, fixed-rate debt issues, including government and corporate securities, with maturities between one and ten years. This Index does not reflect any deduction for fees, expenses or taxes. A direct investment in an index is not possible. |
The returns shown in the table above reflect reinvestment of dividends and/or capital gains distributions in additional shares. The returns do not reflect the deduction of taxes that a shareholder would pay on Fund distributions or the redemption of Fund shares. The returns reflect the actual performance for each period and do not include the impact of trades executed on the last business day of the period that were recorded on the first business day of the next period.
The Fund’s gross expense ratio for each Class, as reflected in the Fund’s current prospectus, is set forth under “Portfolio Characteristics”.
The Fund may invest in U.S. dollar denominated foreign securities which involve additional risks such as political and economic instability, and different and sometimes less strict financial reporting standards and regulation. The Fund may also invest in mortgage- and asset-backed securities, which include interest rate and prepayment risks more pronounced than those of other fixed income securities.
Past performance does not guarantee future results. Investment return and principal value will fluctuate so that an investor’s shares, when redeemed, may be worth more or less than their original cost.
For information about the performance of the Fund as of the most recent month-end, please call 1-866-44BAIRD or visit www.bairdfunds.com. Mutual fund performance changes over time and current performance may be lower or higher than that stated.
Page 18
Baird Intermediate Bond Fund
Summary Schedule of Investments, June 30, 2017 (Unaudited)
This schedule summarizes the Fund’s holdings by asset type. Details are reported for each of the Fund’s 50 largest individual holdings and for investments that, in total for any issuer, represent more than 1% of the Fund’s net assets. The total value of smaller holdings is reported as a single amount within each category.
The Fund reports a complete list of its holdings in regulatory filings four times in each fiscal year, at the quarter end. For the second and fourth fiscal quarters, the complete listing of the Fund’s holdings is available electronically in the Fund’s Form N-CSR at http://www.bairdassetmanagement.com/baird-funds/funds-and-performance#Literature and on the Securities and Exchange Commission’s website (www.sec.gov) or you can have it mailed to you without charge by calling 1-866-44BAIRD. For the first and third fiscal quarters, the Fund files the lists with the SEC on Form N-Q. Shareholders can look up the Fund’s Forms N-CSR and N-Q on the SEC’s website (www.sec.gov).
Long-Term Investments
| Principal | % of | |||||||||||
| Amount | Value | Net Assets | ||||||||||
| U.S. Treasury Securities | ||||||||||||
| U.S. Treasury Bonds: | ||||||||||||
| 1.625%, 08/31/2019 | $ | 30,000,000 | $ | 30,137,100 | 1.1 | % | ||||||
| 2.625%, 08/15/2020 | 48,700,000 | 50,227,573 | 1.9 | % | ||||||||
| 1.375%, 08/31/2020 | 217,250,000 | 215,722,515 | 8.1 | % | ||||||||
| 1.750%, 03/31/2022 | 290,900,000 | 289,400,120 | 10.8 | % | ||||||||
| 1.875%, 03/31/2022 | 22,000,000 | 22,012,892 | 0.8 | % | ||||||||
| 2.500%, 05/15/2024 | 141,800,000 | 145,284,026 | 5.4 | % | ||||||||
| 2.250%, 11/15/2025 | 188,000,000 | 188,043,992 | 7.0 | % | ||||||||
| 2.000%, 11/15/2026 | 35,875,000 | 34,986,520 | 1.3 | % | ||||||||
| Total U.S. Treasury Securities | ||||||||||||
| (Cost $984,156,463) | 975,814,738 | 36.4 | % | |||||||||
| Other Government Related Securities | ||||||||||||
| Electricite de France SA, | ||||||||||||
| 2.350%, 10/13/2020 | ||||||||||||
(Acquired 10/07/2015, Cost $8,800,006)* f | 8,875,000 | 8,909,479 | 0.3 | % | ||||||||
| Other Government Related Securities# | 42,866,772 | 1.7 | % | |||||||||
| Total Other Government Related Securities | ||||||||||||
| (Cost $50,676,747) | 51,776,251 | 2.0 | % | |||||||||
| Corporate Bonds | ||||||||||||
| Industrials | ||||||||||||
| Abbott Laboratories, | ||||||||||||
| 3.400%, 11/30/2023 | 10,000,000 | 10,236,800 | 0.4 | % | ||||||||
| Anheuser-Busch InBev Finance, Inc., | ||||||||||||
| 3.300%, 02/01/2023 | 9,300,000 | 9,576,498 | 0.4 | % | ||||||||
| AT&T, Inc., | ||||||||||||
| 3.600%, 02/17/2023 | 9,000,000 | 9,211,140 | 0.3 | % | ||||||||
| Diamond 1 Finance Corp. / Diamond 2 Finance Corp., | ||||||||||||
| 3.480%, 06/01/2019 (Acquired 05/17/2016 | ||||||||||||
| through 10/07/2016, Cost $10,984,801)* | 10,900,000 | 11,154,798 | 0.4 | % | ||||||||
| EnLink Midstream Partners LP, | ||||||||||||
| 4.400%, 04/01/2024 | 10,000,000 | 10,151,990 | 0.4 | % | ||||||||
The accompanying notes are an integral part of these financial statements.
Page 19
Baird Intermediate Bond Fund
Summary Schedule of Investments, June 30, 2017 (Unaudited)
Long-Term Investments (cont.)
| Principal | % of | |||||||||||
| Amount | Value | Net Assets | ||||||||||
| Kinder Morgan, Inc./DE, | ||||||||||||
| 7.800%, 08/01/2031 | $ | 7,000,000 | $ | 8,824,718 | 0.3 | % | ||||||
| MPLX LP, | ||||||||||||
| 4.875%, 06/01/2025 | 10,192,000 | 10,807,576 | 0.4 | % | ||||||||
| Sabine Pass Liquefaction LLC, | ||||||||||||
| 5.875%, 06/30/2026 | 8,730,000 | 9,757,015 | 0.4 | % | ||||||||
| The Dow Chemical Co., | ||||||||||||
| 8.550%, 05/15/2019 | 8,800,000 | 9,856,326 | 0.4 | % | ||||||||
| The Mosaic Co., | ||||||||||||
| 4.250%, 11/15/2023 | 8,606,000 | 9,055,543 | 0.3 | % | ||||||||
| Other Industrials# | 439,304,621 | 16.5 | % | |||||||||
| Total Industrials | ||||||||||||
| (Cost $531,078,729) | 537,937,025 | 20.2 | % | |||||||||
| Utilities | ||||||||||||
| Other Utilities# | 30,780,304 | 1.1 | % | |||||||||
| Total Utilities | ||||||||||||
| (Cost $30,289,832) | 30,780,304 | 1.1 | % | |||||||||
| Financials | ||||||||||||
| BNZ International Funding Ltd./London, | ||||||||||||
| 2.100%, 09/14/2021 | ||||||||||||
(Acquired 09/06/2016, Cost $9,990,600)* f | 10,000,000 | 9,785,630 | 0.4 | % | ||||||||
| Citigroup, Inc., | ||||||||||||
3.887%, 01/10/2028∞ | 9,000,000 | 9,146,376 | 0.3 | % | ||||||||
| Cooperatieve Rabobank UA/NY, | ||||||||||||
2.500%, 01/19/2021 f | 8,175,000 | 8,223,388 | 0.3 | % | ||||||||
| Credit Suisse Group Funding Guernsey Ltd., | ||||||||||||
3.800%, 06/09/2023 f | 8,700,000 | 8,969,308 | 0.3 | % | ||||||||
| Discover Financial Services, | ||||||||||||
| 4.100%, 02/09/2027 | 9,000,000 | 9,015,552 | 0.3 | % | ||||||||
| First Horizon National Corp., | ||||||||||||
| 3.500%, 12/15/2020 | 11,496,000 | 11,790,769 | 0.4 | % | ||||||||
| ING Bank NV, | ||||||||||||
| 5.800%, 09/25/2023 (Acquired 10/15/2015 | ||||||||||||
through 05/02/2017, Cost $9,784,155)* f | 8,865,000 | 10,010,278 | 0.4 | % | ||||||||
| Jackson National Life Global Funding, | ||||||||||||
| 3.250%, 01/30/2024 | ||||||||||||
| (Acquired 01/24/2017, Cost $9,992,500)* | 10,000,000 | 10,132,530 | 0.4 | % | ||||||||
| Skandinaviska Enskilda Banken AB, | ||||||||||||
| 2.450%, 05/27/2020 | ||||||||||||
(Acquired 05/19/2015, Cost $8,486,910)* f | 8,500,000 | 8,567,898 | 0.3 | % | ||||||||
| Standard Chartered PLC, | ||||||||||||
| 1.798%, 04/17/2018 | ||||||||||||
(Acquired 04/13/2015, Cost $8,500,000)∞* f | 8,500,000 | 8,490,395 | 0.3 | % | ||||||||
The accompanying notes are an integral part of these financial statements.
Page 20
Baird Intermediate Bond Fund
Summary Schedule of Investments, June 30, 2017 (Unaudited)
Long-Term Investments (cont.)
| Principal | % of | |||||||||||
| Amount | Value | Net Assets | ||||||||||
| Sumitomo Mitsui Trust Bank Ltd, | ||||||||||||
| 2.050%, 03/06/2019 | ||||||||||||
(Acquired 02/27/2017, Cost $11,993,160)* f | $ | 12,000,000 | $ | 11,999,916 | 0.4 | % | ||||||
| SunTrust Bank/Atlanta GA, | ||||||||||||
| 3.300%, 05/15/2026 | 9,000,000 | 8,796,285 | 0.3 | % | ||||||||
| Other Financials# | 510,030,459 | 19.2 | % | |||||||||
| Total Financials | ||||||||||||
| (Cost $618,429,945) | 624,958,784 | 23.3 | % | |||||||||
| Total Corporate Bonds | ||||||||||||
| (Cost $1,179,798,506) | 1,193,676,113 | 44.6 | % | |||||||||
| Taxable Municipal Bonds | ||||||||||||
| Other Taxable Municipal Bonds# | 58,775,598 | 2.2 | % | |||||||||
| Total Taxable Municipal Bonds | ||||||||||||
| (Cost $57,399,359) | 58,775,598 | 2.2 | % | |||||||||
| Residential Mortgage-Backed Securities | ||||||||||||
| U.S. Government Agency Issues | ||||||||||||
| Other U.S. Government Agency Issues# | 189,338 | 0.0 | % | |||||||||
| Total U.S. Government Agency Issues | ||||||||||||
| (Cost $175,319) | 189,338 | 0.0 | % | |||||||||
| Non-U.S. Government Agency Issues | ||||||||||||
| Argent Securities Inc. Asset-Backed | ||||||||||||
| Pass-Through Certificates, | ||||||||||||
Series 2005-W5, Class A1, 1.451%, 01/25/2036∞ | 8,764,202 | 8,404,060 | 0.3 | % | ||||||||
| Towd Point Mortgage Trust, | ||||||||||||
| Series 2017-1, Class A1, 2.750%, 10/25/2056 | ||||||||||||
(Acquired 02/07/2017, Cost $8,736,585)∞* | 8,725,392 | 8,792,648 | 0.3 | % | ||||||||
| Other Non-U.S. Government Agency Issues# | 92,407,211 | 3.5 | % | |||||||||
| Total Non-U.S. Government Agency Issues | ||||||||||||
| (Cost $108,246,509) | 109,603,919 | 4.1 | % | |||||||||
| Commercial Mortgage-Backed Securities | ||||||||||||
| U.S. Government Agency Issues | ||||||||||||
| Freddie Mac Multifamily Structured | ||||||||||||
| Pass Through Certificates: | ||||||||||||
| Series K003, Class A4, 5.053%, 01/25/2019 | 9,000,000 | 9,344,368 | 0.3 | % | ||||||||
| Series K004, Class A2, 4.186%, 08/25/2019 | 8,095,000 | 8,474,307 | 0.3 | % | ||||||||
| Series K720, Class A2, 2.716%, 06/25/2022 | 15,725,000 | 16,090,630 | 0.6 | % | ||||||||
Series K-050, Class A2, 3.334%, 08/25/2025∞ | 12,150,000 | 12,715,214 | 0.5 | % | ||||||||
| Other U.S. Government Agency Issues# | 13,918,000 | 14,477,452 | 0.6 | % | ||||||||
| Total U.S. Government Agency Issues | ||||||||||||
| (Cost $60,557,061) | 61,101,971 | 2.3 | % | |||||||||
The accompanying notes are an integral part of these financial statements.
Page 21
Baird Intermediate Bond Fund
Summary Schedule of Investments, June 30, 2017 (Unaudited)
Long-Term Investments (cont.)
| Principal | % of | |||||||||||
| Amount | Value | Net Assets | ||||||||||
| Non-U.S. Government Agency Issues | ||||||||||||
| Citigroup Commercial Mortgage Trust 2013-GC11, | ||||||||||||
| Series 2013-GC11, Class A4, 3.093%, 04/10/2046 | $ | 11,050,000 | $ | 11,279,060 | 0.4 | % | ||||||
| J.P. Morgan Chase Commercial Mortgage Securities Trust, | ||||||||||||
| Series 2011-C5, Class A3, 4.171%, 08/15/2046 | 9,832,773 | 10,468,173 | 0.4 | % | ||||||||
| Wells Fargo Commercial Mortgage Trust: | ||||||||||||
| Series 2014-LC18, Class ASB, 3.244%, 12/15/2047 | 16,400,000 | 16,946,202 | 0.6 | % | ||||||||
| Series 2015-P2, Class ASB, 3.656%, 12/15/2048 | 10,600,000 | 11,116,544 | 0.4 | % | ||||||||
| WFRBS Commercial Mortgage Trust: | ||||||||||||
| Series 2012-C6, Class A4, 3.440%, 04/15/2045 | 8,375,000 | 8,707,067 | 0.3 | % | ||||||||
| Series 2014-C24, Class ASB, 3.324%, 11/15/2047 | 8,652,000 | 8,974,176 | 0.3 | % | ||||||||
| Series 2013-C12, Class ASB, 2.838%, 03/15/2048 | 8,750,000 | 8,902,376 | 0.3 | % | ||||||||
| Other Non-U.S. Government Agency Issues# | 14,224,205 | 0.7 | % | |||||||||
| Total Non-U.S. Government Agency Issues | ||||||||||||
| (Cost $90,493,870) | 90,617,803 | 3.4 | % | |||||||||
| Other Asset Backed Securities | ||||||||||||
| American Express Credit Account Master Trust, | ||||||||||||
| Series 2017-1, Class A, 1.930%, 09/15/2022 | 11,750,000 | 11,788,011 | 0.4 | % | ||||||||
| Citibank Credit Card Issuance Trust, | ||||||||||||
| Series 2017-A3, Class A3, 1.920%, 04/07/2022 | 13,375,000 | 13,389,782 | 0.5 | % | ||||||||
| Discover Card Execution Note Trust, | ||||||||||||
| Series 2016-A4, Class A4, 1.390%, 03/15/2022 | 10,925,000 | 10,833,273 | 0.4 | % | ||||||||
| Ford Credit Auto Owner Trust: | ||||||||||||
| Series 2014-1, Class A, 2.260%, 11/15/2025 | ||||||||||||
| (Acquired 10/07/2014 through 10/09/2014, | ||||||||||||
| Cost $10,889,121)* | 10,859,000 | 10,958,645 | 0.4 | % | ||||||||
| Series 2014-2, Class A, 2.310%, 04/15/2026 | ||||||||||||
| (Acquired 10/07/2014, Cost $11,745,689)* | 11,750,000 | 11,863,714 | 0.4 | % | ||||||||
| Synchrony Credit Card Master Note Trust, | ||||||||||||
| Series 2012-2, Class A, 2.220%, 01/15/2022 | 8,375,000 | 8,437,541 | 0.3 | % | ||||||||
| Other Asset Backed Securities# | 16,923,807 | 0.7 | % | |||||||||
| Total Other Asset Backed Securities | ||||||||||||
| (Cost $83,939,567) | 84,194,773 | 3.1 | % | |||||||||
| Total Long-Term Investments | ||||||||||||
| (Cost $2,615,443,401) | 2,625,750,504 | 98.1 | % | |||||||||
The accompanying notes are an integral part of these financial statements.
Page 22
Baird Intermediate Bond Fund
Summary Schedule of Investments, June 30, 2017 (Unaudited)
Short-Term Investment
| % of | ||||||||||||
| Shares | Value | Net Assets | ||||||||||
| Money Market Mutual Fund | ||||||||||||
| Fidelity Institutional Money Market Fund – | ||||||||||||
| Government Portfolio, Institutional Class, 0.85%« | 68,493,027 | $ | 68,493,027 | 2.6 | % | |||||||
| Total Short-Term Investment | ||||||||||||
| (Cost $68,493,027) | 68,493,027 | 2.6 | % | |||||||||
| Total Investments | ||||||||||||
| (Cost $2,683,936,428) | 2,694,243,531 | 100.7 | % | |||||||||
| Liabilities in Excess of Other Assets | (17,450,624 | ) | (0.7 | )% | ||||||||
| TOTAL NET ASSETS | $ | 2,676,792,907 | 100.0 | % | ||||||||
Notes to Summary Schedule of Investments
| ∞ | Variable or Floating rate security. Floating rate securities are securities whose yields vary with a designated index rate. These securities’ rates are as of June 30, 2017. | |
| * | Restricted security as defined in Rule 144(a) under the Securities Act of 1933 and determined to be liquid. Purchased in a private placement transaction; resale to the public may require registration or may extend only to qualified institutional buyers. At June 30, 2017, the value of these securities total $110,665,931, which represents 4.13% of total net assets. | |
| f | Foreign Security. | |
| # | Represents the aggregate value, by category, securities that are not among the 50 largest holdings and, in total for any issuer, represent 1% or less of net assets. | |
| ~ | Groupings contain, in aggregate, restricted securities totaling $355,243,113 representing 13.28% of net assets. | |
| « | 7-Day Yield. |
Summary of Fair Value Exposure at June 30, 2017 (Unaudited)
The Fund has adopted authoritative fair valuation accounting standards which establish a definition of fair value and set out a hierarchy for measuring fair value. These standards require additional disclosures about the various inputs and valuation techniques used to develop the measurements of fair value and a discussion on changes in valuation techniques and related inputs during the period. These standards define fair value as the price that would be received to sell an asset or paid to transfer a liability in an orderly transaction between market participants at the measurement date.
The fair value hierarchy is organized into three levels based upon the assumptions (referred to as “inputs”) used in pricing the asset or liability. These standards state that “observable inputs” reflect the assumptions market participants would use in pricing the asset or liability based on market data obtained from independent sources and “unobservable inputs” reflect an entity’s own assumptions about the assumptions market participants would use in pricing the asset or liability. These inputs are summarized into three broad levels and described below:
Level 1 – | Unadjusted quoted prices in active markets for identical unrestricted securities. |
Level 2 – | Other significant observable inputs (including quoted prices for similar securities, quoted prices in inactive markets, dealer indications, interest rates, yield curves, prepayment speeds, credit risk, default rates, inputs corroborated by observable market data, etc.). |
Level 3 – | Significant unobservable inputs (including the Fund’s own assumptions about the factors that market participants would use in valuing the security) based on the best information available. |
The accompanying notes are an integral part of these financial statements.
Page 23
Baird Intermediate Bond Fund
Summary Schedule of Investments, June 30, 2017 (Unaudited)
Summary of Fair Value Exposure at June 30, 2017 (Unaudited) (cont.)
The inputs or methodology used for valuing securities are not necessarily an indication of the risk associated with investing in those securities.
The following is a summary of the inputs used to value the Fund’s investments as of June 30, 2017:
| Level 1 | Level 2 | Level 3 | Total | |||||||||||||
| Long-Term Investments | ||||||||||||||||
| U.S. Treasury Securities | $ | — | $ | 975,814,738 | $ | — | $ | 975,814,738 | ||||||||
| Other Government Related Securities | — | 51,776,251 | — | 51,776,251 | ||||||||||||
| Corporate Bonds | — | 1,193,676,113 | — | 1,193,676,113 | ||||||||||||
| Taxable Municipal Bonds | — | 58,775,598 | — | 58,775,598 | ||||||||||||
| Residential Mortgage-Backed Securities – | ||||||||||||||||
| U.S. Government Agency Issues | — | 189,338 | — | 189,338 | ||||||||||||
| Residential Mortgage-Backed Securities – | ||||||||||||||||
| Non-U.S. Government Agency Issues | — | 109,603,919 | — | 109,603,919 | ||||||||||||
| Commercial Mortgage-Backed Securities – | ||||||||||||||||
| U.S. Government Agency Issues | — | 61,101,971 | — | 61,101,971 | ||||||||||||
| Commercial Mortgage-Backed Securities – | ||||||||||||||||
| Non-U.S. Government Agency Issues | — | 90,617,803 | — | 90,617,803 | ||||||||||||
| Other Asset Backed Securities | — | 84,194,773 | — | 84,194,773 | ||||||||||||
| Total Long-Term Investments | — | 2,625,750,504 | — | 2,625,750,504 | ||||||||||||
| Short-Term Investment | ||||||||||||||||
| Money Market Mutual Fund | 68,493,027 | — | — | 68,493,027 | ||||||||||||
| Total Short-Term Investment | 68,493,027 | — | — | 68,493,027 | ||||||||||||
| Total Investments | $ | 68,493,027 | $ | 2,625,750,504 | $ | — | $ | 2,694,243,531 | ||||||||
Changes in valuation techniques may result in transfers into or out of assigned levels within the fair value hierarchy. There were no transfers between Level 1 and Level 2 fair value measurements during the reporting period, as compared to their classification from the prior year’s annual report. See the Fund’s valuation policy in Note 2a to the financial statements.
The accompanying notes are an integral part of these financial statements.
Page 24
Baird Aggregate Bond Fund
June 30, 2017 (Unaudited)
Portfolio Characteristics
Quality Distribution(1)(2)
 | Net Assets | $12,726,917,717 | |||
| SEC 30-Day | |||||
Yield(3) | |||||
| Institutional Class | 2.49% | ||||
| Investor Class | 2.25% | ||||
| Average | |||||
| Effective | |||||
| Duration | 6.01 years | ||||
| Average | |||||
| Effective | |||||
| Maturity | 7.85 years | ||||
| Annualized | |||||
| Expense | |||||
Sector Weightings(1) | Ratio(4) | ||||
| Institutional Class | 0.30% | ||||
 | Investor Class | 0.55% | (5) | ||
| Portfolio | |||||
| Turnover Rate | 13.1% | † | |||
| Number of | |||||
| Holdings | 1,046 | ||||
(1) | Percentages shown are based on the Fund’s total investments. | |
(2) | The quality profile is calculated on a market value-weighted basis using the highest credit quality rating for each security held by the Fund given by S&P, Moody’s or Fitch, each of which is a Nationally Recognized Statistical Rating Organization (NRSRO). NRSROs rate the credit quality of securities using a scale that generally ranges from AAA (highest) to D (lowest). | |
(3) | SEC yields are based on SEC guidelines and are calculated for the 30 days ended June 30, 2017. | |
(4) | Reflects expense ratios as stated in the Fund’s current prospectus. | |
(5) | Includes 0.25% 12b-1 fee. | |
| † | Not annualized. |
Page 25
Baird Aggregate Bond Fund
June 30, 2017 (Unaudited)
Total Returns
| Average Annual | |||||
| Six | One | Five | Ten | Since | |
| For the Periods Ended June 30, 2017 | Months | Year | Years | Years | Inception(1) |
| Institutional Class Shares | 2.72% | 0.63% | 3.21% | 4.86% | 5.52% |
| Investor Class Shares | 2.60% | 0.37% | 2.98% | 4.60% | 5.27% |
| Bloomberg Barclays U.S. | |||||
Aggregate Bond Index(2) | 2.27% | -0.31% | 2.21% | 4.48% | 5.00% |
| (1) | For the period from September 29, 2000 (inception date) through June 30, 2017. |
| (2) | The Bloomberg Barclays U.S. Aggregate Bond Index is an unmanaged, market value weighted index of investment grade, fixed-rate debt issues, including government, corporate, asset-backed and mortgage-backed securities, with maturities of at least one year. This Index does not reflect any deduction for fees, expenses or taxes. A direct investment in an index is not possible. |
The returns shown in the table above reflect reinvestment of dividends and/or capital gains distributions in additional shares. The returns do not reflect the deduction of taxes that a shareholder would pay on Fund distributions or the redemption of Fund shares. The returns reflect the actual performance for each period and do not include the impact of trades executed on the last business day of the period that were recorded on the first business day of the next period.
The Fund’s gross expense ratio for each Class, as reflected in the Fund’s current prospectus, is set forth under “Portfolio Characteristics”.
The Fund maintains securities with longer maturities in order to provide a greater potential for return. Generally, the longer a bond’s maturity, the greater the interest rate risk. The Fund may also invest in U.S. dollar denominated foreign securities which involve additional risks such as political and economic instability, and different and sometimes less strict financial reporting standards and regulation. The Fund may also invest in mortgage- and asset-backed securities, which include interest rate and prepayment risks more pronounced than those of other fixed income securities.
Past performance does not guarantee future results. Investment return and principal value will fluctuate so that an investor’s shares, when redeemed, may be worth more or less than their original cost.
For information about the performance of the Fund as of the most recent month-end, please call 1-866-44BAIRD or visit www.bairdfunds.com. Mutual fund performance changes over time and current performance may be lower or higher than that stated.
Page 26
Baird Aggregate Bond Fund
Summary Schedule of Investments, June 30, 2017 (Unaudited)
This schedule summarizes the Fund’s holdings by asset type. Details are reported for each of the Fund’s 50 largest individual holdings and for investments that, in total for any issuer, represent more than 1% of the Fund’s net assets. The total value of smaller holdings is reported as a single amount within each category.
The Fund reports a complete list of its holdings in regulatory filings four times in each fiscal year, at the quarter end. For the second and fourth fiscal quarters, the complete listing of the Fund’s holdings is available electronically in the Fund’s Form N-CSR at http://www.bairdassetmanagement.com/baird-funds/funds-and-performance#Literature and on the Securities and Exchange Commission’s website (www.sec.gov) or you can have it mailed to you without charge by calling 1-866-44BAIRD. For the first and third fiscal quarters, the Fund files the lists with the SEC on Form N-Q. Shareholders can look up the Fund’s Forms N-CSR and N-Q on the SEC’s website (www.sec.gov).
Long-Term Investments
| Principal | % of | |||||||||||
| Amount | Value | Net Assets | ||||||||||
| U.S. Treasury Securities | ||||||||||||
| U.S. Treasury Bonds: | ||||||||||||
| 1.750%, 03/31/2022 | $ | 211,855,000 | $ | 210,762,676 | 1.7 | % | ||||||
| 1.875%, 03/31/2022 | 125,000,000 | 125,073,250 | 1.0 | % | ||||||||
| 2.500%, 05/15/2024 | 508,950,000 | 521,454,901 | 4.1 | % | ||||||||
| 2.250%, 11/15/2025 | 165,875,000 | 165,913,815 | 1.3 | % | ||||||||
| 5.250%, 11/15/2028 | 92,576,500 | 119,177,802 | 0.9 | % | ||||||||
| 3.500%, 02/15/2039 | 371,355,900 | 419,559,753 | 3.3 | % | ||||||||
| 2.875%, 05/15/2043 | 693,050,000 | 699,764,268 | 5.5 | % | ||||||||
| 2.500%, 02/15/2045 | 4,900,000 | 4,572,886 | 0.0 | % | ||||||||
| Total U.S. Treasury Securities | ||||||||||||
| (Cost $2,283,661,550) | 2,266,279,351 | 17.8 | % | |||||||||
| Other Government Related Securities | ||||||||||||
| Other Government Related Securities#~ | 150,580,874 | 1.2 | % | |||||||||
| Total Other Government Related Securities | ||||||||||||
| (Cost $147,980,367) | 150,580,874 | 1.2 | % | |||||||||
| Corporate Bonds | ||||||||||||
| Industrials | ||||||||||||
| Abbott Laboratories, | ||||||||||||
| 4.750%, 11/30/2036 | 33,949,000 | 36,952,196 | 0.3 | % | ||||||||
| DXC Technology Co., | ||||||||||||
| 4.250%, 04/15/2024 (Acquired 03/28/2017 | ||||||||||||
| through 06/22/2017, Cost $35,590,000)* | 34,725,000 | 35,927,492 | 0.3 | % | ||||||||
| Solvay Finance America LLC, | ||||||||||||
| 4.450%, 12/03/2025 (Acquired 05/03/2016 | ||||||||||||
| through 03/27/2017, Cost $45,176,414)* | 43,329,000 | 46,112,845 | 0.4 | % | ||||||||
| Verizon Communications, Inc., | ||||||||||||
| 4.812%, 03/15/2039 (Acquired 09/25/2013 | ||||||||||||
| through 11/08/2016, Cost $35,461,968)* | 36,839,000 | 37,237,524 | 0.3 | % | ||||||||
| Other Industrials#~ | 2,430,636,504 | 19.0 | % | |||||||||
| Total Industrials | ||||||||||||
| (Cost $2,536,834,561) | 2,586,866,561 | 20.3 | % | |||||||||
The accompanying notes are an integral part of these financial statements.
Page 27
Baird Aggregate Bond Fund
Summary Schedule of Investments, June 30, 2017 (Unaudited)
Long-Term Investments (cont.)
| Principal | % of | |||||||||||
| Amount | Value | Net Assets | ||||||||||
| Utilities | ||||||||||||
| Other Utilities#~ | $ | 140,239,119 | 1.1 | % | ||||||||
| Total Utilities | ||||||||||||
| (Cost $139,240,498) | 140,239,119 | 1.1 | % | |||||||||
| Financials | ||||||||||||
| Capital One Bank (USA) NA, | ||||||||||||
| 3.375%, 02/15/2023 | $ | 35,650,000 | 35,954,380 | 0.3 | % | |||||||
| Nationwide Building Society, | ||||||||||||
| 2.450%, 07/27/2021 (Acquired 07/20/2016 | ||||||||||||
through 08/01/2016, Cost $38,472,894)* f | 38,500,000 | 38,474,397 | 0.3 | % | ||||||||
| Other Financials#~ | 2,584,398,973 | 20.3 | % | |||||||||
| Total Financials | ||||||||||||
| (Cost $2,616,452,555) | 2,658,827,750 | 20.9 | % | |||||||||
| Total Corporate Bonds | ||||||||||||
| (Cost $5,292,527,614) | 5,385,933,430 | 42.3 | % | |||||||||
| Taxable Municipal Bonds | ||||||||||||
| Other Taxable Municipal Bonds# | 171,348,155 | 1.3 | % | |||||||||
| Total Taxable Municipal Bonds | ||||||||||||
| (Cost $167,019,152) | 171,348,155 | 1.3 | % | |||||||||
| Residential Mortgage-Backed Securities | ||||||||||||
| U.S. Government Agency Issues | ||||||||||||
| Fannie Mae Pool: | ||||||||||||
| 3.500%, 12/01/2045 | 44,798,833 | 46,039,718 | 0.4 | % | ||||||||
| 3.500%, 11/01/2046 | 68,408,590 | 70,303,443 | 0.6 | % | ||||||||
| 3.000%-3.000%, 07/01/2043-11/01/2046 | 47,784,919 | 47,850,439 | 0.4 | % | ||||||||
| Federal Gold Loan Mortgage Corp. (FGLMC): | ||||||||||||
| 3.000%, 02/01/2032 | 43,308,987 | 44,522,119 | 0.3 | % | ||||||||
| 4.000%, 01/01/2041 | 60,578,804 | 63,968,675 | 0.5 | % | ||||||||
| 3.000%, 11/01/2042 | 46,990,114 | 47,152,800 | 0.4 | % | ||||||||
| 3.000%, 01/01/2043 | 53,506,359 | 53,660,851 | 0.4 | % | ||||||||
| 3.000%, 04/01/2043 | 38,427,345 | 38,578,279 | 0.3 | % | ||||||||
| 3.500%, 05/01/2044 | 53,738,061 | 55,559,380 | 0.4 | % | ||||||||
| 3.000%, 10/01/2045 | 52,261,999 | 52,472,655 | 0.4 | % | ||||||||
| 3.500%, 01/01/2046 | 47,199,313 | 48,691,360 | 0.4 | % | ||||||||
| 2.500%-6.500%, 06/01/2020-04/01/2046 | 409,321,283 | 428,403,835 | 3.4 | % | ||||||||
| Federal National Mortgage Association (FNMA): | ||||||||||||
| 3.500%, 07/01/2027 | 52,219,830 | 54,502,144 | 0.4 | % | ||||||||
| 3.000%, 12/01/2030 | 49,089,798 | 50,443,578 | 0.4 | % | ||||||||
| 5.000%, 06/01/2039 | 37,829,930 | 41,496,951 | 0.3 | % | ||||||||
| 3.500%, 12/01/2041 | 50,077,025 | 51,672,175 | 0.4 | % | ||||||||
| 3.000%, 03/01/2043 | 53,534,804 | 53,760,917 | 0.4 | % | ||||||||
| 4.000%, 07/01/2043 | 42,165,317 | 44,491,457 | 0.3 | % | ||||||||
| 3.500%, 10/01/2043 | 79,949,978 | 82,342,112 | 0.6 | % | ||||||||
The accompanying notes are an integral part of these financial statements.
Page 28
Baird Aggregate Bond Fund
Summary Schedule of Investments, June 30, 2017 (Unaudited)
Long-Term Investments (cont.)
| Principal | % of | |||||||||||
| Amount | Value | Net Assets | ||||||||||
| Federal National Mortgage Association (FNMA): (cont.) | ||||||||||||
| 3.000%, 11/01/2043 | $ | 35,848,168 | $ | 35,999,899 | 0.3 | % | ||||||
| 3.500%, 02/01/2045 | 56,679,718 | 58,468,163 | 0.5 | % | ||||||||
| 3.500%, 04/01/2045 | 42,408,950 | 43,758,215 | 0.3 | % | ||||||||
| 4.500%, 02/01/2046 | 49,986,544 | 54,003,245 | 0.4 | % | ||||||||
3.000%, 05/01/2046∞ | 19,669,770 | 19,714,420 | 0.2 | % | ||||||||
| 2.500%-6.000%, 11/01/2021-10/01/2045 | 668,345,915 | 702,780,574 | 5.5 | % | ||||||||
| Ginnie Mae II Pool: | ||||||||||||
| 4.000%, 05/20/2046 | 46,647,796 | 49,125,798 | 0.4 | % | ||||||||
| 4.000%, 04/20/2046 | 19,158,490 | 20,176,219 | 0.2 | % | ||||||||
| Government National Mortgage Association (GNMA): | ||||||||||||
| 3.000%, 04/20/2045 | 40,911,981 | 41,367,623 | 0.3 | % | ||||||||
| 3.500%, 04/20/2045 | 38,209,001 | 39,617,838 | 0.3 | % | ||||||||
| 3.000%, 08/20/2046 | 54,628,428 | 55,236,832 | 0.4 | % | ||||||||
| 3.000%-6.000%, 11/20/2033-06/20/2046 | 132,860,005 | 138,544,662 | 1.1 | % | ||||||||
| Other U.S. Government Agency Issues# | 20,972,371 | 0.3 | % | |||||||||
| Total U.S. Government Agency Issues | ||||||||||||
| (Cost $2,653,056,703) | 2,655,678,747 | 20.9 | % | |||||||||
| Non-U.S. Government Agency Issues | ||||||||||||
| Argent Securities Inc. Asset-Backed | ||||||||||||
| Pass-Through Certificates, | ||||||||||||
Series 2005-W5, Class A1, 1.451%, 01/25/2036∞ | 40,037,983 | 38,392,731 | 0.3 | % | ||||||||
| New Residential Mortgage Loan Trust, | ||||||||||||
Series 2017-4A, Class A1, 4.000%, 05/25/2057∞ | 36,025,000 | 37,628,112 | 0.3 | % | ||||||||
| Towd Point Mortgage Trust, | ||||||||||||
| Series 2017-1, Class A1, 2.750%, 10/25/2056 | ||||||||||||
| (Acquired 02/07/2017 through 04/17/2017, | ||||||||||||
Cost $45,585,476)∞* | 45,530,851 | 45,881,803 | 0.4 | % | ||||||||
| Other Non-U.S. Government Agency Issues#~ | 539,958,246 | 4.2 | % | |||||||||
| Total Non-U.S. Government Agency Issues | ||||||||||||
| (Cost $658,210,291) | 661,860,892 | 5.2 | % | |||||||||
| Commercial Mortgage-Backed Securities | ||||||||||||
| U.S. Government Agency Issues | ||||||||||||
| Freddie Mac Multifamily Structured | ||||||||||||
| Pass Through Certificates: | ||||||||||||
Series K714, Class A2, 3.034%, 10/25/2020∞ | 34,345,000 | 35,439,915 | 0.3 | % | ||||||||
Series K-050, Class A2, 3.334%, 08/25/2025∞ | 72,374,000 | 75,740,817 | 0.6 | % | ||||||||
| 1.869%-5.053%, 01/25/2019-03/25/2027 | 123,815,000 | 127,683,452 | 1.0 | % | ||||||||
| Other U.S. Government Agency Issues# | 21,169,214 | 0.2 | % | |||||||||
| Total U.S. Government Agency Issues | ||||||||||||
| (Cost $259,284,398) | 260,033,398 | 2.1 | % | |||||||||
The accompanying notes are an integral part of these financial statements.
Page 29
Baird Aggregate Bond Fund
Summary Schedule of Investments, June 30, 2017 (Unaudited)
Long-Term Investments (cont.)
| Principal | % of | |||||||||||
| Amount | Value | Net Assets | ||||||||||
| Non-U.S. Government Agency Issues | ||||||||||||
| GS Mortgage Securities Trust, | ||||||||||||
| Series 2012-GCJ9, Class A3, 2.773%, 11/10/2045 | $ | 36,997,320 | $ | 37,343,741 | 0.3 | % | ||||||
| Morgan Stanley Bank of America Merrill Lynch Trust, | ||||||||||||
| Series 2012-C5, Class A4, 3.176%, 08/15/2045 | 37,550,000 | 38,705,203 | 0.3 | % | ||||||||
| Wells Fargo Commercial Mortgage Trust, | ||||||||||||
| Series 2015-P2, Class A3, 3.541%, 12/15/2048 | 44,050,000 | 45,576,689 | 0.4 | % | ||||||||
| Other Non-U.S. Government Agency Issues# | 426,243,295 | 3.3 | % | |||||||||
| Total Non-U.S. Government Agency Issues | ||||||||||||
| (Cost $548,158,247) | 547,868,928 | 4.3 | % | |||||||||
| Other Asset Backed Securities | ||||||||||||
| Capital One Multi-Asset Execution Trust, | ||||||||||||
| Series 2016-A4, Class A4, 1.330%, 06/15/2022 | 47,425,000 | 47,022,281 | 0.4 | % | ||||||||
| Chase Issuance Trust, | ||||||||||||
| Series 2016-A5, Class A5, 1.270%, 07/15/2021 | 40,100,000 | 39,733,093 | 0.3 | % | ||||||||
| Discover Card Execution Note Trust, | ||||||||||||
| Series 2016-A4, Class A4, 1.390%, 03/15/2022 | 50,225,000 | 49,803,306 | 0.4 | % | ||||||||
| Verizon Owner Trust, | ||||||||||||
| Series 2016-2A, Class A, 1.680%, 05/20/2021 | ||||||||||||
| (Acquired 11/16/2016 through 05/19/2017, | ||||||||||||
| Cost $51,644,822)* | 51,650,000 | 51,508,923 | 0.4 | % | ||||||||
| Other Asset Backed Securities#~ | 198,670,479 | 1.5 | % | |||||||||
| Total Other Asset Backed Securities | ||||||||||||
| (Cost $387,243,295) | 386,738,082 | 3.0 | % | |||||||||
| Total Long-Term Investments | ||||||||||||
| (Cost $12,397,141,617) | 12,486,321,857 | 98.1 | % | |||||||||
The accompanying notes are an integral part of these financial statements.
Page 30
Baird Aggregate Bond Fund
Summary Schedule of Investments, June 30, 2017 (Unaudited)
Short-Term Investment
| % of | ||||||||||||
| Shares | Value | Net Assets | ||||||||||
| Money Market Mutual Fund | ||||||||||||
| Fidelity Institutional Money Market Fund – | ||||||||||||
| Government Portfolio, Institutional Class, 0.85%« | 268,848,669 | $ | 268,848,669 | 2.1 | % | |||||||
| Total Short-Term Investment | ||||||||||||
| (Cost $268,848,669) | 268,848,669 | 2.1 | % | |||||||||
| Total Investments | ||||||||||||
| (Cost $12,665,990,286) | 12,755,170,526 | 100.2 | % | |||||||||
| Liabilities in Excess of Other Assets | (28,252,809 | ) | (0.2 | )% | ||||||||
| TOTAL NET ASSETS | $ | 12,726,917,717 | 100.0 | % | ||||||||
Notes to Summary Schedule of Investments
| ∞ | Variable or Floating rate security. Floating rate securities are securities whose yields vary with a designated index rate. These securities’ rates are as of June 30, 2017. | |
| * | Restricted security as defined in Rule 144(a) under the Securities Act of 1933 and determined to be liquid. Purchased in a private placement transaction; resale to the public may require registration or may extend only to qualified institutional buyers. At June 30, 2017, the value of these securities total $255,142,984, which represents 2.00% of total net assets. | |
| f | Foreign Security. | |
| # | Represents the aggregate value, by category, securities that are not among the 50 largest holdings and, in total for any issuer, represent 1% or less of net assets. | |
| ~ | Groupings contain, in aggregate, restricted securities totaling $1,763,235,114 representing 13.86% of net assets. | |
| « | 7-Day Yield. |
Summary of Fair Value Exposure at June 30, 2017 (Unaudited)
The Fund has adopted authoritative fair valuation accounting standards which establish a definition of fair value and set out a hierarchy for measuring fair value. These standards require additional disclosures about the various inputs and valuation techniques used to develop the measurements of fair value and a discussion on changes in valuation techniques and related inputs during the period. These standards define fair value as the price that would be received to sell an asset or paid to transfer a liability in an orderly transaction between market participants at the measurement date.
The fair value hierarchy is organized into three levels based upon the assumptions (referred to as “inputs”) used in pricing the asset or liability. These standards state that “observable inputs” reflect the assumptions market participants would use in pricing the asset or liability based on market data obtained from independent sources and “unobservable inputs” reflect an entity’s own assumptions about the assumptions market participants would use in pricing the asset or liability. These inputs are summarized into three broad levels and described below:
Level 1 – | Unadjusted quoted prices in active markets for identical unrestricted securities. |
Level 2 – | Other significant observable inputs (including quoted prices for similar securities, quoted prices in inactive markets, dealer indications, interest rates, yield curves, prepayment speeds, credit risk, default rates, inputs corroborated by observable market data, etc.). |
Level 3 – | Significant unobservable inputs (including the Fund’s own assumptions about the factors that market participants would use in valuing the security) based on the best information available. |
The accompanying notes are an integral part of these financial statements.
Page 31
Baird Aggregate Bond Fund
Summary Schedule of Investments, June 30, 2017 (Unaudited)
Summary of Fair Value Exposure at June 30, 2017 (Unaudited) (cont.)
The inputs or methodology used for valuing securities are not necessarily an indication of the risk associated with investing in those securities.
The following is a summary of the inputs used to value the Fund’s investments as of June 30, 2017:
| Level 1 | Level 2 | Level 3 | Total | |||||||||||||
| Long-Term Investments | ||||||||||||||||
| U.S. Treasury Securities | $ | — | $ | 2,266,279,351 | $ | — | $ | 2,266,279,351 | ||||||||
| Other Government Related Securities | — | 150,580,874 | — | 150,580,874 | ||||||||||||
| Corporate Bonds | — | 5,385,933,430 | — | 5,385,933,430 | ||||||||||||
| Taxable Municipal Bonds | — | 171,348,155 | — | 171,348,155 | ||||||||||||
| Residential Mortgage-Backed Securities – | ||||||||||||||||
| U.S. Government Agency Issues | — | 2,655,678,747 | — | 2,655,678,747 | ||||||||||||
| Residential Mortgage-Backed Securities – | ||||||||||||||||
| Non-U.S. Government Agency Issues | — | 661,860,892 | — | 661,860,892 | ||||||||||||
| Commercial Mortgage-Backed Securities – | ||||||||||||||||
| U.S. Government Agency Issues | — | 260,033,398 | — | 260,033,398 | ||||||||||||
| Commercial Mortgage-Backed Securities – | ||||||||||||||||
| Non-U.S. Government Agency Issues | — | 547,868,928 | — | 547,868,928 | ||||||||||||
| Other Asset Backed Securities | — | 386,738,082 | — | 386,738,082 | ||||||||||||
| Total Long-Term Investments | — | 12,486,321,857 | — | 12,486,321,857 | ||||||||||||
| Short-Term Investment | ||||||||||||||||
| Money Market Mutual Fund | 268,848,669 | — | — | 268,848,669 | ||||||||||||
| Total Short-Term Investment | 268,848,669 | — | — | 268,848,669 | ||||||||||||
| Total Investments | $ | 268,848,669 | $ | 12,486,321,857 | $ | — | $ | 12,755,170,526 | ||||||||
Changes in valuation techniques may result in transfers into or out of assigned levels within the fair value hierarchy. There were no transfers between Level 1, Level 2 and Level 3 fair value measurements during the reporting period, as compared to their classification from the prior year’s annual report. See the Fund’s valuation policy in Note 2a to the financial statements.
The accompanying notes are an integral part of these financial statements.
Page 32
Baird Core Plus Bond Fund
June 30, 2017 (Unaudited)
Portfolio Characteristics
Quality Distribution(1)(2)
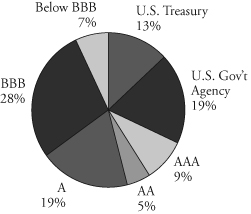 | Net Assets | $14,468,269,494 | |||
| SEC 30-Day | |||||
Yield(3) | |||||
| Institutional Class | 2.71% | ||||
| Investor Class | 2.46% | ||||
| Average | |||||
| Effective | |||||
| Duration | 5.80 years | ||||
| Average | |||||
| Effective | |||||
| Maturity | 7.62 years | ||||
| Annualized | |||||
Sector Weightings(1) | Expense Ratio(4) | ||||
| Institutional Class | 0.30% | ||||
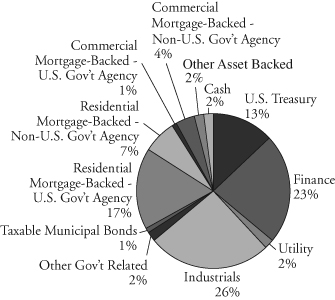 | Investor Class | 0.55% | (5) | ||
| Portfolio | |||||
| Turnover Rate | 15.5% | † | |||
| Number of | |||||
| Holdings | 1,214 | ||||
(1) | Percentages shown are based on the Fund’s total investments. | |
(2) | The quality profile is calculated on a market value-weighted basis using the highest credit quality rating for each security held by the Fund given by S&P, Moody’s or Fitch, each of which is a Nationally Recognized Statistical Rating Organization (NRSRO). NRSROs rate the credit quality of securities using a scale that generally ranges from AAA (highest) to D (lowest). | |
(3) | SEC yields are based on SEC guidelines and are calculated for the 30 days ended June 30, 2017. | |
(4) | Reflects expense ratios as stated in the Fund’s current prospectus. | |
(5) | Includes 0.25% 12b-1 fee. | |
| † | Not annualized. |
Page 33
Baird Core Plus Bond Fund
June 30, 2017 (Unaudited)
Total Returns
| Average Annual | |||||
| Six | One | Five | Ten | Since | |
| For the Periods Ended June 30, 2017 | Months | Year | Years | Years | Inception(1) |
| Institutional Class Shares | 2.99% | 1.65% | 3.38% | 5.58% | 6.02% |
| Investor Class Shares | 2.93% | 1.42% | 3.13% | 5.32% | 5.76% |
| Bloomberg Barclays U.S. | |||||
Universal Bond Index(2) | 2.63% | 0.91% | 2.73% | 4.73% | 5.27% |
| (1) | For the period from September 29, 2000 (inception date) through June 30, 2017. |
| (2) | The Bloomberg Barclays U.S. Universal Bond Index is an unmanaged, market value weighted index of fixed income securities issued in U.S. dollars, including U.S. government and investment grade debt, non-investment grade debt, asset-backed and mortgage-backed securities, Eurobonds, 144A securities and emerging market debt, with maturities of at least one year. This Index does not reflect any deduction for fees, expenses or taxes. A direct investment in an index is not possible. |
The returns shown in the table above reflect reinvestment of dividends and/or capital gains distributions in additional shares. The returns do not reflect the deduction of taxes that a shareholder would pay on Fund distributions or the redemption of Fund shares. The returns reflect the actual performance for each period and do not include the impact of trades executed on the last business day of the period that were recorded on the first business day of the next period.
The Fund’s gross expense ratio for each Class, as reflected in the Fund’s current prospectus, is set forth under “Portfolio Characteristics”.
The Fund may invest up to 20% of its net assets in non-investment grade debt securities (commonly referred to as “high yield” bonds). While these types of debt securities typically offer higher yields than investment grade securities, they also include greater risks including increased credit risk and the increased risk of default or bankruptcy. The Fund maintains securities with longer maturities in order to provide a greater potential for return. Generally, the longer a bond’s maturity, the greater the interest rate risk. The Fund may also invest in U.S. dollar denominated foreign securities which involve additional risks such as political and economic instability, and different and sometimes less strict financial reporting standards and regulation. The Fund may also invest in mortgage- and asset-backed securities, which include interest rate and prepayment risks more pronounced than those of other fixed income securities.
Past performance does not guarantee future results. Investment return and principal value will fluctuate so that an investor’s shares, when redeemed, may be worth more or less than their original cost.
For information about the performance of the Fund as of the most recent month-end, please call 1-866-44BAIRD or visit www.bairdfunds.com. Mutual fund performance changes over time and current performance may be lower or higher than that stated.
Page 34
Baird Core Plus Bond Fund
Summary Schedule of Investments, June 30, 2017 (Unaudited)
This schedule summarizes the Fund’s holdings by asset type. Details are reported for each of the Fund’s 50 largest individual holdings and for investments that, in total for any issuer, represent more than 1% of the Fund’s net assets. The total value of smaller holdings is reported as a single amount within each category.
The Fund reports a complete list of its holdings in regulatory filings four times in each fiscal year, at the quarter end. For the second and fourth fiscal quarters, the complete listing of the Fund’s holdings is available electronically in the Fund’s Form N-CSR at http://www.bairdassetmanagement.com/baird-funds/funds-and-performance#Literature and on the Securities and Exchange Commission’s website (www.sec.gov) or you can have it mailed to you without charge by calling 1-866-44BAIRD. For the first and third fiscal quarters, the Fund files the lists with the SEC on Form N-Q. Shareholders can look up the Fund’s Forms N-CSR and N-Q on the SEC’s website (www.sec.gov).
Long-Term Investments
| Principal | % of | |||||||||||
| Amount | Value | Net Assets | ||||||||||
| U.S. Treasury Securities | ||||||||||||
| U.S. Treasury Bonds: | ||||||||||||
| 1.750%, 03/31/2022 | $ | 231,750,000 | $ | 230,555,097 | 1.6 | % | ||||||
| 1.875%, 03/31/2022 | 192,500,000 | 192,612,805 | 1.3 | % | ||||||||
| 2.500%, 05/15/2024 | 193,975,000 | 198,740,966 | 1.4 | % | ||||||||
| 2.250%, 11/15/2025 | 158,725,000 | 158,762,141 | 1.1 | % | ||||||||
| 3.500%, 02/15/2039 | 379,170,000 | 428,388,162 | 3.0 | % | ||||||||
| 2.875%, 05/15/2043 | 594,625,000 | 600,385,727 | 4.1 | % | ||||||||
| 2.500%, 02/15/2045 | 34,850,000 | 32,523,484 | 0.2 | % | ||||||||
| Total U.S. Treasury Securities | ||||||||||||
| (Cost $1,863,259,635) | 1,841,968,382 | 12.7 | % | |||||||||
| Other Government Related Securities | ||||||||||||
| Other Government Related Securities#~ | 221,706,052 | 1.5 | % | |||||||||
| Total Other Government Related Securities | ||||||||||||
| (Cost $218,817,383) | 221,706,052 | 1.5 | % | |||||||||
| Corporate Bonds | ||||||||||||
| Industrials | ||||||||||||
| Abbott Laboratories, | ||||||||||||
| 4.750%, 11/30/2036 | 38,500,000 | 41,905,787 | 0.3 | % | ||||||||
| DXC Technology Co., | ||||||||||||
| 4.250%, 04/15/2024 (Acquired 03/13/2017 | ||||||||||||
| through 06/22/2017, Cost $38,359,941)* | 37,639,000 | 38,942,401 | 0.3 | % | ||||||||
| Forest Laboratories, Inc., | ||||||||||||
| 5.000%, 12/15/2021 (Acquired 08/26/2014 | ||||||||||||
| through 05/11/2016, Cost $43,986,150)* | 41,397,000 | 45,197,410 | 0.3 | % | ||||||||
| Shire Acquisitions Investments Ireland DAC, | ||||||||||||
2.875%, 09/23/2023 f | 51,400,000 | 50,946,292 | 0.4 | % | ||||||||
| Solvay Finance America LLC, | ||||||||||||
| 3.400%, 12/03/2020 (Acquired 11/30/2015 | ||||||||||||
| through 01/14/2016, Cost $39,200,406)* | 39,226,000 | 40,475,740 | 0.3 | % | ||||||||
| TSMC Global Ltd., | ||||||||||||
| 1.625%, 04/03/2018 (Acquired 03/27/2013 | ||||||||||||
through 06/28/2017, Cost $37,499,379)* f | 37,655,000 | 37,579,041 | 0.3 | % | ||||||||
The accompanying notes are an integral part of these financial statements.
Page 35
Baird Core Plus Bond Fund
Summary Schedule of Investments, June 30, 2017 (Unaudited)
Long-Term Investments
| Principal | % of | |||||||||||
| Amount | Value | Net Assets | ||||||||||
| Verizon Communications, Inc., | ||||||||||||
| 4.812%, 03/15/2039 (Acquired 09/30/2013 | ||||||||||||
| through 11/08/2016, Cost $37,298,658)* | $ | 37,955,000 | $ | 38,365,597 | 0.3 | % | ||||||
| Other Industrials#~ | 3,509,169,943 | 24.1 | % | |||||||||
| Total Industrials | ||||||||||||
| (Cost $3,734,768,202) | 3,802,582,211 | 26.3 | % | |||||||||
| Utilities | ||||||||||||
| Other Utilities#~ | 214,788,005 | 1.5 | % | |||||||||
| Total Utilities | ||||||||||||
| (Cost $210,881,698) | 214,788,005 | 1.5 | % | |||||||||
| Financials | ||||||||||||
| Capital One Bank (USA) NA, | ||||||||||||
| 3.375%, 02/15/2023 | 37,888,000 | 38,211,488 | 0.3 | % | ||||||||
| Compass Bank, | ||||||||||||
| 2.750%, 09/29/2019 | 38,994,000 | 39,295,970 | 0.3 | % | ||||||||
| HSBC Finance Corp., | ||||||||||||
| 6.676%, 01/15/2021 | 42,705,000 | 48,126,998 | 0.3 | % | ||||||||
| Other Financials#~ | 3,164,920,796 | 21.8 | % | |||||||||
| Total Financials | ||||||||||||
| (Cost $3,230,431,185) | 3,290,555,252 | 22.7 | % | |||||||||
| Total Corporate Bonds | ||||||||||||
| (Cost $7,176,081,085) | 7,307,925,468 | 50.5 | % | |||||||||
| Taxable Municipal Bonds | ||||||||||||
| Other Taxable Municipal Bonds# | 132,370,265 | 0.9 | % | |||||||||
| Total Taxable Municipal Bonds | ||||||||||||
| (Cost $129,298,779) | 132,370,265 | 0.9 | % | |||||||||
| Residential Mortgage-Backed Securities | ||||||||||||
| U.S. Government Agency Issues | ||||||||||||
| Fannie Mae Pool: | ||||||||||||
| 3.500%, 12/01/2045 | 51,204,431 | 52,622,745 | 0.4 | % | ||||||||
| 3.500%, 11/01/2046 | 41,988,433 | 43,151,473 | 0.3 | % | ||||||||
| 3.000%-4.500%, 01/01/2040-04/01/2043 | 7,477,969 | 7,874,783 | 0.1 | % | ||||||||
| Federal Gold Loan Mortgage Corp. (FGLMC): | ||||||||||||
| 3.000%, 10/01/2030 | 46,323,748 | 47,607,944 | 0.3 | % | ||||||||
| 3.000%, 02/01/2032 | 47,347,290 | 48,673,540 | 0.3 | % | ||||||||
| 3.500%, 01/01/2034 | 35,069,754 | 36,614,151 | 0.3 | % | ||||||||
| 3.500%, 07/01/2042 | 29,403,916 | 30,340,483 | 0.2 | % | ||||||||
| 3.500%, 07/01/2042 | 47,230,238 | 48,734,569 | 0.3 | % | ||||||||
| 3.000%, 11/01/2042 | 62,877,706 | 63,095,396 | 0.4 | % | ||||||||
| 3.000%, 01/01/2043 | 47,673,262 | 47,861,814 | 0.3 | % | ||||||||
| 3.000%, 10/01/2045 | 43,455,803 | 43,630,963 | 0.3 | % | ||||||||
| 3.500%, 01/01/2046 | 66,401,248 | 68,500,299 | 0.5 | % | ||||||||
The accompanying notes are an integral part of these financial statements.
Page 36
Baird Core Plus Bond Fund
Summary Schedule of Investments, June 30, 2017 (Unaudited)
Long-Term Investments
| Principal | % of | |||||||||||
| Amount | Value | Net Assets | ||||||||||
| Federal Gold Loan Mortgage Corp. (FGLMC): (cont.) | ||||||||||||
| 3.500%, 08/01/2046 | $ | 69,781,461 | $ | 72,130,888 | 0.5 | % | ||||||
| 3.000%-6.500%, 12/01/2020-06/01/2045 | 416,012,691 | 431,044,712 | 3.0 | % | ||||||||
| Federal National Mortgage Association (FNMA): | ||||||||||||
| 3.500%, 07/01/2027 | 48,777,096 | 50,908,943 | 0.4 | % | ||||||||
| 3.500%, 07/01/2028 | 35,902,655 | 37,378,853 | 0.3 | % | ||||||||
| 3.000%, 08/01/2030 | 36,702,824 | 37,715,398 | 0.3 | % | ||||||||
| 5.000%, 02/01/2035 | 43,338,761 | 47,502,213 | 0.3 | % | ||||||||
| 3.500%, 09/01/2041 | 43,212,455 | 44,618,704 | 0.3 | % | ||||||||
| 4.000%, 01/01/2042 | 36,714,047 | 38,732,818 | 0.3 | % | ||||||||
| 4.000%, 07/01/2043 | 42,566,576 | 44,914,853 | 0.3 | % | ||||||||
| 3.500%, 02/01/2045 | 69,749,334 | 71,950,172 | 0.5 | % | ||||||||
| 4.000%, 02/01/2045 | 40,677,969 | 43,027,689 | 0.3 | % | ||||||||
| 4.500%, 02/01/2046 | 45,940,994 | 49,632,612 | 0.3 | % | ||||||||
| 2.500%-6.500%, 11/01/2021-03/01/2045 | 680,692,320 | 714,353,823 | 4.8 | % | ||||||||
| Government National Mortgage Association (GNMA): | ||||||||||||
| 3.500%, 04/20/2045 | 35,610,713 | 36,923,747 | 0.3 | % | ||||||||
| 3.000%, 08/20/2046 | 64,690,943 | 65,411,413 | 0.5 | % | ||||||||
| 3.000%-6.500%, 12/20/2028-06/20/2046 | 176,353,942 | 183,579,676 | 1.3 | % | ||||||||
| Other U.S. Government Agency Issues# | 1,036,293 | 0.0 | % | |||||||||
| Total U.S. Government Agency Issues | ||||||||||||
| (Cost $2,504,090,437) | 2,509,570,967 | 17.4 | % | |||||||||
| Non-U.S. Government Agency Issues | ||||||||||||
| Argent Securities Inc. Asset-Backed | ||||||||||||
| Pass-Through Certificates, | ||||||||||||
Series 2005-W5, Class A1, 1.451%, 01/25/2036∞ | 49,408,629 | 47,378,315 | 0.3 | % | ||||||||
| Citicorp Residential Mortgage Trust, | ||||||||||||
Series 2007-2, Class A4, 5.282%, 06/25/2037∞ | 35,639,567 | 36,395,892 | 0.3 | % | ||||||||
| Countrywide Asset-Backed Certificates, | ||||||||||||
Series 2007-9, Class 2A3, 1.396%, 06/25/2047∞ | 40,335,743 | 39,513,236 | 0.3 | % | ||||||||
| Other Non-U.S. Government Agency Issues#~ | 961,439,329 | 6.6 | % | |||||||||
| Total Non-U.S. Government Agency Issues | ||||||||||||
| (Cost $1,081,241,503) | 1,084,726,772 | 7.5 | % | |||||||||
| Commercial Mortgage-Backed Securities | ||||||||||||
| U.S. Government Agency Issues | ||||||||||||
| Freddie Mac Multifamily Structured | ||||||||||||
| Pass Through Certificates: | ||||||||||||
| Series K-716, Class A2, 3.130%, 06/25/2021 | 13,550,000 | 14,074,031 | 0.1 | % | ||||||||
Series K-048, Class A2, 3.284%, 06/25/2025∞ | 53,605,000 | 55,939,449 | 0.4 | % | ||||||||
Series K-050, Class A2, 3.334%, 08/25/2025∞ | 82,601,000 | 86,443,574 | 0.6 | % | ||||||||
| Other U.S. Government Agency Issues# | 29,544,195 | 0.2 | % | |||||||||
| Total U.S. Government Agency Issues | ||||||||||||
| (Cost $185,067,935) | 186,001,249 | 1.3 | % | |||||||||
The accompanying notes are an integral part of these financial statements.
Page 37
Baird Core Plus Bond Fund
Summary Schedule of Investments, June 30, 2017 (Unaudited)
Long-Term Investments
| Principal | % of | |||||||||||
| Amount | Value | Net Assets | ||||||||||
| Non-U.S. Government Agency Issues | ||||||||||||
| GS Mortgage Securities Trust, | ||||||||||||
| Series 2012-GCJ9, Class A3, 2.773%, 11/10/2045 | $ | 41,464,000 | $ | 41,852,244 | 0.3 | % | ||||||
| Morgan Stanley Bank of America Merrill Lynch Trust: | ||||||||||||
| Series 2012-C5, Class A4, 3.176%, 08/15/2045 | 40,030,000 | 41,261,499 | 0.3 | % | ||||||||
Series 2013-C10, Class A3, 4.104%, 07/15/2046∞ | 44,160,000 | 47,202,028 | 0.3 | % | ||||||||
| Other Non-U.S. Government Agency Issues# | 524,193,262 | 3.6 | % | |||||||||
| Total Non-U.S. Government Agency Issues | ||||||||||||
| (Cost $652,363,710) | 654,509,033 | 4.5 | % | |||||||||
| Other Asset Backed Securities | ||||||||||||
| Ford Credit Auto Owner Trust, | ||||||||||||
| Series 2016-1, Class A, 2.310%, 08/15/2027 | ||||||||||||
| (Acquired 02/23/2016 through 05/27/2016, | ||||||||||||
| Cost $37,658,146)* | 37,625,000 | 37,825,259 | 0.3 | % | ||||||||
| PFS Financing Corp., | ||||||||||||
| Series 2016-BA, Class A, 1.870%, 10/15/2021 | ||||||||||||
| (Acquired 10/18/2016 through 12/21/2016, | ||||||||||||
| Cost $40,196,932)* | 40,200,000 | 40,014,513 | 0.3 | % | ||||||||
| TCF Auto Receivables Owner Trust, | ||||||||||||
| Series 2016-1A, Class A3, 1.710%, 04/15/2021 | ||||||||||||
| (Acquired 09/14/2016, Cost $38,993,592)* | 39,000,000 | 38,874,065 | 0.3 | % | ||||||||
| Other Asset Backed Securities#~ | 168,070,765 | 1.1 | % | |||||||||
| Total Other Asset Backed Securities | ||||||||||||
| (Cost $284,880,149) | 284,784,602 | 2.0 | % | |||||||||
| Total Long-Term Investments | ||||||||||||
| (Cost $14,095,100,616) | 14,223,562,790 | 98.3 | % | |||||||||
The accompanying notes are an integral part of these financial statements.
Page 38
Baird Core Plus Bond Fund
Summary Schedule of Investments, June 30, 2017 (Unaudited)
Short-Term Investment
| % of | ||||||||||||
| Shares | Value | Net Assets | ||||||||||
| Money Market Mutual Fund | ||||||||||||
| Fidelity Institutional Money Market Fund – | ||||||||||||
| Government Portfolio, Institutional Class, 0.85%« | 366,705,083 | $ | 366,705,083 | 2.5 | % | |||||||
| Total Short-Term Investment | ||||||||||||
| (Cost $366,705,083) | 366,705,083 | 2.5 | % | |||||||||
| Total Investments | ||||||||||||
| (Cost $14,461,805,699) | 14,590,267,873 | 100.8 | % | |||||||||
| Liabilities in Excess of Other Assets | (121,998,379 | ) | (0.8 | )% | ||||||||
| TOTAL NET ASSETS | $ | 14,468,269,494 | 100.0 | % | ||||||||
Notes to Summary Schedule of Investments
| ∞ | Variable or Floating rate security. Floating rate securities are securities whose yields vary with a designated index rate. These securities’ rates are as of June 30, 2017. | |
| * | Restricted security as defined in Rule 144(a) under the Securities Act of 1933 and determined to be liquid. Purchased in a private placement transaction; resale to the public may require registration or may extend only to qualified institutional buyers. At June 30, 2017, the value of these securities total $317,274,026, which represents 2.19% of total net assets. | |
| f | Foreign Security. | |
| # | Represents the aggregate value, by category, securities that are not among the 50 largest holdings and, in total for any issuer, represent 1% or less of net assets. | |
| ~ | Groupings contain, in aggregate, restricted securities totaling $2,329,658,999 representing 16.10% of net assets. | |
| « | 7-Day Yield. |
Summary of Fair Value Exposure at June 30, 2017 (Unaudited)
The Fund has adopted authoritative fair valuation accounting standards which establish a definition of fair value and set out a hierarchy for measuring fair value. These standards require additional disclosures about the various inputs and valuation techniques used to develop the measurements of fair value and a discussion on changes in valuation techniques and related inputs during the period. These standards define fair value as the price that would be received to sell an asset or paid to transfer a liability in an orderly transaction between market participants at the measurement date.
The fair value hierarchy is organized into three levels based upon the assumptions (referred to as “inputs”) used in pricing the asset or liability. These standards state that “observable inputs” reflect the assumptions market participants would use in pricing the asset or liability based on market data obtained from independent sources and “unobservable inputs” reflect an entity’s own assumptions about the assumptions market participants would use in pricing the asset or liability. These inputs are summarized into three broad levels and described below:
Level 1 – | Unadjusted quoted prices in active markets for identical unrestricted securities. |
Level 2 – | Other significant observable inputs (including quoted prices for similar securities, quoted prices in inactive markets, dealer indications, interest rates, yield curves, prepayment speeds, credit risk, default rates, inputs corroborated by observable market data, etc.). |
Level 3 – | Significant unobservable inputs (including the Fund’s own assumptions about the factors that market participants would use in valuing the security) based on the best information available. |
The accompanying notes are an integral part of these financial statements.
Page 39
Baird Core Plus Bond Fund
Summary Schedule of Investments, June 30, 2017 (Unaudited)
Summary of Fair Value Exposure at June 30, 2017 (Unaudited) (cont.)
The inputs or methodology used for valuing securities are not necessarily an indication of the risk associated with investing in those securities.
The following is a summary of the inputs used to value the Fund’s investments as of June 30, 2017:
| Level 1 | Level 2 | Level 3 | Total | |||||||||||||
| Long-Term Investments | ||||||||||||||||
| U.S. Treasury Securities | $ | — | $ | 1,841,968,382 | $ | — | $ | 1,841,968,382 | ||||||||
| Other Government Related Securities | — | 221,706,052 | — | 221,706,052 | ||||||||||||
| Corporate Bonds | — | 7,307,925,468 | — | 7,307,925,468 | ||||||||||||
| Taxable Municipal Bonds | — | 132,370,265 | — | 132,370,265 | ||||||||||||
| Residential Mortgage-Backed Securities – | ||||||||||||||||
| U.S. Government Agency Issues | — | 2,509,570,967 | — | 2,509,570,967 | ||||||||||||
| Residential Mortgage-Backed Securities – | ||||||||||||||||
| Non-U.S. Government Agency Issues | — | 1,084,726,772 | — | 1,084,726,772 | ||||||||||||
| Commercial Mortgage-Backed Securities – | ||||||||||||||||
| U.S. Government Agency Issues | — | 186,001,249 | — | 186,001,249 | ||||||||||||
| Commercial Mortgage-Backed Securities – | ||||||||||||||||
| Non-U.S. Government Agency Issues | — | 654,509,033 | — | 654,509,033 | ||||||||||||
| Other Asset Backed Securities | — | 284,784,602 | — | 284,784,602 | ||||||||||||
| Total Long-Term Investments | — | 14,223,562,790 | — | 14,223,562,790 | ||||||||||||
| Short-Term Investment | ||||||||||||||||
| Money Market Mutual Fund | 366,705,083 | — | — | 366,705,083 | ||||||||||||
| Total Short-Term Investment | 366,705,083 | — | — | 366,705,083 | ||||||||||||
| Total Investments | $ | 366,705,083 | $ | 14,223,562,790 | $ | — | $ | 14,590,267,873 | ||||||||
Changes in valuation techniques may result in transfers into or out of assigned levels within the fair value hierarchy. There were no transfers between Level 1, Level 2 and Level 3 fair value measurements during the reporting period, as compared to their classification from the prior year’s annual report. See the Fund’s valuation policy in Note 2a to the financial statements.
The accompanying notes are an integral part of these financial statements.
Page 40
Baird Short-Term Municipal Bond Fund
June 30, 2017 (Unaudited)
Portfolio Characteristics
Quality Distribution(1)(2)
 | Net Assets | $87,004,777 | |||
| SEC 30-Day | |||||
Yield(4) | |||||
| Institutional Class | 1.58% | ||||
| Investor Class | 1.33% | ||||
| Average | |||||
| Effective | |||||
| Duration | 2.29 years | ||||
| Average | |||||
| Effective | |||||
| Maturity | 2.65 years | ||||
| Annualized | |||||
| Expense | |||||
Sector Weightings(1) | Ratio(5) | ||||
| Institutional Class | 0.30% | ||||
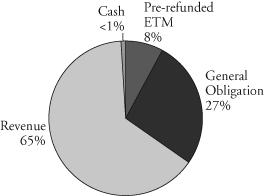 | Investor Class | 0.55% | (6) | ||
| Portfolio | |||||
| Turnover Rate | 33.9% | † | |||
| Number of | |||||
| Holdings | 521 | ||||
(1) | Percentages shown are based on the Fund’s total investments. | |
(2) | The quality profile is calculated on a market value-weighted basis using the highest credit quality rating for each security held by the Fund given by S&P, Moody’s or Fitch, each of which is a Nationally Recognized Statistical Rating Organization (NRSRO). NRSROs rate the credit quality of securities using a scale that generally ranges from AAA (highest) to D (lowest). | |
(3) | Includes pre-refunded and escrowed-to-maturity (ETM) bonds. | |
(4) | SEC yields are based on SEC guidelines and are calculated for the 30 days ended June 30, 2017. | |
(5) | Reflects expense ratios as stated in the Fund’s current prospectus. | |
(6) | Includes 0.25% 12b-1 fee. | |
| † | Not annualized. |
Page 41
Baird Short-Term Municipal Bond Fund
June 30, 2017 (Unaudited)
Total Returns
| Average | |||
| Annual | |||
| Six | One | Since | |
| For the Periods Ended June 30, 2017 | Months | Year | Inception(1) |
| Institutional Class Shares | 2.09% | 1.04% | 2.04% |
| Investor Class Shares | 1.92% | 0.76% | 1.74% |
Bloomberg Barclays Short (1-5 Year) Municipal Index(2) | 1.77% | 0.47% | 1.22% |
| (1) | For the period from August 31, 2015 (inception date) through June 30, 2017. |
| (2) | The Bloomberg Barclays Short (1-5 Year) Municipal Bond Index is an unmanaged, market value weighted index that measures the performance of investment-grade, tax-exempt, and fixed-rated municipal securities with time to maturity of more than one year and less than five years. Securities must have an outstanding par value of at least $7 million and be issued as part of a transaction of at least $75 million. The bonds must be fixed rate, have a dated-date after December 31, 1990, and must be at least one year from their maturity date. This Index does not reflect any deduction for fees, expenses or taxes. A direct investment in an index is not possible. |
The returns shown in the table above reflect reinvestment of dividends and/or capital gains distributions in additional shares. The returns do not reflect the deduction of taxes that a shareholder would pay on Fund distributions or the redemption of Fund shares. The returns reflect the actual performance for each period and do not include the impact of trades executed on the last business day of the period that were recorded on the first business day of the next period.
The Fund’s gross expense ratio for each Class, as reflected in the Fund’s current prospectus, is set forth under “Portfolio Characteristics”.
The Fund may invest up to 10% of its net assets in non-investment grade debt securities (commonly referred to as “high yield” bonds). While these types of debt securities typically offer higher yields than investment grade securities, they also include greater risks including increased credit risk and the increased risk of default or bankruptcy. The Fund may invest up to 25% of its total assets in municipal obligations issued by persons in the same state. As a result, changes in economic, business or political conditions of a particular state may have a disproportionate impact on the Fund’s share price. Municipal securities investments are not appropriate for all investors, especially those taxed at lower rates.
Past performance does not guarantee future results. Investment return and principal value will fluctuate so that an investor’s shares, when redeemed, may be worth more or less than their original cost.
For information about the performance of the Fund as of the most recent month-end, please call 1-866-44BAIRD or visit www.bairdfunds.com. Mutual fund performance changes over time and current performance may be lower or higher than that stated.
Page 42
Baird Short-Term Municipal Bond Fund
Summary Schedule of Investments, June 30, 2017 (Unaudited)
This schedule summarizes the Fund’s holdings by asset type. Details are reported for each of the Fund’s 50 largest individual holdings and for investments that, in total for any issuer, represent more than 1% of the Fund’s net assets. The total value of smaller holdings is reported as a single amount within each category.
The Fund reports a complete list of its holdings in regulatory filings four times in each fiscal year, at the quarter end. For the second and fourth fiscal quarters, the complete listing of the Fund’s holdings is available electronically in the Fund’s Form N-CSR at http://www.bairdfunds.com/prospectuses-reports and on the Securities and Exchange Commission’s website (www.sec.gov) or you can have it mailed to you without charge by calling 1-866-44BAIRD. For the first and third fiscal quarters, the Fund files the lists with the SEC on Form N-Q. Shareholders can look up the Fund’s Forms N-CSR and N-Q on the SEC’s website (www.sec.gov).
Long-Term Investments
| Principal | % of | |||||||||||
| Amount | Value | Net Assets | ||||||||||
| Municipal Bonds | ||||||||||||
| Alabama | ||||||||||||
| Black Belt Energy Gas District | ||||||||||||
| 4.000%, 08/01/2047 (Callable 04/01/2022) | ||||||||||||
| (Mandatory Tender Date 07/01/2022) | $ | 500,000 | $ | 544,960 | 0.6 | % | ||||||
| Other Alabama# | 436,144 | 0.5 | % | |||||||||
| Total Alabama | ||||||||||||
| (Cost $986,712) | 981,104 | 1.1 | % | |||||||||
| Alaska | ||||||||||||
| Total Alaska | ||||||||||||
| (Cost $25,584)# | 25,445 | 0.0 | % | |||||||||
| Arizona | ||||||||||||
| Total Arizona | ||||||||||||
| (Cost $1,235,659)# | 1,236,706 | 1.4 | % | |||||||||
| Arkansas | ||||||||||||
| City of Fayetteville AR | ||||||||||||
3.050%, 01/01/2047 (Callable 01/01/2027)(3) | 700,000 | 690,599 | 0.8 | % | ||||||||
| City of Pine Bluff AR | ||||||||||||
| 3.000%, 02/01/2047 (Callable 08/01/2027) | ||||||||||||
| (Insured by BAM) | 625,000 | 634,794 | 0.7 | % | ||||||||
| Mountain View Public Facilities Board | ||||||||||||
| 2.000%, 06/01/2018 | 445,000 | 445,752 | 0.5 | % | ||||||||
| Other Arkansas# | 1,309,532 | 1.5 | % | |||||||||
| Total Arkansas | ||||||||||||
| (Cost $3,067,655) | 3,080,677 | 3.5 | % | |||||||||
| California | ||||||||||||
| City of Chula Vista CA | ||||||||||||
| 1.650%, 07/01/2018 (Callable 07/31/2017) | 510,000 | 510,479 | 0.6 | % | ||||||||
| Fresno Joint Powers Financing Authority | ||||||||||||
| 5.000%, 04/01/2021 | 500,000 | 560,245 | 0.6 | % | ||||||||
| Northern California Gas Authority | ||||||||||||
1.399%, 07/01/2019(1) | 505,000 | 503,187 | 0.6 | % | ||||||||
The accompanying notes are an integral part of these financial statements.
Page 43
Baird Short-Term Municipal Bond Fund
Summary Schedule of Investments, June 30, 2017 (Unaudited)
Long-Term Investments (cont.)
| Principal | % of | |||||||||||
| Amount | Value | Net Assets | ||||||||||
| Other California# | $ | 3,764,380 | 4.3 | % | ||||||||
| Total California | ||||||||||||
| (Cost $5,327,938) | 5,338,291 | 6.1 | % | |||||||||
| Colorado | ||||||||||||
| Colorado Educational & Cultural Facilities Authority | ||||||||||||
| 3.000%-5.000%, 07/01/2018-10/01/2025 | $ | 1,075,000 | 1,150,359 | 1.3 | % | |||||||
| High Plains Metropolitan District | ||||||||||||
| 4.000%, 12/01/2022 | 420,000 | 460,324 | 0.5 | % | ||||||||
| Other Colorado# | 1,597,902 | 1.9 | % | |||||||||
| Total Colorado | ||||||||||||
| (Cost $3,181,509) | 3,208,585 | 3.7 | % | |||||||||
| Connecticut | ||||||||||||
| Total Connecticut | ||||||||||||
| (Cost $747,508)# | 748,076 | 0.9 | % | |||||||||
| District of Columbia | ||||||||||||
| Total District of Columbia | ||||||||||||
| (Cost $228,848)# | 227,542 | 0.3 | % | |||||||||
| Florida | ||||||||||||
| City of Tampa FL | ||||||||||||
| 5.250%, 11/15/2024 (Callable 05/15/2020) | 375,000 | 418,106 | 0.5 | % | ||||||||
| Florida State Municipal Loan Council | ||||||||||||
| 3.000%, 10/01/2020 | 500,000 | 520,695 | 0.6 | % | ||||||||
| Orange County Housing Finance Authority | ||||||||||||
| 4.000%, 09/01/2040 (Callable 09/01/2024) | 705,000 | 746,200 | 0.8 | % | ||||||||
| Other Florida# | 1,747,118 | 2.0 | % | |||||||||
| Total Florida | ||||||||||||
| (Cost $3,412,998) | 3,432,119 | 3.9 | % | |||||||||
| Georgia | ||||||||||||
| City of Atlanta GA | ||||||||||||
| 5.000%, 01/01/2023 (Callable 01/01/2020) | 450,000 | 486,112 | 0.6 | % | ||||||||
| 5.000%, 01/01/2024 (Callable 01/01/2020) | 500,000 | 537,590 | 0.6 | % | ||||||||
| Gainesville & Hall County Hospital Authority | ||||||||||||
| 0.000%, 02/15/2047 (Callable 07/03/2017) | ||||||||||||
(Optional Put Date 07/07/2017)(1) | 500,000 | 500,000 | 0.6 | % | ||||||||
| Other Georgia# | 1,417,269 | 1.6 | % | |||||||||
| Total Georgia | ||||||||||||
| (Cost $2,928,791) | 2,940,971 | 3.4 | % | |||||||||
| Idaho | ||||||||||||
| Total Idaho | ||||||||||||
| (Cost $25,976)# | 25,973 | 0.0 | % | |||||||||
The accompanying notes are an integral part of these financial statements.
Page 44
Baird Short-Term Municipal Bond Fund
Summary Schedule of Investments, June 30, 2017 (Unaudited)
Long-Term Investments (cont.)
| Principal | % of | |||||||||||
| Amount | Value | Net Assets | ||||||||||
| Illinois | ||||||||||||
| Champaign County Community Unit | ||||||||||||
| School District No 116 Urbana | ||||||||||||
| 5.000%, 01/01/2019 | $ | 1,100,000 | $ | 1,150,391 | 1.3 | % | ||||||
| Cook County School District No 170 Chicago Heights | ||||||||||||
| 5.000%, 12/01/2026 (Callable 07/27/2017) | 750,000 | 751,230 | 0.9 | % | ||||||||
| Illinois Finance Authority | ||||||||||||
| 2.085%-6.250%, 08/15/2017-05/01/2036 | 860,000 | 920,020 | 1.1 | % | ||||||||
| Illinois Housing Development Authority | ||||||||||||
| 2.450%, 06/01/2043 (Callable 01/01/2023) | 530,112 | 514,956 | 0.6 | % | ||||||||
| Jefferson County Township High School District No. 201 | ||||||||||||
| 6.500%, 12/30/2020 (Insured by BAM) | 420,000 | 482,677 | 0.6 | % | ||||||||
| South Suburban College Community | ||||||||||||
| School District No 510 | ||||||||||||
| 0.000%, 12/01/2019 (Insured by AGM) | 500,000 | 467,795 | 0.5 | % | ||||||||
| Other Illinois# | 7,196,844 | 8.2 | % | |||||||||
| Total Illinois | ||||||||||||
| (Cost $11,489,231) | 11,483,913 | 13.2 | % | |||||||||
| Indiana | ||||||||||||
| City of Goshen IN Waterworks Revenue | ||||||||||||
| 4.100%, 01/01/2021 (Callable 07/31/2017) | ||||||||||||
| (Insured by AGM) | 470,000 | 470,940 | 0.5 | % | ||||||||
| Indiana Housing & Community Development Authority | ||||||||||||
| 4.000%, 12/01/2027 (Callable 06/01/2021) | 480,000 | 499,032 | 0.6 | % | ||||||||
| Other Indiana# | 817,017 | 1.0 | % | |||||||||
| Total Indiana | ||||||||||||
| (Cost $1,782,451) | 1,786,989 | 2.1 | % | |||||||||
| Iowa | ||||||||||||
| Iowa Higher Education Loan Authority | ||||||||||||
| 2.000%, 12/01/2018 (Callable 06/01/2018) | 1,000,000 | 1,005,090 | 1.2 | % | ||||||||
| Other Iowa# | 591,968 | 0.6 | % | |||||||||
| Total Iowa | ||||||||||||
| (Cost $1,597,471) | 1,597,058 | 1.8 | % | |||||||||
| Kansas | ||||||||||||
| Total Kansas | ||||||||||||
| (Cost $478,599)# | 480,317 | 0.6 | % | |||||||||
| Kentucky | ||||||||||||
| Total Kentucky | ||||||||||||
| (Cost $491,923)# | 494,783 | 0.6 | % | |||||||||
| Louisiana | ||||||||||||
| Calcasieu Parish School Board | ||||||||||||
| 5.000%, 02/01/2025 (Callable 02/01/2022) | 425,000 | 477,836 | 0.5 | % | ||||||||
The accompanying notes are an integral part of these financial statements.
Page 45
Baird Short-Term Municipal Bond Fund
Summary Schedule of Investments, June 30, 2017 (Unaudited)
Long-Term Investments (cont.)
| Principal | % of | |||||||||||
| Amount | Value | Net Assets | ||||||||||
| Louisiana Local Government Environmental | ||||||||||||
| Facilities & Community Development Authority | ||||||||||||
| 5.875%, 10/01/2040 (Pre-refunded to 10/01/2020) | $ | 755,000 | $ | 864,875 | 1.0 | % | ||||||
| 5.500%-6.000%, 10/01/2025-10/01/2044 | 525,000 | 602,095 | 0.7 | % | ||||||||
| Other Louisiana# | 302,290 | 0.4 | % | |||||||||
| Total Louisiana | ||||||||||||
| (Cost $2,239,206) | 2,247,096 | 2.6 | % | |||||||||
| Maine | ||||||||||||
| Total Maine | ||||||||||||
| (Cost $308,807)# | 302,431 | 0.3 | % | |||||||||
| Maryland | ||||||||||||
| Total Maryland | ||||||||||||
| (Cost $55,823)# | 55,841 | 0.1 | % | |||||||||
| Massachusetts | ||||||||||||
| Massachusetts Housing Finance Agency | ||||||||||||
| 3.500%, 12/01/2046 (Callable 12/01/2025) | 1,005,000 | 1,042,698 | 1.2 | % | ||||||||
| 4.000%, 12/01/2044 (Callable 06/01/2025) | 175,000 | 186,679 | 0.2 | % | ||||||||
| Other Massachusetts#~ | 507,398 | 0.6 | % | |||||||||
| Total Massachusetts | ||||||||||||
| (Cost $1,727,574) | 1,736,775 | 2.0 | % | |||||||||
| Michigan | ||||||||||||
| Michigan State Housing Development Authority | ||||||||||||
| 3.500%, 06/01/2047 (Callable 06/01/2026) | 660,000 | 689,588 | 0.8 | % | ||||||||
| Other Michigan# | 1,987,582 | 2.3 | % | |||||||||
| Total Michigan | ||||||||||||
| (Cost $2,670,305) | 2,677,170 | 3.1 | % | |||||||||
| Minnesota | ||||||||||||
| City of Maple Grove MN | ||||||||||||
| 4.000%, 05/01/2022 | 500,000 | 544,995 | 0.6 | % | ||||||||
| Minnesota Housing Finance Agency | ||||||||||||
| 4.000%, 01/01/2047 (Callable 01/01/2026) | 485,000 | 519,813 | 0.6 | % | ||||||||
| Other Minnesota# | 725,200 | 0.9 | % | |||||||||
| Total Minnesota | ||||||||||||
| (Cost $1,776,703) | 1,790,008 | 2.1 | % | |||||||||
| Mississippi | ||||||||||||
| Total Mississippi | ||||||||||||
| (Cost $371,538)# | 373,760 | 0.4 | % | |||||||||
| Missouri | ||||||||||||
| City of St Louis MO Airport Revenue | ||||||||||||
| 5.000%, 07/01/2023 (Insured by AGM) | 400,000 | 473,076 | 0.5 | % | ||||||||
The accompanying notes are an integral part of these financial statements.
Page 46
Baird Short-Term Municipal Bond Fund
Summary Schedule of Investments, June 30, 2017 (Unaudited)
Long-Term Investments (cont.)
| Principal | % of | |||||||||||
| Amount | Value | Net Assets | ||||||||||
| County of Boone MO | ||||||||||||
| 5.750%, 08/01/2028 (Pre-refunded to 08/01/2018) | $ | 630,000 | $ | 661,191 | 0.8 | % | ||||||
| Kirkwood Industrial Development Authority | ||||||||||||
| 8.000%, 05/15/2021 (Pre-refunded 05/15/2020) | 535,000 | 606,155 | 0.7 | % | ||||||||
| Missouri Housing Development Commission | ||||||||||||
| 4.000%, 05/01/2042 (Callable 11/01/2026) | 750,000 | 817,035 | 0.9 | % | ||||||||
| Move Rolla Transportation Development District | ||||||||||||
| 3.750%, 06/01/2029 (Callable 06/01/2026) | 500,000 | 510,630 | 0.6 | % | ||||||||
| Other Missouri# | 1,029,411 | 1.2 | % | |||||||||
| Total Missouri | ||||||||||||
| (Cost $4,080,027) | 4,097,498 | 4.7 | % | |||||||||
| Nebraska | ||||||||||||
| Total Nebraska | ||||||||||||
| (Cost $391,538)# | 392,218 | 0.5 | % | |||||||||
| Nevada | ||||||||||||
| Total Nevada | ||||||||||||
| (Cost $504,671)# | 513,173 | 0.6 | % | |||||||||
| New Jersey | ||||||||||||
| Total New Jersey | ||||||||||||
| (Cost $2,436,064)# | 2,449,308 | 2.8 | % | |||||||||
| New Mexico | ||||||||||||
| Total New Mexico | ||||||||||||
| (Cost $215,685)# | 216,059 | 0.3 | % | |||||||||
| New York | ||||||||||||
| Metropolitan Transportation Authority | ||||||||||||
| 1.490%, 11/01/2031 (Callable 05/01/2019) | ||||||||||||
(Mandatory Tender Date 11/01/2019)(1) | 500,000 | 501,865 | 0.6 | % | ||||||||
| MTA Hudson Rail Yards Trust Obligations | ||||||||||||
| 5.000%, 11/15/2046 (Callable 11/15/2019) | 500,000 | 537,615 | 0.6 | % | ||||||||
| New York City Transitional Finance | ||||||||||||
| Authority Future Tax Secured Revenue | ||||||||||||
1.020%, 08/01/2022 (Callable 07/01/2017)(1) | 500,000 | 500,000 | 0.6 | % | ||||||||
1.000%, 11/01/2022 (Optional Put Date 06/30/2017)(1) | 500,000 | 500,000 | 0.6 | % | ||||||||
| 1.000%-5.000%, 11/01/2018-08/01/2031 | 250,000 | 252,614 | 0.2 | % | ||||||||
| State of New York Mortgage Agency | ||||||||||||
| 3.500%, 10/01/2043 (Callable 04/01/2023) | 400,000 | 416,124 | 0.5 | % | ||||||||
| Other New York# | 3,035,539 | 3.5 | % | |||||||||
| Total New York | ||||||||||||
| (Cost $5,730,964) | 5,743,757 | 6.6 | % | |||||||||
| North Carolina | ||||||||||||
| North Carolina Eastern Municipal Power Agency | ||||||||||||
| 5.000%, 01/01/2021 (ETM) | 650,000 | 733,135 | 0.8 | % | ||||||||
| 5.000%-6.000%, 01/01/2021-01/01/2022 | 290,000 | 334,845 | 0.4 | % | ||||||||
The accompanying notes are an integral part of these financial statements.
Page 47
Baird Short-Term Municipal Bond Fund
Summary Schedule of Investments, June 30, 2017 (Unaudited)
Long-Term Investments (cont.)
| Principal | % of | |||||||||||
| Amount | Value | Net Assets | ||||||||||
| State of North Carolina | ||||||||||||
| 5.000%, 05/01/2024 (Callable 05/01/2023) | $ | 1,000,000 | $ | 1,180,270 | 1.3 | % | ||||||
| Other North Carolina# | 487,434 | 0.6 | % | |||||||||
| Total North Carolina | ||||||||||||
| (Cost $2,667,461) | 2,735,684 | 3.1 | % | |||||||||
| North Dakota | ||||||||||||
| County of Ward ND | ||||||||||||
| 4.000%, 04/01/2024 (Callable 04/01/2023) | ||||||||||||
| (Insured by AGM) | 500,000 | 546,265 | 0.6 | % | ||||||||
| Jamestown Park District/ND | ||||||||||||
| 2.900%, 07/01/2035 (Callable 07/17/2017) | 585,000 | 561,354 | 0.7 | % | ||||||||
| Other North Dakota# | 484,574 | 0.5 | % | |||||||||
| Total North Dakota | ||||||||||||
| (Cost $1,581,493) | 1,592,193 | 1.8 | % | |||||||||
| Ohio | ||||||||||||
| Total Ohio | ||||||||||||
| (Cost $1,320,141)# | 1,322,172 | 1.5 | % | |||||||||
| Oklahoma | ||||||||||||
| Total Oklahoma | ||||||||||||
| (Cost $76,614)# | 76,715 | 0.1 | % | |||||||||
| Oregon | ||||||||||||
| Total Oregon | ||||||||||||
| (Cost $375,908)# | 376,378 | 0.4 | % | |||||||||
| Pennsylvania | ||||||||||||
| Greater Latrobe School Authority | ||||||||||||
| 2.250%, 04/15/2019 (Callable 07/31/2017) | 500,000 | 500,630 | 0.6 | % | ||||||||
| Montgomery County Industrial Development Authority/PA | ||||||||||||
| 1.020%, 11/15/2029 (Callable 07/01/2017) | ||||||||||||
(Optional Put Date 06/30/2017)(1) | 495,000 | 495,000 | 0.6 | % | ||||||||
| Other Pennsylvania# | 4,489,923 | 5.1 | % | |||||||||
| Total Pennsylvania | ||||||||||||
| (Cost $5,476,858) | 5,485,553 | 6.3 | % | |||||||||
| Puerto Rico | ||||||||||||
| Total Puerto Rico | ||||||||||||
| (Cost $95,483)# | 97,896 | 0.1 | % | |||||||||
| Rhode Island | ||||||||||||
| Rhode Island Health & Educational Building Corp. | ||||||||||||
| 5.000%, 05/15/2024 | 500,000 | 591,455 | 0.7 | % | ||||||||
| Other Rhode Island# | 273,843 | 0.3 | % | |||||||||
| Total Rhode Island | ||||||||||||
| (Cost $872,333) | 865,298 | 1.0 | % | |||||||||
The accompanying notes are an integral part of these financial statements.
Page 48
Baird Short-Term Municipal Bond Fund
Summary Schedule of Investments, June 30, 2017 (Unaudited)
Long-Term Investments (cont.)
| Principal | % of | |||||||||||
| Amount | Value | Net Assets | ||||||||||
| South Carolina | ||||||||||||
| Total South Carolina | ||||||||||||
| (Cost $1,113,049)# | $ | 1,105,149 | 1.3 | % | ||||||||
| Tennessee | ||||||||||||
| Metropolitan Government Nashville | ||||||||||||
| & Davidson County Revenue | ||||||||||||
| 1.550%, 11/15/2030 | ||||||||||||
| (Mandatory Tender Date 11/03/2020) | $ | 750,000 | 750,480 | 0.9 | % | |||||||
| Other Tennessee# | 548,949 | 0.6 | % | |||||||||
| Total Tennessee | ||||||||||||
| (Cost $1,296,307) | 1,299,429 | 1.5 | % | |||||||||
| Texas | ||||||||||||
| City of Fort Worth TX | ||||||||||||
| 5.000%, 03/01/2026 (Pre-refunded to 03/01/2019) | 500,000 | 532,015 | 0.6 | % | ||||||||
| Texas Transportation Commission State Highway Fund | ||||||||||||
| 4.000%, 04/01/2026 | ||||||||||||
| (Mandatory Tender Date 10/01/2021) | 430,000 | 471,912 | 0.5 | % | ||||||||
| Other Texas# | 7,192,643 | 8.3 | % | |||||||||
| Total Texas | ||||||||||||
| (Cost $8,178,895) | 8,196,570 | 9.4 | % | |||||||||
| Utah | ||||||||||||
| Total Utah | ||||||||||||
| (Cost $101,289)# | 101,260 | 0.1 | % | |||||||||
| Vermont | ||||||||||||
| Total Vermont | ||||||||||||
| (Cost $27,971)# | 27,218 | 0.0 | % | |||||||||
| Virgin Islands | ||||||||||||
| Total Virgin Islands | ||||||||||||
| (Cost $108,972)# | 107,018 | 0.1 | % | |||||||||
| Washington | ||||||||||||
| Total Washington | ||||||||||||
| (Cost $411,437)# | 411,644 | 0.5 | % | |||||||||
| Wisconsin | ||||||||||||
| Wisconsin Housing & Economic Development Authority | ||||||||||||
| 3.500%, 09/01/2046 (Callable 09/01/2025) | 495,000 | 519,022 | 0.6 | % | ||||||||
| Other Wisconsin# | 2,146,243 | 2.5 | % | |||||||||
| Total Wisconsin | ||||||||||||
| (Cost $2,669,858) | 2,665,265 | 3.1 | % | |||||||||
| Total Long-Term Investments | ||||||||||||
| (Cost $85,891,819) | 86,149,085 | 99.0 | % | |||||||||
The accompanying notes are an integral part of these financial statements.
Page 49
Baird Short-Term Municipal Bond Fund
Summary Schedule of Investments, June 30, 2017 (Unaudited)
Short-Term Investment
| % of | ||||||||||||
| Shares | Value | Net Assets | ||||||||||
| Money Market Mutual Fund | ||||||||||||
| Fidelity Institutional Money Market Fund – | ||||||||||||
| Government Portfolio, Institutional Class, 0.85%« | 698,984 | $ | 698,984 | 0.8 | % | |||||||
| Total Short-Term Investment | ||||||||||||
| (Cost $698,984) | 698,984 | 0.8 | % | |||||||||
| Total Investments | ||||||||||||
| (Cost $86,590,803) | 86,848,069 | 99.8 | % | |||||||||
| Other Assets in Excess of Liabilities | 156,708 | 0.2 | % | |||||||||
| TOTAL NET ASSETS | $ | 87,004,777 | 100.0 | % | ||||||||
Notes to Summary Schedule of Investments
AGM – Assured Guaranty Municipal
BAM – Build America Mutual Assurance Co.
ETM – Escrowed to Maturity
| (1) | Variable or floating rate security. Floating rate securities are securities whose yields vary with a designated index rate. These securities’ rates are as of June 30, 2017. | |
| # | Represents the aggregate value, by category, of securities that are not among the 50 largest holdings and, in total for any issuer, represent 1% or less of net assets. | |
| « | 7-Day Yield. | |
| ~ | Groupings contain, in aggregate, restricted securities totaling $99,986 or 0.11% of net assets. |
Summary of Fair Value Exposure at June 30, 2017 (Unaudited)
The Fund has adopted authoritative fair valuation accounting standards which establish a definition of fair value and set out a hierarchy for measuring fair value. These standards require additional disclosures about the various inputs and valuation techniques used to develop the measurements of fair value and a discussion on changes in valuation techniques and related inputs during the period. These standards define fair value as the price that would be received to sell an asset or paid to transfer a liability in an orderly transaction between market participants at the measurement date.
The fair value hierarchy is organized into three levels based upon the assumptions (referred to as “inputs”) used in pricing the asset or liability. These standards state that “observable inputs” reflect the assumptions market participants would use in pricing the asset or liability based on market data obtained from independent sources and “unobservable inputs” reflect an entity’s own assumptions about the assumptions market participants would use in pricing the asset or liability. These inputs are summarized into three broad levels and described below:
Level 1 – | Unadjusted quoted prices in active markets for identical unrestricted securities. |
Level 2 – | Other significant observable inputs (including quoted prices for similar securities, quoted prices in inactive markets, dealer indications, interest rates, yield curves, prepayment speeds, credit risk, default rates, inputs corroborated by observable market data, etc.). |
Level 3 – | Significant unobservable inputs (including the Fund’s own assumptions about the factors that market participants would use in valuing the security) based on the best information available. |
The accompanying notes are an integral part of these financial statements.
Page 50
Baird Short-Term Municipal Bond Fund
Summary Schedule of Investments, June 30, 2017 (Unaudited)
Summary of Fair Value Exposure at June 30, 2017 (Unaudited) (cont.)
The inputs or methodology used for valuing securities are not necessarily an indication of the risk associated with investing in those securities.
The following is a summary of the inputs used to value the Fund’s investments as of June 30, 2017:
| Level 1 | Level 2 | Level 3 | Total | |||||||||||||
| Long-Term Investments | ||||||||||||||||
| Municipal Bonds | $ | — | $ | 86,149,085 | $ | — | $ | 86,149,085 | ||||||||
| Total Long-Term Investments | — | 86,149,085 | — | 86,149,085 | ||||||||||||
| Short-Term Investment | ||||||||||||||||
| Money Market Mutual Fund | 698,984 | — | — | 698,984 | ||||||||||||
| Total Short-Term Investment | 698,984 | — | — | 698,984 | ||||||||||||
| Total Investments | $ | 698,984 | $ | 86,149,085 | $ | — | $ | 86,848,069 | ||||||||
Changes in valuation techniques may result in transfers into or out of assigned levels within the fair value hierarchy. There were no transfers between Level 1, Level 2 and Level 3 fair value measurements during the reporting period, as compared to their classification from the prior year’s annual report. See the Fund’s valuation policy in Note 2a to the financial statements.
The accompanying notes are an integral part of these financial statements.
Page 51
Baird Quality Intermediate Municipal Bond Fund
June 30, 2017 (Unaudited)
Portfolio Characteristics
Quality Distribution(1)(2)
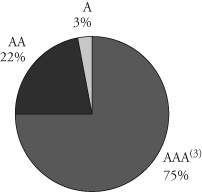 | Net Assets | $1,056,773,749 | |||
| SEC 30-Day | |||||
Yield(4) | |||||
| Institutional Class | 1.58% | ||||
| Investor Class | 1.33% | ||||
| Average | |||||
| Effective | |||||
| Duration | 4.34 years | ||||
| Average | |||||
| Effective | |||||
| Maturity | 4.74 years | ||||
Sector Weightings(1) | Annualized | ||||
| Expense | |||||
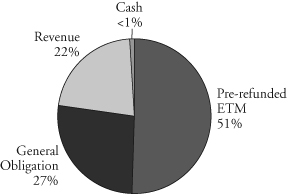 | Ratio(5) | ||||
| Institutional Class | 0.30% | ||||
| Investor Class | 0.55% | (6) | |||
| Portfolio | |||||
| Turnover Rate | 8.1% | † | |||
| Number of | |||||
| Holdings | 350 | ||||
(1) | Percentages shown are based on the Fund’s total investments. | |
(2) | The quality profile is calculated on a market value-weighted basis using the highest credit quality rating for each security held by the Fund given by S&P, Moody’s or Fitch, each of which is a Nationally Recognized Statistical Rating Organization (NRSRO). NRSROs rate the credit quality of securities using a scale that generally ranges from AAA (highest) to D (lowest). | |
(3) | Includes pre-refunded and escrowed-to-maturity (ETM) bonds. | |
(4) | SEC yields are based on SEC guidelines and are calculated for the 30 days ended June 30, 2017. | |
(5) | Reflects expense ratios as stated in the Fund’s current prospectus. | |
(6) | Includes 0.25% 12b-1 fee. | |
| † | Not annualized. |
Page 52
Baird Quality Intermediate Municipal Bond Fund
June 30, 2017 (Unaudited)
Total Returns
| Average Annual | |||||
| Six | One | Five | Ten | Since | |
| For the Periods Ended June 30, 2017 | Months | Year | Years | Years | Inception(1) |
| Institutional Class Shares | 2.81% | -0.20% | 1.88% | 3.88% | 4.14% |
| Investor Class Shares | 2.71% | -0.45% | 1.63% | 3.62% | 3.87% |
| Bloomberg Barclays Quality Intermediate | |||||
Municipal Bond Index(2) | 3.29% | 0.10% | 2.48% | 4.21% | 4.16% |
| (1) | For the period from March 30, 2001 (inception date) through June 30, 2017. |
| (2) | The Bloomberg Barclays Quality Intermediate Municipal Bond Index is an unmanaged, market value weighted index consisting of tax-exempt, fixed-rate securities that are rated A3 or better, with maturities between 2 and 12 years. Securities must have an outstanding par value of at least $7 million and be issued as part of a transaction of at least $75 million. The bonds must be fixed rate, have a dated-date after December 31, 1990. This Index does not reflect any deduction for fees, expenses or taxes. A direct investment in an index is not possible. |
The returns shown in the table above reflect reinvestment of dividends and/or capital gains distributions in additional shares. The returns do not reflect the deduction of taxes that a shareholder would pay on Fund distributions or the redemption of Fund shares. The returns reflect the actual performance for each period and do not include the impact of trades executed on the last business day of the period that were recorded on the first business day of the next period.
The Fund’s gross expense ratio for each Class, as reflected in the Fund’s current prospectus, is set forth under “Portfolio Characteristics”.
The Fund may invest up to 25% of its total assets in municipal obligations issued by persons in the same state. As a result, changes in economic, business or political conditions of a particular state may have a disproportionate impact on the Fund’s share price. Municipal securities investments are not appropriate for all investors, especially those taxed at lower rates.
Past performance does not guarantee future results. Investment return and principal value will fluctuate so that an investor’s shares, when redeemed, may be worth more or less than their original cost.
For information about the performance of the Fund as of the most recent month-end, please call 1-866-44BAIRD or visit www.bairdfunds.com. Mutual fund performance changes over time and current performance may be lower or higher than that stated.
Page 53
Baird Quality Intermediate Municipal Bond Fund
Summary Schedule of Investments, June 30, 2017 (Unaudited)
This schedule summarizes the Fund’s holdings by asset type. Details are reported for each of the Fund’s 50 largest individual holdings and for investments that, in total for any issuer, represent more than 1% of the Fund’s net assets. The total value of smaller holdings is reported as a single amount within each category.
The Fund reports a complete list of its holdings in regulatory filings four times in each fiscal year, at the quarter end. For the second and fourth fiscal quarters, the complete listing of the Fund’s holdings is available electronically in the Fund’s Form N-CSR at http://www.bairdfunds.com/prospectuses-reports and on the Securities and Exchange Commission’s website (www.sec.gov) or you can have it mailed to you without charge by calling 1-866-44BAIRD. For the first and third fiscal quarters, the Fund files the lists with the SEC on Form N-Q. Shareholders can look up the Fund’s Forms N-CSR and N-Q on the SEC’s website (www.sec.gov).
Long-Term Investments
| Principal | % of | |||||||||||
| Amount | Value | Net Assets | ||||||||||
| Municipal Bonds | ||||||||||||
| Alabama | ||||||||||||
| Total Alabama | ||||||||||||
| (Cost $1,027,143)# | $ | 1,070,800 | 0.1 | % | ||||||||
| Arizona | ||||||||||||
| Total Arizona | ||||||||||||
| (Cost $1,890,568)# | 1,895,755 | 0.2 | % | |||||||||
| Arkansas | ||||||||||||
| Total Arkansas | ||||||||||||
| (Cost $5,533,898)# | 5,576,958 | 0.5 | % | |||||||||
| California | ||||||||||||
| City of Bakersfield CA | ||||||||||||
| 0.000%, 04/15/2021 (ETM) | $ | 12,380,000 | 11,758,029 | 1.1 | % | |||||||
| San Joaquin Hills Transportation Corridor Agency | ||||||||||||
| 0.000%, 01/01/2020 (ETM) | 6,865,000 | 6,655,617 | 0.6 | % | ||||||||
| 0.000%, 01/01/2023 (ETM) | 14,000,000 | 12,827,920 | 1.2 | % | ||||||||
| 0.000%, 01/01/2027-01/01/2028 | 1,750,000 | 1,415,651 | 0.2 | % | ||||||||
| San Marcos Public Facilities Authority | ||||||||||||
| 0.000%, 09/01/2019 (ETM) | 17,495,000 | 16,984,671 | 1.6 | % | ||||||||
| Other California# | 10,533,579 | 1.0 | % | |||||||||
| Total California | ||||||||||||
| (Cost $56,885,866) | 60,175,467 | 5.7 | % | |||||||||
| Colorado | ||||||||||||
| Dawson Ridge Metropolitan District No. 1 | ||||||||||||
| 0.000%, 10/01/2022 (ETM) | 36,045,000 | 33,073,450 | 3.1 | % | ||||||||
| 0.000%, 10/01/2022 (ETM) | 22,540,000 | 20,681,803 | 2.0 | % | ||||||||
| Other Colorado# | 10,502,680 | 1.0 | % | |||||||||
| Total Colorado | ||||||||||||
| (Cost $61,535,693) | 64,257,933 | 6.1 | % | |||||||||
| Connecticut | ||||||||||||
| Total Connecticut | ||||||||||||
| (Cost $6,803,785)# | 6,879,260 | 0.7 | % | |||||||||
The accompanying notes are an integral part of these financial statements.
Page 54
Baird Quality Intermediate Municipal Bond Fund
Summary Schedule of Investments, June 30, 2017 (Unaudited)
Long-Term Investments (cont.)
| Principal | % of | |||||||||||
| Amount | Value | Net Assets | ||||||||||
| District of Columbia | ||||||||||||
| Total District of Columbia | ||||||||||||
| (Cost $1,117,346)# | $ | 1,140,341 | 0.1 | % | ||||||||
| Florida | ||||||||||||
| County of Miami-Dade FL | ||||||||||||
| 4.500%, 10/01/2020 | $ | 7,100,000 | 7,829,454 | 0.7 | % | |||||||
| School District of Broward County/FL | ||||||||||||
| 5.250%, 07/01/2022 (Callable 07/01/2021) | 8,390,000 | 9,581,967 | 0.9 | % | ||||||||
| 5.250%, 07/01/2023 (Callable 07/01/2021) | 4,915,000 | 5,600,987 | 0.5 | % | ||||||||
| State of Florida | ||||||||||||
| 5.000%, 06/01/2022 (Callable 06/01/2019) | 13,800,000 | 14,810,574 | 1.4 | % | ||||||||
| Other Florida# | 48,758,557 | 4.7 | % | |||||||||
| Total Florida | ||||||||||||
| (Cost $82,989,336) | 86,581,539 | 8.2 | % | |||||||||
| Georgia | ||||||||||||
| Athens-Clarke County Unified | ||||||||||||
| Government Development Authority | ||||||||||||
0.890%, 07/01/2035 (Callable 07/01/2017)(1) | 5,800,000 | 5,800,000 | 0.5 | % | ||||||||
| Forsyth County Hospital Authority | ||||||||||||
| 6.375%, 10/01/2028 (ETM) | 8,050,000 | 10,259,564 | 1.0 | % | ||||||||
| Other Georgia# | 9,711,484 | 0.9 | % | |||||||||
| Total Georgia | ||||||||||||
| (Cost $25,028,977) | 25,771,048 | 2.4 | % | |||||||||
| Illinois | ||||||||||||
| Illinois Finance Authority | ||||||||||||
| 0.000%, 07/15/2023 (ETM) | 25,510,000 | 22,681,706 | 2.1 | % | ||||||||
| 0.000%, 07/15/2025 (ETM) | 34,705,000 | 29,093,201 | 2.8 | % | ||||||||
| 5.000%, 12/01/2030 (Callable 12/01/2021) | 6,775,000 | 7,548,637 | 0.7 | % | ||||||||
| 6.250%-6.625%, 05/01/2022-11/01/2039 | 2,945,000 | 3,333,605 | 0.3 | % | ||||||||
| Kendall Kane & Will Counties | ||||||||||||
| Community Unit School District No. 308 | ||||||||||||
| 0.000%, 02/01/2021 (Insured by AGM) | 13,625,000 | 12,574,785 | 1.2 | % | ||||||||
| Village of Schaumburg IL | ||||||||||||
| 4.000%, 12/01/2024 (Callable 12/01/2022) | 5,750,000 | 6,348,460 | 0.6 | % | ||||||||
| Other Illinois# | 35,906,740 | 3.4 | % | |||||||||
| Total Illinois | ||||||||||||
| (Cost $114,011,600) | 117,487,134 | 11.1 | % | |||||||||
| Indiana | ||||||||||||
| Total Indiana | ||||||||||||
| (Cost $5,509,205)# | 5,696,850 | 0.5 | % | |||||||||
The accompanying notes are an integral part of these financial statements.
Page 55
Baird Quality Intermediate Municipal Bond Fund
Summary Schedule of Investments, June 30, 2017 (Unaudited)
Long-Term Investments (cont.)
| Principal | % of | |||||||||||
| Amount | Value | Net Assets | ||||||||||
| Iowa | ||||||||||||
| Iowa Higher Education Loan Authority | ||||||||||||
| 5.000%, 09/01/2043 (Pre-refunded to 09/01/2023) | $ | 5,050,000 | $ | 5,993,592 | 0.6 | % | ||||||
| Other Iowa# | 9,192,999 | 0.8 | % | |||||||||
| Total Iowa | ||||||||||||
| (Cost $15,201,928) | 15,186,591 | 1.4 | % | |||||||||
| Kansas | ||||||||||||
| Total Kansas | ||||||||||||
| (Cost $4,343,849)# | 4,425,807 | 0.4 | % | |||||||||
| Kentucky | ||||||||||||
| Total Kentucky | ||||||||||||
| (Cost $249,259)# | 250,075 | 0.0 | % | |||||||||
| Louisiana | ||||||||||||
| Louisiana Public Facilities Authority | ||||||||||||
| 5.500%, 05/15/2027 (Pre-refunded to 05/15/2026) | 11,625,000 | 14,677,957 | 1.4 | % | ||||||||
| 5.500%, 05/15/2032 (Pre-refunded to 05/15/2026) | 22,125,000 | 28,196,543 | 2.7 | % | ||||||||
| 6.750%, 07/01/2039 (Pre-refunded to 07/01/2019) | 6,655,000 | 7,354,108 | 0.7 | % | ||||||||
| State of Louisiana | ||||||||||||
| 5.000%, 11/15/2020 (Callable 05/15/2020) | 10,000,000 | 11,008,000 | 1.0 | % | ||||||||
| Other Louisiana# | 3,995,790 | 0.4 | % | |||||||||
| Total Louisiana | ||||||||||||
| (Cost $60,261,229) | 65,232,398 | 6.2 | % | |||||||||
| Maryland | ||||||||||||
| Total Maryland | ||||||||||||
| (Cost $2,500,741)# | 2,542,475 | 0.2 | % | |||||||||
| Massachusetts | ||||||||||||
| Commonwealth of Massachusetts | ||||||||||||
| 4.000%, 12/01/2022 (Callable 12/01/2019) | 15,000,000 | 16,010,100 | 1.5 | % | ||||||||
| Other Massachusetts# | 5,633,842 | 0.5 | % | |||||||||
| Total Massachusetts | ||||||||||||
| (Cost $21,268,008) | 21,643,942 | 2.0 | % | |||||||||
| Michigan | ||||||||||||
| Michigan Finance Authority | ||||||||||||
| 5.000%, 01/01/2019 | 7,000,000 | 7,408,800 | 0.7 | % | ||||||||
| Other Michigan# | 24,558,884 | 2.3 | % | |||||||||
| Total Michigan | ||||||||||||
| (Cost $31,435,291) | 31,967,684 | 3.0 | % | |||||||||
| Minnesota | ||||||||||||
| University of Minnesota | ||||||||||||
| 5.500%, 07/01/2021 (ETM) | 10,380,000 | 11,627,572 | 1.1 | % | ||||||||
| Other Minnesota# | 1,562,106 | 0.1 | % | |||||||||
| Total Minnesota | ||||||||||||
| (Cost $13,081,031) | 13,189,678 | 1.2 | % | |||||||||
The accompanying notes are an integral part of these financial statements.
Page 56
Baird Quality Intermediate Municipal Bond Fund
Summary Schedule of Investments, June 30, 2017 (Unaudited)
Long-Term Investments (cont.)
| Principal | % of | |||||||||||
| Amount | Value | Net Assets | ||||||||||
| Mississippi | ||||||||||||
| Total Mississippi | ||||||||||||
| (Cost $4,337,473)# | $ | 4,338,484 | 0.4 | % | ||||||||
| Missouri | ||||||||||||
| Total Missouri | ||||||||||||
| (Cost $2,458,557)# | 2,452,367 | 0.2 | % | |||||||||
| New Hampshire | ||||||||||||
| Total New Hampshire | ||||||||||||
| (Cost $2,686,041)# | 2,763,261 | 0.3 | % | |||||||||
| New Jersey | ||||||||||||
| Total New Jersey | ||||||||||||
| (Cost $16,546,184)# | 16,902,210 | 1.6 | % | |||||||||
| New Mexico | ||||||||||||
| Total New Mexico | ||||||||||||
| (Cost $3,992,297)# | 3,957,515 | 0.4 | % | |||||||||
| New York | ||||||||||||
| City of New York NY | ||||||||||||
| 5.000%, 08/01/2022 | $ | 5,000,000 | 5,848,450 | 0.6 | % | |||||||
| Metropolitan Transportation Authority | ||||||||||||
| 6.000%, 04/01/2020 (ETM) | 10,525,000 | 11,331,952 | 1.1 | % | ||||||||
| New York State Dormitory Authority | ||||||||||||
| 5.000%, 12/15/2023 (Callable 12/15/2022) | 11,685,000 | 13,807,580 | 1.3 | % | ||||||||
| 5.000%, 03/15/2030 (Callable 03/15/2024) | 6,665,000 | 7,892,960 | 0.7 | % | ||||||||
| New York State Urban Development Corp. | ||||||||||||
| 5.000%, 03/15/2032 (Callable 03/15/2024) | 6,000,000 | 6,966,960 | 0.7 | % | ||||||||
| Other New York# | 11,818,800 | 1.1 | % | |||||||||
| Total New York | ||||||||||||
| (Cost $56,190,471) | 57,666,702 | 5.5 | % | |||||||||
| North Carolina | ||||||||||||
| North Carolina Eastern Municipal Power Agency | ||||||||||||
| 5.000%, 01/01/2021 (ETM)(Callable 07/31/2017) | 10,355,000 | 11,448,177 | 1.1 | % | ||||||||
| 4.500%, 01/01/2024 (Pre-refunded to 01/01/2022) | 12,170,000 | 13,527,198 | 1.3 | % | ||||||||
| 6.400%, 01/01/2021 (ETM) | 3,352,000 | 3,676,608 | 0.3 | % | ||||||||
| Other North Carolina# | 1,784,839 | 0.2 | % | |||||||||
| Total North Carolina | ||||||||||||
| (Cost $29,977,280) | 30,436,822 | 2.9 | % | |||||||||
| North Dakota | ||||||||||||
| Total North Dakota | ||||||||||||
| (Cost $6,240,057)# | 6,140,091 | 0.6 | % | |||||||||
The accompanying notes are an integral part of these financial statements.
Page 57
Baird Quality Intermediate Municipal Bond Fund
Summary Schedule of Investments, June 30, 2017 (Unaudited)
Long-Term Investments (cont.)
| Principal | % of | |||||||||||
| Amount | Value | Net Assets | ||||||||||
| Ohio | ||||||||||||
| Ohio Housing Finance Agency | ||||||||||||
| 4.000%, 03/01/2047 (Callable 09/01/2025) | $ | 7,035,000 | $ | 7,502,265 | 0.7 | % | ||||||
| State of Ohio | ||||||||||||
| 5.000%, 06/15/2021 | 6,740,000 | 7,695,125 | 0.7 | % | ||||||||
| Other Ohio# | 7,853,401 | 0.8 | % | |||||||||
| Total Ohio | ||||||||||||
| (Cost $22,614,747) | 23,050,791 | 2.2 | % | |||||||||
| Oregon | ||||||||||||
| Total Oregon | ||||||||||||
| (Cost $6,853,465)# | 6,808,888 | 0.6 | % | |||||||||
| Pennsylvania | ||||||||||||
| Total Pennsylvania | ||||||||||||
| (Cost $17,638,140)# | 17,724,031 | 1.7 | % | |||||||||
| Puerto Rico | ||||||||||||
| Puerto Rico Public Finance Corp. | ||||||||||||
| 5.500%, 08/01/2027 (ETM)(Insured by AMBAC) | 6,500,000 | 8,082,165 | 0.8 | % | ||||||||
| 6.000%-6.000%, 08/01/2026-08/01/2026 | 4,115,000 | 5,242,675 | 0.5 | % | ||||||||
| Other Puerto Rico# | 3,218,222 | 0.3 | % | |||||||||
| Total Puerto Rico | ||||||||||||
| (Cost $16,639,062) | 16,543,062 | 1.6 | % | |||||||||
| Rhode Island | ||||||||||||
| State of Rhode Island | ||||||||||||
| 5.000%, 08/01/2024 | 5,000,000 | 6,053,900 | 0.6 | % | ||||||||
| Total Rhode Island | ||||||||||||
| (Cost $5,793,092) | 6,053,900 | 0.6 | % | |||||||||
| South Carolina | ||||||||||||
| Piedmont Municipal Power Agency | ||||||||||||
| 6.750%, 01/01/2020 (ETM) | 6,450,000 | 7,307,205 | 0.7 | % | ||||||||
| Other South Carolina# | 5,456,407 | 0.5 | % | |||||||||
| Total South Carolina | ||||||||||||
| (Cost $12,249,033) | 12,763,612 | 1.2 | % | |||||||||
| South Dakota | ||||||||||||
| Total South Dakota | ||||||||||||
| (Cost $795,612)# | 793,793 | 0.1 | % | |||||||||
| Tennessee | ||||||||||||
| Total Tennessee | ||||||||||||
| (Cost $4,877,447)# | 4,995,853 | 0.5 | % | |||||||||
The accompanying notes are an integral part of these financial statements.
Page 58
Baird Quality Intermediate Municipal Bond Fund
Summary Schedule of Investments, June 30, 2017 (Unaudited)
Long-Term Investments (cont.)
| Principal | % of | |||||||||||
| Amount | Value | Net Assets | ||||||||||
| Texas | ||||||||||||
| City of Houston TX Combined Utility System Revenue | ||||||||||||
| 0.000%, 12/01/2019 (ETM)(Insured by AGM) | $ | 13,355,000 | $ | 12,930,177 | 1.2 | % | ||||||
| 5.500%, 12/01/2029 (ETM) | 16,050,000 | 20,915,237 | 2.0 | % | ||||||||
| 5.500%, 12/01/2024 (ETM) | 1,735,000 | 2,129,747 | 0.2 | % | ||||||||
| City of San Antonio TX Electric & Gas Systems Revenue | ||||||||||||
| 5.650%, 02/01/2019 (ETM) | 7,865,000 | 8,268,160 | 0.8 | % | ||||||||
| County of Harris TX | ||||||||||||
| 5.750%, 10/01/2028 (Pre-refunded to 10/01/2018) | 6,930,000 | 7,336,791 | 0.7 | % | ||||||||
| 5.000%-5.750%, 10/01/2020-08/15/2027 | 7,810,000 | 9,306,200 | 0.9 | % | ||||||||
| Harris County Health Facilities Development Corp. | ||||||||||||
| 5.750%, 07/01/2027 (ETM) | 5,000,000 | 6,209,850 | 0.6 | % | ||||||||
| Lamar Consolidated Independent School District | ||||||||||||
| 5.000%, 02/15/2026 (Callable 02/15/2025) | ||||||||||||
| (PSF Guaranteed) | 5,860,000 | 7,094,936 | 0.7 | % | ||||||||
| North East Independent School District/TX | ||||||||||||
| 5.000%, 08/01/2021 (PSF Guaranteed) | 6,095,000 | 6,957,381 | 0.7 | % | ||||||||
| 5.000%, 08/01/2023 (PSF Guaranteed) | 5,330,000 | 6,353,733 | 0.6 | % | ||||||||
| 5.000%, 02/01/2024 (PSF Guaranteed) | 2,930,000 | 3,528,570 | 0.3 | % | ||||||||
| Tarrant County Health Facilities Development Corp. | ||||||||||||
| 6.000%, 09/01/2024 (ETM) | 6,745,000 | 7,819,816 | 0.7 | % | ||||||||
| The University of Texas System | ||||||||||||
| 5.000%, 08/15/2022 | 8,595,000 | 10,096,632 | 1.0 | % | ||||||||
| Tomball Independent School District | ||||||||||||
| 5.000%, 02/15/2025 (PSF Guaranteed) | 5,440,000 | 6,650,835 | 0.6 | % | ||||||||
| Other Texas# | 113,483,453 | 10.7 | % | |||||||||
| Total Texas | ||||||||||||
| (Cost $221,805,234) | 229,081,518 | 21.7 | % | |||||||||
| Utah | ||||||||||||
| Total Utah | ||||||||||||
| (Cost $9,331,668)# | 9,765,000 | 0.9 | % | |||||||||
| Virginia | ||||||||||||
| Total Virginia | ||||||||||||
| (Cost $4,581,863)# | 4,563,944 | 0.4 | % | |||||||||
| Washington | ||||||||||||
| State of Washington | ||||||||||||
| 5.500%, 07/01/2023 | 5,040,000 | 5,958,188 | 0.6 | % | ||||||||
| 5.000%, 07/01/2032 (Callable 01/01/2025) | 6,000,000 | 6,996,000 | 0.6 | % | ||||||||
| 5.000%-5.000%, 08/01/2034-08/01/2038 | 3,730,000 | 4,330,766 | 0.4 | % | ||||||||
The accompanying notes are an integral part of these financial statements.
Page 59
Baird Quality Intermediate Municipal Bond Fund
Summary Schedule of Investments, June 30, 2017 (Unaudited)
Long-Term Investments (cont.)
| Principal | % of | |||||||||||
| Amount | Value | Net Assets | ||||||||||
| Washington Health Care Facilities Authority | ||||||||||||
| 6.250%, 08/01/2036 (Pre-refunded to 08/01/2018) | $ | 8,100,000 | $ | 8,552,952 | 0.8 | % | ||||||
| 6.125%-6.250%, 11/15/2031-11/15/2041 | 5,380,000 | 6,391,693 | 0.6 | % | ||||||||
| Other Washington# | 11,003,655 | 1.1 | % | |||||||||
| Total Washington | ||||||||||||
| (Cost $42,268,093) | 43,233,254 | 4.1 | % | |||||||||
| Wisconsin | ||||||||||||
| Total Wisconsin | ||||||||||||
| (Cost $13,737,467)# | 13,611,791 | 1.3 | % | |||||||||
| Total Long-Term Investments | ||||||||||||
| (Cost $1,012,288,035) | 1,044,618,623 | 98.8 | % | |||||||||
| Short-Term Investment | ||||||||||||
| Shares | ||||||||||||
| Money Market Mutual Fund | ||||||||||||
| Fidelity Institutional Money Market Fund – | ||||||||||||
| Government Portfolio, Institutional Class, 0.85%« | 739,371 | 739,371 | 0.1 | % | ||||||||
| Total Short-Term Investments | ||||||||||||
| (Cost $739,371) | 739,371 | |||||||||||
| Total Investments | ||||||||||||
| (Cost $1,013,027,406) | 1,045,357,994 | 98.9 | % | |||||||||
| Other Assets in Excess of Liabilities | 11,415,755 | 1.1 | % | |||||||||
| TOTAL NET ASSETS | $ | 1,056,773,749 | 100.0 | % | ||||||||
Notes to Summary Schedule of Investments
AGM – Assured Guaranty Municipal
AMBAC – Ambac Assurance Corporation
ETM – Escrowed to Maturity
PSF – Texas Permanent School Fund
| # | Represents the aggregate value, by category, of securities that are not among the 50 largest holdings and, in total for any issuer, represent 1% or less of net assets. | |
| (1) | Variable or floating rate security. Floating rate securities are securities whose yields vary with a designated index rate. These securities rates are as of June 30, 2017. | |
| « | 7-Day Yield. |
Summary of Fair Value Exposure at June 30, 2017 (Unaudited)
The Fund has adopted authoritative fair valuation accounting standards which establish a definition of fair value and set out a hierarchy for measuring fair value. These standards require additional disclosures about the various inputs and valuation techniques used to develop the measurements of fair value and a discussion on changes in valuation techniques and related inputs during the period. These standards define fair value as the price that would be received to sell an asset or paid to transfer a liability in an orderly transaction between market participants at the measurement date.
The accompanying notes are an integral part of these financial statements.
Page 60
Baird Quality Intermediate Municipal Bond Fund
Summary Schedule of Investments, June 30, 2017 (Unaudited)
Summary of Fair Value Exposure at June 30, 2017 (Unaudited) (cont.)
The fair value hierarchy is organized into three levels based upon the assumptions (referred to as “inputs”) used in pricing the asset or liability. These standards state that “observable inputs” reflect the assumptions market participants would use in pricing the asset or liability based on market data obtained from independent sources and “unobservable inputs” reflect an entity’s own assumptions about the assumptions market participants would use in pricing the asset or liability. These inputs are summarized into three broad levels and described below:
Level 1 – | Unadjusted quoted prices in active markets for identical unrestricted securities. |
Level 2 – | Other significant observable inputs (including quoted prices for similar securities, quoted prices in inactive markets, dealer indications, interest rates, yield curves, prepayment speeds, credit risk, default rates, inputs corroborated by observable market data, etc.). |
Level 3 – | Significant unobservable inputs (including the Fund’s own assumptions about the factors that market participants would use in valuing the security) based on the best information available. |
The inputs or methodology used for valuing securities are not necessarily an indication of the risk associated with investing in those securities.
The following is a summary of the inputs used to value the Fund’s investments as of June 30, 2017:
| Level 1 | Level 2 | Level 3 | Total | |||||||||||||
| Long-Term Investments | ||||||||||||||||
| Municipal Bonds | $ | — | $ | 1,044,618,623 | $ | — | $ | 1,044,618,623 | ||||||||
| Total Long-Term Investments | — | 1,044,618,623 | — | 1,044,618,623 | ||||||||||||
| Short-Term Investment | ||||||||||||||||
| Money Market Mutual Fund | 739,371 | — | — | 739,371 | ||||||||||||
| Total Short-Term Investment | 739,371 | — | — | 739,371 | ||||||||||||
| Total Investments | $ | 739,371 | $ | 1,044,618,623 | $ | — | $ | 1,045,357,994 | ||||||||
Changes in valuation techniques may result in transfers into or out of assigned levels within the fair value hierarchy. There were no transfers between Level 1, Level 2 and Level 3 fair value measurements during the reporting period, as compared to their classification from the prior year’s annual report. See the Fund’s valuation policy in Note 2a to the financial statements.
The accompanying notes are an integral part of these financial statements.
Page 61
Baird Core Intermediate Municipal Bond Fund
June 30, 2017 (Unaudited)
Portfolio Characteristics
Quality Distribution(1)(2)
 | Net Assets | $136,800,178 | |||
| SEC 30-Day | |||||
Yield(4) | |||||
| Institutional Class | 2.05% | ||||
| Investor Class | 1.81% | ||||
| Average | |||||
| Effective | |||||
| Duration | 4.89 years | ||||
| Average | |||||
| Effective | |||||
| Maturity | 5.08 years | ||||
| Annualized | |||||
| Expense | |||||
Ratio(5) | |||||
Sector Weightings(1) | Institutional Class | 0.30% | |||
| Investor Class | 0.55% | (6) | |||
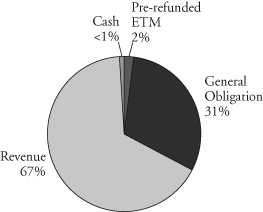 | |||||
| Portfolio | |||||
| Turnover Rate | 44.7% | † | |||
| Number of | |||||
| Holdings | 436 | ||||
(1) | Percentages shown are based on the Fund’s total investments. | |
(2) | The quality profile is calculated on a market value-weighted basis using the highest credit quality rating for each security held by the Fund given by S&P, Moody’s or Fitch, each of which is a Nationally Recognized Statistical Rating Organization (NRSRO). NRSROs rate the credit quality of securities using a scale that generally ranges from AAA (highest) to D (lowest). | |
(3) | Includes pre-refunded and escrowed-to-maturity (ETM) bonds. | |
(4) | SEC yields are based on SEC guidelines and are calculated for the 30 days ended June 30, 2017. | |
(5) | Reflects expense ratios as stated in the Fund’s current prospectus. | |
(6) | Includes 0.25% 12b-1 fee. | |
| † | Not annualized. |
Page 62
Baird Core Intermediate Municipal Bond Fund
June 30, 2017 (Unaudited)
Total Returns
| Average | |||
| Annual | |||
| Six | One | Since | |
| For the Periods Ended June 30, 2017 | Months | Year | Inception(1) |
| Institutional Class Shares | 3.28% | 0.40% | 3.51% |
| Investor Class Shares | 3.16% | 0.16% | 3.27% |
Bloomberg Barclays Municipal Bond (1-15 Year) Index(2) | 3.21% | -0.15% | 2.76% |
| (1) | For the period from August 31, 2015 (inception date) through June 30, 2017. |
| (2) | The Bloomberg Barclays Municipal Bond (1-15 Year) Index is an unmanaged, market value weighted index of investment-grade, tax-exempt, and fixed-rate securities with maturities between 1 and 17 years. Securities must have an outstanding par value of at least $7 million and be issued as part of a transaction of at least $75 million. The bonds must be fixed rate, have a dated-date after December 31, 1990, and must be at least one year from their maturity date. This Index does not reflect any deduction for fees, expenses or taxes. A direct investment in an index is not possible. |
The returns shown in the table above reflect reinvestment of dividends and/or capital gains distributions in additional shares. The returns do not reflect the deduction of taxes that a shareholder would pay on Fund distributions or the redemption of Fund shares. The returns reflect the actual performance for each period and do not include the impact of trades executed on the last business day of the period that were recorded on the first business day of the next period.
The Fund’s gross expense ratio for each Class, as reflected in the Fund’s current prospectus, is set forth under “Portfolio Characteristics”.
The Fund may invest up to 10% of its net assets in non-investment grade debt securities (commonly referred to as “high yield” bonds). While these types of debt securities typically offer higher yields than investment grade securities, they also include greater risks including increased credit risk and the increased risk of default or bankruptcy. The Fund may invest up to 25% of its total assets in municipal obligations issued by persons in the same state. As a result, changes in economic, business or political conditions of a particular state may have a disproportionate impact on the Fund’s share price. Municipal securities investments are not appropriate for all investors, especially those taxed at lower rates.
Past performance does not guarantee future results. Investment return and principal value will fluctuate so that an investor’s shares, when redeemed, may be worth more or less than their original cost.
For information about the performance of the Fund as of the most recent month-end, please call 1-866-44BAIRD or visit www.bairdfunds.com. Mutual fund performance changes over time and current performance may be lower or higher than that stated.
Page 63
Baird Core Intermediate Municipal Bond Fund
Summary Schedule of Investments, June 30, 2017 (Unaudited)
This schedule summarizes the Fund’s holdings by asset type. Details are reported for each of the Fund’s 50 largest individual holdings and for investments that, in total for any issuer, represent more than 1% of the Fund’s net assets. The total value of smaller holdings is reported as a single amount within each category.
The Fund reports a complete list of its holdings in regulatory filings four times in each fiscal year, at the quarter end. For the second and fourth fiscal quarters, the complete listing of the Fund’s holdings is available electronically in the Fund’s Form N-CSR at http://www.bairdassetmanagement.com/baird-funds/funds-and-performance#Literature and on the Securities and Exchange Commission’s website (www.sec.gov) or you can have it mailed to you without charge by calling 1-866-44BAIRD. For the first and third fiscal quarters, the Fund files the lists with the SEC on Form N-Q. Shareholders can look up the Fund’s Forms N-CSR and N-Q on the SEC’s website (www.sec.gov).
Long-Term Investments
| Principal | % of | |||||||||||
| Amount | Value | Net Assets | ||||||||||
| Municipal Bonds | ||||||||||||
| Alabama | ||||||||||||
| Black Belt Energy Gas District | ||||||||||||
| 4.000%, 08/01/2047 (Callable 04/01/2022) | ||||||||||||
| (Mandatory Tender Date 07/01/2022) | $ | 1,000,000 | $ | 1,089,920 | 0.8 | % | ||||||
| Special Care Facilities Financing | ||||||||||||
| Authority of the City of Pell City AL | ||||||||||||
| 5.000%, 12/01/2031 (Callable 12/01/2021) | 1,000,000 | 1,098,340 | 0.8 | % | ||||||||
| Other Alabama# | 1,338,865 | 1.0 | % | |||||||||
| Total Alabama | ||||||||||||
| (Cost $3,487,424) | 3,527,125 | 2.6 | % | |||||||||
| Alaska | ||||||||||||
| Total Alaska | ||||||||||||
| (Cost $1,347,555)# | 1,366,939 | 1.0 | % | |||||||||
| Arizona | ||||||||||||
| City of Tucson AZ Water System Revenue | ||||||||||||
| 5.000%, 07/01/2032 (Callable 07/01/2025) | 500,000 | 587,215 | 0.4 | % | ||||||||
| Other Arizona# | 3,021,129 | 2.2 | % | |||||||||
| Total Arizona | ||||||||||||
| (Cost $3,564,299) | 3,608,344 | 2.6 | % | |||||||||
| Arkansas | ||||||||||||
| City of Fayetteville AR | ||||||||||||
3.050%, 01/01/2047 (Callable 01/01/2027)(3) | 1,050,000 | 1,035,898 | 0.8 | % | ||||||||
| City of Pine Bluff AR | ||||||||||||
| 3.000%, 02/01/2047 (Callable 08/01/2027) | ||||||||||||
| (Insured by BAM) | 1,000,000 | 1,015,670 | 0.7 | % | ||||||||
| Little Rock Metrocentere Improvement District No 1 | ||||||||||||
0.960%, 12/01/2025 (Callable 06/30/2017)(1) | 600,000 | 600,000 | 0.4 | % | ||||||||
| Other Arkansas# | 1,405,067 | 1.1 | % | |||||||||
| Total Arkansas | ||||||||||||
| (Cost $4,041,500) | 4,056,635 | 3.0 | % | |||||||||
The accompanying notes are an integral part of these financial statements.
Page 64
Baird Core Intermediate Municipal Bond Fund
Summary Schedule of Investments, June 30, 2017 (Unaudited)
Long-Term Investments (cont.)
| Principal | % of | |||||||||||
| Amount | Value | Net Assets | ||||||||||
| California | ||||||||||||
| California Statewide Communities Development Authority | ||||||||||||
3.143%, 04/01/2028(1)(2) | $ | 700,000 | $ | 633,449 | 0.5 | % | ||||||
| Corona-Norca Unified School District | ||||||||||||
| 0.000%, 08/01/2039 (Callable 08/01/2027) | ||||||||||||
| (Insured by AGM) | 890,000 | 1,199,106 | 0.9 | % | ||||||||
| Redondo Beach Unified School District | ||||||||||||
| 6.375%, 08/01/2034 (Callable 08/01/2026) | 590,000 | 780,110 | 0.6 | % | ||||||||
| San Diego Unified School District/CA | ||||||||||||
| 5.000%, 07/01/2030 (Callable 07/01/2026) | 570,000 | 686,086 | 0.5 | % | ||||||||
| Other California# | 10,340,226 | 7.5 | % | |||||||||
| Total California | ||||||||||||
| (Cost $13,383,953) | 13,638,977 | 10.0 | % | |||||||||
| Colorado | ||||||||||||
| City of Commerce City CO | ||||||||||||
| 5.000%, 12/15/2030 (Callable 12/15/2027) | ||||||||||||
| (Insured by AGM) | 500,000 | 591,035 | 0.4 | % | ||||||||
| Colorado Educational & Cultural Facilities Authority | ||||||||||||
| 5.000%, 10/01/2025 | 750,000 | 887,535 | 0.6 | % | ||||||||
| 5.000%, 08/15/2030 (Callable 08/15/2024) | 500,000 | 546,490 | 0.4 | % | ||||||||
| Vista Ridge Metropolitan District | ||||||||||||
| 5.000%, 12/01/2025 (Insured by BAM) | 600,000 | 715,542 | 0.5 | % | ||||||||
| Other Colorado# | 2,635,720 | 2.0 | % | |||||||||
| Total Colorado | ||||||||||||
| (Cost $5,206,728) | 5,376,322 | 3.9 | % | |||||||||
| Connecticut | ||||||||||||
| Total Connecticut | ||||||||||||
| (Cost $615,698)# | 609,508 | 0.4 | % | |||||||||
| District of Columbia | ||||||||||||
| Total District of Columbia | ||||||||||||
| (Cost $1,585,390)# | 1,577,806 | 1.2 | % | |||||||||
| Florida | ||||||||||||
| Total Florida | ||||||||||||
| (Cost $3,347,621)# | 3,394,677 | 2.5 | % | |||||||||
| Georgia | ||||||||||||
| City of Atlanta GA | ||||||||||||
| 5.000%, 01/01/2028 (Callable 01/01/2020) | 1,000,000 | 1,068,880 | 0.8 | % | ||||||||
| Gainesville & Hall County Hospital Authority | ||||||||||||
| 5.000%, 02/15/2029 (Callable 02/15/2027) | 500,000 | 586,115 | 0.4 | % | ||||||||
| Other Georgia# | 1,351,179 | 1.0 | % | |||||||||
| Total Georgia | ||||||||||||
| (Cost $2,974,423) | 3,006,174 | 2.2 | % | |||||||||
The accompanying notes are an integral part of these financial statements.
Page 65
Baird Core Intermediate Municipal Bond Fund
Summary Schedule of Investments, June 30, 2017 (Unaudited)
Long-Term Investments (cont.)
| Principal | % of | |||||||||||
| Amount | Value | Net Assets | ||||||||||
| Illinois | ||||||||||||
| Cook County School District No 170 Chicago Heights | ||||||||||||
| 5.000%, 12/01/2026 (Callable 07/27/2017) | $ | 1,250,000 | $ | 1,252,050 | 0.9 | % | ||||||
| Ford Etc Counties Community Unit | ||||||||||||
| School District No. 10 | ||||||||||||
| 5.000%, 12/01/2027 (Callable 12/01/2026) | ||||||||||||
| (Insured by AGM) | 550,000 | 643,456 | 0.5 | % | ||||||||
| Illinois Finance Authority | ||||||||||||
| 2.085%-6.625%, 11/15/2017-11/01/2039 | 2,450,000 | 2,672,746 | 2.0 | % | ||||||||
| Illinois Housing Development Authority | ||||||||||||
| 2.450%, 06/01/2043 (Callable 01/01/2023) | 868,019 | 843,202 | 0.6 | % | ||||||||
| State of Illinois | ||||||||||||
| 5.000%, 08/01/2024 (Callable 08/01/2022) | 665,000 | 683,540 | 0.5 | % | ||||||||
| 5.000%-5.500%, 01/01/2022-07/01/2033 | 925,000 | 947,592 | 0.7 | % | ||||||||
| Village of Rosemont IL | ||||||||||||
| 5.375%, 12/01/2031 (Callable 12/01/2020) | 685,000 | 739,074 | 0.5 | % | ||||||||
| Other Illinois# | 9,447,612 | 6.9 | % | |||||||||
| Total Illinois | ||||||||||||
| (Cost $17,145,841) | 17,229,272 | 12.6 | % | |||||||||
| Indiana | ||||||||||||
| Total Indiana | ||||||||||||
| (Cost $1,636,249)# | 1,668,947 | 1.2 | % | |||||||||
| Iowa | ||||||||||||
| Iowa Higher Education Loan Authority | ||||||||||||
| 2.000%, 12/01/2018 (Callable 06/01/2018) | 1,000,000 | 1,005,090 | 0.7 | % | ||||||||
| Other Iowa# | 1,554,274 | 1.2 | % | |||||||||
| Total Iowa | ||||||||||||
| (Cost $2,531,854) | 2,559,364 | 1.9 | % | |||||||||
| Kansas | ||||||||||||
| Total Kansas | ||||||||||||
| (Cost $1,053,939)# | 1,081,808 | 0.8 | % | |||||||||
| Kentucky | ||||||||||||
| Total Kentucky | ||||||||||||
| (Cost $436,007)# | 434,032 | 0.3 | % | |||||||||
| Louisiana | ||||||||||||
| Total Louisiana | ||||||||||||
| (Cost $50,000)# | 50,000 | 0.0 | % | |||||||||
| Maine | ||||||||||||
| Maine State Housing Authority | ||||||||||||
| 4.000%, 11/15/2045 (Callable 11/15/2025) | 625,000 | 664,969 | 0.5 | % | ||||||||
| Other Maine# | 302,783 | 0.2 | % | |||||||||
| Total Maine | ||||||||||||
| (Cost $977,967) | 967,752 | 0.7 | % | |||||||||
The accompanying notes are an integral part of these financial statements.
Page 66
Baird Core Intermediate Municipal Bond Fund
Summary Schedule of Investments, June 30, 2017 (Unaudited)
Long-Term Investments (cont.)
| Principal | % of | |||||||||||
| Amount | Value | Net Assets | ||||||||||
| Massachusetts | ||||||||||||
| Town of Ashburnham MA | ||||||||||||
| 4.250%, 07/01/2021 (Callable 07/01/2018) | $ | 700,000 | $ | 720,727 | 0.5 | % | ||||||
| Other Massachusetts#~ | 489,980 | 0.4 | % | |||||||||
| Total Massachusetts | ||||||||||||
| (Cost $1,207,270) | 1,210,707 | 0.9 | % | |||||||||
| Michigan | ||||||||||||
| Lake Orion Community School District | ||||||||||||
| 5.000%, 05/01/2025 (Insured By Q-SBLF) | 1,635,000 | 1,971,303 | 1.4 | % | ||||||||
| Other Michigan# | 1,728,687 | 1.3 | % | |||||||||
| Total Michigan | ||||||||||||
| (Cost $3,577,989) | 3,699,990 | 2.7 | % | |||||||||
| Minnesota | ||||||||||||
| Minnesota Housing Finance Agency | ||||||||||||
| 4.000%, 01/01/2047 (Callable 01/01/2026) | 1,105,000 | 1,184,317 | 0.9 | % | ||||||||
| Other Minnesota# | 1,098,444 | 0.8 | % | |||||||||
| Total Minnesota | ||||||||||||
| (Cost $2,255,178) | 2,282,761 | 1.7 | % | |||||||||
| Mississippi | ||||||||||||
| Mississippi Development Bank | ||||||||||||
| 5.500%, 10/01/2019 | 550,000 | 587,879 | 0.4 | % | ||||||||
| Other Mississippi# | 761,026 | 0.6 | % | |||||||||
| Total Mississippi | ||||||||||||
| (Cost $1,341,465) | 1,348,905 | 1.0 | % | |||||||||
| Missouri | ||||||||||||
| Missouri Housing Development Commission | ||||||||||||
| 4.000%, 05/01/2042 (Callable 11/01/2026) | 1,250,000 | 1,361,725 | 1.0 | % | ||||||||
| 3.700%, 11/01/2035 (Callable 05/01/2025) | 225,000 | 227,585 | 0.2 | % | ||||||||
| Other Missouri# | 1,493,824 | 1.1 | % | |||||||||
| Total Missouri | ||||||||||||
| (Cost $3,066,283) | 3,083,134 | 2.3 | % | |||||||||
| Montana | ||||||||||||
| City of Billings MT Sewer System Revenue | ||||||||||||
| 5.000%, 07/01/2029 (Callable 07/01/2027) | 550,000 | 671,935 | 0.5 | % | ||||||||
| Other Montana# | 856,798 | 0.6 | % | |||||||||
| Total Montana | ||||||||||||
| (Cost $1,505,102) | 1,528,733 | 1.1 | % | |||||||||
| Nebraska | ||||||||||||
| Total Nebraska | ||||||||||||
| (Cost $2,264,777)# | 2,272,564 | 1.7 | % | |||||||||
The accompanying notes are an integral part of these financial statements.
Page 67
Baird Core Intermediate Municipal Bond Fund
Summary Schedule of Investments, June 30, 2017 (Unaudited)
Long-Term Investments (cont.)
| Principal | % of | |||||||||||
| Amount | Value | Net Assets | ||||||||||
| Nevada | ||||||||||||
| Nevada Housing Division | ||||||||||||
| 4.400%, 04/01/2029 (Callable 10/01/2021) | $ | 860,000 | $ | 892,861 | 0.7 | % | ||||||
| Other Nevada# | 675,125 | 0.4 | % | |||||||||
| Total Nevada | ||||||||||||
| (Cost $1,584,635) | 1,567,986 | 1.1 | % | |||||||||
| New Jersey | ||||||||||||
| New Jersey Turnpike Authority | ||||||||||||
| 5.000%, 01/01/2026 (Callable 01/01/2023) | 500,000 | 578,695 | 0.4 | % | ||||||||
| Other New Jersey# | 2,396,943 | 1.8 | % | |||||||||
| Total New Jersey | ||||||||||||
| (Cost $2,929,027) | 2,975,638 | 2.2 | % | |||||||||
| New Mexico | ||||||||||||
| Total New Mexico | ||||||||||||
| (Cost $188,385)# | 189,517 | 0.1 | % | |||||||||
| New York | ||||||||||||
| Brooklyn Arena Local Development Corp. | ||||||||||||
| 4.000%, 07/15/2029 (Callable 01/15/2027) | ||||||||||||
| (Insured by AGM) | 610,000 | 660,734 | 0.5 | % | ||||||||
| JPMorgan Chase Putters/Drivers Trust | ||||||||||||
1.000%, 11/01/2019 (Callable 05/01/2019)(1) | 1,500,000 | 1,500,000 | 1.1 | % | ||||||||
| New York City Water & Sewer System | ||||||||||||
| 1.070%, 06/15/2032 (Callable 07/17/2017) | ||||||||||||
(Optional Put Date 07/31/2017)(1) | 875,000 | 875,000 | 0.6 | % | ||||||||
| New York State Energy Research | ||||||||||||
| & Development Authority | ||||||||||||
1.523%, 12/01/2020(1)(2) | 750,000 | 741,002 | 0.5 | % | ||||||||
| Other New York# | 3,689,604 | 2.8 | % | |||||||||
| Total New York | ||||||||||||
| (Cost $7,421,542) | 7,466,340 | 5.5 | % | |||||||||
| North Carolina | ||||||||||||
| North Carolina Housing Finance Agency | ||||||||||||
| 4.000%, 07/01/2047 (Callable 01/01/2027) | 650,000 | 704,243 | 0.5 | % | ||||||||
| Other North Carolina# | 320,703 | 0.2 | % | |||||||||
| Total North Carolina | ||||||||||||
| (Cost $1,024,474) | 1,024,946 | 0.7 | % | |||||||||
| North Dakota | ||||||||||||
| County of Ward ND | ||||||||||||
| 4.000%, 04/01/2026 (Callable 04/01/2023) | ||||||||||||
| (Insured by AGM) | 1,030,000 | 1,108,630 | 0.8 | % | ||||||||
The accompanying notes are an integral part of these financial statements.
Page 68
Baird Core Intermediate Municipal Bond Fund
Summary Schedule of Investments, June 30, 2017 (Unaudited)
Long-Term Investments (cont.)
| Principal | % of | |||||||||||
| Amount | Value | Net Assets | ||||||||||
| Jamestown Park District/ND | ||||||||||||
| 2.900%, 07/01/2035 (Callable 07/17/2017) | $ | 915,000 | $ | 878,016 | 0.6 | % | ||||||
| Other North Dakota# | 958,150 | 0.8 | % | |||||||||
| Total North Dakota | ||||||||||||
| (Cost $2,959,956) | 2,944,796 | 2.2 | % | |||||||||
| Ohio | ||||||||||||
| Total Ohio | ||||||||||||
| (Cost $4,983,066)# | 5,050,332 | 3.7 | % | |||||||||
| Oklahoma | ||||||||||||
| Total Oklahoma | ||||||||||||
| (Cost $256,885)# | 267,312 | 0.2 | % | |||||||||
| Oregon | ||||||||||||
| Total Oregon | ||||||||||||
| (Cost $1,729,477)# | 1,796,425 | 1.3 | % | |||||||||
| Pennsylvania | ||||||||||||
| Greater Latrobe School Authority | ||||||||||||
| 2.250%, 04/15/2019 (Callable 07/31/2017) | 670,000 | 670,844 | 0.5 | % | ||||||||
| Montgomery County Industrial | ||||||||||||
| Development Authority/PA | ||||||||||||
| 1.020%, 11/15/2029 (Callable 07/01/2017) | ||||||||||||
(Optional Put Date 07/31/2017)(1) | 1,250,000 | 1,250,000 | 0.9 | % | ||||||||
| Pennsylvania Turnpike Commission | ||||||||||||
| 0.000%, 12/01/2030 (Callable 12/01/2027) | 475,000 | 588,254 | 0.4 | % | ||||||||
| 0.000%-5.000%, 12/01/2023-12/01/2038 | 920,000 | 1,032,785 | 0.8 | % | ||||||||
| Other Pennsylvania# | 2,228,587 | 1.6 | % | |||||||||
| Total Pennsylvania | ||||||||||||
| (Cost $5,699,426) | 5,770,470 | 4.2 | % | |||||||||
| Puerto Rico | ||||||||||||
| Total Puerto Rico | ||||||||||||
| (Cost $288,166)# | 291,556 | 0.2 | % | |||||||||
| Rhode Island | ||||||||||||
| Total Rhode Island | ||||||||||||
| (Cost $691,219)# | 687,140 | 0.5 | % | |||||||||
| South Carolina | ||||||||||||
| Scago Educational Facilities Corp. for Union School District | ||||||||||||
| 5.000%, 12/01/2023 (Insured by BAM) | 500,000 | 588,400 | 0.4 | % | ||||||||
| Other South Carolina# | 939,234 | 0.7 | % | |||||||||
| Total South Carolina | ||||||||||||
| (Cost $1,486,470) | 1,527,634 | 1.1 | % | |||||||||
The accompanying notes are an integral part of these financial statements.
Page 69
Baird Core Intermediate Municipal Bond Fund
Summary Schedule of Investments, June 30, 2017 (Unaudited)
Long-Term Investments (cont.)
| Principal | % of | |||||||||||
| Amount | Value | Net Assets | ||||||||||
| South Dakota | ||||||||||||
| Total South Dakota | ||||||||||||
| (Cost $351,136)# | $ | 355,579 | 0.3 | % | ||||||||
| Tennessee | ||||||||||||
| Total Tennessee | ||||||||||||
| (Cost $1,863,517)# | 1,899,134 | 1.4 | % | |||||||||
| Texas | ||||||||||||
| Mesquite Independent School District | ||||||||||||
| 5.000%, 08/15/2029 (Callable 08/15/2025) | ||||||||||||
| (PSF Guaranteed) | $ | 500,000 | 595,665 | 0.4 | % | |||||||
| North Texas Tollway Authority | ||||||||||||
| 5.000%, 01/01/2033 (Callable 01/01/2026) | 675,000 | 779,855 | 0.6 | % | ||||||||
| Washington County Junior College District | ||||||||||||
| 5.000%, 10/01/2028 (Callable 04/01/2026) | ||||||||||||
| (Insured by BAM) | 500,000 | 592,365 | 0.4 | % | ||||||||
| Other Texas# | 6,843,293 | 5.0 | % | |||||||||
| Total Texas | ||||||||||||
| (Cost $8,701,058) | 8,811,178 | 6.4 | % | |||||||||
| Utah | ||||||||||||
| Utah Charter School Finance Authority | ||||||||||||
| 5.000%, 04/15/2028 (Callable 04/15/2026) | 720,000 | 836,978 | 0.6 | % | ||||||||
| 5.000%-5.000%, 04/15/2027-04/15/2037 | 885,000 | 1,004,506 | 0.7 | % | ||||||||
| Other Utah# | 646,508 | 0.5 | % | |||||||||
| Total Utah | ||||||||||||
| (Cost $2,443,659) | 2,487,992 | 1.8 | % | |||||||||
| Virgin Islands | ||||||||||||
| Total Virgin Islands | ||||||||||||
| (Cost $435,855)# | 428,072 | 0.3 | % | |||||||||
| Washington | ||||||||||||
| State of Washington | ||||||||||||
| 5.000%, 02/01/2038 (Callable 02/01/2024) | 645,000 | 734,578 | 0.5 | % | ||||||||
| Other Washington# | 1,641,939 | 1.2 | % | |||||||||
| Total Washington | ||||||||||||
| (Cost $2,354,905) | 2,376,517 | 1.7 | % | |||||||||
| Wisconsin | ||||||||||||
| Public Finance Authority | ||||||||||||
| 4.000%, 12/01/2020 | 650,000 | 647,322 | 0.5 | % | ||||||||
| 3.000%, 11/15/2022 (Callable 11/15/2018) | 750,000 | 752,370 | 0.5 | % | ||||||||
| University of Wisconsin Hospitals & Clinics | ||||||||||||
| 5.000%, 04/01/2038 (Callable 04/01/2023) | 625,000 | 692,475 | 0.5 | % | ||||||||
The accompanying notes are an integral part of these financial statements.
Page 70
Baird Core Intermediate Municipal Bond Fund
Summary Schedule of Investments, June 30, 2017 (Unaudited)
Long-Term Investments (cont.)
| Principal | % of | |||||||||||
| Amount | Value | Net Assets | ||||||||||
| Wisconsin Health & Educational Facilities Authority | ||||||||||||
| 5.000%, 08/15/2028 (Callable 08/15/2023) | $ | 1,000,000 | $ | 1,146,270 | 0.8 | % | ||||||
| 5.000%-5.250%, 09/01/2018-10/15/2039 | 1,950,000 | 2,149,851 | 1.6 | % | ||||||||
| Other Wisconsin# | 2,595,366 | 1.9 | % | |||||||||
| Total Wisconsin | ||||||||||||
| (Cost $7,925,958) | 7,983,654 | 5.8 | % | |||||||||
| Total Long-Term Investments | ||||||||||||
| (Cost $133,923,328) | 135,482,694 | 99.0 | % | |||||||||
| Short-Term Investment | ||||||||||||
| Shares | ||||||||||||
| Money Market Mutual Fund | ||||||||||||
| Fidelity Institutional Money Market Fund – | ||||||||||||
| Government Portfolio, Institutional Class, 0.85%« | 265,084 | 265,084 | 0.2 | % | ||||||||
| Total Short-Term Investment | ||||||||||||
| (Cost $265,084) | 265,084 | 0.2 | % | |||||||||
| Total Investments | ||||||||||||
| (Cost $134,188,412) | 135,747,778 | 99.2 | % | |||||||||
| Other Assets in Excess of Liabilities | 1,052,400 | 0.8 | % | |||||||||
| TOTAL NET ASSETS | $ | 136,800,178 | 100.0 | % | ||||||||
Notes to Schedule of Investments
AGM – Assured Guaranty Municipal
BAM – Build America Mutual Assurance Co.
PSF – Texas Permanent School Fund
Q-SBLF – Qualified School Building Loan Fund
| (1) | Variable or Floating rate security. Floating rate securities are securities whose yields vary with a designated index rate. These securities' rates are as of June 30, 2017. | |
| (2) | Auction Rate Security. An Auction Rate Security is a debt instrument with a long nominal maturity for which the interest rate is regularly reset through a Dutch auction. The rate presented is either the rate set through the auction or the maximum interest rate provided for in the security issuance provision. | |
| (3) | Security or a portion of the security purchased on a when-issued or delayed delivery basis. | |
| « | 7-Day Yield. | |
| # | Represents the aggregate value, by category, securities that are not among the 50 largest holdings and, in total for any issuer, represent 1% or less of net assets. | |
| ~ | Groupings contain, in aggregate, restricted securities totaling $149,980 representing 0.11% of net assets. |
Summary of Fair Value Exposure at June 30, 2017 (Unaudited)
The Fund has adopted authoritative fair valuation accounting standards which establish a definition of fair value and set out a hierarchy for measuring fair value. These standards require additional disclosures about the various inputs and valuation techniques used to develop the measurements of fair value and a discussion on changes in valuation techniques and related inputs during the period. These standards define fair value as the price that would be received to sell an asset or paid to transfer a liability in an orderly transaction between market participants at the measurement date.
The accompanying notes are an integral part of these financial statements.
Page 71
Baird Core Intermediate Municipal Bond Fund
Summary Schedule of Investments, June 30, 2017 (Unaudited)
Summary of Fair Value Exposure at June 30, 2017 (Unaudited) (cont.)
The fair value hierarchy is organized into three levels based upon the assumptions (referred to as “inputs”) used in pricing the asset or liability. These standards state that “observable inputs” reflect the assumptions market participants would use in pricing the asset or liability based on market data obtained from independent sources and “unobservable inputs” reflect an entity’s own assumptions about the assumptions market participants would use in pricing the asset or liability. These inputs are summarized into three broad levels and described below:
Level 1 – | Unadjusted quoted prices in active markets for identical unrestricted securities. |
Level 2 – | Other significant observable inputs (including quoted prices for similar securities, quoted prices in inactive markets, dealer indications, interest rates, yield curves, prepayment speeds, credit risk, default rates, inputs corroborated by observable market data, etc.). |
Level 3 – | Significant unobservable inputs (including the Fund’s own assumptions about the factors that market participants would use in valuing the security) based on the best information available. |
The inputs or methodology used for valuing securities are not necessarily an indication of the risk associated with investing in those securities.
The following is a summary of the inputs used to value the Fund’s investments as of June 30, 2017:
| Level 1 | Level 2 | Level 3 | Total | |||||||||||||
| Long-Term Investments | ||||||||||||||||
| Municipal Bonds | $ | — | $ | 135,482,694 | $ | — | $ | 135,482,694 | ||||||||
| Total Long-Term Investments | — | 135,482,694 | — | 135,482,694 | ||||||||||||
| Short-Term Investment | ||||||||||||||||
| Money Market Mutual Fund | 265,084 | — | — | 265,084 | ||||||||||||
| Total Short-Term Investment | 265,084 | — | — | 265,084 | ||||||||||||
| Total Investments | $ | 265,084 | $ | 135,482,694 | $ | — | $ | 135,747,778 | ||||||||
Changes in valuation techniques may result in transfers into or out of assigned levels within the fair value hierarchy. There were no transfers between Level 1, Level 2 and Level 3 fair value measurements during the reporting period, as compared to their classification from the prior year’s annual report. See the Fund’s valuation policy in Note 2a to the financial statements.
The accompanying notes are an integral part of these financial statements.
Page 72
(This Page Intentionally Left Blank.)
Page 73
Additional Information on Fund Expenses
June 30, 2017 (Unaudited)
As a shareholder of a mutual fund, you incur two types of costs: (1) transaction costs, which may include sales charges (loads) on purchase payments, reinvested dividends, or other distributions; redemption fees; and exchange fees; and (2) ongoing costs, such as management fees; distribution and/or service (12b-1) fees; and other fund expenses. Although the Funds do not charge any sales loads, redemption fees, or other transaction fees, you will be assessed fees for outgoing wire transfers, returned checks and stop payment orders at prevailing rates charged by U.S. Bancorp Fund Services, LLC, the Funds’ transfer agent. If you request that a redemption be made by wire transfer, currently the Funds’ transfer agent charges a $15.00 fee.
This Example is intended to help you understand your ongoing costs (in dollars) of investing in each Fund and to compare these costs with the ongoing costs of investing in other mutual funds. The Example is based on an investment of $1,000 invested at the beginning of the period and held for the entire period (1/1/17 – 6/30/17).
Actual Expenses
The third and fourth columns of the following table provide information about account values based on actual returns and actual expenses. You may use the information in these columns, together with the amount you invested, to estimate the expenses that you paid over the period. Simply divide your account value by $1,000 (for example, an $8,600 account value divided by $1,000 = 8.6), then multiply the result by the number in the fourth column entitled “Expenses Paid During Period’’ to estimate the expenses you paid on your account during this period.
Hypothetical Example for Comparison Purposes
The fifth and sixth columns of the following table provide information about hypothetical account values and hypothetical expenses based on the Funds’ actual expense ratios and an assumed rate of return of 5% per year before expenses, which is not the Funds’ actual return. The hypothetical account values and expenses may not be used to estimate the actual ending account balance or expenses you paid for the period. You may use this information to compare the ongoing costs of investing in the Funds and other mutual funds. To do so, compare this 5% hypothetical example with the 5% hypothetical examples that appear in the shareholder reports of the other mutual funds. Please note that the expenses shown in the table are meant to highlight your ongoing costs only and do not reflect any transactional costs. Therefore, the sixth column of the table (entitled “Expenses Paid During Period”) is useful in comparing ongoing costs only, and will not help you determine the relative total costs of owning different mutual funds. In addition, if these transactional costs were included, your costs could have been higher.
Page 74
Additional Information on Fund Expenses
June 30, 2017 (Unaudited)
Actual vs. Hypothetical Returns
| Hypothetical | ||||||
| (5% return | ||||||
Actual | before expenses) | |||||
| Fund’s | Beginning | Ending | Expenses | Ending | Expenses | |
| Annualized | Account | Account | Paid | Account | Paid | |
| Expense | Value | Value | During | Value | During | |
Ratio(1) | 1/1/17 | 6/30/17 | Period(1) | 6/30/17 | Period(1) | |
| Baird Ultra Short | ||||||
| Bond Fund | ||||||
| Institutional Class | 0.15% | $1,000.00 | $1,006.30 | $0.75 | $1,024.05 | $0.75 |
| Investor Class | 0.40% | $1,000.00 | $1,005.20 | $1.99 | $1,022.81 | $2.01 |
| Baird Short-Term | ||||||
| Bond Fund | ||||||
| Institutional Class | 0.30% | $1,000.00 | $1,011.00 | $1.50 | $1,023.31 | $1.51 |
| Investor Class | 0.55% | $1,000.00 | $1,009.80 | $2.74 | $1,022.07 | $2.76 |
| Baird Intermediate | ||||||
| Bond Fund | ||||||
| Institutional Class | 0.30% | $1,000.00 | $1,020.20 | $1.50 | $1,023.31 | $1.51 |
| Investor Class | 0.55% | $1,000.00 | $1,019.00 | $2.75 | $1,022.07 | $2.76 |
| Baird Aggregate | ||||||
| Bond Fund | ||||||
| Institutional Class | 0.30% | $1,000.00 | $1,027.20 | $1.51 | $1,023.31 | $1.51 |
| Investor Class | 0.55% | $1,000.00 | $1,026.00 | $2.76 | $1,022.07 | $2.76 |
| Baird Core Plus | ||||||
| Bond Fund | ||||||
| Institutional Class | 0.30% | $1,000.00 | $1,029.90 | $1.51 | $1,023.31 | $1.51 |
| Investor Class | 0.55% | $1,000.00 | $1,029.30 | $2.77 | $1,022.07 | $2.76 |
| Baird Short-Term | ||||||
| Municipal Bond Fund | ||||||
| Institutional Class | 0.30% | $1,000.00 | $1,020.90 | $1.50 | $1,023.31 | $1.51 |
| Investor Class | 0.55% | $1,000.00 | $1,019.20 | $2.75 | $1,022.07 | $2.76 |
| Baird Quality Intermediate | ||||||
| Municipal Bond Fund | ||||||
| Institutional Class | 0.30% | $1,000.00 | $1,028.10 | $1.51 | $1,023.31 | $1.51 |
| Investor Class | 0.55% | $1,000.00 | $1,027.10 | $2.76 | $1,022.07 | $2.76 |
| Baird Core Intermediate | ||||||
| Municipal Bond Fund | ||||||
| Institutional Class | 0.30% | $1,000.00 | $1,032.80 | $1.51 | $1,023.31 | $1.51 |
| Investor Class | 0.55% | $1,000.00 | $1,031.60 | $2.77 | $1,022.07 | $2.76 |
| (1) | Expenses are equal to the Fund’s annualized net expense ratio multiplied by the average account value over the period, multiplied by 181 days and divided by 365 to reflect the one-half year period. |
Page 75
Statements of Assets and Liabilities
June 30, 2017 (Unaudited)
| Baird | Baird | Baird | ||||||||||
| Ultra Short | Short-Term | Intermediate | ||||||||||
| Bond Fund | Bond Fund | Bond Fund | ||||||||||
| ASSETS: | ||||||||||||
| Investments, at value | ||||||||||||
| (cost $567,053,366, $4,657,905,655 | ||||||||||||
| and $2,683,936,428, respectively) | $ | 567,331,747 | $ | 4,663,856,282 | $ | 2,694,243,531 | ||||||
| Interest receivable | 2,615,313 | 28,425,632 | 16,847,395 | |||||||||
| Receivable for investments sold | — | — | 23 | |||||||||
| Receivable for Fund shares sold | 4,713,300 | 14,435,579 | 45,097,858 | |||||||||
| Uninvested cash | — | — | 6,718 | |||||||||
| Prepaid expenses and other assets | 10 | 68,938 | 258,924 | |||||||||
| Total assets | 574,660,370 | 4,706,786,431 | 2,756,454,449 | |||||||||
| LIABILITIES: | ||||||||||||
| Payable for securities purchased | 6,431,591 | 111,560,901 | 78,200,361 | |||||||||
| Payable for Fund shares repurchased | 386,371 | 3,516,173 | 779,285 | |||||||||
| Payable to Advisor and Distributor, net | 76,418 | 1,166,083 | 681,896 | |||||||||
| Accrued expenses and other liabilities | 440 | 2,001,854 | — | |||||||||
| Total liabilities | 6,894,820 | 118,245,011 | 79,661,542 | |||||||||
| NET ASSETS | $ | 567,765,550 | $ | 4,588,541,420 | $ | 2,676,792,907 | ||||||
| NET ASSETS CONSIST OF: | ||||||||||||
| Capital stock | $ | 567,554,578 | $ | 4,582,528,747 | $ | 2,665,445,121 | ||||||
| Accumulated undistributed net investment | ||||||||||||
| income (distributions in excess of) | 153,781 | 2,112,354 | 1,350,058 | |||||||||
| Accumulated net realized | ||||||||||||
| gain (loss) on investments sold | (221,190 | ) | (2,050,308 | ) | (309,375 | ) | ||||||
| Net unrealized appreciation on investments: | 278,381 | 5,950,627 | 10,307,103 | |||||||||
| NET ASSETS | $ | 567,765,550 | $ | 4,588,541,420 | $ | 2,676,792,907 | ||||||
| INSTITUTIONAL CLASS SHARES | ||||||||||||
| Net Assets | $ | 554,127,839 | $ | 4,461,002,968 | $ | 2,554,535,197 | ||||||
| Shares outstanding ($0.01 par value, | ||||||||||||
| unlimited shares authorized) | 55,198,548 | 460,208,086 | 230,733,948 | |||||||||
| Net asset value, offering and | ||||||||||||
| redemption price per share | $ | 10.04 | $ | 9.69 | $ | 11.07 | ||||||
| INVESTOR CLASS SHARES | ||||||||||||
| Net Assets | $ | 13,637,711 | $ | 127,538,452 | $ | 122,257,710 | ||||||
| Shares outstanding ($0.01 par value, | ||||||||||||
| unlimited shares authorized) | 1,358,685 | 13,159,422 | 10,586,571 | |||||||||
| Net asset value, offering and | ||||||||||||
| redemption price per share | $ | 10.04 | $ | 9.69 | $ | 11.55 | ||||||
The accompanying notes are an integral part of these financial statements.
Page 76
Statements of Assets and Liabilities
June 30, 2017 (Unaudited)
| Baird | Baird | |||||||
| Aggregate | Core Plus | |||||||
| Bond Fund | Bond Fund | |||||||
| ASSETS: | ||||||||
| Investments, at value (cost $12,665,990,286 | ||||||||
| and $14,461,805,699, respectively) | $ | 12,755,170,526 | $ | 14,590,267,873 | ||||
| Interest receivable | 77,623,199 | 100,188,945 | ||||||
| Receivable for investments sold | 1,568 | 10,350,359 | ||||||
| Receivable for Fund shares sold | 224,451,267 | 86,031,352 | ||||||
| Uninvested cash | — | 79,267 | ||||||
| Prepaid expenses and other assets | 458,260 | 40,928 | ||||||
| Total assets | 13,057,704,820 | 14,786,958,724 | ||||||
| LIABILITIES: | ||||||||
| Payable for securities purchased | 312,384,892 | 305,049,296 | ||||||
| Payable for Fund shares repurchased | 14,498,978 | 9,332,270 | ||||||
| Payable to Advisor and Distributor, net | 3,370,001 | 4,307,664 | ||||||
| Accrued expenses and other liabilities | 533,232 | — | ||||||
| Total liabilities | 330,787,103 | 318,689,230 | ||||||
| NET ASSETS | $ | 12,726,917,717 | $ | 14,468,269,494 | ||||
| NET ASSETS CONSIST OF: | ||||||||
| Capital stock | $ | 12,650,861,322 | $ | 14,344,499,363 | ||||
| Accumulated undistributed net investment | ||||||||
| income (distributions in excess of) | (3,277,394 | ) | 838,475 | |||||
| Accumulated net realized | ||||||||
| gain (loss) on investments sold | (9,846,451 | ) | (5,530,518 | ) | ||||
| Net unrealized appreciation on investments: | 89,180,240 | 128,462,174 | ||||||
| NET ASSETS | $ | 12,726,917,717 | $ | 14,468,269,494 | ||||
| INSTITUTIONAL CLASS SHARES | ||||||||
| Net Assets | $ | 11,878,101,049 | $ | 11,360,264,102 | ||||
| Shares outstanding ($0.01 par value, | ||||||||
| unlimited shares authorized) | 1,093,558,666 | 1,013,518,551 | ||||||
| Net asset value, offering and | ||||||||
| redemption price per share | $ | 10.86 | $ | 11.21 | ||||
| INVESTOR CLASS SHARES | ||||||||
| Net Assets | $ | 848,816,668 | $ | 3,108,005,392 | ||||
| Shares outstanding ($0.01 par value, | ||||||||
| unlimited shares authorized) | 75,660,463 | 266,665,830 | ||||||
| Net asset value, offering and | ||||||||
| redemption price per share | $ | 11.22 | $ | 11.66 | ||||
The accompanying notes are an integral part of these financial statements.
Page 77
Statements of Assets and Liabilities
June 30, 2017 (Unaudited)
| Baird | Baird | |||||||||||
| Baird | Quality | Core | ||||||||||
| Short-Term | Intermediate | Intermediate | ||||||||||
| Municipal | Municipal | Municipal | ||||||||||
| Bond Fund | Bond Fund | Bond Fund | ||||||||||
| ASSETS: | ||||||||||||
| Investments, at value | ||||||||||||
| (cost $86,590,803, $1,013,027,406 | ||||||||||||
| and $134,188,412, respectively) | $ | 86,848,069 | $ | 1,045,357,994 | $ | 135,747,778 | ||||||
| Interest receivable | 672,925 | 10,652,412 | 1,139,938 | |||||||||
| Receivable for investments sold | 319,415 | — | 760,927 | |||||||||
| Receivable for Fund shares sold | 65,000 | 1,610,946 | 354,821 | |||||||||
| Uninvested cash | 16 | — | 818 | |||||||||
| Prepaid expenses and other assets | 1 | — | — | |||||||||
| Total assets | 87,905,426 | 1,057,621,352 | 138,004,282 | |||||||||
| LIABILITIES: | ||||||||||||
| Payable for securities purchased | 758,618 | 40,237 | 1,050,000 | |||||||||
| Payable for Fund shares repurchased | 120,644 | 471,805 | 120,427 | |||||||||
| Payable to Advisor and Distributor, net | 21,387 | 335,561 | 33,664 | |||||||||
| Accrued expenses and other liabilities | — | — | 13 | |||||||||
| Total liabilities | 900,649 | 847,603 | 1,204,104 | |||||||||
| NET ASSETS | $ | 87,004,777 | $ | 1,056,773,749 | $ | 136,800,178 | ||||||
| NET ASSETS CONSIST OF: | ||||||||||||
| Capital stock | $ | 86,723,672 | $ | 1,030,757,831 | $ | 135,368,064 | ||||||
| Accumulated undistributed | ||||||||||||
| net investment income | 28,612 | 459,746 | 55,215 | |||||||||
| Accumulated net realized loss | ||||||||||||
| on investments sold | (4,773 | ) | (6,774,416 | ) | (182,467 | ) | ||||||
| Net unrealized appreciation | ||||||||||||
| on investments: | 257,266 | 32,330,588 | 1,559,366 | |||||||||
| NET ASSETS | $ | 87,004,777 | $ | 1,056,773,749 | $ | 136,800,178 | ||||||
| INSTITUTIONAL CLASS SHARES | ||||||||||||
| Net Assets | $ | 84,788,034 | $ | 917,905,589 | $ | 135,213,837 | ||||||
| Shares outstanding ($0.01 par value, | ||||||||||||
| unlimited shares authorized) | 8,395,113 | 78,981,985 | 13,217,154 | |||||||||
| Net asset value, offering and | ||||||||||||
| redemption price per share | $ | 10.10 | $ | 11.62 | $ | 10.23 | ||||||
| INVESTOR CLASS SHARES | ||||||||||||
| Net Assets | $ | 2,216,743 | $ | 138,868,160 | $ | 1,586,341 | ||||||
| Shares outstanding ($0.01 par value, | ||||||||||||
| unlimited shares authorized) | 219,779 | 11,676,041 | 155,133 | |||||||||
| Net asset value, offering and | ||||||||||||
| redemption price per share | $ | 10.09 | $ | 11.89 | $ | 10.23 | ||||||
The accompanying notes are an integral part of these financial statements.
Page 78
Statement of Operations
Six Months Ended June 30, 2017 (Unaudited)
| Baird | Baird | Baird | ||||||||||
| Ultra Short | Short-Term | Intermediate | ||||||||||
| Bond Fund | Bond Fund | Bond Fund | ||||||||||
| INVESTMENT INCOME: | ||||||||||||
| Interest income, net of paydowns | $ | 3,424,224 | $ | 42,629,127 | $ | 31,618,607 | ||||||
| Other income | 2,503 | — | — | |||||||||
| Total investment income | 3,426,727 | 42,629,127 | 31,618,607 | |||||||||
| EXPENSES: | ||||||||||||
| Investment advisory fees | 649,364 | 5,343,647 | 3,034,075 | |||||||||
| Administration fees | 129,873 | 1,068,730 | 606,815 | |||||||||
| Distribution expense – | ||||||||||||
| Investor Class Shares (Note 8) | 15,735 | 141,468 | 131,418 | |||||||||
| Total expenses | 794,972 | 6,553,845 | 3,772,308 | |||||||||
| Fee waiver by Advisor (Note 5) | (389,618 | ) | — | — | ||||||||
| Net expenses | 405,354 | 6,553,845 | 3,772,308 | |||||||||
| NET INVESTMENT INCOME | 3,021,373 | 36,075,282 | 27,846,299 | |||||||||
| REALIZED AND UNREALIZED | ||||||||||||
| GAIN (LOSS) ON INVESTMENTS: | ||||||||||||
| Net realized gain (loss) on investments | 11,381 | (2,623,798 | ) | (281,037 | ) | |||||||
| Change in unrealized | ||||||||||||
| appreciation on investments | 147,483 | 13,243,846 | 20,066,544 | |||||||||
| Net realized and unrealized | ||||||||||||
| gain on investments | 158,864 | 10,620,048 | 19,785,507 | |||||||||
| NET INCREASE IN NET ASSETS | ||||||||||||
| RESULTING FROM OPERATIONS | $ | 3,180,237 | $ | 46,695,330 | $ | 47,631,806 | ||||||
The accompanying notes are an integral part of these financial statements.
Page 79
Statement of Operations
Six Months Ended June 30, 2017 (Unaudited)
| Baird | Baird | |||||||
| Aggregate | Core Plus | |||||||
| Bond Fund | Bond Fund | |||||||
| INVESTMENT INCOME: | ||||||||
| Interest income, net of paydowns | $ | 153,650,819 | $ | 200,777,609 | ||||
| Other income | — | — | ||||||
| Total investment income | 153,650,819 | 200,777,609 | ||||||
| EXPENSES: | ||||||||
| Investment advisory fees | 14,389,242 | 16,856,219 | ||||||
| Administration fees | 2,877,849 | 3,371,244 | ||||||
| Distribution expense – | ||||||||
| Investor Class Shares (Note 8) | 1,044,817 | 3,696,555 | ||||||
| Total expenses | 18,311,908 | 23,924,018 | ||||||
| NET INVESTMENT INCOME | 135,338,911 | 176,853,591 | ||||||
| REALIZED AND UNREALIZED | ||||||||
| GAIN (LOSS) ON INVESTMENTS: | ||||||||
| Net realized gain (loss) on investments | (1,331,862 | ) | 675,630 | |||||
| Change in unrealized | ||||||||
| appreciation on investments | 180,382,691 | 221,962,968 | ||||||
| Net realized and unrealized | ||||||||
| gain on investments | 179,050,829 | 222,638,598 | ||||||
| NET INCREASE IN NET ASSETS | ||||||||
| RESULTING FROM OPERATIONS | $ | 314,389,740 | $ | 399,492,189 | ||||
The accompanying notes are an integral part of these financial statements.
Page 80
Statement of Operations
Six Months Ended June 30, 2017 (Unaudited)
| Baird | Baird | |||||||||||
| Baird | Quality | Core | ||||||||||
| Short-Term | Intermediate | Intermediate | ||||||||||
| Municipal | Municipal | Municipal | ||||||||||
| Bond Fund | Bond Fund | Bond Fund | ||||||||||
| INVESTMENT INCOME: | ||||||||||||
| Interest income, net of paydowns | $ | 682,665 | $ | 13,903,658 | $ | 1,394,435 | ||||||
| Other income | 1,099 | — | 1,672 | |||||||||
| Total investment income | 683,764 | 13,903,658 | 1,396,107 | |||||||||
| EXPENSES: | ||||||||||||
| Investment advisory fees | 86,230 | 1,316,714 | 147,869 | |||||||||
| Administration fees | 17,246 | 263,343 | 29,574 | |||||||||
| Distribution expense – | ||||||||||||
| Investor Class Shares (Note 8) | 4,757 | 170,810 | 1,853 | |||||||||
| Total expenses | 108,233 | 1,750,867 | 179,296 | |||||||||
| NET INVESTMENT INCOME | 575,531 | 12,152,791 | 1,216,811 | |||||||||
| REALIZED AND UNREALIZED | ||||||||||||
| GAIN (LOSS) ON INVESTMENTS: | ||||||||||||
| Net realized gain (loss) on investments | 20,801 | (676,880 | ) | 124,515 | ||||||||
| Change in unrealized | ||||||||||||
| appreciation on investments | 732,072 | 18,284,386 | 2,417,571 | |||||||||
| Net realized and unrealized | ||||||||||||
| gain on investments | 752,873 | 17,607,506 | 2,542,086 | |||||||||
| NET INCREASE IN NET ASSETS | ||||||||||||
| RESULTING FROM OPERATIONS | $ | 1,328,404 | $ | 29,760,297 | $ | 3,758,897 | ||||||
The accompanying notes are an integral part of these financial statements.
Page 81
Statement of Changes in Net Assets
Baird Ultra Short Bond Fund
| Six Months Ended | ||||||||
| June 30, 2017 | Year Ended | |||||||
| (Unaudited) | December 31, 2016 | |||||||
| OPERATIONS: | ||||||||
| Net investment income | $ | 3,021,373 | $ | 2,632,655 | ||||
| Net realized gain (loss) on investments | 11,381 | (78,925 | ) | |||||
| Change in unrealized | ||||||||
| appreciation on investments | 147,483 | 1,107,222 | ||||||
| Net increase in net assets | ||||||||
| resulting from operations | 3,180,237 | 3,660,952 | ||||||
| CAPITAL SHARE TRANSACTIONS: | ||||||||
| Proceeds from shares sold | 333,000,797 | 414,868,100 | ||||||
| Shares issued to holders in | ||||||||
| reinvestment of distributions | 2,707,649 | 2,609,293 | ||||||
| Cost of shares redeemed | (160,742,793 | ) | (216,466,024 | ) | ||||
| Net increase in net assets resulting | ||||||||
| from capital share transactions | 174,965,653 | 201,011,369 | ||||||
| DISTRIBUTIONS TO | ||||||||
| INSTITUTIONAL CLASS SHAREHOLDERS: | ||||||||
| From net investment income | (2,826,985 | ) | (2,667,617 | ) | ||||
| Total Distributions | (2,826,985 | ) | (2,667,617 | ) | ||||
| DISTRIBUTIONS TO | ||||||||
| INVESTOR CLASS SHAREHOLDERS: | ||||||||
| From net investment income | (58,229 | ) | (23,258 | ) | ||||
| Total Distributions | (58,229 | ) | (23,258 | ) | ||||
| TOTAL INCREASE IN NET ASSETS | 175,260,676 | 201,981,446 | ||||||
| NET ASSETS: | ||||||||
| Beginning of period | 392,504,874 | 190,523,428 | ||||||
| End of period (including accumulated | ||||||||
| undistributed net investment income | ||||||||
| of $153,781 and $17,622, respectively) | $ | 567,765,550 | $ | 392,504,874 | ||||
The accompanying notes are an integral part of these financial statements.
Page 82
Statement of Changes in Net Assets
Baird Short-Term Bond Fund
| Six Months Ended | ||||||||
| June 30, 2017 | Year Ended | |||||||
| (Unaudited) | December 31, 2016 | |||||||
| OPERATIONS: | ||||||||
| Net investment income | $ | 36,075,282 | $ | 55,411,057 | ||||
| Net realized gain (loss) on investments | (2,623,798 | ) | 5,195,831 | |||||
| Change in unrealized | ||||||||
| appreciation on investments | 13,243,846 | 15,426,285 | ||||||
| Net increase in net assets | ||||||||
| resulting from operations | 46,695,330 | 76,033,173 | ||||||
| CAPITAL SHARE TRANSACTIONS: | ||||||||
| Proceeds from shares sold | 1,362,333,378 | 2,123,359,734 | ||||||
| Shares issued to holders in | ||||||||
| reinvestment of distributions | 31,631,807 | 51,203,187 | ||||||
| Cost of shares redeemed | (692,161,759 | ) | (1,336,016,853 | ) | ||||
| Net increase in net assets resulting | ||||||||
| from capital share transactions | 701,803,426 | 838,546,068 | ||||||
| DISTRIBUTIONS TO | ||||||||
| INSTITUTIONAL CLASS SHAREHOLDERS: | ||||||||
| From net investment income | (33,375,129 | ) | (55,717,798 | ) | ||||
| From net realized gains | — | (282,221 | ) | |||||
| Total Distributions | (33,375,129 | ) | (56,000,019 | ) | ||||
| DISTRIBUTIONS TO | ||||||||
| INVESTOR CLASS SHAREHOLDERS: | ||||||||
| From net investment income | (771,668 | ) | (990,914 | ) | ||||
| From net realized gains | — | (8,002 | ) | |||||
| Total Distributions | (771,668 | ) | (998,916 | ) | ||||
| TOTAL INCREASE IN NET ASSETS | 714,351,959 | 857,580,306 | ||||||
| NET ASSETS: | ||||||||
| Beginning of period | 3,874,189,461 | 3,016,609,155 | ||||||
| End of period (including accumulated | ||||||||
| undistributed net investment income | ||||||||
| of $2,112,354 and $183,869, respectively) | $ | 4,588,541,420 | $ | 3,874,189,461 | ||||
The accompanying notes are an integral part of these financial statements.
Page 83
Statement of Changes in Net Assets
Baird Intermediate Bond Fund
| Six Months Ended | ||||||||
| June 30, 2017 | Year Ended | |||||||
| (Unaudited) | December 31, 2016 | |||||||
| OPERATIONS: | ||||||||
| Net investment income | $ | 27,846,299 | $ | 45,958,502 | ||||
| Net realized gain (loss) on investments | (281,037 | ) | 5,900,423 | |||||
| Change in unrealized | ||||||||
| appreciation/depreciation on investments | 20,066,544 | (1,122,437 | ) | |||||
| Net increase in net assets | ||||||||
| resulting from operations | 47,631,806 | 50,736,488 | ||||||
| CAPITAL SHARE TRANSACTIONS: | ||||||||
| Proceeds from shares sold | 509,527,861 | 737,295,663 | ||||||
| Shares issued to holders in | ||||||||
| reinvestment of distributions | 22,924,237 | 44,018,187 | ||||||
| Cost of shares redeemed | (183,818,349 | ) | (364,012,750 | ) | ||||
| Net increase in net assets resulting | ||||||||
| from capital share transactions | 348,633,749 | 417,301,100 | ||||||
| DISTRIBUTIONS TO | ||||||||
| INSTITUTIONAL CLASS SHAREHOLDERS: | ||||||||
| From net investment income | (25,655,108 | ) | (44,572,517 | ) | ||||
| From net realized gains | — | (4,500,976 | ) | |||||
| Total Distributions | (25,655,108 | ) | (49,073,493 | ) | ||||
| DISTRIBUTIONS TO | ||||||||
| INVESTOR CLASS SHAREHOLDERS: | ||||||||
| From net investment income | (983,775 | ) | (1,932,745 | ) | ||||
| From net realized gains | — | (192,882 | ) | |||||
| Total Distributions | (983,775 | ) | (2,125,627 | ) | ||||
| TOTAL INCREASE IN NET ASSETS | 369,626,672 | 416,838,468 | ||||||
| NET ASSETS: | ||||||||
| Beginning of period | 2,307,166,235 | 1,890,327,767 | ||||||
| End of period (including accumulated | ||||||||
| undistributed net investment income | ||||||||
| of $1,350,058 and $142,642, respectively) | $ | 2,676,792,907 | $ | 2,307,166,235 | ||||
The accompanying notes are an integral part of these financial statements.
Page 84
Statement of Changes in Net Assets
Baird Aggregate Bond Fund
| Six Months Ended | ||||||||
| June 30, 2017 | Year Ended | |||||||
| (Unaudited) | December 31, 2016 | |||||||
| OPERATIONS: | ||||||||
| Net investment income | $ | 135,338,911 | $ | 196,377,284 | ||||
| Net realized gain (loss) on investments | (1,331,862 | ) | 32,403,391 | |||||
| Change in unrealized | ||||||||
| appreciation/depreciation on investments | 180,382,691 | (16,871,849 | ) | |||||
| Net increase in net assets | ||||||||
| resulting from operations | 314,389,740 | 211,908,826 | ||||||
| CAPITAL SHARE TRANSACTIONS: | ||||||||
| Proceeds from shares sold | 2,813,059,019 | 5,417,337,933 | ||||||
| Shares issued to holders in | ||||||||
| reinvestment of distributions | 123,913,217 | 202,259,552 | ||||||
| Cost of shares redeemed | (964,304,524 | ) | (1,765,728,702 | ) | ||||
| Net increase in net assets resulting | ||||||||
| from capital share transactions | 1,972,667,712 | 3,853,868,783 | ||||||
| DISTRIBUTIONS TO | ||||||||
| INSTITUTIONAL CLASS SHAREHOLDERS: | ||||||||
| From net investment income | (130,366,231 | ) | (201,214,756 | ) | ||||
| From net realized gains | — | (19,044,575 | ) | |||||
| Total Distributions | (130,366,231 | ) | (220,259,331 | ) | ||||
| DISTRIBUTIONS TO | ||||||||
| INVESTOR CLASS SHAREHOLDERS: | ||||||||
| From net investment income | (8,797,860 | ) | (13,013,723 | ) | ||||
| From net realized gains | — | (1,543,019 | ) | |||||
| Total Distributions | (8,797,860 | ) | (14,556,742 | ) | ||||
| TOTAL INCREASE IN NET ASSETS | 2,147,893,361 | 3,830,961,536 | ||||||
| NET ASSETS: | ||||||||
| Beginning of period | 10,579,024,356 | 6,748,062,820 | ||||||
| End of period (including distributions in excess | ||||||||
| of net investment income and accumulated | ||||||||
| undistributed net investment income of | ||||||||
| $(3,277,394) and $547,786, respectively) | $ | 12,726,917,717 | $ | 10,579,024,356 | ||||
The accompanying notes are an integral part of these financial statements.
Page 85
Statement of Changes in Net Assets
Baird Core Plus Bond Fund
| Six Months Ended | ||||||||
| June 30, 2017 | Year Ended | |||||||
| (Unaudited) | December 31, 2016 | |||||||
| OPERATIONS: | ||||||||
| Net investment income | $ | 176,853,591 | $ | 286,488,440 | ||||
| Net realized gain on investments | 675,630 | 43,549,062 | ||||||
| Change in unrealized | ||||||||
| appreciation on investments | 221,962,968 | 90,818,651 | ||||||
| Net increase in net assets | ||||||||
| resulting from operations | 399,492,189 | 420,856,153 | ||||||
| CAPITAL SHARE TRANSACTIONS: | ||||||||
| Proceeds from shares sold | 2,399,482,303 | 5,478,976,936 | ||||||
| Shares issued to holders in | ||||||||
| reinvestment of distributions | 166,524,668 | 311,703,965 | ||||||
| Cost of shares redeemed | (1,225,824,183 | ) | (2,357,448,098 | ) | ||||
| Net increase in net assets resulting | ||||||||
| from capital share transactions | 1,340,182,788 | 3,433,232,803 | ||||||
| DISTRIBUTIONS TO | ||||||||
| INSTITUTIONAL CLASS SHAREHOLDERS: | ||||||||
| From net investment income | (142,085,565 | ) | (244,902,899 | ) | ||||
| From net realized gains | — | (19,110,766 | ) | |||||
| Total Distributions | (142,085,565 | ) | (264,013,665 | ) | ||||
| DISTRIBUTIONS TO | ||||||||
| INVESTOR CLASS SHAREHOLDERS: | ||||||||
| From net investment income | (34,764,962 | ) | (62,615,650 | ) | ||||
| From net realized gains | — | (5,344,093 | ) | |||||
| Total Distributions | (34,764,962 | ) | (67,959,743 | ) | ||||
| TOTAL INCREASE IN NET ASSETS | 1,562,824,450 | 3,522,115,548 | ||||||
| NET ASSETS: | ||||||||
| Beginning of period | 12,905,445,044 | 9,383,329,496 | ||||||
| End of period (including accumulated | ||||||||
| undistributed net investment income of | ||||||||
| $838,475 and $835,411, respectively) | $ | 14,468,269,494 | $ | 12,905,445,044 | ||||
The accompanying notes are an integral part of these financial statements.
Page 86
Statement of Changes in Net Assets
Baird Short-Term Municipal Bond Fund
| Six Months Ended | ||||||||
| June 30, 2017 | Year Ended | |||||||
| (Unaudited) | December 31, 2016 | |||||||
| OPERATIONS: | ||||||||
| Net investment income | $ | 575,531 | $ | 413,336 | ||||
| Net realized gain (loss) on investments | 20,801 | (14,434 | ) | |||||
| Change in unrealized | ||||||||
| appreciation/depreciation on investments | 732,072 | (511,890 | ) | |||||
| Net increase (decrease) in net assets | ||||||||
| resulting from operations | 1,328,404 | (112,988 | ) | |||||
| CAPITAL SHARE TRANSACTIONS: | ||||||||
| Proceeds from shares sold | 41,923,304 | 59,918,064 | ||||||
| Shares issued to holders in | ||||||||
| reinvestment of distributions | 381,571 | 310,787 | ||||||
| Cost of shares redeemed | (14,774,526 | ) | (13,385,694 | ) | ||||
| Net increase in net assets resulting | ||||||||
| from capital share transactions | 27,530,349 | 46,843,157 | ||||||
| DISTRIBUTIONS TO | ||||||||
| INSTITUTIONAL CLASS SHAREHOLDERS: | ||||||||
| From net investment income | (528,291 | ) | (404,698 | ) | ||||
| From net realized gains | — | (20,120 | ) | |||||
| Total Distributions | (528,291 | ) | (424,818 | ) | ||||
| DISTRIBUTIONS TO | ||||||||
| INVESTOR CLASS SHAREHOLDERS: | ||||||||
| From net investment income | (19,575 | ) | (15,654 | ) | ||||
| From net realized gains | — | (2,421 | ) | |||||
| Total Distributions | (19,575 | ) | (18,075 | ) | ||||
| TOTAL INCREASE IN NET ASSETS | 28,310,887 | 46,287,276 | ||||||
| NET ASSETS: | ||||||||
| Beginning of period | 58,693,890 | 12,406,614 | ||||||
| End of period (including accumulated | ||||||||
| undistributed net investment income of | ||||||||
| $28,612 and $947, respectively) | $ | 87,004,777 | $ | 58,693,890 | ||||
The accompanying notes are an integral part of these financial statements.
Page 87
Statement of Changes in Net Assets
Baird Quality Intermediate Municipal Bond Fund
| Six Months Ended | ||||||||
| June 30, 2017 | Year Ended | |||||||
| (Unaudited) | December 31, 2016 | |||||||
| OPERATIONS: | ||||||||
| Net investment income | $ | 12,152,791 | $ | 26,013,591 | ||||
| Net realized loss on investments | (676,880 | ) | (4,831,770 | ) | ||||
| Change in unrealized | ||||||||
| appreciation/depreciation on investments | 18,284,386 | (27,953,071 | ) | |||||
| Net increase (decrease) in net assets | ||||||||
| resulting from operations | 29,760,297 | (6,771,250 | ) | |||||
| CAPITAL SHARE TRANSACTIONS: | ||||||||
| Proceeds from shares sold | 144,299,403 | 393,025,806 | ||||||
| Shares issued to holders in | ||||||||
| reinvestment of distributions | 10,198,540 | 23,259,485 | ||||||
| Cost of shares redeemed | (188,075,590 | ) | (459,954,332 | ) | ||||
| Net decrease in net assets resulting | ||||||||
| from capital share transactions | (33,577,647 | ) | (43,669,041 | ) | ||||
| DISTRIBUTIONS TO | ||||||||
| INSTITUTIONAL CLASS SHAREHOLDERS: | ||||||||
| From net investment income | (10,348,020 | ) | (23,096,808 | ) | ||||
| Total Distributions | (10,348,020 | ) | (23,096,808 | ) | ||||
| DISTRIBUTIONS TO | ||||||||
| INVESTOR CLASS SHAREHOLDERS: | ||||||||
| From net investment income | (1,345,025 | ) | (2,962,261 | ) | ||||
| Total Distributions | (1,345,025 | ) | (2,962,261 | ) | ||||
| TOTAL DECREASE IN NET ASSETS | (15,510,395 | ) | (76,499,360 | ) | ||||
| NET ASSETS: | ||||||||
| Beginning of period | 1,072,284,144 | 1,148,783,504 | ||||||
| End of period (including accumulated | ||||||||
| undistributed net investment income of | ||||||||
| $459,746 and $0, respectively) | $ | 1,056,773,749 | $ | 1,072,284,144 | ||||
The accompanying notes are an integral part of these financial statements.
Page 88
Statement of Changes in Net Assets
Baird Core Intermediate Municipal Bond Fund
| Six Months Ended | ||||||||
| June 30, 2017 | Year Ended | |||||||
| (Unaudited) | December 31, 2016 | |||||||
| OPERATIONS: | ||||||||
| Net investment income | $ | 1,216,811 | $ | 1,265,116 | ||||
| Net realized gain on investments | 124,515 | 117,545 | ||||||
| Change in unrealized | ||||||||
| appreciation/depreciation on investments | 2,417,571 | (1,332,991 | ) | |||||
| Net increase in net assets | ||||||||
| resulting from operations | 3,758,897 | 49,670 | ||||||
| CAPITAL SHARE TRANSACTIONS: | ||||||||
| Proceeds from shares sold | 45,985,998 | 66,349,805 | ||||||
| Shares issued to holders in | ||||||||
| reinvestment of distributions | 654,637 | 808,907 | ||||||
| Cost of shares redeemed | (10,139,104 | ) | (18,776,047 | ) | ||||
| Net increase in net assets resulting | ||||||||
| from capital share transactions | 36,501,531 | 48,382,665 | ||||||
| DISTRIBUTIONS TO | ||||||||
| INSTITUTIONAL CLASS SHAREHOLDERS: | ||||||||
| From net investment income | (1,152,067 | ) | (1,251,033 | ) | ||||
| From net realized gains | — | (519,478 | ) | |||||
| Total Distributions | (1,152,067 | ) | (1,770,511 | ) | ||||
| DISTRIBUTIONS TO | ||||||||
| INVESTOR CLASS SHAREHOLDERS: | ||||||||
| From net investment income | (12,677 | ) | (10,871 | ) | ||||
| From net realized gains | — | (8,868 | ) | |||||
| Total Distributions | (12,677 | ) | (19,739 | ) | ||||
| TOTAL INCREASE IN NET ASSETS | 39,095,684 | 46,642,085 | ||||||
| NET ASSETS: | ||||||||
| Beginning of period | 97,704,494 | 51,062,409 | ||||||
| End of period (including accumulated | ||||||||
| undistributed net investment income of | ||||||||
| $55,215 and $3,148, respectively) | $ | 136,800,178 | $ | 97,704,494 | ||||
The accompanying notes are an integral part of these financial statements.
Page 89
Financial Highlights
Baird Ultra Short Bond Fund – Institutional Class
| Six Months | ||||||||||||||||
| Ended | ||||||||||||||||
| June 30, 2017 | Year Ended December 31, | |||||||||||||||
| (Unaudited) | 2016 | 2015 | 2014 | |||||||||||||
| Per Share Data: | ||||||||||||||||
| Net asset value, beginning of period | $ | 10.03 | $ | 9.98 | $ | 10.03 | $ | 10.00 | ||||||||
| Income from investment operations: | ||||||||||||||||
| Net investment income | 0.06 | (1) | 0.11 | (1) | 0.08 | (1) | 0.09 | |||||||||
| Net realized and unrealized | ||||||||||||||||
| gains (losses) on investments | — | 0.04 | (0.05 | ) | 0.03 | (2) | ||||||||||
| Total from investment operations | 0.06 | 0.15 | 0.03 | 0.12 | ||||||||||||
| Less distributions: | ||||||||||||||||
| Distributions from net investment income | (0.05 | ) | (0.10 | ) | (0.08 | ) | (0.09 | ) | ||||||||
| Total distributions | (0.05 | ) | (0.10 | ) | (0.08 | ) | (0.09 | ) | ||||||||
| Net asset value, end of period | $ | 10.04 | $ | 10.03 | $ | 9.98 | $ | 10.03 | ||||||||
| Total return | 0.63 | %(3) | 1.56 | % | 0.30 | % | 1.21 | % | ||||||||
| Supplemental data and ratios: | ||||||||||||||||
| Net assets, end of period (millions) | $ | 554.1 | $ | 387.3 | $ | 189.3 | $ | 84.5 | ||||||||
| Ratio of expenses to average net assets | 0.15 | %(4) | 0.15 | % | 0.15 | % | 0.15 | % | ||||||||
| Ratio of expenses to average | ||||||||||||||||
| net assets (before waivers) | 0.30 | %(4) | 0.30 | % | 0.30 | % | 0.30 | % | ||||||||
| Ratio of net investment income | ||||||||||||||||
| to average net assets | 1.17 | %(4) | 1.05 | % | 0.78 | % | 0.93 | % | ||||||||
| Ratio of net investment income | ||||||||||||||||
| to average net assets (before waivers) | 1.02 | %(4) | 0.90 | % | 0.63 | % | 0.78 | % | ||||||||
Portfolio turnover rate(5) | 40.5 | %(3) | 96.9 | % | 65.5 | % | 57.6 | % | ||||||||
| (1) | Calculated using average shares outstanding during the period. |
| (2) | Due to timing of capital share transactions, the per share amount of net realized and unrealized gain (loss) on investments varies from the amounts shown in the statement of operations. |
| (3) | Not annualized. |
| (4) | Annualized. |
| (5) | Portfolio turnover is calculated on the basis of the Fund as a whole without distinguishing between the classes of shares issued. |
The accompanying notes are an integral part of these financial statements.
Page 90
Financial Highlights
Baird Ultra Short Bond Fund – Investor Class
| Six Months | ||||||||||||||||
| Ended | ||||||||||||||||
| June 30, 2017 | Year Ended December 31, | |||||||||||||||
| (Unaudited) | 2016 | 2015 | 2014 | |||||||||||||
| Per Share Data: | ||||||||||||||||
| Net asset value, beginning of period | $ | 10.03 | $ | 9.98 | $ | 10.02 | $ | 10.00 | ||||||||
| Income from investment operations: | ||||||||||||||||
| Net investment income | 0.05 | (1) | 0.08 | (1) | 0.05 | (1) | 0.07 | |||||||||
| Net realized and unrealized | ||||||||||||||||
| gains (losses) on investments | — | 0.05 | (0.03 | ) | 0.02 | (2) | ||||||||||
| Total from investment operations | 0.05 | 0.13 | 0.02 | 0.09 | ||||||||||||
| Less distributions: | ||||||||||||||||
| Distributions from net investment income | (0.04 | ) | (0.08 | ) | (0.06 | ) | (0.07 | ) | ||||||||
| Total distributions | (0.04 | ) | (0.08 | ) | (0.06 | ) | (0.07 | ) | ||||||||
| Net asset value, end of period | $ | 10.04 | $ | 10.03 | $ | 9.98 | $ | 10.02 | ||||||||
| Total return | 0.52 | %(3) | 1.32 | % | 0.16 | % | 0.88 | % | ||||||||
| Supplemental data and ratios: | ||||||||||||||||
| Net assets, end of period (millions) | $ | 13.6 | $ | 5.2 | $ | 1.2 | $ | 0.9 | ||||||||
| Ratio of expenses to average net assets | 0.40 | %(4) | 0.40 | % | 0.40 | % | 0.40 | % | ||||||||
| Ratio of expenses to average | ||||||||||||||||
| net assets (before waivers) | 0.55 | %(4) | 0.55 | % | 0.55 | % | 0.55 | % | ||||||||
| Ratio of net investment income | ||||||||||||||||
| to average net assets | 0.92 | %(4) | 0.80 | % | 0.53 | % | 0.68 | % | ||||||||
| Ratio of net investment income | ||||||||||||||||
| to average net assets (before waivers) | 0.77 | %(4) | 0.65 | % | 0.38 | % | 0.53 | % | ||||||||
Portfolio turnover rate(5) | 40.5 | %(3) | 96.9 | % | 65.5 | % | 57.6 | % | ||||||||
| (1) | Calculated using average shares outstanding during the period. |
| (2) | Due to timing of capital share transactions, the per share amount of net realized and unrealized gain (loss) on investments varies from the amounts shown in the statement of operations. |
| (3) | Not annualized. |
| (4) | Annualized. |
| (5) | Portfolio turnover is calculated on the basis of the Fund as a whole without distinguishing between the classes of shares issued. |
The accompanying notes are an integral part of these financial statements.
Page 91
Financial Highlights
Baird Short-Term Bond Fund – Institutional Class
| Six Months | ||||||||||||||||||||||||
| Ended | ||||||||||||||||||||||||
| June 30, 2017 | Year Ended December 31, | |||||||||||||||||||||||
| (Unaudited) | 2016 | 2015 | 2014 | 2013 | 2012 | |||||||||||||||||||
| Per Share Data: | ||||||||||||||||||||||||
| Net asset value, | ||||||||||||||||||||||||
| beginning of period | $ | 9.66 | $ | 9.60 | $ | 9.67 | $ | 9.69 | $ | 9.75 | $ | 9.59 | ||||||||||||
| Income from | ||||||||||||||||||||||||
| investment operations: | ||||||||||||||||||||||||
| Net investment income | 0.08 | (1) | 0.15 | (1) | 0.13 | (1) | 0.16 | 0.17 | (1) | 0.22 | ||||||||||||||
| Net realized and unrealized | ||||||||||||||||||||||||
| gains (losses) on investments | 0.03 | 0.06 | (0.05 | ) | (0.01 | ) | (0.04 | ) | 0.17 | |||||||||||||||
| Total from | ||||||||||||||||||||||||
| investment operations | 0.11 | 0.21 | 0.08 | 0.15 | 0.13 | 0.39 | ||||||||||||||||||
| Less distributions: | ||||||||||||||||||||||||
| Distributions from net | ||||||||||||||||||||||||
| investment income | (0.08 | ) | (0.15 | ) | (0.15 | ) | (0.16 | ) | (0.17 | ) | (0.22 | ) | ||||||||||||
| Distributions from | ||||||||||||||||||||||||
| net realized gains | — | (0.00 | )(2) | (0.00 | )(2) | (0.01 | ) | (0.02 | ) | (0.01 | ) | |||||||||||||
| Total distributions | (0.08 | ) | (0.15 | ) | (0.15 | ) | (0.17 | ) | (0.19 | ) | (0.23 | ) | ||||||||||||
| Net asset value, end of period | $ | 9.69 | $ | 9.66 | $ | 9.60 | $ | 9.67 | $ | 9.69 | $ | 9.75 | ||||||||||||
| Total return | 1.10 | %(3) | 2.25 | % | 0.89 | % | 1.49 | % | 1.33 | % | 4.16 | % | ||||||||||||
| Supplemental data and ratios: | ||||||||||||||||||||||||
| Net assets, | ||||||||||||||||||||||||
| end of period (millions) | $ | 4,461.0 | $ | 3,769.3 | $ | 2,976.0 | $ | 2,640.9 | $ | 1,985.0 | $ | 1,295.7 | ||||||||||||
| Ratio of expenses | ||||||||||||||||||||||||
| to average net assets | 0.30 | %(4) | 0.30 | % | 0.30 | % | 0.30 | % | 0.30 | % | 0.30 | % | ||||||||||||
| Ratio of net | ||||||||||||||||||||||||
| investment income | ||||||||||||||||||||||||
| to average net assets | 1.69 | %(4) | 1.57 | % | 1.30 | % | 1.56 | % | 1.71 | % | 2.23 | % | ||||||||||||
Portfolio turnover rate(5) | 24.3 | %(3) | 44.0 | % | 37.8 | % | 51.2 | % | 45.1 | % | 40.1 | % | ||||||||||||
| (1) | Calculated using average shares outstanding during the period. |
| (2) | Amount is less than $0.005. |
| (3) | Not annualized. |
| (4) | Annualized. |
| (5) | Portfolio turnover is calculated on the basis of the Fund as a whole without distinguishing between the classes of shares issued. |
The accompanying notes are an integral part of these financial statements.
Page 92
Financial Highlights
Baird Short-Term Bond Fund – Investor Class
| September 19, | ||||||||||||||||||||||||
| Six Months | 2012^ | |||||||||||||||||||||||
| Ended | through | |||||||||||||||||||||||
| June 30, 2017 | Year Ended December 31, | December 31, | ||||||||||||||||||||||
| (Unaudited) | 2016 | 2015 | 2014 | 2013 | 2012 | |||||||||||||||||||
| Per Share Data: | ||||||||||||||||||||||||
| Net asset value, | ||||||||||||||||||||||||
| beginning of period | $ | 9.66 | $ | 9.60 | $ | 9.67 | $ | 9.69 | $ | 9.75 | $ | 9.77 | ||||||||||||
| Income from | ||||||||||||||||||||||||
| investment operations: | ||||||||||||||||||||||||
| Net investment income | 0.07 | (1) | 0.13 | (1) | 0.10 | (1) | 0.14 | 0.15 | (1) | 0.06 | ||||||||||||||
| Net realized and unrealized | ||||||||||||||||||||||||
| gains (losses) on investments | 0.02 | 0.06 | (0.04 | ) | (0.02 | ) | (0.04 | ) | 0.00 | (2) | ||||||||||||||
| Total from | ||||||||||||||||||||||||
| investment operations | 0.09 | 0.19 | 0.06 | 0.12 | 0.11 | 0.06 | ||||||||||||||||||
| Less distributions: | ||||||||||||||||||||||||
| Distributions from net | ||||||||||||||||||||||||
| investment income | (0.06 | ) | (0.13 | ) | (0.13 | ) | (0.13 | ) | (0.15 | ) | (0.07 | ) | ||||||||||||
| Distributions from | ||||||||||||||||||||||||
| net realized gains | — | (0.00 | )(2) | (0.00 | )(2) | (0.01 | ) | (0.02 | ) | (0.01 | ) | |||||||||||||
| Total distributions | (0.06 | ) | (0.13 | ) | (0.13 | ) | (0.14 | ) | (0.17 | ) | (0.08 | ) | ||||||||||||
| Net asset value, end of period | $ | 9.69 | $ | 9.66 | $ | 9.60 | $ | 9.67 | $ | 9.69 | $ | 9.75 | ||||||||||||
| Total return | 0.98 | %(3) | 2.00 | % | 0.64 | % | 1.25 | % | 1.11 | % | 0.68 | %(3) | ||||||||||||
| Supplemental data and ratios: | ||||||||||||||||||||||||
| Net assets, | ||||||||||||||||||||||||
| end of period (millions) | $ | 127.5 | $ | 104.9 | $ | 40.6 | $ | 35.8 | $ | 2.5 | $ | 1.5 | ||||||||||||
| Ratio of expenses | ||||||||||||||||||||||||
| to average net assets | 0.55 | %(4) | 0.55 | % | 0.55 | % | 0.55 | % | 0.55 | % | 0.55 | %(4) | ||||||||||||
| Ratio of net | ||||||||||||||||||||||||
| investment income | ||||||||||||||||||||||||
| to average net assets | 1.44 | %(4) | 1.32 | % | 1.05 | % | 1.31 | % | 1.46 | % | 1.98 | %(4) | ||||||||||||
Portfolio turnover rate(5) | 24.3 | %(3) | 44.0 | % | 37.8 | % | 51.2 | % | 45.1 | % | 40.1 | %(3) | ||||||||||||
| ^ | Inception date. |
| (1) | Calculated using average shares outstanding during the period. |
| (2) | Amount is less than $0.005. |
| (3) | Not annualized. |
| (4) | Annualized. |
| (5) | Portfolio turnover is calculated on the basis of the Fund as a whole without distinguishing between the classes of shares issued. |
The accompanying notes are an integral part of these financial statements.
Page 93
Financial Highlights
Baird Intermediate Bond Fund – Institutional Class
| Six Months | ||||||||||||||||||||||||
| Ended | ||||||||||||||||||||||||
| June 30, 2017 | Year Ended December 31, | |||||||||||||||||||||||
| (Unaudited) | 2016 | 2015 | 2014 | 2013 | 2012 | |||||||||||||||||||
| Per Share Data: | ||||||||||||||||||||||||
| Net asset value, | ||||||||||||||||||||||||
| beginning of period | $ | 10.97 | $ | 10.93 | $ | 11.10 | $ | 11.00 | $ | 11.31 | $ | 11.06 | ||||||||||||
| Income from | ||||||||||||||||||||||||
| investment operations: | ||||||||||||||||||||||||
| Net investment income | 0.13 | (1) | 0.25 | (1) | 0.24 | (1) | 0.26 | (1) | 0.27 | 0.33 | (1) | |||||||||||||
| Net realized and unrealized | ||||||||||||||||||||||||
| gains (losses) on investments | 0.09 | 0.06 | (0.13 | ) | 0.13 | (0.29 | ) | 0.38 | ||||||||||||||||
| Total from | ||||||||||||||||||||||||
| investment operations | 0.22 | 0.31 | 0.11 | 0.39 | (0.02 | ) | 0.71 | |||||||||||||||||
| Less distributions: | ||||||||||||||||||||||||
| Distributions from net | ||||||||||||||||||||||||
| investment income | (0.12 | ) | (0.25 | ) | (0.25 | ) | (0.27 | ) | (0.27 | ) | (0.33 | ) | ||||||||||||
| Distributions from | ||||||||||||||||||||||||
| net realized gains | — | (0.02 | ) | (0.03 | ) | (0.02 | ) | (0.02 | ) | (0.13 | ) | |||||||||||||
| Total distributions | (0.12 | ) | (0.27 | ) | (0.28 | ) | (0.29 | ) | (0.29 | ) | (0.46 | ) | ||||||||||||
| Net asset value, end of period | $ | 11.07 | $ | 10.97 | $ | 10.93 | $ | 11.10 | $ | 11.00 | $ | 11.31 | ||||||||||||
| Total return | 2.02 | %(2) | 2.83 | % | 0.99 | % | 3.50 | % | (0.17 | )% | 6.52 | % | ||||||||||||
| Supplemental data and ratios: | ||||||||||||||||||||||||
| Net assets, | ||||||||||||||||||||||||
| end of period (millions) | $ | 2,554.5 | $ | 2,209.1 | $ | 1,787.0 | $ | 1,468.2 | $ | 1,113.7 | $ | 867.5 | ||||||||||||
| Ratio of expenses | ||||||||||||||||||||||||
| to average net assets | 0.30 | %(3) | 0.30 | % | 0.30 | % | 0.30 | % | 0.30 | % | 0.30 | % | ||||||||||||
| Ratio of net | ||||||||||||||||||||||||
| investment income | ||||||||||||||||||||||||
| to average net assets | 2.31 | %(3) | 2.21 | % | 2.14 | % | 2.37 | % | 2.45 | % | 2.95 | % | ||||||||||||
Portfolio turnover rate(4) | 18.3 | %(2) | 30.1 | % | 39.0 | % | 29.2 | % | 45.1 | % | 45.1 | % | ||||||||||||
| (1) | Calculated using average shares outstanding during the period. |
| (2) | Not annualized. |
| (3) | Annualized. |
| (4) | Portfolio turnover is calculated on the basis of the Fund as a whole without distinguishing between the classes of shares issued. |
The accompanying notes are an integral part of these financial statements.
Page 94
Financial Highlights
Baird Intermediate Bond Fund – Investor Class
| Six Months | ||||||||||||||||||||||||
| Ended | ||||||||||||||||||||||||
| June 30, 2017 | Year Ended December 31, | |||||||||||||||||||||||
| (Unaudited) | 2016 | 2015 | 2014 | 2013 | 2012 | |||||||||||||||||||
| Per Share Data: | ||||||||||||||||||||||||
| Net asset value, | ||||||||||||||||||||||||
| beginning of period | $ | 11.44 | $ | 11.39 | $ | 11.56 | $ | 11.43 | $ | 11.74 | $ | 11.47 | ||||||||||||
| Income from | ||||||||||||||||||||||||
| investment operations: | ||||||||||||||||||||||||
| Net investment income | 0.12 | (1) | 0.23 | (1) | 0.22 | (1) | 0.25 | (1) | 0.25 | 0.32 | (1) | |||||||||||||
| Net realized and unrealized | ||||||||||||||||||||||||
| gains (losses) on investments | 0.10 | 0.06 | (0.14 | ) | 0.14 | (0.29 | ) | 0.39 | ||||||||||||||||
| Total from | ||||||||||||||||||||||||
| investment operations | 0.22 | 0.29 | 0.08 | 0.39 | (0.04 | ) | 0.71 | |||||||||||||||||
| Less distributions: | ||||||||||||||||||||||||
| Distributions from net | ||||||||||||||||||||||||
| investment income | (0.11 | ) | (0.22 | ) | (0.22 | ) | (0.24 | ) | (0.25 | ) | (0.31 | ) | ||||||||||||
| Distributions from | ||||||||||||||||||||||||
| net realized gains | — | (0.02 | ) | (0.03 | ) | (0.02 | ) | (0.02 | ) | (0.13 | ) | |||||||||||||
| Total distributions | (0.11 | ) | (0.24 | ) | (0.25 | ) | (0.26 | ) | (0.27 | ) | (0.44 | ) | ||||||||||||
| Net asset value, end of period | $ | 11.55 | $ | 11.44 | $ | 11.39 | $ | 11.56 | $ | 11.43 | $ | 11.74 | ||||||||||||
| Total return | 1.90 | %(2) | 2.55 | % | 0.79 | % | 3.29 | % | (0.41 | )% | 6.20 | % | ||||||||||||
| Supplemental data and ratios: | ||||||||||||||||||||||||
| Net assets, | ||||||||||||||||||||||||
| end of period (millions) | $ | 122.3 | $ | 98.1 | $ | 103.4 | $ | 115.6 | $ | 42.1 | $ | 26.7 | ||||||||||||
| Ratio of expenses | ||||||||||||||||||||||||
| to average net assets | 0.55 | %(3) | 0.55 | % | 0.55 | % | 0.55 | % | 0.55 | % | 0.55 | % | ||||||||||||
| Ratio of net | ||||||||||||||||||||||||
| investment income | ||||||||||||||||||||||||
| to average net assets | 2.06 | %(3) | 1.96 | % | 1.89 | % | 2.12 | % | 2.20 | % | 2.70 | % | ||||||||||||
Portfolio turnover rate(4) | 18.3 | %(2) | 30.1 | % | 39.0 | % | 29.2 | % | 45.1 | % | 45.1 | % | ||||||||||||
| (1) | Calculated using average shares outstanding during the period. |
| (2) | Not annualized. |
| (3) | Annualized. |
| (4) | Portfolio turnover is calculated on the basis of the Fund as a whole without distinguishing between the classes of shares issued. |
The accompanying notes are an integral part of these financial statements.
Page 95
Financial Highlights
Baird Aggregate Bond Fund – Institutional Class
| Six Months | ||||||||||||||||||||||||
| Ended | ||||||||||||||||||||||||
| June 30, 2017 | Year Ended December 31, | |||||||||||||||||||||||
| (Unaudited) | 2016 | 2015 | 2014 | 2013 | 2012 | |||||||||||||||||||
| Per Share Data: | ||||||||||||||||||||||||
| Net asset value, | ||||||||||||||||||||||||
| beginning of period | $ | 10.70 | $ | 10.61 | $ | 10.81 | $ | 10.41 | $ | 10.89 | $ | 10.65 | ||||||||||||
| Income from | ||||||||||||||||||||||||
| investment operations: | ||||||||||||||||||||||||
| Net investment income | 0.13 | (1) | 0.25 | (1) | 0.24 | (1) | 0.30 | (2) | 0.32 | (1) | 0.38 | (1) | ||||||||||||
| Net realized and unrealized | ||||||||||||||||||||||||
| gains (losses) on investments | 0.16 | 0.12 | (0.18 | ) | 0.41 | (0.45 | ) | 0.45 | ||||||||||||||||
| Total from | ||||||||||||||||||||||||
| investment operations | 0.29 | 0.37 | 0.06 | 0.71 | (0.13 | ) | 0.83 | |||||||||||||||||
| Less distributions: | ||||||||||||||||||||||||
| Distributions from net | ||||||||||||||||||||||||
| investment income | (0.13 | ) | (0.26 | ) | (0.26 | ) | (0.31 | ) | (0.35 | ) | (0.43 | ) | ||||||||||||
| Distributions from | ||||||||||||||||||||||||
| net realized gains | — | (0.02 | ) | — | — | — | (0.16 | ) | ||||||||||||||||
| Total distributions | (0.13 | ) | (0.28 | ) | (0.26 | ) | (0.31 | ) | (0.35 | ) | (0.59 | ) | ||||||||||||
| Net asset value, end of period | $ | 10.86 | $ | 10.70 | $ | 10.61 | $ | 10.81 | $ | 10.41 | $ | 10.89 | ||||||||||||
| Total return | 2.72 | %(3) | 3.52 | % | 0.55 | % | 6.89 | % | (1.25 | )% | 7.92 | % | ||||||||||||
| Supplemental data and ratios: | ||||||||||||||||||||||||
| Net assets, | ||||||||||||||||||||||||
| end of period (millions) | $ | 11,878.1 | $ | 9,769.9 | $ | 6,318.4 | $ | 3,448.6 | $ | 1,665.0 | $ | 1,495.4 | ||||||||||||
| Ratio of expenses | ||||||||||||||||||||||||
| to average net assets | 0.30 | %(4) | 0.30 | % | 0.30 | % | 0.30 | % | 0.30 | % | 0.30 | % | ||||||||||||
| Ratio of net | ||||||||||||||||||||||||
| investment income | ||||||||||||||||||||||||
| to average net assets | 2.37 | %(4) | 2.25 | % | 2.24 | % | 2.81 | % | 3.01 | % | 3.51 | % | ||||||||||||
Portfolio turnover rate(5) | 13.1 | %(3) | 35.7 | % | 39.6 | % | 32.1 | % | 28.4 | % | 64.4 | % | ||||||||||||
| (1) | Calculated using average shares outstanding during the period. |
| (2) | Net investment income per share is calculated using ending balance prior to consideration of adjustments for permanent book and tax differences. |
| (3) | Not annualized. |
| (4) | Annualized. |
| (5) | Portfolio turnover is calculated on the basis of the Fund as a whole without distinguishing between the classes of shares issued. |
The accompanying notes are an integral part of these financial statements.
Page 96
Financial Highlights
Baird Aggregate Bond Fund – Investor Class
| Six Months | ||||||||||||||||||||||||
| Ended | ||||||||||||||||||||||||
| June 30, 2017 | Year Ended December 31, | |||||||||||||||||||||||
| (Unaudited) | 2016 | 2015 | 2014 | 2013 | 2012 | |||||||||||||||||||
| Per Share Data: | ||||||||||||||||||||||||
| Net asset value, | ||||||||||||||||||||||||
| beginning of period | $ | 11.05 | $ | 10.94 | $ | 11.15 | $ | 10.72 | $ | 11.21 | $ | 10.94 | ||||||||||||
| Income from | ||||||||||||||||||||||||
| investment operations: | ||||||||||||||||||||||||
| Net investment income | 0.12 | (1) | 0.23 | (1) | 0.22 | (1) | 0.28 | (2) | 0.29 | (1) | 0.37 | (1) | ||||||||||||
| Net realized and unrealized | ||||||||||||||||||||||||
| gains (losses) on investments | 0.17 | 0.14 | (0.20 | ) | 0.43 | (0.46 | ) | 0.46 | ||||||||||||||||
| Total from | ||||||||||||||||||||||||
| investment operations | 0.29 | 0.37 | 0.02 | 0.71 | (0.17 | ) | 0.83 | |||||||||||||||||
| Less distributions: | ||||||||||||||||||||||||
| Distributions from net | ||||||||||||||||||||||||
| investment income | (0.12 | ) | (0.24 | ) | (0.23 | ) | (0.28 | ) | (0.32 | ) | (0.40 | ) | ||||||||||||
| Distributions from | ||||||||||||||||||||||||
| net realized gains | — | (0.02 | ) | — | — | — | (0.16 | ) | ||||||||||||||||
| Total distributions | (0.12 | ) | (0.26 | ) | (0.23 | ) | (0.28 | ) | (0.32 | ) | (0.56 | ) | ||||||||||||
| Net asset value, end of period | $ | 11.22 | $ | 11.05 | $ | 10.94 | $ | 11.15 | $ | 10.72 | $ | 11.21 | ||||||||||||
| Total return | 2.60 | %(3) | 3.34 | % | 0.21 | % | 6.71 | % | (1.54 | )% | 7.72 | % | ||||||||||||
| Supplemental data and ratios: | ||||||||||||||||||||||||
| Net assets, | ||||||||||||||||||||||||
| end of period (millions) | $ | 848.8 | $ | 809.1 | $ | 429.6 | $ | 241.7 | $ | 141.9 | $ | 49.4 | ||||||||||||
| Ratio of expenses | ||||||||||||||||||||||||
| to average net assets | 0.55 | %(4) | 0.55 | % | 0.55 | % | 0.55 | % | 0.55 | % | 0.55 | % | ||||||||||||
| Ratio of net | ||||||||||||||||||||||||
| investment income | ||||||||||||||||||||||||
| to average net assets | 2.12 | %(4) | 2.00 | % | 1.99 | % | 2.56 | % | 2.76 | % | 3.26 | % | ||||||||||||
Portfolio turnover rate(5) | 13.1 | %(3) | 35.7 | % | 39.6 | % | 32.1 | % | 28.4 | % | 64.4 | % | ||||||||||||
| (1) | Calculated using average shares outstanding during the period. |
| (2) | Net investment income per share is calculated using ending balance prior to consideration of adjustments for permanent book and tax differences. |
| (3) | Not annualized. |
| (4) | Annualized. |
| (5) | Portfolio turnover is calculated on the basis of the Fund as a whole without distinguishing between the classes of shares issued. |
The accompanying notes are an integral part of these financial statements.
Page 97
Financial Highlights
Baird Core Plus Bond Fund – Institutional Class
| Six Months | ||||||||||||||||||||||||
| Ended | ||||||||||||||||||||||||
| June 30, 2017 | Year Ended December 31, | |||||||||||||||||||||||
| (Unaudited) | 2016 | 2015 | 2014 | 2013 | 2012 | |||||||||||||||||||
| Per Share Data: | ||||||||||||||||||||||||
| Net asset value, | ||||||||||||||||||||||||
| beginning of period | $ | 11.03 | $ | 10.85 | $ | 11.14 | $ | 10.77 | $ | 11.27 | $ | 10.82 | ||||||||||||
| Income from | ||||||||||||||||||||||||
| investment operations: | ||||||||||||||||||||||||
| Net investment income | 0.15 | (1) | 0.29 | (1) | 0.28 | (1) | 0.32 | (2) | 0.31 | (2) | 0.35 | (1) | ||||||||||||
| Net realized and unrealized | ||||||||||||||||||||||||
| gains (losses) on investments | 0.18 | 0.22 | (0.26 | ) | 0.38 | (0.46 | ) | 0.50 | ||||||||||||||||
| Total from | ||||||||||||||||||||||||
| investment operations | 0.33 | 0.51 | 0.02 | 0.70 | (0.15 | ) | 0.85 | |||||||||||||||||
| Less distributions: | ||||||||||||||||||||||||
| Distributions from net | ||||||||||||||||||||||||
| investment income | (0.15 | ) | (0.31 | ) | (0.31 | ) | (0.33 | ) | (0.34 | ) | (0.38 | ) | ||||||||||||
| Distributions from | ||||||||||||||||||||||||
| net realized gains | — | (0.02 | ) | — | — | (0.01 | ) | (0.02 | ) | |||||||||||||||
| Total distributions | (0.15 | ) | (0.33 | ) | (0.31 | ) | (0.33 | ) | (0.35 | ) | (0.40 | ) | ||||||||||||
| Net asset value, end of period | $ | 11.21 | $ | 11.03 | $ | 10.85 | $ | 11.14 | $ | 10.77 | $ | 11.27 | ||||||||||||
| Total return | 2.99 | %(3) | 4.73 | % | 0.14 | % | 6.59 | % | (1.32 | )% | 7.95 | % | ||||||||||||
| Supplemental data and ratios: | ||||||||||||||||||||||||
| Net assets, | ||||||||||||||||||||||||
| end of period (millions) | $ | 11,360.3 | $ | 10,023.6 | $ | 7,199.8 | $ | 4,520.9 | $ | 1,789.7 | $ | 1,573.4 | ||||||||||||
| Ratio of expenses | ||||||||||||||||||||||||
| to average net assets | 0.30 | %(4) | 0.30 | % | 0.30 | % | 0.30 | % | 0.30 | % | 0.30 | % | ||||||||||||
| Ratio of net | ||||||||||||||||||||||||
| investment income | ||||||||||||||||||||||||
| to average net assets | 2.68 | %(4) | 2.61 | % | 2.50 | % | 2.89 | % | 2.83 | % | 3.12 | % | ||||||||||||
Portfolio turnover rate(5) | 15.5 | %(3) | 33.2 | % | 34.2 | % | 35.0 | % | 35.5 | % | 36.7 | % | ||||||||||||
| (1) | Calculated using average shares outstanding during the period. |
| (2) | Net investment income per share is calculated using ending balance prior to consideration of adjustments for permanent book and tax differences. |
| (3) | Not annualized. |
| (4) | Annualized. |
| (5) | Portfolio turnover is calculated on the basis of the Fund as a whole without distinguishing between the classes of shares issued. |
The accompanying notes are an integral part of these financial statements.
Page 98
Financial Highlights
Baird Core Plus Bond Fund – Investor Class
| Six Months | ||||||||||||||||||||||||
| Ended | ||||||||||||||||||||||||
| June 30, 2017 | Year Ended December 31, | |||||||||||||||||||||||
| (Unaudited) | 2016 | 2015 | 2014 | 2013 | 2012 | |||||||||||||||||||
| Per Share Data: | ||||||||||||||||||||||||
| Net asset value, | ||||||||||||||||||||||||
| beginning of period | $ | 11.46 | $ | 11.26 | $ | 11.55 | $ | 11.16 | $ | 11.67 | $ | 11.18 | ||||||||||||
| Income from | ||||||||||||||||||||||||
| investment operations: | ||||||||||||||||||||||||
| Net investment income | 0.14 | (1) | 0.27 | (1) | 0.26 | (1) | 0.29 | (2) | 0.29 | (2) | 0.33 | (1) | ||||||||||||
| Net realized and unrealized | ||||||||||||||||||||||||
| gains (losses) on investments | 0.19 | 0.23 | (0.27 | ) | 0.40 | (0.48 | ) | 0.53 | ||||||||||||||||
| Total from | ||||||||||||||||||||||||
| investment operations | 0.33 | 0.50 | (0.01 | ) | 0.69 | (0.19 | ) | 0.86 | ||||||||||||||||
| Less distributions: | ||||||||||||||||||||||||
| Distributions from net | ||||||||||||||||||||||||
| investment income | (0.13 | ) | (0.28 | ) | (0.28 | ) | (0.30 | ) | (0.31 | ) | (0.35 | ) | ||||||||||||
| Distributions from | ||||||||||||||||||||||||
| net realized gains | — | (0.02 | ) | — | — | (0.01 | ) | (0.02 | ) | |||||||||||||||
| Total distributions | (0.13 | ) | (0.30 | ) | (0.28 | ) | (0.30 | ) | (0.32 | ) | (0.37 | ) | ||||||||||||
| Net asset value, end of period | $ | 11.66 | $ | 11.46 | $ | 11.26 | $ | 11.55 | $ | 11.16 | $ | 11.67 | ||||||||||||
| Total return | 2.93 | %(3) | 4.47 | % | (0.11 | )% | 6.27 | % | (1.61 | )% | 7.80 | % | ||||||||||||
| Supplemental data and ratios: | ||||||||||||||||||||||||
| Net assets, | ||||||||||||||||||||||||
| end of period (millions) | $ | 3,108.0 | $ | 2,881.8 | $ | 2,183.5 | $ | 2,195.7 | $ | 1,044.1 | $ | 1,036.0 | ||||||||||||
| Ratio of expenses | ||||||||||||||||||||||||
| to average net assets | 0.55 | %(4) | 0.55 | % | 0.55 | % | 0.55 | % | 0.55 | % | 0.55 | % | ||||||||||||
| Ratio of net | ||||||||||||||||||||||||
| investment income | ||||||||||||||||||||||||
| to average net assets | 2.43 | %(4) | 2.36 | % | 2.25 | % | 2.64 | % | 2.58 | % | 2.87 | % | ||||||||||||
Portfolio turnover rate(5) | 15.5 | %(3) | 33.2 | % | 34.2 | % | 35.0 | % | 35.5 | % | 36.7 | % | ||||||||||||
| (1) | Calculated using average shares outstanding during the period. |
| (2) | Net investment income per share is calculated using ending balance prior to consideration of adjustments for permanent book and tax differences. |
| (3) | Not annualized. |
| (4) | Annualized. |
| (5) | Portfolio turnover is calculated on the basis of the Fund as a whole without distinguishing between the classes of shares issued. |
The accompanying notes are an integral part of these financial statements.
Page 99
Financial Highlights
Baird Short-Term Municipal Bond Fund – Institutional Class
| Six Months | ||||||||||||
| Ended | Year Ended | Period Ended | ||||||||||
| June 30, 2017 | December 31, | December 31, | ||||||||||
| (Unaudited) | 2016 | 2015^ | ||||||||||
| Per Share Data: | ||||||||||||
| Net asset value, beginning of period | $ | 9.97 | $ | 10.04 | $ | 10.00 | ||||||
| Income from investment operations: | ||||||||||||
| Net investment income | 0.08 | (1) | 0.15 | (1) | 0.05 | (1) | ||||||
| Net realized and unrealized gains (losses) on investments | 0.13 | (0.08 | ) | 0.04 | ||||||||
| Total from investment operations | 0.21 | 0.07 | 0.09 | |||||||||
| Less distributions: | ||||||||||||
| Distributions from net investment income | (0.08 | ) | (0.14 | ) | (0.04 | ) | ||||||
| Distributions from net realized gains | — | (0.00 | )(2) | (0.01 | ) | |||||||
| Total distributions | (0.08 | ) | (0.14 | ) | (0.05 | ) | ||||||
| Net asset value, end of period | $ | 10.10 | $ | 9.97 | $ | 10.04 | ||||||
| Total return | 2.09 | %(3) | 0.71 | % | 0.94 | %(3) | ||||||
| Supplemental data and ratios: | ||||||||||||
| Net assets, end of period (millions) | $ | 84.8 | $ | 52.4 | $ | 12.3 | ||||||
| Ratio of expenses to average net assets | 0.30 | %(4) | 0.30 | % | 0.30 | %(4) | ||||||
| Ratio of net investment income to average net assets | 1.68 | %(4) | 1.44 | % | 1.42 | %(4) | ||||||
Portfolio turnover rate(5) | 33.9 | %(3) | 38.3 | % | 41.4 | %(3) | ||||||
| ^ | Inception was close of business on August 31, 2015. |
| (1) | Calculated using average shares outstanding during the period. |
| (2) | Amount is less then $0.005. |
| (3) | Not annualized. |
| (4) | Annualized. |
| (5) | Portfolio turnover is calculated on the basis of the Fund as a whole without distinguishing between the classes of shares issued. |
The accompanying notes are an integral part of these financial statements.
Page 100
Financial Highlights
Baird Short-Term Municipal Bond Fund – Investor Class
| Six Months | ||||||||||||
| Ended | Year Ended | Period Ended | ||||||||||
| June 30, 2017 | December 31, | December 31, | ||||||||||
| (Unaudited) | 2016 | 2015^ | ||||||||||
| Per Share Data: | ||||||||||||
| Net asset value, beginning of period | $ | 9.96 | $ | 10.04 | $ | 10.00 | ||||||
| Income from investment operations: | ||||||||||||
| Net investment income | 0.07 | (1) | 0.12 | (1) | 0.04 | (1) | ||||||
| Net realized and unrealized gains (losses) on investments | 0.12 | (0.08 | ) | 0.05 | ||||||||
| Total from investment operations | 0.19 | 0.04 | 0.09 | |||||||||
| Less distributions: | ||||||||||||
| Distributions from net investment income | (0.06 | ) | (0.12 | ) | (0.04 | ) | ||||||
| Distributions from net realized gains | — | (0.00 | )(2) | (0.01 | ) | |||||||
| Total distributions | (0.06 | ) | (0.12 | ) | (0.05 | ) | ||||||
| Net asset value, end of period | $ | 10.09 | $ | 9.96 | $ | 10.04 | ||||||
| Total return | 1.92 | %(3) | 0.40 | % | 0.86 | %(3) | ||||||
| Supplemental data and ratios: | ||||||||||||
| Net assets, end of period (millions) | $ | 2.2 | $ | 6.3 | $ | 0.1 | ||||||
| Ratio of expenses to average net assets | 0.55 | %(4) | 0.55 | % | 0.55 | %(4) | ||||||
| Ratio of net investment income to average net assets | 1.43 | %(4) | 1.19 | % | 1.17 | %(4) | ||||||
Portfolio turnover rate(5) | 33.9 | %(3) | 38.3 | % | 41.4 | %(3) | ||||||
| ^ | Inception was close of business on August 31, 2015. |
| (1) | Calculated using average shares outstanding during the period. |
| (2) | Amount is less then $0.005. |
| (3) | Not annualized. |
| (4) | Annualized. |
| (5) | Portfolio turnover is calculated on the basis of the Fund as a whole without distinguishing between the classes of shares issued. |
The accompanying notes are an integral part of these financial statements.
Page 101
Financial Highlights
Baird Quality Intermediate Municipal Bond Fund – Institutional Class
| Six Months | ||||||||||||||||||||||||
| Ended | ||||||||||||||||||||||||
| June 30, 2017 | Year Ended December 31, | |||||||||||||||||||||||
| (Unaudited) | 2016 | 2015 | 2014 | 2013 | 2012 | |||||||||||||||||||
| Per Share Data: | ||||||||||||||||||||||||
| Net asset value, | ||||||||||||||||||||||||
| beginning of period | $ | 11.43 | $ | 11.74 | $ | 11.77 | $ | 11.55 | $ | 12.01 | $ | 11.94 | ||||||||||||
| Income from | ||||||||||||||||||||||||
| investment operations: | ||||||||||||||||||||||||
| Net investment income | 0.13 | (1) | 0.26 | (1) | 0.28 | (1) | 0.30 | 0.32 | (1) | 0.30 | ||||||||||||||
| Net realized and unrealized | ||||||||||||||||||||||||
| gains (losses) on investments | 0.19 | (0.31 | ) | (0.03 | ) | 0.22 | (0.46 | ) | 0.07 | |||||||||||||||
| Total from | ||||||||||||||||||||||||
| investment operations | 0.32 | (0.05 | ) | 0.25 | 0.52 | (0.14 | ) | 0.37 | ||||||||||||||||
| Less distributions: | ||||||||||||||||||||||||
| Distributions from net | ||||||||||||||||||||||||
| investment income | (0.13 | ) | (0.26 | ) | (0.28 | ) | (0.30 | ) | (0.32 | ) | (0.30 | ) | ||||||||||||
| Total distributions | (0.13 | ) | (0.26 | ) | (0.28 | ) | (0.30 | ) | (0.32 | ) | (0.30 | ) | ||||||||||||
| Net asset value, end of period | $ | 11.62 | $ | 11.43 | $ | 11.74 | $ | 11.77 | $ | 11.55 | $ | 12.01 | ||||||||||||
| Total return | 2.81 | %(2) | (0.46 | )% | 2.19 | % | 4.54 | % | (1.19 | )% | 3.12 | % | ||||||||||||
| Supplemental data and ratios: | ||||||||||||||||||||||||
| Net assets, | ||||||||||||||||||||||||
| end of period (millions) | $ | 917.9 | $ | 936.2 | $ | 988.4 | $ | 918.9 | $ | 801.4 | $ | 963.1 | ||||||||||||
| Ratio of expenses | ||||||||||||||||||||||||
| to average net assets | 0.30 | %(3) | 0.30 | % | 0.30 | % | 0.30 | % | 0.30 | % | 0.30 | % | ||||||||||||
| Ratio of net | ||||||||||||||||||||||||
| investment income | ||||||||||||||||||||||||
| to average net assets | 2.34 | %(3) | 2.19 | % | 2.42 | % | 2.56 | % | 2.65 | % | 2.48 | % | ||||||||||||
Portfolio turnover rate(4) | 8.1 | %(2) | 22.0 | % | 9.3 | % | 4.7 | % | 9.0 | % | 5.1 | % | ||||||||||||
| (1) | Calculated using average shares outstanding during the period. |
| (2) | Not annualized. |
| (3) | Annualized. |
| (4) | Portfolio turnover is calculated on the basis of the Fund as a whole without distinguishing between the classes of shares issued. |
The accompanying notes are an integral part of these financial statements.
Page 102
Financial Highlights
Baird Quality Intermediate Municipal Bond Fund – Investor Class
| Six Months | ||||||||||||||||||||||||
| Ended | ||||||||||||||||||||||||
| June 30, 2017 | Year Ended December 31, | |||||||||||||||||||||||
| (Unaudited) | 2016 | 2015 | 2014 | 2013 | 2012 | |||||||||||||||||||
| Per Share Data: | ||||||||||||||||||||||||
| Net asset value, | ||||||||||||||||||||||||
| beginning of period | $ | 11.69 | $ | 12.00 | $ | 12.03 | $ | 11.80 | $ | 12.26 | $ | 12.18 | ||||||||||||
| Income from | ||||||||||||||||||||||||
| investment operations: | ||||||||||||||||||||||||
| Net investment income | 0.12 | (1) | 0.23 | (1) | 0.26 | (1) | 0.28 | 0.29 | (1) | 0.27 | ||||||||||||||
| Net realized and unrealized | ||||||||||||||||||||||||
| gains (losses) on investments | 0.20 | (0.31 | ) | (0.04 | ) | 0.22 | (0.46 | ) | 0.08 | |||||||||||||||
| Total from | ||||||||||||||||||||||||
| investment operations | 0.32 | (0.08 | ) | 0.22 | 0.50 | (0.17 | ) | 0.35 | ||||||||||||||||
| Less distributions: | ||||||||||||||||||||||||
| Distributions from net | ||||||||||||||||||||||||
| investment income | (0.12 | ) | (0.23 | ) | (0.25 | ) | (0.27 | ) | (0.29 | ) | (0.27 | ) | ||||||||||||
| Total distributions | (0.12 | ) | (0.23 | ) | (0.25 | ) | (0.27 | ) | (0.29 | ) | (0.27 | ) | ||||||||||||
| Net asset value, end of period | $ | 11.89 | $ | 11.69 | $ | 12.00 | $ | 12.03 | $ | 11.80 | $ | 12.26 | ||||||||||||
| Total return | 2.71 | %(2) | (0.70 | )% | 1.89 | % | 4.27 | % | (1.42 | )% | 2.88 | % | ||||||||||||
| Supplemental data and ratios: | ||||||||||||||||||||||||
| Net assets, | ||||||||||||||||||||||||
| end of period (millions) | $ | 138.9 | $ | 136.1 | $ | 160.3 | $ | 186.7 | $ | 205.6 | $ | 258.5 | ||||||||||||
| Ratio of expenses | ||||||||||||||||||||||||
| to average net assets | 0.55 | %(3) | 0.55 | % | 0.55 | % | 0.55 | % | 0.55 | % | 0.55 | % | ||||||||||||
| Ratio of net | ||||||||||||||||||||||||
| investment income | ||||||||||||||||||||||||
| to average net assets | 2.09 | %(3) | 1.94 | % | 2.17 | % | 2.31 | % | 2.40 | % | 2.23 | % | ||||||||||||
Portfolio turnover rate(4) | 8.1 | %(2) | 22.0 | % | 9.3 | % | 4.7 | % | 9.0 | % | 5.1 | % | ||||||||||||
| (1) | Calculated using average shares outstanding during the period. |
| (2) | Not annualized. |
| (3) | Annualized. |
| (4) | Portfolio turnover is calculated on the basis of the Fund as a whole without distinguishing between the classes of shares issued. |
The accompanying notes are an integral part of these financial statements.
Page 103
Financial Highlights
Baird Core Intermediate Municipal Bond Fund – Institutional Class
| Six Months | ||||||||||||
| Ended | Year Ended | Period Ended | ||||||||||
| June 30, 2017 | December 31, | December 31, | ||||||||||
| (Unaudited) | 2016 | 2015^ | ||||||||||
| Per Share Data: | ||||||||||||
| Net asset value, beginning of period | $ | 10.01 | $ | 10.13 | $ | 10.00 | ||||||
| Income from investment operations: | ||||||||||||
| Net investment income | 0.10 | (1) | 0.18 | (1) | 0.06 | (1) | ||||||
| Net realized and unrealized gains (losses) on investments | 0.22 | (0.05 | ) | 0.14 | ||||||||
| Total from investment operations | 0.32 | 0.13 | 0.20 | |||||||||
| Less distributions: | ||||||||||||
| Distributions from net investment income | (0.10 | ) | (0.18 | ) | (0.06 | ) | ||||||
| Distributions from net realized gains | — | (0.07 | ) | (0.01 | ) | |||||||
| Total distributions | (0.10 | ) | (0.25 | ) | (0.07 | ) | ||||||
| Net asset value, end of period | $ | 10.23 | $ | 10.01 | $ | 10.13 | ||||||
| Total return | 3.28 | %(2) | 1.14 | % | 1.98 | %(2) | ||||||
| Supplemental data and ratios: | ||||||||||||
| Net assets, end of period (millions) | $ | 135.2 | $ | 96.3 | $ | 50.8 | ||||||
| Ratio of expenses to average net assets | 0.30 | %(3) | 0.30 | % | 0.30 | %(3) | ||||||
| Ratio of net investment income to average net assets | 2.06 | %(3) | 1.79 | % | 1.75 | %(3) | ||||||
Portfolio turnover rate(4) | 44.7 | %(2) | 94.8 | % | 108.3 | %(2) | ||||||
| ^ | Inception was close of business on August 31, 2015. |
| (1) | Calculated using average shares outstanding during the period. |
| (2) | Not annualized. |
| (3) | Annualized. |
| (4) | Portfolio turnover is calculated on the basis of the Fund as a whole without distinguishing between the classes of shares issued. |
The accompanying notes are an integral part of these financial statements.
Page 104
Financial Highlights
Baird Core Intermediate Municipal Bond Fund – Investor Class
| Six Months | ||||||||||||
| Ended | Year Ended | Period Ended | ||||||||||
| June 30, 2017 | December 31, | December 31, | ||||||||||
| (Unaudited) | 2016 | 2015^ | ||||||||||
| Per Share Data: | ||||||||||||
| Net asset value, beginning of period | $ | 10.00 | $ | 10.13 | $ | 10.00 | ||||||
| Income from investment operations: | ||||||||||||
| Net investment income | 0.09 | (1) | 0.16 | (1) | 0.05 | (1) | ||||||
| Net realized and unrealized gains (losses) on investments | 0.23 | (0.06 | ) | 0.14 | ||||||||
| Total from investment operations | 0.32 | 0.10 | 0.19 | |||||||||
| Less distributions: | ||||||||||||
| Distributions from net investment income | (0.09 | ) | (0.16 | ) | (0.05 | ) | ||||||
| Distributions from net realized gains | — | (0.07 | ) | (0.01 | ) | |||||||
| Total distributions | (0.09 | ) | (0.23 | ) | (0.06 | ) | ||||||
| Net asset value, end of period | $ | 10.23 | $ | 10.00 | $ | 10.13 | ||||||
| Total return | 3.16 | %(2) | 0.91 | % | 1.91 | %(2) | ||||||
| Supplemental data and ratios: | ||||||||||||
| Net assets, end of period (millions) | $ | 1.6 | $ | 1.4 | $ | 0.2 | ||||||
| Ratio of expenses to average net assets | 0.55 | %(3) | 0.55 | % | 0.55 | %(3) | ||||||
| Ratio of net investment income to average net assets | 1.81 | %(3) | 1.54 | % | 1.50 | %(3) | ||||||
Portfolio turnover rate(4) | 44.7 | %(2) | 94.8 | % | 108.3 | %(2) | ||||||
| ^ | Inception was close of business on August 31, 2015. |
| (1) | Calculated using average shares outstanding during the period. |
| (2) | Not annualized. |
| (3) | Annualized. |
| (4) | Portfolio turnover is calculated on the basis of the Fund as a whole without distinguishing between the classes of shares issued. |
The accompanying notes are an integral part of these financial statements.
Page 105
Notes to the Financial Statements
June 30, 2017 (Unaudited)
| 1. | Organization |
Baird Funds, Inc. (the “Corporation”) was incorporated on June 9, 2000 as a Wisconsin corporation and is registered as an open-end investment management company under the Investment Company Act of 1940, as amended (the “1940 Act”). The accompanying financial statements include the Baird Ultra Short Bond Fund, Baird Short-Term Bond Fund, Baird Intermediate Bond Fund, Baird Aggregate Bond Fund, Baird Core Plus Bond Fund, Baird Short-Term Municipal Bond Fund, Baird Quality Intermediate Municipal Bond Fund and Baird Core Intermediate Municipal Bond Fund (each, a “Fund” and collectively, the “Funds”), eight of the fifteen series comprising the Corporation, each of which is diversified within the meaning of the 1940 Act. Robert W. Baird & Co. Incorporated (“Baird” or the “Advisor”) serves as investment advisor to the Funds.
The Baird Ultra Short Bond Fund commenced with the sale of both Institutional and Investor Class shares on December 31, 2013. The Baird Short-Term Bond Fund commenced with the sale of Institutional Class shares on August 31, 2004 while the Investor Class shares commenced on September 19, 2012. The Baird Intermediate Bond Fund, Baird Aggregate Bond Fund and Baird Core Plus Bond Fund commenced with the sale of both Institutional and Investor Class shares on September 29, 2000. The Baird Short-Term Municipal Bond Fund and Core Intermediate Municipal Bond Fund commenced with the sale of both Institutional and Investor Class shares on August 31, 2015. The Baird Quality Intermediate Municipal Bond Fund commenced with the sale of both Institutional and Investor Class shares on March 30, 2001. Institutional Class shares are not subject to a distribution and service (12b-1) fee, while Investor Class shares are subject to a distribution and service (12b-1) fee of 0.25%. See Note 8.
The investment objective of the Baird Ultra Short Bond Fund is to seek current income consistent with preservation of capital. The Fund’s benchmark index, the Bloomberg Barclays U.S. Short-Term Government/Corporate Index, is an unmanaged, market value weighted index of investment grade, fixed debt including government and corporate securities with maturities less than one year.
The investment objective of the Baird Short-Term Bond Fund is to seek an annual rate of total return, before Fund expenses, greater than the annual rate of total return of the Bloomberg Barclays 1-3 Year U.S. Government/Credit Bond Index. The Bloomberg Barclays 1-3 Year U.S. Government/Credit Bond Index is an unmanaged, market value weighted index of investment grade, fixed-rate debt including government and corporate securities with maturities between one and three years.
The investment objective of the Baird Intermediate Bond Fund is to seek an annual rate of total return, before Fund expenses, greater than the annual rate of total return of the Bloomberg Barclays Intermediate U.S. Government/Credit Bond Index. The Bloomberg Barclays Intermediate U.S. Government/Credit Bond Index is an unmanaged, market value weighted index of investment grade, fixed-rate debt issues, including government and corporate securities, with maturities between one and ten years.
The investment objective of the Baird Aggregate Bond Fund is to seek an annual rate of total return, before Fund expenses, greater than the annual rate of total return of the Bloomberg Barclays U.S. Aggregate Bond Index. The Bloomberg Barclays U.S. Aggregate Bond Index is an unmanaged, market value weighted index of investment grade, fixed-rate debt issues, including government, corporate, asset-backed and mortgage-backed securities, with maturities of at least one year.
The investment objective of the Baird Core Plus Bond Fund is to seek an annual rate of total return, before Fund expenses, greater than the annual rate of total return of the Bloomberg Barclays U.S. Universal Bond Index. The Bloomberg Barclays U.S. Universal Bond Index is an unmanaged, market value weighted index of fixed income securities issued in U.S. dollars, including U.S. government and investment grade debt, non-investment grade debt, asset-backed and mortgage-backed securities, Eurobonds, 144A securities and emerging market debt, with maturities of at least one year.
The investment objective of the Baird Short-Term Municipal Bond Fund is to seek current income that is exempt from federal income tax and is consistent with the preservation of capital.
Page 106
Notes to the Financial Statements
June 30, 2017 (Unaudited)
| 1. | Organization (cont.) |
The primary investment objective of the Baird Quality Intermediate Municipal Bond Fund is to seek current income that is substantially exempt from federal income tax. A secondary objective is to seek total return with relatively low volatility of principal.
The investment objective of the Baird Core Intermediate Municipal Bond Fund is to seek a high level of current income that is exempt from federal income tax and is consistent with preservation of capital.
| 2. | Significant Accounting Policies |
The following is a summary of significant accounting policies consistently followed by the Funds in the preparation of their financial statements. These policies are in conformity with accounting principles generally accepted in the United States of America.
| a) | Investment Valuation – Section 2(a)(41) of the 1940 Act, together with the rules and interpretations of the Securities and Exchange Commission, require the Funds, in computing net asset value, to value their portfolio securities using market quotations when they are “readily available.” When market quotations are not readily available (e.g., because there is no regular market quotation for such securities, the market for such security is limited, the validity of quotations is questionable or the Funds’ independent pricing service does not provide a price), the Board of Directors of the Corporation must value the securities at “fair value determined in good faith.” The Board has delegated such responsibility to the Advisor pursuant to pricing policies and procedures that the Board has adopted and regularly reviews. In general, the “fair value” of a security means the price that would be received to sell a security in an orderly transaction between market participants at the measurement date. |
The Funds determine the fair value of their investments and compute their net asset value per share as of the close of regular trading of the New York Stock Exchange (4:00 p.m. EST). | |
| Consistent with Section 2(a)(41) of the 1940 Act, the Funds price their securities as follows: debt securities are valued at their evaluated bid prices as provided by an independent pricing service using valuation methods that are designed to represent fair value, such as matrix pricing and other analytical pricing models, market transactions and dealer quotations. Debt securities purchased with maturities of 60 days or less are valued as described above unless an evaluated price is not available, in which case such security is valued at acquisition cost, plus or minus any amortized discount or premium (“amortized cost”), or, if the Advisor does not believe amortized cost is reflective of the value of the security, the security is priced at fair value as described below. Investments in mutual funds are valued at their stated net asset value. Common stocks that are listed on a securities exchange (other than NASDAQ) are valued at the last quoted sales price. Securities traded on Nasdaq are valued at the Nasdaq Official Closing Price. Price information on listed stocks is taken from the exchange where the security is primarily traded. Securities that were not traded on the valuation date, as well as stocks that are not listed on an exchange, including NASDAQ, are valued at the average of the current bid and asked price. Other assets and securities for which market quotations are not readily available are valued at fair value as determined in good faith by the Advisor in accordance with procedures approved by the Corporation’s Board of Directors. In accordance with such procedures, the Advisor may use broker quotes or prices obtained from alternative independent pricing services or, if broker quotes or prices from alternative pricing services are unavailable or deemed to be unreliable, fair value will be determined by a valuation committee of the Advisor. In determining fair value, the valuation committee takes into account all relevant factors and available information. Consequently, the price of the security used by a Fund to calculate its NAV may differ from quoted or published prices for the same security. Fair value pricing involves subjective judgments and there is no single standard for determining a security’s fair value. As a result, different mutual funds could reasonably arrive at a different fair value for the same security. It is possible that the fair value determined for a security is materially different from the value that could be realized upon the sale of that security or from the values that other mutual funds may determine. In addition, given the |
Page 107
Notes to the Financial Statements
June 30, 2017 (Unaudited)
| 2. | Significant Accounting Policies (cont.) |
volatility and periodic illiquidity experienced in recent years, the prices determined for any individual security on any given day may vary significantly from the amount that can be obtained in an actual sale of that security, and the Funds’ NAVs may fluctuate significantly from day to day or from period to period. | |
| b) | Unregistered Securities – Seven of the Funds own certain investment securities which are unregistered and thus restricted with respect to resale. The value of such securities for the Baird Ultra Short Bond, Baird Short-Term Bond, Baird Intermediate Bond, Baird Aggregate Bond, Baird Core Plus Bond, Baird Short-Term Municipal Bond and Baird Core Intermediate Municipal Bond Funds were $76,103,193 (13.41% of net assets), $1,000,899,357 (21.81% of net assets), $465,909,044 (17.41% of net assets), $2,018,378,098 (15.86% of net assets), $2,646,933,025 (18.29% of net assets), $99,986 (0.11% of net assets) and $149,980 (0.11% of net assets), respectively, at June 30, 2017. Restricted securities may be deemed to be liquid as determined by the Advisor based on several factors. All of the restricted securities held by the Funds as of June 30, 2017 consist of securities issued pursuant to Rule 144A under the Securities Act of 1933 and all have been deemed to be liquid. |
| c) | Foreign Securities – Foreign securities are defined as securities of issuers that are organized outside the United States. The Funds may invest in U.S. dollar-denominated debt obligations of foreign companies and foreign governments. Investing in securities of foreign companies and foreign governments involves special risks and considerations not typically associated with investing in U.S. companies and the U.S. government. These risks include foreign currency fluctuations, political and economic instability and differences in financial reporting standards and less strict regulation of securities markets. Moreover, securities of many foreign companies and foreign governments and their markets may be less liquid and their prices more volatile than those of securities of comparable U.S. companies and the U.S. government. Occasionally, events that affect these values and exchange rates may occur after the close of the exchange on which such securities are traded. If such events materially affect the value of a Fund’s securities, these securities may be valued at their fair value pursuant to procedures adopted by the Board of Directors. |
| d) | Income Tax Status – The Funds intend to continue to qualify as regulated investment companies as provided in subchapter M of the Internal Revenue Code and to distribute substantially all of their taxable income to their shareholders in a manner which results in no tax expense to the Funds. Therefore, no federal income or excise tax provision is recorded. |
There is no tax liability resulting from unrecognized tax benefits relating to uncertain income tax positions taken or expected to be taken on the tax return for the fiscal year ended December 31, 2016, or for any other tax years which are open for exam. As of June 30, 2017, open tax years include the tax years ended December 31, 2013 through 2016. The Funds are not aware of any tax positions for which it is reasonably possible that the total amounts of unrecognized tax benefits will significantly change in the next 12 months. The Funds recognize interest and penalties, if any, related to unrecognized tax benefits as interest and other expense, respectively, in the Statement of Operations. During the period, the Funds did not incur any interest or penalties. | |
| e) | Allocation of Income and Expenses – Each Fund is charged for those expenses directly attributable to it. Expenses directly attributable to a class of shares, such as Rule 12b-1 distribution fees, are charged to that class of shares. Income, expenses and realized and unrealized gains and losses are allocated to the classes based on their respective net assets. Expenses that are not directly attributable to a Fund are allocated among the Funds in the series in proportion to their assets or are divided equally amongst the Funds. |
| f) | Distributions to Shareholders – Dividends from net investment income are declared and paid monthly. Distributions of net realized capital gains, if any, are declared and paid at least annually. The book basis character of distributions may differ from their ultimate characterization for Federal income tax purposes. |
| g) | Use of Estimates – The preparation of financial statements in conformity with accounting principles generally accepted in the United States of America requires management to make estimates and assumptions that affect the reported amounts of assets and liabilities and disclosure of contingent assets |
Page 108
Notes to the Financial Statements
June 30, 2017 (Unaudited)
| 2. | Significant Accounting Policies (cont.) |
and liabilities at the date of the financial statements and the reported amounts of revenues and expenses during the reporting period. Actual results could differ from those estimates. | |
| h) | Securities Transactions and Investment Income – Investment and shareholder transactions are recorded on the trade date. The Funds determine the gain or loss realized from investment transactions by comparing the original cost of the security lot sold with the net sales proceeds. Dividend income is recognized on the ex-dividend date and interest income is recognized on an accrual basis. Premiums and discounts on the purchase of securities are amortized/accreted using the effective interest method. Paydown gains and losses are netted and recorded as interest income on the Statements of Operations for financial reporting purposes. Accounting principles generally accepted in the United States of America require that permanent financial reporting and tax differences be reclassified in the capital accounts. |
| i) | Guarantees and Indemnifications – In the normal course of business, the Funds enter into contracts with service providers that contain general indemnification clauses. The Funds’ maximum exposure under these arrangements is unknown and would involve future claims against the Funds that have not yet occurred. Based on experience, the Funds would expect the risk of loss to be remote. |
| j) | Recent Accounting Pronouncement – In October 2016, the U.S. Securities and Exchange Commission adopted new rules and amended existing rules (together, “final rules”) intended to modernize the reporting and disclosure of information by registered investment companies. In part, the final rules amend Regulation S-X and require standardized, enhanced disclosure about derivatives in investment company financial statements, as well as other amendments. The compliance date for the amendments to Regulation S-X is August 1, 2017. Management is currently evaluating the impact that the adoption of the amendments to Regulation S-X will have on the financial statements and related disclosures. |
| 3. | Capital Share Transactions |
The following table summarizes the capital share transactions of each Fund for the past two fiscal periods:
Baird Ultra Short Bond Fund
| Institutional Class Shares | Investor Class Shares | |||||||||||||||||
| Six Months Ended | Six Months Ended | |||||||||||||||||
| June 30, 2017 | June 30, 2017 | |||||||||||||||||
| Shares | Amount | Shares | Amount | |||||||||||||||
| Shares sold | 31,780,542 | $ | 319,060,184 | Shares sold | 1,388,949 | $ | 13,940,613 | |||||||||||
| Shares issued to | Shares issued to | |||||||||||||||||
| shareholders in | shareholders in | |||||||||||||||||
| reinvestment of | reinvestment of | |||||||||||||||||
| dividends | 266,029 | 2,670,183 | dividends | 3,735 | 37,466 | |||||||||||||
| Shares redeemed | (15,453,836 | ) | (155,161,798 | ) | Shares redeemed | (556,192 | ) | (5,580,995 | ) | |||||||||
| Net increase | 16,592,735 | $ | 166,568,569 | Net increase | 836,492 | $ | 8,397,084 | |||||||||||
| Shares Outstanding: | Shares Outstanding: | |||||||||||||||||
| Beginning of period | 38,605,813 | Beginning of period | 522,193 | |||||||||||||||
| End of period | 55,198,548 | End of period | 1,358,685 | |||||||||||||||
Page 109
Notes to the Financial Statements
June 30, 2017 (Unaudited)
| 3. | Capital Share Transactions (cont.) |
Baird Ultra Short Bond Fund (cont.)
| Institutional Class Shares | Investor Class Shares | |||||||||||||||||
| Year Ended | Year Ended | |||||||||||||||||
| December 31, 2016 | December 31, 2016 | |||||||||||||||||
| Shares | Amount | Shares | Amount | |||||||||||||||
| Shares sold | 40,894,406 | $ | 409,656,486 | Shares sold | 519,828 | $ | 5,211,614 | |||||||||||
| Shares issued to | Shares issued to | |||||||||||||||||
| shareholders in | shareholders in | |||||||||||||||||
| reinvestment of | reinvestment of | |||||||||||||||||
| dividends | 260,009 | 2,604,619 | dividends | 466 | 4,674 | |||||||||||||
| Shares redeemed | (21,510,785 | ) | (215,281,434 | ) | Shares redeemed | (118,196 | ) | (1,184,590 | ) | |||||||||
| Net increase | 19,643,630 | $ | 196,979,671 | Net increase | 402,098 | $ | 4,031,698 | |||||||||||
| Shares Outstanding: | Shares Outstanding: | |||||||||||||||||
| Beginning of year | 18,962,183 | Beginning of year | 120,095 | |||||||||||||||
| End of year | 38,605,813 | End of year | 522,193 | |||||||||||||||
| Baird Short-Term Bond Fund | ||||||||||||||||||
| Institutional Class Shares | Investor Class Shares | |||||||||||||||||
| Six Months Ended | Six Months Ended | |||||||||||||||||
| June 30, 2017 | June 30, 2017 | |||||||||||||||||
| Shares | Amount | Shares | Amount | |||||||||||||||
| Shares sold | 134,854,790 | $ | 1,306,280,587 | Shares sold | 5,785,641 | $ | 56,052,791 | |||||||||||
| Shares issued to | Shares issued to | |||||||||||||||||
| shareholders in | shareholders in | |||||||||||||||||
| reinvestment of | reinvestment of | |||||||||||||||||
| dividends | 3,191,408 | 30,914,167 | dividends | 74,084 | 717,640 | |||||||||||||
| Shares redeemed | (67,895,526 | ) | (657,752,585 | ) | Shares redeemed | (3,552,051 | ) | (34,409,174 | ) | |||||||||
| Net increase | 70,150,672 | $ | 679,442,169 | Net increase | 2,307,674 | $ | 22,361,257 | |||||||||||
| Shares Outstanding: | Shares Outstanding: | |||||||||||||||||
| Beginning of period | 390,057,414 | Beginning of period | 10,851,748 | |||||||||||||||
| End of period | 460,208,086 | End of period | 13,159,422 | |||||||||||||||
| Institutional Class Shares | Investor Class Shares | |||||||||||||||||
| Year Ended | Year Ended | |||||||||||||||||
| December 31, 2016 | December 31, 2016 | |||||||||||||||||
| Shares | Amount | Shares | Amount | |||||||||||||||
| Shares sold | 208,721,216 | $ | 2,022,991,247 | Shares sold | 10,339,785 | $ | 100,368,487 | |||||||||||
| Shares issued to | Shares issued to | |||||||||||||||||
| shareholders in | shareholders in | |||||||||||||||||
| reinvestment of | reinvestment of | |||||||||||||||||
| dividends | 5,191,423 | 50,301,475 | dividends | 93,050 | 901,712 | |||||||||||||
| Shares redeemed | (133,931,700 | ) | (1,299,046,819 | ) | Shares redeemed | (3,813,267 | ) | (36,970,034 | ) | |||||||||
| Net increase | 79,980,939 | $ | 774,245,903 | Net increase | 6,619,568 | $ | 64,300,165 | |||||||||||
| Shares Outstanding: | Shares Outstanding: | |||||||||||||||||
| Beginning of year | 310,076,475 | Beginning of year | 4,232,180 | |||||||||||||||
| End of year | 390,057,414 | End of year | 10,851,748 | |||||||||||||||
Page 110
Notes to the Financial Statements
June 30, 2017 (Unaudited)
| 3. | Capital Share Transactions (cont.) |
Baird Intermediate Bond Fund
| Institutional Class Shares | Investor Class Shares | |||||||||||||||||
| Six Months Ended | Six Months Ended | |||||||||||||||||
| June 30, 2017 | June 30, 2017 | |||||||||||||||||
| Shares | Amount | Shares | Amount | |||||||||||||||
| Shares sold | 42,761,585 | $ | 472,305,772 | Shares sold | 3,229,435 | $ | 37,222,089 | |||||||||||
| Shares issued to | Shares issued to | |||||||||||||||||
| shareholders in | shareholders in | |||||||||||||||||
| reinvestment of | reinvestment of | |||||||||||||||||
| dividends | 1,987,057 | 21,957,158 | dividends | 83,900 | 967,079 | |||||||||||||
| Shares redeemed | (15,300,382 | ) | (168,852,565 | ) | Shares redeemed | (1,299,372 | ) | (14,965,784 | ) | |||||||||
| Net increase | 29,448,260 | $ | 325,410,365 | Net increase | 2,013,963 | $ | 23,223,384 | |||||||||||
| Shares Outstanding: | Shares Outstanding: | |||||||||||||||||
| Beginning of period | 201,285,688 | Beginning of period | 8,572,608 | |||||||||||||||
| End of period | 230,733,948 | End of period | 10,586,571 | |||||||||||||||
| Institutional Class Shares | Investor Class Shares | |||||||||||||||||
| Year Ended | Year Ended | |||||||||||||||||
| December 31, 2016 | December 31, 2016 | |||||||||||||||||
| Shares | Amount | Shares | Amount | |||||||||||||||
Shares sold(1) | 64,350,690 | $ | 719,411,019 | Shares sold | 1,543,535 | $ | 17,884,644 | |||||||||||
| Shares issued to | Shares issued to | |||||||||||||||||
| shareholders in | shareholders in | |||||||||||||||||
| reinvestment of | reinvestment of | |||||||||||||||||
| dividends | 3,770,295 | 41,921,480 | dividends | 180,930 | 2,096,707 | |||||||||||||
| Shares redeemed | (30,325,724 | ) | (338,066,847 | ) | Shares redeemed | (2,231,792 | ) | (25,945,903 | ) | |||||||||
| Net increase | 37,795,261 | $ | 423,265,652 | Net decrease | (507,327 | ) | $ | (5,964,552 | ) | |||||||||
| Shares Outstanding: | Shares Outstanding: | |||||||||||||||||
| Beginning of year | 163,490,427 | Beginning of year | 9,079,935 | |||||||||||||||
| End of year | 201,285,688 | End of year | 8,572,608 | |||||||||||||||
| (1) | In the fourth quarter of 2016, the Baird Intermediate Bond Fund satisfied a transfer in kind request made be a large Shareholder by transferring cash and securities into the Fund in the amount of $25,203,041 in exchange for 2,248,264 shares of the Fund. The transfer was effected in accordance with policies and procedures approved by the Board of Directors of the Funds. |
Baird Aggregate Bond Fund
| Institutional Class Shares | Investor Class Shares | |||||||||||||||||
| Six Months Ended | Six Months Ended | |||||||||||||||||
| June 30, 2017 | June 30, 2017 | |||||||||||||||||
| Shares | Amount | Shares | Amount | |||||||||||||||
| Shares sold | 246,521,332 | $ | 2,659,286,449 | Shares sold | 13,793,278 | $ | 153,772,570 | |||||||||||
| Shares issued to | Shares issued to | |||||||||||||||||
| shareholders in | shareholders in | |||||||||||||||||
| reinvestment of | reinvestment of | |||||||||||||||||
| dividends | 10,693,037 | 115,526,418 | dividends | 751,775 | 8,386,799 | |||||||||||||
| Shares redeemed | (76,812,701 | ) | (828,882,802 | ) | Shares redeemed | (12,126,026 | ) | (135,421,722 | ) | |||||||||
| Net increase | 180,401,668 | $ | 1,945,930,065 | Net increase | 2,419,027 | $ | 26,737,647 | |||||||||||
| Shares Outstanding: | Shares Outstanding: | |||||||||||||||||
| Beginning of period | 913,156,998 | Beginning of period | 73,241,436 | |||||||||||||||
| End of period | 1,093,558,666 | End of period | 75,660,463 | |||||||||||||||
Page 111
Notes to the Financial Statements
June 30, 2017 (Unaudited)
| 3. | Capital Share Transactions (cont.) |
Baird Aggregate Bond Fund (cont.)
| Institutional Class Shares | Investor Class Shares | |||||||||||||||||
| Year Ended | Year Ended | |||||||||||||||||
| December 31, 2016 | December 31, 2016 | |||||||||||||||||
| Shares | Amount | Shares | Amount | |||||||||||||||
| Shares sold | 446,191,460 | $ | 4,872,184,789 | Shares sold | 48,411,135 | $ | 545,153,144 | |||||||||||
| Shares issued to | Shares issued to | |||||||||||||||||
| shareholders in | shareholders in | |||||||||||||||||
| reinvestment of | reinvestment of | |||||||||||||||||
| dividends | 17,343,130 | 188,475,045 | dividends | 1,229,171 | 13,784,507 | |||||||||||||
| Shares redeemed | (146,109,105 | ) | (1,589,759,877 | ) | Shares redeemed | (15,658,884 | ) | (175,968,825 | ) | |||||||||
| Net increase | 317,425,485 | $ | 3,470,899,957 | Net increase | 33,981,422 | $ | 382,968,826 | |||||||||||
| Shares Outstanding: | Shares Outstanding: | |||||||||||||||||
| Beginning of year | 595,731,513 | Beginning of year | 39,260,014 | |||||||||||||||
| End of year | 913,156,998 | End of year | 73,241,436 | |||||||||||||||
| Baird Core Plus Bond Fund | ||||||||||||||||||
| Institutional Class Shares | Investor Class Shares | |||||||||||||||||
| Six Months Ended | Six Months Ended | |||||||||||||||||
| June 30, 2017 | June 30, 2017 | |||||||||||||||||
| Shares | Amount | Shares | Amount | |||||||||||||||
Shares sold(1) | 171,024,018 | $ | 1,903,639,037 | Shares sold | 42,862,305 | $ | 495,843,266 | |||||||||||
| Shares issued to | Shares issued to | |||||||||||||||||
| shareholders in | shareholders in | |||||||||||||||||
| reinvestment of | reinvestment of | |||||||||||||||||
| dividends | 11,856,934 | 132,087,225 | dividends | 2,973,893 | 34,437,443 | |||||||||||||
| Shares redeemed | (78,411,313 | ) | (871,822,512 | ) | Shares redeemed | (30,634,478 | ) | (354,001,671 | ) | |||||||||
| Net increase | 104,469,639 | $ | 1,163,903,750 | Net increase | 15,201,720 | $ | 176,279,038 | |||||||||||
| Shares Outstanding: | Shares Outstanding: | |||||||||||||||||
| Beginning of period | 909,048,912 | Beginning of period | 251,464,110 | |||||||||||||||
| End of period | 1,013,518,551 | End of period | 266,665,830 | |||||||||||||||
| (1) | In the second quarter of 2017, the Baird Core Plus Bond Fund processed a transfer in kind for a large shareholder by transferring the shareholder’s securities in kind into the Fund. The transfer was effected in accordance with policies and procedures approved by the Board of Directors of the Funds. |
| Institutional Class Shares | Investor Class Shares | �� | ||||||||||||||||
| Year Ended | Year Ended | |||||||||||||||||
| December 31, 2016 | December 31, 2016 | |||||||||||||||||
| Shares | Amount | Shares | Amount | |||||||||||||||
| Shares sold | 367,562,136 | $ | 4,121,093,117 | Shares sold | 116,052,805 | $ | 1,357,883,819 | |||||||||||
| Shares issued to | Shares issued to | |||||||||||||||||
| shareholders in | shareholders in | |||||||||||||||||
| reinvestment of | reinvestment of | |||||||||||||||||
| dividends | 21,905,632 | 244,377,395 | dividends | 5,809,669 | 67,326,570 | |||||||||||||
| Shares redeemed | (144,024,634 | ) | (1,612,812,024 | ) | Shares redeemed | (64,248,597 | ) | (744,636,074 | ) | |||||||||
| Net increase | 245,443,134 | $ | 2,752,658,488 | Net increase | 57,613,877 | $ | 680,574,315 | |||||||||||
| Shares Outstanding: | Shares Outstanding: | |||||||||||||||||
| Beginning of year | 663,605,778 | Beginning of year | 193,850,233 | |||||||||||||||
| End of year | 909,048,912 | End of year | 251,464,110 | |||||||||||||||
Page 112
Notes to the Financial Statements
June 30, 2017 (Unaudited)
| 3. | Capital Share Transactions (cont.) |
Baird Short-Term Municipal Bond Fund
| Institutional Class Shares | Investor Class Shares | |||||||||||||||||
| Six Months Ended | Six Months Ended | |||||||||||||||||
| June 30, 2017 | June 30, 2017 | |||||||||||||||||
| Shares | Amount | Shares | Amount | |||||||||||||||
| Shares sold | 4,064,005 | $ | 40,951,465 | Shares sold | 96,482 | $ | 971,839 | |||||||||||
| Shares issued to | Shares issued to | |||||||||||||||||
| shareholders in | shareholders in | |||||||||||||||||
| reinvestment of | reinvestment of | |||||||||||||||||
| dividends | 36,063 | 363,327 | dividends | 1,816 | 18,244 | |||||||||||||
| Shares redeemed | (955,603 | ) | (9,613,209 | ) | Shares redeemed | (514,056 | ) | (5,161,317 | ) | |||||||||
| Net increase | 3,144,465 | $ | 31,701,583 | Net decrease | (415,758 | ) | $ | (4,171,234 | ) | |||||||||
| Shares Outstanding: | Shares Outstanding: | |||||||||||||||||
| Beginning of period | 5,250,648 | Beginning of period | 635,537 | |||||||||||||||
| End of period | 8,395,113 | End of period | 219,779 | |||||||||||||||
| Institutional Class Shares | Investor Class Shares | |||||||||||||||||
| Year Ended | Year Ended | |||||||||||||||||
| December 31, 2016 | December 31, 2016 | |||||||||||||||||
| Shares | Amount | Shares | Amount | |||||||||||||||
| Shares sold | 5,168,209 | $ | 52,089,868 | Shares sold | 783,100 | $ | 7,828,196 | |||||||||||
| Shares issued to | Shares issued to | |||||||||||||||||
| shareholders in | shareholders in | |||||||||||||||||
| reinvestment of | reinvestment of | |||||||||||||||||
| dividends | 29,158 | 293,778 | dividends | 1,702 | 17,009 | |||||||||||||
| Shares redeemed | (1,169,212 | ) | (11,765,314 | ) | Shares redeemed | (162,007 | ) | (1,620,380 | ) | |||||||||
| Net increase | 4,028,155 | $ | 40,618,332 | Net increase | 622,795 | $ | 6,224,825 | |||||||||||
| Shares Outstanding: | Shares Outstanding: | |||||||||||||||||
| Beginning of year | 1,222,493 | Beginning of year | 12,742 | |||||||||||||||
| End of year | 5,250,648 | End of year | 635,537 | |||||||||||||||
| Baird Quality Intermediate Municipal Bond Fund | ||||||||||||||||||
| Institutional Class Shares | Investor Class Shares | |||||||||||||||||
| Six Months Ended | Six Months Ended | |||||||||||||||||
| June 30, 2017 | June 30, 2017 | |||||||||||||||||
| Shares | Amount | Shares | Amount | |||||||||||||||
| Shares sold | 10,674,333 | $ | 123,155,637 | Shares sold | 1,786,716 | $ | 21,143,766 | |||||||||||
| Shares issued to | Shares issued to | |||||||||||||||||
| shareholders in | shareholders in | |||||||||||||||||
| reinvestment of | reinvestment of | |||||||||||||||||
| dividends | 770,188 | 8,911,563 | dividends | 108,696 | 1,286,977 | |||||||||||||
| Shares redeemed | (14,401,380 | ) | (166,048,649 | ) | Shares redeemed | (1,860,611 | ) | (22,026,941 | ) | |||||||||
| Net decrease | (2,956,859 | ) | $ | (33,981,449 | ) | Net increase | 34,801 | $ | 403,802 | |||||||||
| Shares Outstanding: | Shares Outstanding: | |||||||||||||||||
| Beginning of period | 81,938,844 | Beginning of period | 11,641,240 | |||||||||||||||
| End of period | 78,981,985 | End of period | 11,676,041 | |||||||||||||||
Page 113
Notes to the Financial Statements
June 30, 2017 (Unaudited)
| 3. | Capital Share Transactions (cont.) |
Baird Quality Intermediate Municipal Bond Fund (cont.)
| Institutional Class Shares | Investor Class Shares | ||||||||||||||||
| Year Ended | Year Ended | ||||||||||||||||
| December 31, 2016 | December 31, 2016 | ||||||||||||||||
| Shares | Amount | Shares | Amount | ||||||||||||||
| Shares sold | 29,580,986 | $ | 348,058,765 | Shares sold | 3,740,560 | $ | 44,967,041 | ||||||||||
| Shares issued to | Shares issued to | ||||||||||||||||
| shareholders in | shareholders in | ||||||||||||||||
| reinvestment of | reinvestment of | ||||||||||||||||
| dividends | 1,732,099 | 20,373,781 | dividends | 239,819 | 2,885,704 | ||||||||||||
| Shares redeemed | (33,599,539 | ) | (391,653,840 | ) | Shares redeemed | (5,700,686 | ) | (68,300,492 | ) | ||||||||
| Net decrease | (2,286,454 | ) | $ | (23,221,294 | ) | Net decrease | (1,720,307 | ) | $ | (20,447,747 | ) | ||||||
| Shares Outstanding: | Shares Outstanding: | ||||||||||||||||
| Beginning of year | 84,225,298 | Beginning of year | 13,361,547 | ||||||||||||||
| End of year | 81,938,844 | End of year | 11,641,240 | ||||||||||||||
| Baird Core Intermediate Municipal Bond Fund | |||||||||||||||||
| Institutional Class Shares | Investor Class Shares | ||||||||||||||||
| Six Months Ended | Six Months Ended | ||||||||||||||||
| June 30, 2017 | June 30, 2017 | ||||||||||||||||
| Shares | Amount | Shares | Amount | ||||||||||||||
| Shares sold | 4,517,052 | $ | 45,702,928 | Shares sold | 28,009 | $ | 283,070 | ||||||||||
| Shares issued to | Shares issued to | ||||||||||||||||
| shareholders in | shareholders in | ||||||||||||||||
| reinvestment of | reinvestment of | ||||||||||||||||
| dividends | 63,236 | 642,067 | dividends | 1,239 | 12,570 | ||||||||||||
| Shares redeemed | (993,027 | ) | (10,041,686 | ) | Shares redeemed | (9,549 | ) | (97,418 | ) | ||||||||
| Net increase | 3,587,261 | $ | 36,303,309 | Net increase | 19,699 | $ | 198,222 | ||||||||||
| Shares Outstanding: | Shares Outstanding: | ||||||||||||||||
| Beginning of period | 9,629,893 | Beginning of period | 135,434 | ||||||||||||||
| End of period | 13,217,154 | End of period | 155,133 | ||||||||||||||
| Institutional Class Shares | Investor Class Shares | ||||||||||||||||
| Year Ended | Year Ended | ||||||||||||||||
| December 31, 2016 | December 31, 2016 | ||||||||||||||||
| Shares | Amount | Shares | Amount | ||||||||||||||
| Shares sold | 6,375,410 | $ | 65,179,152 | Shares sold | 114,091 | $ | 1,170,653 | ||||||||||
| Shares issued to | Shares issued to | ||||||||||||||||
| shareholders in | shareholders in | ||||||||||||||||
| reinvestment of | reinvestment of | ||||||||||||||||
| dividends | 77,830 | 791,320 | dividends | 1,737 | 17,587 | ||||||||||||
| Shares redeemed | (1,839,627 | ) | (18,748,846 | ) | Shares redeemed | (2,653 | ) | (27,201 | ) | ||||||||
| Net increase | 4,613,613 | $ | 47,221,626 | Net increase | 113,175 | $ | 1,161,039 | ||||||||||
| Shares Outstanding: | Shares Outstanding: | ||||||||||||||||
| Beginning of year | 5,016,280 | Beginning of year | 22,259 | ||||||||||||||
| End of year | 9,629,893 | End of year | 135,434 | ||||||||||||||
Page 114
Notes to the Financial Statements
June 30, 2017 (Unaudited)
| 4. | Investment Transactions and Income Tax Information |
During the six months ended June 30, 2017, purchases and sales of investment securities (excluding short-term investments) were as follows:
| Baird | Baird | Baird | ||||||||||
| Ultra Short | Short-Term | Intermediate | ||||||||||
| Purchases: | Bond Fund | Bond Fund | Bond Fund | |||||||||
| U.S. Government | $ | — | $ | — | $ | — | ||||||
| Other | $ | 211,356,563 | $ | 1,636,979,327 | $ | 725,961,864 | ||||||
| Sales: | ||||||||||||
| U.S. Government | $ | — | $ | — | $ | — | ||||||
| Other | $ | 141,449,066 | $ | 995,325,401 | $ | 435,032,608 | ||||||
| Baird | ||||||||||||
| Baird | Baird | Short-Term | ||||||||||
| Aggregate | Core Plus | Municipal | ||||||||||
| Purchases: | Bond Fund | Bond Fund | Bond Fund | |||||||||
| U.S. Government | $ | 147,001,857 | $ | 86,861,200 | $ | — | ||||||
| Other | $ | 3,068,178,484 | $ | 3,032,549,135 | $ | 49,565,356 | ||||||
| Sales: | ||||||||||||
| U.S. Government | $ | 24,512,383 | $ | 26,822,928 | $ | — | ||||||
| Other | $ | 1,462,002,922 | $ | 2,031,147,610 | $ | 21,781,374 | ||||||
| Baird Quality | Baird Core | |||||||||||
| Intermediate | Intermediate | |||||||||||
| Municipal | Municipal | |||||||||||
| Purchases: | Bond Fund | Bond Fund | ||||||||||
| U.S. Government | $ | — | $ | — | ||||||||
| Other | $ | 83,886,001 | $ | 84,885,862 | ||||||||
| Sales: | ||||||||||||
| U.S. Government | $ | — | $ | — | ||||||||
| Other | $ | 133,829,782 | $ | 49,646,632 | ||||||||
At December 31, 2016, gross unrealized appreciation and depreciation of investments and distributable ordinary income and long-term capital gains for federal tax purposes were as follows:
| Baird | Baird | Baird | ||||||||||
| Ultra Short | Short-Term | Intermediate | ||||||||||
| Bond Fund | Bond Fund | Bond Fund | ||||||||||
| Cost of Investments | $ | 386,796,106 | $ | 3,907,255,324 | $ | 2,327,428,894 | ||||||
| Gross unrealized appreciation | 340,605 | 10,841,882 | 18,272,507 | |||||||||
| Gross unrealized depreciation | (215,405 | ) | (18,482,799 | ) | (29,062,970 | ) | ||||||
| Net unrealized appreciation | $ | 125,200 | $ | (7,640,917 | ) | $ | (10,790,463 | ) | ||||
| Undistributed ordinary income | 17,622 | 1,105,057 | 460,714 | |||||||||
| Undistributed long-term capital gain | — | — | 684,612 | |||||||||
| Undistributed tax-exempt income | — | — | — | |||||||||
| Total distributable earnings | $ | 17,622 | $ | 1,105,057 | $ | 1,145,326 | ||||||
| Other accumulated losses | (226,873 | ) | — | — | ||||||||
| Total accumulated earnings | $ | (84,051 | ) | $ | (6,535,860 | ) | $ | (9,645,137 | ) | |||
Page 115
Notes to the Financial Statements
June 30, 2017 (Unaudited)
| 4. | Investment Transactions and Income Tax Information (cont.) |
| Baird | ||||||||||||
| Baird | Baird | Short-Term | ||||||||||
| Aggregate | Core Plus | Municipal | ||||||||||
| Bond Fund | Bond Fund | Bond Fund | ||||||||||
| Cost of Investments | $ | 10,792,712,712 | $ | 13,020,416,854 | $ | 58,456,047 | ||||||
| Gross unrealized appreciation | 81,991,311 | 113,263,030 | 105,428 | |||||||||
| Gross unrealized depreciation | (176,346,455 | ) | (209,524,620 | ) | (570,702 | ) | ||||||
| Net unrealized appreciation | $ | (94,355,144 | ) | $ | (96,261,590 | ) | $ | (465,274 | ) | |||
| Undistributed ordinary income | 547,786 | 835,411 | — | |||||||||
| Undistributed long-term capital gain | — | — | — | |||||||||
| Undistributed tax-exempt income | — | — | 1,316 | |||||||||
| Total distributable earnings | $ | 547,786 | $ | 835,411 | $ | 1,316 | ||||||
| Other accumulated losses | (5,361,896 | ) | (3,445,352 | ) | (35,475 | ) | ||||||
| Total accumulated earnings | $ | (99,169,254 | ) | $ | (98,871,531 | ) | $ | (499,433 | ) | |||
| Baird Quality | Baird Core | |||||||||||
| Intermediate | Intermediate | |||||||||||
| Municipal | Municipal | |||||||||||
| Bond Fund | Bond Fund | |||||||||||
| Cost of Investments | $ | 1,042,486,736 | $ | 97,899,219 | ||||||||
| Gross unrealized appreciation | 23,236,022 | 360,748 | ||||||||||
| Gross unrealized depreciation | (9,246,712 | ) | (1,218,953 | ) | ||||||||
| Net unrealized appreciation | $ | 13,989,310 | $ | (858,205 | ) | |||||||
| Undistributed ordinary income | — | — | ||||||||||
| Undistributed long-term capital gain | — | — | ||||||||||
| Undistributed tax-exempt income | — | 3,148 | ||||||||||
| Total distributable earnings | $ | — | $ | 3,148 | ||||||||
| Other accumulated losses | (6,040,644 | ) | (306,982 | ) | ||||||||
| Total accumulated earnings | $ | 7,948,666 | $ | (1,162,039 | ) | |||||||
Undistributed income or net realized gains for financial statement purposes may differ from amounts recognized for federal income tax purposes due to differences in the recognition and characterization of income, expense and capital gain items. The difference between book-basis and tax-basis unrealized appreciation is attributed primarily to the tax deferral of losses on wash sales.
Additionally, U.S. generally accepted accounting principles require that certain components of net assets relating to permanent differences be reclassified between financial and tax reporting. These reclassifications are primarily due to differing treatments for losses deferred due to wash sales and non-deductible expenses. These reclassifications have no effect on net assets or net asset value per share.
Page 116
Notes to the Financial Statements
June 30, 2017 (Unaudited)
| 4. | Investment Transactions and Income Tax Information (cont.) |
The tax components of dividends paid during the periods shown below were as follows:
| Six Months Ended | Year Ended | |||||||||||||||
| June 30, 2017 | December 31, 2016 | |||||||||||||||
| Ordinary | Long-Term | Ordinary | Long-Term | |||||||||||||
| Income | Capital Gains | Income | Capital Gains | |||||||||||||
| Distributions | Distributions | Distributions | Distributions | |||||||||||||
| Baird Ultra Short Bond Fund | $ | 2,885,214 | $ | — | $ | 2,690,875 | $ | — | ||||||||
| Baird Short-Term Bond Fund | $ | 34,146,797 | $ | — | $ | 56,998,935 | $ | — | ||||||||
| Baird Intermediate Bond Fund | $ | 26,638,883 | $ | — | $ | 46,505,262 | $ | 4,693,858 | ||||||||
| Baird Aggregate Bond Fund | $ | 139,164,091 | $ | — | $ | 227,916,820 | $ | 6,899,253 | ||||||||
| Baird Core Plus Bond Fund | $ | 176,850,527 | $ | — | $ | 328,622,238 | $ | 3,351,170 | ||||||||
| Baird Short-Term Municipal Bond Fund | $ | — | $ | — | $ | 30,307 | $ | — | ||||||||
| Baird Quality Intermediate | ||||||||||||||||
| Municipal Bond Fund | $ | — | $ | — | $ | 189,012 | $ | — | ||||||||
| Baird Core Intermediate | ||||||||||||||||
| Municipal Bond Fund | $ | — | $ | — | $ | 546,276 | $ | 2,509 | ||||||||
For the six months ended June 30, 2017, the Baird Short-Term Municipal Bond Fund, Baird Quality Intermediate Municipal Bond Fund, and Baird Core Intermediate Municipal Bond Fund made distributions of tax-exempt income of $547,866, $11,693,045, and $1,164,744, respectively. For the year ended December 31, 2016, the Baird Short-Term Municipal Bond Fund, Baird Quality Intermediate Municipal Bond Fund, and Baird Core Intermediate Municipal Bond Fund made distributions of tax-exempt income of $412,586, $25,870,057, and $1,241,465, respectively.
To the extent the Funds realize future net capital gains, those gains will be offset by any unused capital loss carryovers. At December 31, 2016, accumulated net realized capital loss carryovers, if any, and the year(s) in which the capital loss carryovers expire were:
| Capital Loss | Year of | |||||
Carryover | Character | Expiration | ||||
| Baird Ultra Short Bond Fund | $ | 86,934 | Short-Term | Indefinitely | ||
| 139,939 | Long-Term | Indefinitely | ||||
| Baird Quality Intermediate Municipal Bond Fund | 3,863,605 | Short-Term | Indefinitely | |||
| 2,177,039 | Long-Term | Indefinitely | ||||
| 5. | Investment Advisory and Other Agreements |
The Funds have entered into an Investment Advisory Agreement with Baird for the provision of investment advisory services. Pursuant to the Investment Advisory Agreement, the Advisor is entitled to receive a fee, calculated daily and payable monthly, at the annual rate of 0.25% for the Funds as applied to the respective Fund’s average daily net assets. Certain officers of the Advisor are also officers of the Funds.
For the six months ended June 30, 2017, the Advisor waived the following amount pursuant to the fee waiver agreement between the Advisor and the Corporation on behalf of the Baird Ultra Short Bond Fund:
Fund | Waived Amount |
| Baird Ultra Short Bond Fund | $389,618 |
Page 117
Notes to the Financial Statements
June 30, 2017 (Unaudited)
| 5. | Investment Advisory and Other Agreements (cont.) |
The Funds have entered into an Administration Agreement with Baird. Under the Administration Agreement, the Advisor assumes and pays all expenses of the applicable Fund other than the investment advisory fees, fees under the 12b-1 plan, costs related to portfolio securities transactions and extraordinary or non-recurring expenses. Pursuant to the Administration Agreement, the Advisor is entitled to receive a fee, calculated daily and payable monthly, at the annual rate of 0.05% for the Funds as applied to the respective Fund’s average daily net assets.
U.S. Bancorp Fund Services, LLC (“USBFS”) serves as transfer agent, administrator, and accounting services agent for the Funds. U.S. Bank, N.A. (“U.S. Bank”) serves as custodian for the Funds.
Baird (the “Distributor”) is the distributor of the Funds pursuant to a distribution agreement.
| 6. | Securities Lending |
During the six months ended June 30, 2017, each Fund (other than the Short-Term Municipal Bond Fund, Quality Intermediate Municipal Bond Fund and Core Intermediate Municipal Bond Fund) was permitted to lend up to one-third of its total assets (including such loans) to borrowers under terms of a securities lending program administered by U.S. Bank, N.A., the Funds’ custodian and an affiliate of USBFS, the Funds’ transfer agent and administrator. A securities lending agreement requires that loans be collateralized at all times in an amount equal to at least 102% of the market value of any loaned securities at the time of the loan, plus accrued interest.
Participating Funds receive compensation in the form of fees and earned interest on the cash collateral. The amount of fees depends on a number of factors including the type of security and length of the loan.
Participating Funds receive cash as collateral in return for securities lent as part of the securities lending program. The collateral gets invested in a securities lending trust subject to Rule 2a-7 under the 1940 Act.
Interest income earned by participating Funds on investments of cash collateral received from borrowers for the securities loaned to them (“securities lending income”) would be reflected in the participating Funds’ statements of operations.
As of June 30, 2017, the Funds did not participate in securities lending activities, although they may do so again in the future.
| 7. | Line of Credit |
The Corporation maintains an uncommitted, senior secured line of credit (“LOC”) with U.S. Bank, N.A. (the “Bank”) to provide the Funds a temporary liquidity source to meet unanticipated redemptions. Under the terms of the LOC, borrowings for each Fund are limited to one-third of the total assets (including the amount borrowed) of the respective Fund, or as otherwise indicated within the Funds’ agreement with the Bank. The Bank charges interest at the Bank’s Prime Rate less 2% (weighted average rate of 1.92% for 2017). The Funds did not borrow from the LOC during the period.
| 8. | Distribution and Shareholder Service Plan |
The Funds have adopted a distribution and shareholder service plan (the “Plan”) pursuant to Rule 12b-1 under the 1940 Act. The Plan allows the Funds to compensate the Distributor for the costs incurred in distributing the Funds’ Investor Class Shares, including amounts paid to brokers or dealers, at an annual rate of 0.25% of the average daily net assets of the Funds’ Investor Class Shares. The Baird Ultra Short Bond, Baird Short-Term Bond, Baird Intermediate Bond, Baird Aggregate Bond, Baird Core Plus Bond, Baird Short-Term Municipal Bond, Baird Quality Intermediate Municipal Bond and Baird Core Intermediate Municipal Bond Funds incurred $15,735, $141,468, $131,418, $1,044,817, $3,696,555, $4,757, $170,810 and $1,853, respectively, in fees pursuant to the Plan during the six months ended June 30, 2017.
Page 118
Notes to the Financial Statements
June 30, 2017 (Unaudited)
| 9. | Change in Independent Registered Public Accounting Firm |
On May 22, 2017, upon the recommendation of the Audit Committee, the Board of Directors of Baird Funds, Inc. (the “Funds”) approved the appointment of Cohen & Company, Ltd. (“Cohen”) as the Funds’ independent registered public accounting firm, following the dismissal of Grant Thornton LLP (“Grant Thornton”). On August 24, 2017, the Audit Committee engaged Cohen to audit the Funds’ financial statements for the fiscal year ended December 31, 2017.
Grant Thornton’s report on the financial statements of the Funds for each of the fiscal years ended December 31, 2016 and December 31, 2015 did not contain an adverse opinion or disclaimer of opinion and was not qualified or modified as to uncertainty, audit scope, or accounting principles. During the fiscal years ended December 31, 2016 and December 31, 2015 and the interim period through May 22, 2017 (the “Interim Period”), there were no disagreements between the Funds and Grant Thornton on any matter of accounting principles or practices, financial statement disclosure or auditing scope or procedure which, if not resolved to the satisfaction of Grant Thornton, would have caused it to make reference to the disagreements in its report on the financial statements for such periods. During the fiscal years ended December 31, 2016 and December 31, 2015 and the Interim Period, there were no reportable events of the kind described in Item 304(a)(1)(v) of Regulation S-K.
During the Funds’ fiscal years ended December 31, 2016 and December 31, 2015 and the Interim Period, neither the Funds nor anyone on their behalf consulted Cohen concerning (i) the application of accounting principles to a specified transaction, either completed or proposed, or the type of audit opinion that might be rendered on the Funds’ financial statements or (ii) the subject of a disagreement (as defined in paragraph (a)(1)(iv) of Item 304 of Regulation S-K) or reportable events (as described in paragraph (a)(1)(v) of said Item 304).
| 10. | Subsequent Event |
In preparing these financial statements, the Corporation has evaluated events after June 30, 2017. At its meeting on August 24, 2017, the Board of Directors of the Corporation elected Heidi Schneider as Treasurer of the Corporation effective upon filing of this report on Form N-CSR, which is expected to be on or about September 7, 2017. Terrance P. Maxwell will continue to serve as Treasurer of the Corporation until such date. There were no other subsequent events since June 30, 2017 through the date the financial statements were issued that would require adjustment to or additional disclosure in these financial statements.
Page 119
Additional Information
Proxy Voting
A description of the policies and procedures that the Funds use to determine how to vote proxies relating to portfolio securities is available without charge, upon request, by calling toll free, 1-866-44BAIRD, or by accessing the Funds’ website at www.bairdfunds.com; and by accessing the SEC’s website at www.sec.gov.
Each Fund’s proxy voting record for the most recent 12-month period ended June 30, if applicable, is available without charge, upon request, by calling toll free, 1-866-44BAIRD, or by accessing the Funds’ website at www.bairdfunds.com; and by accessing the SEC’s website at www.sec.gov. The Funds generally do not vote proxies because the securities held in their portfolios, consisting of bonds and other fixed-income securities, are not entitled to vote.
Portfolio Holdings Disclosure
The Funds file a complete schedule of portfolio holdings with the SEC for the first and third quarters of each fiscal year on Form N-Q. The Funds’ Forms N-Q are available on the SEC’s website at www.sec.gov and may be reviewed and copied at the SEC’s Public Reference Room in Washington, D.C. Information on the operation of the Public Reference Room may be obtained by calling 1-800-732-0330. The Funds’ Forms N-Q may also be obtained by calling toll-free 1-866-44BAIRD.
Page 120
(This Page Intentionally Left Blank.)
Baird Funds, Inc.
c/o U.S. Bancorp Fund Services, LLC
P.O. Box 701
Milwaukee, WI 53201-0701
1-866-44BAIRD
Board of Directors
G. Frederick Kasten, Jr. (Chairman)
John W. Feldt
Cory L. Nettles
Marlyn J. Spear
Frederick P. Stratton, Jr.
Investment Advisor and Distributor
Robert W. Baird & Co. Incorporated
777 East Wisconsin Avenue
Milwaukee, WI 53202
Administrator and Transfer Agent
U.S. Bancorp Fund Services, LLC
P.O. Box 701
615 East Michigan Street
Milwaukee, WI 53202
Custodian
U.S. Bank, N.A.
1555 N. RiverCenter Drive, Suite 302
Milwaukee, WI 53212
Legal Counsel
Godfrey & Kahn, S.C.
833 East Michigan Street, Suite 1800
Milwaukee, WI 53202
Independent Registered Public
Accounting Firm
Cohen & Company, Ltd.
1350 Euclid Avenue, Suite 800
Cleveland, OH 44115
Semi-Annual Report –
Baird Funds
June 30, 2017
Baird LargeCap Fund
Baird MidCap Fund
Baird Small/Mid Cap Value Fund
Baird SmallCap Value Fund
Chautauqua International Growth Fund
Chautauqua Global Growth Fund
| Go Green. | | Go Paperless. |
Sign up to receive your Baird Funds’ prospectuses and reports online.
Table of Contents
| Baird LargeCap Fund | 1 |
| Baird MidCap Fund | 11 |
| Baird Small/Mid Cap Value Fund | 18 |
| Baird SmallCap Value Fund | 24 |
| Chautauqua International Growth Fund | 30 |
| Chautauqua Global Growth Fund | 36 |
| Additional Information on Fund Expenses | 42 |
| Statements of Assets and Liabilities | 44 |
| Statements of Operations | 46 |
| Statements of Changes in Net Assets | 48 |
| Financial Highlights | 54 |
| Notes to the Financial Statements | 66 |
| Additional Information | 79 |
This report has been prepared for shareholders and may be distributed to others only if preceded or accompanied by a current prospectus.
Cautionary Note on Analyses, Opinions and Outlooks: In this report we offer analyses and opinions on the performance of individual securities, companies, industries, sectors, markets, interest rates and governmental policies, including predictions, forecasts and outlooks regarding possible future events. These can generally be identified as such because the context of the statements may include such words as “believe,” “should,” “will,” “expects,” “anticipates,” “hopes” and words of similar effect. These statements reflect the portfolio managers’ good faith beliefs and judgments and involve risks and uncertainties, including the risk that the portfolio managers’ analyses, opinions and outlooks are or will prove to be inaccurate. It is inherently difficult to correctly assess and explain the performance of particular securities, sectors, markets, interest rate movements, governmental actions or general economic trends and conditions, and many unforeseen factors contribute to the performance of Baird Funds. Investors are, therefore, cautioned not to place undue reliance on subjective judgments contained in this report.
Baird LargeCap Fund
June 30, 2017 (Unaudited)
Portfolio Characteristics
A June 30, 2017 summary of the Fund’s top 10 holdings and equity sector analysis compared to the S&P 500® Index is shown below.
| Top 10 Holdings* | Equity Sector Analysis** | ||
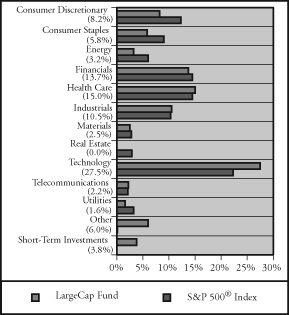 | |||
| Apple, Inc. | 4.5% | ||
| Alphabet, Inc. – Class A | 3.1% | ||
| Vanguard Financials ETF | 2.9% | ||
| PepsiCo, Inc. | 2.5% | ||
| Amgen, Inc. | 2.5% | ||
| The Boeing Co. | 2.4% | ||
| AbbVie, Inc. | 2.4% | ||
| Celgene Corp. | 2.3% | ||
| SPDR S&P 500 ETF Trust | 2.2% | ||
| American Express Co. | 2.1% | ||
| Net Assets: | $41,713,537 | ||
| Portfolio Turnover Rate: | 40.2% | † | |
| Number of Equity Holdings: | 111 | ||
| Annualized Portfolio Expense Ratio:*** | |||
Gross | |||
| Institutional Class: | 1.14% | ||
| Investor Class: | 1.39% | **** | |
Net | |||
| Institutional Class: | 0.75% | ||
| Investor Class: | 1.00% | **** |
| * | The Fund’s portfolio composition is subject to change and there is no assurance that the Fund will continue to hold any particular security. Percentages shown relate to the Fund’s total net assets as of June 30, 2017. | |
| ** | Percentages shown in parentheses relate to the Fund’s total market value of investments as of June 30, 2017, and may not add up to 100% due to rounding. | |
| *** | Reflects expense ratios as stated in the Fund’s current prospectus. The Advisor has contractually agreed to limit the Fund’s total annual fund operating expenses to 0.75% of average daily net assets for the Institutional Class shares and 1.00% of average daily net assets for the Investor Class shares, at least through April 30, 2018. | |
| **** | Includes 0.25% 12b-1 fee. | |
| † | Not annualized. |
Page 1
Baird LargeCap Fund
June 30, 2017 (Unaudited)
Total Returns
| Average Annual | |||||
| Since | |||||
| For the Periods Ended June 30, 2017 | Six Months | One Year | Five Years | Ten Years | Inception(1) |
| Institutional Class Shares | 9.19% | 24.88% | 13.35% | 7.20% | 3.80% |
| Investor Class Shares | 9.09% | 24.79% | 13.07% | 6.96% | 3.54% |
S&P 500® Index(2) | 9.34% | 17.90% | 14.63% | 7.18% | 5.23% |
| (1) | For the period from September 29, 2000 (inception date) through June 30, 2017. |
| (2) | The S&P 500® Index measures the performance of 500 common stocks chosen for market size, liquidity and industry group representation of U.S. equity performance. This Index does not reflect any deduction for fees, expenses or taxes. A direct investment in the Index is not possible. |
L2 Asset Management, LLC (“L2”) became the Fund’s subadvisor effective April 30, 2016. From December 23, 2013 to April 30, 2016, Baird Kailash Group, LLC (“BKG”), was the Fund’s subadvisor. Matthew J. Malgari has served as the Fund’s lead portfolio manager since December 23, 2013, first as an employee of BKG and currently as an employee of L2. The Fund was managed by the Fund’s Advisor from the Fund’s inception date until December 23, 2013.
The returns shown in the table reflect reinvestment of dividends and/or capital gains distributions in additional shares. The returns do not reflect the deduction of taxes that a shareholder would pay on Fund distributions or the redemption of Fund shares. The returns reflect the actual performance for each period and do not include the impact of trades executed on the last business day of the period that were recorded on the first business day of the next period.
The gross expense ratio for each Class, as reflected in the Fund’s current prospectus, is set forth under “Portfolio Characteristics”.
The Fund’s subadviser makes investment decisions for the Fund primarily using quantitative investment models which rank securities based on fundamental measures of value, past performance and indicators of recent positive changes. The success of the quantitative investment methodologies and processes employed by the subadviser depends on the analyses and assessments that were used in developing such methodologies and processes, as well as on the accuracy and reliability of models and data provided by third parties. Incorrect analyses and assessments or inaccurate or incomplete models and data would adversely affect performance. Certain low-probability events or factors that are assigned little weight may occur or prove to be more likely or may have more relevance than expected, for short or extended periods of time. It is also possible that prices of securities may move in directions that were not predicted by the subadviser’s quantitative methodologies. The Fund may invest in stocks (or ADRs representing stocks) of foreign companies that are traded on U.S. exchanges. Foreign investments involve additional risk such as currency rate fluctuations, political and economic instability, and different and sometimes less strict financial reporting standards and regulation.
Past performance does not guarantee future results. Investment return and principal value will fluctuate so that an investor’s shares, when redeemed, may be worth more or less than their original cost.
For information about the performance of the Fund as of the most recent month-end, please call 1-866-44BAIRD or visit www.bairdfunds.com. Mutual fund performance changes over time and current performance may be lower or higher than that stated.
Page 2
Baird LargeCap Fund
Schedule of Investments, June 30, 2017 (Unaudited)
Common Stocks
| % of | ||||||||||||
| Shares | Value | Net Assets | ||||||||||
| Aerospace & Defense | ||||||||||||
| The Boeing Co. | 5,172 | $ | 1,022,763 | 2.4 | % | |||||||
| Huntington Ingalls Industries, Inc. | 600 | 111,696 | 0.3 | % | ||||||||
| 1,134,459 | 2.7 | % | ||||||||||
| Airlines | ||||||||||||
| Alaska Air Group, Inc. | 5,220 | 468,547 | 1.1 | % | ||||||||
| American Airlines Group, Inc. | 10,533 | 530,021 | 1.3 | % | ||||||||
| Delta Air Lines, Inc. | 5,625 | 302,287 | 0.7 | % | ||||||||
| Southwest Airlines Co. | 1,061 | 65,931 | 0.2 | % | ||||||||
| United Continental Holdings, Inc.* | 1,945 | 146,361 | 0.3 | % | ||||||||
| 1,513,147 | 3.6 | % | ||||||||||
| Auto Components | ||||||||||||
| Goodyear Tire & Rubber Co/The | 4,192 | 146,552 | 0.4 | % | ||||||||
| Lear Corp. | 3,027 | 430,076 | 1.0 | % | ||||||||
| 576,628 | 1.4 | % | ||||||||||
| Automobiles | ||||||||||||
Fiat Chrysler Automobiles NV* f | 8,143 | 86,560 | 0.2 | % | ||||||||
| Ford Motor Co. | 13,876 | 155,273 | 0.4 | % | ||||||||
| General Motors Co. | 2,403 | 83,937 | 0.2 | % | ||||||||
| Harley-Davidson, Inc. | 11,216 | 605,888 | 1.4 | % | ||||||||
| 931,658 | 2.2 | % | ||||||||||
| Banks | ||||||||||||
| Citigroup, Inc. | 5,101 | 341,155 | 0.8 | % | ||||||||
| Fifth Third Bancorp | 22,479 | 583,555 | 1.4 | % | ||||||||
| J.P. Morgan Chase & Co. | 8,000 | 731,200 | 1.8 | % | ||||||||
| PNC Financial Services Group, Inc. | 1,381 | 172,445 | 0.4 | % | ||||||||
| U.S. Bancorp | 2,656 | 137,900 | 0.3 | % | ||||||||
| 1,966,255 | 4.7 | % | ||||||||||
| Beverages | ||||||||||||
| The Coca-Cola Co. | 4,009 | 179,804 | 0.4 | % | ||||||||
| PepsiCo, Inc. | 8,942 | 1,032,711 | 2.5 | % | ||||||||
| 1,212,515 | 2.9 | % | ||||||||||
| Biotechnology | ||||||||||||
| AbbVie, Inc. | 13,705 | 993,750 | 2.4 | % | ||||||||
| Amgen, Inc. | 5,967 | 1,027,697 | 2.5 | % | ||||||||
| Biogen, Inc.* | 473 | 128,353 | 0.3 | % | ||||||||
| Celgene Corp.* | 7,467 | 969,739 | 2.3 | % | ||||||||
| Gilead Sciences, Inc. | 990 | 70,072 | 0.2 | % | ||||||||
| United Therapeutics Corp.* | 432 | 56,043 | 0.1 | % | ||||||||
| 3,245,654 | 7.8 | % | ||||||||||
The accompanying notes are an integral part of these financial statements.
Page 3
Baird LargeCap Fund
Schedule of Investments, June 30, 2017 (Unaudited)
Common Stocks (cont.)
| % of | ||||||||||||
| Shares | Value | Net Assets | ||||||||||
| Capital Markets | ||||||||||||
| Ameriprise Financial, Inc. | 4,000 | $ | 509,160 | 1.2 | % | |||||||
| MSCI, Inc. | 7,379 | 759,963 | 1.8 | % | ||||||||
| 1,269,123 | 3.0 | % | ||||||||||
| Chemicals | ||||||||||||
| Celanese Corp. – Series A | 2,721 | 258,332 | 0.6 | % | ||||||||
| Chemours Co/The | 1,542 | 58,473 | 0.1 | % | ||||||||
LyondellBasell Industries NV – Class A f | 2,117 | 178,653 | 0.4 | % | ||||||||
| Monsanto Co. | 564 | 66,755 | 0.2 | % | ||||||||
| 562,213 | 1.3 | % | ||||||||||
| Communications Equipment | ||||||||||||
| Cisco Systems, Inc. | 16,303 | 510,284 | 1.2 | % | ||||||||
| F5 Networks, Inc.* | 5,300 | 673,418 | 1.6 | % | ||||||||
| Juniper Networks, Inc. | 2,128 | 59,329 | 0.2 | % | ||||||||
| 1,243,031 | 3.0 | % | ||||||||||
| Consumer Finance | ||||||||||||
| Ally Financial, Inc. | 7,700 | 160,930 | 0.4 | % | ||||||||
| American Express Co. | 10,621 | 894,713 | 2.1 | % | ||||||||
| Capital One Financial Corp. | 2,736 | 226,048 | 0.5 | % | ||||||||
| Discover Financial Services | 12,646 | 786,455 | 1.9 | % | ||||||||
| Synchrony Financial | 6,729 | 200,659 | 0.5 | % | ||||||||
| 2,268,805 | 5.4 | % | ||||||||||
| Containers & Packaging | ||||||||||||
| International Paper Co. | 3,100 | 175,491 | 0.4 | % | ||||||||
| Packaging Corp of America | 2,762 | 307,659 | 0.7 | % | ||||||||
| 483,150 | 1.1 | % | ||||||||||
| Diversified Telecommunication Services | ||||||||||||
| AT&T, Inc. | 12,954 | 488,754 | 1.2 | % | ||||||||
| Electrical Equipment | ||||||||||||
| Emerson Electric Co. | 5,376 | 320,517 | 0.8 | % | ||||||||
| Rockwell Automation, Inc. | 3,102 | 502,400 | 1.2 | % | ||||||||
| 822,917 | 2.0 | % | ||||||||||
| Electronic Equipment, Instruments & Components | ||||||||||||
| Corning, Inc. | 4,470 | 134,324 | 0.3 | % | ||||||||
Flex Ltd* f | 4,378 | 71,405 | 0.2 | % | ||||||||
| 205,729 | 0.5 | % | ||||||||||
| Energy Equipment & Services | ||||||||||||
| Baker Hughes, Inc. | 2,480 | 135,185 | 0.3 | % | ||||||||
The accompanying notes are an integral part of these financial statements.
Page 4
Baird LargeCap Fund
Schedule of Investments, June 30, 2017 (Unaudited)
Common Stocks (cont.)
| % of | ||||||||||||
| Shares | Value | Net Assets | ||||||||||
| Food & Staples Retailing | ||||||||||||
| The Kroger Co. | 20,156 | $ | 470,038 | 1.1 | % | |||||||
| Sysco Corp. | 6,680 | 336,205 | 0.8 | % | ||||||||
| Wal-Mart Stores, Inc. | 1,530 | 115,790 | 0.3 | % | ||||||||
| 922,033 | 2.2 | % | ||||||||||
| Food Products | ||||||||||||
| Archer-Daniels-Midland Co. | 1,416 | 58,594 | 0.1 | % | ||||||||
| Campbell Soup Co. | 892 | 46,518 | 0.1 | % | ||||||||
| 105,112 | 0.2 | % | ||||||||||
| Gas Utilities | ||||||||||||
| UGI Corp. | 4,798 | 232,271 | 0.6 | % | ||||||||
| Health Care Equipment & Supplies | ||||||||||||
| Hologic, Inc.* | 10,357 | 470,001 | 1.1 | % | ||||||||
| ResMed, Inc. | 5,517 | 429,609 | 1.0 | % | ||||||||
| Varian Medical Systems, Inc.* | 1,419 | 146,426 | 0.4 | % | ||||||||
| 1,046,036 | 2.5 | % | ||||||||||
| Health Care Providers & Services | ||||||||||||
| AmerisourceBergen Corporation | 655 | 61,917 | 0.2 | % | ||||||||
| DaVita, Inc.* | 4,428 | 286,757 | 0.7 | % | ||||||||
| McKesson Corp. | 2,133 | 350,964 | 0.8 | % | ||||||||
| WellCare Health Plans, Inc.* | 550 | 98,758 | 0.2 | % | ||||||||
| 798,396 | 1.9 | % | ||||||||||
| Hotels, Restaurants & Leisure | ||||||||||||
| Wyndham Worldwide Corp. | 7,193 | 722,249 | 1.7 | % | ||||||||
| Wynn Resorts Ltd | 1,100 | 147,532 | 0.4 | % | ||||||||
| 869,781 | 2.1 | % | ||||||||||
| Household Products | ||||||||||||
| Spectrum Brands Holdings, Inc. | 582 | 72,773 | 0.2 | % | ||||||||
| Independent Power and Renewable Electricity Producers | ||||||||||||
| The AES Corp. | 20,789 | 230,966 | 0.6 | % | ||||||||
| Insurance | ||||||||||||
| Aflac, Inc. | 1,642 | 127,551 | 0.3 | % | ||||||||
| The Progressive Corp. | 1,658 | 73,101 | 0.2 | % | ||||||||
| 200,652 | 0.5 | % | ||||||||||
| Internet Software & Services | ||||||||||||
| Alphabet, Inc. – Class A* | 1,421 | 1,321,075 | 3.1 | % | ||||||||
| eBay, Inc.* | 1,971 | 68,828 | 0.2 | % | ||||||||
| 1,389,903 | 3.3 | % | ||||||||||
The accompanying notes are an integral part of these financial statements.
Page 5
Baird LargeCap Fund
Schedule of Investments, June 30, 2017 (Unaudited)
Common Stocks (cont.)
| % of | ||||||||||||
| Shares | Value | Net Assets | ||||||||||
| IT Services | ||||||||||||
| Alliance Data Systems Corp. | 2,324 | $ | 596,547 | 1.4 | % | |||||||
| International Business Machines Corp. | 1,440 | 221,515 | 0.5 | % | ||||||||
| MasterCard, Inc. – Class A | 2,868 | 348,319 | 0.8 | % | ||||||||
| The Western Union Co. | 13,343 | 254,184 | 0.6 | % | ||||||||
| 1,420,565 | 3.3 | % | ||||||||||
| Leisure Products | ||||||||||||
| Hasbro, Inc. | 683 | 76,161 | 0.2 | % | ||||||||
| Life Sciences Tools & Services | ||||||||||||
| Waters Corp.* | 1,484 | 272,819 | 0.7 | % | ||||||||
| Machinery | ||||||||||||
| Cummins, Inc. | 2,339 | 379,433 | 0.9 | % | ||||||||
| Deere & Co. | 2,634 | 325,536 | 0.8 | % | ||||||||
| 704,969 | 1.7 | % | ||||||||||
| Media | ||||||||||||
| Omnicom Group, Inc. | 1,427 | 118,298 | 0.3 | % | ||||||||
| Multi-Utilities | ||||||||||||
| CenterPoint Energy, Inc. | 7,831 | 214,413 | 0.5 | % | ||||||||
| Oil, Gas & Consumable Fuels | ||||||||||||
| Marathon Petroleum Corp. | 3,297 | 172,532 | 0.4 | % | ||||||||
| Tesoro Corp. | 4,947 | 463,039 | 1.1 | % | ||||||||
| Valero Energy Corp. | 8,229 | 555,129 | 1.4 | % | ||||||||
| 1,190,700 | 2.9 | % | ||||||||||
| Personal Products | ||||||||||||
| Coty, Inc. – Class A | 5,983 | 112,241 | 0.3 | % | ||||||||
| Pharmaceuticals | ||||||||||||
Jazz Pharmaceuticals PLC* f | 3,592 | 558,556 | 1.3 | % | ||||||||
| Johnson & Johnson | 500 | 66,145 | 0.2 | % | ||||||||
| Merck & Co., Inc. | 4,413 | 282,829 | 0.7 | % | ||||||||
| 907,530 | 2.2 | % | ||||||||||
| Semiconductors & Semiconductor Equipment | ||||||||||||
| Analog Devices, Inc. | 2,775 | 215,895 | 0.5 | % | ||||||||
| Intel Corp. | 5,887 | 198,627 | 0.5 | % | ||||||||
| Microchip Technology, Inc. | 1,959 | 151,196 | 0.4 | % | ||||||||
| Micron Technology, Inc.* | 7,643 | 228,220 | 0.5 | % | ||||||||
| NVIDIA Corp. | 1,864 | 269,460 | 0.6 | % | ||||||||
| QUALCOMM Incorporated | 4,402 | 243,078 | 0.6 | % | ||||||||
| Xilinx, Inc. | 11,394 | 732,862 | 1.8 | % | ||||||||
| 2,039,338 | 4.9 | % | ||||||||||
The accompanying notes are an integral part of these financial statements.
Page 6
Baird LargeCap Fund
Schedule of Investments, June 30, 2017 (Unaudited)
Common Stocks (cont.)
| % of | ||||||||||||
| Shares | Value | Net Assets | ||||||||||
| Software | ||||||||||||
| Cadence Design System, Inc.* | 4,791 | $ | 160,450 | 0.4 | % | |||||||
| Citrix Systems, Inc.* | 2,770 | 220,437 | 0.5 | % | ||||||||
| Microsoft Corp. | 12,746 | 878,582 | 2.1 | % | ||||||||
| Oracle Corp. | 6,419 | 321,849 | 0.8 | % | ||||||||
| VMware, Inc. – Class A* | 6,624 | 579,136 | 1.4 | % | ||||||||
| 2,160,454 | 5.2 | % | ||||||||||
| Specialty Retail | ||||||||||||
| Best Buy Co., Inc. | 12,779 | 732,620 | 1.8 | % | ||||||||
| The Gap, Inc. | 5,229 | 114,986 | 0.3 | % | ||||||||
| 847,606 | 2.1 | % | ||||||||||
| Technology Hardware, Storage & Peripherals | ||||||||||||
| Apple, Inc. | 13,114 | 1,888,678 | 4.5 | % | ||||||||
| NetApp, Inc. | 11,140 | 446,157 | 1.1 | % | ||||||||
Seagate Technology PLC f | 17,283 | 669,716 | 1.6 | % | ||||||||
| 3,004,551 | 7.2 | % | ||||||||||
| Trading Companies & Distributors | ||||||||||||
| United Rentals, Inc.* | 1,853 | 208,852 | 0.5 | % | ||||||||
| Wireless Telecommunication Services | ||||||||||||
| Sprint Corp.* | 13,315 | 109,316 | 0.2 | % | ||||||||
| T-Mobile US, Inc.* | 5,327 | 322,923 | 0.8 | % | ||||||||
| 432,239 | 1.0 | % | ||||||||||
| Total Common Stocks | ||||||||||||
| (Cost $31,546,475) | 37,637,882 | 90.2 | % | |||||||||
| Contingent Value Rights | ||||||||||||
| Contingent Value Rights | ||||||||||||
| Safeway CASA LEY CVR*^† | 2,216 | 2,249 | 0.0 | % | ||||||||
| Safeway PDC LLC CVR*^† | 2,216 | 1 | 0.0 | % | ||||||||
| Total Contingent Value Rights | ||||||||||||
| (Cost $0) | 2,250 | 0.0 | % | |||||||||
| Exchange Traded Funds | ||||||||||||
| Exchange Traded Funds | ||||||||||||
| SPDR S&P 500 ETF Trust | 3,820 | 923,676 | 2.2 | % | ||||||||
| SPDR S&P Oil & Gas Exploration & Production ETF | 11,320 | 361,334 | 0.9 | % | ||||||||
| Vanguard Financials ETF | 19,204 | 1,201,210 | 2.9 | % | ||||||||
| Total Exchange Traded Funds | ||||||||||||
| (Cost $2,370,397) | 2,486,220 | 6.0 | % | |||||||||
The accompanying notes are an integral part of these financial statements.
Page 7
Baird LargeCap Fund
Schedule of Investments, June 30, 2017 (Unaudited)
Short-Term Investment
| % of | ||||||||||||
| Shares | Value | Net Assets | ||||||||||
| Money Market Mutual Fund | ||||||||||||
| Fidelity Institutional Money Market Fund – | ||||||||||||
| Government Portfolio, Institutional Class, 0.85%« | 1,591,989 | $ | 1,591,989 | 3.8 | % | |||||||
| Total Short-Term Investment | ||||||||||||
| (Cost $1,591,989) | 1,591,989 | 3.8 | % | |||||||||
| Total Investments | ||||||||||||
| (Cost $35,508,861) | 41,718,341 | 100.0 | % | |||||||||
| Liabilities in Excess of Other Assets | (4,804 | ) | 0.0 | % | ||||||||
| TOTAL NET ASSETS | $ | 41,713,537 | 100.0 | % | ||||||||
Notes to Schedule of Investments
| * | Non-Income Producing | |
| f | Foreign Security | |
| ^ | Illiquid Security | |
| † | Priced at Fair Value by the Valuation Committee as delegated by the Baird Funds’ Board of Directors. | |
| « | 7-Day Yield |
Industry classifications shown in the Schedule of Investments are based off of the Global Industry Classification Standard (GICS®). GICS was developed by and/or is the exclusive property of MSCI, Inc. and Standard & Poor Financial Services LLC (“S&P”). GICS is a service mark of MSCI and S&P and has been licensed for use by U.S. Bancorp Fund Services, LLC.
The accompanying notes are an integral part of these financial statements.
Page 8
Baird LargeCap Fund
Schedule of Investments, June 30, 2017 (Unaudited)
Summary of Fair Value Exposure at June 30, 2017 (Unaudited)
The Fund has adopted authoritative fair valuation accounting standards which establish a definition of fair value and set out a hierarchy for measuring fair value. These standards require additional disclosures about the various inputs and valuation techniques used to develop the measurements of fair value and a discussion on changes in valuation techniques and related inputs during the period. These standards define fair value as the price that would be received to sell an asset or paid to transfer a liability in an orderly transaction between market participants at the measurement date. Management has determined that these standards have no material impact on the Funds’ financial statements. The fair value hierarchy is organized into three levels based upon the assumptions (referred to as “inputs”) used in pricing the asset or liability. These standards state that “observable inputs” reflect the assumptions market participants would use in pricing the asset or liability based on market data obtained from independent sources and "unobservable inputs" reflect an entity’s own assumptions about the assumptions market participants would use in pricing the asset or liability. These inputs are summarized into three broad levels and described below:
| Level 1 – | Unadjusted quoted prices in active markets for identical unrestricted securities. |
| Level 2 – | Other significant observable inputs (including quoted prices for similar securities, quoted prices in inactive markets, dealer indications, interest rates, yield curves, prepayment speeds, credit risk, default rates, inputs corroborated by observable market data, etc.). |
| Level 3 – | Significant unobservable inputs (including the Fund’s own assumptions about the factors that market participants would use in valuing the security) based on the best information available. |
The inputs or methodology used for valuing securities are not necessarily an indication of the risk associated with investing in those securities.
The following is a summary of the inputs used to value the Fund’s investments as of June 30, 2017:
| Level 1 | Level 2 | Level 3 | Total | |||||||||||||
| Equity | ||||||||||||||||
| Common Stocks | $ | 37,637,882 | $ | — | $ | — | $ | 37,637,882 | ||||||||
| Total Equity | 37,637,882 | — | — | 37,637,882 | ||||||||||||
| Contingent Value Rights | ||||||||||||||||
| Contingent Value Rights | — | — | 2,250 | 2,250 | ||||||||||||
| Total Contingent Value Rights | — | — | 2,250 | 2,250 | ||||||||||||
| Exchange Traded Funds | ||||||||||||||||
| Exchange Traded Funds | 2,486,220 | — | — | 2,486,220 | ||||||||||||
| Total Exchange Traded Funds | 2,486,220 | — | — | 2,486,220 | ||||||||||||
| Short-Term Investment | ||||||||||||||||
| Money Market Mutual Fund | 1,591,989 | — | — | 1,591,989 | ||||||||||||
| Total Short-Term Investment | 1,591,989 | — | — | 1,591,989 | ||||||||||||
| Total Investments* | $ | 41,716,091 | $ | — | $ | 2,250 | $ | 41,718,341 | ||||||||
| * | Additional information regarding the industry classifications of these investments is disclosed in the Schedule of Investments. |
Changes in valuation techniques may result in transfers into or out of current assigned levels within the hierarchy. Two securities with a fair value of $2,250 are priced at fair value by the Valuation Committee instead of the Fund’s pricing vendor and are valued using level 3 inputs. There were no transfers between Level 1, Level 2 and Level 3 fair value measurements during the reporting period, as compared to their classification from the prior year’s annual report. See the Fund’s valuation policy in Note 2a to the financial statements.
The accompanying notes are an integral part of these financial statements.
Page 9
Baird LargeCap Fund
Schedule of Investments, June 30, 2017 (Unaudited)
Summary of Fair Value Exposure at June 30, 2017 (Unaudited) (cont.)
Level 3 Reconciliation Disclosure
Following is a reconciliation of Level 3 assets for which significant unobservable inputs were used to determine fair value.
Description | Investments in Securities | |||
| Balance as of December 31, 2016 | $ | 2,357 | ||
| Accrued discounts/premiums | — | |||
| Realized gain (loss) | — | |||
| Change in unrealized appreciation (depreciation) | (107 | ) | ||
| Purchases | — | |||
| Sales | — | |||
| Transfers in and/or out of Level 3* | — | |||
| Balance as of June 30, 2017 | $ | 2,250 | ||
* Transfers between levels are recognized at the end of the reporting period.
The accompanying notes are an integral part of these financial statements.
Page 10
Baird MidCap Fund
June 30, 2017 (Unaudited)
Portfolio Characteristics
A June 30, 2017 summary of the Fund’s top 10 holdings and equity sector analysis compared to the Russell MidCap® Growth Index is shown below.
| Top 10 Holdings* | Equity Sector Analysis** | ||
 | |||
| AO Smith Corp. | 2.3% | ||
| Cable One, Inc. | 2.3% | ||
| Edwards Lifesciences Corp. | 2.2% | ||
| Hasbro, Inc. | 2.1% | ||
| The Cooper Cos., Inc. | 2.1% | ||
| Fiserv, Inc. | 2.1% | ||
| Gartner, Inc. | 2.0% | ||
| Dr. Pepper Snapple Group, Inc. | 2.0% | ||
| East West Bancorp, Inc. | 2.0% | ||
| Broadridge Financial Solutions, Inc. | 2.0% | ||
| Net Assets: | $1,365,277,928 | ||
| Portfolio Turnover Rate: | 27.6% | † | |
| Number of Equity Holdings: | 59 | ||
| Annualized Portfolio Expense Ratio:*** | |||
Gross | |||
| Institutional Class: | 0.83% | ||
| Investor Class: | 1.08% | **** | |
Net | |||
| Institutional Class: | 0.81% | ||
| Investor Class: | 1.06% | **** |
| * | The Fund’s portfolio composition is subject to change and there is no assurance that the Fund will continue to hold any particular security. Percentages shown relate to the Fund’s total net assets as of June 30, 2017. | |
| ** | Percentages shown in parentheses relate to the Fund’s total market value of investments as of June 30, 2017, and may not add up to 100% due to rounding. | |
| *** | Reflects expense ratios as stated in the Fund’s current prospectus. The Advisor has contractually agreed to limit the Fund’s total annual fund operating expenses to 0.85% of average daily net assets for the Institutional Class shares and 1.10% of average daily net assets for the Investor Class shares, at least through April 30, 2018. | |
| **** | Includes 0.25% 12b-1 fee. | |
| † | Not annualized. |
Page 11
Baird MidCap Fund
June 30, 2017 (Unaudited)
Total Returns
| Average Annual | |||||
| Since | |||||
| For the Periods Ended June 30, 2017 | Six Months | One Year | Five Years | Ten Years | Inception(1) |
| Institutional Class Shares | 16.08% | 19.25% | 11.50% | 8.45% | 7.01% |
| Investor Class Shares | 15.96% | 18.95% | 11.23% | 8.20% | 6.76% |
Russell MidCap® Growth Index(2) | 11.40% | 17.06% | 14.20% | 7.88% | 6.46% |
| (1) | For the period from December 29, 2000 (inception date) through June 30, 2017. |
| (2) | The Russell Midcap® Growth Index measures the performance of the mid-cap growth segment of the U.S. equity universe. It includes those Russell Midcap® Index companies with higher price-to-book ratios and higher forecasted growth values. This index does not reflect any deduction for fees, expenses or taxes. A direct investment in the index is not possible. |
The returns shown in the table above reflect reinvestment of dividends and/or capital gains distributions in additional shares. The returns do not reflect the deduction of taxes that a shareholder would pay on Fund distributions or the redemption of Fund shares. The returns reflect the actual performance for each period and do not include the impact of trades executed on the last business day of the period that were recorded on the first business day of the next period.
The gross expense ratio for each Class, as reflected in the Fund’s current prospectus, is set forth under “Portfolio Characteristics”.
The Fund focuses on growth-style stocks and therefore the performance of the Fund will typically be more volatile than the performance of funds that focus on types of stocks that have a broader investment style. The Fund may invest up to 15% of its total assets in U.S. dollar denominated foreign securities and ADRs. Foreign investments involve additional risks such as currency rate fluctuations, political and economic instability, and different and sometimes less strict financial reporting standards and regulation. The Fund invests a substantial portion of its assets in the stocks of mid-capitalization companies. Mid-capitalization companies often are more volatile and face greater risks than larger, more established companies.
Past performance does not guarantee future results. Investment return and principal value will fluctuate so that an investor’s shares, when redeemed, may be worth more or less than their original cost.
For information about the performance of the Fund as of the most recent month-end, please call 1-866-44BAIRD or visit www.bairdfunds.com. Mutual fund performance changes over time and current performance may be lower or higher than that stated.
Page 12
Baird MidCap Fund
Schedule of Investments, June 30, 2017 (Unaudited)
Common Stocks
| % of | ||||||||||||
| Shares | Value | Net Assets | ||||||||||
| Aerospace & Defense | ||||||||||||
| Mercury Systems, Inc.* | 87,706 | $ | 3,691,545 | 0.3 | % | |||||||
| Banks | ||||||||||||
| East West Bancorp, Inc. | 471,405 | 27,614,905 | 2.0 | % | ||||||||
| First Republic Bank/CA | 238,628 | 23,886,663 | 1.8 | % | ||||||||
| 51,501,568 | 3.8 | % | ||||||||||
| Beverages | ||||||||||||
| Dr. Pepper Snapple Group, Inc. | 303,670 | 27,667,374 | 2.0 | % | ||||||||
| Building Products | ||||||||||||
| AO Smith Corp. | 570,548 | 32,138,969 | 2.3 | % | ||||||||
| Fortune Brands Home & Security, Inc. | 358,094 | 23,362,052 | 1.7 | % | ||||||||
| 55,501,021 | 4.0 | % | ||||||||||
| Capital Markets | ||||||||||||
| Affiliated Managers Group, Inc. | 137,249 | 22,764,119 | 1.7 | % | ||||||||
| MarketAxess Holdings, Inc. | 57,731 | 11,609,704 | 0.8 | % | ||||||||
| 34,373,823 | 2.5 | % | ||||||||||
| Chemicals | ||||||||||||
| Albemarle Corp. | 192,443 | 20,310,434 | 1.5 | % | ||||||||
| Distributors | ||||||||||||
| LKQ Corp.* | 484,489 | 15,963,912 | 1.2 | % | ||||||||
| Pool Corp. | 202,063 | 23,756,547 | 1.7 | % | ||||||||
| 39,720,459 | 2.9 | % | ||||||||||
| Electrical Equipment | ||||||||||||
| Rockwell Automation, Inc. | 124,856 | 20,221,678 | 1.5 | % | ||||||||
| Electronic Equipment, Instruments & Components | ||||||||||||
| CDW Corp. | 320,528 | 20,042,616 | 1.5 | % | ||||||||
| Trimble Navigation Ltd.* | 594,337 | 21,200,001 | 1.5 | % | ||||||||
| 41,242,617 | 3.0 | % | ||||||||||
| Food & Staples Retailing | ||||||||||||
| Casey’s General Stores, Inc. | 138,942 | 14,882,078 | 1.1 | % | ||||||||
| Food Products | ||||||||||||
| Mccormick & Co., Inc. | 259,564 | 25,310,086 | 1.9 | % | ||||||||
| Health Care Equipment & Supplies | ||||||||||||
| The Cooper Cos., Inc. | 119,621 | 28,639,660 | 2.1 | % | ||||||||
| Edwards Lifesciences Corp.* | 252,714 | 29,880,903 | 2.2 | % | ||||||||
| IDEXX Laboratories, Inc.* | 81,674 | 13,183,817 | 1.0 | % | ||||||||
| 71,704,380 | 5.3 | % | ||||||||||
The accompanying notes are an integral part of these financial statements.
Page 13
Baird MidCap Fund
Schedule of Investments, June 30, 2017 (Unaudited)
Common Stocks (cont.)
| % of | ||||||||||||
| Shares | Value | Net Assets | ||||||||||
| Health Care Providers & Services | ||||||||||||
| Acadia Healthcare Co., Inc.* | 411,671 | $ | 20,328,314 | 1.5 | % | |||||||
| Henry Schein, Inc.* | 74,355 | 13,608,452 | 1.0 | % | ||||||||
| 33,936,766 | 2.5 | % | ||||||||||
| Health Care Technology | ||||||||||||
| Veeva Systems, Inc. – Class A* | 218,996 | 13,426,645 | 1.0 | % | ||||||||
| Hotels, Restaurants & Leisure | ||||||||||||
| Dominos Pizza, Inc. | 108,922 | 23,040,271 | 1.7 | % | ||||||||
| Vail Resorts, Inc. | 106,535 | 21,608,494 | 1.6 | % | ||||||||
| 44,648,765 | 3.3 | % | ||||||||||
| IT Services | ||||||||||||
| Alliance Data Systems Corp. | 65,045 | 16,696,401 | 1.2 | % | ||||||||
| Broadridge Financial Solutions, Inc. | 360,270 | 27,222,001 | 2.0 | % | ||||||||
| EPAM Systems, Inc.* | 294,811 | 24,790,657 | 1.8 | % | ||||||||
| Euronet Worldwide, Inc.* | 305,595 | 26,699,835 | 2.0 | % | ||||||||
| Fiserv, Inc.* | 229,544 | 28,082,413 | 2.1 | % | ||||||||
| Gartner, Inc.* | 225,616 | 27,865,832 | 2.0 | % | ||||||||
| 151,357,139 | 11.1 | % | ||||||||||
| Leisure Products | ||||||||||||
| Hasbro, Inc. | 257,565 | 28,721,073 | 2.1 | % | ||||||||
| Life Sciences Tools & Services | ||||||||||||
ICON PLC* f | 240,165 | 23,485,735 | 1.7 | % | ||||||||
| Illumina, Inc.* | 141,483 | 24,550,130 | 1.8 | % | ||||||||
| 48,035,865 | 3.5 | % | ||||||||||
| Machinery | ||||||||||||
| Fortive Corp. | 399,121 | 25,284,315 | 1.9 | % | ||||||||
| Graco, Inc. | 200,522 | 21,913,044 | 1.6 | % | ||||||||
| The Middleby Corp.* | 200,370 | 24,346,959 | 1.8 | % | ||||||||
| Oshkosh Truck Corporation | 374,492 | 25,795,009 | 1.9 | % | ||||||||
| Snap-on, Inc. | 138,789 | 21,928,662 | 1.5 | % | ||||||||
| WABCO Holdings, Inc.* | 200,909 | 25,617,907 | 1.9 | % | ||||||||
| 144,885,896 | 10.6 | % | ||||||||||
| Media | ||||||||||||
| Cable One, Inc. | 43,646 | 31,027,941 | 2.3 | % | ||||||||
| Multiline Retail | ||||||||||||
| Burlington Stores, Inc.* | 284,195 | 26,143,098 | 1.9 | % | ||||||||
| Dollar General Corp. | 363,331 | 26,192,532 | 1.9 | % | ||||||||
| Ollie’s Bargain Outlet Holdings, Inc.* | 597,203 | 25,440,848 | 1.9 | % | ||||||||
| 77,776,478 | 5.7 | % | ||||||||||
The accompanying notes are an integral part of these financial statements.
Page 14
Baird MidCap Fund
Schedule of Investments, June 30, 2017 (Unaudited)
Common Stocks (cont.)
| % of | ||||||||||||
| Shares | Value | Net Assets | ||||||||||
| Oil, Gas & Consumable Fuels | ||||||||||||
| Diamondback Energy, Inc.* | 217,457 | $ | 19,312,356 | 1.4 | % | |||||||
| Pharmaceuticals | ||||||||||||
Jazz Pharmaceuticals PLC* f | 88,308 | 13,731,894 | 1.0 | % | ||||||||
| Professional Services | ||||||||||||
| Equifax, Inc. | 174,967 | 24,043,965 | 1.7 | % | ||||||||
| Verisk Analytics, Inc.* | 208,223 | 17,567,775 | 1.3 | % | ||||||||
| 41,611,740 | 3.0 | % | ||||||||||
| Road & Rail | ||||||||||||
| J.B. Hunt Transport Services, Inc. | 148,487 | 13,568,742 | 1.0 | % | ||||||||
| Semiconductors & Semiconductor Equipment | ||||||||||||
| Microchip Technology, Inc. | 290,200 | 22,397,636 | 1.6 | % | ||||||||
| Monolithic Power Systems, Inc. | 227,852 | 21,964,933 | 1.6 | % | ||||||||
| 44,362,569 | 3.2 | % | ||||||||||
| Software | ||||||||||||
| Blackbaud, Inc. | 177,920 | 15,256,640 | 1.1 | % | ||||||||
| Red Hat, Inc.* | 142,550 | 13,649,163 | 1.0 | % | ||||||||
| ServiceNow, Inc.* | 226,782 | 24,038,892 | 1.8 | % | ||||||||
| Synopsys, Inc.* | 301,208 | 21,967,099 | 1.6 | % | ||||||||
| Tyler Technologies, Inc.* | 138,327 | 24,299,904 | 1.8 | % | ||||||||
| The Ultimate Software Group, Inc.* | 115,311 | 24,222,229 | 1.7 | % | ||||||||
| 123,433,927 | 9.0 | % | ||||||||||
| Textiles, Apparel & Luxury Goods | ||||||||||||
| Lululemon Athletica, Inc.* | 451,850 | 26,961,889 | 2.0 | % | ||||||||
| Trading Companies & Distributors | ||||||||||||
| Fastenal Co. | 471,557 | 20,526,876 | 1.5 | % | ||||||||
| Watsco, Inc. | 139,173 | 21,460,477 | 1.6 | % | ||||||||
| 41,987,353 | 3.1 | % | ||||||||||
| Total Common Stocks | ||||||||||||
| (Cost $1,011,064,585) | 1,304,914,101 | 95.6 | % | |||||||||
The accompanying notes are an integral part of these financial statements.
Page 15
Baird MidCap Fund
Schedule of Investments, June 30, 2017 (Unaudited)
Short-Term Investment
| % of | ||||||||||||
| Shares | Value | Net Assets | ||||||||||
| Money Market Mutual Fund | ||||||||||||
| Fidelity Institutional Money Market Fund – | ||||||||||||
| Government Portfolio, Institutional Class, 0.85%« | 79,628,687 | $ | 79,628,687 | 5.8 | % | |||||||
| Total Short-Term Investment | ||||||||||||
| (Cost $79,628,687) | 79,628,687 | 5.8 | % | |||||||||
| Total Investments | ||||||||||||
| (Cost $1,090,693,272) | 1,384,542,788 | 101.4 | % | |||||||||
| Liabilities in Excess of Other Assets | (19,264,860 | ) | (1.4 | )% | ||||||||
| TOTAL NET ASSETS | $ | 1,365,277,928 | 100.0 | % | ||||||||
Notes to Schedule of Investments
| * | Non-Income Producing | |
| f | Foreign Security | |
| « | 7-Day Yield |
Industry classifications shown in the Schedule of Investments are based off of the Global Industry Classification Standard (GICS®). GICS was developed by and/or is the exclusive property of MSCI, Inc. and Standard & Poor Financial Services LLC (“S&P”). GICS is a service mark of MSCI and S&P and has been licensed for use by U.S. Bancorp Fund Services, LLC.
The accompanying notes are an integral part of these financial statements.
Page 16
Baird MidCap Fund
Schedule of Investments, June 30, 2017 (Unaudited)
Summary of Fair Value Exposure at June 30, 2017 (Unaudited)
The Fund has adopted authoritative fair valuation accounting standards which establish a definition of fair value and set out a hierarchy for measuring fair value. These standards require additional disclosures about the various inputs and valuation techniques used to develop the measurements of fair value and a discussion on changes in valuation techniques and related inputs during the period. These standards define fair value as the price that would be received to sell an asset or paid to transfer a liability in an orderly transaction between market participants at the measurement date. Management has determined that these standards have no material impact on the Fund’s financial statements. The fair value hierarchy is organized into three levels based upon the assumptions (referred to as “inputs”) used in pricing the asset or liability. These standards state that “observable inputs” reflect the assumptions market participants would use in pricing the asset or liability based on market data obtained from independent sources and “unobservable inputs” reflect an entity’s own assumptions about the assumptions market participants would use in pricing the asset or liability. These inputs are summarized into three broad levels and described below:
| Level 1 – | Unadjusted quoted prices in active markets for identical unrestricted securities. |
| Level 2 – | Other significant observable inputs (including quoted prices for similar securities, quoted prices in inactive markets, dealer indications, interest rates, yield curves, prepayment speeds, credit risk, default rates, inputs corroborated by observable market data, etc.). |
| Level 3 – | Significant unobservable inputs (including the Fund’s own assumptions about the factors that market participants would use in valuing the security) based on the best information available. |
The inputs or methodology used for valuing securities are not necessarily an indication of the risk associated with investing in those securities.
The following is a summary of the inputs used to value the Fund’s investments as of June 30, 2017:
| Level 1 | Level 2 | Level 3 | Total | |||||||||||||
| Equity | ||||||||||||||||
| Common Stocks | $ | 1,304,914,101 | $ | — | $ | — | $ | 1,304,914,101 | ||||||||
| Total Equity | 1,304,914,101 | — | — | 1,304,914,101 | ||||||||||||
| Short-Term Investment | ||||||||||||||||
| Money Market Mutual Fund | 79,628,687 | — | — | 79,628,687 | ||||||||||||
| Total Short-Term Investment | 79,628,687 | — | — | 79,628,687 | ||||||||||||
| Total Investments* | $ | 1,384,542,788 | $ | — | $ | — | $ | 1,384,542,788 | ||||||||
| * | Additional information regarding the industry classifications of these investments is disclosed in the Schedule of Investments. |
Changes in valuation techniques may result in transfers into or out of assigned levels within the fair value hierarchy. There were no transfers between Level 1, Level 2 and Level 3 fair value measurements during the reporting period, as compared to their classification from the prior year’s annual report. See the Fund’s valuation policy in Note 2a to the financial statements.
The accompanying notes are an integral part of these financial statements.
Page 17
Baird Small/Mid Cap Value Fund
June 30, 2017 (Unaudited)
Portfolio Characteristics
A June 30, 2017 summary of the Fund’s top 10 holdings and equity sector analysis compared to the Russell 2500® Value Index is shown below.
| Top 10 Holdings* | Equity Sector Analysis** | ||
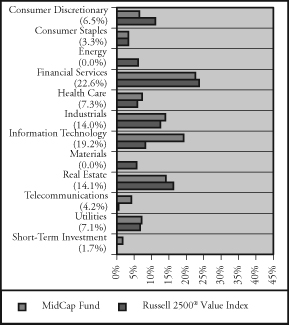 | |||
| Meta Financial Group, Inc. | 4.7% | ||
| Boingo Wireless, Inc. | 4.2% | ||
| Healthcare Trust of America, Inc. | 3.6% | ||
| American Financial Group, Inc. | 3.5% | ||
| VeriSign, Inc. | 3.3% | ||
| ICU Medical, Inc. | 3.2% | ||
| Silicon Motion Technology Corp. | 3.1% | ||
| j2 Global, Inc. | 3.0% | ||
| Physicians Realty Trust | 3.0% | ||
| Stamps.com, Inc. | 2.9% | ||
| Net Assets: | $12,373,886 | ||
| Portfolio Turnover Rate: | 42.1% | † | |
| Number of Equity Holdings: | 39 | ||
| Annualized Portfolio Expense Ratio:*** | |||
Gross | |||
| Institutional Class: | 2.87% | ||
| Investor Class: | 3.12% | **** | |
Net | |||
| Institutional Class: | 0.95% | ||
| Investor Class: | 1.20% | **** |
| * | The Fund’s portfolio composition is subject to change and there is no assurance that the Fund will continue to hold any particular security. Percentages shown relate to the Fund’s total net assets as of June 30, 2017. | |
| ** | Percentages shown in parentheses relate to the Fund’s total market value of investments as of June 30, 2017, and may not add up to 100% due to rounding. | |
| *** | Reflects expense ratios as stated in the Fund’s current prospectus. The Advisor has contractually agreed to limit the Fund’s total annual fund operating expenses to 0.95% of average daily net assets for the Institutional Class shares and 1.20% of average daily net assets for the Investor Class shares, at least through April 30, 2018. | |
| **** | Includes 0.25% 12b-1 fee. | |
| † | Not annualized. |
Page 18
Baird Small/Mid Cap Value Fund
June 30, 2017 (Unaudited)
Total Returns
| Since | |||
| For the Periods Ended June 30, 2017 | Six Months | One Year | Inception(1) |
| Institutional Class Shares | 5.93% | 10.82% | 6.20% |
| Investor Class Shares | 5.84% | 10.57% | 5.97% |
Russell 2500® Value Index(2) | 1.95% | 18.36% | 13.27% |
| (1) | For the period from November 30, 2015 (inception date) through June 30, 2017. |
| (2) | The Russell 2500® Value Index measures the performance of the small cap value segment of the U.S. equity universe. It includes those Russell 2500® Index companies with lower price-to-book ratios and lower forecasted growth values. This index does not reflect any deduction for fees, expenses or taxes. A direct investment in the index is not possible. |
The returns shown in the table above reflect reinvestment of dividends and/or capital gains distributions in additional shares. The returns do not reflect the deduction of taxes that a shareholder would pay on Fund distributions or the redemption of Fund shares. The returns reflect the actual performance for each period and do not include the impact of trades executed on the last business day of the period that were recorded on the first business day of the next period.
The gross expense ratio for each Class, as reflected in the Fund’s current prospectus, is set forth under “Portfolio Characteristics”.
The Fund focuses on small to mid cap value style stocks and therefore the performance of the Fund may be more volatile than the performance of funds that focus on types of stocks that have a broader investment style. The Fund may invest up to 15% of its total assets in U.S. dollar denominated foreign securities and ADRs. Foreign investments involve additional risks such as currency rate fluctuations and the potential for political and economic instability, and different and sometimes less strict financial reporting standards and regulation.
Past performance does not guarantee future results. Investment return and principal value will fluctuate so that an investor’s shares, when redeemed, may be worth more or less than their original cost.
For information about the performance of the Fund as of the most recent month-end, please call 1-866-44BAIRD or visit www.bairdfunds.com. Mutual fund performance changes over time and current performance may be lower or higher than that stated.
Page 19
Baird Small/Mid Cap Value Fund
Schedule of Investments, June 30, 2017 (Unaudited)
Common Stocks
| % of | ||||||||||||
| Shares | Value | Net Assets | ||||||||||
| Aerospace & Defense | ||||||||||||
| Hexcel Corp. | 5,753 | $ | 303,701 | 2.5 | % | |||||||
| Orbital ATK, Inc. | 2,697 | 265,277 | 2.1 | % | ||||||||
| Rockwell Collins, Inc. | 2,397 | 251,877 | 2.0 | % | ||||||||
| 820,855 | 6.6 | % | ||||||||||
| Air Freight & Logistics | ||||||||||||
| Air Transport Services Group, Inc.* | 15,462 | 336,762 | 2.7 | % | ||||||||
| Auto Components | ||||||||||||
| Motorcar Parts of America, Inc.* | 9,589 | 270,793 | 2.2 | % | ||||||||
| Banks | ||||||||||||
| Hilltop Holdings, Inc. | 9,049 | 237,174 | 1.9 | % | ||||||||
| Renasant Corp. | 7,911 | 346,027 | 2.8 | % | ||||||||
| 583,201 | 4.7 | % | ||||||||||
| Capital Markets | ||||||||||||
| Diamond Hill Investment Group, Inc. | 1,139 | 227,117 | 1.8 | % | ||||||||
| Commercial Services & Supplies | ||||||||||||
| Deluxe Corp. | 3,476 | 240,609 | 1.9 | % | ||||||||
| Construction & Engineering | ||||||||||||
| Quanta Services, Inc.* | 10,008 | 329,463 | 2.7 | % | ||||||||
| Distributors | ||||||||||||
| LKQ Corp.* | 7,731 | 254,736 | 2.1 | % | ||||||||
| Electric Utilities | ||||||||||||
| Alliant Energy Corp. | 6,233 | 250,380 | 2.0 | % | ||||||||
| Avangrid, Inc. | 7,132 | 314,877 | 2.6 | % | ||||||||
| Pinnacle West Capital Corp. | 3,656 | 311,345 | 2.5 | % | ||||||||
| 876,602 | 7.1 | % | ||||||||||
| Electronic Equipment, Instruments & Components | ||||||||||||
| Belden, Inc. | 3,296 | 248,617 | 2.0 | % | ||||||||
| Equity Real Estate Investment Trusts (REITs) | ||||||||||||
| Agree Realty Corp. | 6,892 | 316,136 | 2.5 | % | ||||||||
| CyrusOne, Inc. | 4,794 | 267,266 | 2.2 | % | ||||||||
| Healthcare Trust of America, Inc. | 14,323 | 445,589 | 3.6 | % | ||||||||
| LTC Properties, Inc. | 6,652 | 341,846 | 2.8 | % | ||||||||
| Physicians Realty Trust | 18,278 | 368,119 | 3.0 | % | ||||||||
| 1,738,956 | 14.1 | % | ||||||||||
| Food Products | ||||||||||||
| Lamb Weston Holdings, Inc. | 6,832 | 300,881 | 2.4 | % | ||||||||
The accompanying notes are an integral part of these financial statements.
Page 20
Baird Small/Mid Cap Value Fund
Schedule of Investments, June 30, 2017 (Unaudited)
Common Stocks (cont.)
| % of | ||||||||||||
| Shares | Value | Net Assets | ||||||||||
| Health Care Equipment & Supplies | ||||||||||||
| ICU Medical, Inc.* | 2,277 | $ | 392,782 | 3.2 | % | |||||||
| Health Care Providers & Services | ||||||||||||
| Laboratory Corp. of America Holdings* | 2,098 | 323,386 | 2.6 | % | ||||||||
| Household Durables | ||||||||||||
| ZAGG, Inc.* | 32,781 | 283,556 | 2.3 | % | ||||||||
| Household Products | ||||||||||||
| Orchids Paper Products Co. | 8,390 | 108,651 | 0.9 | % | ||||||||
| Insurance | ||||||||||||
| American Financial Group, Inc. | 4,315 | 428,781 | 3.5 | % | ||||||||
Atlas Financial Holdings, Inc.* f | 14,982 | 223,232 | 1.8 | % | ||||||||
| 652,013 | 5.3 | % | ||||||||||
| Internet Software & Services | ||||||||||||
| j2 Global, Inc. | 4,375 | 372,269 | 3.0 | % | ||||||||
| Stamps.com, Inc.* | 2,337 | 361,943 | 2.9 | % | ||||||||
| VeriSign, Inc.* | 4,315 | 401,122 | 3.3 | % | ||||||||
| 1,135,334 | 9.2 | % | ||||||||||
| Mortgage Real Estate Investment Trusts (REITs) | ||||||||||||
| Blackstone Mortgage Trust, Inc. – Class A | 10,667 | 337,077 | 2.7 | % | ||||||||
| Pharmaceuticals | ||||||||||||
Jazz Pharmaceuticals PLC* f | 1,199 | 186,445 | 1.5 | % | ||||||||
| Semiconductors & Semiconductor Equipment | ||||||||||||
| Cypress Semiconductor Corp. | 26,249 | 358,299 | 2.9 | % | ||||||||
Silicon Motion Technology Corp. – ADR f | 8,090 | 390,181 | 3.1 | % | ||||||||
| Skyworks Solutions, Inc. | 2,517 | 241,506 | 2.0 | % | ||||||||
| 989,986 | 8.0 | % | ||||||||||
| Thrifts & Mortgage Finance | ||||||||||||
| Bofi Holding, Inc.* | 7,192 | 170,594 | 1.4 | % | ||||||||
| Meta Financial Group, Inc. | 6,472 | 576,009 | 4.7 | % | ||||||||
| NMI Holdings, Inc. Class A* | 22,054 | 252,518 | 2.0 | % | ||||||||
| 999,121 | 8.1 | % | ||||||||||
| Wireless Telecommunication Services | ||||||||||||
| Boingo Wireless, Inc.* | 35,059 | 524,483 | 4.2 | % | ||||||||
| Total Common Stocks | ||||||||||||
| (Cost $10,531,703) | 12,161,426 | 98.3 | % | |||||||||
The accompanying notes are an integral part of these financial statements.
Page 21
Baird Small/Mid Cap Value Fund
Schedule of Investments, June 30, 2017 (Unaudited)
Short-Term Investment
| % of | ||||||||||||
| Shares | Value | Net Assets | ||||||||||
| Money Market Mutual Fund | ||||||||||||
| Fidelity Institutional Money Market Fund – | ||||||||||||
| Government Portfolio, Institutional Class, 0.85%« | 210,719 | $ | 210,719 | 1.7 | % | |||||||
| Total Short-Term Investment | ||||||||||||
| (Cost $210,719) | 210,719 | 1.7 | % | |||||||||
| Total Investments | ||||||||||||
| (Cost $10,742,422) | 12,372,145 | 100.0 | % | |||||||||
| Other Assets in Excess of Liabilities | 1,741 | 0.0 | % | |||||||||
| TOTAL NET ASSETS | $ | 12,373,886 | 100.0 | % | ||||||||
Notes to Schedule of Investments
| * | Non-Income Producing | |
| f | Foreign Security | |
| « | 7-Day Yield |
ADR – American Depositary Receipt
Industry classifications shown in the Schedule of Investments are based off of the Global Industry Classification Standard (GICS®). GICS was developed by and/or is the exclusive property of MSCI, Inc. and Standard & Poor Financial Services LLC (“S&P”). GICS is a service mark of MSCI and S&P and has been licensed for use by U.S. Bancorp Fund Services, LLC.
The accompanying notes are an integral part of these financial statements.
Page 22
Baird Small/Mid Cap Value Fund
Schedule of Investments, June 30, 2017 (Unaudited)
Summary of Fair Value Exposure at June 30, 2017 (Unaudited)
The Fund has adopted authoritative fair valuation accounting standards which establish a definition of fair value and set out a hierarchy for measuring fair value. These standards require additional disclosures about the various inputs and valuation techniques used to develop the measurements of fair value and a discussion on changes in valuation techniques and related inputs during the period. These standards define fair value as the price that would be received to sell an asset or paid to transfer a liability in an orderly transaction between market participants at the measurement date. Management has determined that these standards have no material impact on the Fund’s financial statements. The fair value hierarchy is organized into three levels based upon the assumptions (referred to as “inputs”) used in pricing the asset or liability. These standards state that “observable inputs” reflect the assumptions market participants would use in pricing the asset or liability based on market data obtained from independent sources and “unobservable inputs” reflect an entity’s own assumptions about the assumptions market participants would use in pricing the asset or liability. These inputs are summarized into three broad levels and described below:
| Level 1 – | Unadjusted quoted prices in active markets for identical unrestricted securities. |
| Level 2 – | Other significant observable inputs (including quoted prices for similar securities, quoted prices in inactive markets, dealer indications, interest rates, yield curves, prepayment speeds, credit risk, default rates, inputs corroborated by observable market data, etc.). |
| Level 3 – | Significant unobservable inputs (including the Fund’s own assumptions about the factors that market participants would use in valuing the security) based on the best information available. |
The inputs or methodology used for valuing securities are not necessarily an indication of the risk associated with investing in those securities.
The following is a summary of the inputs used to value the Fund’s investments as of June 30, 2017:
| Level 1 | Level 2 | Level 3 | Total | |||||||||||||
| Equity | ||||||||||||||||
| Common Stocks | $ | 12,161,426 | $ | — | $ | — | $ | 12,161,426 | ||||||||
| Total Equity | 12,161,426 | — | — | 12,161,426 | ||||||||||||
| Short-Term Investment | ||||||||||||||||
| Money Market Mutual Fund | 210,719 | — | — | 210,719 | ||||||||||||
| Total Short-Term Investment | 210,719 | — | — | 210,719 | ||||||||||||
| Total Investments* | $ | 12,372,145 | $ | — | $ | — | $ | 12,372,145 | ||||||||
| * | Additional information regarding the industry classifications of these investments is disclosed in the Schedule of Investments. |
Changes in valuation techniques may result in transfers into or out of assigned levels within the fair value hierarchy. There were no transfers between Level 1, Level 2 and Level 3 fair value measurements during the reporting period, as compared to their classification from the prior year’s annual report. See the Fund’s valuation policy in Note 2a to the financial statements.
The accompanying notes are an integral part of these financial statements.
Page 23
Baird SmallCap Value Fund
June 30, 2017 (Unaudited)
Portfolio Characteristics
A June 30, 2017 summary of the Fund’s top 10 holdings and equity sector analysis compared to the Russell 2000® Value Index is shown below.
| Top 10 Holdings* | Equity Sector Analysis** | ||
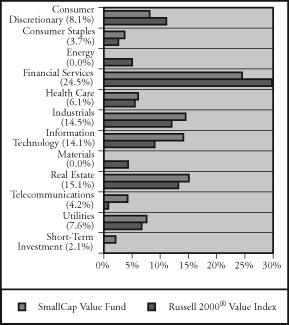 | |||
| Meta Financial Group, Inc. | 4.5% | ||
| Boingo Wireless, Inc. | 4.2% | ||
| ICU Medical, Inc. | 4.1% | ||
| Healthcare Trust of America, Inc. | 3.6% | ||
| LTC Properties, Inc. | 3.5% | ||
| Alliant Energy Corp. | 3.3% | ||
| ZAGG, Inc. | 3.2% | ||
| j2 Global, Inc. | 3.2% | ||
| Renasant Corporation | 3.1% | ||
| Silicon Motion Technology Corp. | 3.1% | ||
| Net Assets: | $31,240,117 | ||
| Portfolio Turnover Rate: | 10.6% | † | |
| Number of Equity Holdings: | 37 | ||
| Annualized Portfolio Expense Ratio:*** | |||
Gross | |||
| Institutional Class: | 1.44% | ||
| Investor Class: | 1.69% | **** | |
Net | |||
| Institutional Class: | 1.00% | ||
| Investor Class: | 1.25% | **** |
| * | The Fund’s portfolio composition is subject to change and there is no assurance that the Fund will continue to hold any particular security. Percentages shown relate to the Fund’s total net assets as of June 30, 2017. | |
| ** | Percentages shown in parentheses relate to the Fund’s total market value of investments as of June 30, 2017, and may not add up to 100% due to rounding. | |
| *** | Reflects expense ratios as stated in the Fund’s current prospectus. The Advisor has contractually agreed to limit the Fund’s total annual fund operating expenses to 1.00% of average daily net assets for the Institutional Class shares and 1.25% of average daily net assets for the Investor Class shares, at least through April 30, 2018. | |
| **** | Includes 0.25% 12b-1 fee. | |
| † | Not annualized. |
Page 24
Baird SmallCap Value Fund
June 30, 2017 (Unaudited)
Total Returns
| Average Annual | |||||
| Since | |||||
| For the Periods Ended June 30, 2017 | Six Months | One Year | Three Year | Five Year | Inception(1) |
| Institutional Class Shares | 3.30% | 12.12% | 3.21% | 10.88% | 10.05% |
| Investor Class Shares | 3.17% | 11.85% | 2.94% | 10.61% | 9.77% |
Russell 2000® Value Index(2) | 0.54% | 24.86% | 7.02% | 13.39% | 12.58% |
| (1) | For the period from May 1, 2012 (inception date) through June 30, 2017. |
| (2) | The Russell 2000® Value Index measures the performance of the small-cap value segment of the U.S. equity universe. It includes those Russell 2000® Index companies with lower price-to-book ratios and lower forecasted growth values. This index does not reflect any deduction for fees, expenses or taxes. A direct investment in the index is not possible. |
The returns shown in the table above reflect reinvestment of dividends and/or capital gains distributions in additional shares. The returns do not reflect the deduction of taxes that a shareholder would pay on Fund distributions or the redemption of Fund shares. The returns reflect the actual performance for each period and do not include the impact of trades executed on the last business day of the period that were recorded on the first business day of the next period.
The gross expense ratio for each Class, as reflected in the Fund’s current prospectus, is set forth under “Portfolio Characteristics”.
The Fund focuses on small cap value style stocks and therefore the performance of the Fund may be more volatile than the performance of funds that focus on types of stocks that have a broader investment style. The Fund may invest up to 15% of its total assets in U.S. dollar denominated foreign securities and ADRs. Foreign investments involve additional risks such as currency rate fluctuations and the potential for political and economic instability, and different and sometimes less strict financial reporting standards and regulation.
Past performance does not guarantee future results. Investment return and principal value will fluctuate so that an investor’s shares, when redeemed, may be worth more or less than their original cost.
For information about the performance of the Fund as of the most recent month-end, please call 1-866-44BAIRD or visit www.bairdfunds.com. Mutual fund performance changes over time and current performance may be lower or higher than that stated.
Page 25
Baird SmallCap Value Fund
Schedule of Investments, June 30, 2017 (Unaudited)
Common Stocks
| % of | ||||||||||||
| Shares | Value | Net Assets | ||||||||||
| Aerospace & Defense | ||||||||||||
| Hexcel Corp. | 12,851 | $ | 678,404 | 2.2 | % | |||||||
| Orbital ATK, Inc. | 6,981 | 686,651 | 2.2 | % | ||||||||
| 1,365,055 | 4.4 | % | ||||||||||
| Air Freight & Logistics | ||||||||||||
| Air Transport Services Group, Inc.* | 38,587 | 840,425 | 2.7 | % | ||||||||
| Auto Components | ||||||||||||
| LCI Industries | 6,822 | 698,573 | 2.2 | % | ||||||||
| Motorcar Parts of America, Inc.* | 29,193 | 824,410 | 2.7 | % | ||||||||
| 1,522,983 | 4.9 | % | ||||||||||
| Banks | ||||||||||||
| Hilltop Holdings, Inc. | 22,847 | 598,820 | 1.9 | % | ||||||||
| Renasant Corp. | 22,371 | 978,507 | 3.1 | % | ||||||||
| 1,577,327 | 5.0 | % | ||||||||||
| Biotechnology | ||||||||||||
| Eagle Pharmaceuticals, Inc./DE* | 7,933 | 625,834 | 2.0 | % | ||||||||
| Building Products | ||||||||||||
| Patrick Industries, Inc.* | 10,630 | 774,396 | 2.5 | % | ||||||||
| Capital Markets | ||||||||||||
| Diamond Hill Investment Group, Inc. | 2,856 | 569,486 | 1.8 | % | ||||||||
| Commercial Services & Supplies | ||||||||||||
| Deluxe Corp. | 10,154 | 702,860 | 2.2 | % | ||||||||
| Construction & Engineering | ||||||||||||
| Quanta Services, Inc.* | 25,861 | 851,344 | 2.7 | % | ||||||||
| Electic Utilities | ||||||||||||
| Alliant Energy Corp. | 25,385 | 1,019,715 | 3.3 | % | ||||||||
| Electronic Equipment, Instruments & Components | ||||||||||||
| Belden, Inc. | 8,291 | 625,390 | 2.0 | % | ||||||||
| Equity Real Estate Investment Trusts (REITs) | ||||||||||||
| Agree Realty Corp. | 19,832 | 909,694 | 2.9 | % | ||||||||
| CyrusOne, Inc. | 12,217 | 681,098 | 2.2 | % | ||||||||
| Healthcare Trust of America, Inc. – Class A | 36,559 | 1,137,351 | 3.6 | % | ||||||||
| LTC Properties, Inc. | 21,102 | 1,084,432 | 3.5 | % | ||||||||
| Physicians Realty Trust | 44,424 | 894,699 | 2.9 | % | ||||||||
| 4,707,274 | 15.1 | % | ||||||||||
| Food Products | ||||||||||||
| Lamb Weston Holdings, Inc. | 17,611 | 775,588 | 2.5 | % | ||||||||
The accompanying notes are an integral part of these financial statements.
Page 26
Baird SmallCap Value Fund
Schedule of Investments, June 30, 2017 (Unaudited)
Common Stocks (cont.)
| % of | ||||||||||||
| Shares | Value | Net Assets | ||||||||||
| Health Care Equipment & Supplies | ||||||||||||
| ICU Medical, Inc.* | 7,457 | $ | 1,286,333 | 4.1 | % | |||||||
| Household Durables | ||||||||||||
| ZAGG, Inc.* | 117,248 | 1,014,195 | 3.2 | % | ||||||||
| Household Products | ||||||||||||
| Orchids Paper Products Co. | 30,304 | 392,437 | 1.3 | % | ||||||||
| Independent Power and Renewable Electricity Producers | ||||||||||||
Algonquin Power & Utilities Corp. f | 64,350 | 678,249 | 2.2 | % | ||||||||
| Insurance | ||||||||||||
Atlas Financial Holdings, Inc.* f | 51,564 | 768,304 | 2.5 | % | ||||||||
| Internet Software & Services | ||||||||||||
| j2 Global, Inc. | 11,741 | 999,042 | 3.2 | % | ||||||||
| Stamps.com, Inc.* | 5,870 | 909,116 | 2.9 | % | ||||||||
| 1,908,158 | 6.1 | % | ||||||||||
| Mortgage Real Estate Investment Trusts (REITs) | ||||||||||||
| Blackstone Mortgage Trust, Inc. | 23,799 | 752,048 | 2.4 | % | ||||||||
| Capstead Mortgage Corp. | 83,295 | 868,767 | 2.8 | % | ||||||||
| 1,620,815 | 5.2 | % | ||||||||||
| Semiconductors & Semiconductor Equipment | ||||||||||||
| Cypress Semiconductor Corp. | 66,768 | 911,383 | 2.9 | % | ||||||||
Silicon Motion Technology Corp. – ADR f | 19,832 | 956,498 | 3.1 | % | ||||||||
| 1,867,881 | 6.0 | % | ||||||||||
| Thrifts & Mortgage Finance | ||||||||||||
| Bofi Holding, Inc.* | 31,732 | 752,683 | 2.4 | % | ||||||||
| Capitol Federal Financial, Inc. | 21,479 | 305,216 | 1.0 | % | ||||||||
| Meta Financial Group, Inc. | 15,866 | 1,412,074 | 4.5 | % | ||||||||
| NMI Holdings, Inc.* | 53,944 | 617,659 | 2.0 | % | ||||||||
| 3,087,632 | 9.9 | % | ||||||||||
| Water Utilities | ||||||||||||
| Connecticut Water Service, Inc. | 11,899 | 660,514 | 2.1 | % | ||||||||
| Wireless Telecommunication Services | ||||||||||||
| Boingo Wireless, Inc.* | 88,531 | 1,324,424 | 4.2 | % | ||||||||
| Total Common Stocks | ||||||||||||
| (Cost $23,896,689) | 30,566,619 | 97.9 | % | |||||||||
The accompanying notes are an integral part of these financial statements.
Page 27
Baird SmallCap Value Fund
Schedule of Investments, June 30, 2017 (Unaudited)
Short-Term Investment
| % of | ||||||||||||
| Shares | Value | Net Assets | ||||||||||
| Money Market Mutual Fund | ||||||||||||
| Fidelity Institutional Money Market Fund – | ||||||||||||
| Government Portfolio, Institutional Class, 0.85%« | 602,233 | $ | 602,233 | 1.9 | % | |||||||
| Total Short-Term Investment | ||||||||||||
| (Cost $602,233) | 602,233 | 1.9 | % | |||||||||
| Total Investments | ||||||||||||
| (Cost $24,498,922) | 31,168,852 | 99.8 | % | |||||||||
| Other Assets in Excess of Liabilities | 71,265 | 0.2 | % | |||||||||
| TOTAL NET ASSETS | $ | 31,240,117 | 100.0 | % | ||||||||
Notes to Schedule of Investments
| * | Non-Income Producing | |
| f | Foreign Security | |
| « | 7-Day Yield |
ADR – American Depositary Receipt
Industry classifications shown in the Schedule of Investments are based off of the Global Industry Classification Standard (GICS®). GICS was developed by and/or is the exclusive property of MSCI, Inc. and Standard & Poor Financial Services LLC (“S&P”). GICS is a service mark of MSCI and S&P and has been licensed for use by U.S. Bancorp Fund Services, LLC.
The accompanying notes are an integral part of these financial statements.
Page 28
Baird SmallCap Value Fund
Schedule of Investments, June 30, 2017 (Unaudited)
Summary of Fair Value Exposure at June 30, 2017 (Unaudited)
The Fund has adopted authoritative fair valuation accounting standards which establish a definition of fair value and set out a hierarchy for measuring fair value. These standards require additional disclosures about the various inputs and valuation techniques used to develop the measurements of fair value and a discussion on changes in valuation techniques and related inputs during the period. These standards define fair value as the price that would be received to sell an asset or paid to transfer a liability in an orderly transaction between market participants at the measurement date.
Management has determined that these standards have no material impact on the Fund’s financial statements. The fair value hierarchy is organized into three levels based upon the assumptions (referred to as “inputs”) used in pricing the asset or liability. These standards state that “observable inputs” reflect the assumptions market participants would use in pricing the asset or liability based on market data obtained from independent sources and “unobservable inputs” reflect an entity’s own assumptions about the assumptions market participants would use in pricing the asset or liability. These inputs are summarized into three broad levels and described below:
| Level 1 – | Unadjusted quoted prices in active markets for identical unrestricted securities. |
| Level 2 – | Other significant observable inputs (including quoted prices for similar securities, quoted prices in inactive markets, dealer indications, interest rates, yield curves, prepayment speeds, credit risk, default rates, inputs corroborated by observable market data, etc.). |
| Level 3 – | Significant unobservable inputs (including the Fund’s own assumptions about the factors that market participants would use in valuing the security) based on the best information available. |
The inputs or methodology used for valuing securities are not necessarily an indication of the risk associated with investing in those securities.
The following is a summary of the inputs used to value the Fund’s investments as of June 30, 2017:
| Level 1 | Level 2 | Level 3 | Total | |||||||||||||
| Equity | ||||||||||||||||
| Common Stocks | $ | 30,566,619 | $ | — | $ | — | $ | 30,566,619 | ||||||||
| Total Equity | 30,566,619 | — | — | 30,566,619 | ||||||||||||
| Short-Term Investment | ||||||||||||||||
| Money Market Mutual Fund | 602,233 | — | — | 602,233 | ||||||||||||
| Total Short-Term Investment | 602,233 | — | — | 602,233 | ||||||||||||
| Total Investments* | $ | 31,168,852 | $ | — | $ | — | $ | 31,168,852 | ||||||||
| * | Additional information regarding the industry classifications of these investments is disclosed in the Schedule of Investments. |
Changes in valuation techniques may result in transfers into or out of assigned levels within the fair value hierarchy. There were no transfers between Level 1, Level 2 and Level 3 fair value measurements during the reporting period, as compared to their classification from the prior year’s annual report. See the Fund’s valuation policy in Note 2a to the financial statements.
The accompanying notes are an integral part of these financial statements.
Page 29
Chautauqua International Growth Fund
June 30, 2017 (Unaudited)
Portfolio Characteristics
A June 30, 2017 summary of the Fund’s top 10 holdings and equity sector analysis compared to the MSCI ACWI ex USA Index is shown below.
| Top 10 Holdings* | |||||
| Wirecard AG | 5.6% | Net Assets: | $59,116,508 | ||
| ASML Holding NV | 5.1% | Portfolio Turnover Rate: | 23.4% | † | |
| Keyence Corp. | 4.5% | Number of Equity Holdings: | 33 | ||
| HDFC Bank Ltd. – ADR | 4.3% | ||||
| LINE Corp. | 4.2% | Annualized Portfolio Expense Ratio:*** | |||
| Julius Baer Group Ltd. | 4.1% | Gross | |||
| AIA Group Ltd. | 4.1% | Institutional Class: | 2.33% | ||
| Genmab A/S | 4.1% | Investor Class: | 2.58% | **** | |
| Hargreaves Lansdown PLC | 3.9% | ||||
| Eni SpA | 3.7% | Net | |||
| Institutional Class: | 0.95% | ||||
| Investor Class: | 1.20% | **** |
| Equity Sector Analysis** | Country Allocation** |
 | 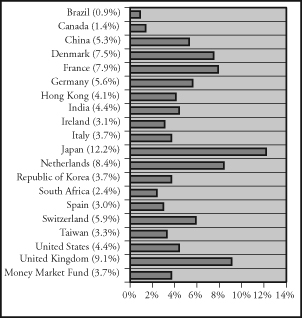 |
| * | The Fund’s portfolio composition is subject to change and there is no assurance that the Fund will continue to hold any particular security. Percentages shown relate to the Fund’s total net assets as of June 30, 2017. | |
| ** | Percentages shown in parentheses relate to the Fund’s total market value of investments as of June 30, 2017, and may not add up to 100% due to rounding. | |
| *** | Reflects expense ratios as stated in the Fund’s current prospectus. The Advisor has contractually agreed to limit the Fund’s total annual fund operating expenses to 0.95% of average daily net assets for the Institutional Class shares and 1.20% of average daily net assets for the Investor Class shares, at least through April 30, 2018. | |
| **** | Includes 0.25% 12b-1 fee. | |
| † | Not annualized. |
Page 30
Chautauqua International Growth Fund
June 30, 2017 (Unaudited)
Total Returns
| Six | One | Since | |
| For the Periods Ended June 30, 2017 | Months | Year | Inception(1) |
| Institutional Class Shares | 16.82% | 13.62% | 9.67% |
| Investor Class Shares | 16.84% | 13.63% | 9.59% |
MSCI ACWI ex USA(2) | 14.10% | 20.45% | 14.31% |
| (1) | For the period from April 15, 2016 (inception date) through June 30, 2017. |
| (2) | The MSCI ACWI ex USA Index is a market-capitalization-weighted index maintained by MSCI, Inc. and designed to provide a broad measure of stock performance throughout the world. The MSCI ACWI ex USA Index includes both developed and emerging markets. This index does not reflect any deduction for fees, expenses, or taxes. A direct investment in the index is not possible. |
The returns shown in the table above reflect reinvestment of dividends and/or capital gains distributions in additional shares. The returns do not reflect the deduction of taxes that a shareholder would pay on Fund distributions or the redemption of Fund shares. The returns reflect the actual performance for each period and do not include the impact of trades executed on the last business day of the period that were recorded on the first business day of the next period.
The gross expense ratio for each Class, as reflected in the Fund’s current prospectus, is set forth under “Portfolio Characteristics”.
The Fund focuses on both U.S. and non-U.S. stocks with medium to large market capitalizations and therefore the performance of the Fund may be more volatile than the performance of funds that focus on types of stocks that have a broader investment style. Under normal market conditions, the Fund will invest at least 65% of its total assets in non-U.S. companies. Foreign investments involve additional risks such as currency rate fluctuations and the potential for political and economic instability, and different and sometimes less strict financial reporting standards and regulation. In June 2016, the United Kingdom (UK) voted to leave the European Union (EU) following a referendum referred to as “Brexit.” It is expected that the UK will exit the EU within two years; however, the exact timeframe for the UK’s exit is unknown. There is significant market uncertainty regarding Brexit’s ramifications, and the range of possible political, regulatory, economic, and market outcomes are difficult to predict. The negative impact could be significant, potentially resulting in increased volatility and illiquidity and lower economic growth for companies that rely significantly on Europe for their business activities and revenues. Geopolitical events, including those in Ukraine and the Middle East, may cause market disruptions. The portfolio manager for the Fund has over 30 years of experience investing in the global markets and will attempt to minimize the negative impact of these events. However, it is possible that these or other geopolitical events could have an adverse effect on the value of the Fund’s investments.
Past performance does not guarantee future results. Investment return and principal value will fluctuate so that an investor’s shares, when redeemed, may be worth more or less than their original cost.
For information about the performance of the Fund as of the most recent month-end, please call 1-866-44BAIRD or visit www.bairdfunds.com. Mutual fund performance changes over time and current performance may be lower or higher than that stated.
Page 31
Chautauqua International Growth Fund
Schedule of Investments, June 30, 2017 (Unaudited)
Common Stocks
| % of | ||||||||||||
| Shares | Value | Net Assets | ||||||||||
| Alternative Carriers | ||||||||||||
| Iliad SA (France)^ | 8,536 | $ | 2,017,303 | 3.4 | % | |||||||
| Apparel, Accessories & Luxury Goods | ||||||||||||
| Lululemon Athletica, Inc. (Canada)* | 13,222 | 788,956 | 1.3 | % | ||||||||
| Application Software | ||||||||||||
| Dassault Systemes (France)^ | 12,871 | 1,154,413 | 2.0 | % | ||||||||
| Asset Management & Custody Banks | ||||||||||||
| Hargreaves Lansdown PLC (United Kingdom)^ | 134,596 | 2,282,403 | 3.9 | % | ||||||||
| Julius Baer Group Ltd. (Switzerland)^ | 45,830 | 2,421,485 | 4.1 | % | ||||||||
| 4,703,888 | 8.0 | % | ||||||||||
| Automobiles | ||||||||||||
| BYD Co Ltd (France)^ | 236,963 | 1,454,075 | 2.5 | % | ||||||||
| Biotechnology | ||||||||||||
| Genmab A/S (Denmark)*^ | 11,337 | 2,417,273 | 4.1 | % | ||||||||
| Cable & Satellite | ||||||||||||
| Naspers Ltd. (South Africa)^ | 7,303 | 1,438,200 | 2.4 | % | ||||||||
| Data Processing & Outsourced Services | ||||||||||||
| Wirecard AG (Germany)^ | 51,619 | 3,292,485 | 5.6 | % | ||||||||
| Electronic Equipment & Instruments | ||||||||||||
| Keyence Corp. (Japan)^ | 6,075 | 2,674,384 | 4.5 | % | ||||||||
| Health Care Distributors | ||||||||||||
| Sinopharm Group Co. Ltd. (China)^ | 88,964 | 401,932 | 0.7 | % | ||||||||
| Health Care Equipment | ||||||||||||
| Olympus Corp. (Japan)^ | 55,782 | 2,043,764 | 3.5 | % | ||||||||
| Household Products | ||||||||||||
| Reckitt Benckiser Group PLC (United Kingdom)^ | 14,095 | 1,428,861 | 2.4 | % | ||||||||
| Insurance Brokers | ||||||||||||
| BB Seguridade Participacoes SA (Brazil) | 58,119 | 502,088 | 0.8 | % | ||||||||
| Internet Retail | ||||||||||||
| Alibaba Group Holding Ltd. – ADR (China)* | 14,661 | 2,065,735 | 3.5 | % | ||||||||
| Ctrip.com International Ltd. – ADR (China)* | 11,661 | 628,061 | 1.1 | % | ||||||||
| 2,693,796 | 4.6 | % | ||||||||||
| Internet Software & Services | ||||||||||||
| LINE Corp. (Japan)^ | 70,828 | 2,458,866 | 4.2 | % | ||||||||
| LINE Corp. (United States)* | 17,104 | 594,877 | 1.0 | % | ||||||||
| 3,053,743 | 5.2 | % | ||||||||||
The accompanying notes are an integral part of these financial statements.
Page 32
Chautauqua International Growth Fund
Schedule of Investments, June 30, 2017 (Unaudited)
Common Stocks (cont.)
| % of | ||||||||||||
| Shares | Value | Net Assets | ||||||||||
| Life & Health Insurance | ||||||||||||
| AIA Group Ltd. (Hong Kong)^ | 332,284 | $ | 2,431,110 | 4.1 | % | |||||||
| Oil & Gas Equipment & Services | ||||||||||||
| Core Laboratories NV (Netherlands) | 18,961 | 1,920,180 | 3.2 | % | ||||||||
| Oil & Gas Exploration & Production | ||||||||||||
| Eni SpA (Italy)^ | 146,352 | 2,199,364 | 3.7 | % | ||||||||
| Oil, Gas & Consumable Fuels | ||||||||||||
| Encana Corp. (United States) | 74,762 | 657,800 | 1.1 | % | ||||||||
| Personal Products | ||||||||||||
| Amorepacific Corp. (Republic of Korea)^ | 8,273 | 2,197,199 | 3.7 | % | ||||||||
| Pharmaceuticals | ||||||||||||
| Allergan PLC (Ireland) | 7,584 | 1,843,595 | 3.1 | % | ||||||||
| Grifols SA – ADR (Spain) | 83,211 | 1,758,248 | 3.0 | % | ||||||||
| Novo Nordisk A/S – ADR (Denmark) | 46,687 | 2,002,405 | 3.4 | % | ||||||||
| Roche Holding AG (Switzerland)^ | 4,147 | 1,059,620 | 1.8 | % | ||||||||
| 6,663,868 | 11.3 | % | ||||||||||
| Professional Services | ||||||||||||
| Recruit Holdings Co Ltd (United States)^ | 39,552 | 680,685 | 1.2 | % | ||||||||
| Regional Banks | ||||||||||||
| HDFC Bank Ltd. – ADR (India) | 29,402 | 2,557,092 | 4.3 | % | ||||||||
| Research & Consulting Services | ||||||||||||
| Nielsen Holdings PLC (United Kingdom) | 43,237 | 1,671,543 | 2.8 | % | ||||||||
| Semiconductor Equipment | ||||||||||||
| ASML Holding NV (Netherlands) | 23,348 | 3,042,478 | 5.1 | % | ||||||||
| Semiconductors | ||||||||||||
| Taiwan Semiconductor Manufacturing Co. Ltd. – ADR (Taiwan) | 54,995 | 1,922,625 | 3.2 | % | ||||||||
| Software | ||||||||||||
| Temenos Group AG (United States)^ | 7,054 | 631,072 | 1.1 | % | ||||||||
| Total Common Stocks | ||||||||||||
| (Cost $52,223,972) | 56,640,177 | 95.8 | % | |||||||||
The accompanying notes are an integral part of these financial statements.
Page 33
Chautauqua International Growth Fund
Schedule of Investments, June 30, 2017 (Unaudited)
Short-Term Investment
| % of | ||||||||||||
| Shares | Value | Net Assets | ||||||||||
| Money Market Mutual Fund | ||||||||||||
| Fidelity Institutional Money Market Fund – | ||||||||||||
| Government Portfolio, Institutional Class, 0.85%« | 2,206,461 | $ | 2,206,461 | 3.7 | % | |||||||
| Total Short-Term Investment | ||||||||||||
| (Cost $2,206,461) | 2,206,461 | 3.7 | % | |||||||||
| Total Investments | ||||||||||||
| (Cost $54,430,433) | 58,846,638 | 99.5 | % | |||||||||
| Other Assets in Excess of Liabilities | 269,870 | 0.5 | % | |||||||||
| TOTAL NET ASSETS | $ | 59,116,508 | 100.0 | % | ||||||||
Notes to Schedule of Investments
| * | Non-Income Producing | |
| ^ | Fair Valued Security – See Note 2a to Financial Statements | |
| « | 7-Day Yield |
ADR – American Depositary Receipt
Industry classifications shown in the Schedule of Investments are based off of the Global Industry Classification Standard (GICS®). GICS was developed by and/or is the exclusive property of MSCI, Inc. and Standard & Poor Financial Services LLC (“S&P”). GICS is a service mark of MSCI and S&P and has been licensed for use by U.S. Bancorp Fund Services, LLC.
The accompanying notes are an integral part of these financial statements.
Page 34
Chautauqua International Growth Fund
Schedule of Investments, June 30, 2017 (Unaudited)
Summary of Fair Value Exposure at June 30, 2017 (Unaudited)
The Fund has adopted authoritative fair valuation accounting standards which establish a definition of fair value and set out a hierarchy for measuring fair value. These standards require additional disclosures about the various inputs and valuation techniques used to develop the measurements of fair value and a discussion on changes in valuation techniques and related inputs during the period. These standards define fair value as the price that would be received to sell an asset or paid to transfer a liability in an orderly transaction between market participants at the measurement date. Management has determined that these standards have no material impact on the Fund’s financial statements. The fair value hierarchy is organized into three levels based upon the assumptions (referred to as “inputs”) used in pricing the asset or liability. These standards state that “observable inputs” reflect the assumptions market participants would use in pricing the asset or liability based on market data obtained from independent sources and “unobservable inputs” reflect an entity’s own assumptions about the assumptions market participants would use in pricing the asset or liability. These inputs are summarized into three broad levels and described below:
| Level 1 – | Unadjusted quoted prices in active markets for identical unrestricted securities. |
| Level 2 – | Other significant observable inputs (including quoted prices for similar securities, quoted prices in inactive markets, dealer indications, interest rates, yield curves, prepayment speeds, credit risk, default rates, inputs corroborated by observable market data, etc.). |
| Level 3 – | Significant unobservable inputs (including the Fund’s own assumptions about the factors that market participants would use in valuing the security) based on the best information available. |
The inputs or methodology used for valuing securities are not necessarily an indication of the risk associated with investing in those securities.
The following is a summary of the inputs used to value the Fund’s investments as of June 30, 2017:
| Level 1 | Level 2 | Level 3 | Total | |||||||||||||
| Equity | ||||||||||||||||
| Common Stocks | $ | 21,955,683 | $ | 34,684,494 | $ | — | $ | 56,640,177 | ||||||||
| Total Equity | 21,955,683 | 34,684,494 | — | 56,640,177 | ||||||||||||
| Short-Term Investments | ||||||||||||||||
| Money Market Mutual Fund | 2,206,461 | — | — | 2,206,461 | ||||||||||||
| Total Short-Term Investments | 2,206,461 | — | — | 2,206,461 | ||||||||||||
| Total Investments* | $ | 24,162,144 | $ | 34,684,494 | $ | — | $ | 58,846,638 | ||||||||
| * | Additional information regarding the industry classifications of these investments is disclosed in the Schedule of Investments. |
Changes in valuation techniques may result in transfers into or out of assigned levels within the fair value hierarchy. There were no transfers between Level 1, Level 2 and Level 3 fair value measurements during the reporting period. See the Fund’s valuation policy in Note 2a to the financial statements.
The accompanying notes are an integral part of these financial statements.
Page 35
Chautauqua Global Growth Fund
June 30, 2017 (Unaudited)
Portfolio Characteristics
A June 30, 2017 summary of the Fund’s top 10 holdings and equity sector analysis compared to the MSCI ACWI Index is shown below.
| Top 10 Holdings* | |||||
| Wirecard AG | 4.2% | Net Assets: | $12,250,635 | ||
| MasterCard, Inc. – Class A | 3.9% | Portfolio Turnover Rate: | 20.5% | † | |
| The Charles Schwab Corp. | 3.7% | Number of Equity Holdings: | 48 | ||
| Nvidia Corp. | 3.7% | ||||
| Palo Alto Networks, Inc. | 3.5% | Annualized Portfolio Expense Ratio:*** | |||
| Regeneron Pharmaceuticals, Inc. | 3.4% | Gross | |||
| Celgene Corp. | 3.4% | Institutional Class: | 3.66% | ||
| Julius Baer Group Ltd. | 3.3% | Investor Class: | 3.91% | **** | |
| Pioneer Natural Resources Co. | 3.2% | ||||
| Adobe Systems, Inc. | 3.0% | Net | |||
| Institutional Class: | 0.95% | ||||
| Investor Class: | 1.20% | **** |
| Equity Sector Analysis** | Country Allocation** |
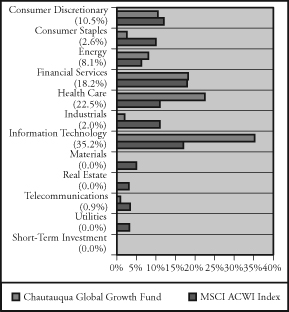 | 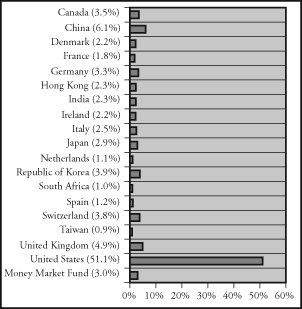 |
| * | The Fund’s portfolio composition is subject to change and there is no assurance that the Fund will continue to hold any particular security. Percentages shown relate to the Fund’s total net assets as of June 30, 2017. | |
| ** | Percentages shown in parentheses relate to the Fund’s total market value of investments as of June 30, 2017, and may not add up to 100% due to rounding | |
| *** | Reflects expense ratios as stated in the Fund’s current prospectus. The Advisor has contractually agreed to limit the Fund’s total annual fund operating expenses to 0.95% of average daily net assets for the Institutional Class shares and 1.20% of average daily net assets for the Investor Class shares, at least through April 30, 2018 | |
| **** | Includes 0.25% 12b-1 fee. | |
| † | Not annualized. |
Page 36
Chautauqua Global Growth Fund
June 30, 2017 (Unaudited)
Total Returns
| Six | One | Since | |
| For the Periods Ended June 30, 2017 | Months | Year | Inception(1) |
| Institutional Class Shares | 19.52% | 23.44% | 16.77% |
| Investor Class Shares | 19.25% | 23.16% | 16.45% |
MSCI ACWI Index(2) | 11.48% | 18.78% | 14.88% |
| (1) | For the period from April 15, 2016 (inception date) through June 30, 2017. |
| (2) | The MSCI ACWI Index is a market-capitalization-weighted index maintained by MSCI, Inc. and designed to provide a broad measure of stock performance throughout the world. The MSCI ACWI Index includes both developed and emerging markets. This index does not reflect any deduction for fees, expenses, or taxes. A direct investment in the index is not possible. |
The returns shown in the table above reflect reinvestment of dividends and/or capital gains distributions in additional shares. The returns do not reflect the deduction of taxes that a shareholder would pay on Fund distributions or the redemption of Fund shares. The returns reflect the actual performance for each period and do not include the impact of trades executed on the last business day of the period that were recorded on the first business day of the next period.
The gross expense ratio for each Class, as reflected in the Fund’s current prospectus, is set forth under “Portfolio Characteristics”.
The Fund focuses on both U.S. and non-U.S. stocks with medium to large market capitalizations and therefore the performance of the Fund may be more volatile than the performance of funds that focus on types of stocks that have a broader investment style. Under normal market conditions, the Fund will invest at least 40% of its total assets in non-U.S. companies. Foreign investments involve additional risks such as currency rate fluctuations and the potential for political and economic instability, and different and sometimes less strict financial reporting standards and regulation. In June 2016, the United Kingdom (UK) voted to leave the European Union (EU) following a referendum referred to as “Brexit.” It is expected that the UK will exit the EU within two years; however, the exact timeframe for the UK’s exit is unknown. There is significant market uncertainty regarding Brexit’s ramifications, and the range of possible political, regulatory, economic, and market outcomes are difficult to predict. The negative impact could be significant, potentially resulting in increased volatility and illiquidity and lower economic growth for companies that rely significantly on Europe for their business activities and revenues. Geopolitical events, including those in Ukraine and the Middle East, may cause market disruptions. The portfolio manager for the Fund has over 30 years of experience investing in the global markets and will attempt to minimize the negative impact of these events. However, it is possible that these or other geopolitical events could have an adverse effect on the value of the Fund’s investments.
Past performance does not guarantee future results. Investment return and principal value will fluctuate so that an investor’s shares, when redeemed, may be worth more or less than their original cost.
For information about the performance of the Fund as of the most recent month-end, please call 1-866-44BAIRD or visit www.bairdfunds.com. Mutual fund performance changes over time and current performance may be lower or higher than that stated.
Page 37
Chautauqua Global Growth Fund
Schedule of Investments, June 30, 2017 (Unaudited)
Common Stocks
| % of | ||||||||||||
| Shares | Value | Net Assets | ||||||||||
| Alternative Carriers | ||||||||||||
| Iliad SA (France)^ | 439 | $ | 103,748 | 0.8 | % | |||||||
| Apparel, Accessories & Luxury Goods | ||||||||||||
| Lululemon Athletica, Inc. (Canada)* | 2,701 | 161,169 | 1.3 | % | ||||||||
| Application Software | ||||||||||||
| Dassault Systemes (France)^ | 1,315 | 117,944 | 1.0 | % | ||||||||
| Temenos Group AG (Switzerland)^ | 1,455 | 130,168 | 1.0 | % | ||||||||
| 248,112 | 2.0 | % | ||||||||||
| Asset Management & Custody Banks | ||||||||||||
| Hargreaves Lansdown PLC (United Kingdom)^ | 19,322 | 327,651 | 2.7 | % | ||||||||
| Julius Baer Group Ltd. (Switzerland)^ | 7,675 | 405,518 | 3.3 | % | ||||||||
| 733,169 | 6.0 | % | ||||||||||
| Automobile Manufacturers | ||||||||||||
| BYD Co Ltd. (China)^ | 30,198 | 185,304 | 1.5 | % | ||||||||
| Biotechnology | ||||||||||||
| Celgene Corp. (United States)* | 3,164 | 410,909 | 3.4 | % | ||||||||
| Genmab A/S (Denmark)*^ | 1,234 | 263,113 | 2.1 | % | ||||||||
| Incyte Corp. (United States)* | 1,915 | 241,118 | 2.0 | % | ||||||||
| Regeneron Pharmaceuticals, Inc. (United States)* | 843 | 414,031 | 3.4 | % | ||||||||
| 1,329,171 | 10.9 | % | ||||||||||
| Cable & Satellite | ||||||||||||
| Naspers Ltd. (South Africa)^ | 1,398 | 275,312 | 2.2 | % | ||||||||
| Data Processing & Outsourced Services | ||||||||||||
| Wirecard AG (Germany)^ | 7,975 | 508,680 | 4.2 | % | ||||||||
| Electronic Equipment & Instruments | ||||||||||||
| Keyence Corp. (Japan)^ | 554 | 243,886 | 2.0 | % | ||||||||
| Health Care Distributors | ||||||||||||
| Sinopharm Group Co. Ltd. (China)^ | 41,818 | 188,930 | 1.5 | % | ||||||||
| Health Care Equipment | ||||||||||||
| Olympus Corp. (Japan)^ | 5,626 | 206,128 | 1.7 | % | ||||||||
| Household Products | ||||||||||||
| Reckitt Benckiser Group PLC (United Kingdom)^ | 1,179 | 119,520 | 1.0 | % | ||||||||
| Internet Retail | ||||||||||||
| Alibaba Group Holding Ltd. – ADR (China)* | 1,927 | 271,514 | 2.2 | % | ||||||||
| Amazon.com, Inc. (United States)* | 254 | 245,872 | 2.0 | % | ||||||||
| Ctrip.com International Ltd. – ADR (China)* | 2,391 | 128,779 | 1.0 | % | ||||||||
| Priceline.com, Inc. (United States)* | 135 | 252,520 | 2.1 | % | ||||||||
| 898,685 | 7.3 | % | ||||||||||
The accompanying notes are an integral part of these financial statements.
Page 38
Chautauqua Global Growth Fund
Schedule of Investments, June 30, 2017 (Unaudited)
Common Stocks (cont.)
| % of | ||||||||||||
| Shares | Value | Net Assets | ||||||||||
| Internet Software & Services | ||||||||||||
| Alphabet, Inc. – Class A (United States)* | 344 | $ | 319,811 | 2.6 | % | |||||||
| LINE Corp. (Japan)^ | 7,030 | 244,053 | 2.0 | % | ||||||||
| LINE Corp. (United States)* | 3,500 | 121,730 | 1.0 | % | ||||||||
| Salesforce.com, Inc. (United States)* | 1,338 | 115,871 | 0.9 | % | ||||||||
| 801,465 | 6.5 | % | ||||||||||
| IT Consulting & Other Services | ||||||||||||
| MasterCard, Inc. – Class A (United States) | 3,919 | 475,964 | 3.9 | % | ||||||||
| Life & Health Insurance | ||||||||||||
| AIA Group Ltd. (Hong Kong)^ | 42,182 | 308,619 | 2.5 | % | ||||||||
| Life Sciences Tools & Services | ||||||||||||
| Illumina, Inc. (United States)* | 1,943 | 337,149 | 2.8 | % | ||||||||
| Oil & Gas Equipment & Services | ||||||||||||
| Core Laboratories NV (Netherlands) | 1,093 | 110,688 | 0.9 | % | ||||||||
| Oil & Gas Exploration & Production | ||||||||||||
| Antero Resources Corp. (United States)* | 10,567 | 228,353 | 1.8 | % | ||||||||
| Eni SpA (Italy)^ | 15,550 | 233,684 | 1.9 | % | ||||||||
| Pioneer Natural Resources Co. (United States) | 2,437 | 388,896 | 3.2 | % | ||||||||
| 850,933 | 6.9 | % | ||||||||||
| Other Diversified Financial Services | ||||||||||||
| The Charles Schwab Corp. (United States) | 10,676 | 458,641 | 3.7 | % | ||||||||
| Personal Products | ||||||||||||
| Amorepacific Corp. (Republic of Korea)^ | 734 | 194,940 | 1.6 | % | ||||||||
| Pharmaceuticals | ||||||||||||
| Allergan PLC (Ireland) | 938 | 228,019 | 1.9 | % | ||||||||
| Grifols SA – ADR (Spain) | 7,960 | 168,195 | 1.4 | % | ||||||||
| Novo Nordisk A/S – ADR (Denmark) | 3,443 | 147,670 | 1.2 | % | ||||||||
| Roche Holding AG (Switzerland)^ | 270 | 68,989 | 0.6 | % | ||||||||
| 612,873 | 5.1 | % | ||||||||||
| Professional Services | ||||||||||||
| Recruit Holdings Co Ltd (United States)^ | 6,836 | 117,646 | 1.0 | % | ||||||||
| Regional Banks | ||||||||||||
| HDFC Bank Ltd. – ADR (India) | 3,558 | 309,439 | 2.5 | % | ||||||||
| SVB Financial Group (United States)* | 2,013 | 353,866 | 2.9 | % | ||||||||
| 663,305 | 5.4 | % | ||||||||||
| Research & Consulting Services | ||||||||||||
| Nielsen Holdings PLC (United Kingdom) | 2,992 | 115,671 | 0.9 | % | ||||||||
The accompanying notes are an integral part of these financial statements.
Page 39
Chautauqua Global Growth Fund
Schedule of Investments, June 30, 2017 (Unaudited)
Common Stocks (cont.)
| % of | ||||||||||||
| Shares | Value | Net Assets | ||||||||||
| Semiconductor Equipment | ||||||||||||
| ASML Holding NV (Netherlands) | 1,012 | $ | 131,874 | 1.1 | % | |||||||
| NVIDIA Corp. (United States) | 3,159 | 456,665 | 3.7 | % | ||||||||
| 588,539 | 4.8 | % | ||||||||||
| Semiconductors | ||||||||||||
| Taiwan Semiconductor Manufacturing Co. Ltd. – ADR (Taiwan) | 3,401 | 118,899 | 1.0 | % | ||||||||
| Systems Software | ||||||||||||
| Adobe Systems, Inc. (United States)* | 2,566 | 362,935 | 3.0 | % | ||||||||
| Palo Alto Networks, Inc. (United States)* | 3,245 | 434,213 | 3.5 | % | ||||||||
| Red Hat, Inc. (United States)* | 1,397 | 133,763 | 1.1 | % | ||||||||
| 931,181 | 7.6 | % | ||||||||||
| Total Common Stocks | ||||||||||||
| (Cost $10,245,634) | 11,888,057 | 97.0 | % | |||||||||
| Short-Term Investment | ||||||||||||
| Money Market Mutual Fund | ||||||||||||
| Fidelity Institutional Money Market Fund – | ||||||||||||
| Government Portfolio, Institutional Class, 0.85%« | 353,603 | 353,603 | 2.9 | % | ||||||||
| Total Short-Term Investment | ||||||||||||
| (Cost $353,603) | 353,603 | 2.9 | % | |||||||||
| Total Investments | ||||||||||||
| (Cost $10,599,237) | 12,241,660 | 99.9 | % | |||||||||
| Other Assets in Excess of Liabilities | 8,975 | 0.1 | % | |||||||||
| TOTAL NET ASSETS | $ | 12,250,635 | 100.0 | % | ||||||||
Notes to Schedule of Investments
| * | Non-Income Producing | |
| « | 7-Day Yield | |
| ^ | Fair Valued Security – See Note 2a to Financial Statements |
ADR – American Depositary Receipt
Industry classifications shown in the Schedule of Investments are based off of the Global Industry Classification Standard (GICS®). GICS was developed by and/or is the exclusive property of MSCI, Inc. and Standard & Poor Financial Services LLC (“S&P”). GICS is a service mark of MSCI and S&P and has been licensed for use by U.S. Bancorp Fund Services, LLC.
The accompanying notes are an integral part of these financial statements.
Page 40
Chautauqua Global Growth Fund
Schedule of Investments, June 30, 2017 (Unaudited)
Summary of Fair Value Exposure at June 30, 2017 (Unaudited)
The Fund has adopted authoritative fair valuation accounting standards which establish a definition of fair value and set out a hierarchy for measuring fair value. These standards require additional disclosures about the various inputs and valuation techniques used to develop the measurements of fair value and a discussion on changes in valuation techniques and related inputs during the period. These standards define fair value as the price that would be received to sell an asset or paid to transfer a liability in an orderly transaction between market participants at the measurement date. Management has determined that these standards have no material impact on the Fund’s financial statements. The fair value hierarchy is organized into three levels based upon the assumptions (referred to as “inputs”) used in pricing the asset or liability. These standards state that “observable inputs” reflect the assumptions market participants would use in pricing the asset or liability based on market data obtained from independent sources and “unobservable inputs” reflect an entity’s own assumptions about the assumptions market participants would use in pricing the asset or liability. These inputs are summarized into three broad levels and described below:
| Level 1 – | Unadjusted quoted prices in active markets for identical unrestricted securities. |
| Level 2 – | Other significant observable inputs (including quoted prices for similar securities, quoted prices in inactive markets, dealer indications, interest rates, yield curves, prepayment speeds, credit risk, default rates, inputs corroborated by observable market data, etc.). |
| Level 3 – | Significant unobservable inputs (including the Fund’s own assumptions about the factors that market participants would use in valuing the security) based on the best information available. |
The inputs or methodology used for valuing securities are not necessarily an indication of the risk associated with investing in those securities.
The following is a summary of the inputs used to value the Fund’s investments as of June 30, 2017:
| Level 1 | Level 2 | Level 3 | Total | |||||||||||||
| Equity | ||||||||||||||||
| Common Stocks | $ | 7,644,224 | $ | 4,243,833 | $ | — | $ | 11,888,057 | ||||||||
| Total Equity | 7,644,224 | 4,243,833 | — | 11,888,057 | ||||||||||||
| Short-Term Investment | ||||||||||||||||
| Money Market Mutual Fund | 353,603 | — | — | 353,603 | ||||||||||||
| Total Short-Term Investment | 353,603 | — | — | 353,603 | ||||||||||||
| Total Investments* | $ | 7,997,827 | $ | 4,243,833 | $ | — | $ | 12,241,660 | ||||||||
| * | Additional information regarding the industry classifications of these investments is disclosed in the Schedule of Investments. |
Changes in valuation techniques may result in transfers into or out of assigned levels within the fair value hierarchy. There were no transfers between Level 1, Level 2 and Level 3 fair value measurements during the reporting period. See the Fund’s valuation policy in Note 2a to the financial statements.
The accompanying notes are an integral part of these financial statements.
Page 41
Additional Information on Fund Expenses
June 30, 2017 (Unaudited)
Example
As a shareholder of a mutual fund, you incur two types of costs: (1) transaction costs, which may include sales charges (loads) on purchase payments, reinvested dividends, or other distributions; redemption fees; and exchange fees; and (2) ongoing costs, such as management fees; distribution and/or service (12b-1) fees; and other fund expenses. Although the Funds do not charge any sales loads, redemption fees, or other transaction fees, you will be assessed fees for outgoing wire transfers, returned checks and stop payment orders at prevailing rates charged by U.S. Bancorp Fund Services, LLC, the Fund’s transfer agent. If you request that a redemption be made by wire transfer, currently the Fund’s transfer agent charges a $15.00 fee.
This Example is intended to help you understand your ongoing costs (in dollars) of investing in each Fund and to compare these costs with the ongoing costs of investing in other mutual funds. The Example is based on an investment of $1,000 invested at the beginning of the period and held for the entire period (1/1/17 – 6/30/17).
Actual Expenses
The third and fourth columns of the following table provide information about account values based on actual returns and actual expenses. You may use the information in these columns, together with the amount you invested, to estimate the expenses that you paid over the period. Simply divide your account value by $1,000 (for example, an $8,600 account value divided by $1,000 = 8.6), then multiply the result by the number in the fourth column entitled “Expenses Paid During Period” to estimate the expenses you paid on your account during this period.
Hypothetical Example for Comparison Purposes
The fifth and sixth columns of the following table provide information about hypothetical account values and hypothetical expenses based on the Funds’ actual expense ratios and an assumed rate of return of 5% per year before expenses, which is not the Funds’ actual return. The hypothetical account values and expenses may not be used to estimate the actual ending account balance or expenses you paid for the period. You may use this information to compare the ongoing costs of investing in the Funds and other mutual funds. To do so, compare this 5% hypothetical example with the 5% hypothetical examples that appear in the shareholder reports of the other mutual funds. Please note that the expenses shown in the table are meant to highlight your ongoing costs only and do not reflect any transactional costs. Therefore, the sixth column of the table (entitled “Expenses Paid During Period”) is useful in comparing ongoing costs only, and will not help you determine the relative total costs of owning different mutual funds. In addition, if these transactional costs were included, your costs could have been higher.
Page 42
Additional Information on Fund Expenses
June 30, 2017 (Unaudited)
Actual vs. Hypothetical Returns
For the Six Months Ended June 30, 2017
| Hypothetical | ||||||
| (5% return | ||||||
Actual | before expenses) | |||||
| Fund’s | Beginning | Ending | Expenses | Ending | Expenses | |
| Annualized | Account | Account | Paid | Account | Paid | |
| Expense | Value | Value | During | Value | During | |
Ratio(1) | 1/1/17 | 6/30/17 | Period(1) | 6/30/17 | Period(1) | |
| Baird LargeCap Fund | ||||||
| Institutional Class | 0.75% | $1,000.00 | $1,091.90 | $3.89 | $1,021.08 | $3.76 |
| Investor Class | 1.00% | $1,000.00 | $1,090.90 | $5.18 | $1,019.84 | $5.01 |
| Baird MidCap Fund | ||||||
| Institutional Class | 0.83% | $1,000.00 | $1,160.80 | $4.45 | $1,020.68 | $4.16 |
| Investor Class | 1.08% | $1,000.00 | $1,159.60 | $5.78 | $1,019.44 | $5.41 |
| Baird Small/Mid | ||||||
| Cap Value Fund | ||||||
| Institutional Class | 0.95% | $1,000.00 | $1,059.30 | $4.85 | $1,020.08 | $4.76 |
| Investor Class | 1.20% | $1,000.00 | $1,058.40 | $6.12 | $1,018.84 | $6.01 |
| Baird SmallCap Value Fund | ||||||
| Institutional Class | 1.00% | $1,000.00 | $1,033.00 | $5.04 | $1,019.84 | $5.01 |
| Investor Class | 1.25% | $1,000.00 | $1,031.70 | $6.30 | $1,018.60 | $6.26 |
| Chautauqua International | ||||||
| Growth Fund | ||||||
| Institutional Class | 0.95% | $1,000.00 | $1,168.20 | $5.11 | $1,020.08 | $4.76 |
| Investor Class | 1.20% | $1,000.00 | $1,168.40 | $6.45 | $1,018.84 | $6.01 |
| Chautauqua Global | ||||||
| Growth Fund | ||||||
| Institutional Class | 0.95% | $1,000.00 | $1,195.20 | $5.17 | $1,020.08 | $4.76 |
| Investor Class | 1.20% | $1,000.00 | $1,192.50 | $6.52 | $1,018.84 | $6.01 |
| (1) | Expenses are equal to the Fund’s annualized net expense ratio multiplied by the average account value over the period, multiplied by 181 days and divided by 365 to reflect the one-half year period. |
Page 43
Statements of Assets and Liabilities
June 30, 2017 (Unaudited)
| Baird | ||||||||||||
| Baird | Baird | Small/Mid | ||||||||||
| LargeCap | MidCap | Cap Value | ||||||||||
| Fund | Fund | Fund | ||||||||||
| ASSETS: | ||||||||||||
| Investments, at value (cost $35,508,861, | ||||||||||||
| $1,090,693,272 and $10,742,422, respectively) | $ | 41,718,341 | $ | 1,384,542,788 | $ | 12,372,145 | ||||||
| Dividends receivable | 39,491 | 498,607 | 27,401 | |||||||||
| Interest receivable | 961 | 36,837 | 297 | |||||||||
| Receivable for investments sold | — | 11,671,359 | — | |||||||||
| Receivable for Fund shares sold | — | 1,962,154 | — | |||||||||
| Receivable from Advisor and Distributor, net | — | — | 2,011 | |||||||||
| Prepaid expenses and other assets | 20,171 | 34,413 | 18,572 | |||||||||
| Total assets | 41,778,964 | 1,398,746,158 | 12,420,426 | |||||||||
| LIABILITIES: | ||||||||||||
| Payable for securities purchased | — | 31,172,363 | — | |||||||||
| Payable for Fund shares repurchased | 20,065 | 1,254,410 | 19,405 | |||||||||
| Payable to Advisor and Distributor, net | 13,393 | 936,248 | — | |||||||||
| Payable to directors | 3,840 | 1,267 | 3,386 | |||||||||
| Accrued expenses and other liabilities | 28,129 | 103,942 | 23,749 | |||||||||
| Total liabilities | 65,427 | 33,468,230 | 46,540 | |||||||||
| NET ASSETS | $ | 41,713,537 | $ | 1,365,277,928 | $ | 12,373,886 | ||||||
| NET ASSETS CONSIST OF: | ||||||||||||
| Capital stock | $ | 33,698,484 | $ | 1,034,158,193 | $ | 11,095,893 | ||||||
| Accumulated undistributed | ||||||||||||
| net investment income (loss) | 245,872 | (996,847 | ) | 68,203 | ||||||||
| Accumulated net realized gain (loss) on investments | ||||||||||||
| sold and foreign currency translations | 1,559,701 | 38,267,066 | (419,933 | ) | ||||||||
| Net unrealized appreciation on: | ||||||||||||
| Investments | 6,209,480 | 293,849,516 | 1,629,723 | |||||||||
| NET ASSETS | $ | 41,713,537 | $ | 1,365,277,928 | $ | 12,373,886 | ||||||
| INSTITUTIONAL CLASS SHARES | ||||||||||||
| Net Assets | $ | 40,930,169 | $ | 1,253,438,751 | $ | 12,316,155 | ||||||
| Shares outstanding ($0.01 par value, | ||||||||||||
| unlimited shares authorized) | 4,200,258 | 68,345,092 | 1,129,891 | |||||||||
| Net asset value, offering and | ||||||||||||
| redemption price per share | $ | 9.74 | $ | 18.34 | $ | 10.90 | ||||||
| INVESTOR CLASS SHARES | ||||||||||||
| Net Assets | $ | 783,368 | $ | 111,839,177 | $ | 57,731 | ||||||
| Shares outstanding ($0.01 par value, | ||||||||||||
| unlimited shares authorized) | 80,603 | 6,387,964 | 5,309 | |||||||||
| Net asset value, offering and | ||||||||||||
| redemption price per share | $ | 9.72 | $ | 17.51 | $ | 10.87 | ||||||
The accompanying notes are an integral part of these financial statements.
Page 44
Statements of Assets and Liabilities
June 30, 2017 (Unaudited)
| Baird | Chautauqua | Chautauqua | ||||||||||
| SmallCap | International | Global | ||||||||||
| Value Fund | Growth Fund | Growth Fund | ||||||||||
| ASSETS: | ||||||||||||
| Investments, at value (cost $24,498,922, | ||||||||||||
| $54,430,433 and $10,599,237, respectively) | $ | 31,168,852 | $ | 58,846,638 | $ | 12,241,660 | ||||||
| Foreign Currency, at value (Cost $0, $36,070 | ||||||||||||
| and $23,633, respectively) | — | 36,224 | 23,486 | |||||||||
| Dividends receivable | 84,773 | 88,386 | 6,595 | |||||||||
| Interest receivable | 395 | 1,266 | 300 | |||||||||
| Receivable for Fund shares sold | 22,488 | 174,686 | 13,042 | |||||||||
| Uninvested cash | — | 953 | — | |||||||||
| Receivable from Advisor and Distributor, net | — | — | 12,439 | |||||||||
| Prepaid expenses and other assets | 21,800 | 35,262 | 26,944 | |||||||||
| Total assets | 31,298,308 | 59,183,415 | 12,324,466 | |||||||||
| LIABILITIES: | ||||||||||||
| Payable for securities purchased | — | — | 29,765 | |||||||||
| Payable for Fund shares repurchased | 19,438 | 18,989 | 19,955 | |||||||||
| Payable to Advisor and Distributor, net | 15,843 | 23,678 | — | |||||||||
| Payable to directors | 874 | 798 | 2,073 | |||||||||
| Accrued expenses and other liabilities | 22,036 | 23,442 | 22,038 | |||||||||
| Total liabilities | 58,191 | 66,907 | 73,831 | |||||||||
| NET ASSETS | $ | 31,240,117 | $ | 59,116,508 | $ | 12,250,635 | ||||||
| NET ASSETS CONSIST OF: | ||||||||||||
| Capital stock | $ | 24,259,144 | $ | 54,390,002 | $ | 10,464,083 | ||||||
| Accumulated undistributed | ||||||||||||
| net investment income (loss) | 158,088 | 207,693 | (7,615 | ) | ||||||||
| Accumulated net realized gain on investments | ||||||||||||
| sold and foreign currency translations | 152,955 | 102,251 | 151,646 | |||||||||
| Net unrealized appreciation on: | ||||||||||||
| Investments | 6,669,930 | 4,416,205 | 1,642,423 | |||||||||
| Foreign currency and other assets | ||||||||||||
| denominated in foreign currency | — | 357 | 98 | |||||||||
| NET ASSETS | $ | 31,240,117 | $ | 59,116,508 | $ | 12,250,635 | ||||||
| INSTITUTIONAL CLASS SHARES | ||||||||||||
| Net Assets | $ | 28,600,627 | $ | 58,240,554 | $ | 11,958,465 | ||||||
| Shares outstanding ($0.01 par value, | ||||||||||||
| unlimited shares authorized) | 1,866,969 | 5,207,290 | 991,702 | |||||||||
| Net asset value, offering and | ||||||||||||
| redemption price per share | $ | 15.32 | $ | 11.18 | $ | 12.06 | ||||||
| INVESTOR CLASS SHARES | ||||||||||||
| Net Assets | $ | 2,639,490 | $ | 875,954 | $ | 292,170 | ||||||
| Shares outstanding ($0.01 par value, | ||||||||||||
| unlimited shares authorized) | 172,718 | 78,447 | 24,298 | |||||||||
| Net asset value, offering and | ||||||||||||
| redemption price per share | $ | 15.28 | $ | 11.17 | $ | 12.02 | ||||||
The accompanying notes are an integral part of these financial statements.
Page 45
Statements of Operations
Six Months Ended June 30, 2017 (Unaudited)
| Baird | ||||||||||||
| Baird | Baird | Small/Mid | ||||||||||
| LargeCap | MidCap | Cap Value | ||||||||||
| Fund | Fund | Fund | ||||||||||
| INVESTMENT INCOME: | ||||||||||||
| Dividends | $ | 393,648 | $ | 4,598,012 | $ | 125,401 | ||||||
| Interest | 4,943 | 157,061 | 1,017 | |||||||||
| Other income | 1,732 | — | 354 | |||||||||
| Total investment income | 400,323 | 4,755,073 | 126,772 | |||||||||
| EXPENSES: | ||||||||||||
| Investment advisory fees | 134,723 | 5,079,592 | 51,395 | |||||||||
| Administration fees | 2,727 | 45,605 | 511 | |||||||||
| Shareholder servicing fees | 7,934 | 312,143 | 8,333 | |||||||||
| Fund accounting fees | 7,525 | 30,414 | 7,167 | |||||||||
| Professional fees | 16,227 | 18,071 | 16,251 | |||||||||
| Federal and state registration | 22,230 | 28,524 | 19,028 | |||||||||
| Directors fees | 21,069 | 19,663 | 18,693 | |||||||||
| Custody fees | 2,811 | 12,127 | 1,927 | |||||||||
| Reports to shareholders | 839 | 45,593 | 632 | |||||||||
| Miscellaneous expenses | 159 | 1,403 | 208 | |||||||||
| Distribution expense – Investor Class Shares (Note 8) | 962 | 158,785 | 79 | |||||||||
| Total expenses | 217,206 | 5,751,920 | 124,224 | |||||||||
| Fee waiver by Advisor (Note 5) | (60,794 | ) | — | (63,113 | ) | |||||||
| Net expenses | 156,412 | 5,751,920 | 61,111 | |||||||||
| NET INVESTMENT INCOME (LOSS) | 243,911 | (996,847 | ) | 65,661 | ||||||||
| REALIZED AND UNREALIZED | ||||||||||||
| GAIN ON INVESTMENTS: | ||||||||||||
| Net realized gain on investments | 2,199,228 | 102,126,707 | 20,709 | |||||||||
| Change in unrealized appreciation on investments | 1,222,740 | 101,634,569 | 619,855 | |||||||||
| Net realized and unrealized gain on investments | 3,421,968 | 203,761,276 | 640,564 | |||||||||
| NET INCREASE IN NET ASSETS | ||||||||||||
| RESULTING FROM OPERATIONS | $ | 3,665,879 | $ | 202,764,429 | $ | 706,225 | ||||||
The accompanying notes are an integral part of these financial statements.
Page 46
Statements of Operations
Six Months Ended June 30, 2017 (Unaudited)
| Baird | Chautauqua | Chautauqua | ||||||||||
| SmallCap | International | Global | ||||||||||
| Value Fund | Growth Fund | Growth Fund | ||||||||||
| INVESTMENT INCOME: | ||||||||||||
| Dividends (of foreign taxes withheld | ||||||||||||
| of $1,125, $45,744 and $3,238, respectively) | $ | 305,400 | $ | 405,194 | $ | 41,967 | ||||||
| Interest | 2,171 | 5,009 | 1,180 | |||||||||
| Other income | 1,769 | 320 | 146 | |||||||||
| Total investment income | 309,340 | 410,523 | 43,293 | |||||||||
| EXPENSES: | ||||||||||||
| Investment advisory fees | 129,292 | 166,932 | 41,077 | |||||||||
| Administration fees | 2,417 | 1,491 | 893 | |||||||||
| Shareholder servicing fees | 7,362 | 6,216 | 4,435 | |||||||||
| Fund accounting fees | 6,647 | 7,114 | 6,940 | |||||||||
| Professional fees | 15,255 | 22,347 | 22,119 | |||||||||
| Federal and state registration | 21,271 | 23,503 | 26,247 | |||||||||
| Directors fees | 19,295 | 19,406 | 20,641 | |||||||||
| Custody fees | 2,196 | 11,893 | 9,841 | |||||||||
| Reports to shareholders | 315 | 1,713 | 1,440 | |||||||||
| Miscellaneous expenses | — | 168 | 168 | |||||||||
| Interest Expense (Note 7) | — | 22 | — | |||||||||
| Distribution expense – Investor Class Shares (Note 8) | 3,222 | 753 | 302 | |||||||||
| Total expenses | 207,272 | 261,558 | 134,103 | |||||||||
| Fee waiver by Advisor | (51,941 | ) | (62,551 | ) | (85,022 | ) | ||||||
| Net expenses | 155,331 | 199,007 | 49,081 | |||||||||
| NET INVESTMENT INCOME (LOSS) | 154,009 | 211,516 | (5,788 | ) | ||||||||
| REALIZED AND UNREALIZED | ||||||||||||
| GAIN (LOSS) ON INVESTMENTS: | ||||||||||||
| Net realized gain on investments | 497,391 | 298,228 | 271,398 | |||||||||
| Net realized loss on foreign currency translations | — | (12,468 | ) | (2,446 | ) | |||||||
| Change in unrealized appreciation on investments | 346,134 | 4,767,649 | 1,458,685 | |||||||||
| Change in unrealized appreciation (depreciation) | ||||||||||||
| on foreign currency translation | — | 472 | (13 | ) | ||||||||
| Net realized and unrealized gain on investments | 843,525 | 5,053,881 | 1,727,624 | |||||||||
| NET INCREASE IN NET ASSETS | ||||||||||||
| RESULTING FROM OPERATIONS | $ | 997,534 | $ | 5,265,397 | $ | 1,721,836 | ||||||
The accompanying notes are an integral part of these financial statements.
Page 47
Statement of Changes in Net Assets
Baird LargeCap Fund
| Six Months Ended | ||||||||
| June 30, 2017 | Year Ended | |||||||
| (Unaudited) | December 31, 2016 | |||||||
| OPERATIONS: | ||||||||
| Net investment income | $ | 243,911 | $ | 549,393 | ||||
| Net realized gain on investments | 2,199,228 | 12,664 | ||||||
| Net realized loss on foreign currency translations | — | (6 | ) | |||||
| Change in unrealized appreciation on investments | 1,222,740 | 4,113,578 | ||||||
| Net increase in net assets resulting from operations | 3,665,879 | 4,675,629 | ||||||
| CAPITAL SHARE TRANSACTIONS: | ||||||||
| Proceeds from shares sold | 2,113,333 | 4,634,043 | ||||||
| Shares issued to holders in reinvestment of distributions | — | 560,003 | ||||||
| Cost of shares redeemed | (3,624,037 | ) | (6,000,917 | ) | ||||
| Net decrease in net assets resulting | ||||||||
| from capital share transactions | (1,510,704 | ) | (806,871 | ) | ||||
| DISTRIBUTIONS TO | ||||||||
| INSTITUTIONAL CLASS SHAREHOLDERS: | ||||||||
| From net investment income | — | (555,559 | ) | |||||
| Total Distributions | — | (555,559 | ) | |||||
| DISTRIBUTIONS TO | ||||||||
| INVESTOR CLASS SHAREHOLDERS: | ||||||||
| From net investment income | — | (5,808 | ) | |||||
| Total Distributions | — | (5,808 | ) | |||||
| TOTAL INCREASE IN NET ASSETS | 2,155,175 | 3,307,391 | ||||||
| NET ASSETS: | ||||||||
| Beginning of period | 39,558,362 | 36,250,971 | ||||||
| End of period (including undistributed net | ||||||||
| investment income of $245,872 and $1,961, respectively) | $ | 41,713,537 | $ | 39,558,362 | ||||
The accompanying notes are an integral part of these financial statements.
Page 48
Statement of Changes in Net Assets
Baird MidCap Fund
| Six Months Ended | ||||||||
| June 30, 2017 | Year Ended | |||||||
| (Unaudited) | December 31, 2016 | |||||||
| OPERATIONS: | ||||||||
| Net investment loss | $ | (996,847 | ) | $ | (2,146,689 | ) | ||
| Net realized gain (loss) on investments | 102,126,707 | (20,374,537 | ) | |||||
| Change in unrealized appreciation on investments | 101,634,569 | 85,885,944 | ||||||
| Net increase in net assets resulting from operations | 202,764,429 | 63,364,718 | ||||||
| CAPITAL SHARE TRANSACTIONS: | ||||||||
| Proceeds from shares sold | 229,518,806 | 439,643,509 | ||||||
| Cost of shares redeemed | (309,233,216 | ) | (479,905,649 | ) | ||||
| Net decrease in net assets resulting | ||||||||
| from capital share transactions | (79,714,410 | ) | (40,262,140 | ) | ||||
| TOTAL INCREASE IN NET ASSETS | 123,050,019 | 23,102,578 | ||||||
| NET ASSETS: | ||||||||
| Beginning of period | 1,242,227,909 | 1,219,125,331 | ||||||
| End of period (including undistributed net | ||||||||
| investment loss of $(996,847) and $0, respectively) | $ | 1,365,277,928 | $ | 1,242,227,909 | ||||
The accompanying notes are an integral part of these financial statements.
Page 49
Statement of Changes in Net Assets
Baird Small/Mid Cap Value Fund
| Six Months Ended | ||||||||
| June 30, 2017 | Year Ended | |||||||
| (Unaudited) | December 31, 2016 | |||||||
| OPERATIONS: | ||||||||
| Net investment income | $ | 65,661 | $ | 95,621 | ||||
| Net realized gain (loss) on investments | 20,709 | (404,287 | ) | |||||
| Change in unrealized appreciation on investments | 619,855 | 1,204,570 | ||||||
| Net increase in net assets resulting from operations | 706,225 | 895,904 | ||||||
| CAPITAL SHARE TRANSACTIONS: | ||||||||
| Proceeds from shares sold | 4,039,140 | 6,833,697 | ||||||
| Shares issued to holders in reinvestment of distributions | — | 79,329 | ||||||
| Cost of shares redeemed | (4,338,457 | ) | (485,000 | ) | ||||
| Net increase (decrease) in net assets resulting | ||||||||
| from capital share transactions | (299,317 | ) | 6,428,026 | |||||
| DISTRIBUTIONS TO | ||||||||
| INSTITUTIONAL CLASS SHAREHOLDERS: | ||||||||
| From net investment income | — | (90,044 | ) | |||||
| Total Distributions | — | (90,044 | ) | |||||
| DISTRIBUTIONS TO | ||||||||
| INVESTOR CLASS SHAREHOLDERS: | ||||||||
| From net investment income | — | (325 | ) | |||||
| Total Distributions | — | (325 | ) | |||||
| TOTAL INCREASE IN NET ASSETS | 406,908 | 7,233,561 | ||||||
| NET ASSETS: | ||||||||
| Beginning of period | 11,966,978 | 4,733,417 | ||||||
| End of period (including undistributed net | ||||||||
| investment income of $68,203 and $2,542, respectively) | $ | 12,373,886 | $ | 11,966,978 | ||||
The accompanying notes are an integral part of these financial statements.
Page 50
Statement of Changes in Net Assets
Baird SmallCap Value Fund
| Six Months Ended | ||||||||
| June 30, 2017 | Year Ended | |||||||
| (Unaudited) | December 31, 2016 | |||||||
| OPERATIONS: | ||||||||
| Net investment income | $ | 154,009 | $ | 345,791 | ||||
| Net realized gain on investments | 497,391 | 406,537 | ||||||
| Change in unrealized appreciation on investments | 346,134 | 3,244,223 | ||||||
| Net increase in net assets resulting from operations | 997,534 | 3,996,551 | ||||||
| CAPITAL SHARE TRANSACTIONS: | ||||||||
| Proceeds from shares sold | 1,991,700 | 5,035,886 | ||||||
| Shares issued to holders in reinvestment of distributions | — | 287,392 | ||||||
| Cost of shares redeemed | (2,598,012 | ) | (3,257,446 | ) | ||||
| Net increase (decrease) in net assets resulting | ||||||||
| from capital share transactions | (606,312 | ) | 2,065,832 | |||||
| DISTRIBUTIONS TO | ||||||||
| INSTITUTIONAL CLASS SHAREHOLDERS: | ||||||||
| From net investment income | — | (321,015 | ) | |||||
| Total Distributions | — | (321,015 | ) | |||||
| DISTRIBUTIONS TO | ||||||||
| INVESTOR CLASS SHAREHOLDERS: | ||||||||
| From net investment income | — | (19,041 | ) | |||||
| Total Distributions | — | (19,041 | ) | |||||
| TOTAL INCREASE IN NET ASSETS | 391,222 | 5,722,327 | ||||||
| NET ASSETS: | ||||||||
| Beginning of period | 30,848,895 | 25,126,568 | ||||||
| End of period (including undistributed net | ||||||||
| investment income of $158,088 and $4,079, respectively) | $ | 31,240,117 | $ | 30,848,895 | ||||
The accompanying notes are an integral part of these financial statements.
Page 51
Statement of Changes in Net Assets
Chautauqua International Growth Fund
| Six Months Ended | April 15, 2016^ | |||||||
| June 30, 2017 | through | |||||||
| (Unaudited) | December 31, 2016 | |||||||
| OPERATIONS: | ||||||||
| Net investment income | $ | 211,516 | $ | 3,896 | ||||
| Net realized gain (loss) on investments | 298,228 | (206,808 | ) | |||||
| Net realized gain (loss) on foreign currency translations | (12,468 | ) | 333 | |||||
| Change in unrealized appreciation | ||||||||
| (depreciation) on investments and foreign currency | 4,768,121 | (351,559 | ) | |||||
| Net increase (decrease) in net assets | ||||||||
| resulting from operations | 5,265,397 | (554,138 | ) | |||||
| CAPITAL SHARE TRANSACTIONS: | ||||||||
| Proceeds from shares sold | 41,060,874 | 16,146,048 | ||||||
| Cost of shares redeemed | (2,372,268 | ) | (436,323 | ) | ||||
| Redemption fees | 5,203 | 1,715 | ||||||
| Net increase in net assets resulting | ||||||||
| from capital share transactions | 38,693,809 | 15,711,440 | ||||||
| TOTAL INCREASE IN NET ASSETS | 43,959,206 | 15,157,302 | ||||||
| NET ASSETS: | ||||||||
| Beginning of period | 15,157,302 | — | ||||||
| End of period (including undistributed net investment | ||||||||
| income (loss) of $207,693 and $(3,823), respectively) | $ | 59,116,508 | $ | 15,157,302 | ||||
^ Inception was the close of business on April 15, 2016.
The accompanying notes are an integral part of these financial statements.
Page 52
Statement of Changes in Net Assets
Chautauqua Global Growth Fund
| Six Months Ended | April 15, 2016^ | |||||||
| June 30, 2017 | through | |||||||
| (Unaudited) | December 31, 2016 | |||||||
| OPERATIONS: | ||||||||
| Net investment loss | $ | (5,788 | ) | $ | (6,417 | ) | ||
| Net realized gain (loss) on investments | 271,398 | (126,573 | ) | |||||
| Net realized gain (loss) on foreign currency translations | (2,446 | ) | 47 | |||||
| Change in unrealized appreciation | ||||||||
| on investments and foreign currency | 1,458,672 | 183,849 | ||||||
| Net increase in net assets resulting from operations | 1,721,836 | 50,906 | ||||||
| CAPITAL SHARE TRANSACTIONS: | ||||||||
| Proceeds from shares sold | 3,140,828 | 8,917,355 | ||||||
| Cost of shares redeemed | (461,524 | ) | (1,119,965 | ) | ||||
| Redemption fees | 684 | 515 | ||||||
| Net increase in net assets resulting | ||||||||
| from capital share transactions | 2,679,988 | 7,797,905 | ||||||
| TOTAL INCREASE IN NET ASSETS | 4,401,824 | 7,848,811 | ||||||
| NET ASSETS: | ||||||||
| Beginning of period | 7,848,811 | — | ||||||
| End of period (including undistributed net | ||||||||
| investment loss of $(7,615) and $(1,827), respectively) | $ | 12,250,635 | $ | 7,848,811 | ||||
^ Inception was the close of business on April 15, 2016.
The accompanying notes are an integral part of these financial statements.
Page 53
Financial Highlights
Baird LargeCap Fund – Institutional Class
| Six Months | ||||||||||||||||||||||||
| Ended | ||||||||||||||||||||||||
| June 30, 2017 | Year Ended December 31, | |||||||||||||||||||||||
| (Unaudited) | 2016(1) | 2015 | 2014 | 2013(1) | 2012 | |||||||||||||||||||
| Per Share Data: | ||||||||||||||||||||||||
| Net asset value, | ||||||||||||||||||||||||
| beginning of period | $ | 8.92 | $ | 8.01 | $ | 8.93 | $ | 7.92 | $ | 9.86 | $ | 8.71 | ||||||||||||
| Income from | ||||||||||||||||||||||||
| investment operations: | ||||||||||||||||||||||||
Net investment income(2) | 0.06 | 0.12 | 0.10 | 0.09 | 0.03 | 0.04 | ||||||||||||||||||
| Net realized and unrealized | ||||||||||||||||||||||||
| gains (losses) on investments | 0.76 | 0.92 | (0.45 | ) | 1.10 | 3.16 | 1.15 | |||||||||||||||||
| Total from | ||||||||||||||||||||||||
| investment operations | 0.82 | 1.04 | (0.35 | ) | 1.19 | 3.19 | 1.19 | |||||||||||||||||
| Less distributions: | ||||||||||||||||||||||||
| Distributions from | ||||||||||||||||||||||||
| net investment income | — | (0.13 | ) | (0.11 | ) | (0.08 | ) | (0.04 | ) | (0.04 | ) | |||||||||||||
| Distributions from | ||||||||||||||||||||||||
| net realized gains | — | — | (0.46 | ) | (0.10 | ) | (5.09 | ) | — | |||||||||||||||
| Total distributions | — | (0.13 | ) | (0.57 | ) | (0.18 | ) | (5.13 | ) | (0.04 | ) | |||||||||||||
| Net asset value, end of period | $ | 9.74 | $ | 8.92 | $ | 8.01 | $ | 8.93 | $ | 7.92 | $ | 9.86 | ||||||||||||
| Total return | 9.19 | %(3) | 12.94 | % | (3.94 | )% | 15.09 | % | 32.68 | % | 13.62 | % | ||||||||||||
| Supplemental data and ratios: | ||||||||||||||||||||||||
| Net assets, | ||||||||||||||||||||||||
| end of period (millions) | $ | 40.9 | $ | 38.8 | $ | 35.6 | $ | 39.0 | $ | 28.0 | $ | 24.0 | ||||||||||||
| Ratio of expenses | ||||||||||||||||||||||||
| to average net assets | 0.75 | %(4) | 0.75 | % | 0.75 | % | 0.75 | % | 0.75 | % | 0.75 | % | ||||||||||||
| Ratio of expenses | ||||||||||||||||||||||||
| to average net assets | ||||||||||||||||||||||||
| (before waivers) | 1.04 | %(4) | 1.13 | % | 1.11 | % | 1.17 | % | 1.24 | % | 1.34 | % | ||||||||||||
| Ratio of net | ||||||||||||||||||||||||
| investment income | ||||||||||||||||||||||||
| to average net assets | 1.18 | %(4) | 1.51 | % | 1.18 | % | 1.08 | % | 0.28 | % | 0.37 | % | ||||||||||||
| Ratio of net | ||||||||||||||||||||||||
| investment income (loss) | ||||||||||||||||||||||||
| to average net assets | ||||||||||||||||||||||||
| (before waivers) | 0.89 | %(4) | 1.13 | % | 0.82 | % | 0.66 | % | (0.21 | )% | (0.22 | )% | ||||||||||||
Portfolio turnover rate(5) | 40.2 | %(3) | 85.0 | % | 86.5 | % | 88.2 | % | 127.7 | % | 39.2 | % | ||||||||||||
| (1) | Effective December 23, 2013, Baird Kailash Group, LLC became the Fund’s subadviser. The Fund changed its subadviser to L2 Asset Management, LLC as of April 30, 2016. |
| (2) | Calculated using average shares outstanding during the period. |
| (3) | Not annualized. |
| (4) | Annualized. |
| (5) | Portfolio turnover is calculated on the basis of the Fund as a whole without distinguishing between the classes of shares issued. The Baird Large Cap Fund’s Portfolio turnover rate in 2013 was higher than previous years primarily due to the implementation of a new investment strategy for the Fund by Baird Kailash Group, LLC, the Fund’s previous subadviser. |
The accompanying notes are an integral part of these financial statements.
Page 54
Financial Highlights
Baird LargeCap Fund – Investor Class
| Six Months | ||||||||||||||||||||||||
| Ended | ||||||||||||||||||||||||
| June 30, 2017 | Year Ended December 31, | |||||||||||||||||||||||
| (Unaudited) | 2016(1) | 2015 | 2014 | 2013(1) | 2012 | |||||||||||||||||||
| Per Share Data: | ||||||||||||||||||||||||
| Net asset value, | ||||||||||||||||||||||||
| beginning of period | $ | 8.91 | $ | 7.97 | $ | 8.87 | $ | 7.87 | $ | 9.82 | $ | 8.68 | ||||||||||||
| Income from | ||||||||||||||||||||||||
| investment operations: | ||||||||||||||||||||||||
Net investment income(2) | 0.04 | 0.10 | 0.08 | 0.05 | 0.00 | (3) | 0.01 | |||||||||||||||||
| Net realized and unrealized | ||||||||||||||||||||||||
| gains (losses) on investments | 0.77 | 0.91 | (0.45 | ) | 1.12 | 3.14 | 1.15 | |||||||||||||||||
| Total from | ||||||||||||||||||||||||
| investment operations | 0.81 | 1.01 | (0.37 | ) | 1.17 | 3.14 | 1.16 | |||||||||||||||||
| Less distributions: | ||||||||||||||||||||||||
| Distributions from | ||||||||||||||||||||||||
| net investment income | — | (0.07 | ) | (0.07 | ) | (0.07 | ) | — | (0.02 | ) | ||||||||||||||
| Distributions from | ||||||||||||||||||||||||
| net realized gains | — | — | (0.46 | ) | (0.10 | ) | (5.09 | ) | — | |||||||||||||||
| Total distributions | — | (0.07 | ) | (0.53 | ) | (0.17 | ) | (5.09 | ) | (0.02 | ) | |||||||||||||
| Net asset value, end of period | $ | 9.72 | $ | 8.91 | $ | 7.97 | $ | 8.87 | $ | 7.87 | $ | 9.82 | ||||||||||||
| Total return | 9.09 | %(4) | 12.67 | % | (4.18 | )% | 14.89 | % | 32.34 | % | 13.32 | % | ||||||||||||
| Supplemental data and ratios: | ||||||||||||||||||||||||
| Net assets, | ||||||||||||||||||||||||
| end of period (millions) | $ | 0.8 | $ | 0.7 | $ | 0.6 | $ | 1.2 | $ | 0.2 | $ | 0.4 | ||||||||||||
| Ratio of expenses | ||||||||||||||||||||||||
| to average net assets | 1.00 | %(5) | 1.00 | % | 1.00 | % | 1.00 | % | 1.00 | % | 1.00 | % | ||||||||||||
| Ratio of expenses | ||||||||||||||||||||||||
| to average net assets | ||||||||||||||||||||||||
| (before waivers) | 1.29 | %(5) | 1.38 | % | 1.36 | % | 1.42 | % | 1.49 | % | 1.59 | % | ||||||||||||
| Ratio of net | ||||||||||||||||||||||||
| investment income | ||||||||||||||||||||||||
| to average net assets | 0.93 | %(5) | 1.26 | % | 0.93 | % | 0.83 | % | 0.03 | % | 0.12 | % | ||||||||||||
| Ratio of net | ||||||||||||||||||||||||
| investment income (loss) | ||||||||||||||||||||||||
| to average net assets | ||||||||||||||||||||||||
| (before waivers) | 0.64 | %(5) | 0.88 | % | 0.57 | % | 0.41 | % | (0.46 | )% | (0.47 | )% | ||||||||||||
Portfolio turnover rate(6) | 40.2 | %(4) | 85.0 | % | 86.5 | % | 88.2 | % | 127.7 | % | 39.2 | % | ||||||||||||
| (1) | Effective December 23, 2013, Baird Kailash Group, LLC became the Fund’s subadviser. The Fund changed its subadviser to L2 Asset Management, LLC as of April 30, 2016. |
| (2) | Calculated using average shares outstanding during the period. |
| (3) | Amount is less than $0.005. |
| (4) | Not annualized. |
| (5) | Annualized. |
| (6) | Portfolio turnover is calculated on the basis of the Fund as a whole without distinguishing between the classes of shares issued. The Baird Large Cap Fund’s Portfolio turnover rate in 2013 was higher than previous years primarily due to the implementation of a new investment strategy for the Fund by Baird Kailash Group, LLC, the Fund’s previous subadviser. |
The accompanying notes are an integral part of these financial statements.
Page 55
Financial Highlights
Baird MidCap Fund – Institutional Class
| Six Months | ||||||||||||||||||||||||
| Ended | ||||||||||||||||||||||||
| June 30, 2017 | Year Ended December 31, | |||||||||||||||||||||||
| (Unaudited) | 2016 | 2015 | 2014 | 2013 | 2012 | |||||||||||||||||||
| Per Share Data: | ||||||||||||||||||||||||
| Net asset value, | ||||||||||||||||||||||||
| beginning of period | $ | 15.80 | $ | 14.99 | $ | 15.57 | $ | 15.00 | $ | 11.52 | $ | 9.98 | ||||||||||||
| Income from | ||||||||||||||||||||||||
| investment operations: | ||||||||||||||||||||||||
| Net investment income (loss) | (0.01 | )(1) | (0.02 | )(1) | (0.03 | )(1) | (0.03 | )(1) | (0.01 | ) | 0.07 | (1) | ||||||||||||
| Net realized and unrealized | ||||||||||||||||||||||||
| gains (losses) on investments | 2.55 | 0.83 | (0.53 | ) | 0.76 | 3.80 | 1.57 | |||||||||||||||||
| Total from | ||||||||||||||||||||||||
| investment operations | 2.54 | 0.81 | (0.56 | ) | 0.73 | 3.79 | 1.64 | |||||||||||||||||
| Less distributions: | ||||||||||||||||||||||||
| Distributions from | �� | |||||||||||||||||||||||
| net investment income | — | — | — | — | — | (0.04 | ) | |||||||||||||||||
| Distributions from | ||||||||||||||||||||||||
| net realized gains | — | — | (0.02 | ) | (0.16 | ) | (0.31 | ) | (0.06 | ) | ||||||||||||||
| Total distributions | — | — | (0.02 | ) | (0.16 | ) | (0.31 | ) | (0.10 | ) | ||||||||||||||
| Net asset value, end of period | $ | 18.34 | $ | 15.80 | $ | 14.99 | $ | 15.57 | $ | 15.00 | $ | 11.52 | ||||||||||||
| Total return | 16.08 | %(2) | 5.40 | % | (3.59 | )% | 4.85 | % | 32.90 | % | 16.49 | % | ||||||||||||
| Supplemental data and ratios: | ||||||||||||||||||||||||
| Net assets, | ||||||||||||||||||||||||
| end of period (millions) | $ | 1,253.4 | $ | 1,105.1 | $ | 1,035.0 | $ | 910.9 | $ | 286.1 | $ | 137.2 | ||||||||||||
| Ratio of expenses | ||||||||||||||||||||||||
| to average net assets | 0.83 | %(3) | 0.82 | % | 0.80 | % | 0.85 | % | 0.85 | % | 0.85 | % | ||||||||||||
| Ratio of expenses | ||||||||||||||||||||||||
| to average net assets | ||||||||||||||||||||||||
| (before waivers) | 0.83 | %(3) | 0.82 | % | 0.80 | % | 0.87 | % | 0.87 | % | 0.97 | % | ||||||||||||
| Ratio of net | ||||||||||||||||||||||||
| investment income (loss) | ||||||||||||||||||||||||
| to average net assets | (0.12 | )%(3) | (0.14 | )% | (0.18 | )% | (0.17 | )% | (0.04 | )% | 0.65 | % | ||||||||||||
| Ratio of net | ||||||||||||||||||||||||
| investment income (loss) | ||||||||||||||||||||||||
| to average net assets | ||||||||||||||||||||||||
| (before waivers) | (0.12 | )%(3) | (0.14 | )% | (0.18 | )% | (0.19 | )% | (0.06 | )% | 0.53 | % | ||||||||||||
Portfolio turnover rate(4) | 27.6 | %(2) | 57.2 | % | 52.8 | % | 37.3 | % | 36.3 | % | 29.5 | % | ||||||||||||
| (1) | Calculated using average shares outstanding during the period. |
| (2) | Not annualized. |
| (3) | Annualized. |
| (4) | Portfolio turnover is calculated on the basis of the Fund as a whole without distinguishing between the classes of shares issued. |
The accompanying notes are an integral part of these financial statements.
Page 56
Financial Highlights
Baird MidCap Fund – Investor Class
| Six Months | ||||||||||||||||||||||||
| Ended | ||||||||||||||||||||||||
| June 30, 2017 | Year Ended December 31, | |||||||||||||||||||||||
| (Unaudited) | 2016 | 2015 | 2014 | 2013 | 2012 | |||||||||||||||||||
| Per Share Data: | ||||||||||||||||||||||||
| Net asset value, | ||||||||||||||||||||||||
| beginning of period | $ | 15.10 | $ | 14.36 | $ | 14.96 | $ | 14.45 | $ | 11.13 | $ | 9.66 | ||||||||||||
| Income from | ||||||||||||||||||||||||
| investment operations: | ||||||||||||||||||||||||
| Net investment income (loss) | (0.03 | )(1) | (0.06 | )(1) | (0.06 | )(1) | (0.06 | )(1) | (0.03 | ) | 0.04 | (1) | ||||||||||||
| Net realized and unrealized | ||||||||||||||||||||||||
| gains (losses) on investments | 2.44 | 0.80 | (0.52 | ) | 0.73 | 3.66 | 1.52 | |||||||||||||||||
| Total from | ||||||||||||||||||||||||
| investment operations | 2.41 | 0.74 | (0.58 | ) | 0.67 | 3.63 | 1.56 | |||||||||||||||||
| Less distributions: | ||||||||||||||||||||||||
| Distributions from | ||||||||||||||||||||||||
| net investment income | — | — | — | — | — | (0.03 | ) | |||||||||||||||||
| Distributions from | ||||||||||||||||||||||||
| net realized gains | — | — | (0.02 | ) | (0.16 | ) | (0.31 | ) | (0.06 | ) | ||||||||||||||
| Total distributions | — | — | (0.02 | ) | (0.16 | ) | (0.31 | ) | (0.09 | ) | ||||||||||||||
| Net asset value, end of period | $ | 17.51 | $ | 15.10 | $ | 14.36 | $ | 14.96 | $ | 14.45 | $ | 11.13 | ||||||||||||
| Total return | 15.96 | %(2) | 5.08 | % | (3.80 | )% | 4.62 | % | 32.62 | % | 16.16 | % | ||||||||||||
| Supplemental data and ratios: | ||||||||||||||||||||||||
| Net assets, | ||||||||||||||||||||||||
| end of period (millions) | $ | 111.8 | $ | 137.2 | $ | 184.1 | $ | 205.4 | $ | 143.1 | $ | 84.1 | ||||||||||||
| Ratio of expenses | ||||||||||||||||||||||||
| to average net assets | 1.08 | %(3) | 1.07 | % | 1.05 | % | 1.10 | % | 1.10 | % | 1.10 | % | ||||||||||||
| Ratio of expenses | ||||||||||||||||||||||||
| to average net assets | ||||||||||||||||||||||||
| (before waivers) | 1.08 | %(3) | 1.07 | % | 1.05 | % | 1.12 | % | 1.12 | % | 1.22 | % | ||||||||||||
| Ratio of net | ||||||||||||||||||||||||
| investment income (loss) | ||||||||||||||||||||||||
| to average net assets | (0.37 | )%(3) | (0.39 | )% | (0.43 | )% | (0.42 | )% | (0.29 | )% | 0.40 | % | ||||||||||||
| Ratio of net | ||||||||||||||||||||||||
| investment income (loss) | ||||||||||||||||||||||||
| to average net assets | ||||||||||||||||||||||||
| (before waivers) | (0.37 | )%(3) | (0.39 | )% | (0.43 | )% | (0.44 | )% | (0.31 | )% | 0.28 | % | ||||||||||||
Portfolio turnover rate(4) | 27.6 | %(2) | 57.2 | % | 52.8 | % | 37.3 | % | 36.3 | % | 29.5 | % | ||||||||||||
| (1) | Calculated using average shares outstanding during the period. |
| (2) | Not annualized. |
| (3) | Annualized. |
| (4) | Portfolio turnover is calculated on the basis of the Fund as a whole without distinguishing between the classes of shares issued. |
The accompanying notes are an integral part of these financial statements.
Page 57
Financial Highlights
Baird Small/Mid Cap Value Fund – Institutional Class
| November 30, | ||||||||||||
| Six Months | 2015^ | |||||||||||
| Ended | Year Ended | through | ||||||||||
| June 30, 2017 | December 31, | December 31, | ||||||||||
| (Unaudited) | 2016 | 2015 | ||||||||||
| Per Share Data: | ||||||||||||
| Net asset value, beginning of period | $ | 10.29 | $ | 9.52 | $ | 10.00 | ||||||
| Income from investment operations: | ||||||||||||
Net investment income(1) | 0.05 | 0.13 | 0.02 | |||||||||
| Net realized and unrealized gains (losses) on investments | 0.56 | 0.72 | (0.49 | ) | ||||||||
| Total from investment operations | 0.61 | 0.85 | (0.47 | ) | ||||||||
| Less distributions: | ||||||||||||
| Distributions from net investment income | — | (0.08 | ) | (0.01 | ) | |||||||
| Total distributions | — | (0.08 | ) | (0.01 | ) | |||||||
| Net asset value, end of period | $ | 10.90 | $ | 10.29 | $ | 9.52 | ||||||
| Total return | 5.93 | %(2) | 8.91 | % | (4.66 | )%(2) | ||||||
| Supplemental data and ratios: | ||||||||||||
| Net assets, end of period (millions) | $ | 12.3 | $ | 11.9 | $ | 4.7 | ||||||
| Ratio of expenses to average net assets | 0.95 | %(3) | 0.95 | % | 0.95 | %(3) | ||||||
| Ratio of expenses to average net assets (before waivers) | 1.93 | %(3) | 2.86 | % | 6.88 | %(3) | ||||||
| Ratio of net investment income to average net assets | 1.02 | %(3) | 1.35 | % | 1.96 | %(3) | ||||||
| Ratio of net investment income (loss) | ||||||||||||
| to average net assets (before waivers) | 0.04 | %(3) | (0.56 | )% | (3.97 | )%(3) | ||||||
Portfolio turnover rate(4) | 42.1 | %(2) | 38.3 | % | 14.7 | %(2) | ||||||
| ^ | Inception date. |
| (1) | Calculated using average shares outstanding during the period. |
| (2) | Not annualized. |
| (3) | Annualized. |
| (4) | Portfolio turnover is calculated on the basis of the Fund as a whole without distinguishing between the classes of shares issued. |
The accompanying notes are an integral part of these financial statements.
Page 58
Financial Highlights
Baird Small/Mid Cap Value Fund – Investor Class
| November 30, | ||||||||||||
| Six Months | 2015^ | |||||||||||
| Ended | Year Ended | through | ||||||||||
| June 30, 2017 | December 31, | December 31, | ||||||||||
| (Unaudited) | 2016 | 2015 | ||||||||||
| Per Share Data: | ||||||||||||
| Net asset value, beginning of period | $ | 10.28 | $ | 9.52 | $ | 10.00 | ||||||
| Income from investment operations: | ||||||||||||
Net investment income(1) | 0.04 | 0.11 | 0.01 | |||||||||
| Net realized and unrealized gains (losses) on investments | 0.55 | 0.71 | (0.48 | ) | ||||||||
| Total from investment operations | 0.59 | 0.82 | (0.47 | ) | ||||||||
| Less distributions: | ||||||||||||
| Distributions from net investment income | — | (0.06 | ) | (0.01 | ) | |||||||
| Total distributions | — | (0.06 | ) | (0.01 | ) | |||||||
| Net asset value, end of period | $ | 10.87 | $ | 10.28 | $ | 9.52 | ||||||
| Total return | 5.84 | %(2) | 8.64 | % | (4.67 | )%(2) | ||||||
| Supplemental data and ratios: | ||||||||||||
| Net assets, end of period (thousands) | $ | 0.1 | $ | 53.2 | $ | 19.0 | ||||||
| Ratio of expenses to average net assets | 1.20 | %(3) | 1.20 | % | 1.20 | %(3) | ||||||
| Ratio of expenses to average net assets (before waivers) | 2.18 | %(3) | 3.11 | % | 7.13 | %(3) | ||||||
| Ratio of net investment income to average net assets | 0.77 | %(3) | 1.10 | % | 1.71 | %(3) | ||||||
| Ratio of net investment loss | ||||||||||||
| to average net assets (before waivers) | (0.21 | )%(3) | (0.81 | )% | (4.22 | )%(3) | ||||||
Portfolio turnover rate(4) | 42.1 | %(2) | 38.3 | % | 14.7 | %(2) | ||||||
| ^ | Inception date. |
| (1) | Calculated using average shares outstanding during the period. |
| (2) | Not annualized. |
| (3) | Annualized. |
| (4) | Portfolio turnover is calculated on the basis of the Fund as a whole without distinguishing between the classes of shares issued. |
The accompanying notes are an integral part of these financial statements.
Page 59
Financial Highlights
Baird SmallCap Value Fund – Institutional Class
| Six Months | May 1, 2012^ | |||||||||||||||||||||||
| Ended | through | |||||||||||||||||||||||
| June 30, 2017 | Year Ended December 31, | December 31, | ||||||||||||||||||||||
| (Unaudited) | 2016 | 2015 | 2014 | 2013 | 2012 | |||||||||||||||||||
| Per Share Data: | ||||||||||||||||||||||||
| Net asset value, | ||||||||||||||||||||||||
| beginning of period | $ | 14.83 | $ | 13.03 | $ | 13.82 | $ | 14.01 | $ | 10.20 | $ | 10.00 | ||||||||||||
| Income from | ||||||||||||||||||||||||
| investment operations: | ||||||||||||||||||||||||
Net investment income(1) | 0.08 | 0.21 | 0.11 | 0.05 | 0.07 | 0.15 | ||||||||||||||||||
| Net realized and unrealized | ||||||||||||||||||||||||
| gains (losses) on investments | 0.41 | 1.76 | (0.82 | ) | 0.01 | 3.99 | 0.20 | |||||||||||||||||
| Total from | ||||||||||||||||||||||||
| investment operations | 0.49 | 1.97 | (0.71 | ) | 0.06 | 4.06 | 0.35 | |||||||||||||||||
| Less distributions: | ||||||||||||||||||||||||
| Distributions from net | ||||||||||||||||||||||||
| investment income | — | (0.17 | ) | (0.08 | ) | (0.05 | ) | (0.05 | ) | (0.12 | ) | |||||||||||||
| Distributions from | ||||||||||||||||||||||||
| net realized gains | — | — | — | (0.20 | ) | (0.20 | ) | (0.03 | ) | |||||||||||||||
| Total distributions | — | (0.17 | ) | (0.08 | ) | (0.25 | ) | (0.25 | ) | (0.15 | ) | |||||||||||||
| Net asset value, end of period | $ | 15.32 | $ | 14.83 | $ | 13.03 | $ | 13.82 | $ | 14.01 | $ | 10.20 | ||||||||||||
| Total return | 3.30 | %(2) | 15.11 | % | (5.11 | )% | 0.42 | % | 39.85 | % | 3.52 | %(2) | ||||||||||||
| Supplemental data and ratios: | ||||||||||||||||||||||||
| Net assets, | ||||||||||||||||||||||||
| end of period (millions) | $ | 28.6 | $ | 28.2 | $ | 23.1 | $ | 23.5 | $ | 19.0 | $ | 8.1 | ||||||||||||
| Ratio of expenses | ||||||||||||||||||||||||
| to average net assets | 1.00 | %(3) | 1.00 | % | 1.00 | % | 1.00 | % | 1.00 | % | 1.00 | %(3) | ||||||||||||
| Ratio of expenses | ||||||||||||||||||||||||
| to average net assets | ||||||||||||||||||||||||
| (before waivers) | 1.34 | %(3) | 1.43 | % | 1.51 | % | 1.55 | % | 2.02 | % | 3.06 | %(3) | ||||||||||||
| Ratio of net | ||||||||||||||||||||||||
| investment income | ||||||||||||||||||||||||
| to average net assets | 1.03 | %(3) | 1.58 | % | 0.79 | % | 0.36 | % | 0.71 | % | 2.32 | %(3) | ||||||||||||
| Ratio of net | ||||||||||||||||||||||||
| investment income (loss) | ||||||||||||||||||||||||
| to average net assets | ||||||||||||||||||||||||
| (before waivers) | 0.69 | %(3) | 1.15 | % | 0.28 | % | (0.19 | )% | (0.31 | )% | 0.26 | %(3) | ||||||||||||
Portfolio turnover rate(4) | 10.6 | %(2) | 48.9 | % | 42.1 | % | 41.9 | % | 36.9 | % | 24.6 | %(2) | ||||||||||||
| ^ | Inception date. |
| (1) | Calculated using average shares outstanding during the period. |
| (2) | Not annualized. |
| (3) | Annualized. |
| (4) | Portfolio turnover is calculated on the basis of the Fund as a whole without distinguishing between the classes of shares issued. |
The accompanying notes are an integral part of these financial statements.
Page 60
Financial Highlights
Baird SmallCap Value Fund – Investor Class
| Six Months | May 1, 2012^ | |||||||||||||||||||||||
| Ended | through | |||||||||||||||||||||||
| June 30, 2017 | Year Ended December 31, | December 31, | ||||||||||||||||||||||
| (Unaudited) | 2016 | 2015 | 2014 | 2013 | 2012 | |||||||||||||||||||
| Per Share Data: | ||||||||||||||||||||||||
| Net asset value, | ||||||||||||||||||||||||
| beginning of period | $ | 14.81 | $ | 12.99 | $ | 13.78 | $ | 13.98 | $ | 10.19 | $ | 10.00 | ||||||||||||
| Income from | ||||||||||||||||||||||||
| investment operations: | ||||||||||||||||||||||||
Net investment income(1) | 0.06 | 0.18 | 0.07 | 0.02 | 0.04 | 0.14 | ||||||||||||||||||
| Net realized and unrealized | ||||||||||||||||||||||||
| gains (losses) on investments | 0.41 | 1.75 | (0.81 | ) | 0.00 | (2) | 3.99 | 0.19 | ||||||||||||||||
| Total from | ||||||||||||||||||||||||
| investment operations | 0.47 | 1.93 | (0.74 | ) | 0.02 | 4.03 | 0.33 | |||||||||||||||||
| Less distributions: | ||||||||||||||||||||||||
| Distributions from net | ||||||||||||||||||||||||
| investment income | — | (0.11 | ) | (0.05 | ) | (0.02 | ) | (0.04 | ) | (0.11 | ) | |||||||||||||
| Distributions from | ||||||||||||||||||||||||
| net realized gains | — | — | — | (0.20 | ) | (0.20 | ) | (0.03 | ) | |||||||||||||||
| Total distributions | — | (0.11 | ) | (0.05 | ) | (0.22 | ) | (0.24 | ) | (0.14 | ) | |||||||||||||
| Net asset value, end of period | $ | 15.28 | $ | 14.81 | $ | 12.99 | $ | 13.78 | $ | 13.98 | $ | 10.19 | ||||||||||||
| Total return | 3.17 | %(3) | 14.84 | % | (5.37 | )% | 0.13 | % | 39.58 | % | 3.32 | %(3) | ||||||||||||
| Supplemental data and ratios: | ||||||||||||||||||||||||
| Net assets, | ||||||||||||||||||||||||
| end of period (millions) | $ | 2.6 | $ | 2.6 | $ | 2.0 | $ | 2.1 | $ | 1.1 | $ | 0.2 | ||||||||||||
| Ratio of expenses | ||||||||||||||||||||||||
| to average net assets | 1.25 | %(4) | 1.25 | % | 1.25 | % | 1.25 | % | 1.25 | % | 1.25 | %(4) | ||||||||||||
| Ratio of expenses | ||||||||||||||||||||||||
| to average net assets | ||||||||||||||||||||||||
| (before waivers) | 1.59 | %(4) | 1.68 | % | 1.76 | % | 1.80 | % | 2.27 | % | 3.31 | %(4) | ||||||||||||
| Ratio of net | ||||||||||||||||||||||||
| investment income | ||||||||||||||||||||||||
| to average net assets | 0.78 | %(4) | 1.33 | % | 0.54 | % | 0.11 | % | 0.46 | % | 2.07 | %(4) | ||||||||||||
| Ratio of net | ||||||||||||||||||||||||
| investment income (loss) | ||||||||||||||||||||||||
| to average net assets | ||||||||||||||||||||||||
| (before waivers) | 0.44 | %(4) | 0.90 | % | 0.03 | % | (0.44 | )% | (0.56 | )% | 0.01 | %(4) | ||||||||||||
Portfolio turnover rate(5) | 10.6 | %(3) | 48.9 | % | 42.1 | % | 41.9 | % | 36.9 | % | 24.6 | %(3) | ||||||||||||
| ^ | Inception date. |
| (1) | Calculated using average shares outstanding during the period. |
| (2) | Amount is less than $0.005. |
| (3) | Not annualized. |
| (4) | Annualized. |
| (5) | Portfolio turnover is calculated on the basis of the Fund as a whole without distinguishing between the classes of shares issued. |
The accompanying notes are an integral part of these financial statements.
Page 61
Financial Highlights
Chautauqua International Growth Fund – Institutional Class
| Six Months | ||||||||
| Ended | April 15, 2016^ | |||||||
| June 30, 2017 | through | |||||||
| (Unaudited) | December 31, 2016 | |||||||
| Per Share Data: | ||||||||
| Net asset value, beginning of period | $ | 9.57 | $ | 10.00 | ||||
| Income from investment operations: | ||||||||
Net investment income(1) | 0.05 | 0.00 | (2) | |||||
| Net realized and unrealized gain on investments | 1.56 | (0.43 | ) | |||||
| Total from investment operations | 1.61 | (0.43 | ) | |||||
| Net asset value, end of period | $ | 11.18 | $ | 9.57 | ||||
| Total return | 16.82 | %(3) | (4.30 | )%(3) | ||||
| Supplemental data and ratios: | ||||||||
| Net assets, end of period (millions) | $ | 58.2 | $ | 14.8 | ||||
| Ratio of expenses to average net assets | 0.95 | %(4) | 0.95 | %(4) | ||||
| Ratio of expenses to average net assets (before waivers) | 1.25 | %(4) | 2.32 | %(4) | ||||
| Ratio of net investment income to average net assets | 1.02 | %(4) | 0.06 | %(4) | ||||
| Ratio of net investment income (loss) to average | ||||||||
| net assets (before waivers) | 0.72 | %(4) | (1.31 | )%(4) | ||||
Portfolio turnover rate(5) | 23.4 | %(3) | 72.6 | %(3) | ||||
| ^ | Inception date. |
| (1) | Calculated using average shares outstanding during the period. |
| (2) | Amount is less than $0.005. |
| (3) | Not annualized. |
| (4) | Annualized. |
| (5) | Portfolio turnover is calculated on the basis of the Fund as a whole without distinguishing between the classes of shares issued. |
The accompanying notes are an integral part of these financial statements.
Page 62
Financial Highlights
Chautauqua International Growth Fund – Investor Class
| Six Months | ||||||||
| Ended | April 15, 2016^ | |||||||
| June 30, 2017 | through | |||||||
| (Unaudited) | December 31, 2016 | |||||||
| Per Share Data: | ||||||||
| Net asset value, beginning of period | $ | 9.56 | $ | 10.00 | ||||
| Income from investment operations: | ||||||||
Net investment income (loss)(1) | 0.04 | (0.01 | ) | |||||
| Net realized and unrealized gain on investments | 1.56 | (0.44 | ) | |||||
| Total from investment operations | 1.60 | (0.45 | ) | |||||
| Paid In Capital from redemption fees | 0.01 | 0.01 | ||||||
| Net asset value, end of period | $ | 11.17 | $ | 9.56 | ||||
| Total return | 16.84 | %(2) | (4.40 | )%(2) | ||||
| Supplemental data and ratios: | ||||||||
| Net assets, end of period (millions) | $ | 0.9 | $ | 0.3 | ||||
| Ratio of expenses to average net assets | 1.20 | %(3) | 1.20 | %(3) | ||||
| Ratio of expenses to average net assets (before waivers) | 1.50 | %(3) | 2.58 | %(3) | ||||
| Ratio of net investment income (loss) to average net assets | 0.77 | %(3) | (0.19 | )%(3) | ||||
| Ratio of net investment income (loss) to | ||||||||
| average net assets (before waivers) | 0.47 | %(3) | (1.57 | )%(3) | ||||
Portfolio turnover rate(4) | 23.4 | %(2) | 72.6 | %(2) | ||||
| ^ | Inception date. |
| (1) | Calculated using average shares outstanding during the period. |
| (2) | Not annualized. |
| (3) | Annualized. |
| (4) | Portfolio turnover is calculated on the basis of the Fund as a whole without distinguishing between the classes of shares issued. |
The accompanying notes are an integral part of these financial statements.
Page 63
Financial Highlights
Chautauqua Global Growth Fund – Institutional Class
| Six Months | ||||||||
| Ended | April 15, 2016^ | |||||||
| June 30, 2017 | through | |||||||
| (Unaudited) | December 31, 2016 | |||||||
| Per Share Data: | ||||||||
| Net asset value, beginning of period | $ | 10.09 | $ | 10.00 | ||||
| Income from investment operations: | ||||||||
Net investment (loss)(1) | (0.01 | ) | (0.01 | ) | ||||
| Net realized and unrealized gain on investments | 1.98 | 0.10 | ||||||
| Total from investment operations | 1.97 | 0.09 | ||||||
| Net asset value, end of period | $ | 12.06 | $ | 10.09 | ||||
| Total return | 19.52 | %(2) | 0.90 | %(2) | ||||
| Supplemental data and ratios: | ||||||||
| Net assets, end of period (millions) | $ | 12.0 | $ | 7.6 | ||||
| Ratio of expenses to average net assets | 0.95 | %(3) | 0.95 | %(3) | ||||
| Ratio of expenses to average net assets (before waivers) | 2.60 | %(3) | 3.65 | %(3) | ||||
| Ratio of net investment loss to average net assets | (0.11 | )%(3) | (0.16 | )%(3) | ||||
| Ratio of net investment loss to | ||||||||
| average net assets (before waivers) | (1.76 | )%(3) | (2.86 | )%(3) | ||||
Portfolio turnover rate(4) | 20.5 | %(2) | 69.40 | %(2) | ||||
| ^ | Inception date. |
| (1) | Calculated using average shares outstanding during the period. |
| (2) | Not annualized. |
| (3) | Annualized. |
| (4) | Portfolio turnover is calculated on the basis of the Fund as a whole without distinguishing between the classes of shares issued. |
The accompanying notes are an integral part of these financial statements.
Page 64
Financial Highlights
Chautauqua Global Growth Fund – Investor Class
| Six Months | ||||||||
| Ended | April 15, 2016^ | |||||||
| June 30, 2017 | through | |||||||
| (Unaudited) | December 31, 2016 | |||||||
| Per Share Data: | ||||||||
| Net asset value, beginning of period | $ | 10.08 | $ | 10.00 | ||||
| Income from investment operations: | ||||||||
Net investment (loss)(1) | (0.02 | ) | (0.03 | ) | ||||
| Net realized and unrealized gain on investments | 1.96 | 0.11 | ||||||
| Total from investment operations | 1.94 | 0.08 | ||||||
| Paid In Capital from redemption fees | 0.00 | (2) | — | |||||
| Net asset value, end of period | $ | 12.02 | $ | 10.08 | ||||
| Total return | 19.25 | %(3) | 0.80 | %(3) | ||||
| Supplemental data and ratios: | ||||||||
| Net assets, end of period (millions) | $ | 0.3 | $ | 0.2 | ||||
| Ratio of expenses to average net assets | 1.20 | %(4) | 1.20 | %(4) | ||||
| Ratio of expenses to average net assets (before waivers) | 2.85 | %(4) | 3.90 | %(4) | ||||
| Ratio of net investment loss to average net assets | (0.36 | )%(4) | (0.41 | )%(4) | ||||
| Ratio of net investment loss to | ||||||||
| average net assets (before waivers) | (2.01 | )%(4) | (3.11 | )%(4) | ||||
Portfolio turnover rate(5) | 20.5 | %(3) | 69.4 | %(3) | ||||
| ^ | Inception date. |
| (1) | Calculated using average shares outstanding during the period. |
| (2) | Amount is less than $0.005. |
| (3) | Not annualized. |
| (4) | Annualized. |
| (5) | Portfolio turnover is calculated on the basis of the Fund as a whole without distinguishing between the classes of shares issued. |
The accompanying notes are an integral part of these financial statements.
Page 65
Notes to the Financial Statements
June 30, 2017 (Unaudited)
| 1. | Organization |
Baird Funds, Inc. (the “Corporation”) was incorporated on June 9, 2000 as a Wisconsin corporation and is registered as an open-end management investment company under the Investment Company Act of 1940, as amended (the “1940 Act”). The accompanying financial statements include the Baird LargeCap Fund, the Baird MidCap Fund, the Baird Small/Mid Cap Value Fund, the Baird SmallCap Value Fund, the Chautauqua International Growth Fund and the Chautauqua Global Growth Fund (each a “Fund” and collectively the “Funds”), six of the fifteen series comprising the Corporation. Pursuant to the 1940 Act, the Funds are “diversified” series of the Corporation. The investment advisor to the Funds is Robert W. Baird & Co. Incorporated (“Baird” or the “Advisor”).
The Baird LargeCap Fund commenced with the sale of both Institutional and Investor Class Shares on September 29, 2000. The Baird MidCap Fund commenced with the sale of both Institutional and Investor Class Shares on December 29, 2000. The Baird Small/Mid Cap Value Fund commenced with the sale of both Institutional and Investor Class Shares on November 30, 2015. The Baird SmallCap Value Fund commenced with the sale of both Institutional and Investor Class Shares to the public on May 1, 2012. The Chautauqua International Growth Fund and the Chautauqua Global Growth Fund commenced with the sale of both Institutional and Investor Class Shares to the public on April 18, 2016. Institutional Class shares are not subject to a distribution and service (12b-1) fee, while Investor Class shares are subject to a distribution and service (12b-1) fee up to 0.25%. See Note 8.
The Baird LargeCap Fund seeks long-term growth of capital through investments in equity securities of large-capitalization companies.
The Baird MidCap Fund seeks long-term growth of capital through investments in equity securities of mid-capitalization companies.
The Baird Small/Mid Cap Value Fund seeks long-term capital appreciation through investments in equity securities of small- to mid-capitalization companies.
The Baird SmallCap Value Fund seeks long-term capital appreciation through investments in equity securities of small-capitalization companies.
The Chautauqua International Growth Fund seeks to provide long-term capital appreciation through investment in equity securities of both U.S. and non-U.S. companies with medium to large market capitalization.
The Chautauqua Global Growth Fund seeks to provide long-term capital appreciation through investment in equity securities of both U.S. and non-U.S. companies with medium to large market capitalization.
On June 30, 2017, shareholders affiliated with the Advisor held 92% of the Institutional Class shares of the Baird LargeCap Fund, 3% of the Institutional Class shares of the Baird MidCap Fund, 56% of the Institutional Class shares of the Baird Small/Mid Cap Value Fund, 53% of the Institutional Class shares of the Baird SmallCap Value Fund, 12% of the Institutional Class shares of the Chautauqua International Growth Fund and 37% of the Institutional Class shares of the Chautauqua Global Growth Fund. These shareholders included the Advisor’s participant-directed retirement and deferred compensation plans and the Baird Foundation.
| 2. | Significant Accounting Policies |
The following is a summary of significant accounting policies consistently followed by the Funds in the preparation of their financial statements. These policies are in conformity with accounting principles generally accepted in the United States of America.
| a) | Investment Valuation – Section 2(a)(41) of the 1940 Act, together with the rules and interpretations of the SEC, require the Funds, in computing net asset value, to value their portfolio securities using market quotations when they are “readily available.” When market quotations are not readily available (e.g., because there is no regular market quotation for such securities, the market for such security is limited, the validity of quotations is questionable or, for debt securities, the Funds’ independent pricing service, |
Page 66
Notes to the Financial Statements
June 30, 2017 (Unaudited)
| 2. | Significant Accounting Policies (cont.) |
does not provide a price), the Board of Directors of the Corporation must value the securities at “fair value determined in good faith.” The Board has delegated such responsibility to the Advisor pursuant to pricing policies and procedures that the Board has adopted and regularly reviews. In general, the “fair value” of a security means the price that would be received to sell a security in an orderly transaction between market participants at the measurement date. | |
The Funds determine the fair value of their investments and compute their net asset value per share as of the close of regular trading of the New York Stock Exchange (4:00 p.m. EST). | |
Consistent with Section 2(a)(41) of the 1940 Act, the Funds price their securities as follows: common stocks that are listed on a securities exchange (other than NASDAQ) are valued at the last quoted sale price. Securities traded on NASDAQ are valued at the NASDAQ Official Closing Price. Price information on listed stocks is taken from the exchange where the security is primarily traded. Securities that were not traded on the valuation date, as well as stocks that are not listed on an exchange, including NASDAQ, are valued at the average of the current bid and asked price. Debt securities are valued at their evaluated bid prices as provided by an independent pricing service using valuation methods that are designed to represent fair value, such as matrix pricing and other analytical pricing models, market transactions and dealer quotations. Debt securities purchased with maturities of 60 days or less are valued as described above unless an evaluated price is not available, in which case such security is valued at acquisition cost, plus or minus any amortized discount or premium (“amortized cost”), or, if the Advisor does not believe amortized cost is reflective of the value of the security, the security is priced at fair value as described below. Investments in mutual funds are valued at their stated net asset value. Other assets and securities for which market quotations are not readily available are valued at fair value as determined in good faith by the Advisor in accordance with procedures approved by the Corporation’s Board of Directors. In accordance with such procedures, the Advisor may use broker quotes or prices obtained from alternative independent pricing services or, if broker quotes or prices from alternative pricing services are unavailable or deemed to be unreliable, fair value will be determined by a valuation committee of the Advisor. In determining fair value, the valuation committee takes into account all relevant factors and available information. Consequently, the price of the security used by a Fund to calculate its NAV may differ from quoted or published prices for the same security. Fair value pricing involves subjective judgments and there is no single standard for determining a security’s fair value. As a result, different mutual funds could reasonably arrive at a different fair value for the same security. It is possible that the fair value determined for a security is materially different from the value that could be realized upon the sale of that security or from the values that other mutual funds may determine. In addition, given the volatility and periodic illiquidity experienced in recent years, the prices determined for any individual security on any given day may vary significantly from the amount that can be obtained in an actual sale of that security, and the Funds’ NAV may fluctuate significantly from day to day or from period to period. | |
The Chautauqua International Growth and Chautauqua Global Growth Funds have retained an independent fair value pricing service to assist in valuing foreign securities in order to adjust for possible changes in value that may occur between the close of the foreign exchange and the time at which the Fund calculates its NAV. The fair value pricing service uses statistical data based on historical performance of securities and markets, and other data in developing factors used to estimate fair value for that day. | |
| b) | Foreign Securities – For purposes of these financial statements, foreign securities are defined as securities issued by companies that are organized outside the United States. Investing in securities of foreign companies and foreign governments involves special risks and considerations not typically associated with investing in U.S. companies and the U.S. government. These risks include foreign currency fluctuations and adverse political and economic developments. Moreover, securities of many foreign companies and foreign governments and their markets may be less liquid and their prices more volatile than those of securities of comparable U.S. companies and the U.S. government. Occasionally, events |
Page 67
Notes to the Financial Statements
June 30, 2017 (Unaudited)
| 2. | Significant Accounting Policies (cont.) |
that affect these values and exchange rates may occur after the close of the exchange on which such securities are traded. If such events materially affect the value of a Fund’s securities, these securities may be valued at their fair value pursuant to procedures adopted by the Board of Directors. | |
| c.) | Foreign Currency Translation – Portfolio securities and other assets and liabilities denominated in foreign currencies are translated into U.S. dollar amounts at date of valuation. Purchases and sales of portfolio securities and income items denominated in foreign currencies are translated into U.S. dollar amounts on the respective dates of such transactions. When a Fund purchases or sells a foreign security, it will customarily enter into a foreign exchange contract to minimize foreign exchange risk from the trade date to the settlement date of such transaction. The Chautauqua Funds do not isolate the portion of the results of operations resulting from changes in foreign exchange rates on investments from the fluctuations arising from changes in market prices of securities held. Such fluctuations are included with the net realized and unrealized gain or loss from investments. Net realized gain (loss) on investments and foreign currency translations include those gains and losses arising from the sale of foreign currencies, currency gains or losses realized between the trade and settlement dates on securities transactions, the differences between the amounts of dividends, and foreign withholding taxes recorded on a Fund’s books, and the U.S. dollar equivalent of the amounts actually received or paid. Net unrealized appreciation (depreciation) on investments and foreign currency translation includes changes in the value of assets and liabilities resulting from exchange rates. |
| d) | Income Tax Status – The Funds intend to continue to qualify as regulated investment companies as provided in subchapter M of the Internal Revenue Code and to distribute substantially all of their taxable income to their shareholders in a manner which results in no tax expense to the Funds. Therefore, no federal income or excise tax provision is recorded. |
There is no tax liability resulting from unrecognized tax benefits relating to uncertain income tax positions taken or expected to be taken on the tax return for the fiscal year ended December 31, 2016, or for any other tax years which are open for exam. As of June 30, 2017, open tax years include the tax years ended December 31, 2013 through 2016. The Funds are not aware of any tax positions for which it is reasonably possible that the total amounts of unrecognized tax benefits will significantly change in the next 12 months. The Funds recognize interest and penalties, if any, related to unrecognized tax benefits as interest expense and other expense, respectively, in the Statement of Operations. During the period, the Funds did not incur any interest or penalties. | |
| e) | Distributions to Shareholders – Dividends from net investment income, if any, are declared and paid annually. Distributions of net realized capital gains, if any, are declared and paid at least annually. The book basis character of distributions may differ from their ultimate characterization for Federal income tax purposes. |
| f) | Allocation of Income and Expenses – Each Fund is charged for those expenses directly attributable to it. Expenses directly attributable to a class of shares, such as Rule 12b-1 distribution fees, are charged to that class of shares. Income, expenses and realized and unrealized gains and losses are allocated to the classes based on their respective net assets. Expenses that are not directly attributable to a Fund are allocated among the Funds in the series in proportion to their assets or are divided equally amongst the Funds. |
| g) | Use of Estimates – The preparation of financial statements in conformity with accounting principles generally accepted in the United States requires management to make estimates and assumptions that affect the reported amounts of assets and liabilities and disclosure of contingent assets and liabilities at the date of the financial statements and the reported amounts of revenues and expenses during the reporting period. Actual results could differ from those estimates. |
| h) | Securities Transactions and Investment Income – Investment and shareholder transactions are recorded on trade date. The Funds determine the gain or loss realized from investment transactions by comparing |
Page 68
Notes to the Financial Statements
June 30, 2017 (Unaudited)
| 2. | Significant Accounting Policies (cont.) |
the original cost of the security lot sold with the net sales proceeds. Dividend income is recognized on the ex-dividend date net of withholding taxes, if any, and interest income is recognized on an accrual basis. | |
| i) | Guarantees and Indemnifications – In the normal course of business, the Funds enter into contracts with service providers that contain general indemnification clauses. The Funds’ maximum exposure under these arrangements is unknown and would involve future claims against the Funds that have not yet occurred. Based on experience, the Funds would expect the risk of loss to be remote. |
| j) | Recent Accounting Pronouncements – In October 2016, the U.S. Securities and Exchange Commission adopted new rules and amended existing rules (together, “final rules”) intended to modernize the reporting and disclosure of information by registered investment companies. In part, the final rules amend Regulation S-X and require standardized, enhanced disclosure about derivatives in investment company financial statements, as well as other amendments. The compliance date for the amendments to Regulation S-X is August 1, 2017. Management is currently evaluating the impact that the adoption of the amendments to Regulation S-X will have on the financial statements and related disclosures. |
| 3. | Capital Share Transactions |
The following table summarizes the capital share transactions of each Fund for the past two fiscal periods:
Baird LargeCap Fund
| Institutional Class Shares | Investor Class Shares | |||||||||||||||||
| Six Months Ended | Six Months Ended | |||||||||||||||||
| June 30, 2017 | June 30, 2017 | |||||||||||||||||
| Shares | Amount | Shares | Amount | |||||||||||||||
| Shares sold | 225,888 | $ | 2,083,556 | Shares sold | 3,169 | $ | 29,777 | |||||||||||
| Shares redeemed | (379,217 | ) | (3,576,738 | ) | Shares redeemed | (4,972 | ) | (47,299 | ) | |||||||||
| Net decrease | (153,329 | ) | $ | (1,493,182 | ) | Net decrease | (1,803 | ) | $ | (17,522 | ) | |||||||
| Shares Outstanding: | Shares Outstanding: | |||||||||||||||||
| Beginning of period | 4,353,587 | Beginning of period | 82,406 | |||||||||||||||
| End of period | 4,200,258 | End of period | 80,603 | |||||||||||||||
| Institutional Class Shares | Investor Class Shares | |||||||||||||||||
| Year Ended | Year Ended | |||||||||||||||||
| December 31, 2016 | December 31, 2016 | |||||||||||||||||
| Shares | Amount | Shares | Amount | |||||||||||||||
| Shares sold | 561,393 | $ | 4,394,392 | Shares sold | 29,776 | $ | 239,651 | |||||||||||
| Shares issued to | Shares issued to | |||||||||||||||||
| shareholders in | shareholders in | |||||||||||||||||
| reinvestment | reinvestment | |||||||||||||||||
| of dividends | 61,211 | 555,182 | of dividends | 533 | 4,821 | |||||||||||||
| Shares redeemed | (718,353 | ) | (5,812,429 | ) | Shares redeemed | (23,384 | ) | (188,488 | ) | |||||||||
| Net decrease | (95,749 | ) | $ | (862,855 | ) | Net decrease | 6,925 | $ | 55,984 | |||||||||
| Shares Outstanding: | Shares Outstanding: | |||||||||||||||||
| Beginning of year | 4,449,336 | Beginning of year | 75,481 | |||||||||||||||
| End of year | 4,353,587 | End of year | 82,406 | |||||||||||||||
Page 69
Notes to the Financial Statements
June 30, 2017 (Unaudited)
| 3. | Capital Share Transactions (cont.) |
Baird MidCap Fund
| Institutional Class Shares | Investor Class Shares | |||||||||||||||||
| Six Months Ended | Six Months Ended | |||||||||||||||||
| June 30, 2017 | June 30, 2017 | |||||||||||||||||
| Shares | Amount | Shares | Amount | |||||||||||||||
| Shares sold | 12,833,296 | $ | 221,052,250 | Shares sold | 515,486 | $ | 8,466,556 | |||||||||||
| Shares redeemed | (14,449,199 | ) | (255,790,945 | ) | Shares redeemed | (3,213,372 | ) | (53,442,271 | ) | |||||||||
| Net decrease | (1,615,903 | ) | $ | (34,738,695 | ) | Net decrease | (2,697,886 | ) | $ | (44,975,715 | ) | |||||||
| Shares Outstanding: | Shares Outstanding: | |||||||||||||||||
| Beginning of period | 69,960,995 | Beginning of period | 9,085,850 | |||||||||||||||
| End of period | 68,345,092 | End of period | 6,387,964 | |||||||||||||||
| Institutional Class Shares | Investor Class Shares | |||||||||||||||||
| Year Ended | Year Ended | |||||||||||||||||
| December 31, 2016 | December 31, 2016 | |||||||||||||||||
| Shares | Amount | Shares | Amount | |||||||||||||||
| Shares sold | 26,778,042 | $ | 402,275,627 | Shares sold | 2,530,062 | $ | 37,367,882 | |||||||||||
Shares redeemed(1) | (25,858,100 | ) | (391,750,978 | ) | Shares redeemed | (6,261,572 | ) | (88,154,671 | ) | |||||||||
| Net increase | 919,942 | $ | 10,524,649 | Net decrease | (3,731,510 | ) | $ | (50,786,789 | ) | |||||||||
| Shares Outstanding: | Shares Outstanding: | |||||||||||||||||
| Beginning of year | 69,041,053 | Beginning of year | 12,817,360 | |||||||||||||||
| End of year | 69,960,995 | End of year | 9,085,850 | |||||||||||||||
| (1) | In the third quarter of 2016, the Baird MidCap Fund satisfied a redemption request made by a large shareholder by distributing the Fund’s portfolio securities in kind to the redeeming shareholder. The redemption was effected in accordance with policies and procedures approved by the Board of Directors of the Funds. |
Baird Small/Mid Cap Value Fund
| Institutional Class Shares | Investor Class Shares | |||||||||||||||||
| Six Months Ended | Six Months Ended | |||||||||||||||||
| June 30, 2017 | June 30, 2017 | |||||||||||||||||
| Shares | Amount | Shares | Amount | |||||||||||||||
| Shares sold | 377,534 | $ | 4,016,490 | Shares sold | 2,138 | $ | 22,650 | |||||||||||
| Shares redeemed | (405,412 | ) | (4,316,761 | ) | Shares redeemed | (2,005 | ) | (21,696 | ) | |||||||||
| Net decrease | (27,878 | ) | $ | (300,271 | ) | Net increase | 133 | $ | 954 | |||||||||
| Shares Outstanding: | Shares Outstanding: | |||||||||||||||||
| Beginning of period | 1,157,769 | Beginning of period | 5,176 | |||||||||||||||
| End of period | 1,129,891 | End of period | 5,309 | |||||||||||||||
Page 70
Notes to the Financial Statements
June 30, 2017 (Unaudited)
| 3. | Capital Share Transactions (cont.) |
Baird Small/Mid Cap Value Fund (cont.)
| Institutional Class Shares | Investor Class Shares | |||||||||||||||||
| Year Ended | Year Ended | |||||||||||||||||
| December 31, 2016 | December 31, 2016 | |||||||||||||||||
| Shares | Amount | Shares | Amount | |||||||||||||||
| Shares sold | 703,038 | $ | 6,800,150 | Shares sold | 3,475 | $ | 33,547 | |||||||||||
| Shares issued to | Shares issued to | |||||||||||||||||
| shareholders in | shareholders in | |||||||||||||||||
| reinvestment | reinvestment | |||||||||||||||||
| of dividends | 7,655 | 79,070 | of dividends | 25 | 259 | |||||||||||||
| Shares redeemed | (48,230 | ) | (481,696 | ) | Shares redeemed | (327 | ) | (3,304 | ) | |||||||||
| Net increase | 662,463 | $ | 6,397,524 | Net increase | 3,173 | $ | 30,502 | |||||||||||
| Shares Outstanding: | Shares Outstanding: | |||||||||||||||||
| Beginning of year | 495,306 | Beginning of year | 2,003 | |||||||||||||||
| End of year | 1,157,769 | End of year | 5,176 | |||||||||||||||
| Baird SmallCap Value Fund | ||||||||||||||||||
| Institutional Class Shares | Investor Class Shares | |||||||||||||||||
| Six Months Ended | Six Months Ended | |||||||||||||||||
| June 30, 2017 | June 30, 2017 | |||||||||||||||||
| Shares | Amount | Shares | Amount | |||||||||||||||
| Shares sold | 125,193 | $ | 1,861,615 | Shares sold | 8,748 | $ | 130,085 | |||||||||||
| Shares redeemed | (161,491 | ) | (2,400,238 | ) | Shares redeemed | (13,193 | ) | (197,774 | ) | |||||||||
| Net decrease | (36,298 | ) | $ | (538,623 | ) | Net decrease | (4,445 | ) | $ | (67,689 | ) | |||||||
| Shares Outstanding: | Shares Outstanding: | |||||||||||||||||
| Beginning of period | 1,903,267 | Beginning of period | 177,163 | |||||||||||||||
| End of period | 1,866,969 | End of period | 172,718 | |||||||||||||||
| Institutional Class Shares | Investor Class Shares | |||||||||||||||||
| Year Ended | Year Ended | |||||||||||||||||
| December 31, 2016 | December 31, 2016 | |||||||||||||||||
| Shares | Amount | Shares | Amount | |||||||||||||||
| Shares sold | 343,811 | $ | 4,541,684 | Shares sold | 35,989 | $ | 494,202 | |||||||||||
| Shares issued to | Shares issued to | |||||||||||||||||
| shareholders in | shareholders in | |||||||||||||||||
| reinvestment | reinvestment | �� | ||||||||||||||||
| of dividends | 18,682 | 278,550 | of dividends | 594 | 8,842 | |||||||||||||
| Shares redeemed | (234,905 | ) | (3,089,099 | ) | Shares redeemed | (12,322 | ) | (168,347 | ) | |||||||||
| Net increase | 127,588 | $ | 1,731,135 | Net increase | 24,261 | $ | 334,697 | |||||||||||
| Shares Outstanding: | Shares Outstanding: | |||||||||||||||||
| Beginning of year | 1,775,679 | Beginning of year | 152,902 | |||||||||||||||
| End of year | 1,903,267 | End of year | 177,163 | |||||||||||||||
Page 71
Notes to the Financial Statements
June 30, 2017 (Unaudited)
| 3. | Capital Share Transactions (cont.) |
Chautauqua International Growth Fund
| Institutional Class Shares | Investor Class Shares | |||||||||||||||||
| Six Months Ended | Six Months Ended | |||||||||||||||||
| June 30, 2017 | June 30, 2017 | |||||||||||||||||
| Shares | Amount | Shares | Amount | |||||||||||||||
Shares sold(1) | 3,875,352 | $ | 40,530,898 | Shares sold | 49,980 | $ | 529,976 | |||||||||||
| Shares redeemed | (219,735 | ) | (2,328,251 | ) | Shares redeemed | (4,081 | ) | (44,017 | ) | |||||||||
| Redemption Fees | — | 4,762 | Shares redeemed | — | 441 | |||||||||||||
| Net increase | 3,655,617 | $ | 38,207,409 | Net increase | 45,899 | $ | 486,400 | |||||||||||
| Shares Outstanding: | Shares Outstanding: | |||||||||||||||||
| Beginning of period | 1,551,673 | Beginning of period | 32,548 | |||||||||||||||
| End of period | 5,207,290 | End of period | 78,447 | |||||||||||||||
| (1) | In the first quarter of 2017, the Chautauqua International Growth Fund processed a transfer in kind for a large shareholder by transferring the shareholder’s securities in kind into the Fund. The transfer was effected in accordance with policies and procedures approved by the Board of Directors of the Funds. |
| Institutional Class Shares | Investor Class Shares | |||||||||||||||||
| Period Ended | Period Ended | |||||||||||||||||
| December 31, 2016^ | December 31, 2016^ | |||||||||||||||||
| Shares | Amount | Shares | Amount | |||||||||||||||
| Shares sold | 1,592,858 | $ | 15,788,874 | Shares sold | 35,224 | $ | 357,174 | |||||||||||
| Shares redeemed | (41,185 | ) | (410,212 | ) | Shares redeemed | (2,676 | ) | (26,111 | ) | |||||||||
| Redemption Fees | — | 1,548 | Shares redeemed | — | 167 | |||||||||||||
| Net increase | 1,551,673 | $ | 15,380,210 | Net increase | 32,548 | $ | 331,230 | |||||||||||
| Shares Outstanding: | Shares Outstanding: | |||||||||||||||||
| Beginning of period | — | Beginning of period | — | |||||||||||||||
| End of period | 1,551,673 | End of period | 32,548 | |||||||||||||||
| ^ | Inception was close of business on April 15, 2016. |
Chautauqua Global Growth Fund
| Institutional Class Shares | Investor Class Shares | ||||||||||||||||
| Six Months Ended | Six Months Ended | ||||||||||||||||
| June 30, 2017 | June 30, 2017 | ||||||||||||||||
| Shares | Amount | Shares | Amount | ||||||||||||||
| Shares sold | 272,423 | $ | 3,069,778 | Shares sold | 6,030 | $ | 71,050 | ||||||||||
| Shares redeemed | (38,416 | ) | (440,919 | ) | Shares redeemed | (1,721 | ) | (20,605 | ) | ||||||||
| Redemption Fees | — | 684 | Shares redeemed | — | — | ||||||||||||
| Net increase | 234,007 | $ | 2,629,543 | Net increase | 4,309 | $ | 50,445 | ||||||||||
| Shares Outstanding: | Shares Outstanding: | ||||||||||||||||
| Beginning of period | 757,695 | Beginning of period | 19,989 | ||||||||||||||
| End of period | 991,702 | End of period | 24,298 | ||||||||||||||
Page 72
Notes to the Financial Statements
June 30, 2017 (Unaudited)
| 3. | Capital Share Transactions (cont.) |
Chautauqua Global Growth Fund (cont.)
| Institutional Class Shares | Investor Class Shares | |||||||||||||||||
| Period Ended | Period Ended | |||||||||||||||||
| December 31, 2016^ | December 31, 2016^ | |||||||||||||||||
| Shares | Amount | Shares | Amount | |||||||||||||||
| Shares sold | 867,491 | $ | 8,702,754 | Shares sold | 21,505 | $ | 214,601 | |||||||||||
| Shares redeemed | (109,796 | ) | (1,104,703 | ) | Shares redeemed | (1,516 | ) | (15,262 | ) | |||||||||
| Redemption Fees | — | 515 | Shares redeemed | — | — | |||||||||||||
| Net increase | 757,695 | $ | 7,598,566 | Net increase | 19,989 | $ | 199,339 | |||||||||||
| Shares Outstanding: | Shares Outstanding: | |||||||||||||||||
| Beginning of period | — | Beginning of period | — | |||||||||||||||
| End of period | 757,695 | End of period | 19,989 | |||||||||||||||
^ Inception was close of business on April 15, 2016.
| 4. | Investment Transactions and Income Tax Information |
During the six months ended June 30, 2017, purchases and sales of investment securities (excluding short-term investments) were as follows:
| Baird | Baird | Baird | |
| LargeCap | MidCap | Small/Mid Cap | |
Fund | Fund | Value Fund | |
| Purchases: | $16,110,415 | $360,613,698 | $5,242,605 |
| Sales: | $18,079,804 | $468,290,193 | $5,574,644 |
| Baird | Chautauqua | Chautauqua | |
| SmallCap | International | Global | |
Value Fund | Growth Fund | Growth Fund | |
| Purchases: | $3,155,813 | $23,044,167 | $4,363,541 |
| Sales: | $3,181,418 | $ 9,418,615 | $2,035,319 |
The Baird LargeCap Fund, Baird MidCap Fund, Baird Small/Mid Cap Value Fund, Baird SmallCap Value Fund, Chautauqua International Growth Fund and Chautauqua Global Growth Fund did not purchase or sell U.S. Government securities during the six months ended June 30, 2017.
Page 73
Notes to the Financial Statements
June 30, 2017 (Unaudited)
| 4. | Investment Transactions and Income Tax Information (cont.) |
At December 31, 2016, accumulated earnings/losses on a tax basis were as follows:
| Baird | Baird | Baird | ||||||||||
| LargeCap | MidCap | Small/Mid Cap | ||||||||||
| Fund | Fund | Value Fund | ||||||||||
| Cost of Investments | $ | 34,936,191 | $ | 1,058,088,437 | $ | 10,959,367 | ||||||
| Gross unrealized appreciation | 5,434,156 | 218,483,638 | 1,297,429 | |||||||||
| Gross unrealized depreciation | (817,171 | ) | (28,499,187 | ) | (289,181 | ) | ||||||
| Net unrealized appreciation | $ | 4,616,985 | $ | 189,984,451 | $ | 1,008,248 | ||||||
| Undistributed ordinary income | 1,961 | — | 2,542 | |||||||||
| Undistributed long-term capital gain | — | — | — | |||||||||
| Total distributable earnings | $ | 1,961 | $ | — | $ | 2,542 | ||||||
| Other accumulated losses | (269,772 | ) | (61,629,145 | ) | (439,022 | ) | ||||||
| Total accumulated earnings | $ | 4,349,174 | $ | 128,355,306 | $ | 571,768 | ||||||
| Baird | Chautauqua | Chautauqua | ||||||||||
| SmallCap | International | Global | ||||||||||
| Value Fund | Growth Fund | Growth Fund | ||||||||||
| Cost of Investments | $ | 24,560,685 | $ | 15,459,231 | $ | 7,819,691 | ||||||
| Gross unrealized appreciation | 6,609,941 | 397,006 | 458,706 | |||||||||
| Gross unrealized depreciation | (324,853 | ) | (820,483 | ) | (376,774 | ) | ||||||
| Net unrealized appreciation (depreciation) | $ | 6,285,088 | $ | (423,477 | ) | $ | 81,932 | |||||
| Undistributed ordinary income | 4,079 | — | — | |||||||||
| Undistributed long-term capital gain | — | — | — | |||||||||
| Total distributable earnings | $ | 4,079 | $ | — | $ | — | ||||||
| Other accumulated losses | (305,728 | ) | (115,414 | ) | (17,216 | ) | ||||||
| Total accumulated earnings (losses) | $ | 5,983,439 | $ | (538,891 | ) | $ | 64,716 | |||||
Undistributed income or net realized gains for financial statement purposes may differ from amounts recognized for federal income tax purposes due to differences in the recognition and characterization of income, expense and capital gain items. The difference between book-basis and tax-basis unrealized appreciation is attributable primarily to the tax deferral of losses on wash sales.
Additionally, U.S. generally accepted accounting principles require that certain components of net assets relating to permanent differences be reclassified between financial and tax reporting. These reclassifications are primarily due to differing treatments for losses deferred due to wash sales, equalization accounting for tax purposes, and non-deductible expenses. These reclassifications have no effect on net assets or net asset value per share.
Under the current tax law, capital losses realized after October 31 may be deferred and treated as occurring on the first day of the following fiscal year. For the year ended December 31, 2016, the Chautauqua International Growth and Chautauqua Global Growth Funds elected to defer capital losses occurring between November 1, 2016 and December 31, 2016 in the amount of $3,823 and $1,827, respectively.
To the extent the Funds realize future net capital gains, those gains will be offset by any unused capital loss carryovers. At December 31, 2016, accumulated net realized capital loss carryovers, if any, and the year(s) in which the capital loss carryovers expire were:
Page 74
Notes to the Financial Statements
June 30, 2017 (Unaudited)
| 4. | Investment Transactions and Income Tax Information (cont.) |
| Capital Loss | Year of | ||||||
| Carryover | Character | Expiration | |||||
| Baird LargeCap Fund | $ | 269,772 | Short-Term | Indefinitely | |||
| Baird MidCap Fund | 61,629,145 | Short-Term | Indefinitely | ||||
| Baird Small/Mid Cap Value Fund | 439,022 | Short-Term | Indefinitely | ||||
| Baird SmallCap Value Fund | 305,728 | Short-Term | Indefinitely | ||||
| Chautauqua International Growth Fund | 115,414 | Short-Term | Indefinitely | ||||
| Chautauqua Global Growth Fund | 17,216 | Short-Term | Indefinitely | ||||
During the six months ended June 30, 2017 the Funds did not pay any distributions.
During the year ended December 31, 2016, the Funds paid the following distributions:
Ordinary Income Dividends | |
| Baird Large Cap Fund | $561,367 |
| Baird Small/ Mid Cap Value Fund | 90,369 |
| Baird SmallCap Value Fund | 340,056 |
For the year ended December 31, 2016 the Baird MidCap Fund, Chautauqua International Growth Fund and Chautauqua Global Growth Fund did not pay any distributions.
The Funds designated as long-term capital gain dividend, pursuant to Internal Revenue Code Section 852(b)(3), the amount necessary to reduce the earnings and profits of the Funds related to net capital gain to zero for the tax year ended December 31, 2015. To the extent necessary to fully distribute such capital gains, the Baird LargeCap Fund designated earnings and profits distributed to shareholders on the redemption of shares.
| 5. | Investment Advisory and Other Agreements |
The Funds have entered into Investment Advisory Agreements with Baird for the provision of investment advisory services. Pursuant to the Investment Advisory Agreements, the Advisor is entitled to receive a fee, calculated daily and payable monthly, at the annual rate of 0.65% for the Baird LargeCap Fund, 0.75% for the Baird MidCap Fund, 0.80% for the Baird Small/Mid Cap Value Fund, 0.85% for the Baird SmallCap Value Fund, 0.80% for the Chautauqua International Growth Fund and 0.80% for the Chautauqua Global Growth Fund as applied to the respective Fund’s average daily net assets. Certain officers of the Advisor are also officers of the Funds.
Baird has entered into a Sub-Advisory Agreement with L2 Asset Management, LLC (“L2”), pursuant to which L2 acts as subadvisor to the Baird LargeCap Fund (the “Sub-Advisory Agreement”). Baird is responsible for paying L2 a sub-advisory fee equivalent to a percentage of the net advisory fee received by the Advisor from the Fund which is calculated daily at the annual rate of 0.65% of the average daily net assets of the Fund and paid monthly after giving effect for the expense cap/reimbursement agreement between the Advisor and the Company on behalf of the LargeCap Fund.
The percentage of sub-advisory fee is subject to increase based on the assets managed by the Subadvisor on behalf of the Advisor as follows:
| Market Value of | |
% Net Advisory Fee | Assets Managed by L2 |
| 50% | Less than $3 billion |
| 60% | Between $3 billion and $5 billion |
| 70% | Greater than $5 billion |
For the six months ended June 30, 2017 and through April 30, 2018 for the Baird LargeCap Fund, Baird MidCap Fund, Baird Small/Mid Cap Value Fund, Baird SmallCap Value Fund, Chautauqua International Growth Fund and Chautauqua Global Growth Fund, the Advisor has contractually agreed to waive its investment advisory fee and/or reimburse the Funds’ operating expenses (exclusive of brokerage, taxes, and extraordinary expenses) to the extent necessary to ensure that each Fund’s annual operating expenses do not exceed the following percentages of average daily net assets:
Page 75
Notes to the Financial Statements
June 30, 2017 (Unaudited)
| 5. | Investment Advisory and Other Agreements (cont.) |
Institutional Class Shares | Investor Class Shares | |
| Baird LargeCap Fund | 0.75% | 1.00% |
| Baird MidCap Fund | 0.85% | 1.10% |
| Baird Small/Mid Cap Value Fund | 0.95% | 1.20% |
| Baird SmallCap Value Fund | 1.00% | 1.25% |
| Chautauqua International Growth Fund | 0.95% | 1.20% |
| Chautauqua Global Growth Fund | 0.95% | 1.20% |
To the extent that the Advisor reimburses or absorbs fees and expenses, it may seek payment of such amounts for three years after the year in which expenses were reimbursed or absorbed. A Fund will make no such payment, however, if its total annual operating expenses exceed the expense limits in effect at the time the expenses were reimbursed or at the time these payments are proposed.
| Six Months | ||||||||||||||||
| Ended | ||||||||||||||||
| June 30, | Fiscal Year Ended December 31, | |||||||||||||||
| 2017 | 2016 | 2015 | 2014 | |||||||||||||
| Reimbursed/Absorbed Expenses Subject | ||||||||||||||||
| to be Recovered by Advisor Until: | 2020 | 2019 | 2018 | 2017 | ||||||||||||
| Baird LargeCap Fund | $ | 60,794 | $ | 138,150 | $ | 143,538 | $ | 140,955 | ||||||||
| Baird Small/MidCap Value Fund | $ | 63,113 | $ | 156,332 | $ | 23,659 | N/A | |||||||||
| Baird SmallCap Value Fund | $ | 51,941 | $ | 116,311 | $ | 131,370 | $ | 131,933 | ||||||||
| Chautauqua International Growth Fund | $ | 62,551 | $ | 95,476 | N/A | N/A | ||||||||||
| Chautauqua Global Growth Fund | $ | 85,022 | $ | 102,142 | N/A | N/A | ||||||||||
U.S. Bancorp Fund Services, LLC (“USBFS”) serves as transfer agent, administrator, and accounting services agent for the Funds. U.S. Bank, N.A. (“U.S. Bank”) serves as custodian for the Funds.
Robert W. Baird & Co. Incorporated (the “Distributor”) is the sole distributor of the Funds pursuant to a distribution agreement.
No commissions were earned by the Distributor for services rendered as a registered broker-dealer in securities transactions for the Baird LargeCap Fund, Baird MidCap Fund, Baird Small/Mid Cap Value Fund, Baird SmallCap Value Fund, Chautauqua International Growth Fund and Chautauqua Global Growth Fund for the six months ended June 30, 2017.
| 6. | Securities Lending |
During the six months ended June 30, 2017, each Fund was permitted to lend up to one-third of its total assets (including such loans) to borrowers under terms of a securities lending program administered by U.S. Bank, N.A., the Funds’ custodian and an affiliate of USBFS, the Funds’ transfer agent and administrator. A securities lending agreement requires that loans be collateralized at all times in an amount equal to at least 102% of the market value of any loaned securities at the time of the loan, plus accrued interest. Participating Funds receive compensation in the form of fees and earned interest on the cash collateral. The amount of fees depends on a number of factors including the type of security and length of the loan. Participating Funds receive cash as collateral in return for securities lent as part of the securities lending program. The collateral gets invested in a securities lending trust subject to Rule 2a-7 under the 1940 Act. Interest income earned by participating Funds on investments of cash collateral received from borrowers for the securities loaned to them (“securities lending income”) would be reflected in the participating Funds’ statements of operations.
As of June 30, 2017, the Funds did not participate in securities lending activities, although they may do so again in the future.
Page 76
Notes to the Financial Statements
June 30, 2017 (Unaudited)
| 7. | Line of Credit |
The Corporation maintains an uncommitted, senior secured and unsecured line of credit (“LOC”) with U.S. Bank, N.A. (the “Bank”) to provide the Funds a temporary liquidity source to meet unanticipated redemptions. The unsecured line of credit is available to the Funds for any period during which U.S. Bank is an affiliate of the Funds. Under the terms of the LOC, borrowings for each Fund are limited to one-third of the total assets (including the amount borrowed) of the respective Fund, or as otherwise indicated within the Funds’ agreement with the Bank. The Bank charges interest at the Bank’s Prime Rate less 2% (weighted average rate of 1.75% for the first six months of 2017). For the six months ended June 30, 2017, the Chautauqua International Growth Fund incurred $22 in interest charges, on an average daily loan balance of $2,478. The Baird LargeCap Fund, Baird MidCap Fund, Baird Small/Mid Cap Value Fund, Baird SmallCap Value Fund and Chautauqua Global Growth Fund did not borrow from the LOC during the period.
| 8. | Distribution and Shareholder Service Plan |
The Funds have adopted a distribution and shareholder service plan (the “Plan”) pursuant to Rule 12b-1 under the 1940 Act. The Plan allows the Funds to compensate the Distributor for the costs incurred in distributing the Funds’ Investor Class Shares, including amounts paid to brokers or dealers, at an annual rate of 0.25% of the average daily net assets of the Funds’ Investor Class Shares. The Baird LargeCap Fund, Baird MidCap Fund, Baird Small/Mid Cap Value Fund, Baird SmallCap Value Fund, Chautauqua International Growth Fund and Chautauqua Global Growth Fund incurred $962, $158,785, $79, $3,222, $753 and $302, respectively, in fees pursuant to the Plan during the six months ended June 30, 2017.
| 9. | Redemption Fees |
A redemption fee of 2.00% will be assessed on Institutional and Investor Class shares of the Chautauqua International Growth Fund and Chautauqua Global Growth Fund if redeemed (including in connection with an exchange) 90 days or less from their date of purchase, determined on a first-in, first-out (“FIFO”) basis. The redemption fee is paid directly to the Funds and is designed to offset brokerage commissions, market impact and other costs associated with fluctuations in Fund asset levels and cash flow caused by short-term shareholder trading. For the six months ended June 30, 2017, the Chautauqua International Growth Fund and Chautauqua Global Growth Fund charged redemption fees of $5,203 and $684, respectively. The Baird LargeCap Fund, Baird MidCap Fund, Baird Small/Mid Cap Value Fund and Baird SmallCap Value Fund do not charge redemption fees.
| 10. | Change in Independent Registered Public Accounting Firm |
On May 22, 2017, upon the recommendation of the Audit Committee, the Board of Directors of Baird Funds, Inc. (the “Funds”) approved the appointment of Cohen & Company, Ltd. (“Cohen”) as the Funds’ independent registered public accounting firm, following the dismissal of Grant Thornton LLP (“Grant Thornton”). On August 24, 2017, the Audit Committee engaged Cohen to audit the Funds’ financial statements for the fiscal year ended December 31, 2017.
Grant Thornton’s report on the financial statements of the Funds for each of the fiscal years ended December 31, 2016 and December 31, 2015 did not contain an adverse opinion or disclaimer of opinion and was not qualified or modified as to uncertainty, audit scope, or accounting principles. During the fiscal years ended December 31, 2016 and December 31, 2015 and the interim period through May 22, 2017 (the “Interim Period”), there were no disagreements between the Funds and Grant Thornton on any matter of accounting principles or practices, financial statement disclosure or auditing scope or procedure which, if not resolved to the satisfaction of Grant Thornton, would have caused it to make reference to the disagreements in its report on the financial statements for such periods. During the fiscal years ended December 31, 2016 and December 31, 2015 and the Interim Period, there were no reportable events of the kind described in Item 304(a)(1)(v) of Regulation S-K.
Page 77
Notes to the Financial Statements
June 30, 2017 (Unaudited)
| 10. | Change in Independent Registered Public Accounting Firm (cont.) |
During the Funds’ fiscal years ended December 31, 2016 and December 31, 2015 and the Interim Period, neither the Funds nor anyone on their behalf consulted Cohen concerning (i) the application of accounting principles to a specified transaction, either completed or proposed, or the type of audit opinion that might be rendered on the Funds’ financial statements or (ii) the subject of a disagreement (as defined in paragraph (a)(1)(iv) of Item 304 of Regulation S-K) or reportable events (as described in paragraph (a)(1)(v) of said Item 304).
| 11. | Subsequent Event |
In preparing these financial statements, the Corporation has evaluated subsequent events after June 30, 2017 through the date the financial statements were issued. At its meeting on August 24, 2017, the Board of Directors of the Corporation elected Heidi Schneider as Treasurer of the Corporation effective upon filing of this report on Form N-CSR, which is expected to be on or around September 7, 2017. Terrance P. Maxwell will continue to serve as Treasurer of the Corporation until such date. There were no other subsequent events since June 30, 2017 that would require adjustment to or additional disclosure in these financial statements.
Page 78
Additional Information
Proxy Voting
A description of the policies and procedures that the Funds use to determine how to vote proxies relating to portfolio securities is available without charge, upon request, by calling toll free, 1-866-44BAIRD, or by accessing the Funds’ website at www.bairdfunds.com; and by accessing the SEC’s website at www.sec.gov.
Each Fund’s proxy voting record for the most recent 12-month period ended June 30 is available without charge, upon request, by calling toll free, 1-866-44BAIRD, or by accessing the Funds’ website at www.bairdfunds.com; and by accessing the SEC’s website at www.sec.gov.
Portfolio Holdings Disclosure
The Funds file a complete schedule of portfolio holdings with the SEC for the first and third quarters of each fiscal year on Form N-Q. The Funds’ Forms N-Q are available on the SEC’s website at www.sec.gov and may be reviewed and copied at the SEC’s Public Reference Room in Washington, D.C. Information on the operation of the Public Reference Room may be obtained by calling 1-800-732-0330. The Funds’ Forms N-Q may also be obtained by calling toll-free 1-866-44BAIRD.
Page 79
(This Page Intentionally Left Blank.)
Baird Funds, Inc.
c/o U.S. Bancorp Fund Services, LLC
P.O. Box 701
Milwaukee, WI 53201-0701
1-866-44BAIRD
Board of Directors
G. Frederick Kasten, Jr. (Chairman)
John W. Feldt
Cory L. Nettles
Marlyn J. Spear
Frederick P. Stratton, Jr.
Investment Advisor and Distributor
Robert W. Baird & Co. Incorporated
777 East Wisconsin Avenue
Milwaukee, WI 53202
Administrator and Transfer Agent
U.S. Bancorp Fund Services, LLC
P.O. Box 701
615 East Michigan Street
Milwaukee, WI 53202
Custodian
U.S. Bank, N.A.
1555 N. RiverCenter Drive, Suite 302
Milwaukee, WI 53212
Legal Counsel
Godfrey & Kahn, S.C.
833 East Michigan Street, Suite 1800
Milwaukee, WI 53202
Independent Registered Public
Accounting Firm
Cohen & Company, Ltd.
1350 Euclid Avenue, Suite 800
Cleveland, OH 44115
Item 2. Code of Ethics.
Not applicable – only required for annual reports on Form N-CSR.
Item 3. Audit Committee Financial Expert.
Not applicable – only required for annual reports on Form N-CSR.
Item 4. Principal Accountant Fees and Services.
Not applicable – only required for annual reports on Form N-CSR.
Item 5. Audit Committee of Listed Registrants.
Not applicable because the Registrant is not a “listed issuer” within the meaning of Rule 10A-3 under the Securities Exchange Act of 1934.
Item 6. Schedule of Investments.
| (a) | The complete Schedules of Investments in securities of unaffiliated issuers as of the close of the reporting period for the Baird LargeCap Fund, Baird MidCap Fund, Baird Small/Mid Cap Value Fund, Baird SmallCap Value Fund, Chautauqua International Growth Fund and Chautauqua Global Growth Fund are included as part of the report to shareholders filed under Item 1. The Summary Schedules of Investments in securities of unaffiliated issuers as of the close of the reporting period for the Baird Ultra Short Bond Fund, Baird Short-Term Bond Fund, Baird Intermediate Bond Fund, Baird Aggregate Bond Fund, Baird Core Plus Bond, Baird Short-Term Municipal Bond Fund, Baird Quality Intermediate Municipal Bond Fund and Baird Core Intermediate Municipal Bond Fund are included as part of the report to shareholders filed under Item 1. The complete Schedule of Investments in securities of unaffiliated issuers as of the close of the reporting period for Baird Ultra Short Bond Fund, Baird Short-Term Bond Fund, Baird Intermediate Bond Fund, Baird Aggregate Bond Fund, Baird Core Plus Bond, Baird Short-Term Municipal Bond Fund, Baird Quality Intermediate Municipal Bond Fund and Baird Core Intermediate Municipal Bond Fund are listed below. |
| Baird Ultra Short Bond Fund | ||||||||||||
| Schedule of Investments | ||||||||||||
| June 30, 2017 (Unaudited) | ||||||||||||
| Principal | % of | |||||||||||
| Amount | Value | Net Assets | ||||||||||
| LONG-TERM INVESTMENTS | ||||||||||||
| U.S. Treasury Securities | ||||||||||||
| United States Treasury Note/Bond: | ||||||||||||
| 1.000%, 09/15/2017 | $ | 34,100,000 | $ | 34,094,987 | ||||||||
| 0.875%, 01/15/2018 | 77,300,000 | 77,179,103 | ||||||||||
| 1.000%, 05/15/2018 | 34,200,000 | 34,117,168 | ||||||||||
| 145,391,258 | 25.6 | % | ||||||||||
| Other Government Related Security | ||||||||||||
| Statoil ASA, | ||||||||||||
| 3.125%, 08/17/2017 f | 1,500,000 | 1,502,719 | ||||||||||
| 1,502,719 | 0.3 | % | ||||||||||
| Corporate Bonds | ||||||||||||
| Industrials | ||||||||||||
| AbbVie, Inc., | ||||||||||||
| 1.800%, 05/14/2018 | 3,500,000 | 3,504,417 | ||||||||||
| Actavis Funding SCS: | ||||||||||||
| 2.350%, 03/12/2018 f | 1,500,000 | 1,506,262 | ||||||||||
| 2.483%, 03/12/2020 ∞ f | 1,500,000 | 1,533,408 | ||||||||||
| Alibaba Group Holding Ltd., | ||||||||||||
| 1.720%, 11/28/2017 ∞ f | 500,000 | 499,705 | ||||||||||
| Allergan Inc/United States, | ||||||||||||
| 1.350%, 03/15/2018 | 650,000 | 648,491 | ||||||||||
| American Honda Finance Corp., | ||||||||||||
| 1.997%, 02/22/2019 ∞ | 200,000 | 202,313 | ||||||||||
| Anheuser-Busch InBev Finance, Inc., | ||||||||||||
| 1.570%, 02/01/2019 ∞ | 1,165,000 | 1,167,107 | ||||||||||
| Anheuser-Busch InBev Worldwide, Inc., | ||||||||||||
| 6.500%, 07/15/2018 | 2,880,000 | 3,019,761 | ||||||||||
| AT&T, Inc.: | ||||||||||||
| 1.750%, 01/15/2018 | 675,000 | 675,489 | ||||||||||
| 5.500%, 02/01/2018 | 765,000 | 781,436 | ||||||||||
| 5.600%, 05/15/2018 | 1,000,000 | 1,032,356 | ||||||||||
| 2.110%, 11/27/2018 ∞ | 400,000 | 403,542 | ||||||||||
| 2.226%, 06/30/2020 ∞ | 1,000,000 | 1,013,085 | ||||||||||
| Baxalta, Inc., | ||||||||||||
| 2.067%, 06/22/2018 ∞ | 1,550,000 | 1,557,668 | ||||||||||
| British Telecommunications PLC, | ||||||||||||
| 5.950%, 01/15/2018 f | 1,280,000 | 1,308,680 | ||||||||||
| Cardinal Health, Inc., | ||||||||||||
| 1.700%, 03/15/2018 | 1,000,000 | 1,001,906 | ||||||||||
| Chevron Phillips Chemical Co. LLC / Chevron Phillips Chemical Co. LP, | ||||||||||||
| 1.920%, 05/01/2020 (Acquired 05/07/2015, Cost $1,500,000) ∞ * | 1,500,000 | 1,513,746 | ||||||||||
| ConocoPhillips Co., | ||||||||||||
| 1.500%, 05/15/2018 | 2,115,000 | 2,112,678 | ||||||||||
| Daimler Finance North America LLC: | ||||||||||||
| 1.375%, 08/01/2017 (Acquired 11/01/2016, Cost $750,105) * | 750,000 | 750,007 | ||||||||||
| 1.510%, 08/01/2017 (Acquired 01/13/2015, Cost $498,615) ∞ * | 500,000 | 500,068 | ||||||||||
| 1.882%, 08/03/2017 (Acquired 07/28/2015, Cost $1,050,000) ∞ * | 1,050,000 | 1,050,365 | ||||||||||
| Deutsche Telekom International Finance BV, | ||||||||||||
| 1.738%, 01/17/2020 (Acquired 01/09/2017, Cost $2,000,000) ∞ * f | 2,000,000 | 2,005,496 | ||||||||||
| Dollar General Corp., | ||||||||||||
| 1.875%, 04/15/2018 | 1,500,000 | 1,501,089 | ||||||||||
| EI du Pont de Nemours & Co., | ||||||||||||
| 1.700%, 05/01/2020 ∞ | 5,000,000 | 5,030,055 | ||||||||||
| Enbridge Energy Partners LP, | ||||||||||||
| Class B, 6.500%, 04/15/2018 | 4,000,000 | 4,141,884 | ||||||||||
| Enterprise Products Operating LLC, | ||||||||||||
| Class L, 6.300%, 09/15/2017 | 3,500,000 | 3,530,499 | ||||||||||
| Federal Express Corp. 2012 Pass Through Trust, | ||||||||||||
| 2.625%, 01/15/2018 (Acquired 08/19/2015, Cost $58,927) * | 58,765 | 59,131 | ||||||||||
| Ford Motor Credit Co. LLC: | ||||||||||||
| 5.000%, 05/15/2018 | 2,328,000 | 2,387,548 | ||||||||||
| 2.018%, 06/12/2020 ∞ | 2,000,000 | 2,000,380 | ||||||||||
| General Motors Financial Co., Inc.: | ||||||||||||
| 2.400%, 04/10/2018 | 2,000,000 | 2,007,480 | ||||||||||
| 2.630%, 05/09/2019 ∞ | 2,000,000 | 2,026,802 | ||||||||||
| Harris Corp., | ||||||||||||
| 1.999%, 04/27/2018 | 4,000,000 | 4,005,464 | ||||||||||
| Hewlett Packard Enterprise Co.: | ||||||||||||
| 2.450%, 10/05/2017 | 494,000 | 495,234 | ||||||||||
| 2.850%, 10/05/2018 | 1,800,000 | 1,815,401 | ||||||||||
| 3.226%, 10/05/2018 ∞ | 1,000,000 | 1,019,045 | ||||||||||
| HP, Inc., | ||||||||||||
| 2.098%, 01/14/2019 ∞ | 737,000 | 740,129 | ||||||||||
| Husky Energy, Inc., | ||||||||||||
| 6.200%, 09/15/2017 f | 2,500,000 | 2,522,122 | ||||||||||
| Hyundai Capital America, | ||||||||||||
| 2.099%, 04/03/2020 (Acquired 03/29/2017, Cost $3,000,000) ∞ * | 3,000,000 | 3,008,529 | ||||||||||
| Ingredion, Inc., | ||||||||||||
| 1.800%, 09/25/2017 | 2,500,000 | 2,501,492 | ||||||||||
| Kinder Morgan Energy Partners LP, | ||||||||||||
| 5.950%, 02/15/2018 | 500,000 | 512,352 | ||||||||||
| Kinder Morgan Finance Co. LLC, | ||||||||||||
| 6.000%, 01/15/2018 (Acquired 01/30/2017 through 03/17/2017, Cost $3,807,216) * | 3,725,000 | 3,802,350 | ||||||||||
| McDonald's Corp., | ||||||||||||
| 5.350%, 03/01/2018 | 620,000 | 635,358 | ||||||||||
| Medco Health Solutions, Inc., | ||||||||||||
| 7.125%, 03/15/2018 | 3,308,000 | 3,430,227 | ||||||||||
| Medtronic, Inc., | ||||||||||||
| 2.046%, 03/15/2020 ∞ | 750,000 | 762,227 | ||||||||||
| Mondelez International, Inc., | ||||||||||||
| 1.690%, 02/01/2019 ∞ | 500,000 | 501,945 | ||||||||||
| Mylan, Inc., | ||||||||||||
| 2.600%, 06/24/2018 | 4,000,000 | 4,028,732 | ||||||||||
| Nabors Industries, Inc., | ||||||||||||
| 6.150%, 02/15/2018 | 1,998,000 | 2,017,980 | ||||||||||
| National Oilwell Varco, Inc., | ||||||||||||
| 1.350%, 12/01/2017 | 2,450,000 | 2,446,707 | ||||||||||
| NBCUniversal Enterprise, Inc., | ||||||||||||
| 1.662%, 04/15/2018 (Acquired 02/21/2017, Cost $805,491) * | 804,000 | 805,400 | ||||||||||
| Pentair Finance SA: | ||||||||||||
| 1.875%, 09/15/2017 f | 2,000,000 | 2,000,784 | ||||||||||
| 2.900%, 09/15/2018 f | 1,957,000 | 1,977,206 | ||||||||||
| Phillips 66, | ||||||||||||
| 1.886%, 04/15/2020 (Acquired 04/11/2017, Cost $3,000,000) ∞ * | 3,000,000 | 3,006,033 | ||||||||||
| Potash Corp of Saskatchewan, Inc., | ||||||||||||
| 3.250%, 12/01/2017 f | 3,609,000 | 3,631,242 | ||||||||||
| Qualcomm, Inc., | ||||||||||||
| 1.722%, 05/20/2020 ∞ | 1,500,000 | 1,510,520 | ||||||||||
| QUALCOMM, Inc., | ||||||||||||
| 1.648%, 05/20/2020 ∞ | 2,000,000 | 2,009,024 | ||||||||||
| Republic Services, Inc., | ||||||||||||
| 3.800%, 05/15/2018 | 4,000,000 | 4,070,688 | ||||||||||
| Rohm and Haas Co., | ||||||||||||
| 6.000%, 09/15/2017 | 2,095,000 | 2,113,176 | ||||||||||
| RPM International, Inc., | ||||||||||||
| 6.500%, 02/15/2018 | 2,750,000 | 2,829,720 | ||||||||||
| Tech Data Corp., | ||||||||||||
| 3.750%, 09/21/2017 | 2,000,000 | 2,006,074 | ||||||||||
| Telefonica Emisiones SAU, | ||||||||||||
| 3.192%, 04/27/2018 f | 1,950,000 | 1,970,615 | ||||||||||
| Teva Pharmaceutical Finance Netherlands III BV, | ||||||||||||
| 1.400%, 07/20/2018 f | 3,500,000 | 3,491,758 | ||||||||||
| Total Capital International SA, | ||||||||||||
| 1.617%, 06/19/2019 ∞ f | 250,000 | 250,733 | ||||||||||
| Toyota Motor Credit Corp., | ||||||||||||
| Class 2547, 1.476%, 01/12/2018 ∞ | 900,000 | 901,337 | ||||||||||
| TransCanada PipeLines Ltd., | ||||||||||||
| 1.946%, 01/12/2018 ∞ f | 1,000,000 | 1,002,821 | ||||||||||
| Verizon Communications, Inc., | ||||||||||||
| 2.992%, 09/14/2018 ∞ | 1,563,000 | 1,591,281 | ||||||||||
| Vodafone Group PLC: | ||||||||||||
| 1.250%, 09/26/2017 f | 1,400,000 | 1,398,614 | ||||||||||
| 1.500%, 02/19/2018 f | 2,100,000 | 2,099,513 | ||||||||||
| Volkswagen Group of America Finance LLC, | ||||||||||||
| 1.612%, 11/20/2017 (Acquired 11/12/2014, Cost $500,000) ∞ * | 500,000 | 500,342 | ||||||||||
| Xstrata Finance Ltd., | ||||||||||||
| 2.700%, 10/25/2017 (Acquired 02/03/2017, Cost $1,003,271) ∞ * f | 1,000,000 | 1,001,499 | ||||||||||
| Zoetis, Inc., | ||||||||||||
| 1.875%, 02/01/2018 | 2,750,000 | 2,751,669 | ||||||||||
| 127,638,197 | 22.4 | % | ||||||||||
| Utilities | ||||||||||||
| American Electric Power Co., Inc., | ||||||||||||
| Class E, 1.650%, 12/15/2017 | 1,460,000 | 1,460,159 | ||||||||||
| Duke Energy Corp., | ||||||||||||
| 2.100%, 06/15/2018 | 1,700,000 | 1,706,582 | ||||||||||
| NextEra Energy Capital Holdings, Inc., | ||||||||||||
| Class F, 2.056%, 09/01/2017 | 2,500,000 | 2,501,168 | ||||||||||
| Sempra Energy, | ||||||||||||
| 6.150%, 06/15/2018 | 2,100,000 | 2,186,793 | ||||||||||
| Tri-State Pass Through Trust, | ||||||||||||
| 6.040%, 01/31/2018 (Acquired 09/18/2014, Cost $19,504) * | 19,325 | 19,664 | ||||||||||
| 7,874,366 | 1.4 | % | ||||||||||
| Financials | ||||||||||||
| ABN AMRO Bank NV, | ||||||||||||
| 1.798%, 01/18/2019 (Acquired 01/11/2017 through 04/04/2017, Cost $4,503,162) ∞ * f | 4,500,000 | 4,516,735 | ||||||||||
| Aetna, Inc., | ||||||||||||
| 1.869%, 12/08/2017 ∞ | 2,000,000 | 2,004,472 | ||||||||||
| American Express Bank FSB, | ||||||||||||
| 6.000%, 09/13/2017 | 2,000,000 | 2,016,336 | ||||||||||
| Australia and New Zealand Banking Group Ltd., | ||||||||||||
| 1.598%, 01/16/2018 (Acquired 01/12/2015, Cost $1,000,000) ∞ * f | 1,000,000 | 1,001,911 | ||||||||||
| Bank of America Corp.: | ||||||||||||
| 5.750%, 12/01/2017 | 1,000,000 | 1,016,923 | ||||||||||
| 6.875%, 04/25/2018 | 3,000,000 | 3,121,887 | ||||||||||
| Bank of Montreal, | ||||||||||||
| 1.755%, 04/09/2018 ∞ f | 1,095,000 | 1,098,946 | ||||||||||
| The Bank of New York Mellon Corp., | ||||||||||||
| 1.730%, 08/01/2018 ∞ | 1,000,000 | 1,005,482 | ||||||||||
| The Bank of Tokyo-Mitsubishi UFJ, Ltd., | ||||||||||||
| 1.529%, 09/08/2017 (Acquired 09/30/2014, Cost $998,890) ∞ * f | 1,000,000 | 1,000,167 | ||||||||||
| Barclays PLC, | ||||||||||||
| 2.000%, 03/16/2018 f | 3,900,000 | 3,903,966 | ||||||||||
| BB&T Corp., | ||||||||||||
| 1.830%, 02/01/2019 ∞ | 880,000 | 886,230 | ||||||||||
| The Bear Stearns Companies LLC, | ||||||||||||
| 6.400%, 10/02/2017 | 500,000 | 505,763 | ||||||||||
| BNP Paribas SA, | ||||||||||||
| 2.375%, 09/14/2017 f | 1,000,000 | 1,001,690 | ||||||||||
| BPCE SA, | ||||||||||||
| 1.625%, 01/26/2018 f | 3,000,000 | 2,995,026 | ||||||||||
| Caisse Centrale Desjardins: | ||||||||||||
| 1.550%, 09/12/2017 (Acquired 08/23/2016 through 09/23/2016, Cost $950,462) * f | 950,000 | 950,055 | ||||||||||
| 1.578%, 09/12/2017 (Acquired 05/26/2016, Cost $99,943) ∞ * f | 100,000 | 100,037 | ||||||||||
| 1.837%, 01/29/2018 (Acquired 01/26/2015, Cost $1,000,000) ∞ * f | 1,000,000 | 1,003,045 | ||||||||||
| Capital One Financial Corp., | ||||||||||||
| 1.941%, 05/12/2020 ∞ | 1,700,000 | 1,708,303 | ||||||||||
| Capital One NA/Mclean VA: | ||||||||||||
| 1.500%, 09/05/2017 | 2,000,000 | 2,000,178 | ||||||||||
| 1.851%, 02/05/2018 ∞ | 500,000 | 501,168 | ||||||||||
| Citigroup, Inc.: | ||||||||||||
| 1.850%, 11/24/2017 | 1,200,000 | 1,201,888 | ||||||||||
| 1.700%, 04/27/2018 | 3,000,000 | 2,996,994 | ||||||||||
| Citizens Bank NA/Providence RI: | ||||||||||||
| 1.600%, 12/04/2017 | 1,890,000 | 1,889,390 | ||||||||||
| 1.750%, 03/02/2020 ∞ | 2,000,000 | 2,001,606 | ||||||||||
| Comerica Bank, | ||||||||||||
| 5.200%, 08/22/2017 | 110,000 | 110,503 | ||||||||||
| Commonwealth Bank of Australia, | ||||||||||||
| 1.636%, 03/12/2018 (Acquired 11/09/2016, Cost $1,000,362) ∞ * f | 1,000,000 | 1,001,810 | ||||||||||
| Commonwealth Bank of Australia/New York NY, | ||||||||||||
| 2.500%, 09/20/2018 f | 500,000 | 504,318 | ||||||||||
| Compass Bank, | ||||||||||||
| 1.850%, 09/29/2017 | 3,015,000 | 3,015,730 | ||||||||||
| Credit Agricole SA/London: | ||||||||||||
| 2.125%, 04/17/2018 (Acquired 03/24/2017, Cost $2,004,011) * f | 2,000,000 | 2,005,658 | ||||||||||
| 2.198%, 06/10/2020 (Acquired 06/03/2015, Cost $1,000,000) ∞ * f | 1,000,000 | 1,011,718 | ||||||||||
| Credit Suisse AG/New York NY: | ||||||||||||
| 1.750%, 01/29/2018 f | 1,700,000 | 1,700,920 | ||||||||||
| 1.850%, 04/27/2018 ∞ f | 1,000,000 | 1,003,855 | ||||||||||
| Deutsche Bank AG, | ||||||||||||
| 2.608%, 01/18/2019 ∞ f | 1,000,000 | 1,011,757 | ||||||||||
| Deutsche Bank AG/London: | ||||||||||||
| 6.000%, 09/01/2017 f | 1,000,000 | 1,006,598 | ||||||||||
| 1.862%, 02/13/2018 ∞ f | 1,000,000 | 999,035 | ||||||||||
| Discover Bank/Greenwood DE, | ||||||||||||
| 2.000%, 02/21/2018 | 2,500,000 | 2,503,072 | ||||||||||
| The Goldman Sachs Group, Inc.: | ||||||||||||
| 6.150%, 04/01/2018 | 2,500,000 | 2,580,225 | ||||||||||
| 2.282%, 11/15/2018 ∞ | 1,285,000 | 1,298,354 | ||||||||||
| HSBC USA, Inc.: | ||||||||||||
| 1.700%, 03/05/2018 | 1,700,000 | 1,700,325 | ||||||||||
| 1.949%, 08/07/2018 ∞ | 1,000,000 | 1,003,930 | ||||||||||
| 1.792%, 11/13/2019 ∞ | 250,000 | 250,294 | ||||||||||
| The Huntington National Bank: | ||||||||||||
| 1.700%, 02/26/2018 | 2,300,000 | 2,300,400 | ||||||||||
| 2.000%, 06/30/2018 | 1,360,000 | 1,364,831 | ||||||||||
| ING Bank NV: | ||||||||||||
| 1.800%, 03/16/2018 (Acquired 02/17/2017, Cost $1,000,738) * f | 1,000,000 | 1,001,253 | ||||||||||
| 2.417%, 03/22/2019 (Acquired 05/26/2016, Cost $803,764) ∞ * f | 800,000 | 810,361 | ||||||||||
| Jefferies Group LLC, | ||||||||||||
| 5.125%, 04/13/2018 | 3,250,000 | 3,333,574 | ||||||||||
| JPMorgan Chase & Co.: | ||||||||||||
| 2.000%, 08/15/2017 | 1,000,000 | 1,000,714 | ||||||||||
| Class 1, 1.802%, 01/28/2019 ∞ | 250,000 | 251,564 | ||||||||||
| 2.108%, 01/23/2020 ∞ | 1,000,000 | 1,016,754 | ||||||||||
| KEB Hana Bank, | ||||||||||||
| 2.021%, 04/05/2020 (Acquired 03/27/2017, Cost $3,000,000) ∞ * f | 3,000,000 | 2,999,595 | ||||||||||
| Kookmin Bank, | ||||||||||||
| 1.625%, 07/14/2017 f | 1,500,000 | 1,499,845 | ||||||||||
| Macquarie Group Ltd., | ||||||||||||
| 4.875%, 08/10/2017 (Acquired 03/17/2017, Cost $2,207,708) * f | 2,200,000 | 2,206,941 | ||||||||||
| Manufacturers & Traders Trust Co., | ||||||||||||
| 6.625%, 12/04/2017 | 2,810,000 | 2,867,172 | ||||||||||
| MetLife, Inc., | ||||||||||||
| Class A, 6.817%, 08/15/2018 | 105,000 | 110,864 | ||||||||||
| Mizuho Bank Ltd.: | ||||||||||||
| 1.746%, 09/25/2017 (Acquired 09/18/2014 through 01/14/2015, Cost $799,361) ∞ * f | 800,000 | 800,584 | ||||||||||
| 1.936%, 03/26/2018 (Acquired 03/19/2015 through 03/14/2016, Cost $1,347,084) ∞ * f | 1,350,000 | 1,354,041 | ||||||||||
| 2.346%, 10/20/2018 (Acquired 10/13/2015, Cost $500,000) ∞ * f | 500,000 | 505,156 | ||||||||||
| Morgan Stanley: | ||||||||||||
| 2.036%, 01/05/2018 ∞ | 500,000 | 501,448 | ||||||||||
| 6.625%, 04/01/2018 | 2,000,000 | 2,071,020 | ||||||||||
| 2.003%, 01/24/2019 ∞ | 250,000 | 251,790 | ||||||||||
| 2.310%, 01/27/2020 ∞ | 500,000 | 507,565 | ||||||||||
| MUFG Union Bank NA, | ||||||||||||
| 2.625%, 09/26/2018 | 2,418,000 | 2,441,815 | ||||||||||
| National Bank of Canada, | ||||||||||||
| 1.788%, 06/12/2020 ∞ f | 4,000,000 | 4,012,988 | ||||||||||
| Nordea Bank AB, | ||||||||||||
| 1.916%, 09/30/2019 (Acquired 09/22/2016, Cost $1,500,000) ∞ * f | 1,500,000 | 1,509,714 | ||||||||||
| Royal Bank of Canada, | ||||||||||||
| 1.415%, 10/13/2017 ∞ f | 3,000,000 | 3,001,938 | ||||||||||
| Santander Bank NA, | ||||||||||||
| 8.750%, 05/30/2018 | 2,200,000 | 2,331,956 | ||||||||||
| Santander Holdings USA, Inc., | ||||||||||||
| 3.450%, 08/27/2018 | 425,000 | 430,962 | ||||||||||
| Societe Generale SA: | ||||||||||||
| 2.750%, 10/12/2017 f | 800,000 | 802,616 | ||||||||||
| 2.379%, 10/01/2018 ∞ f | 1,500,000 | 1,510,063 | ||||||||||
| Standard Chartered Bank, | ||||||||||||
| 6.400%, 09/26/2017 (Acquired 02/21/2017, Cost $2,021,432) * f | 2,000,000 | 2,019,644 | ||||||||||
| Standard Chartered PLC, | ||||||||||||
| 1.798%, 04/17/2018 (Acquired 04/13/2015, Cost $1,200,000) ∞ * f | 1,200,000 | 1,198,644 | ||||||||||
| Sumitomo Mitsui Banking Corp.: | ||||||||||||
| 1.738%, 01/16/2018 ∞ f | 300,000 | 300,705 | ||||||||||
| 1.893%, 07/23/2018 ∞ f | 1,350,000 | 1,356,658 | ||||||||||
| 1.828%, 10/19/2018 ∞ f | 1,000,000 | 1,002,619 | ||||||||||
| Sumitomo Mitsui Trust Bank Ltd, | ||||||||||||
| 1.733%, 03/06/2019 (Acquired 02/27/2017, Cost $2,000,000) ∞ * f | 2,000,000 | 2,000,160 | ||||||||||
| SunTrust Banks, Inc., | ||||||||||||
| 6.000%, 09/11/2017 | 2,143,000 | 2,159,726 | ||||||||||
| Svenska Handelsbanken AB, | ||||||||||||
| 1.757%, 06/17/2019 ∞ f | 850,000 | 853,779 | ||||||||||
| Swedbank AB, | ||||||||||||
| 2.125%, 09/29/2017 (Acquired 08/30/2016, Cost $2,004,189) * f | 2,000,000 | 2,003,358 | ||||||||||
| Synchrony Financial: | ||||||||||||
| 1.875%, 08/15/2017 | 1,000,000 | 1,000,221 | ||||||||||
| 2.580%, 11/09/2017 ∞ | 1,000,000 | 1,003,173 | ||||||||||
| 2.402%, 02/03/2020 ∞ | 1,000,000 | 1,007,553 | ||||||||||
| The Toronto-Dominion Bank, | ||||||||||||
| 1.731%, 11/05/2019 ∞ f | 1,200,000 | 1,207,560 | ||||||||||
| UBS AG/Stamford CT: | ||||||||||||
| 1.800%, 03/26/2018 f | 1,300,000 | 1,302,089 | ||||||||||
| 1.996%, 03/26/2018 ∞ f | 1,000,000 | 1,004,511 | ||||||||||
| 5.750%, 04/25/2018 f | 1,000,000 | 1,031,883 | ||||||||||
| UBS Group Funding Jersey Ltd., | ||||||||||||
| 2.736%, 09/24/2020 (Acquired 09/21/2015, Cost $500,000) ∞ * f | 500,000 | 509,146 | ||||||||||
| UnitedHealth Group, Inc., | ||||||||||||
| 6.000%, 02/15/2018 | 1,724,000 | 1,770,000 | ||||||||||
| Voya Financial, Inc., | ||||||||||||
| 2.900%, 02/15/2018 | 3,834,000 | 3,859,933 | ||||||||||
| WEA Finance LLC / Westfield UK & Europe Finance PLC, | ||||||||||||
| 1.750%, 09/15/2017 (Acquired 08/10/2016, Cost $1,401,129) * | 1,400,000 | 1,399,993 | ||||||||||
| Wells Fargo & Co.: | ||||||||||||
| 5.625%, 12/11/2017 | 2,500,000 | 2,543,485 | ||||||||||
| Class N, 1.852%, 01/30/2020 ∞ | 1,000,000 | 1,006,509 | ||||||||||
| Westpac Banking Corp.: | ||||||||||||
| 2.000%, 08/14/2017 f | 1,165,000 | 1,165,779 | ||||||||||
| 1.619%, 05/25/2018 ∞ f | 1,500,000 | 1,503,614 | ||||||||||
| 140,144,566 | 24.7 | % | ||||||||||
| Total Corporate Bonds | 275,657,129 | 48.5 | % | |||||||||
| Taxable Municipal Bonds | ||||||||||||
| County of Westchester NY, | ||||||||||||
| 2.000%, 12/15/2017 | 2,000,000 | 2,002,740 | ||||||||||
| Metropolitan Government Nashville & Davidson County Health & Educational Facilities, | ||||||||||||
| 2.250%, 07/01/2046 (Callable 07/01/2017) ∞ | 2,000,000 | 2,000,000 | ||||||||||
| 4,002,740 | 0.7 | % | ||||||||||
| Residential Mortgage-Backed Securities | ||||||||||||
| U.S. Government Agency Issues | ||||||||||||
| Federal Gold Loan Mortgage Corp. (FGLMC), | ||||||||||||
| 5.000%, 12/01/2017 | 11,493 | 11,785 | ||||||||||
| Federal National Mortgage Association (FNMA): | ||||||||||||
| 5.000%, 10/01/2017 | 5,053 | 5,174 | ||||||||||
| 5.000%, 11/01/2017 | 5,272 | 5,399 | ||||||||||
| 5.500%, 11/01/2017 | 11,455 | 11,480 | ||||||||||
| 5.000%, 12/01/2017 | 5,891 | 6,033 | ||||||||||
| 5.000%, 12/01/2019 | 186,898 | 191,391 | ||||||||||
| 4.500%, 04/01/2020 | 354,442 | 362,962 | ||||||||||
| 5.000%, 04/01/2020 | 364,302 | 374,021 | ||||||||||
| 968,245 | 0.2 | % | ||||||||||
| Non-U.S. Government Agency Issues | ||||||||||||
| Aames Mortgage Investment Trust, | ||||||||||||
| Series 2006-1, Class A3, 1.536%, 04/25/2036 ∞ | 390,886 | 389,666 | ||||||||||
| Accredited Mortgage Loan Trust: | ||||||||||||
| Series 2005-4, Class A2D, 1.536%, 12/25/2035 ∞ | 558,128 | 550,805 | ||||||||||
| Series 2006-2, Class A3, 1.366%, 09/25/2036 ∞ | 938,194 | 937,053 | ||||||||||
| ACE Securities Corp. Home Equity Loan Trust: | ||||||||||||
| Series 2006-HE1, Class A1B1, 1.406%, 02/25/2036 ∞ | 252,560 | 251,965 | ||||||||||
| Series 2006-HE1, Class A1A, 1.416%, 02/25/2036 ∞ | 63,416 | 63,341 | ||||||||||
| Carrington Mortgage Loan Trust, | ||||||||||||
| Series 2006-RFC1, Class A3, 1.366%, 05/25/2036 ∞ | 983,192 | 976,661 | ||||||||||
| Countrywide Asset-Backed Certificates, | ||||||||||||
| Series 2006-BC4, Class 2A2, 1.376%, 11/25/2036 ∞ | 1,933,195 | 1,914,455 | ||||||||||
| CWABS Asset-Backed Certificates Trust, | ||||||||||||
| Series 2006-14, Class 2A2, 1.366%, 02/25/2037 ∞ | 2,091,792 | 2,063,973 | ||||||||||
| First Franklin Mortgage Loan Trust, | ||||||||||||
| Series 2006-FF4, Class A2, 1.406%, 03/25/2036 ∞ | 2,067,456 | 2,057,560 | ||||||||||
| GSAMP Trust 2006-HE4, | ||||||||||||
| Series 2006-HE4, Class A2C, 1.366%, 06/25/2036 ∞ | 817,689 | 808,194 | ||||||||||
| Home Equity Asset Trust, | ||||||||||||
| Series 2007-2, Class 2A2, 1.401%, 07/25/2037 ∞ | 821,928 | 816,187 | ||||||||||
| HSI Asset Securitization Corp. Trust, | ||||||||||||
| Series 2007-WF1, Class 2A3, 1.386%, 05/25/2037 ∞ | 277,055 | 275,778 | ||||||||||
| J.P. Morgan Mortgage Acquisition Trust: | ||||||||||||
| Series 2006-NC1, Class A4, 1.386%, 04/25/2036 ∞ | 511,275 | 508,312 | ||||||||||
| Series 2007-CH3, Class A3, 1.366%, 03/25/2037 ∞ | 89,586 | 89,522 | ||||||||||
| Long Beach Mortgage Loan Trust: | ||||||||||||
| Series 2005-WL2, Class M1, 1.921%, 08/25/2035 ∞ | 562,150 | 563,576 | ||||||||||
| Series 2006-WL2, Class 2A3, 1.416%, 01/25/2036 ∞ | 18,191 | 18,084 | ||||||||||
| MASTR Alternative Loan Trust, | ||||||||||||
| Series 2004-13, Class 8A1, 5.500%, 01/25/2025 | 57,376 | 57,356 | ||||||||||
| MASTR Asset Backed Securities Trust, | ||||||||||||
| Series 2006-AB1, Class A2, 1.446%, 02/25/2036 ∞ | 31,790 | 31,774 | ||||||||||
| Nationstar Home Equity Loan Trust, | ||||||||||||
| Series 2007-C, Class 2AV2, 1.346%, 06/25/2037 ∞ | 9,489 | 9,465 | ||||||||||
| Park Place Securities, Inc., | ||||||||||||
| Series 2005-WCW1, Class M1, 1.666%, 09/25/2035 ∞ | 352,261 | 352,051 | ||||||||||
| RASC Series Trust, | ||||||||||||
| Series 2006-KS1, Class A4, 1.516%, 02/25/2036 ∞ | 110,557 | 110,465 | ||||||||||
| Saxon Asset Securities Trust, | ||||||||||||
| Series 2006-1, Class A2C, 1.536%, 03/25/2036 ∞ | 549,578 | 546,236 | ||||||||||
| Soundview Home Loan Trust: | ||||||||||||
| Series 2005-OPT4, Class 2A3, 1.476%, 12/25/2035 ∞ | 508,121 | 506,842 | ||||||||||
| Series 2006-2, Class A4, 1.486%, 03/25/2036 ∞ | 128,420 | 128,173 | ||||||||||
| Series 2006-OPT2, Class A3, 1.396%, 05/25/2036 ∞ | 559,682 | 554,062 | ||||||||||
| 14,581,556 | 2.6 | % | ||||||||||
| Commercial Mortgage-Backed Securities | ||||||||||||
| U.S. Government Agency Issues | ||||||||||||
| Fannie Mae REMIC Trust: | ||||||||||||
| Series 2012-M9, Class ASQ2, 1.513%, 12/25/2017 | 1,353,143 | 1,352,159 | ||||||||||
| Series 2015-M1, Class ASQ2, 1.626%, 02/25/2018 | 1,064,177 | 1,063,700 | ||||||||||
| Freddie Mac Multifamily Structured Pass Through Certificates: | ||||||||||||
| Series K701, Class A2, 3.882%, 11/25/2017 ∞ | 1,800,065 | 1,805,168 | ||||||||||
| Series K702, Class A2, 3.154%, 02/25/2018 | 2,007,536 | 2,021,701 | ||||||||||
| Series K008, Class A1, 2.746%, 12/25/2019 | 634,675 | 643,940 | ||||||||||
| Series K009, Class A1, 2.757%, 05/25/2020 | 760,295 | 762,982 | ||||||||||
| 7,649,650 | 1.3 | % | ||||||||||
| Other Asset Backed Securities | ||||||||||||
| Ally Auto Receivables Trust: | ||||||||||||
| Series 2014-2, Class A3, 1.250%, 04/15/2019 | 942,762 | 942,493 | ||||||||||
| Series 2014-1, Class A4, 1.530%, 04/15/2019 | 1,750,000 | 1,750,474 | ||||||||||
| Series 2015-1, Class A3, 1.390%, 09/16/2019 | 1,365,192 | 1,364,786 | ||||||||||
| American Express Credit Account Master Trust, | ||||||||||||
| Series 2014-4, Class A, 1.430%, 06/15/2020 | 3,100,000 | 3,100,611 | ||||||||||
| ARI Fleet Lease Trust 2017-A, | ||||||||||||
| Series 2017-A, Class A2, 1.910%, 04/15/2026 (Acquired 05/16/2017, Cost $1,799,788) * | 1,800,000 | 1,798,592 | ||||||||||
| Bank of The West Auto Trust, | ||||||||||||
| Series 2014-1, Class A4, 1.650%, 03/16/2020 (Acquired 02/16/2017, Cost $2,782,417) * | 2,780,000 | 2,781,518 | ||||||||||
| Barclays Dryrock Issuance Trust, | ||||||||||||
| Series 2014-5, Class A, 1.480%, 09/15/2020 | 3,000,000 | 3,000,585 | ||||||||||
| California Republic Auto Receivables Trust, | ||||||||||||
| Series 2015-3, Class A3, 1.620%, 11/15/2019 | 2,134,737 | 2,135,654 | ||||||||||
| Capital Auto Receivables Asset Trust: | ||||||||||||
| Series 2015-3, Class A2, 1.720%, 01/22/2019 | 3,310,580 | 3,312,315 | ||||||||||
| Series 2016-3, Class A2A, 1.360%, 04/22/2019 | 577,742 | 577,483 | ||||||||||
| Capital One Multi-Asset Execution Trust: | ||||||||||||
| Series 2014-A5, Class A5, 1.480%, 07/15/2020 | 2,000,000 | 2,000,556 | ||||||||||
| Series 2007-A7, Class A7, 5.750%, 07/15/2020 | 3,000,000 | 3,026,594 | ||||||||||
| Carmax Auto Owner Trust: | ||||||||||||
| Series 2013-2, Class A4, 0.840%, 11/15/2018 | 468,436 | 468,345 | ||||||||||
| Series 2014-3, Class A3, 1.160%, 06/17/2019 | 1,040,144 | 1,039,359 | ||||||||||
| Series 2014-4, Class A3, 1.250%, 11/15/2019 | 618,321 | 617,803 | ||||||||||
| Chase Issuance Trust: | ||||||||||||
| Series 2014-A6, Class A6, 1.260%, 07/15/2019 | 4,100,000 | 4,099,768 | ||||||||||
| Series 2013-A1, Class A1, 1.300%, 02/18/2020 | 2,500,000 | 2,497,581 | ||||||||||
| Chrysler Capital Auto Receivables Trust, | ||||||||||||
| Series 2016-BA, Class A2, 1.360%, 01/15/2020 (Acquired 02/22/2017, Cost $3,265,076) * | 3,266,990 | 3,263,073 | ||||||||||
| Citibank Credit Card Issuance Trust, | ||||||||||||
| Series 2008-A1, Class A1, 5.350%, 02/07/2020 | 4,500,000 | 4,601,427 | ||||||||||
| Conseco Financial Corp., | ||||||||||||
| Series 1998-4, Class A6, 6.530%, 04/01/2030 ∞ | 477,234 | 507,054 | ||||||||||
| Dell Equipment Finance Trust, | ||||||||||||
| Series 2015-1, Class A3, 1.300%, 03/23/2020 (Acquired 07/06/2016, Cost $54,830) * | 54,834 | 54,832 | ||||||||||
| Discover Card Execution Note Trust, | ||||||||||||
| Series 2007-A1, Class A1, 5.650%, 03/16/2020 | 3,120,000 | 3,147,658 | ||||||||||
| Enterprise Fleet Financing LLC, | ||||||||||||
| Series 2015-2, Class A2, 1.590%, 02/22/2021 (Acquired 08/23/2016 through 01/18/2017, Cost $2,706,628) * | 2,706,872 | 2,706,980 | ||||||||||
| First National Master Note Trust 2017-1, | ||||||||||||
| Series 2017-1, Class A, 1.559%, 04/18/2022 ∞ | 4,150,000 | 4,153,615 | ||||||||||
| Ford Credit Auto Lease Trust, | ||||||||||||
| Series 2015-A, Class A4, 1.310%, 08/15/2018 | 2,197,679 | 2,197,352 | ||||||||||
| Ford Credit Auto Owner Trust 2015-B, | ||||||||||||
| Series 2015-B, Class A3, 1.160%, 11/15/2019 | 3,132,619 | 3,128,297 | ||||||||||
| Ford Credit Floorplan Master Owner Trust A, | ||||||||||||
| Series 2012-5, Class A, 1.490%, 09/15/2019 | 2,250,000 | 2,249,975 | ||||||||||
| GM Financial Automobile Leasing Trust: | ||||||||||||
| Series 2015-1, Class A3, 1.530%, 09/20/2018 | 547,759 | 547,912 | ||||||||||
| Series 2015-2, Class A3, 1.680%, 12/20/2018 | 2,303,855 | 2,305,638 | ||||||||||
| Series 2016-3, Class A2A, 1.350%, 02/20/2019 | 2,485,709 | 2,482,622 | ||||||||||
| GM Financial Consumer Automobile 2017-1, | ||||||||||||
| Series 2017-1A, Class A2A, 1.510%, 03/16/2020 (Acquired 04/03/2017, Cost $1,499,915) * | 1,500,000 | 1,499,614 | ||||||||||
| Harley-Davidson Motorcycle Trust: | ||||||||||||
| Series 2014-1, Class A3, 1.100%, 09/15/2019 | 581,947 | 581,507 | ||||||||||
| Series 2015-2, Class A3, 1.300%, 03/16/2020 | 1,762,876 | 1,761,566 | ||||||||||
| Series 2015-1, Class A3, 1.410%, 06/15/2020 | 1,370,327 | 1,369,298 | ||||||||||
| Honda Auto Receivables 2015-1 Owner Trust, | ||||||||||||
| Series 2015-1, Class A4, 1.320%, 11/16/2020 | 1,890,000 | 1,887,236 | ||||||||||
| Honda Auto Receivables Owner Trust: | ||||||||||||
| Series 2016-1, Class A2, 1.010%, 06/18/2018 | 466,433 | 466,252 | ||||||||||
| Series 2016-1, Class A3, 1.220%, 12/18/2019 | 470,000 | 468,786 | ||||||||||
| Hyundai Auto Lease Securitization Trust: | ||||||||||||
| Series 2015-A, Class A3, 1.420%, 09/17/2018 (Acquired 09/26/2016 through 11/04/2016, Cost $758,706) * | 758,110 | 758,059 | ||||||||||
| Series 2016-A, Class A3, 1.600%, 07/15/2019 (Acquired 02/23/2017 through 06/20/2017, Cost $3,713,345) * | 3,710,000 | 3,710,867 | ||||||||||
| Kubota Credit Owner Trust, | ||||||||||||
| Series 2015-1A, Class A3, 1.540%, 03/15/2019 (Acquired 07/21/2016, Cost $746,425) * | 745,695 | 745,744 | ||||||||||
| Leaf Receivables Funding 10 LLC, | ||||||||||||
| Series 2015-1, Class A3, 1.490%, 03/15/2018 (Acquired 04/23/2015, Cost $212,107) * | 212,146 | 212,127 | ||||||||||
| Master Credit Card Trust II, | ||||||||||||
| Series 2016-1A, Class A, 1.964%, 09/23/2019 (Acquired 04/11/2016, Cost $1,050,000) ∞ * f | 1,050,000 | 1,054,978 | ||||||||||
| Mercedes Benz Auto Lease Trust, | ||||||||||||
| Series 2015-B, Class A4, 1.530%, 05/17/2021 | 3,600,000 | 3,600,660 | ||||||||||
| Mercedes-Benz Auto Receivables Trust, | ||||||||||||
| Series 2015-1, Class A3, 1.340%, 12/16/2019 | 3,275,560 | 3,272,362 | ||||||||||
| MMAF Equipment Finance LLC: | ||||||||||||
| Series 2016-AA, Class A2, 1.390%, 12/17/2018 (Acquired 10/26/2016 through 02/27/2017, Cost $3,746,051) * | 3,745,143 | 3,744,710 | ||||||||||
| Series 2011-AA, Class A5, 3.040%, 08/15/2028 (Acquired 09/22/2016 through 12/30/2016, Cost $1,185,285) * | 1,177,800 | 1,182,150 | ||||||||||
| Nissan Auto Lease Trust 2017-A, | ||||||||||||
| Series 2017-A, Class A2A, 1.640%, 09/16/2019 | 3,625,000 | 3,623,916 | ||||||||||
| OneMain Financial Issuance Trust, | ||||||||||||
| Series 2014-2A, Class A, 2.470%, 09/18/2024 (Acquired 02/05/2016, Cost $185,311) * | 185,892 | 186,134 | ||||||||||
| Springleaf Funding Trust 2015-A, | ||||||||||||
| Series 2015-AA, Class A, 3.160%, 11/15/2024 (Acquired 06/21/2017, Cost $1,031,458) * | 1,025,000 | 1,034,271 | ||||||||||
| Synchrony Credit Card Master Note Trust: | ||||||||||||
| Series 2012-6, Class A, 1.360%, 08/17/2020 | 3,150,000 | 3,149,702 | ||||||||||
| Series 2014-1, Class A, 1.610%, 11/15/2020 | 5,000,000 | 5,002,847 | ||||||||||
| Toyota Auto Receivables Owner Trust: | ||||||||||||
| Series 2016-B, Class A2A, 1.020%, 10/15/2018 | 919,899 | 919,292 | ||||||||||
| Series 2015-A, Class A3, 1.120%, 02/15/2019 | 434,953 | 434,516 | ||||||||||
| Series 2014-A, Class A4, 1.180%, 06/17/2019 | 1,673,480 | 1,672,701 | ||||||||||
| Wheels SPV 2 LLC, | ||||||||||||
| Series 2014-1A, Class A3, 1.460%, 03/20/2023 (Acquired 05/19/2017, Cost $437,256) * | 437,273 | 437,188 | ||||||||||
| 108,637,435 | 19.1 | % | ||||||||||
| Total Long-Term Investments (Cost $558,112,351) | 558,390,732 | 98.3 | % | |||||||||
| SHORT-TERM INVESTMENT | Shares | |||||||||||
| Short-Term Investment | ||||||||||||
| Fidelity Institutional Money Market Fund - Government Portfolio, Institutional Class, 0.89% ∞ « | 8,941,015 | 8,941,015 | ||||||||||
| Total Short-Term Investment (Cost $8,941,015) | 8,941,015 | 1.6 | % | |||||||||
| Total Investments (Cost $567,053,366) | 567,331,747 | 99.9 | % | |||||||||
| Other Assets in Excess of Liabilities | 433,803 | 0.1 | % | |||||||||
| TOTAL NET ASSETS | $ | 567,765,550 | 100.0 | % | ||||||||
Notes to Schedule of Investments | |
| ∞ | Variable or Floating rate security. Floating rate securities are securities whose yields vary with a designated index rate. These securities' rates are as of June 30, 2017. |
| * | Restricted security as defined in Rule 144(a) under the Securities Act of 1933 and determined to be liquid. Purchased in a private placement transaction; resale to the public may require registration or or may extend only to qualified institutional buyers. At June 30, 2017, the value of these securities total $76,103,193, which represents 13.40% of total net assets. |
| f | Foreign Security. |
| « | 7-Day Yield. |
| Baird Short-Term Bond Fund | ||||||||||||
| Schedule of Investments | ||||||||||||
| June 30, 2017 (Unaudited) | ||||||||||||
| Principal | % of | |||||||||||
| Amount | Value | Net Assets | ||||||||||
| LONG-TERM INVESTMENTS | ||||||||||||
| U.S. Treasury Securities | ||||||||||||
| U.S. Treasury Bonds: | ||||||||||||
| 2.625%, 08/15/2020 | $ | 77,900,000 | $ | 80,343,490 | ||||||||
| 1.375%, 08/31/2020 | 736,225,000 | 731,048,602 | ||||||||||
| United States Treasury Note/Bond, | ||||||||||||
| 1.625%, 08/31/2019 | 163,225,000 | 163,970,938 | ||||||||||
| 975,363,030 | 21.3 | % | ||||||||||
| Other Government Related Securities | ||||||||||||
| CNOOC Finance (2013) Ltd., | ||||||||||||
| 1.750%, 05/09/2018 f | 1,000,000 | 998,115 | ||||||||||
| Electricite de France SA, | ||||||||||||
| 4.600%, 01/27/2020 (Acquired 11/22/2016, Cost $3,091,371) * f | 2,926,000 | 3,103,427 | ||||||||||
| The Korea Development Bank, | ||||||||||||
| 3.000%, 03/17/2019 f | 2,475,000 | 2,509,541 | ||||||||||
| Korea Hydro & Nuclear Power Co. Ltd., | ||||||||||||
| 2.875%, 10/02/2018 (Acquired 09/25/2013, Cost $2,982,150) * f | 3,000,000 | 3,023,886 | ||||||||||
| Nexen Energy ULC, | ||||||||||||
| 6.200%, 07/30/2019 f | 2,065,000 | 2,211,729 | ||||||||||
| Petroleos Mexicanos: | ||||||||||||
| 5.500%, 02/04/2019 f | 3,200,000 | 3,340,800 | ||||||||||
| 8.000%, 05/03/2019 f | 11,800,000 | 12,906,250 | ||||||||||
| Sinopec Group Overseas Development [2015] Ltd., | ||||||||||||
| 2.500%, 04/28/2020 (Acquired 04/21/2015, Cost $2,987,280) * f | 3,000,000 | 3,014,126 | ||||||||||
| Sinopec Group Overseas Development [2016] Ltd.: | ||||||||||||
| 2.125%, 05/03/2019 (Acquired 04/25/2016, Cost $6,982,640) * f | 7,000,000 | 6,974,268 | ||||||||||
| 1.750%, 09/29/2019 (Acquired 09/22/2016, Cost $2,365,761) * f | 2,375,000 | 2,345,058 | ||||||||||
| 2.375%, 04/12/2020 (Acquired 04/05/2017, Cost $10,101,713) * f | 10,125,000 | 10,130,144 | ||||||||||
| 50,557,344 | 1.1 | % | ||||||||||
| Corporate Bonds | ||||||||||||
| Industrials | ||||||||||||
| 21st Century Fox America, Inc., | ||||||||||||
| 6.900%, 03/01/2019 | 10,950,000 | 11,808,513 | ||||||||||
| A.P. Meoller - Maersk A/S, | ||||||||||||
| 2.550%, 09/22/2019 (Acquired 09/15/2014, Cost $4,540,672) * f | 4,550,000 | 4,581,167 | ||||||||||
| Abbott Laboratories: | ||||||||||||
| 2.350%, 11/22/2019 | 14,125,000 | 14,231,192 | ||||||||||
| 4.125%, 05/27/2020 | 480,000 | 505,159 | ||||||||||
| AbbVie, Inc., | ||||||||||||
| 1.800%, 05/14/2018 | 9,450,000 | 9,461,926 | ||||||||||
| Actavis Funding SCS: | ||||||||||||
| 2.450%, 06/15/2019 f | 3,000,000 | 3,018,216 | ||||||||||
| 2.483%, 03/12/2020 ∞ f | 1,000,000 | 1,022,272 | ||||||||||
| 3.000%, 03/12/2020 f | 3,900,000 | 3,982,754 | ||||||||||
| Alibaba Group Holding Ltd., | ||||||||||||
| 1.720%, 11/28/2017 ∞ f | 2,500,000 | 2,498,525 | ||||||||||
| Amgen, Inc., | ||||||||||||
| 5.700%, 02/01/2019 | 10,000,000 | 10,600,540 | ||||||||||
| Anadarko Petroleum Corp., | ||||||||||||
| 8.700%, 03/15/2019 | 2,970,000 | 3,275,646 | ||||||||||
| Anheuser-Busch InBev Finance, Inc., | ||||||||||||
| 1.900%, 02/01/2019 | 11,425,000 | 11,450,558 | ||||||||||
| Anheuser-Busch InBev Worldwide, Inc., | ||||||||||||
| 7.750%, 01/15/2019 | 6,000,000 | 6,523,272 | ||||||||||
| AT&T, Inc.: | ||||||||||||
| 5.800%, 02/15/2019 | 3,000,000 | 3,182,409 | ||||||||||
| 2.300%, 03/11/2019 | 9,682,000 | 9,739,424 | ||||||||||
| 2.226%, 06/30/2020 ∞ | 4,000,000 | 4,052,340 | ||||||||||
| 2.800%, 02/17/2021 | 4,025,000 | 4,067,701 | ||||||||||
| Baxalta, Inc.: | ||||||||||||
| 2.000%, 06/22/2018 | 9,200,000 | 9,214,849 | ||||||||||
| 2.067%, 06/22/2018 ∞ | 3,500,000 | 3,517,314 | ||||||||||
| Becton Dickinson and Co., | ||||||||||||
| 2.404%, 06/05/2020 | 10,350,000 | 10,366,715 | ||||||||||
| Bemis Co., Inc., | ||||||||||||
| 6.800%, 08/01/2019 | 9,075,000 | 9,938,395 | ||||||||||
| Boston Scientific Corp., | ||||||||||||
| 2.650%, 10/01/2018 | 7,077,000 | 7,141,974 | ||||||||||
| BP Capital Markets PLC: | ||||||||||||
| 1.695%, 05/10/2018 ∞ f | 1,575,000 | 1,580,670 | ||||||||||
| 1.926%, 09/26/2018 ∞ f | 7,085,000 | 7,129,196 | ||||||||||
| Broadcom Corp. / Broadcom Cayman Finance Ltd., | ||||||||||||
| 2.375%, 01/15/2020 (Acquired 01/11/2017, Cost $21,950,280) * | 22,000,000 | 22,031,966 | ||||||||||
| Bunge Limited Finance Corp.: | ||||||||||||
| 8.500%, 06/15/2019 | 10,255,000 | 11,469,438 | ||||||||||
| 3.500%, 11/24/2020 | 1,050,000 | 1,076,471 | ||||||||||
| Cardinal Health, Inc., | ||||||||||||
| 1.948%, 06/14/2019 | 14,700,000 | 14,714,597 | ||||||||||
| Celgene Corp., | ||||||||||||
| 2.125%, 08/15/2018 | 6,500,000 | 6,525,110 | ||||||||||
| Cenovus Energy, Inc., | ||||||||||||
| 5.700%, 10/15/2019 f | 20,000,000 | 21,107,800 | ||||||||||
| CF Industries, Inc., | ||||||||||||
| 6.875%, 05/01/2018 | 19,412,000 | 20,164,215 | ||||||||||
| Charter Communications Operating LLC / Charter Communications Operating Capital, | ||||||||||||
| 3.579%, 07/23/2020 | 3,000,000 | 3,100,125 | ||||||||||
| Chevron Phillips Chemical Co. LLC / Chevron Phillips Chemical Co. LP, | ||||||||||||
| 1.920%, 05/01/2020 (Acquired 05/07/2015, Cost $5,050,000) ∞ * | 5,050,000 | 5,096,278 | ||||||||||
| Coca-Cola FEMSA SAB de CV, | ||||||||||||
| 2.375%, 11/26/2018 f | 4,000,000 | 4,019,926 | ||||||||||
| Columbia Pipeline Group, Inc., | ||||||||||||
| 2.450%, 06/01/2018 | 7,000,000 | 7,032,116 | ||||||||||
| Cox Communications, Inc.: | ||||||||||||
| 6.250%, 06/01/2018 (Acquired 06/24/2015, Cost $9,324,111) * | 9,000,000 | 9,331,776 | ||||||||||
| 9.375%, 01/15/2019 (Acquired 02/10/2015 through 01/07/2016, Cost $984,427) * | 899,000 | 990,193 | ||||||||||
| Crane Co., | ||||||||||||
| 2.750%, 12/15/2018 | 7,585,000 | 7,663,770 | ||||||||||
| CVS Health Corp.: | ||||||||||||
| 2.800%, 07/20/2020 | 6,725,000 | 6,846,709 | ||||||||||
| 2.125%, 06/01/2021 | 5,000,000 | 4,939,040 | ||||||||||
| Daimler Finance North America LLC: | ||||||||||||
| 1.510%, 08/01/2017 (Acquired 07/24/2014 through 11/10/2015, Cost $2,699,764) ∞ * | 2,700,000 | 2,700,364 | ||||||||||
| 1.882%, 08/03/2017 (Acquired 08/09/2016, Cost $6,001,557) ∞ * | 6,000,000 | 6,002,088 | ||||||||||
| 1.630%, 03/02/2018 (Acquired 08/05/2015, Cost $748,303) ∞ * | 750,000 | 751,124 | ||||||||||
| 2.030%, 08/01/2018 (Acquired 11/14/2014, Cost $2,007,344) ∞ * | 2,000,000 | 2,012,108 | ||||||||||
| 1.500%, 07/05/2019 (Acquired 09/30/2016, Cost $5,676,288) * | 5,700,000 | 5,645,725 | ||||||||||
| 2.200%, 05/05/2020 (Acquired 05/02/2017, Cost $4,993,350) * | 5,000,000 | 4,999,965 | ||||||||||
| DCP Midstream Operating LP, | ||||||||||||
| 2.500%, 12/01/2017 | 400,000 | 399,500 | ||||||||||
| Deutsche Telekom International Finance BV: | ||||||||||||
| 6.750%, 08/20/2018 f | 3,900,000 | 4,106,938 | ||||||||||
| 1.738%, 01/17/2020 (Acquired 01/09/2017, Cost $8,000,000) ∞ * f | 8,000,000 | 8,021,984 | ||||||||||
| Diamond 1 Finance Corp. / Diamond 2 Finance Corp.: | ||||||||||||
| 3.480%, 06/01/2019 (Acquired 05/17/2016 through 01/03/2017, Cost $19,163,165) * | 19,135,000 | 19,582,300 | ||||||||||
| 4.420%, 06/15/2021 (Acquired 04/06/2017, Cost $2,088,344) * | 2,000,000 | 2,108,436 | ||||||||||
| The Dow Chemical Co., | ||||||||||||
| 8.550%, 05/15/2019 | 14,777,000 | 16,550,787 | ||||||||||
| DXC Technology Co., | ||||||||||||
| 2.875%, 03/27/2020 (Acquired 03/13/2017 through 06/21/2017, Cost $22,467,797) * | 22,344,000 | 22,624,931 | ||||||||||
| Eaton Corp., | ||||||||||||
| 1.500%, 11/02/2017 | 5,000,000 | 5,000,980 | ||||||||||
| Ecolab, Inc., | ||||||||||||
| 2.000%, 01/14/2019 | 14,250,000 | 14,312,073 | ||||||||||
| El du Pont de Nemours & Co., | ||||||||||||
| 2.200%, 05/01/2020 | 5,000,000 | 5,027,135 | ||||||||||
| Enable Midstream Partners LP, | ||||||||||||
| 2.400%, 05/15/2019 | 3,000,000 | 2,988,243 | ||||||||||
| Energy Transfer Partners LP: | ||||||||||||
| 2.500%, 06/15/2018 | 4,000,000 | 4,019,620 | ||||||||||
| 9.700%, 03/15/2019 | 6,994,000 | 7,832,846 | ||||||||||
| 4.150%, 10/01/2020 | 8,500,000 | 8,828,151 | ||||||||||
| Enterprise Products Operating LLC: | ||||||||||||
| Class L, 6.300%, 09/15/2017 | 1,220,000 | 1,230,631 | ||||||||||
| 6.650%, 04/15/2018 | 5,000,000 | 5,182,360 | ||||||||||
| 1.650%, 05/07/2018 | 2,000,000 | 1,998,324 | ||||||||||
| ERAC USA Finance LLC, | ||||||||||||
| 2.350%, 10/15/2019 (Acquired 01/21/2015 through 10/26/2016, Cost $19,118,635) * | 19,000,000 | 19,029,526 | ||||||||||
| Express Scripts Holding Co.: | ||||||||||||
| 2.250%, 06/15/2019 | 2,157,000 | 2,164,148 | ||||||||||
| 3.300%, 02/25/2021 | 5,000,000 | 5,149,545 | ||||||||||
| Exxon Mobil Corp., | ||||||||||||
| 1.708%, 03/01/2019 | 8,000,000 | 8,017,528 | ||||||||||
| Federal Express Corp. 1998 Pass Through Trust, | ||||||||||||
| Class 981B, 6.845%, 01/15/2019 | 1,290,976 | 1,352,297 | ||||||||||
| Federal Express Corp. 2012 Pass Through Trust, | ||||||||||||
| 2.625%, 01/15/2018 (Acquired 08/19/2015, Cost $166,350) * | 165,893 | 166,927 | ||||||||||
| FedEx Corp., | ||||||||||||
| 2.300%, 02/01/2020 | 2,000,000 | 2,015,408 | ||||||||||
| Fidelity National Information Services, Inc.: | ||||||||||||
| 2.000%, 04/15/2018 | 2,295,000 | 2,298,160 | ||||||||||
| 2.850%, 10/15/2018 | 11,640,000 | 11,777,317 | ||||||||||
| 3.625%, 10/15/2020 | 3,000,000 | 3,142,629 | ||||||||||
| Fiserv, Inc., | ||||||||||||
| 2.700%, 06/01/2020 | 3,500,000 | 3,541,237 | ||||||||||
| FMC Corp., | ||||||||||||
| 5.200%, 12/15/2019 | 4,496,000 | 4,790,034 | ||||||||||
| Ford Motor Credit Co. LLC: | ||||||||||||
| 6.625%, 08/15/2017 | 9,100,000 | 9,149,859 | ||||||||||
| 1.724%, 12/06/2017 | 1,250,000 | 1,250,087 | ||||||||||
| 2.021%, 05/03/2019 | 7,000,000 | 6,989,150 | ||||||||||
| 1.897%, 08/12/2019 | 10,000,000 | 9,923,500 | ||||||||||
| 2.681%, 01/09/2020 | 5,000,000 | 5,033,590 | ||||||||||
| 2.425%, 06/12/2020 | 4,505,000 | 4,503,554 | ||||||||||
| Forest Laboratories, Inc., | ||||||||||||
| 4.375%, 02/01/2019 (Acquired 09/29/2014 through 04/29/2015, Cost $2,615,736) * | 2,562,000 | 2,642,134 | ||||||||||
| Fortive Corp., | ||||||||||||
| 1.800%, 06/15/2019 | 4,650,000 | 4,616,669 | ||||||||||
| Freeport-McMoRan, Inc., | ||||||||||||
| 2.300%, 11/14/2017 | 11,469,000 | 11,440,328 | ||||||||||
| General Motors Financial Co., Inc.: | ||||||||||||
| 2.625%, 07/10/2017 | 11,613,000 | 11,614,161 | ||||||||||
| 3.100%, 01/15/2019 | 2,825,000 | 2,863,604 | ||||||||||
| 2.400%, 05/09/2019 | 4,000,000 | 4,010,700 | ||||||||||
| 2.650%, 04/13/2020 | 3,425,000 | 3,440,923 | ||||||||||
| 4.200%, 03/01/2021 | 1,215,000 | 1,274,372 | ||||||||||
| Georgia-Pacific LLC: | ||||||||||||
| 2.539%, 11/15/2019 (Acquired 02/23/2016 through 02/23/2016, Cost $8,741,051) * | 8,750,000 | 8,829,756 | ||||||||||
| 5.400%, 11/01/2020 (Acquired 03/12/2015 through 11/08/2016, Cost $10,927,277) * | 9,968,000 | 10,904,683 | ||||||||||
| Gilead Sciences, Inc., | ||||||||||||
| 2.550%, 09/01/2020 | 5,000,000 | 5,072,060 | ||||||||||
| Glencore Funding LLC: | ||||||||||||
| 2.500%, 01/15/2019 (Acquired 05/22/2013, Cost $597,012) * | 600,000 | 601,786 | ||||||||||
| 2.518%, 01/15/2019 (Acquired 06/17/2014 through 05/24/2016, Cost $5,207,932) ∞ * | 5,200,000 | 5,232,656 | ||||||||||
| 3.125%, 04/29/2019 (Acquired 01/04/2016, Cost $4,639,767) * | 5,154,000 | 5,221,930 | ||||||||||
| Grupo Bimbo SAB de CV, | ||||||||||||
| 4.875%, 06/30/2020 (Acquired 06/13/2017, Cost $1,927,906) * f | 1,800,000 | 1,923,287 | ||||||||||
| Harris Corp.: | ||||||||||||
| 1.999%, 04/27/2018 | 17,030,000 | 17,053,263 | ||||||||||
| 2.700%, 04/27/2020 | 1,000,000 | 1,010,355 | ||||||||||
| Hewlett Packard Enterprise Co.: | ||||||||||||
| 2.850%, 10/05/2018 | 7,000,000 | 7,059,892 | ||||||||||
| 3.226%, 10/05/2018 ∞ | 9,000,000 | 9,171,405 | ||||||||||
| HP, Inc.: | ||||||||||||
| 2.098%, 01/14/2019 ∞ | 5,700,000 | 5,724,197 | ||||||||||
| 4.375%, 09/15/2021 | 3,000,000 | 3,197,427 | ||||||||||
| 4.650%, 12/09/2021 | 1,417,000 | 1,529,317 | ||||||||||
| Husky Energy, Inc., | ||||||||||||
| 6.200%, 09/15/2017 f | 2,615,000 | 2,638,140 | ||||||||||
| Hutchison Whampoa International (14) Ltd., | ||||||||||||
| 1.625%, 10/31/2017 (Acquired 10/28/2014, Cost $4,988,500) * f | 5,000,000 | 4,988,055 | ||||||||||
| Hyundai Capital America: | ||||||||||||
| 2.400%, 10/30/2018 (Acquired 10/27/2015, Cost $8,124,025) * | 8,125,000 | 8,141,981 | ||||||||||
| 2.500%, 03/18/2019 (Acquired 03/14/2016, Cost $2,997,930) * | 3,000,000 | 3,009,231 | ||||||||||
| 1.750%, 09/27/2019 (Acquired 09/22/2016, Cost $4,993,900) * | 5,000,000 | 4,924,060 | ||||||||||
| Hyundai Capital Services, Inc.: | ||||||||||||
| 3.500%, 09/13/2017 (Acquired 06/04/2014 through 10/01/2015, Cost $5,066,415) * f | 5,050,000 | 5,066,382 | ||||||||||
| 1.625%, 08/30/2019 (Acquired 03/10/2017, Cost $1,429,607) * f | 1,455,000 | 1,427,297 | ||||||||||
| Ingersoll-Rand Global Holding Co. Ltd.: | ||||||||||||
| 6.875%, 08/15/2018 | 7,751,000 | 8,179,902 | ||||||||||
| 2.875%, 01/15/2019 | 10,153,000 | 10,301,051 | ||||||||||
| Ingredion, Inc., | ||||||||||||
| 1.800%, 09/25/2017 | 10,100,000 | 10,106,030 | ||||||||||
| The JM Smucker Co.: | ||||||||||||
| 1.750%, 03/15/2018 | 2,550,000 | 2,551,249 | ||||||||||
| 2.500%, 03/15/2020 | 2,725,000 | 2,753,321 | ||||||||||
| Keysight Technologies, Inc., | ||||||||||||
| 3.300%, 10/30/2019 | 20,625,000 | 21,008,625 | ||||||||||
| Kinder Morgan Energy Partners LP: | ||||||||||||
| 9.000%, 02/01/2019 | 2,692,000 | 2,969,540 | ||||||||||
| 6.500%, 04/01/2020 | 9,320,000 | 10,253,286 | ||||||||||
| Kinder Morgan, Inc./DE: | ||||||||||||
| 2.000%, 12/01/2017 | 3,000,000 | 3,001,620 | ||||||||||
| 7.250%, 06/01/2018 | 1,710,000 | 1,790,004 | ||||||||||
| Kraft Heinz Foods Co.: | ||||||||||||
| 2.000%, 07/02/2018 | 10,000,000 | 10,025,320 | ||||||||||
| 5.375%, 02/10/2020 | 2,250,000 | 2,425,005 | ||||||||||
| Laboratory Corp. of America Holdings: | ||||||||||||
| 2.500%, 11/01/2018 | 2,050,000 | 2,066,291 | ||||||||||
| 2.625%, 02/01/2020 | 2,000,000 | 2,016,470 | ||||||||||
| LyondellBasell Industries NV, | ||||||||||||
| 5.000%, 04/15/2019 f | 2,260,000 | 2,362,697 | ||||||||||
| Marathon Oil Corp., | ||||||||||||
| 6.000%, 10/01/2017 | 7,805,000 | 7,879,124 | ||||||||||
| Marathon Petroleum Corp., | ||||||||||||
| 2.700%, 12/14/2018 | 14,100,000 | 14,207,555 | ||||||||||
| Martin Marietta Materials, Inc., | ||||||||||||
| 1.822%, 05/22/2020 ∞ | 5,400,000 | 5,415,050 | ||||||||||
| Masco Corp.: | ||||||||||||
| 7.125%, 03/15/2020 | 40,000 | 44,843 | ||||||||||
| 3.500%, 04/01/2021 | 3,881,000 | 3,985,670 | ||||||||||
| McDonald's Corp., | ||||||||||||
| 2.100%, 12/07/2018 | 9,500,000 | 9,553,447 | ||||||||||
| Medtronic, Inc., | ||||||||||||
| 2.046%, 03/15/2020 ∞ | 2,250,000 | 2,286,680 | ||||||||||
| Molex Electronic Technologies LLC, | ||||||||||||
| 2.878%, 04/15/2020 (Acquired 01/05/2016, Cost $2,264,888) * | 2,300,000 | 2,316,562 | ||||||||||
| Mondelez International Holdings Netherlands BV, | ||||||||||||
| 1.625%, 10/28/2019 (Acquired 10/19/2016, Cost $9,728,940) * f | 9,750,000 | 9,658,399 | ||||||||||
| Mondelez International, Inc., | ||||||||||||
| 1.690%, 02/01/2019 ∞ | 9,337,000 | 9,373,321 | ||||||||||
| Murphy Oil Corp., | ||||||||||||
| 3.500%, 12/01/2017 | 9,756,000 | 9,767,122 | ||||||||||
| Mylan NV: | ||||||||||||
| 3.000%, 12/15/2018 f | 14,095,000 | 14,285,254 | ||||||||||
| 2.500%, 06/07/2019 f | 7,000,000 | 7,055,930 | ||||||||||
| Mylan, Inc., | ||||||||||||
| 2.600%, 06/24/2018 | 1,150,000 | 1,158,260 | ||||||||||
| National Oilwell Varco, Inc., | ||||||||||||
| 1.350%, 12/01/2017 | 5,600,000 | 5,592,474 | ||||||||||
| Newell Brands, Inc., | ||||||||||||
| 2.600%, 03/29/2019 | 798,000 | 805,781 | ||||||||||
| Nissan Motor Acceptance Corp., | ||||||||||||
| 2.650%, 09/26/2018 (Acquired 07/29/2014 through 10/08/2015, Cost $4,795,639) * | 4,760,000 | 4,808,228 | ||||||||||
| Noble Holding International Ltd., | ||||||||||||
| 5.750%, 03/16/2018 ∞ f | 1,848,000 | 1,859,199 | ||||||||||
| Norfolk Southern Railway Co., | ||||||||||||
| 9.750%, 06/15/2020 | 2,000,000 | 2,412,624 | ||||||||||
| ONEOK Partners LP: | ||||||||||||
| 2.000%, 10/01/2017 | 2,858,000 | 2,859,129 | ||||||||||
| 8.625%, 03/01/2019 | 1,500,000 | 1,650,049 | ||||||||||
| Pentair Finance SA: | ||||||||||||
| 1.875%, 09/15/2017 f | 6,000,000 | 6,002,352 | ||||||||||
| 2.900%, 09/15/2018 f | 6,409,000 | 6,475,173 | ||||||||||
| Perrigo Finance Unlimited Co., | ||||||||||||
| 3.500%, 03/15/2021 f | 1,896,000 | 1,958,716 | ||||||||||
| Petrofac Ltd., | ||||||||||||
| 3.400%, 10/10/2018 (Acquired 02/15/2017 through 04/29/2015, Cost $20,190,090) * f | 20,050,000 | 18,849,967 | ||||||||||
| Phillips 66 Partners LP, | ||||||||||||
| 2.646%, 02/15/2020 | 2,000,000 | 2,006,926 | ||||||||||
| Pioneer Natural Resources Co., | ||||||||||||
| 6.875%, 05/01/2018 | 1,000,000 | 1,040,054 | ||||||||||
| Potash Corp of Saskatchewan, Inc., | ||||||||||||
| 6.500%, 05/15/2019 f | 13,500,000 | 14,526,378 | ||||||||||
| Republic Services, Inc.: | ||||||||||||
| 3.800%, 05/15/2018 | 15,490,000 | 15,763,739 | ||||||||||
| 5.500%, 09/15/2019 | 6,446,000 | 6,920,445 | ||||||||||
| Rogers Communications, Inc., | ||||||||||||
| 6.800%, 08/15/2018 f | 3,233,000 | 3,410,482 | ||||||||||
| Rohm and Haas Co., | ||||||||||||
| 6.000%, 09/15/2017 | 1,871,000 | 1,887,233 | ||||||||||
| RPM International, Inc., | ||||||||||||
| 6.500%, 02/15/2018 | 3,870,000 | 3,982,187 | ||||||||||
| Sabine Pass Liquefaction LLC, | ||||||||||||
| 5.625%, 02/01/2021 ∞ | 10,000,000 | 10,886,730 | ||||||||||
| Sherwin-Williams Co/The, | ||||||||||||
| 2.250%, 05/15/2020 | 6,200,000 | 6,213,869 | ||||||||||
| Shire Acquisitions Investments Ireland DAC, | ||||||||||||
| 1.900%, 09/23/2019 f | 9,775,000 | 9,729,615 | ||||||||||
| Smithfield Foods, Inc., | ||||||||||||
| 2.700%, 01/31/2020 (Acquired 01/25/2017, Cost $6,996,990) * | 7,000,000 | 7,036,906 | ||||||||||
| Solvay Finance America LLC, | ||||||||||||
| 3.400%, 12/03/2020 (Acquired 05/04/2016, Cost $7,186,290) * | 7,000,000 | 7,223,020 | ||||||||||
| Stryker Corp., | ||||||||||||
| 2.000%, 03/08/2019 | 6,250,000 | 6,267,250 | ||||||||||
| Talisman Energy, Inc., | ||||||||||||
| 7.750%, 06/01/2019 f | 11,114,000 | 12,157,249 | ||||||||||
| Telefonica Emisiones SAU, | ||||||||||||
| 6.221%, 07/03/2017 f | 1,344,000 | 1,344,000 | ||||||||||
| Temple-Inland, Inc., | ||||||||||||
| 6.625%, 01/15/2018 | 4,676,000 | 4,791,567 | ||||||||||
| Teva Pharmaceutical Finance Netherlands III BV: | ||||||||||||
| 1.700%, 07/19/2019 f | 7,000,000 | 6,937,371 | ||||||||||
| 2.200%, 07/21/2021 f | 15,654,000 | 15,366,890 | ||||||||||
| Texas Eastern Transmission LP, | ||||||||||||
| 6.000%, 09/15/2017 (Acquired 05/21/2015, Cost $3,738,154) * | 3,705,000 | 3,733,829 | ||||||||||
| Thomson Reuters Corp., | ||||||||||||
| 1.650%, 09/29/2017 f | 7,000,000 | 7,001,582 | ||||||||||
| Time Warner Cable LLC: | ||||||||||||
| 6.750%, 07/01/2018 | 6,000,000 | 6,277,248 | ||||||||||
| 8.750%, 02/14/2019 | 4,395,000 | 4,834,096 | ||||||||||
| 8.250%, 04/01/2019 | 2,564,000 | 2,828,484 | ||||||||||
| Time Warner Co., Inc., | ||||||||||||
| 7.250%, 10/15/2017 | 7,831,000 | 7,952,263 | ||||||||||
| Time Warner, Inc., | ||||||||||||
| 4.875%, 03/15/2020 | 3,225,000 | 3,447,122 | ||||||||||
| Total Capital International SA: | ||||||||||||
| 1.755%, 08/10/2018 ∞ f | 4,350,000 | 4,372,720 | ||||||||||
| 1.617%, 06/19/2019 ∞ f | 7,700,000 | 7,722,576 | ||||||||||
| TransCanada PipeLines Ltd.: | ||||||||||||
| 1.875%, 01/12/2018 f | 4,000,000 | 4,005,356 | ||||||||||
| 3.125%, 01/15/2019 f | 6,800,000 | 6,919,932 | ||||||||||
| TSMC Global Ltd., | ||||||||||||
| 1.625%, 04/03/2018 (Acquired 08/05/2014 through 11/03/2015, Cost $15,871,380) * f | 15,919,000 | 15,886,888 | ||||||||||
| TTX Co., | ||||||||||||
| 2.250%, 02/01/2019 (Acquired 01/12/2016, Cost $7,440,390) * | 7,450,000 | 7,454,098 | ||||||||||
| Tyco Electronics Group SA, | ||||||||||||
| 6.550%, 10/01/2017 f | 860,000 | 870,188 | ||||||||||
| Vale Overseas Ltd.: | ||||||||||||
| 4.625%, 09/15/2020 f | 5,000,000 | 5,172,200 | ||||||||||
| 5.875%, 06/10/2021 f | 5,000,000 | 5,367,500 | ||||||||||
| Valero Energy Corp., | ||||||||||||
| 9.375%, 03/15/2019 | 10,349,000 | 11,581,235 | ||||||||||
| Verisk Analytics, Inc.: | ||||||||||||
| 4.875%, 01/15/2019 | 19,150,000 | 19,940,838 | ||||||||||
| 5.800%, 05/01/2021 | 4,949,000 | 5,502,575 | ||||||||||
| Verizon Communications, Inc., | ||||||||||||
| 2.946%, 03/15/2022 (Acquired 09/11/2013 through 12/09/2014, Cost $14,253,335) * | 14,494,000 | 14,594,704 | ||||||||||
| Vodafone Group PLC, | ||||||||||||
| 1.250%, 09/26/2017 f | 10,000,000 | 9,990,100 | ||||||||||
| Volkswagen Group of America Finance LLC, | ||||||||||||
| 1.612%, 11/20/2017 (Acquired 11/12/2014, Cost $4,500,000) ∞ * | 4,500,000 | 4,503,074 | ||||||||||
| Vulcan Materials Co., | ||||||||||||
| 1.846%, 06/15/2020 ∞ | 6,550,000 | 6,549,568 | ||||||||||
| Walgreen Co., | ||||||||||||
| 5.250%, 01/15/2019 | 2,330,000 | 2,440,018 | ||||||||||
| Walgreens Boots Alliance, Inc., | ||||||||||||
| 1.750%, 11/17/2017 | 1,150,000 | 1,150,718 | ||||||||||
| Westlake Chemical Corp., | ||||||||||||
| 4.625%, 02/15/2021 | 11,000,000 | 11,385,000 | ||||||||||
| Yara International ASA, | ||||||||||||
| 7.875%, 06/11/2019 (Acquired 10/02/2014, Cost $546,191) * f | 500,000 | 549,597 | ||||||||||
| Zimmer Holdings, Inc., | ||||||||||||
| 2.700%, 04/01/2020 | 11,610,000 | 11,715,848 | ||||||||||
| Zoetis, Inc.: | ||||||||||||
| 1.875%, 02/01/2018 | 11,000,000 | 11,006,677 | ||||||||||
| 3.450%, 11/13/2020 | 7,932,000 | 8,203,116 | ||||||||||
| 1,298,373,798 | 28.3 | % | ||||||||||
| Utilities | ||||||||||||
| Commonwealth Edison Co., | ||||||||||||
| 6.150%, 09/15/2017 | 100,000 | 100,905 | ||||||||||
| Dominion Resources, Inc./VA: | ||||||||||||
| 6.400%, 06/15/2018 | 3,550,000 | 3,704,673 | ||||||||||
| 2.962%, 07/01/2019 | 4,000,000 | 4,059,812 | ||||||||||
| 2.500%, 12/01/2019 | 9,500,000 | 9,573,977 | ||||||||||
| ENEL Finance International NV, | ||||||||||||
| 5.125%, 10/07/2019 (Acquired 04/13/2017, Cost $13,942,095) * f | 13,116,000 | 13,955,608 | ||||||||||
| Exelon Corp., | ||||||||||||
| 2.850%, 06/15/2020 | 2,275,000 | 2,311,241 | ||||||||||
| Exelon Generation Co LLC: | ||||||||||||
| 2.950%, 01/15/2020 | 7,500,000 | 7,615,672 | ||||||||||
| 4.000%, 10/01/2020 (100.00, 07/01/2020) | 8,300,000 | 8,659,880 | ||||||||||
| Great Plains Energy, Inc., | ||||||||||||
| 2.500%, 03/09/2020 | 10,000,000 | 10,093,320 | ||||||||||
| Iberdrola Finance Ireland Ltd, | ||||||||||||
| 5.000%, 09/11/2019 (Acquired 05/19/2017, Cost $2,543,465) * f | 2,400,000 | 2,541,782 | ||||||||||
| National Rural Utilities Cooperative Finance Corp., | ||||||||||||
| 10.375%, 11/01/2018 | 1,075,000 | 1,195,528 | ||||||||||
| NextEra Energy Capital Holdings, Inc.: | ||||||||||||
| Class F, 2.056%, 09/01/2017 | 9,335,000 | 9,339,360 | ||||||||||
| 1.649%, 09/01/2018 | 6,575,000 | 6,555,130 | ||||||||||
| Orange Cogen Funding Corp., | ||||||||||||
| 8.175%, 03/15/2022 (Acquired 02/10/2015 through 09/16/2015, Cost $9,961,894) * | 8,787,960 | 9,943,454 | ||||||||||
| Pacific Gas & Electric Co., | ||||||||||||
| 8.250%, 10/15/2018 | 8,320,000 | 8,990,118 | ||||||||||
| Public Service Co. of New Mexico, | ||||||||||||
| 7.950%, 05/15/2018 | 1,431,000 | 1,505,797 | ||||||||||
| Sempra Energy, | ||||||||||||
| 9.800%, 02/15/2019 | 2,575,000 | 2,888,048 | ||||||||||
| The Southern Co.: | ||||||||||||
| 1.850%, 07/01/2019 | 4,750,000 | 4,731,589 | ||||||||||
| 2.750%, 06/15/2020 | 11,000,000 | 11,127,963 | ||||||||||
| Southern Power Co., | ||||||||||||
| Class D, 1.950%, 12/15/2019 | 4,600,000 | 4,582,846 | ||||||||||
| 123,476,703 | 2.7 | % | ||||||||||
| Financials | ||||||||||||
| ABN AMRO Bank NV: | ||||||||||||
| 2.500%, 10/30/2018 (Acquired 03/04/2014 through 04/29/2015, Cost $1,153,981) * f | 1,150,000 | 1,158,980 | ||||||||||
| 2.100%, 01/18/2019 (Acquired 04/04/2017, Cost $18,001,080) * f | 18,000,000 | 18,028,134 | ||||||||||
| 1.800%, 09/20/2019 (Acquired 09/13/2016, Cost $4,743,635) * f | 4,750,000 | 4,721,206 | ||||||||||
| American Express Co.: | ||||||||||||
| 7.000%, 03/19/2018 | 2,661,000 | 2,759,909 | ||||||||||
| 1.762%, 05/22/2018 ∞ | 5,528,000 | 5,549,493 | ||||||||||
| American Express Credit Corp., | ||||||||||||
| 1.672%, 08/15/2019 ∞ | 2,000,000 | 2,010,408 | ||||||||||
| American International Group, Inc.: | ||||||||||||
| 2.300%, 07/16/2019 | 1,400,000 | 1,407,427 | ||||||||||
| 3.375%, 08/15/2020 | 2,000,000 | 2,069,590 | ||||||||||
| 6.400%, 12/15/2020 | 10,000,000 | 11,315,970 | ||||||||||
| ANZ New Zealand (Int'l) Ltd./London: | ||||||||||||
| 2.600%, 09/23/2019 (Acquired 09/16/2014, Cost $3,347,822) * f | 3,350,000 | 3,375,460 | ||||||||||
| 2.850%, 08/06/2020 (Acquired 07/30/2015, Cost $2,997,510) * f | 3,000,000 | 3,044,595 | ||||||||||
| Australia & New Zealand Banking Group Ltd./New York NY: | ||||||||||||
| 1.875%, 10/06/2017 f | 750,000 | 750,820 | ||||||||||
| 2.250%, 06/13/2019 f | 1,000,000 | 1,007,264 | ||||||||||
| Bank of America Corp.: | ||||||||||||
| 5.750%, 12/01/2017 | 5,000,000 | 5,084,615 | ||||||||||
| Class L, 2.600%, 01/15/2019 | 5,750,000 | 5,804,148 | ||||||||||
| 5.625%, 07/01/2020 | 2,000,000 | 2,190,212 | ||||||||||
| 2.625%, 10/19/2020 | 10,000,000 | 10,100,830 | ||||||||||
| 5.875%, 01/05/2021 | 10,000,000 | 11,114,360 | ||||||||||
| Bank of Montreal: | ||||||||||||
| 1.755%, 04/09/2018 ∞ f | 1,325,000 | 1,329,775 | ||||||||||
| 1.800%, 07/31/2018 f | 5,000,000 | 5,007,585 | ||||||||||
| 1.900%, 08/27/2021 f | 10,000,000 | 9,813,350 | ||||||||||
| The Bank of New York Mellon Corp., | ||||||||||||
| 1.730%, 08/01/2018 ∞ | 1,000,000 | 1,005,482 | ||||||||||
| The Bank of Nova Scotia, | ||||||||||||
| 1.698%, 06/11/2018 ∞ f | 3,500,000 | 3,510,315 | ||||||||||
| The Bank of Tokyo-Mitsubishi UFJ Ltd., | ||||||||||||
| 2.150%, 09/14/2018 (Acquired 09/08/2015, Cost $6,298,173) * f | 6,300,000 | 6,313,136 | ||||||||||
| Banque Federative du Credit Mutuel SA: | ||||||||||||
| 2.000%, 04/12/2019 (Acquired 04/06/2016 through 10/21/2016, Cost $18,595,831) * f | 18,600,000 | 18,597,954 | ||||||||||
| 2.750%, 10/15/2020 (Acquired 01/24/2017, Cost $2,209,986) * f | 2,200,000 | 2,234,910 | ||||||||||
| Barclays Bank PLC, | ||||||||||||
| 5.140%, 10/14/2020 f | 3,000,000 | 3,210,858 | ||||||||||
| Barclays PLC: | ||||||||||||
| 2.000%, 03/16/2018 f | 4,000,000 | 4,004,068 | ||||||||||
| 2.750%, 11/08/2019 f | 5,000,000 | 5,045,035 | ||||||||||
| 2.875%, 06/08/2020 f | 3,000,000 | 3,029,715 | ||||||||||
| 3.250%, 01/12/2021 f | 6,175,000 | 6,279,777 | ||||||||||
| BB&T Corp., | ||||||||||||
| 2.106%, 06/15/2018 ∞ | 4,150,000 | 4,175,091 | ||||||||||
| The Bear Stearns Companies LLC: | ||||||||||||
| 6.400%, 10/02/2017 | 7,700,000 | 7,788,758 | ||||||||||
| 7.250%, 02/01/2018 | 450,000 | 464,115 | ||||||||||
| BNP Paribas SA: | ||||||||||||
| 2.375%, 09/14/2017 f | 3,000,000 | 3,005,070 | ||||||||||
| 2.400%, 12/12/2018 f | 1,600,000 | 1,613,552 | ||||||||||
| 2.375%, 05/21/2020 f | 3,225,000 | 3,248,372 | ||||||||||
| BNZ International Funding Ltd./London: | ||||||||||||
| 1.900%, 02/26/2018 (Acquired 02/23/2015, Cost $1,701,170) * f | 1,700,000 | 1,701,637 | ||||||||||
| 2.350%, 03/04/2019 (Acquired 09/03/2014 through 11/13/2014, Cost $7,236,251) * f | 7,250,000 | 7,283,647 | ||||||||||
| BPCE SA: | ||||||||||||
| 2.500%, 12/10/2018 f | 10,525,000 | 10,618,704 | ||||||||||
| 2.500%, 07/15/2019 f | 1,000,000 | 1,008,380 | ||||||||||
| 3.000%, 05/22/2022 (Acquired 05/15/2017, Cost $9,938,000) * f | 10,000,000 | 10,086,970 | ||||||||||
| Caisse Centrale Desjardins: | ||||||||||||
| 1.750%, 01/29/2018 (Acquired 04/06/2015, Cost $4,004,578) * f | 4,000,000 | 4,003,360 | ||||||||||
| 1.837%, 01/29/2018 (Acquired 01/26/2015, Cost $10,000,000) ∞ * f | 10,000,000 | 10,030,450 | ||||||||||
| Canadian Imperial Bank of Commerce/Canada, | ||||||||||||
| 1.600%, 09/06/2019 f | 20,000,000 | 19,810,780 | ||||||||||
| Capital One Bank (USA) NA, | ||||||||||||
| 2.250%, 02/13/2019 | 1,500,000 | 1,504,023 | ||||||||||
| Capital One Financial Corp., | ||||||||||||
| 2.500%, 05/12/2020 | 10,400,000 | 10,445,053 | ||||||||||
| Capital One NA/Mclean VA: | ||||||||||||
| 1.500%, 09/05/2017 | 5,000,000 | 5,000,445 | ||||||||||
| 1.851%, 02/05/2018 ∞ | 2,000,000 | 2,004,672 | ||||||||||
| 2.400%, 09/05/2019 | 5,300,000 | 5,318,884 | ||||||||||
| 1.850%, 09/13/2019 | 5,000,000 | 4,957,720 | ||||||||||
| Citigroup, Inc.: | ||||||||||||
| 1.550%, 08/14/2017 | 2,400,000 | 2,400,187 | ||||||||||
| 1.700%, 04/27/2018 | 2,000,000 | 1,997,996 | ||||||||||
| 2.150%, 07/30/2018 | 3,975,000 | 3,987,498 | ||||||||||
| 2.050%, 12/07/2018 | 4,000,000 | 4,005,948 | ||||||||||
| 2.450%, 01/10/2020 | 14,825,000 | 14,914,128 | ||||||||||
| Citizens Bank NA/Providence RI: | ||||||||||||
| 1.600%, 12/04/2017 | 14,300,000 | 14,295,381 | ||||||||||
| 2.500%, 03/14/2019 | 2,700,000 | 2,719,788 | ||||||||||
| 2.250%, 03/02/2020 | 5,000,000 | 4,995,320 | ||||||||||
| 2.200%, 05/26/2020 | 9,100,000 | 9,084,385 | ||||||||||
| CNA Financial Corp., | ||||||||||||
| 7.350%, 11/15/2019 | 14,915,000 | 16,667,319 | �� | |||||||||
| Comerica Bank: | ||||||||||||
| 5.200%, 08/22/2017 | 6,825,000 | 6,856,204 | ||||||||||
| 2.500%, 06/02/2020 | 7,000,000 | 7,015,260 | ||||||||||
| Commonwealth Bank of Australia, | ||||||||||||
| 1.636%, 03/12/2018 (Acquired 11/09/2016, Cost $2,500,905) ∞ * f | 2,500,000 | 2,504,525 | ||||||||||
| Commonwealth Bank of Australia/New York NY: | ||||||||||||
| 2.500%, 09/20/2018 f | 2,150,000 | 2,168,567 | ||||||||||
| 1.750%, 11/02/2018 f | 15,000,000 | 15,012,045 | ||||||||||
| 2.050%, 03/15/2019 f | 1,500,000 | 1,501,559 | ||||||||||
| Compass Bank: | ||||||||||||
| 1.850%, 09/29/2017 | 10,505,000 | 10,507,542 | ||||||||||
| 6.400%, 10/01/2017 | 2,000,000 | 2,020,488 | ||||||||||
| 2.750%, 09/29/2019 | 9,906,000 | 9,982,712 | ||||||||||
| Cooperatieve Rabobank UA/NY, | ||||||||||||
| 2.750%, 01/10/2022 f | 5,000,000 | 5,076,040 | ||||||||||
| Credit Agricole SA/London, | ||||||||||||
| 2.625%, 10/03/2018 (Acquired 03/09/2017, Cost $10,053,943) * f | 10,000,000 | 10,092,810 | ||||||||||
| Credit Suisse, | ||||||||||||
| 2.750%, 03/26/2020 f | 9,000,000 | 9,070,767 | ||||||||||
| Credit Suisse AG/New York NY: | ||||||||||||
| 6.000%, 02/15/2018 f | 8,440,000 | 8,653,574 | ||||||||||
| 1.700%, 04/27/2018 f | 2,500,000 | 2,499,830 | ||||||||||
| Deutsche Bank AG: | ||||||||||||
| 1.875%, 02/13/2018 f | 3,000,000 | 2,999,127 | ||||||||||
| 2.608%, 01/18/2019 ∞ f | 4,000,000 | 4,047,028 | ||||||||||
| 2.500%, 02/13/2019 f | 8,000,000 | 8,029,768 | ||||||||||
| 2.950%, 08/20/2020 f | 4,400,000 | 4,426,070 | ||||||||||
| Deutsche Bank AG/London, | ||||||||||||
| 6.000%, 09/01/2017 f | 3,467,000 | 3,489,875 | ||||||||||
| Discover Bank/Greenwood DE: | ||||||||||||
| 2.000%, 02/21/2018 | 1,875,000 | 1,877,304 | ||||||||||
| 2.600%, 11/13/2018 | 8,000,000 | 8,068,216 | ||||||||||
| 8.700%, 11/18/2019 | 5,395,000 | 6,095,918 | ||||||||||
| 3.100%, 06/04/2020 | 8,735,000 | 8,901,341 | ||||||||||
| Fifth Third Bancorp, | ||||||||||||
| 2.875%, 07/27/2020 | 5,000,000 | 5,103,900 | ||||||||||
| First Horizon National Corp., | ||||||||||||
| 3.500%, 12/15/2020 | 7,569,000 | 7,763,077 | ||||||||||
| First Niagara Financial Group, Inc., | ||||||||||||
| 6.750%, 03/19/2020 | 3,850,000 | 4,300,373 | ||||||||||
| First Tennessee Bank NA, | ||||||||||||
| 2.950%, 12/01/2019 | 15,286,000 | 15,452,786 | ||||||||||
| The Goldman Sachs Group, Inc.: | ||||||||||||
| 2.328%, 12/10/2017 ∞ | 1,000,000 | 996,916 | ||||||||||
| 5.950%, 01/18/2018 | 1,045,000 | 1,068,353 | ||||||||||
| 6.150%, 04/01/2018 | 4,775,000 | 4,928,230 | ||||||||||
| 2.900%, 07/19/2018 | 1,000,000 | 1,011,358 | ||||||||||
| 7.500%, 02/15/2019 | 3,000,000 | 3,254,109 | ||||||||||
| 2.173%, 10/23/2019 ∞ | 2,751,000 | 2,785,440 | ||||||||||
| 2.300%, 12/13/2019 | 12,000,000 | 12,032,772 | ||||||||||
| 3.000%, 04/26/2022 | 5,000,000 | 5,038,415 | ||||||||||
| Guardian Life Global Funding, | ||||||||||||
| 2.000%, 04/26/2021 (Acquired 04/19/2016, Cost $7,814,671) * | 7,825,000 | 7,710,896 | ||||||||||
| The Hartford Financial Services Group, Inc.: | ||||||||||||
| 6.300%, 03/15/2018 | 1,825,000 | 1,881,883 | ||||||||||
| 6.000%, 01/15/2019 | 455,000 | 482,202 | ||||||||||
| 5.500%, 03/30/2020 | 1,947,000 | 2,115,711 | ||||||||||
| HSBC Bank USA NA: | ||||||||||||
| 6.000%, 08/09/2017 | 925,000 | 928,793 | ||||||||||
| 4.875%, 08/24/2020 | 10,000,000 | 10,755,180 | ||||||||||
| HSBC Finance Corp., | ||||||||||||
| 6.676%, 01/15/2021 | 3,221,000 | 3,629,951 | ||||||||||
| HSBC USA, Inc.: | ||||||||||||
| 2.176%, 09/24/2018 ∞ | 1,000,000 | 1,006,851 | ||||||||||
| 1.792%, 11/13/2019 ∞ | 9,750,000 | 9,761,466 | ||||||||||
| Humana, Inc., | ||||||||||||
| 7.200%, 06/15/2018 | 6,610,000 | 6,943,071 | ||||||||||
| Huntington Bancshares Inc./OH: | ||||||||||||
| 2.600%, 08/02/2018 | 7,375,000 | 7,424,715 | ||||||||||
| 3.150%, 03/14/2021 | 1,335,000 | 1,361,331 | ||||||||||
| The Huntington National Bank, | ||||||||||||
| 2.000%, 06/30/2018 | 12,990,000 | 13,036,140 | ||||||||||
| ING Bank NV: | ||||||||||||
| 1.650%, 08/15/2019 (Acquired 08/08/2016, Cost $9,989,800) * f | 10,000,000 | 9,901,550 | ||||||||||
| 2.500%, 10/01/2019 (Acquired 04/18/2016, Cost $9,060,332) * f | 8,961,000 | 9,021,989 | ||||||||||
| Jackson National Life Global Funding, | ||||||||||||
| 2.200%, 01/30/2020 (Acquired 01/24/2017, Cost $24,098,463) * | 24,125,000 | 24,131,972 | ||||||||||
| Jefferies Group LLC: | ||||||||||||
| 5.125%, 04/13/2018 | 4,836,000 | 4,960,358 | ||||||||||
| 6.875%, 04/15/2021 | 1,565,000 | 1,781,303 | ||||||||||
| JPMorgan Chase & Co.: | ||||||||||||
| 1.706%, 04/25/2018 ∞ | 3,500,000 | 3,511,683 | ||||||||||
| Class 1, 1.802%, 01/28/2019 ∞ | 750,000 | 754,691 | ||||||||||
| 6.300%, 04/23/2019 | 5,000,000 | 5,381,345 | ||||||||||
| 2.250%, 01/23/2020 | 8,100,000 | 8,125,126 | ||||||||||
| KEB Hana Bank, | ||||||||||||
| 1.750%, 10/18/2019 (Acquired 10/11/2016, Cost $17,942,040) * f | 18,000,000 | 17,722,620 | ||||||||||
| KeyBank NA/Cleveland OH: | ||||||||||||
| 2.350%, 03/08/2019 | 6,500,000 | 6,542,185 | ||||||||||
| 1.600%, 08/22/2019 | 3,000,000 | 2,977,770 | ||||||||||
| 2.500%, 12/15/2019 | 5,325,000 | 5,378,101 | ||||||||||
| Kookmin Bank: | ||||||||||||
| 1.625%, 07/14/2017 f | 6,000,000 | 5,999,380 | ||||||||||
| 1.625%, 08/01/2019 (Acquired 07/25/2016, Cost $7,976,960) * f | 8,000,000 | 7,875,200 | ||||||||||
| LeasePlan Corp. NV, | ||||||||||||
| 2.500%, 05/16/2018 (Acquired 05/07/2013 through 02/17/2016, Cost $16,370,178) * f | 16,435,000 | 16,478,849 | ||||||||||
| Lloyds Bank PLC: | ||||||||||||
| 1.750%, 05/14/2018 f | 5,825,000 | 5,833,004 | ||||||||||
| 2.000%, 08/17/2018 f | 4,500,000 | 4,507,713 | ||||||||||
| 2.050%, 01/22/2019 f | 4,000,000 | 4,008,380 | ||||||||||
| Macquarie Bank Ltd.: | ||||||||||||
| 1.797%, 10/27/2017 (Acquired 10/22/2014, Cost $5,000,000) ∞ * f | 5,000,000 | 5,008,410 | ||||||||||
| 2.400%, 01/21/2020 (Acquired 11/22/2016 through 02/28/2017, Cost $12,985,028) * f | 13,000,000 | 13,022,243 | ||||||||||
| Macquarie Group Ltd., | ||||||||||||
| 4.875%, 08/10/2017 (Acquired 10/29/2014 through 11/25/2014, Cost $2,759,112) * f | 2,750,000 | 2,758,676 | ||||||||||
| Manufacturers & Traders Trust Co.: | ||||||||||||
| 6.625%, 12/04/2017 | 1,000,000 | 1,020,346 | ||||||||||
| 2.437%, 12/28/2020 ∞ | 282,000 | 282,533 | ||||||||||
| Marsh & McLennan Cos, Inc., | ||||||||||||
| 2.750%, 01/30/2022 | 7,000,000 | 7,068,383 | ||||||||||
| Mizuho Bank Ltd.: | ||||||||||||
| 1.746%, 09/25/2017 (Acquired 03/30/2016, Cost $2,997,472) ∞ * f | 3,000,000 | 3,002,190 | ||||||||||
| 1.936%, 03/26/2018 (Acquired 06/21/2016, Cost $1,248,700) ∞ * f | 1,250,000 | 1,253,741 | ||||||||||
| 2.346%, 10/20/2018 (Acquired 10/13/2015, Cost $2,500,000) ∞ * f | 2,500,000 | 2,525,783 | ||||||||||
| 2.450%, 04/16/2019 (Acquired 09/09/2016, Cost $2,424,244) * f | 2,400,000 | 2,412,818 | ||||||||||
| Morgan Stanley: | ||||||||||||
| 2.036%, 01/05/2018 ∞ | 1,500,000 | 1,504,343 | ||||||||||
| 6.625%, 04/01/2018 | 2,000,000 | 2,071,020 | ||||||||||
| 2.003%, 01/24/2019 ∞ | 4,750,000 | 4,784,019 | ||||||||||
| 7.300%, 05/13/2019 | 15,125,000 | 16,535,633 | ||||||||||
| 2.310%, 01/27/2020 ∞ | 4,000,000 | 4,060,524 | ||||||||||
| National Australia Bank Ltd/New York, | ||||||||||||
| 2.250%, 01/10/2020 f | 24,600,000 | 24,675,473 | ||||||||||
| National Bank of Canada: | ||||||||||||
| 2.082%, 12/14/2018 ∞ f | 1,000,000 | 1,008,984 | ||||||||||
| 2.150%, 06/12/2020 f | 23,525,000 | 23,476,186 | ||||||||||
| Nationwide Building Society: | ||||||||||||
| 2.350%, 01/21/2020 (Acquired 01/12/2015 through 02/16/2017, Cost $9,693,838) * f | 9,700,000 | 9,736,006 | ||||||||||
| 6.250%, 02/25/2020 (Acquired 02/08/2017, Cost $5,503,681) * f | 5,000,000 | 5,505,600 | ||||||||||
| New York Life Global Funding, | ||||||||||||
| 1.550%, 11/02/2018 (Acquired 10/27/2015, Cost $9,486,415) * | 9,500,000 | 9,483,565 | ||||||||||
| Nomura Holdings, Inc., | ||||||||||||
| 2.750%, 03/19/2019 f | 5,313,000 | 5,366,167 | ||||||||||
| Nordea Bank AB, | ||||||||||||
| 1.916%, 09/30/2019 (Acquired 09/22/2016, Cost $2,400,000) ∞ * f | 2,400,000 | 2,415,542 | ||||||||||
| The Northern Trust Co., | ||||||||||||
| 6.500%, 08/15/2018 | 4,075,000 | 4,283,469 | ||||||||||
| Pricoa Global Funding I, | ||||||||||||
| 1.450%, 09/13/2019 (Acquired 09/06/2016, Cost $11,998,920) * | 12,000,000 | 11,841,984 | ||||||||||
| Principal Life Global Funding II: | ||||||||||||
| 1.500%, 04/18/2019 (Acquired 04/11/2016, Cost $2,990,640) * | 3,000,000 | 2,972,328 | ||||||||||
| 2.150%, 01/10/2020 (Acquired 01/03/2017, Cost $19,073,451) * | 19,100,000 | 19,121,640 | ||||||||||
| Protective Life Global Funding, | ||||||||||||
| 1.555%, 09/13/2019 (Acquired 09/07/2016, Cost $18,000,000) * | 18,000,000 | 17,735,886 | ||||||||||
| Prudential Financial, Inc., | ||||||||||||
| 7.375%, 06/15/2019 | 7,000,000 | 7,715,855 | ||||||||||
| Regions Bank/Birmingham AL, | ||||||||||||
| 7.500%, 05/15/2018 | 10,034,000 | 10,504,314 | ||||||||||
| Reliance Standard Life Global Funding II: | ||||||||||||
| 2.150%, 10/15/2018 (Acquired 10/13/2015 through 06/09/2016, Cost $13,013,107) * | 13,000,000 | 13,027,950 | ||||||||||
| 2.500%, 04/24/2019 (Acquired 03/28/2017, Cost $2,314,686) * | 2,300,000 | 2,315,307 | ||||||||||
| 2.500%, 01/15/2020 (Acquired 01/07/2015, Cost $5,979,540) * | 6,000,000 | 6,009,876 | ||||||||||
| Royal Bank of Canada, | ||||||||||||
| 1.400%, 10/13/2017 f | 8,450,000 | 8,450,592 | ||||||||||
| Santander Bank NA, | ||||||||||||
| 8.750%, 05/30/2018 | 3,478,000 | 3,686,610 | ||||||||||
| Santander Holdings USA, Inc., | ||||||||||||
| 2.700%, 05/24/2019 | 5,000,000 | 5,036,915 | ||||||||||
| Santander UK Group Holdings PLC, | ||||||||||||
| 3.125%, 01/08/2021 f | 3,500,000 | 3,553,116 | ||||||||||
| Santander UK PLC, | ||||||||||||
| 2.500%, 03/14/2019 f | 10,000,000 | 10,080,950 | ||||||||||
| Skandinaviska Enskilda Banken AB: | ||||||||||||
| 2.375%, 11/20/2018 (Acquired 08/05/2015, Cost $5,021,290) * f | 5,000,000 | 5,039,295 | ||||||||||
| 2.375%, 03/25/2019 (Acquired 08/23/2016, Cost $962,722) * f | 950,000 | 955,820 | ||||||||||
| 2.450%, 05/27/2020 (Acquired 05/19/2015, Cost $4,692,762) * f | 4,700,000 | 4,737,543 | ||||||||||
| Societe Generale SA: | ||||||||||||
| 2.379%, 10/01/2018 ∞ f | 6,000,000 | 6,040,254 | ||||||||||
| 2.625%, 10/01/2018 f | 5,700,000 | 5,758,801 | ||||||||||
| Standard Chartered PLC: | ||||||||||||
| 1.559%, 09/08/2017 (Acquired 09/03/2014, Cost $10,000,000) ∞ * f | 10,000,000 | 9,998,420 | ||||||||||
| 1.798%, 04/17/2018 (Acquired 04/13/2015, Cost $2,000,000) ∞ * f | 2,000,000 | 1,997,740 | ||||||||||
| 2.100%, 08/19/2019 (Acquired 08/16/2016, Cost $4,492,080) * f | 4,500,000 | 4,483,458 | ||||||||||
| 2.400%, 09/08/2019 (Acquired 09/03/2014 through 10/12/2016, Cost $4,232,068) * f | 4,225,000 | 4,229,153 | ||||||||||
| Sumitomo Mitsui Banking Corp.: | ||||||||||||
| 1.738%, 01/16/2018 ∞ f | 2,885,000 | 2,891,783 | ||||||||||
| 1.950%, 07/23/2018 f | 3,500,000 | 3,509,247 | ||||||||||
| 1.762%, 10/19/2018 f | 5,000,000 | 4,993,050 | ||||||||||
| 2.098%, 01/18/2019 ∞ f | 1,000,000 | 1,008,267 | ||||||||||
| 2.450%, 01/16/2020 f | 4,500,000 | 4,527,832 | ||||||||||
| Sumitomo Mitsui Trust Bank Ltd, | ||||||||||||
| 2.050%, 03/06/2019 (Acquired 02/27/2017, Cost $22,387,232) * f | 22,400,000 | 22,399,843 | ||||||||||
| SunTrust Bank/Atlanta GA, | ||||||||||||
| 7.250%, 03/15/2018 | 154,000 | 159,775 | ||||||||||
| SunTrust Banks, Inc., | ||||||||||||
| 6.000%, 09/11/2017 | 780,000 | 786,088 | ||||||||||
| Svenska Handelsbanken AB: | ||||||||||||
| 1.625%, 03/21/2018 f | 1,100,000 | 1,100,394 | ||||||||||
| 1.757%, 06/17/2019 ∞ f | 2,000,000 | 2,008,892 | ||||||||||
| 2.229%, 10/01/2020 ∞ f | 10,000,000 | 10,043,540 | ||||||||||
| Swedbank AB, | ||||||||||||
| 2.125%, 09/29/2017 (Acquired 08/30/2016, Cost $3,006,284) * f | 3,000,000 | 3,005,037 | ||||||||||
| Synchrony Financial: | ||||||||||||
| 2.600%, 01/15/2019 | 2,000,000 | 2,010,680 | ||||||||||
| 3.000%, 08/15/2019 | 13,350,000 | 13,538,208 | ||||||||||
| 2.700%, 02/03/2020 | 6,600,000 | 6,633,469 | ||||||||||
| UBS AG/Stamford CT: | ||||||||||||
| 1.800%, 03/26/2018 f | 8,825,000 | 8,839,182 | ||||||||||
| 5.750%, 04/25/2018 f | 3,351,000 | 3,457,840 | ||||||||||
| UBS Group Funding Jersey Ltd.: | ||||||||||||
| 2.736%, 09/24/2020 (Acquired 09/21/2015, Cost $2,000,000) ∞ * f | 2,000,000 | 2,036,584 | ||||||||||
| 3.000%, 04/15/2021 (Acquired 03/29/2016, Cost $2,997,750) * f | 3,000,000 | 3,046,011 | ||||||||||
| UBS Group Funding Switzerland AG, | ||||||||||||
| 2.950%, 09/24/2020 (Acquired 05/11/2017, Cost $7,682,487) * f | 7,600,000 | 7,763,909 | ||||||||||
| UnitedHealth Group, Inc., | ||||||||||||
| 6.000%, 02/15/2018 | 2,625,000 | 2,695,040 | ||||||||||
| Voya Financial, Inc., | ||||||||||||
| 2.900%, 02/15/2018 | 17,494,000 | 17,612,329 | ||||||||||
| WEA Finance LLC / Westfield UK & Europe Finance PLC: | ||||||||||||
| 2.700%, 09/17/2019 (Acquired 09/10/2014, Cost $6,986,000) * | 7,000,000 | 7,057,848 | ||||||||||
| 3.250%, 10/05/2020 (Acquired 09/28/2015, Cost $4,982,850) * | 5,000,000 | 5,088,320 | ||||||||||
| Wells Fargo & Co.: | ||||||||||||
| Class N, 1.852%, 01/30/2020 ∞ | 1,975,000 | 1,987,855 | ||||||||||
| 2.500%, 03/04/2021 | 3,900,000 | 3,913,490 | ||||||||||
| Westpac Banking Corp.: | ||||||||||||
| 2.000%, 08/14/2017 f | 8,000,000 | 8,005,352 | ||||||||||
| 1.650%, 05/13/2019 f | 4,650,000 | 4,625,136 | ||||||||||
| Willis Towers Watson PLC, | ||||||||||||
| 5.750%, 03/15/2021 f | 6,800,000 | 7,501,862 | ||||||||||
| 1,247,379,046 | 27.2 | % | ||||||||||
| Total Corporate Bonds | 2,669,229,547 | 58.2 | % | |||||||||
| Taxable Municipal Bonds | ||||||||||||
| City of Bristol VA, | ||||||||||||
| 3.002%, 10/01/2020 | 8,210,000 | 8,323,873 | ||||||||||
| City of Pittsburg CA, | ||||||||||||
| 5.864%, 07/01/2021 | 2,290,000 | 2,429,690 | ||||||||||
| City of Williston ND, | ||||||||||||
| 3.100%, 07/15/2025 (Callable 07/21/2017) | 4,045,000 | 4,045,526 | ||||||||||
| Cook County School District No. 144 Prairie Hills: | ||||||||||||
| 2.000%, 12/01/2017 | 810,000 | 812,495 | ||||||||||
| 2.000%, 12/01/2017 | 120,000 | 119,988 | ||||||||||
| 2.500%, 12/01/2018 | 745,000 | 747,183 | ||||||||||
| Fresno Joint Powers Financing Authority, | ||||||||||||
| 2.880%, 04/01/2021 | 1,685,000 | 1,676,255 | ||||||||||
| Illinois Housing Development Authority, | ||||||||||||
| 4.000%, 02/01/2034 (Callable 08/01/2025) | 9,560,000 | 9,840,012 | ||||||||||
| Iowa Tobacco Settlement Authority, | ||||||||||||
| 6.500%, 06/01/2023 (Callable 07/31/2017) | 175,000 | 175,025 | ||||||||||
| Memphis-Shelby County Industrial Development Board, | ||||||||||||
| 2.222%, 11/01/2020 | 5,990,000 | 5,960,529 | ||||||||||
| Metropolitan Government Nashville & Davidson County Health & Educational Facilities, | ||||||||||||
| 2.250%, 07/01/2046 (Callable 07/01/2017) ∞ | 11,100,000 | 11,100,000 | ||||||||||
| New Hampshire Housing Finance Authority: | ||||||||||||
| 1.650%, 07/01/2017 | 710,000 | 710,000 | ||||||||||
| 4.000%, 07/01/2036 (Callable 07/10/2024) | 8,835,000 | 9,064,533 | ||||||||||
| New Jersey Economic Development Authority, | ||||||||||||
| 2.421%, 06/15/2018 | 10,000,000 | 9,965,800 | ||||||||||
| New Jersey Sports & Exposition Authority: | ||||||||||||
| 6.076%, 03/01/2023 | 2,385,000 | 2,596,764 | ||||||||||
| 5.976%, 03/01/2024 | 4,270,000 | 4,576,842 | ||||||||||
| Oakland Redevelopment Agency Successor Bonds, | ||||||||||||
| 2.271%, 09/01/2018 | 1,675,000 | 1,676,926 | ||||||||||
| Public Finance Authority, | ||||||||||||
| 2.625%, 11/01/2019 (Callable 05/01/2018) | 4,500,000 | 4,477,590 | ||||||||||
| Rhode Island Housing & Mortgage Finance Corp./RI, | ||||||||||||
| 3.000%, 10/01/2034 (Callable 10/01/2022) | 5,800,000 | 5,788,052 | ||||||||||
| San Diego Metropolitan Transit System, | ||||||||||||
| 4.840%, 12/01/2018 | 3,485,000 | 3,540,690 | ||||||||||
| Schenectady Metroplex Development Authority/NY, | ||||||||||||
| 2.232%, 08/01/2017 | 200,000 | 200,036 | ||||||||||
| State of Hawaii Department of Business Economic Development & Tourism, | ||||||||||||
| 1.467%, 07/01/2022 | 11,111,774 | 10,990,989 | ||||||||||
| State of Illinois, | ||||||||||||
| 4.350%, 06/01/2018 | 402,000 | 403,057 | ||||||||||
| Tulsa Airports Improvement Trust, | ||||||||||||
| 3.042%, 06/01/2018 | 100,000 | 101,110 | ||||||||||
| 99,322,965 | 2.2 | % | ||||||||||
| Residential Mortgage-Backed Securities | ||||||||||||
| Non-U.S. Government Agency Issues | ||||||||||||
| Accredited Mortgage Loan Trust, | ||||||||||||
| Series 2006-2, Class A3, 1.366%, 09/25/2036 ∞ | 2,217,816 | 2,215,120 | ||||||||||
| ACE Securities Corp. Home Equity Loan Trust: | ||||||||||||
| Series 2006-HE1, Class A1B1, 1.406%, 02/25/2036 ∞ | 4,468,376 | 4,457,834 | ||||||||||
| Series 2006-OP1, Class A2C, 1.366%, 04/25/2036 ∞ | 4,235,135 | 4,181,331 | ||||||||||
| Aegis Asset Backed Securities Trust, | ||||||||||||
| Series 2005-5, Class 1A3, 1.486%, 12/25/2035 ∞ | 1,498,798 | 1,495,869 | ||||||||||
| Alternative Loan Trust: | ||||||||||||
| Series 2004-12CB, Class 1A1, 5.000%, 07/25/2019 | 414,303 | 420,922 | ||||||||||
| Series 2005-50CB, Class 4A1, 5.000%, 11/25/2020 § | 129,645 | 129,646 | ||||||||||
| Series 2004-J2, Class 3A3, 5.500%, 04/25/2034 | 159,322 | 160,295 | ||||||||||
| Series 2004-8CB, Class A, 1.486%, 06/25/2034 ∞ | 6,244,393 | 6,206,393 | ||||||||||
| Series 2005-73CB, Class 1A7, 5.500%, 01/25/2036 § | 84,370 | 82,887 | ||||||||||
| Series 2006-28CB, Class A17, 6.000%, 10/25/2036 § | 747,606 | 639,830 | ||||||||||
| Argent Securities Inc. Asset-Backed Pass-Through Certificates, | ||||||||||||
| Series 2005-W3, Class A2D, 1.556%, 11/25/2035 ∞ | 7,908,574 | 7,824,873 | ||||||||||
| Asset Backed Securities Corp. Home Equity Loan Trust, | ||||||||||||
| Series 2006-HE1, Class A1, 1.431%, 01/25/2036 ∞ | 11,425,002 | 11,278,471 | ||||||||||
| Banc of America Mortgage Trust, | ||||||||||||
| Series 2004-B, Class 2A2, 3.619%, 03/25/2034 ∞ | 1,858,768 | 1,874,296 | ||||||||||
| Carrington Mortgage Loan Trust: | ||||||||||||
| Series 2006-NC1, Class A3, 1.426%, 01/25/2036 ∞ | 3,060,537 | 3,044,044 | ||||||||||
| Series 2006-OPT1, Class A3, 1.396%, 02/25/2036 ∞ | 2,820,462 | 2,800,154 | ||||||||||
| Countrywide Asset-Backed Certificates: | ||||||||||||
| Series 2006-2, Class 2A3, 1.516%, 06/25/2036 ∞ | 8,358,844 | 8,293,160 | ||||||||||
| Series 2006-13, Class 1AF3, 4.488%, 01/25/2037 ∞ § | 683,856 | 1,196,897 | ||||||||||
| Credit-Based Asset Servicing & Securitization LLC, | ||||||||||||
| Series 2005-CB8, Class AF2, 3.896%, 12/25/2035 | 121,284 | 120,856 | ||||||||||
| CWABS Asset-Backed Certificates Trust: | ||||||||||||
| Series 2005-16, Class 3AV, 1.446%, 05/25/2036 ∞ | 3,590,093 | 3,569,567 | ||||||||||
| Series 2006-9, Class 1AF3, 4.606%, 10/25/2046 ∞ § | 810,027 | 722,386 | ||||||||||
| First Franklin Mortgage Loan Trust, | ||||||||||||
| Series 2005-FF12, Class A2B, 1.476%, 11/25/2036 ∞ | 1,516,189 | 1,514,861 | ||||||||||
| GE-WMC Asset-Backed Pass Through Certificates, | ||||||||||||
| Series 2005-1, Class A2C, 1.936%, 10/25/2035 ∞ | 2,214,105 | 2,213,719 | ||||||||||
| GSAA Trust: | ||||||||||||
| Series 2005-8, Class A4, 1.486%, 06/25/2035 ∞ | 7,941,162 | 7,915,374 | ||||||||||
| Series 2005-6, Class A3, 1.586%, 06/25/2035 ∞ | 1,570,008 | 1,569,011 | ||||||||||
| Home Equity Asset Trust, | ||||||||||||
| Series 2006-4, Class 2A3, 1.386%, 08/25/2036 ∞ | 231,685 | 231,608 | ||||||||||
| J.P. Morgan Mortgage Acquisition Trust, | ||||||||||||
| Series 2006-CH1, Class A1, 1.346%, 07/25/2036 ∞ | 5,864,902 | 5,798,757 | ||||||||||
| J.P. Morgan Mortgage Trust, | ||||||||||||
| Series 2005-A4, Class 1A1, 3.411%, 07/25/2035 ∞ | 1,044,772 | 1,041,666 | ||||||||||
| Long Beach Mortgage Loan Trust, | ||||||||||||
| Series 2005-WL2, Class M1, 1.921%, 08/25/2035 ∞ | 3,528,426 | 3,537,377 | ||||||||||
| MASTR Alternative Loan Trust: | ||||||||||||
| Series 2003-5, Class 7A1, 5.000%, 07/25/2018 | 1,106,392 | 1,105,589 | ||||||||||
| Series 2003-9, Class 3A1, 4.750%, 11/25/2018 | 690,816 | 691,686 | ||||||||||
| Series 2003-5, Class 4A1, 5.500%, 07/25/2033 | 4,490,693 | 4,694,986 | ||||||||||
| MASTR Asset Backed Securities Trust, | ||||||||||||
| Series 2006-AB1, Class A2, 1.446%, 02/25/2036 ∞ | 28,533 | 28,518 | ||||||||||
| New Century Home Equity Loan Trust, | ||||||||||||
| Series 2005-C, Class A1, 1.446%, 12/25/2035 ∞ | 5,992,612 | 5,931,643 | ||||||||||
| Nomura Home Equity Loan, Inc. Home Equity Loan Trust, | ||||||||||||
| Series 2006-HE2, Class A3, 1.386%, 03/25/2036 ∞ | 2,216,180 | 2,205,159 | ||||||||||
| Option One Mortgage Loan Trust Asset-Backed Certificates, | ||||||||||||
| Series 2005-5, Class A3, 1.426%, 12/25/2035 ∞ | 3,192,567 | 3,182,817 | ||||||||||
| Park Place Securities, Inc., | ||||||||||||
| Series 2005-WCW1, Class M1, 1.666%, 09/25/2035 ∞ | 5,130,012 | 5,126,950 | ||||||||||
| Popular ABS Mortgage Pass-Through Trust, | ||||||||||||
| Series 2005-B, Class M2, 1.876%, 08/25/2035 ∞ | 2,492,938 | 2,496,483 | ||||||||||
| RAMP Series Trust: | ||||||||||||
| Series 2003-RS11, Class AI7, 4.828%, 12/25/2033 ∞ | 110,746 | 112,191 | ||||||||||
| Series 2006-NC2, Class A2, 1.406%, 02/25/2036 ∞ | 1,722,175 | 1,717,118 | ||||||||||
| Series 2006-RZ4, Class A2, 1.396%, 10/25/2036 ∞ | 1,465,009 | 1,460,905 | ||||||||||
| RASC Series Trust: | ||||||||||||
| Series 2005-AHL2, Class A3, 1.566%, 10/25/2035 ∞ | 6,129,029 | 6,100,147 | ||||||||||
| Series 2006-KS1, Class A4, 1.516%, 02/25/2036 ∞ | 1,984,204 | 1,982,546 | ||||||||||
| Renaissance Home Equity Loan Trust, | ||||||||||||
| Series 2007-2, Class AF2, 5.675%, 06/25/2037 | 1,924,304 | 965,032 | ||||||||||
| Saxon Asset Securities Trust 2006-2, | ||||||||||||
| Series 2006-2, Class A3C, 1.366%, 09/25/2036 ∞ | 1,402,127 | 1,365,856 | ||||||||||
| Securitized Asset Backed Receivables LLC Trust, | ||||||||||||
| Series 2005-OP2, Class A1, 1.541%, 10/25/2035 (Acquired 03/13/2014, Cost $2,469,212) ∞ * | 2,499,676 | 2,496,631 | ||||||||||
| Soundview Home Loan Trust: | ||||||||||||
| Series 2005-OPT4, Class 2A3, 1.476%, 12/25/2035 ∞ | 758,035 | 756,128 | ||||||||||
| Series 2006-2, Class A4, 1.486%, 03/25/2036 ∞ | 2,349,139 | 2,344,619 | ||||||||||
| Specialty Underwriting & Residential Finance Trust: | ||||||||||||
| Series 2005-BC4, Class A2C, 1.566%, 09/25/2036 ∞ | 134,271 | 134,266 | ||||||||||
| Series 2006-BC1, Class A2D, 1.516%, 12/25/2036 ∞ | 7,700,207 | 7,667,046 | ||||||||||
| Structured Asset Investment Loan Trust, | ||||||||||||
| Series 2004-9, Class A5, 2.216%, 10/25/2034 ∞ | 8,699,062 | 8,656,247 | ||||||||||
| Structured Asset Securities Corp.: | ||||||||||||
| Series 2004-4XS, Class 1A6, 5.050%, 02/25/2034 | 201,958 | 206,296 | ||||||||||
| Series 2004-22, Class A2, 4.984%, 01/25/2035 | 4,857,266 | 5,056,244 | ||||||||||
| Structured Asset Securities Corp. Mortgage Loan Trust, | ||||||||||||
| Series 2007-BC3, Class 2A2, 1.356%, 05/25/2047 ∞ | 355,547 | 354,937 | ||||||||||
| Thornburg Mortgage Securities Trust, | ||||||||||||
| Series 2003-5, Class 3A, 2.883%, 10/25/2043 ∞ | 8,041,032 | 8,116,072 | ||||||||||
| Towd Point Mortgage Trust: | ||||||||||||
| Series 2015-4, Class A1B, 2.750%, 04/25/2055 (Acquired 09/28/2016, Cost $2,652,543) ∞ * | 2,612,931 | 2,632,784 | ||||||||||
| Series 2015-4, Class A1, 3.500%, 04/25/2055 (Acquired 06/09/2016, Cost $5,765,309) ∞ * | 5,626,857 | 5,757,404 | ||||||||||
| Series 2016-5, Class A1, 2.500%, 10/25/2056 (Acquired 12/07/2016 through 03/20/2017, Cost $13,218,399) ∞ * | 13,238,621 | 13,252,104 | ||||||||||
| Series 2017-1, Class A1, 2.750%, 10/25/2056 (Acquired 02/07/2017, Cost $15,416,144) ∞ * | 15,396,393 | 15,515,069 | ||||||||||
| WaMu Mortgage Pass-Through Certificates Trust: | ||||||||||||
| Series 2004-CB4, Class 21A, 5.500%, 12/25/2019 | 35,844 | 36,367 | ||||||||||
| Series 2004-CB4, Class 22A, 6.000%, 12/25/2019 | 83,693 | 85,413 | ||||||||||
| Series 2004-AR3, Class A1, 3.134%, 06/25/2034 ∞ | 6,482,438 | 6,569,489 | ||||||||||
| 203,341,946 | 4.4 | % | ||||||||||
| Commercial Mortgage-Backed Securities | ||||||||||||
| U.S. Government Agency Issues | ||||||||||||
| Federal Home Loan Mortgage Corp. (FHLMC), | ||||||||||||
| Series 5, Class B, 1.859%, 05/15/2019 ∞ | 91 | 91 | ||||||||||
| FHLMC Multifamily Structured Pass Through Certificates, | ||||||||||||
| Series K706, Class A2, 2.323%, 10/25/2018 | 5,604,546 | 5,649,195 | ||||||||||
| Freddie Mac Multifamily Structured Pass Through Certificates: | ||||||||||||
| Series K701, Class A2, 3.882%, 11/25/2017 ∞ | 6,456,467 | 6,474,771 | ||||||||||
| Series K006, Class A2, 4.251%, 01/25/2020 | 15,000,000 | 15,824,216 | ||||||||||
| Series K-504, Class A2, 2.566%, 09/25/2020 ∞ | 10,300,000 | 10,491,762 | ||||||||||
| 38,440,035 | 0.8 | % | ||||||||||
| Non-U.S. Government Agency Issues | ||||||||||||
| J.P. Morgan Chase Commercial Mortgage Securities Trust: | ||||||||||||
| Series 2012-C8, Class ASB, 2.379%, 10/15/2045 | 16,100,000 | 16,214,767 | ||||||||||
| Series 2011-C5, Class ASB, 3.678%, 08/15/2046 | 5,640,087 | 5,810,040 | ||||||||||
| WFRBS Commercial Mortgage Trust, | ||||||||||||
| Series 2012-C6, Class A4, 3.440%, 04/15/2045 | 7,050,000 | 7,329,531 | ||||||||||
| 29,354,338 | 0.6 | % | ||||||||||
| Other Asset Backed Securities | ||||||||||||
| American Express Credit Account Master Trust, | ||||||||||||
| Series 2017-1, Class A, 1.930%, 09/15/2022 | 18,450,000 | 18,509,686 | ||||||||||
| Barclays Dryrock Issuance Trust, | ||||||||||||
| Series 2015-1, Class A, 2.200%, 12/15/2022 | 6,750,000 | 6,792,884 | ||||||||||
| California Republic Auto Receivables Trust, | ||||||||||||
| Series 2015-3, Class A3, 1.620%, 11/15/2019 | 13,848,771 | 13,854,716 | ||||||||||
| California Republic Auto Receivables Trust 2017-1, | ||||||||||||
| Series 2017-1, Class A3, 1.900%, 03/15/2021 | 12,500,000 | 12,492,566 | ||||||||||
| Chesapeake Funding II LLC, | ||||||||||||
| Series 2017-2A, Class A1, 1.990%, 05/15/2029 (Acquired 05/23/2017, Cost $16,324,136) * | 16,325,000 | 16,300,610 | ||||||||||
| Chrysler Capital Auto Receivables Trust, | ||||||||||||
| Series 2013-BA, Class A4, 1.270%, 03/15/2019 (Acquired 11/12/2015 through 12/18/2015, Cost $74,907) * | 75,077 | 75,062 | ||||||||||
| Citibank Credit Card Issuance Trust, | ||||||||||||
| Series 2017-A3, Class A3, 1.920%, 04/07/2022 | 23,225,000 | 23,250,668 | ||||||||||
| Conseco Financial Corp.: | ||||||||||||
| Series 1998-2, Class A5, 6.240%, 12/01/2028 | 9,740 | 10,065 | ||||||||||
| Series 1998-3, Class A5, 6.220%, 03/01/2030 | 148,359 | 158,413 | ||||||||||
| Discover Card Execution Note Trust, | ||||||||||||
| Series 2016-A4, Class A4, 1.390%, 03/15/2022 | 19,075,000 | 18,914,844 | ||||||||||
| Ford Credit Auto Lease Trust 2017-A, | ||||||||||||
| Series 2017-A, Class A3, 1.880%, 04/15/2020 | 10,000,000 | 10,010,836 | ||||||||||
| Ford Credit Auto Owner Trust: | ||||||||||||
| Series 2014-1, Class A, 2.260%, 11/15/2025 (Acquired 05/06/2014 through 11/18/2014, Cost $17,928,558) * | 17,894,000 | 18,058,201 | ||||||||||
| Series 2014-2, Class A, 2.310%, 04/15/2026 (Acquired 01/06/2016 through 05/26/2017, Cost $16,549,229) * | 16,392,000 | 16,550,638 | ||||||||||
| Series 2015-1, Class A, 2.120%, 07/15/2026 (Acquired 01/13/2015 through 03/14/2016, Cost $12,566,749) * | 12,592,000 | 12,641,765 | ||||||||||
| Ford Credit Floorplan Master Owner Trust A, | ||||||||||||
| Series 2016-1, Class A1, 1.760%, 02/15/2021 | 11,425,000 | 11,422,722 | ||||||||||
| GM Financial Automobile Leasing Trust, | ||||||||||||
| Series 2016-3, Class A3, 1.610%, 12/20/2019 | 22,000,000 | 21,961,720 | ||||||||||
| GM Financial Automobile Leasing Trust 2017-2, | ||||||||||||
| Series 2017-2, Class A3, 2.020%, 09/21/2020 | 19,425,000 | 19,400,490 | ||||||||||
| Hyundai Auto Lease Securitization Trust 2017-A, | ||||||||||||
| Series 2017-A, Class A3, 1.880%, 08/17/2020 (Acquired 01/10/2017, Cost $16,674,461) * | 16,675,000 | 16,688,445 | ||||||||||
| Hyundai Auto Lease Securitization Trust 2017-B, | ||||||||||||
| Series 2017-B, Class A3, 1.970%, 07/15/2020 (Acquired 05/24/2017, Cost $12,847,703) * | 12,850,000 | 12,862,991 | ||||||||||
| Leaf Receivables Funding 11 LLC, | ||||||||||||
| Series 2016-1, Class A3, 2.050%, 06/15/2019 (Acquired 05/18/2016, Cost $9,999,075) * | 10,000,000 | 10,001,638 | ||||||||||
| Mercedes-Benz Auto Lease Trust, | ||||||||||||
| Series 2016-B, Class A3, 1.350%, 08/15/2019 | 18,800,000 | 18,751,998 | ||||||||||
| MMAF Equipment Finance LLC 2017-A, | ||||||||||||
| Series 2017-AA, Class A3, 2.040%, 02/16/2022 (Acquired 04/25/2017, Cost $5,624,659) * | 5,625,000 | 5,629,980 | ||||||||||
| Nissan Auto Lease Trust 2017-A, | ||||||||||||
| Series 2017-A, Class A3, 1.910%, 04/15/2020 | 10,825,000 | 10,811,036 | ||||||||||
| OneMain Financial Issuance Trust, | ||||||||||||
| Series 2014-2A, Class A, 2.470%, 09/18/2024 (Acquired 02/05/2016 through 05/04/2016, Cost $4,135,702) * | 4,148,050 | 4,153,443 | ||||||||||
| PFS Financing Corp., | ||||||||||||
| Series 2016-BA, Class A, 1.870%, 10/15/2021 (Acquired 02/10/2017 through 03/31/2017, Cost $15,601,791) * | 15,734,000 | 15,661,402 | ||||||||||
| Sofi Consumer Loan Program 2017-3 LLC, | ||||||||||||
| Series 2017-3, Class A, 2.770%, 05/25/2026 (Acquired 05/11/2017, Cost $9,774,831) * | 9,774,833 | 9,825,076 | ||||||||||
| SoFi Consumer Loan Program 2017-4 LLC, | ||||||||||||
| Series 2017-4, Class A, 2.500%, 05/26/2026 (Acquired 6/27/2017, Cost $6,248,869) * | 6,250,000 | 6,246,812 | ||||||||||
| Synchrony Credit Card Master Note Trust: | ||||||||||||
| Series 2012-2, Class A, 2.220%, 01/15/2022 | 9,243,000 | 9,312,023 | ||||||||||
| Series 2016-3, Class A, 1.580%, 09/15/2022 | 15,670,000 | 15,562,624 | ||||||||||
| TCF Auto Receivables Owner Trust 2016-1, | ||||||||||||
| Series 2016-1A, Class A4, 2.030%, 02/15/2022 (Acquired 02/08/2017, Cost $14,361,238) * | 14,404,000 | 14,326,880 | ||||||||||
| Toyota Auto Receivables Owner Trust, | ||||||||||||
| Series 2016-B, Class A3, 1.300%, 04/15/2020 | 7,000,000 | 6,980,395 | ||||||||||
| Verizon Owner Trust: | ||||||||||||
| Series 2016-1A, Class A, 1.420%, 01/20/2021 (Acquired 07/12/2016, Cost $16,247,263) * | 16,250,000 | 16,169,613 | ||||||||||
| Series 2016-2A, Class A, 1.680%, 05/20/2021 (Acquired 11/16/2016 through 02/02/2017, Cost $22,701,803) * | 22,750,000 | 22,687,861 | ||||||||||
| Verizon Owner Trust 2017-1, | ||||||||||||
| Series 2017-1A, Class A, 2.060%, 09/20/2021 (Acquired 05/26/2017, Cost $5,133,839) * | 5,100,000 | 5,118,451 | ||||||||||
| World Omni Automobile Lease Securitization Trust 2017-A, | ||||||||||||
| Series 2017-A, Class A3, 2.130%, 04/15/2020 | 14,775,000 | 14,836,433 | ||||||||||
| 436,032,987 | 9.5 | % | ||||||||||
| Total Long-Term Investments (Cost $4,495,691,565) | 4,501,642,192 | 98.1 | % | |||||||||
| SHORT-TERM INVESTMENT | Shares | |||||||||||
| Money Market Mutual Fund | ||||||||||||
| Fidelity Institutional Money Market Fund - Government Portfolio, Institutional Class, 0.89% ∞ « | 162,214,090 | 162,214,090 | ||||||||||
| Total Short-Term Investment (Cost $162,214,090) | 162,214,090 | 3.5 | % | |||||||||
| Total Investments (Cost $4,657,905,655) | 4,663,856,282 | 101.6 | % | |||||||||
| Liabilities in Excess of Other Assets | (75,314,862 | ) | (1.6 | )% | ||||||||
| TOTAL NET ASSETS | $ | 4,588,541,420 | 100.0 | % | ||||||||
Notes to Schedule of Investments | |
| ∞ | Variable or Floating rate security. Floating rate securities are securities whose yields vary with a designated index rate. These securities' rates are as of June 30, 2017. |
| * | Restricted security as defined in Rule 144(a) under the Securities Act of 1933 and determined to be liquid. Purchased in a private placement transaction; resale to the public may require registration or or may extend only to qualified institutional buyers. At June 30, 2017, the value of these securities total $1,000,899,357, which represents 21.81% of total net assets. |
| « | 7-Day Yield. |
| § | Security in Default. |
| f | Foreign Security. |
| Baird Intermediate Bond Fund | ||||||||||||
| Schedule of Investments | ||||||||||||
| June 30, 2017 (Unaudited) | ||||||||||||
| Principal | % of | |||||||||||
| Amount | Value | Net Assets | ||||||||||
| LONG-TERM INVESTMENTS | ||||||||||||
| U.S. Treasury Securities | ||||||||||||
| U.S. Treasury Bonds: | ||||||||||||
| 1.625%, 08/31/2019 | $ | 30,000,000 | $ | 30,137,100 | ||||||||
| 2.625%, 08/15/2020 | 48,700,000 | 50,227,573 | ||||||||||
| 1.375%, 08/31/2020 | 217,250,000 | 215,722,515 | ||||||||||
| 1.750%, 03/31/2022 | 290,900,000 | 289,400,120 | ||||||||||
| 1.875%, 03/31/2022 | 22,000,000 | 22,012,892 | ||||||||||
| 2.500%, 05/15/2024 | 141,800,000 | 145,284,026 | ||||||||||
| 2.250%, 11/15/2025 | 188,000,000 | 188,043,992 | ||||||||||
| 2.000%, 11/15/2026 | 35,875,000 | 34,986,520 | ||||||||||
| 975,814,738 | 36.4 | % | ||||||||||
| Other Government Related Securities | ||||||||||||
| CDP Financial, Inc., | ||||||||||||
| 4.400%, 11/25/2019 (Acquired 11/20/2009, Cost $997,520) * f | 1,000,000 | 1,056,764 | ||||||||||
| Centrais Eletricas Brasileiras SA, | ||||||||||||
| 5.750%, 10/27/2021 (Acquired 10/20/2011 through 10/25/2011, Cost $1,151,247) * f | 1,150,000 | 1,173,000 | ||||||||||
| City of Berwyn IL, | ||||||||||||
| 5.790%, 12/01/2022 | 5,095,000 | 5,455,675 | ||||||||||
| CNOOC Finance (2013) Ltd., | ||||||||||||
| 3.000%, 05/09/2023 f | 2,000,000 | 1,978,326 | ||||||||||
| CNOOC Nexen Finance (2014) ULC, | ||||||||||||
| 4.250%, 04/30/2024 f | 5,150,000 | 5,418,943 | ||||||||||
| Corp Andina de Fomento, | ||||||||||||
| 4.375%, 06/15/2022 f | 680,000 | 735,298 | ||||||||||
| Electricite de France SA, | ||||||||||||
| 2.350%, 10/13/2020 (Acquired 10/07/2015, Cost $8,800,006) * f | 8,875,000 | 8,909,479 | ||||||||||
| Export-Import Bank of Korea, | ||||||||||||
| 2.250%, 01/21/2020 f | 3,200,000 | 3,194,342 | ||||||||||
| KFW, | ||||||||||||
| 4.875%, 06/17/2019 f | 3,250,000 | 3,454,822 | ||||||||||
| Korea Electric Power Corp., | ||||||||||||
| 6.750%, 08/01/2027 f | 300,000 | 390,968 | ||||||||||
| Korea Gas Corp., | ||||||||||||
| 2.875%, 07/29/2018 (Acquired 07/22/2013, Cost $994,790) * f | 1,000,000 | 1,008,117 | ||||||||||
| Korea Housing Finance Corp., | ||||||||||||
| 1.625%, 09/15/2018 (Acquired 02/26/2013 through 08/28/2014, Cost $1,043,516) * f | 1,050,000 | 1,043,102 | ||||||||||
| Mexico Government International Bond, | ||||||||||||
| 5.125%, 01/15/2020 f | 2,650,000 | 2,859,350 | ||||||||||
| Petroleos Mexicanos: | ||||||||||||
| 3.125%, 01/23/2019 f | 2,000,000 | 2,014,000 | ||||||||||
| 5.500%, 01/21/2021 f | 2,000,000 | 2,098,000 | ||||||||||
| Sinopec Group Overseas Development [2015] Ltd., | ||||||||||||
| 2.500%, 04/28/2020 (Acquired 04/21/2015, Cost $2,987,280) * f | 3,000,000 | 3,014,126 | ||||||||||
| Sinopec Group Overseas Development [2016] Ltd.: | ||||||||||||
| 1.750%, 09/29/2019 (Acquired 09/22/2016, Cost $2,988,330) * f | 3,000,000 | 2,962,179 | ||||||||||
| 2.750%, 05/03/2021 (Acquired 04/25/2016, Cost $4,990,750) * f | 5,000,000 | 5,009,760 | ||||||||||
| 51,776,251 | 2.0 | % | ||||||||||
| Corporate Bonds | ||||||||||||
| Industrials | ||||||||||||
| 21st Century Fox America, Inc., | ||||||||||||
| 3.700%, 10/15/2025 | 2,825,000 | 2,895,492 | ||||||||||
| Abbott Laboratories, | ||||||||||||
| 3.400%, 11/30/2023 | 10,000,000 | 10,236,800 | ||||||||||
| Agilent Technologies, Inc., | ||||||||||||
| 3.050%, 09/22/2026 | 1,450,000 | 1,399,856 | ||||||||||
| Agrium, Inc., | ||||||||||||
| 3.150%, 10/01/2022 f | 1,306,000 | 1,332,398 | ||||||||||
| Ameritech Capital Funding Corp., | ||||||||||||
| 6.450%, 01/15/2018 | 3,008,000 | 3,082,201 | ||||||||||
| Anadarko Petroleum Corp., | ||||||||||||
| 6.950%, 06/15/2019 | 1,000,000 | 1,083,964 | ||||||||||
| Anglo American Capital PLC, | ||||||||||||
| 9.375%, 04/08/2019 (Acquired 07/11/2012, Cost $2,194,736) * f | 2,000,000 | 2,237,500 | ||||||||||
| Anheuser-Busch InBev Finance, Inc., | ||||||||||||
| 3.300%, 02/01/2023 | 9,300,000 | 9,576,498 | ||||||||||
| Apple, Inc., | ||||||||||||
| 2.400%, 05/03/2023 | 2,000,000 | 1,984,260 | ||||||||||
| AT&T, Inc., | ||||||||||||
| 3.600%, 02/17/2023 | 9,000,000 | 9,211,140 | ||||||||||
| Boardwalk Pipelines LP: | ||||||||||||
| 5.200%, 06/01/2018 | 2,500,000 | 2,562,925 | ||||||||||
| 5.950%, 06/01/2026 | 1,360,000 | 1,514,378 | ||||||||||
| Boston Scientific Corp., | ||||||||||||
| 4.125%, 10/01/2023 | 3,000,000 | 3,171,264 | ||||||||||
| BP Capital Markets PLC: | ||||||||||||
| 4.750%, 03/10/2019 f | 2,500,000 | 2,622,405 | ||||||||||
| 2.521%, 01/15/2020 f | 2,650,000 | 2,686,907 | ||||||||||
| 3.245%, 05/06/2022 f | 1,000,000 | 1,028,684 | ||||||||||
| Broadcom Corp. / Broadcom Cayman Finance Ltd.: | ||||||||||||
| 2.375%, 01/15/2020 (Acquired 01/11/2017, Cost $1,496,610) * | 1,500,000 | 1,502,179 | ||||||||||
| 3.000%, 01/15/2022 (Acquired 01/11/2017, Cost $5,253,478) * | 5,275,000 | 5,322,148 | ||||||||||
| Bunge Limited Finance Corp., | ||||||||||||
| 3.500%, 11/24/2020 | 2,500,000 | 2,563,025 | ||||||||||
| Cardinal Health, Inc., | ||||||||||||
| 1.950%, 06/15/2018 | 5,600,000 | 5,614,812 | ||||||||||
| Cenovus Energy, Inc., | ||||||||||||
| 5.700%, 10/15/2019 f | 3,000,000 | 3,166,170 | ||||||||||
| Charter Communications Operating LLC / Charter Communications Operating Capital, | ||||||||||||
| 4.464%, 07/23/2022 | 7,150,000 | 7,618,082 | ||||||||||
| Chevron Phillips Chemical Co. LLC / Chevron Phillips Chemical Co. LP, | ||||||||||||
| 2.450%, 05/01/2020 (Acquired 05/07/2015, Cost $4,123,680) * | 4,125,000 | 4,141,863 | ||||||||||
| Coca-Cola FEMSA SAB de CV, | ||||||||||||
| 2.375%, 11/26/2018 f | 3,550,000 | 3,567,684 | ||||||||||
| Comcast Corp.: | ||||||||||||
| 2.750%, 03/01/2023 | 1,475,000 | 1,489,409 | ||||||||||
| 2.350%, 01/15/2027 | 4,175,000 | 3,918,568 | ||||||||||
| Constellation Brands, Inc.: | ||||||||||||
| 6.000%, 05/01/2022 | 2,250,000 | 2,568,001 | ||||||||||
| 2.700%, 05/09/2022 | 2,975,000 | 2,971,368 | ||||||||||
| 3.500%, 05/09/2027 | 3,475,000 | 3,471,737 | ||||||||||
| Cox Communications, Inc.: | ||||||||||||
| 3.250%, 12/15/2022 (Acquired 11/26/2012, Cost $3,594,456) * | 3,600,000 | 3,592,465 | ||||||||||
| 3.850%, 02/01/2025 (Acquired 12/01/2014, Cost $4,492,215) * | 4,500,000 | 4,533,926 | ||||||||||
| CVS Health Corp.: | ||||||||||||
| 2.250%, 08/12/2019 | 3,375,000 | 3,395,382 | ||||||||||
| 4.000%, 12/05/2023 | 4,425,000 | 4,674,176 | ||||||||||
| Cytec Industries, Inc., | ||||||||||||
| 3.500%, 04/01/2023 | 2,000,000 | 2,005,410 | ||||||||||
| Daimler Finance North America LLC: | ||||||||||||
| 2.250%, 07/31/2019 (Acquired 07/25/2012, Cost $2,285,234) * | 2,300,000 | 2,310,414 | ||||||||||
| 2.200%, 05/05/2020 (Acquired 05/02/2017, Cost $4,993,350) * | 5,000,000 | 4,999,965 | ||||||||||
| DCP Midstream LLC, | ||||||||||||
| 9.750%, 03/15/2019 (Acquired 10/15/2012, Cost $1,747,814) * | 1,600,000 | 1,788,000 | ||||||||||
| Deutsche Telekom International Finance BV: | ||||||||||||
| 6.750%, 08/20/2018 f | 2,850,000 | 3,001,224 | ||||||||||
| 6.000%, 07/08/2019 f | 1,700,000 | 1,832,122 | ||||||||||
| Diamond 1 Finance Corp. / Diamond 2 Finance Corp., | ||||||||||||
| 3.480%, 06/01/2019 (Acquired 05/17/2016 through 10/07/2016, Cost $10,984,801) * | 10,900,000 | 11,154,798 | ||||||||||
| The Dow Chemical Co., | ||||||||||||
| 8.550%, 05/15/2019 | 8,800,000 | 9,856,326 | ||||||||||
| DXC Technology Co., | ||||||||||||
| 4.250%, 04/15/2024 (Acquired 03/31/2017, Cost $1,723,166) * | 1,700,000 | 1,758,869 | ||||||||||
| Ecolab, Inc.: | ||||||||||||
| 1.450%, 12/08/2017 | 4,000,000 | 3,997,536 | ||||||||||
| 3.250%, 01/14/2023 | 5,000,000 | 5,157,940 | ||||||||||
| El du Pont de Nemours & Co., | ||||||||||||
| 2.200%, 05/01/2020 | 2,500,000 | 2,513,567 | ||||||||||
| Energy Transfer Partners LP, | ||||||||||||
| 9.700%, 03/15/2019 | 2,457,000 | 2,751,688 | ||||||||||
| EnLink Midstream Partners LP, | ||||||||||||
| 4.400%, 04/01/2024 | 10,000,000 | 10,151,990 | ||||||||||
| Enterprise Products Operating LLC, | ||||||||||||
| 2.550%, 10/15/2019 | 3,000,000 | 3,025,902 | ||||||||||
| EQT Midstream Partners LP, | ||||||||||||
| 4.125%, 12/01/2026 | 5,000,000 | 5,045,085 | ||||||||||
| ERAC USA Finance LLC: | ||||||||||||
| 2.350%, 10/15/2019 (Acquired 06/30/2014 through 10/26/2016, Cost $6,664,868) * | 6,650,000 | 6,660,334 | ||||||||||
| 2.600%, 12/01/2021 (Acquired 05/23/2016, Cost $4,818,342) * | 4,825,000 | 4,805,956 | ||||||||||
| Express Scripts Holding Co., | ||||||||||||
| 3.000%, 07/15/2023 | 5,655,000 | 5,616,122 | ||||||||||
| Federal Express Corp. 1998 Pass Through Trust, | ||||||||||||
| Class 981B, 6.845%, 01/15/2019 | 802,111 | 840,211 | ||||||||||
| Fidelity National Information Services, Inc.: | ||||||||||||
| 3.500%, 04/15/2023 | 4,400,000 | 4,571,987 | ||||||||||
| 3.875%, 06/05/2024 | 3,900,000 | 4,085,024 | ||||||||||
| 3.000%, 08/15/2026 | 2,000,000 | 1,936,632 | ||||||||||
| Fiserv, Inc.: | ||||||||||||
| 4.750%, 06/15/2021 | 1,728,000 | 1,867,182 | ||||||||||
| 3.500%, 10/01/2022 | 2,900,000 | 2,999,954 | ||||||||||
| FMC Corp., | ||||||||||||
| 4.100%, 02/01/2024 | 2,000,000 | 2,070,252 | ||||||||||
| Ford Motor Credit Co. LLC: | ||||||||||||
| 1.724%, 12/06/2017 | 3,300,000 | 3,300,231 | ||||||||||
| 5.750%, 02/01/2021 | 2,000,000 | 2,200,686 | ||||||||||
| 3.336%, 03/18/2021 | 1,800,000 | 1,834,754 | ||||||||||
| 3.339%, 03/28/2022 | 2,000,000 | 2,029,466 | ||||||||||
| Freeport-McMoRan, Inc.: | ||||||||||||
| 6.750%, 02/01/2022 | 1,649,000 | 1,706,715 | ||||||||||
| 3.550%, 03/01/2022 | 2,000,000 | 1,874,360 | ||||||||||
| 3.875%, 03/15/2023 | 1,100,000 | 1,023,000 | ||||||||||
| General Electric Co.: | ||||||||||||
| 6.000%, 08/07/2019 | 774,000 | 841,186 | ||||||||||
| 5.500%, 01/08/2020 | 731,000 | 796,238 | ||||||||||
| 5.550%, 05/04/2020 | 816,000 | 896,381 | ||||||||||
| General Motors Financial Co, Inc., | ||||||||||||
| 3.150%, 06/30/2022 | 1,000,000 | 1,001,548 | ||||||||||
| General Motors Financial Co., Inc.: | ||||||||||||
| 2.350%, 10/04/2019 | 5,500,000 | 5,499,461 | ||||||||||
| 4.375%, 09/25/2021 | 5,325,000 | 5,612,907 | ||||||||||
| 3.450%, 01/14/2022 | 1,225,000 | 1,244,486 | ||||||||||
| Georgia-Pacific LLC, | ||||||||||||
| 5.400%, 11/01/2020 (Acquired 06/09/2016, Cost $7,454,323) * | 6,797,000 | 7,435,707 | ||||||||||
| Glencore Funding LLC: | ||||||||||||
| 2.500%, 01/15/2019 (Acquired 05/22/2013 through 10/29/2013, Cost $4,360,722) * | 4,400,000 | 4,413,099 | ||||||||||
| 4.125%, 05/30/2023 (Acquired 04/03/2014, Cost $1,465,220) * | 1,500,000 | 1,539,135 | ||||||||||
| 4.625%, 04/29/2024 (Acquired 10/08/2014, Cost $1,022,356) * | 1,000,000 | 1,045,400 | ||||||||||
| 4.000%, 03/27/2027 (Acquired 03/21/2017, Cost $4,678,506) * | 4,725,000 | 4,648,913 | ||||||||||
| Grupo Bimbo SAB de CV, | ||||||||||||
| 3.875%, 06/27/2024 (Acquired 06/24/2014, Cost $2,987,700) * f | 3,000,000 | 3,087,112 | ||||||||||
| Historic TW, Inc., | ||||||||||||
| 6.875%, 06/15/2018 | 392,000 | 410,470 | ||||||||||
| Hutchison Whampoa International (09) Ltd., | ||||||||||||
| 7.625%, 04/09/2019 (Acquired 10/16/2009 through 04/16/2014, Cost $5,719,131) * f | 5,400,000 | 5,895,720 | ||||||||||
| Hutchison Whampoa International (14) Ltd., | ||||||||||||
| 1.625%, 10/31/2017 (Acquired 10/28/2014, Cost $1,995,400) * f | 2,000,000 | 1,995,222 | ||||||||||
| Hyundai Capital America: | ||||||||||||
| 2.500%, 03/18/2019 (Acquired 03/14/2016, Cost $1,299,103) * | 1,300,000 | 1,304,000 | ||||||||||
| 2.000%, 07/01/2019 (Acquired 06/07/2016, Cost $2,498,225) * | 2,500,000 | 2,480,128 | ||||||||||
| 1.750%, 09/27/2019 (Acquired 09/22/2016, Cost $2,996,340) * | 3,000,000 | 2,954,436 | ||||||||||
| Hyundai Capital Services, Inc., | ||||||||||||
| 3.500%, 09/13/2017 (Acquired 08/04/2014 through 09/30/2014, Cost $6,170,678) * f | 6,150,000 | 6,169,951 | ||||||||||
| Ingersoll-Rand Co., | ||||||||||||
| 6.391%, 11/15/2027 f | 1,195,000 | 1,417,617 | ||||||||||
| Ingersoll-Rand Global Holding Co. Ltd., | ||||||||||||
| 2.875%, 01/15/2019 | 5,000,000 | 5,072,910 | ||||||||||
| Ingredion, Inc., | ||||||||||||
| 1.800%, 09/25/2017 | 1,275,000 | 1,275,761 | ||||||||||
| Johnson Controls International PLC, | ||||||||||||
| 4.250%, 03/01/2021 f | 2,000,000 | 2,123,444 | ||||||||||
| Keysight Technologies, Inc., | ||||||||||||
| 3.300%, 10/30/2019 | 4,690,000 | 4,777,234 | ||||||||||
| Kinder Morgan, Inc./DE: | ||||||||||||
| 5.625%, 11/15/2023 (Acquired 12/15/2016, Cost $1,080,421) * | 1,000,000 | 1,106,449 | ||||||||||
| 7.800%, 08/01/2031 | 7,000,000 | 8,824,718 | ||||||||||
| Kraft Heinz Foods Co.: | ||||||||||||
| 3.500%, 06/06/2022 | 2,000,000 | 2,066,400 | ||||||||||
| 6.375%, 07/15/2028 | 6,629,000 | 7,989,695 | ||||||||||
| Laboratory Corp. of America Holdings, | ||||||||||||
| 4.625%, 11/15/2020 | 468,000 | 496,803 | ||||||||||
| LyondellBasell Industries NV, | ||||||||||||
| 6.000%, 11/15/2021 f | 1,100,000 | 1,242,667 | ||||||||||
| Martin Marietta Materials, Inc., | ||||||||||||
| 6.600%, 04/15/2018 | 75,000 | 77,674 | ||||||||||
| Mead Johnson Nutrition Co., | ||||||||||||
| 3.000%, 11/15/2020 | 5,400,000 | 5,539,142 | ||||||||||
| Midcontinent Express Pipeline LLC, | ||||||||||||
| 6.700%, 09/15/2019 (Acquired 09/30/2014, Cost $1,063,180) * | 1,000,000 | 1,070,000 | ||||||||||
| The Mosaic Co., | ||||||||||||
| 4.250%, 11/15/2023 | 8,606,000 | 9,055,543 | ||||||||||
| MPLX LP, | ||||||||||||
| 4.875%, 06/01/2025 | 10,192,000 | 10,807,576 | ||||||||||
| Nabors Industries, Inc., | ||||||||||||
| 6.150%, 02/15/2018 | 613,000 | 619,130 | ||||||||||
| Noble Energy, Inc.: | ||||||||||||
| 8.250%, 03/01/2019 | 1,000,000 | 1,096,948 | ||||||||||
| 4.150%, 12/15/2021 | 450,000 | 474,158 | ||||||||||
| ONEOK Partners LP, | ||||||||||||
| 3.375%, 10/01/2022 | 6,100,000 | 6,155,839 | ||||||||||
| Pentair Finance SA, | ||||||||||||
| 2.900%, 09/15/2018 f | 2,782,000 | 2,810,724 | ||||||||||
| Petrofac Ltd., | ||||||||||||
| 3.400%, 10/10/2018 (Acquired 10/03/2013 through 09/19/2014, Cost $6,899,267) * f | 6,880,000 | 6,468,218 | ||||||||||
| Phillips 66 Partners LP, | ||||||||||||
| 3.605%, 02/15/2025 | 2,000,000 | 1,980,512 | ||||||||||
| Pioneer Natural Resources Co., | ||||||||||||
| 6.875%, 05/01/2018 | 1,225,000 | 1,274,066 | ||||||||||
| POSCO, | ||||||||||||
| 5.250%, 04/14/2021 (Acquired 04/08/2011 through 09/22/2011, Cost $2,977,190) * f | 3,000,000 | 3,262,479 | ||||||||||
| R.R. Donnelley & Sons Co., | ||||||||||||
| 7.625%, 06/15/2020 | 1,000,000 | 1,112,500 | ||||||||||
| Republic Services, Inc., | ||||||||||||
| 3.800%, 05/15/2018 | 4,000,000 | 4,070,688 | ||||||||||
| Rockies Express Pipeline LLC, | ||||||||||||
| 5.625%, 04/15/2020 (Acquired 03/17/2010, Cost $999,110) * | 1,000,000 | 1,062,500 | ||||||||||
| Roper Technologies, Inc., | ||||||||||||
| 3.800%, 12/15/2026 | 1,450,000 | 1,489,807 | ||||||||||
| Sabine Pass Liquefaction LLC, | ||||||||||||
| 5.875%, 06/30/2026 | 8,730,000 | 9,757,015 | ||||||||||
| Samarco Mineracao SA, | ||||||||||||
| 5.375%, 09/26/2024 (Acquired 09/23/2014, Cost $1,670,511) * f § | 1,675,000 | 950,563 | ||||||||||
| Schlumberger Holdings Corp., | ||||||||||||
| 2.350%, 12/21/2018 (Acquired 12/10/2015, Cost $4,499,460) * | 4,500,000 | 4,526,703 | ||||||||||
| Schneider Electric SE, | ||||||||||||
| 2.950%, 09/27/2022 (Acquired 09/20/2012, Cost $1,994,680) * f | 2,000,000 | 2,018,728 | ||||||||||
| Sherwin-Williams Co/The, | ||||||||||||
| 3.125%, 06/01/2024 | 4,000,000 | 4,020,264 | ||||||||||
| Solvay Finance America LLC, | ||||||||||||
| 3.400%, 12/03/2020 (Acquired 01/08/2016, Cost $3,996,160) * | 4,000,000 | 4,127,440 | ||||||||||
| Sysco Corp.: | ||||||||||||
| 2.600%, 10/01/2020 | 7,600,000 | 7,694,126 | ||||||||||
| 2.500%, 07/15/2021 | 2,000,000 | 2,005,456 | ||||||||||
| 2.600%, 06/12/2022 | 150,000 | 150,680 | ||||||||||
| TC PipeLines LP: | ||||||||||||
| 4.375%, 03/13/2025 | 4,500,000 | 4,689,473 | ||||||||||
| 3.900%, 05/25/2027 | 8,025,000 | 8,007,385 | ||||||||||
| Telefonica Emisiones SAU: | ||||||||||||
| 6.221%, 07/03/2017 f | 1,000,000 | 1,000,000 | ||||||||||
| 3.192%, 04/27/2018 f | 1,000,000 | 1,010,572 | ||||||||||
| Telstra Corp. Ltd., | ||||||||||||
| 3.125%, 04/07/2025 (Acquired 03/30/2015, Cost $5,640,395) * f | 5,650,000 | 5,666,944 | ||||||||||
| Texas Eastern Transmission LP, | ||||||||||||
| 6.000%, 09/15/2017 (Acquired 11/07/2013 through 11/14/2014, Cost $2,090,104) * | 2,073,000 | 2,089,130 | ||||||||||
| Time Warner Cable LLC, | ||||||||||||
| 6.750%, 07/01/2018 | 2,000,000 | 2,092,416 | ||||||||||
| Time Warner, Inc.: | ||||||||||||
| 4.700%, 01/15/2021 | 1,325,000 | 1,423,031 | ||||||||||
| 4.750%, 03/29/2021 | 2,000,000 | 2,153,856 | ||||||||||
| 3.600%, 07/15/2025 | 4,000,000 | 3,990,908 | ||||||||||
| TransCanada PipeLines Ltd., | ||||||||||||
| 9.875%, 01/01/2021 f | 200,000 | 248,191 | ||||||||||
| TSMC Global Ltd., | ||||||||||||
| 1.625%, 04/03/2018 (Acquired 03/27/2013, Cost $3,297,789) * f | 3,300,000 | 3,293,343 | ||||||||||
| Tyco Electronics Group SA, | ||||||||||||
| 6.550%, 10/01/2017 f | 1,245,000 | 1,259,750 | ||||||||||
| Vale Overseas Ltd.: | ||||||||||||
| 4.375%, 01/11/2022 f | 2,500,000 | 2,544,500 | ||||||||||
| 6.250%, 08/10/2026 f | 3,460,000 | 3,732,475 | ||||||||||
| Valero Energy Corp.: | ||||||||||||
| 9.375%, 03/15/2019 | 5,898,000 | 6,600,263 | ||||||||||
| 3.400%, 09/15/2026 | 4,500,000 | 4,402,080 | ||||||||||
| Verizon Communications, Inc.: | ||||||||||||
| 5.150%, 09/15/2023 | 6,100,000 | 6,775,801 | ||||||||||
| 4.150%, 03/15/2024 | 2,000,000 | 2,105,238 | ||||||||||
| 4.125%, 03/16/2027 | 3,000,000 | 3,098,337 | ||||||||||
| Vodafone Group PLC, | ||||||||||||
| 1.250%, 09/26/2017 f | 6,925,000 | 6,918,144 | ||||||||||
| Vulcan Materials Co., | ||||||||||||
| 7.000%, 06/15/2018 | 2,000,000 | 2,094,202 | ||||||||||
| Wabtec Corp./DE: | ||||||||||||
| 4.375%, 08/15/2023 | 3,125,000 | 3,276,263 | ||||||||||
| 3.450%, 11/15/2026 (Acquired 10/31/2016, Cost $4,998,250) * | 5,000,000 | 4,929,925 | ||||||||||
| Walgreen Co., | ||||||||||||
| 5.250%, 01/15/2019 | 605,000 | 633,567 | ||||||||||
| Waste Management, Inc., | ||||||||||||
| 3.125%, 03/01/2025 | 1,975,000 | 2,004,830 | ||||||||||
| Wesfarmers Ltd., | ||||||||||||
| 1.874%, 03/20/2018 (Acquired 03/13/2013, Cost $3,900,000) * f | 3,900,000 | 3,905,780 | ||||||||||
| WestRock MWV LLC, | ||||||||||||
| 7.375%, 09/01/2019 | 2,033,000 | 2,248,915 | ||||||||||
| Williams Partners LP: | ||||||||||||
| 5.250%, 03/15/2020 | 1,000,000 | 1,076,186 | ||||||||||
| 4.125%, 11/15/2020 | 1,625,000 | 1,698,603 | ||||||||||
| 4.300%, 03/04/2024 | 2,500,000 | 2,600,435 | ||||||||||
| Zoetis, Inc.: | ||||||||||||
| 3.250%, 02/01/2023 | 7,150,000 | 7,327,928 | ||||||||||
| 4.500%, 11/13/2025 | 2,000,000 | 2,183,508 | ||||||||||
| 537,937,025 | 20.2 | % | ||||||||||
| Utilities | ||||||||||||
| FORTIS, Inc., | ||||||||||||
| 2.100%, 10/04/2021 (Acquired 09/29/2016, Cost $4,987,250) * f | 5,000,000 | 4,897,220 | ||||||||||
| Great Plains Energy, Inc., | ||||||||||||
| 3.150%, 04/01/2022 | 6,000,000 | 6,063,420 | ||||||||||
| National Rural Utilities Cooperative Finance Corp.: | ||||||||||||
| 10.375%, 11/01/2018 | 3,694,000 | 4,108,168 | ||||||||||
| 2.000%, 01/27/2020 | 3,000,000 | 3,008,232 | ||||||||||
| PPL Capital Funding, Inc., | ||||||||||||
| 3.400%, 06/01/2023 | 2,475,000 | 2,543,563 | ||||||||||
| PSEG Power LLC, | ||||||||||||
| 5.125%, 04/15/2020 | 220,000 | 235,476 | ||||||||||
| Public Service Co. of New Mexico, | ||||||||||||
| 7.950%, 05/15/2018 | 3,220,000 | 3,388,306 | ||||||||||
| RGS I&M Funding Corp., | ||||||||||||
| Class F, 9.820%, 06/07/2022 | 411,732 | 453,805 | ||||||||||
| Southern Power Co., | ||||||||||||
| 1.850%, 12/01/2017 | 2,050,000 | 2,051,800 | ||||||||||
| Talent Yield Investments Ltd., | ||||||||||||
| 4.500%, 04/25/2022 (Acquired 04/18/2012, Cost $3,774,008) * f | 3,800,000 | 4,030,314 | ||||||||||
| 30,780,304 | 1.1 | % | ||||||||||
| Financials | ||||||||||||
| ABN AMRO Bank NV: | ||||||||||||
| 2.500%, 10/30/2018 (Acquired 10/23/2013 through 04/17/2014, Cost $1,199,403) * f | 1,200,000 | 1,209,371 | ||||||||||
| 2.450%, 06/04/2020 (Acquired 05/28/2015, Cost $2,644,170) * f | 2,650,000 | 2,666,075 | ||||||||||
| Aetna, Inc., | ||||||||||||
| 2.800%, 06/15/2023 | 4,000,000 | 3,993,060 | ||||||||||
| AIA Group Ltd., | ||||||||||||
| 3.200%, 03/11/2025 (Acquired 03/04/2015, Cost $2,996,190) * f | 3,000,000 | 2,973,298 | ||||||||||
| Ally Financial, Inc., | ||||||||||||
| 8.000%, 12/31/2018 | 96,000 | 103,560 | ||||||||||
| American International Group, Inc.: | ||||||||||||
| 4.875%, 06/01/2022 | 6,000,000 | 6,583,530 | ||||||||||
| 4.125%, 02/15/2024 | 1,000,000 | 1,055,801 | ||||||||||
| AmSouth Bancorporation, | ||||||||||||
| 6.750%, 11/01/2025 | 630,000 | 739,219 | ||||||||||
| ANZ New Zealand (Int'l) Ltd./London: | ||||||||||||
| 2.600%, 09/23/2019 (Acquired 09/16/2014 through 03/19/2015, Cost $4,149,676) * f | 4,140,000 | 4,171,464 | ||||||||||
| 2.850%, 08/06/2020 (Acquired 07/30/2015, Cost $3,996,680) * f | 4,000,000 | 4,059,460 | ||||||||||
| 2.125%, 07/28/2021 (Acquired 07/21/2016, Cost $899,190) * f | 900,000 | 885,145 | ||||||||||
| Banco Santander SA, | ||||||||||||
| 3.500%, 04/11/2022 f | 4,400,000 | 4,503,299 | ||||||||||
| Bank of America Corp.: | ||||||||||||
| 6.875%, 04/25/2018 | 1,000,000 | 1,040,629 | ||||||||||
| 2.625%, 10/19/2020 | 5,000,000 | 5,050,415 | ||||||||||
| 3.300%, 01/11/2023 | 3,350,000 | 3,415,988 | ||||||||||
| 4.000%, 04/01/2024 | 2,750,000 | 2,881,637 | ||||||||||
| 3.705%, 04/24/2028 ∞ | 5,000,000 | 5,036,625 | ||||||||||
| The Bank of Nova Scotia, | ||||||||||||
| 4.500%, 12/16/2025 f | 7,000,000 | 7,357,028 | ||||||||||
| The Bank of Tokyo-Mitsubishi UFJ Ltd.: | ||||||||||||
| 2.700%, 09/09/2018 (Acquired 09/03/2013, Cost $2,547,756) * f | 2,550,000 | 2,572,703 | ||||||||||
| 2.150%, 09/14/2018 (Acquired 09/08/2015, Cost $999,710) * f | 1,000,000 | 1,002,085 | ||||||||||
| 2.300%, 03/10/2019 (Acquired 03/04/2014 through 11/24/2015, Cost $1,123,448) * f | 1,125,000 | 1,128,143 | ||||||||||
| 2.300%, 03/05/2020 (Acquired 02/25/2015, Cost $2,998,020) * f | 3,000,000 | 3,004,233 | ||||||||||
| BanPonce Trust I, | ||||||||||||
| Class A, 8.327%, 02/01/2027 | 2,500,000 | 2,428,695 | ||||||||||
| Barclays PLC: | ||||||||||||
| 2.000%, 03/16/2018 f | 2,600,000 | 2,602,644 | ||||||||||
| 3.250%, 01/12/2021 f | 2,000,000 | 2,033,936 | ||||||||||
| 3.684%, 01/10/2023 f | 7,000,000 | 7,182,406 | ||||||||||
| BB&T Corp., | ||||||||||||
| 6.850%, 04/30/2019 | 2,322,000 | 2,519,286 | ||||||||||
| The Bear Stearns Companies LLC: | ||||||||||||
| 6.400%, 10/02/2017 | 1,450,000 | 1,466,714 | ||||||||||
| 7.250%, 02/01/2018 | 2,275,000 | 2,346,358 | ||||||||||
| BNZ International Funding Ltd./London: | ||||||||||||
| 2.350%, 03/04/2019 (Acquired 09/03/2014, Cost $2,789,836) * f | 2,800,000 | 2,812,995 | ||||||||||
| 2.100%, 09/14/2021 (Acquired 09/06/2016, Cost $9,990,600) * f | 10,000,000 | 9,785,630 | ||||||||||
| BPCE SA: | ||||||||||||
| 5.700%, 10/22/2023 (Acquired 11/10/2014, Cost $3,685,397) * f | 3,500,000 | 3,894,450 | ||||||||||
| 4.000%, 04/15/2024 f | 3,500,000 | 3,706,391 | ||||||||||
| 4.625%, 07/11/2024 (Acquired 01/20/2017, Cost $4,932,300) * f | 5,000,000 | 5,182,400 | ||||||||||
| Caisse Centrale Desjardins, | ||||||||||||
| 1.837%, 01/29/2018 (Acquired 01/26/2015, Cost $8,000,000) ∞ * f | 8,000,000 | 8,024,360 | ||||||||||
| Capital One Bank (USA) NA, | ||||||||||||
| 2.250%, 02/13/2019 | 3,500,000 | 3,509,387 | ||||||||||
| Capital One NA/Mclean VA, | ||||||||||||
| 1.851%, 02/05/2018 ∞ | 2,000,000 | 2,004,672 | ||||||||||
| Citigroup, Inc.: | ||||||||||||
| 1.700%, 04/27/2018 | 1,500,000 | 1,498,497 | ||||||||||
| 2.050%, 12/07/2018 | 5,700,000 | 5,708,476 | ||||||||||
| 3.750%, 06/16/2024 | 500,000 | 518,174 | ||||||||||
| 3.887%, 01/10/2028 ∞ | 9,000,000 | 9,146,376 | ||||||||||
| Citizens Bank NA/Providence RI: | ||||||||||||
| 2.450%, 12/04/2019 | 8,000,000 | 8,068,208 | ||||||||||
| 2.550%, 05/13/2021 | 2,000,000 | 2,001,104 | ||||||||||
| CNA Financial Corp.: | ||||||||||||
| 7.350%, 11/15/2019 | 2,395,000 | 2,676,381 | ||||||||||
| 5.750%, 08/15/2021 | 1,385,000 | 1,545,699 | ||||||||||
| 4.500%, 03/01/2026 | 5,000,000 | 5,364,150 | ||||||||||
| Comerica Bank, | ||||||||||||
| 2.500%, 06/02/2020 | 3,375,000 | 3,382,357 | ||||||||||
| Commonwealth Bank of Australia, | ||||||||||||
| 5.000%, 10/15/2019 (Acquired 03/02/2012 through 10/03/2014, Cost $4,465,445) * f | 4,335,000 | 4,610,845 | ||||||||||
| Commonwealth Bank of Australia/New York NY, | ||||||||||||
| 1.750%, 11/02/2018 f | 4,500,000 | 4,503,613 | ||||||||||
| Compass Bank: | ||||||||||||
| 2.750%, 09/29/2019 | 8,000,000 | 8,061,952 | ||||||||||
| 3.875%, 04/10/2025 | 3,700,000 | 3,685,644 | ||||||||||
| Cooperatieve Rabobank UA, | ||||||||||||
| 4.625%, 12/01/2023 f | 3,400,000 | 3,663,959 | ||||||||||
| Cooperatieve Rabobank UA/NY, | ||||||||||||
| 2.500%, 01/19/2021 f | 8,175,000 | 8,223,388 | ||||||||||
| Credit Agricole SA/London: | ||||||||||||
| 2.750%, 06/10/2020 (Acquired 06/03/2015, Cost $2,994,570) * f | 3,000,000 | 3,044,961 | ||||||||||
| 3.375%, 01/10/2022 (Acquired 05/02/2017, Cost $7,464,365) * f | 7,400,000 | 7,597,906 | ||||||||||
| Credit Suisse AG/New York NY, | ||||||||||||
| 5.300%, 08/13/2019 f | 3,220,000 | 3,439,314 | ||||||||||
| Credit Suisse Group Funding Guernsey Ltd., | ||||||||||||
| 3.800%, 06/09/2023 f | 8,700,000 | 8,969,308 | ||||||||||
| Deutsche Bank AG: | ||||||||||||
| 2.950%, 08/20/2020 f | 3,000,000 | 3,017,775 | ||||||||||
| 3.125%, 01/13/2021 f | 2,175,000 | 2,185,834 | ||||||||||
| 4.250%, 10/14/2021 f | 7,000,000 | 7,340,781 | ||||||||||
| Discover Bank/Greenwood DE, | ||||||||||||
| 2.600%, 11/13/2018 | 2,500,000 | 2,521,317 | ||||||||||
| Discover Financial Services, | ||||||||||||
| 4.100%, 02/09/2027 | 9,000,000 | 9,015,552 | ||||||||||
| First Horizon National Corp., | ||||||||||||
| 3.500%, 12/15/2020 | 11,496,000 | 11,790,769 | ||||||||||
| First National Bank of Chicago Pass Through Trust, | ||||||||||||
| Class 93-A, 8.080%, 01/05/2018 | 46,617 | 46,808 | ||||||||||
| First Niagara Financial Group, Inc., | ||||||||||||
| 6.750%, 03/19/2020 | 1,618,000 | 1,807,274 | ||||||||||
| Genworth Holdings, Inc., | ||||||||||||
| 4.900%, 08/15/2023 | 1,500,000 | 1,245,000 | ||||||||||
| Goldman Sachs Group Inc/The, | ||||||||||||
| 3.691%, 06/05/2028 ∞ | 4,000,000 | 4,015,880 | ||||||||||
| The Goldman Sachs Group, Inc.: | ||||||||||||
| 6.150%, 04/01/2018 | 4,025,000 | 4,154,162 | ||||||||||
| 2.900%, 07/19/2018 | 1,000,000 | 1,011,358 | ||||||||||
| 7.500%, 02/15/2019 | 865,000 | 938,268 | ||||||||||
| 2.550%, 10/23/2019 | 2,000,000 | 2,021,826 | ||||||||||
| 2.350%, 11/15/2021 | 2,825,000 | 2,786,990 | ||||||||||
| 3.000%, 04/26/2022 | 5,000,000 | 5,038,415 | ||||||||||
| 3.500%, 01/23/2025 | 2,000,000 | 2,021,728 | ||||||||||
| Great-West Life & Annuity Insurance Capital LP II, | ||||||||||||
| 3.718%, 05/16/2046 (Acquired 05/16/2006 through 11/08/2007, Cost $1,792,736) ∞ * | 1,800,000 | 1,786,500 | ||||||||||
| Guardian Life Global Funding, | ||||||||||||
| 2.000%, 04/26/2021 (Acquired 04/19/2016, Cost $3,994,720) * | 4,000,000 | 3,941,672 | ||||||||||
| The Hartford Financial Services Group, Inc., | ||||||||||||
| 5.125%, 04/15/2022 | 500,000 | 555,029 | ||||||||||
| Highmark, Inc., | ||||||||||||
| 4.750%, 05/15/2021 (Acquired 07/30/2014, Cost $2,009,614) * | 2,000,000 | 2,066,206 | ||||||||||
| HSBC Finance Corp., | ||||||||||||
| 6.676%, 01/15/2021 | 4,709,000 | 5,306,873 | ||||||||||
| HSBC Holdings PLC, | ||||||||||||
| 3.600%, 05/25/2023 f | 2,500,000 | 2,583,527 | ||||||||||
| HSBC USA, Inc., | ||||||||||||
| 2.350%, 03/05/2020 | 3,500,000 | 3,520,549 | ||||||||||
| Humana, Inc., | ||||||||||||
| 7.200%, 06/15/2018 | 2,000,000 | 2,100,778 | ||||||||||
| Huntington Bancshares Inc./OH: | ||||||||||||
| 3.150%, 03/14/2021 | 1,500,000 | 1,529,586 | ||||||||||
| 2.300%, 01/14/2022 | 1,000,000 | 984,981 | ||||||||||
| The Huntington National Bank, | ||||||||||||
| 2.875%, 08/20/2020 | 3,500,000 | 3,559,553 | ||||||||||
| ING Bank NV: | ||||||||||||
| 2.500%, 10/01/2019 (Acquired 09/23/2014, Cost $2,461,635) * f | 2,475,000 | 2,491,845 | ||||||||||
| 5.000%, 06/09/2021 (Acquired 06/12/2013, Cost $2,102,513) * f | 2,000,000 | 2,188,760 | ||||||||||
| 5.800%, 09/25/2023 (Acquired 10/15/2015 through 05/02/2017, Cost $9,784,155) * f | 8,865,000 | 10,010,278 | ||||||||||
| Invesco Finance PLC, | ||||||||||||
| 3.125%, 11/30/2022 f | 4,500,000 | 4,585,127 | ||||||||||
| Jackson National Life Global Funding, | ||||||||||||
| 3.250%, 01/30/2024 (Acquired 01/24/2017, Cost $9,992,500) * | 10,000,000 | 10,132,530 | ||||||||||
| Jefferies Group LLC: | ||||||||||||
| 6.875%, 04/15/2021 | 2,000,000 | 2,276,426 | ||||||||||
| 4.850%, 01/15/2027 | 1,425,000 | 1,489,511 | ||||||||||
| John Hancock Life Insurance Co., | ||||||||||||
| 7.375%, 02/15/2024 (Acquired 04/10/2013 through 04/11/2013, Cost $2,786,230) * | 2,325,000 | 2,771,230 | ||||||||||
| JPMorgan Chase & Co.: | ||||||||||||
| 2.250%, 01/23/2020 | 7,875,000 | 7,899,428 | ||||||||||
| 2.295%, 08/15/2021 | 2,500,000 | 2,485,455 | ||||||||||
| 4.500%, 01/24/2022 | 3,000,000 | 3,248,547 | ||||||||||
| 2.383%, 10/24/2023 ∞ | 5,000,000 | 5,075,160 | ||||||||||
| KeyBank NA/Cleveland OH, | ||||||||||||
| 3.400%, 05/20/2026 | 2,200,000 | 2,184,576 | ||||||||||
| LeasePlan Corp. NV: | ||||||||||||
| 3.000%, 10/23/2017 (Acquired 02/07/2013, Cost $4,004,019) * f | 4,000,000 | 4,012,332 | ||||||||||
| 2.500%, 05/16/2018 (Acquired 05/29/2013 through 10/20/2014, Cost $5,007,171) * f | 5,000,000 | 5,013,340 | ||||||||||
| Liberty Mutual Group, Inc., | ||||||||||||
| 4.250%, 06/15/2023 (Acquired 06/13/2013, Cost $1,987,300) * | 2,000,000 | 2,127,770 | ||||||||||
| Lloyds Bank PLC: | ||||||||||||
| 2.050%, 01/22/2019 f | 3,000,000 | 3,006,285 | ||||||||||
| 5.800%, 01/13/2020 (Acquired 02/09/2010 through 03/16/2012, Cost $2,902,084) * f | 2,900,000 | 3,154,927 | ||||||||||
| Lloyds Banking Group PLC, | ||||||||||||
| 3.000%, 01/11/2022 f | 7,000,000 | 7,069,132 | ||||||||||
| Macquarie Bank Ltd, | ||||||||||||
| 6.625%, 04/07/2021 (Acquired 10/05/2016 through 06/08/2017, Cost $6,215,206) * f | 5,482,000 | 6,177,836 | ||||||||||
| Macquarie Bank Ltd.: | ||||||||||||
| 1.600%, 10/27/2017 (Acquired 10/22/2014, Cost $2,498,475) * f | 2,500,000 | 2,500,210 | ||||||||||
| 2.400%, 01/21/2020 (Acquired 01/14/2015, Cost $997,800) * f | 1,000,000 | 1,001,711 | ||||||||||
| Manulife Financial Corp., | ||||||||||||
| 4.900%, 09/17/2020 f | 2,375,000 | 2,553,491 | ||||||||||
| Marsh & McLennan Companies, Inc., | ||||||||||||
| 2.550%, 10/15/2018 | 1,000,000 | 1,009,678 | ||||||||||
| MBIA Insurance Corp., | ||||||||||||
| 12.418%, 01/15/2033 (Acquired 01/11/2008, Cost $500,000) ∞ * | 500,000 | 240,000 | ||||||||||
| Metropolitan Life Global Funding I, | ||||||||||||
| 3.000%, 01/10/2023 (Acquired 01/03/2013, Cost $1,299,337) * | 1,300,000 | 1,321,776 | ||||||||||
| Mitsubishi UFJ Financial Group, Inc.: | ||||||||||||
| 2.190%, 09/13/2021 f | 3,000,000 | 2,956,500 | ||||||||||
| 2.998%, 02/22/2022 f | 2,575,000 | 2,613,246 | ||||||||||
| Mizuho Bank Ltd., | ||||||||||||
| 2.150%, 10/20/2018 (Acquired 10/13/2015, Cost $4,497,390) * f | 4,500,000 | 4,506,152 | ||||||||||
| Morgan Stanley: | ||||||||||||
| 6.625%, 04/01/2018 | 1,700,000 | 1,760,367 | ||||||||||
| 7.300%, 05/13/2019 | 2,700,000 | 2,951,815 | ||||||||||
| 2.375%, 07/23/2019 | 1,000,000 | 1,006,926 | ||||||||||
| 2.553%, 10/24/2023 ∞ | 7,000,000 | 7,121,548 | ||||||||||
| 3.125%, 07/27/2026 | 4,525,000 | 4,399,418 | ||||||||||
| MUFG Americas Holdings Corp., | ||||||||||||
| 3.500%, 06/18/2022 | 225,000 | 231,774 | ||||||||||
| Nationwide Building Society, | ||||||||||||
| 2.350%, 01/21/2020 (Acquired 01/12/2015, Cost $2,999,010) * f | 3,000,000 | 3,011,136 | ||||||||||
| Nationwide Financial Services, Inc., | ||||||||||||
| 5.375%, 03/25/2021 (Acquired 10/07/2013, Cost $863,863) * | 828,000 | 908,084 | ||||||||||
| Nomura Holdings, Inc., | ||||||||||||
| 6.700%, 03/04/2020 f | 1,000,000 | 1,107,694 | ||||||||||
| Peachtree Corners Funding Trust, | ||||||||||||
| 3.976%, 02/15/2025 (Acquired 03/10/2015, Cost $6,000,000) * | 6,000,000 | 6,088,752 | ||||||||||
| Principal Life Global Funding II: | ||||||||||||
| 2.200%, 04/08/2020 (Acquired 03/31/2015, Cost $1,997,360) * | 2,000,000 | 1,994,364 | ||||||||||
| 3.000%, 04/18/2026 (Acquired 04/11/2016, Cost $6,981,380) * | 7,000,000 | 6,899,158 | ||||||||||
| Protective Life Corp., | ||||||||||||
| 7.375%, 10/15/2019 | 2,050,000 | 2,282,523 | ||||||||||
| Protective Life Global Funding, | ||||||||||||
| 2.700%, 11/25/2020 (Acquired 11/19/2015, Cost $2,997,360) * | 3,000,000 | 3,022,302 | ||||||||||
| Prudential Financial, Inc., | ||||||||||||
| 7.375%, 06/15/2019 | 850,000 | 936,925 | ||||||||||
| Regions Bank/Birmingham AL, | ||||||||||||
| 7.500%, 05/15/2018 | 2,475,000 | 2,591,008 | ||||||||||
| Reliance Standard Life Global Funding II, | ||||||||||||
| 3.050%, 01/20/2021 (Acquired 01/12/2016, Cost $4,994,250) * | 5,000,000 | 5,056,220 | ||||||||||
| Santander Bank NA, | ||||||||||||
| 8.750%, 05/30/2018 | 4,415,000 | 4,679,812 | ||||||||||
| Santander Holdings USA, Inc., | ||||||||||||
| 2.700%, 05/24/2019 | 2,000,000 | 2,014,766 | ||||||||||
| Santander UK Group Holdings PLC, | ||||||||||||
| 3.125%, 01/08/2021 f | 2,325,000 | 2,360,284 | ||||||||||
| Santander UK PLC: | ||||||||||||
| 3.050%, 08/23/2018 f | 1,175,000 | 1,189,722 | ||||||||||
| 5.000%, 11/07/2023 (Acquired 10/31/2013, Cost $996,810) * f | 1,000,000 | 1,072,018 | ||||||||||
| Skandinaviska Enskilda Banken AB, | ||||||||||||
| 2.450%, 05/27/2020 (Acquired 05/19/2015, Cost $8,486,910) * f | 8,500,000 | 8,567,898 | ||||||||||
| Societe Generale SA: | ||||||||||||
| 2.379%, 10/01/2018 ∞ f | 2,000,000 | 2,013,418 | ||||||||||
| 2.625%, 10/01/2018 f | 1,000,000 | 1,010,316 | ||||||||||
| 2.500%, 04/08/2021 (Acquired 04/04/2016, Cost $2,148,387) * f | 2,150,000 | 2,155,878 | ||||||||||
| 5.200%, 04/15/2021 (Acquired 01/28/2013, Cost $1,327,946) * f | 1,250,000 | 1,373,312 | ||||||||||
| 5.000%, 01/17/2024 (Acquired 01/14/2014 through 02/18/2014, Cost $3,127,301) * f | 3,150,000 | 3,356,013 | ||||||||||
| Standard Chartered PLC: | ||||||||||||
| 1.798%, 04/17/2018 (Acquired 04/13/2015, Cost $8,500,000) ∞ * f | 8,500,000 | 8,490,395 | ||||||||||
| 2.100%, 08/19/2019 (Acquired 08/16/2016 through 11/17/2016, Cost $3,191,284) * f | 3,200,000 | 3,188,237 | ||||||||||
| Stifel Financial Corp., | ||||||||||||
| 4.250%, 07/18/2024 | 1,156,000 | 1,176,903 | ||||||||||
| Sumitomo Mitsui Banking Corp.: | ||||||||||||
| 2.500%, 07/19/2018 f | 3,000,000 | 3,022,221 | ||||||||||
| 2.250%, 07/11/2019 f | 2,000,000 | 2,008,714 | ||||||||||
| Sumitomo Mitsui Financial Group, Inc., | ||||||||||||
| 2.442%, 10/19/2021 f | 6,200,000 | 6,173,997 | ||||||||||
| Sumitomo Mitsui Trust Bank Ltd, | ||||||||||||
| 2.050%, 03/06/2019 (Acquired 02/27/2017, Cost $11,993,160) * f | 12,000,000 | 11,999,916 | ||||||||||
| SunTrust Bank/Atlanta GA: | ||||||||||||
| 5.450%, 12/01/2017 | 500,000 | 507,675 | ||||||||||
| 7.250%, 03/15/2018 | 1,506,000 | 1,562,475 | ||||||||||
| 3.300%, 05/15/2026 | 9,000,000 | 8,796,285 | ||||||||||
| Svenska Handelsbanken AB: | ||||||||||||
| 2.500%, 01/25/2019 f | 1,000,000 | 1,010,120 | ||||||||||
| 2.400%, 10/01/2020 f | 5,000,000 | 5,032,730 | ||||||||||
| Swedbank AB: | ||||||||||||
| 1.750%, 03/12/2018 (Acquired 03/05/2013, Cost $3,236,382) * f | 3,250,000 | 3,253,227 | ||||||||||
| 2.375%, 02/27/2019 (Acquired 02/20/2014, Cost $2,595,606) * f | 2,600,000 | 2,619,463 | ||||||||||
| 2.650%, 03/10/2021 (Acquired 03/03/2016, Cost $3,795,592) * f | 3,800,000 | 3,845,000 | ||||||||||
| Synchrony Financial: | ||||||||||||
| 3.750%, 08/15/2021 | 5,000,000 | 5,135,625 | ||||||||||
| 4.250%, 08/15/2024 | 4,800,000 | 4,902,749 | ||||||||||
| 3.700%, 08/04/2026 | 3,000,000 | 2,895,147 | ||||||||||
| Trinity Acquisition PLC, | ||||||||||||
| 4.400%, 03/15/2026 f | 1,125,000 | 1,174,744 | ||||||||||
| UBS Group Funding Switzerland AG: | ||||||||||||
| 2.950%, 09/24/2020 (Acquired 09/21/2015, Cost $6,214,355) * f | 6,225,000 | 6,359,255 | ||||||||||
| 2.650%, 02/01/2022 (Acquired 01/20/2017, Cost $4,855,079) * f | 5,000,000 | 4,989,385 | ||||||||||
| 3.491%, 05/23/2023 (Acquired 03/16/2017, Cost $999,980) * f | 1,000,000 | 1,023,103 | ||||||||||
| Voya Financial, Inc.: | ||||||||||||
| 2.900%, 02/15/2018 | 1,525,000 | 1,535,315 | ||||||||||
| 3.125%, 07/15/2024 | 3,000,000 | 2,962,506 | ||||||||||
| 3.650%, 06/15/2026 | 2,000,000 | 2,003,798 | ||||||||||
| WEA Finance LLC / Westfield UK & Europe Finance PLC, | ||||||||||||
| 3.250%, 10/05/2020 (Acquired 09/28/2015, Cost $7,474,275) * | 7,500,000 | 7,632,480 | ||||||||||
| Wells Fargo & Co.: | ||||||||||||
| Class N, 2.150%, 01/30/2020 | 7,000,000 | 7,017,997 | ||||||||||
| 2.402%, 10/31/2023 ∞ | 5,000,000 | 5,088,755 | ||||||||||
| Westpac Banking Corp.: | ||||||||||||
| 1.600%, 01/12/2018 f | 1,250,000 | 1,250,687 | ||||||||||
| 4.875%, 11/19/2019 f | 2,775,000 | 2,955,081 | ||||||||||
| 2.100%, 05/13/2021 f | 5,000,000 | 4,954,245 | ||||||||||
| Willis Towers Watson PLC, | ||||||||||||
| 5.750%, 03/15/2021 f | 3,250,000 | 3,585,449 | ||||||||||
| 624,958,784 | 23.3 | % | ||||||||||
| Total Corporate Bonds | 1,193,676,113 | 44.6 | % | |||||||||
| Taxable Municipal Bonds | ||||||||||||
| Alabama Economic Settlement Authority, | ||||||||||||
| 3.163%, 09/15/2025 | 5,000,000 | 5,076,100 | ||||||||||
| Alaska Municipal Bond Bank Authority: | ||||||||||||
| 4.309%, 08/01/2018 | 1,000,000 | 1,027,230 | ||||||||||
| 4.459%, 08/01/2019 | 1,340,000 | 1,407,147 | ||||||||||
| California Qualified School Bond Joint Powers Authority, | ||||||||||||
| 5.955%, 03/01/2019 | 3,375,000 | 3,556,035 | ||||||||||
| California School Finance Authority, | ||||||||||||
| 4.426%, 07/01/2020 | 2,500,000 | 2,649,625 | ||||||||||
| Central Valley Support Joint Powers Agency, | ||||||||||||
| 5.326%, 09/01/2022 | 2,000,000 | 2,190,840 | ||||||||||
| City of Bristol VA, | ||||||||||||
| 3.668%, 10/01/2022 (Callable 10/01/2020) | 7,500,000 | 7,688,550 | ||||||||||
| Cook County School District No. 104 Summit, | ||||||||||||
| 6.125%, 12/01/2027 (Callable 12/01/2017) | 1,535,000 | 1,557,826 | ||||||||||
| County of Cook IL, | ||||||||||||
| 5.240%, 11/15/2025 (Callable 11/15/2021) | 2,345,000 | 2,496,839 | ||||||||||
| Dallas Independent School District, | ||||||||||||
| 4.950%, 02/15/2022 (Callable 02/15/2021) | 1,965,000 | 2,172,779 | ||||||||||
| Davie Florida Water & Sewer Revenue, | ||||||||||||
| 6.062%, 10/01/2025 (Callable 10/01/2020) | 1,000,000 | 1,118,680 | ||||||||||
| Iowa Tobacco Settlement Authority, | ||||||||||||
| 6.500%, 06/01/2023 (Callable 07/31/2017) | 650,000 | 650,091 | ||||||||||
| New Hampshire Housing Finance Authority, | ||||||||||||
| 2.600%, 01/01/2020 | 1,525,000 | 1,527,730 | ||||||||||
| New Jersey Economic Development Authority: | ||||||||||||
| 2.5170%, 02/15/2019 <<<< | 4,450,000 | 4,264,880 | ||||||||||
| 2.9443%, 02/15/2021 <<<< | 3,000,000 | 2,674,650 | ||||||||||
| North Carolina Housing Finance Agency: | ||||||||||||
| 4.000%, 01/01/2030 (Callable 07/01/2021) | 295,000 | 302,042 | ||||||||||
| 3.000%, 01/01/2033 (Callable 01/01/2025) | 5,060,000 | 5,054,889 | ||||||||||
| North East Independent School District/TX, | ||||||||||||
| 5.240%, 08/01/2027 | 2,100,000 | 2,466,198 | ||||||||||
| Public Finance Authority: | ||||||||||||
| 2.625%, 11/01/2019 (Callable 05/01/2018) | 3,000,000 | 2,985,060 | ||||||||||
| 2.820%, 03/01/2020 (Callable 09/01/2018) | 2,000,000 | 1,998,980 | ||||||||||
| South Dakota Housing Development Authority, | ||||||||||||
| 2.700%, 11/01/2036 (Callable 11/01/2025) | 1,980,000 | 1,965,823 | ||||||||||
| Winnebago & Boone Counties School District No. 205 Rockford: | ||||||||||||
| 3.800%, 12/01/2026 (Callable 12/01/2025) | 2,200,000 | 2,243,230 | ||||||||||
| 3.950%, 12/01/2027 (Callable 12/01/2025) | 1,700,000 | 1,700,374 | ||||||||||
| 58,775,598 | 2.2 | % | ||||||||||
| Residential Mortgage-Backed Securities | ||||||||||||
| U.S. Government Agency Issues | ||||||||||||
| Fannie Mae REMIC Trust: | ||||||||||||
| Series 1989-2, Class D, 8.800%, 01/25/2019 | 1,225 | 1,267 | ||||||||||
| Series 1990-108, Class G, 7.000%, 09/25/2020 | 1,970 | 2,078 | ||||||||||
| Series G-29, Class O, 8.500%, 09/25/2021 | 296 | 320 | ||||||||||
| Series 1991-137, Class H, 7.000%, 10/25/2021 | 16,415 | 17,472 | ||||||||||
| Series 1993-32, Class H, 6.000%, 03/25/2023 | 11,589 | 12,414 | ||||||||||
| Federal Gold Loan Mortgage Corp. (FGLMC): | ||||||||||||
| 6.000%, 06/01/2021 | 61,387 | 64,866 | ||||||||||
| 6.000%, 07/01/2028 | 5,436 | 6,170 | ||||||||||
| Federal Home Loan Mortgage Corp. (FHLMC): | ||||||||||||
| Series 74, Class F, 6.000%, 10/15/2020 | 567 | 586 | ||||||||||
| Series 1395, Class G, 6.000%, 10/15/2022 | 5,401 | 5,763 | ||||||||||
| Government National Mortgage Association (GNMA), | ||||||||||||
| Series 1999-4, Class ZB, 6.000%, 02/20/2029 | 70,508 | 78,402 | ||||||||||
| 189,338 | 0.0 | % | ||||||||||
| Non-U.S. Government Agency Issues | ||||||||||||
| Accredited Mortgage Loan Trust, | ||||||||||||
| Series 2005-4, Class A1, 1.456%, 12/25/2035 ∞ | 2,835,437 | 2,818,683 | ||||||||||
| Alternative Loan Trust: | ||||||||||||
| Series 2005-50CB, Class 4A1, 5.000%, 11/25/2020 § | 149,092 | 149,092 | ||||||||||
| Series 2005-85CB, Class 3A1, 5.250%, 02/25/2021 (Acquired 09/26/2007 through 01/28/2009, Cost $147,480) * § | 148,393 | 144,649 | ||||||||||
| Series 2006-7CB, Class 3A1, 5.250%, 05/25/2021 § | 256,491 | 250,257 | ||||||||||
| Series 2004-8CB, Class A, 1.486%, 06/25/2034 ∞ | 3,835,841 | 3,812,499 | ||||||||||
| Series 2005-11CB, Class 2A1, 5.500%, 06/25/2035 § | 46,499 | 45,525 | ||||||||||
| AMRESCO Residential Securities Corp. Mortgage Loan Trust, | ||||||||||||
| Series 1998-1, Class A6, 6.510%, 08/25/2027 | 5,243 | 5,490 | ||||||||||
| Argent Securities Inc. Asset-Backed Pass-Through Certificates: | ||||||||||||
| Series 2005-W3, Class A2D, 1.556%, 11/25/2035 ∞ | 1,517,232 | 1,501,175 | ||||||||||
| Series 2005-W5, Class A1, 1.451%, 01/25/2036 ∞ | 8,764,202 | 8,404,060 | ||||||||||
| Banc of America Alternative Loan Trust: | ||||||||||||
| Series 2004-11, Class 4A1, 5.500%, 12/25/2019 | 146,209 | 147,608 | ||||||||||
| Series 2005-6, Class 7A1, 5.500%, 07/25/2020 § | 7,189 | 6,904 | ||||||||||
| Series 2006-2, Class 7A1, 6.000%, 03/25/2021 § | 135,924 | 128,807 | ||||||||||
| Series 2006-4, Class 3CB4, 6.000%, 05/25/2046 § | 317,550 | 294,031 | ||||||||||
| Banc of America Funding Trust, | ||||||||||||
| Series 2004-2, Class 1CB1, 5.750%, 09/20/2034 | 3,234,028 | 3,445,410 | ||||||||||
| Bear Stearns ARM Trust, | ||||||||||||
| Series 2004-5, Class 2A, 3.932%, 07/25/2034 ∞ | 1,588,298 | 1,571,485 | ||||||||||
| Citigroup Global Markets Mortgage Securities VII, Inc., | ||||||||||||
| Series 2003-UP2, Class A2, 7.000%, 06/25/2033 ∞ | 59,123 | 59,908 | ||||||||||
| Cityscape Home Equity Loan Trust, | ||||||||||||
| Series 1997-C, Class A4, 7.000%, 07/25/2028 | 3,921 | 3,548 | ||||||||||
| Countrywide Asset-Backed Certificates: | ||||||||||||
| Series 2004-12, Class AF6, 4.634%, 03/25/2035 ∞ | 3,376 | 3,470 | ||||||||||
| Series 2006-13, Class 1AF3, 4.488%, 01/25/2037 ∞ § | 102,784 | 179,894 | ||||||||||
| CWABS Asset-Backed Certificates Trust: | ||||||||||||
| Series 2005-1, Class AF6, 5.030%, 07/25/2035 ∞ | 238,340 | 243,017 | ||||||||||
| §Series 2006-9, Class 1AF3, 4.606%, 10/25/2046 ∞ § | 745,224 | 664,595 | ||||||||||
| Delta Funding Home Equity Loan Trust: | ||||||||||||
| Series 1997-2, Class A6, 7.040%, 06/25/2027 ∞ | 1,274 | 1,255 | ||||||||||
| Series 1999-2, Class A7F, 7.030%, 08/15/2030 | 269,340 | 311,847 | ||||||||||
| GSAMP Trust, | ||||||||||||
| Series 2005-WMC2, Class A1B, 1.526%, 11/25/2035 ∞ | 2,189,426 | 2,178,076 | ||||||||||
| IMC Home Equity Loan Trust, | ||||||||||||
| Series 1998-1, Class A6, 7.020%, 06/20/2029 ∞ | 1,617 | 1,616 | ||||||||||
| J.P. Morgan Alternative Loan Trust: | ||||||||||||
| Series 2005-S1, Class 3A1, 5.500%, 10/25/2020 § | 222,949 | 221,150 | ||||||||||
| Series 2006-A1, Class 2A1, 3.359%, 03/25/2036 ∞ § | 425,709 | 379,530 | ||||||||||
| J.P. Morgan Mortgage Acquisition Trust, | ||||||||||||
| Series 2006-CH1, Class A1, 1.346%, 07/25/2036 ∞ | 2,815,153 | 2,783,403 | ||||||||||
| MASTR Alternative Loan Trust: | ||||||||||||
| Series 2004-1, Class 1A1, 5.000%, 01/25/2019 | 92,410 | 92,569 | ||||||||||
| Series 2004-3, Class 1A1, 5.000%, 03/25/2019 | 21,607 | 21,677 | ||||||||||
| Series 2005-3, Class 4A1, 5.500%, 03/25/2020 | 27,659 | 27,979 | ||||||||||
| MortgageIT Trust, | ||||||||||||
| Series 2005-3, Class A1, 1.516%, 08/25/2035 ∞ | 6,752,864 | 6,418,679 | ||||||||||
| New Century Home Equity Loan Trust: | ||||||||||||
| Series 2005-C, Class A1, 1.446%, 12/25/2035 ∞ | 2,996,306 | 2,965,822 | ||||||||||
| Series 2005-C, Class A2C, 1.466%, 12/25/2035 ∞ | 1,603,333 | 1,595,906 | ||||||||||
| New Residential Mortgage Loan Trust 2017-2, | ||||||||||||
| Series 2017-2A, Class A3, 4.000%, 03/25/2057 (Acquired 04/19/2017, Cost $5,805,194) ∞ * | 5,585,359 | 5,815,560 | ||||||||||
| Nomura Home Equity Loan, Inc. Home Equity Loan Trust, | ||||||||||||
| Series 2006-HE2, Class A3, 1.386%, 03/25/2036 ∞ | 2,954,907 | 2,940,212 | ||||||||||
| RALI Series Trust, | ||||||||||||
| Series 2004-QS6, Class A1, 5.000%, 05/25/2019 | 9,916 | 9,795 | ||||||||||
| RAMP Series Trust, | ||||||||||||
| Series 2005-RS1, Class AI6, 4.713%, 01/25/2035 | 17,110 | 17,268 | ||||||||||
| Saxon Asset Securities Trust, | ||||||||||||
| Series 2005-4, Class A1B, 1.596%, 11/25/2037 ∞ | 3,418,624 | 3,417,129 | ||||||||||
| Securitized Asset Backed Receivables LLC Trust, | ||||||||||||
| Series 2005-OP2, Class A1, 1.541%, 10/25/2035 (Acquired 03/13/2014, Cost $1,367,563) ∞ * | 1,384,436 | 1,382,749 | ||||||||||
| Soundview Home Loan Trust, | ||||||||||||
| Series 2003-2, Class A2, 2.516%, 11/25/2033 ∞ | 2,170,872 | 2,193,109 | ||||||||||
| Specialty Underwriting & Residential Finance Trust: | ||||||||||||
| Series 2004-BC4, Class A1A, 1.886%, 10/25/2035 ∞ | 2,338,522 | 2,326,196 | ||||||||||
| Series 2006-BC1, Class A2D, 1.516%, 12/25/2036 ∞ | 5,955,254 | 5,929,607 | ||||||||||
| Structured Asset Investment Loan Trust, | ||||||||||||
| Series 2004-9, Class A5, 2.216%, 10/25/2034 ∞ | 4,053,617 | 4,033,666 | ||||||||||
| Structured Asset Securities Corp. Mortgage Pass-Through Certificates, | ||||||||||||
| Series 2004-22, Class A2, 4.984%, 01/25/2035 ∞ | 3,238,178 | 3,370,830 | ||||||||||
| Thornburg Mortgage Securities Trust, | ||||||||||||
| Series 2003-5, Class 3A, 2.883%, 10/25/2043 ∞ | 4,824,619 | 4,869,643 | ||||||||||
| Towd Point Mortgage Trust: | ||||||||||||
| Series 2015-5, Class A1B, 2.750%, 05/25/2055 (Acquired 10/28/2016, Cost $3,609,890) ∞ * | 3,565,144 | 3,592,612 | ||||||||||
| Series 2016-2, Class A1, 3.000%, 08/25/2055 (Acquired 05/20/2016, Cost $3,203,287) ∞ * | 3,180,762 | 3,225,379 | ||||||||||
| Series 2017-1, Class A1, 2.750%, 10/25/2056 (Acquired 02/07/2017, Cost $8,736,585) ∞ * | 8,725,392 | 8,792,648 | ||||||||||
| WaMu Mortgage Pass-Through Certificates Trust: | ||||||||||||
| Series 2004-CB1, Class 5A, 5.000%, 06/25/2019 | 136,789 | 137,940 | ||||||||||
| Series 2004-CB3, Class 3A, 5.500%, 10/25/2019 | 180,328 | 182,464 | ||||||||||
| Series 2004-CB3, Class 4A, 6.000%, 10/25/2019 | 92,796 | 95,150 | ||||||||||
| Series 2004-CB4, Class 21A, 5.500%, 12/25/2019 | 86,025 | 87,280 | ||||||||||
| Series 2004-CB4, Class 22A, 6.000%, 12/25/2019 | 57,226 | 58,402 | ||||||||||
| Series 2004-AR3, Class A1, 3.134%, 06/25/2034 ∞ | 3,924,036 | 3,976,731 | ||||||||||
| Series 2004-CB2, Class 3A, 6.000%, 08/25/2034 | 3,247,505 | 3,439,424 | ||||||||||
| Wells Fargo Home Equity Asset-Backed Securities Trust, | ||||||||||||
| Series 2004-2, Class A33, 2.216%, 10/25/2034 ∞ | 3,311,175 | 3,273,419 | ||||||||||
| Wells Fargo Mortgage Backed Securities Trust, | ||||||||||||
| Series 2005-AR10, Class 2A17, 3.152%, 06/25/2035 ∞ | 5,445,884 | 5,557,090 | ||||||||||
| 109,603,919 | 4.1 | % | ||||||||||
| Commercial Mortgage-Backed Securities | ||||||||||||
| U.S. Government Agency Issues | ||||||||||||
| Freddie Mac Multifamily Structured Pass Through Certificates: | ||||||||||||
| Series K003, Class A4, 5.053%, 01/25/2019 | 9,000,000 | 9,344,368 | ||||||||||
| Series K004, Class A2, 4.186%, 08/25/2019 | 8,095,000 | 8,474,307 | ||||||||||
| Series K005, Class A2, 4.317%, 11/25/2019 | 6,475,000 | 6,821,528 | ||||||||||
| Series K006, Class A2, 4.251%, 01/25/2020 | 2,993,000 | 3,157,459 | ||||||||||
| Series K713, Class A2, 2.313%, 03/25/2020 | 4,450,000 | 4,498,465 | ||||||||||
| Series K720, Class A2, 2.716%, 06/25/2022 | 15,725,000 | 16,090,630 | ||||||||||
| Series K-050, Class A2, 3.334%, 08/25/2025 ∞ | 12,150,000 | 12,715,214 | ||||||||||
| 61,101,971 | 2.3 | % | ||||||||||
| Non-U.S. Government Agency Issues | ||||||||||||
| Citigroup Commercial Mortgage Trust 2013-GC11, | ||||||||||||
| Series 2013-GC11, Class A4, 3.093%, 04/10/2046 | 11,050,000 | 11,279,060 | ||||||||||
| J.P. Morgan Chase Commercial Mortgage Securities Trust, | ||||||||||||
| Series 2011-C5, Class A3, 4.171%, 08/15/2046 | 9,832,773 | 10,468,173 | ||||||||||
| Morgan Stanley Bank of America Merrill Lynch Trust, | ||||||||||||
| Series 2016-C29, Class ASB, 3.140%, 05/15/2049 | 5,000,000 | 5,114,427 | ||||||||||
| Morgan Stanley Bank of America Merrill Lynch Trust 2013-C7, | ||||||||||||
| Series 2013-C7, Class A4, 2.918%, 02/15/2046 | 6,540,000 | 6,629,377 | ||||||||||
| Wells Fargo Commercial Mortgage Trust: | ||||||||||||
| Series 2014-LC18, Class ASB, 3.244%, 12/15/2047 | 16,400,000 | 16,946,202 | ||||||||||
| Series 2015-P2, Class ASB, 3.656%, 12/15/2048 | 10,600,000 | 11,116,544 | ||||||||||
| WFRBS Commercial Mortgage Trust: | ||||||||||||
| Series 2012-C6, Class A4, 3.440%, 04/15/2045 | 8,375,000 | 8,707,067 | ||||||||||
| Series 2014-C21, Class A2, 2.917%, 08/15/2047 | 2,435,234 | 2,480,401 | ||||||||||
| Series 2014-C24, Class ASB, 3.324%, 11/15/2047 | 8,652,000 | 8,974,176 | ||||||||||
| Series 2013-C12, Class ASB, 2.838%, 03/15/2048 | 8,750,000 | 8,902,376 | ||||||||||
| 90,617,803 | 3.4 | % | ||||||||||
| Other Asset Backed Securities | ||||||||||||
| American Express Credit Account Master Trust, | ||||||||||||
| Series 2017-1, Class A, 1.930%, 09/15/2022 | 11,750,000 | 11,788,011 | ||||||||||
| Citibank Credit Card Issuance Trust, | ||||||||||||
| Series 2017-A3, Class A3, 1.920%, 04/07/2022 | 13,375,000 | 13,389,782 | ||||||||||
| Conseco Financial Corp.: | ||||||||||||
| Series 1998-2, Class A5, 6.240%, 12/01/2028 | 151,678 | 156,735 | ||||||||||
| Series 1998-3, Class A5, 6.220%, 03/01/2030 | 271,003 | 289,368 | ||||||||||
| Series 1998-4, Class A5, 6.180%, 04/01/2030 | 115,420 | 121,750 | ||||||||||
| Series 1998-7, Class A1, 6.320%, 07/01/2030 | 2,379,843 | 2,500,813 | ||||||||||
| Discover Card Execution Note Trust, | ||||||||||||
| Series 2016-A4, Class A4, 1.390%, 03/15/2022 | 10,925,000 | 10,833,273 | ||||||||||
| Ford Credit Auto Owner Trust: | ||||||||||||
| Series 2014-1, Class A, 2.260%, 11/15/2025 (Acquired 10/07/2014 through 10/09/2014, Cost $10,889,121) * | 10,859,000 | 10,958,645 | ||||||||||
| Series 2014-2, Class A, 2.310%, 04/15/2026 (Acquired 10/07/2014, Cost $11,745,689) * | 11,750,000 | 11,863,714 | ||||||||||
| MMAF Equipment Finance LLC 2017-A, | ||||||||||||
| Series 2017-AA, Class A3, 2.040%, 02/16/2022 (Acquired 04/25/2017, Cost $6,249,621) * | 6,250,000 | 6,255,534 | ||||||||||
| Oakwood Mortgage Investors, Inc., | ||||||||||||
| Series 1999-B, Class A3, 6.450%, 11/15/2017 | 57,047 | 57,751 | ||||||||||
| OneMain Financial Issuance Trust, | ||||||||||||
| Series 2014-2A, Class A, 2.470%, 09/18/2024 (Acquired 07/30/2015 through 02/03/2016, Cost $1,784,895) * | 1,785,892 | 1,788,214 | ||||||||||
| Sofi Consumer Loan Program 2017-3 LLC, | ||||||||||||
| Series 2017-3, Class A, 2.770%, 05/25/2026 (Acquired 05/11/2017, Cost $5,724,219) * | 5,724,220 | 5,753,642 | ||||||||||
| Synchrony Credit Card Master Note Trust, | ||||||||||||
| Series 2012-2, Class A, 2.220%, 01/15/2022 | 8,375,000 | 8,437,541 | ||||||||||
| 84,194,773 | 3.1 | % | ||||||||||
| Total Long-Term Investments (Cost $2,615,443,401) | 2,625,750,504 | 98.1 | % | |||||||||
| SHORT-TERM INVESTMENT | Shares | |||||||||||
| Money Market Mutual Fund | ||||||||||||
| Fidelity Institutional Money Market Fund - Government Portfolio, Institutional Class, 0.85% « | 68,493,027 | 68,493,027 | ||||||||||
| Total Short-Term Investment (Cost $68,493,027) | 68,493,027 | 2.6 | % | |||||||||
| Total Investments (Cost $2,683,936,428) | 2,694,243,531 | 100.7 | % | |||||||||
| Liabilities in Excess of Other Assets | (17,450,624 | ) | (0.7 | )% | ||||||||
| TOTAL NET ASSETS | $ | 2,676,792,907 | 100.0 | % | ||||||||
Notes to Schedule of Investments | |
| ∞ | Variable or Floating rate security. Floating rate securities are securities whose yields vary with a designated index rate. These securities' rates are as of June 30, 2017. |
| * | Restricted security as defined in Rule 144(a) under the Securities Act of 1933 and determined to be liquid. Purchased in a private placement transaction; resale to the public may require registration or or may extend only to qualified institutional buyers. At June 30, 2017, the value of these securities total $465,909,044, which represents 17.41% of total net assets. |
| f | Foreign Security. |
| § | Security in Default. |
| « | 7-Day Yield. |
| § | Security in Default. |
| <<<< | Effective yield as of June 30, 2017. |
| Baird Aggregate Bond Fund | ||||||||||||
| Schedule of Investments | ||||||||||||
| June 30, 2017 (Unaudited) | ||||||||||||
| Principal | % of | |||||||||||
| Amount | Value | Net Assets | ||||||||||
| LONG-TERM INVESTMENTS | ||||||||||||
| U.S. Treasury Securities | ||||||||||||
| U.S. Treasury Bonds: | ||||||||||||
| 1.750%, 03/31/2022 | $ | 211,855,000 | $ | 210,762,676 | ||||||||
| 1.875%, 03/31/2022 | 125,000,000 | 125,073,250 | ||||||||||
| 2.500%, 05/15/2024 | 508,950,000 | 521,454,901 | ||||||||||
| 2.250%, 11/15/2025 | 165,875,000 | 165,913,815 | ||||||||||
| 5.250%, 11/15/2028 | 92,576,500 | 119,177,802 | ||||||||||
| 3.500%, 02/15/2039 | 371,355,900 | 419,559,753 | ||||||||||
| 2.875%, 05/15/2043 | 693,050,000 | 699,764,268 | ||||||||||
| 2.500%, 02/15/2045 | 4,900,000 | 4,572,886 | ||||||||||
| 2,266,279,351 | 17.8 | % | ||||||||||
| Other Government Related Securities | ||||||||||||
| City of Berwyn IL, | ||||||||||||
| 5.790%, 12/01/2022 | 10,000,000 | 10,707,900 | ||||||||||
| CNOOC Finance (2015) Australia Pty Ltd., | ||||||||||||
| 2.625%, 05/05/2020 f | 14,500,000 | 14,537,751 | ||||||||||
| CNPC General Capital Ltd., | ||||||||||||
| 2.750%, 05/14/2019 (Acquired 05/07/2014, Cost $1,983,740) * f | 2,000,000 | 2,012,287 | ||||||||||
| Comision Federal de Electricidad, | ||||||||||||
| 4.875%, 01/15/2024 (Acquired 10/17/2013, Cost $2,662,655) * f | 2,678,000 | 2,828,638 | ||||||||||
| Corp Andina de Fomento, | ||||||||||||
| 4.375%, 06/15/2022 f | 6,107,000 | 6,603,621 | ||||||||||
| Export-Import Bank of Korea, | ||||||||||||
| 2.250%, 01/21/2020 f | 11,000,000 | 10,980,552 | ||||||||||
| Industrial Bank of Korea, | ||||||||||||
| 2.000%, 04/23/2020 (Acquired 04/16/2015, Cost $6,972,210) * f | 7,000,000 | 6,898,007 | ||||||||||
| The Korea Development Bank, | ||||||||||||
| 2.250%, 05/18/2020 f | 2,000,000 | 1,991,021 | ||||||||||
| Korea Electric Power Corp., | ||||||||||||
| 6.750%, 08/01/2027 f | 1,932,000 | 2,517,834 | ||||||||||
| Korea Gas Corp., | ||||||||||||
| 4.250%, 11/02/2020 (Acquired 10/26/2010, Cost $2,309,418) * f | 2,321,000 | 2,436,586 | ||||||||||
| Nexen Energy ULC: | ||||||||||||
| 6.400%, 05/15/2037 f | 3,392,000 | 4,321,123 | ||||||||||
| 7.500%, 07/30/2039 f | 4,175,000 | 6,030,228 | ||||||||||
| Pemex Finance Ltd., | ||||||||||||
| 10.610%, 08/15/2017 f | 167,375 | 168,933 | ||||||||||
| Petroleos Mexicanos: | ||||||||||||
| 5.750%, 03/01/2018 f | 2,499,000 | 2,557,347 | ||||||||||
| 8.000%, 05/03/2019 f | 7,000,000 | 7,656,250 | ||||||||||
| 5.500%, 01/21/2021 f | 5,600,000 | 5,874,400 | ||||||||||
| 4.875%, 01/24/2022 f | 4,000,000 | 4,120,840 | ||||||||||
| 4.500%, 01/23/2026 f | 2,500,000 | 2,430,075 | ||||||||||
| 6.625%, 06/15/2035 f | 893,000 | 923,139 | ||||||||||
| Sinopec Group Overseas Development [2014] Ltd., | ||||||||||||
| 4.375%, 04/10/2024 (Acquired 04/02/2014, Cost $1,496,505) * f | 1,500,000 | 1,595,067 | ||||||||||
| Sinopec Group Overseas Development [2015] Ltd.: | ||||||||||||
| 2.500%, 04/28/2020 (Acquired 04/21/2015, Cost $14,936,400) * f | 15,000,000 | 15,070,629 | ||||||||||
| 3.250%, 04/28/2025 (Acquired 04/21/2015, Cost $9,902,200) * f | 10,000,000 | 9,828,544 | ||||||||||
| Sinopec Group Overseas Development [2016] Ltd., | ||||||||||||
| 3.500%, 05/03/2026 (Acquired 04/25/2016 through 04/28/2016, Cost $13,365,147) * f | 13,450,000 | 13,369,502 | ||||||||||
| Sinopec Group Overseas Development [2017] Ltd, | ||||||||||||
| 3.000%, 04/12/2022 (Acquired 04/05/2017, Cost $14,987,550) * f | 15,000,000 | 15,120,600 | ||||||||||
| 150,580,874 | 1.2 | % | ||||||||||
| Corporate Bonds | ||||||||||||
| Industrials | ||||||||||||
| 21st Century Fox America, Inc.: | ||||||||||||
| 7.300%, 04/30/2028 | 6,350,000 | 8,115,078 | ||||||||||
| 6.150%, 03/01/2037 | 2,570,000 | 3,210,837 | ||||||||||
| 6.750%, 01/09/2038 | 5,650,000 | 7,156,488 | ||||||||||
| Abbott Laboratories: | ||||||||||||
| 4.750%, 11/30/2036 | 33,949,000 | 36,952,196 | ||||||||||
| 4.900%, 11/30/2046 | 4,700,000 | 5,176,759 | ||||||||||
| AbbVie, Inc.: | ||||||||||||
| 2.500%, 05/14/2020 | 9,500,000 | 9,610,133 | ||||||||||
| 4.500%, 05/14/2035 | 9,000,000 | 9,491,715 | ||||||||||
| 4.300%, 05/14/2036 | 6,000,000 | 6,106,212 | ||||||||||
| Actavis Funding SCS: | ||||||||||||
| 3.850%, 06/15/2024 f | 12,067,000 | 12,588,162 | ||||||||||
| 3.800%, 03/15/2025 f | 12,000,000 | 12,412,188 | ||||||||||
| Acuity Brands Lighting, Inc., | ||||||||||||
| 6.000%, 12/15/2019 | 3,749,000 | 4,061,093 | ||||||||||
| Agrium, Inc., | ||||||||||||
| 3.375%, 03/15/2025 f | 2,625,000 | 2,625,276 | ||||||||||
| Ameritech Capital Funding Corp., | ||||||||||||
| 6.450%, 01/15/2018 | 2,668,000 | 2,733,814 | ||||||||||
| Amgen, Inc., | ||||||||||||
| 4.400%, 05/01/2045 | 12,300,000 | 12,633,933 | ||||||||||
| Anadarko Finance Co., | ||||||||||||
| Class B, 7.500%, 05/01/2031 f | 7,170,000 | 8,959,811 | ||||||||||
| Anadarko Petroleum Corp., | ||||||||||||
| 8.700%, 03/15/2019 | 2,432,000 | 2,682,280 | ||||||||||
| Analog Devices, Inc., | ||||||||||||
| 3.125%, 12/05/2023 | 10,000,000 | 10,106,680 | ||||||||||
| Anglo American Capital PLC, | ||||||||||||
| 9.375%, 04/08/2019 (Acquired 04/02/2009, Cost $1,785,000) * f | 1,785,000 | 1,996,969 | ||||||||||
| Anheuser-Busch InBev Finance, Inc.: | ||||||||||||
| 2.650%, 02/01/2021 | 6,300,000 | 6,384,471 | ||||||||||
| 3.300%, 02/01/2023 | 7,400,000 | 7,620,009 | ||||||||||
| 3.650%, 02/01/2026 | 10,400,000 | 10,714,808 | ||||||||||
| Apple, Inc., | ||||||||||||
| 2.400%, 05/03/2023 | 2,678,000 | 2,656,924 | ||||||||||
| AT&T, Inc.: | ||||||||||||
| 3.400%, 05/15/2025 | 23,200,000 | 22,807,688 | ||||||||||
| 4.125%, 02/17/2026 | 7,650,000 | 7,843,308 | ||||||||||
| 5.250%, 03/01/2037 | 10,000,000 | 10,653,770 | ||||||||||
| 4.800%, 06/15/2044 | 1,375,000 | 1,362,686 | ||||||||||
| 4.750%, 05/15/2046 | 5,000,000 | 4,903,020 | ||||||||||
| 5.650%, 02/15/2047 | 4,200,000 | 4,624,943 | ||||||||||
| Baxalta, Inc., | ||||||||||||
| 2.875%, 06/23/2020 | 5,000,000 | 5,079,830 | ||||||||||
| Bayer US Finance LLC, | ||||||||||||
| 2.375%, 10/08/2019 (Acquired 10/01/2014, Cost $9,954,200) * | 10,000,000 | 10,079,610 | ||||||||||
| Becton Dickinson and Co.: | ||||||||||||
| 2.675%, 12/15/2019 | 4,007,000 | 4,056,062 | ||||||||||
| 3.250%, 11/12/2020 | 7,000,000 | 7,167,223 | ||||||||||
| 3.363%, 06/06/2024 | 6,300,000 | 6,314,402 | ||||||||||
| 3.734%, 12/15/2024 | 4,000,000 | 4,065,544 | ||||||||||
| 4.875%, 05/15/2044 | 3,815,000 | 3,957,151 | ||||||||||
| Boardwalk Pipelines LP: | ||||||||||||
| 5.950%, 06/01/2026 | 6,000,000 | 6,681,078 | ||||||||||
| 4.450%, 07/15/2027 | 7,000,000 | 7,166,747 | ||||||||||
| Boston Scientific Corp.: | ||||||||||||
| 2.650%, 10/01/2018 | 10,000,000 | 10,091,810 | ||||||||||
| 2.850%, 05/15/2020 | 7,000,000 | 7,097,076 | ||||||||||
| Bunge Limited Finance Corp.: | ||||||||||||
| 8.500%, 06/15/2019 | 6,933,000 | 7,754,034 | ||||||||||
| 3.500%, 11/24/2020 | 12,235,000 | 12,543,444 | ||||||||||
| 3.250%, 08/15/2026 | 11,550,000 | 11,035,875 | ||||||||||
| Burlington Northern Santa Fe LLC, | ||||||||||||
| 4.150%, 04/01/2045 | 3,000,000 | 3,135,960 | ||||||||||
| Canadian Natural Resources Ltd., | ||||||||||||
| 6.500%, 02/15/2037 f | 982,000 | 1,166,086 | ||||||||||
| Celgene Corp.: | ||||||||||||
| 3.550%, 08/15/2022 | 6,450,000 | 6,714,540 | ||||||||||
| 4.000%, 08/15/2023 | 2,477,000 | 2,627,089 | ||||||||||
| CF Industries, Inc.: | ||||||||||||
| 3.450%, 06/01/2023 | 21,000,000 | 19,845,000 | ||||||||||
| 5.150%, 03/15/2034 | 3,000,000 | 2,775,000 | ||||||||||
| Charter Communications Operating LLC / Charter Communications Operating Capital: | ||||||||||||
| 4.464%, 07/23/2022 | 13,773,000 | 14,674,663 | ||||||||||
| 6.384%, 10/23/2035 | 5,800,000 | 6,875,048 | ||||||||||
| Chevron Phillips Chemical Co. LLC / Chevron Phillips Chemical Co. LP, | ||||||||||||
| 1.920%, 05/01/2020 (Acquired 05/07/2015, Cost $25,000,000) ∞ * | 25,000,000 | 25,229,100 | ||||||||||
| CK Hutchinson International Ltd., | ||||||||||||
| 2.875%, 04/05/2022 (Acquired 03/30/2017, Cost $7,992,640) * f | 8,000,000 | 8,034,888 | ||||||||||
| Columbia Pipeline Group, Inc.: | ||||||||||||
| 2.450%, 06/01/2018 | 4,004,000 | 4,022,370 | ||||||||||
| 3.300%, 06/01/2020 | 14,575,000 | 14,933,778 | ||||||||||
| 4.500%, 06/01/2025 | 2,819,000 | 3,000,792 | ||||||||||
| Comcast Corp.: | ||||||||||||
| 4.250%, 01/15/2033 | 5,712,000 | 6,087,678 | ||||||||||
| 3.200%, 07/15/2036 | 6,000,000 | 5,615,490 | ||||||||||
| 6.950%, 08/15/2037 | 5,953,000 | 8,398,207 | ||||||||||
| ConAgra Foods, Inc.: | ||||||||||||
| 4.950%, 08/15/2020 | 332,000 | 351,031 | ||||||||||
| 9.750%, 03/01/2021 | 4,548,000 | 5,562,445 | ||||||||||
| 7.125%, 10/01/2026 | 6,441,000 | 8,073,239 | ||||||||||
| 7.000%, 10/01/2028 | 4,300,000 | 5,441,048 | ||||||||||
| ConocoPhillips Co., | ||||||||||||
| 2.082%, 05/15/2022 ∞ | 8,425,000 | 8,602,388 | ||||||||||
| Continental Airlines Pass Through Trust, | ||||||||||||
| Class 974A, 6.900%, 01/02/2018 | 12,304 | 12,446 | ||||||||||
| Cox Communications, Inc.: | ||||||||||||
| 3.850%, 02/01/2025 (Acquired 12/01/2014 through 01/11/2017, Cost $7,490,671) * | 7,525,000 | 7,581,731 | ||||||||||
| 4.800%, 02/01/2035 (Acquired 12/01/2014, Cost $8,996,760) * | 9,000,000 | 8,801,109 | ||||||||||
| 8.375%, 03/01/2039 (Acquired 10/08/2014, Cost $2,833,066) * | 2,000,000 | 2,650,722 | ||||||||||
| Crane Co., | ||||||||||||
| 2.750%, 12/15/2018 | 10,000,000 | 10,103,850 | ||||||||||
| CVS Health Corp., | ||||||||||||
| 3.500%, 07/20/2022 | 7,000,000 | 7,259,441 | ||||||||||
| Daimler Finance North America LLC, | ||||||||||||
| 1.500%, 07/05/2019 (Acquired 11/22/2016, Cost $10,566,191) * | 10,700,000 | 10,598,115 | ||||||||||
| Danone SA, | ||||||||||||
| 2.589%, 11/02/2023 (Acquired 10/26/2016, Cost $19,600,000) * f | 19,600,000 | 19,123,269 | ||||||||||
| DCP Midstream LLC, | ||||||||||||
| 9.750%, 03/15/2019 (Acquired 02/29/2012 through 10/15/2012, Cost $5,511,272) * | 5,065,000 | 5,660,137 | ||||||||||
| Deutsche Telekom International Finance BV, | ||||||||||||
| 8.750%, 06/15/2030 f | 1,661,000 | 2,463,394 | ||||||||||
| Diamond 1 Finance Corp. / Diamond 2 Finance Corp.: | ||||||||||||
| 3.480%, 06/01/2019 (Acquired 07/19/2016, Cost $9,113,557) * | 8,947,000 | 9,156,145 | ||||||||||
| 4.420%, 06/15/2021 (Acquired 05/17/2016 through 05/09/2017, Cost $33,366,702) * | 32,150,000 | 33,893,109 | ||||||||||
| Dominion Gas Holdings LLC, | ||||||||||||
| 2.800%, 11/15/2020 | 7,275,000 | 7,363,355 | ||||||||||
| The Dow Chemical Co., | ||||||||||||
| 8.550%, 05/15/2019 | 26,000,000 | 29,120,962 | ||||||||||
| DXC Technology Co., | ||||||||||||
| 4.250%, 04/15/2024 (Acquired 03/28/2017 through 06/22/2017, Cost $35,590,000) * | 34,725,000 | 35,927,492 | ||||||||||
| Enable Midstream Partners LP, | ||||||||||||
| 3.900%, 05/15/2024 | 5,000,000 | 4,958,420 | ||||||||||
| Energy Transfer Partners LP: | ||||||||||||
| 9.700%, 03/15/2019 | 893,000 | 1,000,104 | ||||||||||
| 4.150%, 10/01/2020 | 10,000,000 | 10,386,060 | ||||||||||
| 4.050%, 03/15/2025 | 26,585,000 | 26,691,739 | ||||||||||
| Ensco PLC, | ||||||||||||
| 5.200%, 03/15/2025 f | 4,000,000 | 3,250,000 | ||||||||||
| Enterprise Products Operating LLC, | ||||||||||||
| 3.700%, 02/15/2026 | 8,350,000 | 8,504,500 | ||||||||||
| EQT Midstream Partners LP: | ||||||||||||
| 4.000%, 08/01/2024 | 3,000,000 | 3,044,289 | ||||||||||
| 4.125%, 12/01/2026 | 10,000,000 | 10,090,170 | ||||||||||
| ERAC USA Finance LLC: | ||||||||||||
| 2.350%, 10/15/2019 (Acquired 10/26/2016, Cost $4,041,131) * | 4,000,000 | 4,006,216 | ||||||||||
| 3.300%, 12/01/2026 (Acquired 05/23/2016 through 04/04/2017, Cost $19,894,996) * | 20,225,000 | 19,692,476 | ||||||||||
| Express Scripts Holding Co.: | ||||||||||||
| 3.300%, 02/25/2021 | 2,350,000 | 2,420,286 | ||||||||||
| 4.750%, 11/15/2021 | 5,000,000 | 5,403,215 | ||||||||||
| 3.900%, 02/15/2022 | 10,000,000 | 10,468,100 | ||||||||||
| 3.000%, 07/15/2023 | 5,512,000 | 5,474,105 | ||||||||||
| 3.500%, 06/15/2024 | 9,000,000 | 9,078,597 | ||||||||||
| Federal Express Corp. 1998 Pass Through Trust, | ||||||||||||
| Class 981B, 6.845%, 01/15/2019 | 772,729 | 809,434 | ||||||||||
| FedEx Corp., | ||||||||||||
| 3.200%, 02/01/2025 | 6,000,000 | 6,072,396 | ||||||||||
| Fidelity National Information Services, Inc.: | ||||||||||||
| 3.625%, 10/15/2020 | 10,000,000 | 10,475,430 | ||||||||||
| 3.500%, 04/15/2023 | 23,125,000 | 24,028,910 | ||||||||||
| 3.875%, 06/05/2024 | 2,150,000 | 2,252,000 | ||||||||||
| 4.500%, 08/15/2046 | 7,000,000 | 7,180,712 | ||||||||||
| Fiserv, Inc.: | ||||||||||||
| 2.700%, 06/01/2020 | 10,000,000 | 10,117,820 | ||||||||||
| 4.625%, 10/01/2020 | 1,785,000 | 1,909,109 | ||||||||||
| 3.500%, 10/01/2022 | 5,410,000 | 5,596,467 | ||||||||||
| FMC Corp., | ||||||||||||
| 4.100%, 02/01/2024 | 6,400,000 | 6,624,806 | ||||||||||
| Fomento Economico Mexicano SAB de CV: | ||||||||||||
| 2.875%, 05/10/2023 f | 5,000,000 | 4,977,427 | ||||||||||
| 4.375%, 05/10/2043 f | 4,374,000 | 4,437,703 | ||||||||||
| Ford Motor Credit Co. LLC: | ||||||||||||
| 2.145%, 01/09/2018 | 1,800,000 | 1,806,113 | ||||||||||
| 2.240%, 06/15/2018 | 6,250,000 | 6,265,219 | ||||||||||
| 2.375%, 03/12/2019 | 6,806,000 | 6,836,831 | ||||||||||
| 2.597%, 11/04/2019 | 10,000,000 | 10,066,470 | ||||||||||
| 3.200%, 01/15/2021 | 20,000,000 | 20,299,900 | ||||||||||
| 3.336%, 03/18/2021 | 7,500,000 | 7,644,810 | ||||||||||
| 3.339%, 03/28/2022 | 5,000,000 | 5,073,665 | ||||||||||
| Fortive Corp., | ||||||||||||
| 2.350%, 06/15/2021 | 5,125,000 | 5,095,357 | ||||||||||
| Forest Laboratories, Inc., | ||||||||||||
| 5.000%, 12/15/2021 (Acquired 08/26/2014 through 04/24/2015, Cost $25,594,053) * | 24,000,000 | 26,203,296 | ||||||||||
| Freeport-McMoRan, Inc.: | ||||||||||||
| 6.500%, 11/15/2020 | 3,221,000 | 3,305,551 | ||||||||||
| 6.625%, 05/01/2021 | 1,447,000 | 1,475,940 | ||||||||||
| 6.750%, 02/01/2022 | 2,649,000 | 2,741,715 | ||||||||||
| General Electric Co.: | ||||||||||||
| 2.200%, 01/09/2020 | 1,432,000 | 1,444,958 | ||||||||||
| 5.550%, 05/04/2020 | 1,585,000 | 1,741,132 | ||||||||||
| 4.650%, 10/17/2021 | 1,534,000 | 1,689,795 | ||||||||||
| General Motors Financial Co., Inc.: | ||||||||||||
| 2.400%, 05/09/2019 | 9,000,000 | 9,024,075 | ||||||||||
| 2.350%, 10/04/2019 | 6,800,000 | 6,799,334 | ||||||||||
| 2.650%, 04/13/2020 | 3,500,000 | 3,516,271 | ||||||||||
| 4.200%, 03/01/2021 | 30,000,000 | 31,465,980 | ||||||||||
| 4.375%, 09/25/2021 | 2,675,000 | 2,819,629 | ||||||||||
| 3.450%, 01/14/2022 | 5,000,000 | 5,079,535 | ||||||||||
| 3.150%, 06/30/2022 | 6,000,000 | 6,009,288 | ||||||||||
| Georgia-Pacific LLC, | ||||||||||||
| 2.539%, 11/15/2019 (Acquired 11/03/2014 through 02/25/2016, Cost $19,111,420) * | 19,125,000 | 19,299,324 | ||||||||||
| Gilead Sciences, Inc., | ||||||||||||
| 4.600%, 09/01/2035 | 4,600,000 | 4,932,198 | ||||||||||
| Glencore Funding LLC: | ||||||||||||
| 2.500%, 01/15/2019 (Acquired 05/22/2013, Cost $4,440,774) * | 4,463,000 | 4,476,286 | ||||||||||
| 4.125%, 05/30/2023 (Acquired 07/22/2013 through 04/20/2015, Cost $6,691,396) * | 6,746,000 | 6,922,003 | ||||||||||
| 4.625%, 04/29/2024 (Acquired 04/22/2014 through 05/11/2017, Cost $30,136,346) * | 30,620,000 | 32,010,148 | ||||||||||
| 4.000%, 04/16/2025 (Acquired 04/08/2015, Cost $4,411,285) * | 4,450,000 | 4,451,736 | ||||||||||
| 4.000%, 03/27/2027 (Acquired 03/21/2017, Cost $17,377,308) * | 17,550,000 | 17,267,392 | ||||||||||
| Grupo Bimbo SAB de CV: | ||||||||||||
| 4.500%, 01/25/2022 (Acquired 03/29/2016 through 04/07/2016, Cost $13,788,047) * f | 13,157,000 | 14,061,133 | ||||||||||
| 3.875%, 06/27/2024 (Acquired 02/14/2017 through 03/27/2017, Cost $18,147,960) * f | 18,220,000 | 18,749,061 | ||||||||||
| Gulf South Pipeline Co. LP, | ||||||||||||
| 4.000%, 06/15/2022 | 3,633,000 | 3,740,936 | ||||||||||
| Gulfstream Natural Gas System LLC, | ||||||||||||
| 4.600%, 09/15/2025 (Acquired 09/24/2015, Cost $5,035,251) * | 5,000,000 | 5,366,345 | ||||||||||
| Halliburton Co., | ||||||||||||
| 3.800%, 11/15/2025 | 9,000,000 | 9,223,416 | ||||||||||
| Harris Corp.: | ||||||||||||
| 2.700%, 04/27/2020 | 4,000,000 | 4,041,420 | ||||||||||
| 3.832%, 04/27/2025 | 5,000,000 | 5,160,210 | ||||||||||
| Hewlett Packard Enterprise Co.: | ||||||||||||
| 3.600%, 10/15/2020 | 10,000,000 | 10,310,990 | ||||||||||
| 4.400%, 10/15/2022 | 15,150,000 | 16,061,000 | ||||||||||
| Historic TW, Inc., | ||||||||||||
| 9.150%, 02/01/2023 | 5,535,000 | 7,099,844 | ||||||||||
| Holcim US Finance Sarl & Cie SCS, | ||||||||||||
| 6.000%, 12/30/2019 (Acquired 09/24/2009 through 09/04/2013, Cost $1,235,203) * f | 1,232,000 | 1,333,374 | ||||||||||
| HP, Inc., | ||||||||||||
| 4.650%, 12/09/2021 | 6,645,000 | 7,171,709 | ||||||||||
| Hutchison Whampoa International (09) Ltd., | ||||||||||||
| 7.625%, 04/09/2019 (Acquired 10/22/2009 through 04/16/2014, Cost $8,704,448) * f | 8,288,000 | 9,048,838 | ||||||||||
| Hutchison Whampoa International (09/19) Ltd., | ||||||||||||
| 5.750%, 09/11/2019 (Acquired 04/27/2015, Cost $9,841,052) * f | 9,150,000 | 9,823,376 | ||||||||||
| Hutchison Whampoa International (14) Ltd., | ||||||||||||
| 3.625%, 10/31/2024 (Acquired 10/28/2014 through 07/22/2016, Cost $7,993,049) * f | 7,850,000 | 8,097,102 | ||||||||||
| Hyundai Capital America: | ||||||||||||
| 2.500%, 03/18/2019 (Acquired 10/25/2016, Cost $4,321,883) * | 4,275,000 | 4,288,154 | ||||||||||
| 2.000%, 07/01/2019 (Acquired 06/07/2016, Cost $8,593,894) * | 8,600,000 | 8,531,639 | ||||||||||
| 3.000%, 03/18/2021 (Acquired 12/02/2016, Cost $15,015,184) * | 15,000,000 | 15,084,270 | ||||||||||
| 3.100%, 04/05/2022 (Acquired 03/29/2017 through 04/26/2017, Cost $17,800,765) * | 17,825,000 | 17,872,040 | ||||||||||
| Hyundai Capital Services, Inc.: | ||||||||||||
| 3.500%, 09/13/2017 (Acquired 03/07/2012 through 08/21/2014, Cost $7,478,224) * f | 7,458,000 | 7,482,194 | ||||||||||
| 2.625%, 09/29/2020 (Acquired 03/23/2015, Cost $5,142,172) * f | 5,150,000 | 5,125,537 | ||||||||||
| Ingersoll-Rand Luxembourg Finance SA, | ||||||||||||
| 2.625%, 05/01/2020 f | 2,650,000 | 2,676,211 | ||||||||||
| The JM Smucker Co., | ||||||||||||
| 3.500%, 03/15/2025 | 5,000,000 | 5,138,755 | ||||||||||
| Johnson Controls International PLC: | ||||||||||||
| 6.000%, 01/15/2036 f | 1,168,000 | 1,434,801 | ||||||||||
| 4.500%, 02/15/2047 f | 4,400,000 | 4,676,747 | ||||||||||
| 4.950%, 07/02/2064 f | 2,400,000 | 2,570,273 | ||||||||||
| Keysight Technologies, Inc.: | ||||||||||||
| 3.300%, 10/30/2019 | 16,500,000 | 16,806,900 | ||||||||||
| 4.600%, 04/06/2027 | 27,450,000 | 28,835,429 | ||||||||||
| Kinder Morgan Energy Partners LP: | ||||||||||||
| 9.000%, 02/01/2019 | 893,000 | 985,067 | ||||||||||
| 4.300%, 05/01/2024 | 10,000,000 | 10,335,590 | ||||||||||
| 6.950%, 01/15/2038 | 2,008,000 | 2,398,150 | ||||||||||
| 6.500%, 09/01/2039 | 893,000 | 1,011,242 | ||||||||||
| 7.500%, 11/15/2040 | 4,017,000 | 5,011,340 | ||||||||||
| Kinder Morgan, Inc./DE: | ||||||||||||
| 5.000%, 02/15/2021 (Acquired 05/26/2015, Cost $4,352,990) * | 4,155,000 | 4,454,791 | ||||||||||
| 5.625%, 11/15/2023 (Acquired 06/14/2016, Cost $5,275,597) * | 5,017,000 | 5,551,055 | ||||||||||
| 7.800%, 08/01/2031 | 9,650,000 | 12,165,504 | ||||||||||
| 7.750%, 01/15/2032 | 13,170,000 | 16,559,721 | ||||||||||
| Kraft Heinz Foods Co.: | ||||||||||||
| 2.800%, 07/02/2020 | 4,000,000 | 4,059,832 | ||||||||||
| 3.000%, 06/01/2026 | 10,000,000 | 9,570,510 | ||||||||||
| 5.000%, 07/15/2035 | 14,740,000 | 15,939,512 | ||||||||||
| Laboratory Corp. of America Holdings: | ||||||||||||
| 2.500%, 11/01/2018 | 11,345,000 | 11,435,159 | ||||||||||
| 3.200%, 02/01/2022 | 2,400,000 | 2,449,353 | ||||||||||
| Lafarge SA, | ||||||||||||
| 7.125%, 07/15/2036 f | 893,000 | 1,148,362 | ||||||||||
| Lockheed Martin Corp.: | ||||||||||||
| 3.100%, 01/15/2023 | 5,000,000 | 5,115,465 | ||||||||||
| 4.700%, 05/15/2046 | 1,000,000 | 1,123,646 | ||||||||||
| Magellan Midstream Partners LP, | ||||||||||||
| 3.200%, 03/15/2025 | 5,000,000 | 4,849,205 | ||||||||||
| Marathon Petroleum Corp.: | ||||||||||||
| 3.400%, 12/15/2020 | 10,825,000 | 11,135,158 | ||||||||||
| 3.625%, 09/15/2024 | 1,600,000 | 1,616,706 | ||||||||||
| 4.750%, 09/15/2044 | 1,500,000 | 1,425,076 | ||||||||||
| Martin Marietta Materials, Inc., | ||||||||||||
| 6.250%, 05/01/2037 | 893,000 | 1,064,789 | ||||||||||
| Medtronic, Inc., | ||||||||||||
| 3.150%, 03/15/2022 | 3,975,000 | 4,113,477 | ||||||||||
| Microsoft Corp.: | ||||||||||||
| 4.450%, 11/03/2045 | 10,000,000 | 11,126,710 | ||||||||||
| 3.950%, 08/08/2056 | 12,000,000 | 12,001,716 | ||||||||||
| Molex Electronic Technologies LLC, | ||||||||||||
| 2.878%, 04/15/2020 (Acquired 10/23/2015 through 03/15/2016, Cost $22,885,945) * | 23,093,000 | 23,259,293 | ||||||||||
| The Mosaic Co.: | ||||||||||||
| 4.250%, 11/15/2023 | 5,000,000 | 5,261,180 | ||||||||||
| 5.450%, 11/15/2033 | 2,000,000 | 2,110,054 | ||||||||||
| 4.875%, 11/15/2041 | 5,000,000 | 4,690,585 | ||||||||||
| MPLX LP: | ||||||||||||
| 4.500%, 07/15/2023 | 22,405,000 | 23,784,543 | ||||||||||
| 4.875%, 12/01/2024 | 8,310,000 | 8,859,840 | ||||||||||
| 4.125%, 03/01/2027 | 7,275,000 | 7,299,771 | ||||||||||
| Mylan NV: | ||||||||||||
| 3.150%, 06/15/2021 f | 5,000,000 | 5,086,715 | ||||||||||
| 3.950%, 06/15/2026 f | 28,925,000 | 29,307,938 | ||||||||||
| Nabors Industries, Inc., | ||||||||||||
| 6.150%, 02/15/2018 | 686,000 | 692,860 | ||||||||||
| New Cingular Wireless Services, Inc., | ||||||||||||
| 8.750%, 03/01/2031 | 1,360,000 | 1,949,827 | ||||||||||
| Newell Brands, Inc., | ||||||||||||
| 3.850%, 04/01/2023 | 15,000,000 | 15,749,085 | ||||||||||
| Nissan Motor Acceptance Corp., | ||||||||||||
| 1.500%, 03/02/2018 (Acquired 02/24/2015, Cost $5,897,404) * | 5,900,000 | 5,889,362 | ||||||||||
| Noble Energy, Inc., | ||||||||||||
| 8.250%, 03/01/2019 | 2,684,000 | 2,944,208 | ||||||||||
| Noble Holding International Ltd., | ||||||||||||
| 5.750%, 03/16/2018 f | 4,000,000 | 4,024,240 | ||||||||||
| ONEOK Partners LP: | ||||||||||||
| 8.625%, 03/01/2019 | 7,627,000 | 8,389,952 | ||||||||||
| 3.375%, 10/01/2022 | 1,130,000 | 1,140,344 | ||||||||||
| Oracle Corp.: | ||||||||||||
| 3.400%, 07/08/2024 | 3,000,000 | 3,124,017 | ||||||||||
| 2.950%, 05/15/2025 | 6,025,000 | 6,054,486 | ||||||||||
| Pacific Bell Telephone Co., | ||||||||||||
| 7.125%, 03/15/2026 | 5,000,000 | 6,075,820 | ||||||||||
| Pactiv LLC, | ||||||||||||
| 7.950%, 12/15/2025 | 286,000 | 320,320 | ||||||||||
| Pentair Finance SA, | ||||||||||||
| 1.875%, 09/15/2017 f | 7,620,000 | 7,622,987 | ||||||||||
| Pernod Ricard SA: | ||||||||||||
| 4.450%, 01/15/2022 (Acquired 12/01/2016, Cost $349,165) * f | 331,000 | 354,892 | ||||||||||
| 4.250%, 07/15/2022 (Acquired 06/09/2016 through 09/08/2016, Cost $22,166,226) * f | 20,527,000 | 21,892,887 | ||||||||||
| Perrigo Finance Unlimited Co., | ||||||||||||
| 4.375%, 03/15/2026 f | 4,875,000 | 5,027,802 | ||||||||||
| Petrofac Ltd., | ||||||||||||
| 3.400%, 10/10/2018 (Acquired 10/03/2013 through 12/03/2014, Cost $15,534,875) * f | 15,546,000 | 14,615,541 | ||||||||||
| Pfizer, Inc., | ||||||||||||
| 5.800%, 08/12/2023 | 6,000,000 | 7,049,592 | ||||||||||
| Phillips 66: | ||||||||||||
| 4.300%, 04/01/2022 | 10,000,000 | 10,715,420 | ||||||||||
| 5.875%, 05/01/2042 | 6,000,000 | 7,249,254 | ||||||||||
| 4.875%, 11/15/2044 | 21,130,000 | 22,649,416 | ||||||||||
| Phillips 66 Partners LP, | ||||||||||||
| 3.550%, 10/01/2026 | 7,000,000 | 6,799,142 | ||||||||||
| POSCO, | ||||||||||||
| 4.250%, 10/28/2020 (Acquired 12/18/2014, Cost $1,015,270) * f | 975,000 | 1,021,946 | ||||||||||
| Potash Corp of Saskatchewan, Inc., | ||||||||||||
| 6.500%, 05/15/2019 f | 5,000,000 | 5,380,140 | ||||||||||
| QEP Resources, Inc., | ||||||||||||
| 6.800%, 03/01/2020 | 893,000 | 928,720 | ||||||||||
| Qualcomm, Inc.: | ||||||||||||
| 1.722%, 05/20/2020 ∞ | 7,450,000 | 7,502,247 | ||||||||||
| 2.250%, 05/20/2020 | 3,600,000 | 3,634,146 | ||||||||||
| R.R. Donnelley & Sons Co., | ||||||||||||
| 7.625%, 06/15/2020 | 893,000 | 993,462 | ||||||||||
| Regency Energy Partners LP / Regency Energy Finance Corp., | ||||||||||||
| 5.875%, 03/01/2022 | 8,955,000 | 9,864,676 | ||||||||||
| Republic Services, Inc.: | ||||||||||||
| 5.500%, 09/15/2019 | 7,400,000 | 7,944,662 | ||||||||||
| 3.550%, 06/01/2022 | 3,000,000 | 3,122,463 | ||||||||||
| Rio Tinto Alcan, Inc., | ||||||||||||
| 5.750%, 06/01/2035 f | 446,000 | 523,651 | ||||||||||
| Rockies Express Pipeline LLC, | ||||||||||||
| 5.625%, 04/15/2020 (Acquired 03/17/2010, Cost $1,783,411) * | 1,785,000 | 1,896,563 | ||||||||||
| Rockwell Collins, Inc., | ||||||||||||
| 4.350%, 04/15/2047 | 9,175,000 | 9,595,380 | ||||||||||
| Sabine Pass Liquefaction LLC: | ||||||||||||
| 5.625%, 03/01/2025 | 27,500,000 | 30,334,123 | ||||||||||
| 5.875%, 06/30/2026 | 11,500,000 | 12,852,883 | ||||||||||
| Samarco Mineracao SA, | ||||||||||||
| 5.750%, 10/24/2023 (Acquired 10/22/2013, Cost $4,475,203) * § f | 4,463,000 | 2,532,753 | ||||||||||
| Schlumberger Holdings Corp., | ||||||||||||
| 2.350%, 12/21/2018 (Acquired 12/10/2015, Cost $9,998,800) * | 10,000,000 | 10,059,340 | ||||||||||
| Shell International Finance BV: | ||||||||||||
| 3.250%, 05/11/2025 f | 5,725,000 | 5,848,185 | ||||||||||
| 4.125%, 05/11/2035 f | 10,000,000 | 10,411,720 | ||||||||||
| The Sherwin-Williams Co., | ||||||||||||
| 4.500%, 06/01/2047 | 4,000,000 | 4,191,312 | ||||||||||
| Shire Acquisitions Investments Ireland DAC, | ||||||||||||
| 2.875%, 09/23/2023 f | 25,000,000 | 24,779,325 | ||||||||||
| SK Telecom Co. Ltd., | ||||||||||||
| 6.625%, 07/20/2027 (Acquired 07/13/2007, Cost $1,322,945) * f | 1,339,000 | 1,716,875 | ||||||||||
| Smithfield Foods, Inc., | ||||||||||||
| 3.350%, 02/01/2022 (Acquired 03/20/2017, Cost $6,986,420) * | 7,000,000 | 7,036,403 | ||||||||||
| Solvay Finance America LLC: | ||||||||||||
| 3.400%, 12/03/2020 (Acquired 01/08/2016 through 02/23/2016, Cost $15,075,620) * | 15,088,000 | 15,568,704 | ||||||||||
| 4.450%, 12/03/2025 (Acquired 05/03/2016 through 03/27/2017, Cost $45,176,414) * | 43,329,000 | 46,112,845 | ||||||||||
| Spectra Energy Partners LP, | ||||||||||||
| 4.500%, 03/15/2045 | 7,000,000 | 6,898,878 | ||||||||||
| Sprint Capital Corp., | ||||||||||||
| 6.900%, 05/01/2019 | 2,499,000 | 2,667,558 | ||||||||||
| Stryker Corp., | ||||||||||||
| 2.625%, 03/15/2021 | 6,225,000 | 6,289,709 | ||||||||||
| Sunoco Logistics Partners Operations LP, | ||||||||||||
| 3.900%, 07/15/2026 | 12,000,000 | 11,774,304 | ||||||||||
| Sysco Corp., | ||||||||||||
| 3.300%, 07/15/2026 | 11,550,000 | 11,458,339 | ||||||||||
| TC PipeLines LP, | ||||||||||||
| 4.375%, 03/13/2025 | 19,265,000 | 20,076,153 | ||||||||||
| Telecom Italia Capital SA: | ||||||||||||
| 7.175%, 06/18/2019 f | 1,785,000 | 1,947,881 | ||||||||||
| 7.200%, 07/18/2036 f | 5,475,000 | 6,347,578 | ||||||||||
| Telefonica Emisiones SAU: | ||||||||||||
| 6.221%, 07/03/2017 f | 4,530,000 | 4,530,000 | ||||||||||
| 5.462%, 02/16/2021 f | 8,830,000 | 9,712,373 | ||||||||||
| 5.213%, 03/08/2047 f | 7,225,000 | 7,801,064 | ||||||||||
| Teva Pharmaceutical Finance Netherlands III BV, | ||||||||||||
| 3.150%, 10/01/2026 f | 5,000,000 | 4,748,390 | ||||||||||
| Thermo Fisher Scientific, Inc.: | ||||||||||||
| 2.150%, 12/14/2018 | 4,000,000 | 4,014,996 | ||||||||||
| 3.000%, 04/15/2023 | 7,975,000 | 8,039,741 | ||||||||||
| Time Warner Cable LLC: | ||||||||||||
| 6.550%, 05/01/2037 | 893,000 | 1,066,345 | ||||||||||
| 6.750%, 06/15/2039 | 2,767,000 | 3,386,811 | ||||||||||
| Time Warner, Inc.: | ||||||||||||
| 3.600%, 07/15/2025 | 2,200,000 | 2,195,000 | ||||||||||
| 3.875%, 01/15/2026 | 7,000,000 | 7,118,587 | ||||||||||
| 2.950%, 07/15/2026 | 6,250,000 | 5,896,281 | ||||||||||
| 3.800%, 02/15/2027 | 6,300,000 | 6,342,588 | ||||||||||
| 7.625%, 04/15/2031 | 5,207,000 | 7,101,895 | ||||||||||
| 7.700%, 05/01/2032 | 12,018,000 | 16,729,861 | ||||||||||
| The Timken Co., | ||||||||||||
| 3.875%, 09/01/2024 | 2,000,000 | 1,992,222 | ||||||||||
| TransCanada PipeLines Ltd., | ||||||||||||
| 4.875%, 01/15/2026 f | 12,000,000 | 13,422,528 | ||||||||||
| TSMC Global Ltd., | ||||||||||||
| 1.625%, 04/03/2018 (Acquired 12/03/2013 through 04/29/2015, Cost $9,831,485) * f | 9,865,000 | 9,845,100 | ||||||||||
| TTX Co.: | ||||||||||||
| 3.600%, 01/15/2025 (Acquired 11/13/2014, Cost $4,999,250) * | 5,000,000 | 5,035,170 | ||||||||||
| 3.900%, 02/01/2045 (Acquired 01/26/2015 through 04/29/2015, Cost $10,151,754) * | 10,250,000 | 9,826,983 | ||||||||||
| Tyco Electronics Group SA, | ||||||||||||
| 6.550%, 10/01/2017 f | 6,248,000 | 6,322,020 | ||||||||||
| US Airways Pass Through Trust, | ||||||||||||
| Class 981A, 6.850%, 01/30/2018 | 36,609 | 37,341 | ||||||||||
| Vale Overseas Ltd.: | ||||||||||||
| 5.875%, 06/10/2021 f | 11,075,000 | 11,889,013 | ||||||||||
| 6.250%, 08/10/2026 f | 7,000,000 | 7,551,250 | ||||||||||
| 8.250%, 01/17/2034 f | 8,526,000 | 10,124,625 | ||||||||||
| 6.875%, 11/21/2036 f | 1,483,000 | 1,590,517 | ||||||||||
| 6.875%, 11/10/2039 f | 2,893,000 | 3,102,743 | ||||||||||
| Valero Energy Corp.: | ||||||||||||
| 9.375%, 03/15/2019 | 15,578,000 | 17,432,841 | ||||||||||
| 6.625%, 06/15/2037 | 2,100,000 | 2,593,710 | ||||||||||
| Valero Energy Partners LP, | ||||||||||||
| 4.375%, 12/15/2026 | 10,000,000 | 10,221,870 | ||||||||||
| Verisk Analytics, Inc., | ||||||||||||
| 5.800%, 05/01/2021 | 8,325,000 | 9,256,201 | ||||||||||
| Verizon Communications, Inc.: | ||||||||||||
| 4.150%, 03/15/2024 | 3,000,000 | 3,157,857 | ||||||||||
| 4.272%, 01/15/2036 | 8,148,000 | 7,864,091 | ||||||||||
| 5.250%, 03/16/2037 | 18,000,000 | 19,349,838 | ||||||||||
| 4.812%, 03/15/2039 (Acquired 09/25/2013 through 11/08/2016, Cost $35,461,968) * | 36,839,000 | 37,237,524 | ||||||||||
| Vodafone Group PLC, | ||||||||||||
| 1.250%, 09/26/2017 f | 10,000,000 | 9,990,100 | ||||||||||
| Vulcan Materials Co.: | ||||||||||||
| 7.000%, 06/15/2018 | 1,785,000 | 1,869,075 | ||||||||||
| 7.500%, 06/15/2021 | 4,000,000 | 4,720,660 | ||||||||||
| 7.150%, 11/30/2037 | 3,446,000 | �� | 4,523,523 | |||||||||
| Wabtec Corp./DE: | ||||||||||||
| 4.375%, 08/15/2023 | 2,678,000 | 2,807,626 | ||||||||||
| 3.450%, 11/15/2026 (Acquired 10/31/2016 through 01/24/2017, Cost $19,111,939) * | 19,315,000 | 19,044,300 | ||||||||||
| Walgreens Boots Alliance, Inc.: | ||||||||||||
| 3.300%, 11/18/2021 | 6,383,000 | 6,581,441 | ||||||||||
| 3.800%, 11/18/2024 | 5,934,000 | 6,163,070 | ||||||||||
| Western Gas Partners LP, | ||||||||||||
| 5.375%, 06/01/2021 | 10,701,000 | 11,487,845 | ||||||||||
| WestRock MWV LLC: | ||||||||||||
| 9.750%, 06/15/2020 | 143,000 | 169,166 | ||||||||||
| 8.200%, 01/15/2030 | 7,963,000 | 11,210,463 | ||||||||||
| The Williams Companies, Inc., | ||||||||||||
| 4.550%, 06/24/2024 | 5,000,000 | 5,137,500 | ||||||||||
| Williams Partners LP: | ||||||||||||
| 3.600%, 03/15/2022 | 10,176,000 | 10,396,382 | ||||||||||
| 6.300%, 04/15/2040 | 2,767,000 | 3,206,698 | ||||||||||
| Williams Partners LP / ACMP Finance Corp., | ||||||||||||
| 4.875%, 05/15/2023 | 10,000,000 | 10,376,200 | ||||||||||
| Woodside Finance Ltd., | ||||||||||||
| 3.650%, 03/05/2025 (Acquired 02/26/2015 through 04/14/2015, Cost $12,292,106) * f | 12,300,000 | 12,255,339 | ||||||||||
| Yara International ASA, | ||||||||||||
| 3.800%, 06/06/2026 (Acquired 06/01/2016 through 07/06/2016, Cost $14,095,089) * f | 13,965,000 | 13,857,428 | ||||||||||
| Zimmer Holdings, Inc., | ||||||||||||
| 3.150%, 04/01/2022 | 9,500,000 | 9,644,723 | ||||||||||
| Zoetis, Inc.: | ||||||||||||
| 3.450%, 11/13/2020 | 5,145,000 | 5,320,856 | ||||||||||
| 3.250%, 02/01/2023 | 34,200,000 | 35,051,067 | ||||||||||
| 4.700%, 02/01/2043 (100.000000, 08/01/2042) | 3,568,000 | 3,875,890 | ||||||||||
| 2,586,866,561 | 20.3 | % | ||||||||||
| Utilities | ||||||||||||
| Ameren Corp., | ||||||||||||
| 2.700%, 11/15/2020 | 10,000,000 | 10,119,230 | ||||||||||
| Arizona Public Service Co., | ||||||||||||
| 8.750%, 03/01/2019 | 759,000 | 842,120 | ||||||||||
| Berkshire Hathaway Energy Co., | ||||||||||||
| 2.400%, 02/01/2020 | 5,000,000 | 5,043,495 | ||||||||||
| Duke Energy Corp., | ||||||||||||
| 2.650%, 09/01/2026 | 10,000,000 | 9,497,340 | ||||||||||
| Edison International, | ||||||||||||
| 2.950%, 03/15/2023 | 5,000,000 | 5,048,995 | ||||||||||
| EDP Finance BV, | ||||||||||||
| 3.625%, 07/15/2024 (Acquired 06/21/2017, Cost $19,094,465) * f | 19,175,000 | 19,030,037 | ||||||||||
| Enel Finance International NV: | ||||||||||||
| 2.875%, 05/25/2022 (Acquired 05/22/2017, Cost $6,979,000) * f | 7,000,000 | 7,009,709 | ||||||||||
| 3.625%, 05/25/2027 (Acquired 05/22/2017 through 05/23/2017, Cost $17,302,925) * f | 17,500,000 | 17,331,020 | ||||||||||
| 4.750%, 05/25/2047 (Acquired 05/24/2017, Cost $4,984,100) * f | 5,000,000 | 5,144,795 | ||||||||||
| ENEL Finance International NV: | ||||||||||||
| 5.125%, 10/07/2019 (Acquired 09/30/2009, Cost $2,199,280) * f | 2,209,000 | 2,350,407 | ||||||||||
| 6.800%, 09/15/2037 (Acquired 09/13/2007, Cost $1,560,853) * f | 1,565,000 | 2,005,069 | ||||||||||
| Entergy Corp., | ||||||||||||
| 2.950%, 09/01/2026 | 13,075,000 | 12,520,136 | ||||||||||
| Exelon Corp., | ||||||||||||
| 4.950%, 06/15/2035 | 3,500,000 | 3,831,712 | ||||||||||
| Exelon Generation Co. LLC, | ||||||||||||
| 6.200%, 10/01/2017 | 1,964,000 | 1,984,325 | ||||||||||
| Mega Advance Investments Ltd., | ||||||||||||
| 5.000%, 05/12/2021 (Acquired 05/09/2011, Cost $4,858,830) * f | 4,909,000 | 5,253,308 | ||||||||||
| National Rural Utilities Cooperative Finance Corp.: | ||||||||||||
| 2.000%, 01/27/2020 | 2,000,000 | 2,005,488 | ||||||||||
| 8.000%, 03/01/2032 | 4,659,000 | 6,826,698 | ||||||||||
| NextEra Energy Capital Holdings, Inc., | ||||||||||||
| Class D, 7.300%, 09/01/2067 ∞ | 2,455,000 | 2,470,393 | ||||||||||
| PSEG Power LLC, | ||||||||||||
| 5.125%, 04/15/2020 | 3,575,000 | 3,826,487 | ||||||||||
| RGS I&M Funding Corp., | ||||||||||||
| Class F, 9.820%, 06/07/2022 | 713,509 | 786,420 | ||||||||||
| South Carolina Electric & Gas Co., | ||||||||||||
| 4.100%, 06/15/2046 | 10,000,000 | 9,794,480 | ||||||||||
| The Southern Co., | ||||||||||||
| 4.250%, 07/01/2036 | 5,525,000 | 5,624,268 | ||||||||||
| Talent Yield Investments Ltd., | ||||||||||||
| 4.500%, 04/25/2022 (Acquired 04/18/2012, Cost $1,772,791) * f | 1,785,000 | 1,893,187 | ||||||||||
| 140,239,119 | 1.1 | % | ||||||||||
| Financials | ||||||||||||
| ABN AMRO Bank NV: | ||||||||||||
| 2.500%, 10/30/2018 (Acquired 10/23/2013 through 01/13/2014, Cost $11,022,782) * f | 11,033,000 | 11,119,157 | ||||||||||
| 2.100%, 01/18/2019 (Acquired 04/04/2017, Cost $10,550,633) * f | 10,550,000 | 10,566,489 | ||||||||||
| 2.450%, 06/04/2020 (Acquired 05/28/2015, Cost $8,980,200) * f | 9,000,000 | 9,054,594 | ||||||||||
| 4.750%, 07/28/2025 (Acquired 06/15/2017, Cost $4,029,921) * f | 3,800,000 | 4,006,116 | ||||||||||
| 4.800%, 04/18/2026 (Acquired 04/11/2016, Cost $8,984,430) * f | 9,000,000 | 9,556,479 | ||||||||||
| AIA Group Ltd., | ||||||||||||
| 3.200%, 03/11/2025 (Acquired 03/04/2015, Cost $5,992,380) * f | 6,000,000 | 5,946,596 | ||||||||||
| Ally Financial, Inc., | ||||||||||||
| 8.000%, 12/31/2018 | 360,000 | 388,350 | ||||||||||
| American International Group, Inc.: | ||||||||||||
| 6.400%, 12/15/2020 | 10,830,000 | 12,255,196 | ||||||||||
| 4.875%, 06/01/2022 | 17,698,000 | 19,419,219 | ||||||||||
| 4.125%, 02/15/2024 | 893,000 | 942,830 | ||||||||||
| 3.875%, 01/15/2035 | 4,875,000 | 4,726,127 | ||||||||||
| 8.175%, 05/15/2058 ∞ | 893,000 | 1,205,550 | ||||||||||
| Ameriprise Financial, Inc., | ||||||||||||
| 7.300%, 06/28/2019 | 1,785,000 | 1,966,708 | ||||||||||
| AmSouth Bancorporation, | ||||||||||||
| 6.750%, 11/01/2025 | 223,000 | 261,660 | ||||||||||
| Anthem, Inc., | ||||||||||||
| 5.100%, 01/15/2044 | 1,584,000 | 1,832,756 | ||||||||||
| ANZ New Zealand (Int'l) Ltd./London: | ||||||||||||
| 1.750%, 03/29/2018 f | 2,435,000 | 2,437,174 | ||||||||||
| 2.850%, 08/06/2020 (Acquired 07/30/2015, Cost $15,337,260) * f | 15,350,000 | 15,578,178 | ||||||||||
| 2.750%, 02/03/2021 (Acquired 01/27/2016, Cost $2,996,790) * f | 3,000,000 | 3,018,030 | ||||||||||
| Aon PLC: | ||||||||||||
| 4.000%, 11/27/2023 f | 6,150,000 | 6,494,302 | ||||||||||
| 3.875%, 12/15/2025 f | 9,126,000 | 9,536,396 | ||||||||||
| 4.450%, 05/24/2043 f | 1,274,000 | 1,285,532 | ||||||||||
| Australia & New Zealand Banking Group Ltd., | ||||||||||||
| 4.500%, 03/19/2024 (Acquired 03/12/2014 through 02/23/2016, Cost $15,997,360) * f | 16,000,000 | 16,713,744 | ||||||||||
| BAC Capital Trust VI, | ||||||||||||
| 5.625%, 03/08/2035 | 357,000 | 380,145 | ||||||||||
| Banco Santander SA, | ||||||||||||
| 3.500%, 04/11/2022 f | 13,000,000 | 13,305,201 | ||||||||||
| Bank of America Corp.: | ||||||||||||
| 6.400%, 08/28/2017 | 893,000 | 899,341 | ||||||||||
| 6.875%, 04/25/2018 | 3,162,000 | 3,290,469 | ||||||||||
| 2.625%, 10/19/2020 | 5,000,000 | 5,050,415 | ||||||||||
| 3.300%, 01/11/2023 | 7,000,000 | 7,137,886 | ||||||||||
| 4.125%, 01/22/2024 | 15,000,000 | 15,828,855 | ||||||||||
| 3.500%, 04/19/2026 | 9,000,000 | 9,030,654 | ||||||||||
| 3.248%, 10/21/2027 | 6,000,000 | 5,797,998 | ||||||||||
| 3.705%, 04/24/2028 ∞ | 12,000,000 | 12,087,900 | ||||||||||
| 7.750%, 05/14/2038 | 1,138,000 | 1,636,555 | ||||||||||
| Bank of Montreal, | ||||||||||||
| 1.800%, 07/31/2018 f | 3,600,000 | 3,605,461 | ||||||||||
| The Bank of Nova Scotia: | ||||||||||||
| 1.700%, 06/11/2018 f | 15,000,000 | 15,019,545 | ||||||||||
| 4.500%, 12/16/2025 f | 5,500,000 | 5,780,522 | ||||||||||
| The Bank of Tokyo-Mitsubishi UFJ Ltd.: | ||||||||||||
| 4.100%, 09/09/2023 (Acquired 09/03/2013 through 03/26/2014, Cost $2,930,855) * f | 2,911,000 | 3,111,291 | ||||||||||
| 3.750%, 03/10/2024 (Acquired 03/04/2014 through 04/29/2015, Cost $2,802,840) * f | 2,800,000 | 2,922,293 | ||||||||||
| BanPonce Trust I, | ||||||||||||
| Class A, 8.327%, 02/01/2027 | 1,941,000 | 1,885,639 | ||||||||||
| Barclays Bank PLC, | ||||||||||||
| 6.050%, 12/04/2017 (Acquired 05/27/2015, Cost $10,163,291) * f | 10,000,000 | 10,171,610 | ||||||||||
| Barclays PLC: | ||||||||||||
| 3.250%, 01/12/2021 f | 12,175,000 | 12,381,586 | ||||||||||
| 3.200%, 08/10/2021 f | 5,000,000 | 5,071,865 | ||||||||||
| 3.684%, 01/10/2023 f | 9,625,000 | 9,875,808 | ||||||||||
| 3.650%, 03/16/2025 f | 8,100,000 | 8,059,735 | ||||||||||
| BB&T Corp., | ||||||||||||
| 2.625%, 06/29/2020 | 5,000,000 | 5,084,895 | ||||||||||
| The Bear Stearns Companies LLC, | ||||||||||||
| 7.250%, 02/01/2018 | 5,547,000 | 5,720,987 | ||||||||||
| Berkshire Hathaway, Inc., | ||||||||||||
| 2.750%, 03/15/2023 | 14,675,000 | 14,869,444 | ||||||||||
| BNP Paribas SA: | ||||||||||||
| 2.375%, 05/21/2020 f | 10,000,000 | 10,072,470 | ||||||||||
| 3.250%, 03/03/2023 f | 3,570,000 | 3,661,853 | ||||||||||
| BNZ International Funding Ltd./London: | ||||||||||||
| 2.350%, 03/04/2019 (Acquired 09/03/2014 through 04/17/2015, Cost $7,316,599) * f | 7,300,000 | 7,333,879 | ||||||||||
| 2.400%, 02/21/2020 (Acquired 02/13/2017, Cost $6,997,550) * f | 7,000,000 | 7,029,393 | ||||||||||
| 2.750%, 03/02/2021 (Acquired 02/23/2016, Cost $13,990,200) * f | 14,000,000 | 14,108,318 | ||||||||||
| BPCE SA: | ||||||||||||
| 2.500%, 07/15/2019 f | 7,925,000 | 7,991,411 | ||||||||||
| 5.700%, 10/22/2023 (Acquired 10/15/2013 through 11/30/2016, Cost $22,163,603) * f | 21,395,000 | 23,806,217 | ||||||||||
| 4.000%, 04/15/2024 f | 2,500,000 | 2,647,422 | ||||||||||
| 5.150%, 07/21/2024 (Acquired 05/10/2016 through 05/31/2017, Cost $27,278,523) * f | 26,285,000 | 28,082,053 | ||||||||||
| Caisse Centrale Desjardins: | ||||||||||||
| 1.550%, 09/12/2017 (Acquired 07/07/2015, Cost $4,000,670) * f | 4,000,000 | 4,000,232 | ||||||||||
| 1.837%, 01/29/2018 (Acquired 01/26/2015, Cost $19,000,000) ∞ * f | 19,000,000 | 19,057,855 | ||||||||||
| Capital One Bank (USA) NA, | ||||||||||||
| 3.375%, 02/15/2023 | 35,650,000 | 35,954,380 | ||||||||||
| Capital One Financial Corp., | ||||||||||||
| 3.050%, 03/09/2022 | 4,000,000 | 4,031,428 | ||||||||||
| Capital One NA/Mclean VA: | ||||||||||||
| 1.851%, 02/05/2018 ∞ | 3,625,000 | 3,633,468 | ||||||||||
| 2.400%, 09/05/2019 | 12,000,000 | 12,042,756 | ||||||||||
| 1.850%, 09/13/2019 | 5,000,000 | 4,957,720 | ||||||||||
| Chubb INA Holdings, Inc., | ||||||||||||
| 2.875%, 11/03/2022 | 8,750,000 | 8,901,183 | ||||||||||
| Citigroup, Inc.: | ||||||||||||
| 1.700%, 04/27/2018 | 13,000,000 | 12,986,974 | ||||||||||
| 2.050%, 12/07/2018 | 11,000,000 | 11,016,357 | ||||||||||
| 2.350%, 08/02/2021 | 9,000,000 | 8,918,271 | ||||||||||
| 2.750%, 04/25/2022 | 8,675,000 | 8,661,267 | ||||||||||
| 2.632%, 09/01/2023 ∞ | 7,000,000 | 7,129,990 | ||||||||||
| 3.750%, 06/16/2024 | 1,000,000 | 1,036,349 | ||||||||||
| 3.700%, 01/12/2026 | 4,500,000 | 4,551,251 | ||||||||||
| 3.887%, 01/10/2028 ∞ | 7,600,000 | 7,723,606 | ||||||||||
| Citizens Bank NA/Providence RI: | ||||||||||||
| 2.300%, 12/03/2018 | 4,000,000 | 4,014,408 | ||||||||||
| 2.500%, 03/14/2019 | 7,800,000 | 7,857,166 | ||||||||||
| 2.450%, 12/04/2019 | 19,300,000 | 19,464,552 | ||||||||||
| 2.250%, 03/02/2020 | 4,750,000 | 4,745,554 | ||||||||||
| CNA Financial Corp.: | ||||||||||||
| 5.750%, 08/15/2021 | 7,199,000 | 8,034,286 | ||||||||||
| 7.250%, 11/15/2023 | 4,000,000 | 4,841,744 | ||||||||||
| 4.500%, 03/01/2026 | 14,000,000 | 15,019,620 | ||||||||||
| Comerica Bank: | ||||||||||||
| 2.500%, 06/02/2020 | 29,000,000 | 29,063,220 | ||||||||||
| 4.000%, 07/27/2025 | 10,000,000 | 10,334,230 | ||||||||||
| Commonwealth Bank of Australia/New York NY, | ||||||||||||
| 2.050%, 03/15/2019 f | 10,275,000 | 10,285,676 | ||||||||||
| Compass Bank: | ||||||||||||
| 2.750%, 09/29/2019 | 31,216,000 | 31,457,737 | ||||||||||
| 2.875%, 06/29/2022 | 8,000,000 | 7,969,496 | ||||||||||
| 3.875%, 04/10/2025 | 15,885,000 | 15,823,366 | ||||||||||
| Cooperatieve Rabobank UA: | ||||||||||||
| 4.625%, 12/01/2023 f | 14,630,000 | 15,765,800 | ||||||||||
| 3.750%, 07/21/2026 f | 12,000,000 | 11,998,020 | ||||||||||
| Credit Agricole SA/London, | ||||||||||||
| 3.375%, 01/10/2022 (Acquired 06/29/2017, Cost $10,462,699) * f | 10,180,000 | 10,452,254 | ||||||||||
| Credit Suisse AG/New York NY: | ||||||||||||
| 1.700%, 04/27/2018 f | 6,000,000 | 5,999,592 | ||||||||||
| 5.300%, 08/13/2019 f | 1,406,000 | 1,501,763 | ||||||||||
| 5.400%, 01/14/2020 f | 5,000,000 | 5,369,245 | ||||||||||
| 3.625%, 09/09/2024 f | 4,325,000 | 4,467,733 | ||||||||||
| Credit Suisse Group AG, | ||||||||||||
| 4.282%, 01/09/2028 (Acquired 01/04/2017, Cost $8,900,000) * f | 8,900,000 | 9,199,761 | ||||||||||
| Credit Suisse Group Funding Guernsey Ltd.: | ||||||||||||
| 3.800%, 06/09/2023 f | 14,550,000 | 15,000,395 | ||||||||||
| 4.550%, 04/17/2026 f | 2,000,000 | 2,124,592 | ||||||||||
| Credit Suisse USA, Inc., | ||||||||||||
| 7.125%, 07/15/2032 | 5,063,000 | 6,942,634 | ||||||||||
| Daiwa Securities Group, Inc., | ||||||||||||
| 3.129%, 04/19/2022 (Acquired 04/12/2017, Cost $12,000,000) * f | 12,000,000 | 12,083,352 | ||||||||||
| Deutsche Bank AG: | ||||||||||||
| 2.950%, 08/20/2020 f | 575,000 | 578,407 | ||||||||||
| 3.125%, 01/13/2021 f | 10,800,000 | 10,853,795 | ||||||||||
| 4.250%, 10/14/2021 f | 26,925,000 | 28,235,789 | ||||||||||
| Deutsche Bank AG/London, | ||||||||||||
| 3.700%, 05/30/2024 f | 10,000,000 | 9,998,050 | ||||||||||
| Discover Bank/Greenwood DE: | ||||||||||||
| 2.600%, 11/13/2018 | 4,875,000 | 4,916,569 | ||||||||||
| 4.200%, 08/08/2023 | 20,000,000 | 21,035,120 | ||||||||||
| 3.450%, 07/27/2026 | 12,000,000 | 11,606,328 | ||||||||||
| Discover Financial Services: | ||||||||||||
| 3.950%, 11/06/2024 | 5,000,000 | 5,077,430 | ||||||||||
| 4.100%, 02/09/2027 | 9,150,000 | 9,165,811 | ||||||||||
| Fifth Third Bancorp, | ||||||||||||
| 2.875%, 07/27/2020 | 6,000,000 | 6,124,680 | ||||||||||
| First Horizon National Corp., | ||||||||||||
| 3.500%, 12/15/2020 | 29,078,000 | 29,823,589 | ||||||||||
| First Tennessee Bank NA, | ||||||||||||
| 2.950%, 12/01/2019 | 5,612,000 | 5,673,233 | ||||||||||
| FirstMerit Bank NA/Akron OH, | ||||||||||||
| 4.270%, 11/25/2026 | 4,600,000 | 4,757,076 | ||||||||||
| FMR LLC, | ||||||||||||
| 4.950%, 02/01/2033 (Acquired 01/29/2013, Cost $1,747,795) * | 1,750,000 | 1,949,519 | ||||||||||
| GE Capital International Funding Co. Unlimited Co., | ||||||||||||
| 2.342%, 11/15/2020 f | 12,638,000 | 12,739,041 | ||||||||||
| Genworth Holdings, Inc., | ||||||||||||
| 4.900%, 08/15/2023 | 1,339,000 | 1,111,370 | ||||||||||
| Goldman Sachs Capital I, | ||||||||||||
| 6.345%, 02/15/2034 | 1,053,000 | 1,293,256 | ||||||||||
| The Goldman Sachs Group, Inc.: | ||||||||||||
| 6.150%, 04/01/2018 | 5,634,000 | 5,814,795 | ||||||||||
| 7.500%, 02/15/2019 | 1,964,000 | 2,130,357 | ||||||||||
| 2.550%, 10/23/2019 | 2,700,000 | 2,729,465 | ||||||||||
| 2.350%, 11/15/2021 | 6,175,000 | 6,091,915 | ||||||||||
| 3.000%, 04/26/2022 | 20,000,000 | 20,153,660 | ||||||||||
| 2.800%, 11/29/2023 ∞ | 5,000,000 | 5,161,120 | ||||||||||
| 3.850%, 07/08/2024 | 3,000,000 | 3,113,742 | ||||||||||
| 3.500%, 01/23/2025 | 3,000,000 | 3,032,592 | ||||||||||
| 3.750%, 05/22/2025 | 5,000,000 | 5,119,955 | ||||||||||
| 2.922%, 10/28/2027 ∞ | 10,000,000 | 10,395,260 | ||||||||||
| 3.691%, 06/05/2028 ∞ | 6,775,000 | 6,801,897 | ||||||||||
| Great-West Life & Annuity Insurance Capital LP II, | ||||||||||||
| 3.718%, 05/16/2046 (Acquired 05/16/2006 through 11/08/2007, Cost $2,482,656) ∞ * | 2,499,000 | 2,480,258 | ||||||||||
| The Guardian Life Insurance Co. of America: | ||||||||||||
| 7.375%, 09/30/2039 (Acquired 05/04/2016 through 10/12/2016, Cost $12,311,492) * | 9,425,000 | 13,430,295 | ||||||||||
| 4.875%, 06/19/2064 (Acquired 06/16/2014, Cost $1,993,300) * | 2,000,000 | 2,200,040 | ||||||||||
| The Hartford Financial Services Group, Inc.: | ||||||||||||
| 5.125%, 04/15/2022 | 1,538,000 | 1,707,268 | ||||||||||
| 8.125%, 06/15/2038 ∞ | 1,964,000 | 2,072,530 | ||||||||||
| Highmark, Inc., | ||||||||||||
| 4.750%, 05/15/2021 (Acquired 05/03/2011 through 07/30/2014, Cost $4,375,353) * | 4,378,000 | 4,522,925 | ||||||||||
| HSBC Bank PLC, | ||||||||||||
| 1.822%, 05/15/2018 (Acquired 12/17/2014, Cost $4,956,253) ∞ * f | 4,950,000 | 4,969,884 | ||||||||||
| HSBC Bank USA NA, | ||||||||||||
| 7.000%, 01/15/2039 | 4,200,000 | 5,876,963 | ||||||||||
| HSBC Finance Corp., | ||||||||||||
| 6.676%, 01/15/2021 | 24,347,000 | 27,438,193 | ||||||||||
| HSBC Holdings PLC: | ||||||||||||
| 2.650%, 01/05/2022 f | 4,000,000 | 3,990,776 | ||||||||||
| 3.600%, 05/25/2023 f | 2,275,000 | 2,351,010 | ||||||||||
| 4.375%, 11/23/2026 f | 10,000,000 | 10,376,210 | ||||||||||
| HSBC USA, Inc.: | ||||||||||||
| 2.350%, 03/05/2020 | 3,000,000 | 3,017,613 | ||||||||||
| 5.000%, 09/27/2020 | 3,716,000 | 3,994,470 | ||||||||||
| 9.125%, 05/15/2021 | 625,000 | 759,295 | ||||||||||
| Humana, Inc., | ||||||||||||
| 7.200%, 06/15/2018 | 1,870,000 | 1,964,227 | ||||||||||
| Huntington Bancshares Inc./OH: | ||||||||||||
| 3.150%, 03/14/2021 | 7,600,000 | 7,749,902 | ||||||||||
| 2.300%, 01/14/2022 | 26,450,000 | 26,052,748 | ||||||||||
| The Huntington National Bank: | ||||||||||||
| 2.000%, 06/30/2018 | 9,000,000 | 9,031,968 | ||||||||||
| 2.200%, 11/06/2018 | 4,825,000 | 4,838,341 | ||||||||||
| ING Bank NV: | ||||||||||||
| 2.050%, 08/17/2018 (Acquired 08/10/2015, Cost $7,270,562) * f | 7,275,000 | 7,288,728 | ||||||||||
| 2.000%, 11/26/2018 (Acquired 11/17/2015, Cost $5,984,160) * f | 6,000,000 | 6,004,986 | ||||||||||
| 2.500%, 10/01/2019 (Acquired 09/23/2014, Cost $3,481,100) * f | 3,500,000 | 3,523,821 | ||||||||||
| 2.450%, 03/16/2020 (Acquired 03/10/2015 through 04/29/2015, Cost $9,209,711) * f | 9,225,000 | 9,267,048 | ||||||||||
| 5.800%, 09/25/2023 (Acquired 01/14/2014 through 02/08/2017, Cost $25,113,749) * f | 22,950,000 | 25,914,933 | ||||||||||
| Invesco Finance PLC: | ||||||||||||
| 3.125%, 11/30/2022 f | 5,902,000 | 6,013,648 | ||||||||||
| 3.750%, 01/15/2026 f | 4,900,000 | 5,080,330 | ||||||||||
| Jackson National Life Global Funding, | ||||||||||||
| 3.250%, 01/30/2024 (Acquired 01/24/2017, Cost $23,457,394) * | 23,475,000 | 23,786,114 | ||||||||||
| Jefferies Group LLC: | ||||||||||||
| 6.875%, 04/15/2021 | 3,570,000 | 4,063,420 | ||||||||||
| 4.850%, 01/15/2027 | 4,600,000 | 4,808,247 | ||||||||||
| 6.250%, 01/15/2036 | 1,390,000 | 1,515,193 | ||||||||||
| John Hancock Life Insurance Co., | ||||||||||||
| 7.375%, 02/15/2024 (Acquired 08/26/2010, Cost $6,554,375) * | 6,069,000 | 7,233,805 | ||||||||||
| JPMorgan Chase & Co.: | ||||||||||||
| 2.250%, 01/23/2020 | 3,675,000 | 3,686,400 | ||||||||||
| 4.250%, 10/15/2020 | 886,000 | 940,828 | ||||||||||
| 2.550%, 03/01/2021 | 7,000,000 | 7,034,391 | ||||||||||
| 2.295%, 08/15/2021 | 18,000,000 | 17,895,276 | ||||||||||
| 2.383%, 10/24/2023 ∞ | 15,000,000 | 15,225,480 | ||||||||||
| 3.125%, 01/23/2025 | 14,000,000 | 13,918,058 | ||||||||||
| 5.600%, 07/15/2041 | 4,106,000 | 5,091,982 | ||||||||||
| KEB Hana Bank, | ||||||||||||
| 1.750%, 10/18/2019 (Acquired 10/11/2016, Cost $19,935,600) * f | 20,000,000 | 19,691,800 | ||||||||||
| KeyBank NA/Cleveland OH: | ||||||||||||
| 2.250%, 03/16/2020 | 5,000,000 | 5,025,075 | ||||||||||
| 3.400%, 05/20/2026 | 18,965,000 | 18,832,036 | ||||||||||
| Kookmin Bank: | ||||||||||||
| 1.625%, 07/14/2017 f | 4,000,000 | 3,999,587 | ||||||||||
| 1.625%, 08/01/2019 (Acquired 07/25/2016, Cost $6,979,840) * f | 7,000,000 | 6,890,800 | ||||||||||
| LeasePlan Corp. NV: | ||||||||||||
| 3.000%, 10/23/2017 (Acquired 12/03/2013 through 04/29/2015, Cost $952,211) * f | 950,000 | 952,929 | ||||||||||
| 2.500%, 05/16/2018 (Acquired 09/24/2013 through 04/27/2015, Cost $11,678,583) * f | 11,658,000 | 11,689,103 | ||||||||||
| 2.875%, 01/22/2019 (Acquired 10/14/2015, Cost $10,993,180) * f | 11,000,000 | 11,034,870 | ||||||||||
| Liberty Mutual Group, Inc.: | ||||||||||||
| 4.250%, 06/15/2023 (Acquired 06/13/2013, Cost $2,660,995) * | 2,678,000 | 2,849,084 | ||||||||||
| 10.750%, 06/15/2058 (Acquired 05/21/2008, Cost $2,182,029) ∞ * | 2,231,000 | 3,536,135 | ||||||||||
| Liberty Mutual Insurance Co., | ||||||||||||
| 7.697%, 10/15/2097 (Acquired 03/26/2003, Cost $297,833) * | 465,000 | 655,624 | ||||||||||
| Lincoln National Corp.: | ||||||||||||
| 8.750%, 07/01/2019 | 1,601,000 | 1,799,988 | ||||||||||
| 3.196%, 04/20/2067 ∞ | 1,004,000 | 918,660 | ||||||||||
| Lloyds Bank PLC: | ||||||||||||
| 1.750%, 05/14/2018 f | 7,775,000 | 7,785,683 | ||||||||||
| 5.800%, 01/13/2020 (Acquired 02/10/2010, Cost $1,414,654) * f | 1,428,000 | 1,553,530 | ||||||||||
| Macquarie Bank Ltd.: | ||||||||||||
| 1.600%, 10/27/2017 (Acquired 10/22/2014, Cost $4,996,950) * f | 5,000,000 | 5,000,420 | ||||||||||
| 2.400%, 01/21/2020 (Acquired 01/14/2015 through 02/28/2017, Cost $16,976,778) * f | 17,000,000 | 17,029,087 | ||||||||||
| Macquarie Group Ltd.: | ||||||||||||
| 3.000%, 12/03/2018 (Acquired 11/25/2013, Cost $8,490,900) * f | 8,525,000 | 8,631,008 | ||||||||||
| 7.625%, 08/13/2019 (Acquired 02/12/2014 through 05/18/2015, Cost $4,320,069) * f | 3,944,000 | 4,365,799 | ||||||||||
| Manufacturers & Traders Trust Co., | ||||||||||||
| 2.100%, 02/06/2020 | 10,850,000 | 10,865,852 | ||||||||||
| Manulife Financial Corp.: | ||||||||||||
| 4.150%, 03/04/2026 f | 10,000,000 | 10,568,950 | ||||||||||
| 5.375%, 03/04/2046 f | 5,150,000 | 6,187,612 | ||||||||||
| Marsh & McLennan Companies, Inc., | ||||||||||||
| 4.350%, 01/30/2047 | 8,150,000 | 8,709,905 | ||||||||||
| Massachusetts Mutual Life Insurance Co.: | ||||||||||||
| 8.875%, 06/01/2039 (Acquired 05/04/2016 through 10/31/2016, Cost $12,588,034) * | 8,124,000 | 13,311,434 | ||||||||||
| 4.500%, 04/15/2065 (Acquired 04/08/2015, Cost $2,945,520) * | 3,000,000 | 3,034,446 | ||||||||||
| 4.900%, 04/01/2077 (Acquired 03/20/2017, Cost $11,074,313) * | 11,175,000 | 11,947,159 | ||||||||||
| MBIA Insurance Corp., | ||||||||||||
| 12.418%, 01/15/2033 (Acquired 01/11/2008, Cost $714,000) ∞ * | 714,000 | 342,720 | ||||||||||
| MetLife, Inc.: | ||||||||||||
| 7.717%, 02/15/2019 | 982,000 | 1,072,614 | ||||||||||
| 6.500%, 12/15/2032 | 466,000 | 605,706 | ||||||||||
| 4.875%, 11/13/2043 | 3,375,000 | 3,814,982 | ||||||||||
| 4.050%, 03/01/2045 | 12,375,000 | 12,479,792 | ||||||||||
| Metropolitan Life Global Funding I, | ||||||||||||
| 3.000%, 01/10/2023 (Acquired 04/27/2015, Cost $2,035,694) * | 2,004,000 | 2,037,569 | ||||||||||
| Mitsubishi UFJ Financial Group, Inc.: | ||||||||||||
| 2.950%, 03/01/2021 f | 15,200,000 | 15,446,559 | ||||||||||
| 2.190%, 09/13/2021 f | 12,400,000 | 12,220,200 | ||||||||||
| Mizuho Bank Ltd.: | ||||||||||||
| 1.850%, 03/21/2018 (Acquired 03/14/2013 through 04/29/2015, Cost $3,344,920) * f | 3,349,000 | 3,353,477 | ||||||||||
| 1.800%, 03/26/2018 (Acquired 06/16/2016, Cost $24,316,946) * f | 24,275,000 | 24,290,779 | ||||||||||
| 2.450%, 04/16/2019 (Acquired 04/09/2014, Cost $2,096,262) * f | 2,100,000 | 2,111,216 | ||||||||||
| Mizuho Financial Group, Inc.: | ||||||||||||
| 2.632%, 04/12/2021 (Acquired 04/05/2016, Cost $13,000,000) * f | 13,000,000 | 12,999,896 | ||||||||||
| 2.953%, 02/28/2022 f | 12,575,000 | 12,683,271 | ||||||||||
| Morgan Stanley: | ||||||||||||
| 7.300%, 05/13/2019 | 15,110,000 | 16,519,234 | ||||||||||
| 2.375%, 07/23/2019 | 1,000,000 | 1,006,926 | ||||||||||
| 5.625%, 09/23/2019 | 1,941,000 | 2,085,247 | ||||||||||
| 2.650%, 01/27/2020 | 4,200,000 | 4,244,289 | ||||||||||
| 2.800%, 06/16/2020 | 5,000,000 | 5,072,700 | ||||||||||
| 2.500%, 04/21/2021 | 8,000,000 | 7,993,832 | ||||||||||
| 2.750%, 05/19/2022 | 20,000,000 | 19,995,680 | ||||||||||
| 2.553%, 10/24/2023 ∞ | 8,000,000 | 8,138,912 | ||||||||||
| Class F, 3.875%, 04/29/2024 | 1,650,000 | 1,714,827 | ||||||||||
| 3.700%, 10/23/2024 | 4,000,000 | 4,105,032 | ||||||||||
| MUFG Americas Holdings Corp., | ||||||||||||
| 2.250%, 02/10/2020 | 5,000,000 | 5,003,130 | ||||||||||
| National Australia Bank Ltd./New York, | ||||||||||||
| 2.500%, 07/12/2026 f | 7,875,000 | 7,432,110 | ||||||||||
| Nationwide Building Society: | ||||||||||||
| 2.450%, 07/27/2021 (Acquired 07/20/2016 through 08/01/2016, Cost $38,472,894) * f | 38,500,000 | 38,474,397 | ||||||||||
| 4.000%, 09/14/2026 (Acquired 06/05/2017 through 06/22/2017, Cost $8,788,048) * f | 8,757,000 | 8,661,829 | ||||||||||
| Nationwide Financial Services, Inc., | ||||||||||||
| 5.375%, 03/25/2021 (Acquired 02/05/2015 through 05/08/2015, Cost $18,339,558) * | 16,905,000 | 18,540,052 | ||||||||||
| New York Life Insurance Co., | ||||||||||||
| 6.750%, 11/15/2039 (Acquired 05/04/2016 through 02/21/2017, Cost $16,070,008) * | 12,026,000 | 16,892,044 | ||||||||||
| Nomura Holdings, Inc.: | ||||||||||||
| 2.750%, 03/19/2019 f | 1,625,000 | 1,641,261 | ||||||||||
| 6.700%, 03/04/2020 f | 1,667,000 | 1,846,526 | ||||||||||
| Nordea Bank AB, | ||||||||||||
| 4.250%, 09/21/2022 (Acquired 02/02/2017, Cost $5,407,883) * f | 5,220,000 | 5,535,653 | ||||||||||
| Peachtree Corners Funding Trust, | ||||||||||||
| 3.976%, 02/15/2025 (Acquired 03/10/2015 through 04/24/2015, Cost $8,106,752) * | 8,000,000 | 8,118,336 | ||||||||||
| People's United Bank NA, | ||||||||||||
| 4.000%, 07/15/2024 | 5,000,000 | 5,051,675 | ||||||||||
| PNC Bank NA, | ||||||||||||
| 4.200%, 11/01/2025 | 2,678,000 | 2,877,559 | ||||||||||
| Pricoa Global Funding I, | ||||||||||||
| 2.550%, 11/24/2020 | 14,000,000 | 14,097,636 | ||||||||||
| Principal Financial Group, Inc.: | ||||||||||||
| 3.300%, 09/15/2022 | 1,860,000 | 1,911,593 | ||||||||||
| 3.125%, 05/15/2023 | 4,667,000 | 4,704,186 | ||||||||||
| 3.400%, 05/15/2025 | 16,000,000 | 16,329,552 | ||||||||||
| 4.300%, 11/15/2046 | 2,325,000 | 2,418,614 | ||||||||||
| Principal Life Global Funding II: | ||||||||||||
| 2.200%, 04/08/2020 (Acquired 03/31/2015, Cost $3,994,720) * | 4,000,000 | 3,988,728 | ||||||||||
| 3.000%, 04/18/2026 (Acquired 04/11/2016, Cost $13,364,356) * | 13,400,000 | 13,206,960 | ||||||||||
| Protective Life Corp.: | ||||||||||||
| 7.375%, 10/15/2019 | 7,096,000 | 7,900,871 | ||||||||||
| 8.450%, 10/15/2039 | 1,400,000 | 2,076,284 | ||||||||||
| Protective Life Global Funding, | ||||||||||||
| 2.700%, 11/25/2020 (Acquired 11/19/2015, Cost $7,992,960) * | 8,000,000 | 8,059,472 | ||||||||||
| Prudential Financial, Inc., | ||||||||||||
| 6.625%, 12/01/2037 | 5,000,000 | 6,670,525 | ||||||||||
| Raymond James Financial, Inc., | ||||||||||||
| 8.600%, 08/15/2019 | 5,000,000 | 5,650,120 | ||||||||||
| RBC USA Holdco Corp., | ||||||||||||
| 5.250%, 09/15/2020 | 2,025,000 | 2,200,452 | ||||||||||
| Regions Bank/Birmingham AL: | ||||||||||||
| 7.500%, 05/15/2018 | 8,518,000 | 8,917,256 | ||||||||||
| 2.250%, 09/14/2018 | 5,000,000 | 5,020,305 | ||||||||||
| Regions Financial Corp., | ||||||||||||
| 3.200%, 02/08/2021 | 25,000,000 | 25,560,250 | ||||||||||
| Reliance Standard Life Global Funding II: | ||||||||||||
| 2.500%, 04/24/2019 (Acquired 03/28/2017, Cost $5,389,193) * | 5,355,000 | 5,390,638 | ||||||||||
| 2.500%, 01/15/2020 (Acquired 04/14/2015, Cost $6,986,671) * | 6,940,000 | 6,951,423 | ||||||||||
| 2.375%, 05/04/2020 (Acquired 04/27/2015 through 11/08/2016, Cost $29,982,313) * | 30,000,000 | 29,886,090 | ||||||||||
| Royal Bank of Canada, | ||||||||||||
| 4.650%, 01/27/2026 f | 7,773,000 | 8,331,024 | ||||||||||
| Santander Bank NA, | ||||||||||||
| 8.750%, 05/30/2018 | 9,442,000 | 10,008,331 | ||||||||||
| Santander Holdings USA, Inc.: | ||||||||||||
| 2.700%, 05/24/2019 | 5,000,000 | 5,036,915 | ||||||||||
| 2.650%, 04/17/2020 | 2,000,000 | 1,994,890 | ||||||||||
| Santander Issuances SAU, | ||||||||||||
| 5.179%, 11/19/2025 f | 9,000,000 | 9,646,902 | ||||||||||
| Santander UK Group Holdings PLC: | ||||||||||||
| 2.875%, 10/16/2020 f | 4,866,000 | 4,935,496 | ||||||||||
| 3.125%, 01/08/2021 f | 2,600,000 | 2,639,458 | ||||||||||
| 3.571%, 01/10/2023 f | 5,000,000 | 5,113,780 | ||||||||||
| Santander UK PLC, | ||||||||||||
| 5.000%, 11/07/2023 (Acquired 10/31/2013 through 03/30/2017, Cost $16,479,794) * f | 15,880,000 | 17,023,646 | ||||||||||
| Skandinaviska Enskilda Banken AB: | ||||||||||||
| 2.375%, 11/20/2018 (Acquired 11/13/2013 through 05/07/2015, Cost $6,842,366) * f | 6,835,000 | 6,888,716 | ||||||||||
| 2.375%, 03/25/2019 (Acquired 03/18/2014 through 04/29/2015, Cost $1,725,742) * f | 1,725,000 | 1,735,568 | ||||||||||
| 2.450%, 05/27/2020 (Acquired 05/19/2015, Cost $14,976,900) * f | 15,000,000 | 15,119,820 | ||||||||||
| Societe Generale SA: | ||||||||||||
| 2.379%, 10/01/2018 ∞ f | 6,000,000 | 6,040,254 | ||||||||||
| 2.500%, 04/08/2021 (Acquired 04/04/2016, Cost $10,217,331) * f | 10,225,000 | 10,252,955 | ||||||||||
| 3.250%, 01/12/2022 (Acquired 01/05/2017, Cost $7,979,840) * f | 8,000,000 | 8,178,656 | ||||||||||
| 4.250%, 04/14/2025 (Acquired 04/08/2015, Cost $4,092,109) * f | 4,157,000 | 4,215,302 | ||||||||||
| 4.750%, 11/24/2025 (Acquired 11/17/2015, Cost $11,954,640) * f | 12,000,000 | 12,582,000 | ||||||||||
| SpareBank 1 Boligkreditt AS, | ||||||||||||
| 1.750%, 11/15/2019 (Acquired 11/07/2012, Cost $4,428,322) * f | 4,463,000 | 4,435,432 | ||||||||||
| Springleaf Finance Corp., | ||||||||||||
| 6.900%, 12/15/2017 | 400,000 | 406,000 | ||||||||||
| Standard Chartered PLC: | ||||||||||||
| 1.700%, 04/17/2018 (Acquired 04/13/2015 through 04/24/2015, Cost $11,588,924) * f | 11,600,000 | 11,580,280 | ||||||||||
| 1.798%, 04/17/2018 (Acquired 04/13/2015, Cost $3,000,000) ∞ * f | 3,000,000 | 2,996,610 | ||||||||||
| 2.100%, 08/19/2019 (Acquired 11/17/2016, Cost $13,917,342) * f | 14,000,000 | 13,948,536 | ||||||||||
| 3.050%, 01/15/2021 (Acquired 01/12/2016, Cost $4,490,910) * f | 4,500,000 | 4,555,449 | ||||||||||
| 5.700%, 03/26/2044 (Acquired 03/21/2014, Cost $5,988,000) * f | 6,000,000 | 6,816,288 | ||||||||||
| Sumitomo Mitsui Banking Corp.: | ||||||||||||
| 2.450%, 01/16/2020 f | 20,500,000 | 20,626,793 | ||||||||||
| 3.950%, 07/19/2023 f | 1,850,000 | 1,962,565 | ||||||||||
| Sumitomo Mitsui Financial Group, Inc.: | ||||||||||||
| 2.934%, 03/09/2021 f | 5,950,000 | 6,044,563 | ||||||||||
| 2.442%, 10/19/2021 f | 15,775,000 | 15,708,840 | ||||||||||
| SunTrust Bank/Atlanta GA: | ||||||||||||
| 7.250%, 03/15/2018 | 1,874,000 | 1,944,275 | ||||||||||
| 3.300%, 05/15/2026 | 3,925,000 | 3,836,158 | ||||||||||
| SunTrust Banks, Inc.: | ||||||||||||
| 2.900%, 03/03/2021 | 14,150,000 | 14,365,660 | ||||||||||
| 2.700%, 01/27/2022 | 12,800,000 | 12,826,727 | ||||||||||
| Svenska Handelsbanken AB, | ||||||||||||
| 2.400%, 10/01/2020 f | 5,200,000 | 5,234,039 | ||||||||||
| Swedbank AB: | ||||||||||||
| 2.375%, 02/27/2019 (Acquired 02/20/2014, Cost $7,287,663) * f | 7,300,000 | 7,354,648 | ||||||||||
| 2.200%, 03/04/2020 (Acquired 02/25/2015 through 04/29/2015, Cost $6,464,359) * f | 6,468,000 | 6,474,727 | ||||||||||
| Synchrony Financial: | ||||||||||||
| 3.000%, 08/15/2019 | 2,000,000 | 2,028,196 | ||||||||||
| 3.750%, 08/15/2021 | 10,225,000 | 10,502,353 | ||||||||||
| 4.250%, 08/15/2024 | 26,864,000 | 27,439,051 | ||||||||||
| 4.500%, 07/23/2025 | 18,127,000 | 18,640,900 | ||||||||||
| TD Ameritrade Holding Corp.: | ||||||||||||
| 5.600%, 12/01/2019 | 2,945,000 | 3,183,153 | ||||||||||
| 2.950%, 04/01/2022 | 4,625,000 | 4,732,740 | ||||||||||
| 3.625%, 04/01/2025 | 7,000,000 | 7,243,124 | ||||||||||
| Torchmark Corp., | ||||||||||||
| 3.800%, 09/15/2022 | 12,475,000 | 12,844,771 | ||||||||||
| Trinity Acquisition PLC: | ||||||||||||
| 4.400%, 03/15/2026 f | 27,305,000 | 28,512,345 | ||||||||||
| 6.125%, 08/15/2043 f | 3,625,000 | 4,241,692 | ||||||||||
| UBS AG/Stamford CT: | ||||||||||||
| 1.996%, 03/26/2018 ∞ f | 8,250,000 | 8,287,216 | ||||||||||
| 5.750%, 04/25/2018 f | 2,678,000 | 2,763,383 | ||||||||||
| 2.052%, 06/01/2020 ∞ f | 4,710,000 | 4,746,474 | ||||||||||
| UBS Group Funding Switzerland AG: | ||||||||||||
| 2.650%, 02/01/2022 (Acquired 08/19/2016 through 11/07/2016, Cost $14,134,282) * f | 14,150,000 | 14,119,960 | ||||||||||
| 3.491%, 05/23/2023 (Acquired 03/29/2017, Cost $4,852,886) * f | 4,825,000 | 4,936,472 | ||||||||||
| 4.253%, 03/23/2028 (Acquired 03/16/2017, Cost $17,150,000) * f | 17,150,000 | 17,917,119 | ||||||||||
| Voya Financial, Inc.: | ||||||||||||
| 5.500%, 07/15/2022 | 23,802,000 | 26,433,407 | ||||||||||
| 3.125%, 07/15/2024 | 14,375,000 | 14,195,341 | ||||||||||
| 3.650%, 06/15/2026 | 5,800,000 | 5,811,014 | ||||||||||
| WEA Finance LLC / Westfield UK & Europe Finance PLC: | ||||||||||||
| 2.700%, 09/17/2019 (Acquired 04/06/2016 through 07/01/2016, Cost $6,036,190) * | 5,985,000 | 6,034,460 | ||||||||||
| 3.250%, 10/05/2020 (Acquired 09/28/2015, Cost $7,972,560) * | 8,000,000 | 8,141,312 | ||||||||||
| Wells Fargo & Co.: | ||||||||||||
| Class N, 2.150%, 01/30/2020 | 2,750,000 | 2,757,070 | ||||||||||
| 2.500%, 03/04/2021 | 5,000,000 | 5,017,295 | ||||||||||
| 3.069%, 01/24/2023 | 10,000,000 | 10,140,090 | ||||||||||
| 2.402%, 10/31/2023 ∞ | 5,000,000 | 5,088,755 | ||||||||||
| 3.000%, 02/19/2025 | 5,000,000 | 4,922,395 | ||||||||||
| 3.000%, 04/22/2026 | 8,000,000 | 7,813,232 | ||||||||||
| 3.900%, 05/01/2045 | 15,000,000 | 15,005,775 | ||||||||||
| Westpac Banking Corp.: | ||||||||||||
| 1.600%, 01/12/2018 f | 7,229,000 | 7,232,976 | ||||||||||
| 4.322%, 11/23/2031 ∞ f | 8,350,000 | 8,558,157 | ||||||||||
| Willis North America, Inc.: | ||||||||||||
| 7.000%, 09/29/2019 | 5,463,000 | 6,005,596 | ||||||||||
| 3.600%, 05/15/2024 | 7,000,000 | 7,070,532 | ||||||||||
| Willis Towers Watson PLC, | ||||||||||||
| 5.750%, 03/15/2021 f | 13,879,000 | 15,311,521 | ||||||||||
| 2,658,827,750 | 20.9% | |||||||||||
| Total Corporate Bonds | 5,385,933,430 | 42.3% | ||||||||||
| Taxable Municipal Bonds | ||||||||||||
| Atlanta Independent School System, | ||||||||||||
| 5.557%, 03/01/2026 | 4,465,000 | 5,217,085 | ||||||||||
| California Housing Finance Agency: | ||||||||||||
| 3.656%, 02/01/2029 (Callable 08/01/2025) | 19,650,000 | 19,772,812 | ||||||||||
| 2.794%, 08/01/2036 (Callable 08/01/2025) | 13,980,000 | 13,838,103 | ||||||||||
| California Qualified School Bond Joint Powers Authority, | ||||||||||||
| 7.155%, 03/01/2027 | 6,695,000 | 7,756,626 | ||||||||||
| California School Finance Authority, | ||||||||||||
| 5.041%, 07/01/2020 | 2,230,000 | 2,374,905 | ||||||||||
| City of Vernon CA Electric System Revenue, | ||||||||||||
| 4.500%, 08/01/2022 | 7,265,000 | 7,608,344 | ||||||||||
| County of Cuyahoga OH, | ||||||||||||
| 9.125%, 10/01/2023 | 895,000 | 1,065,775 | ||||||||||
| Eaton Community City School District, | ||||||||||||
| 5.390%, 08/25/2027 (Callable 06/01/2020) | 2,305,000 | 2,392,383 | ||||||||||
| Elgin Local School District, | ||||||||||||
| 5.499%, 08/31/2027 (Callable 12/01/2019) | 4,440,000 | 4,599,796 | ||||||||||
| Iowa Tobacco Settlement Authority, | ||||||||||||
| 6.500%, 06/01/2023 (Callable 07/31/2017) | 3,415,000 | 3,415,478 | ||||||||||
| Kentucky Housing Corp., | ||||||||||||
| 3.500%, 01/01/2040 (Callable 07/01/2025) | 5,650,000 | 5,775,882 | ||||||||||
| Louisiana Housing Corp., | ||||||||||||
| 2.100%, 12/01/2038 (Callable 09/01/2024) | 5,965,297 | 5,753,588 | ||||||||||
| Maryland Community Development Administration Housing Revenue, | ||||||||||||
| 3.160%, 09/01/2041 (Callable 09/01/2025) | 18,755,000 | 18,727,618 | ||||||||||
| New Hampshire Housing Finance Authority: | ||||||||||||
| 3.050%, 01/01/2021 | 810,000 | 813,329 | ||||||||||
| 3.750%, 07/01/2034 (Callable 07/01/2023) | 1,650,000 | 1,678,925 | ||||||||||
| 4.000%, 07/01/2036 (Callable 07/01/2025) | 8,465,000 | 8,716,918 | ||||||||||
| New Jersey Economic Development Authority, | ||||||||||||
| 2.421%, 06/15/2018 | 7,000,000 | 6,976,060 | ||||||||||
| North Carolina Housing Finance Agency, | ||||||||||||
| 2.812%, 07/01/2035 (Callable 01/01/2024) | 3,410,000 | 3,381,697 | ||||||||||
| North Texas Tollway Authority, | ||||||||||||
| 8.910%, 02/01/2030 (Callable 02/01/2020) | 17,270,000 | 19,784,339 | ||||||||||
| San Dieguito Public Facilities Authority, | ||||||||||||
| 6.459%, 05/01/2027 | 5,675,000 | 6,958,798 | ||||||||||
| State of California, | ||||||||||||
| 7.950%, 03/01/2036 (Callable 05/01/2020) | 10,125,000 | 11,551,207 | ||||||||||
| State Public School Building Authority, | ||||||||||||
| 5.000%, 09/15/2027 | 4,458,000 | 4,881,956 | ||||||||||
| Three Rivers Local School District, | ||||||||||||
| 5.209%, 09/15/2027 (Callable 12/01/2020) | 2,365,000 | 2,455,461 | ||||||||||
| West Contra Costa Unified School District, | ||||||||||||
| 6.250%, 08/01/2030 | 1,785,000 | 2,214,275 | ||||||||||
| Westlake City School District, | ||||||||||||
| 5.227%, 12/01/2026 (Callable 12/01/2020) | 3,570,000 | 3,636,795 | ||||||||||
| 171,348,155 | 1.3% | |||||||||||
| Residential Mortgage-Backed Securities | ||||||||||||
| U.S. Government Agency Issues | ||||||||||||
| Fannie Mae Pool: | ||||||||||||
| 3.000%, 07/01/2043 | 4,292,442 | 4,309,980 | ||||||||||
| 3.500%, 12/01/2045 | 44,798,833 | 46,039,718 | ||||||||||
| 3.000%, 07/01/2046 | 12,471,688 | 12,500,132 | ||||||||||
| 3.000%, 11/01/2046 | 31,020,789 | 31,040,327 | ||||||||||
| 3.500%, 11/01/2046 | 68,408,590 | 70,303,443 | ||||||||||
| Fannie Mae REMIC Trust: | �� | |||||||||||
| Series 1989-37, Class G, 8.000%, 07/25/2019 | 26,366 | 27,360 | ||||||||||
| Series 1989-94, Class G, 7.500%, 12/25/2019 | 11,976 | 12,545 | ||||||||||
| Series 1990-58, Class J, 7.000%, 05/25/2020 | 1,281 | 1,358 | ||||||||||
| Series 1990-76, Class G, 7.000%, 07/25/2020 | 12,426 | 13,011 | ||||||||||
| Series 1990-105, Class J, 6.500%, 09/25/2020 | 8,493 | 8,889 | ||||||||||
| Series 1990-108, Class G, 7.000%, 09/25/2020 | 2,272 | 2,396 | ||||||||||
| Series 1991-1, Class G, 7.000%, 01/25/2021 | 2,996 | 3,159 | ||||||||||
| Series 1991-86, Class Z, 6.500%, 07/25/2021 | 8,256 | 8,787 | ||||||||||
| Series 1993-58, Class H, 5.500%, 04/25/2023 | 92,045 | 97,493 | ||||||||||
| Series 1998-66, Class C, 6.000%, 12/25/2028 | 63,300 | 68,595 | ||||||||||
| Federal Gold Loan Mortgage Corp. (FGLMC): | ||||||||||||
| 6.000%, 06/01/2020 | 36,709 | 37,782 | ||||||||||
| 3.500%, 11/01/2025 | 3,813,434 | 3,974,241 | ||||||||||
| 2.500%, 04/01/2028 | 3,711,295 | 3,757,102 | ||||||||||
| 6.500%, 06/01/2029 | 175,228 | 196,277 | ||||||||||
| 3.000%, 04/01/2031 | 10,150,725 | 10,432,125 | ||||||||||
| 3.000%, 02/01/2032 | 43,308,987 | 44,522,119 | ||||||||||
| 3.500%, 05/01/2032 | 10,954,239 | 11,437,516 | ||||||||||
| 3.500%, 07/01/2032 | 32,757,052 | 34,241,655 | ||||||||||
| 5.000%, 08/01/2033 | 6,909,965 | 7,589,179 | ||||||||||
| 3.500%, 01/01/2034 | 27,559,984 | 28,773,667 | ||||||||||
| 5.000%, 09/01/2035 | 14,421,862 | 15,769,572 | ||||||||||
| 5.500%, 01/01/2036 | 251,689 | 279,843 | ||||||||||
| 5.000%, 03/01/2036 | 6,301,369 | 6,888,758 | ||||||||||
| 6.000%, 12/01/2036 | 216,115 | 244,196 | ||||||||||
| 5.500%, 05/01/2038 | 777,798 | 863,092 | ||||||||||
| 5.500%, 01/01/2039 | 15,328,099 | 17,165,907 | ||||||||||
| 4.500%, 11/01/2039 | 5,357,874 | 5,760,734 | ||||||||||
| 4.500%, 11/01/2039 | 6,447,507 | 6,932,349 | ||||||||||
| 4.500%, 12/01/2039 | 32,543,450 | 34,986,991 | ||||||||||
| 5.000%, 03/01/2040 | 1,407,505 | 1,544,134 | ||||||||||
| 4.500%, 08/01/2040 | 1,166,135 | 1,253,888 | ||||||||||
| 4.500%, 09/01/2040 | 4,523,808 | 4,864,119 | ||||||||||
| 4.000%, 01/01/2041 | 20,477,919 | 21,622,689 | ||||||||||
| 4.000%, 01/01/2041 | 40,100,885 | 42,345,986 | ||||||||||
| 4.500%, 03/01/2041 | 3,177,566 | 3,423,378 | ||||||||||
| 3.500%, 10/01/2041 | 12,484,746 | 12,884,561 | ||||||||||
| 4.000%, 03/01/2042 | 9,659,786 | 10,215,760 | ||||||||||
| 3.500%, 06/01/2042 | 6,332,461 | 6,534,154 | ||||||||||
| 3.500%, 07/01/2042 | 16,772,214 | 17,306,439 | ||||||||||
| 3.000%, 08/01/2042 | 21,468,501 | 21,543,903 | ||||||||||
| 3.000%, 10/01/2042 | 8,175,640 | 8,206,034 | ||||||||||
| 3.000%, 11/01/2042 | 46,990,114 | 47,152,800 | ||||||||||
| 3.000%, 01/01/2043 | 36,560,613 | 36,705,214 | ||||||||||
| 3.000%, 01/01/2043 | 16,945,746 | 16,955,637 | ||||||||||
| 3.000%, 02/01/2043 | 4,490,752 | 4,508,378 | ||||||||||
| 3.000%, 04/01/2043 | 7,396,493 | 7,425,489 | ||||||||||
| 3.000%, 04/01/2043 | 19,754,572 | 19,831,074 | ||||||||||
| 3.000%, 04/01/2043 | 11,276,279 | 11,321,716 | ||||||||||
| 3.500%, 05/01/2043 | 17,125,551 | 17,670,841 | ||||||||||
| 3.000%, 06/01/2043 | 23,217,347 | 23,291,762 | ||||||||||
| 3.000%, 08/01/2043 | 7,223,452 | 7,240,637 | ||||||||||
| 3.500%, 11/01/2043 | 13,155,989 | 13,574,813 | ||||||||||
| 3.500%, 01/01/2044 | 14,522,045 | 14,984,088 | ||||||||||
| 4.000%, 03/01/2044 | 8,568,953 | 9,018,888 | ||||||||||
| 3.500%, 05/01/2044 | 53,738,061 | 55,559,380 | ||||||||||
| 4.000%, 07/01/2044 | 7,346,372 | 7,732,113 | ||||||||||
| 3.500%, 10/01/2044 | 14,027,482 | 14,435,768 | ||||||||||
| 4.000%, 10/01/2044 | 16,985,261 | 17,983,263 | ||||||||||
| 3.500%, 06/01/2045 | 3,379,623 | 3,494,362 | ||||||||||
| 3.000%, 10/01/2045 | 52,261,999 | 52,472,655 | ||||||||||
| 3.500%, 01/01/2046 | 47,199,313 | 48,691,360 | ||||||||||
| 4.000%, 04/01/2046 | 16,395,701 | 17,361,566 | ||||||||||
| Federal Home Loan Mortgage Corp. (FHLMC): | ||||||||||||
| Series 141, Class D, 5.000%, 05/15/2021 | 6,761 | 6,911 | ||||||||||
| Series 1074, Class I, 6.750%, 05/15/2021 | 5,374 | 5,554 | ||||||||||
| Series 1081, Class K, 7.000%, 05/15/2021 | 33,340 | 35,315 | ||||||||||
| Series 163, Class F, 6.000%, 07/15/2021 ∞ | 7,035 | 7,352 | ||||||||||
| Series 188, Class H, 7.000%, 09/15/2021 | 16,748 | 17,587 | ||||||||||
| Series 1286, Class A, 6.000%, 05/15/2022 | 5,348 | 5,639 | ||||||||||
| Federal National Mortgage Association (FNMA): | ||||||||||||
| 5.000%, 11/01/2021 | 661,691 | 677,597 | ||||||||||
| 3.000%, 04/01/2027 | 10,261,441 | 10,561,233 | ||||||||||
| 3.500%, 07/01/2027 | 52,219,830 | 54,502,144 | ||||||||||
| 2.500%, 12/01/2027 | 13,104,000 | 13,259,524 | ||||||||||
| 2.500%, 05/01/2028 | 17,099,494 | 17,296,792 | ||||||||||
| 5.000%, 05/01/2028 | 256,917 | 280,472 | ||||||||||
| 4.500%, 08/01/2029 | 2,009,248 | 2,159,942 | ||||||||||
| 4.500%, 09/01/2029 | 2,336,369 | 2,511,477 | ||||||||||
| 2.500%, 05/01/2030 | 19,647,371 | 19,819,568 | ||||||||||
| 3.000%, 12/01/2030 | 18,777,568 | 19,294,929 | ||||||||||
| 3.000%, 12/01/2030 | 30,312,230 | 31,148,649 | ||||||||||
| 3.500%, 01/01/2032 | 15,972,554 | 16,681,770 | ||||||||||
| 6.000%, 03/01/2033 | 60,228 | 68,656 | ||||||||||
| 3.500%, 10/01/2033 | 30,735,679 | 32,083,555 | ||||||||||
| 4.500%, 10/01/2033 § | 23,207,986 | 25,009,476 | ||||||||||
| 5.000%, 10/01/2033 | 25,447,166 | 27,917,982 | ||||||||||
| 5.000%, 11/01/2033 | 68,870 | 75,568 | ||||||||||
| 4.000%, 01/01/2034 | 10,131,125 | 10,751,075 | ||||||||||
| 5.500%, 04/01/2034 | 8,409,788 | 9,421,650 | ||||||||||
| 4.000%, 06/01/2034 | 13,133,118 | 13,934,247 | ||||||||||
| 4.000%, 09/01/2034 | 15,770,097 | 16,732,725 | ||||||||||
| 5.500%, 09/01/2034 | 223,538 | 250,191 | ||||||||||
| 6.000%, 11/01/2034 | 60,368 | 68,933 | ||||||||||
| 5.500%, 02/01/2035 | 775,899 | 869,052 | ||||||||||
| 5.000%, 07/01/2035 | 6,494,309 | 7,129,576 | ||||||||||
| 5.000%, 10/01/2035 | 3,343,703 | 3,670,767 | ||||||||||
| 5.000%, 02/01/2036 | 4,703,560 | 5,164,086 | ||||||||||
| 5.500%, 11/01/2036 | 313,398 | 350,239 | ||||||||||
| 5.500%, 04/01/2037 | 1,900,316 | 2,125,917 | ||||||||||
| 4.000%, 04/01/2039 | 17,098,984 | 18,120,709 | ||||||||||
| 5.000%, 06/01/2039 | 15,222,877 | 16,707,915 | ||||||||||
| 5.000%, 06/01/2039 | 22,607,053 | 24,789,036 | ||||||||||
| 4.500%, 11/01/2039 | 305,183 | 328,763 | ||||||||||
| 4.000%, 08/01/2040 | 2,159,755 | 2,281,106 | ||||||||||
| 3.500%, 12/01/2040 | 12,724,977 | 13,142,000 | ||||||||||
| 4.000%, 12/01/2040 | 12,434,267 | 13,128,005 | ||||||||||
| 3.500%, 02/01/2041 | 19,786,445 | 20,432,503 | ||||||||||
| 4.000%, 02/01/2041 | 30,083,911 | 31,776,934 | ||||||||||
| 3.500%, 03/01/2041 | 28,637,878 | 29,572,962 | ||||||||||
| 4.500%, 05/01/2041 | 11,302,352 | 12,224,669 | ||||||||||
| 4.000%, 06/01/2041 | 24,952,354 | 26,339,695 | ||||||||||
| 4.500%, 07/01/2041 | 12,332,289 | 13,332,091 | ||||||||||
| 5.000%, 07/01/2041 | 17,446,528 | 19,196,386 | ||||||||||
| 3.500%, 09/01/2041 | 28,990,437 | 29,933,863 | ||||||||||
| 4.000%, 09/01/2041 | 3,442,538 | 3,632,492 | ||||||||||
| 4.000%, 10/01/2041 | 8,513,700 | 8,982,305 | ||||||||||
| 3.500%, 11/01/2041 | 11,638,869 | 12,007,928 | ||||||||||
| 3.500%, 12/01/2041 | 50,077,025 | 51,672,175 | ||||||||||
| 4.000%, 12/01/2041 | 12,182,213 | 12,854,739 | ||||||||||
| 4.000%, 01/01/2042 | 16,263,701 | 17,157,982 | ||||||||||
| 4.500%, 01/01/2042 | 16,492,626 | 17,835,089 | ||||||||||
| 3.000%, 05/01/2042 | 6,480,669 | 6,508,102 | ||||||||||
| 3.500%, 08/01/2042 | 11,435,060 | 11,797,631 | ||||||||||
| 4.000%, 08/01/2042 | 22,755,611 | 24,009,884 | ||||||||||
| 3.000%, 03/01/2043 | 8,223,538 | 8,263,219 | ||||||||||
| 3.000%, 03/01/2043 | 45,311,266 | 45,497,698 | ||||||||||
| 3.000%, 05/01/2043 | 26,309,444 | 26,419,424 | ||||||||||
| 3.000%, 06/01/2043 | 11,095,634 | 11,142,054 | ||||||||||
| 4.000%, 07/01/2043 | 42,165,317 | 44,491,457 | ||||||||||
| 3.000%, 08/01/2043 | 6,834,012 | 6,860,851 | ||||||||||
| 4.500%, 09/01/2043 | 18,061,710 | 19,533,556 | ||||||||||
| 3.500%, 10/01/2043 | 79,949,978 | 82,342,112 | ||||||||||
| 3.000%, 11/01/2043 | 35,848,168 | 35,999,899 | ||||||||||
| 4.000%, 01/01/2045 | 13,181,662 | 13,926,160 | ||||||||||
| 3.500%, 02/01/2045 | 56,679,718 | 58,468,163 | ||||||||||
| 4.000%, 02/01/2045 | 28,677,325 | 30,235,520 | ||||||||||
| 3.500%, 04/01/2045 | 42,408,950 | 43,758,215 | ||||||||||
| 4.000%, 10/01/2045 | 10,597,543 | 11,195,101 | ||||||||||
| 4.500%, 02/01/2046 | 49,986,544 | 54,003,245 | ||||||||||
| 3.000%, 05/01/2046 | 19,669,770 | 19,714,420 | ||||||||||
| Ginnie Mae I Pool, | ||||||||||||
| 3.500%, 01/15/2042 | 19,875,708 | 20,650,420 | ||||||||||
| Ginnie Mae II Pool: | ||||||||||||
| 4.000%, 04/20/2046 | 19,158,490 | 20,176,219 | ||||||||||
| 4.000%, 05/20/2046 | 46,647,796 | 49,125,798 | ||||||||||
| Government National Mortgage Association (GNMA): | ||||||||||||
| 6.000%, 11/20/2033 | 55,942 | 63,415 | ||||||||||
| 5.000%, 07/20/2040 | 2,741,749 | 3,013,098 | ||||||||||
| 3.500%, 10/20/2041 | 12,155,026 | 12,628,287 | ||||||||||
| 4.000%, 06/20/2042 | 13,701,278 | 14,487,326 | ||||||||||
| 3.500%, 09/20/2042 | 5,111,848 | 5,317,197 | ||||||||||
| 3.500%, 01/20/2043 | 31,879,783 | 33,160,466 | ||||||||||
| 3.000%, 04/20/2045 | 40,911,981 | 41,367,623 | ||||||||||
| 3.500%, 04/20/2045 | 38,209,001 | 39,617,838 | ||||||||||
| 4.000%, 08/20/2045 | 18,421,533 | 19,405,155 | ||||||||||
| 4.500%, 01/20/2046 | 21,701,831 | 23,076,985 | ||||||||||
| 3.000%, 06/20/2046 | 27,091,017 | 27,392,733 | ||||||||||
| 3.000%, 08/20/2046 | 54,628,428 | 55,236,832 | ||||||||||
| 2,655,678,747 | 20.9 | % | ||||||||||
| Non-U.S. Government Agency Issues | ||||||||||||
| Accredited Mortgage Loan Trust: | ||||||||||||
| Series 2005-4, Class A1, 1.456%, 12/25/2035 ∞ | 7,223,332 | 7,180,651 | ||||||||||
| Series 2006-2, Class A3, 1.366%, 09/25/2036 ∞ | 2,898,742 | 2,895,219 | ||||||||||
| ACE Securities Corp. Home Equity Loan Trust, | ||||||||||||
| Series 2006-HE1, Class A1B1, 1.406%, 02/25/2036 ∞ | 3,382,017 | 3,374,038 | ||||||||||
| Alternative Loan Trust: | ||||||||||||
| Series 2005-50CB, Class 4A1, 5.000%, 11/25/2020 § | 144,620 | 144,620 | ||||||||||
| Series 2006-7CB, Class 3A1, 5.250%, 05/25/2021 § | 731,592 | 713,810 | ||||||||||
| Series 2006-J5, Class 3A1, 4.494%, 07/25/2021 ∞ | 145,806 | 138,949 | ||||||||||
| Series 2006-43CB, Class 2A1, 6.000%, 02/25/2022 § | 169,548 | 170,671 | ||||||||||
| Series 2002-11, Class A4, 6.250%, 10/25/2032 | 22,475 | 22,871 | ||||||||||
| Series 2004-8CB, Class A, 1.486%, 06/25/2034 ∞ | 16,770,656 | 16,668,600 | ||||||||||
| Series 2006-28CB, Class A17, 6.000%, 10/25/2036 § | 750,693 | 642,471 | ||||||||||
| Argent Securities Inc. Asset-Backed Pass-Through Certificates: | ||||||||||||
| Series 2005-W3, Class A2D, 1.556%, 11/25/2035 ∞ | 4,779,282 | 4,728,700 | ||||||||||
| Series 2005-W5, Class A1, 1.451%, 01/25/2036 ∞ | 40,037,983 | 38,392,731 | ||||||||||
| Asset Backed Securities Corp. Home Equity Loan Trust: | ||||||||||||
| Series 2006-HE1, Class A3, 1.416%, 01/25/2036 ∞ | 9,555,135 | 9,479,724 | ||||||||||
| Series 2006-HE1, Class A1, 1.431%, 01/25/2036 ∞ | 3,836,352 | 3,787,150 | ||||||||||
| Series 2006-HE3, Class A2, 1.381%, 03/25/2036 ∞ | 16,159,041 | 15,716,277 | ||||||||||
| Series 2006-HE6, Class A1, 1.361%, 11/25/2036 ∞ | 31,993,339 | 30,194,795 | ||||||||||
| Banc of America Alternative Loan Trust: | ||||||||||||
| Series 2004-11, Class 4A1, 5.500%, 12/25/2019 | 46,240 | 46,683 | ||||||||||
| Series 2005-2, Class 4A1, 5.500%, 03/25/2020 | 75,998 | 75,967 | ||||||||||
| Series 2005-4, Class 3A1, 5.500%, 05/25/2020 | 342,159 | 338,555 | ||||||||||
| Series 2005-10, Class 5A1, 5.250%, 11/25/2020 | 139,499 | 140,246 | ||||||||||
| Series 2007-1, Class 1A1, 5.824%, 04/25/2022 ∞ § | 491,780 | 475,230 | ||||||||||
| Series 2005-2, Class 1CB2, 5.500%, 03/25/2035 § | 86,701 | 85,920 | ||||||||||
| Series 2005-9, Class 1CB3, 5.500%, 10/25/2035 § | 201,640 | 199,308 | ||||||||||
| Series 2005-11, Class 1CB4, 5.500%, 12/25/2035 § | 129,350 | 123,592 | ||||||||||
| Series 2006-5, Class CB7, 6.000%, 06/25/2046 § | 455,296 | 398,112 | ||||||||||
| Bayview Financial Acquisition Trust, | ||||||||||||
| Series 2007-A, Class 1A2, 6.205%, 05/28/2037 | 1,837,191 | 1,908,985 | ||||||||||
| Bayview Financial Mortgage Pass-Through Trust, | ||||||||||||
| Series 2007-B, Class 1A2, 6.831%, 08/28/2047 ∞ | 1,889,079 | 1,698,015 | ||||||||||
| Bear Stearns ALT-A Trust: | ||||||||||||
| Series 2004-4, Class A1, 1.816%, 06/25/2034 ∞ | 2,689,849 | 2,661,355 | ||||||||||
| Series 2005-4, Class 1A1, 1.656%, 04/25/2035 ∞ | 6,833,239 | 6,608,169 | ||||||||||
| Series 2005-7, Class 12A1, 1.756%, 08/25/2035 ∞ | 19,868,518 | 19,731,610 | ||||||||||
| Bear Stearns Asset Backed Securities I Trust, | ||||||||||||
| Series 2004-AC2, Class 2A, 5.000%, 05/25/2034 | 538,433 | 536,142 | ||||||||||
| Chase Mortgage Finance Trust, | ||||||||||||
| Series 2006-A1, Class 2A3, 3.277%, 09/25/2036 ∞ § | 1,849,293 | 1,667,620 | ||||||||||
| Citigroup Global Markets Mortgage Securities VII, Inc., | ||||||||||||
| Series 2003-UP2, Class A2, 7.000%, 06/25/2033 ∞ | 212,842 | 215,669 | ||||||||||
| Citigroup Mortgage Loan Trust, Inc.: | ||||||||||||
| Series 2005-HE4, Class A2D, 1.576%, 10/25/2035 ∞ | 732,531 | 732,167 | ||||||||||
| Series 2005-9, Class 2A2, 5.500%, 11/25/2035 § | 113,178 | 113,511 | ||||||||||
| Countrywide Asset-Backed Certificates: | ||||||||||||
| Series 2004-S1, Class A3, 5.115%, 02/25/2035 ∞ | 479,059 | 484,639 | ||||||||||
| Series 2005-10, Class AF6, 4.542%, 02/25/2036 ∞ | 343,066 | 351,066 | ||||||||||
| Series 2005-13, Class AF3, 4.741%, 04/25/2036 ∞ | 1,334,069 | 1,230,582 | ||||||||||
| Series 2006-10, Class 1AF3, 4.629%, 09/25/2046 ∞ § | 834,777 | 725,110 | ||||||||||
| Credit Suisse First Boston Mortgage Securities Corp., | ||||||||||||
| Series 2003-AR26, Class 8A1, 3.325%, 11/25/2033 ∞ | 10,082,789 | 10,188,273 | ||||||||||
| Credit-Based Asset Servicing & Securitization LLC, | ||||||||||||
| Series 2005-CB8, Class AF2, 3.896%, 12/25/2035 ∞ | 115,470 | 115,063 | ||||||||||
| CWABS Asset-Backed Certificates Trust: | ||||||||||||
| Series 2004-15, Class AF6, 4.613%, 04/25/2035 ∞ | 199,662 | 200,731 | ||||||||||
| Series 2005-1, Class AF6, 5.030%, 07/25/2035 ∞ | 512,669 | 522,730 | ||||||||||
| Series 2005-11, Class AF3, 4.674%, 02/25/2036 ∞ | 1,860,491 | 1,878,583 | ||||||||||
| Series 2005-16, Class 3AV, 1.446%, 05/25/2036 ∞ | 9,350,653 | 9,297,192 | ||||||||||
| Series 2005-17, Class 1AF5, 4.641%, 05/25/2036 ∞ § | 344,811 | 581,845 | ||||||||||
| CWHEQ Home Equity Loan Trust, | ||||||||||||
| Series 2007-S1, Class A6, 5.693%, 11/25/2036 ∞ | 120,662 | 119,273 | ||||||||||
| Deutsche Mortgage Securities, Inc. Mortgage Loan Trust, | ||||||||||||
| Series 2004-4, Class 1A6, 6.150%, 04/25/2034 ∞ | 7,190 | 7,312 | ||||||||||
| First Franklin Mortgage Loan Trust: | ||||||||||||
| Series 2006-FFH1, Class A4, 1.516%, 01/25/2036 ∞ | 2,604,457 | 2,582,662 | ||||||||||
| Series 2006-FF1, Class 2A4, 1.556%, 01/25/2036 ∞ | 10,100,000 | 9,915,882 | ||||||||||
| Series 2005-FF12, Class A2C, 1.546%, 11/25/2036 ∞ | 6,946,500 | 6,911,843 | ||||||||||
| First Horizon Alternative Mortgage Securities Trust: | ||||||||||||
| Series 2005-FA7, Class 2A1, 5.000%, 09/25/2020 | 67,411 | 67,696 | ||||||||||
| Series 2006-FA6, Class 3A1, 5.750%, 11/25/2021 § | 158,443 | 155,965 | ||||||||||
| Series 2006-FA8, Class 2A1, 5.750%, 02/25/2037 | 543,798 | 479,107 | ||||||||||
| GE Capital Mortgage Services, Inc. Trust, | ||||||||||||
| Series 1999-HE1, Class A7, 6.265%, 04/25/2029 | 654 | 655 | ||||||||||
| GE Mortgage Services LLC, | ||||||||||||
| Series 1997-HE4, Class A7, 6.735%, 12/25/2028 § | 41 | 35 | ||||||||||
| GMACM Mortgage Loan Trust, | ||||||||||||
| Series 2004-GH1, Class A6, 4.810%, 07/25/2035 ∞ | 2,078 | 2,069 | ||||||||||
| GSAA Home Equity Trust, | ||||||||||||
| Series 2004-6, Class A1, 2.016%, 06/25/2034 ∞ | 2,644,382 | 2,536,937 | ||||||||||
| GSAMP Trust: | ||||||||||||
| Series 2005-WMC2, Class A1B, 1.526%, 11/25/2035 ∞ | 10,598,617 | 10,543,674 | ||||||||||
| Series 2005-WMC2, Class A2C, 1.566%, 11/25/2035 ∞ | 9,686,071 | 9,668,535 | ||||||||||
| HomeBanc Mortgage Trust, | ||||||||||||
| Series 2005-3, Class A1, 1.456%, 07/25/2035 ∞ | 5,159,293 | 5,084,553 | ||||||||||
| IMC Home Equity Loan Trust, | ||||||||||||
| Series 1997-5, Class A10, 6.880%, 11/20/2028 | 1,195 | 1,192 | ||||||||||
| Impac CMB Trust: | ||||||||||||
| Series 2004-4, Class 2A2, 4.632%, 09/25/2034 ∞ | 97,206 | 94,312 | ||||||||||
| Series 2004-5, Class 1A2, 1.916%, 10/25/2034 ∞ | 5,852,841 | 5,659,282 | ||||||||||
| Series 2004-6, Class 1A1, 2.016%, 10/25/2034 ∞ | 4,234,936 | 4,055,729 | ||||||||||
| J.P. Morgan Alternative Loan Trust, | ||||||||||||
| Series 2006-A1, Class 2A1, 3.359%, 03/25/2036 ∞ § | 379,970 | 338,753 | ||||||||||
| J.P. Morgan Mortgage Acquisition Trust, | ||||||||||||
| Series 2006-CH1, Class A1, 1.346%, 07/25/2036 ∞ | 5,386,913 | 5,326,158 | ||||||||||
| J.P. Morgan Mortgage Trust: | ||||||||||||
| Series 2007-A1, Class 5A5, 3.406%, 07/25/2035 ∞ | 6,951,520 | 6,971,924 | ||||||||||
| Series 2007-A1, Class 5A2, 3.406%, 07/25/2035 ∞ | 4,591,002 | 4,655,906 | ||||||||||
| Series 2005-A4, Class 1A1, 3.411%, 07/25/2035 ∞ | 1,885,730 | 1,880,125 | ||||||||||
| Series 2006-A7, Class 2A4R, 3.263%, 01/25/2037 ∞ | 884,318 | 875,537 | ||||||||||
| Series 2006-A7, Class 2A2, 3.263%, 01/25/2037 ∞ | 206,982 | 204,926 | ||||||||||
| Series 2007-A2, Class 2A3, 3.422%, 04/25/2037 ∞ | 2,423,597 | 2,177,003 | ||||||||||
| Long Beach Mortgage Loan Trust, | ||||||||||||
| Series 2006-WL2, Class 2A3, 1.416%, 01/25/2036 ∞ | 2,503,344 | 2,488,666 | ||||||||||
| MASTR Alternative Loan Trust: | ||||||||||||
| Series 2004-2, Class 6A1, 5.250%, 12/25/2018 | 674,055 | 683,095 | ||||||||||
| Series 2004-1, Class 1A1, 5.000%, 01/25/2019 | 115,474 | 115,674 | ||||||||||
| Series 2004-2, Class 4A1, 5.000%, 02/25/2019 | 6,316 | 6,348 | ||||||||||
| Series 2004-4, Class 4A1, 5.000%, 04/25/2019 | 94,273 | 94,697 | ||||||||||
| Series 2003-5, Class 6A1, 6.000%, 08/25/2033 | 266,339 | 279,748 | ||||||||||
| MASTR Asset Backed Securities Trust, | ||||||||||||
| Series 2006-NC1, Class A4, 1.516%, 01/25/2036 ∞ | 9,240,555 | 9,175,787 | ||||||||||
| Merrill Lynch Mortgage Investors Trust: | ||||||||||||
| Series 2004-F, Class A1A, 2.695%, 12/25/2029 ∞ | 7,883,034 | 7,906,987 | ||||||||||
| Series 2005-A10, Class A, 1.426%, 02/25/2036 ∞ | 21,894,022 | 20,933,512 | ||||||||||
| Morgan Stanley Mortgage Loan Trust, | ||||||||||||
| Series 2004-7AR, Class 2A1, 3.267%, 09/25/2034 ∞ | 4,365,452 | 4,451,526 | ||||||||||
| MortgageIT Trust: | ||||||||||||
| Series 2005-2, Class 1A1, 1.736%, 05/25/2035 ∞ | 2,395,027 | 2,384,749 | ||||||||||
| Series 2005-3, Class A1, 1.516%, 08/25/2035 ∞ | 5,483,785 | 5,212,404 | ||||||||||
| New Century Home Equity Loan Trust, | ||||||||||||
| Series 2005-C, Class A1, 1.446%, 12/25/2035 ∞ | 14,981,531 | 14,829,107 | ||||||||||
| New Residential Mortgage Loan Trust, | ||||||||||||
| Series 2017-2A, Class A3, 4.000%, 03/25/2057 (Acquired 04/19/2017, Cost $20,746,833) ∞ * | 19,961,179 | 20,783,877 | ||||||||||
| Series 2017-3A, Class A1, 4.000%, 04/25/2057 (Acquired 06/05/2017, Cost $21,919,286) ∞ * | 21,050,000 | 21,863,126 | ||||||||||
| Series 2017-4A, Class A1, 4.000%, 05/25/2057 ∞ | 36,025,000 | 37,628,112 | ||||||||||
| Park Place Securities, Inc., | ||||||||||||
| Series 2005-WCW1, Class M1, 1.666%, 09/25/2035 ∞ | 5,224,062 | 5,220,944 | ||||||||||
| Popular ABS Mortgage Pass-Through Trust, | ||||||||||||
| Series 2006-E, Class A2, 1.366%, 01/25/2037 ∞ | 5,688,260 | 5,624,814 | ||||||||||
| RALI Series Trust, | ||||||||||||
| Series 2004-QS6, Class A1, 5.000%, 05/25/2019 | 51,543 | 50,913 | ||||||||||
| RAMP Series Trust, | ||||||||||||
| Series 2005-RS1, Class AI6, 4.713%, 01/25/2035 | 26,705 | 26,952 | ||||||||||
| RASC Series Trust: | ||||||||||||
| Series 2003-KS5, Class AI6, 3.620%, 07/25/2033 ∞ | 9,329 | 9,310 | ||||||||||
| Series 2004-KS2, Class AI6, 4.300%, 03/25/2034 ∞ | 16,515 | 16,669 | ||||||||||
| Series 2006-KS4, Class A4, 1.456%, 06/25/2036 ∞ | 16,025,217 | 15,870,734 | ||||||||||
| Renaissance Home Equity Loan Trust, | ||||||||||||
| Series 2007-1, Class AF3, 5.612%, 04/25/2037 ∞ | 2,524,349 | 1,358,726 | ||||||||||
| Securitized Asset Backed Receivables LLC Trust, | ||||||||||||
| Series 2005-OP2, Class A1, 1.541%, 10/25/2035 (Acquired 03/13/2014, Cost $524,620) ∞ * | 531,093 | 530,446 | ||||||||||
| Specialty Underwriting & Residential Finance Trust: | ||||||||||||
| Series 2004-BC4, Class A1A, 1.886%, 10/25/2035 ∞ | 2,468,405 | 2,455,393 | ||||||||||
| Series 2005-AB3, Class A2C, 1.576%, 09/25/2036 ∞ | 3,971,688 | 3,957,442 | ||||||||||
| Series 2006-BC1, Class A2D, 1.516%, 12/25/2036 ∞ | 3,468,375 | 3,453,438 | ||||||||||
| Structured Adjustable Rate Mortgage Loan Trust: | ||||||||||||
| Series 2004-12, Class 3A1, 3.366%, 09/25/2034 ∞ | 5,863,722 | 5,832,615 | ||||||||||
| Series 2004-16, Class 2A, 3.575%, 11/25/2034 ∞ | 7,242,986 | 7,222,755 | ||||||||||
| Series 2004-16, Class 1A2, 4.055%, 11/25/2034 ∞ | 9,028,405 | 9,035,499 | ||||||||||
| Structured Asset Securities Corp., | ||||||||||||
| Series 2005-WF1, Class A3, 1.876%, 02/25/2035 ∞ | 10,596,877 | 10,584,178 | ||||||||||
| Structured Asset Securities Corp. Mortgage Loan Trust: | ||||||||||||
| Series 2005-7XS, Class 1A4B, 5.440%, 04/25/2035 ∞ | 65,378 | 67,821 | ||||||||||
| Series 2006-OPT1, Class A6, 1.366%, 04/25/2036 ∞ | 15,446,568 | 14,956,083 | ||||||||||
| Thornburg Mortgage Securities Trust, | ||||||||||||
| Series 2003-5, Class 3A, 2.883%, 10/25/2043 ∞ | 18,697,915 | 18,872,408 | ||||||||||
| Towd Point Mortgage Trust: | ||||||||||||
| Series 2015-3, Class A1A, 3.500%, 03/25/2054 (Acquired 06/21/2016, Cost $9,567,474) ∞ * | 9,334,521 | 9,522,517 | ||||||||||
| Series 2015-5, Class A1, 3.500%, 05/25/2055 (Acquired 06/15/2016, Cost $4,915,483) ∞ * | 4,785,429 | 4,910,441 | ||||||||||
| Series 2016-2, Class A1, 3.000%, 08/25/2055 (Acquired 05/20/2016, Cost $13,225,842) ∞ * | 13,132,840 | 13,317,058 | ||||||||||
| Series 2016-3, Class A1, 2.250%, 04/25/2056 (Acquired 09/08/2016, Cost $2,587,547) ∞ * | 2,577,772 | 2,569,933 | ||||||||||
| Series 2016-5, Class A1, 2.500%, 10/25/2056 (Acquired 12/07/2016, Cost $6,865,925) ∞ * | 6,869,525 | 6,876,522 | ||||||||||
| Series 2017-1, Class A1, 2.750%, 10/25/2056 (Acquired 02/07/2017 through 04/17/2017, Cost $45,585,476) ∞ * | 45,530,851 | 45,881,803 | ||||||||||
| WaMu Mortgage Pass-Through Certificates Trust: | ||||||||||||
| Series 2004-CB1, Class 5A, 5.000%, 06/25/2019 | 133,533 | 134,657 | ||||||||||
| Series 2004-CB2, Class 7A, 5.500%, 08/25/2019 | 240,586 | 242,971 | ||||||||||
| Series 2004-CB3, Class 3A, 5.500%, 10/25/2019 | 19,067 | 19,293 | ||||||||||
| Series 2004-CB3, Class 4A, 6.000%, 10/25/2019 | 84,474 | 86,617 | ||||||||||
| Series 2004-CB4, Class 21A, 5.500%, 12/25/2019 | 64,435 | 65,376 | ||||||||||
| Series 2004-CB2, Class 3A, 6.000%, 08/25/2034 | 8,029,367 | 8,503,882 | ||||||||||
| Series 2004-CB3, Class 2A, 6.500%, 10/25/2034 | 4,389,261 | 4,688,067 | ||||||||||
| Series 2004-AR14, Class A1, 2.908%, 01/25/2035 ∞ | 12,210,352 | 12,431,485 | ||||||||||
| Wells Fargo Mortgage Backed Securities Trust, | ||||||||||||
| Series 2005-AR10, Class 2A17, 3.152%, 06/25/2035 ∞ | 20,309,989 | 20,724,723 | ||||||||||
| 661,860,892 | 5.2 | % | ||||||||||
| Commercial Mortgage-Backed Securities | ||||||||||||
| U.S. Government Agency Issues | ||||||||||||
| Fannie Mae REMIC Trust, | ||||||||||||
| Series 2011-M4, Class A2, 3.726%, 06/25/2021 | 20,000,000 | 21,169,214 | ||||||||||
| Freddie Mac Multifamily Structured Pass Through Certificates: | ||||||||||||
| Series K003, Class A4, 5.053%, 01/25/2019 | 27,000,000 | 28,033,104 | ||||||||||
| Series K004, Class A2, 4.186%, 08/25/2019 | 6,200,000 | 6,490,513 | ||||||||||
| Series K712, Class A2, 1.869%, 11/25/2019 | 18,225,000 | 18,266,637 | ||||||||||
| Series K714, Class A2, 3.034%, 10/25/2020 ∞ | 34,345,000 | 35,439,915 | ||||||||||
| Series K720, Class A2, 2.716%, 06/25/2022 | 17,950,000 | 18,367,364 | ||||||||||
| Series K-721, Class A2, 3.090%, 08/25/2022 ∞ | 25,545,000 | 26,558,715 | ||||||||||
| Series K-028, Class A2, 3.111%, 02/25/2023 | 23,175,000 | 24,079,318 | ||||||||||
| Series K-050, Class A2, 3.334%, 08/25/2025 ∞ | 72,374,000 | 75,740,817 | ||||||||||
| Series K-064, Class A2, 3.224%, 03/25/2027 ∞ | 5,720,000 | 5,887,801 | ||||||||||
| 260,033,398 | 2.1 | % | ||||||||||
| Non-U.S. Government Agency Issues | ||||||||||||
| BANK 2017-BNK4, | ||||||||||||
| Series 2017-BNK4, Class A4, 3.625%, 05/15/2050 | 19,675,000 | 20,411,093 | ||||||||||
| CD Mortgage Trust, | ||||||||||||
| Series 2016-CD1, Class A4, 2.724%, 08/10/2049 | 32,725,000 | 31,727,404 | ||||||||||
| Citigroup Commercial Mortgage Trust, | ||||||||||||
| Series 2013-GC11, Class A4, 3.093%, 04/10/2046 | 18,933,388 | 19,325,866 | ||||||||||
| Series 2014-GC19, Class A3, 3.753%, 03/10/2047 | 11,025,000 | 11,582,908 | ||||||||||
| COMM Mortgage Trust: | ||||||||||||
| Series 2012-CR1, Class A3, 3.391%, 05/15/2045 | 7,397,167 | 7,680,392 | ||||||||||
| Series 2013-CR9, Class A3, 4.022%, 07/10/2045 | 25,725,000 | 27,425,042 | ||||||||||
| Series 2012-CR2, Class A4, 3.147%, 08/15/2045 | 19,660,536 | 20,203,816 | ||||||||||
| Series 2013-CR10, Class A3, 3.923%, 08/10/2046 | 13,875,000 | 14,729,411 | ||||||||||
| DBJPM Mortgage Trust, | ||||||||||||
| Series 2016-C3, Class ASB, 2.756%, 09/10/2049 | 9,500,000 | 9,490,941 | ||||||||||
| GS Mortgage Securities Trust, | ||||||||||||
| Series 2012-GCJ9, Class A3, 2.773%, 11/10/2045 | 36,997,320 | 37,343,741 | ||||||||||
| J.P. Morgan Chase Commercial Mortgage Securities Trust: | ||||||||||||
| Series 2013-LC11, Class A5, 2.960%, 04/15/2046 | 16,702,913 | 16,887,415 | ||||||||||
| Series 2013-C10, Class ASB, 2.702%, 12/15/2047 | 10,000,000 | 10,153,349 | ||||||||||
| Series 2012-LC9, Class A5, 2.840%, 12/15/2047 | 8,700,059 | 8,803,877 | ||||||||||
| JPMBB Commercial Mortgage Securities Trust: | ||||||||||||
| Series 2013-C12, Class ASB, 3.157%, 07/15/2045 | 4,500,000 | 4,650,342 | ||||||||||
| Series 2013-C12, Class A5, 3.664%, 07/15/2045 | 6,835,000 | 7,167,252 | ||||||||||
| Series 2013-C15, Class A4, 4.096%, 11/15/2045 | 2,130,000 | 2,283,080 | ||||||||||
| Series 2013-C17, Class A3, 3.928%, 01/15/2047 | 8,450,000 | 8,952,901 | ||||||||||
| Series 2014-C24, Class ASB, 3.368%, 11/15/2047 | 10,000,000 | 10,396,153 | ||||||||||
| Series 2014-C25, Class ASB, 3.407%, 11/15/2047 | 7,138,000 | 7,433,160 | ||||||||||
| Morgan Stanley Bank of America Merrill Lynch Trust: | ||||||||||||
| Series 2012-C5, Class A4, 3.176%, 08/15/2045 | 37,550,000 | 38,705,203 | ||||||||||
| Series 2012-C6, Class A4, 2.858%, 11/15/2045 | 25,685,945 | 26,062,671 | ||||||||||
| Series 2013-C10, Class A3, 4.104%, 07/15/2046 ∞ | 6,500,000 | 6,947,762 | ||||||||||
| Series 2013-C12, Class A3, 3.973%, 10/15/2046 | 22,850,000 | 24,329,816 | ||||||||||
| Series 2016-C29, Class ASB, 3.140%, 05/15/2049 | 12,250,000 | 12,530,346 | ||||||||||
| Wells Fargo Commercial Mortgage Trust: | ||||||||||||
| Series 2015-C27, Class ASB, 3.278%, 02/15/2048 | 18,000,000 | 18,653,085 | ||||||||||
| Series 2015-SG1, Class ASB, 3.556%, 09/15/2048 | 18,900,000 | 19,764,031 | ||||||||||
| Series 2015-P2, Class A3, 3.541%, 12/15/2048 | 44,050,000 | 45,576,689 | ||||||||||
| WFRBS Commercial Mortgage Trust: | ||||||||||||
| Series 2012-C6, Class A4, 3.440%, 04/15/2045 | 24,764,220 | 25,746,116 | ||||||||||
| Series 2013-C13, Class ASB, 2.654%, 05/15/2045 | 7,450,000 | 7,565,326 | ||||||||||
| Series 2013-C18, Class A4, 3.896%, 12/15/2046 | 12,900,000 | 13,687,472 | ||||||||||
| Series 2014-C21, Class A5, 3.678%, 08/15/2047 | 13,254,000 | 13,818,994 | ||||||||||
| Series 2014-C24, Class A4, 3.343%, 11/15/2047 | 10,330,000 | 10,550,126 | ||||||||||
| Series 2014-C23, Class ASB, 3.636%, 10/15/2057 | 6,920,000 | 7,283,148 | ||||||||||
| 547,868,928 | 4.3 | % | ||||||||||
| Other Asset Backed Securities | ||||||||||||
| Capital One Multi-Asset Execution Trust, | ||||||||||||
| Series 2016-A4, Class A4, 1.330%, 06/15/2022 | 47,425,000 | 47,022,281 | ||||||||||
| Chase Issuance Trust, | ||||||||||||
| Series 2016-A5, Class A5, 1.270%, 07/15/2021 | 40,100,000 | 39,733,093 | ||||||||||
| Citibank Credit Card Issuance Trust, | ||||||||||||
| Series 2007-A3, Class A3, 6.150%, 06/15/2039 | 4,166,000 | 5,520,036 | ||||||||||
| Conseco Financial Corp.: | ||||||||||||
| Series 1993-3, Class A7, 6.400%, 10/15/2018 | 13,497 | 13,500 | ||||||||||
| Series 1998-2, Class A5, 6.240%, 12/01/2028 | 303,202 | 313,312 | ||||||||||
| Series 1998-3, Class A5, 6.220%, 03/01/2030 | 365,013 | 389,750 | ||||||||||
| Series 1998-4, Class A5, 6.180%, 04/01/2030 | 2,157,746 | 2,276,087 | ||||||||||
| Series 1998-7, Class A1, 6.320%, 07/01/2030 | 18,213,233 | 19,139,033 | ||||||||||
| Discover Card Execution Note Trust, | ||||||||||||
| Series 2016-A4, Class A4, 1.390%, 03/15/2022 | 50,225,000 | 49,803,306 | ||||||||||
| Ford Credit Auto Owner Trust: | ||||||||||||
| Series 2014-2, Class A, 2.310%, 04/15/2026 (Acquired 02/20/2015 through 03/23/2016, Cost $27,169,676) * | 27,030,000 | 27,291,591 | ||||||||||
| Series 2015-1, Class A, 2.120%, 07/15/2026 (Acquired 03/14/2016 through 10/31/2016, Cost $9,526,881) * | 9,540,000 | 9,577,703 | ||||||||||
| Series 2016-1, Class A, 2.310%, 08/15/2027 (Acquired 02/23/2016 through 05/24/2016, Cost $28,343,040) * | 28,325,000 | 28,475,760 | ||||||||||
| Series 2016-2, Class A, 2.030%, 12/15/2027 (Acquired 06/20/2016 through 05/26/2017, Cost $21,703,749) * | 21,720,000 | 21,561,357 | ||||||||||
| GM Financial Automobile Leasing Trust, | ||||||||||||
| Series 2016-3, Class A3, 1.610%, 12/20/2019 | 10,500,000 | 10,481,730 | ||||||||||
| Hyundai Auto Lease Securitization Trust, | ||||||||||||
| Series 2016-C, Class A3, 1.490%, 02/18/2020 (Acquired 08/09/2016, Cost $14,773,378) * | 14,775,000 | 14,743,956 | ||||||||||
| Kubota Credit Owner Trust, | ||||||||||||
| Series 2016-1A, Class A3, 1.500%, 07/15/2020 (Acquired 07/26/2016, Cost $12,172,018) * | 12,175,000 | 12,099,000 | ||||||||||
| MMAF Equipment Finance LLC, | ||||||||||||
| Series 2016-AA, Class A5, 2.210%, 12/15/2032 (Acquired 05/03/2016 through 05/10/2017, Cost $13,220,417) * | 13,250,000 | 13,174,182 | ||||||||||
| Oakwood Mortgage Investors, Inc., | ||||||||||||
| Series 1999-B, Class A3, 6.450%, 11/15/2017 | 25,459 | 25,773 | ||||||||||
| OneMain Financial Issuance Trust, | ||||||||||||
| Series 2014-2A, Class A, 2.470%, 09/18/2024 (Acquired 11/16/2015 through 01/29/2016, Cost $7,851,037) * | 7,875,719 | 7,885,957 | ||||||||||
| Synchrony Credit Card Master Note Trust: | ||||||||||||
| Series 2015-1, Class A, 2.370%, 03/15/2023 | 12,841,000 | 12,968,817 | ||||||||||
| Series 2016-2, Class A, 2.210%, 05/15/2024 | 8,900,000 | 8,908,521 | ||||||||||
| Verizon Owner Trust, | ||||||||||||
| Series 2016-2A, Class A, 1.680%, 05/20/2021 (Acquired 11/16/2016 through 05/19/2017, Cost $51,644,822) * | 51,650,000 | 51,508,923 | ||||||||||
| Verizon Owner Trust 2017-2, | ||||||||||||
| Series 2017-2A, Class A, 1.920%, 12/20/2021 (Acquired 06/13/2017, Cost $3,824,414) * | 3,825,000 | 3,824,414 | ||||||||||
| 386,738,082 | 3.0 | % | ||||||||||
| Total Long-Term Investments (Cost $12,397,141,617) | 12,486,321,857 | 98.1 | % | |||||||||
| SHORT-TERM INVESTMENT | Shares | |||||||||||
| Money Market Mutual Fund | ||||||||||||
| Fidelity Institutional Money Market Fund - Government Portfolio, Institutional Class, 0.85% « | 268,848,669 | 268,848,669 | ||||||||||
| Total Short-Term Investment (Cost $268,848,669) | 268,848,669 | 2.1 | % | |||||||||
| Total Investments (Cost $12,665,990,286) | 12,755,170,526 | 100.2 | % | |||||||||
| Liabilities in Excess of Other Assets | (28,252,809 | ) | (0.2 | )% | ||||||||
| TOTAL NET ASSETS | $ | 12,726,917,717 | 100.0 | % | ||||||||
Notes to Schedule of Investments | |
| ∞ | Variable or Floating rate security. Floating rate securities are securities whose yields vary with a designated index rate. These securities rates are as of June 30, 2017. |
| * | Restricted security as defined in Rule 144(a) under the Securities Act of 1933 and determined to be liquid. Purchased in a private placement transaction; resale to the public may require registration or may extend only to qualified institutional buyers. At June 30, 2017, the value of these securities total $2,018,378,098, which represents 15.86% of total net assets. |
| « | 7-Day Yield. |
| § | Security in Default. |
| f | Foreign Security. |
| Baird Core Plus Bond Fund | ||||||||||||
| Schedule of Investments | ||||||||||||
| June 30, 2017 (Unaudited) | ||||||||||||
| Principal | % of | |||||||||||
| Amount | Value | Net Assets | ||||||||||
| LONG-TERM INVESTMENTS | ||||||||||||
| U.S. Treasury Securities | ||||||||||||
| U.S. Treasury Bonds: | ||||||||||||
| 1.750%, 03/31/2022 | $ | 231,750,000 | $ | 230,555,097 | ||||||||
| 1.875%, 03/31/2022 | 192,500,000 | 192,612,805 | ||||||||||
| 2.500%, 05/15/2024 | 193,975,000 | 198,740,966 | ||||||||||
| 2.250%, 11/15/2025 | 158,725,000 | 158,762,141 | ||||||||||
| 3.500%, 02/15/2039 | 379,170,000 | 428,388,162 | ||||||||||
| 2.875%, 05/15/2043 | 594,625,000 | 600,385,727 | ||||||||||
| 2.500%, 02/15/2045 | 34,850,000 | 32,523,484 | ||||||||||
| 1,841,968,382 | 12.7 | % | ||||||||||
| Other Government Related Securities | ||||||||||||
| Centrais Eletricas Brasileiras SA: | ||||||||||||
| 6.875%, 07/30/2019 (Acquired 12/06/2012, Cost $3,174,750) * f | 3,000,000 | 3,159,000 | ||||||||||
| 5.750%, 10/27/2021 (Acquired 10/20/2011, Cost $4,000,000) * f | 4,000,000 | 4,080,000 | ||||||||||
| CNOOC Curtis Funding No. 1 Pty Ltd., | ||||||||||||
| 4.500%, 10/03/2023 (Acquired 02/26/2014, Cost $5,029,504) * f | 5,000,000 | 5,350,930 | ||||||||||
| CNOOC Finance (2013) Ltd., | ||||||||||||
| 3.000%, 05/09/2023 f | 2,415,000 | 2,388,829 | ||||||||||
| CNOOC Finance (2015) USA LLC, | ||||||||||||
| 3.500%, 05/05/2025 | 21,075,000 | 21,078,393 | ||||||||||
| CNOOC Nexen Finance (2014) ULC, | ||||||||||||
| 4.250%, 04/30/2024 f | 4,450,000 | 4,682,388 | ||||||||||
| CNPC General Capital Ltd., | ||||||||||||
| 2.750%, 05/14/2019 (Acquired 05/07/2014, Cost $1,983,740) * f | 2,000,000 | 2,012,287 | ||||||||||
| Comision Federal de Electricidad, | ||||||||||||
| 5.750%, 02/14/2042 (Acquired 02/08/2012, Cost $5,116,800) * f | 5,200,000 | 5,310,500 | ||||||||||
| Corp Andina de Fomento, | ||||||||||||
| 4.375%, 06/15/2022 f | 3,956,000 | 4,277,702 | ||||||||||
| Electricite de France SA, | ||||||||||||
| 4.750%, 10/13/2035 (Acquired 10/07/2015, Cost $9,790,200) * f | 10,000,000 | 10,681,200 | ||||||||||
| Export-Import Bank of Korea: | ||||||||||||
| 2.250%, 01/21/2020 f | 14,000,000 | 13,975,248 | ||||||||||
| 4.000%, 01/29/2021 f | 2,400,000 | 2,517,735 | ||||||||||
| The Korea Development Bank: | ||||||||||||
| 2.250%, 05/18/2020 f | 7,200,000 | 7,167,676 | ||||||||||
| 3.000%, 09/14/2022 f | 4,400,000 | 4,460,650 | ||||||||||
| Korea Electric Power Corp., | ||||||||||||
| 6.750%, 08/01/2027 f | 490,000 | 638,581 | ||||||||||
| Nexen Energy ULC, | ||||||||||||
| 7.500%, 07/30/2039 f | 6,175,000 | 8,918,960 | ||||||||||
| Petrobras Global Finance BV: | ||||||||||||
| 5.375%, 01/27/2021 f | 3,200,000 | 3,253,440 | ||||||||||
| 7.375%, 01/17/2027 f | 9,300,000 | 9,839,400 | ||||||||||
| Petroleos Mexicanos: | ||||||||||||
| 4.875%, 01/24/2022 f | 6,500,000 | 6,696,365 | ||||||||||
| 4.250%, 01/15/2025 f | 15,000,000 | 14,587,500 | ||||||||||
| 4.500%, 01/23/2026 f | 4,500,000 | 4,374,135 | ||||||||||
| 6.500%, 06/02/2041 f | 4,000,000 | 3,972,000 | ||||||||||
| PTT PCL, | ||||||||||||
| 3.375%, 10/25/2022 (Acquired 10/19/2012, Cost $4,958,500) * f | 5,000,000 | 5,082,607 | ||||||||||
| Sinopec Group Overseas Development [2014] Ltd., | ||||||||||||
| 4.375%, 04/10/2024 (Acquired 04/02/2014, Cost $1,496,505) * f | 1,500,000 | 1,595,067 | ||||||||||
| Sinopec Group Overseas Development [2015] Ltd.: | ||||||||||||
| 2.500%, 04/28/2020 (Acquired 04/21/2015, Cost $19,915,200) * f | 20,000,000 | 20,094,172 | ||||||||||
| 3.250%, 04/28/2025 (Acquired 04/21/2015, Cost $19,804,400) * f | 20,000,000 | 19,657,087 | ||||||||||
| Sinopec Group Overseas Development [2016] Ltd.: | ||||||||||||
| 1.750%, 09/29/2019 (Acquired 09/22/2016, Cost $7,968,880) * f | 8,000,000 | 7,899,144 | ||||||||||
| 3.500%, 05/03/2026 (Acquired 04/25/2016, Cost $9,916,600) * f | 10,000,000 | 9,940,150 | ||||||||||
| Sinopec Group Overseas Development [2017] Ltd, | ||||||||||||
| 3.000%, 04/12/2022 (Acquired 04/05/2017, Cost $6,944,232) * f | 6,950,000 | 7,005,878 | ||||||||||
| State Bank of India/London, | ||||||||||||
| 4.125%, 08/01/2017 (Acquired 07/25/2012, Cost $6,939,800) * f | 7,000,000 | 7,009,028 | ||||||||||
| 221,706,052 | 1.5 | % | ||||||||||
| Corporate Bonds | ||||||||||||
| Industrials | ||||||||||||
| 21st Century Fox America, Inc.: | ||||||||||||
| 6.900%, 03/01/2019 | 6,659,000 | 7,181,085 | ||||||||||
| 3.700%, 09/15/2024 | 4,025,000 | 4,207,743 | ||||||||||
| 7.430%, 10/01/2026 | 3,300,000 | 4,181,305 | ||||||||||
| 6.150%, 03/01/2037 | 9,000,000 | 11,244,177 | ||||||||||
| 5.400%, 10/01/2043 | 5,000,000 | 5,746,310 | ||||||||||
| 4.750%, 09/15/2044 | 1,950,000 | 2,052,798 | ||||||||||
| A.P. Meoller - Maersk A/S: | ||||||||||||
| 2.550%, 09/22/2019 (Acquired 11/24/2014, Cost $10,031,983) * f | 10,000,000 | 10,068,500 | ||||||||||
| 3.750%, 09/22/2024 (Acquired 09/15/2014, Cost $4,459,830) * f | 4,475,000 | 4,512,192 | ||||||||||
| Abbott Laboratories: | ||||||||||||
| 3.400%, 11/30/2023 | 10,000,000 | 10,236,800 | ||||||||||
| 4.750%, 11/30/2036 | 38,500,000 | 41,905,787 | ||||||||||
| AbbVie, Inc.: | ||||||||||||
| 2.000%, 11/06/2018 | 10,835,000 | 10,860,712 | ||||||||||
| 3.200%, 11/06/2022 | 3,000,000 | 3,076,974 | ||||||||||
| 3.600%, 05/14/2025 | 2,500,000 | 2,550,160 | ||||||||||
| 4.300%, 05/14/2036 | 3,825,000 | 3,892,710 | ||||||||||
| Actavis Funding SCS, | ||||||||||||
| 3.850%, 06/15/2024 f | 125,000 | 130,399 | ||||||||||
| Acuity Brands Lighting, Inc., | ||||||||||||
| 6.000%, 12/15/2019 | 700,000 | 758,273 | ||||||||||
| The ADT Corp., | ||||||||||||
| 3.500%, 07/15/2022 | 6,900,000 | 6,673,680 | ||||||||||
| Agilent Technologies, Inc., | ||||||||||||
| 3.875%, 07/15/2023 | 5,325,000 | 5,570,935 | ||||||||||
| Agrium, Inc., | ||||||||||||
| 4.125%, 03/15/2035 f | 6,550,000 | 6,518,187 | ||||||||||
| Alibaba Group Holding Ltd., | ||||||||||||
| 3.125%, 11/28/2021 f | 10,000,000 | 10,199,240 | ||||||||||
| Allergan Funding SCS, | ||||||||||||
| 4.550%, 03/15/2035 f | 125,000 | 133,416 | ||||||||||
| Ameritech Capital Funding Corp., | ||||||||||||
| 6.450%, 01/15/2018 | 3,175,000 | 3,253,321 | ||||||||||
| Amgen, Inc., | ||||||||||||
| 4.400%, 05/01/2045 | 8,000,000 | 8,217,192 | ||||||||||
| Anadarko Petroleum Corp.: | ||||||||||||
| 8.700%, 03/15/2019 | 4,380,000 | 4,830,750 | ||||||||||
| 6.450%, 09/15/2036 | 4,025,000 | 4,737,795 | ||||||||||
| Anglo American Capital PLC: | ||||||||||||
| 9.375%, 04/08/2019 (Acquired 09/20/2011 through 12/29/2014, Cost $6,107,987) * f | 5,600,000 | 6,265,000 | ||||||||||
| 3.750%, 04/10/2022 (Acquired 04/03/2017, Cost $7,000,000) * f | 7,000,000 | 7,035,000 | ||||||||||
| Anheuser-Busch InBev Finance, Inc.: | ||||||||||||
| 3.300%, 02/01/2023 | 20,350,000 | 20,955,026 | ||||||||||
| 3.650%, 02/01/2026 | 25,625,000 | 26,400,669 | ||||||||||
| ANR Pipeline Co., | ||||||||||||
| 9.625%, 11/01/2021 | 9,150,000 | 11,663,981 | ||||||||||
| ArcelorMittal: | ||||||||||||
| 6.125%, 06/01/2018 f | 150,000 | 155,437 | ||||||||||
| 6.000%, 03/01/2021 f | 7,950,000 | 8,556,188 | ||||||||||
| 6.750%, 02/25/2022 f | 2,000,000 | 2,250,000 | ||||||||||
| AT&T, Inc.: | ||||||||||||
| 3.600%, 02/17/2023 | 10,550,000 | 10,797,503 | ||||||||||
| 3.400%, 05/15/2025 | 20,225,000 | 19,882,995 | ||||||||||
| 4.125%, 02/17/2026 | 8,925,000 | 9,150,526 | ||||||||||
| 5.250%, 03/01/2037 | 7,125,000 | 7,590,811 | ||||||||||
| 5.650%, 02/15/2047 | 4,225,000 | 4,652,473 | ||||||||||
| 4.500%, 03/09/2048 | 15,264,000 | 14,282,128 | ||||||||||
| Avnet, Inc., | ||||||||||||
| 3.750%, 12/01/2021 | 5,000,000 | 5,080,770 | ||||||||||
| Ball Corp., | ||||||||||||
| 5.250%, 07/01/2025 | 25,000,000 | 27,593,750 | ||||||||||
| Bayer US Finance LLC, | ||||||||||||
| 2.375%, 10/08/2019 (Acquired 10/01/2014, Cost $14,657,559) * | 14,725,000 | 14,842,226 | ||||||||||
| Beam Suntory, Inc.: | ||||||||||||
| 3.250%, 05/15/2022 | 7,000,000 | 7,168,742 | ||||||||||
| 3.250%, 06/15/2023 | 10,960,000 | 11,118,010 | ||||||||||
| Becton Dickinson and Co.: | ||||||||||||
| 3.250%, 11/12/2020 | 13,000,000 | 13,310,557 | ||||||||||
| 3.363%, 06/06/2024 | 10,000,000 | 10,022,860 | ||||||||||
| 3.734%, 12/15/2024 | 9,250,000 | 9,401,570 | ||||||||||
| 4.875%, 05/15/2044 | 4,000,000 | 4,149,044 | ||||||||||
| Bemis Co., Inc., | ||||||||||||
| 4.500%, 10/15/2021 | 1,000,000 | 1,066,329 | ||||||||||
| Boardwalk Pipelines LP: | ||||||||||||
| 4.950%, 12/15/2024 | 13,875,000 | 14,698,911 | ||||||||||
| 5.950%, 06/01/2026 | 17,025,000 | 18,957,559 | ||||||||||
| Boston Scientific Corp., | ||||||||||||
| 2.650%, 10/01/2018 | 10,000,000 | 10,091,810 | ||||||||||
| BP Capital Markets PLC: | ||||||||||||
| 1.926%, 09/26/2018 ∞ f | 5,000,000 | 5,031,190 | ||||||||||
| 4.750%, 03/10/2019 f | 1,500,000 | 1,573,443 | ||||||||||
| Broadridge Financial Solutions, Inc., | ||||||||||||
| 3.400%, 06/27/2026 | 18,286,000 | 18,003,664 | ||||||||||
| Browning-Ferris Industries, Inc., | ||||||||||||
| 9.250%, 05/01/2021 | 1,600,000 | 1,924,854 | ||||||||||
| Bunge Limited Finance Corp.: | ||||||||||||
| 8.500%, 06/15/2019 | 13,690,000 | 15,311,224 | ||||||||||
| 3.250%, 08/15/2026 | 13,188,000 | 12,600,963 | ||||||||||
| Burlington Northern Santa Fe LLC, | ||||||||||||
| 4.150%, 04/01/2045 | 3,100,000 | 3,240,492 | ||||||||||
| Celgene Corp., | ||||||||||||
| 3.550%, 08/15/2022 | 5,730,000 | 5,965,010 | ||||||||||
| CF Industries, Inc.: | ||||||||||||
| 6.875%, 05/01/2018 | 8,480,000 | 8,808,600 | ||||||||||
| 3.450%, 06/01/2023 | 24,874,000 | 23,505,930 | ||||||||||
| 5.375%, 03/15/2044 | 10,922,000 | 9,747,885 | ||||||||||
| Charter Communications Operating LLC / Charter Communications Operating Capital: | ||||||||||||
| 4.464%, 07/23/2022 | 33,748,000 | 35,957,347 | ||||||||||
| 6.384%, 10/23/2035 | 6,000,000 | 7,112,118 | ||||||||||
| CK Hutchinson International Ltd., | ||||||||||||
| 2.875%, 04/05/2022 (Acquired 03/30/2017, Cost $7,468,123) * f | 7,475,000 | 7,507,598 | ||||||||||
| Columbia Pipeline Group, Inc.: | ||||||||||||
| 3.300%, 06/01/2020 | 9,943,000 | 10,187,757 | ||||||||||
| 4.500%, 06/01/2025 | 14,010,000 | 14,913,477 | ||||||||||
| 5.800%, 06/01/2045 | 2,223,000 | 2,644,481 | ||||||||||
| Comcast Cable Communications Holdings Inc., | ||||||||||||
| 9.455%, 11/15/2022 | 2,030,000 | 2,718,659 | ||||||||||
| Comcast Corp.: | ||||||||||||
| 4.250%, 01/15/2033 | 5,900,000 | 6,288,043 | ||||||||||
| 4.400%, 08/15/2035 | 13,450,000 | 14,457,903 | ||||||||||
| 3.200%, 07/15/2036 | 15,000,000 | 14,038,725 | ||||||||||
| 4.650%, 07/15/2042 | 2,000,000 | 2,192,852 | ||||||||||
| Computer Sciences Corp., | ||||||||||||
| 4.450%, 09/15/2022 | 2,000,000 | 2,117,122 | ||||||||||
| ConocoPhillips Canada Funding Co. I, | ||||||||||||
| 5.950%, 10/15/2036 f | 845,000 | 1,030,341 | ||||||||||
| Constellation Brands, Inc.: | ||||||||||||
| 4.750%, 11/15/2024 | 100,000 | 109,002 | ||||||||||
| 4.750%, 12/01/2025 | 1,000,000 | 1,095,341 | ||||||||||
| Continental Airlines Pass Through Trust, | ||||||||||||
| Class 974A, 6.900%, 01/02/2018 | 2,114 | 2,138 | ||||||||||
| Cox Communications, Inc.: | ||||||||||||
| 9.375%, 01/15/2019 (Acquired 10/06/2014, Cost $8,469,874) * | 7,670,000 | 8,448,030 | ||||||||||
| 2.950%, 06/30/2023 (Acquired 04/24/2013 through 12/29/2014, Cost $5,443,251) * | 5,475,000 | 5,340,052 | ||||||||||
| 3.850%, 02/01/2025 (Acquired 12/01/2014, Cost $4,616,999) * | 4,625,000 | 4,659,868 | ||||||||||
| 3.350%, 09/15/2026 (Acquired 09/08/2016, Cost $14,974,650) * | 15,000,000 | 14,729,190 | ||||||||||
| 4.800%, 02/01/2035 (Acquired 12/01/2014, Cost $4,448,398) * | 4,450,000 | 4,351,659 | ||||||||||
| 6.450%, 12/01/2036 (Acquired 01/27/2017, Cost $5,773,812) * | 5,550,000 | 6,093,439 | ||||||||||
| 4.700%, 12/15/2042 (Acquired 11/26/2012, Cost $4,999,050) * | 5,000,000 | 4,557,505 | ||||||||||
| CSX Corp., | ||||||||||||
| 6.220%, 04/30/2040 | 350,000 | 460,406 | ||||||||||
| CVS Health Corp., | ||||||||||||
| 3.875%, 07/20/2025 | 2,302,000 | 2,393,495 | ||||||||||
| Danone SA: | ||||||||||||
| 3.000%, 06/15/2022 (Acquired 05/29/2012, Cost $3,489,465) * f | 3,500,000 | 3,541,076 | ||||||||||
| 2.589%, 11/02/2023 (Acquired 10/26/2016, Cost $10,000,000) * f | 10,000,000 | 9,756,770 | ||||||||||
| DCP Midstream LLC: | ||||||||||||
| 9.750%, 03/15/2019 (Acquired 02/29/2012 through 07/22/2016, Cost $11,397,834) * | 10,505,000 | 11,739,337 | ||||||||||
| 4.750%, 09/30/2021 (Acquired 09/14/2011 through 11/18/2011, Cost $2,248,313) * | 2,245,000 | 2,289,900 | ||||||||||
| DCP Midstream Operating LP, | ||||||||||||
| 2.500%, 12/01/2017 | 175,000 | 174,781 | ||||||||||
| Deutsche Telekom International Finance BV: | ||||||||||||
| 6.750%, 08/20/2018 f | 1,250,000 | 1,316,326 | ||||||||||
| 8.750%, 06/15/2030 f | 925,000 | 1,371,848 | ||||||||||
| Devon Financing Corp. LLC, | ||||||||||||
| 7.875%, 09/30/2031 | 5,000,000 | 6,488,355 | ||||||||||
| Diamond 1 Finance Corp. / Diamond 2 Finance Corp.: | ||||||||||||
| 3.480%, 06/01/2019 (Acquired 08/16/2016, Cost $13,976,166) * | 13,685,000 | 14,004,901 | ||||||||||
| 4.420%, 06/15/2021 (Acquired 04/06/2017 through 05/09/2017, Cost $30,498,459) * | 29,125,000 | 30,704,099 | ||||||||||
| 5.450%, 06/15/2023 (Acquired 05/17/2016, Cost $7,996,560) * | 8,000,000 | 8,681,360 | ||||||||||
| DISH DBS Corp., | ||||||||||||
| 5.000%, 03/15/2023 | 2,500,000 | 2,562,500 | ||||||||||
| Dollar General Corp., | ||||||||||||
| 1.875%, 04/15/2018 | 2,100,000 | 2,101,525 | ||||||||||
| Dominion Gas Holdings LLC, | ||||||||||||
| 3.600%, 12/15/2024 | 6,100,000 | 6,238,738 | ||||||||||
| The Dow Chemical Co.: | ||||||||||||
| 8.550%, 05/15/2019 | 32,350,000 | 36,233,197 | ||||||||||
| 4.125%, 11/15/2021 | 835,000 | 887,069 | ||||||||||
| DXC Technology Co., | ||||||||||||
| 4.250%, 04/15/2024 (Acquired 03/13/2017 through 06/22/2017, Cost $38,359,941) * | 37,639,000 | 38,942,401 | ||||||||||
| Eaton Corp.: | ||||||||||||
| 2.750%, 11/02/2022 | 2,500,000 | 2,513,627 | ||||||||||
| 4.000%, 11/02/2032 | 3,660,000 | 3,786,179 | ||||||||||
| Ecolab, Inc., | ||||||||||||
| 3.250%, 01/14/2023 | 6,325,000 | 6,524,794 | ||||||||||
| El du Pont de Nemours & Co., | ||||||||||||
| 2.200%, 05/01/2020 | 7,700,000 | 7,741,788 | ||||||||||
| EMC Corp., | ||||||||||||
| 2.650%, 06/01/2020 | 200,000 | 196,246 | ||||||||||
| Enable Midstream Partners LP, | ||||||||||||
| 4.400%, 03/15/2027 | 15,000,000 | 15,054,015 | ||||||||||
| Enable Oklahoma Intrastate Transmission LLC, | ||||||||||||
| 6.250%, 03/15/2020 (Acquired 10/25/2012 through 05/10/2013, Cost $3,391,003) * | 3,190,000 | 3,431,429 | ||||||||||
| Enbridge, Inc., | ||||||||||||
| 5.500%, 12/01/2046 f | 5,000,000 | 5,592,560 | ||||||||||
| Encana Corp., | ||||||||||||
| 6.500%, 05/15/2019 f | 610,000 | 650,608 | ||||||||||
| Energy Transfer Partners LP: | ||||||||||||
| 2.500%, 06/15/2018 | 5,700,000 | 5,727,958 | ||||||||||
| 9.700%, 03/15/2019 | 1,189,000 | 1,331,606 | ||||||||||
| 4.150%, 10/01/2020 | 13,475,000 | 13,995,216 | ||||||||||
| 5.200%, 02/01/2022 | 1,000,000 | 1,075,184 | ||||||||||
| 3.600%, 02/01/2023 | 5,000,000 | 5,023,155 | ||||||||||
| 4.050%, 03/15/2025 | 6,204,000 | 6,228,909 | ||||||||||
| 4.200%, 04/15/2027 | 8,275,000 | 8,272,460 | ||||||||||
| 5.150%, 03/15/2045 | 5,000,000 | 4,857,875 | ||||||||||
| EnLink Midstream Partners LP, | ||||||||||||
| 4.400%, 04/01/2024 | 23,605,000 | 23,963,772 | ||||||||||
| Ensco PLC, | ||||||||||||
| 5.200%, 03/15/2025 f | 6,000,000 | 4,875,000 | ||||||||||
| Enterprise Products Operating LLC: | ||||||||||||
| 2.850%, 04/15/2021 | 10,000,000 | 10,113,200 | ||||||||||
| 3.350%, 03/15/2023 | 10,000,000 | 10,268,250 | ||||||||||
| 3.750%, 02/15/2025 | 7,000,000 | 7,208,614 | ||||||||||
| EQT Midstream Partners LP, | ||||||||||||
| 4.125%, 12/01/2026 | 14,750,000 | 14,883,001 | ||||||||||
| ERAC USA Finance LLC: | ||||||||||||
| 2.350%, 10/15/2019 (Acquired 10/26/2016, Cost $5,440,372) * | 5,385,000 | 5,393,368 | ||||||||||
| 2.600%, 12/01/2021 (Acquired 05/23/2016 through 06/28/2017, Cost $10,260,804) * | 10,275,000 | 10,234,445 | ||||||||||
| Express Scripts Holding Co.: | ||||||||||||
| 4.750%, 11/15/2021 | 14,700,000 | 15,885,452 | ||||||||||
| 3.500%, 06/15/2024 | 7,500,000 | 7,565,498 | ||||||||||
| FedEx Corp.: | ||||||||||||
| 8.000%, 01/15/2019 | 6,100,000 | 6,649,695 | ||||||||||
| 3.900%, 02/01/2035 | 7,000,000 | 6,948,060 | ||||||||||
| Fidelity National Information Services, Inc.: | ||||||||||||
| 3.625%, 10/15/2020 | 5,000,000 | 5,237,715 | ||||||||||
| 4.500%, 10/15/2022 | 3,100,000 | 3,368,376 | ||||||||||
| 3.500%, 04/15/2023 | 6,075,000 | 6,312,459 | ||||||||||
| 3.875%, 06/05/2024 | 23,522,000 | 24,637,931 | ||||||||||
| 3.000%, 08/15/2026 | 9,300,000 | 9,005,339 | ||||||||||
| Fiserv, Inc.: | ||||||||||||
| 4.625%, 10/01/2020 | 3,000,000 | 3,208,587 | ||||||||||
| 3.500%, 10/01/2022 | 11,500,000 | 11,896,371 | ||||||||||
| 3.850%, 06/01/2025 | 11,720,000 | 12,174,771 | ||||||||||
| Florida Gas Transmission Co. LLC, | ||||||||||||
| 3.875%, 07/15/2022 (Acquired 06/12/2012, Cost $2,996,190) * | 3,000,000 | 3,120,744 | ||||||||||
| Fomento Economico Mexicano SAB de CV: | ||||||||||||
| 2.875%, 05/10/2023 f | 11,700,000 | 11,647,179 | ||||||||||
| 4.375%, 05/10/2043 f | 4,000,000 | 4,058,256 | ||||||||||
| Ford Motor Credit Co. LLC: | ||||||||||||
| 2.145%, 01/09/2018 | 5,375,000 | 5,393,253 | ||||||||||
| 2.551%, 10/05/2018 | 8,500,000 | 8,555,947 | ||||||||||
| 2.681%, 01/09/2020 | 5,000,000 | 5,033,590 | ||||||||||
| 3.200%, 01/15/2021 | 11,250,000 | 11,418,694 | ||||||||||
| 5.750%, 02/01/2021 | 13,000,000 | 14,304,459 | ||||||||||
| 3.336%, 03/18/2021 | 5,500,000 | 5,606,194 | ||||||||||
| 5.875%, 08/02/2021 | 8,975,000 | 10,008,328 | ||||||||||
| 4.250%, 09/20/2022 | 4,459,000 | 4,684,309 | ||||||||||
| Forest Laboratories, Inc.: | ||||||||||||
| 4.375%, 02/01/2019 (Acquired 10/20/2014, Cost $1,082,874) * | 1,060,000 | 1,093,155 | ||||||||||
| 5.000%, 12/15/2021 (Acquired 08/26/2014 through 05/11/2016, Cost $43,986,150) * | 41,397,000 | 45,197,410 | ||||||||||
| Freeport-McMoRan, Inc.: | ||||||||||||
| 3.100%, 03/15/2020 | 3,775,000 | 3,694,781 | ||||||||||
| 6.500%, 11/15/2020 | 6,337,000 | 6,503,346 | ||||||||||
| 6.625%, 05/01/2021 | 6,447,000 | 6,575,940 | ||||||||||
| 6.750%, 02/01/2022 | 2,649,000 | 2,741,715 | ||||||||||
| 3.550%, 03/01/2022 | 6,275,000 | 5,880,805 | ||||||||||
| 3.875%, 03/15/2023 | 8,000,000 | 7,440,000 | ||||||||||
| Fresenius US Finance II, Inc., | ||||||||||||
| 4.500%, 01/15/2023 (Acquired 09/16/2015 through 02/24/2016, Cost $25,122,279) * | 25,000,000 | 26,250,000 | ||||||||||
| General Electric Co.: | ||||||||||||
| 2.200%, 01/09/2020 | 2,864,000 | 2,889,916 | ||||||||||
| 5.550%, 05/04/2020 | 1,199,000 | 1,317,109 | ||||||||||
| 4.375%, 09/16/2020 | 838,000 | 899,491 | ||||||||||
| 5.300%, 02/11/2021 | 859,000 | 949,962 | ||||||||||
| 4.650%, 10/17/2021 | 2,420,000 | 2,665,778 | ||||||||||
| General Mills, Inc., | ||||||||||||
| 2.200%, 10/21/2019 | 12,000,000 | 12,078,612 | ||||||||||
| General Motors Financial Co., Inc.: | ||||||||||||
| 2.400%, 05/09/2019 | 6,500,000 | 6,517,388 | ||||||||||
| 2.350%, 10/04/2019 | 2,700,000 | 2,699,735 | ||||||||||
| 3.700%, 11/24/2020 | 1,509,000 | 1,561,317 | ||||||||||
| 4.200%, 03/01/2021 | 21,158,000 | 22,191,907 | ||||||||||
| 3.200%, 07/06/2021 | 25,600,000 | 25,887,744 | ||||||||||
| 4.375%, 09/25/2021 | 4,450,000 | 4,690,598 | ||||||||||
| 3.450%, 01/14/2022 | 5,200,000 | 5,282,716 | ||||||||||
| 3.150%, 06/30/2022 | 6,325,000 | 6,334,791 | ||||||||||
| Genpact Luxembourg Sarl, | ||||||||||||
| 3.700%, 04/01/2022 (Acquired 06/08/2017 through 06/20/2017, Cost $31,043,598) * f | 30,620,000 | 31,005,108 | ||||||||||
| Georgia-Pacific LLC: | ||||||||||||
| 5.400%, 11/01/2020 (Acquired 10/27/2010 through 06/09/2016, Cost $11,961,209) * | 11,000,000 | 12,033,659 | ||||||||||
| 3.163%, 11/15/2021 (Acquired 11/03/2014, Cost $19,999,800) * | 20,000,000 | 20,424,180 | ||||||||||
| Glencore Finance (Canada) Ltd.: | ||||||||||||
| 4.950%, 11/15/2021 (Acquired 11/03/2011, Cost $1,997,480) * f | 2,000,000 | 2,139,000 | ||||||||||
| 4.250%, 10/25/2022 (Acquired 10/18/2012 through 05/22/2013, Cost $7,084,274) * f | 7,000,000 | 7,251,776 | ||||||||||
| 6.000%, 11/15/2041 (Acquired 04/14/2016 through 10/12/2016, Cost $6,556,898) * f | 7,400,000 | 8,170,192 | ||||||||||
| Glencore Funding LLC: | ||||||||||||
| 4.125%, 05/30/2023 (Acquired 05/22/2013 through 09/16/2016, Cost $16,889,152) * | 16,940,000 | 17,381,965 | ||||||||||
| 4.625%, 04/29/2024 (Acquired 10/08/2014 through 06/28/2017, Cost $25,550,978) * | 26,730,000 | 27,943,542 | ||||||||||
| 4.000%, 03/27/2027 (Acquired 03/21/2017, Cost $6,931,120) * | 7,000,000 | 6,887,279 | ||||||||||
| Grupo Bimbo SAB de CV, | ||||||||||||
| 3.875%, 06/27/2024 (Acquired 06/27/2014 through 04/10/2017, Cost $26,977,624) * f | 26,633,000 | 27,406,353 | ||||||||||
| Gulf South Pipeline Co. LP, | ||||||||||||
| 4.000%, 06/15/2022 | 3,000,000 | 3,089,130 | ||||||||||
| Gulfstream Natural Gas System LLC, | ||||||||||||
| 4.600%, 09/15/2025 (Acquired 09/21/2015, Cost $9,996,200) * | 10,000,000 | 10,732,690 | ||||||||||
| HB Fuller Co., | ||||||||||||
| 4.000%, 02/15/2027 | 6,725,000 | 6,867,261 | ||||||||||
| HCA, Inc.: | ||||||||||||
| 4.250%, 10/15/2019 | 10,900,000 | 11,308,750 | ||||||||||
| 6.500%, 02/15/2020 | 5,000,000 | 5,456,250 | ||||||||||
| 5.000%, 03/15/2024 | 8,366,000 | 8,857,503 | ||||||||||
| 5.375%, 02/01/2025 | 25,175,000 | 26,554,590 | ||||||||||
| Hewlett Packard Enterprise Co., | ||||||||||||
| 3.600%, 10/15/2020 | 7,550,000 | 7,784,797 | ||||||||||
| Hexcel Corp., | ||||||||||||
| 3.950%, 02/15/2027 | 19,000,000 | 19,456,399 | ||||||||||
| HP, Inc., | ||||||||||||
| 4.650%, 12/09/2021 | 32,425,000 | 34,995,135 | ||||||||||
| Husky Energy, Inc., | ||||||||||||
| 4.000%, 04/15/2024 f | 7,380,000 | 7,483,475 | ||||||||||
| Hutchison Whampoa International (09) Ltd., | ||||||||||||
| 7.625%, 04/09/2019 (Acquired 01/20/2015, Cost $2,189,417) * f | 2,000,000 | 2,183,600 | ||||||||||
| Hutchison Whampoa International (12) (II) Ltd., | ||||||||||||
| 3.250%, 11/08/2022 (Acquired 11/05/2012 through 12/18/2014, Cost $4,603,093) * f | 4,625,000 | 4,723,527 | ||||||||||
| Hutchison Whampoa International (14) Ltd., | ||||||||||||
| 3.625%, 10/31/2024 (Acquired 10/28/2014, Cost $14,982,600) * f | 15,000,000 | 15,472,170 | ||||||||||
| Hyundai Capital America: | ||||||||||||
| 2.500%, 03/18/2019 (Acquired 03/14/2016, Cost $24,583,026) * | 24,600,000 | 24,675,694 | ||||||||||
| 1.750%, 09/27/2019 (Acquired 09/22/2016, Cost $9,987,800) * | 10,000,000 | 9,848,120 | ||||||||||
| 3.000%, 03/18/2021 (Acquired 12/02/2016, Cost $10,010,123) * | 10,000,000 | 10,056,180 | ||||||||||
| 3.100%, 04/05/2022 (Acquired 04/26/2017, Cost $1,992,540) * | 2,000,000 | 2,005,278 | ||||||||||
| Hyundai Capital Services, Inc.: | ||||||||||||
| 3.500%, 09/13/2017 (Acquired 03/06/2012 through 12/30/2014, Cost $12,497,034) * f | 12,470,000 | 12,510,453 | ||||||||||
| 2.625%, 09/29/2020 (Acquired 03/23/2015 through 06/28/2017, Cost $9,210,458) * f | 9,225,000 | 9,181,181 | ||||||||||
| Ingersoll-Rand Global Holding Co. Ltd, | ||||||||||||
| 5.750%, 06/15/2043 | 4,126,000 | 5,198,067 | ||||||||||
| Ingersoll-Rand Luxembourg Finance SA: | ||||||||||||
| 3.550%, 11/01/2024 f | 8,425,000 | 8,628,396 | ||||||||||
| 4.650%, 11/01/2044 f | 1,300,000 | 1,401,953 | ||||||||||
| Ingredion, Inc., | ||||||||||||
| 1.800%, 09/25/2017 | 13,020,000 | 13,027,773 | ||||||||||
| Johnson Controls International PLC: | ||||||||||||
| 3.900%, 02/14/2026 f | 10,000,000 | 10,470,240 | ||||||||||
| 5.250%, 12/01/2041 f | 1,150,000 | 1,309,962 | ||||||||||
| Kerr-McGee Corp., | ||||||||||||
| 7.875%, 09/15/2031 | 12,790,000 | 16,444,001 | ||||||||||
| Keysight Technologies, Inc.: | ||||||||||||
| 3.300%, 10/30/2019 | 13,300,000 | 13,547,380 | ||||||||||
| 4.550%, 10/30/2024 | 4,417,000 | 4,636,494 | ||||||||||
| 4.600%, 04/06/2027 | 15,000,000 | 15,757,065 | ||||||||||
| Kinder Morgan Energy Partners LP: | ||||||||||||
| 9.000%, 02/01/2019 | 8,828,000 | 9,738,149 | ||||||||||
| 6.850%, 02/15/2020 | 4,645,000 | 5,121,261 | ||||||||||
| 6.500%, 02/01/2037 | 400,000 | 442,878 | ||||||||||
| 6.950%, 01/15/2038 | 1,350,000 | 1,612,302 | ||||||||||
| 7.500%, 11/15/2040 | 2,500,000 | 3,118,833 | ||||||||||
| Kinder Morgan Finance Co. LLC, | ||||||||||||
| 6.000%, 01/15/2018 (Acquired 12/06/2010, Cost $999,930) * | 1,000,000 | 1,020,765 | ||||||||||
| Kinder Morgan, Inc./DE: | ||||||||||||
| 3.050%, 12/01/2019 | 7,000,000 | 7,121,618 | ||||||||||
| 5.000%, 02/15/2021 (Acquired 05/26/2015 through 04/22/2016, Cost $10,378,244) * | 10,008,000 | 10,730,097 | ||||||||||
| 8.050%, 10/15/2030 | 14,009,000 | 17,039,679 | ||||||||||
| 7.800%, 08/01/2031 | 10,000,000 | 12,606,740 | ||||||||||
| Kinross Gold Corp., | ||||||||||||
| 6.875%, 09/01/2041 f | 5,500,000 | 5,871,250 | ||||||||||
| Kraft Heinz Foods Co.: | ||||||||||||
| 3.500%, 07/15/2022 | 17,000,000 | 17,526,796 | ||||||||||
| 6.750%, 03/15/2032 | 10,000,000 | 12,383,110 | ||||||||||
| 5.000%, 07/15/2035 | 7,075,000 | 7,650,749 | ||||||||||
| 5.000%, 06/04/2042 | 5,000,000 | 5,278,420 | ||||||||||
| Lafarge SA, | ||||||||||||
| 7.125%, 07/15/2036 f | 1,425,000 | 1,832,493 | ||||||||||
| LafargeHolcim Finance US LLC, | ||||||||||||
| 3.500%, 09/22/2026 (Acquired 09/15/2016, Cost $9,991,600) * | 10,000,000 | 9,886,590 | ||||||||||
| Lear Corp., | ||||||||||||
| 5.250%, 01/15/2025 | 21,600,000 | 22,855,349 | ||||||||||
| Lennox International, Inc., | ||||||||||||
| 3.000%, 11/15/2023 | 10,000,000 | 9,984,970 | ||||||||||
| Magellan Midstream Partners LP: | ||||||||||||
| 5.000%, 03/01/2026 | 10,000,000 | 11,028,070 | ||||||||||
| 4.200%, 03/15/2045 | 8,770,000 | 8,143,524 | ||||||||||
| 4.250%, 09/15/2046 | 1,230,000 | 1,201,012 | ||||||||||
| Marathon Oil Corp., | ||||||||||||
| 2.800%, 11/01/2022 | 10,175,000 | 9,755,271 | ||||||||||
| Marathon Petroleum Corp.: | ||||||||||||
| 3.400%, 12/15/2020 | 20,000,000 | 20,573,040 | ||||||||||
| 3.625%, 09/15/2024 | 2,500,000 | 2,526,103 | ||||||||||
| 4.750%, 09/15/2044 | 3,985,000 | 3,785,953 | ||||||||||
| Martin Marietta Materials, Inc.: | ||||||||||||
| 6.600%, 04/15/2018 | 475,000 | 491,936 | ||||||||||
| 6.250%, 05/01/2037 | 450,000 | 536,568 | ||||||||||
| Masco Corp., | ||||||||||||
| 7.125%, 03/15/2020 | 232,000 | 260,088 | ||||||||||
| McDonald's Corp., | ||||||||||||
| 3.700%, 01/30/2026 | 7,250,000 | 7,508,252 | ||||||||||
| Medtronic, Inc., | ||||||||||||
| 2.500%, 03/15/2020 | 5,000,000 | 5,072,455 | ||||||||||
| Microsoft Corp.: | ||||||||||||
| 4.200%, 11/03/2035 | 5,650,000 | 6,173,518 | ||||||||||
| 3.950%, 08/08/2056 | 17,000,000 | 17,002,431 | ||||||||||
| Molex Electronic Technologies LLC: | ||||||||||||
| 2.878%, 04/15/2020 (Acquired 04/01/2015 through 06/28/2017, Cost $26,149,337) * | 26,313,000 | 26,502,480 | ||||||||||
| 3.900%, 04/15/2025 (Acquired 06/20/2016, Cost $4,471,290) * | 4,500,000 | 4,587,426 | ||||||||||
| The Mosaic Co., | ||||||||||||
| 5.450%, 11/15/2033 | 16,101,000 | 16,986,990 | ||||||||||
| MPLX LP: | ||||||||||||
| 5.500%, 02/15/2023 | 1,900,000 | 1,950,863 | ||||||||||
| 4.500%, 07/15/2023 | 275,000 | 291,932 | ||||||||||
| 4.875%, 12/01/2024 | 9,650,000 | 10,288,502 | ||||||||||
| 4.000%, 02/15/2025 | 8,000,000 | 8,054,448 | ||||||||||
| 4.875%, 06/01/2025 | 7,000,000 | 7,422,786 | ||||||||||
| Murphy Oil Corp., | ||||||||||||
| 4.700%, 12/01/2022 | 12,600,000 | 12,165,300 | ||||||||||
| Mylan NV: | ||||||||||||
| 3.000%, 12/15/2018 f | 4,500,000 | 4,560,741 | ||||||||||
| 3.750%, 12/15/2020 f | 5,875,000 | 6,106,528 | ||||||||||
| 3.150%, 06/15/2021 f | 8,100,000 | 8,240,478 | ||||||||||
| Mylan, Inc.: | ||||||||||||
| 2.600%, 06/24/2018 | 7,775,000 | 7,830,848 | ||||||||||
| 3.125%, 01/15/2023 (Acquired 11/21/2016, Cost $11,264,356) * | 11,800,000 | 11,739,973 | ||||||||||
| 4.200%, 11/29/2023 | 4,525,000 | 4,738,304 | ||||||||||
| Nabors Industries, Inc., | ||||||||||||
| 6.150%, 02/15/2018 | 176,000 | 177,760 | ||||||||||
| New Cingular Wireless Services, Inc., | ||||||||||||
| 8.750%, 03/01/2031 | 3,400,000 | 4,874,566 | ||||||||||
| Newell Brands, Inc., | ||||||||||||
| 3.850%, 04/01/2023 | 20,000,000 | 20,998,780 | ||||||||||
| Noble Energy, Inc.: | ||||||||||||
| 3.900%, 11/15/2024 | 3,000,000 | 3,082,692 | ||||||||||
| 5.050%, 11/15/2044 | 3,000,000 | 3,081,057 | ||||||||||
| Noble Holding International Ltd., | ||||||||||||
| 5.750%, 03/16/2018 f | 7,000,000 | 7,042,420 | ||||||||||
| NuStar Logistics LP: | ||||||||||||
| 4.800%, 09/01/2020 | 4,275,000 | 4,446,000 | ||||||||||
| 6.750%, 02/01/2021 | 3,000,000 | 3,270,000 | ||||||||||
| Oi Brasil Holdings Cooperatief UA, | ||||||||||||
| 5.750%, 02/10/2022 (Acquired 02/06/2012, Cost $3,000,000) * f § | 3,000,000 | 1,042,500 | ||||||||||
| ONEOK Partners LP: | ||||||||||||
| 3.375%, 10/01/2022 | 9,500,000 | 9,586,963 | ||||||||||
| 5.000%, 09/15/2023 | 5,800,000 | 6,267,155 | ||||||||||
| ONEOK, Inc., | ||||||||||||
| 4.250%, 02/01/2022 | 6,325,000 | 6,530,563 | ||||||||||
| Oracle Corp.: | ||||||||||||
| 3.400%, 07/08/2024 | 8,850,000 | 9,215,850 | ||||||||||
| 3.900%, 05/15/2035 | 7,425,000 | 7,651,299 | ||||||||||
| Owens Corning: | ||||||||||||
| 4.200%, 12/01/2024 | 10,000,000 | 10,470,850 | ||||||||||
| 3.400%, 08/15/2026 | 5,000,000 | 4,925,520 | ||||||||||
| Packaging Corp. of America, | ||||||||||||
| 4.500%, 11/01/2023 | 4,700,000 | 5,042,968 | ||||||||||
| Pactiv LLC, | ||||||||||||
| 7.950%, 12/15/2025 | 1,338,000 | 1,498,560 | ||||||||||
| Pentair Finance SA: | ||||||||||||
| 2.900%, 09/15/2018 f | 2,206,000 | 2,228,777 | ||||||||||
| 2.650%, 12/01/2019 f | 5,000,000 | 5,037,875 | ||||||||||
| Pernod Ricard SA, | ||||||||||||
| 4.250%, 07/15/2022 (Acquired 06/09/2016 through 06/28/2017, Cost $28,814,517) * f | 26,700,000 | 28,476,645 | ||||||||||
| Petrofac Ltd., | ||||||||||||
| 3.400%, 10/10/2018 (Acquired 10/03/2013 through 06/13/2017, Cost $31,452,801) * f | 31,475,000 | 29,591,158 | ||||||||||
| Pfizer, Inc., | ||||||||||||
| 5.800%, 08/12/2023 | 7,938,000 | 9,326,610 | ||||||||||
| Phillips 66: | ||||||||||||
| 4.300%, 04/01/2022 | 6,168,000 | 6,609,271 | ||||||||||
| 4.650%, 11/15/2034 | 13,000,000 | 13,683,332 | ||||||||||
| 5.875%, 05/01/2042 | 5,000,000 | 6,041,045 | ||||||||||
| 4.875%, 11/15/2044 | 15,000,000 | 16,078,620 | ||||||||||
| Phillips 66 Partners LP, | ||||||||||||
| 4.680%, 02/15/2045 | 2,000,000 | 1,915,736 | ||||||||||
| Pioneer Natural Resources Co., | ||||||||||||
| 6.875%, 05/01/2018 | 14,075,000 | 14,638,760 | ||||||||||
| Plum Creek Timberlands LP: | ||||||||||||
| 4.700%, 03/15/2021 | 1,200,000 | 1,277,457 | ||||||||||
| 3.250%, 03/15/2023 | 8,375,000 | 8,503,598 | ||||||||||
| POSCO, | ||||||||||||
| 4.250%, 10/28/2020 (Acquired 10/21/2010, Cost $2,165,365) * f | 2,175,000 | 2,279,726 | ||||||||||
| Potash Corp of Saskatchewan, Inc., | ||||||||||||
| 4.000%, 12/15/2026 f | 10,000,000 | 10,311,120 | ||||||||||
| Qwest Capital Funding, Inc., | ||||||||||||
| 7.625%, 08/03/2021 | 200,000 | 208,000 | ||||||||||
| Regency Energy Partners LP / Regency Energy Finance Corp., | ||||||||||||
| 4.500%, 11/01/2023 | 11,850,000 | 12,295,809 | ||||||||||
| Reliance Holding USA, Inc.: | ||||||||||||
| 4.500%, 10/19/2020 (Acquired 10/14/2010 through 10/18/2010, Cost $1,988,700) * | 2,000,000 | 2,107,500 | ||||||||||
| 5.400%, 02/14/2022 (Acquired 02/09/2012 through 02/23/2012, Cost $3,508,403) * | 3,500,000 | 3,833,809 | ||||||||||
| Republic Services, Inc.: | ||||||||||||
| 5.500%, 09/15/2019 | 13,000,000 | 13,956,839 | ||||||||||
| 3.550%, 06/01/2022 | 4,000,000 | 4,163,284 | ||||||||||
| 4.750%, 05/15/2023 | 13,459,000 | 14,795,452 | ||||||||||
| 2.900%, 07/01/2026 | 20,000,000 | 19,608,420 | ||||||||||
| Rockies Express Pipeline LLC: | ||||||||||||
| 6.850%, 07/15/2018 (Acquired 12/21/2011, Cost $2,007,654) * | 2,000,000 | 2,082,500 | ||||||||||
| 5.625%, 04/15/2020 (Acquired 12/10/2010 through 12/29/2011, Cost $2,697,945) * | 2,695,000 | 2,863,438 | ||||||||||
| Sabine Pass Liquefaction LLC: | ||||||||||||
| 5.625%, 03/01/2025 | 24,500,000 | 27,024,946 | ||||||||||
| 5.875%, 06/30/2026 | 27,935,000 | 31,221,329 | ||||||||||
| Samarco Mineracao SA: | ||||||||||||
| 5.750%, 10/24/2023 (Acquired 10/21/2013 through 12/09/2014, Cost $5,330,242) * f § | 5,475,000 | 3,107,062 | ||||||||||
| 5.375%, 09/26/2024 (Acquired 09/23/2014 through 12/09/2014, Cost $4,873,256) * f § | 5,125,000 | 2,908,438 | ||||||||||
| Schlumberger Holdings Corp., | ||||||||||||
| 3.000%, 12/21/2020 (Acquired 12/10/2015, Cost $10,975,140) * | 11,000,000 | 11,200,167 | ||||||||||
| Schneider Electric SE, | ||||||||||||
| 2.950%, 09/27/2022 (Acquired 09/20/2012, Cost $4,986,700) * f | 5,000,000 | 5,046,820 | ||||||||||
| Seagate HDD Cayman, | ||||||||||||
| 4.250%, 03/01/2022 (Acquired 01/31/2017, Cost $14,965,500) * f | 15,000,000 | 15,247,155 | ||||||||||
| The Sherwin-Williams Co., | ||||||||||||
| 4.500%, 06/01/2047 | 10,550,000 | 11,054,585 | ||||||||||
| Shire Acquisitions Investments Ireland DAC, | ||||||||||||
| 2.875%, 09/23/2023 f | 51,400,000 | 50,946,292 | ||||||||||
| Silgan Holdings, Inc., | ||||||||||||
| 4.750%, 03/15/2025 (Acquired 02/08/2017, Cost $1,000,000) * | 1,000,000 | 1,025,000 | ||||||||||
| SK Telecom Co. Ltd., | ||||||||||||
| 6.625%, 07/20/2027 (Acquired 07/13/2007 through 04/30/2013, Cost $987,608) * f | 960,000 | 1,230,919 | ||||||||||
| Smithfield Foods, Inc., | ||||||||||||
| 3.350%, 02/01/2022 (Acquired 01/25/2017 through 06/13/2017, Cost $20,490,328) * | 20,482,000 | 20,588,515 | ||||||||||
| Solvay Finance America LLC: | ||||||||||||
| 3.400%, 12/03/2020 (Acquired 11/30/2015 through 01/14/2016, Cost $39,200,406) * | 39,226,000 | 40,475,740 | ||||||||||
| 4.450%, 12/03/2025 (Acquired 05/04/2016 through 06/28/2017, Cost $25,497,212) * | 24,426,000 | 25,995,346 | ||||||||||
| Sonoco Products Co., | ||||||||||||
| 4.375%, 11/01/2021 | 1,000,000 | 1,057,204 | ||||||||||
| Spectra Energy Partners LP, | ||||||||||||
| 3.500%, 03/15/2025 | 15,150,000 | 14,995,440 | ||||||||||
| Sprint Capital Corp., | ||||||||||||
| 6.900%, 05/01/2019 | 675,000 | 720,529 | ||||||||||
| Sunoco Logistics Partners Operations LP: | ||||||||||||
| 3.450%, 01/15/2023 | 2,000,000 | 2,007,152 | ||||||||||
| 6.100%, 02/15/2042 | 1,000,000 | 1,050,728 | ||||||||||
| Targa Resources Partners LP / Targa Resources Partners Finance Corp., | ||||||||||||
| 4.125%, 11/15/2019 | 7,000,000 | 7,078,750 | ||||||||||
| TC PipeLines LP, | ||||||||||||
| 4.375%, 03/13/2025 | 25,830,000 | 26,917,572 | ||||||||||
| Tech Data Corp., | ||||||||||||
| 3.700%, 02/15/2022 | 7,000,000 | 7,142,884 | ||||||||||
| Telecom Italia Capital SA: | ||||||||||||
| 7.175%, 06/18/2019 f | 500,000 | 545,625 | ||||||||||
| 7.200%, 07/18/2036 f | 3,175,000 | 3,681,016 | ||||||||||
| Telecom Italia SpA/Milano, | ||||||||||||
| 5.303%, 05/30/2024 (Acquired 05/22/2014 through 09/23/2015, Cost $21,646,582) * f | 21,500,000 | 23,058,750 | ||||||||||
| Telefonica Emisiones SAU: | ||||||||||||
| 6.221%, 07/03/2017 f | 8,942,000 | 8,942,000 | ||||||||||
| 5.462%, 02/16/2021 f | 2,402,000 | 2,642,030 | ||||||||||
| 4.570%, 04/27/2023 f | 1,000,000 | 1,088,617 | ||||||||||
| 4.103%, 03/08/2027 f | 8,125,000 | 8,394,311 | ||||||||||
| 7.045%, 06/20/2036 f | 4,925,000 | 6,469,785 | ||||||||||
| 5.213%, 03/08/2047 f | 5,000,000 | 5,398,660 | ||||||||||
| TELUS Corp., | ||||||||||||
| 2.800%, 02/16/2027 f | 13,100,000 | 12,346,776 | ||||||||||
| Tenet Healthcare Corp., | ||||||||||||
| 6.750%, 06/15/2023 | 1,000,000 | 1,000,000 | ||||||||||
| Teva Pharmaceutical Finance Netherlands III BV, | ||||||||||||
| 2.800%, 07/21/2023 f | 14,275,000 | 13,884,507 | ||||||||||
| Thermo Fisher Scientific, Inc., | ||||||||||||
| 3.300%, 02/15/2022 | 7,000,000 | 7,233,058 | ||||||||||
| Time Warner Cable LLC: | ||||||||||||
| 6.750%, 07/01/2018 | 11,000,000 | 11,508,288 | ||||||||||
| 8.750%, 02/14/2019 | 1,132,000 | 1,245,096 | ||||||||||
| 8.250%, 04/01/2019 | 35,000 | 38,610 | ||||||||||
| Time Warner Co., Inc., | ||||||||||||
| 7.250%, 10/15/2017 | 2,300,000 | 2,335,616 | ||||||||||
| Time Warner, Inc.: | ||||||||||||
| 3.800%, 02/15/2027 | 3,500,000 | 3,523,660 | ||||||||||
| 7.625%, 04/15/2031 | 13,500,000 | 18,412,825 | ||||||||||
| 7.700%, 05/01/2032 | 19,233,000 | 26,773,625 | ||||||||||
| 4.850%, 07/15/2045 | 12,000,000 | 12,356,208 | ||||||||||
| The Timken Co., | ||||||||||||
| 3.875%, 09/01/2024 | 18,500,000 | 18,428,054 | ||||||||||
| Transcontinental Gas Pipe Line Co. LLC, | ||||||||||||
| 4.450%, 08/01/2042 | 2,600,000 | 2,574,962 | ||||||||||
| Transocean, Inc.: | ||||||||||||
| 8.375%, 12/15/2021 f | 5,500,000 | 5,830,000 | ||||||||||
| 5.800%, 10/15/2022 f | 5,000,000 | 4,637,500 | ||||||||||
| TSMC Global Ltd., | ||||||||||||
| 1.625%, 04/03/2018 (Acquired 03/27/2013 through 06/28/2017, Cost $37,499,379) * f | 37,655,000 | 37,579,041 | ||||||||||
| TTX Co.: | ||||||||||||
| 4.650%, 06/15/2044 (Acquired 11/07/2016, Cost $8,226,565) * | 7,710,000 | 8,137,713 | ||||||||||
| 3.900%, 02/01/2045 (Acquired 01/26/2015, Cost $25,121,134) * | 25,325,000 | 24,279,837 | ||||||||||
| Tyco Electronics Group SA, | ||||||||||||
| 7.125%, 10/01/2037 f | 500,000 | 686,099 | ||||||||||
| US Airways Pass Through Trust, | ||||||||||||
| Class 981B, 7.350%, 01/30/2018 | 177,936 | 181,494 | ||||||||||
| Vale Overseas Ltd.: | ||||||||||||
| 5.875%, 06/10/2021 f | 25,125,000 | 26,971,688 | ||||||||||
| 4.375%, 01/11/2022 f | 2,700,000 | 2,748,060 | ||||||||||
| 6.250%, 08/10/2026 f | 22,000,000 | 23,732,500 | ||||||||||
| 8.250%, 01/17/2034 f | 425,000 | 504,687 | ||||||||||
| 6.875%, 11/21/2036 f | 150,000 | 160,875 | ||||||||||
| 6.875%, 11/10/2039 f | 13,425,000 | 14,398,313 | ||||||||||
| Valeant Pharmaceuticals International, Inc., | ||||||||||||
| 5.875%, 05/15/2023 (Acquired 05/12/2015, Cost $5,069,313) * f | 5,000,000 | 4,287,500 | ||||||||||
| Valero Energy Corp.: | ||||||||||||
| 9.375%, 03/15/2019 | 19,806,000 | 22,164,261 | ||||||||||
| 3.400%, 09/15/2026 | 17,500,000 | 17,119,200 | ||||||||||
| 6.625%, 06/15/2037 | 5,000,000 | 6,175,500 | ||||||||||
| Verisk Analytics, Inc.: | ||||||||||||
| 5.800%, 05/01/2021 | 2,585,000 | 2,874,148 | ||||||||||
| 4.000%, 06/15/2025 | 10,000,000 | 10,332,880 | ||||||||||
| Verizon Communications, Inc.: | ||||||||||||
| 4.272%, 01/15/2036 | 19,649,000 | 18,964,350 | ||||||||||
| 5.250%, 03/16/2037 | 18,225,000 | 19,591,711 | ||||||||||
| 4.812%, 03/15/2039 (Acquired 09/30/2013 through 11/08/2016, Cost $37,298,658) * | 37,955,000 | 38,365,597 | ||||||||||
| Viacom, Inc., | ||||||||||||
| 2.750%, 12/15/2019 | 10,000,000 | 10,113,100 | ||||||||||
| Viterra, Inc., | ||||||||||||
| 5.950%, 08/01/2020 (Acquired 03/18/2015, Cost $7,461,740) * f | 7,000,000 | 7,603,197 | ||||||||||
| Vodafone Group PLC: | ||||||||||||
| 1.250%, 09/26/2017 f | 15,000,000 | 14,985,150 | ||||||||||
| 6.150%, 02/27/2037 f | 3,150,000 | 3,818,250 | ||||||||||
| Vulcan Materials Co.: | ||||||||||||
| 7.000%, 06/15/2018 | 2,435,000 | 2,549,691 | ||||||||||
| 7.500%, 06/15/2021 | 16,763,000 | 19,783,106 | ||||||||||
| 4.500%, 04/01/2025 | 3,000,000 | 3,203,679 | ||||||||||
| 7.150%, 11/30/2037 | 500,000 | 656,344 | ||||||||||
| Wabtec Corp./DE, | ||||||||||||
| 3.450%, 11/15/2026 (Acquired 10/31/2016 through 06/28/2017, Cost $27,243,541) * | 27,225,000 | 26,843,442 | ||||||||||
| Walgreen Co., | ||||||||||||
| 5.250%, 01/15/2019 | 2,482,000 | 2,599,195 | ||||||||||
| Walgreens Boots Alliance, Inc.: | ||||||||||||
| 3.300%, 11/18/2021 | 8,060,000 | 8,310,577 | ||||||||||
| 3.800%, 11/18/2024 | 10,000,000 | 10,386,030 | ||||||||||
| 3.450%, 06/01/2026 | 7,000,000 | 6,985,202 | ||||||||||
| Waste Management, Inc.: | ||||||||||||
| 6.100%, 03/15/2018 | 200,000 | 206,046 | ||||||||||
| 3.900%, 03/01/2035 | 5,000,000 | 5,161,690 | ||||||||||
| Weatherford International Ltd., | ||||||||||||
| 4.500%, 04/15/2022 f | 5,020,000 | 4,430,150 | ||||||||||
| Western Gas Partners LP, | ||||||||||||
| 5.375%, 06/01/2021 | 18,000,000 | 19,323,540 | ||||||||||
| WestRock MWV LLC: | ||||||||||||
| 7.375%, 09/01/2019 | 6,650,000 | 7,356,263 | ||||||||||
| 9.750%, 06/15/2020 | 1,060,000 | 1,253,960 | ||||||||||
| 8.200%, 01/15/2030 | 3,012,000 | 4,240,351 | ||||||||||
| Weyerhaeuser Co., | ||||||||||||
| 7.375%, 10/01/2019 | 11,865,000 | 13,161,607 | ||||||||||
| The Williams Companies, Inc.: | ||||||||||||
| 7.875%, 09/01/2021 | 5,065,000 | 5,875,400 | ||||||||||
| 3.700%, 01/15/2023 | 3,000,000 | 2,955,000 | ||||||||||
| Class A, 7.500%, 01/15/2031 | 120,000 | 142,200 | ||||||||||
| 7.750%, 06/15/2031 | 3,500,000 | 4,165,000 | ||||||||||
| 5.750%, 06/24/2044 | 2,500,000 | 2,581,250 | ||||||||||
| Williams Partners LP: | ||||||||||||
| 5.250%, 03/15/2020 | 2,000,000 | 2,152,372 | ||||||||||
| 6.300%, 04/15/2040 | 1,590,000 | 1,842,664 | ||||||||||
| Woodside Finance Ltd., | ||||||||||||
| 3.650%, 03/05/2025 (Acquired 02/26/2015, Cost $14,991,300) * f | 15,000,000 | 14,945,535 | ||||||||||
| WPX Energy, Inc., | ||||||||||||
| 6.000%, 01/15/2022 | 4,000,000 | 3,960,000 | ||||||||||
| Wynn Las Vegas LLC / Wynn Las Vegas Capital Corp., | ||||||||||||
| 4.250%, 05/30/2023 (Acquired 05/15/2013, Cost $4,000,000) * | 4,000,000 | 4,030,000 | ||||||||||
| Yara International ASA: | ||||||||||||
| 7.875%, 06/11/2019 (Acquired 12/03/2012 through 10/31/2013, Cost $6,434,285) * f | 5,880,000 | 6,463,261 | ||||||||||
| 3.800%, 06/06/2026 (Acquired 06/01/2016 through 02/08/2017, Cost $20,646,143) * f | 20,250,000 | 20,094,014 | ||||||||||
| Zoetis, Inc.: | ||||||||||||
| 3.450%, 11/13/2020 | 11,885,000 | 12,291,229 | ||||||||||
| 3.250%, 02/01/2023 | 24,276,000 | 24,880,108 | ||||||||||
| 4.500%, 11/13/2025 | 16,275,000 | 17,768,297 | ||||||||||
| 3,802,582,211 | 26.3 | % | ||||||||||
| Utilities | ||||||||||||
| Appalachian Power Co., | ||||||||||||
| Class P, 6.700%, 08/15/2037 | 1,275,000 | 1,681,711 | ||||||||||
| Arizona Public Service Co., | ||||||||||||
| 8.750%, 03/01/2019 | 1,150,000 | 1,275,940 | ||||||||||
| Berkshire Hathaway Energy Co., | ||||||||||||
| 3.500%, 02/01/2025 | 7,000,000 | 7,181,503 | ||||||||||
| CMS Energy Corp., | ||||||||||||
| 5.050%, 03/15/2022 | 1,000,000 | 1,099,958 | ||||||||||
| Consolidated Edison Co. of New York, Inc., | ||||||||||||
| 4.625%, 12/01/2054 | 7,600,000 | 8,387,139 | ||||||||||
| Dominion Resources, Inc./VA: | ||||||||||||
| 2.500%, 12/01/2019 | 5,225,000 | 5,265,687 | ||||||||||
| Class B, 5.950%, 06/15/2035 | 1,880,000 | 2,307,211 | ||||||||||
| Edison International, | ||||||||||||
| 2.950%, 03/15/2023 | 5,000,000 | 5,048,995 | ||||||||||
| EDP Finance BV: | ||||||||||||
| 4.900%, 10/01/2019 (Acquired 02/04/2015, Cost $1,614,951) * f | 1,564,000 | 1,642,278 | ||||||||||
| 4.125%, 01/15/2020 (Acquired 03/03/2015 through 03/04/2015, Cost $9,008,831) * f | 8,816,000 | 9,113,540 | ||||||||||
| 3.625%, 07/15/2024 (Acquired 06/21/2017, Cost $9,958,000) * f | 10,000,000 | 9,924,400 | ||||||||||
| Enel Finance International NV: | ||||||||||||
| 2.875%, 05/25/2022 (Acquired 05/22/2017, Cost $7,477,500) * f | 7,500,000 | 7,510,402 | ||||||||||
| 3.625%, 05/25/2027 (Acquired 05/22/2017 through 05/23/2017, Cost $17,302,925) * f | 17,500,000 | 17,331,020 | ||||||||||
| 6.000%, 10/07/2039 (Acquired 10/04/2016, Cost $760,242) * f | 631,000 | 750,409 | ||||||||||
| 4.750%, 05/25/2047 (Acquired 05/23/2017 through 05/24/2017, Cost $9,973,750) * f | 10,000,000 | 10,289,590 | ||||||||||
| Exelon Corp.: | ||||||||||||
| 3.950%, 06/15/2025 | 15,650,000 | 16,195,262 | ||||||||||
| 5.100%, 06/15/2045 | 5,875,000 | 6,583,178 | ||||||||||
| Exelon Generation Co. LLC: | ||||||||||||
| 6.200%, 10/01/2017 | 4,350,000 | 4,395,018 | ||||||||||
| 5.600%, 06/15/2042 | 6,100,000 | 6,125,541 | ||||||||||
| FORTIS, Inc., | ||||||||||||
| 3.055%, 10/04/2026 (Acquired 09/29/2016, Cost $14,150,000) * f | 14,150,000 | 13,654,637 | ||||||||||
| IPALCO Enterprises, Inc., | ||||||||||||
| 5.000%, 05/01/2018 | 1,000,000 | 1,016,250 | ||||||||||
| KeySpan Corp., | ||||||||||||
| 8.000%, 11/15/2030 | 1,875,000 | 2,524,376 | ||||||||||
| Mega Advance Investments Ltd., | ||||||||||||
| 5.000%, 05/12/2021 (Acquired 05/09/2011 through 05/23/2012, Cost $2,802,381) * f | 2,800,000 | 2,996,387 | ||||||||||
| National Rural Utilities Cooperative Finance Corp., | ||||||||||||
| 2.300%, 11/15/2019 | 5,000,000 | 5,031,015 | ||||||||||
| NextEra Energy Capital Holdings, Inc., | ||||||||||||
| Class D, 7.300%, 09/01/2067 ∞ | 2,600,000 | 2,616,302 | ||||||||||
| PSEG Power LLC, | ||||||||||||
| 3.000%, 06/15/2021 | 26,550,000 | 26,957,994 | ||||||||||
| Public Service Co. of New Mexico, | ||||||||||||
| 7.950%, 05/15/2018 | 6,553,000 | 6,895,519 | ||||||||||
| RGS I&M Funding Corp., | ||||||||||||
| Class F, 9.820%, 06/07/2022 | 145,317 | 160,166 | ||||||||||
| South Carolina Electric & Gas Co., | ||||||||||||
| 4.100%, 06/15/2046 | 7,325,000 | 7,174,457 | ||||||||||
| The Southern Co., | ||||||||||||
| 2.950%, 07/01/2023 | 17,400,000 | 17,288,466 | ||||||||||
| Talent Yield Investments Ltd., | ||||||||||||
| 4.500%, 04/25/2022 (Acquired 04/18/2012, Cost $5,958,960) * f | 6,000,000 | 6,363,654 | ||||||||||
| 214,788,005 | 1.5 | % | ||||||||||
| Financials | ||||||||||||
| ABN AMRO Bank NV: | ||||||||||||
| 2.500%, 10/30/2018 (Acquired 10/23/2013 through 10/24/2014, Cost $6,775,793) * f | 6,750,000 | 6,802,711 | ||||||||||
| 2.450%, 06/04/2020 (Acquired 05/28/2015 through 06/28/2017, Cost $12,972,958) * f | 13,000,000 | 13,078,858 | ||||||||||
| 4.750%, 07/28/2025 (Acquired 07/21/2015 through 04/05/2017, Cost $23,413,337) * f | 23,150,000 | 24,405,679 | ||||||||||
| 4.800%, 04/18/2026 (Acquired 04/11/2016 through 11/30/2016, Cost $19,729,796) * f | 19,600,000 | 20,811,887 | ||||||||||
| AIA Group Ltd., | ||||||||||||
| 3.200%, 03/11/2025 (Acquired 03/04/2015, Cost $8,988,570) * f | 9,000,000 | 8,919,894 | ||||||||||
| AIG SunAmerica Global Financing X, | ||||||||||||
| 6.900%, 03/15/2032 (Acquired 11/10/2011, Cost $2,116,167) * | 2,000,000 | 2,644,080 | ||||||||||
| Ally Financial, Inc.: | ||||||||||||
| 3.600%, 05/21/2018 | 7,000,000 | 7,078,750 | ||||||||||
| 3.250%, 11/05/2018 | 8,200,000 | 8,300,040 | ||||||||||
| 8.000%, 12/31/2018 | 1,206,000 | 1,300,972 | ||||||||||
| 3.750%, 11/18/2019 | 18,200,000 | 18,609,500 | ||||||||||
| 4.125%, 03/30/2020 | 10,000,000 | 10,275,000 | ||||||||||
| 5.125%, 09/30/2024 | 3,000,000 | 3,164,760 | ||||||||||
| American International Group, Inc.: | ||||||||||||
| 6.400%, 12/15/2020 | 3,500,000 | 3,960,589 | ||||||||||
| 4.875%, 06/01/2022 | 25,551,000 | 28,035,963 | ||||||||||
| 3.750%, 07/10/2025 | 11,400,000 | 11,611,812 | ||||||||||
| 3.875%, 01/15/2035 | 5,000,000 | 4,847,310 | ||||||||||
| 6.820%, 11/15/2037 | 4,173,000 | 5,496,692 | ||||||||||
| AmSouth Bancorporation, | ||||||||||||
| 6.750%, 11/01/2025 | 860,000 | 1,009,093 | ||||||||||
| ANZ New Zealand (Int'l) Ltd./London: | ||||||||||||
| 1.750%, 03/29/2018 f | 6,150,000 | 6,155,492 | ||||||||||
| 2.750%, 02/03/2021 (Acquired 01/27/2016, Cost $9,989,300) * f | 10,000,000 | 10,060,100 | ||||||||||
| 2.125%, 07/28/2021 (Acquired 07/21/2016 through 06/28/2017, Cost $16,731,699) * f | 16,750,000 | 16,473,524 | ||||||||||
| Aon Corp., | ||||||||||||
| 5.000%, 09/30/2020 f | 150,000 | 161,526 | ||||||||||
| Aon PLC, | ||||||||||||
| 3.875%, 12/15/2025 f | 14,490,000 | 15,141,615 | ||||||||||
| Australia & New Zealand Banking Group Ltd.: | ||||||||||||
| 1.600%, 07/15/2019 f | 5,000,000 | 4,967,035 | ||||||||||
| 4.500%, 03/19/2024 (Acquired 03/12/2014, Cost $8,987,760) * f | 9,000,000 | 9,401,481 | ||||||||||
| Banco Santander SA, | ||||||||||||
| 3.500%, 04/11/2022 f | 12,000,000 | 12,281,724 | ||||||||||
| Bank of America Corp.: | ||||||||||||
| 6.875%, 04/25/2018 | 1,250,000 | 1,300,786 | ||||||||||
| 7.625%, 06/01/2019 | 7,735,000 | 8,529,168 | ||||||||||
| 2.625%, 10/19/2020 | 4,500,000 | 4,545,374 | ||||||||||
| 2.625%, 04/19/2021 | 17,500,000 | 17,577,560 | ||||||||||
| 3.300%, 01/11/2023 | 22,650,000 | 23,096,160 | ||||||||||
| 3.248%, 10/21/2027 | 6,000,000 | 5,797,998 | ||||||||||
| 3.705%, 04/24/2028 ∞ | 23,000,000 | 23,168,475 | ||||||||||
| 7.750%, 05/14/2038 | 725,000 | 1,042,620 | ||||||||||
| Bank of Montreal, | ||||||||||||
| 1.900%, 08/27/2021 f | 26,450,000 | 25,956,311 | ||||||||||
| The Bank of Nova Scotia: | ||||||||||||
| 1.700%, 06/11/2018 f | 15,325,000 | 15,344,969 | ||||||||||
| 4.500%, 12/16/2025 f | 8,048,000 | 8,458,480 | ||||||||||
| The Bank of Tokyo-Mitsubishi UFJ Ltd., | ||||||||||||
| 2.300%, 03/05/2020 (Acquired 02/25/2015 through 06/28/2017, Cost $8,070,413) * f | 8,075,000 | 8,086,394 | ||||||||||
| BanPonce Trust I, | ||||||||||||
| Class A, 8.327%, 02/01/2027 | 2,310,000 | 2,244,114 | ||||||||||
| Barclays PLC: | ||||||||||||
| 2.750%, 11/08/2019 f | 7,000,000 | 7,063,049 | ||||||||||
| 3.250%, 01/12/2021 f | 25,000,000 | 25,424,200 | ||||||||||
| 3.200%, 08/10/2021 f | 16,000,000 | 16,229,968 | ||||||||||
| 3.684%, 01/10/2023 f | 5,000,000 | 5,130,290 | ||||||||||
| 3.650%, 03/16/2025 f | 8,000,000 | 7,960,232 | ||||||||||
| 4.337%, 01/10/2028 f | 10,000,000 | 10,280,140 | ||||||||||
| BB&T Corp.: | ||||||||||||
| 2.450%, 01/15/2020 | 15,000,000 | 15,167,565 | ||||||||||
| 2.625%, 06/29/2020 | 13,000,000 | 13,220,727 | ||||||||||
| The Bear Stearns Companies LLC, | ||||||||||||
| 7.250%, 02/01/2018 | 2,250,000 | 2,320,573 | ||||||||||
| Berkshire Hathaway Finance Corp., | ||||||||||||
| 4.400%, 05/15/2042 | 3,500,000 | 3,811,825 | ||||||||||
| BNP Paribas SA: | ||||||||||||
| 5.000%, 01/15/2021 f | 5,000,000 | 5,466,660 | ||||||||||
| 3.250%, 03/03/2023 f | 4,000,000 | 4,102,916 | ||||||||||
| BNZ International Funding Ltd./London: | ||||||||||||
| 2.350%, 03/04/2019 (Acquired 09/03/2014 through 06/28/2017, Cost $14,001,122) * f | 14,025,000 | 14,090,090 | ||||||||||
| 2.400%, 02/21/2020 (Acquired 02/13/2017, Cost $7,997,200) * f | 8,000,000 | 8,033,592 | ||||||||||
| 2.750%, 03/02/2021 (Acquired 02/23/2016, Cost $18,736,875) * f | 18,750,000 | 18,895,069 | ||||||||||
| BPCE SA: | ||||||||||||
| 2.500%, 12/10/2018 f | 5,750,000 | 5,801,192 | ||||||||||
| 2.250%, 01/27/2020 f | 4,000,000 | 4,002,692 | ||||||||||
| 5.700%, 10/22/2023 (Acquired 10/21/2014 through 11/21/2016, Cost $32,815,175) * f | 31,200,000 | 34,716,240 | ||||||||||
| 5.150%, 07/21/2024 (Acquired 05/10/2016 through 12/14/2016, Cost $27,098,527) * f | 26,500,000 | 28,311,752 | ||||||||||
| Brighthouse Financial, Inc., | ||||||||||||
| 4.700%, 06/22/2047 (Acquired 06/15/2017, Cost $6,952,120) * | 7,000,000 | 6,910,638 | ||||||||||
| Caisse Centrale Desjardins, | ||||||||||||
| 1.837%, 01/29/2018 (Acquired 01/26/2015 through 03/08/2016, Cost $29,174,628) ∞ * f | 29,175,000 | 29,263,838 | ||||||||||
| Canadian Imperial Bank of Commerce/Canada, | ||||||||||||
| 1.600%, 09/06/2019 f | 8,475,000 | 8,394,818 | ||||||||||
| Capital One Bank (USA) NA, | ||||||||||||
| 3.375%, 02/15/2023 | 37,888,000 | 38,211,488 | ||||||||||
| Capital One Financial Corp.: | ||||||||||||
| 2.450%, 04/24/2019 | 3,975,000 | 3,996,258 | ||||||||||
| 3.050%, 03/09/2022 | 14,725,000 | 14,840,695 | ||||||||||
| Capital One NA/Mclean VA: | ||||||||||||
| 1.650%, 02/05/2018 | 8,400,000 | 8,396,556 | ||||||||||
| 1.850%, 09/13/2019 | 5,000,000 | 4,957,720 | ||||||||||
| The Chubb Corp., | ||||||||||||
| 3.408%, 04/15/2037 ∞ | 1,320,000 | 1,310,100 | ||||||||||
| CIT Group, Inc.: | ||||||||||||
| 5.500%, 02/15/2019 (Acquired 02/02/2012, Cost $168,000) * | 168,000 | 176,400 | ||||||||||
| 5.000%, 08/01/2023 | 5,000,000 | 5,387,500 | ||||||||||
| Citigroup, Inc.: | ||||||||||||
| 1.700%, 04/27/2018 | 12,650,000 | 12,637,325 | ||||||||||
| 2.050%, 12/07/2018 | 12,825,000 | 12,844,071 | ||||||||||
| 2.400%, 02/18/2020 | 8,000,000 | 8,043,024 | ||||||||||
| 2.350%, 08/02/2021 | 8,125,000 | 8,051,217 | ||||||||||
| 2.632%, 09/01/2023 ∞ | 8,000,000 | 8,148,560 | ||||||||||
| 3.700%, 01/12/2026 | 4,700,000 | 4,753,528 | ||||||||||
| 3.887%, 01/10/2028 ∞ | 30,000,000 | 30,487,920 | ||||||||||
| Citizens Bank NA/Providence RI: | ||||||||||||
| 2.450%, 12/04/2019 | 36,000,000 | 36,306,936 | ||||||||||
| 2.550%, 05/13/2021 | 6,175,000 | 6,178,409 | ||||||||||
| CNA Financial Corp.: | ||||||||||||
| 7.350%, 11/15/2019 | 1,175,000 | 1,313,047 | ||||||||||
| 5.875%, 08/15/2020 | 6,839,000 | 7,531,681 | ||||||||||
| 5.750%, 08/15/2021 | 9,177,000 | 10,241,789 | ||||||||||
| 7.250%, 11/15/2023 | 7,400,000 | 8,957,227 | ||||||||||
| 4.500%, 03/01/2026 | 21,000,000 | 22,529,430 | ||||||||||
| CNO Financial Group, Inc.: | ||||||||||||
| 4.500%, 05/30/2020 | 5,000,000 | 5,187,500 | ||||||||||
| 5.250%, 05/30/2025 | 18,640,000 | 19,739,760 | ||||||||||
| Comerica Bank, | ||||||||||||
| 4.000%, 07/27/2025 | 21,425,000 | 22,141,088 | ||||||||||
| Commonwealth Bank of Australia, | ||||||||||||
| 5.000%, 10/15/2019 (Acquired 03/02/2012 through 08/16/2012, Cost $6,077,020) * f | 5,900,000 | 6,275,429 | ||||||||||
| Compass Bank: | ||||||||||||
| 2.750%, 09/29/2019 | 38,994,000 | 39,295,970 | ||||||||||
| 2.875%, 06/29/2022 | 7,150,000 | 7,122,737 | ||||||||||
| 3.875%, 04/10/2025 | 23,875,000 | 23,782,365 | ||||||||||
| Cooperatieve Rabobank UA: | ||||||||||||
| 3.875%, 02/08/2022 f | 4,150,000 | 4,402,681 | ||||||||||
| 3.750%, 07/21/2026 f | 23,000,000 | 22,996,205 | ||||||||||
| Cooperatieve Rabobank UA/NY: | ||||||||||||
| 1.700%, 03/19/2018 f | 5,500,000 | 5,507,156 | ||||||||||
| 2.750%, 01/10/2022 f | 15,250,000 | 15,481,922 | ||||||||||
| Credit Agricole SA/London, | ||||||||||||
| 3.375%, 01/10/2022 (Acquired 01/03/2017, Cost $23,212,226) * f | 23,225,000 | 23,846,129 | ||||||||||
| Credit Mutuel - CIC Home Loan SFH, | ||||||||||||
| 1.500%, 11/16/2017 (Acquired 11/08/2012, Cost $4,981,300) * f | 5,000,000 | 4,996,950 | ||||||||||
| Credit Suisse AG/New York NY: | ||||||||||||
| 1.700%, 04/27/2018 f | 5,800,000 | 5,799,606 | ||||||||||
| 5.300%, 08/13/2019 f | 7,166,000 | 7,654,076 | ||||||||||
| Credit Suisse Group AG, | ||||||||||||
| 4.282%, 01/09/2028 (Acquired 01/04/2017, Cost $10,000,000) * f | 10,000,000 | 10,336,810 | ||||||||||
| Credit Suisse Group Funding Guernsey Ltd.: | ||||||||||||
| 3.800%, 06/09/2023 f | 21,100,000 | 21,753,151 | ||||||||||
| 3.750%, 03/26/2025 f | 15,000,000 | 15,155,295 | ||||||||||
| 4.550%, 04/17/2026 f | 5,000,000 | 5,311,480 | ||||||||||
| Daiwa Securities Group, Inc., | ||||||||||||
| 3.129%, 04/19/2022 (Acquired 04/12/2017, Cost $13,775,000) * f | 13,775,000 | 13,870,681 | ||||||||||
| Deutsche Bank AG: | ||||||||||||
| 2.950%, 08/20/2020 f | 8,625,000 | 8,676,103 | ||||||||||
| 3.125%, 01/13/2021 f | 4,500,000 | 4,522,414 | ||||||||||
| 3.375%, 05/12/2021 f | 5,450,000 | 5,519,896 | ||||||||||
| 4.250%, 10/14/2021 f | 26,200,000 | 27,475,495 | ||||||||||
| Deutsche Bank AG/London: | ||||||||||||
| 1.862%, 02/13/2018 ∞ f | 9,000,000 | 8,991,315 | ||||||||||
| 1.875%, 02/13/2018 f | 8,769,000 | 8,766,448 | ||||||||||
| Discover Bank/Greenwood DE: | ||||||||||||
| 8.700%, 11/18/2019 | 3,237,000 | 3,657,551 | ||||||||||
| 3.100%, 06/04/2020 | 12,000,000 | 12,228,516 | ||||||||||
| Discover Financial Services, | ||||||||||||
| 3.950%, 11/06/2024 | 25,000,000 | 25,387,150 | ||||||||||
| Fifth Third Bancorp, | ||||||||||||
| 2.875%, 07/27/2020 | 9,250,000 | 9,442,215 | ||||||||||
| First Horizon National Corp., | ||||||||||||
| 3.500%, 12/15/2020 | 28,897,000 | 29,637,948 | ||||||||||
| First Republic Bank/CA, | ||||||||||||
| 4.625%, 02/13/2047 | 1,850,000 | 1,900,379 | ||||||||||
| First Tennessee Bank NA, | ||||||||||||
| 2.950%, 12/01/2019 | 12,000,000 | 12,130,932 | ||||||||||
| FMR LLC: | ||||||||||||
| 4.950%, 02/01/2033 (Acquired 01/29/2013 through 12/23/2014, Cost $4,388,274) * | 4,235,000 | 4,717,837 | ||||||||||
| 6.500%, 12/14/2040 (Acquired 04/04/2013 through 10/28/2013, Cost $2,254,737) * | 1,820,000 | 2,420,110 | ||||||||||
| GE Capital International Funding Co. Unlimited Co., | ||||||||||||
| 2.342%, 11/15/2020 f | 24,096,000 | 24,288,648 | ||||||||||
| Genworth Holdings, Inc., | ||||||||||||
| 7.625%, 09/24/2021 | 1,000,000 | 965,000 | ||||||||||
| Goldman Sachs Capital I, | ||||||||||||
| 6.345%, 02/15/2034 | 125,000 | 153,520 | ||||||||||
| The Goldman Sachs Group, Inc.: | ||||||||||||
| 5.950%, 01/18/2018 | 3,000,000 | 3,067,044 | ||||||||||
| 6.150%, 04/01/2018 | 6,650,000 | 6,863,399 | ||||||||||
| 7.500%, 02/15/2019 | 1,825,000 | 1,979,583 | ||||||||||
| 2.550%, 10/23/2019 | 4,000,000 | 4,043,652 | ||||||||||
| 2.300%, 12/13/2019 | 12,450,000 | 12,484,001 | ||||||||||
| 5.250%, 07/27/2021 | 1,100,000 | 1,205,655 | ||||||||||
| 2.350%, 11/15/2021 | 10,000,000 | 9,865,450 | ||||||||||
| 5.750%, 01/24/2022 | 15,100,000 | 17,000,697 | ||||||||||
| 2.800%, 11/29/2023 ∞ | 10,000,000 | 10,322,240 | ||||||||||
| 3.500%, 01/23/2025 | 9,250,000 | 9,350,492 | ||||||||||
| 6.750%, 10/01/2037 | 300,000 | 389,412 | ||||||||||
| The Guardian Life Insurance Co. of America: | ||||||||||||
| 7.375%, 09/30/2039 (Acquired 08/27/2015, Cost $8,391,351) * | 6,507,000 | 9,272,247 | ||||||||||
| 4.875%, 06/19/2064 (Acquired 06/16/2014, Cost $2,989,950) * | 3,000,000 | 3,300,060 | ||||||||||
| The Hartford Financial Services Group, Inc.: | ||||||||||||
| 6.300%, 03/15/2018 | 200,000 | 206,234 | ||||||||||
| 5.125%, 04/15/2022 | 6,097,000 | 6,768,017 | ||||||||||
| 8.125%, 06/15/2038 ∞ | 1,365,000 | 1,440,430 | ||||||||||
| Highmark, Inc., | ||||||||||||
| 4.750%, 05/15/2021 (Acquired 07/30/2014, Cost $7,837,494) * | 7,800,000 | 8,058,203 | ||||||||||
| HSBC Bank USA NA/New York NY, | ||||||||||||
| 6.000%, 08/09/2017 | 2,720,000 | 2,731,152 | ||||||||||
| HSBC Finance Corp., | ||||||||||||
| 6.676%, 01/15/2021 | 42,705,000 | 48,126,998 | ||||||||||
| HSBC Holdings PLC: | ||||||||||||
| 3.400%, 03/08/2021 f | 9,100,000 | 9,352,953 | ||||||||||
| 2.650%, 01/05/2022 f | 4,000,000 | 3,990,776 | ||||||||||
| 3.600%, 05/25/2023 f | 6,000,000 | 6,200,466 | ||||||||||
| HSBC USA, Inc., | ||||||||||||
| 2.350%, 03/05/2020 | 2,750,000 | 2,766,145 | ||||||||||
| Humana, Inc.: | ||||||||||||
| 7.200%, 06/15/2018 | 800,000 | 840,311 | ||||||||||
| 8.150%, 06/15/2038 | 8,983,000 | 13,058,920 | ||||||||||
| Huntington Bancshares Inc./OH: | ||||||||||||
| 3.150%, 03/14/2021 | 17,100,000 | 17,437,280 | ||||||||||
| 2.300%, 01/14/2022 | 15,225,000 | 14,996,336 | ||||||||||
| The Huntington National Bank: | ||||||||||||
| 2.000%, 06/30/2018 | 13,000,000 | 13,046,176 | ||||||||||
| 2.200%, 11/06/2018 | 5,000,000 | 5,013,825 | ||||||||||
| 2.875%, 08/20/2020 | 12,275,000 | 12,483,859 | ||||||||||
| ING Bank NV: | ||||||||||||
| 2.050%, 08/17/2018 (Acquired 08/10/2015, Cost $4,122,484) * f | 4,125,000 | 4,132,784 | ||||||||||
| 2.450%, 03/16/2020 (Acquired 03/10/2015 through 06/28/2017, Cost $9,483,962) * f | 9,500,000 | 9,543,301 | ||||||||||
| 2.750%, 03/22/2021 (Acquired 03/15/2016, Cost $9,166,100) * f | 9,175,000 | 9,284,421 | ||||||||||
| 5.000%, 06/09/2021 (Acquired 10/12/2011, Cost $2,468,800) * f | 2,500,000 | 2,735,950 | ||||||||||
| 5.800%, 09/25/2023 (Acquired 01/14/2014 through 02/08/2017, Cost $34,554,149) * f | 31,680,000 | 35,772,771 | ||||||||||
| ING Groep NV, | ||||||||||||
| 3.150%, 03/29/2022 f | 4,000,000 | 4,076,188 | ||||||||||
| Invesco Finance PLC, | ||||||||||||
| 3.125%, 11/30/2022 f | 5,500,000 | 5,604,044 | ||||||||||
| Jackson National Life Global Funding, | ||||||||||||
| 3.250%, 01/30/2024 (Acquired 01/24/2017, Cost $9,992,500) * | 10,000,000 | 10,132,530 | ||||||||||
| Jefferies Group LLC: | ||||||||||||
| 4.850%, 01/15/2027 | 15,750,000 | 16,463,018 | ||||||||||
| 6.450%, 06/08/2027 | 1,000,000 | 1,146,008 | ||||||||||
| John Hancock Life Insurance Co., | ||||||||||||
| 7.375%, 02/15/2024 (Acquired 08/26/2010 through 07/13/2016, Cost $20,238,275) * | 17,115,000 | 20,399,831 | ||||||||||
| JPMorgan Chase & Co.: | ||||||||||||
| 2.250%, 01/23/2020 | 3,650,000 | 3,661,322 | ||||||||||
| 4.250%, 10/15/2020 | 8,250,000 | 8,760,535 | ||||||||||
| 2.295%, 08/15/2021 | 22,000,000 | 21,872,004 | ||||||||||
| 4.350%, 08/15/2021 | 2,400,000 | 2,568,852 | ||||||||||
| 4.500%, 01/24/2022 | 4,400,000 | 4,764,536 | ||||||||||
| 3.200%, 01/25/2023 | 5,350,000 | 5,454,694 | ||||||||||
| 2.383%, 10/24/2023 ∞ | 10,000,000 | 10,150,320 | ||||||||||
| 3.125%, 01/23/2025 | 21,850,000 | 21,722,112 | ||||||||||
| KEB Hana Bank, | ||||||||||||
| 1.750%, 10/18/2019 (Acquired 10/12/2016, Cost $16,696,065) * f | 16,750,000 | 16,491,883 | ||||||||||
| KeyBank NA/Cleveland OH: | ||||||||||||
| 4.625%, 06/15/2018 | 2,670,000 | 2,732,275 | ||||||||||
| 2.250%, 03/16/2020 | 9,425,000 | 9,472,266 | ||||||||||
| 3.400%, 05/20/2026 | 21,575,000 | 21,423,738 | ||||||||||
| KeyCorp, | ||||||||||||
| 2.900%, 09/15/2020 | 17,200,000 | 17,497,526 | ||||||||||
| Kookmin Bank, | ||||||||||||
| 1.625%, 07/14/2017 f | 5,000,000 | 4,999,484 | ||||||||||
| LeasePlan Corp. NV: | ||||||||||||
| 3.000%, 10/23/2017 (Acquired 10/15/2012 through 02/07/2013, Cost $10,001,774) * f | 10,000,000 | 10,030,830 | ||||||||||
| 2.500%, 05/16/2018 (Acquired 09/24/2014 through 08/27/2015, Cost $27,260,782) * f | 27,204,000 | 27,276,580 | ||||||||||
| 2.875%, 01/22/2019 (Acquired 10/14/2015 through 06/28/2017, Cost $5,197,662) * f | 5,200,000 | 5,216,484 | ||||||||||
| Liberty Mutual Group, Inc.: | ||||||||||||
| 6.500%, 03/15/2035 (Acquired 09/29/2008 through 04/16/2013, Cost $699,526) * | 700,000 | 875,223 | ||||||||||
| 10.750%, 06/15/2058 (Acquired 05/21/2008 through 05/06/2009, Cost $751,629) ∞ * | 900,000 | 1,426,500 | ||||||||||
| Liberty Mutual Insurance Co., | ||||||||||||
| 7.697%, 10/15/2097 (Acquired 03/26/2003, Cost $240,188) * | 375,000 | 528,729 | ||||||||||
| Lincoln National Corp.: | ||||||||||||
| 8.750%, 07/01/2019 | 3,490,000 | 3,923,772 | ||||||||||
| 3.196%, 04/20/2067 ∞ | 930,000 | 850,950 | ||||||||||
| Lloyds Bank PLC, | ||||||||||||
| 5.800%, 01/13/2020 (Acquired 01/05/2010 through 01/19/2012, Cost $6,374,601) * f | 6,350,000 | 6,908,203 | ||||||||||
| Lloyds Banking Group PLC, | ||||||||||||
| 3.750%, 01/11/2027 f | 7,800,000 | 7,830,919 | ||||||||||
| Macquarie Bank Ltd.: | ||||||||||||
| 1.600%, 10/27/2017 (Acquired 10/22/2014, Cost $7,595,364) * f | 7,600,000 | 7,600,639 | ||||||||||
| 1.797%, 10/27/2017 (Acquired 10/22/2014, Cost $8,000,000) ∞ * f | 8,000,000 | 8,013,456 | ||||||||||
| 2.400%, 01/21/2020 (Acquired 01/14/2015 through 02/28/2017, Cost $17,728,076) * f | 17,750,000 | 17,780,370 | ||||||||||
| Macquarie Group Ltd.: | ||||||||||||
| 4.875%, 08/10/2017 (Acquired 10/30/2014, Cost $1,003,259) * f | 1,000,000 | 1,003,155 | ||||||||||
| 7.625%, 08/13/2019 (Acquired 12/15/2014, Cost $2,707,421) * f | 2,467,000 | 2,730,838 | ||||||||||
| Manufacturers & Traders Trust Co.: | ||||||||||||
| 6.625%, 12/04/2017 | 1,120,000 | 1,142,787 | ||||||||||
| 2.100%, 02/06/2020 | 8,000,000 | 8,011,688 | ||||||||||
| 2.437%, 12/28/2020 ∞ | 9,483,000 | 9,500,923 | ||||||||||
| Manulife Financial Corp.: | ||||||||||||
| 4.900%, 09/17/2020 f | 3,109,000 | 3,342,654 | ||||||||||
| 4.150%, 03/04/2026 f | 16,375,000 | 17,306,655 | ||||||||||
| Marsh & McLennan Companies, Inc.: | ||||||||||||
| 4.800%, 07/15/2021 | 1,000,000 | 1,087,167 | ||||||||||
| 3.300%, 03/14/2023 | 6,875,000 | 7,065,568 | ||||||||||
| 3.750%, 03/14/2026 | 9,225,000 | 9,604,572 | ||||||||||
| Massachusetts Mutual Life Insurance Co.: | ||||||||||||
| 7.625%, 11/15/2023 (Acquired 10/10/2012, Cost $3,912,785) * | 3,184,000 | 3,879,408 | ||||||||||
| 8.875%, 06/01/2039 (Acquired 07/21/2015 through 06/28/2017, Cost $17,989,206) * | 11,820,000 | 19,367,448 | ||||||||||
| 4.900%, 04/01/2077 (Acquired 03/20/2017, Cost $7,927,920) * | 8,000,000 | 8,552,776 | ||||||||||
| MBIA Insurance Corp., | ||||||||||||
| 12.418%, 01/15/2033 (Acquired 01/11/2008, Cost $700,000) ∞ * | 700,000 | 336,000 | ||||||||||
| MetLife Capital Trust IV, | ||||||||||||
| 7.875%, 12/15/2037 (Acquired 03/26/2012 through 04/05/2013, Cost $1,039,064) * | 900,000 | 1,215,090 | ||||||||||
| MetLife, Inc.: | ||||||||||||
| 7.717%, 02/15/2019 | 1,407,000 | 1,536,831 | ||||||||||
| 4.875%, 11/13/2043 | 3,375,000 | 3,814,982 | ||||||||||
| 4.050%, 03/01/2045 | 9,025,000 | 9,101,424 | ||||||||||
| Metropolitan Life Global Funding I, | ||||||||||||
| 3.875%, 04/11/2022 (Acquired 12/18/2012, Cost $1,571,387) * | 1,500,000 | 1,587,792 | ||||||||||
| Mitsubishi UFJ Financial Group, Inc.: | ||||||||||||
| 2.950%, 03/01/2021 f | 10,000,000 | 10,162,210 | ||||||||||
| 2.190%, 09/13/2021 f | 20,000,000 | 19,710,000 | ||||||||||
| Mitsubishi UFJ Trust & Banking Corp., | ||||||||||||
| 2.450%, 10/16/2019 (Acquired 07/12/2016, Cost $10,143,292) * f | 10,000,000 | 10,064,750 | ||||||||||
| Mizuho Bank Ltd.: | ||||||||||||
| 1.850%, 03/21/2018 (Acquired 03/14/2013, Cost $1,847,447) * f | 1,850,000 | 1,852,473 | ||||||||||
| 2.650%, 09/25/2019 (Acquired 09/18/2014, Cost $4,991,400) * f | 5,000,000 | 5,036,615 | ||||||||||
| 2.400%, 03/26/2020 (Acquired 03/19/2015, Cost $19,974,800) * f | 20,000,000 | 20,018,200 | ||||||||||
| Morgan Stanley: | ||||||||||||
| 6.625%, 04/01/2018 | 1,275,000 | 1,320,275 | ||||||||||
| 7.300%, 05/13/2019 | 4,675,000 | 5,111,014 | ||||||||||
| 2.375%, 07/23/2019 | 2,000,000 | 2,013,852 | ||||||||||
| 5.625%, 09/23/2019 | 10,100,000 | 10,850,592 | ||||||||||
| 2.650%, 01/27/2020 | 7,000,000 | 7,073,815 | ||||||||||
| 3.750%, 02/25/2023 | 1,000,000 | 1,039,813 | ||||||||||
| 2.553%, 10/24/2023 ∞ | 10,000,000 | 10,173,640 | ||||||||||
| 3.700%, 10/23/2024 | 5,000,000 | 5,131,290 | ||||||||||
| 4.000%, 07/23/2025 | 2,500,000 | 2,609,337 | ||||||||||
| 3.875%, 01/27/2026 | 7,000,000 | 7,206,353 | ||||||||||
| 3.125%, 07/27/2026 | 13,175,000 | 12,809,354 | ||||||||||
| MUFG Americas Holdings Corp.: | ||||||||||||
| 2.250%, 02/10/2020 | 7,000,000 | 7,004,382 | ||||||||||
| 3.500%, 06/18/2022 | 1,150,000 | 1,184,623 | ||||||||||
| National Australia Bank Ltd./New York: | ||||||||||||
| 1.875%, 07/23/2018 f | 6,000,000 | 6,019,512 | ||||||||||
| 2.500%, 07/12/2026 f | 5,000,000 | 4,718,800 | ||||||||||
| Nationwide Building Society: | ||||||||||||
| 2.350%, 01/21/2020 (Acquired 01/12/2015, Cost $13,770,454) * f | 13,775,000 | 13,826,133 | ||||||||||
| 3.900%, 07/21/2025 (Acquired 07/14/2015, Cost $8,069,463) * f | 8,100,000 | 8,471,579 | ||||||||||
| 4.000%, 09/14/2026 (Acquired 06/05/2017, Cost $15,066,094) * f | 15,000,000 | 14,836,980 | ||||||||||
| Nationwide Financial Services, Inc., | ||||||||||||
| 5.375%, 03/25/2021 (Acquired 02/05/2015 through 05/08/2015, Cost $16,041,956) * | 14,788,000 | 16,218,295 | ||||||||||
| Nationwide Mutual Insurance Co.: | ||||||||||||
| 7.875%, 04/01/2033 (Acquired 10/13/2009 through 04/12/2017, Cost $4,964,815) * | 3,600,000 | 5,102,039 | ||||||||||
| 9.375%, 08/15/2039 (Acquired 10/06/2015 through 08/26/2016, Cost $25,712,857) * | 16,803,000 | 28,058,456 | ||||||||||
| New England Mutual Life Insurance Co., | ||||||||||||
| 7.875%, 02/15/2024 (Acquired 11/07/2012, Cost $3,962,255) * | 3,200,000 | 3,964,970 | ||||||||||
| New York Life Insurance Co., | ||||||||||||
| 6.750%, 11/15/2039 (Acquired 04/06/2016 through 01/05/2017, Cost $33,790,085) * | 25,105,000 | 35,263,161 | ||||||||||
| Nippon Life Insurance Co., | ||||||||||||
| 5.000%, 10/18/2042 (Acquired 10/11/2012, Cost $2,000,000) ∞ * f | 2,000,000 | 2,130,000 | ||||||||||
| Nomura Holdings, Inc.: | ||||||||||||
| 2.750%, 03/19/2019 f | 11,268,000 | 11,380,759 | ||||||||||
| 6.700%, 03/04/2020 f | 2,525,000 | 2,796,927 | ||||||||||
| Peachtree Corners Funding Trust, | ||||||||||||
| 3.976%, 02/15/2025 (Acquired 03/10/2015, Cost $16,000,000) * | 16,000,000 | 16,236,672 | ||||||||||
| Principal Financial Group, Inc.: | ||||||||||||
| 3.300%, 09/15/2022 | 1,215,000 | 1,248,702 | ||||||||||
| 3.125%, 05/15/2023 | 3,550,000 | 3,578,286 | ||||||||||
| Principal Life Global Funding II, | ||||||||||||
| 2.200%, 04/08/2020 (Acquired 03/31/2015, Cost $7,989,440) * | 8,000,000 | 7,977,456 | ||||||||||
| Protective Life Corp., | ||||||||||||
| 7.375%, 10/15/2019 | 5,360,000 | 5,967,963 | ||||||||||
| Protective Life Global Funding, | ||||||||||||
| 2.700%, 11/25/2020 (Acquired 11/19/2015, Cost $10,715,562) * | 10,725,000 | 10,804,730 | ||||||||||
| Prudential Financial, Inc., | ||||||||||||
| 6.000%, 12/01/2017 | 384,000 | 390,702 | ||||||||||
| Raymond James Financial, Inc.: | ||||||||||||
| 8.600%, 08/15/2019 | 14,527,000 | 16,415,859 | ||||||||||
| 4.950%, 07/15/2046 | 15,000,000 | 16,278,225 | ||||||||||
| Regions Bank/Birmingham AL, | ||||||||||||
| 7.500%, 05/15/2018 | 15,864,000 | 16,607,577 | ||||||||||
| Regions Financial Corp., | ||||||||||||
| 3.200%, 02/08/2021 | 30,600,000 | 31,285,746 | ||||||||||
| Reliance Standard Life Global Funding II: | ||||||||||||
| 2.500%, 01/15/2020 (Acquired 01/07/2015, Cost $13,952,260) * | 14,000,000 | 14,023,044 | ||||||||||
| 2.375%, 05/04/2020 (Acquired 04/27/2015 through 11/08/2016, Cost $23,754,172) * | 23,750,000 | 23,659,821 | ||||||||||
| 3.050%, 01/20/2021 (Acquired 01/12/2016, Cost $10,941,403) * | 10,954,000 | 11,077,167 | ||||||||||
| Royal Bank of Canada, | ||||||||||||
| 4.650%, 01/27/2026 f | 29,930,000 | 32,078,675 | ||||||||||
| Royal Bank of Scotland Group PLC, | ||||||||||||
| 3.498%, 05/15/2023 ∞ f | 26,500,000 | 26,671,853 | ||||||||||
| Santander Bank NA, | ||||||||||||
| 8.750%, 05/30/2018 | 7,259,000 | 7,694,395 | ||||||||||
| Santander Issuances SAU, | ||||||||||||
| 5.179%, 11/19/2025 f | 11,150,000 | 11,951,440 | ||||||||||
| Santander UK Group Holdings PLC, | ||||||||||||
| 2.875%, 08/05/2021 f | 9,375,000 | 9,396,553 | ||||||||||
| Santander UK PLC: | ||||||||||||
| 5.000%, 11/07/2023 (Acquired 10/31/2013 through 03/30/2017, Cost $29,552,415) * f | 28,200,000 | 30,230,908 | ||||||||||
| 4.000%, 03/13/2024 f | 7,700,000 | 8,133,048 | ||||||||||
| Simon Property Group LP, | ||||||||||||
| 1.500%, 02/01/2018 (Acquired 12/10/2012, Cost $11,962,200) * | 12,000,000 | 11,991,096 | ||||||||||
| Societe Generale SA: | ||||||||||||
| 5.200%, 04/15/2021 (Acquired 09/20/2011 through 02/13/2013, Cost $10,016,822) * f | 10,100,000 | 11,096,355 | ||||||||||
| 3.250%, 01/12/2022 (Acquired 01/05/2017, Cost $19,949,600) * f | 20,000,000 | 20,446,640 | ||||||||||
| 5.000%, 01/17/2024 (Acquired 01/14/2014, Cost $2,972,790) * f | 3,000,000 | 3,196,203 | ||||||||||
| 4.250%, 04/14/2025 (Acquired 04/08/2015, Cost $6,201,657) * f | 6,300,000 | 6,388,357 | ||||||||||
| 4.750%, 11/24/2025 (Acquired 11/17/2015, Cost $10,759,176) * f | 10,800,000 | 11,323,800 | ||||||||||
| SpareBank 1 Boligkreditt AS, | ||||||||||||
| 1.750%, 11/15/2019 (Acquired 11/07/2012, Cost $4,961,150) * f | 5,000,000 | 4,969,115 | ||||||||||
| Springleaf Finance Corp., | ||||||||||||
| 6.900%, 12/15/2017 | 1,000,000 | 1,015,000 | ||||||||||
| Standard Chartered PLC: | ||||||||||||
| 1.700%, 04/17/2018 (Acquired 04/13/2015, Cost $9,988,900) * f | 10,000,000 | 9,983,000 | ||||||||||
| 2.100%, 08/19/2019 (Acquired 08/16/2016 through 11/17/2016, Cost $18,613,222) * f | 18,685,000 | 18,616,314 | ||||||||||
| 3.050%, 01/15/2021 (Acquired 01/12/2016, Cost $13,971,720) * f | 14,000,000 | 14,172,508 | ||||||||||
| 5.700%, 03/26/2044 (Acquired 03/21/2014 through 05/01/2014, Cost $14,100,325) * f | 14,000,000 | 15,904,672 | ||||||||||
| Stifel Financial Corp.: | ||||||||||||
| 3.500%, 12/01/2020 | 5,000,000 | 5,102,355 | ||||||||||
| 4.250%, 07/18/2024 | 13,115,000 | 13,352,145 | ||||||||||
| Sumitomo Mitsui Banking Corp.: | ||||||||||||
| 1.950%, 07/23/2018 f | 4,000,000 | 4,010,568 | ||||||||||
| 2.250%, 07/11/2019 f | 12,050,000 | 12,102,502 | ||||||||||
| 2.450%, 01/16/2020 f | 12,450,000 | 12,527,003 | ||||||||||
| 3.000%, 01/18/2023 f | 2,500,000 | 2,533,240 | ||||||||||
| SunTrust Bank/Atlanta GA: | ||||||||||||
| 7.250%, 03/15/2018 | 5,682,000 | 5,895,075 | ||||||||||
| 3.300%, 05/15/2026 | 28,734,000 | 28,083,606 | ||||||||||
| SunTrust Banks, Inc., | ||||||||||||
| 2.900%, 03/03/2021 | 15,000,000 | 15,228,615 | ||||||||||
| Swedbank AB, | ||||||||||||
| 2.650%, 03/10/2021 (Acquired 03/03/2016, Cost $7,016,851) * f | 7,025,000 | 7,108,190 | ||||||||||
| Synchrony Financial: | ||||||||||||
| 3.750%, 08/15/2021 | 16,825,000 | 17,281,378 | ||||||||||
| 4.250%, 08/15/2024 | 33,325,000 | 34,038,355 | ||||||||||
| 4.500%, 07/23/2025 | 12,295,000 | 12,643,563 | ||||||||||
| 3.700%, 08/04/2026 | 3,000,000 | 2,895,147 | ||||||||||
| TD Ameritrade Holding Corp., | ||||||||||||
| 5.600%, 12/01/2019 | 1,000,000 | 1,080,867 | ||||||||||
| Torchmark Corp., | ||||||||||||
| 3.800%, 09/15/2022 | 1,275,000 | 1,312,792 | ||||||||||
| Trinity Acquisition PLC, | ||||||||||||
| 4.400%, 03/15/2026 f | 15,776,000 | 16,473,567 | ||||||||||
| UBS Group Funding Switzerland AG: | ||||||||||||
| 2.736%, 09/24/2020 (Acquired 09/21/2015, Cost $26,350,000) ∞ * f | 26,350,000 | 26,831,994 | ||||||||||
| 2.650%, 02/01/2022 (Acquired 10/14/2016 through 11/07/2016, Cost $9,967,450) * f | 10,000,000 | 9,978,770 | ||||||||||
| 3.491%, 05/23/2023 (Acquired 03/16/2017 through 04/07/2017, Cost $21,115,710) * f | 21,075,000 | 21,561,896 | ||||||||||
| UnitedHealth Group, Inc., | �� | |||||||||||
| 4.625%, 07/15/2035 | 12,175,000 | 13,683,775 | ||||||||||
| Voya Financial, Inc.: | ||||||||||||
| 5.500%, 07/15/2022 | 23,194,000 | 25,758,189 | ||||||||||
| 3.650%, 06/15/2026 | 7,102,000 | 7,115,487 | ||||||||||
| Wells Fargo & Co.: | ||||||||||||
| Class N, 2.150%, 01/30/2020 | 7,000,000 | 7,017,997 | ||||||||||
| 2.500%, 03/04/2021 | 15,950,000 | 16,005,171 | ||||||||||
| 3.069%, 01/24/2023 | 12,000,000 | 12,168,108 | ||||||||||
| 2.402%, 10/31/2023 ∞ | 10,000,000 | 10,177,510 | ||||||||||
| 3.000%, 02/19/2025 | 5,225,000 | 5,143,903 | ||||||||||
| 3.000%, 04/22/2026 | 4,000,000 | 3,906,616 | ||||||||||
| Westpac Banking Corp.: | ||||||||||||
| 1.600%, 08/19/2019 f | 15,000,000 | 14,883,495 | ||||||||||
| 4.875%, 11/19/2019 f | 636,000 | 677,272 | ||||||||||
| 2.100%, 05/13/2021 f | 13,300,000 | 13,178,292 | ||||||||||
| 4.322%, 11/23/2031 ∞ f | 10,000,000 | 10,249,290 | ||||||||||
| Willis North America, Inc., | ||||||||||||
| 7.000%, 09/29/2019 | 16,003,000 | 17,592,450 | ||||||||||
| Willis Towers Watson PLC, | ||||||||||||
| 5.750%, 03/15/2021 f | 20,329,000 | 22,427,258 | ||||||||||
| 3,290,555,252 | 22.7 | % | ||||||||||
| Total Corporate Bonds | 7,307,925,468 | 50.5 | % | |||||||||
| Taxable Municipal Bonds | ||||||||||||
| Bellevue Union School District, | ||||||||||||
| 5.000%, 08/01/2028 | 625,000 | 667,850 | ||||||||||
| California Housing Finance Agency, | ||||||||||||
| 2.794%, 08/01/2036 (Callable 08/01/2025) | 19,155,000 | 18,960,577 | ||||||||||
| California Qualified School Bond Joint Powers Authority: | ||||||||||||
| 6.739%, 09/01/2026 | 2,415,000 | 2,755,298 | ||||||||||
| 7.155%, 03/01/2027 | 1,700,000 | 1,969,569 | ||||||||||
| California School Finance Authority, | ||||||||||||
| 5.041%, 07/01/2020 | 1,500,000 | 1,597,470 | ||||||||||
| Camden County Improvement Authority, | ||||||||||||
| 7.747%, 07/01/2034 (Callable 07/01/2020) | 1,100,000 | 1,244,815 | ||||||||||
| Central Valley Support Joint Powers Agency, | ||||||||||||
| 5.676%, 09/01/2024 | 1,500,000 | 1,680,915 | ||||||||||
| City of Vernon CA Electric System Revenue, | ||||||||||||
| 4.500%, 08/01/2022 | 7,500,000 | 7,854,450 | ||||||||||
| City of Williston ND, | ||||||||||||
| 3.100%, 07/15/2025 (Callable 07/21/2017) | 6,065,000 | 6,065,788 | ||||||||||
| Colton Joint Unified School District, | ||||||||||||
| 6.008%, 08/01/2026 | 1,250,000 | 1,445,312 | ||||||||||
| Elgin Local School District, | ||||||||||||
| 5.499%, 08/31/2027 (Callable 12/01/2019) | 1,000,000 | 1,035,990 | ||||||||||
| Hillsborough City School District: | ||||||||||||
| –%, 09/01/2036 (Callable 09/01/2021) | 10,000,000 | 4,349,800 | ||||||||||
| –%, 09/01/2042 (Callable 09/01/2021) | 10,000,000 | 3,153,700 | ||||||||||
| Iowa Tobacco Settlement Authority, | ||||||||||||
| 6.500%, 06/01/2023 (Callable 07/31/2017) | 1,885,000 | 1,885,264 | ||||||||||
| New Hampshire Housing Finance Authority: | ||||||||||||
| 3.100%, 07/01/2021 | 1,510,000 | 1,511,404 | ||||||||||
| 3.750%, 07/01/2034 (Callable 07/01/2023) | 4,850,000 | 4,935,021 | ||||||||||
| North Carolina Housing Finance Agency: | ||||||||||||
| 2.870%, 07/01/2032 (Callable 01/01/2024) | 4,615,000 | 4,582,326 | ||||||||||
| 2.812%, 07/01/2035 (Callable 01/01/2024) | 6,020,000 | 5,970,034 | ||||||||||
| North East Independent School District/TX, | ||||||||||||
| 5.240%, 08/01/2027 | 3,000,000 | 3,523,140 | ||||||||||
| Port of Oakland, | ||||||||||||
| 5.000%, 11/01/2020 (Callable 11/01/2017) | 2,900,000 | 2,936,192 | ||||||||||
| Rhode Island Housing & Mortgage Finance Corp./RI, | ||||||||||||
| 2.913%, 10/01/2039 (Callable 10/01/2023) | 3,065,000 | 3,051,115 | ||||||||||
| San Dieguito Public Facilities Authority, | ||||||||||||
| 6.459%, 05/01/2027 | 1,825,000 | 2,237,851 | ||||||||||
| State of Illinois: | ||||||||||||
| 5.163%, 02/01/2018 | 3,000,000 | 3,031,050 | ||||||||||
| 6.200%, 07/01/2021 | 17,500,000 | 18,065,950 | ||||||||||
| State Public School Building Authority, | ||||||||||||
| 5.000%, 09/15/2027 | 1,998,000 | 2,188,010 | ||||||||||
| Three Rivers Local School District, | ||||||||||||
| 5.209%, 09/15/2027 (Callable 12/01/2020) | 1,350,000 | 1,401,637 | ||||||||||
| Town of Davie FL Water & Sewer Revenue, | ||||||||||||
| 6.599%, 10/01/2030 (Callable 10/01/2020) | 1,000,000 | 1,121,890 | ||||||||||
| West Allis West Milwaukee School District, | ||||||||||||
| 4.000%, 04/01/2020 (Callable 04/01/2018) | 16,520,000 | 16,607,226 | ||||||||||
| West Contra Costa Unified School District, | ||||||||||||
| 6.250%, 08/01/2030 | 4,320,000 | 5,358,917 | ||||||||||
| Westlake City School District, | ||||||||||||
| 5.227%, 12/01/2026 (Callable 12/01/2020) | 1,160,000 | 1,181,704 | ||||||||||
| 132,370,265 | 0.9 | % | ||||||||||
| Residential Mortgage-Backed Securities | ||||||||||||
| U.S. Government Agency Issues | ||||||||||||
| Fannie Mae Pool: | ||||||||||||
| 4.500%, 01/01/2040 | 4,980,477 | 5,366,718 | ||||||||||
| 3.000%, 04/01/2043 | 2,497,492 | 2,508,065 | ||||||||||
| 3.500%, 12/01/2045 | 51,204,431 | 52,622,745 | ||||||||||
| 3.500%, 11/01/2046 | 41,988,433 | 43,151,473 | ||||||||||
| Fannie Mae REMIC Trust: | ||||||||||||
| Series 1989-94, Class G, 7.500%, 12/25/2019 | 1,720 | 1,802 | ||||||||||
| Series 1990-15, Class J, 7.000%, 02/25/2020 | 2,248 | 2,300 | ||||||||||
| Series 1991-21, Class J, 7.000%, 03/25/2021 | 1,335 | 1,406 | ||||||||||
| Series 1991-43, Class J, 7.000%, 05/25/2021 | 24,182 | 25,639 | ||||||||||
| Series 1991-65, Class Z, 6.500%, 06/25/2021 | 15,368 | 16,244 | ||||||||||
| Series 1992-129, Class L, 6.000%, 07/25/2022 | 47,633 | 50,428 | ||||||||||
| Series 1993-32, Class H, 6.000%, 03/25/2023 | 13,400 | 14,354 | ||||||||||
| Series 1993-58, Class H, 5.500%, 04/25/2023 | 58,256 | 61,704 | ||||||||||
| Series 2004-90, Class LH, 5.000%, 04/25/2034 | 768,408 | 782,570 | ||||||||||
| Federal Gold Loan Mortgage Corp. (FGLMC): | ||||||||||||
| 5.000%, 12/01/2020 | 23,350 | 24,314 | ||||||||||
| 5.000%, 05/01/2021 | 42,168 | 43,772 | ||||||||||
| 6.000%, 06/01/2021 | 9,444 | 9,979 | ||||||||||
| 3.000%, 05/01/2027 | 7,015,334 | 7,209,815 | ||||||||||
| 6.500%, 12/01/2028 | 19,642 | 21,959 | ||||||||||
| 6.500%, 06/01/2029 | 8,666 | 9,707 | ||||||||||
| 3.000%, 10/01/2030 | 46,323,748 | 47,607,944 | ||||||||||
| 3.000%, 02/01/2032 | 47,347,290 | 48,673,540 | ||||||||||
| 3.500%, 05/01/2032 | 33,738,006 | 35,226,450 | ||||||||||
| 3.500%, 01/01/2034 | 35,069,754 | 36,614,151 | ||||||||||
| 5.000%, 03/01/2036 | 4,876,288 | 5,330,836 | ||||||||||
| 5.500%, 04/01/2037 | 157,017 | 174,894 | ||||||||||
| 5.500%, 04/01/2038 | 82,896 | 92,263 | ||||||||||
| 5.500%, 05/01/2038 | 161,708 | 179,441 | ||||||||||
| 5.500%, 01/01/2039 | 24,645,432 | 27,600,368 | ||||||||||
| 4.500%, 11/01/2039 | 935,851 | 1,006,225 | ||||||||||
| 4.500%, 11/01/2039 | 3,109,055 | 3,342,825 | ||||||||||
| 4.500%, 08/01/2040 | 2,994,885 | 3,226,308 | ||||||||||
| 4.500%, 08/01/2040 | 4,489,033 | 4,826,835 | ||||||||||
| 4.000%, 01/01/2041 | 20,357,729 | 21,497,483 | ||||||||||
| 3.500%, 06/01/2042 | 8,121,149 | 8,379,813 | ||||||||||
| 3.500%, 07/01/2042 | 29,403,916 | 30,340,483 | ||||||||||
| 3.500%, 07/01/2042 | 47,230,238 | 48,734,569 | ||||||||||
| 3.000%, 08/01/2042 | 25,455,629 | 25,545,035 | ||||||||||
| 3.500%, 09/01/2042 | 18,629,605 | 19,222,998 | ||||||||||
| 3.000%, 11/01/2042 | 62,877,706 | 63,095,396 | ||||||||||
| 3.000%, 01/01/2043 | 47,673,262 | 47,861,814 | ||||||||||
| 3.000%, 02/01/2043 | 8,385,536 | 8,418,449 | ||||||||||
| 3.500%, 02/01/2043 | 18,421,126 | 19,019,653 | ||||||||||
| 3.000%, 03/01/2043 | 19,400,074 | 19,475,968 | ||||||||||
| 3.000%, 04/01/2043 | 15,931,335 | 15,995,529 | ||||||||||
| 3.000%, 04/01/2043 | 15,706,793 | 15,768,368 | ||||||||||
| 3.000%, 06/01/2043 | 14,020,045 | 14,064,981 | ||||||||||
| 3.000%, 08/01/2043 | 31,729,756 | 31,805,245 | ||||||||||
| 3.500%, 05/01/2044 | 417,983 | 432,149 | ||||||||||
| 3.500%, 08/01/2044 | 33,698,637 | 34,701,981 | ||||||||||
| 4.000%, 09/01/2044 | 19,411,716 | 20,430,978 | ||||||||||
| 4.000%, 10/01/2044 | 28,076,967 | 29,726,684 | ||||||||||
| 4.000%, 02/01/2045 | 21,252,901 | 22,368,839 | ||||||||||
| 3.500%, 06/01/2045 | 34,686,935 | 35,864,568 | ||||||||||
| 3.000%, 10/01/2045 | 43,455,803 | 43,630,963 | ||||||||||
| 3.500%, 01/01/2046 | 66,401,248 | 68,500,299 | ||||||||||
| 3.500%, 08/01/2046 | 69,781,461 | 72,130,888 | ||||||||||
| Federal Home Loan Mortgage Corp. (FHLMC): | ||||||||||||
| Series 1053, Class G, 7.000%, 03/15/2021 | 1,597 | 1,699 | ||||||||||
| Series 136, Class E, 6.000%, 04/15/2021 | 2,440 | 2,528 | ||||||||||
| Series 2804, Class VC, 5.000%, 07/15/2021 | 61,912 | 62,214 | ||||||||||
| Series 1122, Class G, 7.000%, 08/15/2021 | 4,425 | 4,727 | ||||||||||
| Series 1186, Class I, 7.000%, 12/15/2021 | 8,013 | 8,678 | ||||||||||
| Federal National Mortgage Association (FNMA): | ||||||||||||
| 5.000%, 11/01/2021 | 107,380 | 109,961 | ||||||||||
| 3.000%, 04/01/2027 | 13,125,787 | 13,509,261 | ||||||||||
| 3.500%, 07/01/2027 | 48,777,096 | 50,908,943 | ||||||||||
| 2.500%, 12/01/2027 | 19,709,068 | 19,942,983 | ||||||||||
| 5.000%, 05/01/2028 | 51,999 | 56,767 | ||||||||||
| 3.500%, 07/01/2028 | 35,902,655 | 37,378,853 | ||||||||||
| 6.500%, 09/01/2028 | 13,798 | 15,558 | ||||||||||
| 6.500%, 02/01/2029 | 31,357 | 34,902 | ||||||||||
| 4.500%, 07/01/2030 | 5,913,034 | 6,359,990 | ||||||||||
| 3.000%, 08/01/2030 | 36,702,824 | 37,715,398 | ||||||||||
| 4.000%, 11/01/2031 | 25,521,233 | 27,120,292 | ||||||||||
| 5.500%, 01/01/2032 | 13,181 | 14,720 | ||||||||||
| 5.000%, 09/01/2033 | 17,547,126 | 19,253,219 | ||||||||||
| 4.500%, 10/01/2033 | 32,169,911 | 34,667,059 | ||||||||||
| 4.000%, 01/01/2034 | 17,582,022 | 18,657,912 | ||||||||||
| 5.500%, 04/01/2034 | 978,788 | 1,096,524 | ||||||||||
| 4.000%, 09/01/2034 | 25,490,951 | 27,046,953 | ||||||||||
| 5.500%, 09/01/2034 | 30,354 | 33,974 | ||||||||||
| 5.000%, 02/01/2035 | 24,871,589 | 27,292,994 | ||||||||||
| 5.000%, 02/01/2035 | 18,467,172 | 20,209,219 | ||||||||||
| 5.500%, 02/01/2035 | 14,873 | 16,659 | ||||||||||
| 5.000%, 04/01/2035 | 1,797,381 | 1,973,324 | ||||||||||
| 5.000%, 07/01/2035 | 5,039,584 | 5,532,551 | ||||||||||
| 5.000%, 02/01/2036 | 3,191,118 | 3,503,561 | ||||||||||
| 5.000%, 03/01/2036 | 1,409,241 | 1,547,612 | ||||||||||
| 5.500%, 04/01/2036 | 4,784,983 | 5,354,174 | ||||||||||
| 6.000%, 05/01/2038 | 7,945,467 | 8,977,071 | ||||||||||
| 4.000%, 06/01/2039 | 15,105,527 | 15,989,541 | ||||||||||
| 5.000%, 06/01/2039 | 18,261,263 | 20,023,800 | ||||||||||
| 4.500%, 01/01/2040 | 10,764,590 | 11,595,222 | ||||||||||
| 5.000%, 06/01/2040 | 18,641,640 | 20,374,224 | ||||||||||
| 4.000%, 08/01/2040 | 1,397,172 | 1,475,675 | ||||||||||
| 4.500%, 08/01/2040 | 6,490,312 | 7,011,114 | ||||||||||
| 4.500%, 08/01/2040 | 17,231,456 | 18,614,739 | ||||||||||
| 4.000%, 10/01/2040 | 2,534,875 | 2,676,545 | ||||||||||
| 4.000%, 11/01/2040 | 25,688,052 | 27,126,388 | ||||||||||
| 4.000%, 12/01/2040 | 5,200,611 | 5,544,658 | ||||||||||
| 3.500%, 01/01/2041 | 2,477,939 | 2,557,891 | ||||||||||
| 4.000%, 01/01/2041 | 5,382,813 | 5,681,907 | ||||||||||
| 3.500%, 02/01/2041 | 2,970,436 | 3,067,425 | ||||||||||
| 4.000%, 02/01/2041 | 378,018 | 399,292 | ||||||||||
| 3.500%, 03/01/2041 | 20,895,093 | 21,577,360 | ||||||||||
| 4.000%, 03/01/2041 | 9,565,448 | 10,098,512 | ||||||||||
| 4.500%, 07/01/2041 | 7,863,946 | 8,501,491 | ||||||||||
| 3.500%, 09/01/2041 | 43,212,455 | 44,618,704 | ||||||||||
| 4.000%, 09/01/2041 | 4,439,227 | 4,684,177 | ||||||||||
| 3.500%, 11/01/2041 | 23,269,168 | 24,007,015 | ||||||||||
| 3.500%, 12/01/2041 | 4,059,562 | 4,188,874 | ||||||||||
| 4.000%, 12/01/2041 | 19,271,793 | 20,335,702 | ||||||||||
| 4.000%, 01/01/2042 | 36,714,047 | 38,732,818 | ||||||||||
| 4.500%, 01/01/2042 | 15,056,214 | 16,281,756 | ||||||||||
| 3.000%, 05/01/2042 | 4,441,914 | 4,460,717 | ||||||||||
| 3.500%, 05/01/2042 | 23,476,312 | 24,238,935 | ||||||||||
| 3.500%, 06/01/2042 | 9,030,495 | 9,317,259 | ||||||||||
| 3.500%, 08/01/2042 | 14,408,502 | 14,865,352 | ||||||||||
| 3.500%, 09/01/2042 | 23,478,783 | 24,218,369 | ||||||||||
| 3.000%, 03/01/2043 | 8,583,166 | 8,619,520 | ||||||||||
| 3.000%, 05/01/2043 | 34,272,904 | 34,416,172 | ||||||||||
| 3.500%, 05/01/2043 | 21,404,201 | 22,069,190 | ||||||||||
| 3.000%, 06/01/2043 | 35,832,698 | 35,982,610 | ||||||||||
| 3.000%, 07/01/2043 | 27,886,029 | 27,999,965 | ||||||||||
| 4.000%, 07/01/2043 | 42,566,576 | 44,914,853 | ||||||||||
| 3.000%, 08/01/2043 | 10,251,020 | 10,291,277 | ||||||||||
| 4.500%, 09/01/2043 | 10,494,064 | 11,349,223 | ||||||||||
| 4.000%, 01/01/2045 | 22,490,329 | 23,760,578 | ||||||||||
| 3.500%, 02/01/2045 | 69,749,334 | 71,950,172 | ||||||||||
| 4.000%, 02/01/2045 | 10,519,301 | 11,090,872 | ||||||||||
| 4.000%, 02/01/2045 | 30,158,668 | 31,936,817 | ||||||||||
| 4.000%, 03/01/2045 | 15,228,114 | 16,126,321 | ||||||||||
| 4.500%, 02/01/2046 | 45,940,994 | 49,632,612 | ||||||||||
| Government National Mortgage Association (GNMA): | ||||||||||||
| 6.000%, 12/20/2028 | 23,633 | 26,843 | ||||||||||
| 6.500%, 01/20/2029 | 12,009 | 13,887 | ||||||||||
| 6.000%, 11/20/2033 | 16,714 | 18,946 | ||||||||||
| 5.000%, 07/20/2040 | 896,554 | 985,285 | ||||||||||
| 3.500%, 10/20/2041 | 15,121,859 | 15,710,635 | ||||||||||
| 4.000%, 06/20/2042 | 17,796,370 | 18,817,356 | ||||||||||
| 3.500%, 09/20/2042 | 11,285,299 | 11,738,643 | ||||||||||
| 3.000%, 04/20/2045 | 23,928,851 | 24,195,349 | ||||||||||
| 3.500%, 04/20/2045 | 35,610,713 | 36,923,747 | ||||||||||
| 4.000%, 05/20/2045 | 27,786,794 | 29,367,836 | ||||||||||
| 3.500%, 06/20/2045 | 33,002,454 | 34,219,316 | ||||||||||
| 4.500%, 01/20/2046 | 28,422,730 | 30,223,758 | ||||||||||
| 3.000%, 06/20/2046 | 18,060,678 | 18,261,822 | ||||||||||
| 3.000%, 08/20/2046 | 64,690,943 | 65,411,413 | ||||||||||
| 2,509,570,967 | 17.4 | % | ||||||||||
| Non-U.S. Government Agency Issues | ||||||||||||
| ABFC Trust, | ||||||||||||
| Series 2006-OPT1, Class A3C2, 1.366%, 09/25/2036 ∞ | 9,202,951 | 8,706,618 | ||||||||||
| Accredited Mortgage Loan Trust: | ||||||||||||
| Series 2005-4, Class A2D, 1.536%, 12/25/2035 ∞ | 10,201,095 | 10,067,259 | ||||||||||
| Series 2007-1, Class A3, 1.346%, 02/25/2037 ∞ | 5,603,392 | 5,547,924 | ||||||||||
| ACE Securities Corp. Home Equity Loan Trust, | ||||||||||||
| Series 2006-OP1, Class A2C, 1.366%, 04/25/2036 ∞ | 10,495,845 | 10,362,503 | ||||||||||
| Alternative Loan Trust: | ||||||||||||
| Series 2005-3CB, Class 2A1, 5.000%, 03/25/2020 | 888,810 | 884,850 | ||||||||||
| Series 2005-50CB, Class 4A1, 5.000%, 11/25/2020 § | 254,429 | 254,429 | ||||||||||
| Series 2005-85CB, Class 3A1, 5.250%, 02/25/2021 (Acquired 06/29/2015, Cost $11,511) * | 11,639 | 11,345 | ||||||||||
| Series 2006-7CB, Class 3A1, 5.250%, 05/25/2021 § | 324,650 | 316,759 | ||||||||||
| Series 2006-J5, Class 3A1, 4.494%, 07/25/2021 ∞ | 16,336 | 15,568 | ||||||||||
| Series 2006-43CB, Class 2A1, 6.000%, 02/25/2022 § | 247,450 | 249,090 | ||||||||||
| Series 2004-18CB, Class 1A1, 6.000%, 09/25/2034 | 6,924,500 | 7,151,106 | ||||||||||
| Series 2005-6CB, Class 1A4, 5.500%, 04/25/2035 § | 20,595,923 | 20,117,784 | ||||||||||
| Series 2005-11CB, Class 2A6, 5.500%, 06/25/2035 § | 8,157,534 | 7,986,592 | ||||||||||
| Series 2005-29CB, Class A1, 5.500%, 07/25/2035 | 4,099,424 | 3,832,456 | ||||||||||
| Series 2005-49CB, Class A5, 5.500%, 11/25/2035 § | 3,832,219 | 3,590,023 | ||||||||||
| Series 2005-73CB, Class 1A7, 5.500%, 01/25/2036 § | 508,246 | 499,313 | ||||||||||
| Series 2005-85CB, Class 2A2, 5.500%, 02/25/2036 § | 4,689,620 | 4,431,964 | ||||||||||
| Series 2006-28CB, Class A17, 6.000%, 10/25/2036 § | 640,138 | 547,854 | ||||||||||
| AMRESCO Residential Securities Corp. Mortgage Loan Trust, | ||||||||||||
| Series 1998-2, Class A6, 6.405%, 12/25/2027 | 2,269 | 2,251 | ||||||||||
| Argent Securities Inc. Asset-Backed Pass-Through Certificates, | ||||||||||||
| Series 2005-W5, Class A1, 1.451%, 01/25/2036 ∞ | 49,408,629 | 47,378,315 | ||||||||||
| Asset Backed Securities Corp. Home Equity Loan Trust, | ||||||||||||
| Series 2006-HE3, Class A4, 1.386%, 03/25/2036 ∞ | 1,083,032 | 1,070,496 | ||||||||||
| Series 2006-HE2, Class A1, 1.406%, 03/25/2036 ∞ | 24,638,800 | 23,065,184 | ||||||||||
| Series 2006-HE6, Class A4, 1.376%, 11/25/2036 ∞ | 1,010,536 | 971,739 | ||||||||||
| Banc of America Alternative Loan Trust: | ||||||||||||
| Series 2004-6, Class 4A1, 5.000%, 07/25/2019 | 1,995,417 | 2,004,954 | ||||||||||
| Series 2004-11, Class 4A1, 5.500%, 12/25/2019 | 3,454 | 3,487 | ||||||||||
| Series 2005-2, Class 4A1, 5.500%, 03/25/2020 | 338,079 | 337,944 | ||||||||||
| Series 2005-4, Class 3A1, 5.500%, 05/25/2020 | 231,427 | 228,990 | ||||||||||
| Series 2005-8, Class 5A1, 5.500%, 09/25/2020 § | 68,542 | 66,729 | ||||||||||
| Series 2007-1, Class 1A1, 5.824%, 04/25/2022 ∞ § | 358,136 | 346,083 | ||||||||||
| Series 2003-8, Class 1CB1, 5.500%, 10/25/2033 | 3,069,536 | 3,128,374 | ||||||||||
| Series 2004-5, Class 1A1, 6.000%, 06/25/2034 | 9,849,717 | 10,279,969 | ||||||||||
| Series 2004-6, Class 1A1, 6.000%, 07/25/2034 | 9,365,258 | 9,806,562 | ||||||||||
| Series 2004-10, Class 1CB1, 6.000%, 11/25/2034 | 16,480,528 | 17,331,137 | ||||||||||
| Series 2004-11, Class 1CB1, 6.000%, 12/25/2034 | 15,829,038 | 16,521,209 | ||||||||||
| Series 2005-2, Class 1CB2, 5.500%, 03/25/2035 § | 1,117,080 | 1,107,014 | ||||||||||
| Series 2005-6, Class CB7, 5.250%, 07/25/2035 § | 3,888,239 | 3,847,845 | ||||||||||
| Series 2005-9, Class 1CB3, 5.500%, 10/25/2035 § | 21,964 | 21,710 | ||||||||||
| Series 2005-9, Class 2CB1, 6.000%, 10/25/2035 § | 8,031,101 | 7,814,005 | ||||||||||
| Series 2006-4, Class 3CB4, 6.000%, 05/25/2046 § | 39,694 | 36,754 | ||||||||||
| Series 2006-5, Class CB7, 6.000%, 06/25/2046 § | 314,563 | 275,054 | ||||||||||
| Banc of America Funding Trust: | ||||||||||||
| Series 2005-C, Class A1, 1.452%, 05/20/2035 ∞ | 10,965,048 | 10,330,059 | ||||||||||
| Series 2007-C, Class 1A3, 3.171%, 05/20/2036 ∞ § | 4,228,637 | 3,836,229 | ||||||||||
| Series 2007-C, Class 7A5, 1.512%, 05/20/2047 ∞ | 4,666,955 | 4,034,700 | ||||||||||
| Bayview Financial Acquisition Trust, | ||||||||||||
| Series 2007-A, Class 1A2, 6.205%, 05/28/2037 | 416,912 | 433,204 | ||||||||||
| Bayview Financial Mortgage Pass-Through Trust, | ||||||||||||
| Series 2007-B, Class 1A2, 6.831%, 08/28/2047 ∞ | 126,989 | 114,145 | ||||||||||
| Bear Stearns ARM Trust, | ||||||||||||
| Series 2005-9, Class A1, 2.830%, 10/25/2035 ∞ | 1,382,357 | 1,355,576 | ||||||||||
| Bear Stearns Asset Backed Securities I Trust: | ||||||||||||
| Series 2006-HE8, Class 21A2, 1.386%, 10/25/2036 ∞ | 8,686,673 | 8,383,284 | ||||||||||
| Series 2007-HE5, Class 1A2, 1.396%, 06/25/2047 ∞ | 8,292,337 | 8,182,877 | ||||||||||
| Bear Stearns Asset Backed Securities Trust, | ||||||||||||
| Series 2007-2, Class A2, 1.536%, 01/25/2047 ∞ | 9,098,817 | 8,922,311 | ||||||||||
| Carrington Mortgage Loan Trust: | ||||||||||||
| Series 2005-FRE1, Class A6, 1.596%, 12/25/2035 ∞ | 10,696,917 | 10,597,115 | ||||||||||
| Series 2006-NC1, Class A3, 1.426%, 01/25/2036 ∞ | 3,485,611 | 3,466,828 | ||||||||||
| Series 2006-OPT1, Class A3, 1.396%, 02/25/2036 ∞ | 5,316,897 | 5,278,615 | ||||||||||
| Chase Mortgage Finance Trust: | ||||||||||||
| Series 2005-A2, Class 1A5, 3.257%, 01/25/2036 ∞ § | 1,365,126 | 1,301,941 | ||||||||||
| Series 2006-A1, Class 2A3, 3.277%, 09/25/2036 ∞ § | 1,070,552 | 965,382 | ||||||||||
| Series 2007-A1, Class 3A1, 3.458%, 02/25/2037 ∞ | 5,566,279 | 5,532,320 | ||||||||||
| Series 2007-A1, Class 2A3, 3.618%, 02/25/2037 ∞ | 2,869,198 | 2,893,972 | ||||||||||
| CHL Mortgage Pass-Through Trust, | ||||||||||||
| Series 2005-6, Class 2A1, 5.500%, 04/25/2035 | 746,134 | 731,707 | ||||||||||
| Citicorp Mortgage Securities Trust: | ||||||||||||
| Series 2006-3, Class 1A4, 6.000%, 06/25/2036 | 7,279,050 | 7,280,864 | ||||||||||
| Series 2007-2, Class 1A3, 6.000%, 02/25/2037 | 1,650,852 | 1,623,480 | ||||||||||
| Citicorp Residential Mortgage Trust: | ||||||||||||
| Series 2006-2, Class A4, 5.623%, 09/25/2036 ∞ | 3,367,528 | 3,414,650 | ||||||||||
| Series 2006-3, Class A4, 5.534%, 11/25/2036 ∞ | 2,065,858 | 2,106,568 | ||||||||||
| Series 2007-1, Class A6, 5.583%, 03/25/2037 ∞ | 111,764 | 115,293 | ||||||||||
| Series 2007-2, Class A4, 5.282%, 06/25/2037 ∞ | 35,639,567 | 36,395,892 | ||||||||||
| Citigroup Mortgage Loan Trust, Inc.: | ||||||||||||
| Series 2006-AR1, Class 1A1, 3.210%, 10/25/2035 ∞ | 20,740,709 | 20,718,226 | ||||||||||
| Series 2005-9, Class 2A2, 5.500%, 11/25/2035 § | 358,630 | 359,688 | ||||||||||
| Series 2005-9, Class 22A2, 6.000%, 11/25/2035 § | 5,211,419 | 5,274,488 | ||||||||||
| Series 2007-AMC4, Class A2C, 1.386%, 05/25/2037 ∞ | 4,202,137 | 4,155,651 | ||||||||||
| Cityscape Home Equity Loan Trust, | ||||||||||||
| Series 1997-C, Class A4, 7.000%, 07/25/2028 | 7,057 | 6,387 | ||||||||||
| Countrywide Asset-Backed Certificates: | ||||||||||||
| Series 2006-22, Class 2A3, 1.376%, 01/25/2034 ∞ | 16,652,515 | 16,242,411 | ||||||||||
| Series 2004-12, Class AF6, 4.634%, 03/25/2035 ∞ | 60,773 | 62,452 | ||||||||||
| Series 2005-10, Class AF6, 4.542%, 02/25/2036 ∞ | 546,543 | 559,289 | ||||||||||
| Series 2005-13, Class AF3, 4.741%, 04/25/2036 ∞ | 870,769 | 803,222 | ||||||||||
| Series 2006-S9, Class A3, 5.728%, 08/25/2036 ∞ | 31,074 | 31,010 | ||||||||||
| Series 2006-13, Class 3AV2, 1.366%, 01/25/2037 ∞ | 9,640,183 | 9,545,453 | ||||||||||
| Series 2006-13, Class 1AF3, 4.488%, 01/25/2037 ∞ § | 68,523 | 119,929 | ||||||||||
| Series 2006-23, Class 2A3, 1.386%, 05/25/2037 ∞ | 6,648,341 | 6,505,139 | ||||||||||
| Series 2006-10, Class 1AF3, 4.629%, 09/25/2046 ∞ § | 810,560 | 704,075 | ||||||||||
| Series 2007-9, Class 2A3, 1.396%, 06/25/2047 ∞ | 40,335,743 | 39,513,236 | ||||||||||
| Series 2007-11, Class 2A3, 1.406%, 06/25/2047 ∞ | 11,082,872 | 10,727,481 | ||||||||||
| Credit Suisse First Boston Mortgage Securities Corp., | ||||||||||||
| Series 2005-7, Class 3A1, 5.000%, 08/25/2020 | 183,507 | 176,594 | ||||||||||
| Credit-Based Asset Servicing & Securitization LLC: | ||||||||||||
| Series 2005-CB8, Class AF2, 3.896%, 12/25/2035 ∞ | 626,281 | 624,070 | ||||||||||
| Series 2007-CB4, Class A1A, 1.306%, 04/25/2037 ∞ | 5,237,243 | 4,955,069 | ||||||||||
| CWABS Asset-Backed Certificates Trust: | ||||||||||||
| Series 2004-15, Class AF6, 4.613%, 04/25/2035 ∞ | 50,240 | 50,509 | ||||||||||
| Series 2005-7, Class AF6, 4.693%, 10/25/2035 ∞ | 196,656 | 201,463 | ||||||||||
| Series 2005-11, Class AF3, 4.674%, 02/25/2036 ∞ | 6,286,016 | 6,347,143 | ||||||||||
| Series 2006-14, Class 2A2, 1.366%, 02/25/2037 ∞ | 7,124,397 | 7,029,649 | ||||||||||
| Series 2006-18, Class 2A2, 1.376%, 03/25/2037 ∞ | 7,271,539 | 7,104,765 | ||||||||||
| Series 2006-9, Class 1AF3, 4.606%, 10/25/2046 ∞ § | 332,651 | 296,660 | ||||||||||
| CWHEQ Home Equity Loan Trust, | ||||||||||||
| Series 2007-S1, Class A6, 5.693%, 11/25/2036 ∞ | 13,083 | 12,932 | ||||||||||
| Deutsche Alt-A Securities, Inc. Mortgage Loan Trust: | ||||||||||||
| Series 2005-1, Class 1A1, 1.716%, 02/25/2035 ∞ | 9,543,018 | 9,279,549 | ||||||||||
| Series 2005-2, Class 1A7, 5.522%, 04/25/2035 ∞ | 12,493,121 | 12,864,153 | ||||||||||
| Series 2005-3, Class 4A5, 5.250%, 06/25/2035 | 2,106,531 | 2,117,496 | ||||||||||
| First Franklin Mortgage Loan Trust: | ||||||||||||
| Series 2006-FF3, Class A2B, 1.416%, 02/25/2036 ∞ | 12,597,876 | 12,451,966 | ||||||||||
| Series 2006-FF4, Class A2, 1.406%, 03/25/2036 ∞ | 8,820,085 | 8,777,866 | ||||||||||
| Series 2006-FF15, Class A5, 1.376%, 11/25/2036 ∞ | 20,296,351 | 19,236,270 | ||||||||||
| First Horizon Alternative Mortgage Securities Trust: | ||||||||||||
| Series 2006-FA6, Class 3A1, 5.750%, 11/25/2021 § | 115,231 | 113,429 | ||||||||||
| Series 2004-AA1, Class A1, 3.129%, 06/25/2034 ∞ | 6,249,380 | 6,128,299 | ||||||||||
| Series 2005-AA2, Class 2A1, 3.153%, 04/25/2035 ∞ | 3,500,531 | 3,449,849 | ||||||||||
| Series 2006-FA8, Class 2A1, 5.750%, 02/25/2037 | 384,277 | 338,562 | ||||||||||
| GE Capital Mortgage Services, Inc. Trust, | ||||||||||||
| Series 1999-HE1, Class A7, 6.265%, 04/25/2029 | 395 | 395 | ||||||||||
| GSAA Home Equity Trust: | ||||||||||||
| Series 2004-6, Class A1, 2.016%, 06/25/2034 ∞ | 3,881,469 | 3,723,760 | ||||||||||
| Series 2005-14, Class 1A1, 1.466%, 12/25/2035 ∞ | 27,110,909 | 25,849,834 | ||||||||||
| Series 2007-8, Class A3, 1.666%, 08/25/2037 ∞ | 9,587,069 | 8,948,870 | ||||||||||
| GSAMP Trust: | ||||||||||||
| Series 2005-AHL2, Class A2C, 1.456%, 12/25/2035 ∞ | 8,066,871 | 7,994,651 | ||||||||||
| Series 2006-HE7, Class A2D, 1.446%, 10/25/2046 ∞ | 1,119,070 | 1,104,783 | ||||||||||
| GSR Mortgage Loan Trust: | ||||||||||||
| Series 2004-15F, Class 5A1, 5.500%, 01/25/2020 | 340,033 | 337,560 | ||||||||||
| Series 2005-3F, Class 2A4, 6.000%, 03/25/2035 | 3,251,007 | 3,377,077 | ||||||||||
| Series 2005-AR2, Class 2A1, 3.608%, 04/25/2035 ∞ | 4,936,549 | 4,964,254 | ||||||||||
| Home Equity Asset Trust: | ||||||||||||
| Series 2006-4, Class 2A3, 1.386%, 08/25/2036 ∞ | 57,969 | 57,950 | ||||||||||
| Series 2007-2, Class 2A2, 1.401%, 07/25/2037 ∞ | 1,347,963 | 1,338,546 | ||||||||||
| HomeBanc Mortgage Trust, | ||||||||||||
| Series 2005-4, Class A1, 1.486%, 10/25/2035 ∞ | 9,785,892 | 9,519,025 | ||||||||||
| HSI Asset Securitization Corp. Trust: | ||||||||||||
| Series 2006-OPT4, Class 2A3, 1.376%, 03/25/2036 ∞ | 4,944,367 | 4,869,296 | ||||||||||
| Series 2007-WF1, Class 2A3, 1.386%, 05/25/2037 ∞ | 10,868,030 | 10,817,960 | ||||||||||
| J.P. Morgan Alternative Loan Trust: | ||||||||||||
| Series 2005-S1, Class 3A1, 5.500%, 10/25/2020 § | 805,442 | 798,940 | ||||||||||
| Series 2006-A1, Class 2A1, 3.359%, 03/25/2036 ∞ § | 117,070 | 104,371 | ||||||||||
| Series 2006-S3, Class A3A, 6.000%, 08/25/2036 ∞ § | 554,020 | 564,823 | ||||||||||
| Series 2007-S1, Class A1, 1.496%, 04/25/2047 ∞ | 9,819,124 | 9,443,273 | ||||||||||
| J.P. Morgan Mortgage Acquisition Trust: | ||||||||||||
| Series 2007-CH1, Class AV5, 1.456%, 11/25/2036 ∞ | 6,075,270 | 6,037,706 | ||||||||||
| Series 2007-CH3, Class A3, 1.366%, 03/25/2037 ∞ | 1,189,511 | 1,188,660 | ||||||||||
| J.P. Morgan Mortgage Trust: | ||||||||||||
| Series 2006-S3, Class 2A3, 5.000%, 08/25/2021 | 86,007 | 86,353 | ||||||||||
| Series 2005-A8, Class 2A3, 3.024%, 11/25/2035 ∞ | 9,270,161 | 8,905,238 | ||||||||||
| Series 2006-A2, Class 3A3, 3.260%, 04/25/2036 ∞ § | 2,722,532 | 2,507,599 | ||||||||||
| Series 2006-A2, Class 2A1, 3.324%, 04/25/2036 ∞ § | 2,258,536 | 2,192,140 | ||||||||||
| Series 2006-A7, Class 2A2, 3.263%, 01/25/2037 ∞ | 3,461,444 | 3,427,071 | ||||||||||
| Series 2006-A7, Class 2A4R, 3.263%, 01/25/2037 ∞ | 3,534,801 | 3,499,701 | ||||||||||
| Series 2007-A2, Class 2A3, 3.422%, 04/25/2037 ∞ | 7,030,938 | 6,315,561 | ||||||||||
| Series 2007-A4, Class 2A3, 3.550%, 06/25/2037 ∞ § | 8,388,868 | 7,813,862 | ||||||||||
| Long Beach Mortgage Loan Trust, | ||||||||||||
| Series 2006-WL2, Class 2A3, 1.416%, 01/25/2036 ∞ | 1,035,049 | 1,028,981 | ||||||||||
| Luminent Mortgage Trust, | ||||||||||||
| Series 2005-1, Class A1, 1.476%, 11/25/2035 ∞ | 12,325,211 | 11,342,957 | ||||||||||
| MASTR Alternative Loan Trust: | ||||||||||||
| Series 2004-1, Class 1A1, 5.000%, 01/25/2019 | 36,964 | 37,028 | ||||||||||
| Series 2004-5, Class 4A1, 5.500%, 07/25/2019 | 102,266 | 103,726 | ||||||||||
| Series 2005-3, Class 4A1, 5.500%, 03/25/2020 | 264,993 | 268,060 | ||||||||||
| Series 2003-5, Class 6A1, 6.000%, 08/25/2033 | 40,408 | 42,442 | ||||||||||
| Series 2004-2, Class 2A1, 6.000%, 02/25/2034 | 3,858,620 | 4,088,016 | ||||||||||
| Series 2004-8, Class 2A1, 6.000%, 09/25/2034 | 3,117,713 | 3,313,511 | ||||||||||
| Series 2005-6, Class 1A5, 5.500%, 12/25/2035 § | 3,482,280 | 3,318,526 | ||||||||||
| MASTR Asset Backed Securities Trust, | ||||||||||||
| Series 2006-NC1, Class A4, 1.516%, 01/25/2036 ∞ | 5,100,075 | 5,064,328 | ||||||||||
| Merrill Lynch Mortgage Investors Trust: | ||||||||||||
| Series 2004-F, Class A1B, 1.836%, 12/25/2029 ∞ | 10,168,997 | 9,778,740 | ||||||||||
| Series 2005-A5, Class A3, 3.126%, 06/25/2035 ∞ | 3,938,663 | 3,941,387 | ||||||||||
| Morgan Stanley Capital I, Inc. Trust, | ||||||||||||
| Series 2006-HE2, Class A1, 1.386%, 03/25/2036 ∞ | 9,806,953 | 9,269,716 | ||||||||||
| MortgageIT Trust: | ||||||||||||
| Series 2005-4, Class A1, 1.496%, 10/25/2035 ∞ | 7,695,825 | 7,346,434 | ||||||||||
| Series 2005-5, Class A1, 1.476%, 12/25/2035 ∞ | 6,965,473 | 6,511,494 | ||||||||||
| Nationstar Home Equity Loan Trust, | ||||||||||||
| Series 2007-C, Class 2AV2, 1.346%, 06/25/2037 ∞ | 3,301,626 | 3,293,050 | ||||||||||
| New Century Home Equity Loan Trust, | ||||||||||||
| Series 2005-C, Class A1, 1.446%, 12/25/2035 ∞ | 8,960,993 | 8,869,823 | ||||||||||
| New Residential Mortgage Loan Trust: | ||||||||||||
| Series 2017-1A, Class A1, 4.000%, 02/25/2057 (Acquired 03/06/2017 through 04/11/2017, Cost $33,941,628) ∞ * | 32,975,828 | 34,282,845 | ||||||||||
| Series 2017-3A, Class A1, 4.000%, 04/25/2057 (Acquired 06/05/2017, Cost $14,384,751) ∞ * | 13,814,274 | 14,347,895 | ||||||||||
| Nomura Asset Acceptance Corp. Alternative Loan Trust, | ||||||||||||
| Series 2005-WF1, Class 2A3, 5.100%, 03/25/2035 | 8,375,198 | 8,671,798 | ||||||||||
| RALI Series Trust: | ||||||||||||
| Series 2004-QS3, Class CB, 5.000%, 03/25/2019 | 410,391 | 409,388 | ||||||||||
| Series 2004-QS13, Class CB, 5.000%, 09/25/2019 | 437,639 | 439,099 | ||||||||||
| Series 2005-QS2, Class A1, 5.500%, 02/25/2035 | 268,612 | 264,507 | ||||||||||
| Series 2005-QS5, Class A1, 1.616%, 04/25/2035 ∞ § | 3,331,858 | 2,592,493 | ||||||||||
| Series 2005-QS9, Class A2, 1.716%, 06/25/2035 ∞ § | 1,337,857 | 1,095,011 | ||||||||||
| Series 2005-QS11, Class A2, 1.716%, 07/25/2035 ∞ | 5,808,888 | 4,937,349 | ||||||||||
| Series 2005-QA7, Class A22, 3.837%, 07/25/2035 ∞ | 3,654,766 | 3,373,844 | ||||||||||
| RAMP Series Trust: | ||||||||||||
| Series 2002-RS3, Class AI5, 5.572%, 06/25/2032 ∞ | 1,968,922 | 1,921,790 | ||||||||||
| Series 2006-NC2, Class A2, 1.406%, 02/25/2036 ∞ | 5,978,290 | 5,960,736 | ||||||||||
| Series 2006-RS4, Class A3, 1.386%, 07/25/2036 ∞ | 2,237,732 | 2,226,330 | ||||||||||
| RASC Series Trust: | ||||||||||||
| Series 2003-KS5, Class AI6, 3.620%, 07/25/2033 ∞ | 13,438 | 13,411 | ||||||||||
| Series 2003-KS9, Class AI6, 4.710%, 11/25/2033 ∞ § | 30,795 | 30,107 | ||||||||||
| Series 2006-EMX2, Class A3, 1.516%, 02/25/2036 ∞ | 10,381,478 | 10,354,703 | ||||||||||
| Series 2007-KS1, Class A3, 1.366%, 01/25/2037 ∞ | 3,199,485 | 2,990,363 | ||||||||||
| Renaissance Home Equity Loan Trust: | ||||||||||||
| Series 2005-1, Class AF6, 4.970%, 05/25/2035 | 45,161 | 46,185 | ||||||||||
| Series 2005-2, Class AF6, 4.781%, 08/25/2035 | 2,667,486 | 2,730,447 | ||||||||||
| Series 2005-3, Class AF3, 4.814%, 11/25/2035 ∞ | 809,121 | 821,350 | ||||||||||
| Series 2006-2, Class AF3, 5.797%, 08/25/2036 ∞ | 15,838,003 | 10,052,770 | ||||||||||
| Series 2006-3, Class AF2, 5.580%, 11/25/2036 ∞ | 10,496,683 | 6,018,950 | ||||||||||
| Series 2007-1, Class AF2, 5.512%, 04/25/2037 | 471,369 | 249,552 | ||||||||||
| Series 2007-1, Class AF3, 5.612%, 04/25/2037 | 282,822 | 152,228 | ||||||||||
| Series 2007-2, Class AF2, 5.675%, 06/25/2037 ∞ | 1,443,228 | 723,774 | ||||||||||
| SOUNDVIEW HM LN 2006-EQ1, | ||||||||||||
| Series 2006-EQ1, Class A3, 1.376%, 10/25/2036 ∞ | 20,151,202 | 19,393,978 | ||||||||||
| Soundview Home Loan Trust: | ||||||||||||
| Series 2005-OPT4, Class 2A3, 1.476%, 12/25/2035 ∞ | 3,364,644 | 3,356,178 | ||||||||||
| Series 2006-OPT4, Class 2A3, 1.366%, 06/25/2036 ∞ | 4,137,147 | 4,053,174 | ||||||||||
| Specialty Underwriting & Residential Finance Trust, | ||||||||||||
| Series 2004-BC4, Class A1A, 1.886%, 10/25/2035 ∞ | 2,765,536 | 2,750,959 | ||||||||||
| Structured Asset Securities Corp.: | ||||||||||||
| Series 2003-31A, Class 2A7, 3.280%, 10/25/2033 ∞ | 2,236,934 | 2,264,400 | ||||||||||
| Series 2005-7XS, Class 1A4B, 5.440%, 04/25/2035 ∞ | 114,822 | 119,111 | ||||||||||
| Towd Point Mortgage Trust: | ||||||||||||
| Series 2015-3, Class A1A, 3.500%, 03/25/2054 (Acquired 06/21/2016, Cost $12,294,854) ∞ * | 11,995,493 | 12,237,081 | ||||||||||
| Series 2016-2, Class A1, 3.000%, 08/25/2055 (Acquired 05/20/2016, Cost $17,215,212) ∞ * | 17,094,157 | 17,333,942 | ||||||||||
| Series 2016-3, Class A1, 2.250%, 04/25/2056 (Acquired 06/28/2017, Cost $154,996) ∞ * | 155,287 | 154,815 | ||||||||||
| Series 2016-4, Class A1, 2.250%, 07/25/2056 (Acquired 09/27/2016 through 12/06/2016, Cost $20,843,655) ∞ * | 20,783,386 | 20,692,882 | ||||||||||
| Series 2017-1, Class A1, 2.750%, 10/25/2056 (Acquired 06/20/2017 through 06/28/2017, Cost $5,994,144) ∞ * | 5,932,343 | 5,978,070 | ||||||||||
| WaMu Mortgage Pass-Through Certificates Trust: | ||||||||||||
| Series 2004-CB1, Class 5A, 5.000%, 06/25/2019 | 78,692 | 79,354 | ||||||||||
| Series 2004-CB2, Class 5A, 5.000%, 07/25/2019 | 18,235 | 18,373 | ||||||||||
| Series 2004-CB2, Class 7A, 5.500%, 08/25/2019 | 37,802 | 38,177 | ||||||||||
| Series 2004-CB3, Class 3A, 5.500%, 10/25/2019 | 8,118 | 8,214 | ||||||||||
| Series 2004-CB3, Class 4A, 6.000%, 10/25/2019 | 24,623 | 25,247 | ||||||||||
| Series 2004-CB4, Class 22A, 6.000%, 12/25/2019 | 69,387 | 70,813 | ||||||||||
| Series 2004-CB3, Class 1A, 6.000%, 10/25/2034 | 4,740,360 | 4,984,140 | ||||||||||
| Series 2004-CB3, Class 2A, 6.500%, 10/25/2034 | 5,060,058 | 5,404,531 | ||||||||||
| Series 2005-3, Class 1CB3, 1.666%, 05/25/2035 ∞ § | 8,032,475 | 6,149,978 | ||||||||||
| Series 2005-6, Class 2A4, 5.500%, 08/25/2035 § | 10,208,487 | 9,895,174 | ||||||||||
| Series 2006-AR10, Class 1A1, 2.918%, 09/25/2036 ∞ § | 1,546,934 | 1,453,577 | ||||||||||
| Series 2007-HY3, Class 4A1, 3.202%, 03/25/2037 ∞ § | 23,741,409 | 23,283,757 | ||||||||||
| Wells Fargo Alternative Loan Trust, | ||||||||||||
| Series 2007-PA1, Class A4, 6.000%, 03/25/2037 § | 71,059 | 63,883 | ||||||||||
| Wells Fargo Mortgage Backed Securities Trust: | ||||||||||||
| Series 2005-AR16, Class 4A2, 3.232%, 10/25/2035 ∞ | 2,330,282 | 2,315,384 | ||||||||||
| Series 2005-16, Class A18, 6.000%, 01/25/2036 § | 1,751,085 | 1,762,692 | ||||||||||
| Series 2006-AR10, Class 5A5, 3.324%, 07/25/2036 ∞ § | 8,543,535 | 8,551,369 | ||||||||||
| Series 2006-AR14, Class 2A3, 3.075%, 10/25/2036 ∞ § | 4,302,761 | 4,043,689 | ||||||||||
| Series 2006-15, Class A1, 6.000%, 11/25/2036 § | 6,026,699 | 6,015,767 | ||||||||||
| Series 2007-4, Class A15, 6.000%, 04/25/2037 § | 6,816,285 | 6,946,802 | ||||||||||
| Series 2007-7, Class A49, 6.000%, 06/25/2037 § | 6,638,101 | 6,673,713 | ||||||||||
| Series 2007-8, Class 2A8, 6.000%, 07/25/2037 § | 6,099,578 | 6,092,461 | ||||||||||
| 1,084,726,772 | 7.5 | % | ||||||||||
| Commercial Mortgage-Backed Securities | ||||||||||||
| U.S. Government Agency Issues | ||||||||||||
| Fannie Mae-Aces, | ||||||||||||
| Series 2017-M4, Class A2, 2.684%, 12/25/2026 ∞ | 30,250,000 | 29,544,195 | ||||||||||
| Freddie Mac Multifamily Structured Pass Through Certificates: | ||||||||||||
| Series K-716, Class A2, 3.130%, 06/25/2021 | 13,550,000 | 14,074,031 | ||||||||||
| Series K-048, Class A2, 3.284%, 06/25/2025 ∞ | 53,605,000 | 55,939,449 | ||||||||||
| Series K-050, Class A2, 3.334%, 08/25/2025 ∞ | 82,601,000 | 86,443,574 | ||||||||||
| 186,001,249 | 1.3 | % | ||||||||||
| Non-U.S. Government Agency Issues | ||||||||||||
| BANK 2017-BNK4, | ||||||||||||
| Series 2017-BNK4, Class A4, 3.625%, 05/15/2050 | 21,425,000 | 22,226,565 | ||||||||||
| Citigroup Commercial Mortgage Trust, | ||||||||||||
| Series 2014-GC19, Class A3, 3.753%, 03/10/2047 | 5,000,000 | 5,253,020 | ||||||||||
| COMM Mortgage Trust: | ||||||||||||
| Series 2012-CR1, Class A3, 3.391%, 05/15/2045 | 24,465,159 | 25,401,888 | ||||||||||
| Series 2013-CR9, Class A3, 4.022%, 07/10/2045 | 24,675,000 | 26,305,652 | ||||||||||
| Series 2012-CR2, Class A4, 3.147%, 08/15/2045 | 30,463,000 | 31,304,784 | ||||||||||
| Series 2014-CR18, Class A4, 3.550%, 07/15/2047 | 5,000,000 | 5,165,895 | ||||||||||
| Series 2014-CR19, Class A5, 3.796%, 08/10/2047 | 18,000,000 | 18,901,085 | ||||||||||
| Series 2014-CR20, Class ASB, 3.305%, 11/10/2047 | 22,000,000 | 22,877,453 | ||||||||||
| DBUBS Mortgage Trust, | ||||||||||||
| Series 2011-LC3A, Class A4, 4.551%, 08/10/2044 | 2,275,000 | 2,428,495 | ||||||||||
| GS Mortgage Securities Trust: | ||||||||||||
| Series 2011-GC5, Class A4, 3.707%, 08/10/2044 | 17,924,873 | 18,836,306 | ||||||||||
| Series 2012-GCJ9, Class A3, 2.773%, 11/10/2045 | 41,464,000 | 41,852,244 | ||||||||||
| Series 2014-GC20, Class AAB, 3.655%, 04/10/2047 | 23,004,000 | 24,170,032 | ||||||||||
| J.P. Morgan Chase Commercial Mortgage Securities Trust: | ||||||||||||
| Series 2013-LC11, Class A4, 2.694%, 04/15/2046 | 10,150,000 | 10,246,188 | ||||||||||
| Series 2013-LC11, Class A5, 2.960%, 04/15/2046 | 22,075,000 | 22,318,843 | ||||||||||
| Series 2011-C5, Class A3, 4.171%, 08/15/2046 | 8,212,470 | 8,743,165 | ||||||||||
| Series 2012-LC9, Class ASB, 2.437%, 12/15/2047 | 3,850,000 | 3,883,070 | ||||||||||
| Series 2013-C10, Class ASB, 2.702%, 12/15/2047 | 20,075,000 | 20,382,848 | ||||||||||
| JPMBB Commercial Mortgage Securities Trust: | ||||||||||||
| Series 2013-C17, Class A3, 3.928%, 01/15/2047 | 23,700,000 | 25,110,503 | ||||||||||
| Series 2014-C25, Class A5, 3.672%, 11/15/2047 | 34,585,000 | 36,036,284 | ||||||||||
| Morgan Stanley Bank of America Merrill Lynch Trust: | ||||||||||||
| Series 2012-C5, Class A4, 3.176%, 08/15/2045 | 40,030,000 | 41,261,499 | ||||||||||
| Series 2012-C6, Class A4, 2.858%, 11/15/2045 | 33,760,000 | 34,255,144 | ||||||||||
| Series 2013-C10, Class A3, 4.104%, 07/15/2046 ∞ | 44,160,000 | 47,202,028 | ||||||||||
| Series 2013-C12, Class A3, 3.973%, 10/15/2046 | 19,350,000 | 20,603,149 | ||||||||||
| Series 2015-C25, Class ASB, 3.383%, 10/15/2048 | 19,192,000 | 20,007,537 | ||||||||||
| Wells Fargo Commercial Mortgage Trust: | ||||||||||||
| Series 2015-C26, Class ASB, 2.991%, 02/15/2048 | 15,049,000 | 15,390,918 | ||||||||||
| Series 2016-C35, Class ASB, 2.788%, 07/15/2048 | 11,000,000 | 11,045,710 | ||||||||||
| WFRBS Commercial Mortgage Trust: | ||||||||||||
| Series 2013-C11, Class A5, 3.071%, 03/15/2045 | 12,000,000 | 12,237,605 | ||||||||||
| Series 2012-C6, Class A4, 3.440%, 04/15/2045 | 19,291,000 | 20,055,884 | ||||||||||
| Series 2013-C18, Class A4, 3.896%, 12/15/2046 | 21,950,000 | 23,289,922 | ||||||||||
| Series 2014-C24, Class A5, 3.607%, 11/15/2047 | 25,695,000 | 26,664,298 | ||||||||||
| Series 2014-C23, Class ASB, 3.636%, 10/15/2057 | 10,500,000 | 11,051,019 | ||||||||||
| 654,509,033 | 4.5 | % | ||||||||||
| Other Asset Backed Securities | ||||||||||||
| Citibank Credit Card Issuance Trust, | ||||||||||||
| Series 2007-A3, Class A3, 6.150%, 06/15/2039 | 6,100,000 | 8,082,626 | ||||||||||
| Conseco Financial Corp.: | ||||||||||||
| Series 1998-3, Class A5, 6.220%, 03/01/2030 | 210,274 | 224,525 | ||||||||||
| Series 1998-4, Class A5, 6.180%, 04/01/2030 | 99,549 | 105,009 | ||||||||||
| Dell Equipment Finance Trust, | ||||||||||||
| Series 2016-1, Class A3, 1.650%, 07/22/2021 (Acquired 07/12/2016, Cost $11,999,688) * | 12,000,000 | 11,998,801 | ||||||||||
| Discover Card Execution Note Trust, | ||||||||||||
| Series 2016-A4, Class A4, 1.390%, 03/15/2022 | 30,675,000 | 30,417,450 | ||||||||||
| Ford Credit Auto Owner Trust: | ||||||||||||
| Series 2014-2, Class A, 2.310%, 04/15/2026 (Acquired 09/28/2016 through 10/20/2016, Cost $33,511,437) * | 32,858,000 | 33,175,993 | ||||||||||
| Series 2016-1, Class A, 2.310%, 08/15/2027 (Acquired 02/23/2016 through 05/27/2016, Cost $37,658,146) * | 37,625,000 | 37,825,259 | ||||||||||
| Series 2016-2, Class A, 2.030%, 12/15/2027 (Acquired 06/20/2016, Cost $29,264,882) * | 29,275,000 | 29,061,176 | ||||||||||
| Leaf Receivables Funding 11 LLC, | ||||||||||||
| Series 2016-1, Class A3, 2.050%, 06/15/2019 (Acquired 05/18/2016 through 08/05/2016, Cost $18,003,551) * | 18,000,000 | 18,002,948 | ||||||||||
| Oakwood Mortgage Investors, Inc., | ||||||||||||
| Series 1999-B, Class A3, 6.450%, 11/15/2017 | 16,299 | 16,500 | ||||||||||
| OneMain Financial Issuance Trust: | ||||||||||||
| Series 2014-2A, Class A, 2.470%, 09/18/2024 (Acquired 02/05/2016 through 02/22/2016, Cost $3,070,760) * | 3,080,498 | 3,084,503 | ||||||||||
| Series 2015-2A, Class A, 2.570%, 07/18/2025 (Acquired 03/22/2016 through 10/19/2016, Cost $7,538,989) * | 7,563,559 | 7,572,085 | ||||||||||
| PFS Financing Corp., | ||||||||||||
| Series 2016-BA, Class A, 1.870%, 10/15/2021 (Acquired 10/18/2016 through 12/21/2016, Cost $40,196,932) * | 40,200,000 | 40,014,513 | ||||||||||
| SoFi Consumer Loan Program 2017-4 LLC, | ||||||||||||
| Series 2017-4, Class A, 2.500%, 05/26/2026 (Acquired 06/27/2017, Cost $18,746,606) * | 18,750,000 | 18,740,438 | ||||||||||
| TCF Auto Receivables Owner Trust: | ||||||||||||
| Series 2015-1A, Class A3, 1.490%, 12/16/2019 (Acquired 06/03/2015 through 07/28/2016, Cost $7,592,854) * | 7,592,750 | 7,588,711 | ||||||||||
| Series 2016-1A, Class A3, 1.710%, 04/15/2021 (Acquired 09/14/2016, Cost $38,993,592) * | 39,000,000 | 38,874,065 | ||||||||||
| 284,784,602 | 2.0 | % | ||||||||||
| Total Long-Term Investments (Cost $14,095,100,616) | 14,223,562,790 | 98.3 | % | |||||||||
| SHORT-TERM INVESTMENT | Shares | |||||||||||
| Money Market Mutual Fund | ||||||||||||
| Fidelity Institutional Money Market Fund - Government Portfolio, Institutional Class, 0.85% « | 366,705,083 | 366,705,083 | ||||||||||
| Total Short-Term Investment (Cost $366,705,083) | 366,705,083 | 2.5 | % | |||||||||
| Total Investments (Cost $14,461,805,699) | 14,590,267,873 | 100.8 | % | |||||||||
| Liabilities in Excess of Other Assets | (121,998,379 | ) | (0.8 | )% | ||||||||
| TOTAL NET ASSETS | $ | 14,468,269,494 | 100.0 | % | ||||||||
Notes to Schedule of Investments | |
| ∞ | Variable or Floating rate security. Floating rate securities are securities whose yields vary with a designated index rate. These securities' rates are as of June 30, 2017. |
| * | Restricted security as defined in Rule 144(a) under the Securities Act of 1933 and determined to be liquid. Purchased in a private placement transaction; resale to the public may require registration or may extend only to qualified institutional buyers. At June 30, 2017, the value of these securities total $2,646,933,025, which represents 18.29% of total net assets. |
| f | Foreign Security. |
| § | Security in Default. |
| « | 7-Day Yield. |
| Baird Short-Term Municipal Bond Fund | ||||||||||||
| Schedule of Investments | ||||||||||||
| June 30, 2017 (Unaudited) | ||||||||||||
| LONG-TERM INVESTMENTS | ||||||||||||
| Principal | % of | |||||||||||
| Amount | Value | Net Assets | ||||||||||
| Municipal Bonds | ||||||||||||
| Alabama | ||||||||||||
| Black Belt Energy Gas District: | ||||||||||||
| 4.000%, 07/01/2046 (Callable 03/01/2021)(Mandatory Tender Date 06/01/2021) | $ | 300,000 | $ | 324,057 | ||||||||
| 4.000%, 08/01/2047 (Callable 04/01/2022)(Mandatory Tender Date 07/01/2022) | 500,000 | 544,960 | ||||||||||
| Jasper Water Works & Sewer Board, Inc., | ||||||||||||
| 5.000%, 06/01/2024 (Callable 06/01/2021) | 100,000 | 112,087 | ||||||||||
| 981,104 | 1.1 | % | ||||||||||
| Alaska | ||||||||||||
| Alaska Housing Finance Corp., | ||||||||||||
| 4.000%, 06/01/2040 (Callable 06/01/2021) | 25,000 | 25,445 | 0.0 | % | ||||||||
| Arizona | ||||||||||||
| Arizona Health Facilities Authority, | ||||||||||||
| 4.625%, 07/01/2019 | 30,000 | 31,846 | ||||||||||
| Arizona Transportation Board, | ||||||||||||
| 5.000%, 07/01/2017 | 25,000 | 25,000 | ||||||||||
| BluePath 2016-1 TE Trust, | ||||||||||||
| 2.750%, 09/01/2026 (Callable 08/27/2021) | 244,179 | 242,412 | ||||||||||
| City of El Mirage AZ, | ||||||||||||
| 5.000%, 07/01/2026 (Callable 07/01/2020) | 50,000 | 54,861 | ||||||||||
| City of Winslow AZ Wastewater System Revenue, | ||||||||||||
| 2.000%, 07/01/2019 (Insured by AGM) | 25,000 | 25,200 | ||||||||||
| Estrella Mountain Ranch Community Facilities District, | ||||||||||||
| 4.000%, 07/15/2019 (Insured by AGM) | 390,000 | 408,018 | ||||||||||
| Festival Ranch Community Facilities District, | ||||||||||||
| 2.000%, 07/15/2018 (Insured by BAM) | 25,000 | 25,147 | ||||||||||
| Maricopa County Industrial Development Authority: | ||||||||||||
| 2.550%, 07/01/2021 | 60,000 | 59,954 | ||||||||||
| 2.625%, 07/01/2021 | 100,000 | 98,491 | ||||||||||
| Scottsdale Mountain Community Facilities District, | ||||||||||||
| 4.600%, 07/15/2017 | 100,000 | 100,074 | ||||||||||
| Vistancia Community Facilities District, | ||||||||||||
| 5.000%, 07/15/2021 (Callable 07/15/2020) | 150,000 | 165,703 | ||||||||||
| 1,236,706 | 1.4 | % | ||||||||||
| Arkansas | ||||||||||||
| City of Bentonville AR: | ||||||||||||
| 5.000%, 11/01/2021 (Callable 11/01/2017)(Insured by AMBAC) | 100,000 | 101,229 | ||||||||||
| 2.625%, 11/01/2027 (Callable 11/01/2025) | 300,000 | 310,101 | ||||||||||
| City of Fayetteville AR, | ||||||||||||
| 3.050%, 01/01/2047 (Callable 01/01/2027) (3) | 700,000 | 690,599 | ||||||||||
| City of Jacksonville AR Wastewater Revenue, | ||||||||||||
| 4.000%, 12/01/2025 (Callable 06/01/2021) | 110,000 | 117,833 | ||||||||||
| City of Little Rock AR, | ||||||||||||
| 2.000%, 03/01/2038 (Callable 03/01/2021) | 125,000 | 124,950 | ||||||||||
| City of Pine Bluff AR, | ||||||||||||
| 3.000%, 02/01/2047 (Callable 08/01/2027)(Insured by BAM) | 625,000 | 634,794 | ||||||||||
| City of Rogers AR, | ||||||||||||
| 2.125%, 11/01/2029 (Callable 11/01/2021) | 60,000 | 60,085 | ||||||||||
| City of Van Buren AR Water & Sewer Revenue, | ||||||||||||
| 2.000%, 12/01/2019 (Insured by AGM) | 150,000 | 151,905 | ||||||||||
| Mountain View Public Facilities Board, | ||||||||||||
| 2.000%, 06/01/2018 | 445,000 | 445,752 | ||||||||||
| Northwest Arkansas Conservation Authority, | ||||||||||||
| 4.000%, 03/01/2024 (Callable 09/01/2022)(Insured by BAM) | 325,000 | 353,343 | ||||||||||
| Pulaski County Public Facilities Board, | ||||||||||||
| 4.000%, 07/01/2017 | 50,000 | 50,000 | ||||||||||
| University of Central Arkansas, | ||||||||||||
| 2.500%, 09/01/2017 (Insured by AGM) | 40,000 | 40,086 | ||||||||||
| 3,080,677 | 3.5 | % | ||||||||||
| California | ||||||||||||
| Bay Area Toll Authority: | ||||||||||||
| 1.510%, 04/01/2034 (Callable 10/01/2019)(Mandatory Tender Date 04/01/2020)(1) | 270,000 | 271,283 | ||||||||||
| 1.610%, 04/01/2047 (Callable 04/01/2019)(Mandatory Tender Date 10/01/2019)(1) | 150,000 | 150,835 | ||||||||||
| California Health Facilities Financing Authority: | ||||||||||||
| 5.000%, 04/01/2020 | 65,000 | 69,554 | ||||||||||
| 1.330%, 07/01/2022 (Callable 07/01/2017)(2) | 300,000 | 286,069 | ||||||||||
| California Infrastructure & Economic Development Bank, | ||||||||||||
| 1.190%, 10/01/2047 (Callable 10/01/2017)(Mandatory Tender Date 04/02/2018)(1) | 200,000 | 200,194 | ||||||||||
| California School Finance Authority: | ||||||||||||
| 3.000%, 08/01/2017 | 50,000 | 50,057 | ||||||||||
| 3.000%, 08/01/2017 | 100,000 | 100,115 | ||||||||||
| California State Public Works Board, | ||||||||||||
| 5.000%, 12/01/2019 (Insured by AMBAC) | 70,000 | 73,777 | ||||||||||
| California State University, | ||||||||||||
| 4.000%, 11/01/2049 (Callable 05/01/2021)(Mandatory Tender Date 11/01/2021) | 75,000 | 82,344 | ||||||||||
| California Statewide Communities Development Authority: | �� | |||||||||||
| 6.000%, 01/01/2021 (ETM) | 100,000 | 107,710 | ||||||||||
| 3.500%, 11/01/2021 (Callable 11/01/2019) | 200,000 | 208,290 | ||||||||||
| 3.143%, 04/01/2028 (1)(2) | 400,000 | 361,971 | ||||||||||
| Central School District, | ||||||||||||
| 6.250%, 08/01/2040 (Callable 08/01/2021) | 225,000 | 266,450 | ||||||||||
| City of Chula Vista CA, | ||||||||||||
| 1.650%, 07/01/2018 (Callable 07/31/2017) | 510,000 | 510,479 | ||||||||||
| City of Redding CA, | ||||||||||||
| 1.383%, 07/01/2022 (ETM)(1)(2) | 50,000 | 47,753 | ||||||||||
| Commerce Community Development Commission Successor Agency, | ||||||||||||
| 0.000%, 08/01/2021 (ETM) | 300,000 | 246,852 | ||||||||||
| Corona-Norca Unified School District, | ||||||||||||
| 0.000%, 08/01/2026 | 20,000 | 20,440 | ||||||||||
| Dublin Unified School District, | ||||||||||||
| 0.000%, 08/01/2028 (Callable 08/01/2017) | 50,000 | 28,804 | ||||||||||
| Fresno Joint Powers Financing Authority, | ||||||||||||
| 5.000%, 04/01/2021 | 500,000 | 560,245 | ||||||||||
| Fresno Unified School District, | ||||||||||||
| 0.000%, 08/01/2033 (Callable 08/01/2021) | 100,000 | 40,710 | ||||||||||
| Golden State Tobacco Securitization Corp., | ||||||||||||
| 5.000%, 06/01/2022 ^ | 135,000 | 154,568 | ||||||||||
| Jurupa Public Financing Authority, | ||||||||||||
| 4.000%, 09/01/2018 | 25,000 | 25,697 | ||||||||||
| La Quinta Financing Authority, | ||||||||||||
| 5.550%, 10/01/2018 | 40,000 | 41,300 | ||||||||||
| Northern California Gas Authority, | ||||||||||||
| 1.399%, 07/01/2019 (1) | 505,000 | 503,187 | ||||||||||
| Palomar Health, | ||||||||||||
| 3.000%, 11/01/2017 | 100,000 | 100,314 | ||||||||||
| Roseville Finance Authority, | ||||||||||||
| 4.000%, 09/01/2019 | 50,000 | 52,628 | ||||||||||
| San Diego Community Facilities District No. 3, | ||||||||||||
| 5.000%, 09/01/2018 | 25,000 | 25,958 | ||||||||||
| San Diego Redevelopment Agency Successor Agency, | ||||||||||||
| 4.000%, 09/01/2018 | 50,000 | 51,685 | ||||||||||
| State of California: | ||||||||||||
| 5.000%, 09/01/2022 | 165,000 | 193,888 | ||||||||||
| 1.360%, 05/01/2033 (Callable 11/01/2017)(Mandatory Tender Date 05/01/2018)(1) | 100,000 | 100,110 | ||||||||||
| University of California, | ||||||||||||
| 1.400%, 05/15/2046 (Callable 11/15/2020)(Mandatory Tender Date 05/15/2021) | 330,000 | 328,766 | ||||||||||
| Washington Township Health Care District, | ||||||||||||
| 5.000%, 07/01/2017 | 50,000 | 50,000 | ||||||||||
| Yuba Community College District, | ||||||||||||
| 0.000%, 08/01/2028 (Callable 08/01/2017)(Insured by AMBAC) | 45,000 | 26,258 | ||||||||||
| 5,338,291 | 6.1 | % | ||||||||||
| Colorado | ||||||||||||
| Bromley Park Metropolitan District No. 2, | ||||||||||||
| 4.250%, 12/01/2022 (Callable 12/01/2017) | 60,000 | 60,082 | ||||||||||
| Colorado Educational & Cultural Facilities Authority: | ||||||||||||
| 4.000%, 07/01/2018 | 120,000 | 123,020 | ||||||||||
| 3.000%, 12/01/2018 | 125,000 | 128,172 | ||||||||||
| 3.000%, 12/15/2018 | 75,000 | 76,609 | ||||||||||
| 4.000%, 12/01/2019 | 275,000 | 290,961 | ||||||||||
| 4.000%, 06/01/2020 | 100,000 | 106,428 | ||||||||||
| 4.000%, 10/01/2020 | 125,000 | 133,320 | ||||||||||
| 4.000%, 11/01/2021 | 50,000 | 53,945 | ||||||||||
| 4.000%, 03/01/2022 | 45,000 | 48,563 | ||||||||||
| 5.000%, 10/01/2025 | 160,000 | 189,341 | ||||||||||
| Colorado Health Facilities Authority, | ||||||||||||
| 5.000%, 05/15/2019 | 250,000 | 264,220 | ||||||||||
| E-470 Public Highway Authority: | ||||||||||||
| 0.000%, 09/01/2020 | 125,000 | 118,022 | ||||||||||
| 1.870%, 09/01/2039 (Callable 03/01/2021)(Mandatory Tender Date 09/01/2021)(1) | 400,000 | 403,332 | ||||||||||
| Fossil Ridge Metropolitan District No. 3, | ||||||||||||
| 4.000%, 12/01/2020 | 50,000 | 52,800 | ||||||||||
| High Plains Metropolitan District, | ||||||||||||
| 4.000%, 12/01/2022 | 420,000 | 460,324 | ||||||||||
| Park 70 Metropolitan District: | ||||||||||||
| 5.000%, 12/01/2017 | 135,000 | 136,866 | ||||||||||
| 5.000%, 12/01/2018 | 160,000 | 167,149 | ||||||||||
| Regional Transportation District, | ||||||||||||
| 5.000%, 06/01/2025 (Callable 06/01/2020) | 100,000 | 110,024 | ||||||||||
| VDW Metropolitan District No. 2, | ||||||||||||
| 1.250%, 12/01/2018 (Insured by AGM) | 55,000 | 55,029 | ||||||||||
| Vista Ridge Metropolitan District, | ||||||||||||
| 4.500%, 12/01/2024 (Insured by BAM) | 200,000 | 230,378 | ||||||||||
| 3,208,585 | 3.7 | % | ||||||||||
| Connecticut | ||||||||||||
| Bristol Housing Authority, | ||||||||||||
| 0.820%, 08/01/2018 (Callable 08/01/2017)(Mandatory Tender Date 08/01/2017)(1) | 50,000 | 49,982 | ||||||||||
| City of Hartford CT, | ||||||||||||
| 5.000%, 04/01/2020 (ETM) | 100,000 | 110,140 | ||||||||||
| Connecticut Housing Finance Authority, | ||||||||||||
| 4.000%, 11/15/2044 (Callable 11/15/2023) | 100,000 | 105,960 | ||||||||||
| Southeastern Connecticut Water Authority, | ||||||||||||
| 4.000%, 09/01/2022 (Callable 07/31/2017) | 355,000 | 355,639 | ||||||||||
| State of Connecticut, | ||||||||||||
| 1.560%, 09/15/2024 (Callable 07/18/2017)(Mandatory Tender Date 09/15/2017)(1) | 100,000 | 100,016 | ||||||||||
| Town of Plymouth CT, | ||||||||||||
| 4.000%, 07/15/2019 | 25,000 | 26,339 | ||||||||||
| 748,076 | 0.9 | % | ||||||||||
| District of Columbia | ||||||||||||
| District of Columbia Housing Finance Agency, | ||||||||||||
| 3.500%, 06/15/2023 | 220,000 | 227,542 | 0.3 | % | ||||||||
| Florida | ||||||||||||
| City of Jacksonville FL, | ||||||||||||
| 5.000%, 11/01/2022 | 50,000 | 56,641 | ||||||||||
| City of North Port FL, | ||||||||||||
| 4.000%, 07/01/2018 (Insured by BAM) | 50,000 | 51,433 | ||||||||||
| City of Port St Lucie FL Utility System Revenue: | ||||||||||||
| 5.000%, 09/01/2021 | 35,000 | 39,807 | ||||||||||
| 5.250%, 09/01/2022 | 100,000 | 117,495 | ||||||||||
| City of Tallahassee FL, | ||||||||||||
| 5.000%, 12/01/2019 | 190,000 | 203,026 | ||||||||||
| City of Tampa FL, | ||||||||||||
| 5.250%, 11/15/2024 (Callable 05/15/2020) | 375,000 | 418,106 | ||||||||||
| Florida Housing Finance Corp., | ||||||||||||
| 4.000%, 07/01/2047 (Callable 07/01/2025) | 150,000 | 160,353 | ||||||||||
| Florida Municipal Power Agency: | ||||||||||||
| 1.523%, 10/01/2021 (Callable 07/05/2017)(Insured by AMBAC)(2) | 75,000 | 69,833 | ||||||||||
| 1.523%, 10/01/2021 (Callable 07/06/2017)(Insured by AMBAC)(1)(2) | 100,000 | 93,072 | ||||||||||
| 1.523%, 10/01/2027 (Callable 07/05/2017)(Insured by AMBAC)(1)(2) | 100,000 | 92,863 | ||||||||||
| Florida State Municipal Loan Council, | ||||||||||||
| 3.000%, 10/01/2020 | 500,000 | 520,695 | ||||||||||
| Lee County School Board, | ||||||||||||
| 5.000%, 08/01/2023 | 140,000 | 166,090 | ||||||||||
| Martin County Health Facilities Authority, | ||||||||||||
| 3.750%, 11/15/2020 | 125,000 | 133,118 | ||||||||||
| Miami Health Facilities Authority: | ||||||||||||
| 2.250%, 07/01/2018 | 45,000 | 45,031 | ||||||||||
| 5.000%, 07/01/2020 | 300,000 | 320,736 | ||||||||||
| Orange County Health Facilities Authority, | ||||||||||||
| 6.250%, 10/01/2021 | 100,000 | 110,202 | ||||||||||
| Orange County Housing Finance Authority, | ||||||||||||
| 4.000%, 09/01/2040 (Callable 09/01/2024) | 705,000 | 746,200 | ||||||||||
| Orange County School Board, | ||||||||||||
| 4.500%, 08/01/2020 (Pre-refunded to 08/01/2017) | 35,000 | 35,088 | ||||||||||
| St. Lucie County School Board, | ||||||||||||
| 5.000%, 10/01/2018 (Insured by AGM) | 50,000 | 52,330 | ||||||||||
| 3,432,119 | 3.9 | % | ||||||||||
| Georgia | ||||||||||||
| Bartow County Development Authority, | ||||||||||||
| 2.375%, 09/01/2029 (Mandatory Tender Date 08/10/2017)(1) | 285,000 | 285,313 | ||||||||||
| Burke County Development Authority: | ||||||||||||
| 1.000%, 07/01/2049 (Callable 07/01/2017)(1) | 100,000 | 100,000 | ||||||||||
| 1.850%, 12/01/2049 (Mandatory Tender Date 08/22/2019) | 100,000 | 99,731 | ||||||||||
| 1.850%, 12/01/2049 (Mandatory Tender Date 08/22/2019) | 50,000 | 49,866 | ||||||||||
| City of Atlanta GA: | ||||||||||||
| 5.000%, 01/01/2023 (Callable 01/01/2020) | 450,000 | 486,112 | ||||||||||
| 5.000%, 01/01/2024 (Callable 01/01/2020) | 500,000 | 537,590 | ||||||||||
| Gainesville & Hall County Hospital Authority, | ||||||||||||
| 0.000%, 02/15/2047 (Callable 07/03/2017)(Optional Put Date 07/07/2017)(1) | 500,000 | 500,000 | ||||||||||
| Main Street Natural Gas, Inc.: | ||||||||||||
| 5.000%, 03/15/2019 | 125,000 | 132,128 | ||||||||||
| 5.000%, 03/15/2022 | 10,000 | 11,208 | ||||||||||
| Monroe County Development Authority, | ||||||||||||
| 2.000%, 07/01/2025 (Mandatory Tender Date 06/13/2019) | 380,000 | 380,790 | ||||||||||
| Peach County GA Development Authority, | ||||||||||||
| 1.200%, 10/01/2018 (Callable 04/01/2018) | 250,000 | 249,663 | ||||||||||
| Private Colleges & Universities Authority: | ||||||||||||
| 3.750%, 10/01/2021 | 25,000 | 26,207 | ||||||||||
| 5.000%, 10/01/2021 | 75,000 | 82,363 | ||||||||||
| 2,940,971 | 3.4 | % | ||||||||||
| Idaho | ||||||||||||
| Idaho Housing & Finance Association, | ||||||||||||
| 5.000%, 07/15/2018 | 25,000 | 25,973 | 0.0 | % | ||||||||
| Illinois | ||||||||||||
| Champaign County Community Unit School District No 116 Urbana, | ||||||||||||
| 5.000%, 01/01/2019 | 1,100,000 | 1,150,391 | ||||||||||
| Chicago O'Hare International Airport, | ||||||||||||
| 5.000%, 01/01/2020 | 50,000 | 54,575 | ||||||||||
| Chicago Transit Authority, | ||||||||||||
| 5.250%, 12/01/2023 (Callable 12/01/2021) | 25,000 | 27,982 | ||||||||||
| City of Berwyn IL: | ||||||||||||
| 3.000%, 12/01/2017 | 50,000 | 50,275 | ||||||||||
| 4.000%, 12/01/2019 | 125,000 | 130,835 | ||||||||||
| City of Chicago IL, | ||||||||||||
| 5.000%, 01/01/2023 (Callable 01/01/2019) | 50,000 | 50,255 | ||||||||||
| City of Chicago IL Motor Fuel Tax Revenue, | ||||||||||||
| 5.000%, 01/01/2019 | 100,000 | 101,732 | ||||||||||
| City of Chicago IL Wastewater Transmission Revenue, | ||||||||||||
| 5.000%, 01/01/2020 | 50,000 | 53,923 | ||||||||||
| City of Fairfield IL, | ||||||||||||
| 2.000%, 12/01/2018 | 275,000 | 275,415 | ||||||||||
| City of Flora IL, | ||||||||||||
| 4.000%, 11/15/2023 (Callable 11/15/2017)(Insured by AMBAC) | 100,000 | 99,996 | ||||||||||
| City of Rockford IL, | ||||||||||||
| 4.700%, 12/15/2017 (Insured by AGM) | 25,000 | 25,064 | ||||||||||
| City of Springfield IL, | ||||||||||||
| 4.000%, 12/01/2019 | 95,000 | 99,778 | ||||||||||
| Cook County Community College District No 524 Moraine Valley, | ||||||||||||
| 5.000%, 12/01/2021 (Callable 12/01/2017) | 325,000 | 329,888 | ||||||||||
| Cook County Community High School District No 219 Niles Township, | ||||||||||||
| 0.000%, 12/01/2020 | 35,000 | 31,979 | ||||||||||
| Cook County School District No 170 Chicago Heights, | ||||||||||||
| 5.000%, 12/01/2026 (Callable 07/27/2017) | 750,000 | 751,230 | ||||||||||
| County of Cook IL, | ||||||||||||
| 5.000%, 11/15/2021 (Callable 11/15/2019) | 100,000 | 106,803 | ||||||||||
| Danville Public Building Commission, | ||||||||||||
| 4.000%, 12/01/2019 | 115,000 | 121,451 | ||||||||||
| DuPage County Community High School District No. 100 Fenton, | ||||||||||||
| 2.000%, 12/15/2018 | 70,000 | 70,848 | ||||||||||
| Governors State University, | ||||||||||||
| 4.000%, 10/01/2020 (Callable 10/01/2017)(Insured by CIFG) | 50,000 | 50,230 | ||||||||||
| Homewood-Flossmoor Park District, | ||||||||||||
| 3.000%, 12/01/2017 (Insured by AGM) | 50,000 | 50,289 | ||||||||||
| Illinois Finance Authority: | ||||||||||||
| 5.000%, 08/15/2017 | 50,000 | 50,174 | ||||||||||
| 4.000%, 10/01/2017 | 75,000 | 75,460 | ||||||||||
| 5.000%, 10/01/2019 | 75,000 | 79,572 | ||||||||||
| 5.000%, 02/15/2020 | 100,000 | 106,272 | ||||||||||
| 5.000%, 10/01/2020 | 105,000 | 113,679 | ||||||||||
| 5.000%, 01/01/2021 | 125,000 | 136,904 | ||||||||||
| 6.250%, 05/01/2022 (Pre-refunded to 05/01/2020) | 45,000 | 51,173 | ||||||||||
| 5.000%, 10/01/2022 | 50,000 | 55,575 | ||||||||||
| 5.000%, 05/15/2023 | 100,000 | 116,144 | ||||||||||
| 2.085%, 05/01/2036 (Callable 11/01/2020)(Mandatory Tender Date 05/01/2021)(1) | 135,000 | 135,067 | ||||||||||
| Illinois Housing Development Authority, | ||||||||||||
| 2.450%, 06/01/2043 (Callable 01/01/2023) | 530,112 | 514,956 | ||||||||||
| The Illinois Sports Facilities Authority, | ||||||||||||
| 0.000%, 06/15/2018 (Insured by AMBAC) | 50,000 | 48,510 | ||||||||||
| Illinois State University, | ||||||||||||
| 5.000%, 04/01/2023 (Callable 04/01/2021) | 100,000 | 109,010 | ||||||||||
| Jefferson County Township High School District No. 201, | ||||||||||||
| 6.500%, 12/30/2020 (Insured by BAM) | 420,000 | 482,677 | ||||||||||
| Joliet Park District, | ||||||||||||
| 4.000%, 02/01/2023 (Insured by BAM) | 150,000 | 162,033 | ||||||||||
| Kane County Community Unit School District, | ||||||||||||
| 4.250%, 01/01/2025 (Callable 01/01/2018)(Insured by AGM) | 25,000 | 25,310 | ||||||||||
| Lake County Community Consolidated School District No. 3 Beach Park, | ||||||||||||
| 0.000%, 02/01/2018 (Insured by AMBAC) | 290,000 | 285,476 | ||||||||||
| Lake County Community High School District No. 117 Antioch, | ||||||||||||
| 0.000%, 12/01/2019 | 140,000 | 132,609 | ||||||||||
| Lake County Community High School District No. 127 Grayslake, | ||||||||||||
| 0.000%, 02/01/2020 | 150,000 | 143,945 | ||||||||||
| Lake County Community Unit School District No 116 Round Lake, | ||||||||||||
| 5.000%, 01/15/2025 (Callable 01/15/2023) | 35,000 | 39,935 | ||||||||||
| Lake County School District No. 1 Winthrop Harbor, | ||||||||||||
| 3.000%, 02/01/2019 | 85,000 | 87,144 | ||||||||||
| Metropolitan Pier & Exposition Authority: | ||||||||||||
| 5.300%, 06/15/2018 (Callable 07/31/2017)(Insured by NPFGC) | 120,000 | 121,530 | ||||||||||
| 0.000%, 06/15/2019 | 50,000 | 47,308 | ||||||||||
| 0.000%, 06/15/2019 | 135,000 | 127,929 | ||||||||||
| 5.700%, 06/15/2025 (Callable 06/15/2022) | 45,000 | 51,219 | ||||||||||
| Monroe & St Clair Counties Community Unit School District No. 5 Waterloo, | ||||||||||||
| 5.000%, 04/15/2020 (Insured by BAM) | 270,000 | 294,505 | ||||||||||
| Ogle & Winnebago Counties Community Unit School District: | ||||||||||||
| 0.000%, 12/01/2017 (ETM)(Insured by AGM) | 20,000 | 19,927 | ||||||||||
| 5.000%, 12/01/2021 (Insured by BAM) | 150,000 | 169,278 | ||||||||||
| Peoria Public Building Commission, | ||||||||||||
| 5.000%, 12/01/2020 (Insured by BAM) | 125,000 | 137,534 | ||||||||||
| Public Building Commission of Chicago, | ||||||||||||
| 5.000%, 03/01/2020 (Callable 07/31/2017)(Insured by AMBAC) | 100,000 | 100,250 | ||||||||||
| South Suburban College Community School District No 510, | ||||||||||||
| 0.000%, 12/01/2019 (Insured by AGM) | 500,000 | 467,795 | ||||||||||
| St Clair County School District No 119 Belle Valley: | ||||||||||||
| 5.000%, 04/01/2022 (Insured by AGM) | 350,000 | 396,025 | ||||||||||
| 5.000%, 04/01/2023 (Insured by AGM) | 300,000 | 343,806 | ||||||||||
| State of Illinois: | ||||||||||||
| 0.000%, 08/01/2017 | 20,000 | 19,962 | ||||||||||
| 5.000%, 06/01/2019 | 100,000 | 102,660 | ||||||||||
| 5.000%, 03/01/2020 | 90,000 | 93,134 | ||||||||||
| 5.000%, 04/01/2020 | 30,000 | 31,075 | ||||||||||
| 5.000%, 01/01/2022 (Callable 01/01/2020) | 100,000 | 102,320 | ||||||||||
| 6.500%, 06/15/2022 | 60,000 | 67,306 | ||||||||||
| 5.000%, 08/01/2024 (Callable 08/01/2022) | 100,000 | 102,788 | ||||||||||
| 4.500%, 09/01/2024 (Callable 09/01/2018) | 100,000 | 100,128 | ||||||||||
| University of Illinois, | ||||||||||||
| 0.000%, 04/01/2018 | 140,000 | 138,317 | ||||||||||
| Village of Cary IL, | ||||||||||||
| 1.500%, 03/01/2019 (Insured by BAM) | 97,000 | 96,952 | ||||||||||
| Village of Crestwood IL: | ||||||||||||
| 2.000%, 12/15/2018 (Insured by BAM) | 150,000 | 151,108 | ||||||||||
| 4.500%, 12/15/2025 (Callable 12/15/2022)(Insured by BAM) | 60,000 | 65,590 | ||||||||||
| Village of Lyons IL, | ||||||||||||
| 5.000%, 12/01/2025 (Callable 12/01/2022)(Insured by BAM) | 25,000 | 28,465 | ||||||||||
| Village of McCook IL, | ||||||||||||
| 5.000%, 12/01/2020 (Callable 12/01/2018) | 50,000 | 51,916 | ||||||||||
| Village of River Grove IL: | ||||||||||||
| 3.000%, 12/15/2020 (Insured by BAM) | 150,000 | 153,404 | ||||||||||
| 3.000%, 12/15/2021 (Insured by BAM) | 120,000 | 122,202 | ||||||||||
| West Chicago Park District, | ||||||||||||
| 4.000%, 12/01/2022 (Callable 06/01/2018) | 230,000 | 234,340 | ||||||||||
| Western Illinois University, | ||||||||||||
| 4.000%, 04/01/2019 | 50,000 | 51,732 | ||||||||||
| White County Community Unit School District No. 5, | ||||||||||||
| 4.300%, 12/01/2021 (Insured by AGM) | 100,000 | 108,896 | ||||||||||
| Will County Community Consolidated School District No 70-C Laraway: | ||||||||||||
| 4.000%, 12/01/2019 (Insured by AGM) | 155,000 | 163,206 | ||||||||||
| 4.000%, 12/01/2020 (Insured by AGM) | 130,000 | 139,219 | ||||||||||
| 4.000%, 12/01/2022 (Insured by AGM) | 245,000 | 268,393 | ||||||||||
| Will County Community High School District No 210 Lincoln-Way, | ||||||||||||
| 5.000%, 01/01/2021 (Callable 01/01/2019) | 70,000 | 69,054 | ||||||||||
| Will County IL School District No. 114 Manhattan, | ||||||||||||
| 0.000%, 12/01/2019 | 50,000 | 47,282 | ||||||||||
| Will County IL School District No. 365 Valley View, | ||||||||||||
| 0.000%, 11/01/2021 (Insured by AGM) | 100,000 | 92,631 | ||||||||||
| Wilmette Park District, | ||||||||||||
| 3.000%, 12/01/2017 | 20,000 | 20,163 | ||||||||||
| 11,483,913 | 13.2 | % | ||||||||||
| Indiana | ||||||||||||
| City of Goshen IN Waterworks Revenue, | ||||||||||||
| 4.100%, 01/01/2021 (Callable 07/31/2017)(Insured by AGM) | 470,000 | 470,940 | ||||||||||
| City of Whiting IN, | ||||||||||||
| 1.850%, 06/01/2044 (Mandatory Tender Date 10/01/2019) | 100,000 | 100,700 | ||||||||||
| East Porter County School Building Corp., | ||||||||||||
| 4.000%, 01/15/2018 | 50,000 | 50,804 | ||||||||||
| Indiana Bond Bank, | ||||||||||||
| 5.250%, 10/15/2019 | 55,000 | 59,440 | ||||||||||
| Indiana Finance Authority: | ||||||||||||
| 4.000%, 12/01/2017 | 50,000 | 50,603 | ||||||||||
| 4.000%, 02/01/2018 | 50,000 | 50,887 | ||||||||||
| Indiana Health & Educational Facilities Financing Authority, | ||||||||||||
| 1.750%, 11/15/2031 (Mandatory Tender Date 11/02/2021) | 260,000 | 259,782 | ||||||||||
| Indiana Health Facility Financing Authority, | ||||||||||||
| 1.890%, 05/01/2020 (Callable 07/21/2017)(Insured by AMBAC)(1)(2) | 25,000 | 23,833 | ||||||||||
| Indiana Housing & Community Development Authority, | ||||||||||||
| 4.000%, 12/01/2027 (Callable 06/01/2021) | 480,000 | 499,032 | ||||||||||
| Noblesville High School Building Corp., | ||||||||||||
| 0.000%, 02/15/2018 | 20,000 | 19,807 | ||||||||||
| Plainfield Community School Corp., | ||||||||||||
| 2.000%, 07/15/2018 | 100,000 | 100,599 | ||||||||||
| South Bend Community School Corp., | ||||||||||||
| 5.000%, 07/15/2017 | 50,000 | 50,051 | ||||||||||
| Twin Lakes Regional Sewer District, | ||||||||||||
| 3.000%, 01/01/2018 (Insured by AGM) | 50,000 | 50,511 | ||||||||||
| 1,786,989 | 2.1 | % | ||||||||||
| Iowa | ||||||||||||
| City of Coralville IA, | ||||||||||||
| 4.000%, 06/01/2019 | 100,000 | 104,058 | ||||||||||
| Iowa Finance Authority: | ||||||||||||
| 3.500%, 09/01/2017 | 100,000 | 100,106 | �� | |||||||||
| 3.500%, 07/01/2046 (Callable 01/01/2026) | 250,000 | 262,505 | ||||||||||
| Iowa Higher Education Loan Authority, | ||||||||||||
| 2.000%, 12/01/2018 (Callable 06/01/2018) | 1,000,000 | 1,005,090 | ||||||||||
| Xenia Rural Water District, | ||||||||||||
| 2.000%, 12/01/2017 | 125,000 | 125,299 | ||||||||||
| 1,597,058 | 1.8 | % | ||||||||||
| Kansas | ||||||||||||
| City of Hutchinson KS: | ||||||||||||
| 4.000%, 12/01/2017 | 70,000 | 70,501 | ||||||||||
| 4.000%, 12/01/2018 | 200,000 | 204,802 | ||||||||||
| State of Kansas Department of Transportation, | ||||||||||||
| 1.104%, 09/01/2019 (1) | 205,000 | 205,014 | ||||||||||
| 480,317 | 0.6 | % | ||||||||||
| Kentucky | ||||||||||||
| Kentucky Economic Development Finance Authority: | ||||||||||||
| 6.000%, 06/01/2030 (Pre-refunded to 06/01/2020) | 90,000 | 101,900 | ||||||||||
| 6.375%, 06/01/2040 (Pre-refunded to 06/01/2020) | 300,000 | 342,858 | ||||||||||
| Kentucky Municipal Power Agency, | ||||||||||||
| 2.310%, 09/01/2042 (Callable 03/01/2018)(Mandatory Tender Date 09/01/2018)(1) | 50,000 | 50,025 | ||||||||||
| 494,783 | 0.6 | % | ||||||||||
| Louisiana | ||||||||||||
| Calcasieu Parish School Board, | ||||||||||||
| 5.000%, 02/01/2025 (Callable 02/01/2022) | 425,000 | 477,836 | ||||||||||
| Louisiana Local Government Environmental Facilities & Community Development Auth: | ||||||||||||
| 5.500%, 10/01/2025 (Pre-refunded to 10/01/2020) | 50,000 | 56,684 | ||||||||||
| 5.625%, 10/01/2030 (Pre-refunded to 10/01/2020) | 50,000 | 56,882 | ||||||||||
| 5.875%, 10/01/2040 (Pre-refunded to 10/01/2020) | 755,000 | 864,875 | ||||||||||
| 6.000%, 10/01/2044 (Pre-refunded to 10/01/2020) | 120,000 | 137,938 | ||||||||||
| 6.000%, 10/01/2044 (Pre-refunded to 10/01/2020) | 305,000 | 350,591 | ||||||||||
| Louisiana Public Facilities Authority, | ||||||||||||
| 0.000%, 10/01/2018 | 235,000 | 228,925 | ||||||||||
| Regional Transit Authority, | ||||||||||||
| 0.000%, 12/01/2021 | 90,000 | 73,365 | ||||||||||
| 2,247,096 | 2.6 | % | ||||||||||
| Maine | ||||||||||||
| Maine State Housing Authority: | ||||||||||||
| 3.500%, 11/15/2045 (Callable 05/15/2025) | 40,000 | 41,763 | ||||||||||
| 4.000%, 11/15/2045 (Callable 11/15/2025) | 245,000 | 260,668 | ||||||||||
| 302,431 | 0.3 | % | ||||||||||
| Maryland | ||||||||||||
| Maryland Health & Higher Educational Facilities Authority, | ||||||||||||
| 5.000%, 07/01/2018 | 25,000 | 25,791 | ||||||||||
| Maryland State Transportation Authority, | ||||||||||||
| 5.000%, 03/01/2018 (Callable 07/21/2017) | 30,000 | 30,050 | ||||||||||
| 55,841 | 0.1 | % | ||||||||||
| Massachusetts | ||||||||||||
| Commonwealth of Massachusetts, | ||||||||||||
| 1.210%, 08/01/2043 (Callable 07/21/2017)(Mandatory Tender Date 08/01/2017)(1) | 150,000 | 150,009 | ||||||||||
| Eaton Vance Municipal Bond Fund II, | ||||||||||||
| 1.960%, 07/01/2019 (Acquired 12/9/2015, Cost $150,000)(Callable 07/31/2017)(1) * ^ | 100,000 | 99,986 | ||||||||||
| Massachusetts Housing Finance Agency: | ||||||||||||
| 4.000%, 12/01/2044 (Callable 06/01/2025) | 175,000 | 186,679 | ||||||||||
| 3.500%, 12/01/2046 (Callable 12/01/2025) | 1,005,000 | 1,042,698 | ||||||||||
| Town of Ashburnham MA, | ||||||||||||
| 4.250%, 07/01/2021 (Callable 07/01/2018) | 250,000 | 257,403 | ||||||||||
| 1,736,775 | 2.0 | % | ||||||||||
| Michigan | ||||||||||||
| City of Detroit MI Sewage Disposal System Revenue: | ||||||||||||
| 5.000%, 07/01/2020 | 265,000 | 289,870 | ||||||||||
| 7.000%, 07/01/2027 (Callable 07/01/2019)(Insured by AGM) | 50,000 | 55,195 | ||||||||||
| City of Detroit MI Water Supply System Revenue, | ||||||||||||
| 4.250%, 07/01/2017 | 55,000 | 55,000 | ||||||||||
| City of Saginaw MI Water Supply System Revenue, | ||||||||||||
| 4.000%, 07/01/2020 (Insured by AGM) | 25,000 | 26,849 | ||||||||||
| Dexter Community Schools, | ||||||||||||
| 5.100%, 05/01/2018 | 15,000 | 15,504 | ||||||||||
| Michigan Finance Authority: | ||||||||||||
| 5.000%, 07/01/2017 | 40,000 | 40,000 | ||||||||||
| 3.400%, 10/01/2020 | 100,000 | 103,251 | ||||||||||
| 1.582%, 10/15/2038 (Callable 04/15/2020)(Mandatory Tender Date 10/15/2020)(1) | 350,000 | 350,241 | ||||||||||
| 1.360%, 12/01/2039 (Callable 06/01/2020)(Mandatory Tender Date 12/01/2020)(1) | 100,000 | 99,465 | ||||||||||
| Michigan State Hospital Finance Authority: | ||||||||||||
| 5.000%, 07/15/2021 (Pre-refunded to 07/15/2017) | 50,000 | 50,051 | ||||||||||
| 1.625%, 11/01/2027 (Mandatory Tender Date 11/01/2019) | 155,000 | 155,087 | ||||||||||
| Michigan State Housing Development Authority, | ||||||||||||
| 3.500%, 06/01/2047 (Callable 06/01/2026) | 660,000 | 689,588 | ||||||||||
| Michigan Strategic Fund, | ||||||||||||
| 0.960%, 12/01/2033 (Callable 07/01/2017)(1) | 350,000 | 350,000 | ||||||||||
| Pinckney Community Schools, | ||||||||||||
| 5.000%, 05/01/2021 (Insured by Q-SBLF) | 100,000 | 112,388 | ||||||||||
| Rudyard MI Area Schools, | ||||||||||||
| 1.500%, 05/01/2019 | 25,000 | 25,045 | ||||||||||
| South Haven Public Schools, | ||||||||||||
| 4.000%, 05/01/2020 (Insured by AGM) | 50,000 | 53,595 | ||||||||||
| Western Michigan University, | ||||||||||||
| 5.000%, 11/15/2025 (Callable 11/15/2021) | 75,000 | 85,353 | ||||||||||
| White Cloud Public Schools: | ||||||||||||
| 4.000%, 05/01/2018 (Insured by Q-SBLF) | 35,000 | 35,819 | ||||||||||
| 4.000%, 05/01/2019 (Insured by Q-SBLF) | 30,000 | 31,446 | ||||||||||
| Ypsilanti School District/MI, | ||||||||||||
| 4.000%, 05/01/2020 (Insured by Q-SBLF) | 50,000 | 53,423 | ||||||||||
| 2,677,170 | 3.1 | % | ||||||||||
| Minnesota | ||||||||||||
| City of Maple Grove MN, | ||||||||||||
| 4.000%, 05/01/2022 | 500,000 | 544,995 | ||||||||||
| City of Minneapolis MN/St Paul Housing & Redevelopment Authority, | ||||||||||||
| 1.740%, 08/01/2027 (Callable 07/05/2017)(1)(2) | 25,000 | 23,345 | ||||||||||
| City of Plato MN, | ||||||||||||
| 4.000%, 04/01/2022 | 265,000 | 286,709 | ||||||||||
| Minneapolis-Saint Paul Metropolitan Airports Commission, | ||||||||||||
| 5.000%, 01/01/2025 | 125,000 | 152,408 | ||||||||||
| Minnesota Housing Finance Agency: | ||||||||||||
| 2.900%, 01/01/2025 | 80,000 | 83,508 | ||||||||||
| 4.000%, 01/01/2047 (Callable 01/01/2026) | 485,000 | 519,813 | ||||||||||
| University of Minnesota, | ||||||||||||
| 5.500%, 07/01/2021 (ETM) | 160,000 | 179,230 | ||||||||||
| 1,790,008 | 2.1 | % | ||||||||||
| Mississippi | ||||||||||||
| City of Jackson MS Water & Sewer System Revenue, | ||||||||||||
| 4.000%, 09/01/2018 (Insured by BAM) | 135,000 | 138,919 | ||||||||||
| Mississippi Development Bank: | ||||||||||||
| 5.500%, 10/01/2019 | 75,000 | 80,165 | ||||||||||
| 5.000%, 03/01/2024 (Insured by AGM) | 50,000 | 58,754 | ||||||||||
| University of Southern Mississippi/The, | ||||||||||||
| 2.000%, 09/01/2018 | 95,000 | 95,922 | ||||||||||
| 373,760 | 0.4 | % | ||||||||||
| Missouri | ||||||||||||
| City of St Louis MO Airport Revenue: | ||||||||||||
| 5.000%, 07/01/2023 (Insured by AGM) | 400,000 | 473,076 | ||||||||||
| 5.000%, 07/01/2025 (Callable 07/01/2017)(Insured by AGM) | 265,000 | 265,000 | ||||||||||
| County of Boone MO, | ||||||||||||
| 5.750%, 08/01/2028 (Pre-refunded to 08/01/2018) | 630,000 | 661,191 | ||||||||||
| Health & Educational Facilities Authority of the State of Missouri: | ||||||||||||
| 4.000%, 02/01/2019 | 250,000 | 259,935 | ||||||||||
| 5.000%, 05/15/2022 | 50,000 | 57,511 | ||||||||||
| Jasper County Reorganized School District No. R-9/MO, | ||||||||||||
| 2.000%, 04/01/2018 | 150,000 | 150,942 | ||||||||||
| Kirkwood Industrial Development Authority, | ||||||||||||
| 8.000%, 05/15/2021 (Pre-refunded 05/15/2020) | 535,000 | 606,155 | ||||||||||
| Missouri Housing Development Commission, | ||||||||||||
| 4.000%, 05/01/2042 (Callable 11/01/2026) | 750,000 | 817,035 | ||||||||||
| Move Rolla Transportation Development District, | ||||||||||||
| 3.750%, 06/01/2029 (Callable 06/01/2026) | 500,000 | 510,630 | ||||||||||
| St Charles County School District No. R-IV Wentzville, | ||||||||||||
| 0.000%, 03/01/2027 (Pre-refunded to 03/01/2019) | 65,000 | 39,447 | ||||||||||
| State of Missouri Environmental Improvement & Energy Resources Authority, | ||||||||||||
| 1.418%, 12/01/2022 (Callable 07/01/2017)(1)(2) | 275,000 | 256,576 | ||||||||||
| 4,097,498 | 4.7 | % | ||||||||||
| Nebraska | ||||||||||||
| Central Plains Energy Project, | ||||||||||||
| 1.305%, 12/01/2017 (1) | 95,000 | 94,875 | ||||||||||
| Douglas County Hospital Authority No. 2, | ||||||||||||
| 5.000%, 05/15/2019 | 50,000 | 53,185 | ||||||||||
| Gering School District: | ||||||||||||
| 5.000%, 12/01/2026 (Callable 05/30/2022) | 115,000 | 130,730 | ||||||||||
| 5.000%, 12/01/2027 (Callable 05/30/2022) | 100,000 | 113,428 | ||||||||||
| 392,218 | 0.5 | % | ||||||||||
| Nevada | ||||||||||||
| City of North Las Vegas NV, | ||||||||||||
| 2.000%, 12/01/2018 | 100,000 | 100,705 | ||||||||||
| Las Vegas Redevelopment Agency, | ||||||||||||
| 5.000%, 06/15/2023 | 250,000 | 287,883 | ||||||||||
| Nevada Housing Division, | ||||||||||||
| 4.400%, 04/01/2029 (Callable 10/01/2021) | 120,000 | 124,585 | ||||||||||
| 513,173 | 0.6 | % | ||||||||||
| New Jersey | ||||||||||||
| City of Atlantic City NJ, | ||||||||||||
| 5.000%, 03/01/2022 | 100,000 | 111,099 | ||||||||||
| Landis Sewage Authority, | ||||||||||||
| 3.127%, 09/19/2019 (1)(2) | 100,000 | 96,721 | ||||||||||
| New Jersey Economic Development Authority: | ||||||||||||
| 2.635%, 02/01/2018 (Callable 08/01/2017)(1) | 150,000 | 150,159 | ||||||||||
| 2.710%, 02/01/2018 (Callable 08/01/2017)(1) | 50,000 | 50,047 | ||||||||||
| 4.000%, 07/15/2018 | 100,000 | 102,101 | ||||||||||
| 5.000%, 11/01/2018 | 100,000 | 103,738 | ||||||||||
| 5.250%, 09/01/2019 | 250,000 | 264,205 | ||||||||||
| 5.000%, 03/01/2020 | 100,000 | 105,636 | ||||||||||
| 5.000%, 06/15/2023 (Insured by BAM) | 50,000 | 54,692 | ||||||||||
| New Jersey Educational Facilities Authority, | ||||||||||||
| 5.000%, 07/01/2022 | 150,000 | 172,253 | ||||||||||
| New Jersey Health Care Facilities Financing Authority: | ||||||||||||
| 4.000%, 07/01/2019 (ETM) | 105,000 | 110,923 | ||||||||||
| 4.250%, 11/15/2021 (Callable 11/15/2020) | 65,000 | 70,654 | ||||||||||
| 5.000%, 07/01/2025 (Insured by AGM) | 50,000 | 58,879 | ||||||||||
| New Jersey Higher Education Student Assistance Authority, | ||||||||||||
| 5.250%, 06/01/2020 (Callable 06/01/2019) | 100,000 | 106,734 | ||||||||||
| New Jersey Sports & Exposition Authority, | ||||||||||||
| 4.500%, 09/01/2022 (Callable 09/01/2018) | 250,000 | 253,273 | ||||||||||
| New Jersey Transportation Trust Fund Authority: | ||||||||||||
| 5.000%, 06/15/2019 | 100,000 | 104,669 | ||||||||||
| 5.000%, 06/15/2021 (Callable 06/15/2018) | 150,000 | 155,105 | ||||||||||
| New Jersey Turnpike Authority, | ||||||||||||
| 1.523%, 01/01/2030 (Callable 07/06/2017)(1)(2) | 130,000 | 119,270 | ||||||||||
| Town of West New York NJ, | ||||||||||||
| 4.000%, 04/15/2019 | 200,000 | 210,200 | ||||||||||
| Township of Irvington NJ, | ||||||||||||
| 0.000%, 07/15/2018 | 50,000 | 48,950 | ||||||||||
| 2,449,308 | 2.8 | % | ||||||||||
| New Mexico | ||||||||||||
| Montecito Estates Public Improvement District, | ||||||||||||
| 2.000%, 10/01/2018 (Insured by BAM) | 100,000 | 101,250 | ||||||||||
| New Mexico Municipal Energy Acquisition Authority, | ||||||||||||
| 1.454%, 11/01/2039 (Callable 02/01/2019)(Mandatory Tender Date 08/01/2019)(1) | 75,000 | 74,809 | ||||||||||
| State of New Mexico Severance Tax Permanent Fund, | ||||||||||||
| 5.000%, 07/01/2017 | 40,000 | 40,000 | ||||||||||
| 216,059 | 0.3 | % | ||||||||||
| New York | ||||||||||||
| Brooklyn Arena Local Development Corp., | ||||||||||||
| 5.000%, 07/15/2020 | 100,000 | 111,287 | ||||||||||
| City of Yonkers NY, | ||||||||||||
| 5.000%, 03/15/2024 (Callable 03/15/2021) | 50,000 | 56,242 | ||||||||||
| JPMorgan Chase Putters/Drivers Trust, | ||||||||||||
| 1.000%, 11/01/2019 (Callable 05/01/2019)(1) | 250,000 | 250,000 | ||||||||||
| Long Island Power Authority, | ||||||||||||
| 1.385%, 05/01/2033 (Callable 05/01/2018)(Mandatory Tender Date 11/01/2018)(1) | 75,000 | 75,120 | ||||||||||
| Metropolitan Transportation Authority: | ||||||||||||
| 1.490%, 11/01/2031 (Callable 05/01/2019)(Mandatory Tender Date 11/01/2019)(1) | 500,000 | 501,865 | ||||||||||
| 1.360%, 11/01/2034 (Callable 05/01/2019)(Mandatory Tender Date 11/01/2019)(1) | 50,000 | 49,950 | ||||||||||
| 4.000%, 11/15/2034 (Callable 08/15/2019)(Mandatory Tender Date 11/15/2019) | 195,000 | 205,119 | ||||||||||
| MTA Hudson Rail Yards Trust Obligations, | ||||||||||||
| 5.000%, 11/15/2046 (Callable 11/15/2019) | 500,000 | 537,615 | ||||||||||
| Nassau Health Care Corp., | ||||||||||||
| 2.750%, 01/16/2018 | 250,000 | 250,935 | ||||||||||
| New York City Transitional Finance Authority Future Tax Secured Revenue: | ||||||||||||
| 5.000%, 11/01/2018 | 50,000 | 52,614 | ||||||||||
| 1.020%, 08/01/2022 (Callable 07/01/2017)(1) | 500,000 | 500,000 | ||||||||||
| 1.000%, 11/01/2022 (Optional Put Date 06/30/2017)(1) | 500,000 | 500,000 | ||||||||||
| 1.000%, 08/01/2031 (Optional Put Date 06/30/2017)(1) | 200,000 | 200,000 | ||||||||||
| New York City Water & Sewer System, | ||||||||||||
| 1.070%, 06/15/2032 (Callable 07/17/2017)(Optional Put Date 06/30/2017)(1) | 280,000 | 280,000 | ||||||||||
| New York State Dormitory Authority: | ||||||||||||
| 5.000%, 07/01/2017 | 25,000 | 25,000 | ||||||||||
| 1.514%, 05/01/2018 (Callable 07/01/2017)(1) | 200,000 | 200,026 | ||||||||||
| 4.000%, 12/01/2018 | 200,000 | 205,334 | ||||||||||
| 5.000%, 12/15/2021 | 45,000 | 51,889 | ||||||||||
| New York State Energy Research & Development Authority, | ||||||||||||
| 1.523%, 12/01/2020 (1)(2) | 400,000 | 395,201 | ||||||||||
| New York State Housing Finance Agency, | ||||||||||||
| 1.250%, 11/01/2018 | 15,000 | 15,043 | ||||||||||
| Niskayuna Central School District, | ||||||||||||
| 1.300%, 03/15/2018 | 160,000 | 159,563 | ||||||||||
| Oneida County Industrial Development Agency, | ||||||||||||
| 0.000%, 07/01/2026 (Callable 07/01/2017) | 75,000 | 50,293 | ||||||||||
| Shenendehowa Central School District, | ||||||||||||
| 1.550%, 08/01/2018 | 200,000 | 199,852 | ||||||||||
| State of New York: | ||||||||||||
| 1.697%, 03/15/2021 (Callable 07/06/2017)(Insured by AGM)(1)(2) | 50,000 | 47,356 | ||||||||||
| 1.697%, 02/15/2022 (Callable 07/06/2017)(2) | 25,000 | 24,322 | ||||||||||
| State of New York Mortgage Agency, | ||||||||||||
| 3.500%, 10/01/2043 (Callable 04/01/2023) | 400,000 | 416,124 | ||||||||||
| Town of Oyster Bay NY, | ||||||||||||
| 3.000%, 03/01/2020 (Insured by AGM) | 150,000 | 153,698 | ||||||||||
| Triborough Bridge & Tunnel Authority: | ||||||||||||
| 1.204%, 11/15/2027 (Callable 05/15/2021)(Mandatory Tender Date 11/15/2021)(1) | 100,000 | 99,394 | ||||||||||
| 1.301%, 01/01/2031 (Callable 11/01/2018)(Mandatory Tender Date 12/01/2018)(1) | 100,000 | 100,060 | ||||||||||
| 1.054%, 01/01/2033 (Callable 06/03/2019)(Mandatory Tender Date 12/03/2019)(1) | 30,000 | 29,855 | ||||||||||
| 5,743,757 | 6.6 | % | ||||||||||
| North Carolina | ||||||||||||
| North Carolina Capital Facilities Finance Agency, | ||||||||||||
| 5.000%, 06/01/2022 | 100,000 | 112,894 | ||||||||||
| North Carolina Eastern Municipal Power Agency: | ||||||||||||
| 5.000%, 01/01/2021 (ETM) | 185,000 | 208,661 | ||||||||||
| 5.000%, 01/01/2021 (ETM) | 650,000 | 733,135 | ||||||||||
| 6.000%, 01/01/2022 (ETM) | 105,000 | 126,184 | ||||||||||
| North Carolina Medical Care Commission: | ||||||||||||
| 4.750%, 11/01/2017 | 50,000 | 50,618 | ||||||||||
| 5.000%, 11/01/2018 | 25,000 | 26,287 | ||||||||||
| 5.000%, 10/01/2019 (Callable 10/01/2017) | 55,000 | 55,499 | ||||||||||
| 5.750%, 01/01/2035 (Pre-refunded to 01/01/2021) | 80,000 | 92,125 | ||||||||||
| State of North Carolina, | ||||||||||||
| 5.000%, 05/01/2024 (Callable 05/01/2023) | 1,000,000 | 1,180,270 | ||||||||||
| University of North Carolina at Chapel Hill, | ||||||||||||
| 1.454%, 12/01/2041 (Callable 07/21/2017)(Mandatory Tender Date 12/01/2017)(1) | 150,000 | 150,011 | ||||||||||
| 2,735,684 | 3.1 | % | ||||||||||
| North Dakota | ||||||||||||
| City of Mandan ND, | ||||||||||||
| 2.750%, 09/01/2041 (Callable 07/31/2017) | 205,000 | 203,893 | ||||||||||
| County of Ward ND, | ||||||||||||
| 4.000%, 04/01/2024 (Callable 04/01/2023)(Insured by AGM) | 500,000 | 546,265 | ||||||||||
| Jamestown Park District/ND, | ||||||||||||
| 2.900%, 07/01/2035 (Callable 07/17/2017) | 585,000 | 561,354 | ||||||||||
| Williston Parks & Recreation District, | ||||||||||||
| 3.250%, 03/01/2032 (Callable 08/14/2017) | 280,000 | 280,681 | ||||||||||
| 1,592,193 | 1.8 | % | ||||||||||
| Ohio | ||||||||||||
| City of Bowling Green OH: | ||||||||||||
| 4.500%, 06/01/2019 | 60,000 | 62,009 | ||||||||||
| 5.000%, 06/01/2020 | 100,000 | 106,464 | ||||||||||
| City of Hamilton OH Gas System Revenue, | ||||||||||||
| 4.000%, 10/15/2023 (Callable 10/15/2019) | 25,000 | 26,294 | ||||||||||
| Cleveland-Cuyahoga County Port Authority, | ||||||||||||
| 3.000%, 05/15/2018 | 50,000 | 50,568 | ||||||||||
| County of Crawford OH, | ||||||||||||
| 1.430%, 11/01/2017 (Callable 07/31/2017) | 100,000 | 100,027 | ||||||||||
| County of Hamilton OH, | ||||||||||||
| 4.000%, 01/01/2018 | 100,000 | 101,177 | ||||||||||
| County of Huron OH, | ||||||||||||
| 5.250%, 12/01/2017 (Callable 07/31/2017) | 50,000 | 50,140 | ||||||||||
| Groveport-Madison Local School District, | ||||||||||||
| 4.000%, 12/01/2024 (Callable 12/01/2022)(Insured by BAM) | 50,000 | 54,640 | ||||||||||
| Lancaster Port Authority, | ||||||||||||
| 1.324%, 08/01/2019 (Callable 02/01/2019)(1) | 70,000 | 69,684 | ||||||||||
| Ohio Higher Educational Facility Commission, | ||||||||||||
| 5.000%, 12/01/2020 | 35,000 | 38,901 | ||||||||||
| Ohio Housing Finance Agency, | ||||||||||||
| 4.000%, 03/01/2047 (Callable 09/01/2025) | 230,000 | 245,277 | ||||||||||
| Shawnee State University, | ||||||||||||
| 2.000%, 06/01/2019 (Insured by BAM) | 250,000 | 250,417 | ||||||||||
| Summit County Development Finance Authority: | ||||||||||||
| 3.000%, 05/15/2018 | 135,000 | 136,245 | ||||||||||
| 2.000%, 11/15/2019 | 30,000 | 30,329 | ||||||||||
| 1,322,172 | 1.5 | % | ||||||||||
| Oklahoma | ||||||||||||
| Logan County Independent School District, | ||||||||||||
| 4.000%, 08/01/2020 | 25,000 | 26,821 | ||||||||||
| Oklahoma City Industrial & Cultural Facilities Trust, | ||||||||||||
| 1.453%, 06/01/2019 (Callable 07/01/2017)(1)(2) | 50,000 | 49,894 | ||||||||||
| 76,715 | 0.1 | % | ||||||||||
| Oregon | ||||||||||||
| City of Portland OR, | ||||||||||||
| 4.000%, 02/01/2018 | 25,000 | 25,439 | ||||||||||
| Oregon State Facilities Authority: | ||||||||||||
| 1.790%, 10/01/2020 (Callable 07/31/2017)(Mandatory Tender Date 10/01/2017)(1) | 40,000 | 40,009 | ||||||||||
| 1.910%, 10/01/2022 (Callable 04/01/2018)(Mandatory Tender Date 09/15/2018)(1) | 100,000 | 100,380 | ||||||||||
| 4.750%, 03/15/2024 (Callable 03/15/2020) | 15,000 | 16,202 | ||||||||||
| State of Oregon Housing & Community Services Department, | ||||||||||||
| 3.500%, 07/01/2036 (Callable 01/01/2025) | 185,000 | 194,348 | ||||||||||
| 376,378 | 0.4 | % | ||||||||||
| Pennsylvania | ||||||||||||
| Allegheny County Higher Education Building Authority, | ||||||||||||
| 4.000%, 10/15/2018 | 365,000 | 375,585 | ||||||||||
| Allegheny County Hospital Development Authority, | ||||||||||||
| 4.125%, 10/15/2026 (Callable 10/15/2021) | 30,000 | 31,864 | ||||||||||
| Bethlehem Parking Authority, | ||||||||||||
| 2.000%, 10/01/2018 | 100,000 | 101,250 | ||||||||||
| Borough of Wilkinsburg PA, | ||||||||||||
| 1.500%, 07/15/2019 | 315,000 | 315,690 | ||||||||||
| Chester County Health & Education Facilities Authority, | ||||||||||||
| 5.000%, 11/01/2019 | 225,000 | 241,384 | ||||||||||
| City of Erie PA, | ||||||||||||
| 0.000%, 11/15/2018 (ETM)(Insured by AGM) | 60,000 | 59,137 | ||||||||||
| Coatesville School District, | ||||||||||||
| 5.000%, 08/01/2023 | 150,000 | 174,757 | ||||||||||
| Commonwealth Financing Authority, | ||||||||||||
| 5.000%, 06/01/2023 | 225,000 | 263,358 | ||||||||||
| County of Allegheny PA, | ||||||||||||
| 1.334%, 11/01/2026 (Callable 11/01/2017)(Insured by AGM)(1) | 75,000 | 73,729 | ||||||||||
| County of Westmoreland PA, | ||||||||||||
| 0.000%, 08/01/2017 (ETM)(Insured by AMBAC) | 40,000 | 39,974 | ||||||||||
| Crawford Central School District, | ||||||||||||
| 5.000%, 02/01/2019 (Callable 08/01/2018) | 100,000 | 103,862 | ||||||||||
| Erie Parking Authority, | ||||||||||||
| 2.000%, 09/01/2019 | 105,000 | 105,906 | ||||||||||
| Greater Latrobe School Authority, | ||||||||||||
| 2.250%, 04/15/2019 (Callable 07/31/2017) | 500,000 | 500,630 | ||||||||||
| Hollidaysburg Sewer Authority: | ||||||||||||
| 2.000%, 12/01/2018 (Insured by BAM) | 50,000 | 50,568 | ||||||||||
| 2.000%, 12/01/2019 (Insured by BAM) | 105,000 | 106,234 | ||||||||||
| Lancaster Higher Education Authority, | ||||||||||||
| 5.000%, 10/01/2022 (Insured by BAM) | 35,000 | 40,288 | ||||||||||
| Lancaster Industrial Development Authority, | ||||||||||||
| 5.000%, 05/01/2022 | 45,000 | 49,925 | ||||||||||
| Montgomery County Industrial Development Authority/PA: | ||||||||||||
| 5.000%, 01/15/2018 | 50,000 | 50,827 | ||||||||||
| 1.020%, 11/15/2029 (Callable 07/01/2017)(Optional Put Date 06/30/2017)(1) | 495,000 | 495,000 | ||||||||||
| Pennsylvania Economic Development Financing Authority: | ||||||||||||
| 5.000%, 03/01/2019 | 130,000 | 137,992 | ||||||||||
| 1.550%, 12/01/2033 (Mandatory Tender Date 12/03/2018) | 310,000 | 309,396 | ||||||||||
| Pennsylvania Higher Educational Facilities Authority, | ||||||||||||
| 5.000%, 08/15/2024 (Pre-refunded to 08/15/2021) | 100,000 | 114,927 | ||||||||||
| Pennsylvania Housing Finance Agency: | ||||||||||||
| 3.700%, 10/01/2042 (Callable 10/01/2021) | 100,000 | 102,528 | ||||||||||
| 3.500%, 10/01/2046 (Callable 10/01/2025) | 230,000 | 242,650 | ||||||||||
| 4.000%, 10/01/2046 (Callable 04/01/2026) | 260,000 | 277,729 | ||||||||||
| Pennsylvania Turnpike Commission: | ||||||||||||
| 1.790%, 12/01/2020 (Callable 06/01/2020)(1) | 225,000 | 225,781 | ||||||||||
| 1.890%, 12/01/2021 (Callable 06/01/2021)(1) | 215,000 | 215,819 | ||||||||||
| Scranton School District/PA: | ||||||||||||
| 4.000%, 06/01/2018 | 150,000 | 152,723 | ||||||||||
| 5.000%, 06/01/2019 | 100,000 | 105,360 | ||||||||||
| Somerset County General Authority, | ||||||||||||
| 2.000%, 10/01/2019 | 155,000 | 156,697 | ||||||||||
| Southern Columbia PA Area School District, | ||||||||||||
| 1.000%, 04/01/2018 | 50,000 | 49,911 | ||||||||||
| West Mifflin Sanitary Sewer Municipal Authority, | ||||||||||||
| 4.000%, 08/01/2020 (Insured by BAM) | 200,000 | 214,072 | ||||||||||
| 5,485,553 | 6.3 | % | ||||||||||
| Puerto Rico | ||||||||||||
| Commonwealth of Puerto Rico: | ||||||||||||
| 5.500%, 07/01/2018 | 50,000 | 51,452 | ||||||||||
| 0.000%, 07/01/2019 | 50,000 | 46,444 | ||||||||||
| 97,896 | 0.1 | % | ||||||||||
| Rhode Island | ||||||||||||
| Providence Public Buildings Authority, | ||||||||||||
| 5.125%, 06/15/2021 (Insured by AGM) | 80,000 | 85,931 | ||||||||||
| Rhode Island Health & Educational Building Corp., | ||||||||||||
| 5.000%, 05/15/2024 | 500,000 | 591,455 | ||||||||||
| Rhode Island Housing & Mortgage Finance Corp./RI: | ||||||||||||
| 1.050%, 10/01/2044 (Callable 10/01/2017)(Mandatory Tender Date 04/01/2018) | 100,000 | 99,926 | ||||||||||
| 3.500%, 10/01/2046 (Callable 04/01/2025) | 85,000 | 87,986 | ||||||||||
| 865,298 | 1.0 | % | ||||||||||
| South Carolina | ||||||||||||
| City of Charleston SC Waterworks & Sewer System Revenue, | ||||||||||||
| 1.412%, 01/01/2028 (Callable 07/31/2017)(Mandatory Tender Date 01/01/2018)(1) | 50,000 | 50,015 | ||||||||||
| City of Myrtle Beach SC, | ||||||||||||
| 5.000%, 10/01/2020 | 100,000 | 110,412 | ||||||||||
| Easley Combined Utility System, | ||||||||||||
| 3.250%, 12/01/2017 | 50,000 | 50,439 | ||||||||||
| Scago Educational Facilities Corp. for Union School District, | ||||||||||||
| 4.000%, 12/01/2017 | 100,000 | 101,161 | ||||||||||
| South Carolina Jobs-Economic Development Authority, | ||||||||||||
| 4.500%, 11/01/2017 | 40,000 | 40,437 | ||||||||||
| South Carolina Public Service Authority: | ||||||||||||
| 5.000%, 12/01/2021 | 110,000 | 123,692 | ||||||||||
| 5.000%, 12/01/2025 | 240,000 | 280,850 | ||||||||||
| South Carolina State Housing Finance & Development Authority, | ||||||||||||
| 4.000%, 07/01/2036 (Callable 07/01/2025) | 325,000 | 348,143 | ||||||||||
| 1,105,149 | 1.3 | % | ||||||||||
| Tennessee | ||||||||||||
| Clarksville Natural Gas Acquisition Corp., | ||||||||||||
| 5.000%, 12/15/2020 | 75,000 | 82,631 | ||||||||||
| Knox County Health Educational & Housing Facility Board, | ||||||||||||
| 5.000%, 04/01/2020 | 200,000 | 215,726 | ||||||||||
| Metropolitan Government Nashville & Davidson County Health & Educational Facilities, | ||||||||||||
| 0.900%, 04/01/2019 (Mandatory Tender Date 04/01/2018)(1) | 150,000 | 149,606 | ||||||||||
| Metropolitan Government Nashville & Davidson County Revenue, | ||||||||||||
| 1.550%, 11/15/2030 (Mandatory Tender Date 11/03/2020) | 750,000 | 750,480 | ||||||||||
| Tennessee Energy Acquisition Corp., | ||||||||||||
| 5.250%, 09/01/2018 | 30,000 | 31,400 | ||||||||||
| Tennessee Housing Development Agency, | ||||||||||||
| 4.000%, 01/01/2046 (Callable 01/01/2025) | 65,000 | 69,586 | ||||||||||
| 1,299,429 | 1.5 | % | ||||||||||
| Texas | ||||||||||||
| Bexar County Health Facilities Development Corp.: | ||||||||||||
| 4.000%, 07/15/2018 | 50,000 | 51,112 | ||||||||||
| 4.000%, 07/15/2019 | 75,000 | 77,901 | ||||||||||
| Central Texas Turnpike System, | ||||||||||||
| 5.000%, 08/15/2042 (Callable 04/01/2020)(Mandatory Tender Date 04/01/2020)(1) | 315,000 | 343,463 | ||||||||||
| City of Bullard TX, | ||||||||||||
| 3.000%, 09/01/2020 (Insured by BAM) | 135,000 | 140,068 | ||||||||||
| City of Fort Worth TX, | ||||||||||||
| 5.000%, 03/01/2026 (Pre-refunded to 03/01/2019) | 500,000 | 532,015 | ||||||||||
| City of Round Rock TX: | ||||||||||||
| 4.000%, 12/01/2023 | 30,000 | 33,417 | ||||||||||
| 4.000%, 12/01/2024 | 250,000 | 279,495 | ||||||||||
| Clear Creek Independent School District: | ||||||||||||
| 3.000%, 02/15/2035 (Mandatory Tender Date 08/14/2017)(PSF Guaranteed) | 225,000 | 225,482 | ||||||||||
| 1.350%, 02/15/2038 (Mandatory Tender Date 08/15/2018)(PSF Guaranteed) | 50,000 | 50,203 | ||||||||||
| Clifton Higher Education Finance Corp., | ||||||||||||
| 5.000%, 08/15/2018 | 100,000 | 103,899 | ||||||||||
| Coastal Water Authority, | ||||||||||||
| 4.000%, 12/15/2017 | 25,000 | 25,344 | ||||||||||
| County of Denton TX, | ||||||||||||
| 2.625%, 07/15/2017 | 25,000 | 25,011 | ||||||||||
| County of Harris TX, | ||||||||||||
| 1.610%, 08/15/2021 (Callable 02/15/2018)(Mandatory Tender Date 08/15/2018)(1) | 65,000 | 65,005 | ||||||||||
| Cypress-Fairbanks Independent School District, | ||||||||||||
| 3.000%, 02/15/2036 (Mandatory Tender Date 08/15/2019)(PSF Guaranteed) | 270,000 | 278,608 | ||||||||||
| Dallas Independent School District: | ||||||||||||
| 5.000%, 02/15/2036 (Mandatory Tender Date 02/15/2020)(PSF Guaranteed) | 200,000 | 217,514 | ||||||||||
| 5.000%, 02/15/2036 (Mandatory Tender Date 02/15/2022)(PSF Guaranteed) | 340,000 | 390,663 | ||||||||||
| Dawson Independent School District, | ||||||||||||
| 0.000%, 02/16/2019 (PSF Guaranteed) | 245,000 | 239,179 | ||||||||||
| Denton County Fresh Water Supply District No 6: | ||||||||||||
| 4.000%, 02/15/2018 (Insured by BAM) | 150,000 | 152,554 | ||||||||||
| 4.000%, 02/15/2019 (Insured by BAM) | 150,000 | 156,107 | ||||||||||
| 4.000%, 02/15/2020 (Insured by BAM) | 175,000 | 185,593 | ||||||||||
| Fort Bend County Municipal Utility District No. 187, | ||||||||||||
| 3.000%, 09/01/2017 | 20,000 | 20,049 | ||||||||||
| Fort Bend County Municipal Utility District No. 58, | ||||||||||||
| 5.000%, 04/01/2019 (Insured by BAM) | 150,000 | 159,387 | ||||||||||
| Fort Bend Independent School District, | ||||||||||||
| 0.900%, 08/01/2040 (Mandatory Tender Date 08/01/2018)(PSF Guaranteed) | 115,000 | 114,902 | ||||||||||
| Fort Worth Independent School District, | ||||||||||||
| 5.000%, 02/15/2029 (Pre-refunded to 02/15/2019) | 300,000 | 318,747 | ||||||||||
| Generation Park Management District, | ||||||||||||
| 3.000%, 09/01/2018 | 160,000 | 162,344 | ||||||||||
| Harlingen Consolidated Independent School District, | ||||||||||||
| 5.000%, 08/15/2021 (PSF Guaranteed) | 100,000 | 114,280 | ||||||||||
| Harris County Cultural Education Facilities Finance Corp.: | ||||||||||||
| 1.490%, 12/01/2042 (Callable 06/01/2019)(Mandatory Tender Date 12/01/2019)(1) | 50,000 | 50,039 | ||||||||||
| 1.684%, 10/01/2045 (Callable 12/01/2019)(Mandatory Tender Date 06/01/2020)(1) | 300,000 | 302,568 | ||||||||||
| Harris County Municipal Utility District No. 153, | ||||||||||||
| 4.000%, 09/01/2023 (Callable 09/01/2022)(Insured by BAM) | 100,000 | 110,208 | ||||||||||
| Harris County Municipal Utility District No. 419: | ||||||||||||
| 3.000%, 09/01/2017 (Insured by AGM) | 25,000 | 25,075 | ||||||||||
| 3.000%, 09/01/2017 (Insured by AGM) | 50,000 | 50,145 | ||||||||||
| Harris County-Houston Sports Authority, | ||||||||||||
| 0.000%, 11/15/2017 | 25,000 | 24,862 | ||||||||||
| Katy Independent School District, | ||||||||||||
| 1.327%, 08/15/2036 (Callable 02/15/2019)(Callable 08/15/2019)(PSF Guaranteed)(1) | 300,000 | 300,687 | ||||||||||
| Laredo Independent School District, | ||||||||||||
| 4.000%, 08/01/2017 | 25,000 | 25,052 | ||||||||||
| Lewisville Independent School District, | ||||||||||||
| 4.500%, 08/15/2023 (Callable 08/15/2017)(PSF Guaranteed) | 25,000 | 25,099 | ||||||||||
| Metropolitan Transit Authority of Harris County, | ||||||||||||
| 5.000%, 11/01/2017 | 25,000 | 25,328 | ||||||||||
| Mission Economic Development Corp., | ||||||||||||
| 1.800%, 12/01/2018 | 100,000 | 100,664 | ||||||||||
| New Hope Cultural Education Facilities Finance Corp.: | ||||||||||||
| 1.250%, 11/01/2018 | 100,000 | 99,804 | ||||||||||
| 3.000%, 07/01/2019 | 100,000 | 101,605 | ||||||||||
| 4.000%, 04/01/2020 | 50,000 | 52,416 | ||||||||||
| 3.000%, 07/01/2021 | 120,000 | 124,576 | ||||||||||
| 3.625%, 08/15/2022 (Callable 08/15/2021) | 100,000 | 100,553 | ||||||||||
| North East Independent School District/TX, | ||||||||||||
| 2.000%, 08/01/2044 (Mandatory Tender Date 08/01/2019)(PSF Guaranteed) | 50,000 | 50,589 | ||||||||||
| North Texas Health Facilities Development Corp., | ||||||||||||
| 5.000%, 09/01/2020 (Callable 09/01/2017)(Insured by AGM) | 55,000 | 55,313 | ||||||||||
| North Texas Higher Education Authority, Inc., | ||||||||||||
| 2.048%, 07/01/2030 (1) | 45,000 | 44,963 | ||||||||||
| North Texas Tollway Authority: | ||||||||||||
| 5.000%, 01/01/2022 | 25,000 | 28,665 | ||||||||||
| 1.950%, 01/01/2038 (Mandatory Tender Date 01/01/2019)(1) | 100,000 | 100,647 | ||||||||||
| Northside Independent School District, | ||||||||||||
| 2.000%, 06/01/2046 (Mandatory Tender Date 06/01/2021)(PSF Guaranteed)(1) | 300,000 | 304,293 | ||||||||||
| Northwest Harris County Municipal Utility District No. 16, | ||||||||||||
| 5.500%, 10/01/2021 (Insured by BAM) | 25,000 | 28,734 | ||||||||||
| Round Rock Independent School District, | ||||||||||||
| 1.500%, 08/01/2040 (Callable 08/01/2017)(Mandatory Tender Date 08/01/2021)(PSF Guaranteed) | 60,000 | 60,006 | ||||||||||
| SA Energy Acquisition Public Facility Corp.: | ||||||||||||
| 5.500%, 08/01/2021 | 25,000 | 28,529 | ||||||||||
| 5.500%, 08/01/2022 | 200,000 | 233,268 | ||||||||||
| Sam Rayburn Municipal Power Agency, | ||||||||||||
| 5.000%, 10/01/2020 | 150,000 | 163,093 | ||||||||||
| San Jacinto College District, | ||||||||||||
| 5.000%, 02/15/2034 (Pre-refunded to 02/15/2019) | 25,000 | 26,542 | ||||||||||
| Siena Municipal Utility District No. 1, | ||||||||||||
| 2.250%, 09/01/2018 (Insured by BAM) | 100,000 | 101,463 | ||||||||||
| Tarrant County Cultural Education Facilities Finance Corp., | ||||||||||||
| 2.100%, 11/15/2017 | 50,000 | 50,088 | ||||||||||
| Texas Municipal Gas Acquisition & Supply Corp. I: | ||||||||||||
| 5.250%, 12/15/2018 | 180,000 | 188,507 | ||||||||||
| 5.250%, 12/15/2021 | 75,000 | 84,866 | ||||||||||
| Texas Municipal Gas Acquisition & Supply Corp. II, | ||||||||||||
| 1.535%, 09/15/2017 (1) | 30,000 | 30,007 | ||||||||||
| Texas Transportation Commission State Highway Fund, | ||||||||||||
| 4.000%, 04/01/2026 (Mandatory Tender Date 10/01/2021) | 430,000 | 471,912 | ||||||||||
| Viridian Municipal Management District, | ||||||||||||
| 6.000%, 12/01/2023 (Insured by BAM) | 50,000 | 61,963 | ||||||||||
| West Ranch Management District: | ||||||||||||
| 2.000%, 09/01/2018 | 50,000 | 50,387 | ||||||||||
| 3.000%, 09/01/2019 | 50,000 | 51,712 | ||||||||||
| 8,196,570 | 9.4 | % | ||||||||||
| Utah | ||||||||||||
| Utah Housing Corp., | ||||||||||||
| 4.000%, 01/01/2045 (Callable 01/01/2026) | 95,000 | 101,260 | 0.1 | % | ||||||||
| Vermont | ||||||||||||
| City of Burlington VT Electric System Revenue, | ||||||||||||
| 5.000%, 07/01/2023 (Callable 07/01/2021) | 25,000 | 27,218 | 0.0 | % | ||||||||
| Virgin Islands | ||||||||||||
| Virgin Islands Public Finance Authority, | ||||||||||||
| 5.000%, 09/01/2020 | 100,000 | 107,018 | 0.1 | % | ||||||||
| Washington | ||||||||||||
| Central Puget Sound Regional Transit Authority, | ||||||||||||
| 1.610%, 11/01/2045 (Callable (05/01/2018)(1) | 50,000 | 50,072 | ||||||||||
| Washington Economic Development Finance Authority, | ||||||||||||
| 1.250%, 11/01/2017 | 250,000 | 250,300 | ||||||||||
| Washington Health Care Facilities Authority, | ||||||||||||
| 4.000%, 01/01/2018 | 70,000 | 70,974 | ||||||||||
| Washington State University, | ||||||||||||
| 4.000%, 10/01/2017 | 40,000 | 40,298 | ||||||||||
| 411,644 | 0.5 | % | ||||||||||
| Wisconsin | ||||||||||||
| City of Two Rivers WI, | ||||||||||||
| 4.000%, 04/01/2018 | 125,000 | 126,575 | ||||||||||
| Kaukauna Redevelopment Authority, | ||||||||||||
| 4.000%, 06/01/2018 | 25,000 | 25,656 | ||||||||||
| Milwaukee Redevelopment Authority, | ||||||||||||
| 1.950%, 12/01/2038 (Callable 07/01/2017)(Optional Put Date 07/07/2017)(1) | 140,000 | 140,000 | ||||||||||
| Public Finance Authority: | ||||||||||||
| 4.000%, 12/01/2020 | 350,000 | 348,558 | ||||||||||
| 3.000%, 11/15/2022 (Callable 11/15/2018) | 250,000 | 250,790 | ||||||||||
| Waukesha Housing Authority, | ||||||||||||
| 1.950%, 12/01/2042 (Callable 07/01/2017)(Optional Put Date 07/07/2017)(1) | 145,000 | 145,000 | ||||||||||
| West Allis West Milwaukee School District: | ||||||||||||
| 3.000%, 04/01/2019 | 150,000 | 149,392 | ||||||||||
| 3.000%, 04/01/2020 | 50,000 | 49,584 | ||||||||||
| Whitehall School District, | ||||||||||||
| 1.500%, 10/25/2017 | 250,000 | 250,303 | ||||||||||
| Wisconsin Center District: | ||||||||||||
| 0.000%, 12/15/2018 | 80,000 | 78,026 | ||||||||||
| 5.250%, 12/15/2023 | 70,000 | 80,856 | ||||||||||
| 5.250%, 12/15/2027 | 15,000 | 17,921 | ||||||||||
| Wisconsin Health & Educational Facilities Authority: | ||||||||||||
| 3.000%, 07/01/2017 | 125,000 | 125,000 | ||||||||||
| 3.000%, 07/01/2018 | 25,000 | 25,363 | ||||||||||
| 5.000%, 11/15/2018 | 15,000 | 15,799 | ||||||||||
| 5.500%, 02/15/2019 (Insured by AMBAC) | 125,000 | 130,714 | ||||||||||
| 5.000%, 08/15/2020 | 35,000 | 38,393 | ||||||||||
| 5.875%, 02/15/2022 | 25,000 | 29,020 | ||||||||||
| 4.000%, 09/15/2023 (Callable 09/15/2022) | 50,000 | 53,528 | ||||||||||
| 5.250%, 04/15/2024 (Callable 04/15/2020) | 60,000 | 65,765 | ||||||||||
| Wisconsin Housing & Economic Development Authority, | ||||||||||||
| 3.500%, 09/01/2046 (Callable 09/01/2025) | 495,000 | 519,022 | ||||||||||
| 2,665,265 | 3.1 | % | ||||||||||
| Total Municipal Bonds (Cost $85,891,819) | 86,149,085 | 99.0 | % | |||||||||
| SHORT-TERM INVESTMENTS | Shares | |||||||||||
| Money Market Mutual Funds | ||||||||||||
| Fidelity Institutional Money Market Fund - Government Portfolio, Institutional Class, 0.85% « | 698,984 | 698,984 | ||||||||||
| Total Short-Term Investments (Cost $698,984) | 698,984 | 0.8 | % | |||||||||
| Total Investments (Cost $86,590,803) | 86,848,069 | 99.8 | % | |||||||||
| Other Assets in Excess of Liabilities | 156,708 | 0.2 | % | |||||||||
| TOTAL NET ASSETS | $ | 87,004,777 | 100.0 | % | ||||||||
Notes to Schedule of Investments | |
| AGM | Assured Guaranty Municipal |
| AMBAC | Ambac Assurance Corp. |
| BAM | Build America Mutual Assurance Co. |
| ETM | Escrowed to Maturity |
| NPFGC | National Public Finance Guarantee Corp. |
| PSF | Texas Permanent School Fund |
| Q-SBLF | Qualified School Building Loan Fund |
| (1) | Variable or floating rate security. Floating rate securities are securities whose yields vary with a designated index rate. These securities rates are as of June 30, 2017. |
| (2) | Auction Rate Security. An Auction Rate Security is a debt instrument with a long nominal maturity for which the interest rate is regularly reset through a Dutch auction. The rate presented is either the rate set through the auction or the maximum interest rate provided for in the security issuance provision. |
| (3) | Security or a portion of the security purchased on a when-issued or delayed delivery basis. |
| « | 7-Day Yield. |
| * | Restricted security as defined in Rule 144(a) under the Securities Act of 1933 and determined to be liquid. Purchased in a private placement transaction; resale to the public may require registration or or may extend only to qualified institutional buyers. At June 30, 2017, the value of these securities total $99,986, which represents 0.11% of total net assets. |
| Baird Quality Intermediate Municipal Bond Fund | ||||||||||||
| Schedule of Investments | ||||||||||||
| June 30, 2017 (Unaudited) | ||||||||||||
| Principal | % of | |||||||||||
| Amount | Value | Net Assets | ||||||||||
| LONG-TERM INVESTMENTS | ||||||||||||
| Municipal Bonds | ||||||||||||
| Alabama | ||||||||||||
| Alabama State Public School & College Authority, | ||||||||||||
| 5.000%, 05/01/2019 | $ | 1,000,000 | 1,070,800 | 0.1 | % | |||||||
| Arizona | ||||||||||||
| City of Tucson AZ Water System Revenue, | ||||||||||||
| 5.000%, 07/01/2028 (Callable 07/01/2025) | 750,000 | 895,755 | ||||||||||
| Gila County Unified School District No. 10-Payson, | ||||||||||||
| 5.250%, 07/01/2027 (Callable 07/01/2017)(Insured by AMBAC) | 1,000,000 | 1,000,000 | ||||||||||
| 1,895,755 | 0.2 | % | ||||||||||
| Arkansas | ||||||||||||
| Arkansas Development Finance Authority, | ||||||||||||
| 5.500%, 12/01/2018 (ETM) | 1,000,000 | 1,036,100 | ||||||||||
| City of Pine Bluff AR, | ||||||||||||
| 3.000%, 02/01/2047 (Callable 08/01/2027)(Insured by BAM) | 2,460,000 | 2,498,548 | ||||||||||
| City of Rogers AR Sewer Revenue: | ||||||||||||
| 4.000%, 11/01/2025 (Callable 05/01/2024) | 570,000 | 640,777 | ||||||||||
| 4.000%, 11/01/2026 (Callable 05/01/2024) | 680,000 | 756,187 | ||||||||||
| 4.000%, 11/01/2027 (Callable 05/01/2024) | 460,000 | 508,167 | ||||||||||
| 4.000%, 11/01/2028 (Callable 05/01/2024) | 125,000 | 137,179 | ||||||||||
| 5,576,958 | 0.5 | % | ||||||||||
| California | ||||||||||||
| Aromas-San Juan Unified School District, | ||||||||||||
| 0.000%, 08/01/2050 (Pre-refunded to 08/01/2021)(Insured by AGM) | 700,000 | 58,660 | ||||||||||
| California Infrastructure & Economic Development Bank, | ||||||||||||
| 5.000%, 07/01/2029 (Pre-refunded to 01/01/2028) | 150,000 | 191,211 | ||||||||||
| Centinela Valley Union High School District, | ||||||||||||
| 5.000%, 08/01/2050 (Callable 08/01/2022)(Insured by AGM) | 385,000 | 445,364 | ||||||||||
| Citrus Community College District, | ||||||||||||
| 0.000%, 08/01/2034 (Callable 02/01/2024) | 885,000 | 748,790 | ||||||||||
| City of Bakersfield CA, | ||||||||||||
| 0.000%, 04/15/2021 (ETM) | 12,380,000 | 11,758,029 | ||||||||||
| Commerce Community Development Commission Successor Agency, | ||||||||||||
| 0.000%, 08/01/2021 (ETM) | 535,000 | 440,219 | ||||||||||
| Contra Costa Transportation Authority, | ||||||||||||
| 5.000%, 03/01/2028 (Callable 03/01/2025) | 1,500,000 | 1,806,000 | ||||||||||
| El Rancho Unified School District, | ||||||||||||
| 0.000%, 08/01/2035 (Pre-refunded to 08/01/2023)(Insured by BAM) | 300,000 | 131,865 | ||||||||||
| Mount San Antonio Community College District, | ||||||||||||
| 0.000%, 08/01/2028 (Callable 02/01/2028) | 300,000 | 285,060 | ||||||||||
| Newport Mesa Unified School District, | ||||||||||||
| 0.000%, 08/01/2027 | 1,075,000 | 818,139 | ||||||||||
| Northern California Power Agency, | ||||||||||||
| 7.500%, 07/01/2023 (Pre-refunded to 07/01/2021)(Insured by AMBAC) | 575,000 | 664,545 | ||||||||||
| Pittsburg Unified School District Financing Authority, | ||||||||||||
| 0.000%, 09/01/2040 (Pre-refunded to 09/01/2021) | 675,000 | 151,159 | ||||||||||
| Roseville Joint Union School District GO, | ||||||||||||
| 0.000%, 08/01/2039 (Pre-refunded to 08/01/2021)(Insured by AGM) | 105,000 | 24,756 | ||||||||||
| San Diego Unified School District/CA, | ||||||||||||
| 0.000%, 07/01/2033 (Pre-refunded to 07/01/2024) | 250,000 | 290,243 | ||||||||||
| San Joaquin Hills Transportation Corridor Agency: | ||||||||||||
| 0.000%, 01/01/2020 (ETM) | 6,865,000 | 6,655,617 | ||||||||||
| 0.000%, 01/01/2023 (ETM) | 14,000,000 | 12,827,920 | ||||||||||
| 0.000%, 01/01/2027 (ETM) | 1,030,000 | 840,882 | ||||||||||
| 0.000%, 01/01/2028 (ETM) | 720,000 | 574,769 | ||||||||||
| San Marcos Public Facilities Authority, | ||||||||||||
| 0.000%, 09/01/2019 (ETM) | 17,495,000 | 16,984,671 | ||||||||||
| San Mateo Union High School District, | ||||||||||||
| 5.000%, 09/01/2041 (Callable 09/01/2023) | 1,695,000 | 2,006,338 | ||||||||||
| San Ysidro School District: | ||||||||||||
| 0.000%, 08/01/2042 (Pre-refunded to 08/01/2021)(Insured by AGM) | 275,000 | 54,532 | ||||||||||
| 0.000%, 08/01/2043 (Pre-refunded to 08/01/2021)(Insured by AGM) | 290,000 | 53,227 | ||||||||||
| 0.000%, 08/01/2044 (Pre-refunded to 08/01/2021)(Insured by AGM) | 150,000 | 25,476 | ||||||||||
| 0.000%, 08/01/2050 (Pre-refunded to 08/01/2021)(Insured by AGM) | 525,000 | 55,755 | ||||||||||
| Sutter Union High School District: | ||||||||||||
| 0.000%, 08/01/2036 (Pre-refunded to 08/01/2025) | 50,000 | 19,396 | ||||||||||
| 0.000%, 08/01/2037 (Pre-refunded to 08/01/2025) | 50,000 | 18,059 | ||||||||||
| 0.000%, 08/01/2041 (Pre-refunded to 08/01/2025) | 50,000 | 13,526 | ||||||||||
| 0.000%, 08/01/2043 (Pre-refunded to 08/01/2025) | 200,000 | 46,630 | ||||||||||
| 0.000%, 08/01/2044 (Pre-refunded to 08/01/2025) | 345,000 | 74,634 | ||||||||||
| 0.000%, 06/01/2050 (Pre-refunded to 08/01/2025) | 700,000 | 96,782 | ||||||||||
| Tustin Unified School District, | ||||||||||||
| 0.000%, 08/01/2028 (Callable 08/01/2021) | 600,000 | 635,376 | ||||||||||
| Victor Valley Union High School District: | ||||||||||||
| 0.000%, 08/01/2036 (Pre-refunded to 08/01/2023) | 510,000 | 225,853 | ||||||||||
| 0.000%, 08/01/2038 (Pre-refunded to 08/01/2023) | 460,000 | 179,694 | ||||||||||
| 0.000%, 08/01/2041 (Pre-refunded to 08/01/2023) | 545,000 | 178,248 | ||||||||||
| 0.000%, 08/01/2042 (Pre-refunded to 08/01/2023) | 2,000,000 | 615,180 | ||||||||||
| 0.000%, 08/01/2046 (Pre-refunded to 08/01/2023) | 200,000 | 48,172 | ||||||||||
| 0.000%, 08/01/2052 (Pre-refunded to 08/01/2023) | 790,000 | 130,690 | ||||||||||
| 60,175,467 | 5.7 | % | ||||||||||
| Colorado | ||||||||||||
| City of Colorado Springs CO, | ||||||||||||
| 5.000%, 12/15/2032 (Pre-refunded to 12/15/2018)(Insured by AGM) | 1,300,000 | 1,372,696 | ||||||||||
| Colorado Health Facilities Authority, | ||||||||||||
| 0.000%, 07/15/2022 (ETM) | 5,090,000 | 4,670,278 | ||||||||||
| Colorado Springs Colorado Utilities Revenue Bonds, | ||||||||||||
| 5.875%, 11/15/2017 (ETM) | 1,665,000 | 1,694,787 | ||||||||||
| Dawson Ridge Metropolitan District No. 1: | ||||||||||||
| 0.000%, 10/01/2022 (ETM) | 36,045,000 | 33,073,450 | ||||||||||
| 0.000%, 10/01/2022 (ETM) | 22,540,000 | 20,681,803 | ||||||||||
| Weld County Reorganized School District No Re-8: | ||||||||||||
| 5.000%, 12/01/2027 (Callable 12/01/2026) | 755,000 | 932,938 | ||||||||||
| 5.000%, 12/01/2028 (Callable 12/01/2026) | 800,000 | 980,928 | ||||||||||
| 5.000%, 12/01/2029 (Callable 12/01/2026) | 700,000 | 851,053 | ||||||||||
| 64,257,933 | 6.1 | % | ||||||||||
| Connecticut | ||||||||||||
| Connecticut Housing Finance Authority, | ||||||||||||
| 4.000%, 11/15/2047 (Callable 11/15/2026) | 1,890,000 | 2,048,987 | ||||||||||
| State of Connecticut, | ||||||||||||
| 5.000%, 10/15/2020 | 4,390,000 | 4,830,273 | ||||||||||
| 6,879,260 | 0.7 | % | ||||||||||
| District of Columbia | ||||||||||||
| District of Columbia: | ||||||||||||
| 5.000%, 06/01/2028 (Callable 12/01/2026) | 800,000 | 983,968 | ||||||||||
| 5.250%, 07/15/2038 (Pre-refunded to 07/15/2018) | 150,000 | 156,373 | ||||||||||
| 1,140,341 | 0.1 | % | ||||||||||
| Florida | ||||||||||||
| City of Miami Beach FL, | ||||||||||||
| 6.250%, 10/01/2022 (ETM)(Insured by AMBAC) | 1,470,000 | 1,648,899 | ||||||||||
| City of Sunrise FL Utility System Revenue, | ||||||||||||
| 5.500%, 10/01/2018 (ETM)(Insured by AMBAC) | 1,695,000 | 1,744,189 | ||||||||||
| County of Miami-Dade FL: | ||||||||||||
| 4.500%, 10/01/2020 | 7,100,000 | 7,829,454 | ||||||||||
| 5.250%, 10/01/2030 (ETM) | 1,695,000 | 2,158,956 | ||||||||||
| County of Miami-Dade FL Water & Sewer System Revenue, | ||||||||||||
| 5.250%, 10/01/2022 (Insured by AGM) | 1,125,000 | 1,331,674 | ||||||||||
| County of Palm Beach FL, | ||||||||||||
| 5.000%, 11/01/2018 (Pre-refunded to 11/01/2017) | 1,000,000 | 1,013,000 | ||||||||||
| County of Seminole FL Water & Sewer Revenue, | ||||||||||||
| 6.000%, 10/01/2019 (ETM) | 3,625,000 | 3,829,196 | ||||||||||
| Escambia County Housing Finance Authority, | ||||||||||||
| 0.000%, 10/15/2018 (ETM) | 4,130,000 | 4,064,374 | ||||||||||
| Florida Housing Finance Corp., | ||||||||||||
| 4.000%, 07/01/2047 (Callable 07/01/2025) | 5,000,000 | 5,345,100 | ||||||||||
| Florida Municipal Power Agency, | ||||||||||||
| 5.000%, 10/01/2017 (ETM) | 1,590,000 | 1,605,503 | ||||||||||
| Gulf Environmental Services Inc., | ||||||||||||
| 5.000%, 10/01/2018 (ETM) | 585,000 | 600,432 | ||||||||||
| Highlands County Health Facilities Authority: | ||||||||||||
| 0.900%, 11/15/2035 (Callable 07/03/2017)(Optional Put Date 07/07/2017)(1) | 1,695,000 | 1,695,000 | ||||||||||
| 0.900%, 11/15/2037 (Callable 07/01/2017)(Optional Put Date 07/07/2017)(1) | 1,150,000 | 1,150,000 | ||||||||||
| Hillsborough County Industrial Development Authority: | ||||||||||||
| 5.625%, 08/15/2029 (Pre-refunded to 08/15/2018) | 2,950,000 | 3,098,975 | ||||||||||
| 8.000%, 08/15/2032 (Pre-refunded to 08/15/2019) | 2,065,000 | 2,375,638 | ||||||||||
| Lee County School Board: | ||||||||||||
| 5.000%, 08/01/2031 (Callable 08/01/2026) | 2,170,000 | 2,544,303 | ||||||||||
| 5.000%, 08/01/2032 (Callable 08/01/2026) | 1,000,000 | 1,162,070 | ||||||||||
| Miami-Dade County Health Facilities Authority, | ||||||||||||
| 5.750%, 05/01/2021 (ETM) | 970,000 | 1,062,761 | ||||||||||
| Mid-Bay Bridge Authority: | ||||||||||||
| 6.875%, 10/01/2022 (ETM) | 4,675,000 | 5,428,890 | ||||||||||
| 6.875%, 10/01/2022 (ETM) | 3,175,000 | 3,687,001 | ||||||||||
| Orlando Utilities Commission, | ||||||||||||
| 6.750%, 10/01/2017 (ETM) | 580,000 | 587,975 | ||||||||||
| Pinellas County Housing Finance Authority, | ||||||||||||
| 4.250%, 03/01/2027 (Callable 09/01/2019) | 740,000 | 760,468 | ||||||||||
| School District of Broward County/FL: | ||||||||||||
| 5.250%, 07/01/2022 (Callable 07/01/2021) | 8,390,000 | 9,581,967 | ||||||||||
| 5.250%, 07/01/2023 (Callable 07/01/2021) | 4,915,000 | 5,600,987 | ||||||||||
| State of Florida, | ||||||||||||
| 5.000%, 06/01/2022 (Callable 06/01/2019) | 13,800,000 | 14,810,574 | ||||||||||
| Tampa Bay Water, | ||||||||||||
| 5.000%, 10/01/2019 (ETM) | 1,720,000 | 1,864,153 | ||||||||||
| 86,581,539 | 8.2 | % | ||||||||||
| Georgia | ||||||||||||
| Athens-Clarke County Unified Government Development Authority, | ||||||||||||
| 0.890%, 07/01/2035 (Callable 07/01/2017)(1) | 5,800,000 | 5,800,000 | ||||||||||
| Atlanta Development Authority, | ||||||||||||
| 5.000%, 09/01/2023 (ETM) | 2,325,000 | 2,789,419 | ||||||||||
| Forsyth County Hospital Authority, | ||||||||||||
| 6.375%, 10/01/2028 (ETM) | 8,050,000 | 10,259,564 | ||||||||||
| Georgia Housing & Finance Authority, | ||||||||||||
| 3.500%, 12/01/2046 (Callable 12/01/2025) | 1,410,000 | 1,484,716 | ||||||||||
| Richmond County Development Authority: | ||||||||||||
| 0.000%, 12/01/2021 (ETM) | 1,835,000 | 1,711,412 | ||||||||||
| 0.000%, 12/01/2021 (ETM) | 3,995,000 | 3,725,937 | ||||||||||
| 25,771,048 | 2.4 | % | ||||||||||
| Illinois | ||||||||||||
| Cook County Community High School District No. 233, | ||||||||||||
| 4.000%, 12/01/2026 (Callable 06/01/2022) | 3,695,000 | 4,029,398 | ||||||||||
| Cook County Illinois School District No. 159, | ||||||||||||
| 0.000%, 12/01/2022 (ETM) | 2,000,000 | 1,828,140 | ||||||||||
| County of Du Page IL, | ||||||||||||
| 5.600%, 01/01/2021 | 670,000 | 730,963 | ||||||||||
| Illinois Finance Authority: | ||||||||||||
| 6.250%, 05/01/2022 (Pre-refunded to 05/01/2020) | 2,550,000 | 2,899,784 | ||||||||||
| 0.000%, 07/15/2023 (ETM) | 25,510,000 | 22,681,706 | ||||||||||
| 0.000%, 07/15/2025 (ETM) | 34,705,000 | 29,093,201 | ||||||||||
| 5.000%, 12/01/2030 (Callable 12/01/2021) | 6,775,000 | 7,548,637 | ||||||||||
| 6.625%, 11/01/2039 (Pre-refunded to 05/01/2019) | 395,000 | 433,821 | ||||||||||
| Kane County Community Unit School District, | ||||||||||||
| 9.000%, 01/01/2023 (Insured by AGM) | 3,525,000 | 4,766,082 | ||||||||||
| Kane McHenry Cook & De Kalb Counties Unit School District: | ||||||||||||
| 7.000%, 01/01/2018 (ETM)(Insured by AMBAC) | 365,000 | 375,556 | ||||||||||
| 7.000%, 01/01/2019 (ETM)(Insured by AMBAC) | 1,755,000 | 1,906,930 | ||||||||||
| Kendall Kane & Will Counties Community Unit School District No. 308, | ||||||||||||
| 0.000%, 02/01/2021 (Insured by AGM) | 13,625,000 | 12,574,785 | ||||||||||
| Lake County Community Consolidated School District No. 50 Woodland, | ||||||||||||
| 5.000%, 01/01/2021 | 1,375,000 | 1,529,921 | ||||||||||
| Lake County Illinois Community High School District No. 124 Grant, | ||||||||||||
| 5.000%, 12/01/2017 | 1,050,000 | 1,067,000 | ||||||||||
| Metropolitan Pier & Exposition Authority, | ||||||||||||
| 5.500%, 12/15/2023 (ETM) | 2,250,000 | 2,581,065 | ||||||||||
| Public Building Commission of Chicago, | ||||||||||||
| 7.000%, 01/01/2020 (ETM) | 1,555,000 | 1,720,514 | ||||||||||
| Regional Transportation Authority: | ||||||||||||
| 7.750%, 06/01/2020 | 560,000 | 620,760 | ||||||||||
| 6.700%, 11/01/2021 | 910,000 | 1,014,532 | ||||||||||
| 6.000%, 07/01/2022 | 4,705,000 | 5,601,255 | ||||||||||
| Southern Illinois University: | ||||||||||||
| 5.250%, 04/01/2018 | 1,075,000 | 1,101,251 | ||||||||||
| 5.250%, 04/01/2019 | 1,390,000 | 1,454,010 | ||||||||||
| State of Illinois: | ||||||||||||
| 6.500%, 06/15/2022 | 180,000 | 201,917 | ||||||||||
| 6.000%, 11/01/2026 | 3,000,000 | 3,418,470 | ||||||||||
| Village of Schaumburg IL, | ||||||||||||
| 4.000%, 12/01/2024 (Callable 12/01/2022) | 5,750,000 | 6,348,460 | ||||||||||
| Will County Community Unit School District No. 201-U Crete-Monee, | ||||||||||||
| 0.000%, 11/01/2024 (ETM) | 705,000 | 613,428 | ||||||||||
| Winnebago County IL School District: | ||||||||||||
| 0.000%, 01/01/2018 (ETM)(Insured by AGM) | 155,000 | 154,273 | ||||||||||
| 0.000%, 01/01/2018 (Insured by AGM) | 1,205,000 | 1,191,275 | ||||||||||
| 117,487,134 | 11.1 | % | ||||||||||
| Indiana | ||||||||||||
| Franklin Community Multi-School Building Corp., | ||||||||||||
| 5.000%, 07/15/2020 | 1,990,000 | 2,188,383 | ||||||||||
| Hammond Multi-School Building Corp., | ||||||||||||
| 6.000%, 01/15/2018 (ETM) | 220,000 | 225,779 | ||||||||||
| Indiana Health & Educational Facilities Financing Authority, | ||||||||||||
| 1.750%, 11/15/2031 (Mandatory Tender Date 11/02/2021)(1) | 1,550,000 | 1,548,698 | ||||||||||
| Indianapolis Local Public Improvement Bond Bank, | ||||||||||||
| 5.500%, 01/01/2019 | 1,155,000 | 1,228,470 | ||||||||||
| South Bend Community School Corp., | ||||||||||||
| 5.000%, 07/15/2017 | 505,000 | 505,520 | ||||||||||
| 5,696,850 | 0.5 | % | ||||||||||
| Iowa | ||||||||||||
| Iowa Finance Authority, | ||||||||||||
| 0.920%, 12/01/2033 (Callable 07/01/2017)(Option Put Date 07/07/2017)(1) | 4,050,000 | 4,050,000 | ||||||||||
| Iowa Higher Education Loan Authority: | ||||||||||||
| 0.970%, 11/01/2030 (Callable 07/01/2017)(1) | 400,000 | 400,000 | ||||||||||
| 4.500%, 10/01/2033 (Pre-refunded to 10/01/2021) | 2,100,000 | 2,355,759 | ||||||||||
| 5.000%, 10/01/2038 (Pre-refunded to 10/01/2021) | 2,090,000 | 2,387,240 | ||||||||||
| 5.000%, 09/01/2043 (Pre-refunded to 09/01/2023) | 5,050,000 | 5,993,592 | ||||||||||
| 15,186,591 | 1.4 | % | ||||||||||
| Kansas | ||||||||||||
| City of Wichita KS: | ||||||||||||
| 5.000%, 11/15/2020 (ETM) | 1,120,000 | 1,256,909 | ||||||||||
| 5.000%, 11/15/2029 (Pre-refunded to 11/15/2021) | 40,000 | 46,104 | ||||||||||
| 5.000%, 11/15/2034 (Pre-refunded to 11/15/2019) | 1,055,000 | 1,148,188 | ||||||||||
| Wyandotte County-Kansas City Unified Government Utility System Revenue, | ||||||||||||
| 5.000%, 09/01/2019 (Callable 03/01/2019)(Insured by BHAC) | 1,865,000 | 1,974,606 | ||||||||||
| 4,425,807 | 0.4 | % | ||||||||||
| Kentucky | ||||||||||||
| Kentucky Infrastructure Authority: | ||||||||||||
| 5.000%, 02/01/2023 (Pre-refunded to 02/01/2022) | 70,000 | 81,420 | ||||||||||
| 5.000%, 02/01/2025 (Pre-refunded to 02/01/2022) | 70,000 | 81,420 | ||||||||||
| 5.000%, 02/01/2026 (Pre-refunded to 02/01/2022) | 75,000 | 87,235 | ||||||||||
| 250,075 | 0.0 | % | ||||||||||
| Louisiana | ||||||||||||
| Jefferson Parish Hospital Service District: | ||||||||||||
| 6.000%, 01/01/2039 (Pre-refunded to 01/01/2021)(Insured by AGM) | 2,370,000 | 2,744,934 | ||||||||||
| 6.000%, 01/01/2039 (Pre-refunded to 01/01/2021) | 1,080,000 | 1,250,856 | ||||||||||
| Louisiana Public Facilities Authority: | ||||||||||||
| 5.500%, 05/15/2027 (Pre-refunded to 05/15/2026) | 11,625,000 | 14,677,957 | ||||||||||
| 5.500%, 05/15/2032 (Pre-refunded to 05/15/2026) | 22,125,000 | 28,196,543 | ||||||||||
| 6.750%, 07/01/2039 (Pre-refunded to 07/01/2019) | 6,655,000 | 7,354,108 | ||||||||||
| State of Louisiana, | ||||||||||||
| 5.000%, 11/15/2020 (Callable 05/15/2020) | 10,000,000 | 11,008,000 | ||||||||||
| 65,232,398 | 6.2 | % | ||||||||||
| Maryland | ||||||||||||
| City of Baltimore MD, | ||||||||||||
| 5.000%, 07/01/2024 (ETM) | 1,220,000 | 1,444,395 | ||||||||||
| State of Maryland, | ||||||||||||
| 5.000%, 03/01/2021 (Callable 03/01/2020) | 1,000,000 | 1,098,080 | ||||||||||
| 2,542,475 | 0.2 | % | ||||||||||
| Massachusetts | ||||||||||||
| Commonwealth of Massachusetts, | ||||||||||||
| 4.000%, 12/01/2022 (Callable 12/01/2019) | 15,000,000 | 16,010,100 | ||||||||||
| Massachusetts Department of Transportation, | ||||||||||||
| 5.000%, 01/01/2020 (ETM) | 1,175,000 | 1,236,182 | ||||||||||
| Massachusetts Housing Finance Agency: | ||||||||||||
| 4.000%, 12/01/2044 (Callable 06/01/2025) | 1,840,000 | 1,962,801 | ||||||||||
| 3.500%, 12/01/2046 (Callable 12/01/2025) | 970,000 | 1,006,385 | ||||||||||
| Massachusetts Water Resources Authority, | ||||||||||||
| 6.500%, 07/15/2019 (ETM)(Insured by FGIC-TCRS) | 1,375,000 | 1,428,474 | ||||||||||
| 21,643,942 | 2.0 | % | ||||||||||
| Michigan | ||||||||||||
| Brighton Area School District/MI: | ||||||||||||
| 5.000%, 05/01/2020 (Insured by Q-SBLF) | 1,300,000 | 1,431,573 | ||||||||||
| 5.000%, 05/01/2021 (Insured by Q-SBLF) | 500,000 | 565,910 | ||||||||||
| Fraser Public School District: | ||||||||||||
| 5.000%, 05/01/2024 (Insured by Q-SBLF) | 1,000,000 | 1,196,670 | ||||||||||
| 5.000%, 05/01/2026 (Callable 05/01/2025)(Insured by Q-SBLF) | 1,140,000 | 1,360,898 | ||||||||||
| Garden City Hospital Finance Authority, | ||||||||||||
| 4.875%, 08/15/2027 (Pre-refunded to 08/15/2017) | 1,000,000 | 1,004,190 | ||||||||||
| Michigan Finance Authority, | ||||||||||||
| 5.000%, 01/01/2019 | 7,000,000 | 7,408,800 | ||||||||||
| Michigan State Housing Development Authority: | ||||||||||||
| 4.000%, 06/01/2046 (Callable 12/01/2025) | 3,955,000 | 4,203,770 | ||||||||||
| 3.500%, 06/01/2047 (Callable 06/01/2026) | 1,410,000 | 1,473,210 | ||||||||||
| Michigan Strategic Fund, | ||||||||||||
| 0.960%, 12/01/2033 (Callable 07/01/2017)(1) | 4,500,000 | 4,500,000 | ||||||||||
| Pinckney Community Schools: | ||||||||||||
| 5.000%, 05/01/2022 (Insured by Q-SBLF) | 1,935,000 | 2,219,561 | ||||||||||
| 5.000%, 05/01/2023 (Insured by Q-SBLF) | 2,200,000 | 2,564,760 | ||||||||||
| State of Michigan, | ||||||||||||
| 0.000%, 06/01/2022 (ETM)(Insured by AMBAC) | 2,000,000 | 1,853,280 | ||||||||||
| Wayne-Westland Community Schools, | ||||||||||||
| 5.000%, 05/01/2019 (Insured by Q-SBLF) | 2,060,000 | 2,185,062 | ||||||||||
| 31,967,684 | 3.0 | % | ||||||||||
| Minnesota | ||||||||||||
| Minneapolis-Saint Paul Metropolitan Airports Commission, | ||||||||||||
| 5.000%, 01/01/2032 (Callable 01/01/2027) | 500,000 | 595,670 | ||||||||||
| Minnesota Housing Finance Agency: | ||||||||||||
| 4.250%, 07/01/2028 (Callable 01/01/2020) | 270,000 | 280,592 | ||||||||||
| 4.500%, 07/01/2034 (Callable 07/01/2021) | 655,000 | 685,844 | ||||||||||
| University of Minnesota, | ||||||||||||
| 5.500%, 07/01/2021 (ETM) | 10,380,000 | 11,627,572 | ||||||||||
| 13,189,678 | 1.2 | % | ||||||||||
| Mississippi | ||||||||||||
| Mississippi Development Bank, | ||||||||||||
| 5.000%, 03/01/2029 (Callable 03/01/2027) | 825,000 | 985,264 | ||||||||||
| State of Mississippi: | ||||||||||||
| 5.000%, 10/01/2028 (Callable 10/01/2027) | 1,000,000 | 1,231,630 | ||||||||||
| 4.000%, 10/01/2035 (Callable 10/01/2027) | 1,000,000 | 1,062,140 | ||||||||||
| 4.000%, 10/01/2036 (Callable 10/01/2027) | 1,000,000 | 1,059,450 | ||||||||||
| 4,338,484 | 0.4 | % | ||||||||||
| Missouri | ||||||||||||
| Health & Educational Facilities Authority of the State of Missouri, | ||||||||||||
| 0.890%, 03/01/2040 (Callable 07/03/2017)(Optional Put Date 06/30/2017)(1) | 900,000 | 900,000 | ||||||||||
| Missouri Housing Development Commission, | ||||||||||||
| 4.000%, 05/01/2042 (Callable 11/01/2026) | 1,425,000 | 1,552,367 | ||||||||||
| 2,452,367 | 0.2 | % | ||||||||||
| New Hampshire | ||||||||||||
| New Hampshire Housing Finance Authority, | ||||||||||||
| 5.250%, 07/01/2028 (Callable 01/01/2021) | 1,575,000 | 1,654,301 | ||||||||||
| State of New Hampshire, | ||||||||||||
| 5.000%, 07/01/2021 (Callable 07/01/2020) | 1,000,000 | 1,108,960 | ||||||||||
| 2,763,261 | 0.3 | % | ||||||||||
| New Jersey | ||||||||||||
| County of Hudson NJ, | ||||||||||||
| 3.000%, 03/15/2021 | 825,000 | 869,880 | ||||||||||
| New Jersey Educational Facilities Authority, | ||||||||||||
| 7.500%, 12/01/2032 (Pre-refunded to 06/01/2019) | 3,635,000 | 4,067,420 | ||||||||||
| New Jersey Health Care Facilities Financing Authority, | ||||||||||||
| 5.750%, 07/01/2039 (Pre-refunded to 07/01/2019) | 2,230,000 | 2,427,622 | ||||||||||
| New Jersey State Housing & Mortgage Finance Agency Bonds, | ||||||||||||
| 4.500%, 10/01/2029 (Callable 04/01/2021) | 485,000 | 495,631 | ||||||||||
| New Jersey Transportation Trust Fund Authority: | ||||||||||||
| 5.250%, 12/15/2020 | 5,000,000 | 5,392,350 | ||||||||||
| 5.000%, 06/15/2021 (Callable 06/15/2018) | 1,000,000 | 1,034,030 | ||||||||||
| New Jersey Turnpike Authority, | ||||||||||||
| 5.500%, 01/01/2025 | 2,100,000 | 2,615,277 | ||||||||||
| 16,902,210 | 1.6 | % | ||||||||||
| New Mexico | ||||||||||||
| New Mexico Finance Authority, | ||||||||||||
| 4.000%, 06/01/2029 (Callable 06/01/2026) | 2,615,000 | 2,904,245 | ||||||||||
| New Mexico Mortgage Financial Authority: | ||||||||||||
| 4.625%, 09/01/2025 (Callable 03/01/2020) | 670,000 | 697,296 | ||||||||||
| 4.500%, 09/01/2028 (Callable 03/01/2020) | 345,000 | 355,974 | ||||||||||
| 3,957,515 | 0.4 | % | ||||||||||
| New York | ||||||||||||
| City of New York NY: | ||||||||||||
| 5.250%, 08/15/2021 (Callable 08/15/2018) | 1,125,000 | 1,177,807 | ||||||||||
| 5.000%, 08/01/2022 | 5,000,000 | 5,848,450 | ||||||||||
| Metropolitan Transportation Authority, | ||||||||||||
| 6.000%, 04/01/2020 (ETM) | 10,525,000 | 11,331,952 | ||||||||||
| New York City Water & Sewer System: | ||||||||||||
| 1.020%, 06/15/2032 (Callable 07/17/2017)(Optional Put Date 06/30/2017)(1) | 2,000,000 | 2,000,000 | ||||||||||
| 0.950%, 06/15/2043 (Callable 07/01/2017)(1) | 2,000,000 | 2,000,000 | ||||||||||
| New York State Dormitory Authority: | ||||||||||||
| 5.000%, 12/15/2023 (Callable 12/15/2022) | 11,685,000 | 13,807,580 | ||||||||||
| 5.000%, 03/15/2030 (Callable 03/15/2024) | 6,665,000 | 7,892,960 | ||||||||||
| New York State Thruway Authority, | ||||||||||||
| 5.000%, 03/15/2022 (Callable 03/15/2019) | 4,040,000 | 4,304,701 | ||||||||||
| New York State Urban Development Corp.: | ||||||||||||
| 5.000%, 03/15/2022 | 2,015,000 | 2,336,292 | ||||||||||
| 5.000%, 03/15/2032 (Callable 03/15/2024) | 6,000,000 | 6,966,960 | ||||||||||
| 57,666,702 | 5.5 | % | ||||||||||
| North Carolina | ||||||||||||
| North Carolina Eastern Municipal Power Agency: | ||||||||||||
| 5.000%, 01/01/2021 (ETM)(Callable 07/31/2017) | 10,355,000 | 11,448,177 | ||||||||||
| 6.400%, 01/01/2021 (ETM) | 3,352,000 | 3,676,608 | ||||||||||
| 4.500%, 01/01/2024 (Pre-refunded to 01/01/2022) | 12,170,000 | 13,527,198 | ||||||||||
| North Carolina Medical Care Commission, | ||||||||||||
| 5.750%, 01/01/2035 (Pre-refunded to 01/01/2021) | 525,000 | 604,569 | ||||||||||
| State of North Carolina, | ||||||||||||
| 5.000%, 05/01/2024 (Callable 05/01/2023) | 1,000,000 | 1,180,270 | ||||||||||
| 30,436,822 | 2.9 | % | ||||||||||
| North Dakota | ||||||||||||
| County of Burleigh ND: | ||||||||||||
| 5.000%, 07/01/2025 (Pre-refunded to 07/01/2021) | 1,500,000 | 1,702,395 | ||||||||||
| 5.000%, 07/01/2029 (Pre-refunded to 07/01/2021) | 470,000 | 533,417 | ||||||||||
| North Dakota Housing Finance Agency, | ||||||||||||
| 3.500%, 07/01/2046 (Callable 01/01/2026) | 3,715,000 | 3,904,279 | ||||||||||
| 6,140,091 | 0.6 | % | ||||||||||
| Ohio | ||||||||||||
| Akron Bath Copley Joint Township Hospital District, | ||||||||||||
| 3.800%, 01/01/2027 ((Pre-refunded to 01/01/2022) | 960,000 | 1,026,355 | ||||||||||
| Cleveland Municipal School District: | ||||||||||||
| 4.000%, 12/01/2019 | 1,940,000 | 2,065,402 | ||||||||||
| 5.000%, 12/01/2020 | 2,015,000 | 2,259,500 | ||||||||||
| Ohio Housing Finance Agency: | ||||||||||||
| 5.000%, 11/01/2028 (Callable 05/01/2020) | 715,000 | 737,666 | ||||||||||
| 3.500%, 09/01/2046 (Callable 09/01/2025) | 1,690,000 | 1,764,478 | ||||||||||
| 4.000%, 03/01/2047 (Callable 09/01/2025) | 7,035,000 | 7,502,265 | ||||||||||
| State of Ohio, | ||||||||||||
| 5.000%, 06/15/2021 | 6,740,000 | 7,695,125 | ||||||||||
| 23,050,791 | 2.2 | % | ||||||||||
| Oregon | ||||||||||||
| State of Oregon, | ||||||||||||
| 4.000%, 12/01/2045 (Callable 06/01/2025) | 4,470,000 | 4,786,342 | ||||||||||
| State of Oregon Housing & Community Services Department, | ||||||||||||
| 4.000%, 01/01/2047 (Callable 07/01/2025) | 1,890,000 | 2,022,546 | ||||||||||
| 6,808,888 | 0.6 | % | ||||||||||
| Pennsylvania | ||||||||||||
| Erie Sewer Authority, | ||||||||||||
| 5.125%, 06/01/2020 (ETM)(Insured by AMBAC) | 1,270,000 | 1,348,715 | ||||||||||
| Geisinger Authority, | ||||||||||||
| 0.870%, 10/01/2043 (Callable 07/01/2017)(1) | 3,650,000 | 3,650,000 | ||||||||||
| Latrobe Municipal Authority: | ||||||||||||
| 1.250%, 04/01/2019 (Insured by BAM) | 120,000 | 119,815 | ||||||||||
| 3.000%, 04/01/2020 (Insured by BAM) | 325,000 | 337,305 | ||||||||||
| Pennsylvania Housing Finance Agency, | ||||||||||||
| 3.500%, 10/01/2046 (Callable 10/01/2025) | 1,850,000 | 1,951,750 | ||||||||||
| Philadelphia Gas Works Co., | ||||||||||||
| 7.000%, 05/15/2020 (ETM) | 1,165,000 | 1,281,954 | ||||||||||
| Philadelphia Hospitals & Higher Education Facilities Authority: | ||||||||||||
| 5.000%, 05/15/2020 (ETM) | 1,575,000 | 1,738,910 | ||||||||||
| 5.250%, 05/15/2023 (Pre-refunded to 05/15/2020) | 2,790,000 | 3,099,858 | ||||||||||
| South Fork Municipal Authority: | ||||||||||||
| 5.500%, 07/01/2029 (Pre-refunded to 07/01/2020) | 2,450,000 | 2,754,265 | ||||||||||
| 5.375%, 07/01/2035 (Pre-refunded to 07/01/2020) | 1,290,000 | 1,441,459 | ||||||||||
| 17,724,031 | 1.7 | % | ||||||||||
| Puerto Rico | ||||||||||||
| Puerto Rico Electric Power Authority: | ||||||||||||
| 0.000%, 07/01/2017 (ETM) | 1,555,000 | 1,555,000 | ||||||||||
| 0.000%, 07/01/2017 (Pre-refunded to various dates)(ETM) | 620,000 | 620,000 | ||||||||||
| Puerto Rico Highways & Transportation Authority, | ||||||||||||
| 5.250%, 07/01/2022 (ETM)(Insured by AGM) | 890,000 | 1,043,222 | ||||||||||
| Puerto Rico Public Finance Corp.: | ||||||||||||
| 6.000%, 08/01/2026 (ETM) | 1,080,000 | 1,375,963 | ||||||||||
| 6.000%, 08/01/2026 (ETM) | 1,750,000 | 2,229,570 | ||||||||||
| 6.000%, 08/01/2026 (ETM) | 535,000 | 681,612 | ||||||||||
| 6.000%, 08/01/2026 (ETM) | 750,000 | 955,530 | ||||||||||
| 5.500%, 08/01/2027 (ETM)(Insured by AMBAC) | 6,500,000 | 8,082,165 | ||||||||||
| 16,543,062 | 1.6 | % | ||||||||||
| Rhode Island | ||||||||||||
| State of Rhode Island, | ||||||||||||
| 5.000%, 08/01/2024 | 5,000,000 | 6,053,900 | 0.6 | % | ||||||||
| South Carolina | ||||||||||||
| Charleston Educational Excellence Finance Corp., | ||||||||||||
| 5.000%, 12/01/2026 (Callable 12/01/2023) | 4,580,000 | 5,353,791 | ||||||||||
| Piedmont Municipal Power Agency, | ||||||||||||
| 6.750%, 01/01/2020 (ETM) | 6,450,000 | 7,307,205 | ||||||||||
| South Carolina Jobs-Economic Development Authority, | ||||||||||||
| 6.500%, 04/01/2042 (Pre-refunded to 04/01/2020) | 90,000 | 102,616 | ||||||||||
| 12,763,612 | 1.2 | % | ||||||||||
| South Dakota | ||||||||||||
| Harrisburg School District No 41-2, | ||||||||||||
| 2.375%, 08/01/2026 | 415,000 | 423,068 | ||||||||||
| South Dakota Housing Development Authority, | ||||||||||||
| 3.375%, 05/01/2033 (Callable 05/01/2022) | 370,000 | 370,725 | ||||||||||
| 793,793 | 0.1 | % | ||||||||||
| Tennessee | ||||||||||||
| Metropolitan Government Nashville & Davidson County Health & Educational Facilities, | ||||||||||||
| 0.000%, 06/01/2021 (ETM) | 1,270,000 | 1,200,836 | ||||||||||
| Shelby County Health Educational & Housing Facilities Board, | ||||||||||||
| 5.500%, 08/15/2019 (ETM) | 2,375,000 | 2,480,403 | ||||||||||
| Tennessee Housing Development Agency, | ||||||||||||
| 4.500%, 07/01/2028 (Callable 01/01/2020) | 1,275,000 | 1,314,614 | ||||||||||
| 4,995,853 | 0.5 | % | ||||||||||
| Texas | ||||||||||||
| Amarillo Independent School District, | ||||||||||||
| 5.000%, 02/01/2026 (Callable 02/01/2024)(PSF Guaranteed) | 1,370,000 | 1,628,313 | ||||||||||
| Arlington Higher Education Finance Corp.: | ||||||||||||
| 4.000%, 08/15/2024 (PSF Guaranteed) | 1,025,000 | 1,148,646 | ||||||||||
| 5.000%, 08/15/2024 (PSF Guaranteed) | 1,000,000 | 1,186,190 | ||||||||||
| 5.000%, 08/15/2026 (PSF Guaranteed) | 500,000 | 603,510 | ||||||||||
| 4.000%, 08/15/2027 (Callable 08/15/2026)(PSF Guaranteed) | 865,000 | 961,889 | ||||||||||
| 5.000%, 02/15/2028 (Callable 02/15/2025)(PSF Guaranteed) | 1,675,000 | 1,965,981 | ||||||||||
| 4.000%, 08/15/2028 (Callable 08/15/2026)(PSF Guaranteed) | 850,000 | 937,235 | ||||||||||
| 5.000%, 08/15/2033 (Callable 08/15/2024)(PSF Guaranteed) | 1,460,000 | 1,673,802 | ||||||||||
| Burleson Independent School District, | ||||||||||||
| 5.000%, 08/01/2025 (PSF Guaranteed) | 1,240,000 | 1,519,025 | ||||||||||
| City of Austin TX Water & Wastewater System Revenue, | ||||||||||||
| 5.000%, 11/15/2024 (Callable 11/15/2022) | 3,000,000 | 3,520,050 | ||||||||||
| City of El Paso TX Water & Sewer Revenue, | ||||||||||||
| 4.000%, 03/01/2028 (Callable 03/01/2026) | 1,000,000 | 1,115,210 | ||||||||||
| City of Houston TX Combined Utility System Revenue: | ||||||||||||
| 0.000%, 12/01/2019 (ETM)(Insured by AGM) | 13,355,000 | 12,930,177 | ||||||||||
| 5.500%, 12/01/2024 (ETM) | 1,735,000 | 2,129,747 | ||||||||||
| 5.500%, 12/01/2029 (ETM) | 16,050,000 | 20,915,237 | ||||||||||
| City of San Antonio TX Electric & Gas Systems Revenue, | ||||||||||||
| 5.650%, 02/01/2019 (ETM) | 7,865,000 | 8,268,160 | ||||||||||
| Conroe Independent School District, | ||||||||||||
| 5.000%, 02/15/2023 (Callable 02/15/2021)(PSF Guaranteed) | 2,680,000 | 3,016,286 | ||||||||||
| County of Harris TX: | ||||||||||||
| 5.750%, 10/01/2020 (Pre-refunded to 10/01/2018) | 175,000 | 185,273 | ||||||||||
| 5.000%, 10/01/2026 (Callable 10/01/2025) | 4,155,000 | 5,075,914 | ||||||||||
| 5.000%, 08/15/2027 (Callable 08/15/2022) | 3,480,000 | 4,045,013 | ||||||||||
| 5.750%, 10/01/2028 (Pre-refunded to 10/01/2018) | 6,930,000 | 7,336,791 | ||||||||||
| Dallas Independent School District, | ||||||||||||
| 5.000%, 02/15/2020 (PSF Guaranteed) | 2,410,000 | 2,642,493 | ||||||||||
| DeSoto Independent School District, | ||||||||||||
| 5.000%, 08/15/2032 (Callable 08/15/2025)(Insured by BAM) | 1,080,000 | 1,242,799 | ||||||||||
| Ennis Independent School District, | ||||||||||||
| 5.000%, 08/15/2025 (PSF Guaranteed) | 1,145,000 | 1,403,793 | ||||||||||
| Fort Bend Independent School District, | ||||||||||||
| 5.000%, 08/15/2024 (PSF Guaranteed) | 1,655,000 | 2,011,785 | ||||||||||
| Georgetown Independent School District, | ||||||||||||
| 4.000%, 02/15/2020 (PSF Guaranteed) | 1,900,000 | 2,034,672 | ||||||||||
| Godley Independent School District, | ||||||||||||
| 5.000%, 02/15/2023 (PSF Guaranteed) | 1,445,000 | 1,698,178 | ||||||||||
| Goose Creek Consolidated Independent School District, | ||||||||||||
| 5.000%, 02/15/2021 (PSF Guaranteed) | 1,050,000 | 1,184,915 | ||||||||||
| Harlingen Consolidated Independent School District: | ||||||||||||
| 5.000%, 08/15/2024 (PSF Guaranteed) | 2,810,000 | 3,407,406 | ||||||||||
| 5.000%, 08/15/2025 (PSF Guaranteed) | 1,430,000 | 1,753,209 | ||||||||||
| Harris County Health Facilities Development Corp.: | ||||||||||||
| 5.500%, 10/01/2019 (ETM) | 4,370,000 | 4,566,213 | ||||||||||
| 5.750%, 07/01/2027 (ETM) | 5,000,000 | 6,209,850 | ||||||||||
| Houston Higher Education Finance Corp.: | ||||||||||||
| 5.000%, 02/15/2020 (PSF Guaranteed) | 1,000,000 | 1,089,450 | ||||||||||
| 5.000%, 02/15/2026 (Callable 02/15/2024)(PSF Guaranteed) | 1,030,000 | 1,204,379 | ||||||||||
| Humble Independent School District, | ||||||||||||
| 5.000%, 02/15/2021 (PSF Guaranteed) | 1,500,000 | 1,693,860 | ||||||||||
| Irving Independent School District, | ||||||||||||
| 5.000%, 02/15/2025 (Callable 08/15/2024)(PSF Guaranteed) | 1,250,000 | 1,517,613 | ||||||||||
| Keller Independent School District/TX: | ||||||||||||
| 5.000%, 02/15/2022 (PSF Guaranteed) | 1,370,000 | 1,584,035 | ||||||||||
| 5.000%, 02/15/2023 (PSF Guaranteed) | 3,340,000 | 3,940,866 | ||||||||||
| Killeen Independent School District, | ||||||||||||
| 4.000%, 02/15/2024 (Callable 02/15/2021)(PSF Guaranteed) | 1,145,000 | 1,238,443 | ||||||||||
| La Porte Independent School District/TX, | ||||||||||||
| 5.000%, 02/15/2025 (PSF Guaranteed) | 1,080,000 | 1,319,533 | ||||||||||
| Lamar Consolidated Independent School District: | ||||||||||||
| 5.000%, 02/15/2026 (Callable 02/15/2025)(PSF Guaranteed) | 5,860,000 | 7,094,936 | ||||||||||
| 5.000%, 02/15/2027 (Callable 02/15/2025)(PSF Guaranteed) | 2,550,000 | 3,059,490 | ||||||||||
| Llano Independent School District, | ||||||||||||
| 5.000%, 02/15/2024 (Callable 02/15/2023)(PSF Guaranteed) | 1,265,000 | 1,486,641 | ||||||||||
| Lower Colorado River Authority, | ||||||||||||
| 4.750%, 01/01/2028 (ETM)(Insured by AGM) | 1,200,000 | 1,408,860 | ||||||||||
| Lubbock Housing Finance Corp., | ||||||||||||
| 8.000%, 10/01/2021 (ETM) | 1,980,000 | 2,519,966 | ||||||||||
| Lubbock Independent School District, | ||||||||||||
| 4.000%, 02/15/2022 (Callable 02/15/2020)(PSF Guaranteed) | 1,000,000 | 1,064,760 | ||||||||||
| Mansfield Independent School District: | ||||||||||||
| 5.000%, 02/15/2023 (PSF Guaranteed) | 1,725,000 | 2,035,327 | ||||||||||
| 5.000%, 02/15/2024 (PSF Guaranteed) | 1,905,000 | 2,292,382 | ||||||||||
| Mesquite Independent School District: | ||||||||||||
| 5.000%, 08/15/2024 (PSF Guaranteed) | 1,425,000 | 1,727,955 | ||||||||||
| 5.000%, 08/15/2025 (PSF Guaranteed) | 2,600,000 | 3,192,020 | ||||||||||
| 5.000%, 08/15/2025 (PSF Guaranteed) | 1,500,000 | 1,841,550 | ||||||||||
| Montgomery County Health Facilities Development Corp., | ||||||||||||
| 0.000%, 07/15/2023 (ETM) | 200,000 | 180,500 | ||||||||||
| New Caney Independent School District: | ||||||||||||
| 5.000%, 02/15/2023 (PSF Guaranteed) | 1,000,000 | 1,181,080 | ||||||||||
| 5.000%, 02/15/2024 (PSF Guaranteed) | 1,030,000 | 1,240,882 | ||||||||||
| Newark Higher Education Finance Corp.: | ||||||||||||
| 4.000%, 08/15/2020 (PSF Guaranteed) | 355,000 | 381,739 | ||||||||||
| 4.000%, 08/15/2022 (PSF Guaranteed) | 215,000 | 237,872 | ||||||||||
| 5.000%, 08/15/2024 (PSF Guaranteed) | 135,000 | 160,724 | ||||||||||
| North East Independent School District/TX: | ||||||||||||
| 5.000%, 08/01/2021 (PSF Guaranteed) | 6,095,000 | 6,957,381 | ||||||||||
| 5.000%, 08/01/2023 (PSF Guaranteed) | 5,330,000 | 6,353,733 | ||||||||||
| 5.000%, 02/01/2024 (PSF Guaranteed) | 2,930,000 | 3,528,570 | ||||||||||
| North Texas Tollway Authority: | ||||||||||||
| 5.125%, 01/01/2028 (Pre-refunded to 01/01/2018) | 70,000 | 71,425 | ||||||||||
| 0.000%, 09/01/2043 (Callable 09/01/2031) | 1,400,000 | 1,489,488 | ||||||||||
| Northside Independent School District: | ||||||||||||
| 5.000%, 08/15/2025 (PSF Guaranteed) | 1,000,000 | 1,228,540 | ||||||||||
| 2.000%, 06/01/2046 (Mandatory Tender Date 06/01/2021)(PSF Guaranteed)(1) | 1,450,000 | 1,470,750 | ||||||||||
| Pasadena Independent School District, | ||||||||||||
| 5.000%, 02/15/2022 (Callable 02/15/2021)(PSF Guaranteed) | 1,115,000 | 1,255,746 | ||||||||||
| Pflugerville Independent School District, | ||||||||||||
| 5.000%, 02/15/2025 (Callable 02/15/2024)(PSF Guaranteed) | 1,000,000 | 1,196,450 | ||||||||||
| Port Arthur Independent School District, | ||||||||||||
| 5.000%, 02/15/2024 (PSF Guaranteed) | 1,700,000 | 2,044,522 | ||||||||||
| Retama Development Corp., | ||||||||||||
| 8.750%, 12/15/2018 (ETM) | 2,035,000 | 2,246,782 | ||||||||||
| San Jacinto College District, | ||||||||||||
| 5.000%, 02/15/2026 (Pre-refunded to 02/15/2021) | 700,000 | 791,000 | ||||||||||
| Sherman Independent School District/TX, | ||||||||||||
| 5.000%, 02/15/2026 (Callable 02/15/2024)(PSF Guaranteed) | 1,775,000 | 2,106,694 | ||||||||||
| Spring Independent School District, | ||||||||||||
| 5.000%, 08/15/2019 (Pre-refunded to 08/15/2018)(PSF Guaranteed) | 1,020,000 | 1,064,503 | ||||||||||
| State of Texas, | ||||||||||||
| 5.000%, 08/01/2021 | 1,205,000 | 1,380,123 | ||||||||||
| Tarrant County Health Facilities Development Corp., | ||||||||||||
| 6.000%, 09/01/2024 (ETM) | 6,745,000 | 7,819,816 | ||||||||||
| Temple Independent School District/TX, | ||||||||||||
| 4.000%, 02/01/2022 (Callable 02/01/2021)(PSF Guaranteed) | 1,120,000 | 1,220,621 | ||||||||||
| Texas State Public Finance Authority, | ||||||||||||
| 6.200%, 02/15/2040 (Pre-refunded to 02/15/2020) | 380,000 | 425,927 | ||||||||||
| Texas Transportation Commission State Highway Fund, | ||||||||||||
| 4.000%, 04/01/2026 (Mandatory Tender Date 10/01/2021)(1) | 1,585,000 | 1,739,490 | ||||||||||
| Tomball Independent School District, | ||||||||||||
| 5.000%, 02/15/2025 (PSF Guaranteed) | 5,440,000 | 6,650,835 | ||||||||||
| Town of Flower Mound TX, | ||||||||||||
| 5.000%, 03/01/2031 (Callable 03/01/2024) | 505,000 | 595,339 | ||||||||||
| Tyler Health Facilities Development Corp., | ||||||||||||
| 5.500%, 07/01/2027 (Pre-refunded to 07/01/2021) | 600,000 | 692,526 | ||||||||||
| The University of Texas System, | ||||||||||||
| 5.000%, 08/15/2022 | 8,595,000 | 10,096,632 | ||||||||||
| Waco Independent School District: | ||||||||||||
| 5.000%, 08/15/2022 (PSF Guaranteed) | 3,085,000 | 3,605,748 | ||||||||||
| 5.000%, 08/15/2023 (PSF Guaranteed) | 3,090,000 | 3,677,224 | ||||||||||
| Wichita Falls Independent School District, | ||||||||||||
| 5.000%, 02/01/2024 (PSF Guaranteed) | 1,670,000 | 2,004,267 | ||||||||||
| Wylie Independent School District/TX, | ||||||||||||
| 6.750%, 08/15/2023 (PSF Guaranteed) | 1,010,000 | 1,312,202 | ||||||||||
| Ysleta Independent School District: | ||||||||||||
| 5.000%, 08/15/2023 (Callable 08/15/2021)(PSF Guaranteed) | 1,020,000 | 1,171,378 | ||||||||||
| 5.000%, 08/15/2025 (Callable 08/15/2024)(PSF Guaranteed) | 1,545,000 | 1,871,181 | ||||||||||
| 229,081,518 | 21.7 | % | ||||||||||
| Utah | ||||||||||||
| Granite School District Board of Education: | ||||||||||||
| 5.000%, 06/01/2022 (Pre-refunded to 06/01/2021) | 3,900,000 | 4,456,959 | ||||||||||
| 5.000%, 06/01/2023 (Pre-refunded to 06/01/2021) | 1,750,000 | 1,999,917 | ||||||||||
| Utah Charter School Finance Authority: | ||||||||||||
| 5.000%, 04/15/2024 | 235,000 | 269,975 | ||||||||||
| 5.000%, 04/15/2037 (Callable 04/15/2026) | 500,000 | 554,625 | ||||||||||
| Utah Housing Corp., | ||||||||||||
| 4.000%, 01/01/2045 (Callable 01/01/2026) | 2,330,000 | 2,483,524 | ||||||||||
| 9,765,000 | 0.9 | % | ||||||||||
| Virginia | ||||||||||||
| City of Bristol VA, | ||||||||||||
| 5.500%, 11/01/2018 (ETM)(Insured by AGM) | 1,095,000 | 1,128,606 | ||||||||||
| Danville Industrial Development Authority, | ||||||||||||
| 5.250%, 10/01/2028 (ETM)(Insured by AMBAC) | 1,500,000 | 1,757,175 | ||||||||||
| Virginia College Building Authority, | ||||||||||||
| 0.890%, 11/01/2036 (Callable 07/01/2017)(1) | 300,000 | 300,000 | ||||||||||
| Virginia Public School Authority, | ||||||||||||
| 6.250%, 12/01/2028 (Pre-refunded to 12/01/2018) | 1,285,000 | 1,378,162 | ||||||||||
| 4,563,943 | 0.4 | % | ||||||||||
| Washington | ||||||||||||
| Snohomish County Public Utility District No. 1, | ||||||||||||
| 6.800%, 01/01/2020 (ETM)(Callable 07/31/2017) | 2,835,000 | 3,063,189 | ||||||||||
| Snohomish County School District No. 201, | ||||||||||||
| 4.000%, 12/01/2021 (Callable 12/01/2020) | 4,500,000 | 4,910,985 | ||||||||||
| State of Washington: | ||||||||||||
| 5.500%, 07/01/2023 | 5,040,000 | 5,958,187 | ||||||||||
| 5.000%, 07/01/2032 (Callable 01/01/2025) | 6,000,000 | 6,996,000 | ||||||||||
| 5.000%, 08/01/2034 (Callable 08/01/2023) | 2,755,000 | 3,192,687 | ||||||||||
| 5.000%, 08/01/2038 (Callable 08/01/2026) | 975,000 | 1,138,079 | ||||||||||
| Thurston & Pierce Counties Community Schools, | ||||||||||||
| 4.250%, 12/01/2021 (Callable 12/01/2020) | 2,755,000 | 3,029,481 | ||||||||||
| Washington Health Care Facilities Authority: | ||||||||||||
| 6.125%, 11/15/2031 (Pre-refunded to 05/15/2021) | 610,000 | 722,167 | ||||||||||
| 6.250%, 08/01/2036 (Pre-refunded to 08/01/2018) | 8,100,000 | 8,552,952 | ||||||||||
| 6.250%, 11/15/2041 (Pre-refunded to 05/15/2021) | 4,770,000 | 5,669,526 | ||||||||||
| 43,233,253 | 4.1 | % | ||||||||||
| Wisconsin | ||||||||||||
| Southeast Wisconsin Professional Baseball Park District: | ||||||||||||
| 5.500%, 12/15/2026 | 685,000 | 842,975 | ||||||||||
| 0.000%, 12/15/2027 (ETM) | 25,000 | 19,730 | ||||||||||
| 0.000%, 12/15/2029 (ETM) | 70,000 | 51,324 | ||||||||||
| University of Wisconsin Hospitals & Clinics, | ||||||||||||
| 5.000%, 04/01/2038 (Callable 04/01/2023) | 2,295,000 | 2,542,768 | ||||||||||
| Wisconsin Center District: | ||||||||||||
| 4.000%, 12/15/2029 (Callable 06/15/2026) | 1,410,000 | 1,529,061 | ||||||||||
| 5.000%, 12/15/2030 (Callable 06/15/2026) | 775,000 | 907,696 | ||||||||||
| 5.000%, 12/15/2031 (Callable 06/15/2026) | 2,530,000 | 2,950,132 | ||||||||||
| Wisconsin Health & Educational Facilities Authority, | ||||||||||||
| 5.000%, 08/15/2027 (Pre-refunded to 08/15/2022) | 1,500,000 | 1,758,825 | ||||||||||
| Wisconsin Housing & Economic Development Authority, | ||||||||||||
| 3.500%, 09/01/2046 (Callable 09/01/2025) | 2,870,000 | 3,009,282 | ||||||||||
| 13,611,792 | 1.3 | % | ||||||||||
| Total Municipal Bonds (Cost $1,012,288,035) | 1,044,618,623 | 98.8 | % | |||||||||
| SHORT-TERM INVESTMENT | Shares | |||||||||||
| Short-Term Investment | ||||||||||||
| Fidelity Institutional Money Market Fund - Government Portfolio, Institutional Class, 0.85% « | 739,371 | 739,371 | ||||||||||
| Total Short-Term Investment (Cost $739,371) | 739,371 | 0.1 | % | |||||||||
| Total Investments (Cost $1,013,027,406) | 1,045,357,994 | 98.9 | % | |||||||||
| Other Assets in Excess of Liabilities | 11,415,755 | 1.1 | % | |||||||||
| TOTAL NET ASSETS | $ | 1,056,773,749 | 100.0 | % | ||||||||
Notes to Schedule of Investments | |
| AGM | Assured Guaranty Municipal |
| AMBAC | Ambac Assurance Corporation |
| BHAC | Berkshire Hathaway Assurance Corp. |
| ETM | Escrowed to Maturity |
| FGIC-TCRS | Financial Guaranty Insurance Company |
| PSF | Texas Permanent School Fund |
| Q-SBLF | Qualified School Building Loan Fund |
| (1) | Variable or floating rate security. Floating rate securities are securities whose yields vary with a designated index rate. These securities' rates are as of June 30, 2017. |
| (2) | Security or a portion of the security purchased on a when-issued or delayed delivery basis. |
| ^ | Non Income Producing . |
| « | 7-Day Yield. |
| Baird Core Intermediate Municipal Bond Fund | ||||||||||||
| Schedule of Investments | ||||||||||||
| June 30, 2017 (Unaudited) | ||||||||||||
| Principal | % of | |||||||||||
| Amount | Value | Net Assets | ||||||||||
| LONG-TERM INVESTMENTS | ||||||||||||
| Municipal Bonds | ||||||||||||
| Alabama | ||||||||||||
| Alabama Community College System, | ||||||||||||
| 5.000%, 10/01/2028 (Callable 10/01/2026)(Insured by AGM) | $ | 310,000 | $ | 364,325 | ||||||||
| Black Belt Energy Gas District, | ||||||||||||
| 4.000%, 08/01/2047 (Callable 04/01/2022)(Mandatory Tender Date 07/01/2022) | 1,000,000 | 1,089,920 | ||||||||||
| City of Birmingham AL: | ||||||||||||
| 5.000%, 03/01/2037 (Callable 03/01/2023) | 30,000 | 33,677 | ||||||||||
| 5.000%, 03/01/2043 (Callable 03/01/2023) | 285,000 | 315,675 | ||||||||||
| 0.000%, 03/01/2045 (Callable 09/01/2025) | 45,000 | 46,402 | ||||||||||
| Industrial Development Board of the City of Mobile Alabama, | ||||||||||||
| 1.625%, 07/15/2034 (Mandatory Tender Date 10/02/2018) | 150,000 | 150,192 | ||||||||||
| Jasper Water Works & Sewer Board, Inc., | ||||||||||||
| 5.000%, 06/01/2024 (Callable 06/01/2021) | 200,000 | 224,174 | ||||||||||
| Special Care Facilities Financing Authority of the City of Pell City AL, | ||||||||||||
| 5.000%, 12/01/2031 (Callable 12/01/2021) | 1,000,000 | 1,098,340 | ||||||||||
| Town of Mulga AL, | ||||||||||||
| 3.000%, 08/15/2018 (Insured by AGM) | 200,000 | 204,420 | ||||||||||
| 3,527,125 | 2.6 | % | ||||||||||
| Alaska | ||||||||||||
| Alaska Housing Finance Corp.: | ||||||||||||
| 5.000%, 12/01/2029 (Callable 06/01/2024) | 225,000 | 256,172 | ||||||||||
| 4.000%, 06/01/2040 (Callable 06/01/2021) | 50,000 | 50,890 | ||||||||||
| Alaska Municipal Bond Bank Authority, | ||||||||||||
| 5.000%, 08/01/2027 (Callable 08/01/2023) | 500,000 | 578,515 | ||||||||||
| City of Valdez AK, | ||||||||||||
| 5.000%, 01/01/2021 | 435,000 | 481,362 | ||||||||||
| 1,366,939 | 1.0 | % | ||||||||||
| Arizona | ||||||||||||
| Arizona Department of Transportation State Highway Fund Revenue, | ||||||||||||
| 4.000%, 07/01/2030 (Callable 07/01/2022) | 15,000 | 15,976 | ||||||||||
| Arizona Health Facilities Authority, | ||||||||||||
| 2.760%, 02/01/2048 (Callable 08/09/2019)(Mandatory Tender Date 02/05/2020)(1) | 100,000 | 101,612 | ||||||||||
| Arizona Industrial Development Authority, | ||||||||||||
| 4.000%, 07/01/2018 | 490,000 | 493,489 | ||||||||||
| BluePath 2016-1 TE Trust, | ||||||||||||
| 2.750%, 09/01/2026 (Callable 08/27/2021) | 488,359 | 484,823 | ||||||||||
| City of El Mirage AZ, | ||||||||||||
| 5.000%, 07/01/2026 (Callable 07/01/2020) | 400,000 | 438,888 | ||||||||||
| City of Tucson AZ Water System Revenue, | ||||||||||||
| 5.000%, 07/01/2032 (Callable 07/01/2025) | 500,000 | 587,215 | ||||||||||
| The Industrial Development Authority of the County of Yavapai, | ||||||||||||
| 3.000%, 08/01/2017 | 220,000 | 220,220 | ||||||||||
| Maricopa County Industrial Development Authority: | ||||||||||||
| 2.625%, 07/01/2021 | 250,000 | 246,228 | ||||||||||
| 4.000%, 07/01/2026 | 125,000 | 128,615 | ||||||||||
| Town of Marana AZ: | ||||||||||||
| 4.000%, 07/01/2036 (Callable 07/01/2027) | 350,000 | 367,353 | ||||||||||
| 4.000%, 07/01/2037 (Callable 07/01/2027) | 500,000 | 523,925 | ||||||||||
| 3,608,344 | 2.6 | % | ||||||||||
| Arkansas | ||||||||||||
| Arkansas Development Finance Authority, | ||||||||||||
| 3.000%, 07/01/2018 | 100,000 | 101,315 | ||||||||||
| City of Conway AR Wasterwater Department, | ||||||||||||
| 5.000%, 10/01/2035 (Callable 04/01/2024) | 185,000 | 208,850 | ||||||||||
| City of Fayetteville AR, | ||||||||||||
| 3.050%, 01/01/2047 (Callable 01/01/2027)(3) | 1,050,000 | 1,035,898 | ||||||||||
| City of Little Rock AR, | ||||||||||||
| 2.000%, 03/01/2038 (Callable 03/01/2021) | 325,000 | 324,870 | ||||||||||
| City of Pine Bluff AR, | ||||||||||||
| 3.000%, 02/01/2047 (Callable 08/01/2027)(Insured by BAM) | 1,000,000 | 1,015,670 | ||||||||||
| Little Rock Metrocentere Improvement District No 1, | ||||||||||||
| 0.960%, 12/01/2025 (Callable 07/01/2017)(1) | 600,000 | 600,000 | ||||||||||
| Northwest Arkansas Conservation Authority, | ||||||||||||
| 4.000%, 03/01/2027 (Callable 09/01/2022)(Insured by BAM) | 365,000 | 390,032 | ||||||||||
| Pulaski County Public Facilities Board, | ||||||||||||
| 4.000%, 07/01/2017 | 380,000 | 380,000 | ||||||||||
| 4,056,635 | 3.0 | % | ||||||||||
| California | ||||||||||||
| Abag Finance Authority for Nonprofit Corps., | ||||||||||||
| 5.000%, 09/02/2025 (Insured by AGM) | 350,000 | 425,999 | ||||||||||
| Bay Area Toll Authority: | ||||||||||||
| 2.010%, 04/01/2045 (Callable 10/01/2023)(Mandatory Tender Date 04/01/2024)(1) | 300,000 | 309,306 | ||||||||||
| 1.610%, 04/01/2047 (Callable 04/01/2019)(Mandatory Tender Date 10/01/2019)(1) | 250,000 | 251,392 | ||||||||||
| Belmont-Redwood Shores CA School District, | ||||||||||||
| 0.000%, 08/01/2031 (Callable 08/01/2026) | 75,000 | 75,451 | ||||||||||
| California Community College Financing Authority, | ||||||||||||
| 0.000%, 05/01/2034 (Callable 05/01/2018) | 200,000 | 79,136 | ||||||||||
| California Health Facilities Financing Authority: | ||||||||||||
| 5.000%, 04/01/2020 | 300,000 | 321,021 | ||||||||||
| 1.330%, 07/01/2022 (Callable 07/01/2017)(2) | 300,000 | 286,069 | ||||||||||
| California Public Finance Authority: | ||||||||||||
| 5.000%, 10/15/2020 | 180,000 | 195,064 | ||||||||||
| 5.000%, 10/15/2021 | 200,000 | 220,744 | ||||||||||
| California School Finance Authority: | ||||||||||||
| 3.000%, 08/01/2017 | 50,000 | 50,057 | ||||||||||
| 3.000%, 08/01/2017 | 300,000 | 300,345 | ||||||||||
| California Statewide Communities Development Authority: | ||||||||||||
| 5.250%, 12/01/2027 (Pre-refunded to 12/01/2017) | 35,000 | 35,615 | ||||||||||
| 3.143%, 04/01/2028 (1)(2) | 700,000 | 633,449 | ||||||||||
| Chawanakee Unified School District: | ||||||||||||
| 0.000%, 08/01/2026 (Insured by BAM) | 110,000 | 113,099 | ||||||||||
| 0.000%, 08/01/2027 (Callable 08/01/2026)(Insured by BAM) | 100,000 | 101,897 | ||||||||||
| 0.000%, 08/01/2028 (Callable 08/01/2026)(Insured by BAM) | 75,000 | 75,677 | ||||||||||
| 0.000%, 08/01/2029 (Callable 08/01/2026)(Insured by BAM) | 80,000 | 79,871 | ||||||||||
| City of Redding CA, | ||||||||||||
| 1.383%, 07/01/2022 (ETM)(1)(2) | 150,000 | 143,258 | ||||||||||
| College of the Sequoias Tulare Area Improvement District No. 3, | ||||||||||||
| 0.000%, 08/01/2041 (Callable 08/01/2026)(Insured by AGM) | 140,000 | 146,129 | ||||||||||
| Corona-Norca Unified School District, | ||||||||||||
| 0.000%, 08/01/2039 (Callable 08/01/2027)(Insured by AGM) | 890,000 | 1,199,106 | ||||||||||
| Denair Unified School District, | ||||||||||||
| 0.000%, 08/01/2031 (Insured by AGM) | 30,000 | 30,446 | ||||||||||
| Desert Hot Springs Redevelopment Agency Successor Agency, | ||||||||||||
| 5.000%, 09/01/2029 (Callable 09/01/2027)(Insured by BAM) | 300,000 | 354,183 | ||||||||||
| Dinuba Redevelopment Agency, | ||||||||||||
| 5.000%, 09/01/2028 (Callable 09/01/2024)(Insured by BAM) | 330,000 | 382,312 | ||||||||||
| East Bay Municipal Utility District Water System Revenue, | ||||||||||||
| 5.000%, 06/01/2033 (Callable 06/01/2024) | 475,000 | 557,740 | ||||||||||
| El Rancho Unified School District, | ||||||||||||
| 0.000%, 08/01/2034 (Callable 08/01/2028)(Insured by AGM) | 225,000 | 214,560 | ||||||||||
| Encinitas Union School District/CA, | ||||||||||||
| 0.000%, 08/01/2030 (Callable 08/01/2025) | 205,000 | 131,177 | ||||||||||
| Fresno Joint Powers Financing Authority: | ||||||||||||
| 5.000%, 04/01/2020 | 250,000 | 273,012 | ||||||||||
| 5.000%, 04/01/2027 (Insured by AGM) | 305,000 | 367,013 | ||||||||||
| Golden State Tobacco Securitization Corp., | ||||||||||||
| 5.000%, 06/01/2022 | 365,000 | 417,907 | ||||||||||
| Imperial Community College District, | ||||||||||||
| 0.000%, 08/01/2040 (Callable 08/01/2030)(Insured by AGM) | 140,000 | 163,272 | ||||||||||
| Lake Elsinore Redevelopment Agency Successor Agency, | ||||||||||||
| 5.000%, 09/01/2027 (Callable 09/01/2025)(Insured by BAM) | 275,000 | 323,197 | ||||||||||
| Long Beach Bond Finance Authority: | ||||||||||||
| 5.250%, 11/15/2023 | 50,000 | 58,612 | ||||||||||
| 5.000%, 11/15/2029 | 50,000 | 59,577 | ||||||||||
| Mount Diablo Unified School District/CA, | ||||||||||||
| 0.000%, 08/01/2035 (Callable 08/01/2025)(Insured by AGM) | 530,000 | 484,627 | ||||||||||
| Mountain View Los Altos Union High School District/CA, | ||||||||||||
| 0.000%, 08/01/2030 | 85,000 | 86,894 | ||||||||||
| Needles Unified School District, | ||||||||||||
| 0.000%, 08/01/2034 (Insured by AGM) | 25,000 | 22,761 | ||||||||||
| Northern California Gas Authority, | ||||||||||||
| 1.399%, 07/01/2019 (1) | 480,000 | 478,277 | ||||||||||
| Oak Park Unified School District, | ||||||||||||
| 0.000%, 08/01/2038 (Callable 08/01/2031) | 110,000 | 125,329 | ||||||||||
| Palomar Health: | ||||||||||||
| 3.000%, 11/01/2017 | 150,000 | 150,471 | ||||||||||
| 0.000%, 08/01/2040 (Callable 08/01/2030) | 95,000 | 106,706 | ||||||||||
| Redondo Beach Unified School District: | ||||||||||||
| 0.000%, 08/01/2031 | 20,000 | 20,136 | ||||||||||
| 6.375%, 08/01/2034 (Callable 08/01/2026) | 590,000 | 780,110 | ||||||||||
| Rialto Unified School District, | ||||||||||||
| 0.000%, 08/01/2041 (Callable 08/01/2036)(Insured by AGM) | 240,000 | 228,682 | ||||||||||
| Rio Hondo Community College District/CA, | ||||||||||||
| 0.000%, 08/01/2042 (Callable 08/01/2034) | 125,000 | 122,694 | ||||||||||
| Riverside County Public Financing Authority, | ||||||||||||
| 5.000%, 10/01/2026 (Callable 10/01/2025)(Insured by AGM) | 250,000 | 298,100 | ||||||||||
| San Bernardino City Unified School District, | ||||||||||||
| 5.000%, 08/01/2027 (Callable 08/01/2023)(Insured by AGM) | 450,000 | 525,393 | ||||||||||
| San Diego Unified School District/CA: | ||||||||||||
| 5.000%, 07/01/2030 (Callable 07/01/2026) | 570,000 | 686,086 | ||||||||||
| 4.000%, 07/01/2032 (Callable 07/01/2026) | 300,000 | 327,180 | ||||||||||
| Solano County Community College District, | ||||||||||||
| 0.000%, 08/01/2041 (Callable 08/01/2028) | 100,000 | 86,281 | ||||||||||
| State of California: | ||||||||||||
| 5.000%, 10/01/2029 (Callable 10/01/2024) | 225,000 | 265,768 | ||||||||||
| 1.572%, 12/01/2029 (Callable 06/01/2018)(Mandatory Tender Date 12/03/2018)(1) | 125,000 | 125,415 | ||||||||||
| Upland Unified School District, | ||||||||||||
| 0.000%, 08/01/2041 (Callable 08/01/2025) | 245,000 | 254,768 | ||||||||||
| West Hills Community College District, | ||||||||||||
| 0.000%, 08/01/2035 (Callable 08/01/2027)(Insured by AGM) | 50,000 | 44,736 | ||||||||||
| Wiseburn School District, | ||||||||||||
| 0.000%, 08/01/2036 (Callable 08/01/2031)(Insured by AGM) | 50,000 | 42,870 | ||||||||||
| 13,638,977 | 10.0 | % | ||||||||||
| Colorado | ||||||||||||
| Board of Governors of Colorado State University System, | ||||||||||||
| 5.000%, 03/01/2032 (Callable 03/01/2027) | 125,000 | 150,106 | ||||||||||
| Bromley Park Metropolitan District No. 2, | ||||||||||||
| 4.250%, 12/01/2022 (Callable 12/01/2017) | 300,000 | 300,408 | ||||||||||
| Cathedral Pines Metropolitan District, | ||||||||||||
| 2.625%, 12/01/2021 | 175,000 | 171,173 | ||||||||||
| City of Commerce City CO: | ||||||||||||
| 5.000%, 12/15/2028 (Callable 12/15/2027)(Insured by AGM) | 100,000 | 120,501 | ||||||||||
| 5.000%, 12/15/2029 (Callable 12/15/2027)(Insured by AGM) | 300,000 | 360,900 | ||||||||||
| 5.000%, 12/15/2030 (Callable 12/15/2027)(Insured by AGM) | 500,000 | 591,035 | ||||||||||
| Colorado Educational & Cultural Facilities Authority: | ||||||||||||
| 5.000%, 10/01/2025 | 750,000 | 887,535 | ||||||||||
| 5.000%, 08/15/2030 (Callable 08/15/2024) | 500,000 | 546,490 | ||||||||||
| Denver Health & Hospital Authority, | ||||||||||||
| 5.000%, 12/01/2017 (Callable 07/31/2017) | 250,000 | 250,823 | ||||||||||
| E-470 Public Highway Authority, | ||||||||||||
| 1.870%, 09/01/2039 (Callable 03/01/2021)(Mandatory Tender Date 09/01/2021)(1) | 500,000 | 504,165 | ||||||||||
| Glen Metropolitan District No. 1, | ||||||||||||
| 2.500%, 12/01/2025 (Insured by BAM) | 160,000 | 160,205 | ||||||||||
| VDW Metropolitan District No. 2, | ||||||||||||
| 1.250%, 12/01/2018 (Insured by AGM) | 65,000 | 65,034 | ||||||||||
| Vista Ridge Metropolitan District: | ||||||||||||
| 5.000%, 12/01/2025 (Insured by BAM) | 600,000 | 715,542 | ||||||||||
| 5.000%, 12/01/2026 (Insured by BAM) | 460,000 | 552,405 | ||||||||||
| 5,376,322 | 3.9 | % | ||||||||||
| Connecticut | ||||||||||||
| Connecticut Housing Finance Authority, | ||||||||||||
| 4.000%, 11/15/2047 (Callable 11/15/2026) | 250,000 | 271,030 | ||||||||||
| State of Connecticut Special Tax Revenue, | ||||||||||||
| 5.000%, 09/01/2033 (Callable 09/01/2026) | 300,000 | 338,478 | ||||||||||
| 609,508 | 0.4 | % | ||||||||||
| District of Columbia | ||||||||||||
| District of Columbia, | ||||||||||||
| 5.250%, 07/15/2045 (Pre-refunded to 07/15/2018)(Insured by AGM) | 100,000 | 104,249 | ||||||||||
| District of Columbia Housing Finance Agency, | ||||||||||||
| 3.500%, 06/15/2023 | 470,000 | 486,111 | ||||||||||
| Metropolitan Washington Airports Authority, | ||||||||||||
| 5.000%, 10/01/2033 (Callable 10/01/2025) | 250,000 | 292,600 | ||||||||||
| Metropolitan Washington Airports Authority Dulles Toll Road Revenue: | ||||||||||||
| 6.500%, 10/01/2041 (Callable 10/01/2026) | 305,000 | 393,966 | ||||||||||
| 0.000%, 10/01/2044 (Callable 10/01/2028) | 210,000 | 247,092 | ||||||||||
| Washington Metropolitan Area Transit Authority, | ||||||||||||
| 5.250%, 07/01/2024 (Callable 07/01/2019) | 50,000 | 53,788 | ||||||||||
| 1,577,806 | 1.2 | % | ||||||||||
| Florida | ||||||||||||
| City of Orlando FL, | ||||||||||||
| 5.000%, 10/01/2027 (Pre-refunded to 10/01/2020) | 100,000 | 111,957 | ||||||||||
| County of Bay FL Water and Sewer System Revenue, | ||||||||||||
| 4.000%, 09/01/2018 | 250,000 | 257,900 | ||||||||||
| County of Miami-Dade FL: | ||||||||||||
| 5.000%, 04/01/2027 (Callable 04/01/2026) | 120,000 | 146,036 | ||||||||||
| 0.000%, 10/01/2039 (Callable 10/01/2029) | 50,000 | 59,832 | ||||||||||
| Florida Housing Finance Corp., | ||||||||||||
| 4.000%, 07/01/2047 (Callable 07/01/2025) | 350,000 | 374,157 | ||||||||||
| Hillsborough County Aviation Authority, | ||||||||||||
| 5.000%, 10/01/2035 (Callable 10/01/2024) | 500,000 | 567,375 | ||||||||||
| Hollywood Community Redevelopment Agency, | ||||||||||||
| 5.000%, 03/01/2018 | 200,000 | 205,070 | ||||||||||
| Martin County Health Facilities Authority, | ||||||||||||
| 5.000%, 11/15/2023 | 260,000 | 301,964 | ||||||||||
| Miami Health Facilities Authority: | ||||||||||||
| 5.000%, 07/01/2020 | 140,000 | 149,677 | ||||||||||
| 5.000%, 07/01/2021 | 250,000 | 271,295 | ||||||||||
| Monroe County School District/FL, | ||||||||||||
| 5.000%, 10/01/2025 (Insured by AGM) | 200,000 | 242,304 | ||||||||||
| Palm Beach County Health Facilities Authority, | ||||||||||||
| 4.750%, 07/01/2025 (Callable 07/01/2020)(Insured by AGM) | 130,000 | 140,746 | ||||||||||
| Pinellas County Health Facilities Authority, | ||||||||||||
| 1.784%, 11/15/2023 (Callable 07/01/2017)(1)(2) | 325,000 | 311,261 | ||||||||||
| Village Community Development District No. 7, | ||||||||||||
| 4.000%, 05/01/2021 | 240,000 | 255,103 | ||||||||||
| 3,394,677 | 2.5 | % | ||||||||||
| Georgia | ||||||||||||
| Athens-Clarke County Unified Government Development Authority, | ||||||||||||
| 0.890%, 07/01/2035 (Callable 07/01/2017)(1) | 35,000 | 35,000 | ||||||||||
| Bartow County Development Authority, | ||||||||||||
| 2.375%, 09/01/2029 (Mandatory Tender Date 08/10/2017)(1) | 400,000 | 400,440 | ||||||||||
| Burke County Development Authority, | ||||||||||||
| 2.350%, 10/01/2032 (Mandatory Tender Date 12/11/2020) | 100,000 | 100,955 | ||||||||||
| Chatham County Hospital Authority, | ||||||||||||
| 5.000%, 01/01/2031 (Callable 01/01/2022) | 150,000 | 167,508 | ||||||||||
| City of Atlanta GA: | ||||||||||||
| 5.000%, 01/01/2025 (Callable 01/01/2020) | 225,000 | 241,290 | ||||||||||
| 5.000%, 01/01/2028 (Callable 01/01/2020) | 1,000,000 | 1,068,880 | ||||||||||
| City of Dahlonega GA Water & Sewer Revenue, | ||||||||||||
| 4.000%, 09/01/2021 (Insured by AGM) | 150,000 | 164,280 | ||||||||||
| Gainesville & Hall County Hospital Authority, | ||||||||||||
| 5.000%, 02/15/2029 (Callable 02/15/2027) | 500,000 | 586,115 | ||||||||||
| Murray County School District, | ||||||||||||
| 4.000%, 10/01/2017 | 240,000 | 241,706 | ||||||||||
| 3,006,174 | 2.2 | % | ||||||||||
| Illinois | ||||||||||||
| Bureau County Township High School District No. 502, | ||||||||||||
| 6.625%, 10/01/2043 (Callable 12/01/2023)(Insured by BAM) | 110,000 | 135,445 | ||||||||||
| Chicago O'Hare International Airport, | ||||||||||||
| 5.500%, 01/01/2031 (Pre-refunded to 1/01/2021) | 500,000 | 572,450 | ||||||||||
| City of Berwyn IL, | ||||||||||||
| 4.000%, 12/01/2020 | 100,000 | 105,835 | ||||||||||
| City of Chicago IL: | ||||||||||||
| 4.250%, 01/01/2019 | 175,000 | 180,320 | ||||||||||
| 5.000%, 01/01/2023 (Callable 01/01/2020) | 100,000 | 100,835 | ||||||||||
| 5.000%, 01/01/2024 | 250,000 | 252,895 | ||||||||||
| 5.000%, 01/01/2026 (Callable 07/31/2017)(Insured by AGM) | 60,000 | 60,165 | ||||||||||
| City of Chicago IL Motor Fuel Tax Revenue, | ||||||||||||
| 5.000%, 01/01/2026 (Callable 01/01/2024) | 250,000 | 253,452 | ||||||||||
| City of Chicago IL Wastewater Transmission Revenue: | ||||||||||||
| 5.000%, 01/01/2018 (Insured by BHAC) | 150,000 | 152,673 | ||||||||||
| 5.000%, 01/01/2023 | 170,000 | 193,623 | ||||||||||
| 5.000%, 01/01/2025 (Callable 01/01/2024) | 110,000 | 127,083 | ||||||||||
| City of Flora IL, | ||||||||||||
| 4.000%, 11/15/2023 (Callable 11/15/2017)(Insured by AMBAC) | 240,000 | 239,990 | ||||||||||
| Coles Cumberland Moultrie Etc Counties Community Unit School District No. 2, | ||||||||||||
| 4.000%, 12/01/2018 (Insured by BAM) | 250,000 | 259,065 | ||||||||||
| Cook & Will Counties School District No. 194: | ||||||||||||
| 4.000%, 12/01/2025 (Callable 12/01/2024)(Insured by BAM) | 160,000 | 174,880 | ||||||||||
| 4.000%, 12/01/2026 (Callable 12/01/2024)(Insured by BAM) | 130,000 | 140,815 | ||||||||||
| Cook County Community College District No 524 Moraine Valley, | ||||||||||||
| 5.000%, 12/01/2021 (Callable 12/01/2017) | 500,000 | 507,520 | ||||||||||
| Cook County Community College District No. 508, | ||||||||||||
| 5.000%, 12/01/2017 | 200,000 | 202,698 | ||||||||||
| Cook County Community Consolidated School District No. 65, | ||||||||||||
| 0.000%, 12/01/2023 | 200,000 | 168,336 | ||||||||||
| Cook County School District No 170 Chicago Heights, | ||||||||||||
| 5.000%, 12/01/2026 (Callable 07/27/2017) | 1,250,000 | 1,252,050 | ||||||||||
| Cook County School District No. 83, | ||||||||||||
| 5.625%, 06/01/2033 | 245,000 | 285,518 | ||||||||||
| DeKalb County Community Unit School District No. 428, | ||||||||||||
| 0.000%, 01/01/2030 (Callable 07/01/2020) | 300,000 | 155,292 | ||||||||||
| Ford Etc Counties Community Unit School District No. 10, | ||||||||||||
| 5.000%, 12/01/2027 (Callable 12/01/2026)(Insured by AGM) | 550,000 | 643,456 | ||||||||||
| Illinois Finance Authority: | ||||||||||||
| 4.000%, 11/15/2017 | 100,000 | 101,047 | ||||||||||
| 5.000%, 02/15/2021 | 100,000 | 108,249 | ||||||||||
| 5.000%, 10/01/2021 | 170,000 | 186,822 | ||||||||||
| 5.000%, 10/01/2023 | 205,000 | 229,750 | ||||||||||
| 5.000%, 01/01/2029 (Callable 01/01/2027) | 380,000 | 434,910 | ||||||||||
| 5.250%, 02/15/2030 (Callable 02/15/2020) | 200,000 | 216,170 | ||||||||||
| 5.000%, 08/01/2030 (Callable 08/01/2024) | 265,000 | 303,247 | ||||||||||
| 5.000%, 12/01/2030 (Callable 12/01/2021) | 500,000 | 557,095 | ||||||||||
| 4.000%, 05/15/2034 (Callable 05/15/2026) | 180,000 | 180,392 | ||||||||||
| 2.085%, 05/01/2036 (Callable 11/01/2020)(Mandatory Tender Date 05/01/2021)(1) | 300,000 | 300,150 | ||||||||||
| 6.625%, 11/01/2039 (Pre-refunded to 05/01/2019) | 50,000 | 54,914 | ||||||||||
| Illinois Housing Development Authority, | ||||||||||||
| 2.450%, 06/01/2043 (Callable 01/01/2023) | 868,019 | 843,202 | ||||||||||
| Illinois State University, | ||||||||||||
| 5.000%, 04/01/2023 (Callable 04/01/2021) | 440,000 | 479,644 | ||||||||||
| Joliet Park District, | ||||||||||||
| 4.000%, 02/01/2018 | 350,000 | 354,358 | ||||||||||
| Knox & Warren Counties Community Unit School District No. 205, | ||||||||||||
| 6.125%, 01/01/2036 (Callable 01/01/2021) | 285,000 | 321,930 | ||||||||||
| Metropolitan Pier & Exposition Authority: | ||||||||||||
| 5.500%, 12/15/2023 | 150,000 | 171,584 | ||||||||||
| 5.700%, 06/15/2025 (Callable 06/15/2022) | 50,000 | 56,909 | ||||||||||
| Monroe & St. Clair Counties Community Unit School District No. 5, | ||||||||||||
| 5.000%, 04/15/2021 (Insured by BAM) | 100,000 | 111,781 | ||||||||||
| Ogle & Winnebago Counties Community Unit School District: | ||||||||||||
| 5.000%, 12/01/2023 (Insured by BAM) | 400,000 | 462,920 | ||||||||||
| 5.000%, 12/01/2024 (Insured by BAM) | 100,000 | 115,409 | ||||||||||
| State of Illinois: | ||||||||||||
| 5.000%, 01/01/2022 (Callable 01/01/2020) | 215,000 | 219,988 | ||||||||||
| 5.000%, 08/01/2024 (Callable 08/01/2022) | 665,000 | 683,540 | ||||||||||
| 5.000%, 05/01/2027 (Callable 05/01/2024) | 150,000 | 151,892 | ||||||||||
| 5.250%, 07/01/2028 (Callable 07/01/2023) | 150,000 | 153,084 | ||||||||||
| 5.500%, 07/01/2033 (Callable 07/01/2023) | 410,000 | 422,628 | ||||||||||
| Town of Cicero IL, | ||||||||||||
| 5.000%, 01/01/2019 (Insured by AGM) | 400,000 | 419,712 | ||||||||||
| Village of Cary IL, | ||||||||||||
| 1.500%, 03/01/2019 (Insured by BAM) | 128,000 | 127,937 | ||||||||||
| Village of Crestwood IL: | ||||||||||||
| 2.000%, 12/15/2018 (Insured by BAM) | 225,000 | 226,663 | ||||||||||
| 4.500%, 12/15/2026 (Callable 12/15/2022)(Insured by BAM) | 200,000 | 217,152 | ||||||||||
| Village of Franklin Park IL, | ||||||||||||
| 5.000%, 04/01/2023 (Insured by BAM) | 400,000 | 458,408 | ||||||||||
| Village of River Grove IL: | ||||||||||||
| 4.000%, 12/15/2026 (Insured by BAM) | 220,000 | 228,237 | ||||||||||
| 4.000%, 12/15/2027 (Callable 12/15/2026)(Insured by BAM) | 185,000 | 190,278 | ||||||||||
| 4.000%, 12/15/2028 (Callable 12/15/2026)(Insured by BAM) | 205,000 | 209,202 | ||||||||||
| Village of Rosemont IL, | ||||||||||||
| 5.375%, 12/01/2031 (Callable 12/01/2020) | 685,000 | 739,074 | ||||||||||
| Will County Community High School District No 210 Lincoln-Way, | ||||||||||||
| 0.000%, 01/01/2033 | 25,000 | 10,221 | ||||||||||
| Will County Community High School District No. 210 Lincoln-Way: | ||||||||||||
| 4.000%, 01/01/2022 (Callable 01/01/2019) | 75,000 | 73,850 | ||||||||||
| 5.000%, 01/01/2027 (Callable 01/01/2023) | 220,000 | 208,371 | ||||||||||
| Will County IL School District No. 365 Valley View, | ||||||||||||
| 0.000%, 11/01/2021 (Insured by AGM) | 260,000 | 240,841 | ||||||||||
| Will County Township High School District No. 204 Joliet: | ||||||||||||
| 5.000%, 01/01/2025 | 125,000 | 148,183 | ||||||||||
| 6.250%, 01/01/2031 (Callable 01/01/2021) | 300,000 | 345,132 | ||||||||||
| 17,229,272 | 12.6 | % | ||||||||||
| Indiana | ||||||||||||
| City of Rockport IN, | ||||||||||||
| 1.750%, 06/01/2025 (Mandatory Tender Date 06/01/2018) | 100,000 | 100,411 | ||||||||||
| City of Whiting IN, | ||||||||||||
| 1.850%, 06/01/2044 (Mandatory Tender Date 10/01/2019) | 300,000 | 302,100 | ||||||||||
| Indiana Bond Bank: | ||||||||||||
| 1.570%, 10/15/2022 (1) | 100,000 | 96,027 | ||||||||||
| 1.746%, 10/15/2022 (1) | 510,000 | 495,746 | ||||||||||
| Indiana Finance Authority, | ||||||||||||
| 5.500%, 08/15/2045 (Callable 08/15/2020) | 165,000 | 175,083 | ||||||||||
| Indiana Health & Educational Facilities Financing Authority, | ||||||||||||
| 1.750%, 11/15/2031 (Mandatory Tender Date 11/02/2021) | 500,000 | 499,580 | ||||||||||
| 1,668,947 | 1.2 | % | ||||||||||
| Iowa | ||||||||||||
| City of Coralville IA: | ||||||||||||
| 4.000%, 06/01/2019 | 100,000 | 104,058 | ||||||||||
| 4.000%, 05/01/2037 (Callable 05/01/2025) | 500,000 | 495,245 | ||||||||||
| 4.250%, 05/01/2037 (Callable 05/01/2022) | 450,000 | 454,865 | ||||||||||
| Iowa Finance Authority: | ||||||||||||
| 3.500%, 09/01/2017 | 100,000 | 100,106 | ||||||||||
| 0.920%, 12/01/2033 (Callable 07/01/2017)(Optional Put Date 07/07/2017)(1) | 400,000 | 400,000 | ||||||||||
| Iowa Higher Education Loan Authority, | ||||||||||||
| 2.000%, 12/01/2018 (Callable 06/01/2018) | 1,000,000 | 1,005,090 | ||||||||||
| 2,559,364 | 1.9 | % | ||||||||||
| Kansas | ||||||||||||
| City of Hutchinson KS: | ||||||||||||
| 4.000%, 12/01/2020 | 330,000 | 346,154 | ||||||||||
| 4.000%, 12/01/2021 | 440,000 | 465,084 | ||||||||||
| 5.000%, 12/01/2022 | 140,000 | 155,562 | ||||||||||
| State of Kansas Department of Transportation, | ||||||||||||
| 1.104%, 09/01/2019 (1) | 115,000 | 115,008 | ||||||||||
| 1,081,808 | 0.8 | % | ||||||||||
| Kentucky | ||||||||||||
| Kentucky Municipal Power Agency, | ||||||||||||
| 5.000%, 09/01/2037 (Pre-refunded to 09/01/2017) | 85,000 | 85,531 | ||||||||||
| Louisville/Jefferson County Metropolitan Government, | ||||||||||||
| 5.000%, 10/01/2019 | 325,000 | 348,501 | ||||||||||
| 434,032 | 0.3 | % | ||||||||||
| Louisiana | ||||||||||||
| Louisiana Public Facilities Authority, | ||||||||||||
| 5.000%, 07/01/2017 | 50,000 | 50,000 | 0.0 | % | ||||||||
| Maine | ||||||||||||
| Maine State Housing Authority: | ||||||||||||
| 3.500%, 11/15/2045 (Callable 05/15/2025) | 290,000 | 302,783 | ||||||||||
| 4.000%, 11/15/2045 (Callable 11/15/2025) | 625,000 | 664,969 | ||||||||||
| 967,752 | 0.7 | % | ||||||||||
| Massachusetts | ||||||||||||
| Eaton Vance Municipal Bond Fund II, | ||||||||||||
| 1.960%, 07/01/2019 (Acquired 12/9/2015, Cost $150,000)(Callable 07/31/2017)(1) * | 150,000 | 149,980 | ||||||||||
| Massachusetts Development Finance Agency, | ||||||||||||
| 5.000%, 07/01/2017 | 340,000 | 340,000 | ||||||||||
| Town of Ashburnham MA, | ||||||||||||
| 4.250%, 07/01/2021 (Callable 07/01/2018) | 700,000 | 720,727 | ||||||||||
| 1,210,707 | 0.9 | % | ||||||||||
| Michigan | ||||||||||||
| Adrian City School District, | ||||||||||||
| 5.000%, 05/01/2029 (Callable 05/01/2027)(Insured by Q-SBLF) | 125,000 | 149,172 | ||||||||||
| City of Detroit MI Sewage Disposal System Revenue, | ||||||||||||
| 5.000%, 07/01/2039 (Callable 07/01/2022)(Insured by AGM) | 155,000 | 169,107 | ||||||||||
| City of Detroit MI Water Supply System Revenue: | ||||||||||||
| 4.250%, 07/01/2018 | 100,000 | 102,861 | ||||||||||
| 5.250%, 07/01/2041 (Callable 07/01/2021) | 50,000 | 54,511 | ||||||||||
| City of Wyandotte MI Electric System Revenue, | ||||||||||||
| 5.000%, 10/01/2023 (Insured by BAM) | 25,000 | 28,433 | ||||||||||
| Hudsonville Public Schools, | ||||||||||||
| 4.000%, 05/01/2018 (Insured by Q-SBLF) | 100,000 | 102,358 | ||||||||||
| Lake Orion Community School District, | ||||||||||||
| 5.000%, 05/01/2025 (Insured By Q-SBLF) | 1,635,000 | 1,971,303 | ||||||||||
| Michigan Finance Authority, | ||||||||||||
| 5.000%, 07/01/2034 (Callable 07/01/2025) | 250,000 | 279,807 | ||||||||||
| Warren Consolidated Schools: | ||||||||||||
| 5.000%, 05/01/2019 (Insured by BAM) | 130,000 | 138,522 | ||||||||||
| 5.000%, 05/01/2025 (Insured by BAM) | 300,000 | 360,033 | ||||||||||
| Western Michigan University, | ||||||||||||
| 5.000%, 11/15/2029 (Callable 05/15/2025) | 250,000 | 290,460 | ||||||||||
| Ypsilanti School District/MI, | ||||||||||||
| 4.000%, 05/01/2020 (Insured by Q-SBLF) | 50,000 | 53,423 | ||||||||||
| 3,699,990 | 2.7 | % | ||||||||||
| Minnesota | ||||||||||||
| City of Maple Grove MN: | ||||||||||||
| 5.000%, 05/01/2027 | 200,000 | 238,676 | ||||||||||
| 5.000%, 05/01/2031 (Callable 05/01/2027) | 200,000 | 230,486 | ||||||||||
| City of Plato MN, | ||||||||||||
| 4.000%, 04/01/2021 | 280,000 | 299,953 | ||||||||||
| Minnesota Housing Finance Agency: | ||||||||||||
| 4.375%, 07/01/2026 (Callable 07/01/2021) | 160,000 | 169,752 | ||||||||||
| 4.000%, 01/01/2047 (Callable 01/01/2026) | 1,105,000 | 1,184,317 | ||||||||||
| Western Minnesota Municipal Power Agency, | ||||||||||||
| 5.000%, 01/01/2033 (Callable 01/01/2024) | 140,000 | 159,577 | ||||||||||
| 2,282,761 | 1.7 | % | ||||||||||
| Mississippi | ||||||||||||
| City of Jackson MS Water & Sewer System Revenue, | ||||||||||||
| 4.000%, 09/01/2018 (Insured by BAM) | 250,000 | 257,257 | ||||||||||
| Mississippi Development Bank: | ||||||||||||
| 5.500%, 10/01/2019 | 550,000 | 587,879 | ||||||||||
| 4.375%, 03/01/2023 (Callable 07/01/2019) | 150,000 | 156,933 | ||||||||||
| 6.750%, 12/01/2033 (Callable 12/01/2023)(Insured by AGM) | 100,000 | 126,759 | ||||||||||
| State of Mississippi, | ||||||||||||
| 1.440%, 09/01/2017 (Callable 07/31/2017)(1) | 220,000 | 220,077 | ||||||||||
| 1,348,905 | 1.0 | % | ||||||||||
| Missouri | ||||||||||||
| County of Boone MO, | ||||||||||||
| 4.000%, 08/01/2019 | 250,000 | 260,757 | ||||||||||
| Health & Educational Facilities Authority of the State of Missouri: | ||||||||||||
| 4.000%, 08/01/2018 | 100,000 | 101,763 | ||||||||||
| 4.000%, 08/01/2019 | 150,000 | 154,172 | ||||||||||
| Missouri Housing Development Commission: | ||||||||||||
| 3.700%, 11/01/2035 (Callable 05/01/2025) | 225,000 | 227,585 | ||||||||||
| 4.000%, 05/01/2042 (Callable 11/01/2026) | 1,250,000 | 1,361,725 | ||||||||||
| Move Rolla Transportation Development District, | ||||||||||||
| 3.750%, 06/01/2029 (Callable 06/01/2026) | 500,000 | 510,630 | ||||||||||
| State of Missouri Environmental Improvement & Energy Resources Authority, | ||||||||||||
| 1.418%, 12/01/2022 (Callable 07/01/2017)(1)(2) | 500,000 | 466,502 | ||||||||||
| 3,083,134 | 2.3 | % | ||||||||||
| Montana | ||||||||||||
| City of Billings MT Sewer System Revenue: | ||||||||||||
| 5.000%, 07/01/2028 (Callable 07/01/2027) | 300,000 | 369,795 | ||||||||||
| 5.000%, 07/01/2029 (Callable 07/01/2027) | 550,000 | 671,935 | ||||||||||
| Montana Board of Housing, | ||||||||||||
| 3.600%, 12/01/2030 (Callable 06/01/2022) | 480,000 | 487,003 | ||||||||||
| 1,528,733 | 1.1 | % | ||||||||||
| Nebraska | ||||||||||||
| County of Buffalo NE: | ||||||||||||
| 4.000%, 12/15/2029 (Callable 09/13/2021) | 200,000 | 213,490 | ||||||||||
| 4.000%, 12/15/2031 (Callable 09/13/2021) | 300,000 | 318,018 | ||||||||||
| Douglas County Hospital Authority No. 2, | ||||||||||||
| 5.000%, 05/15/2019 | 150,000 | 159,555 | ||||||||||
| Gering School District: | ||||||||||||
| 5.000%, 12/01/2031 (Callable 05/30/2022) | 225,000 | 252,418 | ||||||||||
| 5.000%, 12/01/2033 (Callable 05/30/2022) | 430,000 | 481,127 | ||||||||||
| 5.000%, 12/01/2034 (Callable 05/30/2022) | 300,000 | 335,226 | ||||||||||
| Papio-Missouri River Natural Resource District: | ||||||||||||
| 4.000%, 12/15/2027 (Callable 06/15/2022) | 200,000 | 216,280 | ||||||||||
| 4.000%, 12/15/2028 (Callable 06/15/2022) | 275,000 | 296,450 | ||||||||||
| 2,272,564 | 1.7 | % | ||||||||||
| Nevada | ||||||||||||
| City of North Las Vegas NV: | ||||||||||||
| 2.000%, 12/01/2017 | 190,000 | 190,555 | ||||||||||
| 2.000%, 12/01/2018 | 190,000 | 191,339 | ||||||||||
| Nevada Housing Division: | ||||||||||||
| 4.400%, 04/01/2029 (Callable 10/01/2021) | 860,000 | 892,861 | ||||||||||
| 5.375%, 10/01/2039 (Callable 04/01/2019) | 285,000 | 293,231 | ||||||||||
| 1,567,986 | 1.1 | % | ||||||||||
| New Jersey | ||||||||||||
| City of Atlantic City NJ, | ||||||||||||
| 5.000%, 03/01/2021 | 100,000 | 109,368 | ||||||||||
| City of Newark NJ, | ||||||||||||
| 5.000%, 09/01/2017 | 100,000 | 100,553 | ||||||||||
| Landis Sewage Authority, | ||||||||||||
| 3.127%, 09/19/2019 (1)(2) | 150,000 | 145,082 | ||||||||||
| New Jersey Economic Development Authority, | ||||||||||||
| 5.000%, 06/15/2023 (Insured by BAM) | 275,000 | 300,809 | ||||||||||
| New Jersey Health Care Facilities Financing Authority: | ||||||||||||
| 5.000%, 07/01/2025 (Insured by AGM) | 200,000 | 235,518 | ||||||||||
| 4.500%, 11/15/2025 (Callable 11/15/2020) | 150,000 | 161,662 | ||||||||||
| 5.000%, 07/01/2026 (Callable 07/01/2025)(Insured by AGM) | 225,000 | 262,303 | ||||||||||
| New Jersey Higher Education Student Assistance Authority, | ||||||||||||
| 5.250%, 12/01/2028 (Callable 12/01/2019) | 65,000 | 69,220 | ||||||||||
| New Jersey Transportation Trust Fund Authority: | ||||||||||||
| 5.250%, 12/15/2019 | 345,000 | 367,080 | ||||||||||
| 5.000%, 06/15/2021 (Callable 06/15/2018) | 350,000 | 361,910 | ||||||||||
| 0.000%, 12/15/2024 | 340,000 | 283,438 | ||||||||||
| New Jersey Turnpike Authority, | ||||||||||||
| 5.000%, 01/01/2026 (Callable 01/01/2023) | 500,000 | 578,695 | ||||||||||
| 2,975,638 | 2.2 | % | ||||||||||
| New Mexico | ||||||||||||
| New Mexico Municipal Energy Acquisition Authority, | ||||||||||||
| 1.454%, 11/01/2039 (Callable 02/01/2019)(Mandatory Tender Date 08/01/2019)(1) | 190,000 | 189,517 | 0.1 | % | ||||||||
| New York | ||||||||||||
| Brooklyn Arena Local Development Corp., | ||||||||||||
| 4.000%, 07/15/2029 (Callable 01/15/2027)(Insured by AGM) | 610,000 | 660,734 | ||||||||||
| City of New York NY: | ||||||||||||
| 0.940%, 08/01/2021 (Callable 07/01/2017)(Insured by AGM)(1) | 200,000 | 200,000 | ||||||||||
| 1.020%, 11/01/2026 (Insured by AGM)(Optional Put Date 07/31/2017)(1) | 100,000 | 100,000 | ||||||||||
| City of New York NY Transitional Revenue, | ||||||||||||
| 5.250%, 07/01/2029 (Callable 07/01/2023) | 250,000 | 291,935 | ||||||||||
| County of Nassau NY: | ||||||||||||
| 5.000%, 07/01/2022 (Callable 07/01/2018)(Insured by AGM) | 95,000 | 98,777 | ||||||||||
| 5.000%, 07/01/2022 (Callable 07/01/2018)(Insured by AGM) | 5,000 | 5,178 | ||||||||||
| JPMorgan Chase Putters/Drivers Trust, | ||||||||||||
| 1.000%, 11/01/2019 (Callable 05/01/2019)(1) | 1,500,000 | 1,500,000 | ||||||||||
| Metropolitan Transportation Authority, | ||||||||||||
| 5.000%, 11/15/2038 (Callable 11/15/2023) | 170,000 | 192,486 | ||||||||||
| MTA Hudson Rail Yards Trust Obligations, | ||||||||||||
| 5.000%, 11/15/2046 (Callable 11/15/2019) | 500,000 | 537,615 | ||||||||||
| Nassau Health Care Corp., | ||||||||||||
| 2.750%, 01/16/2018 | 450,000 | 451,683 | ||||||||||
| New York City Transitional Finance Authority Future Tax Secured Revenue, | ||||||||||||
| 1.020%, 11/01/2022 (Optional Put Date 07/31/2017)(1) | 200,000 | 200,000 | ||||||||||
| New York City Water & Sewer System, | ||||||||||||
| 1.070%, 06/15/2032 (Callable 07/17/2017)(Optional Put Date 07/31/2017)(1) | 875,000 | 875,000 | ||||||||||
| New York State Dormitory Authority: | ||||||||||||
| 4.000%, 12/01/2018 | 400,000 | 410,668 | ||||||||||
| 5.000%, 07/01/2023 | 150,000 | 178,061 | ||||||||||
| New York State Energy Research & Development Authority, | ||||||||||||
| 1.523%, 12/01/2020 (1)(2) | 750,000 | 741,002 | ||||||||||
| Niskayuna Central School District, | ||||||||||||
| 1.630%, 03/15/2019 | 165,000 | 164,753 | ||||||||||
| Port Authority of New York & New Jersey, | ||||||||||||
| 5.000%, 09/01/2031 (Callable 09/01/2024) | 250,000 | 296,270 | ||||||||||
| State of New York, | ||||||||||||
| 1.697%, 02/13/2032 (Callable 07/06/2017)(2) | 125,000 | 114,845 | ||||||||||
| State of New York Mortgage Agency, | ||||||||||||
| 3.500%, 10/01/2043 (Callable 04/01/2023) | 430,000 | 447,333 | ||||||||||
| 7,466,340 | 5.5 | % | ||||||||||
| North Carolina | ||||||||||||
| North Carolina Capital Facilities Finance Agency, | ||||||||||||
| 5.000%, 06/01/2022 | 150,000 | 169,341 | ||||||||||
| North Carolina Housing Finance Agency, | ||||||||||||
| 4.000%, 07/01/2047 (Callable 01/01/2027) | 650,000 | 704,243 | ||||||||||
| North Carolina Medical Care Commission, | ||||||||||||
| 5.000%, 10/01/2019 (Callable 10/01/2017) | 150,000 | 151,362 | ||||||||||
| 1,024,946 | 0.7 | % | ||||||||||
| North Dakota | ||||||||||||
| City of Mandan ND, | ||||||||||||
| 2.750%, 09/01/2041 (Callable 07/31/2017) | 370,000 | 368,002 | ||||||||||
| County of Ward ND, | ||||||||||||
| 4.000%, 04/01/2026 (Callable 04/01/2023)(Insured by AGM) | 1,030,000 | 1,108,630 | ||||||||||
| Jamestown Park District/ND, | ||||||||||||
| 2.900%, 07/01/2035 (Callable 07/17/2017) | 915,000 | 878,016 | ||||||||||
| North Dakota Housing Finance Agency, | ||||||||||||
| 3.500%, 07/01/2046 (Callable 01/01/2026) | 490,000 | 514,966 | ||||||||||
| Williston Parks & Recreation District, | ||||||||||||
| 3.250%, 03/01/2032 (Callable 08/14/2017) | 75,000 | 75,182 | ||||||||||
| 2,944,796 | 2.2 | % | ||||||||||
| Ohio | ||||||||||||
| American Municipal Power, Inc., | ||||||||||||
| 5.250%, 02/15/2027 (Callable 02/15/2022) | 245,000 | 279,883 | ||||||||||
| City of Bowling Green OH, | ||||||||||||
| 4.500%, 06/01/2019 | 150,000 | 155,022 | ||||||||||
| City of Cleveland OH, | ||||||||||||
| 5.000%, 10/01/2023 | 430,000 | 510,535 | ||||||||||
| City of Cleveland OH Airport System Revenue, | ||||||||||||
| 5.000%, 01/01/2025 (Insured by AGM) | 100,000 | 119,229 | ||||||||||
| Clermont County Port Authority, | ||||||||||||
| 5.000%, 12/01/2023 (Insured by BAM) | 300,000 | 350,295 | ||||||||||
| Columbus-Franklin County Finance Authority, | ||||||||||||
| 3.820%, 11/15/2036 (Callable 11/15/2021) | 500,000 | 501,575 | ||||||||||
| County of Crawford OH, | ||||||||||||
| 1.430%, 11/01/2017 (Callable 07/31/2017) | 300,000 | 300,081 | ||||||||||
| County of Licking OH: | ||||||||||||
| 4.000%, 12/01/2026 (Callable 12/01/2021) | 105,000 | 113,806 | ||||||||||
| 4.000%, 12/01/2027 (Callable 12/01/2021) | 60,000 | 64,717 | ||||||||||
| 4.000%, 12/01/2028 (Callable 12/01/2021) | 250,000 | 268,455 | ||||||||||
| Lancaster Port Authority, | ||||||||||||
| 1.324%, 08/01/2019 (Callable 02/01/2019)(1) | 200,000 | 199,096 | ||||||||||
| New Riegel Local School District: | ||||||||||||
| 4.000%, 12/01/2033 (Callable 12/01/2020)(Insured by BAM) | 215,000 | 224,952 | ||||||||||
| 4.000%, 12/01/2035 (Callable 12/01/2020)(Insured by BAM) | 345,000 | 360,052 | ||||||||||
| 4.000%, 12/01/2037 (Callable 12/01/2020)(Insured by BAM) | 370,000 | 385,163 | ||||||||||
| Ohio Housing Finance Agency, | ||||||||||||
| 4.000%, 03/01/2047 (Callable 09/01/2025) | 460,000 | 490,553 | ||||||||||
| Ohio Turnpike & Infrastructure Commission: | ||||||||||||
| 0.000%, 02/15/2034 (Callable 02/15/2031) | 150,000 | 143,493 | ||||||||||
| 0.000%, 02/15/2036 (Callable 02/15/2031) | 335,000 | 320,069 | ||||||||||
| State of Ohio, | ||||||||||||
| 5.000%, 11/15/2028 (Callable 05/15/2023) | 225,000 | 263,356 | ||||||||||
| 5,050,332 | 3.7 | % | ||||||||||
| Oklahoma | ||||||||||||
| Oklahoma City Industrial & Cultural Facilities Trust, | ||||||||||||
| 1.453%, 06/01/2019 (Callable 07/01/2017)(1)(2) | 50,000 | 49,894 | ||||||||||
| Oklahoma Water Resources Board, | ||||||||||||
| 5.000%, 10/01/2028 (Callable 10/01/2024) | 180,000 | 217,418 | ||||||||||
| 267,312 | 0.2 | % | ||||||||||
| Oregon | ||||||||||||
| Clackamas Community College District, | ||||||||||||
| 0.000%, 06/15/2040 (Callable 06/15/2027) | 300,000 | 303,612 | ||||||||||
| Umatilla County School District No. 6R, | ||||||||||||
| 0.000%, 06/15/2035 (Callable 06/15/2027) | 415,000 | 362,909 | ||||||||||
| Washington & Multnomah Counties School District No 48J Beaverton: | ||||||||||||
| 0.000%, 06/15/2035 (Callable 06/15/2027) | 505,000 | 568,469 | ||||||||||
| 0.000%, 06/15/2036 (Callable 06/15/2027) | 500,000 | 561,435 | ||||||||||
| 1,796,425 | 1.3 | % | ||||||||||
| Pennsylvania | ||||||||||||
| Bethlehem Area School District, | ||||||||||||
| 5.000%, 10/15/2017 | 115,000 | 116,291 | ||||||||||
| Bethlehem Parking Authority, | ||||||||||||
| 2.000%, 10/01/2018 | 250,000 | 253,125 | ||||||||||
| Greater Latrobe School Authority, | ||||||||||||
| 2.250%, 04/15/2019 (Callable 07/31/2017) | 670,000 | 670,844 | ||||||||||
| Montgomery County Industrial Development Authority/PA, | ||||||||||||
| 1.020%, 11/15/2029 (Callable 07/01/2017)(Optional Put Date 07/31/2017)(1) | 1,250,000 | 1,250,000 | ||||||||||
| Northampton County General Purpose Authority, | ||||||||||||
| 2.310%, 08/15/2043 (Callable 02/15/2020)(Mandatory Tender Date 08/15/2020)(1) | 225,000 | 225,875 | ||||||||||
| Pennsylvania Housing Finance Agency, | ||||||||||||
| 3.500%, 10/01/2046 (Callable 10/01/2025) | 510,000 | 538,050 | ||||||||||
| Pennsylvania Turnpike Commission: | ||||||||||||
| 5.000%, 12/01/2023 (Pre-refunded to 12/01/2019) | 200,000 | 218,194 | ||||||||||
| 0.000%, 12/01/2028 | 305,000 | 335,717 | ||||||||||
| 0.000%, 12/01/2030 (Callable 12/01/2027) | 205,000 | 258,097 | ||||||||||
| 0.000%, 12/01/2030 (Callable 12/01/2027) | 475,000 | 588,254 | ||||||||||
| 0.000%, 12/01/2038 (Callable 12/01/2028) | 210,000 | 220,777 | ||||||||||
| Reading School District, | ||||||||||||
| 5.000%, 02/01/2023 | 230,000 | 264,491 | ||||||||||
| The School District of Philadelphia: | ||||||||||||
| 5.000%, 09/01/2017 | 100,000 | 100,525 | ||||||||||
| 5.000%, 09/01/2017 | 300,000 | 301,575 | ||||||||||
| Upper Moreland Township School District, | ||||||||||||
| 5.000%, 10/01/2030 (Callable 04/01/2025) | 250,000 | 294,860 | ||||||||||
| West Mifflin Sanitary Sewer Municipal Authority, | ||||||||||||
| 4.000%, 08/01/2020 (Insured by BAM) | 125,000 | 133,795 | ||||||||||
| 5,770,470 | 4.2 | % | ||||||||||
| Puerto Rico | ||||||||||||
| Commonwealth of Puerto Rico: | ||||||||||||
| 4.700%, 07/01/2017 | 25,000 | 25,000 | ||||||||||
| 4.750%, 07/01/2018 | 60,000 | 60,748 | ||||||||||
| 5.500%, 07/01/2018 | 200,000 | 205,808 | ||||||||||
| 291,556 | 0.2 | % | ||||||||||
| Rhode Island | ||||||||||||
| Providence Public Buildings Authority, | ||||||||||||
| 5.125%, 06/15/2021 (Insured by AGM) | 80,000 | 85,931 | ||||||||||
| Rhode Island Health & Educational Building Corp., | ||||||||||||
| 5.000%, 05/15/2024 | 200,000 | 236,582 | ||||||||||
| Rhode Island Housing & Mortgage Finance Corp./RI: | ||||||||||||
| 0.800%, 04/01/2044 (Callable 07/21/2017)(Mandatory Tender Date 10/01/2017) | 75,000 | 74,995 | ||||||||||
| 1.050%, 10/01/2044 (Callable 10/01/2017)(Mandatory Tender Date 04/01/2018) | 150,000 | 149,889 | ||||||||||
| 3.500%, 10/01/2046 (Callable 04/01/2025) | 135,000 | 139,743 | ||||||||||
| 687,140 | 0.5 | % | ||||||||||
| South Carolina | ||||||||||||
| County of Florence SC, | ||||||||||||
| 5.000%, 11/01/2033 (Callable 11/01/2024) | 250,000 | 284,213 | ||||||||||
| Scago Educational Facilities Corp. for Union School District, | ||||||||||||
| 5.000%, 12/01/2023 (Insured by BAM) | 500,000 | 588,400 | ||||||||||
| South Carolina Jobs-Economic Development Authority, | ||||||||||||
| 6.500%, 08/01/2039 (Callable 08/01/2021)(Insured by AGM) | 60,000 | 69,786 | ||||||||||
| South Carolina Public Service Authority, | ||||||||||||
| 5.000%, 12/01/2022 | 165,000 | 188,319 | ||||||||||
| Sumter Two School Facilities, Inc., | ||||||||||||
| 5.000%, 12/01/2023 (Insured by BAM) | 200,000 | 232,104 | ||||||||||
| University of South Carolina, | ||||||||||||
| 5.000%, 05/01/2023 | 140,000 | 164,812 | ||||||||||
| 1,527,634 | 1.1 | % | ||||||||||
| South Dakota | ||||||||||||
| South Dakota Health & Educational Facilities Authority, | ||||||||||||
| 5.000%, 09/01/2028 (Callable 09/01/2020) | 325,000 | 355,579 | 0.3 | % | ||||||||
| Tennessee | ||||||||||||
| Knox County Health Educational & Housing Facility Board: | ||||||||||||
| 5.000%, 04/01/2022 | 200,000 | 224,380 | ||||||||||
| 5.000%, 01/01/2026 (Callable 01/01/2023) | 145,000 | 164,270 | ||||||||||
| 5.000%, 04/01/2028 (Callable 04/01/2027) | 500,000 | 577,470 | ||||||||||
| Metropolitan Government Nashville & Davidson County Revenue, | ||||||||||||
| 1.550%, 11/15/2030 (Mandatory Tender Date 11/03/2020) | 255,000 | 255,163 | ||||||||||
| Tennessee Energy Acquisition Corp., | ||||||||||||
| 5.625%, 09/01/2026 | 50,000 | 59,160 | ||||||||||
| Tennessee Housing Development Agency: | ||||||||||||
| 4.000%, 01/01/2042 (Callable 07/01/2026) | 300,000 | 326,457 | ||||||||||
| 4.000%, 07/01/2043 (Callable 01/01/2023) | 75,000 | 78,256 | ||||||||||
| 4.000%, 07/01/2045 (Callable 01/01/2025) | 200,000 | 213,978 | ||||||||||
| 1,899,134 | 1.4 | % | ||||||||||
| Texas | ||||||||||||
| Allen Independent School District, | ||||||||||||
| 5.000%, 02/15/2023 (PSF Guaranteed) | 350,000 | 413,171 | ||||||||||
| Arlington Higher Education Finance Corp., | ||||||||||||
| 4.000%, 08/15/2028 (Callable 08/15/2026)(PSF Guaranteed) | 250,000 | 273,545 | ||||||||||
| City of Round Rock TX: | ||||||||||||
| 4.000%, 12/01/2022 | 280,000 | 309,750 | ||||||||||
| 4.000%, 12/01/2024 | 205,000 | 229,186 | ||||||||||
| Clifton Higher Education Finance Corp., | ||||||||||||
| 5.000%, 08/15/2018 | 180,000 | 187,018 | ||||||||||
| Crane County Water District, | ||||||||||||
| 5.000%, 02/15/2023 | 250,000 | 290,317 | ||||||||||
| Grand Parkway Transportation Corp., | ||||||||||||
| 0.000%, 10/01/2048 (Callable 10/01/2028) | 250,000 | 225,243 | ||||||||||
| Harris County Cultural Education Facilities Finance Corp.: | ||||||||||||
| 5.000%, 12/01/2026 (Callable 12/01/2024) | 100,000 | 117,982 | ||||||||||
| 5.000%, 12/01/2035 (Callable 12/01/2022) | 425,000 | 469,124 | ||||||||||
| Harris County Municipal Utility District No. 390: | ||||||||||||
| 2.000%, 04/01/2018 (Insured by BAM) | 140,000 | 140,683 | ||||||||||
| 2.000%, 04/01/2019 (Insured by BAM) | 375,000 | 376,658 | ||||||||||
| Harris County Municipal Utility District No. 419, | ||||||||||||
| 3.000%, 09/01/2017 (Insured by AGM) | 200,000 | 200,598 | ||||||||||
| Harris County Municipal Utility District No. 71, | ||||||||||||
| 4.000%, 09/01/2028 (Callable 09/01/2023)(Insured by BAM) | 250,000 | 266,840 | ||||||||||
| Leander Independent School District, | ||||||||||||
| 0.000%, 08/15/2047 (Pre-refunded to 8/15/24)(PSF Guaranteed) | 950,000 | 234,555 | ||||||||||
| Mesquite Independent School District, | ||||||||||||
| 5.000%, 08/15/2029 (Callable 08/15/2025)(PSF Guaranteed) | 500,000 | 595,665 | ||||||||||
| Millsap Independent School District, | ||||||||||||
| 0.000%, 02/15/2018 | 125,000 | 123,771 | ||||||||||
| New Hope Cultural Education Facilities Finance Corp.: | ||||||||||||
| 1.000%, 02/01/2018 (Callable 08/01/2017) | 200,000 | 199,526 | ||||||||||
| 3.000%, 07/01/2019 | 125,000 | 127,006 | ||||||||||
| 4.000%, 04/01/2020 | 175,000 | 183,458 | ||||||||||
| 4.000%, 07/01/2022 | 120,000 | 129,323 | ||||||||||
| 3.625%, 08/15/2022 (Callable 08/15/2021) | 230,000 | 231,272 | ||||||||||
| North Texas Tollway Authority: | ||||||||||||
| 5.000%, 01/01/2024 | 100,000 | 119,169 | ||||||||||
| 5.000%, 01/01/2033 (Callable 01/01/2026) | 675,000 | 779,855 | ||||||||||
| 0.000%, 09/01/2043 (Callable 09/01/2031) | 300,000 | 319,176 | ||||||||||
| Rosebud-Lott Independent School District: | ||||||||||||
| 5.500%, 02/15/2030 (Callable 02/15/2025)(PSF Guaranteed) | 100,000 | 119,976 | ||||||||||
| 5.500%, 02/15/2031 (Callable 02/15/2025)(PSF Guaranteed) | 100,000 | 119,594 | ||||||||||
| SA Energy Acquisition Public Facility Corp., | ||||||||||||
| 5.500%, 08/01/2022 | 100,000 | 116,634 | ||||||||||
| Siena Municipal Utility District No. 1, | ||||||||||||
| 2.250%, 09/01/2018 (Insured by BAM) | 75,000 | 76,097 | ||||||||||
| Tarrant County Cultural Education Facilities Finance Corp., | ||||||||||||
| 2.100%, 11/15/2017 | 200,000 | 200,352 | ||||||||||
| Texas Municipal Gas Acquisition & Supply Corp. I, | ||||||||||||
| 5.625%, 12/15/2017 | 105,000 | 106,216 | ||||||||||
| Texas Municipal Gas Acquisition & Supply Corp. II, | ||||||||||||
| 1.535%, 09/15/2017 (1) | 55,000 | 55,013 | ||||||||||
| Texas Municipal Gas Acquisition & Supply Corp. III: | ||||||||||||
| 5.000%, 12/15/2026 (Callable 12/15/2022) | 190,000 | 214,540 | ||||||||||
| 5.000%, 12/15/2028 (Callable 12/15/2022) | 500,000 | 557,560 | ||||||||||
| Viridian Municipal Management District, | ||||||||||||
| 6.000%, 12/01/2035 (Callable 12/01/2024)(Insured by BAM) | 90,000 | 109,940 | ||||||||||
| Washington County Junior College District, | ||||||||||||
| 5.000%, 10/01/2028 (Callable 04/01/2026)(Insured by BAM) | 500,000 | 592,365 | ||||||||||
| 8,811,178 | 6.4 | % | ||||||||||
| Utah | ||||||||||||
| Salt Lake City Corp Airport Revenue, | ||||||||||||
| 5.000%, 07/01/2030 (Callable 07/01/2027) | 125,000 | 150,869 | ||||||||||
| Utah Charter School Finance Authority: | ||||||||||||
| 5.000%, 04/15/2027 (Callable 04/15/2026) | 365,000 | 427,696 | ||||||||||
| 5.000%, 04/15/2028 (Callable 04/15/2026) | 720,000 | 836,978 | ||||||||||
| 5.000%, 04/15/2037 (Callable 04/15/2026) | 520,000 | 576,810 | ||||||||||
| Utah Housing Corp., | ||||||||||||
| 4.000%, 01/01/2045 (Callable 01/01/2026) | 465,000 | 495,639 | ||||||||||
| 2,487,992 | 1.8 | % | ||||||||||
| Virgin Islands | ||||||||||||
| Virgin Islands Public Finance Authority, | ||||||||||||
| 5.000%, 09/01/2020 | 400,000 | 428,072 | 0.3 | % | ||||||||
| Washington | ||||||||||||
| Central Puget Sound Regional Transit Authority, | ||||||||||||
| 1.610%, 11/01/2045 (Callable 05/01/2018)(Mandatory Tender Date 11/01/2018)(1) | 250,000 | 250,357 | ||||||||||
| City of Tacoma WA Solid Waste Utility Revenue: | ||||||||||||
| 5.000%, 12/01/2026 (Callable 06/01/2026) | 360,000 | 438,811 | ||||||||||
| 5.000%, 12/01/2027 (Callable 06/01/2026) | 400,000 | 482,200 | ||||||||||
| State of Washington, | ||||||||||||
| 5.000%, 02/01/2038 (Callable 02/01/2024) | 645,000 | 734,578 | ||||||||||
| Washington State Housing Finance Commission, | ||||||||||||
| 3.700%, 12/01/2034 (Callable 06/01/2025) | 375,000 | 383,254 | ||||||||||
| WBRP 3.2, | ||||||||||||
| 5.000%, 01/01/2037 (Callable 07/01/2025) | 75,000 | 87,317 | ||||||||||
| 2,376,517 | 1.7 | % | ||||||||||
| Wisconsin | ||||||||||||
| Baraboo Community Development Authority, | ||||||||||||
| 3.500%, 03/01/2019 (Callable 03/01/2018) | 500,000 | 504,605 | ||||||||||
| Public Finance Authority: | ||||||||||||
| 4.000%, 12/01/2020 | 650,000 | 647,322 | ||||||||||
| 3.000%, 11/15/2022 (Callable 11/15/2018) | 750,000 | 752,370 | ||||||||||
| State of Wisconsin, | ||||||||||||
| 5.000%, 05/01/2029 (Callable 05/01/2024) | 350,000 | 413,434 | ||||||||||
| University of Wisconsin Hospitals & Clinics, | ||||||||||||
| 5.000%, 04/01/2038 (Callable 04/01/2023) | 625,000 | 692,475 | ||||||||||
| Waukesha Housing Authority, | ||||||||||||
| 1.950%, 12/01/2042 (Callable 07/01/2017)(Optional Put Date 07/07/2017)(1) | 230,000 | 230,000 | ||||||||||
| West Allis West Milwaukee School District: | ||||||||||||
| 3.000%, 04/01/2019 | 130,000 | 129,474 | ||||||||||
| 4.000%, 04/01/2024 (Insured by AGM) | 180,000 | 192,942 | ||||||||||
| Wisconsin Center District: | ||||||||||||
| 5.250%, 12/15/2023 | 175,000 | 202,139 | ||||||||||
| 5.250%, 12/15/2027 | 70,000 | 83,629 | ||||||||||
| 5.000%, 12/15/2028 (Callable 06/15/2026) | 125,000 | 148,357 | ||||||||||
| 5.000%, 12/15/2030 (Callable 12/15/2022) | 395,000 | 429,215 | ||||||||||
| Wisconsin Health & Educational Facilities Authority: | ||||||||||||
| 5.000%, 09/01/2018 (Callable 09/01/2017) | 175,000 | 175,836 | ||||||||||
| 5.000%, 07/01/2023 | 165,000 | 186,430 | ||||||||||
| 5.000%, 07/01/2024 | 250,000 | 286,558 | ||||||||||
| 5.000%, 07/01/2026 (Callable 07/01/2024) | 50,000 | 56,698 | ||||||||||
| 5.000%, 08/15/2028 (Callable 08/15/2023) | 1,000,000 | 1,146,270 | ||||||||||
| 5.000%, 12/15/2030 (Callable 12/15/2024) | 350,000 | 397,369 | ||||||||||
| 5.125%, 04/15/2031 (Callable 04/15/2023) | 350,000 | 393,694 | ||||||||||
| 5.000%, 09/15/2037 (Callable 09/15/2022) | 350,000 | 369,096 | ||||||||||
| 5.250%, 10/15/2039 (Callable 10/15/2021) | 260,000 | 284,170 | ||||||||||
| Wisconsin Housing & Economic Development Authority: | ||||||||||||
| 4.550%, 07/01/2037 (Callable 07/01/2022) | 165,000 | 169,196 | ||||||||||
| 4.700%, 07/01/2047 (Callable 07/01/2022) | 90,000 | 92,375 | ||||||||||
| 7,983,654 | 5.8 | % | ||||||||||
| Total Municipal Bonds (Cost $133,923,328) | 135,482,694 | 99.0 | % | |||||||||
| SHORT-TERM INVESTMENT | Shares | |||||||||||
| Money Market Mutual Fund | ||||||||||||
| Fidelity Institutional Money Market Fund - Government Portfolio, Institutional Class, 0.85% « | 265,084 | 265,084 | ||||||||||
| Total Short-Term Investment (Cost $265,084) | 265,084 | 0.2 | % | |||||||||
| Total Investments (Cost $134,188,412) | 135,747,778 | 99.2 | % | |||||||||
| Other Assets in Excess of Liabilities | 1,052,400 | 0.8 | % | |||||||||
| TOTAL NET ASSETS | $ | 136,800,178 | 100.0 | % | ||||||||
Notes to Schedule of Investments | |
| AGM | Assured Guaranty Municipal |
| AMBAC | Ambac Assurance Corp. |
| BAM | Build America Mutual Assurance Co. |
| BHAC | Berkshire Hathaway Assurance Corp. |
| ETM | Escrowed to Maturity |
| PSF | Texas Permanent School Fund |
| Q-SBLF | Qualified School Building Loan Fund |
| (1) | Variable or Floating rate security. Floating rate securities are securities whose yields vary with a designated index rate. These securities' rates are as of June 30, 2017. |
| (2) | Auction Rate Security. An Auction Rate Security is a debt instrument with a long nominal maturity for which the interest rate is regularly reset through a Dutch auction. The rate presented is either the rate set through the auction or the maximum interest rate provided for in the security issuance provision. |
| (3) | Security or a portion of the security purchased on a when-issued or delayed delivery basis. |
| « | 7-Day Yield. |
| * | Restricted security as defined in Rule 144(a) under the Securities Act of 1933 and determined to be liquid. Purchased in a private placement transaction; resale to the public may require registration or or may extend only to qualified institutional buyers. At June 30, 2017, the value of these securities total $149,980, which represents 0.11% of total net assets. |
(b) Not applicable
Item 7. Disclosure of Proxy Voting Policies and Procedures for Closed-End Management Investment Companies.
Not applicable because the Registrant is not a closed-end management investment company.
Item 8. Portfolio Managers of Closed-End Management Investment Companies.
Not applicable because the Registrant is not a closed-end management investment company.
Item 9. Purchases of Equity Securities by Closed‑End Management Investment Company and Affiliated Purchasers.
Not applicable because the Registrant is not a closed-end management investment company.
Item 10. Submission of Matters to a Vote of Security Holders.
There have been no material changes to the procedures by which shareholders may recommend nominees to the Registrant’s board of directors.
Item 11. Controls and Procedures.
| (a) | The Registrant’s management, with the participation of its principal executive and principal financial officers, has evaluated the effectiveness of the Registrant's disclosure controls and procedures (as defined in Rule 30a-3(c) under the Investment Company Act of 1940 (the “Act”)), as of a date within 90 days prior to the filing date of this Form N-CSR, as required by Rule 30a-3(b) under the Act and Rules 13a-15(b) or 15d-15(b) under the Securities Exchange Act of 1934. Based on such evaluation, the Registrant's principal executive and principal financial officers have concluded that the design and operation of the Registrant's disclosure controls and procedures are effective in providing reasonable assurance that the information required to be disclosed on Form N-CSR is recorded, processed, summarized and reported within the applicable time periods. |
| (b) | There were no changes in the Registrant's internal control over financial reporting (as defined in Rule 30a-3(d) under the Act) that occurred during the second fiscal quarter of the period covered by this report that have materially affected, or are reasonably likely to materially affect, the Registrant's internal control over financial reporting. |
Item 12. Exhibits.
| (a) | (1) Code of ethics. |
Filed herewith.
(2) Certifications pursuant to Section 302 of the Sarbanes-Oxley Act of 2002. Filed herewith.
(3) Any written solicitation to purchase securities under Rule 23c‑1 under the Act sent or given during the period covered by the report by or on behalf of the Registrant to 10 or more persons. Not applicable because the Registrant is not a closed-end management investment company.
(b) Certification pursuant to Section 906 of the Sarbanes‑Oxley Act of 2002. Furnished herewith.
SIGNATURES
Pursuant to the requirements of the Securities Exchange Act of 1934 and the Investment Company Act of 1940, the Registrant has duly caused this report to be signed on its behalf by the undersigned, thereunto duly authorized.
BAIRD FUNDS, INC.
By: /s/Mary Ellen Stanek
Mary Ellen Stanek, President
Date: September 5, 2017
Pursuant to the requirements of the Securities Exchange Act of 1934 and the Investment Company Act of 1940, this report has been signed below by the following persons on behalf of the Registrant and in the capacities and on the dates indicated.
By: /s/Mary Ellen Stanek
Mary Ellen Stanek, President
Date: September 5, 2017
By: /s/Terrance Maxwell
Terrance Maxwell, Treasurer
Date: September 5, 2017