UNITED STATES
SECURITIES AND EXCHANGE COMMISSION
Washington, D.C. 20549
SECURITIES AND EXCHANGE COMMISSION
Washington, D.C. 20549
FORM N-CSR
CERTIFIED SHAREHOLDER REPORT OF REGISTERED
MANAGEMENT INVESTMENT COMPANIES
Investment Company Act file number: 811-09997
Baird Funds, Inc.
(Exact name of Registrant as specified in charter)
(Exact name of Registrant as specified in charter)
777 East Wisconsin Avenue
Milwaukee, WI 53202
(Address of principal executive offices) (Zip code)
(Address of principal executive offices) (Zip code)
Andrew D. Ketter
Robert W. Baird & Co. Incorporated
777 East Wisconsin Avenue
Milwaukee, WI 53202
(Name and address of agent for service)
(Name and address of agent for service)
1-866-442-2473
Registrant's telephone number, including area code
Date of fiscal year end: December 31, 2016
Date of reporting period: June 30, 2016
Item 1. Reports to Stockholders.
Semi-Annual Report –
Baird Funds
June 30, 2016
Taxable Bond Funds
Baird Ultra Short Bond Fund
Baird Short-Term Bond Fund
Baird Intermediate Bond Fund
Baird Aggregate Bond Fund
Baird Core Plus Bond Fund
Municipal Bond Funds
Baird Short-Term Municipal Bond Fund
Baird Quality Intermediate Municipal Bond Fund
Baird Core Intermediate Municipal Bond Fund
Go Green.  Go Paperless.
Go Paperless.Sign up to receive your Baird Funds’ prospectuses and reports online.
Table of Contents
| Baird Ultra Short Bond Fund | 1 |
| Baird Short-Term Bond Fund | 9 |
| Baird Intermediate Bond Fund | 17 |
| Baird Aggregate Bond Fund | 26 |
| Baird Core Plus Bond Fund | 34 |
| Baird Short-Term Municipal Bond Fund | 42 |
| Baird Quality Intermediate Municipal Bond Fund | 53 |
| Baird Core Intermediate Municipal Bond Fund | 63 |
| Additional Information on Fund Expenses | 74 |
| Statements of Assets and Liabilities | 76 |
| Statements of Operations | 79 |
| Statements of Changes in Net Assets | 82 |
| Financial Highlights | 90 |
| Notes to the Financial Statements | 106 |
| Additional Information | 121 |
This report has been prepared for shareholders and may be distributed to others only if preceded or accompanied by a current prospectus.
Cautionary Note on Analyses, Opinions and Outlooks: In this report we offer analyses and opinions on the performance of individual securities, companies, industries, sectors, markets, interest rates and governmental policies, including predictions, forecasts and outlooks regarding possible future events. These can generally be identified as such because the context of the statements may include such words as “believe,” “should,” “will,” “expects,” “anticipates,” “hopes” and words of similar effect. These statements reflect the portfolio managers’ good faith beliefs and judgments and involve risks and uncertainties, including the risk that the portfolio managers’ analyses, opinions and outlooks are or will prove to be inaccurate. It is inherently difficult to correctly assess and explain the performance of particular securities, sectors, markets, interest rate movements, governmental actions or general economic trends and conditions, and many unforeseen factors contribute to the performance of Baird Funds. Investors are, therefore, cautioned not to place undue reliance on subjective judgments contained in this report.
Baird Ultra Short Bond Fund
June 30, 2016 (Unaudited)
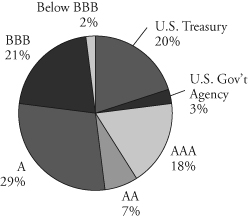
Portfolio Characteristics
| Quality Distribution(1)(2) | ||||||
 | Net Assets | $228,169,375 | ||||
| SEC 30-Day | ||||||
Yield(3) | ||||||
| Institutional Class | ||||||
| (Subsidized) | 1.11% | |||||
| Institutional Class | ||||||
| (Unsubsidized) | 0.96% | |||||
| Investor Class | ||||||
| (Subsidized) | 0.87% | |||||
| Investor Class | ||||||
| (Unsubsidized) | 0.72% | |||||
| Average | ||||||
| Effective | ||||||
| Duration | 0.52 years | |||||
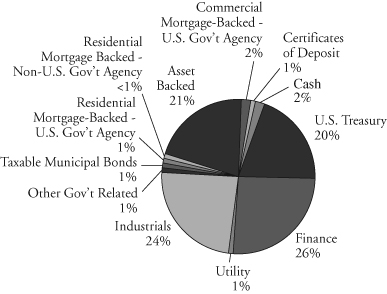
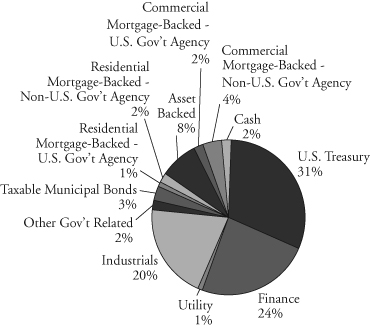
Sector Weightings(1) | Average | |||||
| Effective | ||||||
 | Maturity | 0.52 years | ||||
| Annualized | ||||||
Expense Ratio(4) | ||||||
Gross | ||||||
| Institutional Class | 0.30% | |||||
| Investor Class | 0.55% | (5) | ||||
Net | ||||||
| Institutional Class | 0.15% | |||||
| Investor Class | 0.40% | (5) | ||||
| Portfolio | ||||||
| Turnover Rate | 63.5% | (6) | ||||
| Number of | ||||||
| Holdings | 208 | |||||
(1) | Percentages shown are based on the Fund’s total investments. |
(2) | The quality profile is calculated on a market value-weighted basis using the highest credit quality rating for each security held by the Fund given by S&P, Moody’s or Fitch, each of which is a Nationally Recognized Statistical Rating Organization (NRSRO). NRSROs rate the credit quality of securities using a scale that generally ranges from AAA (highest) to D (lowest). |
(3) | SEC yields are based on SEC guidelines and are calculated for the 30 days ended June 30, 2016. |
(4) | Reflects expense ratios as stated in the Fund’s current prospectus. The Advisor has contractually agreed to waive management fees in an amount equal to an annual rate of 0.15% of average daily net assets for the Fund, at least through April 30, 2017. The agreement may only be terminated prior to the end of this term by or with the consent of the Board of Directors of Baird Funds, Inc. |
(5) | Includes 0.25% 12b-1 fee. |
(6) | Not annualized. |
Page 1
Baird Ultra Short Bond Fund
June 30, 2016 (Unaudited)
Total Returns
| Average | |||
| Annual | |||
| Six | One | Since | |
| For the Periods Ended June 30, 2016 | Months | Year | Inception(1) |
| Institutional Class Shares | 0.92% | 0.77% | 0.97% |
| Investor Class Shares | 0.80% | 0.53% | 0.73% |
Barclays U.S. Short-Term Government/Corporate Index(2) | 0.50% | 0.59% | 0.38% |
| (1) | For the period from December 31, 2013 (inception date) through June 30, 2016. |
| (2) | The Barclays U.S. Short-Term Government/Corporate Index is an unmanaged, market value weighted index of investment grade, fixed debt including government and corporate securities with maturities less than one year. This index does not reflect any deduction for fees, expenses or taxes. A direct investment in an index is not possible. |
The returns shown in the table above reflect reinvestment of dividends and/or capital gains distributions in additional shares. The returns do not reflect the deduction of taxes that a shareholder would pay on Fund distributions or the redemption of Fund shares. The returns reflect the actual performance for each period and do not include the impact of trades executed on the last business day of the period that were recorded on the first business day of the next period.
The Fund’s gross expense ratio for each Class, as reflected in the Fund’s current prospectus, is set forth under “Portfolio Characteristics”.
The Fund may invest up to 10% of its net assets in non-investment grade debt securities (commonly referred to as “high yield” bonds). While these types of securities typically offer higher yields than investment grade securities, they also include greater risks including increased credit risk and the increased risk of default or bankruptcy. The Fund may also invest in U.S. dollar denominated foreign securities which involve additional risks such as political and economic instability, and different and sometimes less strict financial reporting standards and regulation. The Fund may also invest in mortgage- and asset-backed securities, which include interest rate and prepayment risks more pronounced than those of other fixed income securities.
Past performance does not guarantee future results. Investment return and principal value will fluctuate so that an investor’s shares, when redeemed, may be worth more or less than their original cost.
For information about the performance of the Fund as of the most recent month-end, please call 1-866-44BAIRD or visit www.bairdfunds.com. Mutual fund performance changes over time and current performance may be lower or higher than that stated.
Page 2
Baird Ultra Short Bond Fund
Summary Schedule of Investments, June 30, 2016 (Unaudited)
This schedule summarizes the Fund’s holdings by asset type. Details are reported for each of the Fund’s 50 largest individual holdings and for investments that, in total for any issuer, represent more than 1% of the Fund’s net assets. The total value of smaller holdings is reported as a single amount within each category.
The Fund reports a complete list of its holdings in regulatory filings four times in each fiscal year, at the quarter end. For the second and fourth fiscal quarters, the complete listing of the Fund’s holdings is available electronically in the Fund’s Form N-CSR at http://www.bairdfunds.com/prospectuses-reports and on the Securities and Exchange Commission’s website (www.sec.gov) or you can have it mailed to you without charge by calling 1-866-44BAIRD. For the first and third fiscal quarters, the Fund files the lists with the SEC on Form N-Q. Shareholders can look up the Fund’s Forms N-CSR and N-Q on the SEC’s website (www.sec.gov).
Long-Term Investments
| Principal | % of | |||||||||||
| Amount | Value | Net Assets | ||||||||||
| U.S. Treasury Securities | ||||||||||||
| U.S. Treasury Bonds, | ||||||||||||
| 0.625%, 05/31/2017 | $ | 11,000,000 | $ | 11,009,878 | 4.8 | % | ||||||
| 2.375%, 07/31/2017 | 34,200,000 | 34,875,997 | 15.3 | % | ||||||||
| Total U.S. Treasury Securities | ||||||||||||
| (Cost $45,794,915) | 45,885,875 | 20.1 | % | |||||||||
| Corporate Bonds | ||||||||||||
| Finance | ||||||||||||
| Aetna, Inc., | ||||||||||||
1.307%, 12/08/2017∞ | 2,000,000 | 2,002,910 | 0.9 | % | ||||||||
| American Express Bank FSB, | ||||||||||||
| 6.000%, 09/13/2017 | 2,000,000 | 2,107,006 | 0.9 | % | ||||||||
| American International Group, Inc., | ||||||||||||
| 5.600%, 10/18/2016 | 1,500,000 | 1,518,540 | 0.7 | % | ||||||||
| Bank of America NA, | ||||||||||||
| 5.300%, 03/15/2017 | 2,000,000 | 2,053,934 | 0.9 | % | ||||||||
| Barclays Bank PLC, | ||||||||||||
Class 1, 5.000%, 09/22/2016 f | 1,200,000 | 1,210,170 | 0.5 | % | ||||||||
| Citigroup, Inc., | ||||||||||||
1.198%, 03/10/2017∞ | 1,500,000 | 1,500,910 | 0.7 | % | ||||||||
| Comerica Bank, | ||||||||||||
| 5.750%, 11/21/2016 | 1,500,000 | 1,524,114 | 0.7 | % | ||||||||
| Liberty Mutual Group, Inc., | ||||||||||||
| 6.700%, 08/15/2016 | ||||||||||||
| (Acquired 02/02/2016, Cost $2,013,141)* | 2,000,000 | 2,012,450 | 0.9 | % | ||||||||
| Lloyds Bank PLC, | ||||||||||||
1.176%, 05/14/2018 f ∞ | 1,500,000 | 1,489,560 | 0.6 | % | ||||||||
| Mizuho Bank Ltd.: | ||||||||||||
| 1.063%, 04/16/2017 | ||||||||||||
(Acquired 04/09/2014, Cost $200,000)* f ∞ | 200,000 | 199,960 | 0.1 | % | ||||||||
| 1.090%, 09/25/2017 (Acquired 09/18/2014 | ||||||||||||
through 01/14/2015, Cost $799,360)* f ∞ | 800,000 | 796,702 | 0.3 | % | ||||||||
| 1.280%, 03/26/2018 (Acquired 03/19/2015 | ||||||||||||
through 03/14/2016, Cost $1,343,182)* f ∞ | 1,350,000 | 1,346,961 | 0.6 | % | ||||||||
The accompanying notes are an integral part of these financial statements.
Page 3
Baird Ultra Short Bond Fund
Summary Schedule of Investments, June 30, 2016 (Unaudited)
Long-Term Investments (cont.)
| Principal | % of | |||||||||||
| Amount | Value | Net Assets | ||||||||||
| Mizuho Bank Ltd.: (cont.) | ||||||||||||
| 1.824%, 10/20/2018 | ||||||||||||
(Acquired 10/13/2015, Cost $500,000)* f ∞ | $ | 500,000 | $ | 503,242 | 0.2 | % | ||||||
| Santander Bank NA, | ||||||||||||
1.561%, 01/12/2018∞ | 1,400,000 | 1,392,287 | 0.6 | % | ||||||||
| Societe Generale, | ||||||||||||
1.726%, 10/01/2018 f ∞ | 1,500,000 | 1,511,820 | 0.7 | % | ||||||||
| Sumitomo Mitsui Banking Corp., | ||||||||||||
1.213%, 01/16/2018 f ∞ | 300,000 | 299,360 | 0.1 | % | ||||||||
1.378%, 07/23/2018 f ∞ | 1,350,000 | 1,347,710 | 0.6 | % | ||||||||
| The Goldman Sachs Group, Inc., | ||||||||||||
1.726%, 11/15/2018∞ | 1,285,000 | 1,288,135 | 0.5 | % | ||||||||
| Westpac Banking Corp., | ||||||||||||
1.092%, 05/25/2018 f ∞ | 1,500,000 | 1,495,811 | 0.7 | % | ||||||||
| Other Finance#~ | 34,617,601 | 15.2 | % | |||||||||
| Total Finance | ||||||||||||
| (Cost $60,322,077) | 60,219,183 | 26.4 | % | |||||||||
| Utility | ||||||||||||
| Other Utility#~ | 1,111,123 | 0.5 | % | |||||||||
| Total Utility | ||||||||||||
| (Cost $1,110,775) | 1,111,123 | 0.5 | % | |||||||||
| Industrials | ||||||||||||
| Actavis Funding SCS, | ||||||||||||
1.911%, 03/12/2020 f ∞ | 1,500,000 | 1,504,579 | 0.7 | % | ||||||||
| Baxalta, Inc., | ||||||||||||
1.427%, 06/22/2018∞ | 1,500,000 | 1,484,143 | 0.6 | % | ||||||||
| Boston Scientific Corp., | ||||||||||||
| 5.125%, 01/12/2017 | 1,500,000 | 1,529,298 | 0.7 | % | ||||||||
| Bunge Limited Finance Corp., | ||||||||||||
| 3.200%, 06/15/2017 | 2,000,000 | 2,031,082 | 0.9 | % | ||||||||
| Chevron Phillips Chemical Co. LLC, | ||||||||||||
| 1.387%, 05/01/2020 | ||||||||||||
(Acquired 05/07/2015, Cost $1,500,000)*∞ | 1,500,000 | 1,453,405 | 0.6 | % | ||||||||
| Dollar General Corp., | ||||||||||||
| 4.125%, 07/15/2017 | 1,500,000 | 1,542,226 | 0.7 | % | ||||||||
| Ford Motor Credit Co. LLC, | ||||||||||||
| 1.461%, 03/27/2017 | 1,200,000 | 1,202,126 | 0.5 | % | ||||||||
| General Motors Financial Co., Inc., | ||||||||||||
2.082%, 05/09/2019∞ | 2,000,000 | 2,004,964 | 0.9 | % | ||||||||
| Hyundai Capital Services, Inc., | ||||||||||||
| 4.375%, 07/27/2016 (Acquired 05/28/2015 | ||||||||||||
through 07/28/2015, Cost $1,403,059)* f | 1,400,000 | 1,402,507 | 0.6 | % | ||||||||
| 1.447%, 03/18/2017 (Acquired 01/13/2015 | ||||||||||||
through 04/04/2016, Cost $450,243)* f ∞ | 450,000 | 449,798 | 0.2 | % | ||||||||
The accompanying notes are an integral part of these financial statements.
Page 4
Baird Ultra Short Bond Fund
Summary Schedule of Investments, June 30, 2016 (Unaudited)
Long-Term Investments (cont.)
| Principal | % of | |||||||||||
| Amount | Value | Net Assets | ||||||||||
| Johnson Controls, Inc., | ||||||||||||
| 2.600%, 12/01/2016 | $ | 1,250,000 | $ | 1,257,970 | 0.5 | % | ||||||
| Kinder Morgan Energy Partners LP, | ||||||||||||
| 6.000%, 02/01/2017 | 1,500,000 | 1,534,855 | 0.7 | % | ||||||||
| Mylan, Inc., | ||||||||||||
| 1.350%, 11/29/2016 | 1,722,000 | 1,720,099 | 0.8 | % | ||||||||
| Pentair Finance SA, | ||||||||||||
1.875%, 09/15/2017 f | 2,000,000 | 1,996,366 | 0.9 | % | ||||||||
| Qualcomm, Inc., | ||||||||||||
1.186%, 05/20/2020∞ | 1,500,000 | 1,462,590 | 0.6 | % | ||||||||
| The Kroger Co., | ||||||||||||
1.163%, 10/17/2016∞ | 2,110,000 | 2,111,471 | 0.9 | % | ||||||||
| Thermo Fisher Scientific, Inc., | ||||||||||||
| 1.300%, 02/01/2017 | 2,000,000 | 2,001,488 | 0.9 | % | ||||||||
| Verizon Communications, Inc., | ||||||||||||
2.406%, 09/14/2018∞ | 1,563,000 | 1,601,997 | 0.7 | % | ||||||||
| Wm Wrigley Jr Co., | ||||||||||||
| 1.400%, 10/21/2016 | ||||||||||||
| (Acquired 02/01/2016, Cost $1,200,358)* | 1,200,000 | 1,201,824 | 0.5 | % | ||||||||
| Xerox Corp., | ||||||||||||
| 6.750%, 02/01/2017 | 1,600,000 | 1,642,938 | 0.7 | % | ||||||||
| Other Industrials#~ | 24,600,418 | 10.8 | % | |||||||||
| Total Industrials | ||||||||||||
| (Cost $55,941,878) | 55,736,144 | 24.4 | % | |||||||||
| Total Corporate Bonds | ||||||||||||
| (Cost $117,374,730) | 117,066,450 | 51.3 | % | |||||||||
| Other Government Related Securities | ||||||||||||
| Other Government Related Securities#~ | 1,604,031 | 0.7 | % | |||||||||
| Total Other Government Related Securities | ||||||||||||
| (Cost $1,603,133) | 1,604,031 | 0.7 | % | |||||||||
| Taxable Municipal Bonds | ||||||||||||
| Other Taxable Municipal Bonds# | 1,751,730 | 0.8 | % | |||||||||
| Total Taxable Municipal Bonds | ||||||||||||
| (Cost $1,749,397) | 1,751,730 | 0.8 | % | |||||||||
| Residential Mortgage-Backed Securities | ||||||||||||
| U.S. Government Agency Issues | ||||||||||||
| Other U.S. Government Agency Issues# | 2,436,230 | 1.1 | % | |||||||||
| Total U.S. Government Agency Issues | ||||||||||||
| (Cost $2,430,611) | 2,436,230 | 1.1 | % | |||||||||
| Non-U.S. Government Agency Issues | ||||||||||||
| Other Non-U.S. Government Agency Issues# | 113,958 | 0.0 | % | |||||||||
| Total Non-U.S. Government Agency Issues | ||||||||||||
| (Cost $113,904) | 113,958 | 0.0 | % | |||||||||
The accompanying notes are an integral part of these financial statements.
Page 5
Baird Ultra Short Bond Fund
Summary Schedule of Investments, June 30, 2016 (Unaudited)
Long-Term Investments (cont.)
| Principal | % of | |||||||||||
| Amount | Value | Net Assets | ||||||||||
| Asset Backed Securities | ||||||||||||
| Ally Auto Receivables Trust, | ||||||||||||
| Series 2014-2, Class A3, 1.250%, 04/15/2019 | $ | 2,420,942 | $ | 2,426,201 | 1.1 | % | ||||||
| Capital One Multi-Asset Execution Trust, | ||||||||||||
| Series 2014-A2, Class A2, 1.260%, 01/15/2020 | 2,000,000 | 2,006,355 | 0.9 | % | ||||||||
| Chase Issuance Trust, | ||||||||||||
| Series 2014-A1, Class A1, 1.150%, 01/15/2019 | 1,960,000 | 1,963,925 | 0.8 | % | ||||||||
| Citibank Credit Card Issuance Trust: | ||||||||||||
| Series 2014-A2, Class A2, 1.020%, 02/22/2019 | 835,000 | 835,870 | 0.4 | % | ||||||||
| Series 2014-A4, Class A4, 1.230%, 04/24/2019 | 2,000,000 | 2,005,877 | 0.9 | % | ||||||||
Series 2008-A2, Class A2, 1.601%, 01/23/2020∞ | 1,000,000 | 1,013,785 | 0.4 | % | ||||||||
| Dell Equipment Finance Trust, | ||||||||||||
| Series 2015-1, Class A2, 1.010%, 07/24/2017 | ||||||||||||
| (Acquired 04/15/2015 through 05/11/2016, | ||||||||||||
| Cost $1,304,948)* | 1,305,044 | 1,304,570 | 0.6 | % | ||||||||
| First National Master Note Trust, | ||||||||||||
Series 2013-2, Class A, 0.972%, 10/15/2019∞ | 1,500,000 | 1,500,227 | 0.6 | % | ||||||||
| Ford Credit Auto Lease Trust, | ||||||||||||
| Series 2014-B, Class A4, 1.100%, 11/15/2017 | 1,205,000 | 1,204,956 | 0.5 | % | ||||||||
| Golden Credit Card Trust, | ||||||||||||
| Series 2013-2A, Class A, 0.872%, 09/15/2018 | ||||||||||||
(Acquired 03/29/2016, Cost $2,000,000)* f ∞ | 2,000,000 | 2,000,193 | 0.9 | % | ||||||||
| Harley-Davidson Motorcycle Trust, | ||||||||||||
| Series 2014-1, Class A3, 1.100%, 09/15/2019 | 1,430,152 | 1,430,750 | 0.6 | % | ||||||||
| Honda Auto Receivables Owner Trust: | ||||||||||||
| Series 2016-1, Class A2, 1.010%, 06/18/2018 | 2,000,000 | 2,001,288 | 0.9 | % | ||||||||
| Series 2013-3, Class A4, 1.130%, 09/16/2019 | 2,503,000 | 2,504,603 | 1.1 | % | ||||||||
| Toyota Auto Receivables Owner Trust, | ||||||||||||
| Series 2016-B, Class A2A, 1.020%, 10/15/2018 | 2,000,000 | 2,002,803 | 0.9 | % | ||||||||
| Other Asset Backed Securities#~ | 23,218,625 | 10.2 | % | |||||||||
| Total Asset Backed Securities | ||||||||||||
| (Cost $47,359,174) | 47,420,028 | 20.8 | % | |||||||||
| Commercial Mortgage-Backed Securities | ||||||||||||
| U.S. Government Agency Issues | ||||||||||||
| Fannie Mae REMIC Trust, | ||||||||||||
| Series 2015-M1, Class ASQ2, 1.626%, 02/25/2018 | 1,625,921 | 1,639,001 | 0.7 | % | ||||||||
| FHLMC Multifamily Structured Pass Through Certificates: | ||||||||||||
| Series K502, Class A2, 1.426%, 08/25/2017 | 1,061,252 | 1,064,595 | 0.5 | % | ||||||||
Series K701, Class A2, 3.882%, 11/25/2017∞ | 2,045,000 | 2,107,450 | 0.9 | % | ||||||||
| Total U.S. Government Agency Issues | ||||||||||||
| (Cost $4,796,724) | 4,811,046 | 2.1 | % | |||||||||
| Total Long-Term Investments | ||||||||||||
| (Cost $221,222,588) | 221,089,348 | 96.9 | % | |||||||||
The accompanying notes are an integral part of these financial statements.
Page 6
Baird Ultra Short Bond Fund
Summary Schedule of Investments, June 30, 2016 (Unaudited)
Short-Term Investments
| Principal | % of | |||||||||||
| Amount | Value | Net Assets | ||||||||||
| Certificate of Deposit | ||||||||||||
| ACTS Retirement-Life Communities, Inc. | $ | 1,030,000 | $ | 1,030,000 | 0.4 | % | ||||||
| Total Certificate of Deposit | ||||||||||||
| (Cost $1,030,000) | 1,030,000 | 0.4 | % | |||||||||
| Shares | ||||||||||||
| Money Market Mutual Fund | ||||||||||||
| Dreyfus Institutional Cash Advantage Fund, | ||||||||||||
| Institutional Class, 0.39%« | 5,907,556 | 5,907,556 | 2.6 | % | ||||||||
| Total Money Market Mutual Fund | ||||||||||||
| (Cost $5,907,556) | 5,907,556 | 2.6 | % | |||||||||
| Total Short-Term Investments | ||||||||||||
| (Cost $6,937,556) | 6,937,556 | 3.0 | % | |||||||||
| Total Investments | ||||||||||||
| (Cost $228,160,144) | 228,026,904 | 99.9 | % | |||||||||
| Other Assets in Excess of Liabilities | 142,471 | 0.1 | % | |||||||||
| TOTAL NET ASSETS | $ | 228,169,375 | 100.0 | % | ||||||||
Notes to Summary Schedule of Investments
| * | Restricted security as defined in Rule 144 under the Securities Act of 1933 and determined to be liquid. Purchased in a private placement transaction; resale to the public may require registration or may extend only to qualified institutional buyers. At June 30, 2016, the value of these securities total $12,221,814 which represents 5.36% of total net assets. | |
| f | Foreign Security | |
| ∞ | Variable or Floating rate security. Floating rate securities are securities whose yields vary with a designated index rate. These securities rates are as of June 30, 2016. | |
| # | Represents the aggregate value, by category, of securities that are not among the 50 largest holdings and, in total for any issuer, represent 1% or less of net assets. | |
| ~ | Groupings contain, in aggregate, restricted securities totaling $23,355,583 representing 10.23% of net assets. | |
| « | 7-Day Yield |
Summary of Fair Value Exposure at June 30, 2016 (Unaudited)
The Fund has adopted authoritative fair valuation accounting standards which establish a definition of fair value and set out a hierarchy for measuring fair value. These standards require additional disclosures about the various inputs and valuation techniques used to develop the measurements of fair value and a discussion on changes in valuation techniques and related inputs during the period. These standards define fair value as the price that would be received to sell an asset or paid to transfer a liability in an orderly transaction between market participants at the measurement date.
The fair value hierarchy is organized into three levels based upon the assumptions (referred to as “inputs”) used in pricing the asset or liability. These standards state that “observable inputs” reflect the assumptions market participants would use in pricing the asset or liability based on market data obtained from independent sources and “unobservable inputs” reflect an entity’s own assumptions about the assumptions market participants would use in pricing the asset or liability. These inputs are summarized into three broad levels and described below:
The accompanying notes are an integral part of these financial statements.
Page 7
Baird Ultra Short Bond Fund
Summary Schedule of Investments, June 30, 2016 (Unaudited)
Summary of Fair Value Exposure at June 30, 2016 (Unaudited) (cont.)
Level 1 – | Unadjusted quoted prices in active markets for identical unrestricted securities. |
Level 2 – | Other significant observable inputs (including quoted prices for similar securities, quoted prices in inactive markets, dealer indications, interest rates, yield curves, prepayment speeds, credit risk, default rates, inputs corroborated by observable market data, etc.). |
Level 3 – | Significant unobservable inputs (including the Fund’s own assumptions about the factors that market participants would use in valuing the security) based on the best information available. |
The inputs or methodology used for valuing securities are not necessarily an indication of the risk associated with investing in those securities.
The following is a summary of the inputs used to value the Fund’s investments as of June 30, 2016.
| Level 1 | Level 2 | Level 3 | Total | |||||||||||||
| Long-Term Investments | ||||||||||||||||
| U.S. Treasury Securities | $ | — | $ | 45,885,875 | $ | — | $ | 45,885,875 | ||||||||
| Corporate Bonds | — | 117,066,450 | — | 117,066,450 | ||||||||||||
| Other Government Related Securities | — | 1,604,031 | — | 1,604,031 | ||||||||||||
| Taxable Municipal Bonds | — | 1,751,730 | — | 1,751,730 | ||||||||||||
| Residential Mortgage-Backed Securities – | ||||||||||||||||
| U.S. Government Agency Issues | — | 2,436,230 | — | 2,436,230 | ||||||||||||
| Residential Mortgage-Backed Securities – | ||||||||||||||||
| Non-U.S. Government Agency Issues | — | 113,958 | — | 113,958 | ||||||||||||
| Asset Backed Securities | — | 47,420,028 | — | 47,420,028 | ||||||||||||
| Commercial Mortgage-Backed Securities – | ||||||||||||||||
| U.S. Government Agency Issues | — | 4,811,046 | — | 4,811,046 | ||||||||||||
| Total Long-Term Investments | — | 221,089,348 | — | 221,089,348 | ||||||||||||
| Short-Term Investments | ||||||||||||||||
| Certificate of Deposit | — | 1,030,000 | — | 1,030,000 | ||||||||||||
| Money Market Mutual Fund | 5,907,556 | — | — | 5,907,556 | ||||||||||||
| Total Short-Term Investments | 5,907,556 | 1,030,000 | — | 6,937,556 | ||||||||||||
| Total Investments | $ | 5,907,556 | $ | 222,119,348 | $ | — | $ | 228,026,904 | ||||||||
Changes in valuation techniques may result in transfers into or out of assigned levels within the fair value hierarchy. There were no transfers between Level 1, Level 2 and Level 3 fair value measurements during the reporting period. See the Fund’s valuation policy in Note 2a to the financial statements.
The accompanying notes are an integral part of these financial statements.
Page 8
Baird Short-Term Bond Fund
June 30, 2016 (Unaudited)
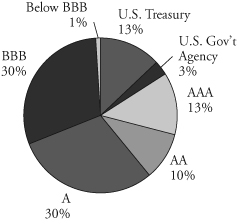
Portfolio Characteristics
Quality Distribution(1)(2) | |||||
 | Net Assets | $3,569,851,996 | |||
| SEC 30-Day | |||||
Yield(3) | |||||
| Institutional Class | 1.41% | ||||
| Investor Class | 1.16% | ||||
| Average | |||||
| Effective | |||||
| Duration | 1.91 years | ||||
| Average | |||||
| Effective | |||||
| Maturity | 1.94 years | ||||
| Annualized | |||||
| Expense | |||||
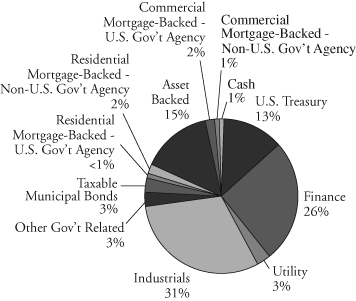
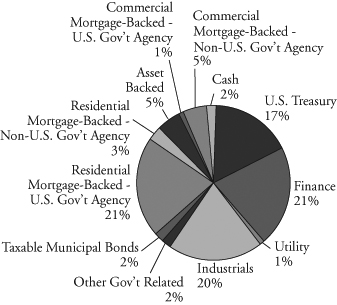
Sector Weightings(1) | Ratio | ||||
| Institutional Class | 0.30% | ||||
 | Investor Class | 0.55% | (4) | ||
| Portfolio | |||||
| Turnover Rate | 20.0% | (5) | |||
| Number of | |||||
| Holdings | 583 | ||||
(1) | Percentages shown are based on the Fund’s total investments (less investments purchased with cash proceeds from securities lending). |
(2) | The quality profile is calculated on a market value-weighted basis using the highest credit quality rating for each security held by the Fund given by S&P, Moody’s or Fitch, each of which is a Nationally Recognized Statistical Rating Organization (NRSRO). NRSROs rate the credit quality of securities using a scale that generally ranges from AAA (highest) to D (lowest). |
(3) | SEC yields are based on SEC guidelines and are calculated for the 30 days ended June 30, 2016. |
(4) | Includes 0.25% 12b-1 fee. |
(5) | Not annualized. |
Page 9
Baird Short-Term Bond Fund
June 30, 2016 (Unaudited)
Total Returns
| Average Annual | ||||||
| Since | Since | |||||
| Six | One | Five | Ten | Inception | Inception | |
| For the Periods Ended June 30, 2016 | Months | Year | Years | Years | (8/31/04) | (9/19/12) |
| Institutional Class Shares | 2.33% | 2.35% | 2.11% | 3.21% | 2.99% | N/A |
| Investor Class Shares | 2.22% | 2.11% | N/A | N/A | N/A | 1.56% |
| Barclays 1-3 Year U.S. | ||||||
Government/Credit Bond Index(1) | 1.65% | 1.59% | 1.10% | 2.80% | 2.61% | 1.04% |
| (1) | The Barclays 1-3 Year U.S. Government/Credit Bond Index is an unmanaged, market value weighted index of investment grade, fixed-rate debt issues, including government and corporate securities, with maturities between one and three years. This index does not reflect any deduction for fees, expenses or taxes. A direct investment in an index is not possible. |
The returns shown in the table above reflect reinvestment of dividends and/or capital gains distributions in additional shares. Returns do not reflect the deduction of taxes that a shareholder would pay on Fund distributions or the redemption of Fund shares. The returns reflect the actual performance for each period and do not include the impact of trades executed on the last business day of the period that were recorded on the first business day of the next period.
The Fund’s gross expense ratio for each Class, as reflected in the Fund’s current prospectus, is set forth under “Portfolio Characteristics”.
The Fund may invest in U.S. dollar denominated foreign securities which involve additional risks such as political and economic instability, and different and sometimes less strict financial reporting standards and regulation. The Fund may also invest in mortgage- and asset-backed securities, which include interest rate and prepayment risks more pronounced than those of other fixed income securities.
Past performance does not guarantee future results. Investment returns and principal value will fluctuate so that an investor’s shares, when redeemed, may be worth more or less than their original cost.
For information about the performance of the Fund as of the most recent month-end, please call 1-866-44BAIRD or visit www.bairdfunds.com. Mutual fund performance changes over time and current performance may be lower or higher than that stated.
Page 10
Baird Short-Term Bond Fund
Summary Schedule of Investments, June 30, 2016 (Unaudited)
This schedule summarizes the Fund’s holdings by asset type. Details are reported for each of the Fund’s 50 largest individual holdings and for investments that, in total for any issuer, represent more than 1% of the Fund’s net assets. The total value of smaller holdings is reported as a single amount within each category.
The Fund reports a complete list of its holdings in regulatory filings four times in each fiscal year, at the quarter end. For the second and fourth fiscal quarters, the complete listing of the Fund’s holdings is available electronically in the Fund’s Form N-CSR at http://www.bairdfunds.com/prospectuses-reports and on the Securities and Exchange Commission’s website (www.sec.gov) or you can have it mailed to you without charge by calling 1-866-44BAIRD. For the first and third fiscal quarters, the Fund files the lists with the SEC on Form N-Q. Shareholders can look up the Fund’s Forms N-CSR and N-Q on the SEC’s website (www.sec.gov).
Long-Term Investments
| Principal | % of | |||||||||||
| Amount | Value | Net Assets | ||||||||||
| U.S. Treasury Securities | ||||||||||||
| U.S. Treasury Bonds: | ||||||||||||
| 1.250%, 04/30/2019 | $ | 224,825,000 | $ | 228,364,195 | 6.4 | % | ||||||
| 2.625%, 08/15/2020 | 233,925,000 | 250,080,329 | 7.0 | % | ||||||||
| Total U.S. Treasury Securities | ||||||||||||
| (Cost $471,326,008) | 478,444,524 | 13.4 | % | |||||||||
| Corporate Bonds | ||||||||||||
| Finance | ||||||||||||
| Banque Federative du Credit Mutuel SA, | ||||||||||||
| 2.000%, 04/12/2019 | ||||||||||||
(Acquired 04/06/2016, Cost $14,983,950)* @ f | 15,000,000 | 15,138,675 | 0.4 | % | ||||||||
| BPCE, | ||||||||||||
1.480%, 02/10/2017 f ∞ | 11,944,000 | 11,985,159 | 0.3 | % | ||||||||
| Citizens Bank National Association, | ||||||||||||
| 1.600%, 12/04/2017 | 14,300,000 | 14,305,992 | 0.4 | % | ||||||||
| CNA Financial Corp., | ||||||||||||
| 7.350%, 11/15/2019 | 14,915,000 | 17,223,230 | 0.5 | % | ||||||||
| Commonwealth Bank of Australia/New York NY, | ||||||||||||
| 1.750%, 11/02/2018 f | 15,000,000 | 15,107,640 | 0.4 | % | ||||||||
| LeasePlan Corp. NV, | ||||||||||||
| 2.500%, 05/16/2018 (Acquired 05/07/2013 | ||||||||||||
through 10/20/2014, Cost $16,350,190)* f | 16,435,000 | 16,441,443 | 0.5 | % | ||||||||
| Reliance Standard Life Global Funding II, | ||||||||||||
| 2.150%, 10/15/2018 | ||||||||||||
| (Acquired 10/13/2015, Cost $13,027,683)* | 13,000,000 | 13,121,394 | 0.3 | % | ||||||||
| Synchrony Financial, | ||||||||||||
| 3.000%, 08/15/2019 | 13,350,000 | 13,572,505 | 0.4 | % | ||||||||
| Other Finance#~ | 794,373,370 | 22.3 | % | |||||||||
| Total Finance | ||||||||||||
| (Cost $905,748,030) | 911,269,408 | 25.5 | % | |||||||||
| Utility | ||||||||||||
| Other Utility#~ | 91,783,700 | 2.6 | % | |||||||||
| Total Utility | ||||||||||||
| (Cost $90,715,741) | 91,783,700 | 2.6 | % | |||||||||
The accompanying notes are an integral part of these financial statements.
Page 11
Baird Short-Term Bond Fund
Summary Schedule of Investments, June 30, 2016 (Unaudited)
Long-Term Investments (cont.)
| Principal | % of | |||||||||||
| Amount | Value | Net Assets | ||||||||||
| Industrials | ||||||||||||
| Boardwalk Pipelines LP, | ||||||||||||
| 5.500%, 02/01/2017 | $ | 17,884,000 | $ | 18,155,086 | 0.5 | % | ||||||
| CF Industries, Inc., | ||||||||||||
| 6.875%, 05/01/2018 | 11,182,000 | 12,149,086 | 0.3 | % | ||||||||
| Diamond 1 Finance Corp. / Diamond 2 Finance Corp., | ||||||||||||
| 3.480%, 06/01/2019 | ||||||||||||
| (Acquired 05/17/2016, Cost $17,495,625)*@ | 17,500,000 | 17,927,175 | 0.5 | % | ||||||||
| Dollar General Corp., | ||||||||||||
| 4.125%, 07/15/2017 | 17,321,000 | 17,808,603 | 0.5 | % | ||||||||
| Ecolab, Inc., | ||||||||||||
| 2.000%, 01/14/2019 | 14,250,000 | 14,435,906 | 0.4 | % | ||||||||
| ERAC USA Finance LLC, | ||||||||||||
| 2.350%, 10/15/2019 | ||||||||||||
| (Acquired 01/21/2015, Cost $16,632,032)* | 16,500,000 | 16,811,503 | 0.5 | % | ||||||||
| Fidelity National Information Services, Inc., | ||||||||||||
| 2.850%, 10/15/2018 | 11,640,000 | 11,945,981 | 0.3 | % | ||||||||
| Marathon Petroleum Corp., | ||||||||||||
| 2.700%, 12/14/2018 | 14,100,000 | 14,416,601 | 0.4 | % | ||||||||
| Pentair Finance SA, | ||||||||||||
2.900%, 09/15/2018 f | 13,075,000 | 13,207,450 | 0.4 | % | ||||||||
| Petrofac Ltd., | ||||||||||||
| 3.400%, 10/10/2018 (Acquired 10/03/2013 | ||||||||||||
through 09/25/2015, Cost $12,177,810)* f | 12,050,000 | 12,049,964 | 0.3 | % | ||||||||
| Potash Corp of Saskatchewan, Inc., | ||||||||||||
6.500%, 05/15/2019 f | 11,500,000 | 12,997,197 | 0.4 | % | ||||||||
| The Dow Chemical Co., | ||||||||||||
| 8.550%, 05/15/2019 | 14,777,000 | 17,540,816 | 0.5 | % | ||||||||
| Thermo Fisher Scientific, Inc., | ||||||||||||
| 1.850%, 01/15/2018 | 12,000,000 | 12,079,068 | 0.3 | % | ||||||||
| TSMC Global Ltd., | ||||||||||||
| 1.625%, 04/03/2018 (Acquired 08/05/2014 | ||||||||||||
through 11/03/2015, Cost $15,809,482)* f | 15,919,000 | 15,962,204 | 0.5 | % | ||||||||
| Vale Overseas Ltd., | ||||||||||||
6.250%, 01/23/2017@ f | 15,250,000 | 15,599,225 | 0.4 | % | ||||||||
| Valero Energy Corp., | ||||||||||||
| 9.375%, 03/15/2019 | 10,349,000 | 12,367,293 | 0.4 | % | ||||||||
| Verizon Communications, Inc., | ||||||||||||
| 3.650%, 09/14/2018 | 14,000,000 | 14,711,158 | 0.4 | % | ||||||||
| Other Industrials#~ | 866,552,872 | 24.3 | % | |||||||||
| Total Industrials | ||||||||||||
| (Cost $1,107,522,516) | 1,116,717,188 | 31.3 | % | |||||||||
| Total Corporate Bonds | ||||||||||||
| (Cost $2,103,986,287) | 2,119,770,296 | 59.4 | % | |||||||||
The accompanying notes are an integral part of these financial statements.
Page 12
Baird Short-Term Bond Fund
Summary Schedule of Investments, June 30, 2016 (Unaudited)
Long-Term Investments (cont.)
| Principal | % of | |||||||||||
| Amount | Value | Net Assets | ||||||||||
| Other Government Related Securities | ||||||||||||
| Federal Home Loan Mortgage Corp., | ||||||||||||
| Class 0003, 1.000%, 04/27/2018 | $ | 35,000,000 | $ | 35,065,835 | 1.0 | % | ||||||
| Other Government Related Securities#~ | 79,642,233 | 2.2 | % | |||||||||
| Total Other Government Related Securities | ||||||||||||
| (Cost $114,059,384) | 114,708,068 | 3.2 | % | |||||||||
| Taxable Municipal Bond | ||||||||||||
| Illinois Housing Development Authority, | ||||||||||||
| 4.000%, 02/01/2034 (Callable 08/01/2025) | 12,535,000 | 13,413,327 | 0.4 | % | ||||||||
| Other Taxable Municipal Bonds# | 94,819,631 | 2.6 | % | |||||||||
| Total Taxable Municipal Bonds | ||||||||||||
| (Cost $107,414,348) | 108,232,958 | 3.0 | % | |||||||||
| Residential Mortgage-Backed Securities | ||||||||||||
| U.S. Government Agency Issues | ||||||||||||
| Other U.S. Government Agency Issues#~ | 65,571 | 0.0 | % | |||||||||
| Total U.S. Government Agency Issues | ||||||||||||
| (Cost $64,012) | 65,571 | 0.0 | % | |||||||||
| Non-U.S. Government Agency Issue | ||||||||||||
| GSAA Trust, | ||||||||||||
Series 2005-8, Class A4, 0.723%, 06/25/2035∞ | 14,572,838 | 14,028,107 | 0.4 | % | ||||||||
| Other Non-U.S. Government Agency Issues#~ | 51,588,156 | 1.4 | % | |||||||||
| Total Non-U.S. Government Agency Issues | ||||||||||||
| (Cost $65,887,813) | 65,616,263 | 1.8 | % | |||||||||
| Asset Backed Securities | ||||||||||||
| California Republic Auto Receivables Trust, | ||||||||||||
| Series 2015-3, Class A3, 1.620%, 11/15/2019 | 17,500,000 | 17,561,526 | 0.5 | % | ||||||||
| Capital Auto Receivables Asset Trust: | ||||||||||||
| Series 2014-3, Class A2, 1.180%, 12/20/2017 | 14,442,016 | 14,446,744 | 0.4 | % | ||||||||
| Series 2015-3, Class A1A, 1.390%, 02/20/2018 | 13,790,000 | 13,803,742 | 0.4 | % | ||||||||
| Chase Issuance Trust: | ||||||||||||
| Series 2014-A1, Class A1, 1.150%, 01/15/2019 | 31,310,000 | 31,372,698 | 0.9 | % | ||||||||
| Series 2015-A5, Class A5, 1.360%, 04/15/2020 | 13,300,000 | 13,379,527 | 0.4 | % | ||||||||
Series 2016-A1, Class A, 0.852%, 05/17/2021∞ | 7,800,000 | 7,802,243 | 0.2 | % | ||||||||
| Dell Equipment Finance Trust, | ||||||||||||
| Series 2015-1, Class A2, 1.010%, 07/24/2017 | ||||||||||||
| (Acquired 04/15/2015 through 09/22/2015, | ||||||||||||
| Cost $17,426,516)* | 17,427,771 | 17,421,441 | 0.5 | % | ||||||||
| Ford Credit Auto Owner Trust: | ||||||||||||
| Series 2014-1, Class A, 2.260%, 11/15/2025 | ||||||||||||
| (Acquired 05/06/2014 through 11/18/2014, | ||||||||||||
| Cost $17,939,285)* | 17,894,000 | 18,253,879 | 0.5 | % | ||||||||
| Series 2015-1, Class A, 2.120%, 07/15/2026 | ||||||||||||
| (Acquired 01/13/2015 through 03/14/2016, | ||||||||||||
| Cost $12,566,749)* | 12,592,000 | 12,782,420 | 0.4 | % | ||||||||
The accompanying notes are an integral part of these financial statements.
Page 13
Baird Short-Term Bond Fund
Summary Schedule of Investments, June 30, 2016 (Unaudited)
Long-Term Investments (cont.)
| Principal | % of | |||||||||||
| Amount | Value | Net Assets | ||||||||||
| GM Financial Automobile Leasing Trust, | ||||||||||||
| Series 2016-2, Class A3, 1.620%, 09/20/2019 | $ | 12,675,000 | $ | 12,771,193 | 0.4 | % | ||||||
| GMF Floorplan Owner Revolving Trust, | ||||||||||||
| Series 2015-1, Class A1, 1.650%, 05/15/2020 | ||||||||||||
| (Acquired 05/13/2015, Cost $14,699,441)* | 14,700,000 | 14,719,410 | 0.4 | % | ||||||||
| Honda Auto Receivables Owner Trust, | ||||||||||||
| Series 2016-1, Class A3, 1.220%, 12/18/2019 | 13,000,000 | 13,038,000 | 0.3 | % | ||||||||
| Kubota Credit Owner Trust, | ||||||||||||
| Series 2015-1A, Class A3, 1.540%, 03/15/2019 | ||||||||||||
| (Acquired 01/22/2015, Cost $17,572,547)* | 17,575,000 | 17,663,297 | 0.5 | % | ||||||||
| OneMain Financial Issuance Trust, | ||||||||||||
| Series 2014-2A, Class A, 2.470%, 09/18/2024 | ||||||||||||
| (Acquired 02/05/2016, Cost $15,573,595)* | 15,620,000 | 15,653,919 | 0.4 | % | ||||||||
| Structured Asset Investment Loan Trust, | ||||||||||||
Series 2004-9, Class A5, 1.453%, 10/25/2034∞ | 12,036,837 | 11,955,216 | 0.3 | % | ||||||||
| Synchrony Credit Card Master Note Trust, | ||||||||||||
| Series 2014-1, Class A, 1.610%, 11/15/2020 | 18,437,000 | 18,552,829 | 0.5 | % | ||||||||
| Other Asset Backed Securities#~ | 282,208,218 | 8.0 | % | |||||||||
| Total Asset Backed Securities | ||||||||||||
| (Cost $531,762,301) | 533,386,302 | 15.0 | % | |||||||||
| Commercial Mortgage-Backed Securities | ||||||||||||
| U.S. Government Agency Issues | ||||||||||||
| Fannie Mae REMIC Trust: | ||||||||||||
| Series 2015-M1, Class ASQ2, 1.626%, 02/25/2018 | 25,535,570 | 25,740,988 | 0.7 | % | ||||||||
| Series 2016-M6, Class ASQ2, 1.785%, 06/25/2019 | 13,650,000 | 13,827,672 | 0.4 | % | ||||||||
| FHLMC Multifamily Structured | ||||||||||||
| Pass Through Certificates: | ||||||||||||
| Series K502, Class A2, 1.426%, 08/25/2017 | 16,733,050 | 16,785,770 | 0.5 | % | ||||||||
| Series K006, Class A2, 4.251%, 01/25/2020 | 15,000,000 | 16,451,305 | 0.4 | % | ||||||||
| Total U.S. Government Agency Issues | ||||||||||||
| (Cost $72,528,985) | 72,805,735 | 2.1 | % | |||||||||
| Non-U.S. Government Agency Issue | ||||||||||||
| J.P. Morgan Chase Commercial | ||||||||||||
| Mortgage Securities Trust, | ||||||||||||
| Series 2012-C8, Class ASB, 2.379%, 10/15/2045 | 16,100,000 | 16,540,353 | 0.5 | % | ||||||||
| Other Non-U.S. Government Agency Issues# | 20,354,345 | 0.6 | % | |||||||||
| Total Non-U.S. Government Agency Issues | ||||||||||||
| (Cost $36,703,172) | 36,894,698 | 1.0 | % | |||||||||
| Total Long-Term Investments | ||||||||||||
| (Cost $3,503,732,310) | 3,529,924,415 | 98.9 | % | |||||||||
The accompanying notes are an integral part of these financial statements.
Page 14
Baird Short-Term Bond Fund
Summary Schedule of Investments, June 30, 2016 (Unaudited)
Short-Term Investment
| % of | ||||||||||||
| Shares | Value | Net Assets | ||||||||||
| Money Market Mutual Fund | ||||||||||||
| Short-Term Investments Trust – Liquid Assets Portfolio, | ||||||||||||
| Institutional Class, 0.43%« | 48,142,514 | $ | 48,142,514 | 1.3 | % | |||||||
| Total Short-Term Investment | ||||||||||||
| (Cost $48,142,514) | 48,142,514 | 1.3 | % | |||||||||
| Investment Purchased with Cash | ||||||||||||
| Proceeds from Securities Lending | ||||||||||||
| Investment Company | ||||||||||||
| Mount Vernon Securities Lending | ||||||||||||
| Trust Prime Portfolio, 0.56%« | 39,767,555 | 39,767,555 | 1.1 | % | ||||||||
| Total Investment Company | ||||||||||||
| (Cost $39,767,555) | 39,767,555 | 1.1 | % | |||||||||
| Total Investment Purchased With Cash | ||||||||||||
| Proceeds From Securities Lending | ||||||||||||
| (Cost $39,767,555) | 39,767,555 | 1.1 | % | |||||||||
| Total Investments | ||||||||||||
| (Cost $3,591,642,379) | 3,617,834,484 | 101.3 | % | |||||||||
| Liabilities in Excess of Other Assets | (47,982,488 | ) | (1.3 | )% | ||||||||
| TOTAL NET ASSETS | $ | 3,569,851,996 | 100.0 | % | ||||||||
Notes to Summary Schedule of Investments
| * | Restricted security as defined in Rule 144 under the Securities Act of 1933 and determined to be liquid. Purchased in a private placement transaction; resale to the public may require registration or may extend only to qualified institutional buyers. At June 30, 2016, the value of these securities total $203,946,724, which represents 5.71% of total net assets. | |
| @ | This security or portion of this security is out on loan at June 30, 2016. | |
| f | Foreign Security | |
| ∞ | Variable or Floating rate security. Floating rate securities are securities whose rates vary with a designated index rate. These securities rates are as of June 30, 2016. | |
| # | Represents the aggregate value, by category, of securities that are not among the 50 largest holdings and, in total for any issuer, represent 1% or less of net assets. | |
| ~ | Groupings contain, in aggregate, restricted securities totaling $545,381,161 representing 15.28% of net assets. | |
| « | 7-Day Yield |
Summary of Fair Value Exposure at June 30, 2016 (Unaudited)
The Fund has adopted authoritative fair valuation accounting standards which establish a definition of fair value and set out a hierarchy for measuring fair value. These standards require additional disclosures about the various inputs and valuation techniques used to develop the measurements of fair value and a discussion on changes in valuation techniques and related inputs during the period. These standards define fair value as the price that would be received to sell an asset or paid to transfer a liability in an orderly transaction between market participants at the measurement date.
The fair value hierarchy is organized into three levels based upon the assumptions (referred to as “inputs”) used in pricing the asset or liability. These standards state that “observable inputs” reflect the assumptions market
The accompanying notes are an integral part of these financial statements.
Page 15
Baird Short-Term Bond Fund
Summary Schedule of Investments, June 30, 2016 (Unaudited)
Summary of Fair Value Exposure at June 30, 2016 (Unaudited) (cont.)
participants would use in pricing the asset or liability based on market data obtained from independent sources and “unobservable inputs” reflect an entity’s own assumptions about the assumptions market participants would use in pricing the asset or liability. These inputs are summarized into three broad levels and described below:
Level 1 – | Unadjusted quoted prices in active markets for identical unrestricted securities. |
Level 2 – | Other significant observable inputs (including quoted prices for similar securities, quoted prices in inactive markets, dealer indications, interest rates, yield curves, prepayment speeds, credit risk, default rates, inputs corroborated by observable market data, etc.). |
Level 3 – | Significant unobservable inputs (including the Fund’s own assumptions about the factors that market participants would use in valuing the security) based on the best information available. |
The inputs or methodology used for valuing securities are not necessarily an indication of the risk associated with investing in those securities.
The following is a summary of the inputs used to value the Fund’s investments as of June 30, 2016:
| Level 1 | Level 2 | Level 3 | Total | |||||||||||||
| Long-Term Investments | ||||||||||||||||
| U.S. Treasury Securities | $ | — | $ | 478,444,524 | $ | — | $ | 478,444,524 | ||||||||
| Corporate Bonds | — | 2,119,770,296 | — | 2,119,770,296 | ||||||||||||
| Other Government Related Securities | — | 114,708,068 | — | 114,708,068 | ||||||||||||
| Taxable Municipal Bonds | — | 108,232,958 | — | 108,232,958 | ||||||||||||
| Residential Mortgage-Backed Securities – | ||||||||||||||||
| U.S. Government Agency Issues | — | 65,571 | — | 65,571 | ||||||||||||
| Residential Mortgage-Backed Securities – | ||||||||||||||||
| Non-U.S. Government Agency Issues | — | 65,616,263 | — | 65,616,263 | ||||||||||||
| Asset Backed Securities | — | 533,386,302 | — | 533,386,302 | ||||||||||||
| Commercial Mortgage-Backed Securities – | ||||||||||||||||
| U.S. Government Agency Issues | — | 72,805,735 | — | 72,805,735 | ||||||||||||
| Commercial Mortgage-Backed Securities – | ||||||||||||||||
| Non-U.S. Government Agency Issues | — | 36,894,698 | — | 36,894,698 | ||||||||||||
| Total Long-Term Investments | — | 3,529,924,415 | — | 3,529,924,415 | ||||||||||||
| Short-Term Investment | ||||||||||||||||
| Money Market Mutual Fund | 48,142,514 | — | — | 48,142,514 | ||||||||||||
| Total Short-Term Investment | 48,142,514 | — | — | 48,142,514 | ||||||||||||
| Investment Purchased with Cash | ||||||||||||||||
| Proceeds from Securities Lending | ||||||||||||||||
| Investment Company | 39,767,555 | — | — | 39,767,555 | ||||||||||||
| Total Investment Purchased with Cash | ||||||||||||||||
| Proceeds from Securities Lending | 39,767,555 | — | — | 39,767,555 | ||||||||||||
| Total Investments | $ | 87,910,069 | $ | 3,529,924,415 | $ | — | $ | 3,617,834,484 | ||||||||
Changes in valuation techniques may result in transfers into or out of assigned levels within the fair value hierarchy. There were no transfers between Level 1, Level 2 and Level 3 fair value measurements during the reporting period, as compared to their classification from the prior year’s annual report. See the Fund’s valuation policy in Note 2a to the financial statements.
The accompanying notes are an integral part of these financial statements.
Page 16
Baird Intermediate Bond Fund
June 30, 2016 (Unaudited)
Portfolio Characteristics
Quality Distribution(1)(2) | |||||
 | Net Assets | $2,086,372,360 | |||
| SEC 30-Day | |||||
Yield(3) | |||||
| Institutional Class | 1.74% | ||||
| Investor Class | 1.49% | ||||
| Average | |||||
| Effective | |||||
| Duration | 4.08 years | ||||
| Average | |||||
| Effective | |||||
| Maturity | 4.44 years | ||||
| Annualized | |||||
| Expense | |||||
| Ratio | |||||
Sector Weightings(1) | Institutional Class | 0.30% | |||
| Investor Class | 0.55% | (4) | |||
 | |||||
| Portfolio | |||||
| Turnover Rate | 14.8% | (5) | |||
| Number of | |||||
| Holdings | 477 | ||||
(1) | Percentages shown are based on the Fund’s total investments (less investments purchased with cash proceeds from securities lending). |
(2) | The quality profile is calculated on a market value-weighted basis using the highest credit quality rating for each security held by the Fund given by S&P, Moody’s or Fitch, each of which is a Nationally Recognized Statistical Rating Organization (NRSRO). NRSROs rate the credit quality of securities using a scale that generally ranges from AAA (highest) to D (lowest). |
(3) | SEC yields are based on SEC guidelines and are calculated for the 30 days ended June 30, 2016. |
(4) | Includes 0.25% 12b-1 fee. |
(5) | Not annualized. |
Page 17
Baird Intermediate Bond Fund
June 30, 2016 (Unaudited)
Total Returns
| Average Annual | |||||
| Six | One | Five | Ten | Since | |
| For the Periods Ended June 30, 2016 | Months | Year | Years | Years | Inception(1) |
| Institutional Class Shares | 4.51% | 4.50% | 3.61% | 5.02% | 5.28% |
| Investor Class Shares | 4.29% | 4.24% | 3.36% | 4.74% | 5.01% |
| Barclays Intermediate | |||||
U.S. Government/Credit Bond Index(2) | 4.07% | 4.33% | 2.90% | 4.48% | 4.81% |
| (1) | For the period from September 29, 2000 (inception date) through June 30, 2016. |
| (2) | The Barclays Intermediate U.S. Government/Credit Bond Index is an unmanaged, market value weighted index of investment grade, fixed-rate debt issues, including government and corporate securities, with maturities between one and ten years. This index does not reflect any deduction for fees, expenses or taxes. A direct investment in an index is not possible. |
The returns shown in the table above reflect reinvestment of dividends and/or capital gains distributions in additional shares. The returns do not reflect the deduction of taxes that a shareholder would pay on Fund distributions or the redemption of Fund shares. The returns reflect the actual performance for each period and do not include the impact of trades executed on the last business day of the period that were recorded on the first business day of the next period.
The Fund’s gross expense ratio for each Class, as reflected in the Fund’s current prospectus, is set forth under “Portfolio Characteristics”.
The Fund may invest in U.S. dollar denominated foreign securities which involve additional risks such as political and economic instability, and different and sometimes less strict financial reporting standards and regulation. The Fund may also invest in mortgage- and asset-backed securities, which include interest rate and prepayment risks more pronounced than those of other fixed income securities.
Past performance does not guarantee future results. Investment return and principal value will fluctuate so that an investor’s shares, when redeemed, may be worth more or less than their original cost.
For information about the performance of the Fund as of the most recent month-end, please call 1-866-44BAIRD or visit www.bairdfunds.com. Mutual fund performance changes over time and current performance may be lower or higher than that stated.
Page 18
Baird Intermediate Bond Fund
Summary Schedule of Investments, June 30, 2016 (Unaudited)
This schedule summarizes the Fund’s holdings by asset type. Details are reported for each of the Fund’s 50 largest individual holdings and for investments that, in total for any issuer, represent more than 1% of the Fund’s net assets. The total value of smaller holdings is reported as a single amount within each category.
The Fund reports a complete list of its holdings in regulatory filings four times in each fiscal year, at the quarter end. For the second and fourth fiscal quarters, the complete listing of the Fund’s holdings is available electronically in the Fund’s Form N-CSR at http://www.bairdfunds.com/prospectuses-reports and on the Securities and Exchange Commission’s website (www.sec.gov) or you can have it mailed to you without charge by calling 1-866-44BAIRD. For the first and third fiscal quarters, the Fund files the lists with the SEC on Form N-Q. Shareholders can look up the Fund’s Forms N-CSR and N-Q on the SEC’s website (www.sec.gov).
Long-Term Investments
| Principal | % of | |||||||||||
| Amount | Value | Net Assets | ||||||||||
| U.S. Treasury Securities | ||||||||||||
| U.S. Treasury Bonds: | ||||||||||||
| 2.625%, 08/15/2020 | $ | 197,225,000 | $ | 210,845,753 | 10.1 | % | ||||||
| 1.750%, 03/31/2022 | 232,050,000 | 239,763,806 | 11.5 | % | ||||||||
| 2.500%, 05/15/2024 | 186,200,000 | 202,237,965 | 9.7 | % | ||||||||
| Total U.S. Treasury Securities | ||||||||||||
| (Cost $631,373,370) | 652,847,524 | 31.3 | % | |||||||||
| Corporate Bonds | ||||||||||||
| Finance | ||||||||||||
| Caisse Centrale Desjardins, | ||||||||||||
| 1.303%, 01/29/2018 | ||||||||||||
(Acquired 01/26/2015, Cost $8,000,000)* f ∞ | 8,000,000 | 7,978,600 | 0.4 | % | ||||||||
| Citizens Bank National Association, | ||||||||||||
| 2.450%, 12/04/2019 | 8,000,000 | 8,106,080 | 0.4 | % | ||||||||
| Compass Bank, | ||||||||||||
| 2.750%, 09/29/2019 | 8,000,000 | 7,900,488 | 0.4 | % | ||||||||
| Cooperatieve Rabobank UA/NY, | ||||||||||||
2.500%, 01/19/2021 (Acquired 01/11/2016, Cost) f | 8,175,000 | 8,379,506 | 0.4 | % | ||||||||
| GE Capital International Funding Co., | ||||||||||||
| 2.342%, 11/15/2020 (Acquired 02/11/2010 | ||||||||||||
through 12/24/2014, Cost $6,207,882)* f | 6,730,000 | 6,932,984 | 0.3 | % | ||||||||
| J.P. Morgan Chase & Co., | ||||||||||||
| 2.250%, 01/23/2020 | 7,875,000 | 7,983,305 | 0.4 | % | ||||||||
| Keybank National Association, | ||||||||||||
1.193%, 06/01/2018 ∞ | 8,000,000 | 7,983,896 | 0.4 | % | ||||||||
| Principal Life Global Funding II, | ||||||||||||
| 3.000%, 04/18/2026 | ||||||||||||
| (Acquired 04/11/2016, Cost $6,981,380)* | 7,000,000 | 7,139,517 | 0.3 | % | ||||||||
| Skandinaviska Enskilda Banken AB, | ||||||||||||
| 2.450%, 05/27/2020 | ||||||||||||
(Acquired 05/19/2015, Cost $8,486,910)* f | 8,500,000 | 8,683,940 | 0.4 | % | ||||||||
| Standard Chartered PLC, | ||||||||||||
| 1.273%, 04/17/2018 | ||||||||||||
(Acquired 04/13/2015, Cost $8,500,000)* f ∞ | 8,500,000 | 8,402,590 | 0.4 | % | ||||||||
The accompanying notes are an integral part of these financial statements.
Page 19
Baird Intermediate Bond Fund
Summary Schedule of Investments, June 30, 2016 (Unaudited)
Long-Term Investments (cont.)
| Principal | % of | |||||||||||
| Amount | Value | Net Assets | ||||||||||
| WEA Finance LLC / Westfield UK | ||||||||||||
| & Europe Finance PLC, | ||||||||||||
| 3.250%, 10/05/2020 | ||||||||||||
| (Acquired 09/28/2015, Cost $7,474,275)* | $ | 7,500,000 | $ | 7,805,213 | 0.4 | % | ||||||
| Wells Fargo & Co., | ||||||||||||
| Class N, 2.150%, 01/30/2020 | 7,000,000 | 7,118,748 | 0.3 | % | ||||||||
| Other Finance#~ | 406,243,527 | 19.5 | % | |||||||||
| Total Finance | ||||||||||||
| (Cost $489,616,026) | 500,658,394 | 24.0 | % | |||||||||
| Utility | ||||||||||||
| Other Utility#~ | 23,646,421 | 1.1 | % | |||||||||
| Total Utility | ||||||||||||
| (Cost $22,780,081) | 23,646,421 | 1.1 | % | |||||||||
| Industrials | ||||||||||||
| Anheuser-Busch InBev Finance, Inc., | ||||||||||||
| 3.300%, 02/01/2023 | 9,300,000 | 9,799,131 | 0.5 | % | ||||||||
| AT&T, Inc., | ||||||||||||
| 3.600%, 02/17/2023 @ | 9,000,000 | 9,388,611 | 0.5 | % | ||||||||
| Charter Communications Operating LLC / | ||||||||||||
| Charter Communications Operating Capital, | ||||||||||||
| 4.464%, 07/23/2022 | ||||||||||||
| (Acquired 07/09/2015, Cost $7,150,000)* | 7,150,000 | 7,684,362 | 0.4 | % | ||||||||
| Diamond 1 Finance Corp. / Diamond 2 Finance Corp., | ||||||||||||
| 3.480%, 06/01/2019 | ||||||||||||
| (Acquired 05/17/2016, Cost $6,906,340)* | 6,900,000 | 7,068,429 | 0.3 | % | ||||||||
| Georgia-Pacific LLC, | ||||||||||||
| 5.400%, 11/01/2020 | ||||||||||||
| (Acquired 06/09/2016, Cost $7,641,599)* | 6,797,000 | 7,698,371 | 0.4 | % | ||||||||
| Sysco Corp., | ||||||||||||
| 2.600%, 10/01/2020 | 7,600,000 | 7,847,456 | 0.4 | % | ||||||||
| The Mosaic Co., | ||||||||||||
| 4.250%, 11/15/2023 | 8,606,000 | 9,269,153 | 0.5 | % | ||||||||
| Valero Energy Corp., | ||||||||||||
| 9.375%, 03/15/2019 | 5,898,000 | 7,048,246 | 0.3 | % | ||||||||
| Verizon Communications, Inc., | ||||||||||||
| 5.150%, 09/15/2023 | 6,100,000 | 7,104,219 | 0.3 | % | ||||||||
| Waste Management, Inc., | ||||||||||||
| 2.400%, 05/15/2023 | 7,000,000 | 7,100,989 | 0.3 | % | ||||||||
| Other Industrials#~ | 348,441,911 | 16.7 | % | |||||||||
| Total Industrials | ||||||||||||
| (Cost $417,380,158) | 428,450,878 | 20.6 | % | |||||||||
| Total Corporate Bonds | ||||||||||||
| (Cost $929,776,265) | 952,755,693 | 45.7 | % | |||||||||
The accompanying notes are an integral part of these financial statements.
Page 20
Baird Intermediate Bond Fund
Summary Schedule of Investments, June 30, 2016 (Unaudited)
Long-Term Investments (cont.)
| Principal | % of | |||||||||||
| Amount | Value | Net Assets | ||||||||||
| Other Government Related Securities | ||||||||||||
| Electricite de France SA, | ||||||||||||
| 2.350%, 10/13/2020 | ||||||||||||
(Acquired 10/07/2015, Cost $8,800,006)*@ f | $ | 8,875,000 | $ | 9,069,123 | 0.4 | % | ||||||
| Other Government Related Securities#~ | 41,772,899 | 2.0 | % | |||||||||
| Total Other Government Related Securities | ||||||||||||
| (Cost $49,002,526) | 50,842,022 | 2.4 | % | |||||||||
| Taxable Municipal Bonds | ||||||||||||
| City of Bristol VA, | ||||||||||||
| 3.668%, 10/01/2022 (Callable 10/01/2020) | 7,500,000 | 7,802,400 | 0.4 | % | ||||||||
| North Carolina Housing Finance Agency, | ||||||||||||
| 3.000%, 01/01/2033 (Callable 01/01/2025) | 6,995,000 | 7,125,876 | 0.4 | % | ||||||||
| Other Taxable Municipal Bonds# | 44,515,295 | 2.0 | % | |||||||||
| Total Taxable Municipal Bonds | ||||||||||||
| (Cost $59,032,153) | 59,443,571 | 2.8 | % | |||||||||
| Residential Mortgage-Backed Securities | ||||||||||||
| U.S. Government Agency Issues | ||||||||||||
| Federal Home Loan Mortgage Corp. (FHLMC), | ||||||||||||
| 1.375%, 05/01/2020 @ | 10,000,000 | 10,150,760 | 0.5 | % | ||||||||
| Other U.S. Government Agency Issues# | 4,466,663 | 0.2 | % | |||||||||
| Total U.S. Government Agency Issues | ||||||||||||
| (Cost $14,000,238) | 14,617,423 | 0.7 | % | |||||||||
| Non-U.S. Government Agency Issues | ||||||||||||
| MortgageIT Trust, | ||||||||||||
Series 2005-3, Class A1, 0.753%, 08/25/2035∞ | 8,881,504 | 8,192,742 | 0.4 | % | ||||||||
| Thornburg Mortgage Securities Trust, | ||||||||||||
Series 2003-5, Class 3A, 2.418%, 10/25/2043∞ | 6,881,309 | 6,893,921 | 0.3 | % | ||||||||
| Wells Fargo Mortgage Backed Securities, | ||||||||||||
Series 2005-AR10, Class 2A17, 2.880%, 06/25/2035∞ | 7,083,847 | 7,161,096 | 0.4 | % | ||||||||
| Other Non-U.S. Government Agency Issues# | 23,515,481 | 1.1 | % | |||||||||
| Total Non-U.S. Government Agency Issues | ||||||||||||
| (Cost $46,034,837) | 45,763,240 | 2.2 | % | |||||||||
| Asset Backed Securities | ||||||||||||
| Capital Auto Receivables Asset Trust, | ||||||||||||
| Series 2015-2, Class A2, 1.390%, 09/20/2018 | 10,125,000 | 10,139,259 | 0.5 | % | ||||||||
| Dell Equipment Finance Trust, | ||||||||||||
| Series 2015-1, Class A2, 1.010%, 07/24/2017 | ||||||||||||
| (Acquired 04/15/2015, Cost $9,787,475)* | 9,787,828 | 9,784,273 | 0.5 | % | ||||||||
The accompanying notes are an integral part of these financial statements.
Page 21
Baird Intermediate Bond Fund
Summary Schedule of Investments, June 30, 2016 (Unaudited)
Long-Term Investments (cont.)
| Principal | % of | |||||||||||
| Amount | Value | Net Assets | ||||||||||
| Ford Credit Auto Owner Trust: | ||||||||||||
| Series 2014-1, Class A, 2.260%, 11/15/2025 | ||||||||||||
| (Acquired 10/07/2014 through 10/09/2014, | ||||||||||||
| Cost $10,897,836)* | $ | 10,859,000 | $ | 11,077,393 | 0.5 | % | ||||||
| Series 2014-2, Class A, 2.310%, 04/15/2026 | ||||||||||||
| (Acquired 10/07/2014, Cost $11,745,689)* | 11,750,000 | 12,002,875 | 0.6 | % | ||||||||
| Kubota Credit Owner Trust, | ||||||||||||
| Series 2015-1A, Class A3, 1.540%, 03/15/2019 | ||||||||||||
| (Acquired 01/22/2015, Cost $10,048,597)* | 10,050,000 | 10,100,491 | 0.5 | % | ||||||||
| Specialty Underwriting & Residential Finance Trust, | ||||||||||||
Series 2006-BC1, Class A2D, 0.753%, 12/25/2036∞ | 7,617,879 | 7,511,265 | 0.4 | % | ||||||||
| Springleaf Funding Trust, | ||||||||||||
| Series 2014-AA, Class A, 2.410%, 12/15/2022 | ||||||||||||
| (Acquired 10/26/2015, Cost $7,532,728)* | 7,528,878 | 7,533,418 | 0.4 | % | ||||||||
| Synchrony Credit Card Master Note Trust, | ||||||||||||
| Series 2012-2, Class A, 2.220%, 01/15/2022 | 8,250,000 | 8,406,388 | 0.4 | % | ||||||||
| TCF Auto Receivables Owner Trust, | ||||||||||||
| Series 2014-1A, Class A4, 1.560%, 01/15/2020 | ||||||||||||
| (Acquired 05/29/2015 through 06/12/2015, | ||||||||||||
| Cost $15,598,877)* | 15,575,000 | 15,605,803 | 0.7 | % | ||||||||
| Other Asset Backed Securities#~ | 73,862,212 | 3.5 | % | |||||||||
| Total Asset Backed Securities | ||||||||||||
| (Cost $164,984,863) | 166,023,377 | 8.0 | % | |||||||||
| Commercial Mortgage-Backed Securities | ||||||||||||
| U.S. Government Agency Issues | ||||||||||||
| FHLMC Multifamily Structured | ||||||||||||
| Pass Through Certificates: | ||||||||||||
| Series K708, Class A2, 2.130%, 01/25/2019 | 8,300,000 | 8,499,701 | 0.4 | % | ||||||||
| Series K003, Class A4, 5.053%, 01/25/2019 | 9,000,000 | 9,783,329 | 0.5 | % | ||||||||
| Series K004, Class A2, 4.186%, 08/25/2019 | 6,825,000 | 7,400,098 | 0.3 | % | ||||||||
| 1.083%-4.317%, 02/25/2018-07/25/2020 | 15,075,380 | 15,937,818 | 0.8 | % | ||||||||
| Total U.S. Government Agency Issues | ||||||||||||
| (Cost $40,090,084) | 41,620,946 | 2.0 | % | |||||||||
| Non-U.S. Government Agency Issues | ||||||||||||
| J.P. Morgan Chase Commercial Mortgage Securities Trust, | ||||||||||||
| Series 2012-C8, Class ASB, 2.379%, 10/15/2045 | 8,004,000 | 8,222,918 | 0.4 | % | ||||||||
| Wells Fargo Commercial Mortgage Trust: | ||||||||||||
| Series 2014-LC18, Class ASB, 3.244%, 12/15/2047 | 16,400,000 | 17,362,493 | 0.8 | % | ||||||||
| Series 2015-P2, Class ASB, 3.656%, 12/15/2048 | 10,400,000 | 11,298,243 | 0.5 | % | ||||||||
| WFRBS Commercial Mortgage Trust: | ||||||||||||
| Series 2012-C6, Class A4, 3.440%, 04/15/2045 | 8,000,000 | 8,599,018 | 0.4 | % | ||||||||
| Series 2014-C21, Class A2, 2.917%, 08/15/2047 | 2,435,234 | 2,535,295 | 0.1 | % | ||||||||
| Series 2014-C24, Class ASB, 3.324%, 11/15/2047 | 8,652,000 | 9,188,201 | 0.5 | % | ||||||||
| Series 2013-C12, Class ASB, 2.838%, 03/15/2048 | 8,500,000 | 8,867,991 | 0.4 | % | ||||||||
The accompanying notes are an integral part of these financial statements.
Page 22
Baird Intermediate Bond Fund
Summary Schedule of Investments, June 30, 2016 (Unaudited)
Long-Term Investments (cont.)
| Principal | % of | |||||||||||
| Amount | Value | Net Assets | ||||||||||
| Other Non-U.S. Government Agency Issues# | $ | 13,771,352 | 0.6 | % | ||||||||
| Total Non-U.S. Government Agency Issues | ||||||||||||
| (Cost $77,929,244) | 79,845,511 | 3.8 | % | |||||||||
| Total Long-Term Investments | ||||||||||||
| (Cost $2,012,223,580) | 2,063,759,307 | 98.9 | % | |||||||||
| Short-Term Investments | ||||||||||||
| Shares | ||||||||||||
| Money Market Mutual Funds | ||||||||||||
| Dreyfus Institutional Cash Advantage Fund, | ||||||||||||
| Institutional Class, 0.39%« | 834,543 | 834,543 | 0.0 | % | ||||||||
| Short-Term Investments Trust – Liquid Assets Portfolio, | ||||||||||||
| Institutional Class, 0.43%« | 41,000,000 | 41,000,000 | 2.0 | % | ||||||||
| Total Short-Term Investments | ||||||||||||
| (Cost $41,834,543) | 41,834,543 | 2.0 | % | |||||||||
| Investment Purchased with Cash | ||||||||||||
| Proceeds from Securities Lending | ||||||||||||
| Investment Company | ||||||||||||
| Mount Vernon Securities Lending | ||||||||||||
| Trust Prime Portfolio, 0.56%« | 54,964,493 | 54,964,493 | 2.7 | % | ||||||||
| Total Investment Company | ||||||||||||
| (Cost $54,964,493) | 54,964,493 | 2.7 | % | |||||||||
| Total Investment Purchased With | ||||||||||||
| Cash Proceeds From Securities Lending | ||||||||||||
| (Cost $54,964,493) | 54,964,493 | 2.7 | % | |||||||||
| Total Investments | ||||||||||||
| (Cost $2,109,022,616) | 2,160,558,343 | 103.6 | % | |||||||||
| Liabilities in Excess of Other Assets | (74,185,983 | ) | (3.6 | )% | ||||||||
| TOTAL NET ASSETS | $ | 2,086,372,360 | 100.0 | % | ||||||||
Notes to Summary Schedule of Investments
| * | Restricted security as defined in Rule 144 under the Securities Act of 1933 and determined to be liquid. Purchased in a private placement transaction; resale to the public may require registration or may extend only to qualified institutional buyers. At June 30, 2016, the value of these securities total $152,946,888 which represents 7.33% of total net assets. | |
| @ | This security or portion of this security is out on loan at June 30, 2016. | |
| f | Foreign Security | |
| ∞ | Variable or Floating rate security. Floating rate securities are securities whose yields vary with a designated index rate. These securities rates are as of June 30, 2016. | |
| # | Represents the aggregate value, by category, of securities that are not among the 50 largest holdings and, in total for any issuer, represent 1% or less of net assets. | |
| ~ | Groupings contain, in aggregate, restricted securities totaling $279,151,246 representing 13.38% of net assets. | |
| « | 7-Day Yield |
The accompanying notes are an integral part of these financial statements.
Page 23
Baird Intermediate Bond Fund
Summary Schedule of Investments, June 30, 2016 (Unaudited)
Summary of Fair Value Exposure at June 30, 2016 (Unaudited)
The Fund has adopted authoritative fair valuation accounting standards which establish a definition of fair value and set out a hierarchy for measuring fair value. These standards require additional disclosures about the various inputs and valuation techniques used to develop the measurements of fair value and a discussion on changes in valuation techniques and related inputs during the period. These standards define fair value as the price that would be received to sell an asset or paid to transfer a liability in an orderly transaction between market participants at the measurement date.
The fair value hierarchy is organized into three levels based upon the assumptions (referred to as “inputs”) used in pricing the asset or liability. These standards state that “observable inputs” reflect the assumptions market participants would use in pricing the asset or liability based on market data obtained from independent sources and “unobservable inputs” reflect an entity’s own assumptions about the assumptions market participants would use in pricing the asset or liability. These inputs are summarized into three broad levels and described below:
Level 1 – | Unadjusted quoted prices in active markets for identical unrestricted securities. |
Level 2 – | Other significant observable inputs (including quoted prices for similar securities, quoted prices in inactive markets, dealer indications, interest rates, yield curves, prepayment speeds, credit risk, default rates, inputs corroborated by observable market data, etc.). |
Level 3 – | Significant unobservable inputs (including the Fund’s own assumptions about the factors that market participants would use in valuing the security) based on the best information available. |
The inputs or methodology used for valuing securities are not necessarily an indication of the risk associated with investing in those securities.
The accompanying notes are an integral part of these financial statements.
Page 24
Baird Intermediate Bond Fund
Summary Schedule of Investments, June 30, 2016 (Unaudited)
Summary of Fair Value Exposure at June 30, 2016 (Unaudited) (cont.)
The following is a summary of the inputs used to value the Fund’s investments as of June 30, 2016:
| Level 1 | Level 2 | Level 3 | Total | |||||||||||||
| Long-Term Investments | ||||||||||||||||
| U.S. Treasury Securities | $ | — | $ | 652,847,524 | $ | — | $ | 652,847,524 | ||||||||
| Corporate Bonds | — | 952,755,693 | — | 952,755,693 | ||||||||||||
| Other Government Related Securities | — | 50,842,022 | — | 50,842,022 | ||||||||||||
| Taxable Municipal Bonds | — | 59,443,571 | — | 59,443,571 | ||||||||||||
| Residential Mortgage-Backed Securities – | ||||||||||||||||
| U.S. Government Agency Issues | — | 14,617,423 | — | 14,617,423 | ||||||||||||
| Residential Mortgage-Backed Securities – | ||||||||||||||||
| Non-U.S. Government Agency Issues | — | 45,763,240 | — | 45,763,240 | ||||||||||||
| Asset Backed Securities | — | 166,023,377 | — | 166,023,377 | ||||||||||||
| Commercial Mortgage-Backed Securities – | ||||||||||||||||
| U.S. Government Agency Issues | — | 41,620,946 | — | 41,620,946 | ||||||||||||
| Commercial Mortgage-Backed Securities – | ||||||||||||||||
| Non-U.S. Government Agency Issues | — | 79,845,511 | — | 79,845,511 | ||||||||||||
| Total Long-Term Investments | — | 2,063,759,307 | — | 2,063,759,307 | ||||||||||||
| Short-Term Investments | ||||||||||||||||
| Money Market Mutual Funds | 41,834,543 | — | — | 41,834,543 | ||||||||||||
| Total Short-Term Investments | 41,834,543 | — | — | 41,834,543 | ||||||||||||
| Investment Purchased with Cash | ||||||||||||||||
| Proceeds from Securities Lending | ||||||||||||||||
| Investment Company | 54,964,493 | — | — | 54,964,493 | ||||||||||||
| Total Investment Purchased with Cash | ||||||||||||||||
| Proceeds from Securities Lending | 54,964,493 | — | — | 54,964,493 | ||||||||||||
| Total Investments | $ | 96,799,036 | $ | 2,063,759,307 | $ | — | $ | 2,160,558,343 | ||||||||
Changes in valuation techniques may result in transfers into or out of assigned levels within the fair value hierarchy. There were no transfers between Level 1, Level 2 and Level 3 fair value measurements during the reporting period, as compared to their classification from the prior year’s annual report. See the Fund’s valuation policy in Note 2a to the financial statements.
Level 3 Reconciliation Disclosure
Following is a reconciliation of Level 3 assets for which significant unobservable inputs were used to determine fair value.
Description | Investments in Securities | |||
| Balance as of December 31, 2015 | $ | 17,673 | ||
| Accrued discounts/premiums | — | |||
| Realized gain (loss) | (61,400 | ) | ||
| Change in unrealized appreciation (depreciation) | 56,083 | |||
| Purchases | — | |||
| Sales | (12,356 | ) | ||
| Transfers in and/or out of Level 3* | — | |||
| Balance as of June 30, 2016 | $ | — | ||
* Transfers between levels are recognized at the end of the reporting period.
The accompanying notes are an integral part of these financial statements.
Page 25
Baird Aggregate Bond Fund
June 30, 2016 (Unaudited)
Portfolio Characteristics
Quality Distribution(1)(2) | |||||
 | Net Assets | $8,736,666,204 | |||
| SEC 30-Day | |||||
Yield(3) | |||||
| Institutional Class | 2.28% | ||||
| Investor Class | 2.03% | ||||
| Average | |||||
| Effective | |||||
| Duration | 5.47 years | ||||
| Average | |||||
| Effective | |||||
| Maturity | 7.35 years | ||||
| Annualized | |||||
| Expense | |||||
Sector Weightings(1) | Ratio | ||||
| Institutional Class | 0.30% | ||||
 | Investor Class | 0.55% | (4) | ||
| Portfolio | |||||
| Turnover Rate | 20.7% | (5) | |||
| Number of | |||||
| Holdings | 899 | ||||
(1) | Percentages shown are based on the Fund’s total investments (less investments purchased with cash proceeds from securities lending). |
(2) | The quality profile is calculated on a market value-weighted basis using the highest credit quality rating for each security held by the Fund given by S&P, Moody’s or Fitch, each of which is a Nationally Recognized Statistical Rating Organization (NRSRO). NRSROs rate the credit quality of securities using a scale that generally ranges from AAA (highest) to D (lowest). |
(3) | SEC yields are based on SEC guidelines and are calculated for the 30 days ended June 30, 2016. |
(4) | Includes 0.25% 12b-1 fee. |
(5) | Not annualized. |
Page 26
Baird Aggregate Bond Fund
June 30, 2016 (Unaudited)
Total Returns
| Average Annual | |||||
| Six | One | Five | Ten | Since | |
| For the Periods Ended June 30, 2016 | Months | Year | Years | Years | Inception(1) |
| Institutional Class Shares | 5.66% | 6.11% | 4.78% | 5.47% | 5.84% |
| Investor Class Shares | 5.64% | 5.95% | 4.54% | 5.21% | 5.59% |
Barclays U.S. Aggregate Bond Index(2) | 5.31% | 6.00% | 3.76% | 5.13% | 5.34% |
| (1) | For the period from September 29, 2000 (inception date) through June 30, 2016. |
| (2) | The Barclays U.S. Aggregate Bond Index is an unmanaged, market value weighted index of investment grade, fixed-rate debt issues, including government, corporate, asset-backed and mortgage-backed securities, with maturities of at least one year. This index does not reflect any deduction for fees, expenses or taxes. A direct investment in an index is not possible. |
The returns shown in the table above reflect reinvestment of dividends and/or capital gains distributions in additional shares. The returns do not reflect the deduction of taxes that a shareholder would pay on Fund distributions or the redemption of Fund shares. The returns reflect the actual performance for each period and do not include the impact of trades executed on the last business day of the period that were recorded on the first business day of the next period.
The Fund’s gross expense ratio for each Class, as reflected in the Fund’s current prospectus, is set forth under “Portfolio Characteristics”.
The Fund maintains securities with longer maturities in order to provide a greater potential for return. Generally, the longer a bond’s maturity, the greater the interest rate risk. The Fund may also invest in U.S. dollar denominated foreign securities which involve additional risks such as political and economic instability, and different and sometimes less strict financial reporting standards and regulation. The Fund may also invest in mortgage- and asset-backed securities, which include interest rate and prepayment risks more pronounced than those of other fixed income securities.
Past performance does not guarantee future results. Investment return and principal value will fluctuate so that an investor’s shares, when redeemed, may be worth more or less than their original cost.
For information about the performance of the Fund as of the most recent month-end, please call 1-866-44BAIRD or visit www.bairdfunds.com. Mutual fund performance changes over time and current performance may be lower or higher than that stated.
Page 27
Baird Aggregate Bond Fund
Summary Schedule of Investments, June 30, 2016 (Unaudited)
This schedule summarizes the Fund’s holdings by asset type. Details are reported for each of the Fund’s 50 largest individual holdings and for investments that, in total for any issuer, represent more than 1% of the Fund’s net assets. The total value of smaller holdings is reported as a single amount within each category.
The Fund reports a complete list of its holdings in regulatory filings four times in each fiscal year, at the quarter end. For the second and fourth fiscal quarters, the complete listing of the Fund’s holdings is available electronically in the Fund’s Form N-CSR at http://www.bairdfunds.com/prospectuses-reports and on the Securities and Exchange Commission’s website (www.sec.gov) or you can have it mailed to you without charge by calling 1-866-44BAIRD. For the first and third fiscal quarters, the Fund files the lists with the SEC on Form N-Q. Shareholders can look up the Fund’s Forms N-CSR and N-Q on the SEC’s website (www.sec.gov).
Long-Term Investments
| Principal | % of | |||||||||||
| Amount | Value | Net Assets | ||||||||||
| U.S. Treasury Securities | ||||||||||||
| U.S. Treasury Bonds: | ||||||||||||
| 2.625%, 08/15/2020 | $ | 140,475,000 | $ | 150,176,484 | 1.7 | % | ||||||
| 1.750%, 03/31/2022 | 403,705,000 | 417,124,961 | 4.8 | % | ||||||||
| 2.500%, 05/15/2024 | 164,675,000 | 178,858,952 | 2.0 | % | ||||||||
| 5.250%, 11/15/2028 | 77,576,500 | 109,194,975 | 1.3 | % | ||||||||
| 3.500%, 02/15/2039 | 351,355,900 | 443,422,038 | 5.1 | % | ||||||||
| 2.875%, 05/15/2043 | 164,600,000 | 185,091,383 | 2.1 | % | ||||||||
| 2.500%, 02/15/2045@ | 15,525,000 | 16,163,590 | 0.2 | % | ||||||||
| Total U.S. Treasury Securities | ||||||||||||
| (Cost $1,422,511,400) | 1,500,032,383 | 17.2 | % | |||||||||
| Corporate Bonds | ||||||||||||
| Finance | ||||||||||||
| Comerica Bank, | ||||||||||||
| 2.500%, 06/02/2020 | 29,000,000 | 29,847,351 | 0.4 | % | ||||||||
| Compass Bank, | ||||||||||||
| 2.750%, 09/29/2019 | 31,216,000 | 30,827,704 | 0.4 | % | ||||||||
| First Horizon National Corp., | ||||||||||||
| 3.500%, 12/15/2020 | 29,078,000 | 29,344,267 | 0.3 | % | ||||||||
| Massachusetts Mutual Life Insurance Co., | ||||||||||||
| 8.875%, 06/01/2039 (Acquired 05/27/2009 | ||||||||||||
| through 03/31/2016, Cost $29,839,678)* | 20,177,000 | 30,193,650 | 0.4 | % | ||||||||
| Regions Financial Corp., | ||||||||||||
| 3.200%, 02/08/2021 | 25,000,000 | 25,732,450 | 0.3 | % | ||||||||
| Voya Financial, Inc., | ||||||||||||
| 5.500%, 07/15/2022 | 23,802,000 | 27,091,151 | 0.3 | % | ||||||||
| Other Finance#~ | 1,709,383,072 | 19.5 | % | |||||||||
| Total Finance | ||||||||||||
| (Cost $1,841,068,868) | 1,882,419,645 | 21.6 | % | |||||||||
| Utility | ||||||||||||
| Other Utility#~ | 80,892,300 | 0.9 | % | |||||||||
| Total Utility | ||||||||||||
| (Cost $77,217,876) | 80,892,300 | 0.9 | % | |||||||||
The accompanying notes are an integral part of these financial statements.
Page 28
Baird Aggregate Bond Fund
Summary Schedule of Investments, June 30, 2016 (Unaudited)
Long-Term Investments (cont.)
| Principal | % of | |||||||||||
| Amount | Value | Net Assets | ||||||||||
| Industrials | ||||||||||||
| AT&T, Inc., | ||||||||||||
| 3.400%, 05/15/2025 | $ | 28,200,000 | $ | 28,845,978 | 0.3 | % | ||||||
| Forest Laboratories, Inc., | ||||||||||||
| 5.000%, 12/15/2021 (Acquired 08/26/2014 | ||||||||||||
| through 04/24/2015, Cost $25,941,520)* | 24,000,000 | 26,859,192 | 0.3 | % | ||||||||
| General Motors Financial Co., Inc., | ||||||||||||
| 4.200%, 03/01/2021 | 30,000,000 | 31,384,560 | 0.4 | % | ||||||||
| Mylan NV, | ||||||||||||
| 3.950%, 06/15/2026 (Acquired 05/31/2016 | ||||||||||||
through 06/30/2016, Cost $28,880,488)*@ f | 28,925,000 | 29,271,753 | 0.3 | % | ||||||||
| Pentair Finance SA, | ||||||||||||
3.625%, 09/15/2020 f | 26,620,000 | 27,288,934 | 0.3 | % | ||||||||
| Verizon Communications, Inc., | ||||||||||||
| 6.400%, 09/15/2033 | 29,640,000 | 37,832,585 | 0.4 | % | ||||||||
| Zoetis, Inc., | ||||||||||||
| 3.250%, 02/01/2023 | 34,200,000 | 34,850,518 | 0.4 | % | ||||||||
| Other Industrials#~ | 1,547,250,678 | 17.8 | % | |||||||||
| Total Industrials | ||||||||||||
| (Cost $1,719,891,699) | 1,763,584,198 | 20.2 | % | |||||||||
| Total Corporate Bonds | ||||||||||||
| (Cost $3,638,178,443) | 3,726,896,143 | 42.7 | % | |||||||||
| Other Government Related Securities | ||||||||||||
| Other Government Related Securities#~ | 131,510,932 | 1.5 | % | |||||||||
| Total Other Government Related Securities | ||||||||||||
| (Cost $127,942,880) | 131,510,932 | 1.5 | % | |||||||||
| Taxable Municipal Bonds | ||||||||||||
| Other Taxable Municipal Bonds# | 152,170,797 | 1.8 | % | |||||||||
| Total Taxable Municipal Bonds | ||||||||||||
| (Cost $143,452,305) | 152,170,797 | 1.8 | % | |||||||||
| Residential Mortgage-Backed Securities | ||||||||||||
| U.S. Government Agency Issues | ||||||||||||
| Federal Gold Loan Mortgage Corp. (FGLMC): | ||||||||||||
| 3.500%, 07/01/2032 | 38,395,353 | 41,147,451 | 0.5 | % | ||||||||
| 4.000%, 01/01/2041 | 26,154,027 | 28,097,792 | 0.3 | % | ||||||||
| 3.000%, 08/01/2042 | 25,267,663 | 26,264,593 | 0.3 | % | ||||||||
| 3.000%, 11/01/2042 | 53,790,978 | 56,360,304 | 0.6 | % | ||||||||
| 3.000%, 06/01/2043 | 26,551,185 | 27,578,111 | 0.3 | % | ||||||||
| 3.500%, 05/01/2044 | 61,665,654 | 65,972,310 | 0.8 | % | ||||||||
| 3.500%, 01/01/2046 | 52,866,433 | 56,180,793 | 0.6 | % | ||||||||
| 2.500%-6.500%, 06/01/2020-04/01/2046 | 343,573,058 | 368,382,346 | 4.3 | % | ||||||||
The accompanying notes are an integral part of these financial statements.
Page 29
Baird Aggregate Bond Fund
Summary Schedule of Investments, June 30, 2016 (Unaudited)
Long-Term Investments (cont.)
| Principal | % of | |||||||||||
| Amount | Value | Net Assets | ||||||||||
| Federal National Mortgage Association (FNMA): | ||||||||||||
| 3.000%, 12/01/2030 | $ | 34,852,912 | $ | 36,770,464 | 0.4 | % | ||||||
| 4.500%, 10/01/2033 | 31,056,088 | 34,106,024 | 0.4 | % | ||||||||
| 5.000%, 10/01/2033 | 32,805,620 | 36,621,613 | 0.4 | % | ||||||||
| 3.500%, 03/01/2041 | 35,819,451 | 37,882,890 | 0.4 | % | ||||||||
| 4.000%, 06/01/2041 | 29,485,306 | 31,691,127 | 0.4 | % | ||||||||
| 3.500%, 12/01/2041 | 33,344,610 | 35,337,998 | 0.4 | % | ||||||||
| 4.000%, 08/01/2042 | 29,201,624 | 31,448,697 | 0.4 | % | ||||||||
| 3.000%, 05/01/2043 | 30,812,199 | 32,043,090 | 0.4 | % | ||||||||
| 4.500%, 09/01/2043 | 23,540,131 | 25,785,116 | 0.3 | % | ||||||||
| 3.500%, 04/01/2045 | 48,543,614 | 51,621,343 | 0.6 | % | ||||||||
| 2.500%-6.000%, 01/01/2020-05/01/2046 | 509,629,274 | 568,243,127 | 6.5 | % | ||||||||
| Government National Mortgage Association (GNMA): | ||||||||||||
| 3.500%, 01/20/2043 | 39,652,193 | 42,263,168 | 0.5 | % | ||||||||
| 3.000%, 04/20/2045 | 50,868,369 | 53,255,126 | 0.6 | % | ||||||||
| 3.500%, 04/20/2045 | 51,806,851 | 55,027,955 | 0.6 | % | ||||||||
| 4.000%, 08/20/2045 | 26,671,730 | 28,521,096 | 0.3 | % | ||||||||
| 3.500%-6.000%, 11/20/2033-09/20/2042 | 43,291,958 | 46,486,661 | 0.5 | % | ||||||||
| Other U.S. Government Agency Issues#~ | 37,405,912 | 0.4 | % | |||||||||
| Total U.S. Government Agency Issues | ||||||||||||
| (Cost $1,813,996,330) | 1,854,495,107 | 21.2 | % | |||||||||
| Non-U.S. Government Agency Issues | ||||||||||||
| Banc of America Alternative Loan Trust, | ||||||||||||
| Series 2004-7, Class 1A1, 6.000%, 08/25/2034 | 25,786,975 | 26,989,179 | 0.3 | % | ||||||||
| Thornburg Mortgage Securities Trust, | ||||||||||||
Series 2003-5, Class 3A, 2.418%, 10/25/2043∞ | 26,668,662 | 26,717,540 | 0.3 | % | ||||||||
| Wells Fargo Mortgage Backed Securities, | ||||||||||||
Series 2005-AR10, Class 2A17, 2.880%, 06/25/2035∞ | 26,418,642 | 26,706,737 | 0.3 | % | ||||||||
| Other Non-U.S. Government Agency Issues# | 176,115,542 | 2.0 | % | |||||||||
| Total Non-U.S. Government Agency Issues | ||||||||||||
| (Cost $259,174,035) | 256,528,998 | 2.9 | % | |||||||||
| Asset Backed Securities | ||||||||||||
| Ford Credit Auto Owner Trust: | ||||||||||||
| Series 2014-2, Class A, 2.310%, 04/15/2026 | ||||||||||||
| (Acquired 02/20/2015 through 03/23/2016, | ||||||||||||
| Cost $27,208,283)* | 27,030,000 | 27,611,721 | 0.3 | % | ||||||||
| Series 2016-1, Class A, 2.310%, 08/15/2027 | ||||||||||||
| (Acquired 02/23/2016 through 05/24/2016, | ||||||||||||
| Cost $28,349,066)* | 28,325,000 | 28,917,151 | 0.4 | % | ||||||||
| OneMain Financial Issuance Trust, | ||||||||||||
| Series 2014-2A, Class A, 2.470%, 09/18/2024 | ||||||||||||
| (Acquired 11/16/2015 through 01/29/2016, | ||||||||||||
| Cost $29,564,059)* | 29,657,000 | 29,721,400 | 0.3 | % | ||||||||
The accompanying notes are an integral part of these financial statements.
Page 30
Baird Aggregate Bond Fund
Summary Schedule of Investments, June 30, 2016 (Unaudited)
Long-Term Investments (cont.)
| Principal | % of | |||||||||||
| Amount | Value | Net Assets | ||||||||||
| Other Asset Backed Securities#~ | $ | 394,201,526 | 4.5 | % | ||||||||
| Total Asset Backed Securities | ||||||||||||
| (Cost $478,358,382) | 480,451,798 | 5.5 | % | |||||||||
| Commercial Mortgage-Backed Securities | ||||||||||||
| U.S. Government Agency Issues | ||||||||||||
| Other U.S. Government Agency Issues# | 55,562,572 | 0.6 | % | |||||||||
| Total U.S. Government Agency Issues | ||||||||||||
| (Cost $53,840,589) | 55,562,572 | 0.6 | % | |||||||||
| Non-U.S. Government Agency Issues | ||||||||||||
| COMM Mortgage Trust, | ||||||||||||
| Series 2013-CR9, Class A3, 4.022%, 07/10/2045 | $ | 25,725,000 | 28,609,899 | 0.3 | % | |||||||
| GS Mortgage Securities Corp. II, | ||||||||||||
| Series 2012-GCJ9, Class A3, 2.773%, 11/10/2045 | 36,997,320 | 38,668,489 | 0.4 | % | ||||||||
| Morgan Stanley Bank of America Merrill Lynch Trust, | ||||||||||||
| Series 2012-C5, Class A4, 3.176%, 08/15/2045 | 37,550,000 | 40,000,813 | 0.5 | % | ||||||||
| Wells Fargo Commercial Mortgage Trust, | ||||||||||||
| Series 2015-P2, Class A3, 3.541%, 12/15/2048 | 31,100,000 | 33,588,075 | 0.4 | % | ||||||||
| Other Non-U.S. Government Agency Issues# | 329,496,116 | 3.8 | % | |||||||||
| Total Non-U.S. Government Agency Issues | ||||||||||||
| (Cost $452,557,207) | 470,363,392 | 5.4 | % | |||||||||
| Total Long-Term Investments | ||||||||||||
| (Cost $8,390,011,571) | 8,628,012,122 | 98.8 | % | |||||||||
| Short-Term Investments | ||||||||||||
| Shares | ||||||||||||
| Money Market Mutual Funds | ||||||||||||
| Dreyfus Institutional Cash Advantage Fund, | ||||||||||||
| Institutional Class, 0.39%« | 20,260,216 | 20,260,216 | 0.2 | % | ||||||||
| Short-Term Investments Trust – Liquid Assets | ||||||||||||
| Portfolio, Institutional Class, 0.43%« | 172,000,000 | 172,000,000 | 2.0 | % | ||||||||
| Total Short-Term Investments | ||||||||||||
| (Cost $192,260,216) | 192,260,216 | 2.2 | % | |||||||||
The accompanying notes are an integral part of these financial statements.
Page 31
Baird Aggregate Bond Fund
Summary Schedule of Investments, June 30, 2016 (Unaudited)
Investment Purchased with Cash
Proceeds from Securities Lending
| % of | ||||||||||||
| Shares | Value | Net Assets | ||||||||||
| Investment Company | ||||||||||||
| Mount Vernon Securities Lending | ||||||||||||
| Trust Prime Portfolio, 0.56%« | 164,963,964 | $ | 164,963,964 | 1.9 | % | |||||||
| Total Investment Company | ||||||||||||
| (Cost $164,963,964) | 164,963,964 | 1.9 | % | |||||||||
| Total Investment Purchased With Cash | ||||||||||||
| Proceeds From Securities Lending | ||||||||||||
| (Cost $164,963,964) | 164,963,964 | 1.9 | % | |||||||||
| Total Investments | ||||||||||||
| (Cost $8,747,235,751) | 8,985,236,302 | 102.9 | % | |||||||||
| Liabilities in Excess of Other Assets | (248,570,098 | ) | (2.9 | )% | ||||||||
| TOTAL NET ASSETS | $ | 8,736,666,204 | 100.0 | % | ||||||||
Notes to Summary Schedule of Investments
| * | Restricted security as defined in Rule 144 under the Securities Act of 1933 and determined to be liquid. Purchased in a private placement transaction; resale to the public may require registration or may extend only to qualified institutional buyers. At June 30, 2016, the value of these securities total $172,574,867, which represents 1.98% of total net assets. | |
| @ | This security or portion of this security is out on loan at June 30, 2016. | |
| f | Foreign Security | |
| ∞ | Variable or Floating rate security. Floating rate securities are securities whose yields vary with a designated index rate. These securities rates are as of June 30, 2016. | |
| # | Represents the aggregate value, by category, of securities that are not among the 50 largest holdings and, in total for any issuer, represent 1% or less of net assets. | |
| ~ | Groupings contain, in aggregate, restricted securities totaling $1,243,754,096 representing 14.24% of net assets. | |
| « | 7-Day Yield |
Summary of Fair Value Exposure at June 30, 2016 (Unaudited)
The Fund has adopted authoritative fair valuation accounting standards which establish a definition of fair value and set out a hierarchy for measuring fair value. These standards require additional disclosures about the various inputs and valuation techniques used to develop the measurements of fair value and a discussion on changes in valuation techniques and related inputs during the period. These standards define fair value as the price that would be received to sell an asset or paid to transfer a liability in an orderly transaction between market participants at the measurement date.
The fair value hierarchy is organized into three levels based upon the assumptions (referred to as “inputs”) used in pricing the asset or liability. These standards state that “observable inputs” reflect the assumptions market participants would use in pricing the asset or liability based on market data obtained from independent sources and “unobservable inputs” reflect an entity’s own assumptions about the assumptions market participants would use in pricing the asset or liability. These inputs are summarized into three broad levels and described below:
The accompanying notes are an integral part of these financial statements.
Page 32
Baird Aggregate Bond Fund
Summary Schedule of Investments, June 30, 2016 (Unaudited)
Summary of Fair Value Exposure at June 30, 2016 (Unaudited) (cont.)
Level 1 – | Unadjusted quoted prices in active markets for identical unrestricted securities. |
Level 2 – | Other significant observable inputs (including quoted prices for similar securities, quoted prices in inactive markets, dealer indications, interest rates, yield curves, prepayment speeds, credit risk, default rates, inputs corroborated by observable market data, etc.). |
Level 3 – | Significant unobservable inputs (including the Fund’s own assumptions about the factors that market participants would use in valuing the security) based on the best information available. |
The inputs or methodology used for valuing securities are not necessarily an indication of the risk associated with investing in those securities.
The following is a summary of the inputs used to value the Fund’s investments as of June 30, 2016:
| Level 1 | Level 2 | Level 3 | Total | |||||||||||||
| Long-Term Investments | ||||||||||||||||
| U.S. Treasury Securities | $ | — | $ | 1,500,032,383 | $ | — | $ | 1,500,032,383 | ||||||||
| Corporate Bonds | — | 3,726,896,143 | — | 3,726,896,143 | ||||||||||||
| Other Government Related Securities | — | 131,510,932 | — | 131,510,932 | ||||||||||||
| Taxable Municipal Bonds | — | 152,170,797 | — | 152,170,797 | ||||||||||||
| Residential Mortgage-Backed Securities – | ||||||||||||||||
| U.S. Government Agency Issues | — | 1,854,495,107 | — | 1,854,495,107 | ||||||||||||
| Residential Mortgage-Backed Securities – | ||||||||||||||||
| Non-U.S. Government Agency Issues | — | 256,528,998 | — | 256,528,998 | ||||||||||||
| Asset Backed Securities | — | 480,451,798 | — | 480,451,798 | ||||||||||||
| Commercial Mortgage-Backed Securities – | ||||||||||||||||
| U.S. Government Agency Issues | — | 55,562,572 | — | 55,562,572 | ||||||||||||
| Commercial Mortgage-Backed Securities – | ||||||||||||||||
| Non-U.S. Government Agency Issues | — | 470,363,392 | — | 470,363,392 | ||||||||||||
| Total Long-Term Investments | — | 8,628,012,122 | — | 8,628,012,122 | ||||||||||||
| Short-Term Investments | ||||||||||||||||
| Money Market Mutual Funds | 192,260,216 | — | — | 192,260,216 | ||||||||||||
| Total Short-Term Investments | 192,260,216 | — | — | 192,260,216 | ||||||||||||
| Investment Purchased with Cash | ||||||||||||||||
| Proceeds from Securities Lending | ||||||||||||||||
| Investment Company | 164,963,964 | — | — | 164,963,964 | ||||||||||||
| Total Investment Purchased with Cash | ||||||||||||||||
| Proceeds from Securities Lending | 164,963,964 | — | — | 164,963,964 | ||||||||||||
| Total Investments | $ | 357,224,180 | $ | 8,628,012,122 | $ | — | $ | 8,985,236,302 | ||||||||
Changes in valuation techniques may result in transfers into or out of assigned levels within the fair value hierarchy. There were no transfers between Level 1, Level 2 and Level 3 fair value measurements during the reporting period, as compared to their classification from the prior year’s annual report. See the Fund’s valuation policy in Note 2a to the financial statements.
The accompanying notes are an integral part of these financial statements.
Page 33
Baird Core Plus Bond Fund
June 30, 2016 (Unaudited)
Portfolio Characteristics
Quality Distribution(1)(2) | |||||
 | Net Assets | $11,223,358,097 | |||
| SEC 30-Day | |||||
Yield(3) | |||||
| Institutional Class | 2.61% | ||||
| Investor Class | 2.36% | ||||
| Average | |||||
| Effective | |||||
| Duration | 5.36 years | ||||
| Average | |||||
| Effective | |||||
| Maturity | 7.18 years | ||||
| Annualized | |||||
Sector Weightings(1) | Expense Ratio | ||||
| Institutional Class | 0.30% | ||||
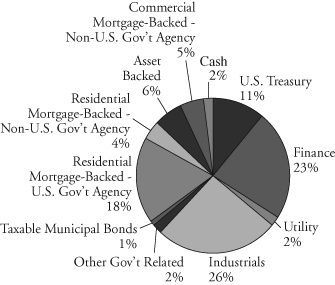 | Investor Class | 0.55% | (4) | ||
| Portfolio | |||||
| Turnover Rate | 20.0% | (5) | |||
| Number of | |||||
| Holdings | 1,122 | ||||
(1) | Percentages shown are based on the Fund’s total investments (less investments purchased with cash proceeds from securities lending). |
(2) | The quality profile is calculated on a market value-weighted basis using the highest credit quality rating for each security held by the Fund given by S&P, Moody’s or Fitch, each of which is a Nationally Recognized Statistical Rating Organization (NRSRO). NRSROs rate the credit quality of securities using a scale that generally ranges from AAA (highest) to D (lowest). |
(3) | SEC yields are based on SEC guidelines and are calculated for the 30 days ended June 30, 2016. |
(4) | Includes 0.25% 12b-1 fee. |
(5) | Not annualized. |
Page 34
Baird Core Plus Bond Fund
June 30, 2016 (Unaudited)
Total Returns
| Average Annual | |||||
| Six | One | Five | Ten | Since | |
| For the Periods Ended June 30, 2016 | Months | Year | Years | Years | Inception(1) |
| Institutional Class Shares | 6.11% | 6.03% | 4.66% | 6.20% | 6.31% |
| Investor Class Shares | 6.02% | 5.72% | 4.40% | 5.93% | 6.04% |
Barclays U.S. Universal Bond Index(2) | 5.68% | 5.82% | 4.01% | 5.30% | 5.56% |
| (1) | For the period from September 29, 2000 (inception date) through June 30, 2016. |
| (2) | The Barclays U.S. Universal Bond Index is an unmanaged, market value weighted index of fixed income securities issued in U.S. dollars, including U.S. government and investment grade debt, non-investment grade debt, asset-backed and mortgage-backed securities, Eurobonds, 144A securities and emerging market debt, with maturities of at least one year. This index does not reflect any deduction for fees, expenses or taxes. A direct investment in an index is not possible. |
The returns shown in the table above reflect reinvestment of dividends and/or capital gains distributions in additional shares. The returns do not reflect the deduction of taxes that a shareholder would pay on Fund distributions or the redemption of Fund shares. The returns reflect the actual performance for each period and do not include the impact of trades executed on the last business day of the period that were recorded on the first business day of the next period.
The Fund’s gross expense ratio for each Class, as reflected in the Fund’s current prospectus, is set forth under “Portfolio Characteristics”.
The Fund may invest up to 20% of its net assets in non-investment grade debt securities (commonly referred to as “high yield” bonds). While these types of debt securities typically offer higher yields than investment grade securities, they also include greater risks including increased credit risk and the increased risk of default or bankruptcy. The Fund maintains securities with longer maturities in order to provide a greater potential for return. Generally, the longer a bond’s maturity, the greater the interest rate risk. The Fund may also invest in U.S. dollar denominated foreign securities which involve additional risks such as political and economic instability, and different and sometimes less strict financial reporting standards and regulation. The Fund may also invest in mortgage- and asset-backed securities, which include interest rate and prepayment risks more pronounced than those of other fixed income securities.
Past performance does not guarantee future results. Investment return and principal value will fluctuate so that an investor’s shares, when redeemed, may be worth more or less than their original cost.
For information about the performance of the Fund as of the most recent month-end, please call 1-866-44BAIRD or visit www.bairdfunds.com. Mutual fund performance changes over time and current performance may be lower or higher than that stated.
Page 35
Baird Core Plus Bond Fund
Summary Schedule of Investments, June 30, 2016 (Unaudited)
This schedule summarizes the Fund’s holdings by asset type. Details are reported for each of the Fund’s 50 largest individual holdings and for investments that, in total for any issuer, represent more than 1% of the Fund’s net assets. The total value of smaller holdings is reported as a single amount within each category.
The Fund reports a complete list of its holdings in regulatory filings four times in each fiscal year, at the quarter end. For the second and fourth fiscal quarters, the complete listing of the Fund’s holdings is available electronically in the Fund’s Form N-CSR at http://www.bairdfunds.com/prospectuses-reports and on the Securities and Exchange Commission’s website (www.sec.gov) or you can have it mailed to you without charge by calling 1-866-44BAIRD. For the first and third fiscal quarters, the Fund files the lists with the SEC on Form N-Q. Shareholders can look up the Fund’s Forms N-CSR and N-Q on the SEC’s website (www.sec.gov).
Long-Term Investments
| Principal | % of | |||||||||||
| Amount | Value | Net Assets | ||||||||||
| U.S. Treasury Securities | ||||||||||||
| U.S. Treasury Bonds: | ||||||||||||
| 2.625%, 08/15/2020 | $ | 181,775,000 | $ | 194,328,745 | 1.7 | % | ||||||
| 1.750%, 03/31/2022 | 141,350,000 | 146,048,757 | 1.3 | % | ||||||||
| 2.500%, 05/15/2024 | 73,950,000 | 80,319,535 | 0.7 | % | ||||||||
| 3.500%, 02/15/2039 | 377,695,000 | 476,662,799 | 4.3 | % | ||||||||
| 2.875%, 05/15/2043 | 237,900,000 | 267,516,647 | 2.4 | % | ||||||||
| 2.500%, 02/15/2045@ | 36,550,000 | 38,053,411 | 0.3 | % | ||||||||
| Total U.S. Treasury Securities | ||||||||||||
| (Cost $1,127,156,255) | 1,202,929,894 | 10.7 | % | |||||||||
| Corporate Bonds | ||||||||||||
| Finance | ||||||||||||
| Capital One Bank (USA) National Association, | ||||||||||||
| 3.375%, 02/15/2023 | 32,638,000 | 33,336,486 | 0.3 | % | ||||||||
| Citizens Bank National Association, | ||||||||||||
| 2.450%, 12/04/2019 | 36,000,000 | 36,477,360 | 0.3 | % | ||||||||
| Compass Bank, | ||||||||||||
| 2.750%, 09/29/2019 | 38,994,000 | 38,508,954 | 0.4 | % | ||||||||
| HSBC Finance Corp., | ||||||||||||
| 6.676%, 01/15/2021 | 32,693,000 | 36,632,637 | 0.3 | % | ||||||||
| LeasePlan Corp. NV, | ||||||||||||
| 2.500%, 05/16/2018 (Acquired 05/07/2013 | ||||||||||||
through 08/27/2015, Cost $35,310,998)* f | 35,204,000 | 35,217,800 | 0.3 | % | ||||||||
| Massachusetts Mutual Life Insurance Co., | ||||||||||||
| 8.875%, 06/01/2039 (Acquired 10/03/2012 | ||||||||||||
| through 01/22/2016, Cost $44,577,985)* | 29,340,000 | 43,905,520 | 0.4 | % | ||||||||
| Other Finance#~ | 2,336,146,640 | 20.8 | % | |||||||||
| Total Finance | ||||||||||||
| (Cost $2,506,689,626) | 2,560,225,397 | 22.8 | % | |||||||||
| Utility | ||||||||||||
| Other Utility#~ | 184,532,359 | 1.6 | % | |||||||||
| Total Utility | ||||||||||||
| (Cost $175,690,839) | 184,532,359 | 1.6 | % | |||||||||
The accompanying notes are an integral part of these financial statements.
Page 36
Baird Core Plus Bond Fund
Summary Schedule of Investments, June 30, 2016 (Unaudited)
Long-Term Investments (cont.)
| Principal | % of | |||||||||||
| Amount | Value | Net Assets | ||||||||||
| Industrials | ||||||||||||
| Forest Laboratories, Inc., | ||||||||||||
| 5.000%, 12/15/2021 (Acquired 08/26/2014 | ||||||||||||
| through 05/11/2016, Cost)@ | $ | 41,397,000 | $ | 46,328,749 | 0.4 | % | ||||||
| Hewlett-Packard Co., | ||||||||||||
| 4.650%, 12/09/2021 | 32,425,000 | 35,063,357 | 0.3 | % | ||||||||
| Solvay Finance America LLC, | ||||||||||||
| 3.400%, 12/03/2020 (Acquired 11/30/2015 | ||||||||||||
| through 01/14/2016, Cost $39,205,876)* | 39,226,000 | 41,078,683 | 0.4 | % | ||||||||
| TSMC Global Ltd., | ||||||||||||
| 1.625%, 04/03/2018 (Acquired 03/27/2013 | ||||||||||||
through 03/14/2016, Cost $37,051,154)* f | 37,405,000 | 37,506,517 | 0.3 | % | ||||||||
| Verizon Communications, Inc., | ||||||||||||
| 6.400%, 09/15/2033 | 30,175,000 | 38,515,461 | 0.3 | % | ||||||||
| Other Industrials#~ | 2,715,264,988 | 24.3 | % | |||||||||
| Total Industrials | ||||||||||||
| (Cost $2,868,948,683) | 2,913,757,755 | 26.0 | % | |||||||||
| Total Corporate Bonds | ||||||||||||
| (Cost $5,551,329,148) | 5,658,515,511 | 50.4 | % | |||||||||
| Other Government Related Securities | ||||||||||||
| Other Government Related Securities#~ | 218,231,320 | 1.9 | % | |||||||||
| Total Other Government Related Securities | ||||||||||||
| (Cost $214,543,835) | 218,231,320 | 1.9 | % | |||||||||
| Taxable Municipal Bonds | ||||||||||||
| Other Taxable Municipal Bonds# | 135,811,177 | 1.2 | % | |||||||||
| Total Taxable Municipal Bonds | ||||||||||||
| (Cost $130,434,156) | 135,811,177 | 1.2 | % | |||||||||
| Residential Mortgage-Backed Securities | ||||||||||||
| U.S. Government Agency Issues | ||||||||||||
| Federal Gold Loan Mortgage Corp. (FGLMC): | ||||||||||||
| 3.000%, 10/01/2030 | 54,935,828 | 57,997,286 | 0.5 | % | ||||||||
| 3.500%, 05/01/2032 | 41,242,413 | 44,199,570 | 0.4 | % | ||||||||
| 5.500%, 01/01/2039 | 31,819,629 | 36,004,077 | 0.3 | % | ||||||||
| 3.500%, 07/01/2042 | 35,461,018 | 37,443,911 | 0.3 | % | ||||||||
| 3.000%, 08/01/2042 | 29,960,372 | 31,142,452 | 0.3 | % | ||||||||
| 3.000%, 11/01/2042 | 71,977,975 | 75,416,003 | 0.7 | % | ||||||||
| 3.500%, 08/01/2044 | 43,640,505 | 46,025,045 | 0.4 | % | ||||||||
| 4.000%, 10/01/2044 | 34,769,273 | 37,636,048 | 0.3 | % | ||||||||
| 3.500%, 06/01/2045 | 39,507,223 | 42,212,702 | 0.4 | % | ||||||||
| 3.500%, 01/01/2046 | 47,160,370 | 50,116,999 | 0.4 | % | ||||||||
| 3.000%-6.500%, 12/01/2020-01/01/2046 | 205,444,082 | 208,401,500 | 1.9 | % | ||||||||
The accompanying notes are an integral part of these financial statements.
Page 37
Baird Core Plus Bond Fund
Summary Schedule of Investments, June 30, 2016 (Unaudited)
Long-Term Investments (cont.)
| Principal | % of | |||||||||||
| Amount | Value | Net Assets | ||||||||||
| Federal National Mortgage Association (FNMA): | ||||||||||||
| 3.500%, 07/01/2028 | $ | 47,387,882 | $ | 50,248,068 | 0.4 | % | ||||||
| 3.000%, 08/01/2030 | 43,568,774 | 45,937,276 | 0.4 | % | ||||||||
| 4.000%, 11/01/2031 | 31,850,699 | 34,493,035 | 0.3 | % | ||||||||
| 4.500%, 10/01/2033 | 42,831,857 | 47,038,261 | 0.4 | % | ||||||||
| 4.000%, 09/01/2034 | 31,247,030 | 33,830,342 | 0.3 | % | ||||||||
| 4.500%, 08/01/2040 | 31,313,808 | 34,312,707 | 0.3 | % | ||||||||
| 3.500%, 09/01/2041 | 53,559,420 | 56,656,639 | 0.5 | % | ||||||||
| 4.000%, 01/01/2042 | 47,887,219 | 51,428,564 | 0.5 | % | ||||||||
| 3.000%, 05/01/2043 | 39,772,098 | 41,360,921 | 0.4 | % | ||||||||
| 3.000%, 06/01/2043 | 41,184,913 | 42,832,833 | 0.4 | % | ||||||||
| 4.000%, 02/01/2045 | 37,851,896 | 41,031,765 | 0.4 | % | ||||||||
| 2.500%-7.500%, 12/25/2019-03/01/2045 | 470,143,104 | 653,726,084 | 5.8 | % | ||||||||
| Government National Mortgage Association (GNMA): | ||||||||||||
| 3.500%, 04/20/2045 | 48,283,881 | 51,285,944 | 0.4 | % | ||||||||
| 4.000%, 05/20/2045 | 38,428,173 | 41,097,516 | 0.4 | % | ||||||||
| 3.500%, 06/20/2045 | 43,208,803 | 45,909,520 | 0.4 | % | ||||||||
| 3.000%-6.500%, 12/20/2028-06/20/2045 | 59,636,358 | 83,985,974 | 0.8 | % | ||||||||
| Other U.S. Government Agency Issues#~ | 41,063,772 | 0.4 | % | |||||||||
| Total U.S. Government Agency Issues | ||||||||||||
| (Cost $2,013,917,993) | 2,062,834,814 | 18.4 | % | |||||||||
| Non-U.S. Government Agency Issues | ||||||||||||
| Other Non-U.S. Government Agency Issues#~ | 495,086,301 | 4.4 | % | |||||||||
| Total Non-U.S. Government Agency Issues | ||||||||||||
| (Cost $504,684,216) | 495,086,301 | 4.4 | % | |||||||||
| Asset Backed Securities | ||||||||||||
| Chase Issuance Trust, | ||||||||||||
| Series 2015-A5, Class A5, 1.360%, 04/15/2020 | 35,796,000 | 36,010,042 | 0.3 | % | ||||||||
| Citicorp Residential Mortgage Trust, | ||||||||||||
| Series 2007-2, Class A4, 5.436%, 06/25/2037 | 49,733,363 | 51,368,033 | 0.4 | % | ||||||||
| Ford Credit Auto Owner Trust, | ||||||||||||
| Series 2016-1, Class A, 2.310%, 08/15/2027 | ||||||||||||
| (Acquired 02/23/2016 through 05/27/2016, | ||||||||||||
| Cost $37,668,385)* | 37,625,000 | 38,411,573 | 0.3 | % | ||||||||
| Other Asset Backed Securities#~ | 520,750,242 | 4.8 | % | |||||||||
| Total Asset Backed Securities | ||||||||||||
| (Cost $647,245,665) | 646,539,890 | 5.8 | % | |||||||||
| Commercial Mortgage-Backed Securities | ||||||||||||
| Non-U.S. Government Agency Issues | ||||||||||||
| COMM Mortgage Trust, | ||||||||||||
| Series 2012-CR2, Class A4, 3.147%, 08/15/2045 | 30,063,000 | 32,001,667 | 0.3 | % | ||||||||
| GS Mortgage Securities Corp. II, | ||||||||||||
| Series 2012-GCJ9, Class A3, 2.773%, 11/10/2045 | 41,464,000 | 43,336,929 | 0.4 | % | ||||||||
The accompanying notes are an integral part of these financial statements.
Page 38
Baird Core Plus Bond Fund
Summary Schedule of Investments, June 30, 2016 (Unaudited)
Long-Term Investments (cont.)
| Principal | % of | |||||||||||
| Amount | Value | Net Assets | ||||||||||
| JPMBB Commercial Mortgage Securities Trust, | ||||||||||||
| Series 2014-C25, Class A5, 3.672%, 11/15/2047 | $ | 34,585,000 | $ | 37,683,885 | 0.4 | % | ||||||
| Morgan Stanley Bank of America Merrill Lynch Trust: | ||||||||||||
| Series 2012-C5, Class A4, 3.176%, 08/15/2045 | 40,030,000 | 42,642,678 | 0.4 | % | ||||||||
| Series 2012-C6, Class A4, 2.858%, 11/15/2045 | 32,035,000 | 33,580,647 | 0.3 | % | ||||||||
| Series 2013-C10, Class A3, 4.104%, 07/15/2046 | 43,985,000 | 48,958,261 | 0.4 | % | ||||||||
| Other Non-U.S. Government Agency Issues# | 356,355,420 | 3.1 | % | |||||||||
| Total Non-U.S. Government Agency Issues | ||||||||||||
| (Cost $571,733,100) | 594,559,487 | 5.3 | % | |||||||||
| Total Long-Term Investments | ||||||||||||
| (Cost $10,761,044,368) | 11,014,508,394 | 98.1 | % | |||||||||
| Short-Term Investment | ||||||||||||
| Shares | ||||||||||||
| Money Market Mutual Funds | ||||||||||||
| Dreyfus Institutional Cash Advantage Fund, | ||||||||||||
| Institutional Class, 0.39%« | 184,638,042 | 184,638,042 | 1.6 | % | ||||||||
| Short-Term Investments Trust – Liquid Assets | ||||||||||||
| Portfolio, Institutional Class, 0.43%« | 221,000,000 | 221,000,000 | 2.0 | % | ||||||||
| Total Short-Term Investments | ||||||||||||
| (Cost $405,638,042) | 405,638,042 | 3.6 | % | |||||||||
| Investment Purchased with Cash | ||||||||||||
| Proceeds from Securities Lending | ||||||||||||
| Investment Company | ||||||||||||
| Mount Vernon Securities Lending | ||||||||||||
| Trust Prime Portfolio, 0.56%« | 276,410,416 | 276,410,416 | 2.5 | % | ||||||||
| Total Investment Company | ||||||||||||
| (Cost $276,410,416) | 276,410,416 | 2.5 | % | |||||||||
| Total Investment Purchased With Cash | ||||||||||||
| Proceeds From Securities Lending | ||||||||||||
| (Cost $276,410,416) | 276,410,416 | 2.5 | % | |||||||||
| Total Investments | ||||||||||||
| (Cost $11,443,092,826) | 11,696,556,852 | 104.2 | % | |||||||||
| Liabilities in Excess of Other Assets | (473,198,755 | ) | (4.2 | )% | ||||||||
| TOTAL NET ASSETS | $ | 11,223,358,097 | 100.0 | % | ||||||||
Notes to Summary Schedule of Investments
| * | Restricted security as defined in Rule 144 under the Securities Act of 1933 and determined to be liquid. Purchased in a private placement transaction; resale to the public may require registration or may extend only to qualified institutional buyers. At June 30, 2016, the value of these securities total $242,448,842, which represents 2.16% of total net assets. | |
| @ | This security or portion of this security is out on loan at June 30, 2016. |
The accompanying notes are an integral part of these financial statements.
Page 39
Baird Core Plus Bond Fund
Summary Schedule of Investments, June 30, 2016 (Unaudited)
| f | Foreign Security | |
| ∞ | Variable or Floating rate security. Floating rate securities are securities whose yields vary with a designated index rate. These securities rates are as of June 30, 2016. | |
| # | Represents the aggregate value, by category, of securities that are not among the 50 largest holdings and, in total for any issuer, represent 1% or less of net assets. | |
| ~ | Groupings contain, in aggregate, restricted securities totaling $1,739,106,822 representing 15.50% of net assets. | |
| « | 7-Day Yield |
Summary of Fair Value Exposure at June 30, 2016 (Unaudited)
The Fund has adopted authoritative fair valuation accounting standards which establish a definition of fair value and set out a hierarchy for measuring fair value. These standards require additional disclosures about the various inputs and valuation techniques used to develop the measurements of fair value and a discussion on changes in valuation techniques and related inputs during the period. These standards define fair value as the price that would be received to sell an asset or paid to transfer a liability in an orderly transaction between market participants at the measurement date.
The fair value hierarchy is organized into three levels based upon the assumptions (referred to as “inputs”) used in pricing the asset or liability. These standards state that “observable inputs” reflect the assumptions market participants would use in pricing the asset or liability based on market data obtained from independent sources and “unobservable inputs” reflect an entity’s own assumptions about the assumptions market participants would use in pricing the asset or liability. These inputs are summarized into three broad levels and described below:
Level 1 – | Unadjusted quoted prices in active markets for identical unrestricted securities. |
Level 2 – | Other significant observable inputs (including quoted prices for similar securities, quoted prices in inactive markets, dealer indications, interest rates, yield curves, prepayment speeds, credit risk, default rates, inputs corroborated by observable market data, etc.). |
Level 3 – | Significant unobservable inputs (including the Fund’s own assumptions about the factors that market participants would use in valuing the security) based on the best information available. |
The inputs or methodology used for valuing securities are not necessarily an indication of the risk associated with investing in those securities.
The accompanying notes are an integral part of these financial statements.
Page 40
Baird Core Plus Bond Fund
Summary Schedule of Investments, June 30, 2016 (Unaudited)
Summary of Fair Value Exposure at June 30, 2016 (Unaudited) (cont.)
The following is a summary of the inputs used to value the Fund’s investments as of June 30, 2016:
| Level 1 | Level 2 | Level 3 | Total | |||||||||||||
| Long-Term Investments | ||||||||||||||||
| U.S. Treasury Securities | $ | — | $ | 1,202,929,894 | $ | — | $ | 1,202,929,894 | ||||||||
| Corporate Bonds | — | 5,658,515,511 | — | 5,658,515,511 | ||||||||||||
| Other Government Related Securities | — | 218,231,320 | — | 218,231,320 | ||||||||||||
| Taxable Municipal Bonds | — | 135,811,177 | — | 135,811,177 | ||||||||||||
| Residential Mortgage-Backed Securities – | ||||||||||||||||
| U.S. Government Agency Issues | — | 2,062,834,814 | — | 2,062,834,814 | ||||||||||||
| Residential Mortgage-Backed Securities – | ||||||||||||||||
| Non-U.S. Government Agency Issues | — | 495,086,301 | — | 495,086,301 | ||||||||||||
| Asset Backed Securities | — | 646,539,890 | — | 646,539,890 | ||||||||||||
| Commercial Mortgage-Backed Securities – | ||||||||||||||||
| Non-U.S. Government Agency Issues | — | 594,559,487 | — | 594,559,487 | ||||||||||||
| Total Long-Term Investments | — | 11,014,508,394 | — | 11,014,508,394 | ||||||||||||
| Short-Term Investments | ||||||||||||||||
| Money Market Mutual Funds | 405,638,042 | — | — | 405,638,042 | ||||||||||||
| Total Short-Term Investments | 405,638,042 | — | — | 405,638,042 | ||||||||||||
| Investment Purchased with Cash | ||||||||||||||||
| Proceeds from Securities Lending | ||||||||||||||||
| Investment Company | 276,410,416 | — | — | 276,410,416 | ||||||||||||
| Total Investment Purchased with Cash | ||||||||||||||||
| Proceeds from Securities Lending | 276,410,416 | — | — | 276,410,416 | ||||||||||||
| Total Investments | $ | 682,048,458 | $ | 11,014,508,394 | $ | — | $ | 11,696,556,852 | ||||||||
Changes in valuation techniques may result in transfers into or out of assigned levels within the fair value hierarchy. There were no transfers between Level 1, Level 2 and Level 3 fair value measurements during the reporting period, as compared to their classification from the prior year’s annual report. See the Fund’s valuation policy in Note 2a to the financial statements.
Level 3 Reconciliation Disclosure
Following is a reconciliation of Level 3 assets for which significant unobservable inputs were used to determine fair value.
Description | Investments in Securities | |||
| Balance as of December 31, 2015 | $ | 14,727 | ||
| Accrued discounts/premiums | — | |||
| Realized gain (loss) | (12,810 | ) | ||
| Change in unrealized appreciation (depreciation) | 8,379 | |||
| Purchases | — | |||
| Sales | (10,296 | ) | ||
| Transfers in and/or out of Level 3* | — | |||
| Balance as of June 30, 2016 | $ | — | ||
* Transfers between levels are recognized at the end of the reporting period.
The accompanying notes are an integral part of these financial statements.
Page 41
Baird Short-Term Municipal Bond Fund
June 30, 2016 (Unaudited)
Portfolio Characteristics
Quality Distribution(1)(2) | |||||
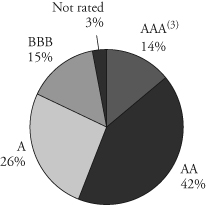 | Net Assets | $25,036,643 | |||
| SEC 30-Day | |||||
Yield(4) | |||||
| Institutional Class | 1.24% | ||||
| Investor Class | 0.99% | ||||
| Average | |||||
| Effective | |||||
| Duration | 2.32 years | ||||
| Average | |||||
| Effective | |||||
| Maturity | 2.65 years | ||||
| Annualized | |||||
Sector Weightings(1) | Expense Ratio | ||||
| Institutional Class | 0.30% | ||||
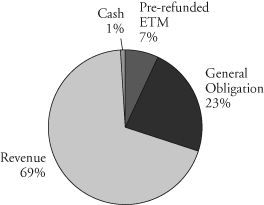 | Investor Class | 0.55% | (5) | ||
| Portfolio | |||||
| Turnover | |||||
| Rate | 13.5% | (6) | |||
| Number of | |||||
| Holdings | 299 | ||||
(1) | Percentages shown are based on the Fund’s total investments. |
(2) | The quality profile is calculated on a market value-weighted basis using the highest credit quality rating for each security held by the Fund given by S&P, Moody’s or Fitch, each of which is a Nationally Recognized Statistical Rating Organization (NRSRO). NRSROs rate the credit quality of securities using a scale that generally ranges from AAA (highest) to D (lowest). |
(3) | Includes pre-refunded and escrowed-to-maturity (ETM) bonds. |
(4) | SEC yields are based on SEC guidelines and are calculated for the 30 days ended June 30, 2016. |
(5) | Includes 0.25% 12b-1 fee. |
(6) | Not annualized. |
Page 42
Baird Short-Term Municipal Bond Fund
June 30, 2016 (Unaudited)
Total Returns
| Six | Since | |
| For the Periods Ended June 30, 2016 | Months | Inception(1) |
| Institutional Class Shares | 1.76% | 2.71% |
| Investor Class Shares | 1.56% | 2.43% |
Barclays Short (1-5 Year) Municipal Index(2) | 1.37% | 1.77% |
| (1) | For the period from August 31, 2015 (inception date) through June 30, 2016. |
| (2) | The Barclays Short (1-5 Year) Municipal Bond Index is an unmanaged, market value weighted index that measures the performance of investment-grade, tax-exempt, and fixed-rated municipal securities with time to maturity of more than one year and less than five years. Securities must have an outstanding par value of at least $7 million and be issued as part of a transaction of at least $75 million. The bonds must be fixed rate, have a dated-date after December 31, 1990, and must be at least one year from their maturity date. This Index does not reflect any deduction for fees, expenses or taxes. A direct investment in an index is not possible. |
The returns shown in the table above reflect reinvestment of dividends and/or capital gains distributions in additional shares. The returns do not reflect the deduction of taxes that a shareholder would pay on Fund distributions or the redemption of Fund shares. The returns reflect the actual performance for each period and do not include the impact of trades executed on the last business day of the period that were recorded on the first business day of the next period.
The Fund’s gross expense ratio for each Class, as reflected in the Fund’s current prospectus, is set forth under “Portfolio Characteristics”.
The Fund may invest up to 25% of its total assets in municipal obligations issued by persons in the same state. As a result, changes in economic, business or political conditions of a particular state may have a disproportionate impact on the Fund’s share price. Municipal securities investments are not appropriate for all investors, especially those taxed at lower rates.
Past performance does not guarantee future results. Investment return and principal value will fluctuate so that an investor’s shares, when redeemed, may be worth more or less than their original cost.
For information about the performance of the Fund as of the most recent month-end, please call 1-866-44BAIRD or visit www.bairdfunds.com. Mutual fund performance changes over time and current performance may be lower or higher than that stated.
Page 43
Baird Short-Term Municipal Bond Fund
Summary Schedule of Investments, June 30, 2016 (Unaudited)
This schedule summarizes the Fund’s holdings by asset type. Details are reported for each of the Fund’s 50 largest individual holdings and for investments that, in total for any issuer, represent more than 1% of the Fund’s net assets. The total value of smaller holdings is reported as a single amount within each category.
The Fund reports a complete list of its holdings in regulatory filings four times in each fiscal year, at the quarter end. For the second and fourth fiscal quarters, the complete listing of the Fund’s holdings is available electronically in the Fund’s Form N-CSR at http://www.bairdfunds.com/prospectuses-reports and on the Securities and Exchange Commission’s website (www.sec.gov) or you can have it mailed to you without charge by calling 1-866-44BAIRD. For the first and third fiscal quarters, the Fund files the lists with the SEC on Form N-Q. Shareholders can look up the Fund’s Forms N-CSR and N-Q on the SEC’s website (www.sec.gov).
Long-Term Investments
| Principal | % of | |||||||||||
| Amount | Value | Net Assets | ||||||||||
| Municipal Bonds | ||||||||||||
| Alabama | ||||||||||||
| Total Alabama | ||||||||||||
| (Cost $139,946)# | $ | 141,248 | 0.6 | % | ||||||||
| Alaska | ||||||||||||
| Total Alaska | ||||||||||||
| (Cost $56,586)# | 57,100 | 0.2 | % | |||||||||
| Arizona | ||||||||||||
| Arizona Transportation Board | ||||||||||||
| 5.000%, 07/01/2017 | $ | 25,000 | 26,092 | 0.1 | % | |||||||
| 5.000%, 07/01/2025 (Pre-refunded to 07/01/2019) | 250,000 | 281,317 | 1.1 | % | ||||||||
| BluePath 2016-1 TE Trust | ||||||||||||
| 2.750%, 09/01/2026 (Callable 08/27/2021) | 250,000 | 249,995 | 1.0 | % | ||||||||
| Maricopa County Industrial Development Authority | ||||||||||||
| 2.550%, 07/01/2021 | 175,000 | 176,720 | 0.7 | % | ||||||||
| 2.625%, 07/01/2021 | 100,000 | 101,051 | 0.4 | % | ||||||||
| Vistancia Community Facilities District | ||||||||||||
| 5.000%, 07/15/2021 (Callable 07/15/2020) | 150,000 | 173,228 | 0.7 | % | ||||||||
| Other Arizona# | 228,716 | 0.9 | % | |||||||||
| Total Arizona | ||||||||||||
| (Cost $1,221,082) | 1,237,119 | 4.9 | % | |||||||||
| Arkansas | ||||||||||||
| City of Jacksonville AR Wastewater Revenue | ||||||||||||
| 4.000%, 12/01/2025 (Callable 06/01/2021) | 110,000 | 122,290 | 0.5 | % | ||||||||
| Other Arkansas# | 223,066 | 0.9 | % | |||||||||
| Total Arkansas | ||||||||||||
| (Cost $339,645) | 345,356 | 1.4 | % | |||||||||
| California | ||||||||||||
| Total California | ||||||||||||
| (Cost $975,963)# | 982,059 | 3.9 | % | |||||||||
The accompanying notes are an integral part of these financial statements.
Page 44
Baird Short-Term Municipal Bond Fund
Summary Schedule of Investments, June 30, 2016 (Unaudited)
Long-Term Investments (cont.)
| Principal | % of | |||||||||||
| Amount | Value | Net Assets | ||||||||||
| Colorado | ||||||||||||
| Colorado Educational & Cultural Facilities Authority | ||||||||||||
| 4.000%, 07/01/2018 | $ | 120,000 | $ | 126,891 | 0.5 | % | ||||||
| 4.000%, 10/01/2020 | 125,000 | 136,969 | 0.6 | % | ||||||||
| 3.000%, 12/15/2018 | 75,000 | 78,331 | 0.3 | % | ||||||||
4.000%, 06/01/2020(3) | 100,000 | 109,441 | 0.4 | % | ||||||||
| Other Colorado# | 547,134 | 2.2 | % | |||||||||
| Total Colorado | ||||||||||||
| (Cost $993,874) | 998,766 | 4.0 | % | |||||||||
| Connecticut | ||||||||||||
| Connecticut Housing Finance Authority | ||||||||||||
| 4.000%, 11/15/2045 (Callable 05/15/2025) | 200,000 | 219,476 | 0.9 | % | ||||||||
| Other Connecticut# | 104,251 | 0.4 | % | |||||||||
| Total Connecticut | ||||||||||||
| (Cost $322,357) | 323,727 | 1.3 | % | |||||||||
| District of Columbia | ||||||||||||
| District of Columbia | ||||||||||||
| 5.450%, 07/15/2035 (Pre-refunded to 07/15/2018) | ||||||||||||
| (Insured by AGM) | 100,000 | 109,326 | 0.4 | % | ||||||||
| 5.250%, 07/15/2038 (Pre-refunded to 07/15/2018) | 295,000 | 321,877 | 1.3 | % | ||||||||
| 5.250%, 07/15/2045 (Pre-refunded to 07/15/2018) | ||||||||||||
| (Insured by AGM) | 170,000 | 185,489 | 0.8 | % | ||||||||
| Total District of Columbia | ||||||||||||
| (Cost $612,087) | 616,692 | 2.5 | % | |||||||||
| Florida | ||||||||||||
| City of Port St. Lucie FL | ||||||||||||
| 5.250%, 09/01/2022 | 100,000 | 122,025 | 0.5 | % | ||||||||
| Florida Housing Finance Corp. | ||||||||||||
| 4.000%, 07/01/2047 (Callable 07/01/2025) | 150,000 | 165,883 | 0.7 | % | ||||||||
| Other Florida# | 574,521 | 2.3 | % | |||||||||
| Total Florida | ||||||||||||
| (Cost $855,406) | 862,429 | 3.5 | % | |||||||||
| Georgia | ||||||||||||
| Bartow County Development Authority | ||||||||||||
| 2.375%, 09/01/2029 (Mandatory Tender Date 08/10/2017) | 185,000 | 187,579 | 0.8 | % | ||||||||
| Main Street Natural Gas, Inc. | ||||||||||||
| 5.000%, 03/15/2019 | 125,000 | 137,158 | 0.5 | % | ||||||||
| Other Georgia# | 110,006 | 0.4 | % | |||||||||
| Total Georgia | ||||||||||||
| (Cost $433,548) | 434,743 | 1.7 | % | |||||||||
The accompanying notes are an integral part of these financial statements.
Page 45
Baird Short-Term Municipal Bond Fund
Summary Schedule of Investments, June 30, 2016 (Unaudited)
Long-Term Investments (cont.)
| Principal | % of | |||||||||||
| Amount | Value | Net Assets | ||||||||||
| Idaho | ||||||||||||
| Total Idaho | ||||||||||||
| (Cost $26,903)# | $ | 27,037 | 0.1 | % | ||||||||
| Illinois | ||||||||||||
| Danville Public Building Commission | ||||||||||||
| 4.000%, 12/01/2019 | $ | 115,000 | 124,183 | 0.5 | % | |||||||
| Illinois Finance Authority | ||||||||||||
| 4.000%, 10/01/2016 | 125,000 | 125,877 | 0.5 | % | ||||||||
| 6.250%, 05/01/2022 (Callable 05/01/2020) | 45,000 | 53,125 | 0.2 | % | ||||||||
| 1.670%, 05/01/2036 (Callable 11/01/2020) | ||||||||||||
(Mandatory Tender Date 05/01/2021)(1) | 100,000 | 100,078 | 0.4 | % | ||||||||
| 1.300%, 07/01/2042 | ||||||||||||
| (Mandatory Tender Date 05/08/2017) | 65,000 | 65,103 | 0.3 | % | ||||||||
| Kane County School District No. 131 Aurora East Side | ||||||||||||
1.250%, 06/01/2036 (Callable 08/02/2016)(1) | 250,000 | 250,003 | 1.0 | % | ||||||||
| Lake County Community High School | ||||||||||||
| District No. 117 Antioch | ||||||||||||
| 0.000%, 12/01/2019 | 140,000 | 130,701 | 0.5 | % | ||||||||
| Lake County Community High School | ||||||||||||
| District No. 127 Grayslake | ||||||||||||
| 0.000%, 02/01/2020 | 150,000 | 142,359 | 0.6 | % | ||||||||
| Metropolitan Pier & Exposition Authority | ||||||||||||
| 5.300%, 06/15/2018 | ||||||||||||
| (Callable 06/15/2017) (Insured by NPFGC) | 120,000 | 126,140 | 0.5 | % | ||||||||
| Ogle & Winnebago Counties | ||||||||||||
| Community Unit School District | ||||||||||||
| 5.000%, 12/01/2021 (Insured by BAM) | 150,000 | 174,689 | 0.7 | % | ||||||||
| State of Illinois | ||||||||||||
| 5.000%, 06/01/2019 | 100,000 | 108,506 | 0.5 | % | ||||||||
| 5.000%, 03/01/2020 | 90,000 | 97,674 | 0.4 | % | ||||||||
| 5.000%, 04/01/2020 | 30,000 | 32,602 | 0.1 | % | ||||||||
| 5.000%, 01/01/2022 (Callable 01/01/2020) | 100,000 | 107,984 | 0.4 | % | ||||||||
| 6.500%, 06/15/2022 | 45,000 | 52,182 | 0.2 | % | ||||||||
| 5.000%, 01/01/2025 (Callable 08/01/2016) | 50,000 | 50,202 | 0.2 | % | ||||||||
| Other Illinois # | 1,946,193 | 7.7 | % | |||||||||
| Total Illinois | ||||||||||||
| (Cost $3,654,137) | 3,687,601 | 14.7 | % | |||||||||
| Indiana | ||||||||||||
| Total Indiana | ||||||||||||
| (Cost $396,112)# | 396,996 | 1.6 | % | |||||||||
| Iowa | ||||||||||||
| Total Iowa | ||||||||||||
| (Cost $100,406)# | 100,481 | 0.4 | % | |||||||||
The accompanying notes are an integral part of these financial statements.
Page 46
Baird Short-Term Municipal Bond Fund
Summary Schedule of Investments, June 30, 2016 (Unaudited)
Long-Term Investments (cont.)
| Principal | % of | |||||||||||
| Amount | Value | Net Assets | ||||||||||
| Kansas | ||||||||||||
| State of Kansas Department of Transportation | ||||||||||||
0.706%, 09/01/2019(1) | $ | 125,000 | $ | 124,301 | 0.5 | % | ||||||
| Total Kansas | ||||||||||||
| (Cost $123,631) | 124,301 | 0.5 | % | |||||||||
| Kentucky | ||||||||||||
| Total Kentucky | ||||||||||||
| (Cost $60,050)# | 60,061 | 0.2 | % | |||||||||
| Louisiana | ||||||||||||
| Total Louisiana | ||||||||||||
| (Cost $89,655)# | 89,486 | 0.4 | % | |||||||||
| Maine | ||||||||||||
| Maine State Housing Authority | ||||||||||||
| 3.500%, 11/15/2045 (Callable 05/15/2025) | 50,000 | 53,777 | 0.2 | % | ||||||||
| 4.000%, 11/15/2045 (Callable 11/15/2025) | 250,000 | 274,885 | 1.1 | % | ||||||||
| Total Maine | ||||||||||||
| (Cost $327,376) | 328,662 | 1.3 | % | |||||||||
| Maryland | ||||||||||||
| Total Maryland | ||||||||||||
| (Cost $118,772)# | 121,218 | 0.5 | % | |||||||||
| Massachusetts | ||||||||||||
| Total Massachusetts | ||||||||||||
| (Cost $258,906)# | 258,873 | 1.0 | % | |||||||||
| Michigan | ||||||||||||
| Saginaw MI City School District | ||||||||||||
| 5.000%, 05/01/2024 (Insured by Q-SBLF) | 100,000 | 121,452 | 0.5 | % | ||||||||
| Other Michigan# | 769,581 | 3.1 | % | |||||||||
| Total Michigan | ||||||||||||
| (Cost $872,693) | 891,033 | 3.6 | % | |||||||||
| Minnesota | ||||||||||||
| Total Minnesota | ||||||||||||
| (Cost $101,891)# | 105,869 | 0.4 | % | |||||||||
| Mississippi | ||||||||||||
| Total Mississippi | ||||||||||||
| (Cost $139,048)# | 143,332 | 0.6 | % | |||||||||
| Missouri | ||||||||||||
| Jasper County Reorganized School District No. R-9/MO | ||||||||||||
| 2.000%, 04/01/2018 | 150,000 | 152,679 | 0.6 | % | ||||||||
| Total Missouri | ||||||||||||
| (Cost $152,463) | 152,679 | 0.6 | % | |||||||||
The accompanying notes are an integral part of these financial statements.
Page 47
Baird Short-Term Municipal Bond Fund
Summary Schedule of Investments, June 30, 2016 (Unaudited)
Long-Term Investments (cont.)
| Principal | % of | |||||||||||
| Amount | Value | Net Assets | ||||||||||
| Nebraska | ||||||||||||
| Total Nebraska | ||||||||||||
| (Cost $105,265)# | $ | 105,525 | 0.4 | % | ||||||||
| Nevada | ||||||||||||
| Total Nevada | ||||||||||||
| (Cost $101,898)# | 102,032 | 0.4 | % | |||||||||
| New Jersey | ||||||||||||
| Total New Jersey | ||||||||||||
| (Cost $1,026,448)# | 1,043,644 | 4.2 | % | |||||||||
| New Mexico | ||||||||||||
| Total New Mexico | ||||||||||||
| (Cost $178,352)# | 178,491 | 0.7 | % | |||||||||
| New York | ||||||||||||
| Metropolitan Transportation Authority, 0.891%, 11/01/2022 | ||||||||||||
(Callable 07/07/2016) (Insured by AGM)(1)(2) | $ | 250,000 | 241,771 | 1.0 | % | |||||||
| New York City Transitional Finance | ||||||||||||
| Authority Future Tax Secured Revenue | ||||||||||||
| 5.000%, 11/01/2018 | 50,000 | 54,974 | 0.2 | % | ||||||||
| 0.600%, 08/01/2022 | ||||||||||||
(Optional Put Date 07/01/2016) (Callable 07/01/2016)(1) | 300,000 | 300,000 | 1.2 | % | ||||||||
| New York State Dormitory Authority | ||||||||||||
| 4.000%, 05/15/2017 | 25,000 | 25,733 | 0.1 | % | ||||||||
| 5.000%, 07/01/2017 | 25,000 | 26,065 | 0.1 | % | ||||||||
1.157%, 05/01/2018 (Callable 07/01/2016)(1) | 210,000 | 209,231 | 0.9 | % | ||||||||
| 5.000%, 12/15/2021 | 45,000 | 54,298 | 0.2 | % | ||||||||
| State of New York Mortgage Agency | ||||||||||||
| 4.000%, 10/01/2046 (Callable 04/01/2025) | 250,000 | 275,458 | 1.1 | % | ||||||||
| Town of Oyster Bay NY | ||||||||||||
| 3.000%, 03/01/2020 (Insured by AGM) | 250,000 | 258,850 | 1.0 | % | ||||||||
| Other New York# | 328,973 | 1.3 | % | |||||||||
| Total New York | ||||||||||||
| (Cost $1,783,436) | 1,775,353 | 7.1 | % | |||||||||
| North Carolina | ||||||||||||
| Total North Carolina | ||||||||||||
| (Cost $300,698)# | 304,539 | 1.2 | % | |||||||||
| North Dakota | ||||||||||||
| City of Mandan ND | ||||||||||||
2.750%, 09/01/2041 (Callable 09/01/2016)(3) | 150,000 | 150,021 | 0.6 | % | ||||||||
| Jamestown Park District/ND | ||||||||||||
| 2.900%, 07/01/2035 (Callable 01/01/2017) | 150,000 | 150,229 | 0.6 | % | ||||||||
| Other North Dakota# | 160,122 | 0.6 | % | |||||||||
| Total North Dakota | ||||||||||||
| (Cost $459,952) | 460,372 | 1.8 | % | |||||||||
The accompanying notes are an integral part of these financial statements.
Page 48
Baird Short-Term Municipal Bond Fund
Summary Schedule of Investments, June 30, 2016 (Unaudited)
Long-Term Investments (cont.)
| Principal | % of | |||||||||||
| Amount | Value | Net Assets | ||||||||||
| Ohio | ||||||||||||
| County of Summit OH Development Finance Authority | ||||||||||||
| 0.000%, 05/15/2018(3) | $ | 135,000 | $ | 138,210 | 0.6 | % | ||||||
| Other Ohio# | 450,389 | 1.8 | % | |||||||||
| Total Ohio | ||||||||||||
| (Cost $583,561) | 588,599 | 2.4 | % | |||||||||
| Oklahoma | ||||||||||||
| Total Oklahoma | ||||||||||||
| (Cost $147,056)# | 148,573 | 0.6 | % | |||||||||
| Oregon | ||||||||||||
| Total Oregon | ||||||||||||
| (Cost $67,718)# | 68,553 | 0.3 | % | |||||||||
| Pennsylvania | ||||||||||||
| Pennsylvania Economic Development Financing Authority | ||||||||||||
| 5.000%, 03/01/2019 | 130,000 | 142,215 | 0.6 | % | ||||||||
| Pennsylvania Housing Finance Agency | ||||||||||||
| 3.700%, 10/01/2042 (Callable 10/01/2021) | 100,000 | 105,802 | 0.4 | % | ||||||||
3.500%, 10/01/2046 (Callable 10/01/2025)(3) | 250,000 | 268,282 | 1.1 | % | ||||||||
| West Mifflin Sanitary Sewer Municipal Authority | ||||||||||||
| 4.000%, 08/01/2020 (Insured by BAM) | 200,000 | 218,506 | 0.9 | % | ||||||||
| Other Pennsylvania# | 604,474 | 2.4 | % | |||||||||
| Total Pennsylvania | ||||||||||||
| (Cost $1,326,310) | 1,339,279 | 5.4 | % | |||||||||
| Puerto Rico | ||||||||||||
| Puerto Rico Public Finance Corp. | ||||||||||||
| 6.000%, 08/01/2026 (ETM) | 150,000 | 204,638 | 0.8 | % | ||||||||
| Other Puerto Rico# | 96,037 | 0.4 | % | |||||||||
| Total Puerto Rico | ||||||||||||
| (Cost $296,865) | 300,675 | 1.2 | % | |||||||||
| Rhode Island | ||||||||||||
| Total Rhode Island | ||||||||||||
| (Cost $303,975)# | 306,777 | 1.2 | % | |||||||||
| South Carolina | ||||||||||||
| South Carolina State Housing | ||||||||||||
| Finance & Development Authority | ||||||||||||
| 4.000%, 07/01/2036 (Callable 07/01/2025) | 250,000 | 274,022 | 1.1 | % | ||||||||
| Other South Carolina# | 198,188 | 0.8 | % | |||||||||
| Total South Carolina | ||||||||||||
| (Cost $469,667) | 472,210 | 1.9 | % | |||||||||
The accompanying notes are an integral part of these financial statements.
Page 49
Baird Short-Term Municipal Bond Fund
Summary Schedule of Investments, June 30, 2016 (Unaudited)
Long-Term Investments (cont.)
| Principal | % of | |||||||||||
| Amount | Value | Net Assets | ||||||||||
| Tennessee | ||||||||||||
| Metropolitan Government Nashville & Davidson County | ||||||||||||
| Health & Educational Facilities, 0.900%, 04/01/2019 | ||||||||||||
| (Mandatory Tender Date 04/01/2018) | $ | 150,000 | $ | 150,439 | 0.6 | % | ||||||
| Other Tennessee# | 57,794 | 0.2 | % | |||||||||
| Total Tennessee | ||||||||||||
| (Cost $207,140) | 208,233 | 0.8 | % | |||||||||
| Texas | ||||||||||||
| City of Bullard TX | ||||||||||||
3.000%, 09/01/2020 (Insured by BAM)(3) | 135,000 | 143,655 | 0.6 | % | ||||||||
| Fort Bend County Municipal Utility District No. 58 | ||||||||||||
| 5.000%, 04/01/2019 (Insured by BAM) | 150,000 | 164,910 | 0.7 | % | ||||||||
| Generation Park Management District | ||||||||||||
| 3.000%, 09/01/2018 | 160,000 | 165,754 | 0.7 | % | ||||||||
| Northside Independent School District | ||||||||||||
| 2.000%, 06/01/2046 | ||||||||||||
| (Mandatory Tender Date 06/01/2021) (PSF Guaranteed) | 200,000 | 207,912 | 0.8 | % | ||||||||
| SA Energy Acquisition Public Facility Corp. | ||||||||||||
| 5.500%, 08/01/2022 | 100,000 | 121,182 | 0.5 | % | ||||||||
| Texas State Refunding | ||||||||||||
| 0.000%, 08/01/2025 | ||||||||||||
(Mandatory Tender Date 08/01/2019)(3) | 200,000 | 202,162 | 0.8 | % | ||||||||
| Other Texas# | 1,981,107 | 7.8 | % | |||||||||
| Total Texas | ||||||||||||
| (Cost $2,950,947) | 2,986,682 | 11.9 | % | |||||||||
| Utah | ||||||||||||
| Total Utah | ||||||||||||
| (Cost $107,291)# | 108,307 | 0.4 | % | |||||||||
| Vermont | ||||||||||||
| Total Vermont | ||||||||||||
| (Cost $28,680)# | 28,200 | 0.1 | % | |||||||||
| VI | ||||||||||||
| Total VI | ||||||||||||
| (Cost $250,791)# | 252,552 | 1.0 | % | |||||||||
| Virginia | ||||||||||||
| Total Virginia | ||||||||||||
| (Cost $50,062)# | 50,004 | 0.2 | % | |||||||||
| Washington | ||||||||||||
| Washington Economic Development Finance Authority | ||||||||||||
| 1.250%, 11/01/2017 | 250,000 | 251,375 | 1.0 | % | ||||||||
| Other Washington# | 195,244 | 0.8 | % | |||||||||
| Total Washington | ||||||||||||
| (Cost $445,476) | 446,619 | 1.8 | % | |||||||||
The accompanying notes are an integral part of these financial statements.
Page 50
Baird Short-Term Municipal Bond Fund
Summary Schedule of Investments, June 30, 2016 (Unaudited)
Long-Term Investments (cont.)
| Principal | % of | |||||||||||
| Amount | Value | Net Assets | ||||||||||
| Wisconsin | ||||||||||||
| City of Two Rivers WI | ||||||||||||
| 4.000%, 04/01/2018 | $ | 125,000 | $ | 129,350 | 0.5 | % | ||||||
| Milwaukee Redevelopment Authority | ||||||||||||
| 1.250%, 12/01/2038 | ||||||||||||
(Optional Put Date 07/01/2016) (Callable 07/01/2016)(1) | 140,000 | 140,000 | 0.6 | % | ||||||||
| Wisconsin Health & Educational Facilities Authority | ||||||||||||
| 5.000%, 09/01/2016 | 245,000 | 246,700 | 1.0 | % | ||||||||
| 3.000%, 07/01/2017 | 100,000 | 102,376 | 0.4 | % | ||||||||
| 5.250%, 08/15/2017 (Pre-refunded to 08/15/2016) | 25,000 | 25,127 | 0.1 | % | ||||||||
| 5.000%, 08/15/2020 | 35,000 | 39,953 | 0.2 | % | ||||||||
| 4.000%, 09/15/2023 (Callable 09/15/2022) | 50,000 | 55,857 | 0.2 | % | ||||||||
| 5.250%, 04/15/2024 (Callable 04/15/2020) | 50,000 | 57,291 | 0.2 | % | ||||||||
| Other Wisconsin# | 178,471 | 0.7 | % | |||||||||
| Total Wisconsin | ||||||||||||
| (Cost $967,794) | 975,125 | 3.9 | % | |||||||||
| Total Long-Term Investments | ||||||||||||
| (Cost $24,531,919) | 24,737,212 | 98.8 | % | |||||||||
| Short-Term Investments | ||||||||||||
| Shares | ||||||||||||
| Money Market Mutual Funds | ||||||||||||
| Goldman Sachs Financial Square Funds, | ||||||||||||
| Institutional Class, 0.25%« | 1,100,000 | 1,100,000 | 4.4 | % | ||||||||
| Wells Fargo Advantage Municipal Cash Management | ||||||||||||
| Money Market Fund/NC, Institutional Class, 0.30%« | 3,750 | 3,750 | 0.0 | % | ||||||||
| Total Short-Term Investments | ||||||||||||
| (Cost $1,103,750) | 1,103,750 | 4.4 | % | |||||||||
| Total Investments | ||||||||||||
| (Cost $25,635,669) | 25,840,962 | 103.2 | % | |||||||||
| Liabilities in Excess of Other Assets | (804,319 | ) | (3.2 | )% | ||||||||
| TOTAL NET ASSETS | $ | 25,036,643 | 100.0 | % | ||||||||
Notes to Summary Schedule of Investments
AGM – Assured Guaranty Municipal
BAM – Build America Mutual Assurance Co.
ETM – Escrowed to Maturity
NPFGC – National Public Finance Guarantee Corp.
Q-SBLF – Qualified School Building Loan Fund
| (1) | Variable or floating rate security. Floating rate securities are securities whose yields vary with a designated index rate. These securities rates are as of June 30, 2016. |
| (2) | Auction Rate Security. An Auction Rate Security is a debt instrument with a long nominal maturity for which the interest rate is regularly reset through a Dutch auction. The rate presented is either the rate set through the auction or the maximum interest rate provided for in the security issuance provision. |
The accompanying notes are an integral part of these financial statements.
Page 51
Baird Short-Term Municipal Bond Fund
Summary Schedule of Investments, June 30, 2016 (Unaudited)
| (3) | Security or a portion of the security purchased on a when-issued or delayed delivery basis. | ||
| # | Represents the aggregate value, by category, of securities that are not among the 50 largest holdings and, in total for any issuer, represent 1% or less of net assets. | ||
| « | 7-Day Yield |
Summary of Fair Value Exposure at June 30, 2016 (Unaudited)
The Fund has adopted authoritative fair valuation accounting standards which establish a definition of fair value and set out a hierarchy for measuring fair value. These standards require additional disclosures about the various inputs and valuation techniques used to develop the measurements of fair value and a discussion on changes in valuation techniques and related inputs during the period. These standards define fair value as the price that would be received to sell an asset or paid to transfer a liability in an orderly transaction between market participants at the measurement date.
The fair value hierarchy is organized into three levels based upon the assumptions (referred to as “inputs”) used in pricing the asset or liability. These standards state that “observable inputs” reflect the assumptions market participants would use in pricing the asset or liability based on market data obtained from independent sources and “unobservable inputs” reflect an entity’s own assumptions about the assumptions market participants would use in pricing the asset or liability. These inputs are summarized into three broad levels and described below:
Level 1 – | Unadjusted quoted prices in active markets for identical unrestricted securities. |
Level 2 – | Other significant observable inputs (including quoted prices for similar securities, quoted prices in inactive markets, dealer indications, interest rates, yield curves, prepayment speeds, credit risk, default rates, inputs corroborated by observable market data, etc.). |
Level 3 – | Significant unobservable inputs (including the Fund’s own assumptions about the factors that market participants would use in valuing the security) based on the best information available. |
The inputs or methodology used for valuing securities are not necessarily an indication of the risk associated with investing in those securities.
The following is a summary of the inputs used to value the Fund’s investments as of June 30, 2016:
| Level 1 | Level 2 | Level 3 | Total | |||||||||||||
| Municipal Bonds | ||||||||||||||||
| Municipal Bonds | $ | — | $ | 24,737,212 | $ | — | $ | 24,737,212 | ||||||||
| Total Municipal Bonds | — | 24,737,212 | — | 24,737,212 | ||||||||||||
| Short-Term Investments | ||||||||||||||||
| Money Market Mutual Funds | 1,103,750 | — | — | 1,103,750 | ||||||||||||
| Total Short-Term Investments | 1,103,750 | — | — | 1,103,750 | ||||||||||||
| Total Investments | $ | 1,103,750 | $ | 24,737,212 | $ | — | $ | 25,840,962 | ||||||||
Changes in valuation techniques may result in transfers into or out of assigned levels within the fair value hierarchy. There were no transfers between Level 1, Level 2 and Level 3 fair value measurements during the reporting period, as compared to their classification from the prior year’s annual report. See the Fund’s valuation policy in Note 2a to the financial statements.
The accompanying notes are an integral part of these financial statements.
Page 52
Baird Quality Intermediate Municipal Bond Fund
June 30, 2016 (Unaudited)
Portfolio Characteristics
Quality Distribution(1)(2) | |||||
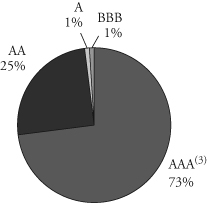 | Net Assets | $1,237,435,218 | |||
| SEC 30-Day | |||||
Yield(4) | |||||
| Institutional Class | 1.33% | ||||
| Investor Class | 1.08% | ||||
| Average | |||||
| Effective | |||||
| Duration | 4.42 years | ||||
| Average | |||||
| Effective | |||||
| Maturity | 4.93 years | ||||
| Annualized | |||||
Sector Weightings(1) | Expense | ||||
| Ratio | |||||
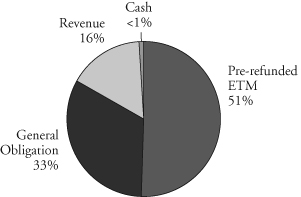 | Institutional Class | 0.30% | |||
| Investor Class | 0.55% | (5) | |||
| Portfolio | |||||
| Turnover Rate | 6.2% | (6) | |||
| Number of | |||||
| Holdings | 327 | ||||
(1) | Percentages shown are based on the Fund’s total investments. |
(2) | The quality profile is calculated on a market value-weighted basis using the highest credit quality rating for each security held by the Fund given by S&P, Moody’s or Fitch, each of which is a Nationally Recognized Statistical Rating Organization (NRSRO). NRSROs rate the credit quality of securities using a scale that generally ranges from AAA (highest) to D (lowest). |
(3) | Includes pre-refunded and escrowed-to-maturity (ETM) bonds. |
(4) | SEC yields are based on SEC guidelines and are calculated for the 30 days ended June 30, 2016. |
(5) | Includes 0.25% 12b-1 fee. |
(6) | Not annualized. |
Page 53
Baird Quality Intermediate Municipal Bond Fund(1)
June 30, 2016 (Unaudited)
Total Returns
| Average Annual | |||||
| Six | One | Five | Ten | Since | |
| For the Periods Ended June 30, 2016 | Months | Year | Years | Years | Inception(2) |
| Institutional Class Shares | 2.54% | 4.79% | 3.15% | 4.33% | 4.43% |
| Investor Class Shares | 2.45% | 4.51% | 2.88% | 4.05% | 4.16% |
| Barclays Quality Intermediate | |||||
Municipal Bond Index(3) | 2.98% | 5.42% | 3.82% | 4.63% | 4.44% |
| Barclays 7-Year General | |||||
Obligation Bond Index(4) | 3.08% | 6.17% | 4.13% | 5.05% | 4.83% |
| (1) | Effective September 1, 2015, the Fund changed its name from the Baird Intermediate Municipal Bond Fund to the Baird Quality Intermediate Municipal Bond Fund. |
| (2) | For the period from March 30, 2001 (inception date) through June 30, 2016. |
| (3) | The Barclays Quality Intermediate Municipal Bond Index is an unmanaged, market value weighted index consisting of tax-exempt, fixed-rate securities that are rated A3 or better, with maturities between 2 and 12 years. Securities must have an outstanding par value of at least $7 million and be issued as part of a transaction of at least $75 million. The bonds must be fixed rate, have a dated-date after December 31, 1990. This Index does not reflect any deduction for fees, expenses or taxes. A direct investment in an index is not possible. The Fund changed its benchmark from the Barclays 7-Year General Obligation Bond Index to the Barclays Quality Intermediate Municipal Bond Index effective September 1, 2015 because the Fund’s investment advisor believes that the Barclays Quality Intermediate Municipal Bond Index is more representative of the investment approach used to manage the Fund. |
| (4) | The Barclays 7-Year General Obligation Bond Index is an unmanaged, market value weighted index comprised of investment grade state and local general obligation bonds that have been issued as part of an offering of at least $50 million, have a minimum amount outstanding of $5 million, have been issued in the last 5 years and have a maturity of six to eight years. This index does not reflect any deduction for fees, expenses or taxes. A direct investment in an index is not possible. |
The returns shown in the table above reflect reinvestment of dividends and/or capital gains distributions in additional shares. The returns do not reflect the deduction of taxes that a shareholder would pay on Fund distributions or the redemption of Fund shares. The returns reflect the actual performance for each period and do not include the impact of trades executed on the last business day of the period that were recorded on the first business day of the next period.
The Fund’s gross expense ratio for each Class, as reflected in the Fund’s current prospectus, is set forth under “Portfolio Characteristics”.
The Fund may invest up to 25% of its total assets in municipal obligations issued by persons in the same state. As a result, changes in economic, business or political conditions of a particular state may have a disproportionate impact on the Fund’s share price. Municipal securities investments are not appropriate for all investors, especially those taxed at lower rates.
Past performance does not guarantee future results. Investment return and principal value will fluctuate so that an investor’s shares, when redeemed, may be worth more or less than their original cost.
For information about the performance of the Fund as of the most recent month-end, please call 1-866-44BAIRD or visit www.bairdfunds.com. Mutual fund performance changes over time and current performance may be lower or higher than that stated.
Page 54
Baird Quality Intermediate Municipal Bond Fund
Summary Schedule of Investments, June 30, 2016 (Unaudited)
This schedule summarizes the Fund’s holdings by asset type. Details are reported for each of the Fund’s 50 largest individual holdings and for investments that, in total for any issuer, represent more than 1% of the Fund’s net assets. The total value of smaller holdings is reported as a single amount within each category.
The Fund reports a complete list of its holdings in regulatory filings four times in each fiscal year, at the quarter end. For the second and fourth fiscal quarters, the complete listing of the Fund’s holdings is available electronically in the Fund’s Form N-CSR at http://www.bairdfunds.com/prospectuses-reports and on the Securities and Exchange Commission’s website (www.sec.gov) or you can have it mailed to you without charge by calling 1-866-44BAIRD. For the first and third fiscal quarters, the Fund files the lists with the SEC on Form N-Q. Shareholders can look up the Fund’s Forms N-CSR and N-Q on the SEC’s website (www.sec.gov).
Long-Term Investments
| Principal | % of | |||||||||||
| Amount | Value | Net Assets | ||||||||||
| Municipal Bonds | ||||||||||||
| Alabama | ||||||||||||
| Total Alabama | ||||||||||||
| (Cost $2,139,430)# | $ | 2,264,698 | 0.2 | % | ||||||||
| Arizona | ||||||||||||
| Total Arizona | ||||||||||||
| (Cost $1,006,468)# | 1,045,950 | 0.1 | % | |||||||||
| Arkansas | ||||||||||||
| Total Arkansas | ||||||||||||
| (Cost $1,086,246)# | 1,081,510 | 0.1 | % | |||||||||
| California | ||||||||||||
| Bakersfield California Certificates Participation | ||||||||||||
| 0.000%, 04/15/2021 (ETM) | $ | 12,380,000 | 11,664,807 | 0.9 | % | |||||||
| San Joaquin Hills California Transportation | ||||||||||||
| Corridor Agency Toll Road Revenue | ||||||||||||
| 0.000%, 01/01/2020 (ETM) | 6,865,000 | 6,667,288 | 0.5 | % | ||||||||
| 0.000%, 01/01/2023 (ETM) | 14,000,000 | 12,946,360 | 1.1 | % | ||||||||
| San Marcos California Public Facilities Authority Revenue | ||||||||||||
| 0.000%, 09/01/2019 (ETM) | 17,495,000 | 16,921,514 | 1.4 | % | ||||||||
| Other California# | 4,315,801 | 0.3 | % | |||||||||
| Total California | ||||||||||||
| (Cost $47,656,533) | 52,515,770 | 4.2 | % | |||||||||
| Colorado | ||||||||||||
| Dawson Ridge Metropolitan District No. 1 Colorado | ||||||||||||
| 0.000%, 10/01/2022 (ETM) | 32,895,000 | 29,819,975 | 2.4 | % | ||||||||
| 0.000%, 10/01/2022 (ETM) | 22,540,000 | 20,432,961 | 1.7 | % | ||||||||
| Regional Transportation District Colorado | ||||||||||||
| Sales Tax Revenue, 5.000%, 11/01/2036 | ||||||||||||
| (Pre-refunded to 11/01/2016) (Insured by AMBAC) | 6,785,000 | 6,882,026 | 0.6 | % | ||||||||
| Other Colorado# | 10,457,532 | 0.8 | % | |||||||||
| Total Colorado | ||||||||||||
| (Cost $64,110,099) | 67,592,494 | 5.5 | % | |||||||||
The accompanying notes are an integral part of these financial statements.
Page 55
Baird Quality Intermediate Municipal Bond Fund
Summary Schedule of Investments, June 30, 2016 (Unaudited)
Long-Term Investments (cont.)
| Principal | % of | |||||||||||
| Amount | Value | Net Assets | ||||||||||
| Connecticut | ||||||||||||
| Total Connecticut | ||||||||||||
| (Cost $4,865,637)# | $ | 5,071,152 | 0.4 | % | ||||||||
| Delaware | ||||||||||||
| Total Delaware | ||||||||||||
| (Cost $2,263,358)# | 2,305,680 | 0.2 | % | |||||||||
| District of Columbia | ||||||||||||
| Total District of Columbia | ||||||||||||
| (Cost $162,541)# | 163,667 | 0.0 | % | |||||||||
| Florida | ||||||||||||
| Broward County Florida School Board | ||||||||||||
| 5.250%, 07/01/2022 (Callable 07/01/2021) | $ | 8,390,000 | 10,034,272 | 0.8 | % | |||||||
| 5.250%, 07/01/2023 (Callable 07/01/2021) | 4,915,000 | 5,857,206 | 0.5 | % | ||||||||
| County of St. Lucie Florida | ||||||||||||
| 6.000%, 10/01/2020 (ETM) | 6,520,000 | 7,563,070 | 0.6 | % | ||||||||
| Florida State Board of Education | ||||||||||||
| 5.000%, 06/01/2022 (Callable 06/01/2019) | 13,800,000 | 15,463,866 | 1.2 | % | ||||||||
| Miami-Dade County Florida | ||||||||||||
| 4.500%, 10/01/2020 | 7,100,000 | 8,124,885 | 0.7 | % | ||||||||
| Other Florida# | 51,692,675 | 4.2 | % | |||||||||
| Total Florida | ||||||||||||
| (Cost $92,318,159) | 98,735,974 | 8.0 | % | |||||||||
| Georgia | ||||||||||||
| Forsyth County Georgia Hospital Authority | ||||||||||||
| Revenue Anticipation Certificates | ||||||||||||
| 6.375%, 10/01/2028 (ETM) | 8,050,000 | 10,841,498 | 0.9 | % | ||||||||
| Gwinnett County Georgia School District | ||||||||||||
| 5.000%, 02/01/2026 (Pre-refunded to 02/01/2018) | 7,500,000 | 8,018,325 | 0.6 | % | ||||||||
| State of Georgia | ||||||||||||
| 5.000%, 07/01/2020 (Callable 07/01/2017) | 12,570,000 | 13,113,024 | 1.1 | % | ||||||||
| Other Georgia# | 7,827,590 | 0.6 | % | |||||||||
| Total Georgia | ||||||||||||
| (Cost $38,253,838) | 39,800,437 | 3.2 | % | |||||||||
| Illinois | ||||||||||||
| Chicago Illinois Board of Education | ||||||||||||
| 5.000%, 12/01/2017 | ||||||||||||
| (Callable 12/01/2016) (Insured by AGM) | 4,345,000 | 4,425,165 | 0.3 | % | ||||||||
| 6.000%, 01/01/2020 (Insured by NPFGC) | 14,745,000 | 15,657,716 | 1.3 | % | ||||||||
| Illinois Finance Authority | ||||||||||||
| 0.000%, 07/15/2023 (ETM) | 25,120,000 | 22,381,418 | 1.8 | % | ||||||||
| 0.000%, 07/15/2025 (ETM) | 31,660,000 | 26,668,801 | 2.2 | % | ||||||||
| 6.625%, 11/01/2039 (Pre-refunded to 05/01/2019) | 395,000 | 460,463 | 0.0 | % | ||||||||
The accompanying notes are an integral part of these financial statements.
Page 56
Baird Quality Intermediate Municipal Bond Fund
Summary Schedule of Investments, June 30, 2016 (Unaudited)
Long-Term Investments (cont.)
| Principal | % of | |||||||||||
| Amount | Value | Net Assets | ||||||||||
| Kendall Kane & Will Counties | ||||||||||||
| Community Unit School District No. 308 | ||||||||||||
| 0.000%, 02/01/2021 (Insured by AGM) | $ | 13,625,000 | $ | 12,418,234 | 1.0 | % | ||||||
| Other Illinois# | 62,524,192 | 5.1 | % | |||||||||
| Total Illinois | ||||||||||||
| (Cost $137,705,982) | 144,535,989 | 11.7 | % | |||||||||
| Indiana | ||||||||||||
| Total Indiana | ||||||||||||
| (Cost $12,102,529)# | 12,710,035 | 1.0 | % | |||||||||
| Kansas | ||||||||||||
| Total Kansas | ||||||||||||
| (Cost $4,440,241)# | 4,624,571 | 0.4 | % | |||||||||
| Kentucky | ||||||||||||
| Louisville & Jefferson County Metropolitan Government | ||||||||||||
| 6.125%, 02/01/2037 (Pre-refunded to 02/01/2018) | 13,980,000 | 15,180,043 | 1.2 | % | ||||||||
| Other Kentucky# | 3,833,564 | 0.3 | % | |||||||||
| Total Kentucky | ||||||||||||
| (Cost $18,827,174) | 19,013,607 | 1.5 | % | |||||||||
| Louisiana | ||||||||||||
| Louisiana Public Facilities Authority | ||||||||||||
| 6.750%, 07/01/2039 (Pre-refunded to 07/01/2019) | 6,155,000 | 7,223,508 | 0.6 | % | ||||||||
| Louisiana Public Facilities Authority Revenue | ||||||||||||
| 5.500%, 05/15/2027 (Pre-refunded to 05/15/2026) | 10,390,000 | 13,930,289 | 1.1 | % | ||||||||
| 5.500%, 05/15/2032 (Pre-refunded to 05/15/2026) | 21,985,000 | 29,799,348 | 2.4 | % | ||||||||
| State of Louisiana | ||||||||||||
| 5.000%, 11/15/2018 | 1,775,000 | 1,945,737 | 0.2 | % | ||||||||
| 5.000%, 11/15/2020 (Callable 05/15/2020) | 10,000,000 | 11,489,600 | 0.9 | % | ||||||||
| Other Louisiana# | 3,690,025 | 0.3 | % | |||||||||
| Total Louisiana | ||||||||||||
| (Cost $60,429,972) | 68,078,507 | 5.5 | % | |||||||||
| Maine | ||||||||||||
| Total Maine | ||||||||||||
| (Cost $2,196,076)# | 2,203,001 | 0.2 | % | |||||||||
| Maryland | ||||||||||||
| Total Maryland | ||||||||||||
| (Cost $3,694,275)# | 3,790,701 | 0.3 | % | |||||||||
| Massachusetts | ||||||||||||
| Massachusetts State | ||||||||||||
| 4.000%, 12/01/2022 (Callable 12/01/2019) | 15,000,000 | 16,602,750 | 1.3 | % | ||||||||
| Other Massachusetts# | 7,970,214 | 0.7 | % | |||||||||
| Total Massachusetts | ||||||||||||
| (Cost $23,821,165) | 24,572,964 | 2.0 | % | |||||||||
The accompanying notes are an integral part of these financial statements.
Page 57
Baird Quality Intermediate Municipal Bond Fund
Summary Schedule of Investments, June 30, 2016 (Unaudited)
Long-Term Investments (cont.)
| Principal | % of | |||||||||||
| Amount | Value | Net Assets | ||||||||||
| Michigan | ||||||||||||
| Michigan Finance Authority | ||||||||||||
| 5.000%, 01/01/2019 | $ | 7,000,000 | $ | 7,740,530 | 0.6 | % | ||||||
| Other Michigan# | 30,590,428 | 2.5 | % | |||||||||
| Total Michigan | ||||||||||||
| (Cost $36,812,511) | 38,330,958 | 3.1 | % | |||||||||
| Minnesota | ||||||||||||
| University of Minnesota | ||||||||||||
| 5.500%, 07/01/2021 (ETM) | 10,380,000 | 12,170,861 | 1.0 | % | ||||||||
| Other Minnesota# | 4,602,263 | 0.3 | % | |||||||||
| Total Minnesota | ||||||||||||
| (Cost $16,349,558) | 16,773,124 | 1.3 | % | |||||||||
| Missouri | ||||||||||||
| Total Missouri | ||||||||||||
| (Cost $2,267,222)# | 2,368,770 | 0.2 | % | |||||||||
| Nebraska | ||||||||||||
| Total Nebraska | ||||||||||||
| (Cost $2,056,820)# | 2,095,934 | 0.2 | % | |||||||||
| New Hampshire | ||||||||||||
| Total New Hampshire | ||||||||||||
| (Cost $3,158,697)# | 3,250,930 | 0.3 | % | |||||||||
| New Jersey | ||||||||||||
| Total New Jersey | ||||||||||||
| (Cost $19,077,909)# | 19,878,491 | 1.6 | % | |||||||||
| New Mexico | ||||||||||||
| Total New Mexico | ||||||||||||
| (Cost $4,331,450)# | 4,425,144 | 0.4 | % | |||||||||
| New York | ||||||||||||
| Metropolitan Transit Authority New York | ||||||||||||
| 6.000%, 04/01/2020 (ETM) | 13,615,000 | 15,164,387 | 1.2 | % | ||||||||
| New York State Dormitory Authority | ||||||||||||
| 5.000%, 12/15/2023 (Callable 12/15/2022) | 11,685,000 | 14,429,573 | 1.2 | % | ||||||||
| Westchester Tobacco Asset Securitization/NY | ||||||||||||
| 6.950%, 07/15/2039 (Pre-refunded to 07/15/2017) | 13,075,000 | 14,053,533 | 1.1 | % | ||||||||
| Other New York# | 24,818,476 | 2.0 | % | |||||||||
| Total New York | ||||||||||||
| (Cost $65,829,137) | 68,465,969 | 5.5 | % | |||||||||
| North Carolina | ||||||||||||
| North Carolina Eastern Municipal Power Agency | ||||||||||||
| 5.000%, 01/01/2017 (ETM) | 1,460,000 | 1,492,076 | 0.1 | % | ||||||||
5.000%, 01/01/2021 (ETM)(2) | 10,150,000 | 11,737,765 | 0.9 | % | ||||||||
The accompanying notes are an integral part of these financial statements.
Page 58
Baird Quality Intermediate Municipal Bond Fund
Summary Schedule of Investments, June 30, 2016 (Unaudited)
Long-Term Investments (cont.)
| Principal | % of | |||||||||||
| Amount | Value | Net Assets | ||||||||||
| North Carolina Eastern Municipal Power Agency (cont.) | ||||||||||||
| 6.400%, 01/01/2021 (ETM) | $ | 4,062,000 | $ | 4,597,697 | 0.4 | % | ||||||
| 4.500%, 01/01/2024 (Pre-refunded to 01/01/2022) | 11,740,000 | 13,646,341 | 1.1 | % | ||||||||
| 6.000%, 01/01/2026 (Pre-refunded to 01/01/2022) | 2,635,000 | 3,326,977 | 0.3 | % | ||||||||
| Other North Carolina# | 518,963 | 0.0 | % | |||||||||
| Total North Carolina | ||||||||||||
| (Cost $34,065,363) | 35,319,819 | 2.8 | % | |||||||||
| North Dakota | ||||||||||||
| Total North Dakota | ||||||||||||
| (Cost $1,775,010)# | 1,784,685 | 0.1 | % | |||||||||
| Ohio | ||||||||||||
| State of Ohio | ||||||||||||
| 5.000%, 06/15/2021 | 6,740,000 | 8,040,281 | 0.7 | % | ||||||||
| Other Ohio# | 18,147,190 | 1.4 | % | |||||||||
| Total Ohio | ||||||||||||
| (Cost $25,216,061) | 26,187,471 | 2.1 | % | |||||||||
| Oregon | ||||||||||||
| Total Oregon | ||||||||||||
| (Cost $7,482,961)# | 7,526,761 | 0.6 | % | |||||||||
| Pennsylvania | ||||||||||||
| Pennsylvania Convention Center | ||||||||||||
| Authority Revenue Bonds | ||||||||||||
| 6.000%, 09/01/2019 (ETM) | 14,055,000 | 15,571,253 | 1.3 | % | ||||||||
| Other Pennsylvania# | 18,568,847 | 1.5 | % | |||||||||
| Total Pennsylvania | ||||||||||||
| (Cost $33,670,034) | 34,140,100 | 2.8 | % | |||||||||
| Puerto Rico | ||||||||||||
| Total Puerto Rico | ||||||||||||
| (Cost $20,776,147)# | 18,744,488 | 1.5 | % | |||||||||
| Rhode Island | ||||||||||||
| Total Rhode Island | ||||||||||||
| (Cost $5,893,993)# | 6,329,650 | 0.5 | % | |||||||||
| South Carolina | ||||||||||||
| Piedmont Municipal Power Agency | ||||||||||||
| South Carolina Electric Revenue | ||||||||||||
| 6.750%, 01/01/2020 (ETM) | 6,450,000 | 7,732,260 | 0.6 | % | ||||||||
| Other South Carolina# | 5,785,999 | 0.5 | % | |||||||||
| Total South Carolina | ||||||||||||
| (Cost $12,539,208) | 13,518,259 | 1.1 | % | |||||||||
The accompanying notes are an integral part of these financial statements.
Page 59
Baird Quality Intermediate Municipal Bond Fund
Summary Schedule of Investments, June 30, 2016 (Unaudited)
Long-Term Investments (cont.)
| Principal | % of | |||||||||||
| Amount | Value | Net Assets | ||||||||||
| South Dakota | ||||||||||||
| Total South Dakota | ||||||||||||
| (Cost $2,429,329)# | $ | 2,438,078 | 0.2 | % | ||||||||
| Tennessee | ||||||||||||
| Total Tennessee | ||||||||||||
| (Cost $10,818,612)# | 11,145,424 | 0.9 | % | |||||||||
| Texas | ||||||||||||
| Alvin Independent School District/TX | ||||||||||||
| 5.000%, 02/15/2027 | ||||||||||||
| (Callable 02/15/2026) (PSF Guaranteed) | $ | 8,110,000 | 10,489,717 | 0.9 | % | |||||||
| City of Houston TX Combined Utility System Revenue | ||||||||||||
| 0.000%, 12/01/2019 (ETM) (Insured by AGM) | 13,355,000 | 12,896,256 | 1.1 | % | ||||||||
| 5.500%, 12/01/2029 (ETM) | 16,050,000 | 22,662,760 | 1.8 | % | ||||||||
| 5.500%, 12/01/2024 (ETM) | 1,735,000 | 2,238,098 | 0.2 | % | ||||||||
| Harris County Health Facilities Development Corp. | ||||||||||||
| 5.750%, 07/01/2027 (ETM) | 5,000,000 | 6,563,050 | 0.6 | % | ||||||||
| Harris County Texas | ||||||||||||
| 5.750%, 10/01/2028 (Pre-refunded to 10/01/2018) | 6,930,000 | 7,693,547 | 0.6 | % | ||||||||
| 5.000%-5.750%, 10/01/2019-10/01/2026 | 5,855,000 | 7,328,822 | 0.6 | % | ||||||||
| Lamar Consolidated Independent School District | ||||||||||||
| 5.000%, 02/15/2026 | ||||||||||||
| (Callable 02/15/2025) (PSF Guaranteed) | 5,860,000 | 7,477,829 | 0.6 | % | ||||||||
| North East Independent School District/TX | ||||||||||||
| 5.000%, 08/01/2021 (PSF Guaranteed) | 6,095,000 | 7,270,543 | 0.6 | % | ||||||||
| 5.000%, 08/01/2023 (PSF Guaranteed) | 5,805,000 | 7,251,200 | 0.6 | % | ||||||||
| 5.000%, 02/01/2024 (PSF Guaranteed) | 2,930,000 | 3,699,447 | 0.3 | % | ||||||||
| San Antonio Texas Electric & Gas Revenue | ||||||||||||
| 5.650%, 02/01/2019 (ETM) | 9,765,000 | 10,596,880 | 0.9 | % | ||||||||
| Tarrant County Texas Health Facilities Revenue | ||||||||||||
| 6.000%, 09/01/2024 (ETM) | 7,385,000 | 8,835,783 | 0.7 | % | ||||||||
| Texas State | ||||||||||||
| 5.000%, 10/01/2018 | 6,285,000 | 6,887,920 | 0.6 | % | ||||||||
| Tomball Independent School District | ||||||||||||
| 5.000%, 02/15/2025 (PSF Guaranteed) | 5,865,000 | 7,549,663 | 0.6 | % | ||||||||
| University of Texas System | ||||||||||||
| 5.000%, 08/15/2022 | 9,530,000 | 11,694,454 | 0.9 | % | ||||||||
| Other Texas# | 133,084,694 | 10.6 | % | |||||||||
| Total Texas | ||||||||||||
| (Cost $260,088,984) | 274,220,663 | 22.2 | % | |||||||||
| Utah | ||||||||||||
| Total Utah | ||||||||||||
| (Cost $8,798,947)# | 9,460,216 | 0.8 | % | |||||||||
The accompanying notes are an integral part of these financial statements.
Page 60
Baird Quality Intermediate Municipal Bond Fund
Summary Schedule of Investments, June 30, 2016 (Unaudited)
Long-Term Investments (cont.)
| Principal | % of | |||||||||||
| Amount | Value | Net Assets | ||||||||||
| Virginia | ||||||||||||
| Total Virginia | ||||||||||||
| (Cost $4,371,879)# | $ | 4,471,799 | 0.4 | % | ||||||||
| Washington | ||||||||||||
| Washington Health Care Facilities Authority | ||||||||||||
| 6.250%, 08/01/2028 (Pre-refunded to 08/01/2018) | $ | 1,355,000 | 1,504,470 | 0.1 | % | |||||||
| 6.125%, 11/15/2031 (Pre-refunded to 05/15/2021) | 610,000 | 757,553 | 0.0 | % | ||||||||
| 6.250%, 08/01/2036 (Pre-refunded to 08/01/2018) | 8,100,000 | 8,993,511 | 0.7 | % | ||||||||
| 6.250%, 11/15/2041 (Pre-refunded to 05/15/2021) | 4,750,000 | 5,927,097 | 0.5 | % | ||||||||
| Washington State | ||||||||||||
| 5.000%, 01/01/2021 | 10,000,000 | 11,716,900 | 1.0 | % | ||||||||
| 5.500%, 07/01/2023 | 5,040,000 | 6,259,025 | 0.5 | % | ||||||||
| Other Washington# | 27,197,181 | 2.2 | % | |||||||||
| Total Washington | ||||||||||||
| (Cost $59,963,050) | 62,355,737 | 5.0 | % | |||||||||
| West Virginia | ||||||||||||
| Total West Virginia | ||||||||||||
| (Cost $1,208,667)# | 1,227,011 | 0.1 | % | |||||||||
| Wisconsin | ||||||||||||
| Total Wisconsin | ||||||||||||
| (Cost $4,326,238)# | 4,370,059 | 0.3 | % | |||||||||
| Total Long-Term Investments | ||||||||||||
| (Cost $1,160,387,510) | 1,218,936,247 | 98.5 | % | |||||||||
| Short-Term Investment | ||||||||||||
| Shares | ||||||||||||
| Money Market Mutual Fund | ||||||||||||
| Goldman Sachs Financial Square Funds, | ||||||||||||
| Institutional Class, 0.25%« | 16,931,307 | 16,931,307 | 1.4 | % | ||||||||
| Total Short-Term Investment | ||||||||||||
| (Cost $16,931,307) | 16,931,307 | 1.4 | % | |||||||||
| Total Investments | ||||||||||||
| (Cost $1,177,318,817) | 1,235,867,554 | 99.9 | % | |||||||||
| Other Assets in Excess of Liabilities | 1,567,664 | 0.1 | % | |||||||||
| TOTAL NET ASSETS | $ | 1,237,435,218 | 100.0 | % | ||||||||
Notes to Summary Schedule of Investments
AGM – Assured Guaranty Municipal
AMBAC – Ambac Assurance Corporation
ETM – Escrowed to Maturity
NPFGC – National Public Finance Guarantee Corp.
PSF – Texas Permanent School Fund
The accompanying notes are an integral part of these financial statements.
Page 61
Baird Quality Intermediate Municipal Bond Fund
Summary Schedule of Investments, June 30, 2016 (Unaudited)
| # | Represents the aggregate value, by category, of securities that are not among the 50 largest holdings and, in total for any issuer, represent 1% or less of net assets. | |
| (1) | Variable or floating rate security. Floating rate securities are securities whose yields vary with a designated index rate. These securities rates are as of June 30, 2016. | |
| (2) | Security or a portion of the security purchased on a when-issued or delayed delivery basis. | |
| « | 7-Day Yield |
Summary of Fair Value Exposure at June 30, 2016 (Unaudited)
The Fund has adopted authoritative fair valuation accounting standards which establish a definition of fair value and set out a hierarchy for measuring fair value. These standards require additional disclosures about the various inputs and valuation techniques used to develop the measurements of fair value and a discussion on changes in valuation techniques and related inputs during the period. These standards define fair value as the price that would be received to sell an asset or paid to transfer a liability in an orderly transaction between market participants at the measurement date.
The fair value hierarchy is organized into three levels based upon the assumptions (referred to as “inputs”) used in pricing the asset or liability. These standards state that “observable inputs” reflect the assumptions market participants would use in pricing the asset or liability based on market data obtained from independent sources and “unobservable inputs” reflect an entity’s own assumptions about the assumptions market participants would use in pricing the asset or liability. These inputs are summarized into three broad levels and described below:
Level 1 – | Unadjusted quoted prices in active markets for identical unrestricted securities. |
Level 2 – | Other significant observable inputs (including quoted prices for similar securities, quoted prices in inactive markets, dealer indications, interest rates, yield curves, prepayment speeds, credit risk, default rates, inputs corroborated by observable market data, etc.). |
Level 3 – | Significant unobservable inputs (including the Fund’s own assumptions about the factors that market participants would use in valuing the security) based on the best information available. |
The inputs or methodology used for valuing securities are not necessarily an indication of the risk associated with investing in those securities.
The following is a summary of the inputs used to value the Fund’s investments as of June 30, 2016:
| Level 1 | Level 2 | Level 3 | Total | |||||||||||||
| Municipal Bonds | ||||||||||||||||
| Municipal Bonds | $ | — | $ | 1,218,936,247 | $ | — | $ | 1,218,936,247 | ||||||||
| Total Municipal Bonds | — | 1,218,936,247 | — | 1,218,936,247 | ||||||||||||
| Short-Term Investment | ||||||||||||||||
| Money Market Mutual Fund | 16,931,307 | — | — | 16,931,307 | ||||||||||||
| Total Short-Term Investment | 16,931,307 | — | — | 16,931,307 | ||||||||||||
| Total Investments | $ | 16,931,307 | $ | 1,218,936,247 | $ | — | $ | 1,235,867,554 | ||||||||
Changes in valuation techniques may result in transfers into or out of assigned levels within the fair value hierarchy. There were no transfers between Level 1, Level 2 and Level 3 fair value measurements during the reporting period, as compared to their classification from the prior year’s annual report. See the Fund’s valuation policy in Note 2a to the financial statements.
The accompanying notes are an integral part of these financial statements.
Page 62
Baird Core Intermediate Municipal Bond Fund
June 30, 2016 (Unaudited)
Portfolio Characteristics
Quality Distribution(1)(2) | |||||
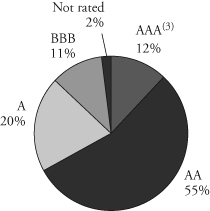 | Net Assets | $71,426,566 | |||
| SEC 30-Day | |||||
Yield(4) | |||||
| Institutional Class | 1.55% | ||||
| Investor Class | 1.30% | ||||
| Average | |||||
| Effective | |||||
| Duration | 4.48 years | ||||
| Average | |||||
| Effective | |||||
| Maturity | 5.02 years | ||||
| Annualized | |||||
Sector Weightings(1) | Expense | ||||
| Ratio | |||||
 | Institutional Class | 0.30% | |||
| Investor Class | 0.55% | (5) | |||
| Portfolio | |||||
| Turnover Rate | 55.5% | (6) | |||
| Number of | |||||
| Holdings | 272 | ||||
(1) | Percentages shown are based on the Fund’s total investments. |
(2) | The quality profile is calculated on a market value-weighted basis using the highest credit quality rating for each security held by the Fund given by S&P, Moody’s or Fitch, each of which is a Nationally Recognized Statistical Rating Organization (NRSRO). NRSROs rate the credit quality of securities using a scale that generally ranges from AAA (highest) to D (lowest). |
(3) | Includes pre-refunded and escrowed-to-maturity (ETM) bonds. |
(4) | SEC yields are based on SEC guidelines and are calculated for the 30 days ended June 30, 2016. |
(5) | Includes 0.25% 12b-1 fee. |
(6) | Not annualized. |
Page 63
Baird Core Intermediate Municipal Bond Fund
June 30, 2016 (Unaudited)
Total Returns
| Six | Since | |
| For the Periods Ended June 30, 2016 | Months | Inception(1) |
| Institutional Class Shares | 4.05% | 6.11% |
| Investor Class Shares | 3.93% | 5.91% |
Barclays Municipal Bond (1-15 Year) Index(2) | 3.38% | 5.28% |
| (1) | For the period from August 31, 2015 (inception date) through June 30, 2016. |
| (2) | The Barclays Municipal Bond (1-15 Year) Index is an unmanaged, market value weighted index of investment-grade, tax-exempt, and fixed-rate securities with maturities between 1 and 17 years. Securities must have an outstanding par value of at least $7 million and be issued as part of a transaction of at least $75 million. The bonds must be fixed rate, have a dated-date after December 31, 1990, and must be at least one year from their maturity date. This Index does not reflect any deduction for fees, expenses or taxes. A direct investment in an index is not possible. |
The returns shown in the table above reflect reinvestment of dividends and/or capital gains distributions in additional shares. The returns do not reflect the deduction of taxes that a shareholder would pay on Fund distributions or the redemption of Fund shares. The returns reflect the actual performance for each period and do not include the impact of trades executed on the last business day of the period that were recorded on the first business day of the next period.
The Fund’s gross expense ratio for each Class, as reflected in the Fund’s current prospectus, is set forth under “Portfolio Characteristics”.
The Fund may invest up to 25% of its total assets in municipal obligations issued by persons in the same state. As a result, changes in economic, business or political conditions of a particular state may have a disproportionate impact on the Fund’s share price. Municipal securities investments are not appropriate for all investors, especially those taxed at lower rates.
Past performance does not guarantee future results. Investment return and principal value will fluctuate so that an investor’s shares, when redeemed, may be worth more or less than their original cost.
For information about the performance of the Fund as of the most recent month-end, please call 1-866-44BAIRD or visit www.bairdfunds.com. Mutual fund performance changes over time and current performance may be lower or higher than that stated.
Page 64
Baird Core Intermediate Municipal Bond Fund
Summary Schedule of Investments, June 30, 2016 (Unaudited)
This schedule summarizes the Fund’s holdings by asset type. Details are reported for each of the Fund’s 50 largest individual holdings and for investments that, in total for any issuer, represent more than 1% of the Fund’s net assets. The total value of smaller holdings is reported as a single amount within each category.
The Fund reports a complete list of its holdings in regulatory filings four times in each fiscal year, at the quarter end. For the second and fourth fiscal quarters, the complete listing of the Fund’s holdings is available electronically in the Fund’s Form N-CSR at http://www.bairdfunds.com/prospectuses-reports and on the Securities and Exchange Commission’s website (www.sec.gov) or you can have it mailed to you without charge by calling 1-866-44BAIRD. For the first and third fiscal quarters, the Fund files the lists with the SEC on Form N-Q. Shareholders can look up the Fund’s Forms N-CSR and N-Q on the SEC’s website (www.sec.gov).
Long-Term Investments
| Principal | % of | |||||||||||
| Amount | Value | Net Assets | ||||||||||
| Municipal Bonds | ||||||||||||
| Alabama | ||||||||||||
| Total Alabama | ||||||||||||
| (Cost $995,038)# | $ | 1,001,791 | 1.4 | % | ||||||||
| Alaska | ||||||||||||
| Alaska Municipal Bond Bank Authority | ||||||||||||
| 5.000%, 08/01/2027 (Callable 08/01/2023) | $ | 500,000 | 615,075 | 0.9 | % | |||||||
| City of Valdez AK | ||||||||||||
| 5.000%, 01/01/2021 | 435,000 | 501,020 | 0.7 | % | ||||||||
| Other Alaska# | 359,195 | 0.5 | % | |||||||||
| Total Alaska | ||||||||||||
| (Cost $1,403,150) | 1,475,290 | 2.1 | % | |||||||||
| Arizona | ||||||||||||
| BluePath 2016-1 TE Trust | ||||||||||||
| 2.750%, 09/01/2026 (Callable 08/27/2021) | 500,000 | 499,990 | 0.7 | % | ||||||||
| City of El Mirage AZ | ||||||||||||
| 5.000%, 07/01/2026 (Callable 07/01/2020) | 400,000 | 462,368 | 0.6 | % | ||||||||
| City of Tucson AZ Water System Revenue | ||||||||||||
| 5.000%, 07/01/2032 (Callable 07/01/2025) | 500,000 | 626,550 | 0.9 | % | ||||||||
| Other Arizona# | 948,939 | 1.4 | % | |||||||||
| Total Arizona | ||||||||||||
| (Cost $2,448,909) | 2,537,847 | 3.6 | % | |||||||||
| Arkansas | ||||||||||||
| Total Arkansas | ||||||||||||
| (Cost $962,942)# | 988,355 | 1.4 | % | |||||||||
| California | ||||||||||||
| Corona-Norca Unified School District | ||||||||||||
| 0.000%, 08/01/2039 | ||||||||||||
| (Callable 08/01/2027) (Insured by AGM) | 350,000 | 484,533 | 0.7 | % | ||||||||
| East Bay Municipal Utility District Water System Revenue | ||||||||||||
| 5.000%, 06/01/2033 (Callable 06/01/2024) | 475,000 | 593,636 | 0.8 | % | ||||||||
The accompanying notes are an integral part of these financial statements.
Page 65
Baird Core Intermediate Municipal Bond Fund
Summary Schedule of Investments, June 30, 2016 (Unaudited)
Long-Term Investments (cont.)
| Principal | % of | |||||||||||
| Amount | Value | Net Assets | ||||||||||
| Redondo Beach Unified School District | ||||||||||||
| 0.000%, 08/01/2034 (Callable 08/01/2026) | $ | 455,000 | $ | 607,652 | 0.9 | % | ||||||
| San Bernardino City Unified School District | ||||||||||||
| 5.000%, 08/01/2027 | ||||||||||||
| (Callable 08/01/2023) (Insured by AGM) | 450,000 | 540,878 | 0.8 | % | ||||||||
| San Diego Unified School District/CA | ||||||||||||
| 4.000%, 07/01/2033 (Callable 07/01/2026) | 500,000 | 584,690 | 0.8 | % | ||||||||
| Westlands Water District | ||||||||||||
| 5.000%, 09/01/2030 | ||||||||||||
| (Callable 09/01/2022) (Insured by AGM) | 500,000 | 604,110 | 0.8 | % | ||||||||
| Other California# | 4,218,019 | 5.9 | % | |||||||||
| Total California | ||||||||||||
| (Cost $7,270,227) | 7,633,518 | 10.7 | % | |||||||||
| Colorado | ||||||||||||
| Total Colorado | ||||||||||||
| (Cost $1,309,056)# | 1,321,665 | 1.8 | % | |||||||||
| Connecticut | ||||||||||||
| Connecticut Housing Finance Authority | ||||||||||||
| 4.000%, 11/15/2045 (Callable 05/15/2025) | 700,000 | 768,166 | 1.1 | % | ||||||||
| Other Connecticut# | 200,000 | 0.3 | % | |||||||||
| Total Connecticut | ||||||||||||
| (Cost $964,556) | 968,166 | 1.4 | % | |||||||||
| District of Columbia | ||||||||||||
| Total District of Columbia | ||||||||||||
| (Cost $859,873)# | 884,702 | 1.2 | % | |||||||||
| Florida | ||||||||||||
| City of Orlando FL | ||||||||||||
| 5.250%, 11/01/2026 (Callable 05/01/2024) | 500,000 | 639,115 | 0.9 | % | ||||||||
| 5.000%, 10/01/2027 (Pre-refunded to 10/01/2020) | 100,000 | 117,139 | 0.2 | % | ||||||||
| County of Escambia FL | ||||||||||||
| 0.550%, 04/01/2039 | ||||||||||||
(Optional Put Date 07/01/2016) (Callable 07/01/2016)(1) | 600,000 | 600,000 | 0.8 | % | ||||||||
| Other Florida# | 1,684,301 | 2.4 | % | |||||||||
| Total Florida | ||||||||||||
| (Cost $2,953,715) | 3,040,555 | 4.3 | % | |||||||||
| Georgia | ||||||||||||
| Total Georgia | ||||||||||||
| (Cost $1,167,338)# | 1,187,901 | 1.7 | % | |||||||||
| Illinois | ||||||||||||
| Bureau County Township High School District No. 502 | ||||||||||||
| 6.625%, 10/01/2043 | ||||||||||||
| (Callable 12/01/2023) (Insured by BAM) | 370,000 | 482,158 | 0.7 | % | ||||||||
The accompanying notes are an integral part of these financial statements.
Page 66
Baird Core Intermediate Municipal Bond Fund
Summary Schedule of Investments, June 30, 2016 (Unaudited)
Long-Term Investments (cont.)
| Principal | % of | |||||||||||
| Amount | Value | Net Assets | ||||||||||
| Chicago O’Hare International Airport: | ||||||||||||
| 5.000%, 01/01/2020 | ||||||||||||
| (Callable 01/01/2017) (Insured by AGM) | $ | 100,000 | $ | 102,029 | 0.1 | % | ||||||
| 5.500%, 01/01/2031 (Callable 01/01/2021) | 500,000 | 585,035 | 0.8 | % | ||||||||
| City of Chicago IL Waterworks Revenue | ||||||||||||
| 5.000%, 11/01/2028 | ||||||||||||
| (Callable 11/01/2018) (Insured by AGM) | 450,000 | 477,697 | 0.7 | % | ||||||||
| Illinois State University | ||||||||||||
| 5.000%, 04/01/2023 (Callable 04/01/2021) | 440,000 | 498,498 | 0.7 | % | ||||||||
| Ogle & Winnebago Counties | ||||||||||||
| Community Unit School District: | ||||||||||||
| 5.000%, 12/01/2023 (Insured by BAM) | 400,000 | 478,232 | 0.7 | % | ||||||||
| 5.000%, 12/01/2024 (Insured by BAM) | 175,000 | 211,507 | 0.3 | % | ||||||||
| St. Clair County IL Community | ||||||||||||
| Consolidated School District | ||||||||||||
| 0.000%, 12/01/2020 | 500,000 | 466,120 | 0.6 | % | ||||||||
| State of Illinois | ||||||||||||
| 5.000%, 06/01/2019 | 400,000 | 434,024 | 0.6 | % | ||||||||
| 5.000%, 01/01/2022 (Callable 01/01/2020) | 215,000 | 232,165 | 0.3 | % | ||||||||
| 5.000%, 01/01/2025 (Callable 08/01/2016) | 225,000 | 225,907 | 0.3 | % | ||||||||
| Town of Cicero IL | ||||||||||||
| 5.000%, 01/01/2019 (Insured by AGM) | 400,000 | 432,712 | 0.6 | % | ||||||||
| Village of Franklin Park IL | ||||||||||||
| 5.000%, 04/01/2023 (Insured by BAM) | 400,000 | 467,024 | 0.7 | % | ||||||||
| Other Illinois# | 4,425,337 | 6.2 | % | |||||||||
| Total Illinois | ||||||||||||
| (Cost $9,300,966) | 9,518,445 | 13.3 | % | |||||||||
| Indiana | ||||||||||||
| Total Indiana | ||||||||||||
| (Cost $646,582)# | 654,917 | 0.9 | % | |||||||||
| Iowa | ||||||||||||
| Total Iowa | ||||||||||||
| (Cost $100,406)# | 100,481 | 0.1 | % | |||||||||
| Kansas | ||||||||||||
| Total Kansas | ||||||||||||
| (Cost $113,744)# | 114,357 | 0.2 | % | |||||||||
| Kentucky | ||||||||||||
| Paducah Electric Plant Board | ||||||||||||
| 5.000%, 10/01/2026 (Insured by AGM) | 450,000 | 560,237 | 0.8 | % | ||||||||
| Other Kentucky# | 89,158 | 0.1 | % | |||||||||
| Total Kentucky | ||||||||||||
| (Cost $634,645) | 649,395 | 0.9 | % | |||||||||
The accompanying notes are an integral part of these financial statements.
Page 67
Baird Core Intermediate Municipal Bond Fund
Summary Schedule of Investments, June 30, 2016 (Unaudited)
Long-Term Investments (cont.)
| Principal | % of | |||||||||||
| Amount | Value | Net Assets | ||||||||||
| Louisiana | ||||||||||||
| Total Louisiana | ||||||||||||
| (Cost $51,914)# | $ | 52,073 | 0.1 | % | ||||||||
| Maine | ||||||||||||
| Maine State Housing Authority | ||||||||||||
| 3.500%, 11/15/2045 (Callable 05/15/2025) | $ | 300,000 | 322,659 | 0.4 | % | |||||||
| 4.000%, 11/15/2045 (Callable 11/15/2025) | 450,000 | 494,793 | 0.7 | % | ||||||||
| Total Maine | ||||||||||||
| (Cost $811,293) | 817,452 | 1.1 | % | |||||||||
| Maryland | ||||||||||||
| Total Maryland | ||||||||||||
| (Cost $25,064)# | 25,075 | 0.0 | % | |||||||||
| Massachusetts | ||||||||||||
| Total Massachusetts | ||||||||||||
| (Cost $500,048)# | 500,589 | 0.7 | % | |||||||||
| Michigan | ||||||||||||
| Total Michigan | ||||||||||||
| (Cost $1,651,094)# | 1,705,712 | 2.4 | % | |||||||||
| Minnesota | ||||||||||||
| Total Minnesota | ||||||||||||
| (Cost $160,196)# | 171,905 | 0.2 | % | |||||||||
| Mississippi | ||||||||||||
| Mississippi Development Bank | ||||||||||||
| 5.500%, 10/01/2019 | 550,000 | 608,190 | 0.8 | % | ||||||||
| Other Mississippi# | 133,833 | 0.2 | % | |||||||||
| Total Mississippi | ||||||||||||
| (Cost $724,203) | 742,023 | 1.0 | % | |||||||||
| Missouri | ||||||||||||
| Total Missouri | ||||||||||||
| (Cost $570,018)# | 590,873 | 0.8 | % | |||||||||
| Montana | ||||||||||||
| Montana Board of Housing | ||||||||||||
| 3.600%, 12/01/2030 (Callable 06/01/2022) | 510,000 | 531,624 | 0.7 | % | ||||||||
| Total Montana | ||||||||||||
| (Cost $527,278) | 531,624 | 0.7 | % | |||||||||
| Nebraska | ||||||||||||
| Total Nebraska | ||||||||||||
| (Cost $164,658)# | 165,475 | 0.2 | % | |||||||||
The accompanying notes are an integral part of these financial statements.
Page 68
Baird Core Intermediate Municipal Bond Fund
Summary Schedule of Investments, June 30, 2016 (Unaudited)
Long-Term Investments (cont.)
| Principal | % of | |||||||||||
| Amount | Value | Net Assets | ||||||||||
| Nevada | ||||||||||||
| Las Vegas Valley Water District | ||||||||||||
0.590%, 06/01/2036 (Callable 07/18/2016)(1) | $ | 500,000 | $ | 500,000 | 0.7 | % | ||||||
| Other Nevada# | 406,954 | 0.6 | % | |||||||||
| Total Nevada | ||||||||||||
| (Cost $906,627) | 906,954 | 1.3 | % | |||||||||
| New Jersey | ||||||||||||
| New Jersey State Turnpike Authority | ||||||||||||
| 5.000%, 01/01/2026 (Callable 01/01/2023) | 500,000 | 608,465 | 0.8 | % | ||||||||
| Other New Jersey# | 2,843,857 | 4.0 | % | |||||||||
| Total New Jersey | ||||||||||||
| (Cost $3,319,684) | 3,452,322 | 4.8 | % | |||||||||
| New York | ||||||||||||
| Metropolitan Transportation Authority | ||||||||||||
| 0.891%, 11/01/2022 | ||||||||||||
(Callable 07/07/2016) (Insured by AGM)(1)(2) | 475,000 | 459,365 | 0.6 | % | ||||||||
| New York City Municipal Water Finance Authority | ||||||||||||
| 0.500%, 06/15/2032 | ||||||||||||
(Optional Put Date 07/01/2016) (Callable 07/15/2016)(1) | 600,000 | 600,000 | 0.8 | % | ||||||||
| New York City Transitional Finance | ||||||||||||
| Authority Future Tax Secured Revenue | ||||||||||||
0.600%, 11/01/2022 (Optional Put Date 07/01/2016)(1) | 500,000 | 500,000 | 0.7 | % | ||||||||
| State of New York Mortgage Agency | ||||||||||||
| 4.000%, 10/01/2046 (Callable 04/01/2025) | 500,000 | 550,915 | 0.8 | % | ||||||||
| Other New York# | 980,593 | 1.4 | % | |||||||||
| Total New York | ||||||||||||
| (Cost $3,067,144) | 3,090,873 | 4.3 | % | |||||||||
| North Carolina | ||||||||||||
| Total North Carolina | ||||||||||||
| (Cost $532,616)# | 538,517 | 0.8 | % | |||||||||
| North Dakota | ||||||||||||
| Jamestown Park District/ND | ||||||||||||
| 2.900%, 07/01/2035 (Callable 01/01/2017) | 500,000 | 500,765 | 0.7 | % | ||||||||
| Other North Dakota# | 885,415 | 1.2 | % | |||||||||
| Total North Dakota | ||||||||||||
| (Cost $1,384,932) | 1,386,180 | 1.9 | % | |||||||||
| Ohio | ||||||||||||
| City of Cleveland OH | ||||||||||||
| 5.000%, 10/01/2023 | 430,000 | 530,835 | 0.7 | % | ||||||||
| Other Ohio# | 2,817,529 | 4.0 | % | |||||||||
| Total Ohio | ||||||||||||
| (Cost $3,251,151) | 3,348,364 | 4.7 | % | |||||||||
The accompanying notes are an integral part of these financial statements.
Page 69
Baird Core Intermediate Municipal Bond Fund
Summary Schedule of Investments, June 30, 2016 (Unaudited)
Long-Term Investments (cont.)
| Principal | % of | |||||||||||
| Amount | Value | Net Assets | ||||||||||
| Oklahoma | ||||||||||||
| Total Oklahoma | ||||||||||||
| (Cost $356,884)# | $ | 375,803 | 0.5 | % | ||||||||
| Pennsylvania | ||||||||||||
| Pennsylvania Housing Finance Agency | ||||||||||||
3.500%, 10/01/2046 (Callable 10/01/2025)(3) | $ | 550,000 | 590,222 | 0.8 | % | |||||||
| Pennsylvania Turnpike Commission: | ||||||||||||
| 5.000%, 12/01/2023 (Pre-refunded to 12/01/2019) | 200,000 | 228,286 | 0.3 | % | ||||||||
| 0.000%, 12/01/2028 | 100,000 | 113,019 | 0.1 | % | ||||||||
| 0.000%, 12/01/2030 (Callable 12/01/2027) | 205,000 | 261,857 | 0.4 | % | ||||||||
| 0.000%, 12/01/2030 (Callable 12/01/2027) | 205,000 | 259,435 | 0.4 | % | ||||||||
| Other Pennsylvania# | 1,171,017 | 1.7 | % | |||||||||
| Total Pennsylvania | ||||||||||||
| (Cost $2,571,986) | 2,623,836 | 3.7 | % | |||||||||
| Puerto Rico | ||||||||||||
| Puerto Rico Public Finance Corp. | ||||||||||||
| 5.500%, 08/01/2027 (ETM) (Insured by AMBAC) | 500,000 | 668,290 | 0.9 | % | ||||||||
| Other Puerto Rico# | 502,047 | 0.7 | % | |||||||||
| Total Puerto Rico | ||||||||||||
| (Cost $1,143,693) | 1,170,337 | 1.6 | % | |||||||||
| Rhode Island | ||||||||||||
| Total Rhode Island | ||||||||||||
| (Cost $336,259)# | 339,817 | 0.5 | % | |||||||||
| South Carolina | ||||||||||||
| Scago Educational Facilities Corp. for Union School District | ||||||||||||
| 5.000%, 12/01/2023 (Insured by BAM) | 500,000 | 608,100 | 0.9 | % | ||||||||
| Other South Carolina# | 866,030 | 1.2 | % | |||||||||
| Total South Carolina | ||||||||||||
| (Cost $1,396,558) | 1,474,130 | 2.1 | % | |||||||||
| South Dakota | ||||||||||||
| South Dakota Housing Development Authority | ||||||||||||
| 3.500%, 11/01/2046 (Callable 11/01/2025) | 500,000 | 541,795 | 0.8 | % | ||||||||
| Other South Dakota# | 372,603 | 0.5 | % | |||||||||
| Total South Dakota | ||||||||||||
| (Cost $898,844) | 914,398 | 1.3 | % | |||||||||
| Tennessee | ||||||||||||
| Total Tennessee | ||||||||||||
| (Cost $545,234)# | 562,102 | 0.8 | % | |||||||||
| Texas | ||||||||||||
| Allen Independent School District | ||||||||||||
| 5.000%, 02/15/2023 (PSF Guaranteed) | 350,000 | 432,747 | 0.6 | % | ||||||||
The accompanying notes are an integral part of these financial statements.
Page 70
Baird Core Intermediate Municipal Bond Fund
Summary Schedule of Investments, June 30, 2016 (Unaudited)
Long-Term Investments (cont.)
| Principal | % of | |||||||||||
| Amount | Value | Net Assets | ||||||||||
| Mesquite Independent School District | ||||||||||||
| 5.000%, 08/15/2029 | ||||||||||||
| (Callable 08/15/2025) (PSF Guaranteed) | $ | 500,000 | $ | 637,710 | 0.9 | % | ||||||
| Washington County Junior College District | ||||||||||||
| 5.000%, 10/01/2028 | ||||||||||||
| (Callable 04/01/2026) (Insured by BAM) | 500,000 | 625,060 | 0.9 | % | ||||||||
| Other Texas# | 5,487,187 | 7.7 | % | |||||||||
| Total Texas | ||||||||||||
| (Cost $6,904,624) | 7,182,704 | 10.1 | % | |||||||||
| Utah | ||||||||||||
| Utah Charter School Finance Authority | ||||||||||||
| 5.000%, 10/15/2035 (Callable 10/15/2025) | 400,000 | 472,864 | 0.7 | % | ||||||||
| Utah Housing Corp. | ||||||||||||
| 4.000%, 01/01/2045 (Callable 01/01/2026) | 500,000 | 541,535 | 0.7 | % | ||||||||
| Other Utah# | 188,989 | 0.3 | % | |||||||||
| Total Utah | ||||||||||||
| (Cost $1,172,723) | 1,203,388 | 1.7 | % | |||||||||
| Virgin Islands | ||||||||||||
| Virgin Islands Public Finance Authority | ||||||||||||
| 5.000%, 10/01/2017 | 20,000 | 20,859 | 0.0 | % | ||||||||
| 5.000%, 09/01/2020 | 400,000 | 452,388 | 0.7 | % | ||||||||
| Total Virgin Islands | ||||||||||||
| (Cost $467,505) | 473,247 | 0.7 | % | |||||||||
| Virginia | ||||||||||||
| Fredericksburg Economic Development Authority | ||||||||||||
| 2.310%, 08/01/2038 (Callable 08/01/2016) | ||||||||||||
(Mandatory Tender Date 02/01/2017)(1) | 430,000 | 430,030 | 0.6 | % | ||||||||
| Other Virginia# | 250,000 | 0.4 | % | |||||||||
| Total Virginia | ||||||||||||
| (Cost $680,181) | 680,030 | 1.0 | % | |||||||||
| Washington | ||||||||||||
| City of Tacoma WA Solid Waste Utility Revenue | ||||||||||||
5.000%, 12/01/2027 (Callable 06/01/2026)(3) | 400,000 | 497,240 | 0.7 | % | ||||||||
| Other Washington# | 249,987 | 0.3 | % | |||||||||
| Total Washington | ||||||||||||
| (Cost $735,520) | 747,227 | 1.0 | % | |||||||||
| Wisconsin | ||||||||||||
| State of Wisconsin | ||||||||||||
| 5.000%, 05/01/2029 (Callable 05/01/2024) | 350,000 | 438,592 | 0.6 | % | ||||||||
| Wisconsin Center District | ||||||||||||
| 5.000%, 12/15/2030 (Callable 12/15/2022) | 395,000 | 453,666 | 0.6 | % | ||||||||
The accompanying notes are an integral part of these financial statements.
Page 71
Baird Core Intermediate Municipal Bond Fund
Summary Schedule of Investments, June 30, 2016 (Unaudited)
Long-Term Investments (cont.)
| Principal | % of | |||||||||||
| Amount | Value | Net Assets | ||||||||||
| Wisconsin Health & Educational Facilities Authority: | ||||||||||||
| 5.000%, 09/01/2018 (Callable 09/01/2017) | $ | 175,000 | $ | 182,485 | 0.3 | % | ||||||
| 5.000%, 07/01/2026 (Callable 07/01/2024) | 50,000 | 58,919 | 0.1 | % | ||||||||
| 5.000%, 12/15/2030 (Callable 12/15/2024) | 350,000 | 427,231 | 0.6 | % | ||||||||
| 5.000%, 09/15/2037 (Callable 09/15/2022) | 250,000 | 279,097 | 0.4 | % | ||||||||
| Total Wisconsin | ||||||||||||
| (Cost $1,738,775) | 1,839,990 | 2.6 | % | |||||||||
| Total Long-Term Investments | ||||||||||||
| (Cost $67,727,853) | 69,690,405 | 97.6 | % | |||||||||
| Short-Term Investment | ||||||||||||
| Shares | ||||||||||||
| Money Market Mutual Fund | ||||||||||||
| Goldman Sachs Financial Square Funds, | ||||||||||||
| Institutional Class, 0.25%« | 1,913,669 | 1,913,669 | 2.7 | % | ||||||||
| Total Short-Term Investment | ||||||||||||
| (Cost $1,913,669) | 1,913,669 | 2.7 | % | |||||||||
| Total Investments | ||||||||||||
| (Cost $69,641,522) | 71,604,074 | 100.3 | % | |||||||||
| Liabilities in Excess of Other Assets | (177,508 | ) | (0.3 | )% | ||||||||
| TOTAL NET ASSETS | $ | 71,426,566 | 100.0 | % | ||||||||
Notes to Summary Schedule of Investments
AGM – Assured Guaranty Municipal
AMBAC – Ambac Assurance Corp.
BAM – Build America Mutual Assurance Co.
ETM – Escrowed to Maturity
PSF – Texas Permanent School Fund
| (1) | Variable or floating rate security. Floating rate securities are securities whose yields vary with a designated index rate. These securities rates are as of June 30, 2016. | |
| (2) | Auction Rate Security. An Auction Rate Security is a debt instrument with a long nominal maturity for which the interest rate is regularly reset through a Dutch auction. The rate presented is either the rate set through the auction or the maximum interest rate provided for in the security issuance provision. | |
| (3) | Security or a portion of the security purchased on a when-issued or delayed delivery basis. | |
| # | Represents the aggregate value, by category, of securities that are not among the 50 largest holdings and, in total for any issuer, represent 1% or less of net assets. | |
| « | 7-Day Yield |
The accompanying notes are an integral part of these financial statements.
Page 72
Baird Core Intermediate Municipal Bond Fund
Summary Schedule of Investments, June 30, 2016 (Unaudited)
Summary of Fair Value Exposure at June 30, 2016 (Unaudited)
The Fund has adopted authoritative fair valuation accounting standards which establish a definition of fair value and set out a hierarchy for measuring fair value. These standards require additional disclosures about the various inputs and valuation techniques used to develop the measurements of fair value and a discussion on changes in valuation techniques and related inputs during the period. These standards define fair value as the price that would be received to sell an asset or paid to transfer a liability in an orderly transaction between market participants at the measurement date.
The fair value hierarchy is organized into three levels based upon the assumptions (referred to as “inputs”) used in pricing the asset or liability. These standards state that “observable inputs” reflect the assumptions market participants would use in pricing the asset or liability based on market data obtained from independent sources and “unobservable inputs” reflect an entity’s own assumptions about the assumptions market participants would use in pricing the asset or liability. These inputs are summarized into three broad levels and described below:
Level 1 – | Unadjusted quoted prices in active markets for identical unrestricted securities. |
Level 2 – | Other significant observable inputs (including quoted prices for similar securities, quoted prices in inactive markets, dealer indications, interest rates, yield curves, prepayment speeds, credit risk, default rates, inputs corroborated by observable market data, etc.). |
Level 3 – | Significant unobservable inputs (including the Fund’s own assumptions about the factors that market participants would use in valuing the security) based on the best information available. |
The inputs or methodology used for valuing securities are not necessarily an indication of the risk associated with investing in those securities.
The following is a summary of the inputs used to value the Fund’s investments as of June 30, 2016:
| Level 1 | Level 2 | Level 3 | Total | |||||||||||||
| Municipal Bonds | ||||||||||||||||
| Municipal Bonds | $ | — | $ | 69,690,405 | $ | — | $ | 69,690,405 | ||||||||
| Total Municipal Bonds | — | 69,690,405 | — | 69,690,405 | ||||||||||||
| Short-Term Investment | ||||||||||||||||
| Money Market Mutual Fund | 1,913,669 | — | — | 1,913,669 | ||||||||||||
| Total Short-Term Investment | 1,913,669 | — | — | 1,913,669 | ||||||||||||
| Total Investments | $ | 1,913,669 | $ | 69,690,405 | $ | — | $ | 71,604,074 | ||||||||
Changes in valuation techniques may result in transfers into or out of assigned levels within the fair value hierarchy. There were no transfers between Level 1, Level 2 and Level 3 fair value measurements during the reporting period, as compared to their classification from the prior year’s annual report. See the Fund’s valuation policy in Note 2a to the financial statements.
The accompanying notes are an integral part of these financial statements.
Page 73
Additional Information on Fund Expenses
June 30, 2016 (Unaudited)
As a shareholder of a mutual fund, you incur two types of costs: (1) transaction costs, which may include sales charges (loads) on purchase payments, reinvested dividends, or other distributions; redemption fees; and exchange fees; and (2) ongoing costs, such as management fees; distribution and/or service (12b-1) fees; and other fund expenses. Although the Funds do not charge any sales loads, redemption fees, or other transaction fees, you will be assessed fees for outgoing wire transfers, returned checks and stop payment orders at prevailing rates charged by U.S. Bancorp Fund Services, LLC, the Funds’ transfer agent. If you request that a redemption be made by wire transfer, currently the Funds’ transfer agent charges a $15.00 fee.
This Example is intended to help you understand your ongoing costs (in dollars) of investing in each Fund and to compare these costs with the ongoing costs of investing in other mutual funds. The Example is based on an investment of $1,000 invested at the beginning of the period and held for the entire period (1/1/16 – 6/30/16).
Actual Expenses
The third and fourth columns of the following table provide information about account values based on actual returns and actual expenses. You may use the information in these columns, together with the amount you invested, to estimate the expenses that you paid over the period. Simply divide your account value by $1,000 (for example, an $8,600 account value divided by $1,000 = 8.6), then multiply the result by the number in the fourth column entitled “Expenses Paid During Period’’ to estimate the expenses you paid on your account during this period.
Hypothetical Example for Comparison Purposes
The fifth and sixth columns of the following table provide information about hypothetical account values and hypothetical expenses based on the Funds’ actual expense ratios and an assumed rate of return of 5% per year before expenses, which is not the Funds’ actual return. The hypothetical account values and expenses may not be used to estimate the actual ending account balance or expenses you paid for the period. You may use this information to compare the ongoing costs of investing in the Funds and other mutual funds. To do so, compare this 5% hypothetical example with the 5% hypothetical examples that appear in the shareholder reports of the other mutual funds. Please note that the expenses shown in the table are meant to highlight your ongoing costs only and do not reflect any transactional costs. Therefore, the sixth column of the table (entitled “Expenses Paid During Period”) is useful in comparing ongoing costs only, and will not help you determine the relative total costs of owning different mutual funds. In addition, if these transactional costs were included, your costs could have been higher.
Page 74
Additional Information on Fund Expenses
June 30, 2016 (Unaudited)
Actual vs. Hypothetical Returns
| Hypothetical | |||||||||||
| (5% return | |||||||||||
| Actual | before expenses) | ||||||||||
| Fund’s | Beginning | Ending | Expenses | Ending | Expenses | ||||||
| Annualized | Account | Account | Paid | Account | Paid | ||||||
| Expense | Value | Value | During | Value | During | ||||||
Ratio(1) | 1/1/16 | 6/30/16 | Period(1) | 6/30/16 | Period(1) | ||||||
| Baird Ultra Short | |||||||||||
| Bond Fund | |||||||||||
| Institutional Class | 0.15% | $1,000.00 | $1,009.20 | $0.75 | $1,024.12 | $0.75 | |||||
| Investor Class | 0.40% | $1,000.00 | $1,008.00 | $2.00 | $1,022.87 | $2.01 | |||||
| Baird Short-Term | |||||||||||
| Bond Fund | |||||||||||
| Institutional Class | 0.30% | $1,000.00 | $1,023.30 | $1.51 | $1,023.37 | $1.51 | |||||
| Investor Class | 0.55% | $1,000.00 | $1,022.20 | $2.77 | $1,022.13 | $2.77 | |||||
| Baird Intermediate | |||||||||||
| Bond Fund | |||||||||||
| Institutional Class | 0.30% | $1,000.00 | $1,045.10 | $1.53 | $1,023.37 | $1.51 | |||||
| Investor Class | 0.55% | $1,000.00 | $1,042.90 | $2.79 | $1,022.13 | $2.77 | |||||
| Baird Aggregate | |||||||||||
| Bond Fund | |||||||||||
| Institutional Class | 0.30% | $1,000.00 | $1,056.60 | $1.53 | $1,023.37 | $1.51 | |||||
| Investor Class | 0.55% | $1,000.00 | $1,056.40 | $2.81 | $1,022.13 | $2.77 | |||||
| Baird Core Plus | |||||||||||
| Bond Fund | |||||||||||
| Institutional Class | 0.30% | $1,000.00 | $1,061.10 | $1.54 | $1,023.37 | $1.51 | |||||
| Investor Class | 0.55% | $1,000.00 | $1,060.20 | $2.82 | $1,022.13 | $2.77 | |||||
| Baird Short-Term | |||||||||||
| Municipal Bond Fund | |||||||||||
| Institutional Class | 0.30% | $1,000.00 | $1,017.60 | $1.50 | $1,023.37 | $1.51 | |||||
| Investor Class | 0.55% | $1,000.00 | $1,015.60 | $2.76 | $1,022.13 | $2.77 | |||||
| Baird Quality Intermediate | |||||||||||
| Municipal Bond Fund | |||||||||||
| Institutional Class | 0.30% | $1,000.00 | $1,025.40 | $1.51 | $1,023.37 | $1.51 | |||||
| Investor Class | 0.55% | $1,000.00 | $1,024.50 | $2.77 | $1,022.13 | $2.77 | |||||
| Baird Core Intermediate | |||||||||||
| Municipal Bond Fund | |||||||||||
| Institutional Class | 0.30% | $1,000.00 | $1,040.50 | $1.52 | $1,023.37 | $1.51 | |||||
| Investor Class | 0.55% | $1,000.00 | $1,039.30 | $2.79 | $1,022.13 | $2.77 | |||||
| (1) | Expenses are equal to the Fund’s annualized net expense ratio multiplied by the average account value over the period, 182 days and divided by 366 to reflect the one-half year period. |
Page 75
Statements of Assets and Liabilities
June 30, 2016 (Unaudited)
| Baird | Baird | Baird | ||||||||||
| Ultra Short | Short-Term | Intermediate | ||||||||||
| Bond Fund | Bond Fund | Bond Fund | ||||||||||
| ASSETS: | ||||||||||||
| Investments, at value | ||||||||||||
| (cost $228,160,144, $3,591,642,379 | ||||||||||||
| and $2,109,022,616, respectively)* | $ | 228,026,904 | $ | 3,617,834,484 | $ | 2,160,558,343 | ||||||
| Interest receivable | 1,092,350 | 21,959,382 | 14,065,218 | |||||||||
| Receivable for investments sold | — | — | 31 | |||||||||
| Receivable for Fund shares sold | 316,006 | 27,774,180 | 2,200,996 | |||||||||
| Uninvested cash | 1 | — | — | |||||||||
| Receivable for Securities Lending | 78 | 14,834 | 17,573 | |||||||||
| Other assets | — | — | 12,412 | |||||||||
| Total assets | 229,435,339 | 3,667,582,880 | 2,176,854,573 | |||||||||
| LIABILITIES: | ||||||||||||
| Payable for collateral received | ||||||||||||
| for securities loaned (Note 6) | — | 39,767,555 | 54,964,493 | |||||||||
| Payable for securities purchased | 1,234,949 | 34,806,157 | 33,454,641 | |||||||||
| Payable for Fund shares repurchased | 2,000 | 22,155,180 | 1,383,097 | |||||||||
| Payable to Advisor and Distributor, net | 28,805 | 921,039 | 553,478 | |||||||||
| Other liabilities | 210 | 80,953 | 126,504 | |||||||||
| Total liabilities | 1,265,964 | 97,730,884 | 90,482,213 | |||||||||
| NET ASSETS | $ | 228,169,375 | $ | 3,569,851,996 | $ | 2,086,372,360 | ||||||
| NET ASSETS CONSIST OF: | ||||||||||||
| Capital stock | $ | 228,412,253 | $ | 3,542,817,784 | $ | 2,029,913,755 | ||||||
| Accumulated undistributed | ||||||||||||
| net investment income | 81,631 | 913,667 | 823,439 | |||||||||
| Accumulated net realized | ||||||||||||
| gain (loss) on investments sold | (191,269 | ) | (71,560 | ) | 4,099,439 | |||||||
| Net unrealized appreciation/depreciation | ||||||||||||
| on investments | (133,240 | ) | 26,192,105 | 51,535,727 | ||||||||
| NET ASSETS | $ | 228,169,375 | $ | 3,569,851,996 | $ | 2,086,372,360 | ||||||
| INSTITUTIONAL CLASS SHARES | ||||||||||||
| Net Assets | $ | 226,114,234 | $ | 3,501,027,739 | $ | 1,981,179,094 | ||||||
| Shares outstanding ($0.01 par value, | ||||||||||||
| unlimited shares authorized) | 22,562,475 | 359,112,479 | 175,338,962 | |||||||||
| Net asset value, offering and | ||||||||||||
| redemption price per share | $ | 10.02 | $ | 9.75 | $ | 11.30 | ||||||
| INVESTOR CLASS SHARES | ||||||||||||
| Net Assets | $ | 2,055,141 | $ | 68,824,257 | $ | 105,193,266 | ||||||
| Shares outstanding ($0.01 par value, | ||||||||||||
| unlimited shares authorized) | 205,071 | 7,060,477 | 8,934,225 | |||||||||
| Net asset value, offering and | ||||||||||||
| redemption price per share | $ | 10.02 | $ | 9.75 | $ | 11.77 | ||||||
| * | Includes securities out on loan to brokers with a market value of $0, $38,960,156 and $53,842,395, respectively. |
The accompanying notes are an integral part of these financial statements.
Page 76
Statements of Assets and Liabilities
June 30, 2016 (Unaudited)
| Baird | Baird | |||||||
| Aggregate | Core Plus | |||||||
| Bond Fund | Bond Fund | |||||||
| ASSETS: | ||||||||
| Investments, at value (cost $8,747,235,751 | ||||||||
| and $11,443,092,826, respectively)* | $ | 8,985,236,302 | $ | 11,696,556,852 | ||||
| Interest receivable | 53,646,507 | 78,884,810 | ||||||
| Receivable for investments sold | 17,122,074 | 32,851,379 | ||||||
| Receivable for Fund shares sold | 18,462,265 | 50,156,690 | ||||||
| Uninvested cash | 354,874 | 436,340 | ||||||
| Receivable for securities lending | 25,145 | 80,091 | ||||||
| Total assets | 9,074,847,167 | 11,858,966,162 | ||||||
| LIABILITIES: | ||||||||
| Payable for collateral received | ||||||||
| for securities loaned (Note 6) | 164,963,964 | 276,410,416 | ||||||
| Payable for securities purchased | 163,313,755 | 345,167,949 | ||||||
| Payable for Fund shares repurchased | 7,541,217 | 10,310,103 | ||||||
| Payable to Advisor and Distributor, net | 2,361,767 | 3,719,597 | ||||||
| Other liabilities | 260 | — | ||||||
| Total liabilities | 338,180,963 | 635,608,065 | ||||||
| NET ASSETS | $ | 8,736,666,204 | $ | 11,223,358,097 | ||||
| NET ASSETS CONSIST OF: | ||||||||
| Capital stock | $ | 8,473,320,854 | $ | 10,939,246,021 | ||||
| Accumulated undistributed net investment | ||||||||
| income (distributions in excess of) | (2,014,099 | ) | 677,585 | |||||
| Accumulated net realized | ||||||||
| gain on investments sold | 27,358,898 | 29,970,465 | ||||||
| Net unrealized appreciation | ||||||||
| on investments | 238,000,551 | 253,464,026 | ||||||
| NET ASSETS | $ | 8,736,666,204 | $ | 11,223,358,097 | ||||
| INSTITUTIONAL CLASS SHARES | ||||||||
| Net Assets | $ | 8,152,081,742 | $ | 8,769,894,445 | ||||
| Shares outstanding ($0.01 par value, | ||||||||
| unlimited shares authorized) | 735,596,122 | 772,123,220 | ||||||
| Net asset value, offering and | ||||||||
| redemption price per share | $ | 11.08 | $ | 11.36 | ||||
| INVESTOR CLASS SHARES | ||||||||
| Net Assets | $ | 584,584,462 | $ | 2,453,463,652 | ||||
| Shares outstanding ($0.01 par value, | ||||||||
| unlimited shares authorized) | 51,113,061 | 207,966,428 | ||||||
| Net asset value, offering and | ||||||||
| redemption price per share | $ | 11.44 | $ | 11.80 | ||||
| * | Includes securities out on loan to brokers with a market value of $161,602,769 and $271,561,442, respectively. |
The accompanying notes are an integral part of these financial statements.
Page 77
Statements of Assets and Liabilities
June 30, 2016 (Unaudited)
| Baird | Baird | |||||||||||
| Baird | Quality | Core | ||||||||||
| Short-Term | Intermediate | Intermediate | ||||||||||
| Municipal | Municipal | Municipal | ||||||||||
| Bond Fund | Bond Fund | Bond Fund | ||||||||||
| ASSETS: | ||||||||||||
| Investments, at value (cost $25,635,669, | ||||||||||||
| $1,177,318,817 and $69,641,522, respectively) | $ | 25,840,962 | $ | 1,235,867,554 | $ | 71,604,074 | ||||||
| Interest receivable | 187,558 | 14,055,028 | 624,387 | |||||||||
| Receivable for investments sold | — | 408,928 | 1,156,780 | |||||||||
| Receivable for Fund shares sold | 50,000 | 1,941,745 | 1,011,500 | |||||||||
| Total assets | 26,078,520 | 1,252,273,255 | 74,396,741 | |||||||||
| LIABILITIES: | ||||||||||||
| Payable for securities purchased | 1,035,903 | 13,538,748 | 2,930,536 | |||||||||
| Payable for Fund shares repurchased | — | 897,354 | 22,285 | |||||||||
| Payable to Advisor and Distributor, net | 5,974 | 401,913 | 17,351 | |||||||||
| Accrued expenses and other liabilities | — | 22 | 3 | |||||||||
| Total liabilities | 1,041,877 | 14,838,037 | 2,970,175 | |||||||||
| NET ASSETS | $ | 25,036,643 | $ | 1,237,435,218 | $ | 71,426,566 | ||||||
| NET ASSETS CONSIST OF: | ||||||||||||
| Capital stock | $ | 24,801,621 | $ | 1,180,289,193 | $ | 68,965,552 | ||||||
| Accumulated undistributed | ||||||||||||
| net investment income | 7,912 | 444,949 | 20,189 | |||||||||
| Accumulated net realized | ||||||||||||
| gain (loss) on investments sold | 21,817 | (1,847,661 | ) | 478,273 | ||||||||
| Net unrealized appreciation on investments | 205,293 | 58,548,737 | 1,962,552 | |||||||||
| NET ASSETS | $ | 25,036,643 | $ | 1,237,435,218 | $ | 71,426,566 | ||||||
| INSTITUTIONAL CLASS SHARES | ||||||||||||
| Net Assets | $ | 24,451,271 | $ | 1,077,367,841 | $ | 70,807,546 | ||||||
| Shares outstanding ($0.01 par value, | ||||||||||||
| unlimited shares authorized) | 2,408,975 | 90,549,175 | 6,776,912 | |||||||||
| Net asset value, offering and | ||||||||||||
| redemption price per share | $ | 10.15 | $ | 11.90 | $ | 10.45 | ||||||
| INVESTOR CLASS SHARES | ||||||||||||
| Net Assets | $ | 585,372 | $ | 160,067,377 | $ | 619,020 | ||||||
| Shares outstanding ($0.01 par value, | ||||||||||||
| unlimited shares authorized) | 57,720 | 13,152,865 | 59,261 | |||||||||
| Net asset value, offering and | ||||||||||||
| redemption price per share | $ | 10.14 | $ | 12.17 | $ | 10.45 | ||||||
The accompanying notes are an integral part of these financial statements.
Page 78
Statement of Operations
Six Months Ended June 30, 2016 (Unaudited)
| Baird | Baird | Baird | ||||||||||
| Ultra Short | Short-Term | Intermediate | ||||||||||
| Bond Fund | Bond Fund | Bond Fund | ||||||||||
| INVESTMENT INCOME: | ||||||||||||
| Interest income, net of paydowns | $ | 1,171,546 | $ | 30,904,580 | $ | 24,890,299 | ||||||
| Income from securities lending (Note 6) | 1,095 | 114,782 | 102,047 | |||||||||
| Other income | 593 | 7,330 | 26,015 | |||||||||
| Total investment income | 1,173,234 | 31,026,692 | 25,018,361 | |||||||||
| EXPENSES: | ||||||||||||
| Investment advisory fees | 239,357 | 4,137,156 | 2,455,339 | |||||||||
| Administration fees | 47,871 | 827,431 | 491,068 | |||||||||
| Interest expense (Note 7) | 144 | — | — | |||||||||
| Distribution expense – | ||||||||||||
| Investor Class Shares (Note 8) | 1,662 | 63,509 | 130,264 | |||||||||
| Total expenses | 289,034 | 5,028,096 | 3,076,671 | |||||||||
| Fee waiver by Advisor (Note 5) | (143,451 | ) | — | — | ||||||||
| Net expenses | 145,583 | 5,028,096 | 3,076,671 | |||||||||
| NET INVESTMENT INCOME | 1,027,651 | 25,998,596 | 21,941,690 | |||||||||
| REALIZED AND UNREALIZED | ||||||||||||
| GAIN (LOSS) ON INVESTMENTS: | ||||||||||||
| Net realized gain (loss) on investments | (96,086 | ) | 2,981,279 | 4,799,998 | ||||||||
| Change in unrealized | ||||||||||||
| appreciation on investments | 843,084 | 48,911,609 | 60,172,731 | |||||||||
| Net realized and unrealized | ||||||||||||
| gain on investments | 746,998 | 51,892,888 | 64,972,729 | |||||||||
| NET INCREASE IN NET ASSETS | ||||||||||||
| RESULTING FROM OPERATIONS | $ | 1,774,649 | $ | 77,891,484 | $ | 86,914,419 | ||||||
The accompanying notes are an integral part of these financial statements.
Page 79
Statement of Operations
Six Months Ended June 30, 2016 (Unaudited)
| Baird | Baird | |||||||
| Aggregate | Core Plus | |||||||
| Bond Fund | Bond Fund | |||||||
| INVESTMENT INCOME: | ||||||||
| Interest income, net of paydowns | $ | 101,011,845 | $ | 152,053,269 | ||||
| Income from securities lending (Note 6) | 207,702 | 480,522 | ||||||
| Other income | 23,471 | 13,277 | ||||||
| Total investment income | 101,243,018 | 152,547,068 | ||||||
| EXPENSES: | ||||||||
| Investment advisory fees | 9,585,190 | 12,687,715 | ||||||
| Administration fees | 1,917,038 | 2,537,543 | ||||||
| Distribution expense – | ||||||||
| Investor Class Shares (Note 8) | 608,476 | 2,852,377 | ||||||
| Total expenses | 12,110,704 | 18,077,635 | ||||||
| NET INVESTMENT INCOME | 89,132,314 | 134,469,433 | ||||||
| REALIZED AND UNREALIZED | ||||||||
| GAIN ON INVESTMENTS: | ||||||||
| Net realized gain on investments | 29,496,801 | 33,801,350 | ||||||
| Change in unrealized | ||||||||
| appreciation on investments | 312,331,153 | 437,783,471 | ||||||
| Net realized and unrealized | ||||||||
| gain on investments | 341,827,954 | 471,584,821 | ||||||
| NET INCREASE IN NET ASSETS | ||||||||
| RESULTING FROM OPERATIONS | $ | 430,960,268 | $ | 606,054,254 | ||||
The accompanying notes are an integral part of these financial statements.
Page 80
Statement of Operations
Six Months Ended June 30, 2016 (Unaudited)
| Baird | Baird | |||||||||||
| Baird | Quality | Core | ||||||||||
| Short-Term | Intermediate | Intermediate | ||||||||||
| Municipal | Municipal | Municipal | ||||||||||
| Bond Fund | Bond Fund | Bond Fund | ||||||||||
| INVESTMENT INCOME: | ||||||||||||
| Interest income, net of paydowns | $ | 156,315 | $ | 16,026,244 | $ | 633,511 | ||||||
| Other income | 522 | — | 6,927 | |||||||||
| Total investment income | 156,837 | 16,026,244 | 640,438 | |||||||||
| EXPENSES: | ||||||||||||
| Investment advisory fees | 23,065 | 1,484,354 | 75,058 | |||||||||
| Administration fees | 4,613 | 296,871 | 15,011 | |||||||||
| Distribution expense – | ||||||||||||
| Investor Class Shares (Note 8) | 364 | 198,482 | 498 | |||||||||
| Total expenses | 28,042 | 1,979,707 | 90,567 | |||||||||
| NET INVESTMENT INCOME | 128,795 | 14,046,537 | 549,871 | |||||||||
| REALIZED AND UNREALIZED | ||||||||||||
| GAIN (LOSS) ON INVESTMENTS: | ||||||||||||
| Net realized gain (loss) on investments | 11,058 | (581,895 | ) | 374,518 | ||||||||
| Change in unrealized | ||||||||||||
| appreciation on investments | 168,209 | 16,549,464 | 1,487,766 | |||||||||
| Net realized and unrealized | ||||||||||||
| gain on investments | 179,267 | 15,967,569 | 1,862,284 | |||||||||
| NET INCREASE IN NET ASSETS | ||||||||||||
| RESULTING FROM OPERATIONS | $ | 308,062 | $ | 30,014,106 | $ | 2,412,155 | ||||||
The accompanying notes are an integral part of these financial statements.
Page 81
Statement of Changes in Net Assets
Baird Ultra Short Bond Fund
| Six Months Ended | ||||||||
| June 30, 2016 | Year Ended | |||||||
| (Unaudited) | December 31, 2015 | |||||||
| OPERATIONS: | ||||||||
| Net investment income | $ | 1,027,651 | $ | 1,199,495 | ||||
| Net realized gain (loss) on investments | (96,086 | ) | 20,975 | |||||
| Change in unrealized | ||||||||
| appreciation/depreciation on investments | 843,084 | (791,398 | ) | |||||
| Net increase in net assets resulting from operations | 1,774,649 | 429,072 | ||||||
| CAPITAL SHARE TRANSACTIONS: | ||||||||
| Proceeds from shares sold | 167,455,755 | 184,101,859 | ||||||
| Shares issued to holders in | ||||||||
| reinvestment of distributions | 923,092 | 1,160,831 | ||||||
| Cost of shares redeemed | (131,544,150 | ) | (79,248,259 | ) | ||||
| Net increase in net assets resulting | ||||||||
| from capital share transactions | 36,834,697 | 106,014,431 | ||||||
| DISTRIBUTIONS TO | ||||||||
| INSTITUTIONAL CLASS SHAREHOLDERS: | ||||||||
| From net investment income | (958,158 | ) | (1,283,032 | ) | ||||
| Total Distributions | (958,158 | ) | (1,283,032 | ) | ||||
| DISTRIBUTIONS TO | ||||||||
| INVESTOR CLASS SHAREHOLDERS: | ||||||||
| From net investment income | (5,241 | ) | (5,607 | ) | ||||
| Total Distributions | (5,241 | ) | (5,607 | ) | ||||
| TOTAL INCREASE IN NET ASSETS | 37,645,947 | 105,154,864 | ||||||
| NET ASSETS: | ||||||||
| Beginning of period | 190,523,428 | 85,368,564 | ||||||
| End of period (including accumulated | ||||||||
| undistributed net investment income | ||||||||
| of $81,631 and $17,379, respectively) | $ | 228,169,375 | $ | 190,523,428 | ||||
The accompanying notes are an integral part of these financial statements.
Page 82
Statement of Changes in Net Assets
Baird Short-Term Bond Fund
| Six Months Ended | ||||||||
| June 30, 2016 | Year Ended | |||||||
| (Unaudited) | December 31, 2015 | |||||||
| OPERATIONS: | ||||||||
| Net investment income | $ | 25,998,596 | $ | 37,079,091 | ||||
| Net realized gain on investments | 2,981,279 | 4,894,794 | ||||||
| Change in unrealized | ||||||||
| appreciation/depreciation on investments | 48,911,609 | (17,981,848 | ) | |||||
| Net increase in net assets resulting from operations | 77,891,484 | 23,992,037 | ||||||
| CAPITAL SHARE TRANSACTIONS: | ||||||||
| Proceeds from shares sold | 1,065,157,501 | 1,344,761,825 | ||||||
| Shares issued to holders in | ||||||||
| reinvestment of distributions | 22,090,453 | 39,526,909 | ||||||
| Cost of shares redeemed | (586,609,423 | ) | (1,022,131,532 | ) | ||||
| Net increase in net assets resulting | ||||||||
| from capital share transactions | 500,638,531 | 362,157,202 | ||||||
| DISTRIBUTIONS TO | ||||||||
| INSTITUTIONAL CLASS SHAREHOLDERS: | ||||||||
| From net investment income | (24,947,578 | ) | (44,451,797 | ) | ||||
| From net realized gains | — | (1,279,663 | ) | |||||
| Total Distributions | (24,947,578 | ) | (45,731,460 | ) | ||||
| DISTRIBUTIONS TO | ||||||||
| INVESTOR CLASS SHAREHOLDERS: | ||||||||
| From net investment income | (339,596 | ) | (499,196 | ) | ||||
| From net realized gains | — | (17,313 | ) | |||||
| Total Distributions | (339,596 | ) | (516,509 | ) | ||||
| TOTAL INCREASE IN NET ASSETS | 553,242,841 | 339,901,270 | ||||||
| NET ASSETS: | ||||||||
| Beginning of period | 3,016,609,155 | 2,676,707,885 | ||||||
| End of period (including accumulated | ||||||||
| undistributed net investment income | ||||||||
| of $913,667 and $202,243, respectively) | $ | 3,569,851,996 | $ | 3,016,609,155 | ||||
The accompanying notes are an integral part of these financial statements.
Page 83
Statement of Changes in Net Assets
Baird Intermediate Bond Fund
| Six Months Ended | ||||||||
| June 30, 2016 | Year Ended | |||||||
| (Unaudited) | December 31, 2015 | |||||||
| OPERATIONS: | ||||||||
| Net investment income | $ | 21,941,690 | $ | 37,098,867 | ||||
| Net realized gain on investments | 4,799,998 | 6,368,705 | ||||||
| Change in unrealized | ||||||||
| appreciation/depreciation on investments | 60,172,731 | (29,926,270 | ) | |||||
| Net increase in net assets resulting from operations | 86,914,419 | 13,541,302 | ||||||
| CAPITAL SHARE TRANSACTIONS: | ||||||||
| Proceeds from shares sold | 284,747,527 | 579,672,473 | ||||||
| Shares issued to holders in | ||||||||
| reinvestment of distributions | 18,268,351 | 38,528,099 | ||||||
| Cost of shares redeemed | (172,612,394 | ) | (280,699,940 | ) | ||||
| Net increase in net assets resulting | ||||||||
| from capital share transactions | 130,403,484 | 337,500,632 | ||||||
| DISTRIBUTIONS TO | ||||||||
| INSTITUTIONAL CLASS SHAREHOLDERS: | ||||||||
| From net investment income | (20,316,363 | ) | (36,711,858 | ) | ||||
| From net realized gains | — | (5,444,825 | ) | |||||
| Total Distributions | (20,316,363 | ) | (42,156,683 | ) | ||||
| DISTRIBUTIONS TO | ||||||||
| INVESTOR CLASS SHAREHOLDERS: | ||||||||
| From net investment income | (956,947 | ) | (2,032,634 | ) | ||||
| From net realized gains | — | (303,761 | ) | |||||
| Total Distributions | (956,947 | ) | (2,336,395 | ) | ||||
| TOTAL INCREASE IN NET ASSETS | 196,044,593 | 306,548,856 | ||||||
| NET ASSETS: | ||||||||
| Beginning of period | 1,890,327,767 | 1,583,778,911 | ||||||
| End of period (including accumulated | ||||||||
| undistributed net investment income | ||||||||
| of $823,439 and $155,059, respectively) | $ | 2,086,372,360 | $ | 1,890,327,767 | ||||
The accompanying notes are an integral part of these financial statements.
Page 84
Statement of Changes in Net Assets
Baird Aggregate Bond Fund
| Six Months Ended | ||||||||
| June 30, 2016 | Year Ended | |||||||
| (Unaudited) | December 31, 2015 | |||||||
| OPERATIONS: | ||||||||
| Net investment income | $ | 89,132,314 | $ | 121,685,194 | ||||
| Net realized gain on investments | 29,496,801 | 21,969,042 | ||||||
| Change in unrealized | ||||||||
| appreciation/depreciation on investments | 312,331,153 | (152,187,244 | ) | |||||
| Net increase (decrease) in net assets | ||||||||
| resulting from operations | 430,960,268 | (8,533,008 | ) | |||||
| CAPITAL SHARE TRANSACTIONS: | ||||||||
| Proceeds from shares sold | 2,291,371,959 | 4,245,682,244 | ||||||
| Shares issued to holders in | ||||||||
| reinvestment of distributions | 76,853,138 | 111,982,131 | ||||||
| Cost of shares redeemed | (719,229,070 | ) | (1,155,475,332 | ) | ||||
| Net increase in net assets resulting | ||||||||
| from capital share transactions | 1,648,996,027 | 3,202,189,043 | ||||||
| DISTRIBUTIONS TO | ||||||||
| INSTITUTIONAL CLASS SHAREHOLDERS: | ||||||||
| From net investment income | (86,225,609 | ) | (125,932,125 | ) | ||||
| Total Distributions | (86,225,609 | ) | (125,932,125 | ) | ||||
| DISTRIBUTIONS TO | ||||||||
| INVESTOR CLASS SHAREHOLDERS: | ||||||||
| From net investment income | (5,127,302 | ) | (9,901,008 | ) | ||||
| Total Distributions | (5,127,302 | ) | (9,901,008 | ) | ||||
| TOTAL INCREASE IN NET ASSETS | 1,988,603,384 | 3,057,822,902 | ||||||
| NET ASSETS: | ||||||||
| Beginning of period | 6,748,062,820 | 3,690,239,918 | ||||||
| End of period (including distributions in excess | ||||||||
| of net investment income and accumulated | ||||||||
| undistributed net investment income | ||||||||
| of $(2,014,099) and $206,498, respectively) | $ | 8,736,666,204 | $ | 6,748,062,820 | ||||
The accompanying notes are an integral part of these financial statements.
Page 85
Statement of Changes in Net Assets
Baird Core Plus Bond Fund
| Six Months Ended | ||||||||
| June 30, 2016 | Year Ended | |||||||
| (Unaudited) | December 31, 2015 | |||||||
| OPERATIONS: | ||||||||
| Net investment income | $ | 134,469,433 | $ | 208,299,299 | ||||
| Net realized gain on investments | 33,801,350 | 33,091,952 | ||||||
| Change in unrealized | ||||||||
| appreciation/depreciation on investments | 437,783,471 | (263,684,236 | ) | |||||
| Net increase (decrease) in net assets | ||||||||
| resulting from operations | 606,054,254 | (22,292,985 | ) | |||||
| CAPITAL SHARE TRANSACTIONS: | ||||||||
| Proceeds from shares sold | 2,205,638,699 | 4,831,257,948 | ||||||
| Shares issued to holders in | ||||||||
| reinvestment of distributions | 125,528,307 | 220,307,283 | ||||||
| Cost of shares redeemed | (963,004,756 | ) | (2,128,911,254 | ) | ||||
| Net increase in net assets resulting | ||||||||
| from capital share transactions | 1,368,162,250 | 2,922,653,977 | ||||||
| DISTRIBUTIONS TO | ||||||||
| INSTITUTIONAL CLASS SHAREHOLDERS: | ||||||||
| From net investment income | (107,255,852 | ) | (177,376,139 | ) | ||||
| Total Distributions | (107,255,852 | ) | (177,376,139 | ) | ||||
| DISTRIBUTIONS TO | ||||||||
| INVESTOR CLASS SHAREHOLDERS: | ||||||||
| From net investment income | (26,932,051 | ) | (56,262,268 | ) | ||||
| Total Distributions | (26,932,051 | ) | (56,262,268 | ) | ||||
| TOTAL INCREASE IN NET ASSETS | 1,840,028,601 | 2,666,722,585 | ||||||
| NET ASSETS: | ||||||||
| Beginning of period | 9,383,329,496 | 6,716,606,911 | ||||||
| End of period (including accumulated | ||||||||
| undistributed net investment income | ||||||||
| of $677,585 and $396,055, respectively) | $ | 11,223,358,097 | $ | 9,383,329,496 | ||||
The accompanying notes are an integral part of these financial statements.
Page 86
Statement of Changes in Net Assets
Baird Short-Term Municipal Bond Fund
| Six Months Ended | August 31, 2015^ | |||||||
| June 30, 2016 | through | |||||||
| (Unaudited) | December 31, 2015 | |||||||
| OPERATIONS: | ||||||||
| Net investment income | $ | 128,795 | $ | 45,049 | ||||
| Net realized gain on investments | 11,058 | 13,112 | ||||||
| Change in unrealized | ||||||||
| appreciation on investments | 168,209 | 37,084 | ||||||
| Net increase in net assets | ||||||||
| resulting from operations | 308,062 | 95,245 | ||||||
| CAPITAL SHARE TRANSACTIONS: | ||||||||
| Proceeds from shares sold | 14,710,174 | 12,347,906 | ||||||
| Shares issued to holders in | ||||||||
| reinvestment of distributions | 92,030 | 32,065 | ||||||
| Cost of shares redeemed | (2,350,749 | ) | (13,607 | ) | ||||
| Net increase in net assets resulting | ||||||||
| from capital share transactions | 12,451,455 | 12,366,364 | ||||||
| DISTRIBUTIONS TO | ||||||||
| INSTITUTIONAL CLASS SHAREHOLDERS: | ||||||||
| From net investment income | (127,567 | ) | (44,658 | ) | ||||
| From net realized gains | — | (10,100 | ) | |||||
| Total Distributions | (127,567 | ) | (54,758 | ) | ||||
| DISTRIBUTIONS TO | ||||||||
| INVESTOR CLASS SHAREHOLDERS: | ||||||||
| From net investment income | (1,921 | ) | (190 | ) | ||||
| From net realized gains | — | (47 | ) | |||||
| Total Distributions | (1,921 | ) | (237 | ) | ||||
| TOTAL INCREASE IN NET ASSETS | 12,630,029 | 12,406,614 | ||||||
| NET ASSETS: | ||||||||
| Beginning of period | 12,406,614 | — | ||||||
| End of period (including accumulated | ||||||||
| undistributed net investment income | ||||||||
| of $7,912 and $8,605, respectively) | $ | 25,036,643 | $ | 12,406,614 | ||||
| ^ | Inception was the close of business on August 31, 2015. |
The accompanying notes are an integral part of these financial statements.
Page 87
Statement of Changes in Net Assets
Baird Quality Intermediate Municipal Bond Fund
| Six Months Ended | ||||||||
| June 30, 2016 | Year Ended | |||||||
| (Unaudited) | December 31, 2015 | |||||||
| OPERATIONS: | ||||||||
| Net investment income | $ | 14,046,537 | $ | 27,130,248 | ||||
| Net realized loss on investments | (581,895 | ) | (364,295 | ) | ||||
| Change in unrealized | ||||||||
| appreciation/depreciation on investments | 16,549,464 | (2,897,788 | ) | |||||
| Net increase in net assets | ||||||||
| resulting from operations | 30,014,106 | 23,868,165 | ||||||
| CAPITAL SHARE TRANSACTIONS: | ||||||||
| Proceeds from shares sold | 199,333,231 | 350,569,939 | ||||||
| Shares issued to holders in | ||||||||
| reinvestment of distributions | 12,153,368 | 23,964,903 | ||||||
| Cost of shares redeemed | (139,225,221 | ) | (328,099,203 | ) | ||||
| Net increase in net assets resulting | ||||||||
| from capital share transactions | 72,261,378 | 46,435,639 | ||||||
| DISTRIBUTIONS TO | ||||||||
| INSTITUTIONAL CLASS SHAREHOLDERS: | ||||||||
| From net investment income | (12,011,379 | ) | (23,455,666 | ) | ||||
| Total Distributions | (12,011,379 | ) | (23,455,666 | ) | ||||
| DISTRIBUTIONS TO | ||||||||
| INVESTOR CLASS SHAREHOLDERS: | ||||||||
| From net investment income | (1,612,391 | ) | (3,677,285 | ) | ||||
| Total Distributions | (1,612,391 | ) | (3,677,285 | ) | ||||
| TOTAL INCREASE IN NET ASSETS | 88,651,714 | 43,170,853 | ||||||
| NET ASSETS: | ||||||||
| Beginning of period | 1,148,783,504 | 1,105,612,651 | ||||||
| End of period (including accumulated | ||||||||
| undistributed net investment income | ||||||||
| of $444,949 and $22,182, respectively) | $ | 1,237,435,218 | $ | 1,148,783,504 | ||||
The accompanying notes are an integral part of these financial statements.
Page 88
Statement of Changes in Net Assets
Baird Core Intermediate Municipal Bond Fund
| Six Months Ended | August 31, 2015^ | |||||||
| June 30, 2016 | through | |||||||
| (Unaudited) | December 31, 2015 | |||||||
| OPERATIONS: | ||||||||
| Net investment income | $ | 549,871 | $ | 259,616 | ||||
| Net realized gain on investments | 374,518 | 153,970 | ||||||
| Change in unrealized | ||||||||
| appreciation on investments | 1,487,766 | 474,786 | ||||||
| Net increase in net assets | ||||||||
| resulting from operations | 2,412,155 | 888,372 | ||||||
| CAPITAL SHARE TRANSACTIONS: | ||||||||
| Proceeds from shares sold | 21,996,544 | 52,495,493 | ||||||
| Shares issued to holders in | ||||||||
| reinvestment of distributions | 194,499 | 126,064 | ||||||
| Cost of shares redeemed | (3,709,359 | ) | (2,137,689 | ) | ||||
| Net increase in net assets resulting | ||||||||
| from capital share transactions | 18,481,684 | 50,483,868 | ||||||
| DISTRIBUTIONS TO | ||||||||
| INSTITUTIONAL CLASS SHAREHOLDERS: | ||||||||
| From net investment income | (526,497 | ) | (262,655 | ) | ||||
| From net realized gains | — | (46,564 | ) | |||||
| Total Distributions | (526,497 | ) | (309,219 | ) | ||||
| DISTRIBUTIONS TO | ||||||||
| INVESTOR CLASS SHAREHOLDERS: | ||||||||
| From net investment income | (3,185 | ) | (450 | ) | ||||
| From net realized gains | — | (162 | ) | |||||
| Total Distributions | (3,185 | ) | (612 | ) | ||||
| TOTAL INCREASE IN NET ASSETS | 20,364,157 | 51,062,409 | ||||||
| NET ASSETS: | ||||||||
| Beginning of period | 51,062,409 | — | ||||||
| End of period (including accumulated | ||||||||
| undistributed net investment income | ||||||||
| of $20,189 and $0, respectively) | $ | 71,426,566 | $ | 51,062,409 | ||||
| ^ | Inception was the close of business on August 31, 2015. |
The accompanying notes are an integral part of these financial statements.
Page 89
Financial Highlights
Baird Ultra Short Bond Fund – Institutional Class
| Six Months | ||||||||||||
| Ended | Year Ended | |||||||||||
| June 30, 2016 | December 31, | |||||||||||
| (Unaudited) | 2015 | 2014^ | ||||||||||
| Per Share Data: | ||||||||||||
| Net asset value, beginning of period | $ | 9.98 | $ | 10.03 | $ | 10.00 | ||||||
| Income from investment operations: | ||||||||||||
| Net investment income | 0.05 | (1) | 0.08 | (1) | 0.09 | |||||||
| Net realized and unrealized | ||||||||||||
| gains (losses) on investments | 0.04 | (0.05 | ) | 0.03 | (2) | |||||||
| Total from investment operations | 0.09 | 0.03 | 0.12 | |||||||||
| Less distributions: | ||||||||||||
| Distributions from net investment income | (0.05 | ) | (0.08 | ) | (0.09 | ) | ||||||
| Total distributions | (0.05 | ) | (0.08 | ) | (0.09 | ) | ||||||
| Net asset value, end of period | $ | 10.02 | $ | 9.98 | $ | 10.03 | ||||||
| Total return | 0.92 | %(3) | 0.30 | % | 1.21 | % | ||||||
| Supplemental data and ratios: | ||||||||||||
| Net assets, end of period (millions) | $ | 226.1 | $ | 189.3 | $ | 84.5 | ||||||
| Ratio of expenses to average net assets | 0.15 | %(4) | 0.15 | % | 0.15 | % | ||||||
| Ratio of expenses to | ||||||||||||
| average net assets (before waivers) | 0.30 | %(4) | 0.30 | % | 0.30 | % | ||||||
| Ratio of net investment income | ||||||||||||
| to average net assets | 1.07 | %(4) | 0.78 | % | 0.93 | % | ||||||
| Ratio of net investment income | ||||||||||||
| to average net assets (before waivers) | 0.92 | %(4) | 0.63 | % | 0.78 | % | ||||||
Portfolio turnover rate(5) | 63.50 | %(3) | 65.5 | % | 57.6 | % | ||||||
| ^ | Inception was the close of business on December 31, 2013. |
| (1) | Calculated using average shares outstanding during the period. |
| (2) | Due to timing of capital share transactions, the per share amount of net realized and unrealized gain (loss) on investments varies from the amounts shown in the statement of operations. |
| (3) | Not Annualized. |
| (4) | Annualized. |
| (5) | Portfolio turnover is calculated on the basis of the Fund as a whole without distinguishing between the classes of shares issued. |
The accompanying notes are an integral part of these financial statements.
Page 90
Financial Highlights
Baird Ultra Short Bond Fund – Investor Class
| Six Months | ||||||||||||
| Ended | Year Ended | |||||||||||
| June 30, 2016 | December 31, | |||||||||||
| (Unaudited) | 2015 | 2014^ | ||||||||||
| Per Share Data: | ||||||||||||
| Net asset value, beginning of period | $ | 9.98 | $ | 10.02 | $ | 10.00 | ||||||
| Income from investment operations: | ||||||||||||
| Net investment income | 0.04 | (1) | 0.05 | (1) | 0.07 | |||||||
| Net realized and unrealized | ||||||||||||
| gains (losses) on investments | 0.04 | (0.03 | ) | 0.02 | (2) | |||||||
| Total from investment operations | 0.08 | 0.02 | 0.09 | |||||||||
| Less distributions: | ||||||||||||
| Distributions from net investment income | (0.04 | ) | (0.06 | ) | (0.07 | ) | ||||||
| Total distributions | (0.04 | ) | (0.06 | ) | (0.07 | ) | ||||||
| Net asset value, end of period | $ | 10.02 | $ | 9.98 | $ | 10.02 | ||||||
| Total return | 0.80 | %(3) | 0.16 | % | 0.88 | % | ||||||
| Supplemental data and ratios: | ||||||||||||
| Net assets, end of period (millions) | $ | 2.1 | $ | 1.2 | $ | 0.9 | ||||||
| Ratio of expenses to average net assets | 0.40 | %(4) | 0.40 | % | 0.40 | % | ||||||
| Ratio of expenses to | ||||||||||||
| average net assets (before waivers) | 0.55 | %(4) | 0.55 | % | 0.55 | % | ||||||
| Ratio of net investment income | ||||||||||||
| to average net assets | 0.82 | %(4) | 0.53 | % | 0.68 | % | ||||||
| Ratio of net investment income | ||||||||||||
| to average net assets (before waivers) | 0.67 | %(4) | 0.38 | % | 0.53 | % | ||||||
Portfolio turnover rate(5) | 63.50 | %(3) | 65.5 | % | 57.6 | % | ||||||
| ^ | Inception was the close of business on December 31, 2013. |
| (1) | Calculated using average shares outstanding during the period. |
| (2) | Due to timing of capital share transactions, the per share amount of net realized and unrealized gain (loss) on investments varies from the amounts shown in the statement of operations. |
| (3) | Not Annualized. |
| (4) | Annualized. |
| (5) | Portfolio turnover is calculated on the basis of the Fund as a whole without distinguishing between the classes of shares issued. |
The accompanying notes are an integral part of these financial statements.
Page 91
Financial Highlights
Baird Short-Term Bond Fund – Institutional Class
| Six Months | ||||||||||||||||||||||||
| Ended | ||||||||||||||||||||||||
| June 30, 2016 | Year Ended December 31, | |||||||||||||||||||||||
| (Unaudited) | 2015 | 2014 | 2013 | 2012 | 2011 | |||||||||||||||||||
| Per Share Data: | ||||||||||||||||||||||||
| Net asset value, | ||||||||||||||||||||||||
| beginning of period | $ | 9.60 | $ | 9.67 | $ | 9.69 | $ | 9.75 | $ | 9.59 | $ | 9.68 | ||||||||||||
| Income from | ||||||||||||||||||||||||
| investment operations: | ||||||||||||||||||||||||
| Net investment income | 0.08 | (1) | 0.13 | (1) | 0.16 | 0.17 | (1) | 0.22 | 0.23 | |||||||||||||||
| Net realized and unrealized | ||||||||||||||||||||||||
| gains (losses) on investments | 0.14 | (0.05 | ) | (0.01 | ) | (0.04 | ) | 0.17 | (0.03 | ) | ||||||||||||||
| Total from | ||||||||||||||||||||||||
| investment operations | 0.22 | 0.08 | 0.15 | 0.13 | 0.39 | 0.20 | ||||||||||||||||||
| Less distributions: | ||||||||||||||||||||||||
| Distributions from net | ||||||||||||||||||||||||
| investment income | (0.07 | ) | (0.15 | ) | (0.16 | ) | (0.17 | ) | (0.22 | ) | (0.23 | ) | ||||||||||||
| Distributions from | ||||||||||||||||||||||||
| net realized gains | — | (0.00 | )(2) | (0.01 | ) | (0.02 | ) | (0.01 | ) | (0.06 | ) | |||||||||||||
| Total distributions | (0.07 | ) | (0.15 | ) | (0.17 | ) | (0.19 | ) | (0.23 | ) | (0.29 | ) | ||||||||||||
| Net asset value, end of period | $ | 9.75 | $ | 9.60 | $ | 9.67 | $ | 9.69 | $ | 9.75 | $ | 9.59 | ||||||||||||
| Total return | 2.33 | %(3) | 0.89 | % | 1.49 | % | 1.33 | % | 4.16 | % | 2.08 | % | ||||||||||||
| Supplemental data and ratios: | ||||||||||||||||||||||||
| Net assets, | ||||||||||||||||||||||||
| end of period (millions) | $ | 3,501.0 | $ | 2,976.0 | $ | 2,640.9 | $ | 1,985.0 | $ | 1,295.7 | $ | 1,017.2 | ||||||||||||
| Ratio of expenses | ||||||||||||||||||||||||
| to average net assets | 0.30 | %(4) | 0.30 | % | 0.30 | % | 0.30 | % | 0.30 | % | 0.30 | % | ||||||||||||
| Ratio of net | ||||||||||||||||||||||||
| investment income | ||||||||||||||||||||||||
| to average net assets | 1.57 | %(4) | 1.30 | % | 1.56 | % | 1.71 | % | 2.23 | % | 2.40 | % | ||||||||||||
Portfolio turnover rate(5) | 20.0 | %(3) | 37.8 | % | 51.2 | % | 45.1 | % | 40.1 | % | 61.1 | % | ||||||||||||
| (1) | Calculated using average shares outstanding during the period. |
| (2) | Amount is less than $0.005. |
| (3) | Not Annualized. |
| (4) | Annualized. |
| (5) | Portfolio turnover is calculated on the basis of the Fund as a whole without distinguishing between the classes of shares issued. |
The accompanying notes are an integral part of these financial statements.
Page 92
Financial Highlights
Baird Short-Term Bond Fund – Investor Class
| September 19, | ||||||||||||||||||||
| Six Months | 2012^ | |||||||||||||||||||
| Ended | through | |||||||||||||||||||
| June 30, 2016 | Year Ended December 31, | December 31, | ||||||||||||||||||
| (Unaudited) | 2015 | 2014 | 2013 | 2012 | ||||||||||||||||
| Per Share Data: | ||||||||||||||||||||
| Net asset value, beginning of period | $ | 9.60 | $ | 9.67 | $ | 9.69 | $ | 9.75 | $ | 9.77 | ||||||||||
| Income from investment operations: | ||||||||||||||||||||
| Net investment income | 0.06 | (1) | 0.10 | (1) | 0.14 | 0.15 | (1) | 0.06 | ||||||||||||
| Net realized and unrealized | ||||||||||||||||||||
| gains (losses) on investments | 0.15 | (0.04 | ) | (0.02 | ) | (0.04 | ) | 0.00 | (2) | |||||||||||
| Total from investment operations | 0.21 | 0.06 | 0.12 | 0.11 | 0.06 | |||||||||||||||
| Less distributions: | ||||||||||||||||||||
| Distributions from | ||||||||||||||||||||
| net investment income | (0.06 | ) | (0.13 | ) | (0.13 | ) | (0.15 | ) | (0.07 | ) | ||||||||||
| Distributions from net realized gains | — | (0.00 | )(2) | (0.01 | ) | (0.02 | ) | (0.01 | ) | |||||||||||
| Total distributions | (0.06 | ) | (0.13 | ) | (0.14 | ) | (0.17 | ) | (0.08 | ) | ||||||||||
| Net asset value, end of period | $ | 9.75 | $ | 9.60 | $ | 9.67 | $ | 9.69 | $ | 9.75 | ||||||||||
| Total return | 2.22 | %(3) | 0.64 | % | 1.25 | % | 1.11 | % | 0.68 | %(3) | ||||||||||
| Supplemental data and ratios: | ||||||||||||||||||||
| Net assets, end of period (millions) | $ | 68.8 | $ | 40.6 | $ | 35.8 | $ | 2.5 | $ | 1.5 | ||||||||||
| Ratio of expenses to average net assets | 0.55 | %(4) | 0.55 | % | 0.55 | % | 0.55 | % | 0.55 | %(4) | ||||||||||
| Ratio of net investment income | ||||||||||||||||||||
| to average net assets | 1.33 | %(4) | 1.05 | % | 1.31 | % | 1.46 | % | 1.98 | %(4) | ||||||||||
Portfolio turnover rate(5) | 20.0 | %(3) | 37.8 | % | 51.2 | % | 45.1 | % | 40.1 | %(3) | ||||||||||
| ^ | Inception date. |
| (1) | Calculated using average shares outstanding during the period. |
| (2) | Amount is less than $0.005. |
| (3) | Not Annualized. |
| (4) | Annualized. |
| (5) | Portfolio turnover is calculated on the basis of the Fund as a whole without distinguishing between the classes of shares issued. |
The accompanying notes are an integral part of these financial statements.
Page 93
Financial Highlights
Baird Intermediate Bond Fund – Institutional Class
| Six Months | ||||||||||||||||||||||||
| Ended | ||||||||||||||||||||||||
| June 30, 2016 | Year Ended December 31, | |||||||||||||||||||||||
| (Unaudited) | 2015 | 2014 | 2013 | 2012 | 2011 | |||||||||||||||||||
| Per Share Data: | ||||||||||||||||||||||||
| Net asset value, | ||||||||||||||||||||||||
| beginning of period | $ | 10.93 | $ | 11.10 | $ | 11.00 | $ | 11.31 | $ | 11.06 | $ | 10.87 | ||||||||||||
| Income from | ||||||||||||||||||||||||
| investment operations: | ||||||||||||||||||||||||
| Net investment income | 0.12 | (1) | 0.24 | (1) | 0.26 | (1) | 0.27 | 0.33 | (1) | 0.39 | ||||||||||||||
| Net realized and unrealized | ||||||||||||||||||||||||
| gains (losses) on investments | 0.37 | (0.13 | ) | 0.13 | (0.29 | ) | 0.38 | 0.27 | ||||||||||||||||
| Total from | ||||||||||||||||||||||||
| investment operations | 0.49 | 0.11 | 0.39 | (0.02 | ) | 0.71 | 0.66 | |||||||||||||||||
| Less distributions: | ||||||||||||||||||||||||
| Distributions from | ||||||||||||||||||||||||
| net investment income | (0.12 | ) | (0.25 | ) | (0.27 | ) | (0.27 | ) | (0.33 | ) | (0.39 | ) | ||||||||||||
| Distributions from | ||||||||||||||||||||||||
| net realized gains | — | (0.03 | ) | (0.02 | ) | (0.02 | ) | (0.13 | ) | (0.08 | ) | |||||||||||||
| Total distributions | (0.12 | ) | (0.28 | ) | (0.29 | ) | (0.29 | ) | (0.46 | ) | (0.47 | ) | ||||||||||||
| Net asset value, end of period | $ | 11.30 | $ | 10.93 | $ | 11.10 | $ | 11.00 | $ | 11.31 | $ | 11.06 | ||||||||||||
| Total return | 4.51 | %(2) | 0.99 | % | 3.50 | % | (0.17 | )% | 6.52 | % | 6.14 | % | ||||||||||||
| Supplemental data and ratios: | ||||||||||||||||||||||||
| Net assets, | ||||||||||||||||||||||||
| end of period (millions) | $ | 1,981.2 | $ | 1,787.0 | $ | 1,468.2 | $ | 1,113.7 | $ | 867.5 | $ | 703.2 | ||||||||||||
| Ratio of expenses | ||||||||||||||||||||||||
| to average net assets | 0.30 | %(3) | 0.30 | % | 0.30 | % | 0.30 | % | 0.30 | % | 0.30 | % | ||||||||||||
| Ratio of net | ||||||||||||||||||||||||
| investment income | ||||||||||||||||||||||||
| to average net assets | 2.25 | %(3) | 2.14 | % | 2.37 | % | 2.45 | % | 2.95 | % | 3.49 | % | ||||||||||||
Portfolio turnover rate(4) | 14.8 | %(2) | 39.0 | % | 29.2 | % | 45.1 | % | 45.1 | % | 24.1 | % | ||||||||||||
| (1) | Calculated using average shares outstanding during the period. |
| (2) | Not Annualized. |
| (3) | Annualized. |
| (4) | Portfolio turnover is calculated on the basis of the Fund as a whole without distinguishing between the classes of shares issued. |
The accompanying notes are an integral part of these financial statements.
Page 94
Financial Highlights
Baird Intermediate Bond Fund – Investor Class
| Six Months | ||||||||||||||||||||||||
| Ended | ||||||||||||||||||||||||
| June 30, 2016 | Year Ended December 31, | |||||||||||||||||||||||
| (Unaudited) | 2015 | 2014 | 2013 | 2012 | 2011 | |||||||||||||||||||
| Per Share Data: | ||||||||||||||||||||||||
| Net asset value, | ||||||||||||||||||||||||
| beginning of period | $ | 11.39 | $ | 11.56 | $ | 11.43 | $ | 11.74 | $ | 11.47 | $ | 11.26 | ||||||||||||
| Income from | ||||||||||||||||||||||||
| investment operations: | ||||||||||||||||||||||||
| Net investment income | 0.12 | (1) | 0.22 | (1) | 0.25 | (1) | 0.25 | 0.32 | (1) | 0.37 | ||||||||||||||
| Net realized and unrealized | ||||||||||||||||||||||||
| gains (losses) on investments | 0.37 | (0.14 | ) | 0.14 | (0.29 | ) | 0.39 | 0.28 | ||||||||||||||||
| Total from | ||||||||||||||||||||||||
| investment operations | 0.49 | 0.08 | 0.39 | (0.04 | ) | 0.71 | 0.65 | |||||||||||||||||
| Less distributions: | ||||||||||||||||||||||||
| Distributions from | ||||||||||||||||||||||||
| net investment income | (0.11 | ) | (0.22 | ) | (0.24 | ) | (0.25 | ) | (0.31 | ) | (0.36 | ) | ||||||||||||
| Distributions from | ||||||||||||||||||||||||
| net realized gains | — | (0.03 | ) | (0.02 | ) | (0.02 | ) | (0.13 | ) | (0.08 | ) | |||||||||||||
| Total distributions | (0.11 | ) | (0.25 | ) | (0.26 | ) | (0.27 | ) | (0.44 | ) | (0.44 | ) | ||||||||||||
| Net asset value, end of period | $ | 11.77 | $ | 11.39 | $ | 11.56 | $ | 11.43 | $ | 11.74 | $ | 11.47 | ||||||||||||
| Total return | 4.29 | %(2) | 0.79 | % | 3.29 | % | (0.41 | )% | 6.20 | % | 5.84 | % | ||||||||||||
| Supplemental data and ratios: | ||||||||||||||||||||||||
| Net assets, | ||||||||||||||||||||||||
| end of period (millions) | $ | 105.2 | $ | 103.4 | $ | 115.6 | $ | 42.1 | $ | 26.7 | $ | 14.7 | ||||||||||||
| Ratio of expenses | ||||||||||||||||||||||||
| to average net assets | 0.55 | %(3) | 0.55 | % | 0.55 | % | 0.55 | % | 0.55 | % | 0.55 | % | ||||||||||||
| Ratio of net | ||||||||||||||||||||||||
| investment income | ||||||||||||||||||||||||
| to average net assets | 2.00 | %(3) | 1.89 | % | 2.12 | % | 2.20 | % | 2.70 | % | 3.24 | % | ||||||||||||
Portfolio turnover rate(4) | 14.8 | %(2) | 39.0 | % | 29.2 | % | 45.1 | % | 45.1 | % | 24.1 | % | ||||||||||||
| (1) | Calculated using average shares outstanding during the period. |
| (2) | Not Annualized. |
| (3) | Annualized. |
| (4) | Portfolio turnover is calculated on the basis of the Fund as a whole without distinguishing between the classes of shares issued. |
The accompanying notes are an integral part of these financial statements.
Page 95
Financial Highlights
Baird Aggregate Bond Fund – Institutional Class
| Six Months | ||||||||||||||||||||||||
| Ended | ||||||||||||||||||||||||
| June 30, 2016 | Year Ended December 31, | |||||||||||||||||||||||
| (Unaudited) | 2015 | 2014 | 2013 | 2012 | 2011 | |||||||||||||||||||
| Per Share Data: | ||||||||||||||||||||||||
| Net asset value, | ||||||||||||||||||||||||
| beginning of period | $ | 10.61 | $ | 10.81 | $ | 10.41 | $ | 10.89 | $ | 10.65 | $ | 10.52 | ||||||||||||
| Income from | ||||||||||||||||||||||||
| investment operations: | ||||||||||||||||||||||||
| Net investment income | 0.13 | (1) | 0.24 | (1) | 0.30 | (2) | 0.32 | (1) | 0.38 | (1) | 0.44 | (1) | ||||||||||||
| Net realized and unrealized | ||||||||||||||||||||||||
| gains (losses) on investments | 0.47 | (0.18 | ) | 0.41 | (0.45 | ) | 0.45 | 0.36 | ||||||||||||||||
| Total from | ||||||||||||||||||||||||
| investment operations | 0.60 | 0.06 | 0.71 | (0.13 | ) | 0.83 | 0.80 | |||||||||||||||||
| Less distributions: | ||||||||||||||||||||||||
| Distributions from | ||||||||||||||||||||||||
| net investment income | (0.13 | ) | (0.26 | ) | (0.31 | ) | (0.35 | ) | (0.43 | ) | (0.46 | ) | ||||||||||||
| Distributions from | ||||||||||||||||||||||||
| net realized gains | — | — | — | — | (0.16 | ) | (0.21 | ) | ||||||||||||||||
| Total distributions | (0.13 | ) | (0.26 | ) | (0.31 | ) | (0.35 | ) | (0.59 | ) | (0.67 | ) | ||||||||||||
| Net asset value, end of period | $ | 11.08 | $ | 10.61 | $ | 10.81 | $ | 10.41 | $ | 10.89 | $ | 10.65 | ||||||||||||
| Total return | 5.66 | %(3) | 0.55 | % | 6.89 | % | (1.25 | )% | 7.92 | % | 7.85 | % | ||||||||||||
| Supplemental data and ratios: | ||||||||||||||||||||||||
| Net assets, | ||||||||||||||||||||||||
| end of period (millions) | $ | 8,152.1 | $ | 6,318.4 | $ | 3,448.6 | $ | 1,665.0 | $ | 1,495.4 | $ | 1,480.3 | ||||||||||||
| Ratio of expenses | ||||||||||||||||||||||||
| to average net assets | 0.30 | %(4) | 0.30 | % | 0.30 | % | 0.30 | % | 0.30 | % | 0.30 | % | ||||||||||||
| Ratio of net | ||||||||||||||||||||||||
| investment income | ||||||||||||||||||||||||
| to average net assets | 2.34 | %(4) | 2.24 | % | 2.81 | % | 3.01 | % | 3.51 | % | 4.10 | % | ||||||||||||
Portfolio turnover rate(5) | 20.7 | %(3) | 39.6 | % | 32.1 | % | 28.4 | % | 64.4 | % | 45.9 | % | ||||||||||||
| (1) | Calculated using average shares outstanding during the period. |
| (2) | Net investment income (loss) per share is calculated using ending balance prior to consideration of adjustments for permanent book and tax differences. |
| (3) | Not Annualized. |
| (4) | Annualized. |
| (5) | Portfolio turnover is calculated on the basis of the Fund as a whole without distinguishing between the classes of shares issued. |
The accompanying notes are an integral part of these financial statements.
Page 96
Financial Highlights
Baird Aggregate Bond Fund – Investor Class
| Six Months | ||||||||||||||||||||||||
| Ended | ||||||||||||||||||||||||
| June 30, 2016 | Year Ended December 31, | |||||||||||||||||||||||
| (Unaudited) | 2015 | 2014 | 2013 | 2012 | 2011 | |||||||||||||||||||
| Per Share Data: | ||||||||||||||||||||||||
| Net asset value, | ||||||||||||||||||||||||
| beginning of period | $ | 10.94 | $ | 11.15 | $ | 10.72 | $ | 11.21 | $ | 10.94 | $ | 10.80 | ||||||||||||
| Income from | ||||||||||||||||||||||||
| investment operations: | ||||||||||||||||||||||||
| Net investment income | 0.12 | (1) | 0.22 | (1) | 0.28 | (2) | 0.29 | (1) | 0.37 | (1) | 0.42 | (1) | ||||||||||||
| Net realized and unrealized | ||||||||||||||||||||||||
| gains (losses) on investments | 0.49 | (0.20 | ) | 0.43 | (0.46 | ) | 0.46 | 0.37 | ||||||||||||||||
| Total from | ||||||||||||||||||||||||
| investment operations | 0.61 | 0.02 | 0.71 | (0.17 | ) | 0.83 | 0.79 | |||||||||||||||||
| Less distributions: | ||||||||||||||||||||||||
| Distributions from | ||||||||||||||||||||||||
| net investment income | (0.11 | ) | (0.23 | ) | (0.28 | ) | (0.32 | ) | (0.40 | ) | (0.44 | ) | ||||||||||||
| Distributions from | ||||||||||||||||||||||||
| net realized gains | — | — | — | — | (0.16 | ) | (0.21 | ) | ||||||||||||||||
| Total distributions | (0.11 | ) | (0.23 | ) | (0.28 | ) | (0.32 | ) | (0.56 | ) | (0.65 | ) | ||||||||||||
| Net asset value, end of period | $ | 11.44 | $ | 10.94 | $ | 11.15 | $ | 10.72 | $ | 11.21 | $ | 10.94 | ||||||||||||
| Total return | 5.64 | %(3) | 0.21 | % | 6.71 | % | (1.54 | )% | 7.72 | % | 7.46 | % | ||||||||||||
| Supplemental data and ratios: | ||||||||||||||||||||||||
| Net assets, | ||||||||||||||||||||||||
| end of period (millions) | $ | 584.6 | $ | 429.6 | $ | 241.7 | $ | 141.9 | $ | 49.4 | $ | 26.1 | ||||||||||||
| Ratio of expenses | ||||||||||||||||||||||||
| to average net assets | 0.55 | %(4) | 0.55 | % | 0.55 | % | 0.55 | % | 0.55 | % | 0.55 | % | ||||||||||||
| Ratio of net | ||||||||||||||||||||||||
| investment income | ||||||||||||||||||||||||
| to average net assets | 2.09 | %(4) | 1.99 | % | 2.56 | % | 2.76 | % | 3.26 | % | 3.85 | % | ||||||||||||
Portfolio turnover rate(5) | 20.7 | %(3) | 39.6 | % | 32.1 | % | 28.4 | % | 64.4 | % | 45.9 | % | ||||||||||||
| (1) | Calculated using average shares outstanding during the period. |
| (2) | Net investment income (loss) per share is calculated using ending balance prior to consideration of adjustments for permanent book and tax differences. |
| (3) | Not Annualized. |
| (4) | Annualized. |
| (5) | Portfolio turnover is calculated on the basis of the Fund as a whole without distinguishing between the classes of shares issued. |
The accompanying notes are an integral part of these financial statements.
Page 97
Financial Highlights
Baird Core Plus Bond Fund – Institutional Class
| Six Months | ||||||||||||||||||||||||
| Ended | ||||||||||||||||||||||||
| June 30, 2016 | Year Ended December 31, | |||||||||||||||||||||||
| (Unaudited) | 2015 | 2014 | 2013 | 2012 | 2011 | |||||||||||||||||||
| Per Share Data: | ||||||||||||||||||||||||
| Net asset value, | ||||||||||||||||||||||||
| beginning of period | $ | 10.85 | $ | 11.14 | $ | 10.77 | $ | 11.27 | $ | 10.82 | $ | 10.51 | ||||||||||||
| Income from | ||||||||||||||||||||||||
| investment operations: | ||||||||||||||||||||||||
| Net investment income | 0.15 | (1) | 0.28 | (1) | 0.32 | (2) | 0.31 | (2) | 0.35 | (1) | 0.45 | (1) | ||||||||||||
| Net realized and unrealized | ||||||||||||||||||||||||
| gains (losses) on investments | 0.51 | (0.26 | ) | 0.38 | (0.46 | ) | 0.50 | 0.36 | ||||||||||||||||
| Total from | ||||||||||||||||||||||||
| investment operations | 0.66 | 0.02 | 0.70 | (0.15 | ) | 0.85 | 0.81 | |||||||||||||||||
| Less distributions: | ||||||||||||||||||||||||
| Distributions from | ||||||||||||||||||||||||
| net investment income | (0.15 | ) | (0.31 | ) | (0.33 | ) | (0.34 | ) | (0.38 | ) | (0.46 | ) | ||||||||||||
| Distributions from | ||||||||||||||||||||||||
| net realized gains | — | — | — | (0.01 | ) | (0.02 | ) | (0.04 | ) | |||||||||||||||
| Total distributions | (0.15 | ) | (0.31 | ) | (0.33 | ) | (0.35 | ) | (0.40 | ) | (0.50 | ) | ||||||||||||
| Net asset value, end of period | $ | 11.36 | $ | 10.85 | $ | 11.14 | $ | 10.77 | $ | 11.27 | $ | 10.82 | ||||||||||||
| Total return | 6.11 | %(3) | 0.14 | % | 6.59 | % | (1.32 | )% | 7.95 | % | 7.89 | % | ||||||||||||
| Supplemental data and ratios: | ||||||||||||||||||||||||
| Net assets, | ||||||||||||||||||||||||
| end of period (millions) | $ | 8,769.9 | $ | 7,199.8 | $ | 4,520.9 | $ | 1,789.7 | $ | 1,573.4 | $ | 768.9 | ||||||||||||
| Ratio of expenses | ||||||||||||||||||||||||
| to average net assets | 0.30 | %(4) | 0.30 | % | 0.30 | % | 0.30 | % | 0.30 | % | 0.30 | % | ||||||||||||
| Ratio of net | ||||||||||||||||||||||||
| investment income | ||||||||||||||||||||||||
| to average net assets | 2.71 | %(4) | 2.50 | % | 2.89 | % | 2.83 | % | 3.12 | % | 4.22 | % | ||||||||||||
Portfolio turnover rate(5) | 20.0 | %(3) | 34.2 | % | 35.0 | % | 35.5 | % | 36.7 | % | 34.6 | % | ||||||||||||
| (1) | Calculated using average shares outstanding during the period. |
| (2) | Net investment income (loss) per share is calculated using ending balance prior to consideration of adjustments for permanent book and tax differences. |
| (3) | Not Annualized. |
| (4) | Annualized. |
| (5) | Portfolio turnover is calculated on the basis of the Fund as a whole without distinguishing between the classes of shares issued. |
The accompanying notes are an integral part of these financial statements.
Page 98
Financial Highlights
Baird Core Plus Bond Fund – Investor Class
| Six Months | ||||||||||||||||||||||||
| Ended | ||||||||||||||||||||||||
| June 30, 2016 | Year Ended December 31, | |||||||||||||||||||||||
| (Unaudited) | 2015 | 2014 | 2013 | 2012 | 2011 | |||||||||||||||||||
| Per Share Data: | ||||||||||||||||||||||||
| Net asset value, | ||||||||||||||||||||||||
| beginning of period | $ | 11.26 | $ | 11.55 | $ | 11.16 | $ | 11.67 | $ | 11.18 | $ | 10.85 | ||||||||||||
| Income from | ||||||||||||||||||||||||
| investment operations: | ||||||||||||||||||||||||
| Net investment income | 0.14 | (1) | 0.26 | (1) | 0.29 | (2) | 0.29 | (2) | 0.33 | (1) | 0.44 | (1) | ||||||||||||
| Net realized and unrealized | ||||||||||||||||||||||||
| gains (losses) on investments | 0.53 | (0.27 | ) | 0.40 | (0.48 | ) | 0.53 | 0.37 | ||||||||||||||||
| Total from | ||||||||||||||||||||||||
| investment operations | 0.67 | (0.01 | ) | 0.69 | (0.19 | ) | 0.86 | 0.81 | ||||||||||||||||
| Less distributions: | ||||||||||||||||||||||||
| Distributions from | ||||||||||||||||||||||||
| net investment income | (0.13 | ) | (0.28 | ) | (0.30 | ) | (0.31 | ) | (0.35 | ) | (0.44 | ) | ||||||||||||
| Distributions from | ||||||||||||||||||||||||
| net realized gains | — | — | — | (0.01 | ) | (0.02 | ) | (0.04 | ) | |||||||||||||||
| Total distributions | (0.13 | ) | (0.28 | ) | (0.30 | ) | (0.32 | ) | (0.37 | ) | (0.48 | ) | ||||||||||||
| Net asset value, end of period | $ | 11.80 | $ | 11.26 | $ | 11.55 | $ | 11.16 | $ | 11.67 | $ | 11.18 | ||||||||||||
| Total return | 6.02 | %(3) | (0.11 | )% | 6.27 | % | (1.61 | )% | 7.80 | % | 7.57 | % | ||||||||||||
| Supplemental data and ratios: | ||||||||||||||||||||||||
| Net assets, | ||||||||||||||||||||||||
| end of period (millions) | $ | 2,453.5 | $ | 2,183.5 | $ | 2,195.7 | $ | 1,044.1 | $ | 1,036.0 | $ | 331.9 | ||||||||||||
| Ratio of expenses | ||||||||||||||||||||||||
| to average net assets | 0.55 | %(4) | 0.55 | % | 0.55 | % | 0.55 | % | 0.55 | % | 0.55 | % | ||||||||||||
| Ratio of net | ||||||||||||||||||||||||
| investment income | ||||||||||||||||||||||||
| to average net assets | 2.46 | %(4) | 2.25 | % | 2.64 | % | 2.58 | % | 2.87 | % | 3.97 | % | ||||||||||||
Portfolio turnover rate(5) | 20.0 | %(3) | 34.2 | % | 35.0 | % | 35.5 | % | 36.7 | % | 34.6 | % | ||||||||||||
| (1) | Calculated using average shares outstanding during the period. |
| (2) | Net investment income (loss) per share is calculated using ending balance prior to consideration of adjustments for permanent book and tax differences. |
| (3) | Not Annualized. |
| (4) | Annualized. |
| (5) | Portfolio turnover is calculated on the basis of the Fund as a whole without distinguishing between the classes of shares issued. |
The accompanying notes are an integral part of these financial statements.
Page 99
Financial Highlights
Baird Short-Term Municipal Bond Fund – Institutional Class
| Six Months Ended | ||||||||
| June 30, 2016 | Period Ended | |||||||
| (Unaudited) | December 31, 2015^ | |||||||
| Per Share Data: | ||||||||
| Net asset value, beginning of period | $ | 10.04 | $ | 10.00 | ||||
| Income from investment operations: | ||||||||
| Net investment income | 0.07 | (1) | 0.05 | (1) | ||||
| Net realized and unrealized gain on investments | 0.11 | 0.04 | ||||||
| Total from investment operations | 0.18 | 0.09 | ||||||
| Less distributions: | ||||||||
| Distributions from net investment income | (0.07 | ) | (0.04 | ) | ||||
| Distributions from net realized gains | — | (0.01 | ) | |||||
| Total distributions | (0.07 | ) | (0.05 | ) | ||||
| Net asset value, end of period | $ | 10.15 | $ | 10.04 | ||||
| Total return | 1.76 | %(2) | 0.94 | %(2) | ||||
| Supplemental data and ratios: | ||||||||
| Net assets, end of period (millions) | $ | 24.5 | $ | 12.3 | ||||
| Ratio of expenses to average net assets | 0.30 | %(3) | 0.30 | %(3) | ||||
| Ratio of net investment income to average net assets | 1.39 | %(3) | 1.42 | %(3) | ||||
Portfolio turnover rate(4) | 13.5 | %(2) | 41.4 | %(2) | ||||
| ^ | Inception was close of business on August 31, 2015. |
| (1) | Calculated using average shares outstanding during the period. |
| (2) | Not annualized. |
| (3) | Annualized. |
| (4) | Portfolio turnover is calculated on the basis of the Fund as a whole without distinguishing between the classes of shares issued. |
The accompanying notes are an integral part of these financial statements.
Page 100
Financial Highlights
Baird Short-Term Municipal Bond Fund – Investor Class
| Six Months Ended | ||||||||
| June 30, 2016 | Period Ended | |||||||
| (Unaudited) | December 31, 2015^ | |||||||
| Per Share Data: | ||||||||
| Net asset value, beginning of period | $ | 10.04 | $ | 10.00 | ||||
| Income from investment operations: | ||||||||
| Net investment income | 0.06 | (1) | 0.04 | (1) | ||||
| Net realized and unrealized gain on investments | 0.10 | 0.05 | ||||||
| Total from investment operations | 0.16 | 0.09 | ||||||
| Less distributions: | ||||||||
| Distributions from net investment income | (0.06 | ) | (0.04 | ) | ||||
| Distributions from net realized gains | — | (0.01 | ) | |||||
| Total distributions | (0.06 | ) | (0.05 | ) | ||||
| Net asset value, end of period | $ | 10.14 | $ | 10.04 | ||||
| Total return | 1.56 | %(2) | 0.86 | %(2) | ||||
| Supplemental data and ratios: | ||||||||
| Net assets, end of period (millions) | $ | 0.6 | $ | 0.1 | ||||
| Ratio of expenses to average net assets | 0.55 | %(3) | 0.55 | %(3) | ||||
| Ratio of net investment income to average net assets | 1.15 | %(3) | 1.17 | %(3) | ||||
Portfolio turnover rate(4) | 13.5 | %(2) | 41.4 | %(2) | ||||
| ^ | Inception was close of business on August 31, 2015. |
| (1) | Calculated using average shares outstanding during the period. |
| (2) | Not annualized. |
| (3) | Annualized. |
| (4) | Portfolio turnover is calculated on the basis of the Fund as a whole without distinguishing between the classes of shares issued. |
The accompanying notes are an integral part of these financial statements.
Page 101
Financial Highlights
Baird Quality Intermediate Municipal Bond Fund – Institutional Class
| Six Months | ||||||||||||||||||||||||
| Ended | ||||||||||||||||||||||||
| June 30, 2016 | Year Ended December 31, | |||||||||||||||||||||||
| (Unaudited) | 2015 | 2014 | 2013 | 2012 | 2011 | |||||||||||||||||||
| Per Share Data: | ||||||||||||||||||||||||
| Net asset value, | ||||||||||||||||||||||||
| beginning of period | $ | 11.74 | $ | 11.77 | $ | 11.55 | $ | 12.01 | $ | 11.94 | $ | 11.31 | ||||||||||||
| Income from | ||||||||||||||||||||||||
| investment operations: | ||||||||||||||||||||||||
| Net investment income | 0.14 | (1) | 0.28 | (1) | 0.30 | 0.32 | (1) | 0.30 | 0.32 | |||||||||||||||
| Net realized and unrealized | ||||||||||||||||||||||||
| gains (losses) on investments | 0.16 | (0.03 | ) | 0.22 | (0.46 | ) | 0.07 | 0.64 | ||||||||||||||||
| Total from | ||||||||||||||||||||||||
| investment operations | 0.30 | 0.25 | 0.52 | (0.14 | ) | 0.37 | 0.96 | |||||||||||||||||
| Less distributions: | ||||||||||||||||||||||||
| Distributions from | ||||||||||||||||||||||||
| net investment income | (0.14 | ) | (0.28 | ) | (0.30 | ) | (0.32 | ) | (0.30 | ) | (0.32 | ) | ||||||||||||
| Distributions from | ||||||||||||||||||||||||
| net realized gains | — | — | — | — | — | (0.01 | ) | |||||||||||||||||
| Total distributions | (0.14 | ) | (0.28 | ) | (0.30 | ) | (0.32 | ) | (0.30 | ) | (0.33 | ) | ||||||||||||
| Net asset value, end of period | $ | 11.90 | $ | 11.74 | $ | 11.77 | $ | 11.55 | $ | 12.01 | $ | 11.94 | ||||||||||||
| Total return | 2.54 | %(2) | 2.19 | % | 4.54 | % | (1.19 | )% | 3.12 | % | 8.55 | % | ||||||||||||
| Supplemental data and ratios: | ||||||||||||||||||||||||
| Net assets, | ||||||||||||||||||||||||
| end of period (millions) | $ | 1,077.4 | $ | 988.4 | $ | 918.9 | $ | 801.4 | $ | 963.1 | $ | 836.1 | ||||||||||||
| Ratio of expenses | ||||||||||||||||||||||||
| to average net assets | 0.30 | %(3) | 0.30 | % | 0.30 | % | 0.30 | % | 0.30 | % | 0.30 | % | ||||||||||||
| Ratio of net | ||||||||||||||||||||||||
| investment income | ||||||||||||||||||||||||
| to average net assets | 2.40 | %(3) | 2.42 | % | 2.56 | % | 2.65 | % | 2.48 | % | 2.74 | % | ||||||||||||
Portfolio turnover rate(4) | 6.20 | %(2) | 9.3 | % | 4.7 | % | 9.0 | % | 5.1 | % | 8.0 | % | ||||||||||||
| (1) | Calculated using average shares outstanding during the period. |
| (2) | Not annualized. |
| (3) | Annualized. |
| (4) | Portfolio turnover is calculated on the basis of the Fund as a whole without distinguishing between the classes of shares issued. |
The accompanying notes are an integral part of these financial statements.
Page 102
Financial Highlights
Baird Quality Intermediate Municipal Bond Fund – Investor Class
| Six Months | ||||||||||||||||||||||||
| Ended | ||||||||||||||||||||||||
| June 30, 2016 | Year Ended December 31, | |||||||||||||||||||||||
| (Unaudited) | 2015 | 2014 | 2013 | 2012 | 2011 | |||||||||||||||||||
| Per Share Data: | ||||||||||||||||||||||||
| Net asset value, | ||||||||||||||||||||||||
| beginning of period | $ | 12.00 | $ | 12.03 | $ | 11.80 | $ | 12.26 | $ | 12.18 | $ | 11.53 | ||||||||||||
| Income from | ||||||||||||||||||||||||
| investment operations: | ||||||||||||||||||||||||
| Net investment income | 0.13 | (1) | 0.26 | (1) | 0.28 | 0.29 | (1) | 0.27 | 0.29 | |||||||||||||||
| Net realized and unrealized | ||||||||||||||||||||||||
| gains (losses) on investments | 0.16 | (0.04 | ) | 0.22 | (0.46 | ) | 0.08 | 0.66 | ||||||||||||||||
| Total from | ||||||||||||||||||||||||
| investment operations | 0.29 | 0.22 | 0.50 | (0.17 | ) | 0.35 | 0.95 | |||||||||||||||||
| Less distributions: | ||||||||||||||||||||||||
| Distributions from | ||||||||||||||||||||||||
| net investment income | (0.12 | ) | (0.25 | ) | (0.27 | ) | (0.29 | ) | (0.27 | ) | (0.29 | ) | ||||||||||||
| Distributions from | ||||||||||||||||||||||||
| net realized gains | — | — | — | — | — | (0.01 | ) | |||||||||||||||||
| Total distributions | (0.12 | ) | (0.25 | ) | (0.27 | ) | (0.29 | ) | (0.27 | ) | (0.30 | ) | ||||||||||||
| Net asset value, end of period | $ | 12.17 | $ | 12.00 | $ | 12.03 | $ | 11.80 | $ | 12.26 | $ | 12.18 | ||||||||||||
| Total return | 2.45 | %(2) | 1.89 | % | 4.27 | % | (1.42 | )% | 2.88 | % | 8.30 | % | ||||||||||||
| Supplemental data and ratios: | ||||||||||||||||||||||||
| Net assets, | ||||||||||||||||||||||||
| end of period (millions) | $ | 160.1 | $ | 160.3 | $ | 186.7 | $ | 205.6 | $ | 258.5 | $ | 257.9 | ||||||||||||
| Ratio of expenses | ||||||||||||||||||||||||
| to average net assets | 0.55 | %(3) | 0.55 | % | 0.55 | % | 0.55 | % | 0.55 | % | 0.55 | % | ||||||||||||
| Ratio of net | ||||||||||||||||||||||||
| investment income | ||||||||||||||||||||||||
| to average net assets | 2.15 | %(3) | 2.17 | % | 2.31 | % | 2.40 | % | 2.23 | % | 2.49 | % | ||||||||||||
Portfolio turnover rate(4) | 6.20 | %(2) | 9.3 | % | 4.7 | % | 9.0 | % | 5.1 | % | 8.0 | % | ||||||||||||
| (1) | Calculated using average shares outstanding during the period. |
| (2) | Not annualized. |
| (3) | Annualized. |
| (4) | Portfolio turnover is calculated on the basis of the Fund as a whole without distinguishing between the classes of shares issued. |
The accompanying notes are an integral part of these financial statements.
Page 103
Financial Highlights
Baird Core Intermediate Municipal Bond Fund – Institutional Class
| Six Months Ended | ||||||||
| June 30, 2016 | Period Ended | |||||||
| (Unaudited) | December 31, 2015^ | |||||||
| Per Share Data: | ||||||||
| Net asset value, beginning of period | $ | 10.13 | $ | 10.00 | ||||
| Income from investment operations: | ||||||||
| Net investment income | 0.09 | (1) | 0.06 | (1) | ||||
| Net realized and unrealized gain on investments | 0.32 | 0.14 | ||||||
| Total from investment operations | 0.41 | 0.20 | ||||||
| Less distributions: | ||||||||
| Distributions from net investment income | (0.09 | ) | (0.06 | ) | ||||
| Distributions from net realized gains | — | (0.01 | ) | |||||
| Total distributions | (0.09 | ) | (0.07 | ) | ||||
| Net asset value, end of period | $ | 10.45 | $ | 10.13 | ||||
| Total return | 4.05 | %(2) | 1.98 | %(2) | ||||
| Supplemental data and ratios: | ||||||||
| Net assets, end of period (millions) | $ | 70.8 | $ | 50.8 | ||||
| Ratio of expenses to average net assets | 0.30 | %(3) | 0.30 | %(3) | ||||
| Ratio of net investment income to average net assets | 1.83 | %(3) | 1.75 | %(3) | ||||
Portfolio turnover rate(4) | 55.5 | %(2) | 108.3 | %(2) | ||||
| ^ | Inception was close of business on August 31, 2015. |
| (1) | Calculated using average shares outstanding during the period. |
| (2) | Not annualized. |
| (3) | Annualized. |
| (4) | Portfolio turnover is calculated on the basis of the Fund as a whole without distinguishing between the classes of shares issued. |
The accompanying notes are an integral part of these financial statements.
Page 104
Financial Highlights
Baird Core Intermediate Municipal Bond Fund – Investor Class
| Six Months Ended | ||||||||
| June 30, 2016 | Period Ended | |||||||
| (Unaudited) | December 31, 2015^ | |||||||
| Per Share Data: | ||||||||
| Net asset value, beginning of period | $ | 10.13 | $ | 10.00 | ||||
| Income from investment operations: | ||||||||
| Net investment income | 0.08 | (1) | 0.05 | (1) | ||||
| Net realized and unrealized gain on investments | 0.32 | 0.14 | ||||||
| Total from investment operations | 0.40 | 0.19 | ||||||
| Less distributions: | ||||||||
| Distributions from net investment income | (0.08 | ) | (0.05 | ) | ||||
| Distributions from net realized gains | — | (0.01 | ) | |||||
| Total distributions | (0.08 | ) | (0.06 | ) | ||||
| Net asset value, end of period | $ | 10.45 | $ | 10.13 | ||||
| Total return | 3.93 | %(2) | 1.91 | %(2) | ||||
| Supplemental data and ratios: | ||||||||
| Net assets, end of period (millions) | $ | 0.6 | $ | 0.2 | ||||
| Ratio of expenses to average net assets | 0.55 | %(3) | 0.55 | %(3) | ||||
| Ratio of net investment income to average net assets | 1.58 | %(3) | 1.50 | %(3) | ||||
Portfolio turnover rate(4) | 55.5 | %(2) | 108.3 | %(2) | ||||
| ^ | Inception was close of business on August 31, 2015. |
| (1) | Calculated using average shares outstanding during the period. |
| (2) | Not annualized. |
| (3) | Annualized. |
| (4) | Portfolio turnover is calculated on the basis of the Fund as a whole without distinguishing between the classes of shares issued. |
The accompanying notes are an integral part of these financial statements.
Page 105
Notes to the Financial Statements
June 30, 2016 (Unaudited)
1. Organization
Baird Funds, Inc. (the “Corporation”) was incorporated on June 9, 2000 as a Wisconsin corporation and is registered as an open-end investment management company under the Investment Company Act of 1940, as amended (the “1940 Act”). The accompanying financial statements include the Baird Ultra Short Bond Fund, Baird Short-Term Bond Fund, Baird Intermediate Bond Fund, Baird Aggregate Bond Fund and Baird Core Plus Bond Fund, Baird Short-Term Municipal Bond Fund, Baird Quality Intermediate Municipal Bond Fund and Baird Core Intermediate Municipal Bond Fund (each, a “Fund” and collectively, the “Funds”), eight of the fifteen series comprising the Corporation, each of which is diversified within the meaning of the 1940 Act. Robert W. Baird & Co. Incorporated (“Baird” or the “Advisor”) serves as investment advisor to the Funds.
The Baird Ultra Short Bond Fund commenced with the sale of both Institutional and Investor Class shares on December 31, 2013. The Baird Short-Term Bond Fund commenced with the sale of Institutional Class shares on August 31, 2004 while the Investor Class shares commenced on September 19, 2012. The Baird Intermediate Bond Fund, Baird Aggregate Bond Fund and Baird Core Plus Bond Fund commenced with the sale of both Institutional and Investor Class shares on September 29, 2000. The Baird Short-Term Municipal Bond Fund and Core Intermediate Municipal Bond Fund commenced with the sale of both Institutional and Investor Class shares on August 31, 2015. The Baird Quality Intermediate Municipal Bond Fund commenced with the sale of both Institutional and Investor Class shares on March 30, 2001. Institutional Class shares are not subject to a distribution and service (12b-1) fee, while Investor Class shares are subject to a distribution and service (12b-1) fee of 0.25%. See Note 8.
The investment objective of the Baird Ultra Short Bond Fund is to seek current income consistent with preservation of capital. The Fund’s benchmark index, the Barclays U.S. Short-Term Government/Corporate Index, is an unmanaged, market value weighted index of investment grade, fixed debt including government and corporate securities with maturities less than one year.
The investment objective of the Baird Short-Term Bond Fund is to provide an annual rate of total return, before Fund expenses, greater than the annual rate of total return of the Barclays 1-3 Year U.S. Government/Credit Bond Index. The Barclays 1-3 Year U.S. Government/Credit Bond Index is an unmanaged, market value weighted index of investment grade, fixed-rate debt including government and corporate securities with maturities between one and three years.
The investment objective of the Baird Intermediate Bond Fund is to provide an annual rate of total return, before Fund expenses, greater than the annual rate of total return of the Barclays Intermediate U.S. Government/Credit Bond Index. The Barclays Intermediate U.S. Government/Credit Bond Index is an unmanaged, market value weighted index of investment grade, fixed-rate debt issues, including government and corporate securities, with maturities between one and ten years.
The investment objective of the Baird Aggregate Bond Fund is to provide an annual rate of total return, before Fund expenses, greater than the annual rate of total return of the Barclays U.S. Aggregate Bond Index. The Barclays U.S. Aggregate Bond Index is an unmanaged, market value weighted index of investment grade, fixed-rate debt issues, including government, corporate, asset-backed and mortgage-backed securities, with maturities of at least one year.
The investment objective of the Baird Core Plus Bond Fund is to provide an annual rate of total return, before Fund expenses, greater than the annual rate of total return of the Barclays U.S. Universal Bond Index. The Barclays U.S. Universal Bond Index is an unmanaged, market value weighted index of fixed income securities issued in U.S. dollars, including U.S. government and investment grade debt, non-investment grade debt, asset-backed and mortgage-backed securities, Eurobonds, 144A securities and emerging market debt, with maturities of at least one year.
The investment objective of the Baird Short-Term Municipal Bond Fund is to seek current income that is exempt from federal income tax and is consistent with the preservation of capital.
Page 106
Notes to the Financial Statements
June 30, 2016 (Unaudited)
| 1. | Organization (cont.) |
The primary investment objective of the Baird Quality Intermediate Municipal Bond Fund is to provide current income that is substantially exempt from federal income tax. A secondary objective is to provide total return with relatively low volatility of principal.
The investment objective of the Baird Core Intermediate Municipal Bond Fund is to seek a high level of current income that is exempt from federal income tax and is consistent with preservation of capital.
| 2. | Significant Accounting Policies |
The following is a summary of significant accounting policies consistently followed by the Funds in the preparation of their financial statements. These policies are in conformity with accounting principles generally accepted in the United States of America.
| a) | Investment Valuation – Section 2(a)(41) of the 1940 Act, together with the rules and interpretations of the Securities and Exchange Commission, require the Funds, in computing net asset value, to value their portfolio securities using market quotations when they are “readily available.” When market quotations are not readily available (e.g., because there is no regular market quotation for such securities, the market for such security is limited, the validity of quotations is questionable or the Funds’ independent pricing service does not provide a price), the Board of Directors of the Corporation must value the securities at “fair value determined in good faith.” The Board has delegated such responsibility to the Advisor pursuant to pricing policies and procedures that the Board has adopted and regularly reviews. In general, the “fair value” of a security means the price that would be received to sell a security in an orderly transaction between market participants at the measurement date. |
The Funds determine the fair value of their investments and compute their net asset value per share as of the close of regular trading of the New York Stock Exchange (4:00 p.m. EST). | |
| Consistent with Section 2(a)(41) of the 1940 Act, the Funds price their securities as follows: debt securities are valued at their evaluated bid prices as provided by an independent pricing service using valuation methods that are designed to represent fair value, such as matrix pricing and other analytical pricing models, market transactions and dealer quotations. Debt securities purchased with maturities of 60 days or less are valued as described above unless an evaluated price is not available, in which case such security is valued at acquisition cost, plus or minus any amortized discount or premium (“amortized cost”), or, if the Advisor does not believe amortized cost is reflective of the value of the security, the security is priced at fair value as described below. Investments in mutual funds are valued at their stated net asset value. Common stocks that are listed on a securities exchange (other than NASDAQ) are valued at the last quoted sales price. Securities traded on Nasdaq are valued at the Nasdaq Official Closing Price. Price information on listed stocks is taken from the exchange where the security is primarily traded. Securities that were not traded on the valuation date, as well as stocks that are not listed on an exchange, including NASDAQ, are valued at the average of the current bid and asked price. Other assets and securities for which market quotations are not readily available are valued at fair value as determined in good faith by the Advisor in accordance with procedures approved by the Corporation’s Board of Directors. In accordance with such procedures, the Advisor may use broker quotes or prices obtained from alternative independent pricing services or, if broker quotes or prices from alternative pricing services are unavailable or deemed to be unreliable, fair value will be determined by a valuation committee of the Advisor. In determining fair value, the valuation committee takes into account all relevant factors and available information. Consequently, the price of the security used by a Fund to calculate its NAV may differ from quoted or published prices for the same security. Fair value pricing involves subjective judgments and there is no single standard for determining a security’s fair value. As a result, different mutual funds could reasonably arrive at a different fair value for the same security. It is possible that the fair value determined for a security is materially different from the value that could be realized upon the |
Page 107
Notes to the Financial Statements
June 30, 2016 (Unaudited)
| 2. | Significant Accounting Policies (cont.) |
sale of that security or from the values that other mutual funds may determine. In addition, given the volatility and periodic illiquidity experienced in recent years, the prices determined for any individual security on any given day may vary significantly from the amount that can be obtained in an actual sale of that security, and the Funds’ NAVs may fluctuate significantly from day to day or from period to period. | |
| b) | Unregistered Securities – Five of the Funds own certain investment securities which are unregistered and thus restricted with respect to resale. The value of such securities for the Baird Ultra Short Bond, Baird Short-Term Bond, Baird Intermediate Bond, Baird Aggregate Bond and Baird Core Plus Bond Funds were $35,577,397 (15.59% of net assets), $749,327,885 (20.99% of net assets), $432,098,134 (20.71% of net assets), $1,416,328,963 (16.21% of net assets), and $1,981,555,664 (17.66% of net assets), respectively, at June 30, 2016. Restricted securities may be deemed to be liquid as determined by the Advisor based on several factors. All of the restricted securities held by the Funds as of June 30, 2016 consist of securities issued pursuant to Rule 144A under the Securities Act of 1933 and all have been deemed to be liquid. |
| c) | Foreign Securities – For purposes of these financial statements, foreign securities are defined as securities of issuers that are organized outside the United States. The Funds may invest in U.S. dollar-denominated debt obligations of foreign companies and foreign governments. Investing in securities of foreign companies and foreign governments involves special risks and considerations not typically associated with investing in U.S. companies and the U.S. government. These risks include foreign currency fluctuations, political and economic instability and differences in financial reporting standards and less strict regulation of securities markets. Moreover, securities of many foreign companies and foreign governments and their markets may be less liquid and their prices more volatile than those of securities of comparable U.S. companies and the U.S. government. Occasionally, events that affect these values and exchange rates may occur after the close of the exchange on which such securities are traded. If such events materially affect the value of a Fund’s securities, these securities may be valued at their fair value pursuant to procedures adopted by the Board of Directors. |
| d) | Income Tax Status – The Funds intend to continue to qualify as regulated investment companies as provided in subchapter M of the Internal Revenue Code and to distribute substantially all of their taxable income to their shareholders in a manner which results in no tax expense to the Funds. Therefore, no federal income or excise tax provision is recorded. |
There is no tax liability resulting from unrecognized tax benefits relating to uncertain income tax positions taken or expected to be taken on the tax return for the fiscal year ended December 31, 2015, or for any other tax years which are open for exam. As of June 30, 2016, open tax years include the tax years ended December 31, 2012 through 2015. The Funds are not aware of any tax positions for which it is reasonably possible that the total amounts of unrecognized tax benefits will significantly change in the next 12 months. The Funds recognize interest and penalties, if any, related to unrecognized tax benefits as interest and other expense, respectively, in the Statement of Operations. During the period, the Funds did not incur any interest or penalties. | |
| e) | Allocation of Income and Expenses – Each Fund is charged for those expenses directly attributable to it. Expenses directly attributable to a class of shares, such as Rule 12b-1 distribution fees, are charged to that class of shares. Income, expenses and realized and unrealized gains and losses are allocated to the classes based on their respective net assets. Expenses that are not directly attributable to a Fund are allocated among the Funds in the series in proportion to their assets or are divided equally amongst the Funds. |
| f) | Distributions to Shareholders – Dividends from net investment income are declared and paid monthly. Distributions of net realized capital gains, if any, are declared and paid at least annually. The book basis character of distributions may differ from their ultimate characterization for Federal income tax purposes. |
Page 108
Notes to the Financial Statements
June 30, 2016 (Unaudited)
| 2. | Significant Accounting Policies (cont.) |
| g) | Use of Estimates – The preparation of financial statements in conformity with accounting principles generally accepted in the United States of America requires management to make estimates and assumptions that affect the reported amounts of assets and liabilities and disclosure of contingent assets and liabilities at the date of the financial statements and the reported amounts of revenues and expenses during the reporting period. Actual results could differ from those estimates. |
| h) | Securities Transactions and Investment Income – Investment and shareholder transactions are recorded on the trade date. The Funds determine the gain or loss realized from investment transactions by comparing the original cost of the security lot sold with the net sales proceeds. Dividend income is recognized on the ex-dividend date and interest income is recognized on an accrual basis. Premiums and discounts on the purchase of securities are amortized/accreted using the effective interest method. Paydown gains and losses are netted and recorded as interest income on the Statements of Operations for financial reporting purposes. Accounting principles generally accepted in the United States of America require that permanent financial reporting and tax differences be reclassified in the capital accounts. |
| i) | Guarantees and Indemnifications – In the normal course of business, the Funds enter into contracts with service providers that contain general indemnification clauses. The Funds’ maximum exposure under these arrangements is unknown and would involve future claims against the Funds that have not yet occurred. Based on experience, the Funds would expect the risk of loss to be remote. |
| j) | Recent Accounting Pronouncement – In May 2015, the Financial Accounting Standards Board (“FASB”) issued Accounting Standards Update (“ASU”) No. 2015-07 “Disclosure for Investments in Certain Entities that Calculate Net Asset Value per Share (or Its Equivalent)”. The amendments in ASU No. 2015-07 remove the requirement to categorize within the fair value hierarchy investments measured using the NAV practical expedient. The ASU also removes certain disclosure requirements for investments that qualify, but do not utilize, the NAV practical expedient. The amendments in the ASU are effective for fiscal years beginning after December 15, 2015, and interim periods within those fiscal years. Management has evaluated this standard and determined it will not affect the Baird Funds. |
Page 109
Notes to the Financial Statements
June 30, 2016 (Unaudited)
3. Capital Share Transactions
The following table summarizes the capital share transactions of each Fund for the past two fiscal periods:
Baird Ultra Short Bond Fund
| Institutional Class Shares | Investor Class Shares | |||||||||||||||||
| Six Months Ended | Six Months Ended | |||||||||||||||||
| June 30, 2016 | June 30, 2016 | |||||||||||||||||
| Shares | Amount | Shares | Amount | |||||||||||||||
| Shares sold | 16,646,748 | $ | 166,352,366 | Shares sold | �� | 110,256 | $ | 1,103,389 | ||||||||||
| Shares issued to | Shares issued to | |||||||||||||||||
| shareholders in | shareholders in | |||||||||||||||||
| reinvestment of | reinvestment of | |||||||||||||||||
| dividends | 92,204 | 921,715 | dividends | 138 | 1,377 | |||||||||||||
| Shares redeemed | (13,138,660 | ) | (131,290,124 | ) | Shares redeemed | (25,418 | ) | (254,026 | ) | |||||||||
| Net increase | 3,600,292 | $ | 35,983,957 | Net increase | 84,976 | $ | 850,740 | |||||||||||
| Shares Outstanding: | Shares Outstanding: | |||||||||||||||||
| Beginning of period | 18,962,183 | Beginning of period | 120,095 | |||||||||||||||
| End of period | 22,562,475 | End of period | 205,071 | |||||||||||||||
| Institutional Class Shares | Investor Class Shares | |||||||||||||||||
| Year Ended | Year Ended | |||||||||||||||||
| December 31, 2015 | December 31, 2015 | |||||||||||||||||
| Shares | Amount | Shares | Amount | |||||||||||||||
| Shares sold | 18,194,582 | $ | 182,496,800 | Shares sold | 160,110 | $ | 1,605,059 | |||||||||||
| Shares issued to | Shares issued to | |||||||||||||||||
| shareholders in | shareholders in | |||||||||||||||||
| reinvestment of | reinvestment of | |||||||||||||||||
| dividends | 115,607 | 1,158,204 | dividends | 262 | 2,627 | |||||||||||||
| Shares redeemed | (7,772,290 | ) | (77,953,294 | ) | Shares redeemed | (129,177 | ) | (1,294,965 | ) | |||||||||
| Net increase | 10,537,899 | $ | 105,701,710 | Net increase | 31,195 | $ | 312,721 | |||||||||||
| Shares Outstanding: | Shares Outstanding: | |||||||||||||||||
| Beginning of year | 8,424,284 | Beginning of year | 88,900 | |||||||||||||||
| End of year | 18,962,183 | End of year | 120,095 | |||||||||||||||
| Baird Short-Term Bond Fund | ||||||||||||||||||
| Institutional Class Shares | Investor Class Shares | |||||||||||||||||
| Six Months Ended | Six Months Ended | |||||||||||||||||
| June 30, 2016 | June 30, 2016 | |||||||||||||||||
| Shares | Amount | Shares | Amount | |||||||||||||||
| Shares sold | 106,230,872 | $ | 1,027,025,172 | Shares sold | 3,940,761 | $ | 38,132,329 | |||||||||||
| Shares issued to | Shares issued to | |||||||||||||||||
| shareholders in | shareholders in | |||||||||||||||||
| reinvestment of | reinvestment of | |||||||||||||||||
| dividends | 2,253,655 | 21,793,839 | dividends | 30,650 | 296,614 | |||||||||||||
| Shares redeemed | (59,448,523 | ) | (575,581,785 | ) | Shares redeemed | (1,143,114 | ) | (11,027,638 | ) | |||||||||
| Net increase | 49,036,004 | $ | 473,237,226 | Net increase | 2,828,297 | $ | 27,401,305 | |||||||||||
| Shares Outstanding: | Shares Outstanding: | |||||||||||||||||
| Beginning of period | 310,076,475 | Beginning of period | 4,232,180 | |||||||||||||||
| End of period | 359,112,479 | End of period | 7,060,477 | |||||||||||||||
Page 110
Notes to the Financial Statements
June 30, 2016 (Unaudited)
3. Capital Share Transactions (cont.)
Baird Short-Term Bond Fund (cont.)
| Institutional Class Shares | Investor Class Shares | |||||||||||||||||
| Year Ended | Year Ended | |||||||||||||||||
| December 31, 2015 | December 31, 2015 | |||||||||||||||||
| Shares | Amount | Shares | Amount | |||||||||||||||
| Shares sold | 135,569,368 | $ | 1,312,782,673 | Shares sold | 3,300,557 | $ | 31,979,152 | |||||||||||
| Shares issued to | Shares issued to | |||||||||||||||||
| shareholders in | shareholders in | |||||||||||||||||
| reinvestment of | reinvestment of | |||||||||||||||||
| dividends | 4,045,771 | 39,128,874 | dividends | 41,160 | 398,035 | |||||||||||||
| Shares redeemed | (102,702,980 | ) | (994,845,046 | ) | Shares redeemed | (2,814,301 | ) | (27,286,486 | ) | |||||||||
| Net increase | 36,912,159 | $ | 357,066,501 | Net increase | 527,416 | $ | 5,090,701 | |||||||||||
| Shares Outstanding: | Shares Outstanding: | |||||||||||||||||
| Beginning of year | 273,164,316 | Beginning of year | 3,704,764 | |||||||||||||||
| End of year | 310,076,475 | End of year | 4,232,180 | |||||||||||||||
| Baird Intermediate Bond Fund | ||||||||||||||||||
| Institutional Class Shares | Investor Class Shares | |||||||||||||||||
| Six Months Ended | Six Months Ended | |||||||||||||||||
| June 30, 2016 | June 30, 2016 | |||||||||||||||||
| Shares | Amount | Shares | Amount | |||||||||||||||
| Shares sold | 24,659,542 | $ | 274,297,364 | Shares sold | 903,918 | $ | 10,450,163 | |||||||||||
| Shares issued to | Shares issued to | |||||||||||||||||
| shareholders in | shareholders in | |||||||||||||||||
| reinvestment of | reinvestment of | |||||||||||||||||
| dividends | 1,556,355 | 17,323,181 | dividends | 81,543 | 945,170 | |||||||||||||
| Shares redeemed | (14,367,362 | ) | (159,504,772 | ) | Shares redeemed | (1,131,171 | ) | (13,107,622 | ) | |||||||||
| Net increase | 11,848,535 | $ | 132,115,773 | Net decrease | (145,710 | ) | $ | (1,712,289 | ) | |||||||||
| Shares Outstanding: | Shares Outstanding: | |||||||||||||||||
| Beginning of period | 163,490,427 | Beginning of period | 9,079,935 | |||||||||||||||
| End of period | 175,338,962 | End of period | 8,934,225 | |||||||||||||||
| Institutional Class Shares | Investor Class Shares | |||||||||||||||||
| Year Ended | Year Ended | |||||||||||||||||
| December 31, 2015 | December 31, 2015 | |||||||||||||||||
| Shares | Amount | Shares | Amount | |||||||||||||||
| Shares sold | 50,507,223 | $ | 562,212,364 | Shares sold | 1,510,863 | $ | 17,460,109 | |||||||||||
| Shares issued to | Shares issued to | |||||||||||||||||
| shareholders in | shareholders in | |||||||||||||||||
| reinvestment of | reinvestment of | |||||||||||||||||
| dividends | 3,265,821 | 36,214,342 | dividends | 200,312 | 2,313,757 | |||||||||||||
| Shares redeemed | (22,506,173 | ) | (250,191,862 | ) | Shares redeemed | (2,632,587 | ) | (30,508,078 | ) | |||||||||
| Net increase | 31,266,871 | $ | 348,234,844 | Net decrease | (921,412 | ) | $ | (10,734,212 | ) | |||||||||
| Shares Outstanding: | Shares Outstanding: | |||||||||||||||||
| Beginning of year | 132,223,556 | Beginning of year | 10,001,347 | |||||||||||||||
| End of year | 163,490,427 | End of year | 9,079,935 | |||||||||||||||
Page 111
Notes to the Financial Statements
June 30, 2016 (Unaudited)
3. Capital Share Transactions (cont.)
Baird Aggregate Bond Fund
| Institutional Class Shares | Investor Class Shares | ||||||||||||||||
| Six Months Ended | Six Months Ended | ||||||||||||||||
| June 30, 2016 | June 30, 2016 | ||||||||||||||||
| Shares | Amount | Shares | Amount | ||||||||||||||
| Shares sold | 192,588,351 | $ | 2,087,397,410 | Shares sold | 18,190,684 | $ | 203,974,549 | ||||||||||
| Shares issued to | Shares issued to | ||||||||||||||||
| shareholders in | shareholders in | ||||||||||||||||
| reinvestment of | reinvestment of | ||||||||||||||||
| dividends | 6,635,832 | 72,087,126 | dividends | 425,057 | 4,766,012 | ||||||||||||
| Shares redeemed | (59,359,574 | ) | (643,670,833 | ) | Shares redeemed | (6,762,694 | ) | (75,558,237 | ) | ||||||||
| Net increase | 139,864,609 | $ | 1,515,813,703 | Net increase | 11,853,047 | $ | 133,182,324 | ||||||||||
| Shares Outstanding: | Shares Outstanding: | ||||||||||||||||
| Beginning of period | 595,731,513 | Beginning of period | 39,260,014 | ||||||||||||||
| End of period | 735,596,122 | End of period | 51,113,061 | ||||||||||||||
| Institutional Class Shares | Investor Class Shares | ||||||||||||||||
| Year Ended | Year Ended | ||||||||||||||||
| December 31, 2015 | December 31, 2015 | ||||||||||||||||
| Shares | Amount | Shares | Amount | ||||||||||||||
| Shares sold | 356,830,993 | $ | 3,865,220,032 | Shares sold | 33,925,649 | $ | 380,462,212 | ||||||||||
| Shares issued to | Shares issued to | ||||||||||||||||
| shareholders in | shareholders in | ||||||||||||||||
| reinvestment of | reinvestment of | ||||||||||||||||
| dividends | 9,544,951 | 102,735,825 | dividends | 832,114 | 9,246,306 | ||||||||||||
| Shares redeemed | (89,632,870 | ) | (965,571,353 | ) | Shares redeemed | (17,180,037 | ) | (189,903,979 | ) | ||||||||
| Net increase | 276,743,074 | $ | 3,002,384,504 | Net increase | 17,577,726 | $ | 199,804,539 | ||||||||||
| Shares Outstanding: | Shares Outstanding: | ||||||||||||||||
| Beginning of year | 318,988,439 | Beginning of year | 21,682,288 | ||||||||||||||
| End of year | 595,731,513 | End of year | 39,260,014 | ||||||||||||||
| Baird Core Plus Bond Fund | |||||||||||||||||
| Institutional Class Shares | Investor Class Shares | ||||||||||||||||
| Six Months Ended | Six Months Ended | ||||||||||||||||
| June 30, 2016 | June 30, 2016 | ||||||||||||||||
| Shares | Amount | Shares | Amount | ||||||||||||||
| Shares sold | 158,684,933 | $ | 1,761,509,592 | Shares sold | 38,557,508 | $ | 444,129,107 | ||||||||||
| Shares issued to | Shares issued to | ||||||||||||||||
| shareholders in | shareholders in | ||||||||||||||||
| reinvestment of | reinvestment of | ||||||||||||||||
| dividends | 8,901,757 | 98,835,429 | dividends | 2,314,900 | 26,692,878 | ||||||||||||
| Shares redeemed | (59,069,248 | ) | (655,336,733 | ) | Shares redeemed | (26,756,213 | ) | (307,668,023 | ) | ||||||||
| Net increase | 108,517,442 | $ | 1,205,008,288 | Net increase | 14,116,195 | $ | 163,153,962 | ||||||||||
| Shares Outstanding: | Shares Outstanding: | ||||||||||||||||
| Beginning of period | 663,605,778 | Beginning of period | 193,850,233 | ||||||||||||||
| End of period | 772,123,220 | End of period | 207,966,428 | ||||||||||||||
Page 112
Notes to the Financial Statements
June 30, 2016 (Unaudited)
3. Capital Share Transactions (cont.)
Baird Core Plus Bond Fund (cont.)
| Institutional Class Shares | Investor Class Shares | ||||||||||||||||
| Year Ended | Year Ended | ||||||||||||||||
| December 31, 2015 | December 31, 2015 | ||||||||||||||||
| Shares | Amount | Shares | Amount | ||||||||||||||
| Shares sold | 338,402,581 | $ | 3,765,813,087 | Shares sold | 92,075,541 | $ | 1,065,444,861 | ||||||||||
| Shares issued to | Shares issued to | ||||||||||||||||
| shareholders in | shareholders in | ||||||||||||||||
| reinvestment of | reinvestment of | ||||||||||||||||
| dividends | 14,978,062 | 165,809,786 | dividends | 4,736,958 | 54,497,497 | ||||||||||||
| Shares redeemed | (95,670,704 | ) | (1,059,277,984 | ) | Shares redeemed | (93,017,178 | ) | (1,069,633,270 | ) | ||||||||
| Net increase | 257,709,939 | $ | 2,872,344,889 | Net increase | 3,795,321 | $ | 50,309,088 | ||||||||||
| Shares Outstanding: | Shares Outstanding: | ||||||||||||||||
| Beginning of year | 405,895,839 | Beginning of year | 190,054,912 | ||||||||||||||
| End of year | 663,605,778 | End of year | 193,850,233 | ||||||||||||||
| Baird Short-Term Municipal Bond Fund^ | |||||||||||||||||
| Institutional Class Shares | Investor Class Shares | ||||||||||||||||
| Six Months Ended | Six Months Ended | ||||||||||||||||
| June 30, 2016 | June 30, 2016 | ||||||||||||||||
| Shares | Amount | Shares | Amount | ||||||||||||||
| Shares sold | 1,399,506 | $ | 14,152,744 | Shares sold | 55,108 | $ | 557,430 | ||||||||||
| Shares issued to | Shares issued to | ||||||||||||||||
| shareholders in | shareholders in | ||||||||||||||||
| reinvestment of | reinvestment of | ||||||||||||||||
| dividends | 8,930 | 90,346 | dividends | 166 | 1,684 | ||||||||||||
| Shares redeemed | (221,954 | ) | (2,246,505 | ) | Shares redeemed | (10,296 | ) | (104,244 | ) | ||||||||
| Net increase | 1,186,482 | $ | 11,996,585 | Net increase | 44,978 | $ | 454,870 | ||||||||||
| Shares Outstanding: | Shares Outstanding: | ||||||||||||||||
| Beginning of period | 1,222,493 | Beginning of period | 12,742 | ||||||||||||||
| End of period | 2,408,975 | End of period | 57,720 | ||||||||||||||
| Institutional Class Shares | Investor Class Shares | ||||||||||||||||
| Period Ended | Period Ended | ||||||||||||||||
| December 31, 2015 | December 31, 2015 | ||||||||||||||||
| Shares | Amount | Shares | Amount | ||||||||||||||
| Shares sold | 1,220,676 | $ | 12,220,406 | Shares sold | 12,719 | $ | 127,500 | ||||||||||
| Shares issued to | Shares issued to | ||||||||||||||||
| shareholders in | shareholders in | ||||||||||||||||
| reinvestment of | reinvestment of | ||||||||||||||||
| dividends | 3,170 | 31,828 | dividends | 24 | 237 | ||||||||||||
| Shares redeemed | (1,353 | ) | (13,600 | ) | Shares redeemed | (1 | ) | (7 | ) | ||||||||
| Net increase | 1,222,493 | $ | 12,238,634 | Net increase | 12,742 | $ | 127,730 | ||||||||||
| Shares Outstanding: | Shares Outstanding: | ||||||||||||||||
| Beginning of period | — | Beginning of period | — | ||||||||||||||
| End of period | 1,222,493 | End of period | 12,742 | ||||||||||||||
^ Inception was the close of business on August 31, 2015.
Page 113
Notes to the Financial Statements
June 30, 2016 (Unaudited)
3. Capital Share Transactions (cont.)
Baird Quality Intermediate Municipal Bond Fund
| Institutional Class Shares | Investor Class Share | |||||||||||||||||
| Six Months Ended | Six Months Ended | |||||||||||||||||
| June 30, 2016 | June 30, 2016 | |||||||||||||||||
| Shares | Amount | Shares | Amount | |||||||||||||||
| Shares sold | 15,174,671 | $ | 179,616,554 | Shares sold | 1,628,962 | $ | 19,716,677 | |||||||||||
| Shares issued to | Shares issued to | |||||||||||||||||
| shareholders in | shareholders in | |||||||||||||||||
| reinvestment of | reinvestment of | |||||||||||||||||
| dividends | 893,807 | 10,578,919 | dividends | 130,080 | 1,574,449 | |||||||||||||
| Shares redeemed | (9,744,601 | ) | (115,395,434 | ) | Shares redeemed | (1,967,724 | ) | (23,829,787 | ) | |||||||||
| Net increase | 6,323,877 | $ | 74,800,039 | Net decrease | (208,682 | ) | $ | (2,538,661 | ) | |||||||||
| Shares Outstanding: | Shares Outstanding: | |||||||||||||||||
| Beginning of period | 84,225,298 | Beginning of period | 13,361,547 | |||||||||||||||
| End of period | 90,549,175 | End of period | 13,152,865 | |||||||||||||||
| Institutional Class Shares | Investor Class Shares | |||||||||||||||||
| Year Ended | Year Ended | |||||||||||||||||
| December 31, 2015 | December 31, 2015 | |||||||||||||||||
| Shares | Amount | Shares | Amount | |||||||||||||||
| Shares sold | 26,646,569 | $ | 312,714,221 | Shares sold | 3,150,812 | $ | 37,855,718 | |||||||||||
| Shares issued to | Shares issued to | |||||||||||||||||
| shareholders in | shareholders in | |||||||||||||||||
| reinvestment of | reinvestment of | |||||||||||||||||
| dividends | 1,741,307 | 20,418,954 | dividends | 295,661 | 3,545,949 | |||||||||||||
| Shares redeemed | (22,266,810 | ) | (260,976,248 | ) | Shares redeemed | (5,607,213 | ) | (67,122,955 | ) | |||||||||
| Net increase | 6,121,066 | $ | 72,156,927 | Net decrease | (2,160,740 | ) | $ | (25,721,288 | ) | |||||||||
| Shares Outstanding: | Shares Outstanding: | |||||||||||||||||
| Beginning of year | 78,104,232 | Beginning of year | 15,522,287 | |||||||||||||||
| End of year | 84,225,298 | End of year | 13,361,547 | |||||||||||||||
| Baird Core Intermediate Municipal Bond Fund^ | ||||||||||||||||||
| Institutional Class Shares | Investor Class Shares | |||||||||||||||||
| Six Months Ended | Six Months Ended | |||||||||||||||||
| June 30, 2016 | June 30, 2016 | |||||||||||||||||
| Shares | Amount | Shares | Amount | |||||||||||||||
| Shares sold | 2,102,144 | $ | 21,619,424 | Shares sold | 36,767 | $ | 377,120 | |||||||||||
| Shares issued to | Shares issued to | |||||||||||||||||
| shareholders in | shareholders in | |||||||||||||||||
| reinvestment of | reinvestment of | |||||||||||||||||
| dividends | 18,570 | 191,328 | dividends | 308 | 3,171 | |||||||||||||
| Shares redeemed | (360,082 | ) | (3,708,611 | ) | Shares redeemed | (73 | ) | (748 | ) | |||||||||
| Net increase | 1,760,632 | $ | 18,102,141 | Net increase | 37,002 | $ | 379,543 | |||||||||||
| Shares Outstanding: | Shares Outstanding: | |||||||||||||||||
| Beginning of period | 5,016,280 | Beginning of period | 22,259 | |||||||||||||||
| End of period | 6,776,912 | End of period | 59,261 | |||||||||||||||
Page 114
Notes to the Financial Statements
June 30, 2016 (Unaudited)
3. Capital Share Transactions (cont.)
Baird Core Intermediate Municipal Bond Fund^ (cont.)
| Institutional Class Shares | Investor Class Shares | |||||||||||||||||
| Period Ended | Period Ended | |||||||||||||||||
| December 31, 2015 | December 31, 2015 | |||||||||||||||||
| Shares | Amount | Shares | Amount | |||||||||||||||
| Shares sold | 5,216,078 | $ | 52,271,310 | Shares sold | 22,221 | $ | 224,183 | |||||||||||
| Shares issued to | Shares issued to | |||||||||||||||||
| shareholders in | shareholders in | |||||||||||||||||
| reinvestment of | reinvestment of | |||||||||||||||||
| dividends | 12,426 | 125,453 | dividends | 60 | 611 | |||||||||||||
| Shares redeemed | (212,224 | ) | (2,137,467 | ) | Shares redeemed | (22 | ) | (222 | ) | |||||||||
| Net increase | 5,016,280 | $ | 50,259,296 | Net increase | 22,259 | $ | 224,572 | |||||||||||
| Shares Outstanding: | Shares Outstanding: | |||||||||||||||||
| Beginning of period | — | Beginning of period | — | |||||||||||||||
| End of period | 5,016,280 | End of period | 22,259 | |||||||||||||||
^ Inception was the close of business on August 31, 2015.
4. Investment Transactions and Income Tax Information
During the six months ended June 30, 2016, purchases and sales of investment securities (excluding short-term investments) were as follows:
| Baird | Baird | Baird | ||||||||||
| Ultra Short | Short-Term | Intermediate | ||||||||||
| Bond Fund | Bond Fund | Bond Fund | ||||||||||
| Purchases: | ||||||||||||
| U.S. Government | $ | — | $ | — | $ | — | ||||||
| Other | $ | 150,764,748 | $ | 1,147,893,352 | $ | 436,437,079 | ||||||
| Sales: | ||||||||||||
| U.S. Government | $ | — | $ | — | $ | — | ||||||
| Other | $ | 116,043,681 | $ | 644,673,833 | $ | 283,571,722 | ||||||
| Baird | ||||||||||||
| Baird | Baird | Short-Term | ||||||||||
| Aggregate | Core Plus | Municipal | ||||||||||
| Bond Fund | Bond Fund | Bond Fund | ||||||||||
| Purchases: | ||||||||||||
| U.S. Government | $ | 60,208,427 | $ | 24,222,945 | $ | — | ||||||
| Other | $ | 3,160,331,149 | $ | 3,345,244,593 | $ | 14,792,366 | ||||||
| Sales: | ||||||||||||
| U.S. Government | $ | 19,271,814 | $ | 21,404,573 | $ | — | ||||||
| Other | $ | 1,562,188,971 | $ | 1,993,697,998 | $ | 2,455,039 | ||||||
Page 115
Notes to the Financial Statements
June 30, 2016 (Unaudited)
4. Investment Transactions and Income Tax Information (cont.)
| Baird Quality | Baird Core | |||||||
| Intermediate | Intermediate | |||||||
| Municipal | Municipal | |||||||
| Bond Fund | Bond Fund | |||||||
| Purchases: | ||||||||
| U.S. Government | $ | — | $ | — | ||||
| Other | $ | 153,638,189 | $ | 50,091,611 | ||||
| Sales: | ||||||||
| U.S. Government | $ | — | $ | — | ||||
| Other | $ | 73,001,800 | $ | 32,931,490 | ||||
At December 31, 2015, gross unrealized appreciation and depreciation of investments and distributable ordinary income and long-term capital gains for federal tax purposes were as follows:
| Baird | Baird | Baird | ||||||||||
| Ultra Short | Short-Term | Intermediate | ||||||||||
| Bond Fund | Bond Fund | Bond Fund | ||||||||||
| Cost of Investments | $ | 194,611,111 | $ | 3,099,443,684 | $ | 1,965,120,976 | ||||||
| Gross unrealized appreciation | 96,128 | 4,813,823 | 16,111,626 | |||||||||
| Gross unrealized depreciation | (1,072,452 | ) | (27,644,854 | ) | (25,378,797 | ) | ||||||
| Net unrealized depreciation | $ | (976,324 | ) | $ | (22,831,031 | ) | $ | (9,267,171 | ) | |||
| Undistributed ordinary income | 17,379 | 202,243 | 155,059 | |||||||||
| Undistributed long-term capital gain | — | — | — | |||||||||
| Undistributed tax-exempt income | — | — | — | |||||||||
| Total distributable earnings | $ | 17,379 | $ | 202,243 | $ | 155,059 | ||||||
| Other accumulated losses | (95,183 | ) | (2,941,310 | ) | (70,393 | ) | ||||||
| Total accumulated losses | $ | (1,054,128 | ) | $ | (25,570,098 | ) | $ | (9,182,505 | ) | |||
| Baird | ||||||||||||
| Baird | Baird | Short-Term | ||||||||||
| Aggregate | Core Plus | Municipal | ||||||||||
| Bond Fund | Bond Fund | Bond Fund | ||||||||||
| Cost of Investments | $ | 7,133,256,261 | $ | 9,776,697,957 | $ | 12,382,945 | ||||||
| Gross unrealized appreciation | 49,297,807 | 63,986,465 | 77,567 | |||||||||
| Gross unrealized depreciation | (125,663,269 | ) | (249,776,466 | ) | (21,119 | ) | ||||||
| Net unrealized appreciation (depreciation) | $ | (76,365,462 | ) | $ | (185,790,001 | ) | $ | 56,448 | ||||
| Undistributed ordinary income | 206,498 | 396,055 | — | |||||||||
| Undistributed long-term capital gain | — | — | — | |||||||||
| Undistributed tax-exempt income | — | — | — | |||||||||
| Total distributable earnings | $ | 206,498 | $ | 396,055 | $ | — | ||||||
| Other accumulated losses | (103,043 | ) | (2,360,330 | ) | — | |||||||
| Total accumulated earnings (losses) | $ | (76,262,007 | ) | $ | (187,754,276 | ) | $ | 56,448 | ||||
Page 116
Notes to the Financial Statements
June 30, 2016 (Unaudited)
4. Investment Transactions and Income Tax Information (cont.)
| Baird Quality | Baird Core | |||||||
| Intermediate | Intermediate | |||||||
| Municipal | Municipal | |||||||
| Bond Fund | Bond Fund | |||||||
| Cost of Investments | $ | 1,091,002,914 | $ | 50,771,716 | ||||
| Gross unrealized appreciation | 45,616,699 | 551,583 | ||||||
| Gross unrealized depreciation | (3,655,123 | ) | (76,797 | ) | ||||
| Net unrealized appreciation | $ | 41,961,576 | $ | 474,786 | ||||
| Undistributed ordinary income | — | 103,686 | ||||||
| Undistributed long-term capital gain | — | 69 | ||||||
| Undistributed tax-exempt income | 22,182 | — | ||||||
| Total distributable earnings | $ | 22,182 | $ | 103,755 | ||||
| Other accumulated losses | (1,228,069 | ) | — | |||||
| Total accumulated earnings | $ | 40,755,689 | $ | 578,541 | ||||
Undistributed income or net realized gains for financial statement purposes may differ from amounts recognized for federal income tax purposes due to differences in the recognition and characterization of income, expense and capital gain items. The difference between book-basis and tax-basis unrealized appreciation is attributed primarily to the tax deferral of losses on wash sales.
Additionally, U.S. generally accepted accounting principles require that certain components of net assets relating to permanent differences be reclassified between financial and tax reporting. These reclassifications are primarily due to differing treatments for losses deferred due to wash sales and non-deductible expenses. These reclassifications have no effect on net assets or net asset value per share.
The tax components of dividends paid during the periods shown below were as follows:
| Six Months Ended | Year Ended | |||||||||||||||
| June 30, 2016 | December 31, 2015 | |||||||||||||||
| Ordinary | Long-Term | Ordinary | Long-Term | |||||||||||||
| Income | Capital Gains | Income | Capital Gains | |||||||||||||
| Distributions | Distributions | Distributions | Distributions | |||||||||||||
| Baird Ultra Short Bond Fund | $ | 963,399 | $ | — | $ | 1,288,639 | $ | — | ||||||||
| Baird Short-Term Bond Fund | $ | 25,287,174 | $ | — | $ | 45,056,387 | $ | 1,191,582 | ||||||||
| Baird Intermediate Bond Fund | $ | 21,273,310 | $ | — | $ | 40,089,420 | $ | 4,403,658 | ||||||||
| Baird Aggregate Bond Fund | $ | 91,352,911 | $ | — | $ | 135,833,133 | $ | — | ||||||||
| Baird Core Plus Bond Fund | $ | 134,187,903 | $ | — | $ | 233,638,407 | $ | — | ||||||||
| Baird Short-Term Municipal Bond Fund | $ | — | $ | — | $ | 18,089 | $ | — | ||||||||
| Baird Quality Intermediate | ||||||||||||||||
| Municipal Bond Fund | $ | — | $ | — | $ | 216,080 | $ | — | ||||||||
| Baird Core Intermediate | ||||||||||||||||
| Municipal Bond Fund | $ | — | $ | — | $ | 75,435 | $ | — | ||||||||
For the six months ended June 30, 2016 and the year ended December 31, 2015, distributions of $13,623,770 and $26,916,871, respectively, from the Baird Quality Intermediate Municipal Bond Fund were tax-exempt.
Page 117
Notes to the Financial Statements
June 30, 2016 (Unaudited)
4. Investment Transactions and Income Tax Information (cont.)
For the period August 31, 2015 (inception) through December 31, 2015 the Baird Short-Term Municipal Bond Fund and Baird Core Intermediate Municipal Bond Fund made distributions of tax-exempt income of $36,906 and $234,396, respectively. For the six months ended June 30, 2016, the Baird Short-Term Municipal Bond Fund and Baird Core Intermediate Municipal Bond Fund made distributions of tax-exempt income of $129,488 and $529,682, respectively.
The Baird Short-Term Municipal Bond Fund, Baird Quality Intermediate Municipal Bond Fund and Baird Core Intermediate Municipal Bond Fund designated as long-term capital gain dividend, pursuant to Internal Revenue Code Section 852(b)(3), the amount necessary to reduce the earnings and profits of the Fund related to net capital gain to zero for the tax year ended December 31, 2015.
Under the current tax law, capital losses realized after October 31 may be deferred and treated as occurring on the first day of the following fiscal year. For the year ended December 31, 2015, the Baird Intermediate Bond Fund elected to defer capital losses occurring between November 1, 2015 and December 31, 2015 in the amount of $70,393.
At December 31, 2015, accumulated net realized capital loss carryovers, if any, and the year(s) in which the capital loss carryovers expire were:
| Capital Loss | Year of | |||||
Carryover | Character | Expiration | ||||
| Baird Ultra Short Bond Fund | $ | 85,608 | Short-Term | Indefinitely | ||
| 9,575 | Long-Term | Indefinitely | ||||
| Baird Short-Term Bond Fund | 2,941,310 | Long-Term | Indefinitely | |||
| Baird Aggregate Bond Fund | 103,043 | Short-Term | Indefinitely | |||
| Baird Core Plus Bond Fund | 2,360,330 | Long-Term | Indefinitely | |||
| Baird Quality Intermediate Municipal Bond Fund | 387,722 | Short-Term | Indefinitely | |||
| 840,347 | Long-Term | Indefinitely | ||||
5. Investment Advisory and Other Agreements
The Funds have entered into an Investment Advisory Agreement with Baird for the provision of investment advisory services. Pursuant to the Investment Advisory Agreement, the Advisor is entitled to receive a fee, calculated daily and payable monthly, at the annual rate of 0.25% for the Funds as applied to the respective Fund’s average daily net assets. Certain officers of the Advisor are also officers of the Funds.
For the six months ended June 30, 2016, the Advisor waived the following amount pursuant to the fee waiver agreement between the Advisor and the Corporation on behalf of the Baird Ultra Short Bond Fund:
Fund | Waived Amount | |
| Baird Ultra Short Bond Fund | $143,451 |
The Funds have entered into an Administration Agreement with Baird. Under the Administration Agreement, the Advisor assumes and pays all expenses of the applicable Fund other than the investment advisory fees, fees under the 12b-1 plan, costs related to portfolio securities transactions and extraordinary or non-recurring expenses. Pursuant to the Administration Agreement, the Advisor is entitled to receive a fee, calculated daily and payable monthly, at the annual rate of 0.05% for the Funds as applied to the respective Fund’s average daily net assets.
U.S. Bancorp Fund Services, LLC (“USBFS”) serves as transfer agent, administrator, and accounting services agent for the Funds. U.S. Bank, N.A. (“U.S. Bank”) serves as custodian for the Funds. U.S. Bank may be considered an “affiliated person” of the Funds for purposes of the 1940 Act, as a result of U.S. Bank’s fiduciary accounts for which it has investment authority and/or voting authority collectively acquiring 5% or more of the shares of the Baird Aggregate Bond Fund, a separate series of the Company. As a result, USBFS would be an
Page 118
Notes to the Financial Statements
June 30, 2016 (Unaudited)
5. Investment Advisory and Other Agreements (cont.)
affiliated person of an affiliated person (or a “second tier” affiliate) of the Funds. Effective March 9, 2016, U.S. Bank was not considered an “affiliated person” of the Funds for purposes of the 1940 Act.
Baird (the “Distributor”) is the distributor of the Funds pursuant to a distribution agreement.
6. Securities Lending
Each Fund (other than the Short-Term Municipal Bond Fund, Quality Intermediate Municipal Bond Fund and Core Intermediate Municipal Bond Fund) may lend up to one-third of its total assets (including such loans) to borrowers under terms of participation in a securities lending program administered by U.S. Bank, N.A., the Funds’ custodian and an affiliated person of the Funds, and an affiliate of USBFS, the Funds’ transfer agent and administrator and a second-tier affiliate of the Funds. The securities lending agreement requires that loans are collateralized at all times in an amount equal to at least 102% of the market value of any loaned securities at the time of the loan, plus accrued interest.
The Funds receive compensation in the form of fees and earn interest on the cash collateral. The amount of fees depends on a number of factors including the type of security and length of the loan. Each Fund continues to receive interest payments or dividends on the securities loaned during the borrowing period. Each Fund has the right under the terms of the securities lending agreement to recall the securities from the borrower on demand.
As of June 30, 2016, the Baird Short-Term Bond Fund, Baird Intermediate Bond Fund, Baird Aggregate Bond Fund and Baird Core Plus Bond Fund had loaned securities that were collateralized by cash equivalents. The cash collateral is invested by the custodian in accordance with approved investment guidelines. Those guidelines require the cash collateral to be invested in readily marketable, high quality, short-term obligations; however, such investments are subject to risk of payment delays or default on the part of the issuer or counterparty or otherwise may not generate sufficient interest to support the costs associated with securities lending. A Fund could also experience delays in recovering its securities and possible loss of income or value if the borrower fails to return the borrowed securities, although the Funds are indemnified from this risk by contract with the securities lending agent.
As of June 30, 2016, the market value of the securities on loan and payable on collateral due to broker were as follows:
| Market Value of | Payable on Collateral | |||||||
| Securities on Loan | due to Broker | |||||||
| Baird Ultra Short Bond Fund | $ | — | $ | — | ||||
| Baird Short-Term Bond Fund | 38,960,156 | 39,767,555 | ||||||
| Baird Intermediate Bond Fund | 53,842,395 | 54,964,493 | ||||||
| Baird Aggregate Bond Fund | 161,602,769 | 164,963,964 | ||||||
| Baird Core Plus Bond Fund | 271,561,442 | 276,410,416 | ||||||
The Funds receive cash as collateral in return for securities lent as part of the securities lending program. The collateral is invested in the Mount Vernon Securities Lending Prime Portfolio (a securities lending trust subject to Rule 2a-7 under the 1940 Act). The schedules of investments for the Funds include the particular cash collateral holdings as of June 30, 2016.
The interest income earned by the Funds on investments of cash collateral received from borrowers for the securities loaned to them (“securities lending income”) is reflected in the Funds’ statements of operations. Interest income earned on collateral investments and recognized by the Funds during the six months ended June 30, 2016 for the Baird Ultra Short Bond Fund, Baird Short-Term Bond Fund, Baird Intermediate Bond Fund, Baird Aggregate Bond Fund, and Baird Core Plus Bond Fund were $1,095, $114,782, $102,047, $207,702, and $480,522, respectively.
Page 119
Notes to the Financial Statements
June 30, 2016 (Unaudited)
6. Securities Lending (cont.)
The Funds recently adopted guidance requiring entities to present gross obligations for secured borrowings by the type of collateral pledged and remaining time to maturity. The table below outlines the nature of these obligations at June 30, 2016.
| Overnight and | Up to | Greater Than | |||||||||||||||
| Continuous | 30 Days | 30-90 Days | 90 Days | Total | |||||||||||||
| Securities lending transactions | |||||||||||||||||
| Money Market Fund^ | |||||||||||||||||
| Baird Short-Term Bond Fund | $ | 39,767,555 | — | — | — | $ | 39,767,555 | ||||||||||
| Baird Intermediate Bond Fund | 54,964,493 | — | — | — | 54,964,493 | ||||||||||||
| Baird Aggregate Bond Fund | 164,963,964 | — | — | — | 164,963,964 | ||||||||||||
| Baird Core Plus Bond Fund | 276,410,416 | — | — | — | 276,410,416 | ||||||||||||
| Total borrowings | $ | 536,106,428 | — | — | — | $ | 536,106,428 | ||||||||||
| ^ | Represents an interest in Mount Vernon Securities Lending Prime Portfolio, an investment purchased with cash proceeds from securities lending collateral received. |
7. Line of Credit
The Corporation maintains an uncommitted, senior secured line of credit (“LOC”) with U.S. Bank, N.A. (the “Bank”) to provide the Funds a temporary liquidity source to meet unanticipated redemptions. Under the terms of the LOC, borrowings for each Fund are limited to one-third of the total assets (including the amount borrowed) of the respective Fund, or as otherwise indicated within the Funds’ agreement with the Bank. The Bank charges interest at the Bank’s Prime Rate less 2% (weighted average rate of 1.50% for the first six months of 2016). For the six months ended June 30, 2016, the Baird Ultra Short Bond Fund incurred $144 in interest charges, on an average daily loan balance of $18,989. The Baird Short-Term Bond Fund, Baird Intermediate Bond Fund, Baird Aggregate Bond Fund, Baird Core Plus Bond Fund, Baird Short-Term Municipal Bond Fund, Baird Quality Intermediate Municipal Bond Fund, and Baird Core Intermediate Municipal Bond Fund did not borrow from the LOC during the period.
8. Distribution and Shareholder Service Plan
The Funds have adopted a distribution and shareholder service plan (the “Plan”) pursuant to Rule 12b-1 under the 1940 Act. The Plan allows the Funds to compensate the Distributor for the costs incurred in distributing the Funds’ Investor Class Shares, including amounts paid to brokers or dealers, at an annual rate of 0.25% of the average daily net assets of the Funds’ Investor Class Shares. The Baird Ultra Short Bond, Baird Short-Term Bond, Baird Intermediate Bond, Baird Aggregate Bond, Baird Core Plus Bond, Baird Short-Term Municipal Bond Fund, Baird Quality Intermediate Municipal Bond and Baird Core Intermediate Municipal Bond Funds incurred $1,662, $63,509, $130,264, $608,476, $2,852,377, $364, $198,482 and $498, respectively, in fees pursuant to the Plan during the six months ended June 30, 2016.
9. Subsequent Event
In preparing these financial statements, the Corporation has evaluated events after June 30, 2016. There were no subsequent events since June 30, 2016 through the date the financial statements were issued that would require adjustment to or additional disclosure in these financial statements.
Page 120
Additional Information
Proxy Voting
A description of the policies and procedures that the Funds use to determine how to vote proxies relating to portfolio securities is available without charge, upon request, by calling toll free, 1-866-44BAIRD, or by accessing the Funds’ website at www.bairdfunds.com; and by accessing the SEC’s website at www.sec.gov.
Each Fund’s proxy voting record for the most recent 12-month period ended June 30, if applicable, is available without charge, upon request, by calling toll free, 1-866-44BAIRD, or by accessing the Funds’ website at www.bairdfunds.com; and by accessing the SEC’s website at www.sec.gov. The Funds generally do not vote proxies because the securities held in their portfolios, consisting of bonds and other fixed-income securities, are not entitled to vote.
Portfolio Holdings Disclosure
The Funds file a complete schedule of portfolio holdings with the SEC for the first and third quarters of each fiscal year on Form N-Q. The Funds’ Forms N-Q are available on the SEC’s website at www.sec.gov and may be reviewed and copied at the SEC’s Public Reference Room in Washington, D.C. Information on the operation of the Public Reference Room may be obtained by calling 1-800-732-0330. The Funds’ Forms N-Q may also be obtained by calling toll-free 1-866-44BAIRD.
Page 121
Baird Funds, Inc.
c/o U.S. Bancorp Fund Services, LLC
P.O. Box 701
Milwaukee, WI 53201-0701
1-866-44BAIRD
Board of Directors
G. Frederick Kasten, Jr. (Chairman)
John W. Feldt
Cory L. Nettles
Marlyn J. Spear
Frederick P. Stratton, Jr.
Investment Advisor and Distributor
Robert W. Baird & Co. Incorporated
777 East Wisconsin Avenue
Milwaukee, WI 53202
Administrator and Transfer Agent
U.S. Bancorp Fund Services, LLC
P.O. Box 701
615 East Michigan Street
Milwaukee, WI 53202
Custodian
U.S. Bank, N.A.
1555 N. RiverCenter Drive, Suite 302
Milwaukee, WI 53212
Legal Counsel
Godfrey & Kahn, S.C.
780 North Water Street
Milwaukee, WI 53202
Independent Registered Public
Accounting Firm
Grant Thornton LLP
Grant Thornton Tower
171 N. Clark Street, Suite 200
Chicago, IL 60601
Semi-Annual Report –
Baird Funds
June 30, 2016
Baird LargeCap Fund
Baird MidCap Fund
Baird Small/Mid Cap Value Fund
Baird SmallCap Value Fund
Chautauqua International Growth Fund
Chautauqua Global Growth Fund
Go Green. Go Paperless.
Go Paperless.Sign up to receive your Baird Funds’ prospectuses and reports online.
Table of Contents
| Baird LargeCap Fund | 1 |
| Baird MidCap Fund | 11 |
| Baird Small/Mid Cap Value Fund | 17 |
| Baird SmallCap Value Fund | 23 |
| Chautauqua International Growth Fund | 29 |
| Chautauqua Global Growth Fund | 34 |
| Additional Information on Fund Expenses | 40 |
| Statements of Assets and Liabilities | 42 |
| Statements of Operations | 44 |
| Statements of Changes in Net Assets | 46 |
| Financial Highlights | 52 |
| Notes to the Financial Statements | 64 |
| Disclosure Regarding the Board of Directors’ Approval of the | |
| Subadvisory Agreement for the Baird LargeCap Fund | 76 |
| Disclosure Regarding the Board of Directors’ Approval of the | |
| Investment Advisory Agreement for the Chautauqua | |
| International Growth and Global Growth Funds | 78 |
| Additional Information | 80 |
This report has been prepared for shareholders and may be distributed to others only if preceded or accompanied by a current prospectus.
Cautionary Note on Analyses, Opinions and Outlooks: In this report we offer analyses and opinions on the performance of individual securities, companies, industries, sectors, markets, interest rates and governmental policies, including predictions, forecasts and outlooks regarding possible future events. These can generally be identified as such because the context of the statements may include such words as “believe,” “should,” “will,” “expects,” “anticipates,” “hopes” and words of similar effect. These statements reflect the portfolio managers’ good faith beliefs and judgments and involve risks and uncertainties, including the risk that the portfolio managers’ analyses, opinions and outlooks are or will prove to be inaccurate. It is inherently difficult to correctly assess and explain the performance of particular securities, sectors, markets, interest rate movements, governmental actions or general economic trends and conditions, and many unforeseen factors contribute to the performance of Baird Funds. Investors are, therefore, cautioned not to place undue reliance on subjective judgments contained in this report.
Baird LargeCap Fund
June 30, 2016 (Unaudited)
Portfolio Characteristics
A June 30, 2016 summary of the Fund’s top 10 holdings and equity sector analysis compared to the S&P 500® Index is shown below.
| Top 10 Holdings* | Equity Sector Analysis** | ||
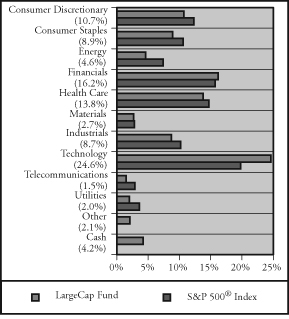 | |||
| Microsoft Corp. | 2.9% | ||
| Apple, Inc. | 2.3% | ||
| Rockwell Automation, Inc. | 2.2% | ||
| Vanguard Consumer Staples ETF | 2.1% | ||
| Exxon Mobil Corp. | 2.1% | ||
| Amgen, Inc. | 2.0% | ||
| Financial Select Sector SPDR Fund | 1.9% | ||
| PepsiCo, Inc. | 1.9% | ||
| Oracle Corp. | 1.9% | ||
| The Coca-Cola Co. | 1.9% | ||
| Net Assets: | $35,559,395 | ||
| Portfolio Turnover Rate: | 46.2% | † | |
| Number of Equity Holdings: | 107 | ||
| Annualized Portfolio Expense Ratio:*** | |||
Gross | |||
| Institutional Class: | 1.11% | ||
| Investor Class: | 1.36% | **** | |
Net | |||
| Institutional Class: | 0.75% | ||
| Investor Class: | 1.00% | **** |
| * | The Fund’s portfolio composition is subject to change and there is no assurance that the Fund will continue to hold any particular security. Percentages shown relate to the Fund’s total net assets as of June 30, 2016. | |
| ** | Percentages shown in parentheses relate to the Fund’s total market value of investments as of June 30, 2016, and may not add up to 100% due to rounding. | |
| *** | Reflects expense ratios as stated in the Fund’s current prospectus. The Advisor has contractually agreed to limit the Fund’s total annual fund operating expenses to 0.75% of average daily net assets for the Institutional Class shares and 1.00% of average daily net assets for the Investor Class shares, at least through April 30, 2017. | |
| **** | Includes 0.25% 12b-1 fee. | |
| † | Not annualized. |
Page 1
Baird LargeCap Fund
June 30, 2016 (Unaudited)
Total Returns
| Average Annual | |||||
| Since | |||||
| For the Periods Ended June 30, 2016 | Six Months | One Year | Five Years | Ten Years | Inception(1) |
| Institutional Class Shares | -1.25% | -5.03% | 8.93% | 6.09% | 2.58% |
| Investor Class Shares | -1.51% | -5.30% | 8.63% | 5.83% | 2.32% |
S&P 500® Index(2) | 3.84% | 3.99% | 12.10% | 7.42% | 4.47% |
| (1) | For the period from September 29, 2000 (inception date) through June 30, 2016. |
| (2) | The S&P 500® Index measures the performance of 500 common stocks chosen for market size, liquidity and industry group representation of U.S. equity performance. This index does not reflect any deduction for fees, expenses or taxes. A direct investment in the index is not possible. |
Effective December 23, 2013, Baird Kailash Group, LLC (“BKG”) became the Fund’s subadviser. Effective April 30, 2016, L2 Asset Management, LLC replaced BKG as the Fund’s subadviser. The returns shown in the table above reflect reinvestment of dividends and/or capital gains distributions in additional shares. The returns do not reflect the deduction of taxes that a shareholder would pay on Fund distributions or the redemption of Fund shares. The returns reflect the actual performance for each period and do not include the impact of trades executed on the last business day of the period that were recorded on the first business day of the next period.
The gross expense ratio for each Class, as reflected in the Fund’s current prospectus, is set forth under “Portfolio Characteristics”.
The Fund’s subadviser makes investment decisions for the Fund primarily using quantitative investment models which rank securities based on fundamental measures of value, past performance and indicators of recent positive changes. The success of the quantitative investment methodologies and processes employed by the subadviser depends on the analyses and assessments that were used in developing such methodologies and processes, as well as on the accuracy and reliability of models and data provided by third parties. Incorrect analyses and assessments or inaccurate or incomplete models and data would adversely affect performance. Certain low-probability events or factors that are assigned little weight may occur or prove to be more likely or may have more relevance than expected, for short or extended periods of time. It is also possible that prices of securities may move in directions that were not predicted by the subadviser’s quantitative methodologies. The Fund may invest in stocks (or ADRs representing stocks) of foreign companies that are traded on U.S. exchanges. Foreign investments involve additional risk such as currency rate fluctuations, political and economic instability, and different and sometimes less strict financial reporting standards and regulation.
Past performance does not guarantee future results. Investment return and principal value will fluctuate so that an investor’s shares, when redeemed, may be worth more or less than their original cost.
For information about the performance of the Fund as of the most recent month-end, please call 1-866-44BAIRD or visit www.bairdfunds.com. Mutual fund performance changes over time and current performance may be lower or higher than that stated.
Page 2
Baird LargeCap Fund
Schedule of Investments, June 30, 2016 (Unaudited)
Common Stocks
| % of | ||||||||||||
| Shares | Value | Net Assets | ||||||||||
| Aerospace & Defense | ||||||||||||
| The Boeing Co. | 3,955 | $ | 513,636 | 1.4 | % | |||||||
| Spirit AeroSystems Holdings, Inc. – Class A* | 3,153 | 135,579 | 0.4 | % | ||||||||
| 649,215 | 1.8 | % | ||||||||||
| Airlines | ||||||||||||
| Alaska Air Group, Inc. | 3,079 | 179,475 | 0.5 | % | ||||||||
| American Airlines Group, Inc. | 6,438 | 182,260 | 0.5 | % | ||||||||
| United Continental Holdings, Inc.* | 2,670 | 109,577 | 0.3 | % | ||||||||
| 471,312 | 1.3 | % | ||||||||||
| Auto Components | ||||||||||||
Delphi Automotive PLC f | 3,282 | 205,453 | 0.6 | % | ||||||||
| Lear Corp. | 4,582 | 466,265 | 1.3 | % | ||||||||
| 671,718 | 1.9 | % | ||||||||||
| Automobiles | ||||||||||||
| Ford Motor Co. | 42,938 | 539,731 | 1.5 | % | ||||||||
| General Motors Co. | 2,403 | 68,005 | 0.2 | % | ||||||||
| Harley-Davidson, Inc. | 7,647 | 346,409 | 1.0 | % | ||||||||
| 954,145 | 2.7 | % | ||||||||||
| Banks | ||||||||||||
| Fifth Third Bancorp | 4,509 | 79,313 | 0.2 | % | ||||||||
| J.P. Morgan Chase & Co. | 8,653 | 537,698 | 1.5 | % | ||||||||
| U.S. Bancorp | 4,531 | 182,735 | 0.5 | % | ||||||||
| Wells Fargo & Co. | 8,982 | 425,118 | 1.2 | % | ||||||||
| 1,224,864 | 3.4 | % | ||||||||||
| Beverages | ||||||||||||
| The Coca-Cola Co. | 14,773 | 669,660 | 1.9 | % | ||||||||
Coca-Cola European Partners PLC f | 3,573 | 127,520 | 0.4 | % | ||||||||
| Dr Pepper Snapple Group, Inc. | 659 | 63,679 | 0.2 | % | ||||||||
| PepsiCo, Inc. | 6,476 | 686,068 | 1.9 | % | ||||||||
| 1,546,927 | 4.4 | % | ||||||||||
| Biotechnology | ||||||||||||
| AbbVie, Inc. | 10,395 | 643,554 | 1.8 | % | ||||||||
| Amgen, Inc. | 4,724 | 718,757 | 2.0 | % | ||||||||
| Biogen, Inc.* | 523 | 126,472 | 0.4 | % | ||||||||
| Celgene Corp.* | 2,097 | 206,827 | 0.6 | % | ||||||||
| United Therapeutics Corp.* | 982 | 104,013 | 0.3 | % | ||||||||
| 1,799,623 | 5.1 | % | ||||||||||
| Building Products | ||||||||||||
| Masco Corp. | 5,546 | 171,593 | 0.5 | % | ||||||||
The accompanying notes are an integral part of these financial statements.
Page 3
Baird LargeCap Fund
Schedule of Investments, June 30, 2016 (Unaudited)
Common Stocks (cont.)
| % of | ||||||||||||
| Shares | Value | Net Assets | ||||||||||
| Capital Markets | ||||||||||||
| Ameriprise Financial, Inc. | 4,986 | $ | 447,992 | 1.3 | % | |||||||
| The Blackstone Group LP | 5,771 | 141,620 | 0.4 | % | ||||||||
| SEI Investments Co. | 6,758 | 325,128 | 0.9 | % | ||||||||
| 914,740 | 2.6 | % | ||||||||||
| Chemicals | ||||||||||||
| CF Industries Holdings, Inc. | 4,308 | 103,823 | 0.3 | % | ||||||||
LyondellBasell Industries NV – Class A f | 7,772 | 578,392 | 1.6 | % | ||||||||
| The Mosaic Co. | 2,488 | 65,136 | 0.2 | % | ||||||||
| Westlake Chemical Corp. | 2,796 | 120,004 | 0.3 | % | ||||||||
| 867,355 | 2.4 | % | ||||||||||
| Commercial Banks | ||||||||||||
| PNC Financial Services Group, Inc. | 2,774 | 225,776 | 0.6 | % | ||||||||
| Communications Equipment | ||||||||||||
| Cisco Systems, Inc. | 4,292 | 123,137 | 0.3 | % | ||||||||
| F5 Networks, Inc.* | 2,645 | 301,107 | 0.9 | % | ||||||||
| 424,244 | 1.2 | % | ||||||||||
| Consumer Finance | ||||||||||||
| American Express Co. | 8,048 | 488,997 | 1.4 | % | ||||||||
| Discover Financial Services | 10,516 | 563,552 | 1.6 | % | ||||||||
| Synchrony Financial* | 21,796 | 551,003 | 1.5 | % | ||||||||
| 1,603,552 | 4.5 | % | ||||||||||
| Containers & Packaging | ||||||||||||
| Sealed Air Corp. | 1,757 | 80,769 | 0.2 | % | ||||||||
| Diversified Consumer Services | ||||||||||||
| H&R Block, Inc. | 6,754 | 155,342 | 0.4 | % | ||||||||
| Diversified Financial Services | ||||||||||||
| MSCI, Inc. | 3,438 | 265,139 | 0.8 | % | ||||||||
| Diversified Telecommunication Services | ||||||||||||
| AT&T, Inc. | 12,205 | 527,378 | 1.5 | % | ||||||||
| Electrical Equipment | ||||||||||||
| Emerson Electric Co. | 2,214 | 115,482 | 0.3 | % | ||||||||
| Rockwell Automation, Inc. | 6,774 | 777,791 | 2.2 | % | ||||||||
| 893,273 | 2.5 | % | ||||||||||
| Energy Equipment & Services | ||||||||||||
| FMC Technologies, Inc.* | 7,553 | 201,439 | 0.6 | % | ||||||||
| Food & Staples Retailing | ||||||||||||
| Rite Aid Corp.* | 8,115 | 60,782 | 0.2 | % | ||||||||
The accompanying notes are an integral part of these financial statements.
Page 4
Baird LargeCap Fund
Schedule of Investments, June 30, 2016 (Unaudited)
Common Stocks (cont.)
| % of | ||||||||||||
| Shares | Value | Net Assets | ||||||||||
| Food Products | ||||||||||||
| Archer-Daniels-Midland Co. | 5,335 | $ | 228,818 | 0.6 | % | |||||||
Bunge Ltd. f | 204 | 12,067 | 0.0 | % | ||||||||
| Campbell Soup Co. | 1,586 | 105,516 | 0.3 | % | ||||||||
| Ingredion, Inc. | 4,148 | 536,793 | 1.5 | % | ||||||||
| Mead Johnson Nutrition Co. | 983 | 89,207 | 0.3 | % | ||||||||
| 972,401 | 2.7 | % | ||||||||||
| Gas Utilities | ||||||||||||
| UGI Corp. | 8,065 | 364,941 | 1.0 | % | ||||||||
| Health Care Equipment & Supplies | ||||||||||||
Medtronic PLC f | 1,165 | 101,087 | 0.3 | % | ||||||||
| ResMed, Inc. | 2,029 | 128,294 | 0.3 | % | ||||||||
| Varian Medical Systems, Inc.* | 2,968 | 244,058 | 0.7 | % | ||||||||
| 473,439 | 1.3 | % | ||||||||||
| Health Care Providers & Services | ||||||||||||
| Anthem, Inc. | 572 | 75,127 | 0.2 | % | ||||||||
| Centene Corp.* | 2,225 | 158,798 | 0.5 | % | ||||||||
| 233,925 | 0.7 | % | ||||||||||
| Hotels, Restaurants & Leisure | ||||||||||||
| McDonald’s Corp. | 916 | 110,232 | 0.3 | % | ||||||||
| Wyndham Worldwide Corp. | 5,075 | 361,492 | 1.0 | % | ||||||||
| 471,724 | 1.3 | % | ||||||||||
| Household Products | ||||||||||||
| The Procter & Gamble Co. | 4,912 | 415,899 | 1.2 | % | ||||||||
| Independent Power and Renewable Electricity Producers | ||||||||||||
| The AES Corp. | 26,387 | 329,310 | 0.9 | % | ||||||||
| Insurance | ||||||||||||
| Aflac, Inc. | 6,180 | 445,949 | 1.2 | % | ||||||||
| The Progressive Corp. | 9,372 | 313,962 | 0.9 | % | ||||||||
| The Travelers Companies, Inc. | 514 | 61,186 | 0.2 | % | ||||||||
| 821,097 | 2.3 | % | ||||||||||
| Internet & Catalog Retail | ||||||||||||
| Expedia, Inc. | 1,308 | 139,040 | 0.4 | % | ||||||||
| Internet Software & Services | ||||||||||||
| Alphabet, Inc.* | 584 | 410,862 | 1.2 | % | ||||||||
| Alphabet, Inc. – Class C* | 585 | 404,878 | 1.1 | % | ||||||||
| 815,740 | 2.3 | % | ||||||||||
The accompanying notes are an integral part of these financial statements.
Page 5
Baird LargeCap Fund
Schedule of Investments, June 30, 2016 (Unaudited)
Common Stocks (cont.)
| % of | ||||||||||||
| Shares | Value | Net Assets | ||||||||||
| IT Services | ||||||||||||
Amdocs Ltd. f | 1,594 | $ | 92,006 | 0.3 | % | |||||||
| Global Payments, Inc. | 4,859 | 346,835 | 1.0 | % | ||||||||
| International Business Machines Corp. | 757 | 114,898 | 0.3 | % | ||||||||
| MasterCard, Inc. – Class A | 972 | 85,594 | 0.2 | % | ||||||||
| Visa, Inc. – Class A | 2,116 | 156,944 | 0.4 | % | ||||||||
| The Western Union Co. | 21,880 | 419,658 | 1.2 | % | ||||||||
| 1,215,935 | 3.4 | % | ||||||||||
| Leisure Products | ||||||||||||
| Hasbro, Inc. | 4,118 | 345,871 | 1.0 | % | ||||||||
| Life Sciences Tools & Services | ||||||||||||
| Waters Corp.* | 3,951 | 555,708 | 1.6 | % | ||||||||
| Machinery | ||||||||||||
| Caterpillar, Inc. | 6,630 | 502,620 | 1.4 | % | ||||||||
| Deere & Co. | 5,026 | 407,307 | 1.2 | % | ||||||||
| 909,927 | 2.6 | % | ||||||||||
| Media | ||||||||||||
| Omnicom Group, Inc. | 6,390 | 520,721 | 1.5 | % | ||||||||
| Scripps Networks Interactive, Inc. – Class A | 4,303 | 267,948 | 0.7 | % | ||||||||
| 788,669 | 2.2 | % | ||||||||||
| Multiline Retail | ||||||||||||
| Kohl’s Corp. | 1,378 | 52,254 | 0.1 | % | ||||||||
| Macy’s, Inc. | 1,311 | 44,062 | 0.1 | % | ||||||||
| Nordstrom, Inc. | 1,495 | 56,885 | 0.2 | % | ||||||||
| 153,201 | 0.3 | % | ||||||||||
| Oil, Gas & Consumable Fuels | ||||||||||||
| Exxon Mobil Corp. | 7,859 | 736,703 | 2.1 | % | ||||||||
| Marathon Petroleum Corp. | 3,499 | 132,822 | 0.4 | % | ||||||||
| Tesoro Corp. | 2,197 | 164,599 | 0.4 | % | ||||||||
| Valero Energy Corp. | 7,832 | 399,432 | 1.1 | % | ||||||||
| 1,433,556 | 4.0 | % | ||||||||||
| Personal Products | ||||||||||||
| Coty, Inc. | 5,983 | 155,498 | 0.4 | % | ||||||||
| Pharmaceuticals | ||||||||||||
Jazz Pharmaceuticals PLC* f | 746 | 105,417 | 0.3 | % | ||||||||
| Johnson & Johnson | 5,286 | 641,192 | 1.8 | % | ||||||||
| Merck & Co., Inc. | 11,265 | 648,977 | 1.8 | % | ||||||||
| Pfizer, Inc. | 12,772 | 449,702 | 1.3 | % | ||||||||
| 1,845,288 | 5.2 | % | ||||||||||
The accompanying notes are an integral part of these financial statements.
Page 6
Baird LargeCap Fund
Schedule of Investments, June 30, 2016 (Unaudited)
Common Stocks (cont.)
| % of | ||||||||||||
| Shares | Value | Net Assets | ||||||||||
| Semiconductors & Semiconductor Equipment | ||||||||||||
| Intel Corp. | 18,723 | $ | 614,114 | 1.7 | % | |||||||
| Linear Technology Corp. | 4,047 | 188,307 | 0.5 | % | ||||||||
| Microchip Technology, Inc. | 5,699 | 289,281 | 0.8 | % | ||||||||
| NVIDIA Corp. | 13,953 | 655,931 | 1.9 | % | ||||||||
NXP Semiconductors NV* f | 5,393 | 422,488 | 1.2 | % | ||||||||
| Xilinx, Inc. | 14,242 | 656,983 | 1.9 | % | ||||||||
| 2,827,104 | 8.0 | % | ||||||||||
| Software | ||||||||||||
| Cadence Design System, Inc.* | 19,399 | 471,396 | 1.4 | % | ||||||||
| Citrix Systems, Inc.* | 1,024 | 82,012 | 0.2 | % | ||||||||
| Microsoft Corp. | 20,092 | 1,028,107 | 2.9 | % | ||||||||
| Oracle Corp. | 16,586 | 678,865 | 1.9 | % | ||||||||
| 2,260,380 | 6.4 | % | ||||||||||
| Specialty Retail | ||||||||||||
| The Gap, Inc. | 5,654 | 119,978 | 0.3 | % | ||||||||
| Technology Hardware, Storage & Peripherals | ||||||||||||
| Apple, Inc. | 8,668 | 828,661 | 2.3 | % | ||||||||
Seagate Technology PLC f | 15,996 | 389,662 | 1.1 | % | ||||||||
| 1,218,323 | 3.4 | % | ||||||||||
| Total Common Stocks | ||||||||||||
| (Cost $31,732,005) | 32,576,140 | 91.5 | % | |||||||||
| Contingent Value Rights | ||||||||||||
| Contingent Value Rights | ||||||||||||
| Safeway CASA LEY CVR*^† | 2,216 | 2,249 | 0.0 | % | ||||||||
| Safeway PDC LLC CVR*^† | 2,216 | 108 | 0.0 | % | ||||||||
| Total Contingent Value Rights | ||||||||||||
| (Cost $0) | 2,357 | 0.0 | % | |||||||||
| Exchange Traded Funds | ||||||||||||
| Exchange Traded Funds | ||||||||||||
| Financial Select Sector SPDR Fund | 30,542 | 697,274 | 1.9 | % | ||||||||
| Vanguard Consumer Staples ETF | 5,250 | 741,353 | 2.1 | % | ||||||||
| Total Exchange Traded Funds | ||||||||||||
| (Cost $1,368,363) | 1,438,627 | 4.0 | % | |||||||||
The accompanying notes are an integral part of these financial statements.
Page 7
Baird LargeCap Fund
Schedule of Investments, June 30, 2016 (Unaudited)
Short-Term Investments
| % of | ||||||||||||
| Shares | Value | Net Assets | ||||||||||
| Money Market Mutual Funds | ||||||||||||
| Dreyfus Institutional Cash Advantage Fund, | ||||||||||||
| Institutional Class, 0.39%« | 861,755 | $ | 861,755 | 2.4 | % | |||||||
| Short-Term Investments Trust – Liquid Assets | ||||||||||||
| Portfolio, Institutional Class, 0.43%« | 650,000 | 650,000 | 1.9 | % | ||||||||
| Total Short-Term Investments | ||||||||||||
| (Cost $1,511,755) | 1,511,755 | 4.3 | % | |||||||||
| Total Investments | ||||||||||||
| (Cost $34,612,123) | 35,528,879 | 99.8 | % | |||||||||
| Other Assets in Excess of Liabilities | 30,516 | 0.2 | % | |||||||||
| TOTAL NET ASSETS | $ | 35,559,395 | 100.0 | % | ||||||||
Notes to Schedule of Investments
| * | Non-Income Producing |
| f | Foreign Security |
| ^ | Illiquid Security |
| † | Priced at Fair Value by the Valuation Committee as delegated by the Baird Funds’ Board of Directors. |
| « | 7-Day Yield |
Industry classifications shown in the Schedule of Investments are based off of the Global Industry Classification Standard (GICS®). GICS was developed by and/or is the exclusive property of MSCI, Inc. and Standard & Poor Financial Services LLC (“S&P”). GICS is a service mark of MSCI and S&P and has been licensed for use by U.S. Bancorp Fund Services, LLC.
The accompanying notes are an integral part of these financial statements.
Page 8
Baird LargeCap Fund
Schedule of Investments, June 30, 2016 (Unaudited)
Summary of Fair Value Exposure at June 30, 2016 (Unaudited)
The Fund has adopted authoritative fair valuation accounting standards which establish a definition of fair value and set out a hierarchy for measuring fair value. These standards require additional disclosures about the various inputs and valuation techniques used to develop the measurements of fair value and a discussion on changes in valuation techniques and related inputs during the period. These standards define fair value as the price that would be received to sell an asset or paid to transfer a liability in an orderly transaction between market participants at the measurement date. Management has determined that these standards have no material impact on the Funds’ financial statements. The fair value hierarchy is organized into three levels based upon the assumptions (referred to as “inputs”) used in pricing the asset or liability. These standards state that “observable inputs” reflect the assumptions market participants would use in pricing the asset or liability based on market data obtained from independent sources and “unobservable inputs” reflect an entity’s own assumptions about the assumptions market participants would use in pricing the asset or liability. These inputs are summarized into three broad levels and described below:
| Level 1 – | Unadjusted quoted prices in active markets for identical unrestricted securities. |
| Level 2 – | Other significant observable inputs (including quoted prices for similar securities, quoted prices in inactive markets, dealer indications, interest rates, yield curves, prepayment speeds, credit risk, default rates, inputs corroborated by observable market data, etc.). |
| Level 3 – | Significant unobservable inputs (including the Fund’s own assumptions about the factors that market participants would use in valuing the security) based on the best information available. |
The inputs or methodology used for valuing securities are not necessarily an indication of the risk associated with investing in those securities.
The following is a summary of the inputs used to value the Fund’s investments as of June 30, 2016:
| Level 1 | Level 2 | Level 3 | Total | |||||||||||||
| Equity | ||||||||||||||||
| Common Stocks | $ | 32,576,140 | $ | — | $ | — | $ | 32,576,140 | ||||||||
| Total Equity | 32,576,140 | — | — | 32,576,140 | ||||||||||||
| Contingent Value Rights | ||||||||||||||||
| Contingent Value Rights | — | — | 2,357 | 2,357 | ||||||||||||
| Total Contingent Value Rights | — | — | 2,357 | 2,357 | ||||||||||||
| Exchange Traded Funds | ||||||||||||||||
| Exchange Traded Funds | 1,438,627 | — | — | 1,438,627 | ||||||||||||
| Total Exchange Traded Funds | 1,438,627 | — | — | 1,438,627 | ||||||||||||
| Short-Term Investments | ||||||||||||||||
| Money Market Mutual Funds | 1,511,755 | — | — | 1,511,755 | ||||||||||||
| Total Short-Term Investments | 1,511,755 | — | — | 1,511,755 | ||||||||||||
| Total Investments* | $ | 35,526,522 | $ | — | $ | 2,357 | $ | 35,528,879 | ||||||||
| * | Additional information regarding the industry classifications of these investments is disclosed in the Schedule of Investments. |
Changes in valuation techniques may result in transfers into or out of current assigned levels within the hierarchy. Two securities with a fair value of $2,357 are priced at fair value by the Valuation Committee instead of the Fund’s pricing vendor and are valued using level 3 inputs. There were no transfers between Level 1, Level 2 and Level 3 fair value measurements during the reporting period, as compared to their classification from the prior year’s annual report. See the Fund’s valuation policy in Note 2a to the financial statements.
The accompanying notes are an integral part of these financial statements.
Page 9
Baird LargeCap Fund
Schedule of Investments, June 30, 2016 (Unaudited)
Summary of Fair Value Exposure at June 30, 2016 (Unaudited) (cont.)
Level 3 Reconciliation Disclosure
Following is a reconciliation of Level 3 assets for which significant unobservable inputs were used to determine fair value.
Description | Investments in Securities | |||
| Balance as of December 31, 2015 | $ | 2,357 | ||
| Accrued discounts/premiums | — | |||
| Realized gain (loss) | — | |||
| Change in unrealized appreciation (depreciation) | — | |||
| Purchases | — | |||
| Sales | — | |||
| Transfers in and/or out of Level 3* | — | |||
| Balance as of June 30, 2016 | $ | 2,357 | ||
* Transfers between levels are recognized at the end of the reporting period.
The accompanying notes are an integral part of these financial statements.
Page 10
Baird MidCap Fund
June 30, 2016 (Unaudited)
Portfolio Characteristics
A June 30, 2016 summary of the Fund’s top 10 holdings and equity sector analysis compared to the Russell MidCap® Growth Index is shown below.
| Top 10 Holdings* | Equity Sector Analysis** | ||
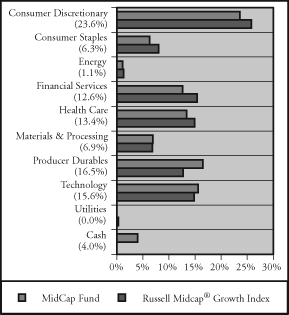 | |||
| Fiserv, Inc. | 3.2% | ||
| A.O. Smith Corp. | 2.9% | ||
| LKQ Corp. | 2.8% | ||
| Burlington Stores, Inc. | 2.6% | ||
| Dollar General Corp. | 2.6% | ||
| Acuity Brands, Inc. | 2.5% | ||
| Fortune Brands Home & Security, Inc. | 2.5% | ||
| Hasbro, Inc. | 2.4% | ||
| Genpact Ltd. | 2.4% | ||
| Watsco, Inc. | 2.4% | ||
| Net Assets: | $1,313,144,891 | ||
| Portfolio Turnover Rate: | 29.4% | ||
| Number of Equity Holdings: | 54 | ||
| Annualized Portfolio Expense Ratio:*** | |||
Gross | |||
| Institutional Class: | 0.81% | ||
| Investor Class: | 1.06% | **** | |
Net | |||
| Institutional Class: | 0.81% | ||
| Investor Class: | 1.06% | **** |
| * | The Fund’s portfolio composition is subject to change and there is no assurance that the Fund will continue to hold any particular security. Percentages shown relate to the Fund’s total net assets as of June 30, 2016. | |
| ** | Percentages shown in parentheses relate to the Fund’s total market value of investments as of June 30, 2016, and may not add up to 100% due to rounding. | |
| *** | Reflects expense ratios as stated in the Fund’s current prospectus. The Advisor has contractually agreed to limit the Fund’s total annual fund operating expenses to 0.85% of average daily net assets for the Institutional Class shares and 1.10% of average daily net assets for the Investor Class shares, at least through April 30, 2017. | |
| **** | Includes 0.25% 12b-1 fee. | |
| † | Not annualized. |
Page 11
Baird MidCap Fund
June 30, 2016 (Unaudited)
Total Returns
| Average Annual | |||||
| Since | |||||
| For the Periods Ended June 30, 2016 | Six Months | One Year | Five Years | Ten Years | Inception(1) |
| Institutional Class Shares | 2.60% | -4.93% | 8.88% | 7.92% | 6.26% |
| Investor Class Shares | 2.44% | -5.20% | 8.61% | 7.67% | 6.01% |
Russell MidCap® Growth Index(2) | 2.15% | -2.14% | 9.98% | 8.12% | 5.62% |
| (1) | For the period from December 29, 2000 (inception date) through June 30, 2016. |
| (2) | The Russell Midcap® Growth Index measures the performance of the mid-cap growth segment of the U.S. equity universe. It includes those Russell Midcap® Index companies with higher price-to-book ratios and higher forecasted growth values. This index does not reflect any deduction for fees, expenses or taxes. A direct investment in the index is not possible. |
The returns shown in the table above reflect reinvestment of dividends and/or capital gains distributions in additional shares. The returns do not reflect the deduction of taxes that a shareholder would pay on Fund distributions or the redemption of Fund shares. The returns reflect the actual performance for each period and do not include the impact of trades executed on the last business day of the period that were recorded on the first business day of the next period.
The gross expense ratio for each Class, as reflected in the Fund’s current prospectus, is set forth under “Portfolio Characteristics”.
The Fund focuses on growth-style stocks and therefore the performance of the Fund will typically be more volatile than the performance of funds that focus on types of stocks that have a broader investment style. The Fund may invest up to 15% of its total assets in U.S. dollar denominated foreign securities and ADRs. Foreign investments involve additional risks such as currency rate fluctuations, political and economic instability, and different and sometimes less strict financial reporting standards and regulation. The Fund invests a substantial portion of its assets in the stocks of mid-capitalization companies. Mid-capitalization companies often are more volatile and face greater risks than larger, more established companies.
Past performance does not guarantee future results. Investment return and principal value will fluctuate so that an investor’s shares, when redeemed, may be worth more or less than their original cost.
For information about the performance of the Fund as of the most recent month-end, please call 1-866-44BAIRD or visit www.bairdfunds.com. Mutual fund performance changes over time and current performance may be lower or higher than that stated.
Page 12
Baird MidCap Fund
Schedule of Investments, June 30, 2016 (Unaudited)
Common Stocks
| % of | ||||||||||||
| Shares | Value | Net Assets | ||||||||||
| Banks | ||||||||||||
| East West Bancorp, Inc. | 615,276 | $ | 21,030,134 | 1.6 | % | |||||||
| Beverages | ||||||||||||
| Constellation Brands, Inc. | 3 | 496 | 0.0 | % | ||||||||
| Dr Pepper Snapple Group, Inc. | 197,890 | 19,122,111 | 1.5 | % | ||||||||
| 19,122,607 | 1.5 | % | ||||||||||
| Building Products | ||||||||||||
| AO Smith Corp. | 437,040 | 38,507,594 | 2.9 | % | ||||||||
| Fortune Brands Home & Security, Inc. | 566,399 | 32,834,150 | 2.5 | % | ||||||||
| 71,341,744 | 5.4 | % | ||||||||||
| Capital Markets | ||||||||||||
| Affiliated Managers Group, Inc.* | 204,620 | 28,804,357 | 2.2 | % | ||||||||
| Northern Trust Corp. | 280,410 | 18,579,967 | 1.4 | % | ||||||||
| 47,384,324 | 3.6 | % | ||||||||||
| Commercial Services & Supplies | ||||||||||||
| Stericycle, Inc.* | 148,822 | 15,495,347 | 1.2 | % | ||||||||
| Distributors | ||||||||||||
| LKQ Corp.* | 1,156,709 | 36,667,675 | 2.8 | % | ||||||||
| Electrical Equipment | ||||||||||||
| Acuity Brands, Inc. | 135,026 | 33,481,047 | 2.5 | % | ||||||||
| Rockwell Automation, Inc. | 181,687 | 20,861,301 | 1.6 | % | ||||||||
| 54,342,348 | 4.1 | % | ||||||||||
| Electronic Equipment, Instruments & Components | ||||||||||||
| CDW Corp. | 601,994 | 24,127,920 | 1.9 | % | ||||||||
| Trimble Navigation Ltd.* | 882,404 | 21,495,361 | 1.6 | % | ||||||||
| 45,623,281 | 3.5 | % | ||||||||||
| Food & Staples Retailing | ||||||||||||
| Casey’s General Stores, Inc. | 48,990 | 6,442,675 | 0.5 | % | ||||||||
| Food Products | ||||||||||||
| Mccormick & Co, Inc. | 259,163 | 27,644,917 | 2.1 | % | ||||||||
| Health Care Equipment & Supplies | ||||||||||||
| The Cooper Cos, Inc. | 114,307 | 19,611,652 | 1.5 | % | ||||||||
| Edwards Lifesciences Corp.* | 241,036 | 24,038,520 | 1.8 | % | ||||||||
| Globus Medical, Inc.* | 622,273 | 14,828,766 | 1.1 | % | ||||||||
| IDEXX Laboratories, Inc.* | 300,685 | 27,921,609 | 2.1 | % | ||||||||
| Intuitive Surgical, Inc.* | 36,826 | 24,357,085 | 1.9 | % | ||||||||
| 110,757,632 | 8.4 | % | ||||||||||
| Health Care Providers & Services | ||||||||||||
| Acadia Healthcare Co., Inc.* | 310,160 | 17,182,864 | 1.3 | % | ||||||||
The accompanying notes are an integral part of these financial statements.
Page 13
Baird MidCap Fund
Schedule of Investments, June 30, 2016 (Unaudited)
Common Stocks (cont.)
| % of | ||||||||||||
| Shares | Value | Net Assets | ||||||||||
| Health Care Providers & Services (cont.) | ||||||||||||
| Laboratory Corp. of America Holdings* | 205,151 | $ | 26,725,021 | 2.0 | % | |||||||
| 43,907,885 | 3.3 | % | ||||||||||
| Health Care Technology | ||||||||||||
| Veeva Systems, Inc.* | 615,295 | 20,993,865 | 1.6 | % | ||||||||
| Hotels, Restaurants & Leisure | ||||||||||||
| Dominos Pizza, Inc. | 196,120 | 25,766,246 | 2.0 | % | ||||||||
| Household Durables | ||||||||||||
| Harman International Industries, Inc. | 171,151 | 12,292,065 | 0.9 | % | ||||||||
| Household Products | ||||||||||||
| Church & Dwight Co., Inc. | 292,717 | 30,117,652 | 2.3 | % | ||||||||
| IT Services | ||||||||||||
| Alliance Data Systems Corp.* | 133,963 | 26,246,031 | 2.0 | % | ||||||||
| Euronet Worldwide, Inc.* | 415,705 | 28,762,629 | 2.2 | % | ||||||||
| Fiserv, Inc.* | 391,973 | 42,619,224 | 3.2 | % | ||||||||
| Gartner, Inc.* | 217,014 | 21,139,334 | 1.6 | % | ||||||||
Genpact Ltd.* f | 1,161,046 | 31,162,475 | 2.4 | % | ||||||||
| 149,929,693 | 11.4 | % | ||||||||||
| Leisure Products | ||||||||||||
| Hasbro, Inc. | 372,406 | 31,278,380 | 2.4 | % | ||||||||
| Machinery | ||||||||||||
| Graco, Inc. | 230,652 | 18,219,201 | 1.4 | % | ||||||||
| The Middleby Corp.* | 230,474 | 26,562,128 | 2.0 | % | ||||||||
| Snap On, Inc. | 163,802 | 25,851,232 | 2.0 | % | ||||||||
| WABCO Holdings, Inc.* | 231,094 | 21,161,278 | 1.6 | % | ||||||||
| 91,793,839 | 7.0 | % | ||||||||||
| Media | ||||||||||||
| Cable One, Inc. | 26,525 | 13,565,150 | 1.0 | % | ||||||||
Lions Gate Entertainment Corp. f | 572,420 | 11,580,057 | 0.9 | % | ||||||||
| 25,145,207 | 1.9 | % | ||||||||||
| Multiline Retail | ||||||||||||
| Burlington Stores, Inc.* | 510,179 | 34,034,041 | 2.6 | % | ||||||||
| Dollar General Corp. | 359,035 | 33,749,290 | 2.6 | % | ||||||||
| 67,783,331 | 5.2 | % | ||||||||||
| Oil, Gas & Consumable Fuels | ||||||||||||
| Diamondback Energy, Inc.* | 161,590 | 14,738,624 | 1.1 | % | ||||||||
| Road & Rail | ||||||||||||
| J.B. Hunt Transport Services, Inc. | 223,480 | 18,086,236 | 1.4 | % | ||||||||
The accompanying notes are an integral part of these financial statements.
Page 14
Baird MidCap Fund
Schedule of Investments, June 30, 2016 (Unaudited)
Common Stocks (cont.)
| % of | ||||||||||||
| Shares | Value | Net Assets | ||||||||||
| Semiconductors & Semiconductor Equipment | ||||||||||||
| Integrated Device Technology, Inc.* | 984,194 | $ | 19,811,825 | 1.5 | % | |||||||
| Monolithic Power Systems, Inc. | 260,525 | 17,799,068 | 1.4 | % | ||||||||
| 37,610,893 | 2.9 | % | ||||||||||
| Software | ||||||||||||
| Akamai Technologies, Inc.* | 348,410 | 19,486,571 | 1.5 | % | ||||||||
| ANSYS, Inc.* | 142,818 | 12,960,733 | 1.0 | % | ||||||||
| Manhattan Associates, Inc.* | 204,975 | 13,145,047 | 1.0 | % | ||||||||
| Synopsys, Inc.* | 427,921 | 23,141,968 | 1.7 | % | ||||||||
| Tyler Technologies, Inc.* | 170,620 | 28,444,060 | 2.2 | % | ||||||||
| The Ultimate Software Group, Inc.* | 118,203 | 24,856,909 | 1.9 | % | ||||||||
| 122,035,288 | 9.3 | % | ||||||||||
| Specialty Retail | ||||||||||||
| O’Reilly Automotive, Inc.* | 101,380 | 27,484,118 | 2.1 | % | ||||||||
| Tractor Supply Co. | 321,497 | 29,314,097 | 2.2 | % | ||||||||
| 56,798,215 | 4.3 | % | ||||||||||
| Trading Companies & Distributors | ||||||||||||
| Fastenal Co. | 587,119 | 26,062,212 | 2.0 | % | ||||||||
| Watsco, Inc. | 219,672 | 30,905,654 | 2.3 | % | ||||||||
| 56,967,866 | 4.3 | % | ||||||||||
| Total Common Stocks | ||||||||||||
| (Cost $1,076,568,748) | 1,261,097,969 | 96.0 | % | |||||||||
| Short-Term Investments | ||||||||||||
| Money Market Mutual Funds | ||||||||||||
| Dreyfus Institutional Cash Advantage Fund, | ||||||||||||
| Institutional Class, 0.39%« | 32,404,225 | 32,404,225 | 2.5 | % | ||||||||
| Short-Term Investments Trust – Liquid Assets | ||||||||||||
| Portfolio, Institutional Class, 0.43%« | 25,000,000 | 25,000,000 | 1.9 | % | ||||||||
| Total Short-Term Investments | ||||||||||||
| (Cost $57,404,225) | 57,404,225 | 4.4 | % | |||||||||
| Total Investments | ||||||||||||
| (Cost $1,133,972,973) | 1,318,502,194 | 100.4 | % | |||||||||
| Liabilities in Excess of Other Assets | (5,357,303 | ) | (0.4 | )% | ||||||||
| TOTAL NET ASSETS | $ | 1,313,144,891 | 100.0 | % | ||||||||
Notes to Schedule of Investments
| * | Non-Income Producing |
| f | Foreign Security |
| « | 7-Day Yield |
Industry classifications shown in the Schedule of Investments are based off of the Global Industry Classification Standard (GICS®). GICS was developed by and/or is the exclusive property of MSCI, Inc. and Standard & Poor Financial Services LLC (“S&P”). GICS is a service mark of MSCI and S&P and has been licensed for use by U.S. Bancorp Fund Services, LLC.
The accompanying notes are an integral part of these financial statements.
Page 15
Baird MidCap Fund
Schedule of Investments, June 30, 2016 (Unaudited)
Summary of Fair Value Exposure at June 30, 2016 (Unaudited)
The Fund has adopted authoritative fair valuation accounting standards which establish a definition of fair value and set out a hierarchy for measuring fair value. These standards require additional disclosures about the various inputs and valuation techniques used to develop the measurements of fair value and a discussion on changes in valuation techniques and related inputs during the period. These standards define fair value as the price that would be received to sell an asset or paid to transfer a liability in an orderly transaction between market participants at the measurement date. Management has determined that these standards have no material impact on the Fund’s financial statements. The fair value hierarchy is organized into three levels based upon the assumptions (referred to as “inputs”) used in pricing the asset or liability. These standards state that “observable inputs” reflect the assumptions market participants would use in pricing the asset or liability based on market data obtained from independent sources and “unobservable inputs” reflect an entity’s own assumptions about the assumptions market participants would use in pricing the asset or liability. These inputs are summarized into three broad levels and described below:
| Level 1 – | Unadjusted quoted prices in active markets for identical unrestricted securities. |
| Level 2 – | Other significant observable inputs (including quoted prices for similar securities, quoted prices in inactive markets, dealer indications, interest rates, yield curves, prepayment speeds, credit risk, default rates, inputs corroborated by observable market data, etc.). |
| Level 3 – | Significant unobservable inputs (including the Fund’s own assumptions about the factors that market participants would use in valuing the security) based on the best information available. |
The inputs or methodology used for valuing securities are not necessarily an indication of the risk associated with investing in those securities.
The following is a summary of the inputs used to value the Fund’s investments as of June 30, 2016:
| Level 1 | Level 2 | Level 3 | Total | |||||||||||||
| Equity | ||||||||||||||||
| Common Stocks | $ | 1,261,097,969 | $ | — | $ | — | $ | 1,261,097,969 | ||||||||
| Total Equity | 1,261,097,969 | — | — | 1,261,097,969 | ||||||||||||
| Short-Term Investments | ||||||||||||||||
| Money Market Mutual Funds | 57,404,225 | — | — | 57,404,225 | ||||||||||||
| Total Short-Term Investments | 57,404,225 | — | — | 57,404,225 | ||||||||||||
| Total Investments* | $ | 1,318,502,194 | $ | — | $ | — | $ | 1,318,502,194 | ||||||||
| * | Additional information regarding the industry classifications of these investments is disclosed in the Schedule of Investments. |
Changes in valuation techniques may result in transfers into or out of assigned levels within the fair value hierarchy. There were no transfers between Level 1, Level 2 and Level 3 fair value measurements during the reporting period, as compared to their classification from the prior year’s annual report. See the Fund’s valuation policy in Note 2a to the financial statements.
The accompanying notes are an integral part of these financial statements.
Page 16
Baird Small/Mid Cap Value Fund
June 30, 2016 (Unaudited)
Portfolio Characteristics
A June 30, 2016 summary of the Fund’s top 10 holdings and equity sector analysis compared to the Russell 2500® Value Index is shown below.
| Top 10 Holdings* | Equity Sector Analysis** | ||
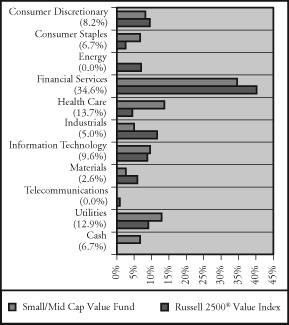 | |||
| Mid-America Apartment | |||
| Communities, Inc. | 3.9% | ||
| B & G Foods, Inc. | 3.8% | ||
| LTC Properties, Inc. | 3.8% | ||
| Silicon Motion Technology Corp. | 3.4% | ||
| Physicians Realty Trust | 3.4% | ||
| Alliant Energy Corp. | 3.4% | ||
| CMS Energy Corp. | 3.3% | ||
| Pinnacle West Cap Corp. | 3.2% | ||
| Healthcare Trust of America, Inc. | 3.1% | ||
| Omega Healthcare Investors, Inc. | 3.0% | ||
| Net Assets: | $8,761,695 | ||
| Portfolio Turnover Rate: | 21.4% | † | |
| Number of Equity Holdings: | 37 | ||
| Annualized Portfolio Expense Ratio:*** | |||
Gross | |||
| Institutional Class: | 6.88% | ||
| Investor Class: | 7.13% | **** | |
Net | |||
| Institutional Class: | 0.95% | ||
| Investor Class: | 1.20% | **** |
| * | The Fund’s portfolio composition is subject to change and there is no assurance that the Fund will continue to hold any particular security. Percentages shown relate to the Fund’s total net assets as of June 30, 2016. | |
| ** | Percentages shown in parentheses relate to the Fund’s total market value of investments as of June 30, 2016, and may not add up to 100% due to rounding. | |
| *** | Reflects expense ratios as stated in the Fund’s current prospectus. The Advisor has contractually agreed to limit the Fund’s total annual fund operating expenses to 0.95% of average daily net assets for the Institutional Class shares and 1.20% of average daily net assets for the Investor Class shares, at least through April 30, 2017. | |
| **** | Includes 0.25% 12b-1 fee. | |
| † | Not annualized. |
Page 17
Baird Small/Mid Cap Value Fund
June 30, 2016 (Unaudited)
Total Returns
| Since | ||
| For the Periods Ended June 30, 2016 | Six Months | Inception(1) |
| Institutional Class Shares | 4.10% | -0.75% |
| Investor Class Shares | 3.99% | -0.87% |
Russell 2500® Value Index(2) | 7.84% | 2.91% |
| (1) | For the period from November 30, 2015 (inception date) through June 30, 2016. |
| (2) | The Russell 2500® Value Index measures the performance of the small cap value segment of the U.S. equity universe. It includes those Russell 2500® Index companies with lower price-to-book ratios and lower forecasted growth values. This index does not reflect any deduction for fees, expenses or taxes. A direct investment in the index is not possible. |
The returns shown in the table above reflect reinvestment of dividends and/or capital gains distributions in additional shares. The returns do not reflect the deduction of taxes that a shareholder would pay on Fund distributions or the redemption of Fund shares. The returns reflect the actual performance for each period and do not include the impact of trades executed on the last business day of the period that were recorded on the first business day of the next period.
The gross expense ratio for each Class, as reflected in the Fund’s current prospectus, is set forth under “Portfolio Characteristics”.
The Fund focuses on small to mid cap value style stocks and therefore the performance of the Fund may be more volatile than the performance of funds that focus on types of stocks that have a broader investment style. The Fund may invest up to 15% of its total assets in U.S. dollar denominated foreign securities and ADRs. Foreign investments involve additional risks such as currency rate fluctuations and the potential for political and economic instability, and different and sometimes less strict financial reporting standards and regulation.
Past performance does not guarantee future results. Investment return and principal value will fluctuate so that an investor’s shares, when redeemed, may be worth more or less than their original cost.
For information about the performance of the Fund as of the most recent month-end, please call 1-866-44BAIRD or visit www.bairdfunds.com. Mutual fund performance changes over time and current performance may be lower or higher than that stated.
Page 18
Baird Small/Mid Cap Value Fund
Schedule of Investments, June 30, 2016 (Unaudited)
Common Stocks
| % of | ||||||||||||
| Shares | Value | Net Assets | ||||||||||
| Aerospace & Defense | ||||||||||||
| Hexcel Corp. | 4,470 | $ | 186,131 | 2.1 | % | |||||||
| Auto Components | ||||||||||||
| Motorcar Parts of America, Inc.* | 7,450 | 202,491 | 2.3 | % | ||||||||
| Banks | ||||||||||||
| Renasant Corp. | 7,078 | 228,832 | 2.6 | % | ||||||||
| Commercial Services & Supplies | ||||||||||||
| Deluxe Corp. | 2,700 | 179,199 | 2.1 | % | ||||||||
| Distributors | ||||||||||||
| LKQ Corp.* | 6,005 | 190,359 | 2.2 | % | ||||||||
| Diversified Consumer Services | ||||||||||||
| H&R Block, Inc. | 5,820 | 133,860 | 1.5 | % | ||||||||
| Electric Utilities | ||||||||||||
| Avangrid, Inc. | 5,540 | 255,172 | 2.9 | % | ||||||||
| Pinnacle West Cap Corp. | 3,490 | 282,900 | 3.2 | % | ||||||||
| 538,072 | 6.1 | % | ||||||||||
| Food Products | ||||||||||||
| B & G Foods, Inc. | 6,985 | 336,678 | 3.8 | % | ||||||||
| Pinnacle Foods, Inc. | 5,260 | 243,485 | 2.8 | % | ||||||||
| 580,163 | 6.6 | % | ||||||||||
| Health Care Equipment & Supplies | ||||||||||||
| Alere, Inc.* | 3,541 | 147,589 | 1.7 | % | ||||||||
| ICU Medical, Inc.* | 1,770 | 199,567 | 2.3 | % | ||||||||
| 347,156 | 4.0 | % | ||||||||||
| Health Care Providers & Services | ||||||||||||
| Aceto Corp. | 10,245 | 224,262 | 2.6 | % | ||||||||
| Laboratory Corp. of America Holdings* | 1,630 | 212,340 | 2.4 | % | ||||||||
| Mednax, Inc.* | 2,885 | 208,961 | 2.4 | % | ||||||||
| PAREXEL International Corp.* | 3,260 | 204,989 | 2.3 | % | ||||||||
| 850,552 | 9.7 | % | ||||||||||
| Household Products | ||||||||||||
| Orchids Paper Products Co. | 6,520 | 231,916 | 2.6 | % | ||||||||
| Insurance | ||||||||||||
| American Financial Group, Inc. | 3,355 | 248,035 | 2.8 | % | ||||||||
Atlas Financial Holdings, Inc.* f | 11,640 | 200,441 | 2.3 | % | ||||||||
| 448,476 | 5.1 | % | ||||||||||
The accompanying notes are an integral part of these financial statements.
Page 19
Baird Small/Mid Cap Value Fund
Schedule of Investments, June 30, 2016 (Unaudited)
Common Stocks (cont.)
| % of | ||||||||||||
| Shares | Value | Net Assets | ||||||||||
| Internet Software & Services | ||||||||||||
| j2 Global, Inc. | 3,400 | $ | 214,778 | 2.4 | % | |||||||
| VeriSign, Inc.* | 2,190 | 189,347 | 2.2 | % | ||||||||
| 404,125 | 4.6 | % | ||||||||||
| Multiline Retail | ||||||||||||
| Dollar Tree, Inc.* | 2,000 | 188,480 | 2.2 | % | ||||||||
| Multi-Utilities | ||||||||||||
| Alliant Energy Corp. | 7,450 | 295,765 | 3.4 | % | ||||||||
| CMS Energy Corp. | 6,285 | 288,230 | 3.3 | % | ||||||||
| 583,995 | 6.7 | % | ||||||||||
| Oil, Gas & Consumable Fuels | ||||||||||||
Navigator Holdings Ltd.* f | 6,145 | 70,668 | 0.8 | % | ||||||||
| Real Estate Investment Trusts (REITs) | ||||||||||||
| Agree Realty Corp. | 5,355 | 258,325 | 2.9 | % | ||||||||
| Blackstone Mortgage Trust, Inc. | 8,290 | 229,384 | 2.6 | % | ||||||||
| Healthcare Trust of America, Inc. | 8,380 | 271,009 | 3.1 | % | ||||||||
| LTC Properties, Inc. | 6,380 | 330,037 | 3.8 | % | ||||||||
| Mid-America Apartment Communities, Inc. | 3,215 | 342,076 | 3.9 | % | ||||||||
| Omega Healthcare Investors, Inc. | 7,685 | 260,906 | 3.0 | % | ||||||||
| Physicians Realty Trust | 14,200 | 298,342 | 3.4 | % | ||||||||
| 1,990,079 | 22.7 | % | ||||||||||
| Semiconductors & Semiconductor Equipment | ||||||||||||
| Integrated Device Technology, Inc.* | 6,610 | 133,059 | 1.5 | % | ||||||||
Silicon Motion Technology Corp. f | 6,285 | 300,424 | 3.4 | % | ||||||||
| 433,483 | 4.9 | % | ||||||||||
| Thrifts & Mortgage Finance | ||||||||||||
| Bofi Holding, Inc.* | 5,588 | 98,963 | 1.1 | % | ||||||||
| Meta Financial Group, Inc. | 5,029 | 256,278 | 3.0 | % | ||||||||
| 355,241 | 4.1 | % | ||||||||||
| Total Common Stocks | ||||||||||||
| (Cost $7,828,840) | 8,143,278 | 92.9 | % | |||||||||
The accompanying notes are an integral part of these financial statements.
Page 20
Baird Small/Mid Cap Value Fund
Schedule of Investments, June 30, 2016 (Unaudited)
Short-Term Investments
| % of | ||||||||||||
| Shares | Value | Net Assets | ||||||||||
| Money Market Mutual Funds | ||||||||||||
| Dreyfus Institutional Cash Advantage Fund, | ||||||||||||
| Institutional Class, 0.39%« | 254,142 | $ | 254,142 | 2.9 | % | |||||||
| Short-Term Investments Trust – Liquid Assets | ||||||||||||
| Portfolio, Institutional Class, 0.43%« | 150,000 | 150,000 | 1.7 | % | ||||||||
| Total Short-Term Investments | ||||||||||||
| (Cost $404,142) | 404,142 | 4.6 | % | |||||||||
| Total Investments | ||||||||||||
| (Cost $8,232,982) | 8,547,420 | 97.5 | % | |||||||||
| Other Assets in Excess of Liabilities | 214,275 | 2.5 | % | |||||||||
| TOTAL NET ASSETS | $ | 8,761,695 | 100.0 | % | ||||||||
Notes to Schedule of Investments
| * | Non-Income Producing |
| f | Foreign Security |
| « | 7-Day Yield |
Industry classifications shown in the Schedule of Investments are based off of the Global Industry Classification Standard (GICS®). GICS was developed by and/or is the exclusive property of MSCI, Inc. and Standard & Poor Financial Services LLC (“S&P”). GICS is a service mark of MSCI and S&P and has been licensed for use by U.S. Bancorp Fund Services, LLC.
The accompanying notes are an integral part of these financial statements.
Page 21
Baird Small/Mid Cap Value Fund
Schedule of Investments, June 30, 2016 (Unaudited)
Summary of Fair Value Exposure at June 30, 2016 (Unaudited)
The Fund has adopted authoritative fair valuation accounting standards which establish a definition of fair value and set out a hierarchy for measuring fair value. These standards require additional disclosures about the various inputs and valuation techniques used to develop the measurements of fair value and a discussion on changes in valuation techniques and related inputs during the period. These standards define fair value as the price that would be received to sell an asset or paid to transfer a liability in an orderly transaction between market participants at the measurement date. Management has determined that these standards have no material impact on the Fund’s financial statements. The fair value hierarchy is organized into three levels based upon the assumptions (referred to as “inputs”) used in pricing the asset or liability. These standards state that “observable inputs” reflect the assumptions market participants would use in pricing the asset or liability based on market data obtained from independent sources and “unobservable inputs” reflect an entity’s own assumptions about the assumptions market participants would use in pricing the asset or liability. These inputs are summarized into three broad levels and described below:
| Level 1 – | Unadjusted quoted prices in active markets for identical unrestricted securities. |
| Level 2 – | Other significant observable inputs (including quoted prices for similar securities, quoted prices in inactive markets, dealer indications, interest rates, yield curves, prepayment speeds, credit risk, default rates, inputs corroborated by observable market data, etc.). |
| Level 3 – | Significant unobservable inputs (including the Fund’s own assumptions about the factors that market participants would use in valuing the security) based on the best information available. |
The inputs or methodology used for valuing securities are not necessarily an indication of the risk associated with investing in those securities.
The following is a summary of the inputs used to value the Fund’s investments as of June 30, 2016:
| Level 1 | Level 2 | Level 3 | Total | |||||||||||||
| Equity | ||||||||||||||||
| Common Stocks | $ | 8,143,278 | $ | — | $ | — | $ | 8,143,278 | ||||||||
| Total Equity | 8,143,278 | — | — | 8,143,278 | ||||||||||||
| Short-Term Investments | ||||||||||||||||
| Money Market Mutual Funds | 404,142 | — | — | $ | 404,142 | |||||||||||
| Total Short-Term Investments | 404,142 | — | — | 404,142 | ||||||||||||
| Total Investments* | $ | 8,547,420 | $ | — | $ | — | $ | 8,547,420 | ||||||||
| * | Additional information regarding the industry classifications of these investments is disclosed in the Schedule of Investments. |
Changes in valuation techniques may result in transfers into or out of assigned levels within the fair value hierarchy. There were no transfers between Level 1, Level 2 and Level 3 fair value measurements during the reporting period, as compared to their classification from the prior year’s annual report. See the Fund’s valuation policy in Note 2a to the financial statements.
The accompanying notes are an integral part of these financial statements.
Page 22
Baird SmallCap Value Fund
June 30, 2016 (Unaudited)
Portfolio Characteristics
A June 30, 2016 summary of the Fund’s top 10 holdings and equity sector analysis compared to the Russell 2000® Value Index is shown below.
| Top 10 Holdings* | Equity Sector Analysis** | ||
 | |||
| Pinnacle Foods, Inc. | 4.8% | ||
| LTC Properties, Inc. | 3.9% | ||
| B & G Foods, Inc. | 3.9% | ||
| South Jersey Industries, Inc. | 3.8% | ||
| Alliant Energy Corp. | 3.6% | ||
| Agree Realty Corp. | 3.4% | ||
| Silicon Motion Technology Corp. | 3.4% | ||
| Physicians Realty Trust | 3.4% | ||
| Omega Healthcare Investors, Inc. | 3.1% | ||
| ICU Medical, Inc. | 3.0% | ||
| Net Assets: | $27,405,990 | ||
| Portfolio Turnover Rate: | 26.6% | † | |
| Number of Equity Holdings: | 34 | ||
| Annualized Portfolio Expense Ratio:*** | |||
Gross | |||
| Institutional Class: | 1.52% | ||
| Investor Class: | 1.77% | **** | |
Net | |||
| Institutional Class: | 1.00% | ||
| Investor Class: | 1.25% | **** |
| * | The Fund’s portfolio composition is subject to change and there is no assurance that the Fund will continue to hold any particular security. Percentages shown relate to the Fund’s total net assets as of June 30, 2016. | |
| ** | Percentages shown in parentheses relate to the Fund’s total market value of investments as of June 30, 2016, and may not add up to 100% due to rounding. | |
| *** | Reflects expense ratios as stated in the Fund’s current prospectus. The Advisor has contractually agreed to limit the Fund’s total annual fund operating expenses to 1.00% of average daily net assets for the Institutional Class shares and 1.25% of average daily net assets for the Investor Class shares, at least through April 30, 2017. | |
| **** | Includes 0.25% 12b-1 fee. |
Page 23
Baird SmallCap Value Fund
June 30, 2016 (Unaudited)
Total Returns
| Average Annual | ||||
| Since | ||||
| For the Periods Ended June 30, 2016 | Six Months | One Year | Three Year | Inception(1) |
| Institutional Class Shares | 6.06% | -1.78% | 6.93% | 9.56% |
| Investor Class Shares | 5.93% | -2.04% | 6.65% | 9.28% |
Russell 2000® Value Index(2) | 6.08% | -2.58% | 6.36% | 9.81% |
| (1) | For the period from April 30, 2012 (inception date) through June 30, 2016. |
| (2) | The Russell 2000® Value Index measures the performance of the small-cap value segment of the U.S. equity universe. It includes those Russell 2000® Index companies with lower price-to-book ratios and lower forecasted growth values. This index does not reflect any deduction for fees, expenses or taxes. A direct investment in the index is not possible. |
The returns shown in the table above reflect reinvestment of dividends and/or capital gains distributions in additional shares. The returns do not reflect the deduction of taxes that a shareholder would pay on Fund distributions or the redemption of Fund shares. The returns reflect the actual performance for each period and do not include the impact of trades executed on the last business day of the period that were recorded on the first business day of the next period.
The gross expense ratio for each Class, as reflected in the Fund’s current prospectus, is set forth under “Portfolio Characteristics”.
The Fund focuses on small cap value style stocks and therefore the performance of the Fund may be more volatile than the performance of funds that focus on types of stocks that have a broader investment style. The Fund may invest up to 15% of its total assets in U.S. dollar denominated foreign securities and ADRs. Foreign investments involve additional risks such as currency rate fluctuations and the potential for political and economic instability, and different and sometimes less strict financial reporting standards and regulation.
Past performance does not guarantee future results. Investment return and principal value will fluctuate so that an investor’s shares, when redeemed, may be worth more or less than their original cost.
For information about the performance of the Fund as of the most recent month-end, please call 1-866-44BAIRD or visit www.bairdfunds.com. Mutual fund performance changes over time and current performance may be lower or higher than that stated.
Page 24
Baird SmallCap Value Fund
Schedule of Investments, June 30, 2016 (Unaudited)
Common Stocks
| % of | ||||||||||||
| Shares | Value | Net Assets | ||||||||||
| Aerospace & Defense | ||||||||||||
| Hexcel Corp. | 12,706 | $ | 529,078 | 1.9 | % | |||||||
| Auto Components | ||||||||||||
| Drew Industries, Inc. | 6,747 | 572,415 | 2.1 | % | ||||||||
| Motorcar Parts of America, Inc.* | 28,860 | 784,415 | 2.9 | % | ||||||||
| 1,356,830 | 5.0 | % | ||||||||||
| Banks | ||||||||||||
| Renasant Corp. | 22,117 | 715,043 | 2.6 | % | ||||||||
| Building Products | ||||||||||||
| Patrick Industries, Inc.* | 10,588 | 638,351 | 2.3 | % | ||||||||
| Commercial Services & Supplies | ||||||||||||
| Deluxe Corp. | 10,037 | 666,156 | 2.4 | % | ||||||||
| Electric Utilities | ||||||||||||
| Avangrid, Inc. | 16,626 | 765,794 | 2.8 | % | ||||||||
| Food Products | ||||||||||||
| B & G Foods, Inc. | 21,960 | 1,058,472 | 3.9 | % | ||||||||
| Pinnacle Foods, Inc. | 28,234 | 1,306,952 | 4.8 | % | ||||||||
| 2,365,424 | 8.7 | % | ||||||||||
| Gas Utilities | ||||||||||||
| South Jersey Industries, Inc. | 32,783 | 1,036,598 | 3.8 | % | ||||||||
| Health Care Equipment & Supplies | ||||||||||||
| Alere, Inc.* | 16,472 | 686,553 | 2.5 | % | ||||||||
| ICU Medical, Inc.* | 7,373 | 831,306 | 3.0 | % | ||||||||
| 1,517,859 | 5.5 | % | ||||||||||
| Health Care Providers & Services | ||||||||||||
| Aceto Corp. | 31,370 | 686,689 | 2.5 | % | ||||||||
| PAREXEL International Corp.* | 11,275 | 708,972 | 2.6 | % | ||||||||
| 1,395,661 | 5.1 | % | ||||||||||
| Hotels, Restaurants & Leisure | ||||||||||||
| Diamond Resorts International, Inc.* | 17,602 | 527,356 | 1.9 | % | ||||||||
| Household Products | ||||||||||||
| Orchids Paper Products Co. | 22,900 | 814,553 | 3.0 | % | ||||||||
| Insurance | ||||||||||||
Atlas Financial Holdings, Inc.* f | 39,215 | 675,282 | 2.5 | % | ||||||||
| Internet Software & Services | ||||||||||||
| j2 Global, Inc. | 11,606 | 733,151 | 2.7 | % | ||||||||
The accompanying notes are an integral part of these financial statements.
Page 25
Baird SmallCap Value Fund
Schedule of Investments, June 30, 2016 (Unaudited)
Common Stocks (cont.)
| % of | ||||||||||||
| Shares | Value | Net Assets | ||||||||||
| Multi-Utilities | ||||||||||||
| Alliant Energy Corp. | 25,100 | $ | 996,470 | 3.6 | % | |||||||
| Oil, Gas & Consumable Fuels | ||||||||||||
Navigator Holdings Ltd.* f | 21,566 | 248,009 | 0.9 | % | ||||||||
| Real Estate Investment Trusts (REITs) | ||||||||||||
| Agree Realty Corp. | 19,605 | 945,745 | 3.4 | % | ||||||||
| Blackstone Mortgage Trust, Inc. | 23,531 | 651,103 | 2.4 | % | ||||||||
| Capstead Mortgage Corp. | 82,890 | 804,033 | 2.9 | % | ||||||||
| Healthcare Trust of America, Inc. | 21,960 | 710,186 | 2.6 | % | ||||||||
| Hersha Hospitality Trust | 18,632 | 319,539 | 1.2 | % | ||||||||
| LTC Properties, Inc. | 20,860 | 1,079,088 | 3.9 | % | ||||||||
| Omega Healthcare Investors, Inc. | 25,095 | 851,975 | 3.1 | % | ||||||||
| Physicians Realty Trust | 43,920 | 922,759 | 3.4 | % | ||||||||
| 6,284,428 | 22.9 | % | ||||||||||
| Semiconductors & Semiconductor Equipment | ||||||||||||
| Integrated Device Technology, Inc.* | 29,488 | 593,593 | 2.2 | % | ||||||||
Silicon Motion Technology Corp. f | 19,605 | 937,119 | 3.4 | % | ||||||||
| 1,530,712 | 5.6 | % | ||||||||||
| Thrifts & Mortgage Finance | ||||||||||||
| Bofi Holding, Inc.* | 23,783 | 421,197 | 1.5 | % | ||||||||
| Capitol Federal Financial, Inc. | 21,247 | 296,396 | 1.1 | % | ||||||||
| Meta Financial Group, Inc. | 15,850 | 807,716 | 3.0 | % | ||||||||
| 1,525,309 | 5.6 | % | ||||||||||
| Water Utilities | ||||||||||||
| Connecticut Water Service, Inc. | 11,765 | 661,193 | 2.4 | % | ||||||||
| Total Common Stocks | ||||||||||||
| (Cost $20,718,254) | 24,983,257 | 91.2 | % | |||||||||
The accompanying notes are an integral part of these financial statements.
Page 26
Baird SmallCap Value Fund
Schedule of Investments, June 30, 2016 (Unaudited)
Short-Term Investments
| % of | ||||||||||||
| Shares | Value | Net Assets | ||||||||||
| Money Market Mutual Funds | ||||||||||||
| Dreyfus Institutional Cash Advantage Fund, | ||||||||||||
| Institutional Class, 0.39%« | 1,841,210 | $ | 1,841,210 | 6.7 | % | |||||||
| Short-Term Investments Trust – Liquid Assets | ||||||||||||
| Portfolio, Institutional Class, 0.43%« | 500,000 | 500,000 | 1.8 | % | ||||||||
| Total Short-Term Investments | ||||||||||||
| (Cost $2,341,210) | 2,341,210 | 8.5 | % | |||||||||
| Total Investments | ||||||||||||
| (Cost $23,059,464) | 27,324,467 | 99.7 | % | |||||||||
| Other Assets in Excess of Liabilities | 81,523 | 0.3 | % | |||||||||
| TOTAL NET ASSETS | $ | 27,405,990 | 100.0 | % | ||||||||
Notes to Schedule of Investments
| * | Non-Income Producing |
| f | Foreign Security |
| « | 7-Day Yield |
Industry classifications shown in the Schedule of Investments are based off of the Global Industry Classification Standard (GICS®). GICS was developed by and/or is the exclusive property of MSCI, Inc. and Standard & Poor Financial Services LLC (“S&P”). GICS is a service mark of MSCI and S&P and has been licensed for use by U.S. Bancorp Fund Services, LLC.
The accompanying notes are an integral part of these financial statements.
Page 27
Baird SmallCap Value Fund
Schedule of Investments, June 30, 2016 (Unaudited)
Summary of Fair Value Exposure at June 30, 2016 (Unaudited)
The Fund has adopted authoritative fair valuation accounting standards which establish a definition of fair value and set out a hierarchy for measuring fair value. These standards require additional disclosures about the various inputs and valuation techniques used to develop the measurements of fair value and a discussion on changes in valuation techniques and related inputs during the period. These standards define fair value as the price that would be received to sell an asset or paid to transfer a liability in an orderly transaction between market participants at the measurement date. Management has determined that these standards have no material impact on the Fund’s financial statements. The fair value hierarchy is organized into three levels based upon the assumptions (referred to as “inputs”) used in pricing the asset or liability. These standards state that “observable inputs” reflect the assumptions market participants would use in pricing the asset or liability based on market data obtained from independent sources and “unobservable inputs” reflect an entity’s own assumptions about the assumptions market participants would use in pricing the asset or liability. These inputs are summarized into three broad levels and described below:
| Level 1 – | Unadjusted quoted prices in active markets for identical unrestricted securities. |
| Level 2 – | Other significant observable inputs (including quoted prices for similar securities, quoted prices in inactive markets, dealer indications, interest rates, yield curves, prepayment speeds, credit risk, default rates, inputs corroborated by observable market data, etc.). |
| Level 3 – | Significant unobservable inputs (including the Fund’s own assumptions about the factors that market participants would use in valuing the security) based on the best information available. |
The following is a summary of the inputs used to value the Fund’s investments as of June 30, 2016:
| Level 1 | Level 2 | Level 3 | Total | |||||||||||||
| Equity | ||||||||||||||||
| Common Stocks | $ | 24,983,257 | $ | — | $ | — | $ | 24,983,257 | ||||||||
| Total Equity | 24,983,257 | — | — | 24,983,257 | ||||||||||||
| Short-Term Investments | ||||||||||||||||
| Money Market Mutual Funds | 2,341,210 | — | — | 2,341,210 | ||||||||||||
| Total Short-Term Investments | 2,341,210 | — | — | 2,341,210 | ||||||||||||
| Total Investments* | $ | 27,324,467 | $ | — | $ | — | $ | 27,324,467 | ||||||||
| * | Additional information regarding the industry classifications of these investments is disclosed in the Schedule of Investments. |
Changes in valuation techniques may result in transfers into or out of assigned levels within the fair value hierarchy. There were no transfers between Level 1, Level 2 and Level 3 fair value measurements during the reporting period, as compared to their classification from the prior year’s annual report. See the Fund’s valuation policy in Note 2a to the financial statements.
The accompanying notes are an integral part of these financial statements.
Page 28
Chautauqua International Growth Fund
June 30, 2016 (Unaudited)
Portfolio Characteristics
A June 30, 2016 summary of the Fund’s top 10 holdings and equity sector analysis compared to the MSCI ACWI ex USA Index is shown below.
| Top 10 Holdings* | Equity Sector Analysis** | ||
 | |||
| Dreyfus Institutional Cash | |||
| Advantage Fund, Institutional Class | 14.9% | ||
| Ctrip.com International Ltd. | 5.6% | ||
| Sinopharm Group Co. Ltd. | 5.1% | ||
| Hargreaves Lansdown PLC | 4.5% | ||
| AIA Group Ltd. | 4.1% | ||
| Julius Baer Group Ltd. | 4.1% | ||
| Lululemon Athletica, Inc. | 4.1% | ||
| Wirecard AG | 4.0% | ||
| Tencent Holdings Ltd. | 4.0% | ||
| Alibaba Group Holding Ltd. | 4.0% | ||
| Net Assets: | $8,536,050 | ||
| Portfolio Turnover Rate: | 7.0% | † | |
| Number of Equity Holdings: | 31 | ||
| Annualized Portfolio Expense Ratio:*** | |||
Gross | |||
| Institutional Class: | 2.36% | ||
| Investor Class: | 2.61% | **** | |
Net | |||
| Institutional Class: | 0.95% | ||
| Investor Class: | 1.20% | **** |
| * | The Fund’s portfolio composition is subject to change and there is no assurance that the Fund will continue to hold any particular security. Percentages shown relate to the Fund’s total net assets as of June 30, 2016. | |
| ** | Percentages shown in parentheses relate to the Fund’s total market value of investments as of June 30, 2016, and may not add up to 100% due to rounding. | |
| *** | Reflects expense ratios as stated in the Fund’s current prospectus. The Advisor has contractually agreed to limit the Fund’s total annual fund operating expenses to 0.95% of average daily net assets for the Institutional Class shares and 1.20% of average daily net assets for the Investor Class shares, at least through April 30, 2018. | |
| **** | Includes 0.25% 12b-1 fee. | |
| † | Not annualized. |
Page 29
Chautauqua International Growth Fund
June 30, 2016 (Unaudited)
Total Returns
| Since | |
| For The Period Ended June 30, 2016 | Inception(1) |
| Institutional Class Shares | -1.60% |
| Investor Class Shares | -1.70% |
MSCI ACWI ex USA Index(2) | -2.42% |
| (1) | For the period from April 15, 2016 (inception date) through June 30, 2016. |
| (2) | The MSCI ACWI ex USA Index is a market-capitalization-weighted index maintained by MSCI, Inc. and designed to provide a broad measure of stock performance throughout the world, with the exception of U.S.-based companies. The MSCI ACWI ex USA Index includes both developed and emerging markets. This index does not reflect any deduction for fees, expenses or taxes. A direct investment in the index is not possible. |
The returns shown in the table above reflect reinvestment of dividends and/or capital gains distributions in additional shares. The returns do not reflect the deduction of taxes that a shareholder would pay on Fund distributions or the redemption of Fund shares. The returns reflect the actual performance for each period and do not include the impact of trades executed on the last business day of the period that were recorded on the first business day of the next period.
The gross expense ratio for each Class, as reflected in the Fund’s current prospectus, is set forth under “Portfolio Characteristics”.
The Fund focuses on both U.S. and non-U.S. stocks with medium to large market capitalizations and therefore the performance of the Fund may be more volatile than the performance of funds that focus on types of stocks that have a broader investment style. Under normal market conditions, the Fund will invest at least 65% of its total assets in non-U.S. companies. Foreign investments involve additional risks such as currency rate fluctuations and the potential for political and economic instability, and different and sometimes less strict financial reporting standards and regulation. In June 2016, the United Kingdom (UK) voted to leave the European Union (EU) following a referendum referred to as “Brexit.” It is expected that the UK will exit the EU within two years; however, the exact timeframe for the UK’s exit is unknown. There is significant market uncertainty regarding Brexit’s ramifications, and the range of possible political, regulatory, economic, and market outcomes are difficult to predict. The negative impact could be significant, potentially resulting in increased volatility and illiquidity and lower economic growth for companies that rely significantly on Europe for their business activities and revenues. Geopolitical events, including those in Ukraine and the Middle East, may cause market disruptions. The portfolio manager for the Fund has over 30 years of experience investing in the global markets and will attempt to minimize the negative impact of these events. However, it is possible that these or other geopolitical events could have an adverse effect on the value of the Fund’s investments.
Past performance does not guarantee future results. Investment return and principal value will fluctuate so that an investor’s shares, when redeemed, may be worth more or less than their original cost.
For information about the performance of the Fund as of the most recent month-end, please call 1-866-44BAIRD or visit www.bairdfunds.com. Mutual fund performance changes over time and current performance may be lower or higher than that stated.
Page 30
Chautauqua International Growth Fund
Schedule of Investments, June 30, 2016 (Unaudited)
Common Stocks
| % of | ||||||||||||
| Shares | Value | Net Assets | ||||||||||
| Alternative Carriers | ||||||||||||
| Iliad SA (France)^ | 1,002 | $ | 202,269 | 2.4 | % | |||||||
| Apparel, Accessories & Luxury Goods | ||||||||||||
| Lululemon Athletica, Inc. (Canada)* | 4,685 | 346,034 | 4.1 | % | ||||||||
| Asset Management & Custody Banks | ||||||||||||
| Hargreaves Lansdown PLC (United Kingdom)^ | 23,153 | 386,217 | 4.5 | % | ||||||||
| Julius Baer Group Ltd. (Switzerland)^ | 8,649 | 348,107 | 4.1 | % | ||||||||
| 734,324 | 8.6 | % | ||||||||||
| Auto Parts & Equipment | ||||||||||||
| Delphi Automotive PLC (Jersey) | 2,228 | 139,473 | 1.6 | % | ||||||||
| Cable & Satellite | ||||||||||||
| Naspers Ltd. (South Africa)^ | 1,180 | 180,180 | 2.1 | % | ||||||||
| Data Processing & Outsourced Services | ||||||||||||
| Wirecard AG (Germany)^ | 7,832 | 344,969 | 4.0 | % | ||||||||
| Diversified Banks | ||||||||||||
| Banco Santander SA (Spain)^ | 63,430 | 246,153 | 2.9 | % | ||||||||
| Electronic Equipment & Instruments | ||||||||||||
| Keyence Corp. (Japan)^ | 142 | 96,891 | 1.1 | % | ||||||||
| Health Care Equipment | ||||||||||||
| Olympus Corp. (Japan)^ | 5,994 | 223,825 | 2.6 | % | ||||||||
| Integrated Oil & Gas | ||||||||||||
| Galp Energia SGPS (Portugal)^ | 13,501 | 187,777 | 2.2 | % | ||||||||
| Internet Retail | ||||||||||||
| Ctrip.com International Ltd. (Cayman Islands)* | 11,589 | 477,467 | 5.6 | % | ||||||||
| Internet Software & Services | ||||||||||||
| NAVER Corp. (Republic of Korea)^ | 157 | 97,264 | 1.2 | % | ||||||||
| Tencent Holdings Ltd. (Cayman Islands)^ | 15,032 | 344,829 | 4.0 | % | ||||||||
| 442,093 | 5.2 | % | ||||||||||
| IT Consulting & Other Services | ||||||||||||
| Alibaba Group Holding Ltd. (Cayman Islands)* | 4,294 | 341,502 | 4.0 | % | ||||||||
| Life & Health Insurance | ||||||||||||
| AIA Group Ltd. (Hong Kong)^ | 57,990 | 348,736 | 4.1 | % | ||||||||
| Oil & Gas Equipment & Services | ||||||||||||
| Core Laboratories NV (Netherlands) | 1,012 | 125,377 | 1.5 | % | ||||||||
| Oil & Gas Exploration & Production | ||||||||||||
| ENN Energy Holdings Ltd. (Cayman Islands)^ | 24,561 | 121,650 | 1.4 | % | ||||||||
The accompanying notes are an integral part of these financial statements.
Page 31
Chautauqua International Growth Fund
Schedule of Investments, June 30, 2016 (Unaudited)
Common Stocks (cont.)
| % of | ||||||||||||
| Shares | Value | Net Assets | ||||||||||
| Pharmaceuticals | ||||||||||||
| Allergan PLC (Ireland)* | 1,068 | $ | 246,804 | 2.9 | % | |||||||
| Grifols SA (Spain) | 11,024 | 183,770 | 2.2 | % | ||||||||
| Novo Nordisk A/S (Denmark) | 6,325 | 340,158 | 4.0 | % | ||||||||
| Roche Holding AG (Switzerland)^ | 1,011 | 266,783 | 3.1 | % | ||||||||
| Sinopharm Group Co. Ltd. (China)^ | 91,110 | 437,664 | 5.1 | % | ||||||||
| 1,475,179 | 17.3 | % | ||||||||||
| Research & Consulting Services | ||||||||||||
| Nielsen Holdings PLC (United Kingdom) | 1,681 | 87,362 | 1.0 | % | ||||||||
| Semiconductor Equipment | ||||||||||||
| ARM Holdings PLC (United Kingdom)^ | 17,268 | 262,298 | 3.1 | % | ||||||||
| ASML Holding NV (Netherlands) | 778 | 77,186 | 0.9 | % | ||||||||
| 339,484 | 4.0 | % | ||||||||||
| Semiconductors | ||||||||||||
| Taiwan Semiconductor Manufacturing Co. Ltd. (Taiwan) | 2,527 | 66,283 | 0.8 | % | ||||||||
| Specialty Chemicals | ||||||||||||
| Croda International PLC (United Kingdom)^ | 3,620 | 151,963 | 1.8 | % | ||||||||
| Trading Companies & Distributors | ||||||||||||
| Bunzl PLC (United Kingdom)^ | 2,281 | 70,183 | 0.8 | % | ||||||||
| Total Common Stocks | ||||||||||||
| (Cost $6,718,726) | 6,749,174 | 79.1 | % | |||||||||
| Short-Term Investments | ||||||||||||
| Money Market Mutual Funds | ||||||||||||
| Dreyfus Institutional Cash Advantage Fund, | ||||||||||||
| Institutional Class, 0.39%« | 1,273,041 | 1,273,041 | 14.9 | % | ||||||||
| Short-Term Investments Trust – Liquid Assets | ||||||||||||
| Portfolio, Institutional Class, 0.43%« | 100,000 | 100,000 | 1.2 | % | ||||||||
| Total Short-Term Investments | ||||||||||||
| (Cost $1,373,041) | 1,373,041 | 16.1 | % | |||||||||
| Total Investments | ||||||||||||
| (Cost $8,091,767) | 8,122,215 | 95.2 | % | |||||||||
| Other Assets in excess of Liabilities | 413,835 | 4.8 | % | |||||||||
| TOTAL NET ASSETS | $ | 8,536,050 | 100.0 | % | ||||||||
Notes to Schedule of Investments
| * | Non-Income Producing |
| ^ | Fair Valued Security – See Note 2a to Financial Statements |
| « | 7-Day Yield |
Industry classifications shown in the Schedule of Investments are based off of the Global Industry Classification Standard (GICS®). GICS was developed by and/or is the exclusive property of MSCI, Inc. and Standard & Poor Financial Services LLC (“S&P”). GICS is a service mark of MSCI and S&P and has been licensed for use by U.S. Bancorp Fund Services, LLC.
The accompanying notes are an integral part of these financial statements.
Page 32
Chautauqua International Growth Fund
Schedule of Investments, June 30, 2016 (Unaudited)
Summary of Fair Value Exposure at June 30, 2016 (Unaudited)
The Fund has adopted authoritative fair valuation accounting standards which establish a definition of fair value and set out a hierarchy for measuring fair value. These standards require additional disclosures about the various inputs and valuation techniques used to develop the measurements of fair value and a discussion on changes in valuation techniques and related inputs during the period. These standards define fair value as the price that would be received to sell an asset or paid to transfer a liability in an orderly transaction between market participants at the measurement date. Management has determined that these standards have no material impact on the Fund’s financial statements. The fair value hierarchy is organized into three levels based upon the assumptions (referred to as “inputs”) used in pricing the asset or liability. These standards state that “observable inputs” reflect the assumptions market participants would use in pricing the asset or liability based on market data obtained from independent sources and “unobservable inputs” reflect an entity’s own assumptions about the assumptions market participants would use in pricing the asset or liability. These inputs are summarized into three broad levels and described below:
| Level 1 – | Unadjusted quoted prices in active markets for identical unrestricted securities. |
| Level 2 – | Other significant observable inputs (including quoted prices for similar securities, quoted prices in inactive markets, dealer indications, interest rates, yield curves, prepayment speeds, credit risk, default rates, inputs corroborated by observable market data, etc.). |
| Level 3 – | Significant unobservable inputs (including the Fund’s own assumptions about the factors that market participants would use in valuing the security) based on the best information available. |
The inputs or methodology used for valuing securities are not necessarily an indication of the risk associated with investing in those securities.
The following is a summary of the inputs used to value the Fund’s investments as of June 30, 2016:
| Level 1 | Level 2 | Level 3 | Total | |||||||||||||
| Equity | ||||||||||||||||
| Common Stocks | $ | 2,431,416 | $ | 4,317,758 | $ | — | $ | 6,749,174 | ||||||||
| Total Equity | 2,431,416 | 4,317,758 | — | 6,749,174 | ||||||||||||
| Short-Term Investments | ||||||||||||||||
| Money Market Mutual Funds | 1,373,041 | — | — | $ | 1,373,041 | |||||||||||
| Total Short-Term Investments | 1,373,041 | — | — | 1,373,041 | ||||||||||||
| Total Investments* | $ | 3,804,457 | $ | 4,317,758 | $ | — | $ | 8,122,215 | ||||||||
| * | Additional information regarding the industry classifications of these investments is disclosed in the Schedule of Investments. |
Changes in valuation techniques may result in transfers into or out of assigned levels within the fair value hierarchy. There were no transfers between Level 1, Level 2 and Level 3 fair value measurements during the reporting period. See the Fund’s valuation policy in Note 2a to the financial statements.
The accompanying notes are an integral part of these financial statements.
Page 33
Chautauqua Global Growth Fund
June 30, 2016 (Unaudited)
Portfolio Characteristics
A June 30, 2016 summary of the Fund’s top 10 holdings and equity sector analysis compared to the MSCI ACWI Index is shown below.
| Top 10 Holdings* | Equity Sector Analysis** | ||
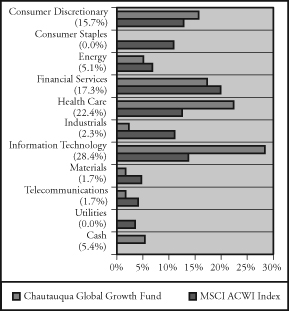 | |||
| Hargreaves Lansdown PLC | 4.6% | ||
| Illumina, Inc. | 4.4% | ||
| Sinopharm Group Co. Ltd. | 4.4% | ||
| MasterCard, Inc. – Class A | 4.2% | ||
| Dreyfus Institutional Cash | |||
| Advantage Fund, Institutional Class | 4.1% | ||
| Lululemon Athletica, Inc. | 4.0% | ||
| Priceline.com, Inc. | 4.0% | ||
| Julius Baer Group Ltd. | 4.0% | ||
| Amazon.com, Inc. | 3.7% | ||
| ARM Holdings PLC | 3.6% | ||
| Net Assets: | $3,124,014 | ||
| Portfolio Turnover Rate: | 10.2% | † | |
| Number of Equity Holdings: | 45 | ||
| Annualized Portfolio Expense Ratio:*** | |||
Gross | |||
| Institutional Class: | 2.36% | ||
| Investor Class: | 2.61% | **** | |
Net | |||
| Institutional Class: | 0.95% | ||
| Investor Class: | 1.20% | **** |
| * | The Fund’s portfolio composition is subject to change and there is no assurance that the Fund will continue to hold any particular security. Percentages shown relate to the Fund’s total net assets as of June 30, 2016. | |
| ** | Percentages shown in parentheses relate to the Fund’s total market value of investments as of June 30, 2016, and may not add up to 100% due to rounding. | |
| *** | Reflects expense ratios as stated in the Fund’s current prospectus. The Advisor has contractually agreed to limit the Fund’s total annual fund operating expenses to 0.95% of average daily net assets for the Institutional Class shares and 1.20% of average daily net assets for the Investor Class shares, at least through April 30, 2018. | |
| **** | Includes 0.25% 12b-1 fee. | |
| † | Not annualized. |
Page 34
Chautauqua Global Growth Fund
June 30, 2016 (Unaudited)
Total Returns
| Since | |
| For The Period Ended June 30, 2016 | Inception(1) |
| Institutional Class Shares | -2.30% |
| Investor Class Shares | -2.40% |
MSCI ACWI Index(2) | -0.45% |
| (1) | For the period from April 15, 2016 (inception date) through June 30, 2016. |
| (2) | The MSCI ACWI Index is a market-capitalization-weighted index maintained by MSCI, Inc. and designed to provide a broad measure of stock performance throughout the world. The MSCI ACWI Index includes both developed and emerging markets. This index does not reflect any deduction for fees, expenses or taxes. A direct investment in the index is not possible. |
The returns shown in the table above reflect reinvestment of dividends and/or capital gains distributions in additional shares. The returns do not reflect the deduction of taxes that a shareholder would pay on Fund distributions or the redemption of Fund shares. The returns reflect the actual performance for each period and do not include the impact of trades executed on the last business day of the period that were recorded on the first business day of the next period.
The gross expense ratio for each Class, as reflected in the Fund’s current prospectus, is set forth under “Portfolio Characteristics”.
The Fund focuses on both U.S. and non-U.S. stocks with medium to large market capitalizations and therefore the performance of the Fund may be more volatile than the performance of funds that focus on types of stocks that have a broader investment style. Under normal market conditions, the Fund will invest at least 40% of its total assets in non-U.S. companies. Foreign investments involve additional risks such as currency rate fluctuations and the potential for political and economic instability, and different and sometimes less strict financial reporting standards and regulation. In June 2016, the United Kingdom (UK) voted to leave the European Union (EU) following a referendum referred to as “Brexit.” It is expected that the UK will exit the EU within two years; however, the exact timeframe for the UK’s exit is unknown. There is significant market uncertainty regarding Brexit’s ramifications, and the range of possible political, regulatory, economic, and market outcomes are difficult to predict. The negative impact could be significant, potentially resulting in increased volatility and illiquidity and lower economic growth for companies that rely significantly on Europe for their business activities and revenues. Geopolitical events, including those in Ukraine and the Middle East, may cause market disruptions. The portfolio manager for the Fund has over 30 years of experience investing in the global markets and will attempt to minimize the negative impact of these events. However, it is possible that these or other geopolitical events could have an adverse effect on the value of the Fund’s investments.
Past performance does not guarantee future results. Investment return and principal value will fluctuate so that an investor’s shares, when redeemed, may be worth more or less than their original cost.
For information about the performance of the Fund as of the most recent month-end, please call 1-866-44BAIRD or visit www.bairdfunds.com. Mutual fund performance changes over time and current performance may be lower or higher than that stated.
Page 35
Chautauqua Global Growth Fund
Schedule of Investments, June 30, 2016 (Unaudited)
Common Stocks
| % of | ||||||||||||
| Shares | Value | Net Assets | ||||||||||
| Alternative Carriers | ||||||||||||
| Iliad SA (France)^ | 268 | $ | 54,100 | 1.7 | % | |||||||
| Apparel, Accessories & Luxury Goods | ||||||||||||
| Lululemon Athletica, Inc. (Canada)* | 1,698 | 125,414 | 4.0 | % | ||||||||
| Asset Management & Custody Banks | ||||||||||||
| Hargreaves Lansdown PLC (United Kingdom)^ | 8,715 | 145,376 | 4.6 | % | ||||||||
| Julius Baer Group Ltd. (Switzerland)^ | 3,086 | 124,206 | 4.0 | % | ||||||||
| 269,582 | 8.6 | % | ||||||||||
| Biotechnology | ||||||||||||
| Regeneron Pharmaceuticals, Inc. (United States)* | 259 | 90,450 | 2.9 | % | ||||||||
| Cable & Satellite | ||||||||||||
| Naspers Ltd. (South Africa)^ | 333 | 50,847 | 1.6 | % | ||||||||
| Communications Equipment | ||||||||||||
| Palo Alto Networks, Inc. (United States)* | 258 | 31,641 | 1.0 | % | ||||||||
| Computer Hardware | ||||||||||||
| Apple, Inc. (United States) | 651 | 62,236 | 2.0 | % | ||||||||
| Data Processing & Outsourced Services | ||||||||||||
| Wirecard AG (Germany)^ | 2,393 | 105,402 | 3.4 | % | ||||||||
| Diversified Banks | ||||||||||||
| Banco Santander SA (Spain)^ | 20,278 | 78,693 | 2.5 | % | ||||||||
| Electronic Equipment & Instruments | ||||||||||||
| Keyence Corp. (Japan)^ | 50 | 34,116 | 1.1 | % | ||||||||
| Health Care Equipment | ||||||||||||
| Athenahealth, Inc. (United States)* | 568 | 78,390 | 2.5 | % | ||||||||
| Olympus Corp. (Japan)^ | 776 | 28,977 | 0.9 | % | ||||||||
| 107,367 | 3.4 | % | ||||||||||
| Health Care Services | ||||||||||||
| Celgene Corp. (United States)* | 668 | 65,885 | 2.1 | % | ||||||||
| Integrated Oil & Gas | ||||||||||||
| Galp Energia SGPS (Portugal)^ | 5,781 | 80,404 | 2.6 | % | ||||||||
| Internet Retail | ||||||||||||
| Amazon.com, Inc. (United States)* | 160 | 114,499 | 3.7 | % | ||||||||
| Ctrip.com International Ltd. (Cayman Islands)* | 2,352 | 96,902 | 3.1 | % | ||||||||
| Priceline.com, Inc. (United States)* | 100 | 124,842 | 4.0 | % | ||||||||
| 336,243 | 10.8 | % | ||||||||||
The accompanying notes are an integral part of these financial statements.
Page 36
Chautauqua Global Growth Fund
Schedule of Investments, June 30, 2016 (Unaudited)
Common Stocks (cont.)
| % of | ||||||||||||
| Shares | Value | Net Assets | ||||||||||
| Internet Software & Services | ||||||||||||
| Alphabet, Inc. (United States)* | 111 | $ | 78,092 | 2.5 | % | |||||||
| NAVER Corp. (Republic of Korea)^ | 94 | 58,235 | 1.9 | % | ||||||||
| Salesforce.com, Inc. (United States)* | 383 | 30,414 | 1.0 | % | ||||||||
| Tencent Holdings Ltd. (Cayman Islands)^ | 4,006 | 91,896 | 2.9 | % | ||||||||
| 258,637 | 8.3 | % | ||||||||||
| IT Consulting & Other Services | ||||||||||||
| Alibaba Group Holding Ltd. (Cayman Islands)* | 827 | 65,771 | 2.1 | % | ||||||||
| MasterCard, Inc. – Class A (United States) | 1,477 | 130,065 | 4.2 | % | ||||||||
| 195,836 | 6.3 | % | ||||||||||
| Life & Health Insurance | ||||||||||||
| AIA Group Ltd. (Hong Kong)^ | 12,598 | 75,761 | 2.4 | % | ||||||||
| Life Sciences Tools & Services | ||||||||||||
| Illumina, Inc. (United States)* | 982 | 137,853 | 4.4 | % | ||||||||
| Oil& Gas Exploration & Production | ||||||||||||
| Antero Resources Corp. (United States)* | 2,192 | 56,949 | 1.8 | % | ||||||||
| Pioneer Natural Resources Co. (United States) | 200 | 30,242 | 1.0 | % | ||||||||
| 87,191 | 2.8 | % | ||||||||||
| Other Diversified Financial Services | ||||||||||||
| The Charles Schwab Corp. (United States) | 4,189 | 106,024 | 3.4 | % | ||||||||
| Pharmaceuticals | ||||||||||||
| Allergan PLC (Ireland)* | 288 | 66,554 | 2.1 | % | ||||||||
| Grifols SA (Spain) | 2,961 | 49,360 | 1.6 | % | ||||||||
| Novo Nordisk A/S (Denmark) | 1,034 | 55,609 | 1.8 | % | ||||||||
| Roche Holding AG (Switzerland)^ | 74 | 19,527 | 0.6 | % | ||||||||
| Sinopharm Group Co. Ltd. (China)^ | 28,539 | 137,092 | 4.4 | % | ||||||||
| 328,142 | 10.5 | % | ||||||||||
| Regional Banks | ||||||||||||
| SVB Financial Group (United States)* | 351 | 33,401 | 1.1 | % | ||||||||
| Research & Consulting Services | ||||||||||||
| Nielsen Holdings PLC (United Kingdom) | 860 | 44,694 | 1.4 | % | ||||||||
| Semiconductor Equipment | ||||||||||||
| ARM Holdings PLC (United Kingdom)^ | 7,446 | 113,103 | 3.6 | % | ||||||||
| ASML Holding NV (Netherlands) | 303 | 30,061 | 1.0 | % | ||||||||
| 143,164 | 4.6 | % | ||||||||||
| Semiconductors | ||||||||||||
| Taiwan Semiconductor Manufacturing Co. Ltd. (Taiwan) | 1,067 | 27,987 | 0.9 | % | ||||||||
The accompanying notes are an integral part of these financial statements.
Page 37
Chautauqua Global Growth Fund
Schedule of Investments, June 30, 2016 (Unaudited)
Common Stocks (cont.)
| % of | ||||||||||||
| Shares | Value | Net Assets | ||||||||||
| Specialty Chemicals | ||||||||||||
| Croda International PLC (United Kingdom)^ | 537 | $ | 22,543 | 0.7 | % | |||||||
| The Sherwin-Williams Co. (United States) | 110 | 32,304 | 1.0 | % | ||||||||
| 54,847 | 1.7 | % | ||||||||||
| Systems Software | ||||||||||||
| Adobe Systems, Inc. (United States)* | 674 | 64,562 | 2.1 | % | ||||||||
| Trading Companies & Distributors | ||||||||||||
| Bunzl PLC (United Kingdom)^ | 1,003 | 30,862 | 1.0 | % | ||||||||
| Total Common Stocks | ||||||||||||
| (Cost $3,113,568) | 3,081,341 | 98.6 | % | |||||||||
| Short-Term Investments | ||||||||||||
| Money Market Mutual Funds | ||||||||||||
| Dreyfus Institutional Cash Advantage Fund, | ||||||||||||
| Institutional Class, 0.39%« | 126,655 | 126,655 | 4.1 | % | ||||||||
| Short-Term Investments Trust – Liquid Assets | ||||||||||||
| Portfolio, Institutional Class, 0.43%« | 50,000 | 50,000 | 1.6 | % | ||||||||
| Total Short-Term Investments | ||||||||||||
| (Cost $176,655) | 176,655 | 5.7 | % | |||||||||
| Total Investments | ||||||||||||
| (Cost $3,290,223) | 3,257,996 | 104.3 | % | |||||||||
| Liabilities in Excess of Other Assets | (133,982 | ) | (4.3 | )% | ||||||||
| TOTAL NET ASSETS | $ | 3,124,014 | 100.0 | % | ||||||||
Notes to Schedule of Investments
| * | Non-Income Producing |
| ^ | Fair Valued Security – See Note 2a to Financial Statements |
| « | 7-Day Yield |
Industry classifications shown in the Schedule of Investments are based off of the Global Industry Classification Standard (GICS®). GICS was developed by and/or is the exclusive property of MSCI, Inc. and Standard & Poor Financial Services LLC (“S&P”). GICS is a service mark of MSCI and S&P and has been licensed for use by U.S. Bancorp Fund Services, LLC.
The accompanying notes are an integral part of these financial statements.
Page 38
Chautauqua Global Growth Fund
Schedule of Investments, June 30, 2016 (Unaudited)
Summary of Fair Value Exposure at June 30, 2016 (Unaudited)
The Fund has adopted authoritative fair valuation accounting standards which establish a definition of fair value and set out a hierarchy for measuring fair value. These standards require additional disclosures about the various inputs and valuation techniques used to develop the measurements of fair value and a discussion on changes in valuation techniques and related inputs during the period. These standards define fair value as the price that would be received to sell an asset or paid to transfer a liability in an orderly transaction between market participants at the measurement date. Management has determined that these standards have no material impact on the Fund’s financial statements. The fair value hierarchy is organized into three levels based upon the assumptions (referred to as “inputs”) used in pricing the asset or liability. These standards state that “observable inputs” reflect the assumptions market participants would use in pricing the asset or liability based on market data obtained from independent sources and “unobservable inputs” reflect an entity’s own assumptions about the assumptions market participants would use in pricing the asset or liability. These inputs are summarized into three broad levels and described below:
| Level 1 – | Unadjusted quoted prices in active markets for identical unrestricted securities. |
| Level 2 – | Other significant observable inputs (including quoted prices for similar securities, quoted prices in inactive markets, dealer indications, interest rates, yield curves, prepayment speeds, credit risk, default rates, inputs corroborated by observable market data, etc.). |
| Level 3 – | Significant unobservable inputs (including the Fund’s own assumptions about the factors that market participants would use in valuing the security) based on the best information available. |
The inputs or methodology used for valuing securities are not necessarily an indication of the risk associated with investing in those securities.
The following is a summary of the inputs used to value the Fund’s investments as of June 30, 2016:
| Level 1 | Level 2 | Level 3 | Total | |||||||||||||
| Equity | ||||||||||||||||
| Common Stocks | $ | 1,830,201 | $ | 1,251,140 | $ | — | $ | 3,081,341 | ||||||||
| Total Equity | 1,830,201 | 1,251,140 | — | 3,081,341 | ||||||||||||
| Short-Term Investments | ||||||||||||||||
| Money Market Mutual Funds | 176,655 | — | — | $ | 176,655 | |||||||||||
| Total Short-Term Investments | 176,655 | — | — | 176,655 | ||||||||||||
| Total Investments* | $ | 2,006,856 | $ | 1,251,140 | $ | — | $ | 3,257,996 | ||||||||
| * | Additional information regarding the industry classifications of these investments is disclosed in the Schedule of Investments. |
Changes in valuation techniques may result in transfers into or out of assigned levels within the fair value hierarchy. There were no transfers between Level 1, Level 2 and Level 3 fair value measurements during the reporting period. See the Fund’s valuation policy in Note 2a to the financial statements.
The accompanying notes are an integral part of these financial statements.
Page 39
Additional Information on Fund Expenses
June 30, 2016 (Unaudited)
Example
As a shareholder of a mutual fund, you incur two types of costs: (1) transaction costs, which may include sales charges (loads) on purchase payments, reinvested dividends, or other distributions; redemption fees; and exchange fees; and (2) ongoing costs, such as management fees; distribution and/or service (12b-1) fees; and other fund expenses. Although the Funds do not charge any sales loads, redemption fees (with the exception of the Chautauqua International Growth Fund and Chautauqua Global Growth Fund. See Note 9 to the financial statements), or other transaction fees, you will be assessed fees for outgoing wire transfers, returned checks and stop payment orders at prevailing rates charged by U.S. Bancorp Fund Services, LLC, the Fund’s transfer agent. If you request that a redemption be made by wire transfer, currently the Fund’s transfer agent charges a $15.00 fee.
This Example is intended to help you understand your ongoing costs (in dollars) of investing in each Fund and to compare these costs with the ongoing costs of investing in other mutual funds. The Example is based on an investment of $1,000 invested at the beginning of the period and held for the entire period (1/1/16 – 6/30/16).
Actual Expenses
The third and fourth columns of the following table provide information about account values based on actual returns and actual expenses. You may use the information in these columns, together with the amount you invested, to estimate the expenses that you paid over the period. Simply divide your account value by $1,000 (for example, an $8,600 account value divided by $1,000 = 8.6), then multiply the result by the number in the fourth column entitled “Expenses Paid During Period” to estimate the expenses you paid on your account during this period.
Hypothetical Example for Comparison Purposes
The fifth and sixth columns of the following table provide information about hypothetical account values and hypothetical expenses based on the Funds’ actual expense ratios and an assumed rate of return of 5% per year before expenses, which is not the Funds’ actual return. The hypothetical account values and expenses may not be used to estimate the actual ending account balance or expenses you paid for the period. You may use this information to compare the ongoing costs of investing in the Funds and other mutual funds. To do so, compare this 5% hypothetical example with the 5% hypothetical examples that appear in the shareholder reports of the other mutual funds. Please note that the expenses shown in the table are meant to highlight your ongoing costs only and do not reflect any transactional costs. Therefore, the sixth column of the table (entitled “Expenses Paid During Period”) is useful in comparing ongoing costs only, and will not help you determine the relative total costs of owning different mutual funds. In addition, if these transactional costs were included, your costs could have been higher.
Page 40
Additional Information on Fund Expenses
June 30, 2016 (Unaudited)
Actual vs. Hypothetical Returns
For the Six Months Ended June 30, 2016
| Hypothetical | |||||||||||
| (5% return | |||||||||||
| Actual | before expenses) | ||||||||||
| Fund’s | Beginning | Ending | Expenses | Ending | Expenses | ||||||
| Annualized | Account | Account | Paid | Account | Paid | ||||||
| Expense | Value | Value | During | Value | During | ||||||
Ratio(1)(2) | 1/1/16 | 6/30/16 | Period(1)(2) | 6/30/16 | Period(1)(2) | ||||||
| Baird LargeCap Fund | |||||||||||
| Institutional Class | 0.75% | $1,000.00 | $ 987.50 | $3.71 | $1,021.13 | $3.77 | |||||
| Investor Class | 1.00% | $1,000.00 | $ 984.90 | $4.94 | $1,019.89 | $5.02 | |||||
| Baird MidCap Fund | |||||||||||
| Institutional Class | 0.83% | $1,000.00 | $1,026.00 | $4.18 | $1,020.74 | $4.17 | |||||
| Investor Class | 1.08% | $1,000.00 | $1,024.40 | $5.44 | $1,019.49 | $5.42 | |||||
| Baird Small/Mid | |||||||||||
| Cap Value Fund | |||||||||||
| Institutional Class | 0.95% | $1,000.00 | $1,041.00 | $4.82 | $1,020.14 | $4.77 | |||||
| Investor Class | 1.20% | $1,000.00 | $1,039.90 | $6.09 | $1,018.90 | $6.02 | |||||
| Baird SmallCap Value Fund | |||||||||||
| Institutional Class | 1.00% | $1,000.00 | $1,060.60 | $5.12 | $1,019.89 | $5.02 | |||||
| Investor Class | 1.25% | $1,000.00 | $1,059.30 | $6.40 | $1,018.65 | $6.27 | |||||
| Chautauqua International | |||||||||||
| Growth Fund | |||||||||||
| Institutional Class | 0.95% | $1,000.00 | $ 984.00 | $1.98 | $1,008.52 | $2.01 | |||||
| Investor Class | 1.20% | $1,000.00 | $ 983.00 | $2.50 | $1,007.99 | $2.53 | |||||
| Chautauqua Global | |||||||||||
| Growth Fund | |||||||||||
| Institutional Class | 0.95% | $1,000.00 | $ 977.00 | $1.98 | $1,008.52 | $2.01 | |||||
| Investor Class | 1.20% | $1,000.00 | $ 976.00 | $2.49 | $1,007.99 | $2.53 | |||||
| (1) | Expenses are equal to the Fund’s annualized net expense ratio multiplied by the average account value over the period, multiplied by 182 days and divided by 366 to reflect the one-half year period. |
| (2) | Expenses are equal to the annualized net expense ratio for the Chautauqua International Growth Fund and the Chautauqua Global Growth Fund multiplied by the average account value over the period, multiplied by 77 days and divided by 366 to reflect the period since the Fund’s inception on April 15, 2016. |
Page 41
Statements of Assets and Liabilities
June 30, 2016 (Unaudited)
| Baird | ||||||||||||
| Baird | Baird | Small/Mid | ||||||||||
| LargeCap | MidCap | Cap Value | ||||||||||
| Fund | Fund | Fund | ||||||||||
| ASSETS: | ||||||||||||
| Investments, at value (cost $34,612,123, | ||||||||||||
| $1,133,972,973 and $8,232,982, respectively)* | $ | 35,528,879 | $ | 1,318,502,194 | $ | 8,547,420 | ||||||
| Dividends receivable | 27,786 | 378,899 | 21,050 | |||||||||
| Interest receivable | 460 | 16,702 | 207 | |||||||||
| Receivable for investments sold | — | 7,981,685 | — | |||||||||
| Receivable for Fund shares sold | 29,300 | 1,521,903 | — | |||||||||
| Receivable from Advisor and Distributor | — | — | 4,573 | |||||||||
| Uninvested cash | — | — | 179,243 | |||||||||
| Prepaid expenses and other assets | 16,995 | 533,098 | 24,527 | |||||||||
| Total assets | 35,603,420 | 1,328,934,481 | 8,777,020 | |||||||||
| LIABILITIES: | ||||||||||||
| Payable for securities purchased | — | 12,850,365 | — | |||||||||
| Payable for Fund shares repurchased | 2,403 | 1,291,413 | — | |||||||||
| Payable to Advisor and Distributor | 6,408 | 1,390,880 | — | |||||||||
| Payable to directors | 390 | 976 | 841 | |||||||||
| Accrued expenses and other liabilities | 34,824 | 255,956 | 14,484 | |||||||||
| Total liabilities | 44,025 | 15,789,590 | 15,325 | |||||||||
| NET ASSETS | $ | 35,559,395 | $ | 1,313,144,891 | $ | 8,761,695 | ||||||
| NET ASSETS CONSIST OF: | ||||||||||||
| Capital stock | $ | 35,765,105 | $ | 1,206,205,318 | $ | 8,649,499 | ||||||
| Accumulated undistributed | ||||||||||||
| net investment income (loss) | 273,538 | (905,595 | ) | 46,578 | ||||||||
| Accumulated net realized | ||||||||||||
| loss on investments sold | (1,396,004 | ) | (76,684,053 | ) | (248,820 | ) | ||||||
| Net unrealized appreciation | ||||||||||||
| on investments | 916,756 | 184,529,221 | 314,438 | |||||||||
| NET ASSETS | $ | 35,559,395 | $ | 1,313,144,891 | $ | 8,761,695 | ||||||
| INSTITUTIONAL CLASS SHARES | ||||||||||||
| Net Assets | $ | 34,963,593 | $ | 1,174,149,066 | $ | 8,733,505 | ||||||
| Shares outstanding ($0.01 par value, | ||||||||||||
| unlimited shares authorized) | 4,422,701 | 76,347,029 | 881,322 | |||||||||
| Net asset value, offering and | ||||||||||||
| redemption price per share | $ | 7.91 | $ | 15.38 | $ | 9.91 | ||||||
| INVESTOR CLASS SHARES | ||||||||||||
| Net Assets | $ | 595,802 | $ | 138,995,825 | $ | 28,190 | ||||||
| Shares outstanding ($0.01 par value, | ||||||||||||
| unlimited shares authorized) | 75,861 | 9,443,401 | 2,848 | |||||||||
| Net asset value, offering and | ||||||||||||
| redemption price per share | $ | 7.85 | $ | 14.72 | $ | 9.90 | ||||||
The accompanying notes are an integral part of these financial statements.
Page 42
Statements of Assets and Liabilities
June 30, 2016 (Unaudited)
| Baird | Chautauqua | Chautauqua | ||||||||||
| SmallCap | International | Global | ||||||||||
| Value Fund | Growth Fund | Growth Fund | ||||||||||
| ASSETS: | ||||||||||||
| Investments, at value (cost $23,059,464, | ||||||||||||
| $8,091,767 and $3,290,223, respectively)* | $ | 27,324,467 | $ | 8,122,215 | $ | 3,257,996 | ||||||
| Dividends receivable | 98,728 | 8,816 | 3,821 | |||||||||
| Interest receivable | 765 | 159 | 62 | |||||||||
| Receivable for investments sold | — | — | 29,543 | |||||||||
| Receivable for Fund shares sold | 26,000 | 1,553,588 | — | |||||||||
| Receivable from Advisor and Distributor | — | 10,787 | 12,969 | |||||||||
| Prepaid expenses and other assets | 17,174 | 911 | 890 | |||||||||
| Total assets | 27,467,134 | 9,696,476 | 3,305,281 | |||||||||
| LIABILITIES: | ||||||||||||
| Payable for securities purchased | — | 1,120,930 | 143,625 | |||||||||
| Payable for Fund shares repurchased | 18,318 | 1,666 | — | |||||||||
| Payable to Advisor and Distributor | 9,792 | — | — | |||||||||
| Payable to directors | 490 | 7,104 | 7,104 | |||||||||
| Accrued expenses and other liabilities | 32,544 | 30,726 | 30,538 | |||||||||
| Total liabilities | 61,144 | 1,160,426 | 181,267 | |||||||||
| NET ASSETS | $ | 27,405,990 | $ | 8,536,050 | $ | 3,124,014 | ||||||
| NET ASSETS CONSIST OF: | ||||||||||||
| Capital stock | $ | 23,500,209 | $ | 8,501,202 | $ | 3,161,119 | ||||||
| Accumulated undistributed | ||||||||||||
| net investment income | 228,652 | 15,597 | 4,085 | |||||||||
| Accumulated net realized loss on investments | ||||||||||||
| sold and foreign currency translations | (587,874 | ) | (10,903 | ) | (8,909 | ) | ||||||
| Net unrealized appreciation/depreciation on: | ||||||||||||
| Investments | 4,265,003 | 30,448 | (32,227 | ) | ||||||||
| Other assets and liabilities | ||||||||||||
| denominated in foreign currency | — | (294 | ) | (54 | ) | |||||||
| NET ASSETS | $ | 27,405,990 | $ | 8,536,050 | $ | 3,124,014 | ||||||
| INSTITUTIONAL CLASS SHARES | ||||||||||||
| Net Assets | $ | 25,215,110 | $ | 8,498,388 | $ | 2,991,216 | ||||||
| Shares outstanding ($0.01 par value, | ||||||||||||
| unlimited shares authorized) | 1,824,648 | 862,261 | 306,233 | |||||||||
| Net asset value, offering and | ||||||||||||
| redemption price per share | $ | 13.82 | $ | 9.86 | $ | 9.77 | ||||||
| INVESTOR CLASS SHARES | ||||||||||||
| Net Assets | $ | 2,190,880 | $ | 37,662 | $ | 132,798 | ||||||
| Shares outstanding ($0.01 par value, | ||||||||||||
| unlimited shares authorized) | 159,188 | 3,824 | 13,598 | |||||||||
| Net asset value, offering and | ||||||||||||
| redemption price per share | $ | 13.76 | $ | 9.85 | $ | 9.77 | ||||||
The accompanying notes are an integral part of these financial statements.
Page 43
Statements of Operations
Six Months Ended June 30, 2016 (Unaudited)
| Baird | ||||||||||||
| Baird | Baird | Small/Mid | ||||||||||
| LargeCap | MidCap | Cap Value | ||||||||||
| Fund | Fund | Fund | ||||||||||
| INVESTMENT INCOME: | ||||||||||||
| Dividends (net of foreign taxes withheld | ||||||||||||
| of $0, $14,938 and $0, respectively) | $ | 402,121 | $ | 4,208,961 | $ | 73,274 | ||||||
| Interest | 1,944 | 88,976 | 976 | |||||||||
| Total investment income | 404,065 | 4,297,937 | 74,250 | |||||||||
| EXPENSES: | ||||||||||||
| Investment advisory fees | 112,409 | 4,557,180 | 23,480 | |||||||||
| Administration fees | 3,289 | 46,535 | 3,924 | |||||||||
| Shareholder servicing fees | 6,789 | 249,271 | 1,021 | |||||||||
| Fund accounting fees | 6,524 | 30,989 | 3,293 | |||||||||
| Professional fees | 18,665 | 19,722 | 15,925 | |||||||||
| Federal and state registration | 21,126 | 45,669 | 19,000 | |||||||||
| Directors fees | 23,695 | 25,172 | 20,340 | |||||||||
| Custody fees | 3,425 | 13,333 | 3,442 | |||||||||
| Reports to shareholders | 3,001 | 30,304 | 3,546 | |||||||||
| Miscellaneous expenses | 96 | 544 | 295 | |||||||||
| Distribution expense – Investor Class Shares (Note 8) | 724 | 184,813 | 27 | |||||||||
| Total expenses | 199,743 | 5,203,532 | 94,293 | |||||||||
| Fee waiver by Advisor (Note 5) | (69,216 | ) | — | (66,332 | ) | |||||||
| Net expenses | 130,527 | 5,203,532 | 27,961 | |||||||||
| NET INVESTMENT INCOME (LOSS) | 273,538 | (905,595 | ) | 46,289 | ||||||||
| REALIZED AND UNREALIZED | ||||||||||||
| GAIN (LOSS) ON INVESTMENTS: | ||||||||||||
| Net realized loss on investments | (757,868 | ) | (47,817,057 | ) | (209,466 | ) | ||||||
| Change in unrealized appreciation on investments | 43,594 | 78,200,218 | 509,140 | |||||||||
| Net realized and unrealized gain (loss) on investments | (714,274 | ) | 30,383,161 | 299,674 | ||||||||
| NET INCREASE (DECREASE) IN NET | ||||||||||||
| ASSETS RESULTING FROM OPERATIONS | $ | (440,736 | ) | $ | 29,477,566 | $ | 345,963 | |||||
The accompanying notes are an integral part of these financial statements.
Page 44
Statements of Operations
Six Months Ended June 30, 2016 (Unaudited)
| Baird | Chautauqua | Chautauqua | ||||||||||
| SmallCap | International | Global | ||||||||||
| Value Fund | Growth Fund^ | Growth Fund^ | ||||||||||
| INVESTMENT INCOME: | ||||||||||||
| Dividends (net of foreign taxes withheld | ||||||||||||
| of $0, $1,985 and $715, respectively) | $ | 341,954 | $ | 24,152 | $ | 8,931 | ||||||
| Interest | 4,381 | 396 | 176 | |||||||||
| Other income | 910 | 14 | — | |||||||||
| Total investment income | 347,245 | 24,562 | 9,107 | |||||||||
| EXPENSES: | ||||||||||||
| Investment advisory fees | 105,067 | 7,560 | 4,222 | |||||||||
| Administration fees | 2,012 | 1,110 | 1,110 | |||||||||
| Shareholder servicing fees | 7,460 | 2,405 | 2,405 | |||||||||
| Fund accounting fees | 7,990 | 5,846 | 5,846 | |||||||||
| Professional fees | 12,207 | 9,176 | 9,176 | |||||||||
| Federal and state registration | 19,406 | 10,064 | 10,149 | |||||||||
| Directors fees | 24,614 | 7,104 | 7,104 | |||||||||
| Custody fees | 2,621 | 740 | 740 | |||||||||
| Reports to shareholders | 3,842 | 1,036 | 1,036 | |||||||||
| Miscellaneous expenses | 287 | 154 | 154 | |||||||||
| Distribution expense – Investor Class Shares (Note 8) | 2,475 | 13 | 34 | |||||||||
| Total expenses | 187,981 | 45,208 | 41,976 | |||||||||
| Fee waiver by Advisor (Note 5) | (61,901 | ) | (36,243 | ) | (36,954 | ) | ||||||
| Net expenses | 126,080 | 8,965 | 5,022 | |||||||||
| NET INVESTMENT INCOME | 221,165 | 15,597 | 4,085 | |||||||||
| REALIZED AND UNREALIZED | ||||||||||||
| GAIN (LOSS) ON INVESTMENTS: | ||||||||||||
| Net realized gain (loss) on investments | 172,241 | (6,900 | ) | (6,950 | ) | |||||||
| Net realized loss on foreign currency translations | — | (4,003 | ) | (1,959 | ) | |||||||
| Change in unrealized appreciation/depreciation | ||||||||||||
| on investments and foreign currency translations | 1,185,430 | 30,154 | (32,281 | ) | ||||||||
| Net realized and unrealized gain (loss) on investments | 1,357,671 | 19,251 | (41,190 | ) | ||||||||
| NET INCREASE (DECREASE) IN NET | ||||||||||||
| ASSETS RESULTING FROM OPERATIONS | $ | 1,578,836 | $ | 34,848 | $ | (37,105 | ) | |||||
| ^ | Inception of the Chautauqua International Growth Fund and the Chautauqua Global Growth Fund was the close of business on April 15, 2016. |
The accompanying notes are an integral part of these financial statements.
Page 45
Statement of Changes in Net Assets
Baird LargeCap Fund
| Six Months Ended | ||||||||
| June 30, 2016 | Year Ended | |||||||
| (Unaudited) | December 31, 2015 | |||||||
| OPERATIONS: | ||||||||
| Net investment income | $ | 273,538 | $ | 467,691 | ||||
| Net realized gain (loss) on investments | (757,868 | ) | 1,215,765 | |||||
| Change in unrealized appreciation/depreciation | ||||||||
| on investments | 43,594 | (3,284,296 | ) | |||||
| Net decrease in net assets resulting from operations | (440,736 | ) | (1,600,840 | ) | ||||
| CAPITAL SHARE TRANSACTIONS: | ||||||||
| Proceeds from shares sold | 2,975,663 | 7,717,424 | ||||||
| Shares issued to holders in reinvestment of distributions | — | 2,431,224 | ||||||
| Cost of shares redeemed | (3,226,503 | ) | (10,040,992 | ) | ||||
| Net increase (decrease) in net assets resulting | ||||||||
| from capital share transactions | (250,840 | ) | 107,656 | |||||
| DISTRIBUTIONS TO | ||||||||
| INSTITUTIONAL CLASS SHAREHOLDERS: | ||||||||
| From net investment income | — | (469,154 | ) | |||||
| From net realized gains | — | (1,918,299 | ) | |||||
| Total Distributions | — | (2,387,453 | ) | |||||
| DISTRIBUTIONS TO | ||||||||
| INVESTOR CLASS SHAREHOLDERS: | ||||||||
| From net investment income | — | (6,047 | ) | |||||
| From net realized gains | — | (37,847 | ) | |||||
| Total Distributions | — | (43,894 | ) | |||||
| TOTAL DECREASE IN NET ASSETS | (691,576 | ) | (3,924,531 | ) | ||||
| NET ASSETS: | ||||||||
| Beginning of period | 36,250,971 | 40,175,502 | ||||||
| End of period (including accumulated undistributed | ||||||||
| net investment income of $273,538 and $0, respectively) | $ | 35,559,395 | $ | 36,250,971 | ||||
The accompanying notes are an integral part of these financial statements.
Page 46
Statement of Changes in Net Assets
Baird MidCap Fund
| Six Months Ended | ||||||||
| June 30, 2016 | Year Ended | |||||||
| (Unaudited) | December 31, 2015 | |||||||
| OPERATIONS: | ||||||||
| Net investment loss | $ | (905,595 | ) | $ | (2,768,264 | ) | ||
| Net realized loss on investments | (47,817,057 | ) | (27,744,335 | ) | ||||
| Change in unrealized appreciation/depreciation | ||||||||
| on investments | 78,200,218 | (22,515,811 | ) | |||||
| Net increase (decrease) in net assets resulting from operations | 29,477,566 | (53,028,410 | ) | |||||
| CAPITAL SHARE TRANSACTIONS: | ||||||||
| Proceeds from shares sold | 297,612,068 | 449,697,294 | ||||||
| Shares issued to holders in reinvestment of distributions | — | 1,614,082 | ||||||
| Cost of shares redeemed | (233,070,074 | ) | (293,658,295 | ) | ||||
| Net increase in net assets resulting | ||||||||
| from capital share transactions | 64,541,994 | 157,653,081 | ||||||
| DISTRIBUTIONS TO | ||||||||
| INSTITUTIONAL CLASS SHAREHOLDERS: | ||||||||
| From net realized gains | — | (1,484,630 | ) | |||||
| Total Distributions | — | (1,484,630 | ) | |||||
| DISTRIBUTIONS TO | ||||||||
| INVESTOR CLASS SHAREHOLDERS: | ||||||||
| From net realized gains | — | (278,941 | ) | |||||
| Total Distributions | — | (278,941 | ) | |||||
| TOTAL INCREASE IN NET ASSETS | 94,019,560 | 102,861,100 | ||||||
| NET ASSETS: | ||||||||
| Beginning of period | 1,219,125,331 | 1,116,264,231 | ||||||
| End of period (including distributions in excess of | ||||||||
| net investment income of $(905,595) and $0, respectively) | $ | 1,313,144,891 | $ | 1,219,125,331 | ||||
The accompanying notes are an integral part of these financial statements.
Page 47
Statement of Changes in Net Assets
Baird Small/Mid Cap Value Fund
| Six Months Ended | November 30, 2015^ | |||||||
| June 30, 2016 | through | |||||||
| (Unaudited) | December 31, 2015 | |||||||
| OPERATIONS: | ||||||||
| Net investment income | $ | 46,289 | $ | 7,703 | ||||
| Net realized loss on investments | (209,466 | ) | (39,584 | ) | ||||
| Change in unrealized appreciation/depreciation | ||||||||
| on investments | 509,140 | (194,702 | ) | |||||
| Net increase (decrease) in net assets resulting from operations | 345,963 | (226,583 | ) | |||||
| CAPITAL SHARE TRANSACTIONS: | ||||||||
| Proceeds from shares sold | 3,758,304 | 4,960,000 | ||||||
| Shares issued to holders in reinvestment of distributions | — | 7,184 | ||||||
| Cost of shares redeemed | (75,989 | ) | — | |||||
| Net increase in net assets resulting | ||||||||
| from capital share transactions | 3,682,315 | 4,967,184 | ||||||
| DISTRIBUTIONS TO | ||||||||
| INSTITUTIONAL CLASS SHAREHOLDERS: | ||||||||
| From net investment income | — | (7,158 | ) | |||||
| Total Distributions | — | (7,158 | ) | |||||
| DISTRIBUTIONS TO | ||||||||
| INVESTOR CLASS SHAREHOLDERS: | ||||||||
| From net investment income | — | (26 | ) | |||||
| Total Distributions | — | (26 | ) | |||||
| TOTAL INCREASE IN NET ASSETS | 4,028,278 | 4,733,417 | ||||||
| NET ASSETS: | ||||||||
| Beginning of period | 4,733,417 | — | ||||||
| End of period (including accumulated undistributed | ||||||||
| net investment income of $46,578 and $289, respectively) | $ | 8,761,695 | $ | 4,733,417 | ||||
| ^ | Inception was the close of business on November 30, 2015. |
The accompanying notes are an integral part of these financial statements.
Page 48
Statement of Changes in Net Assets
Baird SmallCap Value Fund
| Six Months Ended | ||||||||
| June 30, 2016 | Year Ended | |||||||
| (Unaudited) | December 31, 2015 | |||||||
| OPERATIONS: | ||||||||
| Net investment income | $ | 221,165 | $ | 186,109 | ||||
| Net realized gain (loss) on investments | 172,241 | (676,064 | ) | |||||
| Change in unrealized appreciation/depreciation | ||||||||
| on investments | 1,185,430 | (826,483 | ) | |||||
| Net increase (decrease) in net assets resulting from operations | 1,578,836 | (1,316,438 | ) | |||||
| CAPITAL SHARE TRANSACTIONS: | ||||||||
| Proceeds from shares sold | 2,845,893 | 5,084,558 | ||||||
| Shares issued to holders in reinvestment of distributions | — | 133,162 | ||||||
| Cost of shares redeemed | (2,145,307 | ) | (4,171,336 | ) | ||||
| Net increase in net assets resulting | ||||||||
| from capital share transactions | 700,586 | 1,046,384 | ||||||
| DISTRIBUTIONS TO | ||||||||
| INSTITUTIONAL CLASS SHAREHOLDERS: | ||||||||
| From net investment income | — | (148,738 | ) | |||||
| Total Distributions | — | (148,738 | ) | |||||
| DISTRIBUTIONS TO | ||||||||
| INVESTOR CLASS SHAREHOLDERS: | ||||||||
| From net investment income | — | (8,071 | ) | |||||
| Total Distributions | — | (8,071 | ) | |||||
| TOTAL INCREASE (DECREASE) IN NET ASSETS | 2,279,422 | (426,863 | ) | |||||
| NET ASSETS: | �� | |||||||
| Beginning of period | 25,126,568 | 25,553,431 | ||||||
| End of period (including accumulated undistributed | ||||||||
| net investment income of $228,652 and $7,487, respectively) | $ | 27,405,990 | $ | 25,126,568 | ||||
The accompanying notes are an integral part of these financial statements.
Page 49
Statement of Changes in Net Assets
Chautauqua International Growth Fund
| April 15, 2016^ | ||||
| through | ||||
| June 30, 2016 | ||||
| (Unaudited) | ||||
| OPERATIONS: | ||||
| Net investment income | $ | 15,597 | ||
| Net realized loss on investments | (6,900 | ) | ||
| Net realized loss on foreign currency translations | (4,003 | ) | ||
| Change in unrealized appreciation on investments | ||||
| and foreign currency translations | 30,154 | |||
| Net increase in net assets resulting from operations | 34,848 | |||
| CAPITAL SHARE TRANSACTIONS: | ||||
| Proceeds from shares sold | 8,514,809 | |||
| Cost of shares redeemed | (13,607 | ) | ||
| Net increase in net assets resulting from capital share transactions | 8,501,202 | |||
| TOTAL INCREASE IN NET ASSETS | 8,536,050 | |||
| NET ASSETS: | ||||
| Beginning of period | — | |||
| End of period (including accumulated undistributed | ||||
| net investment income of $15,597) | $ | 8,536,050 | ||
| ^ | Inception was the close of business on April 15, 2016. |
The accompanying notes are an integral part of these financial statements.
Page 50
Statement of Changes in Net Assets
Chautauqua Global Growth Fund
| April 15, 2016^ | ||||
| through | ||||
| June 30, 2016 | ||||
| (Unaudited) | ||||
| OPERATIONS: | ||||
| Net investment income | $ | 4,085 | ||
| Net realized loss on investments | (6,950 | ) | ||
| Net realized loss on foreign currency translations | (1,959 | ) | ||
| Change in unrealized depreciation on investments | ||||
| and foreign currency translations | (32,281 | ) | ||
| Net decrease in net assets resulting from operations | (37,105 | ) | ||
| CAPITAL SHARE TRANSACTIONS: | ||||
| Proceeds from shares sold | 3,174,809 | |||
| Cost of shares redeemed | (13,690 | ) | ||
| Net increase in net assets resulting from capital share transactions | 3,161,119 | |||
| TOTAL INCREASE IN NET ASSETS | 3,124,014 | |||
| NET ASSETS: | ||||
| Beginning of period | — | |||
| End of period (including accumulated undistributed | ||||
| net investment income of $4,085) | $ | 3,124,014 | ||
| ^ | Inception was the close of business on April 15, 2016. |
The accompanying notes are an integral part of these financial statements.
Page 51
Financial Highlights
Baird LargeCap Fund – Institutional Class
| Six Months | ||||||||||||||||||||||||
| Ended | ||||||||||||||||||||||||
June 30, 2016(1) | Year Ended December 31, | |||||||||||||||||||||||
| (Unaudited) | 2015 | 2014 | 2013(1) | 2012 | 2011 | |||||||||||||||||||
| Per Share Data: | ||||||||||||||||||||||||
| Net asset value, | ||||||||||||||||||||||||
| beginning of period | $ | 8.01 | $ | 8.93 | $ | 7.92 | $ | 9.86 | $ | 8.71 | $ | 8.93 | ||||||||||||
| Income from | ||||||||||||||||||||||||
| investment operations: | ||||||||||||||||||||||||
| Net investment income | 0.06 | (2) | 0.10 | (2) | 0.09 | (2) | 0.03 | (2) | 0.04 | (2) | 0.01 | |||||||||||||
| Net realized and unrealized | ||||||||||||||||||||||||
| gains (losses) on investments | (0.16 | ) | (0.45 | ) | 1.10 | 3.16 | 1.15 | (0.22 | ) | |||||||||||||||
| Total from | ||||||||||||||||||||||||
| investment operations | (0.10 | ) | (0.35 | ) | 1.19 | 3.19 | 1.19 | (0.21 | ) | |||||||||||||||
| Less distributions: | ||||||||||||||||||||||||
| Distributions from | ||||||||||||||||||||||||
| net investment income | — | (0.11 | ) | (0.08 | ) | (0.04 | ) | (0.04 | ) | (0.01 | ) | |||||||||||||
| Distributions from | ||||||||||||||||||||||||
| net realized gains | — | (0.46 | ) | (0.10 | ) | (5.09 | ) | — | — | |||||||||||||||
| Total distributions | — | (0.57 | ) | (0.18 | ) | (5.13 | ) | (0.04 | ) | (0.01 | ) | |||||||||||||
| Net asset value, end of period | $ | 7.91 | $ | 8.01 | $ | 8.93 | $ | 7.92 | $ | 9.86 | $ | 8.71 | ||||||||||||
| Total return | (1.25 | )%(3) | (3.94 | )% | 15.09 | % | 32.68 | % | 13.62 | % | (2.34 | )% | ||||||||||||
| Supplemental data and ratios: | ||||||||||||||||||||||||
| Net assets, | ||||||||||||||||||||||||
| end of period (millions) | $ | 35.0 | $ | 35.6 | $ | 39.0 | $ | 28.0 | $ | 24.0 | $ | 20.5 | ||||||||||||
| Ratio of expenses | ||||||||||||||||||||||||
| to average net assets | 0.75 | %(4) | 0.75 | % | 0.75 | % | 0.75 | % | 0.75 | % | 0.75 | % | ||||||||||||
| Ratio of expenses | ||||||||||||||||||||||||
| to average net assets | ||||||||||||||||||||||||
| (before waivers) | 1.15 | %(4) | 1.11 | % | 1.17 | % | 1.24 | % | 1.34 | % | 1.35 | % | ||||||||||||
| Ratio of net | ||||||||||||||||||||||||
| investment income | ||||||||||||||||||||||||
| to average net assets | 1.59 | %(4) | 1.18 | % | 1.08 | % | 0.28 | % | 0.37 | % | 0.12 | % | ||||||||||||
| Ratio of net | ||||||||||||||||||||||||
| investment income (loss) | ||||||||||||||||||||||||
| to average net assets | ||||||||||||||||||||||||
| (before waivers) | 1.19 | %(4) | 0.82 | % | 0.66 | % | (0.21 | )% | (0.22 | )% | (0.48 | )% | ||||||||||||
Portfolio turnover rate(5) | 46.2 | %(3) | 86.5 | % | 88.2 | % | 127.7 | % | 39.2 | % | 38.2 | % | ||||||||||||
| (1) | Effective December 23, 2013, Baird Kailash Group, LLC became the Fund’s subadviser. The Fund changed its subadviser to L2 Asset Management, LLC as of April 30, 2016. |
| (2) | Calculated using average shares outstanding during the period. |
| (3) | Not annualized. |
| (4) | Annualized. |
| (5) | Portfolio turnover is calculated on the basis of the Fund as a whole without distinguishing between the classes of shares issued. The Baird LargeCap Fund’s portfolio turnover rate in 2013 was higher than previous years primarily due to the implementation of a new investment strategy for the Fund by Baird Kailash Group, LLC, the Fund’s previous subadviser. |
The accompanying notes are an integral part of these financial statements.
Page 52
Financial Highlights
Baird LargeCap Fund – Investor Class
| Six Months | ||||||||||||||||||||||||
| Ended | ||||||||||||||||||||||||
June 30, 2016(1) | Year Ended December 31, | |||||||||||||||||||||||
| (Unaudited) | 2015 | 2014 | 2013(1) | 2012 | 2011 | |||||||||||||||||||
| Per Share Data: | ||||||||||||||||||||||||
| Net asset value, | ||||||||||||||||||||||||
| beginning of period | $ | 7.97 | $ | 8.87 | $ | 7.87 | $ | 9.82 | $ | 8.68 | $ | 8.91 | ||||||||||||
| Income from | ||||||||||||||||||||||||
| investment operations: | ||||||||||||||||||||||||
| Net investment income (loss) | 0.05 | (2) | 0.08 | (2) | 0.05 | (2) | 0.00 | (2)(3) | 0.01 | (2) | (0.01 | ) | ||||||||||||
| Net realized and unrealized | ||||||||||||||||||||||||
| gains (losses) on investments | (0.17 | ) | (0.45 | ) | 1.12 | 3.14 | 1.15 | (0.22 | ) | |||||||||||||||
| Total from | ||||||||||||||||||||||||
| investment operations | (0.12 | ) | (0.37 | ) | 1.17 | 3.14 | 1.16 | (0.23 | ) | |||||||||||||||
| Less distributions: | ||||||||||||||||||||||||
| Distributions from | ||||||||||||||||||||||||
| net investment income | — | (0.07 | ) | (0.07 | ) | — | (0.02 | ) | — | |||||||||||||||
| Distributions from | ||||||||||||||||||||||||
| net realized gains | — | (0.46 | ) | (0.10 | ) | (5.09 | ) | — | — | |||||||||||||||
| Total distributions | — | (0.53 | ) | (0.17 | ) | (5.09 | ) | (0.02 | ) | — | ||||||||||||||
| Net asset value, end of period | $ | 7.85 | $ | 7.97 | $ | 8.87 | $ | 7.87 | $ | 9.82 | $ | 8.68 | ||||||||||||
| Total return | (1.51 | )%(4) | (4.18 | )% | 14.89 | % | 32.34 | % | 13.32 | % | (2.58 | )% | ||||||||||||
| Supplemental data and ratios: | ||||||||||||||||||||||||
| Net assets, | ||||||||||||||||||||||||
| end of period (millions) | $ | 0.6 | $ | 0.6 | $ | 1.2 | $ | 0.2 | $ | 0.4 | $ | 0.2 | ||||||||||||
| Ratio of expenses | ||||||||||||||||||||||||
| to average net assets | 1.00 | %(5) | 1.00 | % | 1.00 | % | 1.00 | % | 1.00 | % | 1.00 | % | ||||||||||||
| Ratio of expenses | ||||||||||||||||||||||||
| to average net assets | ||||||||||||||||||||||||
| (before waivers) | 1.40 | %(5) | 1.36 | % | 1.42 | % | 1.49 | % | 1.59 | % | 1.60 | % | ||||||||||||
| Ratio of net | ||||||||||||||||||||||||
| investment income (loss) | ||||||||||||||||||||||||
| to average net assets | 1.34 | %(5) | 0.93 | % | 0.83 | % | 0.03 | % | 0.12 | % | (0.13 | )% | ||||||||||||
| Ratio of net | ||||||||||||||||||||||||
| investment income (loss) | ||||||||||||||||||||||||
| to average net assets | ||||||||||||||||||||||||
| (before waivers) | 0.94 | %(5) | 0.57 | % | 0.41 | % | (0.46 | )% | (0.47 | )% | (0.73 | )% | ||||||||||||
Portfolio turnover rate(6) | 46.2 | %(4) | 86.5 | % | 88.2 | % | 127.7 | % | 39.2 | % | 38.2 | % | ||||||||||||
| (1) | Effective December 23, 2013, Baird Kailash Group, LLC became the Fund’s subadviser. The Fund changed its subadviser to L2 Asset Management, LLC as of April 30, 2016. |
| (2) | Calculated using average shares outstanding during the period. |
| (3) | Amount is less than $0.005. |
| (4) | Not annualized. |
| (5) | Annualized. |
| (6) | Portfolio turnover is calculated on the basis of the Fund as a whole without distinguishing between the classes of shares issued. The Baird LargeCap Fund’s portfolio turnover rate in 2013 was higher than previous years primarily due to the implementation of a new investment strategy for the Fund by Baird Kailash Group, LLC, the Fund’s previous subadviser. |
The accompanying notes are an integral part of these financial statements.
Page 53
Financial Highlights
Baird MidCap Fund – Institutional Class
| Six Months | ||||||||||||||||||||||||
| Ended | ||||||||||||||||||||||||
| June 30, 2016 | Year Ended December 31, | |||||||||||||||||||||||
| (Unaudited) | 2015 | 2014 | 2013 | 2012 | 2011 | |||||||||||||||||||
| Per Share Data: | ||||||||||||||||||||||||
| Net asset value, | ||||||||||||||||||||||||
| beginning of period | $ | 14.99 | $ | 15.57 | $ | 15.00 | $ | 11.52 | $ | 9.98 | $ | 10.04 | ||||||||||||
| Income from | ||||||||||||||||||||||||
| investment operations: | ||||||||||||||||||||||||
| Net investment income (loss) | (0.01 | )(1) | (0.03 | )(1) | (0.03 | )(1) | (0.01 | ) | 0.07 | (1) | (0.01 | )(1) | ||||||||||||
| Net realized and unrealized | ||||||||||||||||||||||||
| gains (losses) on investments | 0.40 | (0.53 | ) | 0.76 | 3.80 | 1.57 | 0.54 | |||||||||||||||||
| Total from | ||||||||||||||||||||||||
| investment operations | 0.39 | (0.56 | ) | 0.73 | 3.79 | 1.64 | 0.53 | |||||||||||||||||
| Less distributions: | ||||||||||||||||||||||||
| Distributions from | ||||||||||||||||||||||||
| net investment income | — | — | — | — | (0.04 | ) | — | |||||||||||||||||
| Distributions from | ||||||||||||||||||||||||
| net realized gains | — | (0.02 | ) | (0.16 | ) | (0.31 | ) | (0.06 | ) | (0.59 | ) | |||||||||||||
| Total distributions | — | (0.02 | ) | (0.16 | ) | (0.31 | ) | (0.10 | ) | (0.59 | ) | |||||||||||||
Net asset value, end of period | $ | 15.38 | $ | 14.99 | $ | 15.57 | $ | 15.00 | $ | 11.52 | $ | 9.98 | ||||||||||||
| Total return | 2.60 | %(2) | (3.59 | )% | 4.85 | % | 32.90 | % | 16.49 | % | 5.19 | % | ||||||||||||
| Supplemental data and ratios: | ||||||||||||||||||||||||
| Net assets, | ||||||||||||||||||||||||
| end of period (millions) | $ | 1,174.1 | $ | 1,035.0 | $ | 910.9 | $ | 286.1 | $ | 137.2 | $ | 40.9 | ||||||||||||
| Ratio of expenses | ||||||||||||||||||||||||
| to average net assets | 0.83 | %(3) | 0.80 | % | 0.85 | % | 0.85 | % | 0.85 | % | 0.85 | % | ||||||||||||
| Ratio of expenses | ||||||||||||||||||||||||
| to average net assets | ||||||||||||||||||||||||
| (before waivers) | 0.83 | %(3) | 0.80 | % | 0.87 | % | 0.87 | % | 0.97 | % | 1.21 | % | ||||||||||||
| Ratio of net | ||||||||||||||||||||||||
| investment income (loss) | ||||||||||||||||||||||||
| to average net assets | (0.12 | )%(3) | (0.18 | )% | (0.17 | )% | (0.04 | )% | 0.65 | % | (0.10 | )% | ||||||||||||
| Ratio of net | ||||||||||||||||||||||||
| investment income (loss) | ||||||||||||||||||||||||
| to average net assets | ||||||||||||||||||||||||
| (before waivers) | (0.12 | )%(3) | (0.18 | )% | (0.19 | )% | (0.06 | )% | 0.53 | % | (0.46 | )% | ||||||||||||
Portfolio turnover rate(4) | 29.4 | %(2) | 52.8 | % | 37.3 | % | 36.3 | % | 29.5 | % | 44.8 | % | ||||||||||||
| (1) | Calculated using average shares outstanding during the period. |
| (2) | Not annualized. |
| (3) | Annualized. |
| (4) | Portfolio turnover is calculated on the basis of the Fund as a whole without distinguishing between the classes of shares issued. |
The accompanying notes are an integral part of these financial statements.
Page 54
Financial Highlights
Baird MidCap Fund – Investor Class
| Six Months | ||||||||||||||||||||||||
| Ended | ||||||||||||||||||||||||
| June 30, 2016 | Year Ended December 31, | |||||||||||||||||||||||
| (Unaudited) | 2015 | 2014 | 2013 | 2012 | 2011 | |||||||||||||||||||
| Per Share Data: | ||||||||||||||||||||||||
| Net asset value, | ||||||||||||||||||||||||
| beginning of period | $ | 14.36 | $ | 14.96 | $ | 14.45 | $ | 11.13 | $ | 9.66 | $ | 9.76 | ||||||||||||
| Income from | ||||||||||||||||||||||||
| investment operations: | ||||||||||||||||||||||||
| Net investment income (loss) | (0.03 | )(1) | (0.06 | )(1) | (0.06 | )(1) | (0.03 | ) | 0.04 | (1) | (0.03 | )(1) | ||||||||||||
| Net realized and unrealized | ||||||||||||||||||||||||
| gains (losses) on investments | 0.39 | (0.52 | ) | 0.73 | 3.66 | 1.52 | 0.52 | |||||||||||||||||
| Total from | ||||||||||||||||||||||||
| investment operations | 0.36 | (0.58 | ) | 0.67 | 3.63 | 1.56 | 0.49 | |||||||||||||||||
| Less distributions: | ||||||||||||||||||||||||
| Distributions from | ||||||||||||||||||||||||
| net investment income | — | — | — | — | (0.03 | ) | — | |||||||||||||||||
| Distributions from | ||||||||||||||||||||||||
| net realized gains | — | (0.02 | ) | (0.16 | ) | (0.31 | ) | (0.06 | ) | (0.59 | ) | |||||||||||||
| Total distributions | — | (0.02 | ) | (0.16 | ) | (0.31 | ) | (0.09 | ) | (0.59 | ) | |||||||||||||
| Net asset value, end of period | $ | 14.72 | $ | 14.36 | $ | 14.96 | $ | 14.45 | $ | 11.13 | $ | 9.66 | ||||||||||||
| Total return | 2.44 | %(2) | (3.80 | )% | 4.62 | % | 32.62 | % | 16.16 | % | 4.93 | % | ||||||||||||
| Supplemental data and ratios: | ||||||||||||||||||||||||
| Net assets, | ||||||||||||||||||||||||
| end of period (millions) | $ | 139.0 | $ | 184.1 | $ | 205.4 | $ | 143.1 | $ | 84.1 | $ | 2.6 | ||||||||||||
| Ratio of expenses | ||||||||||||||||||||||||
| to average net assets | 1.08 | %(3) | 1.05 | % | 1.10 | % | 1.10 | % | 1.10 | % | 1.10 | % | ||||||||||||
| Ratio of expenses | ||||||||||||||||||||||||
| to average net assets | ||||||||||||||||||||||||
| (before waivers) | 1.08 | %(3) | 1.05 | % | 1.12 | % | 1.12 | % | 1.22 | % | 1.46 | % | ||||||||||||
| Ratio of net | ||||||||||||||||||||||||
| investment income (loss) | ||||||||||||||||||||||||
| to average net assets | (0.37 | )%(3) | (0.43 | )% | (0.42 | )% | (0.29 | )% | 0.40 | % | (0.35 | )% | ||||||||||||
| Ratio of net | ||||||||||||||||||||||||
| investment income (loss) | ||||||||||||||||||||||||
| to average net assets | ||||||||||||||||||||||||
| (before waivers) | (0.37 | )%(3) | (0.43 | )% | (0.44 | )% | (0.31 | )% | 0.28 | % | (0.71 | )% | ||||||||||||
Portfolio turnover rate(4) | 29.4 | %(2) | 52.8 | % | 37.3 | % | 36.3 | % | 29.5 | % | 44.8 | % | ||||||||||||
| (1) | Calculated using average shares outstanding during the period. |
| (2) | Not annualized. |
| (3) | Annualized. |
| (4) | Portfolio turnover is calculated on the basis of the Fund as a whole without distinguishing between the classes of shares issued. |
The accompanying notes are an integral part of these financial statements.
Page 55
Financial Highlights
Baird Small/Mid Cap Value Fund – Institutional Class
| Six Months | ||||||||
| Ended | November 30, 2015^ | |||||||
| June 30, 2016 | through | |||||||
| (Unaudited) | December 31, 2015 | |||||||
| Per Share Data: | ||||||||
| Net asset value, beginning of period | $ | 9.52 | $ | 10.00 | ||||
| Income from investment operations: | ||||||||
| Net investment income | 0.08 | (1) | 0.02 | (1) | ||||
| Net realized and unrealized gains (losses) on investments | 0.31 | (0.49 | ) | |||||
| Total from investment operations | 0.39 | (0.47 | ) | |||||
| Less distributions: | ||||||||
| Distributions from net investment income | — | (0.01 | ) | |||||
| Total distributions | — | (0.01 | ) | |||||
| Net asset value, end of period | $ | 9.91 | $ | 9.52 | ||||
| Total return | 4.10 | %(2) | (4.66 | )%(2) | ||||
| Supplemental data and ratios: | ||||||||
| Net assets, end of period (millions) | $ | 8.7 | $ | 4.7 | ||||
| Ratio of expenses to average net assets | 0.95 | %(3) | 0.95 | %(3) | ||||
| Ratio of expenses to average net assets (before waivers) | 3.21 | %(3) | 6.88 | %(3) | ||||
| Ratio of net investment income to average net assets | 1.58 | %(3) | 1.96 | %(3) | ||||
| Ratio of net investment loss to average net assets (before waivers) | (0.68 | )%(3) | (3.97 | )%(3) | ||||
Portfolio turnover rate(4) | 21.4 | %(2) | 14.7 | %(2) | ||||
| ^ | Inception was the close of business on November 30, 2015. |
| (1) | Calculated using average shares outstanding during the period. |
| (2) | Not annualized. |
| (3) | Annualized. |
| (4) | Portfolio turnover is calculated on the basis of the Fund as a whole without distinguishing between the classes of shares issued. |
The accompanying notes are an integral part of these financial statements.
Page 56
Financial Highlights
Baird Small/Mid Cap Value Fund – Investor Class
| Six Months | ||||||||
| Ended | November 30, 2015^ | |||||||
| June 30, 2016 | through | |||||||
| (Unaudited) | December 31, 2015 | |||||||
| Per Share Data: | ||||||||
| Net asset value, beginning of period | $ | 9.52 | $ | 10.00 | ||||
| Income from investment operations: | ||||||||
| Net investment income | 0.07 | (1) | 0.01 | (1) | ||||
| Net realized and unrealized gains (losses) on investments | 0.31 | (0.48 | ) | |||||
| Total from investment operations | 0.38 | (0.47 | ) | |||||
| Less distributions: | ||||||||
| Distributions from net investment income | — | (0.01 | ) | |||||
| Total distributions | — | (0.01 | ) | |||||
| Net asset value, end of period | $ | 9.90 | $ | 9.52 | ||||
| Total return | 3.99 | %(2) | (4.67 | )%(2) | ||||
| Supplemental data and ratios: | ||||||||
| Net assets, end of period (thousands) | $ | 28.2 | $ | 19.0 | ||||
| Ratio of expenses to average net assets | 1.20 | %(3) | 1.20 | %(3) | ||||
| Ratio of expenses to average net assets (before waivers) | 3.46 | %(3) | 7.13 | %(3) | ||||
| Ratio of net investment income to average net assets | 1.33 | %(3) | 1.71 | %(3) | ||||
| Ratio of net investment loss to average net assets (before waivers) | (0.93 | )%(3) | (4.22 | )%(3) | ||||
Portfolio turnover rate(4) | 21.4 | %(2) | 14.7 | %(2) | ||||
| ^ | Inception was the close of business on November 30, 2015. |
| (1) | Calculated using average shares outstanding during the period. |
| (2) | Not annualized. |
| (3) | Annualized. |
| (4) | Portfolio turnover is calculated on the basis of the Fund as a whole without distinguishing between the classes of shares issued. |
The accompanying notes are an integral part of these financial statements.
Page 57
Financial Highlights
Baird SmallCap Value Fund – Institutional Class
| Six Months | April 30, 2012^ | |||||||||||||||||||
| Ended | through | |||||||||||||||||||
| June 30, 2016 | Year Ended December 31, | December 31, | ||||||||||||||||||
| (Unaudited) | 2015 | 2014 | 2013 | 2012 | ||||||||||||||||
| Per Share Data: | ||||||||||||||||||||
| Net asset value, beginning of period | $ | 13.03 | $ | 13.82 | $ | 14.01 | $ | 10.20 | $ | 10.00 | ||||||||||
| Income from investment operations: | ||||||||||||||||||||
Net investment income(1) | 0.12 | 0.11 | 0.05 | 0.07 | 0.15 | |||||||||||||||
| Net realized and unrealized | ||||||||||||||||||||
| gains (losses) on investments | 0.67 | (0.82 | ) | 0.01 | 3.99 | 0.20 | ||||||||||||||
| Total from investment operations | 0.79 | (0.71 | ) | 0.06 | 4.06 | 0.35 | ||||||||||||||
| Less distributions: | ||||||||||||||||||||
| Distributions from | ||||||||||||||||||||
| net investment income | — | (0.08 | ) | (0.05 | ) | (0.05 | ) | (0.12 | ) | |||||||||||
| Distributions from net realized gains | — | — | (0.20 | ) | (0.20 | ) | (0.03 | ) | ||||||||||||
| Total distributions | — | (0.08 | ) | (0.25 | ) | (0.25 | ) | (0.15 | ) | |||||||||||
| Net asset value, end of period | $ | 13.82 | $ | 13.03 | $ | 13.82 | $ | 14.01 | $ | 10.20 | ||||||||||
| Total return | 6.06 | %(2) | (5.11 | )% | 0.42 | % | 39.85 | % | 3.52 | %(2) | ||||||||||
| Supplemental data and ratios: | ||||||||||||||||||||
| Net assets, end of period (millions) | $ | 25.2 | $ | 23.1 | $ | 23.5 | $ | 19.0 | $ | 8.1 | ||||||||||
| Ratio of expenses to average net assets | 1.00 | %(3) | 1.00 | % | 1.00 | % | 1.00 | % | 1.00 | %(3) | ||||||||||
| Ratio of expenses to average | ||||||||||||||||||||
| net assets (before waivers) | 1.50 | %(3) | 1.51 | % | 1.55 | % | 2.02 | % | 3.06 | %(3) | ||||||||||
| Ratio of net investment income | ||||||||||||||||||||
| to average net assets | 1.81 | %(3) | 0.79 | % | 0.36 | % | 0.71 | % | 2.32 | %(3) | ||||||||||
| Ratio of net investment income (loss) | ||||||||||||||||||||
| to average net assets (before waivers) | 1.31 | %(3) | 0.28 | % | (0.19 | )% | (0.31 | )% | 0.26 | %(3) | ||||||||||
Portfolio turnover rate(4) | 26.6 | %(2) | 42.1 | % | 41.9 | % | 36.9 | % | 24.6 | %(2) | ||||||||||
| ^ | Inception was the close of business on April 30, 2012. |
| (1) | Calculated using average shares outstanding during the period. |
| (2) | Not annualized. |
| (3) | Annualized. |
| (4) | Portfolio turnover is calculated on the basis of the Fund as a whole without distinguishing between the classes of shares issued. |
The accompanying notes are an integral part of these financial statements.
Page 58
Financial Highlights
Baird SmallCap Value Fund – Investor Class
| Six Months | April 30, 2012^ | |||||||||||||||||||
| Ended | through | |||||||||||||||||||
| June 30, 2016 | Year Ended December 31, | December 31, | ||||||||||||||||||
| (Unaudited) | 2015 | 2014 | 2013 | 2012 | ||||||||||||||||
| Per Share Data: | ||||||||||||||||||||
| Net asset value, beginning of period | $ | 12.99 | $ | 13.78 | $ | 13.98 | $ | 10.19 | $ | 10.00 | ||||||||||
| Income from investment operations: | ||||||||||||||||||||
Net investment income(1) | 0.10 | 0.07 | 0.02 | 0.04 | 0.14 | |||||||||||||||
| Net realized and unrealized | ||||||||||||||||||||
| gains (losses) on investments | 0.67 | (0.81 | ) | 0.00 | (2) | 3.99 | 0.19 | |||||||||||||
| Total from investment operations | 0.77 | (0.74 | ) | 0.02 | 4.03 | 0.33 | ||||||||||||||
| Less distributions: | ||||||||||||||||||||
| Distributions from | ||||||||||||||||||||
| net investment income | — | (0.05 | ) | (0.02 | ) | (0.04 | ) | (0.11 | ) | |||||||||||
| Distributions from net realized gains | — | — | (0.20 | ) | (0.20 | ) | (0.03 | ) | ||||||||||||
| Total distributions | — | (0.05 | ) | (0.22 | ) | (0.24 | ) | (0.14 | ) | |||||||||||
| Net asset value, end of period | $ | 13.76 | $ | 12.99 | $ | 13.78 | $ | 13.98 | $ | 10.19 | ||||||||||
| Total return | 5.93 | %(3) | (5.37 | )% | 0.13 | % | 39.58 | % | 3.32 | %(3) | ||||||||||
| Supplemental data and ratios: | ||||||||||||||||||||
| Net assets, end of period (millions) | $ | 2.2 | $ | 2.0 | $ | 2.1 | $ | 1.1 | $ | 0.2 | ||||||||||
| Ratio of expenses to average net assets | 1.25 | %(4) | 1.25 | % | 1.25 | % | 1.25 | % | 1.25 | %(4) | ||||||||||
| Ratio of expenses to average | ||||||||||||||||||||
| net assets (before waivers) | 1.75 | %(4) | 1.76 | % | 1.80 | % | 2.27 | % | 3.31 | %(4) | ||||||||||
| Ratio of net investment income | ||||||||||||||||||||
| to average net assets | 1.56 | %(4) | 0.54 | % | 0.11 | % | 0.46 | % | 2.07 | %(4) | ||||||||||
| Ratio of net investment income (loss) | ||||||||||||||||||||
| to average net assets (before waivers) | 1.06 | %(4) | 0.03 | % | (0.44 | )% | (0.56 | )% | 0.01 | %(4) | ||||||||||
Portfolio turnover rate(5) | 26.6 | %(3) | 42.1 | % | 41.9 | % | 36.9 | % | 24.6 | %(3) | ||||||||||
| ^ | Inception was the close of business on April 30, 2012. |
| (1) | Calculated using average shares outstanding during the period. |
| (2) | Amount is less than $0.005. |
| (3) | Not annualized. |
| (4) | Annualized. |
| (5) | Portfolio turnover is calculated on the basis of the Fund as a whole without distinguishing between the classes of shares issued. |
The accompanying notes are an integral part of these financial statements.
Page 59
Financial Highlights
Chautauqua International Growth Fund – Institutional Class
| April 15, 2016^ | ||||
| through | ||||
| June 30, 2016 | ||||
| (Unaudited) | ||||
| Per Share Data: | ||||
| Net asset value, beginning of period | $ | 10.00 | ||
| Income from investment operations: | ||||
| Net investment income | 0.03 | (1) | ||
| Net realized and unrealized loss on investments | ||||
| and foreign currency translations | (0.17 | )(2) | ||
| Total from investment operations | (0.14 | ) | ||
| Less distributions: | ||||
| Distributions from net investment income | — | |||
| Total distributions | — | |||
| Net asset value, end of period | $ | 9.86 | ||
| Total return | (1.60 | )%(3) | ||
| Supplemental data and ratios: | ||||
| Net assets, end of period (millions) | $ | 8.5 | ||
| Ratio of expenses to average net assets | 0.95 | %(4) | ||
| Ratio of expenses to average net assets (before waivers) | 4.80 | %(4) | ||
| Ratio of net investment income to average net assets | 1.66 | %(4) | ||
| Ratio of net investment loss to average net assets (before waivers) | (2.19 | )%(4) | ||
Portfolio turnover rate(5) | 7.0 | %(3) | ||
| ^ | Inception was close of business on April 15, 2016. |
| (1) | Calculated using average shares outstanding during the period. |
| (2) | Due to timing of capital share transactions, the per share amount of net realized and unrealized loss on investments and foreign currency transactions varies from the amounts shown in the statement of operations. |
| (3) | Not annualized. |
| (4) | Annualized. |
| (5) | Portfolio turnover is calculated on the basis of the Fund as a whole without distinguishing between the classes of shares issued. |
The accompanying notes are an integral part of these financial statements.
Page 60
Financial Highlights
Chautauqua International Growth Fund – Investor Class
| April 15, 2016^ | ||||
| through | ||||
| June 30, 2016 | ||||
| (Unaudited) | ||||
| Per Share Data: | ||||
| Net asset value, beginning of period | $ | 10.00 | ||
| Income from investment operations: | ||||
| Net investment income | 0.03 | (1) | ||
| Net realized and unrealized loss on investments | ||||
| and foreign currency translations | (0.18 | )(2) | ||
| Total from investment operations | (0.15 | ) | ||
| Less distributions: | ||||
| Distributions from net investment income | — | |||
| Total distributions | — | |||
| Net asset value, end of period | $ | 9.85 | ||
| Total return | (1.70 | )%(3) | ||
| Supplemental data and ratios: | ||||
| Net assets, end of period (thousands) | $ | 37.6 | ||
| Ratio of expenses to average net assets | 1.20 | %(4) | ||
| Ratio of expenses to average net assets (before waivers) | 5.05 | %(4) | ||
| Ratio of net investment income to average net assets | 1.41 | %(4) | ||
| Ratio of net investment loss to average net assets (before waivers) | (2.44 | )%(4) | ||
Portfolio turnover rate(5) | 7.0 | %(3) | ||
| ^ | Inception was close of business on April 15, 2016. |
| (1) | Calculated using average shares outstanding during the period. |
| (2) | Due to timing of capital share transactions, the per share amount of net realized and unrealized loss on investments and foreign currency transactions varies from the amounts shown in the statement of operations. |
| (3) | Not annualized. |
| (4) | Annualized. |
| (5) | Portfolio turnover is calculated on the basis of the Fund as a whole without distinguishing between the classes of shares issued. |
The accompanying notes are an integral part of these financial statements.
Page 61
Financial Highlights
Chautauqua Global Growth Fund – Institutional Class
| April 15, 2016^ | ||||
| through | ||||
| June 30, 2016 | ||||
| (Unaudited) | ||||
| Per Share Data: | ||||
| Net asset value, beginning of period | $ | 10.00 | ||
| Income from investment operations: | ||||
| Net investment income | 0.02 | (1) | ||
| Net realized and unrealized loss on investments | ||||
| and foreign currency translations | (0.25 | ) | ||
| Total from investment operations | (0.23 | ) | ||
| Less distributions: | ||||
| Distributions from net investment income | — | |||
| Total distributions | — | |||
| Net asset value, end of period | $ | 9.77 | ||
| Total return | (2.30 | )%(2) | ||
| Supplemental data and ratios: | ||||
| Net assets, end of period (millions) | $ | 3.0 | ||
| Ratio of expenses to average net assets | 0.95 | %(3) | ||
| Ratio of expenses to average net assets (before waivers) | 7.99 | %(3) | ||
| Ratio of net investment income to average net assets | 0.78 | %(3) | ||
| Ratio of net investment loss to average net assets (before waivers) | (6.26 | )%(3) | ||
Portfolio turnover rate(4) | 10.2 | %(2) | ||
| ^ | Inception was close of business on April 15, 2016. |
| (1) | Calculated using average shares outstanding during the period. |
| (2) | Not annualized. |
| (3) | Annualized. |
| (4) | Portfolio turnover is calculated on the basis of the Fund as a whole without distinguishing between the classes of shares issued. |
The accompanying notes are an integral part of these financial statements.
Page 62
Financial Highlights
Chautauqua Global Growth Fund – Investor Class
| April 15, 2016^ | ||||
| through | ||||
| June 30, 2016 | ||||
| (Unaudited) | ||||
| Per Share Data: | ||||
| Net asset value, beginning of period | $ | 10.00 | ||
| Income from investment operations: | ||||
| Net investment income | 0.01 | (1) | ||
| Net realized and unrealized loss on investments | ||||
| and foreign currency translations | (0.24 | ) | ||
| Total from investment operations | (0.23 | ) | ||
| Less distributions: | ||||
| Distributions from net investment income | — | |||
| Total distributions | — | |||
| Net asset value, end of period | $ | 9.77 | ||
| Total return | (2.40 | )%(2) | ||
| Supplemental data and ratios: | ||||
| Net assets, end of period (millions) | $ | 0.1 | ||
| Ratio of expenses to average net assets | 1.20 | %(3) | ||
| Ratio of expenses to average net assets (before waivers) | 8.24 | %(3) | ||
| Ratio of net investment income to average net assets | 0.53 | %(3) | ||
| Ratio of net investment loss to average net assets (before waivers) | (6.51 | )%(3) | ||
Portfolio turnover rate(4) | 10.2 | %(2) | ||
| ^ | Inception was close of business on April 15, 2016. |
| (1) | Calculated using average shares outstanding during the period. |
| (2) | Not annualized. |
| (3) | Annualized. |
| (4) | Portfolio turnover is calculated on the basis of the Fund as a whole without distinguishing between the classes of shares issued. |
The accompanying notes are an integral part of these financial statements.
Page 63
Notes to the Financial Statements
June 30, 2016 (Unaudited)
1. Organization
Baird Funds, Inc. (the “Corporation”) was incorporated on June 9, 2000 as a Wisconsin corporation and is registered as an open-end management investment company under the Investment Company Act of 1940, as amended (the “1940 Act”). The accompanying financial statements include the Baird LargeCap Fund, the Baird MidCap Fund, the Baird Small/Mid Cap Value Fund, the Baird SmallCap Value Fund, the Chautauqua International Growth Fund and the Chautauqua Global Growth Fund (each a “Fund” and collectively the “Funds”), six of the fifteen series comprising the Corporation. Pursuant to the 1940 Act, the Funds are “diversified” series of the Corporation. The investment advisor to the Funds is Robert W. Baird & Co. Incorporated (“Baird” or the “Advisor”).
The Baird LargeCap Fund commenced with the sale of both Institutional and Investor Class Shares on September 29, 2000. The Baird MidCap Fund commenced with the sale of both Institutional and Investor Class Shares on December 29, 2000. The Baird Small/Mid Cap Value Fund commenced with the sale of both Institutional and Investor Class Shares on November 30, 2015. The Baird SmallCap Value Fund commenced with the sale of both Institutional and Investor Class Shares to the public on May 1, 2012. The Chautauqua International Growth Fund and the Chautauqua Global Growth Fund commenced with the sale of both Institutional and Investor Class Shares to the public on April 18, 2016. Institutional Class shares are not subject to a distribution and service (12b-1) fee, while Investor Class shares are subject to a distribution and service (12b-1) fee up to 0.25%. See Note 8.
The Baird LargeCap Fund seeks long-term growth of capital through investments in equity securities of large-capitalization companies.
The Baird MidCap Fund seeks long-term growth of capital through investments in equity securities of mid-capitalization companies.
The Baird Small/Mid Cap Value Fund seeks long-term growth of capital through investments in equity securities of small- to mid-capitalization companies.
The Baird SmallCap Value Fund seeks long-term growth of capital through investments in equity securities of small-capitalization companies.
The Chautauqua International Growth Fund seeks to provide long-term capital appreciation through investment in equity securities of both U.S. and non-U.S. companies with medium to large market capitalization.
The Chautauqua Global Growth Fund seeks to provide long-term capital appreciation through investment in equity securities of both U.S. and non-U.S. companies with medium to large market capitalization.
On June 30, 2016, shareholders affiliated with the Advisor held 91% of the Institutional Class shares of the Baird LargeCap Fund, 3% of the Institutional Class shares of the Baird MidCap Fund, 66% of the Institutional Class shares of the Baird Small/Mid Cap Value Fund, 53% of the Institutional Class shares of the Baird SmallCap Value Fund, 28% of the Institutional Class shares of the Chautauqua International Growth Fund and 37% of the Institutional Class shares of the Chautauqua Global Growth Fund. These shareholders included the Advisor’s participant-directed retirement and deferred compensation plans and the Baird Foundation.
| 2. | Significant Accounting Policies |
The following is a summary of significant accounting policies consistently followed by the Funds in the preparation of their financial statements. These policies are in conformity with accounting principles generally accepted in the United States of America.
| a) | Investment Valuation – Section 2(a)(41) of the 1940 Act, together with the rules and interpretations of the SEC, require the Funds, in computing net asset value, to value their portfolio securities using market quotations when they are “readily available.” When market quotations are not readily available (e.g., because there is no regular market quotation for such securities, the market for such security is limited, the validity of quotations is questionable or, for debt securities, the Funds’ independent pricing service, |
Page 64
Notes to the Financial Statements
June 30, 2016 (Unaudited)
| 2. | Significant Accounting Policies (cont.) |
does not provide a price), the Board of Directors of the Corporation must value the securities at “fair value determined in good faith.” The Board has delegated such responsibility to the Advisor pursuant to pricing policies and procedures that the Board has adopted and regularly reviews. In general, the “fair value” of a security means the price that would be received to sell a security in an orderly transaction between market participants at the measurement date. | |
The Funds determine the fair value of their investments and compute their net asset value per share as of the close of regular trading of the New York Stock Exchange (4:00 p.m. EST). | |
Consistent with Section 2(a)(41) of the 1940 Act, the Funds price their securities as follows: common stocks that are listed on a securities exchange (other than NASDAQ) are valued at the last quoted sale price. Securities traded on NASDAQ are valued at the NASDAQ Official Closing Price. Price information on listed stocks is taken from the exchange where the security is primarily traded. Securities that were not traded on the valuation date, as well as stocks that are not listed on an exchange, including NASDAQ, are valued at the average of the current bid and asked price. Debt securities are valued at their evaluated bid prices as provided by an independent pricing service using valuation methods that are designed to represent fair value, such as matrix pricing and other analytical pricing models, market transactions and dealer quotations. Debt securities purchased with maturities of 60 days or less are valued as described above unless an evaluated price is not available, in which case such security is valued at acquisition cost, plus or minus any amortized discount or premium (“amortized cost”), or, if the Advisor does not believe amortized cost is reflective of the value of the security, the security is priced at fair value as described below. Investments in mutual funds are valued at their stated net asset value. Other assets and securities for which market quotations are not readily available are valued at fair value as determined in good faith by the Advisor in accordance with procedures approved by the Corporation’s Board of Directors. In accordance with such procedures, the Advisor may use broker quotes or prices obtained from alternative independent pricing services or, if broker quotes or prices from alternative pricing services are unavailable or deemed to be unreliable, fair value will be determined by a valuation committee of the Advisor. In determining fair value, the valuation committee takes into account all relevant factors and available information. Consequently, the price of the security used by a Fund to calculate its NAV may differ from quoted or published prices for the same security. Fair value pricing involves subjective judgments and there is no single standard for determining a security’s fair value. As a result, different mutual funds could reasonably arrive at a different fair value for the same security. It is possible that the fair value determined for a security is materially different from the value that could be realized upon the sale of that security or from the values that other mutual funds may determine. In addition, given the volatility and periodic illiquidity experienced in recent years, the prices determined for any individual security on any given day may vary significantly from the amount that can be obtained in an actual sale of that security, and the Funds’ NAV may fluctuate significantly from day to day or from period to period. | |
The Chautauqua International Growth and Chautauqua Global Growth Funds have retained an independent fair value pricing service to assist in valuing foreign securities in order to adjust for possible changes in value that may occur between the close of the foreign exchange and the time at which the Fund calculates its NAV. The fair value pricing service uses statistical data based on historical performance of securities and markets, and other data in developing factors used to estimate fair value for that day. | |
| b) | Foreign Securities – For purposes of these financial statements, foreign securities are defined as securities issued by companies that are organized outside the United States. Investing in securities of foreign companies and foreign governments involves special risks and considerations not typically associated with investing in U.S. companies and the U.S. government. These risks include foreign currency fluctuations and adverse political and economic developments. Moreover, securities of many foreign companies and foreign governments and their markets may be less liquid and their prices more volatile than those of securities of comparable U.S. companies and the U.S. government. Occasionally, events |
Page 65
Notes to the Financial Statements
June 30, 2016 (Unaudited)
| 2. | Significant Accounting Policies (cont.) |
that affect these values and exchange rates may occur after the close of the exchange on which such securities are traded. If such events materially affect the value of a Fund’s securities, these securities may be valued at their fair value pursuant to procedures adopted by the Board of Directors. All of the foreign securities owned by the Funds as of June 30, 2016 are traded directly on the New York Stock Exchange or NASDAQ or through an American Depository Receipt (ADR). | |
| c) | Income Tax Status – The Funds intend to continue to qualify as regulated investment companies as provided in subchapter M of the Internal Revenue Code and to distribute substantially all of their taxable income to their shareholders in a manner which results in no tax expense to the Funds. Therefore, no federal income or excise tax provision is recorded. |
There is no tax liability resulting from unrecognized tax benefits relating to uncertain income tax positions taken or expected to be taken on the tax return for the fiscal year ended December 31, 2015, or for any other tax years which are open for exam. As of June 30, 2016, open tax years include the tax years ended December 31, 2012 through 2015. The Funds are not aware of any tax positions for which it is reasonably possible that the total amounts of unrecognized tax benefits will significantly change in the next 12 months. The Funds recognize interest and penalties, if any, related to unrecognized tax benefits as interest expense and other expense, respectively, in the Statement of Operations. During the period, the Funds did not incur any interest or penalties. | |
| d) | Distributions to Shareholders – Dividends from net investment income, if any, are declared and paid annually. Distributions of net realized capital gains, if any, are declared and paid at least annually. The book basis character of distributions may differ from their ultimate characterization for Federal income tax purposes. |
| e) | Allocation of Income and Expenses – Each Fund is charged for those expenses directly attributable to it. Expenses directly attributable to a class of shares, such as Rule 12b-1 distribution fees, are charged to that class of shares. Income, expenses and realized and unrealized gains and losses are allocated to the classes based on their respective net assets. Expenses that are not directly attributable to a Fund are allocated among the Funds in the series in proportion to their assets or are divided equally amongst the Funds. |
| f) | Use of Estimates – The preparation of financial statements in conformity with accounting principles generally accepted in the United States requires management to make estimates and assumptions that affect the reported amounts of assets and liabilities and disclosure of contingent assets and liabilities at the date of the financial statements and the reported amounts of revenues and expenses during the reporting period. Actual results could differ from those estimates. |
| g) | Securities Transactions and Investment Income – Investment and shareholder transactions are recorded on trade date. The Funds determine the gain or loss realized from investment transactions by comparing the original cost of the security lot sold with the net sales proceeds. Dividend income is recognized on the ex-dividend date net of withholding taxes, if any, and interest income is recognized on an accrual basis. |
| h) | Guarantees and Indemnifications – In the normal course of business, the Funds enter into contracts with service providers that contain general indemnification clauses. The Funds’ maximum exposure under these arrangements is unknown and would involve future claims against the Funds that have not yet occurred. Based on experience, the Funds would expect the risk of loss to be remote. |
| i) | Recent Accounting Pronouncement – In May 2015, the Financial Accounting Standards Board (“FASB”) issued Accounting Standards Update (“ASU”) No. 2015-07 “Disclosure for Investments in Certain Entities that Calculate Net Asset Value per Share (or Its Equivalent)”. The amendments in ASU No. 2015-07 remove the requirement to categorize within the fair value hierarchy investments measured using the NAV practical expedient. The ASU also removes certain disclosure requirements for |
Page 66
Notes to the Financial Statements
June 30, 2016 (Unaudited)
| 2. | Significant Accounting Policies (cont.) |
investments that qualify, but do not utilize, the NAV practical expedient. The amendments in the ASU are effective for fiscal years beginning after December 15, 2015, and interim periods within those fiscal years. Management has evaluated this standard and determined it will not affect the Baird Funds. | |
| 3. | Capital Share Transactions |
The following table summarizes the capital share transactions of each Fund for the past two fiscal periods:
Baird LargeCap Fund
| Institutional Class Shares | Investor Class Shares | |||||||||||||||||
| Six Months Ended | Six Months Ended | |||||||||||||||||
| June 30, 2016 | June 30, 2016 | |||||||||||||||||
| Shares | Amount | Shares | Amount | |||||||||||||||
| Shares sold | 387,538 | $ | 2,900,466 | Shares sold | 10,085 | $ | 75,197 | |||||||||||
| Shares redeemed | (414,173 | ) | (3,151,937 | ) | Shares redeemed | (9,705 | ) | (74,566 | ) | |||||||||
| Net decrease | (26,635 | ) | $ | (251,471 | ) | Net increase | 380 | $ | 631 | |||||||||
| Shares Outstanding: | Shares Outstanding: | |||||||||||||||||
| Beginning of period | 4,449,336 | Beginning of period | 75,481 | |||||||||||||||
| End of period | 4,422,701 | End of period | 75,861 | |||||||||||||||
| Institutional Class Shares | Investor Class Shares | |||||||||||||||||
| Year Ended | Year Ended | |||||||||||||||||
| December 31, 2015 | December 31, 2015 | |||||||||||||||||
| Shares | Amount | Shares | Amount | |||||||||||||||
| Shares sold | 741,344 | $ | 6,555,160 | Shares sold | 129,900 | $ | 1,162,264 | |||||||||||
| Shares issued to | Shares issued to | |||||||||||||||||
| shareholders in | shareholders in | |||||||||||||||||
| reinvestment | reinvestment | |||||||||||||||||
| of dividends | 295,843 | 2,387,452 | of dividends | 5,451 | 43,772 | |||||||||||||
| Shares redeemed | (949,026 | ) | (8,371,963 | ) | Shares redeemed | (196,702 | ) | (1,669,029 | ) | |||||||||
| Net increase | 88,161 | $ | 570,649 | Net decrease | (61,351 | ) | $ | (462,993 | ) | |||||||||
| Shares Outstanding: | Shares Outstanding: | |||||||||||||||||
| Beginning of year | 4,361,175 | Beginning of year | 136,832 | |||||||||||||||
| End of year | 4,449,336 | End of year | 75,481 | |||||||||||||||
Page 67
Notes to the Financial Statements
June 30, 2016 (Unaudited)
3. Capital Share Transactions (cont.)
Baird MidCap Fund
| Institutional Class Shares | Investor Class Shares | |||||||||||||||||
| Six Months Ended | Six Months Ended | |||||||||||||||||
| June 30, 2016 | June 30, 2016 | |||||||||||||||||
| Shares | Amount | Shares | Amount | |||||||||||||||
| Shares sold | 19,309,632 | $ | 284,179,371 | Shares sold | 955,558 | $ | 13,432,697 | |||||||||||
| Shares redeemed | (12,003,656 | ) | (174,066,898 | ) | Shares redeemed | (4,329,517 | ) | (59,003,176 | ) | |||||||||
| Net increase | 7,305,976 | $ | 110,112,473 | Net decrease | (3,373,959 | ) | $ | (45,570,479 | ) | |||||||||
| Shares Outstanding: | Shares Outstanding: | |||||||||||||||||
| Beginning of period | 69,041,053 | Beginning of period | 12,817,360 | |||||||||||||||
| End of period | 76,347,029 | End of period | 9,443,401 | |||||||||||||||
| Institutional Class Shares | Investor Class Shares | |||||||||||||||||
| Year Ended | Year Ended | |||||||||||||||||
| December 31, 2015 | December 31, 2015 | |||||||||||||||||
| Shares | Amount | Shares | Amount | |||||||||||||||
| Shares sold | 24,895,673 | $ | 397,319,033 | Shares sold | 3,431,190 | $ | 52,378,261 | |||||||||||
| Shares issued to | Shares issued to | |||||||||||||||||
| shareholders in | shareholders in | |||||||||||||||||
| reinvestment | reinvestment | |||||||||||||||||
| of dividends | 88,675 | 1,340,418 | of dividends | 18,891 | 273,664 | |||||||||||||
| Shares redeemed | (14,443,816 | ) | (227,556,679 | ) | Shares redeemed | (4,362,243 | ) | (66,101,616 | ) | |||||||||
| Net increase | 10,540,532 | $ | 171,102,772 | Net decrease | (912,162 | ) | $ | (13,449,691 | ) | |||||||||
| Shares Outstanding: | Shares Outstanding: | |||||||||||||||||
| Beginning of year | 58,500,521 | Beginning of year | 13,729,522 | |||||||||||||||
| End of year | 69,041,053 | End of year | 12,817,360 | |||||||||||||||
| Baird Small/Mid Cap Value Fund | ||||||||||||||||||
| Institutional Class Shares | Investor Class Shares | |||||||||||||||||
| Six Months Ended | Six Months Ended | |||||||||||||||||
| June 30, 2016 | June 30, 2016 | |||||||||||||||||
| Shares | Amount | Shares | Amount | |||||||||||||||
| Shares sold | 394,145 | $ | 3,750,304 | Shares sold | 845 | $ | 8,000 | |||||||||||
| Shares redeemed | (8,129 | ) | (75,989 | ) | Shares redeemed | — | — | |||||||||||
| Net increase | 386,016 | $ | 3,674,315 | Net increase | 845 | $ | 8,000 | |||||||||||
| Shares Outstanding: | Shares Outstanding: | |||||||||||||||||
| Beginning of period | 495,306 | Beginning of period | 2,003 | |||||||||||||||
| End of period | 881,322 | End of period | 2,848 | |||||||||||||||
Page 68
Notes to the Financial Statements
June 30, 2016 (Unaudited)
3. Capital Share Transactions (cont.)
Baird Small/Mid Cap Value Fund (cont.)
| Institutional Class Shares | Investor Class Shares | |||||||||||||||||
| Period Ended | Period Ended | |||||||||||||||||
| December 31, 2015^ | December 31, 2015^ | |||||||||||||||||
| Shares | Amount | Shares | Amount | |||||||||||||||
| Shares sold | 494,559 | $ | 4,940,000 | Shares sold | 2,000 | $ | 20,000 | |||||||||||
| Shares issued to | Shares issued to | |||||||||||||||||
| shareholders in | shareholders in | |||||||||||||||||
| reinvestment | reinvestment | |||||||||||||||||
| of dividends | 747 | 7,158 | of dividends | 3 | 26 | |||||||||||||
| Net increase | 495,306 | $ | 4,947,158 | Net increase | 2,003 | $ | 20,026 | |||||||||||
| Shares Outstanding: | Shares Outstanding: | |||||||||||||||||
| Beginning of period | — | Beginning of period | — | |||||||||||||||
| End of period | 495,306 | End of period | 2,003 | |||||||||||||||
| ^ Inception was the close of business on November 30, 2015. | ||||||||||||||||||
| Baird SmallCap Value Fund | ||||||||||||||||||
| Institutional Class Shares | Investor Class Shares | |||||||||||||||||
| Six Months Ended | Six Months Ended | |||||||||||||||||
| June 30, 2016 | June 30, 2016 | |||||||||||||||||
| Shares | Amount | Shares | Amount | |||||||||||||||
| Shares sold | 212,977 | $ | 2,697,411 | Shares sold | 11,256 | $ | 148,482 | |||||||||||
| Shares redeemed | (164,008 | ) | (2,078,556 | ) | Shares redeemed | (4,970 | ) | (66,751 | ) | |||||||||
| Net increase | 48,969 | $ | 618,855 | Net increase | 6,286 | $ | 81,731 | |||||||||||
| Shares Outstanding: | Shares Outstanding: | |||||||||||||||||
| Beginning of period | 1,775,679 | Beginning of period | 152,902 | |||||||||||||||
| End of period | 1,824,648 | End of period | 159,188 | |||||||||||||||
| Institutional Class Shares | Investor Class Shares | |||||||||||||||||
| Year Ended | Year Ended | |||||||||||||||||
| December 31, 2015 | December 31, 2015 | |||||||||||||||||
| Shares | Amount | Shares | Amount | |||||||||||||||
| Shares sold | 340,633 | $ | 4,606,208 | Shares sold | 35,000 | $ | 478,350 | |||||||||||
| Shares issued to | Shares issued to | |||||||||||||||||
| shareholders in | shareholders in | |||||||||||||||||
| reinvestment | reinvestment | |||||||||||||||||
| of dividends | 9,857 | 129,529 | of dividends | 277 | 3,633 | |||||||||||||
| Shares redeemed | (272,018 | ) | (3,706,223 | ) | Shares redeemed | (34,792 | ) | (465,113 | ) | |||||||||
| Net increase | 78,472 | $ | 1,029,514 | Net increase | 485 | $ | 16,870 | |||||||||||
| Shares Outstanding: | Shares Outstanding: | |||||||||||||||||
| Beginning of year | 1,697,207 | Beginning of year | 152,417 | |||||||||||||||
| End of year | 1,775,679 | End of year | 152,902 | |||||||||||||||
Page 69
Notes to the Financial Statements
June 30, 2016 (Unaudited)
3. Capital Share Transactions (cont.)
Chautauqua International Growth Fund^
| Institutional Class Shares | Investor Class Shares | |||||||||||||||||
| Period Ended | Period Ended | |||||||||||||||||
| June 30, 2016 | June 30, 2016 | |||||||||||||||||
| Shares | Amount | Shares | Amount | |||||||||||||||
| Shares sold | 863,614 | $ | 8,477,455 | Shares sold | 3,824 | $ | 37,354 | |||||||||||
| Shares redeemed | (1,353 | ) | (13,607 | ) | Shares redeemed | — | — | |||||||||||
| Net increase | 862,261 | $ | 8,463,848 | Net increase | 3,824 | $ | 37,354 | |||||||||||
| Shares Outstanding: | Shares Outstanding: | |||||||||||||||||
| Beginning of period | — | Beginning of period | — | |||||||||||||||
| End of period | 862,261 | End of period | 3,824 | |||||||||||||||
| ^ Inception was the close of business on April 15, 2016. | ||||||||||||||||||
| Chautauqua Global Growth Fund^ | ||||||||||||||||||
| Institutional Class Shares | Investor Class Shares | |||||||||||||||||
| Period Ended | Period Ended | |||||||||||||||||
| June 30, 2016 | June 30, 2016 | |||||||||||||||||
| Shares | Amount | Shares | Amount | |||||||||||||||
| Shares sold | 307,617 | $ | 3,040,809 | Shares sold | 13,598 | $ | 134,000 | |||||||||||
| Shares redeemed | (1,384 | ) | (13,690 | ) | Shares redeemed | — | — | |||||||||||
| Net increase | 306,233 | $ | 3,027,119 | Net increase | 13,598 | $ | 134,000 | |||||||||||
| Shares Outstanding: | Shares Outstanding: | |||||||||||||||||
| Beginning of period | — | Beginning of period | — | |||||||||||||||
| End of period | 306,233 | End of period | 13,598 | |||||||||||||||
^ Inception was the close of business on April 15, 2016.
4. Investment Transactions and Income Tax Information
During the six months ended June 30, 2016, purchases and sales of investment securities (excluding short-term investments) were as follows:
| Baird | Baird | Baird | ||||||||||
| LargeCap | MidCap | Small/Mid Cap | ||||||||||
| Fund | Fund | Value Fund | ||||||||||
| Purchases: | $ | 15,818,953 | $ | 396,304,127 | $ | 4,632,295 | ||||||
| Sales: | $ | 17,063,823 | $ | 348,532,102 | $ | 1,178,071 | ||||||
| Baird | Chautauqua | Chautauqua | ||||||||||
| SmallCap | International | Global | ||||||||||
| Value Fund | Growth Fund | Growth Fund | ||||||||||
| Purchases: | $ | 6,520,396 | $ | 7,090,319 | $ | 3,403,507 | ||||||
| Sales: | $ | 6,082,817 | $ | 366,567 | $ | 282,970 | ||||||
The Baird LargeCap Fund, Baird MidCap Fund, Baird Small/Mid Cap Value Fund, and Baird SmallCap Value Fund did not purchase or sell U.S. Government securities during the six months ended June 30, 2016. The Chautauqua International Growth Fund and Chautauqua Global Growth Fund did not purchase or sell U.S. Government securities during the period April 15, 2016 through June 30, 2016.
Page 70
Notes to the Financial Statements
June 30, 2016 (Unaudited)
4. Investment Transactions and Income Tax Information (cont.)
At December 31, 2015, accumulated earnings/losses on a tax basis were as follows:
| Baird | ||||||||||||||||
| Baird | Baird | Small/Mid | Baird | |||||||||||||
| LargeCap | MidCap | Cap | SmallCap | |||||||||||||
| Fund | Fund | Value Fund | Value Fund | |||||||||||||
| Cost of Investments | $ | 35,712,019 | $ | 1,117,935,880 | $ | 4,925,435 | $ | 22,030,410 | ||||||||
| Gross unrealized appreciation | 2,943,658 | 181,880,311 | 29,694 | 4,551,108 | ||||||||||||
| Gross unrealized depreciation | (2,397,998 | ) | (76,205,148 | ) | (224,396 | ) | (1,477,718 | ) | ||||||||
| Net unrealized | ||||||||||||||||
| appreciation (depreciation) | $ | 545,660 | $ | 105,675,163 | $ | (194,702 | ) | $ | 3,073,390 | |||||||
| Undistributed ordinary income | — | — | 289 | 7,487 | ||||||||||||
| Total distributable earnings | $ | — | $ | — | $ | 289 | $ | 7,487 | ||||||||
| Other accumulated losses | (310,635 | ) | (28,213,156 | ) | (39,354 | ) | (753,932 | ) | ||||||||
| Total accumulated earnings (losses) | $ | 235,025 | $ | 77,462,007 | $ | (233,767 | ) | $ | 2,326,945 | |||||||
Undistributed income or net realized gains for financial statement purposes may differ from amounts recognized for federal income tax purposes due to differences in the recognition and characterization of income, expense and capital gain items. The difference between book-basis and tax-basis unrealized appreciation is attributable primarily to the tax deferral of losses on wash sales.
Additionally, U.S. generally accepted accounting principles require that certain components of net assets relating to permanent differences be reclassified between financial and tax reporting. These reclassifications are primarily due to differing treatments for losses deferred due to wash sales, equalization accounting for tax purposes, and non-deductible expenses. These reclassifications have no effect on net assets or net asset value per share.
Under the current tax law, capital losses realized after October 31 may be deferred and treated as occurring on the first day of the following fiscal year. For the year ended December 31, 2015, Baird LargeCap Fund elected to defer capital losses occurring between November 1, 2015 and December 31, 2015 in the amount of $181,372.
To the extent the Funds realize future net capital gains, those gains will be offset by any unused capital loss carryovers. At December 31, 2015, accumulated net realized capital loss carryovers, if any, and the year(s) in which the capital loss carryovers expire were:
| Capital Loss | Year of | |||||
Carryover | Character | Expiration | ||||
| Baird MidCap Fund | $ | 28,213,156 | Short-Term | Indefinitely | ||
| Baird Small/Mid Cap Value Fund | 39,354 | Short-Term | Indefinitely | |||
| Baird SmallCap Value Fund | 528,085 | Short-Term | Indefinitely | |||
| 225,847 | Long-Term | Indefinitely | ||||
During the six months ended June 30, 2016, the Funds did not pay any distributions.
During the year ended December 31, 2015, the Funds paid the following distributions:
Ordinary Income Dividends | Long-Term Capital Gain | ||||||||
| Baird LargeCap Fund | $ | 1,286,082 | $ | 1,145,265 | |||||
| Baird MidCap Fund | 1,763,571 | — | |||||||
| Baird Small/Mid Cap Value Fund | 7,184 | — | |||||||
| Baird SmallCap Value Fund | 156,809 | — | |||||||
Page 71
Notes to the Financial Statements
June 30, 2016 (Unaudited)
4. Investment Transactions and Income Tax Information (cont.)
The Funds designated as long-term capital gain dividend, pursuant to Internal Revenue Code Section 852(b)(3), the amount necessary to reduce the earnings and profits of the Funds related to net capital gain to zero for the tax year ended December 31, 2015. To the extent necessary to fully distribute such capital gains, the Baird LargeCap Fund designated earnings and profits distributed to shareholders on the redemption of shares.
5. Investment Advisory and Other Agreements
The Funds have entered into Investment Advisory Agreements with Baird for the provision of investment advisory services. Pursuant to the Investment Advisory Agreements, the Advisor is entitled to receive a fee, calculated daily and payable monthly, at the annual rate of 0.65% for the Baird LargeCap Fund, 0.75% for the Baird MidCap Fund, 0.80% for the Baird Small/Mid Cap Value Fund, 0.85% for the Baird SmallCap Value Fund, 0.80% for the Chautauqua International Growth Fund and 0.80% for the Chautauqua Global Growth Fund as applied to the respective Fund’s average daily net assets. Certain officers of the Advisor are also officers of the Funds.
Baird has entered into a Sub-Advisory Agreement with L2 Asset Management, LLC (“L2”), pursuant to which L2 acts as subadvisor to the Baird LargeCap Fund (the “Sub-Advisory Agreement”). Baird is responsible for paying L2 a sub-advisory fee equivalent to a percentage of the net advisory fee received by the Advisor from the Fund which is calculated daily at the annual rate of 0.65% of the average daily net assets of the Fund and paid monthly after giving effect for the expense cap/reimbursement agreement between the Advisor and the Company on behalf of the LargeCap Fund.
The percentage of sub-advisory fee is subject to increase based on the assets managed by the Subadvisor on behalf of the Advisor as follows:
| Market Value of | |
% Net Advisory Fee | Assets Managed by L2 |
| 50% | Less than $3 billion |
| 60% | Between $3 billion and $5 billion |
| 70% | Greater than $5 billion |
For the six months ended June 30, 2016 and through April 30, 2017 for the Baird LargeCap Fund, Baird MidCap Fund, Baird Small/Mid Cap Value Fund and Baird SmallCap Value Fund, and through April 30, 2018 for the Chautauqua International Growth Fund and Chautauqua Global Growth Fund, the Advisor has contractually agreed to waive its investment advisory fee and/or reimburse the Funds’ operating expenses (exclusive of brokerage, taxes, and extraordinary expenses) to the extent necessary to ensure that each Fund’s annual operating expenses do not exceed the following percentages of average daily net assets:
Institutional Class Shares | Investor Class Shares | |
| Baird LargeCap Fund | 0.75% | 1.00% |
| Baird MidCap Fund | 0.85% | 1.10% |
| Baird Small/Mid Cap Value Fund | 0.95% | 1.20% |
| Baird SmallCap Value Fund | 1.00% | 1.25% |
| Chautauqua International Growth Fund | 0.95% | 1.20% |
| Chautauqua Global Growth Fund | 0.95% | 1.20% |
To the extent that the Advisor reimburses or absorbs fees and expenses, it may seek payment of such amounts for three years after the year in which expenses were reimbursed or absorbed. A Fund will make no such payment, however, if its total annual operating expenses exceed the expense limits in effect at the time the expenses were reimbursed or at the time these payments are proposed.
Page 72
Notes to the Financial Statements
June 30, 2016 (Unaudited)
5. Investment Advisory and Other Agreements (cont.)
| Six Months | ||||||||||||||||
| Ended | ||||||||||||||||
| June 30, | Fiscal Year Ended December 31, | |||||||||||||||
2016 | 2015 | 2014 | 2013 | |||||||||||||
| Reimbursed/Absorbed Expenses Subject | ||||||||||||||||
| to be Recovered by Advisor Until: | 2019 | 2018 | 2017 | 2016 | ||||||||||||
| Baird LargeCap Fund | $ | 69,216 | $ | 143,538 | $ | 140,955 | $ | 136,768 | ||||||||
| Baird Small/MidCap Value Fund | $ | 66,332 | $ | 23,659 | N/A | N/A | ||||||||||
| Baird SmallCap Value Fund | $ | 61,901 | $ | 131,370 | $ | 131,933 | $ | 133,188 | ||||||||
| Chautauqua International Growth Fund | $ | 36,243 | N/A | N/A | N/A | |||||||||||
| Chautauqua Global Growth Fund | $ | 36,954 | N/A | N/A | N/A | |||||||||||
U.S. Bancorp Fund Services, LLC (“USBFS”) serves as transfer agent, administrator, and accounting services agent for the Funds. U.S. Bank, N.A. (“U.S. Bank”) serves as custodian for the Funds. U.S. Bank may be considered an “affiliated person” of the Funds for purposes of the 1940 Act as a result of U.S. Bank’s fiduciary accounts for which it has investment authority and/or voting authority collectively acquiring 5% or more of the shares of the Baird Aggregate Bond Fund, a separate series of the Company. In such a case, USBFS would be an affiliated person of an affiliated person (or a “second tier” affiliate) of the Funds. Effective March 9, 2016, U.S. Bank was not considered an “affiliated person” of the Funds for purposes of the 1940 Act.
Robert W. Baird & Co. Incorporated (the “Distributor”) is the sole distributor of the Funds pursuant to a distribution agreement.
No commissions were earned by the Distributor for services rendered as a registered broker-dealer in securities transactions for the Baird LargeCap Fund, Baird MidCap Fund, Baird SmallCap Value Fund, Chautauqua International Growth Fund and Chautauqua Global Growth Fund for the six months ended June 30, 2016.
6. Securities Lending
Each Fund may lend up to one-third of its total assets (including such loans) to borrowers under terms of participation in a securities lending program administered by U.S. Bank N.A., the Funds’ custodian and an affiliate of USBFS, the Funds’ transfer agent and administrator. The securities lending agreement requires that loans are collateralized at all times in an amount equal to at least 102% of the market value of any loaned securities at the time of the loan, plus accrued interest.
The Funds receive compensation in the form of fees and earn interest on the cash collateral. The amount of fees depends on a number of factors including the type of security and length of the loan. Each Fund continues to receive interest payments or dividends on the securities loaned during the borrowing period. Each Fund has the right under the terms of the securities lending agreement to recall the securities from the borrower on demand.
As of June 30, 2016, none of the Funds had securities on loan. When a Fund engages in securities lending, loaned securities are collateralized by cash equivalents. The cash collateral is invested by the custodian in accordance with approved investment guidelines. Those guidelines require the cash collateral to be invested in readily marketable, high quality, short-term obligations; however, such investments are subject to risk of payment delays or default on the part of the issuer or counterparty or otherwise may not generate sufficient interest to support the costs associated with securities lending. A Fund could also experience delays in recovering its securities and possible loss of income or value if the borrower fails to return the borrowed securities, although the Funds are indemnified from this risk by contract with the securities lending agent.
The Funds receive cash as collateral in return for securities lent as part of a securities lending program. The collateral is invested in the Mount Vernon Securities Lending Prime Portfolio (a securities lending trust subject to Rule 2a-7 under the 1940 Act).
Page 73
Notes to the Financial Statements
June 30, 2016 (Unaudited)
6. Securities Lending (cont.)
The interest income earned by the Funds, if any, on investments of cash collateral received from borrowers for the securities loaned to them (“securities lending income”) is reflected in the Funds’ statements of operations. The Funds did not participate in the securities lending program during the six months ended June 30, 2016.
7. Line of Credit
The Corporation maintains an uncommitted, senior secured and unsecured line of credit (“LOC”) with U.S. Bank, N.A. (the “Bank”) to provide the Funds a temporary liquidity source to meet unanticipated redemptions. The unsecured line of credit is available to the Funds for any period during which U.S. Bank is an affiliate of the Funds. Under the terms of the LOC, borrowings for each Fund are limited to one-third of the total assets (including the amount borrowed) of the respective Fund, or as otherwise indicated within the Funds’ agreement with the Bank. The Bank charges interest at the Bank’s Prime Rate less 2% (weighted average rate of 1.50% for the first six months of 2016). For the six months ended June 30, 2016, the Funds did not borrow on the LOC.
8. Distribution and Shareholder Service Plan
The Funds have adopted a distribution and shareholder service plan (the “Plan”) pursuant to Rule 12b-1 under the 1940 Act. The Plan allows the Funds to compensate the Distributor for the costs incurred in distributing the Funds’ Investor Class Shares, including amounts paid to brokers or dealers, at an annual rate of 0.25% of the average daily net assets of the Funds’ Investor Class Shares. The Baird LargeCap Fund, Baird MidCap Fund, Baird Small/Mid Cap Value Fund, Baird SmallCap Value Fund, Chautauqua International Growth Fund and Chautauqua Global Growth Fund incurred $724, $184,813, $27, $2,475, $13 and $34, respectively, in fees pursuant to the Plan during the six months ended June 30, 2016.
9. Redemption Fees
A redemption fee of 2.00% will be assessed on Institutional and Investor Class shares of the Chautauqua International Growth Fund and Chautauqua Global Growth Fund if redeemed (including in connection with an exchange) 90 days or less from their date of purchase, determined on a first-in, first-out (“FIFO”) basis. The redemption fee is paid directly to the Funds and is designed to offset brokerage commissions, market impact and other costs associated with fluctuations in Fund asset levels and cash flow caused by short-term shareholder trading. There were no redemption fees charged by the Chautauqua International Growth Fund or Chautauqua Global Growth Fund for the period ended June 30, 2016. The Baird LargeCap Fund, Baird MidCap Fund, Baird Small/ Mid Cap Value Fund and Baird SmallCap Value Fund do not charge redemption fees.
10. Special Meeting of Baird LargeCap Fund Shareholders
A special meeting of the shareholders of the Baird LargeCap Fund (the “LargeCap Fund”), a series of Baird Funds, Inc. (the “Corporation”), was held at the offices of the Corporation at 777 East Wisconsin Avenue, 29th Floor, Milwaukee, Wisconsin 53202 on Friday, April 22, 2016, at 8:00 a.m. (Central Time). The special meeting was held pursuant to notice to all shareholders of record as of the close of business on February 29, 2016. The purpose of the special meeting was to consider the approval of a new subadvisory agreement between the Advisor and L2 Asset Management, LLC, the proposed new subadvisor to the LargeCap Fund. The proposal was more fully described in the LargeCap Fund’s proxy statement dated March 9, 2016 (“Proxy Statement”). At the special meeting, the shareholders of the LargeCap Fund voted unanimously to approve the proposal. A report of the votes cast is set forth below.
| Proposal | For | Against | Abstain |
| To approve a new subadvisory agreement between | |||
| the Advisor and L2 Asset Management, LLC | 4,162,845 | 0 | 0 |
Page 74
Notes to the Financial Statements
June 30, 2016 (Unaudited)
11. Subsequent Event
In preparing these financial statements, the Corporation has evaluated subsequent events after June 30, 2016 through the date the financial statements were issued. There were no subsequent events since June 30, 2016 that would require adjustment to or additional disclosure in these financial statements.
Page 75
Baird Funds, Inc.
Disclosure Regarding the Board of Directors’ Approval of the Subadvisory Agreement for the Baird LargeCap Fund
The Board of Directors (the “Board”) of Baird Funds, Inc. (the “Corporation”), including the directors who are not “interested persons” of the Corporation within the meaning of the Investment Company Act of 1940 (the “Independent Directors”), met on February 23, 2016 to consider the approval of a new subadvisory agreement between Robert W. Baird & Co. Incorporated (“Baird” or the “Advisor”) and L2 Asset Management, LLC (“L2”) with respect to the Baird LargeCap Fund (the “Fund”) (the “Subadvisory Agreement”). The Advisor recommended that L2 replace the Fund’s existing subadvisor, Baird Kailash Group, LLC (“Baird Kailash”). The Board reviewed and discussed various information that had been provided with respect to the Subadvisory Agreement. The Board considered information relevant to its consideration of the Subadvisory Agreement including a copy of the Subadvisory Agreement, information regarding the Advisor’s recommendation of L2 as the subadvisor to the Fund, the fees proposed to be paid by the Advisor to L2, information regarding L2’s investment strategy and financial condition and other information in response to a request for information sent to L2 and the Advisor on behalf of the Board. The Board discussed the Subadvisory Agreement and the response to the Board’s request with representatives of the Advisor and Matthew J. Malgari and Sanjeev Bhojraj, the proposed portfolio managers for the Fund. Mr. Malgari and Dr. Bhojraj also discussed the firm’s investment strategy, personnel, compliance program and operations. The Board also reviewed the proposed fee schedule under the Subadvisory Agreement, noting that the Advisor would pay L2 50% of the net management fee received from the Advisor from the Fund, subject to increase based on the assets managed by L2 on behalf of the Advisor.
The Board, with the assistance of the Corporation’s legal counsel, considered their legal responsibilities and other factors deemed to be relevant, including, but not limited to, the following: (1) the fact that Mr. Malgari will continue to manage the Fund as lead portfolio manager and that Dr. Bhojraj will be added as a co-portfolio manager; (2) the subadvisory fee to be paid to L2 by the Advisor under the Subadvisory Agreement; (3) the fact that the subadvisory services under the Subadvisory Agreement and the existing subadvisory agreement between the Advisor and Baird Kailash are substantially similar; (4) the fact that the replacement of Baird Kailash with L2 is expected to result in organizational and operational efficiencies without any changes to the Fund’s investment objective, strategy, fees or expenses; (5) the fact that Mr. Malgari and Dr. Bhojraj have strong investment experience; and (6) the fact that L2 has sufficient financial resources to conduct investment operations. The Board also considered the Advisor’s responsibilities in overseeing L2 as subadvisor to the Fund and noted that L2 is unaffiliated with the Advisor. The Board also reviewed and analyzed various other factors with respect to the Fund that it determined were relevant, including the factors below, and made the following conclusions. In their deliberations, the Board did not identify any single factor as determinative but considered all factors together.
Nature, Extent and Quality of Services to be Provided by L2
The Board considered L2’s organization, qualification and background, as well as the qualifications of its personnel, and the expertise of L2 and its affiliate, Kailash Capital, LLC (“Kailash Capital”), in developing and implementing investment methodologies to select stocks for the Fund. The Board considered L2’s investment process and analytical/research capabilities. The Board also considered the experience of the investment professionals of L2 who would continue to provide the fundamental analyses and quantitative methodologies behind the investment model employed by the Fund through a licensing agreement with Kailash Capital. The Board noted that Mr. Malgari will continue to serve as the Fund’s lead portfolio manager and that Dr. Bhojraj, the proposed co-manager, had previously provided services to the Fund through the development of Kailash Capital’s methodologies, models and intellectual property. The Board concluded that the nature, extent and quality of the services to be provided by L2 to the Fund were appropriate and that the Fund was likely to benefit from services provided by L2 under the Subadvisory Agreement.
Page 76
Baird Funds, Inc.
Disclosure Regarding the Board of Directors’ Approval of the Subadvisory Agreement for the Baird LargeCap Fund (cont.)
Investment Performance of the Fund and L2
The Board reviewed and considered the performance data for the Fund for the periods ended December 31, 2015. The Board noted that while L2 was proposed to replace Baird Kailash as subadvisor to the Fund, Mr. Malgari would continue to serve as lead portfolio manager using the same quantitative and fundamental investment methodologies and focus on large cap companies. The Board considered the Fund’s performance results for the period during which Mr. Malgari served as portfolio manager, and noted that the Fund outperformed the S&P 500 Index (the “Index”) for the year ended December 31, 2014 and underperformed the Index for the year ended December 31, 2015. After considering Mr. Malgari’s explanation for the Fund’s underperformance for the year ended December 31, 2015, the Board concluded that the Fund and its shareholders were likely to benefit from L2’s management.
Subadvisory Fees
The Board considered the proposed fee payable under the Subadvisory Agreement, noting that the fee would be paid by the Advisor (not the Fund) and therefore would not impact the fees paid by the Fund. The Board also reviewed information regarding L2’s fee schedules for the two private funds managed by L2. The Board determined that the subadvisory fee was appropriate.
Costs of Services to be Provided and Profitability
The Board did not consider the cost of services to be provided by L2 under the Subadvisory Agreement because it did not view this factor as relevant given that the subadvisory fee is paid by the Advisor.
Economies of Scale and Fee Levels Reflecting Those Economies
Because the subadvisory fee is not paid by the Fund, the Board did not consider whether the fees should reflect any potential economies of scale that might be realized as the Fund assets increase.
Benefits to be Derived from the Relationship with the Fund
The Board noted that under the Subadvisory Agreement, L2 is entitled to receive research products and services received from unaffiliated broker dealers who execute portfolio trades for the Fund. The Board noted that L2 uses research from Kailash Capital under a licensing agreement paid for in hard dollars and therefore is unlikely to benefit from third-party research. The Board considered that L2 may benefit from its association with the Fund in terms of name recognition and asset growth in other products managed by L2. The Board also noted that Kailash Capital (an affiliate of L2) receives fees from the Advisor for allowing the Advisor to use Kailash Capital’s investment methodologies, monthly ranking files and other intellectual property in generating research for the Advisor’s institutional equity trading clients. The Board concluded that the other benefits to be realized by L2 from its relationship with the Fund were appropriate.
Based on their evaluation of the above factors, as well as other factors relevant to their consideration of the Subadvisory Agreement, the directors, including all of the Independent Directors, concluded that the approval of the Subadvisory Agreement was in the best interest of the Fund and its shareholders.
Page 77
Baird Funds, Inc.
Disclosure Regarding the Board of Directors’ Approval of the Investment Advisory Agreement for Chautauqua International Growth and Chautauqua Global Growth Funds
The Board of Directors (the “Board”) of Baird Funds, Inc. (the “Corporation”), including the directors who are not “interested persons” of the Corporation within the meaning of the Investment Company Act of 1940 (the “Independent Directors”), met on February 23, 2016 to consider the approval of the investment advisory agreement between Robert W. Baird & Co. Incorporated (the “Advisor”) and the Corporation on behalf of the Chautauqua Global Growth Fund (the “Global Growth Fund”) and the Chautauqua International Growth Fund (the “International Growth Fund” and, together with the Global Growth Fund, the “Funds”), each a new portfolio of the Corporation.
The Board discussed the advisory agreement and various aspects of the response to the Board’s request for information from the Advisor with Brian Beitner, Chief Investment Officer of Chautauqua Capital Management (“CCM”), a division of the Advisor, and the portfolio manager of the Funds. The Board reviewed and discussed the information that had been provided with respect to the investment advisory agreement, including the amendments to the investment advisory agreement, the memorandum provided by legal counsel discussing the Board’s fiduciary obligations and factors the Board should assess in considering the approval of the investment advisory agreement, information in response to the request from the Board from the Advisor, the proposed advisory fee and expense ratios, and other pertinent information. In considering the investment advisory agreement, the Board reviewed and analyzed various factors that it determined were relevant, including the factors below. The Board noted that it had received extensive information about the Funds’ proposed investment strategies, prior performance for the international and global strategies and information about the members of CCM’s investment team at a previous meeting with Mr. Beitner held on November 30, 2015.
Based on their review, the Board concluded that it was in the best interests of the Funds to approve the investment advisory agreement. In deciding to approve the investment advisory agreement for the Funds, the Board did not identify any single factor as determinative but considered all factors together.
Nature, Extent and Quality of Services to be Provided to the Funds
The Board analyzed the nature, extent and quality of the services to be provided by the Advisor to each Fund. The Board discussed the experience and resources of the Advisor, as well as the qualifications of the CCM team. The Board noted that the Funds’ proposed portfolio manager, Mr. Beitner, has extensive experience in international investing and a long career in the financial services industry. The Board further noted that the Advisor, in its capacity as a registered broker-dealer, was proposed to serve as distributor and principal underwriter of shares of the Funds and would assist in marketing the Funds. The Board also considered other services the Advisor would provide the Funds, such as providing compliance support and overseeing the Funds’ other service providers. The Board concluded that the nature, extent and quality of the services to be provided by the Advisor to the Funds were appropriate and that each Fund was likely to benefit from services provided under the investment advisory agreement.
Investment Performance
Because the Funds had not yet commenced operations, the Board did not consider any performance information with respect to the Funds. The Board reviewed the composite performance for the international growth equity and global growth equity strategies for the periods ended December 31, 2015 and concluded that the CCM team appeared to have an effective investment process for each strategy. The Board concluded that although past performance is not a guarantee of future results, each Fund and its shareholders were likely to benefit from the Advisor’s management.
Page 78
Baird Funds, Inc.
Disclosure Regarding the Board of Directors’ Approval of the Investment Advisory Agreement for Chautauqua International Growth and Chautauqua Global Growth Funds (cont.)
Expense Information
The Board examined the proposed fee and expense information for each Fund, including a comparison of such information to other mutual funds in the respective Morningstar category. The Board considered that the Advisor has agreed to a contractual expense limitation for each Fund through at least April 30, 2018. The Board noted that the Global Growth Fund’s proposed advisory fee was slightly below the Morningstar category average and median and the Fund’s total expense ratio for the Institutional Class and Investor Class was below the category median and average, taking into effect the expense cap agreement. With respect to the International Growth Fund, the Fund’s proposed advisory fee was the same or slightly above the Morningstar category average and median and the Fund’s total expense ratio for the Institutional Class and Investor Class was below the category median and average, taking into effect the expense cap agreement.
The Board also reviewed and considered the advisory fees charged to CCM’s other investment advisory clients in similar strategies as well as private limited partnerships managed by CCM and found that the proposed advisory fee was 20 basis points (or 0.20%) less than what CCM charges on the first $50 million for both separately managed accounts and private limited partnerships. The Board also considered the subadvisory fees received by CCM with respect to two registered investment company portfolios, but did not deem them to be relevant due to the differences in services provided. The Board recognized the extent of the significant additional services to be provided to the Funds that the Advisor does not provide to separate account, private limited partnership and subadvisory clients, such as certain administrative services, oversight of the Funds’ other service providers, director support, risk management, regulatory compliance, valuation and various other services.
Costs of Services Provided and Profitability
The Board reviewed updated information about the financial condition of the Advisor. As part of its review at the August 27, 2015 meeting, the Board had reviewed the Advisor’s annual report and determined that the financial condition was sound. The Board did not consider any specific information regarding the costs of services to be provided or the profits the Advisor might realize because the Funds had not yet commenced operations.
In light of all of the information that it received and considered, the Board concluded that the proposed advisory fee and total expense ratio of the Funds were reasonable.
Economies of Scale and Fee Levels Reflecting Those Economies
Because the Funds had not yet commenced operations, the Board did not consider whether any alternative fee structures, such as breakpoint fees, would be appropriate to reflect any economies of scale that may result from increases in the Funds’ assets.
Benefits to be Derived from the Relationship with the Funds
The Board considered other potential benefits to the Advisor from serving as advisor to the Funds (in addition to the advisory fee). The Board noted that the Advisor may derive ancillary benefits from its association with the Funds in the form of research products and services received from unaffiliated broker-dealers who execute portfolio trades for the Funds. The Board noted that the “Baird” name may be more broadly disseminated given the national nature of the mutual fund business, which could result in growth in the Advisor’s asset management business. The Board concluded that other benefits that may be realized by the Advisor from its relationship with the Funds were appropriate.
Based on their evaluation of the above factors, as well as other factors relevant to their consideration of the investment advisory agreement, the directors, including all of the Independent Directors, concluded that the approval of the investment advisory agreement was in the best interest of each Fund.
Page 79
Additional Information
Proxy Voting
A description of the policies and procedures that the Funds use to determine how to vote proxies relating to portfolio securities is available without charge, upon request, by calling toll free, 1-866-44BAIRD, or by accessing the Funds’ website at www.bairdfunds.com; and by accessing the SEC’s website at www.sec.gov.
Each Fund’s proxy voting record for the most recent 12-month period ended June 30 is available without charge, upon request, by calling toll free, 1-866-44BAIRD, or by accessing the Funds’ website at www.bairdfunds.com; and by accessing the SEC’s website at www.sec.gov.
Portfolio Holdings Disclosure
The Funds file a complete schedule of portfolio holdings with the SEC for the first and third quarters of each fiscal year on Form N-Q. The Funds’ Forms N-Q are available on the SEC’s website at www.sec.gov and may be reviewed and copied at the SEC’s Public Reference Room in Washington, D.C. Information on the operation of the Public Reference Room may be obtained by calling 1-800-732-0330. The Funds’ Forms N-Q may also be obtained by calling toll-free 1-866-44BAIRD.
Page 80
(This Page Intentionally Left Blank.)
Baird Funds, Inc.
c/o U.S. Bancorp Fund Services, LLC
P.O. Box 701
Milwaukee, WI 53201-0701
1-866-44BAIRD
Board of Directors
G. Frederick Kasten, Jr. (Chairman)
John W. Feldt
Cory L. Nettles
Marlyn J. Spear
Frederick P. Stratton, Jr.
Investment Advisor and Distributor
Robert W. Baird & Co. Incorporated
777 East Wisconsin Avenue
Milwaukee, WI 53202
Administrator and Transfer Agent
U.S. Bancorp Fund Services, LLC
P.O. Box 701
615 East Michigan Street
Milwaukee, WI 53202
Custodian
U.S. Bank, N.A.
1555 N. RiverCenter Drive, Suite 302
Milwaukee, WI 53212
Legal Counsel
Godfrey & Kahn, S.C.
780 North Water Street
Milwaukee, WI 53202
Independent Registered Public
Accounting Firm
Grant Thornton LLP
Grant Thornton Tower
171 N. Clark Street, Suite 200
Chicago, IL 60601
Item 2. Code of Ethics.
Not applicable – only required for annual reports on Form N-CSR.
Item 3. Audit Committee Financial Expert.
Not applicable – only required for annual reports on Form N-CSR.
Item 4. Principal Accountant Fees and Services.
Not applicable – only required for annual reports on Form N-CSR.
Item 5. Audit Committee of Listed Registrants.
Not applicable because the Registrant is not a “listed issuer” within the meaning of Rule 10A-3 under the Securities Exchange Act of 1934.
Item 6. Schedule of Investments.
| (a) | The complete Schedules of Investments in securities of unaffiliated issuers as of the close of the reporting period for the Baird LargeCap Fund, Baird MidCap Fund, Baird Small/Mid Cap Value Fund, Baird SmallCap Value Fund, Chautauqua International Growth Fund and Chautauqua Global Growth Fund are included as part of the report to shareholders filed under Item 1. The Summary Schedules of Investments in securities of unaffiliated issuers as of the close of the reporting period for the Baird Ultra Short Bond Fund, Baird Short-Term Bond Fund, Baird Intermediate Bond Fund, Baird Aggregate Bond Fund, Baird Core Plus Bond, Baird Short-Term Municipal Bond Fund, Baird Quality Intermediate Municipal Bond Fund and Baird Core Intermediate Municipal Bond Fund are included as part of the report to shareholders filed under Item 1. The complete Schedule of Investments in securities of unaffiliated issuers as of the close of the reporting period for Baird Ultra Short Bond Fund, Baird Short-Term Bond Fund, Baird Intermediate Bond Fund, Baird Aggregate Bond Fund, Baird Core Plus Bond, Baird Short-Term Municipal Bond Fund, Baird Quality Intermediate Municipal Bond Fund and Baird Core Intermediate Municipal Bond Fund are listed below. |
| Baird Ultra Short Bond Fund | ||||||||||||
| Schedule of Investments | ||||||||||||
| June 30, 2016 (Unaudited) | ||||||||||||
| Principal | % of | |||||||||||
| Amount | Value | Net Assets | ||||||||||
| LONG-TERM INVESTMENTS | ||||||||||||
| U.S. Treasury Securities | ||||||||||||
| U.S. Treasury Bonds, | ||||||||||||
| 0.625%, 05/31/2017 | $ | 11,000,000 | $ | 11,009,878 | ||||||||
| 2.375%, 07/31/2017 | 34,200,000 | 34,875,997 | ||||||||||
| 45,885,875 | 20.1 | % | ||||||||||
| Corporate Bonds | ||||||||||||
| Finance | ||||||||||||
| ABN AMRO Bank NV: | ||||||||||||
| 1.434%, 10/28/2016 (Acquired 01/03/2014 through 10/03/2014, Cost $325,204) * f ∞ | 325,000 | 325,577 | ||||||||||
| 4.250%, 02/02/2017 (Acquired 11/16/2015, Cost $251,891) * f | 248,000 | 252,298 | ||||||||||
| Aetna, Inc., | ||||||||||||
| 1.307%, 12/08/2017 ∞ | 2,000,000 | 2,002,910 | ||||||||||
| American Express Bank FSB, | ||||||||||||
| 6.000%, 09/13/2017 | 2,000,000 | 2,107,006 | ||||||||||
| American International Group, Inc., | ||||||||||||
| 5.600%, 10/18/2016 | 1,500,000 | 1,518,540 | ||||||||||
| Australia and New Zealand Banking Group Ltd., | ||||||||||||
| 1.073%, 01/16/2018 (Acquired 01/12/2015, Cost $1,000,000) * f ∞ | 1,000,000 | 998,643 | ||||||||||
| Banco Santander-Chile, | ||||||||||||
| 1.529%, 04/11/2017 (Acquired 04/08/2014, Cost $200,000) * f ∞ | 200,000 | 199,750 | ||||||||||
| Bank of America NA, | ||||||||||||
| 5.300%, 03/15/2017 | 2,000,000 | 2,053,934 | ||||||||||
| Bank of Montreal, | ||||||||||||
| 1.229%, 04/09/2018 f ∞ | 1,095,000 | 1,097,047 | ||||||||||
| Barclays Bank PLC, | ||||||||||||
| Class 1, 5.000%, 09/22/2016 f | 1,200,000 | 1,210,170 | ||||||||||
| BB&T Corp., | ||||||||||||
| 1.297%, 02/01/2019 ∞ | 880,000 | 882,057 | ||||||||||
| BNP Paribas SA, | ||||||||||||
| 1.092%, 05/07/2017 f ∞ | 1,000,000 | 999,969 | ||||||||||
| BOKF NA, | ||||||||||||
| 1.316%, 05/15/2017 ∞ | 250,000 | 249,474 | ||||||||||
| BPCE, | ||||||||||||
| 1.480%, 02/10/2017 f ∞ | 500,000 | 501,723 | ||||||||||
| Caisse Centrale Desjardins: | ||||||||||||
| 1.006%, 09/12/2017 (Acquired 05/26/2016, Cost $99,645) * f ∞ | 100,000 | 99,632 | ||||||||||
| 1.303%, 01/29/2018 (Acquired 01/26/2015, Cost $1,000,000) * f ∞ | 1,000,000 | 997,325 | ||||||||||
| Capital One Financial Corp.: | ||||||||||||
| 3.150%, 07/15/2016 | 1,015,000 | 1,015,578 | ||||||||||
| 6.150%, 09/01/2016 | 150,000 | 151,167 | ||||||||||
| Capital One NA, | ||||||||||||
| 1.313%, 02/05/2018 ∞ | 500,000 | 499,608 | ||||||||||
| Citigroup, Inc., | ||||||||||||
| 1.198%, 03/10/2017 ∞ | 1,500,000 | 1,500,910 | ||||||||||
| Comerica Bank, | ||||||||||||
| 5.750%, 11/21/2016 | 1,500,000 | 1,524,114 | ||||||||||
| Credit Agricole SA: | ||||||||||||
| 1.481%, 10/03/2016 (Acquired 01/03/2014, Cost $250,053) * f ∞ | 250,000 | 250,349 | �� | |||||||||
| 1.628%, 06/10/2020 (Acquired 06/03/2015, Cost $1,000,000) * f ∞ | 1,000,000 | 996,292 | ||||||||||
| Credit Suisse: | ||||||||||||
| 1.155%, 05/26/2017 f ∞ | 500,000 | 499,697 | ||||||||||
| 1.314%, 04/27/2018 f ∞ | 1,000,000 | 999,205 | ||||||||||
| Deutsche Bank AG: | ||||||||||||
| 1.237%, 02/13/2017 f ∞ | 850,000 | 849,133 | ||||||||||
| 1.307%, 02/13/2018 f ∞ | 1,000,000 | 993,409 | ||||||||||
| Fifth Third Bancorp, | ||||||||||||
| 1.067%, 12/20/2016 ∞ | 1,000,000 | 999,407 | ||||||||||
| HSBC USA, Inc.: | ||||||||||||
| 1.402%, 08/07/2018 ∞ | 1,000,000 | 994,742 | ||||||||||
| 1.237%, 11/13/2019 ∞ | 250,000 | 246,890 | ||||||||||
| ING Bank NV, | ||||||||||||
| 1.777%, 03/22/2019 (Acquired 05/26/2016, Cost $805,914) * f ∞ | 800,000 | 805,180 | ||||||||||
| J.P. Morgan Chase & Co.: | ||||||||||||
| Class 1, 1.264%, 01/28/2019 ∞ | 250,000 | 249,571 | ||||||||||
| 1.593%, 01/23/2020 ∞ | 1,000,000 | 1,002,491 | ||||||||||
| JPMorgan Chase & Co., | ||||||||||||
| 2.000%, 08/15/2017 | 1,000,000 | 1,009,317 | ||||||||||
| Kookmin Bank, | ||||||||||||
| 1.509%, 01/27/2017 (Acquired 01/21/2014, Cost $250,000) * f ∞ | 250,000 | 250,077 | ||||||||||
| Liberty Mutual Group, Inc., | ||||||||||||
| 6.700%, 08/15/2016 (Acquired 02/02/2016, Cost $2,013,141) * | 2,000,000 | 2,012,450 | ||||||||||
| Lloyds Bank PLC, | ||||||||||||
| 1.176%, 05/14/2018 f ∞ | 1,500,000 | 1,489,560 | ||||||||||
| Macquarie Bank Ltd., | ||||||||||||
| 1.430%, 03/24/2017 (Acquired 03/18/2014 through 09/17/2015, Cost $1,201,235) * f ∞ | 1,200,000 | 1,198,801 | ||||||||||
| Mizuho Bank Ltd.: | ||||||||||||
| 1.063%, 04/16/2017 (Acquired 04/09/2014, Cost $200,000) * f ∞ | 200,000 | 199,960 | ||||||||||
| 1.090%, 09/25/2017 (Acquired 09/18/2014 through 01/14/2015, Cost $799,360) * f ∞ | 800,000 | 796,702 | ||||||||||
| 1.280%, 03/26/2018 (Acquired 03/19/2015 through 03/14/2016, Cost $1,343,182) * f ∞ | 1,350,000 | 1,346,961 | ||||||||||
| 1.824%, 10/20/2018 (Acquired 10/13/2015, Cost $500,000) * f ∞ | 500,000 | 503,242 | ||||||||||
| Morgan Stanley: | ||||||||||||
| 1.371%, 01/05/2018 ∞ | 500,000 | 500,369 | ||||||||||
| 1.488%, 01/24/2019 ∞ | 250,000 | 249,587 | ||||||||||
| 1.774%, 01/27/2020 ∞ | 500,000 | 501,930 | ||||||||||
| Nomura Holdings, Inc.: | ||||||||||||
| 2.000%, 09/13/2016 f | 700,000 | 701,208 | ||||||||||
| 2.106%, 09/13/2016 f ∞ | 700,000 | 701,570 | ||||||||||
| Principal Life Global Funding II, | ||||||||||||
| 1.125%, 02/24/2017 (Acquired 05/26/2016, Cost $1,001,013) * | 1,000,000 | 1,001,043 | ||||||||||
| Royal Bank of Canada, | ||||||||||||
| 0.890%, 10/13/2017 f ∞ | 1,000,000 | 996,788 | ||||||||||
| Santander Bank NA, | ||||||||||||
| 1.561%, 01/12/2018 ∞ | 1,400,000 | 1,392,287 | ||||||||||
| Societe Generale, | ||||||||||||
| 1.726%, 10/01/2018 f ∞ | 1,500,000 | 1,511,820 | ||||||||||
| Standard Chartered PLC, | ||||||||||||
| 1.273%, 04/17/2018 (Acquired 04/13/2015, Cost $1,200,000) * f ∞ | 1,200,000 | 1,186,248 | ||||||||||
| Sumitomo Mitsui Banking Corp.: | ||||||||||||
| 1.213%, 01/16/2018 f ∞ | 300,000 | 299,360 | ||||||||||
| 1.378%, 07/23/2018 f ∞ | 1,350,000 | 1,347,710 | ||||||||||
| Svenska Handelsbanken AB, | ||||||||||||
| 1.146%, 06/17/2019 f ∞ | 850,000 | 844,277 | ||||||||||
| Synchrony Financial, | ||||||||||||
| 1.867%, 02/03/2020 ∞ | 1,000,000 | 968,719 | ||||||||||
| The Bank of New York Mellon Corp., | ||||||||||||
| 1.197%, 08/01/2018 ∞ | 1,000,000 | 1,003,804 | ||||||||||
| The Bank of Tokyo-Mitsubishi UFJ Ltd., | ||||||||||||
| 1.068%, 03/10/2017 (Acquired 06/01/2016, Cost $500,201) * f ∞ | 500,000 | 500,105 | ||||||||||
| The Bank of Tokyo-Mitsubishi UFJ, Ltd., | ||||||||||||
| 0.971%, 09/08/2017 (Acquired 09/30/2014, Cost $998,890) * f ∞ | 1,000,000 | 996,230 | ||||||||||
| The Goldman Sachs Group, Inc., | ||||||||||||
| 1.726%, 11/15/2018 ∞ | 1,285,000 | 1,288,135 | ||||||||||
| The Huntington National Bank, | ||||||||||||
| 1.300%, 11/20/2016 | 1,160,000 | 1,161,302 | ||||||||||
| The Toronto-Dominion Bank, | ||||||||||||
| 1.193%, 11/05/2019 f ∞ | 1,200,000 | 1,195,064 | ||||||||||
| UBS AG, | ||||||||||||
| 1.340%, 03/26/2018 f ∞ | 1,000,000 | 1,000,859 | ||||||||||
| UBS Group Funding Jersey Ltd., | ||||||||||||
| 2.080%, 09/24/2020 (Acquired 09/21/2015, Cost $500,000) * f ∞ | 500,000 | 500,270 | ||||||||||
| Wells Fargo & Co., | ||||||||||||
| Class N, 1.318%, 01/30/2020 ∞ | 1,000,000 | 993,819 | ||||||||||
| Westpac Banking Corp., | ||||||||||||
| 1.092%, 05/25/2018 f ∞ | 1,500,000 | 1,495,811 | ||||||||||
| 60,219,183 | 26.4 | % | ||||||||||
| Utility | ||||||||||||
| Mississippi Power Co., | ||||||||||||
| 2.350%, 10/15/2016 | 1,000,000 | 1,003,725 | ||||||||||
| Tri-State Pass Through Trust, | ||||||||||||
| 6.040%, 01/31/2018 (Acquired 09/18/2014, Cost $76,474) * | 74,640 | 76,561 | ||||||||||
| W3A Funding Corp., | ||||||||||||
| 8.090%, 01/02/2017 | 30,836 | 30,837 | ||||||||||
| 1,111,123 | 0.5 | % | ||||||||||
| Industrials | ||||||||||||
| Actavis Funding SCS, | ||||||||||||
| 1.911%, 03/12/2020 f ∞ | 1,500,000 | 1,504,579 | ||||||||||
| Alibaba Group Holding Ltd., | ||||||||||||
| 1.194%, 11/28/2017 f ∞ | 500,000 | 496,453 | ||||||||||
| American Honda Finance Corp., | ||||||||||||
| 1.479%, 02/22/2019 ∞ | 200,000 | 202,215 | ||||||||||
| Amgen, Inc., | ||||||||||||
| 1.034%, 05/22/2017 ∞ | 250,000 | 250,045 | ||||||||||
| Anheuser-Busch InBev Finance, Inc., | ||||||||||||
| 1.037%, 02/01/2019 ∞ | 1,165,000 | 1,161,292 | ||||||||||
| AT&T, Inc.: | ||||||||||||
| 1.577%, 11/27/2018 ∞ | 400,000 | 402,058 | ||||||||||
| 1.561%, 06/30/2020 ∞ | 1,000,000 | 996,087 | ||||||||||
| Baxalta, Inc., | ||||||||||||
| 1.427%, 06/22/2018 ∞ | 1,500,000 | 1,484,143 | ||||||||||
| BellSouth LLC, | ||||||||||||
| 4.400%, 04/26/2017 (Acquired 06/15/2016, Cost $1,024,711) * | 1,000,000 | 1,025,000 | ||||||||||
| Boardwalk Pipelines LP, | ||||||||||||
| 5.500%, 02/01/2017 | 1,000,000 | 1,015,158 | ||||||||||
| Boston Scientific Corp., | ||||||||||||
| 5.125%, 01/12/2017 | 1,500,000 | 1,529,298 | ||||||||||
| Bunge Limited Finance Corp., | ||||||||||||
| 3.200%, 06/15/2017 | 2,000,000 | 2,031,082 | ||||||||||
| Bunge NA Finance LP, | ||||||||||||
| 5.900%, 04/01/2017 | 720,000 | 743,095 | ||||||||||
| Chesapeake Energy Corp., | ||||||||||||
| 3.878%, 04/15/2019 ∞ | 250,000 | 188,125 | ||||||||||
| Chevron Phillips Chemical Co. LLC, | ||||||||||||
| 1.387%, 05/01/2020 (Acquired 05/07/2015, Cost $1,500,000) * ∞ | 1,500,000 | 1,453,405 | ||||||||||
| ConAgra Foods, Inc., | ||||||||||||
| 1.005%, 07/21/2016 ∞ | 875,000 | 875,085 | ||||||||||
| Daimler Finance North America LLC: | ||||||||||||
| 0.977%, 08/01/2017 (Acquired 01/13/2015, Cost $498,615) * ∞ | 500,000 | 499,224 | ||||||||||
| 1.347%, 08/03/2017 (Acquired 07/28/2015, Cost $1,050,000) * ∞ | 1,050,000 | 1,050,718 | ||||||||||
| Dollar General Corp., | ||||||||||||
| 4.125%, 07/15/2017 | 1,500,000 | 1,542,226 | ||||||||||
| Enbridge, Inc.: | ||||||||||||
| 1.296%, 10/01/2016 f ∞ | 750,000 | 746,878 | ||||||||||
| 1.136%, 06/02/2017 f ∞ | 450,000 | 442,134 | ||||||||||
| ERAC USA Finance LLC, | ||||||||||||
| 2.750%, 03/15/2017 (Acquired 06/01/2016, Cost $262,620) * | 260,000 | 262,574 | ||||||||||
| Express Scripts Holding Co., | ||||||||||||
| 2.650%, 02/15/2017 | 500,000 | 505,315 | ||||||||||
| Federal Express Corp. 2012 Pass Through Trust, | ||||||||||||
| 2.625%, 01/15/2018 (Acquired 08/19/2015, Cost $238,988) * | 237,140 | 238,752 | ||||||||||
| Ford Motor Credit Co. LLC, | ||||||||||||
| 1.461%, 03/27/2017 | 1,200,000 | 1,202,126 | ||||||||||
| General Motors Financial Co., Inc., | ||||||||||||
| 2.082%, 05/09/2019 ∞ | 2,000,000 | 2,004,964 | ||||||||||
| Glencore Funding LLC, | ||||||||||||
| 1.693%, 04/16/2018 (Acquired 04/08/2015, Cost $1,000,000) * ∞ | 1,000,000 | 960,000 | ||||||||||
| Hanson Ltd., | ||||||||||||
| 6.125%, 08/15/2016 f | 800,000 | 801,000 | ||||||||||
| Hewlett Packard Enterprise Co., | ||||||||||||
| 2.561%, 10/05/2018 (Acquired 09/30/2015, Cost $1,000,000) * ∞ | 1,000,000 | 1,013,784 | ||||||||||
| Hewlett-Packard Co., | ||||||||||||
| 1.570%, 01/14/2019 ∞ | 737,000 | 729,736 | ||||||||||
| Hyundai Capital Services, Inc.: | ||||||||||||
| 4.375%, 07/27/2016 (Acquired 05/28/2015 through 07/28/2015, Cost $1,403,059) * f | 1,400,000 | 1,402,507 | ||||||||||
| 1.447%, 03/18/2017 (Acquired 01/13/2015 through 04/04/2016, Cost $450,243) * f ∞ | 450,000 | 449,798 | ||||||||||
| Johnson Controls, Inc., | ||||||||||||
| 2.600%, 12/01/2016 | 1,250,000 | 1,257,970 | ||||||||||
| Kinder Morgan Energy Partners LP, | ||||||||||||
| 6.000%, 02/01/2017 | 1,500,000 | 1,534,855 | ||||||||||
| Kraft Heinz Foods Co., | ||||||||||||
| 1.600%, 06/30/2017 (Acquired 05/26/2016, Cost $726,061) * | 724,000 | 726,433 | ||||||||||
| Lafarge SA, | ||||||||||||
| 6.500%, 07/15/2016 f | 1,100,000 | 1,101,347 | ||||||||||
| Medtronic, Inc., | ||||||||||||
| 1.453%, 03/15/2020 ∞ | 750,000 | 756,926 | ||||||||||
| Mondelez International, Inc., | ||||||||||||
| 1.157%, 02/01/2019 ∞ | 500,000 | 499,192 | ||||||||||
| Mylan, Inc., | ||||||||||||
| 1.350%, 11/29/2016 | 1,722,000 | 1,720,099 | ||||||||||
| Pentair Finance SA, | ||||||||||||
| 1.875%, 09/15/2017 f | 2,000,000 | 1,996,366 | ||||||||||
| Perrigo Co. PLC, | ||||||||||||
| 1.300%, 11/08/2016 f | 1,200,000 | 1,198,736 | ||||||||||
| Qualcomm, Inc., | ||||||||||||
| 1.186%, 05/20/2020 ∞ | 1,500,000 | 1,462,590 | ||||||||||
| Telefonica Emisiones SAU, | ||||||||||||
| 1.292%, 06/23/2017 f ∞ | 1,000,000 | 998,698 | ||||||||||
| The Kroger Co., | ||||||||||||
| 1.163%, 10/17/2016 ∞ | 2,110,000 | 2,111,471 | ||||||||||
| Thermo Fisher Scientific, Inc., | ||||||||||||
| 1.300%, 02/01/2017 | 2,000,000 | 2,001,488 | ||||||||||
| Total Capital International, | ||||||||||||
| 0.997%, 06/19/2019 f ∞ | 250,000 | 244,180 | ||||||||||
| Toyota Motor Credit Corp., | ||||||||||||
| Class 2547, 0.951%, 01/12/2018 ∞ | 900,000 | 899,338 | ||||||||||
| TransCanada PipeLines Ltd., | ||||||||||||
| 1.421%, 01/12/2018 f ∞ | 1,000,000 | 995,769 | ||||||||||
| Verizon Communications, Inc., | ||||||||||||
| 2.406%, 09/14/2018 ∞ | 1,563,000 | 1,601,997 | ||||||||||
| Viacom, Inc., | ||||||||||||
| 2.500%, 12/15/2016 | 800,000 | 803,466 | ||||||||||
| Vodafone Group PLC, | ||||||||||||
| 5.625%, 02/27/2017 f | 1,000,000 | 1,028,030 | ||||||||||
| Volkswagen Group of America Finance LLC: | ||||||||||||
| 1.024%, 05/23/2017 (Acquired 05/15/2014, Cost $250,000) * ∞ | 250,000 | 248,736 | ||||||||||
| 1.076%, 11/20/2017 (Acquired 11/12/2014, Cost $500,000) * ∞ | 500,000 | 494,839 | ||||||||||
| Wm Wrigley Jr Co., | ||||||||||||
| 1.400%, 10/21/2016 (Acquired 02/01/2016, Cost $1,200,358) * | 1,200,000 | 1,201,824 | ||||||||||
| Xerox Corp., | ||||||||||||
| 6.750%, 02/01/2017 | 1,600,000 | 1,642,938 | ||||||||||
| 55,736,144 | 24.4 | % | ||||||||||
| Total Corporate Bonds | 117,066,450 | 51.3 | % | |||||||||
| Other Government Related Securities | ||||||||||||
| CNPC General Capital Ltd., | ||||||||||||
| 1.526%, 05/14/2017 (Acquired 05/07/2014, Cost $250,000) * f ∞ | 250,000 | 249,958 | ||||||||||
| Electricite de France SA, | ||||||||||||
| 1.094%, 01/20/2017 (Acquired 01/13/2014, Cost $250,000) * f ∞ | 250,000 | 250,168 | ||||||||||
| Export-Import Bank of Korea, | ||||||||||||
| 1.380%, 01/14/2017 f ∞ | 250,000 | 250,345 | ||||||||||
| Petrobras Global Finance BV, | ||||||||||||
| 3.016%, 03/17/2017 f ∞ | 250,000 | 250,123 | ||||||||||
| The Korea Development Bank, | ||||||||||||
| 4.000%, 09/09/2016 f | 600,000 | 603,437 | ||||||||||
| 1,604,031 | 0.7 | % | ||||||||||
| Taxable Municipal Bonds | ||||||||||||
| City of Erie PA, | ||||||||||||
| 6.700%, 11/15/2016 | 630,000 | 643,658 | ||||||||||
| City of Los Angeles Department of Airports, | ||||||||||||
| 5.175%, 05/15/2017 | 65,000 | 66,173 | ||||||||||
| Cook County School District No. 144 Prairie Hills, | ||||||||||||
| 1.500%, 12/01/2016 | 250,000 | 250,862 | ||||||||||
| Madison County Community Unit School District No. 12 Madison, | ||||||||||||
| 1.950%, 01/01/2017 | 200,000 | 200,476 | ||||||||||
| Ohio Air Quality Development Authority, | ||||||||||||
| 2.250%, 08/01/2029 ∞ | 590,000 | 590,561 | ||||||||||
| 1,751,730 | 0.8 | % | ||||||||||
| Residential Mortgage-Backed Securities | ||||||||||||
| U.S. Government Agency Issues | ||||||||||||
| Federal Gold Loan Mortgage Corp. (FGLMC), | ||||||||||||
| 5.000%, 12/01/2017 | 46,116 | 47,303 | ||||||||||
| Federal National Mortgage Association (FNMA): | ||||||||||||
| 5.000%, 10/01/2017 | 40,532 | 41,592 | ||||||||||
| 5.000%, 11/01/2017 | 34,033 | 34,936 | ||||||||||
| 5.500%, 11/01/2017 | 72,210 | 73,867 | ||||||||||
| 5.000%, 12/01/2017 | 31,232 | 32,062 | ||||||||||
| 5.000%, 12/01/2019 | 441,303 | 456,173 | ||||||||||
| 4.500%, 04/01/2020 | 844,251 | 867,413 | ||||||||||
| 5.000%, 04/01/2020 | 852,881 | 882,884 | ||||||||||
| 2,436,230 | 1.1 | % | ||||||||||
| Non-U.S. Government Agency Issues | ||||||||||||
| Banc of America Alternative Loan Trust, | ||||||||||||
| Series 2004-1, Class 5A2, 5.500%, 02/25/2019 | 30,829 | 31,264 | ||||||||||
| MASTR Alternative Loan Trust, | ||||||||||||
| Series 2004-13, Class 8A1, 5.500%, 01/25/2025 | 83,081 | 82,694 | ||||||||||
| 113,958 | 0.0 | % | ||||||||||
| Asset Backed Securities | ||||||||||||
| Aames Mortgage Investment Trust, | ||||||||||||
| Series 2006-1, Class A3, 0.773%, 04/25/2036 ∞ | 613,730 | 598,530 | ||||||||||
| Accredited Mortgage Loan Trust: | ||||||||||||
| Series 2005-4, Class A2D, 0.773%, 12/25/2035 ∞ | 747,871 | 718,841 | ||||||||||
| Series 2006-2, Class A3, 0.603%, 09/25/2036 ∞ | 633,287 | 628,740 | ||||||||||
| ACE Securities Corp. Home Equity Loan Trust: | ||||||||||||
| Series 2006-HE1, Class A1B1, 0.643%, 02/25/2036 ∞ | 408,797 | 403,510 | ||||||||||
| Series 2006-HE1, Class A1A, 0.653%, 02/25/2036 ∞ | 181,061 | 179,857 | ||||||||||
| Ally Auto Receivables Trust, | ||||||||||||
| Series 2014-2, Class A3, 1.250%, 04/15/2019 | 2,420,942 | 2,426,201 | ||||||||||
| California Republic Auto Receivables Trust, | ||||||||||||
| Series 2014-3, Class A3, 1.090%, 11/15/2018 | 947,223 | 947,374 | ||||||||||
| Capital Auto Receivables Asset Trust: | ||||||||||||
| Series 2014-3, Class A2, 1.180%, 12/20/2017 | 730,957 | 731,196 | ||||||||||
| Series 2015-3, Class A1A, 1.390%, 02/20/2018 | 750,000 | 750,747 | ||||||||||
| Series 2014-1, Class A3, 1.320%, 06/20/2018 | 750,228 | 750,605 | ||||||||||
| Capital One Multi-Asset Execution Trust, | ||||||||||||
| Series 2014-A2, Class A2, 1.260%, 01/15/2020 | 2,000,000 | 2,006,355 | ||||||||||
| Carrington Mortgage Loan Trust, | ||||||||||||
| Series 2006-NC2, Class A2, 0.543%, 06/25/2036 ∞ | 162,331 | 161,974 | ||||||||||
| Chase Issuance Trust, | ||||||||||||
| Series 2014-A1, Class A1, 1.150%, 01/15/2019 | 1,960,000 | 1,963,925 | ||||||||||
| Citibank Credit Card Issuance Trust: | ||||||||||||
| Series 2014-A2, Class A2, 1.020%, 02/22/2019 | 835,000 | 835,870 | ||||||||||
| Series 2014-A4, Class A4, 1.230%, 04/24/2019 | 2,000,000 | 2,005,877 | ||||||||||
| Series 2008-A2, Class A2, 1.601%, 01/23/2020 ∞ | 1,000,000 | 1,013,785 | ||||||||||
| Conseco Financial Corp., | ||||||||||||
| Series 1998-4, Class A6, 6.530%, 04/01/2030 ∞ | 604,120 | 641,870 | ||||||||||
| Dell Equipment Finance Trust, | ||||||||||||
| Series 2015-1, Class A2, 1.010%, 07/24/2017 (Acquired 04/15/2015 through 05/11/2016, Cost $1,304,948) * | 1,305,044 | 1,304,570 | ||||||||||
| First Franklin Mortgage Loan Trust, | ||||||||||||
| Series 2004-FF7, Class A1, 1.093%, 09/25/2034 ∞ | 31,018 | 31,004 | ||||||||||
| First National Master Note Trust, | ||||||||||||
| Series 2013-2, Class A, 0.972%, 10/15/2019 ∞ | 1,500,000 | 1,500,227 | ||||||||||
| Ford Credit Auto Lease Trust, | ||||||||||||
| Series 2014-B, Class A4, 1.100%, 11/15/2017 | 1,205,000 | 1,204,956 | ||||||||||
| Ford Credit Auto Owner Trust, | ||||||||||||
| Series 2015-B, Class A2A, 0.720%, 03/15/2018 | 497,256 | 497,142 | ||||||||||
| GM Financial Automobile Leasing Trust: | ||||||||||||
| Series 2014-1A, Class A3, 1.010%, 05/22/2017 (Acquired 12/23/2015, Cost $179,612) * | 179,711 | 179,706 | ||||||||||
| Series 2014-2A, Class A3, 1.220%, 01/22/2018 (Acquired 04/05/2016, Cost $788,056) * | 787,871 | 788,640 | ||||||||||
| Golden Credit Card Trust, | ||||||||||||
| Series 2013-2A, Class A, 0.872%, 09/15/2018 (Acquired 03/29/2016, Cost $2,000,000) * f ∞ | 2,000,000 | 2,000,193 | ||||||||||
| GSAMP Trust, | ||||||||||||
| Series 2006-HE1, Class A2C, 0.663%, 01/25/2036 ∞ | 92,645 | 92,232 | ||||||||||
| Harley-Davidson Motorcycle Trust, | ||||||||||||
| Series 2014-1, Class A3, 1.100%, 09/15/2019 | 1,430,152 | 1,430,750 | ||||||||||
| Honda Auto Receivables Owner Trust: | ||||||||||||
| Series 2016-1, Class A2, 1.010%, 06/18/2018 | 2,000,000 | 2,001,288 | ||||||||||
| Series 2013-3, Class A4, 1.130%, 09/16/2019 | 2,503,000 | 2,504,603 | ||||||||||
| HSI Asset Securitization Corp. Trust, | ||||||||||||
| Series 2007-WF1, Class 2A3, 0.623%, 05/25/2037 ∞ | 444,724 | 425,823 | ||||||||||
| Hyundai Auto Lease Securitization Trust, | ||||||||||||
| Series 2014-A, Class A3, 0.750%, 04/17/2017 (Acquired 02/18/2016, Cost $119,156) * | 119,198 | 119,184 | ||||||||||
| J.P. Morgan Mortgage Acquisition Trust: | ||||||||||||
| Series 2006-NC1, Class A4, 0.623%, 04/25/2036 ∞ | 810,206 | 797,038 | ||||||||||
| Series 2007-CH3, Class A3, 0.603%, 03/25/2037 ∞ | 717,423 | 712,193 | ||||||||||
| Series 2007-CH5, Class A3, 0.563%, 05/25/2037 ∞ | 297,961 | 295,784 | ||||||||||
| JP Morgan Mortgage Acquisition Trust, | ||||||||||||
| Series 2007-CH4, Class A3, 0.563%, 02/25/2032 ∞ | 68,667 | 68,413 | ||||||||||
| Leaf Receivables Funding 10 LLC, | ||||||||||||
| Series 2015-1, Class A3, 1.490%, 03/15/2018 (Acquired 04/23/2015, Cost $749,862) * | 750,000 | 750,158 | ||||||||||
| Long Beach Mortgage Loan Trust: | ||||||||||||
| Series 2005-WL2, Class M1, 1.158%, 08/25/2035 ∞ | 992,224 | 984,542 | ||||||||||
| Series 2006-WL2, Class 2A3, 0.653%, 01/25/2036 ∞ | 28,925 | 27,944 | ||||||||||
| Master Credit Card Trust II, | ||||||||||||
| Series 2016-1A, Class A, 1.198%, 09/23/2019 (Acquired 04/11/2016, Cost $1,050,000) * f ∞ | 1,050,000 | 1,050,192 | ||||||||||
| MASTR Asset Backed Securities Trust, | ||||||||||||
| Series 2006-AB1, Class A2, 0.683%, 02/25/2036 ∞ | 656,219 | 651,911 | ||||||||||
| Merrill Lynch Mortgage Investors Trust, | ||||||||||||
| Series 2006-FF1, Class A1, 0.538%, 08/25/2036 ∞ | 1,028,185 | 1,025,068 | ||||||||||
| Morgan Stanley, | ||||||||||||
| Series 2006-HE3, Class A2C, 0.613%, 04/25/2036 ∞ | 245,861 | 241,976 | ||||||||||
| Nationstar Home Equity Loan Trust, | ||||||||||||
| Series 2007-C, Class 2AV2, 0.583%, 06/25/2037 ∞ | 28,624 | 28,085 | ||||||||||
| Nissan Auto Receivables Owner Trust, | ||||||||||||
| Series 2013-A, Class A4, 0.750%, 07/15/2019 | 358,310 | 358,086 | ||||||||||
| OneMain Financial Issuance Trust, | ||||||||||||
| Series 2014-2A, Class A, 2.470%, 09/18/2024 (Acquired 02/05/2016, Cost $697,813) * | 700,000 | 701,520 | ||||||||||
| Park Place Securities, Inc. Asset-Backed Pass-Through Certificates, | ||||||||||||
| Series 2005-WCW1, Class M1, 0.903%, 09/25/2035 ∞ | 631,617 | 626,854 | ||||||||||
| RAMP Series Trust, | ||||||||||||
| Series 2003-RS7, Class AI6, 5.340%, 08/25/2033 ∞ | 33,508 | 33,587 | ||||||||||
| RASC Series Trust: | ||||||||||||
| Series 2003-KS2, Class AI6, 3.990%, 04/25/2033 ∞ | 26,745 | 26,715 | ||||||||||
| Series 2006-EMX2, Class A2, 0.653%, 02/25/2036 ∞ | 343,919 | 342,252 | ||||||||||
| Series 2006-KS1, Class A4, 0.753%, 02/25/2036 ∞ | 253,636 | 250,598 | ||||||||||
| Saxon Asset Securities Trust, | ||||||||||||
| Series 2006-1, Class A2C, 0.773%, 03/25/2036 ∞ | 968,945 | 951,269 | ||||||||||
| Soundview Home Loan Trust: | ||||||||||||
| Series 2005-OPT4, Class 2A3, 0.713%, 12/25/2035 ∞ | 633,961 | 624,360 | ||||||||||
| Series 2006-WF2, Class A2C, 0.593%, 12/25/2036 ∞ | 1,027,563 | 1,022,824 | ||||||||||
| Specialty Underwriting & Residential Finance Trust, | ||||||||||||
| Series 2006-BC1, Class A2C, 0.653%, 12/25/2036 ∞ | 313,471 | 313,095 | ||||||||||
| Springleaf Funding Trust, | ||||||||||||
| Series 2014-AA, Class A, 2.410%, 12/15/2022 (Acquired 05/13/2015 through 07/28/2015, Cost $862,285) * | 859,736 | 860,254 | ||||||||||
| Synchrony Credit Card Master Note Trust, | ||||||||||||
| Series 2012-3, Class A, 0.892%, 03/15/2020 ∞ | 1,025,000 | 1,025,369 | ||||||||||
| TCF Auto Receivables Owner Trust, | ||||||||||||
| Series 2015-1A, Class A2, 1.020%, 08/15/2018 (Acquired 06/03/2015 through 02/29/2016, Cost $800,776) * | 802,113 | 801,563 | ||||||||||
| Toyota Auto Receivables Owner Trust, | ||||||||||||
| Series 2016-B, Class A2A, 1.020%, 10/15/2018 | 2,000,000 | 2,002,803 | ||||||||||
| 47,420,028 | 20.8 | % | ||||||||||
| Commercial Mortgage Backed Securities | ||||||||||||
| U.S. Government Agency Issues | ||||||||||||
| Fannie Mae REMIC Trust, | ||||||||||||
| Series 2015-M1, Class ASQ2, 1.626%, 02/25/2018 | 1,625,921 | 1,639,001 | ||||||||||
| FHLMC Multifamily Structured Pass Through Certificates: | ||||||||||||
| Series K502, Class A2, 1.426%, 08/25/2017 | 1,061,252 | 1,064,595 | ||||||||||
| Series K701, Class A2, 3.882%, 11/25/2017 ∞ | 2,045,000 | 2,107,450 | ||||||||||
| 4,811,046 | 2.1 | % | ||||||||||
| Total Long-Term Investments (Cost $221,222,588) | 221,089,348 | 96.9 | % | |||||||||
| SHORT-TERM INVESTMENTS | ||||||||||||
| CERTIFICATE OF DEPOSIT | ||||||||||||
| ACTS Retirement-Life Communities, Inc. | ||||||||||||
| 1.354%, 11/16/2016 | 1,030,000 | 1,030,000 | ||||||||||
| Total Certificate of Deposit (Cost $1,030,000) | 1,030,000 | 0.4 | % | |||||||||
| Money Market Mutual Fund | Shares | |||||||||||
| Dreyfus Institutional Cash Advantage Fund, Institutional Class, 0.39% « | 5,907,556 | 5,907,556 | ||||||||||
| Total Money Market Mutual Fund (Cost $5,907,556) | 5,907,556 | 2.6 | % | |||||||||
| Total Short-Term Investments (Cost $6,937,556) | 6,937,556 | 3.0 | % | |||||||||
| Total Investments (Cost $228,160,144) | 228,026,904 | 99.9 | % | |||||||||
| Other Assets in Excess of Liabilities | 142,471 | 0.1 | % | |||||||||
| TOTAL NET ASSETS | $ | 228,169,375 | 100.0 | % | ||||||||
Notes to Schedule of Investments | |
| * | Restricted security as defined in Rule 144 under the Securities Act of 1933 and determined to be liquid. Purchased in a private placement transaction; resale to the public may require registration or or may extend only to qualified institutional buyers. At June 30, 2016, the value of these securities total $35,577,397, which represents 15.59% of total net assets. |
| f | Foreign Security |
| ∞ | Variable or Floating rate security. Floating rate securities are securities whose yields vary with a designated index rate. These securities rates are as of June 30, 2016. |
| « | 7-Day Yield |
| Baird Short-Term Bond Fund | ||||||||||||
| Schedule of Investments | ||||||||||||
| June 30, 2016 (Unaudited) | ||||||||||||
| Principal | % of | |||||||||||
| Amount | Value | Net Assets | ||||||||||
| LONG-TERM INVESTMENTS | ||||||||||||
| U.S. Treasury Securities | ||||||||||||
| U.S. Treasury Bonds: | ||||||||||||
| 1.250%, 04/30/2019 | $ | 224,825,000 | $ | 228,364,195 | ||||||||
| 2.625%, 08/15/2020 | 233,925,000 | 250,080,329 | ||||||||||
| 478,444,524 | 13.4 | % | ||||||||||
| Corporate Bonds | ||||||||||||
| Finance | ||||||||||||
| ABN AMRO Bank NV: | ||||||||||||
| 1.434%, 10/28/2016 (Acquired 10/23/2013 through 05/19/2014, Cost $11,051,573) * f ∞ | 11,050,000 | 11,069,636 | ||||||||||
| 4.250%, 02/02/2017 (Acquired 08/23/2013 through 11/21/2014, Cost $3,725,595) * f | 3,675,000 | 3,738,686 | ||||||||||
| 2.500%, 10/30/2018 (Acquired 03/04/2014 through 04/29/2015, Cost $1,156,900) * f | 1,150,000 | 1,176,694 | ||||||||||
| American Express Bank FSB, | ||||||||||||
| 0.747%, 06/12/2017 ∞ | 750,000 | 748,426 | ||||||||||
| American Express Co.: | ||||||||||||
| 5.500%, 09/12/2016 | 1,213,000 | 1,223,494 | ||||||||||
| 7.000%, 03/19/2018 | 2,661,000 | 2,906,690 | ||||||||||
| 1.244%, 05/22/2018 ∞ | 5,528,000 | 5,515,871 | ||||||||||
| American Express Credit Corp.: | ||||||||||||
| 1.148%, 07/29/2016 ∞ | 5,000,000 | 5,002,205 | ||||||||||
| 1.116%, 08/15/2019 ∞ | 2,000,000 | 1,981,820 | ||||||||||
| American International Group, Inc.: | ||||||||||||
| 5.600%, 10/18/2016 | 5,120,000 | 5,183,283 | ||||||||||
| 2.300%, 07/16/2019 | 1,400,000 | 1,424,548 | ||||||||||
| ANZ New Zealand (Int'l) Ltd.: | ||||||||||||
| 2.600%, 09/23/2019 (Acquired 09/16/2014, Cost $3,347,822) * f | 3,350,000 | 3,427,747 | ||||||||||
| 2.850%, 08/06/2020 (Acquired 07/30/2015, Cost $2,997,510) * f | 3,000,000 | 3,093,813 | ||||||||||
| Australia and New Zealand Banking Group Ltd.: | ||||||||||||
| 1.009%, 01/10/2017 (Acquired 01/06/2014, Cost $750,000) * f ∞ | 750,000 | 750,600 | ||||||||||
| 1.875%, 10/06/2017 f | 750,000 | 756,859 | ||||||||||
| 2.250%, 06/13/2019 f | 1,000,000 | 1,021,402 | ||||||||||
| Banco Santander-Chile, | ||||||||||||
| 1.529%, 04/11/2017 (Acquired 04/08/2014, Cost $1,800,000) * f ∞ | 1,800,000 | 1,797,750 | ||||||||||
| Bank of America Corp.: | ||||||||||||
| 5.750%, 12/01/2017 | 5,000,000 | 5,292,210 | ||||||||||
| 5.625%, 07/01/2020 | 2,000,000 | 2,250,080 | ||||||||||
| Bank of Montreal: | ||||||||||||
| 1.229%, 04/09/2018 f ∞ | 1,325,000 | 1,327,476 | ||||||||||
| 1.800%, 07/31/2018 f | 5,000,000 | 5,061,425 | ||||||||||
| Banque Federative du Credit Mutuel SA, | ||||||||||||
| 2.000%, 04/12/2019 (Acquired 04/06/2016, Cost $14,983,950) * @ f | 15,000,000 | 15,138,675 | ||||||||||
| Barclays Bank PLC: | ||||||||||||
| Class 1, 5.000%, 09/22/2016 f | 5,630,000 | 5,677,714 | ||||||||||
| 1.208%, 02/17/2017 f ∞ | 4,000,000 | 3,994,348 | ||||||||||
| Barclays PLC: | ||||||||||||
| 2.000%, 03/16/2018 f | 4,000,000 | 3,969,196 | ||||||||||
| 2.875%, 06/08/2020 f | 2,000,000 | 1,970,856 | ||||||||||
| 3.250%, 01/12/2021 f | 2,375,000 | 2,366,680 | ||||||||||
| BB&T Corp., | ||||||||||||
| 1.513%, 06/15/2018 ∞ | 4,150,000 | 4,172,132 | ||||||||||
| BNP Paribas SA: | ||||||||||||
| 1.246%, 12/12/2016 f ∞ | 4,540,000 | 4,547,659 | ||||||||||
| 1.092%, 05/07/2017 f ∞ | 4,500,000 | 4,499,860 | ||||||||||
| 2.375%, 09/14/2017 f | 3,000,000 | 3,043,200 | ||||||||||
| 2.375%, 05/21/2020 f | 3,225,000 | 3,286,533 | ||||||||||
| BNZ International Funding Ltd.: | ||||||||||||
| 1.900%, 02/26/2018 (Acquired 02/23/2015, Cost $1,702,930) * f | 1,700,000 | 1,712,978 | ||||||||||
| 2.350%, 03/04/2019 (Acquired 09/03/2014 through 11/13/2014, Cost $7,237,748) * f | 7,250,000 | 7,361,795 | ||||||||||
| BPCE: | ||||||||||||
| 1.480%, 02/10/2017 f ∞ | 11,944,000 | 11,985,159 | ||||||||||
| 2.500%, 12/10/2018 f | 3,525,000 | 3,614,634 | ||||||||||
| Branch Banking and Trust Co., | ||||||||||||
| 0.954%, 05/23/2017 ∞ | 9,620,000 | 9,608,235 | ||||||||||
| Caisse Centrale Desjardins: | ||||||||||||
| 1.303%, 01/29/2018 (Acquired 01/26/2015, Cost $10,000,000) * f ∞ | 10,000,000 | 9,973,250 | ||||||||||
| 1.750%, 01/29/2018 (Acquired 04/06/2015, Cost $4,012,410) * f | 4,000,000 | 4,019,696 | ||||||||||
| Canadian Imperial Bank of Commerce, | ||||||||||||
| 1.350%, 07/18/2016 f | 5,000,000 | 5,001,310 | ||||||||||
| Capital One Bank (USA) National Association, | ||||||||||||
| 2.250%, 02/13/2019 | 1,500,000 | 1,519,176 | ||||||||||
| Capital One Financial Corp.: | ||||||||||||
| 6.150%, 09/01/2016 | 1,403,000 | 1,413,912 | ||||||||||
| 5.250%, 02/21/2017 | 1,100,000 | 1,125,804 | ||||||||||
| Capital One NA: | ||||||||||||
| 1.500%, 09/05/2017 | 5,000,000 | 4,997,695 | ||||||||||
| 1.313%, 02/05/2018 ∞ | 2,000,000 | 1,998,434 | ||||||||||
| 2.400%, 09/05/2019 | 5,300,000 | 5,370,130 | ||||||||||
| CIGNA Corp., | ||||||||||||
| 5.375%, 03/15/2017 | 2,300,000 | 2,354,432 | ||||||||||
| Citigroup, Inc.: | ||||||||||||
| 1.306%, 11/15/2016 ∞ | 2,000,000 | 2,001,202 | ||||||||||
| 1.550%, 08/14/2017 | 2,400,000 | 2,407,805 | ||||||||||
| 1.850%, 11/24/2017 | 5,000,000 | 5,027,560 | ||||||||||
| 1.700%, 04/27/2018 | 2,000,000 | 2,003,206 | ||||||||||
| 2.150%, 07/30/2018 | 3,975,000 | 4,023,451 | ||||||||||
| 2.050%, 12/07/2018 | 4,000,000 | 4,031,788 | ||||||||||
| Citizens Bank National Association, | ||||||||||||
| 1.600%, 12/04/2017 | 14,300,000 | 14,305,992 | ||||||||||
| 2.500%, 03/14/2019 | 2,700,000 | 2,738,445 | ||||||||||
| CNA Financial Corp., | ||||||||||||
| 7.350%, 11/15/2019 | 14,915,000 | 17,223,230 | ||||||||||
| Comerica Bank: | ||||||||||||
| 5.750%, 11/21/2016 | 1,925,000 | 1,955,946 | ||||||||||
| 5.200%, 08/22/2017 | 6,825,000 | 7,106,204 | ||||||||||
| 2.500%, 06/02/2020 @ | 7,000,000 | 7,204,533 | ||||||||||
| Commonwealth Bank of Australia, | ||||||||||||
| 2.050%, 03/15/2019 f | 1,500,000 | 1,520,929 | ||||||||||
| Commonwealth Bank of Australia/New York NY, | ||||||||||||
| 1.750%, 11/02/2018 f | 15,000,000 | 15,107,640 | ||||||||||
| Compass Bank: | ||||||||||||
| 1.850%, 09/29/2017 | 10,505,000 | 10,474,252 | ||||||||||
| 2.750%, 09/29/2019 | 8,337,000 | 8,233,296 | ||||||||||
| Credit Agricole SA, | ||||||||||||
| 1.481%, 10/03/2016 (Acquired 09/26/2013, Cost $10,000,000) * f ∞ | 10,000,000 | 10,013,960 | ||||||||||
| Credit Suisse: | ||||||||||||
| 1.155%, 05/26/2017 f ∞ | 2,000,000 | 1,998,788 | ||||||||||
| 6.000%, 02/15/2018 f | 8,440,000 | 8,916,683 | ||||||||||
| 1.700%, 04/27/2018 f | 2,500,000 | 2,502,675 | ||||||||||
| Deutsche Bank AG: | ||||||||||||
| 1.237%, 02/13/2017 f ∞ | 5,450,000 | 5,444,441 | ||||||||||
| 1.875%, 02/13/2018 f | 3,000,000 | 2,981,217 | ||||||||||
| 2.500%, 02/13/2019 f | 3,000,000 | 3,006,033 | ||||||||||
| Deutsche Bank Aktiengesellschaft: | ||||||||||||
| 1.144%, 05/30/2017 f ∞ | 2,640,000 | 2,627,383 | ||||||||||
| 6.000%, 09/01/2017 f | 3,467,000 | 3,617,326 | ||||||||||
| Discover Bank, | ||||||||||||
| 8.700%, 11/18/2019 | 5,395,000 | 6,352,683 | ||||||||||
| Discover Bank of Greenwood DE, | ||||||||||||
| 2.600%, 11/13/2018 | 8,000,000 | 8,120,344 | ||||||||||
| Fifth Third Bancorp: | ||||||||||||
| 1.067%, 12/20/2016 ∞ | 7,825,000 | 7,820,360 | ||||||||||
| 5.450%, 01/15/2017 | 919,000 | 939,461 | ||||||||||
| 2.150%, 08/20/2018 | 2,000,000 | 2,031,240 | ||||||||||
| 2.875%, 07/27/2020 | 5,000,000 | 5,210,800 | ||||||||||
| First Tennessee Bank National Association, | ||||||||||||
| 2.950%, 12/01/2019 | 4,436,000 | 4,456,224 | ||||||||||
| Hana Bank, | ||||||||||||
| 1.757%, 11/09/2016 (Acquired 11/05/2013, Cost $7,001,232) * f ∞ | 7,000,000 | 7,004,942 | ||||||||||
| HSBC Bank USA National Association, | ||||||||||||
| 6.000%, 08/09/2017 | 925,000 | 967,508 | ||||||||||
| HSBC Finance Corp., | ||||||||||||
| 6.676%, 01/15/2021 | 221,000 | 247,631 | ||||||||||
| HSBC USA, Inc.: | ||||||||||||
| 1.520%, 09/24/2018 ∞ | 1,000,000 | 997,853 | ||||||||||
| 1.237%, 11/13/2019 ∞ | 9,750,000 | 9,628,700 | ||||||||||
| Humana, Inc., | ||||||||||||
| 7.200%, 06/15/2018 | 6,610,000 | 7,319,537 | ||||||||||
| Huntington Bancshares, Inc., | ||||||||||||
| 2.600%, 08/02/2018 @ | 3,375,000 | 3,439,662 | ||||||||||
| ING Bank NV: | ||||||||||||
| 3.750%, 03/07/2017 (Acquired 05/30/2013 through 01/13/2014, Cost $3,239,683) * f | 3,200,000 | 3,255,264 | ||||||||||
| 2.500%, 10/01/2019 (Acquired 04/18/2016, Cost $9,103,015) * f | 8,961,000 | 9,143,294 | ||||||||||
| J.P. Morgan Chase & Co.: | ||||||||||||
| 1.188%, 04/25/2018 ∞ | 3,500,000 | 3,494,610 | ||||||||||
| Class 1, 1.264%, 01/28/2019 ∞ | 750,000 | 748,714 | ||||||||||
| 2.250%, 01/23/2020 @ | 8,100,000 | 8,211,399 | ||||||||||
| Kemper Corp., | ||||||||||||
| 6.000%, 05/15/2017 | 4,565,000 | 4,725,898 | ||||||||||
| KeyBank National Association: | ||||||||||||
| 2.350%, 03/08/2019 | 6,500,000 | 6,639,217 | ||||||||||
| 2.500%, 12/15/2019 | 5,325,000 | 5,460,441 | ||||||||||
| Kookmin Bank: | ||||||||||||
| 1.509%, 01/27/2017 (Acquired 01/21/2014 through 02/20/2014, Cost $4,750,741) * f ∞ | 4,750,000 | 4,751,458 | ||||||||||
| 1.625%, 07/14/2017 (Acquired 07/07/2014, Cost $5,983,080) * f | 6,000,000 | 6,020,640 | ||||||||||
| LeasePlan Corp. NV, | ||||||||||||
| 2.500%, 05/16/2018 (Acquired 05/07/2013 through 10/20/2014, Cost $16,350,190) * f | 16,435,000 | 16,441,443 | ||||||||||
| Lloyds Bank PLC: | ||||||||||||
| 1.750%, 05/14/2018 f | 5,825,000 | 5,808,614 | ||||||||||
| 2.000%, 08/17/2018 f | 4,500,000 | 4,494,956 | ||||||||||
| 2.050%, 01/22/2019 f | 4,000,000 | 3,989,624 | ||||||||||
| M&I Marshall & Ilsley Bank, | ||||||||||||
| 5.000%, 01/17/2017 | 2,488,000 | 2,533,580 | ||||||||||
| Macquarie Bank Ltd.: | ||||||||||||
| 2.000%, 08/15/2016 (Acquired 08/07/2013 through 04/29/2015, Cost $10,149,722) * f | 10,150,000 | 10,162,383 | ||||||||||
| 1.266%, 10/27/2017 (Acquired 10/22/2014, Cost $5,000,000) * f ∞ | 5,000,000 | 4,989,740 | ||||||||||
| Macquarie Group Ltd., | ||||||||||||
| 4.875%, 08/10/2017 (Acquired 10/29/2014 through 11/25/2014, Cost $2,840,982) * f | 2,750,000 | 2,838,212 | ||||||||||
| Manufacturers And Traders Trust Co.: | ||||||||||||
| 6.625%, 12/04/2017 | 1,000,000 | 1,067,035 | ||||||||||
| 1.664%, 12/28/2020 ∞ | 282,000 | 276,272 | ||||||||||
| Marsh & McLennan Cos., Inc., | ||||||||||||
| 2.300%, 04/01/2017 | 1,297,000 | 1,308,463 | ||||||||||
| Metropolitan Life Global Funding I, | ||||||||||||
| 1.009%, 04/10/2017 (Acquired 04/07/2014, Cost $8,500,000) * ∞ | 8,500,000 | 8,514,008 | ||||||||||
| Mizuho Bank Ltd.: | ||||||||||||
| 2.550%, 03/17/2017 (Acquired 05/30/2013, Cost $6,938,414) * f | 6,900,000 | 6,960,665 | ||||||||||
| 1.063%, 04/16/2017 (Acquired 04/09/2014, Cost $2,800,000) * f ∞ | 2,800,000 | 2,799,434 | ||||||||||
| 1.090%, 09/25/2017 (Acquired 03/30/2016, Cost $2,986,835) * f ∞ | 3,000,000 | 2,987,634 | ||||||||||
| 1.280%, 03/26/2018 (Acquired 06/21/2016, Cost $1,248,700) * f ∞ | 1,250,000 | 1,247,186 | ||||||||||
| 1.824%, 10/20/2018 (Acquired 10/13/2015, Cost $2,500,000) * f ∞ | 2,500,000 | 2,516,208 | ||||||||||
| Morgan Stanley: | ||||||||||||
| 5.450%, 01/09/2017 | 2,950,000 | 3,013,065 | ||||||||||
| 1.371%, 01/05/2018 ∞ | 1,500,000 | 1,501,105 | ||||||||||
| 6.625%, 04/01/2018 | 2,000,000 | 2,167,546 | ||||||||||
| 1.488%, 01/24/2019 ∞ | 4,750,000 | 4,742,158 | ||||||||||
| 1.774%, 01/27/2020 ∞ | 4,000,000 | 4,015,440 | ||||||||||
| MUFG Union Bank, National Association, | ||||||||||||
| 2.125%, 06/16/2017 | 3,500,000 | 3,532,274 | ||||||||||
| National Bank of Canada, | ||||||||||||
| 1.496%, 12/14/2018 f ∞ | 1,000,000 | 1,004,052 | ||||||||||
| National City Bank, | ||||||||||||
| 5.800%, 06/07/2017 | 8,695,000 | 9,046,000 | ||||||||||
| Nationwide Building Society, | ||||||||||||
| 2.350%, 01/21/2020 (Acquired 01/12/2015, Cost $4,998,350) * f | 5,000,000 | 5,053,565 | ||||||||||
| New York Life Global Funding, | ||||||||||||
| 1.550%, 11/02/2018 (Acquired 10/27/2015, Cost $9,486,415) * | 9,500,000 | 9,588,188 | ||||||||||
| Nomura Holdings, Inc.: | ||||||||||||
| 2.000%, 09/13/2016 f | 10,205,000 | 10,222,614 | ||||||||||
| 2.750%, 03/19/2019 f | 2,000,000 | 2,046,680 | ||||||||||
| Nordea Bank AB: | ||||||||||||
| 3.125%, 03/20/2017 (Acquired 10/03/2012 through 08/21/2013, Cost $5,183,557) * f | 5,140,000 | 5,214,674 | ||||||||||
| 1.250%, 04/04/2017 (Acquired 03/31/2014, Cost $3,988,880) * f | 4,000,000 | 4,000,884 | ||||||||||
| Paine Webber Group, Inc., | ||||||||||||
| 7.990%, 06/09/2017 | 300,000 | 314,041 | ||||||||||
| Principal Financial Group, Inc.: | ||||||||||||
| 1.850%, 11/15/2017 | 3,500,000 | 3,519,114 | ||||||||||
| 8.875%, 05/15/2019 | 7,435,000 | 8,822,497 | ||||||||||
| Principal Life Global Funding II, | ||||||||||||
| 1.500%, 04/18/2019 (Acquired 04/11/2016, Cost $2,990,640) * | 3,000,000 | 3,011,664 | ||||||||||
| Prudential Financial, Inc., | ||||||||||||
| 7.375%, 06/15/2019 | 7,000,000 | 8,121,113 | ||||||||||
| Regions Bank, | ||||||||||||
| 7.500%, 05/15/2018 | 7,670,000 | 8,411,651 | ||||||||||
| Regions Financial Corp., | ||||||||||||
| 2.000%, 05/15/2018 | 10,000,000 | 10,017,480 | ||||||||||
| Reliance Standard Life Global Funding II: | ||||||||||||
| 2.150%, 10/15/2018 (Acquired 10/13/2015, Cost $13,027,683) * | 13,000,000 | 13,121,394 | ||||||||||
| 2.500%, 01/15/2020 (Acquired 01/07/2015, Cost $5,979,540) * | 6,000,000 | 6,088,998 | ||||||||||
| Royal Bank of Canada, | ||||||||||||
| 1.400%, 10/13/2017 f | 8,450,000 | 8,475,536 | ||||||||||
| Santander Bank NA, | ||||||||||||
| 8.750%, 05/30/2018 | 2,238,000 | 2,492,317 | ||||||||||
| Santander Holdings USA, Inc., | ||||||||||||
| 2.700%, 05/24/2019 | 5,000,000 | 5,024,055 | ||||||||||
| Santander UK PLC: | ||||||||||||
| 2.500%, 03/14/2019 @ f | 10,000,000 | 10,102,030 | ||||||||||
| 3.125%, 01/08/2021 f | 3,500,000 | 3,507,609 | ||||||||||
| Skandinaviska Enskilda Banken AB: | ||||||||||||
| 2.375%, 11/20/2018 (Acquired 08/05/2015, Cost $5,036,285) * f | 5,000,000 | 5,100,695 | ||||||||||
| 2.450%, 05/27/2020 (Acquired 05/19/2015, Cost $4,692,762) * f | 4,700,000 | 4,801,708 | ||||||||||
| Societe Generale: | ||||||||||||
| 1.726%, 10/01/2018 f ∞ | 6,000,000 | 6,047,280 | ||||||||||
| 2.625%, 10/01/2018 f | 1,000,000 | 1,023,650 | ||||||||||
| Standard Chartered PLC: | ||||||||||||
| 1.001%, 09/08/2017 (Acquired 09/03/2014, Cost $10,000,000) * f ∞ | 10,000,000 | 9,928,240 | ||||||||||
| 1.273%, 04/17/2018 (Acquired 04/13/2015, Cost $2,000,000) * f ∞ | 2,000,000 | 1,977,080 | ||||||||||
| 2.400%, 09/08/2019 (Acquired 09/03/2014 through 04/29/2015, Cost $2,223,115) * @ f | 2,225,000 | 2,230,689 | ||||||||||
| Sumitomo Mitsui Banking Corp.: | ||||||||||||
| 1.450%, 07/19/2016 f | 4,000,000 | 4,001,400 | ||||||||||
| 1.059%, 01/10/2017 f ∞ | 2,075,000 | 2,076,133 | ||||||||||
| 1.213%, 01/16/2018 f ∞ | 2,885,000 | 2,878,846 | ||||||||||
| 1.950%, 07/23/2018 f | 3,500,000 | 3,538,553 | ||||||||||
| 2.450%, 01/16/2020 f | 4,500,000 | 4,598,604 | ||||||||||
| SunTrust Bank, | ||||||||||||
| 7.250%, 03/15/2018 | 154,000 | 167,849 | ||||||||||
| SunTrust Banks, Inc., | ||||||||||||
| 6.000%, 09/11/2017 | 780,000 | 821,865 | ||||||||||
| SUSA Partnership LP, | ||||||||||||
| 8.200%, 06/01/2017 | 714,000 | 757,939 | ||||||||||
| Svenska Handelsbanken AB: | ||||||||||||
| 1.625%, 03/21/2018 f | 1,100,000 | 1,107,015 | ||||||||||
| 1.146%, 06/17/2019 f ∞ | 2,000,000 | 1,986,534 | ||||||||||
| 1.576%, 10/01/2020 f ∞ | 10,000,000 | 9,999,800 | ||||||||||
| Synchrony Financial: | ||||||||||||
| 2.600%, 01/15/2019 | 2,000,000 | 2,021,886 | ||||||||||
| 3.000%, 08/15/2019 | 13,350,000 | 13,572,505 | ||||||||||
| 2.700%, 02/03/2020 | 3,250,000 | 3,258,895 | ||||||||||
| The Bank of New York Mellon Corp., | ||||||||||||
| 1.197%, 08/01/2018 @ ∞ | 1,000,000 | 1,003,804 | ||||||||||
| The Bank of Nova Scotia, | ||||||||||||
| 1.126%, 06/11/2018 f ∞ | 3,500,000 | 3,493,094 | ||||||||||
| The Bank of Tokyo-Mitsubishi UFJ Ltd.: | ||||||||||||
| 1.008%, 07/15/2016 f ∞ | 5,000,000 | 5,001,210 | ||||||||||
| 1.068%, 03/10/2017 (Acquired 11/24/2014 through 12/03/2015, Cost $9,044,347) * f ∞ | 9,050,000 | 9,051,909 | ||||||||||
| 2.150%, 09/14/2018 (Acquired 09/08/2015, Cost $6,298,173) * f | 6,300,000 | 6,366,616 | ||||||||||
| The Bear Stearns Companies LLC: | ||||||||||||
| 6.400%, 10/02/2017 | 7,700,000 | 8,180,788 | ||||||||||
| 7.250%, 02/01/2018 | 450,000 | 490,543 | ||||||||||
| The Goldman Sachs Group, Inc.: | ||||||||||||
| 1.758%, 12/10/2017 ∞ | 1,000,000 | 998,861 | ||||||||||
| 5.950%, 01/18/2018 | 1,045,000 | 1,113,226 | ||||||||||
| 6.150%, 04/01/2018 | 4,775,000 | 5,145,039 | ||||||||||
| 2.900%, 07/19/2018 | 1,000,000 | 1,026,170 | ||||||||||
| 7.500%, 02/15/2019 | 3,000,000 | 3,430,830 | ||||||||||
| 1.658%, 10/23/2019 ∞ | 2,751,000 | 2,732,450 | ||||||||||
| The Hartford Financial Services Group, Inc., | ||||||||||||
| 5.500%, 10/15/2016 | 3,150,000 | 3,189,869 | ||||||||||
| 5.375%, 03/15/2017 | 3,145,000 | 3,234,504 | ||||||||||
| 6.300%, 03/15/2018 | 1,825,000 | 1,957,493 | ||||||||||
| 6.000%, 01/15/2019 | 455,000 | 499,431 | ||||||||||
| 5.500%, 03/30/2020 | 1,947,000 | 2,198,539 | ||||||||||
| The Huntington National Bank: | ||||||||||||
| 1.350%, 08/02/2016 | 5,000,000 | 5,000,275 | ||||||||||
| 2.000%, 06/30/2018 | 7,990,000 | 8,069,317 | ||||||||||
| The Northern Trust Co., | ||||||||||||
| 6.500%, 08/15/2018 | 4,075,000 | 4,508,543 | ||||||||||
| UBS AG: | ||||||||||||
| 1.800%, 03/26/2018 f | 8,825,000 | 8,908,961 | ||||||||||
| 5.750%, 04/25/2018 f | 3,351,000 | 3,594,252 | ||||||||||
| UBS Group Funding Jersey Ltd.: | ||||||||||||
| 2.080%, 09/24/2020 (Acquired 09/21/2015, Cost $2,000,000) * f ∞ | 2,000,000 | 2,001,078 | ||||||||||
| 3.000%, 04/15/2021 (Acquired 03/29/2016, Cost $2,997,750) * f | 3,000,000 | 3,059,850 | ||||||||||
| Voya Financial, Inc., | ||||||||||||
| 2.900%, 02/15/2018 | 11,211,000 | 11,420,814 | ||||||||||
| WEA Finance LLC / Westfield UK & Europe Finance PLC: | ||||||||||||
| 2.700%, 09/17/2019 (Acquired 09/10/2014, Cost $6,986,000) * | 7,000,000 | 7,139,972 | ||||||||||
| 3.250%, 10/05/2020 (Acquired 09/28/2015, Cost $4,982,850) * | 5,000,000 | 5,203,475 | ||||||||||
| Wells Fargo & Co.: | ||||||||||||
| Class N, 1.318%, 01/30/2020 ∞ | 1,975,000 | 1,962,793 | ||||||||||
| 2.600%, 07/22/2020 | 3,900,000 | 4,008,096 | ||||||||||
| Wells Fargo Bank National Association, | ||||||||||||
| 6.000%, 11/15/2017 | 610,000 | 649,056 | ||||||||||
| Westpac Banking Corp.: | ||||||||||||
| 2.000%, 08/14/2017 f | 2,000,000 | 2,019,598 | ||||||||||
| 1.043%, 12/01/2017 f ∞ | 10,000,000 | 9,998,980 | ||||||||||
| 1.650%, 05/13/2019 f | 4,650,000 | 4,663,532 | ||||||||||
| 911,269,408 | 25.5 | % | ||||||||||
| Utility | ||||||||||||
| Beaver Valley II Funding Corp., | ||||||||||||
| 9.000%, 06/01/2017 | 39,000 | 39,195 | ||||||||||
| Commonwealth Edison Co.: | ||||||||||||
| Class 104, 5.950%, 08/15/2016 | 550,000 | 553,100 | ||||||||||
| 6.150%, 09/15/2017 | 100,000 | 106,009 | ||||||||||
| Dominion Resources, Inc.: | ||||||||||||
| 6.400%, 06/15/2018 | 3,550,000 | 3,874,214 | ||||||||||
| 2.962%, 07/01/2019 | 4,000,000 | 4,072,136 | ||||||||||
| 2.500%, 12/01/2019 | 9,500,000 | 9,705,960 | ||||||||||
| Entergy Corp., | ||||||||||||
| 4.700%, 01/15/2017 | 8,750,000 | 8,873,218 | ||||||||||
| Exelon Corp.: | ||||||||||||
| 1.550%, 06/09/2017 | 2,000,000 | 2,003,462 | ||||||||||
| 2.850%, 06/15/2020 | 2,275,000 | 2,346,817 | ||||||||||
| National Rural Utilities Cooperative Finance Corp., | ||||||||||||
| 10.375%, 11/01/2018 | 1,075,000 | 1,298,925 | ||||||||||
| NextEra Energy Capital Holdings, Inc., | ||||||||||||
| Class F, 2.056%, 09/01/2017 | 7,250,000 | 7,300,931 | ||||||||||
| NiSource Finance Corp., | ||||||||||||
| 6.400%, 03/15/2018 | 199,000 | 215,411 | ||||||||||
| Orange Cogen Funding Corp., | ||||||||||||
| 8.175%, 03/15/2022 (Acquired 02/10/2015 through 09/16/2015, Cost $11,498,921) * | 9,926,625 | 11,625,279 | ||||||||||
| Pacific Gas and Electric Co., | ||||||||||||
| 8.250%, 10/15/2018 | 8,320,000 | 9,583,242 | ||||||||||
| PSEG Power LLC, | ||||||||||||
| 5.320%, 09/15/2016 | 4,905,000 | 4,941,640 | ||||||||||
| Public Service Co. of New Mexico, | ||||||||||||
| 7.950%, 05/15/2018 | 1,431,000 | 1,593,582 | ||||||||||
| Sempra Energy: | ||||||||||||
| 2.300%, 04/01/2017 | 1,300,000 | 1,310,760 | ||||||||||
| 9.800%, 02/15/2019 | 2,575,000 | 3,099,373 | ||||||||||
| Southwestern Public Service Co., | ||||||||||||
| 5.600%, 10/01/2016 | 3,000,000 | 3,029,613 | ||||||||||
| The Southern Co.: | ||||||||||||
| 1.850%, 07/01/2019 | 4,750,000 | 4,810,092 | ||||||||||
| 2.750%, 06/15/2020 | 11,000,000 | 11,400,741 | ||||||||||
| 91,783,700 | 2.6 | % | ||||||||||
| Industrials | ||||||||||||
| A.P. Meoller - Maersk A/S, | ||||||||||||
| 2.550%, 09/22/2019 (Acquired 09/15/2014, Cost $4,540,672) * f | 4,550,000 | 4,639,225 | ||||||||||
| AbbVie, Inc.: | ||||||||||||
| 1.750%, 11/06/2017 | 6,049,000 | 6,084,725 | ||||||||||
| 1.800%, 05/14/2018 | 9,450,000 | 9,516,330 | ||||||||||
| Actavis Funding SCS: | ||||||||||||
| 2.450%, 06/15/2019 f | 3,000,000 | 3,046,989 | ||||||||||
| 1.911%, 03/12/2020 f ∞ | 1,000,000 | 1,003,053 | ||||||||||
| 3.000%, 03/12/2020 f | 3,900,000 | 4,022,183 | ||||||||||
| ACTAVIS, Inc., | ||||||||||||
| 1.875%, 10/01/2017 | 1,392,000 | 1,398,950 | ||||||||||
| Agrium, Inc., | ||||||||||||
| 7.700%, 02/01/2017 f | 5,000,000 | 5,170,625 | ||||||||||
| Alibaba Group Holding Ltd., | ||||||||||||
| 1.194%, 11/28/2017 f ∞ | 2,500,000 | 2,482,265 | ||||||||||
| Altera Corp., | ||||||||||||
| 2.500%, 11/15/2018 | 3,000,000 | 3,103,014 | ||||||||||
| America Movil, SAB de CV, | ||||||||||||
| 1.656%, 09/12/2016 f ∞ | 9,000,000 | 9,002,250 | ||||||||||
| Amgen, Inc.: | ||||||||||||
| 1.034%, 05/22/2017 ∞ | 2,750,000 | 2,750,492 | ||||||||||
| 5.700%, 02/01/2019 | 10,000,000 | 11,079,590 | ||||||||||
| Anadarko Petroleum Corp.: | ||||||||||||
| 6.375%, 09/15/2017 | 304,000 | 319,975 | ||||||||||
| 8.700%, 03/15/2019 | 2,970,000 | 3,387,053 | ||||||||||
| Anheuser-Busch InBev Finance, Inc., | ||||||||||||
| 1.900%, 02/01/2019 | 11,425,000 | 11,618,996 | ||||||||||
| AT&T, Inc.: | ||||||||||||
| 5.800%, 02/15/2019 | 3,000,000 | 3,325,065 | ||||||||||
| 2.300%, 03/11/2019 @ | 9,682,000 | 9,888,062 | ||||||||||
| 1.561%, 06/30/2020 ∞ | 4,000,000 | 3,984,348 | ||||||||||
| 2.800%, 02/17/2021 | 4,025,000 | 4,129,811 | ||||||||||
| Baxalta, Inc.: | ||||||||||||
| 1.427%, 06/22/2018 ∞ | 3,500,000 | 3,463,001 | ||||||||||
| 2.000%, 06/22/2018 | 9,200,000 | 9,204,692 | ||||||||||
| Beam Suntory, Inc., | ||||||||||||
| 1.875%, 05/15/2017 | 8,000,000 | 8,029,952 | ||||||||||
| Becton Dickinson & Co.: | ||||||||||||
| 1.450%, 05/15/2017 | 5,315,000 | 5,328,814 | ||||||||||
| 5.000%, 05/15/2019 | 1,213,000 | 1,323,741 | ||||||||||
| Bemis Co., Inc., | ||||||||||||
| 6.800%, 08/01/2019 | 9,075,000 | 10,358,749 | ||||||||||
| Boardwalk Pipelines LP, | ||||||||||||
| 5.500%, 02/01/2017 | 17,884,000 | 18,155,086 | ||||||||||
| Boston Scientific Corp.: | ||||||||||||
| 5.125%, 01/12/2017 | 3,500,000 | 3,568,362 | ||||||||||
| 2.650%, 10/01/2018 | 7,077,000 | 7,234,024 | ||||||||||
| BP Capital Markets: | ||||||||||||
| 1.140%, 05/10/2018 f ∞ | 1,575,000 | 1,568,122 | ||||||||||
| 1.270%, 09/26/2018 f ∞ | 7,085,000 | 7,058,793 | ||||||||||
| Bunge Limited Finance Corp.: | ||||||||||||
| 3.200%, 06/15/2017 | 500,000 | 507,771 | ||||||||||
| 8.500%, 06/15/2019 | 7,081,000 | 8,279,629 | ||||||||||
| Bunge NA Finance LP, | ||||||||||||
| 5.900%, 04/01/2017 | 5,635,000 | 5,815,748 | ||||||||||
| Celgene Corp., | ||||||||||||
| 2.125%, 08/15/2018 | 6,500,000 | 6,597,149 | ||||||||||
| CF Industries, Inc., | ||||||||||||
| 6.875%, 05/01/2018 | 11,182,000 | 12,149,086 | ||||||||||
| Charter Communications Operating LLC / Charter Communications Operating Capital, | ||||||||||||
| 3.579%, 07/23/2020 (Acquired 07/09/2015, Cost $3,000,000) * @ | 3,000,000 | 3,136,332 | ||||||||||
| Chevron Phillips Chemical Co. LLC, | ||||||||||||
| 1.387%, 05/01/2020 (Acquired 05/07/2015, Cost $5,050,000) * ∞ | 5,050,000 | 4,893,132 | ||||||||||
| Coca-Cola FEMSA SAB de CV, | ||||||||||||
| 2.375%, 11/26/2018 f | 4,000,000 | 4,076,940 | ||||||||||
| Columbia Pipeline Group, Inc., | ||||||||||||
| 2.450%, 06/01/2018 | 7,000,000 | 7,022,568 | ||||||||||
| ConAgra Foods, Inc.: | ||||||||||||
| 5.819%, 06/15/2017 | 6,234,000 | 6,486,221 | ||||||||||
| 1.900%, 01/25/2018 | 9,889,000 | 9,967,163 | ||||||||||
| Cox Communications, Inc.: | ||||||||||||
| 6.250%, 06/01/2018 (Acquired 06/24/2015, Cost $9,669,774) * | 9,000,000 | 9,664,479 | ||||||||||
| 9.375%, 01/15/2019 (Acquired 02/10/2015, Cost $1,037,905) * | 899,000 | 1,047,307 | ||||||||||
| Crane Co., | ||||||||||||
| 2.750%, 12/15/2018 | 7,585,000 | 7,795,825 | ||||||||||
| CSX Corp., | ||||||||||||
| 7.900%, 05/01/2017 | 2,221,000 | 2,344,081 | ||||||||||
| CVS Health Corp.: | ||||||||||||
| 2.800%, 07/20/2020 | 6,725,000 | 7,002,541 | ||||||||||
| 2.125%, 06/01/2021 | 5,000,000 | 5,061,485 | ||||||||||
| Daimler Finance North America LLC: | ||||||||||||
| 1.317%, 08/01/2016 (Acquired 07/24/2013 through 08/26/2014, Cost $2,280,106) * ∞ | 2,280,000 | 2,280,930 | ||||||||||
| 1.008%, 03/10/2017 (Acquired 03/03/2014, Cost $2,000,000) * ∞ | 2,000,000 | 1,999,720 | ||||||||||
| 0.977%, 08/01/2017 (Acquired 07/24/2014 through 11/10/2015, Cost $2,696,877) * ∞ | 2,700,000 | 2,695,810 | ||||||||||
| 1.106%, 03/02/2018 (Acquired 08/05/2015, Cost $745,857) * ∞ | 750,000 | 746,437 | ||||||||||
| 1.497%, 08/01/2018 (Acquired 11/14/2014, Cost $2,013,946) * ∞ | 2,000,000 | 2,004,470 | ||||||||||
| DCP Midstream Operating LP, | ||||||||||||
| 2.500%, 12/01/2017 | 400,000 | 391,000 | ||||||||||
| Deutsche Telekom International Finance BV, | ||||||||||||
| 6.750%, 08/20/2018 f | 3,900,000 | 4,352,497 | ||||||||||
| Diamond 1 Finance Corp. / Diamond 2 Finance Corp., | ||||||||||||
| 3.480%, 06/01/2019 (Acquired 05/17/2016, Cost $17,495,625) * @ | 17,500,000 | 17,927,175 | ||||||||||
| Dollar General Corp., | ||||||||||||
| 4.125%, 07/15/2017 | 17,321,000 | 17,808,603 | ||||||||||
| Eaton Corp., | ||||||||||||
| 1.500%, 11/02/2017 | 5,000,000 | 5,024,335 | ||||||||||
| Ecolab, Inc., | ||||||||||||
| 2.000%, 01/14/2019 | 14,250,000 | 14,435,906 | ||||||||||
| El Paso Natural Gas Co. LLC, | ||||||||||||
| 5.950%, 04/15/2017 | 2,050,000 | 2,110,145 | ||||||||||
| Enable Midstream Partners LP, | ||||||||||||
| 2.400%, 05/15/2019 | 3,000,000 | 2,816,970 | ||||||||||
| Enbridge, Inc.: | ||||||||||||
| 1.296%, 10/01/2016 f ∞ | 2,100,000 | 2,091,258 | ||||||||||
| 5.600%, 04/01/2017 f | 5,125,000 | 5,272,615 | ||||||||||
| Energy Transfer Partners LP: | ||||||||||||
| 6.125%, 02/15/2017 | 645,000 | 661,666 | ||||||||||
| 2.500%, 06/15/2018 | 4,000,000 | 3,981,532 | ||||||||||
| 9.700%, 03/15/2019 | 6,994,000 | 7,918,516 | ||||||||||
| Enterprise Products Operating LLC: | ||||||||||||
| 6.650%, 04/15/2018 | 5,000,000 | 5,437,040 | ||||||||||
| 1.650%, 05/07/2018 | 2,000,000 | 2,001,684 | ||||||||||
| ERAC USA Finance LLC, | ||||||||||||
| 2.350%, 10/15/2019 (Acquired 01/21/2015, Cost $16,632,032) * | 16,500,000 | 16,811,503 | ||||||||||
| Express Scripts Holding Co.: | ||||||||||||
| 2.650%, 02/15/2017 | 1,959,000 | 1,979,826 | ||||||||||
| 2.250%, 06/15/2019 | 2,157,000 | 2,192,066 | ||||||||||
| Exxon Mobil Corp., | ||||||||||||
| 1.708%, 03/01/2019 | 8,000,000 | 8,129,976 | ||||||||||
| Federal Express Corp. 1998 Pass Through Trust, | ||||||||||||
| Class 981B, 6.845%, 01/15/2019 | 2,262,717 | 2,415,450 | ||||||||||
| Federal Express Corp. 2012 Pass Through Trust, | ||||||||||||
| 2.625%, 01/15/2018 (Acquired 01/20/2012 through 08/19/2015, Cost $671,661) * | 669,444 | 673,996 | ||||||||||
| FedEx Corp., | ||||||||||||
| 2.300%, 02/01/2020 | 2,000,000 | 2,047,614 | ||||||||||
| Fidelity National Information Services, Inc.: | ||||||||||||
| 1.450%, 06/05/2017 | 3,000,000 | 2,996,457 | ||||||||||
| 2.000%, 04/15/2018 | 2,295,000 | 2,306,417 | ||||||||||
| 2.850%, 10/15/2018 | 11,640,000 | 11,945,981 | ||||||||||
| Fiserv, Inc., | ||||||||||||
| 2.700%, 06/01/2020 | 3,500,000 | 3,623,484 | ||||||||||
| Ford Motor Credit Co. LLC: | ||||||||||||
| 8.000%, 12/15/2016 | 2,000,000 | 2,060,480 | ||||||||||
| 6.625%, 08/15/2017 | 9,100,000 | 9,605,332 | ||||||||||
| 1.724%, 12/06/2017 | 1,250,000 | 1,252,659 | ||||||||||
| 2.021%, 05/03/2019 @ | 7,000,000 | 7,059,563 | ||||||||||
| Forest Laboratories, Inc., | ||||||||||||
| 4.375%, 02/01/2019 (Acquired 08/13/2014 through 04/29/2015, Cost $10,092,247) * | 9,675,000 | 10,204,639 | ||||||||||
| Fortive Corp., | ||||||||||||
| 1.800%, 06/15/2019 (Acquired 06/06/2016, Cost $4,645,024) * | 4,650,000 | 4,679,830 | ||||||||||
| Freeport-McMoRan, Inc.: | ||||||||||||
| 2.150%, 03/01/2017 @ | 2,000,000 | 1,985,000 | ||||||||||
| 2.300%, 11/14/2017 | 11,469,000 | 11,268,293 | ||||||||||
| General Motors Financial Co., Inc., | ||||||||||||
| 2.625%, 07/10/2017 | 11,613,000 | 11,720,351 | ||||||||||
| 3.100%, 01/15/2019 | 2,825,000 | 2,885,904 | ||||||||||
| 2.400%, 05/09/2019 | 4,000,000 | 4,011,144 | ||||||||||
| Georgia-Pacific LLC: | ||||||||||||
| 2.539%, 11/15/2019 (Acquired 02/23/2016, Cost $8,741,051) * | 8,750,000 | 8,960,884 | ||||||||||
| 5.400%, 11/01/2020 (Acquired 03/12/2015, Cost $3,942,501) * | 3,570,000 | 4,043,428 | ||||||||||
| Gilead Sciences, Inc., | ||||||||||||
| 2.550%, 09/01/2020 | 5,000,000 | 5,195,445 | ||||||||||
| Glencore Funding LLC: | ||||||||||||
| 1.988%, 01/15/2019 (Acquired 06/17/2014, Cost $5,213,741) * ∞ | 5,200,000 | 4,888,000 | ||||||||||
| 2.500%, 01/15/2019 (Acquired 05/22/2013, Cost $597,012) * | 600,000 | 576,750 | ||||||||||
| 3.125%, 04/29/2019 (Acquired 01/04/2016, Cost $4,391,354) * @ | 5,154,000 | 5,025,150 | ||||||||||
| GTE Corp., | ||||||||||||
| 6.840%, 04/15/2018 | 140,000 | 150,625 | ||||||||||
| H.J. Heinz Co., | ||||||||||||
| 2.000%, 07/02/2018 (Acquired 06/23/2015, Cost $9,980,000) * | 10,000,000 | 10,125,680 | ||||||||||
| Harris Corp., | ||||||||||||
| 1.999%, 04/27/2018 | 5,000,000 | 5,025,455 | ||||||||||
| Heineken NV, | ||||||||||||
| 1.400%, 10/01/2017 (Acquired 10/02/2012, Cost $1,993,400) * f | 2,000,000 | 2,009,228 | ||||||||||
| Hess Corp., | ||||||||||||
| 8.125%, 02/15/2019 | 3,982,000 | 4,437,577 | ||||||||||
| Hewlett Packard Enterprise Co.: | ||||||||||||
| 2.561%, 10/05/2018 (Acquired 09/30/2015, Cost $9,000,000) * ∞ | 9,000,000 | 9,124,056 | ||||||||||
| 2.850%, 10/05/2018 (Acquired 01/07/2016, Cost $7,004,265) * | 7,000,000 | 7,168,420 | ||||||||||
| Hewlett-Packard Co., | ||||||||||||
| 1.570%, 01/14/2019 @ ∞ | 5,700,000 | 5,643,821 | ||||||||||
| Husky Energy, Inc., | ||||||||||||
| 6.200%, 09/15/2017 f | 1,000,000 | 1,036,739 | ||||||||||
| Husky Oil Ltd., | ||||||||||||
| 7.550%, 11/15/2016 f | 2,500,000 | 2,526,465 | ||||||||||
| Hutchison Whampoa International (14) Ltd., | ||||||||||||
| 1.625%, 10/31/2017 (Acquired 10/28/2014, Cost $4,988,500) * f | 5,000,000 | 5,022,795 | ||||||||||
| Hyundai Capital America, | ||||||||||||
| 2.400%, 10/30/2018 (Acquired 10/27/2015, Cost $8,124,025) * | 8,125,000 | 8,238,482 | ||||||||||
| Hyundai Capital Services, Inc.: | ||||||||||||
| 4.375%, 07/27/2016 (Acquired 05/11/2012 through 07/28/2015, Cost $7,950,294) * f | 7,938,000 | 7,952,217 | ||||||||||
| 1.447%, 03/18/2017 (Acquired 04/04/2016, Cost $2,001,480) * f ∞ | 2,000,000 | 1,999,102 | ||||||||||
| 3.500%, 09/13/2017 (Acquired 06/04/2014 through 10/01/2015, Cost $5,147,368) * f | 5,050,000 | 5,173,159 | ||||||||||
| 2.500%, 03/18/2019 (Acquired 03/14/2016, Cost $2,997,930) * | 3,000,000 | 3,066,669 | ||||||||||
| Ingersoll-Rand Global Holding Co. Ltd.: | ||||||||||||
| 6.875%, 08/15/2018 | 7,751,000 | 8,606,904 | ||||||||||
| 2.875%, 01/15/2019 | 10,153,000 | 10,514,477 | ||||||||||
| Ingredion, Inc., | ||||||||||||
| 1.800%, 09/25/2017 | 10,100,000 | 10,152,106 | ||||||||||
| Kinder Morgan Energy Partners LP: | ||||||||||||
| 6.000%, 02/01/2017 | 1,925,000 | 1,969,731 | ||||||||||
| 9.000%, 02/01/2019 | 1,842,000 | 2,097,609 | ||||||||||
| Kinder Morgan, Inc.: | ||||||||||||
| 2.000%, 12/01/2017 | 3,000,000 | 2,983,953 | ||||||||||
| 7.250%, 06/01/2018 | 1,710,000 | 1,849,314 | ||||||||||
| L-3 Communications Corp., | ||||||||||||
| 1.500%, 05/28/2017 | 2,000,000 | 2,001,752 | ||||||||||
| Laboratory Corp. of America Holdings, | ||||||||||||
| 2.625%, 02/01/2020 | 2,000,000 | 2,042,780 | ||||||||||
| Lafarge SA, | ||||||||||||
| 6.500%, 07/15/2016 f | 3,843,000 | 3,847,708 | ||||||||||
| LyondellBasell Industries NV, | ||||||||||||
| 5.000%, 04/15/2019 f | 1,120,000 | 1,212,270 | ||||||||||
| Marathon Oil Corp., | ||||||||||||
| 6.000%, 10/01/2017 | 7,805,000 | 8,086,284 | ||||||||||
| Marathon Petroleum Corp., | ||||||||||||
| 2.700%, 12/14/2018 | 14,100,000 | 14,416,601 | ||||||||||
| Masco Corp., | ||||||||||||
| 3.500%, 04/01/2021 | 1,000,000 | 1,020,300 | ||||||||||
| McDonald's Corp., | ||||||||||||
| 2.100%, 12/07/2018 | 9,500,000 | 9,722,034 | ||||||||||
| Medtronic, Inc., | ||||||||||||
| 1.453%, 03/15/2020 f ∞ | 2,250,000 | 2,270,777 | ||||||||||
| Merey Sweeny LP, | ||||||||||||
| 8.850%, 12/18/2019 (Acquired 11/16/2015, Cost $2,822,711) * | 2,544,273 | 2,846,367 | ||||||||||
| Molex Electronic Technologies LLC, | ||||||||||||
| 2.878%, 04/15/2020 (Acquired 01/05/2016, Cost $2,253,091) * | 2,300,000 | 2,290,030 | ||||||||||
| Mondelez International, Inc., | ||||||||||||
| 1.157%, 02/01/2019 ∞ | 9,337,000 | 9,321,902 | ||||||||||
| Murphy Oil Corp., | ||||||||||||
| 3.500%, 12/01/2017 | 10,281,000 | 10,250,784 | ||||||||||
| Mylan NV, | ||||||||||||
| 2.500%, 06/07/2019 (Acquired 05/31/2016, Cost $4,994,400) * f | 5,000,000 | 5,066,390 | ||||||||||
| Mylan, Inc., | ||||||||||||
| 2.600%, 06/24/2018 | 1,150,000 | 1,164,604 | ||||||||||
| Nabors Industries, Inc., | ||||||||||||
| 2.350%, 09/15/2016 | 2,000,000 | 1,996,906 | ||||||||||
| Newell Rubbermaid, Inc., | ||||||||||||
| 2.600%, 03/29/2019 | 4,250,000 | 4,361,269 | ||||||||||
| Nissan Motor Acceptance Corp.: | ||||||||||||
| 1.340%, 09/26/2016 (Acquired 09/19/2013, Cost $5,000,000) * ∞ | 5,000,000 | 5,005,245 | ||||||||||
| 1.231%, 03/03/2017 (Acquired 02/25/2014, Cost $3,000,000) * ∞ | 3,000,000 | 3,002,202 | ||||||||||
| 2.650%, 09/26/2018 (Acquired 07/29/2014 through 10/08/2015, Cost $4,823,835) * | 4,760,000 | 4,882,656 | ||||||||||
| Noble Holding International Ltd.: | ||||||||||||
| 2.500%, 03/15/2017 @ f | 5,510,000 | 5,447,737 | ||||||||||
| 5.000%, 03/16/2018 @ f | 1,848,000 | 1,820,280 | ||||||||||
| ONEOK Partners LP: | ||||||||||||
| 6.150%, 10/01/2016 | 5,289,000 | 5,340,906 | ||||||||||
| 2.000%, 10/01/2017 | 2,858,000 | 2,854,053 | ||||||||||
| 8.625%, 03/01/2019 | 1,500,000 | 1,699,367 | ||||||||||
| Pentair Finance SA: | ||||||||||||
| 1.875%, 09/15/2017 f | 6,000,000 | 5,989,098 | ||||||||||
| 2.900%, 09/15/2018 f | 13,075,000 | 13,207,450 | ||||||||||
| Perrigo Finance Unlimited Co., | ||||||||||||
| 3.500%, 03/15/2021 @ f | 4,500,000 | 4,656,231 | ||||||||||
| Petrofac Ltd., | ||||||||||||
| 3.400%, 10/10/2018 (Acquired 10/03/2013 through 09/25/2015, Cost $12,177,810) * f | 12,050,000 | 12,049,964 | ||||||||||
| Phillips 66, | ||||||||||||
| 2.950%, 05/01/2017 | 3,000,000 | 3,043,914 | ||||||||||
| Phillips 66 Partners LP, | ||||||||||||
| 2.646%, 02/15/2020 | 2,000,000 | 2,010,940 | ||||||||||
| Pioneer Natural Resources Co.: | ||||||||||||
| 5.875%, 07/15/2016 | 10,133,000 | 10,146,771 | ||||||||||
| 6.650%, 03/15/2017 | 1,260,000 | 1,304,043 | ||||||||||
| 6.875%, 05/01/2018 | 1,000,000 | 1,081,048 | ||||||||||
| Potash Corp of Saskatchewan, Inc., | ||||||||||||
| 6.500%, 05/15/2019 f | 11,500,000 | 12,997,197 | ||||||||||
| Republic Services, Inc.: | ||||||||||||
| 3.800%, 05/15/2018 | 7,990,000 | 8,359,993 | ||||||||||
| 5.500%, 09/15/2019 | 6,446,000 | 7,198,267 | ||||||||||
| Rogers Communications, Inc., | ||||||||||||
| 6.800%, 08/15/2018 f | 3,233,000 | 3,580,344 | ||||||||||
| Rohm and Haas Co., | ||||||||||||
| 6.000%, 09/15/2017 | 646,000 | 680,369 | ||||||||||
| RPM International, Inc., | ||||||||||||
| 6.500%, 02/15/2018 | 3,870,000 | 4,140,242 | ||||||||||
| SABMiller Holdings, Inc., | ||||||||||||
| 1.327%, 08/01/2018 (Acquired 08/06/2013 through 11/14/2014, Cost $9,416,012) * ∞ | 9,400,000 | 9,394,031 | ||||||||||
| Solvay Finance America LLC, | ||||||||||||
| 3.400%, 12/03/2020 (Acquired 05/04/2016, Cost $7,239,025) * | 7,000,000 | 7,330,617 | ||||||||||
| Southern Railway Co., | ||||||||||||
| 9.750%, 06/15/2020 | 2,000,000 | 2,572,044 | ||||||||||
| Stryker Corp., | ||||||||||||
| 2.000%, 03/08/2019 | 6,250,000 | 6,353,419 | ||||||||||
| Sunoco, Inc., | ||||||||||||
| 5.750%, 01/15/2017 | 600,000 | 611,273 | ||||||||||
| Telefonica Emisiones SAU, | ||||||||||||
| 6.221%, 07/03/2017 f | 1,344,000 | 1,403,205 | ||||||||||
| Temple-Inland, Inc., | ||||||||||||
| 6.625%, 01/15/2018 | 4,676,000 | 5,032,629 | ||||||||||
| Texas Eastern Transmission LP, | ||||||||||||
| 6.000%, 09/15/2017 (Acquired 05/21/2015, Cost $3,897,508) * | 3,705,000 | 3,886,719 | ||||||||||
| The Dow Chemical Co., | ||||||||||||
| 8.550%, 05/15/2019 | 14,777,000 | 17,540,816 | ||||||||||
| The JM Smucker Co.: | ||||||||||||
| 1.750%, 03/15/2018 | 2,550,000 | 2,570,086 | ||||||||||
| 2.500%, 03/15/2020 | 2,725,000 | 2,810,475 | ||||||||||
| Thermo Fisher Scientific, Inc., | ||||||||||||
| 1.850%, 01/15/2018 | 12,000,000 | 12,079,068 | ||||||||||
| Thomson Reuters Corp., | ||||||||||||
| 1.650%, 09/29/2017 f | 7,000,000 | 7,029,953 | ||||||||||
| Time Warner Cable, Inc.: | ||||||||||||
| 5.850%, 05/01/2017 | 2,355,000 | 2,437,837 | ||||||||||
| 6.750%, 07/01/2018 | 6,000,000 | 6,579,234 | ||||||||||
| 8.750%, 02/14/2019 | 4,395,000 | 5,131,642 | ||||||||||
| 8.250%, 04/01/2019 | 2,564,000 | 2,977,319 | ||||||||||
| Time Warner Co., Inc., | ||||||||||||
| 7.250%, 10/15/2017 | 7,831,000 | 8,416,195 | ||||||||||
| Total Capital International: | ||||||||||||
| 1.200%, 08/10/2018 f ∞ | 4,350,000 | 4,338,921 | ||||||||||
| 0.997%, 06/19/2019 f ∞ | 7,700,000 | 7,520,736 | ||||||||||
| TransCanada PipeLines Ltd.: | ||||||||||||
| 1.875%, 01/12/2018 f | 4,000,000 | 4,019,184 | ||||||||||
| 3.125%, 01/15/2019 f | 6,800,000 | 7,022,931 | ||||||||||
| Transocean, Inc.: | ||||||||||||
| 6.800%, 12/15/2016 f | 400,000 | 404,000 | ||||||||||
| 3.750%, 10/15/2017 @ f | 7,400,000 | 7,455,500 | ||||||||||
| TSMC Global Ltd., | ||||||||||||
| 1.625%, 04/03/2018 (Acquired 08/05/2014 through 11/03/2015, Cost $15,809,482) * f | 15,919,000 | 15,962,204 | ||||||||||
| TTX Co., | ||||||||||||
| 2.250%, 02/01/2019 (Acquired 01/12/2016, Cost $7,440,390) * | 7,450,000 | 7,576,151 | ||||||||||
| Tyco Electronics Group SA, | ||||||||||||
| 6.550%, 10/01/2017 f | 860,000 | 914,239 | ||||||||||
| Vale Overseas Ltd., | ||||||||||||
| 6.250%, 01/23/2017 @ f | 15,250,000 | 15,599,225 | ||||||||||
| Valero Energy Corp.: | ||||||||||||
| 6.125%, 06/15/2017 | 1,120,000 | 1,164,529 | ||||||||||
| 9.375%, 03/15/2019 | 10,349,000 | 12,367,293 | ||||||||||
| Verisk Analytics, Inc., | ||||||||||||
| 4.875%, 01/15/2019 | 9,900,000 | 10,555,568 | ||||||||||
| Verizon Communications, Inc.: | ||||||||||||
| 2.183%, 09/15/2016 ∞ | 600,000 | 601,540 | ||||||||||
| 3.650%, 09/14/2018 | 14,000,000 | 14,711,158 | ||||||||||
| Viacom, Inc.: | ||||||||||||
| 2.500%, 12/15/2016 | 1,250,000 | 1,255,415 | ||||||||||
| 2.500%, 09/01/2018 | 11,005,000 | 11,157,903 | ||||||||||
| Vodafone Group PLC, | ||||||||||||
| 5.625%, 02/27/2017 f | 2,000,000 | 2,056,060 | ||||||||||
| Volkswagen Group of America Finance LLC: | ||||||||||||
| 1.024%, 05/23/2017 (Acquired 05/15/2014, Cost $2,750,000) * ∞ | 2,750,000 | 2,736,096 | ||||||||||
| 1.076%, 11/20/2017 (Acquired 11/12/2014, Cost $4,500,000) * ∞ | 4,500,000 | 4,453,551 | ||||||||||
| Walgreen Co., | ||||||||||||
| 5.250%, 01/15/2019 | 2,330,000 | 2,525,168 | ||||||||||
| Walgreens Boots Alliance, Inc.: | ||||||||||||
| 1.750%, 11/17/2017 | 1,150,000 | 1,158,203 | ||||||||||
| 1.750%, 05/30/2018 | 2,750,000 | 2,771,483 | ||||||||||
| Williams Partners LP, | ||||||||||||
| 7.250%, 02/01/2017 | 935,000 | 962,968 | ||||||||||
| Xerox Corp.: | ||||||||||||
| 6.750%, 02/01/2017 | 2,626,000 | 2,696,471 | ||||||||||
| 2.950%, 03/15/2017 | 5,245,000 | 5,290,427 | ||||||||||
| Yara International ASA, | ||||||||||||
| 7.875%, 06/11/2019 (Acquired 10/02/2014, Cost $568,934) * f | 500,000 | 579,704 | ||||||||||
| Zimmer Holdings, Inc., | ||||||||||||
| 2.700%, 04/01/2020 | 4,725,000 | 4,782,362 | ||||||||||
| Zoetis, Inc., | ||||||||||||
| 1.875%, 02/01/2018 | 11,000,000 | 11,032,252 | ||||||||||
| 1,116,717,188 | 31.3 | % | ||||||||||
| Total Corporate Bonds | 2,119,770,296 | 59.4 | % | |||||||||
| Other Government Related Securities | ||||||||||||
| CNOOC Finance 2013 Ltd., | ||||||||||||
| 1.750%, 05/09/2018 f | 1,000,000 | 999,846 | ||||||||||
| CNOOC Nexen Finance (2014) ULC, | ||||||||||||
| 1.625%, 04/30/2017 f | 5,000,000 | 5,008,175 | ||||||||||
| CNPC General Capital Ltd., | ||||||||||||
| 1.526%, 05/14/2017 (Acquired 05/07/2014, Cost $4,750,000) * f ∞ | 4,750,000 | 4,749,211 | ||||||||||
| Corp Andina de Fomento, | ||||||||||||
| 5.750%, 01/12/2017 f | 250,000 | 255,912 | ||||||||||
| Electricite de France SA, | ||||||||||||
| 1.094%, 01/20/2017 (Acquired 01/13/2014, Cost $9,750,000) * f ∞ | 9,750,000 | 9,756,542 | ||||||||||
| Export-Import Bank of Korea, | ||||||||||||
| 1.380%, 01/14/2017 f ∞ | 1,570,000 | 1,572,167 | ||||||||||
| Federal Home Loan Mortgage Corp., | ||||||||||||
| Class 0003, 1.000%, 04/27/2018 | 35,000,000 | 35,065,835 | ||||||||||
| Guardian Life Global Funding, | ||||||||||||
| 2.000%, 04/26/2021 (Acquired 04/19/2016, Cost $7,814,671) * | 7,825,000 | 7,927,954 | ||||||||||
| Korea Expressway Corp., | ||||||||||||
| 1.625%, 04/28/2017 (Acquired 06/23/2014, Cost $3,989,480) * f | 4,000,000 | 4,012,260 | ||||||||||
| Korea Hydro & Nuclear Power Co. Ltd., | ||||||||||||
| 2.875%, 10/02/2018 (Acquired 09/25/2013, Cost $2,982,150) * f | 3,000,000 | 3,074,424 | ||||||||||
| Nexen Energy ULC, | ||||||||||||
| 6.200%, 07/30/2019 f | 2,065,000 | 2,289,678 | ||||||||||
| Petrobras Global Finance BV, | ||||||||||||
| 3.016%, 03/17/2017 f ∞ | 4,000,000 | 4,001,960 | ||||||||||
| Petroleos Mexicanos: | ||||||||||||
| 5.500%, 02/04/2019 (Acquired 01/28/2016 through 01/29/2016, Cost $3,200,000) * f | 3,200,000 | 3,363,200 | ||||||||||
| 8.000%, 05/03/2019 f | 5,000,000 | 5,570,300 | ||||||||||
| Sinopec Group Overseas Development [2014] Ltd., | ||||||||||||
| 1.750%, 04/10/2017 (Acquired 04/02/2014, Cost $6,984,110) * f | 7,000,000 | 7,022,834 | ||||||||||
| Sinopec Group Overseas Development [2015] Ltd., | ||||||||||||
| 2.500%, 04/28/2020 (Acquired 04/21/2015, Cost $2,987,280) * f | 3,000,000 | 3,032,361 | ||||||||||
| Sinopec Group Overseas Development [2016] Ltd., | ||||||||||||
| 2.125%, 05/03/2019 (Acquired 04/25/2016, Cost $6,982,640) * f | 7,000,000 | 7,029,533 | ||||||||||
| The Korea Development Bank: | ||||||||||||
| 1.260%, 01/22/2017 f ∞ | 5,000,000 | 5,000,015 | ||||||||||
| 3.875%, 05/04/2017 f | 2,350,000 | 2,403,336 | ||||||||||
| 3.000%, 03/17/2019 f | 2,475,000 | 2,572,525 | ||||||||||
| 114,708,068 | 3.2 | % | ||||||||||
| Taxable Municipal Bonds | ||||||||||||
| Chippewa Valley Schools, | ||||||||||||
| 1.180%, 05/01/2017 | 7,175,000 | 7,191,933 | ||||||||||
| City of Bristol VA, | ||||||||||||
| 3.002%, 10/01/2020 | 8,210,000 | 8,527,399 | ||||||||||
| City of Williston ND, | ||||||||||||
| 3.100%, 07/15/2025 (Callable 07/21/2016) | 5,765,000 | 5,767,364 | ||||||||||
| Consolidated Municipalities Electric Power Systems Joint Powers Board, | ||||||||||||
| 1.550%, 06/01/2017 | 590,000 | 592,236 | ||||||||||
| Cook County School District No. 144 Prairie Hills: | ||||||||||||
| 2.000%, 12/01/2017 | 810,000 | 823,300 | ||||||||||
| 2.000%, 12/01/2017 | 120,000 | 120,868 | ||||||||||
| 2.500%, 12/01/2018 | 745,000 | 759,818 | ||||||||||
| Government Development Bank for Puerto Rico, | ||||||||||||
| 4.704%, 05/01/2016 | 725,000 | 211,156 | ||||||||||
| Illinois Housing Development Authority, | ||||||||||||
| 4.000%, 02/01/2034 (Callable 08/01/2025) | 12,535,000 | 13,413,327 | ||||||||||
| Indiana Bond Bank, | ||||||||||||
| 1.689%, 01/15/2017 | 1,000,000 | 1,005,740 | ||||||||||
| Iowa Tobacco Settlement Authority, | ||||||||||||
| 6.500%, 06/01/2023 (Callable 08/01/2016) | 205,000 | 209,063 | ||||||||||
| Metropolitan Government Nashville & Davidson County Health & Educational Facilities, | ||||||||||||
| 1.600%, 07/01/2046 (Callable 06/30/2016) ∞ | 10,000,000 | 10,000,000 | ||||||||||
| New Hampshire Housing Finance Authority: | ||||||||||||
| 1.250%, 07/01/2016 | 820,000 | 820,000 | ||||||||||
| 1.500%, 01/01/2017 | 765,000 | 767,088 | ||||||||||
| 1.650%, 07/01/2017 | 725,000 | 728,582 | ||||||||||
| 4.000%, 07/01/2036 (Callable 07/10/2024) | 10,805,000 | 11,368,265 | ||||||||||
| New Jersey Economic Development Authority: | ||||||||||||
| 1.802%, 06/15/2017 | 2,980,000 | 2,993,082 | ||||||||||
| 3.375%, 06/15/2017 | 5,000,000 | 5,060,500 | ||||||||||
| 2.421%, 06/15/2018 | 10,000,000 | 10,045,300 | ||||||||||
| New Jersey Sports & Exposition Authority: | ||||||||||||
| 6.076%, 03/01/2023 | 2,705,000 | 3,025,245 | ||||||||||
| 5.976%, 03/01/2024 | 5,000,000 | 5,538,850 | ||||||||||
| Oakland Redevelopment Agency Successor Bonds, | ||||||||||||
| 2.271%, 09/01/2018 | 1,675,000 | 1,697,211 | ||||||||||
| Rhode Island Housing & Mortgage Finance Corp./RI: | ||||||||||||
| 1.930%, 04/01/2017 | 600,000 | 604,032 | ||||||||||
| 3.000%, 10/01/2034 (Callable 10/01/2022) | 7,405,000 | 7,595,012 | ||||||||||
| San Diego Metropolitan Transit System, | ||||||||||||
| 4.840%, 12/01/2018 | 5,110,000 | 5,348,944 | ||||||||||
| Schenectady Metroplex Development Authority/NY, | ||||||||||||
| 2.232%, 08/01/2017 | 200,000 | 201,754 | ||||||||||
| State of Illinois: | ||||||||||||
| 5.090%, 04/01/2017 | 2,785,000 | 2,836,662 | ||||||||||
| 4.350%, 06/01/2018 | 737,000 | 759,640 | ||||||||||
| Tulsa Airports Improvement Trust: | ||||||||||||
| 2.592%, 06/01/2017 | 115,000 | 117,154 | ||||||||||
| 3.042%, 06/01/2018 | 100,000 | 103,433 | ||||||||||
| 108,232,958 | 3.0 | % | ||||||||||
| Residential Mortgage-Backed Securities | ||||||||||||
| U.S. Government Agency Issues | ||||||||||||
| Fannie Mae REMIC Trust, | ||||||||||||
| Series 2004-W6, Class 1A6, 5.500%, 07/25/2034 | 63,835 | 64,124 | ||||||||||
| Federal Home Loan Mortgage Corp. (FHLMC), | ||||||||||||
| Series 5, Class B, 1.142%, 05/15/2019 ∞ | 1,445 | 1,447 | ||||||||||
| 65,571 | 0.0 | % | ||||||||||
| Non-U.S. Government Agency Issues | ||||||||||||
| Alternative Loan Trust: | ||||||||||||
| Series 2005-50CB, Class 4A1, 5.000%, 11/25/2020 | 190,181 | 188,595 | ||||||||||
| Series 2005-73CB, Class 1A7, 5.500%, 01/25/2036 | 108,423 | 99,769 | ||||||||||
| Series 2006-28CB, Class A17, 6.000%, 10/25/2036 | 876,106 | 637,223 | ||||||||||
| Banc of America Alternative Loan Trust: | ||||||||||||
| Series 2004-2, Class 5A1, 5.500%, 03/25/2019 | 306,055 | 307,401 | ||||||||||
| Series 2004-B, Class 2A2, 3.051%, 03/25/2034 ∞ | 2,615,312 | 2,595,027 | ||||||||||
| Countrywide Alternative Loan Trust: | ||||||||||||
| Series 2004-12CB, Class 1A1, 5.000%, 07/25/2019 | 799,497 | 815,719 | ||||||||||
| Series 2004-J2, Class 3A3, 5.500%, 04/25/2034 | 206,061 | 207,260 | ||||||||||
| GSAA Trust, | ||||||||||||
| Series 2005-8, Class A4, 0.723%, 06/25/2035 ∞ | 14,572,838 | 14,028,107 | ||||||||||
| J.P. Morgan Mortgage Trust, | ||||||||||||
| Series 2005-A4, Class 1A1, 2.870%, 07/25/2035 ∞ | 1,259,767 | 1,232,679 | ||||||||||
| MASTR Alternative Loan Trust: | ||||||||||||
| Series 2003-5, Class 7A1, 5.000%, 07/25/2018 | 3,304,573 | 3,305,598 | ||||||||||
| Series 2003-9, Class 3A1, 4.750%, 11/25/2018 | 1,714,189 | 1,723,911 | ||||||||||
| Series 2003-5, Class 4A1, 5.500%, 07/25/2033 | 5,605,871 | 5,845,684 | ||||||||||
| Structured Asset Securities Corp., | ||||||||||||
| Series 2004-4XS, Class 1A6, 5.050%, 02/25/2034 | 321,142 | 325,559 | ||||||||||
| Structured Asset Securities Corp. Mortgage Pass-Through Certificates, | ||||||||||||
| Series 2004-22, Class A2, 5.067%, 01/25/2035 | 6,629,305 | 6,783,292 | ||||||||||
| Thornburg Mortgage Securities Trust, | ||||||||||||
| Series 2003-5, Class 3A, 2.418%, 10/25/2043 ∞ | 11,468,848 | 11,489,868 | ||||||||||
| Towd Point Mortgage Trust, | ||||||||||||
| Series 2015-4, Class A1, 3.500%, 04/25/2055 (Acquired 06/09/2016, Cost $7,870,260) * ∞ | 7,660,393 | 7,896,061 | ||||||||||
| WaMu Mortgage Pass-Through Certificates: | ||||||||||||
| Series 2004-CB4, Class 21A, 5.500%, 12/25/2019 | 62,012 | 63,127 | ||||||||||
| Series 2004-CB4, Class 22A, 6.000%, 12/25/2019 | 148,173 | 151,635 | ||||||||||
| Series 2004-AR3, Class A1, 2.785%, 06/25/2034 ∞ | 7,871,039 | 7,919,748 | ||||||||||
| 65,616,263 | 1.8 | % | ||||||||||
| Asset Backed Securities | ||||||||||||
| Accredited Mortgage Loan Trust: | ||||||||||||
| Series 2006-1, Class A3, 0.633%, 04/25/2036 ∞ | 3,875,431 | 3,858,039 | ||||||||||
| Series 2006-2, Class A3, 0.603%, 09/25/2036 ∞ | 8,725,613 | 8,662,953 | ||||||||||
| ACE Securities Corp. Home Equity Loan Trust: | ||||||||||||
| Series 2006-HE1, Class A1B1, 0.643%, 02/25/2036 ∞ | 7,232,555 | 7,139,022 | ||||||||||
Series 2006-OP1, Class A2C, 0.603%, 04/25/2036 ∞ | 5,665,566 | 5,446,031 | ||||||||||
| Aegis Asset Backed Securities Trust, | ||||||||||||
| Series 2005-5, Class 1A3, 0.723%, 12/25/2035 ∞ | 3,788,208 | 3,735,302 | ||||||||||
| American Express Credit Account Master Trust, | ||||||||||||
| Series 2014-4, Class A, 1.430%, 06/15/2020 | 5,545,000 | 5,582,092 | ||||||||||
| Ameriquest Mortgage Securities, Inc. Asset-Backed Pass-Through Trust, | ||||||||||||
| Series 2005-R8, Class A2D, 0.813%, 10/25/2035 ∞ | 2,262,383 | 2,261,154 | ||||||||||
| Argent Securities Inc Asset-Backed Pass-Through Certificates, | ||||||||||||
| Series 2005-W3, Class A2D, 0.793%, 11/25/2035 ∞ | 10,485,259 | 10,187,453 | ||||||||||
| Barclays Dryrock Issuance Trust, | ||||||||||||
| Series 2015-1, Class A, 2.200%, 12/15/2022 | 6,750,000 | 6,943,621 | ||||||||||
| California Republic Auto Receivables Trust, | ||||||||||||
| Series 2015-3, Class A3, 1.620%, 11/15/2019 | 17,500,000 | 17,561,526 | ||||||||||
| Capital Auto Receivables Asset Trust: | ||||||||||||
| Series 2014-3, Class A2, 1.180%, 12/20/2017 | 14,442,016 | 14,446,744 | ||||||||||
| Series 2015-3, Class A1A, 1.390%, 02/20/2018 | 13,790,000 | 13,803,742 | ||||||||||
| Series 2015-4, Class A3, 1.830%, 03/20/2020 | 3,075,000 | 3,095,676 | ||||||||||
| Capital One Multi-Asset Execution Trust, | ||||||||||||
| Series 2014-A2, Class A2, 1.260%, 01/15/2020 | 11,172,000 | 11,207,499 | ||||||||||
| Carrington Mortgage Loan Trust: | ||||||||||||
| Series 2006-OPT1, Class A3, 0.633%, 02/25/2036 ∞ | 4,203,302 | 4,102,698 | ||||||||||
Series 2006-NC2, Class A2, 0.543%, 06/25/2036 ∞ | 423,221 | 422,290 | ||||||||||
| Chase Issuance Trust: | ||||||||||||
| Series 2014-A1, Class A1, 1.150%, 01/15/2019 | 31,310,000 | 31,372,698 | ||||||||||
| Series 2015-A5, Class A5, 1.360%, 04/15/2020 | 13,300,000 | 13,379,527 | ||||||||||
| Series 2016-A1, Class A, 0.852%, 05/17/2021 ∞ | 7,800,000 | 7,802,243 | ||||||||||
| Chrysler Capital Auto Receivables Trust: | ||||||||||||
| Series 2015-BA, Class A2, 1.460%, 12/17/2018 (Acquired 11/12/2015, Cost $4,253,417) * | 4,253,485 | 4,256,042 | ||||||||||
| Series 2013-BA, Class A4, 1.270%, 03/15/2019 (Acquired 11/12/2015 through 12/18/2015, Cost $5,078,093) * | 5,089,596 | 5,092,171 | ||||||||||
| Citibank Credit Card Issuance Trust, | ||||||||||||
| Series 2008-1A, Class A1, 5.350%, 02/07/2020 | 2,325,000 | 2,484,729 | ||||||||||
| Conseco Financial Corp.: | ||||||||||||
| Series 1998-2, Class A5, 6.240%, 12/01/2028 ∞ | 13,961 | 14,560 | ||||||||||
| Series 1998-3, Class A5, 6.220%, 03/01/2030 | 196,137 | 206,201 | ||||||||||
| Countrywide Asset-Backed Certificates: | ||||||||||||
| Series 2006-13, Class 1AF3, 4.626%, 01/25/2037 § ∞ | 1,004,422 | 1,439,061 | ||||||||||
Series 2006-9, Class 1AF3, 4.841%, 10/25/2046 ∞ | 994,787 | 788,143 | ||||||||||
| Credit-Based Asset Servicing and Securitization LLC, | ||||||||||||
| Series 2005-CB8, Class AF2, 4.070%, 12/25/2035 | 215,278 | 213,015 | ||||||||||
| Dell Equipment Finance Trust, | ||||||||||||
| Series 2015-1, Class A2, 1.010%, 07/24/2017 (Acquired 04/15/2015 through 09/22/2015, Cost $17,426,516) * | 17,427,771 | 17,421,441 | ||||||||||
| Discover Card Execution Note Trust, | ||||||||||||
| Series 2014-A5, Class A, 1.390%, 04/15/2020 | 7,399,000 | 7,445,068 | ||||||||||
| First Franklin Mortgage Loan Trust: | ||||||||||||
| Series 2004-FF7, Class A1, 1.093%, 09/25/2034 ∞ | 1,362,390 | 1,361,781 | ||||||||||
Series 2005-FF12, Class A2B, 0.713%, 11/25/2036 ∞ | 3,657,215 | 3,609,249 | ||||||||||
| First National Master Note Trust, | ||||||||||||
Series 2015-1, Class A, 1.212%, 09/15/2020 ∞ | 7,500,000 | 7,517,375 | ||||||||||
| Ford Credit Auto Owner Trust: | ||||||||||||
| Series 2014-1, Class A, 2.260%, 11/15/2025 (Acquired 05/06/2014 through 11/18/2014, Cost $17,939,285) * | 17,894,000 | 18,253,879 | ||||||||||
| Series 2014-2, Class A, 2.310%, 04/15/2026 (Acquired 01/06/2016, Cost $8,217,289) * | 8,192,000 | 8,368,302 | ||||||||||
| Series 2015-1, Class A, 2.120%, 07/15/2026 (Acquired 01/13/2015 through 03/14/2016, Cost $12,566,749) * | 12,592,000 | 12,782,420 | ||||||||||
| Ford Credit Floorplan Master Owner Trust A, | ||||||||||||
| Series 2016-1, Class A1, 1.760%, 02/15/2021 | 11,425,000 | 11,458,695 | ||||||||||
| GE-WMC Asset-Backed Pass Through Certificates, | ||||||||||||
| Series 2005-1, Class A2C, 1.173%, 10/25/2035 ∞ | 3,688,688 | 3,655,244 | ||||||||||
| GM Financial Automobile Leasing Trust, | ||||||||||||
| Series 2016-2, Class A3, 1.620%, 09/20/2019 | 12,675,000 | 12,771,193 | ||||||||||
| GMF Floorplan Owner Revolving Trust, | ||||||||||||
| Series 2015-1, Class A1, 1.650%, 05/15/2020 (Acquired 05/13/2015, Cost $14,699,441) * | 14,700,000 | 14,719,410 | ||||||||||
| Golden Credit Card Trust, | ||||||||||||
| Series 2013-2A, Class A, 0.872%, 09/15/2018 (Acquired 03/29/2016, Cost $2,425,000) f * ∞ | 2,425,000 | 2,425,233 | ||||||||||
| GSAMP Trust, | ||||||||||||
| Series 2006-HE1, Class A2C, 0.663%, 01/25/2036 ∞ | 759,689 | 756,304 | ||||||||||
| Home Equity Asset Trust, | ||||||||||||
Series 2006-4, Class 2A3, 0.623%, 08/25/2036 ∞ | 1,592,296 | 1,574,359 | ||||||||||
| Honda Auto Receivables Owner Trust: | ||||||||||||
| Series 2016-1, Class A2, 1.010%, 06/18/2018 | 3,000,000 | 3,001,933 | ||||||||||
| Series 2016-1, Class A3, 1.220%, 12/18/2019 | 13,000,000 | 13,038,000 | ||||||||||
| J.P. Morgan Mortgage Acquisition Trust, | ||||||||||||
| Series 2006-CH1, Class A1, 0.583%, 07/25/2036 ∞ | 7,397,454 | 7,119,898 | ||||||||||
| Kubota Credit Owner Trust, | ||||||||||||
| Series 2015-1A, Class A3, 1.540%, 03/15/2019 (Acquired 01/22/2015, Cost $17,572,547) * | 17,575,000 | 17,663,297 | ||||||||||
| Leaf Receivables Funding 10 LLC, | ||||||||||||
| Series 2015-1, Class A3, 1.490%, 03/15/2018 (Acquired 04/23/2015, Cost $5,249,036) * | 5,250,000 | 5,251,108 | ||||||||||
| Leaf Receivables Funding 11 LLC, | ||||||||||||
| Series 2016-1, Class A3, 2.050%, 06/15/2019 (Acquired 05/18/2016, Cost $9,999,075) * | 10,000,000 | 10,030,779 | ||||||||||
| Long Beach Mortgage Loan Trust, | ||||||||||||
| Series 2005-WL2, Class M1, 1.158%, 08/25/2035 ∞ | 4,961,121 | 4,922,709 | ||||||||||
| Master Credit Card Trust II, | ||||||||||||
Series 2013-3A, Class A, 0.878%, 01/22/2018 (Acquired 07/25/2013 through 11/05/2014, Cost $8,950,025) f * ∞ | 8,950,000 | 8,950,521 | ||||||||||
| MASTR Asset Backed Securities Trust, | ||||||||||||
| Series 2006-AB1, Class A2, 0.683%, 02/25/2036 ∞ | 588,970 | 585,103 | ||||||||||
| Morgan Stanley ABS Capital I, Inc. Trust, | ||||||||||||
| Series 2005-HE2, Class A3B, 0.893%, 01/25/2035 ∞ | 4,262,344 | 4,231,089 | ||||||||||
| Nomura Holdings, Inc., | ||||||||||||
| Series 2006-HE2, Class A3, 0.623%, 03/25/2036 ∞ | 3,821,594 | 3,710,799 | ||||||||||
| OneMain Financial Issuance Trust, | ||||||||||||
| Series 2014-2A, Class A, 2.470%, 09/18/2024 (Acquired 02/05/2016, Cost $15,573,595) * | 15,620,000 | 15,653,919 | ||||||||||
| Option One Mortgage Loan Trust Asset-Backed Certificates, | ||||||||||||
| Series 2005-5, Class A3, 0.663%, 12/25/2035 ∞ | 5,899,107 | 5,859,197 | ||||||||||
| Park Place Securities, Inc. Asset-Backed Pass-Through Certificates, | ||||||||||||
| Series 2005-WCW1, Class M1, 0.903%, 09/25/2035 ∞ | 9,198,310 | 9,128,939 | ||||||||||
| Popular ABS Mortgage Pass-Through Trust, | ||||||||||||
| Series 2005-B, Class M2, 1.113%, 08/25/2035 ∞ | 3,900,706 | 3,808,635 | ||||||||||
| RAMP Series Trust: | ||||||||||||
| Series 2003-RS7, Class AI6, 5.340%, 08/25/2033 ∞ | 20,465 | 20,513 | ||||||||||
| Series 2003-RS11, Class AI7, 4.828%, 12/25/2033 ∞ | 197,776 | 200,559 | ||||||||||
| Series 2006-NC2, Class A2, 0.643%, 02/25/2036 ∞ | 3,159,590 | 3,107,964 | ||||||||||
| RASC Series Trust: | ||||||||||||
| Series 2005-AHL2, Class A3, 0.803%, 10/25/2035 ∞ | 8,556,533 | 8,446,295 | ||||||||||
| Series 2006-KS1, Class A4, 0.753%, 02/25/2036 ∞ | 4,552,071 | 4,497,550 | ||||||||||
| Renaissance Home Equity Loan Trust, | ||||||||||||
| Series 2007-2, Class AF2, 5.675%, 06/25/2037 | 1,949,147 | 894,249 | ||||||||||
| Securitized Asset Backed Receivables LLC Trust, | ||||||||||||
| Series 2005-OP2, Class A1, 0.778%, 10/25/2035 (Acquired 03/13/2014, Cost $7,836,676) * ∞ | 7,933,364 | 7,856,417 | ||||||||||
| Soundview Home Loan Trust: | ||||||||||||
| Series 2005-OPT4, Class 2A3, 0.713%, 12/25/2035 ∞ | 1,717,318 | 1,691,310 | ||||||||||
Series 2006-2, Class A4, 0.723%, 03/25/2036 ∞ | 6,170,211 | 6,109,569 | ||||||||||
| Specialty Underwriting & Residential Finance Trust: | ||||||||||||
| Series 2005-BC4, Class A2C, 0.803%, 09/25/2036 ∞ | 3,168,083 | 3,148,124 | ||||||||||
| Series 2006-BC1, Class A2C, 0.653%, 12/25/2036 ∞ | 744,886 | 743,993 | ||||||||||
| Series 2006-BC1, Class A2D, 0.753%, 12/25/2036 ∞ | 9,850,000 | 9,712,147 | ||||||||||
| Springleaf Funding Trust, | ||||||||||||
| Series 2014-AA, Class A, 2.410%, 12/15/2022 (Acquired 09/11/2015, Cost $5,163,027) * | 5,158,413 | 5,161,524 | ||||||||||
| Structured Asset Investment Loan Trust, | ||||||||||||
| Series 2004-9, Class A5, 1.453%, 10/25/2034 ∞ | 12,036,837 | 11,955,216 | ||||||||||
| Structured Asset Securities Corp. Mortgage Loan Trust: | ||||||||||||
| Series 2007-BC2, Class A3, 0.583%, 03/25/2037 ∞ | 1,567,535 | 1,564,119 | ||||||||||
| Series 2007-BC3, Class 2A2, 0.593%, 05/25/2047 ∞ | 983,230 | 957,376 | ||||||||||
| Synchrony Credit Card Master Note Trust: | ||||||||||||
| Series 2014-1, Class A, 1.610%, 11/15/2020 | 18,437,000 | 18,552,829 | ||||||||||
| Series 2012-2, Class A, 2.220%, 01/15/2022 | 9,243,000 | 9,418,211 | ||||||||||
| TCF Auto Receivables Owner Trust, | ||||||||||||
| Series 2014-1A, Class A4, 1.560%, 01/15/2020 (Acquired 10/21/2015, Cost $6,251,809) * | 6,250,000 | 6,262,361 | ||||||||||
| Toyota Auto Receivables 2016-B Owner Trust, | ||||||||||||
| Series 2016-B, Class A3, 1.300%, 04/15/2020 | 7,000,000 | 7,032,004 | ||||||||||
| Toyota Auto Receivables Owner Trust, | ||||||||||||
| Series 2016-B, Class A2A, 1.020%, 10/15/2018 | 3,469,000 | 3,473,861 | ||||||||||
| 533,386,302 | 15.0 | % | ||||||||||
| Commercial Mortgage-Backed Securities | ||||||||||||
| U.S. Government Agency Issues | ||||||||||||
| Fannie Mae REMIC Trust: | ||||||||||||
| Series 2015-M1, Class ASQ2, 1.626%, 02/25/2018 | 25,535,570 | 25,740,988 | ||||||||||
| Series 2016-M6, Class ASQ2, 1.785%, 06/25/2019 | 13,650,000 | 13,827,672 | ||||||||||
| FHLMC Multifamily Structured Pass Through Certificates: | ||||||||||||
| Series K502, Class A2, 1.426%, 08/25/2017 | 16,733,050 | 16,785,770 | ||||||||||
| Series K006, Class A2, 4.251%, 01/25/2020 | 15,000,000 | 16,451,305 | ||||||||||
| 72,805,735 | 2.1 | % | ||||||||||
| Non-U.S. Government Agency Issue | ||||||||||||
| DBUBS Mortgage Trust, | ||||||||||||
| Series 2011-LC3A, Class A2, 3.642%, 08/10/2044 | 5,865,814 | 5,863,911 | ||||||||||
| J.P. Morgan Chase Commercial Mortgage Securities Trust: | ||||||||||||
| Series 2012-C8, Class ASB, 2.379%, 10/15/2045 | 16,100,000 | 16,540,353 | ||||||||||
| Series 2011-C5, Class ASB, 3.678%, 08/15/2046 | 6,567,176 | 6,912,550 | ||||||||||
| WFRBS Commercial Mortgage Trust, | ||||||||||||
| Series 2012-C6, Class A4, 3.440%, 04/15/2045 | 7,050,000 | 7,577,884 | ||||||||||
| 36,894,698 | 1.0 | % | ||||||||||
| Total Long-Term Investments (Cost $3,503,732,310) | 3,529,924,415 | 98.9 | % | |||||||||
| Shares | ||||||||||||
| SHORT-TERM INVESTMENT | ||||||||||||
| Money Market Mutual Fund | ||||||||||||
| Short-Term Investments Trust - Liquid Assets Portfolio, Institutional Class, 0.43% « | 48,142,514 | 48,142,514 | ||||||||||
| Total Short-Term Investment (Cost $48,142,514) | 48,142,514 | 1.3 | % | |||||||||
| INVESTMENT PURCHASED WITH CASH PROCEEDS FROM | ||||||||||||
| SECURITIES LENDING | ||||||||||||
| Investment Company | ||||||||||||
| Mount Vernon Securities Lending Trust Prime Portfolio, 0.56% « | 39,767,555 | 39,767,555 | ||||||||||
| Total Investment Company (Cost $39,767,555) | 39,767,555 | 1.1 | % | |||||||||
| Total Investment Purchased with Cash Proceeds From | ||||||||||||
| Securities Lending (Cost $39,767,555) | 39,767,555 | 1.1 | % | |||||||||
| Total Investments (Cost $3,591,642,379) | 3,617,834,484 | 101.3 | % | |||||||||
| Liabilities in Excess of Other Assets | (47,982,488 | ) | (1.3 | )% | ||||||||
| TOTAL NET ASSETS | $ | 3,569,851,996 | 100.0 | % | ||||||||
Notes to Schedule of Investments | |
| * | Restricted security as defined in Rule 144 under the Securities Act of 1933 and determined to be liquid. Purchased in a private placement transaction; resale to the public may require registration or or may extend only to qualified institutional buyers. At June 30, 2016, the value of these securities total $749,327,885, which represents 20.99% of total net assets. |
| @ | This security or portion of this security is out on loan at June 30, 2016. |
| f | Foreign Security |
| § | Security in Default |
| ∞ | Variable or Floating rate security. Floating rate securities are securities whose rates vary with a designated index rate. These securities rates are as of June 30, 2016. |
| « | 7-Day Yield |
| Baird Intermediate Bond Fund | ||||||||||||
| Schedule of Investments | ||||||||||||
| June 30, 2016 (Unaudited) | ||||||||||||
| Principal | % of | |||||||||||
| Amount | Value | Net Assets | ||||||||||
| LONG-TERM INVESTMENTS | ||||||||||||
| U.S. Treasury Securities | ||||||||||||
| U.S. Treasury Bonds: | ||||||||||||
| 2.625%, 08/15/2020 | $ | 197,225,000 | $ | 210,845,753 | ||||||||
| 1.750%, 03/31/2022 | 232,050,000 | 239,763,806 | ||||||||||
| 2.500%, 05/15/2024 | 186,200,000 | 202,237,965 | ||||||||||
| 652,847,524 | 31.3 | % | ||||||||||
| Corporate Bonds | ||||||||||||
| Finance | ||||||||||||
| ABN AMRO Bank NV: | ||||||||||||
| 4.250%, 02/02/2017 (Acquired 11/22/2013, Cost $4,568,753) * f | 4,500,000 | 4,577,985 | ||||||||||
| 2.500%, 10/30/2018 (Acquired 10/23/2013 through 04/17/2014, Cost $1,199,896) * f | 1,200,000 | 1,227,854 | ||||||||||
| 2.450%, 06/04/2020 (Acquired 05/28/2015, Cost $2,644,170) * f | 2,650,000 | 2,709,832 | ||||||||||
| Aetna, Inc., | ||||||||||||
| 2.800%, 06/15/2023 | 4,000,000 | 4,086,016 | ||||||||||
| AgriBank FCB, | ||||||||||||
| 9.125%, 07/15/2019 (Acquired 02/24/2014, Cost $3,346,349) * | 2,850,000 | 2,855,962 | ||||||||||
| AIA Group Ltd., | ||||||||||||
| 3.200%, 03/11/2025 (Acquired 03/04/2015, Cost $2,996,190) * f | 3,000,000 | 3,057,978 | ||||||||||
| Ally Financial, Inc., | ||||||||||||
| 8.000%, 12/31/2018 | 96,000 | 104,880 | ||||||||||
| American International Group, Inc.: | ||||||||||||
| 3.300%, 03/01/2021 | 3,000,000 | 3,099,315 | ||||||||||
| 4.875%, 06/01/2022 | 3,000,000 | 3,342,078 | ||||||||||
| AmSouth Bancorporation, | ||||||||||||
| 6.750%, 11/01/2025 | 630,000 | 724,385 | ||||||||||
| ANZ New Zealand (Int'l) Ltd.: | ||||||||||||
| 2.600%, 09/23/2019 (Acquired 09/16/2014 through 03/19/2015, Cost $4,154,719) * f | 4,140,000 | 4,236,081 | ||||||||||
| 2.850%, 08/06/2020 (Acquired 07/30/2015, Cost $3,996,680) * f | 4,000,000 | 4,125,084 | ||||||||||
| Australia & New Zealand Banking Group Ltd./New York NY, | ||||||||||||
| 3.700%, 11/16/2025 f | 1,000,000 | 1,107,093 | ||||||||||
| Bank of America Corp.: | ||||||||||||
| 5.700%, 05/02/2017 | 1,100,000 | 1,138,695 | ||||||||||
| 6.875%, 04/25/2018 | 1,000,000 | 1,091,747 | ||||||||||
| 2.625%, 10/19/2020 @ | 5,000,000 | 5,079,685 | ||||||||||
| 3.300%, 01/11/2023 | 3,350,000 | 3,447,642 | ||||||||||
| 4.000%, 04/01/2024 @ | 2,750,000 | 2,935,056 | ||||||||||
| BanPonce Trust I, | ||||||||||||
| Series A, 8.327%, 02/01/2027 | 2,500,000 | 2,347,502 | ||||||||||
| Barclays Bank PLC, | ||||||||||||
| Series 1, 5.000%, 09/22/2016 f | 2,565,000 | 2,586,738 | ||||||||||
| Barclays PLC: | ||||||||||||
| 2.000%, 03/16/2018 f | 2,600,000 | 2,579,977 | ||||||||||
| 3.250%, 01/12/2021 f | 2,000,000 | 1,992,994 | ||||||||||
| BB&T Corp., | ||||||||||||
| 6.850%, 04/30/2019 | 2,322,000 | 2,664,922 | ||||||||||
| BNZ International Funding Ltd., | ||||||||||||
| 2.350%, 03/04/2019 (Acquired 09/03/2014, Cost $2,789,836) * f | 2,800,000 | 2,843,176 | ||||||||||
| BPCE: | ||||||||||||
| 5.700%, 10/22/2023 (Acquired 11/10/2014, Cost $3,710,098) * @ f | 3,500,000 | 3,753,967 | ||||||||||
| 4.000%, 04/15/2024 f | 3,500,000 | 3,814,545 | ||||||||||
| Caisse Centrale Desjardins, | ||||||||||||
| 1.303%, 01/29/2018 (Acquired 01/26/2015, Cost $8,000,000) * f ∞ | 8,000,000 | 7,978,600 | ||||||||||
| Capital One Bank (USA) National Association, | ||||||||||||
| 2.250%, 02/13/2019 | 3,500,000 | 3,544,744 | ||||||||||
| Capital One Financial Corp., | ||||||||||||
| 3.150%, 07/15/2016 | 2,596,000 | 2,597,480 | ||||||||||
| Capital One NA, | ||||||||||||
| 1.313%, 02/05/2018 ∞ | 2,000,000 | 1,998,434 | ||||||||||
| Citigroup, Inc.: | ||||||||||||
| 1.550%, 08/14/2017 | 1,000,000 | 1,003,252 | ||||||||||
| 1.700%, 04/27/2018 | 1,500,000 | 1,502,405 | ||||||||||
| 2.050%, 12/07/2018 | 5,700,000 | 5,745,298 | ||||||||||
| 3.750%, 06/16/2024 | 500,000 | 526,244 | ||||||||||
| Citizens Bank NA/Providence RI, | ||||||||||||
| 2.550%, 05/13/2021 | 2,000,000 | 2,019,312 | ||||||||||
| Citizens Bank National Association, | ||||||||||||
| 2.450%, 12/04/2019 | 8,000,000 | 8,106,080 | ||||||||||
| CNA Financial Corp.: | ||||||||||||
| 7.350%, 11/15/2019 | 2,395,000 | 2,765,648 | ||||||||||
| 5.750%, 08/15/2021 | 1,385,000 | 1,594,636 | ||||||||||
| 4.500%, 03/01/2026 @ | 5,000,000 | 5,322,030 | ||||||||||
| Comerica Bank: | ||||||||||||
| 5.200%, 08/22/2017 | 5,570,000 | 5,799,495 | ||||||||||
| 2.500%, 06/02/2020 | 3,375,000 | 3,473,614 | ||||||||||
| Commonwealth Bank of Australia, | ||||||||||||
| 5.000%, 10/15/2019 (Acquired 03/02/2012 through 10/03/2014, Cost $4,519,244) * f | 4,335,000 | 4,799,491 | ||||||||||
| Commonwealth Bank of Australia/New York NY, | ||||||||||||
| 1.750%, 11/02/2018 f | 4,500,000 | 4,532,292 | ||||||||||
| Compass Bank: | ||||||||||||
| 2.750%, 09/29/2019 | 8,000,000 | 7,900,488 | ||||||||||
| 3.875%, 04/10/2025 | 2,700,000 | 2,590,990 | ||||||||||
| Cooperatieve Rabobank UA/NY, | ||||||||||||
| 2.500%, 01/19/2021 f | 8,175,000 | 8,379,506 | ||||||||||
| Credit Agricole SA, | ||||||||||||
| 2.750%, 06/10/2020 (Acquired 06/03/2015, Cost $2,994,570) * f | 3,000,000 | 3,094,920 | ||||||||||
| Credit Suisse, | ||||||||||||
| 5.300%, 08/13/2019 f | 3,220,000 | 3,553,956 | ||||||||||
| Credit Suisse Group Funding Guernsey Ltd.: | ||||||||||||
| 3.450%, 04/16/2021 (Acquired 06/03/2016, Cost $2,482,832) * f | 2,450,000 | 2,474,375 | ||||||||||
| 3.800%, 06/09/2023 (Acquired 06/07/2016, Cost $6,232,125) * @ f | 6,250,000 | 6,233,963 | ||||||||||
| Deutsche Bank AG: | ||||||||||||
| 2.950%, 08/20/2020 f | 3,000,000 | 2,973,669 | ||||||||||
| 3.125%, 01/13/2021 @ f | 2,175,000 | 2,172,255 | ||||||||||
| 3.375%, 05/12/2021 f | 5,000,000 | 5,017,210 | ||||||||||
| Discover Bank of Greenwood DE, | ||||||||||||
| 2.600%, 11/13/2018 | 2,500,000 | 2,537,607 | ||||||||||
| GE Capital International Funding Co., | ||||||||||||
| 2.342%, 11/15/2020 (Acquired 02/11/2010 through 12/24/2014, Cost $6,207,882) * f | 6,730,000 | 6,932,984 | ||||||||||
| Genworth Holdings, Inc., | ||||||||||||
| 4.900%, 08/15/2023 | 1,500,000 | 1,128,750 | ||||||||||
| Great-West Life & Annuity Insurance Capital LP II, | ||||||||||||
| 3.164%, 05/16/2046 (Acquired 05/16/2006 through 11/08/2007, Cost $1,792,736) * ∞ | 1,800,000 | 1,588,500 | ||||||||||
| Highmark, Inc., | ||||||||||||
| 4.750%, 05/15/2021 (Acquired 07/30/2014, Cost $2,011,833) * | 2,000,000 | 2,047,660 | ||||||||||
| HSBC Finance Corp., | ||||||||||||
| 6.676%, 01/15/2021 | 4,559,000 | 5,108,378 | ||||||||||
| HSBC Holdings PLC, | ||||||||||||
| 3.600%, 05/25/2023 f | 2,500,000 | 2,554,925 | ||||||||||
| HSBC USA, Inc., | ||||||||||||
| 2.350%, 03/05/2020 | 3,500,000 | 3,498,845 | ||||||||||
| Humana, Inc., | ||||||||||||
| 7.200%, 06/15/2018 | 2,000,000 | 2,214,686 | ||||||||||
| ING Bank NV: | ||||||||||||
| 2.500%, 10/01/2019 (Acquired 09/23/2014, Cost $2,461,635) * f | 2,475,000 | 2,525,349 | ||||||||||
| 5.000%, 06/09/2021 (Acquired 06/12/2013, Cost $2,126,326) * f | 2,000,000 | 2,270,870 | ||||||||||
| 5.800%, 09/25/2023 (Acquired 10/15/2015, Cost $4,159,372) * f | 3,810,000 | 4,181,159 | ||||||||||
| Invesco Finance PLC, | ||||||||||||
| 3.125%, 11/30/2022 f | 4,225,000 | 4,408,902 | ||||||||||
| iStar Financial, Inc., | ||||||||||||
| 5.850%, 03/15/2017 | 75,000 | 75,937 | ||||||||||
| J.P. Morgan Chase & Co.: | ||||||||||||
| 2.250%, 01/23/2020 | 7,875,000 | 7,983,305 | ||||||||||
| 4.500%, 01/24/2022 | 3,000,000 | 3,338,535 | ||||||||||
| Jefferies Group LLC, | ||||||||||||
| 6.875%, 04/15/2021 | 2,000,000 | 2,271,374 | ||||||||||
| John Hancock Life Insurance Co., | ||||||||||||
| 7.375%, 02/15/2024 (Acquired 04/10/2013 through 04/11/2013, Cost $2,846,035) * | 2,325,000 | 2,870,498 | ||||||||||
| Kemper Corp., | ||||||||||||
| 6.000%, 05/15/2017 | 600,000 | 621,148 | ||||||||||
| KeyBank NA/Cleveland OH, | ||||||||||||
| 3.400%, 05/20/2026 | 2,200,000 | 2,233,876 | ||||||||||
| Keybank National Association, | ||||||||||||
| 1.193%, 06/01/2018 ∞ | 8,000,000 | 7,983,896 | ||||||||||
| Korea Housing Finance Corp., | ||||||||||||
| 1.625%, 09/15/2018 (Acquired 02/26/2013 through 08/28/2014, Cost $1,041,904) * f | 1,050,000 | 1,051,303 | ||||||||||
| LeasePlan Corp. NV: | ||||||||||||
| 3.000%, 10/23/2017 (Acquired 02/07/2013, Cost $4,016,732) * f | 4,000,000 | 4,029,408 | ||||||||||
| 2.500%, 05/16/2018 (Acquired 05/29/2013 through 10/20/2014, Cost $5,015,227) * f | 5,000,000 | 5,001,960 | ||||||||||
| Liberty Mutual Group, Inc., | ||||||||||||
| 4.250%, 06/15/2023 (Acquired 06/13/2013, Cost $1,987,300) * | 2,000,000 | 2,124,474 | ||||||||||
| Lloyds Bank PLC: | ||||||||||||
| 2.050%, 01/22/2019 f | 3,000,000 | 2,992,218 | ||||||||||
| 5.800%, 01/13/2020 (Acquired 02/09/2010 through 03/16/2012, Cost $2,902,907) * f | 2,900,000 | 3,244,155 | ||||||||||
| M&I Marshall & Ilsley Bank, | ||||||||||||
| 5.000%, 01/17/2017 | 1,000,000 | 1,018,320 | ||||||||||
| Macquarie Bank Ltd.: | ||||||||||||
| 2.000%, 08/15/2016 (Acquired 08/07/2013, Cost $4,998,250) * f | 5,000,000 | 5,006,100 | ||||||||||
| 1.600%, 10/27/2017 (Acquired 10/22/2014, Cost $2,498,475) * f | 2,500,000 | 2,502,667 | ||||||||||
| 2.400%, 01/21/2020 (Acquired 01/14/2015, Cost $997,800) * f | 1,000,000 | 1,009,566 | ||||||||||
| Manulife Financial Corp., | ||||||||||||
| 4.900%, 09/17/2020 f | 2,300,000 | 2,551,167 | ||||||||||
| Marsh & McLennan Cos., Inc., | ||||||||||||
| 2.550%, 10/15/2018 | 1,000,000 | 1,022,463 | ||||||||||
| MassMutual Global Funding II, | ||||||||||||
| 2.000%, 04/05/2017 (Acquired 03/29/2012, Cost $3,783,470) * | 3,800,000 | 3,833,258 | ||||||||||
| MBIA Insurance Corp., | ||||||||||||
| 11.888%, 01/15/2033 (Acquired 01/11/2008, Cost $500,000) * | 500,000 | 185,000 | ||||||||||
| Metropolitan Life Global Funding I, | ||||||||||||
| 3.000%, 01/10/2023 (Acquired 01/03/2013, Cost $1,299,337) * | 1,300,000 | 1,332,782 | ||||||||||
| Mizuho Bank Ltd., | ||||||||||||
| 2.150%, 10/20/2018 (Acquired 10/13/2015, Cost $4,497,390) * @ f | 4,500,000 | 4,562,703 | ||||||||||
| Morgan Stanley: | ||||||||||||
| 6.625%, 04/01/2018 | 1,600,000 | 1,734,037 | ||||||||||
| 7.300%, 05/13/2019 | 2,700,000 | 3,102,192 | ||||||||||
| 2.375%, 07/23/2019 | 1,000,000 | 1,016,499 | ||||||||||
| MUFG Americas Holdings Corp., | ||||||||||||
| 3.500%, 06/18/2022 | 225,000 | 238,864 | ||||||||||
| MUFG Union Bank, National Association, | ||||||||||||
| 2.125%, 06/16/2017 | 1,800,000 | 1,816,598 | ||||||||||
| Nationwide Building Society, | ||||||||||||
| 2.350%, 01/21/2020 (Acquired 01/12/2015, Cost $2,999,010) * f | 3,000,000 | 3,032,139 | ||||||||||
| Nationwide Financial Services, Inc., | ||||||||||||
| 5.375%, 03/25/2021 (Acquired 10/07/2013, Cost $872,582) * | 828,000 | 924,810 | ||||||||||
| Nomura Holdings, Inc.: | ||||||||||||
| 2.000%, 09/13/2016 f | 2,450,000 | 2,454,229 | ||||||||||
| 6.700%, 03/04/2020 @ f | 1,000,000 | 1,161,060 | ||||||||||
| NYSE Euronext, | ||||||||||||
| 2.000%, 10/05/2017 | 800,000 | 808,100 | ||||||||||
| Peachtree Corners Funding Trust, | ||||||||||||
| 3.976%, 02/15/2025 (Acquired 03/10/2015, Cost $6,000,000) * | 6,000,000 | 6,015,546 | ||||||||||
| PNC Bank, National Association, | ||||||||||||
| 2.950%, 01/30/2023 | 4,000,000 | 4,073,140 | ||||||||||
| Principal Life Global Funding II: | ||||||||||||
| 2.200%, 04/08/2020 (Acquired 03/31/2015, Cost $1,997,360) * | 2,000,000 | 2,031,756 | ||||||||||
| 3.000%, 04/18/2026 (Acquired 04/11/2016, Cost $6,981,380) * | 7,000,000 | 7,139,517 | ||||||||||
| Protective Life Corp.: | ||||||||||||
| 7.375%, 10/15/2019 | 2,050,000 | 2,379,052 | ||||||||||
| 2.700%, 11/25/2020 (Acquired 11/19/2015, Cost $2,997,360) * | 3,000,000 | 3,101,799 | ||||||||||
| Prudential Financial, Inc., | ||||||||||||
| 7.375%, 06/15/2019 | 850,000 | 986,135 | ||||||||||
| Regions Bank, | ||||||||||||
| 7.500%, 05/15/2018 | 2,475,000 | 2,714,320 | ||||||||||
| Regions Financial Corp., | ||||||||||||
| 2.000%, 05/15/2018 | 6,000,000 | 6,010,488 | ||||||||||
| Reliance Standard Life Global Funding II, | ||||||||||||
| 3.050%, 01/20/2021 (Acquired 01/12/2016, Cost $4,994,250) * | 5,000,000 | 5,167,060 | ||||||||||
| Santander Bank NA, | ||||||||||||
| 8.750%, 05/30/2018 | 4,415,000 | 4,916,703 | ||||||||||
| Santander Holdings USA, Inc., | ||||||||||||
| 2.700%, 05/24/2019 | 2,000,000 | 2,009,622 | ||||||||||
| Santander UK PLC: | ||||||||||||
| 3.050%, 08/23/2018 f | 1,050,000 | 1,074,820 | ||||||||||
| 3.125%, 01/08/2021 @ f | 2,325,000 | 2,330,054 | ||||||||||
| 5.000%, 11/07/2023 (Acquired 10/31/2013, Cost $996,810) * @ f | 1,000,000 | 1,026,499 | ||||||||||
| Skandinaviska Enskilda Banken AB, | ||||||||||||
| 2.450%, 05/27/2020 (Acquired 05/19/2015, Cost $8,486,910) * f | 8,500,000 | 8,683,940 | ||||||||||
| Societe Generale: | ||||||||||||
| 1.726%, 10/01/2018 f ∞ | 2,000,000 | 2,015,760 | ||||||||||
| 2.625%, 10/01/2018 f | 1,000,000 | 1,023,650 | ||||||||||
| 5.200%, 04/15/2021 (Acquired 01/28/2013, Cost $1,346,899) * f | 1,250,000 | 1,429,841 | ||||||||||
| 5.000%, 01/17/2024 (Acquired 01/14/2014 through 02/18/2014, Cost $3,127,585) * f | 3,150,000 | 3,275,701 | ||||||||||
| Societe Generale SA, | ||||||||||||
| 2.500%, 04/08/2021 (Acquired 04/04/2016, Cost $2,148,388) * f | 2,150,000 | 2,189,394 | ||||||||||
| Standard Chartered PLC: | ||||||||||||
| 1.273%, 04/17/2018 (Acquired 04/13/2015, Cost $8,500,000) * f ∞ | 8,500,000 | 8,402,590 | ||||||||||
| 3.050%, 01/15/2021 (Acquired 01/12/2016, Cost $997,980) * @ f | 1,000,000 | 1,013,220 | ||||||||||
| Sumitomo Mitsui Banking Corp.: | ||||||||||||
| 2.500%, 07/19/2018 f | 3,000,000 | 3,062,034 | ||||||||||
| 2.250%, 07/11/2019 f | 2,000,000 | 2,029,326 | ||||||||||
| SunTrust Bank: | ||||||||||||
| 5.450%, 12/01/2017 | 500,000 | 526,039 | ||||||||||
| 7.250%, 03/15/2018 | 1,506,000 | 1,641,435 | ||||||||||
| SunTrust Bank/Atlanta GA, | ||||||||||||
| 3.300%, 05/15/2026 | 5,000,000 | 5,040,695 | ||||||||||
| SUSA Partnership LP, | ||||||||||||
| 8.200%, 06/01/2017 | 2,800,000 | �� | 2,972,309 | |||||||||
| Svenska Handelsbanken AB: | ||||||||||||
| 2.500%, 01/25/2019 f | 1,000,000 | 1,029,714 | ||||||||||
| 2.400%, 10/01/2020 f | 5,000,000 | 5,123,580 | ||||||||||
| Swedbank AB: | ||||||||||||
| 1.750%, 03/12/2018 (Acquired 03/05/2013, Cost $3,236,383) * f | 3,250,000 | 3,268,882 | ||||||||||
| 2.375%, 02/27/2019 (Acquired 02/20/2014, Cost $2,595,606) * f | 2,600,000 | 2,653,110 | ||||||||||
| 2.650%, 03/10/2021 (Acquired 03/03/2016, Cost $3,795,592) * f | 3,800,000 | 3,926,263 | ||||||||||
| Synchrony Financial: | ||||||||||||
| 3.750%, 08/15/2021 | 5,000,000 | 5,179,685 | ||||||||||
| 4.250%, 08/15/2024 | 4,800,000 | 4,967,664 | ||||||||||
| The Bank of Tokyo-Mitsubishi UFJ Ltd.: | ||||||||||||
| 2.700%, 09/09/2018 (Acquired 09/03/2013, Cost $2,547,756) * f | 2,550,000 | 2,611,067 | ||||||||||
| 2.150%, 09/14/2018 (Acquired 09/08/2015, Cost $999,710) * f | 1,000,000 | 1,010,574 | ||||||||||
| 2.300%, 03/10/2019 (Acquired 03/04/2014 through 11/24/2015, Cost $1,123,476) * f | 1,125,000 | 1,145,399 | ||||||||||
| 2.300%, 03/05/2020 (Acquired 02/25/2015, Cost $2,998,020) * f | 3,000,000 | 3,047,292 | ||||||||||
| The Bear Stearns Companies LLC: | ||||||||||||
| 6.400%, 10/02/2017 | 1,450,000 | 1,540,538 | ||||||||||
| 7.250%, 02/01/2018 | 2,275,000 | 2,479,966 | ||||||||||
| The Charles Schwab Corp., | ||||||||||||
| 6.375%, 09/01/2017 | 325,000 | 344,583 | ||||||||||
| The Goldman Sachs Group, Inc.: | ||||||||||||
| 6.150%, 04/01/2018 | 3,900,000 | 4,202,230 | ||||||||||
| 2.900%, 07/19/2018 | 1,000,000 | 1,026,170 | ||||||||||
| 7.500%, 02/15/2019 | 865,000 | 989,223 | ||||||||||
| 2.550%, 10/23/2019 | 2,000,000 | 2,046,310 | ||||||||||
| 3.500%, 01/23/2025 | 2,000,000 | 2,055,016 | ||||||||||
| The Hartford Financial Services Group, Inc.: | ||||||||||||
| 5.500%, 10/15/2016 | 1,500,000 | 1,518,985 | ||||||||||
| 5.125%, 04/15/2022 | 500,000 | 568,648 | ||||||||||
| The Huntington National Bank: | ||||||||||||
| 1.300%, 11/20/2016 | 4,850,000 | 4,855,442 | ||||||||||
| 2.875%, 08/20/2020 | 3,500,000 | 3,599,347 | ||||||||||
| 3.150%, 03/14/2021 @ | 1,500,000 | 1,553,877 | ||||||||||
| Trinity Acquisition PLC, | ||||||||||||
| 4.400%, 03/15/2026 f | 1,125,000 | 1,174,639 | ||||||||||
| UBS AG, | ||||||||||||
| 2.950%, 09/24/2020 (Acquired 09/21/2015, Cost $6,214,355) * f | 6,225,000 | 6,330,632 | ||||||||||
| UnitedHealth Group, Inc., | ||||||||||||
| 3.350%, 07/15/2022 | 1,575,000 | 1,684,970 | ||||||||||
| Voya Financial, Inc., | ||||||||||||
| 2.900%, 02/15/2018 | 1,525,000 | 1,553,540 | ||||||||||
| WEA Finance LLC / Westfield UK & Europe Finance PLC, | ||||||||||||
| 3.250%, 10/05/2020 (Acquired 09/28/2015, Cost $7,474,275) * | 7,500,000 | 7,805,213 | ||||||||||
| Wells Fargo & Co., | ||||||||||||
| Class N, 2.150%, 01/30/2020 | 7,000,000 | 7,118,748 | ||||||||||
| Wells Fargo Bank National Association, | ||||||||||||
| 6.000%, 11/15/2017 | 1,479,000 | 1,573,696 | ||||||||||
| Westpac Banking Corp.: | ||||||||||||
| 1.600%, 01/12/2018 f | 1,250,000 | 1,256,915 | ||||||||||
| 4.875%, 11/19/2019 f | 2,775,000 | 3,070,094 | ||||||||||
| 2.100%, 05/13/2021 f | 5,000,000 | 5,064,965 | ||||||||||
| Willis Group Holdings PLC, | ||||||||||||
| 5.750%, 03/15/2021 f | 3,250,000 | 3,634,140 | ||||||||||
| 500,658,394 | 24.0 | % | ||||||||||
| Utility | ||||||||||||
| Commonwealth Edison Co., | ||||||||||||
| Class 104, 5.950%, 08/15/2016 | 375,000 | 377,114 | ||||||||||
| National Rural Utilities Cooperative Finance Corp.: | ||||||||||||
| 10.375%, 11/01/2018 | 3,619,000 | 4,372,845 | ||||||||||
| 2.000%, 01/27/2020 | 3,000,000 | 3,061,779 | ||||||||||
| PPL Capital Funding, Inc., | ||||||||||||
| 3.400%, 06/01/2023 | 2,475,000 | 2,582,672 | ||||||||||
| PSEG Power LLC: | ||||||||||||
| 2.750%, 09/15/2016 | 75,000 | 75,252 | ||||||||||
| 5.320%, 09/15/2016 | 994,000 | 1,001,425 | ||||||||||
| 5.125%, 04/15/2020 | 220,000 | 239,271 | ||||||||||
| Public Service Co. of New Mexico, | ||||||||||||
| 7.950%, 05/15/2018 | 3,220,000 | 3,585,837 | ||||||||||
| RGS I&M Funding Corp., | ||||||||||||
| Series F*, 9.820%, 06/07/2022 | 416,033 | 425,097 | ||||||||||
| Southern Power Co., | ||||||||||||
| 1.850%, 12/01/2017 | 1,775,000 | 1,789,007 | ||||||||||
| Talent Yield Investments Ltd., | ||||||||||||
| 4.500%, 04/25/2022 (Acquired 04/18/2012, Cost $3,774,008) * f | 3,800,000 | 4,126,918 | ||||||||||
| West Penn Power Co., | ||||||||||||
| 5.875%, 08/15/2016 (Acquired 10/25/2010, Cost $2,006,756) * | 2,000,000 | 2,009,204 | ||||||||||
| 23,646,421 | 1.1 | % | ||||||||||
| Industrials | ||||||||||||
| 21st Century Fox America, Inc.: | ||||||||||||
| 8.000%, 10/17/2016 | 5,575,000 | 5,683,885 | ||||||||||
| 3.700%, 10/15/2025 | 2,825,000 | 3,060,029 | ||||||||||
| Agrium, Inc., | ||||||||||||
| 3.150%, 10/01/2022 f | 1,306,000 | 1,330,230 | ||||||||||
| Altera Corp., | ||||||||||||
| 2.500%, 11/15/2018 | 2,000,000 | 2,068,676 | ||||||||||
| America Movil, SAB de CV, | ||||||||||||
| 1.656%, 09/12/2016 f ∞ | 3,200,000 | 3,200,800 | ||||||||||
| Ameritech Capital Funding Corp., | ||||||||||||
| 6.450%, 01/15/2018 | 2,758,000 | 2,951,482 | ||||||||||
| Anadarko Petroleum Corp.: | ||||||||||||
| 6.375%, 09/15/2017 | 253,000 | 266,295 | ||||||||||
| 6.950%, 06/15/2019 | 1,000,000 | 1,108,153 | ||||||||||
| Anglo American Capital PLC, | ||||||||||||
| 9.375%, 04/08/2019 (Acquired 07/11/2012, Cost $2,299,418) * f | 2,000,000 | 2,287,500 | ||||||||||
| Anheuser-Busch InBev Finance, Inc., | ||||||||||||
| 3.300%, 02/01/2023 | 9,300,000 | 9,799,131 | ||||||||||
| Apple, Inc., | ||||||||||||
| 2.400%, 05/03/2023 | 2,000,000 | 2,036,702 | ||||||||||
| AT&T, Inc., | ||||||||||||
| 3.600%, 02/17/2023 @ | 9,000,000 | 9,388,611 | ||||||||||
| Boardwalk Pipelines LP, | ||||||||||||
| 5.200%, 06/01/2018 | 2,500,000 | 2,546,670 | ||||||||||
| Boston Scientific Corp., | ||||||||||||
| 4.125%, 10/01/2023 | 3,000,000 | 3,250,911 | ||||||||||
| BP Capital Markets: | ||||||||||||
| 4.750%, 03/10/2019 f | 2,500,000 | 2,715,513 | ||||||||||
| 2.521%, 01/15/2020 f | 2,650,000 | 2,733,822 | ||||||||||
| 3.245%, 05/06/2022 f | 1,000,000 | 1,049,466 | ||||||||||
| British Telecommunications PLC, | ||||||||||||
| 5.950%, 01/15/2018 f | 2,000,000 | 2,140,558 | ||||||||||
| Bunge Limited Finance Corp.: | ||||||||||||
| 3.200%, 06/15/2017 | 1,300,000 | 1,320,203 | ||||||||||
| 3.500%, 11/24/2020 @ | 2,500,000 | 2,620,545 | ||||||||||
| Bunge NA Finance LP, | ||||||||||||
| 5.900%, 04/01/2017 | 575,000 | 593,444 | ||||||||||
| Cardinal Health, Inc., | ||||||||||||
| 1.950%, 06/15/2018 | 5,600,000 | 5,664,904 | ||||||||||
| Charter Communications Operating LLC / Charter Communications Operating Capital, | ||||||||||||
| 4.464%, 07/23/2022 (Acquired 07/09/2015, Cost $7,150,000) * | 7,150,000 | 7,684,362 | ||||||||||
| Chevron Phillips Chemical Co. LLC, | ||||||||||||
| 2.450%, 05/01/2020 (Acquired 05/07/2015, Cost $4,123,680) * | 4,125,000 | 4,131,691 | ||||||||||
| Coca-Cola FEMSA SAB de CV, | ||||||||||||
| 2.375%, 11/26/2018 f | 3,425,000 | 3,490,880 | ||||||||||
| Comcast Cable Communications, LLC: | ||||||||||||
| 8.875%, 05/01/2017 | 550,000 | 585,789 | ||||||||||
| 2.750%, 03/01/2023 | 1,475,000 | 1,544,704 | ||||||||||
| ConAgra Foods, Inc.: | ||||||||||||
| 1.005%, 07/21/2016 ∞ | 2,125,000 | 2,125,206 | ||||||||||
| 7.000%, 04/15/2019 | 317,000 | 358,298 | ||||||||||
| Cox Communications, Inc.: | ||||||||||||
| 3.250%, 12/15/2022 (Acquired 11/26/2012, Cost $3,594,456) * | 3,600,000 | 3,589,985 | ||||||||||
| 3.850%, 02/01/2025 (Acquired 12/01/2014, Cost $4,492,215) * | 4,500,000 | 4,532,463 | ||||||||||
| CVS Health Corp.: | ||||||||||||
| 2.250%, 08/12/2019 | 3,375,000 | 3,466,051 | ||||||||||
| 4.000%, 12/05/2023 | 4,425,000 | 4,893,399 | ||||||||||
| Daimler Finance North America LLC, | ||||||||||||
| 2.250%, 07/31/2019 (Acquired 07/25/2012, Cost $2,285,234) * | 2,300,000 | 2,358,809 | ||||||||||
| DCP Midstream LLC, | ||||||||||||
| 9.750%, 03/15/2019 (Acquired 10/15/2012, Cost $1,829,867) * | 1,600,000 | 1,752,000 | ||||||||||
| Deutsche Telekom International Finance BV: | ||||||||||||
| 2.250%, 03/06/2017 (Acquired 03/24/2015, Cost $1,409,035) * f | 1,400,000 | 1,409,282 | ||||||||||
| 6.750%, 08/20/2018 f | 2,850,000 | 3,180,671 | ||||||||||
| 6.000%, 07/08/2019 f | 1,700,000 | 1,907,033 | ||||||||||
| Devon Energy Corp., | ||||||||||||
| 6.300%, 01/15/2019 | 910,000 | 985,844 | ||||||||||
| Diamond 1 Finance Corp. / Diamond 2 Finance Corp., | ||||||||||||
| 3.480%, 06/01/2019 (Acquired 05/17/2016, Cost $6,906,340) * | 6,900,000 | 7,068,429 | ||||||||||
| Ecolab, Inc.: | ||||||||||||
| 1.450%, 12/08/2017 | 4,000,000 | 4,006,996 | ||||||||||
| 3.250%, 01/14/2023 | 5,000,000 | 5,249,630 | ||||||||||
| Energy Transfer Partners LP, | ||||||||||||
| 9.700%, 03/15/2019 | 2,457,000 | 2,781,783 | ||||||||||
| Enterprise Products Operating LLC, | ||||||||||||
| 2.550%, 10/15/2019 | 3,000,000 | 3,082,788 | ||||||||||
| ERAC USA Finance LLC: | ||||||||||||
| 2.350%, 10/15/2019 (Acquired 06/30/2014 through 01/08/2015, Cost $4,644,303) * | 4,650,000 | 4,737,788 | ||||||||||
| 2.600%, 12/01/2021 (Acquired 05/23/2016, Cost $4,818,341) * | 4,825,000 | 4,903,628 | ||||||||||
| Express Scripts Holding Co.: | ||||||||||||
| 2.650%, 02/15/2017 | 2,313,000 | 2,337,589 | ||||||||||
| 7.250%, 06/15/2019 | 1,000,000 | 1,151,897 | ||||||||||
| 3.000%, 07/15/2023 | 4,900,000 | 4,905,488 | ||||||||||
| Federal Express Corp. 1998 Pass Through Trust, | ||||||||||||
| Series 981B, 6.845%, 01/15/2019 | 1,405,874 | 1,500,770 | ||||||||||
| Fidelity National Information Services, Inc.: | ||||||||||||
| 3.500%, 04/15/2023 | 4,400,000 | 4,568,436 | ||||||||||
| 3.875%, 06/05/2024 | 3,900,000 | 4,123,373 | ||||||||||
| Fiserv, Inc.: | ||||||||||||
| 4.750%, 06/15/2021 | 1,728,000 | 1,918,292 | ||||||||||
| 3.500%, 10/01/2022 | 2,850,000 | 3,019,957 | ||||||||||
| FMC Corp., | ||||||||||||
| 4.100%, 02/01/2024 | 2,000,000 | 2,105,804 | ||||||||||
| Ford Motor Credit Co. LLC: | ||||||||||||
| 1.724%, 12/06/2017 | 3,300,000 | 3,307,019 | ||||||||||
| 5.750%, 02/01/2021 | 2,000,000 | 2,273,450 | ||||||||||
| 3.336%, 03/18/2021 | 1,800,000 | 1,866,829 | ||||||||||
| Freeport-McMoran Oil & Gas LLC / FCX Oil & Gas, Inc., | ||||||||||||
| 6.750%, 02/01/2022 | 1,649,000 | 1,616,536 | ||||||||||
| Freeport-McMoRan, Inc.: | ||||||||||||
| 3.550%, 03/01/2022 @ | 2,000,000 | 1,760,000 | ||||||||||
| 3.875%, 03/15/2023 @ | 1,100,000 | 962,500 | ||||||||||
| General Electric Capital Corp.: | ||||||||||||
| 6.000%, 08/07/2019 | 774,000 | 886,634 | ||||||||||
| 5.500%, 01/08/2020 | 731,000 | 835,548 | ||||||||||
| 5.550%, 05/04/2020 | 816,000 | 939,729 | ||||||||||
| Georgia-Pacific LLC, | ||||||||||||
| 5.400%, 11/01/2020 (Acquired 06/09/2016, Cost $7,641,599) * | 6,797,000 | 7,698,371 | ||||||||||
| Glencore Funding LLC: | ||||||||||||
| 2.500%, 01/15/2019 (Acquired 05/22/2013 through 10/29/2013, Cost $4,340,524) * | 4,400,000 | 4,229,500 | ||||||||||
| 4.125%, 05/30/2023 (Acquired 04/03/2014, Cost $1,460,202) * | 1,500,000 | 1,380,000 | ||||||||||
| 4.625%, 04/29/2024 (Acquired 10/08/2014, Cost $1,025,124) * @ | 1,000,000 | 935,000 | ||||||||||
| Grupo Bimbo, SAB de CV, | ||||||||||||
| 3.875%, 06/27/2024 (Acquired 06/24/2014, Cost $2,987,700) * f | 3,000,000 | 3,121,932 | ||||||||||
| GTE Corp., | ||||||||||||
| 8.750%, 11/01/2021 | 2,150,000 | 2,727,688 | ||||||||||
| Hanson Ltd., | ||||||||||||
| 6.125%, 08/15/2016 f | 650,000 | 650,812 | ||||||||||
| Hess Corp., | ||||||||||||
| 8.125%, 02/15/2019 | 1,200,000 | 1,337,291 | ||||||||||
| Historic TW, Inc., | ||||||||||||
| 6.875%, 06/15/2018 | 392,000 | 433,005 | ||||||||||
| Hutchison Whampoa International (09) Ltd., | ||||||||||||
| 7.625%, 04/09/2019 (Acquired 10/16/2009 through 04/16/2014, Cost $5,890,622) * f | 5,400,000 | 6,231,087 | ||||||||||
| Hutchison Whampoa International (14) Ltd., | ||||||||||||
| 1.625%, 10/31/2017 (Acquired 10/28/2014, Cost $1,995,400) * f | 2,000,000 | 2,009,118 | ||||||||||
| Hyundai Capital America, | ||||||||||||
| 2.000%, 07/01/2019 (Acquired 06/07/2016, Cost $2,498,225) * | 2,500,000 | 2,515,437 | ||||||||||
| Hyundai Capital Services, Inc.: | ||||||||||||
| 3.500%, 09/13/2017 (Acquired 08/04/2014 through 09/30/2014, Cost $6,272,678) * f | 6,150,000 | 6,299,986 | ||||||||||
| 2.500%, 03/18/2019 (Acquired 03/14/2016, Cost $1,299,103) * | 1,300,000 | 1,328,890 | ||||||||||
| Ingersoll-Rand Co., | ||||||||||||
| 6.391%, 11/15/2027 f | 1,195,000 | 1,448,666 | ||||||||||
| Ingersoll-Rand Global Holding Co. Ltd., | ||||||||||||
| 2.875%, 01/15/2019 | 5,000,000 | 5,178,015 | ||||||||||
| Ingredion, Inc., | ||||||||||||
| 1.800%, 09/25/2017 | 1,275,000 | 1,281,578 | ||||||||||
| Johnson Controls, Inc., | ||||||||||||
| 4.250%, 03/01/2021 | 2,000,000 | 2,156,860 | ||||||||||
| Kraft Foods Group, Inc., | ||||||||||||
| 3.500%, 06/06/2022 | 2,000,000 | 2,127,036 | ||||||||||
| Laboratory Corporation of America Holdings, | ||||||||||||
| 4.625%, 11/15/2020 | 400,000 | 436,219 | ||||||||||
| Lafarge SA, | ||||||||||||
| 6.500%, 07/15/2016 f | 625,000 | 625,766 | ||||||||||
| Martin Marietta Materials, Inc., | ||||||||||||
| 6.600%, 04/15/2018 | 75,000 | 80,786 | ||||||||||
| Mead Johnson Nutrition Co., | ||||||||||||
| 3.000%, 11/15/2020 | 5,400,000 | 5,641,272 | ||||||||||
| MeadWestvaco Corp., | ||||||||||||
| 7.375%, 09/01/2019 | 2,033,000 | 2,333,622 | ||||||||||
| Medco Health Solutions, Inc., | ||||||||||||
| 7.125%, 03/15/2018 | 1,850,000 | 2,019,763 | ||||||||||
| Merey Sweeny LP, | ||||||||||||
| 8.850%, 12/18/2019 (Acquired 06/11/2013, Cost $1,337,716) * | 1,211,416 | 1,355,253 | ||||||||||
| Midcontinent Express Pipeline LLC, | ||||||||||||
| 6.700%, 09/15/2019 (Acquired 09/30/2014, Cost $1,090,191) * | 1,000,000 | 955,000 | ||||||||||
| Murphy Oil Corp., | ||||||||||||
| 4.700%, 12/01/2022 @ | 5,000,000 | 4,574,360 | ||||||||||
| Nabors Industries, Inc., | ||||||||||||
| 6.150%, 02/15/2018 | 825,000 | 848,670 | ||||||||||
| Noble Energy, Inc.: | ||||||||||||
| 8.250%, 03/01/2019 | 1,000,000 | 1,145,313 | ||||||||||
| 4.150%, 12/15/2021 @ | 450,000 | 473,163 | ||||||||||
| ONEOK Partners LP, | ||||||||||||
| 3.375%, 10/01/2022 | 6,000,000 | 5,870,406 | ||||||||||
| Pentair Finance SA: | ||||||||||||
| 2.900%, 09/15/2018 f | 5,675,000 | 5,732,488 | ||||||||||
| 3.625%, 09/15/2020 f | 5,500,000 | 5,638,209 | ||||||||||
| Petrofac Ltd., | ||||||||||||
| 3.400%, 10/10/2018 (Acquired 10/03/2013 through 09/19/2014, Cost $6,923,872) * f | 6,880,000 | 6,879,979 | ||||||||||
| Phillips 66 Partners LP, | ||||||||||||
| 3.605%, 02/15/2025 | 2,000,000 | 1,965,330 | ||||||||||
| Pioneer Natural Resources Co., | ||||||||||||
| 6.875%, 05/01/2018 | 1,225,000 | 1,324,284 | ||||||||||
| POSCO, | ||||||||||||
| 5.250%, 04/14/2021 (Acquired 04/08/2011 through 09/22/2011, Cost $2,977,417) * @ f | 3,000,000 | 3,373,542 | ||||||||||
| R.R. Donnelley & Sons Co.: | ||||||||||||
| 8.600%, 08/15/2016 | 1,000,000 | 1,007,500 | ||||||||||
| 6.125%, 01/15/2017 | 43,000 | 43,537 | ||||||||||
| 7.625%, 06/15/2020 | 1,000,000 | 1,047,500 | ||||||||||
| Rio Tinto Finance (USA) Ltd., | ||||||||||||
| 9.000%, 05/01/2019 f | 2,975,000 | 3,574,570 | ||||||||||
| Rockies Express Pipeline LLC, | ||||||||||||
| 5.625%, 04/15/2020 (Acquired 03/17/2010, Cost $999,110) * | 1,000,000 | 1,002,500 | ||||||||||
| Rockwell Automation, Inc., | ||||||||||||
| 2.875%, 03/01/2025 | 3,000,000 | 3,112,893 | ||||||||||
| SABMiller Holdings, Inc., | ||||||||||||
| 1.327%, 08/01/2018 (Acquired 10/28/2014, Cost $3,991,071) * | 3,980,000 | 3,977,473 | ||||||||||
| Samarco Mineracao SA, | ||||||||||||
| 5.375%, 09/26/2024 (Acquired 09/23/2014, Cost $1,670,511) * f | 1,675,000 | 644,875 | ||||||||||
| Schlumberger Holdings Corp., | ||||||||||||
| 2.350%, 12/21/2018 (Acquired 12/10/2015, Cost $4,499,460) * | 4,500,000 | 4,587,795 | ||||||||||
| Schneider Electric SE, | ||||||||||||
| 2.950%, 09/27/2022 (Acquired 09/20/2012, Cost $1,994,680) * f | 2,000,000 | 2,073,970 | ||||||||||
| Solvay Finance America LLC, | ||||||||||||
| 3.400%, 12/03/2020 (Acquired 01/08/2016, Cost $3,996,160) * | 4,000,000 | 4,188,924 | ||||||||||
| Sprint Communications, Inc., | ||||||||||||
| 6.000%, 12/01/2016 | 500,000 | 503,125 | ||||||||||
| Sunoco, Inc., | ||||||||||||
| 5.750%, 01/15/2017 | 1,275,000 | 1,298,955 | ||||||||||
| Sysco Corp.: | ||||||||||||
| 2.600%, 10/01/2020 | 7,600,000 | 7,847,456 | ||||||||||
| 2.500%, 07/15/2021 @ | 2,000,000 | 2,043,734 | ||||||||||
| 2.600%, 06/12/2022 | 150,000 | 152,705 | ||||||||||
| TC PipeLines LP, | ||||||||||||
| 4.375%, 03/13/2025 | 2,500,000 | 2,461,287 | ||||||||||
| Telefonica Emisiones SAU: | ||||||||||||
| 6.221%, 07/03/2017 f | 1,000,000 | 1,044,051 | ||||||||||
| 3.192%, 04/27/2018 f | 1,000,000 | 1,026,780 | ||||||||||
| Telstra Corp. Ltd., | ||||||||||||
| 3.125%, 04/07/2025 (Acquired 03/30/2015, Cost $5,640,395) * f | 5,650,000 | 5,903,233 | ||||||||||
| Texas Eastern Transmission LP, | ||||||||||||
| 6.000%, 09/15/2017 (Acquired 11/07/2013 through 11/14/2014, Cost $2,172,190) * | 2,073,000 | 2,174,674 | ||||||||||
| The Dow Chemical Co., | ||||||||||||
| 8.550%, 05/15/2019 | 2,800,000 | 3,323,698 | ||||||||||
| The Mosaic Co., | ||||||||||||
| 4.250%, 11/15/2023 | 8,606,000 | 9,269,153 | ||||||||||
| Time Warner Cable, Inc.: | ||||||||||||
| 5.850%, 05/01/2017 | 1,000,000 | 1,035,175 | ||||||||||
| 6.750%, 07/01/2018 | 2,000,000 | 2,193,078 | ||||||||||
| Time Warner, Inc.: | ||||||||||||
| 4.700%, 01/15/2021 | 1,325,000 | 1,477,914 | ||||||||||
| 4.750%, 03/29/2021 | 2,000,000 | 2,246,736 | ||||||||||
| 3.600%, 07/15/2025 @ | 4,000,000 | 4,232,580 | ||||||||||
| TransCanada PipeLines Ltd.: | ||||||||||||
| 1.875%, 01/12/2018 f | 3,000,000 | 3,014,388 | ||||||||||
| 9.875%, 01/01/2021 f | 150,000 | 192,944 | ||||||||||
| 4.875%, 01/15/2026 f | 3,000,000 | 3,425,988 | ||||||||||
| TSMC Global Ltd., | ||||||||||||
| 1.625%, 04/03/2018 (Acquired 03/27/2013, Cost $3,297,789) * f | 3,300,000 | 3,308,956 | ||||||||||
| Tyco Electronics Group SA, | ||||||||||||
| 6.550%, 10/01/2017 f | 1,245,000 | 1,323,521 | ||||||||||
| Vale Overseas Ltd.: | ||||||||||||
| 6.250%, 01/23/2017 f | 1,650,000 | 1,687,785 | ||||||||||
| 4.375%, 01/11/2022 @ f | 2,425,000 | 2,272,710 | ||||||||||
| Valero Energy Corp., | ||||||||||||
| 9.375%, 03/15/2019 | 5,898,000 | 7,048,246 | ||||||||||
| Verizon Communications, Inc.: | ||||||||||||
| 5.150%, 09/15/2023 | 6,100,000 | 7,104,219 | ||||||||||
| 4.150%, 03/15/2024 | 2,000,000 | 2,206,328 | ||||||||||
| Visa, Inc., | ||||||||||||
| 3.150%, 12/14/2025 @ | 4,700,000 | 5,024,822 | ||||||||||
| Vulcan Materials Co., | ||||||||||||
| 7.000%, 06/15/2018 | 2,000,000 | 2,190,000 | ||||||||||
| Wabtec Corp., | ||||||||||||
| 4.375%, 08/15/2023 | 3,000,000 | 3,275,430 | ||||||||||
| Walgreen Co., | ||||||||||||
| 5.250%, 01/15/2019 | 605,000 | 655,677 | ||||||||||
| Waste Management, Inc.: | ||||||||||||
| 2.400%, 05/15/2023 | 7,000,000 | 7,100,989 | ||||||||||
| 3.125%, 03/01/2025 | 1,975,000 | 2,065,052 | ||||||||||
| Wesfarmers Ltd., | ||||||||||||
| 1.874%, 03/20/2018 (Acquired 03/13/2013, Cost $3,900,000) * f | 3,900,000 | 3,921,957 | ||||||||||
| Williams Partners LP: | ||||||||||||
| 5.250%, 03/15/2020 | 1,000,000 | 1,028,866 | ||||||||||
| 4.125%, 11/15/2020 | 1,475,000 | 1,460,983 | ||||||||||
| 4.300%, 03/04/2024 | 2,500,000 | 2,351,873 | ||||||||||
| Zoetis, Inc., | ||||||||||||
| 4.500%, 11/13/2025 @ | 2,000,000 | 2,205,686 | ||||||||||
| 428,450,878 | 20.6 | % | ||||||||||
| Total Corporate Bonds | 952,755,693 | 45.7 | % | |||||||||
| Other Government Related Securities | ||||||||||||
| CDP Financial, Inc., | ||||||||||||
| 4.400%, 11/25/2019 (Acquired 11/20/2009, Cost $997,520) * f | 1,000,000 | 1,100,517 | ||||||||||
| Centrais Eletricas Brasileiras SA, | ||||||||||||
| 5.750%, 10/27/2021 (Acquired 10/20/2011 through 10/25/2011, Cost $1,151,496) * f | 1,150,000 | 1,059,725 | ||||||||||
| CNOOC Finance 2013 Ltd., | ||||||||||||
| 3.000%, 05/09/2023 f | 2,000,000 | 1,986,634 | ||||||||||
| CNOOC Nexen Finance (2014) ULC, | ||||||||||||
| 4.250%, 04/30/2024 f | 5,150,000 | 5,457,862 | ||||||||||
| Corp Andina de Fomento, | ||||||||||||
| 4.375%, 06/15/2022 f | 680,000 | 759,145 | ||||||||||
| Electricite de France SA, | ||||||||||||
| 2.350%, 10/13/2020 (Acquired 10/07/2015, Cost $8,800,006) * @ f | 8,875,000 | 9,069,123 | ||||||||||
| Export-Import Bank of Korea, | ||||||||||||
| 2.250%, 01/21/2020 f | 3,200,000 | 3,248,698 | ||||||||||
| Guardian Life Global Funding, | ||||||||||||
| 2.000%, 04/26/2021 (Acquired 04/19/2016, Cost $3,994,720) * | 4,000,000 | 4,052,628 | ||||||||||
| KFW, | ||||||||||||
| 4.875%, 06/17/2019 f | 3,250,000 | 3,618,329 | ||||||||||
| Korea Electric Power Corp., | ||||||||||||
| 6.750%, 08/01/2027 f | 300,000 | 389,098 | ||||||||||
| Korea Gas Corp., | ||||||||||||
| 2.875%, 07/29/2018 (Acquired 07/22/2013, Cost $994,790) * f | 1,000,000 | 1,026,713 | ||||||||||
| Mexico Government International Bond, | ||||||||||||
| 5.125%, 01/15/2020 f | 2,650,000 | 2,941,500 | ||||||||||
| Petrobras Global Finance BV, | ||||||||||||
| 3.016%, 03/17/2017 f ∞ | 1,700,000 | 1,700,833 | ||||||||||
| Petroleos Mexicanos: | ||||||||||||
| 3.125%, 01/23/2019 @ f | 2,000,000 | 1,995,000 | ||||||||||
| 5.500%, 01/21/2021 f | 2,000,000 | 2,117,800 | ||||||||||
| Sinopec Group Overseas Development [2015] Ltd., | ||||||||||||
| 2.500%, 04/28/2020 (Acquired 04/21/2015, Cost $2,987,280) * f | 3,000,000 | 3,032,361 | ||||||||||
| Sinopec Group Overseas Development [2016] Ltd., | ||||||||||||
| 2.750%, 05/03/2021 (Acquired 04/25/2016, Cost $4,990,750) * f | 5,000,000 | 5,087,260 | ||||||||||
| The Korea Development Bank, | ||||||||||||
| 3.875%, 05/04/2017 f | 2,150,000 | 2,198,796 | ||||||||||
| 50,842,022 | 2.4 | % | ||||||||||
| Taxable Municipal Bonds | ||||||||||||
| Alaska Municipal Bond Bank Authority: | ||||||||||||
| 4.309%, 08/01/2018 | 1,000,000 | 1,063,350 | ||||||||||
| 4.459%, 08/01/2019 | 1,340,000 | 1,463,990 | ||||||||||
| California Qualified School Bond Joint Powers Authority, | ||||||||||||
| 5.955%, 03/01/2019 | 3,375,000 | 3,715,133 | ||||||||||
| California School Finance Authority, | ||||||||||||
| 4.426%, 07/01/2020 | 2,500,000 | 2,753,450 | ||||||||||
| Central Valley Support Joint Powers Agency, | ||||||||||||
| 5.326%, 09/01/2022 | 2,000,000 | 2,281,640 | ||||||||||
| City of Berwyn IL, | ||||||||||||
| 5.790%, 12/01/2022 | 5,095,000 | 5,714,603 | ||||||||||
| City of Bristol VA, | ||||||||||||
| 3.668%, 10/01/2022 (Callable 10/01/2020) | 7,500,000 | 7,802,400 | ||||||||||
| Cook County School District No. 104 Summit, | ||||||||||||
| 6.125%, 12/01/2027 (Callable 12/01/2017) | 1,535,000 | 1,615,219 | ||||||||||
| County of Contra Costa CA, | ||||||||||||
| 5.140%, 06/01/2017 | 2,500,000 | 2,571,375 | ||||||||||
| County of Cook IL, | ||||||||||||
| 5.240%, 11/15/2025 (Callable 11/15/2021) | 1,465,000 | 1,658,366 | ||||||||||
| Dallas Independent School District, | ||||||||||||
| 4.950%, 02/15/2022 (Callable 02/15/2021) | 1,965,000 | 2,271,363 | ||||||||||
| Davie Florida Water & Sewer Revenue, | ||||||||||||
| 6.062%, 10/01/2025 (Callable 10/01/2020) | 1,000,000 | 1,166,930 | ||||||||||
| Government Development Bank for Puerto Rico, | ||||||||||||
| 4.704%, 05/01/2016 § | 3,525,000 | 1,026,656 | ||||||||||
| Iowa Tobacco Settlement Authority, | ||||||||||||
| 6.500%, 06/01/2023 (Callable 08/01/2016) | 760,000 | 775,063 | ||||||||||
| New Hampshire Housing Finance Authority, | ||||||||||||
| 2.600%, 01/01/2020 | 1,670,000 | 1,706,974 | ||||||||||
| New Jersey Economic Development Authority, | ||||||||||||
| 1.802%, 06/15/2017 | 5,000,000 | 5,021,950 | ||||||||||
| North Carolina Housing Finance Agency: | ||||||||||||
| 4.000%, 01/01/2030 (Callable 07/01/2021) | 330,000 | 352,846 | ||||||||||
| 3.000%, 01/01/2033 (Callable 01/01/2025) | 6,995,000 | 7,125,876 | ||||||||||
| North East Independent School District/TX, | ||||||||||||
| 5.240%, 08/01/2027 | 2,100,000 | 2,659,167 | ||||||||||
| South Dakota Housing Development Authority, | ||||||||||||
| 2.700%, 11/01/2036 (Callable 11/01/2025) | 2,500,000 | 2,517,625 | ||||||||||
| Winnebago & Boone Counties School District No. 205 Rockford: | ||||||||||||
| 3.800%, 12/01/2026 (Callable 12/01/2025) | 2,200,000 | 2,379,652 | ||||||||||
| 3.950%, 12/01/2027 (Callable 12/01/2025) | 1,700,000 | 1,799,943 | ||||||||||
| 59,443,571 | 2.8 | % | ||||||||||
| Residential Mortgage-Backed Securities | ||||||||||||
| U.S. Government Agency Issues | ||||||||||||
| Fannie Mae REMIC Trust, | ||||||||||||
| Series 2004-W6, Class 1A6, 5.500%, 07/25/2034 | 123,251 | 123,809 | ||||||||||
| Federal Gold Loan Mortgage Corp. (FGLMC): | ||||||||||||
| 6.000%, 06/01/2021 | 81,653 | 88,532 | ||||||||||
| 6.000%, 07/01/2028 | 6,864 | 7,918 | ||||||||||
| Federal Home Loan Mortgage Corp. (FHLMC): | ||||||||||||
| 1.375%, 05/01/2020 @ | 10,000,000 | 10,150,760 | ||||||||||
| Series 74, Class F, 6.000%, 10/15/2020 | 880 | 923 | ||||||||||
| Series 1395, Class G, 6.000%, 10/15/2022 | 7,651 | 8,328 | ||||||||||
| Federal National Mortgage Association (FNMA): | ||||||||||||
| Series 1989-2, Class D, 8.800%, 01/25/2019 | 2,691 | 2,849 | ||||||||||
| Series 1990-108, Class G, 7.000%, 09/25/2020 | 3,201 | 3,430 | ||||||||||
| Series G-29, Class O, 8.500%, 09/25/2021 | 433 | 485 | ||||||||||
| Series 1991-137, Class H, 7.000%, 10/25/2021 | 22,478 | 24,531 | ||||||||||
| Series 1993-32, Class H, 6.000%, 03/25/2023 | 15,054 | 16,281 | ||||||||||
| Government National Mortgage Association (GNMA), | ||||||||||||
| Series 1999-4, Class ZB, 6.000%, 02/20/2029 | 88,374 | 100,065 | ||||||||||
| Towd Point Mortgage Trust, | ||||||||||||
| Series 2016-2, Class A1, 3.000%, 08/25/2055 (Acquired 05/20/2016, Cost $4,035,323) * ∞ | 4,004,228 | 4,089,512 | ||||||||||
| 14,617,423 | 0.7 | % | ||||||||||
| Non-U.S. Government Agency Issues | ||||||||||||
| Alternative Loan Trust: | ||||||||||||
| Series 2005-50CB, Class 4A1, 5.000%, 11/25/2020 | 218,708 | 216,884 | ||||||||||
| Series 2005-85CB, Class 3A1, 5.250%, 02/25/2021 (Acquired 09/26/2007 through 01/28/2009, Cost $200,570) * | 202,273 | 193,775 | ||||||||||
| Series 2006-7CB, Class 3A1, 5.250%, 05/25/2021 | 349,064 | 334,472 | ||||||||||
| Series 2005-11CB, Class 2A1, 5.500%, 06/25/2035 § | 58,527 | 55,565 | ||||||||||
| Banc of America Alternative Loan Trust: | ||||||||||||
| Series 2003-11, Class 4A1, 4.750%, 01/25/2019 | 44,797 | 44,973 | ||||||||||
| Series 2004-2, Class 5A1, 5.500%, 03/25/2019 | 151,637 | 152,304 | ||||||||||
| Series 2004-11, Class 4A1, 5.500%, 12/25/2019 | 233,431 | 235,883 | ||||||||||
| Series 2005-6, Class 7A1, 5.500%, 07/25/2020 § | 10,673 | 10,443 | ||||||||||
| Series 2006-2, Class 7A1, 6.000%, 03/25/2021 | 204,488 | 193,144 | ||||||||||
| Series 2006-4, Class 3CB4, 6.000%, 05/25/2046 § | 377,670 | 308,202 | ||||||||||
| Banc of America Funding Trust, | ||||||||||||
| Series 2004-2, Class 1CB1, 5.750%, 09/20/2034 | 3,833,944 | 3,965,865 | ||||||||||
| Bear Stearns ARM Trust, | ||||||||||||
| Series 2004-5, Class 2A, 3.480%, 07/25/2034 ∞ | 2,211,827 | 2,202,095 | ||||||||||
| J.P. Morgan Alternative Loan Trust: | ||||||||||||
| Series 2005-S1, Class 3A1, 5.500%, 10/25/2020 | 369,681 | 364,611 | ||||||||||
| Series 2006-A1, Class 2A1, 2.806%, 03/25/2036 § ∞ | 493,009 | 410,217 | ||||||||||
| MASTR Alternative Loan Trust: | ||||||||||||
| Series 2004-1, Class 1A1, 5.000%, 01/25/2019 | 187,479 | 188,309 | ||||||||||
| Series 2004-3, Class 1A1, 5.000%, 03/25/2019 | 45,994 | 46,294 | ||||||||||
| Series 2005-3, Class 4A1, 5.500%, 03/25/2020 | 52,234 | 53,260 | ||||||||||
| MortgageIT Trust, | ||||||||||||
| Series 2005-3, Class A1, 0.753%, 08/25/2035 ∞ | 8,881,504 | 8,192,742 | ||||||||||
| RALI Series Trust, | ||||||||||||
| Series 2004-QS6, Class A1, 5.000%, 05/25/2019 | 17,926 | 17,908 | ||||||||||
| Salomon Brothers Mortgage Securities VII, Inc., | ||||||||||||
| Series 2003-UP2, Class A2, 7.000%, 06/25/2033 | 70,518 | 71,413 | ||||||||||
| Structured Asset Securities Corp. Mortgage Pass-Through Certificates, | ||||||||||||
| Series 2004-22, Class A2, 5.067%, 01/25/2035 ∞ | 4,419,537 | 4,522,195 | ||||||||||
| Thornburg Mortgage Securities Trust, | ||||||||||||
| Series 2003-5, Class 3A, 2.418%, 10/25/2043 ∞ | 6,881,309 | 6,893,921 | ||||||||||
| WaMu Mortgage Pass-Through Certificates: | ||||||||||||
| Series 2004-CB1, Class 5A, 5.000%, 06/25/2019 | 256,160 | 259,124 | ||||||||||
| Series 2004-CB3, Class 3A, 5.500%, 10/25/2019 | 381,769 | 387,483 | ||||||||||
| Series 2004-CB3, Class 4A, 6.000%, 10/25/2019 | 145,839 | 150,870 | ||||||||||
| Series 2004-CB4, Class 21A, 5.500%, 12/25/2019 | 148,829 | 151,506 | ||||||||||
| Series 2004-CB4, Class 22A, 6.000%, 12/25/2019 | 101,315 | 103,682 | ||||||||||
| Series 2004-AR3, Class A1, 2.785%, 06/25/2034 ∞ | 4,764,602 | 4,794,087 | ||||||||||
| Series 2004-CB2, Class 3A, 6.000%, 08/25/2034 | 3,870,364 | 4,080,917 | ||||||||||
| Wells Fargo Mortgage Backed Securities, | ||||||||||||
| Series 2005-AR10, Class 2A17, 2.880%, 06/25/2035 ∞ | 7,083,847 | 7,161,096 | ||||||||||
| 45,763,240 | 2.2 | % | ||||||||||
| Asset Backed Securities | ||||||||||||
| Accredited Mortgage Loan Trust, | ||||||||||||
| Series 2005-4, Class A1, 0.693%, 12/25/2035 ∞ | 4,623,022 | 4,549,120 | ||||||||||
| Amresco Residential Securities Mortgage Loan Trust, | ||||||||||||
| Series 1998-1, Class A6, 6.510%, 08/25/2027 | 8,622 | 9,186 | ||||||||||
| Argent Securities Inc Asset-Backed Pass-Through Certificates, | ||||||||||||
| Series 2005-W3, Class A2D, 0.793%, 11/25/2035 ∞ | 2,011,561 | 1,954,427 | ||||||||||
| Capital Auto Receivables Asset Trust: | ||||||||||||
| Series 2015-2, Class A2, 1.390%, 09/20/2018 | 10,125,000 | 10,139,259 | ||||||||||
| Series 2015-3, Class A2, 1.720%, 01/22/2019 | 6,875,000 | 6,893,851 | ||||||||||
| Cityscape Home Equity Loan Trust, | ||||||||||||
| Series 1997-C, Class A4, 7.000%, 07/25/2028 § | 3,921 | 3,567 | ||||||||||
| Conseco Financial Corp.: | ||||||||||||
| Series 1993-4, Class A5, 7.050%, 01/15/2019 | 2,454 | 2,496 | ||||||||||
| Series 1998-2, Class A5, 6.240%, 12/01/2028 ∞ | 217,419 | 226,740 | ||||||||||
| Series 1998-3, Class A5, 6.220%, 03/01/2030 | 358,277 | 376,661 | ||||||||||
| Series 1998-4, Class A5, 6.180%, 04/01/2030 | 146,107 | 153,949 | ||||||||||
| Series 1998-7, Class A1, 6.320%, 07/01/2030 | 3,009,468 | 3,181,005 | ||||||||||
| Countrywide Asset-Backed Certificates: | ||||||||||||
| Series 2004-12, Class AF6, 4.634%, 03/25/2035 ∞ | 8,759 | 9,043 | ||||||||||
| Series 2005-1, Class AF6, 5.030%, 07/25/2035 ∞ | 423,262 | 432,547 | ||||||||||
| Series 2006-13, Class 1AF3, 4.626%, 01/25/2037 § ∞ | 150,965 | 216,292 | ||||||||||
| Series 2006-9, Class 1AF3, 4.841%, 10/25/2046 ∞ | 915,204 | 725,091 | ||||||||||
| Dell Equipment Finance Trust, | ||||||||||||
| Series 2015-1, Class A2, 1.010%, 07/24/2017 (Acquired 04/15/2015, Cost $9,787,475) * | 9,787,828 | 9,784,273 | ||||||||||
| Delta Funding Home Equity Loan Trust: | ||||||||||||
| Series 1997-2, Class A6, 7.040%, 06/25/2027 | 2,401 | 2,382 | ||||||||||
| Series 1999-2, Class A7F, 7.030%, 08/15/2030 | 318,184 | 346,576 | ||||||||||
| First Franklin Mortgage Loan Trust, | ||||||||||||
| Series 2004-FF7, Class A1, 1.093%, 09/25/2034 ∞ | 848,088 | 847,709 | ||||||||||
| Ford Credit Auto Owner Trust: | ||||||||||||
| Series 2014-1, Class A, 2.260%, 11/15/2025 (Acquired 10/07/2014 through 10/09/2014, Cost $10,897,836) * | 10,859,000 | 11,077,393 | ||||||||||
| Series 2014-2, Class A, 2.310%, 04/15/2026 (Acquired 10/07/2014, Cost $11,745,689) * | 11,750,000 | 12,002,875 | ||||||||||
| GSAMP Trust, | ||||||||||||
| Series 2005-WMC2, Class A1B, 0.763%, 11/25/2035 ∞ | 2,778,739 | 2,699,107 | ||||||||||
| Home Equity Asset Trust, | ||||||||||||
| Series 2006-8, Class 2A2, 0.563%, 03/25/2037 ∞ | 5,432,799 | 5,404,113 | ||||||||||
| IMC Home Equity Loan Trust, | ||||||||||||
| Series 1998-1, Class A6, 7.020%, 06/20/2029 | 2,497 | 2,496 | ||||||||||
| J.P. Morgan Mortgage Acquisition Trust, | ||||||||||||
| Series 2006-CH1, Class A1, 0.583%, 07/25/2036 ∞ | 3,550,778 | 3,417,551 | ||||||||||
| Kubota Credit Owner Trust, | ||||||||||||
| Series 2015-1A, Class A3, 1.540%, 03/15/2019 (Acquired 01/22/2015, Cost $10,048,597) * | 10,050,000 | 10,100,491 | ||||||||||
| New Century Home Equity Loan Trust, | ||||||||||||
| Series 2005-C, Class A2C, 0.703%, 12/25/2035 ∞ | 2,647,796 | 2,591,823 | ||||||||||
| Nomura Holdings, Inc., | ||||||||||||
| Series 2006-HE2, Class A3, 0.623%, 03/25/2036 ∞ | 5,095,458 | 4,947,732 | ||||||||||
| Oakwood Mortgage Investors, Inc., | ||||||||||||
| Series 1999-B, Class A3, 6.450%, 11/15/2017 | 69,684 | 71,780 | ||||||||||
| OneMain Financial Issuance Trust, | ||||||||||||
| Series 2014-2A, Class A, 2.470%, 09/18/2024 (Acquired 07/30/2015 through 07/31/2015, Cost $6,722,811) * | 6,725,000 | 6,739,603 | ||||||||||
| RAAC Series Trust, | ||||||||||||
| Series 2004-SP1, Class AI4, 5.285%, 08/25/2027 ∞ | 3,573 | 3,618 | ||||||||||
| RAMP Series Trust, | ||||||||||||
| Series 2005-RS1, Class AI6, 4.713%, 01/25/2035 | 39,250 | 39,662 | ||||||||||
| Saxon Asset Securities Trust, | ||||||||||||
| Series 2005-4, Class A1B, 0.833%, 11/25/2037 ∞ | 4,205,803 | 4,100,632 | ||||||||||
| Securitized Asset Backed Receivables LLC Trust, | ||||||||||||
| Series 2005-OP2, Class A1, 0.778%, 10/25/2035 (Acquired 03/13/2014, Cost $4,340,313) * ∞ | 4,393,863 | 4,351,246 | ||||||||||
| Soundview Home Loan Trust, | ||||||||||||
| Series 2003-2, Class A2, 1.753%, 11/25/2033 ∞ | 2,633,386 | 2,603,903 | ||||||||||
| Specialty Underwriting & Residential Finance Trust: | ||||||||||||
| Series 2004-BC4, Class A1A, 1.123%, 10/25/2035 ∞ | 2,716,096 | 2,653,574 | ||||||||||
| Series 2006-BC1, Class A2D, 0.753%, 12/25/2036 ∞ | 7,617,879 | 7,511,265 | ||||||||||
| Springleaf Funding Trust, | ||||||||||||
| Series 2014-AA, Class A, 2.410%, 12/15/2022 (Acquired 10/26/2015, Cost $7,532,728) * | 7,528,878 | 7,533,418 | ||||||||||
| Structured Asset Investment Loan Trust, | ||||||||||||
| Series 2004-9, Class A5, 1.453%, 10/25/2034 ∞ | 5,608,964 | 5,570,930 | ||||||||||
| Synchrony Credit Card Master Note Trust: | ||||||||||||
| Series 2014-1, Class A, 1.610%, 11/15/2020 | 5,325,000 | 5,358,454 | ||||||||||
| Series 2012-2, Class A, 2.220%, 01/15/2022 | 8,250,000 | 8,406,388 | ||||||||||
| TCF Auto Receivables Owner Trust, | ||||||||||||
| Series 2014-1A, Class A4, 1.560%, 01/15/2020 (Acquired 05/29/2015 through 06/12/2015, Cost $15,598,877) * | 15,575,000 | 15,605,803 | ||||||||||
| Wells Fargo Home Equity Asset-Backed Securities, | ||||||||||||
| Series 2004-2, Class A33, 1.453%, 10/25/2034 ∞ | 3,473,159 | 3,375,346 | ||||||||||
| 166,023,377 | 8.0 | % | ||||||||||
| Commercial Mortgage-Backed Securities | ||||||||||||
| U.S. Government Agency Issues | ||||||||||||
| FHLMC Multifamily Structured Pass Through Certificates: | ||||||||||||
| Series K702, Class A2, 3.154%, 02/25/2018 | 298,835 | 307,362 | ||||||||||
| Series K704, Class A2, 2.412%, 08/25/2018 | 622,073 | 637,594 | ||||||||||
| Series K705, Class A2, 2.303%, 09/25/2018 | 4,250,000 | 4,358,008 | ||||||||||
| Series K708, Class A2, 2.130%, 01/25/2019 | 8,300,000 | 8,499,701 | ||||||||||
| Series K003, Class A4, 5.053%, 01/25/2019 | 9,000,000 | 9,783,329 | ||||||||||
| Series K004, Class A2, 4.186%, 08/25/2019 | 6,825,000 | 7,400,098 | ||||||||||
| Series K005, Class A2, 4.317%, 11/25/2019 | 4,975,000 | 5,445,144 | ||||||||||
| Series K006, Class A2, 4.251%, 01/25/2020 | 2,643,000 | 2,898,720 | ||||||||||
| Series KF02, Class A3, 1.083%, 07/25/2020 ∞ | 2,286,471 | 2,290,990 | ||||||||||
| 41,620,946 | 2.0 | % | ||||||||||
| Non-U.S. Government Agency Issues | ||||||||||||
| DBUBS Mortgage Trust, | ||||||||||||
| Series 2011-LC3A, Class A2, 3.642%, 08/10/2044 | 2,937,676 | 2,936,723 | ||||||||||
| J.P. Morgan Chase Commercial Mortgage Securities Corp., | ||||||||||||
| Series 2011-C5, Class A3, 4.171%, 08/15/2046 | 5,000,000 | 5,460,251 | ||||||||||
| J.P. Morgan Chase Commercial Mortgage Securities Trust, | ||||||||||||
| Series 2012-C8, Class ASB, 2.379%, 10/15/2045 | 8,004,000 | 8,222,918 | ||||||||||
| Morgan Stanley Bank of America Merrill Lynch Trust, | ||||||||||||
| Series 2016-C29, Class ASB, 3.140%, 05/15/2049 | 5,000,000 | 5,287,594 | ||||||||||
| NCUA Guaranteed Notes Trust, | ||||||||||||
| Series 2010-C1, Class A2, 2.900%, 10/29/2020 | 86,745 | 86,784 | ||||||||||
| Wells Fargo Commercial Mortgage Trust: | ||||||||||||
| Series 2014-LC18, Class ASB, 3.244%, 12/15/2047 | 16,400,000 | 17,362,493 | ||||||||||
| Series 2015-P2, Class ASB, 3.656%, 12/15/2048 | 10,400,000 | 11,298,243 | ||||||||||
| WFRBS Commercial Mortgage Trust: | ||||||||||||
| Series 2012-C6, Class A4, 3.440%, 04/15/2045 | 8,000,000 | 8,599,018 | ||||||||||
| Series 2014-C21, Class A2, 2.917%, 08/15/2047 | 2,435,234 | 2,535,295 | ||||||||||
| Series 2014-C24, Class ASB, 3.324%, 11/15/2047 | 8,652,000 | 9,188,201 | ||||||||||
| Series 2013-C12, Class ASB, 2.838%, 03/15/2048 | 8,500,000 | 8,867,991 | ||||||||||
| 79,845,511 | 3.8 | % | ||||||||||
| Total Long-Term Investments (Cost $2,012,223,580) | 2,063,759,307 | 98.9 | % | |||||||||
| SHORT-TERM INVESTMENTS | ||||||||||||
| Money Market Mutual Funds | ||||||||||||
| Dreyfus Institutional Cash Advantage Fund, Institutional Class, 0.39% « | 834,543 | 834,543 | ||||||||||
| Short-Term Investments Trust - Liquid Assets Portfolio, Institutional Class, 0.43% « | 41,000,000 | 41,000,000 | ||||||||||
| Total Short-Term Investments (Cost $41,834,543) | 41,834,543 | 2.0 | % | |||||||||
| INVESTMENT PURCHASED WITH CASH PROCEEDS FROM | ||||||||||||
| SECURITIES LENDING | ||||||||||||
| Investment Company | ||||||||||||
| Mount Vernon Securities Lending Trust Prime Portfolio, 0.56% « | 54,964,493 | 54,964,493 | ||||||||||
| Total Investment Company (Cost $54,964,493) | 54,964,493 | 2.7 | % | |||||||||
| Total Investment Purchased With Cash Proceeds From | ||||||||||||
| Securities Lending (Cost $54,964,493) | 54,964,493 | 2.7 | % | |||||||||
| Total Investments (Cost $2,109,022,616) | 2,160,558,343 | 103.6 | % | |||||||||
| Liabilities in Excess of Other Assets | (74,185,983 | ) | (3.6 | )% | ||||||||
| TOTAL NET ASSETS | $ | 2,086,372,360 | 100.0 | % | ||||||||
Notes to Schedule of Investments | |
| * | Restricted security as defined in Rule 144 under the Securities Act of 1933 and determined to be liquid. Purchased in a private placement transaction; resale to the public may require registration or or may extend only to qualified institutional buyers. At June 30, 2016, the value of these securities total $432,098,134 which represents 20.71% of total net assets. |
| @ | This security or portion of this security is out on loan at June 30, 2016. |
| f | Foreign Security |
| § | Security in Default |
| ∞ | Variable or Floating rate security. Floating rate securities are securities whose yields vary with a designated index rate. These securities rates are as of June 30, 2016. |
| « | 7-Day Yield |
| Baird Aggregate Bond Fund | ||||||||||||
| Schedule of Investments | ||||||||||||
| June 30, 2016 (Unaudited) | ||||||||||||
| Principal | % of | |||||||||||
| Amount | Value | Net Assets | ||||||||||
| LONG-TERM INVESTMENTS | ||||||||||||
| U.S. Treasury Securities | ||||||||||||
| U.S. Treasury Bonds: | ||||||||||||
| 2.625%, 08/15/2020 | $ | 140,475,000 | $ | 150,176,484 | ||||||||
| 1.750%, 03/31/2022 | 403,705,000 | 417,124,961 | ||||||||||
| 2.500%, 05/15/2024 | 164,675,000 | 178,858,952 | ||||||||||
| 5.250%, 11/15/2028 | 77,576,500 | 109,194,975 | ||||||||||
| 3.500%, 02/15/2039 | 351,355,900 | 443,422,038 | ||||||||||
| 2.875%, 05/15/2043 | 164,600,000 | 185,091,383 | ||||||||||
| 2.500%, 02/15/2045 @ | 15,525,000 | 16,163,590 | ||||||||||
| 1,500,032,383 | 17.2 | % | ||||||||||
| Corporate Bonds | ||||||||||||
| Finance | ||||||||||||
| ABN AMRO Bank NV: | ||||||||||||
| 2.500%, 10/30/2018 (Acquired 10/23/2013 through 01/13/2014, Cost $11,024,650) * f | 11,033,000 | 11,289,098 | ||||||||||
| 2.450%, 06/04/2020 (Acquired 05/28/2015, Cost $8,980,200) * f | 9,000,000 | 9,203,202 | ||||||||||
| 4.800%, 04/18/2026 (Acquired 04/11/2016, Cost $8,984,430) * @ f | 9,000,000 | 9,370,593 | ||||||||||
| ACE INA Holdings, Inc., | ||||||||||||
| 2.875%, 11/03/2022 | 8,750,000 | 9,152,868 | ||||||||||
| Aetna, Inc., | ||||||||||||
| 4.250%, 06/15/2036 @ | 4,575,000 | 4,726,776 | ||||||||||
| AIA Group Ltd., | ||||||||||||
| 3.200%, 03/11/2025 (Acquired 03/04/2015, Cost $5,992,380) * f | 6,000,000 | 6,115,956 | ||||||||||
| Ally Financial, Inc., | ||||||||||||
| 8.000%, 12/31/2018 | 360,000 | 393,300 | ||||||||||
| American International Group, Inc.: | ||||||||||||
| 6.400%, 12/15/2020 | 10,830,000 | 12,736,741 | ||||||||||
| 4.875%, 06/01/2022 | 17,698,000 | 19,716,032 | ||||||||||
| 4.125%, 02/15/2024 | 893,000 | 942,053 | ||||||||||
| 3.875%, 01/15/2035 | 4,875,000 | 4,667,637 | ||||||||||
| 8.175%, 05/15/2058 ∞ | 893,000 | 1,122,442 | ||||||||||
| Ameriprise Financial, Inc., | ||||||||||||
| 7.300%, 06/28/2019 | 1,785,000 | 2,069,309 | ||||||||||
| AmSouth Bancorporation, | ||||||||||||
| 6.750%, 11/01/2025 | 223,000 | 256,409 | ||||||||||
| ANZ New Zealand (Int'l) Ltd.: | ||||||||||||
| 1.750%, 03/29/2018 (Acquired 03/24/2015 through 06/15/2015, Cost $2,434,251) * f | 2,435,000 | 2,445,371 | ||||||||||
| 2.850%, 08/06/2020 (Acquired 07/30/2015, Cost $15,337,260) * @ f | 15,350,000 | 15,830,010 | ||||||||||
| 2.750%, 02/03/2021 (Acquired 01/27/2016, Cost $2,996,790) * f | 3,000,000 | 3,104,790 | ||||||||||
| Aon PLC: | ||||||||||||
| 4.000%, 11/27/2023 f | 6,150,000 | 6,570,230 | ||||||||||
| 3.875%, 12/15/2025 f | 7,000,000 | 7,383,159 | ||||||||||
| Australia & New Zealand Banking Group Ltd./New York NY, | ||||||||||||
| 3.700%, 11/16/2025 @ f | 6,500,000 | 7,196,105 | ||||||||||
| Australia and New Zealand Banking Group Ltd., | ||||||||||||
| 4.500%, 03/19/2024 (Acquired 03/12/2014 through 02/23/2016, Cost $15,998,050) * @ f | 16,000,000 | 16,681,616 | ||||||||||
| BAC Capital Trust VI, | ||||||||||||
| 5.625%, 03/08/2035 ^ | 357,000 | 387,748 | ||||||||||
| Bank of America Corp.: | ||||||||||||
| 6.400%, 08/28/2017 | 893,000 | 942,262 | ||||||||||
| 6.875%, 04/25/2018 | 3,162,000 | 3,452,104 | ||||||||||
| 2.625%, 10/19/2020 @ | 5,000,000 | 5,079,685 | ||||||||||
| 3.300%, 01/11/2023 | 7,000,000 | 7,204,029 | ||||||||||
| 4.125%, 01/22/2024 | 15,000,000 | 16,133,685 | ||||||||||
| 3.500%, 04/19/2026 @ | 9,000,000 | 9,300,492 | ||||||||||
| 7.750%, 05/14/2038 | 1,138,000 | 1,602,412 | ||||||||||
| Bank of Montreal, | ||||||||||||
| 1.800%, 07/31/2018 f | 3,600,000 | 3,644,226 | ||||||||||
| BanPonce Trust I, | ||||||||||||
| Class A, 8.327%, 02/01/2027 | 1,941,000 | 1,822,601 | ||||||||||
| Barclays Bank PLC, | ||||||||||||
| 6.050%, 12/04/2017 (Acquired 05/27/2015, Cost $10,540,838) * f | 10,000,000 | 10,472,320 | ||||||||||
| Barclays PLC: | ||||||||||||
| 2.875%, 06/08/2020 f | 5,000,000 | 4,927,140 | ||||||||||
| 3.250%, 01/12/2021 f | 12,175,000 | 12,132,351 | ||||||||||
| 3.650%, 03/16/2025 f | 8,100,000 | 7,788,709 | ||||||||||
| BB&T Corp., | ||||||||||||
| 2.625%, 06/29/2020 | 5,000,000 | 5,164,925 | ||||||||||
| Berkshire Hathaway, Inc., | ||||||||||||
| 2.750%, 03/15/2023 | 14,675,000 | 15,162,680 | ||||||||||
| BNP Paribas SA: | ||||||||||||
| 2.375%, 05/21/2020 f | 10,000,000 | 10,190,800 | ||||||||||
| 3.250%, 03/03/2023 f | 3,570,000 | 3,712,589 | ||||||||||
| BNZ International Funding Ltd.: | ||||||||||||
| 2.350%, 03/04/2019 (Acquired 09/03/2014 through 04/17/2015, Cost $7,333,219) * f | 7,300,000 | 7,412,566 | ||||||||||
| 2.750%, 03/02/2021 (Acquired 02/23/2016, Cost $13,990,200) * @ f | 14,000,000 | 14,465,934 | ||||||||||
| BPCE: | ||||||||||||
| 2.500%, 07/15/2019 f | 7,925,000 | 8,114,074 | ||||||||||
| 5.700%, 10/22/2023 (Acquired 10/15/2013 through 09/30/2014, Cost $8,204,773) * f | 8,055,000 | 8,639,487 | ||||||||||
| 4.000%, 04/15/2024 @ f | 2,500,000 | 2,724,675 | ||||||||||
| 4.625%, 07/11/2024 (Acquired 04/13/2016, Cost $4,921,733) * f | 5,060,000 | 5,071,294 | ||||||||||
| BPCE SA, | ||||||||||||
| 5.150%, 07/21/2024 (Acquired 05/10/2016 through 05/16/2016, Cost $11,428,601) * f | 11,125,000 | 11,576,731 | ||||||||||
| Caisse Centrale Desjardins: | ||||||||||||
| 1.550%, 09/12/2017 (Acquired 07/07/2015, Cost $4,004,026) * f | 4,000,000 | 4,008,088 | ||||||||||
| 1.303%, 01/29/2018 (Acquired 01/26/2015, Cost $19,000,000) * f ∞ | 19,000,000 | 18,949,175 | ||||||||||
| Capital One Bank (USA) National Association, | ||||||||||||
| 3.375%, 02/15/2023 | 22,650,000 | 23,134,733 | ||||||||||
| Capital One NA: | ||||||||||||
| 1.313%, 02/05/2018 ∞ | 3,625,000 | 3,622,162 | ||||||||||
| 2.400%, 09/05/2019 | 12,000,000 | 12,158,784 | ||||||||||
| Citigroup, Inc.: | ||||||||||||
| 1.850%, 11/24/2017 | 6,100,000 | 6,133,623 | ||||||||||
| 1.700%, 04/27/2018 | 13,000,000 | 13,020,839 | ||||||||||
| 2.050%, 12/07/2018 | 11,000,000 | 11,087,417 | ||||||||||
| 3.750%, 06/16/2024 | 1,000,000 | 1,052,489 | ||||||||||
| 3.700%, 01/12/2026 | 4,500,000 | 4,737,096 | ||||||||||
| Citizens Bank National Association: | ||||||||||||
| 2.500%, 03/14/2019 | 7,800,000 | 7,911,064 | ||||||||||
| 2.450%, 12/04/2019 | 19,300,000 | 19,555,918 | ||||||||||
| Citizens Bank, National Association, | ||||||||||||
| 2.300%, 12/03/2018 | 4,000,000 | 4,052,344 | ||||||||||
| CNA Financial Corp.: | ||||||||||||
| 5.750%, 08/15/2021 | 7,199,000 | 8,288,655 | ||||||||||
| 7.250%, 11/15/2023 | 4,000,000 | 4,853,724 | ||||||||||
| 4.500%, 03/01/2026 | 14,000,000 | 14,901,684 | ||||||||||
| Comerica Bank: | ||||||||||||
| 2.500%, 06/02/2020 | 29,000,000 | 29,847,351 | ||||||||||
| 4.000%, 07/27/2025 | 10,000,000 | 10,319,300 | ||||||||||
| Commonwealth Bank of Australia, | ||||||||||||
| 2.050%, 03/15/2019 f | 10,275,000 | 10,418,367 | ||||||||||
| Compass Bank: | ||||||||||||
| 2.750%, 09/29/2019 | 31,216,000 | 30,827,704 | ||||||||||
| 3.875%, 04/10/2025 | 13,000,000 | 12,475,138 | ||||||||||
| Credit Agricole SA: | ||||||||||||
| 1.481%, 10/03/2016 (Acquired 09/26/2013, Cost $1,500,000) * f ∞ | 1,500,000 | 1,502,094 | ||||||||||
| 6.637%, 05/31/2017 (Acquired 05/23/2007, Cost $893,000) * f ∞ | 893,000 | 879,605 | ||||||||||
| Credit Suisse: | ||||||||||||
| 1.700%, 04/27/2018 @ f | 6,000,000 | 6,006,420 | ||||||||||
| 5.300%, 08/13/2019 f | 1,406,000 | 1,551,821 | ||||||||||
| 5.400%, 01/14/2020 f | 5,000,000 | 5,427,900 | ||||||||||
| 3.000%, 10/29/2021 f | 7,000,000 | 7,170,086 | ||||||||||
| 3.625%, 09/09/2024 f | 4,325,000 | 4,474,502 | ||||||||||
| Credit Suisse Group Funding Guernsey Ltd.: | ||||||||||||
| 3.800%, 09/15/2022 @ f | 3,000,000 | 3,012,966 | ||||||||||
| 3.800%, 06/09/2023 (Acquired 06/07/2016, Cost $4,536,987) * f | 4,550,000 | 4,538,325 | ||||||||||
| 4.550%, 04/17/2026 (Acquired 04/13/2016, Cost $1,999,520) * f | 2,000,000 | 2,074,758 | ||||||||||
| Credit Suisse USA, Inc., | ||||||||||||
| 7.125%, 07/15/2032 | 5,063,000 | 6,744,432 | ||||||||||
| Deutsche Bank AG: | ||||||||||||
| 1.237%, 02/13/2017 f ∞ | 9,000,000 | 8,990,820 | ||||||||||
| 2.950%, 08/20/2020 f | 4,500,000 | 4,460,504 | ||||||||||
| 3.125%, 01/13/2021 @ f | 10,800,000 | 10,786,370 | ||||||||||
| Deutsche Bank Aktiengesellschaft, | ||||||||||||
| 3.700%, 05/30/2024 f | 10,000,000 | 9,940,520 | ||||||||||
| Discover Bank of Greenwood DE, | ||||||||||||
| 2.600%, 11/13/2018 | 4,875,000 | 4,948,335 | ||||||||||
| Discover Financial Services, | ||||||||||||
| 3.950%, 11/06/2024 | 5,000,000 | 5,124,675 | ||||||||||
| Fifth Third Bancorp, | ||||||||||||
| 2.875%, 07/27/2020 | 6,000,000 | 6,252,960 | ||||||||||
| First Horizon National Corp., | ||||||||||||
| 3.500%, 12/15/2020 | 29,078,000 | 29,344,267 | ||||||||||
| First Tennessee Bank National Association, | ||||||||||||
| 2.950%, 12/01/2019 | 5,612,000 | 5,637,585 | ||||||||||
| FMR LLC, | ||||||||||||
| 4.950%, 02/01/2033 (Acquired 01/29/2013, Cost $1,747,795) * | 1,750,000 | 1,944,857 | ||||||||||
| GE Capital International Funding Co., | ||||||||||||
| 2.342%, 11/15/2020 (Acquired 01/04/2012 through 01/06/2015, Cost $11,853,296) * f | 12,638,000 | 13,019,175 | ||||||||||
| Genworth Holdings, Inc., | ||||||||||||
| 4.900%, 08/15/2023 | 1,339,000 | 1,007,598 | ||||||||||
| Goldman Sachs Capital I, | ||||||||||||
| 6.345%, 02/15/2034 | 1,053,000 | 1,238,289 | ||||||||||
| Great-West Life & Annuity Insurance Capital LP II, | ||||||||||||
| 3.164%, 05/16/2046 (Acquired 05/16/2006 through 11/08/2007, Cost $2,482,656) * ∞ | 2,499,000 | 2,205,368 | ||||||||||
| Highmark, Inc., | ||||||||||||
| 4.750%, 05/15/2021 (Acquired 05/03/2011 through 07/30/2014, Cost $4,377,239) * | 4,378,000 | 4,482,328 | ||||||||||
| HSBC Bank PLC, | ||||||||||||
| 1.266%, 05/15/2018 (Acquired 12/17/2014, Cost $4,963,285) * f ∞ | 4,950,000 | 4,928,982 | ||||||||||
| HSBC Finance Corp., | ||||||||||||
| 6.676%, 01/15/2021 | 15,925,000 | 17,844,026 | ||||||||||
| HSBC Holdings PLC: | ||||||||||||
| 3.600%, 05/25/2023 f | 2,275,000 | 2,324,982 | ||||||||||
| 6.500%, 09/15/2037 f | 1,874,000 | 2,252,776 | ||||||||||
| HSBC USA, Inc.: | ||||||||||||
| 2.350%, 03/05/2020 | 3,000,000 | 2,999,010 | ||||||||||
| 5.000%, 09/27/2020 | 3,716,000 | 3,992,623 | ||||||||||
| 9.125%, 05/15/2021 | 625,000 | 775,229 | ||||||||||
| Humana, Inc., | ||||||||||||
| 7.200%, 06/15/2018 | 1,870,000 | 2,070,731 | ||||||||||
| ING Bank NV: | ||||||||||||
| 3.750%, 03/07/2017 (Acquired 03/28/2012, Cost $1,903,782) * f | 1,919,000 | 1,952,141 | ||||||||||
| 2.050%, 08/17/2018 (Acquired 08/10/2015, Cost $7,270,562) * f | 7,275,000 | 7,376,181 | ||||||||||
| 2.000%, 11/26/2018 (Acquired 11/17/2015, Cost $5,984,160) * f | 6,000,000 | 6,063,858 | ||||||||||
| 2.500%, 10/01/2019 (Acquired 09/23/2014, Cost $3,481,100) * f | 3,500,000 | 3,571,200 | ||||||||||
| 2.450%, 03/16/2020 (Acquired 03/10/2015 through 04/29/2015, Cost $9,210,258) * f | 9,225,000 | 9,411,013 | ||||||||||
| 5.800%, 09/25/2023 (Acquired 01/14/2014 through 04/07/2014, Cost $11,384,562) * f | 10,450,000 | 11,468,008 | ||||||||||
| Invesco Finance PLC: | ||||||||||||
| 3.125%, 11/30/2022 f | 5,902,000 | 6,158,896 | ||||||||||
| 3.750%, 01/15/2026 f | 4,900,000 | 5,259,866 | ||||||||||
| J.P. Morgan Chase & Co.: | ||||||||||||
| 2.200%, 10/22/2019 | 3,675,000 | 3,735,487 | ||||||||||
| 4.250%, 10/15/2020 | 886,000 | 965,696 | ||||||||||
| 2.550%, 03/01/2021 | 7,000,000 | 7,114,681 | ||||||||||
| 3.125%, 01/23/2025 | 14,000,000 | 14,312,620 | ||||||||||
| 5.600%, 07/15/2041 | 4,106,000 | 5,206,465 | ||||||||||
| J.P. Morgan Chase Bank, National Association, | ||||||||||||
| 6.000%, 10/01/2017 | 500,000 | 528,106 | ||||||||||
| Jefferies Group LLC: | ||||||||||||
| 6.875%, 04/15/2021 | 3,570,000 | 4,054,402 | ||||||||||
| 6.250%, 01/15/2036 | 1,390,000 | 1,397,719 | ||||||||||
| John Hancock Life Insurance Co., | ||||||||||||
| 7.375%, 02/15/2024 (Acquired 08/26/2010, Cost $6,612,705) * | 6,069,000 | 7,492,927 | ||||||||||
| KeyBank National Association: | ||||||||||||
| 1.193%, 06/01/2018 ∞ | 10,600,000 | 10,578,662 | ||||||||||
| 2.250%, 03/16/2020 | 5,000,000 | 5,068,725 | ||||||||||
| Kookmin Bank, | ||||||||||||
| 1.625%, 07/14/2017 (Acquired 07/07/2014, Cost $3,988,720) * f | 4,000,000 | 4,013,760 | ||||||||||
| LeasePlan Corp. NV: | ||||||||||||
| 3.000%, 10/23/2017 (Acquired 12/03/2013 through 04/29/2015, Cost $959,224) * f | 950,000 | 956,984 | ||||||||||
| 2.500%, 05/16/2018 (Acquired 08/02/2013 through 04/27/2015, Cost $18,632,828) * f | 18,658,000 | 18,665,314 | ||||||||||
| 2.875%, 01/22/2019 (Acquired 10/14/2015, Cost $10,993,180) * f | 11,000,000 | 11,005,236 | ||||||||||
| Liberty Mutual Group, Inc.: | ||||||||||||
| 4.250%, 06/15/2023 (Acquired 06/13/2013, Cost $2,660,995) * | 2,678,000 | 2,844,671 | ||||||||||
| 10.750%, 06/15/2058 (Acquired 05/21/2008, Cost $2,182,029) * ∞ | 2,231,000 | 3,234,950 | ||||||||||
| Liberty Mutual Insurance Co., | ||||||||||||
| 7.697%, 10/15/2097 (Acquired 03/26/2003, Cost $297,831) * | 465,000 | 593,739 | ||||||||||
| Lincoln National Corp.: | ||||||||||||
| 8.750%, 07/01/2019 | 5,218,000 | 6,172,471 | ||||||||||
| 6.050%, 04/20/2067 ∞ | 1,004,000 | 670,170 | ||||||||||
| Lloyds Bank PLC: | ||||||||||||
| 1.750%, 05/14/2018 f | 7,775,000 | 7,753,129 | ||||||||||
| 5.800%, 01/13/2020 (Acquired 02/10/2010, Cost $1,409,924) * f | 1,428,000 | 1,597,466 | ||||||||||
| 2.400%, 03/17/2020 f | 20,000,000 | 20,172,660 | ||||||||||
| Macquarie Bank Ltd.: | ||||||||||||
| 1.600%, 10/27/2017 (Acquired 10/22/2014, Cost $4,996,950) * f | 5,000,000 | 5,005,335 | ||||||||||
| 2.400%, 01/21/2020 (Acquired 01/14/2015, Cost $4,989,000) * f | 5,000,000 | 5,047,830 | ||||||||||
| Macquarie Group Ltd.: | ||||||||||||
| 3.000%, 12/03/2018 (Acquired 11/25/2013, Cost $8,490,900) * f | 8,525,000 | 8,755,303 | ||||||||||
| 7.625%, 08/13/2019 (Acquired 02/12/2014 through 05/18/2015, Cost $4,489,631) * f | 3,944,000 | 4,578,329 | ||||||||||
| Manufacturers & Traders Trust Co., | ||||||||||||
| 2.100%, 02/06/2020 | 10,850,000 | 10,977,303 | ||||||||||
| Manulife Financial Corp.: | ||||||||||||
| 4.150%, 03/04/2026 f | 10,000,000 | 10,726,070 | ||||||||||
| 5.375%, 03/04/2046 f | 5,150,000 | 6,018,089 | ||||||||||
| Marsh & McLennan Cos., Inc., | ||||||||||||
| 2.300%, 04/01/2017 | 2,231,000 | 2,250,718 | ||||||||||
| Massachusetts Mutual Life Insurance Co.: | ||||||||||||
| 8.875%, 06/01/2039 (Acquired 05/27/2009 through 03/31/2016, Cost $29,839,678) * | 20,177,000 | 30,193,650 | ||||||||||
| 4.500%, 04/15/2065 (Acquired 04/08/2015, Cost $2,945,520) * | 3,000,000 | 2,866,998 | ||||||||||
| MBIA Insurance Corp., | ||||||||||||
| 11.888%, 01/15/2033 (Acquired 01/11/2008, Cost $714,000) * § | 714,000 | 264,180 | ||||||||||
| MetLife, Inc.: | ||||||||||||
| 7.717%, 02/15/2019 | 982,000 | 1,138,969 | ||||||||||
| 6.500%, 12/15/2032 | 466,000 | 599,668 | ||||||||||
| 4.050%, 03/01/2045 | 10,000,000 | 9,851,080 | ||||||||||
| 4.600%, 05/13/2046 @ | 5,750,000 | 6,181,618 | ||||||||||
| Metropolitan Life Global Funding I, | ||||||||||||
| 3.000%, 01/10/2023 (Acquired 04/27/2015, Cost $2,040,947) * | 2,004,000 | 2,054,535 | ||||||||||
| Mitsubishi UFJ Financial Group, Inc., | ||||||||||||
| 2.950%, 03/01/2021 f | 15,200,000 | 15,766,534 | ||||||||||
| Mizuho Bank Ltd.: | ||||||||||||
| 1.850%, 03/21/2018 (Acquired 03/14/2013 through 04/29/2015, Cost $3,345,235) * f | 3,349,000 | 3,372,768 | ||||||||||
| 1.800%, 03/26/2018 (Acquired 06/16/2016, Cost $24,373,029) * f | 24,275,000 | 24,420,553 | ||||||||||
| 2.450%, 04/16/2019 (Acquired 04/09/2014, Cost $2,096,262) * f | 2,100,000 | 2,141,126 | ||||||||||
| Mizuho Financial Group, Inc., | ||||||||||||
| 2.632%, 04/12/2021 (Acquired 04/05/2016, Cost $13,000,000) * f | 13,000,000 | 13,238,303 | ||||||||||
| Morgan Stanley: | ||||||||||||
| 7.300%, 05/13/2019 | 15,110,000 | 17,360,785 | ||||||||||
| 2.375%, 07/23/2019 | 1,000,000 | 1,016,499 | ||||||||||
| 5.625%, 09/23/2019 | 1,941,000 | 2,153,555 | ||||||||||
| 2.650%, 01/27/2020 | 4,200,000 | 4,269,254 | ||||||||||
| 2.800%, 06/16/2020 | 5,000,000 | 5,123,035 | ||||||||||
| 2.500%, 04/21/2021 @ | 8,000,000 | 8,083,680 | ||||||||||
| Class F, 3.875%, 04/29/2024 | 1,650,000 | 1,766,188 | ||||||||||
| 3.700%, 10/23/2024 | 4,000,000 | 4,185,496 | ||||||||||
| MUFG Americas Holdings Corp., | ||||||||||||
| 2.250%, 02/10/2020 | 5,000,000 | 5,036,105 | ||||||||||
| National City Bank, | ||||||||||||
| 5.800%, 06/07/2017 | 1,750,000 | 1,820,644 | ||||||||||
| Nationwide Financial Services, Inc., | ||||||||||||
| 5.375%, 03/25/2021 (Acquired 02/05/2015 through 05/08/2015, Cost $18,697,962) * | 16,905,000 | 18,881,533 | ||||||||||
| Navient LLC, | ||||||||||||
| 5.625%, 08/01/2033 | 446,000 | 313,315 | ||||||||||
| New York Life Insurance Co., | ||||||||||||
| 6.750%, 11/15/2039 (Acquired 05/04/2016, Cost $3,969,308) * | 3,000,000 | 4,099,098 | ||||||||||
| Nomura Holdings, Inc.: | ||||||||||||
| 2.000%, 09/13/2016 f | 6,248,000 | 6,258,784 | ||||||||||
| 2.750%, 03/19/2019 f | 1,625,000 | 1,662,928 | ||||||||||
| 6.700%, 03/04/2020 @ f | 1,667,000 | 1,935,487 | ||||||||||
| Peachtree Corners Funding Trust, | ||||||||||||
| 3.976%, 02/15/2025 (Acquired 03/10/2015 through 04/24/2015, Cost $8,118,686) * | 8,000,000 | 8,020,728 | ||||||||||
| PNC Bank, National Association, | ||||||||||||
| 4.200%, 11/01/2025 | 2,678,000 | 3,009,311 | ||||||||||
| Pricoa Global Funding I, | ||||||||||||
| 2.550%, 11/24/2020 (Acquired 11/17/2015, Cost $14,000,000) * | 14,000,000 | 14,473,494 | ||||||||||
| Principal Financial Group, Inc.: | ||||||||||||
| 8.875%, 05/15/2019 | 2,215,000 | 2,628,357 | ||||||||||
| 3.300%, 09/15/2022 | 1,860,000 | 1,931,506 | ||||||||||
| 3.400%, 05/15/2025 | 16,000,000 | 16,382,992 | ||||||||||
| Principal Life Global Funding II: | ||||||||||||
| 2.200%, 04/08/2020 (Acquired 03/31/2015, Cost $3,994,720) * | 4,000,000 | 4,063,512 | ||||||||||
| 3.000%, 04/18/2026 (Acquired 04/11/2016, Cost $13,364,356) * @ | 13,400,000 | 13,667,075 | ||||||||||
| Protective Life Corp.: | ||||||||||||
| 7.375%, 10/15/2019 | 7,096,000 | 8,235,000 | ||||||||||
| 2.700%, 11/25/2020 (Acquired 11/19/2015, Cost $7,992,960) * | 8,000,000 | 8,271,464 | ||||||||||
| 8.450%, 10/15/2039 | 1,400,000 | 1,958,887 | ||||||||||
| Raymond James Financial, Inc., | ||||||||||||
| 8.600%, 08/15/2019 | 5,000,000 | 5,915,525 | ||||||||||
| RBC USA Holdco Corp., | ||||||||||||
| 5.250%, 09/15/2020 | 2,025,000 | 2,285,040 | ||||||||||
| Regions Bank, | ||||||||||||
| 7.500%, 05/15/2018 | 8,518,000 | 9,341,648 | ||||||||||
| Regions Financial Corp., | ||||||||||||
| 3.200%, 02/08/2021 | 25,000,000 | 25,732,450 | ||||||||||
| Reliance Standard Life Global Funding II: | ||||||||||||
| 2.500%, 01/15/2020 (Acquired 04/14/2015, Cost $7,004,344) * | 6,940,000 | 7,042,941 | ||||||||||
| 2.375%, 05/04/2020 (Acquired 04/27/2015, Cost $20,936,160) * | 21,000,000 | 21,081,627 | ||||||||||
| Santander Bank NA, | ||||||||||||
| 8.750%, 05/30/2018 | 8,802,000 | 9,802,224 | ||||||||||
| Santander Holdings USA, Inc., | ||||||||||||
| 2.700%, 05/24/2019 | 5,000,000 | 5,024,055 | ||||||||||
| Santander Issuances SAU, | ||||||||||||
| 5.179%, 11/19/2025 f | 4,000,000 | 3,996,132 | ||||||||||
| Santander UK Group Holdings PLC, | ||||||||||||
| 2.875%, 10/16/2020 f | 4,866,000 | 4,828,405 | ||||||||||
| Santander UK PLC: | ||||||||||||
| 2.650%, 04/17/2020 | 2,000,000 | 1,974,950 | ||||||||||
| 3.125%, 01/08/2021 f | 2,600,000 | 2,605,653 | ||||||||||
| 5.000%, 11/07/2023 (Acquired 10/31/2013 through 12/02/2014, Cost $10,254,830) * f | 9,880,000 | 10,141,810 | ||||||||||
| Skandinaviska Enskilda Banken AB: | ||||||||||||
| 2.375%, 11/20/2018 (Acquired 11/13/2013 through 05/07/2015, Cost $6,850,704) * f | 6,835,000 | 6,972,650 | ||||||||||
| 2.375%, 03/25/2019 (Acquired 03/18/2014 through 04/29/2015, Cost $1,726,792) * f | 1,725,000 | 1,755,621 | ||||||||||
| 2.450%, 05/27/2020 (Acquired 05/19/2015, Cost $14,976,900) * f | 15,000,000 | 15,324,600 | ||||||||||
| Societe Generale SA: | ||||||||||||
| 1.726%, 10/01/2018 f ∞ | 6,000,000 | 6,047,280 | ||||||||||
| 2.500%, 04/08/2021 (Acquired 04/04/2016, Cost $10,217,331) * f | 10,225,000 | 10,412,353 | ||||||||||
| 4.250%, 04/14/2025 (Acquired 04/08/2015, Cost $4,092,109) * f | 4,157,000 | 4,111,809 | ||||||||||
| 4.750%, 11/24/2025 (Acquired 11/17/2015, Cost $11,954,640) * @ f | 12,000,000 | 12,260,976 | ||||||||||
| SpareBank 1 Boligkreditt AS, | ||||||||||||
| 1.750%, 11/15/2019 (Acquired 11/07/2012, Cost $4,428,322) * f | 4,463,000 | 4,505,881 | ||||||||||
| Springleaf Finance Corp., | ||||||||||||
| 6.900%, 12/15/2017 @ | 400,000 | 414,500 | ||||||||||
| Standard Chartered PLC: | ||||||||||||
| 1.273%, 04/17/2018 (Acquired 04/13/2015, Cost $3,000,000) * f ∞ | 3,000,000 | 2,965,620 | ||||||||||
| 1.700%, 04/17/2018 (Acquired 04/13/2015 through 04/24/2015, Cost $11,588,924) * f | 11,600,000 | 11,475,497 | ||||||||||
| 3.050%, 01/15/2021 (Acquired 01/12/2016, Cost $4,490,910) * @ f | 4,500,000 | 4,559,490 | ||||||||||
| 5.700%, 03/26/2044 (Acquired 03/21/2014, Cost $5,988,000) * @ f | 6,000,000 | 6,104,886 | ||||||||||
| Sumitomo Mitsui Banking Corp.: | ||||||||||||
| 2.450%, 01/16/2020 f | 20,500,000 | 20,949,196 | ||||||||||
| 3.950%, 07/19/2023 f | 1,850,000 | 2,021,863 | ||||||||||
| Sumitomo Mitsui Financial Group, Inc., | ||||||||||||
| 2.934%, 03/09/2021 f | 5,950,000 | 6,201,524 | ||||||||||
| SunTrust Bank, | ||||||||||||
| 7.250%, 03/15/2018 | 1,874,000 | 2,042,529 | ||||||||||
| SunTrust Banks, Inc., | ||||||||||||
| 2.900%, 03/03/2021 | 14,150,000 | 14,650,627 | ||||||||||
| SUSA Partnership LP, | ||||||||||||
| 8.200%, 06/01/2017 | 921,000 | 977,677 | ||||||||||
| Svenska Handelsbanken AB, | ||||||||||||
| 2.400%, 10/01/2020 f | 5,200,000 | 5,328,523 | ||||||||||
| Swedbank AB: | ||||||||||||
| 2.125%, 09/29/2017 (Acquired 09/24/2012, Cost $1,782,304) * f | 1,785,000 | 1,803,628 | ||||||||||
| 2.375%, 02/27/2019 (Acquired 02/20/2014, Cost $7,287,663) * f | 7,300,000 | 7,449,117 | ||||||||||
| 2.200%, 03/04/2020 (Acquired 02/25/2015 through 04/29/2015, Cost $6,464,531) * @ f | 6,468,000 | 6,568,267 | ||||||||||
| Synchrony Financial: | ||||||||||||
| 3.000%, 08/15/2019 | 2,000,000 | 2,033,334 | ||||||||||
| 3.750%, 08/15/2021 | 10,225,000 | 10,592,456 | ||||||||||
| 4.250%, 08/15/2024 | 21,464,000 | 22,213,737 | ||||||||||
| 4.500%, 07/23/2025 | 5,140,000 | 5,329,661 | ||||||||||
| TD Ameritrade Holding Corp.: | ||||||||||||
| 5.600%, 12/01/2019 | 2,945,000 | 3,316,494 | ||||||||||
| 2.950%, 04/01/2022 | 4,625,000 | 4,818,857 | ||||||||||
| 3.625%, 04/01/2025 | 7,000,000 | 7,498,617 | ||||||||||
| The Bank of Nova Scotia: | ||||||||||||
| 1.700%, 06/11/2018 f | 15,000,000 | 15,138,150 | ||||||||||
| 4.500%, 12/16/2025 | 5,500,000 | 5,714,313 | ||||||||||
| The Bank of Tokyo-Mitsubishi UFJ Ltd.: | ||||||||||||
| 1.008%, 07/15/2016 f ∞ | 4,600,000 | 4,601,113 | ||||||||||
| 4.100%, 09/09/2023 (Acquired 09/03/2013 through 03/26/2014, Cost $2,934,776) * f | 2,911,000 | 3,230,485 | ||||||||||
| 3.750%, 03/10/2024 (Acquired 03/04/2014 through 04/29/2015, Cost $2,803,959) * f | 2,800,000 | 3,044,835 | ||||||||||
| The Bear Stearns Companies LLC, | ||||||||||||
| 7.250%, 02/01/2018 | 5,547,000 | 6,046,757 | ||||||||||
| The Goldman Sachs Group, Inc.: | ||||||||||||
| 6.150%, 04/01/2018 | 5,634,000 | 6,070,607 | ||||||||||
| 7.500%, 02/15/2019 | 1,964,000 | 2,246,050 | ||||||||||
| 2.550%, 10/23/2019 | 2,700,000 | 2,762,518 | ||||||||||
| 2.274%, 11/29/2023 ∞ | 5,000,000 | 4,989,315 | ||||||||||
| 3.850%, 07/08/2024 | 3,000,000 | 3,180,933 | ||||||||||
| 3.500%, 01/23/2025 | 3,000,000 | 3,082,524 | ||||||||||
| 3.750%, 05/22/2025 | 5,000,000 | 5,221,855 | ||||||||||
| The Guardian Life Insurance Co. of America: | ||||||||||||
| 7.375%, 09/30/2039 (Acquired 05/04/2016, Cost $11,568,578) * | 8,850,000 | 12,163,989 | ||||||||||
| 4.875%, 06/19/2064 (Acquired 06/16/2014, Cost $1,993,300) * | 2,000,000 | 2,059,864 | ||||||||||
| The Hartford Financial Services Group, Inc.: | ||||||||||||
| 5.125%, 04/15/2022 | 1,538,000 | 1,749,160 | ||||||||||
| 8.125%, 06/15/2038 ∞ | 1,964,000 | 2,101,480 | ||||||||||
| The Huntington National Bank: | ||||||||||||
| 2.000%, 06/30/2018 | 9,000,000 | 9,089,343 | ||||||||||
| 2.200%, 11/06/2018 | 4,825,000 | 4,884,068 | ||||||||||
| Torchmark Corp., | ||||||||||||
| 3.800%, 09/15/2022 | 12,475,000 | 12,891,278 | ||||||||||
| Trinity Acquisition PLC, | ||||||||||||
| 4.400%, 03/15/2026 f | 15,000,000 | 15,661,860 | ||||||||||
| UBS AG: | ||||||||||||
| 1.375%, 08/14/2017 f | 7,000,000 | 7,005,908 | ||||||||||
| 1.340%, 03/26/2018 f ∞ | 8,250,000 | 8,257,087 | ||||||||||
| 5.750%, 04/25/2018 f | 2,678,000 | 2,872,398 | ||||||||||
| 1.523%, 06/01/2020 f ∞ | 4,710,000 | 4,703,246 | ||||||||||
| UBS Group Funding Jersey Ltd., | ||||||||||||
| 3.000%, 04/15/2021 (Acquired 03/30/2016, Cost $4,996,950) * @ f | 5,000,000 | 5,099,750 | ||||||||||
| Voya Financial, Inc.: | ||||||||||||
| 5.500%, 07/15/2022 | 23,802,000 | 27,091,151 | ||||||||||
| 3.650%, 06/15/2026 | 5,800,000 | 5,827,329 | ||||||||||
| WEA Finance LLC / Westfield UK & Europe Finance PLC: | ||||||||||||
| 2.700%, 09/17/2019 (Acquired 04/06/2016, Cost $4,183,829) * | 4,150,000 | 4,232,983 | ||||||||||
| 3.250%, 10/05/2020 (Acquired 09/28/2015, Cost $7,972,560) * | 8,000,000 | 8,325,560 | ||||||||||
| WellPoint, Inc., | ||||||||||||
| 5.100%, 01/15/2044 | 1,584,000 | 1,780,562 | ||||||||||
| Wells Fargo & Co.: | ||||||||||||
| Class N, 2.150%, 01/30/2020 | 2,750,000 | 2,796,651 | ||||||||||
| 2.500%, 03/04/2021 | 5,000,000 | 5,127,180 | ||||||||||
| 3.000%, 02/19/2025 | 5,000,000 | 5,121,130 | ||||||||||
| 3.000%, 04/22/2026 | 8,000,000 | 8,154,808 | ||||||||||
| 3.900%, 05/01/2045 | 15,000,000 | 15,744,315 | ||||||||||
| Wells Fargo Bank National Association, | ||||||||||||
| 6.000%, 11/15/2017 | 3,789,000 | 4,031,598 | ||||||||||
| Westpac Banking Corp., | ||||||||||||
| 1.600%, 01/12/2018 f | 7,229,000 | 7,268,991 | ||||||||||
| Willis Group Holdings PLC, | ||||||||||||
| 5.750%, 03/15/2021 f | 13,879,000 | 15,519,456 | ||||||||||
| Willis North America, Inc., | ||||||||||||
| 7.000%, 09/29/2019 | 5,463,000 | 6,184,651 | ||||||||||
| 1,882,419,645 | 21.6 | % | ||||||||||
| Utility | ||||||||||||
| Ameren Corp., | ||||||||||||
| 2.700%, 11/15/2020 | 10,000,000 | 10,298,960 | ||||||||||
| Arizona Public Service Co., | ||||||||||||
| 8.750%, 03/01/2019 | 759,000 | 899,325 | ||||||||||
| Beaver Valley II Funding Corp., | ||||||||||||
| 9.000%, 06/01/2017 | 19,000 | 19,095 | ||||||||||
| Berkshire Hathaway Energy Co., | ||||||||||||
| 2.400%, 02/01/2020 | 5,000,000 | 5,135,825 | ||||||||||
| Edison International, | ||||||||||||
| 2.950%, 03/15/2023 | 5,000,000 | 5,126,450 | ||||||||||
| ENEL Finance International NV: | ||||||||||||
| 5.125%, 10/07/2019 (Acquired 09/30/2009, Cost $2,199,280) * f | 2,209,000 | 2,439,549 | ||||||||||
| 6.800%, 09/15/2037 (Acquired 09/13/2007, Cost $1,691,506) * f | 1,696,000 | 2,199,639 | ||||||||||
| Exelon Corp., | ||||||||||||
| 4.950%, 06/15/2035 | 3,500,000 | 3,949,827 | ||||||||||
| Exelon Generation Co. LLC, | ||||||||||||
| 6.200%, 10/01/2017 | 1,964,000 | 2,075,184 | ||||||||||
| Mega Advance Investments Ltd., | ||||||||||||
| 5.000%, 05/12/2021 (Acquired 05/09/2011, Cost $4,858,830) * f | 4,909,000 | 5,432,928 | ||||||||||
| National Rural Utilities Cooperative Finance Corp.: | ||||||||||||
| 10.375%, 11/01/2018 | 547,000 | 660,941 | ||||||||||
| 2.000%, 01/27/2020 | 2,000,000 | 2,041,186 | ||||||||||
| 8.000%, 03/01/2032 | 4,659,000 | 6,978,567 | ||||||||||
| NextEra Energy Capital Holdings, Inc.: | ||||||||||||
| 1.586%, 06/01/2017 | 5,375,000 | 5,387,954 | ||||||||||
| Class D, 7.300%, 09/01/2067 ∞ | 2,455,000 | 2,344,525 | ||||||||||
| PSEG Power LLC: | ||||||||||||
| 5.320%, 09/15/2016 | 2,877,000 | 2,898,491 | ||||||||||
| 5.125%, 04/15/2020 | 3,575,000 | 3,888,152 | ||||||||||
| RGS I&M Funding Corp., | ||||||||||||
| Class F*, 9.820%, 06/07/2022 | 720,962 | 736,671 | ||||||||||
| South Carolina Electric & Gas Co., | ||||||||||||
| 4.100%, 06/15/2046 | 10,000,000 | 10,581,170 | ||||||||||
| Talent Yield Investments Ltd., | ||||||||||||
| 4.500%, 04/25/2022 (Acquired 04/18/2012, Cost $1,772,791) * f | 1,785,000 | 1,938,565 | ||||||||||
| The Southern Co., | ||||||||||||
| 4.250%, 07/01/2036 | 5,525,000 | 5,859,296 | ||||||||||
| 80,892,300 | 0.9 | % | ||||||||||
| Industrials | ||||||||||||
| 21st Century Fox America, Inc., | ||||||||||||
| 6.150%, 03/01/2037 @ | 2,570,000 | 3,189,974 | ||||||||||
| AbbVie, Inc.: | ||||||||||||
| 2.500%, 05/14/2020 @ | 9,500,000 | 9,712,068 | ||||||||||
| 4.300%, 05/14/2036 | 6,000,000 | 6,119,676 | ||||||||||
| Actavis Funding SCS, | ||||||||||||
| 3.850%, 06/15/2024 f | 12,067,000 | 12,627,959 | ||||||||||
| Acuity Brands Lighting, Inc., | ||||||||||||
| 6.000%, 12/15/2019 | 3,749,000 | 4,201,879 | ||||||||||
| Agrium, Inc., | ||||||||||||
| 3.375%, 03/15/2025 f | 2,625,000 | 2,670,166 | ||||||||||
| Altera Corp., | ||||||||||||
| 4.100%, 11/15/2023 | 2,000,000 | 2,273,590 | ||||||||||
| Ameritech Capital Funding Corp., | ||||||||||||
| 6.450%, 01/15/2018 | 2,668,000 | 2,855,168 | ||||||||||
| Amgen, Inc., | ||||||||||||
| 4.400%, 05/01/2045 | 5,300,000 | 5,505,958 | ||||||||||
| Anadarko Finance Co., | ||||||||||||
| Class B, 7.500%, 05/01/2031 f | 7,170,000 | 8,584,333 | ||||||||||
| Anadarko Petroleum Corp.: | ||||||||||||
| 6.375%, 09/15/2017 | 677,000 | 712,575 | ||||||||||
| 8.700%, 03/15/2019 | 2,432,000 | 2,773,506 | ||||||||||
| Anglo American Capital PLC, | ||||||||||||
| 9.375%, 04/08/2019 (Acquired 04/02/2009, Cost $1,785,000) * @ f | 1,785,000 | 2,041,594 | ||||||||||
| Anheuser-Busch InBev Finance, Inc.: | ||||||||||||
| 2.650%, 02/01/2021 @ | 6,300,000 | 6,533,194 | ||||||||||
| 3.300%, 02/01/2023 | 7,400,000 | 7,797,158 | ||||||||||
| 3.650%, 02/01/2026 | 9,000,000 | 9,641,214 | ||||||||||
| Apple, Inc., | ||||||||||||
| 2.400%, 05/03/2023 | 2,678,000 | 2,727,144 | ||||||||||
| AT&T, Inc.: | ||||||||||||
| 3.400%, 05/15/2025 | 28,200,000 | 28,845,978 | ||||||||||
| 4.125%, 02/17/2026 | 7,650,000 | 8,217,890 | ||||||||||
| 4.800%, 06/15/2044 | 1,375,000 | 1,411,590 | ||||||||||
| 4.750%, 05/15/2046 | 5,000,000 | 5,124,365 | ||||||||||
| 5.650%, 02/15/2047 | 4,200,000 | 4,809,882 | ||||||||||
| Baxalta, Inc., | ||||||||||||
| 2.875%, 06/23/2020 | 5,000,000 | 5,081,395 | ||||||||||
| Bayer US Finance LLC, | ||||||||||||
| 2.375%, 10/08/2019 (Acquired 10/01/2014, Cost $9,954,200) * | 10,000,000 | 10,222,350 | ||||||||||
| Beam Suntory, Inc., | ||||||||||||
| 1.875%, 05/15/2017 | 2,000,000 | 2,007,488 | ||||||||||
| Becton Dickinson and Co.: | ||||||||||||
| 2.675%, 12/15/2019 | 4,600,000 | 4,731,247 | ||||||||||
| 3.250%, 11/12/2020 | 7,000,000 | 7,357,910 | ||||||||||
| Boston Scientific Corp.: | ||||||||||||
| 2.650%, 10/01/2018 | 10,000,000 | 10,221,880 | ||||||||||
| 2.850%, 05/15/2020 | 7,000,000 | 7,251,601 | ||||||||||
| Bunge Limited Finance Corp.: | ||||||||||||
| 8.500%, 06/15/2019 | 6,933,000 | 8,106,577 | ||||||||||
| 3.500%, 11/24/2020 @ | 12,235,000 | 12,824,947 | ||||||||||
| Bunge NA Finance LP, | ||||||||||||
| 5.900%, 04/01/2017 | 3,392,000 | 3,500,802 | ||||||||||
| Burlington Northern Santa Fe LLC, | ||||||||||||
| 4.150%, 04/01/2045 | 3,000,000 | 3,267,084 | ||||||||||
| Canadian Natural Resources Ltd.: | ||||||||||||
| 5.700%, 05/15/2017 f | 2,550,000 | 2,623,315 | ||||||||||
| 6.500%, 02/15/2037 f | 982,000 | 1,071,473 | ||||||||||
| Celgene Corp.: | ||||||||||||
| 3.550%, 08/15/2022 | 6,450,000 | 6,757,497 | ||||||||||
| 4.000%, 08/15/2023 | 2,477,000 | 2,639,137 | ||||||||||
| CenturyLink, Inc., | ||||||||||||
| Class R, 5.150%, 06/15/2017 | 2,678,000 | 2,738,255 | ||||||||||
| CF Industries, Inc.: | ||||||||||||
| 3.450%, 06/01/2023 | 21,000,000 | 20,981,268 | ||||||||||
| 5.150%, 03/15/2034 | 3,000,000 | 2,929,017 | ||||||||||
| Charter Communications Operating LLC / Charter Communications Operating Capital, | ||||||||||||
| 6.384%, 10/23/2035 (Acquired 07/09/2015, Cost $5,800,000) * | 5,800,000 | 6,868,273 | ||||||||||
| Chevron Phillips Chemical Co. LLC, | ||||||||||||
| 1.387%, 05/01/2020 (Acquired 05/07/2015, Cost $25,000,000) * ∞ | 25,000,000 | 24,223,425 | ||||||||||
| Columbia Pipeline Group, Inc.: | ||||||||||||
| 2.450%, 06/01/2018 | 4,004,000 | 4,016,909 | ||||||||||
| 3.300%, 06/01/2020 | 14,575,000 | 15,069,311 | ||||||||||
| Comcast Corp.: | ||||||||||||
| 4.250%, 01/15/2033 | 5,712,000 | 6,302,421 | ||||||||||
| 6.950%, 08/15/2037 | 1,953,000 | 2,809,107 | ||||||||||
| ConAgra Foods, Inc.: | ||||||||||||
| 1.005%, 07/21/2016 ∞ | 4,000,000 | 4,000,388 | ||||||||||
| 5.819%, 06/15/2017 | 1,506,000 | 1,566,931 | ||||||||||
| 1.900%, 01/25/2018 | 11,635,000 | 11,726,963 | ||||||||||
| 7.000%, 04/15/2019 | 826,000 | 933,610 | ||||||||||
| 4.950%, 08/15/2020 | 772,000 | 844,482 | ||||||||||
| 9.750%, 03/01/2021 | 4,548,000 | 5,783,915 | ||||||||||
| ConocoPhillips Co., | ||||||||||||
| 1.526%, 05/15/2022 ∞ | 8,425,000 | 7,991,096 | ||||||||||
| Continental Airlines Pass Through Trust, | ||||||||||||
| Class 974A, 6.900%, 01/02/2018 | 50,563 | 51,417 | ||||||||||
| Cox Communications, Inc.: | ||||||||||||
| 3.850%, 02/01/2025 (Acquired 12/01/2014, Cost $4,991,350) * | 5,000,000 | 5,036,070 | ||||||||||
| 4.800%, 02/01/2035 (Acquired 12/01/2014, Cost $8,996,760) * | 9,000,000 | 8,409,357 | ||||||||||
| 8.375%, 03/01/2039 (Acquired 10/08/2014, Cost $2,853,595) * | 2,000,000 | 2,416,848 | ||||||||||
| Crane Co., | ||||||||||||
| 2.750%, 12/15/2018 | 10,000,000 | 10,277,950 | ||||||||||
| CVS Health Corp., | ||||||||||||
| 3.500%, 07/20/2022 | 7,000,000 | 7,536,823 | ||||||||||
| DCP Midstream LLC, | ||||||||||||
| 9.750%, 03/15/2019 (Acquired 02/29/2012 through 10/15/2012, Cost $5,758,219) * | 5,065,000 | 5,546,175 | ||||||||||
| Deutsche Telekom International Finance BV, | ||||||||||||
| 8.750%, 06/15/2030 f | 511,000 | 769,509 | ||||||||||
| Diamond 1 Finance Corp. / Diamond 2 Finance Corp., | ||||||||||||
| 4.420%, 06/15/2021 (Acquired 05/17/2016, Cost $4,998,550) * | 5,000,000 | 5,146,355 | ||||||||||
| Dominion Gas Holdings LLC, | ||||||||||||
| 2.800%, 11/15/2020 @ | 7,275,000 | 7,517,527 | ||||||||||
| El Paso Pipeline Partners Operating Co. LLC, | ||||||||||||
| 7.500%, 11/15/2040 | 4,017,000 | 4,544,942 | ||||||||||
| Enable Midstream Partners LP, | ||||||||||||
| 3.900%, 05/15/2024 | 5,000,000 | 4,456,625 | ||||||||||
| Energy Transfer Partners LP: | ||||||||||||
| 9.700%, 03/15/2019 | 893,000 | 1,011,043 | ||||||||||
| 4.050%, 03/15/2025 | 16,585,000 | 16,275,458 | ||||||||||
| Ensco PLC, | ||||||||||||
| 5.200%, 03/15/2025 f | 4,000,000 | 2,780,000 | ||||||||||
| Enterprise Products Operating LLC, | ||||||||||||
| 3.700%, 02/15/2026 @ | 8,350,000 | 8,689,494 | ||||||||||
| EQT Midstream Partners LP, | ||||||||||||
| 4.000%, 08/01/2024 | 3,000,000 | 2,881,419 | ||||||||||
| ERAC USA Finance LLC, | ||||||||||||
| 3.300%, 12/01/2026 (Acquired 05/23/2016, Cost $13,156,968) * | 13,200,000 | 13,496,353 | ||||||||||
| Express Scripts Holding Co.: | ||||||||||||
| 2.650%, 02/15/2017 | 2,678,000 | 2,706,470 | ||||||||||
| 3.300%, 02/25/2021 | 2,350,000 | 2,464,243 | ||||||||||
| 4.750%, 11/15/2021 @ | 5,000,000 | 5,608,295 | ||||||||||
| 3.900%, 02/15/2022 @ | 10,000,000 | 10,716,760 | ||||||||||
| 3.000%, 07/15/2023 | 5,000,000 | 5,005,600 | ||||||||||
| 3.500%, 06/15/2024 | 9,000,000 | 9,291,186 | ||||||||||
| Exxon Mobil Corp., | ||||||||||||
| 2.726%, 03/01/2023 | 6,175,000 | 6,446,749 | ||||||||||
| Federal Express Corp. 1998 Pass Through Trust, | ||||||||||||
| Class 981B, 6.845%, 01/15/2019 | 1,354,375 | 1,445,795 | ||||||||||
| FedEx Corp., | ||||||||||||
| 3.200%, 02/01/2025 | 6,000,000 | 6,246,942 | ||||||||||
| Fidelity National Information Services, Inc.: | ||||||||||||
| 3.625%, 10/15/2020 | 10,000,000 | 10,571,200 | ||||||||||
| 3.500%, 04/15/2023 | 23,125,000 | 24,010,248 | ||||||||||
| 3.875%, 06/05/2024 | 2,150,000 | 2,273,141 | ||||||||||
| Fiserv, Inc.: | ||||||||||||
| 2.700%, 06/01/2020 | 10,000,000 | 10,352,810 | ||||||||||
| 4.625%, 10/01/2020 | 1,785,000 | 1,969,792 | ||||||||||
| 3.500%, 10/01/2022 | 5,410,000 | 5,732,620 | ||||||||||
| FMC Corp., | ||||||||||||
| 4.100%, 02/01/2024 | 6,400,000 | 6,738,573 | ||||||||||
| Fomento Economico Mexicano SAB de CV: | ||||||||||||
| 2.875%, 05/10/2023 f | 5,000,000 | 4,994,865 | ||||||||||
| 4.375%, 05/10/2043 f | 4,374,000 | 4,542,675 | ||||||||||
| Ford Motor Credit Co. LLC: | ||||||||||||
| 2.145%, 01/09/2018 | 1,800,000 | 1,815,763 | ||||||||||
| 2.240%, 06/15/2018 | 6,250,000 | 6,313,012 | ||||||||||
| 2.375%, 03/12/2019 | 6,806,000 | 6,901,461 | ||||||||||
| 2.597%, 11/04/2019 | 10,000,000 | 10,230,800 | ||||||||||
| 3.200%, 01/15/2021 | 20,000,000 | 20,601,680 | ||||||||||
| 3.336%, 03/18/2021 @ | 7,500,000 | 7,778,453 | ||||||||||
| Forest Laboratories, Inc., | ||||||||||||
| 5.000%, 12/15/2021 (Acquired 08/26/2014 through 04/24/2015, Cost $25,941,520) * | 24,000,000 | 26,859,192 | ||||||||||
| Fortive Corp., | ||||||||||||
| 2.350%, 06/15/2021 (Acquired 06/06/2016, Cost $5,123,821) * | 5,125,000 | 5,200,173 | ||||||||||
| Freeport-McMoran Oil & Gas LLC / FCX Oil & Gas, Inc.: | ||||||||||||
| 6.500%, 11/15/2020 | 3,221,000 | 3,227,829 | ||||||||||
| 6.625%, 05/01/2021 | 1,447,000 | 1,439,765 | ||||||||||
| 6.750%, 02/01/2022 @ | 2,649,000 | 2,596,849 | ||||||||||
| General Electric Capital Corp.: | ||||||||||||
| 2.200%, 01/09/2020 | 1,432,000 | 1,475,970 | ||||||||||
| 5.550%, 05/04/2020 | 1,585,000 | 1,825,332 | ||||||||||
| 4.650%, 10/17/2021 | 1,534,000 | 1,756,695 | ||||||||||
| General Motors Financial Co., Inc.: | ||||||||||||
| 2.400%, 05/09/2019 | 9,000,000 | 9,025,074 | ||||||||||
| 4.200%, 03/01/2021 | 30,000,000 | 31,384,560 | ||||||||||
| Georgia-Pacific LLC, | ||||||||||||
| 2.539%, 11/15/2019 (Acquired 11/03/2014 through 02/25/2016, Cost $19,113,641) * | 19,125,000 | 19,585,932 | ||||||||||
| Gilead Sciences, Inc., | ||||||||||||
| 4.600%, 09/01/2035 | 4,600,000 | 5,114,717 | ||||||||||
| Glencore Finance (Canada) Ltd., | ||||||||||||
| 5.800%, 11/15/2016 (Acquired 12/06/2011, Cost $620,181) * f | 616,000 | 623,392 | ||||||||||
| Glencore Funding LLC: | ||||||||||||
| 2.500%, 01/15/2019 (Acquired 05/22/2013, Cost $4,440,774) * | 4,463,000 | 4,290,059 | ||||||||||
| 4.125%, 05/30/2023 (Acquired 07/22/2013 through 04/20/2015, Cost $6,683,814) * | 6,746,000 | 6,206,320 | ||||||||||
| 4.625%, 04/29/2024 (Acquired 04/22/2014 through 03/24/2016, Cost $11,448,443) * | 12,620,000 | 11,799,700 | ||||||||||
| 4.000%, 04/16/2025 (Acquired 04/08/2015, Cost $4,411,285) * @ | 4,450,000 | 3,938,250 | ||||||||||
| Grupo Bimbo SAB de CV, | ||||||||||||
| 4.500%, 01/25/2022 (Acquired 03/29/2016, Cost $13,913,783) * f | 13,157,000 | 14,248,334 | ||||||||||
| GTE Corp., | ||||||||||||
| 8.750%, 11/01/2021 | 89,000 | 112,914 | ||||||||||
| Gulf South Pipeline Co. LP, | ||||||||||||
| 4.000%, 06/15/2022 | 3,633,000 | 3,480,385 | ||||||||||
| Gulfstream Natural Gas System LLC, | ||||||||||||
| 4.600%, 09/15/2025 (Acquired 09/24/2015, Cost $5,038,831) * @ | 5,000,000 | 5,217,210 | ||||||||||
| H. J. Heinz Co.: | ||||||||||||
| 2.800%, 07/02/2020 (Acquired 06/23/2015, Cost $3,990,920) * @ | 4,000,000 | 4,153,764 | ||||||||||
| 5.000%, 07/15/2035 (Acquired 11/16/2015 through 11/18/2015, Cost $15,185,303) * @ | 14,740,000 | 16,905,616 | ||||||||||
| Halliburton Co., | ||||||||||||
| 3.800%, 11/15/2025 | 9,000,000 | 9,400,041 | ||||||||||
| Harris Corp.: | ||||||||||||
| 2.700%, 04/27/2020 | 4,000,000 | 4,054,364 | ||||||||||
| 3.832%, 04/27/2025 | 5,000,000 | 5,301,380 | ||||||||||
| Hess Corp., | ||||||||||||
| 8.125%, 02/15/2019 | 4,376,000 | 4,876,654 | ||||||||||
| Hewlett Packard Enterprise Co.: | ||||||||||||
| 3.600%, 10/15/2020 (Acquired 11/17/2015, Cost $10,037,618) * | 10,000,000 | 10,437,810 | ||||||||||
| 4.400%, 10/15/2022 (Acquired 09/30/2015, Cost $15,120,003) * @ | 15,150,000 | 16,213,015 | ||||||||||
| Hewlett-Packard Co., | ||||||||||||
| 4.650%, 12/09/2021 | 6,645,000 | 7,185,690 | ||||||||||
| Historic TW, Inc., | ||||||||||||
| 9.150%, 02/01/2023 | 5,535,000 | 7,440,064 | ||||||||||
| Holcim US Finance Sarl & Cie SCS, | ||||||||||||
| 6.000%, 12/30/2019 (Acquired 09/24/2009 through 09/04/2013, Cost $1,240,600) * f | 1,232,000 | 1,376,142 | ||||||||||
| Hutchison Whampoa International (09) Ltd., | ||||||||||||
| 7.625%, 04/09/2019 (Acquired 10/22/2009 through 04/16/2014, Cost $8,927,227) * f | 8,288,000 | 9,563,565 | ||||||||||
| Hutchison Whampoa International (09/19) Ltd., | ||||||||||||
| 5.750%, 09/11/2019 (Acquired 04/27/2015, Cost $10,145,015) * f | 9,150,000 | 10,264,406 | ||||||||||
| Hutchison Whampoa International (14) Ltd., | ||||||||||||
| 3.625%, 10/31/2024 (Acquired 10/28/2014, Cost $4,994,200) * f | 5,000,000 | 5,289,165 | ||||||||||
| Hyundai Capital America, | ||||||||||||
| 2.000%, 07/01/2019 (Acquired 06/07/2016, Cost $8,593,894) * | 8,600,000 | 8,653,105 | ||||||||||
| Hyundai Capital Services, Inc.: | ||||||||||||
| 1.447%, 03/18/2017 (Acquired 03/11/2014, Cost $2,000,000) * f ∞ | 2,000,000 | 1,999,102 | ||||||||||
| 3.500%, 09/13/2017 (Acquired 03/07/2012 through 08/21/2014, Cost $7,577,981) * f | 7,458,000 | 7,639,886 | ||||||||||
| 2.625%, 09/29/2020 (Acquired 03/23/2015, Cost $5,142,172) * f | 5,150,000 | 5,256,842 | ||||||||||
| Ingersoll-Rand Luxembourg Finance SA, | ||||||||||||
| 2.625%, 05/01/2020 f | 2,650,000 | 2,692,750 | ||||||||||
| Johnson Controls, Inc.: | ||||||||||||
| 6.000%, 01/15/2036 | 1,168,000 | 1,384,365 | ||||||||||
| 4.950%, 07/02/2064 | 2,400,000 | 2,392,517 | ||||||||||
| Kinder Morgan Energy Partners LP: | ||||||||||||
| 9.000%, 02/01/2019 | 893,000 | 1,016,919 | ||||||||||
| 6.950%, 01/15/2038 | 2,008,000 | 2,215,981 | ||||||||||
| 6.500%, 09/01/2039 | 893,000 | 933,960 | ||||||||||
| Kinder Morgan, Inc., | ||||||||||||
| 5.000%, 02/15/2021 (Acquired 05/26/2015, Cost $4,404,517) * | 4,155,000 | 4,379,162 | ||||||||||
| Kinder Morgan, Inc./DE, | ||||||||||||
| 5.625%, 11/15/2023 (Acquired 06/14/2016, Cost $5,311,133) * | 5,017,000 | 5,373,834 | ||||||||||
| Kraft Heinz Foods Co., | ||||||||||||
| 3.000%, 06/01/2026 (Acquired 05/10/2016, Cost $9,956,200) * @ | 10,000,000 | 10,081,780 | ||||||||||
| Laboratory Corp. of America Holdings, | ||||||||||||
| 3.200%, 02/01/2022 | 2,400,000 | 2,482,512 | ||||||||||
| Lafarge SA, | ||||||||||||
| 7.125%, 07/15/2036 f | 893,000 | 1,085,213 | ||||||||||
| Lockheed Martin Corp.: | ||||||||||||
| 3.100%, 01/15/2023 | 5,000,000 | 5,269,925 | ||||||||||
| 4.700%, 05/15/2046 | 1,000,000 | 1,178,771 | ||||||||||
| Magellan Midstream Partners LP, | ||||||||||||
| 3.200%, 03/15/2025 | 5,000,000 | 4,961,735 | ||||||||||
| Marathon Petroleum Corp.: | ||||||||||||
| 3.400%, 12/15/2020 | 10,825,000 | 11,190,387 | ||||||||||
| 3.625%, 09/15/2024 @ | 1,600,000 | 1,571,194 | ||||||||||
| 4.750%, 09/15/2044 | 1,500,000 | 1,279,090 | ||||||||||
| Martin Marietta Materials, Inc., | ||||||||||||
| 6.250%, 05/01/2037 | 893,000 | 989,890 | ||||||||||
| Medtronic, Inc.: | ||||||||||||
| 3.150%, 03/15/2022 f | 3,975,000 | 4,241,997 | ||||||||||
| 4.375%, 03/15/2035 f | 2,808,000 | 3,176,241 | ||||||||||
| Microsoft Corp., | ||||||||||||
| 4.450%, 11/03/2045 | 10,000,000 | 11,276,500 | ||||||||||
| Molex Electronic Technologies LLC, | ||||||||||||
| 2.878%, 04/15/2020 (Acquired 10/23/2015 through 03/15/2016, Cost $22,816,080) * | 23,093,000 | 22,992,892 | ||||||||||
| Murphy Oil Corp., | ||||||||||||
| 4.000%, 06/01/2022 @ | 4,463,000 | 3,958,851 | ||||||||||
| Mylan NV: | ||||||||||||
| 3.150%, 06/15/2021 (Acquired 06/14/2016, Cost $5,009,435) * f | 5,000,000 | 5,071,740 | ||||||||||
| 3.950%, 06/15/2026 (Acquired 05/31/2016 through 06/30/2016, Cost $28,880,488) * @ f | 28,925,000 | 29,271,753 | ||||||||||
| Nabors Industries, Inc., | ||||||||||||
| 6.150%, 02/15/2018 | 982,000 | 1,010,175 | ||||||||||
| New Cingular Wireless Services, Inc., | ||||||||||||
| 8.750%, 03/01/2031 | 1,360,000 | 2,029,037 | ||||||||||
| Newell Rubbermaid, Inc., | ||||||||||||
| 3.850%, 04/01/2023 | 15,000,000 | 15,910,035 | ||||||||||
| Nissan Motor Acceptance Corp., | ||||||||||||
| 1.500%, 03/02/2018 (Acquired 02/24/2015, Cost $5,897,404) * | 5,900,000 | 5,916,508 | ||||||||||
| Noble Energy, Inc., | ||||||||||||
| 8.250%, 03/01/2019 | 2,684,000 | 3,074,020 | ||||||||||
| Noble Holding International Ltd., | ||||||||||||
| 5.000%, 03/16/2018 f | 4,000,000 | 3,940,000 | ||||||||||
| ONEOK Partners LP: | ||||||||||||
| 6.150%, 10/01/2016 | 3,036,000 | 3,065,796 | ||||||||||
| 8.625%, 03/01/2019 | 7,627,000 | 8,640,712 | ||||||||||
| 3.375%, 10/01/2022 | 1,130,000 | 1,105,593 | ||||||||||
| Oracle Corp.: | ||||||||||||
| 3.400%, 07/08/2024 | 3,000,000 | 3,226,311 | ||||||||||
| 2.950%, 05/15/2025 | 6,025,000 | 6,261,722 | ||||||||||
| Pactiv LLC, | ||||||||||||
| 7.950%, 12/15/2025 | 286,000 | 296,725 | ||||||||||
| Pentair Finance SA: | ||||||||||||
| 1.875%, 09/15/2017 f | 7,620,000 | 7,606,154 | ||||||||||
| 3.625%, 09/15/2020 f | 26,620,000 | 27,288,934 | ||||||||||
| Pernod Ricard SA, | ||||||||||||
| 4.250%, 07/15/2022 (Acquired 06/09/2016, Cost $10,880,956) * f | 10,000,000 | 10,918,090 | ||||||||||
| Perrigo Finance Unlimited Co., | ||||||||||||
| 4.375%, 03/15/2026 @ f | 4,875,000 | 5,077,322 | ||||||||||
| Petrofac Ltd., | ||||||||||||
| 3.400%, 10/10/2018 (Acquired 10/03/2013 through 12/03/2014, Cost $15,550,661) * f | 15,546,000 | 15,545,953 | ||||||||||
| Pfizer, Inc., | ||||||||||||
| 5.800%, 08/12/2023 | 6,000,000 | 7,373,136 | ||||||||||
| Phillips 66: | ||||||||||||
| 4.300%, 04/01/2022 | 10,000,000 | 10,921,940 | ||||||||||
| 5.875%, 05/01/2042 | 6,000,000 | 7,204,824 | ||||||||||
| 4.875%, 11/15/2044 | 21,130,000 | 23,064,705 | ||||||||||
| POSCO, | ||||||||||||
| 4.250%, 10/28/2020 (Acquired 12/18/2014, Cost $1,026,639) * f | 975,000 | 1,049,550 | ||||||||||
| Potash Corp of Saskatchewan, Inc., | ||||||||||||
| 6.500%, 05/15/2019 f | 5,000,000 | 5,650,955 | ||||||||||
| QEP Resources, Inc., | ||||||||||||
| 6.800%, 03/01/2020 | 893,000 | 899,697 | ||||||||||
| Qualcomm, Inc.: | ||||||||||||
| 1.186%, 05/20/2020 ∞ | 7,450,000 | 7,264,197 | ||||||||||
| 2.250%, 05/20/2020 | 3,600,000 | 3,700,141 | ||||||||||
| R.R. Donnelley & Sons Co.: | ||||||||||||
| 8.600%, 08/15/2016 | 2,231,000 | 2,247,732 | ||||||||||
| 6.125%, 01/15/2017 | 88,000 | 89,100 | ||||||||||
| 7.625%, 06/15/2020 | 893,000 | 935,418 | ||||||||||
| Republic Services, Inc.: | ||||||||||||
| 5.500%, 09/15/2019 | 7,400,000 | 8,263,602 | ||||||||||
| 3.550%, 06/01/2022 | 3,000,000 | 3,239,679 | ||||||||||
| Rio Tinto Alcan, Inc., | ||||||||||||
| 5.750%, 06/01/2035 f | 446,000 | 494,887 | ||||||||||
| Rio Tinto Finance (USA) Ltd., | ||||||||||||
| 9.000%, 05/01/2019 f | 4,909,000 | 5,898,340 | ||||||||||
| Rockies Express Pipeline LLC, | ||||||||||||
| 5.625%, 04/15/2020 (Acquired 03/17/2010, Cost $1,783,411) * | 1,785,000 | 1,789,462 | ||||||||||
| SABMiller Holdings, Inc., | ||||||||||||
| 1.327%, 08/01/2018 (Acquired 10/21/2014, Cost $10,030,007) * ∞ | 10,000,000 | 9,993,650 | ||||||||||
| Samarco Mineracao SA, | ||||||||||||
| 5.750%, 10/24/2023 (Acquired 10/22/2013, Cost $4,475,644) * f | 4,463,000 | 1,718,255 | ||||||||||
| Schlumberger Holdings Corp., | ||||||||||||
| 2.350%, 12/21/2018 (Acquired 12/10/2015, Cost $9,998,800) * | 10,000,000 | 10,195,100 | ||||||||||
| Shell International Finance BV: | ||||||||||||
| 3.250%, 05/11/2025 @ f | 5,725,000 | 6,006,023 | ||||||||||
| 4.125%, 05/11/2035 f | 10,000,000 | 10,783,850 | ||||||||||
| SK Telecom Co. Ltd., | ||||||||||||
| 6.625%, 07/20/2027 (Acquired 07/13/2007, Cost $1,322,945) * f | 1,339,000 | 1,826,128 | ||||||||||
| Solvay Finance America LLC: | ||||||||||||
| 3.400%, 12/03/2020 (Acquired 01/08/2016, Cost $15,076,383) * | 15,088,000 | 15,800,622 | ||||||||||
| 4.450%, 12/03/2025 (Acquired 05/03/2016 through 06/16/2016, Cost $22,970,825) * | 22,050,000 | 23,603,753 | ||||||||||
| Southern Natural Gas Company LLC, | ||||||||||||
| 5.900%, 04/01/2017 (Acquired 03/14/2007, Cost $1,247,925) * | 1,250,000 | 1,283,248 | ||||||||||
| Spectra Energy Partners LP, | ||||||||||||
| 4.500%, 03/15/2045 | 7,000,000 | 6,968,206 | ||||||||||
| Sprint Capital Corp.: | ||||||||||||
| 6.900%, 05/01/2019 | 2,499,000 | 2,386,545 | ||||||||||
| 8.750%, 03/15/2032 | 320,000 | 273,600 | ||||||||||
| Stryker Corp., | ||||||||||||
| 2.625%, 03/15/2021 | 6,225,000 | 6,434,104 | ||||||||||
| Sysco Corp., | ||||||||||||
| 3.300%, 07/15/2026 @ | 11,550,000 | 11,982,813 | ||||||||||
| Talisman Energy, Inc., | ||||||||||||
| 7.750%, 06/01/2019 f | 1,071,000 | 1,175,697 | ||||||||||
| TC PipeLines LP, | ||||||||||||
| 4.375%, 03/13/2025 | 9,000,000 | 8,860,635 | ||||||||||
| Telecom Italia Capital: | ||||||||||||
| 7.175%, 06/18/2019 f | 1,785,000 | 2,012,587 | ||||||||||
| 7.200%, 07/18/2036 f | 5,475,000 | 5,481,844 | ||||||||||
| Telefonica Emisiones SAU: | ||||||||||||
| 6.221%, 07/03/2017 f | 4,530,000 | 4,729,551 | ||||||||||
| 5.462%, 02/16/2021 @ f | 8,830,000 | 10,074,103 | ||||||||||
| The Dow Chemical Co., | ||||||||||||
| 8.550%, 05/15/2019 | 8,000,000 | 9,496,280 | ||||||||||
| The JM Smucker Co., | ||||||||||||
| 3.500%, 03/15/2025 @ | 5,000,000 | 5,399,310 | ||||||||||
| The Mosaic Co., | ||||||||||||
| 5.450%, 11/15/2033 | 2,000,000 | 2,211,866 | ||||||||||
| The Williams Companies, Inc., | ||||||||||||
| 4.550%, 06/24/2024 @ | 5,000,000 | 4,592,500 | ||||||||||
| Thermo Fisher Scientific, Inc.: | ||||||||||||
| 1.850%, 01/15/2018 | 4,925,000 | 4,957,451 | ||||||||||
| 2.150%, 12/14/2018 | 4,000,000 | 4,045,440 | ||||||||||
| 3.000%, 04/15/2023 | 7,975,000 | 8,141,454 | ||||||||||
| Time Warner Cable, Inc.: | ||||||||||||
| 6.550%, 05/01/2037 | 893,000 | 1,040,536 | ||||||||||
| 6.750%, 06/15/2039 @ | 2,767,000 | 3,250,932 | ||||||||||
| Time Warner, Inc.: | ||||||||||||
| 3.600%, 07/15/2025 @ | 2,200,000 | 2,327,919 | ||||||||||
| 3.875%, 01/15/2026 @ | 7,000,000 | 7,547,134 | ||||||||||
| 2.950%, 07/15/2026 @ | 6,250,000 | 6,297,138 | ||||||||||
| 7.625%, 04/15/2031 | 5,207,000 | 7,142,098 | ||||||||||
| 7.700%, 05/01/2032 | 8,418,000 | 11,752,597 | ||||||||||
| Timken Co., | ||||||||||||
| 3.875%, 09/01/2024 | 2,000,000 | 2,021,184 | ||||||||||
| TransCanada PipeLines Ltd., | ||||||||||||
| 4.875%, 01/15/2026 f | 12,000,000 | 13,703,952 | ||||||||||
| Transocean, Inc., | ||||||||||||
| 6.500%, 11/15/2020 f | 4,000,000 | 3,554,800 | ||||||||||
| TSMC Global Ltd., | ||||||||||||
| 1.625%, 04/03/2018 (Acquired 12/03/2013 through 04/29/2015, Cost $9,787,963) * f | 9,865,000 | 9,891,774 | ||||||||||
| TTX Co.: | ||||||||||||
| 3.600%, 01/15/2025 (Acquired 11/13/2014, Cost $4,999,250) * | 5,000,000 | 5,228,050 | ||||||||||
| 3.900%, 02/01/2045 (Acquired 01/26/2015 through 04/29/2015, Cost $10,151,754) * | 10,250,000 | 10,032,403 | ||||||||||
| Tyco Electronics Group SA, | ||||||||||||
| 6.550%, 10/01/2017 f | 6,248,000 | 6,642,055 | ||||||||||
| Union Pacific Corp., | ||||||||||||
| 3.375%, 02/01/2035 | 3,000,000 | 3,022,371 | ||||||||||
| US Airways Pass Through Trust, | ||||||||||||
| Class 981A, 6.850%, 01/30/2018 | 162,130 | 166,994 | ||||||||||
| Vale Overseas Ltd.: | ||||||||||||
| 5.875%, 06/10/2021 @ f | 11,075,000 | 11,088,844 | ||||||||||
| 8.250%, 01/17/2034 f | 8,526,000 | 8,915,553 | ||||||||||
| 6.875%, 11/21/2036 f | 1,483,000 | 1,349,530 | ||||||||||
| 6.875%, 11/10/2039 f | 2,893,000 | 2,633,498 | ||||||||||
| Valero Energy Corp.: | ||||||||||||
| 9.375%, 03/15/2019 | 15,578,000 | 18,616,068 | ||||||||||
| 6.625%, 06/15/2037 | 2,100,000 | 2,304,064 | ||||||||||
| Verizon Communications, Inc.: | ||||||||||||
| 4.150%, 03/15/2024 | 3,000,000 | 3,309,492 | ||||||||||
| 6.400%, 09/15/2033 | 29,640,000 | 37,832,585 | ||||||||||
| 4.272%, 01/15/2036 | 8,148,000 | 8,338,761 | ||||||||||
| Viacom, Inc., | ||||||||||||
| 2.500%, 09/01/2018 | 7,628,000 | 7,733,983 | ||||||||||
| Vulcan Materials Co.: | ||||||||||||
| 7.000%, 06/15/2018 | 1,785,000 | 1,954,575 | ||||||||||
| 7.500%, 06/15/2021 | 4,000,000 | 4,805,200 | ||||||||||
| 7.150%, 11/30/2037 | 446,000 | 526,280 | ||||||||||
| Wabtec Corp., | ||||||||||||
| 4.375%, 08/15/2023 | 2,678,000 | 2,923,867 | ||||||||||
| Walgreens Boots Alliance, Inc.: | ||||||||||||
| 3.300%, 11/18/2021 | 6,383,000 | 6,693,469 | ||||||||||
| 3.800%, 11/18/2024 | 5,934,000 | 6,286,966 | ||||||||||
| Western Gas Partners LP, | ||||||||||||
| 5.375%, 06/01/2021 | 8,701,000 | 9,173,838 | ||||||||||
| Westvaco Corp.: | ||||||||||||
| 9.750%, 06/15/2020 | 143,000 | 176,143 | ||||||||||
| 8.200%, 01/15/2030 | 4,963,000 | 6,662,381 | ||||||||||
| Williams Partners LP, | ||||||||||||
| 6.300%, 04/15/2040 | 2,767,000 | 2,624,688 | ||||||||||
| Woodside Finance Ltd., | ||||||||||||
| 3.650%, 03/05/2025 (Acquired 02/26/2015 through 04/14/2015, Cost $12,292,106) * f | 12,300,000 | 12,014,812 | ||||||||||
| Yara International ASA, | ||||||||||||
| 3.800%, 06/06/2026 (Acquired 06/01/2016, Cost $9,959,600) * f | 10,000,000 | 10,344,360 | ||||||||||
| Zimmer Holdings, Inc., | ||||||||||||
| 3.150%, 04/01/2022 | 9,500,000 | 9,737,500 | ||||||||||
| Zoetis, Inc.: | ||||||||||||
| 3.450%, 11/13/2020 | 5,145,000 | 5,311,564 | ||||||||||
| 3.250%, 02/01/2023 | 34,200,000 | 34,850,518 | ||||||||||
| 1,763,584,198 | 20.2 | % | ||||||||||
| Total Corporate Bonds | 3,726,896,143 | 42.7 | % | |||||||||
| Other Government Related Securities | ||||||||||||
| CNOOC Finance 2015 Australia Pty Ltd., | ||||||||||||
| 2.625%, 05/05/2020 f | 14,500,000 | 14,633,661 | ||||||||||
| CNPC General Capital Ltd., | ||||||||||||
| 2.750%, 05/14/2019 (Acquired 05/07/2014, Cost $1,983,740) * f | 2,000,000 | 2,037,908 | ||||||||||
| Comision Federal de Electricidad, | ||||||||||||
| 4.875%, 01/15/2024 (Acquired 10/17/2013, Cost $2,662,655) * f | 2,678,000 | 2,801,857 | ||||||||||
| Corp Andina de Fomento, | ||||||||||||
| 4.375%, 06/15/2022 f | 6,107,000 | 6,817,794 | ||||||||||
| Export-Import Bank of Korea: | ||||||||||||
| 4.000%, 01/11/2017 f | 1,400,000 | 1,420,860 | ||||||||||
| 2.250%, 01/21/2020 f | 11,000,000 | 11,167,398 | ||||||||||
| Industrial Bank of Korea, | ||||||||||||
| 2.000%, 04/23/2020 (Acquired 04/16/2015, Cost $6,972,210) * f | 7,000,000 | 7,070,672 | ||||||||||
| Korea Electric Power Corp., | ||||||||||||
| 6.750%, 08/01/2027 f | 1,932,000 | 2,505,792 | ||||||||||
| Korea Gas Corp., | ||||||||||||
| 4.250%, 11/02/2020 (Acquired 10/26/2010, Cost $2,309,418) * f | 2,321,000 | 2,567,887 | ||||||||||
| Nexen Energy ULC: | ||||||||||||
| 6.400%, 05/15/2037 f | 3,392,000 | 4,201,274 | ||||||||||
| 7.500%, 07/30/2039 f | 4,175,000 | 5,644,362 | ||||||||||
| Pemex Finance Ltd., | ||||||||||||
| 10.610%, 08/15/2017 f | 836,875 | 881,490 | ||||||||||
| Petrobras Global Finance BV, | ||||||||||||
| 3.016%, 03/17/2017 f ∞ | 3,000,000 | 3,001,470 | ||||||||||
| Petrobras International Finance Company SA, | ||||||||||||
| 3.500%, 02/06/2017 f | 4,463,000 | 4,463,000 | ||||||||||
| Petroleos Mexicanos: | ||||||||||||
| 5.750%, 03/01/2018 f | 2,499,000 | 2,613,104 | ||||||||||
| 8.000%, 05/03/2019 f | 1,500,000 | 1,671,090 | ||||||||||
| 5.500%, 01/21/2021 f | 5,600,000 | 5,929,840 | ||||||||||
| 4.875%, 01/24/2022 @ f | 4,000,000 | 4,089,560 | ||||||||||
| 4.500%, 01/23/2026 @ f | 2,500,000 | 2,406,000 | ||||||||||
| 6.625%, 06/15/2035 f | 893,000 | 920,683 | ||||||||||
| Sinopec Group Overseas Development [2014] Ltd., | ||||||||||||
| 4.375%, 04/10/2024 (Acquired 04/02/2014, Cost $1,496,505) * f | 1,500,000 | 1,620,827 | ||||||||||
| Sinopec Group Overseas Development [2015] Ltd.: | ||||||||||||
| 2.500%, 04/28/2020 (Acquired 04/21/2015, Cost $14,936,400) * f | 15,000,000 | 15,161,805 | ||||||||||
| 3.250%, 04/28/2025 (Acquired 04/21/2015, Cost $9,902,200) * f | 10,000,000 | 10,090,500 | ||||||||||
| Sinopec Group Overseas Development [2016] Ltd., | ||||||||||||
| 3.500%, 05/03/2026 (Acquired 04/25/2016 through 04/28/2016, Cost $13,365,147) * f | 13,450,000 | 13,754,952 | ||||||||||
| The Korea Development Bank: | ||||||||||||
| 1.260%, 01/22/2017 f ∞ | 2,000,000 | 2,000,006 | ||||||||||
| 2.250%, 05/18/2020 f | 2,000,000 | 2,037,140 | ||||||||||
| 131,510,932 | 1.5 | % | ||||||||||
| Taxable Municipal Bonds | ||||||||||||
| Atlanta Independent School System, | ||||||||||||
| 5.557%, 03/01/2026 | 4,465,000 | 5,404,793 | ||||||||||
| California Housing Finance Agency, | ||||||||||||
| 2.794%, 08/01/2036 (Callable 08/01/2025) | 15,000,000 | 15,044,700 | ||||||||||
| California Qualified School Bond Joint Powers Authority, | ||||||||||||
| 7.155%, 03/01/2027 | 6,695,000 | 8,245,160 | ||||||||||
| California School Finance Authority, | ||||||||||||
| 5.041%, 07/01/2020 | 2,230,000 | 2,470,327 | ||||||||||
| City of Berwyn IL, | ||||||||||||
| 5.790%, 12/01/2022 | 10,000,000 | 11,216,100 | ||||||||||
| City of Vernon CA Electric System Revenue, | ||||||||||||
| 4.500%, 08/01/2022 | 7,265,000 | 7,919,722 | ||||||||||
| County of Contra Costa CA, | ||||||||||||
| 5.140%, 06/01/2017 | 5,335,000 | 5,487,314 | ||||||||||
| County of Cuyahoga OH, | ||||||||||||
| 9.125%, 10/01/2023 | 895,000 | 911,110 | ||||||||||
| Eaton Community City School District, | ||||||||||||
| 5.390%, 08/25/2027 (Callable 06/01/2020) | 2,305,000 | 2,478,221 | ||||||||||
| Elgin Local School District, | ||||||||||||
| 5.499%, 08/31/2027 (Callable 12/01/2019) | 4,440,000 | 4,737,169 | ||||||||||
| Iowa Tobacco Settlement Authority, | ||||||||||||
| 6.500%, 06/01/2023 (Callable 08/01/2016) | 4,005,000 | 4,084,379 | ||||||||||
| Kentucky Housing Corp., | ||||||||||||
| 3.500%, 01/01/2040 (Callable 07/01/2025) | 6,500,000 | 6,788,795 | ||||||||||
| Maryland Community Development Administration Housing Revenue, | ||||||||||||
| 3.160%, 09/01/2041 (Callable 09/01/2025) | 21,480,000 | 21,915,829 | ||||||||||
| New Hampshire Housing Finance Authority: | ||||||||||||
| 3.050%, 01/01/2021 | 890,000 | 929,018 | ||||||||||
| 3.750%, 07/01/2034 (Callable 07/01/2023) | 2,045,000 | 2,121,115 | ||||||||||
| 4.000%, 07/01/2036 (Callable 07/01/2025) | 10,195,000 | 11,146,091 | ||||||||||
| New Jersey Economic Development Authority: | ||||||||||||
| 3.375%, 06/15/2017 | 9,000,000 | 9,108,900 | ||||||||||
| 2.421%, 06/15/2018 | 7,000,000 | 7,031,710 | ||||||||||
| North Carolina Housing Finance Agency, | ||||||||||||
| 2.812%, 07/01/2035 (Callable 01/01/2024) | 4,225,000 | 4,295,557 | ||||||||||
| San Dieguito Public Facilities Authority, | ||||||||||||
| 6.459%, 05/01/2027 | 5,675,000 | 7,394,639 | ||||||||||
| State Public School Building Authority, | ||||||||||||
| 5.000%, 09/15/2027 | 4,458,000 | 4,957,207 | ||||||||||
| Three Rivers Local School District, | ||||||||||||
| 5.209%, 09/15/2027 (Callable 12/01/2020) | 2,365,000 | 2,554,224 | ||||||||||
| West Contra Costa Unified School District, | ||||||||||||
| 6.250%, 08/01/2030 | 1,785,000 | 2,188,071 | ||||||||||
| Westlake City School District, | ||||||||||||
| 5.227%, 12/01/2026 (Callable 12/01/2020) | 3,570,000 | 3,740,646 | ||||||||||
| 152,170,797 | 1.8 | % | ||||||||||
| Residential Mortgage-Backed Securities | ||||||||||||
| U.S. Government Agency Issues | ||||||||||||
| Fannie Mae REMIC Trust, | ||||||||||||
| Series 2004-W6, Class 1A6, 5.500%, 07/25/2034 | 233,166 | 234,222 | ||||||||||
| Federal Gold Loan Mortgage Corp. (FGLMC): | ||||||||||||
| 6.000%, 06/01/2020 | 70,887 | 74,492 | ||||||||||
| 3.500%, 11/01/2025 | 5,115,032 | 5,421,173 | ||||||||||
| 2.500%, 04/01/2028 | 4,495,536 | 4,656,506 | ||||||||||
| 6.500%, 06/01/2029 | 222,482 | 263,516 | ||||||||||
| 3.000%, 04/01/2031 | 11,636,445 | 12,261,400 | ||||||||||
| 3.500%, 05/01/2032 | 13,390,811 | 14,350,957 | ||||||||||
| 3.500%, 07/01/2032 | 38,395,353 | 41,147,451 | ||||||||||
| 5.000%, 08/01/2033 | 8,997,905 | 10,081,391 | ||||||||||
| 5.000%, 09/01/2035 | 18,016,771 | 20,032,030 | ||||||||||
| 5.500%, 01/01/2036 | 372,764 | 419,440 | ||||||||||
| 5.000%, 03/01/2036 | 8,380,898 | 9,313,281 | ||||||||||
| 6.000%, 12/01/2036 | 284,663 | 326,304 | ||||||||||
| 5.500%, 05/01/2038 | 1,119,490 | 1,255,736 | ||||||||||
| 5.500%, 01/01/2039 | 19,790,054 | 22,392,551 | ||||||||||
| 4.500%, 11/01/2039 | 6,971,410 | 7,646,756 | ||||||||||
| 4.500%, 11/01/2039 | 8,579,573 | 9,381,483 | ||||||||||
| 5.000%, 03/01/2040 | 1,834,096 | 2,025,101 | ||||||||||
| 4.500%, 08/01/2040 | 1,532,444 | 1,683,216 | ||||||||||
| 4.500%, 09/01/2040 | 5,554,073 | 6,099,912 | ||||||||||
| 4.000%, 01/01/2041 | 26,154,027 | 28,097,792 | ||||||||||
| 4.500%, 03/01/2041 | 4,100,970 | 4,504,823 | ||||||||||
| 3.500%, 10/01/2041 | 15,334,905 | 16,194,518 | ||||||||||
| 4.000%, 03/01/2042 | 12,112,819 | 13,046,247 | ||||||||||
| 3.500%, 06/01/2042 | 7,803,462 | 8,240,908 | ||||||||||
| 3.500%, 07/01/2042 | 20,227,231 | 21,358,287 | ||||||||||
| 3.000%, 08/01/2042 | 25,267,663 | 26,264,593 | ||||||||||
| 3.000%, 10/01/2042 | 9,453,349 | 9,824,399 | ||||||||||
| 3.000%, 11/01/2042 | 53,790,978 | 56,360,304 | ||||||||||
| 3.000%, 01/01/2043 | 19,963,289 | 20,720,586 | ||||||||||
| 3.000%, 02/01/2043 | 5,124,767 | 5,324,721 | ||||||||||
| 3.000%, 04/01/2043 | 12,659,230 | 13,151,451 | ||||||||||
| 3.000%, 04/01/2043 | 8,415,669 | 8,811,995 | ||||||||||
| 3.500%, 05/01/2043 | 21,416,397 | 22,614,870 | ||||||||||
| 3.000%, 06/01/2043 | 26,551,185 | 27,578,111 | ||||||||||
| 3.000%, 08/01/2043 | 8,157,447 | 8,470,440 | ||||||||||
| 4.000%, 03/01/2044 | 11,535,934 | 12,345,696 | ||||||||||
| 3.500%, 05/01/2044 | 61,665,654 | 65,972,310 | ||||||||||
| 4.000%, 07/01/2044 | 9,964,325 | 10,662,039 | ||||||||||
| 3.500%, 10/01/2044 | 18,203,397 | 19,198,040 | ||||||||||
| 4.000%, 10/01/2044 | 19,985,393 | 21,633,216 | ||||||||||
| 3.500%, 06/01/2045 | 3,849,274 | 4,112,874 | ||||||||||
| 3.500%, 01/01/2046 | 52,866,433 | 56,180,793 | ||||||||||
| 4.000%, 04/01/2046 | 18,899,863 | 20,481,991 | ||||||||||
| Federal Home Loan Mortgage Corp. (FHLMC): | ||||||||||||
| Series 206, Class E, 0.000%, 07/15/2019 ^ | 5,069 | 5,042 | ||||||||||
| Series 141, Class D, 5.000%, 05/15/2021 | 10,473 | 10,834 | ||||||||||
| Series 1074, Class I, 6.750%, 05/15/2021 | 8,094 | 8,522 | ||||||||||
| Series 1081, Class K, 7.000%, 05/15/2021 | 62,523 | 67,917 | ||||||||||
| Series 163, Class F, 6.000%, 07/15/2021 ∞ | 9,706 | 10,370 | ||||||||||
| Series 188, Class H, 7.000%, 09/15/2021 | 24,957 | 26,667 | ||||||||||
| Series 1286, Class A, 6.000%, 05/15/2022 | 7,505 | 7,989 | ||||||||||
| Federal National Mortgage Association (FNMA): | ||||||||||||
| Series 1989-37, Class G, 8.000%, 07/25/2019 | 46,675 | 49,703 | ||||||||||
| Series 1989-94, Class G, 7.500%, 12/25/2019 | 19,371 | 20,610 | ||||||||||
| 4.500%, 01/01/2020 | 22,201,704 | 22,795,556 | ||||||||||
| Series 1990-58, Class J, 7.000%, 05/25/2020 | 2,279 | 2,476 | ||||||||||
| Series 1990-76, Class G, 7.000%, 07/25/2020 | 19,042 | 20,274 | ||||||||||
| Series 1990-105, Class J, 6.500%, 09/25/2020 | 12,173 | 12,889 | ||||||||||
| Series 1990-108, Class G, 7.000%, 09/25/2020 | 3,691 | 3,955 | ||||||||||
| Series 1991-1, Class G, 7.000%, 01/25/2021 | 4,745 | 5,077 | ||||||||||
| Series 1991-86, Class Z, 6.500%, 07/25/2021 | 10,994 | 11,758 | ||||||||||
| 5.000%, 11/01/2021 | 1,309,815 | 1,355,736 | ||||||||||
| Series 1993-58, Class H, 5.500%, 04/25/2023 | 126,401 | 136,624 | ||||||||||
| 3.000%, 04/01/2027 | 8,508,731 | 8,934,910 | ||||||||||
| 2.500%, 12/01/2027 | 14,112,430 | 14,643,275 | ||||||||||
| 5.000%, 05/01/2028 | 344,879 | 382,657 | ||||||||||
| Series 1998-66, Class C, 6.000%, 12/25/2028 | 84,482 | 93,466 | ||||||||||
| 4.500%, 08/01/2029 | 2,676,624 | 2,919,711 | ||||||||||
| 4.500%, 09/01/2029 | 3,007,551 | 3,280,693 | ||||||||||
| 2.500%, 05/01/2030 | 22,568,519 | 23,409,178 | ||||||||||
| 3.000%, 12/01/2030 | 34,852,912 | 36,770,464 | ||||||||||
| 3.000%, 12/01/2030 | 21,114,826 | 22,274,896 | ||||||||||
| 3.500%, 01/01/2032 | 20,388,361 | 21,713,254 | ||||||||||
| 6.000%, 03/01/2033 | 75,147 | 87,173 | ||||||||||
| 4.500%, 10/01/2033 | 31,056,088 | 34,106,024 | ||||||||||
| 5.000%, 10/01/2033 | 32,805,620 | 36,621,613 | ||||||||||
| 5.000%, 11/01/2033 | 87,501 | 97,679 | ||||||||||
| 4.000%, 01/01/2034 | 12,461,924 | 13,496,156 | ||||||||||
| 5.500%, 04/01/2034 | 10,857,452 | 12,304,235 | ||||||||||
| 4.000%, 06/01/2034 | 16,429,182 | 17,785,599 | ||||||||||
| 4.000%, 09/01/2034 | 19,331,123 | 20,929,301 | ||||||||||
| 5.500%, 09/01/2034 | 287,232 | 326,188 | ||||||||||
| 6.000%, 11/01/2034 | 76,661 | 88,548 | ||||||||||
| 5.500%, 02/01/2035 | 995,878 | 1,129,843 | ||||||||||
| 5.000%, 07/01/2035 | 8,433,366 | 9,405,963 | ||||||||||
| 5.000%, 10/01/2035 | 4,429,145 | 4,931,070 | ||||||||||
| 5.500%, 11/01/2036 | 418,185 | 471,046 | ||||||||||
| 5.500%, 04/01/2037 | 2,403,129 | 2,725,347 | ||||||||||
| 4.000%, 04/01/2039 | 21,711,187 | 23,488,522 | ||||||||||
| 5.000%, 06/01/2039 | 19,763,754 | 21,994,495 | ||||||||||
| 4.500%, 11/01/2039 | 414,059 | 453,007 | ||||||||||
| 4.000%, 08/01/2040 | 2,908,565 | 3,128,823 | ||||||||||
| 3.500%, 12/01/2040 | 15,776,574 | 16,685,456 | ||||||||||
| 4.000%, 12/01/2040 | 15,633,599 | 16,815,308 | ||||||||||
| 3.500%, 02/01/2041 | 24,193,207 | 25,587,012 | ||||||||||
| 4.000%, 02/01/2041 | 21,923,132 | 23,581,414 | ||||||||||
| 3.500%, 03/01/2041 | 35,819,451 | 37,882,890 | ||||||||||
| 4.500%, 05/01/2041 | 14,672,550 | 16,084,982 | ||||||||||
| 4.000%, 06/01/2041 | 29,485,306 | 31,691,127 | ||||||||||
| 4.500%, 07/01/2041 | 17,299,322 | 18,943,131 | ||||||||||
| 4.000%, 09/01/2041 | 4,611,963 | 4,958,424 | ||||||||||
| 4.000%, 10/01/2041 | 10,977,869 | 11,802,981 | ||||||||||
| 3.500%, 11/01/2041 | 14,927,134 | 15,809,003 | ||||||||||
| 3.500%, 12/01/2041 | 33,344,610 | 35,337,998 | ||||||||||
| 4.000%, 12/01/2041 | 15,977,113 | 17,175,915 | ||||||||||
| 4.000%, 01/01/2042 | 21,213,227 | 22,781,983 | ||||||||||
| 4.500%, 01/01/2042 | 21,301,421 | 23,340,213 | ||||||||||
| 3.000%, 05/01/2042 | 7,611,664 | 7,915,634 | ||||||||||
| 3.500%, 08/01/2042 | 13,356,464 | 14,141,924 | ||||||||||
| 4.000%, 08/01/2042 | 29,201,624 | 31,448,697 | ||||||||||
| 3.000%, 03/01/2043 | 3,240,785 | 3,394,730 | ||||||||||
| 3.000%, 05/01/2043 | 30,812,199 | 32,043,090 | ||||||||||
| 3.000%, 06/01/2043 | 12,870,350 | 13,385,328 | ||||||||||
| 3.000%, 08/01/2043 | 7,770,543 | 8,080,667 | ||||||||||
| 4.500%, 09/01/2043 | 23,540,131 | 25,785,116 | ||||||||||
| 4.000%, 01/01/2045 | 16,269,734 | 17,554,253 | ||||||||||
| 3.500%, 04/01/2045 | 48,543,614 | 51,621,343 | ||||||||||
| 4.000%, 10/01/2045 | 12,685,689 | 13,695,557 | ||||||||||
| 3.000%, 05/01/2046 | 20,683,836 | 21,599,519 | ||||||||||
| Government National Mortgage Association (GNMA): | ||||||||||||
| 6.000%, 11/20/2033 | 69,467 | 82,107 | ||||||||||
| 5.000%, 07/20/2040 | 3,659,990 | 4,071,333 | ||||||||||
| 3.500%, 10/20/2041 | 15,509,588 | 16,530,767 | ||||||||||
| 4.000%, 06/20/2042 | 17,664,326 | 18,993,209 | ||||||||||
| 3.500%, 09/20/2042 | 6,388,587 | 6,809,245 | ||||||||||
| 3.500%, 01/20/2043 | 39,652,193 | 42,263,168 | ||||||||||
| 3.000%, 04/20/2045 | 50,868,369 | 53,255,126 | ||||||||||
| 3.500%, 04/20/2045 | 51,806,851 | 55,027,955 | ||||||||||
| 4.000%, 08/20/2045 | 26,671,730 | 28,521,096 | ||||||||||
| Towd Point Mortgage Trust: | ||||||||||||
| Series 2015-3, Class A1A, 3.500%, 03/25/2054 (Acquired 06/21/2016, Cost $13,526,437) * ∞ | 13,141,024 | 13,584,950 | ||||||||||
| Series 2015-5, Class A1, 3.500%, 05/25/2055 (Acquired 06/15/2016, Cost $6,555,866) * ∞ | 6,363,449 | 6,564,483 | ||||||||||
| Series 2016-2, Class A1, 3.000%, 08/25/2055 (Acquired 05/20/2016, Cost $16,661,182) * ∞ | 16,532,793 | 16,884,916 | ||||||||||
| 1,854,495,107 | 21.2 | % | ||||||||||
| Non-U.S. Government Agency Issues | ||||||||||||
| Alternative Loan Trust: | ||||||||||||
| Series 2005-50CB, Class 4A1, 5.000%, 11/25/2020 | 212,147 | 210,378 | ||||||||||
| Series 2006-7CB, Class 3A1, 5.250%, 05/25/2021 | 995,638 | 954,016 | ||||||||||
| Series 2006-43CB, Class 2A1, 6.000%, 02/25/2022 | 232,581 | 247,353 | ||||||||||
| Series 2006-28CB, Class A17, 6.000%, 10/25/2036 | 879,723 | 639,854 | ||||||||||
| Banc of America Alternative Loan Trust: | ||||||||||||
| Series 2003-11, Class 4A1, 4.750%, 01/25/2019 | 78,858 | 79,166 | ||||||||||
| Series 2004-11, Class 4A1, 5.500%, 12/25/2019 | 73,825 | 74,601 | ||||||||||
| Series 2005-2, Class 4A1, 5.500%, 03/25/2020 | 107,969 | 109,463 | ||||||||||
| Series 2005-4, Class 3A1, 5.500%, 05/25/2020 | 605,479 | 600,412 | ||||||||||
| Series 2007-1, Class 1A1, 5.839%, 04/25/2022 ∞ | 637,860 | 613,306 | ||||||||||
| Series 2004-7, Class 1A1, 6.000%, 08/25/2034 | 25,786,975 | 26,989,179 | ||||||||||
| Series 2005-2, Class 1CB2, 5.500%, 03/25/2035 § | 108,872 | 98,727 | ||||||||||
| Series 2005-9, Class 1CB3, 5.500%, 10/25/2035 § | 270,721 | 243,391 | ||||||||||
| Series 2006-5, Class CB7, 6.000%, 06/25/2046 § | 582,177 | 475,833 | ||||||||||
| Bank of America Alternative Loan Trust: | ||||||||||||
| Series 2004-7, Class 4A1, 5.000%, 08/25/2019 | 1,361,160 | 1,377,229 | ||||||||||
| Series 2005-10, Class 5A1, 5.250%, 11/25/2020 | 297,819 | 300,414 | ||||||||||
| Series 2003-11, Class 2A1, 6.000%, 01/25/2034 | 411,448 | 421,836 | ||||||||||
| Series 2005-11, Class 1CB4, 5.500%, 12/25/2035 § | 160,760 | 145,928 | ||||||||||
| Bear Stearns ALT-A Trust: | ||||||||||||
| Series 2004-4, Class A1, 1.053%, 06/25/2034 ∞ | 3,347,783 | 3,175,641 | ||||||||||
| Series 2005-4, Class 1A1, 0.893%, 04/25/2035 ∞ | 9,113,938 | 8,691,191 | ||||||||||
| Bear Stearns Asset Backed Securities I Trust, | ||||||||||||
| Series 2004-AC2, Class 2A, 5.000%, 05/25/2034 | 654,803 | 649,230 | ||||||||||
| Chase Mortgage Finance Trust, | ||||||||||||
| Series 2006-A1, Class 2A3, 2.763%, 09/25/2036 § ∞ | 2,308,171 | 2,046,798 | ||||||||||
| Citigroup Mortgage Loan Trust, Inc., | ||||||||||||
| Series 2005-9, Class 2A2, 5.500%, 11/25/2035 § | 172,997 | 171,544 | ||||||||||
| Countrywide Alternative Loan Trust: | ||||||||||||
| Series 2006-J5, Class 3A1, 4.777%, 07/25/2021 ∞ | 199,040 | 180,091 | ||||||||||
| Series 2002-11, Class A4, 6.250%, 10/25/2032 | 29,748 | 29,943 | ||||||||||
| Series 2003-20CB, Class 1A1, 5.500%, 10/25/2033 | 4,288,921 | 4,313,947 | ||||||||||
| Credit Suisse First Boston Mortgage Securities Corp., | ||||||||||||
| Series 2003-AR26, Class 8A1, 2.845%, 11/25/2033 ∞ | 13,056,328 | 13,078,291 | ||||||||||
| First Horizon Alternative Mortgage Securities Trust: | ||||||||||||
| Series 2005-FA7, Class 2A1, 5.000%, 09/25/2020 | 119,389 | 120,140 | ||||||||||
| Series 2006-FA6, Class 3A1, 5.750%, 11/25/2021 | 197,938 | 197,166 | ||||||||||
| Series 2006-FA8, Class 2A1, 5.750%, 02/25/2037 § | 704,840 | 605,585 | ||||||||||
| GSAA Home Equity Trust, | ||||||||||||
| Series 2004-6, Class A1, 1.253%, 06/25/2034 ∞ | 2,984,602 | 2,864,722 | ||||||||||
| Impac CMB Trust: | ||||||||||||
| Series 2004-4, Class 2A2, 4.967%, 09/25/2034 | 117,199 | 112,982 | ||||||||||
| Series 2004-5, Class 1A2, 1.153%, 10/25/2034 ∞ | 8,055,441 | 7,704,751 | ||||||||||
| J.P. Morgan Alternative Loan Trust, | ||||||||||||
| Series 2006-A1, Class 2A1, 2.806%, 03/25/2036 § ∞ | 440,040 | 366,143 | ||||||||||
| J.P. Morgan Mortgage Trust: | ||||||||||||
| Series 2007-A1, Class 5A5, 2.827%, 07/25/2035 ∞ | 8,631,520 | 8,609,281 | ||||||||||
| Series 2007-A1, Class 5A2, 2.827%, 07/25/2035 ∞ | 5,700,527 | 5,755,349 | ||||||||||
| Series 2005-A4, Class 1A1, 2.870%, 07/25/2035 ∞ | 2,273,780 | 2,224,888 | ||||||||||
| Series 2006-A7, Class 2A4R, 2.787%, 01/25/2037 § ∞ | 1,153,962 | 1,017,874 | ||||||||||
| Series 2006-A7, Class 2A2, 2.787%, 01/25/2037 ∞ | 270,094 | 239,805 | ||||||||||
| Series 2007-A2, Class 2A3, 2.860%, 04/25/2037 ∞ | 3,045,698 | 2,674,494 | ||||||||||
| MASTR Alternative Loan Trust: | ||||||||||||
| Series 2004-2, Class 6A1, 5.250%, 12/25/2018 | 1,590,636 | 1,620,779 | ||||||||||
| Series 2004-1, Class 1A1, 5.000%, 01/25/2019 | 234,271 | 235,307 | ||||||||||
| Series 2004-2, Class 4A1, 5.000%, 02/25/2019 | 13,307 | 13,418 | ||||||||||
| Series 2004-4, Class 4A1, 5.000%, 04/25/2019 | 208,237 | 209,928 | ||||||||||
| Series 2003-5, Class 6A1, 6.000%, 08/25/2033 | 341,576 | 357,267 | ||||||||||
| Merrill Lynch Mortgage Investors Trust: | ||||||||||||
| Series 2004-F, Class A1A, 2.236%, 12/25/2029 ∞ | 10,540,921 | 10,548,007 | ||||||||||
| Series 2005-A10, Class A, 0.663%, 02/25/2036 ∞ | 25,259,844 | 22,868,537 | ||||||||||
| MortgageIT Trust: | ||||||||||||
| Series 2005-2, Class 1A1, 0.713%, 05/25/2035 ∞ | 3,381,971 | 3,295,336 | ||||||||||
| Series 2005-3, Class A1, 0.753%, 08/25/2035 ∞ | 7,212,385 | 6,653,064 | ||||||||||
| RALI Series Trust, | ||||||||||||
| Series 2004-QS6, Class A1, 5.000%, 05/25/2019 | 93,176 | 93,083 | ||||||||||
| RFMSI Series Trust, | ||||||||||||
| Series 2003-S11, Class A2, 4.000%, 06/25/2018 | 3,338 | 3,313 | ||||||||||
| Salomon Brothers Mortgage Securities VII, Inc., | ||||||||||||
| Series 2003-UP2, Class A2, 7.000%, 06/25/2033 | 253,863 | 257,087 | ||||||||||
| Structured Adjustable Rate Mortgage Loan Trust: | ||||||||||||
| Series 2004-12, Class 3A1, 2.855%, 09/25/2034 ∞ | 7,964,961 | 7,840,650 | ||||||||||
| Series 2004-16, Class 1A2, 2.945%, 11/25/2034 ∞ | 12,294,951 | 12,249,082 | ||||||||||
| Series 2004-16, Class 2A, 2.959%, 11/25/2034 ∞ | 9,354,084 | 9,330,322 | ||||||||||
| Structured Asset Securities Corp. Mortgage Loan Trust, | ||||||||||||
| Series 2005-7XS, Class 1A4B, 5.440%, 04/25/2035 | 123,820 | 128,883 | ||||||||||
| Thornburg Mortgage Securities Trust, | ||||||||||||
| Series 2003-5, Class 3A, 2.418%, 10/25/2043 ∞ | 26,668,662 | 26,717,540 | ||||||||||
| WaMu Mortgage Pass-Through Certificates: | ||||||||||||
| Series 2004-CB1, Class 5A, 5.000%, 06/25/2019 | 250,062 | 252,955 | ||||||||||
| Series 2004-CB2, Class 7A, 5.500%, 08/25/2019 | 454,187 | 460,440 | ||||||||||
| Series 2004-CB3, Class 3A, 5.500%, 10/25/2019 | 40,367 | 40,971 | ||||||||||
| Series 2004-CB3, Class 4A, 6.000%, 10/25/2019 | 148,800 | 153,934 | ||||||||||
| Series 2004-CB4, Class 21A, 5.500%, 12/25/2019 | 111,478 | 113,483 | ||||||||||
| Series 2004-CB2, Class 3A, 6.000%, 08/25/2034 | 9,569,370 | 10,089,957 | ||||||||||
| Series 2004-CB3, Class 2A, 6.500%, 10/25/2034 | 5,631,812 | 6,065,657 | ||||||||||
| Series 2004-AR14, Class A1, 2.600%, 01/25/2035 ∞ | 11,822,893 | 11,812,319 | ||||||||||
| Wells Fargo Mortgage Backed Securities, | ||||||||||||
| Series 2005-AR10, Class 2A17, 2.880%, 06/25/2035 ∞ | 26,418,642 | 26,706,737 | ||||||||||
| 256,528,998 | 2.9 | % | ||||||||||
| Asset Backed Securities | ||||||||||||
| Accredited Mortgage Loan Trust: | ||||||||||||
| Series 2005-4, Class A1, 0.693%, 12/25/2035 ∞ | 11,777,241 | 11,588,974 | ||||||||||
| Series 2006-1, Class A3, 0.633%, 04/25/2036 ∞ | 5,528,057 | 5,503,248 | ||||||||||
| Series 2006-2, Class A3, 0.603%, 09/25/2036 ∞ | 11,404,599 | 11,322,700 | ||||||||||
| ACE Securities Corp. Home Equity Loan Trust, | ||||||||||||
| Series 2006-HE1, Class A1B1, 0.643%, 02/25/2036 ∞ | 5,474,163 | 5,403,371 | ||||||||||
| Argent Securities Inc Asset-Backed Pass-Through Certificates, | ||||||||||||
| Series 2005-W3, Class A2D, 0.793%, 11/25/2035 ∞ | 6,336,416 | 6,156,446 | ||||||||||
| Asset Backed Securities Corp. Home Equity Loan Trust, | ||||||||||||
| Series 2006-HE1, Class A3, 0.653%, 01/25/2036 ∞ | 14,682,262 | 14,316,930 | ||||||||||
| Bayview Financial Acquisition Trust, | ||||||||||||
| Series 2007-A, Class 1A2, 6.205%, 05/28/2037 | 93,319 | 97,091 | ||||||||||
| Bayview Financial Mortgage Pass-Through Trust, | ||||||||||||
| Series 2007-B, Class 1A2, 6.831%, 08/28/2047 | 2,120,291 | 1,793,739 | ||||||||||
| Capital Auto Receivables Asset Trust: | ||||||||||||
| Series 2013-4, Class A3, 1.090%, 03/20/2018 | 13,570,941 | 13,571,066 | ||||||||||
| Series 2014-1, Class A3, 1.320%, 06/20/2018 | 7,274,322 | 7,277,981 | ||||||||||
| Citibank Credit Card Issuance Trust, | ||||||||||||
| Series 2007-A3, Class A3, 6.150%, 06/15/2039 | 4,166,000 | 5,782,722 | ||||||||||
| Citigroup Mortgage Loan Trust, Inc., | ||||||||||||
| Series 2005-HE4, Class A2D, 0.813%, 10/25/2035 ∞ | 8,233,972 | 8,135,893 | ||||||||||
| Conseco Financial Corp.: | ||||||||||||
| Series 1993-3, Class A7, 6.400%, 10/15/2018 | 30,844 | 30,844 | ||||||||||
| Series 1993-4, Class A5, 7.050%, 01/15/2019 | 11,710 | 11,910 | ||||||||||
| Series 1998-2, Class A5, 6.240%, 12/01/2028 ∞ | 434,618 | 453,251 | ||||||||||
| Series 1998-3, Class A5, 6.220%, 03/01/2030 | 482,562 | 507,325 | ||||||||||
| Series 1998-4, Class A5, 6.180%, 04/01/2030 | 2,731,442 | 2,878,041 | ||||||||||
| Series 1998-7, Class A1, 6.320%, 07/01/2030 | 23,031,832 | 24,344,630 | ||||||||||
| Contimortgage Home Equity Loan Trust, | ||||||||||||
| Series 1997-2, Class A9, 7.090%, 04/15/2028 | 1 | 1 | ||||||||||
| Countrywide Asset-Backed Certificates: | ||||||||||||
| Series 2004-S1, Class A3, 5.115%, 02/25/2035 | 688,067 | 698,665 | ||||||||||
| Series 2004-15, Class AF6, 4.613%, 04/25/2035 ∞ | 459,381 | 462,328 | ||||||||||
| Series 2005-1, Class AF6, 5.030%, 07/25/2035 ∞ | 910,437 | 930,408 | ||||||||||
| Series 2005-10, Class AF6, 4.576%, 02/25/2036 ∞ | 616,990 | 632,616 | ||||||||||
| Series 2005-11, Class AF3, 4.761%, 02/25/2036 ∞ | 3,487,871 | 3,561,224 | ||||||||||
| Series 2005-13, Class AF3, 4.821%, 04/25/2036 ∞ | 2,041,709 | 1,768,846 | ||||||||||
| Series 2005-17, Class 1AF5, 4.705%, 05/25/2036 § ∞ | 478,402 | 688,937 | ||||||||||
| Series 2006-10, Class 1AF3, 4.776%, 09/25/2046 ∞ | 1,052,814 | 848,965 | ||||||||||
| Credit-Based Asset Servicing and Securitization LLC, | ||||||||||||
| Series 2005-CB8, Class AF2, 4.070%, 12/25/2035 | 204,958 | 202,804 | ||||||||||
| CWHEQ Home Equity Loan Trust, | ||||||||||||
| Series 2007-S1, Class A6, 5.693%, 11/25/2036 ∞ | 278,842 | 275,026 | ||||||||||
| Deutsche Mortgage Securities Inc. Mortgage Loan Trust, | ||||||||||||
| Series 2004-4, Class 1A6, 6.000%, 04/25/2034 | 17,110 | 17,363 | ||||||||||
| First Franklin Mortgage Loan Trust: | ||||||||||||
| Series 2006-FFH1, Class A4, 0.746%, 01/25/2036 ∞ | 3,680,872 | 3,576,607 | ||||||||||
| Series 2006-FF1, Class 2A4, 0.793%, 01/25/2036 ∞ | 8,500,000 | 8,045,347 | ||||||||||
| Ford Credit Auto Owner Trust: | ||||||||||||
| Series 2014-2, Class A, 2.310%, 04/15/2026 (Acquired 02/20/2015 through 03/23/2016, Cost $27,208,283) * | 27,030,000 | 27,611,721 | ||||||||||
| Series 2015-1, Class A, 2.120%, 07/15/2026 (Acquired 03/14/2016 through 05/27/2016, Cost $8,719,266) * | 8,740,000 | 8,872,169 | ||||||||||
| Series 2016-1, Class A, 2.310%, 08/15/2027 (Acquired 02/23/2016 through 05/24/2016, Cost $28,349,066) * | 28,325,000 | 28,917,151 | ||||||||||
| Series 2016-2, Class A, 2.030%, 12/15/2027 (Acquired 06/20/2016, Cost $19,993,088) * | 20,000,000 | 20,105,104 | ||||||||||
| GE Capital Mortgage Services, Inc. Trust, | ||||||||||||
| Series 1999-HE1, Class A7, 6.265%, 04/25/2029 | 1,059 | 1,067 | ||||||||||
| GE Mortgage Services LLC, | ||||||||||||
| Series 1997-HE4, Class A7, 6.735%, 12/25/2028 | 64 | 46 | ||||||||||
| GMACM Mortgage Loan Trust, | ||||||||||||
| Series 2004-GH1, Class A6, 4.810%, 07/25/2035 | 5,506 | 5,487 | ||||||||||
| GSAMP Trust: | ||||||||||||
| Series 2005-WMC2, Class A1B, 0.763%, 11/25/2035 ∞ | 13,451,374 | 13,065,891 | ||||||||||
| Series 2005-WMC2, Class A2C, 0.803%, 11/25/2035 ∞ | 13,250,338 | 12,799,754 | ||||||||||
| IMC Home Equity Loan Trust, | ||||||||||||
| Series 1997-5, Class A10, 6.880%, 11/20/2028 | 2,193 | 2,188 | ||||||||||
| J.P. Morgan Mortgage Acquisition Trust, | ||||||||||||
| Series 2006-CH1, Class A1, 0.583%, 07/25/2036 ∞ | 6,794,561 | 6,539,626 | ||||||||||
| Leaf Receivables Funding 10 LLC, | ||||||||||||
| Series 2015-1, Class A3, 1.490%, 03/15/2018 (Acquired 04/23/2015, Cost $13,997,428) * | 14,000,000 | 14,002,954 | ||||||||||
| Long Beach Mortgage Loan Trust, | ||||||||||||
| Series 2006-WL2, Class 2A3, 0.653%, 01/25/2036 ∞ | 3,980,466 | 3,845,488 | ||||||||||
| MASTR Asset Backed Securities Trust, | ||||||||||||
| Series 2006-NC1, Class A4, 0.753%, 01/25/2036 ∞ | 12,380,396 | 11,946,945 | ||||||||||
| MMAF Equipment Finance LLC, | ||||||||||||
| Series 2016-AA, Class A5, 2.210%, 12/15/2032 (Acquired 05/03/2016, Cost $10,624,553) * | 10,625,000 | 10,719,209 | ||||||||||
| Oakwood Mortgage Investors, Inc., | ||||||||||||
| Series 1999-B, Class A3, 6.450%, 11/15/2017 | 31,098 | 32,034 | ||||||||||
| OneMain Financial Issuance Trust, | ||||||||||||
| Series 2014-2A, Class A, 2.470%, 09/18/2024 (Acquired 11/16/2015 through 01/29/2016, Cost $29,564,059) * | 29,657,000 | 29,721,400 | ||||||||||
| Park Place Securities, Inc. Asset-Backed Pass-Through Certificates, | ||||||||||||
| Series 2005-WCW1, Class M1, 0.903%, 09/25/2035 ∞ | 9,366,945 | 9,296,303 | ||||||||||
| RAAC Series Trust, | ||||||||||||
| Series 2004-SP1, Class AI4, 5.285%, 08/25/2027 ∞ | 10,045 | 10,173 | ||||||||||
| RAMP Series Trust: | ||||||||||||
| Series 2003-RS7, Class AI6, 5.340%, 08/25/2033 ∞ | 132,378 | 132,690 | ||||||||||
| Series 2003-RS10, Class AI7, 4.850%, 11/25/2033 ∞ | 3,073 | 3,086 | ||||||||||
| Series 2005-RS1, Class AI6, 4.713%, 01/25/2035 | 61,261 | 61,905 | ||||||||||
| RASC Series Trust: | ||||||||||||
| Series 2003-KS2, Class AI6, 3.990%, 04/25/2033 ∞ | 252,643 | 252,359 | ||||||||||
| Series 2003-KS5, Class AI6, 3.620%, 07/25/2033 ∞ | 15,332 | 14,921 | ||||||||||
| Series 2004-KS2, Class AI6, 4.300%, 03/25/2034 ∞ | 30,429 | 30,735 | ||||||||||
| Renaissance Home Equity Loan Trust, | ||||||||||||
| Series 2007-1, Class AF3, 5.612%, 04/25/2037 | 2,567,320 | 1,243,505 | ||||||||||
| Republic Services, Inc., | ||||||||||||
| Series 2006-KS4, Class A4, 0.693%, 06/25/2036 ∞ | 22,216,045 | 21,595,575 | �� | |||||||||
| Securitized Asset Backed Receivables LLC Trust, | ||||||||||||
| Series 2005-OP2, Class A1, 0.778%, 10/25/2035 (Acquired 03/13/2014, Cost $1,665,016) * ∞ | 1,685,559 | 1,669,211 | ||||||||||
| Specialty Underwriting & Residential Finance Trust: | ||||||||||||
| Series 2004-BC4, Class A1A, 1.123%, 10/25/2035 ∞ | 2,866,949 | 2,800,954 | ||||||||||
| Series 2006-BC1, Class A2D, 0.753%, 12/25/2036 ∞ | 4,436,698 | 4,374,605 | ||||||||||
| Springleaf Funding Trust, | ||||||||||||
| Series 2014-AA, Class A, 2.410%, 12/15/2022 (Acquired 02/10/2015 through 09/03/2015, Cost $13,560,746) * | 13,546,319 | 13,554,489 | ||||||||||
| Structured Asset Securities Corp., | ||||||||||||
| Series 2005-WF1, Class A3, 1.113%, 02/25/2035 ∞ | 16,465,865 | 16,007,857 | ||||||||||
| Synchrony Credit Card Master Note Trust: | ||||||||||||
| Series 2012-3, Class A, 0.892%, 03/15/2020 ∞ | 23,815,000 | 23,823,569 | ||||||||||
| Series 2016-2, Class A, 1.600%, 04/15/2021 | 8,625,000 | 8,659,935 | ||||||||||
| Series 2015-1, Class A, 2.370%, 03/15/2023 | 12,841,000 | 13,222,754 | ||||||||||
| Series 2016-2, Class A, 2.040%, 05/15/2024 | 7,500,000 | 7,639,405 | ||||||||||
| TCF Auto Receivables Owner Trust: | ||||||||||||
| Series 2015-1A, Class A2, 1.020%, 08/15/2018 (Acquired 06/03/2015 through 02/29/2016, Cost $9,166,138) * | 9,167,011 | 9,160,723 | ||||||||||
| Series 2015-2A, Class A2, 1.640%, 01/15/2019 (Acquired 11/18/2015, Cost $17,804,638) * | 17,804,700 | 17,823,511 | ||||||||||
| 480,451,798 | 5.5 | % | ||||||||||
| Commercial Mortgage-Backed Securities | ||||||||||||
| U.S. Government Agency Issues | ||||||||||||
| Federal National Mortgage Association (FNMA): | ||||||||||||
| Series K-714, Class A2, 3.034%, 10/25/2020 ∞ | 18,070,000 | 19,239,295 | ||||||||||
| Series 2011-M4, Class A2, 3.726%, 06/25/2021 | 20,000,000 | 22,001,570 | ||||||||||
| FHLMC Multifamily Structured Pass Through Certificates, | ||||||||||||
| Series K003, Class A4, 5.053%, 01/25/2019 | 13,175,000 | 14,321,707 | ||||||||||
| 55,562,572 | 0.6 | % | ||||||||||
| Non-U.S. Government Agency Issues | ||||||||||||
| Citigroup Commercial Mortgage Trust, | ||||||||||||
| Series 2014-GC19, Class A3, 3.753%, 03/10/2047 | 11,025,000 | 12,090,566 | ||||||||||
| COMM Mortgage Trust: | ||||||||||||
| Series 2012-CR1, Class A3, 3.391%, 05/15/2045 | 7,813,462 | 8,412,557 | ||||||||||
| Series 2013-CR9, Class A3, 4.022%, 07/10/2045 | 25,725,000 | 28,609,899 | ||||||||||
| Series 2012-CR2, Class A4, 3.147%, 08/15/2045 | 19,660,536 | 20,928,381 | ||||||||||
| Series 2013-CR10, Class A3, 3.923%, 08/10/2046 | 13,875,000 | 15,369,802 | ||||||||||
| GS Mortgage Securities Corp. II, | ||||||||||||
| Series 2012-GCJ9, Class A3, 2.773%, 11/10/2045 | 36,997,320 | 38,668,489 | ||||||||||
| J.P. Morgan Chase Commercial Mortgage Securities Corp., | ||||||||||||
| Series 2012-LC9, Class A5, 2.840%, 12/15/2047 | 8,700,059 | 9,085,023 | ||||||||||
| J.P. Morgan Chase Commercial Mortgage Securities Trust: | ||||||||||||
| Series 2012-C8, Class ASB, 2.379%, 10/15/2045 | 9,965,000 | 10,237,554 | ||||||||||
| Series 2013-LC11, Class A5, 2.960%, 04/15/2046 | 11,802,913 | 12,368,589 | ||||||||||
| Series 2013-C10, Class ASB, 2.702%, 12/15/2047 | 10,000,000 | 10,400,252 | ||||||||||
| JPMBB Commercial Mortgage Securities Trust: | ||||||||||||
| Series 2013-C17, Class A3, 3.928%, 01/15/2047 | 8,450,000 | 9,387,150 | ||||||||||
| Series 2014-C24, Class ASB, 3.368%, 11/15/2047 | 10,000,000 | 10,737,471 | ||||||||||
| Series 2014-C25, Class ASB, 3.407%, 11/15/2047 | 7,138,000 | 7,665,359 | ||||||||||
| Morgan Stanley Bank of America Merrill Lynch Trust: | ||||||||||||
| Series 2012-C5, Class A4, 3.176%, 08/15/2045 | 37,550,000 | 40,000,813 | ||||||||||
| Series 2012-C6, Class A4, 2.858%, 11/15/2045 | 23,670,945 | 24,813,037 | ||||||||||
| Series 2013-C11, Class A3, 3.960%, 08/15/2046 | 12,100,000 | 13,508,169 | ||||||||||
| Series 2013-C12, Class A3, 3.973%, 10/15/2046 | 22,850,000 | 25,393,105 | ||||||||||
| Series 2016-C29, Class ASB, 3.140%, 05/15/2049 | 12,250,000 | 12,954,605 | ||||||||||
| Wells Fargo Commercial Mortgage Trust: | ||||||||||||
| Series 2013-LC12, Class A3, 3.986%, 07/15/2046 | 9,300,000 | 10,362,392 | ||||||||||
| Series 2015-SG1, Class ASB, 3.556%, 12/15/2047 | 18,900,000 | 20,347,020 | ||||||||||
| Series 2015-C27, Class ASB, 3.278%, 02/15/2048 | 18,000,000 | 19,095,039 | ||||||||||
| Series 2015-P2, Class A3, 3.541%, 12/15/2048 | 31,100,000 | 33,588,075 | ||||||||||
| WFRBS Commercial Mortgage Trust: | ||||||||||||
| Series 2012-C6, Class A4, 3.440%, 04/15/2045 | 22,864,220 | 24,576,229 | ||||||||||
| Series 2013-C13, Class ASB, 2.654%, 05/15/2045 | 6,450,000 | 6,686,781 | ||||||||||
| Series 2013-C18, Class A4, 3.896%, 12/15/2046 | 12,900,000 | 14,321,159 | ||||||||||
| Series 2014-C21, Class A5, 3.678%, 08/15/2047 | 11,254,000 | 12,278,810 | ||||||||||
| Series 2014-C24, Class A4, 3.343%, 11/15/2047 | 10,330,000 | 11,008,059 | ||||||||||
| Series 2014-C23, Class ASB, 3.636%, 10/15/2057 | 6,920,000 | 7,469,007 | ||||||||||
| 470,363,392 | 5.4 | % | ||||||||||
| Total Long-Term Investments (Cost $8,390,011,571) | 8,628,012,122 | 98.8 | % | |||||||||
| Shares | ||||||||||||
| SHORT-TERM INVESTMENTS | ||||||||||||
| Money Market Mutual Funds | ||||||||||||
| Dreyfus Institutional Cash Advantage Fund, Institutional Class, 0.39% « | 20,260,216 | 20,260,216 | ||||||||||
| Short-Term Investments Trust - Liquid Assets Portfolio, Institutional Class, 0.43% « | 172,000,000 | 172,000,000 | ||||||||||
| Total Short-Term Investments (Cost $192,260,216) | 192,260,216 | 2.2 | % | |||||||||
| INVESTMENT PURCHASED WITH CASH PROCEEDS FROM | ||||||||||||
| SECURITIES LENDING | ||||||||||||
| Investment Company | ||||||||||||
| Mount Vernon Securities Lending Trust Prime Portfolio, 0.56% « | 164,963,964 | 164,963,964 | ||||||||||
| Total Investment Company (Cost $164,963,964) | 164,963,964 | 1.9 | % | |||||||||
| Total Investment Purchased With Cash Proceeds From | ||||||||||||
| Securities Lending (Cost $164,963,964) | 164,963,964 | 1.9 | % | |||||||||
| Total Investments (Cost $8,747,235,751) | 8,985,236,302 | 102.9 | % | |||||||||
| Liabilities in Excess of Other Assets | (248,570,098 | ) | (2.9 | )% | ||||||||
| TOTAL NET ASSETS | $ | 8,736,666,204 | 100.0 | % | ||||||||
Notes to Schedule of Investments | |
| * | Restricted security as defined in Rule 144 under the Securities Act of 1933 and determined to be liquid. Purchased in a private placement transaction; resale to the public may require registration or or may extend only to qualified institutional buyers. At June 30, 2016, the value of these securities total $1,416,328,963, which represents 16.21% of total net assets. |
| @ | This security or portion of this security is out on loan at June 30, 2016. |
| f | Foreign Security |
| § | Security in Default |
| ∞ | Variable or Floating rate security. Floating rate securities are securities whose yields vary with a designated index rate. These securities rates are as of June 30, 2016. |
| ^ | Non-Income Producing |
| « | 7-Day Yield |
| Baird Core Plus Bond Fund | ||||||||||||
| Schedule of Investments | ||||||||||||
| June 30, 2016 (Unaudited) | ||||||||||||
| Principal | % of | |||||||||||
| Amount | Value | Net Assets | ||||||||||
| LONG-TERM INVESTMENTS | ||||||||||||
| U.S. Treasury Securities | ||||||||||||
| U.S. Treasury Bonds: | ||||||||||||
| 2.625%, 08/15/2020 | $ | 181,775,000 | $ | 194,328,745 | ||||||||
| 1.750%, 03/31/2022 | 141,350,000 | 146,048,757 | ||||||||||
| 2.500%, 05/15/2024 | 73,950,000 | 80,319,535 | ||||||||||
| 3.500%, 02/15/2039 | 377,695,000 | 476,662,799 | ||||||||||
| 2.875%, 05/15/2043 | 237,900,000 | 267,516,647 | ||||||||||
| 2.500%, 02/15/2045 @ | 36,550,000 | 38,053,411 | ||||||||||
| 1,202,929,894 | 10.7 | % | ||||||||||
| Corporate Bonds | ||||||||||||
| Finance | ||||||||||||
| ABN AMRO Bank NV: | ||||||||||||
| 4.250%, 02/02/2017 (Acquired 01/30/2012, Cost $4,995,100) * f | 5,000,000 | 5,086,650 | ||||||||||
| 2.500%, 10/30/2018 (Acquired 10/23/2013 through 10/24/2014, Cost $6,797,069) * f | 6,750,000 | 6,906,681 | ||||||||||
| 2.450%, 06/04/2020 (Acquired 05/28/2015, Cost $12,771,840) * f | 12,800,000 | 13,088,998 | ||||||||||
| 4.750%, 07/28/2025 (Acquired 07/21/2015, Cost $9,973,200) * f | 10,000,000 | 10,380,800 | ||||||||||
| 4.800%, 04/18/2026 (Acquired 04/11/2016, Cost $10,980,970) * @ f | 11,000,000 | 11,452,947 | ||||||||||
| AIA Group Ltd., | ||||||||||||
| 3.200%, 03/11/2025 (Acquired 03/04/2015, Cost $8,988,570) * f | 9,000,000 | 9,173,934 | ||||||||||
| AIG SunAmerica Global Financing X, | ||||||||||||
| 6.900%, 03/15/2032 (Acquired 11/10/2011, Cost $2,120,862) * | 2,000,000 | 2,602,314 | ||||||||||
| Ally Financial, Inc.: | ||||||||||||
| 5.500%, 02/15/2017 @ | 7,275,000 | 7,384,125 | ||||||||||
| 3.600%, 05/21/2018 @ | 7,000,000 | 7,017,500 | ||||||||||
| 3.250%, 11/05/2018 @ | 8,000,000 | 7,990,000 | ||||||||||
| 8.000%, 12/31/2018 | 1,206,000 | 1,317,555 | ||||||||||
| 3.750%, 11/18/2019 @ | 18,200,000 | 18,245,500 | ||||||||||
| 5.125%, 09/30/2024 @ | 3,000,000 | 3,056,250 | ||||||||||
| American Express Credit Corp., | ||||||||||||
| 1.116%, 08/15/2019 ∞ | 7,450,000 | 7,382,279 | ||||||||||
| American International Group, Inc.: | ||||||||||||
| 6.400%, 12/15/2020 | 3,500,000 | 4,116,213 | ||||||||||
| 3.300%, 03/01/2021 @ | 13,500,000 | 13,946,917 | ||||||||||
| 4.875%, 06/01/2022 | 10,625,000 | 11,836,526 | ||||||||||
| 3.750%, 07/10/2025 | 11,400,000 | 11,618,937 | ||||||||||
| 3.875%, 01/15/2035 @ | 5,000,000 | 4,787,320 | ||||||||||
| 6.820%, 11/15/2037 | 4,173,000 | 5,315,697 | ||||||||||
| AmSouth Bancorporation, | ||||||||||||
| 6.750%, 11/01/2025 | 710,000 | 816,370 | ||||||||||
| ANZ New Zealand (Int'l) Ltd.: | ||||||||||||
| 1.750%, 03/29/2018 (Acquired 03/24/2015, Cost $6,149,262) * f | 6,150,000 | 6,176,193 | ||||||||||
| 2.750%, 02/03/2021 (Acquired 01/27/2016, Cost $9,989,300) * f | 10,000,000 | 10,349,300 | ||||||||||
| Aon PLC, | ||||||||||||
| 3.875%, 12/15/2025 f | 14,490,000 | 15,283,139 | ||||||||||
| Australia & New Zealand Banking Group Ltd./New York NY, | ||||||||||||
| 3.700%, 11/16/2025 f | 2,875,000 | 3,182,892 | ||||||||||
| Australia and New Zealand Banking Group Ltd., | ||||||||||||
| 4.500%, 03/19/2024 (Acquired 03/12/2014, Cost $8,987,760) * @ f | 9,000,000 | 9,383,409 | ||||||||||
| Banco Santander (Brasil) SA, | ||||||||||||
| 4.625%, 02/13/2017 (Acquired 02/06/2012, Cost $994,140) * f | 1,000,000 | 1,014,200 | ||||||||||
| Bank of America Corp.: | ||||||||||||
| 6.875%, 04/25/2018 | 1,250,000 | 1,364,684 | ||||||||||
| 7.625%, 06/01/2019 @ | 7,735,000 | 8,952,713 | ||||||||||
| 2.625%, 10/19/2020 @ | 4,500,000 | 4,571,716 | ||||||||||
| 2.625%, 04/19/2021 @ | 17,500,000 | 17,768,398 | ||||||||||
| 3.300%, 01/11/2023 | 22,450,000 | 23,104,350 | ||||||||||
| 7.750%, 05/14/2038 | 725,000 | 1,020,869 | ||||||||||
| BanPonce Trust I, | ||||||||||||
| Class A, 8.327%, 02/01/2027 | 2,310,000 | 2,169,092 | ||||||||||
| Barclays PLC: | ||||||||||||
| 2.750%, 11/08/2019 f | 7,000,000 | 6,950,601 | ||||||||||
| 2.875%, 06/08/2020 f | 6,000,000 | 5,912,568 | ||||||||||
| 3.250%, 01/12/2021 f | 25,000,000 | 24,912,425 | ||||||||||
| 3.650%, 03/16/2025 f | 8,000,000 | 7,692,552 | ||||||||||
| BB&T Corp.: | ||||||||||||
| 2.450%, 01/15/2020 | 15,000,000 | 15,418,020 | ||||||||||
| 2.625%, 06/29/2020 | 13,000,000 | 13,428,805 | ||||||||||
| Berkshire Hathaway Finance Corp., | ||||||||||||
| 4.400%, 05/15/2042 | 3,500,000 | 3,928,820 | ||||||||||
| BNP Paribas SA: | ||||||||||||
| 2.375%, 09/14/2017 f | 3,000,000 | 3,043,200 | ||||||||||
| 5.000%, 01/15/2021 f | 5,000,000 | 5,615,680 | ||||||||||
| 3.250%, 03/03/2023 f | 4,000,000 | 4,159,764 | ||||||||||
| BNZ International Funding Ltd.: | ||||||||||||
| 2.350%, 03/04/2019 (Acquired 09/03/2014 through 11/03/2014, Cost $13,751,687) * f | 13,775,000 | 13,987,410 | ||||||||||
| 2.750%, 03/02/2021 (Acquired 02/23/2016, Cost $18,736,875) * f | 18,750,000 | 19,374,019 | ||||||||||
| BOKF NA, | ||||||||||||
| 1.316%, 05/15/2017 ∞ | 3,000,000 | 2,993,685 | ||||||||||
| BPCE: | ||||||||||||
| 2.500%, 12/10/2018 f | 5,500,000 | 5,639,854 | ||||||||||
| 2.250%, 01/27/2020 @ f | 4,000,000 | 4,065,644 | ||||||||||
| 5.700%, 10/22/2023 (Acquired 10/15/2013 through 11/10/2014, Cost $29,886,601) * f | 28,500,000 | 30,568,017 | ||||||||||
| 4.625%, 07/11/2024 (Acquired 04/07/2016, Cost $3,442,320) * f | 3,500,000 | 3,507,812 | ||||||||||
| BPCE SA, | ||||||||||||
| 5.150%, 07/21/2024 (Acquired 05/10/2016 through 05/16/2016, Cost $10,988,721) * f | 10,700,000 | 11,134,474 | ||||||||||
| Caisse Centrale Desjardins: | ||||||||||||
| 1.550%, 09/12/2017 (Acquired 07/07/2015, Cost $6,006,039) * f | 6,000,000 | 6,012,132 | ||||||||||
| 1.303%, 01/29/2018 (Acquired 01/26/2015 through 03/08/2016, Cost $29,173,999) * f ∞ | 29,175,000 | 29,096,957 | ||||||||||
| Capital One Bank (USA) National Association, | ||||||||||||
| 3.375%, 02/15/2023 | 32,638,000 | 33,336,486 | ||||||||||
| Capital One Financial Corp.: | ||||||||||||
| 6.150%, 09/01/2016 | 4,425,000 | 4,459,418 | ||||||||||
| 2.450%, 04/24/2019 | 3,975,000 | 4,036,056 | ||||||||||
| Capital One NA, | ||||||||||||
| 1.650%, 02/05/2018 | 8,400,000 | 8,407,073 | ||||||||||
| CIT Group, Inc.: | ||||||||||||
| 4.250%, 08/15/2017 | 1,000,000 | 1,018,500 | ||||||||||
| 5.500%, 02/15/2019 (Acquired 02/02/2012, Cost $500,000) * | 500,000 | 523,125 | ||||||||||
| 5.000%, 08/01/2023 | 5,000,000 | 5,037,500 | ||||||||||
| Citigroup, Inc.: | ||||||||||||
| 1.850%, 11/24/2017 | 11,500,000 | 11,563,388 | ||||||||||
| 1.700%, 04/27/2018 | 12,650,000 | 12,670,278 | ||||||||||
| 2.050%, 12/07/2018 @ | 12,550,000 | 12,649,735 | ||||||||||
| 2.400%, 02/18/2020 @ | 8,000,000 | 8,081,896 | ||||||||||
| 3.700%, 01/12/2026 @ | 4,700,000 | 4,947,633 | ||||||||||
| Citizens Bank NA/Providence RI, | ||||||||||||
| 2.550%, 05/13/2021 @ | 6,175,000 | 6,234,626 | ||||||||||
| Citizens Bank National Association, | ||||||||||||
| 2.450%, 12/04/2019 | 36,000,000 | 36,477,360 | ||||||||||
| CNA Financial Corp.: | ||||||||||||
| 7.350%, 11/15/2019 | 1,175,000 | 1,356,842 | ||||||||||
| 5.875%, 08/15/2020 | 6,839,000 | 7,708,531 | ||||||||||
| 5.750%, 08/15/2021 | 9,177,000 | 10,566,049 | ||||||||||
| 7.250%, 11/15/2023 | 7,400,000 | 8,979,389 | ||||||||||
| 4.500%, 03/01/2026 | 20,750,000 | 22,086,425 | ||||||||||
| CNO Financial Group, Inc.: | ||||||||||||
| 4.500%, 05/30/2020 | 5,000,000 | 5,175,000 | ||||||||||
| 5.250%, 05/30/2025 | 18,640,000 | 19,199,200 | ||||||||||
| Comerica Bank: | ||||||||||||
| 5.200%, 08/22/2017 | 5,980,000 | 6,226,388 | ||||||||||
| 4.000%, 07/27/2025 | 21,425,000 | 22,109,100 | ||||||||||
| Commonwealth Bank of Australia: | ||||||||||||
| 1.056%, 03/12/2018 (Acquired 03/30/2016, Cost $4,479,089) * f ∞ | 4,500,000 | 4,489,385 | ||||||||||
| 5.000%, 10/15/2019 (Acquired 03/02/2012 through 08/16/2012, Cost $6,149,966) * f | 5,900,000 | 6,532,179 | ||||||||||
| Compass Bank: | ||||||||||||
| 2.750%, 09/29/2019 | 38,994,000 | 38,508,954 | ||||||||||
| 3.875%, 04/10/2025 | 16,700,000 | 16,025,754 | ||||||||||
| Cooperatieve Centrale Raiffeisen-Boerenleenbank BA, | ||||||||||||
| 1.700%, 03/19/2018 f | 5,250,000 | 5,296,163 | ||||||||||
| Credit Mutuel-CIC Home Loan SFH, | ||||||||||||
| 1.500%, 11/16/2017 (Acquired 11/08/2012, Cost $4,981,300) * f | 5,000,000 | 5,014,040 | ||||||||||
| Credit Suisse: | ||||||||||||
| 1.700%, 04/27/2018 f | 5,800,000 | 5,806,206 | ||||||||||
| 5.300%, 08/13/2019 f | 6,966,000 | 7,688,465 | ||||||||||
| 3.000%, 10/29/2021 f | 12,600,000 | 12,906,155 | ||||||||||
| Credit Suisse Group Funding Guernsey Ltd.: | ||||||||||||
| 3.800%, 09/15/2022 @ f | 8,500,000 | 8,536,737 | ||||||||||
| 3.750%, 03/26/2025 @ f | 15,000,000 | 14,681,310 | ||||||||||
| 4.550%, 04/17/2026 (Acquired 04/13/2016, Cost $4,998,800) * f | 5,000,000 | 5,186,895 | ||||||||||
| Deutsche Bank AG: | ||||||||||||
| 1.237%, 02/13/2017 f ∞ | 9,729,000 | 9,719,077 | ||||||||||
| 1.307%, 02/13/2018 f ∞ | 9,000,000 | 8,940,681 | ||||||||||
| 1.875%, 02/13/2018 f | 8,494,000 | 8,440,819 | ||||||||||
| 2.950%, 08/20/2020 f | 8,625,000 | 8,549,298 | ||||||||||
| 3.125%, 01/13/2021 @ f | 9,500,000 | 9,488,011 | ||||||||||
| 3.375%, 05/12/2021 f | 7,650,000 | 7,676,331 | ||||||||||
| Discover Bank: | ||||||||||||
| 8.700%, 11/18/2019 | 3,237,000 | 3,811,610 | ||||||||||
| 3.100%, 06/04/2020 | 12,000,000 | 12,259,188 | ||||||||||
| Discover Financial Services, | ||||||||||||
| 3.950%, 11/06/2024 | 25,000,000 | 25,623,375 | ||||||||||
| Fifth Third Bancorp: | ||||||||||||
| 1.067%, 12/20/2016 ∞ | 9,585,000 | 9,579,316 | ||||||||||
| 2.150%, 08/20/2018 | 7,200,000 | 7,312,464 | ||||||||||
| 2.875%, 07/27/2020 @ | 9,250,000 | 9,639,980 | ||||||||||
| First Horizon National Corp., | ||||||||||||
| 3.500%, 12/15/2020 | 13,861,000 | 13,987,925 | ||||||||||
| First Tennessee Bank National Association, | ||||||||||||
| 2.950%, 12/01/2019 | 12,000,000 | 12,054,708 | ||||||||||
| FMR LLC: | ||||||||||||
| 4.950%, 02/01/2033 (Acquired 01/29/2013 through 12/23/2014, Cost $4,395,359) * | 4,235,000 | 4,706,555 | ||||||||||
| 6.500%, 12/14/2040 (Acquired 04/04/2013 through 10/28/2013, Cost $2,264,630) * | 1,820,000 | 2,396,363 | ||||||||||
| GE Capital International Funding Co., | ||||||||||||
| 2.342%, 11/15/2020 (Acquired 01/29/2010 through 01/06/2015, Cost $22,597,857) * f | 24,096,000 | 24,822,759 | ||||||||||
| Genworth Holdings, Inc., | ||||||||||||
| 7.625%, 09/24/2021 | 1,000,000 | 851,250 | ||||||||||
| Goldman Sachs Capital I, | ||||||||||||
| 6.345%, 02/15/2034 | 125,000 | 146,995 | ||||||||||
| Highmark, Inc., | ||||||||||||
| 4.750%, 05/15/2021 (Acquired 07/30/2014, Cost $7,846,150) * | 7,800,000 | 7,985,874 | ||||||||||
| HSBC Bank USA National Association, | ||||||||||||
| 6.000%, 08/09/2017 | 2,720,000 | 2,844,998 | ||||||||||
| HSBC Finance Corp., | ||||||||||||
| 6.676%, 01/15/2021 | 32,693,000 | 36,632,637 | ||||||||||
| HSBC Holdings PLC: | ||||||||||||
| 3.400%, 03/08/2021 f | 9,100,000 | 9,376,858 | ||||||||||
| 3.600%, 05/25/2023 f | 6,000,000 | 6,131,820 | ||||||||||
| HSBC USA, Inc., | ||||||||||||
| 2.350%, 03/05/2020 | 2,750,000 | 2,749,093 | ||||||||||
| Humana, Inc., | ||||||||||||
| 7.200%, 06/15/2018 | 800,000 | 885,874 | ||||||||||
| ING Bank NV: | ||||||||||||
| 3.750%, 03/07/2017 (Acquired 02/29/2012 through 04/24/2013, Cost $4,978,116) * f | 5,000,000 | 5,086,350 | ||||||||||
| 2.050%, 08/17/2018 (Acquired 08/10/2015, Cost $4,122,484) * f | 4,125,000 | 4,182,371 | ||||||||||
| 2.450%, 03/16/2020 (Acquired 03/10/2015, Cost $9,257,656) * f | 9,275,000 | 9,462,021 | ||||||||||
| 2.750%, 03/22/2021 (Acquired 03/15/2016, Cost $9,166,100) * @ f | 9,175,000 | 9,481,546 | ||||||||||
| 5.000%, 06/09/2021 (Acquired 10/12/2011, Cost $2,468,800) * f | 2,500,000 | 2,838,587 | ||||||||||
| 5.800%, 09/25/2023 (Acquired 01/14/2014 through 04/29/2016, Cost $20,922,546) * f | 19,180,000 | 21,048,458 | ||||||||||
| Invesco Finance PLC, | ||||||||||||
| 3.125%, 11/30/2022 f | 5,500,000 | 5,739,399 | ||||||||||
| iStar Financial, Inc., | ||||||||||||
| 5.850%, 03/15/2017 | 500,000 | 506,250 | ||||||||||
| J.P. Morgan Chase & Co.: | ||||||||||||
| 1.188%, 04/25/2018 ∞ | 2,300,000 | 2,296,458 | ||||||||||
| 2.200%, 10/22/2019 | 3,500,000 | 3,557,607 | ||||||||||
| 4.250%, 10/15/2020 | 8,100,000 | 8,828,595 | ||||||||||
| 4.350%, 08/15/2021 | 2,400,000 | 2,640,324 | ||||||||||
| 4.500%, 01/24/2022 | 4,400,000 | 4,896,518 | ||||||||||
| 3.200%, 01/25/2023 | 5,350,000 | 5,545,414 | ||||||||||
| 3.125%, 01/23/2025 | 21,850,000 | 22,337,910 | ||||||||||
| Jefferies Group LLC, | ||||||||||||
| 6.450%, 06/08/2027 | 1,000,000 | 1,110,841 | ||||||||||
| John Hancock Life Insurance Co., | ||||||||||||
| 7.375%, 02/15/2024 (Acquired 08/26/2010 through 04/11/2013, Cost $11,628,364) * | 9,765,000 | 12,056,094 | ||||||||||
| Kemper Corp., | ||||||||||||
| 6.000%, 05/15/2017 | 1,000,000 | 1,035,246 | ||||||||||
| KeyBank NA/Cleveland OH, | ||||||||||||
| 3.400%, 05/20/2026 | 10,500,000 | 10,661,679 | ||||||||||
| KeyBank National Association: | ||||||||||||
| 4.625%, 06/15/2018 | 2,670,000 | 2,790,027 | ||||||||||
| 2.250%, 03/16/2020 | 9,425,000 | 9,554,547 | ||||||||||
| KeyCorp, | ||||||||||||
| 2.900%, 09/15/2020 | 17,200,000 | 17,789,736 | ||||||||||
| Kookmin Bank, | ||||||||||||
| 1.625%, 07/14/2017 (Acquired 07/07/2014, Cost $4,985,900) * f | 5,000,000 | 5,017,200 | ||||||||||
| LeasePlan Corp. NV: | ||||||||||||
| 3.000%, 10/23/2017 (Acquired 10/15/2012 through 02/07/2013, Cost $10,017,666) * f | 10,000,000 | 10,073,520 | ||||||||||
| 2.500%, 05/16/2018 (Acquired 05/07/2013 through 08/27/2015, Cost $35,310,998) * f | 35,204,000 | 35,217,800 | ||||||||||
| 2.875%, 01/22/2019 (Acquired 10/14/2015, Cost $4,996,900) * f | 5,000,000 | 5,002,380 | ||||||||||
| Liberty Mutual Group, Inc.: | ||||||||||||
| 6.500%, 03/15/2035 (Acquired 09/29/2008 through 04/16/2013, Cost $699,822) * | 700,000 | 858,820 | ||||||||||
| 10.750%, 06/15/2058 (Acquired 05/21/2008 through 05/06/2009, Cost $751,629) * ∞ | 900,000 | 1,305,000 | ||||||||||
| Liberty Mutual Insurance Co., | �� | |||||||||||
| 7.697%, 10/15/2097 (Acquired 03/26/2003, Cost $240,187) * | 375,000 | 478,821 | ||||||||||
| Lincoln National Corp.: | ||||||||||||
| 8.750%, 07/01/2019 | 11,378,000 | 13,459,252 | ||||||||||
| 6.050%, 04/20/2067 ∞ | 930,000 | 620,775 | ||||||||||
| Lloyds Bank PLC: | ||||||||||||
| 4.200%, 03/28/2017 f | 2,000,000 | 2,045,342 | ||||||||||
| 1.176%, 05/14/2018 f ∞ | 3,200,000 | 3,177,728 | ||||||||||
| 5.800%, 01/13/2020 (Acquired 01/05/2010 through 01/19/2012, Cost $6,384,401) * f | 6,350,000 | 7,103,580 | ||||||||||
| 2.400%, 03/17/2020 @ f | 6,700,000 | 6,757,841 | ||||||||||
| Macquarie Bank Ltd.: | ||||||||||||
| 2.000%, 08/15/2016 (Acquired 09/27/2013, Cost $3,500,906) * f | 3,500,000 | 3,504,270 | ||||||||||
| 1.266%, 10/27/2017 (Acquired 10/22/2014, Cost $8,000,000) * f ∞ | 8,000,000 | 7,983,584 | ||||||||||
| 1.600%, 10/27/2017 (Acquired 10/22/2014, Cost $7,595,364) * f | 7,600,000 | 7,608,109 | ||||||||||
| 2.400%, 01/21/2020 (Acquired 01/14/2015, Cost $12,971,400) * f | 13,000,000 | 13,124,358 | ||||||||||
| Macquarie Group Ltd.: | ||||||||||||
| 4.875%, 08/10/2017 (Acquired 10/30/2014, Cost $1,032,536) * f | 1,000,000 | 1,032,077 | ||||||||||
| 7.625%, 08/13/2019 (Acquired 12/15/2014, Cost $2,815,944) * f | 2,467,000 | 2,863,778 | ||||||||||
| Manufacturers & Traders Trust Co., | ||||||||||||
| 2.100%, 02/06/2020 | 8,000,000 | 8,093,864 | ||||||||||
| Manufacturers And Traders Trust Co.: | ||||||||||||
| 6.625%, 12/04/2017 | 1,120,000 | 1,195,079 | ||||||||||
| 1.664%, 12/28/2020 ∞ | 9,483,000 | 9,290,372 | ||||||||||
| Manulife Financial Corp.: | ||||||||||||
| 4.900%, 09/17/2020 f | 2,784,000 | 3,088,021 | ||||||||||
| 4.150%, 03/04/2026 f | 23,875,000 | 25,608,492 | ||||||||||
| Marsh & McLennan Cos., Inc.: | ||||||||||||
| 4.800%, 07/15/2021 | 1,000,000 | 1,108,900 | ||||||||||
| 3.300%, 03/14/2023 | 6,875,000 | 7,177,122 | ||||||||||
| 3.750%, 03/14/2026 | 9,225,000 | 9,729,174 | ||||||||||
| Massachusetts Mutual Life Insurance Co.: | ||||||||||||
| 7.625%, 11/15/2023 (Acquired 10/10/2012, Cost $4,012,953) * | 3,184,000 | 3,958,769 | ||||||||||
| 8.875%, 06/01/2039 (Acquired 10/03/2012 through 01/22/2016, Cost $44,577,985) * | 29,340,000 | 43,905,520 | ||||||||||
| MBIA Insurance Corp., | ||||||||||||
| 11.888%, 01/15/2033 (Acquired 01/11/2008, Cost $700,000) * § | 700,000 | 259,000 | ||||||||||
| MetLife Capital Trust IV, | ||||||||||||
| 7.875%, 12/15/2037 (Acquired 03/26/2012 through 04/05/2013, Cost $1,042,348) * | 900,000 | 1,073,250 | ||||||||||
| MetLife, Inc.: | ||||||||||||
| 7.717%, 02/15/2019 | 1,157,000 | 1,341,942 | ||||||||||
| 4.050%, 03/01/2045 @ | 6,400,000 | 6,304,691 | ||||||||||
| 4.600%, 05/13/2046 @ | 6,000,000 | 6,450,384 | ||||||||||
| Metropolitan Life Global Funding I, | ||||||||||||
| 3.875%, 04/11/2022 (Acquired 12/18/2012, Cost $1,585,164) * | 1,500,000 | 1,631,646 | ||||||||||
| Mitsubishi UFJ Financial Group, Inc., | ||||||||||||
| 2.950%, 03/01/2021 f | 10,000,000 | 10,372,720 | ||||||||||
| Mizuho Bank Ltd.: | ||||||||||||
| 1.850%, 03/21/2018 (Acquired 03/14/2013, Cost $1,847,447) * f | 1,850,000 | 1,863,129 | ||||||||||
| 2.650%, 09/25/2019 (Acquired 09/18/2014, Cost $4,991,400) * f | 5,000,000 | 5,137,440 | ||||||||||
| 2.400%, 03/26/2020 (Acquired 03/19/2015, Cost $19,974,800) * f | 20,000,000 | 20,393,900 | ||||||||||
| Morgan Stanley: | ||||||||||||
| 6.625%, 04/01/2018 | 1,275,000 | 1,381,811 | ||||||||||
| 7.300%, 05/13/2019 | 4,675,000 | 5,371,388 | ||||||||||
| 2.375%, 07/23/2019 | 2,000,000 | 2,032,998 | ||||||||||
| 5.625%, 09/23/2019 | 10,100,000 | 11,206,031 | ||||||||||
| 2.650%, 01/27/2020 | 7,000,000 | 7,115,423 | ||||||||||
| 3.750%, 02/25/2023 | 1,000,000 | 1,059,175 | ||||||||||
| 3.700%, 10/23/2024 | 5,000,000 | 5,231,870 | ||||||||||
| 4.000%, 07/23/2025 | 2,500,000 | 2,676,972 | ||||||||||
| 3.875%, 01/27/2026 @ | 7,000,000 | 7,431,116 | ||||||||||
| MUFG Americas Holdings Corp.: | ||||||||||||
| 2.250%, 02/10/2020 | 7,000,000 | 7,050,547 | ||||||||||
| 3.500%, 06/18/2022 | 1,150,000 | 1,220,862 | ||||||||||
| National Australia Bank Ltd., | ||||||||||||
| 1.875%, 07/23/2018 f | 6,000,000 | 6,074,904 | ||||||||||
| Nationwide Building Society: | ||||||||||||
| 2.350%, 01/21/2020 (Acquired 01/12/2015, Cost $13,770,454) * f | 13,775,000 | 13,922,572 | ||||||||||
| 3.900%, 07/21/2025 (Acquired 07/14/2015, Cost $8,069,463) * f | 8,100,000 | 8,660,212 | ||||||||||
| Nationwide Financial Services, Inc., | ||||||||||||
| 5.375%, 03/25/2021 (Acquired 02/05/2015 through 05/08/2015, Cost $16,355,247) * | 14,788,000 | 16,517,013 | ||||||||||
| Nationwide Mutual Insurance Co.: | ||||||||||||
| 7.875%, 04/01/2033 (Acquired 10/13/2009, Cost $91,200) * | 100,000 | 133,814 | ||||||||||
| 9.375%, 08/15/2039 (Acquired 10/06/2015 through 04/20/2016, Cost $13,525,705) * | 9,028,000 | 13,725,639 | ||||||||||
| Navient LLC, | ||||||||||||
| 5.625%, 08/01/2033 | 50,000 | 35,125 | ||||||||||
| New England Mutual Life Insurance Co., | ||||||||||||
| 7.875%, 02/15/2024 (Acquired 11/07/2012, Cost $4,061,729) * | 3,200,000 | 4,039,712 | ||||||||||
| New York Life Insurance Co., | ||||||||||||
| 6.750%, 11/15/2039 (Acquired 04/06/2016 through 04/07/2016, Cost $21,457,815) * | 16,067,000 | 21,953,403 | ||||||||||
| Nippon Life Insurance Co., | ||||||||||||
| 5.000%, 10/18/2042 (Acquired 10/11/2012, Cost $2,000,000) * f ∞ | 2,000,000 | 2,154,600 | ||||||||||
| Nomura Holdings, Inc.: | ||||||||||||
| 2.000%, 09/13/2016 f | 3,000,000 | 3,005,178 | ||||||||||
| 2.750%, 03/19/2019 f | 11,268,000 | 11,530,995 | ||||||||||
| 6.700%, 03/04/2020 f | 2,525,000 | 2,931,677 | ||||||||||
| Peachtree Corners Funding Trust, | ||||||||||||
| 3.976%, 02/15/2025 (Acquired 10/19/2012, Cost $16,000,000) * | 16,000,000 | 16,041,456 | ||||||||||
| Principal Financial Group, Inc.: | ||||||||||||
| 3.300%, 09/15/2022 | 1,000,000 | 1,038,444 | ||||||||||
| 3.125%, 05/15/2023 | 3,550,000 | 3,596,310 | ||||||||||
| Principal Life Global Funding II, | ||||||||||||
| 2.200%, 04/08/2020 (Acquired 03/31/2015, Cost $7,989,440) * | 8,000,000 | 8,127,024 | ||||||||||
| Protective Life Corp., | ||||||||||||
| 2.700%, 11/25/2020 (Acquired 11/19/2015, Cost $10,715,562) * | 10,725,000 | 11,088,931 | ||||||||||
| Prudential Financial, Inc., | ||||||||||||
| 6.000%, 12/01/2017 | 384,000 | 409,068 | ||||||||||
| Rabobank Nederland, | ||||||||||||
| 3.875%, 02/08/2022 f | 4,150,000 | 4,508,564 | ||||||||||
| Raymond James Financial, Inc., | ||||||||||||
| 8.600%, 08/15/2019 | 14,527,000 | 17,186,966 | ||||||||||
| Regions Bank, | ||||||||||||
| 7.500%, 05/15/2018 | 15,864,000 | 17,397,969 | ||||||||||
| Regions Financial Corp., | ||||||||||||
| 3.200%, 02/08/2021 | 30,600,000 | 31,496,519 | ||||||||||
| Reliance Standard Life Global Funding II: | ||||||||||||
| 2.500%, 01/15/2020 (Acquired 01/07/2015, Cost $13,952,260) * | 14,000,000 | 14,207,662 | ||||||||||
| 2.375%, 05/04/2020 (Acquired 04/27/2015, Cost $14,356,224) * | 14,400,000 | 14,455,973 | ||||||||||
| 3.050%, 01/20/2021 (Acquired 01/12/2016, Cost $14,982,750) * | 15,000,000 | 15,501,180 | ||||||||||
| Royal Bank of Canada, | ||||||||||||
| 0.890%, 10/13/2017 f ∞ | 9,000,000 | 8,971,092 | ||||||||||
| Santander Bank NA, | ||||||||||||
| 8.750%, 05/30/2018 | 7,034,000 | 7,833,316 | ||||||||||
| Santander Issuances SAU, | ||||||||||||
| 5.179%, 11/19/2025 f | 6,150,000 | 6,144,053 | ||||||||||
| Santander UK PLC: | ||||||||||||
| 5.000%, 11/07/2023 (Acquired 10/31/2013 through 01/27/2015, Cost $24,277,262) * f | 22,975,000 | 23,583,815 | ||||||||||
| 4.000%, 03/13/2024 f | 7,700,000 | 8,267,120 | ||||||||||
| Simon Property Group LP, | ||||||||||||
| 1.500%, 02/01/2018 (Acquired 12/10/2012, Cost $11,962,200) * | 12,000,000 | 12,051,324 | ||||||||||
| Societe Generale: | ||||||||||||
| 5.200%, 04/15/2021 (Acquired 09/20/2011 through 02/13/2013, Cost $10,004,418) * f | 10,100,000 | 11,553,117 | ||||||||||
| 5.000%, 01/17/2024 (Acquired 01/14/2014, Cost $2,972,790) * f | 3,000,000 | 3,119,715 | ||||||||||
| 4.250%, 04/14/2025 (Acquired 04/08/2015, Cost $6,201,657) * f | 6,300,000 | 6,231,513 | ||||||||||
| Societe Generale SA, | ||||||||||||
| 4.750%, 11/24/2025 (Acquired 11/17/2015, Cost $10,759,176) * @ f | 10,800,000 | 11,034,878 | ||||||||||
| SpareBank 1 Boligkreditt AS, | ||||||||||||
| 1.750%, 11/15/2019 (Acquired 11/07/2012, Cost $4,961,150) * f | 5,000,000 | 5,048,040 | ||||||||||
| Springleaf Finance Corp., | ||||||||||||
| 6.900%, 12/15/2017 @ | 1,000,000 | 1,036,250 | ||||||||||
| Standard Chartered PLC: | ||||||||||||
| 1.700%, 04/17/2018 (Acquired 04/13/2015, Cost $9,988,900) * f | 10,000,000 | 9,892,670 | ||||||||||
| 3.050%, 01/15/2021 (Acquired 01/12/2016, Cost $13,971,720) * @ f | 14,000,000 | 14,185,080 | ||||||||||
| 5.700%, 03/26/2044 (Acquired 03/21/2014 through 05/01/2014, Cost $14,102,230) * f | 14,000,000 | 14,244,734 | ||||||||||
| Stifel Financial Corp.: | ||||||||||||
| 3.500%, 12/01/2020 | 5,000,000 | 5,067,985 | ||||||||||
| 4.250%, 07/18/2024 | 13,115,000 | 13,450,862 | ||||||||||
| Sumitomo Mitsui Banking Corp.: | ||||||||||||
| 1.950%, 07/23/2018 f | 4,000,000 | 4,044,060 | ||||||||||
| 2.250%, 07/11/2019 f | 12,050,000 | 12,226,689 | ||||||||||
| 2.450%, 01/16/2020 f | 12,200,000 | 12,467,327 | ||||||||||
| 3.000%, 01/18/2023 f | 2,500,000 | 2,581,920 | ||||||||||
| SunTrust Bank, | ||||||||||||
| 7.250%, 03/15/2018 | 5,682,000 | 6,192,982 | ||||||||||
| SunTrust Bank/Atlanta GA, | ||||||||||||
| 3.300%, 05/15/2026 | 20,000,000 | 20,162,780 | ||||||||||
| SunTrust Banks, Inc., | ||||||||||||
| 2.900%, 03/03/2021 | 15,000,000 | 15,530,700 | ||||||||||
| SUSA Partnership LP, | ||||||||||||
| 8.200%, 06/01/2017 | 1,000,000 | 1,061,539 | ||||||||||
| Swedbank AB: | ||||||||||||
| 2.125%, 09/29/2017 (Acquired 09/24/2012, Cost $2,995,470) * f | 3,000,000 | 3,031,308 | ||||||||||
| 2.650%, 03/10/2021 (Acquired 03/03/2016, Cost $7,016,851) * f | 7,025,000 | 7,258,420 | ||||||||||
| Synchrony Financial: | ||||||||||||
| 3.750%, 08/15/2021 | 16,650,000 | 17,248,351 | ||||||||||
| 4.250%, 08/15/2024 | 30,225,000 | 31,280,759 | ||||||||||
| 4.500%, 07/23/2025 | 4,600,000 | 4,769,736 | ||||||||||
| TD Ameritrade Holding Corp., | ||||||||||||
| 5.600%, 12/01/2019 | 1,000,000 | 1,126,144 | ||||||||||
| The Bank of Nova Scotia: | ||||||||||||
| 1.700%, 06/11/2018 f | 15,325,000 | 15,466,143 | ||||||||||
| 4.500%, 12/16/2025 | 8,048,000 | 8,361,599 | ||||||||||
| The Bank of Tokyo-Mitsubishi UFJ Ltd.: | ||||||||||||
| 1.008%, 07/15/2016 f ∞ | 10,000,000 | 10,002,420 | ||||||||||
| 2.350%, 02/23/2017 (Acquired 02/14/2012, Cost $5,996,640) * f | 6,000,000 | 6,046,062 | ||||||||||
| 2.300%, 03/05/2020 (Acquired 02/25/2015, Cost $7,844,819) * f | 7,850,000 | 7,973,747 | ||||||||||
| The Bear Stearns Companies LLC, | ||||||||||||
| 7.250%, 02/01/2018 | 2,250,000 | 2,452,714 | ||||||||||
| The Chubb Corp., | ||||||||||||
| 6.375%, 04/15/2037 ∞ | 1,320,000 | 1,148,400 | ||||||||||
| The Goldman Sachs Group Inc., | ||||||||||||
| 2.625%, 04/25/2021 | 7,000,000 | 7,098,896 | ||||||||||
| The Goldman Sachs Group, Inc.: | ||||||||||||
| 5.950%, 01/18/2018 | 3,000,000 | 3,195,864 | ||||||||||
| 6.150%, 04/01/2018 | 6,500,000 | 7,003,718 | ||||||||||
| 7.500%, 02/15/2019 | 1,825,000 | 2,087,088 | ||||||||||
| 2.550%, 10/23/2019 | 4,000,000 | 4,092,620 | ||||||||||
| 5.250%, 07/27/2021 | 1,000,000 | 1,128,482 | ||||||||||
| 5.750%, 01/24/2022 | 8,100,000 | 9,403,776 | ||||||||||
| 2.274%, 11/29/2023 ∞ | 10,000,000 | 9,978,630 | ||||||||||
| 3.500%, 01/23/2025 | 9,250,000 | 9,504,449 | ||||||||||
| 6.750%, 10/01/2037 | 300,000 | 370,060 | ||||||||||
| The Guardian Life Insurance Co. of America: | ||||||||||||
| 7.375%, 09/30/2039 (Acquired 08/27/2015, Cost $8,435,734) * | 6,507,000 | 8,943,624 | ||||||||||
| 4.875%, 06/19/2064 (Acquired 06/16/2014, Cost $2,989,950) * | 3,000,000 | 3,089,796 | ||||||||||
| The Hartford Financial Services Group, Inc.: | ||||||||||||
| 5.375%, 03/15/2017 | 2,913,000 | 2,995,901 | ||||||||||
| 5.125%, 04/15/2022 | 6,097,000 | 6,934,088 | ||||||||||
| 8.125%, 06/15/2038 ∞ | 1,365,000 | 1,460,550 | ||||||||||
| The Huntington National Bank: | ||||||||||||
| 2.000%, 06/30/2018 | 13,000,000 | 13,129,051 | ||||||||||
| 2.200%, 11/06/2018 | 5,000,000 | 5,061,210 | ||||||||||
| 2.875%, 08/20/2020 | 12,000,000 | 12,340,620 | ||||||||||
| 3.150%, 03/14/2021 @ | 10,100,000 | 10,462,772 | ||||||||||
| Torchmark Corp., | ||||||||||||
| 3.800%, 09/15/2022 | 1,275,000 | 1,317,545 | ||||||||||
| Trinity Acquisition PLC, | ||||||||||||
| 4.400%, 03/15/2026 f | 10,405,000 | 10,864,110 | ||||||||||
| UBS AG: | ||||||||||||
| 1.375%, 08/14/2017 f | 3,000,000 | 3,002,532 | ||||||||||
| 1.800%, 03/26/2018 f | 14,500,000 | 14,637,953 | ||||||||||
| UBS Group Funding Jersey Ltd., | ||||||||||||
| 2.080%, 09/24/2020 (Acquired 09/21/2015, Cost $26,350,000) * f ∞ | 26,350,000 | 26,364,203 | ||||||||||
| UnitedHealth Group, Inc., | ||||||||||||
| 4.625%, 07/15/2035 @ | 12,175,000 | 14,140,008 | ||||||||||
| Voya Financial, Inc., | ||||||||||||
| 5.500%, 07/15/2022 | 22,944,000 | 26,114,585 | ||||||||||
| Wells Fargo & Co.: | ||||||||||||
| Class N, 2.150%, 01/30/2020 | 7,000,000 | 7,118,748 | ||||||||||
| 2.600%, 07/22/2020 | 8,950,000 | 9,198,067 | ||||||||||
| 2.500%, 03/04/2021 | 10,000,000 | 10,254,360 | ||||||||||
| 3.000%, 02/19/2025 | 5,000,000 | 5,121,130 | ||||||||||
| 3.000%, 04/22/2026 @ | 4,000,000 | 4,077,404 | ||||||||||
| Wells Fargo Bank National Association, | ||||||||||||
| 6.000%, 11/15/2017 | 8,322,000 | 8,854,833 | ||||||||||
| Westpac Banking Corp.: | ||||||||||||
| 2.000%, 08/14/2017 f | 8,000,000 | 8,078,392 | ||||||||||
| 4.875%, 11/19/2019 f | 636,000 | 703,632 | ||||||||||
| 2.100%, 05/13/2021 @ f | 13,300,000 | 13,472,807 | ||||||||||
| Willis Group Holdings PLC, | ||||||||||||
| 5.750%, 03/15/2021 f | 20,329,000 | 22,731,827 | ||||||||||
| Willis North America, Inc., | ||||||||||||
| 7.000%, 09/29/2019 | 16,003,000 | 18,116,964 | ||||||||||
| 2,560,225,397 | 22.8 | % | ||||||||||
| Utility | ||||||||||||
| Appalachian Power Co., | ||||||||||||
| Class P, 6.700%, 08/15/2037 | 1,275,000 | 1,649,080 | ||||||||||
| Arizona Public Service Co., | ||||||||||||
| 8.750%, 03/01/2019 | 1,150,000 | 1,362,614 | ||||||||||
| Berkshire Hathaway Energy Co., | ||||||||||||
| 3.500%, 02/01/2025 | 7,000,000 | 7,549,619 | ||||||||||
| CMS Energy Corp., | ||||||||||||
| 5.050%, 03/15/2022 | 1,000,000 | 1,143,239 | ||||||||||
| Consolidated Edison Co. of New York, Inc., | ||||||||||||
| 4.625%, 12/01/2054 | 7,600,000 | 8,711,850 | ||||||||||
| Dominion Resources, Inc.: | ||||||||||||
| 2.500%, 12/01/2019 | 5,225,000 | 5,338,278 | ||||||||||
| Class B, 5.950%, 06/15/2035 | 1,880,000 | 2,290,786 | ||||||||||
| Edison International, | ||||||||||||
| 2.950%, 03/15/2023 | 5,000,000 | 5,126,450 | ||||||||||
| EDP Finance BV: | ||||||||||||
| 4.900%, 10/01/2019 (Acquired 02/04/2015, Cost $1,636,387) * f | 1,564,000 | 1,661,249 | ||||||||||
| 4.125%, 01/15/2020 (Acquired 03/03/2015 through 03/04/2015, Cost $9,080,591) * f | 8,816,000 | 9,094,586 | ||||||||||
| ENEL Finance International NV, | ||||||||||||
| 6.800%, 09/15/2037 (Acquired 09/13/2007 through 09/29/2008, Cost $498,897) * f | 500,000 | 648,478 | ||||||||||
| Exelon Corp.: | ||||||||||||
| 3.950%, 06/15/2025 | 6,050,000 | 6,467,886 | ||||||||||
| 3.400%, 04/15/2026 | 9,600,000 | 10,033,219 | ||||||||||
| 5.100%, 06/15/2045 | 5,875,000 | 6,751,227 | ||||||||||
| Exelon Generation Co. LLC: | ||||||||||||
| 6.200%, 10/01/2017 | 4,350,000 | 4,596,258 | ||||||||||
| 5.600%, 06/15/2042 | 6,100,000 | 6,377,977 | ||||||||||
| IPALCO Enterprises, Inc., | ||||||||||||
| 5.000%, 05/01/2018 | 1,000,000 | 1,045,000 | ||||||||||
| KeySpan Corp., | ||||||||||||
| 8.000%, 11/15/2030 | 1,875,000 | 2,650,785 | ||||||||||
| Mega Advance Investments Ltd., | ||||||||||||
| 5.000%, 05/12/2021 (Acquired 05/09/2011 through 05/23/2012, Cost $2,806,480) * f | 2,800,000 | 3,098,838 | ||||||||||
| National Rural Utilities Cooperative Finance Corp.: | ||||||||||||
| 10.375%, 11/01/2018 | 6,673,000 | 8,062,999 | ||||||||||
| 2.300%, 11/15/2019 | 5,000,000 | 5,154,565 | ||||||||||
| 2.850%, 01/27/2025 | 12,875,000 | 13,466,207 | ||||||||||
| NextEra Energy Capital Holdings, Inc., | ||||||||||||
| Class D, 7.300%, 09/01/2067 ∞ | 2,600,000 | 2,483,000 | ||||||||||
| PSEG Power LLC: | ||||||||||||
| 5.320%, 09/15/2016 | 3,077,000 | 3,099,985 | ||||||||||
| 3.000%, 06/15/2021 | 26,550,000 | 26,916,921 | ||||||||||
| Public Service Co. of New Mexico, | ||||||||||||
| 7.950%, 05/15/2018 | 6,553,000 | 7,297,513 | ||||||||||
| RGS I&M Funding Corp., | ||||||||||||
| Class F*, 9.820%, 06/07/2022 | 146,835 | 150,034 | ||||||||||
| South Carolina Electric & Gas Co., | ||||||||||||
| 4.100%, 06/15/2046 | 7,325,000 | 7,750,707 | ||||||||||
| Talent Yield Investments Ltd., | ||||||||||||
| 4.500%, 04/25/2022 (Acquired 04/18/2012, Cost $5,958,960) * f | 6,000,000 | 6,516,186 | ||||||||||
| The Southern Co., | ||||||||||||
| 2.950%, 07/01/2023 | 17,400,000 | 18,036,823 | ||||||||||
| 184,532,359 | 1.6 | % | ||||||||||
| Industrials | ||||||||||||
| 21st Century Fox America, Inc.: | ||||||||||||
| 6.900%, 03/01/2019 | 6,659,000 | 7,576,430 | ||||||||||
| 3.700%, 09/15/2024 | 4,025,000 | 4,345,861 | ||||||||||
| 7.430%, 10/01/2026 | 1,500,000 | 2,001,366 | ||||||||||
| 6.150%, 03/01/2037 | 9,000,000 | 11,171,115 | ||||||||||
| 4.750%, 09/15/2044 @ | 1,950,000 | 2,160,380 | ||||||||||
| A.P. Meoller - Maersk A/S: | ||||||||||||
| 2.550%, 09/22/2019 (Acquired 11/24/2014, Cost $10,045,814) * f | 10,000,000 | 10,196,100 | ||||||||||
| 3.750%, 09/22/2024 (Acquired 09/15/2014, Cost $4,459,830) * f | 4,475,000 | 4,579,858 | ||||||||||
| AbbVie, Inc.: | ||||||||||||
| 1.750%, 11/06/2017 | 7,450,000 | 7,494,000 | ||||||||||
| 2.000%, 11/06/2018 | 10,835,000 | 10,945,615 | ||||||||||
| 3.200%, 11/06/2022 @ | 3,000,000 | 3,102,090 | ||||||||||
| 3.600%, 05/14/2025 @ | 2,500,000 | 2,619,575 | ||||||||||
| 4.300%, 05/14/2036 | 3,825,000 | 3,901,293 | ||||||||||
| Access Midstream Partners LP / ACMP Finance Corp., | ||||||||||||
| 6.125%, 07/15/2022 | 300,000 | 307,771 | ||||||||||
| Acuity Brands Lighting, Inc., | ||||||||||||
| 6.000%, 12/15/2019 | 700,000 | 784,560 | ||||||||||
| Agrium, Inc., | ||||||||||||
| 4.125%, 03/15/2035 f | 6,550,000 | 6,325,342 | ||||||||||
| Alibaba Group Holding Ltd., | ||||||||||||
| 3.125%, 11/28/2021 f | 10,000,000 | 10,226,550 | ||||||||||
| Altera Corp., | ||||||||||||
| 4.100%, 11/15/2023 | 3,000,000 | 3,410,385 | ||||||||||
| Ameritech Capital Funding Corp., | ||||||||||||
| 6.450%, 01/15/2018 | 3,175,000 | 3,397,736 | ||||||||||
| Amgen, Inc., | ||||||||||||
| 4.400%, 05/01/2045 @ | 8,000,000 | 8,310,880 | ||||||||||
| Anadarko Petroleum Corp.: | ||||||||||||
| 6.375%, 09/15/2017 | 123,000 | 129,464 | ||||||||||
| 8.700%, 03/15/2019 | 4,380,000 | 4,995,048 | ||||||||||
| 6.450%, 09/15/2036 | 4,025,000 | 4,637,255 | ||||||||||
| Anglo American Capital PLC, | ||||||||||||
| 9.375%, 04/08/2019 (Acquired 09/20/2011 through 12/29/2014, Cost $6,379,833) * f | 5,600,000 | 6,405,000 | ||||||||||
| Anheuser-Busch InBev Finance, Inc.: | ||||||||||||
| 3.300%, 02/01/2023 @ | 20,350,000 | 21,442,184 | ||||||||||
| 3.650%, 02/01/2026 | 25,625,000 | 27,450,679 | ||||||||||
| ANR Pipeline Co., | ||||||||||||
| 9.625%, 11/01/2021 | 9,150,000 | 12,005,505 | ||||||||||
| Apple, Inc., | ||||||||||||
| 2.150%, 02/09/2022 @ | 3,500,000 | 3,567,095 | ||||||||||
| ArcelorMittal SA, | ||||||||||||
| 7.250%, 02/25/2022 @ f | 2,000,000 | 2,105,000 | ||||||||||
| AT&T, Inc.: | ||||||||||||
| 3.600%, 02/17/2023 @ | 10,550,000 | 11,005,539 | ||||||||||
| 3.400%, 05/15/2025 | 20,000,000 | 20,458,140 | ||||||||||
| 4.125%, 02/17/2026 | 8,925,000 | 9,587,538 | ||||||||||
| 6.300%, 01/15/2038 | 11,000,000 | 13,226,642 | ||||||||||
| 5.550%, 08/15/2041 | 1,000,000 | 1,120,366 | ||||||||||
| 5.650%, 02/15/2047 | 4,225,000 | 4,838,512 | ||||||||||
| Ball Corp., | ||||||||||||
| 5.250%, 07/01/2025 @ | 25,000,000 | 26,062,500 | ||||||||||
| Bayer US Finance LLC, | ||||||||||||
| 2.375%, 10/08/2019 (Acquired 10/01/2014, Cost $14,657,559) * | 14,725,000 | 15,052,410 | ||||||||||
| Beam Suntory, Inc., | ||||||||||||
| 3.250%, 05/15/2022 @ | 2,000,000 | 2,060,002 | ||||||||||
| Becton Dickinson and Co.: | ||||||||||||
| 6.375%, 08/01/2019 | 5,000,000 | 5,694,845 | ||||||||||
| 3.250%, 11/12/2020 | 13,000,000 | 13,664,690 | ||||||||||
| 3.875%, 05/15/2024 | 7,500,000 | 8,162,505 | ||||||||||
| 3.734%, 12/15/2024 | 4,900,000 | 5,277,996 | ||||||||||
| Bemis Co., Inc., | ||||||||||||
| 4.500%, 10/15/2021 | 1,000,000 | 1,092,702 | ||||||||||
| Boardwalk Pipelines LP: | ||||||||||||
| 5.500%, 02/01/2017 | 3,175,000 | 3,223,127 | ||||||||||
| 4.950%, 12/15/2024 | 13,875,000 | 13,647,117 | ||||||||||
| 5.950%, 06/01/2026 | 7,000,000 | 7,352,912 | ||||||||||
| Boston Scientific Corp., | ||||||||||||
| 2.650%, 10/01/2018 @ | 10,000,000 | 10,221,880 | ||||||||||
| BP Capital Markets: | ||||||||||||
| 1.270%, 09/26/2018 f ∞ | 5,000,000 | 4,981,505 | ||||||||||
| 4.750%, 03/10/2019 f | 1,500,000 | 1,629,307 | ||||||||||
| Broadridge Financial Solutions, Inc., | ||||||||||||
| 3.400%, 06/27/2026 | 7,000,000 | 7,075,593 | ||||||||||
| Browning-Ferris Industries, Inc., | ||||||||||||
| 9.250%, 05/01/2021 | 1,600,000 | 2,054,221 | ||||||||||
| Bunge Limited Finance Corp., | ||||||||||||
| 8.500%, 06/15/2019 | 13,690,000 | 16,007,361 | ||||||||||
| Bunge NA Finance LP, | ||||||||||||
| 5.900%, 04/01/2017 | 4,024,000 | 4,153,074 | ||||||||||
| Burlington Northern Santa Fe LLC, | ||||||||||||
| 4.150%, 04/01/2045 | 3,100,000 | 3,375,987 | ||||||||||
| Celgene Corp., | ||||||||||||
| 3.550%, 08/15/2022 @ | 5,730,000 | 6,003,172 | ||||||||||
| CenturyLink, Inc., | ||||||||||||
| Class R, 5.150%, 06/15/2017 | 2,000,000 | 2,045,000 | ||||||||||
| CF Industries, Inc.: | ||||||||||||
| 6.875%, 05/01/2018 | 5,000,000 | 5,432,430 | ||||||||||
| 3.450%, 06/01/2023 | 16,955,000 | 16,939,876 | ||||||||||
| 5.375%, 03/15/2044 | 10,922,000 | 10,300,047 | ||||||||||
| Charter Communications Operating LLC / Charter Communications Operating Capital: | ||||||||||||
| 4.464%, 07/23/2022 (Acquired 06/09/2016, Cost $15,377,302) * | 14,425,000 | 15,503,067 | ||||||||||
| 6.384%, 10/23/2035 (Acquired 07/09/2015, Cost $5,800,000) * | 5,800,000 | 6,868,273 | ||||||||||
| Chesapeake Energy Corp.: | ||||||||||||
| 6.500%, 08/15/2017 @ | 4,044,000 | 3,791,250 | ||||||||||
| 3.878%, 04/15/2019 @ ∞ | 4,500,000 | 3,386,250 | ||||||||||
| Cliffs Natural Resources, Inc., | ||||||||||||
| 5.950%, 01/15/2018 | 11,579,000 | 10,942,155 | ||||||||||
| Columbia Pipeline Group, Inc.: | ||||||||||||
| 3.300%, 06/01/2020 | 9,943,000 | 10,280,217 | ||||||||||
| 4.500%, 06/01/2025 | 13,735,000 | 14,764,026 | ||||||||||
| Comcast Cable Communications Holdings Inc., | ||||||||||||
| 9.455%, 11/15/2022 | 2,030,000 | 2,895,091 | ||||||||||
| Comcast Corp.: | ||||||||||||
| 4.250%, 01/15/2033 | 5,900,000 | 6,509,853 | ||||||||||
| 4.400%, 08/15/2035 | 13,450,000 | 15,171,560 | ||||||||||
| 4.650%, 07/15/2042 | 2,000,000 | 2,295,032 | ||||||||||
| Computer Sciences Corp., | ||||||||||||
| 4.450%, 09/15/2022 | 2,000,000 | 2,132,134 | ||||||||||
| ConAgra Foods, Inc.: | ||||||||||||
| 5.819%, 06/15/2017 | 8,417,000 | 8,757,544 | ||||||||||
| 1.900%, 01/25/2018 | 13,569,000 | 13,676,249 | ||||||||||
| 7.000%, 04/15/2019 | 1,270,000 | 1,435,453 | ||||||||||
| ConocoPhillips Canada Funding Co. I, | ||||||||||||
| 5.950%, 10/15/2036 f | 845,000 | 996,159 | ||||||||||
| ConocoPhillips Co., | ||||||||||||
| 6.000%, 01/15/2020 | 3,550,000 | 4,037,607 | ||||||||||
| Constellation Brands, Inc.: | ||||||||||||
| 4.750%, 11/15/2024 | 100,000 | 105,250 | ||||||||||
| 4.750%, 12/01/2025 @ | 1,000,000 | 1,053,750 | ||||||||||
| Continental Airlines Pass Through Trust, | ||||||||||||
| Class 974A, 6.900%, 01/02/2018 | 8,686 | 8,833 | ||||||||||
| Cox Communications, Inc.: | ||||||||||||
| 9.375%, 01/15/2019 (Acquired 10/06/2014, Cost $8,973,987) * | 7,670,000 | 8,935,312 | ||||||||||
| 2.950%, 06/30/2023 (Acquired 04/24/2013 through 12/29/2014, Cost $5,441,980) * | 5,475,000 | 5,276,422 | ||||||||||
| 3.850%, 02/01/2025 (Acquired 12/01/2014, Cost $4,616,999) * | 4,625,000 | 4,658,365 | ||||||||||
| 4.800%, 02/01/2035 (Acquired 12/01/2014, Cost $9,996,400) * | 10,000,000 | 9,343,730 | ||||||||||
| 4.700%, 12/15/2042 (Acquired 11/26/2012, Cost $4,999,050) * | 5,000,000 | 4,441,485 | ||||||||||
| CSX Corp., | ||||||||||||
| 6.220%, 04/30/2040 | 175,000 | 240,990 | ||||||||||
| CVS Health Corp., | ||||||||||||
| 3.875%, 07/20/2025 | 2,302,000 | 2,532,147 | ||||||||||
| D.R. Horton, Inc., | ||||||||||||
| 4.750%, 05/15/2017 | 1,447,000 | 1,476,834 | ||||||||||
| Daimler Finance North America LLC: | ||||||||||||
| 1.347%, 08/03/2017 (Acquired 07/28/2015, Cost $8,000,000) * ∞ | 8,000,000 | 8,005,472 | ||||||||||
| 1.875%, 01/11/2018 (Acquired 01/07/2013, Cost $2,116,139) * | 2,125,000 | 2,144,403 | ||||||||||
| Danone, | ||||||||||||
| 3.000%, 06/15/2022 (Acquired 05/29/2012, Cost $3,489,465) * f | 3,500,000 | 3,660,643 | ||||||||||
| DCP Midstream LLC: | ||||||||||||
| 9.750%, 03/15/2019 (Acquired 02/29/2012 through 06/25/2015, Cost $10,947,035) * | 9,655,000 | 10,572,225 | ||||||||||
| 4.750%, 09/30/2021 (Acquired 09/14/2011 through 11/18/2011, Cost $2,249,218) * | 2,245,000 | 2,099,075 | ||||||||||
| Deutsche Telekom International Finance BV: | ||||||||||||
| 6.750%, 08/20/2018 f | 1,250,000 | 1,395,031 | ||||||||||
| 8.750%, 06/15/2030 f | 825,000 | 1,242,359 | ||||||||||
| Devon Energy Corp., | ||||||||||||
| 6.300%, 01/15/2019 @ | 5,220,000 | 5,655,061 | ||||||||||
| Devon Financing Corp. LLC, | ||||||||||||
| 7.875%, 09/30/2031 | 5,000,000 | 5,818,370 | ||||||||||
| Diamond 1 Finance Corp. / Diamond 2 Finance Corp., | ||||||||||||
| 5.450%, 06/15/2023 (Acquired 05/17/2016, Cost $7,996,560) * | 8,000,000 | 8,300,584 | ||||||||||
| DISH DBS Corp., | ||||||||||||
| 5.000%, 03/15/2023 | 2,500,000 | 2,275,000 | ||||||||||
| Dollar General Corp.: | ||||||||||||
| 4.125%, 07/15/2017 | 4,545,000 | 4,672,946 | ||||||||||
| 1.875%, 04/15/2018 | 2,100,000 | 2,122,390 | ||||||||||
| Dominion Gas Holdings LLC, | ||||||||||||
| 3.600%, 12/15/2024 | 6,100,000 | 6,448,645 | ||||||||||
| Eaton Corp.: | ||||||||||||
| 2.750%, 11/02/2022 | 2,500,000 | 2,562,930 | ||||||||||
| 4.000%, 11/02/2032 | 3,660,000 | 3,905,707 | ||||||||||
| Ecolab, Inc.: | ||||||||||||
| 1.450%, 12/08/2017 | 5,200,000 | 5,209,095 | ||||||||||
| 3.250%, 01/14/2023 | 6,325,000 | 6,640,782 | ||||||||||
| El Paso Pipeline Partners Operating Co. LLC, | ||||||||||||
| 7.500%, 11/15/2040 § | 2,500,000 | 2,828,567 | ||||||||||
| Encana Corp., | ||||||||||||
| 6.500%, 05/15/2019 f | 610,000 | 646,600 | ||||||||||
| Energy Transfer Partners LP: | ||||||||||||
| 2.500%, 06/15/2018 | 5,700,000 | 5,673,683 | ||||||||||
| 9.700%, 03/15/2019 | 1,189,000 | 1,346,170 | ||||||||||
| 5.200%, 02/01/2022 | 1,000,000 | 1,053,549 | ||||||||||
| 3.600%, 02/01/2023 | 5,000,000 | 4,791,210 | ||||||||||
| 5.150%, 03/15/2045 | 5,000,000 | 4,543,475 | ||||||||||
| EnLink Midstream Partners LP, | ||||||||||||
| 4.400%, 04/01/2024 | 7,000,000 | 6,566,448 | ||||||||||
| Enogex LLC, | ||||||||||||
| 6.250%, 03/15/2020 (Acquired 10/25/2012 through 05/10/2013, Cost $3,460,301) * | 3,190,000 | 3,160,327 | ||||||||||
| Ensco PLC, | ||||||||||||
| 5.200%, 03/15/2025 @ f | 6,000,000 | 4,170,000 | ||||||||||
| Enterprise Products Operating LLC: | ||||||||||||
| 2.850%, 04/15/2021 | 10,000,000 | 10,332,030 | ||||||||||
| 3.350%, 03/15/2023 | 10,000,000 | 10,272,690 | ||||||||||
| 3.750%, 02/15/2025 @ | 7,000,000 | 7,300,888 | ||||||||||
| ERAC USA Finance LLC, | ||||||||||||
| 2.600%, 12/01/2021 (Acquired 05/23/2016, Cost $9,986,200) * | 10,000,000 | 10,162,960 | ||||||||||
| Express Scripts Holding Co.: | ||||||||||||
| 7.250%, 06/15/2019 | 4,600,000 | 5,298,726 | ||||||||||
| 4.750%, 11/15/2021 | 14,700,000 | 16,488,387 | ||||||||||
| 3.500%, 06/15/2024 | 7,500,000 | 7,742,655 | ||||||||||
| Exxon Mobil Corp., | ||||||||||||
| 2.709%, 03/06/2025 @ | 10,025,000 | 10,467,503 | ||||||||||
| FedEx Corp.: | ||||||||||||
| 8.000%, 01/15/2019 | 6,100,000 | 7,088,725 | ||||||||||
| 3.900%, 02/01/2035 | 7,000,000 | 7,115,829 | ||||||||||
| Fidelity National Information Services, Inc.: | ||||||||||||
| 3.625%, 10/15/2020 | 5,000,000 | 5,285,600 | ||||||||||
| 5.000%, 03/15/2022 | 9,345,000 | 9,736,864 | ||||||||||
| 4.500%, 10/15/2022 | 3,100,000 | 3,433,355 | ||||||||||
| 3.500%, 04/15/2023 | 5,850,000 | 6,073,944 | ||||||||||
| 3.875%, 06/05/2024 | 23,522,000 | 24,869,223 | ||||||||||
| Fiserv, Inc.: | ||||||||||||
| 4.625%, 10/01/2020 | 3,000,000 | 3,310,575 | ||||||||||
| 3.500%, 10/01/2022 | 11,500,000 | 12,185,791 | ||||||||||
| 3.850%, 06/01/2025 | 11,720,000 | 12,528,282 | ||||||||||
| Florida Gas Transmission Co. LLC, | ||||||||||||
| 3.875%, 07/15/2022 (Acquired 06/12/2012, Cost $2,996,190) * | 3,000,000 | 3,040,941 | ||||||||||
| Fomento Economico Mexicano SAB de CV: | ||||||||||||
| 2.875%, 05/10/2023 f | 11,700,000 | 11,687,984 | ||||||||||
| 4.375%, 05/10/2043 f | 4,000,000 | 4,154,252 | ||||||||||
| Ford Motor Credit Co. LLC: | ||||||||||||
| 3.000%, 06/12/2017 | 3,000,000 | 3,045,699 | ||||||||||
| 6.625%, 08/15/2017 | 1,063,000 | 1,122,029 | ||||||||||
| 2.145%, 01/09/2018 | 5,375,000 | 5,422,069 | ||||||||||
| 2.551%, 10/05/2018 | 8,500,000 | 8,657,122 | ||||||||||
| 3.200%, 01/15/2021 | 11,250,000 | 11,588,445 | ||||||||||
| 5.750%, 02/01/2021 | 13,000,000 | 14,777,425 | ||||||||||
| 3.336%, 03/18/2021 @ | 5,500,000 | 5,704,199 | ||||||||||
| Forest Laboratories, Inc.: | ||||||||||||
| 4.375%, 02/01/2019 (Acquired 10/20/2014, Cost) | 4,000,000 | 4,218,972 | ||||||||||
| 5.000%, 12/15/2021 (Acquired 08/26/2014 through 05/11/2016, Cost) @ | 41,397,000 | 46,328,749 | ||||||||||
| Freeport-McMoran Oil & Gas LLC / FCX Oil & Gas, Inc.: | ||||||||||||
| 6.500%, 11/15/2020 | 6,337,000 | 6,350,435 | ||||||||||
| 6.625%, 05/01/2021 | 6,447,000 | 6,414,765 | ||||||||||
| 6.750%, 02/01/2022 @ | 2,649,000 | 2,596,849 | ||||||||||
| Freeport-McMoRan, Inc.: | ||||||||||||
| 3.100%, 03/15/2020 @ | 3,775,000 | 3,567,375 | ||||||||||
| 3.550%, 03/01/2022 @ | 6,275,000 | 5,522,000 | ||||||||||
| 3.875%, 03/15/2023 @ | 8,000,000 | 7,000,000 | ||||||||||
| Fresenius US Finance II, Inc., | ||||||||||||
| 4.500%, 01/15/2023 (Acquired 09/16/2015 through 02/24/2016, Cost $25,142,679) * | 25,000,000 | 25,562,500 | ||||||||||
| General Electric Capital Corp.: | ||||||||||||
| 5.500%, 01/08/2020 | 537,000 | 613,802 | ||||||||||
| 2.200%, 01/09/2020 | 2,864,000 | 2,951,939 | ||||||||||
| 5.550%, 05/04/2020 | 1,199,000 | 1,380,803 | ||||||||||
| 4.375%, 09/16/2020 | 838,000 | 933,319 | ||||||||||
| 5.300%, 02/11/2021 | 859,000 | 996,601 | ||||||||||
| 4.650%, 10/17/2021 | 2,420,000 | 2,771,319 | ||||||||||
| General Mills, Inc., | ||||||||||||
| 2.200%, 10/21/2019 | 12,000,000 | 12,287,820 | ||||||||||
| General Motors Financial Co., Inc.: | ||||||||||||
| 2.400%, 05/09/2019 | 6,500,000 | 6,518,109 | ||||||||||
| 3.200%, 07/13/2020 | 10,000,000 | 10,130,710 | ||||||||||
| 3.700%, 11/24/2020 | 1,509,000 | 1,550,360 | ||||||||||
| 4.200%, 03/01/2021 | 20,908,000 | 21,872,946 | ||||||||||
| –%, 07/06/2021 | 15,000,000 | 15,023,865 | ||||||||||
| Georgia-Pacific LLC: | ||||||||||||
| 5.400%, 11/01/2020 (Acquired 10/27/2010, Cost $12,236,735) * | 11,000,000 | 12,458,743 | ||||||||||
| 3.163%, 11/15/2021 (Acquired 11/03/2014, Cost $19,999,800) * | 20,000,000 | 21,044,940 | ||||||||||
| Glencore Finance (Canada) Ltd.: | ||||||||||||
| 4.950%, 11/15/2021 (Acquired 11/03/2011, Cost $1,997,480) * f | 2,000,000 | 2,000,000 | ||||||||||
| 4.250%, 10/25/2022 (Acquired 10/18/2012 through 05/22/2013, Cost $7,099,136) * f | 7,000,000 | 6,583,500 | ||||||||||
| Glencore Finance Canada Ltd., | ||||||||||||
| 6.000%, 11/15/2041 (Acquired 04/14/2016, Cost $4,127,996) * @ f | 5,000,000 | 4,255,100 | ||||||||||
| Glencore Funding LLC: | ||||||||||||
| 4.125%, 05/30/2023 (Acquired 05/22/2013 through 04/20/2015, Cost $15,419,400) * @ | 15,450,000 | 14,214,000 | ||||||||||
| 4.625%, 04/29/2024 (Acquired 10/08/2014 through 11/09/2015, Cost $13,765,924) * | 15,484,000 | 14,477,540 | ||||||||||
| Grupo Bimbo, SAB de CV, | ||||||||||||
| 3.875%, 06/27/2024 (Acquired 06/27/2014, Cost $20,587,862) * f | 20,178,000 | 20,998,115 | ||||||||||
| GTE Corp., | ||||||||||||
| 8.750%, 11/01/2021 | 975,000 | 1,236,975 | ||||||||||
| Gulf South Pipeline Co. LP, | ||||||||||||
| 4.000%, 06/15/2022 | 3,000,000 | 2,873,976 | ||||||||||
| Gulfstream Natural Gas System LLC, | ||||||||||||
| 4.600%, 09/15/2025 (Acquired 09/21/2015, Cost $9,996,200) * | 10,000,000 | 10,434,420 | ||||||||||
| H. J. Heinz Co.: | ||||||||||||
| 3.500%, 07/15/2022 (Acquired 06/23/2015 through 06/24/2015, Cost $16,982,780) * | 17,000,000 | 18,055,037 | ||||||||||
| 5.000%, 07/15/2035 (Acquired 06/23/2015, Cost $6,735,332) * | 6,800,000 | 7,799,063 | ||||||||||
| H. J. Heinz Finance Co., | ||||||||||||
| 6.750%, 03/15/2032 | 10,000,000 | 12,804,420 | ||||||||||
| Hanson Ltd., | ||||||||||||
| 6.125%, 08/15/2016 f | 15,157,000 | 15,175,946 | ||||||||||
| HCA, Inc.: | ||||||||||||
| 4.250%, 10/15/2019 @ | 10,900,000 | 11,363,250 | ||||||||||
| 6.500%, 02/15/2020 @ | 5,000,000 | 5,531,250 | ||||||||||
| 5.000%, 03/15/2024 @ | 8,366,000 | 8,658,810 | ||||||||||
| 5.375%, 02/01/2025 @ | 24,950,000 | 25,573,750 | ||||||||||
| Hess Corp., | ||||||||||||
| 8.125%, 02/15/2019 | 1,262,000 | 1,406,384 | ||||||||||
| Hewlett Packard Enterprise Co., | ||||||||||||
| 3.600%, 10/15/2020 (Acquired 09/30/2015, Cost $7,272,963) * | 7,275,000 | 7,593,507 | ||||||||||
| Hewlett-Packard Co., | ||||||||||||
| 4.650%, 12/09/2021 | 32,425,000 | 35,063,357 | ||||||||||
| Husky Energy, Inc., | ||||||||||||
| 4.000%, 04/15/2024 f | 1,605,000 | 1,630,452 | ||||||||||
| Hutchison Whampoa International (09) Ltd., | ||||||||||||
| 7.625%, 04/09/2019 (Acquired 01/20/2015, Cost $2,293,151) * f | 2,000,000 | 2,307,810 | ||||||||||
| Hutchison Whampoa International (11) Ltd., | ||||||||||||
| 3.500%, 01/13/2017 (Acquired 12/11/2014, Cost $1,010,593) * f | 1,000,000 | 1,011,600 | ||||||||||
| Hutchison Whampoa International (12) (II) Ltd., | ||||||||||||
| 3.250%, 11/08/2022 (Acquired 11/05/2012 through 12/18/2014, Cost $4,603,093) * f | 4,625,000 | 4,876,494 | ||||||||||
| Hutchison Whampoa International (14) Ltd., | ||||||||||||
| 3.625%, 10/31/2024 (Acquired 10/28/2014, Cost $14,982,600) * f | 15,000,000 | 15,867,495 | ||||||||||
| Hyundai Capital Services, Inc.: | ||||||||||||
| 1.447%, 03/18/2017 (Acquired 03/11/2014, Cost $2,400,000) * f ∞ | 2,400,000 | 2,398,923 | ||||||||||
| 3.500%, 09/13/2017 (Acquired 03/06/2012 through 12/30/2014, Cost $12,666,967) * f | 12,470,000 | 12,774,118 | ||||||||||
| 2.500%, 03/18/2019 (Acquired 03/14/2016, Cost $24,583,026) * | 24,600,000 | 25,146,686 | ||||||||||
| 2.625%, 09/29/2020 (Acquired 03/23/2015, Cost $8,986,320) * f | 9,000,000 | 9,186,714 | ||||||||||
| Ingersoll-Rand Luxembourg Finance SA: | ||||||||||||
| 3.550%, 11/01/2024 f | 3,200,000 | 3,366,893 | ||||||||||
| 4.650%, 11/01/2044 f | 1,300,000 | 1,393,877 | ||||||||||
| Ingredion, Inc., | ||||||||||||
| 1.800%, 09/25/2017 | 13,020,000 | 13,087,170 | ||||||||||
| Johnson Controls, Inc., | ||||||||||||
| 5.250%, 12/01/2041 | 1,150,000 | 1,282,625 | ||||||||||
| Kerr-McGee Corp., | ||||||||||||
| 7.875%, 09/15/2031 | 12,790,000 | 15,238,658 | ||||||||||
| Keysight Technologies, Inc., | ||||||||||||
| 3.300%, 10/30/2019 | 5,000,000 | 5,077,470 | ||||||||||
| Kinder Morgan Energy Partners LP: | ||||||||||||
| 9.000%, 02/01/2019 | 8,828,000 | 10,053,035 | ||||||||||
| 6.850%, 02/15/2020 | 4,645,000 | 5,198,340 | ||||||||||
| 6.500%, 02/01/2037 | 400,000 | 419,683 | ||||||||||
| 6.950%, 01/15/2038 | 350,000 | 386,252 | ||||||||||
| Kinder Morgan Finance Co. LLC, | ||||||||||||
| 6.000%, 01/15/2018 (Acquired 12/06/2010, Cost $999,930) * | 1,000,000 | 1,052,199 | ||||||||||
| Kinder Morgan, Inc.: | ||||||||||||
| 3.050%, 12/01/2019 | 7,000,000 | 7,073,108 | ||||||||||
| 5.000%, 02/15/2021 (Acquired 05/26/2015 through 04/22/2016, Cost $10,473,947) * | 10,008,000 | 10,547,932 | ||||||||||
| Kinross Gold Corp., | ||||||||||||
| 6.875%, 09/01/2041 f | 5,500,000 | 4,785,000 | ||||||||||
| Kraft Foods Group, Inc., | ||||||||||||
| 5.000%, 06/04/2042 | 5,000,000 | 5,748,560 | ||||||||||
| Lafarge SA, | ||||||||||||
| 7.125%, 07/15/2036 f | 1,425,000 | 1,731,723 | ||||||||||
| Lear Corp., | ||||||||||||
| 5.250%, 01/15/2025 | 21,600,000 | 22,653,000 | ||||||||||
| Magellan Midstream Partners LP: | ||||||||||||
| 5.000%, 03/01/2026 | 10,000,000 | 11,312,350 | ||||||||||
| 4.200%, 03/15/2045 | 3,000,000 | 2,741,877 | ||||||||||
| Marathon Oil Corp., | ||||||||||||
| 2.800%, 11/01/2022 @ | 10,175,000 | 9,227,972 | ||||||||||
| Marathon Petroleum Corp.: | ||||||||||||
| 3.400%, 12/15/2020 | 20,000,000 | 20,675,080 | ||||||||||
| 3.625%, 09/15/2024 @ | 2,500,000 | 2,454,990 | ||||||||||
| 4.750%, 09/15/2044 | 3,985,000 | 3,398,117 | ||||||||||
| Martin Marietta Materials, Inc.: | ||||||||||||
| 6.600%, 04/15/2018 | 475,000 | 511,648 | ||||||||||
| 6.250%, 05/01/2037 | 450,000 | 498,825 | ||||||||||
| Masco Corp., | ||||||||||||
| 7.125%, 03/15/2020 | 1,800,000 | 2,072,700 | ||||||||||
| McDonald's Corp., | ||||||||||||
| 3.700%, 01/30/2026 | 7,250,000 | 7,833,219 | ||||||||||
| MeadWestvaco Corp., | ||||||||||||
| 7.375%, 09/01/2019 | 6,650,000 | 7,633,342 | ||||||||||
| Medtronic, Inc.: | ||||||||||||
| 2.500%, 03/15/2020 @ f | 5,000,000 | 5,185,565 | ||||||||||
| 4.375%, 03/15/2035 @ f | 6,552,000 | 7,411,229 | ||||||||||
| Microsoft Corp., | ||||||||||||
| 4.200%, 11/03/2035 | 5,650,000 | 6,399,167 | ||||||||||
| Molex Electronic Technologies LLC: | ||||||||||||
| 2.878%, 04/15/2020 (Acquired 04/01/2015 through 03/15/2016, Cost $24,610,012) * | 24,847,000 | 24,739,288 | ||||||||||
| 3.900%, 04/15/2025 (Acquired 06/20/2016, Cost $4,471,290) * | 4,500,000 | 4,592,489 | ||||||||||
| MPLX LP: | ||||||||||||
| 5.500%, 02/15/2023 (Acquired 06/17/2016, Cost $1,900,000) * | 1,900,000 | 1,930,394 | ||||||||||
| 4.000%, 02/15/2025 | 8,000,000 | 7,266,848 | ||||||||||
| Murphy Oil Corp., | ||||||||||||
| 4.000%, 06/01/2022 @ | 12,600,000 | 11,176,679 | ||||||||||
| Mylan NV, | ||||||||||||
| 3.150%, 06/15/2021 (Acquired 05/31/2016, Cost $8,090,604) * f | 8,100,000 | 8,216,219 | ||||||||||
| Mylan, Inc.: | ||||||||||||
| 3.000%, 12/15/2018 (Acquired 12/04/2015, Cost $4,494,330) * f | 4,500,000 | 4,607,113 | ||||||||||
| 3.750%, 12/15/2020 (Acquired 12/04/2015, Cost $5,873,120) * f | 5,875,000 | 6,125,140 | ||||||||||
| 4.200%, 11/29/2023 | 4,525,000 | 4,779,070 | ||||||||||
| Nabors Industries, Inc., | ||||||||||||
| 6.150%, 02/15/2018 | 250,000 | 257,173 | ||||||||||
| New Cingular Wireless Services, Inc., | ||||||||||||
| 8.750%, 03/01/2031 | 3,300,000 | 4,923,399 | ||||||||||
| Newell Rubbermaid, Inc., | ||||||||||||
| 3.850%, 04/01/2023 | 20,000,000 | 21,213,380 | ||||||||||
| Noble Energy, Inc.: | ||||||||||||
| 3.900%, 11/15/2024 @ | 3,000,000 | 3,047,733 | ||||||||||
| 5.050%, 11/15/2044 @ | 3,000,000 | 3,021,087 | ||||||||||
| Noble Holding International Ltd., | ||||||||||||
| 5.000%, 03/16/2018 @ f | 7,000,000 | 6,895,000 | ||||||||||
| Northern Tier Energy LLC / Northern Tier Finance Corp., | ||||||||||||
| 7.125%, 11/15/2020 | 15,935,000 | 16,213,862 | ||||||||||
| NuStar Logistics LP: | ||||||||||||
| 4.800%, 09/01/2020 | 4,275,000 | 4,146,750 | ||||||||||
| 6.750%, 02/01/2021 | 3,000,000 | 3,030,000 | ||||||||||
| Oi SA, | ||||||||||||
| 5.750%, 02/10/2022 (Acquired 02/06/2012, Cost $3,000,000) * f § | 3,000,000 | 457,500 | ||||||||||
| ONEOK Partners LP: | ||||||||||||
| 3.375%, 10/01/2022 | 9,500,000 | 9,294,809 | ||||||||||
| 5.000%, 09/15/2023 | 5,800,000 | 6,106,704 | ||||||||||
| ONEOK, Inc., | ||||||||||||
| 4.250%, 02/01/2022 | 6,150,000 | 5,658,000 | ||||||||||
| Oracle Corp.: | ||||||||||||
| 3.400%, 07/08/2024 | 8,850,000 | 9,517,617 | ||||||||||
| 3.900%, 05/15/2035 | 7,425,000 | 7,576,537 | ||||||||||
| Owens Corning, | ||||||||||||
| 4.200%, 12/01/2024 | 10,000,000 | 10,463,790 | ||||||||||
| Packaging Corp. of America, | ||||||||||||
| 4.500%, 11/01/2023 | 4,700,000 | 5,105,102 | ||||||||||
| Pactiv LLC, | ||||||||||||
| 7.950%, 12/15/2025 | 1,338,000 | 1,388,175 | ||||||||||
| Pentair Finance SA: | ||||||||||||
| 2.900%, 09/15/2018 f | 4,500,000 | 4,545,585 | ||||||||||
| 2.650%, 12/01/2019 f | 5,000,000 | 5,000,720 | ||||||||||
| 3.625%, 09/15/2020 f | 16,000,000 | 16,402,064 | ||||||||||
| Pepsico, Inc., | ||||||||||||
| 4.250%, 10/22/2044 | 2,850,000 | 3,196,842 | ||||||||||
| Pernod Ricard SA, | ||||||||||||
| 4.250%, 07/15/2022 (Acquired 06/09/2016, Cost $10,989,766) * f | 10,100,000 | 11,027,271 | ||||||||||
| Petrofac Ltd., | ||||||||||||
| 3.400%, 10/10/2018 (Acquired 10/03/2013 through 04/17/2015, Cost $31,214,033) * f | 31,200,000 | 31,199,906 | ||||||||||
| Pfizer, Inc., | ||||||||||||
| 5.800%, 08/12/2023 | 7,938,000 | 9,754,659 | ||||||||||
| Phillips 66: | ||||||||||||
| 4.300%, 04/01/2022 | 6,168,000 | 6,736,653 | ||||||||||
| 4.650%, 11/15/2034 | 13,000,000 | 13,857,935 | ||||||||||
| 5.875%, 05/01/2042 | 5,000,000 | 6,004,020 | ||||||||||
| 4.875%, 11/15/2044 | 15,000,000 | 16,373,430 | ||||||||||
| Phillips 66 Partners LP, | ||||||||||||
| 4.680%, 02/15/2045 | 2,000,000 | 1,846,344 | ||||||||||
| Pioneer Natural Resources Co., | ||||||||||||
| 6.875%, 05/01/2018 | 14,075,000 | 15,215,751 | ||||||||||
| Plum Creek Timberlands LP: | ||||||||||||
| 4.700%, 03/15/2021 | 1,200,000 | 1,306,614 | ||||||||||
| 3.250%, 03/15/2023 | 8,375,000 | 8,405,309 | ||||||||||
| POSCO, | ||||||||||||
| 4.250%, 10/28/2020 (Acquired 10/21/2010, Cost $2,165,365) * f | 2,175,000 | 2,341,305 | ||||||||||
| Qualcomm, Inc., | ||||||||||||
| 3.000%, 05/20/2022 | 5,500,000 | 5,804,172 | ||||||||||
| Qwest Capital Funding, Inc., | ||||||||||||
| 7.625%, 08/03/2021 | 200,000 | 204,000 | ||||||||||
| R.R. Donnelley & Sons Co.: | ||||||||||||
| 8.600%, 08/15/2016 | 1,250,000 | 1,259,375 | ||||||||||
| 6.125%, 01/15/2017 | 76,000 | 76,950 | ||||||||||
| Reliance Holding USA, Inc.: | ||||||||||||
| 4.500%, 10/19/2020 (Acquired 10/14/2010 through 10/18/2010, Cost $1,988,700) * | 2,000,000 | 2,164,910 | ||||||||||
| 5.400%, 02/14/2022 (Acquired 02/09/2012 through 02/23/2012, Cost $3,510,938) * | 3,500,000 | 3,918,999 | ||||||||||
| Republic Services, Inc.: | ||||||||||||
| 5.500%, 09/15/2019 | 13,000,000 | 14,517,139 | ||||||||||
| 3.550%, 06/01/2022 | 4,000,000 | 4,319,572 | ||||||||||
| 4.750%, 05/15/2023 | 13,459,000 | 15,407,500 | ||||||||||
| 2.900%, 07/01/2026 | 20,000,000 | 20,283,380 | ||||||||||
| Rio Tinto Finance (USA) Ltd., | ||||||||||||
| 9.000%, 05/01/2019 f | 11,000,000 | 13,216,896 | ||||||||||
| Rockies Express Pipeline LLC: | ||||||||||||
| 6.850%, 07/15/2018 (Acquired 12/21/2011, Cost $2,014,563) * | 2,000,000 | 2,075,000 | ||||||||||
| 5.625%, 04/15/2020 (Acquired 12/10/2010 through 12/29/2011, Cost $2,698,983) * | 2,695,000 | 2,701,737 | ||||||||||
| SABMiller Holdings, Inc., | ||||||||||||
| 1.327%, 08/01/2018 (Acquired 10/16/2014, Cost $15,045,057) * ∞ | 15,000,000 | 14,990,475 | ||||||||||
| Samarco Mineracao SA: | ||||||||||||
| 5.750%, 10/24/2023 (Acquired 10/21/2013 through 12/09/2014, Cost $5,332,011) * f | 5,475,000 | 2,107,875 | ||||||||||
| 5.375%, 09/26/2024 (Acquired 09/23/2014 through 12/09/2014, Cost $4,869,479) * f | 5,125,000 | 1,973,125 | ||||||||||
| Schlumberger Holdings Corp., | ||||||||||||
| 3.000%, 12/21/2020 (Acquired 12/10/2015, Cost $10,975,140) * | 11,000,000 | 11,472,516 | ||||||||||
| Schneider Electric SE, | ||||||||||||
| 2.950%, 09/27/2022 (Acquired 09/20/2012, Cost $4,986,700) * f | 5,000,000 | 5,184,925 | ||||||||||
| SK Telecom Co. Ltd., | ||||||||||||
| 6.625%, 07/20/2027 (Acquired 07/13/2007 through 04/30/2013, Cost $991,032) * f | 960,000 | 1,309,248 | ||||||||||
| Solvay Finance America LLC: | ||||||||||||
| 3.400%, 12/03/2020 (Acquired 11/30/2015 through 01/14/2016, Cost $39,205,876) * | 39,226,000 | 41,078,683 | ||||||||||
| 4.450%, 12/03/2025 (Acquired 05/04/2016 through 06/16/2016, Cost $10,759,506) * | 10,323,000 | 11,050,410 | ||||||||||
| Sonoco Products Co., | ||||||||||||
| 4.375%, 11/01/2021 | 1,000,000 | 1,076,312 | ||||||||||
| Spectra Energy Partners LP, | ||||||||||||
| 3.500%, 03/15/2025 @ | 15,000,000 | 15,345,375 | ||||||||||
| Sprint Capital Corp.: | ||||||||||||
| 6.900%, 05/01/2019 @ | 675,000 | 644,625 | ||||||||||
| 8.750%, 03/15/2032 | 325,000 | 277,875 | ||||||||||
| Sprint Communications, Inc., | ||||||||||||
| 6.000%, 12/01/2016 | 200,000 | 201,250 | ||||||||||
| Sunoco Logistics Partners Operations LP: | ||||||||||||
| 3.450%, 01/15/2023 | 2,000,000 | 1,972,228 | ||||||||||
| 6.100%, 02/15/2042 | 1,000,000 | 1,038,763 | ||||||||||
| Sunoco, Inc., | ||||||||||||
| 5.750%, 01/15/2017 | 701,000 | 714,170 | ||||||||||
| Targa Resources Partners LP / Targa Resources Partners Finance Corp., | ||||||||||||
| 4.125%, 11/15/2019 | 7,000,000 | 6,930,000 | ||||||||||
| TC PipeLines LP, | ||||||||||||
| 4.375%, 03/13/2025 | 15,005,000 | 14,772,648 | ||||||||||
| Telecom Italia Capital: | ||||||||||||
| 7.175%, 06/18/2019 f | 500,000 | 563,750 | ||||||||||
| 7.200%, 07/18/2036 f | 3,050,000 | 3,053,813 | ||||||||||
| Telecom Italia SPA, | ||||||||||||
| 5.303%, 05/30/2024 (Acquired 05/22/2014 through 09/23/2015, Cost $21,663,858) * f | 21,500,000 | 21,446,250 | ||||||||||
| Telefonica Emisiones SAU: | ||||||||||||
| 6.221%, 07/03/2017 f | 8,942,000 | 9,335,904 | ||||||||||
| 5.462%, 02/16/2021 @ f | 2,402,000 | 2,740,430 | ||||||||||
| 4.570%, 04/27/2023 f | 1,000,000 | 1,107,045 | ||||||||||
| 7.045%, 06/20/2036 f | 4,925,000 | 6,292,136 | ||||||||||
| Tenet Healthcare Corp., | ||||||||||||
| 6.750%, 06/15/2023 @ | 1,000,000 | 957,500 | ||||||||||
| The ADT Corp., | ||||||||||||
| 3.500%, 07/15/2022 @ | 6,900,000 | 6,322,125 | ||||||||||
| The Dow Chemical Co.: | ||||||||||||
| 8.550%, 05/15/2019 | 14,800,000 | 17,568,118 | ||||||||||
| 4.125%, 11/15/2021 | 835,000 | 916,063 | ||||||||||
| The Williams Companies, Inc.: | ||||||||||||
| 7.875%, 09/01/2021 | 1,335,000 | 1,435,125 | ||||||||||
| 3.700%, 01/15/2023 | 3,000,000 | 2,655,000 | ||||||||||
| Class A, 7.500%, 01/15/2031 | 120,000 | 120,600 | ||||||||||
| 7.750%, 06/15/2031 | 3,500,000 | 3,535,000 | ||||||||||
| 5.750%, 06/24/2044 @ | 2,500,000 | 2,131,250 | ||||||||||
| Thermo Fisher Scientific, Inc., | ||||||||||||
| 3.300%, 02/15/2022 @ | 7,000,000 | 7,262,451 | ||||||||||
| Time Warner Cable, Inc.: | ||||||||||||
| 6.750%, 07/01/2018 | 11,000,000 | 12,061,929 | ||||||||||
| 8.750%, 02/14/2019 | 1,132,000 | 1,321,733 | ||||||||||
| 8.250%, 04/01/2019 | 35,000 | 40,642 | ||||||||||
| Time Warner Co., Inc., | ||||||||||||
| 7.250%, 10/15/2017 | 2,300,000 | 2,471,874 | ||||||||||
| Time Warner, Inc.: | ||||||||||||
| 7.625%, 04/15/2031 | 13,375,000 | 18,345,605 | ||||||||||
| 7.700%, 05/01/2032 | 7,908,000 | 11,040,572 | ||||||||||
| 4.850%, 07/15/2045 @ | 12,000,000 | 13,047,228 | ||||||||||
| Timken Co., | ||||||||||||
| 3.875%, 09/01/2024 | 18,500,000 | 18,695,952 | ||||||||||
| Transcontinental Gas Pipe Line Co. LLC, | ||||||||||||
| 4.450%, 08/01/2042 | 2,600,000 | 2,364,170 | ||||||||||
| Transocean, Inc.: | ||||||||||||
| 6.500%, 11/15/2020 @ f | 9,500,000 | 8,442,650 | ||||||||||
| 8.125%, 12/15/2021 @ f | 5,500,000 | 4,647,500 | ||||||||||
| 5.050%, 10/15/2022 f | 5,000,000 | 3,537,500 | ||||||||||
| 6.800%, 03/15/2038 f | 878,000 | 572,895 | ||||||||||
| TSMC Global Ltd., | ||||||||||||
| 1.625%, 04/03/2018 (Acquired 03/27/2013 through 03/14/2016, Cost $37,051,154) * f | 37,405,000 | 37,506,517 | ||||||||||
| TTX Co., | ||||||||||||
| 3.900%, 02/01/2045 (Acquired 01/26/2015, Cost $25,121,134) * | 25,325,000 | 24,787,376 | ||||||||||
| Tyco Electronics Group SA: | ||||||||||||
| 6.550%, 10/01/2017 f | 5,243,000 | 5,573,671 | ||||||||||
| 3.900%, 02/14/2026 f | 10,000,000 | 10,769,410 | ||||||||||
| 7.125%, 10/01/2037 f | 500,000 | 681,992 | ||||||||||
| Ultramar Diamond Shamrock Corp., | ||||||||||||
| 7.200%, 10/15/2017 | 7,100,000 | 7,472,480 | ||||||||||
| Union Pacific Corp., | ||||||||||||
| 3.375%, 02/01/2035 | 6,000,000 | 6,044,742 | ||||||||||
| US Airways Pass Through Trust, | ||||||||||||
| Class 981B, 7.350%, 01/30/2018 | 198,394 | 206,330 | ||||||||||
| Vale Overseas Ltd.: | ||||||||||||
| 6.250%, 01/23/2017 f | 3,850,000 | 3,938,165 | ||||||||||
| 5.875%, 06/10/2021 @ f | 18,000,000 | 18,022,500 | ||||||||||
| 4.375%, 01/11/2022 @ f | 2,700,000 | 2,530,440 | ||||||||||
| 8.250%, 01/17/2034 @ f | 425,000 | 444,418 | ||||||||||
| 6.875%, 11/10/2039 f | 13,425,000 | 12,220,778 | ||||||||||
| Valero Energy Corp.: | ||||||||||||
| 9.375%, 03/15/2019 | 19,606,000 | 23,429,621 | ||||||||||
| 6.625%, 06/15/2037 | 5,000,000 | 5,485,865 | ||||||||||
| Verisk Analytics, Inc., | ||||||||||||
| 4.000%, 06/15/2025 | 10,000,000 | 10,503,180 | ||||||||||
| Verizon Communications, Inc.: | ||||||||||||
| 6.400%, 09/15/2033 | 30,175,000 | 38,515,461 | ||||||||||
| 4.272%, 01/15/2036 | 19,649,000 | 20,109,022 | ||||||||||
| Viacom, Inc., | ||||||||||||
| 2.750%, 12/15/2019 | 10,000,000 | 10,145,140 | ||||||||||
| Visa, Inc., | ||||||||||||
| 4.300%, 12/14/2045 | 9,075,000 | 10,506,536 | ||||||||||
| Viterra, Inc., | ||||||||||||
| 5.950%, 08/01/2020 (Acquired 03/18/2015, Cost $7,600,572) * f | 7,000,000 | 7,016,877 | ||||||||||
| Vodafone Group PLC, | ||||||||||||
| 6.150%, 02/27/2037 f | 500,000 | 580,070 | ||||||||||
| Vrx Escrow Corp., | ||||||||||||
| 5.875%, 05/15/2023 (Acquired 05/12/2015, Cost $5,091,093) * @ f | 5,000,000 | 4,037,500 | ||||||||||
| Vulcan Materials Co.: | ||||||||||||
| 7.000%, 06/15/2018 | 2,435,000 | 2,666,325 | ||||||||||
| 7.500%, 06/15/2021 | 16,763,000 | 20,137,392 | ||||||||||
| 4.500%, 04/01/2025 | 3,000,000 | 3,202,500 | ||||||||||
| 7.150%, 11/30/2037 | 500,000 | 590,000 | ||||||||||
| Walgreen Co., | ||||||||||||
| 5.250%, 01/15/2019 | 2,482,000 | 2,689,900 | ||||||||||
| Walgreens Boots Alliance, Inc.: | ||||||||||||
| 3.300%, 11/18/2021 | 8,060,000 | 8,452,038 | ||||||||||
| 3.100%, 06/01/2023 | 10,000,000 | 10,185,150 | ||||||||||
| 3.800%, 11/18/2024 | 10,000,000 | 10,594,820 | ||||||||||
| 3.450%, 06/01/2026 | 7,000,000 | 7,185,780 | ||||||||||
| Wal-Mart Stores, Inc., | ||||||||||||
| 3.300%, 04/22/2024 @ | 12,000,000 | 13,145,496 | ||||||||||
| Waste Management, Inc., | ||||||||||||
| 3.900%, 03/01/2035 @ | 5,000,000 | 5,239,400 | ||||||||||
| Weatherford International Ltd.: | ||||||||||||
| 4.500%, 04/15/2022 @ f | 5,020,000 | 4,304,650 | ||||||||||
| 6.750%, 09/15/2040 f | 1,250,000 | 925,000 | ||||||||||
| Western Gas Partners LP, | ||||||||||||
| 5.375%, 06/01/2021 | 18,000,000 | 18,978,174 | ||||||||||
| Westvaco Corp.: | ||||||||||||
| 9.750%, 06/15/2020 | 1,060,000 | 1,305,678 | ||||||||||
| 8.200%, 01/15/2030 | 2,790,000 | 3,745,324 | ||||||||||
| Weyerhaeuser Co., | ||||||||||||
| 7.375%, 10/01/2019 | 11,865,000 | 13,638,224 | ||||||||||
| Williams Partners LP: | ||||||||||||
| 5.250%, 03/15/2020 | 2,000,000 | 2,057,732 | ||||||||||
| 6.300%, 04/15/2040 | 1,590,000 | 1,508,223 | ||||||||||
| Woodside Finance Ltd., | ||||||||||||
| 3.650%, 03/05/2025 (Acquired 02/26/2015, Cost $14,991,300) * f | 15,000,000 | 14,652,210 | ||||||||||
| WPX Energy, Inc., | ||||||||||||
| 6.000%, 01/15/2022 @ | 4,000,000 | 3,720,000 | ||||||||||
| Wynn Las Vegas LLC / Wynn Las Vegas Capital Corp., | ||||||||||||
| 4.250%, 05/30/2023 (Acquired 05/15/2013, Cost $4,000,000) * @ | 4,000,000 | 3,700,000 | ||||||||||
| Xerox Corp., | ||||||||||||
| 6.750%, 02/01/2017 | 10,517,000 | 10,799,234 | ||||||||||
| Yara International ASA: | ||||||||||||
| 7.875%, 06/11/2019 (Acquired 12/03/2012 through 06/06/2013, Cost $6,707,592) * f | 5,880,000 | 6,817,313 | ||||||||||
| 3.800%, 06/06/2026 (Acquired 06/01/2016, Cost $9,959,600) * f | 10,000,000 | 10,344,360 | ||||||||||
| Zoetis, Inc.: | ||||||||||||
| 3.450%, 11/13/2020 | 11,885,000 | 12,269,765 | ||||||||||
| 3.250%, 02/01/2023 | 24,076,000 | 24,533,950 | ||||||||||
| 4.500%, 11/13/2025 | 16,000,000 | 17,645,488 | ||||||||||
| 2,913,757,755 | 26.0 | % | ||||||||||
| Total Corporate Bonds | 5,658,515,511 | 50.4 | % | |||||||||
| Other Government Related Securities | ||||||||||||
| Centrais Eletricas Brasileiras SA: | ||||||||||||
| 6.875%, 07/30/2019 (Acquired 12/06/2012, Cost $3,253,847) * f | 3,000,000 | 3,007,500 | ||||||||||
| 5.750%, 10/27/2021 (Acquired 10/20/2011, Cost $4,000,000) * f | 4,000,000 | 3,686,000 | ||||||||||
| CNOOC Curtis Funding No. 1 Pty Ltd., | ||||||||||||
| 4.500%, 10/03/2023 (Acquired 02/26/2014, Cost $5,033,521) * f | 5,000,000 | 5,411,990 | ||||||||||
| CNOOC Finance 2013 Ltd., | ||||||||||||
| 3.000%, 05/09/2023 f | 2,415,000 | 2,398,861 | ||||||||||
| CNOOC Ltd., | ||||||||||||
| 3.500%, 05/05/2025 | 21,075,000 | 21,349,923 | ||||||||||
| CNOOC Nexen Finance (2014) ULC, | ||||||||||||
| 4.250%, 04/30/2024 f | 4,450,000 | 4,716,016 | ||||||||||
| CNPC General Capital Ltd., | ||||||||||||
| 2.750%, 05/14/2019 (Acquired 05/07/2014, Cost $1,983,740) * f | 2,000,000 | 2,037,908 | ||||||||||
| CNPC HK Overseas Capital Ltd., | ||||||||||||
| 5.950%, 04/28/2041 (Acquired 04/20/2011, Cost $978,120) * f | 1,000,000 | 1,281,377 | ||||||||||
| Comision Federal de Electricidad, | ||||||||||||
| 5.750%, 02/14/2042 (Acquired 02/08/2012, Cost $5,116,800) * f | 5,200,000 | 5,336,500 | ||||||||||
| Corp Andina de Fomento, | ||||||||||||
| 4.375%, 06/15/2022 f | 3,956,000 | 4,416,439 | ||||||||||
| Electricite de France SA, | ||||||||||||
| 4.750%, 10/13/2035 (Acquired 10/07/2015, Cost $9,790,200) * f | 10,000,000 | 10,632,500 | ||||||||||
| Export-Import Bank of Korea: | ||||||||||||
| 2.250%, 01/21/2020 f | 14,000,000 | 14,213,052 | ||||||||||
| 4.000%, 01/29/2021 f | 2,400,000 | 2,618,784 | ||||||||||
| Korea Electric Power Corp., | ||||||||||||
| 6.750%, 08/01/2027 f | 490,000 | 635,527 | ||||||||||
| Korea Expressway Corp., | ||||||||||||
| 1.625%, 04/28/2017 (Acquired 04/22/2014 through 02/12/2015, Cost $2,942,070) * f | 2,950,000 | 2,959,042 | ||||||||||
| Korea National Oil Corp., | ||||||||||||
| 3.125%, 04/03/2017 (Acquired 02/18/2015, Cost $8,181,580) * f | 8,100,000 | 8,207,017 | ||||||||||
| Nexen Energy ULC, | ||||||||||||
| 7.500%, 07/30/2039 f | 6,175,000 | 8,348,248 | ||||||||||
| Petrobras Global Finance BV, | ||||||||||||
| 3.000%, 01/15/2019 f | 3,000,000 | 2,779,500 | ||||||||||
| Petrobras International Finance Co. SA: | ||||||||||||
| 7.875%, 03/15/2019 f | 5,000,000 | 5,162,500 | ||||||||||
| 5.375%, 01/27/2021 f | 3,200,000 | 2,931,040 | ||||||||||
| Petroleos Mexicanos: | ||||||||||||
| 4.875%, 01/24/2022 @ f | 6,500,000 | 6,645,535 | ||||||||||
| 4.250%, 01/15/2025 @ f | 15,000,000 | 14,445,000 | ||||||||||
| 4.500%, 01/23/2026 @ f | 4,500,000 | 4,330,800 | ||||||||||
| 6.500%, 06/02/2041 f | 4,000,000 | 4,050,000 | ||||||||||
| PTT PCL, | ||||||||||||
| 3.375%, 10/25/2022 (Acquired 10/19/2012, Cost $4,958,500) * @ f | 5,000,000 | 5,238,275 | ||||||||||
| Sinopec Group Overseas Development [2014] Ltd., | ||||||||||||
| 4.375%, 04/10/2024 (Acquired 04/02/2014, Cost $1,496,505) * f | 1,500,000 | 1,620,826 | ||||||||||
| Sinopec Group Overseas Development [2015] Ltd.: | ||||||||||||
| 2.500%, 04/28/2020 (Acquired 04/21/2015, Cost $19,915,200) * f | 20,000,000 | 20,215,740 | ||||||||||
| 3.250%, 04/28/2025 (Acquired 04/21/2015, Cost $19,804,400) * f | 20,000,000 | 20,181,000 | ||||||||||
| Sinopec Group Overseas Development [2016] Ltd., | ||||||||||||
| 3.500%, 05/03/2026 (Acquired 04/25/2016, Cost $9,916,600) * f | 10,000,000 | 10,226,730 | ||||||||||
| State Bank of India, | ||||||||||||
| 4.125%, 08/01/2017 (Acquired 07/25/2012, Cost $6,939,800) * f | 7,000,000 | 7,177,842 | ||||||||||
| The Korea Development Bank: | ||||||||||||
| 2.250%, 05/18/2020 f | 7,200,000 | 7,333,704 | ||||||||||
| 3.000%, 09/14/2022 f | 4,400,000 | 4,636,144 | ||||||||||
| 218,231,320 | 1.9 | % | ||||||||||
| Taxable Municipal Bonds | ||||||||||||
| Bellevue Union School District, | ||||||||||||
| 5.000%, 08/01/2028 | 625,000 | 715,675 | ||||||||||
| California Housing Finance Agency, | ||||||||||||
| 2.794%, 08/01/2036 (Callable 08/01/2025) | 20,550,000 | 20,611,239 | ||||||||||
| California Qualified School Bond Joint Powers Authority: | ||||||||||||
| 6.739%, 09/01/2026 | 2,415,000 | 2,923,961 | ||||||||||
| 7.155%, 03/01/2027 | 1,700,000 | 2,093,618 | ||||||||||
| California School Finance Authority, | ||||||||||||
| 5.041%, 07/01/2020 | 1,500,000 | 1,661,655 | ||||||||||
| Camden County Improvement Authority, | ||||||||||||
| 7.747%, 07/01/2034 (Callable 07/01/2020) | 1,100,000 | 1,318,229 | ||||||||||
| Central Valley Support Joint Powers Agency, | ||||||||||||
| 5.676%, 09/01/2024 | 1,500,000 | 1,752,540 | ||||||||||
| City of Vernon CA Electric System Revenue, | ||||||||||||
| 4.500%, 08/01/2022 | 7,000,000 | 7,630,840 | ||||||||||
| City of Weyauwega WI Sewerage System Revenue, | ||||||||||||
| 3.150%, 05/01/2017 (Callable 08/01/2016) | 5,700,000 | 5,700,513 | ||||||||||
| City of Williston ND, | ||||||||||||
| 3.100%, 07/15/2025 (Callable 07/21/2016) | 8,640,000 | 8,643,542 | ||||||||||
| Colton Joint Unified School District, | ||||||||||||
| 6.008%, 08/01/2026 | 1,250,000 | 1,545,787 | ||||||||||
| County of Contra Costa CA, | ||||||||||||
| 5.140%, 06/01/2017 | 1,300,000 | 1,337,115 | ||||||||||
| Elgin Local School District, | ||||||||||||
| 5.499%, 08/31/2027 (Callable 12/01/2019) | 1,000,000 | 1,066,930 | ||||||||||
| Government Development Bank for Puerto Rico, | ||||||||||||
| 4.704%, 05/01/2016 § | 875,000 | 254,844 | ||||||||||
| Iowa Tobacco Settlement Authority, | ||||||||||||
| 6.500%, 06/01/2023 (Callable 08/01/2016) | 2,205,000 | 2,248,703 | ||||||||||
| New Hampshire Housing Finance Authority: | ||||||||||||
| 3.100%, 07/01/2021 | 1,670,000 | 1,740,541 | ||||||||||
| 3.750%, 07/01/2034 (Callable 07/01/2023) | 6,005,000 | 6,228,506 | ||||||||||
| New Jersey Economic Development Authority: | ||||||||||||
| 1.802%, 06/15/2017 | 15,000,000 | 15,065,850 | ||||||||||
| 3.375%, 06/15/2017 | 13,000,000 | 13,157,300 | ||||||||||
| North Carolina Housing Finance Agency: | ||||||||||||
| 2.870%, 07/01/2032 (Callable 01/01/2024) | 5,740,000 | 5,800,844 | ||||||||||
| 2.812%, 07/01/2035 (Callable 01/01/2024) | 7,550,000 | 7,676,085 | ||||||||||
| North East Independent School District/TX, | ||||||||||||
| 5.240%, 08/01/2027 | 3,000,000 | 3,798,810 | ||||||||||
| Port of Oakland, | ||||||||||||
| 5.000%, 11/01/2020 (Callable 11/01/2017) | 2,900,000 | 3,053,990 | ||||||||||
| Rhode Island Housing & Mortgage Finance Corp./RI, | ||||||||||||
| 2.913%, 10/01/2039 (Callable 10/01/2023) | 2,860,000 | 2,925,351 | ||||||||||
| San Dieguito Public Facilities Authority, | ||||||||||||
| 6.459%, 05/01/2027 | 1,825,000 | 2,378,012 | ||||||||||
| State of Illinois, | ||||||||||||
| 5.163%, 02/01/2018 | 3,000,000 | 3,110,940 | ||||||||||
| State Public School Building Authority, | ||||||||||||
| 5.000%, 09/15/2027 | 1,998,000 | 2,221,736 | ||||||||||
| Three Rivers Local School District, | ||||||||||||
| 5.209%, 09/15/2027 (Callable 12/01/2020) | 1,350,000 | 1,458,014 | ||||||||||
| Town of Davie FL Water & Sewer Revenue, | ||||||||||||
| 6.599%, 10/01/2030 (Callable 10/01/2020) | 1,000,000 | 1,179,060 | ||||||||||
| West Contra Costa Unified School District, | ||||||||||||
| 6.250%, 08/01/2030 | 4,320,000 | 5,295,499 | ||||||||||
| Westlake City School District, | ||||||||||||
| 5.227%, 12/01/2026 (Callable 12/01/2020) | 1,160,000 | 1,215,448 | ||||||||||
| 135,811,177 | 1.2 | % | ||||||||||
| Residential Mortgage-Backed Securities | ||||||||||||
| U.S. Government Agency Issues | ||||||||||||
| Fannie Mae REMIC Trust, | ||||||||||||
| Series 2004-90, Class LH, 5.000%, 04/25/2034 | 1,503,961 | 1,564,291 | ||||||||||
| Series 2004-W6, Class 1A6, 5.500%, 07/25/2034 | 38,301 | 38,474 | ||||||||||
| Federal Gold Loan Mortgage Corp. (FGLMC): | ||||||||||||
| 5.000%, 12/01/2020 | 36,155 | 38,030 | ||||||||||
| 5.000%, 05/01/2021 | 66,677 | 70,139 | ||||||||||
| 6.000%, 06/01/2021 | 14,201 | 15,397 | ||||||||||
| 3.000%, 05/01/2027 | 8,881,624 | 9,338,831 | ||||||||||
| 6.500%, 12/01/2028 | 24,736 | 28,904 | ||||||||||
| 6.500%, 06/01/2029 | 11,003 | 13,033 | ||||||||||
| 3.000%, 10/01/2030 | 54,935,828 | 57,997,286 | ||||||||||
| 3.500%, 05/01/2032 | 41,242,413 | 44,199,570 | ||||||||||
| 5.000%, 03/01/2036 | 6,485,523 | 7,207,044 | ||||||||||
| 5.500%, 04/01/2037 | 210,794 | 236,742 | ||||||||||
| 5.500%, 04/01/2038 | 112,250 | 125,946 | ||||||||||
| 5.500%, 05/01/2038 | 232,747 | 261,073 | ||||||||||
| 5.500%, 01/01/2039 | 31,819,629 | 36,004,077 | ||||||||||
| 4.500%, 11/01/2039 | 1,245,319 | 1,361,715 | ||||||||||
| 4.500%, 11/01/2039 | 4,045,354 | 4,437,242 | ||||||||||
| 4.500%, 08/01/2040 | 4,039,806 | 4,437,272 | ||||||||||
| 4.500%, 08/01/2040 | 5,899,137 | 6,479,533 | ||||||||||
| 3.500%, 06/01/2042 | 10,007,655 | 10,568,663 | ||||||||||
| 3.500%, 07/01/2042 | 35,461,018 | 37,443,911 | ||||||||||
| 3.000%, 08/01/2042 | 29,960,372 | 31,142,452 | ||||||||||
| 3.000%, 11/01/2042 | 71,977,975 | 75,416,003 | ||||||||||
| 3.000%, 02/01/2043 | 9,569,427 | 9,942,798 | ||||||||||
| 3.500%, 02/01/2043 | 21,134,336 | 22,553,892 | ||||||||||
| 3.000%, 04/01/2043 | 11,794,314 | 12,252,905 | ||||||||||
| 3.000%, 04/01/2043 | 17,871,060 | 18,712,677 | ||||||||||
| 3.000%, 06/01/2043 | 16,033,219 | 16,653,339 | ||||||||||
| 3.000%, 08/01/2043 | 24,595,319 | 25,539,016 | ||||||||||
| 3.500%, 08/01/2044 | 43,640,505 | 46,025,045 | ||||||||||
| 4.000%, 09/01/2044 | 26,519,277 | 28,378,155 | ||||||||||
| 4.000%, 10/01/2044 | 34,769,273 | 37,636,048 | ||||||||||
| 4.000%, 02/01/2045 | 27,788,116 | 29,749,154 | ||||||||||
| 3.500%, 06/01/2045 | 39,507,223 | 42,212,702 | ||||||||||
| 3.500%, 01/01/2046 | 47,160,370 | 50,116,999 | ||||||||||
| Federal Home Loan Mortgage Corp. (FHLMC): | ||||||||||||
| Series 1053, Class G, 7.000%, 03/15/2021 | 2,232 | 2,486 | ||||||||||
| Series 136, Class E, 6.000%, 04/15/2021 | 4,324 | 4,550 | ||||||||||
| Series 1122, Class G, 7.000%, 08/15/2021 | 5,803 | 6,235 | ||||||||||
| Series 1186, Class I, 7.000%, 12/15/2021 | 10,971 | 12,164 | ||||||||||
| Federal National Mortgage Association (FNMA): | ||||||||||||
| Series 1989-94, Class G, 7.500%, 12/25/2019 | 2,782 | 2,960 | ||||||||||
| Series 1990-15, Class J, 7.000%, 02/25/2020 | 6,660 | 6,938 | ||||||||||
| Series 1991-21, Class J, 7.000%, 03/25/2021 | 2,005 | 2,146 | ||||||||||
| Series 1991-43, Class J, 7.000%, 05/25/2021 | 31,019 | 33,752 | ||||||||||
| Series 1991-65, Class Z, 6.500%, 06/25/2021 | 27,636 | 29,235 | ||||||||||
| Series 2804, Class VC, 5.000%, 07/15/2021 | 115,857 | 120,206 | ||||||||||
| 5.000%, 11/01/2021 | 212,557 | 220,009 | ||||||||||
| Series 1992-129, Class L, 6.000%, 07/25/2022 | 69,596 | 75,223 | ||||||||||
| Series 1993-32, Class H, 6.000%, 03/25/2023 | 17,406 | 18,825 | ||||||||||
| Series 1993-58, Class H, 5.500%, 04/25/2023 | 80,000 | 86,471 | ||||||||||
| 3.000%, 04/01/2027 | 16,188,048 | 16,998,862 | ||||||||||
| 2.500%, 12/01/2027 | 24,303,724 | 25,217,918 | ||||||||||
| 5.000%, 05/01/2028 | 69,803 | 77,449 | ||||||||||
| 3.500%, 07/01/2028 | 47,387,882 | 50,248,068 | ||||||||||
| 6.500%, 09/01/2028 | 18,662 | 21,780 | ||||||||||
| 6.500%, 02/01/2029 | 40,240 | 46,700 | ||||||||||
| 4.500%, 07/01/2030 | 7,659,440 | 8,355,559 | ||||||||||
| 3.000%, 08/01/2030 | 43,568,774 | 45,937,276 | ||||||||||
| 4.000%, 11/01/2031 | 31,850,699 | 34,493,035 | ||||||||||
| 5.500%, 01/01/2032 | 15,764 | 17,876 | ||||||||||
| 5.000%, 09/01/2033 | 23,032,303 | 25,712,712 | ||||||||||
| 4.500%, 10/01/2033 | 42,831,857 | 47,038,261 | ||||||||||
| 4.000%, 01/01/2034 | 21,626,999 | 23,421,851 | ||||||||||
| 5.500%, 04/01/2034 | 1,248,382 | 1,416,161 | ||||||||||
| 4.000%, 09/01/2034 | 31,247,030 | 33,830,342 | ||||||||||
| 5.500%, 09/01/2034 | 39,004 | 44,294 | ||||||||||
| 5.000%, 02/01/2035 | 27,869,927 | 31,096,177 | ||||||||||
| 5.000%, 02/01/2035 | 31,345,557 | 34,986,723 | ||||||||||
| 5.500%, 02/01/2035 | 19,090 | 21,658 | ||||||||||
| 5.000%, 04/01/2035 | 2,248,542 | 2,505,592 | ||||||||||
| 5.000%, 07/01/2035 | 6,544,292 | 7,299,027 | ||||||||||
| 5.000%, 02/01/2036 | 4,112,070 | 4,577,082 | ||||||||||
| 5.000%, 03/01/2036 | 1,850,743 | 2,059,485 | ||||||||||
| 5.500%, 04/01/2036 | 6,257,111 | 7,070,760 | ||||||||||
| 6.000%, 05/01/2038 | 10,539,573 | 12,057,971 | ||||||||||
| 4.000%, 06/01/2039 | 18,466,913 | 19,952,379 | ||||||||||
| 4.500%, 01/01/2040 | 13,939,085 | 15,251,519 | ||||||||||
| 5.000%, 06/01/2040 | 25,314,498 | 28,160,961 | ||||||||||
| 4.000%, 08/01/2040 | 1,822,249 | 1,960,243 | ||||||||||
| 4.500%, 08/01/2040 | 22,701,887 | 24,875,314 | ||||||||||
| 4.500%, 08/01/2040 | 8,611,921 | 9,437,393 | ||||||||||
| 4.000%, 10/01/2040 | 1,251,823 | 1,346,878 | ||||||||||
| 4.000%, 12/01/2040 | 5,503,758 | 6,035,741 | ||||||||||
| 3.500%, 01/01/2041 | 3,129,913 | 3,312,175 | ||||||||||
| 4.000%, 01/01/2041 | 6,928,515 | 7,450,467 | ||||||||||
| 3.500%, 02/01/2041 | 3,453,673 | 3,652,644 | ||||||||||
| 3.500%, 03/01/2041 | 26,134,994 | 27,640,544 | ||||||||||
| 4.500%, 07/01/2041 | 11,031,280 | 12,079,490 | ||||||||||
| 3.500%, 09/01/2041 | 53,559,420 | 56,656,639 | ||||||||||
| 4.000%, 09/01/2041 | 5,830,615 | 6,268,624 | ||||||||||
| 3.500%, 11/01/2041 | 29,654,567 | 31,406,506 | ||||||||||
| 3.500%, 12/01/2041 | 5,002,952 | 5,298,332 | ||||||||||
| 4.000%, 12/01/2041 | 25,275,178 | 27,171,637 | ||||||||||
| 4.000%, 01/01/2042 | 47,887,219 | 51,428,564 | ||||||||||
| 4.500%, 01/01/2042 | 19,446,190 | 21,307,416 | ||||||||||
| 3.000%, 05/01/2042 | 4,967,884 | 5,166,275 | ||||||||||
| 3.500%, 05/01/2042 | 28,453,285 | 30,129,861 | ||||||||||
| 3.500%, 06/01/2042 | 11,265,456 | 11,921,527 | ||||||||||
| 3.500%, 08/01/2042 | 16,829,526 | 17,819,228 | ||||||||||
| 3.500%, 09/01/2042 | 28,701,513 | 30,371,488 | ||||||||||
| 3.000%, 03/01/2043 | 9,446,906 | 9,825,384 | ||||||||||
| 3.000%, 05/01/2043 | 39,772,098 | 41,360,921 | ||||||||||
| 3.500%, 05/01/2043 | 24,173,447 | 25,812,303 | ||||||||||
| 3.000%, 06/01/2043 | 41,184,913 | 42,832,833 | ||||||||||
| 3.000%, 07/01/2043 | 24,787,297 | 25,777,825 | ||||||||||
| 3.000%, 08/01/2043 | 11,655,816 | 12,121,002 | ||||||||||
| 4.500%, 09/01/2043 | 13,677,090 | 14,981,452 | ||||||||||
| 4.000%, 01/01/2045 | 27,759,145 | 29,950,769 | ||||||||||
| 4.000%, 02/01/2045 | 37,851,896 | 41,031,765 | ||||||||||
| 4.000%, 03/01/2045 | 16,558,014 | 17,952,012 | ||||||||||
| Government National Mortgage Association (GNMA): | ||||||||||||
| 6.000%, 12/20/2028 | 28,403 | 32,645 | ||||||||||
| 6.500%, 01/20/2029 | 13,961 | 16,522 | ||||||||||
| 6.000%, 11/20/2033 | 20,754 | 24,531 | ||||||||||
| 5.000%, 07/20/2040 | 1,196,819 | 1,331,329 | ||||||||||
| 3.500%, 10/20/2041 | 19,295,212 | 20,565,644 | ||||||||||
| 4.000%, 06/20/2042 | 22,492,491 | 24,184,595 | ||||||||||
| 3.500%, 09/20/2042 | 13,902,026 | 14,817,409 | ||||||||||
| 3.000%, 04/20/2045 | 21,981,903 | 23,013,299 | ||||||||||
| 3.500%, 04/20/2045 | 48,283,881 | 51,285,944 | ||||||||||
| 4.000%, 05/20/2045 | 38,428,173 | 41,097,516 | ||||||||||
| 3.500%, 06/20/2045 | 43,208,803 | 45,909,520 | ||||||||||
| Towd Point Mortgage Trust: | ||||||||||||
| Series 2015-3, Class A1A, 3.500%, 03/25/2054 (Acquired 06/21/2016, Cost $17,382,389) * ∞ | 16,887,108 | 17,457,583 | ||||||||||
| Series 2016-2, Class A1, 3.000%, 08/25/2055 (Acquired 05/20/2016, Cost $21,686,769) * ∞ | 21,519,653 | 21,977,989 | ||||||||||
| 2,062,834,814 | 18.4 | % | ||||||||||
| Non-U.S. Government Agency Issues | ||||||||||||
| Alternative Loan Trust: | ||||||||||||
| Series 2005-3CB, Class 2A1, 5.000%, 03/25/2020 | 1,338,498 | 1,331,683 | ||||||||||
| Series 2005-50CB, Class 4A1, 5.000%, 11/25/2020 | 373,231 | 370,118 | ||||||||||
| Series 2005-85CB, Class 3A1, 5.250%, 02/25/2021 (Acquired 06/29/2015, Cost $15,570) * | 15,865 | 15,198 | ||||||||||
| Series 2006-7CB, Class 3A1, 5.250%, 05/25/2021 | 441,822 | 423,352 | ||||||||||
| Series 2006-43CB, Class 2A1, 6.000%, 02/25/2022 | 339,446 | 361,005 | ||||||||||
| Series 2004-18CB, Class 1A1, 6.000%, 09/25/2034 | 9,082,749 | 9,386,526 | ||||||||||
| Series 2005-11CB, Class 2A6, 5.500%, 06/25/2035 | 10,267,718 | 9,748,114 | ||||||||||
| Series 2005-49CB, Class A5, 5.500%, 11/25/2035 | 4,650,057 | 4,130,467 | ||||||||||
| Series 2005-73CB, Class 1A7, 5.500%, 01/25/2036 | 653,140 | 601,007 | ||||||||||
| Series 2005-85CB, Class 2A2, 5.500%, 02/25/2036 | 5,592,639 | 4,959,061 | ||||||||||
| Series 2006-28CB, Class A17, 6.000%, 10/25/2036 | 750,166 | 545,622 | ||||||||||
| Banc of America Alternative Loan Trust: | ||||||||||||
| Series 2003-11, Class 4A1, 4.750%, 01/25/2019 | 9,955 | 9,994 | ||||||||||
| Series 2004-1, Class 5A2, 5.500%, 02/25/2019 | 440,680 | 446,887 | ||||||||||
| Series 2004-2, Class 5A1, 5.500%, 03/25/2019 | 117,519 | 118,036 | ||||||||||
| Series 2004-6, Class 4A1, 5.000%, 07/25/2019 | 3,476,914 | 3,525,431 | ||||||||||
| Series 2004-8, Class 3A1, 5.500%, 09/25/2019 § | 639,333 | 623,130 | ||||||||||
| Series 2004-11, Class 4A1, 5.500%, 12/25/2019 | 5,514 | 5,572 | ||||||||||
| Series 2005-2, Class 4A1, 5.500%, 03/25/2020 | 480,307 | 486,950 | ||||||||||
| Series 2005-4, Class 3A1, 5.500%, 05/25/2020 | 409,530 | 406,103 | ||||||||||
| Series 2005-8, Class 5A1, 5.500%, 09/25/2020 § | 102,295 | 100,254 | ||||||||||
| Series 2007-1, Class 1A1, 5.839%, 04/25/2022 ∞ | 464,517 | 446,636 | ||||||||||
| Series 2003-8, Class 1CB1, 5.500%, 10/25/2033 | 3,753,408 | 3,822,236 | ||||||||||
| Series 2003-11, Class 1A1, 6.000%, 01/25/2034 | 5,208,854 | 5,332,964 | ||||||||||
| Series 2004-2, Class 1A1, 6.000%, 03/25/2034 | 3,323,765 | 3,420,845 | ||||||||||
| Series 2004-5, Class 1A1, 6.000%, 06/25/2034 | 12,141,887 | 12,627,162 | ||||||||||
| Series 2004-6, Class 1A1, 6.000%, 07/25/2034 | 11,689,795 | 12,161,271 | ||||||||||
| Series 2004-10, Class 1CB1, 6.000%, 11/25/2034 | 19,673,692 | 20,612,794 | ||||||||||
| Series 2004-11, Class 1CB1, 6.000%, 12/25/2034 | 18,537,990 | 19,570,265 | ||||||||||
| Series 2005-2, Class 1CB2, 5.500%, 03/25/2035 § | 1,402,734 | 1,272,031 | ||||||||||
| Series 2005-9, Class 1CB3, 5.500%, 10/25/2035 § | 29,488 | 26,511 | ||||||||||
| Series 2005-9, Class 2CB1, 6.000%, 10/25/2035 § | 10,855,935 | 10,304,750 | ||||||||||
| Series 2007-C, Class 1A3, 3.023%, 05/20/2036 § ∞ | 5,456,901 | 4,880,511 | ||||||||||
| Series 2006-4, Class 3CB4, 6.000%, 05/25/2046 § | 47,209 | 38,525 | ||||||||||
| Series 2006-5, Class CB7, 6.000%, 06/25/2046 § | 402,225 | 328,751 | ||||||||||
| Series 2007-C, Class 7A5, 0.748%, 05/20/2047 ∞ | 5,499,487 | 4,486,651 | ||||||||||
| Banc of America Funding Trust, | ||||||||||||
| Series 2005-C, Class A1, 0.688%, 05/20/2035 ∞ | 13,945,722 | 12,872,561 | ||||||||||
| Banc of America Mortgage Trust, | ||||||||||||
| Series 2003-L, Class 2A1, 2.897%, 01/25/2034 ∞ | 3,140,469 | 3,112,127 | ||||||||||
| Bear Stearns ARM Trust, | ||||||||||||
| Series 2005-9, Class A1, 2.660%, 10/25/2035 ∞ | 1,745,272 | 1,675,620 | ||||||||||
| Chase Mortgage Finance Trust: | ||||||||||||
| Series 2006-A1, Class 2A3, 2.763%, 09/25/2036 § ∞ | 1,336,196 | 1,184,888 | ||||||||||
| Series 2007-A1, Class 3A1, 2.875%, 02/25/2037 ∞ | 6,921,995 | 6,834,239 | ||||||||||
| Series 2007-A1, Class 2A3, 3.044%, 02/25/2037 ∞ | 3,769,073 | 3,760,414 | ||||||||||
| Chase Mortgage Finance Trust Series, | ||||||||||||
| Series 2005-A2, Class 1A5, 2.672%, 01/25/2036 ∞ | 1,675,243 | 1,550,539 | ||||||||||
| CHL Mortgage Pass-Through Trust, | ||||||||||||
| Series 2005-6, Class 2A1, 5.500%, 04/25/2035 | 808,464 | 793,961 | ||||||||||
| Citicorp Mortgage Securities Trust: | ||||||||||||
| Series 2006-3, Class 1A4, 6.000%, 06/25/2036 | 9,352,853 | 9,440,431 | ||||||||||
| Series 2007-2, Class 1A3, 6.000%, 02/25/2037 | 1,886,265 | 1,800,749 | ||||||||||
| Citigroup Mortgage Loan Trust, Inc.: | ||||||||||||
| Series 2006-AR1, Class 1A1, 2.870%, 10/25/2035 ∞ | 28,199,978 | 27,869,080 | ||||||||||
| Series 2005-9, Class 2A2, 5.500%, 11/25/2035 § | 548,182 | 543,576 | ||||||||||
| Series 2005-9, Class 22A2, 6.000%, 11/25/2035 § | 6,310,314 | 5,701,211 | ||||||||||
| Countrywide Alternative Loan Trust, | ||||||||||||
| Series 2006-J5, Class 3A1, 4.777%, 07/25/2021 ∞ | 22,300 | 20,177 | ||||||||||
| Credit Suisse First Boston Mortgage Securities Corp., | ||||||||||||
| Series 2005-7, Class 3A1, 5.000%, 08/25/2020 § | 306,097 | 291,461 | ||||||||||
| Deutsche Alt-A Securities. Inc, Mortgage Loan Trust, | ||||||||||||
| Series 2005-3, Class 4A5, 5.250%, 06/25/2035 | 4,346,648 | 4,395,126 | ||||||||||
| First Horizon Alternative Mortgage Securities Trust: | ||||||||||||
| Series 2006-FA6, Class 3A1, 5.750%, 11/25/2021 | 143,955 | 143,394 | ||||||||||
| Series 2004-AA1, Class A1, 2.684%, 06/25/2034 ∞ | 8,430,648 | 8,197,726 | ||||||||||
| Series 2005-AA2, Class 2A1, 2.667%, 04/25/2035 ∞ | 4,267,046 | 4,133,400 | ||||||||||
| Series 2006-FA8, Class 2A1, 5.750%, 02/25/2037 § | 498,077 | 427,938 | ||||||||||
| GSAA Home Equity Trust: | ||||||||||||
| Series 2004-6, Class A1, 1.253%, 06/25/2034 ∞ | 4,380,850 | 4,204,888 | ||||||||||
| Series 2007-8, Class A3, 0.903%, 08/25/2037 ∞ | 11,931,342 | 10,925,508 | ||||||||||
| GSR Mortgage Loan Trust: | ||||||||||||
| Series 2004-15F, Class 5A1, 5.500%, 01/25/2020 | 717,697 | 728,274 | ||||||||||
| Series 2005-3F, Class 2A4, 6.000%, 03/25/2035 | 5,084,770 | 5,319,487 | ||||||||||
| Series 2005-AR2, Class 2A1, 3.032%, 04/25/2035 ∞ | 6,883,611 | 6,836,181 | ||||||||||
| HomeBanc Mortgage Trust, | ||||||||||||
| Series 2005-4, Class A1, 0.723%, 10/25/2035 ∞ | 13,510,917 | 12,375,981 | ||||||||||
| J.P. Morgan Alternative Loan Trust: | ||||||||||||
| Series 2005-S1, Class 3A1, 5.500%, 10/25/2020 | 1,335,535 | 1,317,220 | ||||||||||
| Series 2006-A1, Class 2A1, 2.806%, 03/25/2036 § ∞ | 135,577 | 112,810 | ||||||||||
| Series 2006-S3, Class A3A, 6.000%, 08/25/2036 § | 913,432 | 877,946 | ||||||||||
| Series 2007-S1, Class A1, 0.733%, 04/25/2047 ∞ | 11,456,476 | 10,191,706 | ||||||||||
| J.P. Morgan Mortgage Trust: | ||||||||||||
| Series 2006-S3, Class 2A3, 5.000%, 08/25/2021 | 176,043 | 175,238 | ||||||||||
| Series 2006-A2, Class 3A3, 2.767%, 04/25/2036 § ∞ | 3,337,595 | 3,039,093 | ||||||||||
| Series 2006-A2, Class 2A1, 2.993%, 04/25/2036 § ∞ | 2,792,164 | 2,546,909 | ||||||||||
| Series 2006-A7, Class 2A2, 2.787%, 01/25/2037 § ∞ | 4,516,896 | 4,010,354 | ||||||||||
| Series 2006-A7, Class 2A4R, 2.787%, 01/25/2037 § ∞ | 4,623,731 | 4,078,449 | ||||||||||
| Series 2007-A2, Class 2A3, 2.860%, 04/25/2037 § ∞ | 8,835,674 | 7,758,800 | ||||||||||
| Series 2007-A4, Class 2A3, 3.455%, 06/25/2037 § ∞ | 10,075,384 | 9,239,327 | ||||||||||
| Luminent Mortgage Trust, | ||||||||||||
| Series 2005-1, Class A1, 0.713%, 11/25/2035 ∞ | 15,630,765 | 13,950,242 | ||||||||||
| MASTR Alternative Loan Trust: | ||||||||||||
| Series 2004-1, Class 1A1, 5.000%, 01/25/2019 | 74,992 | 75,323 | ||||||||||
| Series 2004-5, Class 4A1, 5.500%, 07/25/2019 | 219,411 | 223,818 | ||||||||||
| Series 2005-3, Class 4A1, 5.500%, 03/25/2020 | 500,444 | 510,267 | ||||||||||
| Series 2003-5, Class 6A1, 6.000%, 08/25/2033 | 51,823 | 54,204 | ||||||||||
| Series 2004-2, Class 2A1, 6.000%, 02/25/2034 | 4,681,877 | 4,936,214 | ||||||||||
| Series 2004-8, Class 2A1, 6.000%, 09/25/2034 | 3,741,553 | 3,865,432 | ||||||||||
| Series 2005-6, Class 1A5, 5.500%, 12/25/2035 § | 4,465,532 | 3,900,932 | ||||||||||
| Merrill Lynch Mortgage Investors Trust: | ||||||||||||
| Series 2004-F, Class A1B, 1.073%, 12/25/2029 ∞ | 13,597,632 | 12,955,989 | ||||||||||
| Series 2005-A5, Class A3, 3.064%, 06/25/2035 ∞ | 5,016,628 | 4,888,876 | ||||||||||
| MortgageIT Trust: | ||||||||||||
| Series 2005-4, Class A1, 0.733%, 10/25/2035 ∞ | 10,131,508 | 9,218,412 | ||||||||||
| Series 2005-5, Class A1, 0.713%, 12/25/2035 ∞ | 9,070,001 | 8,101,286 | ||||||||||
| Nomura Asset Acceptance Corp. Alternative Loan Trust, | ||||||||||||
| Series 2005-WF1, Class 2A3, 5.100%, 03/25/2035 | 13,139,640 | 13,508,384 | ||||||||||
| RALI Series Trust: | ||||||||||||
| Series 2004-QS3, Class CB, 5.000%, 03/25/2019 | 807,557 | 803,188 | ||||||||||
| Series 2004-QS13, Class CB, 5.000%, 09/25/2019 | 779,898 | 783,578 | ||||||||||
| Series 2004-QS5, Class A5, 4.750%, 04/25/2034 | 2,491 | 2,507 | ||||||||||
| Series 2004-QS16, Class 1A1, 5.500%, 12/25/2034 | 1,111,766 | 1,113,658 | ||||||||||
| Series 2005-QS2, Class A1, 5.500%, 02/25/2035 | 347,460 | 343,308 | ||||||||||
| Series 2005-QS5, Class A1, 0.853%, 04/25/2035 § ∞ | 3,967,779 | 2,938,237 | ||||||||||
Series 2005-QS9, Class A2, 0.953%, 06/25/2035 § ∞ | 1,653,681 | 1,299,336 | ||||||||||
| Series 2005-QS11, Class A2, 0.953%, 07/25/2035 ∞ | 6,908,154 | 5,607,716 | ||||||||||
| Series 2005-QA7, Class A22, 3.366%, 07/25/2035 ∞ | 4,717,295 | 4,329,971 | ||||||||||
| Structured Asset Securities Corp., | ||||||||||||
| Series 2003-31A, Class 2A7, 2.824%, 10/25/2033 ∞ | 2,741,380 | 2,689,486 | ||||||||||
| Structured Asset Securities Corp. Mortgage Loan Trust, | ||||||||||||
| Series 2005-7XS, Class 1A4B, 5.440%, 04/25/2035 | 217,461 | 226,353 | ||||||||||
| WaMu Mortgage Pass-Through Certificates: | ||||||||||||
| Series 2004-CB1, Class 5A, 5.000%, 06/25/2019 | 35,978 | 36,394 | ||||||||||
| Series 2004-CB2, Class 5A, 5.000%, 07/25/2019 | 32,195 | 32,532 | ||||||||||
| Series 2004-CB2, Class 7A, 5.500%, 08/25/2019 | 71,364 | 72,347 | ||||||||||
| Series 2004-CB3, Class 3A, 5.500%, 10/25/2019 | 7,365 | 7,476 | ||||||||||
| Series 2004-CB3, Class 4A, 6.000%, 10/25/2019 | 21,686 | 22,434 | ||||||||||
| Series 2004-CB4, Class 22A, 6.000%, 12/25/2019 | 101,315 | 103,682 | ||||||||||
| Series 2004-CB3, Class 1A, 6.000%, 10/25/2034 | 6,301,289 | 6,604,478 | ||||||||||
| Series 2004-CB3, Class 2A, 6.500%, 10/25/2034 | 6,309,618 | 6,795,677 | ||||||||||
| Series 2005-3, Class 1CB3, 0.903%, 05/25/2035 § ∞ | 9,432,082 | 6,930,281 | ||||||||||
| Series 2005-6, Class 2A4, 5.500%, 08/25/2035 § | 12,197,524 | 11,093,556 | ||||||||||
| Wells Fargo Alternative Loan Trust, | ||||||||||||
| Series 2007-PA1, Class A4, 6.000%, 03/25/2037 | 87,206 | 72,053 | ||||||||||
| Wells Fargo Mortgage Backed Securities: | ||||||||||||
| Series 2005-AR16, Class 4A2, 2.952%, 10/25/2035 ∞ | 4,808,168 | 4,762,240 | ||||||||||
| Series 2006-AR10, Class 5A5, 3.046%, 07/25/2036 § ∞ | 11,875,356 | 11,389,602 | ||||||||||
| Series 2006-AR14, Class 2A3, 2.751%, 10/25/2036 § ∞ | 6,055,722 | 5,603,738 | ||||||||||
| Series 2006-15, Class A1, 6.000%, 11/25/2036 | 8,781,003 | 8,753,060 | ||||||||||
| Series 2007-8, Class 2A8, 6.000%, 07/25/2037 | 9,196,216 | 9,159,459 | ||||||||||
| Wells Fargo Mortgage Backed Securities Trust: | ||||||||||||
| Series 2005-16, Class A18, 6.000%, 01/25/2036 | 2,446,807 | 2,416,112 | ||||||||||
| Series 2007-4, Class A15, 6.000%, 04/25/2037 § | 9,681,424 | 9,491,261 | ||||||||||
| 495,086,301 | 4.4 | % | ||||||||||
| Asset Backed Securities | ||||||||||||
| ABFC Trust, | ||||||||||||
| Series 2006-OPT1, Class A3C2, 0.603%, 09/25/2036 ∞ | 11,153,462 | 10,339,038 | ||||||||||
| Accredited Mortgage Loan Trust: | ||||||||||||
| Series 2005-4, Class A2D, 0.773%, 12/25/2035 ∞ | 13,523,024 | 12,998,113 | ||||||||||
| Series 2007-1, Class A3, 0.583%, 02/25/2037 ∞ | 7,398,439 | 7,069,341 | ||||||||||
| ACE Securities Corp. Home Equity Loan Trust, | ||||||||||||
| Series 2006-OP1, Class A2C, 0.603%, 04/25/2036 ∞ | 14,040,850 | 13,496,782 | ||||||||||
| AMRESCO Residential Securities Corp. Mortgage Loan Trust, | ||||||||||||
| Series 1998-2, Class A6, 6.405%, 12/25/2027 | 2,445 | 2,414 | ||||||||||
| Asset Backed Securities Corp. Home Equity Loan Trust, | ||||||||||||
| Series 2006-HE2, Class A1, 0.643%, 03/25/2036 ∞ | 29,943,833 | 27,361,477 | ||||||||||
| Bayview Financial Acquisition Trust, | ||||||||||||
| Series 2007-A, Class 1A2, 6.205%, 05/28/2037 | 559,916 | 582,546 | ||||||||||
| Bayview Financial Mortgage Pass-Through Trust, | ||||||||||||
| Series 2007-B, Class 1A2, 6.831%, 08/28/2047 | 142,531 | 120,580 | ||||||||||
| Bear Stearns Asset Backed Securities I Trust: | ||||||||||||
| Series 2006-HE8, Class 21A2, 0.623%, 10/25/2036 ∞ | 11,013,002 | 10,457,801 | ||||||||||
| Series 2007-HE5, Class 1A2, 0.633%, 06/25/2047 ∞ | 12,176,396 | 11,775,943 | ||||||||||
| Bear Stearns Asset Backed Securities Trust, | ||||||||||||
| Series 2007-2, Class A2, 0.773%, 01/25/2047 ∞ | 10,919,060 | 10,501,544 | ||||||||||
| BMW Floorplan Master Owner Trust, | ||||||||||||
| Series 2015-1A, Class A, 0.942%, 07/15/2020 (Acquired 07/15/2015, Cost $14,925,000) * ∞ | 14,925,000 | 14,925,916 | ||||||||||
| Carrington Mortgage Loan Trust: | ||||||||||||
| Series 2005-FRE1, Class A6, 0.833%, 12/25/2035 ∞ | 15,698,002 | 15,208,292 | ||||||||||
| Series 2006-NC1, Class A3, 0.663%, 01/25/2036 ∞ | 6,070,199 | 5,884,429 | ||||||||||
| Series 2006-OPT1, Class A3, 0.633%, 02/25/2036 ∞ | 7,923,712 | 7,734,060 | ||||||||||
| Series 2006-NC2, Class A2, 0.543%, 06/25/2036 ∞ | 311,039 | 310,355 | ||||||||||
| Chase Issuance Trust, | ||||||||||||
| Series 2015-A5, Class A5, 1.360%, 04/15/2020 | 35,796,000 | 36,010,042 | ||||||||||
| Citibank Credit Card Issuance Trust, | ||||||||||||
| Series 2007-A3, Class A3, 6.150%, 06/15/2039 | 6,100,000 | 8,467,259 | ||||||||||
| Citicorp Residential Mortgage Trust: | ||||||||||||
| Series 2006-2, Class A4, 5.775%, 09/25/2036 | 6,347,137 | 6,544,745 | ||||||||||
| Series 2006-3, Class A4, 5.703%, 11/25/2036 | 3,209,732 | 3,318,192 | ||||||||||
| Series 2007-1, Class A6, 5.702%, 03/25/2037 | 224,057 | 232,487 | ||||||||||
| Series 2007-2, Class A4, 5.436%, 06/25/2037 | 49,733,363 | 51,368,033 | ||||||||||
| Citigroup Mortgage Loan Trust, Inc., | ||||||||||||
| Series 2007-WFH1, Class A3, 0.603%, 01/25/2037 ∞ | 3,243,918 | 3,209,609 | ||||||||||
| Cityscape Home Equity Loan Trust, | ||||||||||||
| Series 1997-C, Class A4, 7.000%, 07/25/2028 § | 7,057 | 6,420 | ||||||||||
| Conseco Financial Corp.: | ||||||||||||
| Series 1993-4, Class A5, 7.050%, 01/15/2019 | 1,321 | 1,344 | ||||||||||
| Series 1998-3, Class A5, 6.220%, 03/01/2030 | 277,992 | 292,256 | ||||||||||
| Series 1998-4, Class A5, 6.180%, 04/01/2030 | 126,017 | 132,781 | ||||||||||
| Countrywide Asset-Backed Certificates: | ||||||||||||
| Series 2007-4, Class A3, 5.329%, 10/25/2032 § ∞ | 758,036 | 625,579 | ||||||||||
| Series 2004-12, Class AF6, 4.634%, 03/25/2035 ∞ | 157,653 | 162,769 | ||||||||||
| Series 2004-15, Class AF6, 4.613%, 04/25/2035 ∞ | 115,592 | 116,333 | ||||||||||
| Series 2005-7, Class AF6, 4.693%, 10/25/2035 ∞ | 378,547 | 388,768 | ||||||||||
| Series 2005-10, Class AF6, 4.576%, 02/25/2036 ∞ | 982,936 | 1,007,830 | ||||||||||
| Series 2005-11, Class AF3, 4.761%, 02/25/2036 ∞ | 716,146 | 731,207 | ||||||||||
| Series 2005-13, Class AF3, 4.821%, 04/25/2036 ∞ | 1,332,657 | 1,154,555 | ||||||||||
| Series 2006-S9, Class A3, 5.728%, 08/25/2036 ∞ | 78,623 | 78,606 | ||||||||||
| Series 2006-13, Class 1AF3, 4.626%, 01/25/2037 § ∞ | 100,643 | 144,195 | ||||||||||
| Series 2006-10, Class 1AF3, 4.776%, 09/25/2046 ∞ | 1,022,273 | 824,337 | ||||||||||
| Series 2006-9, Class 1AF3, 4.841%, 10/25/2046 ∞ | 408,526 | 323,664 | ||||||||||
| Credit-Based Asset Servicing and Securitization LLC: | ||||||||||||
| Series 2005-CB8, Class AF2, 4.070%, 12/25/2035 | 1,111,637 | 1,099,953 | ||||||||||
| Series 2007-CB4, Class A1A, 0.543%, 04/25/2037 ∞ | 6,361,384 | 5,747,080 | ||||||||||
| CWHEQ Home Equity Loan Trust, | ||||||||||||
| Series 2007-S1, Class A6, 5.693%, 11/25/2036 ∞ | 30,233 | 29,819 | ||||||||||
| Enterprise Fleet Financing LLC, | ||||||||||||
| Series 2015-2, Class A2, 1.590%, 02/22/2021 (Acquired 07/22/2015 through 06/22/2016, Cost $9,996,929) * | 10,000,419 | 10,012,914 | ||||||||||
| First Franklin Mortgage Loan Trust: | ||||||||||||
| Series 2006-FF3, Class A2B, 0.653%, 02/25/2036 ∞ | 16,936,112 | 16,290,479 | ||||||||||
| Series 2006-FF4, Class A2, 0.643%, 03/25/2036 ∞ | 5,305,546 | 5,116,850 | ||||||||||
| Series 2006-FF15, Class A5, 0.613%, 11/25/2036 ∞ | 10,676,056 | 9,456,408 | ||||||||||
| Ford Credit Auto Owner Trust: | ||||||||||||
| Series 2016-1, Class A, 2.310%, 08/15/2027 (Acquired 02/23/2016 through 05/27/2016, Cost $37,668,385) * | 37,625,000 | 38,411,573 | ||||||||||
| Series 2016-2, Class A, 2.030%, 12/15/2027 (Acquired 06/20/2016, Cost $29,264,882) * | 29,275,000 | 29,428,846 | ||||||||||
| GE Capital Mortgage Services, Inc. Trust, | ||||||||||||
| Series 1999-HE1, Class A7, 6.265%, 04/25/2029 | 639 | 644 | ||||||||||
| GSAMP Trust, | ||||||||||||
| Series 2005-AHL2, Class A2C, 0.693%, 12/25/2035 ∞ | 8,931,015 | 8,336,249 | ||||||||||
| Home Equity Asset Trust, | ||||||||||||
| Series 2006-4, Class 2A3, 0.623%, 08/25/2036 ∞ | 398,401 | 393,913 | ||||||||||
| HSI Asset Securitization Corp. Trust: | ||||||||||||
| Series 2006-OPT4, Class 2A3, 0.613%, 03/25/2036 ∞ | 5,266,396 | 4,885,088 | ||||||||||
| Series 2007-WF1, Class 2A3, 0.623%, 05/25/2037 ∞ | 17,445,184 | 16,703,767 | ||||||||||
| J.P. Morgan Mortgage Acquisition Trust: | ||||||||||||
| Series 2007-CH1, Class AV5, 0.693%, 11/25/2036 ∞ | 9,265,769 | 8,991,758 | ||||||||||
| Series 2007-CH3, Class A3, 0.603%, 03/25/2037 ∞ | 9,525,849 | 9,456,409 | ||||||||||
| Series 2007-CH5, Class A3, 0.563%, 05/25/2037 ∞ | 1,191,846 | 1,183,136 | ||||||||||
| Leaf Receivables Funding 11 LLC, | ||||||||||||
| Series 2016-1, Class A3, 2.050%, 06/15/2019 (Acquired 05/18/2016, Cost $12,998,798) * | 13,000,000 | 13,040,013 | ||||||||||
| Long Beach Mortgage Loan Trust, | ||||||||||||
| Series 2006-WL2, Class 2A3, 0.653%, 01/25/2036 ∞ | 1,645,790 | 1,589,981 | ||||||||||
| MASTR Asset Backed Securities Trust, | ||||||||||||
| Series 2006-NC1, Class A4, 0.753%, 01/25/2036 ∞ | 6,833,026 | 6,593,794 | ||||||||||
| Morgan Stanley: | ||||||||||||
| Series 2006-HE2, Class A1, 0.623%, 03/25/2036 ∞ | 12,659,819 | 11,697,721 | ||||||||||
| Series 2006-HE3, Class A2C, 0.613%, 04/25/2036 ∞ | 957,322 | 942,194 | ||||||||||
| Nationstar Home Equity Loan Trust, | ||||||||||||
| Series 2007-C, Class 2AV2, 0.583%, 06/25/2037 ∞ | 9,959,285 | 9,771,632 | ||||||||||
| Navistar Financial Dealer Note Master Owner Trust II, | ||||||||||||
| Series 2015-1, Class A, 1.846%, 06/25/2020 (Acquired 07/22/2015 through 08/26/2015, Cost $32,067,008) * ∞ | 32,070,000 | 31,868,844 | ||||||||||
| Oakwood Mortgage Investors, Inc., | ||||||||||||
| Series 1999-B, Class A3, 6.450%, 11/15/2017 | 19,910 | 20,509 | ||||||||||
| OneMain Financial Issuance Trust: | ||||||||||||
| Series 2014-2A, Class A, 2.470%, 09/18/2024 (Acquired 02/05/2016 through 02/22/2016, Cost $11,563,328) * | 11,600,000 | 11,625,190 | ||||||||||
| Series 2015-2A, Class A, 2.570%, 07/18/2025 (Acquired 03/22/2016, Cost $2,460,547) * | 2,500,000 | 2,499,260 | ||||||||||
| Option One Mortgage Loan Trust Asset-Backed Certificates, | ||||||||||||
| Series 2005-4, Class A3, 0.713%, 11/25/2035 ∞ | 224,470 | 223,195 | ||||||||||
| RAMP Series Trust: | ||||||||||||
| Series 2002-RS3, Class AI5, 5.572%, 06/25/2032 ∞ | 2,424,416 | 2,385,698 | ||||||||||
| Series 2003-RS10, Class AI7, 4.850%, 11/25/2033 ∞ | 9,220 | 9,257 | ||||||||||
| Series 2006-NC2, Class A2, 0.643%, 02/25/2036 ∞ | 11,788,705 | 11,596,084 | ||||||||||
| Series 2006-RS4, Class A3, 0.623%, 07/25/2036 ∞ | 5,491,210 | 5,362,654 | ||||||||||
| RASC Series Trust: | ||||||||||||
| Series 2003-KS5, Class AI6, 3.620%, 07/25/2033 ∞ | 22,085 | 21,493 | ||||||||||
| Series 2003-KS9, Class AI6, 4.710%, 11/25/2033 ∞ | 47,378 | 45,626 | ||||||||||
| Series 2006-EMX2, Class A2, 0.653%, 02/25/2036 ∞ | 2,051,334 | 2,041,388 | ||||||||||
| Series 2006-EMX2, Class A3, 0.753%, 02/25/2036 ∞ | 11,596,000 | 11,147,991 | ||||||||||
| Series 2007-KS1, Class A3, 0.603%, 01/25/2037 ∞ | 3,813,787 | 3,501,866 | ||||||||||
| Renaissance Home Equity Loan Trust: | ||||||||||||
| Series 2005-1, Class AF6, 4.970%, 05/25/2035 | 69,908 | 70,944 | ||||||||||
| Series 2005-2, Class AF6, 4.781%, 08/25/2035 | 3,333,775 | 3,410,734 | ||||||||||
| Series 2005-3, Class AF3, 4.814%, 11/25/2035 | 1,226,166 | 1,235,293 | ||||||||||
| Series 2006-2, Class AF3, 5.797%, 08/25/2036 | 16,175,101 | 9,638,083 | ||||||||||
| Series 2006-3, Class AF2, 5.580%, 11/25/2036 | 10,779,716 | 5,850,907 | ||||||||||
| Series 2007-1, Class AF2, 5.512%, 04/25/2037 | 479,393 | 228,064 | ||||||||||
| Series 2007-1, Class AF3, 5.612%, 04/25/2037 | 287,636 | 139,319 | ||||||||||
| Series 2007-2, Class AF2, 5.675%, 06/25/2037 | 1,461,860 | 670,687 | ||||||||||
| Security National Mortgage Co., | ||||||||||||
| Series 2005-1A, Class AF1, 4.670%, 02/25/2035 (Acquired 06/29/2015, Cost $1,439) * ∞ | 1,439 | 1,436 | ||||||||||
| Soundview Home Loan Trust: | ||||||||||||
| Series 2005-OPT4, Class 2A3, 0.713%, 12/25/2035 ∞ | 7,622,551 | 7,507,113 | ||||||||||
| Series 2006-OPT4, Class 2A3, 0.603%, 06/25/2036 ∞ | 5,485,249 | 5,018,735 | ||||||||||
| Specialty Underwriting & Residential Finance Trust, | ||||||||||||
| Series 2004-BC4, Class A1A, 1.123%, 10/25/2035 ∞ | 3,212,055 | 3,138,116 | ||||||||||
| Springleaf Funding Trust, | ||||||||||||
| Series 2014-AA, Class A, 2.410%, 12/15/2022 (Acquired 06/11/2015 through 12/03/2015, Cost $25,258,876) * | 25,211,834 | 25,227,039 | ||||||||||
| TCF Auto Receivables Owner Trust: | ||||||||||||
| Series 2015-1A, Class A3, 1.490%, 12/16/2019 (Acquired 06/03/2015 through 06/23/2016, Cost $18,076,433) * | 18,075,000 | 18,093,044 | ||||||||||
| Series 2014-1A, Class A4, 1.560%, 01/15/2020 (Acquired 05/29/2015 through 01/26/2016, Cost $10,801,260) * | 10,850,000 | 10,871,458 | ||||||||||
| 646,539,890 | 5.8 | % | ||||||||||
| Commercial Mortgage-Backed Securities | ||||||||||||
| Non-U.S. Government Agency Issues | ||||||||||||
| Citigroup Commercial Mortgage Trust, | ||||||||||||
| Series 2014-GC19, Class A3, 3.753%, 03/10/2047 | 5,000,000 | 5,483,250 | ||||||||||
| COMM Mortgage Trust: | ||||||||||||
| Series 2012-CR1, Class A3, 3.391%, 05/15/2045 | 25,842,000 | 27,823,428 | ||||||||||
| Series 2013-CR9, Class A3, 4.022%, 07/10/2045 | 23,325,000 | 25,940,754 | ||||||||||
| Series 2012-CR2, Class A4, 3.147%, 08/15/2045 | 30,063,000 | �� | 32,001,667 | |||||||||
| Series 2014-CR18, Class A4, 3.550%, 07/15/2047 | 5,000,000 | 5,407,884 | ||||||||||
| Series 2014-CR20, Class ASB, 3.305%, 11/10/2047 | 12,000,000 | 12,778,602 | ||||||||||
| DBUBS Mortgage Trust, | ||||||||||||
| Series 2011-LC3A, Class A4, 4.551%, 08/10/2044 | 2,275,000 | 2,531,855 | ||||||||||
| GS Mortgage Securities Corp. II, | ||||||||||||
| Series 2012-GCJ9, Class A3, 2.773%, 11/10/2045 | 41,464,000 | 43,336,929 | ||||||||||
| GS Mortgage Securities Trust: | ||||||||||||
| Series 2011-GC5, Class A4, 3.707%, 08/10/2044 | 14,724,873 | 16,001,609 | ||||||||||
| Series 2014-GC20, Class AAB, 3.655%, 04/10/2047 | 14,620,000 | 15,878,347 | ||||||||||
| J.P. Morgan Chase Commercial Mortgage Securities Corp., | ||||||||||||
| Series 2012-LC9, Class ASB, 2.437%, 12/15/2047 | 3,450,000 | 3,551,603 | ||||||||||
| J.P. Morgan Chase Commercial Mortgage Securities Trust: | ||||||||||||
| Series 2013-LC11, Class A4, 2.694%, 04/15/2046 | 10,150,000 | 10,482,476 | ||||||||||
| Series 2013-LC11, Class A5, 2.960%, 04/15/2046 | 22,075,000 | 23,132,984 | ||||||||||
| Series 2013-C10, Class ASB, 2.702%, 12/15/2047 | 19,950,000 | 20,748,503 | ||||||||||
| JPMBB Commercial Mortgage Securities Trust: | ||||||||||||
| Series 2013-C17, Class A3, 3.928%, 01/15/2047 | 23,700,000 | 26,328,456 | ||||||||||
| Series 2014-C25, Class A5, 3.672%, 11/15/2047 | 34,585,000 | 37,683,885 | ||||||||||
| Morgan Stanley Bank of America Merrill Lynch Trust: | ||||||||||||
| Series 2012-C5, Class A4, 3.176%, 08/15/2045 | 40,030,000 | 42,642,678 | ||||||||||
| Series 2012-C6, Class A4, 2.858%, 11/15/2045 | 32,035,000 | 33,580,647 | ||||||||||
| Series 2013-C10, Class A3, 4.104%, 07/15/2046 ∞ | 43,985,000 | 48,958,261 | ||||||||||
| Series 2013-C11, Class A3, 3.960%, 08/15/2046 | 19,100,000 | 21,322,812 | ||||||||||
| Series 2015-C25, Class ASB, 3.383%, 10/15/2048 | 16,332,000 | 17,508,583 | ||||||||||
| Wells Fargo Commercial Mortgage Trust: | ||||||||||||
| Series 2013-LC12, Class A3, 3.986%, 07/15/2046 | 13,600,000 | 15,153,606 | ||||||||||
| Series 2015-C26, Class ASB, 2.991%, 02/15/2048 | 15,049,000 | 15,728,521 | ||||||||||
| WFRBS Commercial Mortgage Trust: | ||||||||||||
| Series 2013-C11, Class A5, 3.071%, 03/15/2045 | 12,000,000 | 12,671,088 | ||||||||||
| Series 2012-C6, Class A4, 3.440%, 04/15/2045 | 19,016,000 | 20,439,865 | ||||||||||
| Series 2013-C18, Class A4, 3.896%, 12/15/2046 | 21,950,000 | 24,368,174 | ||||||||||
| Series 2014-C24, Class A5, 3.607%, 11/15/2047 | 20,000,000 | 21,739,988 | ||||||||||
| Series 2014-C23, Class ASB, 3.636%, 10/15/2057 | 10,500,000 | 11,333,032 | ||||||||||
| 594,559,487 | 5.3 | % | ||||||||||
| Total Long-Term Investments (Cost $10,761,044,368) | 11,014,508,394 | 98.1 | % | |||||||||
| Shares | ||||||||||||
| SHORT-TERM INVESTMENTS | ||||||||||||
| Money Market Mutual Funds | ||||||||||||
| Dreyfus Institutional Cash Advantage Fund, Institutional Class, 0.39% « | 184,638,042 | 184,638,042 | ||||||||||
| Short-Term Investments Trust - Liquid Assets Portfolio, Institutional Class, 0.43% « | 221,000,000 | 221,000,000 | ||||||||||
| Total Short-Term Investments (Cost $405,638,042) | 405,638,042 | 3.6 | % | |||||||||
| INVESTMENT PURCHASED WITH CASH PROCEEDS FROM | ||||||||||||
| SECURITIES LENDING | ||||||||||||
| Investment Company | ||||||||||||
| Mount Vernon Securities Lending Trust Prime Portfolio, 0.56% « | 276,410,416 | 276,410,416 | ||||||||||
| Total Investment Company (Cost $276,410,416) | 276,410,416 | 2.5 | % | |||||||||
| Total Investment Purchased With Cash Proceeds From | ||||||||||||
| Securities Lending (Cost $276,410,416) | 276,410,416 | 2.5 | % | |||||||||
| Total Investments (Cost $11,443,092,826) | 11,696,556,852 | 104.2 | % | |||||||||
| Liabilities in Excess of Other Assets | (473,198,755 | ) | (4.2 | )% | ||||||||
| TOTAL NET ASSETS | $ | 11,223,358,097 | 100.0 | % | ||||||||
Notes to Schedule of Investments | |
| * | Restricted security as defined in Rule 144 under the Securities Act of 1933 and determined to be liquid. Purchased in a private placement transaction; resale to the public may require registration or or may extend only to qualified institutional buyers. At June 30, 2016, the value of these securities total $1,981,555,664, which represents 17.66% of total net assets. |
| @ | This security or portion of this security is out on loan at June 30, 2016. |
| f | Foreign Security |
| § | Security in Default |
| ∞ | Variable or Floating rate security. Floating rate securities are securities whose yields vary with a designated index rate. These securities rates are as of June 30, 2016. |
| « | 7-Day Yield |
| Baird Short-Term Municipal Bond Fund | ||||||||||||
| Schedule of Investments | ||||||||||||
| June 30, 2016 (Unaudited) | ||||||||||||
| LONG-TERM INVESTMENTS | ||||||||||||
| Principal | % of | |||||||||||
| Amount | Value | Net Assets | ||||||||||
| Municipal Bonds | ||||||||||||
| Alabama | ||||||||||||
| Jasper Water Works & Sewer Board, Inc., | ||||||||||||
| 5.000%, 06/01/2024 (Callable 06/01/2021) | $ | 100,000 | $ | 116,021 | ||||||||
| State of Alabama Docks Department, | ||||||||||||
| 5.000%, 10/01/2022 (Callable 10/01/2016) | 25,000 | 25,227 | ||||||||||
| 141,248 | 0.6 | % | ||||||||||
| Alaska | ||||||||||||
| Alaska Housing Finance Corp., | ||||||||||||
| 4.000%, 06/01/2040 (Callable 06/01/2021) | 55,000 | 57,100 | 0.2 | % | ||||||||
| Arizona | ||||||||||||
| Arizona Health Facilities Authority, | ||||||||||||
| 4.625%, 07/01/2019 | 30,000 | 33,229 | ||||||||||
| Arizona Transportation Board: | ||||||||||||
| 5.000%, 07/01/2017 | 25,000 | 26,092 | ||||||||||
| 5.000%, 07/01/2025 (Pre-refunded to 07/01/2019) | 250,000 | 281,317 | ||||||||||
| BluePath 2016-1 TE Trust, | ||||||||||||
| 2.750%, 09/01/2026 (Callable 08/27/2021) | 250,000 | 249,995 | ||||||||||
| City of El Mirage AZ, | ||||||||||||
| 5.000%, 07/01/2026 (Callable 07/01/2020) | 50,000 | 57,796 | ||||||||||
| Festival Ranch Community Facilities District, | ||||||||||||
| 2.000%, 07/15/2018 (Insured by BAM)(3) | 25,000 | 25,440 | ||||||||||
| Maricopa County Industrial Development Authority: | ||||||||||||
| 2.550%, 07/01/2021 | 175,000 | 176,720 | ||||||||||
| 2.625%, 07/01/2021 | 100,000 | 101,051 | ||||||||||
| Pima County AZ Revenue Bonds, | ||||||||||||
| 3.500%, 12/01/2016 | 20,000 | 20,204 | ||||||||||
| State of Arizona, | ||||||||||||
| 5.000%, 10/01/2017 | 50,000 | 52,647 | ||||||||||
| The Industrial Development Authority of the County of Pima, | ||||||||||||
| 4.950%, 10/01/2020 | 35,000 | 39,400 | ||||||||||
| Vistancia Community Facilities District, | ||||||||||||
| 5.000%, 07/15/2021 (Callable 07/15/2020) | 150,000 | 173,228 | ||||||||||
| 1,237,119 | 4.9 | % | ||||||||||
| Arkansas | ||||||||||||
| City of Jacksonville AR Wastewater Revenue, | ||||||||||||
| 4.000%, 12/01/2025 (Callable 06/01/2021) | 110,000 | 122,290 | ||||||||||
| City of Little Rock AR, | ||||||||||||
| 2.000%, 03/01/2038 (Callable 03/01/2021) | 50,000 | 50,797 | ||||||||||
| City of Rogers AR, | ||||||||||||
| 2.125%, 11/01/2029 (Callable 11/01/2021) | 80,000 | 80,280 | ||||||||||
| Pulaski County Public Facilities Board, | ||||||||||||
| 4.000%, 07/01/2017 | 50,000 | 51,224 | ||||||||||
| University of Central Arkansas, | ||||||||||||
| 2.500%, 09/01/2017 (Insured by AGM) | 40,000 | 40,765 | ||||||||||
| 345,356 | 1.4 | % | ||||||||||
| California | ||||||||||||
| California Health Facilities Financing Authority, | ||||||||||||
| 5.000%, 04/01/2020 | 65,000 | 71,787 | ||||||||||
| California Municipal Finance Authority, | ||||||||||||
| 0.650%, 09/01/2021 (Mandatory Tender Date 10/03/2016)(1) | 100,000 | 100,000 | ||||||||||
| California School Finance Authority: | ||||||||||||
| 3.000%, 08/01/2017 | 50,000 | 51,061 | ||||||||||
| 3.000%, 08/01/2017 | 100,000 | 102,122 | ||||||||||
| California State Public Works Board, | ||||||||||||
| 5.000%, 12/01/2019 (Insured by AMBAC) | 80,000 | 86,811 | ||||||||||
| City of Redding CA, | ||||||||||||
| 0.963%, 07/01/2022 (ETM)(1)(2) | 50,000 | 46,965 | ||||||||||
| Corona-Norca Unified School District, | ||||||||||||
| 0.000%, 08/01/2026 | 20,000 | 20,657 | ||||||||||
| Jurupa Public Financing Authority, | ||||||||||||
| 4.000%, 09/01/2018 | 25,000 | 26,379 | ||||||||||
| La Quinta Financing Authority, | ||||||||||||
| 5.550%, 10/01/2018 | 55,000 | 58,046 | ||||||||||
| Los Angeles Unified School District/CA, | ||||||||||||
| 4.750%, 07/01/2019 (Callable 07/01/2016)(Insured by AGM) | 30,000 | 30,000 | ||||||||||
| Menlo Park City School District, | ||||||||||||
| 0.000%, 07/01/2025 (Callable 07/01/2018) | 100,000 | 68,357 | ||||||||||
| Northern California Gas Authority No. 1, | ||||||||||||
| 1.049%, 07/01/2019 (1) | 100,000 | 97,435 | ||||||||||
| Rocklin Unified School District Community Facilities District, | ||||||||||||
| 0.000%, 09/01/2022 (Insured by AMBAC) | 50,000 | 43,358 | ||||||||||
| San Diego Community Facilities District No. 3, | ||||||||||||
| 5.000%, 09/01/2018 | 25,000 | 27,079 | ||||||||||
| Twin Rivers Unified School District, | ||||||||||||
| 3.200%, 06/01/2035 (Callable 08/01/2016)(Mandatory Tender Date 06/01/2020)(Insured by AGM) | 100,000 | 100,180 | ||||||||||
| Washington Township Health Care District, | ||||||||||||
| 5.000%, 07/01/2017 | 50,000 | 51,822 | ||||||||||
| 982,059 | 3.9 | % | ||||||||||
| Colorado | ||||||||||||
| Bromley Park Metropolitan District No. 2, | ||||||||||||
| 4.250%, 12/01/2022 (Callable 12/01/2017) | 60,000 | 60,642 | ||||||||||
| City of Golden CO, | ||||||||||||
| 4.375%, 12/01/2020 (Callable 12/01/2016) | 25,000 | 25,357 | ||||||||||
| Colorado Educational & Cultural Facilities Authority: | ||||||||||||
| 4.000%, 07/01/2018 | 120,000 | 126,891 | ||||||||||
| 3.000%, 12/15/2018 | 75,000 | 78,331 | ||||||||||
| 4.000%, 06/01/2020(3) | 100,000 | 109,441 | ||||||||||
| 4.000%, 10/01/2020 | 125,000 | 136,969 | ||||||||||
| E-470 Public Highway Authority: | ||||||||||||
| 0.000%, 09/01/2020 | 125,000 | 118,012 | ||||||||||
| 2.160%, 09/01/2039 (Callable 03/01/2017)(Mandatory Tender Date 09/01/2017)(1) | 75,000 | 75,356 | ||||||||||
| Fossil Ridge Metropolitan District No. 3, | ||||||||||||
| 4.000%, 12/01/2020 | 50,000 | 54,524 | ||||||||||
| Regional Transportation District, | ||||||||||||
| 5.000%, 06/01/2025 (Callable 06/01/2020) | 100,000 | 113,096 | ||||||||||
| VDW Metropolitan District No. 2, | ||||||||||||
| 1.250%, 12/01/2018 (Insured by AGM) | 100,000 | 100,147 | ||||||||||
| 998,766 | 4.0 | % | ||||||||||
| Connecticut | ||||||||||||
| Connecticut Housing Finance Authority, | ||||||||||||
| 4.000%, 11/15/2045 (Callable 05/15/2025) | 200,000 | 219,476 | ||||||||||
| Regional School District No. 8, | ||||||||||||
| 5.000%, 05/01/2019 (Callable 05/01/2017) | 75,000 | 77,699 | ||||||||||
| Town of Plymouth CT, | ||||||||||||
| 4.000%, 07/15/2019 | 25,000 | 26,552 | ||||||||||
| 323,727 | 1.3 | % | ||||||||||
| District of Columbia | ||||||||||||
| District of Columbia: | ||||||||||||
| 5.450%, 07/15/2035 (Pre-refunded to 07/15/2018)(Insured by AGM) | 100,000 | 109,326 | ||||||||||
| 5.250%, 07/15/2038 (Pre-refunded to 07/15/2018) | 295,000 | 321,877 | ||||||||||
| 5.250%, 07/15/2045 (Pre-refunded to 07/15/2018)(Insured by AGM) | 170,000 | 185,489 | ||||||||||
| 616,692 | 2.5 | % | ||||||||||
| Florida | ||||||||||||
| City of Cocoa FL Water & Sewer Revenue, | ||||||||||||
| 5.500%, 10/01/2016 (Insured by AMBAC) | 15,000 | 15,179 | ||||||||||
| City of Jacksonville FL, | ||||||||||||
| 5.000%, 11/01/2022 | 50,000 | 58,959 | ||||||||||
| City of North Port FL, | ||||||||||||
| 4.000%, 07/01/2018 (Insured by BAM) | 50,000 | 53,013 | ||||||||||
| City of Port St Lucie FL Utility System Revenue, | ||||||||||||
| 5.000%, 09/01/2021 | 35,000 | 41,071 | ||||||||||
| City of Port St. Lucie FL, | ||||||||||||
| 5.250%, 09/01/2022 | 100,000 | 122,025 | ||||||||||
| City of Tallahassee FL, | ||||||||||||
| 5.000%, 12/01/2019 | 50,000 | 55,961 | ||||||||||
| Florida Housing Finance Corp., | ||||||||||||
| 4.000%, 07/01/2047 (Callable 07/01/2025) | 150,000 | 165,883 | ||||||||||
| Florida Municipal Power Agency, | ||||||||||||
| 0.753%, 10/01/2021 (Callable 07/07/2016)(Insured by AMBAC)(1)(2) | 50,000 | 45,423 | ||||||||||
| Halifax Hospital Medical Center, | ||||||||||||
| 3.000%, 06/01/2017 | 55,000 | 56,111 | ||||||||||
| Orange County Health Facilities Authority, | ||||||||||||
| 6.250%, 10/01/2021 | 50,000 | 57,886 | ||||||||||
| Orange County School Board, | ||||||||||||
| 4.500%, 08/01/2020 (Pre-refunded to 08/01/2017) | 35,000 | 36,461 | ||||||||||
| Pasco County School Board, | ||||||||||||
| 0.890%, 08/01/2030 (Callable 07/01/2016)(Insured by AMBAC)(1)(2) | 100,000 | 100,000 | ||||||||||
| St. Lucie County FL School Board, | ||||||||||||
| 5.000%, 10/01/2018 (Insured by AGM) | 50,000 | 54,457 | ||||||||||
| 862,429 | 3.5 | % | ||||||||||
| Georgia | ||||||||||||
| Bartow County Development Authority, | ||||||||||||
| 2.375%, 09/01/2029 (Mandatory Tender Date 08/10/2017) | 185,000 | 187,579 | ||||||||||
| Georgia State Road & Tollway Authority, | ||||||||||||
| 5.000%, 06/01/2017 (Callable 08/01/2016) | 30,000 | 30,100 | ||||||||||
| Main Street Natural Gas, Inc.: | ||||||||||||
| 5.000%, 03/15/2019 | 125,000 | 137,158 | ||||||||||
| 5.000%, 03/15/2022 | 20,000 | 23,235 | ||||||||||
| Private Colleges & Universities Authority, | ||||||||||||
| 5.000%, 10/01/2020 | 50,000 | 56,671 | ||||||||||
| 434,743 | 1.7 | % | ||||||||||
| Idaho | ||||||||||||
| Idaho Housing & Finance Association, | ||||||||||||
| 5.000%, 07/15/2018 | 25,000 | 27,037 | 0.1 | % | ||||||||
| Illinois | ||||||||||||
| Chicago O'Hare International Airport: | ||||||||||||
| 5.000%, 01/01/2020 (Callable 01/01/2017)(Insured by AGM) | 65,000 | 66,319 | ||||||||||
| 5.000%, 01/01/2020 | 50,000 | 56,688 | ||||||||||
| Chicago Transit Authority, | ||||||||||||
| 5.250%, 12/01/2023 (Callable 12/01/2021) | 25,000 | 29,238 | ||||||||||
| City of Chicago IL: | ||||||||||||
| 5.000%, 01/01/2017 | 30,000 | 30,372 | ||||||||||
| 5.000%, 01/01/2018 (Callable 08/01/2016)(Insured by AGM) | 75,000 | 76,192 | ||||||||||
| City of Chicago IL Motor Fuel Tax Revenue, | ||||||||||||
| 5.000%, 01/01/2019 | 100,000 | 105,125 | ||||||||||
| City of Chicago IL Wastewater Transmission Revenue, | ||||||||||||
| 5.000%, 01/01/2020 | 50,000 | 55,347 | ||||||||||
| City of Rockford IL, | ||||||||||||
| 4.700%, 12/15/2017 (Insured by AGM) | 25,000 | 25,935 | ||||||||||
| Cook County Township High School District No. 227 Rich Township, | ||||||||||||
| 4.000%, 12/01/2016 (Insured by AGM) | 75,000 | 76,024 | ||||||||||
| Danville Public Building Commission, | ||||||||||||
| 4.000%, 12/01/2019 | 115,000 | 124,183 | ||||||||||
| DeWitt Ford & Livingston Etc Counties Community College Dist No. 540 Heartland, | ||||||||||||
| 5.000%, 12/01/2016 (Insured by AGM) | 100,000 | 101,771 | ||||||||||
| DuPage County Community High School District No. 100 Fenton, | ||||||||||||
| 2.000%, 12/15/2018 | 70,000 | 70,802 | ||||||||||
| Governors State University, | ||||||||||||
| 4.000%, 10/01/2020 (Callable 10/01/2017)(Insured by CIFG) | 50,000 | 51,562 | ||||||||||
| Homewood-Flossmoor Park District, | ||||||||||||
| 3.000%, 12/01/2017 (Insured by AGM) | 50,000 | 51,079 | ||||||||||
| Illinois Finance Authority: | ||||||||||||
| 4.000%, 10/01/2016 | 125,000 | 125,877 | ||||||||||
| 6.250%, 05/01/2022 (Callable 05/01/2020) | 45,000 | 53,125 | ||||||||||
| 1.670%, 05/01/2036 (Callable 11/01/2020)(Mandatory Tender Date 05/01/2021)(1) | 100,000 | 100,078 | ||||||||||
| 1.300%, 07/01/2042 (Mandatory Tender Date 05/08/2017) | 65,000 | 65,103 | ||||||||||
| Illinois State University, | ||||||||||||
| 5.000%, 04/01/2023 (Callable 04/01/2021) | 100,000 | 113,295 | ||||||||||
| Kane County School District No. 131 Aurora East Side, | ||||||||||||
| 1.250%, 06/01/2036 (Callable 08/02/2016)(1) | 250,000 | 250,003 | ||||||||||
| Lake County Community High School District No. 117 Antioch, | ||||||||||||
| 0.000%, 12/01/2019 | 140,000 | 130,701 | ||||||||||
| Lake County Community High School District No. 127 Grayslake, | ||||||||||||
| 0.000%, 02/01/2020 | 150,000 | 142,359 | ||||||||||
| Lake County Forest Preserve District, | ||||||||||||
| 0.887%, 12/15/2016 (1) | 35,000 | 34,983 | ||||||||||
| Lake County School District No. 1 Winthrop Harbor, | ||||||||||||
| 3.000%, 02/01/2019 | 85,000 | 88,947 | ||||||||||
| McHenry & Kane County School District, | ||||||||||||
| 0.000%, 01/01/2017 | 25,000 | 24,812 | ||||||||||
| Metropolitan Pier & Exposition Authority: | ||||||||||||
| 5.300%, 06/15/2018 (Pre-refunded to 06/15/2017)(Insured by NPFGC) | 50,000 | 52,715 | ||||||||||
| 5.300%, 06/15/2018 (Callable 06/15/2017)(Insured by NPFGC) | 120,000 | 126,140 | ||||||||||
| Ogle & Winnebago Counties Community Unit School District, | ||||||||||||
| 5.000%, 12/01/2021 (Insured by BAM) | 150,000 | 174,689 | ||||||||||
| Public Building Commission of Chicago, | ||||||||||||
| 5.000%, 03/01/2020 (Callable 03/01/2017)(Insured by AMBAC) | 100,000 | 102,006 | ||||||||||
| Southern Illinois University, | ||||||||||||
| 2.050%, 04/01/2017 | 60,000 | 60,523 | ||||||||||
| St Clair County Community Consolidated School District No. 90 O'Fallon, | ||||||||||||
| 3.000%, 12/01/2016 (Insured by BAM) | 70,000 | 70,555 | ||||||||||
| St. Clair County IL Community Consolidated School District, | ||||||||||||
| 0.000%, 12/01/2020 | 100,000 | 93,224 | ||||||||||
| State of Illinois: | ||||||||||||
| 5.000%, 06/01/2019 | 100,000 | 108,506 | ||||||||||
| 5.000%, 03/01/2020 | 90,000 | 97,674 | ||||||||||
| 5.000%, 04/01/2020 | 30,000 | 32,602 | ||||||||||
| 5.000%, 01/01/2022 (Callable 01/01/2020) | 100,000 | 107,984 | ||||||||||
| 6.500%, 06/15/2022 | 45,000 | 52,182 | ||||||||||
| 5.000%, 01/01/2025 (Callable 08/01/2016) | 50,000 | 50,202 | ||||||||||
| The Illinois Sports Facilities Authority, | ||||||||||||
| 0.000%, 06/15/2017 (Insured by AMBAC) | 50,000 | 49,140 | ||||||||||
| Village of Cary IL, | ||||||||||||
| 1.500%, 03/01/2019 (Insured by BAM) | 100,000 | 100,285 | ||||||||||
| Village of Crestwood IL, | ||||||||||||
| 4.500%, 12/15/2025 (Callable 12/15/2022)(Insured by BAM) | 60,000 | 67,669 | ||||||||||
| Village of Lyons IL, | ||||||||||||
| 5.000%, 12/01/2025 (Callable 12/01/2022)(Insured by BAM) | 25,000 | 29,568 | ||||||||||
| Village of Oak Lawn IL, | ||||||||||||
| 4.250%, 12/01/2016 | 30,000 | 30,419 | ||||||||||
| Western Illinois University, | ||||||||||||
| 4.000%, 04/01/2019 | 50,000 | 53,102 | ||||||||||
| White County Community Unit School District No. 5, | ||||||||||||
| 4.300%, 12/01/2021 (Insured by AGM) | 100,000 | 111,018 | ||||||||||
| Will County School District No. 114 Manhattan, | ||||||||||||
| 0.000%, 12/01/2019 | 50,000 | 46,837 | ||||||||||
| Wilmette Park District, | ||||||||||||
| 3.000%, 12/01/2017 | 20,000 | 20,641 | ||||||||||
| 3,687,601 | 14.7 | % | ||||||||||
| Indiana | ||||||||||||
| East Porter County School Building Corp., | ||||||||||||
| 4.000%, 01/15/2018 | 50,000 | 52,506 | ||||||||||
| Indiana Bond Bank, | ||||||||||||
| 5.250%, 10/15/2019 | 55,000 | 61,510 | ||||||||||
| Indiana Finance Authority: | ||||||||||||
| 4.500%, 08/15/2016 | 55,000 | 55,219 | ||||||||||
| 4.000%, 12/01/2017 | 50,000 | 52,342 | ||||||||||
| 4.000%, 02/01/2018 | 50,000 | 52,611 | ||||||||||
| Indianapolis Local Public Improvement Bond Bank, | ||||||||||||
| 4.000%, 02/01/2017 | 45,000 | 45,897 | ||||||||||
| Pike Township IN School District, | ||||||||||||
| 2.000%, 01/15/2017 | 25,000 | 25,183 | ||||||||||
| Twin Lakes Regional Sewer District, | ||||||||||||
| 3.000%, 01/01/2018 (Insured by AGM) | 50,000 | 51,728 | ||||||||||
| 396,996 | 1.6 | % | ||||||||||
| Iowa | ||||||||||||
| Iowa Finance Authority, | ||||||||||||
| 3.500%, 09/01/2017 | 100,000 | 100,481 | 0.4 | % | ||||||||
| Kansas | ||||||||||||
| State of Kansas Department of Transportation, | ||||||||||||
| 0.706%, 09/01/2019 (1) | 125,000 | 124,301 | 0.5 | % | ||||||||
| Kentucky | ||||||||||||
| Floyd County School District Finance Corp., | ||||||||||||
| 2.000%, 08/01/2016 | 10,000 | 10,011 | ||||||||||
| Kentucky Municipal Power Agency, | ||||||||||||
| 1.810%, 09/01/2042 (Callable 03/01/2018)(Mandatory Tender Date 09/01/2018)(1) | 50,000 | 50,050 | ||||||||||
| 60,061 | 0.2 | % | ||||||||||
| Louisiana | ||||||||||||
| Regional Transit Authority, | ||||||||||||
| 0.000%, 12/01/2021 | 115,000 | 89,486 | 0.4 | % | ||||||||
| Maine | ||||||||||||
| Maine State Housing Authority: | ||||||||||||
| 3.500%, 11/15/2045 (Callable 05/15/2025) | 50,000 | 53,777 | ||||||||||
| 4.000%, 11/15/2045 (Callable 11/15/2025) | 250,000 | 274,885 | ||||||||||
| 328,662 | 1.3 | % | ||||||||||
| Maryland | ||||||||||||
| City of Baltimore MD, | ||||||||||||
| 0.761%, 07/01/2020 (1)(2) | 50,000 | 48,228 | ||||||||||
| County of Baltimore MD, | ||||||||||||
| 5.000%, 09/01/2026 (Pre-refunded to 09/01/2016) | 15,000 | 15,100 | ||||||||||
| Maryland Health & Higher Educational Facilities Authority, | ||||||||||||
| 5.000%, 07/01/2018 | 25,000 | 27,003 | ||||||||||
| Maryland State Transportation Authority, | ||||||||||||
| 5.000%, 03/01/2018 (Callable 03/01/2017) | 30,000 | 30,887 | ||||||||||
| 121,218 | 0.5 | % | ||||||||||
| Massachusetts | ||||||||||||
| Eaton Vance Municipal Bond Fund II, | ||||||||||||
| 1.460%, 07/01/2019 (Callable 01/01/2017)(1) | 100,000 | 100,001 | ||||||||||
| Massachusetts Development Finance Agency, | ||||||||||||
| 2.250%, 12/01/2041 (Pre-refunded to 09/01/2016) | 50,000 | 50,125 | ||||||||||
| Massachusetts Housing Finance Agency, | ||||||||||||
| 4.000%, 12/01/2044 (Callable 06/01/2025) | 100,000 | 108,747 | ||||||||||
| 258,873 | 1.0 | % | ||||||||||
| Michigan | ||||||||||||
| City of Detroit MI Water Supply System Revenue, | ||||||||||||
| 4.250%, 07/01/2017 | 55,000 | 56,596 | ||||||||||
| City of Wyandotte MI Electric System Revenue, | ||||||||||||
| 5.000%, 10/01/2023 (Insured by BAM) | 100,000 | 116,451 | ||||||||||
| Hudsonville Public Schools, | ||||||||||||
| 4.000%, 05/01/2017 (Insured by Q-SBLF) | 75,000 | 77,012 | ||||||||||
| Lowell MI Area Schools, | ||||||||||||
| 0.000%, 05/01/2019 | 100,000 | 96,116 | ||||||||||
| Michigan Finance Authority, | ||||||||||||
| 3.400%, 10/01/2020 | 100,000 | 105,782 | ||||||||||
| Michigan State Building Authority: | ||||||||||||
| 0.000%, 10/15/2018 (Callable 10/15/2016) | 80,000 | 73,048 | ||||||||||
| 0.000%, 10/15/2019 (Pre-refunded to 10/15/2016) | 25,000 | 21,772 | ||||||||||
| 0.000%, 10/15/2029 (Callable 10/15/2016) | 20,000 | 10,490 | ||||||||||
| Mount Clemens MI School District, | ||||||||||||
| 4.000%, 05/01/2017 (Insured by Q-SBLF) | 100,000 | 102,424 | ||||||||||
| Saginaw MI City School District, | ||||||||||||
| 5.000%, 05/01/2024 (Insured by Q-SBLF) | 100,000 | 121,452 | ||||||||||
| South Haven Public Schools, | ||||||||||||
| 4.000%, 05/01/2020 (Insured by AGM) | 50,000 | 55,053 | ||||||||||
| Ypsilanti School District/MI, | ||||||||||||
| 4.000%, 05/01/2020 (Insured by Q-SBLF) | 50,000 | 54,837 | ||||||||||
| 891,033 | 3.6 | % | ||||||||||
| Minnesota | ||||||||||||
| Minnesota Housing Finance Agency, | ||||||||||||
| 2.900%, 01/01/2025 | 100,000 | 105,869 | 0.4 | % | ||||||||
| Mississippi | ||||||||||||
| Mississippi Development Bank: | ||||||||||||
| 5.500%, 10/01/2019 | 75,000 | 82,935 | ||||||||||
| 5.000%, 03/01/2024 (Insured by AGM) | 50,000 | 60,397 | ||||||||||
| 143,332 | 0.6 | % | ||||||||||
| Missouri | ||||||||||||
| Jasper County Reorganized School District No. R-9/MO, | ||||||||||||
| 2.000%, 04/01/2018 | 150,000 | 152,679 | 0.6 | % | ||||||||
| Nebraska | ||||||||||||
| Douglas County Hospital Authority No. 2, | ||||||||||||
| 5.000%, 05/15/2019 | 50,000 | 55,159 | ||||||||||
| Douglas County Hospital Authority No. 3, | ||||||||||||
| 3.000%, 11/01/2016 | 50,000 | 50,366 | ||||||||||
| 105,525 | 0.4 | % | ||||||||||
| Nevada | ||||||||||||
| City of North Las Vegas NV, | ||||||||||||
| 2.000%, 12/01/2018 | 100,000 | 102,032 | 0.4 | % | ||||||||
| New Jersey | ||||||||||||
| Landis Sewage Authority, | ||||||||||||
| 2.094%, 09/19/2019 (1)(2) | 100,000 | 94,880 | ||||||||||
| New Jersey Economic Development Authority: | ||||||||||||
| 4.000%, 06/15/2017 | 50,000 | 51,383 | ||||||||||
| 2.210%, 02/01/2018 (Callable 08/01/2017)(1) | 50,000 | 50,294 | ||||||||||
| 5.000%, 06/15/2023 (Insured by BAM) | 50,000 | 59,819 | ||||||||||
| New Jersey Educational Facilities Authority, | ||||||||||||
| 4.500%, 09/01/2021 (Callable 09/01/2016)(Insured by AGM) | 100,000 | 100,560 | ||||||||||
| New Jersey Health Care Facilities Financing Authority: | ||||||||||||
| 4.000%, 07/01/2019 | 105,000 | 114,277 | ||||||||||
| 4.250%, 11/15/2021 (Callable 11/15/2020) | 65,000 | 73,393 | ||||||||||
| 5.000%, 07/01/2025 (Insured by AGM) | 50,000 | 62,281 | ||||||||||
| New Jersey State Turnpike Authority, | ||||||||||||
| 0.753%, 01/01/2030 (Callable 07/07/2016)(1)(2) | 130,000 | 119,319 | ||||||||||
| New Jersey Transportation Trust Fund Authority: | ||||||||||||
| 5.500%, 12/15/2017 (Insured by AGM) | 100,000 | 105,949 | ||||||||||
| 5.500%, 12/15/2021 | 75,000 | 87,501 | ||||||||||
| Roselle Park NJ School District, | ||||||||||||
| 3.000%, 02/15/2017 | 75,000 | 76,059 | ||||||||||
| Township of Irvington NJ, | ||||||||||||
| 0.000%, 07/15/2018 | 50,000 | 47,929 | ||||||||||
| 1,043,644 | 4.2 | % | ||||||||||
| New Mexico | ||||||||||||
| City of Farmington NM, | ||||||||||||
| 5.200%, 06/01/2040 (Mandatory Tender Date 06/01/2020) | 100,000 | 111,317 | ||||||||||
| Santa Fe NM Community College, | ||||||||||||
| 2.250%, 08/01/2017 | 25,000 | 25,442 | ||||||||||
| State of New Mexico Severance Tax Permanent Fund, | ||||||||||||
| 5.000%, 07/01/2017 | 40,000 | 41,732 | ||||||||||
| 178,491 | 0.7 | % | ||||||||||
| New York | ||||||||||||
| Build NYC Resource Corp., | ||||||||||||
| 5.000%, 07/01/2016 | 100,000 | 100,000 | ||||||||||
| City of New York NY, | ||||||||||||
| 0.520%, 08/01/2026 (Callable 07/07/2016)(Insured by AGM)(1)(2) | 100,000 | 100,000 | ||||||||||
| Metropolitan Transportation Authority, | ||||||||||||
| 0.891%, 11/01/2022 (Callable 07/07/2016)(Insured by AGM)(1)(2) | 250,000 | 241,771 | ||||||||||
| New York City Industrial Development Agency, | ||||||||||||
| 0.000%, 03/01/2017 | 85,000 | 84,339 | ||||||||||
| New York City Transit Authority, | ||||||||||||
| 1.228%, 01/01/2030 (Callable 07/18/2016)(Insured by AMBAC)(1)(2) | 50,000 | 44,634 | ||||||||||
| New York City Transitional Finance Authority Future Tax Secured Revenue: | ||||||||||||
| 5.000%, 11/01/2018 | 50,000 | 54,974 | ||||||||||
| 0.600%, 08/01/2022 (Optional Put Date 07/01/2016)(Callable 07/01/2016)(1) | 300,000 | 300,000 | ||||||||||
| New York State Dormitory Authority: | ||||||||||||
| 4.000%, 05/15/2017 | 25,000 | 25,733 | ||||||||||
| 5.000%, 07/01/2017 | 25,000 | 26,065 | ||||||||||
| 1.157%, 05/01/2018 (Callable 07/01/2016)(1) | 210,000 | 209,231 | ||||||||||
| 5.000%, 12/15/2021 | 45,000 | 54,298 | ||||||||||
| State of New York Mortgage Agency, | ||||||||||||
| 4.000%, 10/01/2046 (Callable 04/01/2025) | 250,000 | 275,458 | ||||||||||
| Town of Oyster Bay NY, | ||||||||||||
| 3.000%, 03/01/2020 (Insured by AGM) | 250,000 | 258,850 | ||||||||||
| 1,775,353 | 7.1 | % | ||||||||||
| North Carolina | ||||||||||||
| North Carolina Capital Facilities Finance Agency, | ||||||||||||
| 5.000%, 06/01/2022 | 100,000 | 116,744 | ||||||||||
| North Carolina Medical Care Commission: | ||||||||||||
| 4.750%, 11/01/2017 | 50,000 | 52,383 | ||||||||||
| 5.000%, 11/01/2018 | 25,000 | 27,178 | ||||||||||
| 5.000%, 10/01/2019 (Callable 10/01/2017) | 55,000 | 58,053 | ||||||||||
| University of North Carolina at Chapel Hill, | ||||||||||||
| 1.056%, 12/01/2041 (Callable 06/01/2017)(Mandatory Tender Date 12/01/2017)(1) | 50,000 | 50,181 | ||||||||||
| 304,539 | 1.2 | % | ||||||||||
| North Dakota | ||||||||||||
| City of Hazen ND, | ||||||||||||
| 2.500%, 07/01/2017 (Callable 01/01/2017) | 100,000 | 100,072 | ||||||||||
| City of Mandan ND, | ||||||||||||
| 2.750%, 09/01/2041 (Callable 09/01/2016)(3) | 150,000 | 150,021 | ||||||||||
| Jamestown Park District/ND, | ||||||||||||
| 2.900%, 07/01/2035 (Callable 01/01/2017) | 150,000 | 150,229 | ||||||||||
| Williston Parks & Recreation District, | ||||||||||||
| 3.250%, 03/01/2032 (Callable 07/18/2016) | 60,000 | 60,050 | ||||||||||
| 460,372 | 1.8 | % | ||||||||||
| Ohio | ||||||||||||
| City of Akron OH, | ||||||||||||
| 5.000%, 12/01/2016 | 5,000 | 5,085 | ||||||||||
| City of Bowling Green OH, | ||||||||||||
| 4.500%, 06/01/2019 | 60,000 | 63,740 | ||||||||||
| City of Toledo OH, | ||||||||||||
| 4.000%, 12/01/2017 (Insured by AGM) | 50,000 | 52,270 | ||||||||||
| Cleveland-Cuyahoga County Port Authority, | ||||||||||||
| 3.000%, 05/15/2018 | 50,000 | 51,294 | ||||||||||
| County of Crawford OH, | ||||||||||||
| 1.430%, 11/01/2017 (Callable 05/01/2017) | 100,000 | 100,358 | ||||||||||
| County of Huron OH, | ||||||||||||
| 5.250%, 12/01/2017 (Callable 06/01/2017) | 50,000 | 51,970 | ||||||||||
| County of Summit OH Development Finance Authority, | ||||||||||||
| 0.000%, 05/15/2018(3) | 135,000 | 138,210 | ||||||||||
| Groveport-Madison Local School District, | ||||||||||||
| 4.000%, 12/01/2024 (Callable 12/01/2022)(Insured by BAM) | 50,000 | 56,301 | ||||||||||
| Lancaster Port Authority, | ||||||||||||
| 0.926%, 08/01/2019 (Callable 02/01/2019)(1) | 70,000 | 69,371 | ||||||||||
| 588,599 | 2.4 | % | ||||||||||
| Oklahoma | ||||||||||||
| Mayes County Independent School District No. 1, | ||||||||||||
| 0.850%, 06/01/2017 | 50,000 | 50,036 | ||||||||||
| Oklahoma City Industrial & Cultural Facilities Trust, | ||||||||||||
| 0.700%, 06/01/2019 (Callable 07/01/2016)(1)(2) | 100,000 | 98,537 | ||||||||||
| 148,573 | 0.6 | % | ||||||||||
| Oregon | ||||||||||||
| City of Portland OR, | ||||||||||||
| 4.000%, 02/01/2018 | 25,000 | 26,322 | ||||||||||
| Oregon State Facilities Authority, | ||||||||||||
| 4.750%, 03/15/2024 (Callable 03/15/2020) | 15,000 | 16,870 | ||||||||||
| State of Oregon Department of Administrative Services, | ||||||||||||
| 5.000%, 11/01/2016 | 25,000 | 25,361 | ||||||||||
| 68,553 | 0.3 | % | ||||||||||
| Pennsylvania | ||||||||||||
| Bethlehem Parking Authority, | ||||||||||||
| 2.000%, 10/01/2018 | 100,000 | 101,493 | ||||||||||
| City of Erie PA, | ||||||||||||
| 0.000%, 11/15/2018 (ETM)(Insured by AGM) | 60,000 | 58,840 | ||||||||||
| County of Westmoreland PA, | ||||||||||||
| 0.000%, 08/01/2017 (ETM)(Insured by AMBAC) | 40,000 | 39,668 | ||||||||||
| Erie Parking Authority, | ||||||||||||
| 2.000%, 09/01/2019 | 105,000 | 107,689 | ||||||||||
| Lancaster Industrial Development Authority, | ||||||||||||
| 5.000%, 05/01/2022 | 45,000 | 51,344 | ||||||||||
| Montgomery County Industrial Development Authority/PA, | ||||||||||||
| 5.000%, 01/15/2018 | 50,000 | 52,551 | ||||||||||
| Pennsylvania Economic Development Financing Authority, | ||||||||||||
| 5.000%, 03/01/2019 | 130,000 | 142,215 | ||||||||||
| Pennsylvania Higher Educational Facilities Authority, | ||||||||||||
| 5.000%, 08/15/2024 (Pre-refunded to 08/15/2021) | 100,000 | 118,174 | ||||||||||
| Pennsylvania Housing Finance Agency: | ||||||||||||
| 3.700%, 10/01/2042 (Callable 10/01/2021) | 100,000 | 105,802 | ||||||||||
| 3.500%, 10/01/2046 (Callable 10/01/2025)(3) | 250,000 | 268,282 | ||||||||||
| Pennsylvania Turnpike Commission, | ||||||||||||
| 1.290%, 12/01/2020 (Callable 06/01/2020)(1) | 75,000 | 74,715 | ||||||||||
| West Mifflin Sanitary Sewer Municipal Authority, | ||||||||||||
| 4.000%, 08/01/2020 (Insured by BAM) | 200,000 | 218,506 | ||||||||||
| 1,339,279 | 5.4 | % | ||||||||||
| Puerto Rico | ||||||||||||
| Commonwealth of Puerto Rico: | ||||||||||||
| 5.500%, 07/01/2018 | 50,000 | 51,951 | ||||||||||
| 0.000%, 07/01/2019 | 50,000 | 44,086 | ||||||||||
| Puerto Rico Public Finance Corp., | ||||||||||||
| 6.000%, 08/01/2026 (ETM) | 150,000 | 204,638 | ||||||||||
| 300,675 | 1.2 | % | ||||||||||
| Rhode Island | ||||||||||||
| Providence Public Buildings Authority, | ||||||||||||
| 5.125%, 06/15/2021 (Insured by AGM) | 90,000 | 99,466 | ||||||||||
| Rhode Island Housing & Mortgage Finance Corp./RI, | ||||||||||||
| 3.500%, 10/01/2046 (Callable 04/01/2025) | 100,000 | 106,550 | ||||||||||
| Rhode Island Student Loan Authority, | ||||||||||||
| 3.000%, 12/01/2016 | 100,000 | 100,761 | ||||||||||
| 306,777 | 1.2 | % | ||||||||||
| South Carolina | ||||||||||||
| Easley Combined Utility System, | ||||||||||||
| 3.250%, 12/01/2017 | 50,000 | 51,748 | ||||||||||
| Scago Educational Facilities Corp. for Union School District, | ||||||||||||
| 4.000%, 12/01/2017 | 100,000 | 104,469 | ||||||||||
| South Carolina Jobs-Economic Development Authority, | ||||||||||||
| 4.500%, 11/01/2017 | 40,000 | 41,971 | ||||||||||
| South Carolina State Housing Finance & Development Authority, | ||||||||||||
| 4.000%, 07/01/2036 (Callable 07/01/2025) | 250,000 | 274,022 | ||||||||||
| 472,210 | 1.9 | % | ||||||||||
| Tennessee | ||||||||||||
| Metropolitan Government Nashville & Davidson County Health & Educational Facilities: | ||||||||||||
| 3.000%, 11/01/2016 | 25,000 | 25,159 | ||||||||||
| 0.900%, 04/01/2019 (Mandatory Tender Date 04/01/2018) | 150,000 | 150,439 | ||||||||||
| Tennessee Energy Acquisition Corp., | ||||||||||||
| 5.250%, 09/01/2018 | 30,000 | 32,635 | ||||||||||
| 208,233 | 0.8 | % | ||||||||||
| Texas | ||||||||||||
| Central Texas Turnpike System, | ||||||||||||
| 5.000%, 08/15/2042 (Callable 04/01/2020)(Mandatory Tender Date 04/01/2020) | 100,000 | 114,077 | ||||||||||
| City of Brownsville TX Utilities System Revenue, | ||||||||||||
| 5.000%, 09/01/2016 (Insured by AGM) | 25,000 | 25,179 | ||||||||||
| City of Bullard TX, | ||||||||||||
| 3.000%, 09/01/2020 (Insured by BAM)(3) | 135,000 | 143,655 | ||||||||||
| City of San Antonio TX Water System Revenue, | ||||||||||||
| 1.090%, 05/01/2043 (Mandatory Tender Date 11/01/2016)(1) | 75,000 | 75,004 | ||||||||||
| Clifton Higher Education Finance Corp., | ||||||||||||
| 5.000%, 08/15/2016 | 75,000 | 75,310 | ||||||||||
| Coastal Water Authority, | ||||||||||||
| 4.000%, 12/15/2017 | 25,000 | 26,218 | ||||||||||
| County of Denton TX, | ||||||||||||
| 2.625%, 07/15/2017 | 25,000 | 25,532 | ||||||||||
| Crane County Water District, | ||||||||||||
| 3.000%, 02/15/2017 | 50,000 | 50,583 | ||||||||||
| Fort Bend County Municipal Utility District No. 187, | ||||||||||||
| 3.000%, 09/01/2017 | 20,000 | 20,439 | ||||||||||
| Fort Bend County Municipal Utility District No. 58, | ||||||||||||
| 5.000%, 04/01/2019 (Insured by BAM) | 150,000 | 164,910 | ||||||||||
| Generation Park Management District, | ||||||||||||
| 3.000%, 09/01/2018 | 160,000 | 165,754 | ||||||||||
| Harlingen Consolidated Independent School District, | ||||||||||||
| 5.000%, 08/15/2021 (PSF Guaranteed) | 100,000 | 119,320 | ||||||||||
| Harris County Cultural Education Facilities Finance Corp., | ||||||||||||
| 0.990%, 12/01/2042 (Callable 06/01/2019)(Mandatory Tender Date 12/01/2019)(1) | 50,000 | 49,733 | ||||||||||
| Harris County Municipal Utility District No. 153, | ||||||||||||
| 4.000%, 09/01/2023 (Callable 09/01/2022)(Insured by BAM) | 100,000 | 114,513 | ||||||||||
| Harris County Municipal Utility District No. 419: | ||||||||||||
| 3.000%, 09/01/2017 (Insured by AGM) | 25,000 | 25,568 | ||||||||||
| 3.000%, 09/01/2017 (Insured by AGM) | 50,000 | 51,056 | ||||||||||
| Harris County-Houston Sports Authority, | ||||||||||||
| 0.000%, 11/15/2017 | 25,000 | 24,610 | ||||||||||
| Laredo Independent School District, | ||||||||||||
| 4.000%, 08/01/2017 | 25,000 | 25,872 | ||||||||||
| Metropolitan Transit Authority of Harris County, | ||||||||||||
| 5.000%, 11/01/2017 | 25,000 | 26,443 | ||||||||||
| Mission Texas Economic Development Corporate Revenue Bonds, | ||||||||||||
| 1.800%, 12/01/2018 | 100,000 | 102,086 | ||||||||||
| New Hope Cultural Education Facilities Corp.: | ||||||||||||
| 3.000%, 07/01/2019 | 100,000 | 103,002 | ||||||||||
| 4.000%, 04/01/2020 | 50,000 | 54,088 | ||||||||||
| North Texas Health Facilities Development Corp., | ||||||||||||
| 5.000%, 09/01/2020 (Callable 09/01/2017)(Insured by AGM) | 55,000 | 57,645 | ||||||||||
| North Texas Higher Education Authority, Inc., | ||||||||||||
| 1.525%, 07/01/2030 (1) | 65,000 | 63,385 | ||||||||||
| North Texas Tollway Authority: | ||||||||||||
| 5.000%, 01/01/2022 | 25,000 | 29,985 | ||||||||||
| 1.950%, 01/01/2038 (Mandatory Tender Date 01/01/2019) | 100,000 | 101,634 | ||||||||||
| Northside Independent School District, | ||||||||||||
| 2.000%, 06/01/2046 (Mandatory Tender Date 06/01/2021)(PSF Guaranteed) | 200,000 | 207,912 | ||||||||||
| SA Energy Acquisition Public Facility Corp., | ||||||||||||
| 5.500%, 08/01/2022 | 100,000 | 121,182 | ||||||||||
| Siena Municipal Utility District No. 1, | ||||||||||||
| 2.250%, 09/01/2018 (Insured by BAM) | 100,000 | 102,482 | ||||||||||
| Spring Meadows Municipal Utility District, | ||||||||||||
| 2.000%, 09/01/2018 | 110,000 | 112,859 | ||||||||||
| Tarrant County Cultural Education Facilities Finance Corp., | ||||||||||||
| 2.100%, 11/15/2017 | 50,000 | 50,591 | ||||||||||
| Texas Municipal Gas Acquisition & Supply Corp. I: | ||||||||||||
| 5.250%, 12/15/2018 | 105,000 | 114,935 | ||||||||||
| 5.250%, 12/15/2021 | 50,000 | 59,017 | ||||||||||
| Texas Municipal Gas Acquisition & Supply Corp. II, | ||||||||||||
| 1.137%, 09/15/2017 (1) | 65,000 | 64,763 | ||||||||||
| Texas State Refunding, | ||||||||||||
| 0.000%, 08/01/2025 (Mandatory Tender Date 08/01/2019)(3) | 200,000 | 202,162 | ||||||||||
| Trophy Club Public Improvement District No. 1, | ||||||||||||
| 0.000%, 06/01/2017 (Insured by AGM) | 50,000 | 49,428 | ||||||||||
| Viridian Municipal Management District, | ||||||||||||
| 6.000%, 12/01/2023 (Insured by BAM) | 50,000 | 65,750 | ||||||||||
| 2,986,682 | 11.9 | % | ||||||||||
| Utah | ||||||||||||
| Utah Housing Corp., | ||||||||||||
| 4.000%, 01/01/2045 (Callable 01/01/2026) | 100,000 | 108,307 | 0.4 | % | ||||||||
| Vermont | ||||||||||||
| City of Burlington VT Electric System Revenue, | ||||||||||||
| 5.000%, 07/01/2023 (Callable 07/01/2021) | 25,000 | 28,200 | 0.1 | % | ||||||||
| VI | ||||||||||||
| Virgin Islands Public Finance Authority: | ||||||||||||
| 4.000%, 10/01/2017 | 110,000 | 113,381 | ||||||||||
| 5.000%, 10/01/2017 | 25,000 | 26,074 | ||||||||||
| 5.000%, 09/01/2020 | 100,000 | 113,097 | ||||||||||
| 252,552 | 1.0 | % | ||||||||||
| Virginia | ||||||||||||
| Fredericksburg Economic Development Authority, | ||||||||||||
| 2.310%, 08/01/2038 (Callable 08/01/2016)(Mandatory Tender Date 02/01/2017)(1) | 50,000 | 50,004 | 0.2 | % | ||||||||
| Washington | ||||||||||||
| Central Puget Sound Regional Transit Authority, | ||||||||||||
| 1.110%, 11/01/2045 (Callable 05/01/2018)(Mandatory Tender Date 11/01/2018)(1) | 50,000 | 49,998 | ||||||||||
| Kittitas County School District No. 401 Ellensburg, | ||||||||||||
| 3.000%, 12/01/2016 | 30,000 | 30,299 | ||||||||||
| Washington Economic Development Finance Authority, | ||||||||||||
| 1.250%, 11/01/2017 | 250,000 | 251,375 | ||||||||||
| Washington Health Care Facilities Authority, | ||||||||||||
| 4.000%, 01/01/2018 | 70,000 | 73,270 | ||||||||||
| Washington State University, | ||||||||||||
| 4.000%, 10/01/2017 | 40,000 | 41,677 | ||||||||||
| 446,619 | 1.8 | % | ||||||||||
| Wisconsin | ||||||||||||
| City of Two Rivers WI, | ||||||||||||
| 4.000%, 04/01/2018 | 125,000 | 129,350 | ||||||||||
| Kaukauna Redevelopment Authority, | ||||||||||||
| 4.000%, 06/01/2018 | 25,000 | 26,493 | ||||||||||
| Milwaukee Redevelopment Authority, | ||||||||||||
| 1.250%, 12/01/2038 (Optional Put Date 07/01/2016)(Callable 07/01/2016)(1) | 140,000 | 140,000 | ||||||||||
| Village of Johnson Creek WI, | ||||||||||||
| 2.700%, 03/01/2017 | 30,000 | 30,194 | ||||||||||
| Village of Somers WI, | ||||||||||||
| 2.000%, 05/01/2017 | 25,000 | 25,191 | ||||||||||
| Wisconsin Center District: | ||||||||||||
| 0.000%, 12/15/2018 | 80,000 | 77,734 | ||||||||||
| 5.250%, 12/15/2027 | 15,000 | 18,859 | ||||||||||
| Wisconsin Health & Educational Facilities Authority: | ||||||||||||
| 5.000%, 09/01/2016 | 245,000 | 246,700 | ||||||||||
| 3.000%, 07/01/2017 | 100,000 | 102,376 | ||||||||||
| 5.250%, 08/15/2017 (Pre-refunded to 08/15/2016) | 25,000 | 25,127 | ||||||||||
| 5.000%, 08/15/2020 | 35,000 | 39,953 | ||||||||||
| 4.000%, 09/15/2023 (Callable 09/15/2022) | 50,000 | 55,857 | ||||||||||
| 5.250%, 04/15/2024 (Callable 04/15/2020) | 50,000 | 57,291 | ||||||||||
| 975,125 | 3.9 | % | ||||||||||
| Total Municipal Bonds (Cost $24,531,919) | 24,737,212 | 98.8 | % | |||||||||
| SHORT-TERM INVESTMENTS | ||||||||||||
| Shares | ||||||||||||
| Money Market Mutual Funds | ||||||||||||
| Goldman Sachs Financial Square Funds, Institutional Class, 0.25% « | 1,100,000 | 1,100,000 | ||||||||||
| Wells Fargo Advantage Municipal Cash Management Money Market Fund/NC, Institutional Class, 0.30% « | 3,750 | 3,750 | ||||||||||
| Total Short-Term Investments (Cost $1,103,750) | 1,103,750 | 4.4 | % | |||||||||
| Total Investments (Cost $25,635,669) | 25,840,962 | 103.2 | % | |||||||||
| Liabilities in Excess of Other Assets | (804,319 | ) | (3.2 | )% | ||||||||
| TOTAL NET ASSETS | $ | 25,036,643 | 100.0 | % | ||||||||
Notes to Schedule of Investments | |
| AGM | Assured Guaranty Municipal |
| AMBAC | Ambac Assurance Corp. |
| BAM | Build America Mutual Assurance Co. |
| CIFG | CIFG Assurance North America, Inc. |
| ETM | Escrowed to Maturity |
| NPFGC | National Public Finance Guarantee Corp. |
| PSF | Texas Permanent School Fund |
| Q-SBLF | Qualified School Building Loan Fund |
| (1) | Variable or floating rate security. Floating rate securities are securities whose yields vary with a designated index rate. These securities rates are as of June 30, 2016. |
| (2) | Auction Rate Security. An Auction Rate Security is a debt instrument with a long nominal maturity for which the interest rate is regularly reset through a Dutch auction. The rate presented is either the rate set through the auction or the maximum interest rate provided for in the security issuance provision. |
| (3) | Security or a portion of the security purchased on a when-issued or delayed delivery basis. |
| « | 7-Day Yield |
| Baird Quality Intermediate Municipal Bond Fund | ||||||||||||
| Schedule of Investments | ||||||||||||
| June 30, 2016 (Unaudited) | ||||||||||||
| Principal | Market | % of | ||||||||||
| LONG-TERM INVESTMENTS | Amount | Value | Net Assets | |||||||||
| Municipal Bonds | ||||||||||||
| Alabama | ||||||||||||
| Alabama State Public School & College Authority, | ||||||||||||
| 5.000%, 05/01/2019 | $ | 1,000,000 | $ | 1,118,040 | ||||||||
| Gulf Shores Alabama, | ||||||||||||
| 5.000%, 12/15/2018 (Callable 12/15/2017) | 1,080,000 | 1,146,658 | ||||||||||
| 2,264,698 | 0.2 | % | ||||||||||
| Arizona | ||||||||||||
| Gila County Arizona Unified School District Bonds, | ||||||||||||
| 5.250%, 07/01/2027 (Pre-Refunded to 07/01/2017)(Insured by AMBAC) | 1,000,000 | 1,045,950 | 0.1 | % | ||||||||
| Arkansas | ||||||||||||
| Arkansas Development Finance Authority, | ||||||||||||
| 5.500%, 12/01/2018 (ETM) | 1,000,000 | 1,081,510 | 0.1 | % | ||||||||
| California | ||||||||||||
| Aromas-San Juan Unified School District, | ||||||||||||
| 0.000%, 08/01/2050 (Pre-refunded to 08/01/2021)(Insured by AGM) | 500,000 | 41,905 | ||||||||||
| Bakersfield California Certificates Participation, | ||||||||||||
| 0.000%, 04/15/2021 (ETM) | 12,380,000 | 11,664,807 | ||||||||||
| Colton Joint Unified School District, | ||||||||||||
| 0.000%, 08/01/2035 (Callable 08/01/2026)(Insured by AGM) | 250,000 | 242,273 | ||||||||||
| Commerce Community Development Commission, | ||||||||||||
| 0.000%, 08/01/2021 (ETM) | 670,000 | 527,109 | ||||||||||
| Port Oakland California Revenue, | ||||||||||||
| 5.000%, 11/01/2017 (Insured by NPFGC) | 1,800,000 | 1,903,662 | ||||||||||
| San Diego Unified School District/CA, | ||||||||||||
| 0.000%, 07/01/2033 (Pre-refunded to 07/01/2024) | 125,000 | 146,660 | ||||||||||
| San Joaquin Hills California Transportation Corridor Agency Toll Road Revenue: | ||||||||||||
| 0.000%, 01/01/2020 (ETM) | 6,865,000 | 6,667,288 | ||||||||||
| 0.000%, 01/01/2023 (ETM) | 14,000,000 | 12,946,360 | ||||||||||
| 0.000%, 01/01/2028 (ETM) | 100,000 | 81,305 | ||||||||||
| San Marcos California Public Facilities Authority Revenue, | ||||||||||||
| 0.000%, 09/01/2019 (ETM) | 17,495,000 | 16,921,514 | ||||||||||
| Sutter Union High School District: | ||||||||||||
| 0.000%, 08/01/2036 (Pre-refunded to 08/01/2025) | 50,000 | 19,500 | ||||||||||
| 0.000%, 08/01/2037 (Pre-refunded to 08/01/2025) | 50,000 | 18,157 | ||||||||||
| 0.000%, 08/01/2041 (Pre-refunded to 08/01/2025) | 50,000 | 13,598 | ||||||||||
| 0.000%, 08/01/2043 (Pre-refunded to 08/01/2025) | 100,000 | 23,440 | ||||||||||
| 0.000%, 08/01/2044 (Pre-refunded to 08/01/2025) (2) | 270,000 | 58,722 | ||||||||||
| 0.000%, 06/01/2050 (Pre-refunded to 08/01/2025) | 700,000 | 97,300 | ||||||||||
| Woodside California Elementary School District Government School Bonds, | ||||||||||||
| 5.000%, 10/01/2023 (Pre-refunded to 10/01/2016)(Insured by NPFGC) | 1,130,000 | 1,142,170 | ||||||||||
| 52,515,770 | 4.2 | % | ||||||||||
| Colorado | ||||||||||||
| Colorado Health Facilities Authority, | ||||||||||||
| 0.000%, 07/15/2022 (ETM) | 4,555,000 | 4,160,309 | ||||||||||
| Colorado Housing & Finance Authority, | ||||||||||||
| 1.050%, 08/01/2018 | 1,500,000 | 1,505,670 | ||||||||||
| Colorado Springs Colorado Hospital Revenue Bonds, | ||||||||||||
| 5.000%, 12/15/2032 (Pre-refunded to 12/15/2018)(Insured by AGM) | 1,300,000 | 1,432,418 | ||||||||||
| Colorado Springs Colorado Utilities Revenue Bonds, | ||||||||||||
| 5.875%, 11/15/2017 (ETM) | 3,230,000 | 3,359,135 | ||||||||||
| Dawson Ridge Metropolitan District No. 1 Colorado: | ||||||||||||
| 0.000%, 10/01/2022 (ETM) | 32,895,000 | 29,819,975 | ||||||||||
| 0.000%, 10/01/2022 (ETM) | 22,540,000 | 20,432,961 | ||||||||||
| Regional Transportation District Colorado Sales Tax Revenue, | ||||||||||||
| 5.000%, 11/01/2036 (Pre-refunded to 11/01/2016)(Insured by AMBAC) | 6,785,000 | 6,882,026 | ||||||||||
| 67,592,494 | 5.5 | % | ||||||||||
| Connecticut | ||||||||||||
| State of Connecticut, | ||||||||||||
| 5.000%, 10/15/2020 | 4,390,000 | 5,071,152 | 0.4 | % | ||||||||
| Delaware | ||||||||||||
| State of Delaware, | ||||||||||||
| 5.000%, 03/01/2020 | 2,000,000 | 2,305,680 | 0.2 | % | ||||||||
| District of Columbia | ||||||||||||
| District of Columbia, | ||||||||||||
| 5.250%, 07/15/2038 (Pre-refunded to 07/15/2018) | 150,000 | 163,667 | 0.0 | % | ||||||||
| Florida | ||||||||||||
| Brevard County School District, | ||||||||||||
| 5.000%, 07/01/2020 (Callable 07/01/2017)(Insured by AMBAC) | 1,925,000 | 2,004,830 | ||||||||||
| Broward County Florida School Board: | ||||||||||||
| 5.250%, 07/01/2022 (Callable 07/01/2021) | 8,390,000 | 10,034,272 | ||||||||||
| 5.250%, 07/01/2023 (Callable 07/01/2021) | 4,915,000 | 5,857,206 | ||||||||||
| County of Palm Beach FL, | ||||||||||||
| 5.000%, 11/01/2018 (Pre-refunded to 11/01/2017) | 1,000,000 | 1,057,190 | ||||||||||
| County of St. Lucie Florida, | ||||||||||||
| 6.000%, 10/01/2020 (ETM) | 6,520,000 | 7,563,070 | ||||||||||
| Dade County Florida Health Facility Authority Hospital Revenue, | ||||||||||||
| 5.750%, 05/01/2021 (ETM) | 1,180,000 | 1,329,907 | ||||||||||
| Escambia County Florida Housing Finance Authority Multifamily Housing Revenue, | ||||||||||||
| 0.000%, 10/15/2018 (ETM) | 4,130,000 | 4,026,378 | ||||||||||
| Florida Housing Finance Corp., | ||||||||||||
| 4.000%, 07/01/2047 (Callable 07/01/2025) | 5,000,000 | 5,529,450 | ||||||||||
| Florida State Board of Education, | ||||||||||||
| 5.000%, 06/01/2022 (Callable 06/01/2019) | 13,800,000 | 15,463,866 | ||||||||||
| Florida State Department of Management Services, | ||||||||||||
| 5.000%, 08/01/2018 | 2,500,000 | 2,718,300 | ||||||||||
| Florida State Mid-Bay Bridge Authority Revenue: | ||||||||||||
| 6.875%, 10/01/2022 (ETM) | 4,675,000 | 5,725,893 | ||||||||||
| 6.875%, 10/01/2022 (ETM) | 3,175,000 | 3,888,708 | ||||||||||
| Florida State Municipal Power Agency Revenue, | ||||||||||||
| 5.000%, 10/01/2017 (Pre-refunded to 08/01/2016)(ETM) | 1,590,000 | 1,676,416 | ||||||||||
| Gulf Environmental Services Inc. Florida Revenue Bonds, | ||||||||||||
| 5.000%, 10/01/2018 (ETM) | 830,000 | 870,023 | ||||||||||
| Hillsborough County Industrial Development Authority: | ||||||||||||
| 5.625%, 08/15/2029 (Pre-refunded to 08/15/2018) | 2,950,000 | 3,252,847 | ||||||||||
| 8.000%, 08/15/2032 (Pre-refunded to 08/15/2019) | 2,065,000 | 2,537,059 | ||||||||||
| Hillsborough County School Board, | ||||||||||||
| 5.500%, 07/01/2018 (Insured by NPFGC) | 2,000,000 | 2,184,840 | ||||||||||
| Miami Beach Florida Resort Tax Revenue, | ||||||||||||
| 6.250%, 10/01/2022 (ETM)(Insured by AMBAC) | 1,470,000 | 1,734,673 | ||||||||||
| Miami-Dade County Florida, | ||||||||||||
| 4.500%, 10/01/2020 | 7,100,000 | 8,124,885 | ||||||||||
| Miami-Dade County Florida Water & Sewer Revenue, | ||||||||||||
| 5.250%, 10/01/2022 (Insured by AGM) | 1,125,000 | 1,394,134 | ||||||||||
| Orlando Utilities Commission, | ||||||||||||
| 6.750%, 10/01/2017 (ETM) | 1,125,000 | 1,171,361 | ||||||||||
| Pinellas County Housing Finance Authority, | ||||||||||||
| 4.250%, 03/01/2027 (Callable 09/01/2019) | 950,000 | 985,578 | ||||||||||
| Seminole County Florida Water & Sewage Revenue, | ||||||||||||
| 6.000%, 10/01/2019 (ETM) | 4,700,000 | 5,070,501 | ||||||||||
| Sunrise Florida Utility System Revenue, | ||||||||||||
| 5.500%, 10/01/2018 (ETM)(Insured by AMBAC) | 2,480,000 | 2,613,796 | ||||||||||
| Tampa Bay Water, | ||||||||||||
| 5.000%, 10/01/2019 (ETM) | 1,695,000 | 1,920,791 | ||||||||||
| 98,735,974 | 8.0 | % | ||||||||||
| Georgia | ||||||||||||
| Atlanta Development Authority, | ||||||||||||
| 5.000%, 09/01/2023 (ETM) | 1,825,000 | 2,281,925 | ||||||||||
| Forsyth County Georgia Hospital Authority Revenue Anticipation Certificates, | ||||||||||||
| 6.375%, 10/01/2028 (ETM) | 8,050,000 | 10,841,498 | ||||||||||
| Georgia Housing & Finance Authority, | ||||||||||||
| 3.500%, 12/01/2046 (Callable 12/01/2025) | 1,500,000 | 1,618,575 | ||||||||||
| Gwinnett County Georgia School District, | ||||||||||||
| 5.000%, 02/01/2026 (Pre-refunded to 02/01/2018) | 7,500,000 | 8,018,325 | ||||||||||
| Richmond County Development Authority: | ||||||||||||
| 0.000%, 12/01/2021 (ETM) | 720,000 | 668,441 | ||||||||||
| 0.000%, 12/01/2021 (ETM) | 3,510,000 | 3,258,649 | ||||||||||
| State of Georgia, | ||||||||||||
| 5.000%, 07/01/2020 (Callable 07/01/2017) | 12,570,000 | 13,113,024 | ||||||||||
| 39,800,437 | 3.2 | % | ||||||||||
| Illinois | ||||||||||||
| Chicago Illinois Board of Education: | ||||||||||||
| 5.000%, 12/01/2017 (Callable 12/01/2016)(Insured by AGM) | 4,345,000 | 4,425,165 | ||||||||||
| 6.000%, 01/01/2020 (Insured by NPFGC) | 14,745,000 | 15,657,716 | ||||||||||
| Chicago Public Building Commission, | ||||||||||||
| 7.000%, 01/01/2020 (ETM) | 1,555,000 | 1,826,316 | ||||||||||
| City of Chicago IL, | ||||||||||||
| 5.000%, 01/01/2017 (Callable 08/01/2016)(Insured by AGM) | 395,000 | 396,236 | ||||||||||
| Cook County Community High School District No. 233, | ||||||||||||
| 4.000%, 12/01/2026 (Callable 06/01/2022) | 3,695,000 | 4,152,663 | ||||||||||
| Cook County Illinois School District No. 100, | ||||||||||||
| 8.100%, 12/01/2016 (ETM)(Insured by AGM) | 1,430,000 | 1,473,372 | ||||||||||
| Cook County Illinois School District No. 159, | ||||||||||||
| 0.000%, 12/01/2022 (ETM) | 2,000,000 | 1,834,920 | ||||||||||
| County of Du Page IL, | ||||||||||||
| 5.600%, 01/01/2021 | 815,000 | 913,330 | ||||||||||
| Illinois Finance Authority: | ||||||||||||
| 0.000%, 07/15/2023 (ETM) | 25,120,000 | 22,381,418 | ||||||||||
| 0.000%, 07/15/2025 (ETM) | 31,660,000 | 26,668,801 | ||||||||||
| 6.625%, 11/01/2039 (Pre-refunded to 05/01/2019) | 395,000 | 460,463 | ||||||||||
| Illinois State Toll Highway Authority: | ||||||||||||
| 5.000%, 01/01/2026 (Pre-refunded to 07/01/2016)(Insured by AGM) | 1,065,000 | 1,065,000 | ||||||||||
| 5.000%, 01/01/2031 (Pre-refunded to 07/01/2016)(Insured by AGM) | 2,055,000 | 2,055,000 | ||||||||||
| Kane County Community Unit School District, | ||||||||||||
| 9.000%, 01/01/2023 (Insured by AGM) | 3,000,000 | 4,309,890 | ||||||||||
| Kane McHenry Cook & De Kalb Counties Illinois School District No. 300: | ||||||||||||
| 7.750%, 01/01/2017 (ETM)(Insured by AMBAC) | 1,835,000 | 1,898,399 | ||||||||||
| 7.000%, 01/01/2018 (ETM)(Insured by AMBAC) | 5,775,000 | 6,311,036 | ||||||||||
| 7.000%, 01/01/2018 (ETM)(Insured by AMBAC) | 365,000 | 398,879 | ||||||||||
| 7.000%, 01/01/2019 (ETM)(Insured by AMBAC) | 1,755,000 | 2,024,673 | ||||||||||
| Kendall Kane & Will Counties Community Unit School District No. 308, | ||||||||||||
| 0.000%, 02/01/2021 (Insured by AGM) | 13,625,000 | 12,418,234 | ||||||||||
| Lake County Community Consolidated School District No. 50 Woodland, | ||||||||||||
| 5.000%, 01/01/2021 | 1,375,000 | 1,594,051 | ||||||||||
| Lake County Illinois Community High School District No. 124 Grant, | ||||||||||||
| 5.000%, 12/01/2017 | 1,050,000 | 1,113,672 | ||||||||||
| Metropolitan Pier & Exposition Authority, | ||||||||||||
| 5.500%, 12/15/2023 (ETM) | 2,250,000 | 2,706,390 | ||||||||||
| Regional Transportation Authority Illinois: | ||||||||||||
| 7.750%, 06/01/2020 (Insured by NPFGC) | 720,000 | 827,899 | ||||||||||
| 6.700%, 11/01/2021 (Insured by NPFGC) | 1,060,000 | 1,226,632 | ||||||||||
| 6.000%, 07/01/2022 (Insured by NPFGC) | 4,705,000 | 5,894,471 | ||||||||||
| Southern Illinois University Revenue: | ||||||||||||
| 5.250%, 04/01/2018 (Insured by NPFGC) | 1,075,000 | 1,153,228 | ||||||||||
| 5.250%, 04/01/2019 (Insured by NPFGC) | 1,390,000 | 1,538,271 | ||||||||||
| State of Illinois: | ||||||||||||
| 5.000%, 01/01/2019 (Insured by AGM) | 1,000,000 | 1,082,290 | ||||||||||
| 4.000%, 09/01/2019 (Callable 09/01/2018) | 5,000,000 | 5,177,400 | ||||||||||
| 6.000%, 11/01/2026 (Insured by NPFGC) | 3,000,000 | 3,698,640 | ||||||||||
| Village of Schaumburg IL, | ||||||||||||
| 4.000%, 12/01/2024 (Callable 12/01/2022) | 5,750,000 | 6,537,808 | ||||||||||
| Winnebago County Illinois School District No. 122 Harlam-Loves Park: | ||||||||||||
| 0.000%, 01/01/2018 (ETM)(Insured by AGM) | 155,000 | 153,263 | ||||||||||
| 0.000%, 01/01/2018 (Insured by AGM) | 1,205,000 | 1,160,463 | ||||||||||
| 144,535,989 | 11.7 | % | ||||||||||
| Indiana | ||||||||||||
| Franklin Community Multi-School Building Corp., | ||||||||||||
| 5.000%, 07/15/2020 | 1,990,000 | 2,283,724 | ||||||||||
| Hammond Indiana Multi-School Building Corporation Revenue Bonds, | ||||||||||||
| 6.000%, 01/15/2018 (ETM) | 435,000 | 456,028 | ||||||||||
| 5.000%, 07/15/2018 | 1,330,000 | 1,434,432 | ||||||||||
| Indiana State Office Building Commission, | ||||||||||||
| 5.250%, 07/01/2017 (Insured by NPFGC) | 1,115,000 | 1,166,691 | ||||||||||
| Indianapolis Local Public Improvement Bond Bank: | ||||||||||||
| 5.500%, 07/01/2018 (Insured by NPFGC) | 3,460,000 | 3,746,142 | ||||||||||
| 5.500%, 01/01/2019 (Insured by NPFGC) | 1,155,000 | 1,275,085 | ||||||||||
| Pike County Multi-School Building Corp., | ||||||||||||
| 5.000%, 07/15/2021 | 1,125,000 | 1,316,633 | ||||||||||
| South Bend Indiana Community School Building Corporation, | ||||||||||||
| 5.000%, 07/15/2017 | 1,000,000 | 1,031,300 | ||||||||||
| 12,710,035 | 1.0 | % | ||||||||||
| Kansas | ||||||||||||
| City of Wichita KS: | ||||||||||||
| 5.000%, 11/15/2020 (ETM) | 1,120,000 | 1,311,621 | ||||||||||
| 5.000%, 11/15/2029 (Pre-refunded to 11/15/2021) | 40,000 | 48,049 | ||||||||||
| 5.000%, 11/15/2034 (Pre-refunded to 11/15/2019) | 1,055,000 | 1,198,891 | ||||||||||
| Wyandotte County Kansas Revenue, | ||||||||||||
| 5.000%, 09/01/2019 (Callable 03/01/2019)(Insured by BHAC) | 1,865,000 | 2,066,010 | ||||||||||
| 4,624,571 | 0.4 | % | ||||||||||
| Kentucky | ||||||||||||
| Jefferson County School District Finance Corp., | ||||||||||||
| 5.500%, 01/01/2018 (Insured by AGM) | 3,340,000 | 3,572,999 | ||||||||||
| Kentucky Infrastructure Authority: | ||||||||||||
| 5.000%, 02/01/2023 (Pre-refunded to 02/01/2022) | 70,000 | 84,835 | ||||||||||
| 5.000%, 02/01/2025 (Pre-refunded to 02/01/2022) | 70,000 | 84,835 | ||||||||||
| 5.000%, 02/01/2026 (Pre-refunded to 02/01/2022) | 75,000 | 90,895 | ||||||||||
| Louisville & Jefferson County Metropolitan Government, | ||||||||||||
| 6.125%, 02/01/2037 (Pre-refunded to 02/01/2018) | 13,980,000 | 15,180,043 | ||||||||||
| 19,013,607 | 1.5 | % | ||||||||||
| Louisiana | ||||||||||||
| Jefferson Parish Hospital Service District No. 1: | ||||||||||||
| 6.000%, 01/01/2039 (Pre-refunded to 01/01/2021)(Insured by AGM) | 1,950,000 | 2,374,769 | ||||||||||
| 6.000%, 01/01/2039 (Pre-refunded to 01/01/2021) | 1,080,000 | 1,315,256 | ||||||||||
| Louisiana Public Facilities Authority, | ||||||||||||
| 6.750%, 07/01/2039 (Pre-refunded to 07/01/2019) | 6,155,000 | 7,223,508 | ||||||||||
| Louisiana Public Facilities Authority Revenue: | ||||||||||||
| 5.500%, 05/15/2027 (Pre-refunded to 05/15/2026) | 10,390,000 | 13,930,289 | ||||||||||
| 5.500%, 05/15/2032 (Pre-refunded to 05/15/2026) | 21,985,000 | 29,799,348 | ||||||||||
| State of Louisiana: | ||||||||||||
| 5.000%, 11/15/2018 | 1,775,000 | 1,945,737 | ||||||||||
| 5.000%, 11/15/2020 (Callable 05/15/2020) | 10,000,000 | 11,489,600 | ||||||||||
| 68,078,507 | 5.5 | % | ||||||||||
| Maine | ||||||||||||
| Maine State Housing Authority, | ||||||||||||
| 3.500%, 11/15/2046 (Callable 11/15/2025)(2) | 2,055,000 | 2,203,001 | 0.2 | % | ||||||||
| Maryland | ||||||||||||
| City of Baltimore MD, | ||||||||||||
| 5.000%, 07/01/2024 (ETM) | 1,195,000 | 1,470,292 | ||||||||||
| State of Maryland: | ||||||||||||
| 5.000%, 03/15/2019 (Pre-refunded to 03/15/2017) | 1,135,000 | 1,170,299 | ||||||||||
| 5.000%, 03/01/2021 (Callable 03/01/2020) | 1,000,000 | 1,150,110 | ||||||||||
| 3,790,701 | 0.3 | % | ||||||||||
| Massachusetts | ||||||||||||
| Massachusetts Clean Water Trust, | ||||||||||||
| 5.000%, 08/01/2018 (Pre-refunded to 08/01/2016)(Partially Pre-refunded) | 2,115,000 | 2,121,683 | ||||||||||
| Massachusetts Department of Transportation, | ||||||||||||
| 5.000%, 01/01/2020 (ETM) | 1,530,000 | 1,648,514 | ||||||||||
| Massachusetts Housing Finance Agency, | ||||||||||||
| 4.000%, 12/01/2044 (Callable 06/01/2025) | 2,000,000 | 2,174,940 | ||||||||||
| Massachusetts State, | ||||||||||||
| 4.000%, 12/01/2022 (Callable 12/01/2019) | 15,000,000 | 16,602,750 | ||||||||||
| Massachusetts State Water Resources Authority, | ||||||||||||
| 6.500%, 07/15/2019 (ETM)(Insured by FGIC-TCRS) | 1,900,000 | 2,025,077 | ||||||||||
| 24,572,964 | 2.0 | % | ||||||||||
| Michigan | ||||||||||||
| Brighton Area School District/MI: | ||||||||||||
| 5.000%, 05/01/2020 (Insured by Q-SBLF) | 1,300,000 | 1,485,952 | ||||||||||
| 5.000%, 05/01/2021 (Insured by Q-SBLF) | 500,000 | 585,125 | ||||||||||
| Chippewa Valley Schools, | ||||||||||||
| 5.000%, 05/01/2023 (Insured by Q-SBLF) | 4,505,000 | 5,490,739 | ||||||||||
| Fraser Public School District: | ||||||||||||
| 5.000%, 05/01/2024 (Insured by Q-SBLF) | 1,000,000 | 1,238,990 | ||||||||||
| 5.000%, 05/01/2026 (Callable 05/01/2025)(Insured by Q-SBLF) | 1,140,000 | 1,418,354 | ||||||||||
| Garden City Hospital Finance Authority, | ||||||||||||
| 4.875%, 08/15/2027 (Pre-refunded to 08/15/2017) | 1,000,000 | 1,046,230 | ||||||||||
| Michigan Finance Authority, | ||||||||||||
| 5.000%, 01/01/2019 | 7,000,000 | 7,740,530 | ||||||||||
| Michigan State Housing Development Authority, | ||||||||||||
| 4.000%, 06/01/2046 (Callable 12/01/2025) | 4,000,000 | 4,392,400 | ||||||||||
| Pinckney Community Schools: | ||||||||||||
| 5.000%, 05/01/2022 (Insured by Q-SBLF) | 1,935,000 | 2,280,301 | ||||||||||
| 5.000%, 05/01/2023 (Insured by Q-SBLF) | 2,200,000 | 2,635,776 | ||||||||||
| St. Johns MI Public Schools, | ||||||||||||
| 5.000%, 05/01/2021 (Insured by Q-SBLF) | 5,040,000 | 5,882,637 | ||||||||||
| State of Michigan, | ||||||||||||
| 0.000%, 06/01/2022 (ETM)(Insured by AMBAC) | 2,000,000 | 1,858,180 | ||||||||||
| Wayne-Westland Community Schools, | ||||||||||||
| 5.000%, 05/01/2019 (Insured by Q-SBLF) | 2,060,000 | 2,275,744 | ||||||||||
| 38,330,958 | 3.1 | % | ||||||||||
| Minnesota | ||||||||||||
| Minnesota Housing Finance Agency, | ||||||||||||
| 3.500%, 07/01/2046 (Callable 07/01/2025) | 3,000,000 | 3,215,010 | ||||||||||
| Minnesota State Housing Finance Agency Homeownership Finance Bond: | ||||||||||||
| 4.250%, 07/01/2028 (Callable 01/01/2020) | 425,000 | 441,686 | ||||||||||
| 4.500%, 07/01/2034 (Callable 07/01/2021) | 900,000 | 945,567 | ||||||||||
| University of Minnesota, | ||||||||||||
| 5.500%, 07/01/2021 (ETM) | 10,380,000 | 12,170,861 | ||||||||||
| 16,773,124 | 1.3 | % | ||||||||||
| Missouri | ||||||||||||
| Missouri State Environmental Improvement & Energy Resources Authority, | ||||||||||||
| 5.000%, 01/01/2026 (Callable 07/01/2025) | 1,000,000 | 1,305,930 | ||||||||||
| St. Charles County MO Francis Howell School District, | ||||||||||||
| 4.500%, 03/01/2018 | 1,000,000 | 1,062,840 | ||||||||||
| 2,368,770 | 0.2 | % | ||||||||||
| Nebraska | ||||||||||||
| Omaha Public Power District, | ||||||||||||
| 6.200%, 02/01/2017 (ETM) | 2,030,000 | 2,095,934 | 0.2 | % | ||||||||
| New Hampshire | ||||||||||||
| New Hampshire Housing Finance Authority, | ||||||||||||
| 5.250%, 07/01/2028 (Callable 01/01/2021) | 2,000,000 | 2,092,460 | ||||||||||
| State of New Hampshire, | ||||||||||||
| 5.000%, 07/01/2021 (Callable 07/01/2020) | 1,000,000 | 1,158,470 | ||||||||||
| 3,250,930 | 0.3 | % | ||||||||||
| New Jersey | ||||||||||||
| County of Hudson NJ, | ||||||||||||
| 3.000%, 03/15/2021 | 1,140,000 | 1,237,128 | ||||||||||
| New Jersey Educational Facilities Authority, | ||||||||||||
| 7.500%, 12/01/2032 (Pre-refunded to 06/01/2019) | 3,635,000 | 4,327,759 | ||||||||||
| New Jersey Health Care Facilities Financing Authority, | ||||||||||||
| 5.750%, 07/01/2039 (Pre-refunded to 07/01/2019) | 2,230,000 | 2,551,499 | ||||||||||
| New Jersey State Housing & Mortgage Finance Agency Bonds, | ||||||||||||
| 4.500%, 10/01/2029 (Callable 04/01/2021) | 3,230,000 | 3,361,170 | ||||||||||
| New Jersey State Transportation Trust Fund Authority, | ||||||||||||
| 5.250%, 12/15/2020 | 5,000,000 | 5,626,100 | ||||||||||
| New Jersey State Turnpike Authority, | ||||||||||||
| 5.500%, 01/01/2025 | 2,100,000 | 2,774,835 | ||||||||||
| 19,878,491 | 1.6 | % | ||||||||||
| New Mexico | ||||||||||||
| New Mexico Finance Authority, | ||||||||||||
| 4.000%, 06/01/2029 (Callable 06/01/2026) | 2,615,000 | 3,059,655 | ||||||||||
| New Mexico Mortgage Financial Authority: | ||||||||||||
| 4.625%, 09/01/2025 (Callable 03/01/2020) | 805,000 | 847,254 | ||||||||||
| 4.500%, 09/01/2028 (Callable 03/01/2020) | 500,000 | 518,235 | ||||||||||
| 4,425,144 | 0.4 | % | ||||||||||
| New York | ||||||||||||
| Cattaraugus-Little Valley Central School District, | ||||||||||||
| 3.125%, 06/15/2017 | 1,000,000 | 1,022,530 | ||||||||||
| Churchville-Chili Central School District: | ||||||||||||
| 3.000%, 06/15/2017 | 1,045,000 | 1,068,314 | ||||||||||
| 3.000%, 06/15/2018 | 1,070,000 | 1,117,797 | ||||||||||
| City of New York NY: | ||||||||||||
| 5.250%, 08/15/2021 (Callable 08/15/2018) | 1,125,000 | 1,232,426 | ||||||||||
| 5.000%, 08/01/2022 | 5,000,000 | 6,092,600 | ||||||||||
| Metropolitan Transit Authority New York, | ||||||||||||
| 6.000%, 04/01/2020 (ETM) | 13,615,000 | 15,164,387 | ||||||||||
| New York State Dormitory Authority, | ||||||||||||
| 5.000%, 12/15/2023 (Callable 12/15/2022) | 11,685,000 | 14,429,573 | ||||||||||
| New York State Thruway Authority, | ||||||||||||
| 5.000%, 03/15/2022 (Callable 03/15/2019) | 4,040,000 | 4,493,207 | ||||||||||
| New York State Urban Development Corp., | ||||||||||||
| 5.000%, 03/15/2022 | 2,000,000 | 2,425,480 | ||||||||||
| State of New York Mortgage Agency, | ||||||||||||
| 4.000%, 10/01/2046 (Callable 04/01/2025) | 2,550,000 | 2,809,666 | ||||||||||
| Suffolk County Water Authority, | ||||||||||||
| 6.000%, 06/01/2017 (ETM) | 1,750,000 | 1,836,748 | ||||||||||
| Susquehanna Valley Central School District: | ||||||||||||
| 3.125%, 06/15/2017 | 1,155,000 | 1,181,022 | ||||||||||
| 3.125%, 06/15/2019 | 1,375,000 | 1,463,619 | ||||||||||
| TSASC, Inc. New York, | ||||||||||||
| 4.750%, 06/01/2022 (Callable 07/18/2016) | 75,000 | 75,067 | ||||||||||
| Westchester Tobacco Asset Securitization/NY, | ||||||||||||
| 6.950%, 07/15/2039 (Pre-refunded to 07/15/2017) | 13,075,000 | 14,053,533 | ||||||||||
| 68,465,969 | 5.5 | % | ||||||||||
| North Carolina | ||||||||||||
| North Carolina Eastern Municipal Power Agency: | ||||||||||||
| 5.000%, 01/01/2017 (ETM) | 1,460,000 | 1,492,076 | ||||||||||
| 5.000%, 01/01/2021 (ETM) (2) | 10,150,000 | 11,737,765 | ||||||||||
| 6.400%, 01/01/2021 (ETM) | 4,062,000 | 4,597,697 | ||||||||||
| 4.500%, 01/01/2024 (Pre-refunded to 01/01/2022) | 11,740,000 | 13,646,341 | ||||||||||
| 6.000%, 01/01/2026 (Pre-refunded to 01/01/2022) | 2,635,000 | 3,326,977 | ||||||||||
| North Carolina Medical Care Commission, | ||||||||||||
| 5.750%, 01/01/2035 (Pre-refunded to 01/01/2021) | 430,000 | 518,963 | ||||||||||
| 35,319,819 | 2.8 | % | ||||||||||
| North Dakota | ||||||||||||
| County of Burleigh ND, | ||||||||||||
| 5.000%, 07/01/2025 (Pre-refunded to 07/01/2021) | 1,500,000 | 1,784,685 | 0.1 | % | ||||||||
| Ohio | ||||||||||||
| Cleveland Municipal School District: | ||||||||||||
| 4.000%, 12/01/2017 | 1,790,000 | 1,869,995 | ||||||||||
| 4.000%, 12/01/2018 | 1,865,000 | 2,002,115 | ||||||||||
| 4.000%, 12/01/2019 | 1,940,000 | 2,136,968 | ||||||||||
| 5.000%, 12/01/2020 | 2,015,000 | 2,362,245 | ||||||||||
| Miamisburg Ohio Water Revenue, | ||||||||||||
| 7.000%, 11/15/2016 (Pre-refunded to 08/01/2016)(ETM) | 40,000 | 40,942 | ||||||||||
| Ohio Housing Finance Agency: | ||||||||||||
| 5.000%, 11/01/2028 (Callable 05/01/2020) | 1,055,000 | 1,103,678 | ||||||||||
| 4.000%, 03/01/2047 (Callable 09/01/2025) | 5,350,000 | 5,880,452 | ||||||||||
| State of Ohio: | ||||||||||||
| 5.000%, 03/01/2019 | 1,220,000 | 1,357,628 | ||||||||||
| 5.500%, 02/01/2020 | 1,195,000 | 1,393,167 | ||||||||||
| 5.000%, 06/15/2021 | 6,740,000 | 8,040,281 | ||||||||||
| 26,187,471 | 2.1 | % | ||||||||||
| Oregon | ||||||||||||
| State of Oregon, | ||||||||||||
| 4.000%, 12/01/2045 (Callable 06/01/2025) | 4,890,000 | 5,325,161 | ||||||||||
| State of Oregon Housing & Community Services Department, | ||||||||||||
| 4.000%, 01/01/2047 (Callable 07/01/2025) | 2,000,000 | 2,201,600 | ||||||||||
| 7,526,761 | 0.6 | % | ||||||||||
| Pennsylvania | ||||||||||||
| Erie Pennsylvania Sewer Authority Revenue, | ||||||||||||
| 5.125%, 06/01/2020 (ETM)(Insured by AMBAC) | 1,410,000 | 1,553,101 | ||||||||||
| Lampeter Strasburg School District, | ||||||||||||
| 4.000%, 06/01/2019 | 1,715,000 | 1,863,879 | ||||||||||
| Pennsylvania Convention Center Authority Revenue Bonds, | ||||||||||||
| 6.000%, 09/01/2019 (ETM) | 14,055,000 | 15,571,253 | ||||||||||
| Pennsylvania Housing Finance Agency, | ||||||||||||
| 3.500%, 10/01/2046 (Callable 10/01/2025)(2) | 2,000,000 | 2,146,260 | ||||||||||
| Philadelphia Hospitals & Higher Education Facilities Authority: | ||||||||||||
| 5.000%, 05/15/2020 (ETM) | 1,575,000 | 1,817,377 | ||||||||||
| 5.250%, 05/15/2023 (Pre-refunded to 05/15/2020) | 2,790,000 | 3,245,718 | ||||||||||
| Philadelphia Pennsylvania Authority For Industrial Development Revenue, | ||||||||||||
| 5.250%, 01/01/2027 (Pre-refunded to 01/01/2017) | 1,790,000 | 1,830,168 | ||||||||||
| Philadelphia Pennsylvania Gas Works, | ||||||||||||
| 7.000%, 05/15/2020 (ETM) | 1,505,000 | 1,712,058 | ||||||||||
| South Fork Municipal Authority: | ||||||||||||
| 5.500%, 07/01/2029 (Pre-refunded to 07/01/2020) | 2,450,000 | 2,890,289 | ||||||||||
| 5.375%, 07/01/2035 (Pre-refunded to 07/01/2020) | 1,290,000 | 1,509,997 | ||||||||||
| 34,140,100 | 2.8 | % | ||||||||||
| Puerto Rico | ||||||||||||
| Commonwealth of Puerto Rico, | ||||||||||||
| 5.000%, 07/01/2021 | 6,000,000 | 3,885,000 | ||||||||||
| Puerto Rico Electric Power Authority: | ||||||||||||
| 0.000%, 07/01/2017 (ETM) | 3,225,000 | 3,100,160 | ||||||||||
| 0.000%, 07/01/2017 (Pre-refunded to various dates)(ETM) | 1,280,000 | 1,230,247 | ||||||||||
| Puerto Rico Highways & Transportation Authority, | ||||||||||||
| 5.250%, 07/01/2022 (ETM)(Insured by AGM) | 890,000 | 1,090,107 | ||||||||||
| Puerto Rico Public Finance Corp.: | ||||||||||||
| 6.000%, 08/01/2026 (ETM) | 1,675,000 | 2,285,119 | ||||||||||
| 6.000%, 08/01/2026 (ETM) | 1,080,000 | 1,473,390 | ||||||||||
| 5.500%, 08/01/2027 (ETM)(Insured by AMBAC) | 4,250,000 | 5,680,465 | ||||||||||
| 18,744,488 | 1.5 | % | ||||||||||
| Rhode Island | ||||||||||||
| State of Rhode Island, | ||||||||||||
| 5.000%, 08/01/2024 | 5,000,000 | 6,329,650 | 0.5 | % | ||||||||
| South Carolina | ||||||||||||
| Charleston Educational Excellence Finance Corp., | ||||||||||||
| 5.000%, 12/01/2026 (Callable 12/01/2023) | 4,580,000 | 5,677,414 | ||||||||||
| Piedmont Municipal Power Agency South Carolina Electric Revenue, | ||||||||||||
| 6.750%, 01/01/2020 (ETM) | 6,450,000 | 7,732,260 | ||||||||||
| South Carolina Jobs-Economic Development Authority, | ||||||||||||
| 6.500%, 04/01/2042 (Pre-refunded to 04/01/2020) | 90,000 | 108,585 | ||||||||||
| 13,518,259 | 1.1 | % | ||||||||||
| South Dakota | ||||||||||||
| South Dakota Housing Development Authority, | ||||||||||||
| 3.500%, 11/01/2046 (Callable 11/01/2025) | 2,250,000 | 2,438,078 | 0.2 | % | ||||||||
| Tennessee | ||||||||||||
| County of Rutherford TN, | ||||||||||||
| 5.000%, 04/01/2021 | 1,955,000 | 2,316,812 | ||||||||||
| Metropolitan Government Nashville & Davidson County Health & Educational Facilities, | ||||||||||||
| 0.900%, 04/01/2019 (Mandatory Tender Date 04/01/2018) (1) | 2,550,000 | 2,557,472 | ||||||||||
| Metropolitan Government Nashville & Davidson County Tennessee H&E, | ||||||||||||
| 0.000%, 06/01/2021 (ETM) | 1,050,000 | 991,630 | ||||||||||
| Shelby County Tennessee Health Educational & Housing Facilities Revenue, | ||||||||||||
| 5.500%, 08/15/2019 (ETM) | 3,080,000 | 3,303,177 | ||||||||||
| Tennessee Housing Development Agency, | ||||||||||||
| 4.500%, 07/01/2028 (Callable 01/01/2020) | 1,895,000 | 1,976,333 | ||||||||||
| 11,145,424 | 0.9 | % | ||||||||||
| Texas | ||||||||||||
| Alvin Independent School District/TX, | ||||||||||||
| 5.000%, 02/15/2027 (Callable 02/15/2026)(PSF Guaranteed) | 8,110,000 | 10,489,717 | ||||||||||
| Amarillo Independent School District, | ||||||||||||
| 5.000%, 02/01/2026 (Callable 02/01/2024)(PSF Guaranteed) | 1,370,000 | 1,719,679 | ||||||||||
| Arlington Higher Education Finance Corp.: | ||||||||||||
| 5.000%, 08/15/2024 (PSF Guaranteed) | 1,000,000 | 1,241,250 | ||||||||||
| 5.000%, 02/15/2028 (Callable 02/15/2025)(PSF Guaranteed) | 1,675,000 | 2,091,556 | ||||||||||
| 5.000%, 08/15/2033 (Callable 08/15/2024)(PSF Guaranteed) | 1,460,000 | 1,778,995 | ||||||||||
| Burleson Independent School District, | ||||||||||||
| 5.000%, 08/01/2025 (PSF Guaranteed) | 1,240,000 | 1,606,718 | ||||||||||
| Central Texas Housing Finance Corp., | ||||||||||||
| 0.000%, 09/01/2016 (ETM) | 1,500,000 | 1,498,485 | ||||||||||
| City of Austin TX Water & Wastewater System Revenue, | ||||||||||||
| 5.000%, 11/15/2024 (Callable 11/15/2022) | 3,000,000 | 3,671,130 | ||||||||||
| City of Houston TX Combined Utility System Revenue: | ||||||||||||
| 0.000%, 12/01/2019 (ETM)(Insured by AGM) | 13,355,000 | 12,896,256 | ||||||||||
| 5.500%, 12/01/2024 (ETM) | 1,735,000 | 2,238,098 | ||||||||||
| 5.500%, 12/01/2029 (ETM) | 16,050,000 | 22,662,760 | ||||||||||
| Conroe Independent School District: | ||||||||||||
| 5.000%, 02/15/2022 (Callable 02/15/2021)(PSF Guaranteed) | 1,000,000 | 1,177,720 | ||||||||||
| 5.000%, 02/15/2023 (Callable 02/15/2021)(PSF Guaranteed) | 2,680,000 | 3,151,010 | ||||||||||
| County of Harris TX, | ||||||||||||
| 5.000%, 08/15/2027 (Callable 08/15/2022) | 3,480,000 | 4,249,428 | ||||||||||
| Dallas Texas Independent School District, | ||||||||||||
| 5.000%, 02/15/2020 (PSF Guaranteed) | 2,410,000 | 2,767,427 | ||||||||||
| Ennis Independent School District, | ||||||||||||
| 5.000%, 08/15/2025 (PSF Guaranteed) | 1,145,000 | 1,496,320 | ||||||||||
| Fort Bend Independent School District, | ||||||||||||
| 5.000%, 08/15/2024 (PSF Guaranteed) | 1,655,000 | 2,114,527 | ||||||||||
| Frisco Texas Independent School District, | ||||||||||||
| 6.000%, 08/15/2018 (Pre-refunded to 08/15/2016)(PSF Guaranteed) | 1,625,000 | 1,634,815 | ||||||||||
| Georgetown Independent School District, | ||||||||||||
| 4.000%, 02/15/2020 (PSF Guaranteed) | 1,900,000 | 2,116,524 | ||||||||||
| Godley Independent School District, | ||||||||||||
| 5.000%, 02/15/2023 (PSF Guaranteed) | 1,445,000 | 1,778,376 | ||||||||||
| Goose Creek Consolidated Independent School District, | ||||||||||||
| 5.000%, 02/15/2021 (PSF Guaranteed) | 1,050,000 | 1,238,170 | ||||||||||
| Harlingen Consolidated Independent School District: | ||||||||||||
| 5.000%, 08/15/2024 (PSF Guaranteed) | 2,810,000 | 3,582,806 | ||||||||||
| 5.000%, 08/15/2025 (PSF Guaranteed) | 1,430,000 | 1,854,596 | ||||||||||
| Harris County Health Facilities Development Corp.: | ||||||||||||
| 5.500%, 10/01/2019 (ETM) | 4,780,000 | 5,201,500 | ||||||||||
| 5.750%, 07/01/2027 (ETM) | 5,000,000 | 6,563,050 | ||||||||||
| Harris County Texas: | ||||||||||||
| 5.000%, 10/01/2019 | 1,525,000 | 1,729,716 | ||||||||||
| 5.750%, 10/01/2020 (Pre-refunded to 10/01/2018) | 175,000 | 194,282 | ||||||||||
| 5.000%, 10/01/2026 (Callable 10/01/2025) | 4,155,000 | 5,404,824 | ||||||||||
| 5.750%, 10/01/2028 (Pre-refunded to 10/01/2018) | 6,930,000 | 7,693,547 | ||||||||||
| Houston Higher Education Finance Corp.: | ||||||||||||
| 5.000%, 02/15/2020 (PSF Guaranteed) | 1,000,000 | 1,137,590 | ||||||||||
| 5.000%, 02/15/2026 (Callable 02/15/2024)(PSF Guaranteed) | 1,030,000 | 1,274,913 | ||||||||||
| Humble Texas Independent School District, | ||||||||||||
| 5.000%, 02/15/2021 (PSF Guaranteed) | 1,500,000 | 1,767,330 | ||||||||||
| Irving Independent School District, | ||||||||||||
| 5.000%, 02/15/2025 (Callable 08/15/2024)(PSF Guaranteed) | 1,250,000 | 1,595,975 | ||||||||||
| Katy Independent School District, | ||||||||||||
| 5.000%, 02/15/2020 (PSF Guaranteed) | 4,635,000 | 5,318,848 | ||||||||||
| Keller Independent School District/TX: | ||||||||||||
| 5.000%, 02/15/2022 (PSF Guaranteed) | 1,370,000 | 1,650,699 | ||||||||||
| 5.000%, 02/15/2023 (PSF Guaranteed) | 3,340,000 | 4,117,719 | ||||||||||
| Killeen Independent School District, | ||||||||||||
| 4.000%, 02/15/2024 (Callable 02/15/2021)(PSF Guaranteed) | 1,145,000 | 1,285,572 | ||||||||||
| La Porte Independent School District/TX, | ||||||||||||
| 5.000%, 02/15/2025 (PSF Guaranteed) | 1,080,000 | 1,388,200 | ||||||||||
| Lamar Consolidated Independent School District: | ||||||||||||
| 5.000%, 02/15/2026 (Callable 02/15/2025)(PSF Guaranteed) | 5,860,000 | 7,477,829 | ||||||||||
| 5.000%, 02/15/2027 (Callable 02/15/2025)(PSF Guaranteed) | 2,550,000 | 3,235,210 | ||||||||||
| Llano Independent School District, | ||||||||||||
| 5.000%, 02/15/2024 (Callable 02/15/2023)(PSF Guaranteed) | 1,265,000 | 1,560,453 | ||||||||||
| Lower Colorado River Authority, | ||||||||||||
| 4.750%, 01/01/2028 (ETM)(Insured by AGM) | 1,200,000 | 1,469,484 | ||||||||||
| Lubbock Texas, | ||||||||||||
| 5.000%, 02/15/2021 (Pre-refunded to 02/15/2018)(Insured by AGM) | 3,425,000 | 3,661,804 | ||||||||||
| Lubbock Texas Housing Finance Corp., | ||||||||||||
| 8.000%, 10/01/2021 (ETM) | 1,780,000 | 2,359,426 | ||||||||||
| Lubbock Texas Independent School District, | ||||||||||||
| 4.000%, 02/15/2022 (Callable 02/15/2020)(PSF Guaranteed) | 1,000,000 | 1,102,680 | ||||||||||
| Mansfield Independent School District: | ||||||||||||
| 5.000%, 02/15/2023 (PSF Guaranteed) | 1,725,000 | 2,127,891 | ||||||||||
| 5.000%, 02/15/2024 (PSF Guaranteed) | 1,905,000 | 2,402,986 | ||||||||||
| Mesquite Independent School District: | ||||||||||||
| 5.000%, 08/15/2024 (PSF Guaranteed) | 1,425,000 | 1,816,904 | ||||||||||
| 5.000%, 08/15/2025 (PSF Guaranteed) | 2,600,000 | 3,371,992 | ||||||||||
| 5.000%, 08/15/2025 (PSF Guaranteed) | 1,500,000 | 1,945,380 | ||||||||||
| Montgomery County Health Facilities Development Corp., | ||||||||||||
| 0.000%, 07/15/2023 (ETM) | 200,000 | 181,962 | ||||||||||
| New Caney Independent School District: | ||||||||||||
| 5.000%, 02/15/2023 (PSF Guaranteed) | 1,000,000 | 1,233,560 | ||||||||||
| 5.000%, 02/15/2024 (PSF Guaranteed) | 1,030,000 | 1,300,107 | ||||||||||
| North East Independent School District/TX: | ||||||||||||
| 5.000%, 08/01/2021 (PSF Guaranteed) | 6,095,000 | 7,270,543 | ||||||||||
| 5.000%, 08/01/2023 (PSF Guaranteed) | 5,805,000 | 7,251,200 | ||||||||||
| 5.000%, 02/01/2024 (PSF Guaranteed) | 2,930,000 | 3,699,447 | ||||||||||
| North Texas Tollway Authority, | ||||||||||||
| 0.000%, 09/01/2043 (Callable 09/01/2031) | 1,400,000 | 1,541,890 | ||||||||||
| Northside Independent School District: | ||||||||||||
| 5.000%, 08/15/2025 (PSF Guaranteed) | 1,000,000 | 1,302,860 | ||||||||||
| 2.000%, 06/01/2046 (Mandatory Tender Date 06/01/2021)(PSF Guaranteed) (1) | 1,450,000 | 1,507,362 | ||||||||||
| Pasadena Independent School District, | ||||||||||||
| 5.000%, 02/15/2022 (Callable 02/15/2021)(PSF Guaranteed) | 1,115,000 | 1,314,819 | ||||||||||
| Pflugerville Independent School District, | ||||||||||||
| 5.000%, 02/15/2025 (Callable 02/15/2024)(PSF Guaranteed) | 1,000,000 | 1,263,890 | ||||||||||
| Pharr San Juan Alamo Independent School District TX, | ||||||||||||
| 5.000%, 02/01/2028 (Callable 02/01/2025)(PSF Guaranteed) | 4,895,000 | 6,173,574 | ||||||||||
| Port Arthur Independent School District, | ||||||||||||
| 5.000%, 02/15/2024 (PSF Guaranteed) | 1,700,000 | 2,147,202 | ||||||||||
| Retama Texas Development Corporation Special Facilities Revenue, | ||||||||||||
| 8.750%, 12/15/2018 (ETM) | 2,035,000 | 2,410,112 | ||||||||||
| San Antonio Texas Electric & Gas Revenue, | ||||||||||||
| 5.650%, 02/01/2019 (ETM) | 9,765,000 | 10,596,880 | ||||||||||
| Sherman Independent School District/TX, | ||||||||||||
| 5.000%, 02/15/2026 (Callable 02/15/2024)(PSF Guaranteed) | 1,775,000 | 2,225,886 | ||||||||||
| Spring Texas Independent School District, | ||||||||||||
| 5.000%, 08/15/2019 (Pre-refunded to 08/15/2018)(PSF Guaranteed) | 1,020,000 | 1,113,656 | ||||||||||
| Tarrant County Texas Health Facilities Revenue, | ||||||||||||
| 6.000%, 09/01/2024 (ETM) | 7,385,000 | 8,835,783 | ||||||||||
| Tarrant County Texas Housing Finance Corporation Revenue Bonds, | ||||||||||||
| 0.000%, 09/15/2016 (ETM) | 1,800,000 | 1,798,074 | ||||||||||
| Temple Independent School District, | ||||||||||||
| 4.000%, 02/01/2022 (Callable 02/01/2021)(PSF Guaranteed) | 1,120,000 | 1,265,958 | ||||||||||
| Texas State: | ||||||||||||
| 5.000%, 10/01/2018 | 6,285,000 | 6,887,920 | ||||||||||
| 5.000%, 08/01/2021 | 1,205,000 | 1,438,722 | ||||||||||
| Tomball Independent School District, | ||||||||||||
| 5.000%, 02/15/2025 (PSF Guaranteed) | 5,865,000 | 7,549,663 | ||||||||||
| University of Texas System, | ||||||||||||
| 5.000%, 08/15/2022 | 9,530,000 | 11,694,454 | ||||||||||
| Waco Independent School District: | ||||||||||||
| 5.000%, 08/15/2022 (PSF Guaranteed) | 3,085,000 | 3,763,268 | ||||||||||
| 5.000%, 08/15/2023 (PSF Guaranteed) | 3,090,000 | 3,851,963 | ||||||||||
| Wichita Falls Independent School District, | ||||||||||||
| 5.000%, 02/01/2024 (PSF Guaranteed) | 1,670,000 | 2,104,451 | ||||||||||
| Wylie Independent School District/TX, | ||||||||||||
| 6.750%, 08/15/2023 (PSF Guaranteed) | 1,010,000 | 1,390,831 | ||||||||||
| Ysleta Independent School District: | ||||||||||||
| 5.000%, 08/15/2023 (Callable 08/15/2021)(PSF Guaranteed) | 1,020,000 | 1,226,632 | ||||||||||
| 5.000%, 08/15/2025 (Callable 08/15/2024)(PSF Guaranteed) | 1,545,000 | 1,965,827 | ||||||||||
| 274,220,663 | 22.2 | % | ||||||||||
| Utah | ||||||||||||
| Granite School District Board of Education: | ||||||||||||
| 5.000%, 06/01/2022 (Pre-refunded to 06/01/2021) | 3,900,000 | 4,661,046 | ||||||||||
| 5.000%, 06/01/2023 (Pre-refunded to 06/01/2021) | 1,750,000 | 2,091,495 | ||||||||||
| Utah Housing Corp., | ||||||||||||
| 4.000%, 01/01/2045 (Callable 01/01/2026) | 2,500,000 | 2,707,675 | ||||||||||
| 9,460,216 | 0.8 | % | ||||||||||
| Virginia | ||||||||||||
| City of Bristol VA, | ||||||||||||
| 5.500%, 11/01/2018 (ETM)(Insured by AGM) | 1,095,000 | 1,177,826 | ||||||||||
| Danville Industrial Development Authority, | ||||||||||||
| 5.250%, 10/01/2028 (ETM)(Insured by AMBAC) | 1,500,000 | 1,838,685 | ||||||||||
| Virginia Public School Authority, | ||||||||||||
| 6.250%, 12/01/2028 (Pre-refunded to 12/01/2018) | 1,285,000 | 1,455,288 | ||||||||||
| 4,471,799 | 0.4 | % | ||||||||||
| Washington | ||||||||||||
| Grant & Douglas Counties School District No. 144-101 Quincy, | ||||||||||||
| 4.000%, 12/01/2027 (Callable 06/01/2026) | 2,200,000 | 2,646,028 | ||||||||||
| Pierce County School District No. 320 Sumner: | ||||||||||||
| 4.000%, 12/01/2026 (Calllable 06/01/2026) | 715,000 | 860,681 | ||||||||||
| 4.000%, 12/01/2027 (Callable 06/01/2026) | 1,000,000 | 1,190,730 | ||||||||||
| Snohomish County School District No. 201, | ||||||||||||
| 4.000%, 12/01/2021 (Callable 12/01/2020) | 4,500,000 | 5,094,585 | ||||||||||
| Snohomish County Washington Public Utilities Revenue, | ||||||||||||
| 6.800%, 01/01/2020 (Pre-refunded to 08/01/2016)(ETM) | 3,605,000 | 4,002,595 | ||||||||||
| Spokane County School District No. 356 Central Valley: | ||||||||||||
| 4.000%, 12/01/2027 (Callable 06/01/2026)(2) | 1,250,000 | 1,488,412 | ||||||||||
| 4.000%, 12/01/2028 (Callable 06/01/2026)(2) | 3,160,000 | 3,734,520 | ||||||||||
| 4.000%, 12/01/2029 (Callable 06/01/2026)(2) | 3,050,000 | 3,571,581 | ||||||||||
| Thurston & Pierce Counties Washington Community Schools, | ||||||||||||
| 4.250%, 12/01/2021 (Callable 12/01/2020) | 2,755,000 | 3,143,538 | ||||||||||
| Walla Walla County School District No. 250 College Place, | ||||||||||||
| 5.000%, 12/01/2019 | 1,290,000 | 1,464,511 | ||||||||||
| Washington Health Care Facilities Authority: | ||||||||||||
| 6.250%, 08/01/2028 (Pre-refunded to 08/01/2018) | 1,355,000 | 1,504,470 | ||||||||||
| 6.125%, 11/15/2031 (Pre-refunded to 05/15/2021) | 610,000 | 757,553 | ||||||||||
| 6.250%, 08/01/2036 (Pre-refunded to 08/01/2018) | 8,100,000 | 8,993,511 | ||||||||||
| 6.250%, 11/15/2041 (Pre-refunded to 05/15/2021) | 4,750,000 | 5,927,097 | ||||||||||
| Washington State: | ||||||||||||
| 5.000%, 01/01/2021 | 10,000,000 | 11,716,900 | ||||||||||
| 5.500%, 07/01/2023 | 5,040,000 | 6,259,025 | ||||||||||
| 62,355,737 | 5.0 | % | ||||||||||
| West Virginia | ||||||||||||
| Ohio County Board of Education, | ||||||||||||
| 5.250%, 06/01/2018 (ETM) | 1,130,000 | 1,227,011 | 0.1 | % | ||||||||
| Wisconsin | ||||||||||||
| Wisconsin Center District, | ||||||||||||
| 4.000%, 12/15/2029 (Callable 06/15/2026) | 2,185,000 | 2,532,349 | ||||||||||
| Wisconsin Health & Educational Facilities Authority, | ||||||||||||
| 5.000%, 08/15/2027 (Pre-refunded to 08/15/2022) | 1,500,000 | 1,837,710 | ||||||||||
| 4,370,059 | 0.3 | % | ||||||||||
| Total Municipal Bonds (Cost $1,160,387,510) | 1,218,936,247 | 98.5 | % | |||||||||
| SHORT-TERM INVESTMENTS | ||||||||||||
| Shares | ||||||||||||
| Money Market Mutual Fund | ||||||||||||
| Goldman Sachs Financial Square Funds, Institutional Class, 0.25% « | 16,931,307 | 16,931,307 | ||||||||||
| Total Short-Term Investment (Cost $16,931,307) | 16,931,307 | 1.4 | % | |||||||||
| Total Investments (Cost $1,177,318,817) | 1,235,867,554 | 99.9 | % | |||||||||
| Other Assets in Excess of Liabilities | 1,567,664 | 0.1 | % | |||||||||
| TOTAL NET ASSETS | $ | 1,237,435,218 | 100.0 | % | ||||||||
Notes to Schedule of Investments | |
| AGM | Assured Guaranty Municipal |
| AMBAC | Ambac Assurance Corporation |
| BHAC | Berkshire Hathaway Assurance Corp. |
| ETM | Escrowed to Maturity |
| FGIC-TCRS | Financial Guaranty Insurance Company |
| NPFGC | National Public Finance Guarantee Corp. |
| PSF | Texas Permanent School Fund |
| Q-SBLF | Qualified School Building Loan Fund |
| (1) | Variable or floating rate security. Floating rate securities are securities whose yields vary with a designated index rate. These securities rates are as of June 30, 2016. |
| (2) | Security or a portion of the security purchased on a when-issued or delayed delivery basis. |
| « | 7-Day Yield |
| Baird Core Intermediate Municipal Bond Fund | ||||||||||||
| Schedule of Investments | ||||||||||||
| June 30, 2016 (Unaudited) | ||||||||||||
| Principal | % of | |||||||||||
| LONG-TERM INVESTMENTS | Amount | Value | Net Assets | |||||||||
| Municipal Bonds | ||||||||||||
| Alabama | ||||||||||||
| City of Birmingham AL, | ||||||||||||
| 0.000%, 03/01/2045 (Callable 09/01/2025) | $ | 75,000 | $ | 79,238 | ||||||||
| County of Cullman AL Water Revenue, | ||||||||||||
| 3.000%, 05/01/2017 (Insured by BAM) | 280,000 | 284,026 | ||||||||||
| Industrial Development Board of the City of Mobile Alabama, | ||||||||||||
| 1.625%, 07/15/2034 (Mandatory Tender Date 10/02/2018) | 150,000 | 151,703 | ||||||||||
| Jasper Water Works & Sewer Board, Inc., | ||||||||||||
| 5.000%, 06/01/2024 (Callable 06/01/2021) | 200,000 | 232,042 | ||||||||||
| Jefferson County Alabama Ltd., | ||||||||||||
| 1.225%, 01/01/2027 (Callable 07/14/2016)(Insured by AMBAC)(1)(2) | 50,000 | 46,374 | ||||||||||
| Town of Mulga AL, | ||||||||||||
| 3.000%, 08/15/2018 (Insured by AGM) | 200,000 | 208,408 | ||||||||||
| 1,001,791 | 1.4 | % | ||||||||||
| Alaska | ||||||||||||
| Alaska Housing Finance Corp.: | ||||||||||||
| 5.000%, 12/01/2029 (Callable 06/01/2024) | 225,000 | 276,140 | ||||||||||
| 4.000%, 06/01/2040 (Callable 06/01/2021) | 80,000 | 83,055 | ||||||||||
| Alaska Municipal Bond Bank Authority, | ||||||||||||
| 5.000%, 08/01/2027 (Callable 08/01/2023) | 500,000 | 615,075 | ||||||||||
| City of Valdez AK, | ||||||||||||
| 5.000%, 01/01/2021 | 435,000 | 501,020 | ||||||||||
| 1,475,290 | 2.1 | % | ||||||||||
| Arizona | ||||||||||||
| Arizona Transportation Board, | ||||||||||||
| 5.000%, 07/01/2025 (Pre-refunded to 07/01/2019) | 350,000 | 393,844 | ||||||||||
| BluePath 2016-1 TE Trust, | ||||||||||||
| 2.750%, 09/01/2026 (Callable 08/27/2021) | 500,000 | 499,990 | ||||||||||
| City of El Mirage AZ, | ||||||||||||
| 5.000%, 07/01/2026 (Callable 07/01/2020) | 400,000 | 462,368 | ||||||||||
| City of Tucson AZ Water System Revenue, | ||||||||||||
| 5.000%, 07/01/2032 (Callable 07/01/2025) | 500,000 | 626,550 | ||||||||||
| Maricopa County Industrial Development Authority: | ||||||||||||
| 2.625%, 07/01/2021 | 250,000 | 252,628 | ||||||||||
| 4.000%, 07/01/2026 | 175,000 | 191,427 | ||||||||||
| Maricopa County Pollution Control Corp., | ||||||||||||
| 5.200%, 06/01/2043 (Mandatory Tender Date 06/01/2020) | 100,000 | 111,040 | ||||||||||
| 2,537,847 | 3.6 | % | ||||||||||
| Arkansas | ||||||||||||
| City of Conway AR Wasterwater Department, | ||||||||||||
| 5.000%, 10/01/2035 (Callable 04/01/2024) | 300,000 | 355,227 | ||||||||||
| City of Little Rock AR, | ||||||||||||
| 2.000%, 03/01/2038 (Callable 03/01/2021) | 240,000 | 243,826 | ||||||||||
| Pulaski County Public Facilities Board, | ||||||||||||
| 4.000%, 07/01/2017 | 380,000 | 389,302 | ||||||||||
| 988,355 | 1.4 | % | ||||||||||
| California | ||||||||||||
| Bay Area Toll Authority, | ||||||||||||
| 1.110%, 04/01/2047 (Callable 04/01/2019)(Mandatory Tender Date 10/01/2019)(1) | 250,000 | 250,005 | ||||||||||
| Belmont-Redwood Shores School District/CA, | ||||||||||||
| 0.000%, 08/01/2031 (Callable 08/01/2026) | 75,000 | 75,770 | ||||||||||
| California Health Facilities Financing Authority, | ||||||||||||
| 5.000%, 04/01/2020 | 300,000 | 331,323 | ||||||||||
| California Municipal Finance Authority, | ||||||||||||
| 0.650%, 09/01/2021 (Mandatory Tender Date 10/03/2016)(1) | 130,000 | 130,000 | ||||||||||
| California School Finance Authority: | ||||||||||||
| 3.000%, 08/01/2017 | 50,000 | 51,061 | ||||||||||
| 3.000%, 08/01/2017 | 300,000 | 306,366 | ||||||||||
| California Statewide Communities Development Authority: | ||||||||||||
| 5.250%, 12/01/2027 (Pre-refunded to 12/01/2017) | 35,000 | 37,295 | ||||||||||
| 1.180%, 04/01/2028 (1)(2) | 200,000 | 177,968 | ||||||||||
| City of Redding CA, | ||||||||||||
| 0.963%, 07/01/2022 (ETM)(1)(2) | 200,000 | 187,859 | ||||||||||
| Corona-Norca Unified School District, | ||||||||||||
| 0.000%, 08/01/2039 (Callable 08/01/2027)(Insured by AGM) | 350,000 | 484,533 | ||||||||||
| Dinuba Redevelopment Agency, | ||||||||||||
| 5.000%, 09/01/2028 (Callable 09/01/2024)(Insured by BAM) | 330,000 | 401,633 | ||||||||||
| East Bay Municipal Utility District Water System Revenue, | ||||||||||||
| 5.000%, 06/01/2033 (Callable 06/01/2024) | 475,000 | 593,636 | ||||||||||
| Encinitas Union School District/CA, | ||||||||||||
| 0.000%, 08/01/2030 (Callable 08/01/2025) | 130,000 | 84,128 | ||||||||||
| Imperial Community College District, | ||||||||||||
| 0.000%, 08/01/2040 (Callable 08/01/2030)(Insured by AGM) | 100,000 | 119,563 | ||||||||||
| Lake Elsinore Redevelopment Agency Successor Agency, | ||||||||||||
| 5.000%, 09/01/2027 (Callable 09/01/2025)(Insured by BAM) | 275,000 | 340,827 | ||||||||||
| Long Beach Bond Finance Authority: | ||||||||||||
| 5.250%, 11/15/2023 | 50,000 | 60,685 | ||||||||||
| 5.000%, 11/15/2029 | 50,000 | 62,568 | ||||||||||
| Magnolia School District/CA, | ||||||||||||
| 0.000%, 08/01/2026 | 155,000 | 211,890 | ||||||||||
| Mount Diablo Unified School District/CA, | ||||||||||||
| 0.000%, 08/01/2035 (Callable 08/01/2025)(Insured by AGM) | 380,000 | 348,665 | ||||||||||
| Mountain View Los Altos Union High School District/CA, | ||||||||||||
| 0.000%, 08/01/2030 | 50,000 | 53,247 | ||||||||||
| Redondo Beach Unified School District, | ||||||||||||
| 0.000%, 08/01/2034 (Callable 08/01/2026) | 455,000 | 607,652 | ||||||||||
| Riverside County Public Financing Authority, | ||||||||||||
| 5.000%, 10/01/2026 (Callable 10/01/2025)(Insured by AGM) | 250,000 | 318,030 | ||||||||||
| San Bernardino City Unified School District, | ||||||||||||
| 5.000%, 08/01/2027 (Callable 08/01/2023)(Insured by AGM) | 450,000 | 540,878 | ||||||||||
| San Diego Unified School District/CA, | ||||||||||||
| 4.000%, 07/01/2033 (Callable 07/01/2026) | 500,000 | 584,690 | ||||||||||
| State of California: | ||||||||||||
| 5.000%, 10/01/2029 (Callable 10/01/2024) | 225,000 | 284,400 | ||||||||||
| 1.158%, 12/01/2029 (Callable 06/01/2018)(Mandatory Tender Date 12/03/2018)(1) | 125,000 | 125,187 | ||||||||||
| Twin Rivers Unified School District, | ||||||||||||
| 3.200%, 06/01/2035 (Callable 08/01/2016)(Mandatory Tender Date 06/01/2020)(Insured by AGM) | 150,000 | 150,270 | ||||||||||
| Upland Unified School District, | ||||||||||||
| 0.000%, 08/01/2041 (Callable 08/01/2025) | 60,000 | 64,120 | ||||||||||
| West Hills Community College District, | ||||||||||||
| 0.000%, 08/01/2035 (Callable 08/01/2027)(Insured by AGM) | 50,000 | 45,159 | ||||||||||
| Westlands Water District, | ||||||||||||
| 5.000%, 09/01/2030 (Callable 09/01/2022)(Insured by AGM) | 500,000 | 604,110 | ||||||||||
| 7,633,518 | 10.7 | % | ||||||||||
| Colorado | ||||||||||||
| Bromley Park Metropolitan District No. 2, | ||||||||||||
| 4.250%, 12/01/2022 (Callable 12/01/2017) | 300,000 | 303,210 | ||||||||||
| Colorado Health Facilities Authority, | ||||||||||||
| 5.000%, 12/01/2042 (Callable 06/01/2022) | 325,000 | 359,174 | ||||||||||
| Denver Health & Hospital Authority, | ||||||||||||
| 5.000%, 12/01/2017 (Callable 12/01/2016) | 250,000 | 254,160 | ||||||||||
| E-470 Public Highway Authority, | ||||||||||||
| 2.160%, 09/01/2039 (Callable 03/01/2017)(Mandatory Tender Date 09/01/2017)(1) | 110,000 | 110,521 | ||||||||||
| Glen Metropolitan District No. 1, | ||||||||||||
| 2.500%, 12/01/2025 (Insured by BAM) | 175,000 | 179,431 | ||||||||||
| VDW Metropolitan District No. 2, | ||||||||||||
| 1.250%, 12/01/2018 (Insured by AGM) | 115,000 | 115,169 | ||||||||||
| 1,321,665 | 1.8 | % | ||||||||||
| Connecticut | ||||||||||||
| Connecticut Housing Finance Authority, | ||||||||||||
| 4.000%, 11/15/2045 (Callable 05/15/2025) | 700,000 | 768,166 | ||||||||||
| Connecticut State Health & Educational Facility Authority, | ||||||||||||
| 0.410%, 01/01/2017 (1) | 200,000 | 200,000 | ||||||||||
| 968,166 | 1.4 | % | ||||||||||
| District of Columbia | ||||||||||||
| District of Columbia, | ||||||||||||
| 5.250%, 07/15/2045 (Pre-refunded to 07/15/2018)(Insured by AGM) | 100,000 | 109,111 | ||||||||||
| Metropolitan Washington Airports Authority, | ||||||||||||
| 5.000%, 10/01/2033 (Callable 10/01/2025) | 250,000 | 310,810 | ||||||||||
| Metropolitan Washington Airports Authority Dulles Toll Road Revenue: | ||||||||||||
| 0.000%, 10/01/2041 (Callable 10/01/2026) | 210,000 | 287,066 | ||||||||||
| 0.000%, 10/01/2044 (Callable 10/01/2028) | 100,000 | 121,668 | ||||||||||
| Washington Metropolitan Area Transit Authority, | ||||||||||||
| 5.250%, 07/01/2024 (Callable 07/01/2019) | 50,000 | 56,047 | ||||||||||
| 884,702 | 1.2 | % | ||||||||||
| Florida | ||||||||||||
| City of Orlando FL: | ||||||||||||
| 5.250%, 11/01/2026 (Callable 05/01/2024) | 500,000 | 639,115 | ||||||||||
| 5.000%, 10/01/2027 (Pre-refunded to 10/01/2020) | 100,000 | 117,139 | ||||||||||
| City of Port St Lucie FL, | ||||||||||||
| 4.500%, 05/01/2025 (Callable 05/01/2020) | 80,000 | 82,573 | ||||||||||
| County of Bay FL Water and Sewer System Revenue, | ||||||||||||
| 4.000%, 09/01/2018 | 250,000 | 265,215 | ||||||||||
| County of Escambia FL, | ||||||||||||
| 0.550%, 04/01/2039 (Optional Put Date 07/01/2016)(Callable 07/01/2016)(1) | 600,000 | 600,000 | ||||||||||
| Florida Housing Finance Corp., | ||||||||||||
| 4.000%, 07/01/2047 (Callable 07/01/2025) | 350,000 | 387,061 | ||||||||||
| Hollywood Community Redevelopment Agency, | ||||||||||||
| 5.000%, 03/01/2018 | 200,000 | 213,556 | ||||||||||
| Martin County Health Facilities Authority, | ||||||||||||
| 5.000%, 11/15/2023 | 260,000 | 313,118 | ||||||||||
| Palm Beach County Health Facilities Authority, | ||||||||||||
| 4.750%, 07/01/2025 (Callable 07/01/2020)(Insured by AGM) | 130,000 | 146,773 | ||||||||||
| Village Community Development District No. 7, | ||||||||||||
| 4.000%, 05/01/2021 | 250,000 | 276,005 | ||||||||||
| 3,040,555 | 4.3 | % | ||||||||||
| Georgia | ||||||||||||
| Bartow County Development Authority, | ||||||||||||
| 2.375%, 09/01/2029 (Mandatory Tender Date 08/10/2017) | 400,000 | 405,576 | ||||||||||
| Chatham County Hospital Authority, | ||||||||||||
| 5.000%, 01/01/2031 (Callable 01/01/2022) | 150,000 | 176,856 | ||||||||||
| City of Dahlonega GA Water & Sewer Revenue, | ||||||||||||
| 4.000%, 09/01/2021 (Insured by AGM) | 200,000 | 225,336 | ||||||||||
| Murray County School District, | ||||||||||||
| 4.000%, 10/01/2017 | 240,000 | 249,790 | ||||||||||
| Private Colleges & Universities Authority, | ||||||||||||
| 5.000%, 10/01/2020 | 115,000 | 130,343 | ||||||||||
| 1,187,901 | 1.7 | % | ||||||||||
| Illinois | ||||||||||||
| Bureau County Township High School District No. 502, | ||||||||||||
| 6.625%, 10/01/2043 (Callable 12/01/2023)(Insured by BAM) | 370,000 | 482,158 | ||||||||||
| Champaign & Piatt Counties Community Unit School District No. 3, | ||||||||||||
| 5.000%, 10/01/2017 (Insured by AGM) | 145,000 | 151,371 | ||||||||||
| Chicago O'Hare International Airport: | ||||||||||||
| 5.000%, 01/01/2020 (Callable 01/01/2017)(Insured by AGM) | 100,000 | 102,029 | ||||||||||
| 5.500%, 01/01/2031 (Callable 01/01/2021) | 500,000 | 585,035 | ||||||||||
| City of Chicago IL: | ||||||||||||
| 4.250%, 01/01/2019 | 175,000 | 185,554 | ||||||||||
| 5.000%, 01/01/2024 | 250,000 | 260,450 | ||||||||||
| 5.000%, 01/01/2026 (Callable 08/01/2016)(Insured by AGM) | 60,000 | 60,194 | ||||||||||
| City of Chicago IL Motor Fuel Tax Revenue, | ||||||||||||
| 5.000%, 01/01/2026 (Callable 01/01/2024) | 250,000 | 270,570 | ||||||||||
| City of Chicago IL Wastewater Transmission Revenue: | ||||||||||||
| 5.000%, 01/01/2018 (Insured by BHAC) | 150,000 | 158,782 | ||||||||||
| 5.000%, 01/01/2023 | 170,000 | 199,861 | ||||||||||
| 5.000%, 01/01/2025 (Callable 01/01/2024) | 110,000 | 132,752 | ||||||||||
| City of Chicago IL Waterworks Revenue, | ||||||||||||
| 5.000%, 11/01/2028 (Callable 11/01/2018)(Insured by AGM) | 450,000 | 477,697 | ||||||||||
| Coles Cumberland Moultrie Etc Counties Community Unit School District No. 2, | ||||||||||||
| 4.000%, 12/01/2018 (Insured by BAM) | 250,000 | 265,853 | ||||||||||
| Cook County Community College District No. 508, | ||||||||||||
| 4.000%, 12/01/2016 | 130,000 | 131,637 | ||||||||||
| Cook County Community Consolidated School District No. 65, | ||||||||||||
| 0.000%, 12/01/2023 | 200,000 | 171,092 | ||||||||||
| Cook County School District No. 83, | ||||||||||||
| 5.625%, 06/01/2033 | 245,000 | 311,716 | ||||||||||
| DeKalb County Community Unit School District No. 428, | ||||||||||||
| 0.000%, 01/01/2030 (Callable 07/01/2020) | 300,000 | 153,981 | ||||||||||
| Illinois Finance Authority: | ||||||||||||
| 4.000%, 11/15/2017 | 100,000 | 104,189 | ||||||||||
| 5.250%, 02/15/2030 (Callable 02/15/2020) | 200,000 | 227,074 | ||||||||||
| 5.000%, 08/01/2030 (Callable 08/01/2024) | 250,000 | 304,175 | ||||||||||
| 1.670%, 05/01/2036 (Callable 11/01/2020)(Mandatory Tender Date 05/01/2021)(1) | 300,000 | 300,234 | ||||||||||
| Illinois State University, | ||||||||||||
| 5.000%, 04/01/2023 (Callable 04/01/2021) | 440,000 | 498,498 | ||||||||||
| Kane County School District No. 131 Aurora East Side, | ||||||||||||
| 1.250%, 06/01/2036 (Callable 08/02/2016)(1) | 250,000 | 250,003 | ||||||||||
| Knox & Warren Counties Community Unit School District No. 205, | ||||||||||||
| 6.125%, 01/01/2036 (Callable 01/01/2021) | 285,000 | 330,948 | ||||||||||
| Ogle & Winnebago Counties Community Unit School District: | ||||||||||||
| 5.000%, 12/01/2023 (Insured by BAM) | 400,000 | 478,232 | ||||||||||
| 5.000%, 12/01/2024 (Insured by BAM) | 175,000 | 211,507 | ||||||||||
| Southern Illinois University, | ||||||||||||
| 2.050%, 04/01/2017 | 100,000 | 100,871 | ||||||||||
| St. Clair County IL Community Consolidated School District, | ||||||||||||
| 0.000%, 12/01/2020 | 500,000 | 466,120 | ||||||||||
| State of Illinois: | ||||||||||||
| 5.000%, 06/01/2019 | 400,000 | 434,024 | ||||||||||
| 5.000%, 01/01/2022 (Callable 01/01/2020) | 215,000 | 232,165 | ||||||||||
| 5.000%, 01/01/2025 (Callable 08/01/2016) | 225,000 | 225,907 | ||||||||||
| Town of Cicero IL, | ||||||||||||
| 5.000%, 01/01/2019 (Insured by AGM) | 400,000 | 432,712 | ||||||||||
| Village of Cary IL, | ||||||||||||
| 1.500%, 03/01/2019 (Insured by BAM) | 130,000 | 130,370 | ||||||||||
| Village of Crestwood IL, | ||||||||||||
| 4.500%, 12/15/2026 (Callable 12/15/2022)(Insured by BAM) | 200,000 | 223,660 | ||||||||||
| Village of Franklin Park IL, | ||||||||||||
| 5.000%, 04/01/2023 (Insured by BAM) | 400,000 | 467,024 | ||||||||||
| 9,518,445 | 13.3 | % | ||||||||||
| Indiana | ||||||||||||
| Indiana Bond Bank, | ||||||||||||
| 1.070%, 10/15/2022 (1) | 100,000 | 95,403 | ||||||||||
| Indiana Finance Authority: | ||||||||||||
| 4.500%, 08/15/2016 | 100,000 | 100,398 | ||||||||||
| 5.500%, 08/15/2045 (Callable 08/15/2020) | 165,000 | 183,119 | ||||||||||
| Indiana Michigan Power Co., | ||||||||||||
| 1.750%, 06/01/2025 (Mandatory Tender Date 06/01/2018) | 100,000 | 100,824 | ||||||||||
| IPS Multi-School Building Corp., | ||||||||||||
| 4.500%, 07/15/2016 (ETM) | 175,000 | 175,173 | ||||||||||
| 654,917 | 0.9 | % | ||||||||||
| Iowa | ||||||||||||
| Iowa Finance Authority, | ||||||||||||
| 3.500%, 09/01/2017 | 100,000 | 100,481 | 0.1 | % | ||||||||
| Kansas | ||||||||||||
| State of Kansas Department of Transportation, | ||||||||||||
| 0.706%, 09/01/2019 (1) | 115,000 | 114,357 | 0.2 | % | ||||||||
| Kentucky | ||||||||||||
| Kentucky Municipal Power Agency, | ||||||||||||
| 5.000%, 09/01/2037 (Pre-refunded to 09/01/2017) | 85,000 | 89,158 | ||||||||||
| Paducah Electric Plant Board, | ||||||||||||
| 5.000%, 10/01/2026 (Insured by AGM) | 450,000 | 560,237 | ||||||||||
| 649,395 | 0.9 | % | ||||||||||
| Louisiana | ||||||||||||
| Louisiana Public Facilities Authority, | ||||||||||||
| 5.000%, 07/01/2017 | 50,000 | 52,073 | 0.1 | % | ||||||||
| Maine | ||||||||||||
| Maine State Housing Authority: | ||||||||||||
| 3.500%, 11/15/2045 (Callable 05/15/2025) | 300,000 | 322,659 | ||||||||||
| 4.000%, 11/15/2045 (Callable 11/15/2025) | 450,000 | 494,793 | ||||||||||
| 817,452 | 1.1 | % | ||||||||||
| Maryland | ||||||||||||
| State of Maryland, | ||||||||||||
| 4.000%, 08/01/2016 | 25,000 | 25,075 | 0.0 | % | ||||||||
| Massachusetts | ||||||||||||
| Eaton Vance Municipal Bond Fund II, | ||||||||||||
| 1.460%, 07/01/2019 (Callable 01/01/2017)(1) | 150,000 | 150,001 | ||||||||||
| Massachusetts Development Finance Agency, | ||||||||||||
| 5.000%, 07/01/2017 | 340,000 | 350,588 | ||||||||||
| 500,589 | 0.7 | % | ||||||||||
| Michigan | ||||||||||||
| City of Detroit MI Sewage Disposal System Revenue, | ||||||||||||
| 5.000%, 07/01/2039 (Callable 07/01/2022)(Insured by AGM) | 155,000 | 176,790 | ||||||||||
| City of Detroit MI Water Supply System Revenue, | ||||||||||||
| 4.250%, 07/01/2018 | 100,000 | 106,355 | ||||||||||
| City of Wyandotte MI Electric System Revenue: | ||||||||||||
| 5.000%, 10/01/2016 (Insured by BAM) | 105,000 | 106,052 | ||||||||||
| 5.000%, 10/01/2023 (Insured by BAM) | 25,000 | 29,113 | ||||||||||
| Hudsonville Public Schools, | ||||||||||||
| 4.000%, 05/01/2018 (Insured by Q-SBLF) | 100,000 | 105,824 | ||||||||||
| Michigan Finance Authority, | ||||||||||||
| 5.000%, 07/01/2034 (Callable 07/01/2025) | 250,000 | 297,142 | ||||||||||
| Mount Clemens MI School District, | ||||||||||||
| 4.000%, 05/01/2017 (Insured by Q-SBLF) | 200,000 | 204,848 | ||||||||||
| Saginaw MI City School District, | ||||||||||||
| 5.000%, 05/01/2024 (Insured by Q-SBLF) | 210,000 | 255,049 | ||||||||||
| Warren MI Consolidated Schools, | ||||||||||||
| 5.000%, 05/01/2025 (Insured by BAM) | 300,000 | 369,702 | ||||||||||
| Ypsilanti School District/MI, | ||||||||||||
| 4.000%, 05/01/2020 (Insured by Q-SBLF) | 50,000 | 54,837 | ||||||||||
| 1,705,712 | 2.4 | % | ||||||||||
| Minnesota | ||||||||||||
| Western Minnesota Municipal Power Agency, | ||||||||||||
| 5.000%, 01/01/2033 (Callable 01/01/2024) | 140,000 | 171,905 | 0.2 | % | ||||||||
| Mississippi | ||||||||||||
| Mississippi Development Bank: | ||||||||||||
| 5.500%, 10/01/2019 | 550,000 | 608,190 | ||||||||||
| 6.750%, 12/01/2033 (Callable 12/01/2023)(Insured by AGM) | 100,000 | 133,833 | ||||||||||
| 742,023 | 1.0 | % | ||||||||||
| Missouri | ||||||||||||
| Health & Educational Facilities Authority of the State of Missouri: | ||||||||||||
| 4.000%, 08/01/2018 | 100,000 | 104,782 | ||||||||||
| 4.000%, 08/01/2019 | 150,000 | 159,348 | ||||||||||
| 5.000%, 02/01/2024 | 50,000 | 60,683 | ||||||||||
| Missouri Housing Development Commission, | ||||||||||||
| 3.700%, 11/01/2035 (Callable 05/01/2025) | 250,000 | 266,060 | ||||||||||
| 590,873 | 0.8 | % | ||||||||||
| Montana | ||||||||||||
| Montana Board of Housing, | ||||||||||||
| 3.600%, 12/01/2030 (Callable 06/01/2022) | 510,000 | 531,624 | 0.7 | % | ||||||||
| Nebraska | ||||||||||||
| Douglas County Hospital Authority No. 2, | ||||||||||||
| 5.000%, 05/15/2019 | 150,000 | 165,475 | 0.2 | % | ||||||||
| Nevada | ||||||||||||
| City of North Las Vegas NV: | ||||||||||||
| 2.000%, 12/01/2017 | 200,000 | 202,890 | ||||||||||
| 2.000%, 12/01/2018 | 200,000 | 204,064 | ||||||||||
| Las Vegas Valley Water District, | ||||||||||||
| 0.590%, 06/01/2036 (Callable 07/18/2016)(1) | 500,000 | 500,000 | ||||||||||
| 906,954 | 1.3 | % | ||||||||||
| New Jersey | ||||||||||||
| Landis Sewage Authority, | ||||||||||||
| 2.094%, 09/19/2019 (1)(2) | 200,000 | 189,760 | ||||||||||
| New Jersey Economic Development Authority: | ||||||||||||
| 4.000%, 06/15/2017 | 375,000 | 385,373 | ||||||||||
| 5.000%, 06/15/2023 (Insured by BAM) | 275,000 | 329,007 | ||||||||||
| New Jersey Educational Facilities Authority, | ||||||||||||
| 5.000%, 07/01/2020 (Pre-refunded to 07/01/2016)(Insured by AMBAC) | 150,000 | 150,000 | ||||||||||
| New Jersey Health Care Facilities Financing Authority: | ||||||||||||
| 5.000%, 07/01/2025 (Insured by AGM) | 200,000 | 249,124 | ||||||||||
| 4.500%, 11/15/2025 (Callable 11/15/2020) | 150,000 | 170,340 | ||||||||||
| 5.000%, 07/01/2026 (Callable 07/01/2025)(Insured by AGM) | 225,000 | 277,558 | ||||||||||
| New Jersey Sports & Exposition Authority, | ||||||||||||
| 5.000%, 09/01/2016 | 210,000 | 211,315 | ||||||||||
| New Jersey State Turnpike Authority, | ||||||||||||
| 5.000%, 01/01/2026 (Callable 01/01/2023) | 500,000 | 608,465 | ||||||||||
| New Jersey Transportation Trust Fund Authority: | ||||||||||||
| 5.500%, 12/15/2017 (Insured by AGM) | 185,000 | 196,005 | ||||||||||
| 5.250%, 12/15/2019 | 345,000 | 381,139 | ||||||||||
| Roselle Park NJ School District, | ||||||||||||
| 3.000%, 02/15/2017 | 300,000 | 304,236 | ||||||||||
| 3,452,322 | 4.8 | % | ||||||||||
| New York | ||||||||||||
| Build NYC Resource Corp., | ||||||||||||
| 5.000%, 08/01/2023 | 200,000 | 241,418 | ||||||||||
| County of Nassau NY: | ||||||||||||
| 5.000%, 07/01/2022 (Callable 07/01/2018)(Insured by AGM) | 95,000 | 103,182 | ||||||||||
| 5.000%, 07/01/2022 (Callable 07/01/2018)(Insured by AGM) | 5,000 | 5,394 | ||||||||||
| Metropolitan Transportation Authority, | ||||||||||||
| 0.891%, 11/01/2022 (Callable 07/07/2016)(Insured by AGM)(1)(2) | 475,000 | 459,365 | ||||||||||
| New York City Municipal Water Finance Authority, | ||||||||||||
| 0.500%, 06/15/2032 (Optional Put Date 07/01/2016)(Callable 07/15/2016)(1) | 600,000 | 600,000 | ||||||||||
| New York City Transit Authority: | ||||||||||||
| 1.228%, 01/01/2030 (Callable 07/18/2016)(Insured by AMBAC)(1)(2) | 75,000 | 66,952 | ||||||||||
| 1.273%, 01/01/2030 (Callable 07/08/2016)(Insured by AMBAC)(1)(2) | 75,000 | 65,896 | ||||||||||
| New York City Transitional Finance Authority Future Tax Secured Revenue, | ||||||||||||
| 0.600%, 11/01/2022 (Optional Put Date 07/01/2016)(1) | 500,000 | 500,000 | ||||||||||
| New York State Dormitory Authority, | ||||||||||||
| 5.000%, 07/01/2023 | 150,000 | 183,028 | ||||||||||
| Port Authority of New York & New Jersey, | ||||||||||||
| 5.000%, 09/01/2031 (Callable 09/01/2024) | 250,000 | 314,723 | ||||||||||
| State of New York Mortgage Agency, | ||||||||||||
| 4.000%, 10/01/2046 (Callable 04/01/2025) | 500,000 | 550,915 | ||||||||||
| 3,090,873 | 4.3 | % | ||||||||||
| North Carolina | ||||||||||||
| City of Raleigh NC, | ||||||||||||
| 5.000%, 02/01/2021 (Pre-refunded to 02/01/2017) | 200,000 | 205,076 | ||||||||||
| North Carolina Capital Facilities Finance Agency, | ||||||||||||
| 5.000%, 06/01/2022 | 150,000 | 175,116 | ||||||||||
| North Carolina Medical Care Commission, | ||||||||||||
| 5.000%, 10/01/2019 (Callable 10/01/2017) | 150,000 | 158,325 | ||||||||||
| 538,517 | 0.8 | % | ||||||||||
| North Dakota | ||||||||||||
| City of Hazen ND, | ||||||||||||
| 2.500%, 07/01/2017 (Callable 01/01/2017) | 400,000 | 400,288 | ||||||||||
| City of Mandan ND, | ||||||||||||
| 2.750%, 09/01/2041 (Callable 09/01/2016) (3) | 400,000 | 400,056 | ||||||||||
| Jamestown Park District/ND, | ||||||||||||
| 2.900%, 07/01/2035 (Callable 01/01/2017) | 500,000 | 500,765 | ||||||||||
| Williston Parks & Recreation District, | ||||||||||||
| 3.250%, 03/01/2032 (Callable 07/18/2016) | 85,000 | 85,071 | ||||||||||
| 1,386,180 | 1.9 | % | ||||||||||
| Ohio | ||||||||||||
| American Municipal Power, Inc., | ||||||||||||
| 5.250%, 02/15/2027 (Callable 02/15/2022) | 245,000 | 295,115 | ||||||||||
| City of Bowling Green OH, | ||||||||||||
| 4.500%, 06/01/2019 | 150,000 | 159,351 | ||||||||||
| City of Cleveland OH, | ||||||||||||
| 5.000%, 10/01/2023 | 430,000 | 530,835 | ||||||||||
| City of Cleveland OH Airport System Revenue, | ||||||||||||
| 5.000%, 01/01/2025 (Insured by AGM) | 100,000 | 124,811 | ||||||||||
| City of Toledo OH, | ||||||||||||
| 4.000%, 12/01/2017 (Insured by AGM) | 200,000 | 209,080 | ||||||||||
| Clermont County Port Authority, | ||||||||||||
| 5.000%, 12/01/2023 (Insured by BAM) | 300,000 | 369,525 | ||||||||||
| County of Crawford OH, | ||||||||||||
| 1.430%, 11/01/2017 (Callable 05/01/2017) | 300,000 | 301,074 | ||||||||||
| County of Licking OH: | ||||||||||||
| 4.000%, 12/01/2026 (Callable 12/01/2021) | 105,000 | 118,398 | ||||||||||
| 4.000%, 12/01/2027 (Callable 12/01/2021) | 60,000 | 67,193 | ||||||||||
| 4.000%, 12/01/2028 (Callable 12/01/2021) | 250,000 | 279,010 | ||||||||||
| 4.000%, 12/01/2030 (Callable 12/01/2021) | 290,000 | 321,282 | ||||||||||
| County of Summit OH Development Finance Authority, | ||||||||||||
| 0.000%, 05/15/2017 (3) | 100,000 | 101,131 | ||||||||||
| Lancaster Port Authority, | ||||||||||||
| 0.926%, 08/01/2019 (Callable 02/01/2019)(1) | 200,000 | 198,202 | ||||||||||
| State of Ohio, | ||||||||||||
| 5.000%, 11/15/2028 (Callable 05/15/2023) | 225,000 | 273,357 | ||||||||||
| 3,348,364 | 4.7 | % | ||||||||||
| Oklahoma | ||||||||||||
| Oklahoma City Industrial & Cultural Facilities Trust, | ||||||||||||
| 0.700%, 06/01/2019 (Callable 07/01/2016)(1)(2) | 150,000 | 147,806 | ||||||||||
| Oklahoma Water Resources Board, | ||||||||||||
| 5.000%, 10/01/2028 (Callable 10/01/2024) | 180,000 | 227,997 | ||||||||||
| 375,803 | 0.5 | % | ||||||||||
| Pennsylvania | ||||||||||||
| Bethlehem Area School District, | ||||||||||||
| 5.000%, 10/15/2017 | 115,000 | 121,295 | ||||||||||
| Bethlehem Parking Authority, | ||||||||||||
| 2.000%, 10/01/2018 | 250,000 | 253,732 | ||||||||||
| New Castle Sanitation Authority, | ||||||||||||
| 2.000%, 06/01/2017 (Insured by BAM) | 320,000 | 323,040 | ||||||||||
| Northampton County General Purpose Authority, | ||||||||||||
| 1.810%, 08/15/2043 (Callable 02/15/2020)(Mandatory Tender Date 08/15/2020)(1) | 65,000 | 65,347 | ||||||||||
| Pennsylvania Housing Finance Agency, | ||||||||||||
| 3.500%, 10/01/2046 (Callable 10/01/2025)(3) | 550,000 | 590,222 | ||||||||||
| Pennsylvania Turnpike Commission: | ||||||||||||
| 5.000%, 12/01/2023 (Pre-refunded to 12/01/2019) | 200,000 | 228,286 | ||||||||||
| 0.000%, 12/01/2028 | 100,000 | 113,019 | ||||||||||
| 0.000%, 12/01/2030 (Callable 12/01/2027) | 205,000 | 261,857 | ||||||||||
| 0.000%, 12/01/2030 (Callable 12/01/2027) | 205,000 | 259,435 | ||||||||||
| Reading School District, | ||||||||||||
| 5.000%, 02/01/2023 | 230,000 | 271,037 | ||||||||||
| West Mifflin Sanitary Sewer Municipal Authority, | ||||||||||||
| 4.000%, 08/01/2020 (Insured by BAM) | 125,000 | 136,566 | ||||||||||
| 2,623,836 | 3.7 | % | ||||||||||
| Puerto Rico | ||||||||||||
| Commonwealth of Puerto Rico: | ||||||||||||
| 4.700%, 07/01/2017 | 25,000 | 25,398 | ||||||||||
| 4.750%, 07/01/2018 | 60,000 | 61,307 | ||||||||||
| 5.500%, 07/01/2018 | 200,000 | 207,804 | ||||||||||
| Puerto Rico Public Finance Corp., | ||||||||||||
| 5.500%, 08/01/2027 (ETM)(Insured by AMBAC) | 500,000 | 668,290 | ||||||||||
| Puerto Rico Sales Tax Financing Corp. Sales Tax Revenue: | ||||||||||||
| 0.000%, 08/01/2042 | 195,000 | 41,028 | ||||||||||
| 0.000%, 08/01/2046 | 1,000,000 | 166,510 | ||||||||||
| 1,170,337 | 1.6 | % | ||||||||||
| Rhode Island | ||||||||||||
| Providence Public Buildings Authority, | ||||||||||||
| 5.125%, 06/15/2021 (Insured by AGM) | 95,000 | 104,992 | ||||||||||
| Rhode Island Housing & Mortgage Finance Corp./RI: | ||||||||||||
| 0.800%, 04/01/2044 (Callable 04/01/2017)(Mandatory Tender Date 10/01/2017) | 75,000 | 75,000 | ||||||||||
| 3.500%, 10/01/2046 (Callable 04/01/2025) | 150,000 | 159,825 | ||||||||||
| 339,817 | 0.5 | % | ||||||||||
| South Carolina | ||||||||||||
| County of Florence SC, | ||||||||||||
| 5.000%, 11/01/2033 (Callable 11/01/2024) | 250,000 | 298,540 | ||||||||||
| Scago Educational Facilities Corp. for Spartanburg School District, | ||||||||||||
| 2.000%, 06/01/2017 | 75,000 | 75,828 | ||||||||||
| Scago Educational Facilities Corp. for Union School District, | ||||||||||||
| 5.000%, 12/01/2023 (Insured by BAM) | 500,000 | 608,100 | ||||||||||
| South Carolina Jobs-Economic Development Authority, | ||||||||||||
| 6.500%, 08/01/2039 (Callable 08/01/2021)(Insured by AGM) | 60,000 | 74,359 | ||||||||||
| Sumter Two School Facilities, Inc., | ||||||||||||
| 5.000%, 12/01/2023 (Insured by BAM) | 200,000 | 244,634 | ||||||||||
| University of South Carolina, | ||||||||||||
| 5.000%, 05/01/2023 | 140,000 | 172,669 | ||||||||||
| 1,474,130 | 2.1 | % | ||||||||||
| South Dakota | ||||||||||||
| South Dakota Health & Educational Facilities Authority, | ||||||||||||
| 5.000%, 09/01/2028 (Callable 09/01/2020) | 325,000 | 372,603 | ||||||||||
| South Dakota Housing Development Authority, | ||||||||||||
| 3.500%, 11/01/2046 (Callable 11/01/2025) | 500,000 | 541,795 | ||||||||||
| 914,398 | 1.3 | % | ||||||||||
| Tennessee | ||||||||||||
| Knox County Health Educational & Housing Facility Board, | ||||||||||||
| 5.000%, 01/01/2026 (Callable 01/01/2023) | 145,000 | 171,338 | ||||||||||
| Tennessee Energy Acquisition Corp., | ||||||||||||
| 5.625%, 09/01/2026 | 50,000 | 60,053 | ||||||||||
| Tennessee Housing Development Agency: | ||||||||||||
| 4.000%, 07/01/2043 (Callable 01/01/2023) | 90,000 | 96,542 | ||||||||||
| 4.000%, 07/01/2045 (Callable 01/01/2025) | 215,000 | 234,169 | ||||||||||
| 562,102 | 0.8 | % | ||||||||||
| Texas | ||||||||||||
| Allen Independent School District, | ||||||||||||
| 5.000%, 02/15/2023 (PSF Guaranteed) | 350,000 | 432,747 | ||||||||||
| City of Dallas TX, | ||||||||||||
| 5.000%, 02/15/2029 (Callable 02/15/2025) | 205,000 | 257,650 | ||||||||||
| Crane County Water District, | ||||||||||||
| 5.000%, 02/15/2023 | 250,000 | 300,837 | ||||||||||
| Dallas County Flood Control District No. 1, | ||||||||||||
| 5.000%, 04/01/2017 | 250,000 | 255,855 | ||||||||||
| Harris County Cultural Education Facilities Finance Corp.: | ||||||||||||
| 5.000%, 12/01/2026 (Callable 12/01/2024) | 100,000 | 125,558 | ||||||||||
| 5.000%, 12/01/2035 (Callable 12/01/2022) | 350,000 | 410,735 | ||||||||||
| Harris County Municipal Utility District No. 390: | ||||||||||||
| 2.000%, 04/01/2018 (Insured by BAM) | 140,000 | 142,087 | ||||||||||
| 2.000%, 04/01/2019 (Insured by BAM) | 375,000 | 379,399 | ||||||||||
| Harris County Municipal Utility District No. 419, | ||||||||||||
| 3.000%, 09/01/2017 (Insured by AGM) | 200,000 | 204,548 | ||||||||||
| Harris County Municipal Utility District No. 71, | ||||||||||||
| 4.000%, 09/01/2028 (Callable 09/01/2023)(Insured by BAM) | 250,000 | 276,660 | ||||||||||
| Lower Colorado River Authority, | ||||||||||||
| 5.000%, 05/15/2023 | 200,000 | 246,482 | ||||||||||
| Mesquite Independent School District, | ||||||||||||
| 5.000%, 08/15/2029 (Callable 08/15/2025)(PSF Guaranteed) | 500,000 | 637,710 | ||||||||||
| New Hope Cultural Education Facilities Corp.: | ||||||||||||
| 0.000%, 02/01/2018 (3) | 200,000 | 200,000 | ||||||||||
| 3.000%, 07/01/2019 | 125,000 | 128,753 | ||||||||||
| 4.000%, 04/01/2020 | 175,000 | 189,308 | ||||||||||
| North Texas Tollway Authority: | ||||||||||||
| 5.000%, 01/01/2024 | 100,000 | 124,696 | ||||||||||
| 0.000%, 09/01/2043 (Callable 09/01/2031) | 225,000 | 247,804 | ||||||||||
| 0.000%, 09/01/2045 (Callable 09/01/2031) | 125,000 | 150,142 | ||||||||||
| Siena Municipal Utility District No. 1, | ||||||||||||
| 2.250%, 09/01/2018 (Insured by BAM) | 75,000 | 76,862 | ||||||||||
| Spring Meadows Municipal Utility District, | ||||||||||||
| 4.000%, 09/01/2028 (Callable 09/01/2023) | 290,000 | 334,106 | ||||||||||
| Tarrant County Cultural Education Facilities Finance Corp., | ||||||||||||
| 2.100%, 11/15/2017 | 200,000 | 202,362 | ||||||||||
| Texas Municipal Gas Acquisition & Supply Corp. II, | ||||||||||||
| 1.137%, 09/15/2017 (1) | 100,000 | 99,636 | ||||||||||
| Texas Municipal Gas Acquisition & Supply Corp. III, | ||||||||||||
| 5.000%, 12/15/2026 (Callable 12/15/2022) | 190,000 | 223,911 | ||||||||||
| Trophy Club Public Improvement District No. 1, | ||||||||||||
| 0.000%, 06/01/2017 (Insured by AGM) | 370,000 | 365,764 | ||||||||||
| Viridian Municipal Management District, | ||||||||||||
| 6.000%, 12/01/2035 (Callable 12/01/2024)(Insured by BAM) | 250,000 | 333,608 | ||||||||||
| Washington County Junior College District, | ||||||||||||
| 5.000%, 10/01/2028 (Callable 04/01/2026)(Insured by BAM) | 500,000 | 625,060 | ||||||||||
| Woodlands Road Utility District No. 1, | ||||||||||||
| 3.800%, 10/01/2016 (Callable 08/01/2016)(Insured by AGM)) | 210,000 | 210,424 | ||||||||||
| 7,182,704 | 10.1 | % | ||||||||||
| Utah | ||||||||||||
| Salt Lake County Housing Authority, | ||||||||||||
| 1.100%, 02/01/2017 | 125,000 | 125,234 | ||||||||||
| Utah Charter School Finance Authority, | ||||||||||||
| 5.000%, 10/15/2035 (Callable 10/15/2025) | 400,000 | 472,864 | ||||||||||
| Utah Housing Corp., | ||||||||||||
| 4.000%, 01/01/2045 (Callable 01/01/2026) | 500,000 | 541,535 | ||||||||||
| Utah Transit Authority, | ||||||||||||
| 0.000%, 06/15/2026 (Pre-refunded to 06/15/2017) | 100,000 | 63,755 | ||||||||||
| 1,203,388 | 1.7 | % | ||||||||||
| Virgin Islands | ||||||||||||
| Virgin Islands Public Finance Authority: | ||||||||||||
| 5.000%, 10/01/2017 | 20,000 | 20,859 | ||||||||||
| 5.000%, 09/01/2020 | 400,000 | 452,388 | ||||||||||
| 473,247 | 0.7 | % | ||||||||||
| Virginia | ||||||||||||
| Fredericksburg Economic Development Authority, | ||||||||||||
| 2.310%, 08/01/2038 (Callable 08/01/2016)(Mandatory Tender Date 02/01/2017)(1) | 430,000 | 430,030 | ||||||||||
| Virginia Port Authority, | ||||||||||||
| 4.000%, 07/01/2016 | 250,000 | 250,000 | ||||||||||
| 680,030 | 1.0 | % | ||||||||||
| Washington | ||||||||||||
| Central Puget Sound Regional Transit Authority, | ||||||||||||
| 1.110%, 11/01/2045 (Callable 05/01/2018)(Mandatory Tender Date 11/01/2018)(1) | 250,000 | 249,987 | ||||||||||
| City of Tacoma WA Solid Waste Utility Revenue, | ||||||||||||
| 5.000%, 12/01/2027 (Callable 06/01/2026)(3) | 400,000 | 497,240 | ||||||||||
| 747,227 | 1.0 | % | ||||||||||
| Wisconsin | ||||||||||||
| State of Wisconsin, | ||||||||||||
| 5.000%, 05/01/2029 (Callable 05/01/2024) | 350,000 | 438,592 | ||||||||||
| Wisconsin Center District, | ||||||||||||
| 5.000%, 12/15/2030 (Callable 12/15/2022) | 395,000 | 453,666 | ||||||||||
| Wisconsin Health & Educational Facilities Authority: | ||||||||||||
| 5.000%, 09/01/2018 (Callable 09/01/2017) | 175,000 | 182,485 | ||||||||||
| 5.000%, 07/01/2026 (Callable 07/01/2024) | 50,000 | 58,919 | ||||||||||
| 5.000%, 12/15/2030 (Callable 12/15/2024) | 350,000 | 427,231 | ||||||||||
| 5.000%, 09/15/2037 (Callable 09/15/2022) | 250,000 | 279,097 | ||||||||||
| 1,839,990 | 2.6 | % | ||||||||||
| Total Municipal Bonds (Cost $67,727,853) | 69,690,405 | 97.6 | % | |||||||||
| SHORT-TERM INVESTMENT | ||||||||||||
| Shares | ||||||||||||
| Money Market Mutual Fund | ||||||||||||
| Goldman Sachs Financial Square Funds, Institutional Class, 0.25% « | 1,913,669 | 1,913,669 | ||||||||||
| Total Short-Term Investment (Cost $1,913,669) | 1,913,669 | 2.7 | % | |||||||||
| Total Investments (Cost $69,641,522) | 71,604,074 | 100.3 | % | |||||||||
| Liabilities in Excess of Other Assets | (177,508 | ) | (0.3 | )% | ||||||||
| TOTAL NET ASSETS | $ | 71,426,566 | 100.0 | % | ||||||||
Notes to Schedule of Investments | |
| AGM | Assured Guaranty Municipal |
| AMBAC | Ambac Assurance Corp. |
| BAM | Build America Mutual Assurance Co. |
| BHAC | Berkshire Hathaway Assurance Corp. |
| ETM | Escrowed to Maturity |
| PSF | Texas Permanent School Fund |
| Q-SBLF | Qualified School Building Loan Fund |
| (1) | Variable or floating rate security. Floating rate securities are securities whose yields vary with a designated index rate. These securities rates are as of June 30, 2016. |
| (2) | Auction Rate Security. An Auction Rate Security is a debt instrument with a long nominal maturity for which the interest rate is regularly reset through a Dutch auction. The rate presented is either the rate set through the auction or the maximum interest rate provided for in the security issuance provision. |
| (3) | Security or a portion of the security purchased on a when-issued or delayed delivery basis. |
| « | 7-Day Yield |
(b) Not applicable
Item 7. Disclosure of Proxy Voting Policies and Procedures for Closed-End Management Investment Companies.
Not applicable because the Registrant is not a closed-end management investment company.
Item 8. Portfolio Managers of Closed-End Management Investment Companies.
Not applicable because the Registrant is not a closed-end management investment company.
Item 9. Purchases of Equity Securities by Closed‑End Management Investment Company and Affiliated Purchasers.
Not applicable because the Registrant is not a closed-end management investment company.
Item 10. Submission of Matters to a Vote of Security Holders.
There have been no material changes to the procedures by which shareholders may recommend nominees to the Registrant’s board of directors.
Item 11. Controls and Procedures.
| (a) | The Registrant’s management, with the participation of its principal executive and principal financial officers, has evaluated the effectiveness of the Registrant's disclosure controls and procedures (as defined in Rule 30a-3(c) under the Investment Company Act of 1940 (the “Act”)), as of a date within 90 days prior to the filing date of this Form N-CSR, as required by Rule 30a-3(b) under the Act and Rules 13a-15(b) or 15d-15(b) under the Securities Exchange Act of 1934. Based on such evaluation, the Registrant's principal executive and principal financial officers have concluded that the design and operation of the Registrant's disclosure controls and procedures are effective in providing reasonable assurance that the information required to be disclosed on Form N-CSR is recorded, processed, summarized and reported within the applicable time periods. |
| (b) | There were no changes in the Registrant's internal control over financial reporting (as defined in Rule 30a-3(d) under the Act) that occurred during the second fiscal quarter of the period covered by this report that have materially affected, or are reasonably likely to materially affect, the Registrant's internal control over financial reporting. |
Item 12. Exhibits.
| (a) | (1) Code of ethics. |
Incorporated by reference to the Registrant’s Form N-CSR filed on March 9, 2004.
(2) Certifications pursuant to Section 302 of the Sarbanes-Oxley Act of 2002. Filed herewith.
(3) Any written solicitation to purchase securities under Rule 23c‑1 under the Act sent or given during the period covered by the report by or on behalf of the Registrant to 10 or more persons. Not applicable because the Registrant is not a closed-end management investment company.
(b) Certification pursuant to Section 906 of the Sarbanes‑Oxley Act of 2002. Furnished herewith.
SIGNATURES
Pursuant to the requirements of the Securities Exchange Act of 1934 and the Investment Company Act of 1940, the Registrant has duly caused this report to be signed on its behalf by the undersigned, thereunto duly authorized.
BAIRD FUNDS, INC.
By: /s/Mary Ellen Stanek
Mary Ellen Stanek, President
Date: September 8, 2016
Pursuant to the requirements of the Securities Exchange Act of 1934 and the Investment Company Act of 1940, this report has been signed below by the following persons on behalf of the Registrant and in the capacities and on the dates indicated.
By: /s/Mary Ellen Stanek
Mary Ellen Stanek, President
Date: September 8, 2016
By: /s/Terrance Maxwell
Terrance Maxwell, Treasurer
Date: September 8, 2016