Semi-Annual Report –
Baird Funds
June 30, 2023
Taxable Bond Funds
Baird Ultra Short Bond Fund
Baird Short-Term Bond Fund
Baird Intermediate Bond Fund
Baird Aggregate Bond Fund
Baird Core Plus Bond Fund
Municipal Bond Funds
Baird Short-Term Municipal Bond Fund
Baird Strategic Municipal Bond Fund
Baird Quality Intermediate Municipal Bond Fund
Baird Core Intermediate Municipal Bond Fund
Baird Municipal Bond Fund
| Go Green. |  | Go Paperless. |
Sign up to receive your Baird Funds’ prospectuses and reports online.
Table of Contents
| Baird Ultra Short Bond Fund | | 1 |
| Baird Short-Term Bond Fund | | 11 |
| Baird Intermediate Bond Fund | | 24 |
| Baird Aggregate Bond Fund | | 41 |
| Baird Core Plus Bond Fund | | 73 |
| Baird Short-Term Municipal Bond Fund | | 102 |
| Baird Strategic Municipal Bond Fund | | 127 |
| Baird Quality Intermediate Municipal Bond Fund | | 143 |
| Baird Core Intermediate Municipal Bond Fund | | 159 |
| Baird Municipal Bond Fund | | 195 |
| Additional Information on Fund Expenses | | 206 |
| Statements of Assets and Liabilities | | 207 |
| Statements of Operations | | 209 |
| Statements of Changes in Net Assets | | 211 |
| Financial Highlights | | 216 |
| Notes to the Financial Statements | | 236 |
| Statement Regarding Liquidity Risk Management Program | | 247 |
| Additional Information | | 247 |
This report has been prepared for shareholders and may be distributed to others only if preceded or accompanied by a current prospectus.
Baird Ultra Short Bond Fund
June 30, 2023 (Unaudited)
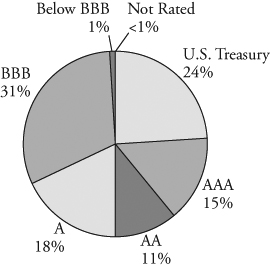
Portfolio Characteristics
Quality Distribution(1)(2)
| | Net Assets | $6,200,539,163 | |
| | | | |
| | SEC 30-Day Yield(3) | | |
| | Institutional Class (Subsidized) | 5.27% | |
| | Institutional Class (Unsubsidized) | 5.12% | |
| | Investor Class (Subsidized) | 5.02% | |
| | Investor Class (Unsubsidized) | 4.87% | |
| | | | |
| | Average Effective Duration | 0.55 years | |
| | | | |
| | Average Effective Maturity | 0.62 years | |
| | | | |
| | Annualized Expense Ratio(4) | | |
| | Gross | | |
| | Institutional Class | 0.30% | |
| | | Investor Class | 0.55% | (5) |
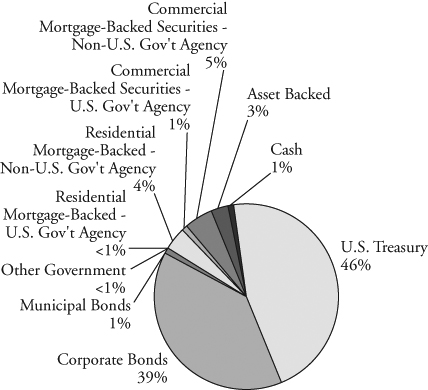
Sector Weightings(7) | | | | |
| | | Net | | |
| | Institutional Class | 0.15% | |
| | Investor Class | 0.40% | (5) |
| | | | |
| | Portfolio Turnover Rate | 58% | (6) |
| | | | |
| | Number of Holdings | 319 | |
| | | | |
| | | | |
| | | | |
| | | | |
| | | | |
| | | | |
| | | | |
| | | | |
| | | | |
| | | | |
| | | | |
| | | | | |
(1) | Percentages shown are based on the Fund’s total investments. |
(2) | The quality profile is calculated on a market value-weighted basis using the highest credit quality rating for each security held by the Fund given by S&P, Moody’s or Fitch, each of which is a Nationally Recognized Statistical Rating Organization (NRSRO). NRSROs rate the credit quality of securities using a scale that generally ranges from AAA (highest) to D (lowest). |
(3) | SEC yields are based on SEC guidelines and are calculated for the 30 days ended June 30, 2023. |
(4) | Reflects expense ratios as stated in the Fund’s current prospectus dated May 1, 2023. The Advisor has contractually agreed to waive management fees in an amount equal to an annual rate of 0.15% of average daily net assets for the Fund, at least through April 30, 2024. The agreement may only be terminated prior to the end of this term by or with the consent of the Board of Directors of Baird Funds, Inc. |
(5) | Includes 0.25% 12b-1 fee. |
(6) | Not annualized. |
(7) | Percentages shown are based on the Fund’s total net assets. |
Baird Ultra Short Bond Fund
June 30, 2023 (Unaudited)
Total Returns
| | | | Average Annual |
| | Six | One | Three | Five | Since |
| For the Periods Ended June 30, 2023 | Months | Year | Years | Years | Inception(1) |
| Institutional Class Shares | 2.44% | 3.88% | 1.35% | 1.89% | 1.54% |
| Investor Class Shares | 2.30% | 3.50% | 1.06% | 1.68% | 1.31% |
Bloomberg Short-Term U.S. Government/Corporate Index(2) | 2.19% | 3.27% | 1.04% | 1.63% | 1.18% |
(1) | For the period from December 31, 2013 (inception date) through June 30, 2023. |
(2) | The Bloomberg Short-Term U.S. Government/Corporate Index is an unmanaged, market value weighted index of investment grade, fixed-rate debt issues, including government and corporate securities, with maturities less than one year. This Index does not reflect any deduction for fees, expenses or taxes. A direct investment in an index is not possible. |
The returns table shown above reflects reinvestment of dividends and/or capital gains distributions in additional shares. The returns in the table do not reflect the deduction of taxes that a shareholder would pay on Fund distributions or the redemption of Fund shares. The returns reflect the actual performance for each period and do not include the impact of trades executed on the last business day of the period that were recorded on the first business day of the next period.
The Fund’s gross and net expense ratio for each Class, as reflected in the Fund’s current prospectus, is set forth under “Portfolio Characteristics”.
The Fund may invest up to 10% of its net assets in non-investment grade debt securities (commonly referred to as “high yield” bonds). While these types of securities typically offer higher yields than investment grade securities, they also include greater risks including increased credit risk and the increased risk of default or bankruptcy. The Fund may also invest in U.S. dollar denominated foreign securities which involve additional risks such as political and economic instability, and different and sometimes less strict financial reporting standards and regulation. The Fund may also invest in mortgage- and asset-backed securities, which include interest rate and prepayment risks more pronounced than those of other fixed income securities. U.S. and international markets have experienced significant periods of volatility in recent years and months due to a number of economic, political and global macro factors. Russia’s ongoing war with Ukraine has heightened global geopolitical tensions, resulting in an elevated risk environment and increased volatility in asset prices. The uncertain course of the war may have a significant negative impact on the global economy. U.S. relations with China have become increasingly strained, and tension between the U.S. and China may have a significant negative impact on the global economy and asset prices. Measures of inflation reached levels not experienced in several decades, leading the Federal Reserve to raise short term interest rates significantly over the last year, with the potential for further rate increases in 2023. Uncertainty regarding the ability of the Federal Reserve to successfully control inflation, the potential for incremental rate increases, and the full impact of prior rate increases on the economy may negatively impact asset prices and increase market volatility. The possibility of a U.S. or global recession may also contribute to market volatility. The coronavirus (COVID-19) pandemic caused significant economic disruption in recent years as countries worked to limit the negative health impacts of the virus. While the virus has entered an endemic stage, significant outbreaks or new variants present a continued risk to the global economy. These and other geopolitical events may cause market disruptions and could have an adverse effect on the value of the Fund’s investments.
Past performance does not guarantee future results. Investment return and principal value will fluctuate so that an investor’s shares, when redeemed, may be worth more or less than their original cost.
For information about the performance of the Fund as of the most recent month-end, please call 1-866-442-2473 or visit www.bairdfunds.com. Mutual fund performance changes over time and current performance may be lower or higher than that stated.
Baird Ultra Short Bond Fund
Schedule of Investments, June 30, 2023 (Unaudited)
Long-Term Investments
| | | Principal | | | | | | % of | |
| | | Amount | | | Value | | | Net Assets | |
| U.S. Treasury Securities | | | | | | | | | |
| U.S. Treasury Bonds: | | | | | | | | | |
| 0.125%, 08/31/2023 | | $ | 70,000,000 | | | $ | 69,426,281 | | | | |
| 0.250%, 09/30/2023 | | | 30,000,000 | | | | 29,635,372 | | | | |
| 0.375%, 10/31/2023 | | | 100,000,000 | | | | 98,429,688 | | | | |
| 0.250%, 11/15/2023 | | | 95,000,000 | | | | 93,252,148 | | | | |
| 0.875%, 01/31/2024 | | | 245,000,000 | | | | 238,674,024 | | | | |
| 1.500%, 02/29/2024 | | | 125,000,000 | | | | 121,787,110 | | | | |
| Total U.S. Treasury Securities | | | | | | | | | | | |
| (Cost $652,651,029) | | | | | | | 651,204,623 | | | | 10.5 | % |
| Corporate Bonds | | | | | | | | | | | | |
| Industrials | | | | | | | | | | | | |
| 7-Eleven, Inc., | | | | | | | | | | | | |
| 0.800%, 02/10/2024 | | | | | | | | | | | | |
(Callable 07/31/2023)(1)(2) | | | 2,918,000 | | | | 2,828,141 | | | | | |
| Adventist Health System, | | | | | | | | | | | | |
| 2.433%, 09/01/2024 | | | | | | | | | | | | |
| (Callable 08/01/2024) | | | 5,120,000 | | | | 4,922,588 | | | | | |
| Anglo American Capital PLC, | | | | | | | | | | | | |
3.625%, 09/11/2024(1)(2) | | | 8,900,000 | | | | 8,649,622 | | | | | |
| Arrow Electronics, Inc., | | | | | | | | | | | | |
| 3.250%, 09/08/2024 | | | | | | | | | | | | |
| (Callable 07/08/2024) | | | 10,715,000 | | | | 10,338,963 | | | | | |
| Bayer US Finance II LLC, | | | | | | | | | | | | |
| 3.875%, 12/15/2023 | | | | | | | | | | | | |
(Callable 11/15/2023)(1)(2) | | | 20,078,000 | | | | 19,884,007 | | | | | |
| Bayer US Finance LLC, | | | | | | | | | | | | |
3.375%, 10/08/2024(1)(2) | | | 4,400,000 | | | | 4,260,056 | | | | | |
| Berry Global, Inc., | | | | | | | | | | | | |
| 0.950%, 02/15/2024 | | | | | | | | | | | | |
| (Callable 01/15/2024) | | | 45,677,000 | | | | 43,909,300 | | | | | |
| Boeing Co., | | | | | | | | | | | | |
| 1.433%, 02/04/2024 | | | | | | | | | | | | |
| (Callable 07/11/2023) | | | 16,005,000 | | | | 15,579,387 | | | | | |
| British Telecommunications PLC, | | | | | | | | | | | | |
| 4.500%, 12/04/2023 | | | | | | | | | | | | |
(Callable 11/04/2023)(1) | | | 14,170,000 | | | | 14,089,205 | | | | | |
| CA Technologies, | | | | | | | | | | | | |
| 4.500%, 08/15/2023 | | | | | | | | | | | | |
| (Callable 07/31/2023) | | | 4,970,000 | | | | 4,961,905 | | | | | |
| Carlisle Companies, Inc., | | | | | | | | | | | | |
| 0.550%, 09/01/2023 | | | | | | | | | | | | |
| (Callable 07/17/2023) | | | 10,000,000 | | | | 9,900,678 | | | | | |
| Celanese US Holdings LLC: | | | | | | | | | | | | |
| 3.500%, 05/08/2024 | | | | | | | | | | | | |
| (Callable 04/08/2024) | | | 7,243,000 | | | | 7,088,412 | | | | | |
| 5.900%, 07/05/2024 | | | 18,113,000 | | | | 18,074,496 | | | | | |
| Charter Communications Operating LLC, | | | | | | | | | | | | |
| 4.500%, 02/01/2024 | | | | | | | | | | | | |
| (Callable 01/01/2024) | | | 11,700,000 | | | | 11,596,726 | | | | | |
| CNH Industrial Capital LLC: | | | | | | | | | | | | |
1.950%, 07/02/2023(1) | | | 13,844,000 | | | | 13,844,000 | | | | | |
4.200%, 01/15/2024(1) | | | 6,700,000 | | | | 6,633,352 | | | | | |
| CNH Industrial NV, | | | | | | | | | | | | |
4.500%, 08/15/2023(1) | | | 5,595,000 | | | | 5,586,117 | | | | | |
| Conagra Brands, Inc., | | | | | | | | | | | | |
| 0.500%, 08/11/2023 | | | | | | | | | | | | |
| (Callable 07/11/2023) | | | 7,000,000 | | | | 6,960,459 | | | | | |
| Cox Communications, Inc., | | | | | | | | | | | | |
| 3.150%, 08/15/2024 | | | | | | | | | | | | |
(Callable 06/15/2024)(2) | | | 20,705,000 | | | | 20,004,572 | | | | | |
| Element Fleet Management Corp., | | | | | | | | | | | | |
| 1.600%, 04/06/2024 | | | | | | | | | | | | |
(Callable 03/06/2024)(1)(2) | | | 17,919,000 | | | | 17,278,819 | | | | | |
| Enbridge, Inc.: | | | | | | | | | | | | |
| 4.000%, 10/01/2023 | | | | | | | | | | | | |
(Callable 07/31/2023)(1) | | | 4,034,000 | | | | 4,017,926 | | | | | |
2.150%, 02/16/2024(1) | | | 19,482,000 | | | | 19,028,442 | | | | | |
| 3.500%, 06/10/2024 | | | | | | | | | | | | |
(Callable 03/10/2024)(1) | | | 2,300,000 | | | | 2,250,241 | | | | | |
| Energy Transfer LP: | | | | | | | | | | | | |
| 5.875%, 01/15/2024 | | | | | | | | | | | | |
| (Callable 10/15/2023) | | | 8,775,000 | | | | 8,776,480 | | | | | |
| 4.900%, 02/01/2024 | | | | | | | | | | | | |
| (Callable 11/01/2023) | | | 13,061,000 | | | | 12,971,387 | | | | | |
| 4.250%, 04/01/2024 | | | | | | | | | | | | |
| (Callable 01/01/2024) | | | 3,055,000 | | | | 3,008,083 | | | | | |
| 4.500%, 04/15/2024 | | | | | | | | | | | | |
| (Callable 03/15/2024) | | | 10,604,000 | | | | 10,482,111 | | | | | |
| 6.022%, 05/15/2024 | | | | | | | | | | | | |
| (Callable 02/15/2024) | | | 2,739,000 | | | | 2,692,637 | | | | | |
| Eni SpA, | | | | | | | | | | | | |
4.000%, 09/12/2023(1)(2) | | | 18,805,000 | | | | 18,725,431 | | | | | |
| EnLink Midstream Partners LP, | | | | | | | | | | | | |
| 4.400%, 04/01/2024 | | | | | | | | | | | | |
| (Callable 01/01/2024) | | | 2,000,000 | | | | 1,965,899 | | | | | |
| Enterprise Products Operating LLC, | | | | | | | | | | | | |
| 3.900%, 02/15/2024 | | | | | | | | | | | | |
| (Callable 11/15/2023) | | | 6,140,000 | | | | 6,072,505 | | | | | |
| ERAC USA Finance LLC, | | | | | | | | | | | | |
| 2.700%, 11/01/2023 | | | | | | | | | | | | |
(Callable 09/01/2023)(2) | | | 8,960,000 | | | | 8,867,524 | | | | | |
| Fortune Brands Home & Security, Inc., | | | | | | | | | | | | |
| 4.000%, 09/21/2023 | | | | | | | | | | | | |
| (Callable 08/21/2023) | | | 42,945,000 | | | | 42,758,372 | | | | | |
| Fresenius Medical Care US Finance II, Inc., | | | | | | | | | | | | |
| 4.750%, 10/15/2024 | | | | | | | | | | | | |
(Callable 07/17/2024)(1)(2) | | | 4,654,000 | | | | 4,555,837 | | | | | |
| General Motors Financial Co., Inc., | | | | | | | | | | | | |
| 1.050%, 03/08/2024 | | | 15,684,000 | | | | 15,166,597 | | | | | |
| Georgia-Pacific LLC, | | | | | | | | | | | | |
3.734%, 07/15/2023(2) | | | 14,935,000 | | | | 14,923,881 | | | | | |
| Graphic Packaging International LLC, | | | | | | | | | | | | |
| 0.821%, 04/15/2024 | | | | | | | | | | | | |
(Callable 03/15/2024)(2) | | | 37,512,000 | | | | 35,992,716 | | | | | |
| Gray Oak Pipeline LLC, | | | | | | | | | | | | |
2.000%, 09/15/2023(1)(2) | | | 28,995,000 | | | | 28,749,588 | | | | | |
| GSK Consumer Healthcare Capital US LLC, | | | | | | | | | | | | |
| 3.024%, 03/24/2024 | | | | | | | | | | | | |
| (Callable 07/17/2023) | | | 22,825,000 | | | | 22,329,554 | | | | | |
| HCA, Inc., | | | | | | | | | | | | |
| 5.000%, 03/15/2024 | | | 14,010,000 | | | | 13,920,010 | | | | | |
| Hewlett Packard Enterprise Co.: | | | | | | | | | | | | |
| 4.450%, 10/02/2023 | | | | | | | | | | | | |
| (Callable 09/02/2023) | | | 7,900,000 | | | | 7,876,889 | | | | | |
| 5.900%, 10/01/2024 | | | 36,450,000 | | | | 36,460,470 | | | | | |
| HF Sinclair Corp., | | | | | | | | | | | | |
| 2.625%, 10/01/2023 | | | 24,141,000 | | | | 23,940,294 | | | | | |
| Huntington Ingalls Industries, Inc., | | | | | | | | | | | | |
| 0.670%, 08/16/2023 | | | | | | | | | | | | |
| (Callable 07/11/2023) | | | 32,144,000 | | | | 31,948,050 | | | | | |
| Hyatt Hotels Corp.: | | | | | | | | | | | | |
| 1.300%, 10/01/2023 | | | | | | | | | | | | |
| (Callable 07/17/2023) | | | 17,070,000 | | | | 16,913,441 | | | | | |
| 1.800%, 10/01/2024 | | | | | | | | | | | | |
| (Callable 07/17/2023) | | | 23,435,000 | | | | 22,305,159 | | | | | |
The accompanying notes are an integral part of these financial statements.
Baird Ultra Short Bond Fund
Schedule of Investments, June 30, 2023 (Unaudited)
Long-Term Investments (cont.)
| | | Principal | | | | | | % of | |
| | | Amount | | | Value | | | Net Assets | |
| Hyundai Capital America: | | | | | | | | | |
1.250%, 09/18/2023(1)(2) | | $ | 2,500,000 | | | $ | 2,476,197 | | | |
| |
0.800%, 01/08/2024(1)(2) | | | 14,605,000 | | | | 14,221,949 | | | | | |
1.000%, 09/17/2024(1)(2) | | | 23,472,000 | | | | 22,073,335 | | | | | |
| Infor, Inc., | | | | | | | | | | | | |
1.450%, 07/15/2023(2) | | | 6,255,000 | | | | 6,244,295 | | | | | |
| Keysight Technologies, Inc., | | | | | | | | | | | | |
| 4.550%, 10/30/2024 | | | | | | | | | | | | |
| (Callable 07/30/2024) | | | 10,755,000 | | | | 10,572,801 | | | | | |
| Kinder Morgan Energy Partners LP: | | | | | | | | | | | | |
| 4.150%, 02/01/2024 | | | | | | | | | | | | |
| (Callable 11/01/2023) | | | 6,407,000 | | | | 6,344,205 | | | | | |
| 4.250%, 09/01/2024 | | | | | | | | | | | | |
| (Callable 06/01/2024) | | | 5,696,000 | | | | 5,580,978 | | | | | |
| Kinder Morgan, Inc., | | | | | | | | | | | | |
| 5.625%, 11/15/2023 | | | | | | | | | | | | |
(Callable 08/15/2023)(2) | | | 17,047,000 | | | | 17,036,695 | | | | | |
| Kinross Gold Corp., | | | | | | | | | | | | |
| 5.950%, 03/15/2024 | | | | | | | | | | | | |
(Callable 12/15/2023)(1) | | | 44,266,000 | | | | 44,192,023 | | | | | |
| Lennar Corp., | | | | | | | | | | | | |
| 4.500%, 04/30/2024 | | | | | | | | | | | | |
| (Callable 01/31/2024) | | | 8,743,000 | | | | 8,668,182 | | | | | |
| LYB International Finance BV, | | | | | | | | | | | | |
| 4.000%, 07/15/2023 | | | 23,642,000 | | | | 23,609,743 | | | | | |
| LyondellBasell Industries NV, | | | | | | | | | | | | |
| 5.750%, 04/15/2024 | | | | | | | | | | | | |
| (Callable 01/15/2024) | | | 554,000 | | | | 552,960 | | | | | |
| Marriott International, Inc., | | | | | | | | | | | | |
| 3.600%, 04/15/2024 | | | | | | | | | | | | |
| (Callable 03/15/2024) | | | 22,663,000 | | | | 22,281,971 | | | | | |
| Martin Marietta Materials, Inc., | | | | | | | | | | | | |
| 0.650%, 07/15/2023 | | | | | | | | | | | | |
| (Callable 07/11/2023) | | | 38,650,000 | | | | 38,569,602 | | | | | |
| Microchip Technology, Inc.: | | | | | | | | | | | | |
| 0.972%, 02/15/2024 | | | 1,375,000 | | | | 1,332,167 | | | | | |
| 0.983%, 09/01/2024 | | | 6,724,000 | | | | 6,351,297 | | | | | |
| Midwest Connector Capital Co. LLC, | | | | | | | | | | | | |
| 3.900%, 04/01/2024 | | | | | | | | | | | | |
(Callable 03/01/2024)(2) | | | 25,294,000 | | | | 24,763,772 | | | | | |
| Mylan, Inc., | | | | | | | | | | | | |
| 4.200%, 11/29/2023 | | | | | | | | | | | | |
| (Callable 08/29/2023) | | | 9,805,000 | | | | 9,735,720 | | | | | |
| Nissan Motor Acceptance Co. LLC: | | | | | | | | | | | | |
3.875%, 09/21/2023(1)(2) | | | 4,700,000 | | | | 4,673,665 | | | | | |
1.125%, 09/16/2024(1)(2) | | | 2,071,000 | | | | 1,929,113 | | | | | |
| Nissan Motor Co. Ltd., | | | | | | | | | | | | |
3.043%, 09/15/2023(1)(2) | | | 20,434,000 | | | | 20,289,428 | | | | | |
| NXP BV / NXP Funding LLC / | | | | | | | | | | | | |
| NXP USA, Inc., | | | | | | | | | | | | |
| 4.875%, 03/01/2024 | | | | | | | | | | | | |
(Callable 02/01/2024)(1) | | | 15,386,000 | | | | 15,275,854 | | | | | |
| Occidental Petroleum Corp., | | | | | | | | | | | | |
| 2.900%, 08/15/2024 | | | | | | | | | | | | |
| (Callable 07/15/2024) | | | 20,054,000 | | | | 19,305,458 | | | | | |
| Penske Truck Leasing Co.: | | | | | | | | | | | | |
| 4.125%, 08/01/2023 | | | | | | | | | | | | |
(Callable 07/31/2023)(2) | | | 1,225,000 | | | | 1,223,413 | | | | | |
| 3.900%, 02/01/2024 | | | | | | | | | | | | |
(Callable 01/01/2024)(2) | | | 4,663,000 | | | | 4,601,919 | | | | | |
| PerkinElmer, Inc., | | | | | | | | | | | | |
| 0.550%, 09/15/2023 | | | | | | | | | | | | |
| (Callable 07/11/2023) | | | 23,935,000 | | | | 23,714,894 | | | | | |
| Phillips 66 Co., | | | | | | | | | | | | |
| 0.900%, 02/15/2024 | | | | | | | | | | | | |
| (Callable 07/17/2023) | | | 2,505,000 | | | | 2,430,567 | | | | | |
| Plains All American Pipeline LP / | | | | | | | | | | | | |
| PAA Finance Corp., | | | | | | | | | | | | |
| 3.850%, 10/15/2023 | | | | | | | | | | | | |
| (Callable 07/31/2023) | | | 42,718,000 | | | | 42,481,537 | | | | | |
| PVH Corp., | | | | | | | | | | | | |
| 7.750%, 11/15/2023 | | | 2,910,000 | | | | 2,917,428 | | | | | |
| Rogers Communications, Inc., | | | | | | | | | | | | |
| 4.100%, 10/01/2023 | | | | | | | | | | | | |
(Callable 07/31/2023)(1) | | | 29,075,000 | | | | 28,933,420 | | | | | |
| Royalty Pharma PLC, | | | | | | | | | | | | |
| 0.750%, 09/02/2023 | | | 47,319,000 | | | | 46,883,887 | | | | | |
| Ryder System, Inc., | | | | | | | | | | | | |
| 2.500%, 09/01/2024 | | | | | | | | | | | | |
| (Callable 08/01/2024) | | | 29,861,000 | | | | 28,672,122 | | | | | |
| Sabine Pass Liquefaction LLC, | | | | | | | | | | | | |
| 5.750%, 05/15/2024 | | | | | | | | | | | | |
| (Callable 02/15/2024) | | | 32,200,000 | | | | 32,144,593 | | | | | |
| Shire Acquisitions Investments Ireland DAC, | | | | | | | | | | | | |
| 2.875%, 09/23/2023 | | | | | | | | | | | | |
(Callable 07/31/2023)(1) | | | 5,029,000 | | | | 4,995,780 | | | | | |
| Sprint LLC: | | | | | | | | | | | | |
| 7.875%, 09/15/2023 | | | 40,195,000 | | | | 40,292,071 | | | | | |
| 7.125%, 06/15/2024 | | | 3,425,000 | | | | 3,455,630 | | | | | |
| Synnex Corporation, | | | | | | | | | | | | |
| 1.250%, 08/09/2024 | | | | | | | | | | | | |
| (Callable 07/11/2023) | | | 3,490,000 | | | | 3,301,018 | | | | | |
| Teledyne Technologies, Inc., | | | | | | | | | | | | |
| 0.950%, 04/01/2024 | | | | | | | | | | | | |
| (Callable 07/11/2023) | | | 15,746,000 | | | | 15,163,919 | | | | | |
| Thermo Fisher Scientific, Inc., | | | | | | | | | | | | |
| 0.797%, 10/18/2023 | | | | | | | | | | | | |
| (Callable 07/11/2023) | | | 25,000,000 | | | | 24,673,189 | | | | | |
| Toll Road Investors Partnership II LP, | | | | | | | | | | | | |
| 0.000%, 02/15/2024 | | | | | | | | | | | | |
(Insured by NATL)(1)(2) | | | 1,240,000 | | | | 1,188,927 | | | | | |
| TransCanada PipeLines Ltd., | | | | | | | | | | | | |
| 1.000%, 10/12/2024 | | | | | | | | | | | | |
(Callable 09/12/2024)(1) | | | 16,559,000 | | | | 15,557,133 | | | | | |
| Triton Container International Ltd.: | | | | | | | | | | | | |
0.800%, 08/01/2023(1)(2) | | | 44,377,000 | | | | 44,172,834 | | | | | |
| 1.150%, 06/07/2024 | | | | | | | | | | | | |
(Callable 05/07/2024)(1)(2) | | | 2,185,000 | | | | 2,072,069 | | | | | |
| Verizon Communications, Inc., | | | | | | | | | | | | |
| 6.421%, 05/15/2025 (3 Month LIBOR | | | | | | | | | | | | |
USD + 1.100%) (Callable 03/15/2025)(3) | | | 4,000,000 | | | | 4,032,734 | | | | | |
| VICI Properties LP, | | | | | | | | | | | | |
| 5.625%, 05/01/2024 | | | | | | | | | | | | |
(Callable 02/01/2024)(2) | | | 44,351,000 | | | | 44,077,603 | | | | | |
| Wabtec Corp., | | | | | | | | | | | | |
| 5.875%, 03/15/2024 | | | | | | | | | | | | |
| (Callable 02/15/2024) | | | 11,889,000 | | | | 11,729,445 | | | | | |
| Walgreens Boots Alliance, Inc., | | | | | | | | | | | | |
| 0.950%, 11/17/2023 | | | | | | | | | | | | |
| (Callable 07/11/2023) | | | 43,450,000 | | | | 42,792,519 | | | | | |
| Warnermedia Holdings, Inc.: | | | | | | | | | | | | |
| 3.428%, 03/15/2024 | | | 11,585,000 | | | | 11,374,345 | | | | | |
| 3.528%, 03/15/2024 | | | | | | | | | | | | |
| (Callable 07/11/2023) | | | 24,199,000 | | | | 23,759,252 | | | | | |
The accompanying notes are an integral part of these financial statements.
Baird Ultra Short Bond Fund
Schedule of Investments, June 30, 2023 (Unaudited)
Long-Term Investments (cont.)
| | | Principal | | | | | | % of | |
| | | Amount | | | Value | | | Net Assets | |
| Williams Companies, Inc., | | | | | | | | | |
| 4.550%, 06/24/2024 | | | | | | | | | |
| (Callable 03/24/2024) | | $ | 19,641,000 | | | $ | 19,375,060 | | | | |
| Total Industrials | | | | | | | | | | | |
| (Cost $1,519,503,021) | | | | | | | 1,515,189,047 | | | | 24.5 | % |
| Utilities | | | | | | | | | | | | |
| Black Hills Corp.: | | | | | | | | | | | | |
| 4.250%, 11/30/2023 | | | | | | | | | | | | |
| (Callable 08/30/2023) | | | 5,846,000 | | | | 5,805,190 | | | | | |
| 1.037%, 08/23/2024 | | | | | | | | | | | | |
| (Callable 07/17/2023) | | | 25,946,000 | | | | 24,509,041 | | | | | |
| CenterPoint Energy, Inc., | | | | | | | | | | | | |
| 2.500%, 09/01/2024 | | | | | | | | | | | | |
| (Callable 08/01/2024) | | | 9,603,000 | | | | 9,218,952 | | | | | |
| CMS Energy Corp., | | | | | | | | | | | | |
| 3.875%, 03/01/2024 | | | | | | | | | | | | |
| (Callable 12/01/2023) | | | 2,909,000 | | | | 2,867,545 | | | | | |
| EDP Finance BV, | | | | | | | | | | | | |
3.625%, 07/15/2024(1)(2) | | | 20,778,000 | | | | 20,240,837 | | | | | |
| Evergy, Inc., | | | | | | | | | | | | |
| 2.450%, 09/15/2024 | | | | | | | | | | | | |
| (Callable 08/15/2024) | | | 3,600,000 | | | | 3,448,540 | | | | | |
| IPALCO Enterprises, Inc., | | | | | | | | | | | | |
| 3.700%, 09/01/2024 | | | | | | | | | | | | |
| (Callable 07/01/2024) | | | 2,000,000 | | | | 1,933,631 | | | | | |
| ITC Holdings Corp., | | | | | | | | | | | | |
| 3.650%, 06/15/2024 | | | | | | | | | | | | |
(Callable 03/15/2024)(1) | | | 2,426,000 | | | | 2,375,262 | | | | | |
| Jersey Central Power & Light Co., | | | | | | | | | | | | |
| 4.700%, 04/01/2024 | | | | | | | | | | | | |
(Callable 01/01/2024)(2) | | | 9,438,000 | | | | 9,337,821 | | | | | |
| NextEra Energy Capital Holdings, Inc., | | | | | | | | | | | | |
| 4.200%, 06/20/2024 | | | 5,395,000 | | | | 5,313,081 | | | | | |
| Public Service Enterprise Group, Inc.: | | | | | | | | | | | | |
| 0.841%, 11/08/2023 | | | | | | | | | | | | |
| (Callable 07/11/2023) | | | 9,910,000 | | | | 9,735,876 | | | | | |
| 2.875%, 06/15/2024 | | | | | | | | | | | | |
| (Callable 05/15/2024) | | | 19,993,000 | | | | 19,413,203 | | | | | |
| Southern Co.: | | | | | | | | | | | | |
| 2.950%, 07/01/2023 | | | 4,975,000 | | | | 4,975,000 | | | | | |
| 0.600%, 02/26/2024 | | | | | | | | | | | | |
| (Callable 01/26/2024) | | | 17,138,000 | | | | 16,565,444 | | | | | |
| Xcel Energy, Inc., | | | | | | | | | | | | |
| 0.500%, 10/15/2023 | | | | | | | | | | | | |
| (Callable 09/15/2023) | | | 6,080,000 | | | | 5,989,786 | | | | | |
| Total Utilities | | | | | | | | | | | | |
| (Cost $142,266,826) | | | | | | | 141,729,209 | | | | 2.3 | % |
| Financials | | | | | | | | | | | | |
| AerCap Holdings NV: | | | | | | | | | | | | |
| 4.500%, 09/15/2023 | | | | | | | | | | | | |
(Callable 08/15/2023)(1) | | | 4,055,000 | | | | 4,039,778 | | | | | |
1.150%, 10/29/2023(1) | | | 11,825,000 | | | | 11,635,534 | | | | | |
| 3.150%, 02/15/2024 | | | | | | | | | | | | |
(Callable 01/15/2024)(1) | | | 7,950,000 | | | | 7,798,782 | | | | | |
| AIB Group PLC: | | | | | | | | | | | | |
4.750%, 10/12/2023(1)(2) | | | 8,418,000 | | | | 8,379,453 | | | | | |
| 4.263%, 04/10/2025 | | | | | | | | | | | | |
| (3 Month LIBOR USD + 1.874%) | | | | | | | | | | | | |
(Callable 04/10/2024)(1)(2)(3) | | | 36,420,000 | | | | 35,585,072 | | | | | |
| Air Lease Corp.: | | | | | | | | | | | | |
| 3.875%, 07/03/2023 | | | 31,274,000 | | | | 31,274,000 | | | | | |
| 0.700%, 02/15/2024 | | | | | | | | | | | | |
| (Callable 01/15/2024) | | | 11,550,000 | | | | 11,187,204 | | | | | |
| Ally Financial, Inc., | | | | | | | | | | | | |
| 1.450%, 10/02/2023 | | | | | | | | | | | | |
| (Callable 09/02/2023) | | | 32,785,000 | | | | 32,344,729 | | | | | |
| Australia & New Zealand | | | | | | | | | | | | |
| Banking Group Ltd., | | | | | | | | | | | | |
4.500%, 03/19/2024(1)(2) | | | 9,000,000 | | | | 8,886,573 | | | | | |
| Banco Bilbao Vizcaya Argentaria SA, | | | | | | | | | | | | |
0.875%, 09/18/2023(1) | | | 5,088,000 | | | | 5,035,094 | | | | | |
| Banco Santander SA, | | | | | | | | | | | | |
| 0.701%, 06/30/2024 | | | | | | | | | | | | |
(1 Year CMT Rate + 0.450%)(1)(3) | | | 8,865,000 | | | | 8,816,243 | | | | | |
| Bank of America Corp.: | | | | | | | | | | | | |
| 0.523%, 06/14/2024 (SOFR + 0.410%) | | | | | | | | | | | | |
(Callable 05/14/2024)(3) | | | 10,000,000 | | | | 9,985,033 | | | | | |
| 3.841%, 04/25/2025 (SOFR + 1.110%) | | | | | | | | | | | | |
(Callable 04/25/2024)(3) | | | 32,100,000 | | | | 31,464,167 | | | | | |
| Bank of Ireland Group PLC, | | | | | | | | | | | | |
4.500%, 11/25/2023(1)(2) | | | 15,140,000 | | | | 14,989,829 | | | | | |
| Bank of Nova Scotia, | | | | | | | | | | | | |
0.400%, 09/15/2023(1) | | | 28,133,000 | | | | 27,836,247 | | | | | |
| Barclays PLC, | | | | | | | | | | | | |
| 3.932%, 05/07/2025 | | | | | | | | | | | | |
| (3 Month LIBOR USD + 1.610%) | | | | | | | | | | | | |
(Callable 05/07/2024)(1)(3) | | | 44,025,000 | | | | 43,024,136 | | | | | |
| BGC Partners, Inc., | | | | | | | | | | | | |
| 5.375%, 07/24/2023 | | | 24,196,000 | | | | 24,179,962 | | | | | |
| BNP Paribas SA: | | | | | | | | | | | | |
4.250%, 10/15/2024(1) | | | 7,505,000 | | | | 7,302,262 | | | | | |
| 4.705%, 01/10/2025 | | | | | | | | | | | | |
| (3 Month LIBOR USD + 2.235%) | | | | | | | | | | | | |
(Callable 01/10/2024)(1)(2)(3) | | | 17,700,000 | | | | 17,542,218 | | | | | |
| Boston Properties LP: | | | | | | | | | | | | |
| 3.125%, 09/01/2023 | | | | | | | | | | | | |
| (Callable 07/31/2023) | | | 8,652,000 | | | | 8,599,548 | | | | | |
| 3.800%, 02/01/2024 | | | | | | | | | | | | |
| (Callable 11/01/2023) | | | 25,005,000 | | | | 24,467,520 | | | | | |
| BPCE SA, | | | | | | | | | | | | |
5.700%, 10/22/2023(1)(2) | | | 42,593,000 | | | | 42,406,948 | | | | | |
| Cantor Fitzgerald LP, | | | | | | | | | | | | |
| 4.875%, 05/01/2024 | | | | | | | | | | | | |
(Callable 04/01/2024)(2) | | | 7,336,000 | | | | 7,177,013 | | | | | |
| Capital One Financial Corp.: | | | | | | | | | | | | |
| 1.343%, 12/06/2024 (SOFR + 0.690%) | | | | | | | | | | | | |
(Callable 12/06/2023)(3) | | | 5,305,000 | | | | 5,166,461 | | | | | |
| 4.166%, 05/09/2025 (SOFR + 1.370%) | | | | | | | | | | | | |
(Callable 05/09/2024)(3) | | | 32,961,000 | | | | 32,107,987 | | | | | |
| Citigroup, Inc., | | | | | | | | | | | | |
| 0.776%, 10/30/2024 (SOFR + 0.686%) | | | | | | | | | | | | |
(Callable 10/30/2023)(3) | | | 52,580,000 | | | | 51,651,521 | | | | | |
| CNA Financial Corp., | | | | | | | | | | | | |
| 3.950%, 05/15/2024 | | | | | | | | | | | | |
| (Callable 02/15/2024) | | | 29,285,000 | | | | 28,787,580 | | | | | |
| Cooperatieve Rabobank UA, | | | | | | | | | | | | |
4.625%, 12/01/2023(1) | | | 6,048,000 | | | | 6,005,391 | | | | | |
| Credit Suisse AG, | | | | | | | | | | | | |
0.520%, 08/09/2023(1) | | | 1,125,000 | | | | 1,116,101 | | | | | |
| Credit Suisse Group AG, | | | | | | | | | | | | |
| 2.593%, 09/11/2025 (SOFR + 1.560%) | | | | | | | | | | | | |
(Callable 09/11/2024)(1)(2)(3) | | | 34,307,000 | | | | 32,700,435 | | | | | |
| Danske Bank A/S: | | | | | | | | | | | | |
3.875%, 09/12/2023(1)(2) | | | 1,995,000 | | | | 1,987,319 | | | | | |
| 3.773%, 03/28/2025 | | | | | | | | | | | | |
| (1 Year CMT Rate + 1.450%) | | | | | | | | | | | | |
(Callable 03/28/2024)(1)(2)(3) | | | 28,903,000 | | | | 28,249,832 | | | | | |
The accompanying notes are an integral part of these financial statements.
Baird Ultra Short Bond Fund
Schedule of Investments, June 30, 2023 (Unaudited)
Long-Term Investments (cont.)
| | | Principal | | | | | | % of | |
| | | Amount | | | Value | | | Net Assets | |
| Deutsche Bank AG, | | | | | | | | | |
| 2.222%, 09/18/2024 (SOFR + 2.159%) | | | | | | | | | |
(Callable 09/18/2023)(1)(3) | | $ | 42,078,000 | | | $ | 41,545,246 | | | |
| |
| Discover Bank, | | | | | | | | | | | | |
| 4.682%, 08/09/2028 | | | | | | | | | | | | |
| (5 Year Swap Rate USD + 1.730%) | | | | | | | | | | | | |
(Callable 08/09/2023)(3) | | | 10,189,000 | | | | 9,315,878 | | | | | |
| Five Corners Funding Trust, | | | | | | | | | | | | |
4.419%, 11/15/2023(2) | | | 1,000,000 | | | | 989,013 | | | | | |
| GATX Corp., | | | | | | | | | | | | |
| 4.350%, 02/15/2024 | | | | | | | | | | | | |
| (Callable 01/15/2024) | | | 2,858,000 | | | | 2,822,647 | | | | | |
| Goldman Sachs Group, Inc.: | | | | | | | | | | | | |
| 1.217%, 12/06/2023 | | | | | | | | | | | | |
| (Callable 07/06/2023) | | | 5,000,000 | | | | 4,903,737 | | | | | |
| 0.925%, 10/21/2024 (SOFR + 0.486%) | | | | | | | | | | | | |
(Callable 10/21/2023)(3) | | | 16,930,000 | | | | 16,643,649 | | | | | |
| 3.272%, 09/29/2025 (SOFR + 1.463%) | | | | | | | | | | | | |
(Callable 09/29/2024)(3) | | | 10,242,000 | | | | 9,895,548 | | | | | |
| Host Hotels & Resorts LP, | | | | | | | | | | | | |
| 3.875%, 04/01/2024 | | | | | | | | | | | | |
| (Callable 02/01/2024) | | | 10,803,000 | | | | 10,628,841 | | | | | |
| HSBC Holdings PLC, | | | | | | | | | | | | |
| 3.803%, 03/11/2025 (SOFR + 1.473%) | | | | | | | | | | | | |
(Callable 03/11/2024)(1)(3) | | | 31,698,000 | | | | 31,079,485 | | | | | |
| ING Bank NV, | | | | | | | | | | | | |
5.800%, 09/25/2023(1)(2) | | | 38,289,000 | | | | 38,205,673 | | | | | |
| Invesco Finance PLC, | | | | | | | | | | | | |
| 4.000%, 01/30/2024 | | | 8,745,000 | | | | 8,631,393 | | | | | |
| Jackson National Life Global Funding, | | | | | | | | | | | | |
3.250%, 01/30/2024(2) | | | 2,136,000 | | | | 2,100,585 | | | | | |
| JPMorgan Chase & Co., | | | | | | | | | | | | |
| 3.797%, 07/23/2024 (SOFR + 1.152%) | | | | | | | | | | | | |
(Callable 07/23/2023)(3) | | | 25,174,000 | | | | 25,143,907 | | | | | |
| Lincoln National Corp., | | | | | | | | | | | | |
| 4.000%, 09/01/2023 | | | 1,148,000 | | | | 1,141,944 | | | | | |
| Lloyds Bank PLC, | | | | | | | | | | | | |
| 3.870%, 07/09/2025 | | | | | | | | | | | | |
| (1 Year CMT Rate + 3.500%) | | | | | | | | | | | | |
(Callable 07/09/2024)(1)(3) | | | 20,560,000 | | | | 20,025,208 | | | | | |
| Massachusetts Mutual Life Insurance Co., | | | | | | | | | | | | |
7.625%, 11/15/2023(2) | | | 5,280,000 | | | | 5,291,662 | | | | | |
| Metropolitan Tower Life Insurance Co., | | | | | | | | | | | | |
7.625%, 01/15/2024(2) | | | 2,760,000 | | | | 2,772,481 | | | | | |
| Mitsubishi UFJ Financial Group, Inc., | | | | | | | | | | | | |
| 0.848%, 09/15/2024 | | | | | | | | | | | | |
| (1 Year CMT Rate + 0.680%) | | | | | | | | | | | | |
(Callable 09/15/2023)(1)(3) | | | 15,700,000 | | | | 15,525,553 | | | | | |
| Mizuho Financial Group, Inc.: | | | | | | | | | | | | |
| 1.241%, 07/10/2024 (SOFR + 1.252%) | | | | | | | | | | | | |
(Callable 07/10/2023)(1)(3) | | | 22,209,000 | | | | 22,195,335 | | | | | |
| 3.922%, 09/11/2024 (SOFR + 1.262%) | | | | | | | | | | | | |
(Callable 09/11/2023)(1)(3) | | | 21,756,000 | | | | 21,652,437 | | | | | |
| Morgan Stanley, | | | | | | | | | | | | |
| 4.766%, 11/10/2023 (SOFR + 0.466%) | | | | | | | | | | | | |
(Callable 10/10/2023)(3) | | | 23,014,000 | | | | 22,999,271 | | | | | |
| Nationwide Building Society, | | | | | | | | | | | | |
| 4.363%, 08/01/2024 | | | | | | | | | | | | |
| (3 Month LIBOR USD + 1.392%) | | | | | | | | | | | | |
(Callable 08/01/2023)(1)(2)(3) | | | 38,819,000 | | | | 38,740,579 | | | | | |
| NatWest Group PLC, | | | | | | | | | | | | |
| 4.269%, 03/22/2025 | | | | | | | | | | | | |
| (3 Month LIBOR USD + 1.762%) | | | | | | | | | | | | |
(Callable 03/22/2024)(1)(3) | | | 1,772,000 | | | | 1,740,584 | | | | | |
| New England Mutual Life Insurance Co., | | | | | | | | | | | | |
7.875%, 02/15/2024(2) | | | 3,200,000 | | | | 3,208,122 | | | | | |
| Old Republic International Corp., | | | | | | | | | | | | |
| 4.875%, 10/01/2024 | | | | | | | | | | | | |
| (Callable 09/01/2024) | | | 15,833,000 | | | | 15,524,451 | | | | | |
| Pacific Life Insurance Co., | | | | | | | | | | | | |
7.900%, 12/30/2023(2) | | | 12,825,000 | | | | 12,904,725 | | | | | |
| Piedmont Operating Partnership LP, | | | | | | | | | | | | |
| 4.450%, 03/15/2024 | | | | | | | | | | | | |
| (Callable 12/15/2023) | | | 29,900,000 | | | | 29,220,798 | | | | | |
| PNC Bank NA, | | | | | | | | | | | | |
| 3.800%, 07/25/2023 | | | 14,315,000 | | | | 14,296,336 | | | | | |
| Reinsurance Group of America, Inc., | | | | | | | | | | | | |
| 4.700%, 09/15/2023 | | | 3,000,000 | | | | 2,992,582 | | | | | |
| Santander UK Group Holdings PLC, | | | | | | | | | | | | |
| 4.796%, 11/15/2024 | | | | | | | | | | | | |
| (3 Month LIBOR USD + 1.570%) | | | | | | | | | | | | |
(Callable 11/15/2023)(1)(3) | | | 1,150,000 | | | | 1,141,235 | | | | | |
| SMBC Aviation Capital Finance DAC: | | | | | | | | | | | | |
4.125%, 07/15/2023(1)(2) | | | 7,695,000 | | | | 7,688,830 | | | | | |
| 3.550%, 04/15/2024 | | | | | | | | | | | | |
(Callable 03/15/2024)(1)(2) | | | 4,275,000 | | | | 4,185,004 | | | | | |
| Societe Generale SA: | | | | | | | | | | | | |
4.250%, 09/14/2023(1)(2) | | | 9,050,000 | | | | 9,006,777 | | | | | |
5.000%, 01/17/2024(1)(2) | | | 12,885,000 | | | | 12,728,985 | | | | | |
2.625%, 10/16/2024(1)(2) | | | 1,000,000 | | | | 946,351 | | | | | |
| Standard Chartered PLC: | | | | | | | | | | | | |
| 0.991%, 01/12/2025 | | | | | | | | | | | | |
| (1 Year CMT Rate + 0.780%) | | | | | | | | | | | | |
(Callable 01/12/2024)(1)(2)(3) | | | 24,490,000 | | | | 23,737,422 | | | | | |
| 3.785%, 05/21/2025 | | | | | | | | | | | | |
| (3 Month LIBOR USD + 1.560%) | | | | | | | | | | | | |
(Callable 05/21/2024)(1)(2)(3) | | | 13,427,000 | | | | 13,099,062 | | | | | |
| Sumitomo Mitsui Financial Group, Inc., | | | | | | | | | | | | |
4.436%, 04/02/2024(1)(2) | | | 33,150,000 | | | | 32,616,633 | | | | | |
| Sumitomo Mitsui Trust Bank Ltd., | | | | | | | | | | | | |
0.800%, 09/12/2023(1)(2) | | | 10,729,000 | | | | 10,630,939 | | | | | |
| Synchrony Financial: | | | | | | | | | | | | |
| 4.375%, 03/19/2024 | | | | | | | | | | | | |
| (Callable 02/19/2024) | | | 25,840,000 | | | | 25,335,149 | | | | | |
| 4.250%, 08/15/2024 | | | | | | | | | | | | |
| (Callable 05/15/2024) | | | 3,172,000 | | | | 3,058,225 | | | | | |
| Trinity Acquisition PLC, | | | | | | | | | | | | |
| 4.625%, 08/15/2023 | | | 8,948,000 | | | | 8,922,848 | | | | | |
| Ventas Realty LP, | | | | | | | | | | | | |
| 3.500%, 04/15/2024 | | | | | | | | | | | | |
| (Callable 03/15/2024) | | | 2,750,000 | | | | 2,688,302 | | | | | |
| Willis North America, Inc., | | | | | | | | | | | | |
| 3.600%, 05/15/2024 | | | | | | | | | | | | |
| (Callable 03/15/2024) | | | 34,700,000 | | | | 33,856,737 | | | | | |
| WP Carey, Inc., | | | | | | | | | | | | |
| 4.600%, 04/01/2024 | | | | | | | | | | | | |
| (Callable 01/01/2024) | | | 27,220,000 | | | | 26,845,224 | | | | | |
| Total Financials | | | | | | | | | | | | |
| (Cost $1,260,896,973) | | | | | | | 1,260,355,365 | | | | 20.3 | % |
| Total Corporate Bonds | | | | | | | | | | | | |
| (Cost $2,922,666,820) | | | | | | | 2,917,273,621 | | | | 47.1 | % |
| Municipal Bonds | | | | | | | | | | | | |
| City of Huron OH, | | | | | | | | | | | | |
| 6.875%, 09/07/2023 | | | 2,275,000 | | | | 2,272,561 | | | | | |
| City of West Carrollton OH, | | | | | | | | | | | | |
| 6.000%, 05/01/2024 (Insured by ST AID) | | | 6,150,000 | | | | 6,113,548 | | | | | |
The accompanying notes are an integral part of these financial statements.
Baird Ultra Short Bond Fund
Schedule of Investments, June 30, 2023 (Unaudited)
Long-Term Investments (cont.)
| | | Principal | | | | | | % of | |
| | | Amount | | | Value | | | Net Assets | |
| Massachusetts Development Finance Agency, | | | | | | | | | |
0.250%, 07/01/2024(4) | | $ | 4,235,000 | | | $ | 4,235,000 | | | | |
| New York State Dormitory Authority: | | | | | | | | | | | |
| 2.550%, 07/01/2023 | | | 1,000,000 | | | | 1,000,000 | | | | |
| 3.187%, 07/01/2023 | | | 1,500,000 | | | | 1,500,000 | | | | |
| New York State Housing Finance Agency, | | | | | | | | | | | |
| 1.600%, 11/01/2024 | | | | | | | | | | | |
| (Callable 07/21/2023) | | | 7,875,000 | | | | 7,637,400 | | | | |
| North Dakota Housing Finance Agency, | | | | | | | | | | | |
| 5.500%, 01/01/2047 (Callable 07/03/2023) | | | | | | | | | | | |
(Optional Put Date 07/07/2023)(4) | | | 550,000 | | | | 550,000 | | | | |
| Total Municipal Bonds | | | | | | | | | | | |
| (Cost $23,472,979) | | | | | | | 23,308,509 | | | | 0.4 | % |
| Residential Mortgage-Backed Securities | | | | | | | | | | | | |
| Non-U.S. Government Agency Issues | | | | | | | | | | | | |
| Arroyo Mortgage Trust: | | | | | | | | | | | | |
| Series 2019-3, Class A1, 2.962%, | | | | | | | | | | | | |
10/25/2048 (Callable 07/25/2023)(2)(4) | | | 14,081,078 | | | | 12,751,720 | | | | | |
| Series 2019-1, Class A1, 3.805%, | | | | | | | | | | | | |
01/25/2049 (Callable 07/25/2023)(2)(4) | | | 4,455,710 | | | | 4,144,547 | | | | | |
| Series 2019-2, Class A1, 3.347%, | | | | | | | | | | | | |
04/25/2049 (Callable 07/25/2023)(2)(4) | | | 7,713,481 | | | | 7,115,256 | | | | | |
| Starwood Mortgage Residential Trust, | | | | | | | | | | | | |
| Series 2021-1, Class A1, 1.219%, | | | | | | | | | | | | |
05/25/2065 (Callable 07/25/2023)(2)(4) | | | 8,448,394 | | | | 7,195,016 | | | | | |
| Towd Point Mortgage Trust: | | | | | | | | | | | | |
| Series 2017-1, Class A1, 2.750%, | | | | | | | | | | | | |
10/25/2056 (Callable 01/25/2030)(2)(4) | | | 1,339,572 | | | | 1,319,723 | | | | | |
| Series 2017-3, Class A1, 2.750%, | | | | | | | | | | | | |
06/25/2057 (Callable 10/25/2026)(2)(4) | | | 2,063,467 | | | | 2,003,934 | | | | | |
| Series 2017-4, Class A1, 2.750%, | | | | | | | | | | | | |
06/25/2057 (Callable 12/25/2029)(2)(4) | | | 2,016,438 | | | | 1,893,104 | | | | | |
| Series 2017-6, Class A1, 2.750%, | | | | | | | | | | | | |
10/25/2057 (Callable 02/25/2033)(2)(4) | | | 9,686,902 | | | | 9,154,244 | | | | | |
| Series 2018-6, Class A1A, 3.750%, | | | | | | | | | | | | |
03/25/2058 (Callable 11/25/2031)(2)(4) | | | 12,473,438 | | | | 12,042,643 | | | | | |
| Total Residential | | | | | | | | | | | | |
| Mortgage-Backed Securities | | | | | | | | | | | | |
| (Cost $62,816,603) | | | | | | | 57,620,187 | | | | 0.9 | % |
| Commercial Mortgage-Backed Securities | | | | | | | | | | | | |
| Non-U.S. Government Agency Issues | | | | | | | | | | | | |
| Citigroup Commercial Mortgage Trust: | | | | | | | | | | | | |
| Series 2013-GC15, Class A4, 4.371%, | | | | | | | | | | | | |
09/10/2046 (Callable 09/10/2023)(4) | | | 841,079 | | | | 838,092 | | | | | |
| Series 2014-GC25, Class A4, 3.635%, | | | | | | | | | | | | |
| 10/10/2047 (Callable 10/10/2024) | | | 10,385,000 | | | | 9,985,129 | | | | | |
| COMM Mortgage Trust: | | | | | | | | | | | | |
| Series 2013-CR12, Class A4, 4.046%, | | | | | | | | | | | | |
| 10/10/2046 (Callable 11/10/2023) | | | 58,712,781 | | | | 58,421,578 | | | | | |
| Series 2013-CR13, Class A4, 4.194%, | | | | | | | | | | | | |
11/10/2046 (Callable 12/10/2023)(4) | | | 14,175,000 | | | | 14,020,502 | | | | | |
| Series 2014-LC15, Class A4, 4.006%, | | | | | | | | | | | | |
| 04/10/2047 (Callable 04/10/2024) | | | 7,525,000 | | | | 7,421,667 | | | | | |
| Series 2014-CR16, Class A4, 4.051%, | | | | | | | | | | | | |
| 04/10/2047 (Callable 04/10/2024) | | | 22,750,000 | | | | 22,295,821 | | | | | |
| Series 2014-UBS4, 3.694%, 08/10/2047 | | | 16,460,000 | | | | 15,934,761 | | | | | |
| GS Mortgage Securities Trust: | | | | | | | | | | | | |
| Series 2013-GC14, Class A5, 4.243%, | | | | | | | | | | | | |
| 08/10/2046 (Callable 06/10/2025) | | | 7,891,848 | | | | 7,878,201 | | | | | |
| Series 2014-GC20, Class A5, 3.998%, | | | | | | | | | | | | |
| 04/10/2047 (Callable 04/10/2024) | | | 9,700,000 | | | | 9,557,724 | | | | | |
| Series 2014-GC26, Class A5, 3.629%, | | | | | | | | | | | | |
| 11/10/2047 (Callable 12/10/2024) | | | 47,745,000 | | | | 45,637,464 | | | | | |
| J.P. Morgan Chase Commercial | | | | | | | | | | | | |
| Mortgage Securities Trust, | | | | | | | | | | | | |
| Series 2014-C20, Class A5, 3.805%, | | | | | | | | | | | | |
| 07/15/2047 (Callable 06/15/2024) | | | 18,626,000 | | | | 18,230,935 | | | | | |
| JPMBB Commercial | | | | | | | | | | | | |
| Mortgage Securities Trust: | | | | | | | | | | | | |
| Series 2013-C16, Class A4, 4.166%, | | | | | | | | | | | | |
| 12/15/2046 (Callable 11/15/2023) | | | 5,360,000 | | | | 5,331,022 | | | | | |
| Series 2013-C17, Class A4, 4.199%, | | | | | | | | | | | | |
| 01/15/2047 (Callable 01/15/2024) | | | 19,073,000 | | | | 18,860,565 | | | | | |
| Series 2014-C18, Class A5, 4.079%, | | | | | | | | | | | | |
| 02/15/2047 (Callable 01/15/2029) | | | 22,907,000 | | | | 22,515,666 | | | | | |
| Series 2014-C21, 3.775%, 08/15/2047 | | | 4,815,000 | | | | 4,680,397 | | | | | |
| Series 2014-C23, Class A5, 3.934%, | | | | | | | | | | | | |
| 09/15/2047 (Callable 02/15/2026) | | | 10,000,000 | | | | 9,669,113 | | | | | |
| Series 2014-C24, Class A5, 3.639%, | | | | | | | | | | | | |
| 11/15/2047 (Callable 10/15/2025) | | | 5,775,000 | | | | 5,542,856 | | | | | |
| Series 2014-C25, Class A5, 3.672%, | | | | | | | | | | | | |
| 11/15/2047 (Callable 11/15/2024) | | | 13,425,000 | | | | 12,858,932 | | | | | |
| Morgan Stanley Bank of | | | | | | | | | | | | |
| America Merrill Lynch Trust: | | | | | | | | | | | | |
| Series 2013-C11, Class A4, 4.126%, | | | | | | | | | | | | |
08/15/2046 (Callable 08/15/2023)(4) | | | 61,355,187 | | | | 61,135,486 | | | | | |
| Series 2013-C12, Class A4, 4.259%, | | | | | | | | | | | | |
10/15/2046 (Callable 10/15/2023)(4) | | | 3,633,724 | | | | 3,620,394 | | | | | |
| Series 2014-C16, Class A5, 3.892%, | | | | | | | | | | | | |
| 06/15/2047 (Callable 06/15/2026) | | | 15,705,000 | | | | 15,326,425 | | | | | |
| Series 2014-C17, Class A4, 3.443%, | | | | | | | | | | | | |
| 08/15/2047 (Callable 07/15/2024) | | | 2,518,302 | | | | 2,463,129 | | | | | |
| Series 2014-C19, Class A4, 3.526%, | | | | | | | | | | | | |
| 12/15/2047 (Callable 10/15/2026) | | | 10,700,000 | | | | 10,242,490 | | | | | |
| Wells Fargo Commercial Mortgage Trust: | | | | | | | | | | | | |
| Series 2013-LC12, Class A4, 4.195%, | | | | | | | | | | | | |
07/15/2046 (Callable 07/15/2023)(4) | | | 1,959,570 | | | | 1,954,268 | | | | | |
| Series 2014-LC16, Class A5, 3.817%, | | | | | | | | | | | | |
| 08/15/2050 (Callable 06/15/2024) | | | 7,443,000 | | | | 7,221,796 | | | | | |
| WFRBS Commercial Mortgage Trust: | | | | | | | | | | | | |
| Series 2013-C15, Class A4, 4.153%, | | | | | | | | | | | | |
08/15/2046 (Callable 08/15/2023)(4) | | | 6,232,254 | | | | 6,215,387 | | | | | |
| Series 2013-C16, Class A5, 4.415%, | | | | | | | | | | | | |
| 09/15/2046 (Callable 10/15/2023) | | | 11,235,678 | | | | 11,195,496 | | | | | |
| Series 2013-C18, Class A5, 4.162%, | | | | | | | | | | | | |
12/15/2046 (Callable 01/15/2024)(4) | | | 21,870,000 | | | | 21,546,687 | | | | | |
| Series 2014-LC14, Class A5, 4.045%, | | | | | | | | | | | | |
| 03/15/2047 (Callable 02/15/2024) | | | 11,543,000 | | | | 11,374,849 | | | | | |
| Series 2014-C20, Class A5, 3.995%, | | | | | | | | | | | | |
| 05/15/2047 (Callable 05/15/2024) | | | 30,191,119 | | | | 29,391,613 | | | | | |
| Series 2014-C24, Class A5, 3.607%, | | | | | | | | | | | | |
| 11/15/2047 (Callable 11/15/2024) | | | 5,500,736 | | | | 5,268,073 | | | | | |
| Series 2014-C25, Class A5, 3.631%, | | | | | | | | | | | | |
| 11/15/2047 (Callable 12/15/2024) | | | 6,186,421 | | | | 5,927,244 | | | | | |
| Series 2014-C22, Class A5, 3.752%, | | | | | | | | | | | | |
| 09/15/2057 (Callable 09/15/2024) | | | 11,336,000 | | | | 10,910,274 | | | | | |
| Series 2014-C23, Class A5, 3.917%, | | | | | | | | | | | | |
| 10/15/2057 (Callable 09/15/2025) | | | 3,373,000 | | | | 3,246,234 | | | | | |
| Total Commercial | | | | | | | | | | | | |
| Mortgage-Backed Securities | | | | | | | | | | | | |
| (Cost $495,483,585) | | | | | | | 496,720,270 | | | | 8.0 | % |
| Asset Backed Securities | | | | | | | | | | | | |
| Affirm Asset Securitization Trust: | | | | | | | | | | | | |
| Series 2020-Z2, Class A, 1.900%, | | | | | | | | | | | | |
01/15/2025 (Callable 07/15/2023)(2) | | | 7,836,455 | | | | 7,733,250 | | | | | |
| Series 2021-Z1, Class A, 1.070%, | | | | | | | | | | | | |
08/15/2025 (Callable 11/15/2023)(2) | | | 14,104,883 | | | | 13,708,112 | | | | | |
The accompanying notes are an integral part of these financial statements.
Baird Ultra Short Bond Fund
Schedule of Investments, June 30, 2023 (Unaudited)
Long-Term Investments (cont.)
| | | Principal | | | | | | % of | |
| | | Amount | | | Value | | | Net Assets | |
| Ally Auto Receivables, | | | | | | | | | |
| Series 2022-3, Class A2, 5.290%, | | | | | | | | | |
| 06/16/2025 | | $ | 7,743,205 | | | $ | 7,731,772 | | | |
| |
| Capital One Multi-Asset Execution Trust, | | | | | | | | | | | | |
| Series 2021-A1, Class A1, 0.550%, | | | | | | | | | | | | |
| 07/15/2026 | | | 7,650,000 | | | | 7,253,216 | | | | | |
| Capital One Prime Auto Receivables Trust: | | | | | | | | | | | | |
| Series 2020-1, Class A3, 1.600%, | | | | | | | | | | | | |
| 11/15/2024 (Callable 10/15/2023) | | | 2,147,202 | | | | 2,141,851 | | | | | |
| Series 2022-2, Class A2A, 3.740%, | | | | | | | | | | | | |
| 09/15/2025 | | | 15,120,622 | | | | 14,973,674 | | | | | |
| CarMax Auto Owner Trust, | | | | | | | | | | | | |
| Series 2023-1, Class A2A, 5.230%, | | | | | | | | | | | | |
| 01/15/2026 | | | 6,250,000 | | | | 6,226,982 | | | | | |
| Chase Auto Credit Linked Notes: | | | | | | | | | | | | |
| Series 2021-1, Class B, 0.875%, | | | | | | | | | | | | |
09/25/2028 (Callable 04/25/2025)(2) | | | 11,477,694 | | | | 11,132,183 | | | | | |
| Series 2021-2, Class B, 0.889%, | | | | | | | | | | | | |
12/26/2028 (Callable 04/25/2025)(2) | | | 649,023 | | | | 627,519 | | | | | |
| Series 2021-3, Class B, 0.760%, | | | | | | | | | | | | |
02/26/2029 (Callable 04/25/2025)(2) | | | 6,866,878 | | | | 6,538,776 | | | | | |
| Chase Auto Owner Trust, | | | | | | | | | | | | |
| Series 2022-AA, Class A2, 3.860%, | | | | | | | | | | | | |
10/27/2025(2) | | | 5,742,210 | | | | 5,696,719 | | | | | |
| Citizens Auto Receivables Trust, | | | | | | | | | | | | |
| Series 2023-1, Class A2A, 6.130%, | | | | | | | | | | | | |
07/15/2026(2) | | | 58,350,000 | | | | 58,287,277 | | | | | |
| Dell Equipment Finance Trust: | | | | | | | | | | | | |
| Series 2022-2, Class A2, 4.030%, | | | | | | | | | | | | |
07/22/2027 (Callable 03/22/2025)(2) | | | 14,926,334 | | | | 14,749,257 | | | | | |
| Series 2023-1, Class A2, 5.650%, | | | | | | | | | | | | |
| 09/22/2028 | | | | | | | | | | | | |
(Callable 10/22/2025)(2) | | | 42,600,000 | | | | 42,359,740 | | | | | |
| Series 2023-2, Class A2, 5.840%, | | | | | | | | | | | | |
01/22/2029 (Callable 02/22/2026)(2) | | | 12,000,000 | | | | 11,971,955 | | | | | |
| Discover Card Execution Note Trust, | | | | | | | | | | | | |
| Series 2017-A4, Class A4, 2.530%, | | | | | | | | | | | | |
| 10/15/2026 | | | 2,400,000 | | | | 2,342,604 | | | | | |
| DLLAD LLC: | | | | | | | | | | | | |
| Series 2021-1A, Class A2, 0.350%, | | | | | | | | | | | | |
09/20/2024(2) | | | 947,580 | | | | 944,710 | | | | | |
| Series 2023-1A, Class A2, 5.190%, | | | | | | | | | | | | |
04/20/2026(2) | | | 7,500,000 | | | | 7,428,322 | | | | | |
| DLLMT LLC, | | | | | | | | | | | | |
| Series 2023-1A, Class A2, 5.830%, | | | | | | | | | | | | |
11/20/2025(2) | | | 35,150,000 | | | | 34,929,694 | | | | | |
| Donlen Fleet Lease Funding 2 LLC, | | | | | | | | | | | | |
| Series 2021-2, Class A2, 0.560%, | | | | | | | | | | | | |
12/11/2034(2) | | | 1,198,600 | | | | 1,168,294 | | | | | |
| Ford Credit Auto Lease Trust, | | | | | | | | | | | | |
| Series 2022-A, Class A2A, 2.780%, | | | | | | | | | | | | |
| 10/15/2024 | | | 10,450,801 | | | | 10,415,775 | | | | | |
| Ford Credit Auto Owner Trust: | | | | | | | | | | | | |
| Series 2018-2, Class A, 3.470%, | | | | | | | | | | | | |
01/15/2030 (Callable 07/15/2023)(2) | | | 21,334,000 | | | | 21,317,440 | | | | | |
| Series 2019-1, Class A, 3.520%, | | | | | | | | | | | | |
07/15/2030 (Callable 01/15/2024)(2) | | | 25,965,000 | | | | 25,631,342 | | | | | |
| Ford Credit Floorplan Master Owner Trust: | | | | | | | | | | | | |
| Series 2020-1, Class A1, 0.700%, | | | | | | | | | | | | |
| 09/15/2025 | | | 38,005,000 | | | | 37,593,174 | | | | | |
| Series 2019-2, Class A, 3.060%, | | | | | | | | | | | | |
| 04/15/2026 | | | 2,634,000 | | | | 2,577,642 | | | | | |
| Series 2019-4, Class A, 2.440%, | | | | | | | | | | | | |
| 09/15/2026 | | | 10,798,000 | | | | 10,370,958 | | | | | |
| GM Financial Automobile Leasing Trust: | | | | | | | | | | | | |
| Series 2023-1, Class A2A, 5.270%, | | | | | | | | | | | | |
| 06/20/2025 | | | 37,927,000 | | | | 37,772,701 | | | | | |
| Series 2023-2, Class A2A, 5.440%, | | | | | | | | | | | | |
| 10/20/2025 (Callable 08/20/2025) | | | 5,300,000 | | | | 5,277,632 | | | | | |
| Series 2023-1, Class A3, 5.160%, | | | | | | | | | | | | |
| 04/20/2026 (Callable 08/20/2025) | | | 2,055,000 | | | | 2,040,204 | | | | | |
| GM Financial Consumer | | | | | | | | | | | | |
| Automobile Receivables Trust: | | | | | | | | | | | | |
| Series 2023-1, Class A2A, 5.190%, | | | | | | | | | | | | |
| 03/16/2026 | | | 18,000,000 | | | | 17,932,693 | | | | | |
| Series 2023-2, Class A2A, 5.100%, | | | | | | | | | | | | |
| 05/18/2026 | | | 7,000,000 | | | | 6,962,082 | | | | | |
| GMF Floorplan Owner Revolving Trust: | | | | | | | | | | | | |
| Series 2020-1, Class A, 0.680%, | | | | | | | | | | | | |
08/15/2025(2) | | | 18,467,000 | | | | 18,361,819 | | | | | |
| Series 2020-2, Class A, 0.690%, | | | | | | | | | | | | |
10/15/2025(2) | | | 36,540,000 | | | | 36,039,497 | | | | | |
| Series 2019-2, Class A, 2.900%, | | | | | | | | | | | | |
04/15/2026(2) | | | 31,033,000 | | | | 30,338,479 | | | | | |
| Honda Auto Receivables Owner Trust: | | | | | | | | | | | | |
| Series 2022-1, Class A2, 1.440%, | | | | | | | | | | | | |
| 10/15/2024 | | | 45,187,221 | | | | 44,775,218 | | | | | |
| Series 2023-1, Class A2, 5.220%, | | | | | | | | | | | | |
| 10/21/2025 | | | 7,100,000 | | | | 7,073,446 | | | | | |
| HPEFS Equipment Trust, | | | | | | | | | | | | |
| Series 2022-1A, Class A2, 1.020%, | | | | | | | | | | | | |
05/21/2029 (Callable 03/20/2025)(2) | | | 791,110 | | | | 787,391 | | | | | |
| Hyundai Auto Lease Securitization Trust: | | | | | | | | | | | | |
| Series 2022-A, Class A2, 0.810%, | | | | | | | | | | | | |
04/15/2024(2) | | | 1,948,181 | | | | 1,943,552 | | | | | |
| Series 2023-A, Class A2A, 5.200%, | | | | | | | | | | | | |
04/15/2025(2) | | | 11,117,440 | | | | 11,072,690 | | | | | |
| Hyundai Auto Receivables Trust: | | | | | | | | | | | | |
| Series 2022-C, Class A2A, 5.350%, | | | | | | | | | | | | |
| 11/17/2025 | | | 3,745,053 | | | | 3,733,634 | | | | | |
| Series 2023-A, Class A2A, 5.190%, | | | | | | | | | | | | |
| 12/15/2025 | | | 12,850,000 | | | | 12,798,240 | | | | | |
| Series 2021-B, Class A3, 0.380%, | | | | | | | | | | | | |
| 01/15/2026 (Callable 11/15/2025) | | | 7,462,056 | | | | 7,219,342 | | | | | |
| Marlette Funding Trust, | | | | | | | | | | | | |
| Series 2021-3A, Class A, 0.650%, | | | | | | | | | | | | |
12/15/2031 (Callable 01/15/2026)(2) | | | 319,265 | | | | 318,743 | | | | | |
| Master Credit Card Trust, | | | | | | | | | | | | |
| Series 2021-1A, Class A, 0.530%, | | | | | | | | | | | | |
11/21/2025(1)(2) | | | 12,550,000 | | | | 11,957,673 | | | | | |
| Mercedes-Benz Auto Receivables Trust, | | | | | | | | | | | | |
| Series 2021-1, Class A3, 0.460%, | | | | | | | | | | | | |
| 06/15/2026 (Callable 08/15/2025) | | | 15,794,733 | | | | 15,187,272 | | | | | |
| MMAF Equipment Finance LLC, | | | | | | | | | | | | |
| Series 2020-A, Class A2, 0.740%, | | | | | | | | | | | | |
04/09/2024(2) | | | 313,154 | | | | 312,790 | | | | | |
| Nissan Auto Lease Trust, | | | | | | | | | | | | |
| Series 2023-A, Class A2A, 5.100%, | | | | | | | | | | | | |
| 03/17/2025 | | | 13,000,000 | | | | 12,945,222 | | | | | |
| Nissan Auto Receivables Owner Trust, | | | | | | | | | | | | |
| Series 2022-B, Class A2, 4.500%, | | | | | | | | | | | | |
| 08/15/2025 | | | 3,677,322 | | | | 3,656,555 | | | | | |
| PFS Financing Corp.: | | | | | | | | | | | | |
| Series 2020-E, Class A, 1.000%, | | | | | | | | | | | | |
10/15/2025(2) | | | 27,735,000 | | | | 27,368,765 | | | | | |
| Series 2020-G, Class A, 0.970%, | | | | | | | | | | | | |
02/15/2026(2) | | | 2,910,000 | | | | 2,815,457 | | | | | |
| Series 2021-A, Class A, 0.710%, | | | | | | | | | | | | |
04/15/2026(2) | | | 56,678,000 | | | | 54,287,390 | | | | | |
The accompanying notes are an integral part of these financial statements.
Baird Ultra Short Bond Fund
Schedule of Investments, June 30, 2023 (Unaudited)
Long-Term Investments (cont.)
| | | Principal | | | | | | % of | |
| | | Amount | | | Value | | | Net Assets | |
| Santander Bank Auto Credit, | | | | | | | | | |
| Series 2022-A, Class B, 5.281%, | | | | | | | | | |
05/15/2032 (Callable 10/15/2025)(2) | | $ | 8,446,693 | | | $ | 8,306,551 | | | | |
| Santander Bank NA, | | | | | | | | | | | |
| Series 2021-1A, Class B, 1.833%, | | | | | | | | | | | |
12/15/2031 (Callable 06/15/2025)(2) | | | 13,002,374 | | | | 12,573,560 | | | | |
| Santander Retail Auto Lease Trust, | | | | | | | | | | | |
| Series 2022-A, Class A2, 0.970%, | | | | | | | | | | | |
03/20/2025 (Callable 11/20/2024)(2) | | | 3,966,714 | | | | 3,926,647 | | | | |
| SCF Equipment Leasing 2022-2 LLC, | | | | | | | | | | | |
| Series 2022-2A, Class A2, 6.240%, | | | | | | | | | | | |
07/20/2028(2) | | | 35,218,208 | | | | 35,206,822 | | | | |
| SFS Auto Receivables Securitization Trust, | | | | | | | | | | | |
| Series 2023-1A, Class A2A, 5.890%, | | | | | | | | | | | |
03/22/2027(2) | | | 16,150,000 | | | | 16,130,489 | | | | |
| SoFi Consumer Loan Program Trust, | | | | | | | | | | | |
| Series 2022-1S, Class A, 6.210%, | | | | | | | | | | | |
04/15/2031 (Callable 02/15/2025)(2) | | | 18,807,319 | | | | 18,818,381 | | | | |
| Towd Point Mortgage Trust: | | | | | | | | | | | |
| Series 2019-MH1, Class A1, 3.000%, | | | | | | | | | | | |
11/25/2058 (Callable 09/25/2024)(2)(4) | | | 512,976 | | | | 505,972 | | | | |
| Series 2020-MH1, Class A1, 2.250%, | | | | | | | | | | | |
02/25/2060 (Callable 07/25/2023)(2)(4) | | | 11,793,546 | | | | 10,958,234 | | | | |
| Toyota Auto Loan Extended Note Trust, | | | | | | | | | | | |
| Series 2019-1A, Class A, 2.560%, | | | | | | | | | | | |
11/25/2031 (Callable 05/25/2024)(2) | | | 37,035,000 | | | | 35,964,118 | | | | |
| Verizon Master Trust, | | | | | | | | | | | |
| Series 2022-7, Class A1A, 5.230%, | | | | | | | | | | | |
| 11/22/2027 (Callable 11/20/2024) | | | 45,310,000 | | | | 45,026,627 | | | | |
| Verizon Owner Trust, | | | | | | | | | | | |
| Series 2020-B, Class A, 0.470%, | | | | | | | | | | | |
| 02/20/2025 (Callable 10/20/2023) | | | 2,925,491 | | | | 2,905,084 | | | | |
| Wheels SPV 2 LLC, | | | | | | | | | | | |
| Series 2020-1A, Class A2, 0.510%, | | | | | | | | | | | |
08/20/2029 (Callable 02/20/2024)(2) | | | 95,276 | | | | 95,003 | | | | |
| World Omni Auto Receivables Trust: | | | | | | | | | | | |
| Series 2019-C, Class A3, 1.960%, | | | | | | | | | | | |
| 12/16/2024 (Callable 10/15/2023) | | | 298,373 | | | | 297,933 | | | | |
| Series 2022-D, Class A2A, 5.510%, | | | | | | | | | | | |
| 03/16/2026 (Callable 02/15/2026) | | | 11,142,868 | | | | 11,124,704 | | | | |
| Total Asset Backed Securities | | | | | | | | | | | |
| (Cost $943,548,108) | | | | | | | 940,670,850 | | | | 15.2 | % |
| Total Long-Term Investments | | | | | | | | | | | | |
| (Cost $5,100,639,124) | | | | | | | 5,086,798,060 | | | | 82.1 | % |
| Short-Term Investments | | | | | | | | | | | | |
| Commercial Paper | | | | | | | | | | | | |
| Baptist Memorial Health, 6.50%, | | | | | | | | | | | | |
| 08/14/2023 | | | 25,726,000 | | | | 25,725,401 | | | | | |
| Canadian Natural Resources Ltd., | | | | | | | | | | | | |
5.92%(6), 07/25/2023(1) | | | 25,000,000 | | | | 24,897,225 | | | | | |
| Catholic Health Initiatives, | | | | | | | | | | | | |
5.39%(6), 07/06/2023 | | | 44,600,000 | | | | 44,559,904 | | | | | |
| Friction Marketing Company, | | | | | | | | | | | | |
5.93%(6), 07/24/2023 | | | 11,300,000 | | | | 11,255,365 | | | | | |
AT&T, Inc., 5.73%(6), 12/19/2023 | | | 42,875,000 | | | | 41,701,021 | | | | | |
| Total Commercial Paper | | | | | | | | | | | | |
| (Cost $148,228,371) | | | | | | | 148,138,916 | | | | 2.4 | % |
| U.S. Treasury Securities | | | | | | | | | | | | |
| United States Treasury Bills: | | | | | | | | | | | | |
4.99%(6), 09/28/2023 | | | 100,000,000 | | | | 98,753,000 | | | | | |
5.10%(6), 11/30/2023 | | | 60,000,000 | | | | 58,700,334 | | | | | |
5.04%(6), 10/12/2023 | | | 220,000,000 | | | | 216,798,932 | | | | | |
5.11%(6), 05/16/2024 | | | 246,525,000 | | | | 235,290,567 | | | | | |
5.15%(6), 12/21/2023 | | | 120,000,000 | | | | 117,013,200 | | | | | |
| Total U.S. Treasury Securities | | | | | | | | | | | | |
| (Cost $727,298,418) | | | | | | | 726,556,033 | | | | 11.7 | % |
| | | | | | | | | | | | | |
| | | Shares | | | | | | | | | |
| Money Market Mutual Fund | | | | | | | | | | | | |
| First American Government Obligations | | | | | | | | | | | | |
Fund, Class U, 5.03%(5) | | | 88,273,701 | | | | 88,273,701 | | | | | |
| Total Money Market Mutual Fund | | | | | | | | | | | | |
| (Cost $88,273,701) | | | | | | | 88,273,701 | | | | 1.4 | % |
| Total Short-Term Investments | | | | | | | | | | | | |
| (Cost $963,800,490) | | | | | | | 962,968,650 | | | | 15.5 | % |
| Total Investments | | | | | | | | | | | | |
| (Cost $6,064,439,614) | | | | | | | 6,049,766,710 | | | | 97.6 | % |
| Other Assets in Excess of Liabilities | | | | | | | 150,772,453 | | | | 2.4 | % |
| TOTAL NET ASSETS | | | | | | $ | 6,200,539,163 | | | | 100.0 | % |
Notes to Schedule of Investments
NATL – National Public Finance Guarantee Corp.
ST AID – State Aid Intercept/Withholding
CMT – Constant Maturity Treasury
LIBOR – London Inter-bank Offered Rate
SOFR – Secured Overnight Financing Rate
(1) | Foreign security. |
(2) | Includes securities exempt from registration under Rule 144A of the Securities Act of 1933. These securities may be resold in transactions exempt from registration to qualified institutional buyers. At June 30, 2023, the value of these securities totaled $1,502,036,401, which represented 24.22% of total net assets. |
(3) | Variable rate security based on a reference index and spread. The rate reported is the rate as of the last reset date in effect as of June 30, 2023. |
(4) | Variable rate security. The coupon is based on an underlying pool of loans. The rate reported is the rate in effect as of June 30, 2023. |
(5) | Seven-day yield. |
(6) | Effective yield as of June 30, 2023. |
The accompanying notes are an integral part of these financial statements.
Baird Ultra Short Bond Fund
Schedule of Investments, June 30, 2023 (Unaudited)
Summary of Fair Value Exposure at June 30, 2023 (Unaudited)
The Fund has adopted authoritative fair valuation accounting standards which establish a definition of fair value and set out a hierarchy for measuring fair value. These standards require additional disclosures about the various inputs and valuation techniques used to develop the measurements of fair value and a discussion on changes in valuation techniques and related inputs during the period. These standards define fair value as the price that would be received to sell an asset or paid to transfer a liability in an orderly transaction between market participants at the measurement date.
The fair value hierarchy is organized into three levels based upon the assumptions (referred to as “inputs”) used in pricing the asset or liability. These standards state that “observable inputs” reflect the assumptions market participants would use in pricing the asset or liability based on market data obtained from independent sources and “unobservable inputs” reflect an entity’s own assumptions about the assumptions market participants would use in pricing the asset or liability. These inputs are summarized into three broad levels and described below:
Level 1 – Quoted prices (unadjusted) in active markets for identical assets or liabilities that the reporting entity can access at the measurement date.
Level 2 – Inputs other than quoted prices included within Level 1 that are observable for the asset or liability, either directly or indirectly.
Level 3 – Unobservable inputs for the asset or liability.
The inputs or methodology used for valuing securities are not necessarily an indication of the risk associated with investing in those securities.
The following is a summary of the inputs used to value the Fund’s investments as of June 30, 2023:
| | | Level 1 | | | Level 2 | | | Level 3 | | | Total | |
| Long-Term Investments | | | | | | | | | | | | |
| U.S. Treasury Securities | | $ | — | | | $ | 651,204,623 | | | $ | — | | | $ | 651,204,623 | |
| Corporate Bonds | | | — | | | | 2,917,273,621 | | | | — | | | | 2,917,273,621 | |
| Municipal Bonds | | | — | | | | 23,308,509 | | | | — | | | | 23,308,509 | |
| Residential Mortgage-Backed Securities – Non-U.S. Government Agency Issues | | | — | | | | 57,620,187 | | | | — | | | | 57,620,187 | |
| Commercial Mortgage-Backed Securities – Non-U.S. Government Agency Issues | | | — | | | | 496,720,270 | | | | — | | | | 496,720,270 | |
| Asset Backed Securities | | | — | | | | 940,670,850 | | | | — | | | | 940,670,850 | |
| Total Long-Term Investments | | | — | | | | 5,086,798,060 | | | | — | | | | 5,086,798,060 | |
| Short-Term Investments | | | | | | | | | | | | | | | | |
| Commercial Paper | | | — | | | | 148,138,916 | | | | — | | | | 148,138,916 | |
| U.S. Treasury Securities | | | — | | | | 726,556,033 | | | | — | | | | 726,556,033 | |
| Money Market Mutual Fund | | | 88,273,701 | | | | — | | | | — | | | | 88,273,701 | |
| Total Short-Term Investments | | | 88,273,701 | | | | 874,694,949 | | | | — | | | | 962,968,650 | |
| Total Investments | | $ | 88,273,701 | | | $ | 5,961,493,009 | | | $ | — | | | $ | 6,049,766,710 | |
Changes in valuation techniques may result in transfers into or out of assigned levels within the fair value hierarchy. There were no transfers into or out of Level 3 during the reporting period, as compared to the security classifications from the prior year’s annual report. See the Fund’s Valuation Policy in Note 2a to the financial statements.
The accompanying notes are an integral part of these financial statements.
Baird Short-Term Bond Fund
June 30, 2023 (Unaudited)
Portfolio Characteristics
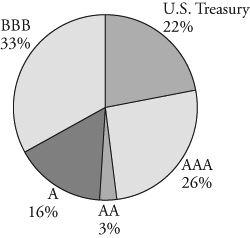
Quality Distribution(1)(2)
 | | Net Assets | $9,148,929,551 | |
| | | | |
| | SEC 30-Day Yield(3) | | |
| | Institutional Class | 4.88% | |
| | Investor Class | 4.63% | |
| | | | |
| | Average Effective Duration | 1.86 years | |
| | | | |
| | Average Effective Maturity | 2.05 years | |
| | | | |
| | Annualized Expense Ratio(4) | | |
| | Institutional Class | 0.30% | |
| | Investor Class | 0.55% | (5) |
| | | | |
| | Portfolio Turnover Rate | 49% | (6) |
| | | | |
| | | Number of Holdings | 459 | |
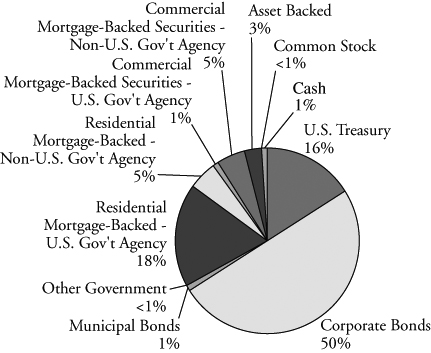
Sector Weightings(7) | | | | |
| | | | | |

| | | | |
| | | | |
| | | | |
| | | | |
| | | | |
| | | | |
| | | | |
| | | | |
| | | | |
| | | | |
| | | | |
| | | | |
| | | | |
| | | | |
| | | | |
| | | | |
| | | | |
| | | | |
| | | | |
| | | | |
| | | | | |
(1) | Percentages shown are based on the Fund’s total investments. |
(2) | The quality profile is calculated on a market value-weighted basis using the highest credit quality rating for each security held by the Fund given by S&P, Moody’s or Fitch, each of which is a Nationally Recognized Statistical Rating Organization (NRSRO). NRSROs rate the credit quality of securities using a scale that generally ranges from AAA (highest) to D (lowest). |
(3) | SEC yields are based on SEC guidelines and are calculated for the 30 days ended June 30, 2023. |
(4) | Reflects expense ratios as stated in the Fund’s current prospectus dated May 1, 2023. |
(5) | Includes 0.25% 12b-1 fee. |
(6) | Not annualized. |
(7) | Percentages shown are based on the Fund’s total net assets. |
Baird Short-Term Bond Fund
June 30, 2023 (Unaudited)
Total Returns
| | | | Average Annual |
| | | | | | Since | Since |
| | Six | One | Five | Ten | Inception | Inception |
| For the Periods Ended June 30, 2023 | Months | Year | Years | Years | (8/31/04) | (9/19/12) |
| Institutional Class Shares | 1.55% | 1.46% | 1.51% | 1.50% | 2.36% | N/A |
| Investor Class Shares | 1.43% | 1.20% | 1.28% | 1.25% | N/A | 1.23% |
Bloomberg 1-3 Year U.S. Government/Credit Index(1) | 1.13% | 0.52% | 1.13% | 0.99% | 1.97% | 0.94% |
(1) | The Bloomberg 1-3 Year U.S. Government/Credit Index is an unmanaged, market value weighted index of investment grade, fixed-rate debt issues, including government and corporate securities, with maturities between one and three years. This Index does not reflect any deduction for fees, expenses or taxes. A direct investment in an index is not possible. |
The returns table shown above reflects reinvestment of dividends and/or capital gains distributions in additional shares. The returns in the table do not reflect the deduction of taxes that a shareholder would pay on Fund distributions or the redemption of Fund shares. The returns reflect the actual performance for each period and do not include the impact of trades executed on the last business day of the period that were recorded on the first business day of the next period.
The Fund’s expense ratio for each Class, as reflected in the Fund’s current prospectus, is set forth under “Portfolio Characteristics”.
The Fund may invest in U.S. dollar denominated foreign securities which involve additional risks such as political and economic instability, and different and sometimes less strict financial reporting standards and regulation. The Fund may also invest in mortgage- and asset-backed securities, which include interest rate and prepayment risks more pronounced than those of other fixed income securities. U.S. and international markets have experienced significant periods of volatility in recent years and months due to a number of economic, political and global macro factors. Russia’s ongoing war with Ukraine has heightened global geopolitical tensions, resulting in an elevated risk environment and increased volatility in asset prices. The uncertain course of the war may have a significant negative impact on the global economy. U.S. relations with China have become increasingly strained, and tension between the U.S. and China may have a significant negative impact on the global economy and asset prices. Measures of inflation reached levels not experienced in several decades, leading the Federal Reserve to raise short term interest rates significantly over the last year, with the potential for further rate increases in 2023. Uncertainty regarding the ability of the Federal Reserve to successfully control inflation, the potential for incremental rate increases, and the full impact of prior rate increases on the economy may negatively impact asset prices and increase market volatility. The possibility of a U.S. or global recession may also contribute to market volatility. The coronavirus (COVID-19) pandemic caused significant economic disruption in recent years as countries worked to limit the negative health impacts of the virus. While the virus has entered an endemic stage, significant outbreaks or new variants present a continued risk to the global economy. These and other geopolitical events may cause market disruptions and could have an adverse effect on the value of the Fund’s investments.
Past performance does not guarantee future results. Investment returns and principal value will fluctuate so that an investor’s shares, when redeemed, may be worth more or less than their original cost.
For information about the performance of the Fund as of the most recent month-end, please call 1-866-442-2473 or visit www.bairdfunds.com. Mutual fund performance changes over time and current performance may be lower or higher than that stated.
Baird Short-Term Bond Fund
Schedule of Investments, June 30, 2023 (Unaudited)
Long-Term Investments
| | | Principal | | | | | | % of | |
| | | Amount | | | Value | | | Net Assets | |
| U.S. Treasury Securities | | | | | | | | | |
| U.S. Treasury Bonds: | | | | | | | | | |
| 1.500%, 02/15/2025 | | $ | 316,450,000 | | | $ | 298,674,409 | | | | |
| 2.875%, 06/15/2025 | | | 685,150,000 | | | | 659,055,418 | | | | |
| 3.125%, 08/15/2025 | | | 794,600,000 | | | | 767,440,818 | | | | |
| 4.000%, 02/15/2026 | | | 476,300,000 | | | | 468,988,052 | | | | |
| Total U.S. Treasury Securities | | | | | | | | | | | |
| (Cost $2,213,833,895) | | | | | | | 2,194,158,697 | | | | 24.0 | % |
| Other Government Related Securities | | | | | | | | | | | | |
| Korea East-West Power Co. Ltd., | | | | | | | | | | | | |
3.600%, 05/06/2025(1)(2) | | | 5,875,000 | | | | 5,650,314 | | | | | |
| Korea Electric Power Corporation, | | | | | | | | | | | | |
5.375%, 04/06/2026(1)(2) | | | 15,000,000 | | | | 14,945,862 | | | | | |
| NBN Co. Ltd., | | | | | | | | | | | | |
| 0.875%, 10/08/2024 | | | | | | | | | | | | |
(Callable 09/08/2024)(1)(2) | | | 36,000,000 | | | | 33,763,931 | | | | | |
| Total Other Government Related Securities | | | | | | | | | | | | |
| (Cost $56,716,324) | | | | | | | 54,360,107 | | | | 0.6 | % |
| Corporate Bonds | | | | | | | | | | | | |
| Industrials | | | | | | | | | | | | |
| Advance Auto Parts, Inc., | | | | | | | | | | | | |
| 5.900%, 03/09/2026 | | | 10,000,000 | | | | 9,889,955 | | | | | |
| Allegion US Holding Co., Inc., | | | | | | | | | | | | |
| 3.200%, 10/01/2024 | | | | | | | | | | | | |
| (Callable 08/01/2024) | | | 20,250,000 | | | | 19,444,474 | | | | | |
| Anglo American Capital PLC: | | | | | | | | | | | | |
| 5.375%, 04/01/2025 | | | | | | | | | | | | |
(Callable 03/01/2025)(1)(2) | | | 13,250,000 | | | | 13,014,602 | | | | | |
4.875%, 05/14/2025(1)(2) | | | 956,000 | | | | 935,902 | | | | | |
| ANR Pipeline Co., | | | | | | | | | | | | |
7.375%, 02/15/2024(1) | | | 13,000,000 | | | | 13,023,909 | | | | | |
| ArcelorMittal: | | | | | | | | | | | | |
6.125%, 06/01/2025(1) | | | 1,413,000 | | | | 1,436,073 | | | | | |
4.550%, 03/11/2026(1) | | | 4,000,000 | | | | 3,897,868 | | | | | |
| Ashtead Capital, Inc., | | | | | | | | | | | | |
| 1.500%, 08/12/2026 | | | | | | | | | | | | |
(Callable 07/12/2026)(1)(2) | | | 25,674,000 | | | | 22,433,509 | | | | | |
| AutoNation, Inc., | | | | | | | | | | | | |
| 4.500%, 10/01/2025 | | | | | | | | | | | | |
| (Callable 07/01/2025) | | | 25,000,000 | | | | 24,015,697 | | | | | |
| Bayer US Finance II LLC, | | | | | | | | | | | | |
5.500%, 08/15/2025(1)(2) | | | 4,000,000 | | | | 3,920,389 | | | | | |
| Berry Global, Inc., | | | | | | | | | | | | |
| 4.875%, 07/15/2026 | | | | | | | | | | | | |
(Callable 07/31/2023)(2) | | | 10,343,000 | | | | 9,942,209 | | | | | |
| Boardwalk Pipelines LP, | | | | | | | | | | | | |
| 4.950%, 12/15/2024 | | | | | | | | | | | | |
| (Callable 09/15/2024) | | | 40,966,000 | | | | 40,297,726 | | | | | |
| BorgWarner, Inc., | | | | | | | | | | | | |
5.000%, 10/01/2025(2) | | | 9,946,000 | | | | 9,765,816 | | | | | |
| Brambles USA, Inc., | | | | | | | | | | | | |
| 4.125%, 10/23/2025 | | | | | | | | | | | | |
(Callable 07/25/2025)(1)(2) | | | 30,041,000 | | | | 28,895,679 | | | | | |
| Broadcom, Inc., | | | | | | | | | | | | |
| 3.150%, 11/15/2025 | | | | | | | | | | | | |
| (Callable 10/15/2025) | | | 5,000,000 | | | | 4,749,958 | | | | | |
| Brunswick Corp., | | | | | | | | | | | | |
| 0.850%, 08/18/2024 | | | | | | | | | | | | |
| (Callable 07/17/2023) | | | 12,500,000 | | | | 11,753,039 | | | | | |
| Bunge Limited Finance Corp., | | | | | | | | | | | | |
| 1.630%, 08/17/2025 | | | | | | | | | | | | |
| (Callable 07/17/2025) | | | 5,006,000 | | | | 4,605,802 | | | | | |
| CCL Industries, Inc., | | | | | | | | | | | | |
| 3.250%, 10/01/2026 | | | | | | | | | | | | |
(Callable 07/01/2026)(1)(2) | | | 1,560,000 | | | | 1,426,257 | | | | | |
| CDW LLC / CDW Finance Corp.: | | | | | | | | | | | | |
| 5.500%, 12/01/2024 | | | | | | | | | | | | |
| (Callable 06/01/2024) | | | 2,958,000 | | | | 2,938,566 | | | | | |
| 4.125%, 05/01/2025 | | | | | | | | | | | | |
| (Callable 07/31/2023) | | | 19,810,000 | | | | 19,076,238 | | | | | |
| Celanese US Holdings LLC: | | | | | | | | | | | | |
| 3.500%, 05/08/2024 | | | | | | | | | | | | |
| (Callable 04/08/2024) | | | 4,450,000 | | | | 4,355,023 | | | | | |
| 6.050%, 03/15/2025 | | | 40,000,000 | | | | 39,836,569 | | | | | |
| Charter Communications Operating LLC, | | | | | | | | | | | | |
| 4.908%, 07/23/2025 | | | | | | | | | | | | |
| (Callable 04/23/2025) | | | 13,000,000 | | | | 12,748,409 | | | | | |
| Cheniere Corpus Christi Holdings LLC, | | | | | | | | | | | | |
| 5.875%, 03/31/2025 | | | | | | | | | | | | |
| (Callable 10/02/2024) | | | 6,595,000 | | | | 6,563,345 | | | | | |
| CNH Industrial Capital LLC: | | | | | | | | | | | | |
3.950%, 05/23/2025(1) | | | 10,000,000 | | | | 9,676,849 | | | | | |
5.450%, 10/14/2025(1) | | | 15,000,000 | | | | 14,896,288 | | | | | |
| CVS Pass-Through Trust: | | | | | | | | | | | | |
| 5.880%, 01/10/2028 | | | 4,612,972 | | | | 4,520,760 | | | | | |
| 6.036%, 12/10/2028 | | | 17,851,572 | | | | 17,704,482 | | | | | |
| Daimler Finance North America LLC, | | | | | | | | | | | | |
1.625%, 12/13/2024(1)(2) | | | 25,000,000 | | | | 23,533,597 | | | | | |
| Daimler Truck Finance North America LLC, | | | | | | | | | | | | |
5.150%, 01/16/2026(1)(2) | | | 11,825,000 | | | | 11,769,670 | | | | | |
| DCP Midstream LLC, | | | | | | | | | | | | |
| 5.375%, 07/15/2025 | | | | | | | | | | | | |
| (Callable 04/15/2025) | | | 36,000,000 | | | | 35,639,982 | | | | | |
| DXC Technology Co., | | | | | | | | | | | | |
| 1.800%, 09/15/2026 | | | | | | | | | | | | |
| (Callable 08/15/2026) | | | 48,650,000 | | | | 42,283,255 | | | | | |
| eBay, Inc., | | | | | | | | | | | | |
| 5.900%, 11/22/2025 | | | | | | | | | | | | |
| (Callable 10/22/2025) | | | 20,000,000 | | | | 20,214,332 | | | | | |
| Element Fleet Management Corp.: | | | | | | | | | | | | |
| 1.600%, 04/06/2024 | | | | | | | | | | | | |
(Callable 03/06/2024)(1)(2) | | | 39,475,000 | | | | 38,064,700 | | | | | |
| 3.850%, 06/15/2025 | | | | | | | | | | | | |
(Callable 05/15/2025)(1)(2) | | | 14,147,000 | | | | 13,376,693 | | | | | |
| Energy Transfer LP, | | | | | | | | | | | | |
| 5.500%, 06/01/2027 | | | | | | | | | | | | |
| (Callable 03/01/2027) | | | 14,000,000 | | | | 13,924,119 | | | | | |
| Energy Transfer Partners LP, | | | | | | | | | | | | |
| 4.050%, 03/15/2025 | | | | | | | | | | | | |
| (Callable 12/15/2024) | | | 16,781,000 | | | | 16,309,565 | | | | | |
| Ferguson Finance PLC, | | | | | | | | | | | | |
| 4.250%, 04/20/2027 | | | | | | | | | | | | |
(Callable 03/20/2027)(2) | | | 3,100,000 | | | | 2,973,946 | | | | | |
| Fidelity National Information Services, Inc., | | | | | | | | | | | | |
| 4.500%, 07/15/2025 | | | 18,900,000 | | | | 18,476,096 | | | | | |
| Flex Ltd.: | | | | | | | | | | | | |
| 4.750%, 06/15/2025 | | | | | | | | | | | | |
| (Callable 03/15/2025) | | | 18,999,000 | | | | 18,549,092 | | | | | |
| 3.750%, 02/01/2026 | | | | | | | | | | | | |
| (Callable 01/01/2026) | | | 28,600,000 | | | | 27,180,652 | | | | | |
| FMC Corp., | | | | | | | | | | | | |
| 5.150%, 05/18/2026 | | | | | | | | | | | | |
| (Callable 04/18/2026) | | | 15,000,000 | | | | 14,756,544 | | | | | |
| Freeport-McMoRan, Inc., | | | | | | | | | | | | |
| 4.550%, 11/14/2024 | | | | | | | | | | | | |
| (Callable 08/14/2024) | | | 3,547,000 | | | | 3,496,278 | | | | | |
The accompanying notes are an integral part of these financial statements.
Baird Short-Term Bond Fund
Schedule of Investments, June 30, 2023 (Unaudited)
Long-Term Investments (cont.)
| | | Principal | | | | | | % of | |
| | | Amount | | | Value | | | Net Assets | |
| Fresenius Medical Care | | | | | | | | | |
| US Finance II, Inc., | | | | | | | | | |
| 4.750%, 10/15/2024 | | | | | | | | | |
(Callable 07/17/2024)(1)(2) | | $ | 18,720,000 | | | $ | 18,325,153 | | | |
| |
| Fresenius Medical Care | | | | | | | | | | | | |
| US Finance III, Inc., | | | | | | | | | | | | |
| 1.875%, 12/01/2026 | | | | | | | | | | | | |
(Callable 11/01/2026)(1)(2) | | | 10,000,000 | | | | 8,625,767 | | | | | |
| General Motors Financial Co., Inc.: | | | | | | | | | | | | |
| 3.800%, 04/07/2025 | | | 30,000,000 | | | | 28,929,094 | | | | | |
| 2.750%, 06/20/2025 | | | | | | | | | | | | |
| (Callable 05/20/2025) | | | 7,302,000 | | | | 6,878,656 | | | | | |
| 5.400%, 04/06/2026 | | | 10,000,000 | | | | 9,885,570 | | | | | |
| Genpact Luxembourg Sarl, | | | | | | | | | | | | |
| 3.375%, 12/01/2024 | | | | | | | | | | | | |
| (Callable 11/01/2024) | | | 1,184,000 | | | | 1,141,165 | | | | | |
| Genuine Parts Co., | | | | | | | | | | | | |
| 1.750%, 02/01/2025 | | | | | | | | | | | | |
| (Callable 07/11/2023) | | | 15,000,000 | | | | 14,049,107 | | | | | |
| Glencore Funding LLC: | | | | | | | | | | | | |
4.000%, 04/16/2025(1)(2) | | | 14,043,000 | | | | 13,634,294 | | | | | |
| 1.625%, 09/01/2025 | | | | | | | | | | | | |
(Callable 08/01/2025)(1)(2) | | | 20,000,000 | | | | 18,358,716 | | | | | |
| Global Payments, Inc.: | | | | | | | | | | | | |
| 1.500%, 11/15/2024 | | | | | | | | | | | | |
| (Callable 10/15/2024) | | | 10,000,000 | | | | 9,397,127 | | | | | |
| 2.650%, 02/15/2025 | | | | | | | | | | | | |
| (Callable 01/15/2025) | | | 30,361,000 | | | | 28,795,221 | | | | | |
| 4.800%, 04/01/2026 | | | | | | | | | | | | |
| (Callable 01/01/2026) | | | 10,000,000 | | | | 9,761,896 | | | | | |
| Gray Oak Pipeline LLC, | | | | | | | | | | | | |
| 2.600%, 10/15/2025 | | | | | | | | | | | | |
(Callable 09/15/2025)(1)(2) | | | 25,650,000 | | | | 23,549,877 | | | | | |
| Gulfstream Natural Gas System LLC: | | | | | | | | | | | | |
| 4.600%, 09/15/2025 | | | | | | | | | | | | |
(Callable 06/15/2025)(2) | | | 27,407,000 | | | | 26,333,482 | | | | | |
6.190%, 11/01/2025(2) | | | 5,720,000 | | | | 5,658,353 | | | | | |
| HCA, Inc.: | | | | | | | | | | | | |
| 5.375%, 02/01/2025 | | | 10,000,000 | | | | 9,912,326 | | | | | |
| 5.250%, 04/15/2025 | | | 16,815,000 | | | | 16,599,081 | | | | | |
| 5.375%, 09/01/2026 | | | | | | | | | | | | |
| (Callable 03/01/2026) | | | 4,250,000 | | | | 4,216,606 | | | | | |
| Hexcel Corp., | | | | | | | | | | | | |
| 4.200%, 02/15/2027 | | | | | | | | | | | | |
| (Callable 11/15/2026) | | | 25,000,000 | | | | 23,528,440 | | | | | |
| HF Sinclair Corp., | | | | | | | | | | | | |
| 5.875%, 04/01/2026 | | | | | | | | | | | | |
| (Callable 01/01/2026) | | | 21,037,000 | | | | 21,129,895 | | | | | |
| Huntington Ingalls Industries, Inc., | | | | | | | | | | | | |
| 3.844%, 05/01/2025 | | | | | | | | | | | | |
| (Callable 04/01/2025) | | | 48,626,000 | | | | 46,755,297 | | | | | |
| Hyatt Hotels Corp.: | | | | | | | | | | | | |
| 1.800%, 10/01/2024 | | | | | | | | | | | | |
| (Callable 07/17/2023) | | | 15,000,000 | | | | 14,276,825 | | | | | |
| 5.750%, 01/30/2027 | | | | | | | | | | | | |
(Callable 12/30/2026)(8) | | | 20,000,000 | | | | 19,948,669 | | | | | |
| Hyundai Capital America: | | | | | | | | | | | | |
| 1.800%, 10/15/2025 | | | | | | | | | | | | |
(Callable 09/15/2025)(1)(2) | | | 5,557,000 | | | | 5,069,021 | | | | | |
5.500%, 03/30/2026(1)(2) | | | 20,000,000 | | | | 19,819,463 | | | | | |
5.650%, 06/26/2026(1)(2) | | | 20,000,000 | | | | 19,874,983 | | | | | |
| Illumina, Inc., | | | | | | | | | | | | |
| 5.800%, 12/12/2025 | | | | | | | | | | | | |
| (Callable 11/12/2025) | | | 42,700,000 | | | | 42,806,853 | | | | | |
| Infor, Inc.: | | | | | | | | | | | | |
1.450%, 07/15/2023(2) | | | 17,022,000 | | | | 16,992,869 | | | | | |
| 1.750%, 07/15/2025 | | | | | | | | | | | | |
(Callable 06/15/2025)(2) | | | 8,145,000 | | | | 7,436,772 | | | | | |
| International Flavors & Fragrances, Inc., | | | | | | | | | | | | |
| 1.230%, 10/01/2025 | | | | | | | | | | | | |
(Callable 09/01/2025)(2) | | | 22,000,000 | | | | 19,612,621 | | | | | |
| JBS USA LUX SA / JBS USA Food Co. / | | | | | | | | | | | | |
| JBS USA Finance, Inc., | | | | | | | | | | | | |
| 2.500%, 01/15/2027 | | | | | | | | | | | | |
(Callable 12/15/2026)(2) | | | 3,700,000 | | | | 3,241,570 | | | | | |
| Kimberly-Clark de Mexico SAB de CV, | | | | | | | | | | | | |
3.250%, 03/12/2025(1)(2) | | | 5,000,000 | | | | 4,779,484 | | | | | |
| Kinross Gold Corp., | | | | | | | | | | | | |
| 5.950%, 03/15/2024 | | | | | | | | | | | | |
(Callable 12/15/2023)(1) | | | 15,680,000 | | | | 15,653,796 | | | | | |
| Kyndryl Holdings, Inc., | | | | | | | | | | | | |
| 2.050%, 10/15/2026 | | | | | | | | | | | | |
| (Callable 09/15/2026) | | | 48,000,000 | | | | 41,419,719 | | | | | |
| Leidos, Inc., | | | | | | | | | | | | |
| 3.625%, 05/15/2025 | | | | | | | | | | | | |
| (Callable 04/15/2025) | | | 10,675,000 | | | | 10,238,520 | | | | | |
| Lennox International, Inc., | | | | | | | | | | | | |
| 1.350%, 08/01/2025 | | | | | | | | | | | | |
| (Callable 07/01/2025) | | | 5,000,000 | | | | 4,557,586 | | | | | |
| Lowe`s Companies, Inc., | | | | | | | | | | | | |
| 4.400%, 09/08/2025 | | | 7,000,000 | | | | 6,860,223 | | | | | |
| Lundin Energy Finance BV, | | | | | | | | | | | | |
| 2.000%, 07/15/2026 | | | | | | | | | | | | |
(Callable 06/15/2026)(1)(2) | | | 538,000 | | | | 483,172 | | | | | |
| Mercedes-Benz Finance | | | | | | | | | | | | |
| North America LLC, | | | | | | | | | | | | |
5.375%, 11/26/2025(1)(2) | | | 10,000,000 | | | | 9,999,589 | | | | | |
| Molex Electronic Technologies LLC, | | | | | | | | | | | | |
| 3.900%, 04/15/2025 | | | | | | | | | | | | |
(Callable 01/15/2025)(2) | | | 2,090,000 | | | | 1,988,765 | | | | | |
| Mondelez International | | | | | | | | | | | | |
| Holdings Netherlands BV, | | | | | | | | | | | | |
4.250%, 09/15/2025(2) | | | 12,000,000 | | | | 11,676,282 | | | | | |
| National Fuel Gas Co.: | | | | | | | | | | | | |
| 5.200%, 07/15/2025 | | | | | | | | | | | | |
| (Callable 04/15/2025) | | | 18,825,000 | | | | 18,440,276 | | | | | |
| 5.500%, 10/01/2026 | | | 18,750,000 | | | | 18,281,855 | | | | | |
| Nissan Motor Acceptance Co. LLC, | | | | | | | | | | | | |
1.125%, 09/16/2024(1)(2) | | | 12,000,000 | | | | 11,177,863 | | | | | |
| Nissan Motor Co. Ltd.: | | | | | | | | | | | | |
3.043%, 09/15/2023(1)(2) | | | 10,000,000 | | | | 9,929,249 | | | | | |
| 3.522%, 09/17/2025 | | | | | | | | | | | | |
(Callable 08/17/2025)(1)(2) | | | 5,291,000 | | | | 4,922,291 | | | | | |
| Nutrien Ltd., | | | | | | | | | | | | |
5.950%, 11/07/2025(1) | | | 8,000,000 | | | | 8,047,930 | | | | | |
| Occidental Petroleum Corp., | | | | | | | | | | | | |
| 8.500%, 07/15/2027 | | | | | | | | | | | | |
| (Callable 01/15/2027) | | | 14,295,000 | | | | 15,441,602 | | | | | |
| OCI NV, | | | | | | | | | | | | |
| 4.625%, 10/15/2025 | | | | | | | | | | | | |
(Callable 07/31/2023)(1)(2) | | | 16,287,000 | | | | 15,531,028 | | | | | |
| Oracle Corp.: | | | | | | | | | | | | |
| 2.950%, 05/15/2025 | | | | | | | | | | | | |
| (Callable 02/15/2025) | | | 5,554,000 | | | | 5,297,383 | | | | | |
| 5.800%, 11/10/2025 | | | 12,000,000 | | | | 12,133,641 | | | | | |
| Ovintiv, Inc., | | | | | | | | | | | | |
| 5.650%, 05/15/2025 | | | 20,000,000 | | | | 19,841,180 | | | | | |
The accompanying notes are an integral part of these financial statements.
Baird Short-Term Bond Fund
Schedule of Investments, June 30, 2023 (Unaudited)
Long-Term Investments (cont.)
| | | Principal | | | | | | % of | |
| | | Amount | | | Value | | | Net Assets | |
| Penske Truck Leasing Co.: | | | | | | | | | |
| 4.000%, 07/15/2025 | | | | | | | | | |
(Callable 06/15/2025)(2) | | $ | 8,000,000 | | | $ | 7,652,363 | | | |
| |
| 5.750%, 05/24/2026 | | | | | | | | | | | | |
(Callable 04/24/2026)(2) | | | 14,275,000 | | | | 14,138,425 | | | | | |
| Perrigo Finance Unlimited Co., | | | | | | | | | | | | |
| 3.900%, 12/15/2024 | | | | | | | | | | | | |
| (Callable 09/15/2024) | | | 45,957,000 | | | | 44,463,398 | | | | | |
| Pioneer Natural Resources Co., | | | | | | | | | | | | |
| 5.100%, 03/29/2026 | | | 7,000,000 | | | | 6,958,005 | | | | | |
| POSCO: | | | | | | | | | | | | |
4.375%, 08/04/2025(1)(2) | | | 15,000,000 | | | | 14,562,359 | | | | | |
5.625%, 01/17/2026(1)(2) | | | 10,000,000 | | | | 9,957,014 | | | | | |
| Premier Health Partners, | | | | | | | | | | | | |
| 2.911%, 11/15/2026 | | | | | | | | | | | | |
| (Callable 05/15/2026) | | | 1,954,000 | | | | 1,724,622 | | | | | |
| PVH Corp., | | | | | | | | | | | | |
| 4.625%, 07/10/2025 | | | | | | | | | | | | |
| (Callable 06/10/2025) | | | 25,839,000 | | | | 24,985,610 | | | | | |
| Quanta Services, Inc., | | | | | | | | | | | | |
| 0.950%, 10/01/2024 | | | | | | | | | | | | |
| (Callable 07/31/2023) | | | 18,200,000 | | | | 17,101,866 | | | | | |
| Regal Rexnord Corp., | | | | | | | | | | | | |
6.050%, 02/15/2026(2) | | | 26,375,000 | | | | 26,408,480 | | | | | |
| Reliance Industries Ltd., | | | | | | | | | | | | |
4.125%, 01/28/2025(1)(2) | | | 8,778,000 | | | | 8,557,985 | | | | | |
| Renesas Electronics Corp.: | | | | | | | | | | | | |
| 1.543%, 11/26/2024 | | | | | | | | | | | | |
(Callable 10/26/2024)(1)(2) | | | 34,180,000 | | | | 31,950,098 | | | | | |
| 2.170%, 11/25/2026 | | | | | | | | | | | | |
(Callable 10/25/2026)(1)(2) | | | 809,000 | | | | 711,575 | | | | | |
| Rogers Communications, Inc., | | | | | | | | | | | | |
| 2.950%, 03/15/2025 | | | | | | | | | | | | |
(Callable 07/31/2023)(1)(2) | | | 46,825,000 | | | | 44,443,880 | | | | | |
| Royalty Pharma PLC, | | | | | | | | | | | | |
| 1.200%, 09/02/2025 | | | | | | | | | | | | |
| (Callable 08/02/2025) | | | 1,000,000 | | | | 901,854 | | | | | |
| Sabine Pass Liquefaction LLC, | | | | | | | | | | | | |
| 5.875%, 06/30/2026 | | | | | | | | | | | | |
| (Callable 12/31/2025) | | | 11,000,000 | | | | 11,090,046 | | | | | |
| Sherwin-Williams Co., | | | | | | | | | | | | |
| 4.250%, 08/08/2025 | | | 7,000,000 | | | | 6,854,147 | | | | | |
| SK Hynix, Inc., | | | | | | | | | | | | |
6.250%, 01/17/2026(1)(2) | | | 13,000,000 | | | | 13,006,738 | | | | | |
| Smurfit Kappa Treasury Funding DAC, | | | | | | | | | | | | |
7.500%, 11/20/2025(1) | | | 5,852,000 | | | | 5,979,326 | | | | | |
| Solvay Finance America LLC, | | | | | | | | | | | | |
| 4.450%, 12/03/2025 | | | | | | | | | | | | |
(Callable 09/03/2025)(1)(2) | | | 32,111,000 | | | | 30,804,432 | | | | | |
| Southern Copper Corp., | | | | | | | | | | | | |
3.875%, 04/23/2025(1) | | | 15,534,000 | | | | 15,111,509 | | | | | |
| Steel Dynamics, Inc., | | | | | | | | | | | | |
| 2.800%, 12/15/2024 | | | | | | | | | | | | |
| (Callable 11/15/2024) | | | 21,338,000 | | | | 20,363,318 | | | | | |
| Synnex Corporation: | | | | | | | | | | | | |
| 1.250%, 08/09/2024 | | | | | | | | | | | | |
| (Callable 07/11/2023) | | | 46,933,000 | | | | 44,391,600 | | | | | |
| 1.750%, 08/09/2026 | | | | | | | | | | | | |
| (Callable 07/09/2026) | | | 1,500,000 | | | | 1,307,343 | | | | | |
| TC PipeLines LP, | | | | | | | | | | | | |
| 4.375%, 03/13/2025 | | | | | | | | | | | | |
(Callable 12/13/2024)(1) | | | 31,166,000 | | | | 30,268,735 | | | | | |
| Timken Co., | | | | | | | | | | | | |
| 3.875%, 09/01/2024 | | | | | | | | | | | | |
| (Callable 06/01/2024) | | | 33,952,000 | | | | 33,070,077 | | | | | |
| T-Mobile USA, Inc., | | | | | | | | | | | | |
| 2.625%, 04/15/2026 | | | | | | | | | | | | |
| (Callable 07/11/2023) | | | 6,000,000 | | | | 5,560,481 | | | | | |
| Toll Road Investors Partnership II LP, | | | | | | | | | | | | |
| 0.000%, 02/15/2024 | | | | | | | | | | | | |
(Insured by NATL)(1)(2) | | | 19,590,000 | | | | 18,783,130 | | | | | |
| Triton Container International Ltd.: | | | | | | | | | | | | |
0.800%, 08/01/2023(1)(2) | | | 30,000,000 | | | | 29,861,978 | | | | | |
| 1.150%, 06/07/2024 | | | | | | | | | | | | |
(Callable 05/07/2024)(1)(2) | | | 22,930,000 | | | | 21,744,875 | | | | | |
| Universal Health Services, Inc., | | | | | | | | | | | | |
| 1.650%, 09/01/2026 | | | | | | | | | | | | |
| (Callable 08/01/2026) | | | 2,129,000 | | | | 1,861,119 | | | | | |
| Utah Acquisition Sub, Inc., | | | | | | | | | | | | |
| 3.950%, 06/15/2026 | | | | | | | | | | | | |
| (Callable 03/15/2026) | | | 22,248,000 | | | | 21,130,850 | | | | | |
| VICI Properties LP, | | | | | | | | | | | | |
| 4.375%, 05/15/2025 | | | 10,000,000 | | | | 9,664,543 | | | | | |
| Viterra Finance BV, | | | | | | | | | | | | |
| 2.000%, 04/21/2026 | | | | | | | | | | | | |
(Callable 03/21/2026)(1)(2) | | | 49,121,000 | | | | 43,866,152 | | | | | |
| VMware, Inc., | | | | | | | | | | | | |
| 1.000%, 08/15/2024 | | | | | | | | | | | | |
| (Callable 07/11/2023) | | | 15,000,000 | | | | 14,201,605 | | | | | |
| Volkswagen Group of America Finance LLC, | | | | | | | | | | | | |
3.950%, 06/06/2025(1)(2) | | | 10,800,000 | | | | 10,484,447 | | | | | |
| Vontier Corp., | | | | | | | | | | | | |
| 1.800%, 04/01/2026 | | | | | | | | | | | | |
| (Callable 03/01/2026) | | | 5,056,000 | | | | 4,489,011 | | | | | |
| Wabtec Corp., | | | | | | | | | | | | |
| 5.875%, 03/15/2024 | | | | | | | | | | | | |
| (Callable 02/15/2024) | | | 20,900,000 | | | | 20,619,515 | | | | | |
| Warnermedia Holdings, Inc.: | | | | | | | | | | | | |
| 3.638%, 03/15/2025 | | | 23,150,000 | | | | 22,328,729 | | | | | |
| 3.788%, 03/15/2025 | | | | | | | | | | | | |
| (Callable 07/11/2023) | | | 24,000,000 | | | | 23,136,937 | | | | | |
| Weir Group PLC, | | | | | | | | | | | | |
| 2.200%, 05/13/2026 | | | | | | | | | | | | |
(Callable 04/13/2026)(1)(2) | | | 50,194,000 | | | | 44,957,561 | | | | | |
| Western Digital Corp., | | | | | | | | | | | | |
| 4.750%, 02/15/2026 | | | | | | | | | | | | |
| (Callable 11/15/2025) | | | 52,570,000 | | | | 50,073,850 | | | | | |
| Western Midstream Operating LP, | | | | | | | | | | | | |
| 5.875%, 02/01/2025 | | | | | | | | | | | | |
| (Callable 01/01/2025) | | | 1,692,000 | | | | 1,617,349 | | | | | |
| Westinghouse Air Brake Technologies Corp., | | | | | | | | | | | | |
| 3.200%, 06/15/2025 | | | | | | | | | | | | |
| (Callable 05/15/2025) | | | 30,724,000 | | | | 29,161,417 | | | | | |
| Westlake Chemical Corp., | | | | | | | | | | | | |
| 0.875%, 08/15/2024 | | | | | | | | | | | | |
| (Callable 07/11/2023) | | | 6,000,000 | | | | 5,666,457 | | | | | |
| Weyerhaeuser Co., | | | | | | | | | | | | |
| 4.750%, 05/15/2026 | | | 28,250,000 | | | | 27,748,885 | | | | | |
| Williams Companies, Inc., | | | | | | | | | | | | |
| 3.900%, 01/15/2025 | | | | | | | | | | | | |
| (Callable 10/15/2024) | | | 14,364,000 | | | | 13,940,821 | | | | | |
| Woodside Finance Ltd., | | | | | | | | | | | | |
| 3.650%, 03/05/2025 | | | | | | | | | | | | |
(Callable 12/05/2024)(1)(2) | | | 39,550,000 | | | | 38,071,188 | | | | | |
| Total Industrials | | | | | | | | | | | | |
| (Cost $2,435,269,476) | | | | | | | 2,343,295,822 | | | | 25.6 | % |
The accompanying notes are an integral part of these financial statements.
Baird Short-Term Bond Fund
Schedule of Investments, June 30, 2023 (Unaudited)
Long-Term Investments (cont.)
| | | Principal | | | | | | % of | |
| | | Amount | | | Value | | | Net Assets | |
| Utilities | | | | | | | | | |
| Black Hills Corp., | | | | | | | | | |
| 1.037%, 08/23/2024 | | | | | | | | | |
| (Callable 07/17/2023) | | $ | 35,275,000 | | | $ | 33,321,376 | | | | |
| DTE Energy Company, | | | | | | | | | | | |
4.220%, 11/01/2025(7) | | | 7,000,000 | | | | 6,843,275 | | | | |
| EDP Finance BV, | | | | | | | | | | | |
3.625%, 07/15/2024(1)(2) | | | 30,833,000 | | | | 30,035,890 | | | | |
| Enel Finance International NV: | | | | | | | | | | | |
4.250%, 06/15/2025(1)(2) | | | 25,000,000 | | | | 24,261,252 | | | | |
6.800%, 10/14/2025(1)(2) | | | 10,000,000 | | | | 10,186,254 | | | | |
| KeySpan Gas East Corp., | | | | | | | | | | | |
| 2.742%, 08/15/2026 | | | | | | | | | | | |
(Callable 05/15/2026)(1)(2) | | | 21,525,000 | | | | 19,544,713 | | | | |
| Metropolitan Edison Co., | | | | | | | | | | | |
4.000%, 04/15/2025(2) | | | 5,173,000 | | | | 4,952,705 | | | | |
| NextEra Energy Capital Holdings, Inc.: | | | | | | | | | | | |
| 6.051%, 03/01/2025 | | | 7,000,000 | | | | 7,026,319 | | | | |
| 4.450%, 06/20/2025 | | | 7,000,000 | | | | 6,866,844 | | | | |
| Pennsylvania Electric Co., | | | | | | | | | | | |
5.150%, 03/30/2026(2) | | | 7,000,000 | | | | 6,893,730 | | | | |
| Pennsylvania-American Water Co., | | | | | | | | | | | |
7.800%, 09/01/2026(2) | | | 8,000,000 | | | | 8,436,532 | | | | |
| Puget Energy, Inc., | | | | | | | | | | | |
| 3.650%, 05/15/2025 | | | | | | | | | | | |
| (Callable 02/15/2025) | | | 16,855,000 | | | | 16,113,433 | | | | |
| Transelec SA, | | | | | | | | | | | |
| 4.250%, 01/14/2025 | | | | | | | | | | | |
(Callable 10/14/2024)(1)(2) | | | 5,000,000 | | | | 4,871,794 | | | | |
| Total Utilities | | | | | | | | | | | |
| (Cost $185,638,892) | | | | | | | 179,354,117 | | | | 1.9 | % |
| Financials | | | | | | | | | | | | |
| ABN AMRO Bank NV: | | | | | | | | | | | | |
4.750%, 07/28/2025(1)(2) | | | 34,188,000 | | | | 32,972,617 | | | | | |
4.800%, 04/18/2026(1)(2) | | | 12,400,000 | | | | 11,862,950 | | | | | |
| AerCap Holdings NV: | | | | | | | | | | | | |
| 1.650%, 10/29/2024 | | | | | | | | | | | | |
(Callable 09/29/2024)(1) | | | 23,675,000 | | | | 22,247,619 | | | | | |
| 4.450%, 10/01/2025 | | | | | | | | | | | | |
(Callable 08/01/2025)(1) | | | 18,937,000 | | | | 18,215,644 | | | | | |
| AIB Group PLC: | | | | | | | | | | | | |
| 4.263%, 04/10/2025 | | | | | | | | | | | | |
| (3 Month LIBOR USD + 1.874%) | | | | | | | | | | | | |
(Callable 04/10/2024)(1)(2)(3) | | | 43,531,000 | | | | 42,533,052 | | | | | |
| 7.583%, 10/14/2026 (SOFR + 3.456%) | | | | | | | | | | | | |
(Callable 10/14/2025)(1)(2)(3) | | | 7,000,000 | | | | 7,110,245 | | | | | |
| Ally Financial, Inc.: | | | | | | | | | | | | |
| 1.450%, 10/02/2023 | | | | | | | | | | | | |
| (Callable 09/02/2023) | | | 12,100,000 | | | | 11,937,509 | | | | | |
| 5.125%, 09/30/2024 | | | 5,000,000 | | | | 4,905,340 | | | | | |
| American Express Co., | | | | | | | | | | | | |
| 4.990%, 05/01/2026 (SOFR + 0.999%) | | | | | | | | | | | | |
(Callable 05/01/2025)(3) | | | 45,300,000 | | | | 44,737,369 | | | | | |
| ASB Bank Ltd., | | | | | | | | | | | | |
5.346%, 06/15/2026(1)(2) | | | 46,375,000 | | | | 46,031,635 | | | | | |
| Assurant, Inc., | | | | | | | | | | | | |
| 6.100%, 02/27/2026 | | | | | | | | | | | | |
| (Callable 01/27/2026) | | | 20,000,000 | | | | 20,066,678 | | | | | |
| Australia & New Zealand | | | | | | | | | | | | |
| Banking Group Ltd., | | | | | | | | | | | | |
4.500%, 03/19/2024(1)(2) | | | 18,269,000 | | | | 18,038,756 | | | | | |
| Banco Santander SA, | | | | | | | | | | | | |
2.746%, 05/28/2025(1) | | | 15,423,000 | | | | 14,479,047 | | | | | |
| Bank of America Corp.: | | | | | | | | | | | | |
| 0.976%, 04/22/2025 (SOFR + 0.690%) | | | | | | | | | | | | |
(Callable 04/22/2024)(3) | | | 45,000,000 | | | | 43,142,286 | | | | | |
| 1.530%, 12/06/2025 (SOFR + 0.650%) | | | | | | | | | | | | |
(Callable 12/06/2024)(3) | | | 30,000,000 | | | | 28,044,266 | | | | | |
| 3.384%, 04/02/2026 (SOFR + 1.330%) | | | | | | | | | | | | |
(Callable 04/02/2025)(3) | | | 25,000,000 | | | | 23,962,624 | | | | | |
| 4.827%, 07/22/2026 (SOFR + 1.750%) | | | | | | | | | | | | |
(Callable 07/22/2025)(3) | | | 10,000,000 | | | | 9,829,571 | | | | | |
| 5.080%, 01/20/2027 (SOFR + 1.290%) | | | | | | | | | | | | |
(Callable 01/20/2026)(3) | | | 15,000,000 | | | | 14,769,871 | | | | | |
| Bank of Ireland Group PLC: | | | | | | | | | | | | |
4.500%, 11/25/2023(1)(2) | | | 2,589,000 | | | | 2,563,320 | | | | | |
| 6.253%, 09/16/2026 | | | | | | | | | | | | |
| (1 Year CMT Rate + 2.650%) | | | | | | | | | | | | |
(Callable 09/16/2025)(1)(2)(3) | | | 27,350,000 | | | | 27,134,499 | | | | | |
| 2.029%, 09/30/2027 | | | | | | | | | | | | |
| (1 Year CMT Rate + 1.100%) | | | | | | | | | | | | |
(Callable 09/30/2026)(1)(2)(3) | | | 18,084,000 | | | | 15,631,556 | | | | | |
| Bank of Montreal, | | | | | | | | | | | | |
1.500%, 01/10/2025(1) | | | 55,000,000 | | | | 51,688,363 | | | | | |
| Bank of New York Mellon Corp., | | | | | | | | | | | | |
| 4.947%, 04/26/2027 (SOFR + 1.026%) | | | | | | | | | | | | |
(Callable 04/26/2026)(3) | | | 7,475,000 | | | | 7,382,784 | | | | | |
| Bank of Nova Scotia, | | | | | | | | | | | | |
4.750%, 02/02/2026(1) | | | 24,600,000 | | | | 24,218,352 | | | | | |
| Banque Federative du Credit Mutuel SA: | | | | | | | | | | | | |
4.524%, 07/13/2025(1)(2) | | | 29,000,000 | | | | 28,195,358 | | | | | |
4.935%, 01/26/2026(1)(2) | | | 16,675,000 | | | | 16,359,852 | | | | | |
| Barclays PLC: | | | | | | | | | | | | |
3.650%, 03/16/2025(1) | | | 8,400,000 | | | | 8,051,671 | | | | | |
| 3.932%, 05/07/2025 | | | | | | | | | | | | |
| (3 Month LIBOR USD + 1.610%) | | | | | | | | | | | | |
(Callable 05/07/2024)(1)(3) | | | 7,250,000 | | | | 7,085,179 | | | | | |
| 2.852%, 05/07/2026 (SOFR + 2.714%) | | | | | | | | | | | | |
(Callable 05/07/2025)(1)(3) | | | 27,787,000 | | | | 26,024,862 | | | | | |
| 5.304%, 08/09/2026 | | | | | | | | | | | | |
| (1 Year CMT Rate + 2.300%) | | | | | | | | | | | | |
(Callable 08/09/2025)(1)(3) | | | 8,000,000 | | | | 7,803,909 | | | | | |
| BNP Paribas SA: | | | | | | | | | | | | |
| 4.705%, 01/10/2025 | | | | | | | | | | | | |
| (3 Month LIBOR USD + 2.235%) | | | | | | | | | | | | |
(Callable 01/10/2024)(1)(2)(3) | | | 11,390,000 | | | | 11,288,467 | | | | | |
| 2.819%, 11/19/2025 | | | | | | | | | | | | |
| (3 Month LIBOR USD + 1.111%) | | | | | | | | | | | | |
(Callable 11/19/2024)(1)(2)(3) | | | 16,502,000 | | | | 15,734,505 | | | | | |
| 2.219%, 06/09/2026 (SOFR + 2.074%) | | | | | | | | | | | | |
(Callable 06/09/2025)(1)(2)(3) | | | 12,500,000 | | | | 11,560,157 | | | | | |
| BPCE SA: | | | | | | | | | | | | |
5.700%, 10/22/2023(1)(2) | | | 17,793,000 | | | | 17,715,278 | | | | | |
4.625%, 07/11/2024(1)(2) | | | 5,294,000 | | | | 5,173,050 | | | | | |
5.150%, 07/21/2024(1)(2) | | | 17,675,000 | | | | 17,354,933 | | | | | |
4.500%, 03/15/2025(1)(2) | | | 6,970,000 | | | | 6,688,435 | | | | | |
| Brown & Brown, Inc., | | | | | | | | | | | | |
| 4.200%, 09/15/2024 | | | | | | | | | | | | |
| (Callable 06/15/2024) | | | 1,000,000 | | | | 976,498 | | | | | |
| Canadian Imperial Bank of Commerce, | | | | | | | | | | | | |
5.144%, 04/28/2025(1) | | | 47,300,000 | | | | 46,909,512 | | | | | |
| Cantor Fitzgerald LP, | | | | | | | | | | | | |
| 4.875%, 05/01/2024 | | | | | | | | | | | | |
(Callable 04/01/2024)(2) | | | 9,600,000 | | | | 9,391,947 | | | | | |
The accompanying notes are an integral part of these financial statements.
Baird Short-Term Bond Fund
Schedule of Investments, June 30, 2023 (Unaudited)
Long-Term Investments (cont.)
| | | Principal | | | | | | % of | |
| | | Amount | | | Value | | | Net Assets | |
| Capital One Financial Corp.: | | | | | | | | | |
| 4.166%, 05/09/2025 (SOFR + 1.370%) | | | | | | | | | |
(Callable 05/09/2024)(3) | | $ | 10,000,000 | | | $ | 9,741,205 | | | |
| |
| 2.636%, 03/03/2026 (SOFR + 1.290%) | | | | | | | | | | | | |
(Callable 03/03/2025)(3) | | | 10,000,000 | | | | 9,337,738 | | | | | |
| 4.985%, 07/24/2026 (SOFR + 2.160%) | | | | | | | | | | | | |
(Callable 07/24/2025)(3) | | | 28,000,000 | | | | 27,139,018 | | | | | |
| Charles Schwab Corp., | | | | | | | | | | | | |
| 3.000%, 03/10/2025 | | | | | | | | | | | | |
| (Callable 12/10/2024) | | | 6,772,000 | | | | 6,445,308 | | | | | |
| Citigroup, Inc.: | | | | | | | | | | | | |
| 0.981%, 05/01/2025 (SOFR + 0.669%) | | | | | | | | | | | | |
(Callable 05/01/2024)(3) | | | 15,000,000 | | | | 14,353,294 | | | | | |
| 1.281%, 11/03/2025 (SOFR + 0.528%) | | | | | | | | | | | | |
(Callable 11/03/2024)(3) | | | 15,000,000 | | | | 14,051,584 | | | | | |
| 3.290%, 03/17/2026 (SOFR + 1.528%) | | | | | | | | | | | | |
(Callable 03/17/2025)(3) | | | 17,700,000 | | | | 16,926,751 | | | | | |
| 5.610%, 09/29/2026 (SOFR + 1.546%) | | | | | | | | | | | | |
(Callable 09/29/2025)(3) | | | 15,000,000 | | | | 14,979,604 | | | | | |
| Citizens Bank NA, | | | | | | | | | | | | |
| 4.119%, 05/23/2025 (SOFR + 1.395%) | | | | | | | | | | | | |
(Callable 05/23/2024)(3) | | | 12,230,000 | | | | 11,582,253 | | | | | |
| CNO Global Funding, | | | | | | | | | | | | |
1.650%, 01/06/2025(2) | | | 15,000,000 | | | | 13,935,422 | | | | | |
| Cooperatieve Rabobank UA: | | | | | | | | | | | | |
| 1.980%, 12/15/2027 | | | | | | | | | | | | |
| (1 Year CMT Rate + 0.730%) | | | | | | | | | | | | |
(Callable 12/15/2026)(1)(2)(3) | | | 7,000,000 | | | | 6,114,995 | | | | | |
| 3.649%, 04/06/2028 | | | | | | | | | | | | |
| (1 Year CMT Rate + 1.220%) | | | | | | | | | | | | |
(Callable 04/06/2027)(1)(2)(3) | | | 6,390,000 | | | | 5,916,036 | | | | | |
| Corebridge Global Funding, | | | | | | | | | | | | |
5.750%, 07/02/2026(2) | | | 37,800,000 | | | | 37,684,420 | | | | | |
| Credit Agricole SA: | | | | | | | | | | | | |
4.375%, 03/17/2025(1)(2) | | | 20,341,000 | | | | 19,594,241 | | | | | |
5.589%, 07/05/2026(1)(2)(8) | | | 26,000,000 | | | | 25,961,984 | | | | | |
| Credit Suisse Group AG: | | | | | | | | | | | | |
| 2.593%, 09/11/2025 (SOFR + 1.560%) | | | | | | | | | | | | |
(Callable 09/11/2024)(1)(2)(3) | | | 12,000,000 | | | | 11,438,051 | | | | | |
| 2.193%, 06/05/2026 (SOFR + 2.044%) | | | | | | | | | | | | |
(Callable 06/05/2025)(1)(2)(3) | | | 5,000,000 | | | | 4,584,843 | | | | | |
| Danske Bank A/S: | | | | | | | | | | | | |
| 3.244%, 12/20/2025 | | | | | | | | | | | | |
| (3 Month LIBOR USD + 1.591%) | | | | | | | | | | | | |
(Callable 12/20/2024)(1)(2)(3) | | | 6,743,000 | | | | 6,401,274 | | | | | |
| 6.466%, 01/09/2026 | | | | | | | | | | | | |
| (1 Year CMT Rate + 2.100%) | | | | | | | | | | | | |
(Callable 01/09/2025)(1)(2)(3) | | | 18,000,000 | | | | 17,957,079 | | | | | |
| 1.621%, 09/11/2026 | | | | | | | | | | | | |
| (1 Year CMT Rate + 1.350%) | | | | | | | | | | | | |
(Callable 09/11/2025)(1)(2)(3) | | | 15,000,000 | | | | 13,454,829 | | | | | |
| Deutsche Bank AG: | | | | | | | | | | | | |
| 2.222%, 09/18/2024 (SOFR + 2.159%) | | | | | | | | | | | | |
(Callable 09/18/2023)(1)(3) | | | 17,000,000 | | | | 16,784,761 | | | | | |
| 1.447%, 04/01/2025 (SOFR + 1.131%) | | | | | | | | | | | | |
(Callable 04/01/2024)(1)(3) | | | 14,500,000 | | | | 13,778,445 | | | | | |
4.162%, 05/13/2025(1) | | | 7,000,000 | | | | 6,742,798 | | | | | |
| 3.961%, 11/26/2025 (SOFR + 2.581%) | | | | | | | | | | | | |
(Callable 11/26/2024)(1)(3) | | | 12,200,000 | | | | 11,632,501 | | | | | |
| 6.119%, 07/14/2026 (SOFR + 3.190%) | | | | | | | | | | | | |
(Callable 07/14/2025)(1)(3) | | | 2,000,000 | | | | 1,977,734 | | | | | |
| Discover Bank, | | | | | | | | | | | | |
| 4.682%, 08/09/2028 | | | | | | | | | | | | |
| (5 Year Swap Rate USD + 1.730%) | | | | | | | | | | | | |
(Callable 08/09/2023)(3) | | | 11,000,000 | | | | 10,057,381 | | | | | |
| Discover Financial Services: | | | | | | | | | | | | |
| 3.750%, 03/04/2025 | | | | | | | | | | | | |
| (Callable 12/04/2024) | | | 13,305,000 | | | | 12,667,880 | | | | | |
| 4.500%, 01/30/2026 | | | | | | | | | | | | |
| (Callable 11/30/2025) | | | 9,500,000 | | | | 9,097,138 | | | | | |
| DNB Bank ASA, | | | | | | | | | | | | |
| 5.896%, 10/09/2026 | | | | | | | | | | | | |
| (SOFRINDX + 1.950%) | | | | | | | | | | | | |
(Callable 10/09/2025)(1)(2)(3) | | | 47,550,000 | | | | 47,091,812 | | | | | |
| F.N.B. Corporation, | | | | | | | | | | | | |
| 5.150%, 08/25/2025 | | | | | | | | | | | | |
| (Callable 07/25/2025) | | | 20,000,000 | | | | 19,150,226 | | | | | |
| Federation des Caisses | | | | | | | | | | | | |
| Desjardins du Quebec: | | | | | | | | | | | | |
4.400%, 08/23/2025(1)(2) | | | 34,475,000 | | | | 33,312,790 | | | | | |
| 5.278%, 01/23/2026 | | | | | | | | | | | | |
| (SOFRINDX + 1.094%) | | | | | | | | | | | | |
(Callable 01/23/2025)(1)(2)(3) | | | 15,000,000 | | | | 14,691,950 | | | | | |
| First Citizens Bancshares, Inc., | | | | | | | | | | | | |
| 2.969%, 09/27/2025 (SOFR + 1.715%) | | | | | | | | | | | | |
(Callable 09/27/2024)(3) | | | 2,340,000 | | | | 2,213,063 | | | | | |
| Goldman Sachs Group, Inc., | | | | | | | | | | | | |
| 1.757%, 01/24/2025 (SOFR + 0.730%) | | | | | | | | | | | | |
(Callable 01/24/2024)(3) | | | 8,250,000 | | | | 8,032,644 | | | | | |
| Health Care Service Corp. | | | | | | | | | | | | |
| A Mutual Legal Reserve Co., | | | | | | | | | | | | |
| 1.500%, 06/01/2025 | | | | | | | | | | | | |
(Callable 05/01/2025)(2) | | | 6,465,000 | | | | 5,922,073 | | | | | |
| HSBC Holdings PLC: | | | | | | | | | | | | |
| 0.732%, 08/17/2024 (SOFR + 0.534%) | | | | | | | | | | | | |
(Callable 08/17/2023)(1)(3) | | | 15,000,000 | | | | 14,889,983 | | | | | |
| 3.803%, 03/11/2025 | | | | | | | | | | | | |
| (3 Month LIBOR USD + 1.473%) | | | | | | | | | | | | |
(Callable 03/11/2024)(1)(3) | | | 28,200,000 | | | | 27,649,741 | | | | | |
| 0.976%, 05/24/2025 (SOFR + 0.708%) | | | | | | | | | | | | |
(Callable 05/24/2024)(1)(3) | | | 9,000,000 | | | | 8,562,141 | | | | | |
| 2.999%, 03/10/2026 (SOFR + 1.430%) | | | | | | | | | | | | |
(Callable 03/10/2025)(1)(3) | | | 7,000,000 | | | | 6,636,428 | | | | | |
| Huntington National Bank, | | | | | | | | | | | | |
| 5.699%, 11/18/2025 (SOFR + 1.215%) | | | | | | | | | | | | |
(Callable 11/18/2024)(3) | | | 37,350,000 | | | | 36,284,404 | | | | | |
| ING Groep NV, | | | | | | | | | | | | |
| 3.869%, 03/28/2026 (SOFR + 1.640%) | | | | | | | | | | | | |
(Callable 03/28/2025)(1)(3) | | | 24,000,000 | | | | 23,047,894 | | | | | |
| Jackson National Life Global Funding: | | | | | | | | | | | | |
1.750%, 01/12/2025(2) | | | 21,850,000 | | | | 20,277,495 | | | | | |
5.500%, 01/09/2026(2) | | | 15,000,000 | | | | 14,651,313 | | | | | |
| JPMorgan Chase & Co.: | | | | | | | | | | | | |
| 3.845%, 06/07/2025 (SOFR + 0.980%) | | | | | | | | | | | | |
(Callable 06/14/2024)(3) | | | 15,000,000 | | | | 14,669,857 | | | | | |
| 5.546%, 12/15/2025 (SOFR + 1.070%) | | | | | | | | | | | | |
(Callable 12/15/2024)(3) | | | 21,003,000 | | | | 20,914,255 | | | | | |
| 2.005%, 03/13/2026 (SOFR + 1.585%) | | | | | | | | | | | | |
(Callable 03/13/2025)(3) | | | 7,947,000 | | | | 7,463,905 | | | | | |
| 4.080%, 04/26/2026 (SOFR + 1.320%) | | | | | | | | | | | | |
(Callable 04/26/2025)(3) | | | 20,000,000 | | | | 19,435,292 | | | | | |
| 1.045%, 11/19/2026 (SOFR + 0.800%) | | | | | | | | | | | | |
(Callable 11/19/2025)(3) | | | 4,300,000 | | | | 3,851,633 | | | | | |
The accompanying notes are an integral part of these financial statements.
Baird Short-Term Bond Fund
Schedule of Investments, June 30, 2023 (Unaudited)
Long-Term Investments (cont.)
| | | Principal | | | | | | % of | |
| | | Amount | | | Value | | | Net Assets | |
| KeyCorp, | | | | | | | | | |
| 3.878%, 05/23/2025 (SOFR + 1.250%) | | | | | | | | | |
(Callable 05/23/2024)(3) | | $ | 7,000,000 | | | $ | 6,473,179 | | | |
| |
| Kimco Realty Corp., | | | | | | | | | | | | |
| 3.850%, 06/01/2025 | | | | | | | | | | | | |
| (Callable 03/01/2025) | | | 3,950,000 | | | | 3,745,720 | | | | | |
| LeasePlan Corp. NV, | | | | | | | | | | | | |
2.875%, 10/24/2024(1)(2) | | | 45,018,000 | | | | 42,885,854 | | | | | |
| Liberty Mutual Insurance Co., | | | | | | | | | | | | |
8.500%, 05/15/2025(2) | | | 2,093,000 | | | | 2,139,067 | | | | | |
| Lloyds Bank PLC: | | | | | | | | | | | | |
| 3.511%, 03/18/2026 | | | | | | | | | | | | |
| (1 Year CMT Rate + 1.600%) | | | | | | | | | | | | |
(Callable 03/18/2025)(1)(3) | | | 15,000,000 | | | | 14,277,088 | | | | | |
| 4.716%, 08/11/2026 | | | | | | | | | | | | |
| (1 Year CMT Rate + 1.750%) | | | | | | | | | | | | |
(Callable 08/11/2025)(1)(3) | | | 6,000,000 | | | | 5,829,469 | | | | | |
| M&T Bank Corp., | | | | | | | | | | | | |
| 4.000%, 07/15/2024 | | | | | | | | | | | | |
| (Callable 04/16/2024) | | | 14,505,000 | | | | 14,128,741 | | | | | |
| Macquarie Bank Ltd., | | | | | | | | | | | | |
4.875%, 06/10/2025(1)(2) | | | 16,375,000 | | | | 15,856,346 | | | | | |
| Macquarie Group Ltd.: | | | | | | | | | | | | |
| 5.108%, 08/09/2026 (SOFR + 2.208%) | | | | | | | | | | | | |
(Callable 08/09/2025)(1)(2)(3) | | | 12,000,000 | | | | 11,825,200 | | | | | |
| 1.629%, 09/23/2027 (SOFR + 0.910%) | | | | | | | | | | | | |
(Callable 09/23/2026)(1)(2)(3) | | | 25,000,000 | | | | 21,734,525 | | | | | |
| Massachusetts Mutual Life Insurance Co., | | | | | | | | | | | | |
7.625%, 11/15/2023(2) | | | 15,648,000 | | | | 15,682,563 | | | | | |
| Met Tower Global Funding, | | | | | | | | | | | | |
5.400%, 06/20/2026(2) | | | 47,200,000 | | | | 46,982,274 | | | | | |
| Mitsubishi UFJ Financial Group, Inc.: | | | | | | | | | | | | |
| 0.848%, 09/15/2024 | | | | | | | | | | | | |
| (1 Year CMT Rate + 0.680%) | | | | | | | | | | | | |
(Callable 09/15/2023)(1)(3) | | | 20,000,000 | | | | 19,777,775 | | | | | |
| 4.788%, 07/18/2025 | | | | | | | | | | | | |
| (1 Year CMT Rate + 1.700%) | | | | | | | | | | | | |
(Callable 07/18/2024)(1)(3) | | | 6,000,000 | | | | 5,913,858 | | | | | |
| 0.953%, 07/19/2025 | | | | | | | | | | | | |
| (1 Year CMT Rate + 0.550%) | | | | | | | | | | | | |
(Callable 07/19/2024)(1)(3) | | | 23,200,000 | | | | 21,918,598 | | | | | |
| 5.063%, 09/12/2025 | | | | | | | | | | | | |
| (1 Year CMT Rate + 1.550%) | | | | | | | | | | | | |
(Callable 09/12/2024)(1)(3) | | | 10,000,000 | | | | 9,878,955 | | | | | |
| Mizuho Financial Group, Inc.: | | | | | | | | | | | | |
4.600%, 03/27/2024(1)(2) | | | 37,170,000 | | | | 36,673,766 | | | | | |
| 1.241%, 07/10/2024 (SOFR + 1.252%) | | | | | | | | | | | | |
(Callable 07/10/2023)(1)(3) | | | 14,700,000 | | | | 14,690,955 | | | | | |
| Morgan Stanley: | | | | | | | | | | | | |
| 2.630%, 02/18/2026 (SOFR + 0.940%) | | | | | | | | | | | | |
(Callable 02/18/2025)(3) | | | 20,000,000 | | | | 18,960,080 | | | | | |
| 4.679%, 07/17/2026 (SOFR + 1.669%) | | | | | | | | | | | | |
(Callable 07/17/2025)(3) | | | 15,000,000 | | | | 14,719,316 | | | | | |
| 5.050%, 01/28/2027 (SOFR + 1.295%) | | | | | | | | | | | | |
(Callable 01/28/2026)(3) | | | 19,000,000 | | | | 18,841,689 | | | | | |
| National Bank of Canada, | | | | | | | | | | | | |
5.250%, 01/17/2025(1) | | | 26,250,000 | | | | 26,015,675 | | | | | |
| National Securities Clearing Corp., | | | | | | | | | | | | |
5.150%, 05/30/2025(2) | | | 7,000,000 | | | | 6,965,272 | | | | | |
| Nationwide Building Society, | | | | | | | | | | | | |
4.000%, 09/14/2026(1)(2) | | | 34,021,000 | | | | 31,239,436 | | | | | |
| NatWest Group PLC: | | | | | | | | | | | | |
| 4.269%, 03/22/2025 | | | | | | | | | | | | |
| (3 Month LIBOR USD + 1.762%) | | | | | | | | | | | | |
(Callable 03/22/2024)(1)(3) | | | 14,250,000 | | �� | | 13,997,360 | | | | | |
| 7.472%, 11/10/2026 | | | | | | | | | | | | |
| (1 Year CMT Rate + 2.850%) | | | | | | | | | | | | |
(Callable 11/10/2025)(1)(3) | | | 22,000,000 | | | | 22,500,655 | | | | | |
| 5.847%, 03/02/2027 | | | | | | | | | | | | |
| (1 Year CMT Rate + 1.350%) | | | | | | | | | | | | |
(Callable 03/02/2026)(1)(3) | | | 8,000,000 | | | | 7,912,369 | | | | | |
| Nomura Holdings, Inc.: | | | | | | | | | | | | |
2.648%, 01/16/2025(1) | | | 7,000,000 | | | | 6,626,833 | | | | | |
5.099%, 07/03/2025(1) | | | 10,000,000 | | | | 9,813,846 | | | | | |
1.851%, 07/16/2025(1) | | | 34,050,000 | | | | 31,142,142 | | | | | |
| Nordea Bank AB, | | | | | | | | | | | | |
4.750%, 09/22/2025(1)(2) | | | 20,000,000 | | | | 19,572,803 | | | | | |
| Old Republic International Corp., | | | | | | | | | | | | |
| 3.875%, 08/26/2026 | | | | | | | | | | | | |
| (Callable 07/26/2026) | | | 7,000,000 | | | | 6,585,561 | | | | | |
| Principal Life Global Funding II, | | | | | | | | | | | | |
1.375%, 01/10/2025(2) | | | 15,000,000 | | | | 13,989,784 | | | | | |
| Protective Life Global Funding: | | | | | | | | | | | | |
5.366%, 01/06/2026(1)(2) | | | 32,500,000 | | | | 32,388,942 | | | | | |
5.209%, 04/14/2026(1)(2) | | | 20,000,000 | | | | 19,683,270 | | | | | |
| Prudential Insurance Co. of America, | | | | | | | | | | | | |
8.300%, 07/01/2025(2) | | | 7,000,000 | | | | 7,251,874 | | | | | |
| Realty Income Corp., | | | | | | | | | | | | |
| 5.050%, 01/13/2026 | | | | | | | | | | | | |
| (Callable 01/13/2024) | | | 15,000,000 | | | | 14,867,696 | | | | | |
| Reliance Standard Life Global Funding II: | | | | | | | | | | | | |
2.500%, 10/30/2024(1)(2) | | | 9,418,000 | | | | 8,919,818 | | | | | |
5.243%, 02/02/2026(1)(2) | | | 36,000,000 | | | | 35,205,417 | | | | | |
| Royal Bank of Canada, | | | | | | | | | | | | |
4.875%, 01/12/2026(1) | | | 32,300,000 | | | | 31,943,485 | | | | | |
| Santander UK PLC, | | | | | | | | | | | | |
5.000%, 11/07/2023(1)(2) | | | 2,300,000 | | | | 2,284,728 | | | | | |
| Skandinaviska Enskilda Banken AB, | | | | | | | | | | | | |
3.700%, 06/09/2025(1)(2) | | | 36,675,000 | | | | 35,255,005 | | | | | |
| SMBC Aviation Capital Finance DAC, | | | | | | | | | | | | |
4.125%, 07/15/2023(1)(2) | | | 1,960,000 | | | | 1,958,428 | | | | | |
| Societe Generale SA: | | | | | | | | | | | | |
5.000%, 01/17/2024(1)(2) | | | 14,511,000 | | | | 14,335,297 | | | | | |
3.875%, 03/28/2024(1)(2) | | | 17,000,000 | | | | 16,634,925 | | | | | |
2.625%, 10/16/2024(1)(2) | | | 14,000,000 | | | | 13,248,912 | | | | | |
| 2.226%, 01/21/2026 | | | | | | | | | | | | |
| (1 Year CMT Rate + 1.050%) | | | | | | | | | | | | |
(Callable 01/21/2025)(1)(2)(3) | | | 10,000,000 | | | | 9,286,666 | | | | | |
| Standard Chartered PLC: | | | | | | | | | | | | |
| 1.822%, 11/23/2025 | | | | | | | | | | | | |
| (1 Year CMT Rate + 0.950%) | | | | | | | | | | | | |
(Callable 11/23/2024)(1)(2)(3) | | | 28,000,000 | | | | 26,179,218 | | | | | |
| 2.819%, 01/30/2026 | | | | | | | | | | | | |
| (3 Month LIBOR USD + 1.209%) | | | | | | | | | | | | |
(Callable 01/30/2025)(1)(2)(3) | | | 8,700,000 | | | | 8,202,812 | | | | | |
| 6.187%, 07/06/2027 | | | | | | | | | | | | |
| (1 Year CMT Rate + 1.850%) | | | | | | | | | | | | |
(Callable 07/06/2026)(1)(2)(3)(8) | | | 8,000,000 | | | | 8,003,767 | | | | | |
| State Street Corp., | | | | | | | | | | | | |
| 5.104%, 05/18/2026 (SOFR + 1.130%) | | | | | | | | | | | | |
(Callable 05/18/2025)(3) | | | 15,000,000 | | | | 14,885,788 | | | | | |
| Stifel Financial Corp., | | | | | | | | | | | | |
| 4.250%, 07/18/2024 | | | 3,021,000 | | | | 2,957,224 | | | | | |
The accompanying notes are an integral part of these financial statements.
Baird Short-Term Bond Fund
Schedule of Investments, June 30, 2023 (Unaudited)
Long-Term Investments (cont.)
| | | Principal | | | | | | % of | |
| | | Amount | | | Value | | | Net Assets | |
| Sumitomo Mitsui Financial Group, Inc.: | | | | | | | | | |
4.436%, 04/02/2024(1)(2) | | $ | 14,085,000 | | | $ | 13,858,379 | | | | |
5.464%, 01/13/2026(1) | | | 32,125,000 | | | | 32,017,768 | | | | |
| Sumitomo Mitsui Trust Bank Ltd., | | | | | | | | | | | |
5.650%, 03/09/2026(1)(2) | | | 22,400,000 | | | | 22,479,959 | | | | |
| Swedbank AB, | | | | | | | | | | | |
5.472%, 06/15/2026(1)(2) | | | 47,475,000 | | | | 47,057,838 | | | | |
| Synchrony Bank, | | | | | | | | | | | |
| 5.400%, 08/22/2025 | | | | | | | | | | | |
| (Callable 07/22/2025) | | | 5,000,000 | | | | 4,784,933 | | | | |
| Synchrony Financial: | | | | | | | | | | | |
| 4.375%, 03/19/2024 | | | | | | | | | | | |
| (Callable 02/19/2024) | | | 12,000,000 | | | | 11,765,549 | | | | |
| 4.250%, 08/15/2024 | | | | | | | | | | | |
| (Callable 05/15/2024) | | | 9,000,000 | | | | 8,677,182 | | | | |
| 4.875%, 06/13/2025 | | | | | | | | | | | |
| (Callable 05/13/2025) | | | 15,000,000 | | | | 14,252,892 | | | | |
| 4.500%, 07/23/2025 | | | | | | | | | | | |
| (Callable 04/23/2025) | | | 6,367,000 | | | | 6,002,353 | | | | |
| Synovus Financial Corp., | | | | | | | | | | | |
| 5.200%, 08/11/2025 | | | | | | | | | | | |
| (Callable 07/11/2025) | | | 31,353,000 | | | | 29,860,636 | | | | |
| Toronto-Dominion Bank, | | | | | | | | | | | |
3.766%, 06/06/2025(1) | | | 27,100,000 | | | | 26,274,007 | | | | |
| UBS Group AG: | | | | | | | | | | | |
| 4.490%, 08/05/2025 | | | | | | | | | | | |
| (1 Year CMT Rate + 1.600%) | | | | | | | | | | | |
(Callable 08/05/2024)(1)(2)(3) | | | 20,000,000 | | | | 19,547,426 | | | | |
| 4.488%, 05/12/2026 | | | | | | | | | | | |
| (1 Year CMT Rate + 1.550%) | | | | | | | | | | | |
(Callable 05/12/2025)(1)(2)(3) | | | 12,000,000 | | | | 11,601,218 | | | | |
| 5.711%, 01/12/2027 | | | | | | | | | | | |
| (1 Year CMT Rate + 1.550%) | | | | | | | | | | | |
(Callable 01/12/2026)(1)(2)(3) | | | 9,000,000 | | | | 8,910,426 | | | | |
| UBS Group Funding Switzerland AG, | | | | | | | | | | | |
4.125%, 09/24/2025(1)(2) | | | 9,454,000 | | | | 9,033,493 | | | | |
| US Bancorp, | | | | | | | | | | | |
| 5.727%, 10/21/2026 (SOFR + 1.430%) | | | | | | | | | | | |
(Callable 10/21/2025)(3) | | | 20,000,000 | | | | 19,988,506 | | | | |
| WEA Finance LLC / | | | | | | | | | | | |
| Westfield UK & Europe Finance PLC, | | | | | | | | | | | |
| 3.750%, 09/17/2024 | | | | | | | | | | | |
(Callable 06/17/2024)(1)(2) | | | 6,912,000 | | | | 6,527,089 | | | | |
| Wells Fargo & Co.: | | | | | | | | | | | |
| 3.908%, 04/25/2026 (SOFR + 1.320%) | | | | | | | | | | | |
(Callable 04/25/2025)(3) | | | 25,000,000 | | | | 24,169,556 | | | | |
| 2.188%, 04/30/2026 (SOFR + 2.000%) | | | | | | | | | | | |
(Callable 04/30/2025)(3) | | | 1,500,000 | | | | 1,405,406 | | | | |
| 4.540%, 08/15/2026 (SOFR + 1.560%) | | | | | | | | | | | |
(Callable 08/15/2025)(3) | | | 5,000,000 | | | | 4,885,452 | | | | |
| Willis North America, Inc., | | | | | | | | | | | |
| 3.600%, 05/15/2024 | | | | | | | | | | | |
| (Callable 03/15/2024) | | | 2,600,000 | | | | 2,536,816 | | | | |
| Total Financials | | | | | | | | | | | |
| (Cost $2,779,776,978) | | | | | | | 2,687,333,942 | | | | 29.4 | % |
| Total Corporate Bonds | | | | | | | | | | | | |
| (Cost $5,400,685,346) | | | | | | | 5,209,983,881 | | | | 56.9 | % |
| Municipal Bonds | | | | | | | | | | | | |
| Alaska Industrial Development | | | | | | | | | | | | |
| & Export Authority, | | | | | | | | | | | | |
| 0.000%, 03/01/2025 (Insured by NATL) | | | 3,200,000 | | | | 2,879,993 | | | | | |
| Arlington Higher Education Finance Corp., | | | | | | | | | | | | |
| 3.000%, 08/15/2044 | | | | | | | | | | | | |
| (Callable 08/15/2024) (Mandatory | | | | | | | | | | | | |
| Tender Date 08/15/2026) | | | | | | | | | | | | |
(PSF Guaranteed)(4) | | | 31,410,000 | | | | 29,401,742 | | | | | |
| Bloomington Redevelopment District, | | | | | | | | | | | | |
| 2.400%, 08/01/2024 | | | 300,000 | | | | 294,425 | | | | | |
| Chicago Transit Authority, | | | | | | | | | | | | |
| 1.838%, 12/01/2023 | | | 1,000,000 | | | | 983,844 | | | | | |
| City of Brockton MA, | | | | | | | | | | | | |
| 5.410%, 08/01/2027 (Insured by AGM) | | | 41,510,000 | | | | 41,896,724 | | | | | |
| City of Johnson TN, | | | | | | | | | | | | |
| 7.850%, 03/01/2024 (Insured by NATL) | | | 1,440,000 | | | | 1,442,224 | | | | | |
| City of Stockton CA, | | | | | | | | | | | | |
| 5.365%, 09/01/2026 (Insured by AGM) | | | 13,200,000 | | | | 13,211,976 | | | | | |
| County of Broward FL, | | | | | | | | | | | | |
| 5.998%, 09/01/2028 | | | | | | | | | | | | |
| (Insured by AMBAC) | | | 20,630,000 | | | | 21,271,890 | | | | | |
| County of Riverside CA, | | | | | | | | | | | | |
| 4.940%, 02/15/2025 | | | 12,870,000 | | | | 12,788,106 | | | | | |
| Great Lakes Water Authority: | | | | | | | | | | | | |
| 1.879%, 07/01/2023 | | | 500,000 | | | | 500,000 | | | | | |
| 1.984%, 07/01/2024 | | | 500,000 | | | | 483,312 | | | | | |
| Housing & Redevelopment Authority | | | | | | | | | | | | |
| of the City of St. Paul MN, | | | | | | | | | | | | |
| 3.539%, 07/01/2023 | | | 5,000,000 | | | | 5,000,000 | | | | | |
| Illinois Housing Development Authority, | | | | | | | | | | | | |
| 4.000%, 02/01/2034 | | | | | | | | | | | | |
| (Callable 08/01/2025) | | | 1,385,000 | | | | 1,356,857 | | | | | |
| Massachusetts Educational | | | | | | | | | | | | |
| Financing Authority: | | | | | | | | | | | | |
| 1.073%, 07/01/2024 | | | 1,725,000 | | | | 1,645,728 | | | | | |
| 1.338%, 07/01/2025 | | | 5,000,000 | | | | 4,603,401 | | | | | |
| 2.000%, 07/01/2037 | | | | | | | | | | | | |
| (Callable 07/01/2031) | | | 1,000,000 | | | | 843,351 | | | | | |
| New Hampshire Housing Finance Authority, | | | | | | | | | | | | |
| 4.000%, 07/01/2036 | | | | | | | | | | | | |
| (Callable 07/10/2024) | | | 255,000 | | | | 254,065 | | | | | |
| New Jersey Economic | | | | | | | | | | | | |
| Development Authority, | | | | | | | | | | | | |
| 6.310%, 07/01/2026 (Insured by AGC) | | | 6,150,000 | | | | 6,173,913 | | | | | |
| New Jersey Sports & Exposition Authority, | | | | | | | | | | | | |
| 5.976%, 03/01/2024 (Insured by NATL) | | | 345,000 | | | | 343,454 | | | | | |
| Peralta Community College District, | | | | | | | | | | | | |
| 0.000%, 08/05/2031 (Mandatory | | | | | | | | | | | | |
| Tender Date 08/05/2025) | | | | | | | | | | | | |
(Insured by NATL)(7) | | | 27,850,000 | | | | 24,046,423 | | | | | |
| Philadelphia Authority | | | | | | | | | | | | |
| for Industrial Development, | | | | | | | | | | | | |
| 3.964%, 04/15/2026 | | | 3,365,000 | | | | 3,256,707 | | | | | |
| State of Connecticut, | | | | | | | | | | | | |
| 2.000%, 07/01/2023 | | | 3,000,000 | | | | 3,000,000 | | | | | |
| Tennessee Housing Development Agency, | | | | | | | | | | | | |
| 4.000%, 07/01/2040 | | | | | | | | | | | | |
| (Callable 07/01/2029) | | | 2,730,000 | | | | 2,616,046 | | | | | |
| Virginia Small Business Financing Authority, | | | | | | | | | | | | |
| 6.500%, 07/01/2050 | | | | | | | | | | | | |
| (Callable 07/31/2023) (Mandatory | | | | | | | | | | | | |
Tender Date 12/31/2024)(2)(4) | | | 10,000,000 | | | | 9,971,132 | | | | | |
| Total Municipal Bonds | | | | | | | | | | | | |
| (Cost $201,741,101) | | | | | | | 188,265,313 | | | | 2.1 | % |
The accompanying notes are an integral part of these financial statements.
Baird Short-Term Bond Fund
Schedule of Investments, June 30, 2023 (Unaudited)
Long-Term Investments (cont.)
| | | Principal | | | | | | % of | |
| | | Amount | | | Value | | | Net Assets | |
| Residential Mortgage-Backed Securities | | | | | | | | | |
| Non-U.S. Government Agency Issues | | | | | | | | | |
| Alternative Loan Trust: | | | | | | | | | |
| Series 2004-J2, Class 3A3, 5.500%, | | | | | | | | | |
| 04/25/2034 (Callable 07/25/2023) | | $ | 36,085 | | | $ | 35,143 | | | | |
| Series 2005-73CB, Class 1A7, 5.500%, | | | | | | | | | | | |
01/25/2036 (Callable 07/25/2023)(6) | | | 32,731 | | | | 30,260 | | | | |
| Series 2006-28CB, Class A17, 6.000%, | | | | | | | | | | | |
| 10/25/2036 (Callable 07/25/2023) | | | 404,093 | | | | 218,914 | | | | |
| Arroyo Mortgage Trust: | | | | | | | | | | | |
| Series 2019-3, Class A1, 2.962%, | | | | | | | | | | | |
10/25/2048 (Callable 07/25/2023)(2)(4) | | | 5,849,109 | | | | 5,296,910 | | | | |
| Series 2019-2, Class A1, 3.347%, | | | | | | | | | | | |
04/25/2049 (Callable 07/25/2023)(2)(4) | | | 4,575,849 | | | | 4,220,966 | | | | |
| Series 2020-1, Class A1A, 1.662%, | | | | | | | | | | | |
03/25/2055 (Callable 07/25/2023)(2) | | | 3,852,107 | | | | 3,493,149 | | | | |
| Series 2022-1, Class A1A, 2.495%, | | | | | | | | | | | |
12/25/2056 (Callable 01/25/2025)(2)(7) | | | 11,783,378 | | | | 10,636,408 | | | | |
| CIM Trust, | | | | | | | | | | | |
| Series 2023-R4, Class A1, 5.000%, | | | | | | | | | | | |
05/25/2062 (Callable 04/25/2028)(2)(4) | | | 30,785,333 | | | | 29,726,456 | | | | |
| Citigroup Mortgage Loan Trust, | | | | | | | | | | | |
| Series 2018-RP2, Class A1, 3.320%, | | | | | | | | | | | |
02/25/2058 (Callable 12/25/2044)(2)(4) | | | 4,488,844 | | | | 4,269,799 | | | | |
| COLT Trust, | | | | | | | | | | | |
| Series 2020-RPL1, Class A1, 1.390%, | | | | | | | | | | | |
01/25/2065 (Callable 09/25/2023)(2)(4) | | | 17,738,289 | | | | 14,517,954 | | | | |
| CSMC Trust, | | | | | | | | | | | |
| Series 2019-RPL1, Class A1A, 3.650%, | | | | | | | | | | | |
07/25/2058 (Callable 10/25/2035)(2)(4) | | | 15,925,122 | | | | 15,064,879 | | | | |
| CWABS Asset-Backed Certificates Trust, | | | | | | | | | | | |
| Series 2006-9, Class 1AF3, 5.859%, | | | | | | | | | | | |
10/25/2046 (Callable 07/25/2023)(4)(6) | | | 107,952 | | | | 111,039 | | | | |
| FirstKey Homes Trust: | | | | | | | | | | | |
| Series 2020-SFR2, Class A, | | | | | | | | | | | |
1.266%, 10/19/2037(2) | | | 53,926,312 | | | | 48,411,074 | | | | |
| Series 2022-SFR3, Class A, | | | | | | | | | | | |
4.250%, 07/17/2038(2) | | | 6,550,000 | | | | 6,239,294 | | | | |
| GCAT Trust, | | | | | | | | | | | |
| Series 2022-HX1, Class A1, 2.885%, | | | | | | | | | | | |
12/27/2066 (Callable 04/25/2043)(2)(4) | | | 30,011,719 | | | | 26,278,186 | | | | |
| Home Partners of America Trust, | | | | | | | | | | | |
| Series 2019-2, Class A, 2.703%, | | | | | | | | | | | |
10/19/2039 (Callable 10/17/2024)(2) | | | 46,454,212 | | | | 41,290,645 | | | | |
| J.P. Morgan Mortgage Trust, | | | | | | | | | | | |
| Series 2005-A4, Class 1A1, 4.683%, | | | | | | | | | | | |
07/25/2035 (Callable 07/25/2023)(4) | | | 31,109 | | | | 31,465 | | | | |
| MASTR Alternative Loan Trust: | | | | | | | | | | | |
| Series 2003-5, Class 7A1, 5.000%, | | | | | | | | | | | |
| 10/01/2031 (Callable 07/25/2023) | | | 32,045 | | | | 11,441 | | | | |
| Series 2003-5, Class 4A1, 5.500%, | | | | | | | | | | | |
| 07/25/2033 (Callable 07/25/2023) | | | 1,163,326 | | | | 1,115,520 | | | | |
| MFA Trust, | | | | | | | | | | | |
| Series 2022-NQM1, Class A1, 4.112%, | | | | | | | | | | | |
12/25/2066 (Callable 03/25/2025)(2)(4) | | | 23,515,010 | | | | 21,860,639 | | | | |
| Mill City Mortgage Loan Trust, | | | | | | | | | | | |
| Series 2018-2, Class A1, 3.500%, | | | | | | | | | | | |
05/25/2058 (Callable 09/25/2033)(2)(4) | | | 338,946 | | | | 329,752 | | | | |
| New Residential Mortgage Loan Trust: | | | | | | | | | | | |
| Series 2019-RPL3, Class A1, 2.750%, | | | | | | | | | | | |
07/25/2059 (Callable 02/25/2039)(2)(4) | | | 14,960,446 | | | | 13,790,228 | | | | |
| Series 2020-RPL1, Class A1, 2.750%, | | | | | | | | | | | |
11/25/2059 (Callable 12/25/2042)(2)(4) | | | 45,204,075 | | | | 41,429,960 | | | | |
| Renaissance Home Equity Loan Trust, | | | | | | | | | | | |
| Series 2007-2, Class AF2, 5.675%, | | | | | | | | | | | |
06/25/2037 (Callable 07/25/2030)(7) | | | 1,914,212 | | | | 540,378 | | | | |
| Structured Asset Securities Corp., | | | | | | | | | | | |
| Series 2004-4XS, Class 1A6, 4.934%, | | | | | | | | | | | |
02/25/2034 (Callable 07/25/2023)(7) | | | 7,102 | | | | 6,791 | | | | |
| Thornburg Mortgage Securities Trust, | | | | | | | | | | | |
| Series 2003-5, Class 3A, 3.634%, | | | | | | | | | | | |
10/25/2043 (Callable 07/25/2023)(4) | | | 1,652,823 | | | | 1,584,253 | | | | |
| Towd Point Mortgage Trust: | | | | | | | | | | | |
| Series 2016-5, Class A1, 2.500%, | | | | | | | | | | | |
10/25/2056 (Callable 06/25/2030)(2)(4) | | | 2,214,209 | | | | 2,178,910 | | | | |
| Series 2017-1, Class A1, 2.750%, | | | | | | | | | | | |
10/25/2056 (Callable 01/25/2030)(2)(4) | | | 1,634,738 | | | | 1,610,515 | | | | |
| Series 2017-2, Class A1, 2.750%, | | | | | | | | | | | |
04/25/2057 (Callable 12/25/2026)(2)(4) | | | 756,651 | | | | 747,926 | | | | |
| Series 2017-3, Class A1, 2.750%, | | | | | | | | | | | |
06/25/2057 (Callable 10/25/2026)(2)(4) | | | 7,018,486 | | | | 6,815,998 | | | | |
| Series 2017-4, Class A1, 2.750%, | | | | | | | | | | | |
06/25/2057 (Callable 12/25/2029)(2)(4) | | | 11,384,157 | | | | 10,687,855 | | | | |
| Series 2017-6, Class A1, 2.750%, | | | | | | | | | | | |
10/25/2057 (Callable 02/25/2033)(2)(4) | | | 22,735,458 | | | | 21,485,294 | | | | |
| Series 2018-6, Class A1A, 3.750%, | | | | | | | | | | | |
03/25/2058 (Callable 11/25/2031)(2)(4) | | | 2,742,790 | | | | 2,648,062 | | | | |
| Series 2018-3, Class A1, 3.750%, | | | | | | | | | | | |
05/25/2058 (Callable 02/25/2031)(2)(4) | | | 3,545,623 | | | | 3,340,825 | | | | |
| Series 2020-1, Class A1, 2.710%, | | | | | | | | | | | |
01/25/2060 (Callable 09/25/2029)(2)(4) | | | 4,010,540 | | | | 3,685,037 | | | | |
| Series 2020-4, Class A1, 1.750%, | | | | | | | | | | | |
10/25/2060 (Callable 01/25/2031)(2) | | | 31,681,386 | | | | 27,524,141 | | | | |
| WaMu Mortgage Pass-Through | | | | | | | | | | | |
| Certificates Trust, | | | | | | | | | | | |
| Series 2004-AR3, Class A1, 4.521%, | | | | | | | | | | | |
06/25/2034 (Callable 07/25/2023)(4) | | | 1,300,737 | | | | 1,184,207 | | | | |
| Total Residential Mortgage-Backed Securities | | | | | | | | | | | |
| (Cost $404,902,305) | | | | | | | 372,450,273 | | | | 4.1 | % |
| Commercial Mortgage-Backed Securities | | | | | | | | | | | | |
| Non-U.S. Government Agency Issues | | | | | | | | | | | | |
| Bank of America Commercial Mortgage Trust, | | | | | | | | | | | | |
| Series 2016-UB10, Class ASB, 3.019%, | | | | | | | | | | | | |
| 07/15/2049 (Callable 02/15/2031) | | | 4,550,928 | | | | 4,343,897 | | | | | |
| Citigroup Commercial Mortgage Trust: | | | | | | | | | | | | |
| Series 2014-GC19, Class AAB, 3.552%, | | | | | | | | | | | | |
| 03/11/2047 (Callable 03/10/2024) | | | 523,362 | | | | 521,162 | | | | | |
| Series 2014-GC23, Class AAB, 3.337%, | | | | | | | | | | | | |
| 07/10/2047 (Callable 07/10/2024) | | | 2,639,942 | | | | 2,604,579 | | | | | |
| Series 2015-GC27, Class A5, 3.137%, | | | | | | | | | | | | |
| 02/10/2048 (Callable 01/10/2025) | | | 9,750,000 | | | | 9,294,223 | | | | | |
| Series 2015-GC31, Class A4, 3.762%, | | | | | | | | | | | | |
| 06/10/2048 (Callable 06/10/2025) | | | 41,915,000 | | | | 39,756,424 | | | | | |
| Series 2016-C3, Class AAB, 2.984%, | | | | | | | | | | | | |
| 11/15/2049 (Callable 11/15/2026) | | | 1,166,320 | | | | 1,117,230 | | | | | |
| COMM Mortgage Trust: | | | | | | | | | | | | |
| Series 2014-LC15, Class ASB, 3.528%, | | | | | | | | | | | | |
| 04/10/2047 (Callable 04/10/2024) | | | 1,024,604 | | | | 1,019,477 | | | | | |
| Series 2014-CR16, Class ASB, 3.653%, | | | | | | | | | | | | |
| 04/10/2047 (Callable 04/10/2024) | | | 1,150,554 | | | | 1,142,347 | | | | | |
| Series 2014-LC17, Class A5, 3.917%, | | | | | | | | | | | | |
| 10/10/2047 (Callable 12/10/2024) | | | 8,600,000 | | | | 8,320,542 | | | | | |
| Series 2014-CR21, Class A3, 3.528%, | | | | | | | | | | | | |
| 12/10/2047 (Callable 12/10/2024) | | | 12,788,846 | | | | 12,264,714 | | | | | |
| Series 2015-LC19, Class A4, 3.183%, | | | | | | | | | | | | |
| 02/10/2048 (Callable 01/10/2027) | | | 10,882,530 | | | | 10,359,321 | | | | | |
The accompanying notes are an integral part of these financial statements.
Baird Short-Term Bond Fund
Schedule of Investments, June 30, 2023 (Unaudited)
Long-Term Investments (cont.)
| | | Principal | | | | | | % of | |
| | | Amount | | | Value | | | Net Assets | |
| COMM Mortgage Trust: (cont.) | | | | | | | | | |
| Series 2015-DC1, Class A5, 3.350%, | | | | | | | | | |
| 02/10/2048 (Callable 02/10/2025) | | $ | 11,960,000 | | | $ | 11,384,243 | | | | |
| Series 2015-CR23, Class A4, 3.497%, | | | | | | | | | | | |
| 05/10/2048 (Callable 05/10/2025) | | | 12,400,000 | | | | 11,756,041 | | | | |
| Series 2015-LC21, Class A4, 3.708%, | | | | | | | | | | | |
| 07/10/2048 (Callable 01/10/2026) | | | 21,560,955 | | | | 20,522,771 | | | | |
| Series 2015-PC1, Class A5, 3.902%, | | | | | | | | | | | |
| 07/10/2050 (Callable 06/10/2025) | | | 18,090,000 | | | | 17,285,055 | | | | |
| Series 2013-CR11, Class A4, 4.258%, | | | | | | | | | | | |
| 08/10/2050 (Callable 10/10/2023) | | | 454,240 | | | | 453,631 | | | | |
| CSAIL Commercial Mortgage Trust: | | | | | | | | | | | |
| Series 2015-C3, Class A4, 3.718%, | | | | | | | | | | | |
| 08/15/2048 (Callable 08/15/2025) | | | 24,716,479 | | | | 23,588,740 | | | | |
| Series 2015-C2, Class A4, 3.504%, | | | | | | | | | | | |
| 06/15/2057 (Callable 05/15/2025) | | | 16,723,632 | | | | 15,912,765 | | | | |
| GS Mortgage Securities Trust: | | | | | | | | | | | |
| Series 2014-GC22, Class A5, 3.862%, | | | | | | | | | | | |
| 06/10/2047 (Callable 06/10/2024) | | | 16,470,023 | | | | 15,991,763 | | | | |
| Series 2015-GS1, Class A2, 3.470%, | | | | | | | | | | | |
| 11/10/2048 (Callable 11/10/2025) | | | 2,050,000 | | | | 1,930,754 | | | | |
| J.P. Morgan Chase Commercial | | | | | | | | | | | |
| Mortgage Securities Trust, | | | | | | | | | | | |
| Series 2014-C20, Class A5, 3.805%, | | | | | | | | | | | |
| 07/15/2047 (Callable 06/15/2024) | | | 11,750,000 | | | | 11,500,778 | | | | |
| JPMBB Commercial | | | | | | | | | | | |
| Mortgage Securities Trust: | | | | | | | | | | | |
| Series 2014-C22, Class A4, 3.801%, | | | | | | | | | | | |
| 09/15/2047 (Callable 03/15/2026) | | | 23,316,000 | | | | 22,501,570 | | | | |
| Series 2014-C24, Class A5, 3.639%, | | | | | | | | | | | |
| 11/15/2047 (Callable 10/15/2025) | | | 10,800,000 | | | | 10,365,862 | | | | |
| Series 2014-C25, Class A5, 3.672%, | | | | | | | | | | | |
| 11/15/2047 (Callable 11/15/2024) | | | 9,543,000 | | | | 9,140,617 | | | | |
| Series 2015-C27, Class A4, 3.179%, | | | | | | | | | | | |
| 02/15/2048 (Callable 09/15/2026) | | | 28,374,055 | | | | 26,768,716 | | | | |
| Series 2015-C31, Class ASB, 3.540%, | | | | | | | | | | | |
| 08/15/2048 (Callable 08/15/2025) | | | 4,170,420 | | | | 4,011,617 | | | | |
| Series 2015-C31, Class A3, 3.801%, | | | | | | | | | | | |
| 08/15/2048 (Callable 08/15/2025) | | | 18,202,378 | | | | 17,144,340 | | | | |
| Series 2015-C28, Class A4, 3.227%, | | | | | | | | | | | |
| 10/15/2048 (Callable 04/15/2025) | | | 15,000,000 | | | | 14,142,768 | | | | |
| Series 2015-C33, Class ASB, 3.562%, | | | | | | | | | | | |
| 12/15/2048 (Callable 11/15/2025) | | | 1,990,394 | | | | 1,918,077 | | | | |
| JPMDB Commercial | | | | | | | | | | | |
| Mortgage Securities Trust, | | | | | | | | | | | |
| Series 2016-C2, Class A4, 3.144%, | | | | | | | | | | | |
| 06/15/2049 (Callable 05/15/2026) | | | 9,010,000 | | | | 8,304,535 | | | | |
| Morgan Stanley Bank of | | | | | | | | | | | |
| America Merrill Lynch Trust: | | | | | | | | | | | |
| Series 2014-C18, Class A4, 3.923%, | | | | | | | | | | | |
| 10/15/2047 (Callable 07/15/2026) | | | 17,470,000 | | | | 16,851,649 | | | | |
| Series 2015-C27, Class ASB, 3.557%, | | | | | | | | | | | |
| 12/15/2047 (Callable 11/15/2025) | | | 2,142,847 | | | | 2,076,670 | | | | |
| Series 2015-C21, Class A4, 3.338%, | | | | | | | | | | | |
| 03/15/2048 (Callable 03/15/2031) | | | 10,702,782 | | | | 10,137,627 | | | | |
| Series 2015-C25, Class ASB, 3.383%, | | | | | | | | | | | |
| 10/15/2048 (Callable 09/15/2025) | | | 5,655,711 | | | | 5,456,497 | | | | |
| Series 2016-C30, Class ASB, 2.729%, | | | | | | | | | | | |
| 09/15/2049 (Callable 10/15/2026) | | | 2,083,338 | | | | 1,986,557 | | | | |
| Wells Fargo Commercial Mortgage Trust: | | | | | | | | | | | |
| Series 2015-C27, Class ASB, 3.278%, | | | | | | | | | | | |
| 02/15/2048 (Callable 03/15/2025) | | | 1,398,155 | | | | 1,359,533 | | | | |
| Series 2015-C31, Class ASB, 3.487%, | | | | | | | | | | | |
| 11/15/2048 (Callable 11/15/2025) | | | 1,224,099 | | | | 1,182,463 | | | | |
| Series 2014-LC16, Class ASB, 3.477%, | | | | | | | | | | | |
| 08/15/2050 (Callable 06/15/2024) | | | 2,528,198 | | | | 2,496,382 | | | | |
| Series 2014-LC16, Class A5, 3.817%, | | | | | | | | | | | |
| 08/15/2050 (Callable 06/15/2024) | | | 31,850,000 | | | | 30,903,424 | | | | |
| WFRBS Commercial Mortgage Trust: | | | | | | | | | | | |
| Series 2014-C23, Class ASB, 3.636%, | | | | | | | | | | | |
| 10/15/2057 (Callable 09/15/2025) | | | 273,302 | | | | 267,329 | | | | |
| Series 2014-C23, Class A4, 3.650%, | | | | | | | | | | | |
| 10/15/2057 (Callable 09/15/2025) | | | 13,880,334 | | | | 13,382,184 | | | | |
| Series 2014-C23, Class A5, 3.917%, | | | | | | | | | | | |
| 10/15/2057 (Callable 09/15/2025) | | | 17,125,000 | | | | 16,481,400 | | | | |
| Total Commercial | | | | | | | | | | | |
| Mortgage-Backed Securities | | | | | | | | | | | |
| (Cost $452,450,028) | | | | | | | 437,950,274 | | | | 4.8 | % |
| Asset Backed Securities | | | | | | | | | | | | |
| Affirm Asset Securitization Trust, | | | | | | | | | | | | |
| Series 2021-B, Class A, 1.030%, | | | | | | | | | | | | |
08/17/2026 (Callable 08/15/2023)(2) | | | 27,500,000 | | | | 26,751,926 | | | | | |
| Ally Auto Receivables, | | | | | | | | | | | | |
| Series 2022-3, Class A3, 5.070%, | | | | | | | | | | | | |
| 04/15/2027 (Callable 11/15/2025) | | | 16,150,000 | | | | 16,011,373 | | | | | |
| Chase Auto Credit Linked Notes: | | | | | | | | | | | | |
| Series 2020-2, Class B, 0.840%, | | | | | | | | | | | | |
02/25/2028 (Callable 09/25/2024)(2) | | | 1,347,207 | | | | 1,324,354 | | | | | |
| Series 2021-1, Class B, 0.875%, | | | | | | | | | | | | |
09/25/2028 (Callable 04/25/2025)(2) | | | 9,110,366 | | | | 8,836,118 | | | | | |
| Series 2021-2, Class B, 0.889%, | | | | | | | | | | | | |
12/26/2028 (Callable 04/25/2025)(2) | | | 8,736,844 | | | | 8,447,367 | | | | | |
| Series 2021-3, Class B, 0.760%, | | | | | | | | | | | | |
02/26/2029 (Callable 04/25/2025)(2) | | | 17,248,944 | | | | 16,424,782 | | | | | |
| Dell Equipment Finance Trust, | | | | | | | | | | | | |
| Series 2023-2, Class A3, 5.650%, | | | | | | | | | | | | |
01/22/2029 (Callable 02/22/2026)(2) | | | 16,100,000 | | | | 16,016,245 | | | | | |
| Ford Credit Auto Owner Trust, | | | | | | | | | | | | |
| Series 2020-2, Class A, 1.060%, | | | | | | | | | | | | |
04/15/2033 (Callable 10/15/2025)(2) | | | 16,881,000 | | | | 15,243,585 | | | | | |
| Ford Credit Floorplan Master Owner Trust: | | | | | | | | | | | | |
| Series 2020-2, Class A, 1.060%, | | | | | | | | | | | | |
| 09/15/2027 | | | 16,594,000 | | | | 15,054,135 | | | | | |
| Series 2023-1, Class A1, 4.920%, | | | | | | | | | | | | |
05/15/2028(2) | | | 40,750,000 | | | | 40,296,554 | | | | | |
| Genesis Sales Finance Master Trust, | | | | | | | | | | | | |
| Series 2021-AA, Class A, 1.200%, | | | | | | | | | | | | |
12/21/2026 (Callable 03/20/2024)(2) | | | 1,080,000 | | | | 1,017,273 | | | | | |
| GM Financial Automobile Leasing Trust, | | | | | | | | | | | | |
| Series 2023-1, Class A3, 5.160%, | | | | | | | | | | | | |
| 04/20/2026 (Callable 08/20/2025) | | | 34,425,000 | | | | 34,177,133 | | | | | |
| GM Financial Consumer | | | | | | | | | | | | |
| Automobile Receivables Trust, | | | | | | | | | | | | |
| Series 2023-1, Class A3, 4.660%, | | | | | | | | | | | | |
| 02/16/2028 (Callable 08/16/2026) | | | 19,000,000 | | | | 18,751,357 | | | | | |
| GMF Floorplan Owner Revolving Trust, | | | | | | | | | | | | |
| Series 2023-1, Class A1, 5.340%, | | | | | | | | | | | | |
06/15/2028(2) | | | 46,025,000 | | | | 45,938,137 | | | | | |
| Golden Credit Card Trust, | | | | | | | | | | | | |
| Series 2022-4A, Class A, 4.310%, | | | | | | | | | | | | |
09/15/2027(1)(2) | | | 34,000,000 | | | | 33,216,643 | | | | | |
| Hyundai Auto Lease Securitization Trust, | | | | | | | | | | | | |
| Series 2023-B, Class A3, 5.150%, | | | | | | | | | | | | |
06/15/2026 (Callable 10/15/2025)(2) | | | 33,475,000 | | | | 33,233,987 | | | | | |
The accompanying notes are an integral part of these financial statements.
Baird Short-Term Bond Fund
Schedule of Investments, June 30, 2023 (Unaudited)
Long-Term Investments (cont.)
| | | Principal | | | | | | % of | |
| | | Amount | | | Value | | | Net Assets | |
| Louisiana Local Government | | | | | | | | | |
| Environmental Facilities & | | | | | | | | | |
| Community Development Authority, | | | | | | | | | |
| 3.615%, 02/01/2029 | | $ | 24,894,251 | | | $ | 23,968,896 | | | | |
| Navient Private Education Refi Loan Trust: | | | | | | | | | | | |
| Series 2019-EA, Class A2A, 2.640%, | | | | | | | | | | | |
05/15/2068 (Callable 08/15/2026)(2) | | | 2,349,089 | | | | 2,205,997 | | | | |
| Series 2019-FA, Class A2, 2.600%, | | | | | | | | | | | |
08/15/2068 (Callable 12/15/2026)(2) | | | 9,546,165 | | | | 8,754,973 | | | | |
| Series 2021-A, Class A, 0.840%, | | | | | | | | | | | |
05/15/2069 (Callable 03/15/2028)(2) | | | 9,788,002 | | | | 8,490,273 | | | | |
| Series 2021-GA, Class A, 1.580%, | | | | | | | | | | | |
04/15/2070 (Callable 05/15/2029)(2) | | | 24,885,430 | | | | 21,358,923 | | | | |
| Navient Student Loan Trust, | | | | | | | | | | | |
| Series 2019-BA, Class A2A, 3.390%, | | | | | | | | | | | |
12/15/2059 (Callable 12/15/2029)(2) | | | 4,456,831 | | | | 4,209,842 | | | | |
| Nelnet Student Loan Trust: | | | | | | | | | | | |
| Series 2021-A, Class APT1, 1.360%, | | | | | | | | | | | |
04/20/2062 (Callable 09/20/2029)(2) | | | 8,094,915 | | | | 7,183,719 | | | | |
| Series 2021-BA, Class AFX, 1.420%, | | | | | | | | | | | |
04/20/2062 (Callable 07/20/2029)(2) | | | 11,180,896 | | | | 9,934,688 | | | | |
| Series 2021-DA, Class AFX, 1.630%, | | | | | | | | | | | |
04/20/2062 (Callable 11/20/2031)(2) | | | 11,271,874 | | | | 10,105,313 | | | | |
| PFS Financing Corp., | | | | | | | | | | | |
| Series 2023-A, Class A, 5.800%, | | | | | | | | | | | |
03/15/2028(2) | | | 24,700,000 | | | | 24,707,734 | | | | |
| Santander Bank Auto Credit, | | | | | | | | | | | |
| Series 2022-A, Class B, 5.281%, | | | | | | | | | | | |
05/15/2032 (Callable 10/15/2025)(2) | | | 6,634,865 | | | | 6,524,783 | | | | |
| SFS Auto Receivables Securitization Trust, | | | | | | | | | | | |
| Series 2023-1A, Class A3, 5.470%, | | | | | | | | | | | |
10/20/2028 (Callable 10/20/2027)(2) | | | 27,100,000 | | | | 27,020,501 | | | | |
| Synchrony Card Funding LLC, | | | | | | | | | | | |
| Series 2022-A1, Class A, 3.370%, | | | | | | | | | | | |
| 04/15/2028 (Callable 04/15/2025) | | | 55,116,000 | | | | 53,146,535 | | | | |
| Towd Point Mortgage Trust: | | | | | | | | | | | |
| Series 2019-MH1, Class A1, 3.000%, | | | | | | | | | | | |
11/25/2058 (Callable 09/25/2024)(2)(4) | | | 1,743,481 | | | | 1,719,675 | | | | |
| Series 2020-MH1, Class A1A, 2.184%, | | | | | | | | | | | |
02/25/2060 (Callable 07/25/2023)(2)(4) | | | 8,997,606 | | | | 8,352,063 | | | | |
| Series 2020-MH1, Class A1, 2.250%, | | | | | | | | | | | |
02/25/2060 (Callable 07/25/2023)(2)(4) | | | 13,992,100 | | | | 13,001,069 | | | | |
| Total Asset Backed Securities | | | | | | | | | | | |
| (Cost $579,454,108) | | | | | | | 561,425,953 | | | | 6.1 | % |
| Total Long-Term Investments | | | | | | | | | | | | |
| (Cost $9,309,783,107) | | | | | | | 9,018,594,498 | | | | 98.6 | % |
| Short-Term Investment | | | | | | | | | | | | |
| | | Shares | | | | | | | | | |
| Money Market Mutual Fund | | | | | | | | | | | | |
| First American Government Obligations | | | | | | | | | | | | |
Fund, Class U, 5.03%(5) | | | 398,801,914 | | | | 398,801,914 | | | | | |
| Total Short-Term Investment | | | | | | | | | | | | |
| (Cost $398,801,914) | | | | | | | 398,801,914 | | | | 4.3 | % |
| Total Investments | | | | | | | | | | | | |
| (Cost $9,708,585,021) | | | | | | | 9,417,396,412 | | | | 102.9 | % |
| Liabilities in Excess of Other Assets | | | | | | | (268,466,861 | ) | | | (2.9 | )% |
| TOTAL NET ASSETS | | | | | | $ | 9,148,929,551 | | | | 100.0 | % |
Notes to Schedule of Investments
AGC – Assured Guaranty Corp.
AGM – Assured Guaranty Municipal
AMBAC – Ambac Assurance Corp.
NATL – National Public Finance Guarantee Corp.
CMT – Constant Maturity Treasury
LIBOR – London Inter-bank Offered Rate
PSF – Permanent School Fund
SOFR – Secured Overnight Financing Rate
SOFRINDX – Secured Overnight Financing Rate Index
(1) | Foreign security. |
(2) | Includes securities exempt from registration under Rule 144A of the Securities Act of 1933. These securities may be resold in transactions exempt from registration to qualified institutional buyers. At June 30, 2023, the value of these securities totaled $3,094,180,824, which represented 33.82% of total net assets. |
(3) | Variable rate security based on a reference index and spread. The rate reported is the rate as of the last reset date in effect as of June 30, 2023. |
(4) | Variable rate security. The coupon is based on an underlying pool of loans. The rate reported is the rate in effect as of June 30, 2023. |
(5) | Seven-day yield. |
(6) | Security that, on the last payment date, missed a partial principal or interest payment. |
(7) | Step-up bond; the interest rate shown is the rate in effect as of June 30, 2023. |
(8) | Security or a portion of the security, purchased on a when-issued or delayed delivery basis. |
The accompanying notes are an integral part of these financial statements.
Baird Short-Term Bond Fund
Schedule of Investments, June 30, 2023 (Unaudited)
Summary of Fair Value Exposure at June 30, 2023 (Unaudited)
The Fund has adopted authoritative fair valuation accounting standards which establish a definition of fair value and set out a hierarchy for measuring fair value. These standards require additional disclosures about the various inputs and valuation techniques used to develop the measurements of fair value and a discussion on changes in valuation techniques and related inputs during the period. These standards define fair value as the price that would be received to sell an asset or paid to transfer a liability in an orderly transaction between market participants at the measurement date.
The fair value hierarchy is organized into three levels based upon the assumptions (referred to as “inputs”) used in pricing the asset or liability. These standards state that “observable inputs” reflect the assumptions market participants would use in pricing the asset or liability based on market data obtained from independent sources and “unobservable inputs” reflect an entity’s own assumptions about the assumptions market participants would use in pricing the asset or liability. These inputs are summarized into three broad levels and described below:
Level 1 – Quoted prices (unadjusted) in active markets for identical assets or liabilities that the reporting entity can access at the measurement date.
Level 2 – Inputs other than quoted prices included within Level 1 that are observable for the asset or liability, either directly or indirectly.
Level 3 – Unobservable inputs for the asset or liability.
The inputs or methodology used for valuing securities are not necessarily an indication of the risk associated with investing in those securities.
The following is a summary of the inputs used to value the Fund’s investments as of June 30, 2023:
| | | Level 1 | | | Level 2 | | | Level 3 | | | Total | |
| Long-Term Investments | | | | | | | | | | | | |
| U.S. Treasury Securities | | $ | — | | | $ | 2,194,158,697 | | | $ | — | | | $ | 2,194,158,697 | |
| Other Government Related Securities | | | — | | | | 54,360,107 | | | | — | | | | 54,360,107 | |
| Corporate Bonds | | | — | | | | 5,209,983,881 | | | | — | | | | 5,209,983,881 | |
| Municipal Bonds | | | — | | | | 188,265,313 | | | | — | | | | 188,265,313 | |
| Residential Mortgage-Backed Securities – Non-U.S. Government Agency Issues | | | — | | | | 372,450,273 | | | | — | | | | 372,450,273 | |
| Commercial Mortgage-Backed Securities – Non-U.S. Government Agency Issues | | | — | | | | 437,950,274 | | | | — | | | | 437,950,274 | |
| Asset Backed Securities | | | — | | | | 561,425,953 | | | | — | | | | 561,425,953 | |
| Total Long-Term Investments | | | — | | | | 9,018,594,498 | | | | — | | | | 9,018,594,498 | |
| Short-Term Investment | | | | | | | | | | | | | | | | |
| Money Market Mutual Fund | | | 398,801,914 | | | | — | | | | — | | | | 398,801,914 | |
| Total Short-Term Investment | | | 398,801,914 | | | | — | | | | — | | | | 398,801,914 | |
| Total Investments | | $ | 398,801,914 | | | $ | 9,018,594,498 | | | $ | — | | | $ | 9,417,396,412 | |
Changes in valuation techniques may result in transfers into or out of assigned levels within the fair value hierarchy. There were no transfers into or out of Level 3 during the reporting period, as compared to the security classifications from the prior year’s annual report. See the Fund’s Valuation Policy in Note 2a to the financial statements.
The accompanying notes are an integral part of these financial statements.
Baird Intermediate Bond Fund
June 30, 2023 (Unaudited)
Portfolio Characteristics
Quality Distribution(1)(2)
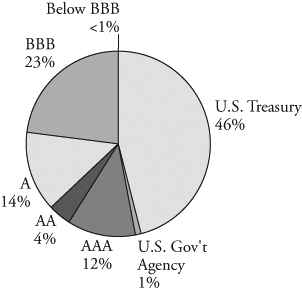
| | Net Assets | $7,440,143,224 | |
| | | | |
| | SEC 30-Day Yield(3) | | |
| | Institutional Class | 4.43% | |
| | Investor Class | 4.18% | |
| | | | |
| | Average Effective Duration | 3.81 years | |
| | | | |
| | Average Effective Maturity | 4.34 years | |
| | | | |
| | Annualized Expense Ratio(4) | | |
| | Institutional Class | 0.30% | |
| | Investor Class | 0.55% | (5) |
| | | | |
| | Portfolio Turnover Rate | 25% | (6) |
| | | | |
| | Number of Holdings | 682 | |
| | | | | |
Sector Weightings(7)
(1) | Percentages shown are based on the Fund’s total investments. |
(2) | The quality profile is calculated on a market value-weighted basis using the highest credit quality rating for each security held by the Fund given by S&P, Moody’s or Fitch, each of which is a Nationally Recognized Statistical Rating Organization (NRSRO). NRSROs rate the credit quality of securities using a scale that generally ranges from AAA (highest) to D (lowest). |
(3) | SEC yields are based on SEC guidelines and are calculated for the 30 days ended June 30, 2023. |
(4) | Reflects expense ratios as stated in the Fund’s current prospectus dated May 1, 2023. |
(5) | Includes 0.25% 12b-1 fee. |
(6) | Not annualized. |
(7) | Percentages shown are based on the Fund’s total net assets. |
Baird Intermediate Bond Fund
June 30, 2023 (Unaudited)
Total Returns
| | | | Average Annual |
| | Six | One | Five | Ten | Since |
| For the Periods Ended June 30, 2023 | Months | Year | Years | Years | Inception(1) |
| Institutional Class Shares | 1.77% | 0.21% | 1.41% | 1.70% | 3.94% |
| Investor Class Shares | 1.57% | -0.14% | 1.15% | 1.45% | 3.68% |
Bloomberg Intermediate U.S. Government/Credit Index(2) | 1.50% | -0.10% | 1.23% | 1.41% | 3.55% |
(1) | For the period from September 29, 2000 (inception date) through June 30, 2023. |
(2) | The Bloomberg Intermediate U.S. Government/Credit Index is an unmanaged, market value weighted index of investment grade, fixed-rate debt issues, including government and corporate securities, with maturities between one and ten years. This Index does not reflect any deduction for fees, expenses or taxes. A direct investment in an index is not possible. |
The returns table shown above reflects reinvestment of dividends and/or capital gains distributions in additional shares. The returns in the table do not reflect the deduction of taxes that a shareholder would pay on Fund distributions or the redemption of Fund shares. The returns reflect the actual performance for each period and do not include the impact of trades executed on the last business day of the period that were recorded on the first business day of the next period.
The Fund’s expense ratio for each Class, as reflected in the Fund’s current prospectus, is set forth under “Portfolio Characteristics”.
The Fund may invest in U.S. dollar denominated foreign securities which involve additional risks such as political and economic instability, and different and sometimes less strict financial reporting standards and regulation. The Fund may also invest in mortgage- and asset-backed securities, which include interest rate and prepayment risks more pronounced than those of other fixed income securities. U.S. and international markets have experienced significant periods of volatility in recent years and months due to a number of economic, political and global macro factors. Russia’s ongoing war with Ukraine has heightened global geopolitical tensions, resulting in an elevated risk environment and increased volatility in asset prices. The uncertain course of the war may have a significant negative impact on the global economy. U.S. relations with China have become increasingly strained, and tension between the U.S. and China may have a significant negative impact on the global economy and asset prices. Measures of inflation reached levels not experienced in several decades, leading the Federal Reserve to raise short term interest rates significantly over the last year, with the potential for further rate increases in 2023. Uncertainty regarding the ability of the Federal Reserve to successfully control inflation, the potential for incremental rate increases, and the full impact of prior rate increases on the economy may negatively impact asset prices and increase market volatility. The possibility of a U.S. or global recession may also contribute to market volatility. The coronavirus (COVID-19) pandemic caused significant economic disruption in recent years as countries worked to limit the negative health impacts of the virus. While the virus has entered an endemic stage, significant outbreaks or new variants present a continued risk to the global economy. These and other geopolitical events may cause market disruptions and could have an adverse effect on the value of the Fund’s investments.
Past performance does not guarantee future results. Investment return and principal value will fluctuate so that an investor’s shares, when redeemed, may be worth more or less than their original cost.
For information about the performance of the Fund as of the most recent month-end, please call 1-866-442-2473 or visit www.bairdfunds.com. Mutual fund performance changes over time and current performance may be lower or higher than that stated.
Baird Intermediate Bond Fund
Schedule of Investments, June 30, 2023 (Unaudited)
Long-Term Investments
| | | Principal | | | | | | % of | |
| | | Amount | | | Value | | | Net Assets | |
| U.S. Treasury Securities | | | | | | | | | |
| U.S. Treasury Bonds: | | | | | | | | | |
| 1.500%, 02/15/2025 | | $ | 98,150,000 | | | $ | 92,636,730 | | | | |
| 0.250%, 05/31/2025 | | | 322,300,000 | | | | 294,942,270 | | | | |
| 2.875%, 06/15/2025 | | | 165,775,000 | | | | 159,461,303 | | | | |
| 3.125%, 08/15/2025 | | | 299,950,000 | | | | 289,697,802 | | | | |
| 2.250%, 11/15/2025 | | | 342,700,000 | | | | 323,771,178 | | | | |
| 4.000%, 02/15/2026 | | | 272,125,000 | | | | 267,947,457 | | | | |
| 1.125%, 10/31/2026 | | | 211,145,000 | | | | 189,865,543 | | | | |
| 1.125%, 08/31/2028 | | | 714,925,000 | | | | 615,980,495 | | | | |
| 2.375%, 03/31/2029 | | | 567,250,000 | | | | 517,881,524 | | | | |
| 3.875%, 12/31/2029 | | | 321,225,000 | | | | 318,426,828 | | | | |
| 1.250%, 08/15/2031 | | | 69,600,000 | | | | 57,115,500 | | | | |
| 2.875%, 05/15/2032 | | | 219,600,000 | | | | 203,610,375 | | | | |
| 3.500%, 02/15/2033 | | | 108,200,000 | | | | 105,393,563 | | | | |
| Total U.S. Treasury Securities | | | | | | | | | | | |
| (Cost $3,568,465,008) | | | | | | | 3,436,730,568 | | | | 46.2 | % |
| Other Government Related Security | | | | | | | | | | | | |
| NBN Co. Ltd., | | | | | | | | | | | | |
| 2.625%, 05/05/2031 | | | | | | | | | | | | |
(Callable 02/05/2031)(1)(2) | | | 20,487,000 | | | | 17,184,119 | | | | | |
| Total Other Government Related Security | | | | | | | | | | | | |
| (Cost $19,726,245) | | | | | | | 17,184,119 | | | | 0.2 | % |
| Corporate Bonds | | | | | | | | | | | | |
| Industrials | | | | | | | | | | | | |
| Adventist Health System, | | | | | | | | | | | | |
| 2.952%, 03/01/2029 | | | | | | | | | | | | |
| (Callable 12/01/2028) | | | 250,000 | | | | 218,799 | | | | | |
| Agilent Technologies, Inc.: | | | | | | | | | | | | |
| 3.050%, 09/22/2026 | | | | | | | | | | | | |
| (Callable 06/22/2026) | | | 1,495,000 | | | | 1,384,012 | | | | | |
| 2.100%, 06/04/2030 | | | | | | | | | | | | |
| (Callable 03/04/2030) | | | 250,000 | | | | 205,417 | | | | | |
| Air Products and Chemicals, Inc., | | | | | | | | | | | | |
| 2.050%, 05/15/2030 | | | | | | | | | | | | |
| (Callable 02/15/2030) | | | 275,000 | | | | 233,447 | | | | | |
| Aker BP ASA, | | | | | | | | | | | | |
| 5.600%, 06/13/2028 | | | | | | | | | | | | |
(Callable 05/13/2028)(1)(2) | | | 2,500,000 | | | | 2,481,805 | | | | | |
| Albemarle Corp., | | | | | | | | | | | | |
| 4.650%, 06/01/2027 | | | | | | | | | | | | |
| (Callable 05/01/2027) | | | 7,000,000 | | | | 6,816,801 | | | | | |
| Allegion PLC, | | | | | | | | | | | | |
| 3.500%, 10/01/2029 | | | | | | | | | | | | |
| (Callable 07/01/2029) | | | 3,160,000 | | | | 2,790,794 | | | | | |
| Allegion US Holding Co., Inc.: | | | | | | | | | | | | |
| 3.200%, 10/01/2024 | | | | | | | | | | | | |
| (Callable 08/01/2024) | | | 4,998,000 | | | | 4,799,184 | | | | | |
| 5.411%, 07/01/2032 | | | | | | | | | | | | |
| (Callable 04/01/2032) | | | 2,000,000 | | | | 1,976,347 | | | | | |
| American Tower Corp., | | | | | | | | | | | | |
| 5.250%, 07/15/2028 | | | | | | | | | | | | |
| (Callable 06/15/2028) | | | 7,800,000 | | | | 7,707,577 | | | | | |
| Amgen, Inc., | | | | | | | | | | | | |
| 5.250%, 03/02/2033 | | | | | | | | | | | | |
| (Callable 12/02/2032) | | | 11,600,000 | | | | 11,614,796 | | | | | |
| Anglo American Capital PLC: | | | | | | | | | | | | |
4.000%, 09/11/2027(1)(2) | | | 1,497,000 | | | | 1,407,176 | | | | | |
| 2.250%, 03/17/2028 | | | | | | | | | | | | |
(Callable 01/17/2028)(1)(2) | | | 6,500,000 | | | | 5,585,833 | | | | | |
| 2.625%, 09/10/2030 | | | | | | | | | | | | |
(Callable 06/10/2030)(1)(2) | | | 300,000 | | | | 247,464 | | | | | |
| 5.500%, 05/02/2033 | | | | | | | | | | | | |
(Callable 02/02/2033)(1)(2) | | | 4,500,000 | | | | 4,396,469 | | | | | |
| Anheuser-Busch InBev Worldwide, Inc., | | | | | | | | | | | | |
6.625%, 08/15/2033(1) | | | 8,085,000 | | | | 9,109,292 | | | | | |
| AP Moller – Maersk A/S, | | | | | | | | | | | | |
| 4.500%, 06/20/2029 | | | | | | | | | | | | |
(Callable 03/20/2029)(1)(2) | | | 4,207,000 | | | | 4,041,263 | | | | | |
| ArcelorMittal: | | | | | | | | | | | | |
4.550%, 03/11/2026(1) | | | 11,355,000 | | | | 11,065,074 | | | | | |
| 6.550%, 11/29/2027 | | | | | | | | | | | | |
(Callable 10/29/2027)(1) | | | 10,000,000 | | | | 10,256,646 | | | | | |
| Ashtead Capital, Inc.: | | | | | | | | | | | | |
| 1.500%, 08/12/2026 | | | | | | | | | | | | |
(Callable 07/12/2026)(1)(2) | | | 10,075,000 | | | | 8,803,365 | | | | | |
| 4.000%, 05/01/2028 | | | | | | | | | | | | |
(Callable 07/11/2023)(1)(2) | | | 7,166,000 | | | | 6,638,234 | | | | | |
| 4.250%, 11/01/2029 | | | | | | | | | | | | |
(Callable 11/01/2024)(1)(2) | | | 2,000,000 | | | | 1,815,138 | | | | | |
| AT&T, Inc.: | | | | | | | | | | | | |
| 4.350%, 03/01/2029 | | | | | | | | | | | | |
| (Callable 12/01/2028) | | | 2,425,000 | | | | 2,329,580 | | | | | |
| 4.300%, 02/15/2030 | | | | | | | | | | | | |
| (Callable 11/15/2029) | | | 9,604,000 | | | | 9,116,351 | | | | | |
| 2.250%, 02/01/2032 | | | | | | | | | | | | |
| (Callable 11/01/2031) | | | 8,975,000 | | | | 7,128,838 | | | | | |
| 2.550%, 12/01/2033 | | | | | | | | | | | | |
| (Callable 09/01/2033) | | | 3,778,000 | | | | 2,967,528 | | | | | |
| Avery Dennison Corp., | | | | | | | | | | | | |
| 5.750%, 03/15/2033 | | | | | | | | | | | | |
| (Callable 12/15/2032) | | | 2,000,000 | | | | 2,041,131 | | | | | |
| Becton Dickinson and Co., | | | | | | | | | | | | |
| 3.734%, 12/15/2024 | | | | | | | | | | | | |
| (Callable 09/15/2024) | | | 82,000 | | | | 79,606 | | | | | |
| Bemis Co., Inc., | | | | | | | | | | | | |
| 2.630%, 06/19/2030 | | | | | | | | | | | | |
| (Callable 03/19/2030) | | | 7,025,000 | | | | 5,842,340 | | | | | |
| Berry Global, Inc., | | | | | | | | | | | | |
| 5.500%, 04/15/2028 | | | | | | | | | | | | |
(Callable 03/15/2028)(2) | | | 2,775,000 | | | | 2,730,877 | | | | | |
| Boardwalk Pipelines LP: | | | | | | | | | | | | |
| 5.950%, 06/01/2026 | | | | | | | | | | | | |
| (Callable 03/01/2026) | | | 12,095,000 | | | | 12,187,447 | | | | | |
| 4.800%, 05/03/2029 | | | | | | | | | | | | |
| (Callable 02/03/2029) | | | 1,750,000 | | | | 1,677,916 | | | | | |
| 3.400%, 02/15/2031 | | | | | | | | | | | | |
| (Callable 11/15/2030) | | | 225,000 | | | | 193,271 | | | | | |
| BorgWarner, Inc., | | | | | | | | | | | | |
5.000%, 10/01/2025(2) | | | 475,000 | | | | 466,395 | | | | | |
| Broadcom, Inc.: | | | | | | | | | | | | |
| 3.125%, 01/15/2025 | | | | | | | | | | | | |
| (Callable 11/15/2024) | | | 925,000 | | | | 888,356 | | | | | |
| 3.150%, 11/15/2025 | | | | | | | | | | | | |
| (Callable 10/15/2025) | | | 5,000,000 | | | | 4,749,958 | | | | | |
| 3.875%, 01/15/2027 | | | | | | | | | | | | |
| (Callable 10/15/2026) | | | 5,000,000 | | | | 4,767,954 | | | | | |
| 4.750%, 04/15/2029 | | | | | | | | | | | | |
| (Callable 01/15/2029) | | | 250,000 | | | | 241,849 | | | | | |
| 4.150%, 11/15/2030 | | | | | | | | | | | | |
| (Callable 08/15/2030) | | | 8,000,000 | | | | 7,360,394 | | | | | |
| 2.450%, 02/15/2031 | | | | | | | | | | | | |
(Callable 11/15/2030)(2) | | | 10,000,000 | | | | 8,133,015 | | | | | |
| Broadridge Financial Solutions, Inc., | | | | | | | | | | | | |
| 3.400%, 06/27/2026 | | | | | | | | | | | | |
| (Callable 03/27/2026) | | | 250,000 | | | | 235,367 | | | | | |
| Bunge Limited Finance Corp., | | | | | | | | | | | | |
| 3.750%, 09/25/2027 | | | | | | | | | | | | |
| (Callable 06/25/2027) | | | 5,225,000 | | | | 4,932,446 | | | | | |
The accompanying notes are an integral part of these financial statements.
Baird Intermediate Bond Fund
Schedule of Investments, June 30, 2023 (Unaudited)
Long-Term Investments (cont.)
| | | Principal | | | | | | % of | |
| | | Amount | | | Value | | | Net Assets | |
| Campbell Soup Co., | | | | | | | | | |
| 3.950%, 03/15/2025 | | | | | | | | | |
| (Callable 01/15/2025) | | $ | 8,000,000 | | | $ | 7,774,196 | | | |
| |
| Carlisle Companies, Inc., | | | | | | | | | | | | |
| 3.750%, 12/01/2027 | | | | | | | | | | | | |
| (Callable 09/01/2027) | | | 275,000 | | | | 261,041 | | | | | |
| Carrier Global Corp., | | | | | | | | | | | | |
| 2.242%, 02/15/2025 | | | | | | | | | | | | |
| (Callable 01/15/2025) | | | 1,921,000 | | | | 1,816,800 | | | | | |
| Celanese US Holdings LLC, | | | | | | | | | | | | |
| 6.050%, 03/15/2025 | | | 10,000,000 | | | | 9,959,142 | | | | | |
| CF Industries, Inc., | | | | | | | | | | | | |
4.500%, 12/01/2026(2) | | | 5,950,000 | | | | 5,738,616 | | | | | |
| CH Robinson Worldwide, Inc., | | | | | | | | | | | | |
| 4.200%, 04/15/2028 | | | | | | | | | | | | |
| (Callable 01/15/2028) | | | 12,600,000 | | | | 12,066,861 | | | | | |
| Charter Communications Operating LLC: | | | | | | | | | | | | |
| 4.908%, 07/23/2025 | | | | | | | | | | | | |
| (Callable 04/23/2025) | | | 1,502,000 | | | | 1,472,931 | | | | | |
| 3.750%, 02/15/2028 | | | | | | | | | | | | |
| (Callable 11/15/2027) | | | 6,105,000 | | | | 5,596,629 | | | | | |
| 4.200%, 03/15/2028 | | | | | | | | | | | | |
| (Callable 12/15/2027) | | | 12,070,000 | | | | 11,315,256 | | | | | |
| 2.250%, 01/15/2029 | | | | | | | | | | | | |
| (Callable 11/15/2028) | | | 2,200,000 | | | | 1,831,897 | | | | | |
| 5.050%, 03/30/2029 | | | | | | | | | | | | |
| (Callable 12/30/2028) | | | 4,155,000 | | | | 3,962,073 | | | | | |
| 4.400%, 04/01/2033 | | | | | | | | | | | | |
| (Callable 01/01/2033) | | | 5,500,000 | | | | 4,827,655 | | | | | |
| Cheniere Energy Partners LP, | | | | | | | | | | | | |
| 5.950%, 06/30/2033 | | | | | | | | | | | | |
(Callable 12/30/2032)(2) | | | 4,000,000 | | | | 4,011,640 | | | | | |
| Cigna Corp., | | | | | | | | | | | | |
| 4.500%, 02/25/2026 | | | | | | | | | | | | |
| (Callable 11/27/2025) | | | 300,000 | | | | 293,472 | | | | | |
| CK Hutchison International Ltd., | | | | | | | | | | | | |
| 2.500%, 04/15/2031 | | | | | | | | | | | | |
(Callable 01/15/2031)(1)(2) | | | 5,000,000 | | | | 4,233,750 | | | | | |
| CNH Industrial Capital LLC: | | | | | | | | | | | | |
| 1.875%, 01/15/2026 | | | | | | | | | | | | |
(Callable 12/15/2025)(1) | | | 250,000 | | | | 228,288 | | | | | |
| 4.550%, 04/10/2028 | | | | | | | | | | | | |
(Callable 03/10/2028)(1) | | | 6,800,000 | | | | 6,575,166 | | | | | |
| CNH Industrial NV, | | | | | | | | | | | | |
| 3.850%, 11/15/2027 | | | | | | | | | | | | |
(Callable 08/15/2027)(1) | | | 2,518,000 | | | | 2,365,947 | | | | | |
| Coca-Cola Femsa SAB de CV, | | | | | | | | | | | | |
| 2.750%, 01/22/2030 | | | | | | | | | | | | |
(Callable 10/22/2029)(1) | | | 8,875,000 | | | | 7,801,956 | | | | | |
| Columbia Pipeline Group, Inc., | | | | | | | | | | | | |
| 4.500%, 06/01/2025 | | | | | | | | | | | | |
(Callable 03/01/2025)(1) | | | 880,000 | | | | 858,715 | | | | | |
| CommonSpirit Health, | | | | | | | | | | | | |
| 2.760%, 10/01/2024 | | | | | | | | | | | | |
| (Callable 07/01/2024) | | | 525,000 | | | | 505,381 | | | | | |
| Conagra Brands, Inc.: | | | | | | | | | | | | |
| 4.600%, 11/01/2025 | | | | | | | | | | | | |
| (Callable 09/01/2025) | | | 500,000 | | | | 488,733 | | | | | |
| 8.250%, 09/15/2030 | | | 1,140,000 | | | | 1,307,726 | | | | | |
| Constellation Brands, Inc., | | | | | | | | | | | | |
| 3.500%, 05/09/2027 | | | | | | | | | | | | |
| (Callable 02/09/2027) | | | 3,625,000 | | | | 3,429,891 | | | | | |
| Cox Communications, Inc.: | | | | | | | | | | | | |
| 3.850%, 02/01/2025 | | | | | | | | | | | | |
(Callable 11/01/2024)(2) | | | 2,800,000 | | | | 2,708,704 | | | | | |
| 3.350%, 09/15/2026 | | | | | | | | | | | | |
(Callable 06/15/2026)(2) | | | 2,527,000 | | | | 2,365,875 | | | | | |
| 5.700%, 06/15/2033 | | | | | | | | | | | | |
(Callable 03/15/2033)(2) | | | 2,000,000 | | | | 2,017,103 | | | | | |
| CVS Health Corp.: | | | | | | | | | | | | |
| 3.625%, 04/01/2027 | | | | | | | | | | | | |
| (Callable 02/01/2027) | | | 2,500,000 | | | | 2,373,208 | | | | | |
| 4.300%, 03/25/2028 | | | | | | | | | | | | |
| (Callable 12/25/2027) | | | 5,818,000 | | | | 5,610,993 | | | | | |
| 5.250%, 02/21/2033 | | | | | | | | | | | | |
| (Callable 11/21/2032) | | | 8,550,000 | | | | 8,516,793 | | | | | |
| 5.300%, 06/01/2033 | | | | | | | | | | | | |
| (Callable 03/01/2033) | | | 8,475,000 | | | | 8,461,838 | | | | | |
| CVS Pass-Through Trust: | | | | | | | | | | | | |
| 6.036%, 12/10/2028 | | | 7,246,827 | | | | 7,187,116 | | | | | |
5.773%, 01/10/2033(2) | | | 173,921 | | | | 167,332 | | | | | |
5.926%, 01/10/2034(2) | | | 1,741,509 | | | | 1,651,895 | | | | | |
4.163%, 08/11/2036(2) | | | 2,581,162 | | | | 2,226,879 | | | | | |
| Daimler Finance North America LLC, | | | | | | | | | | | | |
3.650%, 04/07/2027(1)(2) | | | 13,825,000 | | | | 13,065,608 | | | | | |
| Dell International LLC / EMC Corp.: | | | | | | | | | | | | |
| 6.020%, 06/15/2026 | | | | | | | | | | | | |
| (Callable 03/15/2026) | | | 9,000,000 | | | | 9,147,683 | | | | | |
| 4.900%, 10/01/2026 | | | | | | | | | | | | |
| (Callable 08/01/2026) | | | 425,000 | | | | 421,980 | | | | | |
| Dentsply Sirona, | | | | | | | | | | | | |
| 3.250%, 06/01/2030 | | | | | | | | | | | | |
| (Callable 03/01/2030) | | | 10,900,000 | | | | 9,430,570 | | | | | |
| Diageo Capital PLC, | | | | | | | | | | | | |
| 2.000%, 04/29/2030 | | | | | | | | | | | | |
(Callable 01/29/2030)(1) | | | 3,275,000 | | | | 2,759,876 | | | | | |
| Dow Chemical Co., | | | | | | | | | | | | |
| 4.550%, 11/30/2025 | | | | | | | | | | | | |
| (Callable 09/30/2025) | | | 165,000 | | | | 160,777 | | | | | |
| DuPont de Nemours, Inc., | | | | | | | | | | | | |
| 4.493%, 11/15/2025 | | | | | | | | | | | | |
| (Callable 09/15/2025) | | | 4,450,000 | | | | 4,358,098 | | | | | |
| DXC Technology Co., | | | | | | | | | | | | |
| 1.800%, 09/15/2026 | | | | | | | | | | | | |
| (Callable 08/15/2026) | | | 12,000,000 | | | | 10,429,580 | | | | | |
| Ecolab, Inc., | | | | | | | | | | | | |
| 4.800%, 03/24/2030 | | | | | | | | | | | | |
| (Callable 12/24/2029) | | | 10,000,000 | | | | 10,008,810 | | | | | |
| EI du Pont de Nemours and Co., | | | | | | | | | | | | |
| 1.700%, 07/15/2025 | | | | | | | | | | | | |
| (Callable 06/15/2025) | | | 10,000,000 | | | | 9,294,025 | | | | | |
| Element Fleet Management Corp., | | | | | | | | | | | | |
| 6.271%, 06/26/2026 | | | | | | | | | | | | |
(Callable 05/26/2026)(1)(2) | | | 4,000,000 | | | | 3,986,003 | | | | | |
| Emerson Electric Co., | | | | | | | | | | | | |
| 1.950%, 10/15/2030 | | | | | | | | | | | | |
| (Callable 07/15/2030) | | | 12,600,000 | | | | 10,454,103 | | | | | |
| Energy Transfer LP: | | | | | | | | | | | | |
| 4.500%, 04/15/2024 | | | | | | | | | | | | |
| (Callable 03/15/2024) | | | 1,000,000 | | | | 988,505 | | | | | |
| 5.500%, 06/01/2027 | | | | | | | | | | | | |
| (Callable 03/01/2027) | | | 18,231,000 | | | | 18,132,187 | | | | | |
| 5.250%, 04/15/2029 | | | | | | | | | | | | |
| (Callable 01/15/2029) | | | 14,264,000 | | | | 13,925,119 | | | | | |
| 8.250%, 11/15/2029 | | | | | | | | | | | | |
| (Callable 08/15/2029) | | | 1,500,000 | | | | 1,645,596 | | | | | |
| 3.750%, 05/15/2030 | | | | | | | | | | | | |
| (Callable 02/15/2030) | | | 275,000 | | | | 248,135 | | | | | |
The accompanying notes are an integral part of these financial statements.
Baird Intermediate Bond Fund
Schedule of Investments, June 30, 2023 (Unaudited)
Long-Term Investments (cont.)
| | | Principal | | | | | | % of | |
| | | Amount | | | Value | | | Net Assets | |
| Energy Transfer Partners LP, | | | | | | | | | |
| 4.200%, 04/15/2027 | | | | | | | | | |
| (Callable 01/15/2027) | | $ | 475,000 | | | $ | 453,530 | | | |
| |
| EQT Midstream Partners LP, | | | | | | | | | | | | |
| 4.125%, 12/01/2026 | | | | | | | | | | | | |
| (Callable 09/01/2026) | | | 5,000,000 | | | | 4,650,170 | | | | | |
| Equifax, Inc., | | | | | | | | | | | | |
| 2.600%, 12/01/2024 | | | | | | | | | | | | |
| (Callable 11/01/2024) | | | 5,000,000 | | | | 4,761,957 | | | | | |
| Equinix, Inc.: | | | | | | | | | | | | |
| 1.800%, 07/15/2027 | | | | | | | | | | | | |
| (Callable 05/15/2027) | | | 7,000,000 | | | | 6,064,294 | | | | | |
| 3.900%, 04/15/2032 | | | | | | | | | | | | |
| (Callable 01/15/2032) | | | 11,000,000 | | | | 9,871,005 | | | | | |
| Express Scripts Holding Co., | | | | | | | | | | | | |
| 4.500%, 02/25/2026 | | | | | | | | | | | | |
| (Callable 11/27/2025) | | | 18,000,000 | | | | 17,528,580 | | | | | |
| Exxon Mobil Corp., | | | | | | | | | | | | |
| 2.992%, 03/19/2025 | | | | | | | | | | | | |
| (Callable 02/19/2025) | | | 11,250,000 | | | | 10,838,168 | | | | | |
| Ferguson Finance PLC: | | | | | | | | | | | | |
| 4.500%, 10/24/2028 | | | | | | | | | | | | |
(Callable 07/24/2028)(2) | | | 6,230,000 | | | | 5,969,491 | | | | | |
| 4.650%, 04/20/2032 | | | | | | | | | | | | |
(Callable 01/20/2032)(2) | | | 8,000,000 | | | | 7,544,278 | | | | | |
| Fidelity National Information Services, Inc.: | | | | | | | | | | | | |
| 1.650%, 03/01/2028 | | | | | | | | | | | | |
| (Callable 01/01/2028) | | | 5,000,000 | | | | 4,219,343 | | | | | |
| 5.100%, 07/15/2032 | | | | | | | | | | | | |
| (Callable 04/15/2032) | | | 4,750,000 | | | | 4,608,768 | | | | | |
| Fiserv, Inc.: | | | | | | | | | | | | |
| 2.250%, 06/01/2027 | | | | | | | | | | | | |
| (Callable 04/01/2027) | | | 16,000,000 | | | | 14,368,336 | | | | | |
| 4.200%, 10/01/2028 | | | | | | | | | | | | |
| (Callable 07/01/2028) | | | 1,035,000 | | | | 991,325 | | | | | |
| 3.500%, 07/01/2029 | | | | | | | | | | | | |
| (Callable 04/01/2029) | | | 700,000 | | | | 638,915 | | | | | |
| Flex Intermediate Holdco LLC, | | | | | | | | | | | | |
| 3.363%, 06/30/2031 | | | | | | | | | | | | |
(Callable 12/30/2030)(2) | | | 3,515,000 | | | | 2,794,615 | | | | | |
| Flex Ltd.: | | | | | | | | | | | | |
| 3.750%, 02/01/2026 | | | | | | | | | | | | |
| (Callable 01/01/2026) | | | 6,765,000 | | | | 6,429,269 | | | | | |
| 4.875%, 05/12/2030 | | | | | | | | | | | | |
| (Callable 02/12/2030) | | | 4,073,000 | | | | 3,933,676 | | | | | |
| Florida Gas Transmission Co. LLC: | | | | | | | | | | | | |
| 2.550%, 07/01/2030 | | | | | | | | | | | | |
(Callable 04/01/2030)(2) | | | 7,000,000 | | | | 5,829,654 | | | | | |
| 2.300%, 10/01/2031 | | | | | | | | | | | | |
(Callable 07/01/2031)(2) | | | 10,225,000 | | | | 8,132,254 | | | | | |
| Flowers Foods, Inc., | | | | | | | | | | | | |
| 2.400%, 03/15/2031 | | | | | | | | | | | | |
| (Callable 12/15/2030) | | | 300,000 | | | | 244,757 | | | | | |
| Fortune Brands Home & Security, Inc., | | | | | | | | | | | | |
| 3.250%, 09/15/2029 | | | | | | | | | | | | |
| (Callable 06/15/2029) | | | 2,725,000 | | | | 2,382,321 | | | | | |
| Freeport-McMoRan, Inc., | | | | | | | | | | | | |
| 5.400%, 11/14/2034 | | | | | | | | | | | | |
| (Callable 05/14/2034) | | | 691,000 | | | | 667,285 | | | | | |
| Fresenius Medical Care US Finance III, Inc.: | | | | | | | | | | | | |
| 1.875%, 12/01/2026 | | | | | | | | | | | | |
(Callable 11/01/2026)(1)(2) | | | 20,000,000 | | | | 17,251,533 | | | | | |
| 3.750%, 06/15/2029 | | | | | | | | | | | | |
(Callable 03/15/2029)(1)(2) | | | 500,000 | | | | 439,305 | | | | | |
| General Mills, Inc., | | | | | | | | | | | | |
| 4.000%, 04/17/2025 | | | | | | | | | | | | |
| (Callable 02/17/2025) | | | 275,000 | | | | 267,996 | | | | | |
| General Motors Co., | | | | | | | | | | | | |
| 6.125%, 10/01/2025 | | | | | | | | | | | | |
| (Callable 09/01/2025) | | | 5,861,000 | | | | 5,901,034 | | | | | |
| General Motors Financial Co., Inc.: | | | | | | | | | | | | |
| 2.900%, 02/26/2025 | | | | | | | | | | | | |
| (Callable 01/26/2025) | | | 4,000,000 | | | | 3,795,327 | | | | | |
| 6.000%, 01/09/2028 | | | | | | | | | | | | |
| (Callable 12/09/2027) | | | 2,475,000 | | | | 2,494,835 | | | | | |
| Genpact Luxembourg Sarl, | | | | | | | | | | | | |
| 3.375%, 12/01/2024 | | | | | | | | | | | | |
| (Callable 11/01/2024) | | | 7,525,000 | | | | 7,252,758 | | | | | |
| Genpact Luxembourg SARL, | | | | | | | | | | | | |
| 1.750%, 04/10/2026 | | | | | | | | | | | | |
| (Callable 03/10/2026) | | | 21,600,000 | | | | 19,346,558 | | | | | |
| Glencore Funding LLC: | | | | | | | | | | | | |
| 4.125%, 03/12/2024 | | | | | | | | | | | | |
(Callable 02/12/2024)(1)(2) | | | 5,000,000 | | | | 4,939,648 | | | | | |
| 4.000%, 03/27/2027 | | | | | | | | | | | | |
(Callable 12/27/2026)(1)(2) | | | 4,850,000 | | | | 4,622,514 | | | | | |
| 3.875%, 10/27/2027 | | | | | | | | | | | | |
(Callable 07/27/2027)(2) | | | 1,150,000 | | | | 1,073,318 | | | | | |
| 5.400%, 05/08/2028 | | | | | | | | | | | | |
(Callable 04/08/2028)(1)(2) | | | 12,200,000 | | | | 12,079,916 | | | | | |
| 4.875%, 03/12/2029 | | | | | | | | | | | | |
(Callable 12/12/2028)(1)(2) | | | 175,000 | | | | 168,475 | | | | | |
| 2.500%, 09/01/2030 | | | | | | | | | | | | |
(Callable 06/01/2030)(1)(2) | | | 6,343,000 | | | | 5,193,820 | | | | | |
| 2.625%, 09/23/2031 | | | | | | | | | | | | |
(Callable 06/23/2031)(1)(2) | | | 8,350,000 | | | | 6,722,094 | | | | | |
| Global Payments, Inc.: | | | | | | | | | | | | |
| 4.800%, 04/01/2026 | | | | | | | | | | | | |
| (Callable 01/01/2026) | | | 4,535,000 | | | | 4,427,020 | | | | | |
| 2.900%, 05/15/2030 | | | | | | | | | | | | |
| (Callable 02/15/2030) | | | 275,000 | | | | 233,084 | | | | | |
| Graphic Packaging International LLC, | | | | | | | | | | | | |
| 1.512%, 04/15/2026 | | | | | | | | | | | | |
(Callable 03/15/2026)(2) | | | 300,000 | | | | 267,335 | | | | | |
| Hexcel Corp., | | | | | | | | | | | | |
| 4.200%, 02/15/2027 | | | | | | | | | | | | |
| (Callable 11/15/2026) | | | 300,000 | | | | 282,341 | | | | | |
| HP, Inc., | | | | | | | | | | | | |
| 2.200%, 06/17/2025 | | | | | | | | | | | | |
| (Callable 05/17/2025) | | | 18,325,000 | | | | 17,236,136 | | | | | |
| Hubbell, Inc., | | | | | | | | | | | | |
| 3.350%, 03/01/2026 | | | | | | | | | | | | |
| (Callable 12/01/2025) | | | 225,000 | | | | 213,961 | | | | | |
| Hyundai Capital America: | | | | | | | | | | | | |
| 2.650%, 02/10/2025 | | | | | | | | | | | | |
(Callable 01/10/2025)(1)(2) | | | 525,000 | | | | 497,538 | | | | | |
| 1.300%, 01/08/2026 | | | | | | | | | | | | |
(Callable 12/08/2025)(1)(2) | | | 5,825,000 | | | | 5,211,793 | | | | | |
| 1.650%, 09/17/2026 | | | | | | | | | | | | |
(Callable 08/17/2026)(1)(2) | | | 15,000,000 | | | | 13,214,896 | | | | | |
| IDEX Corp., | | | | | | | | | | | | |
| 3.000%, 05/01/2030 | | | | | | | | | | | | |
| (Callable 02/01/2030) | | | 1,100,000 | | | | 964,247 | | | | | |
| Ingersoll-Rand Co., | | | | | | | | | | | | |
| 6.391%, 11/15/2027 | | | 1,195,000 | | | | 1,261,505 | | | | | |
| Ingredion, Inc., | | | | | | | | | | | | |
| 2.900%, 06/01/2030 | | | | | | | | | | | | |
| (Callable 03/01/2030) | | | 550,000 | | | | 475,185 | | | | | |
The accompanying notes are an integral part of these financial statements.
Baird Intermediate Bond Fund
Schedule of Investments, June 30, 2023 (Unaudited)
Long-Term Investments (cont.)
| | | Principal | | | | | | % of | |
| | | Amount | | | Value | | | Net Assets | |
| Intel Corp., | | | | | | | | | |
| 5.200%, 02/10/2033 | | | | | | | | | |
| (Callable 11/10/2032) | | $ | 5,000,000 | | | $ | 5,047,389 | | | |
| |
| International Business Machines Corp., | | | | | | | | | | | | |
| 3.300%, 05/15/2026 | | | 6,900,000 | | | | 6,576,702 | | | | | |
| International Flavors & Fragrances, Inc., | | | | | | | | | | | | |
| 1.832%, 10/15/2027 | | | | | | | | | | | | |
(Callable 08/15/2027)(2) | | | 10,000,000 | | | | 8,432,453 | | | | | |
| JB Hunt Transport Services, Inc., | | | | | | | | | | | | |
| 3.875%, 03/01/2026 | | | | | | | | | | | | |
| (Callable 01/01/2026) | | | 3,500,000 | | | | 3,374,802 | | | | | |
| JBS USA LUX SA / JBS USA Food Co. / | | | | | | | | | | | | |
| JBS USA Finance, Inc., | | | | | | | | | | | | |
| 5.750%, 04/01/2033 | | | | | | | | | | | | |
(Callable 01/01/2033)(2) | | | 8,000,000 | | | | 7,519,624 | | | | | |
| Keurig Dr Pepper, Inc., | | | | | | | | | | | | |
| 3.950%, 04/15/2029 | | | | | | | | | | | | |
| (Callable 02/15/2029) | | | 7,000,000 | | | | 6,592,646 | | | | | |
| Kinder Morgan, Inc.: | | | | | | | | | | | | |
| 5.625%, 11/15/2023 | | | | | | | | | | | | |
(Callable 08/15/2023)(2) | | | 1,000,000 | | | | 999,395 | | | | | |
| 4.300%, 06/01/2025 | | | | | | | | | | | | |
| (Callable 03/01/2025) | | | 300,000 | | | | 292,615 | | | | | |
| 7.800%, 08/01/2031 | | | 15,425,000 | | | | 17,347,471 | | | | | |
| Kraft Heinz Foods Co., | | | | | | | | | | | | |
| 3.875%, 05/15/2027 | | | | | | | | | | | | |
| (Callable 02/15/2027) | | | 8,129,000 | | | | 7,804,782 | | | | | |
| Kyndryl Holdings, Inc.: | | | | | | | | | | | | |
| 2.050%, 10/15/2026 | | | | | | | | | | | | |
| (Callable 09/15/2026) | | | 5,900,000 | | | | 5,091,174 | | | | | |
| 2.700%, 10/15/2028 | | | | | | | | | | | | |
| (Callable 08/15/2028) | | | 2,730,000 | | | | 2,221,362 | | | | | |
| Lear Corp., | | | | | | | | | | | | |
| 3.800%, 09/15/2027 | | | | | | | | | | | | |
| (Callable 06/15/2027) | | | 410,000 | | | | 380,717 | | | | | |
| Lennar Corp., | | | | | | | | | | | | |
| 4.750%, 11/29/2027 | | | | | | | | | | | | |
| (Callable 05/29/2027) | | | 4,500,000 | | | | 4,366,140 | | | | | |
| Lennox International, Inc.: | | | | | | | | | | | | |
| 1.350%, 08/01/2025 | | | | | | | | | | | | |
| (Callable 07/01/2025) | | | 7,000,000 | | | | 6,380,621 | | | | | |
| 1.700%, 08/01/2027 | | | | | | | | | | | | |
| (Callable 06/01/2027) | | | 475,000 | | | | 412,787 | | | | | |
| Lundin Energy Finance BV, | | | | | | | | | | | | |
| 2.000%, 07/15/2026 | | | | | | | | | | | | |
(Callable 06/15/2026)(1)(2) | | | 14,122,000 | | | | 12,682,804 | | | | | |
| LYB International Finance III LLC, | | | | | | | | | | | | |
| 2.250%, 10/01/2030 | | | | | | | | | | | | |
| (Callable 07/01/2030) | | | 5,000,000 | | | | 4,094,197 | | | | | |
| Marathon Petroleum Corp., | | | | | | | | | | | | |
| 5.125%, 12/15/2026 | | | | | | | | | | | | |
| (Callable 09/15/2026) | | | 150,000 | | | | 148,521 | | | | | |
| Marriott International, Inc., | | | | | | | | | | | | |
| 5.000%, 10/15/2027 | | | | | | | | | | | | |
| (Callable 09/15/2027) | | | 10,000,000 | | | | 9,921,425 | | | | | |
| Martin Marietta Materials, Inc., | | | | | | | | | | | | |
| 2.500%, 03/15/2030 | | | | | | | | | | | | |
| (Callable 12/15/2029) | | | 200,000 | | | | 168,983 | | | | | |
| Metropolitan Detroit Area | | | | | | | | | | | | |
| Hospital Services, Inc., | | | | | | | | | | | | |
4.480%, 12/01/2029(2) | | | 8,334,035 | | | | 7,934,033 | | | | | |
| Midwest Connector Capital Co. LLC: | | | | | | | | | | | | |
| 3.900%, 04/01/2024 | | | | | | | | | | | | |
(Callable 03/01/2024)(2) | | | 7,450,000 | | | | 7,293,829 | | | | | |
| 4.625%, 04/01/2029 | | | | | | | | | | | | |
(Callable 01/01/2029)(2) | | | 2,975,000 | | | | 2,718,422 | | | | | |
| Molex Electronic Technologies LLC, | | | | | | | | | | | | |
| 3.900%, 04/15/2025 | | | | | | | | | | | | |
(Callable 01/15/2025)(2) | | | 1,050,000 | | | | 999,140 | | | | | |
| MPLX LP: | | | | | | | | | | | | |
| 4.875%, 06/01/2025 | | | | | | | | | | | | |
| (Callable 03/01/2025) | | | 10,219,000 | | | | 10,026,697 | | | | | |
| 1.750%, 03/01/2026 | | | | | | | | | | | | |
| (Callable 02/01/2026) | | | 300,000 | | | | 272,317 | | | | | |
| 4.125%, 03/01/2027 | | | | | | | | | | | | |
| (Callable 12/01/2026) | | | 275,000 | | | | 263,131 | | | | | |
| 2.650%, 08/15/2030 | | | | | | | | | | | | |
| (Callable 05/15/2030) | | | 3,950,000 | | | | 3,304,775 | | | | | |
| nVent Finance Sarl, | | | | | | | | | | | | |
| 4.550%, 04/15/2028 | | | | | | | | | | | | |
| (Callable 01/15/2028) | | | 250,000 | | | | 233,854 | | | | | |
| NXP BV / NXP Funding LLC / | | | | | | | | | | | | |
| NXP USA, Inc.: | | | | | | | | | | | | |
| 4.875%, 03/01/2024 | | | | | | | | | | | | |
(Callable 02/01/2024)(1) | | | 5,790,000 | | | | 5,748,550 | | | | | |
| 2.700%, 05/01/2025 | | | | | | | | | | | | |
(Callable 04/01/2025)(1) | | | 550,000 | | | | 521,265 | | | | | |
| Occidental Petroleum Corp.: | | | | | | | | | | | | |
| 2.900%, 08/15/2024 | | | | | | | | | | | | |
| (Callable 07/15/2024) | | | 5,000,000 | | | | 4,813,368 | | | | | |
| 7.500%, 10/15/2026 | | | 1,288,000 | | | | 1,318,590 | | | | | |
| 8.875%, 07/15/2030 | | | | | | | | | | | | |
| (Callable 01/15/2030) | | | 1,000,000 | | | | 1,149,380 | | | | | |
| 7.500%, 05/01/2031 | | | 2,000,000 | | | | 2,183,680 | | | | | |
| Ochsner LSU Health System | | | | | | | | | | | | |
| of North Louisiana, | | | | | | | | | | | | |
| 2.510%, 05/15/2031 | | | | | | | | | | | | |
| (Callable 11/15/2030) | | | 5,000,000 | | | | 3,699,233 | | | | | |
| ONEOK, Inc., | | | | | | | | | | | | |
| 2.750%, 09/01/2024 | | | | | | | | | | | | |
| (Callable 08/01/2024) | | | 3,300,000 | | | | 3,188,973 | | | | | |
| Oracle Corp.: | | | | | | | | | | | | |
| 2.800%, 04/01/2027 | | | | | | | | | | | | |
| (Callable 02/01/2027) | | | 11,050,000 | | | | 10,156,374 | | | | | |
| 2.300%, 03/25/2028 | | | | | | | | | | | | |
| (Callable 01/25/2028) | | | 3,000,000 | | | | 2,647,380 | | | | | |
| 6.150%, 11/09/2029 | | | | | | | | | | | | |
| (Callable 09/09/2029) | | | 3,000,000 | | | | 3,124,703 | | | | | |
| Orange SA, | | | | | | | | | | | | |
9.000%, 03/01/2031(1) | | | 4,125,000 | | | | 5,066,456 | | | | | |
| PeaceHealth Obligated Group, | | | | | | | | | | | | |
| 1.375%, 11/15/2025 | | | | | | | | | | | | |
| (Callable 08/15/2025) | | | 550,000 | | | | 495,582 | | | | | |
| Penske Truck Leasing Co.: | | | | | | | | | | | | |
| 2.700%, 11/01/2024 | | | | | | | | | | | | |
(Callable 10/01/2024)(2) | | | 8,000,000 | | | | 7,633,380 | | | | | |
| 3.950%, 03/10/2025 | | | | | | | | | | | | |
(Callable 01/10/2025)(2) | | | 12,000,000 | | | | 11,533,203 | | | | | |
| 4.000%, 07/15/2025 | | | | | | | | | | | | |
(Callable 06/15/2025)(2) | | | 6,500,000 | | | | 6,217,545 | | | | | |
| 5.875%, 11/15/2027 | | | | | | | | | | | | |
(Callable 10/15/2027)(2) | | | 7,200,000 | | | | 7,137,994 | | | | | |
| 5.700%, 02/01/2028 | | | | | | | | | | | | |
(Callable 01/01/2028)(2) | | | 2,900,000 | | | | 2,861,770 | | | | | |
| 5.550%, 05/01/2028 | | | | | | | | | | | | |
(Callable 04/01/2028)(2) | | | 4,425,000 | | | | 4,356,743 | | | | | |
| Phillips 66 Co.: | | | | | | | | | | | | |
| 3.605%, 02/15/2025 | | | | | | | | | | | | |
| (Callable 11/15/2024) | | | 2,000,000 | | | | 1,929,737 | | | | | |
The accompanying notes are an integral part of these financial statements.
Baird Intermediate Bond Fund
Schedule of Investments, June 30, 2023 (Unaudited)
Long-Term Investments (cont.)
| | | Principal | | | | | | % of | |
| | | Amount | | | Value | | | Net Assets | |
| Phillips 66 Co.: (cont.) | | | | | | | | | |
| 3.150%, 12/15/2029 | | | | | | | | | |
| (Callable 09/15/2029) | | $ | 500,000 | | | $ | 436,240 | | | |
| |
| 2.150%, 12/15/2030 | | | | | | | | | | | | |
| (Callable 09/15/2030) | | | 10,000,000 | | | | 8,159,884 | | | | | |
| Premier Health Partners, | | | | | | | | | | | | |
| 2.911%, 11/15/2026 | | | | | | | | | | | | |
| (Callable 05/15/2026) | | | 17,527,000 | | | | 15,469,521 | | | | | |
| Renesas Electronics Corp., | | | | | | | | | | | | |
| 2.170%, 11/25/2026 | | | | | | | | | | | | |
(Callable 10/25/2026)(1)(2) | | | 5,450,000 | | | | 4,793,676 | | | | | |
| Republic Services, Inc., | | | | | | | | | | | | |
| 4.875%, 04/01/2029 | | | | | | | | | | | | |
| (Callable 03/01/2029) | | | 4,350,000 | | | | 4,343,078 | | | | | |
| Rogers Communications, Inc., | | | | | | | | | | | | |
| 3.800%, 03/15/2032 | | | | | | | | | | | | |
(Callable 12/15/2031)(1)(2) | | | 15,000,000 | | | | 13,111,827 | | | | | |
| Roper Technologies, Inc.: | | | | | | | | | | | | |
| 3.800%, 12/15/2026 | | | | | | | | | | | | |
| (Callable 09/15/2026) | | | 1,450,000 | | | | 1,386,347 | | | | | |
| 2.000%, 06/30/2030 | | | | | | | | | | | | |
| (Callable 03/30/2030) | | | 14,675,000 | | | | 11,993,806 | | | | | |
| Ryder System, Inc.: | | | | | | | | | | | | |
| 2.850%, 03/01/2027 | | | | | | | | | | | | |
| (Callable 02/01/2027) | | | 3,775,000 | | | | 3,448,718 | | | | | |
| 5.250%, 06/01/2028 | | | | | | | | | | | | |
| (Callable 05/01/2028) | | | 6,000,000 | | | | 5,924,161 | | | | | |
| Sabine Pass Liquefaction LLC: | | | | | | | | | | | | |
| 5.875%, 06/30/2026 | | | | | | | | | | | | |
| (Callable 12/31/2025) | | | 10,280,000 | | | | 10,364,153 | | | | | |
| 4.500%, 05/15/2030 | | | | | | | | | | | | |
| (Callable 11/15/2029) | | | 10,450,000 | | | | 9,933,375 | | | | | |
| 5.900%, 09/15/2037 | | | | | | | | | | | | |
(Callable 03/15/2037)(2) | | | 3,000,000 | | | | 3,042,978 | | | | | |
| Samarco Mineracao SA, | | | | | | | | | | | | |
5.375%, 09/26/2024(1)(2)(9) | | | 1,675,000 | | | | 1,104,027 | | | | | |
| Sherwin-Williams Co., | | | | | | | | | | | | |
| 3.300%, 02/01/2025 | | | | | | | | | | | | |
| (Callable 11/01/2024) | | | 3,851,000 | | | | 3,719,431 | | | | | |
| Smith & Nephew PLC, | | | | | | | | | | | | |
| 2.032%, 10/14/2030 | | | | | | | | | | | | |
(Callable 07/14/2030)(1) | | | 5,250,000 | | | | 4,247,528 | | | | | |
| Smurfit Kappa Treasury Funding DAC, | | | | | | | | | | | | |
7.500%, 11/20/2025(1) | | | 7,800,000 | | | | 7,969,710 | | | | | |
| Sodexo, Inc., | | | | | | | | | | | | |
| 1.634%, 04/16/2026 | | | | | | | | | | | | |
(Callable 03/16/2026)(1)(2) | | | 15,000,000 | | | | 13,473,615 | | | | | |
| Solvay Finance America LLC, | | | | | | | | | | | | |
| 4.450%, 12/03/2025 | | | | | | | | | | | | |
(Callable 09/03/2025)(1)(2) | | | 16,495,000 | | | | 15,823,833 | | | | | |
| Southern Natural Gas Co. LLC: | | | | | | | | | | | | |
| 7.350%, 02/15/2031 | | | 8,020,000 | | | | 8,533,257 | | | | | |
| 8.000%, 03/01/2032 | | | 2,523,000 | | | | 2,898,652 | | | | | |
| Sprint Capital Corp., | | | | | | | | | | | | |
| 6.875%, 11/15/2028 | | | 5,000,000 | | | | 5,299,967 | | | | | |
| Stanley Black & Decker, Inc., | | | | | | | | | | | | |
| 6.000%, 03/06/2028 | | | | | | | | | | | | |
| (Callable 02/06/2028) | | | 2,000,000 | | | | 2,055,951 | | | | | |
| Steel Dynamics, Inc., | | | | | | | | | | | | |
| 2.800%, 12/15/2024 | | | | | | | | | | | | |
| (Callable 11/15/2024) | | | 325,000 | | | | 310,155 | | | | | |
| Stellantis Finance US, Inc., | | | | | | | | | | | | |
| 1.711%, 01/29/2027 | | | | | | | | | | | | |
(Callable 12/29/2026)(2) | | | 575,000 | | | | 503,837 | | | | | |
| Sysco Corp., | | | | | | | | | | | | |
| 5.950%, 04/01/2030 | | | | | | | | | | | | |
| (Callable 01/01/2030) | | | 4,232,000 | | | | 4,430,168 | | | | | |
| Targa Resources Corp., | | | | | | | | | | | | |
| 5.200%, 07/01/2027 | | | | | | | | | | | | |
| (Callable 06/01/2027) | | | 5,000,000 | | | | 4,908,910 | | | | | |
| TC PipeLines LP: | | | | | | | | | | | | |
| 4.375%, 03/13/2025 | | | | | | | | | | | | |
(Callable 12/13/2024)(1) | | | 5,500,000 | | | | 5,341,656 | | | | | |
| 3.900%, 05/25/2027 | | | | | | | | | | | | |
(Callable 02/25/2027)(1) | | | 13,850,000 | | | | 13,185,668 | | | | | |
| Timken Co.: | | | | | | | | | | | | |
| 4.500%, 12/15/2028 | | | | | | | | | | | | |
| (Callable 09/15/2028) | | | 225,000 | | | | 213,822 | | | | | |
| 4.125%, 04/01/2032 | | | | | | | | | | | | |
| (Callable 01/01/2032) | | | 8,000,000 | | | | 7,166,226 | | | | | |
| T-Mobile USA, Inc.: | | | | | | | | | | | | |
| 3.375%, 04/15/2029 | | | | | | | | | | | | |
| (Callable 04/15/2024) | | | 4,000,000 | | | | 3,612,192 | | | | | |
| 3.875%, 04/15/2030 | | | | | | | | | | | | |
| (Callable 01/15/2030) | | | 23,206,000 | | | | 21,378,959 | | | | | |
| Toll Road Investors Partnership II LP: | | | | | | | | | | | | |
| 0.000%, 02/15/2026 | | | | | | | | | | | | |
(Insured by NATL)(1)(2) | | | 5,000,000 | | | | 4,155,375 | | | | | |
| 0.000%, 02/15/2028 | | | | | | | | | | | | |
(Insured by NATL)(1)(2) | | | 750,000 | | | | 543,337 | | | | | |
| TransCanada PipeLines Ltd., | | | | | | | | | | | | |
5.600%, 03/31/2034(1) | | | 1,335,000 | | | | 1,323,516 | | | | | |
| Transcontinental Gas Pipe Line Co. LLC, | | | | | | | | | | | | |
| 7.250%, 12/01/2026 | | | 4,748,000 | | | | 4,939,382 | | | | | |
| Triton Container International Ltd.: | | | | | | | | | | | | |
0.800%, 08/01/2023(1)(2) | | | 6,575,000 | | | | 6,544,750 | | | | | |
| 2.050%, 04/15/2026 | | | | | | | | | | | | |
(Callable 03/15/2026)(1)(2) | | | 10,000,000 | | | | 8,729,300 | | | | | |
| TSMC Arizona Corp., | | | | | | | | | | | | |
| 2.500%, 10/25/2031 | | | | | | | | | | | | |
(Callable 07/25/2031)(1) | | | 8,175,000 | | | | 6,853,358 | | | | | |
| Tyson Foods, Inc., | | | | | | | | | | | | |
| 4.000%, 03/01/2026 | | | | | | | | | | | | |
| (Callable 01/01/2026) | | | 3,000,000 | | | | 2,898,917 | | | | | |
| Vale Overseas Ltd.: | | | | | | | | | | | | |
| 3.750%, 07/08/2030 | | | | | | | | | | | | |
(Callable 04/08/2030)(1) | | | 9,500,000 | | | | 8,364,253 | | | | | |
| 6.125%, 06/12/2033 | | | | | | | | | | | | |
(Callable 03/12/2033)(1) | | | 20,000,000 | | | | 20,035,800 | | | | | |
| Valero Energy Corp., | | | | | | | | | | | | |
| 2.150%, 09/15/2027 | | | | | | | | | | | | |
| (Callable 07/15/2027) | | | 300,000 | | | | 265,708 | | | | | |
| Var Energi ASA, | | | | | | | | | | | | |
| 5.000%, 05/18/2027 | | | | | | | | | | | | |
(Callable 04/18/2027)(1)(2) | | | 10,000,000 | | | | 9,486,962 | | | | | |
| Verisk Analytics, Inc., | | | | | | | | | | | | |
| 4.125%, 03/15/2029 | | | | | | | | | | | | |
| (Callable 12/15/2028) | | | 3,000,000 | | | | 2,863,709 | | | | | |
| Verizon Communications, Inc.: | | | | | | | | | | | | |
| 4.125%, 03/16/2027 | | | 3,196,000 | | | | 3,103,133 | | | | | |
| 3.000%, 03/22/2027 | | | | | | | | | | | | |
| (Callable 01/22/2027) | | | 13,000,000 | | | | 12,130,441 | | | | | |
| 2.100%, 03/22/2028 | | | | | | | | | | | | |
| (Callable 01/22/2028) | | | 5,750,000 | | | | 5,051,218 | | | | | |
| 4.329%, 09/21/2028 | | | 2,351,000 | | | | 2,266,373 | | | | | |
| 4.016%, 12/03/2029 | | | | | | | | | | | | |
| (Callable 09/03/2029) | | | 5,628,000 | | | | 5,269,404 | | | | | |
| 2.355%, 03/15/2032 | | | | | | | | | | | | |
| (Callable 12/15/2031) | | | 2,309,000 | | | | 1,857,093 | | | | | |
The accompanying notes are an integral part of these financial statements.
Baird Intermediate Bond Fund
Schedule of Investments, June 30, 2023 (Unaudited)
Long-Term Investments (cont.)
| | | Principal | | | | | | % of | |
| | | Amount | | | Value | | | Net Assets | |
| Viterra Finance BV: | | | | | | | | | |
| 2.000%, 04/21/2026 | | | | | | | | | |
(Callable 03/21/2026)(1)(2) | | $ | 25,000,000 | | | $ | 22,325,559 | | | | |
| 4.900%, 04/21/2027 | | | | | | | | | | | |
(Callable 03/21/2027)(1)(2) | | | 10,500,000 | | | | 10,105,028 | | | | |
| 3.200%, 04/21/2031 | | | | | | | | | | | |
(Callable 01/21/2031)(1)(2) | | | 1,605,000 | | | | 1,344,161 | | | | |
| VMware, Inc., | | | | | | | | | | | |
| 1.400%, 08/15/2026 | | | | | | | | | | | |
| (Callable 07/15/2026) | | | 900,000 | | | | 794,738 | | | | |
| Volkswagen Group of | | | | | | | | | | | |
| America Finance LLC, | | | | | | | | | | | |
2.850%, 09/26/2024(1)(2) | | | 8,850,000 | | | | 8,531,818 | | | | |
| Vontier Corp.: | | | | | | | | | | | |
| 1.800%, 04/01/2026 | | | | | | | | | | | |
| (Callable 03/01/2026) | | | 6,300,000 | | | | 5,593,506 | | | | |
| 2.400%, 04/01/2028 | | | | | | | | | | | |
| (Callable 02/01/2028) | | | 16,375,000 | | | | 13,636,609 | | | | |
| Wabtec Corp.: | | | | | | | | | | | |
| 4.375%, 08/15/2023 | | | | | | | | | | | |
| (Callable 07/31/2023) | | | 12,427,000 | | | | 12,402,976 | | | | |
| 3.450%, 11/15/2026 | | | | | | | | | | | |
| (Callable 08/15/2026) | | | 11,050,000 | | | | 10,332,730 | | | | |
| 5.875%, 09/15/2028 | | | | | | | | | | | |
| (Callable 06/15/2028) | | | 1,500,000 | | | | 1,444,836 | | | | |
| Walgreens Boots Alliance, Inc.: | | | | | | | | | | | |
| 3.450%, 06/01/2026 | | | | | | | | | | | |
| (Callable 03/01/2026) | | | 106,000 | | | | 99,422 | | | | |
| 3.200%, 04/15/2030 | | | | | | | | | | | |
| (Callable 01/15/2030) | | | 6,335,000 | | | | 5,387,115 | | | | |
| Warnermedia Holdings, Inc.: | | | | | | | | | | | |
| 6.412%, 03/15/2026 | | | | | | | | | | | |
| (Callable 03/15/2024) | | | 6,000,000 | | | | 6,004,961 | | | | |
| 4.054%, 03/15/2029 | | | | | | | | | | | |
| (Callable 01/15/2029) | | | 6,000,000 | | | | 5,484,720 | | | | |
| Waste Connections, Inc., | | | | | | | | | | | |
| 3.200%, 06/01/2032 | | | | | | | | | | | |
| (Callable 03/01/2032) | | | 875,000 | | | | 762,590 | | | | |
| Western Digital Corp., | | | | | | | | | | | |
| 2.850%, 02/01/2029 | | | | | | | | | | | |
| (Callable 12/01/2028) | | | 10,000,000 | | | | 7,989,686 | | | | |
| Western Midstream Operating LP: | | | | | | | | | | | |
| 4.500%, 03/01/2028 | | | | | | | | | | | |
| (Callable 12/01/2027) | | | 7,195,000 | | | | 6,784,816 | | | | |
| 5.875%, 02/01/2030 | | | | | | | | | | | |
| (Callable 11/01/2029) | | | 2,000,000 | | | | 1,795,696 | | | | |
| Westinghouse Air Brake Technologies Corp., | | | | | | | | | | | |
| 3.200%, 06/15/2025 | | | | | | | | | | | |
| (Callable 05/15/2025) | | | 5,000,000 | | | | 4,745,706 | | | | |
| Williams Companies, Inc., | | | | | | | | | | | |
| 7.500%, 01/15/2031 | | | 3,400,000 | | | | 3,732,944 | | | | |
| Wipro IT Services LLC, | | | | | | | | | | | |
| 1.500%, 06/23/2026 | | | | | | | | | | | |
(Callable 05/23/2026)(1)(2) | | | 9,000,000 | | | | 8,027,309 | | | | |
| Woodside Finance Ltd., | | | | | | | | | | | |
| 4.500%, 03/04/2029 | | | | | | | | | | | |
(Callable 12/04/2028)(1)(2) | | | 10,000,000 | | | | 9,428,917 | | | | |
| WRKCo, Inc.: | | | | | | | | | | | |
| 4.650%, 03/15/2026 | | | | | | | | | | | |
| (Callable 01/15/2026) | | | 275,000 | | | | 266,814 | | | | |
| 3.900%, 06/01/2028 | | | | | | | | | | | |
| (Callable 03/01/2028) | | | 8,275,000 | | | | 7,709,481 | | | | |
| Yara International ASA, | | | | | | | | | | | |
| 3.800%, 06/06/2026 | | | | | | | | | | | |
(Callable 03/06/2026)(1)(2) | | | 1,150,000 | | | | 1,079,958 | | | | |
| Zoetis, Inc., | | | | | | | | | | | |
| 4.500%, 11/13/2025 | | | | | | | | | | | |
| (Callable 08/13/2025) | | | 2,000,000 | | | | 1,967,254 | | | | |
| Total Industrials | | | | | | | | | | | |
| (Cost $1,530,742,820) | | | | | | | 1,412,623,289 | | | | 19.2 | % |
| Utilities | | | | | | | | | | | | |
| Ausgrid Finance Pty Ltd., | | | | | | | | | | | | |
| 4.350%, 08/01/2028 | | | | | | | | | | | | |
(Callable 05/01/2028)(1)(2) | | | 4,400,000 | | | | 4,154,856 | | | | | |
| Avangrid, Inc., | | | | | | | | | | | | |
| 3.800%, 06/01/2029 | | | | | | | | | | | | |
(Callable 03/01/2029)(1) | | | 10,975,000 | | | | 10,001,608 | | | | | |
| DTE Electric Company: | | | | | | | | | | | | |
| 4.875%, 06/01/2028 | | | | | | | | | | | | |
| (Callable 05/01/2028) | | | 18,000,000 | | | | 17,606,373 | | | | | |
| 2.625%, 03/01/2031 | | | | | | | | | | | | |
| (Callable 12/01/2030) | | | 275,000 | | | | 235,065 | | | | | |
| Duquesne Light Holdings, Inc., | | | | | | | | | | | | |
| 2.775%, 01/07/2032 | | | | | | | | | | | | |
(Callable 10/07/2031)(2) | | | 12,400,000 | | | | 9,669,239 | | | | | |
| East Ohio Gas Co., | | | | | | | | | | | | |
| 2.000%, 06/15/2030 | | | | | | | | | | | | |
(Callable 03/15/2030)(2) | | | 550,000 | | | | 443,095 | | | | | |
| EDP Finance BV, | | | | | | | | | | | | |
3.625%, 07/15/2024(1)(2) | | | 275,000 | | | | 267,890 | | | | | |
| Enel Finance International NV: | | | | | | | | | | | | |
| 4.625%, 06/15/2027 | | | | | | | | | | | | |
(Callable 05/15/2027)(1)(2) | | | 10,000,000 | | | | 9,678,729 | | | | | |
3.500%, 04/06/2028(1)(2) | | | 14,675,000 | | | | 13,427,147 | | | | | |
| Entergy Corp., | | | | | | | | | | | | |
| 2.800%, 06/15/2030 | | | | | | | | | | | | |
| (Callable 03/15/2030) | | | 13,250,000 | | | | 11,230,904 | | | | | |
| Eversource Energy, | | | | | | | | | | | | |
| 1.650%, 08/15/2030 | | | | | | | | | | | | |
| (Callable 05/15/2030) | | | 275,000 | | | | 218,048 | | | | | |
| Fells Point Funding Trust, | | | | | | | | | | | | |
| 3.046%, 01/31/2027 | | | | | | | | | | | | |
(Callable 12/31/2026)(2) | | | 325,000 | | | | 298,769 | | | | | |
| FirstEnergy Corp., | | | | | | | | | | | | |
| 2.050%, 03/01/2025 | | | | | | | | | | | | |
| (Callable 02/01/2025) | | | 6,450,000 | | | | 6,036,031 | | | | | |
| ITC Holdings Corp.: | | | | | | | | | | | | |
| 3.350%, 11/15/2027 | | | | | | | | | | | | |
(Callable 08/15/2027)(1) | | | 275,000 | | | | 256,673 | | | | | |
| 2.950%, 05/14/2030 | | | | | | | | | | | | |
(Callable 02/14/2030)(1)(2) | | | 15,717,000 | | | | 13,513,071 | | | | | |
| 5.400%, 06/01/2033 | | | | | | | | | | | | |
(Callable 03/01/2033)(1)(2) | | | 4,275,000 | | | | 4,253,241 | | | | | |
| KeySpan Corp., | | | | | | | | | | | | |
8.000%, 11/15/2030(1) | | | 2,000,000 | | | | 2,211,554 | | | | | |
| National Grid PLC, | | | | | | | | | | | | |
| 5.602%, 06/12/2028 | | | | | | | | | | | | |
(Callable 05/12/2028)(1) | | | 5,000,000 | | | | 5,020,944 | | | | | |
| Oncor Electric Delivery Co. LLC, | | | | | | | | | | | | |
| 2.750%, 05/15/2030 | | | | | | | | | | | | |
| (Callable 02/15/2030) | | | 6,000,000 | | | | 5,260,085 | | | | | |
| Pacific Gas and Electric Co.: | | | | | | | | | | | | |
| 3.450%, 07/01/2025 | | | 259,500 | | | | 245,012 | | | | | |
| 3.750%, 07/01/2028 | | | 259,500 | | | | 232,507 | | | | | |
| Puget Energy, Inc., | | | | | | | | | | | | |
| 2.379%, 06/15/2028 | | | | | | | | | | | | |
| (Callable 04/15/2028) | | | 325,000 | | | | 280,289 | | | | | |
| Total Utilities | | | | | | | | | | | | |
| (Cost $126,303,691) | | | | | | | 114,541,130 | | | | 1.5 | % |
The accompanying notes are an integral part of these financial statements.
Baird Intermediate Bond Fund
Schedule of Investments, June 30, 2023 (Unaudited)
Long-Term Investments (cont.)
| | | Principal | | | | | | % of | |
| | | Amount | | | Value | | | Net Assets | |
| Financials | | | | | | | | | |
| ABN AMRO Bank NV: | | | | | | | | | |
4.750%, 07/28/2025(1)(2) | | $ | 26,048,000 | | | $ | 25,121,993 | | | |
| |
| 1.542%, 06/16/2027 | | | | | | | | | | | | |
| (1 Year CMT Rate + 0.800%) | | | | | | | | | | | | |
(Callable 06/16/2026)(1)(2)(3) | | | 12,200,000 | | | | 10,675,237 | | | | | |
| AerCap Holdings NV: | | | | | | | | | | | | |
| 2.875%, 08/14/2024 | | | | | | | | | | | | |
(Callable 07/14/2024)(1) | | | 5,525,000 | | | | 5,309,481 | | | | | |
| 2.450%, 10/29/2026 | | | | | | | | | | | | |
(Callable 09/29/2026)(1) | | | 10,000,000 | | | | 8,931,507 | | | | | |
| AIA Group Ltd., | | | | | | | | | | | | |
| 3.200%, 03/11/2025 | | | | | | | | | | | | |
(Callable 12/11/2024)(1)(2) | | | 3,000,000 | | | | 2,884,984 | | | | | |
| Air Lease Corp., | | | | | | | | | | | | |
| 4.250%, 02/01/2024 | | | | | | | | | | | | |
| (Callable 01/01/2024) | | | 525,000 | | | | 519,449 | | | | | |
| American Express Co., | | | | | | | | | | | | |
| 4.990%, 05/01/2026 (SOFR + 0.999%) | | | | | | | | | | | | |
(Callable 05/01/2025)(3) | | | 12,000,000 | | | | 11,850,959 | | | | | |
| American International Group, Inc., | | | | | | | | | | | | |
| 5.125%, 03/27/2033 | | | | | | | | | | | | |
| (Callable 12/27/2032) | | | 1,250,000 | | | | 1,220,678 | | | | | |
| AmFam Holdings, Inc., | | | | | | | | | | | | |
| 2.805%, 03/11/2031 | | | | | | | | | | | | |
(Callable 12/11/2030)(2) | | | 9,000,000 | | | | 6,719,847 | | | | | |
| Aon PLC, | | | | | | | | | | | | |
| 3.500%, 06/14/2024 | | | | | | | | | | | | |
| (Callable 03/14/2024) | | | 300,000 | | | | 293,457 | | | | | |
| Australia & New Zealand | | | | | | | | | | | | |
| Banking Group Ltd., | | | | | | | | | | | | |
6.742%, 12/08/2032(1)(2) | | | 5,000,000 | | | | 5,171,057 | | | | | |
| Banco Santander SA: | | | | | | | | | | | | |
5.179%, 11/19/2025(1) | | | 5,000,000 | | | | 4,855,833 | | | | | |
| 1.722%, 09/14/2027 | | | | | | | | | | | | |
| (1 Year CMT Rate + 0.900%) | | | | | | | | | | | | |
(Callable 09/14/2026)(1)(3) | | | 4,500,000 | | | | 3,906,950 | | | | | |
2.749%, 12/03/2030(1) | | | 4,000,000 | | | | 3,134,850 | | | | | |
| 3.225%, 11/22/2032 | | | | | | | | | | | | |
| (1 Year CMT Rate + 1.600%) | | | | | | | | | | | | |
(Callable 08/22/2031)(1)(3) | | | 2,000,000 | | | | 1,584,445 | | | | | |
| Bank of America Corp.: | | | | | | | | | | | | |
| 3.864%, 07/23/2024 | | | | | | | | | | | | |
| (3 Month LIBOR USD + 1.202%) | | | | | | | | | | | | |
(Callable 07/23/2023)(3) | | | 10,300,000 | | | | 10,287,378 | | | | | |
| 3.093%, 10/01/2025 | | | | | | | | | | | | |
| (3 Month LIBOR USD + 1.352%) | | | | | | | | | | | | |
(Callable 10/01/2024)(3) | | | 3,295,000 | | | | 3,169,345 | | | | | |
| 5.080%, 01/20/2027 (SOFR + 1.290%) | | | | | | | | | | | | |
(Callable 01/20/2026)(3) | | | 7,500,000 | | | | 7,384,936 | | | | | |
| 1.734%, 07/22/2027 (SOFR + 0.960%) | | | | | | | | | | | | |
(Callable 07/22/2026)(3) | | | 5,000,000 | | | | 4,463,824 | | | | | |
| 3.824%, 01/20/2028 | | | | | | | | | | | | |
| (3 Month LIBOR USD + 1.837%) | | | | | | | | | | | | |
(Callable 01/20/2027)(3) | | | 375,000 | | | | 354,580 | | | | | |
| 3.705%, 04/24/2028 | | | | | | | | | | | | |
| (3 Month LIBOR USD + 1.774%) | | | | | | | | | | | | |
(Callable 04/24/2027)(3) | | | 5,050,000 | | | | 4,733,149 | | | | | |
| 4.376%, 04/27/2028 (SOFR + 1.580%) | | | | | | | | | | | | |
(Callable 04/27/2027)(3) | | | 7,675,000 | | | | 7,367,880 | | | | | |
| 4.948%, 07/22/2028 (SOFR + 2.040%) | | | | | | | | | | | | |
(Callable 07/22/2027)(3) | | | 10,000,000 | | | | 9,820,349 | | | | | |
| 6.204%, 11/10/2028 (SOFR + 1.990%) | | | | | | | | | | | | |
(Callable 11/10/2027)(3) | | | 5,000,000 | | | | 5,139,245 | | | | | |
| 3.419%, 12/20/2028 | | | | | | | | | | | | |
| (3 Month LIBOR USD + 1.302%) | | | | | | | | | | | | |
(Callable 12/20/2027)(3) | | | 1,689,000 | | | | 1,548,853 | | | | | |
| 3.970%, 03/05/2029 | | | | | | | | | | | | |
| (3 Month LIBOR USD + 1.332%) | | | | | | | | | | | | |
(Callable 03/05/2028)(3) | | | 10,568,000 | | | | 9,894,071 | | | | | |
| 2.087%, 06/14/2029 (SOFR + 1.060%) | | | | | | | | | | | | |
(Callable 06/14/2028)(3) | | | 4,350,000 | | | | 3,711,241 | | | | | |
| 4.271%, 07/23/2029 | | | | | | | | | | | | |
| (3 Month LIBOR USD + 1.572%) | | | | | | | | | | | | |
(Callable 07/23/2028)(3) | | | 5,295,000 | | | | 5,023,860 | | | | | |
| 5.288%, 04/25/2034 (SOFR + 1.910%) | | | | | | | | | | | | |
(Callable 04/25/2033)(3) | | | 10,650,000 | | | | 10,551,021 | | | | | |
| Bank of Ireland Group PLC, | | | | | | | | | | | | |
| 2.029%, 09/30/2027 | | | | | | | | | | | | |
| (1 Year CMT Rate + 1.100%) | | | | | | | | | | | | |
(Callable 09/30/2026)(1)(2)(3) | | | 11,243,000 | | | | 9,718,292 | | | | | |
| Bank of Nova Scotia: | | | | | | | | | | | | |
4.500%, 12/16/2025(1) | | | 7,000,000 | | | | 6,756,773 | | | | | |
5.250%, 06/12/2028(1) | | | 5,000,000 | | | | 4,965,958 | | | | | |
| Banque Federative du Credit Mutuel SA, | | | | | | | | | | | | |
4.753%, 07/13/2027(1)(2) | | | 14,850,000 | | | | 14,466,223 | | | | | |
| Barclays PLC: | | | | | | | | | | | | |
3.650%, 03/16/2025(1) | | | 275,000 | | | | 263,596 | | | | | |
| 3.932%, 05/07/2025 | | | | | | | | | | | | |
| (3 Month LIBOR USD + 1.610%) | | | | | | | | | | | | |
(Callable 05/07/2024)(1)(3) | | | 4,500,000 | | | | 4,397,697 | | | | | |
| 4.337%, 01/10/2028 | | | | | | | | | | | | |
(Callable 01/10/2027)(1) | | | 8,790,000 | | | | 8,281,918 | | | | | |
| 6.224%, 05/09/2034 (SOFR + 2.980%) | | | | | | | | | | | | |
(Callable 05/09/2033)(1)(3) | | | 4,500,000 | | | | 4,482,159 | | | | | |
| BBVA USA, | | | | | | | | | | | | |
| 3.875%, 04/10/2025 | | | | | | | | | | | | |
| (Callable 03/10/2025) | | | 4,700,000 | | | | 4,486,541 | | | | | |
| BNP Paribas SA: | | | | | | | | | | | | |
| 2.819%, 11/19/2025 | | | | | | | | | | | | |
| (3 Month LIBOR USD + 1.111%) | | | | | | | | | | | | |
(Callable 11/19/2024)(1)(2)(3) | | | 5,000,000 | | | | 4,767,454 | | | | | |
4.375%, 05/12/2026(1)(2) | | | 8,288,000 | | | | 7,953,585 | | | | | |
| 1.323%, 01/13/2027 (SOFR + 1.004%) | | | | | | | | | | | | |
(Callable 01/13/2026)(1)(2)(3) | | | 4,250,000 | | | | 3,768,816 | | | | | |
| 5.335%, 06/12/2029 | | | | | | | | | | | | |
| (1 Year CMT Rate + 1.500%) | | | | | | | | | | | | |
(Callable 06/12/2028)(1)(2)(3) | | | 5,000,000 | | | | 4,931,109 | | | | | |
| 2.159%, 09/15/2029 (SOFR + 1.218%) | | | | | | | | | | | | |
(Callable 09/15/2028)(1)(2)(3) | | | 2,000,000 | | | | 1,665,487 | | | | | |
| 2.871%, 04/19/2032 (SOFR + 1.387%) | | | | | | | | | | | | |
(Callable 04/19/2031)(1)(2)(3) | | | 3,000,000 | | | | 2,457,132 | | | | | |
| 3.132%, 01/20/2033 (SOFR + 1.561%) | | | | | | | | | | | | |
(Callable 01/20/2032)(1)(2)(3) | | | 7,000,000 | | | | 5,744,301 | | | | | |
| Boston Properties LP, | | | | | | | | | | | | |
| 3.200%, 01/15/2025 | | | | | | | | | | | | |
| (Callable 10/15/2024) | | | 12,400,000 | | | | 11,761,867 | | | | | |
| BPCE SA: | | | | | | | | | | | | |
5.700%, 10/22/2023(1)(2) | | | 5,675,000 | | | | 5,650,211 | | | | | |
4.625%, 07/11/2024(1)(2) | | | 10,500,000 | | | | 10,260,109 | | | | | |
4.875%, 04/01/2026(1)(2) | | | 3,386,000 | | | | 3,242,103 | | | | | |
| 3.116%, 10/19/2032 (SOFR + 1.730%) | | | | | | | | | | | | |
(Callable 10/19/2031)(1)(2)(3) | | | 11,500,000 | | | | 8,876,007 | | | | | |
| 5.748%, 07/19/2033 (SOFR + 2.865%) | | | | | | | | | | | | |
(Callable 07/19/2032)(1)(2)(3) | | | 6,200,000 | | | | 6,054,079 | | | | | |
The accompanying notes are an integral part of these financial statements.
Baird Intermediate Bond Fund
Schedule of Investments, June 30, 2023 (Unaudited)
Long-Term Investments (cont.)
| | | Principal | | | | | | % of | |
| | | Amount | | | Value | | | Net Assets | |
| Brown & Brown, Inc.: | | | | | | | | | |
| 4.200%, 09/15/2024 | | | | | | | | | |
| (Callable 06/15/2024) | | $ | 10,461,000 | | | $ | 10,215,150 | | | |
| |
| 4.500%, 03/15/2029 | | | | | | | | | | | | |
| (Callable 12/15/2028) | | | 8,747,000 | | | | 8,253,865 | | | | | |
| 2.375%, 03/15/2031 | | | | | | | | | | | | |
| (Callable 12/15/2030) | | | 3,500,000 | | | | 2,821,227 | | | | | |
| 4.200%, 03/17/2032 | | | | | | | | | | | | |
| (Callable 12/17/2031) | | | 10,000,000 | | | | 8,980,267 | | | | | |
| Cantor Fitzgerald LP, | | | | | | | | | | | | |
| 4.500%, 04/14/2027 | | | | | | | | | | | | |
(Callable 01/14/2027)(2) | | | 5,000,000 | | | | 4,669,973 | | | | | |
| Capital One Financial Corp.: | | | | | | | | | | | | |
| 3.650%, 05/11/2027 | | | | | | | | | | | | |
| (Callable 04/11/2027) | | | 3,275,000 | | | | 3,041,870 | | | | | |
| 5.468%, 02/01/2029 (SOFR + 2.080%) | | | | | | | | | | | | |
(Callable 02/01/2028)(3) | | | 3,000,000 | | | | 2,873,887 | | | | | |
| Centene Corp., | | | | | | | | | | | | |
| 2.450%, 07/15/2028 | | | | | | | | | | | | |
| (Callable 05/15/2028) | | | 5,450,000 | | | | 4,658,420 | | | | | |
| Citigroup, Inc.: | | | | | | | | | | | | |
| 3.352%, 04/24/2025 | | | | | | | | | | | | |
| (3 Month LIBOR USD + 1.158%) | | | | | | | | | | | | |
(Callable 04/24/2024)(3) | | | 10,590,000 | | | | 10,352,446 | | | | | |
| 3.887%, 01/10/2028 | | | | | | | | | | | | |
| (3 Month LIBOR USD + 1.825%) | | | | | | | | | | | | |
(Callable 01/10/2027)(3) | | | 14,000,000 | | | | 13,266,475 | | | | | |
| 3.520%, 10/27/2028 | | | | | | | | | | | | |
| (3 Month LIBOR USD + 1.413%) | | | | | | | | | | | | |
(Callable 10/27/2027)(3) | | | 3,000,000 | | | | 2,786,254 | | | | | |
| 3.057%, 01/25/2033 (SOFR + 1.351%) | | | | | | | | | | | | |
(Callable 01/25/2032)(3) | | | 10,000,000 | | | | 8,348,747 | | | | | |
| 3.785%, 03/17/2033 (SOFR + 1.939%) | | | | | | | | | | | | |
(Callable 03/17/2032)(3) | | | 7,425,000 | | | | 6,560,040 | | | | | |
| 6.270%, 11/17/2033 (SOFR + 2.338%) | | | | | | | | | | | | |
(Callable 11/17/2032)(3) | | | 5,000,000 | | | | 5,307,086 | | | | | |
| Citizens Bank NA, | | | | | | | | | | | | |
| 2.250%, 04/28/2025 | | | | | | | | | | | | |
| (Callable 03/28/2025) | | | 19,275,000 | | | | 17,431,360 | | | | | |
| Citizens Financial Group, Inc., | | | | | | | | | | | | |
| 2.850%, 07/27/2026 | | | | | | | | | | | | |
| (Callable 04/27/2026) | | | 300,000 | | | | 264,071 | | | | | |
| CNA Financial Corp.: | | | | | | | | | | | | |
| 4.500%, 03/01/2026 | | | | | | | | | | | | |
| (Callable 12/01/2025) | | | 5,370,000 | | | | 5,209,628 | | | | | |
| 3.900%, 05/01/2029 | | | | | | | | | | | | |
| (Callable 02/01/2029) | | | 4,000,000 | | | | 3,670,671 | | | | | |
| 2.050%, 08/15/2030 | | | | | | | | | | | | |
| (Callable 05/15/2030) | | | 875,000 | | | | 699,675 | | | | | |
| CNO Global Funding, | | | | | | | | | | | | |
2.650%, 01/06/2029(2) | | | 15,000,000 | | | | 12,617,839 | | | | | |
| Commonwealth Bank of Australia, | | | | | | | | | | | | |
3.784%, 03/14/2032(1)(2) | | | 20,000,000 | | | | 16,753,861 | | | | | |
| Cooperatieve Rabobank UA: | | | | | | | | | | | | |
4.375%, 08/04/2025(1) | | | 7,700,000 | | | | 7,431,568 | | | | | |
3.750%, 07/21/2026(1) | | | 1,826,000 | | | | 1,704,786 | | | | | |
| 3.649%, 04/06/2028 | | | | | | | | | | | | |
| (1 Year CMT Rate + 1.220%) | | | | | | | | | | | | |
(Callable 04/06/2027)(1)(2)(3) | | | 7,700,000 | | | | 7,128,870 | | | | | |
| Corebridge Financial, Inc., | | | | | | | | | | | | |
| 3.850%, 04/05/2029 | | | | | | | | | | | | |
| (Callable 02/05/2029) | | | 13,825,000 | | | | 12,433,052 | | | | | |
| Credit Agricole SA: | | | | | | | | | | | | |
5.589%, 07/05/2026(1)(2)(8) | | | 8,200,000 | | | | 8,188,010 | | | | | |
| 1.247%, 01/26/2027 (SOFR + 0.892%) | | | | | | | | | | | | |
(Callable 01/26/2026)(1)(2)(3) | | | 4,000,000 | | | | 3,542,806 | | | | | |
| Credit Suisse Group AG: | | | | | | | | | | | | |
| 2.593%, 09/11/2025 (SOFR + 1.560%) | | | | | | | | | | | | |
(Callable 09/11/2024)(1)(2)(3) | | | 12,395,000 | | | | 11,814,554 | | | | | |
| 4.282%, 01/09/2028 | | | | | | | | | | | | |
(Callable 01/09/2027)(1)(2) | | | 500,000 | | | | 462,102 | | | | | |
| 6.442%, 08/11/2028 (SOFR + 3.700%) | | | | | | | | | | | | |
(Callable 08/11/2027)(1)(2)(3) | | | 7,500,000 | | | | 7,527,742 | | | | | |
| 3.869%, 01/12/2029 | | | | | | | | | | | | |
| (3 Month LIBOR USD + 1.410%) | | | | | | | | | | | | |
(Callable 01/12/2028)(1)(2)(3) | | | 250,000 | | | | 225,999 | | | | | |
| Danske Bank A/S: | | | | | | | | | | | | |
| 1.621%, 09/11/2026 | | | | | | | | | | | | |
| (1 Year CMT Rate + 1.350%) | | | | | | | | | | | | |
(Callable 09/11/2025)(1)(2)(3) | | | 5,000,000 | | | | 4,484,943 | | | | | |
| 4.298%, 04/01/2028 | | | | | | | | | | | | |
| (1 Year CMT Rate + 1.750%) | | | | | | | | | | | | |
(Callable 04/01/2027)(1)(2)(3) | | | 25,000,000 | | | | 23,336,178 | | | | | |
| Deutsche Bank AG: | | | | | | | | | | | | |
| 2.222%, 09/18/2024 (SOFR + 2.159%) | | | | | | | | | | | | |
(Callable 09/18/2023)(1)(3) | | | 5,000,000 | | | | 4,936,694 | | | | | |
| 2.311%, 11/16/2027 (SOFR + 1.219%) | | | | | | | | | | | | |
(Callable 11/16/2026)(1)(3) | | | 3,450,000 | | | | 2,964,714 | | | | | |
| 3.035%, 05/28/2032 (SOFR + 1.718%) | | | | | | | | | | | | |
(Callable 05/28/2031)(1)(3) | | | 5,000,000 | | | | 3,937,435 | | | | | |
| Discover Bank, | | | | | | | | | | | | |
| 3.450%, 07/27/2026 | | | | | | | | | | | | |
| (Callable 04/27/2026) | | | 300,000 | | | | 276,123 | | | | | |
| Discover Financial Services: | | | | | | | | | | | | |
| 3.950%, 11/06/2024 | | | | | | | | | | | | |
| (Callable 08/06/2024) | | | 4,200,000 | | | | 4,047,330 | | | | | |
| 3.750%, 03/04/2025 | | | | | | | | | | | | |
| (Callable 12/04/2024) | | | 250,000 | | | | 238,029 | | | | | |
| 4.100%, 02/09/2027 | | | | | | | | | | | | |
| (Callable 11/09/2026) | | | 12,000,000 | | | | 11,132,893 | | | | | |
| 6.700%, 11/29/2032 | | | | | | | | | | | | |
| (Callable 08/29/2032) | | | 6,275,000 | | | | 6,464,712 | | | | | |
| Elevance Health, Inc.: | | | | | | | | | | | | |
| 3.500%, 08/15/2024 | | | | | | | | | | | | |
| (Callable 05/15/2024) | | | 300,000 | | | | 292,275 | | | | | |
| 3.350%, 12/01/2024 | | | | | | | | | | | | |
| (Callable 10/01/2024) | | | 10,225,000 | | | | 9,886,321 | | | | | |
| 2.375%, 01/15/2025 | | | | | | | | | | | | |
| (Callable 12/15/2024) | | | 12,000,000 | | | | 11,406,851 | | | | | |
| Equitable Financial Life Global Funding, | | | | | | | | | | | | |
1.400%, 07/07/2025(2) | | | 225,000 | | | | 204,689 | | | | | |
| Extra Space Storage LP, | | | | | | | | | | | | |
| 5.500%, 07/01/2030 | | | | | | | | | | | | |
| (Callable 05/01/2030) | | | 7,000,000 | | | | 6,942,072 | | | | | |
| Federation des Caisses | | | | | | | | | | | | |
| Desjardins du Quebec: | | | | | | | | | | | | |
2.050%, 02/10/2025(1)(2) | | | 500,000 | | | | 469,211 | | | | | |
5.700%, 03/14/2028(1)(2) | | | 3,275,000 | | | | 3,271,140 | | | | | |
| Fifth Third Bancorp, | | | | | | | | | | | | |
| 4.772%, 07/28/2030 | | | | | | | | | | | | |
| (SOFRINDX + 2.127%) | | | | | | | | | | | | |
(Callable 07/28/2029)(3) | | | 3,000,000 | | | | 2,803,313 | | | | | |
| FirstMerit Bank NA, | | | | | | | | | | | | |
| 4.270%, 11/25/2026 | | | 5,450,000 | | | | 4,913,658 | | | | | |
| Goldman Sachs Group, Inc.: | | | | | | | | | | | | |
| 3.500%, 01/23/2025 | | | | | | | | | | | | |
| (Callable 10/23/2024) | | | 2,000,000 | | | | 1,929,756 | | | | | |
| 3.272%, 09/29/2025 | | | | | | | | | | | | |
| (3 Month LIBOR USD + 1.463%) | | | | | | | | | | | | |
(Callable 09/29/2024)(3) | | | 3,500,000 | | | | 3,381,607 | | | | | |
The accompanying notes are an integral part of these financial statements.
Baird Intermediate Bond Fund
Schedule of Investments, June 30, 2023 (Unaudited)
Long-Term Investments (cont.)
| | | Principal | | | | | | % of | |
| | | Amount | | | Value | | | Net Assets | |
| Goldman Sachs Group, Inc.: (cont.) | | | | | | | | | |
| 1.093%, 12/09/2026 (SOFR + 0.789%) | | | | | | | | | |
(Callable 12/09/2025)(3) | | $ | 2,000,000 | | | $ | 1,782,272 | | | |
| |
| 1.948%, 10/21/2027 (SOFR + 0.913%) | | | | | | | | | | | | |
(Callable 10/21/2026)(3) | | | 15,700,000 | | | | 13,965,589 | | | | | |
| 2.640%, 02/24/2028 (SOFR + 1.114%) | | | | | | | | | | | | |
(Callable 02/24/2027)(3) | | | 2,000,000 | | | | 1,814,689 | | | | | |
| 3.615%, 03/15/2028 (SOFR + 1.846%) | | | | | | | | | | | | |
(Callable 03/15/2027)(3) | | | 26,125,000 | | | | 24,512,354 | | | | | |
| 3.691%, 06/05/2028 | | | | | | | | | | | | |
| (3 Month LIBOR USD + 1.772%) | | | | | | | | | | | | |
(Callable 06/05/2027)(3) | | | 5,025,000 | | | | 4,721,204 | | | | | |
| 4.223%, 05/01/2029 | | | | | | | | | | | | |
| (3 Month LIBOR USD + 1.563%) | | | | | | | | | | | | |
(Callable 05/01/2028)(3) | | | 3,100,000 | | | | 2,927,921 | | | | | |
| 2.383%, 07/21/2032 (SOFR + 1.248%) | | | | | | | | | | | | |
(Callable 07/21/2031)(3) | | | 5,000,000 | | | | 4,004,995 | | | | | |
| Guardian Life Global Funding, | | | | | | | | | | | | |
5.550%, 10/28/2027(2) | | | 15,000,000 | | | | 15,158,149 | | | | | |
| Hartford Financial Services Group, Inc., | | | | | | | | | | | | |
| 2.800%, 08/19/2029 | | | | | | | | | | | | |
| (Callable 05/19/2029) | | | 4,600,000 | | | | 3,959,931 | | | | | |
| Health Care Service Corp. A | | | | | | | | | | | | |
| Mutual Legal Reserve Co., | | | | | | | | | | | | |
| 2.200%, 06/01/2030 | | | | | | | | | | | | |
(Callable 03/01/2030)(2) | | | 10,275,000 | | | | 8,483,209 | | | | | |
| High Street Funding Trust I, | | | | | | | | | | | | |
| 4.111%, 02/15/2028 | | | | | | | | | | | | |
(Callable 11/15/2027)(2) | | | 5,000,000 | | | | 4,648,171 | | | | | |
| HSBC Holdings PLC: | | | | | | | | | | | | |
| 3.803%, 03/11/2025 | | | | | | | | | | | | |
| (3 Month LIBOR USD + 1.473%) | | | | | | | | | | | | |
(Callable 03/11/2024)(1)(3) | | | 3,000,000 | | | | 2,941,462 | | | | | |
| 4.292%, 09/12/2026 | | | | | | | | | | | | |
| (3 Month LIBOR USD + 1.609%) | | | | | | | | | | | | |
(Callable 09/12/2025)(1)(3) | | | 7,485,000 | | | | 7,198,399 | | | | | |
| 2.251%, 11/22/2027 (SOFR + 1.100%) | | | | | | | | | | | | |
(Callable 11/22/2026)(1)(3) | | | 10,000,000 | | | | 8,873,107 | | | | | |
| 3.973%, 05/22/2030 | | | | | | | | | | | | |
| (3 Month LIBOR USD + 1.872%) | | | | | | | | | | | | |
(Callable 05/22/2029)(1)(3) | | | 1,500,000 | | | | 1,346,975 | | | | | |
| Huntington Bancshares, Inc., | | | | | | | | | | | | |
| 4.443%, 08/04/2028 (SOFR + 1.970%) | | | | | | | | | | | | |
(Callable 08/04/2027)(3) | | | 4,837,000 | | | | 4,493,514 | | | | | |
| ING Groep NV, | | | | | | | | | | | | |
| 4.017%, 03/28/2028 (SOFR + 1.830%) | | | | | | | | | | | | |
(Callable 03/28/2027)(1)(3) | | | 3,833,000 | | | | 3,596,131 | | | | | |
| Invesco Finance PLC, | | | | | | | | | | | | |
| 3.750%, 01/15/2026 | | | 300,000 | | | | 289,051 | | | | | |
| Jackson National Life Global Funding, | | | | | | | | | | | | |
5.250%, 04/12/2028(2) | | | 4,000,000 | | | | 3,815,162 | | | | | |
| Jefferies Group LLC: | | | | | | | | | | | | |
| 4.850%, 01/15/2027 | | | 1,700,000 | | | | 1,665,282 | | | | | |
| 6.450%, 06/08/2027 | | | 3,325,000 | | | | 3,432,733 | | | | | |
| John Hancock Life Insurance Co., | | | | | | | | | | | | |
7.375%, 02/15/2024(1)(2) | | | 11,650,000 | | | | 11,727,781 | | | | | |
| JPMorgan Chase & Co.: | | | | | | | | | | | | |
| 2.301%, 10/15/2025 (SOFR + 1.160%) | | | | | | | | | | | | |
(Callable 10/15/2024)(3) | | | 13,000,000 | | | | 12,387,848 | | | | | |
| 2.005%, 03/13/2026 (SOFR + 1.585%) | | | | | | | | | | | | |
(Callable 03/13/2025)(3) | | | 7,625,000 | | | | 7,161,479 | | | | | |
| 2.083%, 04/22/2026 (SOFR + 1.850%) | | | | | | | | | | | | |
(Callable 04/22/2025)(3) | | | 3,000,000 | | | | 2,809,505 | | | | | |
| 1.045%, 11/19/2026 (SOFR + 0.800%) | | | | | | | | | | | | |
(Callable 11/19/2025)(3) | | | 5,000,000 | | | | 4,478,644 | | | | | |
| 1.578%, 04/22/2027 (SOFR + 0.885%) | | | | | | | | | | | | |
(Callable 04/22/2026)(3) | | | 7,000,000 | | | | 6,287,492 | | | | | |
| 1.470%, 09/22/2027 (SOFR + 0.765%) | | | | | | | | | | | | |
(Callable 09/22/2026)(3) | | | 5,000,000 | | | | 4,414,117 | | | | | |
| 3.509%, 01/23/2029 | | | | | | | | | | | | |
| (3 Month LIBOR USD + 0.945%) | | | | | | | | | | | | |
(Callable 01/23/2028)(3) | | | 13,150,000 | | | | 12,155,558 | | | | | |
| 2.522%, 04/22/2031 (SOFR + 2.040%) | | | | | | | | | | | | |
(Callable 04/22/2030)(3) | | | 1,500,000 | | | | 1,268,767 | | | | | |
| 1.953%, 02/04/2032 (SOFR + 1.065%) | | | | | | | | | | | | |
(Callable 02/04/2031)(3) | | | 150,000 | | | | 119,519 | | | | | |
| 2.580%, 04/22/2032 (SOFR + 1.250%) | | | | | | | | | | | | |
(Callable 04/22/2031)(3) | | | 5,000,000 | | | | 4,153,087 | | | | | |
| Kemper Corp., | | | | | | | | | | | | |
| 3.800%, 02/23/2032 | | | | | | | | | | | | |
| (Callable 11/23/2031) | | | 4,000,000 | | | | 3,303,774 | | | | | |
| KeyBank NA, | | | | | | | | | | | | |
| 3.400%, 05/20/2026 | | | 2,200,000 | | | | 1,895,150 | | | | | |
| LeasePlan Corp. NV, | | | | | | | | | | | | |
2.875%, 10/24/2024(1)(2) | | | 10,250,000 | | | | 9,764,539 | | | | | |
| Liberty Mutual Group, Inc., | | | | | | | | | | | | |
4.569%, 02/01/2029(2) | | | 1,559,000 | | | | 1,470,242 | | | | | |
| Life Storage LP: | | | | | | | | | | | | |
| 3.875%, 12/15/2027 | | | | | | | | | | | | |
| (Callable 09/15/2027) | | | 8,000,000 | | | | 7,425,888 | | | | | |
| 4.000%, 06/15/2029 | | | | | | | | | | | | |
| (Callable 03/15/2029) | | | 1,500,000 | | | | 1,359,966 | | | | | |
| Lloyds Bank PLC: | | | | | | | | | | | | |
| 1.627%, 05/11/2027 | | | | | | | | | | | | |
| (1 Year CMT Rate + 0.850%) | | | | | | | | | | | | |
(Callable 05/11/2026)(1)(3) | | | 8,850,000 | | | | 7,827,991 | | | | | |
| 3.750%, 03/18/2028 | | | | | | | | | | | | |
| (1 Year CMT Rate + 1.800%) | | | | | | | | | | | | |
(Callable 03/18/2027)(1)(3) | | | 10,000,000 | | | | 9,233,168 | | | | | |
| M&T Bank Corp., | | | | | | | | | | | | |
| 4.000%, 07/15/2024 | | | | | | | | | | | | |
| (Callable 04/16/2024) | | | 5,000,000 | | | | 4,870,300 | | | | | |
| Macquarie Group Ltd.: | | | | | | | | | | | | |
| 5.108%, 08/09/2026 (SOFR + 2.208%) | | | | | | | | | | | | |
(Callable 08/09/2025)(1)(2)(3) | | | 5,000,000 | | | | 4,927,167 | | | | | |
| 2.691%, 06/23/2032 (SOFR + 1.440%) | | | | | | | | | | | | |
(Callable 06/23/2031)(1)(2)(3) | | | 5,000,000 | | | | 3,940,221 | | | | | |
| 2.871%, 01/14/2033 (SOFR + 1.532%) | | | | | | | | | | | | |
(Callable 01/14/2032)(1)(2)(3) | | | 4,350,000 | | | | 3,474,142 | | | | | |
| 4.442%, 06/21/2033 (SOFR + 2.405%) | | | | | | | | | | | | |
(Callable 06/21/2032)(1)(2)(3) | | | 5,000,000 | | | | 4,458,665 | | | | | |
| Marsh & McLennan Companies, Inc., | | | | | | | | | | | | |
| 2.250%, 11/15/2030 | | | | | | | | | | | | |
| (Callable 08/15/2030) | | | 550,000 | | | | 457,184 | | | | | |
| Massachusetts Mutual Life Insurance Co.: | | | | | | | | | | | | |
7.625%, 11/15/2023(2) | | | 5,769,000 | | | | 5,781,742 | | | | | |
5.625%, 05/15/2033(2) | | | 10,000,000 | | | | 9,860,913 | | | | | |
| MBIA Insurance Corp., | | | | | | | | | | | | |
| 16.830%, 01/15/2033 | | | | | | | | | | | | |
| (3 Month LIBOR USD + 11.260%) | | | | | | | | | | | | |
(Callable 01/15/2028)(2)(9) | | | 500,000 | | | | 15,000 | | | | | |
| Metropolitan Life Insurance Co., | | | | | | | | | | | | |
7.800%, 11/01/2025(2) | | | 390,000 | | | | 401,590 | | | | | |
| Mitsubishi UFJ Financial Group, Inc.: | | | | | | | | | | | | |
2.801%, 07/18/2024(1) | | | 500,000 | | | | 484,211 | | | | | |
2.193%, 02/25/2025(1) | | | 5,000,000 | | | | 4,711,769 | | | | | |
The accompanying notes are an integral part of these financial statements.
Baird Intermediate Bond Fund
Schedule of Investments, June 30, 2023 (Unaudited)
Long-Term Investments (cont.)
| | | Principal | | | | | | % of | |
| | | Amount | | | Value | | | Net Assets | |
| Mitsubishi UFJ Financial Group, Inc.: (cont.) | | | | | | | | | |
| 1.538%, 07/20/2027 | | | | | | | | | |
| (1 Year CMT Rate + 0.750%) | | | | | | | | | |
(Callable 07/20/2026)(1)(3) | | $ | 5,000,000 | | | $ | 4,412,824 | | | |
| |
| 5.354%, 09/13/2028 | | | | | | | | | | | | |
| (1 Year CMT Rate + 1.900%) | | | | | | | | | | | | |
(Callable 09/13/2027)(1)(3) | | | 5,000,000 | | | | 4,962,473 | | | | | |
| 2.494%, 10/13/2032 | | | | | | | | | | | | |
| (1 Year CMT Rate + 0.970%) | | | | | | | | | | | | |
(Callable 10/13/2031)(1)(3) | | | 6,000,000 | | | | 4,823,575 | | | | | |
| Mizuho Financial Group, Inc.: | | | | | | | | | | | | |
4.600%, 03/27/2024(1)(2) | | | 7,000,000 | | | | 6,906,547 | | | | | |
| 3.922%, 09/11/2024 | | | | | | | | | | | | |
| (3 Month LIBOR USD + 1.262%) | | | | | | | | | | | | |
(Callable 09/11/2023)(1)(3) | | | 3,000,000 | | | | 2,985,720 | | | | | |
| 5.414%, 09/13/2028 | | | | | | | | | | | | |
| (1 Year CMT Rate + 2.050%) | | | | | | | | | | | | |
(Callable 09/13/2027)(1)(3) | | | 7,000,000 | | | | 6,944,394 | | | | | |
| Morgan Stanley: | | | | | | | | | | | | |
| 2.188%, 04/28/2026 (SOFR + 1.990%) | | | | | | | | | | | | |
(Callable 04/28/2025)(3) | | | 10,000,000 | | | | 9,387,079 | | | | | |
| 3.125%, 07/27/2026 | | | 4,750,000 | | | | 4,448,108 | | | | | |
| 6.296%, 10/18/2028 (SOFR + 2.240%) | | | | | | | | | | | | |
(Callable 10/18/2027)(3) | | | 15,000,000 | | | | 15,413,253 | | | | | |
| 3.622%, 04/01/2031 (SOFR + 3.120%) | | | | | | | | | | | | |
(Callable 04/01/2030)(3) | | | 525,000 | | | | 473,073 | | | | | |
| 2.239%, 07/21/2032 (SOFR + 1.178%) | | | | | | | | | | | | |
(Callable 07/21/2031)(3) | | | 18,750,000 | | | | 14,902,245 | | | | | |
| 2.511%, 10/20/2032 (SOFR + 1.200%) | | | | | | | | | | | | |
(Callable 10/20/2031)(3) | | | 8,200,000 | | | | 6,623,277 | | | | | |
| National Australia Bank Ltd.: | | | | | | | | | | | | |
3.375%, 01/14/2026(1) | | | 500,000 | | | | 479,164 | | | | | |
2.332%, 08/21/2030(1)(2) | | | 7,850,000 | | | | 6,117,796 | | | | | |
| National Securities Clearing Corp., | | | | | | | | | | | | |
| 5.100%, 11/21/2027 | | | | | | | | | | | | |
(Callable 10/21/2027)(2) | | | 6,825,000 | | | | 6,783,559 | | | | | |
| Nationwide Building Society, | | | | | | | | | | | | |
4.000%, 09/14/2026(1)(2) | | | 20,675,000 | | | | 18,984,607 | | | | | |
| Nationwide Mutual Insurance Co., | | | | | | | | | | | | |
8.250%, 12/01/2031(2) | | | 2,195,000 | | | | 2,466,337 | | | | | |
| NatWest Group PLC: | | | | | | | | | | | | |
| 4.269%, 03/22/2025 | | | | | | | | | | | | |
| (3 Month LIBOR USD + 1.762%) | | | | | | | | | | | | |
(Callable 03/22/2024)(1)(3) | | | 7,454,000 | | | | 7,321,847 | | | | | |
| 5.076%, 01/27/2030 | | | | | | | | | | | | |
| (3 Month LIBOR USD + 1.905%) | | | | | | | | | | | | |
(Callable 01/27/2029)(1)(3) | | | 4,700,000 | | | | 4,482,841 | | | | | |
| 4.445%, 05/08/2030 | | | | | | | | | | | | |
| (3 Month LIBOR USD + 1.871%) | | | | | | | | | | | | |
(Callable 05/08/2029)(1)(3) | | | 6,850,000 | | | | 6,296,199 | | | | | |
| Nomura Holdings, Inc.: | | | | | | | | | | | | |
1.653%, 07/14/2026(1) | | | 13,725,000 | | | | 12,073,822 | | | | | |
3.103%, 01/16/2030(1) | | | 5,000,000 | | | | 4,261,322 | | | | | |
| Pacific Life Global Funding II, | | | | | | | | | | | | |
1.200%, 06/24/2025(2) | | | 550,000 | | | | 501,527 | | | | | |
| Peachtree Corners Funding Trust, | | | | | | | | | | | | |
3.976%, 02/15/2025(2) | | | 6,556,000 | | | | 6,311,067 | | | | | |
| Pine Street Trust I, | | | | | | | | | | | | |
| 4.572%, 02/15/2029 | | | | | | | | | | | | |
(Callable 11/15/2028)(2) | | | 5,000,000 | | | | 4,580,554 | | | | | |
| Principal Financial Group, Inc., | | | | | | | | | | | | |
| 3.100%, 11/15/2026 | | | | | | | | | | | | |
| (Callable 08/15/2026) | | | 850,000 | | | | 784,621 | | | | | |
| Principal Life Global Funding II, | | | | | | | | | | | | |
3.000%, 04/18/2026(2) | | | 7,000,000 | | | | 6,485,226 | | | | | |
| Prologis LP, | | | | | | | | | | | | |
| 4.750%, 06/15/2033 | | | | | | | | | | | | |
| (Callable 03/15/2033) | | | 5,000,000 | | | | 4,884,068 | | | | | |
| Protective Life Corp., | | | | | | | | | | | | |
| 4.300%, 09/30/2028 | | | | | | | | | | | | |
(Callable 06/30/2028)(1)(2) | | | 1,400,000 | | | | 1,300,129 | | | | | |
| Protective Life Global Funding, | | | | | | | | | | | | |
5.209%, 04/14/2026(1)(2) | | | 9,775,000 | | | | 9,620,198 | | | | | |
| Prudential Insurance Co. of America, | | | | | | | | | | | | |
8.300%, 07/01/2025(2) | | | 8,600,000 | | | | 8,909,445 | | | | | |
| Realty Income Corp., | | | | | | | | | | | | |
| 3.875%, 07/15/2024 | | | | | | | | | | | | |
| (Callable 04/15/2024) | | | 300,000 | | | | 293,454 | | | | | |
| Reliance Standard Life Global Funding II, | | | | | | | | | | | | |
2.750%, 01/21/2027(1)(2) | | | 11,775,000 | | | | 10,520,105 | | | | | |
| Sammons Financial Group, Inc., | | | | | | | | | | | | |
| 4.750%, 04/08/2032 | | | | | | | | | | | | |
(Callable 01/08/2032)(2) | | | 14,000,000 | | | | 11,703,445 | | | | | |
| Santander UK Group Holdings PLC: | | | | | | | | | | | | |
| 4.796%, 11/15/2024 | | | | | | | | | | | | |
| (3 Month LIBOR USD + 1.570%) | | | | | | | | | | | | |
(Callable 11/15/2023)(1)(3) | | | 5,000,000 | | | | 4,961,892 | | | | | |
| 6.534%, 01/10/2029 (SOFR + 2.600%) | | | | | | | | | | | | |
(Callable 01/10/2028)(1)(3) | | | 5,000,000 | | | | 5,034,182 | | | | | |
| Santander UK PLC, | | | | | | | | | | | | |
5.000%, 11/07/2023(1)(2) | | | 3,950,000 | | | | 3,923,772 | | | | | |
| SMBC Aviation Capital Finance DAC: | | | | | | | | | | | | |
| 3.550%, 04/15/2024 | | | | | | | | | | | | |
(Callable 03/15/2024)(1)(2) | | | 6,550,000 | | | | 6,412,112 | | | | | |
| 1.900%, 10/15/2026 | | | | | | | | | | | | |
(Callable 09/15/2026)(1)(2) | | | 2,000,000 | | | | 1,747,602 | | | | | |
| Societe Generale SA: | | | | | | | | | | | | |
5.000%, 01/17/2024(1)(2) | | | 3,350,000 | | | | 3,309,437 | | | | | |
2.625%, 01/22/2025(1)(2) | | | 3,355,000 | | | | 3,152,539 | | | | | |
4.250%, 04/14/2025(1)(2) | | | 5,846,000 | | | | 5,573,733 | | | | | |
| 2.226%, 01/21/2026 | | | | | | | | | | | | |
| (1 Year CMT Rate + 1.050%) | | | | | | | | | | | | |
(Callable 01/21/2025)(1)(2)(3) | | | 3,968,000 | | | | 3,684,949 | | | | | |
| 1.488%, 12/14/2026 | | | | | | | | | | | | |
| (1 Year CMT Rate + 1.100%) | | | | | | | | | | | | |
(Callable 12/14/2025)(1)(2)(3) | | | 7,415,000 | | | | 6,524,928 | | | | | |
| 1.792%, 06/09/2027 | | | | | | | | | | | | |
| (1 Year CMT Rate + 1.000%) | | | | | | | | | | | | |
(Callable 06/09/2026)(1)(2)(3) | | | 10,000,000 | | | | 8,741,226 | | | | | |
| 6.446%, 01/10/2029 | | | | | | | | | | | | |
| (1 Year CMT Rate + 2.550%) | | | | | | | | | | | | |
(Callable 01/10/2028)(1)(2)(3) | | | 2,000,000 | | | | 2,002,897 | | | | | |
| Standard Chartered PLC: | | | | | | | | | | | | |
| 2.819%, 01/30/2026 | | | | | | | | | | | | |
| (3 Month LIBOR USD + 1.209%) | | | | | | | | | | | | |
(Callable 01/30/2025)(1)(2)(3) | | | 19,825,000 | | | | 18,692,041 | | | | | |
| 3.971%, 03/30/2026 | | | | | | | | | | | | |
| (1 Year CMT Rate + 1.650%) | | | | | | | | | | | | |
(Callable 03/30/2025)(1)(2)(3) | | | 4,500,000 | | | | 4,300,694 | | | | | |
| 1.456%, 01/14/2027 | | | | | | | | | | | | |
| (1 Year CMT Rate + 1.000%) | | | | | | | | | | | | |
(Callable 01/14/2026)(1)(2)(3) | | | 4,500,000 | | | | 3,985,848 | | | | | |
| 2.608%, 01/12/2028 | | | | | | | | | | | | |
| (1 Year CMT Rate + 1.180%) | | | | | | | | | | | | |
(Callable 01/12/2027)(1)(2)(3) | | | 5,000,000 | | | | 4,426,589 | | | | | |
| State Street Corp., | | | | | | | | | | | | |
| 2.901%, 03/30/2026 (SOFR + 2.600%) | | | | | | | | | | | | |
(Callable 03/30/2025)(3) | | | 275,000 | | | | 262,251 | | | | | |
The accompanying notes are an integral part of these financial statements.
Baird Intermediate Bond Fund
Schedule of Investments, June 30, 2023 (Unaudited)
Long-Term Investments (cont.)
| | | Principal | | | | | | % of | |
| | | Amount | | | Value | | | Net Assets | |
| Stifel Financial Corp.: | | | | | | | | | |
| 4.250%, 07/18/2024 | | $ | 10,139,000 | | | $ | 9,924,956 | | | | |
| 4.000%, 05/15/2030 | | | | | | | | | | | |
| (Callable 02/15/2030) | | | 15,245,000 | | | | 13,004,823 | | | | |
| Sumitomo Mitsui Financial Group, Inc.: | | | | | | | | | | | |
1.474%, 07/08/2025(1) | | | 250,000 | | | | 229,591 | | | | |
5.464%, 01/13/2026(1) | | | 8,100,000 | | | | 8,072,962 | | | | |
3.544%, 01/17/2028(1) | | | 2,094,000 | | | | 1,932,068 | | | | |
| Synchrony Financial: | | | | | | | | | | | |
| 4.250%, 08/15/2024 | | | | | | | | | | | |
| (Callable 05/15/2024) | | | 5,275,000 | | | | 5,085,793 | | | | |
| 4.500%, 07/23/2025 | | | | | | | | | | | |
| (Callable 04/23/2025) | | | 775,000 | | | | 730,614 | | | | |
| 3.700%, 08/04/2026 | | | | | | | | | | | |
| (Callable 05/04/2026) | | | 3,000,000 | | | | 2,691,810 | | | | |
| Toronto-Dominion Bank, | | | | | | | | | | | |
4.456%, 06/08/2032(1) | | | 13,000,000 | | | | 12,336,225 | | | | |
| Trinity Acquisition PLC, | | | | | | | | | | | |
| 4.400%, 03/15/2026 | | | | | | | | | | | |
(Callable 12/15/2025)(1) | | | 1,125,000 | | | | 1,083,826 | | | | |
| Trustage Financial Group, Inc., | | | | | | | | | | | |
| 4.625%, 04/15/2032 | | | | | | | | | | | |
(Callable 01/15/2032)(2) | | | 15,000,000 | | | | 13,000,139 | | | | |
| UBS Group AG: | | | | | | | | | | | |
| 4.490%, 08/05/2025 | | | | | | | | | | | |
| (1 Year CMT Rate + 1.600%) | | | | | | | | | | | |
(Callable 08/05/2024)(1)(2)(3) | | | 5,000,000 | | | | 4,886,856 | | | | |
| 5.711%, 01/12/2027 | | | | | | | | | | | |
| (1 Year CMT Rate + 1.550%) | | | | | | | | | | | |
(Callable 01/12/2026)(1)(2)(3) | | | 12,400,000 | | | | 12,276,587 | | | | |
| 1.494%, 08/10/2027 | | | | | | | | | | | |
| (1 Year CMT Rate + 0.850%) | | | | | | | | | | | |
(Callable 08/10/2026)(1)(2)(3) | | | 5,000,000 | | | | 4,294,156 | | | | |
| 4.751%, 05/12/2028 | | | | | | | | | | | |
| (1 Year CMT Rate + 1.750%) | | | | | | | | | | | |
(Callable 05/12/2027)(1)(2)(3) | | | 1,500,000 | | | | 1,421,623 | | | | |
| Voya Financial, Inc., | | | | | | | | | | | |
| 3.650%, 06/15/2026 | | | 2,910,000 | | | | 2,744,720 | | | | |
| Wells Fargo & Co.: | | | | | | | | | | | |
| 2.406%, 10/30/2025 | | | | | | | | | | | |
| (3 Month LIBOR USD + 1.087%) | | | | | | | | | | | |
(Callable 10/30/2024)(3) | | | 500,000 | | | | 476,104 | | | | |
| 2.164%, 02/11/2026 | | | | | | | | | | | |
| (3 Month LIBOR USD + 1.012%) | | | | | | | | | | | |
(Callable 02/11/2025)(3) | | | 5,000,000 | | | | 4,708,354 | | | | |
| 2.188%, 04/30/2026 (SOFR + 2.000%) | | | | | | | | | | | |
(Callable 04/30/2025)(3) | | | 16,000,000 | | | | 14,990,998 | | | | |
| 3.196%, 06/17/2027 | | | | | | | | | | | |
| (3 Month LIBOR USD + 1.432%) | | | | | | | | | | | |
(Callable 06/17/2026)(3) | | | 600,000 | | | | 563,490 | | | | |
| 3.526%, 03/24/2028 (SOFR + 1.510%) | | | | | | | | | | | |
(Callable 03/24/2027)(3) | | | 15,000,000 | | | | 14,000,241 | | | | |
| 2.393%, 06/02/2028 (SOFR + 2.100%) | | | | | | | | | | | |
(Callable 06/02/2027)(3) | | | 10,864,000 | | | | 9,681,245 | | | | |
| 4.808%, 07/25/2028 (SOFR + 1.980%) | | | | | | | | | | | |
(Callable 07/25/2027)(3) | | | 5,000,000 | | | | 4,887,115 | | | | |
| 5.389%, 04/24/2034 (SOFR + 2.020%) | | | | | | | | | | | |
(Callable 04/24/2033)(3) | | | 5,175,000 | | | | 5,141,952 | | | | |
| Western & Southern Financial Group, Inc., | | | | | | | | | | | |
5.750%, 07/15/2033(2) | | | 4,250,000 | | | | 4,259,584 | | | | |
| Westpac Banking Corp.: | | | | | | | | | | | |
| 2.894%, 02/04/2030 | | | | | | | | | | | |
| (5 Year CMT Rate + 1.350%) | | | | | | | | | | | |
(Callable 02/04/2025)(1)(3) | | | 2,300,000 | | | | 2,148,951 | | | | |
| 5.405%, 08/10/2033 | | | | | | | | | | | |
| (1 Year CMT Rate + 2.680%) | | | | | | | | | | | |
(Callable 08/10/2032)(1)(3) | | | 4,000,000 | | | | 3,789,647 | | | | |
| Willis North America, Inc.: | | | | | | | | | | | |
| 3.600%, 05/15/2024 | | | | | | | | | | | |
| (Callable 03/15/2024) | | | 8,150,000 | | | | 7,951,942 | | | | |
| 4.650%, 06/15/2027 | | | | | | | | | | | |
| (Callable 05/15/2027) | | | 8,000,000 | | | | 7,769,705 | | | | |
| 4.500%, 09/15/2028 | | | | | | | | | | | |
| (Callable 06/15/2028) | | | 8,800,000 | | | | 8,392,356 | | | | |
| 2.950%, 09/15/2029 | | | | | | | | | | | |
| (Callable 06/15/2029) | | | 2,000,000 | | | | 1,720,419 | | | | |
| Total Financials | | | | | | | | | | | |
| (Cost $1,497,597,945) | | | | | | | 1,391,781,285 | | | | 18.7 | % |
| Total Corporate Bonds | | | | | | | | | | | | |
| (Cost $3,154,644,456) | | | | | | | 2,918,945,704 | | | | 39.4 | % |
| Municipal Bonds | | | | | | | | | | | | |
| Alabama Economic Settlement Authority, | | | | | | | | | | | | |
| 3.163%, 09/15/2025 | | | 2,050,000 | | | | 1,989,637 | | | | | |
| City of College Park GA, | | | | | | | | | | | | |
| 5.965%, 01/01/2031 (Insured by NATL) | | | 2,335,000 | | | | 2,396,492 | | | | | |
| County of Hamilton OH, | | | | | | | | | | | | |
| 3.374%, 06/01/2034 (Insured by AGM) | | | 10,000,000 | | | | 8,572,293 | | | | | |
| County of Miami-Dade FL, | | | | | | | | | | | | |
| 2.536%, 10/01/2033 | | | | | | | | | | | | |
| (Callable 10/01/2030) | | | 2,800,000 | | | | 2,225,354 | | | | | |
| Dallas/Fort Worth International Airport, | | | | | | | | | | | | |
| 1.329%, 11/01/2025 | | | 525,000 | | | | 480,260 | | | | | |
| Florida Development Finance Corp., | | | | | | | | | | | | |
| 3.223%, 02/01/2032 | | | | | | | | | | | | |
| (Callable 08/01/2031) (Insured by AGM) | | | 5,250,000 | | | | 4,367,870 | | | | | |
| GBG LLC, | | | | | | | | | | | | |
2.250%, 09/01/2030(2) | | | 869,925 | | | | 741,152 | | | | | |
| Great Lakes Water Authority, | | | | | | | | | | | | |
| 2.315%, 07/01/2031 | | | 2,000,000 | | | | 1,659,104 | | | | | |
| Indiana Finance Authority, | | | | | | | | | | | | |
| 2.683%, 09/15/2023 | | | 200,000 | | | | 198,660 | | | | | |
| Massachusetts Educational | | | | | | | | | | | | |
| Financing Authority: | | | | | | | | | | | | |
| 1.921%, 07/01/2027 | | | 10,000,000 | | | | 8,783,131 | | | | | |
| 2.161%, 07/01/2028 | | | 10,000,000 | | | | 8,648,255 | | | | | |
| New Hampshire Business | | | | | | | | | | | | |
| Finance Authority: | | | | | | | | | | | | |
| 3.250%, 04/01/2028 | | | | | | | | | | | | |
| (Callable 01/01/2028) | | | 7,000,000 | | | | 5,968,036 | | | | | |
| 3.300%, 04/01/2032 | | | | | | | | | | | | |
| (Callable 01/01/2032) | | | 13,600,000 | | | | 10,581,898 | | | | | |
| New Jersey Higher Education | | | | | | | | | | | | |
| Student Assistance Authority: | | | | | | | | | | | | |
| 5.000%, 12/01/2027 | | | 1,600,000 | | | | 1,675,948 | | | | | |
| 5.000%, 12/01/2028 | | | 1,225,000 | | | | 1,296,411 | | | | | |
| 5.000%, 12/01/2028 | | | 1,205,000 | | | | 1,275,246 | | | | | |
| New Jersey Turnpike Authority, | | | | | | | | | | | | |
| 3.223%, 01/01/2035 | | | | | | | | | | | | |
(Callable 07/01/2025)(2) | | | 5,000,000 | | | | 4,451,891 | | | | | |
| New York State Dormitory Authority, | | | | | | | | | | | | |
| 3.000%, 08/01/2036 | | | | | | | | | | | | |
| (Callable 08/01/2031) (Insured by BAM) | | | 3,480,000 | | | | 2,708,026 | | | | | |
| Niagara Area Development Corp.: | | | | | | | | | | | | |
| 3.004%, 05/01/2025 | | | 1,000,000 | | | | 950,064 | | | | | |
| 3.204%, 05/01/2026 | | | 1,995,000 | | | | 1,865,430 | | | | | |
| 3.272%, 05/01/2027 | | | 2,060,000 | | | | 1,897,854 | | | | | |
| 3.372%, 05/01/2028 | | | 2,130,000 | | | | 1,933,684 | | | | | |
| 3.422%, 05/01/2029 | | | 2,200,000 | | | | 1,964,745 | | | | | |
The accompanying notes are an integral part of these financial statements.
Baird Intermediate Bond Fund
Schedule of Investments, June 30, 2023 (Unaudited)
Long-Term Investments (cont.)
| | | Principal | | | | | | % of | |
| | | Amount | | | Value | | | Net Assets | |
| North Carolina Housing Finance Agency, | | | | | | | | | |
| 3.000%, 01/01/2033 | | | | | | | | | |
| (Callable 07/01/2023) | | $ | 85,000 | | | $ | 85,000 | | | | |
| North East Independent School District, | | | | | | | | | | | |
| 5.240%, 08/01/2027 | | | 2,100,000 | | | | 2,120,535 | | | | |
| San Diego Convention Center | | | | | | | | | | | |
| Expansion Financing Authority: | | | | | | | | | | | |
| 1.987%, 04/15/2026 | | | 3,440,000 | | | | 3,139,933 | | | | |
| 2.363%, 04/15/2028 | | | 1,325,000 | | | | 1,174,294 | | | | |
| South Dakota Housing | | | | | | | | | | | |
| Development Authority, | | | | | | | | | | | |
| 2.700%, 11/01/2036 | | | | | | | | | | | |
| (Callable 11/01/2025) | | | 355,000 | | | | 345,697 | | | | |
| Westvaco Corp., | | | | | | | | | | | |
7.670%, 01/15/2027(2) | | | 8,400,000 | | | | 8,771,000 | | | | |
| Total Municipal Bonds | | | | | | | | | | | |
| (Cost $106,058,401) | | | | | | | 92,267,900 | | | | 1.2 | % |
| Residential Mortgage-Backed Securities | | | | | | | | | | | | |
| U.S. Government Agency Issue | | | | | | | | | | | | |
| Federal Gold Loan | | | | | | | | | | | | |
| Mortgage Corp. (FGLMC), | | | | | | | | | | | | |
| 6.000%, 07/01/2028 | | | 1,047 | | | | 1,078 | | | | | |
| Total U.S. Government Agency Issue | | | | | | | | | | | | |
| (Cost $1,027) | | | | | | | 1,078 | | | | 0.0 | % |
| Non-U.S. Government Agency Issues | | | | | | | | | | | | |
| Arroyo Mortgage Trust: | | | | | | | | | | | | |
| Series 2019-2, Class A1, 3.347%, | | | | | | | | | | | | |
04/25/2049 (Callable 07/25/2023)(2)(4) | | | 1,312,301 | | | | 1,210,524 | | | | | |
| Series 2022-1, Class A1A, 2.495%, | | | | | | | | | | | | |
12/25/2056 (Callable 01/25/2025)(2)(7) | | | 19,211,586 | | | | 17,341,571 | | | | | |
| Banc of America Funding Trust, | | | | | | | | | | | | |
| Series 2004-2, Class 1CB1, 5.750%, | | | | | | | | | | | | |
| 09/20/2034 (Callable 11/20/2023) | | | 564,065 | | | | 553,635 | | | | | |
| Bear Stearns ARM Trust, | | | | | | | | | | | | |
| Series 2004-5, Class 2A, 3.783%, | | | | | | | | | | | | |
07/25/2034 (Callable 07/25/2023)(4) | | | 352,761 | | | | 315,280 | | | | | |
| CIM Trust, | | | | | | | | | | | | |
| Series 2023-R4, Class A1, 5.000%, | | | | | | | | | | | | |
05/25/2062 (Callable 04/25/2028)(2)(4) | | | 36,545,327 | | | | 35,288,332 | | | | | |
| CWABS Asset-Backed Certificates Trust, | | | | | | | | | | | | |
| Series 2006-9, Class 1AF3, 5.859%, | | | | | | | | | | | | |
10/25/2046 (Callable 07/25/2023)(4)(6) | | | 99,315 | | | | 102,156 | | | | | |
| FirstKey Homes Trust: | | | | | | | | | | | | |
| Series 2020-SFR2, Class A, 1.266%, | | | | | | | | | | | | |
10/19/2037(2) | | | 40,317,403 | | | | 36,193,997 | | | | | |
| Series 2022-SFR3, Class A, 4.250%, | | | | | | | | | | | | |
07/17/2038(2) | | | 21,775,000 | | | | 20,742,081 | | | | | |
| Series 2021-SFR2, Class A, 1.376%, | | | | | | | | | | | | |
09/17/2038(2) | | | 21,951,542 | | | | 18,990,787 | | | | | |
| Series 2022-SFR1, Class A, 4.145%, | | | | | | | | | | | | |
05/17/2039(2) | | | 21,130,501 | | | | 19,907,311 | | | | | |
| Home Partners of America Trust: | | | | | | | | | | | | |
| Series 2019-1, Class A, 2.908%, | | | | | | | | | | | | |
09/17/2039 (Callable 09/17/2024)(2) | | | 16,425,449 | | | | 14,838,339 | | | | | |
| Series 2021-3, Class A, 2.200%, | | | | | | | | | | | | |
01/17/2041(2) | | | 32,254,409 | | | | 27,336,547 | | | | | |
| IMC Home Equity Loan Trust, | | | | | | | | | | | | |
| Series 1998-1, Class A6, 7.020%, | | | | | | | | | | | | |
06/20/2029(7) | | | 27 | | | | 26 | | | | | |
| J.P. Morgan Alternative Loan Trust, | | | | | | | | | | | | |
| Series 2006-A1, Class 2A1, 4.107%, | | | | | | | | | | | | |
| 03/25/2036 | | | | | | | | | | | | |
(Callable 08/25/2025)(4) | | | 145,045 | | | | 111,966 | | | | | |
| MASTR Alternative Loan Trust, | | | | | | | | | | | | |
| Series 2003-5, Class 4A1, 5.500%, | | | | | | | | | | | | |
| 07/25/2033 (Callable 07/25/2023) | | | 151,784 | | | | 145,546 | | | | | |
| MFA Trust, | | | | | | | | | | | | |
| Series 2022-NQM1, Class A1, 4.112%, | | | | | | | | | | | | |
12/25/2066 (Callable 03/25/2025)(2)(4) | | | 28,901,669 | | | | 26,868,327 | | | | | |
| Mill City Mortgage Loan Trust: | | | | | | | | | | | | |
| Series 2018-3, Class A1, 3.500%, | | | | | | | | | | | | |
08/25/2058 (Callable 12/25/2033)(2)(4) | | | 152,043 | | | | 144,991 | | | | | |
| Series 2019-1, Class A1, 3.250%, | | | | | | | | | | | | |
10/25/2069 (Callable 08/25/2031)(2)(4) | | | 202,656 | | | | 190,599 | | | | | |
| New Residential Mortgage Loan Trust, | | | | | | | | | | | | |
| Series 2017-2A, Class A3, 4.000%, | | | | | | | | | | | | |
03/25/2057 (Callable 09/25/2031)(2)(4) | | | 1,286,070 | | | | 1,197,330 | | | | | |
| RALI Series Trust, | | | | | | | | | | | | |
| Series 2004-QS6, Class A1, 5.000%, | | | | | | | | | | | | |
| 11/25/2023 (Callable 07/25/2023) | | | 1,183 | | | | 1,099 | | | | | |
| Thornburg Mortgage Securities Trust, | | | | | | | | | | | | |
| Series 2003-5, Class 3A, 3.634%, | | | | | | | | | | | | |
10/25/2043 (Callable 07/25/2023)(4) | | | 991,694 | | | | 950,552 | | | | | |
| Towd Point Mortgage Trust: | | | | | | | | | | | | |
| Series 2017-1, Class A1, 2.750%, | | | | | | | | | | | | |
10/25/2056 (Callable 01/25/2030)(2)(4) | | | 1,068,995 | | | | 1,053,155 | | | | | |
| Series 2017-6, Class A1, 2.750%, | | | | | | | | | | | | |
10/25/2057 (Callable 02/25/2033)(2)(4) | | | 35,386 | | | | 33,440 | | | | | |
| Series 2018-6, Class A1A, 3.750%, | | | | | | | | | | | | |
03/25/2058 (Callable 11/25/2031)(2)(4) | | | 125,110 | | | | 120,789 | | | | | |
| Series 2019-1, Class A1, 3.750%, | | | | | | | | | | | | |
03/25/2058 (Callable 07/25/2029)(2)(4) | | | 3,822,257 | | | | 3,576,543 | | | | | |
| Series 2018-4, Class A1, 3.000%, | | | | | | | | | | | | |
06/25/2058 (Callable 06/25/2036)(2)(4) | | | 150,645 | | | | 136,932 | | | | | |
| Series 2019-4, Class A1, 2.900%, | | | | | | | | | | | | |
10/25/2059 (Callable 05/25/2031)(2)(4) | | | 9,526,239 | | | | 8,750,876 | | | | | |
| Series 2020-4, Class A1, 1.750%, | | | | | | | | | | | | |
10/25/2060 (Callable 01/25/2031)(2) | | | 12,314,140 | | | | 10,698,274 | | | | | |
| Series 2022-2, Class A1, 3.750%, | | | | | | | | | | | | |
07/01/2062 (Callable 09/25/2035)(2)(4) | | | 5,946,431 | | | | 5,443,946 | | | | | |
| Series 2022-3, Class A1, 3.750%, | | | | | | | | | | | | |
08/01/2062 (Callable 08/25/2030)(2)(4) | | | 10,367,517 | | | | 9,436,457 | | | | | |
| WaMu Mortgage Pass-Through | | | | | | | | | | | | |
| Certificates Trust: | | | | | | | | | | | | |
| Series 2004-AR3, Class A1, 4.521%, | | | | | | | | | | | | |
06/25/2034 (Callable 07/25/2023)(4) | | | 787,379 | | | | 716,840 | | | | | |
| Series 2004-CB2, Class 3A, 6.000%, | | | | | | | | | | | | |
| 08/25/2034 (Callable 07/25/2023) | | | 994,629 | | | | 974,928 | | | | | |
| Total Non-U.S. Government | | | | | | | | | | | | |
| Agency Issues | | | | | | | | | | | | |
| (Cost $282,906,026) | | | | | | | 263,373,176 | | | | 3.5 | % |
| Total Residential | | | | | | | | | | | | |
| Mortgage-Backed Securities | | | | | | | | | | | | |
| (Cost $282,907,053) | | | | | | | 263,374,254 | | | | 3.5 | % |
| Commercial Mortgage-Backed Securities | | | | | | | | | | | | |
| U.S. Government Agency Issues | | | | | | | | | | | | |
| Freddie Mac Multifamily Structured | | | | | | | | | | | | |
| Pass Through Certificates: | | | | | | | | | | | | |
| Series K062, Class A2, 3.413%, | | | | | | | | | | | | |
| 12/25/2026 | | | 11,274,000 | | | | 10,801,199 | | | | | |
| Series K069, Class A2, 3.187%, | | | | | | | | | | | | |
09/25/2027(4) | | | 1,075,000 | | | | 1,013,930 | | | | | |
| Series K071, Class A2, 3.286%, | | | | | | | | | | | | |
| 11/25/2027 | | | 7,375,000 | | | | 6,974,943 | | | | | |
| Series K076, Class A2, 3.900%, | | | | | | | | | | | | |
| 04/25/2028 | | | 22,525,000 | | | | 21,854,145 | | | | | |
The accompanying notes are an integral part of these financial statements.
Baird Intermediate Bond Fund
Schedule of Investments, June 30, 2023 (Unaudited)
Long-Term Investments (cont.)
| | | Principal | | | | | | % of | |
| | | Amount | | | Value | | | Net Assets | |
| Freddie Mac Multifamily Structured | | | | | | | | | |
| Pass Through Certificates: (cont.) | | | | | | | | | |
| Series K092, Class A2, 3.298%, | | | | | | | | | |
| 04/25/2029 | | $ | 11,943,000 | | | $ | 11,189,594 | | | | |
| Total U.S. Government Agency Issues | | | | | | | | | | | |
| (Cost $53,967,505) | | | | | | | 51,833,811 | | | | 0.7 | % |
| Non-U.S. Government Agency Issues | | | | | | | | | | | | |
| BANK: | | | | | | | | | | | | |
| Series 2017-BNK4, Class A4, 3.625%, | | | | | | | | | | | | |
| 05/15/2050 (Callable 04/15/2027) | | | 575,000 | | | | 527,384 | | | | | |
| Series 2017-BNK8, Class A4, 3.488%, | | | | | | | | | | | | |
| 11/15/2050 (Callable 11/15/2027) | | | 575,000 | | | | 520,237 | | | | | |
| Series 2017-BNK9, Class A4, 3.538%, | | | | | | | | | | | | |
| 11/15/2054 (Callable 12/15/2029) | | | 9,275,000 | | | | 8,507,248 | | | | | |
| Series 2022-BNK44, Class A5, 5.746%, | | | | | | | | | | | | |
11/15/2055 (Callable 11/15/2032)(4) | | | 13,475,000 | | | | 13,956,315 | | | | | |
| Series 2017-BNK5, Class A5, 3.390%, | | | | | | | | | | | | |
| 06/15/2060 (Callable 07/15/2027) | | | 2,665,000 | | | | 2,444,804 | | | | | |
| Series 2017-BNK7, Class ASB, 3.265%, | | | | | | | | | | | | |
| 09/15/2060 (Callable 09/15/2027) | | | 1,042,234 | | | | 990,285 | | | | | |
| Series 2017-BNK7, Class A5, 3.435%, | | | | | | | | | | | | |
| 09/15/2060 (Callable 09/15/2027) | | | 950,000 | | | | 870,092 | | | | | |
| Series 2018-BN10, Class A5, 3.688%, | | | | | | | | | | | | |
| 02/15/2061 (Callable 02/15/2028) | | | 895,000 | | | | 825,382 | | | | | |
| Series 2022-BNK40, Class ASB, 3.394%, | | | | | | | | | | | | |
03/15/2064 (Callable 03/15/2032)(4) | | | 16,205,000 | | | | 14,637,792 | | | | | |
| Benchmark Mortgage Trust, | | | | | | | | | | | | |
| Series 2022-B33, Class ASB, 3.469%, | | | | | | | | | | | | |
| 03/15/2055 (Callable 03/15/2032) | | | 6,407,000 | | | | 5,769,546 | | | | | |
| CD Mortgage Trust: | | | | | | | | | | | | |
| Series 2017-CD6, Class ASB, 3.332%, | | | | | | | | | | | | |
| 11/13/2050 (Callable 11/13/2027) | | | 9,474,577 | | | | 8,960,780 | | | | | |
| Series 2018-CD7, Class A4, 4.279%, | | | | | | | | | | | | |
| 08/15/2051 (Callable 08/15/2028) | | | 2,495,000 | | | | 2,317,276 | | | | | |
| CFCRE Commercial Mortgage Trust, | | | | | | | | | | | | |
| Series 2016-C4, Class ASB, 3.091%, | | | | | | | | | | | | |
| 05/10/2058 (Callable 05/10/2026) | | | 193,956 | | | | 185,802 | | | | | |
| Citigroup Commercial Mortgage Trust: | | | | | | | | | | | | |
| Series 2014-GC23, Class A4, 3.622%, | | | | | | | | | | | | |
| 07/10/2047 (Callable 07/10/2024) | | | 5,285,000 | | | | 5,122,519 | | | | | |
| Series 2015-GC27, Class A5, 3.137%, | | | | | | | | | | | | |
| 02/10/2048 (Callable 01/10/2025) | | | 14,085,576 | | | | 13,427,126 | | | | | |
| Series 2015-GC35, Class A4, 3.818%, | | | | | | | | | | | | |
| 11/10/2048 (Callable 11/10/2025) | | | 15,860,000 | | | | 14,967,607 | | | | | |
| Series 2017-P8, Class A3, 3.203%, | | | | | | | | | | | | |
| 09/15/2050 (Callable 09/15/2027) | | | 2,350,000 | | | | 2,137,958 | | | | | |
| Series 2017-P8, Class A4, 3.465%, | | | | | | | | | | | | |
| 09/15/2050 (Callable 09/15/2027) | | | 350,000 | | | | 319,465 | | | | | |
| Series 2017-C4, Class A3, 3.209%, | | | | | | | | | | | | |
| 10/12/2050 (Callable 11/12/2027) | | | 7,231,105 | | | | 6,661,715 | | | | | |
| COMM Mortgage Trust: | | | | | | | | | | | | |
| Series 2014-CR19, Class A5, 3.796%, | | | | | | | | | | | | |
| 08/10/2047 (Callable 08/10/2024) | | | 2,954,200 | | | | 2,871,302 | | | | | |
| Series 2014-CR21, Class A3, 3.528%, | | | | | | | | | | | | |
| 12/10/2047 (Callable 12/10/2024) | | | 4,136,599 | | | | 3,967,067 | | | | | |
| Series 2013-CR11, Class A4, 4.258%, | | | | | | | | | | | | |
| 08/10/2050 (Callable 10/10/2023) | | | 1,153,309 | | | | 1,151,763 | | | | | |
| Series 2017-COR2, Class A3, 3.510%, | | | | | | | | | | | | |
| 09/10/2050 (Callable 09/10/2027) | | | 16,210,172 | | | | 14,742,592 | | | | | |
| CSAIL Commercial Mortgage Trust: | | | | | | | | | | | | |
| Series 2016-C6, Class A5, 3.090%, | | | | | | | | | | | | |
| 01/15/2049 (Callable 05/15/2026) | | | 7,545,000 | | | | 6,980,104 | | | | | |
| Series 2018-CX12, Class A3, 3.959%, | | | | | | | | | | | | |
| 08/15/2051 (Callable 08/15/2028) | | | 5,025,000 | | | | 4,692,444 | | | | | |
| Series 2021-C20, Class ASB, 2.436%, | | | | | | | | | | | | |
| 03/15/2054 (Callable 03/15/2031) | | | 6,866,000 | | | | 6,000,680 | | | | | |
| GS Mortgage Securities Trust, | | | | | | | | | | | | |
| Series 2018-GS10, Class A5, 4.155%, | | | | | | | | | | | | |
07/10/2051 (Callable 07/10/2028)(4) | | | 9,372,252 | | | | 8,687,560 | | | | | |
| JP Morgan Chase Commercial | | | | | | | | | | | | |
| Mortgage Securities Trust, | | | | | | | | | | | | |
| Series 2016-JP2, Class A4, 2.822%, | | | | | | | | | | | | |
| 08/15/2049 (Callable 07/15/2026) | | | 7,168,000 | | | | 6,514,492 | | | | | |
| JPMBB Commercial Mortgage | | | | | | | | | | | | |
| Securities Trust: | | | | | | | | | | | | |
| Series 2013-C17, Class A3, 3.928%, | | | | | | | | | | | | |
| 01/15/2047 (Callable 01/15/2024) | | | 25,366 | | | | 25,253 | | | | | |
| Series 2014-C23, Class A5, 3.934%, | | | | | | | | | | | | |
| 09/15/2047 (Callable 02/15/2026) | | | 600,000 | | | | 580,147 | | | | | |
| Series 2014-C25, Class ASB, 3.407%, | | | | | | | | | | | | |
| 11/15/2047 (Callable 11/15/2024) | | | 68,950 | | | | 67,301 | | | | | |
| Series 2014-C26, Class A4, 3.494%, | | | | | | | | | | | | |
| 01/15/2048 (Callable 01/15/2025) | | | 14,480,202 | | | | 13,820,226 | | | | | |
| Series 2015-C30, Class A5, 3.822%, | | | | | | | | | | | | |
| 07/15/2048 (Callable 07/15/2025) | | | 250,000 | | | | 235,714 | | | | | |
| Series 2016-C4, Class A3, 3.141%, | | | | | | | | | | | | |
| 12/15/2049 (Callable 04/15/2027) | | | 17,200,000 | | | | 15,552,298 | | | | | |
| JPMCC Commercial | | | | | | | | | | | | |
| Mortgage Securities Trust: | | | | | | | | | | | | |
| Series 2017-JP6, Class A5, 3.490%, | | | | | | | | | | | | |
| 07/15/2050 (Callable 06/15/2027) | | | 18,900,000 | | | | 17,186,558 | | | | | |
| Series 2017-C7, Class A5, 3.409%, | | | | | | | | | | | | |
| 10/15/2050 (Callable 11/15/2027) | | | 5,300,000 | | | | 4,810,473 | | | | | |
| Morgan Stanley Bank of | | | | | | | | | | | | |
| America Merrill Lynch Trust: | | | | | | | | | | | | |
| Series 2014-C16, Class A4, 3.600%, | | | | | | | | | | | | |
| 06/15/2047 (Callable 06/15/2026) | | | 6,742,577 | | | | 6,606,822 | | | | | |
| Series 2015-C27, Class A4, 3.753%, | | | | | | | | | | | | |
| 12/15/2047 (Callable 11/15/2025) | | | 29,745,000 | | | | 28,075,883 | | | | | |
| Series 2015-C25, Class ASB, 3.383%, | | | | | | | | | | | | |
| 10/15/2048 (Callable 09/15/2025) | | | 85,802 | | | | 82,780 | | | | | |
| Series 2016-C29, Class ASB, 3.140%, | | | | | | | | | | | | |
| 05/15/2049 (Callable 05/15/2026) | | | 3,110,483 | | | | 2,970,257 | | | | | |
| Series 2017-C34, Class A4, 3.536%, | | | | | | | | | | | | |
| 11/15/2052 (Callable 10/15/2027) | | | 14,450,000 | | | | 13,215,620 | | | | | |
| Morgan Stanley Capital I Trust: | | | | | | | | | | | | |
| Series 2016-BNK2, Class A4, 3.049%, | | | | | | | | | | | | |
| 11/15/2049 (Callable 11/15/2026) | | | 2,660,000 | | | | 2,419,722 | | | | | |
| Series 2016-UB12, Class A4, 3.596%, | | | | | | | | | | | | |
| 12/15/2049 (Callable 12/15/2026) | | | 9,607,210 | | | | 8,871,153 | | | | | |
| Morgan Stanley Capital I, Inc., | | | | | | | | | | | | |
| Series 2022-L8, Class ASB, 3.794%, | | | | | | | | | | | | |
04/15/2055 (Callable 04/15/2032)(4) | | | 9,422,000 | | | | 8,632,384 | | | | | |
| UBS Commercial Mortgage Trust, | | | | | | | | | | | | |
| Series 2018-C13, Class A3, 4.069%, | | | | | | | | | | | | |
| 10/15/2051 (Callable 10/15/2028) | | | 5,000,000 | | | | 4,707,753 | | | | | |
| Wells Fargo Commercial Mortgage Trust: | | | | | | | | | | | | |
| Series 2014-LC18, Class ASB, 3.244%, | | | | | | | | | | | | |
| 12/15/2047 (Callable 01/15/2025) | | | 4,527,357 | | | | 4,422,450 | | | | | |
| Series 2015-C26, Class ASB, 2.991%, | | | | | | | | | | | | |
| 02/15/2048 (Callable 02/15/2025) | | | 30,537 | | | | 29,743 | | | | | |
| Series 2015-P2, Class ASB, 3.656%, | | | | | | | | | | | | |
| 12/15/2048 (Callable 12/15/2025) | | | 6,138,637 | | | | 5,918,806 | | | | | |
| Series 2015-P2, Class A4, 3.809%, | | | | | | | | | | | | |
| 12/15/2048 (Callable 12/15/2025) | | | 21,269,144 | | | | 20,104,920 | | | | | |
| Series 2017-C40, Class A3, 3.317%, | | | | | | | | | | | | |
| 10/15/2050 (Callable 10/15/2027) | | | 8,800,000 | | | | 8,036,352 | | | | | |
The accompanying notes are an integral part of these financial statements.
Baird Intermediate Bond Fund
Schedule of Investments, June 30, 2023 (Unaudited)
Long-Term Investments (cont.)
| | | Principal | | | | | | % of | |
| | | Amount | | | Value | | | Net Assets | |
| Wells Fargo Commercial | | | | | | | | | |
| Mortgage Trust: (cont.) | | | | | | | | | |
| Series 2019-C50, Class ASB, 3.635%, | | | | | | | | | |
| 05/15/2052 (Callable 05/15/2029) | | $ | 4,100,000 | | | $ | 3,847,752 | | | | |
| Series 2019-C54, Class A4, 3.146%, | | | | | | | | | | | |
| 12/15/2052 (Callable 11/15/2029) | | | 14,625,000 | | | | 12,730,435 | | | | |
| WFRBS Commercial Mortgage Trust: | | | | | | | | | | | |
| Series 2014-C24, Class ASB, 3.324%, | | | | | | | | | | | |
| 11/15/2047 (Callable 11/15/2024) | | | 2,668,483 | | | | 2,601,862 | | | | |
| Series 2014-C24, Class A4, 3.343%, | | | | | | | | | | | |
| 11/15/2047 (Callable 11/15/2024) | | | 250,000 | | | | 239,254 | | | | |
| Total Non-U.S. Government Agency Issues | | | | | | | | | | | |
| (Cost $374,866,294) | | | | | | | 344,549,255 | | | | 4.6 | % |
| Total Commercial Mortgage-Backed Securities | | | | | | | | | | | | |
| (Cost $428,833,799) | | | | | | | 396,383,066 | | | | 5.3 | % |
| Asset Backed Securities | | | | | | | | | | | | |
| DLLAD LLC, | | | | | | | | | | | | |
| Series 2023-1A, Class A3, 4.790%, | | | | | | | | | | | | |
01/20/2028 (Callable 10/20/2027)(2) | | | 29,500,000 | | | | 28,911,962 | | | | | |
| Ford Credit Auto Owner Trust, | | | | | | | | | | | | |
| Series 2018-1, Class A, 3.190%, | | | | | | | | | | | | |
07/15/2031 (Callable 01/15/2025)(2) | | | 12,375,000 | | | | 11,891,119 | | | | | |
| Golden Credit Card Trust, | | | | | | | | | | | | |
| Series 2022-4A, Class A, 4.310%, | | | | | | | | | | | | |
09/15/2027(1)(2) | | | 24,675,000 | | | | 24,106,490 | | | | | |
| Hyundai Auto Lease Securitization Trust, | | | | | | | | | | | | |
| Series 2023-B, Class A3, 5.150%, | | | | | | | | | | | | |
06/15/2026 (Callable 10/15/2025)(2) | | | 25,900,000 | | | | 25,713,525 | | | | | |
| Louisiana Local Government | | | | | | | | | | | | |
| Environmental Facilities & | | | | | | | | | | | | |
| Community Development Authority, | | | | | | | | | | | | |
| 3.615%, 02/01/2029 | | | 25,028,935 | | | | 24,098,575 | | | | | |
| MMAF Equipment Finance LLC, | | | | | | | | | | | | |
| Series 2020-A, Class A3, 0.970%, | | | | | | | | | | | | |
04/09/2027(2) | | | 6,550,000 | | | | 6,111,812 | | | | | |
| Navient Private Education Refi Loan Trust: | | | | | | | | | | | | |
| Series 2021-GA, Class A, 1.580%, | | | | | | | | | | | | |
04/15/2070 (Callable 05/15/2029)(2) | | | 16,033,298 | | | | 13,761,224 | | | | | |
| Series 2022-BA, Class A, 4.160%, | | | | | | | | | | | | |
10/15/2070 (Callable 10/15/2029)(2) | | | 18,037,313 | | | | 17,041,648 | | | | | |
| Nelnet Student Loan Trust: | | | | | | | | | | | | |
| Series 2021-A, Class APT1, 1.360%, | | | | | | | | | | | | |
04/20/2062 (Callable 09/20/2029)(2) | | | 5,203,874 | | | | 4,618,105 | | | | | |
| Series 2021-DA, Class AFX, 1.630%, | | | | | | | | | | | | |
04/20/2062 (Callable 11/20/2031)(2) | | | 1,210,069 | | | | 1,084,835 | | | | | |
| PFS Financing Corp., | | | | | | | | | | | | |
| Series 2020-G, Class A, 0.970%, | | | | | | | | | | | | |
02/15/2026(2) | | | 4,985,000 | | | | 4,823,042 | | | | | |
| SBA Tower Trust, | | | | | | | | | | | | |
| 1.840%, 10/15/2051 | | | | | | | | | | | | |
(Callable 04/15/2026)(2) | | | 16,200,000 | | | | 13,934,109 | | | | | |
| Synchrony Card Funding LLC: | | | | | | | | | | | | |
| Series 2022-A1, Class A, 3.370%, | | | | | | | | | | | | |
| 04/15/2028 (Callable 04/15/2025) | | | 21,075,000 | | | | 20,321,925 | | | | | |
| Series 2022-A2, Class A, 3.860%, | | | | | | | | | | | | |
| 07/15/2028 | | | 13,200,000 | | | | 12,800,810 | | | | | |
| Texas Electric Market | | | | | | | | | | | | |
| Stabilization Funding N LLC, | | | | | | | | | | | | |
4.265%, 08/01/2036(2) | | | 15,873,355 | | | | 15,101,479 | | | | | |
| Towd Point Mortgage Trust, | | | | | | | | | | | | |
| Series 2020-MH1, Class A1, 2.250%, | | | | | | | | | | | | |
02/25/2060 (Callable 07/25/2023)(2)(4) | | | 5,811,155 | | | | 5,399,564 | | | | | |
| Toyota Auto Loan Extended Note Trust, | | | | | | | | | | | | |
| Series 2020-1A, Class A, 1.350%, | | | | | | | | | | | | |
05/25/2033 (Callable 05/25/2025)(2) | | | 225,000 | | | | 207,726 | | | | | |
| Total Asset Backed Securities | | | | | | | | | | | | |
| (Cost $241,368,599) | | | | | | | 229,927,950 | | | | 3.1 | % |
| Total Long-Term Investments | | | | | | | | | | | | |
| (Cost $7,802,003,561) | | | | | | | 7,354,813,561 | | | | 98.9 | % |
| Short-Term Investment | | | | | | | | | | | | |
| | | Shares | | | | | | | | | |
| Money Market Mutual Fund | | | | | | | | | | | | |
| First American Government Obligations | | | | | | | | | | | | |
Fund, Class U, 5.03%(5) | | | 179,998,000 | | | | 179,998,000 | | | | | |
| Total Short-Term Investment | | | | | | | | | | | | |
| (Cost $179,998,000) | | | | | | | 179,998,000 | | | | 2.4 | % |
| Total Investments | | | | | | | | | | | | |
| (Cost $7,982,001,561) | | | | | | | 7,534,811,561 | | | | 101.3 | % |
| Liabilities in Excess of Other Assets | | | | | | | (94,668,337 | ) | | | (1.3 | )% |
| TOTAL NET ASSETS | | | | | | $ | 7,440,143,224 | | | | 100.0 | % |
Notes to Schedule of Investments
AGM – Assured Guaranty Municipal
BAM – Build America Mutual Assurance Co.
NATL – National Public Finance Guarantee Corp.
CMT – Constant Maturity Treasury
LIBOR – London Inter-bank Offered Rate
SOFR – Secured Overnight Financing Rate
SOFRINDX – Secured Overnight Financing Rate Index
(1) | Foreign security. |
(2) | Includes securities exempt from registration under Rule 144A of the Securities Act of 1933. These securities may be resold in transactions exempt from registration to qualified institutional buyers. At June 30, 2023, the value of these securities totaled $1,490,971,995, which represented 20.04% of total net assets. |
(3) | Variable rate security based on a reference index and spread. The rate reported is the rate as of the last reset date in effect as of June 30, 2023. |
(4) | Variable rate security. The coupon is based on an underlying pool of loans. The rate reported is the rate in effect as of June 30, 2023. |
(5) | Seven-day yield. |
(6) | Security that, on the last payment date, missed a partial principal or interest payment. |
(7) | Step-up bond; the interest rate shown is the rate in effect as of June 30, 2023. |
(8) | Security or a portion of the security, purchased on a when-issued or delayed delivery basis. |
(9) | Security in default. |
The accompanying notes are an integral part of these financial statements.
Baird Intermediate Bond Fund
Schedule of Investments, June 30, 2023 (Unaudited)
Summary of Fair Value Exposure at June 30, 2023 (Unaudited)
The Fund has adopted authoritative fair valuation accounting standards which establish a definition of fair value and set out a hierarchy for measuring fair value. These standards require additional disclosures about the various inputs and valuation techniques used to develop the measurements of fair value and a discussion on changes in valuation techniques and related inputs during the period. These standards define fair value as the price that would be received to sell an asset or paid to transfer a liability in an orderly transaction between market participants at the measurement date.
The fair value hierarchy is organized into three levels based upon the assumptions (referred to as “inputs”) used in pricing the asset or liability. These standards state that “observable inputs” reflect the assumptions market participants would use in pricing the asset or liability based on market data obtained from independent sources and “unobservable inputs” reflect an entity’s own assumptions about the assumptions market participants would use in pricing the asset or liability. These inputs are summarized into three broad levels and described below:
Level 1 – Quoted prices (unadjusted) in active markets for identical assets or liabilities that the reporting entity can access at the measurement date.
Level 2 – Inputs other than quoted prices included within Level 1 that are observable for the asset or liability, either directly or indirectly.
Level 3 – Unobservable inputs for the asset or liability.
The inputs or methodology used for valuing securities are not necessarily an indication of the risk associated with investing in those securities.
The following is a summary of the inputs used to value the Fund’s investments as of June 30, 2023:
| | | Level 1 | | | Level 2 | | | Level 3 | | | Total | |
| Long-Term Investments | | | | | | | | | | | | |
| U.S. Treasury Securities | | $ | — | | | $ | 3,436,730,568 | | | $ | — | | | $ | 3,436,730,568 | |
| Other Government Related Security | | | — | | | | 17,184,119 | | | | — | | | | 17,184,119 | |
| Corporate Bonds | | | — | | | | 2,918,945,704 | | | | — | | | | 2,918,945,704 | |
| Municipal Bonds | | | — | | | | 92,267,900 | | | | — | | | | 92,267,900 | |
| Residential Mortgage-Backed Securities – U.S. Government Agency Issue | | | — | | | | 1,078 | | | | — | | | | 1,078 | |
| Residential Mortgage-Backed Securities – Non-U.S. Government Agency Issues | | | — | | | | 263,373,176 | | | | — | | | | 263,373,176 | |
| Commercial Mortgage-Backed Securities – U.S. Government Agency Issues | | | — | | | | 51,833,811 | | | | — | | | | 51,833,811 | |
| Commercial Mortgage-Backed Securities – Non-U.S. Government Agency Issues | | | — | | | | 344,549,255 | | | | — | | | | 344,549,255 | |
| Asset Backed Securities | | | — | | | | 229,927,950 | | | | — | | | | 229,927,950 | |
| Total Long-Term Investments | | | — | | | | 7,354,813,561 | | | | — | | | | 7,354,813,561 | |
| Short-Term Investment | | | | | | | | | | | | | | | | |
| Money Market Mutual Fund | | | 179,998,000 | | | | — | | | | — | | | | 179,998,000 | |
| Total Short-Term Investment | | | 179,998,000 | | | | — | | | | — | | | | 179,998,000 | |
| Total Investments | | $ | 179,998,000 | | | $ | 7,354,813,561 | | | $ | — | | | $ | 7,534,811,561 | |
Changes in valuation techniques may result in transfers into or out of assigned levels within the fair value hierarchy. There were no transfers into or out of Level 3 during the reporting period, as compared to the security classifications from the prior year’s annual report. See the Fund’s Valuation Policy in Note 2a to the financial statements.
The accompanying notes are an integral part of these financial statements.
Baird Aggregate Bond Fund
June 30, 2023 (Unaudited)
Portfolio Characteristics
Quality Distribution(1)(2)
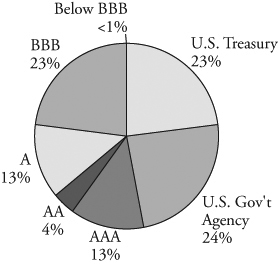
| | Net Assets | $39,322,591,772 | |
| | | | |
| | SEC 30-Day Yield(3) | | |
| | Institutional Class | 4.32% | |
| | Investor Class | 4.07% | |
| | | | |
| | Average Effective Duration | 6.31 years | |
| | | | |
| | Average Effective Maturity | 8.44 years | |
| | | | |
| | Annualized Expense Ratio(4) | | |
| | Institutional Class | 0.30% | |
| | Investor Class | 0.55% | (5) |
| | | | |
| | Portfolio Turnover Rate | 20% | (6) |
| | | | |
| | | Number of Holdings | 1,708 | |
Sector Weightings(7)
(1) | Percentages shown are based on the Fund’s total investments. |
(2) | The quality profile is calculated on a market value-weighted basis using the highest credit quality rating for each security held by the Fund given by S&P, Moody’s or Fitch, each of which is a Nationally Recognized Statistical Rating Organization (NRSRO). NRSROs rate the credit quality of securities using a scale that generally ranges from AAA (highest) to D (lowest). |
(3) | SEC yields are based on SEC guidelines and are calculated for the 30 days ended June 30, 2023. |
(4) | Reflects expense ratios as stated in the Fund’s current prospectus dated May 1, 2023. |
(5) | Includes 0.25% 12b-1 fee. |
(6) | Not annualized. |
(7) | Percentages shown are based on the Fund’s total net assets. |
Baird Aggregate Bond Fund
June 30, 2023 (Unaudited)
Total Returns
| | | | Average Annual |
| | Six | One | Five | Ten | Since |
| For the Periods Ended June 30, 2023 | Months | Year | Years | Years | Inception(1) |
| Institutional Class Shares | 2.43% | -0.25% | 1.09% | 1.94% | 4.27% |
| Investor Class Shares | 2.22% | -0.59% | 0.83% | 1.69% | 4.01% |
Bloomberg U.S. Aggregate Index(2) | 2.09% | -0.94% | 0.77% | 1.52% | 3.81% |
(1) | For the period from September 29, 2000 (inception date) through June 30, 2023. |
(2) | The Bloomberg U.S. Aggregate Index is an unmanaged, market value weighted index of investment grade, fixed-rate debt issues, including government, corporate, asset-backed, mortgage-backed and commercial mortgage-backed securities, with maturities of at least one year. This Index does not reflect any deduction for fees, expenses or taxes. A direct investment in an index is not possible. |
The returns table shown above reflects reinvestment of dividends and/or capital gains distributions in additional shares. The returns in the table do not reflect the deduction of taxes that a shareholder would pay on Fund distributions or the redemption of Fund shares. The returns reflect the actual performance for each period and do not include the impact of trades executed on the last business day of the period that were recorded on the first business day of the next period.
The Fund’s expense ratio for each Class, as reflected in the Fund’s current prospectus, is set forth under “Portfolio Characteristics”.
The Fund maintains securities with longer maturities in order to provide a greater potential for return. Generally, the longer a bond’s maturity, the greater the interest rate risk. The Fund may also invest in U.S. dollar denominated foreign securities which involve additional risks such as political and economic instability, and different and sometimes less strict financial reporting standards and regulation. The Fund may also invest in mortgage- and asset-backed securities, which include interest rate and prepayment risks more pronounced than those of other fixed income securities. U.S. and international markets have experienced significant periods of volatility in recent years and months due to a number of economic, political and global macro factors. Russia’s ongoing war with Ukraine has heightened global geopolitical tensions, resulting in an elevated risk environment and increased volatility in asset prices. The uncertain course of the war may have a significant negative impact on the global economy. U.S. relations with China have become increasingly strained, and tension between the U.S. and China may have a significant negative impact on the global economy and asset prices. Measures of inflation reached levels not experienced in several decades, leading the Federal Reserve to raise short term interest rates significantly over the last year, with the potential for further rate increases in 2023. Uncertainty regarding the ability of the Federal Reserve to successfully control inflation, the potential for incremental rate increases, and the full impact of prior rate increases on the economy may negatively impact asset prices and increase market volatility. The possibility of a U.S. or global recession may also contribute to market volatility. The coronavirus (COVID-19) pandemic caused significant economic disruption in recent years as countries worked to limit the negative health impacts of the virus. While the virus has entered an endemic stage, significant outbreaks or new variants present a continued risk to the global economy. These and other geopolitical events may cause market disruptions and could have an adverse effect on the value of the Fund’s investments.
Past performance does not guarantee future results. Investment return and principal value will fluctuate so that an investor’s shares, when redeemed, may be worth more or less than their original cost.
For information about the performance of the Fund as of the most recent month-end, please call 1-866-442-2473 or visit www.bairdfunds.com. Mutual fund performance changes over time and current performance may be lower or higher than that stated.
Baird Aggregate Bond Fund
Schedule of Investments, June 30, 2023 (Unaudited)
Long-Term Investments
| | | Principal | | | | | | % of | |
| | | Amount | | | Value | | | Net Assets | |
| U.S. Treasury Securities | | | | | | | | | |
| U.S. Treasury Bonds: | | | | | | | | | |
| 0.250%, 05/31/2025 | | $ | 330,125,000 | | | $ | 302,103,062 | | | | |
| 2.875%, 06/15/2025 | | | 348,450,000 | | | | 335,178,954 | | | | |
| 3.125%, 08/15/2025 | | | 41,075,000 | | | | 39,671,069 | | | | |
| 1.125%, 10/31/2026 | | | 1,715,175,000 | | | | 1,542,317,520 | | | | |
| 1.125%, 08/31/2028 | | | 1,105,550,000 | | | | 952,543,605 | | | | |
| 2.375%, 03/31/2029 | | | 769,975,000 | | | | 702,963,113 | | | | |
| 3.875%, 12/31/2029 | | | 157,450,000 | | | | 156,078,463 | | | | |
| 1.250%, 08/15/2031 | | | 87,025,000 | | | | 71,414,891 | | | | |
| 2.875%, 05/15/2032 | | | 440,950,000 | | | | 408,843,328 | | | | |
| 3.500%, 02/15/2033 | | | 229,000,000 | | | | 223,060,313 | | | | |
| 1.375%, 11/15/2040 | | | 1,036,475,000 | | | | 693,466,555 | | | | |
| 2.250%, 05/15/2041 | | | 396,825,000 | | | | 305,617,254 | | | | |
| 2.375%, 02/15/2042 | | | 636,525,000 | | | | 495,569,524 | | | | |
| 2.875%, 05/15/2043 | | | 1,064,445,000 | | | | 890,350,028 | | | | |
| 2.500%, 02/15/2045 | | | 1,580,750,000 | | | | 1,223,846,289 | | | | |
| 1.250%, 05/15/2050 | | | 169,875,000 | | | | 95,521,509 | | | | |
| 1.375%, 08/15/2050 | | | 395,800,000 | | | | 229,981,446 | | | | |
| 2.875%, 05/15/2052 | | | 505,025,000 | | | | 418,519,742 | | | | |
| Total U.S. Treasury Securities | | | | | | | | | | | |
| (Cost $10,204,818,413) | | | | | | | 9,087,046,665 | | | | 23.1 | % |
| Other Government Related Securities | | | | | | | | | | | | |
| Comision Federal de Electricidad, | | | | | | | | | | | | |
4.875%, 01/15/2024(1)(2) | | | 3,423,000 | | | | 3,393,049 | | | | | |
| Freeport Indonesia PT, | | | | | | | | | | | | |
| 5.315%, 04/14/2032 | | | | | | | | | | | | |
(Callable 01/01/2032)(1)(2) | | | 15,000,000 | | | | 14,146,298 | | | | | |
| NBN Co. Ltd.: | | | | | | | | | | | | |
| 2.625%, 05/05/2031 | | | | | | | | | | | | |
(Callable 02/05/2031)(1)(2) | | | 18,625,000 | | | | 15,622,308 | | | | | |
| 2.500%, 01/08/2032 | | | | | | | | | | | | |
(Callable 10/08/2031)(1)(2) | | | 46,650,000 | | | | 38,210,154 | | | | | |
| Petroleos Mexicanos: | | | | | | | | | | | | |
| 5.950%, 01/28/2031 | | | | | | | | | | | | |
(Callable 10/28/2030)(1) | | | 558,000 | | | | 407,647 | | | | | |
| 6.700%, 02/16/2032 | | | | | | | | | | | | |
(Callable 11/16/2031)(1) | | | 1,020,000 | | | | 775,561 | | | | | |
6.350%, 02/12/2048(1) | | | 8,500,000 | | | | 5,141,001 | | | | | |
| Total Other Government | | | | | | | | | | | | |
| Related Securities | | | | | | | | | | | | |
| (Cost $92,659,296) | | | | | | | 77,696,018 | | | | 0.2 | % |
| Corporate Bonds | | | | | | | | | | | | |
| Industrials | | | | | | | | | | | | |
| Abbott Laboratories, | | | | | | | | | | | | |
| 4.900%, 11/30/2046 | | | | | | | | | | | | |
| (Callable 05/30/2046) | | | 4,700,000 | | | | 4,745,256 | | | | | |
| AbbVie, Inc.: | | | | | | | | | | | | |
| 3.800%, 03/15/2025 | | | | | | | | | | | | |
| (Callable 12/15/2024) | | | 16,425,000 | | | | 15,968,707 | | | | | |
| 2.950%, 11/21/2026 | | | | | | | | | | | | |
| (Callable 09/21/2026) | | | 9,625,000 | | | | 8,992,102 | | | | | |
| 4.550%, 03/15/2035 | | | | | | | | | | | | |
| (Callable 09/15/2034) | | | 26,098,000 | | | | 24,852,422 | | | | | |
| 4.500%, 05/14/2035 | | | | | | | | | | | | |
| (Callable 11/14/2034) | | | 17,395,000 | | | | 16,526,915 | | | | | |
| 4.300%, 05/14/2036 | | | | | | | | | | | | |
| (Callable 11/14/2035) | | | 6,000,000 | | | | 5,510,118 | | | | | |
| 4.050%, 11/21/2039 | | | | | | | | | | | | |
| (Callable 05/21/2039) | | | 12,700,000 | | | | 11,057,409 | | | | | |
| Adventist Health System: | | | | | | | | | | | | |
| 2.952%, 03/01/2029 | | | | | | | | | | | | |
| (Callable 12/01/2028) | | | 19,250,000 | | | | 16,847,552 | | | | | |
| 3.630%, 03/01/2049 | | | | | | | | | | | | |
| (Callable 09/01/2048) | | | 9,000,000 | | | | 6,696,961 | | | | | |
| Agilent Technologies, Inc., | | | | | | | | | | | | |
| 2.100%, 06/04/2030 | | | | | | | | | | | | |
| (Callable 03/04/2030) | | | 14,000,000 | | | | 11,503,357 | | | | | |
| Air Products and Chemicals, Inc., | | | | | | | | | | | | |
| 2.700%, 05/15/2040 | | | | | | | | | | | | |
| (Callable 11/15/2039) | | | 10,425,000 | | | | 7,774,744 | | | | | |
| Aker BP ASA: | | | | | | | | | | | | |
| 5.600%, 06/13/2028 | | | | | | | | | | | | |
(Callable 05/13/2028)(1)(2) | | | 15,500,000 | | | | 15,387,193 | | | | | |
| 6.000%, 06/13/2033 | | | | | | | | | | | | |
(Callable 03/13/2033)(1)(2) | | | 16,500,000 | | | | 16,505,853 | | | | | |
| Alcon Finance Corp.: | | | | | | | | | | | | |
| 2.750%, 09/23/2026 | | | | | | | | | | | | |
(Callable 07/23/2026(1)(2) | | | 14,770,000 | | | | 13,564,712 | | | | | |
| 3.800%, 09/23/2049 | | | | | | | | | | | | |
(Callable 03/23/2049)(1)(2) | | | 7,000,000 | | | | 5,413,261 | | | | | |
| Allegion PLC, | | | | | | | | | | | | |
| 3.500%, 10/01/2029 | | | | | | | | | | | | |
| (Callable 07/01/2029) | | | 21,494,000 | | | | 18,982,698 | | | | | |
| Allegion US Holding Co., Inc.: | | | | | | | | | | | | |
| 3.200%, 10/01/2024 | | | | | | | | | | | | |
| (Callable 08/01/2024) | | | 29,750,000 | | | | 28,566,573 | | | | | |
| 3.550%, 10/01/2027 | | | | | | | | | | | | |
| (Callable 07/01/2027) | | | 11,975,000 | | | | 11,074,617 | | | | | |
| 5.411%, 07/01/2032 | | | | | | | | | | | | |
| (Callable 04/01/2032) | | | 12,675,000 | | | | 12,525,100 | | | | | |
| Amgen, Inc.: | | | | | | | | | | | | |
| 3.150%, 02/21/2040 | | | | | | | | | | | | |
| (Callable 08/21/2039) | | | 13,350,000 | | | | 10,209,135 | | | | | |
| 4.400%, 05/01/2045 | | | | | | | | | | | | |
| (Callable 11/01/2044) | | | 12,300,000 | | | | 10,653,165 | | | | | |
| 4.200%, 02/22/2052 | | | | | | | | | | | | |
| (Callable 08/22/2051) | | | 4,000,000 | | | | 3,309,517 | | | | | |
| 5.650%, 03/02/2053 | | | | | | | | | | | | |
| (Callable 09/02/2052) | | | 16,925,000 | | | | 17,140,034 | | | | | |
| Anglo American Capital PLC: | | | | | | | | | | | | |
4.875%, 05/14/2025(1)(2) | | | 3,376,000 | | | | 3,305,026 | | | | | |
4.750%, 04/10/2027(1)(2) | | | 10,000,000 | | | | 9,664,380 | | | | | |
| 4.500%, 03/15/2028 | | | | | | | | | | | | |
(Callable 12/15/2027)(1)(2) | | | 2,570,000 | | | | 2,449,274 | | | | | |
| 5.625%, 04/01/2030 | | | | | | | | | | | | |
(Callable 01/01/2030)(1)(2) | | | 10,439,000 | | | | 10,391,260 | | | | | |
| 2.625%, 09/10/2030 | | | | | | | | | | | | |
(Callable 06/10/2030)(1)(2) | | | 35,000,000 | | | | 28,870,863 | | | | | |
| Anheuser-Busch InBev Worldwide, Inc.: | | | | | | | | | | | | |
| 4.750%, 01/23/2029 | | | | | | | | | | | | |
(Callable 10/23/2028)(1) | | | 4,075,000 | | | | 4,057,300 | | | | | |
| 4.375%, 04/15/2038 | | | | | | | | | | | | |
(Callable 10/15/2037)(1) | | | 7,000,000 | | | | 6,481,134 | | | | | |
| 5.450%, 01/23/2039 | | | | | | | | | | | | |
(Callable 07/23/2038)(1) | | | 20,000,000 | | | | 20,694,976 | | | | | |
| 4.900%, 02/01/2046 | | | | | | | | | | | | |
(Callable 08/01/2045)(1) | | | 52,184,000 | | | | 49,876,988 | | | | | |
| AP Moller – Maersk A/S: | | | | | | | | | | | | |
| 3.875%, 09/28/2025 | | | | | | | | | | | | |
(Callable 06/28/2025)(1)(2) | | | 8,900,000 | | | | 8,581,761 | | | | | |
| 4.500%, 06/20/2029 | | | | | | | | | | | | |
(Callable 03/20/2029)(1)(2) | | | 8,000,000 | | | | 7,684,836 | | | | | |
| Apple, Inc., | | | | | | | | | | | | |
| 2.650%, 05/11/2050 | | | | | | | | | | | | |
| (Callable 11/11/2049) | | | 10,000,000 | | | | 6,961,150 | | | | | |
| AptarGroup, Inc., | | | | | | | | | | | | |
| 3.600%, 03/15/2032 | | | | | | | | | | | | |
| (Callable 12/15/2031) | | | 7,500,000 | | | | 6,433,847 | | | | | |
The accompanying notes are an integral part of these financial statements.
Baird Aggregate Bond Fund
Schedule of Investments, June 30, 2023 (Unaudited)
Long-Term Investments (cont.)
| | | Principal | | | | | | % of | |
| | | Amount | | | Value | | | Net Assets | |
| ArcelorMittal: | | | | | | | | | |
4.550%, 03/11/2026(1) | | $ | 13,000,000 | | | $ | 12,668,072 | | | |
| |
| 6.550%, 11/29/2027 | | | | | | | | | | | | |
(Callable 10/29/2027)(1) | | | 14,600,000 | | | | 14,974,704 | | | | | |
4.250%, 07/16/2029(1) | | | 25,000,000 | | | | 23,642,222 | | | | | |
| 6.800%, 11/29/2032 | | | | | | | | | | | | |
(Callable 08/29/2032)(1) | | | 25,000,000 | | | | 25,666,435 | | | | | |
7.000%, 10/15/2039(1) | | | 15,906,000 | | | | 16,603,529 | | | | | |
| Ashtead Capital, Inc.: | | | | | | | | | | | | |
| 4.000%, 05/01/2028 | | | | | | | | | | | | |
(Callable 07/11/2023)(1)(2) | | | 8,010,000 | | | | 7,420,074 | | | | | |
| 5.500%, 08/11/2032 | | | | | | | | | | | | |
(Callable 05/11/2032)(1)(2) | | | 28,369,000 | | | | 27,428,953 | | | | | |
| 5.550%, 05/30/2033 | | | | | | | | | | | | |
(Callable 02/28/2033)(1)(2) | | | 15,000,000 | | | | 14,621,766 | | | | | |
| AT&T, Inc.: | | | | | | | | | | | | |
| 2.550%, 12/01/2033 | | | | | | | | | | | | |
| (Callable 09/01/2033) | | | 22,965,000 | | | | 18,038,458 | | | | | |
| 5.400%, 02/15/2034 | | | | | | | | | | | | |
| (Callable 11/15/2033) | | | 12,000,000 | | | | 12,020,614 | | | | | |
| 4.900%, 08/15/2037 | | | | | | | | | | | | |
| (Callable 02/14/2037) | | | 20,000,000 | | | | 18,770,809 | | | | | |
| 3.500%, 09/15/2053 | | | | | | | | | | | | |
| (Callable 03/15/2053) | | | 10,000,000 | | | | 7,079,157 | | | | | |
| 3.550%, 09/15/2055 | | | | | | | | | | | | |
| (Callable 03/15/2055) | | | 60,110,000 | | | | 42,080,950 | | | | | |
| 3.800%, 12/01/2057 | | | | | | | | | | | | |
| (Callable 06/01/2057) | | | 19,423,000 | | | | 14,062,204 | | | | | |
| 3.650%, 09/15/2059 | | | | | | | | | | | | |
| (Callable 03/15/2059) | | | 49,359,000 | | | | 34,364,674 | | | | | |
| Bacardi Ltd., | | | | | | | | | | | | |
| 5.400%, 06/15/2033 | | | | | | | | | | | | |
(Callable 03/15/2033)(1)(2) | | | 15,000,000 | | | | 14,867,370 | | | | | |
| BAE Systems PLC, | | | | | | | | | | | | |
| 1.900%, 02/15/2031 | | | | | | | | | | | | |
(Callable 11/15/2030)(1)(2) | | | 18,500,000 | | | | 14,853,770 | | | | | |
| Bayer US Finance II LLC: | | | | | | | | | | | | |
5.500%, 08/15/2025(1)(2) | | | 14,400,000 | | | | 14,113,402 | | | | | |
| 4.250%, 12/15/2025 | | | | | | | | | | | | |
(Callable 10/15/2025)(1)(2) | | | 14,440,000 | | | | 13,933,129 | | | | | |
| Bayport Polymers LLC, | | | | | | | | | | | | |
| 4.743%, 04/14/2027 | | | | | | | | | | | | |
(Callable 03/14/2027)(2) | | | 61,325,000 | | | | 57,039,922 | | | | | |
| Becle SAB de, | | | | | | | | | | | | |
| 2.500%, 10/14/2031 | | | | | | | | | | | | |
(Callable 07/14/2031)(1)(2) | | | 39,193,000 | | | | 31,622,872 | | | | | |
| Becton Dickinson and Co.: | | | | | | | | | | | | |
| 3.734%, 12/15/2024 | | | | | | | | | | | | |
| (Callable 09/15/2024) | | | 1,094,000 | | | | 1,062,065 | | | | | |
| 2.823%, 05/20/2030 | | | | | | | | | | | | |
| (Callable 02/20/2030) | | | 15,000,000 | | | | 13,118,920 | | | | | |
| 4.875%, 05/15/2044 | | | | | | | | | | | | |
| (Callable 11/15/2043) | | | 10,815,000 | | | | 9,544,572 | | | | | |
| Bell Canada, Inc.: | | | | | | | | | | | | |
| 5.100%, 05/11/2033 | | | | | | | | | | | | |
(Callable 02/11/2033)(1) | | | 11,000,000 | | | | 10,865,008 | | | | | |
| 4.464%, 04/01/2048 | | | | | | | | | | | | |
(Callable 10/01/2047)(1) | | | 1,225,000 | | | | 1,062,746 | | | | | |
| 4.300%, 07/29/2049 | | | | | | | | | | | | |
(Callable 01/29/2049)(1) | | | 4,123,000 | | | | 3,487,862 | | | | | |
| Berry Global, Inc., | | | | | | | | | | | | |
| 5.500%, 04/15/2028 | | | | | | | | | | | | |
(Callable 03/15/2028)(2) | | | 19,345,000 | | | | 19,037,412 | | | | | |
| Bimbo Bakeries USA, Inc., | | | | | | | | | | | | |
| 4.000%, 05/17/2051 | | | | | | | | | | | | |
(Callable 11/17/2050)(1)(2) | | | 20,009,000 | | | | 16,061,582 | | | | | |
| Boardwalk Pipelines LP: | | | | | | | | | | | | |
| 4.950%, 12/15/2024 | | | | | | | | | | | | |
| (Callable 09/15/2024) | | | 27,631,000 | | | | 27,180,258 | | | | | |
| 5.950%, 06/01/2026 | | | | | | | | | | | | |
| (Callable 03/01/2026) | | | 28,506,000 | | | | 28,723,883 | | | | | |
| 4.450%, 07/15/2027 | | | | | | | | | | | | |
| (Callable 04/15/2027) | | | 14,877,000 | | | | 14,193,549 | | | | | |
| 4.800%, 05/03/2029 | | | | | | | | | | | | |
| (Callable 02/03/2029) | | | 16,918,000 | | | | 16,221,134 | | | | | |
| 3.400%, 02/15/2031 | | | | | | | | | | | | |
| (Callable 11/15/2030) | | | 5,825,000 | | | | 5,003,573 | | | | | |
| 3.600%, 09/01/2032 | | | | | | | | | | | | |
| (Callable 06/01/2032) | | | 25,550,000 | | | | 21,691,080 | | | | | |
| Boeing Co.: | | | | | | | | | | | | |
| 2.196%, 02/04/2026 | | | | | | | | | | | | |
| (Callable 07/11/2023) | | | 47,500,000 | | | | 43,595,891 | | | | | |
| 5.040%, 05/01/2027 | | | | | | | | | | | | |
| (Callable 03/01/2027) | | | 5,140,000 | | | | 5,077,125 | | | | | |
| 5.150%, 05/01/2030 | | | | | | | | | | | | |
| (Callable 02/01/2030) | | | 26,150,000 | | | | 25,897,656 | | | | | |
| Bon Secours Mercy Health, Inc.: | | | | | | | | | | | | |
| 3.464%, 06/01/2030 | | | | | | | | | | | | |
| (Callable 12/01/2029) | | | 8,000,000 | | | | 7,182,793 | | | | | |
| 3.205%, 06/01/2050 | | | | | | | | | | | | |
| (Callable 12/01/2049) | | | 10,800,000 | | | | 7,531,679 | | | | | |
| BorgWarner, Inc., | | | | | | | | | | | | |
5.000%, 10/01/2025(2) | | | 27,301,000 | | | | 26,806,410 | | | | | |
| Boston Scientific Corp., | | | | | | | | | | | | |
| 1.900%, 06/01/2025 | | | | | | | | | | | | |
| (Callable 05/01/2025) | | | 15,000,000 | | | | 14,059,090 | | | | | |
| BP Capital Markets America, Inc.: | | | | | | | | | | | | |
| 4.812%, 02/13/2033 | | | | | | | | | | | | |
(Callable 11/13/2032)(1) | | | 7,600,000 | | | | 7,489,546 | | | | | |
| 4.893%, 09/11/2033 | | | | | | | | | | | | |
(Callable 06/11/2033)(1) | | | 8,350,000 | | | | 8,263,780 | | | | | |
| Bristol-Myers Squibb Co., | | | | | | | | | | | | |
| 3.700%, 03/15/2052 | | | | | | | | | | | | |
| (Callable 09/15/2051) | | | 10,000,000 | | | | 8,108,863 | | | | | |
| British Telecommunications PLC, | | | | | | | | | | | | |
9.625%, 12/15/2030(1) | | | 47,015,000 | | | | 57,845,837 | | | | | |
| Broadcom, Inc.: | | | | | | | | | | | | |
| 3.625%, 10/15/2024 | | | | | | | | | | | | |
| (Callable 09/15/2024) | | | 13,075,000 | | | | 12,711,456 | | | | | |
| 3.150%, 11/15/2025 | | | | | | | | | | | | |
| (Callable 10/15/2025) | | | 23,600,000 | | | | 22,419,803 | | | | | |
| 4.000%, 04/15/2029 | | | | | | | | | | | | |
(Callable 02/15/2029)(2) | | | 6,000,000 | | | | 5,541,623 | | | | | |
| 4.750%, 04/15/2029 | | | | | | | | | | | | |
| (Callable 01/15/2029) | | | 43,900,000 | | | | 42,468,745 | | | | | |
| 5.000%, 04/15/2030 | | | | | | | | | | | | |
| (Callable 01/15/2030) | | | 11,000,000 | | | | 10,799,269 | | | | | |
| 4.150%, 11/15/2030 | | | | | | | | | | | | |
| (Callable 08/15/2030) | | | 6,000,000 | | | | 5,520,295 | | | | | |
| 4.150%, 04/15/2032 | | | | | | | | | | | | |
(Callable 01/15/2032)(2) | | | 33,000,000 | | | | 29,890,422 | | | | | |
| 3.137%, 11/15/2035 | | | | | | | | | | | | |
(Callable 08/15/2035)(2) | | | 12,000,000 | | | | 9,204,541 | | | | | |
| 3.500%, 02/15/2041 | | | | | | | | | | | | |
(Callable 08/15/2040)(2) | | | 21,000,000 | | | | 15,708,559 | | | | | |
| Broadridge Financial Solutions, Inc., | | | | | | | | | | | | |
| 2.900%, 12/01/2029 | | | | | | | | | | | | |
| (Callable 09/01/2029) | | | 11,300,000 | | | | 9,637,034 | | | | | |
The accompanying notes are an integral part of these financial statements.
Baird Aggregate Bond Fund
Schedule of Investments, June 30, 2023 (Unaudited)
Long-Term Investments (cont.)
| | | Principal | | | | | | % of | |
| | | Amount | | | Value | | | Net Assets | |
| Bunge Limited Finance Corp.: | | | | | | | | | |
| 1.630%, 08/17/2025 | | | | | | | | | |
| (Callable 07/17/2025) | | $ | 10,000,000 | | | $ | 9,200,562 | | | |
| |
| 3.250%, 08/15/2026 | | | | | | | | | | | | |
| (Callable 05/15/2026) | | | 11,550,000 | | | | 10,864,911 | | | | | |
| Burlington Northern Santa Fe LLC, | | | | | | | | | | | | |
| 4.150%, 04/01/2045 | | | | | | | | | | | | |
| (Callable 10/01/2044) | | | 3,000,000 | | | | 2,609,498 | | | | | |
| Cameron LNG LLC, | | | | | | | | | | | | |
| 3.302%, 01/15/2035 | | | | | | | | | | | | |
(Callable 09/15/2034)(2) | | | 20,000,000 | | | | 16,672,084 | | | | | |
| Campbell Soup Co., | | | | | | | | | | | | |
| 3.950%, 03/15/2025 | | | | | | | | | | | | |
| (Callable 01/15/2025) | | | 21,325,000 | | | | 20,723,091 | | | | | |
| Canadian Natural Resources Ltd., | | | | | | | | | | | | |
6.500%, 02/15/2037(1) | | | 982,000 | | | | 996,125 | | | | | |
| Canadian Pacific Railway Co.: | | | | | | | | | | | | |
| 4.700%, 05/01/2048 | | | | | | | | | | | | |
(Callable 11/01/2047)(1) | | | 10,075,000 | | | | 9,148,254 | | | | | |
| 3.500%, 05/01/2050 | | | | | | | | | | | | |
(Callable 11/01/2049)(1) | | | 12,000,000 | | | | 9,175,102 | | | | | |
| Cargill, Inc., | | | | | | | | | | | | |
| 4.750%, 04/24/2033 | | | | | | | | | | | | |
(Callable 01/24/2033)(2) | | | 10,200,000 | | | | 10,053,701 | | | | | |
| Carlisle Companies, Inc.: | | | | | | | | | | | | |
| 3.500%, 12/01/2024 | | | | | | | | | | | | |
| (Callable 10/01/2024) | | | 5,000,000 | | | | 4,824,657 | | | | | |
| 2.750%, 03/01/2030 | | | | | | | | | | | | |
| (Callable 12/01/2029) | | | 16,000,000 | | | | 13,638,708 | | | | | |
| Carrier Global Corp.: | | | | | | | | | | | | |
| 2.242%, 02/15/2025 | | | | | | | | | | | | |
| (Callable 01/15/2025) | | | 1,130,000 | | | | 1,068,706 | | | | | |
| 2.493%, 02/15/2027 | | | | | | | | | | | | |
| (Callable 12/15/2026) | | | 25,975,000 | | | | 23,669,957 | | | | | |
| 2.722%, 02/15/2030 | | | | | | | | | | | | |
| (Callable 11/15/2029) | | | 6,861,000 | | | | 5,905,357 | | | | | |
| 2.700%, 02/15/2031 | | | | | | | | | | | | |
| (Callable 11/15/2030) | | | 18,500,000 | | | | 15,575,023 | | | | | |
| 3.377%, 04/05/2040 | | | | | | | | | | | | |
| (Callable 10/05/2039) | | | 10,000,000 | | | | 7,676,758 | | | | | |
| CBRE Services, Inc., | | | | | | | | | | | | |
| 5.950%, 08/15/2034 | | | | | | | | | | | | |
| (Callable 05/15/2034) | | | 20,000,000 | | | | 19,748,496 | | | | | |
| CCL Industries, Inc., | | | | | | | | | | | | |
| 3.050%, 06/01/2030 | | | | | | | | | | | | |
(Callable 03/01/2030)(1)(2) | | | 20,000,000 | | | | 16,893,270 | | | | | |
| CDW LLC / CDW Finance Corp., | | | | | | | | | | | | |
| 2.670%, 12/01/2026 | | | | | | | | | | | | |
| (Callable 11/01/2026) | | | 9,000,000 | | | | 8,080,920 | | | | | |
| Celanese US Holdings LLC: | | | | | | | | | | | | |
| 3.500%, 05/08/2024 | | | | | | | | | | | | |
| (Callable 04/08/2024) | | | 10,640,000 | | | | 10,412,909 | | | | | |
| 6.330%, 07/15/2029 | | | | | | | | | | | | |
| (Callable 05/15/2029) | | | 8,675,000 | | | | 8,615,304 | | | | | |
| Cellnex Finance Co., | | | | | | | | | | | | |
| 3.875%, 07/07/2041 | | | | | | | | | | | | |
(Callable 04/07/2041)(1)(2) | | | 51,774,000 | | | | 37,934,726 | | | | | |
| Celulosa Arauco y Constitucion SA, | | | | | | | | | | | | |
| 3.875%, 11/02/2027 | | | | | | | | | | | | |
(Callable 08/02/2027)(1) | | | 12,000,000 | | | | 11,028,182 | | | | | |
| CF Industries, Inc., | | | | | | | | | | | | |
| 5.150%, 03/15/2034 | | | 3,000,000 | | | | 2,869,939 | | | | | |
| Charter Communications | | | | | | | | | | | | |
| Operating LLC: | | | | | | | | | | | | |
| 4.908%, 07/23/2025 | | | | | | | | | | | | |
| (Callable 04/23/2025) | | | 54,750,000 | | | | 53,690,415 | | | | | |
| 3.750%, 02/15/2028 | | | | | | | | | | | | |
| (Callable 11/15/2027) | | | 5,000,000 | | | | 4,583,644 | | | | | |
| 5.050%, 03/30/2029 | | | | | | | | | | | | |
| (Callable 12/30/2028) | | | 36,857,000 | | | | 35,145,634 | | | | | |
| 2.300%, 02/01/2032 | | | | | | | | | | | | |
| (Callable 11/01/2031) | | | 15,525,000 | | | | 11,752,437 | | | | | |
| 6.384%, 10/23/2035 | | | | | | | | | | | | |
| (Callable 04/23/2035) | | | 40,506,000 | | | | 39,480,583 | | | | | |
| 3.500%, 06/01/2041 | | | | | | | | | | | | |
| (Callable 12/01/2040) | | | 22,225,000 | | | | 15,033,087 | | | | | |
| 3.500%, 03/01/2042 | | | | | | | | | | | | |
| (Callable 09/01/2041) | | | 11,050,000 | | | | 7,391,316 | | | | | |
| 4.400%, 12/01/2061 | | | | | | | | | | | | |
| (Callable 06/01/2061) | | | 24,375,000 | | | | 16,454,360 | | | | | |
| Cheniere Corpus Christi Holdings LLC, | | | | | | | | | | | | |
| 5.875%, 03/31/2025 | | | | | | | | | | | | |
| (Callable 10/02/2024) | | | 5,646,000 | | | | 5,618,900 | | | | | |
| Cheniere Energy Partners LP, | | | | | | | | | | | | |
| 5.950%, 06/30/2033 | | | | | | | | | | | | |
(Callable 12/30/2032)(2) | | | 26,000,000 | | | | 26,075,660 | | | | | |
| Church & Dwight Co., Inc., | | | | | | | | | | | | |
| 5.000%, 06/15/2052 | | | | | | | | | | | | |
| (Callable 12/15/2051) | | | 6,725,000 | | | | 6,648,796 | | | | | |
| Cia Cervecerias Unidas SA, | | | | | | | | | | | | |
| 3.350%, 01/19/2032 | | | | | | | | | | | | |
(Callable 10/19/2031)(1)(2) | | | 25,000,000 | | | | 21,312,750 | | | | | |
| Cigna Corp.: | | | | | | | | | | | | |
| 4.125%, 11/15/2025 | | | | | | | | | | | | |
| (Callable 09/15/2025) | | | 3,190,000 | | | | 3,105,469 | | | | | |
| 4.500%, 02/25/2026 | | | | | | | | | | | | |
| (Callable 11/27/2025) | | | 9,810,000 | | | | 9,596,533 | | | | | |
| 2.400%, 03/15/2030 | | | | | | | | | | | | |
| (Callable 12/15/2029) | | | 15,000,000 | | | | 12,744,331 | | | | | |
| 4.800%, 08/15/2038 | | | | | | | | | | | | |
| (Callable 02/15/2038) | | | 5,000,000 | | | | 4,720,064 | | | | | |
| CNH Industrial Capital LLC, | | | | | | | | | | | | |
| 1.875%, 01/15/2026 | | | | | | | | | | | | |
(Callable 12/15/2025)(1) | | | 20,000,000 | | | | 18,263,071 | | | | | |
| CNH Industrial NV, | | | | | | | | | | | | |
| 3.850%, 11/15/2027 | | | | | | | | | | | | |
(Callable 08/15/2027)(1) | | | 23,656,000 | | | | 22,227,500 | | | | | |
| Columbia Pipeline Group, Inc.: | | | | | | | | | | | | |
| 4.500%, 06/01/2025 | | | | | | | | | | | | |
(Callable 03/01/2025)(1) | | | 6,199,000 | | | | 6,049,061 | | | | | |
| 5.800%, 06/01/2045 | | | | | | | | | | | | |
(Callable 12/01/2044)(1) | | | 10,776,000 | | | | 10,630,048 | | | | | |
| Comcast Corp.: | | | | | | | | | | | | |
| 3.300%, 04/01/2027 | | | | | | | | | | | | |
| (Callable 02/01/2027) | | | 9,125,000 | | | | 8,629,477 | | | | | |
| 3.200%, 07/15/2036 | | | | | | | | | | | | |
| (Callable 01/15/2036) | | | 6,000,000 | | | | 4,922,190 | | | | | |
| 3.969%, 11/01/2047 | | | | | | | | | | | | |
| (Callable 05/01/2047) | | | 8,622,000 | | | | 7,140,995 | | | | | |
| 5.350%, 05/15/2053 | | | | | | | | | | | | |
| (Callable 11/15/2052) | | | 19,000,000 | | | | 19,291,064 | | | | | |
| 2.987%, 11/01/2063 | | | | | | | | | | | | |
| (Callable 05/01/2063) | | | 14,646,000 | | | | 9,279,509 | | | | | |
| CommonSpirit Health, | | | | | | | | | | | | |
| 3.347%, 10/01/2029 | | | | | | | | | | | | |
| (Callable 04/01/2029) | | | 17,635,000 | | | | 15,514,397 | | | | | |
The accompanying notes are an integral part of these financial statements.
Baird Aggregate Bond Fund
Schedule of Investments, June 30, 2023 (Unaudited)
Long-Term Investments (cont.)
| | | Principal | | | | | | % of | |
| | | Amount | | | Value | | | Net Assets | |
| Conagra Brands, Inc.: | | | | | | | | | |
| 7.125%, 10/01/2026 | | $ | 6,441,000 | | | $ | 6,668,757 | | | |
| |
| 7.000%, 10/01/2028 | | | 4,300,000 | | | | 4,587,452 | | | | | |
| 5.300%, 11/01/2038 | | | | | | | | | | | | |
| (Callable 05/01/2038) | | | 5,000,000 | | | | 4,804,336 | | | | | |
| Constellation Brands, Inc., | | | | | | | | | | | | |
| 4.900%, 05/01/2033 | | | | | | | | | | | | |
| (Callable 02/01/2033) | | | 7,950,000 | | | | 7,811,166 | | | | | |
| Corning, Inc., | | | | | | | | | | | | |
| 4.375%, 11/15/2057 | | | | | | | | | | | | |
| (Callable 05/15/2057) | | | 9,000,000 | | | | 7,289,629 | | | | | |
| Cox Communications, Inc.: | | | | | | | | | | | | |
| 3.850%, 02/01/2025 | | | | | | | | | | | | |
(Callable 11/01/2024)(2) | | | 4,725,000 | | | | 4,570,939 | | | | | |
| 3.350%, 09/15/2026 | | | | | | | | | | | | |
(Callable 06/15/2026)(2) | | | 25,300,000 | | | | 23,686,841 | | | | | |
| 5.700%, 06/15/2033 | | | | | | | | | | | | |
(Callable 03/15/2033)(2) | | | 5,900,000 | | | | 5,950,452 | | | | | |
| 4.800%, 02/01/2035 | | | | | | | | | | | | |
(Callable 08/01/2034)(2) | | | 14,000,000 | | | | 12,606,420 | | | | | |
| 3.600%, 06/15/2051 | | | | | | | | | | | | |
(Callable 12/15/2050)(2) | | | 21,000,000 | | | | 14,700,398 | | | | | |
| Crown Castle, Inc., | | | | | | | | | | | | |
| 5.100%, 05/01/2033 | | | | | | | | | | | | |
| (Callable 02/01/2033) | | | 20,400,000 | | | | 20,046,761 | | | | | |
| CSL Finance PLC, | | | | | | | | | | | | |
| 4.050%, 04/27/2029 | | | | | | | | | | | | |
(Callable 02/27/2029)(2) | | | 7,500,000 | | | | 7,116,181 | | | | | |
| CSX Corp., | | | | | | | | | | | | |
| 4.650%, 03/01/2068 | | | | | | | | | | | | |
| (Callable 09/01/2067) | | | 9,000,000 | | | | 8,054,919 | | | | | |
| CVS Health Corp.: | | | | | | | | | | | | |
| 3.625%, 04/01/2027 | | | | | | | | | | | | |
| (Callable 02/01/2027) | | | 3,000,000 | | | | 2,847,850 | | | | | |
| 3.250%, 08/15/2029 | | | | | | | | | | | | |
| (Callable 05/15/2029) | | | 8,000,000 | | | | 7,184,210 | | | | | |
| 5.300%, 06/01/2033 | | | | | | | | | | | | |
| (Callable 03/01/2033) | | | 6,500,000 | | | | 6,489,905 | | | | | |
| 4.780%, 03/25/2038 | | | | | | | | | | | | |
| (Callable 09/25/2037) | | | 40,059,000 | | | | 36,969,309 | | | | | |
| 2.700%, 08/21/2040 | | | | | | | | | | | | |
| (Callable 02/21/2040) | | | 5,000,000 | | | | 3,490,163 | | | | | |
| 5.125%, 07/20/2045 | | | | | | | | | | | | |
| (Callable 01/20/2045) | | | 44,155,000 | | | | 40,849,184 | | | | | |
| 5.050%, 03/25/2048 | | | | | | | | | | | | |
| (Callable 09/25/2047) | | | 42,300,000 | | | | 38,989,718 | | | | | |
| 5.875%, 06/01/2053 | | | | | | | | | | | | |
| (Callable 12/01/2052) | | | 9,000,000 | | | | 9,229,070 | | | | | |
| Dell International LLC / EMC Corp.: | | | | | | | | | | | | |
| 6.020%, 06/15/2026 | | | | | | | | | | | | |
| (Callable 03/15/2026) | | | 80,596,000 | | | | 81,918,517 | | | | | |
| 5.300%, 10/01/2029 | | | | | | | | | | | | |
| (Callable 07/01/2029) | | | 6,000,000 | | | | 5,956,254 | | | | | |
| Dentsply Sirona, | | | | | | | | | | | | |
| 3.250%, 06/01/2030 | | | | | | | | | | | | |
| (Callable 03/01/2030) | | | 27,000,000 | | | | 23,360,128 | | | | | |
| Deutsche Telekom | | | | | | | | | | | | |
| International Finance BV, | | | | | | | | | | | | |
9.625%, 06/15/2030(1) | | | 8,661,000 | | | | 10,372,276 | | | | | |
| Dignity Health, | | | | | | | | | | | | |
| 5.267%, 11/01/2064 | | | 2,921,000 | | | | 2,741,740 | | | | | |
| Dollar General Corp., | | | | | | | | | | | | |
| 3.500%, 04/03/2030 | | | | | | | | | | | | |
| (Callable 01/03/2030) | | | 7,000,000 | | | | 6,277,122 | | | | | |
| DuPont de Nemours, Inc.: | | | | | | | | | | | | |
| 4.493%, 11/15/2025 | | | | | | | | | | | | |
| (Callable 09/15/2025) | | | 10,000,000 | | | | 9,793,479 | | | | | |
| 5.319%, 11/15/2038 | | | | | | | | | | | | |
| (Callable 05/15/2038) | | | 29,000,000 | | | | 28,733,517 | | | | | |
| DXC Technology Co.: | | | | | | | | | | | | |
| 1.800%, 09/15/2026 | | | | | | | | | | | | |
| (Callable 08/15/2026) | | | 29,000,000 | | | | 25,204,818 | | | | | |
| 2.375%, 09/15/2028 | | | | | | | | | | | | |
| (Callable 07/15/2028) | | | 79,050,000 | | | | 65,881,074 | | | | | |
| Eagle Materials, Inc., | | | | | | | | | | | | |
| 2.500%, 07/01/2031 | | | | | | | | | | | | |
| (Callable 04/01/2031) | | | 8,700,000 | | | | 7,095,525 | | | | | |
| Eastern Gas Transmission & Storage, Inc.: | | | | | | | | | | | | |
| 4.800%, 11/01/2043 | | | | | | | | | | | | |
| (Callable 05/01/2043) | | | 4,017,000 | | | | 3,491,750 | | | | | |
| 4.600%, 12/15/2044 | | | | | | | | | | | | |
| (Callable 06/15/2044) | | | 3,674,000 | | | | 3,092,445 | | | | | |
| Eaton Corp., | | | | | | | | | | | | |
| 4.700%, 08/23/2052 | | | | | | | | | | | | |
| (Callable 02/23/2052) | | | 6,325,000 | | | | 6,058,930 | | | | | |
| Element Fleet Management Corp.: | | | | | | | | | | | | |
| 3.850%, 06/15/2025 | | | | | | | | | | | | |
(Callable 05/15/2025)(1)(2) | | | 18,492,000 | | | | 17,485,106 | | | | | |
| 6.271%, 06/26/2026 | | | | | | | | | | | | |
(Callable 05/26/2026)(1)(2) | | | 40,000,000 | | | | 39,860,035 | | | | | |
| Enbridge Energy Partners LP: | | | | | | | | | | | | |
7.500%, 04/15/2038(1) | | | 4,500,000 | | | | 5,047,919 | | | | | |
| 7.375%, 10/15/2045 | | | | | | | | | | | | |
(Callable 04/15/2045)(1) | | | 20,000,000 | | | | 23,022,577 | | | | | |
| Energy Transfer LP: | | | | | | | | | | | | |
| 6.022%, 05/15/2024 | | | | | | | | | | | | |
| (Callable 02/15/2024) | | | 5,000,000 | | | | 4,915,365 | | | | | |
| 3.900%, 07/15/2026 | | | | | | | | | | | | |
| (Callable 04/15/2026) | | | 10,000,000 | | | | 9,503,407 | | | | | |
| 5.500%, 06/01/2027 | | | | | | | | | | | | |
| (Callable 03/01/2027) | | | 7,019,000 | | | | 6,980,957 | | | | | |
| 4.000%, 10/01/2027 | | | | | | | | | | | | |
| (Callable 07/01/2027) | | | 2,000,000 | | | | 1,872,796 | | | | | |
| 5.250%, 04/15/2029 | | | | | | | | | | | | |
| (Callable 01/15/2029) | | | 22,666,000 | | | | 22,127,507 | | | | | |
| 3.750%, 05/15/2030 | | | | | | | | | | | | |
| (Callable 02/15/2030) | | | 2,775,000 | | | | 2,503,905 | | | | | |
| 4.900%, 03/15/2035 | | | | | | | | | | | | |
| (Callable 09/15/2034) | | | 4,550,000 | | | | 4,170,362 | | | | | |
| 6.625%, 10/15/2036 | | | 15,094,000 | | | | 15,440,092 | | | | | |
| 5.800%, 06/15/2038 | | | | | | | | | | | | |
| (Callable 12/15/2037) | | | 9,539,000 | | | | 9,139,272 | | | | | |
| 7.500%, 07/01/2038 | | | 20,729,000 | | | | 22,729,095 | | | | | |
| 6.050%, 06/01/2041 | | | | | | | | | | | | |
| (Callable 12/01/2040) | | | 1,611,000 | | | | 1,546,796 | | | | | |
| 6.500%, 02/01/2042 | | | | | | | | | | | | |
| (Callable 08/01/2041) | | | 7,603,000 | | | | 7,699,825 | | | | | |
| 5.950%, 10/01/2043 | | | | | | | | | | | | |
| (Callable 04/01/2043) | | | 3,550,000 | | | | 3,311,894 | | | | | |
| 6.125%, 12/15/2045 | | | | | | | | | | | | |
| (Callable 06/15/2045) | | | 5,797,000 | | | | 5,507,486 | | | | | |
| 5.400%, 10/01/2047 | | | | | | | | | | | | |
| (Callable 04/01/2047) | | | 7,425,000 | | | | 6,544,190 | | | | | |
| 6.000%, 06/15/2048 | | | | | | | | | | | | |
| (Callable 12/15/2047) | | | 10,000,000 | | | | 9,483,041 | | | | | |
| 6.250%, 04/15/2049 | | | | | | | | | | | | |
| (Callable 10/15/2048) | | | 3,850,000 | | | | 3,760,213 | | | | | |
The accompanying notes are an integral part of these financial statements.
Baird Aggregate Bond Fund
Schedule of Investments, June 30, 2023 (Unaudited)
Long-Term Investments (cont.)
| | | Principal | | | | | | % of | |
| | | Amount | | | Value | | | Net Assets | |
| Energy Transfer Partners LP, | | | | | | | | | |
| 4.050%, 03/15/2025 | | | | | | | | | |
| (Callable 12/15/2024) | | $ | 21,190,000 | | | $ | 20,594,702 | | | |
| |
| Eni SpA, | | | | | | | | | | | | |
| 4.250%, 05/09/2029 | | | | | | | | | | | | |
(Callable 02/09/2029)(1)(2) | | | 18,250,000 | | | | 17,222,122 | | | | | |
| Enterprise Products Operating LLC: | | | | | | | | | | | | |
| 5.750%, 03/01/2035 | | | 4,930,000 | | | | 4,891,565 | | | | | |
| 3.200%, 02/15/2052 | | | | | | | | | | | | |
| (Callable 08/15/2051) | | | 30,725,000 | | | | 21,580,021 | | | | | |
| EQT Corp.: | | | | | | | | | | | | |
| 5.700%, 04/01/2028 | | | | | | | | | | | | |
| (Callable 03/01/2028) | | | 10,000,000 | | | | 9,869,675 | | | | | |
| 7.000%, 02/01/2030 | | | | | | | | | | | | |
| (Callable 11/01/2029) | | | 5,493,000 | | | | 5,751,336 | | | | | |
| EQT Midstream Partners LP: | | | | | | | | | | | | |
| 4.000%, 08/01/2024 | | | | | | | | | | | | |
| (Callable 05/01/2024) | | | 1,123,000 | | | | 1,098,592 | | | | | |
| 4.125%, 12/01/2026 | | | | | | | | | | | | |
| (Callable 09/01/2026) | | | 10,000,000 | | | | 9,300,340 | | | | | |
| Equifax, Inc., | | | | | | | | | | | | |
| 5.100%, 06/01/2028 | | | | | | | | | | | | |
| (Callable 05/01/2028) | | | 15,000,000 | | | | 14,774,638 | | | | | |
| Equinix, Inc.: | | | | | | | | | | | | |
| 3.200%, 11/18/2029 | | | | | | | | | | | | |
| (Callable 08/18/2029) | | | 2,000,000 | | | | 1,755,847 | | | | | |
| 2.150%, 07/15/2030 | | | | | | | | | | | | |
| (Callable 04/15/2030) | | | 7,675,000 | | | | 6,202,556 | | | | | |
| ERAC USA Finance LLC, | | | | | | | | | | | | |
| 3.300%, 12/01/2026 | | | | | | | | | | | | |
(Callable 09/01/2026)(2) | | | 20,225,000 | | | | 18,790,780 | | | | | |
| Exxon Mobil Corp., | | | | | | | | | | | | |
| 2.992%, 03/19/2025 | | | | | | | | | | | | |
| (Callable 02/19/2025) | | | 33,700,000 | | | | 32,466,334 | | | | | |
| FedEx Corp., | | | | | | | | | | | | |
| 4.950%, 10/17/2048 | | | | | | | | | | | | |
| (Callable 04/17/2048) | | | 15,000,000 | | | | 13,768,776 | | | | | |
| Ferguson Finance PLC: | | | | | | | | | | | | |
| 4.500%, 10/24/2028 | | | | | | | | | | | | |
(Callable 07/24/2028)(2) | | | 43,025,000 | | | | 41,225,898 | | | | | |
| 3.250%, 06/02/2030 | | | | | | | | | | | | |
(Callable 03/02/2030)(2) | | | 28,100,000 | | | | 24,383,466 | | | | | |
| 4.650%, 04/20/2032 | | | | | | | | | | | | |
(Callable 01/20/2032)(2) | | | 28,125,000 | | | | 26,522,853 | | | | | |
| Fidelity National | | | | | | | | | | | | |
| Information Services, Inc.: | | | | | | | | | | | | |
| 5.100%, 07/15/2032 | | | | | | | | | | | | |
| (Callable 04/15/2032) | | | 4,500,000 | | | | 4,366,201 | | | | | |
| 3.100%, 03/01/2041 | | | | | | | | | | | | |
| (Callable 09/01/2040) | | | 7,100,000 | | | | 4,885,963 | | | | | |
| 4.500%, 08/15/2046 | | | | | | | | | | | | |
| (Callable 02/15/2046) | | | 23,740,000 | | | | 18,921,870 | | | | | |
| Fiserv, Inc.: | | | | | | | | | | | | |
| 3.200%, 07/01/2026 | | | | | | | | | | | | |
| (Callable 05/01/2026) | | | 11,650,000 | | | | 10,931,944 | | | | | |
| 4.200%, 10/01/2028 | | | | | | | | | | | | |
| (Callable 07/01/2028) | | | 5,000,000 | | | | 4,789,013 | | | | | |
| 3.500%, 07/01/2029 | | | | | | | | | | | | |
| (Callable 04/01/2029) | | | 4,307,000 | | | | 3,931,152 | | | | | |
| 2.650%, 06/01/2030 | | | | | | | | | | | | |
| (Callable 03/01/2030) | | | 28,900,000 | | | | 24,628,725 | | | | | |
| 4.400%, 07/01/2049 | | | | | | | | | | | | |
| (Callable 01/01/2049) | | | 11,000,000 | | | | 9,294,697 | | | | | |
| Flex Intermediate Holdco LLC, | | | | | | | | | | | | |
| 3.363%, 06/30/2031 | | | | | | | | | | | | |
(Callable 12/30/2030)(2) | | | 16,000,000 | | | | 12,720,863 | | | | | |
| Flex Ltd.: | | | | | | | | | | | | |
| 3.750%, 02/01/2026 | | | | | | | | | | | | |
| (Callable 01/01/2026) | | | 15,000,000 | | | | 14,255,587 | | | | | |
| 6.000%, 01/15/2028 | | | | | | | | | | | | |
| (Callable 12/15/2027) | | | 20,000,000 | | | | 20,311,517 | | | | | |
| 4.875%, 06/15/2029 | | | | | | | | | | | | |
| (Callable 03/15/2029) | | | 30,627,000 | | | | 29,292,650 | | | | | |
| 4.875%, 05/12/2030 | | | | | | | | | | | | |
| (Callable 02/12/2030) | | | 21,830,000 | | | | 21,083,265 | | | | | |
| FLIR Systems, Inc., | | | | | | | | | | | | |
| 2.500%, 08/01/2030 | | | | | | | | | | | | |
| (Callable 05/01/2030) | | | 7,000,000 | | | | 5,785,089 | | | | | |
| Florida Gas Transmission Co. LLC, | | | | | | | | | | | | |
| 2.550%, 07/01/2030 | | | | | | | | | | | | |
(Callable 04/01/2030)(2) | | | 18,500,000 | | | | 15,406,942 | | | | | |
| Flowserve Corp., | | | | | | | | | | | | |
| 2.800%, 01/15/2032 | | | | | | | | | | | | |
| (Callable 10/15/2031) | | | 9,625,000 | | | | 7,669,502 | | | | | |
| FMC Corp.: | | | | | | | | | | | | |
| 4.100%, 02/01/2024 | | | | | | | | | | | | |
| (Callable 11/01/2023) | | | 46,920,000 | | | | 46,316,979 | | | | | |
| 3.200%, 10/01/2026 | | | | | | | | | | | | |
| (Callable 08/01/2026) | | | 5,000,000 | | | | 4,640,875 | | | | | |
| Ford Motor Credit Co. LLC: | | | | | | | | | | | | |
| 5.584%, 03/18/2024 | | | | | | | | | | | | |
| (Callable 02/18/2024) | | | 9,350,000 | | | | 9,284,048 | | | | | |
| 3.664%, 09/08/2024 | | | 5,565,000 | | | | 5,377,604 | | | | | |
| Fortune Brands Home & Security, Inc., | | | | | | | | | | | | |
| 3.250%, 09/15/2029 | | | | | | | | | | | | |
| (Callable 06/15/2029) | | | 15,000,000 | | | | 13,113,693 | | | | | |
| Fortune Brands Innovations, Inc., | | | | | | | | | | | | |
| 5.875%, 06/01/2033 | | | | | | | | | | | | |
| (Callable 03/01/2033) | | | 24,000,000 | | | | 24,031,246 | | | | | |
| Freeport-McMoRan, Inc.: | | | | | | | | | | | | |
| 4.250%, 03/01/2030 | | | | | | | | | | | | |
| (Callable 03/01/2025) | | | 8,000,000 | | | | 7,372,288 | | | | | |
| 4.625%, 08/01/2030 | | | | | | | | | | | | |
| (Callable 08/01/2025) | | | 5,000,000 | | | | 4,711,250 | | | | | |
| 5.450%, 03/15/2043 | | | | | | | | | | | | |
| (Callable 09/15/2042) | | | 8,750,000 | | | | 8,158,883 | | | | | |
| Fresenius Medical Care | | | | | | | | | | | | |
| US Finance II, Inc., | | | | | | | | | | | | |
| 4.750%, 10/15/2024 | | | | | | | | | | | | |
(Callable 07/17/2024)(1)(2) | | | 14,530,000 | | | | 14,223,530 | | | | | |
| Fresenius Medical Care | | | | | | | | | | | | |
| US Finance III, Inc.: | | | | | | | | | | | | |
| 1.875%, 12/01/2026 | | | | | | | | | | | | |
(Callable 11/01/2026)(1)(2) | | | 4,200,000 | | | | 3,622,822 | | | | | |
| 3.750%, 06/15/2029 | | | | | | | | | | | | |
(Callable 03/15/2029)(1)(2) | | | 24,200,000 | | | | 21,262,371 | | | | | |
| 2.375%, 02/16/2031 | | | | | | | | | | | | |
(Callable 11/16/2030)(1)(2) | | | 25,000,000 | | | | 18,968,541 | | | | | |
| 3.000%, 12/01/2031 | | | | | | | | | | | | |
(Callable 09/01/2031)(1)(2) | | | 10,000,000 | | | | 7,763,296 | | | | | |
| GE Capital Funding LLC, | | | | | | | | | | | | |
| 4.550%, 05/15/2032 | | | | | | | | | | | | |
| (Callable 02/15/2032) | | | 10,716,000 | | | | 10,404,265 | | | | | |
| General Motors Co., | | | | | | | | | | | | |
| 6.125%, 10/01/2025 | | | | | | | | | | | | |
| (Callable 09/01/2025) | | | 21,479,000 | | | | 21,625,713 | | | | | |
The accompanying notes are an integral part of these financial statements.
Baird Aggregate Bond Fund
Schedule of Investments, June 30, 2023 (Unaudited)
Long-Term Investments (cont.)
| | | Principal | | | | | | % of | |
| | | Amount | | | Value | | | Net Assets | |
| General Motors Financial Co., Inc.: | | | | | | | | | |
| 2.900%, 02/26/2025 | | | | | | | | | |
| (Callable 01/26/2025) | | $ | 13,000,000 | | | $ | 12,334,812 | | | |
| |
| 6.050%, 10/10/2025 | | | 22,125,000 | | | | 22,163,704 | | | | | |
| 1.250%, 01/08/2026 | | | | | | | | | | | | |
| (Callable 12/08/2025) | | | 19,000,000 | | | | 16,952,048 | | | | | |
| 5.400%, 04/06/2026 | | | 20,000,000 | | | | 19,771,139 | | | | | |
| 2.350%, 02/26/2027 | | | | | | | | | | | | |
| (Callable 01/26/2027) | | | 11,000,000 | | | | 9,805,279 | | | | | |
| 5.800%, 06/23/2028 | | | | | | | | | | | | |
| (Callable 05/23/2028) | | | 30,000,000 | | | | 29,885,552 | | | | | |
| Genpact Luxembourg Sarl, | | | | | | | | | | | | |
| 3.375%, 12/01/2024 | | | | | | | | | | | | |
| (Callable 11/01/2024) | | | 59,575,000 | | | | 57,419,674 | | | | | |
| Genpact Luxembourg SARL, | | | | | | | | | | | | |
| 1.750%, 04/10/2026 | | | | | | | | | | | | |
| (Callable 03/10/2026) | | | 25,000,000 | | | | 22,391,849 | | | | | |
| Gilead Sciences, Inc., | | | | | | | | | | | | |
| 4.600%, 09/01/2035 | | | | | | | | | | | | |
| (Callable 03/01/2035) | | | 4,600,000 | | | | 4,429,066 | | | | | |
| Glencore Finance (Canada) Ltd., | | | | | | | | | | | | |
5.550%, 10/25/2042(1)(2) | | | 5,000,000 | | | | 4,650,237 | | | | | |
| Glencore Funding LLC: | | | | | | | | | | | | |
4.000%, 04/16/2025(1)(2) | | | 4,450,000 | | | | 4,320,488 | | | | | |
| 4.000%, 03/27/2027 | | | | | | | | | | | | |
(Callable 12/27/2026)(1)(2) | | | 25,550,000 | | | | 24,351,594 | | | | | |
| 3.875%, 10/27/2027 | | | | | | | | | | | | |
(Callable 07/27/2027)(1)(2) | | | 2,000,000 | | | | 1,866,640 | | | | | |
| 4.875%, 03/12/2029 | | | | | | | | | | | | |
(Callable 12/12/2028)(1)(2) | | | 11,000,000 | | | | 10,589,872 | | | | | |
| 2.500%, 09/01/2030 | | | | | | | | | | | | |
(Callable 06/01/2030)(1)(2) | | | 61,437,000 | | | | 50,306,278 | | | | | |
| 5.700%, 05/08/2033 | | | | | | | | | | | | |
(Callable 02/08/2033)(1)(2) | | | 20,000,000 | | | | 19,843,504 | | | | | |
| 3.875%, 04/27/2051 | | | | | | | | | | | | |
(Callable 10/27/2050)(1)(2) | | | 6,000,000 | | | | 4,452,136 | | | | | |
| 3.375%, 09/23/2051 | | | | | | | | | | | | |
(Callable 03/23/2051)(1)(2) | | | 6,000,000 | | | | 4,040,278 | | | | | |
| Global Payments, Inc.: | | | | | | | | | | | | |
| 4.800%, 04/01/2026 | | | | | | | | | | | | |
| (Callable 01/01/2026) | | | 13,830,000 | | | | 13,500,702 | | | | | |
| 3.200%, 08/15/2029 | | | | | | | | | | | | |
| (Callable 05/15/2029) | | | 7,500,000 | | | | 6,518,885 | | | | | |
| 2.900%, 05/15/2030 | | | | | | | | | | | | |
| (Callable 02/15/2030) | | | 14,467,000 | | | | 12,261,905 | | | | | |
| Grupo Bimbo SAB de CV: | | | | | | | | | | | | |
4.875%, 06/27/2044(1)(2) | | | 8,250,000 | | | | 7,653,897 | | | | | |
| 4.700%, 11/10/2047 | | | | | | | | | | | | |
(Callable 05/10/2047)(1)(2) | | | 25,000,000 | | | | 22,521,370 | | | | | |
4.000%, 09/06/2049(1)(2) | | | 7,300,000 | | | | 5,899,200 | | | | | |
| Gulfstream Natural Gas System LLC, | | | | | | | | | | | | |
| 4.600%, 09/15/2025 | | | | | | | | | | | | |
(Callable 06/15/2025)(2) | | | 5,000,000 | | | | 4,804,153 | | | | | |
| HCA, Inc.: | | | | | | | | | | | | |
| 5.250%, 04/15/2025 | | | 30,686,000 | | | | 30,291,965 | | | | | |
| 4.500%, 02/15/2027 | | | | | | | | | | | | |
| (Callable 08/15/2026) | | | 15,000,000 | | | | 14,470,030 | | | | | |
| 4.125%, 06/15/2029 | | | | | | | | | | | | |
| (Callable 03/15/2029) | | | 15,000,000 | | | | 13,880,831 | | | | | |
| 3.500%, 09/01/2030 | | | | | | | | | | | | |
| (Callable 03/01/2030) | | | 14,405,000 | | | | 12,626,697 | | | | | |
| 3.625%, 03/15/2032 | | | | | | | | | | | | |
(Callable 12/15/2031)(2) | | | 16,000,000 | | | | 13,888,134 | | | | | |
| 4.625%, 03/15/2052 | | | | | | | | | | | | |
(Callable 09/15/2051)(2) | | | 20,000,000 | | | | 16,434,935 | | | | | |
| 5.900%, 06/01/2053 | | | | | | | | | | | | |
| (Callable 12/01/2052) | | | 8,275,000 | | | | 8,197,613 | | | | | |
| HF Sinclair Corp., | | | | | | | | | | | | |
| 4.500%, 10/01/2030 | | | | | | | | | | | | |
| (Callable 07/01/2030) | | | 8,000,000 | | | | 7,094,352 | | | | | |
| HP, Inc.: | | | | | | | | | | | | |
| 2.200%, 06/17/2025 | | | | | | | | | | | | |
| (Callable 05/17/2025) | | | 15,000,000 | | | | 14,108,707 | | | | | |
| 3.000%, 06/17/2027 | | | | | | | | | | | | |
| (Callable 04/17/2027) | | | 35,000,000 | | | | 32,285,765 | | | | | |
| Hubbell, Inc., | | | | | | | | | | | | |
| 3.150%, 08/15/2027 | | | | | | | | | | | | |
| (Callable 05/15/2027) | | | 11,700,000 | | | | 10,802,279 | | | | | |
| Huntington Ingalls Industries, Inc., | | | | | | | | | | | | |
| 2.043%, 08/16/2028 | | | | | | | | | | | | |
| (Callable 06/16/2028) | | | 35,513,000 | | | | 29,818,438 | | | | | |
| Hutchison Whampoa International Ltd., | | | | | | | | | | | | |
3.625%, 10/31/2024(1)(2) | | | 7,850,000 | | | | 7,637,430 | | | | | |
| Hyundai Capital America: | | | | | | | | | | | | |
1.250%, 09/18/2023(1)(2) | | | 14,000,000 | | | | 13,866,704 | | | | | |
3.400%, 06/20/2024(1)(2) | | | 19,025,000 | | | | 18,548,211 | | | | | |
| 1.800%, 10/15/2025 | | | | | | | | | | | | |
(Callable 09/15/2025)(1)(2) | | | 3,000,000 | | | | 2,736,560 | | | | | |
| 1.300%, 01/08/2026 | | | | | | | | | | | | |
(Callable 12/08/2025)(1)(2) | | | 10,000,000 | | | | 8,947,284 | | | | | |
| 1.650%, 09/17/2026 | | | | | | | | | | | | |
(Callable 08/17/2026)(1)(2) | | | 22,550,000 | | | | 19,866,393 | | | | | |
| 5.680%, 06/26/2028 | | | | | | | | | | | | |
(Callable 05/26/2028)(1)(2) | | | 36,375,000 | | | | 36,083,838 | | | | | |
| Infor, Inc., | | | | | | | | | | | | |
| 1.750%, 07/15/2025 | | | | | | | | | | | | |
(Callable 06/15/2025)(2) | | | 17,375,000 | | | | 15,864,201 | | | | | |
| Ingersoll-Rand Luxembourg Finance SA, | | | | | | | | | | | | |
| 4.500%, 03/21/2049 | | | | | | | | | | | | |
| (Callable 09/21/2048) | | | 10,000,000 | | | | 8,817,763 | | | | | |
| Ingredion, Inc., | | | | | | | | | | | | |
| 2.900%, 06/01/2030 | | | | | | | | | | | | |
| (Callable 03/01/2030) | | | 26,775,000 | | | | 23,132,889 | | | | | |
| Intel Corp.: | | | | | | | | | | | | |
| 5.200%, 02/10/2033 | | | | | | | | | | | | |
| (Callable 11/10/2032) | | | 5,000,000 | | | | 5,047,390 | | | | | |
| 4.900%, 08/05/2052 | | | | | | | | | | | | |
| (Callable 02/05/2052) | | | 10,000,000 | | | | 9,229,687 | | | | | |
| 5.700%, 02/10/2053 | | | | | | | | | | | | |
| (Callable 08/10/2052) | | | 7,175,000 | | | | 7,299,093 | | | | | |
| International Business Machines Corp., | | | | | | | | | | | | |
| 4.150%, 05/15/2039 | | | 11,325,000 | | | | 9,952,673 | | | | | |
| International Flavors & Fragrances, Inc., | | | | | | | | | | | | |
| 1.832%, 10/15/2027 | | | | | | | | | | | | |
(Callable 08/15/2027)(2) | | | 10,000,000 | | | | 8,432,453 | | | | | |
| IQVIA, Inc., | | | | | | | | | | | | |
| 5.700%, 05/15/2028 | | | | | | | | | | | | |
(Callable 04/15/2028)(2) | | | 8,475,000 | | | | 8,390,250 | | | | | |
| JAB Holdings BV: | | | | | | | | | | | | |
| 2.200%, 11/23/2030 | | | | | | | | | | | | |
(Callable 08/23/2030)(1)(2) | | | 18,925,000 | | | | 14,874,870 | | | | | |
| 4.500%, 04/08/2052 | | | | | | | | | | | | |
(Callable 10/08/2051)(1)(2) | | | 20,750,000 | | | | 16,013,200 | | | | | |
| Jacobs Engineering Group, Inc., | | | | | | | | | | | | |
| 5.900%, 03/01/2033 | | | | | | | | | | | | |
| (Callable 12/01/2032) | | | 16,784,000 | | | | 16,466,473 | | | | | |
The accompanying notes are an integral part of these financial statements.
Baird Aggregate Bond Fund
Schedule of Investments, June 30, 2023 (Unaudited)
Long-Term Investments (cont.)
| | | Principal | | | | | | % of | |
| | | Amount | | | Value | | | Net Assets | |
| JBS USA Lux SA / JBS USA Food Co. / | | | | | | | | | |
| JBS USA Finance, Inc.: | | | | | | | | | |
| 3.000%, 02/02/2029 | | | | | | | | | |
(Callable 12/02/2028)(2) | | $ | 10,000,000 | | | $ | 8,480,099 | | | |
| |
| 3.000%, 05/15/2032 | | | | | | | | | | | | |
(Callable 02/15/2032)(2) | | | 18,525,000 | | | | 14,217,017 | | | | | |
| JBS USA LUX SA / JBS USA Food Co. / | | | | | | | | | | | | |
| JBS USA Finance, Inc., | | | | | | | | | | | | |
| 5.750%, 04/01/2033 | | | | | | | | | | | | |
(Callable 01/01/2033)(2) | | | 35,975,000 | | | | 33,814,807 | | | | | |
| JM Smucker Co.: | | | | | | | | | | | | |
| 3.500%, 03/15/2025 | | | 5,000,000 | | | | 4,831,131 | | | | | |
| 2.375%, 03/15/2030 | | | | | | | | | | | | |
| (Callable 12/15/2029) | | | 9,125,000 | | | | 7,763,730 | | | | | |
| Johnson Controls International PLC: | | | | | | | | | | | | |
| 3.900%, 02/14/2026 | | | | | | | | | | | | |
| (Callable 11/14/2025) | | | 3,645,000 | | | | 3,504,958 | | | | | |
| 6.000%, 01/15/2036 | | | 892,000 | | | | 924,672 | | | | | |
| 4.500%, 02/15/2047 | | | | | | | | | | | | |
| (Callable 08/15/2046) | | | 4,400,000 | | | | 3,831,709 | | | | | |
| 4.950%, 07/02/2064 | | | | | | | | | | | | |
(Callable 01/02/2064)(7) | | | 4,029,000 | | | | 3,577,733 | | | | | |
| Kellogg Co., | | | | | | | | | | | | |
| 2.100%, 06/01/2030 | | | | | | | | | | | | |
| (Callable 03/01/2030) | | | 20,000,000 | | | | 16,572,326 | | | | | |
| Keurig Dr Pepper, Inc., | | | | | | | | | | | | |
| 3.950%, 04/15/2029 | | | | | | | | | | | | |
| (Callable 02/15/2029) | | | 17,650,000 | | | | 16,622,887 | | | | | |
| Keysight Technologies, Inc., | | | | | | | | | | | | |
| 4.600%, 04/06/2027 | | | | | | | | | | | | |
| (Callable 01/06/2027) | | | 36,562,000 | | | | 35,976,658 | | | | | |
| Kimberly-Clark de Mexico SAB de CV, | | | | | | | | | | | | |
| 2.431%, 07/01/2031 | | | | | | | | | | | | |
(Callable 04/01/2031)(1)(2) | | | 19,321,000 | | | | 16,390,970 | | | | | |
| Kinder Morgan Energy Partners LP: | | | | | | | | | | | | |
| 4.300%, 05/01/2024 | | | | | | | | | | | | |
| (Callable 02/01/2024) | | | 10,000,000 | | | | 9,864,980 | | | | | |
| 7.300%, 08/15/2033 | | | 8,103,000 | | | | 8,824,885 | | | | | |
| 5.800%, 03/15/2035 | | | 2,150,000 | | | | 2,121,191 | | | | | |
| 6.500%, 02/01/2037 | | | 6,400,000 | | | | 6,579,354 | | | | | |
| 6.950%, 01/15/2038 | | | 14,008,000 | | | | 15,043,148 | | | | | |
| 6.500%, 09/01/2039 | | | 5,359,000 | | | | 5,480,390 | | | | | |
| 7.500%, 11/15/2040 | | | 7,917,000 | | | | 8,790,118 | | | | | |
| Kinder Morgan, Inc.: | | | | | | | | | | | | |
| 5.625%, 11/15/2023 | | | | | | | | | | | | |
(Callable 08/15/2023)(2) | | | 5,017,000 | | | | 5,013,967 | | | | | |
| 8.050%, 10/15/2030 | | | 3,670,000 | | | | 4,083,606 | | | | | |
| 7.800%, 08/01/2031 | | | 16,745,000 | | | | 18,831,987 | | | | | |
| 7.750%, 01/15/2032 | | | 44,035,000 | | | | 49,716,895 | | | | | |
| Kinross Gold Corp., | | | | | | | | | | | | |
| 6.875%, 09/01/2041 | | | | | | | | | | | | |
(Callable 03/01/2041)(1) | | | 3,000,000 | | | | 3,119,007 | | | | | |
| Kraft Heinz Foods Co.: | | | | | | | | | | | | |
| 3.000%, 06/01/2026 | | | | | | | | | | | | |
| (Callable 03/01/2026) | | | 9,249,000 | | | | 8,727,189 | | | | | |
| 5.000%, 07/15/2035 | | | | | | | | | | | | |
| (Callable 01/15/2035) | | | 10,613,000 | | | | 10,454,003 | | | | | |
7.125%, 08/01/2039(2) | | | 1,425,000 | | | | 1,586,777 | | | | | |
| Kyndryl Holdings, Inc.: | | | | | | | | | | | | |
| 2.050%, 10/15/2026 | | | | | | | | | | | | |
| (Callable 09/15/2026) | | | 17,000,000 | | | | 14,669,484 | | | | | |
| 2.700%, 10/15/2028 | | | | | | | | | | | | |
| (Callable 08/15/2028) | | | 50,000,000 | | | | 40,684,282 | | | | | |
| L3Harris Technologies, Inc., | | | | | | | | | | | | |
| 3.832%, 04/27/2025 | | | | | | | | | | | | |
| (Callable 01/27/2025) | | | 5,000,000 | | | | 4,841,901 | | | | | |
| Lafarge SA, | | | | | | | | | | | | |
| 7.125%, 07/15/2036 | | | 13,596,000 | | | | 14,668,990 | | | | | |
| Leidos, Inc.: | | | | | | | | | | | | |
| 3.625%, 05/15/2025 | | | | | | | | | | | | |
| (Callable 04/15/2025) | | | 12,925,000 | | | | 12,396,522 | | | | | |
| 4.375%, 05/15/2030 | | | | | | | | | | | | |
| (Callable 02/15/2030) | | | 47,279,000 | | | | 43,408,554 | | | | | |
| 2.300%, 02/15/2031 | | | | | | | | | | | | |
| (Callable 11/15/2030) | | | 8,175,000 | | | | 6,441,478 | | | | | |
| 5.750%, 03/15/2033 | | | | | | | | | | | | |
| (Callable 12/15/2032) | | | 23,000,000 | | | | 22,849,208 | | | | | |
| LKQ Corp., | | | | | | | | | | | | |
| 5.750%, 06/15/2028 | | | | | | | | | | | | |
(Callable 05/15/2028)(2) | | | 12,000,000 | | | | 11,960,968 | | | | | |
| Lowe`s Companies, Inc., | | | | | | | | | | | | |
| 5.750%, 07/01/2053 | | | | | | | | | | | | |
| (Callable 01/01/2053) | | | 3,450,000 | | | | 3,515,399 | | | | | |
| Lundin Energy Finance BV, | | | | | | | | | | | | |
| 2.000%, 07/15/2026 | | | | | | | | | | | | |
(Callable 06/15/2026)(1)(2) | | | 11,348,000 | | | | 10,191,507 | | | | | |
| LYB International Finance III LLC, | | | | | | | | | | | | |
| 2.250%, 10/01/2030 | | | | | | | | | | | | |
| (Callable 07/01/2030) | | | 5,925,000 | | | | 4,851,623 | | | | | |
| Magellan Midstream Partners LP: | | | | | | | | | | | | |
| 3.200%, 03/15/2025 | | | | | | | | | | | | |
| (Callable 12/15/2024) | | | 5,000,000 | | | | 4,753,754 | | | | | |
| 3.950%, 03/01/2050 | | | | | | | | | | | | |
| (Callable 09/01/2049) | | | 5,100,000 | | | | 3,642,239 | | | | | |
| Marathon Petroleum Corp.: | | | | | | | | | | | | |
| 3.625%, 09/15/2024 | | | | | | | | | | | | |
| (Callable 06/15/2024) | | | 1,600,000 | | | | 1,557,950 | | | | | |
| 4.750%, 09/15/2044 | | | | | | | | | | | | |
| (Callable 03/15/2044) | | | 1,500,000 | | | | 1,254,531 | | | | | |
| Marriott International, Inc.: | | | | | | | | | | | | |
| 5.000%, 10/15/2027 | | | | | | | | | | | | |
| (Callable 09/15/2027) | | | 12,950,000 | | | | 12,848,245 | | | | | |
| 4.900%, 04/15/2029 | | | | | | | | | | | | |
| (Callable 03/15/2029) | | | 10,000,000 | | | | 9,729,420 | | | | | |
| Marshfield Clinic Health System, Inc., | | | | | | | | | | | | |
| 2.703%, 02/15/2030 (Callable | | | | | | | | | | | | |
| 08/15/2029) (Insured by AGM) | | | 23,125,000 | | | | 19,451,817 | | | | | |
| Martin Marietta Materials, Inc.: | | | | | | | | | | | | |
| 2.500%, 03/15/2030 | | | | | | | | | | | | |
| (Callable 12/15/2029) | | | 6,200,000 | | | | 5,238,464 | | | | | |
| 6.250%, 05/01/2037 | | | 893,000 | | | | 883,994 | | | | | |
| McDonald’s Corp., | | | | | | | | | | | | |
| 3.300%, 07/01/2025 | | | | | | | | | | | | |
| (Callable 06/01/2025) | | | 3,000,000 | | | | 2,892,014 | | | | | |
| Mercedes-Benz Finance | | | | | | | | | | | | |
| North America LLC, | | | | | | | | | | | | |
5.250%, 11/29/2027(1)(2) | | | 8,225,000 | | | | 8,278,151 | | | | | |
| Microsoft Corp.: | | | | | | | | | | | | |
| 2.921%, 03/17/2052 | | | | | | | | | | | | |
| (Callable 09/17/2051) | | | 3,125,000 | | | | 2,324,898 | | | | | |
| 3.950%, 08/08/2056 | | | | | | | | | | | | |
| (Callable 02/08/2056) | | | 9,903,000 | | | | 8,892,337 | | | | | |
| 2.675%, 06/01/2060 | | | | | | | | | | | | |
| (Callable 12/01/2059) | | | 2,097,000 | | | | 1,406,330 | | | | | |
| Midwest Connector Capital Co. LLC, | | | | | | | | | | | | |
| 4.625%, 04/01/2029 | | | | | | | | | | | | |
(Callable 01/01/2029)(2) | | | 26,022,000 | | | | 23,777,741 | | | | | |
The accompanying notes are an integral part of these financial statements.
Baird Aggregate Bond Fund
Schedule of Investments, June 30, 2023 (Unaudited)
Long-Term Investments (cont.)
| | | Principal | | | | | | % of | |
| | | Amount | | | Value | | | Net Assets | |
| Mohawk Industries, Inc., | | | | | | | | | |
| 3.625%, 05/15/2030 | | | | | | | | | |
| (Callable 02/15/2030) | | $ | 10,000,000 | | | $ | 9,026,062 | | | |
| |
| Molex Electronic Technologies LLC, | | | | | | | | | | | | |
| 3.900%, 04/15/2025 | | | | | | | | | | | | |
(Callable 01/15/2025)(2) | | | 9,365,000 | | | | 8,911,381 | | | | | |
| Molson Coors Beverage Co., | | | | | | | | | | | | |
| 3.000%, 07/15/2026 | | | | | | | | | | | | |
| (Callable 04/15/2026) | | | 9,889,000 | | | | 9,237,283 | | | | | |
| Mosaic Co.: | | | | | | | | | | | | |
| 5.450%, 11/15/2033 | | | | | | | | | | | | |
| (Callable 05/15/2033) | | | 2,000,000 | | | | 1,947,817 | | | | | |
| 4.875%, 11/15/2041 | | | | | | | | | | | | |
| (Callable 05/15/2041) | | | 5,000,000 | | | | 4,281,750 | | | | | |
| MPLX LP: | | | | | | | | | | | | |
| 4.000%, 02/15/2025 | | | | | | | | | | | | |
| (Callable 11/15/2024) | | | 6,000,000 | | | | 5,814,472 | | | | | |
| 4.875%, 06/01/2025 | | | | | | | | | | | | |
| (Callable 03/01/2025) | | | 18,665,000 | | | | 18,313,760 | | | | | |
| 1.750%, 03/01/2026 | | | | | | | | | | | | |
| (Callable 02/01/2026) | | | 17,125,000 | | | | 15,544,745 | | | | | |
| 4.125%, 03/01/2027 | | | | | | | | | | | | |
| (Callable 12/01/2026) | | | 11,700,000 | | | | 11,195,011 | | | | | |
| 2.650%, 08/15/2030 | | | | | | | | | | | | |
| (Callable 05/15/2030) | | | 22,125,000 | | | | 18,510,925 | | | | | |
| 5.000%, 03/01/2033 | | | | | | | | | | | | |
| (Callable 12/01/2032) | | | 10,000,000 | | | | 9,578,847 | | | | | |
| 4.500%, 04/15/2038 | | | | | | | | | | | | |
| (Callable 10/15/2037) | | | 8,725,000 | | | | 7,509,859 | | | | | |
| Mylan, Inc.: | | | | | | | | | | | | |
| 4.550%, 04/15/2028 | | | | | | | | | | | | |
| (Callable 01/15/2028) | | | 16,705,000 | | | | 15,738,146 | | | | | |
| 5.200%, 04/15/2048 | | | | | | | | | | | | |
| (Callable 10/15/2047) | | | 9,000,000 | | | | 7,012,158 | | | | | |
| Netflix, Inc., | | | | | | | | | | | | |
| 5.875%, 02/15/2025 | | | 5,000,000 | | | | 5,020,000 | | | | | |
| Norfolk Southern Corp., | | | | | | | | | | | | |
| 3.050%, 05/15/2050 | | | | | | | | | | | | |
| (Callable 11/15/2049) | | | 17,000,000 | | | | 11,753,396 | | | | | |
| Nova Southeastern University, Inc., | | | | | | | | | | | | |
| 4.809%, 04/01/2053 | | | 7,200,000 | | | | 6,101,184 | | | | | |
| Nutrien Ltd., | | | | | | | | | | | | |
| 4.200%, 04/01/2029 | | | | | | | | | | | | |
(Callable 01/01/2029)(1) | | | 7,000,000 | | | | 6,608,865 | | | | | |
| nVent Finance Sarl: | | | | | | | | | | | | |
| 4.550%, 04/15/2028 | | | | | | | | | | | | |
| (Callable 01/15/2028) | | | 32,634,000 | | | | 30,526,349 | | | | | |
| 5.650%, 05/15/2033 | | | | | | | | | | | | |
| (Callable 02/15/2033) | | | 5,000,000 | | | | 4,915,531 | | | | | |
| NXP BV / NXP Funding LLC / | | | | | | | | | | | | |
| NXP USA, Inc., | | | | | | | | | | | | |
| 2.650%, 02/15/2032 | | | | | | | | | | | | |
(Callable 11/15/2031)(1) | | | 10,000,000 | | | | 8,095,178 | | | | | |
| Occidental Petroleum Corp.: | | | | | | | | | | | | |
| 8.875%, 07/15/2030 | | | | | | | | | | | | |
| (Callable 01/15/2030) | | | 29,260,000 | | | | 33,630,859 | | | | | |
| 7.500%, 05/01/2031 | | | 28,703,000 | | | | 31,339,083 | | | | | |
| 7.875%, 09/15/2031 | | | 6,320,000 | | | | 7,045,553 | | | | | |
| Ochsner LSU Health System | | | | | | | | | | | | |
| of North Louisiana, | | | | | | | | | | | | |
| 2.510%, 05/15/2031 | | | | | | | | | | | | |
| (Callable 11/15/2030) | | | 26,620,000 | | | | 19,694,715 | | | | | |
| OCI NV, | | | | | | | | | | | | |
| 6.700%, 03/16/2033 | | | | | | | | | | | | |
(Callable 12/16/2032)(1)(2) | | | 10,000,000 | | | | 9,776,569 | | | | | |
| ONEOK, Inc., | | | | | | | | | | | | |
| 2.750%, 09/01/2024 | | | | | | | | | | | | |
| (Callable 08/01/2024) | | | 1,200,000 | | | | 1,159,627 | | | | | |
| Oracle Corp.: | | | | | | | | | | | | |
| 2.800%, 04/01/2027 | | | | | | | | | | | | |
| (Callable 02/01/2027) | | | 26,225,000 | | | | 24,104,155 | | | | | |
| 6.250%, 11/09/2032 | | | | | | | | | | | | |
| (Callable 08/09/2032) | | | 18,000,000 | | | | 19,106,857 | | | | | |
| 3.850%, 07/15/2036 | | | | | | | | | | | | |
| (Callable 01/15/2036) | | | 7,500,000 | | | | 6,259,417 | | | | | |
| 4.500%, 07/08/2044 | | | | | | | | | | | | |
| (Callable 01/08/2044) | | | 3,000,000 | | | | 2,507,152 | | | | | |
| 4.000%, 11/15/2047 | | | | | | | | | | | | |
| (Callable 05/15/2047) | | | 10,250,000 | | | | 7,891,313 | | | | | |
| 3.950%, 03/25/2051 | | | | | | | | | | | | |
| (Callable 09/25/2050) | | | 3,300,000 | | | | 2,495,203 | | | | | |
| 6.900%, 11/09/2052 | | | | | | | | | | | | |
| (Callable 05/09/2052) | | | 56,775,000 | | | | 63,722,426 | | | | | |
| Orange SA, | | | | | | | | | | | | |
9.000%, 03/01/2031(1) | | | 29,044,000 | | | | 35,672,760 | | | | | |
| Otis Worldwide Corp., | | | | | | | | | | | | |
| 3.362%, 02/15/2050 | | | | | | | | | | | | |
| (Callable 08/15/2049) | | | 3,025,000 | | | | 2,220,436 | | | | | |
| PeaceHealth Obligated Group, | | | | | | | | | | | | |
| 3.218%, 11/15/2050 | | | | | | | | | | | | |
| (Callable 05/15/2050) | | | 7,200,000 | | | | 4,856,221 | | | | | |
| Penske Truck Leasing Co.: | | | | | | | | | | | | |
| 2.700%, 11/01/2024 | | | | | | | | | | | | |
(Callable 10/01/2024)(2) | | | 5,275,000 | | | | 5,033,260 | | | | | |
| 4.000%, 07/15/2025 | | | | | | | | | | | | |
(Callable 06/15/2025)(2) | | | 31,150,000 | | | | 29,796,388 | | | | | |
| 5.875%, 11/15/2027 | | | | | | | | | | | | |
(Callable 10/15/2027)(2) | | | 12,000,000 | | | | 11,896,656 | | | | | |
| 5.550%, 05/01/2028 | | | | | | | | | | | | |
(Callable 04/01/2028)(2) | | | 24,065,000 | | | | 23,693,791 | | | | | |
| 3.350%, 11/01/2029 | | | | | | | | | | | | |
(Callable 08/01/2029)(2) | | | 2,199,000 | | | | 1,875,580 | | | | | |
| PerkinElmer, Inc.: | | | | | | | | | | | | |
| 3.300%, 09/15/2029 | | | | | | | | | | | | |
| (Callable 06/15/2029) | | | 24,200,000 | | | | 21,624,643 | | | | | |
| 3.625%, 03/15/2051 | | | | | | | | | | | | |
| (Callable 09/15/2050) | | | 12,000,000 | | | | 8,728,393 | | | | | |
| Perrigo Finance Unlimited Co.: | | | | | | | | | | | | |
| 4.375%, 03/15/2026 | | | | | | | | | | | | |
| (Callable 12/15/2025) | | | 4,875,000 | | | | 4,634,507 | | | | | |
| 4.400%, 06/15/2030 | | | | | | | | | | | | |
| (Callable 03/15/2030) | | | 10,000,000 | | | | 8,849,033 | | | | | |
| Pfizer Investment Enterprises Pte Ltd., | | | | | | | | | | | | |
| 5.300%, 05/19/2053 | | | | | | | | | | | | |
| (Callable 11/19/2052) | | | 18,650,000 | | | | 19,390,056 | | | | | |
| Phillips 66 Co.: | | | | | | | | | | | | |
| 3.605%, 02/15/2025 | | | | | | | | | | | | |
| (Callable 11/15/2024) | | | 3,000,000 | | | | 2,894,605 | | | | | |
| 3.850%, 04/09/2025 | | | | | | | | | | | | |
| (Callable 03/09/2025) | | | 8,000,000 | | | | 7,777,531 | | | | | |
| 3.550%, 10/01/2026 | | | | | | | | | | | | |
| (Callable 07/01/2026) | | | 7,000,000 | | | | 6,566,106 | | | | | |
| 3.150%, 12/15/2029 | | | | | | | | | | | | |
| (Callable 09/15/2029) | | | 12,000,000 | | | | 10,469,765 | | | | | |
| 2.150%, 12/15/2030 | | | | | | | | | | | | |
| (Callable 09/15/2030) | | | 12,000,000 | | | | 9,791,861 | | | | | |
The accompanying notes are an integral part of these financial statements.
Baird Aggregate Bond Fund
Schedule of Investments, June 30, 2023 (Unaudited)
Long-Term Investments (cont.)
| | | Principal | | | | | | % of | |
| | | Amount | | | Value | | | Net Assets | |
| Phillips 66 Co.: (cont.) | | | | | | | | | |
| 5.875%, 05/01/2042 | | $ | 6,000,000 | | | $ | 6,221,085 | | | |
| |
| 4.875%, 11/15/2044 | | | | | | | | | | | | |
| (Callable 05/15/2044) | | | 26,130,000 | | | | 23,946,868 | | | | | |
| Pilgrim’s Pride Corp., | | | | | | | | | | | | |
| 6.250%, 07/01/2033 | | | | | | | | | | | | |
| (Callable 04/01/2033) | | | 39,117,000 | | | | 37,888,413 | | | | | |
| Plains All American Pipeline LP / | | | | | | | | | | | | |
| PAA Finance Corp., | | | | | | | | | | | | |
| 3.550%, 12/15/2029 | | | | | | | | | | | | |
| (Callable 09/15/2029) | | | 10,000,000 | | | | 8,811,877 | | | | | |
| Premier Health Partners, | | | | | | | | | | | | |
| 2.911%, 11/15/2026 | | | | | | | | | | | | |
| (Callable 05/15/2026) | | | 33,267,000 | | | | 29,361,816 | | | | | |
| Quanta Services, Inc., | | | | | | | | | | | | |
| 2.900%, 10/01/2030 | | | | | | | | | | | | |
| (Callable 07/01/2030) | | | 8,275,000 | | | | 7,029,896 | | | | | |
| Raytheon Technologies Corp.: | | | | | | | | | | | | |
| 3.500%, 03/15/2027 | | | | | | | | | | | | |
| (Callable 12/15/2026) | | | 9,578,000 | | | | 9,102,695 | | | | | |
| 2.250%, 07/01/2030 | | | | | | | | | | | | |
| (Callable 04/01/2030) | | | 24,375,000 | | | | 20,559,930 | | | | | |
| 4.350%, 04/15/2047 | | | | | | | | | | | | |
| (Callable 10/15/2046) | | | 9,175,000 | | | | 8,130,751 | | | | | |
| 3.125%, 07/01/2050 | | | | | | | | | | | | |
| (Callable 01/01/2050) | | | 6,000,000 | | | | 4,344,961 | | | | | |
| Regal Rexnord Corp.: | | | | | | | | | | | | |
| 6.300%, 02/15/2030 | | | | | | | | | | | | |
(Callable 12/15/2029)(2) | | | 5,000,000 | | | | 4,985,200 | | | | | |
| 6.400%, 04/15/2033 | | | | | | | | | | | | |
(Callable 01/15/2033)(2) | | | 15,129,000 | | | | 15,116,246 | | | | | |
| Reliance Industries Ltd., | | | | | | | | | | | | |
2.875%, 01/12/2032(1)(2) | | | 26,000,000 | | | | 21,675,264 | | | | | |
| Reliance Steel & Aluminum Co.: | | | | | | | | | | | | |
| 2.150%, 08/15/2030 | | | | | | | | | | | | |
| (Callable 05/15/2030) | | | 10,000,000 | | | | 8,148,087 | | | | | |
| 6.850%, 11/15/2036 | | | 1,650,000 | | | | 1,776,679 | | | | | |
| Republic Services, Inc., | | | | | | | | | | | | |
| 5.000%, 04/01/2034 | | | | | | | | | | | | |
| (Callable 01/01/2034) | | | 10,000,000 | | | | 9,977,536 | | | | | |
| Rio Tinto Alcan, Inc., | | | | | | | | | | | | |
5.750%, 06/01/2035(1) | | | 446,000 | | | | 457,951 | | | | | |
| Roche Holdings, Inc., | | | | | | | | | | | | |
| 2.607%, 12/13/2051 | | | | | | | | | | | | |
(Callable 06/13/2051)(2) | | | 7,000,000 | | | | 4,743,613 | | | | | |
| Rogers Communications, Inc.: | | | | | | | | | | | | |
| 3.800%, 03/15/2032 | | | | | | | | | | | | |
(Callable 12/15/2031)(1)(2) | | | 13,000,000 | | | | 11,363,583 | | | | | |
| 4.500%, 03/15/2042 | | | | | | | | | | | | |
(Callable 09/15/2041)(1)(2) | | | 8,750,000 | | | | 7,263,392 | | | | | |
| 5.450%, 10/01/2043 | | | | | | | | | | | | |
(Callable 04/01/2043)(1) | | | 16,560,000 | | | | 15,166,875 | | | | | |
| RPM International, Inc., | | | | | | | | | | | | |
| 2.950%, 01/15/2032 | | | | | | | | | | | | |
| (Callable 10/15/2031) | | | 7,350,000 | | | | 5,814,360 | | | | | |
| Ryder System, Inc.: | | | | | | | | | | | | |
| 5.650%, 03/01/2028 | | | | | | | | | | | | |
| (Callable 02/01/2028) | | | 14,110,000 | | | | 14,115,892 | | | | | |
| 5.250%, 06/01/2028 | | | | | | | | | | | | |
| (Callable 05/01/2028) | | | 12,000,000 | | | | 11,848,323 | | | | | |
| Sabine Pass Liquefaction LLC: | | | | | | | | | | | | |
| 5.625%, 03/01/2025 | | | | | | | | | | | | |
| (Callable 12/01/2024) | | | 32,000,000 | | | | 31,873,856 | | | | | |
| 5.875%, 06/30/2026 | | | | | | | | | | | | |
| (Callable 12/31/2025) | | | 60,000,000 | | | | 60,491,162 | | | | | |
| 4.500%, 05/15/2030 | | | | | | | | | | | | |
| (Callable 11/15/2029) | | | 43,842,000 | | | | 41,674,549 | | | | | |
| 5.900%, 09/15/2037 | | | | | | | | | | | | |
(Callable 03/15/2037)(2) | | | 10,000,000 | | | | 10,143,260 | | | | | |
| Samarco Mineracao SA, | | | | | | | | | | | | |
5.750%, 10/24/2023(1)(2)(9) | | | 4,463,000 | | | | 2,983,197 | | | | | |
| Santos Finance Ltd., | | | | | | | | | | | | |
| 3.649%, 04/29/2031 | | | | | | | | | | | | |
(Callable 01/29/2031)(1)(2) | | | 9,000,000 | | | | 7,471,695 | | | | | |
| Shell International Finance BV: | | | | | | | | | | | | |
3.250%, 05/11/2025(1) | | | 5,725,000 | | | | 5,533,437 | | | | | |
4.125%, 05/11/2035(1) | | | 10,000,000 | | | | 9,284,511 | | | | | |
| Sherwin-Williams Co., | | | | | | | | | | | | |
| 4.500%, 06/01/2047 | | | | | | | | | | | | |
| (Callable 12/01/2046) | | | 9,000,000 | | | | 7,879,882 | | | | | |
| SK Hynix, Inc., | | | | | | | | | | | | |
1.500%, 01/19/2026(1)(2) | | | 21,852,000 | | | | 19,362,177 | | | | | |
| SK Telecom Co. Ltd., | | | | | | | | | | | | |
6.625%, 07/20/2027(1)(2) | | | 1,339,000 | | | | 1,413,409 | | | | | |
| Smith & Nephew PLC, | | | | | | | | | | | | |
| 2.032%, 10/14/2030 | | | | | | | | | | | | |
(Callable 07/14/2030)(1) | | | 14,575,000 | | | | 11,791,946 | | | | | |
| Smithfield Foods, Inc.: | | | | | | | | | | | | |
| 3.000%, 10/15/2030 | | | | | | | | | | | | |
(Callable 07/15/2030)(1)(2) | | | 10,000,000 | | | | 7,840,565 | | | | | |
| 2.625%, 09/13/2031 | | | | | | | | | | | | |
(Callable 06/13/2031)(1)(2) | | | 20,000,000 | | | | 14,779,477 | | | | | |
| Sodexo, Inc., | | | | | | | | | | | | |
| 1.634%, 04/16/2026 | | | | | | | | | | | | |
(Callable 03/16/2026)(1)(2) | | | 7,000,000 | | | | 6,287,687 | | | | | |
| Solvay Finance America LLC, | | | | | | | | | | | | |
| 4.450%, 12/03/2025 | | | | | | | | | | | | |
(Callable 09/03/2025)(1)(2) | | | 61,307,000 | | | | 58,812,473 | | | | | |
| Southern Copper Corp., | | | | | | | | | | | | |
7.500%, 07/27/2035(1) | | | 5,000,000 | | | | 5,806,600 | | | | | |
| Spectra Energy Partners LP, | | | | | | | | | | | | |
| 4.500%, 03/15/2045 | | | | | | | | | | | | |
(Callable 09/15/2044)(1) | | | 12,000,000 | | | | 9,885,375 | | | | | |
| Stanley Black & Decker, Inc., | | | | | | | | | | | | |
| 6.000%, 03/06/2028 | | | | | | | | | | | | |
| (Callable 02/06/2028) | | | 10,000,000 | | | | 10,279,753 | | | | | |
| Steel Dynamics, Inc.: | | | | | | | | | | | | |
| 2.400%, 06/15/2025 | | | | | | | | | | | | |
| (Callable 05/15/2025) | | | 5,000,000 | | | | 4,670,010 | | | | | |
| 3.250%, 01/15/2031 | | | | | | | | | | | | |
| (Callable 10/15/2030) | | | 7,000,000 | | | | 6,066,961 | | | | | |
| Stellantis Finance US, Inc.: | | | | | | | | | | | | |
| 1.711%, 01/29/2027 | | | | | | | | | | | | |
(Callable 12/29/2026)(2) | | | 8,175,000 | | | | 7,163,244 | | | | | |
| 5.625%, 01/12/2028 | | | | | | | | | | | | |
(Callable 12/12/2027)(2) | | | 5,575,000 | | | | 5,623,561 | | | | | |
| STERIS Irish FinCo Unlimited Co., | | | | | | | | | | | | |
| 3.750%, 03/15/2051 | | | | | | | | | | | | |
| (Callable 09/15/2050) | | | 7,500,000 | | | | 5,627,559 | | | | | |
| Suntory Holdings Ltd., | | | | | | | | | | | | |
| 2.250%, 10/16/2024 | | | | | | | | | | | | |
(Callable 09/16/2024)(1)(2) | | | 8,500,000 | | | | 8,071,687 | | | | | |
| Synnex Corporation, | | | | | | | | | | | | |
| 1.750%, 08/09/2026 | | | | | | | | | | | | |
| (Callable 07/09/2026) | | | 34,843,000 | | | | 30,367,835 | | | | | |
| Sysco Corp.: | | | | | | | | | | | | |
| 3.300%, 07/15/2026 | | | | | | | | | | | | |
| (Callable 04/15/2026) | | | 11,550,000 | | | | 10,909,184 | | | | | |
| 5.950%, 04/01/2030 | | | | | | | | | | | | |
| (Callable 01/01/2030) | | | 4,000,000 | | | | 4,187,304 | | | | | |
The accompanying notes are an integral part of these financial statements.
Baird Aggregate Bond Fund
Schedule of Investments, June 30, 2023 (Unaudited)
Long-Term Investments (cont.)
| | | Principal | | | | | | % of | |
| | | Amount | | | Value | | | Net Assets | |
| Sysco Corp.: (cont.) | | | | | | | | | |
| 6.600%, 04/01/2050 | | | | | | | | | |
| (Callable 10/01/2049) | | $ | 12,455,000 | | | $ | 14,196,888 | | | |
| |
| 3.150%, 12/14/2051 | | | | | | | | | | | | |
| (Callable 06/14/2051) | | | 9,000,000 | | | | 6,235,147 | | | | | |
| Takeda Pharmaceutical Co. Ltd., | | | | | | | | | | | | |
| 3.175%, 07/09/2050 | | | | | | | | | | | | |
(Callable 01/09/2050)(1) | | | 10,000,000 | | | | 7,043,432 | | | | | |
| Targa Resources Corp.: | | | | | | | | | | | | |
| 5.200%, 07/01/2027 | | | | | | | | | | | | |
| (Callable 06/01/2027) | | | 15,000,000 | | | | 14,726,731 | | | | | |
| 6.125%, 03/15/2033 | | | | | | | | | | | | |
| (Callable 12/15/2032) | | | 22,200,000 | | | | 22,683,737 | | | | | |
| TC PipeLines LP: | | | | | | | | | | | | |
| 4.375%, 03/13/2025 | | | | | | | | | | | | |
(Callable 12/13/2024)(1) | | | 31,115,000 | | | | 30,219,203 | | | | | |
| 3.900%, 05/25/2027 | | | | | | | | | | | | |
(Callable 02/25/2027)(1) | | | 30,327,000 | | | | 28,872,330 | | | | | |
| Telecom Italia Capital SA, | | | | | | | | | | | | |
7.200%, 07/18/2036(1) | | | 5,475,000 | | | | 4,705,981 | | | | | |
| Telefonica Emisiones SA: | | | | | | | | | | | | |
4.665%, 03/06/2038(1) | | | 4,000,000 | | | | 3,386,079 | | | | | |
5.213%, 03/08/2047(1) | | | 18,100,000 | | | | 15,742,274 | | | | | |
4.895%, 03/06/2048(1) | | | 29,050,000 | | | | 24,245,328 | | | | | |
| 5.520%, 03/01/2049 | | | | | | | | | | | | |
(Callable 09/01/2048)(1) | | | 18,775,000 | | | | 16,874,052 | | | | | |
| Teva Pharmaceutical Finance | | | | | | | | | | | | |
| Netherlands III BV: | | | | | | | | | | | | |
2.800%, 07/21/2023(1) | | | 2,224,000 | | | | 2,218,319 | | | | | |
3.150%, 10/01/2026(1) | | | 15,000,000 | | | | 13,440,687 | | | | | |
| Textron, Inc., | | | | | | | | | | | | |
| 3.000%, 06/01/2030 | | | | | | | | | | | | |
| (Callable 03/01/2030) | | | 19,675,000 | | | | 17,150,040 | | | | | |
| Time Warner Cable LLC: | | | | | | | | | | | | |
| 6.550%, 05/01/2037 | | | 893,000 | | | | 856,096 | | | | | |
| 6.750%, 06/15/2039 | | | 2,767,000 | | | | 2,659,301 | | | | | |
| Timken Co.: | | | | | | | | | | | | |
| 3.875%, 09/01/2024 | | | | | | | | | | | | |
| (Callable 06/01/2024) | | | 11,255,000 | | | | 10,962,645 | | | | | |
| 4.500%, 12/15/2028 | | | | | | | | | | | | |
| (Callable 09/15/2028) | | | 6,550,000 | | | | 6,224,595 | | | | | |
| T-Mobile USA, Inc.: | | | | | | | | | | | | |
| 3.375%, 04/15/2029 | | | | | | | | | | | | |
| (Callable 04/15/2024) | | | 10,350,000 | | | | 9,346,546 | | | | | |
| 3.875%, 04/15/2030 | | | | | | | | | | | | |
| (Callable 01/15/2030) | | | 119,330,000 | | | | 109,934,982 | | | | | |
| 2.550%, 02/15/2031 | | | | | | | | | | | | |
| (Callable 11/15/2030) | | | 20,000,000 | | | | 16,624,209 | | | | | |
| 3.500%, 04/15/2031 | | | | | | | | | | | | |
| (Callable 04/15/2026) | | | 7,000,000 | | | | 6,176,788 | | | | | |
| 4.375%, 04/15/2040 | | | | | | | | | | | | |
| (Callable 10/15/2039) | | | 24,900,000 | | | | 21,989,013 | | | | | |
| 5.650%, 01/15/2053 | | | | | | | | | | | | |
| (Callable 07/15/2052) | | | 13,000,000 | | | | 13,200,203 | | | | | |
| 3.600%, 11/15/2060 | | | | | | | | | | | | |
| (Callable 05/15/2060) | | | 19,500,000 | | | | 13,685,850 | | | | | |
| Trane Technologies Financing Ltd., | | | | | | | | | | | | |
| 5.250%, 03/03/2033 | | | | | | | | | | | | |
| (Callable 12/03/2032) | | | 11,625,000 | | | | 11,769,535 | | | | | |
| TransCanada PipeLines Ltd.: | | | | | | | | | | | | |
6.200%, 10/15/2037(1) | | | 8,400,000 | | | | 8,698,708 | | | | | |
7.625%, 01/15/2039(1) | | | 21,077,000 | | | | 24,395,384 | | | | | |
| Transcontinental Gas Pipe Line Co. LLC: | | | | | | | | | | | | |
| 7.250%, 12/01/2026 | | | 3,500,000 | | | | 3,641,078 | | | | | |
| 4.600%, 03/15/2048 | | | | | | | | | | | | |
| (Callable 09/15/2047) | | | 5,150,000 | | | | 4,377,429 | | | | | |
| Triton Container International Ltd.: | | | | | | | | | | | | |
| 2.050%, 04/15/2026 | | | | | | | | | | | | |
(Callable 03/15/2026)(1)(2) | | | 20,000,000 | | | | 17,458,599 | | | | | |
| 3.250%, 03/15/2032 | | | | | | | | | | | | |
(Callable 12/15/2031)(1) | | | 10,000,000 | | | | 7,827,184 | | | | | |
| TSMC Arizona Corp., | | | | | | | | | | | | |
| 3.125%, 10/25/2041 | | | | | | | | | | | | |
(Callable 04/25/2041)(1) | | | 3,000,000 | | | | 2,396,284 | | | | | |
| TTX Co.: | | | | | | | | | | | | |
3.600%, 01/15/2025(2) | | | 5,000,000 | | | | 4,839,431 | | | | | |
| 3.900%, 02/01/2045 | | | | | | | | | | | | |
(Callable 08/01/2044)(2) | | | 13,250,000 | | | | 10,758,025 | | | | | |
| 4.600%, 02/01/2049 | | | | | | | | | | | | |
(Callable 08/01/2048)(2) | | | 8,325,000 | | | | 7,487,591 | | | | | |
| Tyson Foods, Inc., | | | | | | | | | | | | |
| 5.100%, 09/23/2048 | | | | | | | | | | | | |
| (Callable 03/28/2048) | | | 10,000,000 | | | | 9,081,940 | | | | | |
| United Rentals North America, Inc., | | | | | | | | | | | | |
| 6.000%, 12/15/2029 | | | | | | | | | | | | |
(Callable 12/15/2025)(2) | | | 15,000,000 | | | | 14,963,109 | | | | | |
| Universal Health Services, Inc.: | | | | | | | | | | | | |
| 1.650%, 09/01/2026 | | | | | | | | | | | | |
| (Callable 08/01/2026) | | | 24,000,000 | | | | 20,980,207 | | | | | |
| 2.650%, 10/15/2030 | | | | | | | | | | | | |
| (Callable 07/15/2030) | | | 10,000,000 | | | | 8,167,474 | | | | | |
| UPMC: | | | | | | | | | | | | |
| 3.600%, 04/03/2025 | | | 45,000,000 | | | | 43,290,053 | | | | | |
| 5.035%, 05/15/2033 | | | | | | | | | | | | |
| (Callable 02/15/2033) | | | 9,275,000 | | | | 9,054,291 | | | | | |
| Utah Acquisition Sub, Inc., | | | | | | | | | | | | |
| 3.950%, 06/15/2026 | | | | | | | | | | | | |
| (Callable 03/15/2026) | | | 37,757,000 | | | | 35,861,089 | | | | | |
| Vale Overseas Ltd.: | | | | | | | | | | | | |
| 3.750%, 07/08/2030 | | | | | | | | | | | | |
(Callable 04/08/2030)(1) | | | 28,721,000 | | | | 25,287,338 | | | | | |
| 6.125%, 06/12/2033 | | | | | | | | | | | | |
(Callable 03/12/2033)(1) | | | 42,450,000 | | | | 42,525,986 | | | | | |
8.250%, 01/17/2034(1) | | | 13,526,000 | | | | 15,737,714 | | | | | |
6.875%, 11/21/2036(1) | | | 45,171,000 | | | | 47,237,031 | | | | | |
6.875%, 11/10/2039(1) | | | 16,643,000 | | | | 17,420,544 | | | | | |
| Valero Energy Corp.: | | | | | | | | | | | | |
| 2.150%, 09/15/2027 | | | | | | | | | | | | |
| (Callable 07/15/2027) | | | 14,150,000 | | | | 12,532,550 | | | | | |
| 4.000%, 04/01/2029 | | | | | | | | | | | | |
| (Callable 01/01/2029) | | | 15,475,000 | | | | 14,580,047 | | | | | |
| 6.625%, 06/15/2037 | | | 2,100,000 | | | | 2,253,265 | | | | | |
| Var Energi ASA: | | | | | | | | | | | | |
| 5.000%, 05/18/2027 | | | | | | | | | | | | |
(Callable 04/18/2027)(1)(2) | | | 23,850,000 | | | | 22,626,404 | | | | | |
| 7.500%, 01/15/2028 | | | | | | | | | | | | |
(Callable 12/15/2027)(1)(2) | | | 65,430,000 | | | | 67,244,390 | | | | | |
| 8.000%, 11/15/2032 | | | | | | | | | | | | |
(Callable 08/15/2032)(1)(2) | | | 6,000,000 | | | | 6,348,060 | | | | | |
| Verizon Communications, Inc.: | | | | | | | | | | | | |
| 3.000%, 03/22/2027 | | | | | | | | | | | | |
| (Callable 01/22/2027) | | | 5,000,000 | | | | 4,665,554 | | | | | |
| 4.329%, 09/21/2028 | | | 3,077,000 | | | | 2,966,240 | | | | | |
| 2.550%, 03/21/2031 | | | | | | | | | | | | |
| (Callable 12/21/2030) | | | 6,600,000 | | | | 5,510,558 | | | | | |
The accompanying notes are an integral part of these financial statements.
Baird Aggregate Bond Fund
Schedule of Investments, June 30, 2023 (Unaudited)
Long-Term Investments (cont.)
| | | Principal | | | | | | % of | |
| | | Amount | | | Value | | | Net Assets | |
| Verizon Communications, Inc.: (cont.) | | | | | | | | | |
| 4.500%, 08/10/2033 | | $ | 16,325,000 | | | $ | 15,405,141 | | | |
| |
| 4.272%, 01/15/2036 | | | 17,148,000 | | | | 15,461,277 | | | | | |
| 5.250%, 03/16/2037 | | | 28,793,000 | | | | 28,511,287 | | | | | |
| 4.812%, 03/15/2039 | | | 36,839,000 | | | | 34,466,376 | | | | | |
| 2.650%, 11/20/2040 | | | | | | | | | | | | |
| (Callable 05/20/2040) | | | 10,000,000 | | | | 6,955,953 | | | | | |
| 3.400%, 03/22/2041 | | | | | | | | | | | | |
| (Callable 09/22/2040) | | | 3,850,000 | | | | 2,971,455 | | | | | |
| 4.862%, 08/21/2046 | | | 2,500,000 | | | | 2,292,005 | | | | | |
| 5.500%, 03/16/2047 | | | 5,650,000 | | | | 5,652,753 | | | | | |
| 3.700%, 03/22/2061 | | | | | | | | | | | | |
| (Callable 09/22/2060) | | | 26,725,000 | | | | 19,434,956 | | | | | |
| Viatris, Inc.: | | | | | | | | | | | | |
| 3.850%, 06/22/2040 | | | | | | | | | | | | |
| (Callable 12/22/2039) | | | 13,083,000 | | | | 9,040,956 | | | | | |
| 4.000%, 06/22/2050 | | | | | | | | | | | | |
| (Callable 12/22/2049) | | | 40,600,000 | | | | 26,850,370 | | | | | |
| VICI Properties LP, | | | | | | | | | | | | |
| 4.750%, 02/15/2028 | | | | | | | | | | | | |
| (Callable 01/15/2028) | | | 20,000,000 | | | | 18,936,678 | | | | | |
| Viterra Finance BV: | | | | | | | | | | | | |
| 2.000%, 04/21/2026 | | | | | | | | | | | | |
(Callable 03/21/2026)(1)(2) | | | 23,641,000 | | | | 21,111,942 | | | | | |
| 4.900%, 04/21/2027 | | | | | | | | | | | | |
(Callable 03/21/2027)(1)(2) | | | 45,000,000 | | | | 43,307,263 | | | | | |
| 3.200%, 04/21/2031 | | | | | | | | | | | | |
(Callable 01/21/2031)(1)(2) | | | 80,020,000 | | | | 67,015,423 | | | | | |
| 5.250%, 04/21/2032 | | | | | | | | | | | | |
(Callable 01/21/2032)(1)(2) | | | 16,631,000 | | | | 15,961,888 | | | | | |
| VMware, Inc., | | | | | | | | | | | | |
| 1.400%, 08/15/2026 | | | | | | | | | | | | |
| (Callable 07/15/2026) | | | 18,850,000 | | | | 16,645,341 | | | | | |
| Vodafone Group PLC: | | | | | | | | | | | | |
7.875%, 02/15/2030(1) | | | 3,100,000 | | | | 3,559,058 | | | | | |
5.000%, 05/30/2038(1) | | | 6,800,000 | | | | 6,405,740 | | | | | |
4.375%, 02/19/2043(1) | | | 15,554,000 | | | | 13,061,980 | | | | | |
| 5.625%, 02/10/2053 | | | | | | | | | | | | |
(Callable 08/10/2052)(1) | | | 10,000,000 | | | | 9,803,273 | | | | | |
| 5.750%, 02/10/2063 | | | | | | | | | | | | |
(Callable 08/10/2062)(1) | | | 5,000,000 | | | | 4,834,818 | | | | | |
| Volkswagen Group of | | | | | | | | | | | | |
| America Finance LLC: | | | | | | | | | | | | |
2.850%, 09/26/2024(1)(2) | | | 14,000,000 | | | | 13,496,662 | | | | | |
3.350%, 05/13/2025(1)(2) | | | 10,000,000 | | | | 9,577,394 | | | | | |
| 1.250%, 11/24/2025 | | | | | | | | | | | | |
(Callable 10/24/2025)(1)(2) | | | 30,000,000 | | | | 27,038,811 | | | | | |
| Vontier Corp., | | | | | | | | | | | | |
| 2.400%, 04/01/2028 | | | | | | | | | | | | |
| (Callable 02/01/2028) | | | 4,921,000 | | | | 4,098,061 | | | | | |
| Vulcan Materials Co., | | | | | | | | | | | | |
| 4.700%, 03/01/2048 | | | | | | | | | | | | |
| (Callable 09/01/2047) | | | 3,446,000 | | | | 3,071,158 | | | | | |
| Wabtec Corp.: | | | | | | | | | | | | |
| 4.375%, 08/15/2023 | | | | | | | | | | | | |
| (Callable 07/31/2023) | | | 2,678,000 | | | | 2,672,823 | | | | | |
| 5.875%, 03/15/2024 | | | | | | | | | | | | |
| (Callable 02/15/2024) | | | 24,825,000 | | | | 24,491,840 | | | | | |
| 3.450%, 11/15/2026 | | | | | | | | | | | | |
| (Callable 08/15/2026) | | | 28,315,000 | | | | 26,477,038 | | | | | |
| 5.875%, 09/15/2028 | | | | | | | | | | | | |
| (Callable 06/15/2028) | | | 4,739,000 | | | | 4,564,717 | | | | | |
| Walgreens Boots Alliance, Inc.: | | | | | | | | | | | | |
| 3.450%, 06/01/2026 | | | | | | | | | | | | |
| (Callable 03/01/2026) | | | 2,080,000 | | | | 1,950,913 | | | | | |
| 3.200%, 04/15/2030 | | | | | | | | | | | | |
| (Callable 01/15/2030) | | | 13,575,000 | | | | 11,543,818 | | | | | |
| 4.800%, 11/18/2044 | | | | | | | | | | | | |
| (Callable 05/18/2044) | | | 5,145,000 | | | | 4,242,371 | | | | | |
| 4.650%, 06/01/2046 | | | | | | | | | | | | |
| (Callable 12/01/2045) | | | 4,000,000 | | | | 3,231,937 | | | | | |
| Walmart, Inc., | | | | | | | | | | | | |
| 4.500%, 04/15/2053 | | | | | | | | | | | | |
| (Callable 10/15/2052) | | | 13,925,000 | | | | 13,580,681 | | | | | |
| Warnermedia Holdings, Inc.: | | | | | | | | | | | | |
| 6.412%, 03/15/2026 | | | | | | | | | | | | |
| (Callable 03/15/2024) | | | 7,000,000 | | | | 7,005,787 | | | | | |
| 4.054%, 03/15/2029 | | | | | | | | | | | | |
| (Callable 01/15/2029) | | | 5,000,000 | | | | 4,570,600 | | | | | |
| 4.279%, 03/15/2032 | | | | | | | | | | | | |
| (Callable 12/15/2031) | | | 53,000,000 | | | | 47,004,400 | | | | | |
| 5.141%, 03/15/2052 | | | | | | | | | | | | |
| (Callable 09/15/2051) | | | 5,000,000 | | | | 4,071,240 | | | | | |
| Weir Group PLC, | | | | | | | | | | | | |
| 2.200%, 05/13/2026 | | | | | | | | | | | | |
(Callable 04/13/2026)(1)(2) | | | 38,555,000 | | | | 34,532,788 | | | | | |
| Western Digital Corp., | | | | | | | | | | | | |
| 4.750%, 02/15/2026 | | | | | | | | | | | | |
| (Callable 11/15/2025) | | | 4,000,000 | | | | 3,810,070 | | | | | |
| Western Gas Partners LP, | | | | | | | | | | | | |
| 3.950%, 06/01/2025 | | | | | | | | | | | | |
| (Callable 03/01/2025) | | | 8,000,000 | | | | 7,684,520 | | | | | |
| Western Midstream Operating LP: | | | | | | | | | | | | |
| 5.875%, 02/01/2025 | | | | | | | | | | | | |
| (Callable 01/01/2025) | | | 20,000,000 | | | | 19,117,604 | | | | | |
| 5.875%, 02/01/2030 | | | | | | | | | | | | |
| (Callable 11/01/2029) | | | 10,500,000 | | | | 9,427,406 | | | | | |
| 6.150%, 04/01/2033 | | | | | | | | | | | | |
| (Callable 01/01/2033) | | | 4,550,000 | | | | 4,585,900 | | | | | |
| Westinghouse Air Brake | | | | | | | | | | | | |
| Technologies Corp., | | | | | | | | | | | | |
| 3.200%, 06/15/2025 | | | | | | | | | | | | |
| (Callable 05/15/2025) | | | 10,295,000 | | | | 9,771,410 | | | | | |
| WestRock MWV LLC, | | | | | | | | | | | | |
| 8.200%, 01/15/2030 | | | 7,963,000 | | | | 9,130,618 | | | | | |
| Williams Companies, Inc.: | | | | | | | | | | | | |
| 3.900%, 01/15/2025 | | | | | | | | | | | | |
| (Callable 10/15/2024) | | | 3,160,000 | | | | 3,066,903 | | | | | |
| 7.750%, 06/15/2031 | | | 3,400,000 | | | | 3,761,348 | | | | | |
| 5.875%, 03/15/2032 | | | 5,750,000 | | | | 6,826,072 | | | | | |
| 6.300%, 04/15/2040 | | | 8,142,000 | | | | 8,549,343 | | | | | |
| 4.850%, 03/01/2048 | | | | | | | | | | | | |
| (Callable 09/01/2047) | | | 7,000,000 | | | | 6,056,151 | | | | | |
| Woodside Finance Ltd.: | | | | | | | | | | | | |
| 3.650%, 03/05/2025 | | | | | | | | | | | | |
(Callable 12/05/2024)(1)(2) | | | 12,300,000 | | | | 11,840,091 | | | | | |
| 4.500%, 03/04/2029 | | | | | | | | | | | | |
(Callable 12/04/2028)(1)(2) | | | 42,480,000 | | | | 40,054,039 | | | | | |
| Worthington Industries, Inc., | | | | | | | | | | | | |
| 4.550%, 04/15/2026 | | | 9,155,000 | | | | 8,654,164 | | | | | |
| WRKCo, Inc., | | | | | | | | | | | | |
| 3.000%, 09/15/2024 | | | | | | | | | | | | |
| (Callable 07/15/2024) | | | 14,895,000 | | | | 14,323,711 | | | | | |
| Yara International ASA, | | | | | | | | | | | | |
| 3.800%, 06/06/2026 | | | | | | | | | | | | |
(Callable 03/06/2026)(1)(2) | | | 23,500,000 | | | | 22,068,712 | | | | | |
The accompanying notes are an integral part of these financial statements.
Baird Aggregate Bond Fund
Schedule of Investments, June 30, 2023 (Unaudited)
Long-Term Investments (cont.)
| | | Principal | | | | | | % of | |
| | | Amount | | | Value | | | Net Assets | |
| Zimmer Biomet Holdings, Inc., | | | | | | | | | |
| 5.750%, 11/30/2039 | | $ | 11,967,000 | | | $ | 11,913,490 | | | | |
| Zoetis, Inc., | | | | | | | | | | | |
| 4.700%, 02/01/2043 | | | | | | | | | | | |
| (Callable 08/01/2042) | | | 3,568,000 | | | | 3,320,117 | | | | |
| Total Industrials | | | | | | | | | | | |
| (Cost $9,175,216,981) | | | | | | | 8,235,294,277 | | | | 20.9 | % |
| Utilities | | | | | | | | | | | | |
| Ameren Corp., | | | | | | | | | | | | |
| 3.500%, 01/15/2031 | | | | | | | | | | | | |
| (Callable 10/15/2030) | | | 20,000,000 | | | | 17,847,523 | | | | | |
| American Electric Power Co., Inc., | | | | | | | | | | | | |
| 3.250%, 03/01/2050 | | | | | | | | | | | | |
| (Callable 09/01/2049) | | | 10,175,000 | | | | 6,954,348 | | | | | |
| Avangrid, Inc., | | | | | | | | | | | | |
| 3.200%, 04/15/2025 | | | | | | | | | | | | |
(Callable 03/15/2025)(1) | | | 14,000,000 | | | | 13,309,853 | | | | | |
| Berkshire Hathaway Energy Co.: | | | | | | | | | | | | |
| 3.700%, 07/15/2030 | | | | | | | | | | | | |
| (Callable 04/15/2030) | | | 18,425,000 | | | | 16,949,162 | | | | | |
| 2.850%, 05/15/2051 | | | | | | | | | | | | |
| (Callable 11/15/2050) | | | 13,675,000 | | | | 8,839,164 | | | | | |
| 4.600%, 05/01/2053 | | | | | | | | | | | | |
| (Callable 11/01/2052) | | | 21,825,000 | | | | 18,699,108 | | | | | |
| Commonwealth Edison Co., | | | | | | | | | | | | |
| 3.850%, 03/15/2052 | | | | | | | | | | | | |
| (Callable 09/15/2051) | | | 6,050,000 | | | | 4,834,390 | | | | | |
| Constellation Energy Generation LLC: | | | | | | | | | | | | |
| 5.600%, 03/01/2028 | | | | | | | | | | | | |
| (Callable 02/01/2028) | | | 12,600,000 | | | | 12,696,493 | | | | | |
| 5.800%, 03/01/2033 | | | | | | | | | | | | |
| (Callable 12/01/2032) | | | 5,000,000 | | | | 5,118,163 | | | | | |
| Consumers Energy Co., | | | | | | | | | | | | |
| 3.500%, 08/01/2051 | | | | | | | | | | | | |
| (Callable 02/01/2051) | | | 9,400,000 | | | | 7,183,861 | | | | | |
| Dominion Energy, Inc., | | | | | | | | | | | | |
| 3.375%, 04/01/2030 | | | | | | | | | | | | |
| (Callable 01/01/2030) | | | 10,000,000 | | | | 8,944,513 | | | | | |
| DTE Electric Company: | | | | | | | | | | | | |
| 4.875%, 06/01/2028 | | | | | | | | | | | | |
| (Callable 05/01/2028) | | | 19,000,000 | | | | 18,584,505 | | | | | |
| 5.400%, 04/01/2053 | | | | | | | | | | | | |
| (Callable 10/01/2052) | | | 9,375,000 | | | | 9,675,498 | | | | | |
| Duke Energy Corp., | | | | | | | | | | | | |
| 2.650%, 09/01/2026 | | | | | | | | | | | | |
| (Callable 06/01/2026) | | | 10,000,000 | | | | 9,242,265 | | | | | |
| Duke Energy Indiana LLC, | | | | | | | | | | | | |
| 5.400%, 04/01/2053 | | | | | | | | | | | | |
| (Callable 10/01/2052) | | | 7,000,000 | | | | 7,055,145 | | | | | |
| Duke Energy Ohio, Inc., | | | | | | | | | | | | |
| 5.250%, 04/01/2033 | | | | | | | | | | | | |
| (Callable 01/01/2033) | | | 5,000,000 | | | | 5,035,522 | | | | | |
| Duke Energy Progress LLC, | | | | | | | | | | | | |
| 4.000%, 04/01/2052 | | | | | | | | | | | | |
| (Callable 10/01/2051) | | | 9,600,000 | | | | 7,772,075 | | | | | |
| Duquesne Light Holdings, Inc.: | | | | | | | | | | | | |
| 3.616%, 08/01/2027 | | | | | | | | | | | | |
(Callable 05/01/2027)(2) | | | 5,000,000 | | | | 4,487,593 | | | | | |
| 2.532%, 10/01/2030 | | | | | | | | | | | | |
(Callable 07/01/2030)(2) | | | 2,550,000 | | | | 2,037,790 | | | | | |
| 2.775%, 01/07/2032 | | | | | | | | | | | | |
(Callable 10/07/2031)(2) | | | 2,810,000 | | | | 2,191,174 | | | | | |
| EDP Finance BV, | | | | | | | | | | | | |
3.625%, 07/15/2024(1)(2) | | | 19,175,000 | | | | 18,679,278 | | | | | |
| Enel Finance International NV: | | | | | | | | | | | | |
3.500%, 04/06/2028(1)(2) | | | 8,000,000 | | | | 7,319,739 | | | | | |
6.800%, 09/15/2037(1)(2) | | | 8,440,000 | | | | 8,883,487 | | | | | |
4.750%, 05/25/2047(1)(2) | | | 66,700,000 | | | | 56,736,646 | | | | | |
| Entergy Corp., | | | | | | | | | | | | |
| 2.950%, 09/01/2026 | | | | | | | | | | | | |
| (Callable 06/01/2026) | | | 13,075,000 | | | | 12,074,145 | | | | | |
| Essential Utilities, Inc., | | | | | | | | | | | | |
| 2.704%, 04/15/2030 | | | | | | | | | | | | |
| (Callable 01/15/2030) | | | 14,100,000 | | | | 11,936,899 | | | | | |
| Evergy, Inc., | | | | | | | | | | | | |
| 2.450%, 09/15/2024 | | | | | | | | | | | | |
| (Callable 08/15/2024) | | | 6,675,000 | | | | 6,394,167 | | | | | |
| Eversource Energy, | | | | | | | | | | | | |
| 1.650%, 08/15/2030 | | | | | | | | | | | | |
| (Callable 05/15/2030) | | | 9,925,000 | | | | 7,869,550 | | | | | |
| Exelon Corp.: | | | | | | | | | | | | |
| 4.050%, 04/15/2030 | | | | | | | | | | | | |
| (Callable 01/15/2030) | | | 8,900,000 | | | | 8,316,842 | | | | | |
| 4.950%, 06/15/2035 | | | | | | | | | | | | |
| (Callable 12/15/2034) | | | 3,500,000 | | | | 3,351,869 | | | | | |
| 4.100%, 03/15/2052 | | | | | | | | | | | | |
| (Callable 09/15/2051) | | | 5,000,000 | | | | 4,030,625 | | | | | |
| Fells Point Funding Trust, | | | | | | | | | | | | |
| 3.046%, 01/31/2027 | | | | | | | | | | | | |
(Callable 12/31/2026)(2) | | | 28,100,000 | | | | 25,832,015 | | | | | |
| FirstEnergy Corp.: | | | | | | | | | | | | |
| 2.650%, 03/01/2030 | | | | | | | | | | | | |
| (Callable 12/01/2029) | | | 4,300,000 | | | | 3,626,491 | | | | | |
| 3.400%, 03/01/2050 | | | | | | | | | | | | |
| (Callable 09/01/2049) | | | 15,000,000 | | | | 10,337,400 | | | | | |
| FirstEnergy Transmission LLC, | | | | | | | | | | | | |
| 2.866%, 09/15/2028 | | | | | | | | | | | | |
(Callable 07/15/2028)(2) | | | 10,000,000 | | | | 8,800,185 | | | | | |
| Interstate Power and Light Co., | | | | | | | | | | | | |
| 2.300%, 06/01/2030 | | | | | | | | | | | | |
| (Callable 03/01/2030) | | | 9,350,000 | | | | 7,766,860 | | | | | |
| ITC Holdings Corp.: | | | | | | | | | | | | |
| 3.350%, 11/15/2027 | | | | | | | | | | | | |
(Callable 08/15/2027)(1) | | | 25,581,000 | | | | 23,876,208 | | | | | |
| 2.950%, 05/14/2030 | | | | | | | | | | | | |
(Callable 02/14/2030)(1)(2) | | | 10,000,000 | | | | 8,597,742 | | | | | |
| KeySpan Corp., | | | | | | | | | | | | |
8.000%, 11/15/2030(1) | | | 6,500,000 | | | | 7,187,551 | | | | | |
| Liberty Utilities Finance GP 1, | | | | | | | | | | | | |
| 2.050%, 09/15/2030 | | | | | | | | | | | | |
(Callable 06/15/2030)(1)(2) | | | 10,000,000 | | | | 7,769,120 | | | | | |
| Metropolitan Edison Co., | | | | | | | | | | | | |
| 5.200%, 04/01/2028 | | | | | | | | | | | | |
(Callable 03/01/2028)(2) | | | 8,125,000 | | | | 8,042,245 | | | | | |
| National Grid PLC, | | | | | | | | | | | | |
| 5.602%, 06/12/2028 | | | | | | | | | | | | |
(Callable 05/12/2028)(1) | | | 10,000,000 | | | | 10,041,888 | | | | | |
| National Rural Utilities | | | | | | | | | | | | |
| Cooperative Finance Corp., | | | | | | | | | | | | |
| 8.000%, 03/01/2032 | | | 4,659,000 | | | | 5,454,906 | | | | | |
| NiSource, Inc.: | | | | | | | | | | | | |
| 3.600%, 05/01/2030 | | | | | | | | | | | | |
| (Callable 02/01/2030) | | | 6,835,000 | | | | 6,155,461 | | | | | |
| 5.400%, 06/30/2033 | | | | | | | | | | | | |
| (Callable 03/30/2033) | | | 13,475,000 | | | | 13,484,009 | | | | | |
| 5.250%, 02/15/2043 | | | | | | | | | | | | |
| (Callable 08/15/2042) | | | 5,779,000 | | | | 5,526,691 | | | | | |
| 3.950%, 03/30/2048 | | | | | | | | | | | | |
| (Callable 09/30/2047) | | | 11,750,000 | | | | 9,428,790 | | | | | |
The accompanying notes are an integral part of these financial statements.
Baird Aggregate Bond Fund
Schedule of Investments, June 30, 2023 (Unaudited)
Long-Term Investments (cont.)
| | | Principal | | | | | | % of | |
| | | Amount | | | Value | | | Net Assets | |
| Oklahoma Gas and Electric Co., | | | | | | | | | |
| 5.600%, 04/01/2053 | | | | | | | | | |
| (Callable 10/01/2052) | | $ | 5,550,000 | | | $ | 5,627,061 | | | | |
| Oncor Electric Delivery Co. LLC, | | | | | | | | | | | |
| 2.750%, 05/15/2030 | | | | | | | | | | | |
| (Callable 02/15/2030) | | | 9,500,000 | | | | 8,328,467 | | | | |
| Southern Co.: | | | | | | | | | | | |
| 5.700%, 10/15/2032 | | | | | | | | | | | |
| (Callable 04/15/2032) | | | 7,000,000 | | | | 7,243,324 | | | | |
| 4.250%, 07/01/2036 | | | | | | | | | | | |
| (Callable 01/01/2036) | | | 5,525,000 | | | | 4,919,272 | | | | |
| Southern Company Gas | | | | | | | | | | | |
| Capital Corporation: | | | | | | | | | | | |
| 5.150%, 09/15/2032 | | | | | | | | | | | |
| (Callable 03/15/2032) | | | 16,425,000 | | | | 16,312,682 | | | | |
| 3.150%, 09/30/2051 | | | | | | | | | | | |
| (Callable 03/30/2051) | | | 7,850,000 | | | | 5,297,018 | | | | |
| Tucson Electric Power Co., | | | | | | | | | | | |
| 5.500%, 04/15/2053 | | | | | | | | | | | |
(Callable 10/15/2052)(1) | | | 5,400,000 | | | | 5,375,999 | | | | |
| Xcel Energy, Inc., | | | | | | | | | | | |
| 3.400%, 06/01/2030 | | | | | | | | | | | |
| (Callable 12/01/2029) | | | 15,000,000 | | | | 13,357,088 | | | | |
| Total Utilities | | | | | | | | | | | |
| (Cost $641,752,509) | | | | | | | 561,439,865 | | | | 1.4 | % |
| Financials | | | | | | | | | | | | |
| ABN AMRO Bank NV: | | | | | | | | | | | | |
4.750%, 07/28/2025(1)(2) | | | 62,453,000 | | | | 60,232,796 | | | | | |
4.800%, 04/18/2026(1)(2) | | | 42,935,000 | | | | 41,075,464 | | | | | |
| 1.542%, 06/16/2027 | | | | | | | | | | | | |
| (1 Year CMT Rate + 0.800%) | | | | | | | | | | | | |
(Callable 06/16/2026)(1)(2)(3) | | | 16,900,000 | | | | 14,787,828 | | | | | |
| 3.324%, 03/13/2037 | | | | | | | | | | | | |
| (5 Year CMT Rate + 1.900%) | | | | | | | | | | | | |
(Callable 12/13/2031)(1)(2)(3) | | | 5,000,000 | | | | 3,798,218 | | | | | |
| AerCap Holdings NV: | | | | | | | | | | | | |
| 4.875%, 01/16/2024 | | | | | | | | | | | | |
(Callable 12/16/2023)(1) | | | 20,000,000 | | | | 19,859,461 | | | | | |
| 2.875%, 08/14/2024 | | | | | | | | | | | | |
(Callable 07/14/2024)(1) | | | 20,000,000 | | | | 19,219,840 | | | | | |
| 2.450%, 10/29/2026 | | | | | | | | | | | | |
(Callable 09/29/2026)(1) | | | 9,350,000 | | | | 8,350,959 | | | | | |
| 5.750%, 06/06/2028 | | | | | | | | | | | | |
(Callable 05/06/2028)(1) | | | 30,000,000 | | | | 29,751,837 | | | | | |
| 3.000%, 10/29/2028 | | | | | | | | | | | | |
(Callable 08/29/2028)(1) | | | 17,441,000 | | | | 15,080,408 | | | | | |
| 3.300%, 01/30/2032 | | | | | | | | | | | | |
(Callable 10/30/2031)(1) | | | 10,000,000 | | | | 8,180,987 | | | | | |
| Agree LP, | | | | | | | | | | | | |
| 4.800%, 10/01/2032 | | | | | | | | | | | | |
| (Callable 07/01/2032) | | | 7,000,000 | | | | 6,501,962 | | | | | |
| AIA Group Ltd., | | | | | | | | | | | | |
| 3.200%, 03/11/2025 | | | | | | | | | | | | |
(Callable 12/11/2024)(1)(2) | | | 6,000,000 | | | | 5,769,968 | | | | | |
| AIB Group PLC, | | | | | | | | | | | | |
| 7.583%, 10/14/2026 (SOFR + 3.456%) | | | | | | | | | | | | |
(Callable 10/14/2025)(1)(2)(3) | | | 34,199,000 | | | | 34,737,606 | | | | | |
| Air Lease Corp.: | | | | | | | | | | | | |
| 2.300%, 02/01/2025 | | | | | | | | | | | | |
| (Callable 01/01/2025) | | | 15,000,000 | | | | 14,104,890 | | | | | |
| 5.850%, 12/15/2027 | | | | | | | | | | | | |
| (Callable 11/15/2027) | | | 10,000,000 | | | | 9,986,567 | | | | | |
| American International Group, Inc.: | | | | | | | | | | | | |
| 5.125%, 03/27/2033 | | | | | | | | | | | | |
| (Callable 12/27/2032) | | | 10,500,000 | | | | 10,253,697 | | | | | |
| 6.820%, 11/15/2037 | | | 1,410,000 | | | | 1,480,037 | | | | | |
| AmFam Holdings, Inc., | | | | | | | | | | | | |
| 2.805%, 03/11/2031 | | | | | | | | | | | | |
(Callable 12/11/2030)(2) | | | 5,000,000 | | | | 3,733,248 | | | | | |
| Aon Corp., | | | | | | | | | | | | |
| 3.900%, 02/28/2052 | | | | | | | | | | | | |
| (Callable 08/28/2051) | | | 5,000,000 | | | | 3,923,568 | | | | | |
| Aon PLC: | | | | | | | | | | | | |
| 3.875%, 12/15/2025 | | | | | | | | | | | | |
| (Callable 09/15/2025) | | | 9,126,000 | | | | 8,795,706 | | | | | |
| 4.450%, 05/24/2043 | | | | | | | | | | | | |
| (Callable 02/24/2043) | | | 1,274,000 | | | | 1,039,636 | | | | | |
| Arthur J Gallagher & Co., | | | | | | | | | | | | |
| 5.750%, 03/02/2053 | | | | | | | | | | | | |
| (Callable 09/02/2052) | | | 5,000,000 | | | | 5,024,509 | | | | | |
| Arthur J. Gallagher & Co., | | | | | | | | | | | | |
| 3.500%, 05/20/2051 | | | | | | | | | | | | |
| (Callable 11/20/2050) | | | 5,625,000 | | | | 4,023,002 | | | | | |
| ASB Bank Ltd.: | | | | | | | | | | | | |
5.346%, 06/15/2026(1)(2) | | | 23,625,000 | | | | 23,450,079 | | | | | |
| 5.284%, 06/17/2032 | | | | | | | | | | | | |
| (5 Year CMT Rate + 2.250%) | | | | | | | | | | | | |
(Callable 06/17/2027)(1)(2)(3) | | | 4,000,000 | | | | 3,838,425 | | | | | |
| Australia & New Zealand | | | | | | | | | | | | |
| Banking Group Ltd.: | | | | | | | | | | | | |
�� 4.500%, 03/19/2024(1)(2) | | | 44,423,000 | | | | 43,863,137 | | | | | |
| 2.950%, 07/22/2030 | | | | | | | | | | | | |
| (5 Year CMT Rate + 1.288%) | | | | | | | | | | | | |
(Callable 07/22/2025)(1)(2)(3) | | | 5,000,000 | | | | 4,580,350 | | | | | |
6.742%, 12/08/2032(1)(2) | | | 38,113,000 | | | | 39,416,897 | | | | | |
| 2.570%, 11/25/2035 | | | | | | | | | | | | |
| (5 Year CMT Rate + 1.700%) | | | | | | | | | | | | |
(Callable 11/25/2030)(1)(2)(3) | | | 15,000,000 | | | | 11,394,220 | | | | | |
| Aviation Capital Group LLC: | | | | | | | | | | | | |
| 6.250%, 04/15/2028 | | | | | | | | | | | | |
(Callable 03/15/2028)(1)(2) | | | 10,000,000 | | | | 9,975,501 | | | | | |
| 6.375%, 07/15/2030 | | | | | | | | | | | | |
(Callable 05/15/2030)(1)(2) | | | 6,500,000 | | | | 6,445,504 | | | | | |
| Banco Bilbao Vizcaya Argentaria SA, | | | | | | | | | | | | |
1.125%, 09/18/2025(1) | | | 25,000,000 | | | | 22,506,204 | | | | | |
| Banco Santander SA: | | | | | | | | | | | | |
2.746%, 05/28/2025(1) | | | 7,000,000 | | | | 6,571,570 | | | | | |
5.179%, 11/19/2025(1) | | | 25,983,000 | | | | 25,233,823 | | | | | |
| 1.722%, 09/14/2027 | | | | | | | | | | | | |
| (1 Year CMT Rate + 0.900%) | | | | | | | | | | | | |
(Callable 09/14/2026)(1)(3) | | | 11,325,000 | | | | 9,832,492 | | | | | |
4.379%, 04/12/2028(1) | | | 13,400,000 | | | | 12,634,694 | | | | | |
3.490%, 05/28/2030(1) | | | 5,000,000 | | | | 4,357,651 | | | | | |
2.749%, 12/03/2030(1) | | | 19,250,000 | | | | 15,086,467 | | | | | |
| 3.225%, 11/22/2032 | | | | | | | | | | | | |
| (1 Year CMT Rate + 1.600%) | | | | | | | | | | | | |
(Callable 08/22/2031)(1)(3) | | | 35,000,000 | | | | 27,727,780 | | | | | |
| Bank of America Corp.: | | | | | | | | | | | | |
| 3.093%, 10/01/2025 | | | | | | | | | | | | |
| (3 Month LIBOR USD + 1.352%) | | | | | | | | | | | | |
(Callable 10/01/2024)(3) | | | 10,000,000 | | | | 9,618,648 | | | | | |
| 2.456%, 10/22/2025 | | | | | | | | | | | | |
| (3 Month LIBOR USD + 1.132%) | | | | | | | | | | | | |
(Callable 10/22/2024)(3) | | | 17,775,000 | | | | 16,971,606 | | | | | |
| 5.080%, 01/20/2027 (SOFR + 1.290%) | | | | | | | | | | | | |
(Callable 01/20/2026)(3) | | | 12,500,000 | | | | 12,308,226 | | | | | |
The accompanying notes are an integral part of these financial statements.
Baird Aggregate Bond Fund
Schedule of Investments, June 30, 2023 (Unaudited)
Long-Term Investments (cont.)
| | | Principal | | | | | | % of | |
| | | Amount | | | Value | | | Net Assets | |
| Bank of America Corp.: (cont.) | | | | | | | | | |
| 3.559%, 04/23/2027 | | | | | | | | | |
| (3 Month LIBOR USD + 1.322%) | | | | | | | | | |
(Callable 04/23/2026)(3) | | $ | 9,000,000 | | | $ | 8,532,645 | | | |
| |
| 1.734%, 07/22/2027 (SOFR + 0.960%) | | | | | | | | | | | | |
(Callable 07/22/2026)(3) | | | 35,000,000 | | | | 31,246,769 | | | | | |
| 4.376%, 04/27/2028 (SOFR + 1.580%) | | | | | | | | | | | | |
(Callable 04/27/2027)(3) | | | 16,000,000 | | | | 15,359,751 | | | | | |
| 6.204%, 11/10/2028 (SOFR + 1.990%) | | | | | | | | | | | | |
(Callable 11/10/2027)(3) | | | 11,425,000 | | | | 11,743,175 | | | | | |
| 3.419%, 12/20/2028 | | | | | | | | | | | | |
| (3 Month LIBOR USD + 1.302%) | | | | | | | | | | | | |
(Callable 12/20/2027)(3) | | | 37,683,000 | | | | 34,556,197 | | | | | |
| 3.970%, 03/05/2029 | | | | | | | | | | | | |
| (3 Month LIBOR USD + 1.332%) | | | | | | | | | | | | |
(Callable 03/05/2028)(3) | | | 14,230,000 | | | | 13,322,543 | | | | | |
| 2.087%, 06/14/2029 (SOFR + 1.060%) | | | | | | | | | | | | |
(Callable 06/14/2028)(3) | | | 15,000,000 | | | | 12,797,382 | | | | | |
| 4.271%, 07/23/2029 | | | | | | | | | | | | |
| (3 Month LIBOR USD + 1.572%) | | | | | | | | | | | | |
(Callable 07/23/2028)(3) | | | 39,571,000 | | | | 37,544,696 | | | | | |
| 3.194%, 07/23/2030 | | | | | | | | | | | | |
| (3 Month LIBOR USD + 1.442%) | | | | | | | | | | | | |
(Callable 07/23/2029)(3) | | | 5,000,000 | | | | 4,407,032 | | | | | |
| 2.496%, 02/13/2031 | | | | | | | | | | | | |
| (3 Month LIBOR USD + 1.252%) | | | | | | | | | | | | |
(Callable 02/13/2030)(3) | | | 13,000,000 | | | | 10,884,008 | | | | | |
| 2.592%, 04/29/2031 (SOFR + 2.150%) | | | | | | | | | | | | |
(Callable 04/29/2030)(3) | | | 60,000,000 | | | | 50,372,199 | | | | | |
| 1.898%, 07/23/2031 (SOFR + 1.530%) | | | | | | | | | | | | |
(Callable 07/23/2030)(3) | | | 10,000,000 | | | | 7,963,508 | | | | | |
| 1.922%, 10/24/2031 (SOFR + 1.370%) | | | | | | | | | | | | |
(Callable 10/24/2030)(3) | | | 5,000,000 | | | | 3,957,860 | | | | | |
| 2.687%, 04/22/2032 (SOFR + 1.320%) | | | | | | | | | | | | |
(Callable 04/22/2031)(3) | | | 15,000,000 | | | | 12,431,196 | | | | | |
| 2.299%, 07/21/2032 (SOFR + 1.220%) | | | | | | | | | | | | |
(Callable 07/21/2031)(3) | | | 5,000,000 | | | | 3,998,834 | | | | | |
| 2.972%, 02/04/2033 (SOFR + 1.330%) | | | | | | | | | | | | |
(Callable 02/04/2032)(3) | | | 10,000,000 | | | | 8,336,262 | | | | | |
| 5.015%, 07/22/2033 (SOFR + 2.160%) | | | | | | | | | | | | |
(Callable 07/22/2032)(3) | | | 5,000,000 | | | | 4,891,219 | | | | | |
| 5.288%, 04/25/2034 (SOFR + 1.910%) | | | | | | | | | | | | |
(Callable 04/25/2033)(3) | | | 16,500,000 | | | | 16,346,653 | | | | | |
| 7.750%, 05/14/2038 | | | 1,138,000 | | | | 1,350,636 | | | | | |
| Bank of Ireland Group PLC: | | | | | | | | | | | | |
| 6.253%, 09/16/2026 | | | | | | | | | | | | |
| (1 Year CMT Rate + 2.650%) | | | | | | | | | | | | |
(Callable 09/16/2025)(1)(2)(3) | | | 8,864,000 | | | | 8,794,157 | | | | | |
| 2.029%, 09/30/2027 | | | | | | | | | | | | |
| (1 Year CMT Rate + 1.100%) | | | | | | | | | | | | |
(Callable 09/30/2026)(1)(2)(3) | | | 20,000,000 | | | | 17,287,720 | | | | | |
| Bank of Montreal: | | | | | | | | | | | | |
4.250%, 09/14/2024(1) | | | 20,000,000 | | | | 19,605,979 | | | | | |
1.500%, 01/10/2025(1) | | | 7,000,000 | | | | 6,578,519 | | | | | |
| Bank of New Zealand, | | | | | | | | | | | | |
2.000%, 02/21/2025(1)(2) | | | 16,000,000 | | | | 15,050,047 | | | | | |
| Bank of Nova Scotia: | | | | | | | | | | | | |
4.500%, 12/16/2025(1) | | | 8,500,000 | | | | 8,204,653 | | | | | |
5.250%, 06/12/2028(1) | | | 10,000,000 | | | | 9,931,915 | | | | | |
| Banque Federative du Credit Mutuel SA, | | | | | | | | | | | | |
4.753%, 07/13/2027(1)(2) | | | 22,290,000 | | | | 21,713,947 | | | | | |
| Barclays PLC: | | | | | | | | | | | | |
3.650%, 03/16/2025(1) | | | 8,100,000 | | | | 7,764,111 | | | | | |
| 3.932%, 05/07/2025 | | | | | | | | | | | | |
| (3 Month LIBOR USD + 1.610%) | | | | | | | | | | | | |
(Callable 05/07/2024)(1)(3) | | | 34,300,000 | | | | 33,520,224 | | | | | |
| 2.852%, 05/07/2026 | | | | | | | | | | | | |
| (3 Month LIBOR USD + 2.714%) | | | | | | | | | | | | |
(Callable 05/07/2025)(1)(3) | | | 10,000,000 | | | | 9,365,841 | | | | | |
| 4.337%, 01/10/2028 | | | | | | | | | | | | |
(Callable 01/10/2027)(1) | | | 20,000,000 | | | | 18,843,954 | | | | | |
| 6.224%, 05/09/2034 (SOFR + 2.980%) | | | | | | | | | | | | |
(Callable 05/09/2033)(1)(3) | | | 25,000,000 | | | | 24,900,882 | | | | | |
| BBVA USA, | | | | | | | | | | | | |
| 3.875%, 04/10/2025 | | | | | | | | | | | | |
| (Callable 03/10/2025) | | | 36,235,000 | | | | 34,589,321 | | | | | |
| Belrose Funding Trust, | | | | | | | | | | | | |
| 2.330%, 08/15/2030 | | | | | | | | | | | | |
(Callable 05/15/2030)(2) | | | 13,950,000 | | | | 10,684,541 | | | | | |
| Berkshire Hathaway Finance Corp., | | | | | | | | | | | | |
| 4.400%, 05/15/2042 | | | 3,500,000 | | | | 3,333,050 | | | | | |
| BNP Paribas SA: | | | | | | | | | | | | |
| 2.819%, 11/19/2025 | | | | | | | | | | | | |
| (3 Month LIBOR USD + 1.111%) | | | | | | | | | | | | |
(Callable 11/19/2024)(1)(2)(3) | | | 17,100,000 | | | | 16,304,693 | | | | | |
4.375%, 05/12/2026(1)(2) | | | 45,131,000 | | | | 43,309,994 | | | | | |
| 2.219%, 06/09/2026 (SOFR + 2.074%) | | | | | | | | | | | | |
(Callable 06/09/2025)(1)(2)(3) | | | 15,000,000 | | | | 13,872,188 | | | | | |
| 1.323%, 01/13/2027 (SOFR + 1.004%) | | | | | | | | | | | | |
(Callable 01/13/2026)(1)(2)(3) | | | 28,350,000 | | | | 25,140,222 | | | | | |
4.625%, 03/13/2027(1)(2) | | | 2,325,000 | | | | 2,223,842 | | | | | |
| 2.591%, 01/20/2028 (SOFR + 1.228%) | | | | | | | | | | | | |
(Callable 01/20/2027)(1)(2)(3) | | | 2,175,000 | | | | 1,943,821 | | | | | |
| 1.904%, 09/30/2028 (SOFR + 1.609%) | | | | | | | | | | | | |
(Callable 09/30/2027)(1)(2)(3) | | | 27,000,000 | | | | 22,995,992 | | | | | |
| 5.335%, 06/12/2029 | | | | | | | | | | | | |
| (1 Year CMT Rate + 1.500%) | | | | | | | | | | | | |
(Callable 06/12/2028)(1)(2)(3) | | | 13,025,000 | | | | 12,845,538 | | | | | |
| 2.159%, 09/15/2029 (SOFR + 1.218%) | | | | | | | | | | | | |
(Callable 09/15/2028)(1)(2)(3) | | | 19,538,000 | | | | 16,270,140 | | | | | |
| 2.871%, 04/19/2032 (SOFR + 1.387%) | | | | | | | | | | | | |
(Callable 04/19/2031)(1)(2)(3) | | | 19,075,000 | | | | 15,623,264 | | | | | |
| 3.132%, 01/20/2033 (SOFR + 1.561%) | | | | | | | | | | | | |
(Callable 01/20/2032)(1)(2)(3) | | | 10,000,000 | | | | 8,206,145 | | | | | |
| 2.588%, 08/12/2035 | | | | | | | | | | | | |
| (5 Year CMT Rate + 2.050%) | | | | | | | | | | | | |
(Callable 08/12/2030)(1)(2)(3) | | | 14,000,000 | | | | 10,731,709 | | | | | |
| BPCE SA: | | | | | | | | | | | | |
5.700%, 10/22/2023(1)(2) | | | 22,955,000 | | | | 22,854,730 | | | | | |
5.150%, 07/21/2024(1)(2) | | | 31,285,000 | | | | 30,718,477 | | | | | |
2.375%, 01/14/2025(1)(2) | | | 12,000,000 | | | | 11,250,137 | | | | | |
4.500%, 03/15/2025(1)(2) | | | 55,492,000 | | | | 53,250,309 | | | | | |
| 1.652%, 10/06/2026 (SOFR + 1.520%) | | | | | | | | | | | | |
(Callable 10/06/2025)(1)(2)(3) | | | 25,000,000 | | | | 22,418,924 | | | | | |
| 2.277%, 01/20/2032 (SOFR + 1.312%) | | | | | | | | | | | | |
(Callable 01/20/2031)(1)(2)(3) | | | 12,850,000 | | | | 9,921,606 | | | | | |
| 3.116%, 10/19/2032 (SOFR + 1.730%) | | | | | | | | | | | | |
(Callable 10/19/2031)(1)(2)(3) | | | 43,420,000 | | | | 33,512,714 | | | | | |
| Brown & Brown, Inc.: | | | | | | | | | | | | |
| 4.500%, 03/15/2029 | | | | | | | | | | | | |
| (Callable 12/15/2028) | | | 23,825,000 | | | | 22,481,804 | | | | | |
| 2.375%, 03/15/2031 | | | | | | | | | | | | |
| (Callable 12/15/2030) | | | 36,789,000 | | | | 29,654,314 | | | | | |
| 4.200%, 03/17/2032 | | | | | | | | | | | | |
| (Callable 12/17/2031) | | | 15,000,000 | | | | 13,470,401 | | | | | |
| 4.950%, 03/17/2052 | | | | | | | | | | | | |
| (Callable 09/17/2051) | | | 9,500,000 | | | | 8,130,927 | | | | | |
The accompanying notes are an integral part of these financial statements.
Baird Aggregate Bond Fund
Schedule of Investments, June 30, 2023 (Unaudited)
Long-Term Investments (cont.)
| | | Principal | | | | | | % of | |
| | | Amount | | | Value | | | Net Assets | |
| Cantor Fitzgerald LP, | | | | | | | | | |
| 4.500%, 04/14/2027 | | | | | | | | | |
(Callable 01/14/2027)(2) | | $ | 17,450,000 | | | $ | 16,298,204 | | | |
| |
| Capital One Financial Corp.: | | | | | | | | | | | | |
| 3.300%, 10/30/2024 | | | | | | | | | | | | |
| (Callable 09/30/2024) | | | 2,998,000 | | | | 2,880,555 | | | | | |
| 3.650%, 05/11/2027 | | | | | | | | | | | | |
| (Callable 04/11/2027) | | | 42,750,000 | | | | 39,706,849 | | | | | |
| 6.312%, 06/08/2029 (SOFR + 2.640%) | | | | | | | | | | | | |
(Callable 06/08/2028)(3) | | | 20,000,000 | | | | 19,865,269 | | | | | |
| 5.817%, 02/01/2034 (SOFR + 2.600%) | | | | | | | | | | | | |
(Callable 02/01/2033)(3) | | | 12,700,000 | | | | 12,116,751 | | | | | |
| Centene Corp.: | | | | | | | | | | | | |
| 3.000%, 10/15/2030 | | | | | | | | | | | | |
| (Callable 07/15/2030) | | | 13,061,000 | | | | 10,883,692 | | | | | |
| 2.500%, 03/01/2031 | | | | | | | | | | | | |
| (Callable 12/01/2030) | | | 35,000,000 | | | | 27,911,450 | | | | | |
| 2.625%, 08/01/2031 | | | | | | | | | | | | |
| (Callable 05/01/2031) | | | 12,000,000 | | | | 9,562,560 | | | | | |
| Charles Schwab Corp.: | | | | | | | | | | | | |
| 3.625%, 04/01/2025 | | | | | | | | | | | | |
| (Callable 01/01/2025) | | | 7,000,000 | | | | 6,728,859 | | | | | |
| 2.900%, 03/03/2032 | | | | | | | | | | | | |
| (Callable 12/03/2031) | | | 5,000,000 | | | | 4,116,125 | | | | | |
| Citigroup, Inc.: | | | | | | | | | | | | |
| 3.700%, 01/12/2026 | | | 4,500,000 | | | | 4,316,845 | | | | | |
| 3.106%, 04/08/2026 (SOFR + 2.842%) | | | | | | | | | | | | |
(Callable 04/08/2025)(3) | | | 20,000,000 | | | | 19,093,914 | | | | | |
| 3.887%, 01/10/2028 | | | | | | | | | | | | |
| (3 Month LIBOR USD + 1.825%) | | | | | | | | | | | | |
(Callable 01/10/2027)(3) | | | 40,600,000 | | | | 38,472,778 | | | | | |
| 3.668%, 07/24/2028 | | | | | | | | | | | | |
| (3 Month LIBOR USD + 1.652%) | | | | | | | | | | | | |
(Callable 07/24/2027)(3) | | | 3,142,000 | | | | 2,937,431 | | | | | |
| 3.520%, 10/27/2028 | | | | | | | | | | | | |
| (3 Month LIBOR USD + 1.413%) | | | | | | | | | | | | |
(Callable 10/27/2027)(3) | | | 11,500,000 | | | | 10,680,638 | | | | | |
| 4.412%, 03/31/2031 (SOFR + 3.914%) | | | | | | | | | | | | |
(Callable 03/31/2030)(3) | | | 26,105,000 | | | | 24,545,529 | | | | | |
| 2.572%, 06/03/2031 (SOFR + 2.107%) | | | | | | | | | | | | |
(Callable 06/03/2030)(3) | | | 25,000,000 | | | | 20,857,911 | | | | | |
| 2.561%, 05/01/2032 (SOFR + 1.167%) | | | | | | | | | | | | |
(Callable 05/01/2031)(3) | | | 6,000,000 | | | | 4,899,160 | | | | | |
| 2.520%, 11/03/2032 (SOFR + 1.177%) | | | | | | | | | | | | |
(Callable 11/03/2031)(3) | | | 11,085,000 | | | | 8,931,295 | | | | | |
| 3.785%, 03/17/2033 (SOFR + 1.939%) | | | | | | | | | | | | |
(Callable 03/17/2032)(3) | | | 18,000,000 | | | | 15,903,127 | | | | | |
| 6.270%, 11/17/2033 (SOFR + 2.338%) | | | | | | | | | | | | |
(Callable 11/17/2032)(3) | | | 29,000,000 | | | | 30,781,098 | | | | | |
| Citizens Bank NA: | | | | | | | | | | | | |
| 2.250%, 04/28/2025 | | | | | | | | | | | | |
| (Callable 03/28/2025) | | | 20,000,000 | | | | 18,087,014 | | | | | |
| 3.750%, 02/18/2026 | | | | | | | | | | | | |
| (Callable 11/18/2025) | | | 12,120,000 | | | | 11,040,316 | | | | | |
| Citizens Financial Group, Inc.: | | | | | | | | | | | | |
| 2.850%, 07/27/2026 | | | | | | | | | | | | |
| (Callable 04/27/2026) | | | 10,000,000 | | | | 8,802,378 | | | | | |
| 3.250%, 04/30/2030 | | | | | | | | | | | | |
| (Callable 01/30/2030) | | | 28,025,000 | | | | 22,900,675 | | | | | |
| CNA Financial Corp.: | | | | | | | | | | | | |
| 4.500%, 03/01/2026 | | | | | | | | | | | | |
| (Callable 12/01/2025) | | | 14,000,000 | | | | 13,581,900 | | | | | |
| 3.450%, 08/15/2027 | | | | | | | | | | | | |
| (Callable 05/15/2027) | | | 12,000,000 | | | | 11,119,748 | | | | | |
| 3.900%, 05/01/2029 | | | | | | | | | | | | |
| (Callable 02/01/2029) | | | 8,000,000 | | | | 7,341,342 | | | | | |
| 5.500%, 06/15/2033 | | | | | | | | | | | | |
| (Callable 03/15/2033) | | | 14,225,000 | | | | 13,871,670 | | | | | |
| CNO Global Funding, | | | | | | | | | | | | |
2.650%, 01/06/2029(2) | | | 10,000,000 | | | | 8,411,893 | | | | | |
| Comerica Bank: | | | | | | | | | | | | |
| 4.000%, 07/27/2025 | | | 10,000,000 | | | | 9,211,643 | | | | | |
| 5.332%, 08/25/2033 (SOFR + 2.610%) | | | | | | | | | | | | |
(Callable 08/25/2032)(3) | | | 15,325,000 | | | | 12,269,269 | | | | | |
| Commonwealth Bank of Australia: | | | | | | | | | | | | |
2.688%, 03/11/2031(1)(2) | | | 15,000,000 | | | | 11,760,705 | | | | | |
3.784%, 03/14/2032(1)(2) | | | 10,000,000 | | | | 8,376,930 | | | | | |
| 3.610%, 09/12/2034 | | | | | | | | | | | | |
| (5 Year CMT Rate + 2.050%) | | | | | | | | | | | | |
(Callable 09/12/2029)(1)(2)(3) | | | 10,000,000 | | | | 8,404,820 | | | | | |
3.743%, 09/12/2039(1)(2) | | | 23,500,000 | | | | 17,658,545 | | | | | |
| Cooperatieve Rabobank UA: | | | | | | | | | | | | |
4.375%, 08/04/2025(1) | | | 20,397,000 | | | | 19,685,935 | | | | | |
3.750%, 07/21/2026(1) | | | 20,829,000 | | | | 19,446,322 | | | | | |
| Credit Agricole SA: | | | | | | | | | | | | |
3.250%, 10/04/2024(1)(2) | | | 8,575,000 | | | | 8,259,082 | | | | | |
4.375%, 03/17/2025(1)(2) | | | 4,204,000 | | | | 4,049,663 | | | | | |
| 1.247%, 01/26/2027 (SOFR + 0.892%) | | | | | | | | | | | | |
(Callable 01/26/2026)(1)(2)(3) | | | 20,000,000 | | | | 17,714,029 | | | | | |
3.250%, 01/14/2030(1)(2) | | | 6,800,000 | | | | 5,805,074 | | | | | |
| 4.000%, 01/10/2033 | | | | | | | | | | | | |
| (5 Year Swap Rate USD + 1.644%) | | | | | | | | | | | | |
(Callable 01/10/2028)(1)(2)(3) | | | 8,000,000 | | | | 7,121,930 | | | | | |
5.514%, 07/05/2033(1)(2)(8) | | | 35,000,000 | | | | 35,209,103 | | | | | |
| Credit Suisse AG, | | | | | | | | | | | | |
3.625%, 09/09/2024(1) | | | 4,325,000 | | | | 4,165,030 | | | | | |
| Credit Suisse Group AG: | | | | | | | | | | | | |
| 2.593%, 09/11/2025 (SOFR + 1.560%) | | | | | | | | | | | | |
(Callable 09/11/2024)(1)(2)(3) | | | 12,250,000 | | | | 11,676,344 | | | | | |
| 2.193%, 06/05/2026 (SOFR + 2.044%) | | | | | | | | | | | | |
(Callable 06/05/2025)(1)(2)(3) | | | 15,000,000 | | | | 13,754,530 | | | | | |
| 1.305%, 02/02/2027 (SOFR + 0.980%) | | | | | | | | | | | | |
(Callable 02/02/2026)(1)(2)(3) | | | 40,000,000 | | | | 34,946,720 | | | | | |
| 4.282%, 01/09/2028 | | | | | | | | | | | | |
(Callable 01/09/2027)(1)(2) | | | 17,403,000 | | | | 16,083,909 | | | | | |
| 6.442%, 08/11/2028 (SOFR + 3.700%) | | | | | | | | | | | | |
(Callable 08/11/2027)(1)(2)(3) | | | 17,500,000 | | | | 17,564,731 | | | | | |
| 3.869%, 01/12/2029 | | | | | | | | | | | | |
| (3 Month LIBOR USD + 1.410%) | | | | | | | | | | | | |
(Callable 01/12/2028)(1)(2)(3) | | | 11,000,000 | | | | 9,943,973 | | | | | |
| 4.194%, 04/01/2031 (SOFR + 3.730%) | | | | | | | | | | | | |
(Callable 04/01/2030)(1)(2)(3) | | | 20,000,000 | | | | 17,801,188 | | | | | |
| 3.091%, 05/14/2032 (SOFR + 1.730%) | | | | | | | | | | | | |
(Callable 05/14/2031)(1)(2)(3) | | | 10,000,000 | | | | 8,089,259 | | | | | |
| 6.537%, 08/12/2033 (SOFR + 3.920%) | | | | | | | | | | | | |
(Callable 08/12/2032)(1)(2)(3) | | | 6,000,000 | | | | 6,146,474 | | | | | |
| Credit Suisse USA, Inc., | | | | | | | | | | | | |
7.125%, 07/15/2032(1) | | | 5,063,000 | | | | 5,607,887 | | | | | |
| Danske Bank A/S, | | | | | | | | | | | | |
| 1.621%, 09/11/2026 | | | | | | | | | | | | |
| (1 Year CMT Rate + 1.350%) | | | | | | | | | | | | |
(Callable 09/11/2025)(1)(2)(3) | | | 20,000,000 | | | | 17,939,772 | | | | | |
| Deutsche Bank AG: | | | | | | | | | | | | |
3.700%, 05/30/2024(1) | | | 10,000,000 | | | | 9,708,787 | | | | | |
| 2.222%, 09/18/2024 (SOFR + 2.159%) | | | | | | | | | | | | |
(Callable 09/18/2023)(1)(3) | | | 52,000,000 | | | | 51,341,623 | | | | | |
The accompanying notes are an integral part of these financial statements.
Baird Aggregate Bond Fund
Schedule of Investments, June 30, 2023 (Unaudited)
Long-Term Investments (cont.)
| | | Principal | | | | | | % of | |
| | | Amount | | | Value | | | Net Assets | |
| Deutsche Bank AG: (cont.) | | | | | | | | | |
| 6.119%, 07/14/2026 | | | | | | | | | |
| (SOFR + 3.190%) | | | | | | | | | |
(Callable 07/14/2025)(1)(3) | | $ | 11,425,000 | | | $ | 11,297,806 | | | |
| |
| 2.129%, 11/24/2026 (SOFR + 1.870%) | | | | | | | | | | | | |
(Callable 11/24/2025)(1)(3) | | | 22,755,000 | | | | 20,245,605 | | | | | |
| 2.311%, 11/16/2027 (SOFR + 1.219%) | | | | | | | | | | | | |
(Callable 11/16/2026)(1)(3) | | | 19,435,000 | | | | 16,701,220 | | | | | |
| 3.035%, 05/28/2032 (SOFR + 1.718%) | | | | | | | | | | | | |
(Callable 05/28/2031)(1)(3) | | | 14,000,000 | | | | 11,024,818 | | | | | |
| 3.742%, 01/07/2033 (SOFR + 2.257%) | | | | | | | | | | | | |
(Callable 10/07/2031)(1)(3) | | | 39,625,000 | | | | 29,059,784 | | | | | |
| Digital Realty Trust LP, | | | | | | | | | | | | |
| 5.550%, 01/15/2028 | | | | | | | | | | | | |
| (Callable 12/15/2027) | | | 9,775,000 | | | | 9,630,597 | | | | | |
| Discover Bank: | | | | | | | | | | | | |
| 3.450%, 07/27/2026 | | | | | | | | | | | | |
| (Callable 04/27/2026) | | | 22,000,000 | | | | 20,249,058 | | | | | |
| 4.650%, 09/13/2028 | | | | | | | | | | | | |
| (Callable 06/13/2028) | | | 24,508,000 | | | | 22,750,789 | | | | | |
| Discover Financial Services: | | | | | | | | | | | | |
| 3.950%, 11/06/2024 | | | | | | | | | | | | |
| (Callable 08/06/2024) | | | 10,000,000 | | | | 9,636,501 | | | | | |
| 4.100%, 02/09/2027 | | | | | | | | | | | | |
| (Callable 11/09/2026) | | | 38,019,000 | | | | 35,271,789 | | | | | |
| DNB Bank ASA: | | | | | | | | | | | | |
| 1.127%, 09/16/2026 | | | | | | | | | | | | |
| (5 Year CMT Rate + 0.850%) | | | | | | | | | | | | |
(Callable 09/16/2025)(1)(2)(3) | | | 2,000,000 | | | | 1,786,065 | | | | | |
| 1.535%, 05/25/2027 | | | | | | | | | | | | |
| (1 Year CMT Rate + 0.720%) | | | | | | | | | | | | |
(Callable 05/25/2026)(1)(2)(3) | | | 15,000,000 | | | | 13,205,089 | | | | | |
| Elevance Health, Inc.: | | | | | | | | | | | | |
| 2.375%, 01/15/2025 | | | | | | | | | | | | |
| (Callable 12/15/2024) | | | 6,000,000 | | | | 5,703,425 | | | | | |
| 5.100%, 01/15/2044 | | | 1,584,000 | | | | 1,501,657 | | | | | |
| 4.375%, 12/01/2047 | | | | | | | | | | | | |
| (Callable 06/01/2047) | | | 8,650,000 | | | | 7,539,342 | | | | | |
| 5.125%, 02/15/2053 | | | | | | | | | | | | |
| (Callable 08/15/2052) | | | 8,150,000 | | | | 7,903,295 | | | | | |
| Extra Space Storage LP: | | | | | | | | | | | | |
| 5.700%, 04/01/2028 | | | | | | | | | | | | |
| (Callable 03/01/2028) | | | 10,000,000 | | | | 9,990,154 | | | | | |
| 5.500%, 07/01/2030 | | | | | | | | | | | | |
| (Callable 05/01/2030) | | | 10,000,000 | | | | 9,917,246 | | | | | |
| 2.550%, 06/01/2031 | | | | | | | | | | | | |
| (Callable 03/01/2031) | | | 10,000,000 | | | | 8,088,842 | | | | | |
| Federation des Caisses | | | | | | | | | | | | |
| Desjardins du Quebec: | | | | | | | | | | | | |
2.050%, 02/10/2025(1)(2) | | | 12,100,000 | | | | 11,354,905 | | | | | |
4.550%, 08/23/2027(1)(2) | | | 11,000,000 | | | | 10,583,341 | | | | | |
5.700%, 03/14/2028(1)(2) | | | 18,000,000 | | | | 17,978,785 | | | | | |
| Fifth Third Bancorp, | | | | | | | | | | | | |
| 4.772%, 07/28/2030 | | | | | | | | | | | | |
| (SOFRINDX + 2.127%) | | | | | | | | | | | | |
(Callable 07/28/2029)(3) | | | 7,525,000 | | | | 7,031,644 | | | | | |
| FirstMerit Bank NA, | | | | | | | | | | | | |
| 4.270%, 11/25/2026 | | | 4,600,000 | | | | 4,147,308 | | | | | |
| Five Corners Funding Trust II, | | | | | | | | | | | | |
| 2.850%, 05/15/2030 | | | | | | | | | | | | |
(Callable 02/15/2030)(2) | | | 30,000,000 | | | | 25,483,469 | | | | | |
| Five Corners Funding Trust III, | | | | | | | | | | | | |
| 5.791%, 02/15/2033 | | | | | | | | | | | | |
(Callable 11/15/2032)(2) | | | 8,000,000 | | | | 8,108,108 | | | | | |
| Five Corners Funding Trust IV, | | | | | | | | | | | | |
| 5.997%, 02/15/2053 | | | | | | | | | | | | |
(Callable 08/15/2052)(2) | | | 10,000,000 | | | | 10,165,728 | | | | | |
| FMR LLC, | | | | | | | | | | | | |
4.950%, 02/01/2033(2) | | | 1,750,000 | | | | 1,658,915 | | | | | |
| Globe Life, Inc., | | | | | | | | | | | | |
| 4.550%, 09/15/2028 | | | | | | | | | | | | |
| (Callable 06/15/2028) | | | 5,000,000 | | | | 4,835,632 | | | | | |
| Goldman Sachs Group, Inc.: | | | | | | | | | | | | |
| 3.500%, 01/23/2025 | | | | | | | | | | | | |
| (Callable 10/23/2024) | | | 3,000,000 | | | | 2,894,634 | | | | | |
| 3.500%, 04/01/2025 | | | | | | | | | | | | |
| (Callable 03/01/2025) | | | 5,000,000 | | | | 4,802,951 | | | | | |
| 3.750%, 05/22/2025 | | | | | | | | | | | | |
| (Callable 02/22/2025) | | | 5,000,000 | | | | 4,825,803 | | | | | |
| 3.272%, 09/29/2025 | | | | | | | | | | | | |
| (3 Month LIBOR USD + 1.463%) | | | | | | | | | | | | |
(Callable 09/29/2024)(3) | | | 15,000,000 | | | | 14,492,601 | | | | | |
| 1.093%, 12/09/2026 (SOFR + 0.789%) | | | | | | | | | | | | |
(Callable 12/09/2025)(3) | | | 10,000,000 | | | | 8,911,360 | | | | | |
| 2.640%, 02/24/2028 (SOFR + 1.114%) | | | | | | | | | | | | |
(Callable 02/24/2027)(3) | | | 89,350,000 | | | | 81,071,242 | | | | | |
| 3.691%, 06/05/2028 | | | | | | | | | | | | |
| (3 Month LIBOR USD + 1.772%) | | | | | | | | | | | | |
(Callable 06/05/2027)(3) | | | 6,775,000 | | | | 6,365,404 | | | | | |
| 3.814%, 04/23/2029 | | | | | | | | | | | | |
| (3 Month LIBOR USD + 1.420%) | | | | | | | | | | | | |
(Callable 04/23/2028)(3) | | | 10,000,000 | | | | 9,282,834 | | | | | |
| 4.223%, 05/01/2029 | | | | | | | | | | | | |
| (3 Month LIBOR USD + 1.563%) | | | | | | | | | | | | |
(Callable 05/01/2028)(3) | | | 13,348,000 | | | | 12,607,061 | | | | | |
| 3.800%, 03/15/2030 | | | | | | | | | | | | |
| (Callable 12/15/2029) | | | 30,000,000 | | | | 27,742,741 | | | | | |
| 1.992%, 01/27/2032 (SOFR + 1.090%) | | | | | | | | | | | | |
(Callable 01/27/2031)(3) | | | 10,000,000 | | | | 7,872,247 | | | | | |
| 2.615%, 04/22/2032 (SOFR + 1.281%) | | | | | | | | | | | | |
(Callable 04/22/2031)(3) | | | 9,625,000 | | | | 7,893,647 | | | | | |
| 2.383%, 07/21/2032 (SOFR + 1.248%) | | | | | | | | | | | | |
(Callable 07/21/2031)(3) | | | 30,000,000 | | | | 24,029,969 | | | | | |
| 6.345%, 02/15/2034 | | | 1,053,000 | | | | 1,055,167 | | | | | |
| Guardian Life Global Funding, | | | | | | | | | | | | |
5.550%, 10/28/2027(2) | | | 16,350,000 | | | | 16,522,383 | | | | | |
| Guardian Life Insurance Co. of America: | | | | | | | | | | | | |
4.875%, 06/19/2064(2) | | | 5,000,000 | | | | 4,355,318 | | | | | |
| 3.700%, 01/22/2070 | | | | | | | | | | | | |
(Callable 07/22/2069)(2) | | | 15,062,000 | | | | 10,137,665 | | | | | |
4.850%, 01/24/2077(2) | | | 24,727,000 | | | | 20,571,225 | | | | | |
| Hanover Insurance Group, Inc., | | | | | | | | | | | | |
| 2.500%, 09/01/2030 | | | | | | | | | | | | |
| (Callable 06/01/2030) | | | 10,550,000 | | | | 8,293,108 | | | | | |
| Hartford Financial Services Group, Inc., | | | | | | | | | | | | |
| 3.600%, 08/19/2049 | | | | | | | | | | | | |
| (Callable 02/19/2049) | | | 7,000,000 | | | | 5,285,349 | | | | | |
| Health Care Service Corp. A | | | | | | | | | | | | |
| Mutual Legal Reserve Co., | | | | | | | | | | | | |
| 2.200%, 06/01/2030 | | | | | | | | | | | | |
(Callable 03/01/2030)(2) | | | 6,125,000 | | | | 5,056,901 | | | | | |
| Healthpeak OP LLC, | | | | | | | | | | | | |
| 5.250%, 12/15/2032 | | | | | | | | | | | | |
| (Callable 09/15/2032) | | | 4,000,000 | | | | 3,892,540 | | | | | |
| High Street Funding Trust II, | | | | | | | | | | | | |
| 4.682%, 02/15/2048 | | | | | | | | | | | | |
(Callable 11/15/2047)(2) | | | 2,000,000 | | | | 1,673,506 | | | | | |
The accompanying notes are an integral part of these financial statements.
Baird Aggregate Bond Fund
Schedule of Investments, June 30, 2023 (Unaudited)
Long-Term Investments (cont.)
| | | Principal | | | | | | % of | |
| | | Amount | | | Value | | | Net Assets | |
| HSBC Bank USA NA, | | | | | | | | | |
7.000%, 01/15/2039(1) | | $ | 4,200,000 | | | $ | 4,563,490 | | | |
| |
| HSBC Holdings PLC: | | | | | | | | | | | | |
| 3.803%, 03/11/2025 | | | | | | | | | | | | |
| (3 Month LIBOR USD + 1.473%) | | | | | | | | | | | | |
(Callable 03/11/2024)(1)(3) | | | 26,550,000 | | | | 26,031,937 | | | | | |
| 1.645%, 04/18/2026 (SOFR + 1.538%) | | | | | | | | | | | | |
(Callable 04/18/2025)(1)(3) | | | 15,000,000 | | | | 13,816,384 | | | | | |
| 4.292%, 09/12/2026 | | | | | | | | | | | | |
| (3 Month LIBOR USD + 1.609%) | | | | | | | | | | | | |
(Callable 09/12/2025)(1)(3) | | | 7,450,000 | | | | 7,164,739 | | | | | |
4.375%, 11/23/2026(1) | | | 5,000,000 | | | | 4,725,588 | | | | | |
| 1.589%, 05/24/2027 (SOFR + 1.290%) | | | | | | | | | | | | |
(Callable 05/24/2026)(1)(3) | | | 22,500,000 | | | | 19,857,612 | | | | | |
| 2.251%, 11/22/2027 (SOFR + 1.100%) | | | | | | | | | | | | |
(Callable 11/22/2026)(1)(3) | | | 10,000,000 | | | | 8,873,107 | | | | | |
| 2.013%, 09/22/2028 (SOFR + 1.732%) | | | | | | | | | | | | |
(Callable 09/22/2027)(1)(3) | | | 25,000,000 | | | | 21,422,585 | | | | | |
| 6.161%, 03/09/2029 (SOFR + 1.970%) | | | | | | | | | | | | |
(Callable 03/09/2028)(1)(3) | | | 8,250,000 | | | | 8,320,209 | | | | | |
| 4.583%, 06/19/2029 | | | | | | | | | | | | |
| (3 Month LIBOR USD + 1.796%) | | | | | | | | | | | | |
(Callable 06/19/2028)(1)(3) | | | 10,000,000 | | | | 9,410,809 | | | | | |
| 2.206%, 08/17/2029 (SOFR + 1.285%) | | | | | | | | | | | | |
(Callable 08/17/2028)(1)(3) | | | 13,200,000 | | | | 11,042,685 | | | | | |
| 3.973%, 05/22/2030 | | | | | | | | | | | | |
| (3 Month LIBOR USD + 1.872%) | | | | | | | | | | | | |
(Callable 05/22/2029)(1)(3) | | | 9,000,000 | | | | 8,081,853 | | | | | |
| 2.804%, 05/24/2032 (SOFR + 1.187%) | | | | | | | | | | | | |
(Callable 05/24/2031)(1)(3) | | | 16,000,000 | | | | 12,940,954 | | | | | |
| Huntington Bancshares, Inc.: | | | | | | | | | | | | |
| 4.443%, 08/04/2028 (SOFR + 1.970%) | | | | | | | | | | | | |
(Callable 08/04/2027)(3) | | | 9,500,000 | | | | 8,825,384 | | | | | |
| 5.023%, 05/17/2033 (SOFR + 2.050%) | | | | | | | | | | | | |
(Callable 05/17/2032)(3) | | | 3,775,000 | | | | 3,450,371 | | | | | |
| Huntington National Bank, | | | | | | | | | | | | |
| 5.650%, 01/10/2030 | | | | | | | | | | | | |
| (Callable 11/10/2029) | | | 1,500,000 | | | | 1,432,255 | | | | | |
| Invesco Finance PLC, | | | | | | | | | | | | |
| 3.750%, 01/15/2026 | | | 4,900,000 | | | | 4,721,159 | | | | | |
| Jefferies Group LLC: | | | | | | | | | | | | |
| 4.150%, 01/23/2030 | | | 10,000,000 | | | | 8,990,555 | | | | | |
| 6.250%, 01/15/2036 | | | 1,390,000 | | | | 1,417,679 | | | | | |
| John Hancock Life Insurance Co., | | | | | | | | | | | | |
7.375%, 02/15/2024(1)(2) | | | 13,339,000 | | | | 13,428,057 | | | | | |
| JPMorgan Chase & Co.: | | | | | | | | | | | | |
| 3.125%, 01/23/2025 | | | | | | | | | | | | |
| (Callable 10/23/2024) | | | 14,000,000 | | | | 13,541,471 | | | | | |
| 2.301%, 10/15/2025 (SOFR + 1.160%) | | | | | | | | | | | | |
(Callable 10/15/2024)(3) | | | 10,000,000 | | | | 9,529,114 | | | | | |
| 2.005%, 03/13/2026 (SOFR + 1.585%) | | | | | | | | | | | | |
(Callable 03/13/2025)(3) | | | 50,000,000 | | | | 46,960,520 | | | | | |
| 2.083%, 04/22/2026 (SOFR + 1.850%) | | | | | | | | | | | | |
(Callable 04/22/2025)(3) | | | 52,000,000 | | | | 48,698,089 | | | | | |
| 1.045%, 11/19/2026 (SOFR + 0.800%) | | | | | | | | | | | | |
(Callable 11/19/2025)(3) | | | 25,000,000 | | | | 22,393,217 | | | | | |
| 1.578%, 04/22/2027 (SOFR + 0.885%) | | | | | | | | | | | | |
(Callable 04/22/2026)(3) | | | 50,000,000 | | | | 44,910,657 | | | | | |
| 1.470%, 09/22/2027 (SOFR + 0.765%) | | | | | | | | | | | | |
(Callable 09/22/2026)(3) | | | 11,875,000 | | | | 10,483,528 | | | | | |
| 4.851%, 07/25/2028 (SOFR + 1.990%) | | | | | | | | | | | | |
(Callable 07/25/2027)(3) | | | 39,000,000 | | | | 38,477,544 | | | | | |
| 3.702%, 05/06/2030 | | | | | | | | | | | | |
| (3 Month LIBOR USD + 1.422%) | | | | | | | | | | | | |
(Callable 05/06/2029)(3) | | | 15,000,000 | | | | 13,746,430 | | | | | |
| 2.522%, 04/22/2031 | | | | | | | | | | | | |
| (SOFR + 2.040%) | | | | | | | | | | | | |
(Callable 04/22/2030)(3) | | | 28,000,000 | | | | 23,683,649 | | | | | |
| 1.953%, 02/04/2032 (SOFR + 1.065%) | | | | | | | | | | | | |
(Callable 02/04/2031)(3) | | | 22,000,000 | | | | 17,529,370 | | | | | |
| 2.580%, 04/22/2032 (SOFR + 1.250%) | | | | | | | | | | | | |
(Callable 04/22/2031)(3) | | | 10,000,000 | | | | 8,306,174 | | | | | |
| 5.600%, 07/15/2041 | | | 4,106,000 | | | | 4,270,132 | | | | | |
| Kemper Corp., | | | | | | | | | | | | |
| 3.800%, 02/23/2032 | | | | | | | | | | | | |
| (Callable 11/23/2031) | | | 8,000,000 | | | | 6,607,548 | | | | | |
| KeyBank NA: | | | | | | | | | | | | |
| 3.400%, 05/20/2026 | | | 18,965,000 | | | | 16,337,052 | | | | | |
| 4.900%, 08/08/2032 | | | 6,000,000 | | | | 4,766,635 | | | | | |
| 5.000%, 01/26/2033 | | | | | | | | | | | | |
| (Callable 10/26/2032) | | | 5,000,000 | | | | 4,327,289 | | | | | |
| LeasePlan Corp. NV, | | | | | | | | | | | | |
2.875%, 10/24/2024(1)(2) | | | 59,600,000 | | | | 56,777,220 | | | | | |
| Liberty Mutual Group, Inc.: | | | | | | | | | | | | |
4.569%, 02/01/2029(2) | | | 2,087,000 | | | | 1,968,181 | | | | | |
| 3.951%, 10/15/2050 | | | | | | | | | | | | |
(Callable 04/15/2050)(2) | | | 2,231,000 | | | | 1,631,616 | | | | | |
| 5.500%, 06/15/2052 | | | | | | | | | | | | |
(Callable 12/15/2051)(2) | | | 5,000,000 | | | | 4,708,898 | | | | | |
| Liberty Mutual Insurance Co., | | | | | | | | | | | | |
7.697%, 10/15/2097(2) | | | 465,000 | | | | 520,579 | | | | | |
| Life Storage LP, | | | | | | | | | | | | |
| 3.500%, 07/01/2026 | | | | | | | | | | | | |
| (Callable 04/01/2026) | | | 6,819,000 | | | | 6,403,721 | | | | | |
| Lincoln National Corp., | | | | | | | | | | | | |
| 3.050%, 01/15/2030 | | | | | | | | | | | | |
| (Callable 10/15/2029) | | | 24,650,000 | | | | 20,380,181 | | | | | |
| Lloyds Bank PLC: | | | | | | | | | | | | |
| 3.870%, 07/09/2025 | | | | | | | | | | | | |
| (1 Year CMT Rate + 3.500%) | | | | | | | | | | | | |
(Callable 07/09/2024)(1)(3) | | | 15,000,000 | | | | 14,609,831 | | | | | |
| 2.438%, 02/05/2026 | | | | | | | | | | | | |
| (1 Year CMT Rate + 1.000%) | | | | | | | | | | | | |
(Callable 02/05/2025)(1)(3) | | | 15,725,000 | | | | 14,804,554 | | | | | |
| 1.627%, 05/11/2027 | | | | | | | | | | | | |
| (1 Year CMT Rate + 0.850%) | | | | | | | | | | | | |
(Callable 05/11/2026)(1)(3) | | | 10,000,000 | | | | 8,845,187 | | | | | |
| 3.574%, 11/07/2028 | | | | | | | | | | | | |
| (3 Month LIBOR USD + 1.205%) | | | | | | | | | | | | |
(Callable 11/07/2027)(1)(3) | | | 10,000,000 | | | | 9,056,759 | | | | | |
| LXP Industrial Trust: | | | | | | | | | | | | |
| 2.700%, 09/15/2030 | | | | | | | | | | | | |
| (Callable 06/15/2030) | | | 14,800,000 | | | | 11,819,375 | | | | | |
| 2.375%, 10/01/2031 | | | | | | | | | | | | |
| (Callable 07/01/2031) | | | 5,747,000 | | | | 4,374,587 | | | | | |
| M&T Bank Corp., | | | | | | | | | | | | |
| 4.000%, 07/15/2024 | | | | | | | | | | | | |
| (Callable 04/16/2024) | | | 11,400,000 | | | | 11,104,285 | | | | | |
| Macquarie Bank Ltd.: | | | | | | | | | | | | |
4.875%, 06/10/2025(1)(2) | | | 23,717,000 | | | | 22,965,799 | | | | | |
3.624%, 06/03/2030(1)(2) | | | 12,550,000 | | | | 10,554,075 | | | | | |
| Macquarie Group Ltd.: | | | | | | | | | | | | |
| 5.108%, 08/09/2026 (SOFR + 2.208%) | | | | | | | | | | | | |
(Callable 08/09/2025)(1)(2)(3) | | | 22,000,000 | | | | 21,679,533 | | | | | |
| 1.340%, 01/12/2027 (SOFR + 1.069%) | | | | | | | | | | | | |
(Callable 01/12/2026)(1)(2)(3) | | | 19,000,000 | | | | 16,912,016 | | | | | |
| 2.871%, 01/14/2033 (SOFR + 1.532%) | | | | | | | | | | | | |
(Callable 01/14/2032)(1)(2)(3) | | | 25,000,000 | | | | 19,966,333 | | | | | |
| 4.442%, 06/21/2033 (SOFR + 2.405%) | | | | | | | | | | | | |
(Callable 06/21/2032)(1)(2)(3) | | | 9,000,000 | | | | 8,025,597 | | | | | |
The accompanying notes are an integral part of these financial statements.
Baird Aggregate Bond Fund
Schedule of Investments, June 30, 2023 (Unaudited)
Long-Term Investments (cont.)
| | | Principal | | | | | | % of | |
| | | Amount | | | Value | | | Net Assets | |
| Manulife Financial Corp.: | | | | | | | | | |
4.150%, 03/04/2026(1) | | $ | 10,000,000 | | | $ | 9,681,668 | | | |
| |
5.375%, 03/04/2046(1) | | | 5,150,000 | | | | 5,097,925 | | | | | |
| Maple Grove Funding Trust I, | | | | | | | | | | | | |
| 4.161%, 08/15/2051 | | | | | | | | | | | | |
(Callable 02/15/2051)(2) | | | 28,600,000 | | | | 19,981,116 | | | | | |
| Marsh & McLennan Companies, Inc.: | | | | | | | | | | | | |
| 2.250%, 11/15/2030 | | | | | | | | | | | | |
| (Callable 08/15/2030) | | | 5,000,000 | | | | 4,156,216 | | | | | |
| 5.875%, 08/01/2033 | | | 8,429,000 | | | | 8,936,758 | | | | | |
| 4.350%, 01/30/2047 | | | | | | | | | | | | |
| (Callable 07/30/2046) | | | 3,450,000 | | | | 2,954,425 | | | | | |
| 5.450%, 03/15/2053 | | | | | | | | | | | | |
| (Callable 09/15/2052) | | | 3,700,000 | | | | 3,765,685 | | | | | |
| Massachusetts Mutual Life Insurance Co.: | | | | | | | | | | | | |
| 5.672%, 12/01/2052 | | | | | | | | | | | | |
(Callable 06/01/2052)(2) | | | 20,000,000 | | | | 20,385,350 | | | | | |
| 5.077%, 02/15/2069 | | | | | | | | | | | | |
| (3 Month LIBOR USD + 3.191%) | | | | | | | | | | | | |
(Callable 02/15/2049)(2)(3) | | | 40,670,000 | | | | 36,960,083 | | | | | |
3.729%, 10/15/2070(2) | | | 16,676,000 | | | | 11,338,240 | | | | | |
4.900%, 04/01/2077(2) | | | 11,175,000 | | | | 9,508,697 | | | | | |
| MBIA Insurance Corp., | | | | | | | | | | | | |
| 16.830%, 01/15/2033 | | | | | | | | | | | | |
| (3 Month LIBOR USD + 11.260%) | | | | | | | | | | | | |
(Callable 01/15/2028)(2)(9) | | | 714,000 | | | | 21,420 | | | | | |
| MetLife, Inc.: | | | | | | | | | | | | |
| 6.500%, 12/15/2032 | | | 466,000 | | | | 509,753 | | | | | |
| 4.875%, 11/13/2043 | | | 3,375,000 | | | | 3,102,384 | | | | | |
| Metropolitan Life Global Funding I: | | | | | | | | | | | | |
2.950%, 04/09/2030(2) | | | 22,375,000 | | | | 19,324,674 | | | | | |
5.150%, 03/28/2033(2) | | | 19,475,000 | | | | 19,260,754 | | | | | |
| Metropolitan Life Insurance Co., | | | | | | | | | | | | |
7.800%, 11/01/2025(2) | | | 6,300,000 | | | | 6,487,230 | | | | | |
| Mitsubishi UFJ Financial Group, Inc.: | | | | | | | | | | | | |
2.193%, 02/25/2025(1) | | | 25,000,000 | | | | 23,558,845 | | | | | |
| 1.538%, 07/20/2027 | | | | | | | | | | | | |
| (1 Year CMT Rate + 0.750%) | | | | | | | | | | | | |
(Callable 07/20/2026)(1)(3) | | | 10,000,000 | | | | 8,825,648 | | | | | |
| 5.017%, 07/20/2028 | | | | | | | | | | | | |
| (1 Year CMT Rate + 1.950%) | | | | | | | | | | | | |
(Callable 07/20/2027)(1)(3) | | | 6,700,000 | | | | 6,566,404 | | | | | |
| 5.354%, 09/13/2028 | | | | | | | | | | | | |
| (1 Year CMT Rate + 1.900%) | | | | | | | | | | | | |
(Callable 09/13/2027)(1)(3) | | | 13,600,000 | | | | 13,497,925 | | | | | |
| 5.475%, 02/22/2031 | | | | | | | | | | | | |
| (1 Year CMT Rate + 1.530%) | | | | | | | | | | | | |
(Callable 02/22/2030)(1)(3) | | | 3,525,000 | | | | 3,505,605 | | | | | |
| 5.406%, 04/19/2034 | | | | | | | | | | | | |
| (1 Year CMT Rate + 1.970%) | | | | | | | | | | | | |
(Callable 04/19/2033)(1)(3) | | | 7,000,000 | | | | 6,945,924 | | | | | |
| Mizuho Financial Group, Inc.: | | | | | | | | | | | | |
| 3.922%, 09/11/2024 | | | | | | | | | | | | |
| (3 Month LIBOR USD + 1.262%) | | | | | | | | | | | | |
(Callable 09/11/2023)(1)(3) | | | 5,000,000 | | | | 4,976,199 | | | | | |
| 2.555%, 09/13/2025 | | | | | | | | | | | | |
| (3 Month LIBOR USD + 1.362%) | | | | | | | | | | | | |
(Callable 09/13/2024)(1)(3) | | | 20,000,000 | | | | 19,094,628 | | | | | |
| 1.234%, 05/22/2027 | | | | | | | | | | | | |
| (1 Year CMT Rate + 0.670%) | | | | | | | | | | | | |
(Callable 05/22/2026)(1)(3) | | | 8,000,000 | | | | 7,029,123 | | | | | |
| 5.414%, 09/13/2028 | | | | | | | | | | | | |
| (1 Year CMT Rate + 2.050%) | | | | | | | | | | | | |
(Callable 09/13/2027)(1)(3) | | | 6,725,000 | | | | 6,671,579 | | | | | |
| 1.979%, 09/08/2031 | | | | | | | | | | | | |
| (3 Month LIBOR USD + 1.532%) | | | | | | | | | | | | |
(Callable 09/08/2030)(1)(3) | | | 10,000,000 | | | | 7,900,887 | | | | | |
| Morgan Stanley: | | | | | | | | | | | | |
| 2.720%, 07/22/2025 (SOFR + 1.152%) | | | | | | | | | | | | |
(Callable 07/22/2024)(3) | | | 19,000,000 | | | | 18,321,463 | | | | | |
| 3.591%, 07/22/2028 | | | | | | | | | | | | |
| (3 Month LIBOR USD + 1.340%) | | | | | | | | | | | | |
(Callable 07/22/2027)(3) | | | 12,000,000 | | | | 11,072,273 | | | | | |
| 6.296%, 10/18/2028 (SOFR + 2.240%) | | | | | | | | | | | | |
(Callable 10/18/2027)(3) | | | 62,625,000 | | | | 64,350,332 | | | | | |
| 3.772%, 01/24/2029 | | | | | | | | | | | | |
| (3 Month LIBOR USD + 1.402%) | | | | | | | | | | | | |
(Callable 01/24/2028)(3) | | | 1,000,000 | | | | 933,575 | | | | | |
| 5.123%, 02/01/2029 (SOFR + 1.730%) | | | | | | | | | | | | |
(Callable 02/01/2028)(3) | | | 8,300,000 | | | | 8,185,767 | | | | | |
| 3.622%, 04/01/2031 (SOFR + 3.120%) | | | | | | | | | | | | |
(Callable 04/01/2030)(3) | | | 10,000,000 | | | | 9,010,907 | | | | | |
| 1.928%, 04/28/2032 (SOFR + 1.020%) | | | | | | | | | | | | |
(Callable 04/28/2031)(3) | | | 25,000,000 | | | | 19,515,735 | | | | | |
| 2.239%, 07/21/2032 (SOFR + 1.178%) | | | | | | | | | | | | |
(Callable 07/21/2031)(3) | | | 25,000,000 | | | | 19,869,660 | | | | | |
| 6.342%, 10/18/2033 (SOFR + 2.560%) | | | | | | | | | | | | |
(Callable 10/18/2032)(3) | | | 20,000,000 | | | | 21,276,064 | | | | | |
| National Australia Bank Ltd.: | | | | | | | | | | | | |
2.332%, 08/21/2030(1)(2) | | | 83,282,000 | | | | 64,904,748 | | | | | |
2.990%, 05/21/2031(1)(2) | | | 19,911,000 | | | | 15,872,366 | | | | | |
6.429%, 01/12/2033(1)(2) | | | 28,262,000 | | | | 28,625,830 | | | | | |
| 3.933%, 08/02/2034 | | | | | | | | | | | | |
| (5 Year CMT Rate + 1.880%) | | | | | | | | | | | | |
(Callable 08/02/2029)(1)(2)(3) | | | 10,000,000 | | | | 8,596,030 | | | | | |
| 3.347%, 01/12/2037 | | | | | | | | | | | | |
| (5 Year CMT Rate + 1.700%) | | | | | | | | | | | | |
(Callable 01/12/2032)(1)(2)(3) | | | 10,000,000 | | | | 7,871,563 | | | | | |
| National Securities Clearing Corp., | | | | | | | | | | | | |
| 1.500%, 04/23/2025 | | | | | | | | | | | | |
(Callable 03/23/2025)(2) | | | 12,124,000 | | | | 11,273,297 | | | | | |
| Nationwide Building Society: | | | | | | | | | | | | |
4.000%, 09/14/2026(1)(2) | | | 73,507,000 | | | | 67,497,052 | | | | | |
| 4.302%, 03/08/2029 | | | | | | | | | | | | |
| (3 Month LIBOR USD + 1.452%) | | | | | | | | | | | | |
(Callable 03/08/2028)(1)(2)(3) | | | 20,000,000 | | | | 18,527,588 | | | | | |
| 3.960%, 07/18/2030 | | | | | | | | | | | | |
| (3 Month LIBOR USD + 1.855%) | | | | | | | | | | | | |
(Callable 07/18/2029)(1)(2)(3) | | | 10,125,000 | | | | 8,983,012 | | | | | |
| Nationwide Financial Services, Inc., | | | | | | | | | | | | |
| 3.900%, 11/30/2049 | | | | | | | | | | | | |
(Callable 05/30/2049)(2) | | | 10,000,000 | | | | 7,298,050 | | | | | |
| Nationwide Mutual Insurance Co.: | | | | | | | | | | | | |
9.375%, 08/15/2039(2) | | | 14,000,000 | | | | 18,024,935 | | | | | |
| 4.350%, 04/30/2050 | | | | | | | | | | | | |
(Callable 10/30/2049)(2) | | | 25,000,000 | | | | 18,967,290 | | | | | |
| NatWest Group PLC: | | | | | | | | | | | | |
| 4.269%, 03/22/2025 | | | | | | | | | | | | |
| (3 Month LIBOR USD + 1.762%) | | | | | | | | | | | | |
(Callable 03/22/2024)(1)(3) | | | 27,351,000 | | | | 26,866,092 | | | | | |
| 7.472%, 11/10/2026 | | | | | | | | | | | | |
| (1 Year CMT Rate + 2.850%) | | | | | | | | | | | | |
(Callable 11/10/2025)(1)(3) | | | 13,000,000 | | | | 13,295,842 | | | | | |
| 1.642%, 06/14/2027 | | | | | | | | | | | | |
| (1 Year CMT Rate + 0.900%) | | | | | | | | | | | | |
(Callable 06/14/2026)(1)(3) | | | 35,000,000 | | | | 30,801,392 | | | | | |
The accompanying notes are an integral part of these financial statements.
Baird Aggregate Bond Fund
Schedule of Investments, June 30, 2023 (Unaudited)
Long-Term Investments (cont.)
| | | Principal | | | | | | % of | |
| | | Amount | | | Value | | | Net Assets | |
| NatWest Group PLC: (cont.) | | | | | | | | | |
| 3.073%, 05/22/2028 | | | | | | | | | |
| (1 Year CMT Rate + 2.550%) | | | | | | | | | |
(Callable 05/22/2027)(1)(3) | | $ | 18,301,000 | | | $ | 16,459,331 | | | |
| |
| 5.516%, 09/30/2028 | | | | | | | | | | | | |
| (1 Year CMT Rate + 2.270%) | | | | | | | | | | | | |
(Callable 09/30/2027)(1)(3) | | | 10,000,000 | | | | 9,802,395 | | | | | |
| 4.892%, 05/18/2029 | | | | | | | | | | | | |
| (3 Month LIBOR USD + 1.754%) | | | | | | | | | | | | |
(Callable 05/18/2028)(1)(3) | | | 10,000,000 | | | | 9,512,463 | | | | | |
| 5.808%, 09/13/2029 | | | | | | | | | | | | |
| (1 Year CMT Rate + 1.950%) | | | | | | | | | | | | |
(Callable 09/13/2028)(1)(3) | | | 37,500,000 | | | | 36,948,951 | | | | | |
| 5.076%, 01/27/2030 | | | | | | | | | | | | |
| (3 Month LIBOR USD + 1.905%) | | | | | | | | | | | | |
(Callable 01/27/2029)(1)(3) | | | 7,000,000 | | | | 6,676,571 | | | | | |
| 4.445%, 05/08/2030 | | | | | | | | | | | | |
| (3 Month LIBOR USD + 1.871%) | | | | | | | | | | | | |
(Callable 05/08/2029)(1)(3) | | | 35,000,000 | | | | 32,170,360 | | | | | |
| 6.016%, 03/02/2034 | | | | | | | | | | | | |
| (1 Year CMT Rate + 2.100%) | | | | | | | | | | | | |
(Callable 03/02/2033)(1)(3) | | | 4,700,000 | | | | 4,725,072 | | | | | |
| New York Life Insurance Co.: | | | | | | | | | | | | |
6.750%, 11/15/2039(2) | | | 12,026,000 | | | | 13,644,472 | | | | | |
| 3.750%, 05/15/2050 | | | | | | | | | | | | |
(Callable 11/15/2049)(2) | | | 17,000,000 | | | | 12,984,754 | | | | | |
| 4.450%, 05/15/2069 | | | | | | | | | | | | |
(Callable 11/15/2068)(2) | | | 10,000,000 | | | | 8,331,179 | | | | | |
| Nomura Holdings, Inc.: | | | | | | | | | | | | |
2.648%, 01/16/2025(1) | | | 20,000,000 | | | | 18,933,808 | | | | | |
1.851%, 07/16/2025(1) | | | 19,000,000 | | | | 17,377,406 | | | | | |
1.653%, 07/14/2026(1) | | | 32,975,000 | | | | 29,007,962 | | | | | |
5.386%, 07/06/2027(1) | | | 10,000,000 | | | | 9,807,553 | | | | | |
2.172%, 07/14/2028(1) | | | 16,055,000 | | | | 13,544,419 | | | | | |
2.710%, 01/22/2029(1) | | | 8,000,000 | | | | 6,742,735 | | | | | |
3.103%, 01/16/2030(1) | | | 2,000,000 | | | | 1,704,529 | | | | | |
| Pacific Life Global Funding II, | | | | | | | | | | | | |
1.200%, 06/24/2025(2) | | | 22,300,000 | | | | 20,334,651 | | | | | |
| Peachtree Corners Funding Trust, | | | | | | | | | | | | |
3.976%, 02/15/2025(2) | | | 12,295,000 | | | | 11,835,658 | | | | | |
| Penn Mutual Life Insurance Co., | | | | | | | | | | | | |
3.800%, 04/29/2061(2) | | | 15,000,000 | | | | 10,115,775 | | | | | |
| Pine Street Trust I, | | | | | | | | | | | | |
| 4.572%, 02/15/2029 | | | | | | | | | | | | |
(Callable 11/15/2028)(2) | | | 7,825,000 | | | | 7,168,567 | | | | | |
| Principal Financial Group, Inc., | | | | | | | | | | | | |
| 4.300%, 11/15/2046 | | | | | | | | | | | | |
| (Callable 05/15/2046) | | | 2,325,000 | | | | 1,854,163 | | | | | |
| Principal Life Global Funding II: | | | | | | | | | | | | |
1.250%, 06/23/2025(2) | | | 16,000,000 | | | | 14,596,499 | | | | | |
3.000%, 04/18/2026(2) | | | 13,400,000 | | | | 12,414,575 | | | | | |
5.500%, 06/28/2028(2) | | | 40,500,000 | | | | 40,236,504 | | | | | |
| Prologis LP: | | | | | | | | | | | | |
| 4.750%, 06/15/2033 | | | | | | | | | | | | |
| (Callable 03/15/2033) | | | 19,425,000 | | | | 18,974,605 | | | | | |
| 5.125%, 01/15/2034 | | | | | | | | | | | | |
| (Callable 10/15/2033) | | | 21,575,000 | | | | 21,420,978 | | | | | |
| Protective Life Corp.: | | | | | | | | | | | | |
| 4.300%, 09/30/2028 | | | | | | | | | | | | |
(Callable 06/30/2028)(1)(2) | | | 10,000,000 | | | | 9,286,634 | | | | | |
8.450%, 10/15/2039(1) | | | 2,650,000 | | | | 3,148,012 | | | | | |
| Protective Life Global Funding, | | | | | | | | | | | | |
5.209%, 04/14/2026(1)(2) | | | 32,900,000 | | | | 32,378,979 | | | | | |
| Prudential Financial, Inc.: | | | | | | | | | | | | |
| 6.625%, 12/01/2037 | | | 5,000,000 | | | | 5,527,464 | | | | | |
| 3.935%, 12/07/2049 | | | | | | | | | | | | |
| (Callable 06/07/2049) | | | 11,426,000 | | | | 9,091,391 | | | | | |
| Raymond James Financial, Inc., | | | | | | | | | | | | |
| 4.650%, 04/01/2030 | | | | | | | | | | | | |
| (Callable 01/01/2030) | | | 9,700,000 | | | | 9,447,330 | | | | | |
| Realty Income Corp.: | | | | | | | | | | | | |
| 4.700%, 12/15/2028 | | | | | | | | | | | | |
| (Callable 11/15/2028) | | | 6,625,000 | | | | 6,417,574 | | | | | |
| 5.625%, 10/13/2032 | | | | | | | | | | | | |
| (Callable 07/13/2032) | | | 6,725,000 | | | | 6,796,355 | | | | | |
| Regions Financial Corp., | | | | | | | | | | | | |
| 2.250%, 05/18/2025 | | | | | | | | | | | | |
| (Callable 04/18/2025) | | | 21,650,000 | | | | 20,023,610 | | | | | |
| Reliance Standard Life Global Funding II, | | | | | | | | | | | | |
2.500%, 10/30/2024(1)(2) | | | 22,800,000 | | | | 21,593,953 | | | | | |
| Royal Bank of Canada, | | | | | | | | | | | | |
4.650%, 01/27/2026(1) | | | 7,773,000 | | | | 7,568,536 | | | | | |
| Sammons Financial Group, Inc.: | | | | | | | | | | | | |
| 3.350%, 04/16/2031 | | | | | | | | | | | | |
(Callable 01/16/2031)(2) | | | 14,350,000 | | | | 11,147,930 | | | | | |
| 4.750%, 04/08/2032 | | | | | | | | | | | | |
(Callable 01/08/2032)(2) | | | 23,000,000 | | | | 19,227,088 | | | | | |
| Santander Holdings USA, Inc., | | | | | | | | | | | | |
| 3.500%, 06/07/2024 | | | | | | | | | | | | |
(Callable 05/07/2024)(1) | | | 5,695,000 | | | | 5,529,997 | | | | | |
| Santander UK Group Holdings PLC: | | | | | | | | | | | | |
| 4.796%, 11/15/2024 | | | | | | | | | | | | |
| (3 Month LIBOR USD + 1.570%) | | | | | | | | | | | | |
(Callable 11/15/2023)(1)(3) | | | 5,250,000 | | | | 5,209,987 | | | | | |
| 1.673%, 06/14/2027 (SOFR + 0.989%) | | | | | | | | | | | | |
(Callable 06/14/2026)(1)(3) | | | 9,500,000 | | | | 8,184,601 | | | | | |
| 6.534%, 01/10/2029 (SOFR + 2.600%) | | | | | | | | | | | | |
(Callable 01/10/2028)(1)(3) | | | 27,600,000 | | | | 27,788,683 | | | | | |
| Santander UK PLC, | | | | | | | | | | | | |
5.000%, 11/07/2023(1)(2) | | | 21,921,000 | | | | 21,775,444 | | | | | |
| SMBC Aviation Capital Finance DAC: | | | | | | | | | | | | |
| 1.900%, 10/15/2026 | | | | | | | | | | | | |
(Callable 09/15/2026)(1)(2) | | | 6,725,000 | | | | 5,876,313 | | | | | |
| 5.450%, 05/03/2028 | | | | | | | | | | | | |
(Callable 04/03/2028)(1)(2) | | | 7,000,000 | | | | 6,904,782 | | | | | |
| Societe Generale SA: | | | | | | | | | | | | |
4.250%, 09/14/2023(1)(2) | | | 8,000,000 | | | | 7,961,791 | | | | | |
5.000%, 01/17/2024(1)(2) | | | 20,000,000 | | | | 19,757,835 | | | | | |
3.875%, 03/28/2024(1)(2) | | | 15,300,000 | | | | 14,971,432 | | | | | |
2.625%, 10/16/2024(1)(2) | | | 23,000,000 | | | | 21,766,070 | | | | | |
2.625%, 01/22/2025(1)(2) | | | 41,125,000 | | | | 38,643,271 | | | | | |
| 2.226%, 01/21/2026 | | | | | | | | | | | | |
| (1 Year CMT Rate + 1.050%) | | | | | | | | | | | | |
(Callable 01/21/2025)(1)(2)(3) | | | 21,032,000 | | | | 19,531,715 | | | | | |
| 1.488%, 12/14/2026 | | | | | | | | | | | | |
| (1 Year CMT Rate + 1.100%) | | | | | | | | | | | | |
(Callable 12/14/2025)(1)(2)(3) | | | 28,800,000 | | | | 25,342,944 | | | | | |
| 2.797%, 01/19/2028 | | | | | | | | | | | | |
| (1 Year CMT Rate + 1.300%) | | | | | | | | | | | | |
(Callable 01/19/2027)(1)(2)(3) | | | 2,225,000 | | | | 1,970,703 | | | | | |
| 6.446%, 01/10/2029 | | | | | | | | | | | | |
| (1 Year CMT Rate + 2.550%) | | | | | | | | | | | | |
(Callable 01/10/2028)(1)(2)(3) | | | 13,000,000 | | | | 13,018,830 | | | | | |
| 2.889%, 06/09/2032 | | | | | | | | | | | | |
| (1 Year CMT Rate + 1.300%) | | | | | | | | | | | | |
(Callable 06/09/2031)(1)(2)(3) | | | 6,775,000 | | | | 5,307,920 | | | | | |
The accompanying notes are an integral part of these financial statements.
Baird Aggregate Bond Fund
Schedule of Investments, June 30, 2023 (Unaudited)
Long-Term Investments (cont.)
| | | Principal | | | | | | % of | |
| | | Amount | | | Value | | | Net Assets | |
| Societe Generale SA: (cont.) | | | | | | | | | |
| 3.337%, 01/21/2033 | | | | | | | | | |
| (1 Year CMT Rate + 1.600%) | | | | | | | | | |
(Callable 01/21/2032)(1)(2)(3) | | $ | 10,000,000 | | | $ | 8,005,208 | | | |
| |
| 6.221%, 06/15/2033 | | | | | | | | | | | | |
| (1 Year CMT Rate + 3.200%) | | | | | | | | | | | | |
(Callable 06/15/2032)(1)(2)(3) | | | 9,150,000 | | | | 8,517,949 | | | | | |
3.625%, 03/01/2041(1)(2) | | | 12,000,000 | | | | 7,784,806 | | | | | |
| Standard Chartered PLC: | | | | | | | | | | | | |
| 3.785%, 05/21/2025 | | | | | | | | | | | | |
| (3 Month LIBOR USD + 1.560%) | | | | | | | | | | | | |
(Callable 05/21/2024)(1)(2)(3) | | | 36,294,000 | | | | 35,407,563 | | | | | |
| 2.819%, 01/30/2026 | | | | | | | | | | | | |
| (3 Month LIBOR USD + 1.209%) | | | | | | | | | | | | |
(Callable 01/30/2025)(1)(2)(3) | | | 21,000,000 | | | | 19,799,892 | | | | | |
| 1.456%, 01/14/2027 | | | | | | | | | | | | |
| (1 Year CMT Rate + 1.000%) | | | | | | | | | | | | |
(Callable 01/14/2026)(1)(2)(3) | | | 20,658,000 | | | | 18,297,700 | | | | | |
| 2.608%, 01/12/2028 | | | | | | | | | | | | |
| (1 Year CMT Rate + 1.180%) | | | | | | | | | | | | |
(Callable 01/12/2027)(1)(2)(3) | | | 24,000,000 | | | | 21,247,629 | | | | | |
| 7.767%, 11/16/2028 | | | | | | | | | | | | |
| (1 Year CMT Rate + 3.450%) | | | | | | | | | | | | |
(Callable 11/16/2027)(1)(2)(3) | | | 8,000,000 | | | | 8,486,802 | | | | | |
| 6.301%, 01/09/2029 | | | | | | | | | | | | |
| (1 Year CMT Rate + 2.450%) | | | | | | | | | | | | |
(Callable 01/09/2028)(1)(2)(3) | | | 4,000,000 | | | | 4,022,401 | | | | | |
| 4.644%, 04/01/2031 | | | | | | | | | | | | |
| (5 Year CMT Rate + 3.850%) | | | | | | | | | | | | |
(Callable 04/01/2030)(1)(2)(3) | | | 14,700,000 | | | | 13,558,313 | | | | | |
| 6.296%, 07/06/2034 | | | | | | | | | | | | |
| (1 Year CMT Rate + 2.580%) | | | | | | | | | | | | |
(Callable 07/06/2033)(1)(2)(3)(8) | | | 13,850,000 | | | | 13,860,311 | | | | | |
5.700%, 03/26/2044(1)(2) | | | 6,000,000 | | | | 5,499,493 | | | | | |
| Stifel Financial Corp.: | | | | | | | | | | | | |
| 4.250%, 07/18/2024 | | | 17,850,000 | | | | 17,473,170 | | | | | |
| 4.000%, 05/15/2030 | | | | | | | | | | | | |
| (Callable 02/15/2030) | | | 51,140,000 | | | | 43,625,229 | | | | | |
| Sumitomo Mitsui Financial Group, Inc.: | | | | | | | | | | | | |
2.448%, 09/27/2024(1) | | | 2,015,000 | | | | 1,930,061 | | | | | |
2.348%, 01/15/2025(1) | | | 8,245,000 | | | | 7,817,346 | | | | | |
1.474%, 07/08/2025(1) | | | 8,740,000 | | | | 8,026,512 | | | | | |
2.130%, 07/08/2030(1) | | | 7,575,000 | | | | 6,164,101 | | | | | |
5.766%, 01/13/2033(1) | | | 33,650,000 | | | | 34,623,508 | | | | | |
| SunTrust Banks, Inc., | | | | | | | | | | | | |
| 3.300%, 05/15/2026 | | | | | | | | | | | | |
| (Callable 04/15/2026) | | | 3,925,000 | | | | 3,598,688 | | | | | |
| Svenska Handelsbanken AB, | | | | | | | | | | | | |
5.500%, 06/15/2028(1)(2) | | | 15,250,000 | | | | 14,943,091 | | | | | |
| Synchrony Bank, | | | | | | | | | | | | |
| 5.625%, 08/23/2027 | | | | | | | | | | | | |
| (Callable 07/23/2027) | | | 8,250,000 | | | | 7,740,726 | | | | | |
| Synchrony Financial: | | | | | | | | | | | | |
| 4.375%, 03/19/2024 | | | | | | | | | | | | |
| (Callable 02/19/2024) | | | 1,538,000 | | | | 1,507,951 | | | | | |
| 4.250%, 08/15/2024 | | | | | | | | | | | | |
| (Callable 05/15/2024) | | | 26,864,000 | | | | 25,900,426 | | | | | |
| 4.500%, 07/23/2025 | | | | | | | | | | | | |
| (Callable 04/23/2025) | | | 23,127,000 | | | | 21,802,484 | | | | | |
| 3.700%, 08/04/2026 | | | | | | | | | | | | |
| (Callable 05/04/2026) | | | 23,023,000 | | | | 20,657,846 | | | | | |
| 3.950%, 12/01/2027 | | | | | | | | | | | | |
| (Callable 09/01/2027) | | | 44,825,000 | | | | 39,051,477 | | | | | |
| 2.875%, 10/28/2031 | | | | | | | | | | | | |
| (Callable 07/28/2031) | | | 5,000,000 | | | | 3,635,745 | | | | | |
| Toronto-Dominion Bank, | | | | | | | | | | | | |
4.456%, 06/08/2032(1) | | | 19,000,000 | | | | 18,029,867 | | | | | |
| Travelers Companies, Inc., | | | | | | | | | | | | |
| 5.450%, 05/25/2053 | | | | | | | | | | | | |
| (Callable 11/25/2052) | | | 4,000,000 | | | | 4,186,343 | | | | | |
| Trinity Acquisition PLC: | | | | | | | | | | | | |
| 4.400%, 03/15/2026 | | | | | | | | | | | | |
| (Callable 12/15/2025) | | | 27,305,000 | | | | 26,305,658 | | | | | |
| 6.125%, 08/15/2043 | | | 22,561,000 | | | | 21,391,987 | | | | | |
| Truist Financial Corp., | | | | | | | | | | | | |
| 5.122%, 01/26/2034 (SOFR + 1.852%) | | | | | | | | | | | | |
(Callable 01/26/2033)(3) | | | 12,000,000 | | | | 11,371,467 | | | | | |
| Trustage Financial Group, Inc., | | | | | | | | | | | | |
| 4.625%, 04/15/2032 | | | | | | | | | | | | |
(Callable 01/15/2032)(2) | | | 2,205,000 | | | | 1,911,020 | | | | | |
| UBS Group AG: | | | | | | | | | | | | |
4.550%, 04/17/2026(1) | | | 7,000,000 | | | | 6,728,162 | | | | | |
| 5.711%, 01/12/2027 | | | | | | | | | | | | |
| (1 Year CMT Rate + 1.550%) | | | | | | | | | | | | |
(Callable 01/12/2026)(1)(2)(3) | | | 14,078,000 | | | | 13,937,887 | | | | | |
| 1.364%, 01/30/2027 | | | | | | | | | | | | |
| (1 Year CMT Rate + 1.080%) | | | | | | | | | | | | |
(Callable 01/30/2026)(1)(2)(3) | | | 21,397,000 | | | | 18,748,741 | | | | | |
| 1.494%, 08/10/2027 | | | | | | | | | | | | |
| (1 Year CMT Rate + 0.850%) | | | | | | | | | | | | |
(Callable 08/10/2026)(1)(2)(3) | | | 9,000,000 | | | | 7,729,480 | | | | | |
| 2.095%, 02/11/2032 | | | | | | | | | | | | |
| (1 Year CMT Rate + 1.000%) | | | | | | | | | | | | |
(Callable 02/11/2031)(1)(2)(3) | | | 43,570,000 | | | | 32,998,930 | | | | | |
| UBS Group Funding Switzerland AG, | | | | | | | | | | | | |
| 4.253%, 03/23/2028 | | | | | | | | | | | | |
(Callable 03/23/2027)(1)(2) | | | 17,150,000 | | | | 15,914,618 | | | | | |
| UnitedHealth Group, Inc.: | | | | | | | | | | | | |
| 2.750%, 05/15/2040 | | | | | | | | | | | | |
| (Callable 11/15/2039) | | | 7,000,000 | | | | 5,200,107 | | | | | |
| 4.750%, 05/15/2052 | | | | | | | | | | | | |
| (Callable 11/15/2051) | | | 8,275,000 | | | | 7,850,097 | | | | | |
| Wells Fargo & Co.: | | | | | | | | | | | | |
| 2.406%, 10/30/2025 | | | | | | | | | | | | |
| (3 Month LIBOR USD + 1.087%) | | | | | | | | | | | | |
(Callable 10/30/2024)(3) | | | 19,000,000 | | | | 18,091,931 | | | | | |
| 2.164%, 02/11/2026 | | | | | | | | | | | | |
| (3 Month LIBOR USD + 1.012%) | | | | | | | | | | | | |
(Callable 02/11/2025)(3) | | | 15,000,000 | | | | 14,125,061 | | | | | |
| 3.000%, 04/22/2026 | | | 3,000,000 | | | | 2,820,898 | | | | | |
| 3.908%, 04/25/2026 (SOFR + 1.320%) | | | | | | | | | | | | |
(Callable 04/25/2025)(3) | | | 5,000,000 | | | | 4,833,911 | | | | | |
| 2.393%, 06/02/2028 (SOFR + 2.100%) | | | | | | | | | | | | |
(Callable 06/02/2027)(3) | | | 64,086,000 | | | | 57,109,009 | | | | | |
| 4.808%, 07/25/2028 (SOFR + 1.980%) | | | | | | | | | | | | |
(Callable 07/25/2027)(3) | | | 13,000,000 | | | | 12,706,499 | | | | | |
| 3.350%, 03/02/2033 (SOFR + 1.500%) | | | | | | | | | | | | |
(Callable 03/02/2032)(3) | | | 5,000,000 | | | | 4,279,268 | | | | | |
| 5.389%, 04/24/2034 (SOFR + 2.020%) | | | | | | | | | | | | |
(Callable 04/24/2033)(3) | | | 23,925,000 | | | | 23,772,214 | | | | | |
| 3.068%, 04/30/2041 (SOFR + 2.530%) | | | | | | | | | | | | |
(Callable 04/30/2040)(3) | | | 25,000,000 | | | | 18,387,897 | | | | | |
| 3.900%, 05/01/2045 | | | 5,000,000 | | | | 4,002,466 | | | | | |
| 5.013%, 04/04/2051 | | | | | | | | | | | | |
| (3 Month LIBOR USD + 4.502%) | | | | | | | | | | | | |
(Callable 04/04/2050)(3) | | | 7,000,000 | | | | 6,519,843 | | | | | |
| Wells Fargo Bank NA, | | | | | | | | | | | | |
| 5.850%, 02/01/2037 | | | 10,000,000 | | | | 10,121,292 | | | | | |
The accompanying notes are an integral part of these financial statements.
Baird Aggregate Bond Fund
Schedule of Investments, June 30, 2023 (Unaudited)
Long-Term Investments (cont.)
| | | Principal | | | | | | % of | |
| | | Amount | | | Value | | | Net Assets | |
| Western & Southern | | | | | | | | | |
| Financial Group, Inc., | | | | | | | | | |
5.750%, 07/15/2033(2) | | $ | 8,300,000 | | | $ | 8,318,717 | | | | |
| Westpac Banking Corp.: | | | | | | | | | | | |
| 2.894%, 02/04/2030 | | | | | | | | | | | |
| (5 Year CMT Rate + 1.350%) | | | | | | | | | | | |
(Callable 02/04/2025)(1)(3) | | | 11,425,000 | | | | 10,674,679 | | | | |
| 4.322%, 11/23/2031 (5 Year | | | | | | | | | | | |
| Mid Swap Rate USD + 2.236%) | | | | | | | | | | | |
(Callable 11/23/2026)(1)(3) | | | 8,350,000 | | | | 7,735,240 | | | | |
| 5.405%, 08/10/2033 | | | | | | | | | | | |
| (1 Year CMT Rate + 2.680%) | | | | | | | | | | | |
(Callable 08/10/2032)(1)(3) | | | 5,000,000 | | | | 4,737,059 | | | | |
| 4.110%, 07/24/2034 | | | | | | | | | | | |
| (5 Year CMT Rate + 2.000%) | | | | | | | | | | | |
(Callable 07/24/2029)(1)(3) | | | 10,000,000 | | | | 8,695,925 | | | | |
| 2.668%, 11/15/2035 | | | | | | | | | | | |
| (5 Year CMT Rate + 1.750%) | | | | | | | | | | | |
(Callable 11/15/2030)(1)(3) | | | 13,600,000 | | | | 10,436,454 | | | | |
4.421%, 07/24/2039(1) | | | 10,000,000 | | | | 8,222,018 | | | | |
| Willis North America, Inc.: | | | | | | | | | | | |
| 3.600%, 05/15/2024 | | | | | | | | | | | |
| (Callable 03/15/2024) | | | 9,000,000 | | | | 8,781,286 | | | | |
| 4.650%, 06/15/2027 | | | | | | | | | | | |
| (Callable 05/15/2027) | | | 8,525,000 | | | | 8,279,592 | | | | |
| 2.950%, 09/15/2029 | | | | | | | | | | | |
| (Callable 06/15/2029) | | | 7,500,000 | | | | 6,451,570 | | | | |
| 5.350%, 05/15/2033 | | | | | | | | | | | |
| (Callable 02/15/2033) | | | 11,425,000 | | | | 11,140,286 | | | | |
| 5.050%, 09/15/2048 | | | | | | | | | | | |
| (Callable 03/15/2048) | | | 10,200,000 | | | | 8,763,725 | | | | |
| Total Financials | | | | | | | | | | | |
| (Cost $7,054,146,525) | | | | | | | 6,444,746,518 | | | | 16.4 | % |
| Total Corporate Bonds | | | | | | | | | | | | |
| (Cost $16,871,116,015) | | | | | | | 15,241,480,660 | | | | 38.7 | % |
| Municipal Bonds | | | | | | | | | | | | |
| Atlanta Independent School System, | | | | | | | | | | | | |
| 5.557%, 03/01/2026 | | | 4,465,000 | | | | 4,494,668 | | | | | |
| California Community | | | | | | | | | | | | |
| Choice Financing Authority, | | | | | | | | | | | | |
| 5.950%, 08/01/2029 | | | 3,155,000 | | | | 3,206,243 | | | | | |
| California Housing Finance Agency, | | | | | | | | | | | | |
| 2.794%, 08/01/2036 | | | | | | | | | | | | |
| (Callable 08/01/2025) | | | 2,325,000 | | | | 2,212,770 | | | | | |
| California Qualified School | | | | | | | | | | | | |
| Bond Joint Powers Authority, | | | | | | | | | | | | |
| 7.155%, 03/01/2027 | | | 4,485,000 | | | | 4,681,577 | | | | | |
| County of Cuyahoga OH, | | | | | | | | | | | | |
| 9.125%, 10/01/2023 (Insured by AGC) | | | 300,000 | | | | 299,983 | | | | | |
| County of Riverside CA, | | | | | | | | | | | | |
| 2.617%, 02/15/2024 | | | 20,000,000 | | | | 19,619,358 | | | | | |
| Dallas/Fort Worth International Airport: | | | | | | | | | | | | |
| 2.246%, 11/01/2031 | | | | | | | | | | | | |
| (Callable 11/01/2030) | | | 2,500,000 | | | | 2,065,519 | | | | | |
| 2.416%, 11/01/2032 | | | | | | | | | | | | |
| (Callable 11/01/2030) | | | 5,000,000 | | | | 4,104,717 | | | | | |
| 2.516%, 11/01/2033 | | | | | | | | | | | | |
| (Callable 11/01/2030) | | | 1,220,000 | | | | 991,690 | | | | | |
| Eaton Community City School District, | | | | | | | | | | | | |
| 5.390%, 08/25/2027 | | | | | | | | | | | | |
| (Callable 07/31/2023) | | | | | | | | | | | | |
| (Insured by SD CRED PROG) | | | 2,305,000 | | | | 2,305,764 | | | | | |
| Kentucky Housing Corp., | | | | | | | | | | | | |
| 3.500%, 01/01/2040 | | | | | | | | | | | | |
| (Callable 07/01/2025) | | | 1,595,000 | | | | 1,534,163 | | | | | |
| Kentucky Public Energy Authority, | | | | | | | | | | | | |
| 4.787%, 12/01/2049 | | | | | | | | | | | | |
| (1 Month LIBOR USD + 1.300%) | | | | | | | | | | | | |
| (Callable 03/01/2025) (Mandatory | | | | | | | | | | | | |
Tender Date 06/01/2025)(3) | | | 28,000,000 | | | | 27,939,962 | | | | | |
| Louisiana Housing Corp., | | | | | | | | | | | | |
| 2.100%, 12/01/2038 (Callable | | | | | | | | | | | | |
| 09/01/2024) (Insured by GNMA) | | | 980,573 | | | | 868,056 | | | | | |
| Maine State Housing Authority, | | | | | | | | | | | | |
| 2.600%, 11/15/2046 | | | | | | | | | | | | |
| (Callable 11/15/2030) | | | 10,000,000 | | | | 7,075,901 | | | | | |
| Maryland Community Development | | | | | | | | | | | | |
| Administration Housing Revenue, | | | | | | | | | | | | |
| 3.160%, 09/01/2041 | | | | | | | | | | | | |
| (Callable 09/01/2025) | | | 3,505,000 | | | | 3,410,779 | | | | | |
| Maryland Economic | | | | | | | | | | | | |
| Development Corp., | | | | | | | | | | | | |
| 3.997%, 04/01/2034 | | | | | | | | | | | | |
| (Callable 01/01/2034) | | | 18,475,000 | | | | 14,823,583 | | | | | |
| Massachusetts Educational | | | | | | | | | | | | |
| Financing Authority, | | | | | | | | | | | | |
| 3.850%, 05/25/2033 | | | 10,873,538 | | | | 10,488,690 | | | | | |
| Minnesota Housing Finance Agency: | | | | | | | | | | | | |
| 2.730%, 08/01/2046 (Callable | | | | | | | | | | | | |
| 07/01/2025) (Insured by GNMA) | | | 2,056,737 | | | | 1,746,311 | | | | | |
| 3.200%, 06/01/2047 (Callable | | | | | | | | | | | | |
| 07/01/2026) (Insured by GNMA) | | | 4,534,923 | | | | 4,202,606 | | | | | |
| 3.000%, 10/01/2047 (Callable | | | | | | | | | | | | |
| 01/01/2027) (Insured by GNMA) | | | 5,641,547 | | | | 5,008,798 | | | | | |
| New Hampshire Business | | | | | | | | | | | | |
| Finance Authority: | | | | | | | | | | | | |
| 3.250%, 04/01/2028 | | | | | | | | | | | | |
| (Callable 01/01/2028) | | | 45,000,000 | | | | 38,365,947 | | | | | |
| 3.300%, 04/01/2032 | | | | | | | | | | | | |
| (Callable 01/01/2032) | | | 35,000,000 | | | | 27,232,825 | | | | | |
| 2.872%, 07/01/2035 | | | | | | | | | | | | |
| (Callable 01/01/2035) | | | 17,575,000 | | | | 12,390,132 | | | | | |
| New Hampshire Housing | | | | | | | | | | | | |
| Finance Authority: | | | | | | | | | | | | |
| 3.750%, 07/01/2034 | | | | | | | | | | | | |
| (Callable 07/31/2023) | | | 35,000 | | | | 35,000 | | | | | |
| 4.000%, 07/01/2036 | | | | | | | | | | | | |
| (Callable 07/01/2025) | | | 1,280,000 | | | | 1,264,744 | | | | | |
| New Jersey Higher Education | | | | | | | | | | | | |
| Student Assistance Authority: | | | | | | | | | | | | |
| 3.500%, 12/01/2039 | | | | | | | | | | | | |
| (Callable 12/01/2028) | | | 14,345,000 | | | | 13,604,464 | | | | | |
| 3.500%, 12/01/2039 | | | | | | | | | | | | |
| (Callable 12/01/2028) | | | 10,615,000 | | | | 10,131,079 | | | | | |
| New Jersey Turnpike Authority, | | | | | | | | | | | | |
| 3.223%, 01/01/2035 | | | | | | | | | | | | |
(Callable 07/01/2025)(2) | | | 90,230,000 | | | | 80,338,825 | | | | | |
| New York State Dormitory Authority, | | | | | | | | | | | | |
| 2.219%, 07/01/2035 | | | 15,000,000 | | | | 11,948,647 | | | | | |
| North Carolina Housing Finance Agency, | | | | | | | | | | | | |
| 2.812%, 07/01/2035 | | | | | | | | | | | | |
| (Callable 01/01/2024) | | | 615,000 | | | | 600,709 | | | | | |
| State Public School Building Authority, | | | | | | | | | | | | |
| 2.966%, 04/01/2027 (Insured by BAM) | | | 5,800,000 | | | | 5,335,729 | | | | | |
| Texas Private Activity Bond Surface | | | | | | | | | | | | |
| Transportation Corp., | | | | | | | | | | | | |
| 3.922%, 12/31/2049 | | | 8,800,000 | | | | 7,128,863 | | | | | |
The accompanying notes are an integral part of these financial statements.
Baird Aggregate Bond Fund
Schedule of Investments, June 30, 2023 (Unaudited)
Long-Term Investments (cont.)
| | | Principal | | | | | | % of | |
| | | Amount | | | Value | | | Net Assets | |
| Three Rivers Local School District, | | | | | | | | | |
| 5.209%, 09/15/2027 | | | | | | | | | |
| (Callable 07/31/2023) | | | | | | | | | |
| (Insured by SD CRED PROG) | | $ | 2,365,000 | | | $ | 2,365,489 | | | | |
| West Contra Costa | | | | | | | | | | | |
| Unified School District, | | | | | | | | | | | |
| 6.250%, 08/01/2030 | | | 1,785,000 | | | | 1,944,501 | | | | |
| Western Michigan University Homer | | | | | | | | | | | |
| Stryker MD School of Medicine, | | | | | | | | | | | |
| 4.750%, 11/15/2028 (Insured by AGM) | | | 12,310,000 | | | | 12,249,760 | | | | |
| Westlake City School District, | | | | | | | | | | | |
| 5.227%, 12/01/2026 | | | | | | | | | | | |
| (Callable 07/31/2023) | | | 3,570,000 | | | | 3,571,110 | | | | |
| Westvaco Corp., | | | | | | | | | | | |
7.670%, 01/15/2027(2) | | | 8,000,000 | | | | 8,353,334 | | | | |
| Total Municipal Bonds | | | | | | | | | | | |
| (Cost $406,115,478) | | | | | | | 357,942,296 | | | | 0.9 | % |
| Residential Mortgage-Backed Securities | | | | | | | | | | | | |
| U.S. Government Agency Issues | | | | | | | | | | | | |
| Fannie Mae REMIC Trust, | | | | | | | | | | | | |
| Series 1998-66, Class C, | | | | | | | | | | | | |
| 6.000%, 12/25/2028 | | | 1,679 | | | | 1,671 | | | | | |
| Federal Gold Loan | | | | | | | | | | | | |
| Mortgage Corp. (FGLMC): | | | | | | | | | | | | |
| 6.500%, 06/01/2029 | | | 39,158 | | | | 40,070 | | | | | |
| 2.500%, 08/01/2030 | | | 86,124,941 | | | | 80,031,521 | | | | | |
| 3.000%, 03/01/2032 | | | 1,006,740 | | | | 943,073 | | | | | |
| 3.000%, 08/01/2032 | | | 6,520,484 | | | | 6,105,257 | | | | | |
| 3.000%, 09/01/2032 | | | 44,109,783 | | | | 41,300,355 | | | | | |
| 3.000%, 02/01/2033 | | | 26,693,836 | | | | 25,126,892 | | | | | |
| 3.000%, 04/01/2033 | | | 897,798 | | | | 840,586 | | | | | |
| 5.000%, 08/01/2033 | | | 2,035,430 | | | | 2,050,713 | | | | | |
| 3.000%, 01/01/2034 | | | 40,530,421 | | | | 38,149,223 | | | | | |
| 3.500%, 01/01/2034 | | | 6,471,434 | | | | 6,219,453 | | | | | |
| 2.500%, 07/01/2035 | | | 5,503,282 | | | | 5,037,366 | | | | | |
| 2.000%, 08/01/2035 | | | 44,299,674 | | | | 39,500,182 | | | | | |
| 5.000%, 09/01/2035 | | | 4,169,270 | | | | 4,203,863 | | | | | |
| 5.500%, 01/01/2036 | | | 68,093 | | | | 69,903 | | | | | |
| 5.000%, 03/01/2036 | | | 1,653,454 | | | | 1,667,172 | | | | | |
| 1.500%, 06/01/2036 | | | 21,571,131 | | | | 18,618,620 | | | | | |
| 6.000%, 12/01/2036 | | | 64,368 | | | | 66,912 | | | | | |
| 3.500%, 03/01/2037 | | | 2,830,191 | | | | 2,681,152 | | | | | |
| 4.000%, 03/01/2037 | | | 1,595,165 | | | | 1,538,562 | | | | | |
| 3.500%, 02/01/2038 | | | 31,347,476 | | | | 29,661,342 | | | | | |
| 5.000%, 02/01/2038 | | | 952,743 | | | | 960,639 | | | | | |
| 5.500%, 05/01/2038 | | | 194,455 | | | | 199,591 | | | | | |
| 4.000%, 06/01/2038 | | | 61,078,674 | | | | 59,600,757 | | | | | |
| 5.500%, 01/01/2039 | | | 4,373,335 | | | | 4,480,017 | | | | | |
| 4.500%, 11/01/2039 | | | 1,471,114 | | | | 1,454,426 | | | | | |
| 4.500%, 11/01/2039 | | | 1,199,042 | | | | 1,185,439 | | | | | |
| 4.500%, 12/01/2039 | | | 6,943,790 | | | | 6,846,977 | | | | | |
| 3.000%, 02/01/2040 | | | 9,740,516 | | | | 8,995,496 | | | | | |
| 5.000%, 03/01/2040 | | | 293,108 | | | | 295,551 | | | | | |
| 4.500%, 08/01/2040 | | | 234,082 | | | | 231,427 | | | | | |
| 2.000%, 09/01/2040 | | | 24,921,893 | | | | 21,433,859 | | | | | |
| 4.500%, 09/01/2040 | | | 978,659 | | | | 967,561 | | | | | |
2.500%, 11/01/2040(8) | | | 60,819,629 | | | | 53,488,792 | | | | | |
| 1.500%, 12/01/2040 | | | 45,252,520 | | | | 36,863,152 | | | | | |
| 2.000%, 12/01/2040 | | | 112,045,277 | | | | 96,102,876 | | | | | |
| 4.000%, 01/01/2041 | | | 4,767,697 | | | | 4,589,290 | | | | | |
| 4.000%, 01/01/2041 | | | 9,336,342 | | | | 8,986,974 | | | | | |
| 4.500%, 03/01/2041 | | | 712,087 | | | | 704,011 | | | | | |
| 3.500%, 10/01/2041 | | | 2,976,424 | | | | 2,790,932 | | | | | |
| 2.000%, 11/01/2041 | | | 76,616,830 | | | | 64,739,534 | | | | | |
| 2.000%, 12/01/2041 | | | 17,162,161 | | | | 14,580,555 | | | | | |
| 2.000%, 02/01/2042 | | | 47,545,509 | | | | 40,390,091 | | | | | |
| 2.500%, 02/01/2042 | | | 11,290,742 | | | | 9,830,266 | | | | | |
| 4.000%, 03/01/2042 | | | 2,825,132 | | | | 2,719,394 | | | | | |
| 3.500%, 06/01/2042 | | | 1,487,875 | | | | 1,394,646 | | | | | |
| 3.500%, 07/01/2042 | | | 3,808,749 | | | | 3,570,082 | | | | | |
| 3.000%, 08/01/2042 | | | 5,655,505 | | | | 5,111,429 | | | | | |
| 3.000%, 10/01/2042 | | | 2,315,129 | | | | 2,092,383 | | | | | |
| 3.000%, 11/01/2042 | | | 20,724,017 | | | | 18,730,325 | | | | | |
| 3.500%, 12/01/2042 | | | 4,488,639 | | | | 4,207,263 | | | | | |
| 3.000%, 01/01/2043 | | | 9,725,790 | | | | 8,789,996 | | | | | |
| 3.500%, 01/01/2043 | | | 7,886,140 | | | | 7,378,256 | | | | | |
| 3.000%, 02/01/2043 | | | 1,298,919 | | | | 1,173,934 | | | | | |
| 3.000%, 04/01/2043 | | | 7,741,084 | | | | 6,996,238 | | | | | |
| 3.000%, 04/01/2043 | | | 3,318,841 | | | | 2,999,480 | | | | | |
| 3.000%, 04/01/2043 | | | 2,830,189 | | | | 2,557,856 | | | | | |
| 4.000%, 04/01/2043 | | | 10,594,389 | | | | 10,270,433 | | | | | |
| 3.500%, 05/01/2043 | | | 5,239,288 | | | | 4,910,938 | | | | | |
| 3.000%, 06/01/2043 | | | 28,201,352 | | | | 25,487,521 | | | | | |
| 3.000%, 08/01/2043 | | | 2,208,192 | | | | 1,995,691 | | | | | |
| 3.500%, 11/01/2043 | | | 2,978,162 | | | | 2,791,505 | | | | | |
| 3.500%, 01/01/2044 | | | 4,239,967 | | | | 3,972,982 | | | | | |
| 3.500%, 02/01/2044 | | | 13,521,113 | | | | 12,673,696 | | | | | |
| 4.000%, 03/01/2044 | | | 1,655,549 | | | | 1,589,961 | | | | | |
| 3.500%, 05/01/2044 | | | 18,911,250 | | | | 17,693,600 | | | | | |
| 4.000%, 05/01/2044 | | | 7,654,485 | | | | 7,367,946 | | | | | |
| 4.000%, 07/01/2044 | | | 1,280,906 | | | | 1,227,778 | | | | | |
| 3.500%, 10/01/2044 | | | 21,722,941 | | | | 20,253,125 | | | | | |
| 4.000%, 10/01/2044 | | | 3,811,617 | | | | 3,654,708 | | | | | |
| 3.000%, 01/01/2045 | | | 7,675,310 | | | | 6,936,404 | | | | | |
| 3.500%, 01/01/2045 | | | 12,431,465 | | | | 11,648,813 | | | | | |
| 4.500%, 01/01/2045 | | | 11,863,371 | | | | 11,655,404 | | | | | |
| 3.000%, 10/01/2045 | | | 15,584,635 | | | | 14,085,062 | | | | | |
| 4.000%, 10/01/2045 | | | 1,900,472 | | | | 1,819,148 | | | | | |
| 4.000%, 11/01/2045 | | | 4,227,989 | | | | 4,047,201 | | | | | |
| 3.500%, 12/01/2045 | | | 3,162,424 | | | | 2,944,474 | | | | | |
| 3.000%, 01/01/2046 | | | 55,916,027 | | | | 50,082,088 | | | | | |
| 3.000%, 01/01/2046 | | | 43,857,309 | | | | 39,327,776 | | | | | |
| 3.500%, 01/01/2046 | | | 13,018,780 | | | | 12,121,652 | | | | | |
| 4.000%, 02/01/2046 | | | 5,590,202 | | | | 5,285,649 | | | | | |
| 4.000%, 02/01/2046 | | | 27,383,055 | | | | 26,329,168 | | | | | |
| 4.000%, 04/01/2046 | | | 3,934,557 | | | | 3,764,037 | | | | | |
| 3.500%, 05/01/2046 | | | 2,378,773 | | | | 2,233,674 | | | | | |
| 3.500%, 08/01/2046 | | | 14,025,357 | | | | 13,058,822 | | | | | |
| 3.000%, 09/01/2046 | | | 47,867,019 | | | | 42,894,733 | | | | | |
| 3.000%, 10/01/2046 | | | 50,811,481 | | | | 45,777,801 | | | | | |
| 3.000%, 10/01/2046 | | | 31,011,292 | | | | 27,794,839 | | | | | |
| 3.000%, 12/01/2046 | | | 27,300,899 | | | | 24,427,669 | | | | | |
| 4.000%, 01/01/2047 | | | 23,998,090 | | | | 22,948,319 | | | | | |
| 3.000%, 02/01/2047 | | | 17,648,959 | | | | 15,774,993 | | | | | |
| 4.500%, 04/01/2047 | | | 11,830,079 | | | | 11,622,585 | | | | | |
| 3.000%, 05/01/2047 | | | 28,346,208 | | | | 25,423,064 | | | | | |
| 4.500%, 06/01/2047 | | | 71,898,852 | | | | 70,507,162 | | | | | |
| 4.500%, 08/01/2047 | | | 19,101,764 | | | | 18,744,895 | | | | | |
| 4.000%, 09/01/2047 | | | 6,417,925 | | | | 6,125,838 | | | | | |
| 3.500%, 03/01/2048 | | | 63,169,767 | | | | 58,366,168 | | | | | |
| 4.000%, 08/01/2048 | | | 10,623,997 | | | | 10,140,579 | | | | | |
| 4.500%, 10/01/2048 | | | 8,279,812 | | | | 8,096,500 | | | | | |
| 3.000%, 02/01/2049 | | | 39,966,191 | | | | 35,978,240 | | | | | |
| 3.000%, 11/01/2049 | | | 45,797,277 | | | | 40,895,288 | | | | | |
| 4.000%, 05/01/2050 | | | 77,129,635 | | | | 73,723,492 | | | | | |
The accompanying notes are an integral part of these financial statements.
Baird Aggregate Bond Fund
Schedule of Investments, June 30, 2023 (Unaudited)
Long-Term Investments (cont.)
| | | Principal | | | | | | % of | |
| | | Amount | | | Value | | | Net Assets | |
| Federal Gold Loan | | | | | | | | | |
| Mortgage Corp. (FGLMC): (cont.) | | | | | | | | | |
| 2.500%, 11/01/2050 | | $ | 22,500,382 | | | $ | 19,271,001 | | | |
| |
| 2.500%, 02/01/2051 | | | 42,320,365 | | | | 36,299,839 | | | | | |
| 2.500%, 02/01/2051 | | | 57,662,113 | | | | 49,357,014 | | | | | |
| 2.500%, 02/01/2051 | | | 20,799,559 | | | | 17,857,562 | | | | | |
| 2.000%, 04/01/2051 | | | 76,371,186 | | | | 63,480,564 | | | | | |
| 3.000%, 04/01/2051 | | | 33,077,430 | | | | 29,265,215 | | | | | |
| 2.000%, 05/01/2051 | | | 31,614,650 | | | | 26,125,243 | | | | | |
| 2.500%, 05/01/2051 | | | 39,702,901 | | | | 33,890,093 | | | | | |
| 2.500%, 06/01/2051 | | | 16,872,836 | | | | 14,394,733 | | | | | |
| 2.500%, 07/01/2051 | | | 33,280,456 | | | | 28,465,161 | | | | | |
| 2.500%, 08/01/2051 | | | 17,802,693 | | | | 15,298,462 | | | | | |
| 2.000%, 09/01/2051 | | | 113,098,378 | | | | 92,461,959 | | | | | |
| 3.000%, 09/01/2051 | | | 16,828,567 | | | | 14,969,434 | | | | | |
| 3.000%, 10/01/2051 | | | 11,708,060 | | | | 10,334,630 | | | | | |
| 2.500%, 11/01/2051 | | | 134,801,006 | | | | 115,571,420 | | | | | |
| 2.500%, 11/01/2051 | | | 9,476,063 | | | | 8,105,032 | | | | | |
| 3.000%, 03/01/2052 | | | 123,984,707 | | | | 110,212,635 | | | | | |
| 4.500%, 07/01/2052 | | | 35,824,389 | | | | 34,645,819 | | | | | |
| 5.000%, 07/01/2052 | | | 105,690,729 | | | | 103,671,396 | | | | | |
| 3.000%, 08/01/2052 | | | 105,030,953 | | | | 93,395,365 | | | | | |
| 5.500%, 01/01/2053 | | | 109,577,729 | | | | 109,729,953 | | | | | |
| 6.000%, 01/01/2053 | | | 38,669,578 | | | | 39,504,338 | | | | | |
| Federal National Mortgage | | | | | | | | | | | | |
| Association (FNMA): | | | | | | | | | | | | |
| 5.000%, 05/01/2028 | | | 51,358 | | | | 50,968 | | | | | |
| 4.500%, 08/01/2029 | | | 423,282 | | | | 415,452 | | | | | |
| 4.500%, 09/01/2029 | | | 470,498 | | | | 461,796 | | | | | |
| 3.500%, 01/01/2032 | | | 15,964,187 | | | | 15,344,732 | | | | | |
3.500%, 06/01/2032(8) | | | 64,082,010 | | | | 61,597,306 | | | | | |
| 3.000%, 10/01/2032 | | | 832,305 | | | | 778,392 | | | | | |
| 3.000%, 12/01/2032 | | | 1,655,281 | | | | 1,548,031 | | | | | |
| 6.000%, 03/01/2033 | | | 16,816 | | | | 17,304 | | | | | |
| 3.000%, 09/01/2033 | | | 28,733,984 | | | | 27,044,997 | | | | | |
| 3.500%, 10/01/2033 | | | 8,475,219 | | | | 8,020,391 | | | | | |
| 4.500%, 10/01/2033 | | | 5,954,243 | | | | 5,866,408 | | | | | |
| 5.000%, 10/01/2033 | | | 6,871,024 | | | | 6,919,956 | | | | | |
| 3.000%, 11/01/2033 | | | 39,683,809 | | | | 37,352,875 | | | | | |
| 5.000%, 11/01/2033 | | | 18,871 | | | | 19,005 | | | | | |
| 4.000%, 01/01/2034 | | | 2,642,439 | | | | 2,578,422 | | | | | |
| 3.000%, 02/01/2034 | | | 24,798,626 | | | | 23,341,277 | | | | | |
| 5.500%, 04/01/2034 | | | 2,384,867 | | | | 2,440,231 | | | | | |
| 4.000%, 06/01/2034 | | | 3,527,049 | | | | 3,439,410 | | | | | |
| 4.000%, 07/01/2034 | | | 34,386,623 | | | | 33,478,904 | | | | | |
| 4.000%, 09/01/2034 | | | 3,926,949 | | | | 3,819,684 | | | | | |
| 5.500%, 09/01/2034 | | | 63,563 | | | | 65,039 | | | | | |
| 2.500%, 10/01/2034 | | | 46,235,073 | | | | 42,436,241 | | | | | |
| 6.000%, 11/01/2034 | | | 17,931 | | | | 18,596 | | | | | |
| 3.500%, 01/01/2035 | | | 21,984,335 | | | | 20,924,898 | | | | | |
| 5.500%, 02/01/2035 | | | 213,254 | | | | 218,373 | | | | | |
| 3.000%, 06/01/2035 | | | 5,164,012 | | | | 4,813,386 | | | | | |
| 5.000%, 07/01/2035 | | | 1,797,798 | | | | 1,810,590 | | | | | |
| 5.000%, 10/01/2035 | | | 848,346 | | | | 854,404 | | | | | |
| 2.000%, 12/01/2035 | | | 48,450,527 | | | | 43,201,629 | | | | | |
| 1.500%, 02/01/2036 | | | 41,109,801 | | | | 35,469,007 | | | | | |
| 5.000%, 02/01/2036 | | | 1,230,345 | | | | 1,239,135 | | | | | |
| 1.500%, 03/01/2036 | | | 2,922,099 | | | | 2,521,257 | | | | | |
| 3.000%, 11/01/2036 | | | 15,423,944 | | | | 14,260,319 | | | | | |
| 5.500%, 11/01/2036 | | | 80,986 | | | | 83,194 | | | | | |
| 2.500%, 12/01/2036 | | | 8,374,439 | | | | 7,563,280 | | | | | |
| 2.000%, 01/01/2037 | | | 31,711,113 | | | | 28,150,180 | | | | | |
| 3.500%, 02/01/2037 | | | 5,632,609 | | | | 5,330,702 | | | | | |
| 5.500%, 04/01/2037 | | | 529,233 | | | | 541,511 | | | | | |
| 4.000%, 05/01/2037 | | | 14,377,148 | | | | 13,851,022 | | | | | |
| 4.000%, 02/01/2038 | | | 10,994,676 | | | | 10,592,207 | | | | | |
| 2.500%, 04/01/2038 | | | 22,649,202 | | | | 20,455,189 | | | | | |
| 3.000%, 05/01/2038 | | | 12,479,798 | | | | 11,574,860 | | | | | |
| 4.000%, 05/01/2038 | | | 8,881,342 | | | | 8,654,926 | | | | | |
| 4.000%, 04/01/2039 | | | 4,332,581 | | | | 4,165,913 | | | | | |
| 4.500%, 04/01/2039 | | | 11,336,491 | | | | 11,349,067 | | | | | |
| 4.000%, 06/01/2039 | | | 8,776,436 | | | | 8,564,206 | | | | | |
| 5.000%, 06/01/2039 | | | 4,267,719 | | | | 4,298,103 | | | | | |
| 5.000%, 06/01/2039 | | | 6,104,714 | | | | 6,148,167 | | | | | |
| 4.500%, 11/01/2039 | | | 67,957 | | | | 66,933 | | | | | |
| 3.000%, 08/01/2040 | | | 28,361,656 | | | | 25,887,639 | | | | | |
| 4.000%, 08/01/2040 | | | 486,887 | | | | 468,141 | | | | | |
| 3.500%, 10/01/2040 | | | 10,221,634 | | | | 9,591,366 | | | | | |
| 4.000%, 10/01/2040 | | | 12,595,867 | | | | 12,110,853 | | | | | |
| 1.500%, 11/01/2040 | | | 139,907,456 | | | | 113,970,583 | | | | | |
| 1.500%, 12/01/2040 | | | 43,682,439 | | | | 35,584,167 | | | | | |
| 3.500%, 12/01/2040 | | | 2,913,838 | | | | 2,729,070 | | | | | |
| 4.000%, 12/01/2040 | | | 2,962,004 | | | | 2,847,943 | | | | | |
| 2.500%, 01/01/2041 | | | 25,265,371 | | | | 22,238,687 | | | | | |
| 3.500%, 02/01/2041 | | | 4,772,201 | | | | 4,469,277 | | | | | |
| 4.500%, 02/01/2041 | | | 23,129,612 | | | | 22,931,293 | | | | | |
| 4.500%, 05/01/2041 | | | 2,717,613 | | | | 2,678,582 | | | | | |
| 4.000%, 06/01/2041 | | | 5,137,878 | | | | 4,940,020 | | | | | |
| 4.500%, 07/01/2041 | | | 2,874,233 | | | | 2,830,885 | | | | | |
| 5.000%, 07/01/2041 | | | 4,776,391 | | | | 4,810,378 | | | | | |
| 3.500%, 09/01/2041 | | | 6,948,400 | | | | 6,505,860 | | | | | |
| 4.000%, 09/01/2041 | | | 671,735 | | | | 645,864 | | | | | |
| 4.000%, 10/01/2041 | | | 2,317,027 | | | | 2,227,775 | | | | | |
| 2.000%, 12/01/2041 | | | 128,880,838 | | | | 109,015,784 | | | | | |
| 4.000%, 12/01/2041 | | | 2,904,221 | | | | 2,792,348 | | | | | |
| 2.000%, 01/01/2042 | | | 48,522,998 | | | | 41,021,084 | | | | | |
| 4.000%, 01/01/2042 | | | 3,801,329 | | | | 3,654,915 | | | | | |
| 4.500%, 01/01/2042 | | | 4,470,725 | | | | 4,414,896 | | | | | |
| 2.000%, 02/01/2042 | | | 13,767,368 | | | | 11,695,409 | | | | | |
| 2.000%, 02/01/2042 | | | 42,447,531 | | | | 35,834,580 | | | | | |
| 2.000%, 02/01/2042 | | | 39,700,244 | | | | 33,490,374 | | | | | |
| 4.000%, 02/01/2042 | | | 16,858,032 | | | | 16,208,587 | | | | | |
| 2.000%, 03/01/2042 | | | 93,994,358 | | | | 79,547,737 | | | | | |
| 2.500%, 03/01/2042 | | | 48,971,520 | | | | 42,579,237 | | | | | |
| 3.000%, 04/01/2042 | | | 25,290,219 | | | | 22,851,767 | | | | | |
| 3.000%, 05/01/2042 | | | 2,793,556 | | | | 2,521,875 | | | | | |
| 3.500%, 07/01/2042 | | | 42,278,679 | | | | 39,584,312 | | | | | |
| 3.500%, 08/01/2042 | | | 3,004,723 | | | | 2,813,196 | | | | | |
| 3.000%, 10/01/2042 | | | 10,593,648 | | | | 9,563,315 | | | | | |
| 3.000%, 03/01/2043 | | | 15,684,428 | | | | 14,158,533 | | | | | |
| 3.000%, 03/01/2043 | | | 3,057,139 | | | | 2,759,746 | | | | | |
| 3.000%, 05/01/2043 | | | 15,943,541 | | | | 14,392,533 | | | | | |
| 3.000%, 05/01/2043 | | | 7,356,525 | | | | 6,640,845 | | | | | |
| 3.500%, 05/01/2043 | | | 15,919,181 | | | | 14,904,428 | | | | | |
| 3.000%, 06/01/2043 | | | 3,198,105 | | | | 2,886,979 | | | | | |
| 3.000%, 07/01/2043 | | | 1,335,066 | | | | 1,205,190 | | | | | |
| 4.000%, 07/01/2043 | | | 11,489,326 | | | | 11,046,984 | | | | | |
| 3.000%, 08/01/2043 | | | 2,100,210 | | | | 1,895,879 | | | | | |
| 3.000%, 09/01/2043 | | | 40,485,861 | | | | 36,546,987 | | | | | |
| 3.500%, 09/01/2043 | | | 18,207,709 | | | | 16,995,153 | | | | | |
| 4.500%, 09/01/2043 | | | 4,259,820 | | | | 4,185,660 | | | | | |
| 3.000%, 10/01/2043 | | | 47,403,175 | | | | 42,827,427 | | | | | |
| 3.500%, 10/01/2043 | | | 21,382,109 | | | | 19,964,029 | | | | | |
| 3.000%, 11/01/2043 | | | 11,034,786 | | | | 9,961,589 | | | | | |
| 4.000%, 11/01/2043 | | | 4,089,834 | | | | 3,928,408 | | | | | |
| 4.000%, 12/01/2044 | | | 104,689,894 | | | | 100,592,210 | | | | | |
The accompanying notes are an integral part of these financial statements.
Baird Aggregate Bond Fund
Schedule of Investments, June 30, 2023 (Unaudited)
Long-Term Investments (cont.)
| | | Principal | | | | | | % of | |
| | | Amount | | | Value | | | Net Assets | |
| Federal National Mortgage | | | | | | | | | |
| Association (FNMA): (cont.) | | | | | | | | | |
| 4.000%, 01/01/2045 | | $ | 2,672,687 | | | $ | 2,556,700 | | | |
| |
| 4.000%, 02/01/2045 | | | 6,668,193 | | | | 6,411,512 | | | | | |
| 3.500%, 04/01/2045 | | | 10,723,021 | | | | 9,982,586 | | | | | |
| 4.000%, 09/01/2045 | | | 1,915,269 | | | | 1,830,182 | | | | | |
| 4.000%, 10/01/2045 | | | 2,483,825 | | | | 2,373,507 | | | | | |
| 4.500%, 10/01/2045 | | | 105,758,611 | | | | 104,112,726 | | | | | |
| 4.000%, 11/01/2045 | | | 9,573,707 | | | | 9,095,260 | | | | | |
| 3.500%, 12/01/2045 | | | 12,391,892 | | | | 11,525,151 | | | | | |
| 4.500%, 02/01/2046 | | | 11,603,574 | | | | 11,458,828 | | | | | |
| 3.000%, 05/01/2046 | | | 6,695,232 | | | | 6,022,853 | | | | | |
| 3.500%, 05/01/2046 | | | 11,998,466 | | | | 11,227,131 | | | | | |
| 3.000%, 07/01/2046 | | | 4,782,279 | | | | 4,293,104 | | | | | |
| 4.500%, 08/01/2046 | | | 8,429,301 | | | | 8,272,022 | | | | | |
| 3.500%, 09/01/2046 | | | 4,513,582 | | | | 4,197,662 | | | | | |
| 2.500%, 10/01/2046 | | | 12,459,775 | | | | 10,672,327 | | | | | |
| 3.000%, 11/01/2046 | | | 20,496,825 | | | | 18,504,403 | | | | | |
| 3.000%, 11/01/2046 | | | 9,539,780 | | | | 8,611,664 | | | | | |
| 3.500%, 11/01/2046 | | | 22,309,717 | | | | 20,753,232 | | | | | |
| 3.000%, 12/01/2046 | | | 13,812,622 | | | | 12,362,256 | | | | | |
| 4.000%, 02/01/2047 | | | 2,356,597 | | | | 2,250,732 | | | | | |
| 3.500%, 05/01/2047 | | | 962,144 | | | | 893,121 | | | | | |
| 3.500%, 08/01/2047 | | | 5,094,399 | | | | 4,701,719 | | | | | |
| 4.000%, 08/01/2047 | | | 18,169,034 | | | | 17,360,147 | | | | | |
| 3.500%, 10/01/2047 | | | 4,737,821 | | | | 4,372,631 | | | | | |
| 4.000%, 10/01/2047 | | | 12,310,221 | | | | 11,738,088 | | | | | |
| 4.000%, 11/01/2047 | | | 9,467,423 | | | | 9,043,194 | | | | | |
| 4.500%, 11/01/2047 | | | 4,210,449 | | | | 4,199,536 | | | | | |
| 3.500%, 12/01/2047 | | | 73,331,956 | | | | 67,792,302 | | | | | |
| 4.000%, 12/01/2047 | | | 15,008,843 | | | | 14,309,720 | | | | | |
| 4.500%, 12/01/2047 | | | 2,342,504 | | | | 2,281,124 | | | | | |
| 3.500%, 01/01/2048 | | | 17,750,934 | | | | 16,413,229 | | | | | |
| 3.500%, 02/01/2048 | | | 23,814,569 | | | | 21,978,892 | | | | | |
| 3.500%, 03/01/2048 | | | 21,300,414 | | | | 19,658,467 | | | | | |
| 4.000%, 04/01/2048 | | | 32,746,377 | | | | 31,262,259 | | | | | |
| 4.000%, 07/01/2048 | | | 12,552,236 | | | | 11,993,573 | | | | | |
| 4.000%, 09/01/2048 | | | 3,278,840 | | | | 3,126,086 | | | | | |
| 4.500%, 09/01/2048 | | | 9,641,506 | | | | 9,424,992 | | | | | |
| 4.500%, 11/01/2048 | | | 12,698,918 | | | | 12,461,840 | | | | | |
| 5.000%, 11/01/2048 | | | 16,447,240 | | | | 16,384,644 | | | | | |
| 4.000%, 01/01/2049 | | | 3,182,084 | | | | 3,035,203 | | | | | |
| 4.500%, 01/01/2049 | | | 8,516,167 | | | | 8,357,184 | | | | | |
| 3.000%, 02/01/2049 | | | 11,841,616 | | | | 10,542,654 | | | | | |
| 4.500%, 02/01/2049 | | | 9,016,393 | | | | 8,803,168 | | | | | |
| 4.000%, 05/01/2049 | | | 7,235,046 | | | | 6,898,205 | | | | | |
| 3.000%, 05/01/2050 | | | 38,480,370 | | | | 34,364,620 | | | | | |
| 2.500%, 07/01/2050 | | | 35,570,224 | | | | 30,527,454 | | | | | |
| 2.500%, 07/01/2050 | | | 101,629,308 | | | | 87,345,802 | | | | | |
| 3.000%, 07/01/2050 | | | 53,762,103 | | | | 48,187,473 | | | | | |
| 2.000%, 09/01/2050 | | | 44,104,211 | | | | 36,202,933 | | | | | |
| 2.500%, 10/01/2050 | | | 40,349,001 | | | | 34,566,203 | | | | | |
| 2.000%, 11/01/2050 | | | 212,911,961 | | | | 175,122,411 | | | | | |
| 2.500%, 11/01/2050 | | | 55,064,610 | | | | 47,082,015 | | | | | |
| 2.500%, 11/01/2050 | | | 6,829,106 | | | | 5,881,286 | | | | | |
| 3.000%, 11/01/2050 | | | 66,321,512 | | | | 59,444,355 | | | | | |
| 3.000%, 11/01/2050 | | | 6,115,665 | | | | 5,455,882 | | | | | |
| 2.500%, 12/01/2050 | | | 79,621,721 | | | | 68,193,672 | | | | | |
| 2.500%, 12/01/2050 | | | 53,215,297 | | | | 45,425,810 | | | | | |
| 2.500%, 01/01/2051 | | | 34,137,767 | | | | 29,340,538 | | | | | |
| 2.500%, 04/01/2051 | | | 18,975,414 | | | | 16,254,112 | | | | | |
| 2.500%, 05/01/2051 | | | 36,392,580 | | | | 31,231,165 | | | | | |
| 2.500%, 05/01/2051 | | | 78,609,366 | | | | 67,695,577 | | | | | |
| 2.500%, 05/01/2051 | | | 67,396,678 | | | | 58,587,919 | | | | | |
| 2.500%, 06/01/2051 | | | 26,449,017 | | | | 22,738,841 | | | | | |
| 2.000%, 07/01/2051 | | | 44,598,986 | | | | 36,906,515 | | | | | |
| 2.500%, 07/01/2051 | | | 69,075,943 | | | | 59,386,399 | | | | | |
| 2.500%, 07/01/2051 | | | 22,757,759 | | | | 19,377,510 | | | | | |
| 2.000%, 08/01/2051 | | | 16,407,925 | | | | 13,559,896 | | | | | |
| 2.000%, 09/01/2051 | | | 12,105,584 | | | | 9,975,216 | | | | | |
| 2.500%, 09/01/2051 | | | 123,995,257 | | | | 105,914,548 | | | | | |
| 2.500%, 10/01/2051 | | | 38,491,540 | | | | 32,909,126 | | | | | |
| 3.000%, 10/01/2051 | | | 62,266,234 | | | | 54,936,599 | | | | | |
| 2.000%, 11/01/2051 | | | 58,039,820 | | | | 47,748,531 | | | | | |
| 2.500%, 11/01/2051 | | | 34,214,249 | | | | 29,637,404 | | | | | |
| 2.500%, 11/01/2051 | | | 29,412,462 | | | | 25,157,085 | | | | | |
| 2.500%, 11/01/2051 | | | 102,828,138 | | | | 87,829,218 | | | | | |
| 3.000%, 11/01/2051 | | | 121,484,804 | | | | 107,927,418 | | | | | |
| 2.000%, 12/01/2051 | | | 34,019,146 | | | | 27,969,268 | | | | | |
| 2.000%, 12/01/2051 | | | 35,900,210 | | | | 29,582,358 | | | | | |
| 2.000%, 12/01/2051 | | | 105,326,384 | | | | 86,506,097 | | | | | |
| 2.000%, 12/01/2051 | | | 25,496,734 | | | | 21,049,158 | | | | | |
| 2.500%, 12/01/2051 | | | 23,523,567 | | | | 20,113,678 | | | | | |
| 2.500%, 12/01/2051 | | | 47,108,878 | | | | 40,003,403 | | | | | |
| 2.500%, 12/01/2051 | | | 132,101,043 | | | | 113,307,687 | | | | | |
| 2.500%, 12/01/2051 | | | 105,040,489 | | | | 89,694,237 | | | | | |
| 2.500%, 01/01/2052 | | | 45,038,841 | | | | 38,594,652 | | | | | |
| 3.000%, 02/01/2052 | | | 25,043,075 | | | | 22,240,926 | | | | | |
| 3.000%, 02/01/2052 | | | 30,476,604 | | | | 27,066,581 | | | | | |
| 3.500%, 02/01/2052 | | | 32,037,680 | | | | 29,337,291 | | | | | |
| 3.000%, 03/01/2052 | | | 68,773,785 | | | | 61,028,525 | | | | | |
| 3.500%, 04/01/2052 | | | 87,512,602 | | | | 79,943,129 | | | | | |
| 3.500%, 05/01/2052 | | | 44,972,889 | | | | 41,769,452 | | | | | |
| 4.500%, 07/01/2052 | | | 14,805,976 | | | | 14,318,854 | | | | | |
| 5.000%, 07/01/2052 | | | 117,040,663 | | | | 114,802,928 | | | | | |
| 5.000%, 07/01/2052 | | | 67,361,683 | | | | 66,159,036 | | | | | |
5.500%, 11/01/2052(8) | | | 50,293,690 | | | | 50,537,854 | | | | | |
| 3.000%, 12/01/2054 | | | 91,378,781 | | | | 80,324,714 | | | | | |
| 3.000%, 11/01/2059 | | | 48,741,542 | | | | 43,024,552 | | | | | |
| 2.500%, 07/01/2061 | | | 9,784,511 | | | | 8,027,432 | | | | | |
| 2.500%, 03/01/2062 | | | 45,933,893 | | | | 37,599,639 | | | | | |
4.000%, 06/01/2062(8) | | | 140,569,220 | | | | 131,668,722 | | | | | |
| Government National | | | | | | | | | | | | |
| Mortgage Association (GNMA): | | | | | | | | | | | | |
| 6.000%, 11/20/2033 | | | 17,016 | | | | 17,654 | | | | | |
| 5.000%, 07/20/2040 | | | 629,890 | | | | 640,026 | | | | | |
| 3.500%, 10/20/2041 | | | 3,093,906 | | | | 2,909,497 | | | | | |
| 3.500%, 01/15/2042 | | | 5,312,585 | | | | 5,010,822 | | | | | |
| 4.000%, 06/20/2042 | | | 3,413,428 | | | | 3,314,229 | | | | | |
| 3.500%, 09/20/2042 | | | 1,296,895 | | | | 1,221,908 | | | | | |
| 3.500%, 01/20/2043 | | | 27,357,681 | | | | 25,763,148 | | | | | |
| 4.000%, 10/20/2043 | | | 4,487,921 | | | | 4,349,106 | | | | | |
| 4.000%, 09/20/2044 | | | 17,244,997 | | | | 16,751,552 | | | | | |
| 4.000%, 01/20/2045 | | | 3,798,447 | | | | 3,679,270 | | | | | |
| 3.500%, 03/20/2045 | | | 6,058,403 | | | | 5,675,784 | | | | | |
| 3.000%, 04/20/2045 | | | 7,050,790 | | | | 6,427,214 | | | | | |
| 3.500%, 04/20/2045 | | | 8,573,167 | | | | 8,046,172 | | | | | |
| 4.000%, 08/20/2045 | | | 3,026,846 | | | | 2,915,389 | | | | | |
| 3.000%, 01/20/2046 | | | 23,138,436 | | | | 21,095,743 | | | | | |
| 4.500%, 01/20/2046 | | | 5,097,875 | | | | 5,052,938 | | | | | |
| 3.500%, 04/20/2046 | | | 26,900,663 | | | | 25,194,486 | | | | | |
| 4.000%, 04/20/2046 | | | 3,285,814 | | | | 3,159,864 | | | | | |
| 3.500%, 05/20/2046 | | | 16,971,854 | | | | 15,912,375 | | | | | |
| 4.000%, 05/20/2046 | | | 8,009,870 | | | | 7,703,977 | | | | | |
| 3.500%, 06/20/2046 | | | 28,118,264 | | | | 26,372,523 | | | | | |
| 3.000%, 11/20/2046 | | | 20,200,961 | | | | 18,385,667 | | | | | |
The accompanying notes are an integral part of these financial statements.
Baird Aggregate Bond Fund
Schedule of Investments, June 30, 2023 (Unaudited)
Long-Term Investments (cont.)
| | | Principal | | | | | | % of | |
| | | Amount | | | Value | | | Net Assets | |
| Government National Mortgage | | | | | | | | | |
| Association (GNMA): (cont.) | | | | | | | | | |
| 5.000%, 04/20/2047 | | $ | 774,822 | | | $ | 776,313 | | | | |
| 3.000%, 06/20/2047 | | | 12,131,812 | | | | 10,994,888 | | | | |
| 4.500%, 06/20/2047 | | | 11,522,177 | | | | 11,328,151 | | | | |
| 4.500%, 07/20/2047 | | | 2,742,709 | | | | 2,691,373 | | | | |
| 4.500%, 09/20/2047 | | | 3,637,623 | | | | 3,572,807 | | | | |
3.000%, 10/20/2047(6) | | | 17,456,825 | | | | 15,802,569 | | | | |
3.000%, 11/20/2047(6) | | | 76,274,609 | | | | 69,051,449 | | | | |
| 4.000%, 01/20/2048 | | | 5,061,865 | | | | 4,858,661 | | | | |
3.500%, 02/20/2048(6) | | | 76,129,116 | | | | 71,214,196 | | | | |
| 3.500%, 05/20/2048 | | | 66,019,684 | | | | 61,545,773 | | | | |
| 5.000%, 02/20/2049 | | | 37,097,611 | | | | 36,860,632 | | | | |
| 3.500%, 02/20/2050 | | | 62,973,268 | | | | 59,325,992 | | | | |
| 2.500%, 06/20/2050 | | | 109,822,551 | | | | 95,790,516 | | | | |
| 2.500%, 03/20/2051 | | | 50,998,568 | | | | 43,474,586 | | | | |
| 2.500%, 04/20/2051 | | | 66,085,936 | | | | 57,008,114 | | | | |
| 2.500%, 06/20/2051 | | | 33,721,204 | | | | 29,090,488 | | | | |
| 4.000%, 04/20/2052 | | | 18,876,005 | | | | 17,859,893 | | | | |
| 4.000%, 04/20/2052 | | | 26,726,709 | | | | 25,296,958 | | | | |
| 6.000%, 01/20/2053 | | | 40,069,844 | | | | 40,348,215 | | | | |
| Seasoned Credit Risk Transfer Trust: | | | | | | | | | | | |
| Series 2019-4, Class MA, 3.000%, | | | | | | | | | | | |
| 02/25/2059 (Callable 07/25/2047) | | | 33,119,453 | | | | 30,217,000 | | | | |
| Series 2020-2, Class MT, 2.000%, | | | | | | | | | | | |
| 11/25/2059 (Callable 06/25/2047) | | | 56,878,377 | | | | 46,420,514 | | | | |
| Series 2020-3, Class MT, 2.000%, | | | | | | | | | | | |
| 05/25/2060 (Callable 08/25/2046) | | | 37,432,137 | | | | 30,566,652 | | | | |
| Series 2021-3, Class MTU, 2.500%, | | | | | | | | | | | |
| 03/25/2061 (Callable 11/25/2044) | | | 68,710,350 | | | | 57,064,358 | | | | |
| Series 2022-1, Class MTU, 3.250%, | | | | | | | | | | | |
| 11/25/2061 (Callable 08/25/2045) | | | 54,158,876 | | | | 47,191,694 | | | | |
| Total U.S. Government Agency Issues | | | | | | | | | | | |
| (Cost $9,611,866,952) | | | | | | | 8,790,860,584 | | | | 22.4 | % |
| Non-U.S. Government Agency Issues | | | | | | | | | | | | |
| Alternative Loan Trust: | | | | | | | | | | | | |
| Series 2006-43CB, Class 2A1, 6.000%, | | | | | | | | | | | | |
| 08/25/2023 (Callable 07/25/2023) | | | 4,895 | | | | 4,865 | | | | | |
| Series 2006-28CB, Class A17, 6.000%, | | | | | | | | | | | | |
| 10/25/2036 (Callable 07/25/2023) | | | 405,761 | | | | 219,817 | | | | | |
| Arroyo Mortgage Trust: | | | | | | | | | | | | |
| Series 2019-3, Class A1, 2.962%, | | | | | | | | | | | | |
10/25/2048 (Callable 07/25/2023)(2)(4) | | | 9,515,581 | | | | 8,617,240 | | | | | |
| Series 2020-1, Class A1A, 1.662%, | | | | | | | | | | | | |
03/25/2055 (Callable 07/25/2023)(2) | | | 8,988,249 | | | | 8,150,682 | | | | | |
| Banc of America Alternative Loan Trust: | | | | | | | | | | | | |
| Series 2005-11, Class 1CB4, 5.500%, | | | | | | | | | | | | |
12/25/2035 (Callable 07/25/2023)(6) | | | 35,453 | | | | 30,744 | | | | | |
| Series 2006-5, Class CB7, 6.000%, | | | | | | | | | | | | |
06/25/2046 (Callable 07/25/2023)(6) | | | 148,562 | | | | 129,993 | | | | | |
| Bayview Financial Trust, | | | | | | | | | | | | |
| Series 2007-B, Class 1A2, 7.331%, | | | | | | | | | | | | |
08/28/2047 (Callable 07/28/2023)(7) | | | 828,740 | | | | 687,203 | | | | | |
| Bear Stearns ALT-A Trust, | | | | | | | | | | | | |
| Series 2004-4, Class A1, 5.750%, | | | | | | | | | | | | |
| 06/25/2034 | | | | | | | | | | | | |
| (1 Month LIBOR USD + 0.600%) | | | | | | | | | | | | |
(Callable 07/25/2023)(3) | | | 1,808 | | | | 1,888 | | | | | |
| Bear Stearns Asset Backed Securities I Trust, | | | | | | | | | | | | |
| Series 2004-AC2, Class 2A, 5.000%, | | | | | | | | | | | | |
| 05/25/2034 (Callable 07/25/2023) | | | 107,320 | | | | 95,406 | | | | | |
| Chase Home Lending Mortgage Trust, | | | | | | | | | | | | |
| Series 2023-RPL1, Class A1, 3.500%, | | | | | | | | | | | | |
06/25/2062 (Callable 12/25/2043(2)(4) | | | 124,839,304 | | | | 111,399,242 | | | | | |
| Chase Mortgage Finance Trust, | | | | | | | | | | | | |
| Series 2006-A1, Class 2A3, | | | | | | | | | | | | |
| 4.374%, 09/25/2036 | | | | | | | | | | | | |
(Callable 07/25/2023)(4)(6) | | | 514,266 | | | | 445,129 | | | | | |
| CIM Trust: | | | | | | | | | | | | |
| Series 2022-R2, Class A1, 3.750%, | | | | | | | | | | | | |
12/25/2061 (Callable 05/25/2027)(2)(4) | | | 53,176,772 | | | | 48,717,267 | | | | | |
| Series 2022-R3, Class A1, 4.500%, | | | | | | | | | | | | |
03/25/2062 (Callable 09/25/2027)(2)(4) | | | 62,454,717 | | | | 59,333,411 | | | | | |
| Series 2023-R2, Class A1, 5.500%, | | | | | | | | | | | | |
08/25/2064 (Callable 03/25/2028)(2)(4) | | | 76,057,899 | | | | 74,979,436 | | | | | |
| Citigroup Mortgage Loan Trust, Inc., | | | | | | | | | | | | |
| Series 2005-9, Class 2A2, 5.500%, | | | | | | | | | | | | |
11/25/2035 (Callable 07/25/2023)(6) | | | 6,336 | | | | 4,759 | | | | | |
| Credit Suisse First Boston | | | | | | | | | | | | |
| Mortgage Securities Corp., | | | | | | | | | | | | |
| Series 2003-AR26, Class 8A1, 4.488%, | | | | | | | | | | | | |
11/25/2033 (Callable 07/25/2023)(4) | | | 2,316,222 | | | | 2,157,132 | | | | | |
| CWABS Asset-Backed Certificates Trust: | | | | | | | | | | | | |
| Series 2004-S1, Class A3, 5.115%, | | | | | | | | | | | | |
02/25/2035 (Callable 07/25/2023)(7) | | | 54,928 | | | | 54,078 | | | | | |
| Series 2005-10, Class AF6, 4.915%, | | | | | | | | | | | | |
02/25/2036 (Callable 07/25/2023)(4) | | | 5,317 | | | | 5,150 | | | | | |
| Series 2005-17, Class 1AF5, 5.564%, | | | | | | | | | | | | |
05/25/2036 (Callable 07/25/2023)(4) | | | 52,326 | | | | 47,687 | | | | | |
| Series 2006-10, Class 1AF3, 5.971%, | | | | | | | | | | | | |
09/25/2046 (Callable 07/25/2023)(4) | | | 57,037 | | | | 57,422 | | | | | |
| First Horizon Alternative | | | | | | | | | | | | |
| Mortgage Securities Trust, | | | | | | | | | | | | |
| Series 2006-FA6, Class 3A1, 5.750%, | | | | | | | | | | | | |
11/25/2036 (Callable 07/25/2023)(6) | | | 2,457 | | | | 1,675 | | | | | |
| FirstKey Homes Trust: | | | | | | | | | | | | |
| Series 2022-SFR3, Class A, 4.250%, | | | | | | | | | | | | |
07/17/2038(2) | | | 55,750,000 | | | | 53,105,443 | | | | | |
| Series 2021-SFR1, Class A, 1.538%, | | | | | | | | | | | | |
08/17/2038(2) | | | 161,943,770 | | | | 141,727,763 | | | | | |
| Series 2021-SFR2, Class A, 1.376%, | | | | | | | | | | | | |
09/17/2038(2) | | | 48,762,021 | | | | 42,185,151 | | | | | |
| Series 2022-SFR1, Class A, 4.145%, | | | | | | | | | | | | |
05/17/2039(2) | | | 120,717,309 | | | | 113,729,297 | | | | | |
| Home Partners of America Trust, | | | | | | | | | | | | |
| Series 2021-2, Class A, 1.901%, | | | | | | | | | | | | |
12/17/2026(2) | | | 108,912,761 | | | | 94,990,105 | | | | | |
| IMC Home Equity Loan Trust, | | | | | | | | | | | | |
| Series 1997-5, Class A10, 6.880%, | | | | | | | | | | | | |
| 11/20/2028 | | | 2 | | | | 2 | | | | | |
| Impac CMB Trust, | | | | | | | | | | | | |
| Series 2004-4, Class 2A2, 5.329%, | | | | | | | | | | | | |
09/25/2034 (Callable 07/25/2023)(7) | | | 43,444 | | | | 45,083 | | | | | |
| Imperial Fund Mortgage Trust, | | | | | | | | | | | | |
| Series 2022-NQM3, Class A1, 4.380%, | | | | | | | | | | | | |
05/25/2067 (Callable 04/25/2025)(2)(7) | | | 6,854,653 | | | | 6,508,418 | | | | | |
| J.P. Morgan Alternative Loan Trust, | | | | | | | | | | | | |
| Series 2006-A1, Class 2A1, 4.107%, | | | | | | | | | | | | |
03/25/2036 (Callable 08/25/2025)(4) | | | 129,461 | | | | 99,936 | | | | | |
| J.P. Morgan Mortgage Trust: | | | | | | | | | | | | |
| Series 2007-A1, Class 5A2, 4.047%, | | | | | | | | | | | | |
07/25/2035 (Callable 12/25/2027)(4) | | | 717,019 | | | | 699,152 | | | | | |
| Series 2007-A1, Class 5A5, 4.047%, | | | | | | | | | | | | |
07/25/2035 (Callable 12/25/2027)(4) | | | 1,085,683 | | | | 1,059,626 | | | | | |
| Series 2005-A4, Class 1A1, 4.683%, | | | | | | | | | | | | |
07/25/2035 (Callable 07/25/2023)(4) | | | 56,150 | | | | 56,793 | | | | | |
| Series 2006-A7, Class 2A2, 3.881%, | | | | | | | | | | | | |
01/25/2037 (Callable 07/25/2023)(4)(6) | | | 48,778 | | | | 39,278 | | | | | |
The accompanying notes are an integral part of these financial statements.
Baird Aggregate Bond Fund
Schedule of Investments, June 30, 2023 (Unaudited)
Long-Term Investments (cont.)
| | | Principal | | | | | | % of | |
| | | Amount | | | Value | | | Net Assets | |
| J.P. Morgan Mortgage Trust: (cont.) | | | | | | | | | |
| Series 2006-A7, Class 2A4R, | | | | | | | | | |
| 3.881%, 01/25/2037 | | | | | | | | | |
(Callable 07/25/2023)(4)(6) | | $ | 208,401 | | | $ | 167,811 | | | | |
| Series 2007-A2, Class 2A3, 4.201%, | | | | | | | | | | | |
04/25/2037 (Callable 07/25/2023)(4) | | | 557,929 | | | | 409,310 | | | | |
| Merrill Lynch Mortgage Investors Trust, | | | | | | | | | | | |
| Series 2004-F, Class A1A, 5.907%, | | | | | | | | | | | |
12/25/2029 (Callable 07/25/2023)(4) | | | 1,941,977 | | | | 1,883,073 | | | | |
| MetLife, Inc., | | | | | | | | | | | |
| Series 2019-1A, Class A1A, 3.750%, | | | | | | | | | | | |
04/25/2058 (Callable 11/25/2035)(2)(4) | | | 5,148,673 | | | | 4,909,766 | | | | |
| Mill City Mortgage Loan Trust, | | | | | | | | | | | |
| Series 2021-NMR1, Class A1, 1.125%, | | | | | | | | | | | |
11/25/2060 (Callable 10/25/2033)(2)(4) | | | 15,643,451 | | | | 14,414,816 | | | | |
| Morgan Stanley Mortgage Loan Trust, | | | | | | | | | | | |
| Series 2004-7AR, Class 2A1, 4.756%, | | | | | | | | | | | |
09/25/2034 (Callable 05/25/2026)(4) | | | 879,732 | | | | 859,611 | | | | |
| New Residential Mortgage Loan Trust: | | | | | | | | | | | |
| Series 2017-2A, Class A3, 4.000%, | | | | | | | | | | | |
03/25/2057 (Callable 09/25/2031)(2)(4) | | | 4,767,683 | | | | 4,438,711 | | | | |
| Series 2017-3A, Class A1, 4.000%, | | | | | | | | | | | |
04/25/2057 (Callable 03/25/2032)(2)(4) | | | 6,701,702 | | | | 6,302,568 | | | | |
| Series 2017-4A, Class A1, 4.000%, | | | | | | | | | | | |
05/25/2057 (Callable 02/25/2032)(2)(4) | | | 9,840,726 | | | | 8,991,909 | | | | |
| Series 2018-1A, Class A1A, 4.000%, | | | | | | | | | | | |
12/25/2057 (Callable 08/25/2032)(2)(4) | | | 5,325,072 | | | | 4,995,930 | | | | |
| Series 2020-1A, Class A1B, 3.500%, | | | | | | | | | | | |
10/25/2059 (Callable 03/25/2042)(2)(4) | | | 10,353,984 | | | | 9,518,891 | | | | |
| Series 2022-NQM2, Class A1, 3.079%, | | | | | | | | | | | |
03/27/2062 (Callable 02/25/2024)(2)(4) | | | 35,389,437 | | | | 31,132,293 | | | | |
| OBX Trust, | | | | | | | | | | | |
| Series 2022-NQM2, Class A1, 2.950%, | | | | | | | | | | | |
01/25/2062 (Callable 02/25/2025)(2)(4) | | | 84,110,808 | | | | 74,670,892 | | | | |
| Progress Residential Trust, | | | | | | | | | | | |
| Series 2021-SFR8, Class A, 1.510%, | | | | | | | | | | | |
10/17/2038(2) | | | 72,992,120 | | | | 63,561,772 | | | | |
| RALI Series Trust, | | | | | | | | | | | |
| Series 2004-QS6, Class A1, 5.000%, | | | | | | | | | | | |
| 11/25/2023 (Callable 07/25/2023) | | | 6,147 | | | | 5,711 | | | | |
| Renaissance Home Equity Loan Trust, | | | | | | | | | | | |
| Series 2007-1, Class AF3, 5.612%, | | | | | | | | | | | |
04/25/2037 (Callable 09/25/2030)(7) | | | 2,482,525 | | | | 689,017 | | | | |
| Starwood Mortgage Residential Trust: | | | | | | | | | | | |
| Series 2021-4, Class A1, 1.162%, | | | | | | | | | | | |
08/25/2056 (Callable 09/25/2024)(2)(4) | | | 32,379,420 | | | | 26,803,253 | | | | |
| Series 2022-4, Class A1, 5.192%, | | | | | | | | | | | |
05/25/2067 (Callable 06/25/2025)(2)(7) | | | 55,064,205 | | | | 53,681,769 | | | | |
| Structured Adjustable Rate Mortgage Loan Trust, | | | | | | | | | | | |
| Series 2004-12, Class 3A1, 5.227%, | | | | | | | | | | | |
09/25/2034 (Callable 07/25/2023)(4) | | | 735,684 | | | | 707,948 | | | | |
| Thornburg Mortgage Securities Trust, | | | | | | | | | | | |
| Series 2003-5, Class 3A, 3.634%, | | | | | | | | | | | |
10/25/2043 (Callable 07/25/2023)(4) | | | 3,843,330 | | | | 3,683,884 | | | | |
| Towd Point Mortgage Trust: | | | | | | | | | | | |
| Series 2016-5, Class A1, 2.500%, | | | | | | | | | | | |
10/25/2056 (Callable 06/25/2030)(2)(4) | | | 511,944 | | | | 503,783 | | | | |
| Series 2017-1, Class A1, 2.750%, | | | | | | | | | | | |
10/25/2056 (Callable 01/25/2030)(2)(4) | | | 2,130,432 | | | | 2,098,864 | | | | |
| Series 2017-6, Class A1, 2.750%, | | | | | | | | | | | |
10/25/2057 (Callable 02/25/2033)(2)(4) | | | 13,871,104 | | | | 13,108,368 | | | | |
| Series 2018-1, Class A1, 3.000%, | | | | | | | | | | | |
01/28/2058 (Callable 10/25/2029)(2)(4) | | | 1,303,860 | | | | 1,248,084 | | | | |
| Series 2018-6, Class A1A, | | | | | | | | | | | |
| 3.750%, 03/25/2058 | | | | | | | | | | | |
(Callable 11/25/2031)(2)(4) | | | 9,655,967 | | | | 9,322,479 | | | | |
| Series 2019-1, Class A1, 3.750%, | | | | | | | | | | | |
03/25/2058 (Callable 07/25/2029)(2)(4) | | | 22,648,966 | | | | 21,192,975 | | | | |
| Series 2018-4, Class A1, 3.000%, | | | | | | | | | | | |
06/25/2058 (Callable 06/25/2036)(2)(4) | | | 12,654,217 | | | | 11,502,303 | | | | |
| Series 2019-4, Class A1, 2.900%, | | | | | | | | | | | |
10/25/2059 (Callable 05/25/2031)(2)(4) | | | 67,056,473 | | | | 61,598,592 | | | | |
| Series 2020-2, Class A1A, 1.636%, | | | | | | | | | | | |
04/25/2060 (Callable 05/25/2032)(2)(4) | | | 147,793,709 | | | | 127,659,949 | | | | |
| Series 2020-4, Class A1, 1.750%, | | | | | | | | | | | |
10/25/2060 (Callable 01/25/2031)(2) | | | 69,830,236 | | | | 60,667,084 | | | | |
| Series 2022-2, Class A1, 3.750%, | | | | | | | | | | | |
07/01/2062 (Callable 09/25/2035)(2)(4) | | | 168,597,605 | | | | 154,350,770 | | | | |
| Series 2022-3, Class A1, 3.750%, | | | | | | | | | | | |
08/01/2062 (Callable 08/25/2030)(2)(4) | | | 168,081,476 | | | | 152,986,835 | | | | |
| Series 2023-1, Class A1, 3.750%, | | | | | | | | | | | |
01/25/2063 (Callable 02/25/2033)(2) | | | 67,572,148 | | | | 61,622,860 | | | | |
| WaMu Mortgage Pass-Through | | | | | | | | | | | |
| Certificates Trust: | | | | | | | | | | | |
| Series 2004-CB2, Class 3A, 6.000%, | | | | | | | | | | | |
| 08/25/2034 (Callable 07/25/2023) | | | 2,459,193 | | | | 2,410,483 | | | | |
| Series 2004-CB3, Class 2A, 6.500%, | | | | | | | | | | | |
| 10/25/2034 (Callable 07/25/2023) | | | 1,073,959 | | | | 1,056,302 | | | | |
| Series 2004-AR14, Class A1, 4.198%, | | | | | | | | | | | |
01/25/2035 (Callable 07/25/2023)(4) | | | 3,085,880 | | | | 2,812,900 | | | | |
| Total Non-U.S. Government | | | | | | | | | | | |
| Agency Issues | | | | | | | | | | | |
| (Cost $1,895,863,971) | | | | | | | 1,765,357,839 | | | | 4.5 | % |
| Total Residential | | | | | | | | | | | | |
| Mortgage-Backed Securities | | | | | | | | | | | | |
| (Cost $11,507,730,923) | | | | | | | 10,556,218,423 | | | | 26.9 | % |
| Commercial Mortgage-Backed Securities | | | | | | | | | | | | |
| U.S. Government Agency Issues | | | | | | | | | | | | |
| Fannie Mae REMIC Trust, | | | | | | | | | | | | |
| Series 2014-M2, Class A2, 3.513%, | | | | | | | | | | | | |
12/25/2023(4) | | | 2,828,454 | | | | 2,797,290 | | | | | |
| Freddie Mac Multifamily Structured | | | | | | | | | | | | |
| Pass Through Certificates: | | | | | | | | | | | | |
| Series K067, Class A2, 3.194%, | | | | | | | | | | | | |
| 07/25/2027 | | | 68,324,045 | | | | 64,496,122 | | | | | |
| Series K068, Class A2, 3.244%, | | | | | | | | | | | | |
| 08/25/2027 | | | 105,313,000 | | | | 99,563,795 | | | | | |
| Series K069, Class A2, 3.187%, | | | | | | | | | | | | |
09/25/2027(4) | | | 25,488,779 | | | | 24,040,792 | | | | | |
| Series K071, Class A2, 3.286%, | | | | | | | | | | | | |
| 11/25/2027 | | | 25,529,000 | | | | 24,144,179 | | | | | |
| Series K072, Class A2, 3.444%, | | | | | | | | | | | | |
| 12/25/2027 | | | 6,050,000 | | | | 5,758,083 | | | | | |
| Series K073, Class A2, 3.350%, | | | | | | | | | | | | |
| 01/25/2028 | | | 1,350,000 | | | | 1,279,632 | | | | | |
| Series K074, Class A2, 3.600%, | | | | | | | | | | | | |
| 01/25/2028 | | | 21,722,000 | | | | 20,805,249 | | | | | |
| Series K076, Class A2, 3.900%, | | | | | | | | | | | | |
| 04/25/2028 | | | 92,070,000 | | | | 89,327,907 | | | | | |
| Series K077, Class A2, 3.850%, | | | | | | | | | | | | |
05/25/2028(4) | | | 68,650,000 | | | | 66,475,559 | | | | | |
| Series K078, Class A2, 3.854%, | | | | | | | | | | | | |
| 06/25/2028 | | | 59,788,633 | | | | 57,909,979 | | | | | |
| Series K080, Class A2, 3.926%, | | | | | | | | | | | | |
07/25/2028(4) | | | 14,950,000 | | | | 14,526,502 | | | | | |
The accompanying notes are an integral part of these financial statements.
Baird Aggregate Bond Fund
Schedule of Investments, June 30, 2023 (Unaudited)
Long-Term Investments (cont.)
| | | Principal | | | | | | % of | |
| | | Amount | | | Value | | | Net Assets | |
| Freddie Mac Multifamily Structured | | | | | | | | | |
| Pass Through Certificates: (cont.) | | | | | | | | | |
| Series K082, Class A2, 3.920%, | | | | | | | | | |
09/25/2028(4) | | $ | 56,545,000 | | | $ | 54,870,612 | | | | |
| Series K083, Class A2, 4.050%, | | | | | | | | | | | |
09/25/2028(4) | | | 1,000,000 | | | | 975,813 | | | | |
| Series K-1510, Class A2, 3.718%, | | | | | | | | | | | |
| 01/25/2031 | | | 39,850,000 | | | | 37,505,744 | | | | |
| Series K156, Class A3, 3.700%, | | | | | | | | | | | |
06/25/2033(4) | | | 11,088,000 | | | | 10,402,754 | | | | |
| Series K-1510, Class A3, 3.794%, | | | | | | | | | | | |
| 01/25/2034 | | | 13,525,000 | | | | 12,593,343 | | | | |
| Total U.S. Government Agency Issues | | | | | | | | | | | |
| (Cost $638,307,449) | | | | | | | 587,473,355 | | | | 1.5 | % |
| Non-U.S. Government Agency Issues | | | | | | | | | | | | |
| BANK: | | | | | | | | | | | | |
| Series 2017-BNK4, Class A3, 3.362%, | | | | | | | | | | | | |
| 05/15/2050 (Callable 04/15/2027) | | | 30,681,557 | | | | 28,120,374 | | | | | |
| Series 2017-BNK4, Class A4, 3.625%, | | | | | | | | | | | | |
| 05/15/2050 (Callable 04/15/2027) | | | 44,535,000 | | | | 40,847,066 | | | | | |
| Series 2017-BNK8, Class A4, 3.488%, | | | | | | | | | | | | |
| 11/15/2050 (Callable 11/15/2027) | | | 67,663,000 | | | | 61,218,830 | | | | | |
| Series 2019-BN21, Class A5, 2.851%, | | | | | | | | | | | | |
| 10/17/2052 (Callable 10/15/2029) | | | 39,560,000 | | | | 33,745,036 | | | | | |
| Series 2020-BN29, Class A4, 1.997%, | | | | | | | | | | | | |
| 11/15/2053 (Callable 12/15/2030) | | | 66,985,000 | | | | 51,772,171 | | | | | |
| Series 2017-BNK9, Class A4, 3.538%, | | | | | | | | | | | | |
| 11/15/2054 (Callable 12/15/2029) | | | 98,103,000 | | | | 89,982,377 | | | | | |
| Series 2022-BNK44, Class A5, 5.746%, | | | | | | | | | | | | |
11/15/2055 (Callable 11/15/2032)(4) | | | 79,775,000 | | | | 82,624,491 | | | | | |
| Series 2017-BNK5, Class A5, 3.390%, | | | | | | | | | | | | |
| 06/15/2060 (Callable 07/15/2027) | | | 22,501,000 | | | | 20,641,850 | | | | | |
| Series 2017-BNK7, Class A4, 3.175%, | | | | | | | | | | | | |
| 09/15/2060 (Callable 09/15/2027) | | | 21,500,000 | | | | 19,544,386 | | | | | |
| Series 2017-BNK7, Class A5, 3.435%, | | | | | | | | | | | | |
| 09/15/2060 (Callable 09/15/2027) | | | 350,000 | | | | 320,560 | | | | | |
| Series 2018-BN10, Class A5, 3.688%, | | | | | | | | | | | | |
| 02/15/2061 (Callable 02/15/2028) | | | 11,050,000 | | | | 10,190,467 | | | | | |
| Series 2018-BN12, Class A4, 4.255%, | | | | | | | | | | | | |
05/15/2061 (Callable 05/15/2028)(4) | | | 15,302,008 | | | | 14,433,930 | | | | | |
| Series 2018-BN13, Class A5, 4.217%, | | | | | | | | | | | | |
08/15/2061 (Callable 08/15/2028)(4) | | | 8,565,000 | | | | 8,054,595 | | | | | |
| BBCMS Mortgage Trust, | | | | | | | | | | | | |
| Series 2022-C15, Class ASB, 3.684%, | | | | | | | | | | | | |
04/15/2055 (Callable 04/15/2032)(4) | | | 7,104,000 | | | | 6,534,524 | | | | | |
| Benchmark Mortgage Trust: | | | | | | | | | | | | |
| Series 2018-B6, Class A4, 4.261%, | | | | | | | | | | | | |
| 10/10/2051 (Callable 10/10/2028) | | | 17,420,000 | | | | 16,060,818 | | | | | |
| Series 2018-B8, Class A5, 4.232%, | | | | | | | | | | | | |
| 01/15/2052 (Callable 12/15/2028) | | | 24,235,000 | | | | 22,246,940 | | | | | |
| Series 2020-B19, Class A5, 1.850%, | | | | | | | | | | | | |
| 09/15/2053 (Callable 10/15/2030) | | | 43,291,000 | | | | 33,507,061 | | | | | |
| Series 2020-B20, Class A5, 2.034%, | | | | | | | | | | | | |
| 10/15/2053 (Callable 10/15/2030) | | | 31,916,000 | | | | 24,745,541 | | | | | |
| Series 2020-B21, Class A5, 1.978%, | | | | | | | | | | | | |
| 12/17/2053 (Callable 12/15/2030) | | | 32,760,000 | | | | 25,795,502 | | | | | |
| Series 2021-B24, Class A5, 2.584%, | | | | | | | | | | | | |
| 03/15/2054 (Callable 03/15/2031) | | | 26,400,000 | | | | 21,043,316 | | | | | |
| Series 2021-B31, Class A5, 2.669%, | | | | | | | | | | | | |
| 12/15/2054 (Callable 12/15/2031) | | | 74,100,000 | | | | 60,566,873 | | | | | |
| Series 2019-B14, Class A5, 3.049%, | | | | | | | | | | | | |
| 12/15/2062 (Callable 11/15/2029) | | | 28,769,000 | | | | 24,819,261 | | | | | |
| CD Mortgage Trust: | | | | | | | | | | | | |
| Series 2016-CD1, Class A4, 2.724%, | | | | | | | | | | | | |
| 08/10/2049 (Callable 08/10/2026) | | | 48,986,454 | | | | 44,161,367 | | | | | |
| Series 2017-CD3, Class A4, 3.631%, | | | | | | | | | | | | |
| 02/10/2050 (Callable 02/10/2027) | | | 7,200,000 | | | | 6,550,949 | | | | | |
| Series 2018-CD7, Class A4, 4.279%, | | | | | | | | | | | | |
| 08/15/2051 (Callable 08/15/2028) | | | 7,400,000 | | | | 6,872,883 | | | | | |
| CFCRE Commercial Mortgage Trust: | | | | | | | | | | | | |
| Series 2016-C3, Class A3, 3.865%, | | | | | | | | | | | | |
| 01/10/2048 (Callable 01/10/2026) | | | 15,445,455 | | | | 14,583,656 | | | | | |
| Series 2016-C4, Class A4, 3.283%, | | | | | | | | | | | | |
| 05/10/2058 (Callable 05/10/2026) | | | 29,732,980 | | | | 27,592,645 | | | | | |
| Citigroup Commercial Mortgage Trust: | | | | | | | | | | | | |
| Series 2014-GC19, Class A3, 3.753%, | | | | | | | | | | | | |
| 03/11/2047 (Callable 03/10/2024) | | | 5,557,807 | | | | 5,527,076 | | | | | |
| Series 2014-GC25, Class A4, 3.635%, | | | | | | | | | | | | |
| 10/10/2047 (Callable 10/10/2024) | | | 16,838,590 | | | | 16,190,225 | | | | | |
| Series 2015-GC27, Class A5, 3.137%, | | | | | | | | | | | | |
| 02/10/2048 (Callable 01/10/2025) | | | 59,202,541 | | | | 56,435,036 | | | | | |
| Series 2015-GC29, Class A4, 3.192%, | | | | | | | | | | | | |
| 04/10/2048 (Callable 04/10/2025) | | | 17,480,000 | | | | 16,487,477 | | | | | |
| Series 2015-GC35, Class A4, 3.818%, | | | | | | | | | | | | |
| 11/10/2048 (Callable 11/10/2025) | | | 68,175,000 | | | | 64,339,004 | | | | | |
| Series 2017-P7, Class A4, 3.712%, | | | | | | | | | | | | |
| 04/14/2050 (Callable 04/14/2027) | | | 12,275,000 | | | | 11,285,625 | | | | | |
| Series 2017-P8, Class A4, 3.465%, | | | | | | | | | | | | |
| 09/15/2050 (Callable 09/15/2027) | | | 22,000,000 | | | | 20,080,665 | | | | | |
| Series 2015-GC33, Class A4, 3.778%, | | | | | | | | | | | | |
| 09/10/2058 (Callable 05/10/2026) | | | 8,600,000 | | | | 8,112,980 | | | | | |
| Series 2019-C7, Class A4, 3.102%, | | | | | | | | | | | | |
| 12/15/2072 (Callable 12/15/2029) | | | 22,880,000 | | | | 19,857,387 | | | | | |
| COMM Mortgage Trust: | | | | | | | | | | | | |
| Series 2014-CR15, Class ASB, 3.595%, | | | | | | | | | | | | |
| 02/10/2047 (Callable 02/10/2024) | | | 2,061,693 | | | | 2,050,674 | | | | | |
| Series 2014-CR19, Class A5, 3.796%, | | | | | | | | | | | | |
| 08/10/2047 (Callable 08/10/2024) | | | 15,789,828 | | | | 15,346,746 | | | | | |
| Series 2014-UBS5, Class A4, 3.838%, | | | | | | | | | | | | |
| 09/10/2047 (Callable 09/10/2024) | | | 17,596,000 | | | | 16,945,779 | | | | | |
| CSAIL Commercial Mortgage Trust: | | | | | | | | | | | | |
| Series 2018-CX11, Class A4, 3.766%, | | | | | | | | | | | | |
| 04/15/2051 (Callable 04/15/2028) | | | 11,440,000 | | | | 10,672,106 | | | | | |
| Series 2018-CX11, Class A5, 4.033%, | | | | | | | | | | | | |
04/15/2051 (Callable 04/15/2028)(4) | | | 10,000,000 | | | | 9,226,135 | | | | | |
| Series 2018-CX12, Class A4, 4.224%, | | | | | | | | | | | | |
08/15/2051 (Callable 08/15/2028)(4) | | | 12,653,000 | | | | 11,811,209 | | | | | |
| Series 2019-C16, Class A3, 3.329%, | | | | | | | | | | | | |
| 06/15/2052 (Callable 06/15/2029) | | | 25,365,000 | | | | 22,340,378 | | | | | |
| DBGS Mortgage Trust, | | | | | | | | | | | | |
| Series 2018-C1, Class A4, 4.466%, | | | | | | | | | | | | |
| 10/15/2051 (Callable 10/15/2028) | | | 19,875,000 | | | | 18,587,448 | | | | | |
| DBJPM Mortgage Trust: | | | | | | | | | | | | |
| Series 2016-C3, Class ASB, 2.756%, | | | | | | | | | | | | |
| 08/10/2049 (Callable 08/10/2026) | | | 6,464,032 | | | | 6,109,293 | | | | | |
| Series 2017-C6, Class A5, 3.328%, | | | | | | | | | | | | |
| 06/10/2050 (Callable 06/10/2027) | | | 20,800,000 | | | | 19,052,143 | | | | | |
| Series 2020-C9, Class A5, 1.926%, | | | | | | | | | | | | |
| 08/15/2053 (Callable 09/15/2030) | | | 22,555,000 | | | | 17,903,622 | | | | | |
| GS Mortgage Securities Trust: | | | | | | | | | | | | |
| Series 2013-GC14, Class A5, 4.243%, | | | | | | | | | | | | |
| 08/10/2046 (Callable 06/10/2025) | | | 17,128,448 | | | | 17,098,828 | | | | | |
| Series 2015-GS1, Class A3, 3.734%, | | | | | | | | | | | | |
| 11/10/2048 (Callable 11/10/2025) | | | 30,493,248 | | | | 28,683,733 | | | | | |
| Series 2017-GS8, Class A4, 3.469%, | | | | | | | | | | | | |
| 11/10/2050 (Callable 11/10/2027) | | | 23,655,000 | | | | 21,480,256 | | | | | |
The accompanying notes are an integral part of these financial statements.
Baird Aggregate Bond Fund
Schedule of Investments, June 30, 2023 (Unaudited)
Long-Term Investments (cont.)
| | | Principal | | | | | | % of | |
| | | Amount | | | Value | | | Net Assets | |
| JPMBB Commercial | | | | | | | | | |
| Mortgage Securities Trust: | | | | | | | | | |
| Series 2013-C17, Class A3, 3.928%, | | | | | | | | | |
| 01/15/2047 (Callable 01/15/2024) | | $ | 933,451 | | | $ | 929,319 | | | | |
| Series 2013-C17, Class A4, 4.199%, | | | | | | | | | | | |
| 01/15/2047 (Callable 01/15/2024) | | | 17,276,000 | | | | 17,083,580 | | | | |
| Series 2014-C24, Class ASB, 3.368%, | | | | | | | | | | | |
| 11/15/2047 (Callable 10/15/2025) | | | 2,399,557 | | | | 2,346,644 | | | | |
| Series 2014-C25, Class ASB, 3.407%, | | | | | | | | | | | |
| 11/15/2047 (Callable 11/15/2024) | | | 2,484,404 | | | | 2,424,998 | | | | |
| Series 2015-C30, Class A5, 3.822%, | | | | | | | | | | | |
| 07/15/2048 (Callable 07/15/2025) | | | 22,658,000 | | | | 21,363,186 | | | | |
| Series 2015-C28, Class A4, 3.227%, | | | | | | | | | | | |
| 10/15/2048 (Callable 04/15/2025) | | | 16,688,500 | | | | 15,734,772 | | | | |
| JPMCC Commercial | | | | | | | | | | | |
| Mortgage Securities Trust: | | | | | | | | | | | |
| Series 2017-JP7, Class A5, 3.454%, | | | | | | | | | | | |
| 09/15/2050 (Callable 08/15/2027) | | | 9,000,000 | | | | 8,149,478 | | | | |
| Series 2017-C7, Class A5, 3.409%, | | | | | | | | | | | |
| 10/15/2050 (Callable 11/15/2027) | | | 6,035,000 | | | | 5,477,585 | | | | |
| JPMDB Commercial | | | | | | | | | | | |
| Mortgage Securities Trust: | | | | | | | | | | | |
| Series 2016-C2, Class A4, 3.144%, | | | | | | | | | | | |
| 06/15/2049 (Callable 05/15/2026) | | | 19,890,000 | | | | 18,332,653 | | | | |
| Series 2017-C5, Class A5, 3.694%, | | | | | | | | | | | |
| 03/15/2050 (Callable 04/15/2027) | | | 24,380,000 | | | | 22,473,040 | | | | |
| Morgan Stanley Bank of | | | | | | | | | | | |
| America Merrill Lynch Trust: | | | | | | | | | | | |
| Series 2014-C16, Class A5, 3.892%, | | | | | | | | | | | |
| 06/15/2047 (Callable 06/15/2026) | | | 25,000,000 | | | | 24,397,365 | | | | |
| Series 2016-C29, Class ASB, 3.140%, | | | | | | | | | | | |
| 05/15/2049 (Callable 05/15/2026) | | | 6,851,285 | | | | 6,542,416 | | | | |
| Series 2016-C30, Class A5, 2.860%, | | | | | | | | | | | |
| 09/15/2049 (Callable 10/15/2026) | | | 18,082,000 | | | | 16,379,077 | | | | |
| Series 2017-C34, Class A4, 3.536%, | | | | | | | | | | | |
| 11/15/2052 (Callable 10/15/2027) | | | 41,287,079 | | | | 37,760,163 | | | | |
| Morgan Stanley Capital I Trust: | | | | | | | | | | | |
| Series 2015-UBS8, Class A4, 3.809%, | | | | | | | | | | | |
| 12/15/2048 (Callable 12/15/2025) | | | 65,135,000 | | | | 61,156,124 | | | | |
| Series 2016-UB12, Class A4, 3.596%, | | | | | | | | | | | |
| 12/15/2049 (Callable 12/15/2026) | | | 5,000,000 | | | | 4,616,925 | | | | |
| Series 2018-H3, Class A5, 4.177%, | | | | | | | | | | | |
| 07/15/2051 (Callable 07/15/2028) | | | 22,101,510 | | | | 20,508,243 | | | | |
| Series 2018-H4, Class A3, 4.043%, | | | | | | | | | | | |
| 12/15/2051 (Callable 01/15/2029) | | | 10,000,000 | | | | 9,277,477 | | | | |
| Series 2018-H4, Class A4, 4.310%, | | | | | | | | | | | |
| 12/15/2051 (Callable 01/15/2029) | | | 4,750,000 | | | | 4,421,534 | | | | |
| UBS Commercial Mortgage Trust: | | | | | | | | | | | |
| Series 2019-C17, Class A4, 2.921%, | | | | | | | | | | | |
| 10/15/2052 (Callable 10/15/2029) | | | 67,494,355 | | | | 57,680,372 | | | | |
| Series 2019-C18, Class A4, 3.035%, | | | | | | | | | | | |
| 12/15/2052 (Callable 12/15/2029) | | | 5,590,000 | | | | 4,792,464 | | | | |
| Wells Fargo Commercial Mortgage Trust: | | | | | | | | | | | |
| Series 2015-C27, Class ASB, 3.278%, | | | | | | | | | | | |
| 02/15/2048 (Callable 03/15/2025) | | | 5,850,320 | | | | 5,688,711 | | | | |
| Series 2016-C35, Class A4, 2.931%, | | | | | | | | | | | |
| 07/15/2048 (Callable 07/15/2026) | | | 25,670,000 | | | | 23,413,966 | | | | |
| Series 2015-SG1, Class ASB, 3.556%, | | | | | | | | | | | |
| 09/15/2048 (Callable 08/15/2025) | | | 7,600,645 | | | | 7,395,319 | | | | |
| Series 2015-SG1, Class A4, 3.789%, | | | | | | | | | | | |
| 09/15/2048 (Callable 08/15/2025) | | | 19,376,623 | | | | 18,376,458 | | | | |
| Series 2015-P2, Class A3, 3.541%, | | | | | | | | | | | |
| 12/15/2048 (Callable 12/15/2025) | | | 32,066,930 | | | | 30,190,540 | | | | |
| Series 2016-C34, Class A4, 3.096%, | | | | | | | | | | | |
| 06/15/2049 (Callable 05/15/2026) | | | 6,000,000 | | | | 5,507,851 | | | | |
| Series 2017-C42, Class A4, 3.589%, | | | | | | | | | | | |
| 12/15/2050 (Callable 12/15/2027) | | | 7,315,000 | | | | 6,608,120 | | | | |
| Series 2019-C50, Class ASB, 3.635%, | | | | | | | | | | | |
| 05/15/2052 (Callable 05/15/2029) | | | 20,000,000 | | | | 18,769,522 | | | | |
| Series 2019-C51, Class A4, 3.311%, | | | | | | | | | | | |
| 06/15/2052 (Callable 06/15/2029) | | | 22,581,000 | | | | 19,848,981 | | | | |
| Series 2019-C52, Class A5, 2.892%, | | | | | | | | | | | |
| 08/15/2052 (Callable 08/15/2029) | | | 10,000,000 | | | | 8,605,901 | | | | |
| Series 2019-C54, Class A4, 3.146%, | | | | | | | | | | | |
| 12/15/2052 (Callable 11/15/2029) | | | 30,610,609 | | | | 26,645,222 | | | | |
| Series 2022-C62, Class A4, 4.000%, | | | | | | | | | | | |
04/15/2055 (Callable 04/15/2032)(4) | | | 42,914,000 | | | | 38,596,551 | | | | |
| Series 2017-RC1, Class A4, 3.631%, | | | | | | | | | | | |
| 01/15/2060 (Callable 03/15/2027) | | | 14,225,000 | | | | 13,184,992 | | | | |
| WFRBS Commercial Mortgage Trust: | | | | | | | | | | | |
| Series 2013-C18, Class A4, 3.896%, | | | | | | | | | | | |
| 12/15/2046 (Callable 01/15/2024) | | | 5,522,591 | | | | 5,448,123 | | | | |
| Series 2014-C21, Class A5, 3.678%, | | | | | | | | | | | |
| 08/15/2047 (Callable 08/15/2024) | | | 34,719,000 | | | | 33,597,785 | | | | |
| Series 2014-C24, Class A4, 3.343%, | | | | | | | | | | | |
| 11/15/2047 (Callable 11/15/2024) | | | 36,730,000 | | | | 35,151,179 | | | | |
| Series 2014-C23, Class ASB, 3.636%, | | | | | | | | | | | |
| 10/15/2057 (Callable 09/15/2025) | | | 1,616,453 | | | | 1,581,125 | | | | |
| Series 2014-C23, Class A5, 3.917%, | | | | | | | | | | | |
| 10/15/2057 (Callable 09/15/2025) | | | 125,000 | | | | 120,302 | | | | |
| Total Non-U.S. Government | | | | | | | | | | | |
| Agency Issues | | | | | | | | | | | |
| (Cost $2,126,775,768) | | | | | | | 1,892,779,357 | | | | 4.8 | % |
| Total Commercial | | | | | | | | | | | | |
| Mortgage-Backed Securities | | | | | | | | | | | | |
| (Cost $2,765,083,217) | | | | | | | 2,480,252,712 | | | | 6.3 | % |
| Asset Backed Securities | | | | | | | | | | | | |
| Citizens Auto Receivables Trust, | | | | | | | | | | | | |
| Series 2023-1, Class A3, 5.840%, | | | | | | | | | | | | |
01/18/2028 (Callable 01/15/2027)(2) | | | 110,500,000 | | | | 110,201,947 | | | | | |
| First National Master Note Trust, | | | | | | | | | | | | |
| Series 2023-1, Class A, 5.130%, | | | | | | | | | | | | |
| 04/15/2029 | | | 63,134,000 | | | | 62,260,478 | | | | | |
| Ford Credit Auto Owner Trust: | | | | | | | | | | | | |
| Series 2018-1, Class A, 3.190%, | | | | | | | | | | | | |
07/15/2031 (Callable 01/15/2025)(2) | | | 51,650,000 | | | | 49,630,408 | | | | | |
| Series 2020-1, Class A, 2.040%, | | | | | | | | | | | | |
08/15/2031 (Callable 02/15/2025)(2) | | | 15,086,000 | | | | 14,197,495 | | | | | |
| Series 2020-2, Class A, 1.060%, | | | | | | | | | | | | |
04/15/2033 (Callable 10/15/2025)(2) | | | 18,600,000 | | | | 16,795,846 | | | | | |
| Series 2023-1, Class A, 4.850%, | | | | | | | | | | | | |
08/15/2035 (Callable 02/15/2028)(2) | | | 91,550,000 | | | | 89,579,817 | | | | | |
| Ford Credit Floorplan Master Owner Trust: | | | | | | | | | | | | |
| Series 2020-2, Class A, 1.060%, | | | | | | | | | | | | |
| 09/15/2027 | | | 11,938,000 | | | | 10,830,195 | | | | | |
| Series 2023-1, Class A1, 4.920%, | | | | | | | | | | | | |
05/15/2028(2) | | | 49,875,000 | | | | 49,320,016 | | | | | |
| GM Financial Revolving | | | | | | | | | | | | |
| Receivables Trust, | | | | | | | | | | | | |
| Series 2022-1, Class A, 5.910%, | | | | | | | | | | | | |
10/11/2035 (Callable 11/11/2027)(2) | | | 64,950,000 | | | | 66,178,334 | | | | | |
The accompanying notes are an integral part of these financial statements.
Baird Aggregate Bond Fund
Schedule of Investments, June 30, 2023 (Unaudited)
Long-Term Investments (cont.)
| | | Principal | | | | | | % of | |
| | | Amount | | | Value | | | Net Assets | |
| GMF Floorplan Owner Revolving Trust: | | | | | | | | | |
Series 2023-1, Class A1, 5.340%, 06/15/2028(2) | | | | | | | | | |
| | $ | 10,300,000 | | | $ | 10,280,561 | | | |
| |
Series 2023-2, Class A, 5.460%, 06/17/2030(2) | | | | | | | | | | | | |
| | | 25,000,000 | | | | 24,886,375 | | | | | |
| Navient Private Education | | | | | | | | | | | | |
| Refi Loan Trust: | | | | | | | | | | | | |
| Series 2021-GA, Class A, 1.580%, | | | | | | | | | | | | |
04/15/2070 (Callable 05/15/2029)(2) | | | 15,734,912 | | | | 13,505,122 | | | | | |
| Series 2022-A, Class A, 2.230%, | | | | | | | | | | | | |
07/15/2070 (Callable 07/15/2029)(2) | | | 24,045,237 | | | | 20,841,573 | | | | | |
| Series 2022-BA, Class A, 4.160%, | | | | | | | | | | | | |
10/15/2070 (Callable 10/15/2029)(2) | | | 44,493,194 | | | | 42,037,157 | | | | | |
| Series 2023-A, Class A, 5.510%, | | | | | | | | | | | | |
10/15/2071 (Callable 10/15/2032)(2) | | | 67,626,922 | | | | 66,656,658 | | | | | |
| Nelnet Student Loan Trust, | | | | | | | | | | | | |
| Series 2021-A, Class APT1, 1.360%, | | | | | | | | | | | | |
04/20/2062 (Callable 09/20/2029)(2) | | | 34,252,477 | | | | 30,396,881 | | | | | |
| PFS Financing Corp., | | | | | | | | | | | | |
| Series 2023-A, Class A, 5.800%, | | | | | | | | | | | | |
03/15/2028(2) | | | 97,570,000 | | | | 97,600,549 | | | | | |
| SBA Tower Trust, | | | | | | | | | | | | |
1.840%, 10/15/2051 (Callable 04/15/2026)(2) | | | | | | | | | | | | |
| | | 94,050,000 | | | | 80,895,245 | | | | | |
| Towd Point Asset Trust, | | | | | | | | | | | | |
| Series 2021-SL1, Class A1, 1.050%, | | | | | | | | | | | | |
11/20/2061(2) | | | 11,405,025 | | | | 10,286,953 | | | | | |
| Towd Point Mortgage Trust: | | | | | | | | | | | | |
| Series 2020-MH1, Class A1A, 2.184%, | | | | | | | | | | | | |
02/25/2060 (Callable 07/25/2023)(2)(4) | | | 24,310,000 | | | | 22,565,853 | | | | | |
| Series 2020-MH1, Class A1, 2.250%, | | | | | | | | | | | | |
02/25/2060 (Callable 07/25/2023)(2)(4) | | | 15,496,415 | | | | 14,398,836 | | | | | |
| Toyota Auto Loan Extended Note Trust: | | | | | | | | | | | | |
| Series 2020-1A, Class A, 1.350%, | | | | | | | | | | | | |
05/25/2033 (Callable 05/25/2025)(2) | | | 104,383,000 | | | | 96,369,308 | | | | | |
| Series 2022-1A, Class A, 3.820%, | | | | | | | | | | | | |
04/25/2035 (Callable 04/25/2027)(2) | | | 25,275,000 | | | | 23,953,578 | | | | | |
| Total Asset Backed Securities | | | | | | | | | | | | |
| (Cost $1,062,305,530) | | | | | | | 1,023,669,185 | | | | 2.6 | % |
| Total Long-Term Investments | | | | | | | | | | | | |
| (Cost $42,909,828,872) | | | | | | | 38,824,305,959 | | | | 98.7 | % |
| Short-Term Investment | | | | | | | | | | | | |
| | | Shares | | | | | | | | | |
| Money Market Mutual Fund | | | | | | | | | | | | |
| First American Government Obligations | | | | | | | | | | | | |
Fund, Class U, 5.03%(5) | | | 891,834,222 | | | $ | 891,834,222 | | | | | |
| Total Short-Term Investment | | | | | | | | | | | | |
| (Cost $891,834,222) | | | | | | | 891,834,222 | | | | 2.3 | % |
| Total Investments | | | | | | | | | | | | |
| (Cost $43,801,663,094) | | | | | | | 39,716,140,181 | | | | 101.0 | % |
| Liabilities in Excess of Other Assets | | | | | | | (393,548,409 | ) | | | (1.0 | )% |
| TOTAL NET ASSETS | | | | | | $ | 39,322,591,772 | | | | 100.0 | % |
Notes to Schedule of Investments
ACA – American Capital Access
AGC – Assured Guaranty Corp.
AGM – Assured Guaranty Municipal
BAM – Build America Mutual Assurance Co.
GNMA – Government National Mortgage Association
SD CRED PROG – State Credit Enhancement Program
CMT – Constant Maturity Treasury
LIBOR – London Inter-bank Offered Rate
SOFR – Secured Overnight Financing Rate
SOFRINDX – Secured Overnight Financing Rate Index
(1) | Foreign security. |
(2) | Includes securities exempt from registration under Rule 144A of the Securities Act of 1933. These securities may be resold in transactions exempt from registration to qualified institutional buyers. At June 30, 2023, the value of these securities totaled $7,737,807,258, which represented 19.68% of total net assets. |
(3) | Variable rate security based on a reference index and spread. The rate reported is the rate as of the last reset date in effect as of June 30, 2023. |
(4) | Variable rate security. The coupon is based on an underlying pool of loans. The rate reported is the rate in effect as of June 30, 2023. |
(5) | Seven-day yield. |
(6) | Security that, on the last payment date, missed a partial principal or interest payment. |
(7) | Step-up bond; the interest rate shown is the rate in effect as of June 30, 2023. |
(8) | Security or a portion of the security, purchased on a when-issued or delayed delivery basis. |
(9) | Security in default. |
The accompanying notes are an integral part of these financial statements.
Baird Aggregate Bond Fund
Schedule of Investments, June 30, 2023 (Unaudited)
Summary of Fair Value Exposure at June 30, 2023 (Unaudited)
The Fund has adopted authoritative fair valuation accounting standards which establish a definition of fair value and set out a hierarchy for measuring fair value. These standards require additional disclosures about the various inputs and valuation techniques used to develop the measurements of fair value and a discussion on changes in valuation techniques and related inputs during the period. These standards define fair value as the price that would be received to sell an asset or paid to transfer a liability in an orderly transaction between market participants at the measurement date.
The fair value hierarchy is organized into three levels based upon the assumptions (referred to as “inputs”) used in pricing the asset or liability. These standards state that “observable inputs” reflect the assumptions market participants would use in pricing the asset or liability based on market data obtained from independent sources and “unobservable inputs” reflect an entity’s own assumptions about the assumptions market participants would use in pricing the asset or liability. These inputs are summarized into three broad levels and described below:
Level 1 – Quoted prices (unadjusted) in active markets for identical assets or liabilities that the reporting entity can access at the measurement date.
Level 2 – Inputs other than quoted prices included within Level 1 that are observable for the asset or liability, either directly or indirectly.
Level 3 – Unobservable inputs for the asset or liability.
The inputs or methodology used for valuing securities are not necessarily an indication of the risk associated with investing in those securities.
The following is a summary of the inputs used to value the Fund’s investments as of June 30, 2023:
| | | Level 1 | | | Level 2 | | | Level 3 | | | Total | |
| Long-Term Investments | | | | | | | | | | | | |
| U.S. Treasury Securities | | $ | — | | | $ | 9,087,046,665 | | | $ | — | | | $ | 9,087,046,665 | |
| Other Government Related Securities | | | — | | | | 77,696,018 | | | | — | | | | 77,696,018 | |
| Corporate Bonds | | | — | | | | 15,241,480,660 | | | | — | | | | 15,241,480,660 | |
| Municipal Bonds | | | — | | | | 357,942,296 | | | | — | | | | 357,942,296 | |
| Residential Mortgage-Backed Securities – U.S. Government Agency Issues | | | — | | | | 8,790,860,584 | | | | — | | | | 8,790,860,584 | |
| Residential Mortgage-Backed Securities – Non-U.S. Government Agency Issues | | | — | | | | 1,765,357,839 | | | | — | | | | 1,765,357,839 | |
| Commercial Mortgage-Backed Securities – U.S. Government Agency Issues | | | — | | | | 587,473,355 | | | | — | | | | 587,473,355 | |
| Commercial Mortgage-Backed Securities – Non-U.S. Government Agency Issues | | | — | | | | 1,892,779,357 | | | | — | | | | 1,892,779,357 | |
| Asset Backed Securities | | | — | | | | 1,023,669,185 | | | | — | | | | 1,023,669,185 | |
| Total Long-Term Investments | | | — | | | | 38,824,305,959 | | | | — | | | | 38,824,305,959 | |
| Short-Term Investment | | | | | | | | | | | | | | | | |
| Money Market Mutual Fund | | | 891,834,222 | | | | — | | | | — | | | | 891,834,222 | |
| Total Short-Term Investment | | | 891,834,222 | | | | — | | | | — | | | | 891,834,222 | |
| Total Investments | | $ | 891,834,222 | | | $ | 38,824,305,959 | | | $ | — | | | $ | 39,716,140,181 | |
Changes in valuation techniques may result in transfers into or out of assigned levels within the fair value hierarchy. There were no transfers into or out of Level 3 during the reporting period, as compared to the security classifications from the prior year’s annual report. See the Fund’s Valuation Policy in Note 2a to the financial statements.
The accompanying notes are an integral part of these financial statements.
Baird Core Plus Bond Fund
June 30, 2023 (Unaudited)
Portfolio Characteristics
Quality Distribution(1)(2)

| | Net Assets | $24,300,262,353 | |
| | | | |
| | SEC 30-Day Yield(3) | | |
| | Institutional Class | 4.61% | |
| | Investor Class | 4.35% | |
| | | | |
| | Average Effective Duration | 6.06 years | |
| | | | |
| | Average Effective Maturity | 8.21 years | |
| | | | |
| | Annualized Expense Ratio(4) | | |
| | Institutional Class | 0.30% | |
| | Investor Class | 0.55% | (5) |
| | | | |
| | Portfolio Turnover Rate | 18% | (6) |
| | | | |
| | Number of Holdings | 1,500 | |
| | | | |
| | | | | |
Sector Weightings(7)
(1) | Percentages shown are based on the Fund’s investments. |
(2) | The quality profile is calculated on a market value-weighted basis using the highest credit quality rating for each security held by the Fund given by S&P, Moody’s or Fitch, each of which is a Nationally Recognized Statistical Rating Organization (NRSRO). NRSROs rate the credit quality of securities using a scale that generally ranges from AAA (highest) to D (lowest). |
(3) | SEC yields are based on SEC guidelines and are calculated for the 30 days ended June 30, 2023. |
(4) | Reflects expense ratios as stated in the Fund’s current prospectus dated May 1, 2023. |
(5) | Includes 0.25% 12b-1 fee. |
(6) | Not annualized. |
(7) | Percentages shown are based on the Fund’s total net assets. |
Baird Core Plus Bond Fund
June 30, 2023 (Unaudited)
Total Returns
| | | | Average Annual |
| | Six | One | Five | Ten | Since |
| For the Periods Ended June 30, 2023 | Months | Year | Years | Years | Inception(1) |
| Institutional Class Shares | 2.59% | 0.48% | 1.42% | 2.25% | 4.72% |
| Investor Class Shares | 2.44% | 0.30% | 1.16% | 1.99% | 4.46% |
Bloomberg U.S. Universal Index(2) | 2.32% | -0.04%
| 0.98% | 1.80% | 4.07% |
(1) | For the period from September 29, 2000 (inception date) through June 30, 2023. |
(2) | The Bloomberg U.S. Universal Index is an unmanaged, market value weighted index of fixed income securities issued in U.S. dollars, including U.S. government and investment grade debt, non-investment grade debt, asset-backed and mortgage-backed securities, Eurobonds, 144A securities and emerging market debt, with maturities of at least one year. This Index does not reflect any deduction for fees, expenses or taxes. A direct investment in an index is not possible. |
The returns table shown above reflects reinvestment of dividends and/or capital gains distributions in additional shares. The returns in the table do not reflect the deduction of taxes that a shareholder would pay on Fund distributions or the redemption of Fund shares. The returns reflect the actual performance for each period and do not include the impact of trades executed on the last business day of the period that were recorded on the first business day of the next period.
The Fund’s expense ratio for each Class, as reflected in the Fund’s current prospectus, is set forth under “Portfolio Characteristics”.
The Fund may invest up to 20% of its net assets in non-investment grade debt securities (commonly referred to as “high yield” bonds). While these types of debt securities typically offer higher yields than investment grade securities, they also include greater risks including increased credit risk and the increased risk of default or bankruptcy. The Fund maintains securities with longer maturities in order to provide a greater potential for return. Generally, the longer a bond’s maturity, the greater the interest rate risk. The Fund may also invest in U.S. dollar denominated foreign securities which involve additional risks such as political and economic instability, and different and sometimes less strict financial reporting standards and regulation. The Fund may also invest in mortgage- and asset-backed securities, which include interest rate and prepayment risks more pronounced than those of other fixed income securities. U.S. and international markets have experienced significant periods of volatility in recent years and months due to a number of economic, political and global macro factors. Russia’s ongoing war with Ukraine has heightened global geopolitical tensions, resulting in an elevated risk environment and increased volatility in asset prices. The uncertain course of the war may have a significant negative impact on the global economy. U.S. relations with China have become increasingly strained, and tension between the U.S. and China may have a significant negative impact on the global economy and asset prices. Measures of inflation reached levels not experienced in several decades, leading the Federal Reserve to raise short term interest rates significantly over the last year, with the potential for further rate increases in 2023. Uncertainty regarding the ability of the Federal Reserve to successfully control inflation, the potential for incremental rate increases, and the full impact of prior rate increases on the economy may negatively impact asset prices and increase market volatility. The possibility of a U.S. or global recession may also contribute to market volatility. The coronavirus (COVID-19) pandemic caused significant economic disruption in recent years as countries worked to limit the negative health impacts of the virus. While the virus has entered an endemic stage, significant outbreaks or new variants present a continued risk to the global economy. These and other geopolitical events may cause market disruptions and could have an adverse effect on the value of the Fund’s investments.
Past performance does not guarantee future results. Investment return and principal value will fluctuate so that an investor’s shares, when redeemed, may be worth more or less than their original cost.
For information about the performance of the Fund as of the most recent month-end, please call 1-866-442-2473 or visit www.bairdfunds.com. Mutual fund performance changes over time and current performance may be lower or higher than that stated.
Baird Core Plus Bond Fund
Schedule of Investments, June 30, 2023 (Unaudited)
Long-Term Investments
| | | Principal | | | | | | % of | |
| | | Amount | | | Value | | | Net Assets | |
| U.S. Treasury Securities | | | | | | | | | |
| U.S. Treasury Bonds: | | | | | | | | | |
| 1.125%, 10/31/2026 | | $ | 534,075,000 | | | $ | 480,250,254 | | | | |
| 1.125%, 08/31/2028 | | | 798,425,000 | | | | 687,924,226 | | | | |
| 2.375%, 03/31/2029 | | | 228,900,000 | | | | 208,978,547 | | | | |
| 3.875%, 12/31/2029 | | | 40,000,000 | | | | 39,651,562 | | | | |
| 2.875%, 05/15/2032 | | | 161,825,000 | | | | 150,042,117 | | | | |
| 3.500%, 02/15/2033 | | | 99,950,000 | | | | 97,357,547 | | | | |
| 1.375%, 11/15/2040 | | | 456,375,000 | | | | 305,343,398 | | | | |
| 2.250%, 05/15/2041 | | | 78,175,000 | | | | 60,206,965 | | | | |
| 2.375%, 02/15/2042 | | | 323,400,000 | | | | 251,784,587 | | | | |
| 2.875%, 05/15/2043 | | | 696,050,000 | | | | 582,207,758 | | | | |
| 2.500%, 02/15/2045 | | | 966,625,000 | | | | 748,379,199 | | | | |
| 1.250%, 05/15/2050 | | | 92,400,000 | | | | 51,956,953 | | | | |
| 1.375%, 08/15/2050 | | | 204,000,000 | | | | 118,535,157 | | | | |
| 2.875%, 05/15/2052 | | | 214,925,000 | | | | 178,110,699 | | | | |
| Total U.S. Treasury Securities | | | | | | | | | | | |
| (Cost $4,579,448,513) | | | | | | | 3,960,728,969 | | | | 16.3 | % |
| Other Government Related Securities | | | | | | | | | | | | |
| Comision Federal de Electricidad, | | | | | | | | | | | | |
5.750%, 02/14/2042(1)(2) | | | 5,200,000 | | | | 4,420,000 | | | | | |
| Electricite de France SA: | | | | | | | | | | | | |
| 6.250%, 05/23/2033 | | | | | | | | | | | | |
(Callable 02/23/2033)(1)(2) | | | 7,000,000 | | | | 7,116,054 | | | | | |
| 4.750%, 10/13/2035 | | | | | | | | | | | | |
(Callable 04/13/2035)(1)(2) | | | 10,000,000 | | | | 8,799,471 | | | | | |
| NBN Co. Ltd., | | | | | | | | | | | | |
| 2.625%, 05/05/2031 | | | | | | | | | | | | |
(Callable 02/05/2031)(1)(2) | | | 5,000,000 | | | | 4,193,908 | | | | | |
| Petroleos Mexicanos: | | | | | | | | | | | | |
| 5.950%, 01/28/2031 | | | | | | | | | | | | |
(Callable 10/28/2030)(1) | | | 1,005,000 | | | | 734,204 | | | | | |
| 6.700%, 02/16/2032 | | | | | | | | | | | | |
(Callable 11/16/2031)(1) | | | 31,343,000 | | | | 23,831,791 | | | | | |
| Total Other Government | | | | | | | | | | | | |
| Related Securities | | | | | | | | | | | | |
| (Cost $57,056,673) | | | | | | | 49,095,428 | | | | 0.2 | % |
| Corporate Bonds | | | | | | | | | | | | |
| Industrials | | | | | | | | | | | | |
| 180 Medical, Inc., | | | | | | | | | | | | |
| 3.875%, 10/15/2029 | | | | | | | | | | | | |
(Callable 10/07/2024)(1)(2) | | | 500,000 | | | | 436,057 | | | | | |
| AbbVie, Inc.: | | | | | | | | | | | | |
| 3.800%, 03/15/2025 | | | | | | | | | | | | |
| (Callable 12/15/2024) | | | 29,200,000 | | | | 28,388,813 | | | | | |
| 3.600%, 05/14/2025 | | | | | | | | | | | | |
| (Callable 02/14/2025) | | | 2,500,000 | | | | 2,416,742 | | | | | |
| 4.300%, 05/14/2036 | | | | | | | | | | | | |
| (Callable 11/14/2035) | | | 3,825,000 | | | | 3,512,700 | | | | | |
| 4.050%, 11/21/2039 | | | | | | | | | | | | |
| (Callable 05/21/2039) | | | 11,250,000 | | | | 9,794,949 | | | | | |
| 4.250%, 11/21/2049 | | | | | | | | | | | | |
| (Callable 05/21/2049) | | | 20,000,000 | | | | 17,262,587 | | | | | |
| ADT Security Corp., | | | | | | | | | | | | |
| 4.125%, 08/01/2029 | | | | | | | | | | | | |
(Callable 08/01/2028)(2) | | | 2,250,000 | | | | 1,943,438 | | | | | |
| Advanced Drainage Systems, Inc., | | | | | | | | | | | | |
| 6.375%, 06/15/2030 | | | | | | | | | | | | |
(Callable 07/15/2025)(2) | | | 1,500,000 | | | | 1,483,905 | | | | | |
| Adventist Health System: | | | | | | | | | | | | |
| 2.952%, 03/01/2029 | | | | | | | | | | | | |
| (Callable 12/01/2028) | | | 7,250,000 | | | | 6,345,182 | | | | | |
| 3.630%, 03/01/2049 | | | | | | | | | | | | |
| (Callable 09/01/2048) | | | 8,900,000 | | | | 6,622,550 | | | | | |
| Air Products and Chemicals, Inc., | | | | | | | | | | | | |
| 2.800%, 05/15/2050 | | | | | | | | | | | | |
| (Callable 11/15/2049) | | | 5,000,000 | | | | 3,570,904 | | | | | |
| Aker BP ASA, | | | | | | | | | | | | |
| 5.600%, 06/13/2028 | | | | | | | | | | | | |
(Callable 05/13/2028)(1)(2) | | | 7,000,000 | | | | 6,949,055 | | | | | |
| Albertsons Companies, Inc.: | | | | | | | | | | | | |
| 3.250%, 03/15/2026 | | | | | | | | | | | | |
(Callable 07/31/2023)(2) | | | 5,000,000 | | | | 4,617,847 | | | | | |
| 3.500%, 03/15/2029 | | | | | | | | | | | | |
(Callable 09/15/2023)(2) | | | 1,500,000 | | | | 1,298,461 | | | | | |
| Alcon Finance Corp.: | | | | | | | | | | | | |
| 3.000%, 09/23/2029 | | | | | | | | | | | | |
(Callable 06/23/2029)(1)(2) | | | 6,110,000 | | | | 5,391,813 | | | | | |
| 2.600%, 05/27/2030 | | | | | | | | | | | | |
(Callable 02/27/2030)(1)(2) | | | 6,475,000 | | | | 5,518,886 | | | | | |
| Alimentation Couche-Tard, Inc., | | | | | | | | | | | | |
| 2.950%, 01/25/2030 | | | | | | | | | | | | |
(Callable 10/25/2029)(1)(2) | | | 6,500,000 | | | | 5,583,156 | | | | | |
| Allegion PLC, | | | | | | | | | | | | |
| 3.500%, 10/01/2029 | | | | | | | | | | | | |
| (Callable 07/01/2029) | | | 12,275,000 | | | | 10,840,822 | | | | | |
| Alpek SAB de CV: | | | | | | | | | | | | |
| 4.250%, 09/18/2029 | | | | | | | | | | | | |
(Callable 06/18/2029)(1)(2) | | | 6,000,000 | | | | 5,362,500 | | | | | |
| 3.250%, 02/25/2031 | | | | | | | | | | | | |
(Callable 11/25/2030)(1)(2) | | | 10,000,000 | | | | 8,081,000 | | | | | |
| America Movil SAB de CV, | | | | | | | | | | | | |
| 2.875%, 05/07/2030 | | | | | | | | | | | | |
(Callable 02/07/2030)(1) | | | 28,000,000 | | | | 24,334,068 | | | | | |
| Amgen, Inc.: | | | | | | | | | | | | |
| 3.150%, 02/21/2040 | | | | | | | | | | | | |
| (Callable 08/21/2039) | | | 5,000,000 | | | | 3,823,646 | | | | | |
| 4.400%, 05/01/2045 | | | | | | | | | | | | |
| (Callable 11/01/2044) | | | 8,000,000 | | | | 6,928,888 | | | | | |
| 5.650%, 03/02/2053 | | | | | | | | | | | | |
| (Callable 09/02/2052) | | | 17,475,000 | | | | 17,697,022 | | | | | |
| Anglo American Capital PLC: | | | | | | | | | | | | |
| 5.625%, 04/01/2030 | | | | | | | | | | | | |
(Callable 01/01/2030)(1)(2) | | | 3,000,000 | | | | 2,986,280 | | | | | |
| 2.625%, 09/10/2030 | | | | | | | | | | | | |
(Callable 06/10/2030)(1)(2) | | | 16,025,000 | | | | 13,218,731 | | | | | |
| 5.500%, 05/02/2033 | | | | | | | | | | | | |
(Callable 02/02/2033)(1)(2) | | | 12,450,000 | | | | 12,163,564 | | | | | |
| 3.950%, 09/10/2050 | | | | | | | | | | | | |
(Callable 03/10/2050)(1)(2) | | | 10,000,000 | | | | 7,415,170 | | | | | |
| Anheuser-Busch InBev Worldwide, Inc.: | | | | | | | | | | | | |
| 4.750%, 01/23/2029 | | | | | | | | | | | | |
(Callable 10/23/2028)(1) | | | 5,000,000 | | | | 4,978,282 | | | | | |
| 5.450%, 01/23/2039 | | | | | | | | | | | | |
(Callable 07/23/2038)(1) | | | 9,975,000 | | | | 10,321,619 | | | | | |
| 4.900%, 02/01/2046 | | | | | | | | | | | | |
(Callable 08/01/2045)(1) | | | 60,675,000 | | | | 57,992,608 | | | | | |
| Antofagasta PLC, | | | | | | | | | | | | |
| 2.375%, 10/14/2030 | | | | | | | | | | | | |
(Callable 07/14/2030)(1)(2) | | | 6,000,000 | | | | 4,890,459 | | | | | |
| AP Moller – Maersk A/S: | | | | | | | | | | | | |
| 3.875%, 09/28/2025 | | | | | | | | | | | | |
(Callable 06/28/2025)(1)(2) | | | 18,140,000 | | | | 17,491,365 | | | | | |
| 4.500%, 06/20/2029 | | | | | | | | | | | | |
(Callable 03/20/2029)(1)(2) | | | 20,575,000 | | | | 19,764,436 | | | | | |
| AptarGroup, Inc., | | | | | | | | | | | | |
| 3.600%, 03/15/2032 | | | | | | | | | | | | |
| (Callable 12/15/2031) | | | 7,500,000 | | | | 6,433,847 | | | | | |
The accompanying notes are an integral part of these financial statements.
Baird Core Plus Bond Fund
Schedule of Investments, June 30, 2023 (Unaudited)
Long-Term Investments (cont.)
| | | Principal | | | | | | % of | |
| | | Amount | | | Value | | | Net Assets | |
| Aramark Services, Inc., | | | | | | | | | |
| 5.000%, 02/01/2028 | | | | | | | | | |
(Callable 07/31/2023)(2) | | $ | 1,000,000 | | | $ | 942,540 | | | |
| |
| ArcelorMittal: | | | | | | | | | | | | |
6.125%, 06/01/2025(1) | | | 6,078,000 | | | | 6,177,248 | | | | | |
4.550%, 03/11/2026(1) | | | 30,930,000 | | | | 30,140,267 | | | | | |
4.250%, 07/16/2029(1) | | | 15,000,000 | | | | 14,185,333 | | | | | |
| 6.800%, 11/29/2032 | | | | | | | | | | | | |
(Callable 08/29/2032)(1) | | | 24,100,000 | | | | 24,742,443 | | | | | |
7.000%, 10/15/2039(1) | | | 11,096,000 | | | | 11,582,595 | | | | | |
| Arcosa, Inc., | | | | | | | | | | | | |
| 4.375%, 04/15/2029 | | | | | | | | | | | | |
(Callable 04/15/2024)(2) | | | 3,000,000 | | | | 2,688,007 | | | | | |
| Ardagh Metal Packaging S.A., | | | | | | | | | | | | |
| 3.250%, 09/01/2028 | | | | | | | | | | | | |
(Callable 05/15/2024)(1)(2) | | | 500,000 | | | | 429,484 | | | | | |
| Arrow Electronics, Inc., | | | | | | | | | | | | |
| 3.250%, 09/08/2024 | | | | | | | | | | | | |
| (Callable 07/08/2024) | | | 15,000,000 | | | | 14,473,583 | | | | | |
| Ashtead Capital, Inc.: | | | | | | | | | | | | |
| 4.000%, 05/01/2028 | | | | | | | | | | | | |
(Callable 07/11/2023)(1)(2) | | | 9,000,000 | | | | 8,337,162 | | | | | |
| 4.250%, 11/01/2029 | | | | | | | | | | | | |
(Callable 11/01/2024)(1)(2) | | | 4,100,000 | | | | 3,721,033 | | | | | |
| 2.450%, 08/12/2031 | | | | | | | | | | | | |
(Callable 05/12/2031)(1)(2) | | | 23,840,000 | | | | 18,707,308 | | | | | |
| 5.500%, 08/11/2032 | | | | | | | | | | | | |
(Callable 05/11/2032)(1)(2) | | | 6,450,000 | | | | 6,236,270 | | | | | |
| 5.550%, 05/30/2033 | | | | | | | | | | | | |
(Callable 02/28/2033)(1)(2) | | | 5,000,000 | | | | 4,873,922 | | | | | |
| AT&T, Inc.: | | | | | | | | | | | | |
| 4.300%, 02/15/2030 | | | | | | | | | | | | |
| (Callable 11/15/2029) | | | 10,980,000 | | | | 10,422,484 | | | | | |
| 2.550%, 12/01/2033 | | | | | | | | | | | | |
| (Callable 09/01/2033) | | | 14,329,000 | | | | 11,255,086 | | | | | |
| 4.650%, 06/01/2044 | | | | | | | | | | | | |
| (Callable 12/01/2043) | | | 9,700,000 | | | | 8,450,631 | | | | | |
| 3.550%, 09/15/2055 | | | | | | | | | | | | |
| (Callable 03/15/2055) | | | 40,029,000 | | | | 28,022,931 | | | | | |
| 3.800%, 12/01/2057 | | | | | | | | | | | | |
| (Callable 06/01/2057) | | | 25,315,000 | | | | 18,327,997 | | | | | |
| 3.650%, 09/15/2059 | | | | | | | | | | | | |
| (Callable 03/15/2059) | | | 31,734,000 | | | | 22,093,814 | | | | | |
| Avery Dennison Corp., | | | | | | | | | | | | |
| 2.650%, 04/30/2030 | | | | | | | | | | | | |
| (Callable 02/01/2030) | | | 10,175,000 | | | | 8,558,007 | | | | | |
| Ball Corp.: | | | | | | | | | | | | |
| 5.250%, 07/01/2025 | | | 21,675,000 | | | | 21,487,566 | | | | | |
| 4.875%, 03/15/2026 | | | | | | | | | | | | |
| (Callable 12/15/2025) | | | 23,125,000 | | | | 22,493,967 | | | | | |
| 6.875%, 03/15/2028 | | | | | | | | | | | | |
| (Callable 11/15/2024) | | | 2,000,000 | | | | 2,039,726 | | | | | |
| 6.000%, 06/15/2029 | | | | | | | | | | | | |
| (Callable 05/15/2026) | | | 5,000,000 | | | | 4,962,500 | | | | | |
| 2.875%, 08/15/2030 | | | | | | | | | | | | |
| (Callable 05/15/2030) | | | 5,000,000 | | | | 4,150,637 | | | | | |
| 3.125%, 09/15/2031 | | | | | | | | | | | | |
| (Callable 06/15/2031) | | | 25,000,000 | | | | 20,564,247 | | | | | |
| Bayer US Finance II LLC: | | | | | | | | | | | | |
| 4.250%, 12/15/2025 | | | | | | | | | | | | |
(Callable 10/15/2025)(1)(2) | | | 25,000,000 | | | | 24,122,452 | | | | | |
| 4.625%, 06/25/2038 | | | | | | | | | | | | |
(Callable 12/25/2037)(1)(2) | | | 12,000,000 | | | | 10,448,231 | | | | | |
| 4.400%, 07/15/2044 | | | | | | | | | | | | |
(Callable 01/15/2044)(1)(2) | | | 5,125,000 | | | | 4,084,160 | | | | | |
| Becton Dickinson and Co., | | | | | | | | | | | | |
| 4.875%, 05/15/2044 | | | | | | | | | | | | |
| (Callable 11/15/2043) | | | 5,455,000 | | | | 4,814,206 | | | | | |
| Bell Canada, Inc., | | | | | | | | | | | | |
| 5.100%, 05/11/2033 | | | | | | | | | | | | |
(Callable 02/11/2033)(1) | | | 7,000,000 | | | | 6,914,096 | | | | | |
| Berry Global, Inc., | | | | | | | | | | | | |
| 4.875%, 07/15/2026 | | | | | | | | | | | | |
(Callable 07/31/2023)(2) | | | 28,000,000 | | | | 26,915,000 | | | | | |
| Bimbo Bakeries USA, Inc., | | | | | | | | | | | | |
| 4.000%, 05/17/2051 | | | | | | | | | | | | |
(Callable 11/17/2050)(1)(2) | | | 5,000,000 | | | | 4,013,589 | | | | | |
| Boardwalk Pipelines LP: | | | | | | | | | | | | |
| 4.950%, 12/15/2024 | | | | | | | | | | | | |
| (Callable 09/15/2024) | | | 17,475,000 | | | | 17,189,932 | | | | | |
| 5.950%, 06/01/2026 | | | | | | | | | | | | |
| (Callable 03/01/2026) | | | 26,406,000 | | | | 26,607,832 | | | | | |
| 4.800%, 05/03/2029 | | | | | | | | | | | | |
| (Callable 02/03/2029) | | | 28,916,000 | | | | 27,724,926 | | | | | |
| 3.600%, 09/01/2032 | | | | | | | | | | | | |
| (Callable 06/01/2032) | | | 15,000,000 | | | | 12,734,489 | | | | | |
| Boeing Co.: | | | | | | | | | | | | |
| 2.196%, 02/04/2026 | | | | | | | | | | | | |
| (Callable 07/11/2023) | | | 25,550,000 | | | | 23,450,000 | | | | | |
| 5.150%, 05/01/2030 | | | | | | | | | | | | |
| (Callable 02/01/2030) | | | 26,000,000 | | | | 25,749,104 | | | | | |
| Bon Secours Mercy Health, Inc., | | | | | | | | | | | | |
| 3.464%, 06/01/2030 | | | | | | | | | | | | |
| (Callable 12/01/2029) | | | 16,330,000 | | | | 14,661,875 | | | | | |
| Booz Allen Hamilton, Inc.: | | | | | | | | | | | | |
| 3.875%, 09/01/2028 | | | | | | | | | | | | |
(Callable 09/01/2023)(2) | | | 1,000,000 | | | | 904,460 | | | | | |
| 4.000%, 07/01/2029 | | | | | | | | | | | | |
(Callable 07/01/2024)(2) | | | 500,000 | | | | 447,874 | | | | | |
| Boral Finance Pty Ltd., | | | | | | | | | | | | |
| 3.750%, 05/01/2028 | | | | | | | | | | | | |
(Callable 02/01/2028)(1)(2) | | | 1,440,000 | | | | 1,285,893 | | | | | |
| BorgWarner, Inc., | | | | | | | | | | | | |
5.000%, 10/01/2025(2) | | | 8,285,000 | | | | 8,134,907 | | | | | |
| BP Capital Markets America, Inc., | | | | | | | | | | | | |
| 4.812%, 02/13/2033 | | | | | | | | | | | | |
(Callable 11/13/2032)(1) | | | 4,575,000 | | | | 4,508,510 | | | | | |
| Bristol-Myers Squibb Co., | | | | | | | | | | | | |
| 3.700%, 03/15/2052 | | | | | | | | | | | | |
| (Callable 09/15/2051) | | | 6,425,000 | | | | 5,209,944 | | | | | |
| British Telecommunications PLC, | | | | | | | | | | | | |
9.625%, 12/15/2030(1) | | | 29,000,000 | | | | 35,680,725 | | | | | |
| Broadcom, Inc.: | | | | | | | | | | | | |
| 3.625%, 10/15/2024 | | | | | | | | | | | | |
| (Callable 09/15/2024) | | | 26,800,000 | | | | 26,054,839 | | | | | |
| 3.150%, 11/15/2025 | | | | | | | | | | | | |
| (Callable 10/15/2025) | | | 7,150,000 | | | | 6,792,440 | | | | | |
| 4.000%, 04/15/2029 | | | | | | | | | | | | |
(Callable 02/15/2029)(2) | | | 4,000,000 | | | | 3,694,415 | | | | | |
| 5.000%, 04/15/2030 | | | | | | | | | | | | |
| (Callable 01/15/2030) | | | 9,000,000 | | | | 8,835,766 | | | | | |
| 4.150%, 11/15/2030 | | | | | | | | | | | | |
| (Callable 08/15/2030) | | | 16,000,000 | | | | 14,720,787 | | | | | |
| 2.450%, 02/15/2031 | | | | | | | | | | | | |
(Callable 11/15/2030)(2) | | | 7,250,000 | | | | 5,896,436 | | | | | |
| 4.150%, 04/15/2032 | | | | | | | | | | | | |
(Callable 01/15/2032)(2) | | | 22,000,000 | | | | 19,926,948 | | | | | |
| 3.137%, 11/15/2035 | | | | | | | | | | | | |
(Callable 08/15/2035)(2) | | | 13,250,000 | | | | 10,163,347 | | | | | |
| 3.500%, 02/15/2041 | | | | | | | | | | | | |
(Callable 08/15/2040)(2) | | | 16,000,000 | | | | 11,968,426 | | | | | |
The accompanying notes are an integral part of these financial statements.
Baird Core Plus Bond Fund
Schedule of Investments, June 30, 2023 (Unaudited)
Long-Term Investments (cont.)
| | | Principal | | | | | | % of | |
| | | Amount | | | Value | | | Net Assets | |
| Bunge Limited Finance Corp.: | | | | | | | | | |
| 3.250%, 08/15/2026 | | | | | | | | | |
| (Callable 05/15/2026) | | $ | 13,188,000 | | | $ | 12,405,752 | | | |
| |
| 3.750%, 09/25/2027 | | | | | | | | | | | | |
| (Callable 06/25/2027) | | | 23,800,000 | | | | 22,467,410 | | | | | |
| Burlington Northern Santa Fe LLC, | | | | | | | | | | | | |
| 4.150%, 04/01/2045 | | | | | | | | | | | | |
| (Callable 10/01/2044) | | | 3,100,000 | | | | 2,696,482 | | | | | |
| Cameron LNG LLC, | | | | | | | | | | | | |
| 3.701%, 01/15/2039 | | | | | | | | | | | | |
(Callable 07/15/2038)(2) | | | 15,000,000 | | | | 12,376,756 | | | | | |
| Canadian Pacific Railway Co.: | | | | | | | | | | | | |
| 4.700%, 05/01/2048 | | | | | | | | | | | | |
(Callable 11/01/2047)(1) | | | 12,000,000 | | | | 10,896,183 | | | | | |
| 3.500%, 05/01/2050 | | | | | | | | | | | | |
(Callable 11/01/2049)(1) | | | 13,000,000 | | | | 9,939,694 | | | | | |
| Canpack SA / Canpack US LLC, | | | | | | | | | | | | |
| 3.875%, 11/15/2029 | | | | | | | | | | | | |
(Callable 11/15/2024)(1)(2) | | | 15,000,000 | | | | 12,201,066 | | | | | |
| Carlisle Companies, Inc.: | | | | | | | | | | | | |
| 3.750%, 12/01/2027 | | | | | | | | | | | | |
| (Callable 09/01/2027) | | | 4,600,000 | | | | 4,366,498 | | | | | |
| 2.750%, 03/01/2030 | | | | | | | | | | | | |
| (Callable 12/01/2029) | | | 21,832,000 | | | | 18,610,017 | | | | | |
| Carrier Global Corp.: | | | | | | | | | | | | |
| 2.493%, 02/15/2027 | | | | | | | | | | | | |
| (Callable 12/15/2026) | | | 12,845,000 | | | | 11,705,124 | | | | | |
| 2.700%, 02/15/2031 | | | | | | | | | | | | |
| (Callable 11/15/2030) | | | 14,700,000 | | | | 12,375,829 | | | | | |
| 3.577%, 04/05/2050 | | | | | | | | | | | | |
| (Callable 10/05/2049) | | | 3,050,000 | | | | 2,253,937 | | | | | |
| CBRE Services, Inc., | | | | | | | | | | | | |
| 5.950%, 08/15/2034 | | | | | | | | | | | | |
| (Callable 05/15/2034) | | | 5,000,000 | | | | 4,937,124 | | | | | |
| CCL Industries, Inc., | | | | | | | | | | | | |
| 3.050%, 06/01/2030 | | | | | | | | | | | | |
(Callable 03/01/2030)(1)(2) | | | 19,725,000 | | | | 16,660,988 | | | | | |
| CDW LLC / CDW Finance Corp., | | | | | | | | | | | | |
| 3.569%, 12/01/2031 | | | | | | | | | | | | |
| (Callable 09/01/2031) | | | 15,000,000 | | | | 12,657,300 | | | | | |
| Celanese US Holdings LLC, | | | | | | | | | | | | |
| 6.330%, 07/15/2029 | | | | | | | | | | | | |
| (Callable 05/15/2029) | | | 14,876,000 | | | | 14,773,633 | | | | | |
| Cellnex Finance Co., | | | | | | | | | | | | |
| 3.875%, 07/07/2041 | | | | | | | | | | | | |
(Callable 04/07/2041)(1)(2) | | | 28,000,000 | | | | 20,515,555 | | | | | |
| CF Industries, Inc., | | | | | | | | | | | | |
| 5.375%, 03/15/2044 | | | 10,922,000 | | | | 9,945,120 | | | | | |
| Charles River Laboratories | | | | | | | | | | | | |
| International, Inc., | | | | | | | | | | | | |
| 4.000%, 03/15/2031 | | | | | | | | | | | | |
(Callable 03/15/2026)(2) | | | 3,000,000 | | | | 2,605,672 | | | | | |
| Charter Communications Operating LLC: | | | | | | | | | | | | |
| 4.908%, 07/23/2025 | | | | | | | | | | | | |
| (Callable 04/23/2025) | | | 63,550,000 | | | | 62,320,107 | | | | | |
| 3.750%, 02/15/2028 | | | | | | | | | | | | |
| (Callable 11/15/2027) | | | 5,000,000 | | | | 4,583,644 | | | | | |
| 4.400%, 04/01/2033 | | | | | | | | | | | | |
| (Callable 01/01/2033) | | | 5,000,000 | | | | 4,388,777 | | | | | |
| 6.384%, 10/23/2035 | | | | | | | | | | | | |
| (Callable 04/23/2035) | | | 32,905,000 | | | | 32,072,004 | | | | | |
| 5.375%, 04/01/2038 | | | | | | | | | | | | |
| (Callable 10/01/2037) | | | 6,000,000 | | | | 5,111,389 | | | | | |
| 3.700%, 04/01/2051 | | | | | | | | | | | | |
| (Callable 10/01/2050) | | | 6,700,000 | | | | 4,233,588 | | | | | |
| 3.850%, 04/01/2061 | | | | | | | | | | | | |
| (Callable 10/01/2060) | | | 12,075,000 | | | | 7,303,302 | | | | | |
| 4.400%, 12/01/2061 | | | | | | | | | | | | |
| (Callable 06/01/2061) | | | 10,000,000 | | | | 6,750,507 | | | | | |
| Cheniere Corpus Christi Holdings LLC, | | | | | | | | | | | | |
| 5.875%, 03/31/2025 | | | | | | | | | | | | |
| (Callable 10/02/2024) | | | 5,005,000 | | | | 4,980,977 | | | | | |
| Cheniere Energy Partners LP, | | | | | | | | | | | | |
| 5.950%, 06/30/2033 | | | | | | | | | | | | |
(Callable 12/30/2032)(2) | | | 13,000,000 | | | | 13,037,830 | | | | | |
| Cia Cervecerias Unidas SA, | | | | | | | | | | | | |
| 3.350%, 01/19/2032 | | | | | | | | | | | | |
(Callable 10/19/2031)(1)(2) | | | 20,000,000 | | | | 17,050,200 | | | | | |
| Cigna Corp.: | | | | | | | | | | | | |
| 4.500%, 02/25/2026 | | | | | | | | | | | | |
| (Callable 11/27/2025) | | | 5,725,000 | | | | 5,600,423 | | | | | |
| 2.400%, 03/15/2030 | | | | | | | | | | | | |
| (Callable 12/15/2029) | | | 9,850,000 | | | | 8,368,777 | | | | | |
| 4.800%, 08/15/2038 | | | | | | | | | | | | |
| (Callable 02/15/2038) | | | 7,600,000 | | | | 7,174,498 | | | | | |
| Clean Harbors, Inc.: | | | | | | | | | | | | |
| 5.125%, 07/15/2029 | | | | | | | | | | | | |
(Callable 07/15/2024)(2) | | | 100,000 | | | | 94,610 | | | | | |
| 6.375%, 02/01/2031 | | | | | | | | | | | | |
(Callable 02/01/2026)(2) | | | 1,000,000 | | | | 1,006,260 | | | | | |
| CNH Industrial Capital LLC, | | | | | | | | | | | | |
| 1.875%, 01/15/2026 | | | | | | | | | | | | |
(Callable 12/15/2025)(1) | | | 14,250,000 | | | | 13,012,438 | | | | | |
| CNH Industrial NV, | | | | | | | | | | | | |
| 3.850%, 11/15/2027 | | | | | | | | | | | | |
(Callable 08/15/2027)(1) | | | 26,114,000 | | | | 24,537,071 | | | | | |
| Columbia Pipeline Group, Inc.: | | | | | | | | | | | | |
| 4.500%, 06/01/2025 | | | | | | | | | | | | |
(Callable 03/01/2025)(1) | | | 2,830,000 | | | | 2,761,549 | | | | | |
| 5.800%, 06/01/2045 | | | | | | | | | | | | |
(Callable 12/01/2044)(1) | | | 4,733,000 | | | | 4,668,896 | | | | | |
| Comcast Corp.: | | | | | | | | | | | | |
| 4.250%, 01/15/2033 | | | 6,500,000 | | | | 6,174,775 | | | | | |
| 4.400%, 08/15/2035 | | | | | | | | | | | | |
| (Callable 02/15/2035) | | | 13,575,000 | | | | 12,759,694 | | | | | |
| 3.200%, 07/15/2036 | | | | | | | | | | | | |
| (Callable 01/15/2036) | | | 15,000,000 | | | | 12,305,475 | | | | | |
| 5.350%, 05/15/2053 | | | | | | | | | | | | |
| (Callable 11/15/2052) | | | 8,000,000 | | | | 8,122,553 | | | | | |
| 2.937%, 11/01/2056 | | | | | | | | | | | | |
| (Callable 05/01/2056) | | | 2,622,000 | | | | 1,707,507 | | | | | |
| 2.987%, 11/01/2063 | | | | | | | | | | | | |
| (Callable 05/01/2063) | | | 10,984,000 | | | | 6,959,315 | | | | | |
| CommonSpirit Health, | | | | | | | | | | | | |
| 2.782%, 10/01/2030 | | | | | | | | | | | | |
| (Callable 04/01/2030) | | | 20,400,000 | | | | 17,149,697 | | | | | |
| Conagra Brands, Inc., | | | | | | | | | | | | |
| 5.300%, 11/01/2038 | | | | | | | | | | | | |
| (Callable 05/01/2038) | | | 6,625,000 | | | | 6,365,745 | | | | | |
| ConocoPhillips Canada Funding Co. I, | | | | | | | | | | | | |
| 5.950%, 10/15/2036 | | | 845,000 | | | | 894,838 | | | | | |
| Constellation Brands, Inc., | | | | | | | | | | | | |
| 4.750%, 12/01/2025 | | | 1,000,000 | | | | 983,077 | | | | | |
| Corning, Inc., | | | | | | | | | | | | |
| 4.375%, 11/15/2057 | | | | | | | | | | | | |
| (Callable 05/15/2057) | | | 10,000,000 | | | | 8,099,588 | | | | | |
The accompanying notes are an integral part of these financial statements.
Baird Core Plus Bond Fund
Schedule of Investments, June 30, 2023 (Unaudited)
Long-Term Investments (cont.)
| | | Principal | | | | | | % of | |
| | | Amount | | | Value | | | Net Assets | |
| Cox Communications, Inc.: | | | | | | | | | |
| 3.850%, 02/01/2025 | | | | | | | | | |
(Callable 11/01/2024)(2) | | $ | 2,875,000 | | | $ | 2,781,259 | | | |
| |
| 4.800%, 02/01/2035 | | | | | | | | | | | | |
(Callable 08/01/2034)(2) | | | 13,047,000 | | | | 11,748,283 | | | | | |
4.700%, 12/15/2042(2) | | | 1,670,000 | | | | 1,434,349 | | | | | |
| 3.600%, 06/15/2051 | | | | | | | | | | | | |
(Callable 12/15/2050)(2) | | | 22,900,000 | | | | 16,030,434 | | | | | |
| Crown Castle, Inc., | | | | | | | | | | | | |
| 5.100%, 05/01/2033 | | | | | | | | | | | | |
| (Callable 02/01/2033) | | | 5,000,000 | | | | 4,913,422 | | | | | |
| CSX Corp.: | | | | | | | | | | | | |
| 6.220%, 04/30/2040 | | | 475,000 | | | | 513,582 | | | | | |
| 4.650%, 03/01/2068 | | | | | | | | | | | | |
| (Callable 09/01/2067) | | | 9,000,000 | | | | 8,054,919 | | | | | |
| CVS Health Corp.: | | | | | | | | | | | | |
| 3.875%, 07/20/2025 | | | | | | | | | | | | |
| (Callable 04/20/2025) | | | 2,302,000 | | | | 2,237,296 | | | | | |
| 3.250%, 08/15/2029 | | | | | | | | | | | | |
| (Callable 05/15/2029) | | | 11,800,000 | | | | 10,596,710 | | | | | |
| 5.300%, 06/01/2033 | | | | | | | | | | | | |
| (Callable 03/01/2033) | | | 4,225,000 | | | | 4,218,438 | | | | | |
| 4.780%, 03/25/2038 | | | | | | | | | | | | |
| (Callable 09/25/2037) | | | 35,075,000 | | | | 32,369,717 | | | | | |
| 5.050%, 03/25/2048 | | | | | | | | | | | | |
| (Callable 09/25/2047) | | | 32,600,000 | | | | 30,048,813 | | | | | |
| 5.875%, 06/01/2053 | | | | | | | | | | | | |
| (Callable 12/01/2052) | | | 6,000,000 | | | | 6,152,714 | | | | | |
| CVS Pass-Through Trust, | | | | | | | | | | | | |
7.507%, 01/10/2032(2) | | | 3,841,046 | | | | 4,006,899 | | | | | |
| Darling Ingredients, Inc., | | | | | | | | | | | | |
| 6.000%, 06/15/2030 | | | | | | | | | | | | |
(Callable 06/15/2025)(2) | | | 1,500,000 | | | | 1,464,981 | | | | | |
| DCP Midstream LLC: | | | | | | | | | | | | |
| 5.375%, 07/15/2025 | | | | | | | | | | | | |
| (Callable 04/15/2025) | | | 3,000,000 | | | | 2,969,999 | | | | | |
| 5.625%, 07/15/2027 | | | | | | | | | | | | |
| (Callable 04/15/2027) | | | 17,000,000 | | | | 16,973,160 | | | | | |
| 5.125%, 05/15/2029 | | | | | | | | | | | | |
| (Callable 02/15/2029) | | | 8,000,000 | | | | 7,825,948 | | | | | |
| 3.250%, 02/15/2032 | | | | | | | | | | | | |
| (Callable 08/15/2031) | | | 10,000,000 | | | | 8,463,886 | | | | | |
| Dell International LLC / EMC Corp.: | | | | | | | | | | | | |
| 5.850%, 07/15/2025 | | | | | | | | | | | | |
| (Callable 06/15/2025) | | | 5,000,000 | | | | 5,018,259 | | | | | |
| 6.020%, 06/15/2026 | | | | | | | | | | | | |
| (Callable 03/15/2026) | | | 37,004,000 | | | | 37,611,207 | | | | | |
| 4.900%, 10/01/2026 | | | | | | | | | | | | |
| (Callable 08/01/2026) | | | 8,395,000 | | | | 8,335,339 | | | | | |
| 5.300%, 10/01/2029 | | | | | | | | | | | | |
| (Callable 07/01/2029) | | | 5,300,000 | | | | 5,261,358 | | | | | |
| 3.450%, 12/15/2051 | | | | | | | | | | | | |
(Callable 06/15/2051)(2) | | | 20,000,000 | | | | 13,413,271 | | | | | |
| Dentsply Sirona, | | | | | | | | | | | | |
| 3.250%, 06/01/2030 | | | | | | | | | | | | |
| (Callable 03/01/2030) | | | 46,120,000 | | | | 39,902,560 | | | | | |
| Deutsche Telekom International | | | | | | | | | | | | |
| Finance BV, | | | | | | | | | | | | |
9.625%, 06/15/2030(1) | | | 28,015,000 | | | | 33,550,317 | | | | | |
| Dignity Health, | | | | | | | | | | | | |
| 5.267%, 11/01/2064 | | | 7,625,000 | | | | 7,157,059 | | | | | |
| Dominion Gas Holdings LLC, | | | | | | | | | | | | |
| 3.600%, 12/15/2024 | | | | | | | | | | | | |
| (Callable 09/15/2024) | | | 4,067,000 | | | | 3,922,580 | | | | | |
| DuPont de Nemours, Inc.: | | | | | | | | | | | | |
| 4.493%, 11/15/2025 | | | | | | | | | | | | |
| (Callable 09/15/2025) | | | 9,275,000 | | | | 9,083,452 | | | | | |
| 5.319%, 11/15/2038 | | | | | | | | | | | | |
| (Callable 05/15/2038) | | | 17,350,000 | | | | 17,190,570 | | | | | |
| DXC Technology Co.: | | | | | | | | | | | | |
| 1.800%, 09/15/2026 | | | | | | | | | | | | |
| (Callable 08/15/2026) | | | 21,000,000 | | | | 18,251,765 | | | | | |
| 2.375%, 09/15/2028 | | | | | | | | | | | | |
| (Callable 07/15/2028) | | | 60,000,000 | | | | 50,004,610 | | | | | |
| Eagle Materials, Inc., | | | | | | | | | | | | |
| 2.500%, 07/01/2031 | | | | | | | | | | | | |
| (Callable 04/01/2031) | | | 15,000,000 | | | | 12,233,664 | | | | | |
| Eastern Gas Transmission & Storage, Inc., | | | | | | | | | | | | |
| 3.600%, 12/15/2024 | | | | | | | | | | | | |
| (Callable 09/15/2024) | | | 2,033,000 | | | | 1,960,808 | | | | | |
| Eaton Corp., | | | | | | | | | | | | |
| 4.000%, 11/02/2032 | | | 3,660,000 | | | | 3,446,917 | | | | | |
| Element Fleet Management Corp.: | | | | | | | | | | | | |
| 3.850%, 06/15/2025 | | | | | | | | | | | | |
(Callable 05/15/2025)(1)(2) | | | 23,000,000 | | | | 21,747,645 | | | | | |
| 6.271%, 06/26/2026 | | | | | | | | | | | | |
(Callable 05/26/2026)(1)(2) | | | 15,600,000 | | | | 15,545,413 | | | | | |
| Enbridge Energy Partners LP: | | | | | | | | | | | | |
7.500%, 04/15/2038(1) | | | 4,500,000 | | | | 5,047,919 | | | | | |
| 7.375%, 10/15/2045 | | | | | | | | | | | | |
(Callable 04/15/2045)(1) | | | 23,298,000 | | | | 26,819,000 | | | | | |
| Energy Transfer LP: | | | | | | | | | | | | |
| 4.400%, 03/15/2027 | | | | | | | | | | | | |
| (Callable 12/15/2026) | | | 15,000,000 | | | | 14,341,939 | | | | | |
| 5.500%, 06/01/2027 | | | | | | | | | | | | |
| (Callable 03/01/2027) | | | 4,653,000 | | | | 4,627,781 | | | | | |
| 4.950%, 05/15/2028 | | | | | | | | | | | | |
| (Callable 02/15/2028) | | | 1,620,000 | | | | 1,567,359 | | | | | |
| 4.950%, 06/15/2028 | | | | | | | | | | | | |
| (Callable 03/15/2028) | | | 4,693,000 | | | | 4,552,073 | | | | | |
| 5.250%, 04/15/2029 | | | | | | | | | | | | |
| (Callable 01/15/2029) | | | 18,925,000 | | | | 18,475,384 | | | | | |
| 4.150%, 09/15/2029 | | | | | | | | | | | | |
| (Callable 06/15/2029) | | | 16,585,000 | | | | 15,263,804 | | | | | |
| 6.625%, 10/15/2036 | | | 3,575,000 | | | | 3,656,972 | | | | | |
| 6.500%, 02/01/2042 | | | | | | | | | | | | |
| (Callable 08/01/2041) | | | 18,727,000 | | | | 18,965,491 | | | | | |
| 6.100%, 02/15/2042 | | | 1,000,000 | | | | 945,252 | | | | | |
| 5.950%, 10/01/2043 | | | | | | | | | | | | |
| (Callable 04/01/2043) | | | 2,702,000 | | | | 2,520,771 | | | | | |
| 6.000%, 06/15/2048 | | | | | | | | | | | | |
| (Callable 12/15/2047) | | | 5,000,000 | | | | 4,741,521 | | | | | |
| Energy Transfer Partners LP: | | | | | | | | | | | | |
| 4.200%, 04/15/2027 | | | | | | | | | | | | |
| (Callable 01/15/2027) | | | 8,650,000 | | | | 8,259,023 | | | | | |
| 5.150%, 03/15/2045 | | | | | | | | | | | | |
| (Callable 09/15/2044) | | | 5,000,000 | | | | 4,311,638 | | | | | |
| Eni SpA, | | | | | | | | | | | | |
| 4.250%, 05/09/2029 | | | | | | | | | | | | |
(Callable 02/09/2029)(1)(2) | | | 18,250,000 | | | | 17,222,122 | | | | | |
| Enterprise Products Operating LLC, | | | | | | | | | | | | |
| 3.950%, 01/31/2060 | | | | | | | | | | | | |
| (Callable 07/31/2059) | | | 14,475,000 | | | | 11,156,598 | | | | | |
| EQT Corp.: | | | | | | | | | | | | |
| 6.125%, 02/01/2025 | | | | | | | | | | | | |
| (Callable 01/01/2025) | | | 10,000,000 | | | | 9,943,800 | | | | | |
| 5.000%, 01/15/2029 | | | | | | | | | | | | |
| (Callable 07/15/2028) | | | 1,000,000 | | | | 941,490 | | | | | |
| 3.625%, 05/15/2031 | | | | | | | | | | | | |
(Callable 05/15/2030)(2) | | | 100,000 | | | | 86,009 | | | | | |
The accompanying notes are an integral part of these financial statements.
Baird Core Plus Bond Fund
Schedule of Investments, June 30, 2023 (Unaudited)
Long-Term Investments (cont.)
| | | Principal | | | | | | % of | |
| | | Amount | | | Value | | | Net Assets | |
| EQT Midstream Partners LP, | | | | | | | | | |
| 4.125%, 12/01/2026 | | | | | | | | | |
| (Callable 09/01/2026) | | $ | 14,750,000 | | | $ | 13,718,002 | | | |
| |
| Equifax, Inc., | | | | | | | | | | | | |
| 5.100%, 06/01/2028 | | | | | | | | | | | | |
| (Callable 05/01/2028) | | | 15,000,000 | | | | 14,774,638 | | | | | |
| Equinix, Inc.: | | | | | | | | | | | | |
| 2.625%, 11/18/2024 | | | | | | | | | | | | |
| (Callable 10/18/2024) | | | 8,000,000 | | | | 7,639,821 | | | | | |
| 3.200%, 11/18/2029 | | | | | | | | | | | | |
| (Callable 08/18/2029) | | | 15,000,000 | | | | 13,168,854 | | | | | |
| Exxon Mobil Corp., | | | | | | | | | | | | |
| 2.992%, 03/19/2025 | | | | | | | | | | | | |
| (Callable 02/19/2025) | | | 35,000,000 | | | | 33,718,745 | | | | | |
| FedEx Corp.: | | | | | | | | | | | | |
| 3.900%, 02/01/2035 | | | 7,000,000 | | | | 6,163,932 | | | | | |
| 4.950%, 10/17/2048 | | | | | | | | | | | | |
| (Callable 04/17/2048) | | | 13,500,000 | | | | 12,391,898 | | | | | |
| Ferguson Finance PLC, | | | | | | | | | | | | |
| 4.500%, 10/24/2028 | | | | | | | | | | | | |
(Callable 07/24/2028)(2) | | | 37,052,000 | | | | 35,502,661 | | | | | |
| Fiserv, Inc.: | | | | | | | | | | | | |
| 3.850%, 06/01/2025 | | | | | | | | | | | | |
| (Callable 03/01/2025) | | | 11,720,000 | | | | 11,321,588 | | | | | |
| 3.200%, 07/01/2026 | | | | | | | | | | | | |
| (Callable 05/01/2026) | | | 6,400,000 | | | | 6,005,531 | | | | | |
| 3.500%, 07/01/2029 | | | | | | | | | | | | |
| (Callable 04/01/2029) | | | 8,810,000 | | | | 8,041,201 | | | | | |
| 4.400%, 07/01/2049 | | | | | | | | | | | | |
| (Callable 01/01/2049) | | | 12,500,000 | | | | 10,562,155 | | | | | |
| Flex Intermediate Holdco LLC, | | | | | | | | | | | | |
| 3.363%, 06/30/2031 | | | | | | | | | | | | |
(Callable 12/30/2030)(2) | | | 30,000,000 | | | | 23,851,619 | | | | | |
| Flex Ltd.: | | | | | | | | | | | | |
| 3.750%, 02/01/2026 | | | | | | | | | | | | |
| (Callable 01/01/2026) | | | 28,300,000 | | | | 26,895,540 | | | | | |
| 6.000%, 01/15/2028 | | | | | | | | | | | | |
| (Callable 12/15/2027) | | | 10,000,000 | | | | 10,155,759 | | | | | |
| 4.875%, 05/12/2030 | | | | | | | | | | | | |
| (Callable 02/12/2030) | | | 17,550,000 | | | | 16,949,671 | | | | | |
| Flowserve Corp.: | | | | | | | | | | | | |
| 3.500%, 10/01/2030 | | | | | | | | | | | | |
| (Callable 07/01/2030) | | | 7,075,000 | | | | 6,037,041 | | | | | |
| 2.800%, 01/15/2032 | | | | | | | | | | | | |
| (Callable 10/15/2031) | | | 5,000,000 | | | | 3,984,157 | | | | | |
| FMG Resources Pty Ltd.: | | | | | | | | | | | | |
| 4.375%, 04/01/2031 | | | | | | | | | | | | |
(Callable 01/01/2031)(1)(2) | | | 1,000,000 | | | | 853,812 | | | | | |
| 6.125%, 04/15/2032 | | | | | | | | | | | | |
(Callable 01/15/2032)(1)(2) | | | 10,000,000 | | | | 9,529,955 | | | | | |
| Ford Motor Credit Co. LLC: | | | | | | | | | | | | |
| 5.584%, 03/18/2024 | | | | | | | | | | | | |
| (Callable 02/18/2024) | | | 29,367,000 | | | | 29,159,854 | | | | | |
| 3.664%, 09/08/2024 | | | 34,000,000 | | | | 32,855,081 | | | | | |
| 4.063%, 11/01/2024 | | | | | | | | | | | | |
| (Callable 10/01/2024) | | | 7,000,000 | | | | 6,773,750 | | | | | |
| 2.300%, 02/10/2025 | | | | | | | | | | | | |
| (Callable 01/10/2025) | | | 30,000,000 | | | | 28,043,700 | | | | | |
| 3.375%, 11/13/2025 | | | | | | | | | | | | |
| (Callable 10/13/2025) | | | 30,000,000 | | | | 27,896,232 | | | | | |
| 2.700%, 08/10/2026 | | | | | | | | | | | | |
| (Callable 07/10/2026) | | | 15,000,000 | | | | 13,391,620 | | | | | |
| Fortune Brands Home & Security, Inc., | | | | | | | | | | | | |
| 3.250%, 09/15/2029 | | | | | | | | | | | | |
| (Callable 06/15/2029) | | | 14,000,000 | | | | 12,239,447 | | | | | |
| Fortune Brands Innovations, Inc., | | | | | | | | | | | | |
| 5.875%, 06/01/2033 | | | | | | | | | | | | |
| (Callable 03/01/2033) | | | 16,000,000 | | | | 16,020,831 | | | | | |
| Freeport-McMoRan, Inc.: | | | | | | | | | | | | |
| 5.000%, 09/01/2027 | | | | | | | | | | | | |
| (Callable 07/31/2023) | | | 12,000,000 | | | | 11,688,344 | | | | | |
| 4.125%, 03/01/2028 | | | | | | | | | | | | |
| (Callable 07/31/2023) | | | 11,550,000 | | | | 10,821,767 | | | | | |
| 4.375%, 08/01/2028 | | | | | | | | | | | | |
| (Callable 08/01/2023) | | | 6,545,000 | | | | 6,175,011 | | | | | |
| 5.250%, 09/01/2029 | | | | | | | | | | | | |
| (Callable 09/01/2024) | | | 14,415,000 | | | | 14,162,128 | | | | | |
| 4.250%, 03/01/2030 | | | | | | | | | | | | |
| (Callable 03/01/2025) | | | 29,799,000 | | | | 27,460,851 | | | | | |
| 4.625%, 08/01/2030 | | | | | | | | | | | | |
| (Callable 08/01/2025) | | | 3,000,000 | | | | 2,826,750 | | | | | |
| Fresenius Medical Care | | | | | | | | | | | | |
| US Finance II, Inc., | | | | | | | | | | | | |
| 4.750%, 10/15/2024 | | | | | | | | | | | | |
(Callable 07/17/2024)(1)(2) | | | 8,075,000 | | | | 7,904,680 | | | | | |
| Fresenius Medical Care | | | | | | | | | | | | |
| US Finance III, Inc.: | | | | | | | | | | | | |
| 3.750%, 06/15/2029 | | | | | | | | | | | | |
(Callable 03/15/2029)(1)(2) | | | 34,130,000 | | | | 29,986,972 | | | | | |
| 2.375%, 02/16/2031 | | | | | | | | | | | | |
(Callable 11/16/2030)(1)(2) | | | 32,300,000 | | | | 24,507,355 | | | | | |
| 3.000%, 12/01/2031 | | | | | | | | | | | | |
(Callable 09/01/2031)(1)(2) | | | 13,625,000 | | | | 10,577,491 | | | | | |
| General Motors Co., | | | | | | | | | | | | |
| 6.125%, 10/01/2025 | | | | | | | | | | | | |
| (Callable 09/01/2025) | | | 22,112,000 | | | | 22,263,037 | | | | | |
| General Motors Financial Co., Inc.: | | | | | | | | | | | | |
| 2.900%, 02/26/2025 | | | | | | | | | | | | |
| (Callable 01/26/2025) | | | 17,725,000 | | | | 16,818,042 | | | | | |
| 1.250%, 01/08/2026 | | | | | | | | | | | | |
| (Callable 12/08/2025) | | | 18,125,000 | | | | 16,171,362 | | | | | |
| 5.400%, 04/06/2026 | | | 10,000,000 | | | | 9,885,569 | | | | | |
| 2.350%, 02/26/2027 | | | | | | | | | | | | |
| (Callable 01/26/2027) | | | 10,900,000 | | | | 9,716,140 | | | | | |
| 5.800%, 06/23/2028 | | | | | | | | | | | | |
| (Callable 05/23/2028) | | | 10,000,000 | | | | 9,961,851 | | | | | |
| Genpact Luxembourg Sarl, | | | | | | | | | | | | |
| 3.375%, 12/01/2024 | | | | | | | | | | | | |
| (Callable 11/01/2024) | | | 36,370,000 | | | | 35,054,193 | | | | | |
| Genpact Luxembourg SARL, | | | | | | | | | | | | |
| 1.750%, 04/10/2026 | | | | | | | | | | | | |
| (Callable 03/10/2026) | | | 29,775,000 | | | | 26,668,692 | | | | | |
| Glencore Finance (Canada) Ltd.: | | | | | | | | | | | | |
6.000%, 11/15/2041(1)(2) | | | 9,400,000 | | | | 9,332,073 | | | | | |
5.550%, 10/25/2042(1)(2) | | | 3,543,000 | | | | 3,295,158 | | | | | |
| Glencore Funding LLC: | | | | | | | | | | | | |
| 4.000%, 03/27/2027 | | | | | | | | | | | | |
(Callable 12/27/2026)(1)(2) | | | 17,000,000 | | | | 16,202,626 | | | | | |
| 4.875%, 03/12/2029 | | | | | | | | | | | | |
(Callable 12/12/2028)(1)(2) | | | 18,000,000 | | | | 17,328,881 | | | | | |
| 2.500%, 09/01/2030 | | | | | | | | | | | | |
(Callable 06/01/2030)(1)(2) | | | 5,615,000 | | | | 4,597,714 | | | | | |
| 5.700%, 05/08/2033 | | | | | | | | | | | | |
(Callable 02/08/2033)(1)(2) | | | 12,500,000 | | | | 12,402,190 | | | | | |
| 3.875%, 04/27/2051 | | | | | | | | | | | | |
(Callable 10/27/2050)(1)(2) | | | 7,500,000 | | | | 5,565,170 | | | | | |
| 3.375%, 09/23/2051 | | | | | | | | | | | | |
(Callable 03/23/2051)(1)(2) | | | 4,000,000 | | | | 2,693,519 | | | | | |
The accompanying notes are an integral part of these financial statements.
Baird Core Plus Bond Fund
Schedule of Investments, June 30, 2023 (Unaudited)
Long-Term Investments (cont.)
| | | Principal | | | | | | % of | |
| | | Amount | | | Value | | | Net Assets | |
| Global Payments, Inc.: | | | | | | | | | |
| 4.800%, 04/01/2026 | | | | | | | | | |
| (Callable 01/01/2026) | | $ | 10,035,000 | | | $ | 9,796,063 | | | |
| |
| 2.900%, 05/15/2030 | | | | | | | | | | | | |
| (Callable 02/15/2030) | | | 5,000,000 | | | | 4,237,888 | | | | | |
| Grand Canyon University, | | | | | | | | | | | | |
| 4.125%, 10/01/2024 | | | 30,000,000 | | | | 28,341,000 | | | | | |
| Graphic Packaging International LLC: | | | | | | | | | | | | |
3.500%, 03/15/2028(2) | | | 5,000,000 | | | | 4,471,112 | | | | | |
| 3.500%, 03/01/2029 | | | | | | | | | | | | |
(Callable 09/01/2028)(2) | | | 5,000,000 | | | | 4,372,175 | | | | | |
| Gray Oak Pipeline LLC, | | | | | | | | | | | | |
| 2.600%, 10/15/2025 | | | | | | | | | | | | |
(Callable 09/15/2025)(1)(2) | | | 15,000,000 | | | | 13,771,858 | | | | | |
| Grupo Bimbo SAB de CV: | | | | | | | | | | | | |
4.875%, 06/27/2044(1)(2) | | | 9,575,000 | | | | 8,883,160 | | | | | |
| 4.700%, 11/10/2047 | | | | | | | | | | | | |
(Callable 05/10/2047)(1)(2) | | | 25,671,000 | | | | 23,125,843 | | | | | |
4.000%, 09/06/2049(1)(2) | | | 19,500,000 | | | | 15,758,136 | | | | | |
| Gulfstream Natural Gas System LLC, | | | | | | | | | | | | |
| 4.600%, 09/15/2025 | | | | | | | | | | | | |
(Callable 06/15/2025)(2) | | | 10,000,000 | | | | 9,608,305 | | | | | |
| GYP Holdings III Corp., | | | | | | | | | | | | |
| 4.625%, 05/01/2029 | | | | | | | | | | | | |
(Callable 05/01/2024)(2) | | | 2,500,000 | | | | 2,200,000 | | | | | |
| HB Fuller Co., | | | | | | | | | | | | |
| 4.000%, 02/15/2027 | | | | | | | | | | | | |
| (Callable 11/15/2026) | | | 6,725,000 | | | | 6,303,479 | | | | | |
| HCA, Inc.: | | | | | | | | | | | | |
| 5.375%, 02/01/2025 | | | 25,300,000 | | | | 25,078,184 | | | | | |
| 5.250%, 04/15/2025 | | | 19,200,000 | | | | 18,953,455 | | | | | |
| 5.375%, 09/01/2026 | | | | | | | | | | | | |
| (Callable 03/01/2026) | | | 1,000,000 | | | | 992,143 | | | | | |
| 4.500%, 02/15/2027 | | | | | | | | | | | | |
| (Callable 08/15/2026) | | | 16,500,000 | | | | 15,917,032 | | | | | |
| 5.200%, 06/01/2028 | | | | | | | | | | | | |
| (Callable 05/01/2028) | | | 10,000,000 | | | | 9,918,674 | | | | | |
| 5.875%, 02/01/2029 | | | | | | | | | | | | |
| (Callable 08/01/2028) | | | 8,500,000 | | | | 8,555,170 | | | | | |
| 3.500%, 09/01/2030 | | | | | | | | | | | | |
| (Callable 03/01/2030) | | | 5,000,000 | | | | 4,382,748 | | | | | |
| 4.375%, 03/15/2042 | | | | | | | | | | | | |
(Callable 09/15/2041)(2) | | | 3,900,000 | | | | 3,221,793 | | | | | |
| 4.625%, 03/15/2052 | | | | | | | | | | | | |
(Callable 09/15/2051)(2) | | | 12,475,000 | | | | 10,251,291 | | | | | |
| Hexcel Corp.: | | | | | | | | | | | | |
| 4.950%, 08/15/2025 | | | | | | | | | | | | |
| (Callable 05/15/2025) | | | 8,303,000 | | | | 8,097,553 | | | | | |
| 4.200%, 02/15/2027 | | | | | | | | | | | | |
| (Callable 11/15/2026) | | | 19,000,000 | | | | 17,881,614 | | | | | |
| HF Sinclair Corp., | | | | | | | | | | | | |
| 4.500%, 10/01/2030 | | | | | | | | | | | | |
| (Callable 07/01/2030) | | | 14,157,000 | | | | 12,554,343 | | | | | |
| Holly Energy Partners LP / | | | | | | | | | | | | |
| Holly Energy Finance Corp., | | | | | | | | | | | | |
| 6.375%, 04/15/2027 | | | | | | | | | | | | |
(Callable 04/15/2024)(2) | | | 7,092,000 | | | | 7,005,646 | | | | | |
| Hologic, Inc., | | | | | | | | | | | | |
| 3.250%, 02/15/2029 | | | | | | | | | | | | |
(Callable 09/28/2023)(2) | | | 21,238,000 | | | | 18,581,215 | | | | | |
| HP, Inc.: | | | | | | | | | | | | |
| 2.200%, 06/17/2025 | | | | | | | | | | | | |
| (Callable 05/17/2025) | | | 10,000,000 | | | | 9,405,804 | | | | | |
| 3.000%, 06/17/2027 | | | | | | | | | | | | |
| (Callable 04/17/2027) | | | 25,000,000 | | | | 23,061,261 | | | | | |
| Huntington Ingalls Industries, Inc.: | | | | | | | | | | | | |
| 3.844%, 05/01/2025 | | | | | | | | | | | | |
| (Callable 04/01/2025) | | | 10,000,000 | | | | 9,615,288 | | | | | |
| 2.043%, 08/16/2028 | | | | | | | | | | | | |
| (Callable 06/16/2028) | | | 12,000,000 | | | | 10,075,782 | | | | | |
| Huntsman International LLC, | | | | | | | | | | | | |
| 2.950%, 06/15/2031 | | | | | | | | | | | | |
| (Callable 03/15/2031) | | | 4,900,000 | | | | 3,911,866 | | | | | |
| Hyundai Capital America: | | | | | | | | | | | | |
3.400%, 06/20/2024(1)(2) | | | 16,850,000 | | | | 16,427,719 | | | | | |
| 1.300%, 01/08/2026 | | | | | | | | | | | | |
(Callable 12/08/2025)(1)(2) | | | 10,000,000 | | | | 8,947,284 | | | | | |
5.500%, 03/30/2026(1)(2) | | | 7,775,000 | | | | 7,704,816 | | | | | |
| 1.650%, 09/17/2026 | | | | | | | | | | | | |
(Callable 08/17/2026)(1)(2) | | | 30,000,000 | | | | 26,429,792 | | | | | |
| 5.680%, 06/26/2028 | | | | | | | | | | | | |
(Callable 05/26/2028)(1)(2) | | | 15,000,000 | | | | 14,879,933 | | | | | |
| Infor, Inc., | | | | | | | | | | | | |
| 1.750%, 07/15/2025 | | | | | | | | | | | | |
(Callable 06/15/2025)(2) | | | 8,375,000 | | | | 7,646,773 | | | | | |
| Ingersoll-Rand Global Holding Co. Ltd., | | | | | | | | | | | | |
| 5.750%, 06/15/2043 | | | 4,126,000 | | | | 4,299,332 | | | | | |
| Ingersoll-Rand Luxembourg Finance SA, | | | | | | | | | | | | |
| 4.650%, 11/01/2044 | | | | | | | | | | | | |
| (Callable 05/01/2044) | | | 1,300,000 | | | | 1,156,703 | | | | | |
| Ingredion, Inc., | | | | | | | | | | | | |
| 2.900%, 06/01/2030 | | | | | | | | | | | | |
| (Callable 03/01/2030) | | | 28,000,000 | | | | 24,191,256 | | | | | |
| Intel Corp.: | | | | | | | | | | | | |
| 5.200%, 02/10/2033 | | | | | | | | | | | | |
| (Callable 11/10/2032) | | | 3,275,000 | | | | 3,306,040 | | | | | |
| 4.900%, 08/05/2052 | | | | | | | | | | | | |
| (Callable 02/05/2052) | | | 2,600,000 | | | | 2,399,719 | | | | | |
| 5.700%, 02/10/2053 | | | | | | | | | | | | |
| (Callable 08/10/2052) | | | 5,575,000 | | | | 5,671,421 | | | | | |
| International Business Machines Corp., | | | | | | | | | | | | |
| 4.150%, 05/15/2039 | | | 13,000,000 | | | | 11,424,701 | | | | | |
| International Flavors & Fragrances, Inc.: | | | | | | | | | | | | |
| 5.000%, 09/26/2048 | | | | | | | | | | | | |
| (Callable 03/26/2048) | | | 10,000,000 | | | | 8,463,994 | | | | | |
| 3.468%, 12/01/2050 | | | | | | | | | | | | |
(Callable 06/01/2050)(2) | | | 8,000,000 | | | | 5,343,900 | | | | | |
| IQVIA, Inc., | | | | | | | | | | | | |
| 6.500%, 05/15/2030 | | | | | | | | | | | | |
(Callable 05/15/2026)(2) | | | 2,000,000 | | | | 2,019,747 | | | | | |
| Iron Mountain, Inc.: | | | | | | | | | | | | |
| 5.250%, 03/15/2028 | | | | | | | | | | | | |
(Callable 07/11/2023)(2) | | | 20,303,000 | | | | 18,982,446 | | | | | |
| 5.000%, 07/15/2028 | | | | | | | | | | | | |
(Callable 07/15/2023)(2) | | | 4,000,000 | | | | 3,706,317 | | | | | |
| 7.000%, 02/15/2029 | | | | | | | | | | | | |
(Callable 08/15/2025)(2) | | | 10,000,000 | | | | 10,016,820 | | | | | |
| 4.500%, 02/15/2031 | | | | | | | | | | | | |
(Callable 02/15/2026)(2) | | | 10,000,000 | | | | 8,592,285 | | | | | |
| JAB Holdings BV: | | | | | | | | | | | | |
| 3.750%, 05/28/2051 | | | | | | | | | | | | |
(Callable 11/28/2050)(1)(2) | | | 8,600,000 | | | | 5,825,316 | | | | | |
| 4.500%, 04/08/2052 | | | | | | | | | | | | |
(Callable 10/08/2051)(1)(2) | | | 13,000,000 | | | | 10,032,366 | | | | | |
| Jabil, Inc., | | | | | | | | | | | | |
| 5.450%, 02/01/2029 | | | | | | | | | | | | |
| (Callable 01/01/2029) | | | 10,000,000 | | | | 9,922,789 | | | | | |
The accompanying notes are an integral part of these financial statements.
Baird Core Plus Bond Fund
Schedule of Investments, June 30, 2023 (Unaudited)
Long-Term Investments (cont.)
| | | Principal | | | | | | % of | |
| | | Amount | | | Value | | | Net Assets | |
| JBS USA Lux SA / JBS USA Food Co. / | | | | | | | | | |
| JBS USA Finance, Inc.: | | | | | | | | | |
| 3.750%, 12/01/2031 | | | | | | | | | |
(Callable 12/01/2026)(2) | | $ | 24,344,000 | | | $ | 19,963,035 | | | |
| |
| 4.375%, 02/02/2052 | | | | | | | | | | | | |
(Callable 08/02/2051)(2) | | | 7,825,000 | | | | 5,488,376 | | | | | |
| JBS USA LUX SA / JBS USA Food Co. / | | | | | | | | | | | | |
| JBS USA Finance, Inc.: | | | | | | | | | | | | |
| 2.500%, 01/15/2027 | | | | | | | | | | | | |
(Callable 12/15/2026)(2) | | | 15,000,000 | | | | 13,141,500 | | | | | |
| 3.625%, 01/15/2032 | | | | | | | | | | | | |
(Callable 01/15/2027)(2) | | | 7,000,000 | | | | 5,680,080 | | | | | |
| 5.750%, 04/01/2033 | | | | | | | | | | | | |
(Callable 01/01/2033)(2) | | | 3,000,000 | | | | 2,819,859 | | | | | |
| JM Smucker Co., | | | | | | | | | | | | |
| 3.550%, 03/15/2050 | | | | | | | | | | | | |
| (Callable 09/15/2049) | | | 3,350,000 | | | | 2,452,799 | | | | | |
| KB Home, | | | | | | | | | | | | |
| 7.250%, 07/15/2030 | | | | | | | | | | | | |
| (Callable 07/15/2025) | | | 5,000,000 | | | | 5,063,005 | | | | | |
| Kennametal, Inc., | | | | | | | | | | | | |
| 4.625%, 06/15/2028 | | | | | | | | | | | | |
| (Callable 03/15/2028) | | | 7,900,000 | | | | 7,513,906 | | | | | |
| Keurig Dr Pepper, Inc., | | | | | | | | | | | | |
| 4.417%, 05/25/2025 | | | | | | | | | | | | |
| (Callable 03/25/2025) | | | 1,671,000 | | | | 1,637,957 | | | | | |
| Keysight Technologies, Inc.: | | | | | | | | | | | | |
| 4.550%, 10/30/2024 | | | | | | | | | | | | |
| (Callable 07/30/2024) | | | 7,283,000 | | | | 7,159,620 | | | | | |
| 4.600%, 04/06/2027 | | | | | | | | | | | | |
| (Callable 01/06/2027) | | | 50,189,000 | | | | 49,385,496 | | | | | |
| Kimberly-Clark de Mexico SAB de CV, | | | | | | | | | | | | |
| 2.431%, 07/01/2031 | | | | | | | | | | | | |
(Callable 04/01/2031)(1)(2) | | | 6,000,000 | | | | 5,090,100 | | | | | |
| Kinder Morgan Energy Partners LP: | | | | | | | | | | | | |
| 7.300%, 08/15/2033 | | | 1,675,000 | | | | 1,824,224 | | | | | |
| 6.500%, 02/01/2037 | | | 6,785,000 | | | | 6,975,144 | | | | | |
| 6.950%, 01/15/2038 | | | 14,755,000 | | | | 15,845,349 | | | | | |
| 7.500%, 11/15/2040 | | | 27,248,000 | | | | 30,253,018 | | | | | |
| Kinder Morgan, Inc.: | | | | | | | | | | | | |
| 8.050%, 10/15/2030 | | | 15,384,000 | | | | 17,117,765 | | | | | |
| 7.800%, 08/01/2031 | | | 16,174,000 | | | | 18,189,821 | | | | | |
| Kinross Gold Corp., | | | | | | | | | | | | |
| 6.875%, 09/01/2041 | | | | | | | | | | | | |
(Callable 03/01/2041)(1) | | | 5,500,000 | | | | 5,718,180 | | | | | |
| Kraft Heinz Foods Co.: | | | | | | | | | | | | |
| 9.000%, 03/15/2032 | | | 10,000,000 | | | | 10,984,524 | | | | | |
| 5.000%, 07/15/2035 | | | | | | | | | | | | |
| (Callable 01/15/2035) | | | 5,311,000 | | | | 5,231,434 | | | | | |
| 5.000%, 06/04/2042 | | | 5,000,000 | | | | 4,679,122 | | | | | |
| Kyndryl Holdings, Inc.: | | | | | | | | | | | | |
| 2.050%, 10/15/2026 | | | | | | | | | | | | |
| (Callable 09/15/2026) | | | 18,100,000 | | | | 15,618,686 | | | | | |
| 2.700%, 10/15/2028 | | | | | | | | | | | | |
| (Callable 08/15/2028) | | | 7,939,000 | | | | 6,459,850 | | | | | |
| Lafarge SA, | | | | | | | | | | | | |
| 7.125%, 07/15/2036 | | | 1,500,000 | | | | 1,618,379 | | | | | |
| LafargeHolcim Finance US LLC, | | | | | | | | | | | | |
| 3.500%, 09/22/2026 | | | | | | | | | | | | |
(Callable 06/22/2026)(2) | | | 12,565,000 | | | | 11,803,225 | | | | | |
| Lear Corp.: | | | | | | | | | | | | |
| 3.800%, 09/15/2027 | | | | | | | | | | | | |
| (Callable 06/15/2027) | | | 3,167,000 | | | | 2,940,807 | | | | | |
| 3.500%, 05/30/2030 | | | | | | | | | | | | |
| (Callable 02/28/2030) | | | 15,000,000 | | | | 13,137,907 | | | | | |
| Leidos Holdings, Inc., | | | | | | | | | | | | |
| 5.950%, 12/01/2040 | | | | | | | | | | | | |
| (Callable 06/04/2040) | | | 2,000,000 | | | | 1,860,488 | | | | | |
| Leidos, Inc.: | | | | | | | | | | | | |
| 4.375%, 05/15/2030 | | | | | | | | | | | | |
| (Callable 02/15/2030) | | | 46,222,000 | | | | 42,438,084 | | | | | |
| 2.300%, 02/15/2031 | | | | | | | | | | | | |
| (Callable 11/15/2030) | | | 7,500,000 | | | | 5,909,613 | | | | | |
| 5.750%, 03/15/2033 | | | | | | | | | | | | |
| (Callable 12/15/2032) | | | 26,839,000 | | | | 26,663,039 | | | | | |
| LKQ Corp., | | | | | | | | | | | | |
| 5.750%, 06/15/2028 | | | | | | | | | | | | |
(Callable 05/15/2028)(2) | | | 8,000,000 | | | | 7,973,978 | | | | | |
| Lockheed Martin Corp., | | | | | | | | | | | | |
| 5.200%, 02/15/2055 | | | | | | | | | | | | |
| (Callable 08/15/2054) | | | 2,725,000 | | | | 2,812,119 | | | | | |
| Louisiana-Pacific Corp., | | | | | | | | | | | | |
| 3.625%, 03/15/2029 | | | | | | | | | | | | |
(Callable 03/15/2024)(2) | | | 25,000,000 | | | | 21,883,750 | | | | | |
| Lowe`s Companies, Inc., | | | | | | | | | | | | |
| 5.750%, 07/01/2053 | | | | | | | | | | | | |
| (Callable 01/01/2053) | | | 10,000,000 | | | | 10,189,563 | | | | | |
| Lundin Energy Finance BV: | | | | | | | | | | | | |
| 2.000%, 07/15/2026 | | | | | | | | | | | | |
(Callable 06/15/2026)(1)(2) | | | 6,725,000 | | | | 6,039,644 | | | | | |
| 3.100%, 07/15/2031 | | | | | | | | | | | | |
(Callable 04/15/2031)(1)(2) | | | 20,958,000 | | | | 17,343,236 | | | | | |
| Magellan Midstream Partners LP: | | | | | | | | | | | | |
| 5.000%, 03/01/2026 | | | | | | | | | | | | |
| (Callable 12/01/2025) | | | 10,000,000 | | | | 9,903,816 | | | | | |
| 4.200%, 03/15/2045 | | | | | | | | | | | | |
| (Callable 09/15/2044) | | | 8,770,000 | | | | 6,396,551 | | | | | |
| Magna International, Inc., | | | | | | | | | | | | |
| 2.450%, 06/15/2030 | | | | | | | | | | | | |
(Callable 03/15/2030)(1) | | | 10,000,000 | | | | 8,466,760 | | | | | |
| Marathon Petroleum Corp.: | | | | | | | | | | | | |
| 4.700%, 05/01/2025 | | | | | | | | | | | | |
| (Callable 04/01/2025) | | | 15,000,000 | | | | 14,717,007 | | | | | |
| 5.125%, 12/15/2026 | | | | | | | | | | | | |
| (Callable 09/15/2026) | | | 3,000,000 | | | | 2,970,415 | | | | | |
| 4.750%, 09/15/2044 | | | | | | | | | | | | |
| (Callable 03/15/2044) | | | 3,985,000 | | | | 3,332,871 | | | | | |
| Marriott International, Inc., | | | | | | | | | | | | |
| 4.900%, 04/15/2029 | | | | | | | | | | | | |
| (Callable 03/15/2029) | | | 5,000,000 | | | | 4,864,710 | | | | | |
| Martin Marietta Materials, Inc.: | | | | | | | | | | | | |
| 2.500%, 03/15/2030 | | | | | | | | | | | | |
| (Callable 12/15/2029) | | | 5,000,000 | | | | 4,224,568 | | | | | |
| 6.250%, 05/01/2037 | | | 450,000 | | | | 445,462 | | | | | |
| Masco Corp., | | | | | | | | | | | | |
| 6.500%, 08/15/2032 | | | 15,834,000 | | | | 16,323,026 | | | | | |
| MasTec, Inc., | | | | | | | | | | | | |
| 4.500%, 08/15/2028 | | | | | | | | | | | | |
(Callable 08/15/2023)(2) | | | 12,948,000 | | | | 11,946,112 | | | | | |
| Microchip Technology, Inc., | | | | | | | | | | | | |
| 4.250%, 09/01/2025 | | | | | | | | | | | | |
| (Callable 07/31/2023) | | | 4,000,000 | | | | 3,875,046 | | | | | |
| Micron Technology, Inc., | | | | | | | | | | | | |
| 5.375%, 04/15/2028 | | | | | | | | | | | | |
| (Callable 03/15/2028) | | | 25,000,000 | | | | 24,758,775 | | | | | |
| Microsoft Corp., | | | | | | | | | | | | |
| 4.200%, 11/03/2035 | | | | | | | | | | | | |
| (Callable 05/03/2035) | | | 5,650,000 | | | | 5,589,444 | | | | | |
The accompanying notes are an integral part of these financial statements.
Baird Core Plus Bond Fund
Schedule of Investments, June 30, 2023 (Unaudited)
Long-Term Investments (cont.)
| | | Principal | | | | | | % of | |
| | | Amount | | | Value | | | Net Assets | |
| Midwest Connector Capital Co. LLC: | | | | | | | | | |
| 3.900%, 04/01/2024 | | | | | | | | | |
(Callable 03/01/2024)(2) | | $ | 13,695,000 | | | $ | 13,407,917 | | | |
| |
| 4.625%, 04/01/2029 | | | | | | | | | | | | |
(Callable 01/01/2029)(2) | | | 14,660,000 | | | | 13,395,653 | | | | | |
| Minera Mexico SA de CV, | | | | | | | | | | | | |
| 4.500%, 01/26/2050 | | | | | | | | | | | | |
(Callable 07/26/2049)(1)(2) | | | 8,000,000 | | | | 6,280,000 | | | | | |
| Mohawk Industries, Inc., | | | | | | | | | | | | |
| 3.625%, 05/15/2030 | | | | | | | | | | | | |
| (Callable 02/15/2030) | | | 5,000,000 | | | | 4,513,031 | | | | | |
| Molex Electronic Technologies LLC, | | | | | | | | | | | | |
| 3.900%, 04/15/2025 | | | | | | | | | | | | |
(Callable 01/15/2025)(2) | | | 8,250,000 | | | | 7,850,389 | | | | | |
| Molson Coors Beverage Co., | | | | | | | | | | | | |
| 3.000%, 07/15/2026 | | | | | | | | | | | | |
| (Callable 04/15/2026) | | | 23,888,000 | | | | 22,313,703 | | | | | |
| Mosaic Co., | | | | | | | | | | | | |
| 5.450%, 11/15/2033 | | | | | | | | | | | | |
| (Callable 05/15/2033) | | | 11,101,000 | | | | 10,811,360 | | | | | |
| MPLX LP: | | | | | | | | | | | | |
| 4.000%, 02/15/2025 | | | | | | | | | | | | |
| (Callable 11/15/2024) | | | 13,125,000 | | | | 12,719,157 | | | | | |
| 4.875%, 06/01/2025 | | | | | | | | | | | | |
| (Callable 03/01/2025) | | | 19,150,000 | | | | 18,789,633 | | | | | |
| 1.750%, 03/01/2026 | | | | | | | | | | | | |
| (Callable 02/01/2026) | | | 20,000,000 | | | | 18,154,447 | | | | | |
| 4.250%, 12/01/2027 | | | | | | | | | | | | |
| (Callable 09/01/2027) | | | 6,519,000 | | | | 6,190,927 | | | | | |
| 5.000%, 03/01/2033 | | | | | | | | | | | | |
| (Callable 12/01/2032) | | | 4,425,000 | | | | 4,238,640 | | | | | |
| 5.500%, 02/15/2049 | | | | | | | | | | | | |
| (Callable 08/15/2048) | | | 8,825,000 | | | | 7,997,175 | | | | | |
| 4.900%, 04/15/2058 | | | | | | | | | | | | |
| (Callable 10/15/2057) | | | 5,000,000 | | | | 4,029,082 | | | | | |
| MSCI, Inc.: | | | | | | | | | | | | |
| 4.000%, 11/15/2029 | | | | | | | | | | | | |
(Callable 11/15/2024)(2) | | | 7,562,000 | | | | 6,843,765 | | | | | |
| 3.625%, 11/01/2031 | | | | | | | | | | | | |
(Callable 11/01/2026)(2) | | | 10,000,000 | | | | 8,536,732 | | | | | |
| Mueller Water Products, Inc., | | | | | | | | | | | | |
| 4.000%, 06/15/2029 | | | | | | | | | | | | |
(Callable 06/15/2024)(2) | | | 500,000 | | | | 443,644 | | | | | |
| Mylan, Inc., | | | | | | | | | | | | |
| 4.550%, 04/15/2028 | | | | | | | | | | | | |
| (Callable 01/15/2028) | | | 5,000,000 | | | | 4,710,609 | | | | | |
| NCL Corp. Ltd., | | | | | | | | | | | | |
| 3.625%, 12/15/2024 | | | | | | | | | | | | |
(Callable 07/11/2023)(2) | | | 20,000,000 | | | | 19,245,614 | | | | | |
| Netflix, Inc., | | | | | | | | | | | | |
| 5.875%, 02/15/2025 | | | 4,270,000 | | | | 4,287,080 | | | | | |
| Newell Brands, Inc.: | | | | | | | | | | | | |
| 4.875%, 06/01/2025 | | | | | | | | | | | | |
| (Callable 05/01/2025) | | | 1,500,000 | | | | 1,446,828 | | | | | |
| 5.875%, 04/01/2026 | | | | | | | | | | | | |
| (Callable 01/01/2026) | | | 15,000,000 | | | | 14,090,253 | | | | | |
| 6.375%, 09/15/2027 | | | | | | | | | | | | |
| (Callable 06/15/2027) | | | 5,000,000 | | | | 4,788,038 | | | | | |
| NGPL PipeCo LLC, | | | | | | | | | | | | |
| 4.875%, 08/15/2027 | | | | | | | | | | | | |
(Callable 02/15/2027)(2) | | | 20,000,000 | | | | 18,952,160 | | | | | |
| Nissan Motor Co. Ltd., | | | | | | | | | | | | |
| 4.345%, 09/17/2027 | | | | | | | | | | | | |
(Callable 07/17/2027)(1)(2) | | | 10,000,000 | | | | 9,095,056 | | | | | |
| Norfolk Southern Corp., | | | | | | | | | | | | |
| 3.050%, 05/15/2050 | | | | | | | | | | | | |
| (Callable 11/15/2049) | | | 18,000,000 | | | | 12,444,773 | | | | | |
| North Mississippi Health Services, Inc., | | | | | | | | | | | | |
| 3.183%, 10/01/2051 | | | | | | | | | | | | |
| (Callable 04/01/2051) | | | 11,800,000 | | | | 8,132,104 | | | | | |
| Nova Southeastern University, Inc., | | | | | | | | | | | | |
| 4.809%, 04/01/2053 | | | 4,800,000 | | | | 4,067,456 | | | | | |
| Nutrien Ltd.: | | | | | | | | | | | | |
| 4.000%, 12/15/2026 | | | | | | | | | | | | |
(Callable 09/15/2026)(1) | | | 10,000,000 | | | | 9,594,205 | | | | | |
| 4.125%, 03/15/2035 | | | | | | | | | | | | |
(Callable 09/15/2034)(1) | | | 6,550,000 | | | | 5,749,430 | | | | | |
| nVent Finance Sarl: | | | | | | | | | | | | |
| 4.550%, 04/15/2028 | | | | | | | | | | | | |
| (Callable 01/15/2028) | | | 32,435,000 | | | | 30,340,202 | | | | | |
| 5.650%, 05/15/2033 | | | | | | | | | | | | |
| (Callable 02/15/2033) | | | 28,950,000 | | | | 28,460,922 | | | | | |
| NXP BV / NXP Funding LLC / | | | | | | | | | | | | |
| NXP USA, Inc.: | | | | | | | | | | | | |
| 4.300%, 06/18/2029 | | | | | | | | | | | | |
(Callable 03/18/2029)(1) | | | 9,625,000 | | | | 9,070,826 | | | | | |
| 2.650%, 02/15/2032 | | | | | | | | | | | | |
(Callable 11/15/2031)(1) | | | 15,000,000 | | | | 12,142,766 | | | | | |
| Occidental Petroleum Corp.: | | | | | | | | | | | | |
| 8.500%, 07/15/2027 | | | | | | | | | | | | |
| (Callable 01/15/2027) | | | 15,000,000 | | | | 16,203,150 | | | | | |
| 7.150%, 05/15/2028 | | | 7,000,000 | | | | 7,284,614 | | | | | |
| 8.875%, 07/15/2030 | | | | | | | | | | | | |
| (Callable 01/15/2030) | | | 8,000,000 | | | | 9,195,040 | | | | | |
| 7.500%, 05/01/2031 | | | 12,000,000 | | | | 13,102,080 | | | | | |
| 7.875%, 09/15/2031 | | | 12,790,000 | | | | 14,258,326 | | | | | |
| 6.450%, 09/15/2036 | | | 7,125,000 | | | | 7,312,385 | | | | | |
| Ochsner LSU Health System | | | | | | | | | | | | |
| of North Louisiana, | | | | | | | | | | | | |
| 2.510%, 05/15/2031 | | | | | | | | | | | | |
| (Callable 11/15/2030) | | | 30,300,000 | | | | 22,417,351 | | | | | |
| OCI NV, | | | | | | | | | | | | |
| 6.700%, 03/16/2033 | | | | | | | | | | | | |
(Callable 12/16/2032)(1)(2) | | | 10,000,000 | | | | 9,776,569 | | | | | |
| ONEOK, Inc., | | | | | | | | | | | | |
| 2.750%, 09/01/2024 | | | | | | | | | | | | |
| (Callable 08/01/2024) | | | 8,300,000 | | | | 8,020,750 | | | | | |
| Oracle Corp.: | | | | | | | | | | | | |
| 2.800%, 04/01/2027 | | | | | | | | | | | | |
| (Callable 02/01/2027) | | | 46,000,000 | | | | 42,279,929 | | | | | |
| 6.250%, 11/09/2032 | | | | | | | | | | | | |
| (Callable 08/09/2032) | | | 7,000,000 | | | | 7,430,444 | | | | | |
| 3.900%, 05/15/2035 | | | | | | | | | | | | |
| (Callable 11/15/2034) | | | 7,425,000 | | | | 6,406,690 | | | | | |
| 3.850%, 07/15/2036 | | | | | | | | | | | | |
| (Callable 01/15/2036) | | | 7,500,000 | | | | 6,259,417 | | | | | |
| 4.000%, 11/15/2047 | | | | | | | | | | | | |
| (Callable 05/15/2047) | | | 2,565,000 | | | | 1,974,753 | | | | | |
| 3.950%, 03/25/2051 | | | | | | | | | | | | |
| (Callable 09/25/2050) | | | 5,000,000 | | | | 3,780,611 | | | | | |
| 6.900%, 11/09/2052 | | | | | | | | | | | | |
| (Callable 05/09/2052) | | | 23,465,000 | | | | 26,336,358 | | | | | |
| 5.550%, 02/06/2053 | | | | | | | | | | | | |
| (Callable 08/06/2052) | | | 2,550,000 | | | | 2,469,275 | | | | | |
| Orange SA, | | | | | | | | | | | | |
9.000%, 03/01/2031(1) | | | 33,426,000 | | | | 41,054,871 | | | | | |
| Oshkosh Corp., | | | | | | | | | | | | |
| 3.100%, 03/01/2030 | | | | | | | | | | | | |
| (Callable 12/01/2029) | | | 5,000,000 | | | | 4,356,291 | | | | | |
The accompanying notes are an integral part of these financial statements.
Baird Core Plus Bond Fund
Schedule of Investments, June 30, 2023 (Unaudited)
Long-Term Investments (cont.)
| | | Principal | | | | | | % of | |
| | | Amount | | | Value | | | Net Assets | |
| Owens Corning: | | | | | | | | | |
| 4.200%, 12/01/2024 | | | | | | | | | |
| (Callable 09/01/2024) | | $ | 10,000,000 | | | $ | 9,785,178 | | | |
| |
| 3.400%, 08/15/2026 | | | | | | | | | | | | |
| (Callable 05/15/2026) | | | 5,000,000 | | | | 4,719,741 | | | | | |
| 5.875%, 12/01/2036 | | | 13,205,000 | | | | 14,443,990 | | | | | |
| Penske Truck Leasing Co.: | | | | | | | | | | | | |
| 4.000%, 07/15/2025 | | | | | | | | | | | | |
(Callable 06/15/2025)(2) | | | 20,000,000 | | | | 19,130,908 | | | | | |
| 1.200%, 11/15/2025 | | | | | | | | | | | | |
(Callable 10/15/2025)(2) | | | 22,800,000 | | | | 20,278,321 | | | | | |
| 5.550%, 05/01/2028 | | | | | | | | | | | | |
(Callable 04/01/2028)(2) | | | 15,000,000 | | | | 14,768,621 | | | | | |
| 6.200%, 06/15/2030 | | | | | | | | | | | | |
(Callable 04/15/2030)(2) | | | 6,000,000 | | | | 6,031,349 | | | | | |
| PerkinElmer, Inc.: | | | | | | | | | | | | |
| 3.300%, 09/15/2029 | | | | | | | | | | | | |
| (Callable 06/15/2029) | | | 25,000,000 | | | | 22,339,508 | | | | | |
| 3.625%, 03/15/2051 | | | | | | | | | | | | |
| (Callable 09/15/2050) | | | 11,775,000 | | | | 8,564,735 | | | | | |
| Perrigo Finance Unlimited Co.: | | | | | | | | | | | | |
| 3.900%, 12/15/2024 | | | | | | | | | | | | |
| (Callable 09/15/2024) | | | 42,000,000 | | | | 40,635,000 | | | | | |
| 4.400%, 06/15/2030 | | | | | | | | | | | | |
| (Callable 03/15/2030) | | | 25,250,000 | | | | 22,343,809 | | | | | |
| Pfizer Investment Enterprises Pte Ltd., | | | | | | | | | | | | |
| 5.300%, 05/19/2053 | | | | | | | | | | | | |
| (Callable 11/19/2052) | | | 11,825,000 | | | | 12,294,231 | | | | | |
| Phillips 66 Co.: | | | | | | | | | | | | |
| 3.150%, 12/15/2029 | | | | | | | | | | | | |
| (Callable 09/15/2029) | | | 12,550,000 | | | | 10,949,629 | | | | | |
| 2.150%, 12/15/2030 | | | | | | | | | | | | |
| (Callable 09/15/2030) | | | 6,000,000 | | | | 4,895,930 | | | | | |
| 4.650%, 11/15/2034 | | | | | | | | | | | | |
| (Callable 05/15/2034) | | | 13,000,000 | | | | 12,272,240 | | | | | |
| 5.875%, 05/01/2042 | | | 5,000,000 | | | | 5,184,238 | | | | | |
| 4.680%, 02/15/2045 | | | | | | | | | | | | |
| (Callable 08/15/2044) | | | 2,000,000 | | | | 1,705,556 | | | | | |
| Pilgrim’s Pride Corp., | | | | | | | | | | | | |
| 6.250%, 07/01/2033 | | | | | | | | | | | | |
| (Callable 04/01/2033) | | | 16,935,000 | | | | 16,403,106 | | | | | |
| Plains All American Pipeline LP / | | | | | | | | | | | | |
| PAA Finance Corp., | | | | | | | | | | | | |
| 3.550%, 12/15/2029 | | | | | | | | | | | | |
| (Callable 09/15/2029) | | | 10,000,000 | | | | 8,811,877 | | | | | |
| POSCO, | | | | | | | | | | | | |
5.750%, 01/17/2028(1)(2) | | | 5,000,000 | | | | 5,072,422 | | | | | |
| Premier Health Partners, | | | | | | | | | | | | |
| 2.911%, 11/15/2026 | | | | | | | | | | | | |
| (Callable 05/15/2026) | | | 10,000,000 | | | | 8,826,109 | | | | | |
| Quanta Services, Inc., | | | | | | | | | | | | |
| 2.900%, 10/01/2030 | | | | | | | | | | | | |
| (Callable 07/01/2030) | | | 10,000,000 | | | | 8,495,343 | | | | | |
| Rand Parent LLC, | | | | | | | | | | | | |
| 8.500%, 02/15/2030 | | | | | | | | | | | | |
(Callable 02/15/2026)(2) | | | 6,500,000 | | | | 5,884,793 | | | | | |
| Raytheon Technologies Corp.: | | | | | | | | | | | | |
| 4.800%, 12/15/2043 | | | | | | | | | | | | |
| (Callable 06/15/2043) | | | 7,925,000 | | | | 7,343,641 | | | | | |
| 3.125%, 07/01/2050 | | | | | | | | | | | | |
| (Callable 01/01/2050) | | | 6,000,000 | | | | 4,344,961 | | | | | |
| Regal Rexnord Corp.: | | | | | | | | | | | | |
| 6.300%, 02/15/2030 | | | | | | | | | | | | |
(Callable 12/15/2029)(2) | | | 26,000,000 | | | | 25,923,040 | | | | | |
| 6.400%, 04/15/2033 | | | | | | | | | | | | |
(Callable 01/15/2033)(2) | | | 7,699,000 | | | | 7,692,510 | | | | | |
| Reliance Industries Ltd., | | | | | | | | | | | | |
2.875%, 01/12/2032(1)(2) | | | 20,400,000 | | | | 17,006,745 | | | | | |
| Reliance Steel & Aluminum Co., | | | | | | | | | | | | |
| 1.300%, 08/15/2025 | | | | | | | | | | | | |
| (Callable 07/15/2025) | | | 6,100,000 | | | | 5,568,689 | | | | | |
| Republic Services, Inc., | | | | | | | | | | | | |
| 5.000%, 04/01/2034 | | | | | | | | | | | | |
| (Callable 01/01/2034) | | | 5,000,000 | | | | 4,988,768 | | | | | |
| Rogers Communications, Inc.: | | | | | | | | | | | | |
| 3.800%, 03/15/2032 | | | | | | | | | | | | |
(Callable 12/15/2031)(1)(2) | | | 13,000,000 | | | | 11,363,583 | | | | | |
| 4.350%, 05/01/2049 | | | | | | | | | | | | |
(Callable 11/01/2048)(1) | | | 10,000,000 | | | | 7,898,031 | | | | | |
| Ryder System, Inc., | | | | | | | | | | | | |
| 5.250%, 06/01/2028 | | | | | | | | | | | | |
| (Callable 05/01/2028) | | | 16,550,000 | | | | 16,340,812 | | | | | |
| Sabine Pass Liquefaction LLC: | | | | | | | | | | | | |
| 5.875%, 06/30/2026 | | | | | | | | | | | | |
| (Callable 12/31/2025) | | | 55,015,000 | | | | 55,465,355 | | | | | |
| 5.000%, 03/15/2027 | | | | | | | | | | | | |
| (Callable 09/15/2026) | | | 20,300,000 | | | | 19,981,029 | | | | | |
| 4.500%, 05/15/2030 | | | | | | | | | | | | |
| (Callable 11/15/2029) | | | 21,897,000 | | | | 20,814,461 | | | | | |
| Samarco Mineracao SA: | | | | | | | | | | | | |
5.750%, 10/24/2023(1)(2)(9) | | | 5,475,000 | | | | 3,659,647 | | | | | |
5.375%, 09/26/2024(1)(2)(9) | | | 5,125,000 | | | | 3,377,992 | | | | | |
| Santos Finance Ltd., | | | | | | | | | | | | |
| 3.649%, 04/29/2031 | | | | | | | | | | | | |
(Callable 01/29/2031)(1)(2) | | | 21,000,000 | | | | 17,433,954 | | | | | |
| Schlumberger Holdings Corp., | | | | | | | | | | | | |
| 3.900%, 05/17/2028 | | | | | | | | | | | | |
(Callable 02/17/2028)(2) | | | 11,096,000 | | | | 10,454,846 | | | | | |
| Sealed Air Corp.: | | | | | | | | | | | | |
| 6.125%, 02/01/2028 | | | | | | | | | | | | |
(Callable 02/01/2025)(2) | | | 1,000,000 | | | | 992,628 | | | | | |
| 5.000%, 04/15/2029 | | | | | | | | | | | | |
(Callable 04/15/2025)(2) | | | 5,000,000 | | | | 4,652,175 | | | | | |
| Sherwin-Williams Co., | | | | | | | | | | | | |
| 4.500%, 06/01/2047 | | | | | | | | | | | | |
| (Callable 12/01/2046) | | | 5,550,000 | | | | 4,859,260 | | | | | |
| Silgan Holdings, Inc., | | | | | | | | | | | | |
| 4.125%, 02/01/2028 | | | | | | | | | | | | |
| (Callable 07/17/2023) | | | 4,000,000 | | | | 3,670,200 | | | | | |
| SK Hynix, Inc.: | | | | | | | | | | | | |
6.250%, 01/17/2026(1)(2) | | | 5,900,000 | | | | 5,903,058 | | | | | |
1.500%, 01/19/2026(1)(2) | | | 13,000,000 | | | | 11,518,776 | | | | | |
| SK Telecom Co. Ltd., | | | | | | | | | | | | |
6.625%, 07/20/2027(1)(2) | | | 960,000 | | | | 1,013,348 | | | | | |
| Smith & Nephew PLC, | | | | | | | | | | | | |
| 2.032%, 10/14/2030 | | | | | | | | | | | | |
(Callable 07/14/2030)(1) | | | 10,000,000 | | | | 8,090,529 | | | | | |
| Smithfield Foods, Inc.: | | | | | | | | | | | | |
| 5.200%, 04/01/2029 | | | | | | | | | | | | |
(Callable 01/01/2029)(1)(2) | | | 16,566,000 | | | | 15,265,835 | | | | | |
| 2.625%, 09/13/2031 | | | | | | | | | | | | |
(Callable 06/13/2031)(1)(2) | | | 18,500,000 | | | | 13,671,016 | | | | | |
| Sodexo, Inc., | | | | | | | | | | | | |
| 1.634%, 04/16/2026 | | | | | | | | | | | | |
(Callable 03/16/2026)(1)(2) | | | 6,725,000 | | | | 6,040,671 | | | | | |
| Solvay Finance America LLC, | | | | | | | | | | | | |
| 4.450%, 12/03/2025 | | | | | | | | | | | | |
(Callable 09/03/2025)(1)(2) | | | 40,018,000 | | | | 38,389,703 | | | | | |
| Southern Copper Corp., | | | | | | | | | | | | |
7.500%, 07/27/2035(1) | | | 19,786,000 | | | | 22,977,878 | | | | | |
The accompanying notes are an integral part of these financial statements.
Baird Core Plus Bond Fund
Schedule of Investments, June 30, 2023 (Unaudited)
Long-Term Investments (cont.)
| | | Principal | | | | | | % of | |
| | | Amount | | | Value | | | Net Assets | |
| Spectra Energy Partners LP, | | | | | | | | | |
| 3.500%, 03/15/2025 | | | | | | | | | |
(Callable 12/15/2024)(1) | | $ | 15,150,000 | | | $ | 14,564,373 | | | |
| |
| Standard Industries, Inc.: | | | | | | | | | | | | |
| 4.750%, 01/15/2028 | | | | | | | | | | | | |
(Callable 07/31/2023)(2) | | | 24,408,000 | | | | 22,729,621 | | | | | |
| 4.375%, 07/15/2030 | | | | | | | | | | | | |
(Callable 07/15/2025)(2) | | | 7,000,000 | | | | 6,062,679 | | | | | |
| 3.375%, 01/15/2031 | | | | | | | | | | | | |
(Callable 07/15/2025)(2) | | | 5,000,000 | | | | 4,025,216 | | | | | |
| Stanley Black & Decker, Inc.: | | | | | | | | | | | | |
| 6.000%, 03/06/2028 | | | | | | | | | | | | |
| (Callable 02/06/2028) | | | 3,000,000 | | | | 3,083,926 | | | | | |
| 4.850%, 11/15/2048 | | | | | | | | | | | | |
| (Callable 05/15/2048) | | | 4,175,000 | | | | 3,568,285 | | | | | |
| Steel Dynamics, Inc., | | | | | | | | | | | | |
| 2.800%, 12/15/2024 | | | | | | | | | | | | |
| (Callable 11/15/2024) | | | 7,000,000 | | | | 6,680,252 | | | | | |
| Stellantis Finance US, Inc., | | | | | | | | | | | | |
| 5.625%, 01/12/2028 | | | | | | | | | | | | |
(Callable 12/12/2027)(2) | | | 3,650,000 | | | | 3,681,793 | | | | | |
| Stericycle, Inc., | | | | | | | | | | | | |
| 3.875%, 01/15/2029 | | | | | | | | | | | | |
(Callable 11/15/2023)(2) | | | 1,000,000 | | | | 887,900 | | | | | |
| STERIS Irish FinCo Unlimited Co., | | | | | | | | | | | | |
| 3.750%, 03/15/2051 | | | | | | | | | | | | |
| (Callable 09/15/2050) | | | 7,500,000 | | | | 5,627,559 | | | | | |
| Synnex Corporation: | | | | | | | | | | | | |
| 1.750%, 08/09/2026 | | | | | | | | | | | | |
| (Callable 07/09/2026) | | | 10,000,000 | | | | 8,715,620 | | | | | |
| 2.375%, 08/09/2028 | | | | | | | | | | | | |
| (Callable 06/09/2028) | | | 25,000,000 | | | | 20,485,964 | | | | | |
| Sysco Corp.: | | | | | | | | | | | | |
| 5.950%, 04/01/2030 | | | | | | | | | | | | |
| (Callable 01/01/2030) | | | 22,570,000 | | | | 23,626,866 | | | | | |
| 3.150%, 12/14/2051 | | | | | | | | | | | | |
| (Callable 06/14/2051) | | | 9,250,000 | | | | 6,408,346 | | | | | |
| Takeda Pharmaceutical Co. Ltd., | | | | | | | | | | | | |
| 2.050%, 03/31/2030 | | | | | | | | | | | | |
(Callable 12/31/2029)(1) | | | 11,825,000 | | | | 9,827,174 | | | | | |
| Targa Resources Partners LP: | | | | | | | | | | | | |
| 6.500%, 07/15/2027 | | | | | | | | | | | | |
| (Callable 07/31/2023) | | | 1,000,000 | | | | 992,757 | | | | | |
| 5.000%, 01/15/2028 | | | | | | | | | | | | |
| (Callable 07/31/2023) | | | 28,000,000 | | | | 26,721,452 | | | | | |
| 4.875%, 02/01/2031 | | | | | | | | | | | | |
| (Callable 02/01/2026) | | | 10,500,000 | | | | 9,703,470 | | | | | |
| 4.000%, 01/15/2032 | | | | | | | | | | | | |
| (Callable 07/15/2026) | | | 14,000,000 | | | | 12,102,028 | | | | | |
| TC PipeLines LP: | | | | | | | | | | | | |
| 4.375%, 03/13/2025 | | | | | | | | | | | | |
(Callable 12/13/2024)(1) | | | 26,205,000 | | | | 25,450,561 | | | | | |
| 3.900%, 05/25/2027 | | | | | | | | | | | | |
(Callable 02/25/2027)(1) | | | 23,285,000 | | | | 22,168,108 | | | | | |
| Teck Resources Ltd., | | | | | | | | | | | | |
| 3.900%, 07/15/2030 | | | | | | | | | | | | |
(Callable 04/15/2030)(1) | | | 10,000,000 | | | | 9,096,688 | | | | | |
| Telecom Italia Capital SA: | | | | | | | | | | | | |
5.303%, 05/30/2024(1)(2) | | | 21,500,000 | | | | 20,897,083 | | | | | |
7.200%, 07/18/2036(1) | | | 3,175,000 | | | | 2,729,039 | | | | | |
| Telefonica Emisiones SA: | | | | | | | | | | | | |
4.103%, 03/08/2027(1) | | | 8,125,000 | | | | 7,795,422 | | | | | |
7.045%, 06/20/2036(1) | | | 4,925,000 | | | | 5,370,936 | | | | | |
5.213%, 03/08/2047(1) | | | 24,108,000 | | | | 20,967,665 | | | | | |
4.895%, 03/06/2048(1) | | | 9,475,000 | | | | 7,907,900 | | | | | |
| 5.520%, 03/01/2049 | | | | | | | | | | | | |
(Callable 09/01/2048)(1) | | | 12,000,000 | | | | 10,785,013 | | | | | |
| Tenet Healthcare Corp.: | | | | | | | | | | | | |
| 4.375%, 01/15/2030 | | | | | | | | | | | | |
| (Callable 12/01/2024) | | | 3,000,000 | | | | 2,707,186 | | | | | |
| 6.125%, 06/15/2030 | | | | | | | | | | | | |
| (Callable 06/15/2025) | | | 1,000,000 | | | | 985,700 | | | | | |
| Teva Pharmaceutical Finance | | | | | | | | | | | | |
| Netherlands III BV: | | | | | | | | | | | | |
3.150%, 10/01/2026(1) | | | 53,000,000 | | | | 47,490,427 | | | | | |
| 4.750%, 05/09/2027 | | | | | | | | | | | | |
(Callable 02/09/2027)(1) | | | 9,000,000 | | | | 8,325,652 | | | | | |
| 7.875%, 09/15/2029 | | | | | | | | | | | | |
(Callable 06/15/2029)(1) | | | 5,000,000 | | | | 5,152,660 | | | | | |
| Textron, Inc., | | | | | | | | | | | | |
| 3.000%, 06/01/2030 | | | | | | | | | | | | |
| (Callable 03/01/2030) | | | 15,000,000 | | | | 13,074,999 | | | | | |
| Timken Co.: | | | | | | | | | | | | |
| 3.875%, 09/01/2024 | | | | | | | | | | | | |
| (Callable 06/01/2024) | | | 18,500,000 | | | | 18,019,451 | | | | | |
| 4.500%, 12/15/2028 | | | | | | | | | | | | |
| (Callable 09/15/2028) | | | 6,025,000 | | | | 5,725,678 | | | | | |
| T-Mobile USA, Inc.: | | | | | | | | | | | | |
| 4.750%, 02/01/2028 | | | | | | | | | | | | |
| (Callable 07/11/2023) | | | 17,250,000 | | | | 16,757,882 | | | | | |
| 3.375%, 04/15/2029 | | | | | | | | | | | | |
| (Callable 04/15/2024) | | | 5,000,000 | | | | 4,515,239 | | | | | |
| 3.875%, 04/15/2030 | | | | | | | | | | | | |
| (Callable 01/15/2030) | | | 53,473,000 | | | | 49,262,996 | | | | | |
| 3.500%, 04/15/2031 | | | | | | | | | | | | |
| (Callable 04/15/2026) | | | 60,000,000 | | | | 52,943,898 | | | | | |
| 4.375%, 04/15/2040 | | | | | | | | | | | | |
| (Callable 10/15/2039) | | | 10,000,000 | | | | 8,830,929 | | | | | |
| 3.600%, 11/15/2060 | | | | | | | | | | | | |
| (Callable 05/15/2060) | | | 15,000,000 | | | | 10,527,577 | | | | | |
| Toll Road Investors Partnership II LP: | | | | | | | | | | | | |
| 0.000%, 02/15/2025 | | | | | | | | | | | | |
(Insured by NATL)(1)(2) | | | 10,000,000 | | | | 8,887,909 | | | | | |
| 0.000%, 02/15/2027 | | | | | | | | | | | | |
(Insured by NATL)(1)(2) | | | 32,855,000 | | | | 25,585,156 | | | | | |
| 0.000%, 02/15/2030 | | | | | | | | | | | | |
(Insured by NATL)(1)(2) | | | 2,000,000 | | | | 1,286,093 | | | | | |
| 0.000%, 02/15/2030 | | | | | | | | | | | | |
(Insured by NATL)(1)(2) | | | 2,938,000 | | | | 2,059,228 | | | | | |
| 0.000%, 02/15/2031 | | | | | | | | | | | | |
(Insured by AGM)(1)(2) | | | 5,396,000 | | | | 3,572,482 | | | | | |
| 0.000%, 02/15/2036 | | | | | | | | | | | | |
(Insured by AGM)(1)(2) | | | 12,500,000 | | | | 6,090,627 | | | | | |
| TopBuild Corp.: | | | | | | | | | | | | |
| 3.625%, 03/15/2029 | | | | | | | | | | | | |
(Callable 03/15/2024)(2) | | | 2,500,000 | | | | 2,175,465 | | | | | |
| 4.125%, 02/15/2032 | | | | | | | | | | | | |
(Callable 10/15/2026)(2) | | | 1,000,000 | | | | 851,914 | | | | | |
| TransCanada PipeLines Ltd., | | | | | | | | | | | | |
| 4.750%, 05/15/2038 | | | | | | | | | | | | |
(Callable 11/15/2037)(1) | | | 10,000,000 | | | | 8,927,941 | | | | | |
| Transcontinental Gas Pipe Line Co. LLC, | | | | | | | | | | | | |
| 4.450%, 08/01/2042 | | | | | | | | | | | | |
| (Callable 02/01/2042) | | | 2,600,000 | | | | 2,224,292 | | | | | |
| TransDigm, Inc., | | | | | | | | | | | | |
| 6.750%, 08/15/2028 | | | | | | | | | | | | |
(Callable 02/15/2025)(2) | | | 5,500,000 | | | | 5,520,845 | | | | | |
The accompanying notes are an integral part of these financial statements.
Baird Core Plus Bond Fund
Schedule of Investments, June 30, 2023 (Unaudited)
Long-Term Investments (cont.)
| | | Principal | | | | | | % of | |
| | | Amount | | | Value | | | Net Assets | |
| TreeHouse Foods, Inc., | | | | | | | | | |
| 4.000%, 09/01/2028 | | | | | | | | | |
| (Callable 09/01/2023) | | $ | 1,500,000 | | | $ | 1,292,145 | | | |
| |
| Trinity Industries, Inc., | | | | | | | | | | | | |
| 7.750%, 07/15/2028 | | | | | | | | | | | | |
(Callable 07/15/2025)(2) | | | 1,000,000 | | | | 1,006,250 | | | | | |
| Triton Container International Ltd.: | | | | | | | | | | | | |
| 2.050%, 04/15/2026 | | | | | | | | | | | | |
(Callable 03/15/2026)(1)(2) | | | 7,425,000 | | | | 6,481,505 | | | | | |
| 3.150%, 06/15/2031 | | | | | | | | | | | | |
(Callable 03/15/2031)(1)(2) | | | 30,475,000 | | | | 23,447,178 | | | | | |
| 3.250%, 03/15/2032 | | | | | | | | | | | | |
(Callable 12/15/2031)(1) | | | 10,000,000 | | | | 7,827,184 | | | | | |
| TTX Co., | | | | | | | | | | | | |
4.650%, 06/15/2044(2) | | | 7,710,000 | | | | 6,695,294 | | | | | |
| Tyco Electronics Group SA, | | | | | | | | | | | | |
| 7.125%, 10/01/2037 | | | 500,000 | | | | 577,851 | | | | | |
| Tyson Foods, Inc., | | | | | | | | | | | | |
| 5.100%, 09/23/2048 | | | | | | | | | | | | |
| (Callable 03/28/2048) | | | 4,650,000 | | | | 4,223,102 | | | | | |
| United Rentals North America, Inc.: | | | | | | | | | | | | |
| 3.875%, 11/15/2027 | | | | | | | | | | | | |
| (Callable 07/11/2023) | | | 5,000,000 | | | | 4,669,006 | | | | | |
| 4.875%, 01/15/2028 | | | | | | | | | | | | |
| (Callable 07/11/2023) | | | 5,000,000 | | | | 4,757,952 | | | | | |
| 6.000%, 12/15/2029 | | | | | | | | | | | | |
(Callable 12/15/2025)(2) | | | 8,700,000 | | | | 8,678,603 | | | | | |
| 5.250%, 01/15/2030 | | | | | | | | | | | | |
| (Callable 01/15/2025) | | | 5,000,000 | | | | 4,772,630 | | | | | |
| 4.000%, 07/15/2030 | | | | | | | | | | | | |
| (Callable 07/15/2025) | | | 10,000,000 | | | | 8,856,368 | | | | | |
| 3.875%, 02/15/2031 | | | | | | | | | | | | |
| (Callable 08/15/2025) | | | 3,000,000 | | | | 2,597,396 | | | | | |
| 3.750%, 01/15/2032 | | | | | | | | | | | | |
| (Callable 07/15/2026) | | | 1,000,000 | | | | 846,959 | | | | | |
| Universal Health Services, Inc.: | | | | | | | | | | | | |
| 1.650%, 09/01/2026 | | | | | | | | | | | | |
| (Callable 08/01/2026) | | | 16,000,000 | | | | 13,986,805 | | | | | |
| 2.650%, 10/15/2030 | | | | | | | | | | | | |
| (Callable 07/15/2030) | | | 24,322,000 | | | | 19,864,930 | | | | | |
| UPMC, | | | | | | | | | | | | |
| 3.600%, 04/03/2025 | | | 47,575,000 | | | | 45,767,206 | | | | | |
| Utah Acquisition Sub, Inc.: | | | | | | | | | | | | |
| 3.950%, 06/15/2026 | | | | | | | | | | | | |
| (Callable 03/15/2026) | | | 10,357,000 | | | | 9,836,939 | | | | | |
| 5.250%, 06/15/2046 | | | | | | | | | | | | |
| (Callable 12/15/2045) | | | 4,000,000 | | | | 3,153,530 | | | | | |
| Vale Canada Ltd., | | | | | | | | | | | | |
7.200%, 09/15/2032(1) | | | 1,600,000 | | | | 1,685,089 | | | | | |
| Vale Overseas Ltd.: | | | | | | | | | | | | |
| 3.750%, 07/08/2030 | | | | | | | | | | | | |
(Callable 04/08/2030)(1) | | | 25,339,000 | | | | 22,309,665 | | | | | |
| 6.125%, 06/12/2033 | | | | | | | | | | | | |
(Callable 03/12/2033)(1) | | | 25,000,000 | | | | 25,044,750 | | | | | |
8.250%, 01/17/2034(1) | | | 5,201,000 | | | | 6,051,445 | | | | | |
6.875%, 11/21/2036(1) | | | 29,519,000 | | | | 30,869,140 | | | | | |
6.875%, 11/10/2039(1) | | | 18,121,000 | | | | 18,967,595 | | | | | |
| Valero Energy Corp., | | | | | | | | | | | | |
| 6.625%, 06/15/2037 | | | 5,000,000 | | | | 5,364,918 | | | | | |
| Valero Energy Partners LP, | | | | | | | | | | | | |
| 4.500%, 03/15/2028 | | | | | | | | | | | | |
| (Callable 12/15/2027) | | | 20,000,000 | | | | 19,240,915 | | | | | |
| Var Energi ASA: | | | | | | | | | | | | |
| 7.500%, 01/15/2028 | | | | | | | | | | | | |
(Callable 12/15/2027)(1)(2) | | | 29,950,000 | | | | 30,780,521 | | | | | |
| 8.000%, 11/15/2032 | | | | | | | | | | | | |
(Callable 08/15/2032)(1)(2) | | | 16,989,000 | | | | 17,974,532 | | | | | |
| Verisk Analytics, Inc., | | | | | | | | | | | | |
| 4.000%, 06/15/2025 | | | | | | | | | | | | |
| (Callable 03/15/2025) | | | 10,000,000 | | | | 9,704,554 | | | | | |
| Verizon Communications, Inc.: | | | | | | | | | | | | |
| 3.000%, 03/22/2027 | | | | | | | | | | | | |
| (Callable 01/22/2027) | | | 5,000,000 | | | | 4,665,554 | | | | | |
| 4.500%, 08/10/2033 | | | 15,710,000 | | | | 14,824,794 | | | | | |
| 4.400%, 11/01/2034 | | | | | | | | | | | | |
| (Callable 05/01/2034) | | | 790,000 | | | | 729,149 | | | | | |
| 4.272%, 01/15/2036 | | | 10,793,000 | | | | 9,731,372 | | | | | |
| 5.250%, 03/16/2037 | | | 18,225,000 | | | | 18,046,685 | | | | | |
| 4.812%, 03/15/2039 | | | 38,575,000 | | | | 36,090,569 | | | | | |
| 4.862%, 08/21/2046 | | | 2,500,000 | | | | 2,292,005 | | | | | |
| 5.500%, 03/16/2047 | | | 2,500,000 | | | | 2,501,218 | | | | | |
| 3.700%, 03/22/2061 | | | | | | | | | | | | |
| (Callable 09/22/2060) | | | 11,200,000 | | | | 8,144,864 | | | | | |
| Viatris, Inc.: | | | | | | | | | | | | |
| 3.850%, 06/22/2040 | | | | | | | | | | | | |
| (Callable 12/22/2039) | | | 10,000,000 | | | | 6,910,461 | | | | | |
| 4.000%, 06/22/2050 | | | | | | | | | | | | |
| (Callable 12/22/2049) | | | 22,000,000 | | | | 14,549,461 | | | | | |
| Viterra Finance BV: | | | | | | | | | | | | |
| 2.000%, 04/21/2026 | | | | | | | | | | | | |
(Callable 03/21/2026)(1)(2) | | | 15,000,000 | | | | 13,395,336 | | | | | |
| 4.900%, 04/21/2027 | | | | | | | | | | | | |
(Callable 03/21/2027)(1)(2) | | | 7,725,000 | | | | 7,434,413 | | | | | |
| 3.200%, 04/21/2031 | | | | | | | | | | | | |
(Callable 01/21/2031)(1)(2) | | | 55,139,000 | | | | 46,177,998 | | | | | |
| 5.250%, 04/21/2032 | | | | | | | | | | | | |
(Callable 01/21/2032)(1)(2) | | | 22,000,000 | | | | 21,114,878 | | | | | |
| VMware, Inc., | | | | | | | | | | | | |
| 1.800%, 08/15/2028 | | | | | | | | | | | | |
| (Callable 06/15/2028) | | | 15,000,000 | | | | 12,572,221 | | | | | |
| Vodafone Group PLC: | | | | | | | | | | | | |
7.875%, 02/15/2030(1) | | | 16,293,000 | | | | 18,705,720 | | | | | |
6.150%, 02/27/2037(1) | | | 13,920,000 | | | | 14,569,966 | | | | | |
4.375%, 02/19/2043(1) | | | 5,054,000 | | | | 4,244,262 | | | | | |
| Volkswagen Group of | | | | | | | | | | | | |
| America Finance LLC: | | | | | | | | | | | | |
3.350%, 05/13/2025(1)(2) | | | 15,000,000 | | | | 14,366,091 | | | | | |
| 1.250%, 11/24/2025 | | | | | | | | | | | | |
(Callable 10/24/2025)(1)(2) | | | 8,300,000 | | | | 7,480,738 | | | | | |
| Vontier Corp., | | | | | | | | | | | | |
| 2.400%, 04/01/2028 | | | | | | | | | | | | |
| (Callable 02/01/2028) | | | 15,725,000 | | | | 13,095,308 | | | | | |
| Vulcan Materials Co.: | | | | | | | | | | | | |
| 4.500%, 04/01/2025 | | | | | | | | | | | | |
| (Callable 01/01/2025) | | | 3,000,000 | | | | 2,939,553 | | | | | |
| 3.500%, 06/01/2030 | | | | | | | | | | | | |
| (Callable 03/01/2030) | | | 11,050,000 | | | | 9,982,927 | | | | | |
| 4.700%, 03/01/2048 | | | | | | | | | | | | |
| (Callable 09/01/2047) | | | 500,000 | | | | 445,612 | | | | | |
| Wabtec Corp.: | | | | | | | | | | | | |
| 3.450%, 11/15/2026 | | | | | | | | | | | | |
| (Callable 08/15/2026) | | | 36,775,000 | | | | 34,387,888 | | | | | |
| 5.875%, 09/15/2028 | | | | | | | | | | | | |
| (Callable 06/15/2028) | | | 10,205,000 | | | | 9,829,699 | | | | | |
| Walgreens Boots Alliance, Inc., | | | | | | | | | | | | |
| 3.450%, 06/01/2026 | | | | | | | | | | | | |
| (Callable 03/01/2026) | | | 5,957,000 | | | | 5,587,303 | | | | | |
The accompanying notes are an integral part of these financial statements.
Baird Core Plus Bond Fund
Schedule of Investments, June 30, 2023 (Unaudited)
Long-Term Investments (cont.)
| | | Principal | | | | | | % of | |
| | | Amount | | | Value | | | Net Assets | |
| Walt Disney Co.: | | | | | | | | | |
| 5.400%, 10/01/2043 | | $ | 5,000,000 | | | $ | 5,097,514 | | | | |
| 4.750%, 09/15/2044 | | | | | | | | | | | |
| (Callable 03/15/2044) | | | 1,950,000 | | | | 1,847,976 | | | | |
| Warnermedia Holdings, Inc.: | | | | | | | | | | | |
| 6.412%, 03/15/2026 | | | | | | | | | | | |
| (Callable 03/15/2024) | | | 7,000,000 | | | | 7,005,787 | | | | |
| 4.279%, 03/15/2032 | | | | | | | | | | | |
| (Callable 12/15/2031) | | | 24,550,000 | | | | 21,772,793 | | | | |
| Weir Group PLC, | | | | | | | | | | | |
| 2.200%, 05/13/2026 | | | | | | | | | | | |
(Callable 04/13/2026)(1)(2) | | | 34,748,000 | | | | 31,122,949 | | | | |
| Western Digital Corp., | | | | | | | | | | | |
| 4.750%, 02/15/2026 | | | | | | | | | | | |
| (Callable 11/15/2025) | | | 57,075,000 | | | | 54,364,942 | | | | |
| Western Midstream Operating LP: | | | | | | | | | | | |
| 5.875%, 02/01/2030 | | | | | | | | | | | |
| (Callable 11/01/2029) | | | 4,000,000 | | | | 3,591,393 | | | | |
| 6.150%, 04/01/2033 | | | | | | | | | | | |
| (Callable 01/01/2033) | | | 2,500,000 | | | | 2,519,725 | | | | |
| 5.875%, 02/01/2050 | | | | | | | | | | | |
| (Callable 08/01/2049) | | | 10,000,000 | | | | 8,190,700 | | | | |
| Westinghouse Air Brake | | | | | | | | | | | |
| Technologies Corp., | | | | | | | | | | | |
| 3.200%, 06/15/2025 | | | | | | | | | | | |
| (Callable 05/15/2025) | | | 14,736,000 | | | | 13,986,546 | | | | |
| WestRock MWV LLC, | | | | | | | | | | | |
| 8.200%, 01/15/2030 | | | 5,012,000 | | | | 5,746,912 | | | | |
| Williams Companies, Inc.: | | | | | | | | | | | |
| 7.500%, 01/15/2031 | | | 120,000 | | | | 131,751 | | | | |
| 7.750%, 06/15/2031 | | | 3,500,000 | | | | 3,871,976 | | | | |
| 5.875%, 03/15/2032 | | | 11,275,000 | | | | 13,385,037 | | | | |
| 6.300%, 04/15/2040 | | | 1,590,000 | | | | 1,669,547 | | | | |
| 5.750%, 06/24/2044 | | | | | | | | | | | |
| (Callable 12/24/2043) | | | 2,500,000 | | | | 2,435,599 | | | | |
| Wipro IT Services LLC, | | | | | | | | | | | |
| 1.500%, 06/23/2026 | | | | | | | | | | | |
(Callable 05/23/2026)(1)(2) | | | 17,800,000 | | | | 15,876,234 | | | | |
| Woodside Finance Ltd.: | | | | | | | | | | | |
| 3.650%, 03/05/2025 | | | | | | | | | | | |
(Callable 12/05/2024)(1)(2) | | | 15,575,000 | | | | 14,992,636 | | | | |
| 4.500%, 03/04/2029 | | | | | | | | | | | |
(Callable 12/04/2028)(1)(2) | | | 30,000,000 | | | | 28,286,751 | | | | |
| Worthington Industries, Inc., | | | | | | | | | | | |
| 4.550%, 04/15/2026 | | | 9,154,000 | | | | 8,653,218 | | | | |
| WRKCo, Inc., | | | | | | | | | | | |
| 3.000%, 09/15/2024 | | | | | | | | | | | |
| (Callable 07/15/2024) | | | 6,000,000 | | | | 5,769,874 | | | | |
| Xerox Holdings Corp., | | | | | | | | | | | |
| 5.000%, 08/15/2025 | | | | | | | | | | | |
(Callable 07/15/2025)(2) | | | 1,000,000 | | | | 944,065 | | | | |
| XPO Escrow Sub LLC, | | | | | | | | | | | |
| 7.500%, 11/15/2027 | | | | | | | | | | | |
(Callable 11/15/2024)(2) | | | 7,000,000 | | | | 7,152,814 | | | | |
| XPO, Inc.: | | | | | | | | | | | |
| 6.250%, 06/01/2028 | | | | | | | | | | | |
(Callable 06/01/2025)(2) | | | 1,000,000 | | | | 983,227 | | | | |
| 7.125%, 06/01/2031 | | | | | | | | | | | |
(Callable 06/01/2026)(2) | | | 500,000 | | | | 503,882 | | | | |
| Yara International ASA, | | | | | | | | | | | |
| 3.800%, 06/06/2026 | | | | | | | | | | | |
(Callable 03/06/2026)(1)(2) | | | 20,250,000 | | | | 19,016,656 | | | | |
| Zimmer Biomet Holdings, Inc.: | | | | | | | | | | | |
| 3.550%, 03/20/2030 | | | | | | | | | | | |
| (Callable 12/20/2029) | | | 1,000,000 | | | | 874,051 | | | | |
| 5.750%, 11/30/2039 | | | 11,375,000 | | | | 11,324,137 | | | | |
| Zoetis, Inc., | | | | | | | | | | | |
| 4.500%, 11/13/2025 | | | | | | | | | | | |
| (Callable 08/13/2025) | | | 5,653,000 | | | | 5,560,444 | | | | |
| Total Industrials | | | | | | | | | | | |
| (Cost $7,852,932,021) | | | | | | | 7,093,183,121 | | | | 29.2 | % |
| Utilities | | | | | | | | | | | | |
| American Transmission Systems, Inc., | | | | | | | | | | | | |
| 2.650%, 01/15/2032 | | | | | | | | | | | | |
(Callable 10/15/2031)(2) | | | 4,850,000 | | | | 4,010,619 | | | | | |
| Appalachian Power Co., | | | | | | | | | | | | |
| 6.700%, 08/15/2037 | | | 1,400,000 | | | | 1,492,107 | | | | | |
| Avangrid, Inc., | | | | | | | | | | | | |
| 3.200%, 04/15/2025 | | | | | | | | | | | | |
(Callable 03/15/2025)(1) | | | 14,000,000 | | | | 13,309,853 | | | | | |
| Berkshire Hathaway Energy Co., | | | | | | | | | | | | |
| 2.850%, 05/15/2051 | | | | | | | | | | | | |
| (Callable 11/15/2050) | | | 10,000,000 | | | | 6,463,740 | | | | | |
| Consolidated Edison Co. | | | | | | | | | | | | |
| of New York, Inc., | | | | | | | | | | | | |
| 4.625%, 12/01/2054 | | | | | | | | | | | | |
| (Callable 06/01/2054) | | | 7,600,000 | | | | 6,522,453 | | | | | |
| Constellation Energy Generation LLC, | | | | | | | | | | | | |
| 5.800%, 03/01/2033 | | | | | | | | | | | | |
| (Callable 12/01/2032) | | | 10,000,000 | | | | 10,236,324 | | | | | |
| Consumers Energy Co., | | | | | | | | | | | | |
| 3.500%, 08/01/2051 | | | | | | | | | | | | |
| (Callable 02/01/2051) | | | 9,425,000 | | | | 7,202,967 | | | | | |
| Dominion Resources, Inc., | | | | | | | | | | | | |
| 5.950%, 06/15/2035 | | | 1,880,000 | | | | 1,931,685 | | | | | |
| DTE Electric Company: | | | | | | | | | | | | |
| 4.875%, 06/01/2028 | | | | | | | | | | | | |
| (Callable 05/01/2028) | | | 11,900,000 | | | | 11,639,769 | | | | | |
| 2.625%, 03/01/2031 | | | | | | | | | | | | |
| (Callable 12/01/2030) | | | 15,200,000 | | | | 12,992,705 | | | | | |
| Duquesne Light Holdings, Inc., | | | | | | | | | | | | |
| 2.532%, 10/01/2030 | | | | | | | | | | | | |
(Callable 07/01/2030)(2) | | | 8,775,000 | | | | 7,012,396 | | | | | |
| EDP Finance BV, | | | | | | | | | | | | |
3.625%, 07/15/2024(1)(2) | | | 41,299,000 | | | | 40,231,317 | | | | | |
| Enel Finance International NV: | | | | | | | | | | | | |
3.500%, 04/06/2028(1)(2) | | | 7,000,000 | | | | 6,404,772 | | | | | |
| 7.500%, 10/14/2032 | | | | | | | | | | | | |
(Callable 07/14/2032)(1)(2) | | | 20,000,000 | | | | 22,174,412 | | | | | |
6.000%, 10/07/2039(1)(2) | | | 4,286,000 | | | | 4,209,635 | | | | | |
4.750%, 05/25/2047(1)(2) | | | 54,084,000 | | | | 46,005,169 | | | | | |
| Engie Energia Chile SA, | | | | | | | | | | | | |
| 3.400%, 01/28/2030 | | | | | | | | | | | | |
(Callable 10/28/2029)(1)(2) | | | 3,000,000 | | | | 2,499,521 | | | | | |
| Exelon Corp.: | | | | | | | | | | | | |
| 3.950%, 06/15/2025 | | | | | | | | | | | | |
| (Callable 03/15/2025) | | | 15,775,000 | | | | 15,253,014 | | | | | |
| 7.600%, 04/01/2032 | | | 1,650,000 | | | | 1,872,403 | | | | | |
| 5.100%, 06/15/2045 | | | | | | | | | | | | |
| (Callable 12/15/2044) | | | 5,875,000 | | | | 5,441,783 | | | | | |
| 4.100%, 03/15/2052 | | | | | | | | | | | | |
| (Callable 09/15/2051) | | | 5,000,000 | | | | 4,030,625 | | | | | |
| Exelon Generation Co. LLC, | | | | | | | | | | | | |
| 5.600%, 06/15/2042 | | | | | | | | | | | | |
| (Callable 12/15/2041) | | | 6,100,000 | | | | 5,893,994 | | | | | |
| Fells Point Funding Trust, | | | | | | | | | | | | |
| 3.046%, 01/31/2027 | | | | | | | | | | | | |
(Callable 12/31/2026)(2) | | | 10,300,000 | | | | 9,468,674 | | | | | |
The accompanying notes are an integral part of these financial statements.
Baird Core Plus Bond Fund
Schedule of Investments, June 30, 2023 (Unaudited)
Long-Term Investments (cont.)
| | | Principal | | | | | | % of | |
| | | Amount | | | Value | | | Net Assets | |
| FirstEnergy Corp.: | | | | | | | | | |
| 2.650%, 03/01/2030 | | | | | | | | | |
| (Callable 12/01/2029) | | $ | 4,300,000 | | | $ | 3,626,491 | | | | |
| 3.400%, 03/01/2050 | | | | | | | | | | | |
| (Callable 09/01/2049) | | | 11,325,000 | | | | 7,804,737 | | | | |
| FirstEnergy Transmission LLC, | | | | | | | | | | | |
| 2.866%, 09/15/2028 | | | | | | | | | | | |
(Callable 07/15/2028)(2) | | | 15,000,000 | | | | 13,200,277 | | | | |
| Fortis, Inc., | | | | | | | | | | | |
| 3.055%, 10/04/2026 | | | | | | | | | | | |
(Callable 07/04/2026)(1) | | | 8,762,000 | | | | 8,072,302 | | | | |
| Infraestructura Energetica | | | | | | | | | | | |
| Nova SAB de CV, | | | | | | | | | | | |
3.750%, 01/14/2028(2) | | | 5,000,000 | | | | 4,550,000 | | | | |
| KeySpan Corp., | | | | | | | | | | | |
8.000%, 11/15/2030(1) | | | 8,375,000 | | | | 9,260,884 | | | | |
| Liberty Utilities Finance GP 1, | | | | | | | | | | | |
| 2.050%, 09/15/2030 | | | | | | | | | | | |
(Callable 06/15/2030)(1)(2) | | | 10,600,000 | | | | 8,235,267 | | | | |
| National Grid PLC, | | | | | | | | | | | |
| 5.602%, 06/12/2028 | | | | | | | | | | | |
(Callable 05/12/2028)(1) | | | 5,000,000 | | | | 5,020,944 | | | | |
| NiSource, Inc.: | | | | | | | | | | | |
| 3.600%, 05/01/2030 | | | | | | | | | | | |
| (Callable 02/01/2030) | | | 20,800,000 | | | | 18,732,053 | | | | |
| 3.950%, 03/30/2048 | | | | | | | | | | | |
| (Callable 09/30/2047) | | | 11,775,000 | | | | 9,448,852 | | | | |
| Ohio Power Co., | | | | | | | | | | | |
| 5.000%, 06/01/2033 | | | | | | | | | | | |
| (Callable 03/01/2033) | | | 8,150,000 | | | | 7,995,477 | | | | |
| Oklahoma Gas and Electric Co., | | | | | | | | | | | |
| 5.600%, 04/01/2053 | | | | | | | | | | | |
| (Callable 10/01/2052) | | | 3,700,000 | | | | 3,751,374 | | | | |
| Oncor Electric Delivery Co. LLC, | | | | | | | | | | | |
| 2.750%, 05/15/2030 | | | | | | | | | | | |
| (Callable 02/15/2030) | | | 9,500,000 | | | | 8,328,467 | | | | |
| Piedmont Natural Gas Company, Inc., | | | | | | | | | | | |
| 5.400%, 06/15/2033 | | | | | | | | | | | |
| (Callable 03/15/2033) | | | 14,050,000 | | | | 14,017,177 | | | | |
| Total Utilities | | | | | | | | | | | |
| (Cost $413,099,281) | | | | | | | 368,344,239 | | | | 1.5 | % |
| Financials | | | | | | | | | | | | |
| ABN AMRO Bank NV: | | | | | | | | | | | | |
4.750%, 07/28/2025(1)(2) | | | 37,818,000 | | | | 36,473,570 | | | | | |
4.800%, 04/18/2026(1)(2) | | | 47,025,000 | | | | 44,988,325 | | | | | |
| 1.542%, 06/16/2027 | | | | | | | | | | | | |
| (1 Year CMT Rate + 0.800%) | | | | | | | | | | | | |
(Callable 06/16/2026)(1)(2)(3) | | | 12,250,000 | | | | 10,718,987 | | | | | |
| 3.324%, 03/13/2037 | | | | | | | | | | | | |
| (5 Year CMT Rate + 1.900%) | | | | | | | | | | | | |
(Callable 12/13/2031)(1)(2)(3) | | | 31,325,000 | | | | 23,795,833 | | | | | |
| AerCap Holdings NV: | | | | | | | | | | | | |
| 2.875%, 08/14/2024 | | | | | | | | | | | | |
(Callable 07/14/2024)(1) | | | 39,395,000 | | | | 37,858,279 | | | | | |
| 6.500%, 07/15/2025 | | | | | | | | | | | | |
(Callable 06/15/2025)(1) | | | 15,000,000 | | | | 15,074,175 | | | | | |
| 2.450%, 10/29/2026 | | | | | | | | | | | | |
(Callable 09/29/2026)(1) | | | 8,000,000 | | | | 7,145,206 | | | | | |
| 5.750%, 06/06/2028 | | | | | | | | | | | | |
(Callable 05/06/2028)(1) | | | 10,000,000 | | | | 9,917,279 | | | | | |
| 3.000%, 10/29/2028 | | | | | | | | | | | | |
(Callable 08/29/2028)(1) | | | 15,500,000 | | | | 13,402,117 | | | | | |
| AIG SunAmerica Global Financing X, | | | | | | | | | | | | |
6.900%, 03/15/2032(2) | | | 2,000,000 | | | | 2,137,772 | | | | | |
| Air Lease Corp.: | | | | | | | | | | | | |
| 2.300%, 02/01/2025 | | | | | | | | | | | | |
| (Callable 01/01/2025) | | | 14,150,000 | | | | 13,305,613 | | | | | |
| 5.850%, 12/15/2027 | | | | | | | | | | | | |
| (Callable 11/15/2027) | | | 10,000,000 | | | | 9,986,567 | | | | | |
| Ally Financial, Inc.: | | | | | | | | | | | | |
| 1.450%, 10/02/2023 | | | | | | | | | | | | |
| (Callable 09/02/2023) | | | 15,000,000 | | | | 14,798,565 | | | | | |
| 5.125%, 09/30/2024 | | | 13,000,000 | | | | 12,753,884 | | | | | |
| 5.800%, 05/01/2025 | | | | | | | | | | | | |
| (Callable 04/01/2025) | | | 10,000,000 | | | | 9,829,863 | | | | | |
| American International Group, Inc.: | | | | | | | | | | | | |
| 5.125%, 03/27/2033 | | | | | | | | | | | | |
| (Callable 12/27/2032) | | | 6,000,000 | | | | 5,859,255 | | | | | |
| 6.820%, 11/15/2037 | | | 4,173,000 | | | | 4,380,280 | | | | | |
| Aon PLC, | | | | | | | | | | | | |
| 3.875%, 12/15/2025 | | | | | | | | | | | | |
| (Callable 09/15/2025) | | | 14,490,000 | | | | 13,965,569 | | | | | |
| Assurant, Inc.: | | | | | | | | | | | | |
| 4.900%, 03/27/2028 | | | | | | | | | | | | |
| (Callable 12/27/2027) | | | 4,250,000 | | | | 4,049,233 | | | | | |
| 3.700%, 02/22/2030 | | | | | | | | | | | | |
| (Callable 11/22/2029) | | | 7,000,000 | | | | 6,010,846 | | | | | |
| Australia & New Zealand | | | | | | | | | | | | |
| Banking Group Ltd.: | | | | | | | | | | | | |
4.500%, 03/19/2024(1)(2) | | | 12,000,000 | | | | 11,848,764 | | | | | |
| 2.950%, 07/22/2030 | | | | | | | | | | | | |
| (5 Year CMT Rate + 1.288%) | | | | | | | | | | | | |
(Callable 07/22/2025)(1)(2)(3) | | | 14,803,000 | | | | 13,560,584 | | | | | |
6.742%, 12/08/2032(1)(2) | | | 33,000,000 | | | | 34,128,974 | | | | | |
| 2.570%, 11/25/2035 | | | | | | | | | | | | |
| (5 Year CMT Rate + 1.700%) | | | | | | | | | | | | |
(Callable 11/25/2030)(1)(2)(3) | | | 13,000,000 | | | | 9,874,991 | | | | | |
| Aviation Capital Group LLC: | | | | | | | | | | | | |
| 6.250%, 04/15/2028 | | | | | | | | | | | | |
(Callable 03/15/2028)(1)(2) | | | 5,000,000 | | | | 4,987,750 | | | | | |
| 6.375%, 07/15/2030 | | | | | | | | | | | | |
(Callable 05/15/2030)(1)(2) | | | 16,000,000 | | | | 15,865,857 | | | | | |
| Avolon Holdings Funding Ltd.: | | | | | | | | | | | | |
| 5.250%, 05/15/2024 | | | | | | | | | | | | |
(Callable 04/15/2024)(1)(2) | | | 5,000,000 | | | | 4,912,366 | | | | | |
| 2.875%, 02/15/2025 | | | | | | | | | | | | |
(Callable 01/15/2025)(1)(2) | | | 10,000,000 | | | | 9,299,651 | | | | | |
| Banco Santander Chile, | | | | | | | | | | | | |
| 2.700%, 01/10/2025 | | | | | | | | | | | | |
(Callable 12/10/2024)(1)(2) | | | 8,000,000 | | | | 7,649,978 | | | | | |
| Banco Santander SA: | | | | | | | | | | | | |
5.179%, 11/19/2025(1) | | | 11,150,000 | | | | 10,828,508 | | | | | |
| 1.722%, 09/14/2027 | | | | | | | | | | | | |
| (1 Year CMT Rate + 0.900%) | | | | | | | | | | | | |
(Callable 09/14/2026)(1)(3) | | | 10,000,000 | | | | 8,682,112 | | | | | |
2.749%, 12/03/2030(1) | | | 5,000,000 | | | | 3,918,563 | | | | | |
| 3.225%, 11/22/2032 | | | | | | | | | | | | |
| (1 Year CMT Rate + 1.600%) | | | | | | | | | | | | |
(Callable 08/22/2031)(1)(3) | | | 35,000,000 | | | | 27,727,780 | | | | | |
| Bank of America Corp.: | | | | | | | | | | | | |
| 3.093%, 10/01/2025 (SOFR + 1.352%) | | | | | | | | | | | | |
(Callable 10/01/2024)(3) | | | 22,000,000 | | | | 21,161,026 | | | | | |
| 2.456%, 10/22/2025 (SOFR + 1.132%) | | | | | | | | | | | | |
(Callable 10/22/2024)(3) | | | 8,000,000 | | | | 7,638,416 | | | | | |
| 3.366%, 01/23/2026 (SOFR + 1.072%) | | | | | | | | | | | | |
(Callable 01/23/2025)(3) | | | 22,700,000 | | | | 21,749,150 | | | | | |
| 5.080%, 01/20/2027 (SOFR + 1.290%) | | | | | | | | | | | | |
(Callable 01/20/2026)(3) | | | 12,750,000 | | | | 12,554,390 | | | | | |
The accompanying notes are an integral part of these financial statements.
Baird Core Plus Bond Fund
Schedule of Investments, June 30, 2023 (Unaudited)
Long-Term Investments (cont.)
| | | Principal | | | | | | % of | |
| | | Amount | | | Value | | | Net Assets | |
| Bank of America Corp.: (cont.) | | | | | | | | | |
| 1.734%, 07/22/2027 | | | | | | | | | |
| (SOFR + 0.960%) | | | | | | | | | |
(Callable 07/22/2026)(3) | | $ | 6,000,000 | | | $ | 5,356,589 | | | |
| |
| 6.204%, 11/10/2028 (SOFR + 1.990%) | | | | | | | | | | | | |
(Callable 11/10/2027)(3) | | | 12,000,000 | | | | 12,334,188 | | | | | |
| 3.419%, 12/20/2028 (SOFR + 1.302%) | | | | | | | | | | | | |
(Callable 12/20/2027)(3) | | | 19,539,000 | | | | 17,917,722 | | | | | |
| 5.202%, 04/25/2029 (SOFR + 1.630%) | | | | | | | | | | | | |
(Callable 04/25/2028)(3) | | | 15,000,000 | | | | 14,836,068 | | | | | |
| 2.087%, 06/14/2029 (SOFR + 1.060%) | | | | | | | | | | | | |
(Callable 06/14/2028)(3) | | | 12,000,000 | | | | 10,237,906 | | | | | |
| 4.271%, 07/23/2029 (SOFR + 1.572%) | | | | | | | | | | | | |
(Callable 07/23/2028)(3) | | | 10,000,000 | | | | 9,487,932 | | | | | |
| 2.496%, 02/13/2031 (SOFR + 1.252%) | | | | | | | | | | | | |
(Callable 02/13/2030)(3) | | | 7,000,000 | | | | 5,860,619 | | | | | |
| 2.592%, 04/29/2031 (SOFR + 2.150%) | | | | | | | | | | | | |
(Callable 04/29/2030)(3) | | | 35,000,000 | | | | 29,383,783 | | | | | |
| 1.898%, 07/23/2031 (SOFR + 1.530%) | | | | | | | | | | | | |
(Callable 07/23/2030)(3) | | | 10,000,000 | | | | 7,963,509 | | | | | |
| 5.015%, 07/22/2033 (SOFR + 2.160%) | | | | | | | | | | | | |
(Callable 07/22/2032)(3) | | | 5,000,000 | | | | 4,891,219 | | | | | |
| 7.750%, 05/14/2038 | | | 725,000 | | | | 860,467 | | | | | |
| Bank of Ireland Group PLC, | | | | | | | | | | | | |
| 2.029%, 09/30/2027 | | | | | | | | | | | | |
| (1 Year CMT Rate + 1.100%) | | | | | | | | | | | | |
(Callable 09/30/2026)(1)(2)(3) | | | 10,202,000 | | | | 8,818,466 | | | | | |
| Bank of Montreal: | | | | | | | | | | | | |
1.500%, 01/10/2025(1) | | | 7,000,000 | | | | 6,578,519 | | | | | |
| 3.803%, 12/15/2032 | | | | | | | | | | | | |
| (5 Year Swap Rate USD + 1.432%) | | | | | | | | | | | | |
(Callable 12/15/2027)(1)(3) | | | 5,000,000 | | | | 4,407,477 | | | | | |
| Bank of New Zealand, | | | | | | | | | | | | |
2.000%, 02/21/2025(1)(2) | | | 15,475,000 | | | | 14,556,217 | | | | | |
| Bank of Nova Scotia, | | | | | | | | | | | | |
5.250%, 06/12/2028(1) | | | 7,000,000 | | | | 6,952,341 | | | | | |
| Banque Federative du Credit Mutuel SA, | | | | | | | | | | | | |
4.753%, 07/13/2027(1)(2) | | | 15,000,000 | | | | 14,612,346 | | | | | |
| Barclays PLC: | | | | | | | | | | | | |
3.650%, 03/16/2025(1) | | | 17,350,000 | | | | 16,630,534 | | | | | |
| 2.852%, 05/07/2026 (SOFR + 2.714%) | | | | | | | | | | | | |
(Callable 05/07/2025)(1)(3) | | | 10,000,000 | | | | 9,365,841 | | | | | |
| 4.337%, 01/10/2028 | | | | | | | | | | | | |
(Callable 01/10/2027)(1) | | | 10,000,000 | | | | 9,421,977 | | | | | |
| 6.224%, 05/09/2034 (SOFR + 2.980%) | | | | | | | | | | | | |
(Callable 05/09/2033)(1)(3) | | | 14,650,000 | | | | 14,591,917 | | | | | |
| BBVA USA, | | | | | | | | | | | | |
| 3.875%, 04/10/2025 | | | | | | | | | | | | |
| (Callable 03/10/2025) | | | 45,470,000 | | | | 43,404,897 | | | | | |
| BGC Partners, Inc.: | | | | | | | | | | | | |
| 4.375%, 12/15/2025 | | | | | | | | | | | | |
| (Callable 09/15/2025) | | | 13,700,000 | | | | 12,646,032 | | | | | |
| 8.000%, 05/25/2028 | | | | | | | | | | | | |
(Callable 04/25/2028)(2) | | | 15,000,000 | | | | 14,491,915 | | | | | |
| BNP Paribas SA: | | | | | | | | | | | | |
4.375%, 09/28/2025(1)(2) | | | 8,200,000 | | | | 7,860,544 | | | | | |
| 2.819%, 11/19/2025 | | | | | | | | | | | | |
| (3 Month LIBOR USD + 1.111%) | | | | | | | | | | | | |
(Callable 11/19/2024)(1)(2)(3) | | | 42,500,000 | | | | 40,523,359 | | | | | |
4.375%, 05/12/2026(1)(2) | | | 16,910,000 | | | | 16,227,693 | | | | | |
| 2.219%, 06/09/2026 (SOFR + 2.074%) | | | | | | | | | | | | |
(Callable 06/09/2025)(1)(2)(3) | | | 16,500,000 | | | | 15,259,407 | | | | | |
| 1.323%, 01/13/2027 (SOFR + 1.004%) | | | | | | | | | | | | |
(Callable 01/13/2026)(1)(2)(3) | | | 8,000,000 | | | | 7,094,243 | | | | | |
| 1.904%, 09/30/2028 | | | | | | | | | | | | |
| (SOFR + 1.609%) | | | | | | | | | | | | |
(Callable 09/30/2027)(1)(2)(3) | | | 16,000,000 | | | | 13,627,254 | | | | | |
| 3.052%, 01/13/2031 (SOFR + 1.507%) | | | | | | | | | | | | |
(Callable 01/13/2030)(1)(2)(3) | | | 10,500,000 | | | | 8,968,295 | | | | | |
| 2.871%, 04/19/2032 (SOFR + 1.387%) | | | | | | | | | | | | |
(Callable 04/19/2031)(1)(2)(3) | | | 25,000,000 | | | | 20,476,100 | | | | | |
| 2.588%, 08/12/2035 | | | | | | | | | | | | |
| (5 Year CMT Rate + 2.050%) | | | | | | | | | | | | |
(Callable 08/12/2030)(1)(2)(3) | | | 5,000,000 | | | | 3,832,753 | | | | | |
| BPCE SA: | | | | | | | | | | | | |
5.700%, 10/22/2023(1)(2) | | | 33,770,000 | | | | 33,622,488 | | | | | |
4.625%, 07/11/2024(1)(2) | | | 3,185,000 | | | | 3,112,233 | | | | | |
5.150%, 07/21/2024(1)(2) | | | 30,902,000 | | | | 30,342,413 | | | | | |
4.500%, 03/15/2025(1)(2) | | | 40,275,000 | | | | 38,648,024 | | | | | |
| 1.652%, 10/06/2026 (SOFR + 1.520%) | | | | | | | | | | | | |
(Callable 10/06/2025)(1)(2)(3) | | | 15,000,000 | | | | 13,451,355 | | | | | |
| 3.116%, 10/19/2032 (SOFR + 1.730%) | | | | | | | | | | | | |
(Callable 10/19/2031)(1)(2)(3) | | | 22,000,000 | | | | 16,980,187 | | | | | |
| Brown & Brown, Inc., | | | | | | | | | | | | |
| 4.500%, 03/15/2029 | | | | | | | | | | | | |
| (Callable 12/15/2028) | | | 11,840,000 | | | | 11,172,489 | | | | | |
| Canadian Imperial Bank of Commerce, | | | | | | | | | | | | |
2.250%, 01/28/2025(1) | | | 8,000,000 | | | | 7,585,085 | | | | | |
| Cantor Fitzgerald LP, | | | | | | | | | | | | |
| 4.875%, 05/01/2024 | | | | | | | | | | | | |
(Callable 04/01/2024)(2) | | | 7,525,000 | | | | 7,361,917 | | | | | |
| Capital One Financial Corp.: | | | | | | | | | | | | |
| 3.750%, 07/28/2026 | | | | | | | | | | | | |
| (Callable 06/28/2026) | | | 5,000,000 | | | | 4,656,381 | | | | | |
| 3.800%, 01/31/2028 | | | | | | | | | | | | |
| (Callable 12/31/2027) | | | 6,960,000 | | | | 6,395,734 | | | | | |
| 5.468%, 02/01/2029 (SOFR + 2.080%) | | | | | | | | | | | | |
(Callable 02/01/2028)(3) | | | 10,000,000 | | | | 9,579,624 | | | | | |
| 6.312%, 06/08/2029 (SOFR + 2.640%) | | | | | | | | | | | | |
(Callable 06/08/2028)(3) | | | 4,600,000 | | | | 4,569,012 | | | | | |
| 3.273%, 03/01/2030 (SOFR + 1.790%) | | | | | | | | | | | | |
(Callable 03/01/2029)(3) | | | 3,250,000 | | | | 2,759,506 | | | | | |
| 6.377%, 06/08/2034 (SOFR + 2.860%) | | | | | | | | | | | | |
(Callable 06/08/2033)(3) | | | 15,000,000 | | | | 14,892,531 | | | | | |
| Centene Corp.: | | | | | | | | | | | | |
| 3.000%, 10/15/2030 | | | | | | | | | | | | |
| (Callable 07/15/2030) | | | 10,000,000 | | | | 8,332,970 | | | | | |
| 2.500%, 03/01/2031 | | | | | | | | | | | | |
| (Callable 12/01/2030) | | | 64,850,000 | | | | 51,715,929 | | | | | |
| Charles Schwab Corp., | | | | | | | | | | | | |
| 2.900%, 03/03/2032 | | | | | | | | | | | | |
| (Callable 12/03/2031) | | | 5,000,000 | | | | 4,116,125 | | | | | |
| Citigroup, Inc.: | | | | | | | | | | | | |
| 3.700%, 01/12/2026 | | | 4,700,000 | | | | 4,508,704 | | | | | |
| 3.106%, 04/08/2026 (SOFR + 2.842%) | | | | | | | | | | | | |
(Callable 04/08/2025)(3) | | | 15,000,000 | | | | 14,320,436 | | | | | |
| 3.887%, 01/10/2028 (SOFR + 1.825%) | | | | | | | | | | | | |
(Callable 01/10/2027)(3) | | | 21,200,000 | | | | 20,089,234 | | | | | |
| 4.412%, 03/31/2031 (SOFR + 3.914%) | | | | | | | | | | | | |
(Callable 03/31/2030)(3) | | | 10,000,000 | | | | 9,402,616 | | | | | |
| 2.572%, 06/03/2031 (SOFR + 2.107%) | | | | | | | | | | | | |
(Callable 06/03/2030)(3) | | | 50,000,000 | | | | 41,715,821 | | | | | |
| 2.561%, 05/01/2032 (SOFR + 1.167%) | | | | | | | | | | | | |
(Callable 05/01/2031)(3) | | | 5,000,000 | | | | 4,082,633 | | | | | |
| 6.270%, 11/17/2033 (SOFR + 2.338%) | | | | | | | | | | | | |
(Callable 11/17/2032)(3) | | | 5,000,000 | | | | 5,307,086 | | | | | |
The accompanying notes are an integral part of these financial statements.
Baird Core Plus Bond Fund
Schedule of Investments, June 30, 2023 (Unaudited)
Long-Term Investments (cont.)
| | | Principal | | | | | | % of | |
| | | Amount | | | Value | | | Net Assets | |
| Citizens Financial Group, Inc.: | | | | | | | | | |
| 2.850%, 07/27/2026 | | | | | | | | | |
| (Callable 04/27/2026) | | $ | 23,400,000 | | | $ | 20,597,564 | | | |
| |
| 3.250%, 04/30/2030 | | | | | | | | | | | | |
| (Callable 01/30/2030) | | | 40,000,000 | | | | 32,686,066 | | | | | |
| CNA Financial Corp.: | | | | | | | | | | | | |
| 4.500%, 03/01/2026 | | | | | | | | | | | | |
| (Callable 12/01/2025) | | | 21,125,000 | | | | 20,494,116 | | | | | |
| 5.500%, 06/15/2033 | | | | | | | | | | | | |
| (Callable 03/15/2033) | | | 14,250,000 | | | | 13,896,049 | | | | | |
| CNO Financial Group, Inc., | | | | | | | | | | | | |
| 5.250%, 05/30/2025 | | | | | | | | | | | | |
| (Callable 02/28/2025) | | | 18,640,000 | | | | 18,308,849 | | | | | |
| CNO Global Funding, | | | | | | | | | | | | |
2.650%, 01/06/2029(2) | | | 7,625,000 | | | | 6,414,068 | | | | | |
| Comerica Bank, | | | | | | | | | | | | |
| 4.000%, 07/27/2025 | | | 21,425,000 | | | | 19,735,945 | | | | | |
| Commonwealth Bank of Australia: | | | | | | | | | | | | |
2.688%, 03/11/2031(1)(2) | | | 20,000,000 | | | | 15,680,940 | | | | | |
3.784%, 03/14/2032(1)(2) | | | 7,250,000 | | | | 6,073,275 | | | | | |
| 3.610%, 09/12/2034 | | | | | | | | | | | | |
| (5 Year CMT Rate + 2.050%) | | | | | | | | | | | | |
(Callable 09/12/2029)(1)(2)(3) | | | 35,000,000 | | | | 29,416,869 | | | | | |
| Compeer Financial, | | | | | | | | | | | | |
| 3.375%, 06/01/2036 (SOFR + 1.965%) | | | | | | | | | | | | |
(Callable 06/01/2031)(2)(3) | | | 5,500,000 | | | | 3,581,410 | | | | | |
| Cooperatieve Rabobank UA: | | | | | | | | | | | | |
4.375%, 08/04/2025(1) | | | 11,975,000 | | | | 11,557,537 | | | | | |
3.750%, 07/21/2026(1) | | | 36,000,000 | | | | 33,610,235 | | | | | |
| Credit Agricole SA: | | | | | | | | | | | | |
4.375%, 03/17/2025(1)(2) | | | 37,093,000 | | | | 35,731,242 | | | | | |
| 1.907%, 06/16/2026 (SOFR + 1.676%) | | | | | | | | | | | | |
(Callable 06/16/2025)(1)(2)(3) | | | 7,000,000 | | | | 6,443,632 | | | | | |
3.250%, 01/14/2030(1)(2) | | | 5,000,000 | | | | 4,268,437 | | | | | |
5.514%, 07/05/2033(1)(2)(8) | | | 10,750,000 | | | | 10,814,224 | | | | | |
| Credit Suisse Group AG: | | | | | | | | | | | | |
| 2.593%, 09/11/2025 (SOFR + 1.560%) | | | | | | | | | | | | |
(Callable 09/11/2024)(1)(2)(3) | | | 13,700,000 | | | | 13,058,442 | | | | | |
| 2.193%, 06/05/2026 (SOFR + 2.044%) | | | | | | | | | | | | |
(Callable 06/05/2025)(1)(2)(3) | | | 10,000,000 | | | | 9,169,686 | | | | | |
| 1.305%, 02/02/2027 | | | | | | | | | | | | |
| (SOFRINDX + 0.980%) | | | | | | | | | | | | |
(Callable 02/02/2026)(1)(2)(3) | | | 19,400,000 | | | | 16,949,159 | | | | | |
| 4.282%, 01/09/2028 | | | | | | | | | | | | |
(Callable 01/09/2027)(1)(2) | | | 24,750,000 | | | | 22,874,030 | | | | | |
| 3.869%, 01/12/2029 | | | | | | | | | | | | |
| (3 Month LIBOR USD + 1.410%) | | | | | | | | | | | | |
(Callable 01/12/2028)(1)(2)(3) | | | 10,850,000 | | | | 9,808,374 | | | | | |
| 4.194%, 04/01/2031 (SOFR + 3.730%) | | | | | | | | | | | | |
(Callable 04/01/2030)(1)(2)(3) | | | 20,000,000 | | | | 17,801,188 | | | | | |
| Danske Bank A/S, | | | | | | | | | | | | |
| 1.621%, 09/11/2026 | | | | | | | | | | | | |
| (1 Year CMT Rate + 1.350%) | | | | | | | | | | | | |
(Callable 09/11/2025)(1)(2)(3) | | | 33,945,000 | | | | 30,448,278 | | | | | |
| Deutsche Bank AG: | | | | | | | | | | | | |
| 2.311%, 11/16/2027 (SOFR + 1.219%) | | | | | | | | | | | | |
(Callable 11/16/2026)(1)(3) | | | 6,000,000 | | | | 5,156,024 | | | | | |
| 6.720%, 01/18/2029 (SOFR + 3.180%) | | | | | | | | | | | | |
(Callable 01/18/2028)(1)(3) | | | 5,000,000 | | | | 5,007,127 | | | | | |
| 5.882%, 07/08/2031 (SOFR + 5.438%) | | | | | | | | | | | | |
(Callable 04/08/2030)(1)(3) | | | 42,175,000 | | | | 36,939,965 | | | | | |
| 3.547%, 09/18/2031 (SOFR + 3.043%) | | | | | | | | | | | | |
(Callable 09/18/2030)(1)(3) | | | 10,000,000 | | | | 8,305,102 | | | | | |
| 3.729%, 01/14/2032 | | | | | | | | | | | | |
| (SOFR + 2.757%) | | | | | | | | | | | | |
(Callable 10/14/2030)(1)(3) | | | 10,000,000 | | | | 7,561,963 | | | | | |
| 3.742%, 01/07/2033 (SOFR + 2.257%) | | | | | | | | | | | | |
(Callable 10/07/2031)(1)(3) | | | 25,000,000 | | | | 18,334,249 | | | | | |
| Digital Realty Trust LP: | | | | | | | | | | | | |
| 4.450%, 07/15/2028 | | | | | | | | | | | | |
| (Callable 04/15/2028) | | | 7,000,000 | | | | 6,552,446 | | | | | |
| 3.600%, 07/01/2029 | | | | | | | | | | | | |
| (Callable 04/01/2029) | | | 41,950,000 | | | | 37,260,664 | | | | | |
| Discover Bank: | | | | | | | | | | | | |
| 4.682%, 08/09/2028 | | | | | | | | | | | | |
| (5 Year Swap Rate USD + 1.730%) | | | | | | | | | | | | |
(Callable 08/09/2023)(3) | | | 6,500,000 | | | | 5,942,998 | | | | | |
| 4.650%, 09/13/2028 | | | | | | | | | | | | |
| (Callable 06/13/2028) | | | 23,225,000 | | | | 21,559,779 | | | | | |
| Discover Financial Services, | | | | | | | | | | | | |
| 3.950%, 11/06/2024 | | | | | | | | | | | | |
| (Callable 08/06/2024) | | | 25,000,000 | | | | 24,091,253 | | | | | |
| DNB Bank ASA: | | | | | | | | | | | | |
| 1.127%, 09/16/2026 | | | | | | | | | | | | |
| (1 Year CMT Rate + 0.850%) | | | | | | | | | | | | |
(Callable 09/16/2025)(1)(2)(3) | | | 10,000,000 | | | | 8,930,326 | | | | | |
| 1.535%, 05/25/2027 | | | | | | | | | | | | |
| (1 Year CMT Rate + 0.720%) | | | | | | | | | | | | |
(Callable 05/25/2026)(1)(2)(3) | | | 5,800,000 | | | | 5,105,968 | | | | | |
| Elevance Health, Inc., | | | | | | | | | | | | |
| 5.125%, 02/15/2053 | | | | | | | | | | | | |
| (Callable 08/15/2052) | | | 5,200,000 | | | | 5,042,593 | | | | | |
| Extra Space Storage LP: | | | | | | | | | | | | |
| 5.700%, 04/01/2028 | | | | | | | | | | | | |
| (Callable 03/01/2028) | | | 3,650,000 | | | | 3,646,406 | | | | | |
| 2.550%, 06/01/2031 | | | | | | | | | | | | |
| (Callable 03/01/2031) | | | 11,000,000 | | | | 8,897,726 | | | | | |
| Federation des Caisses | | | | | | | | | | | | |
| Desjardins du Quebec: | | | | | | | | | | | | |
4.550%, 08/23/2027(1)(2) | | | 5,000,000 | | | | 4,810,610 | | | | | |
5.700%, 03/14/2028(1)(2) | | | 12,000,000 | | | | 11,985,856 | | | | | |
| Fifth Third Bancorp, | | | | | | | | | | | | |
| 4.772%, 07/28/2030 | | | | | | | | | | | | |
| (SOFRINDX + 2.127%) | | | | | | | | | | | | |
(Callable 07/28/2029)(3) | | | 4,000,000 | | | | 3,737,751 | | | | | |
| First Citizens Bancshares, Inc., | | | | | | | | | | | | |
| 2.969%, 09/27/2025 (SOFR + 1.715%) | | | | | | | | | | | | |
(Callable 09/27/2024)(3) | | | 21,219,000 | | | | 20,067,943 | | | | | |
| First Horizon National Corp., | | | | | | | | | | | | |
| 4.000%, 05/26/2025 | | | | | | | | | | | | |
| (Callable 04/26/2025) | | | 30,000,000 | | | | 28,020,520 | | | | | |
| First Republic Bank, | | | | | | | | | | | | |
| 4.625%, 02/13/2047 | | | | | | | | | | | | |
| (Callable 08/13/2046) | | | 1,850,000 | | | | 9,250 | | | | | |
| Five Corners Funding Trust II, | | | | | | | | | | | | |
| 2.850%, 05/15/2030 | | | | | | | | | | | | |
(Callable 02/15/2030)(2) | | | 10,000,000 | | | | 8,494,490 | | | | | |
| Five Corners Funding Trust III, | | | | | | | | | | | | |
| 5.791%, 02/15/2033 | | | | | | | | | | | | |
(Callable 11/15/2032)(2) | | | 5,800,000 | | | | 5,878,379 | | | | | |
| Five Corners Funding Trust IV, | | | | | | | | | | | | |
| 5.997%, 02/15/2053 | | | | | | | | | | | | |
(Callable 08/15/2052)(2) | | | 6,800,000 | | | | 6,912,695 | | | | | |
| FMR LLC: | | | | | | | | | | | | |
4.950%, 02/01/2033(2) | | | 4,235,000 | | | | 4,014,575 | | | | | |
6.500%, 12/14/2040(2) | | | 1,820,000 | | | | 1,916,804 | | | | | |
The accompanying notes are an integral part of these financial statements.
Baird Core Plus Bond Fund
Schedule of Investments, June 30, 2023 (Unaudited)
Long-Term Investments (cont.)
| | | Principal | | | | | | % of | |
| | | Amount | | | Value | | | Net Assets | |
| Globe Life, Inc., | | | | | | | | | |
| 4.550%, 09/15/2028 | | | | | | | | | |
| (Callable 06/15/2028) | | $ | 9,350,000 | | | $ | 9,042,631 | | | |
| |
| Goldman Sachs Group, Inc.: | | | | | | | | | | | | |
| 3.500%, 01/23/2025 | | | | | | | | | | | | |
| (Callable 10/23/2024) | | | 9,400,000 | | | | 9,069,853 | | | | | |
| 3.500%, 04/01/2025 | | | | | | | | | | | | |
| (Callable 03/01/2025) | | | 10,000,000 | | | | 9,605,902 | | | | | |
| 3.814%, 04/23/2029 (SOFR + 1.420%) | | | | | | | | | | | | |
(Callable 04/23/2028)(3) | | | 17,875,000 | | | | 16,593,065 | | | | | |
| 4.223%, 05/01/2029 (SOFR + 1.563%) | | | | | | | | | | | | |
(Callable 05/01/2028)(3) | | | 15,050,000 | | | | 14,214,585 | | | | | |
| 1.992%, 01/27/2032 (SOFR + 1.090%) | | | | | | | | | | | | |
(Callable 01/27/2031)(3) | | | 30,000,000 | | | | 23,616,741 | | | | | |
| 2.615%, 04/22/2032 (SOFR + 1.281%) | | | | | | | | | | | | |
(Callable 04/22/2031)(3) | | | 10,000,000 | | | | 8,201,192 | | | | | |
| 2.383%, 07/21/2032 (SOFR + 1.248%) | | | | | | | | | | | | |
(Callable 07/21/2031)(3) | | | 11,332,000 | | | | 9,076,920 | | | | | |
| 6.345%, 02/15/2034 | | | 125,000 | | | | 125,257 | | | | | |
| 6.750%, 10/01/2037 | | | 300,000 | | | | 322,663 | | | | | |
| Guardian Life Insurance Co. of America: | | | | | | | | | | | | |
4.875%, 06/19/2064(2) | | | 11,215,000 | | | | 9,768,977 | | | | | |
| 3.700%, 01/22/2070 | | | | | | | | | | | | |
(Callable 07/22/2069)(2) | | | 14,000,000 | | | | 9,422,873 | | | | | |
4.850%, 01/24/2077(2) | | | 16,363,000 | | | | 13,612,932 | | | | | |
| Hartford Financial Services Group, Inc.: | | | | | | | | | | | | |
| 6.100%, 10/01/2041 | | | 2,925,000 | | | | 2,930,939 | | | | | |
| 3.600%, 08/19/2049 | | | | | | | | | | | | |
| (Callable 02/19/2049) | | | 15,725,000 | | | | 11,873,160 | | | | | |
| Healthpeak OP LLC, | | | | | | | | | | | | |
| 5.250%, 12/15/2032 | | | | | | | | | | | | |
| (Callable 09/15/2032) | | | 10,000,000 | | | | 9,731,349 | | | | | |
| High Street Funding Trust I, | | | | | | | | | | | | |
| 4.111%, 02/15/2028 | | | | | | | | | | | | |
(Callable 11/15/2027)(2) | | | 9,000,000 | | | | 8,366,707 | | | | | |
| High Street Funding Trust II, | | | | | | | | | | | | |
| 4.682%, 02/15/2048 | | | | | | | | | | | | |
(Callable 11/15/2047)(2) | | | 7,000,000 | | | | 5,857,271 | | | | | |
| HSBC Holdings PLC: | | | | | | | | | | | | |
| 3.803%, 03/11/2025 (SOFR + 1.473%) | | | | | | | | | | | | |
(Callable 03/11/2024)(1)(3) | | | 5,200,000 | | | | 5,098,534 | | | | | |
| 1.645%, 04/18/2026 (SOFR + 1.538%) | | | | | | | | | | | | |
(Callable 04/18/2025)(1)(3) | | | 8,125,000 | | | | 7,483,875 | | | | | |
| 2.251%, 11/22/2027 (SOFR + 1.100%) | | | | | | | | | | | | |
(Callable 11/22/2026)(1)(3) | | | 10,000,000 | | | | 8,873,107 | | | | | |
| 2.013%, 09/22/2028 (SOFR + 1.732%) | | | | | | | | | | | | |
(Callable 09/22/2027)(1)(3) | | | 25,000,000 | | | | 21,422,585 | | | | | |
| 7.390%, 11/03/2028 (SOFR + 3.350%) | | | | | | | | | | | | |
(Callable 11/03/2027)(1)(3) | | | 15,000,000 | | | | 15,830,747 | | | | | |
| 6.161%, 03/09/2029 (SOFR + 1.970%) | | | | | | | | | | | | |
(Callable 03/09/2028)(1)(3) | | | 6,000,000 | | | | 6,051,061 | | | | | |
| 4.583%, 06/19/2029 (SOFR + 1.796%) | | | | | | | | | | | | |
(Callable 06/19/2028)(1)(3) | | | 17,125,000 | | | | 16,116,010 | | | | | |
| 2.206%, 08/17/2029 (SOFR + 1.285%) | | | | | | | | | | | | |
(Callable 08/17/2028)(1)(3) | | | 10,000,000 | | | | 8,365,670 | | | | | |
| 3.973%, 05/22/2030 (SOFR + 1.872%) | | | | | | | | | | | | |
(Callable 05/22/2029)(1)(3) | | | 4,775,000 | | | | 4,287,872 | | | | | |
| 2.804%, 05/24/2032 (SOFR + 1.187%) | | | | | | | | | | | | |
(Callable 05/24/2031)(1)(3) | | | 14,550,000 | | | | 11,768,180 | | | | | |
| Humana, Inc., | | | | | | | | | | | | |
| 8.150%, 06/15/2038 | | | 8,983,000 | | | | 10,674,336 | | | | | |
| Huntington Bancshares, Inc., | | | | | | | | | | | | |
| 2.625%, 08/06/2024 | | | | | | | | | | | | |
| (Callable 07/06/2024) | | | 1,500,000 | | | | 1,434,915 | | | | | |
| Jackson Financial, Inc., | | | | | | | | | | | | |
| 3.125%, 11/23/2031 | | | | | | | | | | | | |
| (Callable 08/23/2031) | | | 15,000,000 | | | | 11,638,688 | | | | | |
| Jefferies Group LLC: | | | | | | | | | | | | |
| 4.850%, 01/15/2027 | | | 14,625,000 | | | | 14,326,319 | | | | | |
| 6.450%, 06/08/2027 | | | 1,300,000 | | | | 1,342,121 | | | | | |
| 4.150%, 01/23/2030 | | | 30,200,000 | | | | 27,151,475 | | | | | |
| John Hancock Life Insurance Co., | | | | | | | | | | | | |
7.375%, 02/15/2024(1)(2) | | | 17,515,000 | | | | 17,631,938 | | | | | |
| JPMorgan Chase & Co.: | | | | | | | | | | | | |
| 3.125%, 01/23/2025 | | | | | | | | | | | | |
| (Callable 10/23/2024) | | | 21,850,000 | | | | 21,134,367 | | | | | |
| 2.301%, 10/15/2025 (SOFR + 1.160%) | | | | | | | | | | | | |
(Callable 10/15/2024)(3) | | | 19,859,000 | | | | 18,923,867 | | | | | |
| 2.005%, 03/13/2026 (SOFR + 1.585%) | | | | | | | | | | | | |
(Callable 03/13/2025)(3) | | | 17,000,000 | | | | 15,966,577 | | | | | |
| 2.083%, 04/22/2026 (SOFR + 1.850%) | | | | | | | | | | | | |
(Callable 04/22/2025)(3) | | | 55,000,000 | | | | 51,507,595 | | | | | |
| 1.045%, 11/19/2026 (SOFR + 0.800%) | | | | | | | | | | | | |
(Callable 11/19/2025)(3) | | | 18,500,000 | | | | 16,570,980 | | | | | |
| 1.470%, 09/22/2027 (SOFR + 0.765%) | | | | | | | | | | | | |
(Callable 09/22/2026)(3) | | | 10,000,000 | | | | 8,828,235 | | | | | |
| 3.509%, 01/23/2029 (SOFR + 0.945%) | | | | | | | | | | | | |
(Callable 01/23/2028)(3) | | | 51,000,000 | | | | 47,143,229 | | | | | |
| 2.522%, 04/22/2031 (SOFR + 2.040%) | | | | | | | | | | | | |
(Callable 04/22/2030)(3) | | | 30,500,000 | | | | 25,798,260 | | | | | |
| 1.953%, 02/04/2032 (SOFR + 1.065%) | | | | | | | | | | | | |
(Callable 02/04/2031)(3) | | | 5,000,000 | | | | 3,983,948 | | | | | |
| 2.580%, 04/22/2032 (SOFR + 1.250%) | | | | | | | | | | | | |
(Callable 04/22/2031)(3) | | | 15,000,000 | | | | 12,459,261 | | | | | |
| Kemper Corp., | | | | | | | | | | | | |
| 3.800%, 02/23/2032 | | | | | | | | | | | | |
| (Callable 11/23/2031) | | | 11,000,000 | | | | 9,085,378 | | | | | |
| KeyBank NA, | | | | | | | | | | | | |
| 3.400%, 05/20/2026 | | | 21,575,000 | | | | 18,585,389 | | | | | |
| LeasePlan Corp. NV, | | | | | | | | | | | | |
2.875%, 10/24/2024(1)(2) | | | 77,403,000 | | | | 73,737,033 | | | | | |
| Liberty Mutual Group, Inc.: | | | | | | | | | | | | |
6.500%, 03/15/2035(2) | | | 750,000 | | | | 762,959 | | | | | |
| 3.951%, 10/15/2050 | | | | | | | | | | | | |
(Callable 04/15/2050)(2) | | | 900,000 | | | | 658,205 | | | | | |
| Liberty Mutual Insurance Co., | | | | | | | | | | | | |
7.697%, 10/15/2097(2) | | | 375,000 | | | | 419,822 | | | | | |
| Life Storage LP: | | | | | | | | | | | | |
| 3.875%, 12/15/2027 | | | | | | | | | | | | |
| (Callable 09/15/2027) | | | 2,575,000 | | | | 2,390,208 | | | | | |
| 2.200%, 10/15/2030 | | | | | | | | | | | | |
| (Callable 07/15/2030) | | | 6,950,000 | | | | 5,560,447 | | | | | |
| Lincoln National Corp.: | | | | | | | | | | | | |
| 3.400%, 01/15/2031 | | | | | | | | | | | | |
| (Callable 10/15/2030) | | | 15,000,000 | | | | 12,657,209 | | | | | |
| 6.300%, 10/09/2037 | | | 2,190,000 | | | | 2,145,448 | | | | | |
| Lloyds Bank PLC: | | | | | | | | | | | | |
| 3.870%, 07/09/2025 | | | | | | | | | | | | |
| (1 Year CMT Rate + 3.500%) | | | | | | | | | | | | |
(Callable 07/09/2024)(1)(3) | | | 15,000,000 | | | | 14,609,831 | | | | | |
3.750%, 01/11/2027(1) | | | 7,800,000 | | | | 7,305,999 | | | | | |
4.375%, 03/22/2028(1) | | | 15,000,000 | | | | 14,221,623 | | | | | |
| 3.574%, 11/07/2028 | | | | | | | | | | | | |
| (3 Month LIBOR USD + 1.205%) | | | | | | | | | | | | |
(Callable 11/07/2027)(1)(3) | | | 21,550,000 | | | | 19,517,316 | | | | | |
| 5.871%, 03/06/2029 | | | | | | | | | | | | |
| (1 Year CMT Rate + 1.700%) | | | | | | | | | | | | |
(Callable 03/06/2028)(1)(3) | | | 11,300,000 | | | | 11,204,539 | | | | | |
The accompanying notes are an integral part of these financial statements.
Baird Core Plus Bond Fund
Schedule of Investments, June 30, 2023 (Unaudited)
Long-Term Investments (cont.)
| | | Principal | | | | | | % of | |
| | | Amount | | | Value | | | Net Assets | |
| LPL Holdings, Inc., | | | | | | | | | |
| 4.000%, 03/15/2029 | | | | | | | | | |
(Callable 03/15/2024)(2) | | $ | 20,076,000 | | | $ | 17,613,044 | | | |
| |
| M&T Bank Corp., | | | | | | | | | | | | |
| 4.000%, 07/15/2024 | | | | | | | | | | | | |
| (Callable 04/16/2024) | | | 4,400,000 | | | | 4,285,864 | | | | | |
| Macquarie Bank Ltd.: | | | | | | | | | | | | |
4.875%, 06/10/2025(1)(2) | | | 7,800,000 | | | | 7,552,946 | | | | | |
3.624%, 06/03/2030(1)(2) | | | 28,805,000 | | | | 24,223,915 | | | | | |
6.798%, 01/18/2033(1)(2) | | | 10,000,000 | | | | 10,033,883 | | | | | |
| Macquarie Group Ltd.: | | | | | | | | | | | | |
| 5.108%, 08/09/2026 (SOFR + 2.208%) | | | | | | | | | | | | |
(Callable 08/09/2025)(1)(2)(3) | | | 9,850,000 | | | | 9,706,518 | | | | | |
| 2.691%, 06/23/2032 (SOFR + 1.440%) | | | | | | | | | | | | |
(Callable 06/23/2031)(1)(2)(3) | | | 10,000,000 | | | | 7,880,443 | | | | | |
| Manulife Financial Corp.: | | | | | | | | | | | | |
4.150%, 03/04/2026(1) | | | 15,000,000 | | | | 14,522,501 | | | | | |
| 2.484%, 05/19/2027 | | | | | | | | | | | | |
(Callable 03/19/2027)(1) | | | 15,225,000 | | | | 13,949,672 | | | | | |
| Maple Grove Funding Trust I, | | | | | | | | | | | | |
| 4.161%, 08/15/2051 | | | | | | | | | | | | |
(Callable 02/15/2051)(2) | | | 15,000,000 | | | | 10,479,606 | | | | | |
| Marsh & McLennan Companies, Inc.: | | | | | | | | | | | | |
| 3.750%, 03/14/2026 | | | | | | | | | | | | |
| (Callable 12/14/2025) | | | 9,225,000 | | | | 8,929,895 | | | | | |
| 5.450%, 03/15/2053 | | | | | | | | | | | | |
| (Callable 09/15/2052) | | | 4,000,000 | | | | 4,071,011 | | | | | |
| Massachusetts Mutual Life Insurance Co.: | | | | | | | | | | | | |
7.625%, 11/15/2023(2) | | | 1,632,000 | | | | 1,635,605 | | | | | |
| 5.077%, 02/15/2069 | | | | | | | | | | | | |
| (3 Month LIBOR USD + 3.191%) | | | | | | | | | | | | |
(Callable 02/15/2049)(2)(3) | | | 26,000,000 | | | | 23,628,280 | | | | | |
3.729%, 10/15/2070(2) | | | 19,253,000 | | | | 13,090,377 | | | | | |
4.900%, 04/01/2077(2) | | | 13,000,000 | | | | 11,061,572 | | | | | |
| MBIA Insurance Corp., | | | | | | | | | | | | |
| 16.830%, 01/15/2033 | | | | | | | | | | | | |
| (3 Month LIBOR USD + 11.260%) | | | | | | | | | | | | |
(Callable 01/15/2028)(2)(3)(9) | | | 700,000 | | | | 21,000 | | | | | |
| MetLife, Inc., | | | | | | | | | | | | |
| 4.875%, 11/13/2043 | | | 3,375,000 | | | | 3,102,384 | | | | | |
| Metropolitan Life Global Funding I: | | | | | | | | | | | | |
2.950%, 04/09/2030(2) | | | 9,025,000 | | | | 7,794,645 | | | | | |
5.150%, 03/28/2033(2) | | | 12,656,000 | | | | 12,516,770 | | | | | |
| Metropolitan Life Insurance Co., | | | | | | | | | | | | |
7.800%, 11/01/2025(2) | | | 3,725,000 | | | | 3,835,703 | | | | | |
| Mitsubishi UFJ Financial Group, Inc.: | | | | | | | | | | | | |
2.193%, 02/25/2025(1) | | | 11,500,000 | | | | 10,837,068 | | | | | |
| 1.538%, 07/20/2027 | | | | | | | | | | | | |
| (1 Year CMT Rate + 0.750%) | | | | | | | | | | | | |
(Callable 07/20/2026)(1)(3) | | | 24,400,000 | | | | 21,534,582 | | | | | |
| 5.475%, 02/22/2031 | | | | | | | | | | | | |
| (1 Year CMT Rate + 1.530%) | | | | | | | | | | | | |
(Callable 02/22/2030)(1)(3) | | | 3,000,000 | | | | 2,983,494 | | | | | |
| Mizuho Financial Group, Inc.: | | | | | | | | | | | | |
| 2.555%, 09/13/2025 (SOFR + 1.362%) | | | | | | | | | | | | |
(Callable 09/13/2024)(1)(3) | | | 20,000,000 | | | | 19,094,627 | | | | | |
| 1.234%, 05/22/2027 | | | | | | | | | | | | |
| (1 Year CMT Rate + 0.670%) | | | | | | | | | | | | |
(Callable 05/22/2026)(1)(3) | | | 10,000,000 | | | | 8,786,404 | | | | | |
3.170%, 09/11/2027(1) | | | 22,000,000 | | | | 20,165,571 | | | | | |
4.018%, 03/05/2028(1) | | | 2,650,000 | | | | 2,491,098 | | | | | |
| 1.979%, 09/08/2031 (SOFR + 1.532%) | | | | | | | | | | | | |
(Callable 09/08/2030)(1)(3) | | | 7,250,000 | | | | 5,728,143 | | | | | |
| Morgan Stanley: | | | | | | | | | | | | |
| 2.720%, 07/22/2025 (SOFR + 1.152%) | | | | | | | | | | | | |
(Callable 07/22/2024)(3) | | | 5,000,000 | | | | 4,821,438 | | | | | |
| 4.000%, 07/23/2025 | | | 2,500,000 | | | | 2,427,206 | | | | | |
| 2.188%, 04/28/2026 (SOFR + 1.990%) | | | | | | | | | | | | |
(Callable 04/28/2025)(3) | | | 40,000,000 | | | | 37,548,315 | | | | | |
| 3.125%, 07/27/2026 | | | 13,175,000 | | | | 12,337,648 | | | | | |
| 3.591%, 07/22/2028 | | | | | | | | | | | | |
(Callable 07/22/2027)(4) | | | 22,350,000 | | | | 20,622,109 | | | | | |
| 6.296%, 10/18/2028 (SOFR + 2.240%) | | | | | | | | | | | | |
(Callable 10/18/2027)(3) | | | 25,000,000 | | | | 25,688,755 | | | | | |
| 5.123%, 02/01/2029 (SOFR + 1.730%) | | | | | | | | | | | | |
(Callable 02/01/2028)(3) | | | 10,000,000 | | | | 9,862,369 | | | | | |
| 2.239%, 07/21/2032 (SOFR + 1.178%) | | | | | | | | | | | | |
(Callable 07/21/2031)(3) | | | 9,705,000 | | | | 7,713,402 | | | | | |
| 6.342%, 10/18/2033 (SOFR + 2.560%) | | | | | | | | | | | | |
(Callable 10/18/2032)(3) | | | 5,000,000 | | | | 5,319,016 | | | | | |
| National Australia Bank Ltd.: | | | | | | | | | | | | |
2.332%, 08/21/2030(1)(2) | | | 60,200,000 | | | | 46,916,090 | | | | | |
2.990%, 05/21/2031(1)(2) | | | 24,495,000 | | | | 19,526,574 | | | | | |
6.429%, 01/12/2033(1)(2) | | | 12,025,000 | | | | 12,179,803 | | | | | |
| 3.933%, 08/02/2034 | | | | | | | | | | | | |
| (5 Year CMT Rate + 1.880%) | | | | | | | | | | | | |
(Callable 08/02/2029)(1)(2)(3) | | | 5,000,000 | | | | 4,298,015 | | | | | |
| 3.347%, 01/12/2037 | | | | | | | | | | | | |
| (5 Year CMT Rate + 1.700%) | | | | | | | | | | | | |
(Callable 01/12/2032)(1)(2)(3) | | | 14,000,000 | | | | 11,020,189 | | | | | |
| Nationwide Building Society: | | | | | | | | | | | | |
3.900%, 07/21/2025(1)(2) | | | 8,100,000 | | | | 7,767,954 | | | | | |
4.000%, 09/14/2026(1)(2) | | | 63,394,000 | | | | 58,210,893 | | | | | |
| 4.302%, 03/08/2029 | | | | | | | | | | | | |
| (3 Month LIBOR USD + 1.452%) | | | | | | | | | | | | |
(Callable 03/08/2028)(1)(2)(3) | | | 3,525,000 | | | | 3,265,487 | | | | | |
| 3.960%, 07/18/2030 | | | | | | | | | | | | |
| (3 Month LIBOR USD + 1.855%) | | | | | | | | | | | | |
(Callable 07/18/2029)(1)(2)(3) | | | 10,125,000 | | | | 8,983,012 | | | | | |
| Nationwide Financial Services, Inc., | | | | | | | | | | | | |
| 3.900%, 11/30/2049 | | | | | | | | | | | | |
(Callable 05/30/2049)(2) | | | 17,500,000 | | | | 12,771,587 | | | | | |
| Nationwide Mutual Insurance Co.: | | | | | | | | | | | | |
7.875%, 04/01/2033(2) | | | 5,600,000 | | | | 6,256,151 | | | | | |
9.375%, 08/15/2039(2) | | | 22,409,000 | | | | 28,851,483 | | | | | |
| NatWest Group PLC: | | | | | | | | | | | | |
| 4.269%, 03/22/2025 | | | | | | | | | | | | |
| (3 Month LIBOR USD + 1.762%) | | | | | | | | | | | | |
(Callable 03/22/2024)(1)(3) | | | 8,300,000 | | | | 8,152,848 | | | | | |
| 1.642%, 06/14/2027 | | | | | | | | | | | | |
| (1 Year CMT Rate + 0.900%) | | | | | | | | | | | | |
(Callable 06/14/2026)(1)(3) | | | 11,725,000 | | | | 10,318,466 | | | | | |
| 4.892%, 05/18/2029 | | | | | | | | | | | | |
| (3 Month LIBOR USD + 1.754%) | | | | | | | | | | | | |
(Callable 05/18/2028)(1)(3) | | | 5,150,000 | | | | 4,898,919 | | | | | |
| 5.808%, 09/13/2029 | | | | | | | | | | | | |
| (1 Year CMT Rate + 1.950%) | | | | | | | | | | | | |
(Callable 09/13/2028)(1)(3) | | | 22,500,000 | | | | 22,169,371 | | | | | |
| 4.445%, 05/08/2030 | | | | | | | | | | | | |
| (3 Month LIBOR USD + 1.871%) | | | | | | | | | | | | |
(Callable 05/08/2029)(1)(3) | | | 11,000,000 | | | | 10,110,685 | | | | | |
| New England Mutual Life Insurance Co., | | | | | | | | | | | | |
7.875%, 02/15/2024(2) | | | 3,200,000 | | | | 3,208,122 | | | | | |
| New York Life Insurance Co.: | | | | | | | | | | | | |
6.750%, 11/15/2039(2) | | | 25,105,000 | | | | 28,483,659 | | | | | |
| 4.450%, 05/15/2069 | | | | | | | | | | | | |
(Callable 11/15/2068)(2) | | | 10,000,000 | | | | 8,331,178 | | | | | |
The accompanying notes are an integral part of these financial statements.
Baird Core Plus Bond Fund
Schedule of Investments, June 30, 2023 (Unaudited)
Long-Term Investments (cont.)
| | | Principal | | | | | | % of | |
| | | Amount | | | Value | | | Net Assets | |
| Nomura Holdings, Inc.: | | | | | | | | | |
2.648%, 01/16/2025(1) | | $ | 10,000,000 | | | $ | 9,466,904 | | | |
| |
1.851%, 07/16/2025(1) | | | 15,000,000 | | | | 13,719,005 | | | | | |
2.172%, 07/14/2028(1) | | | 30,000,000 | | | | 25,308,787 | | | | | |
2.710%, 01/22/2029(1) | | | 9,600,000 | | | | 8,091,281 | | | | | |
| Old Republic International Corp., | | | | | | | | | | | | |
| 3.850%, 06/11/2051 | | | | | | | | | | | | |
| (Callable 12/11/2050) | | | 12,550,000 | | | | 8,953,504 | | | | | |
| Peachtree Corners Funding Trust, | | | | | | | | | | | | |
3.976%, 02/15/2025(2) | | | 16,000,000 | | | | 15,402,239 | | | | | |
| Pine Street Trust I, | | | | | | | | | | | | |
| 4.572%, 02/15/2029 | | | | | | | | | | | | |
(Callable 11/15/2028)(2) | | | 5,000,000 | | | | 4,580,554 | | | | | |
| Pricoa Global Funding I, | | | | | | | | | | | | |
5.100%, 05/30/2028(2) | | | 4,700,000 | | | | 4,655,123 | | | | | |
| Prologis LP, | | | | | | | | | | | | |
| 5.250%, 06/15/2053 | | | | | | | | | | | | |
| (Callable 12/15/2052) | | | 6,600,000 | | | | 6,485,351 | | | | | |
| Protective Life Corp., | | | | | | | | | | | | |
| 4.300%, 09/30/2028 | | | | | | | | | | | | |
(Callable 06/30/2028)(1)(2) | | | 4,105,000 | | | | 3,812,163 | | | | | |
| Protective Life Global Funding, | | | | | | | | | | | | |
5.209%, 04/14/2026(1)(2) | | | 22,000,000 | | | | 21,651,597 | | | | | |
| Prudential Insurance Co. of America, | | | | | | | | | | | | |
8.300%, 07/01/2025(2) | | | 21,011,000 | | | | 21,767,018 | | | | | |
| Raymond James Financial, Inc., | | | | | | | | | | | | |
| 4.950%, 07/15/2046 | | | 15,000,000 | | | | 13,527,888 | | | | | |
| Realty Income Corp., | | | | | | | | | | | | |
| 3.875%, 04/15/2025 | | | | | | | | | | | | |
| (Callable 02/15/2025) | | | 10,000,000 | | | | 9,691,120 | | | | | |
| Regions Bank, | | | | | | | | | | | | |
| 6.450%, 06/26/2037 | | | 3,864,000 | | | | 3,801,804 | | | | | |
| Reliance Standard Life Global Funding II, | | | | | | | | | | | | |
2.500%, 10/30/2024(1)(2) | | | 20,000,000 | | | | 18,942,064 | | | | | |
| Rexford Industrial Realty LP, | | | | | | | | | | | | |
| 2.125%, 12/01/2030 | | | | | | | | | | | | |
| (Callable 09/01/2030) | | | 13,000,000 | | | | 10,255,300 | | | | | |
| Rocket Mortgage LLC / | | | | | | | | | | | | |
| Rocket Mortgage Co-Issuer, Inc., | | | | | | | | | | | | |
| 2.875%, 10/15/2026 | | | | | | | | | | | | |
(Callable 10/15/2023)(2) | | | 10,000,000 | | | | 8,850,000 | | | | | |
| Royal Bank of Canada, | | | | | | | | | | | | |
4.650%, 01/27/2026(1) | | | 29,930,000 | | | | 29,142,709 | | | | | |
| Sammons Financial Group, Inc., | | | | | | | | | | | | |
| 3.350%, 04/16/2031 | | | | | | | | | | | | |
(Callable 01/16/2031)(2) | | | 25,000,000 | | | | 19,421,480 | | | | | |
| Santander Holdings USA, Inc., | | | | | | | | | | | | |
| 3.450%, 06/02/2025 | | | | | | | | | | | | |
(Callable 05/02/2025)(1) | | | 10,000,000 | | | | 9,429,796 | | | | | |
| Santander UK Group Holdings PLC, | | | | | | | | | | | | |
| 1.673%, 06/14/2027 (SOFR + 0.989%) | | | | | | | | | | | | |
(Callable 06/14/2026)(1)(3) | | | 20,000,000 | | | | 17,230,739 | | | | | |
| Santander UK PLC, | | | | | | | | | | | | |
5.000%, 11/07/2023(1)(2) | | | 36,375,000 | | | | 36,133,470 | | | | | |
| Societe Generale SA: | | | | | | | | | | | | |
5.000%, 01/17/2024(1)(2) | | | 18,000,000 | | | | 17,782,052 | | | | | |
3.875%, 03/28/2024(1)(2) | | | 10,000,000 | | | | 9,785,250 | | | | | |
2.625%, 10/16/2024(1)(2) | | | 14,575,000 | | | | 13,793,064 | | | | | |
2.625%, 01/22/2025(1)(2) | | | 24,600,000 | | | | 23,115,488 | | | | | |
4.250%, 04/14/2025(1)(2) | | | 30,420,000 | | | | 29,003,241 | | | | | |
4.250%, 08/19/2026(1)(2) | | | 10,572,000 | | | | 9,818,746 | | | | | |
| 2.797%, 01/19/2028 | | | | | | | | | | | | |
| (1 Year CMT Rate + 1.300%) | | | | | | | | | | | | |
(Callable 01/19/2027)(1)(2)(3) | | | 8,000,000 | | | | 7,085,672 | | | | | |
| 6.446%, 01/10/2029 | | | | | | | | | | | | |
| (1 Year CMT Rate + 2.550%) | | | | | | | | | | | | |
(Callable 01/10/2028)(1)(2)(3) | | | 12,525,000 | | | | 12,543,142 | | | | | |
| 2.889%, 06/09/2032 | | | | | | | | | | | | |
| (1 Year CMT Rate + 1.300%) | | | | | | | | | | | | |
(Callable 06/09/2031)(1)(2)(3) | | | 7,000,000 | | | | 5,484,198 | | | | | |
3.625%, 03/01/2041(1)(2) | | | 9,200,000 | | | | 5,968,351 | | | | | |
| Standard Chartered PLC: | | | | | | | | | | | | |
| 3.785%, 05/21/2025 | | | | | | | | | | | | |
| (3 Month LIBOR USD + 1.560%) | | | | | | | | | | | | |
(Callable 05/21/2024)(1)(2)(3) | | | 25,225,000 | | | | 24,608,910 | | | | | |
| 2.819%, 01/30/2026 | | | | | | | | | | | | |
| (3 Month LIBOR USD + 1.209%) | | | | | | | | | | | | |
(Callable 01/30/2025)(1)(2)(3) | | | 14,075,000 | | | | 13,270,642 | | | | | |
| 1.456%, 01/14/2027 | | | | | | | | | | | | |
| (1 Year CMT Rate + 1.000%) | | | | | | | | | | | | |
(Callable 01/14/2026)(1)(2)(3) | | | 15,000,000 | | | | 13,286,160 | | | | | |
| 2.608%, 01/12/2028 | | | | | | | | | | | | |
| (1 Year CMT Rate + 1.180%) | | | | | | | | | | | | |
(Callable 01/12/2027)(1)(2)(3) | | | 18,000,000 | | | | 15,935,722 | | | | | |
| 6.301%, 01/09/2029 | | | | | | | | | | | | |
| (1 Year CMT Rate + 2.450%) | | | | | | | | | | | | |
(Callable 01/09/2028)(1)(2)(3) | | | 4,000,000 | | | | 4,022,401 | | | | | |
| 4.644%, 04/01/2031 | | | | | | | | | | | | |
| (1 Year CMT Rate + 3.850%) | | | | | | | | | | | | |
(Callable 04/01/2030)(1)(2)(3) | | | 7,000,000 | | | | 6,456,340 | | | | | |
5.700%, 03/26/2044(1)(2) | | | 14,000,000 | | | | 12,832,151 | | | | | |
| State Street Corp., | | | | | | | | | | | | |
| 2.901%, 03/30/2026 (SOFR + 2.600%) | | | | | | | | | | | | |
(Callable 03/30/2025)(3) | | | 12,975,000 | | | | 12,373,469 | | | | | |
| Stifel Financial Corp.: | | | | | | | | | | | | |
| 4.250%, 07/18/2024 | | | 19,615,000 | | | | 19,200,909 | | | | | |
| 4.000%, 05/15/2030 | | | | | | | | | | | | |
| (Callable 02/15/2030) | | | 6,325,000 | | | | 5,395,572 | | | | | |
| Sumitomo Mitsui Financial Group, Inc., | | | | | | | | | | | | |
5.520%, 01/13/2028(1) | | | 40,000,000 | | | | 40,153,054 | | | | | |
| Synchrony Bank, | | | | | | | | | | | | |
| 5.625%, 08/23/2027 | | | | | | | | | | | | |
| (Callable 07/23/2027) | | | 5,000,000 | | | | 4,691,349 | | | | | |
| Synchrony Financial: | | | | | | | | | | | | |
| 4.250%, 08/15/2024 | | | | | | | | | | | | |
| (Callable 05/15/2024) | | | 33,325,000 | | | | 32,129,678 | | | | | |
| 4.500%, 07/23/2025 | | | | | | | | | | | | |
| (Callable 04/23/2025) | | | 12,795,000 | | | | 12,062,212 | | | | | |
| 3.950%, 12/01/2027 | | | | | | | | | | | | |
| (Callable 09/01/2027) | | | 43,000,000 | | | | 37,461,540 | | | | | |
| 2.875%, 10/28/2031 | | | | | | | | | | | | |
| (Callable 07/28/2031) | | | 15,000,000 | | | | 10,907,236 | | | | | |
| 7.250%, 02/02/2033 | | | | | | | | | | | | |
| (Callable 11/02/2032) | | | 7,000,000 | | | | 6,304,008 | | | | | |
| Trinity Acquisition PLC: | | | | | | | | | | | | |
| 4.400%, 03/15/2026 | | | | | | | | | | | | |
| (Callable 12/15/2025) | | | 15,776,000 | | | | 15,198,610 | | | | | |
| 6.125%, 08/15/2043 | | | 23,630,000 | | | | 22,405,596 | | | | | |
| Truist Financial Corp., | | | | | | | | | | | | |
| 4.873%, 01/26/2029 (SOFR + 1.435%) | | | | | | | | | | | | |
(Callable 01/26/2028)(3) | | | 10,000,000 | | | | 9,611,734 | | | | | |
| UBS Group AG: | | | | | | | | | | | | |
3.750%, 03/26/2025(1) | | | 15,000,000 | | | | 14,353,493 | | | | | |
| 5.711%, 01/12/2027 | | | | | | | | | | | | |
| (1 Year CMT Rate + 1.550%) | | | | | | | | | | | | |
(Callable 01/12/2026)(1)(2)(3) | | | 30,000,000 | | | | 29,701,420 | | | | | |
The accompanying notes are an integral part of these financial statements.
Baird Core Plus Bond Fund
Schedule of Investments, June 30, 2023 (Unaudited)
Long-Term Investments (cont.)
| | | Principal | | | | | | % of | |
| | | Amount | | | Value | | | Net Assets | |
| UBS Group AG: (cont.) | | | | | | | | | |
| 1.494%, 08/10/2027 | | | | | | | | | |
| (1 Year CMT Rate + 0.850%) | | | | | | | | | |
(Callable 08/10/2026)(1)(2)(3) | | $ | 10,000,000 | | | $ | 8,588,311 | | | | |
| 2.095%, 02/11/2032 | | | | | | | | | | | |
| (1 Year CMT Rate + 1.000%) | | | | | | | | | | | |
(Callable 02/11/2031)(1)(2)(3) | | | 12,550,000 | | | | 9,505,086 | | | | |
| 4.988%, 08/05/2033 | | | | | | | | | | | |
| (1 Year CMT Rate + 2.400%) | | | | | | | | | | | |
(Callable 08/05/2032)(1)(2)(3) | | | 3,000,000 | | | | 2,779,893 | | | | |
| UBS Group Funding Switzerland AG, | | | | | | | | | | | |
4.125%, 09/24/2025(1)(2) | | | 6,500,000 | | | | 6,210,885 | | | | |
| UnitedHealth Group, Inc., | | | | | | | | | | | |
| 4.625%, 07/15/2035 | | | 12,175,000 | | | | 11,903,151 | | | | |
| US Bancorp, | | | | | | | | | | | |
| 4.653%, 02/01/2029 (SOFR + 1.230%) | | | | | | | | | | | |
(Callable 02/01/2028)(3) | | | 3,684,000 | | | | 3,519,282 | | | | |
| Wells Fargo & Co.: | | | | | | | | | | | |
| 3.000%, 02/19/2025 | | | 5,225,000 | | | | 5,014,774 | | | | |
| 2.406%, 10/30/2025 (SOFR + 1.087%) | | | | | | | | | | | |
(Callable 10/30/2024)(3) | | | 2,500,000 | | | | 2,380,517 | | | | |
| 2.164%, 02/11/2026 (SOFR + 1.012%) | | | | | | | | | | | |
(Callable 02/11/2025)(3) | | | 15,000,000 | | | | 14,125,061 | | | | |
| 3.000%, 04/22/2026 | | | 4,000,000 | | | | 3,761,197 | | | | |
| 4.808%, 07/25/2028 (SOFR + 1.980%) | | | | | | | | | | | |
(Callable 07/25/2027)(3) | | | 5,500,000 | | | | 5,375,827 | | | | |
| 3.350%, 03/02/2033 (SOFR + 1.500%) | | | | | | | | | | | |
(Callable 03/02/2032)(3) | | | 5,000,000 | | | | 4,279,268 | | | | |
| 3.068%, 04/30/2041 (SOFR + 2.530%) | | | | | | | | | | | |
(Callable 04/30/2040)(3) | | | 35,000,000 | | | | 25,743,056 | | | | |
| 5.013%, 04/04/2051 (SOFR + 4.502%) | | | | | | | | | | | |
(Callable 04/04/2050)(3) | | | 8,000,000 | | | | 7,451,249 | | | | |
| Westpac Banking Corp.: | | | | | | | | | | | |
| 2.894%, 02/04/2030 | | | | | | | | | | | |
| (5 Year CMT Rate + 1.350%) | | | | | | | | | | | |
(Callable 02/04/2025)(1)(3) | | | 18,059,000 | | | | 16,873,001 | | | | |
| 4.322%, 11/23/2031 | | | | | | | | | | | |
| (5 Year Mid Swap Rate USD + 2.236%) | | | | | | | | | | | |
(Callable 11/23/2026)(1)(3) | | | 10,000,000 | | | | 9,263,760 | | | | |
| 4.110%, 07/24/2034 | | | | | | | | | | | |
| (5 Year CMT Rate + 2.000%) | | | | | | | | | | | |
(Callable 07/24/2029)(1)(3) | | | 10,000,000 | | | | 8,695,925 | | | | |
| 2.668%, 11/15/2035 | | | | | | | | | | | |
| (5 Year CMT Rate + 1.750%) | | | | | | | | | | | |
(Callable 11/15/2030)(1)(3) | | | 10,000,000 | | | | 7,673,863 | | | | |
| Willis North America, Inc.: | | | | | | | | | | | |
| 2.950%, 09/15/2029 | | | | | | | | | | | |
| (Callable 06/15/2029) | | | 10,600,000 | | | | 9,118,219 | | | | |
| 5.350%, 05/15/2033 | | | | | | | | | | | |
| (Callable 02/15/2033) | | | 6,000,000 | | | | 5,850,478 | | | | |
| 5.050%, 09/15/2048 | | | | | | | | | | | |
| (Callable 03/15/2048) | | | 15,000,000 | | | | 12,887,832 | | | | |
| Total Financials | | | | | | | | | | | |
| (Cost $5,019,516,454) | | | | | | | 4,552,429,298 | | | | 18.8 | % |
| Total Corporate Bonds | | | | | | | | | | | | |
| (Cost $13,285,547,756) | | | | | | | 12,013,956,658 | | | | 49.5 | % |
| Municipal Bonds | | | | | | | | | | | | |
| Arizona Industrial Development Authority: | | | | | | | | | | | | |
| 4.950%, 04/01/2026 | | | | | | | | | | | | |
| (Callable 04/01/2024) (Mandatory | | | | | | | | | | | | |
Tender Date 04/01/2025)(2)(4) | | | 41,325,000 | | | | 39,433,145 | | | | | |
| 4.950%, 04/01/2026 | | | | | | | | | | | | |
| (Callable 04/01/2024) (Mandatory | | | | | | | | | | | | |
Tender Date 04/01/2025)(4) | | | 15,830,000 | | | | 15,088,140 | | | | | |
| Brazos Higher Education Authority, Inc.: | | | | | | | | | | | | |
| 1.931%, 04/01/2024 | | | 1,000,000 | | | | 971,767 | | | | | |
| 1.981%, 04/01/2025 | | | 1,000,000 | | | | 937,687 | | | | | |
| 2.076%, 04/01/2026 | | | 1,000,000 | | | | 913,661 | | | | | |
| 2.176%, 04/01/2027 | | | 1,300,000 | | | | 1,162,342 | | | | | |
| 2.310%, 04/01/2028 | | | 1,000,000 | | | | 876,647 | | | | | |
| 2.410%, 04/01/2029 | | | 2,360,000 | | | | 2,028,680 | | | | | |
| 2.510%, 04/01/2030 | | | 1,175,000 | | | | 991,362 | | | | | |
| 2.760%, 04/01/2040 | | | | | | | | | | | | |
| (Callable 04/01/2030) | | | 125,000 | | | | 123,924 | | | | | |
| California Housing Finance Agency, | | | | | | | | | | | | |
| 2.794%, 08/01/2036 | | | | | | | | | | | | |
| (Callable 08/01/2025) | | | 3,210,000 | | | | 3,055,051 | | | | | |
| California Qualified School | | | | | | | | | | | | |
| Bond Joint Powers Authority, | | | | | | | | | | | | |
| 7.155%, 03/01/2027 | | | 1,135,000 | | | | 1,184,747 | | | | | |
| Colton Joint Unified School District, | | | | | | | | | | | | |
| 6.008%, 08/01/2026 | | | 1,250,000 | | | | 1,283,069 | | | | | |
| County of Hamilton OH, | | | | | | | | | | | | |
| 3.756%, 06/01/2042 (Insured by AGM) | | | 25,725,000 | | | | 20,528,229 | | | | | |
| County of Riverside CA, | | | | | | | | | | | | |
| 2.667%, 02/15/2025 | | | 15,000,000 | | | | 14,330,391 | | | | | |
| Great Lakes Water Authority, | | | | | | | | | | | | |
| 2.615%, 07/01/2036 (Insured by AGM) | | | 20,000,000 | | | | 15,895,922 | | | | | |
| Illinois Housing Development Authority, | | | | | | | | | | | | |
| 5.750%, 10/01/2053 (Callable | | | | | | | | | | | | |
| 10/01/2032) (Insured by GNMA) | | | 5,675,000 | | | | 5,665,373 | | | | | |
| Illinois International Port District, | | | | | | | | | | | | |
| 5.000%, 01/01/2035 | | | | | | | | | | | | |
(Callable 01/01/2026)(2) | | | 3,285,000 | | | | 2,914,491 | | | | | |
| Iowa Student Loan Liquidity Corp., | | | | | | | | | | | | |
| 2.989%, 12/01/2039 | | | | | | | | | | | | |
| (Callable 12/01/2029) | | | 630,000 | | | | 623,778 | | | | | |
| Maryland Economic Development Corp., | | | | | | | | | | | | |
| 3.997%, 04/01/2034 | | | | | | | | | | | | |
| (Callable 01/01/2034) | | | 40,315,000 | | | | 32,347,103 | | | | | |
| Massachusetts Educational | | | | | | | | | | | | |
| Financing Authority: | | | | | | | | | | | | |
| 2.455%, 07/01/2030 | | | 8,375,000 | | | | 7,004,185 | | | | | |
| 2.555%, 07/01/2031 | | | 5,000,000 | | | | 4,109,359 | | | | | |
| 3.775%, 07/01/2035 | | | | | | | | | | | | |
| (Callable 07/01/2029) | | | 4,010,000 | | | | 3,965,595 | | | | | |
| Minnesota Housing Finance Agency: | | | | | | | | | | | | |
| 2.680%, 10/01/2046 (Callable | | | | | | | | | | | | |
| 01/01/2026) (Insured by GNMA) | | | 10,169,088 | | | | 8,618,029 | | | | | |
| 2.650%, 11/01/2046(Callable | | | | | | | | | | | | |
| 01/01/2026) (Insured by GNMA) | | | 10,404,617 | | | | 8,807,675 | | | | | |
| New Hampshire Business | | | | | | | | | | | | |
| Finance Authority: | | | | | | | | | | | | |
| 3.250%, 04/01/2028 | | | | | | | | | | | | |
| (Callable 01/01/2028) | | | 33,000,000 | | | | 28,135,028 | | | | | |
| 3.300%, 04/01/2032 | | | | | | | | | | | | |
| (Callable 01/01/2032) | | | 20,000,000 | | | | 15,561,614 | | | | | |
| 2.872%, 07/01/2035 | | | | | | | | | | | | |
| (Callable 01/01/2035) | | | 17,650,000 | | | | 12,443,006 | | | | | |
| New Hampshire Housing | | | | | | | | | | | | |
| Finance Authority, | | | | | | | | | | | | |
| 3.750%, 07/01/2034 | | | | | | | | | | | | |
| (Callable 07/31/2023) | | | 120,000 | | | | 120,000 | | | | | |
| New Jersey Turnpike Authority, | | | | | | | | | | | | |
| 3.223%, 01/01/2035 | | | | | | | | | | | | |
(Callable 07/01/2025)(2) | | | 40,000,000 | | | | 35,615,128 | | | | | |
The accompanying notes are an integral part of these financial statements.
Baird Core Plus Bond Fund
Schedule of Investments, June 30, 2023 (Unaudited)
Long-Term Investments (cont.)
| | | Principal | | | | | | % of | |
| | | Amount | | | Value | | | Net Assets | |
| North Carolina Housing Finance Agency: | | | | | | | | | |
| 2.870%, 07/01/2032 | | | | | | | | | |
| (Callable 01/01/2024) | | $ | 1,030,000 | | | $ | 991,738 | | | | |
| 2.812%, 07/01/2035 | | | | | | | | | | | |
| (Callable 01/01/2024) | | | 1,080,000 | | | | 1,054,904 | | | | |
| North East Independent School District, | | | | | | | | | | | |
| 5.240%, 08/01/2027 | | | 3,000,000 | | | | 3,029,337 | | | | |
| Public Finance Authority, | | | | | | | | | | | |
| 0.000%, 12/15/2027 | | | | | | | | | | | |
| (Callable 07/31/2023) | | | 12,770,000 | | | | 9,987,298 | | | | |
| Rhode Island Housing & | | | | | | | | | | | |
| Mortgage Finance Corp., | | | | | | | | | | | |
| 2.913%, 10/01/2039 | | | | | | | | | | | |
| (Callable 10/01/2023) | | | 245,000 | | | | 243,040 | | | | |
| Rhode Island Student Loan Authority: | | | | | | | | | | | |
| 2.200%, 12/01/2023 | | | 1,400,000 | | | | 1,378,175 | | | | |
| 2.400%, 12/01/2024 | | | 1,165,000 | | | | 1,105,893 | | | | |
| 2.530%, 12/01/2025 | | | 2,310,000 | | | | 2,135,413 | | | | |
| 2.730%, 12/01/2026 | | | 1,490,000 | | | | 1,353,844 | | | | |
| 2.875%, 12/01/2027 | | | 1,800,000 | | | | 1,608,855 | | | | |
| 5.000%, 12/01/2028 | | | 1,265,000 | | | | 1,354,700 | | | | |
| 5.000%, 12/01/2029 | | | 1,295,000 | | | | 1,408,237 | | | | |
| 3.625%, 12/01/2037 | | | | | | | | | | | |
| (Callable 12/01/2030) | | | 4,630,000 | | | | 4,326,673 | | | | |
| Suburban Hospital | | | | | | | | | | | |
| Healthcare System, Inc., | | | | | | | | | | | |
| 7.865%, 02/15/2027 | | | | | | | | | | | |
| (Insured by AMBAC) | | | 6,430,000 | | | | 6,755,252 | | | | |
| Tennessee Energy Acquisition Corp., | | | | | | | | | | | |
| 5.750%, 05/01/2028 | | | 2,500,000 | | | | 2,516,479 | | | | |
| Three Rivers Local School District, | | | | | | | | | | | |
| 5.209%, 09/15/2027 | | | | | | | | | | | |
| (Callable 07/31/2023) | | | | | | | | | | | |
| (Insured by SD CRED PROG) | | | 1,350,000 | | | | 1,350,279 | | | | |
| Western Michigan University Homer | | | | | | | | | | | |
| Stryker MD School of Medicine, | | | | | | | | | | | |
| 4.750%, 11/15/2028 (Insured by AGM) | | | 12,305,000 | | | | 12,244,784 | | | | |
| Westlake City School District, | | | | | | | | | | | |
| 5.227%, 12/01/2026 | | | | | | | | | | | |
| (Callable 07/31/2023) | | | 1,160,000 | | | | 1,160,361 | | | | |
| Total Municipal Bonds | | | | | | | | | | | |
| (Cost $389,960,205) | | | | | | | 338,740,390 | | | | 1.4 | % |
| Residential Mortgage-Backed Securities | | | | | | | | | | | | |
| U.S. Government Agency Issues | | | | | | | | | | | | |
| Federal Gold Loan Mortgage | | | | | | | | | | | | |
| Corp. (FGLMC): | | | | | | | | | | | | |
| 6.500%, 12/01/2028 | | | 4,517 | | | | 4,622 | | | | | |
| 6.500%, 06/01/2029 | | | 1,937 | | | | 1,982 | | | | | |
| 3.000%, 07/01/2032 | | | 4,015,545 | | | | 3,759,824 | | | | | |
| 3.000%, 10/01/2032 | | | 3,036,238 | | | | 2,842,853 | | | | | |
| 3.000%, 11/01/2032 | | | 4,738,484 | | | | 4,436,654 | | | | | |
| 3.000%, 12/01/2032 | | | 4,802,539 | | | | 4,496,583 | | | | | |
| 3.000%, 01/01/2033 | | | 2,263,315 | | | | 2,119,121 | | | | | |
| 3.000%, 04/01/2033 | | | 7,980,479 | | | | 7,521,520 | | | | | |
| 3.500%, 01/01/2034 | | | 8,234,824 | | | | 7,914,180 | | | | | |
| 3.000%, 05/01/2035 | | | 6,193,070 | | | | 5,782,433 | | | | | |
| 3.000%, 10/01/2035 | | | 5,291,414 | | | | 4,924,104 | | | | | |
| 2.500%, 01/01/2036 | | | 32,282,178 | | | | 29,631,642 | | | | | |
| 5.000%, 03/01/2036 | | | 1,825,968 | | | | 1,841,118 | | | | | |
| 5.500%, 04/01/2037 | | | 43,493 | | | | 44,731 | | | | | |
| 5.500%, 04/01/2038 | | | 24,974 | | | | 25,679 | | | | | |
| 5.500%, 05/01/2038 | | | 40,428 | | | | 41,496 | | | | | |
| 5.500%, 01/01/2039 | | | 7,031,709 | | | | 7,203,237 | | | | | |
| 4.500%, 11/01/2039 | | | 695,777 | | | | 687,883 | | | | | |
| 4.500%, 11/01/2039 | | | 213,531 | | | | 211,109 | | | | | |
| 4.500%, 08/01/2040 | | | 710,724 | | | | 702,665 | | | | | |
| 4.500%, 08/01/2040 | | | 918,461 | | | | 908,047 | | | | | |
| 4.000%, 10/01/2040 | | | 7,954,405 | | | | 7,656,944 | | | | | |
| 1.500%, 12/01/2040 | | | 86,854,709 | | | | 70,752,707 | | | | | |
| 2.000%, 12/01/2040 | | | 69,392,609 | | | | 59,519,058 | | | | | |
| 4.000%, 01/01/2041 | | | 4,739,714 | | | | 4,562,353 | | | | | |
| 2.000%, 11/01/2041 | | | 38,542,034 | | | | 32,567,170 | | | | | |
| 2.000%, 12/01/2041 | | | 107,027,946 | | | | 90,928,340 | | | | | |
| 2.500%, 02/01/2042 | | | 17,377,267 | | | | 15,202,061 | | | | | |
| 2.500%, 03/01/2042 | | | 22,676,004 | | | | 19,717,131 | | | | | |
| 3.500%, 06/01/2042 | | | 1,936,082 | | | | 1,814,770 | | | | | |
| 3.500%, 07/01/2042 | | | 7,229,924 | | | | 6,776,876 | | | | | |
| 3.500%, 07/01/2042 | | | 10,942,799 | | | | 10,257,097 | | | | | |
| 3.000%, 08/01/2042 | | | 6,745,129 | | | | 6,096,228 | | | | | |
| 3.500%, 09/01/2042 | | | 4,314,470 | | | | 4,044,105 | | | | | |
| 3.000%, 11/01/2042 | | | 23,714,739 | | | | 21,433,334 | | | | | |
| 3.500%, 12/01/2042 | | | 7,100,998 | | | | 6,655,862 | | | | | |
| 3.000%, 01/01/2043 | | | 12,681,957 | | | | 11,461,727 | | | | | |
| 3.000%, 02/01/2043 | | | 2,425,458 | | | | 2,192,075 | | | | | |
| 3.500%, 02/01/2043 | | | 8,897,251 | | | | 8,339,683 | | | | | |
| 3.000%, 03/01/2043 | | | 8,124,075 | | | | 7,342,379 | | | | | |
| 3.000%, 04/01/2043 | | | 6,010,037 | | | | 5,431,726 | | | | | |
| 3.000%, 04/01/2043 | | | 5,138,451 | | | | 4,643,995 | | | | | |
| 3.000%, 06/01/2043 | | | 4,236,975 | | | | 3,829,249 | | | | | |
| 3.000%, 07/01/2043 | | | 17,205,079 | | | | 15,548,851 | | | | | |
| 3.000%, 08/01/2043 | | | 9,782,934 | | | | 8,841,492 | | | | | |
| 4.500%, 12/01/2043 | | | 3,969,552 | | | | 3,924,592 | | | | | |
| 3.500%, 05/01/2044 | | | 17,711,932 | | | | 16,571,503 | | | | | |
| 3.500%, 08/01/2044 | | | 11,995,143 | | | | 11,236,565 | | | | | |
| 4.000%, 09/01/2044 | | | 3,321,919 | | | | 3,147,831 | | | | | |
| 4.000%, 10/01/2044 | | | 6,319,230 | | | | 6,059,093 | | | | | |
| 3.500%, 01/01/2045 | | | 9,925,598 | | | | 9,300,709 | | | | | |
| 4.000%, 02/01/2045 | | | 3,851,046 | | | | 3,686,536 | | | | | |
| 3.500%, 07/01/2045 | | | 8,154,973 | | | | 7,632,834 | | | | | |
| 3.000%, 10/01/2045 | | | 12,958,609 | | | | 11,711,716 | | | | | |
| 4.000%, 10/01/2045 | | | 5,404,478 | | | | 5,140,373 | | | | | |
| 3.500%, 12/01/2045 | | | 3,162,424 | | | | 2,944,474 | | | | | |
| 4.000%, 12/01/2045 | | | 2,290,372 | | | | 2,189,918 | | | | | |
| 3.000%, 01/01/2046 | | | 45,666,701 | | | | 40,950,295 | | | | | |
| 3.500%, 01/01/2046 | | | 17,926,250 | | | | 16,690,947 | | | | | |
| 4.000%, 02/01/2046 | | | 2,878,092 | | | | 2,721,294 | | | | | |
| 4.000%, 02/01/2046 | | | 8,201,299 | | | | 7,885,657 | | | | | |
| 3.500%, 03/01/2046 | | | 2,632,956 | | | | 2,452,070 | | | | | |
| 4.000%, 05/01/2046 | | | 242,880 | | | | 232,102 | | | | | |
| 4.000%, 08/01/2046 | | | 4,441,110 | | | | 4,248,672 | | | | | |
| 3.000%, 10/01/2046 | | | 29,350,722 | | | | 26,306,502 | | | | | |
| 3.000%, 10/01/2046 | | | 42,255,775 | | | | 38,069,673 | | | | | |
| 4.500%, 11/01/2046 | | | 27,058,369 | | | | 26,751,828 | | | | | |
| 4.000%, 01/01/2047 | | | 17,332,460 | | | | 16,574,270 | | | | | |
| 3.000%, 02/01/2047 | | | 17,766,657 | | | | 15,919,313 | | | | | |
| 3.000%, 05/01/2047 | | | 32,807,402 | | | | 29,424,207 | | | | | |
| 3.500%, 07/01/2047 | | | 34,930,754 | | | | 32,391,202 | | | | | |
| 3.500%, 08/01/2047 | | | 8,582,573 | | | | 7,995,681 | | | | | |
| 3.500%, 08/01/2047 | | | 23,133,423 | | | | 21,388,119 | | | | | |
| 3.500%, 03/01/2048 | | | 39,966,356 | | | | 36,927,109 | | | | | |
| 4.500%, 05/01/2048 | | | 15,093,381 | | | | 14,867,854 | | | | | |
| 4.000%, 06/01/2048 | | | 28,385,431 | | | | 27,252,085 | | | | | |
| 4.000%, 08/01/2048 | | | 8,692,361 | | | | 8,296,837 | | | | | |
| 3.000%, 02/01/2049 | | | 30,446,789 | | | | 27,408,714 | | | | | |
| 4.000%, 05/01/2050 | | | 51,295,441 | | | | 49,030,169 | | | | | |
The accompanying notes are an integral part of these financial statements.
Baird Core Plus Bond Fund
Schedule of Investments, June 30, 2023 (Unaudited)
Long-Term Investments (cont.)
| | | Principal | | | | | | % of | |
| | | Amount | | | Value | | | Net Assets | |
| Federal Gold Loan Mortgage | | | | | | | | | |
| Corp. (FGLMC): (cont.) | | | | | | | | | |
| 2.500%, 02/01/2051 | | $ | 60,166,078 | | | $ | 51,738,616 | | | |
| |
| 2.500%, 02/01/2051 | | | 102,978,872 | | | | 89,004,765 | | | | | |
| 2.000%, 05/01/2051 | | | 72,505,455 | | | | 59,915,977 | | | | | |
| 2.500%, 05/01/2051 | | | 24,854,741 | | | | 21,320,937 | | | | | |
| 2.000%, 08/01/2051 | | | 15,137,256 | | | | 12,526,314 | | | | | |
| 2.000%, 09/01/2051 | | | 86,148,077 | | | | 70,429,126 | | | | | |
| 2.500%, 11/01/2051 | | | 100,553,906 | | | | 86,209,725 | | | | | |
| 3.000%, 03/01/2052 | | | 84,431,026 | | | | 75,052,529 | | | | | |
| 3.000%, 08/01/2052 | | | 27,187,785 | | | | 24,175,855 | | | | | |
| 5.500%, 01/01/2053 | | | 14,716,766 | | | | 14,652,019 | | | | | |
| 5.500%, 03/01/2053 | | | 53,162,985 | | | | 53,109,541 | | | | | |
| Federal National Mortgage | | | | | | | | | | | | |
| Association (FNMA): | | | | | | | | | | | | |
| 5.000%, 05/01/2028 | | | 10,395 | | | | 10,316 | | | | | |
| 6.500%, 09/01/2028 | | | 3,421 | | | | 3,493 | | | | | |
| 6.500%, 02/01/2029 | | | 7,190 | | | | 7,357 | | | | | |
| 4.500%, 07/01/2030 | | | 1,269,965 | | | | 1,246,415 | | | | | |
| 3.500%, 01/01/2032 | | | 14,544,872 | | | | 13,980,490 | | | | | |
| 5.500%, 01/01/2032 | | | 3,316 | | | | 3,377 | | | | | |
| 3.000%, 11/01/2032 | | | 2,991,273 | | | | 2,799,552 | | | | | |
| 3.000%, 04/01/2033 | | | 5,259,965 | | | | 4,919,045 | | | | | |
| 3.000%, 05/01/2033 | | | 5,248,992 | | | | 4,908,749 | | | | | |
| 5.000%, 09/01/2033 | | | 4,213,158 | | | | 4,243,139 | | | | | |
| 4.500%, 10/01/2033 | | | 8,277,634 | | | | 8,155,525 | | | | | |
| 3.000%, 12/01/2033 | | | 8,973,465 | | | | 8,415,742 | | | | | |
| 4.000%, 01/01/2034 | | | 4,585,810 | | | | 4,474,712 | | | | | |
| 5.500%, 04/01/2034 | | | 280,962 | | | | 287,457 | | | | | |
| 4.000%, 08/01/2034 | | | 47,493,810 | | | | 46,343,717 | | | | | |
| 4.000%, 09/01/2034 | | | 6,347,562 | | | | 6,174,177 | | | | | |
| 5.500%, 09/01/2034 | | | 12,659 | | | | 12,953 | | | | | |
| 5.000%, 02/01/2035 | | | 6,386,979 | | | | 6,432,494 | | | | | |
| 5.000%, 02/01/2035 | | | 4,669,303 | | | | 4,702,510 | | | | | |
| 5.500%, 02/01/2035 | | | 11,006 | | | | 11,270 | | | | | |
| 5.000%, 04/01/2035 | | | 461,385 | | | | 464,668 | | | | | |
| 5.000%, 07/01/2035 | | | 1,405,878 | | | | 1,415,881 | | | | | |
| 2.500%, 01/01/2036 | | | 52,477,478 | | | | 47,972,385 | | | | | |
| 5.000%, 02/01/2036 | | | 834,725 | | | | 840,688 | | | | | |
| 5.000%, 03/01/2036 | | | 385,035 | | | | 387,785 | | | | | |
| 4.000%, 04/01/2036 | | | 2,812,211 | | | | 2,709,294 | | | | | |
| 5.500%, 04/01/2036 | | | 1,263,168 | | | | 1,295,646 | | | | | |
| 2.000%, 06/01/2036 | | | 40,713,919 | | | | 36,308,035 | | | | | |
| 2.000%, 09/01/2036 | | | 18,591,834 | | | | 16,484,951 | | | | | |
| 4.000%, 10/01/2036 | | | 4,500,561 | | | | 4,391,597 | | | | | |
| 4.000%, 05/01/2037 | | | 19,002,504 | | | | 18,307,115 | | | | | |
| 3.500%, 08/01/2037 | | | 11,135,415 | | | | 10,537,077 | | | | | |
| 2.500%, 04/01/2038 | | | 22,798,900 | | | | 20,590,386 | | | | | |
| 6.000%, 05/01/2038 | | | 2,102,498 | | | | 2,181,449 | | | | | |
| 4.500%, 04/01/2039 | | | 6,896,299 | | | | 6,903,949 | | | | | |
| 4.000%, 06/01/2039 | | | 4,054,643 | | | | 3,898,930 | | | | | |
| 5.000%, 06/01/2039 | | | 6,023,525 | | | | 6,066,400 | | | | | |
| 4.500%, 01/01/2040 | | | 3,137,885 | | | | 3,098,704 | | | | | |
| 4.500%, 01/01/2040 | | | 1,328,999 | | | | 1,310,005 | | | | | |
| 5.000%, 06/01/2040 | | | 4,427,534 | | | | 4,447,214 | | | | | |
| 4.000%, 08/01/2040 | | | 322,614 | | | | 310,192 | | | | | |
| 4.500%, 08/01/2040 | | | 1,474,247 | | | | 1,455,864 | | | | | |
| 4.500%, 08/01/2040 | | | 4,053,885 | | | | 4,003,335 | | | | | |
| 4.000%, 10/01/2040 | | | 554,625 | | | | 533,267 | | | | | |
| 4.000%, 11/01/2040 | | | 6,227,333 | | | | 5,987,526 | | | | | |
| 1.500%, 12/01/2040 | | | 99,186,656 | | | | 80,798,477 | | | | | |
| 4.000%, 12/01/2040 | | | 1,892,576 | | | | 1,819,696 | | | | | |
| 3.500%, 01/01/2041 | | | 668,306 | | | | 625,708 | | | | | |
| 4.000%, 01/01/2041 | | | 1,303,376 | | | | 1,253,180 | | | | | |
| 3.500%, 02/01/2041 | | | 739,187 | | | | 692,265 | | | | | |
| 4.000%, 02/01/2041 | | | 126,897 | | | | 120,368 | | | | | |
| 4.500%, 02/01/2041 | | | 21,116,676 | | | | 20,935,616 | | | | | |
| 4.000%, 03/01/2041 | | | 2,434,899 | | | | 2,341,120 | | | | | |
| 4.500%, 07/01/2041 | | | 1,832,816 | | | | 1,805,174 | | | | | |
| 3.500%, 09/01/2041 | | | 10,357,120 | | | | 9,697,481 | | | | | |
| 4.000%, 09/01/2041 | | | 877,894 | | | | 844,083 | | | | | |
| 1.500%, 11/01/2041 | | | 25,918,208 | | | | 20,993,434 | | | | | |
| 3.500%, 12/01/2041 | | | 951,805 | | | | 891,135 | | | | | |
| 4.000%, 12/01/2041 | | | 4,354,509 | | | | 4,186,771 | | | | | |
| 2.000%, 01/01/2042 | | | 89,875,643 | | | | 75,980,390 | | | | | |
| 4.000%, 01/01/2042 | | | 8,581,207 | | | | 8,250,688 | | | | | |
| 4.500%, 01/01/2042 | | | 4,081,351 | | | | 4,030,384 | | | | | |
| 4.000%, 02/01/2042 | | | 8,972,887 | | | | 8,627,212 | | | | | |
| 1.500%, 03/01/2042 | | | 9,183,423 | | | | 7,426,943 | | | | | |
| 3.000%, 04/01/2042 | | | 25,752,246 | | | | 23,269,246 | | | | | |
| 3.000%, 05/01/2042 | | | 1,192,951 | | | | 1,076,933 | | | | | |
| 3.500%, 05/01/2042 | | | 6,463,435 | | | | 6,051,456 | | | | | |
| 3.500%, 06/01/2042 | | | 2,253,849 | | | | 2,110,195 | | | | | |
| 3.500%, 07/01/2042 | | | 49,343,842 | | | | 46,199,222 | | | | | |
| 3.500%, 08/01/2042 | | | 3,786,037 | | | | 3,544,707 | | | | | |
| 3.500%, 09/01/2042 | | | 6,326,341 | | | | 5,923,088 | | | | | |
| 3.000%, 10/01/2042 | | | 9,799,760 | | | | 8,846,640 | | | | | |
| 3.000%, 03/01/2043 | | | 2,596,346 | | | | 2,343,775 | | | | | |
| 3.000%, 04/01/2043 | | | 968,728 | | | | 874,490 | | | | | |
| 3.000%, 05/01/2043 | | | 9,583,231 | | | | 8,650,925 | | | | | |
| 3.000%, 05/01/2043 | | | 3,675,043 | | | | 3,317,536 | | | | | |
| 3.500%, 05/01/2043 | | | 8,552,439 | | | | 7,987,597 | | | | | |
| 3.000%, 06/01/2043 | | | 10,650,383 | | | | 9,614,265 | | | | | |
| 3.500%, 06/01/2043 | | | 4,691,888 | | | | 4,398,478 | | | | | |
| 3.000%, 07/01/2043 | | | 8,572,825 | | | | 7,738,810 | | | | | |
| 4.000%, 07/01/2043 | | | 11,598,662 | | | | 11,152,111 | | | | | |
| 3.000%, 08/01/2043 | | | 3,150,315 | | | | 2,843,818 | | | | | |
| 3.500%, 08/01/2043 | | | 4,103,927 | | | | 3,814,814 | | | | | |
| 3.500%, 09/01/2043 | | | 12,963,452 | | | | 12,100,141 | | | | | |
| 4.500%, 09/01/2043 | | | 5,577,326 | | | | 5,480,229 | | | | | |
| 4.000%, 01/01/2045 | | | 4,560,094 | | | | 4,362,198 | | | | | |
| 4.000%, 02/01/2045 | | | 2,446,000 | | | | 2,351,845 | | | | | |
| 4.000%, 02/01/2045 | | | 4,401,397 | | | | 4,231,949 | | | | | |
| 4.000%, 02/01/2045 | | | 1,121,891 | | | | 1,073,703 | | | | | |
| 4.000%, 02/01/2045 | | | 8,838,846 | | | | 8,456,214 | | | | | |
| 4.000%, 03/01/2045 | | | 3,730,406 | | | | 3,567,376 | | | | | |
| 3.500%, 12/01/2045 | | | 4,506,466 | | | | 4,191,264 | | | | | |
| 4.000%, 12/01/2045 | | | 16,610,563 | | | | 15,857,491 | | | | | |
| 4.000%, 12/01/2045 | | | 9,347,918 | | | | 9,036,001 | | | | | |
| 4.500%, 02/01/2046 | | | 10,664,465 | | | | 10,531,433 | | | | | |
| 4.000%, 04/01/2046 | | | 17,651,914 | | | | 16,906,475 | | | | | |
| 4.500%, 08/01/2046 | | | 9,262,599 | | | | 9,089,772 | | | | | |
| 3.000%, 10/01/2046 | | | 13,018,733 | | | | 11,663,820 | | | | | |
| 3.500%, 11/01/2046 | | | 5,238,930 | | | | 4,873,425 | | | | | |
| 4.000%, 03/01/2047 | | | 11,667,139 | | | | 11,138,008 | | | | | |
| 3.500%, 04/01/2047 | | | 21,718,012 | | | | 20,043,906 | | | | | |
| 4.000%, 11/01/2047 | | | 3,525,809 | | | | 3,367,820 | | | | | |
| 4.000%, 12/01/2047 | | | 17,940,838 | | | | 17,105,140 | | | | | |
| 3.000%, 01/01/2048 | | | 13,747,166 | | | | 12,303,737 | | | | | |
| 3.500%, 05/01/2048 | | | 33,001,751 | | | | 30,457,984 | | | | | |
| 5.000%, 11/01/2048 | | | 12,250,840 | | | | 12,204,215 | | | | | |
| 4.000%, 05/01/2049 | | | 12,907,147 | | | | 12,352,002 | | | | | |
| 4.000%, 09/01/2049 | | | 2,406,333 | | | | 2,292,466 | | | | | |
| 3.500%, 11/01/2049 | | | 48,480,755 | | | | 45,096,281 | | | | | |
| 4.500%, 03/01/2050 | | | 37,974,319 | | | | 37,183,280 | | | | | |
| 3.000%, 05/01/2050 | | | 88,771,549 | | | | 79,276,798 | | | | | |
The accompanying notes are an integral part of these financial statements.
Baird Core Plus Bond Fund
Schedule of Investments, June 30, 2023 (Unaudited)
Long-Term Investments (cont.)
| | | Principal | | | | | | % of | |
| | | Amount | | | Value | | | Net Assets | |
| Federal National Mortgage | | | | | | | | | |
| Association (FNMA): (cont.) | | | | | | | | | |
| 2.500%, 06/01/2050 | | $ | 12,664,680 | | | $ | 10,849,412 | | | | |
| 2.500%, 09/01/2050 | | | 56,900,592 | | | | 48,961,281 | | | | |
| 3.000%, 09/01/2050 | | | 8,598,005 | | | | 7,655,404 | | | | |
| 2.000%, 11/01/2050 | | | 125,461,277 | | | | 103,193,269 | | | | |
| 2.500%, 12/01/2050 | | | 20,976,366 | | | | 17,839,230 | | | | |
| 2.500%, 12/01/2050 | | | 67,615,394 | | | | 57,910,605 | | | | |
| 3.000%, 12/01/2050 | | | 41,241,909 | | | | 36,790,456 | | | | |
| 2.500%, 01/01/2051 | | | 42,252,647 | | | | 36,315,071 | | | | |
| 3.000%, 02/01/2051 | | | 43,679,408 | | | | 38,956,472 | | | | |
| 2.000%, 08/01/2051 | | | 10,635,024 | | | | 8,773,345 | | | | |
| 2.500%, 08/01/2051 | | | 37,601,940 | | | | 32,305,195 | | | | |
| 2.500%, 09/01/2051 | | | 89,955,827 | | | | 76,838,671 | | | | |
| 3.000%, 10/01/2051 | | | 34,754,395 | | | | 30,904,900 | | | | |
| 2.000%, 11/01/2051 | | | 23,026,672 | | | | 18,974,559 | | | | |
| 2.500%, 11/01/2051 | | | 48,132,571 | | | | 41,168,781 | | | | |
| 2.500%, 11/01/2051 | | | 34,028,759 | | | | 29,065,301 | | | | |
| 3.000%, 11/01/2051 | | | 65,951,763 | | | | 58,646,560 | | | | |
| 2.000%, 12/01/2051 | | | 19,369,178 | | | | 16,037,215 | | | | |
| 2.500%, 12/01/2051 | | | 82,678,609 | | | | 70,599,394 | | | | |
| 2.500%, 12/01/2051 | | | 81,249,927 | | | | 69,757,256 | | | | |
| 2.500%, 12/01/2051 | | | 122,127,211 | | | | 103,708,178 | | | | |
| 2.500%, 12/01/2051 | | | 63,866,270 | | | | 54,608,452 | | | | |
| 2.500%, 01/01/2052 | | | 113,514,981 | | | | 96,400,024 | | | | |
| 5.000%, 07/01/2052 | | | 87,093,192 | | | | 85,538,267 | | | | |
| Government National | | | | | | | | | | | |
| Mortgage Association (GNMA): | | | | | | | | | | | |
| 6.000%, 12/20/2028 | | | 5,816 | | | | 5,857 | | | | |
| 6.500%, 01/20/2029 | | | 3,068 | | | | 3,115 | | | | |
| 6.000%, 11/20/2033 | | | 5,084 | | | | 5,274 | | | | |
| 5.000%, 07/20/2040 | | | 216,592 | | | | 220,077 | | | | |
| 4.000%, 01/20/2041 | | | 3,327,198 | | | | 3,230,575 | | | | |
| 4.000%, 08/20/2041 | | | 1,958,663 | | | | 1,901,776 | | | | |
| 3.500%, 10/20/2041 | | | 3,849,076 | | | | 3,619,655 | | | | |
| 4.000%, 12/20/2041 | | | 2,699,408 | | | | 2,621,015 | | | | |
| 4.000%, 02/20/2042 | | | 5,014,794 | | | | 4,869,095 | | | | |
| 4.000%, 06/20/2042 | | | 4,450,714 | | | | 4,321,370 | | | | |
| 3.500%, 09/20/2042 | | | 2,904,108 | | | | 2,736,190 | | | | |
| 4.000%, 09/20/2044 | | | 13,735,470 | | | | 13,342,447 | | | | |
| 3.000%, 04/20/2045 | | | 4,123,909 | | | | 3,759,189 | | | | |
| 3.500%, 04/20/2045 | | | 5,684,172 | | | | 5,334,764 | | | | |
| 4.000%, 05/20/2045 | | | 5,580,852 | | | | 5,379,919 | | | | |
| 3.500%, 06/20/2045 | | | 5,726,489 | | | | 5,363,303 | | | | |
3.500%, 10/20/2045(6) | | | 18,904,507 | | | | 17,705,164 | | | | |
| 3.500%, 01/20/2046 | | | 14,378,789 | | | | 13,498,850 | | | | |
| 4.500%, 01/20/2046 | | | 5,385,661 | | | | 5,338,187 | | | | |
| 4.000%, 04/20/2046 | | | 6,660,619 | | | | 6,405,308 | | | | |
| 3.500%, 05/20/2046 | | | 24,704,014 | | | | 23,161,850 | | | | |
| 4.000%, 05/20/2046 | | | 2,458,137 | | | | 2,364,262 | | | | |
| 3.000%, 08/20/2046 | | | 11,776,939 | | | | 10,698,522 | | | | |
| 4.500%, 06/20/2047 | | | 6,505,681 | | | | 6,396,130 | | | | |
| 4.500%, 07/20/2047 | | | 4,317,617 | | | | 4,236,803 | | | | |
| 4.500%, 09/20/2047 | | | 21,996,798 | | | | 21,604,851 | | | | |
3.000%, 10/20/2047(6) | | | 69,503,487 | | | | 62,917,149 | | | | |
3.000%, 11/20/2047(6) | | | 56,565,322 | | | | 51,208,620 | | | | |
3.500%, 02/20/2048(6) | | | 65,728,910 | | | | 61,485,430 | | | | |
| 3.500%, 02/20/2048 | | | 21,148,833 | | | | 19,166,199 | | | | |
| 5.000%, 02/20/2049 | | | 71,109,967 | | | | 70,655,719 | | | | |
| 2.500%, 07/20/2051 | | | 42,347,854 | | | | 36,713,201 | | | | |
| 6.000%, 01/20/2053 | | | 22,879,462 | | | | 23,038,410 | | | | |
| Seasoned Credit Risk Transfer Trust: | | | | | | | | | | | |
| Series 2019-4, Class MA, 3.000%, | | | | | | | | | | | |
| 02/25/2059 (Callable 07/25/2047) | | | 31,640,573 | | | | 28,867,723 | | | | |
| Series 2020-3, Class MT, 2.000%, | | | | | | | | | | | |
| 05/25/2060 (Callable 08/25/2046) | | | 27,277,411 | | | | 22,274,420 | | | | |
| Total U.S. Government Agency Issues | | | | | | | | | | | |
| (Cost $4,827,549,871) | | | | | | | 4,439,138,598 | | | | 18.3 | % |
| Non-U.S. Government Agency Issues | | | | | | | | | | | | |
| Alternative Loan Trust: | | | | | | | | | | | | |
| Series 2006-43CB, Class 2A1, 6.000%, | | | | | | | | | | | | |
| 08/25/2023 (Callable 07/25/2023) | | | 7,144 | | | | 7,100 | | | | | |
| Series 2005-3CB, Class 2A1, 5.000%, | | | | | | | | | | | | |
12/25/2023 (Callable 07/25/2023)(6) | | | 65,369 | | | | 59,895 | | | | | |
| Series 2005-11CB, Class 2A6, 5.500%, | | | | | | | | | | | | |
06/25/2025 (Callable 07/25/2023)(6) | | | 3,123,695 | | | | 2,537,306 | | | | | |
| Series 2004-18CB, Class 1A1, 6.000%, | | | | | | | | | | | | |
| 09/25/2034 (Callable 07/25/2023) | | | 934,820 | | | | 912,791 | | | | | |
| Series 2005-6CB, Class 1A4, 5.500%, | | | | | | | | | | | | |
04/25/2035 (Callable 07/25/2023)(6) | | | 7,219,472 | | | | 6,174,654 | | | | | |
| Series 2005-29CB, Class A1, 5.500%, | | | | | | | | | | | | |
07/25/2035 (Callable 07/25/2023)(6) | | | 1,179,048 | | | | 738,184 | | | | | |
| Series 2005-49CB, Class A5, 5.500%, | | | | | | | | | | | | |
11/25/2035 (Callable 07/25/2023)(6) | | | 1,287,655 | | | | 877,857 | | | | | |
| Series 2005-73CB, Class 1A7, 5.500%, | | | | | | | | | | | | |
01/25/2036 (Callable 07/25/2023)(6) | | | 197,169 | | | | 182,286 | | | | | |
| Series 2005-85CB, Class 2A2, 5.500%, | | | | | | | | | | | | |
| 02/25/2036 (Callable 07/25/2023) | | | 1,716,519 | | | | 1,355,927 | | | | | |
| Series 2006-28CB, Class A17, 6.000%, | | | | | | | | | | | | |
| 10/25/2036 (Callable 07/25/2023) | | | 346,004 | | | | 187,445 | | | | | |
| Arroyo Mortgage Trust: | | | | | | | | | | | | |
| Series 2019-3, Class A1, 2.962%, | | | | | | | | | | | | |
10/25/2048 (Callable 07/25/2023)(2)(4) | | | 9,847,437 | | | | 8,917,766 | | | | | |
| Series 2022-1, Class A1B, 3.269%, | | | | | | | | | | | | |
12/25/2056 (Callable 01/25/2025)(2)(7) | | | 11,500,000 | | | | 9,963,110 | | | | | |
| Banc of America Alternative Loan Trust: | | | | | | | | | | | | |
| Series 2004-6, Class 4A1, 5.000%, | | | | | | | | | | | | |
| 12/25/2023 (Callable 07/25/2023) | | | 222,608 | | | | 184,096 | | | | | |
| Series 2003-8, Class 1CB1, 5.500%, | | | | | | | | | | | | |
| 10/25/2033 (Callable 07/25/2023) | | | 812,302 | | | | 773,508 | | | | | |
| Series 2006-5, Class CB7, 6.000%, | | | | | | | | | | | | |
06/25/2046 (Callable 07/25/2023)(6) | | | 102,641 | | | | 89,812 | | | | | |
| Banc of America Funding Trust, | | | | | | | | | | | | |
| Series 2007-C, Class 1A3, 3.969%, | | | | | | | | | | | | |
05/20/2036 (Callable 07/20/2023)(4)(6) | | | 892,504 | | | | 791,718 | | | | | |
| Bayview Financial Trust, | | | | | | | | | | | | |
| Series 2007-B, Class 1A2, 7.331%, | | | | | | | | | | | | |
08/28/2047 (Callable 07/28/2023)(7) | | | 55,710 | | | | 46,195 | | | | | |
| Bear Stearns ARM Trust, | | | | | | | | | | | | |
| Series 2005-9, Class A1, 5.230%, | | | | | | | | | | | | |
| 10/25/2035 (1 Year CMT Rate + | | | | | | | | | | | | |
2.300%) (Callable 07/25/2023)(3) | | | 219,509 | | | | 207,481 | | | | | |
| BRAVO Residential Funding Trust, | | | | | | | | | | | | |
| Series 2020-RPL2, Class A1, 2.000%, | | | | | | | | | | | | |
05/25/2059 (Callable 07/25/2048)(2)(4) | | | 27,745,566 | | | | 24,639,692 | | | | | |
| Chase Home Lending Mortgage Trust, | | | | | | | | | | | | |
| Series 2023-RPL1, Class A1, 3.500%, | | | | | | | | | | | | |
06/25/2062 (Callable 12/25/2043)(2)(4) | | | 55,704,699 | | | | 49,707,593 | | | | | |
| Chase Mortgage Finance Trust: | | | | | | | | | | | | |
| Series 2005-A2, Class 1A5, 3.948%, | | | | | | | | | | | | |
01/25/2036 (Callable 07/25/2023)(4)(6) | | | 365,080 | | | | 319,632 | | | | | |
| Series 2006-A1, Class 2A3, 4.374%, | | | | | | | | | | | | |
09/25/2036 (Callable 07/25/2023)(4)(6) | | | 297,708 | | | | 257,684 | | | | | |
| Series 2007-A1, Class 3A1, 4.311%, | | | | | | | | | | | | |
02/25/2037 (Callable 03/25/2024)(4) | | | 1,368,795 | | | | 1,300,704 | | | | | |
| Series 2007-A1, Class 2A3, 5.165%, | | | | | | | | | | | | |
02/25/2037 (Callable 08/25/2025)(4) | | | 419,671 | | | | 386,977 | | | | | |
The accompanying notes are an integral part of these financial statements.
Baird Core Plus Bond Fund
Schedule of Investments, June 30, 2023 (Unaudited)
Long-Term Investments (cont.)
| | | Principal | | | | | | % of | |
| | | Amount | | | Value | | | Net Assets | |
| CHL Mortgage Pass-Through Trust, | | | | | | | | | |
| Series 2005-6, Class 2A1, | | | | | | | | | |
| 5.500%, 04/25/2035 | | | | | | | | | |
(Callable 07/25/2023)(6) | | $ | 149,402 | | | $ | 123,272 | | | |
| |
| CIM Trust, | | | | | | | | | | | | |
| Series 2022-R1, Class A1, 3.000%, | | | | | | | | | | | | |
01/25/2061 (Callable 02/25/2027)(2)(4) | | | 20,291,241 | | | | 18,193,017 | | | | | |
| Citicorp Mortgage Securities Trust: | | | | | | | | | | | | |
| Series 2006-3, Class 1A4, 6.000%, | | | | | | | | | | | | |
| 06/25/2036 (Callable 07/25/2023) | | | 2,266,242 | | | | 1,968,007 | | | | | |
| Series 2007-2, Class 1A3, 6.000%, | | | | | | | | | | | | |
02/25/2037 (Callable 07/25/2023)(6) | | | 719,221 | | | | 596,885 | | | | | |
| Citicorp Residential Mortgage Trust, | | | | | | | | | | | | |
| Series 2007-1, Class A6, 4.915%, | | | | | | | | | | | | |
03/25/2037 (Callable 07/25/2023)(7) | | | 213 | | | | 211 | | | | | |
| Citigroup Mortgage Loan Trust, | | | | | | | | | | | | |
| Series 2018-RP2, Class A1, 3.320%, | | | | | | | | | | | | |
02/25/2058 (Callable 12/25/2044)(2)(4) | | | 10,190,192 | | | | 9,692,934 | | | | | |
| Citigroup Mortgage Loan Trust, Inc.: | | | | | | | | | | | | |
| Series 2006-AR1, Class 1A1, 7.110%, | | | | | | | | | | | | |
| 10/25/2035 (1 Year CMT Rate + | | | | | | | | | | | | |
2.400%) (Callable 07/25/2023)(3) | | | 3,063,530 | | | | 2,971,425 | | | | | |
| Series 2005-9, Class 2A2, 5.500%, | | | | | | | | | | | | |
11/25/2035 (Callable 07/25/2023)(6) | | | 20,077 | | | | 15,079 | | | | | |
| Series 2005-9, Class 22A2, 6.000%, | | | | | | | | | | | | |
11/25/2035 (Callable 07/25/2023)(6) | | | 1,078,460 | | | | 1,042,985 | | | | | |
| Credit Suisse First Boston | | | | | | | | | | | | |
| Mortgage Securities Corp., | | | | | | | | | | | | |
| Series 2005-7, Class 3A1, 5.000%, | | | | | | | | | | | | |
| 12/25/2023 (Callable 07/25/2023) | | | 11,866 | | | | 11,458 | | | | | |
| CWABS Asset-Backed Certificates Trust: | | | | | | | | | | | | |
| Series 2005-10, Class AF6, 4.915%, | | | | | | | | | | | | |
02/25/2036 (Callable 07/25/2023)(4) | | | 8,698 | | | | 8,425 | | | | | |
| Series 2006-10, Class 1AF3, 5.971%, | | | | | | | | | | | | |
09/25/2046 (Callable 07/25/2023)(4) | | | 55,383 | | | | 55,756 | | | | | |
| Series 2006-9, Class 1AF3, 5.859%, | | | | | | | | | | | | |
10/25/2046 (Callable 07/25/2023)(4)(6) | | | 44,332 | | | | 45,600 | | | | | |
| Deutsche Alt-A Securities, Inc. | | | | | | | | | | | | |
| Mortgage Loan Trust, | | | | | | | | | | | | |
| Series 2005-2, Class 1A7, 5.134%, | | | | | | | | | | | | |
04/25/2035 (Callable 07/25/2023)(4) | | | 4,468,779 | | | | 4,088,628 | | | | | |
| First Horizon Alternative | | | | | | | | | | | | |
| Mortgage Securities Trust: | | | | | | | | | | | | |
| Series 2004-AA1, Class A1, 6.227%, | | | | | | | | | | | | |
06/25/2034 (Callable 07/25/2023)(4) | | | 2,062,357 | | | | 1,928,876 | | | | | |
| Series 2005-AA2, Class 2A1, 5.024%, | | | | | | | | | | | | |
04/25/2035 (Callable 07/25/2023)(4) | | | 861,425 | | | | 839,397 | | | | | |
| Series 2006-FA6, Class 3A1, 5.750%, | | | | | | | | | | | | |
11/25/2036 (Callable 07/25/2023)(6) | | | 2,122 | | | | 1,446 | | | | | |
| FirstKey Homes Trust: | | | | | | | | | | | | |
| Series 2022-SFR3, Class A, | | | | | | | | | | | | |
4.250%, 07/17/2038(2) | | | 70,700,000 | | | | 67,346,275 | | | | | |
| Series 2021-SFR1, Class A, | | | | | | | | | | | | |
1.538%, 08/17/2038(2) | | | 97,945,867 | | | | 85,718,941 | | | | | |
| Series 2021-SFR2, Class A, | | | | | | | | | | | | |
1.376%, 09/17/2038(2) | | | 38,476,861 | | | | 33,287,221 | | | | | |
| Series 2022-SFR1, Class A, | | | | | | | | | | | | |
4.145%, 05/17/2039(2) | | | 42,643,837 | | | | 40,175,296 | | | | | |
| Series 2022-SFR2, Class A, | | | | | | | | | | | | |
4.250%, 07/17/2039(2) | | | 4,317,583 | | | | 4,067,317 | | | | | |
| GS Mortgage Securities Trust, | | | | | | | | | | | | |
| Series 2018-RPL1, Class A1A, 3.750%, | | | | | | | | | | | | |
10/25/2057 (Callable 01/25/2032)(2) | | | 22,743,848 | | | | 21,466,474 | | | | | |
| GSR Mortgage Loan Trust: | | | | | | | | | | | | |
| Series 2004-15F, Class 5A1, | | | | | | | | | | | | |
| 5.500%, 11/25/2023 | | | 19,995 | | | | 18,369 | | | | | |
| Series 2005-3F, Class 2A4, 6.000%, | | | | | | | | | | | | |
| 03/25/2035 (Callable 10/25/2033) | | | 1,124,619 | | | | 935,861 | | | | | |
| Series 2005-AR2, Class 2A1, 3.914%, | | | | | | | | | | | | |
04/25/2035 (Callable 07/25/2023)(4) | | | 1,334,778 | | | | 1,210,253 | | | | | |
| Home Partners of America Trust, | | | | | | | | | | | | |
| Series 2021-2, Class A, | | | | | | | | | | | | |
1.901%, 12/17/2026(2) | | | 77,631,738 | | | | 67,707,832 | | | | | |
| J.P. Morgan Alternative Loan Trust, | | | | | | | | | | | | |
| Series 2006-A1, Class 2A1, 4.107%, | | | | | | | | | | | | |
03/25/2036 (Callable 08/25/2025)(4) | | | 39,887 | | | | 30,791 | | | | | |
| J.P. Morgan Mortgage Trust: | | | | | | | | | | | | |
| Series 2005-A8, Class 2A3, 3.909%, | | | | | | | | | | | | |
11/25/2035 (Callable 07/25/2023)(4) | | | 2,323,758 | | | | 2,011,038 | | | | | |
| Series 2006-A2, Class 2A1, 4.035%, | | | | | | | | | | | | |
04/25/2036 (Callable 07/25/2023)(4) | | | 543,000 | | | | 466,563 | | | | | |
| Series 2006-A2, Class 3A3, 4.172%, | | | | | | | | | | | | |
04/25/2036 (Callable 07/25/2023)(4)(6) | | | 587,438 | | | | 495,912 | | | | | |
| Series 2006-A7, Class 2A2, 3.881%, | | | | | | | | | | | | |
01/25/2037 (Callable 07/25/2023)(4)(6) | | | 832,856 | | | | 670,644 | | | | | |
| Series 2006-A7, Class 2A4R, 3.881%, | | | | | | | | | | | | |
01/25/2037 (Callable 07/25/2023)(4)(6) | | | 851,850 | | | | 685,938 | | | | | |
| Series 2007-A2, Class 2A3, 4.201%, | | | | | | | | | | | | |
04/25/2037 (Callable 07/25/2023)(4) | | | 1,746,662 | | | | 1,281,395 | | | | | |
| Series 2007-A4, Class 2A3, 4.403%, | | | | | | | | | | | | |
06/25/2037 (Callable 07/25/2023)(4)(6) | | | 1,940,067 | | | | 1,541,645 | | | | | |
| MASTR Alternative Loan Trust: | | | | | | | | | | | | |
| Series 2004-2, Class 2A1, 6.000%, | | | | | | | | | | | | |
| 02/25/2034 (Callable 07/25/2023) | | | 1,079,237 | | | | 1,031,848 | | | | | |
| Series 2004-8, Class 2A1, 6.000%, | | | | | | | | | | | | |
| 09/25/2034 (Callable 07/25/2023) | | | 705,286 | | | | 671,588 | | | | | |
| Series 2005-6, Class 1A5, 5.500%, | | | | | | | | | | | | |
12/25/2035 (Callable 07/25/2023)(6) | | | 1,246,121 | | | | 887,425 | | | | | |
| Merrill Lynch Mortgage Investors Trust, | | | | | | | | | | | | |
| Series 2005-A5, Class A3, 4.391%, | | | | | | | | | | | | |
06/25/2035 (Callable 07/25/2023)(4) | | | 698,787 | | | | 655,653 | | | | | |
| Mill City Mortgage Loan Trust: | | | | | | | | | | | | |
| Series 2018-2, Class A1, 3.500%, | | | | | | | | | | | | |
05/25/2058 (Callable 09/25/2033)(2)(4) | | | 5,002,730 | | | | 4,867,019 | | | | | |
| Series 2018-3, Class A1, 3.500%, | | | | | | | | | | | | |
08/25/2058 (Callable 12/25/2033)(2)(4) | | | 5,810,801 | | | | 5,541,318 | | | | | |
| Series 2019-1, Class A1, 3.250%, | | | | | | | | | | | | |
10/25/2069 (Callable 08/25/2031)(2)(4) | | | 15,189,516 | | | | 14,285,831 | | | | | |
| New Residential Funding LLC, | | | | | | | | | | | | |
| Series 2023-1, Class A, 3.500%, | | | | | | | | | | | | |
01/25/2063 (Callable 05/25/2036)(2)(4) | | | 61,757,537 | | | | 55,347,370 | | | | | |
| New Residential Mortgage Loan Trust: | | | | | | | | | | | | |
| Series 2016-1A, Class A1, 3.750%, | | | | | | | | | | | | |
03/25/2056 (Callable 12/25/2030)(2)(4) | | | 5,259,395 | | | | 4,823,026 | | | | | |
| Series 2017-1A, Class A1, 4.000%, | | | | | | | | | | | | |
02/25/2057 (Callable 07/25/2031)(2)(4) | | | 10,749,589 | | | | 10,018,571 | | | | | |
| Series 2017-3A, Class A1, 4.000%, | | | | | | | | | | | | |
04/25/2057 (Callable 03/25/2032)(2)(4) | | | 8,907,867 | | | | 8,377,340 | | | | | |
| Series 2017-6A, Class A1, 4.000%, | | | | | | | | | | | | |
08/27/2057 (Callable 10/25/2035)(2)(4) | | | 11,373,167 | | | | 10,492,178 | | | | | |
| Series 2018-1A, Class A1A, 4.000%, | | | | | | | | | | | | |
12/25/2057 (Callable 08/25/2032)(2)(4) | | | 5,942,681 | | | | 5,575,364 | | | | | |
| Series 2019-RPL2, Class A1, 3.250%, | | | | | | | | | | | | |
02/25/2059 (Callable 04/25/2041)(2)(4) | | | 13,211,232 | | | | 12,333,532 | | | | | |
| Series 2022-NQM2, Class A1, 3.079%, | | | | | | | | | | | | |
03/27/2062 (Callable 02/25/2024)(2)(4) | | | 26,542,078 | | | | 23,349,219 | | | | | |
The accompanying notes are an integral part of these financial statements.
Baird Core Plus Bond Fund
Schedule of Investments, June 30, 2023 (Unaudited)
Long-Term Investments (cont.)
| | | Principal | | | | | | % of | |
| | | Amount | | | Value | | | Net Assets | |
| OBX Trust: | | | | | | | | | |
| Series 2022-NQM3, Class A1, | | | | | | | | | |
| 3.383%, 01/25/2062 | | | | | | | | | |
(Callable 03/25/2025)(2)(4) | | $ | 36,161,469 | | | $ | 32,813,061 | | | | |
| Series 2022-NQM5, Class A1, 4.310%, | | | | | | | | | | | |
05/25/2062 (Callable 05/25/2025)(2)(7) | | | 65,871,728 | | | | 62,439,693 | | | | |
| RALI Series Trust: | | | | | | | | | | | |
| Series 2004-QS13, Class CB, 5.000%, | | | | | | | | | | | |
| 12/25/2023 (Callable 07/25/2023) | | | 3,495 | | | | 3,381 | | | | |
| Series 2005-QA7, Class A22, 4.873%, | | | | | | | | | | | |
07/25/2035 (Callable 07/25/2023)(4)(6) | | | 859,997 | | | | 778,408 | | | | |
| Series 2005-QS11, Class A2, 5.500%, | | | | | | | | | | | |
| 07/25/2035 (1 Month LIBOR USD | | | | | | | | | | | |
+ 0.500%) (Callable 07/25/2023)(3)(6) | | | 2,094,162 | | | | 1,513,390 | | | | |
| Renaissance Home Equity Loan Trust: | | | | | | | | | | | |
| Series 2005-1, Class AF6, 4.970%, | | | | | | | | | | | |
05/25/2035 (Callable 07/25/2023)(7) | | | 2,859 | | | | 2,800 | | | | |
| Series 2006-2, Class AF3, 5.797%, | | | | | | | | | | | |
08/25/2036 (Callable 05/25/2028)(7) | | | 14,782,419 | | | | 5,900,043 | | | | |
| Series 2006-3, Class AF2, 5.580%, | | | | | | | | | | | |
11/25/2036 (Callable 01/25/2029)(7) | | | 9,847,275 | | | | 3,539,723 | | | | |
| Series 2007-1, Class AF3, 5.612%, | | | | | | | | | | | |
04/25/2037 (Callable 09/25/2030)(7) | | | 278,136 | | | | 77,196 | | | | |
| Series 2007-2, Class AF2, 5.675%, | | | | | | | | | | | |
06/25/2037 (Callable 07/25/2030)(7) | | | 1,435,659 | | | | 405,284 | | | | |
| Starwood Mortgage Residential Trust, | | | | | | | | | | | |
| Series 2020-3, Class A1, 1.486%, | | | | | | | | | | | |
04/25/2065 (Callable 07/25/2023)(2)(4) | | | 3,469,045 | | | | 3,177,589 | | | | |
| Structured Asset Securities Corp., | | | | | | | | | | | |
| Series 2003-31A, Class 2A7, 5.662%, | | | | | | | | | | | |
10/25/2033 (Callable 07/25/2023)(4) | | | 613,883 | | | | 590,779 | | | | |
| Towd Point Mortgage Trust: | | | | | | | | | | | |
| Series 2017-1, Class A1, 2.750%, | | | | | | | | | | | |
10/25/2056 (Callable 01/25/2030)(2)(4) | | | 227,993 | | | | 224,615 | | | | |
| Series 2017-6, Class A1, 2.750%, | | | | | | | | | | | |
10/25/2057 (Callable 02/25/2033)(2)(4) | | | 8,994,106 | | | | 8,499,544 | | | | |
| Series 2018-6, Class A1A, 3.750%, | | | | | | | | | | | |
03/25/2058 (Callable 11/25/2031)(2)(4) | | | 5,981,206 | | | | 5,774,633 | | | | |
| Series 2019-1, Class A1, 3.750%, | | | | | | | | | | | |
03/25/2058 (Callable 07/25/2029)(2)(4) | | | 5,685,956 | | | | 5,320,434 | | | | |
| Series 2018-4, Class A1, 3.000%, | | | | | | | | | | | |
06/25/2058 (Callable 06/25/2036)(2)(4) | | | 21,220,921 | | | | 19,289,179 | | | | |
| Series 2019-4, Class A1, 2.900%, | | | | | | | | | | | |
10/25/2059 (Callable 05/25/2031)(2)(4) | | | 41,188,973 | | | | 37,836,508 | | | | |
| Series 2020-2, Class A1A, 1.636%, | | | | | | | | | | | |
04/25/2060 (Callable 05/25/2032)(2)(4) | | | 26,399,734 | | | | 22,803,330 | | | | |
| Series 2020-4, Class A1, 1.750%, | | | | | | | | | | | |
10/25/2060 (Callable 01/25/2031)(2) | | | 67,329,231 | | | | 58,494,262 | | | | |
| Series 2022-2, Class A1, 3.750%, | | | | | | | | | | | |
07/01/2062 (Callable 09/25/2035)(2)(4) | | | 111,394,445 | | | | 101,981,391 | | | | |
| Series 2022-3, Class A1, 3.750%, | | | | | | | | | | | |
08/01/2062 (Callable 08/25/2030)(2)(4) | | | 110,193,939 | | | | 100,297,917 | | | | |
| WaMu Mortgage | | | | | | | | | | | |
| Pass-Through Certificates Trust: | | | | | | | | | | | |
| Series 2004-CB3, Class 1A, 6.000%, | | | | | | | | | | | |
| 10/25/2034 (Callable 07/25/2023) | | | 569,087 | | | | 554,908 | | | | |
| Series 2004-CB3, Class 2A, 6.500%, | | | | | | | | | | | |
| 10/25/2034 (Callable 07/25/2023) | | | 1,238,089 | | | | 1,217,734 | | | | |
| Series 2005-6, Class 2A4, 5.500%, | | | | | | | | | | | |
08/25/2035 (Callable 07/25/2023)(6) | | | 2,595,546 | | | | 2,178,318 | | | | |
| Series 2006-AR10, Class 1A1, 3.754%, | | | | | | | | | | | |
09/25/2036 (Callable 07/25/2023)(4)(6) | | | 475,138 | | | | 405,239 | | | | |
| Series 2007-HY3, Class 4A1, 4.156%, | | | | | | | | | | | |
03/25/2037 (Callable 07/25/2023)(4)(6) | | | 5,401,680 | | | | 4,917,945 | | | | |
| Wells Fargo Mortgage | | | | | | | | | | | |
| Backed Securities Trust: | | | | | | | | | | | |
| Series 2006-AR14, Class 2A3, | | | | | | | | | | | |
| 4.509%, 10/25/2036 | | | | | | | | | | | |
(Callable 07/25/2023)(4)(6) | | | 782,049 | | | | 684,287 | | | | |
| Series 2007-7, Class A49, 6.000%, | | | | | | | | | | | |
06/25/2037 (Callable 07/25/2023)(6) | | | 1,073,812 | | | | 963,253 | | | | |
| Total Non-U.S. Government Agency Issues | | | | | | | | | | | |
| (Cost $1,229,143,481) | | | | | | | 1,122,262,705 | | | | 4.6 | % |
| Total Residential | | | | | | | | | | | | |
| Mortgage-Backed Securities | | | | | | | | | | | | |
| (Cost $6,056,693,352) | | | | | | | 5,561,401,303 | | | | 22.9 | % |
| Commercial Mortgage-Backed Securities | | | | | | | | | | | | |
| U.S. Government Agency Issues | | | | | | | | | | | | |
| Fannie Mae REMIC Trust, | | | | | | | | | | | | |
| Series 2017-M4, Class A2, 2.553%, | | | | | | | | | | | | |
12/25/2026(4) | | | 21,552,149 | | | | 20,059,799 | | | | | |
| Freddie Mac Multifamily Structured | | | | | | | | | | | | |
| Pass Through Certificates: | | | | | | | | | | | | |
| Series K072, Class A2 | | | | | | | | | | | | |
| 3.444%, 12/25/2027 | | | 12,000,000 | | | | 11,420,990 | | | | | |
| Series K074, Class A2 | | | | | | | | | | | | |
| 3.600%, 01/25/2028 | | | 40,495,000 | | | | 38,785,957 | | | | | |
| Series K077, Class A2 | | | | | | | | | | | | |
3.850%, 05/25/2028(4) | | | 46,199,000 | | | | 44,735,679 | | | | | |
| Series K079, Class A2 | | | | | | | | | | | | |
| 3.926%, 06/25/2028 | | | 63,251,000 | | | | 61,454,748 | | | | | |
| Series K080, Class A2 | | | | | | | | | | | | |
3.926%, 07/25/2028(4) | | | 34,095,000 | | | | 33,129,171 | | | | | |
| Series K122, Class A2 | | | | | | | | | | | | |
| 1.521%, 11/25/2030 | | | 23,000,000 | | | | 18,676,842 | | | | | |
| Series K153, Class A3, | | | | | | | | | | | | |
3.117%, 10/25/2031(4) | | | 15,655,000 | | | | 13,948,558 | | | | | |
| Series K-154, Class A2 | | | | | | | | | | | | |
4.350%, 01/25/2033(4) | | | 25,000,000 | | | | 24,741,930 | | | | | |
| Series K158, Class A3, | | | | | | | | | | | | |
3.900%, 10/25/2033(4) | | | 18,777,000 | | | | 17,748,991 | | | | | |
| Series K-1517, Class A2 | | | | | | | | | | | | |
| 1.716%, 07/25/2035 | | | 1,000,000 | | | | 735,454 | | | | | |
| Total U.S. Government Agency Issues | | | | | | | | | | | | |
| (Cost $303,466,736) | | | | | | | 285,438,119 | | | | 1.2 | % |
| Non-U.S. Government Agency Issues | | | | | | | | | | | | |
| BANK: | | | | | | | | | | | | |
| Series 2017-BNK4, Class A4, 3.625%, | | | | | | | | | | | | |
| 05/15/2050 (Callable 04/15/2027) | | | 30,037,000 | | | | 27,549,642 | | | | | |
| Series 2017-BNK8, Class A4, 3.488%, | | | | | | | | | | | | |
| 11/15/2050 (Callable 11/15/2027) | | | 69,721,751 | | | | 63,081,507 | | | | | |
| Series 2017-BNK9, Class A4, 3.538%, | | | | | | | | | | | | |
| 11/15/2054 (Callable 12/15/2029) | | | 32,737,000 | | | | 30,027,146 | | | | | |
| Series 2022-BNK44, Class A5, 5.746%, | | | | | | | | | | | | |
11/15/2055 (Callable 11/15/2032)(4) | | | 60,200,000 | | | | 62,350,290 | | | | | |
| Series 2017-BNK5, Class A5, 3.390%, | | | | | | | | | | | | |
| 06/15/2060 (Callable 07/15/2027) | | | 2,070,000 | | | | 1,898,966 | | | | | |
| Series 2018-BN10, Class A5, 3.688%, | | | | | | | | | | | | |
| 02/15/2061 (Callable 02/15/2028) | | | 6,400,000 | | | | 5,902,171 | | | | | |
| Series 2021-BN33, Class A5, 2.556%, | | | | | | | | | | | | |
| 05/15/2064 (Callable 05/15/2031) | | | 53,919,000 | | | | 44,374,366 | | | | | |
| BBCMS Mortgage Trust, | | | | | | | | | | | | |
| Series 2018-C2, Class A5, 4.314%, | | | | | | | | | | | | |
| 12/15/2051 (Callable 12/15/2028) | | | 14,445,000 | | | | 13,590,818 | | | | | |
| Benchmark Mortgage Trust: | | | | | | | | | | | | |
| Series 2018-B1, Class A5, 3.666%, | | | | | | | | | | | | |
01/15/2051 (Callable 01/15/2028)(4) | | | 10,240,000 | | | | 9,355,182 | | | | | |
The accompanying notes are an integral part of these financial statements.
Baird Core Plus Bond Fund
Schedule of Investments, June 30, 2023 (Unaudited)
Long-Term Investments (cont.)
| | | Principal | | | | | | % of | |
| | | Amount | | | Value | | | Net Assets | |
| Benchmark Mortgage Trust: (cont.) | | | | | | | | | |
| Series 2020-B19, Class A5, 1.850%, | | | | | | | | | |
| 09/15/2053 (Callable 10/15/2030) | | $ | 29,825,000 | | | $ | 23,084,431 | | | |
| |
| Series 2020-B21, Class A5, 1.978%, | | | | | | | | | | | | |
| 12/17/2053 (Callable 12/15/2030) | | | 46,400,000 | | | | 36,535,754 | | | | | |
| Series 2021-B24, Class A5, 2.584%, | | | | | | | | | | | | |
| 03/15/2054 (Callable 03/15/2031) | | | 19,075,000 | | | | 15,204,593 | | | | | |
| BMO Mortgage Trust, | | | | | | | | | | | | |
| Series 2022-C1, Class A5, | | | | | | | | | | | | |
3.374%, 02/15/2055(4) | | | 31,900,000 | | | | 27,588,986 | | | | | |
| Citigroup Commercial Mortgage Trust: | | | | | | | | | | | | |
| Series 2015-GC27, Class A5, 3.137%, | | | | | | | | | | | | |
| 02/10/2048 (Callable 01/10/2025) | | | 50,189,111 | | | | 47,842,951 | | | | | |
| Series 2015-GC29, Class A4, 3.192%, | | | | | | | | | | | | |
| 04/10/2048 (Callable 04/10/2025) | | | 25,065,000 | | | | 23,641,797 | | | | | |
| Series 2016-C2, Class A4, 2.832%, | | | | | | | | | | | | |
| 08/10/2049 (Callable 08/10/2026) | | | 33,387,000 | | | | 30,301,393 | | | | | |
| Series 2017-P8, Class A4, 3.465%, | | | | | | | | | | | | |
| 09/15/2050 (Callable 09/15/2027) | | | 29,775,000 | | | | 27,177,355 | | | | | |
| Series 2019-GC43, Class A4, 3.038%, | | | | | | | | | | | | |
| 11/10/2052 (Callable 11/10/2029) | | | 7,350,000 | | | | 6,294,994 | | | | | |
| COMM Mortgage Trust: | | | | | | | | | | | | |
| Series 2014-CR18, Class A4, 3.550%, | | | | | | | | | | | | |
| 07/15/2047 (Callable 07/15/2024) | | | 2,130,749 | | | | 2,078,703 | | | | | |
| Series 2014-CR19, Class A5, 3.796%, | | | | | | | | | | | | |
| 08/10/2047 (Callable 08/10/2024) | | | 33,800,000 | | | | 32,851,531 | | | | | |
| Series 2014-CR20, Class ASB, 3.305%, | | | | | | | | | | | | |
| 11/10/2047 (Callable 01/10/2029) | | | 7,539,469 | | | | 7,361,423 | | | | | |
| Series 2015-LC19, Class A4, 3.183%, | | | | | | | | | | | | |
| 02/10/2048 (Callable 01/10/2027) | | | 27,105,399 | | | | 25,802,228 | | | | | |
| Series 2015-DC1, Class A5, 3.350%, | | | | | | | | | | | | |
| 02/10/2048 (Callable 02/10/2025) | | | 23,390,000 | | | | 22,264,001 | | | | | |
| CSAIL Commercial Mortgage Trust: | | | | | | | | | | | | |
| Series 2018-C14, Class A4, 4.422%, | | | | | | | | | | | | |
11/15/2051 (Callable 11/15/2028)(4) | | | 14,929,000 | | | | 14,007,682 | | | | | |
| Series 2019-C16, Class A3, 3.329%, | | | | | | | | | | | | |
| 06/15/2052 (Callable 06/15/2029) | | | 18,504,000 | | | | 16,297,511 | | | | | |
| DBJPM Mortgage Trust, | | | | | | | | | | | | |
| Series 2020-C9, Class A5, 1.926%, | | | | | | | | | | | | |
| 08/15/2053 (Callable 09/15/2030) | | | 31,100,000 | | | | 24,686,440 | | | | | |
| GS Mortgage Securities Trust: | | | | | | | | | | | | |
| Series 2014-GC20, Class AAB, 3.655%, | | | | | | | | | | | | |
| 04/10/2047 (Callable 04/10/2024) | | | 3,488,935 | | | | 3,456,868 | | | | | |
| Series 2017-GS7, Class A4, 3.430%, | | | | | | | | | | | | |
| 08/10/2050 (Callable 08/10/2027) | | | 21,500,000 | | | | 19,396,844 | | | | | |
| Series 2017-GS8, Class A4, 3.469%, | | | | | | | | | | | | |
| 11/10/2050 (Callable 11/10/2027) | | | 19,575,000 | | | | 17,775,355 | | | | | |
| Series 2019-GC42, Class A4, 3.001%, | | | | | | | | | | | | |
| 09/10/2052 (Callable 09/10/2029) | | | 16,285,000 | | | | 14,029,864 | | | | | |
| JP Morgan Chase Commercial | | | | | | | | | | | | |
| Mortgage Securities Trust, | | | | | | | | | | | | |
| Series 2016-JP2, Class A4, 2.822%, | | | | | | | | | | | | |
| 08/15/2049 (Callable 07/15/2026) | | | 15,150,000 | | | | 13,768,772 | | | | | |
| JPMBB Commercial | | | | | | | | | | | | |
| Mortgage Securities Trust: | | | | | | | | | | | | |
| Series 2013-C17, Class A3, 3.928%, | | | | | | | | | | | | |
| 01/15/2047 (Callable 01/15/2024) | | | 2,404,651 | | | | 2,394,007 | | | | | |
| Series 2014-C24, Class ASB, 3.368%, | | | | | | | | | | | | |
| 11/15/2047 (Callable 10/15/2025) | | | 2,981,449 | | | | 2,915,705 | | | | | |
| Series 2014-C25, Class A5, 3.672%, | | | | | | | | | | | | |
| 11/15/2047 (Callable 11/15/2024) | | | 45,697,000 | | | | 43,770,177 | | | | | |
| Series 2015-C30, Class A5, 3.822%, | | | | | | | | | | | | |
| 07/15/2048 (Callable 07/15/2025) | | | 42,110,000 | | | | 39,703,582 | | | | | |
| Series 2015-C32, Class A5, 3.598%, | | | | | | | | | | | | |
| 11/15/2048 (Callable 10/15/2025) | | | 16,075,000 | | | | 14,990,948 | | | | | |
| Series 2016-C4, Class A3, 3.141%, | | | | | | | | | | | | |
| 12/15/2049 (Callable 04/15/2027) | | | 39,133,000 | | | | 35,384,192 | | | | | |
| JPMCC Commercial | | | | | | | | | | | | |
| Mortgage Securities Trust: | | | | | | | | | | | | |
| Series 2017-JP5, Class A5, 3.723%, | | | | | | | | | | | | |
| 03/15/2050 (Callable 04/15/2027) | | | 17,310,000 | | | | 15,894,155 | | | | | |
| Series 2017-JP7, Class A5, 3.454%, | | | | | | | | | | | | |
| 09/15/2050 (Callable 08/15/2027) | | | 27,356,184 | | | | 24,770,959 | | | | | |
| Morgan Stanley Bank of America | | | | | | | | | | | | |
| Merrill Lynch Trust: | | | | | | | | | | | | |
| Series 2014-C16, Class A5, 3.892%, | | | | | | | | | | | | |
| 06/15/2047 (Callable 06/15/2026) | | | 35,020,000 | | | | 34,175,829 | | | | | |
| Series 2015-C25, Class ASB, 3.383%, | | | | | | | | | | | | |
| 10/15/2048 (Callable 09/15/2025) | | | 11,076,896 | | | | 10,686,728 | | | | | |
| Series 2016-C30, Class A5, 2.860%, | | | | | | | | | | | | |
| 09/15/2049 (Callable 10/15/2026) | | | 9,062,000 | | | | 8,208,561 | | | | | |
| Series 2016-C32, Class A4, 3.720%, | | | | | | | | | | | | |
| 12/15/2049 (Callable 01/15/2027) | | | 14,175,000 | | | | 13,243,162 | | | | | |
| Series 2017-C34, Class A4, 3.536%, | | | | | | | | | | | | |
| 11/15/2052 (Callable 10/15/2027) | | | 8,190,000 | | | | 7,490,376 | | | | | |
| Morgan Stanley Capital I Trust, | | | | | | | | | | | | |
| Series 2017-H1, Class A5, 3.530%, | | | | | | | | | | | | |
| 06/15/2050 (Callable 06/15/2027) | | | 3,470,100 | | | | 3,176,258 | | | | | |
| Morgan Stanley Capital I, Inc., | | | | | | | | | | | | |
| Series 2022-L8, Class A5, 3.794%, | | | | | | | | | | | | |
04/15/2055 (Callable 04/15/2032)(4) | | | 56,678,000 | | | | 50,203,564 | | | | | |
| Wells Fargo Commercial Mortgage Trust: | | | | | | | | | | | | |
| Series 2015-C26, Class ASB, 2.991%, | | | | | | | | | | | | |
| 02/15/2048 (Callable 02/15/2025) | | | 4,595,569 | | | | 4,475,944 | | | | | |
| Series 2016-C35, Class ASB, 2.788%, | | | | | | | | | | | | |
| 07/15/2048 (Callable 07/15/2026) | | | 6,368,235 | | | | 6,100,507 | | | | | |
| Series 2016-BNK1, Class A3, 2.652%, | | | | | | | | | | | | |
| 08/15/2049 (Callable 08/15/2026) | | | 16,807,000 | | | | 15,202,350 | | | | | |
| Series 2017-C40, Class A4, 3.581%, | | | | | | | | | | | | |
| 10/15/2050 (Callable 10/15/2027) | | | 48,894,000 | | | | 44,815,439 | | | | | |
| Series 2017-C42, Class A4, 3.589%, | | | | | | | | �� | | | | |
| 12/15/2050 (Callable 12/15/2027) | | | 52,370,521 | | | | 47,309,732 | | | | | |
| Series 2017-RC1, Class A4, 3.631%, | | | | | | | | | | | | |
| 01/15/2060 (Callable 03/15/2027) | | | 11,875,000 | | | | 11,006,803 | | | | | |
| Series 2018-C47, Class A4, 4.442%, | | | | | | | | | | | | |
| 09/15/2061 (Callable 10/15/2028) | | | 10,850,000 | | | | 10,270,425 | | | | | |
| WFRBS Commercial Mortgage Trust: | | | | | | | | | | | | |
| Series 2013-C18, Class A4, 3.896%, | | | | | | | | | | | | |
| 12/15/2046 (Callable 01/15/2024) | | | 15,414,320 | | | | 15,206,471 | | | | | |
| Series 2014-C21, Class ASB, 3.393%, | | | | | | | | | | | | |
| 08/15/2047 (Callable 08/15/2024) | | | 1,650,747 | | | | 1,634,691 | | | | | |
| Series 2014-C24, Class A5, 3.607%, | | | | | | | | | | | | |
| 11/15/2047 (Callable 11/15/2024) | | | 54,091,000 | | | | 51,803,129 | | | | | |
| Total Non-U.S. | | | | | | | | | | | | |
| Government Agency Issues | | | | | | | | | | | | |
| (Cost $1,370,989,647) | | | | | | | 1,224,413,258 | | | | 5.0 | % |
| Total Commercial | | | | | | | | | | | | |
| Mortgage-Backed Securities | | | | | | | | | | | | |
| (Cost $1,674,456,383) | | | | | | | 1,509,851,377 | | | | 6.2 | % |
| Asset Backed Securities | | | | | | | | | | | | |
| Affirm Asset Securitization Trust, | | | | | | | | | | | | |
| Series 2021-B, Class A, 1.030%, | | | | | | | | | | | | |
08/17/2026 (Callable 08/15/2023)(2) | | | 15,650,000 | | | | 15,224,278 | | | | | |
| Dell Equipment Finance Trust, | | | | | | | | | | | | |
| Series 2023-1, Class A3, 5.650%, | | | | | | | | | | | | |
09/22/2028 (Callable 10/22/2025)(2) | | | 61,075,000 | | | | 61,129,515 | | | | | |
The accompanying notes are an integral part of these financial statements.
Baird Core Plus Bond Fund
Schedule of Investments, June 30, 2023 (Unaudited)
Long-Term Investments (cont.)
| | | Principal | | | | | | % of | |
| | | Amount | | | Value | | | Net Assets | |
| First National Master Note Trust, | | | | | | | | | |
| Series 2023-1, Class A, | | | | | | | | | |
| 5.130%, 04/15/2029 | | $ | 3,250,000 | | | $ | 3,205,033 | | | | |
| Ford Credit Floorplan | | | | | | | | | | | |
| Master Owner Trust, | | | | | | | | | | | |
| Series 2023-1, Class A1, | | | | | | | | | | | |
4.920%, 05/15/2028(2) | | | 72,425,000 | | | | 71,619,091 | | | | |
| GM Financial Revolving | | | | | | | | | | | |
| Receivables Trust, | | | | | | | | | | | |
| Series 2023-1, Class A, 5.120%, | | | | | | | | | | | |
04/11/2035 (Callable 05/11/2028)(2) | | | 85,750,000 | | | | 84,771,721 | | | | |
| Golden Credit Card Trust, | | | | | | | | | | | |
| Series 2022-4A, Class A, | | | | | | | | | | | |
4.310%, 09/15/2027(1)(2) | | | 14,635,000 | | | | 14,297,811 | | | | |
| Navient Private Education | | | | | | | | | | | |
| Refi Loan Trust: | | | | | | | | | | | |
| Series 2021-EA, Class A, 0.970%, | | | | | | | | | | | |
12/16/2069 (Callable 08/15/2029)(2) | | | 10,558,942 | | | | 8,923,939 | | | | |
| Series 2021-GA, Class A, 1.580%, | | | | | | | | | | | |
04/15/2070 (Callable 05/15/2029)(2) | | | 9,850,731 | | | | 8,454,787 | | | | |
| Series 2022-A, Class A, 2.230%, | | | | | | | | | | | |
07/15/2070 (Callable 07/15/2029)(2) | | | 78,015,059 | | | | 67,620,730 | | | | |
| Series 2023-A, Class A, 5.510%, | | | | | | | | | | | |
10/15/2071 (Callable 10/15/2032)(2) | | | 41,448,759 | | | | 40,854,081 | | | | |
| Nelnet Student Loan Trust, | | | | | | | | | | | |
| Series 2021-A, Class APT1, 1.360%, | | | | | | | | | | | |
04/20/2062 (Callable 09/20/2029)(2) | | | 26,019,370 | | | | 23,090,526 | | | | |
| PFS Financing Corp., | | | | | | | | | | | |
| Series 2023-A, Class A, | | | | | | | | | | | |
5.800%, 03/15/2028(2) | | | 23,225,000 | | | | 23,232,272 | | | | |
| SBA Tower Trust, | | | | | | | | | | | |
| 1.840%, 10/15/2051 | | | | | | | | | | | |
(Callable 04/15/2026)(2) | | | 45,100,000 | | | | 38,791,872 | | | | |
| Texas Electric Market | | | | | | | | | | | |
| Stabilization Funding N LLC, | | | | | | | | | | | |
4.966%, 02/01/2044(2) | | | 24,000,000 | | | | 23,356,985 | | | | |
| Towd Point Mortgage Trust: | | | | | | | | | | | |
| Series 2020-MH1, Class A1A, 2.184%, | | | | | | | | | | | |
02/25/2060 (Callable 07/25/2023)(2)(4) | | | 24,803,949 | | | | 23,024,362 | | | | |
| Series 2020-MH1, Class A1, 2.250%, | | | | | | | | | | | |
02/25/2060 (Callable 07/25/2023)(2)(4) | | | 18,014,582 | | | | 16,738,647 | | | | |
| Toyota Auto Loan Extended Note Trust, | | | | | | | | | | | |
| Series 2020-1A, Class A, 1.350%, | | | | | | | | | | | |
05/25/2033 (Callable 05/25/2025)(2) | | | 65,158,000 | | | | 60,155,690 | | | | |
| Total Asset Backed Securities | | | | | | | | | | | |
| (Cost $606,242,837) | | | | | | | 584,491,340 | | | | 2.4 | % |
| | | Shares | | | | | | | | | |
| Common Stock | | | | | | | | | | | | |
| Industrials | | | | | | | | | | | | |
Weatherford International PLC(10) | | | 46,003 | | | | 3,055,519 | | | | | |
| Total Common Stock | | | | | | | | | | | | |
| (Cost $3,790,590) | | | | | | | 3,055,519 | | | | 0.0 | % |
| Total Long-Term Investments | | | | | | | | | | | | |
| (Cost $26,653,196,309) | | | | | | | 24,021,320,984 | | | | 98.9 | % |
| Short-Term Investment | | | | | | | | | | | | |
| | | Shares | | | | | | | | | |
| Money Market Mutual Fund | | | | | | | | | | | | |
| First American Government Obligations | | | | | | | | | | | | |
Fund, Class U, 5.03%(5) | | | 366,991,863 | | | $ | 366,991,863 | | | | | |
| Total Short-Term Investment | | | | | | | | | | | | |
| (Cost $366,991,863) | | | | | | | 366,991,863 | | | | 1.5 | % |
| Total Investments | | | | | | | | | | | | |
| (Cost $27,020,188,172) | | | | | | | 24,388,312,847 | | | | 100.4 | % |
| Liabilities in Excess of Other Assets | | | | | | | (88,050,494 | ) | | | (0.4 | )% |
| TOTAL NET ASSETS | | | | | | $ | 24,300,262,353 | | | | 100.0 | % |
Notes to Schedule of Investments
AGM – Assured Guaranty Municipal
AMBAC – Ambac Assurance Corp.
GNMA – Government National Mortgage Association
NATL – National Public Finance Guarantee Corp.
SD CRED PROG – State Credit Enhancement Program
CMT – Constant Maturity Treasury
LIBOR – London Inter-bank Offered Rate
SOFR – Secured Overnight Financing Rate
SOFRINDX – Secured Overnight Financing Rate Index
(1) | Foreign security. |
(2) | Includes securities exempt from registration under Rule 144A of the Securities Act of 1933. These securities may be resold in transactions exempt from registration to qualified institutional buyers. At June 30, 2023, the value of these securities totaled $5,693,754,987, which represented 23.43% of total net assets. |
(3) | Variable rate security based on a reference index and spread. The rate reported is the rate as of the last reset date in effect as of June 30, 2023. |
(4) | Variable rate security. The coupon is based on an underlying pool of loans. The rate reported is the rate in effect as of June 30, 2023. |
(5) | Seven-day yield. |
(6) | Security that, on the last payment date, missed a partial principal or interest payment. |
(7) | Step-up bond; the interest rate shown is the rate in effect as of June 30, 2023. |
(8) | Security or a portion of the security purchased on a when-issued or delayed delivery basis. |
(9) | Security in default. |
(10) | Non-income producing. |
The accompanying notes are an integral part of these financial statements.
Baird Core Plus Bond Fund
Schedule of Investments, June 30, 2023 (Unaudited)
Summary of Fair Value Exposure at June 30, 2023 (Unaudited)
The Fund has adopted authoritative fair valuation accounting standards which establish a definition of fair value and set out a hierarchy for measuring fair value. These standards require additional disclosures about the various inputs and valuation techniques used to develop the measurements of fair value and a discussion on changes in valuation techniques and related inputs during the period. These standards define fair value as the price that would be received to sell an asset or paid to transfer a liability in an orderly transaction between market participants at the measurement date.
The fair value hierarchy is organized into three levels based upon the assumptions (referred to as “inputs”) used in pricing the asset or liability. These standards state that “observable inputs” reflect the assumptions market participants would use in pricing the asset or liability based on market data obtained from independent sources and “unobservable inputs” reflect an entity’s own assumptions about the assumptions market participants would use in pricing the asset or liability. These inputs are summarized into three broad levels and described below:
Level 1 – Quoted prices (unadjusted) in active markets for identical assets or liabilities that the reporting entity can access at the measurement date.
Level 2 – Inputs other than quoted prices included within Level 1 that are observable for the asset or liability, either directly or indirectly.
Level 3 – Unobservable inputs for the asset or liability.
The inputs or methodology used for valuing securities are not necessarily an indication of the risk associated with investing in those securities.
The following is a summary of the inputs used to value the Fund’s investments as of June 30, 2023:
| | | Level 1 | | | Level 2 | | | Level 3 | | | Total | |
| Long-Term Investments | | | | | | | | | | | | |
| U.S. Treasury Securities | | $ | — | | | $ | 3,960,728,969 | | | $ | — | | | $ | 3,960,728,969 | |
| Other Government Related Securities | | | — | | | | 49,095,428 | | | | — | | | | 49,095,428 | |
| Corporate Bonds | | | — | | | | 12,013,956,658 | | | | — | | | | 12,013,956,658 | |
| Municipal Bonds | | | — | | | | 338,740,390 | | | | — | | | | 338,740,390 | |
| Residential Mortgage-Backed Securities – U.S. Government Agency Issues | | | — | | | | 4,439,138,598 | | | | — | | | | 4,439,138,598 | |
| Residential Mortgage-Backed Securities – Non-U.S. Government Agency Issues | | | — | | | | 1,122,262,705 | | | | — | | | | 1,122,262,705 | |
| Commercial Mortgage-Backed Securities – U.S. Government Agency Issues | | | — | | | | 285,438,119 | | | | — | | | | 285,438,119 | |
| Commercial Mortgage-Backed Securities – Non-U.S. Government Agency Issues | | | — | | | | 1,224,413,258 | | | | — | | | | 1,224,413,258 | |
| Asset Backed Securities | | | — | | | | 584,491,340 | | | | — | | | | 584,491,340 | |
| Common Stock | | | 3,055,519 | | | | — | | | | — | | | | 3,055,519 | |
| Total Long-Term Investments | | | 3,055,519 | | | | 24,018,265,465 | | | | — | | | | 24,021,320,984 | |
| Short-Term Investment | | | | | | | | | | | | | | | | |
| Money Market Mutual Fund | | | 366,991,863 | | | | — | | | | — | | | | 366,991,863 | |
| Total Short-Term Investment | | | 366,991,863 | | | | — | | | | — | | | | 366,991,863 | |
| Total Investments | | $ | 370,047,382 | | | $ | 24,018,265,465 | | | $ | — | | | $ | 24,388,312,847 | |
Changes in valuation techniques may result in transfers into or out of assigned levels within the fair value hierarchy. There were no transfers into or out of Level 3 during the reporting period, as compared to the security classifications from the prior year’s annual report. See the Fund’s Valuation Policy in Note 2a to the financial statements.
The accompanying notes are an integral part of these financial statements.
Baird Short-Term Municipal Bond Fund
June 30, 2023 (Unaudited)
Portfolio Characteristics
Quality Distribution(1)(2)

| | Net Assets | $1,665,815,098 | |
| | | | |
| | SEC 30-Day Yield(4) | | |
| | Institutional Class | 3.30% | |
| | Investor Class | 3.05% | |
| | | | |
| | Average Effective Duration | 2.32 years | |
| | | | |
| | Average Effective Maturity | 2.68 years | |
| | | | |
| | Annualized Expense Ratio(5) | | |
| | Institutional Class | 0.30% | |
| | Investor Class | 0.55% | (6) |
| | | | |
| | Portfolio Turnover Rate | 20% | (7) |
| | | | |
| | | Number of Holdings | 1,320 | |
| | | | | |
Sector Weightings(1) | | | | |
| | | | | |
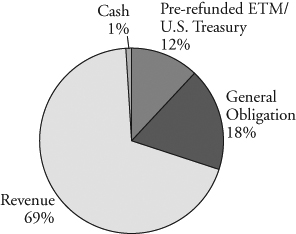 | | | | |
| | | | |
| | | | |
| | | | |
| | | | |
| | | | |
| | | | |
| | | | |
| | | | |
| | | | |
| | | | |
| | | | |
| | | | |
| | | | | |
(1) | Percentages shown are based on the Fund’s total investments. |
(2) | The quality profile is calculated on a market value-weighted basis using the highest credit quality rating for each security held by the Fund given by S&P, Moody’s or Fitch, each of which is a Nationally Recognized Statistical Rating Organization (NRSRO). NRSROs rate the credit quality of securities using a scale that generally ranges from AAA (highest) to D (lowest). |
(3) | Includes pre-refunded and escrowed-to-maturity (ETM) bonds. |
(4) | SEC yields are based on SEC guidelines and are calculated for the 30 days ended June 30, 2023. |
(5) | Reflects expense ratios as stated in the Fund’s current prospectus dated May 1, 2023. |
(6) | Includes 0.25% 12b-1 fee. |
(7) | Not annualized. |
Baird Short-Term Municipal Bond Fund
June 30, 2023 (Unaudited)
Total Returns
| | | | Average Annual |
| | Six | One | Three | Five | Since |
| For the Periods Ended June 30, 2023 | Months | Year | Years | Years | Inception(1) |
| Institutional Class Shares | 1.36% | 1.77% | -0.01% | 1.33% | 1.49% |
| Investor Class Shares | 1.24% | 1.51% | -0.30% | 1.08% | 1.22% |
Bloomberg 1-5 Year Short Municipal Index(2) | 1.00% | 1.08% | -0.28% | 1.11% | 1.07% |
(1) | For the period from August 31, 2015 (inception date) through June 30, 2023. |
(2) | The Bloomberg 1-5 Year Short Municipal Index is an unmanaged, market value weighted index that measures the performance of investment-grade, tax-exempt, and fixed-rated municipal securities with time to maturity of more than one year and less than five years. Securities must have an outstanding par value of at least $7 million and be issued as part of a transaction of at least $75 million. The bonds must be fixed rate, have a dated-date after December 31, 1990, and must be at least one year from their maturity date. This Index does not reflect any deduction for fees, expenses or taxes. A direct investment in an index is not possible. |
The returns table shown above reflects reinvestment of dividends and/or capital gains distributions in additional shares. The returns in the table do not reflect the deduction of taxes that a shareholder would pay on Fund distributions or the redemption of Fund shares. The returns reflect the actual performance for each period and do not include the impact of trades executed on the last business day of the period that were recorded on the first business day of the next period.
The Fund’s expense ratio for each Class, as reflected in the Fund’s current prospectus, is set forth under “Portfolio Characteristics”.
The Fund may invest up to 10% of its net assets in non-investment grade debt securities (commonly referred to as “high yield” bonds). While these types of debt securities typically offer higher yields than investment grade securities, they also include greater risks including increased credit risk and the increased risk of default or bankruptcy. The Fund may invest up to 25% of its total assets in municipal obligations issued by persons in the same state. As a result, changes in economic, business or political conditions of a particular state may have a disproportionate impact on the Fund’s share price. Municipal securities investments are not appropriate for all investors, especially those taxed at lower rates. U.S. and international markets have experienced significant periods of volatility in recent years and months due to a number of economic, political and global macro factors. Russia’s ongoing war with Ukraine has heightened global geopolitical tensions, resulting in an elevated risk environment and increased volatility in asset prices. The uncertain course of the war may have a significant negative impact on the global economy. U.S. relations with China have become increasingly strained, and tension between the U.S. and China may have a significant negative impact on the global economy and asset prices. Measures of inflation reached levels not experienced in several decades, leading the Federal Reserve to raise short term interest rates significantly over the last year, with the potential for further rate increases in 2023. Uncertainty regarding the ability of the Federal Reserve to successfully control inflation, the potential for incremental rate increases, and the full impact of prior rate increases on the economy may negatively impact asset prices and increase market volatility. The possibility of a U.S. or global recession may also contribute to market volatility. The coronavirus (COVID-19) pandemic caused significant economic disruption in recent years as countries worked to limit the negative health impacts of the virus. While the virus has entered an endemic stage, significant outbreaks or new variants present a continued risk to the global economy. These and other geopolitical events may cause market disruptions and could have an adverse effect on the value of the Fund’s investments.
Past performance does not guarantee future results. Investment return and principal value will fluctuate so that an investor’s shares, when redeemed, may be worth more or less than their original cost.
For information about the performance of the Fund as of the most recent month-end, please call 1-866-442-2473 or visit www.bairdfunds.com. Mutual fund performance changes over time and current performance may be lower or higher than that stated.
Baird Short-Term Municipal Bond Fund
Schedule of Investments, June 30, 2023 (Unaudited)
Long-Term Investments
| | | Principal | | | | | | % of | |
| | | Amount | | | Value | | | Net Assets | |
| Municipal Bonds | | | | | | | | | |
| Alabama | | | | | | | | | |
| Alabama Economic Settlement Authority, | | | | | | | | | |
| 4.000%, 09/15/2033 | | | | | | | | | |
| (Callable 09/15/2026) | | $ | 10,000,000 | | | $ | 10,020,360 | | | | |
| Alabama Housing Finance Authority, | | | | | | | | | | | |
| 3.500%, 08/01/2025 (Mandatory Tender | | | | | | | | | | | |
Date 08/01/2024) (Insured by HUD)(1) | | | 5,000,000 | | | | 4,972,399 | | | | |
| Birmingham Airport Authority, | | | | | | | | | | | |
| 5.000%, 07/01/2026 (Insured by BAM) | | | 450,000 | | | | 474,346 | | | | |
| Black Belt Energy Gas District: | | | | | | | | | | | |
| 5.000%, 12/01/2023 | | | 750,000 | | | | 752,404 | | | | |
| 5.250%, 12/01/2028 | | | 3,205,000 | | | | 3,360,380 | | | | |
| 4.387%, 12/01/2048 (1 Month LIBOR | | | | | | | | | | | |
| USD + 0.900%) (Callable 09/01/2023) | | | | | | | | | | | |
(Mandatory Tender Date 12/01/2023)(2) | | | 1,730,000 | | | | 1,728,767 | | | | |
| 2.550%, 10/01/2052 | | | | | | | | | | | |
| (SIFMA Municipal Swap Index + 0.350%) | | | | | | | | | | | |
| (Callable 09/01/2026) | | | | | | | | | | | |
(Mandatory Tender Date 12/01/2026)(2) | | | 1,000,000 | | | | 972,313 | | | | |
| 5.250%, 02/01/2053 (Callable 03/01/2029) | | | | | | | | | | | |
(Mandatory Tender Date 06/01/2029)(1) | | | 3,250,000 | | | | 3,402,161 | | | | |
| 5.000%, 05/01/2053 | | | | | | | | | | | |
(Mandatory Tender Date 06/01/2028)(1) | | | 13,000,000 | | | | 13,608,795 | | | | |
| Chatom Industrial Development Board, | | | | | | | | | | | |
| 3.250%, 08/01/2037 | | | 3,000,000 | | | | 2,986,282 | | | | |
| Chilton County Health Care Authority, | | | | | | | | | | | |
| 5.000%, 11/01/2024 | | | 825,000 | | | | 842,066 | | | | |
| City of Oxford AL, | | | | | | | | | | | |
| 2.600%, 09/01/2041 (Callable 07/03/2023) | | | | | | | | | | | |
(Optional Put Date 07/07/2023)(1) | | | 4,000,000 | | | | 4,000,000 | | | | |
| City of Phenix AL: | | | | | | | | | | | |
| 3.000%, 08/15/2023 (Insured by BAM) | | | 100,000 | | | | 99,910 | | | | |
| 2.000%, 04/01/2027 | | | 1,435,000 | | | | 1,348,955 | | | | |
| County of Jefferson AL, | | | | | | | | | | | |
| 0.000%, 10/01/2025 | | | | | | | | | | | |
| (Callable 10/01/2023) (Insured by AGM) | | | 750,000 | | | | 668,045 | | | | |
| Douglas Water Authority, | | | | | | | | | | | |
| 3.000%, 07/01/2024 (Insured by AGM) | | | 270,000 | | | | 268,822 | | | | |
| Greenville Public Improvement | | | | | | | | | | | |
| Cooperative District, | | | | | | | | | | | |
| 5.000%, 03/01/2024 (Insured by BAM) | | | 140,000 | | | | 141,588 | | | | |
| Industrial Development | | | | | | | | | | | |
| Board of the City of Mobile, | | | | | | | | | | | |
| 3.920%, 06/01/2034 | | | | | | | | | | | |
(Mandatory Tender Date 06/02/2026)(1) | | | 8,400,000 | | | | 8,400,000 | | | | |
| Lauderdale County | | | | | | | | | | | |
| Agriculture Center Authority: | | | | | | | | | | | |
| 5.000%, 07/01/2024 | | | 495,000 | | | | 500,256 | | | | |
| 5.000%, 07/01/2025 (Callable 07/01/2024) | | | 490,000 | | | | 495,410 | | | | |
| 5.000%, 07/01/2027 | | | | | | | | | | | |
| (Pre-refunded to 07/01/2024) | | | 570,000 | | | | 579,548 | | | | |
| Macon County Board of Education, | | | | | | | | | | | |
| 3.250%, 02/01/2026 (Callable 07/31/2023) | | | 375,000 | | | | 370,653 | | | | |
| Pickens County Water Authority: | | | | | | | | | | | |
| 3.000%, 01/01/2024 (Insured by BAM) | | | 100,000 | | | | 99,707 | | | | |
| 3.000%, 01/01/2025 (Insured by BAM) | | | 160,000 | | | | 159,143 | | | | |
| Prattville Industrial Development Board, | | | | | | | | | | | |
| 5.300%, 09/01/2028 | | | 1,600,000 | | | | 1,698,245 | | | | |
| Selma Industrial Development Board, | | | | | | | | | | | |
| 2.000%, 11/01/2033 | | | | | | | | | | | |
(Mandatory Tender Date 10/01/2024)(1) | | | 750,000 | | | | 732,733 | | | | |
| Southeast Alabama Gas Supply District, | | | | | | | | | | | |
| 4.387%, 04/01/2049 (1 Month LIBOR | | | | | | | | | | | |
| USD + 0.900%) (Callable 01/01/2024) | | | | | | | | | | | |
(Mandatory Tender Date 04/01/2024)(2) | | | 920,000 | | | | 919,866 | | | | |
| Southeast Energy Authority | | | | | | | | | | | |
| A Cooperative District: | | | | | | | | | | | |
| 5.500%, 01/01/2053 (Callable 09/01/2029) | | | | | | | | | | | |
(Mandatory Tender Date 12/01/2029)(1) | | | 1,250,000 | | | | 1,329,184 | | | | |
| 5.000%, 05/01/2053 (Callable 05/01/2028) | | | | | | | | | | | |
(Mandatory Tender Date 08/01/2028)(1) | | | 1,250,000 | | | | 1,292,336 | | | | |
| 5.250%, 01/01/2054 (Callable 04/01/2029) | | | | | | | | | | | |
(Mandatory Tender Date 07/01/2029)(1) | | | 8,000,000 | | | | 8,364,764 | | | | |
| Tallassee Board of Education, | | | | | | | | | | | |
| 4.000%, 08/01/2027 (Insured by AGM) | | | 360,000 | | | | 370,277 | | | | |
| Town of Berry AL, | | | | | | | | | | | |
| 3.250%, 09/01/2028 | | | | | | | | | | | |
| (Callable 09/01/2026) (Insured by AGM) | | | 720,000 | | | | 727,270 | | | | |
| Total Alabama | | | | | | | | | | | |
| (Cost $76,773,388) | | | | | | | 75,686,985 | | | | 4.5 | % |
| Alaska | | | | | | | | | | | | |
| Alaska Housing Finance Corp.: | | | | | | | | | | | | |
| 3.750%, 12/01/2042 (Callable 06/01/2028) | | | 5,620,000 | | | | 5,535,744 | | | | | |
| 4.000%, 12/01/2048 (Callable 06/01/2027) | | | 1,440,000 | | | | 1,428,579 | | | | | |
| Alaska Industrial Development | | | | | | | | | | | | |
| & Export Authority, | | | | | | | | | | | | |
| 5.000%, 10/01/2023 | | | 600,000 | | | | 601,886 | | | | | |
| University of Alaska: | | | | | | | | | | | | |
| 5.000%, 10/01/2024 | | | 800,000 | | | | 814,396 | | | | | |
| 4.000%, 10/01/2025 | | | 330,000 | | | | 332,546 | | | | | |
| 4.000%, 10/01/2026 (Callable 10/01/2023) | | | 1,400,000 | | | | 1,401,374 | | | | | |
| 5.000%, 10/01/2026 | | | 865,000 | | | | 903,046 | | | | | |
| Total Alaska | | | | | | | | | | | | |
| (Cost $11,540,812) | | | | | | | 11,017,571 | | | | 0.7 | % |
| Arizona | | | | | | | | | | | | |
| Arizona Industrial Development Authority: | | | | | | | | | | | | |
4.000%, 08/01/2023(3) | | | 265,000 | | | | 264,803 | | | | | |
| 5.000%, 05/01/2025 | | | 405,000 | | | | 283,500 | | | | | |
| 5.000%, 07/01/2027 (Callable 07/01/2026) | | | 230,000 | | | | 236,665 | | | | | |
| 5.000%, 07/01/2028 (Callable 07/01/2026) | | | 170,000 | | | | 175,368 | | | | | |
4.625%, 08/01/2028(3) | | | 375,000 | | | | 364,342 | | | | | |
| 5.000%, 07/01/2029 (Callable 07/01/2026) | | | 260,000 | | | | 268,796 | | | | | |
| 5.000%, 07/01/2030 (Callable 07/01/2026) | | | 380,000 | | | | 392,697 | | | | | |
| 5.000%, 07/01/2031 (Callable 07/01/2026) | | | 195,000 | | | | 201,430 | | | | | |
| 3.625%, 05/20/2033 | | | 3,972,096 | | | | 3,697,723 | | | | | |
| BluePath TE Trust, | | | | | | | | | | | | |
| 2.750%, 09/01/2026 | | | | | | | | | | | | |
(Callable 07/31/2023)(3) | | | 1,982,972 | | | | 1,984,221 | | | | | |
| Glendale Industrial Development Authority: | | | | | | | | | | | | |
| 4.000%, 05/15/2025 (Callable 05/15/2024) | | | 340,000 | | | | 333,776 | | | | | |
| 4.000%, 05/15/2026 (Callable 05/15/2024) | | | 320,000 | | | | 310,805 | | | | | |
| Industrial Development | | | | | | | | | | | | |
| Authority of the County of Pima, | | | | | | | | | | | | |
| 4.000%, 07/01/2023 | | | 265,000 | | | | 265,000 | | | | | |
| Maricopa County AZ, | | | | | | | | | | | | |
| 5.000%, 04/01/2025 | | | | | | | | | | | | |
| (Pre-refunded to 04/01/2024) | | | 200,000 | | | | 202,671 | | | | | |
| Maricopa County Industrial | | | | | | | | | | | | |
| Development Authority, | | | | | | | | | | | | |
| 4.000%, 07/01/2024 | | | | | | | | | | | | |
| (Insured by SD CRED PROG) | | | 135,000 | | | | 135,214 | | | | | |
| Maricopa County Unified | | | | | | | | | | | | |
| School District No. 4, | | | | | | | | | | | | |
| 5.000%, 07/01/2025 | | | 1,000,000 | | | | 1,037,528 | | | | | |
| Salt Verde Financial Corp., | | | | | | | | | | | | |
| 5.250%, 12/01/2026 | | | 2,500,000 | | | | 2,580,210 | | | | | |
| University of Arizona, | | | | | | | | | | | | |
| 5.000%, 06/01/2032 (Callable 06/01/2026) | | | 1,020,000 | | | | 1,068,141 | | | | | |
| Total Arizona | | | | | | | | | | | | |
| (Cost $14,260,347) | | | | | | | 13,802,890 | | | | 0.8 | % |
The accompanying notes are an integral part of these financial statements.
Baird Short-Term Municipal Bond Fund
Schedule of Investments, June 30, 2023 (Unaudited)
Long-Term Investments (cont.)
| | | Principal | | | | | | % of | |
| | | Amount | | | Value | | | Net Assets | |
| Arkansas | | | | | | | | | |
| Arkansas Development Finance Authority: | | | | | | | | | |
| 4.000%, 07/01/2023 | | $ | 110,000 | | | $ | 110,000 | | | | |
| 4.000%, 07/01/2024 | | | 100,000 | | | | 99,384 | | | | |
| 4.000%, 07/01/2025 | | | 140,000 | | | | 138,365 | | | | |
| 4.000%, 07/01/2026 | | | 190,000 | | | | 187,417 | | | | |
| 4.000%, 07/01/2027 | | | 225,000 | | | | 221,964 | | | | |
| 4.000%, 07/01/2028 | | | 230,000 | | | | 225,607 | | | | |
| 3.490%, 09/01/2044 (Callable 07/03/2023) | | | | | | | | | | | |
(Optional Put Date 07/07/2023)(1) | | | 2,500,000 | | | | 2,500,000 | | | | |
| Batesville Public Facilities Board: | | | | | | | | | | | |
| 5.000%, 06/01/2024 | | | 1,000,000 | | | | 1,007,109 | | | | |
| 5.000%, 06/01/2025 | | | 1,385,000 | | | | 1,406,647 | | | | |
| 5.000%, 06/01/2026 | | | 850,000 | | | | 873,242 | | | | |
| Benton Washington Regional | | | | | | | | | | | |
| Public Water Authority, | | | | | | | | | | | |
| 5.000%, 10/01/2025 (Insured by BAM) | | | 465,000 | | | | 483,271 | | | | |
| City of Bentonville AR, | | | | | | | | | | | |
| 1.050%, 11/01/2046 (Callable 11/01/2028) | | | 1,170,000 | | | | 1,150,983 | | | | |
| City of Brookland AR, | | | | | | | | | | | |
| 1.500%, 09/01/2046 (Callable 09/01/2026) | | | 865,000 | | | | 817,536 | | | | |
| City of Conway AR, | | | | | | | | | | | |
| 4.000%, 12/01/2023 (Callable 07/31/2023) | | | 35,000 | | | | 35,016 | | | | |
| City of Elkins AR: | | | | | | | | | | | |
| 1.500%, 09/01/2046 | | | | | | | | | | | |
| (Callable 09/01/2026) (Insured by AGM) | | | 430,000 | | | | 389,603 | | | | |
| 1.500%, 09/01/2046 | | | | | | | | | | | |
| (Callable 09/01/2026) (Insured by AGM) | | | 635,000 | | | | 597,667 | | | | |
| City of Fayetteville AR, | | | | | | | | | | | |
| 3.050%, 01/01/2047 (Callable 01/01/2027) | | | 345,000 | | | | 334,566 | | | | |
| City of Forrest City AR, | | | | | | | | | | | |
| 1.550%, 11/01/2044 (Callable 11/01/2029) | | | 780,000 | | | | 689,891 | | | | |
| City of Hot Springs AR, | | | | | | | | | | | |
| 4.000%, 12/01/2027 | | | | | | | | | | | |
| (Callable 12/01/2023) (Insured by BAM) | | | 255,000 | | | | 256,144 | | | | |
| City of Mountain View AR, | | | | | | | | | | | |
| 1.375%, 11/01/2050 | | | | | | | | | | | |
| (Callable 11/01/2027) (Insured by BAM) | | | 355,000 | | | | 345,601 | | | | |
| City of North Little Rock AR: | | | | | | | | | | | |
| 5.000%, 11/01/2025 | | | 510,000 | | | | 530,200 | | | | |
| 5.000%, 11/01/2026 | | | 535,000 | | | | 568,433 | | | | |
| City of Pine Bluff AR, | | | | | | | | | | | |
| 3.000%, 02/01/2047 | | | | | | | | | | | |
| (Callable 08/01/2027) (Insured by BAM) | | | 345,000 | | | | 329,558 | | | | |
| City of Rogers AR, | | | | | | | | | | | |
| 3.250%, 11/01/2043 (Callable 11/01/2026) | | | 125,000 | | | | 124,789 | | | | |
| Conway Health Facilities Board: | | | | | | | | | | | |
| 5.000%, 08/01/2023 | | | 735,000 | | | | 735,592 | | | | |
| 5.000%, 08/01/2024 | | | 410,000 | | | | 415,545 | | | | |
| County of Cross AR, | | | | | | | | | | | |
| 2.250%, 10/01/2030 (Callable 10/01/2024) | | | 595,000 | | | | 543,858 | | | | |
| Dumas Arkansas School District No. 6, | | | | | | | | | | | |
| 1.500%, 02/01/2024 (Callable 07/31/2023) | | | | | | | | | | | |
| (Insured by ST AID) | | | 245,000 | | | | 241,783 | | | | |
| Jacksonville North Pulaski | | | | | | | | | | | |
| County School District, | | | | | | | | | | | |
| 4.000%, 06/01/2029 (Callable 06/01/2027) | | | | | | | | | | | |
| (Insured by ST AID) | | | 1,240,000 | | | | 1,282,786 | | | | |
| Northwest Arkansas Conservation Authority, | | | | | | | | | | | |
| 4.000%, 03/01/2024 | | | | | | | | | | | |
| (Callable 07/31/2023) (Insured by BAM) | | | 375,000 | | | | 375,234 | | | | |
| Van Buren School District No. 42, | | | | | | | | | | | |
| 2.000%, 04/01/2024 (Insured by ST AID) | | | 130,000 | | | | 128,100 | | | | |
| Total Arkansas | | | | | | | | | | | |
| (Cost $17,671,272) | | | | | | | 17,145,891 | | | | 1.0 | % |
| California | | | | | | | | | | | | |
| Anaheim City School District, | | | | | | | | | | | | |
| 0.000%, 08/01/2028 (Insured by AGM) | | | 580,000 | | | | 491,577 | | | | | |
| Anaheim Public Financing Authority: | | | | | | | | | | | | |
| 5.000%, 09/01/2025 | | | 2,610,000 | | | | 2,684,597 | | | | | |
| 5.000%, 09/01/2026 | | | 990,000 | | | | 1,033,973 | | | | | |
| Bay Area Toll Authority, | | | | | | | | | | | | |
| 3.300%, 04/01/2045 | | | | | | | | | | | | |
| (SIFMA Municipal Swap Index + 1.100%) | | | | | | | | | | | | |
| (Callable 10/01/2023) | | | | | | | | | | | | |
(Mandatory Tender Date 04/01/2024)(2) | | | 3,500,000 | | | | 3,504,779 | | | | | |
| California Community | | | | | | | | | | | | |
| Choice Financing Authority: | | | | | | | | | | | | |
| 5.000%, 10/01/2024 | | | 300,000 | | | | 302,348 | | | | | |
| 5.000%, 10/01/2025 | | | 710,000 | | | | 718,248 | | | | | |
| 5.000%, 10/01/2026 | | | 625,000 | | | | 634,679 | | | | | |
| 5.000%, 10/01/2027 | | | 700,000 | | | | 714,898 | | | | | |
| 5.000%, 10/01/2028 | | | 475,000 | | | | 487,815 | | | | | |
| 5.000%, 10/01/2029 | | | 650,000 | | | | 670,387 | | | | | |
| California Community | | | | | | | | | | | | |
| College Financing Authority, | | | | | | | | | | | | |
4.250%, 07/01/2032(3) | | | 500,000 | | | | 474,153 | | | | | |
| California Health Facilities | | | | | | | | | | | | |
| Financing Authority, | | | | | | | | | | | | |
| 3.000%, 03/01/2041 (Callable 09/01/2023) | | | | | | | | | | | | |
(Mandatory Tender Date 03/01/2024)(1) | | | 390,000 | | | | 388,035 | | | | | |
| California Infrastructure & | | | | | | | | | | | | |
| Economic Development Bank: | | | | | | | | | | | | |
| 2.900%, 12/01/2050 | | | | | | | | | | | | |
| (SIFMA Municipal Swap Index + 0.700%) | | | | | | | | | | | | |
| (Callable 06/01/2025) | | | | | | | | | | | | |
(Mandatory Tender Date 06/01/2026)(2) | | | 5,550,000 | | | | 5,396,010 | | | | | |
| 1.750%, 08/01/2055 (Callable 02/01/2026) | | | | | | | | | | | | |
(Mandatory Tender Date 08/01/2026)(1) | | | 1,265,000 | | | | 1,171,688 | | | | | |
| California Municipal Finance Authority: | | | | | | | | | | | | |
| 5.000%, 08/01/2023 | | | 670,000 | | | | 670,194 | | | | | |
| 4.000%, 10/01/2031 (Callable 10/01/2026) | | | 2,280,000 | | | | 2,284,955 | | | | | |
| 4.000%, 10/01/2032 (Callable 10/01/2026) | | | 1,500,000 | | | | 1,500,678 | | | | | |
| California Public Finance Authority: | | | | | | | | | | | | |
| 2.125%, 11/15/2027 | | | | | | | | | | | | |
(Callable 07/21/2023)(3) | | | 3,445,000 | | | | 3,319,840 | | | | | |
| 2.375%, 11/15/2028 | | | | | | | | | | | | |
(Callable 07/21/2023)(3) | | | 4,250,000 | | | | 4,070,327 | | | | | |
| 3.125%, 05/15/2029 | | | | | | | | | | | | |
(Callable 11/15/2023)(3) | | | 1,000,000 | | | | 939,660 | | | | | |
| California State Public Works Board, | | | | | | | | | | | | |
| 5.000%, 11/01/2038 (Callable 11/01/2023) | | | 2,500,000 | | | | 2,511,839 | | | | | |
| California Statewide Communities | | | | | | | | | | | | |
| Development Authority: | | | | | | | | | | | | |
| 3.000%, 07/01/2026 (Callable 07/01/2023) | | | | | | | | | | | | |
| (Insured by CA MTG) | | | 625,000 | | | | 625,000 | | | | | |
| 5.000%, 08/01/2026 (Callable 02/01/2024) | | | | | | | | | | | | |
| (Mandatory Tender Date 08/01/2024) | | | | | | | | | | | | |
(Insured by HUD)(1) | | | 3,300,000 | | | | 3,291,713 | | | | | |
| 5.000%, 09/01/2026 (Callable 03/01/2024) | | | | | | | | | | | | |
| (Mandatory Tender Date 09/01/2024) | | | | | | | | | | | | |
(Insured by HUD)(1)(3) | | | 1,000,000 | | | | 1,000,000 | | | | | |
| Campbell Union School District, | | | | | | | | | | | | |
| 5.800%, 08/01/2035 | | | | | | | | | | | | |
(Callable 08/01/2026)(5) | | | 775,000 | | | | 843,444 | | | | | |
| Department of Veterans Affairs Veteran’s | | | | | | | | | | | | |
| Farm & Home Purchase Program, | | | | | | | | | | | | |
| 4.000%, 12/01/2049 (Callable 06/01/2028) | | | 1,545,000 | | | | 1,537,357 | | | | | |
The accompanying notes are an integral part of these financial statements.
Baird Short-Term Municipal Bond Fund
Schedule of Investments, June 30, 2023 (Unaudited)
Long-Term Investments (cont.)
| | | Principal | | | | | | % of | |
| | | Amount | | | Value | | | Net Assets | |
| El Centro Financing Authority, | | | | | | | | | |
| 5.000%, 10/01/2027 | | $ | 1,090,000 | | | $ | 1,174,684 | | | | |
| Fresno Unified School District: | | | | | | | | | | | |
| 0.000%, 08/01/2032 | | | | | | | | | | | |
| (Callable 08/01/2023) (Insured by BAM) | | | 100,000 | | | | 56,788 | | | | |
| 0.000%, 08/01/2033 | | | | | | | | | | | |
| (Callable 08/01/2023) (Insured by BAM) | | | 645,000 | | | | 341,724 | | | | |
| 0.000%, 08/01/2034 | | | | | | | | | | | |
| (Callable 08/01/2023) (Insured by BAM) | | | 400,000 | | | | 197,868 | | | | |
| 0.000%, 08/01/2035 | | | | | | | | | | | |
| (Callable 08/01/2023) (Insured by BAM) | | | 150,000 | | | | 69,213 | | | | |
| 0.000%, 08/01/2039 | | | | | | | | | | | |
| (Callable 08/01/2023) (Insured by BAM) | | | 650,000 | | | | 226,618 | | | | |
| 0.000%, 08/01/2040 | | | | | | | | | | | |
| (Callable 08/01/2023) (Insured by BAM) | | | 805,000 | | | | 261,515 | | | | |
| 0.000%, 08/01/2041 | | | | | | | | | | | |
| (Callable 08/01/2023) (Insured by BAM) | | | 1,000,000 | | | | 302,005 | | | | |
| 0.000%, 08/01/2044 (Callable 08/01/2023) | | | 1,140,000 | | | | 273,650 | | | | |
| Indio Finance Authority, | | | | | | | | | | | |
| 3.550%, 09/02/2029 | | | | | | | | | | | |
(Callable 03/02/2024)(3) | | | 5,380,000 | | | | 5,315,517 | | | | |
| La Mirada Redevelopment | | | | | | | | | | | |
| Agency Successor Agency, | | | | | | | | | | | |
| 0.000%, 08/15/2027 (Insured by NATL) | | | 500,000 | | | | 432,676 | | | | |
| Los Angeles County Development Authority: | | | | | | | | | | | |
| 5.000%, 07/01/2043 (Callable 04/01/2026) | | | | | | | | | | | |
| (Mandatory Tender Date 07/01/2026) | | | | | | | | | | | |
(Insured by HUD)(1) | | | 1,850,000 | | | | 1,915,367 | | | | |
| 3.750%, 12/01/2046 (Callable 02/01/2026) | | | | | | | | | | | |
| (Mandatory Tender Date 12/01/2026) | | | | | | | | | | | |
(Insured by HUD)(1) | | | 1,650,000 | | | | 1,652,887 | | | | |
| Newman-Crows Landing | | | | | | | | | | | |
| Unified School District, | | | | | | | | | | | |
| 0.000%, 08/01/2025 | | | 1,000,000 | | | | 928,469 | | | | |
| Ontario Public Financing Authority: | | | | | | | | | | | |
| 5.000%, 11/01/2024 (Insured by AGM) | | | 100,000 | | | | 102,356 | | | | |
| 5.000%, 11/01/2025 (Insured by AGM) | | | 250,000 | | | | 260,986 | | | | |
| 5.000%, 11/01/2027 (Insured by AGM) | | | 175,000 | | | | 190,749 | | | | |
| Piedmont Unified School District: | | | | | | | | | | | |
| 0.000%, 08/01/2029 (Callable 08/01/2023) | | | 200,000 | | | | 142,081 | | | | |
| 0.000%, 08/01/2037 (Callable 08/01/2023) | | | 400,000 | | | | 169,742 | | | | |
| 0.000%, 08/01/2039 (Callable 08/01/2023) | | | 420,000 | | | | 156,279 | | | | |
| Ripon Unified School District: | | | | | | | | | | | |
| 0.000%, 08/01/2025 | | | | | | | | | | | |
| (Callable 08/01/2023) (Insured by BAM) | | | 60,000 | | | | 54,643 | | | | |
| 0.000%, 08/01/2026 | | | | | | | | | | | |
| (Callable 08/01/2023) (Insured by BAM) | | | 35,000 | | | | 30,260 | | | | |
| 0.000%, 08/01/2035 | | | | | | | | | | | |
| (Callable 08/01/2023) (Insured by BAM) | | | 585,000 | | | | 303,988 | | | | |
| Rosemead School District: | | | | | | | | | | | |
| 0.000%, 08/01/2032 | | | | | | | | | | | |
| (Callable 08/01/2023) (Insured by AGM) | | | 495,000 | | | | 287,009 | | | | |
| 0.000%, 08/01/2033 | | | | | | | | | | | |
| (Callable 08/01/2023) (Insured by AGM) | | | 700,000 | | | | 377,705 | | | | |
| 0.000%, 08/01/2035 | | | | | | | | | | | |
| (Callable 08/01/2023) (Insured by AGM) | | | 735,000 | | | | 341,867 | | | | |
| Sacramento City Unified School District: | | | | | | | | | | | |
| 5.000%, 07/01/2025 (Callable 07/01/2024) | | | 900,000 | | | | 912,997 | | | | |
| 0.000%, 07/01/2026 (Insured by AGM) | | | 300,000 | | | | 269,692 | | | | |
| San Joaquin Hills Transportation | | | | | | | | | | | |
| Corridor Agency, | | | | | | | | | | | |
| 0.000%, 01/15/2025 (Insured by NATL) | | | 270,000 | | | | 254,566 | | | | |
| School Project for Utility Rate Reduction, | | | | | | | | | | | |
| 4.000%, 08/01/2023 | | | 500,000 | | | | 500,096 | | | | |
| Sutter Union High School District, | | | | | | | | | | | |
| 0.000%, 06/01/2050 | | | | | | | | | | | |
| (Pre-refunded to 08/01/2025) | | | 300,000 | | | | 46,235 | | | | |
| Tulare Union High School District, | | | | | | | | | | | |
| 0.000%, 08/01/2026 (Insured by NATL) | | | 2,245,000 | | | | 2,019,137 | | | | |
| Tuolumne Utilities District, | | | | | | | | | | | |
| 1.250%, 08/15/2024 (Callable 08/15/2023) | | | 5,000,000 | | | | 4,805,647 | | | | |
| Twin Rivers Unified School District: | | | | | | | | | | | |
| 0.000%, 08/01/2035 (Pre-refunded to | | | | | | | | | | | |
| 02/01/2024) (Insured by BAM) | | | 275,000 | | | | 132,199 | | | | |
| 0.000%, 08/01/2036 (Pre-refunded to | | | | | | | | | | | |
| 02/01/2024) (Insured by BAM) | | | 135,000 | | | | 60,626 | | | | |
| Vallejo City Unified School District, | | | | | | | | | | | |
| 5.900%, 08/01/2025 (Insured by NATL) | | | 300,000 | | | | 305,371 | | | | |
| Victor Valley Union High School District, | | | | | | | | | | | |
| 0.000%, 08/01/2044 | | | | | | | | | | | |
| (Pre-refunded to 08/01/2023) | | | 1,000,000 | | | | 303,969 | | | | |
| Western Placer Unified School District: | | | | | | | | | | | |
| 2.000%, 06/01/2025 (Callable 07/31/2023) | | | 5,735,000 | | | | 5,498,416 | | | | |
| 2.000%, 06/01/2025 (Callable 07/31/2023) | | | 3,300,000 | | | | 3,152,253 | | | | |
| Westminster School District: | | | | | | | | | | | |
| 0.000%, 08/01/2036 | | | | | | | | | | | |
| (Callable 08/01/2023) (Insured by BAM) | | | 315,000 | | | | 137,854 | | | | |
| 0.000%, 08/01/2038 | | | | | | | | | | | |
| (Callable 08/01/2023) (Insured by BAM) | | | 620,000 | | | | 236,262 | | | | |
| 0.000%, 08/01/2048 | | | | | | | | | | | |
| (Callable 08/01/2023) (Insured by BAM) | | | 2,660,000 | | | | 475,147 | | | | |
| 0.000%, 08/01/2053 | | | | | | | | | | | |
| (Callable 08/01/2023) (Insured by BAM) | | | 580,000 | | | | 70,321 | | | | |
| Total California | | | | | | | | | | | |
| (Cost $77,774,323) | | | | | | | 76,015,628 | | | | 4.6 | % |
| Colorado | | | | | | | | | | | | |
| Bromley Park Metropolitan District No. 2: | | | | | | | | | | | | |
| 5.000%, 12/01/2024 (Insured by BAM) | | | 300,000 | | | | 306,284 | | | | | |
| 5.000%, 12/01/2025 (Insured by BAM) | | | 315,000 | | | | 326,444 | | | | | |
| City & County of Denver CO: | | | | | | | | | | | | |
| 5.250%, 11/15/2026 | | | 2,000,000 | | | | 2,106,573 | | | | | |
| 5.500%, 11/15/2026 | | | | | | | | | | | | |
| (Callable 11/15/2023) | | | 1,500,000 | | | | 1,506,859 | | | | | |
| 5.000%, 12/01/2026 | | | 5,035,000 | | | | 5,262,610 | | | | | |
| 5.250%, 11/15/2027 | | | 1,500,000 | | | | 1,606,401 | | | | | |
| Colorado Bridge Enterprise, | | | | | | | | | | | | |
| 4.000%, 06/30/2025 | | | 570,000 | | | | 572,059 | | | | | |
| Colorado Educational & | | | | | | | | | | | | |
| Cultural Facilities Authority: | | | | | | | | | | | | |
| 5.000%, 10/01/2023 (ETM) | | | 1,360,000 | | | | 1,365,160 | | | | | |
| 4.000%, 07/01/2025 | | | 140,000 | | | | 141,196 | | | | | |
4.000%, 12/15/2025(3) | | | 545,000 | | | | 540,524 | | | | | |
| 5.000%, 06/15/2027 (Callable 06/15/2026) | | | 635,000 | | | | 660,379 | | | | | |
| Colorado Health Facilities Authority: | | | | | | | | | | | | |
| 2.125%, 05/15/2028 (Callable 07/31/2023) | | | 1,750,000 | | | | 1,586,742 | | | | | |
| 5.000%, 08/01/2028 | | | 1,235,000 | | | | 1,320,031 | | | | | |
| 3.500%, 05/15/2030 (Callable 07/31/2023) | | | 3,500,000 | | | | 3,074,879 | | | | | |
| 5.000%, 12/01/2030 (Callable 06/01/2025) | | | 1,030,000 | | | | 1,038,614 | | | | | |
| 5.000%, 11/15/2036 | | | | | | | | | | | | |
(Pre-refunded to 11/15/2023)(1) | | | 55,000 | | | | 55,350 | | | | | |
| 5.000%, 11/15/2036 | | | | | | | | | | | | |
(Mandatory Tender Date 11/15/2023)(1) | | | 140,000 | | | | 140,892 | | | | | |
| 5.000%, 06/01/2047 | | | | | | | | | | | | |
| (Pre-refunded to 06/01/2027) | | | 1,750,000 | | | | 1,888,572 | | | | | |
| 5.000%, 11/15/2048 | | | | | | | | | | | | |
(Mandatory Tender Date 11/20/2025)(1) | | | 195,000 | | | | 201,889 | | | | | |
The accompanying notes are an integral part of these financial statements.
Baird Short-Term Municipal Bond Fund
Schedule of Investments, June 30, 2023 (Unaudited)
Long-Term Investments (cont.)
| | | Principal | | | | | | % of | |
| | | Amount | | | Value | | | Net Assets | |
| Colorado Health Facilities Authority: (cont.) | | | | | | | | | |
| 2.750%, 05/15/2061 | | | | | | | | | |
| (SIFMA Municipal Swap Index + 0.550%) | | | | | | | | | |
| (Callable 02/17/2026) | | | | | | | | | |
(Mandatory Tender Date 08/17/2026)(2) | | $ | 3,000,000 | | | $ | 2,971,927 | | | | |
| 5.000%, 05/15/2062 (Callable 08/15/2027) | | | | | | | | | | | |
(Mandatory Tender Date 08/15/2028)(1) | | | 7,515,000 | | | | 8,217,023 | | | | |
| Colorado Housing & Finance Authority: | | | | | | | | | | | |
| 5.000%, 07/01/2026 (Mandatory Tender | | | | | | | | | | | |
Date 01/01/2026) (Insured by FNMA)(1) | | | 1,000,000 | | | | 1,024,467 | | | | |
| 4.000%, 05/01/2048 (Callable 11/01/2026) | | | | | | | | | | | |
| (Insured by GNMA) | | | 610,000 | | | | 605,323 | | | | |
| 4.250%, 11/01/2049 (Callable 11/01/2028) | | | | | | | | | | | |
| (Insured by GNMA) | | | 605,000 | | | | 603,732 | | | | |
| 3.250%, 05/01/2052 (Callable 11/01/2030) | | | | | | | | | | | |
| (Insured by GNMA) | | | 4,360,000 | | | | 4,219,020 | | | | |
| Denver Convention Center Hotel Authority, | | | | | | | | | | | |
| 5.000%, 12/01/2024 | | | 1,170,000 | | | | 1,183,269 | | | | |
| Denver Health & Hospital Authority, | | | | | | | | | | | |
| 4.000%, 12/01/2027 (Callable 12/01/2023) | | | 255,000 | | | | 255,140 | | | | |
| E-470 Public Highway Authority, | | | | | | | | | | | |
| 3.734%, 09/01/2039 (SOFR + 0.350%) | | | | | | | | | | | |
| (Callable 06/01/2024) | | | | | | | | | | | |
(Mandatory Tender Date 09/01/2024)(2) | | | 7,525,000 | | | | 7,493,423 | | | | |
| Fort Collins Housing Authority, | | | | | | | | | | | |
| 1.250%, 07/01/2024 (Callable 01/01/2024) | | | 2,600,000 | | | | 2,531,724 | | | | |
| Lincoln Park Metropolitan District, | | | | | | | | | | | |
| 4.000%, 12/01/2023 (Insured by AGM) | | | 150,000 | | | | 150,373 | | | | |
| Pueblo Urban Renewal Authority, | | | | | | | | | | | |
0.000%, 12/01/2025(3) | | | 850,000 | | | | 686,163 | | | | |
| Tallyns Reach Metropolitan District No. 3, | | | | | | | | | | | |
| 5.000%, 12/01/2023 (Insured by BAM) | | | 30,000 | | | | 30,182 | | | | |
| Vauxmont Metropolitan District: | | | | | | | | | | | |
| 5.000%, 12/15/2026 | | | | | | | | | | | |
| (Callable 12/15/2024) (Insured by AGM) | | | 135,000 | | | | 142,369 | | | | |
| 5.000%, 12/15/2027 | | | | | | | | | | | |
| (Callable 12/15/2024) (Insured by AGM) | | | 160,000 | | | | 168,733 | | | | |
| Vista Ridge Metropolitan District, | | | | | | | | | | | |
| 4.500%, 12/01/2024 (Insured by BAM) | | | 200,000 | | | | 203,176 | | | | |
| Total Colorado | | | | | | | | | | | |
| (Cost $55,243,489) | | | | | | | 54,187,502 | | | | 3.2 | % |
| Connecticut | | | | | | | | | | | | |
| City of Bridgeport CT: | | | | | | | | | | | | |
| 5.000%, 02/01/2024 (Insured by BAM) | | | 475,000 | | | | 479,655 | | | | | |
| 5.000%, 08/01/2024 | | | 175,000 | | | | 178,292 | | | | | |
| 5.000%, 08/01/2025 | | | 200,000 | | | | 207,446 | | | | | |
| 5.000%, 02/15/2027 | | | 2,480,000 | | | | 2,655,502 | | | | | |
| 5.000%, 08/01/2027 | | | 300,000 | | | | 324,442 | | | | | |
| City of West Haven CT: | | | | | | | | | | | | |
| 4.000%, 09/15/2025 | | | 505,000 | | | | 511,693 | | | | | |
| 4.000%, 09/15/2026 | | | 505,000 | | | | 515,229 | | | | | |
| 4.000%, 09/15/2027 | | | 245,000 | | | | 251,734 | | | | | |
| Connecticut Housing Finance Authority: | | | | | | | | | | | | |
| 4.000%, 11/15/2044 (Callable 11/15/2023) | | | 10,000 | | | | 9,984 | | | | | |
| 4.000%, 11/15/2045 (Callable 11/15/2027) | | | 105,000 | | | | 104,137 | | | | | |
| 4.000%, 05/15/2049 (Callable 11/15/2028) | | | 1,025,000 | | | | 1,018,035 | | | | | |
| 3.500%, 11/15/2051 (Callable 05/15/2031) | | | 3,280,000 | | | | 3,189,362 | | | | | |
| Connecticut State Health & | | | | | | | | | | | | |
| Educational Facilities Authority: | | | | | | | | | | | | |
| 5.000%, 07/01/2023 | | | 855,000 | | | | 855,000 | | | | | |
| 5.000%, 07/01/2024 | | | 965,000 | | | | 973,194 | | | | | |
| 5.000%, 07/01/2028 (Callable 07/01/2024) | | | 685,000 | | | | 696,096 | | | | | |
| 3.200%, 07/01/2037 | | | | | | | | | | | | |
(Mandatory Tender Date 07/01/2026)(1)(6) | | | 3,000,000 | | | | 3,002,175 | | | | | |
| 2.800%, 07/01/2057 | | | | | | | | | | | | |
(Mandatory Tender Date 02/03/2026)(1) | | | 3,425,000 | | | | 3,356,579 | | | | | |
| Connecticut State Higher Education | | | | | | | | | | | | |
| Supplement Loan Authority: | | | | | | | | | | | | |
| 5.000%, 11/15/2023 (ETM) | | | 400,000 | | | | 402,621 | | | | | |
| 5.000%, 11/15/2024 (ETM) | | | 450,000 | | | | 461,636 | | | | | |
| 5.000%, 11/15/2024 (ETM) | | | 225,000 | | | | 230,667 | | | | | |
| East Hartford Housing Authority, | | | | | | | | | | | | |
| 4.250%, 02/01/2027 (Callable 08/01/2024) | | | | | | | | | | | | |
| (Mandatory Tender Date 02/01/2025) | | | | | | | | | | | | |
(Insured by HUD)(1) | | | 1,000,000 | | | | 1,001,973 | | | | | |
| State of Connecticut: | | | | | | | | | | | | |
| 3.150%, 03/01/2024 (SIFMA Municipal | | | | | | | | | | | | |
Swap Index + 0.950%)(2) | | | 270,000 | | | | 269,932 | | | | | |
| 4.000%, 06/15/2025 | | | 1,000,000 | | | | 1,019,258 | | | | | |
| 5.000%, 09/15/2026 | | | 1,000,000 | | | | 1,062,517 | | | | | |
| 5.000%, 10/01/2026 | | | 1,080,000 | | | | 1,148,941 | | | | | |
| 5.000%, 06/15/2027 | | | 500,000 | | | | 539,104 | | | | | |
| 5.000%, 10/01/2027 (Callable 10/01/2023) | | | 1,005,000 | | | | 1,008,991 | | | | | |
| Town of Stratford CT: | | | | | | | | | | | | |
| 5.000%, 05/15/2026 (Insured by BAM) | | | 265,000 | | | | 278,091 | | | | | |
| 5.000%, 05/15/2028 (Insured by BAM) | | | 400,000 | | | | 435,335 | | | | | |
| Total Connecticut | | | | | | | | | | | | |
| (Cost $26,850,893) | | | | | | | 26,187,621 | | | | 1.6 | % |
| Delaware | | | | | | | | | | | | |
| Delaware Municipal Electric Corp.: | | | | | | | | | | | | |
| 5.000%, 10/01/2024 (Insured by BAM) | | | 230,000 | | | | 235,264 | | | | | |
| 5.000%, 10/01/2025 (Insured by BAM) | | | 140,000 | | | | 145,902 | | | | | |
| Delaware State Economic | | | | | | | | | | | | |
| Development Authority, | | | | | | | | | | | | |
| 5.000%, 10/01/2029 (Callable 07/31/2023) | | | 1,000,000 | | | | 999,945 | | | | | |
| Delaware State Housing Authority, | | | | | | | | | | | | |
| 2.600%, 07/01/2043 (Callable 07/21/2023) | | | | | | | | | | | | |
| (Insured by GNMA) | | | 94,422 | | | | 85,276 | | | | | |
| Total Delaware | | | | | | | | | | | | |
| (Cost $1,480,656) | | | | | | | 1,466,387 | | | | 0.1 | % |
| District of Columbia | | | | | | | | | | | | |
| District of Columbia: | | | | | | | | | | | | |
| 5.000%, 07/01/2025 | | | 500,000 | | | | 506,497 | | | | | |
| 3.000%, 06/01/2030 | | | 1,205,000 | | | | 1,081,535 | | | | | |
| District of Columbia | | | | | | | | | | | | |
| Housing Finance Agency: | | | | | | | | | | | | |
| 0.350%, 04/01/2025 (Mandatory Tender | | | | | | | | | | | | |
Date 04/01/2024) (Insured by FNMA)(1) | | | 1,800,000 | | | | 1,743,520 | | | | | |
| 1.750%, 09/01/2025 (Mandatory Tender | | | | | | | | | | | | |
Date 09/01/2023) (Insured by FHA)(1) | | | 1,760,000 | | | | 1,753,305 | | | | | |
| District of Columbia | | | | | | | | | | | | |
| Water & Sewer Authority, | | | | | | | | | | | | |
| 3.000%, 10/01/2057 (Callable 07/01/2027) | | | | | | | | | | | | |
(Mandatory Tender Date 10/01/2027)(1) | | | 12,100,000 | | | | 11,853,862 | | | | | |
| Total District of Columbia | | | | | | | | | | | | |
| (Cost $17,546,260) | | | | | | | 16,938,719 | | | | 1.0 | % |
| Florida | | | | | | | | | | | | |
| Broward County Housing Finance Authority, | | | | | | | | | | | | |
| 3.500%, 04/01/2041 (Callable 10/01/2025) | | | | | | | | | | | | |
| (Mandatory Tender Date 04/01/2026) | | | | | | | | | | | | |
(Insured by HUD)(1) | | | 1,000,000 | | | | 1,002,833 | | | | | |
| Capital Trust Agency, Inc., | | | | | | | | | | | | |
| 4.000%, 12/15/2024 | | | 145,000 | | | | 143,863 | | | | | |
| City of Jacksonville FL: | | | | | | | | | | | | |
| 5.000%, 11/01/2028 (Callable 11/01/2027) | | | 445,000 | | | | 468,232 | | | | | |
| 5.000%, 10/01/2029 (Callable 10/01/2026) | | | 1,175,000 | | | | 1,243,287 | | | | | |
| City of Lakeland FL, | | | | | | | | | | | | |
| 5.000%, 11/15/2028 (Callable 11/15/2026) | | | 640,000 | | | | 671,643 | | | | | |
The accompanying notes are an integral part of these financial statements.
Baird Short-Term Municipal Bond Fund
Schedule of Investments, June 30, 2023 (Unaudited)
Long-Term Investments (cont.)
| | | Principal | | | | | | % of | |
| | | Amount | | | Value | | | Net Assets | |
| City of Melbourne FL, | | | | | | | | | |
| 0.000%, 10/01/2023 (Insured by NATL) | | $ | 100,000 | | | $ | 99,160 | | | |
| |
| City of Port St. Lucie FL, | | | | | | | | | | | | |
| 5.000%, 07/01/2026 | | | 3,005,000 | | | | 3,186,994 | | | | | |
| City of Tallahassee FL: | | | | | | | | | | | | |
| 5.000%, 12/01/2024 | | | 200,000 | | | | 202,951 | | | | | |
| 5.000%, 12/01/2025 | | | 500,000 | | | | 513,159 | | | | | |
| 5.000%, 12/01/2026 (Callable 12/01/2025) | | | 955,000 | | | | 982,244 | | | | | |
| 5.000%, 12/01/2027 (Callable 12/01/2025) | | | 400,000 | | | | 411,866 | | | | | |
| County of Broward FL, | | | | | | | | | | | | |
| 4.000%, 10/01/2042 (Callable 07/31/2023) | | | 300,000 | | | | 294,164 | | | | | |
| County of Miami-Dade FL: | | | | | | | | | | | | |
| 0.000%, 10/01/2023 | | | | | | | | | | | | |
| (ETM) (Insured by NATL) | | | 200,000 | | | | 198,405 | | | | | |
| 5.000%, 06/01/2027 (Callable 06/01/2025) | | | 1,500,000 | | | | 1,542,957 | | | | | |
| 4.500%, 03/01/2033 (Callable 07/31/2023) | | | 200,000 | | | | 200,196 | | | | | |
| Florida Department of | | | | | | | | | | | | |
| Environmental Protection, | | | | | | | | | | | | |
| 5.000%, 07/01/2025 | | | 525,000 | | | | 544,085 | | | | | |
| Florida Development Finance Corp.: | | | | | | | | | | | | |
| 4.000%, 06/15/2024 | | | 860,000 | | | | 856,905 | | | | | |
2.625%, 12/15/2024(3) | | | 375,000 | | | | 364,882 | | | | | |
| 5.000%, 06/15/2025 | | | 220,000 | | | | 222,087 | | | | | |
| 5.250%, 02/01/2026 | | | | | | | | | | | | |
| (Pre-refunded to 08/01/2023) | | | 100,000 | | | | 100,140 | | | | | |
| 5.000%, 06/15/2026 | | | 840,000 | | | | 853,831 | | | | | |
| 5.000%, 06/15/2026 | | | 270,000 | | | | 274,446 | | | | | |
| 5.000%, 11/15/2026 | | | 1,000,000 | | | | 1,046,080 | | | | | |
| 2.375%, 06/01/2027 | | | | | | | | | | | | |
(Callable 07/31/2023)(3) | | | 1,665,000 | | | | 1,597,150 | | | | | |
| 5.000%, 06/15/2027 | | | 390,000 | | | | 399,691 | | | | | |
| 5.000%, 06/15/2027 | | | 285,000 | | | | 292,082 | | | | | |
| 5.000%, 06/15/2028 (Callable 06/15/2027) | | | 355,000 | | | | 364,512 | | | | | |
| 5.250%, 06/15/2029 | | | | | | | | | | | | |
(Callable 06/15/2027)(3) | | | 1,200,000 | | | | 1,186,713 | | | | | |
3.000%, 07/01/2031(3) | | | 1,225,000 | | | | 1,104,362 | | | | | |
| 6.125%, 07/01/2032 (Callable 04/02/2026) | | | | | | | | | | | | |
(Mandatory Tender Date 07/01/2026)(1)(3) | | | 2,000,000 | | | | 2,012,523 | | | | | |
| Florida Higher Educational | | | | | | | | | | | | |
| Facilities Financial Authority: | | | | | | | | | | | | |
| 5.000%, 04/01/2028 (Callable 04/01/2026) | | | 485,000 | | | | 503,032 | | | | | |
| 5.000%, 11/01/2032 (Callable 11/01/2026) | | | 965,000 | | | | 1,014,166 | | | | | |
| Florida Housing Finance Corp.: | | | | | | | | | | | | |
| 5.000%, 12/01/2026 (Mandatory Tender | | | | | | | | | | | | |
Date 12/01/2025) (Insured by HUD)(1) | | | 4,000,000 | | | | 4,105,269 | | | | | |
| 4.000%, 07/01/2047 (Callable 07/01/2025) | | | | | | | | | | | | |
| (Insured by GNMA) | | | 40,000 | | | | 39,873 | | | | | |
| Florida Municipal Loan Council, | | | | | | | | | | | | |
| 5.000%, 12/01/2023 (Insured by AGM) | | | 160,000 | | | | 161,042 | | | | | |
| Greater Orlando Aviation Authority, | | | | | | | | | | | | |
| 5.000%, 10/01/2027 | | | 4,000,000 | | | | 4,235,572 | | | | | |
| Herons Glen Recreation District, | | | | | | | | | | | | |
| 2.500%, 05/01/2027 (Insured by BAM) | | | 250,000 | | | | 238,811 | | | | | |
| Hillsborough County Industrial | | | | | | | | | | | | |
| Development Authority, | | | | | | | | | | | | |
| 3.500%, 10/01/2028 | | | | | | | | | | | | |
| (Pre-refunded to 10/01/2023) | | | 405,000 | | | | 405,080 | | | | | |
| Hollywood Beach Community | | | | | | | | | | | | |
| Development District I, | | | | | | | | | | | | |
| 5.000%, 10/01/2027 | | | 545,000 | | | | 572,927 | | | | | |
| Hollywood Community | | | | | | | | | | | | |
| Redevelopment Agency, | | | | | | | | | | | | |
| 5.000%, 03/01/2024 | | | 820,000 | | | | 828,075 | | | | | |
| Jacksonville Electric Authority: | | | | | | | | | | | | |
| 5.000%, 10/01/2023 | | | 150,000 | | | | 150,623 | | | | | |
| 5.000%, 10/01/2023 | | | 210,000 | | | | 210,873 | | | | | |
| Lee County School Board, | | | | | | | | | | | | |
| 5.000%, 08/01/2023 | | | 190,000 | | | | 190,200 | | | | | |
| Miami Beach Redevelopment Agency, | | | | | | | | | | | | |
| 5.000%, 02/01/2027 (Callable 02/01/2024) | | | 1,000,000 | | | | 1,007,136 | | | | | |
| Orange County Health Facilities Authority: | | | | | | | | | | | | |
| 4.000%, 08/01/2024 | | | 25,000 | | | | 24,899 | | | | | |
| 5.000%, 08/01/2028 (Callable 08/01/2024) | | | 2,000,000 | | | | 2,012,869 | | | | | |
| Orange County Housing Finance Authority: | | | | | | | | | | | | |
| 4.000%, 09/01/2040 (Callable 09/01/2024) | | | | | | | | | | | | |
| (Insured by GNMA) | | | 65,000 | | | | 64,903 | | | | | |
| 4.250%, 09/01/2049 (Callable 09/01/2027) | | | | | | | | | | | | |
| (Insured by GNMA) | | | 175,000 | | | | 174,551 | | | | | |
| Osceola County Expressway Authority, | | | | | | | | | | | | |
| 0.000%, 10/01/2024 (ETM) | | | 380,000 | | | | 364,151 | | | | | |
| Pinellas County Housing Authority, | | | | | | | | | | | | |
| 1.000%, 11/01/2027 (Insured by FNMA) | | | 2,345,000 | | | | 2,165,652 | | | | | |
| Pinellas County Industrial | | | | | | | | | | | | |
| Development Authority, | | | | | | | | | | | | |
| 5.000%, 07/01/2029 | | | 450,000 | | | | 460,200 | | | | | |
| Sarasota County Public Hospital District, | | | | | | | | | | | | |
| 5.250%, 07/01/2024 (Insured by NATL) | | | 150,000 | | | | 151,345 | | | | | |
| School Board of Miami-Dade County, | | | | | | | | | | | | |
| 5.000%, 05/01/2029 (Callable 05/01/2025) | | | 4,000,000 | | | | 4,101,864 | | | | | |
| Seminole County Industrial | | | | | | | | | | | | |
| Development Authority: | | | | | | | | | | | | |
4.000%, 06/15/2024(3) | | | 130,000 | | | | 128,495 | | | | | |
4.000%, 06/15/2025(3) | | | 100,000 | | | | 97,859 | | | | | |
4.000%, 06/15/2026(3) | | | 155,000 | | | | 150,554 | | | | | |
4.000%, 06/15/2027(3) | | | 240,000 | | | | 231,581 | | | | | |
| St. Johns River Power Park, | | | | | | | | | | | | |
| 5.000%, 10/01/2024 (Callable 07/31/2023) | | | 105,000 | | | | 105,136 | | | | | |
| St. Lucie County School Board, | | | | | | | | | | | | |
| 5.000%, 07/01/2027 (Callable 07/31/2023) | | | 1,150,000 | | | | 1,151,188 | | | | | |
| State of Florida, | | | | | | | | | | | | |
| 5.000%, 07/01/2025 | | | 1,500,000 | | | | 1,558,354 | | | | | |
| University of North Florida Financing Corp., | | | | | | | | | | | | |
| 5.000%, 11/01/2023 (Insured by AGM) | | | 485,000 | | | | 486,858 | | | | | |
| Volusia County Educational Facility Authority, | | | | | | | | | | | | |
| 5.000%, 10/15/2033 (Callable 04/15/2025) | | | 550,000 | | | | 563,599 | | | | | |
| Total Florida | | | | | | | | | | | | |
| (Cost $51,190,283) | | | | | | | 50,038,180 | | | | 3.0 | % |
| Georgia | | | | | | | | | | | | |
| Atlanta Development Authority, | | | | | | | | | | | | |
| 5.000%, 07/01/2024 | | | 140,000 | | | | 142,167 | | | | | |
| Burke County Development Authority: | | | | | | | | | | | | |
| 1.500%, 01/01/2040 | | | | | | | | | | | | |
(Mandatory Tender Date 02/03/2025)(1) | | | 6,695,000 | | | | 6,325,543 | | | | | |
| 1.700%, 12/01/2049 | | | | | | | | | | | | |
(Mandatory Tender Date 08/22/2024)(1) | | | 2,180,000 | | | | 2,109,796 | | | | | |
| City of Atlanta GA: | | | | | | | | | | | | |
| 5.000%, 01/01/2024 (Callable 07/31/2023) | | | 515,000 | | | | 515,657 | | | | | |
| 4.000%, 07/01/2026 (Callable 07/31/2023) | | | 100,000 | | | | 100,044 | | | | | |
| Cobb-Marietta Coliseum & | | | | | | | | | | | | |
| Exhibit Hall Authority, | | | | | | | | | | | | |
| 5.500%, 10/01/2026 (Insured by NATL) | | | 620,000 | | | | 644,808 | | | | | |
| Development Authority for Fulton County, | | | | | | | | | | | | |
| 5.000%, 10/01/2027 | | | 1,015,000 | | | | 1,083,438 | | | | | |
| Development Authority of Bulloch County, | | | | | | | | | | | | |
| 5.000%, 07/01/2026 | | | 330,000 | | | | 346,986 | | | | | |
| Development Authority of Monroe County, | | | | | | | | | | | | |
| 2.250%, 07/01/2025 (Callable 06/13/2024) | | | 1,390,000 | | | | 1,322,988 | | | | | |
The accompanying notes are an integral part of these financial statements.
Baird Short-Term Municipal Bond Fund
Schedule of Investments, June 30, 2023 (Unaudited)
Long-Term Investments (cont.)
| | | Principal | | | | | | % of | |
| | | Amount | | | Value | | | Net Assets | |
| Forsyth County Hospital Authority, | | | | | | | | | |
| 6.375%, 10/01/2028 (ETM) | | $ | 540,000 | | | $ | 590,561 | | | | |
| George L Smith II Congress Center Authority, | | | | | | | | | | | |
3.625%, 01/01/2031(3) | | | 5,120,000 | | | | 4,579,612 | | | | |
| Main Street Natural Gas, Inc.: | | | | | | | | | | | |
| 5.000%, 05/15/2026 | | | 610,000 | | | | 621,043 | | | | |
| 5.000%, 09/01/2026 (Callable 06/01/2026) | | | 500,000 | | | | 512,431 | | | | |
| 5.500%, 09/15/2028 | | | 1,000,000 | | | | 1,061,546 | | | | |
| 4.000%, 03/01/2050 (Callable 06/01/2026) | | | | | | | | | | | |
(Mandatory Tender Date 09/01/2026)(1) | | | 8,330,000 | | | | 8,279,885 | | | | |
| 4.000%, 07/01/2052 (Callable 06/01/2027) | | | | | | | | | | | |
(Mandatory Tender Date 09/01/2027)(1) | | | 3,700,000 | | | | 3,687,761 | | | | |
| 4.000%, 08/01/2052 (Callable 05/01/2027) | | | | | | | | | | | |
(Mandatory Tender Date 11/01/2027)(1)(3) | | | 14,750,000 | | | | 14,256,527 | | | | |
| 5.000%, 07/01/2053 (Callable 12/01/2029) | | | | | | | | | | | |
(Mandatory Tender Date 03/01/2030)(1) | | | 10,000,000 | | | | 10,447,988 | | | | |
| Pelham School District, | | | | | | | | | | | |
| 5.000%, 09/01/2023 (Insured by ST AID) | | | 290,000 | | | | 290,652 | | | | |
| State of Georgia, | | | | | | | | | | | |
| 5.000%, 12/01/2026 | | | 750,000 | | | | 804,049 | | | | |
| Total Georgia | | | | | | | | | | | |
| (Cost $61,272,587) | | | | | | | 57,723,482 | | | | 3.5 | % |
| Illinois | | | | | | | | | | | | |
| Adams & Hancock Counties Community | | | | | | | | | | | | |
| Unit School District No. 4, | | | | | | | | | | | | |
| 4.000%, 12/01/2026 | | | | | | | | | | | | |
| (Callable 12/01/2025) (Insured by BAM) | | | 275,000 | | | | 280,834 | | | | | |
| Channahon Park District, | | | | | | | | | | | | |
| 4.000%, 12/15/2026 (Insured by BAM) | | | 380,000 | | | | 387,841 | | | | | |
| Chicago Board of Education: | | | | | | | | | | | | |
| 5.000%, 12/01/2023 (Insured by AGM) | | | 500,000 | | | | 501,884 | | | | | |
| 5.250%, 12/01/2023 (Insured by AGC) | | | 345,000 | | | | 346,643 | | | | | |
| Chicago Midway International Airport, | | | | | | | | | | | | |
| 5.000%, 01/01/2028 (Callable 01/01/2026) | | | 1,750,000 | | | | 1,796,842 | | | | | |
| Chicago Park District: | | | | | | | | | | | | |
| 5.000%, 01/01/2024 (ETM) | | | 0 | | | | — | | | | | |
| 5.000%, 01/01/2024 | | | 155,000 | | | | 156,077 | | | | | |
| City of Chicago IL: | | | | | | | | | | | | |
| 5.000%, 11/01/2025 | | | 2,000,000 | | | | 2,071,040 | | | | | |
| 5.000%, 11/01/2026 (Callable 11/01/2024) | | | 1,410,000 | | | | 1,436,332 | | | | | |
| 0.000%, 01/01/2027 (Insured by NATL) | | | 5,540,000 | | | | 4,865,409 | | | | | |
| 5.000%, 11/01/2028 (Callable 11/01/2024) | | | 900,000 | | | | 917,355 | | | | | |
| 5.000%, 11/01/2028 (Callable 11/01/2026) | | | 1,000,000 | | | | 1,043,382 | | | | | |
| 5.000%, 11/01/2029 (Callable 11/01/2026) | | | 1,550,000 | | | | 1,623,401 | | | | | |
| City of Country Club Hills IL, | | | | | | | | | | | | |
| 3.000%, 01/01/2028 (Insured by BAM) | | | 185,000 | | | | 182,624 | | | | | |
| City of Evanston IL, | | | | | | | | | | | | |
| 3.000%, 12/01/2028 | | | 5,885,000 | | | | 5,932,727 | | | | | |
| City of Galesburg IL: | | | | | | | | | | | | |
| 5.000%, 10/01/2025 | | | 125,000 | | | | 127,038 | | | | | |
| 5.000%, 10/01/2026 | | | 145,000 | | | | 148,740 | | | | | |
| 5.000%, 10/01/2027 | | | 175,000 | | | | 181,324 | | | | | |
| 5.000%, 10/01/2028 | | | 175,000 | | | | 183,136 | | | | | |
| City of Princeton IL, | | | | | | | | | | | | |
| 4.000%, 01/01/2025 (Insured by AGM) | | | 120,000 | | | | 121,032 | | | | | |
| City of Rockford IL, | | | | | | | | | | | | |
| 5.000%, 12/15/2023 (Insured by BAM) | | | 110,000 | | | | 110,740 | | | | | |
| City of Springfield IL: | | | | | | | | | | | | |
| 5.000%, 12/01/2023 | | | 155,000 | | | | 155,916 | | | | | |
| 5.000%, 12/01/2031 (Callable 12/01/2025) | | | 325,000 | | | | 336,199 | | | | | |
| Community Unit School District No. 427: | | | | | | | | | | | | |
| 0.000%, 01/01/2026 (Insured by AGM) | | | 1,000,000 | | | | 911,657 | | | | | |
| 0.000%, 01/01/2027 (Insured by AGM) | | | 2,980,000 | | | | 2,622,517 | | | | | |
| Cook County School District No. 130, | | | | | | | | | | | | |
| 5.000%, 12/01/2025 (Insured by AGM) | | | 1,320,000 | | | | 1,375,718 | | | | | |
| Cook County School District No. 154, | | | | | | | | | | | | |
| 3.500%, 12/01/2024 (Insured by BAM) | | | 114,000 | | | | 114,054 | | | | | |
| Cook County School District No. 99: | | | | | | | | | | | | |
| 4.000%, 12/01/2024 | | | 760,000 | | | | 767,313 | | | | | |
| 4.000%, 12/01/2026 (Insured by BAM) | | | 1,150,000 | | | | 1,168,506 | | | | | |
| 4.000%, 12/01/2027 (Insured by BAM) | | | 1,195,000 | | | | 1,223,087 | | | | | |
| Cook County Township | | | | | | | | | | | | |
| High School District No. 201, | | | | | | | | | | | | |
| 0.000%, 12/01/2025 (Insured by AGM) | | | 165,000 | | | | 150,209 | | | | | |
| County of Cook IL: | | | | | | | | | | | | |
| 5.000%, 11/15/2028 (Callable 11/15/2026) | | | 3,000,000 | | | | 3,155,741 | | | | | |
| 5.000%, 11/15/2032 (Callable 11/15/2027) | | | 1,000,000 | | | | 1,072,883 | | | | | |
| DeKalb County Community | | | | | | | | | | | | |
| Unit School District No. 424, | | | | | | | | | | | | |
| 0.000%, 01/01/2024 | | | | | | | | | | | | |
| (ETM) (Insured by AMBAC) | | | 855,000 | | | | 841,214 | | | | | |
| Exceptional Children Have Opportunities, | | | | | | | | | | | | |
| 5.000%, 12/01/2026 | | | 255,000 | | | | 268,199 | | | | | |
| Hampshire Special Service Area No. 13, | | | | | | | | | | | | |
| 3.000%, 03/01/2026 (Insured by BAM) | | | 90,000 | | | | 87,679 | | | | | |
| Illinois Development Finance Authority, | | | | | | | | | | | | |
| 0.000%, 07/15/2025 (ETM) | | | 2,885,000 | | | | 2,688,942 | | | | | |
| Illinois Finance Authority: | | | | | | | | | | | | |
| 5.000%, 08/01/2023 | | | 1,455,000 | | | | 1,455,529 | | | | | |
| 5.000%, 05/15/2024 | | | 350,000 | | | | 354,540 | | | | | |
| 5.000%, 11/01/2024 | | | 385,000 | | | | 388,142 | | | | | |
4.300%, 08/01/2028(3) | | | 1,215,000 | | | | 1,209,495 | | | | | |
| 5.000%, 09/01/2029 (Callable 09/01/2026) | | | 1,575,000 | | | | 1,641,133 | | | | | |
| 5.000%, 10/01/2030 (Callable 10/01/2026) | | | 500,000 | | | | 527,058 | | | | | |
| 4.000%, 12/01/2032 (Callable 06/01/2026) | | | 1,000,000 | | | | 1,004,165 | | | | | |
| 4.735%, 11/01/2034 (SOFR + 1.200%) | | | | | | | | | | | | |
| (Callable 03/01/2025) | | | | | | | | | | | | |
(Mandatory Tender Date 09/01/2025)(2) | | | 1,970,000 | | | | 1,968,506 | | | | | |
| 5.000%, 09/01/2042 | | | | | | | | | | | | |
| (Pre-refunded to 09/01/2024) | | | 570,000 | | | | 581,826 | | | | | |
| 5.000%, 05/15/2050 (Callable 05/15/2026) | | | | | | | | | | | | |
(Mandatory Tender Date 11/15/2026)(1) | | | 4,160,000 | | | | 4,311,245 | | | | | |
| Illinois Housing Development Authority: | | | | | | | | | | | | |
| 2.600%, 10/01/2025 (Insured by GNMA) | | | 475,000 | | | | 468,278 | | | | | |
| 4.000%, 06/01/2026 (Mandatory Tender | | | | | | | | | | | | |
Date 06/01/2025) (Insured by FHA)(1) | | | 1,800,000 | | | | 1,802,355 | | | | | |
| 2.450%, 06/01/2043 (Callable 07/31/2023) | | | | | | | | | | | | |
| (Insured by GNMA) | | | 182,399 | | | | 148,718 | | | | | |
| 4.500%, 10/01/2048 (Callable 04/01/2028) | | | | | | | | | | | | |
| (Insured by GNMA) | | | 460,000 | | | | 461,322 | | | | | |
| 2.830%, 05/15/2050 | | | | | | | | | | | | |
| (SIFMA Municipal Swap Index + 1.000%) | | | | | | | | | | | | |
| (Callable 11/15/2024) | | | | | | | | | | | | |
(Mandatory Tender Date 05/15/2025)(2) | | | 1,250,000 | | | | 1,251,925 | | | | | |
| 6.250%, 10/01/2052 (Callable 04/01/2032) | | | | | | | | | | | | |
| (Insured by GNMA) | | | 4,995,000 | | | | 5,419,789 | | | | | |
| Joliet Regional Port District, | | | | | | | | | | | | |
| 4.000%, 06/30/2025 | | | | | | | | | | | | |
| (Callable 06/30/2024) (Insured by AGM) | | | 40,000 | | | | 40,319 | | | | | |
| Kankakee, Iroquois, Ford, Etc. Counties | | | | | | | | | | | | |
| Community Unit School District No. 2, | | | | | | | | | | | | |
| 4.000%, 12/01/2023 (Insured by AGM) | | | 445,000 | | | | 446,123 | | | | | |
| Kankakee, Will, Grundy, Etc. Counties | | | | | | | | | | | | |
| Community College District No. 520, | | | | | | | | | | | | |
| 3.500%, 12/01/2026 | | | 2,885,000 | | | | 2,875,025 | | | | | |
| Knox & Warren Counties | | | | | | | | | | | | |
| Community Unit School District No. 205, | | | | | | | | | | | | |
| 5.000%, 12/01/2038 (Callable 12/01/2027) | | | 2,000,000 | | | | 2,094,278 | | | | | |
The accompanying notes are an integral part of these financial statements.
Baird Short-Term Municipal Bond Fund
Schedule of Investments, June 30, 2023 (Unaudited)
Long-Term Investments (cont.)
| | | Principal | | | | | | % of | |
| | | Amount | | | Value | | | Net Assets | |
| Lake County Elementary | | | | | | | | | |
| School District No. 6, | | | | | | | | | |
| 0.000%, 12/01/2024 (Insured by AMBAC) | | $ | 70,000 | | | $ | 65,748 | | | |
| |
| Lake County School District No. 38, | | | | | | | | | | | | |
| 0.000%, 02/01/2025 (Insured by AMBAC) | | | 210,000 | | | | 196,905 | | | | | |
| Macon County School District No. 61, | | | | | | | | | | | | |
| 4.000%, 12/01/2027 (Insured by AGM) | | | 850,000 | | | | 879,834 | | | | | |
| McHenry & Kane Counties Community | | | | | | | | | | | | |
| Consolidated School District No. 158, | | | | | | | | | | | | |
| 0.000%, 01/01/2024 (Insured by AGC) | | | 5,200,000 | | | | 5,110,257 | | | | | |
| McHenry County Community | | | | | | | | | | | | |
| Unit School District No. 200, | | | | | | | | | | | | |
| 5.250%, 01/15/2027 (Callable 01/15/2024) | | | 160,000 | | | | 161,712 | | | | | |
| Metropolitan Pier & Exposition Authority: | | | | | | | | | | | | |
| 5.500%, 12/15/2023 (Insured by NATL) | | | 40,000 | | | | 40,259 | | | | | |
| 0.000%, 06/15/2024 (Insured by NATL) | | | 35,000 | | | | 33,718 | | | | | |
| 0.000%, 12/15/2025 (Insured by NATL) | | | 65,000 | | | | 59,134 | | | | | |
| 0.000%, 06/15/2027 (Insured by AGM) | | | 1,000,000 | | | | 864,438 | | | | | |
| Metropolitan Water Reclamation | | | | | | | | | | | | |
| District of Greater Chicago, | | | | | | | | | | | | |
| 5.000%, 12/01/2027 (Callable 12/01/2026) | | | 535,000 | | | | 566,049 | | | | | |
| Northern Illinois University: | | | | | | | | | | | | |
| 5.000%, 04/01/2027 (Insured by BAM) | | | 550,000 | | | | 576,009 | | | | | |
| 5.000%, 04/01/2028 (Insured by BAM) | | | 650,000 | | | | 689,545 | | | | | |
| 5.000%, 10/01/2029 (Insured by BAM) | | | 480,000 | | | | 517,002 | | | | | |
| 5.000%, 10/01/2030 (Insured by BAM) | | | 325,000 | | | | 351,698 | | | | | |
| Park Ridge Park District, | | | | | | | | | | | | |
| 2.500%, 12/01/2028 | | | 2,960,000 | | | | 2,816,581 | | | | | |
| Pike & Adams Counties Community | | | | | | | | | | | | |
| Unit School District No. 4, | | | | | | | | | | | | |
| 4.000%, 12/01/2024 (Insured by BAM) | | | 345,000 | | | | 348,244 | | | | | |
| Plano Special Service Areas No. 3 & 4, | | | | | | | | | | | | |
| 4.000%, 03/01/2030 (Callable 03/01/2025) | | | 210,000 | | | | 213,529 | | | | | |
| Sales Tax Securitization Corp., | | | | | | | | | | | | |
| 5.000%, 01/01/2024 | | | 200,000 | | | | 201,496 | | | | | |
| Shelby Christian Macon Counties | | | | | | | | | | | | |
| Community School District No. 21: | | | | | | | | | | | | |
| 4.000%, 12/01/2025 | | | | | | | | | | | | |
| (Callable 12/01/2023) (Insured by AGM) | | | 400,000 | | | | 400,961 | | | | | |
| 4.000%, 12/01/2026 | | | | | | | | | | | | |
| (Callable 12/01/2023) (Insured by AGM) | | | 435,000 | | | | 435,888 | | | | | |
| South Sangamon Water Commission, | | | | | | | | | | | | |
| 4.000%, 01/01/2027 (Insured by AGM) | | | 400,000 | | | | 406,297 | | | | | |
| Southwestern Illinois Development Authority, | | | | | | | | | | | | |
| 7.125%, 11/01/2030 | | | | | | | | | | | | |
| (Pre-refunded to 11/01/2023) | | | 195,000 | | | | 197,198 | | | | | |
| St. Charles Public Library District, | | | | | | | | | | | | |
| 4.000%, 11/01/2028 (Callable 11/01/2024) | | | 455,000 | | | | 459,581 | | | | | |
| State of Illinois: | | | | | | | | | | | | |
| 5.000%, 10/01/2023 | | | 2,785,000 | | | | 2,793,445 | | | | | |
| 5.000%, 10/01/2025 | | | 4,350,000 | | | | 4,485,344 | | | | | |
| 5.000%, 06/15/2026 | | | 6,580,000 | | | | 6,848,789 | | | | | |
| 6.000%, 06/15/2026 (Insured by BAM) | | | 200,000 | | | | 214,525 | | | | | |
| Town of Cicero IL, | | | | | | | | | | | | |
| 4.000%, 01/01/2026 (Insured by BAM) | | | 590,000 | | | | 592,762 | | | | | |
| United City of Yorkville IL, | | | | | | | | | | | | |
| 4.050%, 12/01/2027 (Callable 12/01/2023) | | | 120,000 | | | | 120,418 | | | | | |
| Upper Illinois River Valley | | | | | | | | | | | | |
| Development Authority: | | | | | | | | | | | | |
| 5.000%, 12/01/2023 | | | 400,000 | | | | 401,411 | | | | | |
| 5.000%, 12/01/2028 | | | 1,050,000 | | | | 1,103,873 | | | | | |
| Village of Calumet Park IL, | | | | | | | | | | | | |
| 5.250%, 12/01/2029 | | | | | | | | | | | | |
| (Callable 12/01/2024) (Insured by BAM) | | | 500,000 | | | | 516,366 | | | | | |
| Village of Crestwood IL, | | | | | | | | | | | | |
| 4.500%, 12/15/2025 | | | | | | | | | | | | |
| (Callable 07/31/2023) (Insured by BAM) | | | 60,000 | | | | 60,056 | | | | | |
| Village of Kenilworth IL: | | | | | | | | | | | | |
| 4.000%, 12/01/2026 | | | 405,000 | | | | 417,649 | | | | | |
| 4.000%, 12/01/2027 | | | 220,000 | | | | 229,767 | | | | | |
| Village of Lansing IL, | | | | | | | | | | | | |
| 5.000%, 03/01/2024 (Insured by BAM) | | | 230,000 | | | | 231,743 | | | | | |
| Village of Lyons IL, | | | | | | | | | | | | |
| 5.000%, 12/01/2025 | | | | | | | | | | | | |
| (Callable 07/31/2023) (Insured by BAM) | | | 25,000 | | | | 25,028 | | | | | |
| Village of Orland Hills IL, | | | | | | | | | | | | |
| 4.000%, 12/01/2023 (Insured by BAM) | | | 130,000 | | | | 130,150 | | | | | |
| Village of Rantoul IL, | | | | | | | | | | | | |
| 4.300%, 01/01/2025 (Callable 07/31/2023) | | | 125,000 | | | | 125,097 | | | | | |
| Village of River Grove IL, | | | | | | | | | | | | |
| 4.000%, 12/15/2028 (Insured by BAM) | | | 430,000 | | | | 444,148 | | | | | |
| Village of Romeoville IL: | | | | | | | | | | | | |
| 5.000%, 10/01/2025 (Callable 04/01/2025) | | | 1,100,000 | | | | 1,107,087 | | | | | |
| 5.000%, 10/01/2030 (Callable 04/01/2025) | | | 1,000,000 | | | | 1,008,948 | | | | | |
| Village of Schaumburg IL: | | | | | | | | | | | | |
| 5.000%, 12/01/2025 | | | 870,000 | | | | 902,017 | | | | | |
| 4.000%, 12/01/2026 | | | 915,000 | | | | 946,276 | | | | | |
| Village of Stone Park IL: | | | | | | | | | | | | |
| 4.000%, 02/01/2024 (Insured by BAM) | | | 135,000 | | | | 135,382 | | | | | |
| 4.000%, 02/01/2025 (Insured by BAM) | | | 140,000 | | | | 141,278 | | | | | |
| 4.000%, 02/01/2026 (Insured by BAM) | | | 220,000 | | | | 223,822 | | | | | |
| 4.750%, 02/01/2028 | | | | | | | | | | | | |
| (Callable 07/31/2023) (Insured by BAM) | | | 50,000 | | | | 50,057 | | | | | |
| Village of Sugar Grove IL, | | | | | | | | | | | | |
| 3.000%, 12/15/2025 (Callable 07/31/2023) | | | 225,000 | | | | 224,961 | | | | | |
| Washington County Community | | | | | | | | | | | | |
| Unit School Dist No. 10, | | | | | | | | | | | | |
| 4.000%, 12/15/2024 (Insured by AGM) | | | 250,000 | | | | 252,425 | | | | | |
| Will County Community | | | | | | | | | | | | |
| High School District No. 210: | | | | | | | | | | | | |
| 0.000%, 01/01/2024 | | | | | | | | | | | | |
| (ETM) (Insured by AGM) | | | 510,000 | | | | 501,656 | | | | | |
| 0.000%, 01/01/2024 (Insured by AGM) | | | 1,275,000 | | | | 1,250,473 | | | | | |
| Total Illinois | | | | | | | | | | | | |
| (Cost $111,815,141) | | | | | | | 108,881,042 | | | | 6.5 | % |
| Indiana | | | | | | | | | | | | |
| Cass County Indiana Building Corp., | | | | | | | | | | | | |
| 5.000%, 01/15/2028 (Insured by ST AID) | | | 400,000 | | | | 428,757 | | | | | |
| City of Elkhart IN, | | | | | | | | | | | | |
| 3.000%, 10/01/2028 (Insured by BAM) | | | 345,000 | | | | 338,395 | | | | | |
| City of Hobart IN, | | | | | | | | | | | | |
| 3.000%, 07/01/2025 (Insured by ST AID) | | | 395,000 | | | | 386,606 | | | | | |
| City of Kendallville IN, | | | | | | | | | | | | |
| 3.500%, 11/01/2024 (Mandatory Tender | | | | | | | | | | | | |
Date 11/01/2023) (Insured by HUD)(1) | | | 1,935,000 | | | | 1,930,762 | | | | | |
| City of Mishawaka IN, | | | | | | | | | | | | |
| 5.000%, 03/01/2025 (Insured by AGM) | | | 100,000 | | | | 102,888 | | | | | |
| City of Muncie IN, | | | | | | | | | | | | |
| 4.000%, 01/15/2024 (Insured by AGM) | | | 170,000 | | | | 170,309 | | | | | |
| City of Valparaiso IN, | | | | | | | | | | | | |
| 4.000%, 08/01/2026 (Callable 08/01/2023) | | | 375,000 | | | | 375,109 | | | | | |
| County of St. Joseph IN, | | | | | | | | | | | | |
| 5.000%, 04/01/2027 | | | 1,500,000 | | | | 1,578,441 | | | | | |
| Fishers Redevelopment Authority, | | | | | | | | | | | | |
| 4.000%, 07/15/2023 | | | 275,000 | | | | 275,042 | | | | | |
| Frankton-Lapel Community | | | | | | | | | | | | |
| Schools Building Corp.: | | | | | | | | | | | | |
| 5.000%, 01/15/2027 (Insured by ST AID) | | | 1,325,000 | | | | 1,407,989 | | | | | |
| 5.000%, 07/15/2027 (Insured by ST AID) | | | 1,390,000 | | | | 1,489,326 | | | | | |
The accompanying notes are an integral part of these financial statements.
Baird Short-Term Municipal Bond Fund
Schedule of Investments, June 30, 2023 (Unaudited)
Long-Term Investments (cont.)
| | | Principal | | | | | | % of | |
| | | Amount | | | Value | | | Net Assets | |
| Hammond Multi-School Building Corp., | | | | | | | | | |
| 5.000%, 01/15/2025 (Insured by ST AID) | | $ | 525,000 | | | $ | 537,790 | | | | |
| Indiana Finance Authority: | | | | | | | | | | | |
| 5.000%, 09/15/2023 | | | 75,000 | | | | 75,124 | | | | |
| 3.500%, 03/01/2024 | | | 5,150,000 | | | | 5,140,342 | | | | |
| 5.000%, 09/01/2024 | | | 390,000 | | | | 392,132 | | | | |
| 5.000%, 09/15/2024 | | | 815,000 | | | | 825,211 | | | | |
| 5.000%, 09/15/2024 | | | 155,000 | | | | 156,743 | | | | |
| 5.000%, 09/01/2025 | | | 445,000 | | | | 448,245 | | | | |
| 5.000%, 09/15/2025 | | | 325,000 | | | | 328,529 | | | | |
| 5.000%, 10/01/2025 | | | 675,000 | | | | 686,151 | | | | |
| 5.000%, 07/01/2026 | | | 730,000 | | | | 747,458 | | | | |
| 5.000%, 09/01/2026 | | | 1,520,000 | | | | 1,538,494 | | | | |
| 5.000%, 09/15/2026 (Callable 09/15/2024) | | | 700,000 | | | | 708,992 | | | | |
| 5.000%, 10/01/2028 | | | 260,000 | | | | 271,213 | | | | |
| 4.000%, 03/01/2038 (Callable 05/01/2028) | | | | | | | | | | | |
(Mandatory Tender Date 08/01/2028)(1) | | | 5,000,000 | | | | 4,951,033 | | | | |
| Indiana Housing & Community | | | | | | | | | | | |
| Development Authority: | | | | | | | | | | | |
| 5.000%, 11/01/2025 | | | | | | | | | | | |
(Mandatory Tender Date 11/01/2024)(1) | | | 1,300,000 | | | | 1,314,612 | | | | |
| 3.500%, 01/01/2049 (Callable 01/01/2029) | | | | | | | | | | | |
| (Insured by GNMA) | | | 880,000 | | | | 862,997 | | | | |
| Indianapolis Board of School Commissioners: | | | | | | | | | | | |
| 5.000%, 07/15/2024 (Insured by ST AID) | | | 500,000 | | | | 508,354 | | | | |
| 5.000%, 07/15/2025 (Insured by ST AID) | | | 750,000 | | | | 778,311 | | | | |
| 5.000%, 01/15/2026 (Insured by ST AID) | | | 1,000,000 | | | | 1,048,446 | | | | |
| Indianapolis Local Public | | | | | | | | | | | |
| Improvement Bond Bank, | | | | | | | | | | | |
| 5.000%, 02/01/2030 (Callable 12/29/2023) | | | 1,025,000 | | | | 1,031,938 | | | | |
| Marion High School Building Corp., | | | | | | | | | | | |
| 4.000%, 01/15/2025 (Insured by ST AID) | | | 200,000 | | | | 201,769 | | | | |
| Michigan City School Building Corp., | | | | | | | | | | | |
| 5.000%, 07/15/2023 (Insured by ST AID) | | | 180,000 | | | | 180,079 | | | | |
| Mishawaka School City | | | | | | | | | | | |
| Multi-School Building Corp., | | | | | | | | | | | |
| 5.000%, 01/15/2024 (Insured by ST AID) | | | 410,000 | | | | 411,668 | | | | |
| Mount Vernon Community School Corp.: | | | | | | | | | | | |
| 5.000%, 07/15/2025 (Insured by ST AID) | | | 395,000 | | | | 407,550 | | | | |
| 5.000%, 01/15/2026 (Insured by ST AID) | | | 1,065,000 | | | | 1,107,628 | | | | |
| Munster School Building Corp.: | | | | | | | | | | | |
| 4.000%, 07/15/2023 (Insured by ST AID) | | | 160,000 | | | | 160,023 | | | | |
| 5.000%, 01/15/2024 (Insured by ST AID) | | | 225,000 | | | | 226,903 | | | | |
| Posey County Redevelopment Authority, | | | | | | | | | | | |
| 5.000%, 07/15/2025 | | | 6,000,000 | | | | 6,149,160 | | | | |
| Salem Middle School Building Corp., | | | | | | | | | | | |
| 4.000%, 01/15/2024 (Insured by ST AID) | | | 195,000 | | | | 195,557 | | | | |
| Tippecanoe County School Building Corp.: | | | | | | | | | | | |
| 5.000%, 07/15/2026 (Insured by ST AID) | | | 330,000 | | | | 346,563 | | | | |
| 5.000%, 01/15/2027 (Insured by ST AID) | | | 300,000 | | | | 318,069 | | | | |
| Town of Rossville IN, | | | | | | | | | | | |
| 3.500%, 07/01/2023 | | | 60,000 | | | | 60,000 | | | | |
| Washington Indiana | | | | | | | | | | | |
| Elementary School Building Corp., | | | | | | | | | | | |
| 3.000%, 01/15/2024 (Insured by ST AID) | | | 225,000 | | | | 223,944 | | | | |
| Total Indiana | | | | | | | | | | | |
| (Cost $41,269,272) | | | | | | | 40,824,652 | | | | 2.4 | % |
| Iowa | | | | | | | | | | | | |
| City of Coralville IA: | | | | | | | | | | | | |
| 4.000%, 06/01/2024 | | | 300,000 | | | | 297,632 | | | | | |
| 4.000%, 06/01/2025 (Callable 06/01/2024) | | | 455,000 | | | | 447,810 | | | | | |
| Iowa Finance Authority: | | | | | | | | | | | | |
| 5.000%, 02/15/2031 (Callable 02/15/2024) | | | 2,225,000 | | | | 2,241,781 | | | | | |
| 7.500%, 01/01/2032 | | | | | | | | | | | | |
(Callable 01/01/2030)(3) | | | 2,250,000 | | | | 2,140,524 | | | | | |
| 3.500%, 07/01/2046 (Callable 01/01/2026) | | | | | | | | | | | | |
| (Insured by GNMA) | | | 80,000 | | | | 79,162 | | | | | |
| 4.000%, 07/01/2047 (Callable 07/01/2027) | | | | | | | | | | | | |
| (Insured by GNMA) | | | 500,000 | | | | 496,323 | | | | | |
| 4.000%, 07/01/2047 (Callable 07/01/2028) | | | | | | | | | | | | |
| (Insured by GNMA) | | | 775,000 | | | | 769,610 | | | | | |
| 3.000%, 07/01/2051 (Callable 01/01/2031) | | | | | | | | | | | | |
| (Insured by GNMA) | | | 970,000 | | | | 928,196 | | | | | |
| 6.000%, 07/01/2052 (Callable 07/01/2032) | | | | | | | | | | | | |
| (Insured by GNMA) | | | 3,250,000 | | | | 3,496,257 | | | | | |
| Iowa Higher Education Loan Authority: | | | | | | | | | | | | |
| 3.000%, 04/01/2025 | | | 775,000 | | | | 762,985 | | | | | |
| 3.000%, 04/01/2026 | | | 800,000 | | | | 781,752 | | | | | |
| 3.000%, 04/01/2027 | | | 820,000 | | | | 800,100 | | | | | |
| 3.000%, 04/01/2028 | | | 845,000 | | | | 815,654 | | | | | |
| Lake Panorama Improvement Zone: | | | | | | | | | | | | |
| 3.000%, 06/01/2024 | | | 420,000 | | | | 416,435 | | | | | |
| 3.000%, 06/01/2025 | | | 430,000 | | | | 422,633 | | | | | |
| PEFA, Inc., | | | | | | | | | | | | |
| 5.000%, 09/01/2049 (Callable 06/01/2026) | | | | | | | | | | | | |
(Mandatory Tender Date 09/01/2026)(1) | | | 6,600,000 | | | | 6,729,424 | | | | | |
| Total Iowa | | | | | | | | | | | | |
| (Cost $22,183,723) | | | | | | | 21,626,278 | | | | 1.3 | % |
| Kansas | | | | | | | | | | | | |
| City of Derby KS, | | | | | | | | | | | | |
| 3.900%, 03/01/2037 (Callable 03/01/2025) | | | 525,000 | | | | 525,396 | | | | | |
| City of Manhattan KS, | | | | | | | | | | | | |
| 4.000%, 06/01/2027 (Callable 06/01/2025) | | | 1,100,000 | | | | 1,097,137 | | | | | |
| Public Building Commission | | | | | | | | | | | | |
| of Johnson County, | | | | | | | | | | | | |
| 5.000%, 09/01/2023 | | | 50,000 | | | | 50,128 | | | | | |
| Total Kansas | | | | | | | | | | | | |
| (Cost $1,641,582) | | | | | | | 1,672,661 | | | | 0.1 | % |
| Kentucky | | | | | | | | | | | | |
| Calloway County Public Library District, | | | | | | | | | | | | |
| 2.500%, 06/01/2029 | | | 685,000 | | | | 668,477 | | | | | |
| City of Henderson KY, | | | | | | | | | | | | |
| 3.500%, 11/01/2028 | | | 2,865,000 | | | | 2,894,718 | | | | | |
| City of Versailles KY, | | | | | | | | | | | | |
| 3.000%, 08/15/2026 (Callable 08/15/2024) | | | 2,570,000 | | | | 2,497,839 | | | | | |
| County of Carroll KY, | | | | | | | | | | | | |
| 1.550%, 09/01/2042 | | | | | | | | | | | | |
(Mandatory Tender Date 09/01/2026)(1) | | | 750,000 | | | | 680,733 | | | | | |
| County of Kenton KY: | | | | | | | | | | | | |
| 5.000%, 04/01/2024 | | | 375,000 | | | | 379,761 | | | | | |
| 5.000%, 04/01/2026 | | | 725,000 | | | | 762,120 | | | | | |
| Frankfort Independent School | | | | | | | | | | | | |
| District Finance Corp., | | | | | | | | | | | | |
| 2.050%, 08/01/2024 (Insured by ST AID) | | | 615,000 | | | | 600,728 | | | | | |
| Kentucky Association of Counties, | | | | | | | | | | | | |
| 4.000%, 02/01/2026 | | | 10,000 | | | | 10,153 | | | | | |
| Kentucky Bond Development Corp.: | | | | | | | | | | | | |
| 5.000%, 03/01/2026 | | | 150,000 | | | | 155,391 | | | | | |
| 5.000%, 03/01/2027 | | | 345,000 | | | | 363,385 | | | | | |
| 5.000%, 03/01/2028 | | | 190,000 | | | | 203,081 | | | | | |
| Kentucky Economic Development | | | | | | | | | | | | |
| Finance Authority: | | | | | | | | | | | | |
| 0.000%, 10/01/2024 (Insured by NATL) | | | 1,145,000 | | | | 1,090,459 | | | | | |
| 0.000%, 12/01/2024 | | | | | | | | | | | | |
| (ETM) (Insured by AGC) | | | 200,000 | | | | 191,118 | | | | | |
The accompanying notes are an integral part of these financial statements.
Baird Short-Term Municipal Bond Fund
Schedule of Investments, June 30, 2023 (Unaudited)
Long-Term Investments (cont.)
| | | Principal | | | | | | % of | |
| | | Amount | | | Value | | | Net Assets | |
| Kentucky Economic Development | | | | | | | | | |
| Finance Authority: (cont.) | | | | | | | | | |
| 5.000%, 07/01/2025 | | $ | 1,500,000 | | | $ | 1,511,880 | | | | |
| 0.000%, 10/01/2025 (Insured by NATL) | | | 335,000 | | | | 306,736 | | | | |
| 5.000%, 06/01/2026 | | | 240,000 | | | | 247,027 | | | | |
| 0.000%, 10/01/2026 (Insured by NATL) | | | 100,000 | | | | 88,273 | | | | |
| 5.000%, 07/01/2028 (Callable 07/01/2025) | | | 1,000,000 | | | | 1,012,874 | | | | |
| Kentucky Housing Corp., | | | | | | | | | | | |
5.850%, 04/01/2048(1) | | | 1,170,900 | | | | 1,143,839 | | | | |
| Kentucky Public Energy Authority: | | | | | | | | | | | |
| 4.607%, 12/01/2049 | | | | | | | | | | | |
| (1 Month LIBOR USD + 1.120%) | | | | | | | | | | | |
| (Callable 03/01/2025) | | | | | | | | | | | |
(Mandatory Tender Date 06/01/2025)(2) | | | 4,410,000 | | | | 4,386,155 | | | | |
| 4.000%, 12/01/2050 (Callable 03/01/2026) | | | | | | | | | | | |
(Mandatory Tender Date 06/01/2026)(1) | | | 7,925,000 | | | | 7,908,827 | | | | |
| Kentucky State Property & | | | | | | | | | | | |
| Building Commission, | | | | | | | | | | | |
| 5.000%, 10/01/2032 | | | | | | | | | | | |
| (Callable 10/01/2027) (Insured by AGM) | | | 250,000 | | | | 266,637 | | | | |
| Louisville & Jefferson County | | | | | | | | | | | |
| Metropolitan Government, | | | | | | | | | | | |
| 5.000%, 10/01/2027 (Callable 10/01/2023) | | | 500,000 | | | | 501,452 | | | | |
| Northern Kentucky University, | | | | | | | | | | | |
| 3.500%, 09/01/2028 (Insured by ST AID) | | | 3,305,000 | | | | 3,356,848 | | | | |
| Perry County School District Finance Corp., | | | | | | | | | | | |
| 2.000%, 12/01/2029 (Insured by ST AID) | | | 2,580,000 | | | | 2,469,744 | | | | |
| Rural Water Financing Agency, | | | | | | | | | | | |
| 3.100%, 11/01/2024 (Callable 07/17/2023) | | | 1,000,000 | | | | 982,572 | | | | |
| University of Louisville, | | | | | | | | | | | |
| 5.000%, 09/01/2026 (Insured by BAM) | | | 845,000 | | | | 883,562 | | | | |
| Total Kentucky | | | | | | | | | | | |
| (Cost $36,751,661) | | | | | | | 35,564,389 | | | | 2.1 | % |
| Louisiana | | | | | | | | | | | | |
| Calcasieu Parish Fire Protection District No. 1, | | | | | | | | | | | | |
| 4.000%, 03/01/2024 (Insured by BAM) | | | 155,000 | | | | 155,612 | | | | | |
| City of Shreveport LA: | | | | | | | | | | | | |
| 5.000%, 08/01/2023 (Insured by BAM) | | | 175,000 | | | | 175,185 | | | | | |
| 5.000%, 03/01/2024 (Insured by BAM) | | | 435,000 | | | | 439,481 | | | | | |
| 5.000%, 08/01/2028 | | | | | | | | | | | | |
| (Callable 08/01/2027) (Insured by BAM) | | | 1,615,000 | | | | 1,713,343 | | | | | |
3.125%, 10/01/2030(3) | | | 2,215,000 | | | | 2,080,821 | | | | | |
| East Ouachita Parish School District, | | | | | | | | | | | | |
| 2.500%, 03/01/2024 | | | 200,000 | | | | 198,668 | | | | | |
| Ernest N. Morial New Orleans | | | | | | | | | | | | |
| Exhibition Hall Authority, | | | | | | | | | | | | |
| 5.000%, 07/15/2024 | | | 1,925,000 | | | | 1,950,341 | | | | | |
| Louisiana Housing Corp., | | | | | | | | | | | | |
| 3.500%, 07/01/2025 (Mandatory Tender | | | | | | | | | | | | |
Date 07/01/2024) (Insured by HUD)(1) | | | 5,000,000 | | | | 4,971,941 | | | | | |
| Louisiana Local Government | | | | | | | | | | | | |
| Environmental Facilities & | | | | | | | | | | | | |
| Community Development Authority: | | | | | | | | | | | | |
| 5.000%, 08/01/2024 (Callable 08/01/2023) | | | 185,000 | | | | 185,206 | | | | | |
| 3.020%, 04/01/2031 | | | | | | | | | | | | |
(Callable 04/01/2025)(3) | | | 4,901,000 | | | | 4,849,985 | | | | | |
| 5.750%, 09/01/2035 | | | | | | | | | | | | |
| (Pre-refunded to 09/01/2023) | | | 75,000 | | | | 75,281 | | | | | |
| Louisiana Public Facilities Authority: | | | | | | | | | | | | |
| 5.000%, 10/01/2023 | | | 705,000 | | | | 707,369 | | | | | |
| 5.500%, 05/15/2027 | | | | | | | | | | | | |
| (Pre-refunded to 05/15/2026) | | | 2,015,000 | | | | 2,107,091 | | | | | |
0.000%, 10/01/2028(5) | | | 160,000 | | | | 163,722 | | | | | |
| Morehouse Parish Hospital | | | | | | | | | | | | |
| Service District No. 1, | | | | | | | | | | | | |
| 4.000%, 10/01/2027 | | | 635,000 | | | | 613,255 | | | | | |
| New Orleans Aviation Board: | | | | | | | | | | | | |
| 5.000%, 10/01/2025 (Insured by AGM) | | | 200,000 | | | | 207,551 | | | | | |
| 5.000%, 01/01/2027 (Callable 01/01/2025) | | | 4,000,000 | | | | 4,051,668 | | | | | |
| Plaquemines Port Harbor & Terminal District, | | | | | | | | | | | | |
| 4.000%, 03/15/2025 | | | | | | | | | | | | |
(Mandatory Tender Date 03/15/2024)(1) | | | 3,050,000 | | | | 3,046,427 | | | | | |
| St. Landry Parish Road District No. 1, | | | | | | | | | | | | |
| 3.250%, 03/01/2025 | | | | | | | | | | | | |
| (Callable 03/01/2024) (Insured by BAM) | | | 210,000 | | | | 209,310 | | | | | |
| St. Tammany Parish Wide | | | | | | | | | | | | |
| School District No. 12: | | | | | | | | | | | | |
| 5.000%, 03/01/2025 | | | 500,000 | | | | 514,769 | | | | | |
| 5.000%, 03/01/2026 | | | 415,000 | | | | 435,611 | | | | | |
| 5.000%, 03/01/2027 | | | 605,000 | | | | 648,635 | | | | | |
| State of Louisiana, | | | | | | | | | | | | |
| 5.000%, 06/15/2034 | | | | | | | | | | | | |
| (Pre-refunded to 06/15/2024) | | | 85,000 | | | | 86,468 | | | | | |
| Total Louisiana | | | | | | | | | | | | |
| (Cost $30,239,048) | | | | | | | 29,587,740 | | | | 1.8 | % |
| Maine | | | | | | | | | | | | |
| Maine State Housing Authority: | | | | | | | | | | | | |
| 2.700%, 11/15/2029 (Callable 11/15/2025) | | | 190,000 | | | | 180,599 | | | | | |
| 3.500%, 11/15/2045 (Callable 05/15/2025) | | | 725,000 | | | | 720,085 | | | | | |
| 4.000%, 11/15/2045 (Callable 11/15/2025) | | | 90,000 | | | | 89,732 | | | | | |
| 4.000%, 11/15/2046 (Callable 05/15/2026) | | | 770,000 | | | | 766,602 | | | | | |
| 3.500%, 11/15/2047 (Callable 11/15/2026) | | | 555,000 | | | | 546,892 | | | | | |
| 4.000%, 11/15/2049 (Callable 05/15/2028) | | | 935,000 | | | | 927,418 | | | | | |
| 4.000%, 11/15/2050 (Callable 05/15/2029) | | | 1,420,000 | | | | 1,408,804 | | | | | |
| 5.000%, 11/15/2052 (Callable 11/15/2031) | | | 3,765,000 | | | | 3,882,487 | | | | | |
| Total Maine | | | | | | | | | | | | |
| (Cost $8,841,240) | | | | | | | 8,522,619 | | | | 0.5 | % |
| Maryland | | | | | | | | | | | | |
| City of Baltimore MD: | | | | | | | | | | | | |
| 5.000%, 07/01/2024 | | | | | | | | | | | | |
| (ETM) (Insured by FGIC) | | | 60,000 | | | | 60,313 | | | | | |
| 5.000%, 10/15/2025 | | | 1,465,000 | | | | 1,529,300 | | | | | |
| County of Frederick MD, | | | | | | | | | | | | |
| 5.000%, 04/01/2027 | | | 1,145,000 | | | | 1,234,024 | | | | | |
| County of Howard MD, | | | | | | | | | | | | |
| 5.000%, 08/15/2026 | | | 3,805,000 | | | | 4,048,551 | | | | | |
| County of Prince George’s MD, | | | | | | | | | | | | |
| 5.000%, 07/15/2026 | | | 1,000,000 | | | | 1,062,065 | | | | | |
| Maryland Community | | | | | | | | | | | | |
| Development Administration: | | | | | | | | | | | | |
| 3.250%, 08/01/2024 (Insured by GNMA) | | | 6,000,000 | | | | 5,883,797 | | | | | |
| 4.050%, 10/01/2024 | | | 2,000,000 | | | | 1,994,672 | | | | | |
| 4.600%, 12/01/2024 | | | 7,545,000 | | | | 7,504,698 | | | | | |
| 3.850%, 03/01/2025 | | | 4,000,000 | | | | 3,949,868 | | | | | |
| 3.750%, 03/01/2050 (Callable 03/01/2029) | | | 2,610,000 | | | | 2,572,761 | | | | | |
| 5.000%, 09/01/2052 (Callable 03/01/2031) | | | | | | | | | | | | |
| (Insured by GNMA) | | | 3,000,000 | | | | 3,091,007 | | | | | |
| Maryland Health & Higher | | | | | | | | | | | | |
| Educational Facilities Authority: | | | | | | | | | | | | |
| 5.000%, 07/01/2024 | | | 3,375,000 | | | | 3,409,532 | | | | | |
| 5.000%, 01/01/2026 | | | 495,000 | | | | 506,839 | | | | | |
| 5.000%, 01/01/2027 | | | 430,000 | | | | 445,764 | | | | | |
| 5.000%, 07/01/2027 | | | | | | | | | | | | |
| (ETM) (Insured by AMBAC) | | | 2,010,000 | | | | 2,082,626 | | | | | |
| 5.000%, 07/01/2045 (Callable 01/01/2027) | | | | | | | | | | | | |
(Mandatory Tender Date 07/01/2027)(1) | | | 3,200,000 | | | | 3,356,726 | | | | | |
The accompanying notes are an integral part of these financial statements.
Baird Short-Term Municipal Bond Fund
Schedule of Investments, June 30, 2023 (Unaudited)
Long-Term Investments (cont.)
| | | Principal | | | | | | % of | |
| | | Amount | | | Value | | | Net Assets | |
| Maryland Stadium Authority, | | | | | | | | | |
| 5.000%, 06/01/2027 | | $ | 1,515,000 | | | $ | 1,627,997 | | | | |
| Montgomery County Housing | | | | | | | | | | | |
| Opportunities Commission, | | | | | | | | | | | |
| 4.000%, 07/01/2048 (Callable 07/01/2026) | | | 250,000 | | | | 248,347 | | | | |
| State of Maryland, | | | | | | | | | | | |
| 5.000%, 03/15/2029 (Callable 03/15/2028) | | | 3,350,000 | | | | 3,689,152 | | | | |
| Total Maryland | | | | | | | | | | | |
| (Cost $49,020,768) | | | | | | | 48,298,039 | | | | 2.9 | % |
| Massachusetts | | | | | | | | | | | | |
| Massachusetts Bay Transportation Authority, | | | | | | | | | | | | |
| 0.000%, 07/01/2030 (Callable 07/01/2026) | | | 9,900,000 | | | | 7,685,179 | | | | | |
| Massachusetts Development Finance Agency: | | | | | | | | | | | | |
| 5.000%, 07/01/2025 | | | 775,000 | | | | 777,975 | | | | | |
| 2.800%, 07/01/2049 | | | | | | | | | | | | |
| (SIFMA Municipal Swap Index + 0.600%) | | | | | | | | | | | | |
| (Callable 07/03/2023) | | | | | | | | | | | | |
(Mandatory Tender Date 01/29/2026)(2)(3) | | | 3,300,000 | | | | 3,263,681 | | | | | |
| Massachusetts Housing Finance Agency: | | | | | | | | | | | | |
| 4.000%, 12/01/2044 (Callable 06/01/2025) | | | 65,000 | | | | 64,766 | | | | | |
| 4.000%, 12/01/2048 (Callable 06/01/2027) | | | | | | | | | | | | |
| (Insured by GNMA) | | | 450,000 | | | | 446,409 | | | | | |
| 4.000%, 12/01/2048 (Callable 06/01/2027) | | | | | | | | | | | | |
| (Insured by GNMA) | | | 260,000 | | | | 258,314 | | | | | |
| 4.000%, 06/01/2049 (Callable 12/01/2028) | | | 565,000 | | | | 560,360 | | | | | |
| Total Massachusetts | | | | | | | | | | | | |
| (Cost $13,447,933) | | | | | | | 13,056,684 | | | | 0.8 | % |
| Michigan | | | | | | | | | | | | |
| Bad Axe Public Schools, | | | | | | | | | | | | |
| 4.000%, 05/01/2027 (Callable 05/01/2024) | | | | | | | | | | | | |
| (Insured by Q-SBLF) | | | 630,000 | | | | 634,630 | | | | | |
| City of Allen Park Brownfield | | | | | | | | | | | | |
| Redevelopment Authority, | | | | | | | | | | | | |
| 4.000%, 05/01/2024 (Insured by BAM) | | | 320,000 | | | | 321,638 | | | | | |
| City of Allen Park MI, | | | | | | | | | | | | |
| 4.000%, 09/01/2023 (Insured by BAM) | | | 300,000 | | | | 300,240 | | | | | |
| City of Kalamazoo MI, | | | | | | | | | | | | |
| 5.000%, 10/01/2023 | | | 50,000 | | | | 50,193 | | | | | |
| Comstock Public Schools, | | | | | | | | | | | | |
| 5.000%, 11/01/2023 (Insured by AGM) | | | 240,000 | | | | 241,292 | | | | | |
| Detroit Wayne County Stadium Authority, | | | | | | | | | | | | |
| 5.000%, 10/01/2026 | | | | | | | | | | | | |
| (Callable 07/31/2023) (Insured by AGM) | | | 90,000 | | | | 90,074 | | | | | |
| Ingham County Brownfield | | | | | | | | | | | | |
| Redevelopment Authority, | | | | | | | | | | | | |
| 4.125%, 08/01/2024 | | | | | | | | | | | | |
| (Callable 07/31/2023) (Insured by AGM) | | | 215,000 | | | | 215,198 | | | | | |
| Michigan Finance Authority: | | | | | | | | | | | | |
| 5.000%, 09/01/2024 | | | 200,000 | | | | 202,783 | | | | | |
| 4.000%, 10/01/2024 | | | 1,350,000 | | | | 1,342,865 | | | | | |
| 5.000%, 07/01/2025 | | | | | | | | | | | | |
| (Callable 07/01/2024) (Insured by AGM) | | | 1,620,000 | | | | 1,643,238 | | | | | |
| 5.000%, 09/01/2025 | | | 200,000 | | | | 203,801 | | | | | |
| 4.000%, 05/01/2026 | | | 60,000 | | | | 61,302 | | | | | |
| 5.000%, 09/01/2026 | | | 200,000 | | | | 206,286 | | | | | |
| 5.500%, 12/01/2026 (Callable 06/01/2025) | | | 635,000 | | | | 657,869 | | | | | |
| 5.000%, 09/01/2027 | | | 280,000 | | | | 292,695 | | | | | |
| 5.000%, 04/01/2028 (Callable 10/01/2026) | | | 1,000,000 | | | | 1,050,550 | | | | | |
| 4.500%, 10/01/2029 (Callable 10/01/2024) | | | 3,000,000 | | | | 2,998,512 | | | | | |
| 5.000%, 07/01/2033 | | | | | | | | | | | | |
| (Callable 07/01/2024) (Insured by AGM) | | | 2,000,000 | | | | 2,029,401 | | | | | |
| 5.000%, 11/15/2044 (Callable 05/16/2026) | | | | | | | | | | | | |
(Mandatory Tender Date 11/16/2026)(1) | | | 3,735,000 | | | | 3,880,829 | | | | | |
| Michigan State Housing | | | | | | | | | | | | |
| Development Authority: | | | | | | | | | | | | |
| 3.500%, 06/01/2024 (Mandatory Tender | | | | | | | | | | | | |
Date 12/01/2023) (Insured by HUD)(1) | | | 3,440,000 | | | | 3,428,060 | | | | | |
| 4.000%, 06/01/2046 (Callable 12/01/2024) | | | 310,000 | | | | 308,921 | | | | | |
| 3.500%, 06/01/2047 (Callable 06/01/2026) | | | 1,930,000 | | | | 1,902,399 | | | | | |
| 3.500%, 12/01/2050 (Callable 06/01/2029) | | | 1,495,000 | | | | 1,462,762 | | | | | |
| 3.000%, 06/01/2052 (Callable 12/01/2030) | | | 900,000 | | | | 864,499 | | | | | |
| 5.500%, 06/01/2053 (Callable 12/01/2031) | | | 2,965,000 | | | | 3,126,571 | | | | | |
| Roseville Community Schools: | | | | | | | | | | | | |
| 5.000%, 05/01/2025 (Insured by Q-SBLF) | | | 2,175,000 | | | | 2,241,653 | | | | | |
| 5.000%, 05/01/2026 (Insured by Q-SBLF) | | | 2,700,000 | | | | 2,833,445 | | | | | |
| 5.000%, 05/01/2027 (Insured by Q-SBLF) | | | 2,265,000 | | | | 2,422,818 | | | | | |
| Southeastern Oakland County | | | | | | | | | | | | |
| Resource Recovery Authority, | | | | | | | | | | | | |
| 4.000%, 07/01/2024 | | | 580,000 | | | | 580,085 | | | | | |
| Total Michigan | | | | | | | | | | | | |
| (Cost $36,140,271) | | | | | | | 35,594,609 | | | | 2.1 | % |
| Minnesota | | | | | | | | | | | | |
| Chaska Independent School District No. 112, | | | | | | | | | | | | |
| 2.500%, 02/01/2029 | | | 2,110,000 | | | | 1,996,372 | | | | | |
| City of Burnsville MN, | | | | | | | | | | | | |
| 2.100%, 12/20/2027 (Callable 12/20/2026) | | | 1,040,000 | | | | 969,293 | | | | | |
| Duluth Economic Development Authority, | | | | | | | | | | | | |
| 5.000%, 06/15/2026 | | | 350,000 | | | | 356,440 | | | | | |
| Duluth Independent School District No. 709, | | | | | | | | | | | | |
| 0.000%, 02/01/2029 (Callable 02/01/2028) | | | | | | | | | | | | |
| (Insured by SD CRED PROG) | | | 1,850,000 | | | | 1,505,995 | | | | | |
| Fergus Falls Independent | | | | | | | | | | | | |
| School District No. 544, | | | | | | | | | | | | |
| 2.500%, 02/01/2024 | | | 105,000 | | | | 104,021 | | | | | |
| Golden Valley Housing & | | | | | | | | | | | | |
| Redevelopment Authority, | | | | | | | | | | | | |
| 4.000%, 02/01/2030 (Callable 02/01/2024) | | | 1,070,000 | | | | 1,076,851 | | | | | |
| Housing & Redevelopment Authority | | | | | | | | | | | | |
| of the City of St. Paul MN: | | | | | | | | | | | | |
| 5.000%, 11/15/2025 | | | 465,000 | | | | 476,426 | | | | | |
| 5.000%, 12/01/2025 | | | 285,000 | | | | 288,332 | | | | | |
| 2.000%, 09/01/2026 (Callable 09/01/2024) | | | 325,000 | | | | 297,387 | | | | | |
| 5.000%, 12/01/2027 | | | 1,065,000 | | | | 1,082,617 | | | | | |
| Minnesota Higher Education | | | | | | | | | | | | |
| Facilities Authority: | | | | | | | | | | | | |
| 3.000%, 12/01/2023 | | | 150,000 | | | | 149,063 | | | | | |
| 5.000%, 03/01/2024 | | | 165,000 | | | | 165,963 | | | | | |
| 4.000%, 12/01/2024 | | | 100,000 | | | | 99,312 | | | | | |
| 5.000%, 03/01/2027 (Callable 03/01/2026) | | | 250,000 | | | | 256,194 | | | | | |
| Minnesota Housing Finance Agency: | | | | | | | | | | | | |
| 4.000%, 01/01/2038 (Callable 01/01/2024) | | | 240,000 | | | | 239,151 | | | | | |
| 2.625%, 01/01/2040 (Callable 07/01/2029) | | | | | | | | | | | | |
| (Insured by GNMA) | | | 4,530,000 | | | | 3,663,828 | | | | | |
| 3.200%, 07/01/2041 | | | | | | | | | | | | |
| (SIFMA Municipal Swap Index + 0.550%) | | | | | | | | | | | | |
| (Callable 07/03/2023) (Mandatory Tender | | | | | | | | | | | | |
Date 12/12/2023) (Insured by GNMA)(2) | | | 310,000 | | | | 309,983 | | | | | |
| 2.800%, 01/01/2044 (Callable 07/01/2029) | | | | | | | | | | | | |
| (Insured by GNMA) | | | 1,200,000 | | | | 1,014,517 | | | | | |
| 3.200%, 01/01/2045 | | | | | | | | | | | | |
| (SIFMA Municipal Swap Index + 0.430%) | | | | | | | | | | | | |
(Insured by GNMA)(2) | | | 210,000 | | | | 210,000 | | | | | |
| 3.500%, 07/01/2046 (Callable 07/01/2025) | | | | | | | | | | | | |
| (Insured by GNMA) | | | 1,535,000 | | | | 1,517,967 | | | | | |
| 4.000%, 01/01/2047 (Callable 01/01/2026) | | | | | | | | | | | | |
| (Insured by GNMA) | | | 75,000 | | | | 74,696 | | | | | |
The accompanying notes are an integral part of these financial statements.
Baird Short-Term Municipal Bond Fund
Schedule of Investments, June 30, 2023 (Unaudited)
Long-Term Investments (cont.)
| | | Principal | | | | | | % of | |
| | | Amount | | | Value | | | Net Assets | |
| Minnesota Housing Finance Agency: (cont.) | | | | | | | | | |
| 4.000%, 07/01/2047 (Callable 01/01/2027) | | | | | | | | | |
| (Insured by GNMA) | | $ | 185,000 | | | $ | 184,083 | | | | |
| 3.000%, 07/01/2052 (Callable 07/01/2031) | | | | | | | | | | | |
| (Insured by GNMA) | | | 4,825,000 | | | | 4,628,074 | | | | |
| Northern Municipal Power Agency, | | | | | | | | | | | |
| 5.000%, 01/01/2027 (Callable 07/31/2023) | | | 230,000 | | | | 230,272 | | | | |
| Zumbro Education District, | | | | | | | | | | | |
| 4.000%, 02/01/2025 | | | 330,000 | | | | 329,208 | | | | |
| Total Minnesota | | | | | | | | | | | |
| (Cost $23,459,548) | | | | | | | 21,226,045 | | | | 1.3 | % |
| Mississippi | | | | | | | | | | | | |
| Brookhaven School District, | | | | | | | | | | | | |
| 3.000%, 08/01/2023 (Insured by AGM) | | | 200,000 | | | | 199,936 | | | | | |
| City of Oxford MS, | | | | | | | | | | | | |
| 3.000%, 09/01/2024 | | | 170,000 | | | | 165,271 | | | | | |
| City of Ridgeland MS, | | | | | | | | | | | | |
| 3.000%, 10/01/2024 | | | 1,505,000 | | | | 1,488,385 | | | | | |
| City of Yazoo MS, | | | | | | | | | | | | |
| 3.000%, 03/01/2026 (Insured by AGM) | | | 130,000 | | | | 129,521 | | | | | |
| County of Warren MS, | | | | | | | | | | | | |
| 2.900%, 09/01/2032 | | | | | | | | | | | | |
(Mandatory Tender Date 09/01/2023)(1) | | | 800,000 | | | | 798,620 | | | | | |
| Mississippi Business Finance Corp., | | | | | | | | | | | | |
| 3.200%, 09/01/2028 (Callable 03/13/2024) | | | 2,460,000 | | | | 2,417,297 | | | | | |
| Mississippi Development Bank: | | | | | | | | | | | | |
5.000%, 10/01/2023(3) | | | 400,000 | | | | 400,393 | | | | | |
| 5.000%, 11/01/2023 | | | 530,000 | | | | 532,031 | | | | | |
| 5.000%, 03/01/2024 (Insured by AGM) | | | 50,000 | | | | 50,538 | | | | | |
5.000%, 10/01/2024(3) | | | 460,000 | | | | 463,159 | | | | | |
| 5.000%, 11/01/2024 | | | 720,000 | | | | 731,808 | | | | | |
| 5.000%, 11/01/2025 (Insured by BAM) | | | 240,000 | | | | 248,634 | | | | | |
| 5.000%, 09/01/2027 | | | 485,000 | | | | 500,961 | | | | | |
| 5.000%, 07/01/2028 | | | 170,000 | | | | 183,836 | | | | | |
| 5.000%, 09/01/2028 | | | 575,000 | | | | 597,959 | | | | | |
| 5.000%, 11/01/2029 (Callable 11/01/2027) | | | 300,000 | | | | 306,324 | | | | | |
| Mississippi Home Corp.: | | | | | | | | | | | | |
| 5.000%, 06/01/2028 (Insured by GNMA) | | | 1,250,000 | | | | 1,361,579 | | | | | |
| 4.000%, 12/01/2048 (Callable 06/01/2028) | | | | | | | | | | | | |
| (Insured by GNMA) | | | 285,000 | | | | 282,658 | | | | | |
| 3.500%, 12/01/2049 (Callable 12/01/2028) | | | | | | | | | | | | |
| (Insured by GNMA) | | | 625,000 | | | | 612,606 | | | | | |
| Mississippi Hospital Equipment | | | | | | | | | | | | |
| & Facilities Authority, | | | | | | | | | | | | |
| 5.000%, 10/01/2040 (Callable 12/01/2026) | | | | | | | | | | | | |
(Mandatory Tender Date 03/01/2027)(1) | | | 1,065,000 | | | | 1,112,101 | | | | | |
| Natchez-Adams School District, | | | | | | | | | | | | |
| 5.000%, 02/01/2027 | | | 380,000 | | | | 399,552 | | | | | |
| Total Mississippi | | | | | | | | | | | | |
| (Cost $13,302,151) | | | | | | | 12,983,169 | | | | 0.8 | % |
| Missouri | | | | | | | | | | | | |
| Arnold Retail Corridor Transportation | | | | | | | | | | | | |
| Development District, | | | | | | | | | | | | |
| 3.000%, 11/01/2028 (Callable 11/01/2024) | | | 185,000 | | | | 174,166 | | | | | |
| City of St. Louis MO, | | | | | | | | | | | | |
| 5.000%, 07/01/2023 (Insured by AGM) | | | 415,000 | | | | 415,000 | | | | | |
| Hanley Road Corridor Transportation | | | | | | | | | | | | |
| Development District, | | | | | | | | | | | | |
| 2.000%, 10/01/2039 (Callable 10/01/2029) | | | 1,155,000 | | | | 1,127,899 | | | | | |
| Health & Educational Facilities Authority | | | | | | | | | | | | |
| of the State of Missouri: | | | | | | | | | | | | |
| 3.000%, 08/01/2023 | | | 140,000 | | | | 139,783 | | | | | |
| 5.000%, 09/01/2023 | | | 285,000 | | | | 285,349 | | | | | |
| 5.000%, 09/01/2024 | | | 295,000 | | | | 296,778 | | | | | |
| 4.000%, 08/01/2025 | | | 150,000 | | | | 146,531 | | | | | |
| 5.000%, 08/01/2025 (Callable 08/01/2024) | | | 350,000 | | | | 348,695 | | | | | |
| 5.000%, 02/01/2029 (Callable 02/01/2024) | | | 4,775,000 | | | | 4,778,017 | | | | | |
| 5.000%, 02/01/2029 (Callable 02/01/2026) | | | 215,000 | | | | 215,608 | | | | | |
| 5.000%, 02/01/2029 (Callable 02/01/2026) | | | 1,195,000 | | | | 1,198,383 | | | | | |
| 5.000%, 02/01/2030 (Callable 02/01/2026) | | | 440,000 | | | | 440,193 | | | | | |
| Missouri Housing Development Commission: | | | | | | | | | | | | |
| 3.400%, 11/01/2030 (Callable 11/01/2024) | | | | | | | | | | | | |
| (Insured by GNMA) | | | 45,000 | | | | 43,955 | | | | | |
| 3.250%, 11/01/2052 (Callable 11/01/2030) | | | | | | | | | | | | |
| (Insured by GNMA) | | | 3,805,000 | | | | 3,683,376 | | | | | |
| 4.750%, 11/01/2052 (Callable 05/01/2032) | | | | | | | | | | | | |
| (Insured by GNMA) | | | 4,140,000 | | | | 4,228,990 | | | | | |
| Missouri Joint Municipal | | | | | | | | | | | | |
| Electric Utility Commission, | | | | | | | | | | | | |
| 5.000%, 12/01/2027 (Callable 06/01/2025) | | | 2,125,000 | | | | 2,182,152 | | | | | |
| Missouri Southern State University: | | | | | | | | | | | | |
| 5.000%, 10/01/2026 (Insured by AGM) | | | 105,000 | | | | 110,242 | | | | | |
| 5.000%, 10/01/2027 (Insured by AGM) | | | 100,000 | | | | 106,824 | | | | | |
| Move Rolla Transportation | | | | | | | | | | | | |
| Development District, | | | | | | | | | | | | |
| 3.750%, 06/01/2029 (Callable 06/01/2026) | | | 10,000 | | | | 9,706 | | | | | |
| Northwest Missouri State University, | | | | | | | | | | | | |
| 5.000%, 06/01/2026 (Insured by BAM) | | | 500,000 | | | | 519,516 | | | | | |
| St. Joseph Industrial Development Authority, | | | | | | | | | | | | |
| 3.350%, 01/01/2024 | | | 125,000 | | | | 123,437 | | | | | |
| St. Louis Land Clearance for | | | | | | | | | | | | |
| Redevelopment Authority, | | | | | | | | | | | | |
| 4.250%, 06/01/2026 | | | 2,655,000 | | | | 2,651,136 | | | | | |
| Total Missouri | | | | | | | | | | | | |
| (Cost $23,707,637) | | | | | | | 23,225,736 | | | | 1.4 | % |
| Montana | | | | | | | | | | | | |
| City of Forsyth MT: | | | | | | | | | | | | |
| 3.875%, 07/01/2028 (Callable 04/02/2028) | | | 2,400,000 | | | | 2,407,548 | | | | | |
| 3.900%, 03/01/2031 | | | | | | | | | | | | |
(Callable 07/31/2023)(1) | | | 11,000,000 | | | | 10,658,738 | | | | | |
| City of Red Lodge MT, | | | | | | | | | | | | |
| 2.000%, 07/01/2023 (Insured by BAM) | | | 270,000 | | | | 270,000 | | | | | |
| Montana Board of Housing: | | | | | | | | | | | | |
| 3.500%, 08/01/2025 | | | | | | | | | | | | |
(Mandatory Tender Date 08/01/2024)(1) | | | 4,000,000 | | | | 3,977,919 | | | | | |
| 4.750%, 12/01/2025 | | | | | | | | | | | | |
(Mandatory Tender Date 12/01/2024)(1) | | | 7,000,000 | | | | 7,070,048 | | | | | |
| 4.000%, 12/01/2043 (Callable 12/01/2027) | | | 520,000 | | | | 515,987 | | | | | |
| 4.000%, 06/01/2049 | | | | | | | | | | | | |
| (Callable 12/01/2027) (Insured by FHA) | | | 550,000 | | | | 545,828 | | | | | |
| 6.000%, 06/01/2053 (Callable 06/01/2032) | | | 2,140,000 | | | | 2,316,547 | | | | | |
| Montana Facility Finance Authority: | | | | | | | | | | | | |
| 4.000%, 07/01/2025 | | | 155,000 | | | | 154,459 | | | | | |
| 5.000%, 07/01/2025 (Insured by MT BRD) | | | 110,000 | | | | 113,784 | | | | | |
| 4.000%, 07/01/2026 | | | 330,000 | | | | 328,979 | | | | | |
| Total Montana | | | | | | | | | | | | |
| (Cost $28,776,011) | | | | | | | 28,359,837 | | | | 1.7 | % |
| Nebraska | | | | | | | | | | | | |
| Douglas County Hospital Authority No. 2, | | | | | | | | | | | | |
| 5.000%, 05/15/2030 (Callable 05/15/2024) | | | 1,500,000 | | | | 1,508,345 | | | | | |
| Nebraska Investment Finance Authority, | | | | | | | | | | | | |
| 3.000%, 03/01/2052 (Callable 03/01/2031) | | | | | | | | | | | | |
| (Insured by GNMA) | | | 4,760,000 | | | | 4,552,660 | | | | | |
The accompanying notes are an integral part of these financial statements.
Baird Short-Term Municipal Bond Fund
Schedule of Investments, June 30, 2023 (Unaudited)
Long-Term Investments (cont.)
| | | Principal | | | | | | % of | |
| | | Amount | | | Value | | | Net Assets | |
| Papio-Missouri River | | | | | | | | | |
| Natural Resources District, | | | | | | | | | |
| 3.000%, 12/01/2029 (Callable 10/12/2026) | | $ | 330,000 | | | $ | 328,015 | | | | |
| Total Nebraska | | | | | | | | | | | |
| (Cost $6,613,731) | | | | | | | 6,389,020 | | | | 0.4 | % |
| Nevada | | | | | | | | | | | | |
| City of Reno NV, | | | | | | | | | | | | |
| 5.000%, 06/01/2031 (Insured by AGM) | | | — | | | | — | | | | | |
| City of Yerington NV, | | | | | | | | | | | | |
| 1.625%, 11/01/2023 (Callable 07/31/2023) | | | | | | | | | | | | |
| (Insured by USDA) | | | 7,000,000 | | | | 6,937,525 | | | | | |
| County of Clark NV: | | | | | | | | | | | | |
| 5.000%, 07/01/2025 | | | 490,000 | | | | 507,717 | | | | | |
| 5.000%, 12/01/2026 | | | 1,430,000 | | | | 1,527,768 | | | | | |
| Las Vegas Redevelopment Agency: | | | | | | | | | | | | |
| 5.000%, 06/15/2026 | | | 1,000,000 | | | | 1,029,827 | | | | | |
| 3.000%, 06/15/2032 (Callable 06/15/2026) | | | 790,000 | | | | 726,102 | | | | | |
| Nevada Housing Division: | | | | | | | | | | | | |
| 4.000%, 10/01/2049 (Callable 10/01/2028) | | | | | | | | | | | | |
| (Insured by GNMA) | | | 900,000 | | | | 892,831 | | | | | |
| 3.000%, 04/01/2051 (Callable 10/01/2030) | | | | | | | | | | | | |
| (Insured by GNMA) | | | 1,225,000 | | | | 1,178,222 | | | | | |
| Total Nevada | | | | | | | | | | | | |
| (Cost $13,096,241) | | | | | | | 12,799,992 | | | | 0.8 | % |
| New Hampshire | | | | | | | | | | | | |
| Hollis School District, | | | | | | | | | | | | |
| 2.769%, 06/28/2027 | | | | | | | | | | | | |
(Callable 07/21/2023)(3) | | | 1,212,469 | | | | 1,144,589 | | | | | |
| New Hampshire Business Finance Authority, | | | | | | | | | | | | |
| 4.000%, 01/01/2028 (Callable 01/01/2026) | | | 575,000 | | | | 555,942 | | | | | |
| Total New Hampshire | | | | | | | | | | | | |
| (Cost $1,827,220) | | | | | | | 1,700,531 | | | | 0.1 | % |
| New Jersey | | | | | | | | | | | | |
| Atlantic City Board of Education: | | | | | | | | | | | | |
3.400%, 08/15/2023(3) | | | 171,000 | | | | 170,828 | | | | | |
3.400%, 08/15/2024(3) | | | 793,000 | | | | 787,529 | | | | | |
| City of Atlantic City NJ, | | | | | | | | | | | | |
| 5.000%, 03/01/2024 (Insured by BAM) | | | 300,000 | | | | 302,973 | | | | | |
| City of Trenton NJ, | | | | | | | | | | | | |
| 4.000%, 07/15/2023 (Insured by AGM) | | | 200,000 | | | | 200,042 | | | | | |
| City of Union City NJ, | | | | | | | | | | | | |
| 5.000%, 11/01/2023 (Insured by ST AID) | | | 1,435,000 | | | | 1,440,730 | | | | | |
| New Jersey Economic Development Authority: | | | | | | | | | | | | |
| 5.000%, 06/15/2024 | | | 390,000 | | | | 395,777 | | | | | |
| 5.250%, 07/01/2025 (Insured by NATL) | | | 380,000 | | | | 390,524 | | | | | |
| 3.450%, 09/01/2025 (SIFMA Municipal | | | | | | | | | | | | |
| Swap Index + 1.250%) (Callable | | | | | | | | | | | | |
03/01/2025) (Insured by ST AID)(2) | | | 20,000 | | | | 20,021 | | | | | |
| 5.000%, 06/15/2026 (Callable 06/15/2024) | | | 400,000 | | | | 406,910 | | | | | |
| 3.125%, 07/01/2029 (Callable 07/01/2027) | | | 935,000 | | | | 892,533 | | | | | |
| New Jersey Health Care | | | | | | | | | | | | |
| Facilities Financing Authority, | | | | | | | | | | | | |
| 5.000%, 07/01/2043 (Callable 04/01/2024) | | | | | | | | | | | | |
(Mandatory Tender Date 07/01/2024)(1) | | | 2,250,000 | | | | 2,285,271 | | | | | |
| New Jersey Housing & | | | | | | | | | | | | |
| Mortgage Finance Agency: | | | | | | | | | | | | |
| 3.125%, 02/01/2025 (Callable 02/01/2024) | | | | | | | | | | | | |
| (Mandatory Tender Date 08/01/2024) | | | | | | | | | | | | |
(Insured by HUD)(1) | | | 1,000,000 | | | | 985,584 | | | | | |
| 5.000%, 05/01/2025 (Insured by HUD) | | | 2,190,000 | | | | 2,220,617 | | | | | |
| 5.000%, 11/01/2025 (Insured by HUD) | | | 1,615,000 | | | | 1,641,268 | | | | | |
| 3.600%, 05/01/2026 (Insured by HUD) | | | 3,045,000 | | | | 3,045,357 | | | | | |
| 4.500%, 10/01/2048 (Callable 10/01/2027) | | | 475,000 | | | | 476,990 | | | | | |
| 4.750%, 10/01/2050 (Callable 04/01/2028) | | | 1,055,000 | | | | 1,064,678 | | | | | |
| 5.000%, 10/01/2053 (Callable 04/01/2031) | | | 3,390,000 | | | | 3,504,649 | | | | | |
| New Jersey Transportation | | | | | | | | | | | | |
| Trust Fund Authority: | | | | | | | | | | | | |
| 0.000%, 12/15/2026 (Insured by AMBAC) | | | 210,000 | | | | 185,953 | | | | | |
| 0.000%, 12/15/2027 (Insured by BAM) | | | 2,245,000 | | | | 1,926,276 | | | | | |
| 0.000%, 12/15/2027 (Insured by NATL) | | | 130,000 | | | | 111,495 | | | | | |
| 0.000%, 12/15/2028 (Insured by BAM) | | | 4,850,000 | | | | 4,014,310 | | | | | |
| 0.000%, 12/15/2029 (Insured by AGM) | | | 3,190,000 | | | | 2,540,369 | | | | | |
| Newark Housing Authority, | | | | | | | | | | | | |
| 5.000%, 12/01/2028 | | | | | | | | | | | | |
| (Callable 12/01/2026) (Insured by AGM) | | | 1,500,000 | | | | 1,594,081 | | | | | |
| Passaic Valley Sewerage Commission, | | | | | | | | | | | | |
| 3.000%, 12/01/2029 | | | | | | | | | | | | |
| (Callable 12/01/2028) (Insured by AGM) | | | 2,000,000 | | | | 1,970,804 | | | | | |
| Salem County Improvement Authority, | | | | | | | | | | | | |
| 4.000%, 08/15/2026 (Insured by AGM) | | | 475,000 | | | | 478,530 | | | | | |
| Township of Mahwah NJ, | | | | | | | | | | | | |
| 1.000%, 01/15/2026 | | | 1,320,000 | | | | 1,237,923 | | | | | |
| Washington Township | | | | | | | | | | | | |
| Municipal Utilities Authority, | | | | | | | | | | | | |
| 0.000%, 12/15/2023 (Insured by NATL) | | | 25,000 | | | | 24,590 | | | | | |
| Total New Jersey | | | | | | | | | | | | |
| (Cost $34,824,865) | | | | | | | 34,316,612 | | | | 2.1 | % |
| New Mexico | | | | | | | | | | | | |
| Los Lunas School District No. 1, | | | | | | | | | | | | |
| 2.000%, 07/15/2024 (Callable 07/31/2023) | | | | | | | | | | | | |
| (Insured by ST AID) | | | 800,000 | | | | 783,327 | | | | | |
| New Mexico Mortgage Finance Authority: | | | | | | | | | | | | |
| 3.500%, 03/01/2045 (Callable 03/01/2026) | | | 50,000 | | | | 49,104 | | | | | |
| 3.750%, 03/01/2048 (Callable 03/01/2027) | | | | | | | | | | | | |
| (Insured by GNMA) | | | 240,000 | | | | 236,718 | | | | | |
| 4.250%, 07/01/2049 (Callable 01/01/2028) | | | | | | | | | | | | |
| (Insured by GNMA) | | | 255,000 | | | | 254,312 | | | | | |
| 3.750%, 01/01/2050 (Callable 01/01/2029) | | | | | | | | | | | | |
| (Insured by GNMA) | | | 1,565,000 | | | | 1,543,035 | | | | | |
| 4.250%, 01/01/2050 (Callable 07/01/2028) | | | | | | | | | | | | |
| (Insured by GNMA) | | | 1,800,000 | | | | 1,795,300 | | | | | |
| 3.000%, 01/01/2052 (Callable 07/01/2030) | | | | | | | | | | | | |
| (Insured by GNMA) | | | 3,870,000 | | | | 3,724,001 | | | | | |
| Roswell Independent School District, | | | | | | | | | | | | |
| 3.000%, 08/01/2024 (Insured by ST AID) | | | 545,000 | | | | 542,021 | | | | | |
| Total New Mexico | | | | | | | | | | | | |
| (Cost $9,244,637) | | | | | | | 8,927,818 | | | | 0.5 | % |
| New York | | | | | | | | | | | | |
| Albany Capital Resource Corp., | | | | | | | | | | | | |
| 5.000%, 05/01/2027 (Callable 05/01/2026) | | | 1,000,000 | | | | 1,038,019 | | | | | |
| Albany County Capital Resource Corp., | | | | | | | | | | | | |
| 2.600%, 07/01/2025 | | | 640,000 | | | | 618,169 | | | | | |
| Amherst Industrial Development Agency, | | | | | | | | | | | | |
| 3.900%, 04/01/2026 (Mandatory Tender | | | | | | | | | | | | |
Date 04/01/2025) (Insured by FHA)(1) | | | 8,250,000 | | | | 8,251,405 | | | | | |
| City of Amsterdam NY, | | | | | | | | | | | | |
| 5.000%, 06/20/2024 | | | 1,597,914 | | | | 1,602,146 | | | | | |
| City of New York NY, | | | | | | | | | | | | |
| 5.000%, 06/01/2044 (Callable 06/01/2025) | | | | | | | | | | | | |
(Mandatory Tender Date 12/01/2025)(1) | | | 4,000,000 | | | | 4,124,737 | | | | | |
| City of Poughkeepsie NY: | | | | | | | | | | | | |
| 4.000%, 04/15/2024 | | | 280,000 | | | | 278,642 | | | | | |
| 4.000%, 04/15/2026 | | | 450,000 | | | | 444,970 | | | | | |
The accompanying notes are an integral part of these financial statements.
Baird Short-Term Municipal Bond Fund
Schedule of Investments, June 30, 2023 (Unaudited)
Long-Term Investments (cont.)
| | | Principal | | | | | | % of | |
| | | Amount | | | Value | | | Net Assets | |
| Genesee Valley Central School District: | | | | | | | | | |
| 5.000%, 06/15/2027 (Insured by AGM) | | $ | 1,390,000 | | | $ | 1,498,708 | | | | |
| 5.000%, 06/15/2028 (Insured by AGM) | | | 1,460,000 | | | | 1,608,448 | | | | |
| Geneva Development Corp.: | | | | | | | | | | | |
| 5.000%, 09/01/2023 (ETM) | | | 30,000 | | | | 30,080 | | | | |
| 5.000%, 09/01/2024 | | | | | | | | | | | |
| (Pre-refunded to 09/01/2023) | | | 50,000 | | | | 50,134 | | | | |
| Hempstead Town Local Development Corp., | | | | | | | | | | | |
| 5.000%, 07/01/2025 (Callable 07/31/2023) | | | 815,000 | | | | 815,908 | | | | |
| Huntington Local Development Corp.: | | | | | | | | | | | |
| 3.000%, 07/01/2025 | | | 130,000 | | | | 130,000 | | | | |
| 4.000%, 07/01/2027 | | | 5,050,000 | | | | 4,823,680 | | | | |
| Long Island Power Authority, | | | | | | | | | | | |
| 4.394%, 05/01/2033 | | | | | | | | | | | |
| (1 Month LIBOR USD + 0.750%) | | | | | | | | | | | |
| (Callable 07/31/2023) | | | | | | | | | | | |
(Mandatory Tender Date 10/01/2023)(2) | | | 3,235,000 | | | | 3,236,413 | | | | |
| New York City Housing Development Corp.: | | | | | | | | | | | |
| 2.950%, 11/01/2045 (Callable 05/01/2025) | | | | | | | | | | | |
| (Mandatory Tender Date 02/01/2026) | | | | | | | | | | | |
(Insured by FNMA)(1) | | | 225,000 | | | | 220,950 | | | | |
| 3.000%, 02/15/2048 (Callable 05/15/2024) | | | 8,000,000 | | | | 7,841,796 | | | | |
| 3.500%, 02/15/2048 (Callable 05/15/2024) | | | 5,100,000 | | | | 5,003,606 | | | | |
| 2.750%, 05/01/2050 (Callable 07/17/2023) | | | | | | | | | | | |
(Mandatory Tender Date 12/29/2023)(1) | | | 300,000 | | | | 298,329 | | | | |
| 0.700%, 11/01/2060 (Callable 07/21/2023) | | | | | | | | | | | |
| (Mandatory Tender Date 05/01/2025) | | | | | | | | | | | |
(Insured by FHA)(1) | | | 2,590,000 | | | | 2,409,704 | | | | |
| 0.600%, 05/01/2061 (Callable 07/21/2023) | | | | | | | | | | | |
| (Mandatory Tender Date 07/01/2025) | | | | | | | | | | | |
(Insured by FHA)(1) | | | 1,520,000 | | | | 1,406,483 | | | | |
| 3.400%, 11/01/2062 (Callable 05/01/2025) | | | | | | | | | | | |
| (Mandatory Tender Date 12/22/2026) | | | | | | | | | | | |
(Insured by FHA)(1) | | | 4,000,000 | | | | 3,940,966 | | | | |
| New York State Dormitory Authority: | | | | | | | | | | | |
| 5.000%, 02/15/2028 (Callable 02/15/2024) | | | 1,180,000 | | | | 1,192,737 | | | | |
| 5.000%, 07/01/2028 (Callable 07/01/2025) | | | 505,000 | | | | 518,736 | | | | |
| 5.000%, 05/01/2048 (Callable 11/01/2023) | | | | | | | | | | | |
(Mandatory Tender Date 05/01/2024)(1) | | | 2,000,000 | | | | 2,008,567 | | | | |
| New York State Housing Finance Agency: | | | | | | | | | | | |
| 0.700%, 11/01/2024 (Callable 07/21/2023) | | | | | | | | | | | |
| (Insured by SONYMA) | | | 2,500,000 | | | | 2,400,542 | | | | |
| 1.600%, 11/01/2024 (Callable 07/21/2023) | | | 8,430,000 | | | | 8,175,654 | | | | |
| 0.750%, 05/01/2025 (Callable 07/21/2023) | | | | | | | | | | | |
| (Insured by SONYMA) | | | 4,820,000 | | | | 4,497,382 | | | | |
| 0.750%, 11/01/2025 (Callable 07/21/2023) | | | | | | | | | | | |
| (Insured by SONYMA) | | | 7,525,000 | | | | 6,944,535 | | | | |
| 0.650%, 11/01/2056 (Callable 07/21/2023) | | | | | | | | | | | |
| (Mandatory Tender Date 11/01/2025) | | | | | | | | | | | |
(Insured by SONYMA)(1) | | | 4,300,000 | | | | 3,945,508 | | | | |
| Oneida County Local Development Corp., | | | | | | | | | | | |
| 5.000%, 12/01/2029 (Callable 12/01/2023) | | | | | | | | | | | |
| (Insured by AGM) | | | 715,000 | | | | 720,470 | | | | |
| State of New York Mortgage Agency: | | | | | | | | | | | |
| 3.500%, 10/01/2043 (Callable 07/17/2023) | | | 25,000 | | | | 24,856 | | | �� | |
| 4.000%, 10/01/2046 (Callable 04/01/2025) | | | 110,000 | | | | 109,565 | | | | |
| Town of Oyster Bay NY, | | | | | | | | | | | |
| 4.000%, 02/15/2026 (Insured by BAM) | | | 95,000 | | | | 97,563 | | | | |
| Triborough Bridge & Tunnel Authority, | | | | | | | | | | | |
| 3.770%, 01/01/2032 (SOFR + 0.380%) | | | | | | | | | | | |
| (Callable 11/01/2023) | | | | | | | | | | | |
(Mandatory Tender Date 02/01/2024)(2) | | | 2,765,000 | | | | 2,749,099 | | | | |
| Village of Island Park NY, | | | | | | | | | | | |
| 4.950%, 03/01/2024 | | | 1,515,000 | | | | 1,513,787 | | | | |
| Westchester County Local Development Corp.: | | | | | | | | | | | |
2.875%, 07/01/2026(3) | |
| 1,000,000 | | | | 953,436 | | | | |
3.200%, 07/01/2028(3) | | | 5,855,000 | | | | 5,478,922 | | | | |
| Total New York | | | | | | | | | | | |
| (Cost $92,923,519) | | | | | | | 91,004,652 | | | | 5.5 | % |
| North Carolina | | | | | | | | | | | | |
| City of Raleigh NC, | | | | | | | | | | | | |
| 5.000%, 09/01/2027 | | | 750,000 | | | | 817,087 | | | | | |
| County of Forsyth NC, | | | | | | | | | | | | |
| 5.000%, 06/01/2027 | | | 4,915,000 | | | | 5,328,807 | | | | | |
| County of Wake NC, | | | | | | | | | | | | |
| 5.000%, 11/01/2027 | | | 1,140,000 | | | | 1,247,463 | | | | | |
| Inlivian: | | | | | | | | | | | | |
| 2.375%, 04/01/2025 | | | | | | | | | | | | |
(Mandatory Tender Date 04/01/2024)(1) | | | 8,332,000 | | | | 8,250,820 | | | | | |
| 5.000%, 06/01/2043 (Callable 12/01/2025) | | | | | | | | | | | | |
| (Mandatory Tender Date 06/01/2026) | | | | | | | | | | | | |
(Insured by HUD)(1) | | | 5,348,000 | | | | 5,483,800 | | | | | |
| North Carolina Housing Finance Agency: | | | | | | | | | | | | |
| 4.000%, 07/01/2048 (Callable 07/01/2027) | | | | | | | | | | | | |
| (Insured by GNMA) | | | 215,000 | | | | 213,315 | | | | | |
| 4.000%, 07/01/2050 (Callable 07/01/2029) | | | 2,600,000 | | | | 2,579,305 | | | | | |
| 6.000%, 07/01/2053 (Callable 07/01/2031) | | | | | | | | | | | | |
| (Insured by GNMA) | | | 4,200,000 | | | | 4,526,841 | | | | | |
| North Carolina Medical Care Commission, | | | | | | | | | | | | |
| 4.000%, 10/01/2027 | | | 1,020,000 | | | | 1,006,261 | | | | | |
| Raleigh Housing Authority: | | | | | | | | | | | | |
| 5.000%, 10/01/2026 | | | | | | | | | | | | |
(Mandatory Tender Date 10/01/2025)(1) | | | 4,000,000 | | | | 4,069,505 | | | | | |
| 5.000%, 12/01/2026 | | | | | | | | | | | | |
| (Mandatory Tender Date 12/01/2025) | | | | | | | | | | | | |
(Insured by FHA)(1) | | | 4,000,000 | | | | 4,090,486 | | | | | |
| Total North Carolina | | | | | | | | | | | | |
| (Cost $38,007,036) | | | | | | | 37,613,690 | | | | 2.3 | % |
| North Dakota | | | | | | | | | | | | |
| Cass County Joint Water Resource District, | | | | | | | | | | | | |
| 0.480%, 05/01/2024 (Callable 07/31/2023) | | | 2,500,000 | | | | 2,406,559 | | | | | |
| City of Horace ND: | | | | | | | | | | | | |
| 4.000%, 01/01/2025 (Callable 01/01/2024) | | | 2,000,000 | | | | 2,001,012 | | | | | |
| 3.000%, 05/01/2025 | | | 250,000 | | | | 240,463 | | | | | |
| 3.000%, 05/01/2025 | | | 205,000 | | | | 197,180 | | | | | |
| 5.125%, 07/01/2025 (Callable 07/01/2024) | | | 1,000,000 | | | | 1,000,222 | | | | | |
| 3.000%, 05/01/2026 | | | 345,000 | | | | 327,064 | | | | | |
| 3.000%, 05/01/2026 | | | 100,000 | | | | 94,801 | | | | | |
| 3.000%, 05/01/2027 (Callable 05/01/2026) | | | 265,000 | | | | 248,076 | | | | | |
| 3.000%, 05/01/2028 (Callable 05/01/2027) | | | 305,000 | | | | 282,190 | | | | | |
| 5.000%, 05/01/2031 | | | 3,465,000 | | | | 3,628,537 | | | | | |
| City of Mayville ND, | | | | | | | | | | | | |
| 3.750%, 08/01/2025 (Callable 08/01/2023) | | | 4,000,000 | | | | 3,862,632 | | | | | |
| City of Watford City ND, | | | | | | | | | | | | |
| 3.000%, 12/01/2023 (Insured by AGM) | | | 1,825,000 | | | | 1,814,856 | | | | | |
| County of McKenzie ND, | | | | | | | | | | | | |
| 5.000%, 08/01/2023 | | | 1,120,000 | | | | 1,120,613 | | | | | |
| County of Ward ND, | | | | | | | | | | | | |
| 4.000%, 04/01/2024 (Callable 07/31/2023) | | | | | | | | | | | | |
| (Insured by AGM) | | | 400,000 | | | | 400,361 | | | | | |
| Jamestown Park District, | | | | | | | | | | | | |
| 2.900%, 07/01/2035 (Callable 07/01/2023) | | | 95,000 | | | | 95,000 | | | | | |
| North Dakota Housing Finance Agency: | | | | | | | | | | | | |
| 4.000%, 07/01/2048 (Callable 01/01/2027) | | | 330,000 | | | | 327,672 | | | | | |
| 4.000%, 01/01/2051 (Callable 07/01/2029) | | | 2,010,000 | | | | 1,994,001 | | | | | |
| 3.000%, 07/01/2052 (Callable 01/01/2031) | | | 2,815,000 | | | | 2,695,264 | | | | | |
The accompanying notes are an integral part of these financial statements.
Baird Short-Term Municipal Bond Fund
Schedule of Investments, June 30, 2023 (Unaudited)
Long-Term Investments (cont.)
| | | Principal | | | | | | % of | |
| | | Amount | | | Value | | | Net Assets | |
| Williston Parks & Recreation District: | | | | | | | | | |
| 4.500%, 03/01/2025 (Callable 07/17/2023) | | $ | 300,000 | | | $ | 295,034 | | | | |
| 4.625%, 03/01/2026 (Callable 07/17/2023) | | | 2,620,000 | | | | 2,552,492 | | | | |
| Williston Public School District No. 1, | | | | | | | | | | | |
| 3.000%, 08/01/2026 (Callable 08/01/2024) | | | | | | | | | | | |
| (Insured by SD CRED PROG) | | | 1,015,000 | | | | 999,833 | | | | |
| Total North Dakota | | | | | | | | | | | |
| (Cost $27,478,563) | | | | | | | 26,583,862 | | | | 1.6 | % |
| Ohio | | | | | | | | | | | | |
| Akron Bath Copley Joint | | | | | | | | | | | | |
| Township Hospital District: | | | | | | | | | | | | |
| 5.000%, 11/15/2025 | | | 50,000 | | | | 51,115 | | | | | |
| 5.000%, 11/15/2026 | | | 120,000 | | | | 123,876 | | | | | |
| 5.000%, 11/15/2028 | | | 1,240,000 | | | | 1,300,542 | | | | | |
| American Municipal Power, Inc., | | | | | | | | | | | | |
| 5.250%, 11/29/2023 (Insured by ST AID) | | | 1,105,000 | | | | 1,110,345 | | | | | |
| City of Cleveland OH, | | | | | | | | | | | | |
| 5.000%, 10/01/2031 (Callable 04/01/2028) | | | 1,070,000 | | | | 1,171,442 | | | | | |
| City of Gahanna OH, | | | | | | | | | | | | |
| 5.000%, 11/02/2023 | | | 5,000,000 | | | | 5,012,548 | | | | | |
| City of Huron OH, | | | | | | | | | | | | |
| 3.125%, 12/01/2024 | | | 225,000 | | | | 221,528 | | | | | |
| City of Kirtland OH, | | | | | | | | | | | | |
| 4.250%, 04/18/2024 (Insured by ST AID) | | | 1,002,000 | | | | 1,003,112 | | | | | |
| City of Lorain OH: | | | | | | | | | | | | |
| 3.000%, 12/01/2023 (Insured by BAM) | | | 185,000 | | | | 184,704 | | | | | |
| 3.000%, 12/01/2024 (Insured by BAM) | | | 130,000 | | | | 129,664 | | | | | |
| 3.000%, 12/01/2025 (Insured by BAM) | | | 135,000 | | | | 133,808 | | | | | |
| 3.000%, 12/01/2026 (Insured by BAM) | | | 135,000 | | | | 134,016 | | | | | |
| City of Middleburg Heights OH: | | | | | | | | | | | | |
| 4.000%, 08/01/2025 | | | 165,000 | | | | 166,273 | | | | | |
| 5.000%, 08/01/2026 | | | 270,000 | | | | 281,132 | | | | | |
| 5.000%, 08/01/2027 | | | 280,000 | | | | 295,093 | | | | | |
| City of Tiffin OH, | | | | | | | | | | | | |
| 2.500%, 12/01/2024 (Callable 12/01/2023) | | | 250,000 | | | | 245,575 | | | | | |
| City of Waterville OH, | | | | | | | | | | | | |
| 1.000%, 12/01/2026 | | | 1,670,000 | | | | 1,550,941 | | | | | |
| City of Whitehall OH, | | | | | | | | | | | | |
| 4.750%, 11/30/2023 (Insured by ST AID) | | | 5,545,000 | | | | 5,547,145 | | | | | |
| Cleveland-Cuyahoga County Port Authority, | | | | | | | | | | | | |
| 5.000%, 08/01/2026 (Callable 08/01/2024) | | | 550,000 | | | | 558,767 | | | | | |
| Columbus-Franklin County Finance Authority, | | | | | | | | | | | | |
| 4.000%, 05/15/2035 (Callable 11/15/2032) | | | 1,625,000 | | | | 1,563,999 | | | | | |
| County of Allen OH, | | | | | | | | | | | | |
| 5.000%, 10/01/2049 (Callable 02/03/2027) | | | | | | | | | | | | |
(Mandatory Tender Date 08/03/2027)(1) | | | 800,000 | | | | 844,697 | | | | | |
| County of Montgomery OH: | | | | | | | | | | | | |
| 5.000%, 11/15/2025 | | | 2,500,000 | | | | 2,557,460 | | | | | |
| 5.000%, 11/15/2027 | | | 2,015,000 | | | | 2,112,758 | | | | | |
| 5.250%, 05/01/2029 | | | | | | | | | | | | |
| (Pre-refunded to 11/12/2023) | | | 1,050,000 | | | | 1,057,073 | | | | | |
| County of Van Wert OH, | | | | | | | | | | | | |
| 6.125%, 12/01/2049 | | | | | | | | | | | | |
| (Pre-refunded to 12/01/2029) | | | 5,000,000 | | | | 5,836,574 | | | | | |
| Cuyahoga Metropolitan Housing Authority: | | | | | | | | | | | | |
| 4.000%, 12/01/2025 | | | 335,000 | | | | 338,341 | | | | | |
| 4.750%, 12/01/2027 (Mandatory Tender | | | | | | | | | | | | |
Date 12/01/2025) (Insured by FHA)(1) | | | 2,550,000 | | | | 2,589,696 | | | | | |
| Greater Cleveland Regional Transit Authority, | | | | | | | | | | | | |
| 5.000%, 12/01/2023 | | | 145,000 | | | | 146,032 | | | | | |
| Northeast Ohio Medical University, | | | | | | | | | | | | |
| 5.000%, 12/01/2025 | | | 125,000 | | | | 128,001 | | | | | |
| Northwest Local School District, | | | | | | | | | | | | |
| 0.000%, 12/01/2026 | | | | | | | | | | | | |
| (Insured by SD CRED PROG) | | | 440,000 | | | | 389,432 | | | | | |
| Ohio Air Quality Development Authority, | | | | | | | | | | | | |
| 4.000%, 09/01/2030 | | | | | | | | | | | | |
(Mandatory Tender Date 06/01/2027)(1) | | | 4,745,000 | | | | 4,703,783 | | | | | |
| Ohio Higher Educational | | | | | | | | | | | | |
| Facility Commission: | | | | | | | | | | | | |
| 5.000%, 11/01/2023 | | | 580,000 | | | | 582,878 | | | | | |
| 5.000%, 05/01/2024 | | | 705,000 | | | | 713,127 | | | | | |
| 5.000%, 05/01/2024 | | | 415,000 | | | | 419,784 | | | | | |
| 5.000%, 03/01/2025 | | | 585,000 | | | | 587,082 | | | | | |
| 5.000%, 05/01/2025 | | | 595,000 | | | | 609,940 | | | | | |
| 5.000%, 05/01/2025 | | | 455,000 | | | | 466,425 | | | | | |
| 5.000%, 05/01/2026 (Callable 05/01/2025) | | | 750,000 | | | | 770,670 | | | | | |
| Ohio Housing Finance Agency: | | | | | | | | | | | | |
| 3.350%, 07/01/2025 (Mandatory Tender | | | | | | | | | | | | |
Date 07/01/2024) (Insured by HUD)(1) | | | 2,500,000 | | | | 2,472,509 | | | | | |
| 4.000%, 11/01/2025 | | | | | | | | | | | | |
(Mandatory Tender Date 11/01/2024)(1) | | | 7,000,000 | | | | 6,997,600 | | | | | |
| 5.000%, 12/01/2026 (Mandatory Tender | | | | | | | | | | | | |
Date 12/01/2025) (Insured by FHA)(1) | | | 1,000,000 | | | | 1,024,929 | | | | | |
| 4.000%, 03/01/2047 (Callable 09/01/2025) | | | | | | | | | | | | |
| (Insured by GNMA) | | | 45,000 | | | | 44,707 | | | | | |
| 4.500%, 03/01/2050 (Callable 09/01/2028) | | | 1,975,000 | | | | 1,980,503 | | | | | |
| 3.750%, 09/01/2050 (Callable 03/01/2029) | | | | | | | | | | | | |
| (Insured by GNMA) | | | 5,435,000 | | | | 5,355,410 | | | | | |
| 3.250%, 09/01/2052 (Callable 09/01/2031) | | | | | | | | | | | | |
| (Insured by GNMA) | | | 5,550,000 | | | | 5,372,659 | | | | | |
| Ohio Turnpike & Infrastructure Commission, | | | | | | | | | | | | |
| 5.500%, 02/15/2024 (Insured by BHAC) | | | 420,000 | | | | 426,151 | | | | | |
| Port of Greater Cincinnati | | | | | | | | | | | | |
| Development Authority: | | | | | | | | | | | | |
| 3.125%, 11/15/2023 | | | 65,000 | | | | 64,849 | | | | | |
| 5.000%, 05/01/2025 | | | | | | | | | | | | |
(Callable 11/01/2023)(3) | | | 8,040,000 | | | | 7,997,788 | | | | | |
| 5.000%, 04/01/2026 | | | 175,000 | | | | 181,716 | | | | | |
| 5.000%, 04/01/2027 | | | 250,000 | | | | 264,062 | | | | | |
| 4.000%, 11/15/2028 | | | 770,000 | | | | 786,085 | | | | | |
| State of Ohio, | | | | | | | | | | | | |
| 5.000%, 05/01/2034 (Callable 05/01/2025) | | | 575,000 | | | | 592,930 | | | | | |
| Toledo-Lucas County Port Authority, | | | | | | | | | | | | |
| 2.000%, 11/15/2031 | | | 955,000 | | | | 868,300 | | | | | |
| Troy City School District, | | | | | | | | | | | | |
| 2.050%, 12/01/2023 (Callable 07/31/2023) | | | 45,000 | | | | 44,660 | | | | | |
| University of Akron, | | | | | | | | | | | | |
| 5.000%, 01/01/2034 | | | | | | | | | | | | |
| (Callable 07/01/2026) (Insured by BAM) | | | 2,195,000 | | | | 2,262,433 | | | | | |
| Village of Bluffton OH, | | | | | | | | | | | | |
| 5.000%, 12/01/2025 | | | 1,500,000 | | | | 1,537,741 | | | | | |
| Village of Cuyahoga Heights OH, | | | | | | | | | | | | |
| 4.000%, 12/01/2023 (Insured by AGM) | | | 95,000 | | | | 95,144 | | | | | |
| Total Ohio | | | | | | | | | | | | |
| (Cost $86,251,749) | | | | | | | 84,009,554 | | | | 5.0 | % |
| Oklahoma | | | | | | | | | | | | |
| Catoosa Industrial Authority, | | | | | | | | | | | | |
| 4.000%, 10/01/2028 (Callable 10/01/2026) | | | 60,000 | | | | 57,985 | | | | | |
| Garfield County Educational | | | | | | | | | | | | |
| Facilities Authority, | | | | | | | | | | | | |
| 5.000%, 09/01/2027 (Callable 09/01/2026) | | | 3,780,000 | | | | 3,960,576 | | | | | |
| Grady County School Finance Authority: | | | | | | | | | | | | |
| 5.000%, 12/01/2024 | | | 565,000 | | | | 576,444 | | | | | |
| 5.000%, 12/01/2025 | | | 945,000 | | | | 974,037 | | | | | |
| 5.000%, 12/01/2026 | | | 1,015,000 | | | | 1,062,211 | | | | | |
| Muskogee Industrial Trust, | | | | | | | | | | | | |
| 5.000%, 09/01/2026 | | | 1,775,000 | | | | 1,829,725 | | | | | |
The accompanying notes are an integral part of these financial statements.
Baird Short-Term Municipal Bond Fund
Schedule of Investments, June 30, 2023 (Unaudited)
Long-Term Investments (cont.)
| | | Principal | | | | | | % of | |
| | | Amount | | | Value | | | Net Assets | |
| Oklahoma County Finance Authority, | | | | | | | | | |
| 5.000%, 09/01/2024 | | $ | 350,000 | | | $ | 355,983 | | | | |
| Oklahoma County Independent | | | | | | | | | | | |
| School District No. 12, | | | | | | | | | | | |
| 0.050%, 03/01/2024 | | | 1,465,000 | | | | 1,423,058 | | | | |
| Oklahoma County Independent | | | | | | | | | | | |
| School District No. 52: | | | | | | | | | | | |
4.000%, 07/01/2027(6) | | | 4,140,000 | | | | 4,270,911 | | | | |
4.000%, 07/01/2028(6) | | | 3,990,000 | | | | 4,152,512 | | | | |
| Oklahoma Development Finance Authority: | | | | | | | | | | | |
| 5.000%, 08/01/2023 | | | 485,000 | | | | 485,051 | | | | |
| 2.600%, 03/01/2024 | | | 345,000 | | | | 341,589 | | | | |
| 5.000%, 08/01/2024 | | | 585,000 | | | | 586,556 | | | | |
| Oklahoma Housing Finance Agency: | | | | | | | | | | | |
| 4.000%, 06/01/2028 (Mandatory Tender | | | | | | | | | | | |
Date 06/01/2025) (Insured by FHA)(1) | | | 1,250,000 | | | | 1,250,560 | | | | |
| 5.000%, 03/01/2052 (Callable 03/01/2031) | | | | | | | | | | | |
| (Insured by GNMA) | | | 1,880,000 | | | | 1,937,925 | | | | |
| Purcell Public Works Authority: | | | | | | | | | | | |
| 5.000%, 03/01/2024 | | | 250,000 | | | | 252,364 | | | | |
| 5.000%, 03/01/2025 | | | 200,000 | | | | 204,996 | | | | |
| 5.000%, 03/01/2026 | | | 435,000 | | | | 453,438 | | | | |
| 5.000%, 03/01/2027 | | | 880,000 | | | | 934,669 | | | | |
| Sallisaw Municipal Authority: | | | | | | | | | | | |
| 4.000%, 06/01/2024 | | | 655,000 | | | | 652,506 | | | | |
| 4.000%, 06/01/2025 | | | 680,000 | | | | 673,737 | | | | |
| 4.000%, 06/01/2026 | | | 710,000 | | | | 702,472 | | | | |
| 4.000%, 06/01/2028 (Callable 06/01/2026) | | | 765,000 | | | | 760,012 | | | | |
| Texas County Development Authority, | | | | | | | | | | | |
| 4.000%, 12/01/2023 | | | 675,000 | | | | 675,808 | | | | |
| Tulsa County Industrial Authority, | | | | | | | | | | | |
| 5.000%, 09/01/2024 | | | 400,000 | | | | 407,522 | | | | |
| Tulsa Industrial Authority, | | | | | | | | | | | |
| 5.000%, 10/01/2023 | | | 790,000 | | | | 789,698 | | | | |
| Total Oklahoma | | | | | | | | | | | |
| (Cost $30,442,430) | | | | | | | 29,772,345 | | | | 1.8 | % |
| Oregon | | | | | | | | | | | | |
| County of Crook OR, | | | | | | | | | | | | |
0.000%, 06/01/2028(5) | | | 455,000 | | | | 414,414 | | | | | |
| County of Yamhill OR: | | | | | | | | | | | | |
| 4.000%, 10/01/2023 | | | 425,000 | | | | 424,323 | | | | | |
| 4.000%, 10/01/2024 | | | 425,000 | | | | 422,350 | | | | | |
| Oregon State Business | | | | | | | | | | | | |
| Development Commission, | | | | | | | | | | | | |
| 2.400%, 12/01/2040 | | | | | | | | | | | | |
(Mandatory Tender Date 08/14/2023)(1) | | | 100,000 | | | | 99,816 | | | | | |
| State of Oregon: | | | | | | | | | | | | |
| 5.000%, 08/01/2026 | | | 1,750,000 | | | | 1,860,412 | | | | | |
| 4.000%, 12/01/2048 (Callable 12/01/2026) | | | 385,000 | | | | 382,226 | | | | | |
| State of Oregon Housing & | | | | | | | | | | | | |
| Community Services Department: | | | | | | | | | | | | |
| 3.875%, 01/01/2033 (Callable 07/01/2024) | | | 235,000 | | | | 232,044 | | | | | |
| 3.500%, 07/01/2036 (Callable 01/01/2025) | | | 35,000 | | | | 34,771 | | | | | |
| 4.500%, 01/01/2049 (Callable 07/01/2027) | | | 845,000 | | | | 846,477 | | | | | |
| 4.500%, 07/01/2049 (Callable 07/01/2027) | | | 235,000 | | | | 235,171 | | | | | |
| Yamhill County Hospital Authority: | | | | | | | | | | | | |
| 1.750%, 11/15/2026 (Callable 07/21/2023) | | | 680,000 | | | | 637,210 | | | | | |
| 2.125%, 11/15/2027 (Callable 07/21/2023) | | | 2,250,000 | | | | 2,033,810 | | | | | |
| 2.500%, 11/15/2028 (Callable 07/21/2023) | | | 2,550,000 | | | | 2,181,738 | | | | | |
| Total Oregon | | | | | | | | | | | | |
| (Cost $10,067,881) | | | | | | | 9,804,762 | | | | 0.6 | % |
| Pennsylvania | | | | | | | | | | | | |
| Aliquippa Municipal Water Authority, | | | | | | | | | | | | |
| 2.000%, 11/15/2023 | | | | | | | | | | | | |
| (Callable 07/31/2023) (Insured by BAM) | | | 250,000 | | | | 248,128 | | | | | |
| Blacklick Valley School District, | | | | | | | | | | | | |
| 5.000%, 11/15/2023 (Insured by AGM) | | | 190,000 | | | | 191,240 | | | | | |
| Borough of Lewistown PA: | | | | | | | | | | | | |
| 4.000%, 09/01/2023 (Insured by AGM) | | | 315,000 | | | | 315,277 | | | | | |
| 4.000%, 09/01/2024 (Insured by AGM) | | | 100,000 | | | | 100,813 | | | | | |
| Bucks County Industrial | | | | | | | | | | | | |
| Development Authority, | | | | | | | | | | | | |
| 5.000%, 07/01/2025 | | | 350,000 | | | | 344,995 | | | | | |
| Caernarvon Township Authority: | | | | | | | | | | | | |
| 4.000%, 09/01/2023 (Insured by AGM) | | | 100,000 | | | | 100,096 | | | | | |
| 4.000%, 09/01/2024 (Insured by AGM) | | | 140,000 | | | | 141,377 | | | | | |
| 4.000%, 09/01/2027 | | | | | | | | | | | | |
| (Callable 09/01/2024) (Insured by AGM) | | | 130,000 | | | | 131,036 | | | | | |
| 4.000%, 09/01/2028 | | | | | | | | | | | | |
| (Callable 09/01/2024) (Insured by AGM) | | | 165,000 | | | | 166,273 | | | | | |
| 4.000%, 09/01/2029 | | | | | | | | | | | | |
| (Callable 09/01/2024) (Insured by AGM) | | | 170,000 | | | | 171,314 | | | | | |
| 4.000%, 09/01/2030 | | | | | | | | | | | | |
| (Callable 09/01/2024) (Insured by AGM) | | | 175,000 | | | | 176,083 | | | | | |
| Carmichaels Area School District, | | | | | | | | | | | | |
| 4.000%, 09/01/2023 (Insured by BAM) | | | 155,000 | | | | 155,136 | | | | | |
| City of Bradford PA, | | | | | | | | | | | | |
| 2.500%, 11/01/2025 (Insured by AGM) | | | 395,000 | | | | 381,080 | | | | | |
| City of Erie Higher Education | | | | | | | | | | | | |
| Building Authority: | | | | | | | | | | | | |
| 5.000%, 05/01/2025 | | | 160,000 | | | | 161,398 | | | | | |
| 5.000%, 05/01/2027 | | | 225,000 | | | | 229,739 | | | | | |
| City of York PA, | | | | | | | | | | | | |
| 5.000%, 11/15/2025 | | | 1,505,000 | | | | 1,520,305 | | | | | |
| Coatesville School District, | | | | | | | | | | | | |
| 5.000%, 08/01/2023 (Insured by AGM) | | | 150,000 | | | | 150,174 | | | | | |
| County of Allegheny PA, | | | | | | | | | | | | |
| 4.100%, 11/01/2026 | | | | | | | | | | | | |
| (3 Month LIBOR USD + 0.550%) | | | | | | | | | | | | |
(Callable 07/31/2023) (Insured by AGM)(2) | | | 1,985,000 | | | | 1,978,528 | | | | | |
| County of Lackawanna PA, | | | | | | | | | | | | |
| 4.000%, 09/01/2026 (Insured by BAM) | | | 1,445,000 | | | | 1,477,339 | | | | | |
| County of McKean PA, | | | | | | | | | | | | |
| 4.000%, 11/01/2023 (Insured by BAM) | | | 395,000 | | | | 395,645 | | | | | |
| Cumberland County Municipal Authority: | | | | | | | | | | | | |
| 5.000%, 01/01/2029 | | | | | | | | | | | | |
| (Pre-refunded to 01/01/2025) | | | 190,000 | | | | 194,981 | | | | | |
| 5.000%, 01/01/2029 | | | | | | | | | | | | |
| (Pre-refunded to 01/01/2025) | | | 445,000 | | | | 456,667 | | | | | |
| 5.000%, 01/01/2029 (Callable 01/01/2025) | | | 490,000 | | | | 493,488 | | | | | |
| Delaware Valley Regional Finance Authority: | | | | | | | | | | | | |
| 4.247%, 09/01/2048 (1 Month LIBOR | | | | | | | | | | | | |
| USD + 0.760%) (Callable 09/01/2023) | | | | | | | | | | | | |
(Mandatory Tender Date 09/01/2024)(2) | | | 2,000,000 | | | | 2,001,292 | | | | | |
| 4.367%, 09/01/2048 (1 Month LIBOR | | | | | | | | | | | | |
| USD + 0.880%) (Callable 09/01/2024) | | | | | | | | | | | | |
(Mandatory Tender Date 09/01/2025)(2) | | | 2,000,000 | | | | 1,997,975 | | | | | |
| East Hempfield Township | | | | | | | | | | | | |
| Industrial Development Authority, | | | | | | | | | | | | |
| 5.000%, 07/01/2029 | | | | | | | | | | | | |
| (Pre-refunded to 07/01/2024) | | | 1,730,000 | | | | 1,758,978 | | | | | |
| Indiana County Municipal | | | | | | | | | | | | |
| Services Authority: | | | | | | | | | | | | |
| 5.000%, 10/01/2026 (Insured by BAM) | | | 300,000 | | | | 311,332 | | | | | |
| 5.000%, 10/01/2027 (Insured by BAM) | | | 310,000 | | | | 325,885 | | | | | |
| 5.000%, 10/01/2028 (Insured by BAM) | | | 325,000 | | | | 345,635 | | | | | |
| Lancaster City Parking Authority, | | | | | | | | | | | | |
| 3.000%, 12/01/2027 (Insured by BAM) | | | 645,000 | | | | 633,060 | | | | | |
The accompanying notes are an integral part of these financial statements.
Baird Short-Term Municipal Bond Fund
Schedule of Investments, June 30, 2023 (Unaudited)
Long-Term Investments (cont.)
| | | Principal | | | | | | % of | |
| | | Amount | | | Value | | | Net Assets | |
| Latrobe Industrial Development Authority: | | | | | | | | | |
| 5.000%, 03/01/2027 | | $ | 395,000 | | | $ | 401,499 | | | | |
| 5.000%, 03/01/2028 | | | 215,000 | | | | 219,748 | | | | |
| 5.000%, 03/01/2029 | | | 150,000 | | | | 154,065 | | | | |
| 5.000%, 03/01/2030 | | | 125,000 | | | | 128,469 | | | | |
| Lycoming County Authority, | | | | | | | | | | | |
| 4.000%, 11/01/2043 | | | | | | | | | | | |
(Mandatory Tender Date 05/01/2024)(1) | | | 1,260,000 | | | | 1,258,139 | | | | |
| Montgomery County Industrial | | | | | | | | | | | |
| Development Authority: | | | | | | | | | | | |
| 4.000%, 12/01/2023 | | | 125,000 | | | | 124,894 | | | | |
| 4.000%, 12/01/2024 | | | 200,000 | | | | 199,675 | | | | |
| 4.000%, 12/01/2025 | | | 240,000 | | | | 239,706 | | | | |
| 4.100%, 04/01/2053 | | | | | | | | | | | |
(Mandatory Tender Date 04/03/2028)(1) | | | 3,400,000 | | | | 3,462,974 | | | | |
| North Penn Water Authority: | | | | | | | | | | | |
| 2.660%, 11/01/2023 (SIFMA Municipal | | | | | | | | | | | |
Swap Index + 0.460%)(2) | | | 205,000 | | | | 204,925 | | | | |
| 2.760%, 11/01/2024 | | | | | | | | | | | |
| (SIFMA Municipal Swap Index + 0.560%) | | | | | | | | | | | |
(Callable 11/01/2023)(2) | | | 845,000 | | | | 845,227 | | | | |
| Northampton County | | | | | | | | | | | |
| General Purpose Authority, | | | | | | | | | | | |
| 4.684%, 08/15/2048 (1 Month LIBOR | | | | | | | | | | | |
| USD + 1.040%) (Callable 07/21/2023) | | | | | | | | | | | |
(Mandatory Tender Date 08/15/2024)(2) | | | 75,000 | | | | 75,051 | | | | |
| Palmyra Area School District, | | | | | | | | | | | |
| 5.000%, 06/01/2030 (Callable 06/01/2025) | | | | | | | | | | | |
| (Insured by ST AID) | | | 400,000 | | | | 410,460 | | | | |
| Pennsylvania Economic | | | | | | | | | | | |
| Development Financing Authority: | | | | | | | | | | | |
| 5.000%, 12/31/2029 | | | 3,000,000 | | | | 3,246,513 | | | | |
| 5.000%, 12/31/2029 (Callable 06/30/2026) | | | 2,655,000 | | | | 2,730,208 | | | | |
| 5.000%, 06/30/2030 | | | 1,500,000 | | | | 1,630,320 | | | | |
| Pennsylvania Higher Educational | | | | | | | | | | | |
| Facilities Authority: | | | | | | | | | | | |
| 5.000%, 05/01/2025 | | | 575,000 | | | | 589,745 | | | | |
| 5.000%, 05/01/2026 | | | 595,000 | | | | 619,502 | | | | |
| Pennsylvania Housing Finance Agency: | | | | | | | | | | | |
| 4.000%, 10/01/2046 (Callable 04/01/2026) | | | 580,000 | | | | 577,286 | | | | |
| 3.000%, 10/01/2049 (Callable 10/01/2029) | | | 4,245,000 | | | | 4,115,663 | | | | |
| 4.000%, 10/01/2049 (Callable 10/01/2028) | | | 3,685,000 | | | | 3,664,663 | | | | |
| 3.000%, 10/01/2052 (Callable 10/01/2031) | | | 1,280,000 | | | | 1,216,527 | | | | |
| 4.250%, 10/01/2052 (Callable 04/01/2032) | | | 1,125,000 | | | | 1,128,834 | | | | |
| Pennsylvania Turnpike Commission: | | | | | | | | | | | |
| 0.000%, 12/01/2023 | | | 85,000 | | | | 83,771 | | | | |
| 2.900%, 12/01/2023 | | | | | | | | | | | |
| (SIFMA Municipal Swap Index + 0.700%) | | | | | | | | | | | |
(Callable 07/31/2023)(2) | | | 2,150,000 | | | | 2,150,279 | | | | |
5.000%, 12/01/2028(5) | | | 450,000 | | | | 479,763 | | | | |
| Pittsburgh Water & Sewer Authority, | | | | | | | | | | | |
| 3.880%, 09/01/2040 | | | | | | | | | | | |
| (SIFMA Municipal Swap Index + 0.650%) | | | | | | | | | | | |
| (Callable 07/03/2023) (Mandatory Tender | | | | | | | | | | | |
Date 12/01/2023) (Insured by AGM)(2) | | | 11,025,000 | | | | 11,025,692 | | | | |
| Public Parking Authority Of Pittsburgh, | | | | | | | | | | | |
| 5.000%, 12/01/2026 (Callable 06/01/2025) | | | 470,000 | | | | 485,448 | | | | |
| Reading School District, | | | | | | | | | | | |
| 0.000%, 01/15/2026 (Insured by NATL) | | | 670,000 | | | | 609,257 | | | | |
| Sayre Area School District, | | | | | | | | | | | |
| 3.000%, 05/15/2024 (Insured by BAM) | | | 25,000 | | | | 24,840 | | | | |
| Sayre Health Care Facilities Authority, | | | | | | | | | | | |
| 4.105%, 12/01/2024 | | | | | | | | | | | |
| (3 Month LIBOR USD + 0.780%) | | | | | | | | | | | |
(Callable 07/31/2023)(2) | | | 125,000 | | | | 125,075 | | | | |
| School District of Philadelphia: | | | | | | | | | | | |
| 5.000%, 06/01/2024 (Insured by AGM) | | | 520,000 | | | | 526,657 | | | | |
| 5.000%, 09/01/2026 (Insured by ST AID) | | | 1,000,000 | | | | 1,047,771 | | | | |
| School District of Reading, | | | | | | | | | | | |
| 5.000%, 03/01/2024 (Insured by AGM) | | | 100,000 | | | | 100,907 | | | | |
| School District of the City of Erie: | | | | | | | | | | | |
| 5.000%, 04/01/2024 (Insured by AGM) | | | 230,000 | | | | 232,532 | | | | |
| 5.000%, 04/01/2024 (Insured by AGM) | | | 250,000 | | | | 252,753 | | | | |
| Scranton-Lackawanna Health | | | | | | | | | | | |
| and Welfare Authority: | | | | | | | | | | | |
| 5.000%, 11/01/2023 | | | 35,000 | | | | 35,191 | | | | |
| 5.000%, 11/01/2025 | | | 40,000 | | | | 41,267 | | | | |
| State Public School Building Authority, | | | | | | | | | | | |
| 0.000%, 05/15/2028 (Insured by NATL) | | | 2,075,000 | | | | 1,734,534 | | | | |
| Steel Valley School District: | | | | | | | | | | | |
| 4.000%, 11/01/2025 (Insured by BAM) | | | 270,000 | | | | 273,492 | | | | |
| 4.000%, 11/01/2025 (Insured by BAM) | | | 50,000 | | | | 50,647 | | | | |
| 4.000%, 11/01/2026 (Insured by BAM) | | | 280,000 | | | | 285,596 | | | | |
| Township of North Fayette PA, | | | | | | | | | | | |
| 4.000%, 04/15/2025 (Callable 04/15/2024) | | | 210,000 | | | | 210,815 | | | | |
| University of Pittsburgh-of the | | | | | | | | | | | |
| Commonwealth System of Higher Education, | | | | | | | | | | | |
| 2.560%, 02/15/2024 | | | | | | | | | | | |
| (SIFMA Municipal Swap Index + 0.360%) | | | | | | | | | | | |
(Callable 08/15/2023)(2) | | | 2,500,000 | | | | 2,500,095 | | | | |
| Westmoreland County Industrial | | | | | | | | | | | |
| Development Authority: | | | | | | | | | | | |
| 4.000%, 07/01/2023 | | | 375,000 | | | | 375,000 | | | | |
| 4.000%, 07/01/2024 | | | 450,000 | | | | 449,146 | | | | |
| 4.000%, 07/01/2025 | | | 550,000 | | | | 545,532 | | | | |
| 4.000%, 07/01/2026 | | | 725,000 | | | | 718,138 | | | | |
| 5.000%, 07/01/2029 | | | 1,450,000 | | | | 1,509,149 | | | | |
| Westmoreland County Municipal Authority, | | | | | | | | | | | |
| 0.000%, 08/15/2023 | | | | | | | | | | | |
| (ETM) (Insured by FGIC) | | | 220,000 | | | | 219,138 | | | | |
| Wilkes-Barre Finance Authority, | | | | | | | | | | | |
| 5.000%, 11/01/2024 | | | 40,000 | | | | 40,734 | | | | |
| Total Pennsylvania | | | | | | | | | | | |
| (Cost $71,657,439) | | | | | | | 70,432,581 | | | | 4.2 | % |
| Puerto Rico | | | | | | | | | | | | |
| Commonwealth of Puerto Rico: | | | | | | | | | | | | |
| 0.000%, 07/01/2024 | | | 5,104,303 | | | | 4,889,278 | | | | | |
| 5.375%, 07/01/2025 | | | 1,806,000 | | | | 1,850,583 | | | | | |
| Puerto Rico Public Finance Corp.: | | | | | | | | | | | | |
| 5.125%, 06/01/2024 (Insured by AMBAC) | | | 245,000 | | | | 248,999 | | | | | |
| 6.000%, 08/01/2026 | | | | | | | | | | | | |
| (ETM) (Insured by AGC) | | | 545,000 | | | | 589,462 | | | | | |
| 6.000%, 08/01/2026 | | | | | | | | | | | | |
| (ETM) (Insured by AGC) | | | 3,535,000 | | | | 3,823,392 | | | | | |
| Total Puerto Rico | | | | | | | | | | | | |
| (Cost $11,491,921) | | | | | | | 11,401,714 | | | | 0.7 | % |
| Rhode Island | | | | | | | | | | | | |
| Providence Public Building Authority: | | | | | | | | | | | | |
| 5.000%, 09/15/2026 (Insured by AGM) | | | 3,230,000 | | | | 3,365,728 | | | | | |
| 5.000%, 09/15/2028 (Insured by AGM) | | | 2,425,000 | | | | 2,601,218 | | | | | |
| Rhode Island Housing & | | | | | | | | | | | | |
| Mortgage Finance Corp., | | | | | | | | | | | | |
| 3.750%, 10/01/2049 (Callable 04/01/2029) | | | | | | | | | | | | |
| (Insured by GNMA) | | | 1,530,000 | | | | 1,508,703 | | | | | |
| Tobacco Settlement Financing Corp., | | | | | | | | | | | | |
| 5.000%, 06/01/2027 (Callable 06/01/2025) | | | 1,075,000 | | | | 1,097,438 | | | | | |
| Total Rhode Island | | | | | | | | | | | | |
| (Cost $8,771,996) | | | | | | | 8,573,087 | | | | 0.5 | % |
The accompanying notes are an integral part of these financial statements.
Baird Short-Term Municipal Bond Fund
Schedule of Investments, June 30, 2023 (Unaudited)
Long-Term Investments (cont.)
| | | Principal | | | | | | % of | |
| | | Amount | | | Value | | | Net Assets | |
| South Carolina | | | | | | | | | |
| City of Myrtle Beach SC, | | | | | | | | | |
| 5.000%, 10/01/2027 | | | | | | | | | |
| (Callable 10/01/2026) | | $ | 1,000,000 | | | $ | 1,049,197 | | | | |
| Greenwood Fifty School Facilities, Inc., | | | | | | | | | | | |
| 5.000%, 12/01/2027 (Callable 06/01/2026) | | | | | | | | | | | |
| (Insured by BAM) | | | 1,125,000 | | | | 1,188,149 | | | | |
| Piedmont Municipal Power Agency: | | | | | | | | | | | |
| 5.375%, 01/01/2025 | | | | | | | | | | | |
| (ETM) (Insured by NATL) | | | 215,000 | | | | 221,201 | | | | |
| 5.000%, 01/01/2030 (Callable 01/01/2027) | | | 4,190,000 | | | | 4,401,158 | | | | |
| South Carolina Jobs-Economic | | | | | | | | | | | |
| Development Authority, | | | | | | | | | | | |
| 5.250%, 08/01/2030 | | | | | | | | | | | |
| (Pre-refunded to 08/01/2023) | | | 110,000 | | | | 110,154 | | | | |
| South Carolina State Housing | | | | | | | | | | | |
| Finance & Development Authority: | | | | | | | | | | | |
| 4.000%, 07/01/2036 (Callable 07/01/2025) | | | | | | | | | | | |
| (Insured by GNMA) | | | 65,000 | | | | 64,571 | | | | |
| 4.000%, 07/01/2047 (Callable 01/01/2027) | | | | | | | | | | | |
| (Insured by FHA) | | | 280,000 | | | | 278,662 | | | | |
| 4.500%, 07/01/2048 (Callable 07/01/2027) | | | 260,000 | | | | 260,268 | | | | |
| 4.000%, 01/01/2050 (Callable 07/01/2028) | | | 1,635,000 | | | | 1,622,604 | | | | |
| 4.000%, 07/01/2050 (Callable 07/01/2029) | | | 1,565,000 | | | | 1,552,788 | | | | |
| 3.000%, 01/01/2052 (Callable 07/01/2030) | | | 9,445,000 | | | | 9,085,871 | | | | |
| Spartanburg County School District No. 5, | | | | | | | | | | | |
| 5.000%, 03/01/2027 (Insured by SCSDE) | | | 2,750,000 | | | | 2,956,253 | | | | |
| Spartanburg Housing Authority, | | | | | | | | | | | |
| 2.000%, 03/01/2026 | | | | | | | | | | | |
(Mandatory Tender Date 03/01/2025)(1) | | | 2,671,000 | | | | 2,596,913 | | | | |
| Total South Carolina | | | | | | | | | | | |
| (Cost $26,468,048) | | | | | | | 25,387,789 | | | | 1.5 | % |
| South Dakota | | | | | | | | | | | | |
| City of Rapid City SD, | | | | | | | | | | | | |
| 5.000%, 12/01/2025 | | | 310,000 | | | | 314,454 | | | | | |
| South Dakota Health & | | | | | | | | | | | | |
| Educational Facilities Authority: | | | | | | | | | | | | |
| 3.000%, 09/01/2025 | | | 100,000 | | | | 97,774 | | | | | |
| 3.000%, 09/01/2027 | | | 105,000 | | | | 100,941 | | | | | |
| 3.000%, 09/01/2028 | | | 200,000 | | | | 190,212 | | | | | |
| South Dakota Housing | | | | | | | | | | | | |
| Development Authority: | | | | | | | | | | | | |
| 3.000%, 11/01/2051 (Callable 05/01/2030) | | | | | | | | | | | | |
| (Insured by GNMA) | | | 1,485,000 | | | | 1,431,740 | | | | | |
| 5.000%, 05/01/2053 (Callable 11/01/2031) | | | 2,975,000 | | | | 3,066,055 | | | | | |
| Total South Dakota | | | | | | | | | | | | |
| (Cost $5,504,079) | | | | | | | 5,201,176 | | | | 0.3 | % |
| Tennessee | | | | | | | | | | | | |
| City of Jackson TN: | | | | | | | | | | | | |
| 5.000%, 04/01/2024 (ETM) | | | 10,000 | | | | 10,123 | | | | | |
| 5.000%, 04/01/2024 | | | 335,000 | | | | 337,906 | | | | | |
| 5.000%, 04/01/2027 | | | | | | | | | | | | |
| (Pre-refunded to 04/01/2025) | | | 20,000 | | | | 20,597 | | | | | |
| 5.000%, 04/01/2027 (Callable 04/01/2025) | | | 645,000 | | | | 658,804 | | | | | |
| City of Manchester TN, | | | | | | | | | | | | |
| 2.000%, 08/01/2028 | | | 1,820,000 | | | | 1,717,172 | | | | | |
| City of Memphis TN: | | | | | | | | | | | | |
| 5.000%, 12/01/2029 (Callable 12/01/2026) | | | 2,165,000 | | | | 2,307,347 | | | | | |
| 5.000%, 12/01/2029 (Callable 12/01/2026) | | | 2,185,000 | | | | 2,332,318 | | | | | |
| City of Morristown TN, | | | | | | | | | | | | |
| 2.000%, 03/01/2029 | | | 1,905,000 | | | | 1,770,524 | | | | | |
| City of Sevierville TN, | | | | | | | | | | | | |
| 5.000%, 06/01/2027 | | | 2,845,000 | | | | 3,068,093 | | | | | |
| Cleveland Housing Authority, | | | | | | | | | | | | |
| 4.000%, 08/01/2026 (Mandatory | | | | | | | | | | | | |
Tender Date 08/01/2025)(1)(3) | | | 2,880,000 | | | | 2,848,876 | | | | | |
| Johnson City Health & | | | | | | | | | | | | |
| Educational Facilities Board, | | | | | | | | | | | | |
| 5.000%, 07/01/2025 | | | 1,125,000 | | | | 1,154,944 | | | | | |
| Nashville & Davidson County | | | | | | | | | | | | |
| Metropolitan Government: | | | | | | | | | | | | |
| 4.000%, 10/01/2028 | | | 125,000 | | | | 122,642 | | | | | |
| 3.850%, 02/01/2048 (Mandatory Tender | | | | | | | | | | | | |
Date 02/01/2026) (Insured by FNMA)(1) | | | 2,000,000 | | | | 1,998,294 | | | | | |
| Tennergy Corp.: | | | | | | | | | | | | |
| 5.250%, 12/01/2024 | | | 575,000 | | | | 582,364 | | | | | |
| 5.250%, 12/01/2025 | | | 560,000 | | | | 571,080 | | | | | |
| 5.250%, 12/01/2026 | | | 700,000 | | | | 719,775 | | | | | |
| 5.500%, 12/01/2027 | | | 770,000 | | | | 806,747 | | | | | |
| 5.500%, 12/01/2028 | | | 1,000,000 | | | | 1,057,476 | | | | | |
| 5.500%, 12/01/2029 | | | 2,230,000 | | | | 2,367,394 | | | | | |
| 5.500%, 10/01/2053 (Callable 09/01/2030) | | | | | | | | | | | | |
(Mandatory Tender Date 12/01/2030)(1) | | | 1,000,000 | | | | 1,058,696 | | | | | |
| Tennessee Energy Acquisition Corp., | | | | | | | | | | | | |
| 5.625%, 09/01/2026 | | | 2,005,000 | | | | 2,060,475 | | | | | |
| Tennessee Housing Development Agency: | | | | | | | | | | | | |
| 3.050%, 07/01/2029 (Callable 07/01/2024) | | | 100,000 | | | | 97,840 | | | | | |
| 3.600%, 01/01/2031 (Callable 07/21/2023) | | | 1,020,000 | | | | 1,020,091 | | | | | |
| 3.850%, 07/01/2032 (Callable 01/01/2025) | | | 685,000 | | | | 679,895 | | | | | |
| 4.000%, 07/01/2039 (Callable 01/01/2024) | | | 165,000 | | | | 164,689 | | | | | |
| 4.000%, 01/01/2043 (Callable 07/01/2027) | | | 385,000 | | | | 382,126 | | | | | |
| 4.000%, 01/01/2046 (Callable 01/01/2025) | | | 5,000 | | | | 4,980 | | | | | |
| 3.750%, 01/01/2050 (Callable 01/01/2029) | | | 1,765,000 | | | | 1,739,576 | | | | | |
| 3.000%, 01/01/2051 (Callable 01/01/2030) | | | 810,000 | | | | 782,743 | | | | | |
| 5.000%, 01/01/2053 (Callable 07/01/2031) | | | 1,750,000 | | | | 1,803,502 | | | | | |
| Total Tennessee | | | | | | | | | | | | |
| (Cost $35,123,220) | | | | | | | 34,247,089 | | | | 2.1 | % |
| Texas | | | | | | | | | | | | |
| Abilene Convention Center | | | | | | | | | | | | |
| Hotel Development Corp.: | | | | | | | | | | | | |
| 2.500%, 10/01/2031 | | | 2,000,000 | | | | 1,660,087 | | | | | |
3.750%, 10/01/2031(3) | | | 1,120,000 | | | | 984,240 | | | | | |
| Alief Independent School District, | | | | | | | | | | | | |
| 5.000%, 02/15/2027 (PSF Guaranteed) | | | 1,035,000 | | | | 1,112,290 | | | | | |
| Arlington Higher Education Finance Corp.: | | | | | | | | | | | | |
| 5.000%, 08/15/2024 | | | | | | | | | | | | |
| (ETM) (PSF Guaranteed) | | | 535,000 | | | | 544,536 | | | | | |
| 5.000%, 08/15/2025 (PSF Guaranteed) | | | 550,000 | | | | 569,084 | | | | | |
| 5.000%, 12/01/2025 (PSF Guaranteed) | | | 555,000 | | | | 577,119 | | | | | |
| 4.000%, 08/15/2026 (PSF Guaranteed) | | | 345,000 | | | | 351,015 | | | | | |
| 4.000%, 08/15/2026 (PSF Guaranteed) | | | 200,000 | | | | 203,487 | | | | | |
| 5.000%, 08/15/2026 (PSF Guaranteed) | | | 450,000 | | | | 474,542 | | | | | |
| 4.000%, 08/15/2027 (PSF Guaranteed) | | | 360,000 | | | | 369,192 | | | | | |
| 5.000%, 08/15/2027 (PSF Guaranteed) | | | 500,000 | | | | 537,947 | | | | | |
| 4.000%, 08/15/2028 (PSF Guaranteed) | | | 370,000 | | | | 381,903 | | | | | |
| 4.000%, 08/15/2028 (PSF Guaranteed) | | | 385,000 | | | | 397,385 | | | | | |
| 7.750%, 06/15/2056 (Callable 06/15/2025) | | | | | | | | | | | | |
(Mandatory Tender Date 06/15/2026)(1)(3) | | | 1,750,000 | | | | 1,752,087 | | | | | |
| Arlington Housing Finance Corp.: | | | | | | | | | | | | |
| 4.500%, 04/01/2041 (Callable 04/01/2026) | | | | | | | | | | | | |
(Mandatory Tender Date 04/01/2027)(1) | | | 4,000,000 | | | | 4,071,528 | | | | | |
| 3.500%, 11/01/2043 (Callable 05/01/2025) | | | | | | | | | | | | |
(Mandatory Tender Date 11/01/2025)(1) | | | 6,500,000 | | | | 6,489,105 | | | | | |
| Austin-Bergstrom Landhost Enterprises, Inc., | | | | | | | | | | | | |
| 5.000%, 10/01/2024 | | | 1,595,000 | | | | 1,609,596 | | | | | |
The accompanying notes are an integral part of these financial statements.
Baird Short-Term Municipal Bond Fund
Schedule of Investments, June 30, 2023 (Unaudited)
Long-Term Investments (cont.)
| | | Principal | | | | | | % of | |
| | | Amount | | | Value | | | Net Assets | |
| Bandera Independent School District: | | | | | | | | | |
| 5.000%, 02/15/2024 | | | | | | | | | |
| (ETM) (PSF Guaranteed) | | $ | 85,000 | | | $ | 85,858 | | | |
| |
| 5.000%, 02/15/2024 | | | | | | | | | | | | |
| (ETM) (PSF Guaranteed) | | | 50,000 | | | | 50,504 | | | | | |
| Brazoria County Municipal | | | | | | | | | | | | |
| Utility District No. 17, | | | | | | | | | | | | |
| 4.000%, 09/01/2024 (Callable 09/01/2023) | | | | | | | | | | | | |
| (Insured by AGM) | | | 175,000 | | | | 175,184 | | | | | |
| Bryan Independent School District, | | | | | | | | | | | | |
| 4.000%, 02/15/2029 (PSF Guaranteed) | | | 1,435,000 | | | | 1,518,451 | | | | | |
| Bryson Independent School District, | | | | | | | | | | | | |
| 4.000%, 08/15/2030 (Callable 08/15/2027) | | | | | | | | | | | | |
| (PSF Guaranteed) | | | 785,000 | | | | 818,866 | | | | | |
| Central Texas Turnpike System: | | | | | | | | | | | | |
| 5.000%, 08/15/2023 | | | 205,000 | | | | 205,361 | | | | | |
| 0.000%, 08/15/2026 (Insured by BHAC) | | | 9,060,000 | | | | 8,184,109 | | | | | |
| 5.000%, 08/15/2027 (Callable 08/15/2024) | | | 545,000 | | | | 551,244 | | | | | |
| Cimarron Municipal Utility District, | | | | | | | | | | | | |
| 4.000%, 03/01/2025 (Insured by AGM) | | | 70,000 | | | | 70,901 | | | | | |
| Cinco Municipal Utility District, | | | | | | | | | | | | |
| 4.000%, 12/01/2023 (Insured by BAM) | | | 690,000 | | | | 691,741 | | | | | |
| City of Dallas Housing Finance Corp., | | | | | | | | | | | | |
| 3.500%, 02/01/2044 (Callable 06/01/2025) | | | | | | | | | | | | |
(Mandatory Tender Date 02/01/2026)(1) | | | 1,900,000 | | | | 1,875,165 | | | | | |
| City of Dallas TX: | | | | | | | | | | | | |
| 5.000%, 02/15/2027 (Callable 02/15/2024) | | | 630,000 | | | | 636,290 | | | | | |
| 4.000%, 08/15/2030 (Callable 08/15/2026) | | | 1,000,000 | | | | 1,011,375 | | | | | |
| City of Denton TX: | | | | | | | | | | | | |
| 5.000%, 12/01/2033 (Callable 12/01/2026) | | | 900,000 | | | | 947,232 | | | | | |
| 5.000%, 12/01/2034 (Callable 12/01/2026) | | | 195,000 | | | | 204,525 | | | | | |
| City of Elgin TX: | | | | | | | | | | | | |
| 4.000%, 07/15/2023 (Insured by AGM) | | | 155,000 | | | | 155,025 | | | | | |
| 4.000%, 07/15/2023 (Insured by BAM) | | | 50,000 | | | | 50,008 | | | | | |
| City of Hearne TX: | | | | | | | | | | | | |
| 3.000%, 08/01/2023 (Insured by BAM) | | | 230,000 | | | | 229,849 | | | | | |
| 3.000%, 08/01/2024 (Insured by BAM) | | | 240,000 | | | | 238,198 | | | | | |
| City of Houston TX: | | | | | | | | | | | | |
| 5.500%, 12/01/2024 | | | | | | | | | | | | |
| (ETM) (Insured by NATL) | | | 635,000 | | | | 644,269 | | | | | |
| 0.000%, 12/01/2025 | | | | | | | | | | | | |
| (ETM) (Insured by AGM) | | | 500,000 | | | | 462,333 | | | | | |
| 5.000%, 09/01/2029 (Callable 09/01/2024) | | | 1,500,000 | | | | 1,520,022 | | | | | |
| City of Temple TX, | | | | | | | | | | | | |
| 5.000%, 08/01/2028 (Insured by BAM) | | | 360,000 | | | | 392,116 | | | | | |
| City of Wilmer TX, | | | | | | | | | | | | |
| 5.000%, 09/01/2026 (Insured by BAM) | | | 410,000 | | | | 430,088 | | | | | |
| Clear Creek Independent School District, | | | | | | | | | | | | |
| 5.000%, 02/15/2024 (PSF Guaranteed) | | | 115,000 | | | | 116,220 | | | | | |
| Clifton Higher Education Finance Corp.: | | | | | | | | | | | | |
| 6.000%, 03/01/2029 | | | | | | | | | | | | |
(Callable 03/01/2024)(5) | | | 1,500,000 | | | | 1,509,052 | | | | | |
| 4.000%, 08/15/2032 | | | | | | | | | | | | |
| (Callable 08/15/2026) (PSF Guaranteed) | | | 725,000 | | | | 735,361 | | | | | |
| Collin County Water Control & | | | | | | | | | | | | |
| Improvement District No. 3: | | | | | | | | | | | | |
| 2.000%, 09/15/2023 (Insured by BAM) | | | 335,000 | | | | 333,417 | | | | | |
| 2.000%, 09/15/2024 (Insured by BAM) | | | 350,000 | | | | 341,027 | | | | | |
| Comal County Water Control & | | | | | | | | | | | | |
| Improvement District No. 6: | | | | | | | | | | | | |
| 4.000%, 03/01/2025 (Insured by BAM) | | | 510,000 | | | | 511,977 | | | | | |
| 4.000%, 03/01/2026 (Insured by BAM) | | | 535,000 | | | | 539,209 | | | | | |
| 4.000%, 03/01/2027 (Insured by BAM) | | | 555,000 | | | | 563,075 | | | | | |
| 4.000%, 03/01/2028 (Insured by BAM) | | | 580,000 | | | | 592,385 | | | | | |
| Cotulla Independent School District, | | | | | | | | | | | | |
| 5.000%, 02/15/2028 (PSF Guaranteed) | | | 1,250,000 | | | | 1,367,516 | | | | | |
| County of Bexar TX, | | | | | | | | | | | | |
| 5.000%, 06/15/2029 (Callable 06/15/2026) | | | 855,000 | | | | 901,678 | | | | | |
| County of Fort Bend TX, | | | | | | | | | | | | |
| 2.000%, 03/01/2027 (Insured by BAM) | | | 745,000 | | | | 694,849 | | | | | |
| County of McLennan TX, | | | | | | | | | | | | |
| 5.000%, 06/01/2025 (Insured by AGM) | | | 240,000 | | | | 245,120 | | | | | |
| County of Montgomery TX, | | | | | | | | | | | | |
| 2.000%, 09/01/2027 | | | | | | | | | | | | |
| (Callable 09/01/2025) (Insured by BAM) | | | 435,000 | | | | 394,952 | | | | | �� |
| County of Wise TX: | | | | | | | | | | | | |
| 5.000%, 08/15/2025 | | | 500,000 | | | | 515,014 | | | | | |
| 5.000%, 08/15/2026 | | | 850,000 | | | | 884,697 | | | | | |
| Cypress-Fairbanks | | | | | | | | | | | | |
| Independent School District: | | | | | | | | | | | | |
| 5.000%, 02/15/2027 (PSF Guaranteed) | | | 2,720,000 | | | | 2,920,214 | | | | | |
| 5.000%, 02/15/2028 (PSF Guaranteed) | | | 1,025,000 | | | | 1,122,293 | | | | | |
| Dallas Convention Center | | | | | | | | | | | | |
| Hotel Development Corp., | | | | | | | | | | | | |
| 0.000%, 01/01/2025 | | | 4,450,000 | | | | 4,184,618 | | | | | |
| Dallas County Utility & Reclamation District, | | | | | | | | | | | | |
| 5.000%, 02/15/2026 | | | 290,000 | | | | 302,427 | | | | | |
| Decatur Hospital Authority, | | | | | | | | | | | | |
| 5.750%, 09/01/2029 (ETM) | | | 1,135,000 | | | | 1,231,072 | | | | | |
| Denton Independent School District: | | | | | | | | | | | | |
| 2.000%, 08/01/2044 (Pre-refunded to | | | | | | | | | | | | |
08/01/2024) (PSF Guaranteed)(1) | | | 1,450,000 | | | | 1,430,750 | | | | | |
| 2.000%, 08/01/2044 (Mandatory Tender | | | | | | | | | | | | |
Date 08/01/2024) (PSF Guaranteed)(1) | | | 1,235,000 | | | | 1,210,208 | | | | | |
| Eanes Independent School District, | | | | | | | | | | | | |
| 5.000%, 08/01/2028 (PSF Guaranteed) | | | 1,060,000 | | | | 1,168,168 | | | | | |
| Fort Bend County Municipal | | | | | | | | | | | | |
| Utility District No. 134B, | | | | | | | | | | | | |
| 4.625%, 09/01/2024 (Insured by AGM) | | | 320,000 | | | | 324,124 | | | | | |
| Fort Bend County Municipal | | | | | | | | | | | | |
| Utility District No. 139: | | | | | | | | | | | | |
| 4.000%, 09/01/2023 (Insured by BAM) | | | 190,000 | | | | 190,167 | | | | | |
| 4.000%, 09/01/2024 (Insured by BAM) | | | 200,000 | | | | 201,604 | | | | | |
| Fort Bend County Municipal | | | | | | | | | | | | |
| Utility District No. 30, | | | | | | | | | | | | |
| 4.000%, 09/01/2024 (Insured by BAM) | | | 500,000 | | | | 503,784 | | | | | |
| Fort Bend County Municipal | | | | | | | | | | | | |
| Utility District No. 58, | | | | | | | | | | | | |
| 3.500%, 04/01/2024 (Insured by AGM) | | | 125,000 | | | | 124,928 | | | | | |
| Fort Bend County Municipal | | | | | | | | | | | | |
| Utility District No. 81, | | | | | | | | | | | | |
| 3.000%, 09/01/2023 (Callable 07/31/2023) | | | | | | | | | | | | |
| (Insured by AGM) | | | 220,000 | | | | 219,861 | | | | | |
| Harris County Cultural Education | | | | | | | | | | | | |
| Facilities Finance Corp., | | | | | | | | | | | | |
| 5.000%, 07/01/2049 (Callable 09/01/2026) | | | | | | | | | | | | |
(Mandatory Tender Date 12/01/2026)(1) | | | 655,000 | | | | 687,612 | | | | | |
| Harris County Health Facilities | | | | | | | | | | | | |
| Development Corp.: | | | | | | | | | | | | |
| 5.750%, 07/01/2027 (ETM) | | | 905,000 | | | | 952,850 | | | | | |
| 5.750%, 07/01/2027 | | | | | | | | | | | | |
| (ETM) (Insured by AMBAC) | | | 3,895,000 | | | | 4,108,634 | | | | | |
| Harris County Municipal | | | | | | | | | | | | |
| Utility District No. 120, | | | | | | | | | | | | |
| 3.250%, 08/01/2025 (Callable 07/31/2023) | | | | | | | | | | | | |
| (Insured by AGM) | | | 350,000 | | | | 348,541 | | | | | |
| Harris County Municipal | | | | | | | | | | | | |
| Utility District No. 153, | | | | | | | | | | | | |
| 4.000%, 09/01/2023 (Callable 07/31/2023) | | | | | | | | | | | | |
| (Insured by BAM) | | | 100,000 | | | | 100,036 | | | | | |
The accompanying notes are an integral part of these financial statements.
Baird Short-Term Municipal Bond Fund
Schedule of Investments, June 30, 2023 (Unaudited)
Long-Term Investments (cont.)
| | | Principal | | | | | | % of | |
| | | Amount | | | Value | | | Net Assets | |
| Harris County Municipal | | | | | | | | | |
| Utility District No. 284, | | | | | | | | | |
| 4.000%, 09/01/2023 (Insured by AGM) | | $ | 370,000 | | | $ | 370,121 | | | |
| |
| Harris County Municipal | | | | | | | | | | | | |
| Utility District No. 374, | | | | | | | | | | | | |
| 3.000%, 09/01/2024 (Insured by BAM) | | | 225,000 | | | | 223,574 | | | | | |
| Harris County Municipal | | | | | | | | | | | | |
| Utility District No. 63, | | | | | | | | | | | | |
| 3.000%, 09/01/2025 (Callable 09/01/2024) | | | | | | | | | | | | |
| (Insured by AGM) | | | 100,000 | | | | 98,640 | | | | | |
| Housing Options, Inc., | | | | | | | | | | | | |
| 3.900%, 02/01/2026 (Mandatory Tender | | | | | | | | | | | | |
Date 02/01/2025) (Insured by HUD)(1) | | | 8,000,000 | | | | 7,980,800 | | | | | |
| Houston Independent School District, | | | | | | | | | | | | |
| 3.500%, 06/01/2039 (Mandatory Tender | | | | | | | | | | | | |
Date 06/01/2025) (PSF Guaranteed)(1) | | | 4,575,000 | | | | 4,585,247 | | | | | |
| Hunt Memorial Hospital District: | | | | | | | | | | | | |
| 5.000%, 02/15/2024 | | | 200,000 | | | | 201,324 | | | | | |
| 5.000%, 02/15/2027 | | | 1,500,000 | | | | 1,571,497 | | | | | |
| 5.000%, 02/15/2028 | | | 1,000,000 | | | | 1,063,713 | | | | | |
| Ingleside Independent School District, | | | | | | | | | | | | |
| 5.000%, 08/15/2024 (PSF Guaranteed) | | | 120,000 | | | | 122,498 | | | | | |
| Katy Development Authority: | | | | | | | | | | | | |
| 4.000%, 06/01/2026 (Insured by BAM) | | | 600,000 | | | | 614,537 | | | | | |
| 4.000%, 06/01/2027 (Insured by BAM) | | | 415,000 | | | | 430,059 | | | | | |
| 3.000%, 06/01/2028 | | | | | | | | | | | | |
| (Callable 06/01/2027) (Insured by BAM) | | | 375,000 | | | | 368,664 | | | | | |
| 3.000%, 06/01/2029 | | | | | | | | | | | | |
| (Callable 06/01/2027) (Insured by BAM) | | | 450,000 | | | | 444,893 | | | | | |
| Klein Independent School District: | | | | | | | | | | | | |
| 5.000%, 08/01/2027 (PSF Guaranteed) | | | 1,230,000 | | | | 1,333,662 | | | | | |
| 5.000%, 08/01/2028 (PSF Guaranteed) | | | 750,000 | | | | 829,148 | | | | | |
| Leander Independent School District: | | | | | | | | | | | | |
| 5.000%, 08/15/2026 (PSF Guaranteed) | | | 1,150,000 | | | | 1,219,731 | | | | | |
| 0.000%, 08/15/2033 (Pre-refunded to | | | | | | | | | | | | |
| 08/15/2024) (PSF Guaranteed) | | | 50,000 | | | | 31,304 | | | | | |
| 0.000%, 08/15/2034 (Pre-refunded to | | | | | | | | | | | | |
| 08/15/2024) (PSF Guaranteed) | | | 485,000 | | | | 286,150 | | | | | |
| 0.000%, 08/15/2035 (Pre-refunded to | | | | | | | | | | | | |
| 08/15/2024) (PSF Guaranteed) | | | 295,000 | | | | 170,738 | | | | | |
| 0.000%, 08/15/2036 (Pre-refunded to | | | | | | | | | | | | |
| 08/15/2024) (PSF Guaranteed) | | | 35,000 | | | | 19,226 | | | | | |
| 0.000%, 08/15/2036 (Pre-refunded to | | | | | | | | | | | | |
| 08/15/2024) (PSF Guaranteed) | | | 225,000 | | | | 117,482 | | | | | |
| 0.000%, 08/15/2038 (Pre-refunded to | | | | | | | | | | | | |
| 08/15/2024) (PSF Guaranteed) | | | 255,000 | | | | 126,161 | | | | | |
| 0.000%, 08/15/2039 (Pre-refunded to | | | | | | | | | | | | |
| 08/15/2024) (PSF Guaranteed) | | | 175,000 | | | | 82,313 | | | | | |
| 0.000%, 08/15/2039 (Pre-refunded to | | | | | | | | | | | | |
| 08/15/2024) (PSF Guaranteed) | | | 60,000 | | | | 26,352 | | | | | |
| 0.000%, 08/15/2040 (Pre-refunded to | | | | | | | | | | | | |
| 08/15/2024) (PSF Guaranteed) | | | 580,000 | | | | 241,019 | | | | | |
| 0.000%, 08/15/2040 (Pre-refunded to | | | | | | | | | | | | |
| 08/15/2024) (PSF Guaranteed) | | | 175,000 | | | | 78,224 | | | | | |
| 0.000%, 08/15/2041 (Pre-refunded to | | | | | | | | | | | | |
| 08/15/2024) (PSF Guaranteed) | | | 1,335,000 | | | | 567,818 | | | | | |
| 0.000%, 08/15/2041 (Pre-refunded to | | | | | | | | | | | | |
| 08/15/2024) (PSF Guaranteed) | | | 435,000 | | | | 170,685 | | | | | |
| 0.000%, 08/15/2041 (Pre-refunded to | | | | | | | | | | | | |
| 08/15/2024) (PSF Guaranteed) | | | 8,465,000 | | | | 3,600,435 | | | | | |
| 0.000%, 08/15/2042 (Pre-refunded to | | | | | | | | | | | | |
| 08/15/2024) (PSF Guaranteed) | | | 410,000 | | | | 165,902 | | | | | |
| 0.000%, 08/15/2042 (Pre-refunded to | | | | | | | | | | | | |
| 08/15/2024) (PSF Guaranteed) | | | 700,000 | | | | 283,248 | | | | | |
| 0.000%, 08/15/2043 (Pre-refunded to | | | | | | | | | | | | |
| 08/15/2024) (PSF Guaranteed) | | | 40,000 | | | | 15,395 | | | | | |
| 0.000%, 08/15/2045 (Pre-refunded to | | | | | | | | | | | | |
| 08/15/2024) (PSF Guaranteed) | | | 4,010,000 | | | | 1,248,593 | | | | | |
| 0.000%, 08/15/2046 (Pre-refunded to | | | | | | | | | | | | |
| 08/15/2024) (PSF Guaranteed) | | | 1,440,000 | | | | 421,317 | | | | | |
| 0.000%, 08/15/2047 (Pre-refunded to | | | | | | | | | | | | |
| 08/15/2024) (PSF Guaranteed) | | | 375,000 | | | | 103,017 | | | | | |
| Lower Colorado River Authority, | | | | | | | | | | | | |
| 4.750%, 01/01/2028 | | | | | | | | | | | | |
| (ETM) (Insured by AGM) | | | 165,000 | | | | 171,160 | | | | | |
| Manor Independent School District: | | | | | | | | | | | | |
| 5.000%, 08/01/2026 (PSF Guaranteed) | | | 100,000 | | | | 106,007 | | | | | |
| 5.000%, 08/01/2027 (PSF Guaranteed) | | | 1,015,000 | | | | 1,098,915 | | | | | |
| Matagorda County Navigation District No. 1, | | | | | | | | | | | | |
| 4.000%, 06/01/2030 (Callable 07/31/2023) | | | 2,375,000 | | | | 2,359,673 | | | | | |
| Montgomery County Health | | | | | | | | | | | | |
| Facilities Development Corp., | | | | | | | | | | | | |
| 0.000%, 07/15/2023 (ETM) | | | 670,000 | | | | 669,334 | | | | | |
| Montgomery County Municipal | | | | | | | | | | | | |
| Utility District No. 112, | | | | | | | | | | | | |
| 3.000%, 10/01/2024 (Insured by BAM) | | | 215,000 | | | | 213,762 | | | | | |
| Montgomery County Municipal | | | | | | | | | | | | |
| Utility District No. 95, | | | | | | | | | | | | |
| 3.000%, 09/01/2023 (Insured by AGM) | | | 115,000 | | | | 114,749 | | | | | |
| New Hope Cultural Education | | | | | | | | | | | | |
| Facilities Finance Corp.: | | | | | | | | | | | | |
| 4.000%, 06/15/2024 | | | 50,000 | | | | 50,178 | | | | | |
| 5.000%, 11/01/2025 (Callable 11/01/2024) | | | 1,050,000 | | | | 1,064,625 | | | | | |
| Newark Higher Education Finance Corp.: | | | | | | | | | | | | |
| 5.000%, 08/15/2023 (PSF Guaranteed) | | | 260,000 | | | | 260,476 | | | | | |
| 5.000%, 08/15/2028 (Callable 08/15/2024) | | | | | | | | | | | | |
| (PSF Guaranteed) | | | 705,000 | | | | 718,359 | | | | | |
| North Central Texas Health | | | | | | | | | | | | |
| Facility Development Corp., | | | | | | | | | | | | |
| 5.750%, 06/01/2026 | | | | | | | | | | | | |
| (ETM) (Insured by NATL) | | | 265,000 | | | | 276,699 | | | | | |
| North East Independent School District, | | | | | | | | | | | | |
| 2.200%, 08/01/2049 (Mandatory Tender | | | | | | | | | | | | |
Date 08/01/2024) (PSF Guaranteed)(1) | | | 725,000 | | | | 713,817 | | | | | |
| Northeast Travis County Utility District, | | | | | | | | | | | | |
| 0.000%, 09/01/2024 (Insured by BAM) | | | 470,000 | | | | 448,789 | | | | | |
| Northside Independent School District, | | | | | | | | | | | | |
| 2.000%, 06/01/2052 (Mandatory Tender | | | | | | | | | | | | |
Date 06/01/2027) (PSF Guaranteed)(1) | | | 3,345,000 | | | | 3,151,248 | | | | | |
| Northwest Harris County | | | | | | | | | | | | |
| Municipal Utility District No. 19: | | | | | | | | | | | | |
| 2.000%, 10/01/2023 (Insured by AGM) | | | 105,000 | | | | 104,532 | | | | | |
| 3.000%, 10/01/2024 (Insured by AGM) | | | 110,000 | | | | 109,853 | | | | | |
| Palestine Independent School District, | | | | | | | | | | | | |
| 5.000%, 02/15/2024 (PSF Guaranteed) | | | 135,000 | | | | 136,392 | | | | | |
| Paseo del Este Municipal | | | | | | | | | | | | |
| Utility District No. 10: | | | | | | | | | | | | |
| 4.000%, 08/15/2023 (Insured by AGM) | | | 130,000 | | | | 130,057 | | | | | |
| 4.000%, 08/15/2024 (Insured by AGM) | | | 180,000 | | | | 181,013 | | | | | |
| Prosper Independent School District, | | | | | | | | | | | | |
| 5.000%, 02/15/2024 (PSF Guaranteed) | | | 110,000 | | | | 111,194 | | | | | |
| San Antonio Independent School District: | | | | | | | | | | | | |
| 5.000%, 08/15/2027 (PSF Guaranteed) | | | 1,500,000 | | | | 1,619,869 | | | | | |
| 5.000%, 08/15/2028 (PSF Guaranteed) | | | 750,000 | | | | 826,412 | | | | | |
| San Benito Consolidated | | | | | | | | | | | | |
| Independent School District, | | | | | | | | | | | | |
| 5.000%, 02/15/2024 (PSF Guaranteed) | | | 100,000 | | | | 101,085 | | | | | |
The accompanying notes are an integral part of these financial statements.
Baird Short-Term Municipal Bond Fund
Schedule of Investments, June 30, 2023 (Unaudited)
Long-Term Investments (cont.)
| | | Principal | | | | | | % of | |
| | | Amount | | | Value | | | Net Assets | |
| Sedona Lakes Municipal Utility District No. 1, | | | | | | | | | |
| 3.000%, 09/01/2024 (Insured by BAM) | | $ | 105,000 | | | $ | 104,426 | | | | |
| Sienna Municipal Utility District No. 4: | | | | | | | | | | | |
| 2.000%, 09/01/2027 | | | | | | | | | | | |
| (Callable 09/01/2025) (Insured by AGM) | | | 500,000 | | | | 454,223 | | | | |
| 2.000%, 09/01/2028 | | | | | | | | | | | |
| (Callable 09/01/2025) (Insured by AGM) | | | 315,000 | | | | 279,956 | | | | |
| South Shore Harbor Municipal | | | | | | | | | | | |
| Utility District No. 7, | | | | | | | | | | | |
| 4.000%, 09/01/2023 (Insured by BAM) | | | 370,000 | | | | 370,296 | | | | |
| Southwest Texas Junior College District, | | | | | | | | | | | |
| 4.000%, 10/01/2023 (Insured by BAM) | | | 100,000 | | | | 100,128 | | | | |
| Spring Creek Utility District | | | | | | | | | | | |
| of Montgomery County: | | | | | | | | | | | |
| 2.500%, 10/01/2023 (Insured by AGM) | | | 150,000 | | | | 149,487 | | | | |
| 3.000%, 10/01/2023 (Insured by AGM) | | | 145,000 | | | | 144,764 | | | | |
| State of Texas: | | | | | | | | | | | |
| 4.000%, 08/01/2028 (Callable 08/01/2025) | | | 2,500,000 | | | | 2,539,447 | | | | |
| 3.200%, 10/01/2028 (Callable 10/01/2025) | | | 3,000,000 | | | | 2,984,710 | | | | |
| Tarrant County Cultural | | | | | | | | | | | |
| Education Facilities Finance Corp.: | | | | | | | | | | | |
| 5.000%, 11/15/2023 | | | 310,000 | | | | 310,173 | | | | |
| 5.000%, 11/15/2024 | | | 335,000 | | | | 335,762 | | | | |
| 2.250%, 11/15/2025 | | | 225,000 | | | | 212,241 | | | | |
| 5.000%, 11/15/2026 | | | 490,000 | | | | 495,061 | | | | |
| 5.000%, 11/15/2028 (Callable 11/15/2027) | | | 1,050,000 | | | | 1,068,496 | | | | |
| 5.000%, 11/15/2029 (Callable 11/15/2027) | | | 1,835,000 | | | | 1,868,965 | | | | |
| Texas Department of Housing | | | | | | | | | | | |
| & Community Affairs: | | | | | | | | | | | |
| 4.000%, 08/01/2025 (Mandatory Tender | | | | | | | | | | | |
Date 08/01/2024) (Insured by HUD)(1) | | | 1,175,000 | | | | 1,174,615 | | | | |
| 4.750%, 03/01/2049 (Callable 09/01/2027) | | | | | | | | | | | |
| (Insured by GNMA) | | | 460,000 | | | | 462,841 | | | | |
| 5.500%, 09/01/2052 (Callable 03/01/2032) | | | | | | | | | | | |
| (Insured by GNMA) | | | 2,975,000 | | | | 3,153,780 | | | | |
| Texas Municipal Gas Acquisition | | | | | | | | | | | |
| & Supply Corp. I: | | | | | | | | | | | |
| 4.710%, 12/15/2026 (3 Month LIBOR | | | | | | | | | | | |
USD + 1.450%) (Callable 07/03/2023)(2) | | | 8,300,000 | | | | 8,177,219 | | | | |
| 5.250%, 12/15/2026 | | | 835,000 | | | | 863,039 | | | | |
| 6.250%, 12/15/2026 | | | 2,095,000 | | | | 2,182,979 | | | | |
| Texas Municipal Gas Acquisition | | | | | | | | | | | |
| & Supply Corp. II, | | | | | | | | | | | |
| 4.130%, 09/15/2027 | | | | | | | | | | | |
(3 Month LIBOR USD + 0.870%)(2) | | | 9,920,000 | | | | 9,922,596 | | | | |
| Texas Municipal Gas Acquisition | | | | | | | | | | | |
| & Supply Corp. III: | | | | | | | | | | | |
| 5.000%, 12/15/2023 | | | 1,000,000 | | | | 1,004,079 | | | | |
| 5.000%, 12/15/2025 | | | 3,100,000 | | | | 3,151,425 | | | | |
| 5.000%, 12/15/2027 | | | 6,250,000 | | | | 6,406,070 | | | | |
| 5.000%, 12/15/2028 | | | 1,500,000 | | | | 1,540,641 | | | | |
| Texas Public Finance Authority, | | | | | | | | | | | |
| 5.000%, 12/01/2027 (Callable 06/01/2025) | | | 975,000 | | | | 1,003,402 | | | | |
| Texas State Affordable Housing Corp.: | | | | | | | | | | | |
| 4.250%, 03/01/2049 (Callable 03/01/2029) | | | | | | | | | | | |
| (Insured by GNMA) | | | 310,000 | | | | 309,040 | | | | |
| 5.500%, 09/01/2053 (Callable 03/01/2033) | | | | | | | | | | | |
| (Insured by GNMA) | | | 3,000,000 | | | | 3,167,056 | | | | |
| Tioga Independent School District | | | | | | | | | | | |
| Public Facility Corp.: | | | | | | | | | | | |
| 4.000%, 08/15/2023 | | | 470,000 | | | | 469,572 | | | | |
| 4.000%, 08/15/2024 | | | 185,000 | | | | 183,409 | | | | |
| 3.250%, 08/15/2026 (Callable 08/15/2024) | | | 195,000 | | | | 185,813 | | | | |
| Town of Providence Village TX, | | | | | | | | | | | |
| 4.000%, 03/01/2024 (Insured by BAM) | | | 275,000 | | | | 276,174 | | | | |
| Travis County Housing Finance Corp., | | | | | | | | | | | |
| 4.125%, 06/01/2045 (Callable 12/01/2025) | | | | | | | | | | | |
(Mandatory Tender Date 06/01/2027)(1) | | | 4,250,000 | | | | 4,255,866 | | | | |
| Viridian Municipal Management District: | | | | | | | | | | | |
| 6.000%, 12/01/2023 (Insured by BAM) | | | 50,000 | | | | 50,495 | | | | |
| 4.000%, 12/01/2024 (Insured by BAM) | | | 425,000 | | | | 428,123 | | | | |
| 4.000%, 12/01/2025 | | | | | | | | | | | |
| (Callable 12/01/2024) (Insured by BAM) | | | 440,000 | | | | 441,965 | | | | |
| 4.000%, 12/01/2026 | | | | | | | | | | | |
| (Callable 12/01/2023) (Insured by AGM) | | | 340,000 | | | | 340,383 | | | | |
| 4.000%, 12/01/2026 | | | | | | | | | | | |
| (Callable 12/01/2024) (Insured by BAM) | | | 460,000 | | | | 462,463 | | | | |
| 4.000%, 12/01/2027 | | | | | | | | | | | |
| (Callable 12/01/2024) (Insured by BAM) | | | 475,000 | | | | 477,892 | | | | |
| 4.000%, 12/01/2028 | | | | | | | | | | | |
| (Callable 12/01/2024) (Insured by BAM) | | | 495,000 | | | | 498,150 | | | | |
| 4.000%, 12/01/2028 | | | | | | | | | | | |
| (Callable 12/01/2024) (Insured by BAM) | | | 455,000 | | | | 457,895 | | | | |
| 4.000%, 12/01/2029 | | | | | | | | | | | |
| (Callable 12/01/2024) (Insured by BAM) | | | 685,000 | | | | 689,159 | | | | |
| West Harris County | | | | | | | | | | | |
| Municipal Utility District No. 17, | | | | | | | | | | | |
| 3.000%, 09/01/2023 (Insured by AGM) | | | 360,000 | | | | 359,558 | | | | |
| Willow Creek Farms | | | | | | | | | | | |
| Municipal Utility District: | | | | | | | | | | | |
| 2.400%, 09/01/2023 (Insured by AGM) | | | 45,000 | | | | 44,883 | | | | |
| 3.500%, 09/01/2023 (Insured by AGM) | | | 125,000 | | | | 124,994 | | | | |
| Total Texas | | | | | | | | | | | |
| (Cost $186,464,486) | | | | | | | 182,446,693 | | | | 10.9 | % |
| Utah | | | | | | | | | | | | |
| City of Salt Lake City UT, | | | | | | | | | | | | |
| 4.000%, 10/01/2027 (Callable 10/01/2025) | | | 1,220,000 | | | | 1,246,400 | | | | | |
| Duchesne County School District, | | | | | | | | | | | | |
| 5.000%, 06/01/2025 | | | 200,000 | | | | 204,896 | | | | | |
| Utah Charter School Finance Authority: | | | | | | | | | | | | |
| 5.000%, 04/15/2024 (Insured by UT CSCE) | | | 240,000 | | | | 242,607 | | | | | |
| 5.000%, 10/15/2024 (Insured by UT CSCE) | | | 355,000 | | | | 361,508 | | | | | |
| 5.000%, 04/15/2025 (Insured by UT CSCE) | | | 135,000 | | | | 138,256 | | | | | |
| 5.000%, 04/15/2026 (Insured by UT CSCE) | | | 150,000 | | | | 154,854 | | | | | |
3.625%, 06/15/2029 (Callable 06/15/2027)(3) | | | 295,000 | | | | 269,653 | | | | | |
| Utah Housing Corp., | | | | | | | | | | | | |
| 4.000%, 01/01/2045 | | | | | | | | | | | | |
| (Callable 01/01/2026) (Insured by FHA) | | | 35,000 | | | | 34,854 | | | | | |
| Utah Infrastructure Agency: | | | | | | | | | | | | |
| 4.000%, 10/15/2023 | | | 180,000 | | | | 180,348 | | | | | |
| 4.000%, 10/15/2024 | | | 190,000 | | | | 191,249 | | | | | |
| 4.000%, 10/15/2025 | | | 100,000 | | | | 101,332 | | | | | |
| Total Utah | | | | | | | | | | | | |
| (Cost $3,214,379) | | | | | | | 3,125,957 | | | | 0.2 | % |
| Vermont | | | | | | | | | | | | |
| Vermont Educational & Health | | | | | | | | | | | | |
| Buildings Financing Agency, | | | | | | | | | | | | |
| 5.000%, 12/01/2033 (Callable 06/01/2026) | | | 2,445,000 | | | | 2,550,537 | | | | | |
| Vermont Housing Finance Agency: | | | | | | | | | | | | |
| 4.000%, 11/01/2044 (Callable 11/01/2023) | | | 25,000 | | | | 24,795 | | | | | |
| 4.000%, 11/01/2048 (Callable 05/01/2027) | | | 715,000 | | | | 709,726 | | | | | |
| 4.000%, 11/01/2049 | | | | | | | | | | | | |
| (Callable 05/01/2028) (Insured by GNMA) | | | 1,780,000 | | | | 1,767,711 | | | | | |
| 3.750%, 11/01/2050 | | | | | | | | | | | | |
| (Callable 05/01/2029) (Insured by GNMA) | | | 1,150,000 | | | | 1,133,854 | | | | | |
The accompanying notes are an integral part of these financial statements.
Baird Short-Term Municipal Bond Fund
Schedule of Investments, June 30, 2023 (Unaudited)
Long-Term Investments (cont.)
| | | Principal | | | | | | % of | |
| | | Amount | | | Value | | | Net Assets | |
| Vermont Student Assistance Corp.: | | | | | | | | | |
| 5.000%, 06/15/2024 | | $ | 850,000 | | | $ | 859,428 | | | | |
| 5.000%, 06/15/2025 | | | 825,000 | | | | 842,224 | | | | |
| Total Vermont | | | | | | | | | | | |
| (Cost $8,329,164) | | | | | | | 7,888,275 | | | | 0.5 | % |
| Virginia | | | | | | | | | | | | |
| Alexandria Industrial Development Authority, | | | | | | | | | | | | |
| 5.000%, 10/01/2050 | | | | | | | | | | | | |
| (Pre-refunded to 10/01/2025) | | | 2,275,000 | | | | 2,369,401 | | | | | |
| Arlington County Industrial | | | | | | | | | | | | |
| Development Authority, | | | | | | | | | | | | |
| 5.000%, 01/01/2026 | | | 3,750,000 | | | | 3,868,407 | | | | | |
| Charles City County Economic | | | | | | | | | | | | |
| Development Authority, | | | | | | | | | | | | |
| 2.875%, 02/01/2029 | | | | | | | | | | | | |
(Callable 11/01/2026)(5) | | | 1,000,000 | | | | 930,979 | | | | | |
| Chesapeake Bay Bridge & Tunnel District, | | | | | | | | | | | | |
| 5.500%, 07/01/2025 | | | | | | | | | | | | |
| (ETM) (Insured by NATL) | | | 1,000,000 | | | | 1,014,684 | | | | | |
| Norfolk Redevelopment | | | | | | | | | | | | |
| & Housing Authority: | | | | | | | | | | | | |
| 4.000%, 01/01/2025 (Callable 07/31/2023) | | | 2,100,000 | | | | 2,047,094 | | | | | |
| 5.000%, 05/01/2043 (Mandatory Tender | | | | | | | | | | | | |
Date 05/01/2026) (Insured by HUD)(1) | | | 1,500,000 | | | | 1,543,440 | | | | | |
| Portsmouth Redevelopment | | | | | | | | | | | | |
| & Housing Authority, | | | | | | | | | | | | |
| 3.500%, 07/01/2025 (Mandatory Tender | | | | | | | | | | | | |
Date 07/01/2024) (Insured by HUD)(1) | | | 3,591,000 | | | | 3,567,419 | | | | | |
| Virginia Public Building Authority: | | | | | | | | | | | | |
| 5.000%, 08/01/2029 | | | 2,400,000 | | | | 2,707,109 | | | | | |
| 5.000%, 08/01/2029 (Callable 08/01/2026) | | | 3,500,000 | | | | 3,676,517 | | | | | |
| Virginia Small Business Financing Authority, | | | | | | | | | | | | |
| 5.250%, 10/01/2029 (Callable 10/01/2024) | | | 1,005,000 | | | | 1,022,307 | | | | | |
| Total Virginia | | | | | | | | | | | | |
| (Cost $22,702,954) | | | | | | | 22,747,357 | | | | 1.4 | % |
| Washington | | | | | | | | | | | | |
| Central Puget Sound Regional | | | | | | | | | | | | |
| Transit Authority: | | | | | | | | | | | | |
| 4.750%, 02/01/2028 (Callable 07/31/2023) | | | | | | | | | | | | |
| (Insured by NATL) | | | 135,000 | | | | 137,066 | | | | | |
| 2.400%, 11/01/2045 | | | | | | | | | | | | |
| (SIFMA Municipal Swap Index + 0.200%) | | | | | | | | | | | | |
| (Callable 11/01/2025) | | | | | | | | | | | | |
(Mandatory Tender Date 11/01/2026)(2) | | | 9,000,000 | | | | 8,793,557 | | | | | |
| 2.650%, 11/01/2045 | | | | | | | | | | | | |
| (SIFMA Municipal Swap Index + 0.450%) | | | | | | | | | | | | |
| (Callable 07/17/2023) | | | | | | | | | | | | |
(Mandatory Tender Date 11/01/2023)(2) | | | 100,000 | | | | 100,008 | | | | | |
| Central Washington University: | | | | | | | | | | | | |
| 4.000%, 05/01/2024 (Callable 07/31/2023) | | | 260,000 | | | | 259,866 | | | | | |
| 4.000%, 05/01/2026 (Callable 07/31/2023) | | | 410,000 | | | | 407,728 | | | | | |
| 5.000%, 05/01/2026 (Insured by BAM) | | | 410,000 | | | | 428,908 | | | | | |
| City of Seattle WA, | | | | | | | | | | | | |
| 2.450%, 05/01/2045 | | | | | | | | | | | | |
| (SIFMA Municipal Swap Index + 0.250%) | | | | | | | | | | | | |
| (Callable 05/01/2026) | | | | | | | | | | | | |
(Mandatory Tender Date 11/01/2026)(2) | | | 8,610,000 | | | | 8,465,684 | | | | | |
| County of King WA, | | | | | | | | | | | | |
| 0.875%, 01/01/2042 (Callable 04/01/2025) | | | | | | | | | | | | |
(Mandatory Tender Date 01/01/2026)(1) | | | 450,000 | | | | 419,519 | | | | | |
| King County Public Hospital District No. 1: | | | | | | | | | | | | |
| 5.000%, 12/01/2031 (Callable 12/01/2026) | | | 1,000,000 | | | | 1,046,513 | | | | | |
| 5.000%, 12/01/2036 (Callable 12/01/2026) | | | 1,250,000 | | | | 1,286,685 | | | | | |
| Pend Oreille County Public | | | | | | | | | | | | |
| Utility District No. 1: | | | | | | | | | | | | |
| 5.000%, 01/01/2024 | | | 1,020,000 | | | | 1,024,035 | | | | | |
| 5.000%, 01/01/2024 | | | 700,000 | | | | 702,735 | | | | | |
| 5.000%, 01/01/2025 | | | 445,000 | | | | 450,772 | | | | | |
| 5.000%, 01/01/2025 | | | 735,000 | | | | 744,427 | | | | | |
| San Juan County School District No. 137, | | | | | | | | | | | | |
| 4.000%, 12/01/2028 (Callable 07/31/2023) | | | | | | | | | | | | |
| (Insured by SCH BD GTY) | | | 675,000 | | | | 675,193 | | | | | |
| Seattle Housing Authority: | | | | | | | | | | | | |
| 1.250%, 06/01/2024 (Callable 12/01/2023) | | | 2,000,000 | | | | 1,956,784 | | | | | |
| 4.000%, 09/01/2025 (Callable 03/01/2025) | | | 9,200,000 | | | | 9,218,976 | | | | | |
| 1.000%, 06/01/2026 (Callable 07/21/2023) | | | 2,000,000 | | | | 1,829,585 | | | | | |
| State of Washington, | | | | | | | | | | | | |
| 5.000%, 07/01/2024 (Callable 07/31/2023) | | | | | | | | | | | | |
| (Insured by ST AID) | | | 20,000 | | | | 20,026 | | | | | |
| Tacoma Metropolitan Park District: | | | | | | | | | | | | |
| 3.000%, 12/01/2023 | | | 115,000 | | | | 114,117 | | | | | |
| 5.000%, 12/01/2024 | | | 415,000 | | | | 419,707 | | | | | |
| 4.000%, 12/01/2026 | | | 175,000 | | | | 174,861 | | | | | |
| 4.000%, 12/01/2027 (Callable 12/01/2026) | | | 4,630,000 | | | | 4,635,982 | | | | | |
| 4.000%, 12/01/2027 | | | 2,480,000 | | | | 2,484,087 | | | | | |
| Washington Health Care Facilities Authority, | | | | | | | | | | | | |
| 5.000%, 10/01/2026 | | | 1,520,000 | | | | 1,584,962 | | | | | |
| Washington State Housing | | | | | | | | | | | | |
| Finance Commission: | | | | | | | | | | | | |
| 6.500%, 07/01/2030 | | | | | | | | | | | | |
(Pre-refunded to 07/01/2025)(3) | | | 800,000 | | | | 842,082 | | | | | |
| 6.750%, 07/01/2035 | | | | | | | | | | | | |
(Pre-refunded to 07/01/2025)(3) | | | 1,130,000 | | | | 1,194,807 | | | | | |
| Total Washington | | | | | | | | | | | | |
| (Cost $50,668,849) | | | | | | | 49,418,672 | | | | 3.0 | % |
| West Virginia | | | | | | | | | | | | |
| West Virginia Housing Development Fund, | | | | | | | | | | | | |
| 3.000%, 11/01/2026 | | | 2,745,000 | | | | 2,688,409 | | | | | |
| Total West Virginia | | | | | | | | | | | | |
| (Cost $2,729,902) | | | | | | | 2,688,409 | | | | 0.2 | % |
| Wisconsin | | | | | | | | | | | | |
| City of Appleton WI, | | | | | | | | | | | | |
| 3.000%, 01/01/2026 (Callable 07/31/2023) | | | 625,000 | | | | 615,564 | | | | | |
| City of Marinette WI, | | | | | | | | | | | | |
| 4.000%, 05/01/2027 (Callable 07/31/2023) | | | 150,000 | | | | 150,067 | | | | | |
| City of Milwaukee WI: | | | | | | | | | | | | |
| 5.000%, 04/01/2024 | | | 2,000,000 | | | | 2,016,912 | | | | | |
| 4.000%, 06/01/2027 (Callable 06/01/2026) | | | 950,000 | | | | 968,681 | | | | | |
| 3.000%, 06/01/2030 (Callable 06/01/2026) | | | 455,000 | | | | 437,732 | | | | | |
| City of Oshkosh WI, | | | | | | | | | | | | |
| 4.000%, 05/01/2029 (Callable 07/31/2023) | | | 125,000 | | | | 125,084 | | | | | |
| County of St. Croix WI, | | | | | | | | | | | | |
| 2.600%, 03/01/2027 | | | 625,000 | | | | 590,190 | | | | | |
| County of Waushara WI, | | | | | | | | | | | | |
| 4.500%, 06/01/2027 (Callable 06/01/2025) | | | 2,500,000 | | | | 2,558,434 | | | | | |
| Palmyra-Eagle Area School District: | | | | | | | | | | | | |
| 3.000%, 03/01/2024 (Callable 07/31/2023) | | | 700,000 | | | | 688,059 | | | | | |
| 3.000%, 03/01/2025 (Callable 07/31/2023) | | | 175,000 | | | | 167,913 | | | | | |
| Public Finance Authority: | | | | | | | | | | | | |
5.000%, 10/01/2023(3) | | | 2,000,000 | | | | 1,998,736 | | | | | |
5.000%, 10/01/2024(3) | | | 1,605,000 | | | | 1,602,970 | | | | | |
| 5.000%, 07/01/2025 | | | 265,000 | | | | 268,443 | | | | | |
| 3.000%, 03/01/2026 | | | | | | | | | | | | |
(Callable 07/31/2023)(3) | | | 2,250,000 | | | | 2,183,293 | | | | | |
| 5.000%, 07/01/2026 | | | 465,000 | | | | 475,727 | | | | | |
| 5.000%, 07/01/2028 | | | 1,245,000 | | | | 1,295,039 | | | | | |
The accompanying notes are an integral part of these financial statements.
Baird Short-Term Municipal Bond Fund
Schedule of Investments, June 30, 2023 (Unaudited)
Long-Term Investments (cont.)
| | | Principal | | | | | | % of | |
| | | Amount | | | Value | | | Net Assets | |
| Public Finance Authority: (cont.) | | | | | | | | | |
| 5.000%, 07/01/2029 | | $ | 1,365,000 | | | $ | 1,428,768 | | | | |
5.000%, 10/01/2029(3) | | | 2,850,000 | | | | 2,881,740 | | | | |
| Southeast Wisconsin Professional | | | | | | | | | | | |
| Baseball Park District, | | | | | | | | | | | |
| 0.000%, 12/15/2024 | | | | | | | | | | | |
| (ETM) (Insured by NATL) | | | 95,000 | | | | 90,667 | | | | |
| Tender Option Bond Trust, | | | | | | | | | | | |
| 2.230%, 06/01/2065 (Callable 06/01/2028) | | | | | | | | | | | |
(Optional Put Date 07/03/2023)(1)(3) | | | 5,400,000 | | | | 5,400,000 | | | | |
| Town of St. Joseph WI, | | | | | | | | | | | |
| 3.000%, 12/01/2023 (Insured by AGM) | | | 450,000 | | | | 449,004 | | | | |
| Village of Waunakee WI, | | | | | | | | | | | |
| 3.200%, 10/01/2026 (Callable 07/31/2023) | | | 225,000 | | | | 221,557 | | | | |
| Wisconsin Center District: | | | | | | | | | | | |
| 5.250%, 12/15/2023 | | | | | | | | | | | |
| (ETM) (Insured by AGM) | | | 10,000 | | | | 10,029 | | | | |
| 5.250%, 12/15/2023 (Insured by AGM) | | | 10,000 | | | | 10,069 | | | | |
| 0.000%, 12/15/2024 (Insured by NATL) | | | 115,000 | | | | 108,875 | | | | |
| 5.000%, 12/15/2025 | | | 245,000 | | | | 256,303 | | | | |
| 5.250%, 12/15/2027 | | | | | | | | | | | |
| (ETM) (Insured by AGM) | | | 50,000 | | | | 52,930 | | | | |
| 5.250%, 12/15/2027 (Insured by AGM) | | | 1,295,000 | | | | 1,381,988 | | | | |
| 0.000%, 12/15/2028 (Insured by AGM) | | | 315,000 | | | | 259,471 | | | | |
| Wisconsin Health & | | | | | | | | | | | |
| Educational Facilities Authority: | | | | | | | | | | | |
| 4.000%, 09/15/2024 | | | | | | | | | | | |
| (Pre-refunded to 09/15/2023) | | | 360,000 | | | | 360,412 | | | | |
| 5.000%, 07/01/2025 (Callable 07/01/2024) | | | 660,000 | | | | 669,082 | | | | |
| 2.750%, 08/15/2025 (Callable 08/15/2024) | | | 1,440,000 | | | | 1,406,831 | | | | |
| 4.000%, 09/15/2025 | | | | | | | | | | | |
| (Pre-refunded to 09/15/2023) | | | 375,000 | | | | 375,429 | | | | |
| 4.000%, 09/15/2025 | | | 765,000 | | | | 754,071 | | | | |
| 5.000%, 11/01/2025 | | | 245,000 | | | | 239,896 | | | | |
| 5.000%, 02/15/2026 | | | 1,105,000 | | | | 1,137,262 | | | | |
| 5.000%, 10/01/2026 | | | 2,000,000 | | | | 2,113,070 | | | | |
| 5.000%, 11/01/2026 | | | 710,000 | | | | 688,425 | | | | |
| 4.000%, 09/15/2027 | | | 830,000 | | | | 805,303 | | | | |
| 5.000%, 11/01/2029 (Callable 11/01/2026) | | | 815,000 | | | | 770,113 | | | | |
| 3.000%, 02/15/2035 | | | | | | | | | | | |
| (Pre-refunded to 08/15/2025) | | | 220,000 | | | | 219,018 | | | | |
| 4.000%, 02/15/2038 | | | | | | | | | | | |
| (Pre-refunded to 08/15/2025) | | | 575,000 | | | | 584,429 | | | | |
| 5.000%, 02/15/2051 (Callable 08/15/2026) | | | | | | | | | | | |
(Mandatory Tender Date 02/15/2027)(1) | | | 5,200,000 | | | | 5,346,656 | | | | |
| 5.000%, 02/15/2052 (Callable 08/15/2024) | | | | | | | | | | | |
(Mandatory Tender Date 02/15/2025)(1) | | | 2,050,000 | | | | 2,072,275 | | | | |
| Wisconsin Housing & Economic | | | | | | | | | | | |
| Development Authority: | | | | | | | | | | | |
| 3.500%, 09/01/2046 (Callable 09/01/2025) | | | | | | | | | | | |
| (Insured by FNMA) | | | 135,000 | | | | 133,028 | | | | |
| 4.000%, 03/01/2048 (Callable 03/01/2027) | | | | | | | | | | | |
| (Insured by FNMA) | | | 295,000 | | | | 293,093 | | | | |
| 4.250%, 03/01/2049 (Callable 09/01/2028) | | | | | | | | | | | |
| (Insured by FNMA) | | | 555,000 | | | | 554,036 | | | | |
| Total Wisconsin | | | | | | | | | | | |
| (Cost $47,878,068) | | | | | | | 47,216,674 | | | | 2.8 | % |
| Wyoming | | | | | | | | | | | | |
| Carbon County Specific Purpose | | | | | | | | | | | | |
| Tax Joint Powers Board: | | | | | | | | | | | | |
| 5.000%, 06/15/2024 | | | 735,000 | | | | 744,934 | | | | | |
| 5.000%, 06/15/2025 | | | 950,000 | | | | 974,022 | | | | | |
| 5.000%, 06/15/2026 | | | 340,000 | | | | 350,970 | | | | | |
| Sublette County Hospital District, | | | | | | | | | | | | |
5.000%, 06/15/2026(6) | | | 2,000,000 | | | | 2,000,103 | | | | | |
| Wyoming Community | | | | | | | | | | | | |
| Development Authority: | | | | | | | | | | | | |
| 4.000%, 12/01/2043 | | | | | | | | | | | | |
| (Callable 06/01/2027) | | | 360,000 | | | | 358,758 | | | | | |
| 3.750%, 12/01/2049 | | | | | | | | | | | | |
| (Callable 12/01/2028) | | | 1,075,000 | | | | 1,063,558 | | | | | |
| Total Wyoming | | | | | | | | | | | | |
| (Cost $5,627,254) | | | | | | | 5,492,345 | | | | 0.3 | % |
| Total Long-Term Investments | | | | | | | | | | | | |
| (Cost $1,689,609,927) | | | | | | | 1,648,825,012 | | | | 99.0 | % |
| Short-Term Investments | | | | | | | | | | | | |
| | | Shares | | | | | | | | | |
| Money Market Mutual Funds | | | | | | | | | | | | |
| Federated Hermes Institutional Tax-Free | | | | | | | | | | | | |
Cash Trust, Premier Shares, 4.04%(4) | | | 13,406,876 | | | | 13,406,876 | | | | | |
| First American Government Obligations | | | | | | | | | | | | |
Fund, Class U, 5.03%(4) | | | 3,675,861 | | | | 3,675,861 | | | | | |
| Total Short-Term Investments | | | | | | | | | | | | |
| (Cost $17,082,737) | | | | | | | 17,082,737 | | | | 1.0 | % |
| Total Investments | | | | | | | | | | | | |
| (Cost $1,706,692,664) | | | | | | | 1,665,907,749 | | | | 100.0 | % |
| Liabilities in Excess of Other Assets | | | | | | | (92,651 | ) | | | (0.0 | )% |
| TOTAL NET ASSETS | | | | | | $ | 1,665,815,098 | | | | 100.0 | % |
Notes to Schedule of Investments
AGC – Assured Guaranty Corp.
AGM – Assured Guaranty Municipal
AMBAC – Ambac Assurance Corp.
BAM – Build America Mutual Assurance Co.
BHAC – Berkshire Hathaway Assurance Corp.
CA MTG – CA Mortgage Insurance
FGIC – Financial Guaranty Insurance Company
FHA – Federal Housing Administration
FNMA – Federal National Mortgage Association
GNMA – Government National Mortgage Association
HUD – US Department of Housing and Development
MT BRD – Montana Board of Investments
NATL – National Public Finance Guarantee Corp.
Q-SBLF – Qualified School Building Loan Fund
SCH BD GTY – School Board Guaranty
SD CRED PROG – State Credit Enhancement Program
SONYMA – State of New York Mortgage Agency
SCSDE – South Carolina School District
ST AID – State Aid Intercept/Withholding
USDA – USDA OneRD Guarantee
UT CSCE – Utah Charter School Credit Enhancement Program
ETM – Escrowed to Maturity
LIBOR – London Inter-bank Offered Rate
PSF – Permanent School Fund
SIFMA – Securities Industry and Financial Markets Association
SOFR – Secured Overnight Financing Rate
(1) | Variable rate security. The rate reported is the rate in effect as of June 30, 2023. |
(2) | Variable rate security based on a reference index and spread. The rate reported is the rate as of the last reset date in effect as of June 30, 2023. |
(3) | Includes securities exempt from registration under Rule 144A of the Securities Act of 1933. These securities may be resold in transactions exempt from registration to qualified institutional buyers. At June 30, 2023, the value of these securities totaled $97,569,442, which represented 5.86% of total net assets. |
(4) | Seven-day yield. |
(5) | Step-up bond; the interest rate shown is the rate in effect as of June 30, 2023. |
(6) | Security or a portion of the security purchased on a when-issued or delayed delivery basis. |
The accompanying notes are an integral part of these financial statements.
Baird Short-Term Municipal Bond Fund
Schedule of Investments, June 30, 2023 (Unaudited)
Summary of Fair Value Exposure at June 30, 2023 (Unaudited)
The Fund has adopted authoritative fair valuation accounting standards which establish a definition of fair value and set out a hierarchy for measuring fair value. These standards require additional disclosures about the various inputs and valuation techniques used to develop the measurements of fair value and a discussion on changes in valuation techniques and related inputs during the period. These standards define fair value as the price that would be received to sell an asset or paid to transfer a liability in an orderly transaction between market participants at the measurement date.
The fair value hierarchy is organized into three levels based upon the assumptions (referred to as “inputs”) used in pricing the asset or liability. These standards state that “observable inputs” reflect the assumptions market participants would use in pricing the asset or liability based on market data obtained from independent sources and “unobservable inputs” reflect an entity’s own assumptions about the assumptions market participants would use in pricing the asset or liability. These inputs are summarized into three broad levels and described below:
Level 1 – Quoted prices (unadjusted) in active markets for identical assets or liabilities that the reporting entity can access at the measurement date.
Level 2 – Inputs other than quoted prices included within Level 1 that are observable for the asset or liability, either directly or indirectly.
Level 3 – Unobservable inputs for the asset or liability.
The inputs or methodology used for valuing securities are not necessarily an indication of the risk associated with investing in those securities.
The following is a summary of the inputs used to value the Fund’s investments as of June 30, 2023:
| | | Level 1 | | | Level 2 | | | Level 3 | | | Total | |
| Long-Term Investments | | | | | | | | | | | | |
| Municipal Bonds | | $ | — | | | $ | 1,648,825,012 | | | $ | — | | | $ | 1,648,825,012 | |
| Total Long-Term Investments | | | — | | | | 1,648,825,012 | | | | — | | | | 1,648,825,012 | |
| Short-Term Investments | | | | | | | | | | | | | | | | |
| Money Market Mutual Funds | | | 17,082,737 | | | | — | | | | — | | | | 17,082,737 | |
| Total Short-Term Investments | | | 17,082,737 | | | | — | | | | — | | | | 17,082,737 | |
| Total Investments | | $ | 17,082,737 | | | $ | 1,648,825,012 | | | $ | — | | | $ | 1,665,907,749 | |
Changes in valuation techniques may result in transfers into or out of assigned levels within the fair value hierarchy. There were no transfers into or out of Level 3 during the reporting period, as compared to the security classifications from the prior year’s annual report. See the Fund’s Valuation Policy in Note 2a to the financial statements.
The accompanying notes are an integral part of these financial statements.
Baird Strategic Municipal Bond Fund
June 30, 2023 (Unaudited)
Portfolio Characteristics
Quality Distribution(1)(2)

| | Net Assets | $630,169,708 | |
| | | | |
| | SEC 30-Day Yield(4) | | |
| | Institutional Class | 3.68% | |
| | Investor Class | 3.43% | |
| | | | |
| | Average Effective Duration | 4.73 years | |
| | | | |
| | Average Effective Maturity | 5.02 years | |
| | Net Derivatives Position (Current Notional | | |
| | Amount as a Percentage of Net Assets) | 2.55% | |
| | | | |
| | Annualized Expense Ratio(5) | | |
| | Institutional Class | 0.30% | |
| | Investor Class | 0.55% | (6) |
| | | | | |
| | | Portfolio Turnover Rate | 32% | (7) |
Sector Weightings(1) | | | | |
| | | Number of Holdings | 701 | |
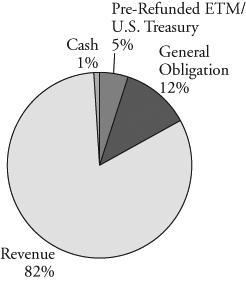 | | | | |
| | | | |
| | | | |
| | | | |
| | | | |
| | | | |
| | | | |
| | | | |
| | | | |
| | | | |
| | | | |
| | | | |
| | | | |
| | | | |
| | | | |
| | | | |
(1) | Percentages shown are based on the Fund’s total investments. |
(2) | The quality profile is calculated on a market value-weighted basis using the highest credit quality rating for each security held by the Fund given by S&P, Moody’s or Fitch, each of which is a Nationally Recognized Statistical Rating Organization (NRSRO). NRSROs rate the credit quality of securities using a scale that generally ranges from AAA (highest) to D (lowest). |
(3) | Includes pre-refunded and escrowed-to-maturity (ETM) bonds. |
(4) | SEC yields are based on SEC guidelines and are calculated for the 30 days ended June 30, 2023. |
(5) | Reflects expense ratios as stated in the Fund’s current prospectus dated May 1, 2023. |
(6) | Includes 0.25% 12b-1 fee. |
(7) | Not annualized. |
Baird Strategic Municipal Bond Fund
June 30, 2023 (Unaudited)
Total Returns
| | | | Average Annual |
| | Six | One | Three | Since |
| For the Periods Ended June 30, 2023 | Months | Year | Years | Inception(1) |
| Institutional Class Shares | 2.87% | 3.91% | 0.99% | 2.38% |
| Investor Class Shares | 2.75% | 3.66% | 0.77% | 2.13% |
Bloomberg 1-10 Year Municipal Blend Index(2) | 1.45% | 2.22% | -0.31%
| 0.50% |
(1) | For the period from November 15, 2019 (inception date) through June 30, 2023. |
(2) | The Bloomberg 1-10 Year Municipal Blend Index is a market value-weighted index which covers the short and intermediate components of the Bloomberg Municipal Index—an unmanaged, market value-weighted index which covers the U.S. investment-grade tax-exempt bond market. The Bloomberg 1-10 Year Municipal Blend Index tracks tax-exempt municipal General Obligation, Revenue, Insured, and Pre-refunded bonds with a minimum $5 million par amount outstanding, issued as part of a transaction of at least $50 million, and with a remaining maturity from 1 up to (but not including) 12 years. The Index includes reinvestment of income. This Index does not reflect any deduction for fees, expenses or taxes. A direct investment in an index is not possible. |
The returns table shown above reflects reinvestment of dividends and/or capital gains distributions in additional shares. The returns in the table do not reflect the deduction of taxes that a shareholder would pay on Fund distributions or the redemption of Fund shares. The returns reflect the actual performance for each period and do not include the impact of trades executed on the last business day of the period that were recorded on the first business day of the next period.
The Fund’s expense ratio for each Class, as reflected in the Fund’s current prospectus, is set forth under “Portfolio Characteristics”.
The Fund may invest up to 30% of its net assets in non-investment grade debt securities (commonly referred to as “high yield” bonds). While these types of debt securities typically offer higher yields than investment grade securities, they also include greater risks including increased credit risk and the increased risk of default or bankruptcy. The Fund may invest up to 25% of its total assets in municipal obligations issued by persons in the same state. As a result, changes in economic, business or political conditions of a particular state may have a disproportionate impact on the Fund’s share price. Municipal securities investments are not appropriate for all investors, especially those taxed at lower rates.
The Fund may invest up to 20% of its net assets in U.S. government and corporate bonds and other debt securities that are of the same quality as its investments in municipal bonds. These bonds produce income that is taxable for federal income tax purposes, unlike municipal bonds which generally provide income exempt from federal income tax.
The Fund may also invest in U.S. Treasury futures contracts. Futures contracts are subject to the risk of loss caused by unanticipated market movements, the risk that there may be an imperfect correlation between the prices of futures contracts and the value of their underlying instruments or indexes, and the risk there may not be a liquid secondary market for them. U.S. and international markets have experienced significant periods of volatility in recent years and months due to a number of economic, political and global macro factors. Russia’s ongoing war with Ukraine has heightened global geopolitical tensions, resulting in an elevated risk environment and increased volatility in asset prices. The uncertain course of the war may have a significant negative impact on the global economy. U.S. relations with China have become increasingly strained, and tension between the U.S. and China may have a significant negative impact on the global economy and asset prices. Measures of inflation reached levels not experienced in several decades, leading the Federal Reserve to raise short term interest rates significantly over the last year, with the potential for further rate increases in 2023. Uncertainty regarding the ability of the Federal Reserve to successfully control inflation, the potential for incremental rate increases, and the full impact of prior rate increases on the economy may negatively impact asset prices and increase market volatility. The possibility of a U.S. or global recession may also contribute to market volatility. The coronavirus (COVID-19) pandemic caused significant economic disruption in recent years as countries worked to limit the negative health impacts of the virus. While the virus has entered an endemic stage, significant outbreaks or new variants present a continued risk to the global economy. These and other geopolitical events may cause market disruptions and could have an adverse effect on the value of the Fund’s investments.
Past performance does not guarantee future results. Investment return and principal value will fluctuate so that an investor’s shares, when redeemed, may be worth more or less than their original cost.
For information about the performance of the Fund as of the most recent month-end, please call 1-866-442-2473 or visit www.bairdfunds.com. Mutual fund performance changes over time and current performance may be lower or higher than that stated.
Baird Strategic Municipal Bond Fund
Schedule of Investments, June 30, 2023 (Unaudited)
Long-Term Investments
| | | Principal | | | | | | % of | |
| | | Amount | | | Value | | | Net Assets | |
| Municipal Bonds | | | | | | | | | |
| Alabama | | | | | | | | | |
| Alabama Corrections Institution | | | | | | | | | |
| Finance Authority, | | | | | | | | | |
| 5.000%, 07/01/2037 (Callable 07/01/2032) | | $ | 195,000 | | | $ | 214,951 | | | | |
| Black Belt Energy Gas District: | | | | | | | | | | | |
| 2.550%, 10/01/2052 (SIFMA Municipal | | | | | | | | | | | |
| Swap Index + 0.350%) (Callable 09/01/2026) | | | | | | | | | | | |
(Mandatory Tender Date 12/01/2026)(2) | | | 1,000,000 | | | | 972,313 | | | | |
| 5.000%, 05/01/2053 | | | | | | | | | | | |
(Mandatory Tender Date 06/01/2028)(1) | | | 3,250,000 | | | | 3,402,199 | | | | |
| 5.500%, 11/01/2053 (Callable 09/01/2028) | | | | | | | | | | | |
(Mandatory Tender Date 12/01/2028)(1) | | | 1,000,000 | | | | 1,055,617 | | | | |
| City of Oxford AL, | | | | | | | | | | | |
| 2.600%, 09/01/2041 (Callable 07/03/2023) | | | | | | | | | | | |
(Optional Put Date 07/07/2023)(1) | | | 1,000,000 | | | | 1,000,000 | | | | |
| County of Elmore AL, | | | | | | | | | | | |
| 5.000%, 05/01/2047 | | | | | | | | | | | |
| (Callable 05/01/2032) (Insured by BAM) | | | 1,000,000 | | | | 1,061,141 | | | | |
| Industrial Development | | | | | | | | | | | |
| Board of the City of Mobile: | | | | | | | | | | | |
| 2.030%, 06/01/2034 | | | | | | | | | | | |
(Optional Put Date 07/03/2023)(1) | | | 1,500,000 | | | | 1,500,000 | | | | |
| 3.920%, 06/01/2034 | | | | | | | | | | | |
(Mandatory Tender Date 06/02/2026)(1) | | | 2,000,000 | | | | 2,000,000 | | | | |
| Prattville Industrial Development Board, | | | | | | | | | | | |
| 5.300%, 09/01/2028 | | | 1,000,000 | | | | 1,061,403 | | | | |
| Southeast Alabama Gas Supply District: | | | | | | | | | | | |
| 4.000%, 06/01/2049 (Callable 03/01/2024) | | | | | | | | | | | |
(Mandatory Tender Date 06/01/2024)(1) | | | 830,000 | | | | 828,393 | | | | |
| 4.337%, 06/01/2049 (1 Month LIBOR | | | | | | | | | | | |
| USD + 0.850%) (Callable 03/01/2024) | | | | | | | | | | | |
(Mandatory Tender Date 06/01/2024)(2) | | | 800,000 | | | | 800,015 | | | | |
| Southeast Energy Authority | | | | | | | | | | | |
| A Cooperative District: | | | | | | | | | | | |
| 5.000%, 05/01/2053 (Callable 05/01/2028) | | | | | | | | | | | |
(Mandatory Tender Date 08/01/2028)(1) | | | 500,000 | | | | 516,934 | | | | |
| 5.250%, 01/01/2054 (Callable 04/01/2029) | | | | | | | | | | | |
(Mandatory Tender Date 07/01/2029)(1) | | | 3,000,000 | | | | 3,136,787 | | | | |
| Total Alabama | | | | | | | | | | | |
| (Cost $17,519,532) | | | | | | | 17,549,753 | | | | 2.8 | % |
| Alaska | | | | | | | | | | | | |
| Alaska Housing Finance Corp., | | | | | | | | | | | | |
| 4.000%, 06/01/2036 | | | | | | | | | | | | |
| (Pre-refunded to 06/01/2025) | | | 215,000 | | | | 218,723 | | | | | |
| Alaska Industrial Development | | | | | | | | | | | | |
| & Export Authority: | | | | | | | | | | | | |
| 4.250%, 04/01/2031 (Callable 07/31/2023) | | | 185,000 | | | | 185,045 | | | | | |
| 4.000%, 04/01/2032 (Callable 04/01/2029) | | | 1,875,000 | | | | 1,884,950 | | | | | |
| Alaska Municipal Bond Bank Authority: | | | | | | | | | | | | |
| 5.000%, 10/01/2026 | | | 175,000 | | | | 184,618 | | | | | |
| 5.000%, 12/01/2028 (Callable 12/01/2026) | | | 615,000 | | | | 638,799 | | | | | |
| CIVIC Ventures: | | | | | | | | | | | | |
| 5.000%, 09/01/2023 | | | 235,000 | | | | 235,103 | | | | | |
| 5.000%, 09/01/2025 | | | 170,000 | | | | 171,900 | | | | | |
| Southeast Alaska Power Agency, | | | | | | | | | | | | |
| 5.250%, 06/01/2029 (Callable 12/01/2024) | | | 150,000 | | | | 153,631 | | | | | |
| University of Alaska, | | | | | | | | | | | | |
| 5.000%, 10/01/2028 (Callable 10/01/2025) | | | 110,000 | | | | 113,407 | | | | | |
| Total Alaska | | | | | | | | | | | | |
| (Cost $3,866,235) | | | | | | | 3,786,176 | | | | 0.6 | % |
| Arizona | | | | | | | | | | | | |
| Arizona Industrial Development Authority: | | | | | | | | | | | | |
| 2.470%, 07/01/2025 | | | | | | | | | | | | |
| (Insured by SD CRED PROG) | | | 115,000 | | | | 111,520 | | | | | |
| 3.169%, 10/01/2025 | | | 95,000 | | | | 90,341 | | | | | |
4.750%, 10/01/2025(3) | | | 155,000 | | | | 150,010 | | | | | |
| 5.000%, 10/01/2028 | | | 110,000 | | | | 115,485 | | | | | |
| 5.000%, 10/01/2029 | | | 10,000 | | | | 10,593 | | | | | |
5.000%, 10/01/2030 (Callable 10/01/2026)(3) | | | 105,000 | | | | 98,078 | | | | | |
| 5.000%, 10/01/2030 (Callable 10/01/2029) | | | 140,000 | | | | 148,166 | | | | | |
| 4.000%, 10/01/2031 (Callable 10/01/2029) | | | 65,000 | | | | 64,071 | | | | | |
| 3.625%, 05/20/2033 | | | 2,991,077 | | | | 2,784,468 | | | | | |
| 4.000%, 10/01/2033 (Callable 10/01/2029) | | | 100,000 | | | | 97,714 | | | | | |
| 4.000%, 10/01/2034 (Callable 10/01/2029) | | | 85,000 | | | | 82,705 | | | | | |
| Cochise County Community College District, | | | | | | | | | | | | |
| 5.000%, 07/01/2026 | | | | | | | | | | | | |
| (Callable 07/01/2025) (Insured by BAM) | | | 120,000 | | | | 124,292 | | | | | |
| Industrial Development Authority | | | | | | | | | | | | |
| of the City of Phoenix, | | | | | | | | | | | | |
| 2.950%, 07/01/2026 (Callable 07/01/2025) | | | 1,315,000 | | | | 1,258,907 | | | | | |
| Maricopa County Industrial | | | | | | | | | | | | |
| Development Authority: | | | | | | | | | | | | |
4.500%, 07/01/2025(3) | | | 125,000 | | | | 120,334 | | | | | |
| 5.000%, 07/01/2025 | | | | | | | | | | | | |
| (Insured by SD CRED PROG) | | | 475,000 | | | | 483,711 | | | | | |
2.100%, 07/01/2026(3)(5) | | | 1,150,000 | | | | 1,076,955 | | | | | |
| 5.000%, 07/01/2026 | | | | | | | | | | | | |
| (Insured by SD CRED PROG) | | | 430,000 | | | | 442,721 | | | | | |
| 5.000%, 07/01/2027 | | | | | | | | | | | | |
| (Insured by SD CRED PROG) | | | 710,000 | | | | 739,864 | | | | | |
5.250%, 07/01/2033 (Callable 07/01/2030)(3) | | | 725,000 | | | | 726,267 | | | | | |
6.000%, 07/01/2043 (Callable 07/01/2030)(3) | | | 1,385,000 | | | | 1,391,245 | | | | | |
| Total Arizona | | | | | | | | | | | | |
| (Cost $10,384,724) | | | | | | | 10,117,447 | | | | 1.6 | % |
| Arkansas | | | | | | | | | | | | |
| Arkansas Development Finance Authority, | | | | | | | | | | | | |
| 3.490%, 09/01/2044 (Callable 07/03/2023) | | | | | | | | | | | | |
(Optional Put Date 07/07/2023)(1) | | | 5,000,000 | | | | 5,000,000 | | | | | |
| Batesville Public Facilities Board, | | | | | | | | | | | | |
| 5.000%, 06/01/2027 | | | 500,000 | | | | 520,413 | | | | | |
| City of Heber Springs AR, | | | | | | | | | | | | |
| 1.625%, 06/01/2047 (Callable 06/01/2028) | | | 810,000 | | | | 731,237 | | | | | |
| City of Prairie Grove AR, | | | | | | | | | | | | |
| 1.750%, 06/01/2051 (Callable 12/01/2026) | | | | | | | | | | | | |
| (Insured by BAM) | | | 560,000 | | | | 498,586 | | | | | |
| City of West Memphis AR, | | | | | | | | | | | | |
| 3.000%, 12/01/2041 (Callable 12/01/2028) | | | | | | | | | | | | |
| (Insured by BAM) | | | 605,000 | | | | 498,413 | | | | | |
| Lonoke School District No. 1, | | | | | | | | | | | | |
| 2.250%, 02/01/2030 (Callable 07/31/2023) | | | | | | | | | | | | |
| (Insured by ST AID) | | | 255,000 | | | | 236,390 | | | | | |
| Total Arkansas | | | | | | | | | | | | |
| (Cost $7,638,348) | | | | | | | 7,485,039 | | | | 1.2 | % |
| California | | | | | | | | | | | | |
| California Community Choice | | | | | | | | | | | | |
| Financing Authority, | | | | | | | | | | | | |
| 5.250%, 01/01/2054 (Callable 10/01/2030) | | | | | | | | | | | | |
(Mandatory Tender Date 10/01/2031)(1) | | | 1,750,000 | | | | 1,830,673 | | | | | |
| California Community College | | | | | | | | | | | | |
| Financing Authority, | | | | | | | | | | | | |
5.750%, 07/01/2060 (Callable 07/01/2032)(3) | | | 1,550,000 | | | | 1,517,082 | | | | | |
| California Health Facilities Financing Authority, | | | | | | | | | | | | |
| 3.000%, 03/01/2041 (Callable 09/01/2023) | | | | | | | | | | | | |
(Mandatory Tender Date 03/01/2024)(1) | | | 900,000 | | | | 895,465 | | | | | |
The accompanying notes are an integral part of these financial statements.
Baird Strategic Municipal Bond Fund
Schedule of Investments, June 30, 2023 (Unaudited)
Long-Term Investments (cont.)
| | | Principal | | | | | | % of | |
| | | Amount | | | Value | | | Net Assets | |
| California Housing Finance Agency: | | | | | | | | | |
| 3.750%, 03/25/2035 (Insured by FHLMC) | | $ | 3,914,254 | | | $ | 3,804,059 | | | | |
| 4.375%, 09/20/2036 | | | 1,499,210 | | | | 1,496,105 | | | | |
| California Infrastructure & | | | | | | | | | | | |
| Economic Development Bank: | | | | | | | | | | | |
| 4.000%, 11/01/2039 (Callable 11/01/2031) | | | 630,000 | | | | 602,526 | | | | |
| 2.900%, 12/01/2050 (SIFMA Municipal | | | | | | | | | | | |
| Swap Index + 0.700%) (Callable 06/01/2025) | | | | | | | | | | | |
(Mandatory Tender Date 06/01/2026)(2) | | | 200,000 | | | | 194,451 | | | | |
| California Municipal Finance Authority, | | | | | | | | | | | |
| 5.000%, 05/15/2024 | | | 1,200,000 | | | | 1,210,304 | | | | |
| California Public Finance Authority: | | | | | | | | | | | |
2.125%, 11/15/2027 (Callable 07/21/2023)(3) | | | 600,000 | | | | 578,201 | | | | |
2.375%, 11/15/2028 (Callable 07/21/2023)(3) | | | 565,000 | | | | 541,114 | | | | |
3.125%, 05/15/2029 (Callable 11/15/2023)(3) | | | 500,000 | | | | 469,830 | | | | |
| California Statewide Communities | | | | | | | | | | | |
| Development Authority: | | | | | | | | | | | |
| 5.000%, 08/01/2026 (Callable 02/01/2024) | | | | | | | | | | | |
| (Mandatory Tender Date 08/01/2024) | | | | | | | | | | | |
(Insured by HUD)(1) | | | 1,000,000 | | | | 997,489 | | | | |
| 4.000%, 04/01/2036 (Callable 04/01/2030) | | | 1,175,000 | | | | 1,181,483 | | | | |
| Calipatria Unified School District, | | | | | | | | | | | |
| 0.000%, 08/01/2027 (Insured by BAM) | | | 165,000 | | | | 141,217 | | | | |
| Cathedral City Public Financing Authority, | | | | | | | | | | | |
| 0.000%, 08/01/2032 (Insured by NATL) | | | 1,085,000 | | | | 757,617 | | | | |
| City of Los Angeles Department of Airports, | | | | | | | | | | | |
| 5.000%, 05/15/2034 (Callable 05/15/2028) | | | 1,710,000 | | | | 1,822,321 | | | | |
| City of Vernon CA, | | | | | | | | | | | |
| 5.000%, 04/01/2025 | | | 3,000,000 | | | | 3,042,318 | | | | |
| Freddie Mac Multifamily ML Certificates: | | | | | | | | | | | |
| 3.350%, 11/25/2033 | | | 2,656,600 | | | | 2,437,282 | | | | |
4.140%, 01/25/2040(5) | | | 2,998,042 | | | | 2,786,194 | | | | |
| Freddie Mac Multifamily | | | | | | | | | | | |
| Variable Rate Certificate, | | | | | | | | | | | |
| 2.875%, 07/25/2036 | | | 3,105,309 | | | | 2,715,444 | | | | |
| Inglewood Unified School District | | | | | | | | | | | |
| School Facilities Financing Authority, | | | | | | | | | | | |
| 5.250%, 10/15/2026 (Insured by AGM) | | | 1,000,000 | | | | 1,031,157 | | | | |
| Irvine Facilities Financing Authority, | | | | | | | | | | | |
| 5.250%, 05/01/2043 (Callable 05/01/2026) | | | 2,000,000 | | | | 2,095,358 | | | | |
| Long Beach Bond Finance Authority, | | | | | | | | | | | |
| 4.689%, 11/15/2026 | | | | | | | | | | | |
(3 Month LIBOR USD + 1.430%)(2) | | | 700,000 | | | | 693,410 | | | | |
| Mayers Memorial Hospital District: | | | | | | | | | | | |
| 0.000%, 08/01/2026 | | | 230,000 | | | | 198,810 | | | | |
| 0.000%, 08/01/2029 | | | 165,000 | | | | 125,626 | | | | |
| 0.000%, 08/01/2032 | | | 210,000 | | | | 139,739 | | | | |
| 0.000%, 08/01/2034 | | | 260,000 | | | | 158,267 | | | | |
| Metropolitan Water District | | | | | | | | | | | |
| of Southern California, | | | | | | | | | | | |
| 2.340%, 07/01/2037 (SIFMA Municipal | | | | | | | | | | | |
| Swap Index + 0.140%) (Callable 11/23/2023) | | | | | | | | | | | |
(Mandatory Tender Date 05/21/2024)(2) | | | 150,000 | | | | 150,064 | | | | |
| Norwalk-La Mirada Unified School District, | | | | | | | | | | | |
| 0.000%, 08/01/2026 (Insured by NATL) | | | 750,000 | | | | 677,608 | | | | |
| Rialto Unified School District: | | | | | | | | | | | |
| 0.000%, 08/01/2037 (Callable 02/01/2033) | | | | | | | | | | | |
(Insured by BAM)(6) | | | 470,000 | | | | 255,790 | | | | |
| 0.000%, 08/01/2038 (Callable 02/01/2033) | | | | | | | | | | | |
(Insured by BAM)(6) | | | 400,000 | | | | 205,804 | | | | |
| 0.000%, 08/01/2039 (Callable 02/01/2033) | | | | | | | | | | | |
(Insured by BAM)(6) | | | 675,000 | | | | 328,460 | | | | |
| River Islands Public Financing Authority, | | | | | | | | | | | |
| 5.000%, 09/01/2035 (Callable 09/01/2029) | | | | | | | | | | | |
| (Insured by AGM) | | | 675,000 | | | | 768,400 | | | | |
| Riverside County | | | | | | | | | | | |
| Redevelopment Successor Agency, | | | | | | | | | | | |
| 5.000%, 10/01/2041 (Callable 10/01/2026) | | | | | | | | | | | |
(Insured by BAM)(5) | | | 80,000 | | | | 83,655 | | | | |
| Santa Cruz City High School District, | | | | | | | | | | | |
| 0.000%, 02/01/2024 (Insured by NATL) | | | 200,000 | | | | 195,823 | | | | |
| Savanna School District, | | | | | | | | | | | |
| 0.000%, 08/01/2047 (Callable 08/01/2029) | | | | | | | | | | | |
(Insured by AGM)(5) | | | 1,000,000 | | | | 1,033,613 | | | | |
| Tuolumne Utilities District, | | | | | | | | | | | |
| 1.250%, 08/15/2024 (Callable 08/15/2023) | | | 2,000,000 | | | | 1,922,259 | | | | |
| West Contra Costa Unified School District, | | | | | | | | | | | |
| 0.000%, 08/01/2031 (Insured by NATL) | | | 2,000,000 | | | | 1,500,114 | | | | |
| Western Placer Unified School District, | | | | | | | | | | | |
| 2.000%, 06/01/2025 (Callable 07/31/2023) | | | 225,000 | | | | 214,926 | | | | |
| Yorba Linda Redevelopment | | | | | | | | | | | |
| Agency Successor Agency, | | | | | | | | | | | |
| 0.000%, 09/01/2026 (Insured by NATL) | | | 315,000 | | | | 279,567 | | | | |
| Total California | | | | | | | | | | | |
| (Cost $41,708,057) | | | | | | | 41,079,625 | | | | 6.5 | % |
| Colorado | | | | | | | | | | | | |
| Arkansas River Power Authority: | | | | | | | | | | | | |
| 5.875%, 10/01/2026 | | | | | | | | | | | | |
| (ETM) (Insured by XLCA) | | | 1,000,000 | | | | 1,040,515 | | | | | |
| 5.000%, 10/01/2029 (Callable 10/01/2028) | | | 725,000 | | | | 752,042 | | | | | |
| 5.000%, 10/01/2032 (Callable 10/01/2028) | | | 1,000,000 | | | | 1,035,145 | | | | | |
| City & County of Denver CO, | | | | | | | | | | | | |
| 5.000%, 11/15/2047 (Callable 11/15/2032) | | | 1,320,000 | | | | 1,391,148 | | | | | |
| Colorado Educational & | | | | | | | | | | | | |
| Cultural Facilities Authority: | | | | | | | | | | | | |
| 5.000%, 10/01/2028 (Callable 10/01/2025) | | | 1,500,000 | | | | 1,513,599 | | | | | |
| 2.000%, 09/01/2030 (Callable 09/01/2028) | | | 550,000 | | | | 496,674 | | | | | |
| 5.000%, 12/01/2038 (Callable 12/01/2028) | | | 1,110,000 | | | | 1,154,341 | | | | | |
| Colorado Health Facilities Authority: | | | | | | | | | | | | |
| 2.125%, 05/15/2028 (Callable 07/31/2023) | | | 750,000 | | | | 680,032 | | | | | |
| 5.000%, 08/01/2028 | | | 390,000 | | | | 416,852 | | | | | |
| 2.625%, 05/15/2029 (Callable 07/31/2023) | | | 1,000,000 | | | | 891,411 | | | | | |
| 5.250%, 11/01/2034 (Callable 11/01/2032) | | | 1,000,000 | | | | 1,121,601 | | | | | |
| 5.000%, 08/01/2044 (Callable 08/01/2029) | | | 170,000 | | | | 175,498 | | | | | |
| 2.750%, 05/15/2061 | | | | | | | | | | | | |
| (SIFMA Municipal Swap Index + 0.550%) | | | | | | | | | | | | |
| (Callable 02/17/2026) | | | | | | | | | | | | |
(Mandatory Tender Date 08/17/2026)(2) | | | 2,000,000 | | | | 1,981,285 | | | | | |
| 5.000%, 05/15/2062 (Callable 02/17/2026) | | | | | | | | | | | | |
(Mandatory Tender Date 08/17/2026)(1) | | | 2,000,000 | | | | 2,100,798 | | | | | |
| Denver Convention Center Hotel Authority: | | | | | | | | | | | | |
| 5.000%, 12/01/2024 | | | 1,500,000 | | | | 1,517,012 | | | | | |
| 5.000%, 12/01/2028 (Callable 12/01/2026) | | | 720,000 | | | | 742,078 | | | | | |
| Denver Health & Hospital Authority, | | | | | | | | | | | | |
| 4.000%, 12/01/2028 (Callable 12/01/2023) | | | 100,000 | | | | 100,028 | | | | | |
| Denver Housing Authority, | | | | | | | | | | | | |
5.000%, 07/01/2027(6) | | | 2,000,000 | | | | 2,079,828 | | | | | |
| E-470 Public Highway Authority, | | | | | | | | | | | | |
| 0.000%, 09/01/2031 (Insured by NATL) | | | 1,500,000 | | | | 1,121,751 | | | | | |
| Fort Collins Housing Authority, | | | | | | | | | | | | |
| 1.250%, 07/01/2024 (Callable 01/01/2024) | | | 565,000 | | | | 550,163 | | | | | |
| Glen Metropolitan District No. 2, | | | | | | | | | | | | |
| 2.000%, 12/01/2030 (Insured by BAM) | | | 220,000 | | | | 195,569 | | | | | |
| Poudre Tech Metropolitan District, | | | | | | | | | | | | |
| 3.000%, 12/01/2026 (Insured by AGM) | | | 115,000 | | | | 114,305 | | | | | |
| Prairie Center Metropolitan District No. 7, | | | | | | | | | | | | |
| 4.125%, 12/15/2036 (Callable 12/15/2025) | | | 140,000 | | | | 123,728 | | | | | |
The accompanying notes are an integral part of these financial statements.
Baird Strategic Municipal Bond Fund
Schedule of Investments, June 30, 2023 (Unaudited)
Long-Term Investments (cont.)
| | | Principal | | | | | | % of | |
| | | Amount | | | Value | | | Net Assets | |
| Vauxmont Metropolitan District: | | | | | | | | | |
| 5.000%, 12/15/2032 (Callable 12/15/2024) | | | | | | | | | |
| (Insured by AGM) | | $ | 135,000 | | | $ | 142,250 | | | | |
| 3.250%, 12/15/2050 (Callable 12/15/2024) | | | | | | | | | | | |
| (Insured by AGM) | | | 1,643,000 | | | | 1,408,143 | | | | |
| Total Colorado | | | | | | | | | | | |
| (Cost $23,119,682) | | | | | | | 22,845,796 | | | | 3.6 | % |
| Connecticut | | | | | | | | | | | | |
| Connecticut Housing Finance Authority, | | | | | | | | | | | | |
| 3.500%, 11/15/2045 (Callable 05/15/2029) | | | 870,000 | | | | 849,872 | | | | | |
| Connecticut State Health & | | | | | | | | | | | | |
| Educational Facilities Authority: | | | | | | | | | | | | |
| 3.500%, 07/01/2026 | | | 700,000 | | | | 675,692 | | | | | |
| 5.000%, 07/01/2027 (Callable 07/01/2026) | | | 60,000 | | | | 60,314 | | | | | |
| 5.000%, 07/01/2029 | | | 400,000 | | | | 430,107 | | | | | |
| 5.000%, 07/01/2030 | | | 425,000 | | | | 462,118 | | | | | |
| 2.800%, 07/01/2057 | | | | | | | | | | | | |
(Mandatory Tender Date 02/03/2026)(1) | | | 2,500,000 | | | | 2,450,057 | | | | | |
| East Hartford Housing Authority, | | | | | | | | | | | | |
| 4.250%, 02/01/2027 (Callable 08/01/2024) | | | | | | | | | | | | |
| (Mandatory Tender Date 02/01/2025) | | | | | | | | | | | | |
(Insured by HUD)(1) | | | 1,000,000 | | | | 1,001,974 | | | | | |
| Town of Sprague CT: | | | | | | | | | | | | |
| 4.000%, 09/01/2024 (Insured by BAM) | | | 40,000 | | | | 40,122 | | | | | |
| 4.000%, 09/01/2025 (Insured by BAM) | | | 55,000 | | | | 55,328 | | | | | |
| Total Connecticut | | | | | | | | | | | | |
| (Cost $6,236,632) | | | | | | | 6,025,584 | | | | 0.9 | % |
| District of Columbia | | | | | | | | | | | | |
| District of Columbia, | | | | | | | | | | | | |
| 5.500%, 02/28/2034 | | | 1,000,000 | | | | 1,109,058 | | | | | |
| District of Columbia Water & Sewer Authority, | | | | | | | | | | | | |
| 3.000%, 10/01/2057 (Callable 07/01/2027) | | | | | | | | | | | | |
(Mandatory Tender Date 10/01/2027)(1) | | | 1,000,000 | | | | 979,658 | | | | | |
| Metropolitan Washington Airports Authority, | | | | | | | | | | | | |
| 5.000%, 10/01/2037 (Callable 10/01/2027) | | | 1,000,000 | | | | 1,040,066 | | | | | |
| Total District of Columbia | | | | | | | | | | | | |
| (Cost $3,204,415) | | | | | | | 3,128,782 | | | | 0.5 | % |
| Florida | | | | | | | | | | | | |
| Capital Trust Agency, Inc.: | | | | | | | | | | | | |
5.250%, 12/01/2024(3) | | | 450,000 | | | | 432,246 | | | | | |
3.375%, 07/01/2031(3) | | | 1,000,000 | | | | 935,433 | | | | | |
| 6.375%, 05/01/2053 | | | | | | | | | | | | |
(Callable 05/01/2033)(3)(6) | | | 750,000 | | | | 748,916 | | | | | |
| City of Sunrise FL, | | | | | | | | | | | | |
| 3.000%, 10/01/2050 (Callable 10/01/2030) | | | 2,000,000 | | | | 1,458,896 | | | | | |
| City of Tallahassee FL, | | | | | | | | | | | | |
| 5.000%, 12/01/2027 (Callable 12/01/2025) | | | 500,000 | | | | 514,832 | | | | | |
| County of Collier FL, | | | | | | | | | | | | |
| 5.000%, 06/01/2025 | | | 850,000 | | | | 858,471 | | | | | |
| County of Miami-Dade FL: | | | | | | | | | | | | |
| 5.000%, 10/01/2024 | | | 285,000 | | | | 288,399 | | | | | |
| 5.000%, 10/01/2031 (Callable 10/01/2024) | | | 160,000 | | | | 162,339 | | | | | |
| Florida Atlantic University Finance Corp., | | | | | | | | | | | | |
| 5.000%, 07/01/2023 | | | 500,000 | | | | 500,000 | | | | | |
| Florida Development Finance Corp.: | | | | | | | | | | | | |
4.000%, 06/01/2024(3) | | | 105,000 | | | | 103,759 | | | | | |
| 5.000%, 11/15/2024 | | | 600,000 | | | | 610,148 | | | | | |
| 4.000%, 06/15/2025 | | | 445,000 | | | | 441,025 | | | | | |
2.375%, 06/01/2027 (Callable 07/31/2023)(3) | | | 1,165,000 | | | | 1,117,525 | | | | | |
5.250%, 06/15/2029 (Callable 06/15/2027)(3) | | | 2,000,000 | | | | 1,977,856 | | | | | |
| 3.000%, 06/01/2032 (Callable 06/01/2024) | | | 2,000,000 | | | | 1,588,232 | | | | | |
5.000%, 08/15/2032(3) | | | 455,000 | | | | 450,713 | | | | | |
| 5.000%, 02/01/2035 (Callable 02/01/2032) | | | 1,000,000 | | | | 1,015,504 | | | | | |
| Florida Housing Finance Corp., | | | | | | | | | | | | |
| 4.200%, 01/01/2045 (Callable 01/01/2028) | | | | | | | | | | | | |
| (Insured by GNMA) | | | 55,000 | | | | 53,954 | | | | | |
| Orange County Health Facilities Authority, | | | | | | | | | | | | |
| 5.000%, 08/01/2028 (Callable 08/01/2024) | | | 300,000 | | | | 301,931 | | | | | |
| Palm Beach County Housing Authority, | | | | | | | | | | | | |
| 5.000%, 04/01/2026 | | | | | | | | | | | | |
(Mandatory Tender Date 04/01/2025)(1) | | | 1,000,000 | | | | 1,017,975 | | | | | |
| School Board of Miami-Dade County, | | | | | | | | | | | | |
| 5.000%, 02/01/2028 (Callable 02/01/2026) | | | 1,000,000 | | | | 1,039,834 | | | | | |
| UCF Stadium Corp., | | | | | | | | | | | | |
| 5.000%, 03/01/2025 | | | 370,000 | | | | 378,282 | | | | | |
| Total Florida | | | | | | | | | | | | |
| (Cost $16,088,306) | | | | | | | 15,996,270 | | | | 2.5 | % |
| Georgia | | | | | | | | | | | | |
| Atlanta Development Authority, | | | | | | | | | | | | |
| 5.000%, 07/01/2024 | | | 200,000 | | | | 203,096 | | | | | |
| Atlanta Urban Residential Finance Authority, | | | | | | | | | | | | |
| 2.000%, 09/01/2025 | | | | | | | | | | | | |
(Mandatory Tender Date 09/01/2024)(1) | | | 2,000,000 | | | | 1,944,612 | | | | | |
| Bartow County Development Authority: | | | | | | | | | | | | |
| 3.950%, 12/01/2032 | | | | | | | | | | | | |
(Mandatory Tender Date 03/08/2028)(1) | | | 1,000,000 | | | | 997,583 | | | | | |
| 2.875%, 08/01/2043 | | | | | | | | | | | | |
(Mandatory Tender Date 08/19/2025)(1) | | | 2,000,000 | | | | 1,941,457 | | | | | |
| Clayton County Development Authority, | | | | | | | | | | | | |
| 4.000%, 07/01/2034 (Callable 07/01/2027) | | | 100,000 | | | | 101,350 | | | | | |
| Development Authority of Gwinnett County, | | | | | | | | | | | | |
| 5.000%, 07/01/2040 (Callable 07/01/2027) | | | 3,010,000 | | | | 3,109,045 | | | | | |
| Gainesville & Hall County | | | | | | | | | | | | |
| Development Authority, | | | | | | | | | | | | |
| 2.050%, 11/15/2033 (Callable 07/01/2023) | | | | | | | | | | | | |
| (Optional Put Date 07/03/2023) | | | | | | | | | | | | |
(Insured by AGC)(1) | | | 2,000,000 | | | | 2,000,000 | | | | | |
| George L Smith II Congress Center Authority, | | | | | | | | | | | | |
3.625%, 01/01/2031(3) | | | 750,000 | | | | 670,841 | | | | | |
| Main Street Natural Gas, Inc.: | | | | | | | | | | | | |
4.000%, 11/01/2023(3) | | | 1,000,000 | | | | 998,588 | | | | | |
| 5.000%, 05/15/2024 | | | 65,000 | | | | 65,474 | | | | | |
| 4.000%, 08/01/2048 (Callable 09/01/2023) | | | | | | | | | | | | |
(Mandatory Tender Date 12/01/2023)(1) | | | 500,000 | | | | 500,116 | | | | | |
| 4.317%, 08/01/2048 (1 Month LIBOR | | | | | | | | | | | | |
| USD + 0.830%) (Callable 09/01/2023) | | | | | | | | | | | | |
(Mandatory Tender Date 12/01/2023)(2) | | | 290,000 | | | | 289,815 | | | | | |
| 4.000%, 08/01/2049 (Callable 09/01/2024) | | | | | | | | | | | | |
(Mandatory Tender Date 12/02/2024)(1) | | | 1,000,000 | | | | 1,002,867 | | | | | |
| 4.000%, 07/01/2052 (Callable 06/01/2027) | | | | | | | | | | | | |
(Mandatory Tender Date 09/01/2027)(1) | | | 1,000,000 | | | | 996,692 | | | | | |
| 4.000%, 08/01/2052 (Callable 05/01/2027) | | | | | | | | | | | | |
(Mandatory Tender Date 11/01/2027)(1)(3) | | | 2,850,000 | | | | 2,754,651 | | | | | |
| 5.000%, 12/01/2052 (Callable 03/01/2029) | | | | | | | | | | | | |
(Mandatory Tender Date 06/01/2029)(1) | | | 1,250,000 | | | | 1,289,486 | | | | | |
| 5.000%, 06/01/2053 (Callable 03/01/2030) | | | | | | | | | | | | |
(Mandatory Tender Date 06/01/2030)(1) | | | 2,000,000 | | | | 2,070,720 | | | | | |
| Oconee County Industrial | | | | | | | | | | | | |
| Development Authority, | | | | | | | | | | | | |
| 5.750%, 03/01/2045 (Callable 03/01/2031) | | | 1,750,000 | | | | 1,487,322 | | | | | |
| Private Colleges & Universities Authority: | | | | | | | | | | | | |
| 5.000%, 06/01/2027 | | | 200,000 | | | | 210,835 | | | | | |
| 5.000%, 06/01/2033 (Callable 06/01/2031) | | | 500,000 | | | | 551,240 | | | | | |
| Total Georgia | | | | | | | | | | | | |
| (Cost $24,078,051) | | | | | | | 23,185,790 | | | | 3.7 | % |
The accompanying notes are an integral part of these financial statements.
Baird Strategic Municipal Bond Fund
Schedule of Investments, June 30, 2023 (Unaudited)
Long-Term Investments (cont.)
| | | Principal | | | | | | % of | |
| | | Amount | | | Value | | | Net Assets | |
| Hawaii | | | | | | | | | |
| State of Hawaii, | | | | | | | | | |
| 5.000%, 08/01/2027 (Callable 08/01/2023) | | $ | 2,535,000 | | | $ | 2,536,398 | | | | |
| Total Hawaii | | | | | | | | | | | |
| (Cost $2,538,953) | | | | | | | 2,536,398 | | | | 0.4 | % |
| Idaho | | | | | | | | | | | | |
| Idaho Housing & Finance Association, | | | | | | | | | | | | |
| 3.000%, 05/01/2042 (Callable 05/01/2032) | | | | | | | | | | | | |
| (Insured by SCH BD GTY) | | | 480,000 | | | | 357,144 | | | | | |
| Total Idaho | | | | | | | | | | | | |
| (Cost $360,449) | | | | | | | 357,144 | | | | 0.1 | % |
| Illinois | | | | | | | | | | | | |
| Champaign & Piatt Counties | | | | | | | | | | | | |
| Community Unit School District No. 3, | | | | | | | | | | | | |
| 3.500%, 09/01/2029 (Callable 07/31/2023) | | | 180,000 | | | | 180,082 | | | | | |
| Chicago Board of Education: | | | | | | | | | | | | |
| 0.000%, 12/01/2025 (Insured by NATL) | | | 1,000,000 | | | | 906,502 | | | | | |
| 5.250%, 04/01/2034 (Callable 04/01/2033) | | | 1,000,000 | | | | 1,118,731 | | | | | |
| Chicago Midway International Airport, | | | | | | | | | | | | |
| 5.000%, 01/01/2030 (Callable 01/01/2024) | | | 1,500,000 | | | | 1,505,557 | | | | | |
| Chicago O’Hare International Airport: | | | | | | | | | | | | |
| 5.000%, 01/01/2036 (Callable 01/01/2032) | | | 500,000 | | | | 544,574 | | | | | |
| 5.500%, 01/01/2055 (Callable 01/01/2032) | | | 1,255,000 | | | | 1,347,315 | | | | | |
| Chicago Park District: | | | | | | | | | | | | |
| 5.000%, 01/01/2024 | | | 225,000 | | | | 226,564 | | | | | |
| 5.000%, 01/01/2029 (Callable 01/01/2024) | | | 1,125,000 | | | | 1,132,821 | | | | | |
| 5.000%, 01/01/2030 | | | | | | | | | | | | |
| (Pre-refunded to 01/01/2024) | | | 100,000 | | | | 100,850 | | | | | |
| 5.000%, 01/01/2030 (Callable 01/01/2024) | | | 50,000 | | | | 50,357 | | | | | |
| 5.250%, 01/01/2042 (Callable 01/01/2033) | | | 1,255,000 | | | | 1,372,938 | | | | | |
| Chicago Transit Authority, | | | | | | | | | | | | |
| 5.250%, 12/01/2049 (Callable 12/01/2024) | | | 2,430,000 | | | | 2,464,820 | | | | | |
| City of Chicago IL: | | | | | | | | | | | | |
| 5.000%, 11/01/2023 | | | 125,000 | | | | 125,539 | | | | | |
| 5.000%, 11/01/2027 (Callable 11/01/2026) | | | | | | | | | | | | |
| (Insured by BAM) | | | 100,000 | | | | 106,226 | | | | | |
| 0.000%, 01/01/2029 (Insured by NATL) | | | 4,125,000 | | | | 3,322,386 | | | | | |
| 5.000%, 11/01/2029 (Callable 11/01/2026) | | | 390,000 | | | | 408,469 | | | | | |
| 5.500%, 01/01/2040 (Callable 01/01/2032) | | | 1,000,000 | | | | 1,093,512 | | | | | |
| 5.250%, 01/01/2042 (Callable 07/01/2032) | | | | | | | | | | | | |
| (Insured by AGM) | | | 1,000,000 | | | | 1,098,559 | | | | | |
| 5.250%, 01/01/2043 (Callable 07/01/2032) | | | | | | | | | | | | |
| (Insured by AGM) | | | 1,000,000 | | | | 1,097,536 | | | | | |
| Cook County Community | | | | | | | | | | | | |
| College District No. 508, | | | | | | | | | | | | |
| 5.250%, 12/01/2028 (Callable 12/01/2023) | | | 325,000 | | | | 325,981 | | | | | |
| Crawford Hospital District, | | | | | | | | | | | | |
| 4.000%, 01/01/2027 (Insured by AGM) | | | 315,000 | | | | 319,755 | | | | | |
| Illinois Finance Authority: | | | | | | | | | | | | |
| 5.000%, 10/01/2023 | | | 100,000 | | | | 100,290 | | | | | |
| 5.000%, 11/01/2024 | | | 50,000 | | | | 50,408 | | | | | |
| 3.000%, 05/01/2025 | | | 265,000 | | | | 256,753 | | | | | |
| 5.000%, 09/01/2025 | | | 1,735,000 | | | | 1,733,568 | | | | | |
| 5.000%, 10/01/2025 | | | 150,000 | | | | 153,574 | | | | | |
| 5.000%, 09/01/2027 (Callable 09/01/2026) | | | 500,000 | | | | 519,037 | | | | | |
| 4.000%, 05/01/2030 (Callable 05/01/2028) | | | 275,000 | | | | 270,967 | | | | | |
| 3.000%, 09/01/2031 (Callable 09/01/2026) | | | 1,475,000 | | | | 1,338,157 | | | | | |
| 5.000%, 02/15/2037 (Callable 08/15/2027) | | | 1,000,000 | | | | 992,716 | | | | | |
| 4.125%, 11/15/2037 (Callable 11/15/2025) | | | 300,000 | | | | 289,680 | | | | | |
| 5.000%, 11/15/2039 (Callable 05/15/2025) | | | 2,500,000 | | | | 2,527,002 | | | | | |
5.625%, 08/01/2053 (Callable 08/01/2033)(3) | | | 2,500,000 | | | | 2,504,642 | | | | | |
| Illinois Housing Development Authority: | | | | | | | | | | | | |
| 4.000%, 06/01/2026 | | | | | | | | | | | | |
| (Mandatory Tender Date 06/01/2025) | | | | | | | | | | | | |
(Insured by FHA)(1) | | | 500,000 | | | | 500,654 | | | | | |
| 2.900%, 08/01/2031 (Callable 02/01/2026) | | | 1,000,000 | | | | 938,361 | | | | | |
| 2.200%, 04/01/2045 (Callable 07/03/2023) | | | | | | | | | | | | |
| (Optional Put Date 07/07/2023) | | | | | | | | | | | | |
(Insured by GNMA)(1) | | | 2,000,000 | | | | 2,000,000 | | | | | |
| Illinois Sports Facilities Authority: | | | | | | | | | | | | |
| 5.000%, 06/15/2030 | | | 900,000 | | | | 918,358 | | | | | |
| 5.000%, 06/15/2031 | | | 2,025,000 | | | | 2,060,802 | | | | | |
| 5.250%, 06/15/2031 (Callable 06/15/2024) | | | | | | | | | | | | |
| (Insured by AGM) | | | 600,000 | | | | 607,977 | | | | | |
| Joliet Park District, | | | | | | | | | | | | |
| 4.000%, 02/01/2033 (Callable 07/31/2023) | | | | | | | | | | | | |
| (Insured by AGM) | | | 150,000 | | | | 150,095 | | | | | |
| Madison County Community | | | | | | | | | | | | |
| Unit School District No. 8, | | | | | | | | | | | | |
| 4.000%, 12/01/2032 (Callable 12/01/2028) | | | | | | | | | | | | |
| (Insured by BAM) | | | 1,000,000 | | | | 1,034,307 | | | | | |
| Madison, Bond, Etc. Counties Community | | | | | | | | | | | | |
| Unit School District No. 5: | | | | | | | | | | | | |
| 5.500%, 02/01/2032 (Callable 02/01/2030) | | | | | | | | | | | | |
| (Insured by AGM) | | | 475,000 | | | | 543,758 | | | | | |
| 5.500%, 02/01/2034 (Callable 02/01/2030) | | | | | | | | | | | | |
| (Insured by AGM) | | | 600,000 | | | | 684,120 | | | | | |
| 5.500%, 02/01/2035 (Callable 02/01/2030) | | | | | | | | | | | | |
| (Insured by AGM) | | | 570,000 | | | | 647,247 | | | | | |
| Metropolitan Pier & Exposition Authority: | | | | | | | | | | | | |
| 0.000%, 06/15/2027 (Insured by AGM) | | | 750,000 | | | | 648,329 | | | | | |
| 0.000%, 12/15/2034 (Insured by NATL) | | | 2,000,000 | | | | 1,261,021 | | | | | |
| Niles Park District, | | | | | | | | | | | | |
| 3.000%, 12/01/2032 (Callable 07/31/2023) | | | 700,000 | | | | 688,061 | | | | | |
| Northern Illinois University: | | | | | | | | | | | | |
| 5.000%, 04/01/2024 (Insured by BAM) | | | 500,000 | | | | 505,103 | | | | | |
| 5.000%, 10/01/2031 (Callable 04/01/2031) | | | | | | | | | | | | |
| (Insured by BAM) | | | 450,000 | | | | 484,440 | | | | | |
| 4.000%, 10/01/2032 (Callable 04/01/2031) | | | | | | | | | | | | |
| (Insured by BAM) | | | 500,000 | | | | 506,180 | | | | | |
| Peoria Public Building Commission, | | | | | | | | | | | | |
| 0.000%, 12/01/2025 | | | 1,000,000 | | | | 903,516 | | | | | |
| Southern Illinois University, | | | | | | | | | | | | |
| 4.000%, 04/01/2030 (Insured by BAM) | | | 1,575,000 | | | | 1,584,171 | | | | | |
| State of Illinois: | | | | | | | | | | | | |
| 6.000%, 06/15/2024 (Insured by NATL) | | | 100,000 | | | | 102,264 | | | | | |
| 5.000%, 01/01/2026 | | | 50,000 | | | | 51,758 | | | | | |
| 5.000%, 11/01/2026 | | | 2,000,000 | | | | 2,098,185 | | | | | |
| 5.250%, 07/01/2031 (Callable 07/10/2023) | | | 1,050,000 | | | | 1,050,275 | | | | | |
| University of Illinois, | | | | | | | | | | | | |
| 4.000%, 04/01/2034 (Callable 04/01/2025) | | | 650,000 | | | | 639,121 | | | | | |
| Upper Illinois River Valley | | | | | | | | | | | | |
| Development Authority, | | | | | | | | | | | | |
4.000%, 01/01/2031 (Callable 01/01/2027)(3) | | | 220,000 | | | | 207,711 | | | | | |
| Village of River Grove IL, | | | | | | | | | | | | |
| 4.000%, 12/15/2032 (Callable 12/15/2030) | | | | | | | | | | | | |
| (Insured by BAM) | | | 505,000 | | | | 524,210 | | | | | |
| Wauconda Special Service Area No. 1, | | | | | | | | | | | | |
| 5.000%, 03/01/2033 (Callable 03/01/2025) | | | | | | | | | | | | |
| (Insured by BAM) | | | 3,410,000 | | | | 3,463,801 | | | | | |
| Will County Community | | | | | | | | | | | | |
| High School District No. 210: | | | | | | | | | | | | |
| 0.000%, 01/01/2028 (Insured by BAM) | | | 310,000 | | | | 262,133 | | | | | |
| 0.000%, 01/01/2032 (Insured by BAM) | | | 125,000 | | | | 90,352 | | | | | |
| 4.000%, 01/01/2034 (Callable 01/01/2029) | | | | | | | | | | | | |
| (Insured by AGM) | | | 150,000 | | | | 153,043 | | | | | |
| Total Illinois | | | | | | | | | | | | |
| (Cost $55,020,641) | | | | | | | 54,895,221 | | | | 8.7 | % |
The accompanying notes are an integral part of these financial statements.
Baird Strategic Municipal Bond Fund
Schedule of Investments, June 30, 2023 (Unaudited)
Long-Term Investments (cont.)
| | | Principal | | | | | | % of | |
| | | Amount | | | Value | | | Net Assets | |
| Indiana | | | | | | | | | |
| City of Rockport IN, | | | | | | | | | |
| 3.125%, 07/01/2025 | | $ | 2,000,000 | | | $ | 1,955,617 | | | | |
| Indiana Finance Authority: | | | | | | | | | | | |
| 5.000%, 09/15/2023 | | | 795,000 | | | | 796,470 | | | | |
| 3.500%, 03/01/2024 | | | 3,000,000 | | | | 2,994,374 | | | | |
| 5.500%, 04/01/2024 | | | 665,000 | | | | 669,873 | | | | |
| 5.000%, 04/01/2028 | | | 870,000 | | | | 887,533 | | | | |
| 5.000%, 06/01/2038 (Callable 06/01/2033) | | | 750,000 | | | | 778,460 | | | | |
| 5.000%, 06/01/2043 (Callable 06/01/2033) | | | 755,000 | | | | 776,356 | | | | |
| 5.000%, 06/01/2053 (Callable 06/01/2033) | | | 700,000 | | | | 706,504 | | | | |
| Indiana Health & Educational | | | | | | | | | | | |
| Facilities Financing Authority, | | | | | | | | | | | |
| 5.000%, 11/15/2046 (Callable 11/15/2026) | | | 150,000 | | | | 152,874 | | | | |
| Indianapolis Local Public | | | | | | | | | | | |
| Improvement Bond Bank, | | | | | | | | | | | |
| 5.250%, 02/01/2048 (Callable 08/01/2033) | | | 2,800,000 | | | | 3,112,987 | | | | |
| Plainfield Redevelopment Authority, | | | | | | | | | | | |
| 3.250%, 08/01/2032 (Callable 08/01/2023) | | | | | | | | | | | |
| (Insured by ST AID) | | | 145,000 | | | | 138,806 | | | | |
| Plainfield Redevelopment District, | | | | | | | | | | | |
| 3.000%, 07/01/2031 (Callable 07/01/2027) | | | 435,000 | | | | 411,759 | | | | |
| Posey County Redevelopment Authority, | | | | | | | | | | | |
| 5.000%, 07/15/2025 | | | 3,000,000 | | | | 3,074,580 | | | | |
| Total Indiana | | | | | | | | | | | |
| (Cost $16,498,402) | | | | | | | 16,456,193 | | | | 2.6 | % |
| Iowa | | | | | | | | | | | | |
| City of Coralville IA, | | | | | | | | | | | | |
| 4.000%, 06/01/2024 | | | 200,000 | | | | 198,422 | | | | | |
| City of Stuart IA, | | | | | | | | | | | | |
| 4.750%, 06/01/2026 (Callable 06/01/2025) | | | 1,000,000 | | | | 999,889 | | | | | |
| Iowa Finance Authority: | | | | | | | | | | | | |
7.500%, 01/01/2032 (Callable 01/01/2030)(3) | | | 1,000,000 | | | | 951,344 | | | | | |
| 4.000%, 07/01/2047 (Callable 07/01/2028) | | | | | | | | | | | | |
| (Insured by GNMA) | | | 175,000 | | | | 173,783 | | | | | |
| 5.500%, 07/01/2053 (Callable 01/01/2033) | | | | | | | | | | | | |
| (Insured by GNMA) | | | 2,575,000 | | | | 2,741,592 | | | | | |
| Iowa Higher Education Loan Authority: | | | | | | | | | | | | |
| 3.000%, 04/01/2024 | | | 255,000 | | | | 253,404 | | | | | |
| 5.000%, 10/01/2037 (Callable 10/01/2030) | | | 400,000 | | | | 415,661 | | | | | |
| PEFA, Inc., | | | | | | | | | | | | |
| 5.000%, 09/01/2049 (Callable 06/01/2026) | | | | | | | | | | | | |
(Mandatory Tender Date 09/01/2026)(1) | | | 1,210,000 | | | | 1,233,728 | | | | | |
| Total Iowa | | | | | | | | | | | | |
| (Cost $6,974,448) | | | | | | | 6,967,823 | | | | 1.1 | % |
| Kansas | | | | | | | | | | | | |
| City of Derby KS, | | | | | | | | | | | | |
| 3.900%, 03/01/2037 (Callable 03/01/2025) | | | 25,000 | | | | 25,019 | | | | | |
| Wyandotte County-Kansas | | | | | | | | | | | | |
| City Unified Government, | | | | | | | | | | | | |
| 0.000%, 12/01/2027 (Insured by NATL) | | | 95,000 | | | | 78,982 | | | | | |
| Total Kansas | | | | | | | | | | | | |
| (Cost $101,792) | | | | | | | 104,001 | | | | 0.0 | % |
| Kentucky | | | | | | | | | | | | |
| Garrard County School District Finance Corp.: | | | | | | | | | | | | |
| 5.000%, 08/01/2036 (Callable 08/01/2031) | | | | | | | | | | | | |
| (Insured by BAM) | | | 1,220,000 | | | | 1,342,483 | | | | | |
| 5.000%, 08/01/2037 (Callable 08/01/2031) | | | | | | | | | | | | |
| (Insured by BAM) | | | 1,000,000 | | | | 1,089,228 | | | | | |
| Kentucky Economic Development | | | | | | | | | | | | |
| Finance Authority: | | | | | | | | | | | | |
| 0.000%, 10/01/2025 (Insured by NATL) | | | 35,000 | | | | 32,047 | | | | | |
| 5.000%, 07/01/2028 (Callable 07/01/2025) | | | 2,335,000 | | | | 2,365,062 | | | | | |
| 5.000%, 06/01/2030 (Callable 06/01/2027) | | | 50,000 | | | | 51,122 | | | | | |
| 5.000%, 07/01/2040 (Callable 07/01/2025) | | | 1,290,000 | | | | 1,294,197 | | | | | |
| Kentucky Higher Education Student Loan Corp., | | | | | | | | | | | | |
| 5.000%, 06/01/2024 | | | 130,000 | | | | 131,374 | | | | | |
| Kentucky Housing Corp., | | | | | | | | | | | | |
5.850%, 04/01/2048(1) | | | 804,742 | | | | 786,143 | | | | | |
| Kentucky Public Energy Authority: | | | | | | | | | | | | |
| 4.000%, 01/01/2049 (Callable 10/01/2024) | | | | | | | | | | | | |
(Mandatory Tender Date 01/01/2025)(1) | | | 2,500,000 | | | | 2,499,756 | | | | | |
| 4.000%, 12/01/2049 (Callable 03/01/2025) | | | | | | | | | | | | |
(Mandatory Tender Date 06/01/2025)(1) | | | 320,000 | | | | 318,444 | | | | | |
| 4.607%, 12/01/2049 (1 Month LIBOR | | | | | | | | | | | | |
| USD + 1.120%) (Callable 03/01/2025) | | | | | | | | | | | | |
(Mandatory Tender Date 06/01/2025)(2) | | | 700,000 | | | | 696,215 | | | | | |
| 4.000%, 12/01/2050 (Callable 03/01/2026) | | | | | | | | | | | | |
(Mandatory Tender Date 06/01/2026)(1) | | | 275,000 | | | | 274,439 | | | | | |
| Morehead State University, | | | | | | | | | | | | |
| 5.000%, 04/01/2028 (Callable 04/01/2025) | | | | | | | | | | | | |
| (Insured by ST AID) | | | 230,000 | | | | 236,045 | | | | | |
| Total Kentucky | | | | | | | | | | | | |
| (Cost $11,348,427) | | | | | | | 11,116,555 | | | | 1.8 | % |
| Louisiana | | | | | | | | | | | | |
| Ernest N. Morial New Orleans | | | | | | | | | | | | |
| Exhibition Hall Authority, | | | | | | | | | | | | |
| 5.000%, 07/15/2038 (Callable 07/15/2033) | | | 1,000,000 | | | | 1,111,067 | | | | | |
| Louisiana Local Government | | | | | | | | | | | | |
| Environmental Facilities & Community | | | | | | | | | | | | |
| Development Authority: | | | | | | | | | | | | |
| 4.000%, 10/01/2023 | | | 100,000 | | | | 99,886 | | | | | |
| 4.000%, 10/01/2024 | | | 145,000 | | | | 144,683 | | | | | |
3.020%, 04/01/2031 (Callable 04/01/2025)(3) | | | 1,123,000 | | | | 1,111,310 | | | | | |
5.250%, 06/15/2033 (Callable 06/15/2031)(3) | | | 1,050,000 | | | | 970,856 | | | | | |
| Louisiana Public Facilities Authority: | | | | | | | | | | | | |
0.000%, 10/01/2024(5) | | | 400,000 | | | | 394,197 | | | | | |
0.000%, 10/01/2029(5) | | | 560,000 | | | | 584,150 | | | | | |
| 5.000%, 05/15/2033 (Callable 05/15/2030) | | | 350,000 | | | | 384,146 | | | | | |
0.000%, 10/01/2033(5) | | | 2,515,000 | | | | 2,661,189 | | | | | |
0.000%, 10/01/2046 (Callable 10/01/2033)(5) | | | 110,000 | | | | 108,732 | | | | | |
| Morehouse Parish Hospital | | | | | | | | | | | | |
| Service District No. 1, | | | | | | | | | | | | |
| 3.000%, 10/01/2030 (Callable 10/01/2027) | | | 100,000 | | | | 85,912 | | | | | |
| St. Tammany Parish Hospital | | | | | | | | | | | | |
| Service District No. 1, | | | | | | | | | | | | |
| 5.000%, 07/01/2034 (Callable 07/01/2028) | | | 1,520,000 | | | | 1,625,446 | | | | | |
| Total Louisiana | | | | | | | | | | | | |
| (Cost $9,292,658) | | | | | | | 9,281,574 | | | | 1.5 | % |
| Maine | | | | | | | | | | | | |
| City of Lewiston ME: | | | | | | | | | | | | |
| 1.375%, 02/15/2033 (Callable 02/15/2028) | | | 1,000,000 | | | | 772,459 | | | | | |
| 1.500%, 02/15/2035 (Callable 02/15/2028) | | | 1,435,000 | | | | 1,058,768 | | | | | |
| Finance Authority of Maine: | | | | | | | | | | | | |
| 5.000%, 12/01/2023 (Insured by AGM) | | | 125,000 | | | | 125,748 | | | | | |
| 5.000%, 12/01/2024 (Insured by AGM) | | | 125,000 | | | | 127,274 | | | | | |
| 5.000%, 12/01/2025 (Insured by AGM) | | | 200,000 | | | | 206,099 | | | | | |
| 5.000%, 12/01/2026 (Insured by AGM) | | | 200,000 | | | | 208,389 | | | | | |
| Maine Health & Higher | | | | | | | | | | | | |
| Educational Facilities Authority: | | | | | | | | | | | | |
| 5.000%, 07/01/2026 (Insured by ST AID) | | | 100,000 | | | | 104,421 | | | | | |
| 5.000%, 07/01/2034 (Callable 07/01/2030) | | | | | | | | | | | | |
| (Insured by ST AID) | | | 960,000 | | | | 1,039,715 | | | | | |
The accompanying notes are an integral part of these financial statements.
Baird Strategic Municipal Bond Fund
Schedule of Investments, June 30, 2023 (Unaudited)
Long-Term Investments (cont.)
| | | Principal | | | | | | % of | |
| | | Amount | | | Value | | | Net Assets | |
| Maine Health & Higher | | | | | | | | | |
| Educational Facilities Authority: (cont.) | | | | | | | | | |
| 5.000%, 07/01/2035 (Callable 07/01/2030) | | | | | | | | | |
| (Insured by ST AID) | | $ | 1,510,000 | | | $ | 1,625,148 | | | | |
| 5.000%, 07/01/2036 (Callable 07/01/2030) | | | | | | | | | | | |
| (Insured by ST AID) | | | 1,615,000 | | | | 1,730,183 | | | | |
| Maine State Housing Authority, | | | | | | | | | | | |
| 5.000%, 11/15/2052 (Callable 11/15/2031) | | | 990,000 | | | | 1,020,893 | | | | |
| Total Maine | | | | | | | | | | | |
| (Cost $8,076,221) | | | | | | | 8,019,097 | | | | 1.3 | % |
| Maryland | | | | | | | | | | | | |
| Maryland Community | | | | | | | | | | | | |
| Development Administration: | | | | | | | | | | | | |
| 4.050%, 10/01/2024 | | | 1,000,000 | | | | 997,336 | | | | | |
| 3.850%, 03/01/2025 | | | 2,000,000 | | | | 1,974,934 | | | | | |
| 0.550%, 09/01/2026 | | | 555,000 | | | | 503,232 | | | | | |
| 2.000%, 03/01/2032 (Callable 09/01/2030) | | | 400,000 | | | | 339,209 | | | | | |
| 3.750%, 03/01/2050 (Callable 03/01/2029) | | | 1,735,000 | | | | 1,710,246 | | | | | |
| Maryland Economic Development Corp., | | | | | | | | | | | | |
3.500%, 07/01/2024(3) | | | 805,000 | | | | 788,466 | | | | | |
| Maryland Health & Higher | | | | | | | | | | | | |
| Educational Facilities Authority: | | | | | | | | | | | | |
| 5.000%, 01/01/2024 | | | 540,000 | | | | 542,136 | | | | | |
| 5.000%, 01/01/2025 | | | 470,000 | | | | 475,486 | | | | | |
| 5.000%, 07/01/2045 (Callable 01/01/2027) | | | | | | | | | | | | |
(Mandatory Tender Date 07/01/2027)(1) | | | 380,000 | | | | 398,611 | | | | | |
| Total Maryland | | | | | | | | | | | | |
| (Cost $7,896,161) | | | | | | | 7,729,656 | | | | 1.2 | % |
| Massachusetts | | | | | | | | | | | | |
| Massachusetts Development Finance Agency: | | | | | | | | | | | | |
5.000%, 07/15/2023(3) | | | 115,000 | | | | 115,023 | | | | | |
5.000%, 07/15/2024(3) | | | 125,000 | | | | 126,004 | | | | | |
5.000%, 07/15/2025(3) | | | 65,000 | | | | 64,943 | | | | | |
| 5.000%, 07/01/2028 (Callable 07/01/2026) | | | 720,000 | | | | 739,461 | | | | | |
| 5.000%, 07/01/2044 (Callable 07/01/2027) | | | 575,000 | | | | 581,061 | | | | | |
| Massachusetts Educational Financing Authority: | | | | | | | | | | | | |
| 2.000%, 07/01/2037 (Callable 07/01/2031) | | | 2,600,000 | | | | 2,192,713 | | | | | |
| 4.250%, 07/01/2044 (Callable 07/01/2033) | | | 2,285,000 | | | | 2,260,501 | | | | | |
| Total Massachusetts | | | | | | | | | | | | |
| (Cost $6,490,926) | | | | | | | 6,079,706 | | | | 1.0 | % |
| Michigan | | | | | | | | | | | | |
| Charter Township of Lansing MI, | | | | | | | | | | | | |
| 2.750%, 05/01/2028 (Callable 07/31/2023) | | | 265,000 | | | | 252,867 | | | | | |
| Flint Hospital Building Authority, | | | | | | | | | | | | |
| 5.000%, 07/01/2023 | | | 30,000 | | | | 30,000 | | | | | |
| Michigan Finance Authority: | | | | | | | | | | | | |
| 5.000%, 07/01/2024 | | | 260,000 | | | | 260,857 | | | | | |
| 5.000%, 07/01/2025 (Callable 07/01/2024) | | | 140,000 | | | | 140,480 | | | | | |
| 5.000%, 07/01/2026 (Callable 07/01/2024) | | | 170,000 | | | | 170,778 | | | | | |
| 5.250%, 02/01/2027 | | | 1,465,000 | | | | 1,474,428 | | | | | |
| 5.000%, 07/01/2027 (Callable 07/01/2025) | | | 160,000 | | | | 164,042 | | | | | |
| 4.500%, 10/01/2029 (Callable 10/01/2024) | | | 3,550,000 | | | | 3,548,240 | | | | | |
| 5.000%, 07/01/2030 (Callable 07/01/2024) | | | 165,000 | | | | 166,222 | | | | | |
| 5.000%, 07/01/2044 (Callable 07/01/2024) | | | 130,000 | | | | 130,040 | | | | | |
| Michigan State Hospital Finance Authority, | | | | | | | | | | | | |
| 5.000%, 11/15/2032 (Callable 05/15/2025) | | | 255,000 | | | | 263,101 | | | | | |
| Michigan State Housing Development Authority, | | | | | | | | | | | | |
| 3.500%, 12/01/2050 (Callable 06/01/2029) | | | 225,000 | | | | 220,148 | | | | | |
| Michigan State University: | | | | | | | | | | | | |
| 5.000%, 02/15/2036 (Callable 02/15/2033) | | | 440,000 | | | | 511,416 | | | | | |
| 5.000%, 08/15/2036 (Callable 02/15/2033) | | | 800,000 | | | | 925,265 | | | | | |
| 5.000%, 08/15/2037 (Callable 02/15/2033) | | | 800,000 | | | | 920,221 | | | | | |
| 5.000%, 08/15/2038 (Callable 02/15/2033) | | | 1,150,000 | | | | 1,318,405 | | | | | |
| Walled Lake Consolidated School District, | | | | | | | | | | | | |
| 5.000%, 05/01/2047 (Callable 05/01/2032) | | | | | | | | | | | | |
| (Insured by Q-SBLF) | | | 435,000 | | | | 467,917 | | | | | |
| Total Michigan | | | | | | | | | | | | |
| (Cost $11,061,284) | | | | | | | 10,964,427 | | | | 1.7 | % |
| Minnesota | | | | | | | | | | | | |
| City of Center City MN, | | | | | | | | | | | | |
| 4.000%, 11/01/2031 (Callable 11/01/2027) | | | 245,000 | | | | 239,556 | | | | | |
| County of Washington MN: | | | | | | | | | | | | |
| 2.375%, 02/01/2035 | | | 1,550,000 | | | | 1,343,884 | | | | | |
| 2.375%, 02/01/2036 | | | 1,590,000 | | | | 1,347,014 | | | | | |
| Housing & Redevelopment Authority | | | | | | | | | | | | |
| of the City of St. Paul MN: | | | | | | | | | | | | |
| 3.500%, 12/01/2025 (Callable 12/01/2023) | | | | | | | | | | | | |
| (Mandatory Tender Date 06/01/2024) | | | | | | | | | | | | |
(Insured by HUD)(1) | | | 1,900,000 | | | | 1,886,631 | | | | | |
| 4.000%, 09/01/2031 (Callable 09/01/2024) | | | 350,000 | | | | 329,462 | | | | | |
| Minnesota Housing Finance Agency: | | | | | | | | | | | | |
| 3.450%, 02/01/2025 (Callable 08/01/2024) | | | 2,000,000 | | | | 1,989,811 | | | | | |
| 3.500%, 07/01/2050 (Callable 07/01/2029) | | | | | | | | | | | | |
| (Insured by GNMA) | | | 1,255,000 | | | | 1,229,138 | | | | | |
| 5.750%, 07/01/2053 (Callable 01/01/2033) | | | | | | | | | | | | |
(Insured by GNMA)(6) | | | 1,000,000 | | | | 1,072,622 | | | | | |
| Zumbro Education District, | | | | | | | | | | | | |
| 4.000%, 02/01/2031 | | | 370,000 | | | | 368,704 | | | | | |
| Total Minnesota | | | | | | | | | | | | |
| (Cost $10,010,983) | | | | | | | 9,806,822 | | | | 1.5 | % |
| Mississippi | | | | | | | | | | | | |
| City of Ridgeland MS, | | | | | | | | | | | | |
| 3.000%, 10/01/2025 | | | 325,000 | | | | 319,966 | | | | | |
| Mississippi Business Finance Corp., | | | | | | | | | | | | |
| 3.200%, 09/01/2028 (Callable 03/13/2024) | | | 1,000,000 | | | | 982,641 | | | | | |
| Mississippi Development Bank: | | | | | | | | | | | | |
| 5.000%, 11/01/2025 | | | 840,000 | | | | 849,586 | | | | | |
| 5.000%, 11/01/2026 | | | 780,000 | | | | 794,561 | | | | | |
| Mississippi Home Corp.: | | | | | | | | | | | | |
| 4.000%, 12/01/2043 (Callable 12/01/2026) | | | | | | | | | | | | |
| (Insured by GNMA) | | | 45,000 | | | | 44,687 | | | | | |
| 5.000%, 12/01/2052 (Callable 06/01/2031) | | �� | | | | | | | | | | |
| (Insured by GNMA) | | | 2,350,000 | | | | 2,426,915 | | | | | |
| Mississippi Hospital Equipment | | | | | | | | | | | | |
| & Facilities Authority, | | | | | | | | | | | | |
| 5.000%, 10/01/2040 (Callable 12/01/2026) | | | | | | | | | | | | |
(Mandatory Tender Date 03/01/2027)(1) | | | 415,000 | | | | 433,354 | | | | | |
| Vicksburg Warren School District: | | | | | | | | | | | | |
| 5.000%, 03/01/2025 | | | 350,000 | | | | 356,141 | | | | | |
| 5.000%, 03/01/2028 | | | 270,000 | | | | 283,482 | | | | | |
| Total Mississippi | | | | | | | | | | | | |
| (Cost $6,683,302) | | | | | | | 6,491,333 | | | | 1.0 | % |
| Missouri | | | | | | | | | | | | |
| Clay County School District No. 40: | | | | | | | | | | | | |
| 5.000%, 04/01/2036 (Callable 04/01/2033) | | | 550,000 | | | | 599,287 | | | | | |
| 5.000%, 04/01/2038 (Callable 04/01/2033) | | | 480,000 | | | | 512,533 | | | | | |
| County of Platte MO: | | | | | | | | | | | | |
| 5.000%, 02/01/2025 (Callable 07/31/2023) | | | 125,000 | | | | 125,004 | | | | | |
| 3.000%, 03/01/2027 (Callable 07/31/2023) | | | 200,000 | | | | 188,277 | | | | | |
| Dunklin R-V School District, | | | | | | | | | | | | |
| 4.000%, 03/01/2043 (Callable 03/01/2031) | | | | | | | | | | | | |
| (Insured by ST AID) | | | 940,000 | | | | 924,830 | | | | | |
| Health & Educational Facilities | | | | | | | | | | | | |
| Authority of the State of Missouri: | | | | | | | | | | | | |
| 4.000%, 02/01/2025 | | | 700,000 | | | | 692,741 | | | | | |
| 5.000%, 02/01/2025 (Callable 02/01/2024) | | | 180,000 | | | | 180,305 | | | | | |
The accompanying notes are an integral part of these financial statements.
Baird Strategic Municipal Bond Fund
Schedule of Investments, June 30, 2023 (Unaudited)
Long-Term Investments (cont.)
| | | Principal | | | | | | % of | |
| | | Amount | | | Value | | | Net Assets | |
| Health & Educational Facilities | | | | | | | | | |
| Authority of the State of Missouri: (cont.) | | | | | | | | | |
| 4.000%, 08/01/2027 | | $ | 440,000 | | | $ | 419,434 | | | | |
| 5.000%, 09/01/2027 | | | 150,000 | | | | 153,555 | | | | |
| 5.000%, 02/01/2029 (Callable 02/01/2024) | | | 1,000,000 | | | | 1,000,632 | | | | |
| 5.000%, 02/01/2030 (Callable 02/01/2026) | | | 160,000 | | | | 160,070 | | | | |
| 4.000%, 08/01/2030 (Callable 08/01/2024) | | | 570,000 | | | | 522,324 | | | | |
| 4.000%, 02/01/2032 (Callable 02/01/2029) | | | 325,000 | | | | 296,603 | | | | |
| 5.000%, 05/15/2036 (Callable 05/15/2026) | | | 875,000 | | | | 901,231 | | | | |
| Industrial Development | | | | | | | | | | | |
| Authority of University City, | | | | | | | | | | | |
| 5.500%, 06/15/2042 (Callable 06/15/2033) | | | 1,000,000 | | | | 999,963 | | | | |
| Joplin Schools, | | | | | | | | | | | |
| 2.000%, 03/01/2032 (Callable 03/01/2029) | | | | | | | | | | | |
| (Insured by BAM) | | | 1,000,000 | | | | 855,229 | | | | |
| Missouri Housing Development Commission, | | | | | | | | | | | |
| 2.350%, 11/01/2046 (Callable 05/01/2030) | | | | | | | | | | | |
| (Insured by GNMA) | | | 730,000 | | | | 507,999 | | | | |
| St. Louis Land Clearance | | | | | | | | | | | |
| for Redevelopment Authority: | | | | | | | | | | | |
| 4.250%, 06/01/2026 | | | 155,000 | | | | 154,775 | | | | |
| 5.000%, 06/01/2028 (Callable 12/01/2026) | | | 1,000,000 | | | | 1,029,017 | | | | |
| 3.875%, 10/01/2035 (Callable 10/01/2029) | | | 2,470,000 | | | | 2,019,878 | | | | |
| 5.000%, 04/01/2038 (Callable 04/01/2027) | | | 595,000 | | | | 612,390 | | | | |
| St. Louis Municipal Finance Corp.: | | | | | | | | | | | |
| 5.000%, 02/15/2025 | | | 300,000 | | | | 306,720 | | | | |
| 5.000%, 10/01/2040 (Callable 10/01/2030) | | | | | | | | | | | |
| (Insured by AGM) | | | 1,750,000 | | | | 1,855,864 | | | | |
| 5.000%, 10/01/2045 (Callable 10/01/2030) | | | | | | | | | | | |
| (Insured by AGM) | | | 1,000,000 | | | | 1,049,955 | | | | |
| Total Missouri | | | | | | | | | | | |
| (Cost $16,315,337) | | | | | | | 16,068,616 | | | | 2.5 | % |
| Montana | | | | | | | | | | | | |
| City of Forsyth MT, | | | | | | | | | | | | |
| 3.875%, 07/01/2028 (Callable 04/02/2028) | | | 600,000 | | | | 601,887 | | | | | |
| Montana Facility Finance Authority: | | | | | | | | | | | | |
| 5.000%, 07/01/2029 (Callable 07/01/2028) | | | 1,040,000 | | | | 1,086,997 | | | | | |
| 5.000%, 07/01/2030 (Callable 07/01/2028) | | | 635,000 | | | | 664,146 | | | | | |
| Total Montana | | | | | | | | | | | | |
| (Cost $2,378,468) | | | | | | | 2,353,030 | | | | 0.4 | % |
| Nebraska | | | | | | | | | | | | |
| City of Fremont NE, | | | | | | | | | | | | |
| 1.750%, 07/15/2034 (Callable 07/08/2028) | | | 1,055,000 | | | | 851,581 | | | | | |
| Douglas County Hospital Authority No. 2, | | | | | | | | | | | | |
| 5.000%, 05/15/2026 (Callable 05/15/2024) | | | 315,000 | | | | 316,275 | | | | | |
| Madison County Hospital Authority No. 1, | | | | | | | | | | | | |
| 5.000%, 07/01/2032 (Callable 07/01/2025) | | | 500,000 | | | | 511,394 | | | | | |
| Total Nebraska | | | | | | | | | | | | |
| (Cost $1,710,060) | | | | | | | 1,679,250 | | | | 0.3 | % |
| Nevada | | | | | | | | | | | | |
| Henderson Public Improvement Trust, | | | | | | | | | | | | |
| 3.000%, 01/01/2026 (ETM) | | | 270,000 | | | | 266,676 | | | | | |
| State of Nevada, | | | | | | | | | | | | |
4.000%, 12/15/2025(3) | | | 1,450,000 | | | | 1,406,950 | | | | | |
| Total Nevada | | | | | | | | | | | | |
| (Cost $1,723,035) | | | | | | | 1,673,626 | | | | 0.3 | % |
| New Hampshire | | | | | | | | | | | | |
| New Hampshire Business Finance Authority: | | | | | | | | | | | | |
| 3.250%, 04/01/2028 (Callable 01/01/2028) | | | 2,000,000 | | | | 1,705,153 | | | | | |
| 2.575%, 10/01/2033 (SIFMA Municipal | | | | | | | | | | | | |
| Swap Index + 0.375%) (Callable 07/03/2023) | | | | | | | | | | | | |
(Mandatory Tender Date 07/01/2024)(2) | | | 1,250,000 | | | | 1,225,152 | | | | | |
| 4.375%, 09/20/2036 | | | 2,468,702 | | | | 2,417,915 | | | | | |
| 4.000%, 10/20/2036 | | | 1,981,802 | | | | 1,876,892 | | | | | |
| 4.500%, 06/01/2053 (Callable 06/01/2033) | | | | | | | | | | | | |
| (Insured by BAM) | | | 1,650,000 | | | | 1,625,923 | | | | | |
| Total New Hampshire | | | | | | | | | | | | |
| (Cost $8,967,284) | | | | | | | 8,851,035 | | | | 1.4 | % |
| New Jersey | | | | | | | | | | | | |
| Atlantic City Board of Education, | | | | | | | | | | | | |
3.400%, 08/15/2024(3) | | | 140,000 | | | | 139,034 | | | | | |
| Gloucester County Improvement Authority, | | | | | | | | | | | | |
| 5.000%, 07/01/2023 | | | 740,000 | | | | 740,000 | | | | | |
| New Jersey Economic Development Authority: | | | | | | | | | | | | |
| 3.450%, 09/01/2025 (SIFMA Municipal | | | | | | | | | | | | |
| Swap Index + 1.250%) (Callable 03/01/2025) | | | | | | | | | | | | |
(Insured by ST AID)(2) | | | 430,000 | | | | 430,451 | | | | | |
| 5.625%, 01/01/2052 (Callable 01/01/2024) | | | 1,000,000 | | | | 1,003,547 | | | | | |
| New Jersey Educational Facilities Authority: | | | | | | | | | | | | |
| 5.000%, 07/01/2026 | | | | | | | | | | | | |
| (Pre-refunded to 07/01/2025) | | | 55,000 | | | | 56,999 | | | | | |
| 5.000%, 07/01/2026 (Callable 07/01/2025) | | | 70,000 | | | | 72,067 | | | | | |
| 5.000%, 07/01/2026 (Callable 07/01/2025) | | | 595,000 | | | | 609,918 | | | | | |
| 5.000%, 07/01/2028 (Insured by AGM) | | | 125,000 | | | | 132,277 | | | | | |
| New Jersey Health Care Facilities | | | | | | | | | | | | |
| Financing Authority, | | | | | | | | | | | | |
| 5.000%, 07/01/2026 (Callable 07/01/2025) | | | | | | | | | | | | |
| (Insured by AGM) | | | 1,095,000 | | | | 1,120,130 | | | | | |
| New Jersey Higher Education | | | | | | | | | | | | |
| Student Assistance Authority: | | | | | | | | | | | | |
| 5.000%, 12/01/2025 | | | 1,200,000 | | | | 1,232,136 | | | | | |
| 5.000%, 12/01/2027 | | | 775,000 | | | | 811,787 | | | | | |
| 5.000%, 12/01/2027 (Callable 12/01/2026) | | | 1,400,000 | | | | 1,452,364 | | | | | |
| New Jersey Housing & | | | | | | | | | | | | |
| Mortgage Finance Agency: | | | | | | | | | | | | |
| 3.600%, 05/01/2026 (Insured by HUD) | | | 3,000,000 | | | | 3,000,352 | | | | | |
| 1.800%, 10/01/2027 | | | 3,655,000 | | | | 3,319,941 | | | | | |
| New Jersey Transportation Trust Fund Authority: | | | | | | | | | | | | |
| 0.000%, 12/15/2027 (Insured by BAM) | | | 1,750,000 | | | | 1,501,551 | | | | | |
| 0.000%, 12/15/2029 (Insured by AGM) | | | 2,000,000 | | | | 1,592,708 | | | | | |
| 0.000%, 12/15/2030 | | | 1,000,000 | | | | 758,683 | | | | | |
| 0.000%, 12/15/2038 (Insured by BAM) | | | 2,000,000 | | | | 1,045,199 | | | | | |
| South Jersey Port Corp., | | | | | | | | | | | | |
| 3.500%, 01/01/2032 (Callable 01/01/2026) | | | 100,000 | | | | 96,287 | | | | | |
| South Jersey Transportation Authority, | | | | | | | | | | | | |
| 5.250%, 11/01/2052 (Callable 11/01/2032) | | | | | | | | | | | | |
| (Insured by BAM) | | | 1,250,000 | | | | 1,371,926 | | | | | |
| Total New Jersey | | | | | | | | | | | | |
| (Cost $20,574,147) | | | | | | | 20,487,357 | | | | 3.2 | % |
| New Mexico | | | | | | | | | | | | |
| Town of Clayton NM, | | | | | | | | | | | | |
| 5.000%, 11/01/2026 (Callable 11/01/2025) | | | | | | | | | | | | |
| (Insured by NATL) | | | 185,000 | | | | 188,158 | | | | | |
| Village of Los Ranchos de Albuquerque NM, | | | | | | | | | | | | |
| 5.000%, 09/01/2027 | | | 350,000 | | | | 371,675 | | | | | |
| Total New Mexico | | | | | | | | | | | | |
| (Cost $588,474) | | | | | | | 559,833 | | | | 0.1 | % |
| New York | | | | | | | | | | | | |
| Albany County Capital Resource Corp., | | | | | | | | | | | | |
| 3.100%, 07/01/2030 | | | 200,000 | | | | 174,253 | | | | | |
| Amherst Industrial Development Agency, | | | | | | | | | | | | |
| 3.900%, 04/01/2026 (Mandatory Tender | | | | | | | | | | | | |
Date 04/01/2025) (Insured by FHA)(1) | | | 2,000,000 | | | | 2,000,341 | | | | | |
The accompanying notes are an integral part of these financial statements.
Baird Strategic Municipal Bond Fund
Schedule of Investments, June 30, 2023 (Unaudited)
Long-Term Investments (cont.)
| | | Principal | | | | | | % of | |
| | | Amount | | | Value | | | Net Assets | |
| Build NYC Resource Corp., | | | | | | | | | |
| 4.000%, 12/01/2031 | | | | | | | | | |
(Callable 12/01/2029)(3) | | $ | 600,000 | | | $ | 541,928 | | | | |
| City of Amsterdam NY, | | | | | | | | | | | |
| 5.000%, 06/20/2024 | | | 1,500,000 | | | | 1,503,972 | | | | |
| City of Long Beach NY, | | | | | | | | | | | |
| 5.250%, 07/15/2037 (Callable 07/15/2030) | | | | | | | | | | | |
| (Insured by BAM) | | | 200,000 | | | | 217,003 | | | | |
| City of Poughkeepsie NY: | | | | | | | | | | | |
| 4.000%, 04/15/2028 | | | 230,000 | | | | 227,450 | | | | |
| 4.000%, 04/15/2030 | | | 250,000 | | | | 247,505 | | | | |
| City of Schenectady NY, | | | | | | | | | | | |
| 4.750%, 05/03/2024 | | | 4,900,000 | | | | 4,946,136 | | | | |
| Dutchess County NY Local Development Corp., | | | | | | | | | | | |
| 5.000%, 07/01/2030 (Callable 07/01/2026) | | | 180,000 | | | | 185,604 | | | | |
| Huntington Local Development Corp., | | | | | | | | | | | |
| 4.000%, 07/01/2027 | | | 1,000,000 | | | | 955,184 | | | | |
| Long Island Power Authority, | | | | | | | | | | | |
| 2.650%, 09/01/2038 (SIFMA Municipal | | | | | | | | | | | |
| Swap Index + 0.450%) (Callable 03/01/2025) | | | | | | | | | | | |
(Mandatory Tender Date 09/01/2025)(2) | | | 485,000 | | | | 482,059 | | | | |
| Monroe County Industrial Development Corp., | | | | | | | | | | | |
| 4.840%, 11/01/2040 (Insured by FNMA) | | | 2,491,794 | | | | 2,540,845 | | | | |
| New York City Housing Development Corp.: | | | | | | | | | | | |
| 2.250%, 11/01/2041 (Callable 05/01/2029) | | | 1,410,000 | | | | 984,022 | | | | |
| 3.000%, 02/15/2048 (Callable 05/15/2024) | | | 2,000,000 | | | | 1,960,449 | | | | |
| 3.500%, 02/15/2048 (Callable 05/15/2024) | | | 1,600,000 | | | | 1,569,759 | | | | |
| 0.700%, 11/01/2060 (Callable 07/21/2023) | | | | | | | | | | | |
(Mandatory Tender Date 07/01/2025)(1) | | | 3,510,000 | | | | 3,276,587 | | | | |
| 0.600%, 05/01/2061 (Callable 07/21/2023) | | | | | | | | | | | |
| (Mandatory Tender Date 07/01/2025) | | | | | | | | | | | |
(Insured by FHA)(1) | | | 2,420,000 | | | | 2,239,268 | | | | |
| New York City Industrial Development Agency, | | | | | | | | | | | |
| 2.000%, 01/01/2038 (Callable 01/01/2031) | | | | | | | | | | | |
| (Insured by AGM) | | | 1,200,000 | | | | 851,457 | | | | |
| New York State Housing Finance Agency: | | | | | | | | | | | |
| 0.750%, 05/01/2025 (Callable 07/21/2023) | | | | | | | | | | | |
| (Insured by SONYMA) | | | 2,000,000 | | | | 1,866,134 | | | | |
| 0.650%, 11/01/2056 (Callable 07/21/2023) | | | | | | | | | | | |
| (Mandatory Tender Date 11/01/2025) | | | | | | | | | | | |
(Insured by SONYMA)(1) | | | 1,000,000 | | | | 917,560 | | | | |
| 1.000%, 11/01/2061 (Callable 09/01/2023) | | | | | | | | | | | |
| (Mandatory Tender Date 11/01/2026) | | | | | | | | | | | |
(Insured by SONYMA)(1) | | | 3,000,000 | | | | 2,727,994 | | | | |
| New York Transportation Development Corp.: | | | | | | | | | | | |
| 5.000%, 01/01/2029 (Callable 01/01/2028) | | | 1,900,000 | | | | 1,971,031 | | | | |
| 4.000%, 10/01/2030 | | | 2,300,000 | | | | 2,292,840 | | | | |
| Onondaga Civic Development Corp.: | | | | | | | | | | | |
| 5.000%, 10/01/2023 | | | 165,000 | | | | 165,180 | | | | |
| 5.000%, 10/01/2024 | | | 35,000 | | | | 35,110 | | | | |
| 5.000%, 10/01/2025 | | | 225,000 | | | | 224,983 | | | | |
| 4.125%, 10/01/2035 (Callable 10/01/2025) | | | 370,000 | | | | 323,286 | | | | |
| Onondaga County Trust for Cultural Resources: | | | | | | | | | | | |
| 5.000%, 05/01/2027 | | | 180,000 | | | | 186,829 | | | | |
| 5.000%, 05/01/2029 (Callable 05/01/2027) | | | 345,000 | | | | 358,088 | | | | |
| State of New York Mortgage Agency, | | | | | | | | | | | |
| 3.500%, 04/01/2049 (Callable 10/01/2028) | | | 130,000 | | | | 127,806 | | | | |
| Town of Ramapo NY: | | | | | | | | | | | |
| 3.375%, 05/15/2024 (Callable 07/31/2023) | | | 25,000 | | | | 24,418 | | | | |
| 3.000%, 11/01/2027 (Callable 07/21/2023) | | | 100,000 | | | | 91,266 | | | | |
| 4.125%, 05/15/2028 (Callable 07/31/2023) | | | 115,000 | | | | 108,932 | | | | |
| Triborough Bridge & Tunnel Authority, | | | | | | | | | | | |
| 3.770%, 01/01/2032 (SOFR + 0.380%) | | | | | | | | | | | |
| (Callable 11/01/2023) | | | | | | | | | | | |
(Mandatory Tender Date 02/01/2024)(2) | | | 1,460,000 | | | | 1,451,604 | | | | |
| Village of Johnson City NY, | | | | | | | | | | | |
| 5.250%, 09/29/2023 | | | 1,000,000 | | | | 999,824 | | | | |
| Westchester County Local Development Corp., | | | | | | | | | | | |
2.875%, 07/01/2026(3) | | | 2,000,000 | | | | 1,906,872 | | | | |
| Total New York | | | | | | | | | | | |
| (Cost $41,388,239) | | | | | | | 40,683,579 | | | | 6.4 | % |
| North Carolina | | | | | | | | | | | | |
| City of Asheville NC, | | | | | | | | | | | | |
| 2.000%, 08/01/2041 (Callable 08/01/2031) | | | 1,185,000 | | | | 814,799 | | | | | |
| Greater Asheville Regional Airport Authority: | | | | | | | | | | | | |
| 5.000%, 07/01/2038 (Callable 07/01/2033) | | | | | | | | | | | | |
| (Insured by AGM) | | | 270,000 | | | | 290,527 | | | | | |
| 5.250%, 07/01/2040 (Callable 07/01/2033) | | | | | | | | | | | | |
| (Insured by AGM) | | | 500,000 | | | | 546,856 | | | | | |
| North Carolina Housing Finance Agency, | | | | | | | | | | | | |
| 4.000%, 07/01/2050 (Callable 01/01/2029) | | | | | | | | | | | | |
| (Insured by GNMA) | | | 905,000 | | | | 897,803 | | | | | |
| North Carolina Medical Care Commission, | | | | | | | | | | | | |
| 5.000%, 01/01/2038 (Callable 01/01/2026) | | | 1,250,000 | | | | 1,243,624 | | | | | |
| State of North Carolina, | | | | | | | | | | | | |
| 2.000%, 06/01/2032 (Callable 06/01/2029) | | | 525,000 | | | | 461,397 | | | | | |
| University of North Carolina at Chapel Hill, | | | | | | | | | | | | |
| 4.034%, 12/01/2041 (SOFR + 0.650%) | | | | | | | | | | | | |
| (Callable 12/01/2024) | | | | | | | | | | | | |
(Mandatory Tender Date 06/01/2025)(2) | | | 1,750,000 | | | | 1,751,363 | | | | | |
| Winston-Salem State University, | | | | | | | | | | | | |
| 4.250%, 06/01/2032 (Callable 06/01/2024) | | | 50,000 | | | | 49,270 | | | | | |
| Total North Carolina | | | | | | | | | | | | |
| (Cost $6,081,123) | | | | | | | 6,055,639 | | | | 1.0 | % |
| North Dakota | | | | | | | | | | | | |
| Cass County Joint Water Resource District, | | | | | | | | | | | | |
| 0.480%, 05/01/2024 (Callable 07/31/2023) | | | 2,000,000 | | | | 1,925,247 | | | | | |
| City of Grand Forks ND: | | | | | | | | | | | | |
| 5.000%, 12/01/2024 | | | 100,000 | | | | 101,503 | | | | | |
| 5.000%, 12/01/2029 | | | 750,000 | | | | 781,846 | | | | | |
| City of Horace ND: | | | | | | | | | | | | |
| 3.250%, 08/01/2024 (Callable 08/01/2023) | | | 1,125,000 | | | | 1,106,510 | | | | | |
| 4.000%, 01/01/2025 (Callable 01/01/2024) | | | 1,000,000 | | | | 1,000,506 | | | | | |
| 5.125%, 07/01/2025 (Callable 07/01/2024) | | | 780,000 | | | | 780,173 | | | | | |
| City of Larimore ND, | | | | | | | | | | | | |
| 0.850%, 05/01/2024 (Callable 07/31/2023) | | | 1,100,000 | | | | 1,063,176 | | | | | |
| City of Mandan ND: | | | | | | | | | | | | |
| 4.000%, 09/01/2034 (Callable 09/01/2024) | | | 1,010,000 | | | | 1,005,159 | | | | | |
| 3.000%, 09/01/2036 (Callable 09/01/2024) | | | 255,000 | | | | 222,127 | | | | | |
| City of Mayville ND, | | | | | | | | | | | | |
| 3.750%, 08/01/2025 (Callable 08/01/2023) | | | 1,000,000 | | | | 965,658 | | | | | |
| County of McKenzie ND: | | | | | | | | | | | | |
| 5.000%, 08/01/2023 | | | 300,000 | | | | 300,164 | | | | | |
| 5.000%, 08/01/2024 (Callable 08/01/2023) | | | 400,000 | | | | 400,255 | | | | | |
| County of Ward ND: | | | | | | | | | | | | |
| 5.000%, 06/01/2029 (Callable 06/01/2028) | | | 1,000,000 | | | | 967,364 | | | | | |
| 5.000%, 06/01/2031 (Callable 06/01/2028) | | | 1,365,000 | | | | 1,305,439 | | | | | |
| Jamestown Park District, | | | | | | | | | | | | |
| 2.900%, 07/01/2035 (Callable 07/01/2023) | | | 20,000 | | | | 20,000 | | | | | |
| Williston Parks & Recreation District: | | | | | | | | | | | | |
| 4.500%, 03/01/2025 (Callable 07/17/2023) | | | 425,000 | | | | 417,965 | | | | | |
| 4.000%, 03/01/2032 (Callable 07/17/2023) | | | 15,000 | | | | 12,917 | | | | | |
| Total North Dakota | | | | | | | | | | | | |
| (Cost $12,623,728) | | | | | | | 12,376,009 | | | | 2.0 | % |
| Ohio | | | | | | | | | | | | |
| City of Whitehall OH, | | | | | | | | | | | | |
| 4.750%, 11/30/2023 (Insured by ST AID) | | | 1,000,000 | | | | 1,000,387 | | | | | |
The accompanying notes are an integral part of these financial statements.
Baird Strategic Municipal Bond Fund
Schedule of Investments, June 30, 2023 (Unaudited)
Long-Term Investments (cont.)
| | | Principal | | | | | | % of | |
| | | Amount | | | Value | | | Net Assets | |
| Cleveland-Cuyahoga County Port Authority: | | | | | | | | | |
| 5.000%, 07/01/2030 | | $ | 350,000 | | | $ | 391,579 | | | | |
| 5.000%, 07/01/2032 (Callable 07/01/2031) | | | 495,000 | | | | 560,753 | | | | |
| 5.500%, 08/01/2052 (Callable 08/01/2032) | | | 1,400,000 | | | | 1,483,361 | | | | |
| Columbus Metropolitan Housing Authority: | | | | | | | | | | | |
| 2.000%, 11/01/2026 (Callable 09/01/2023) | | | 265,000 | | | | 252,325 | | | | |
| 3.000%, 11/01/2028 (Callable 09/01/2023) | | | 275,000 | | | | 269,007 | | | | |
| County of Cuyahoga OH, | | | | | | | | | | | |
| 4.000%, 01/01/2033 (Callable 01/01/2031) | | | 300,000 | | | | 315,513 | | | | |
| County of Hamilton OH, | | | | | | | | | | | |
| 5.000%, 02/01/2028 (Callable 02/01/2024) | | | 250,000 | | | | 250,137 | | | | |
| County of Montgomery OH, | | | | | | | | | | | |
| 3.000%, 08/01/2034 (Callable 02/01/2031) | | | 200,000 | | | | 184,210 | | | | |
| Hamilton County Convention | | | | | | | | | | | |
| Facilities Authority, | | | | | | | | | | | |
| 5.000%, 12/01/2026 (Callable 12/01/2023) | | | 1,000,000 | | | | 1,001,881 | | | | |
| Lancaster Port Authority, | | | | | | | | | | | |
| 5.000%, 08/01/2049 (Callable 11/01/2024) | | | | | | | | | | | |
(Mandatory Tender Date 02/01/2025)(1) | | | 635,000 | | | | 644,695 | | | | |
| Northeast Ohio Medical University: | | | | | | | | | | | |
| 5.000%, 12/01/2024 | | | 75,000 | | | | 76,097 | | | | |
| 5.000%, 12/01/2026 | | | 100,000 | | | | 103,643 | | | | |
| Ohio Air Quality Development Authority: | | | | | | | | | | | |
| 1.375%, 02/01/2026 | | | | | | | | | | | |
(Mandatory Tender Date 11/01/2024)(1) | | | 1,000,000 | | | | 949,597 | | | | |
| 4.000%, 09/01/2030 | | | | | | | | | | | |
(Mandatory Tender Date 06/01/2027)(1) | | | 2,150,000 | | | | 2,131,324 | | | | |
| 4.250%, 11/01/2040 | | | | | | | | | | | |
(Mandatory Tender Date 06/01/2027)(1) | | | 1,000,000 | | | | 995,955 | | | | |
| Ohio Higher Educational Facility Commission: | | | | | | | | | | | |
| 9.662%, 12/01/2023 (CPI YOY + 1.120%) | | | | | | | | | | | |
(Insured by AMBAC)(2) | | | 500,000 | | | | 505,388 | | | | |
| 5.000%, 12/01/2032 | | | 595,000 | | | | 626,163 | | | | |
| Ohio Housing Finance Agency: | | | | | | | | | | | |
| 2.450%, 09/01/2045 (Callable 09/01/2029) | | | | | | | | | | | |
| (Insured by GNMA) | | | 550,000 | | | | 420,183 | | | | |
| 4.500%, 03/01/2050 (Callable 09/01/2028) | | | 840,000 | | | | 842,340 | | | | |
| 3.750%, 09/01/2050 (Callable 03/01/2029) | | | | | | | | | | | |
| (Insured by GNMA) | | | 120,000 | | | | 118,243 | | | | |
| Port of Greater Cincinnati | | | | | | | | | | | |
| Development Authority, | | | | | | | | | | | |
5.000%, 05/01/2025 (Callable 11/01/2023)(3) | | | 3,500,000 | | | | 3,481,624 | | | | |
| State of Ohio: | | | | | | | | | | | |
| 5.000%, 12/31/2026 (Callable 06/30/2025) | | | | | | | | | | | |
| (Insured by AGM) | | | 1,000,000 | | | | 1,017,350 | | | | |
| 5.000%, 12/31/2035 (Callable 06/30/2025) | | | | | | | | | | | |
| (Insured by AGM) | | | 1,600,000 | | | | 1,615,894 | | | | |
| 5.000%, 12/31/2039 (Callable 06/30/2025) | | | 1,000,000 | | | | 1,001,276 | | | | |
| Warren County Port Authority, | | | | | | | | | | | |
| 4.000%, 12/01/2041 (Callable 12/01/2031) | | | 570,000 | | | | 489,321 | | | | |
| Total Ohio | | | | | | | | | | | |
| (Cost $21,062,532) | | | | | | | 20,728,246 | | | | 3.3 | % |
| Oklahoma | | | | | | | | | | | | |
| Delaware County Educational Facilities Authority, | | | | | | | | | | | | |
| 5.000%, 09/01/2029 | | | 1,630,000 | | | | 1,774,689 | | | | | |
| Norman Regional Hospital Authority, | | | | | | | | | | | | |
| 5.000%, 09/01/2029 (Callable 09/01/2026) | | | 1,595,000 | | | | 1,600,001 | | | | | |
| Pontotoc County Educational Facilities Authority: | | | | | | | | | | | | |
| 4.000%, 09/01/2026 | | | 200,000 | | | | 203,439 | | | | | |
| 4.000%, 09/01/2027 | | | 325,000 | | | | 333,999 | | | | | |
| 4.000%, 09/01/2028 | | | 300,000 | | | | 309,463 | | | | | |
| 4.000%, 09/01/2029 | | | 275,000 | | | | 285,714 | | | | | |
| 4.000%, 09/01/2030 | | | 400,000 | | | | 417,151 | | | | | |
| Tulsa County Independent | | | | | | | | | | | | |
| School District No. 3, | | | | | | | | | | | | |
| 4.500%, 03/01/2025 | | | 3,000,000 | | | | 3,045,198 | | | | | |
| Tulsa Industrial Authority, | | | | | | | | | | | | |
| 5.000%, 10/01/2023 | | | 185,000 | | | | 184,929 | | | | | |
| Total Oklahoma | | | | | | | | | | | | |
| (Cost $8,268,689) | | | | | | | 8,154,583 | | | | 1.3 | % |
| Oregon | | | | | | | | | | | | |
| Oregon State Facilities Authority: | | | | | | | | | | | | |
| 5.000%, 10/01/2025 | | | 225,000 | | | | 229,876 | | | | | |
| 5.000%, 10/01/2028 | | | 150,000 | | | | 158,133 | | | | | |
| State of Oregon Housing & | | | | | | | | | | | | |
| Community Services Department: | | | | | | | | | | | | |
| 3.900%, 01/01/2033 (Callable 07/31/2023) | | | 70,000 | | | | 69,669 | | | | | |
| 3.600%, 07/01/2034 (Callable 07/01/2024) | | | 700,000 | | | | 693,398 | | | | | |
| 2.900%, 07/01/2043 (Callable 07/01/2027) | | | 1,000,000 | | | | 901,283 | | | | | |
| 4.000%, 01/01/2047 (Callable 07/01/2025) | | | 15,000 | | | | 14,947 | | | | | |
| 4.000%, 07/01/2047 (Callable 07/01/2026) | | | 180,000 | | | | 178,896 | | | | | |
| Yamhill County Hospital Authority: | | | | | | | | | | | | |
| 1.750%, 11/15/2026 (Callable 07/21/2023) | | | 535,000 | | | | 501,334 | | | | | |
| 4.000%, 11/15/2026 (Callable 11/15/2024) | | | 300,000 | | | | 285,373 | | | | | |
| 2.125%, 11/15/2027 (Callable 07/21/2023) | | | 1,000,000 | | | | 903,916 | | | | | |
| Total Oregon | | | | | | | | | | | | |
| (Cost $4,088,392) | | | | | | | 3,936,825 | | | | 0.6 | % |
| Pennsylvania | | | | | | | | | | | | |
| Bucks County Industrial Development Authority, | | | | | | | | | | | | |
| 5.000%, 07/01/2028 | | | 470,000 | | | | 461,451 | | | | | |
| Central Bradford Progress Authority, | | | | | | | | | | | | |
| 2.700%, 12/01/2041 (Callable 07/03/2023) | | | | | | | | | | | | |
(Optional Put Date 07/07/2023)(1) | | | 1,000,000 | | | | 1,000,000 | | | | | |
| Chester County Industrial | | | | | | | | | | | | |
| Development Authority: | | | | | | | | | | | | |
| 5.000%, 08/01/2035 (Callable 08/01/2023) | | | 730,000 | | | | 720,217 | | | | | |
| 5.000%, 08/01/2045 (Callable 08/01/2023) | | | 500,000 | | | | 471,893 | | | | | |
| City of Bradford PA: | | | | | | | | | | | | |
| 4.000%, 11/01/2026 (Callable 11/01/2025) | | | | | | | | | | | | |
| (Insured by AGM) | | | 415,000 | | | | 421,540 | | | | | |
| 4.000%, 11/01/2027 (Callable 11/01/2025) | | | | | | | | | | | | |
| (Insured by AGM) | | | 370,000 | | | | 375,937 | | | | | |
| City of Erie Higher Education Building Authority, | | | | | | | | | | | | |
| 5.000%, 05/01/2029 | | | 370,000 | | | | 380,665 | | | | | |
| City of York PA: | | | | | | | | | | | | |
| 5.000%, 11/15/2025 | | | 525,000 | | | | 530,339 | | | | | |
| 5.000%, 11/15/2026 | | | 205,000 | | | | 208,776 | | | | | |
| 5.000%, 11/15/2027 | | | 220,000 | | | | 226,127 | | | | | |
| Cumberland County Municipal Authority: | | | | | | | | | | | | |
| 5.000%, 01/01/2029 | | | | | | | | | | | | |
| (Pre-refunded to 01/01/2025) | | | 30,000 | | | | 30,787 | | | | | |
| 5.000%, 01/01/2029 | | | | | | | | | | | | |
| (Pre-refunded to 01/01/2025) | | | 70,000 | | | | 71,835 | | | | | |
| 5.000%, 01/01/2029 (Callable 01/01/2025) | | | 75,000 | | | | 75,534 | | | | | |
| Delaware Valley Regional Finance Authority, | | | | | | | | | | | | |
| 4.367%, 09/01/2048 (1 Month LIBOR | | | | | | | | | | | | |
| USD + 0.880%) (Callable 09/01/2024) | | | | | | | | | | | | |
(Mandatory Tender Date 09/01/2025)(2) | | | 1,000,000 | | | | 998,988 | | | | | |
| East Hempfield Township Industrial | | | | | | | | | | | | |
| Development Authority, | | | | | | | | | | | | |
| 5.000%, 12/01/2027 (Callable 12/01/2025) | | | 1,510,000 | | | | 1,557,605 | | | | | |
| Highlands School District: | | | | | | | | | | | | |
| 5.000%, 04/15/2033 (Callable 04/15/2032) | | | | | | | | | | | | |
| (Insured by AGM) | | | 250,000 | | | | 280,889 | | | | | |
| 5.000%, 04/15/2034 (Callable 04/15/2032) | | | | | | | | | | | | |
| (Insured by AGM) | | | 330,000 | | | | 369,411 | | | | | |
The accompanying notes are an integral part of these financial statements.
Baird Strategic Municipal Bond Fund
Schedule of Investments, June 30, 2023 (Unaudited)
Long-Term Investments (cont.)
| | | Principal | | | | | | % of | |
| | | Amount | | | Value | | | Net Assets | |
| Highlands School District: (cont.) | | | | | | | | | |
| 5.000%, 04/15/2035 (Callable 04/15/2032) | | | | | | | | | |
| (Insured by AGM) | | $ | 270,000 | | | $ | 300,298 | | | | |
| Latrobe Industrial Development Authority: | | | | | | | | | | | |
| 5.000%, 03/01/2024 | | | 80,000 | | | | 80,261 | | | | |
| 5.000%, 03/01/2025 | | | 110,000 | | | | 110,875 | | | | |
| 5.000%, 03/01/2026 | | | 260,000 | | | | 262,831 | | | | |
| Montgomery County Industrial | | | | | | | | | | | |
| Development Authority: | | | | | | | | | | | |
| 2.050%, 11/15/2029 | | | 1,000,000 | | | | 1,000,000 | | | | |
| 4.000%, 10/01/2036 (Callable 10/01/2026) | | | 430,000 | | | | 395,403 | | | | |
| 4.100%, 04/01/2053 | | | | | | | | | | | |
(Mandatory Tender Date 04/03/2028)(1) | | | 1,000,000 | | | | 1,018,522 | | | | |
| Northeastern Pennsylvania | | | | | | | | | | | |
| Hospital and Education Authority, | | | | | | | | | | | |
| 5.000%, 05/01/2033 (Callable 05/01/2029) | | | 260,000 | | | | 264,011 | | | | |
| Pennsylvania Economic | | | | | | | | | | | |
| Development Financing Authority: | | | | | | | | | | | |
| 5.000%, 06/30/2028 (Callable 06/30/2026) | | | 700,000 | | | | 718,702 | | | | |
| 0.000%, 01/01/2031 (County Guaranteed) | | | 1,405,000 | | | | 1,056,416 | | | | |
| 5.500%, 01/01/2033 (Callable 01/01/2024) | | | | | | | | | | | |
| (Insured by AGM) | | | 3,000,000 | | | | 3,024,269 | | | | |
| 5.000%, 12/31/2034 (Callable 06/30/2026) | | | 2,970,000 | | | | 3,034,638 | | | | |
| 0.000%, 01/01/2037 (Insured by AGM) | | | 3,495,000 | | | | 1,963,463 | | | | |
| 0.000%, 01/01/2046 (Insured by BAM) | | | 1,155,000 | | | | 384,684 | | | | |
| Pennsylvania Higher Education | | | | | | | | | | | |
| Assistance Agency, | | | | | | | | | | | |
| 4.500%, 06/01/2043 (Callable 06/01/2031) | | | 1,375,000 | | | | 1,379,625 | | | | |
| Pennsylvania Higher Educational | | | | | | | | | | | |
| Facilities Authority: | | | | | | | | | | | |
| 5.000%, 05/01/2025 | | | 200,000 | | | | 205,129 | | | | |
| 5.000%, 07/01/2035 (Callable 07/01/2026) | | | 1,300,000 | | | | 1,266,833 | | | | |
| Pennsylvania Housing Finance Agency: | | | | | | | | | | | |
| 3.200%, 04/01/2040 (Callable 10/01/2025) | | | 155,000 | | | | 136,382 | | | | |
| 5.500%, 10/01/2053 (Callable 10/01/2032) | | | 1,375,000 | | | | 1,461,530 | | | | |
| Pennsylvania Turnpike Commission: | | | | | | | | | | | |
0.000%, 12/01/2039 (Callable 06/01/2029)(5) | | | 290,000 | | | | 291,965 | | | | |
0.000%, 12/01/2040 (Callable 06/01/2029)(5) | | | 35,000 | | | | 35,161 | | | | |
| Philadelphia Authority for | | | | | | | | | | | |
| Industrial Development, | | | | | | | | | | | |
| 5.250%, 11/01/2052 (Callable 11/01/2032) | | | 1,750,000 | | | | 1,859,028 | | | | |
| Redevelopment Authority | | | | | | | | | | | |
| of the City of Philadelphia, | | | | | | | | | | | |
| 5.000%, 04/15/2027 (Callable 04/15/2025) | | | 100,000 | | | | 102,899 | | | | |
| Sayre Health Care Facilities Authority, | | | | | | | | | | | |
| 4.155%, 12/01/2031 (3 Month LIBOR | | | | | | | | | | | |
USD + 0.830%) (Callable 07/31/2023)(2) | | | 2,180,000 | | | | 2,058,389 | | | | |
| School District of Philadelphia, | | | | | | | | | | | |
| 5.000%, 09/01/2031 (Callable 09/01/2029) | | | | | | | | | | | |
| (Insured by ST AID) | | | 1,000,000 | | | | 1,087,869 | | | | |
| State Public School Building Authority: | | | | | | | | | | | |
| 5.000%, 12/01/2028 (Pre-refunded | | | | | | | | | | | |
| to 12/01/2026) (Insured by AGM) | | | 15,000 | | | | 16,011 | | | | |
| 5.000%, 12/01/2028 (Callable 12/01/2026) | | | | | | | | | | | |
| (Insured by AGM) | | | 85,000 | | | | 89,792 | | | | |
| Westmoreland County Industrial | | | | | | | | | | | |
| Development Authority, | | | | | | | | | | | |
| 5.000%, 07/01/2028 | | | 575,000 | | | | 594,702 | | | | |
| York County Industrial Development Authority, | | | | | | | | | | | |
| 3.000%, 11/01/2036 (Callable 05/01/2026) | | | 730,000 | | | | 629,315 | | | | |
| Total Pennsylvania | | | | | | | | | | | |
| (Cost $33,254,501) | | | | | | | 33,010,997 | | | | 5.2 | % |
| Puerto Rico | | | | | | | | | | | | |
| Commonwealth of Puerto Rico: | | | | | | | | | | | | |
| 0.000%, 07/01/2024 | | | 1,000,000 | | | | 957,874 | | | | | |
| 5.375%, 07/01/2025 | | | 1,500,000 | | | | 1,537,029 | | | | | |
| Total Puerto Rico | | | | | | | | | | | | |
| (Cost $2,490,972) | | | | | | | 2,494,903 | | | | 0.4 | % |
| Rhode Island | | | | | | | | | | | | |
| Providence Redevelopment Agency, | | | | | | | | | | | | |
| 5.000%, 04/01/2027 (Callable 04/01/2025) | | | 500,000 | | | | 507,496 | | | | | |
| Rhode Island Student Loan Authority, | | | | | | | | | | | | |
| 5.000%, 12/01/2028 | | | 1,175,000 | | | | 1,250,585 | | | | | |
| Total Rhode Island | | | | | | | | | | | | |
| (Cost $1,771,757) | | | | | | | 1,758,081 | | | | 0.3 | % |
| South Carolina | | | | | | | | | | | | |
| City of Myrtle Beach SC, | | | | | | | | | | | | |
| 5.000%, 10/01/2029 (Callable 10/01/2026) | | | 500,000 | | | | 523,406 | | | | | |
| Newberry Investing in Children’s Education, | | | | | | | | | | | | |
| 5.000%, 12/01/2029 (Callable 12/01/2024) | | | 500,000 | | | | 509,800 | | | | | |
| Scago Educational Facilities Corp. | | | | | | | | | | | | |
| for Colleton School District, | | | | | | | | | | | | |
| 5.000%, 12/01/2023 | | | 3,700,000 | | | | 3,716,178 | | | | | |
| South Carolina Jobs-Economic | | | | | | | | | | | | |
| Development Authority: | | | | | | | | | | | | |
| 4.000%, 08/15/2030 (Callable 08/15/2026) | | | 130,000 | | | | 129,948 | | | | | |
| 5.250%, 08/15/2033 (Callable 08/15/2026) | | | 350,000 | | | | 363,792 | | | | | |
| 2.670%, 05/01/2048 (Callable 07/03/2023) | | | | | | | | | | | | |
(Optional Put Date 07/07/2023)(1) | | | 1,775,000 | | | | 1,775,000 | | | | | |
| South Carolina Public Service Authority, | | | | | | | | | | | | |
| 5.000%, 12/01/2032 (Callable 06/01/2026) | | | 465,000 | | | | 480,507 | | | | | |
| Spartanburg County School District No. 4, | | | | | | | | | | | | |
| 5.250%, 03/01/2052 (Callable 03/01/2032) | | | | | | | | | | | | |
| (Insured by SCSDE) | | | 1,000,000 | | | | 1,107,124 | | | | | |
| Spartanburg Housing Authority, | | | | | | | | | | | | |
| 2.000%, 03/01/2026 | | | | | | | | | | | | |
(Mandatory Tender Date 03/01/2025)(1) | | | 3,500,000 | | | | 3,402,918 | | | | | |
| Three Rivers Solid Waste Authority, | | | | | | | | | | | | |
| 0.000%, 10/01/2025 | | | 1,085,000 | | | | 996,736 | | | | | |
| Total South Carolina | | | | | | | | | | | | |
| (Cost $13,155,396) | | | | | | | 13,005,409 | | | | 2.1 | % |
| South Dakota | | | | | | | | | | | | |
| City of Rapid City SD, | | | | | | | | | | | | |
| 4.000%, 12/01/2035 (Callable 12/01/2029) | | | 250,000 | | | | 241,841 | | | | | |
| South Dakota Health & | | | | | | | | | | | | |
| Educational Facilities Authority: | | | | | | | | | | | | |
| 4.250%, 09/01/2023 | | | 260,000 | | | | 259,924 | | | | | |
| 5.000%, 09/01/2032 (Callable 09/01/2027) | | | 100,000 | | | | 105,504 | | | | | |
| Total South Dakota | | | | | | | | | | | | |
| (Cost $633,420) | | | | | | | 607,269 | | | | 0.1 | % |
| Tennessee | | | | | | | | | | | | |
| City of Jackson TN, | | | | | | | | | | | | |
| 5.000%, 04/01/2036 (Callable 04/01/2025) | | | 2,000,000 | | | | 2,022,239 | | | | | |
| Greeneville Health & Educational | | | | | | | | | | | | |
| Facilities Board, | | | | | | | | | | | | |
| 5.000%, 07/01/2034 (Callable 07/01/2023) | | | 1,035,000 | | | | 1,035,000 | | | | | |
| Knox County Health Educational | | | | | | | | | | | | |
| & Housing Facility Board, | | | | | | | | | | | | |
| 5.000%, 09/01/2030 (Callable 09/01/2026) | | | 925,000 | | | | 961,139 | | | | | |
| Tennergy Corp., | | | | | | | | | | | | |
| 5.500%, 10/01/2053 (Callable 09/01/2030) | | | | | | | | | | | | |
(Mandatory Tender Date 12/01/2030)(1) | | | 2,500,000 | | | | 2,646,740 | | | | | |
The accompanying notes are an integral part of these financial statements.
Baird Strategic Municipal Bond Fund
Schedule of Investments, June 30, 2023 (Unaudited)
Long-Term Investments (cont.)
| | | Principal | | | | | | % of | |
| | | Amount | | | Value | | | Net Assets | |
| Tennessee Housing Development Agency: | | | | | | | | | |
| 4.000%, 07/01/2048 (Callable 01/01/2027) | | $ | 115,000 | | | $ | 114,207 | | | | |
| 4.500%, 07/01/2049 (Callable 01/01/2028) | | | 20,000 | | | | 20,041 | | | | |
| Total Tennessee | | | | | | | | | | | |
| (Cost $6,753,803) | | | | | | | 6,799,366 | | | | 1.1 | % |
| Texas | | | | | | | | | | | | |
| Arlington Higher Education Finance Corp., | | | | | | | | | | | | |
| 7.750%, 06/15/2056 (Callable 06/15/2025) | | | | | | | | | | | | |
(Mandatory Tender Date 06/15/2026)(1)(3) | | | 1,250,000 | | | | 1,251,491 | | | | | |
| Austin-Bergstrom Landhost Enterprises, Inc.: | | | | | | | | | | | | |
| 5.000%, 10/01/2031 (Callable 10/01/2027) | | | 1,000,000 | | | | 1,041,097 | | | | | |
| 5.000%, 10/01/2035 (Callable 10/01/2027) | | | 1,160,000 | | | | 1,196,009 | | | | | |
| Baytown Municipal Development District, | | | | | | | | | | | | |
| 5.000%, 10/01/2032 (Callable 10/01/2031) | | | 825,000 | | | | 862,130 | | | | | |
| Brazos Higher Education Authority, Inc., | | | | | | | | | | | | |
| 2.350%, 04/01/2040 (Callable 04/01/2030) | | | 5,000 | | | | 4,962 | | | | | |
| Caney Creek Municipal Utility District, | | | | | | | | | | | | |
| 5.000%, 03/01/2024 | | | 390,000 | | | | 393,157 | | | | | |
| Central Texas Turnpike System, | | | | | | | | | | | | |
| 0.000%, 08/15/2026 (Insured by BHAC) | | | 1,750,000 | | | | 1,580,816 | | | | | |
| City of Austin TX, | | | | | | | | | | | | |
| 5.250%, 05/15/2025 (Insured by BHAC) | | | 55,000 | | | | 56,534 | | | | | |
| City of Donna TX, | | | | | | | | | | | | |
| 5.000%, 02/15/2042 (Pre-refunded to | | | | | | | | | | | | |
| 02/15/2024) (Insured by BAM) | | | 120,000 | | | | 121,320 | | | | | |
| City of Houston TX, | | | | | | | | | | | | |
| 5.000%, 07/01/2026 | | | 1,010,000 | | | | 1,047,089 | | | | | |
| City of Magnolia TX, | | | | | | | | | | | | |
5.700%, 09/01/2046(3) | | | 480,000 | | | | 468,393 | | | | | |
| Clifton Higher Education Finance Corp.: | | | | | | | | | | | | |
6.000%, 03/01/2029 (Callable 03/01/2024)(5) | | | 3,220,000 | | | | 3,239,432 | | | | | |
| 4.000%, 08/15/2030 | | | | | | | | | | | | |
| (Callable 08/15/2027) (PSF Guaranteed) | | | 900,000 | | | | 924,041 | | | | | |
| 3.950%, 12/01/2032 (Callable 07/31/2023) | | | 265,000 | | | | 253,991 | | | | | |
| 4.250%, 12/01/2034 (Callable 12/01/2024) | | | 200,000 | | | | 195,467 | | | | | |
| County of Wise TX: | | | | | | | | | | | | |
| 5.000%, 08/15/2024 | | | 225,000 | | | | 228,737 | | | | | |
| 5.000%, 08/15/2025 | | | 250,000 | | | | 257,507 | | | | | |
| 5.000%, 08/15/2026 | | | 330,000 | | | | 343,470 | | | | | |
| 5.000%, 08/15/2027 | | | 505,000 | | | | 529,805 | | | | | |
| El Paso Housing Finance Corp., | | | | | | | | | | | | |
| 4.500%, 03/01/2026 (Mandatory Tender | | | | | | | | | | | | |
Date 03/01/2025) (Insured by HUD)(1) | | | 1,100,000 | | | | 1,111,448 | | | | | |
| Grand Mission Municipal Utility District No. 2, | | | | | | | | | | | | |
| 2.250%, 09/01/2028 (Callable 09/01/2023) | | | | | | | | | | | | |
| (Insured by NATL) | | | 95,000 | | | | 87,443 | | | | | |
| Green Valley Special Utility District: | | | | | | | | | | | | |
| 7.000%, 09/15/2030 (Insured by BAM) | | | 615,000 | | | | 761,162 | | | | | |
| 7.000%, 09/15/2031 (Insured by BAM) | | | 545,000 | | | | 689,364 | | | | | |
| 4.000%, 09/15/2036 (Callable 09/15/2031) | | | | | | | | | | | | |
| (Insured by BAM) | | | 800,000 | | | | 788,852 | | | | | |
| Greenwood Utility District, | | | | | | | | | | | | |
| 9.000%, 08/01/2034 (Callable 02/01/2030) | | | | | | | | | | | | |
| (Insured by BAM) | | | 205,000 | | | | 272,611 | | | | | |
| Harris County Cultural | | | | | | | | | | | | |
| Education Facilities Finance Corp.: | | | | | | | | | | | | |
| 4.000%, 11/15/2029 (Callable 05/15/2026) | | | 285,000 | | | | 288,106 | | | | | |
| 4.272%, 11/15/2046 (1 Month LIBOR | | | | | | | | | | | | |
| USD + 0.650%((Callable 07/17/2023) | | | | | | | | | | | | |
(Mandatory Tender Date 07/01/2024)(2) | | | 1,210,000 | | | | 1,209,886 | | | | | |
| 2.770%, 12/01/2049 (SIFMA Municipal | | | | | | | | | | | | |
| Swap Index + 0.570%) (Callable 06/01/2024) | | | | | | | | | | | | |
(Mandatory Tender Date 12/04/2024)(2) | | | 80,000 | | | | 80,128 | | | | | |
| Harris County Municipal | | | | | | | | | | | | |
| Utility District No. 450, | | | | | | | | | | | | |
| 3.500%, 09/01/2039 (Callable 09/01/2024) | | | | | | | | | | | | |
| (Insured by AGM) | | | 190,000 | | | | 174,461 | | | | | |
| Harris County-Houston Sports Authority, | | | | | | | | | | | | |
| 5.000%, 11/15/2026 (Callable 11/15/2024) | | | | | | | | | | | | |
| (Insured by AGM) | | | 150,000 | | | | 153,597 | | | | | |
| Housing Options, Inc., | | | | | | | | | | | | |
| 3.900%, 02/01/2026 (Mandatory Tender | | | | | | | | | | | | |
Date 02/01/2025) (Insured by HUD)(1) | | | 1,000,000 | | | | 997,600 | | | | | |
| Houston Independent School District, | | | | | | | | | | | | |
| 3.500%, 06/01/2039 (Mandatory Tender | | | | | | | | | | | | |
Date 06/01/2025) (PSF Guaranteed)(1) | | | 1,000,000 | | | | 1,002,240 | | | | | |
| Hunt Memorial Hospital District, | | | | | | | | | | | | |
| 5.000%, 02/15/2030 | | | 1,000,000 | | | | 1,091,992 | | | | | |
| Kerrville Health Facilities Development Corp., | | | | | | | | | | | | |
| 5.000%, 08/15/2025 | | | 925,000 | | | | 945,323 | | | | | |
| Love Field Airport Modernization Corp., | | | | | | | | | | | | |
| 4.000%, 11/01/2035 (Callable 11/01/2031) | | | | | | | | | | | | |
| (Insured by AGM) | | | 2,295,000 | | | | 2,299,406 | | | | | |
| Matagorda County Navigation District No. 1: | | | | | | | | | | | | |
| 2.600%, 11/01/2029 | | | 3,800,000 | | | | 3,426,564 | | | | | |
| 4.000%, 06/01/2030 (Callable 07/31/2023) | | | 800,000 | | | | 794,837 | | | | | |
| New Hope Cultural Education | | | | | | | | | | | | |
| Facilities Finance Corp., | | | | | | | | | | | | |
4.000%, 08/15/2024(3) | | | 270,000 | | | | 266,248 | | | | | |
| Port Beaumont Navigation District, | | | | | | | | | | | | |
4.000%, 01/01/2050 (Callable 07/31/2023)(3) | | | 500,000 | | | | 356,768 | | | | | |
| Port of Beaumont Industrial | | | | | | | | | | | | |
| Development Authority, | | | | | | | | | | | | |
4.100%, 01/01/2028 (Callable 07/31/2023)(3) | | | 2,750,000 | | | | 2,175,100 | | | | | |
| Tarrant County Cultural Education | | | | | | | | | | | | |
| Facilities Finance Corp.: | | | | | | | | | | | | |
| 5.000%, 11/15/2027 (Callable 11/15/2026) | | | 1,000,000 | | | | 1,012,528 | | | | | |
| 5.000%, 11/15/2027 | | | 1,300,000 | | | | 1,320,692 | | | | | |
| 5.000%, 09/01/2030 (Callable 09/01/2024) | | | 365,000 | | | | 371,731 | | | | | |
| Tarrant County Hospital District, | | | | | | | | | | | | |
| 4.000%, 08/15/2043 (Callable 08/15/2032) | | | 500,000 | | | | 491,348 | | | | | |
| Texas Department of Housing | | | | | | | | | | | | |
| & Community Affairs, | | | | | | | | | | | | |
| 3.375%, 09/01/2039 (Callable 09/01/2028) | | | | | | | | | | | | |
| (Insured by GNMA) | | | 2,050,000 | | | | 1,853,108 | | | | | |
| Texas Municipal Gas Acquisition | | | | | | | | | | | | |
| & Supply Corp. I, | | | | | | | | | | | | |
| 4.710%, 12/15/2026 (3 Month LIBOR | | | | | | | | | | | | |
USD + 1.450%) (Callable 07/03/2023)(2) | | | 500,000 | | | | 492,603 | | | | | |
| Texas Municipal Gas Acquisition | | | | | | | | | | | | |
| & Supply Corp. II, | | | | | | | | | | | | |
| 4.130%, 09/15/2027 | | | | | | | | | | | | |
(3 Month LIBOR USD + 0.870%)(2) | | | 2,700,000 | | | | 2,700,707 | | | | | |
| Texas Municipal Gas Acquisition | | | | | | | | | | | | |
| & Supply Corp. III: | | | | | | | | | | | | |
| 5.000%, 12/15/2023 | | | 750,000 | | | | 753,059 | | | | | |
| 5.000%, 12/15/2032 | | | 2,000,000 | | | | 2,089,241 | | | | | |
| Total Texas | | | | | | | | | | | | |
| (Cost $45,213,461) | | | | | | | 44,053,601 | | | | 7.0 | % |
| Utah | | | | | | | | | | | | |
| City of Salt Lake City UT: | | | | | | | | | | | | |
| 5.000%, 07/01/2025 | | | 1,320,000 | | | | 1,352,074 | | | | | |
| 5.000%, 07/01/2034 (Callable 07/01/2027) | | | 1,000,000 | | | | 1,050,697 | | | | | |
| 5.000%, 07/01/2043 (Callable 07/01/2028) | | | 2,000,000 | | | | 2,060,417 | | | | | |
| Duchesne County School District, | | | | | | | | | | | | |
| 5.000%, 06/01/2029 | | | 260,000 | | | | 280,396 | | | | | |
The accompanying notes are an integral part of these financial statements.
Baird Strategic Municipal Bond Fund
Schedule of Investments, June 30, 2023 (Unaudited)
Long-Term Investments (cont.)
| | | Principal | | | | | | % of | |
| | | Amount | | | Value | | | Net Assets | |
| Utah Charter School Finance Authority: | | | | | | | | | |
| 3.000%, 04/15/2027 (Insured by UT CSCE) | | $ | 160,000 | | | $ | 154,823 | | | | |
| 5.000%, 04/15/2037 (Callable 04/15/2026) | | | | | | | | | | | |
| (Insured by UT CSCE) | | | 270,000 | | | | 275,961 | | | | |
| Utah Housing Corp.: | �� | | | | | | | | | | |
| 4.000%, 01/01/2045 (Callable 01/01/2026) | | | | | | | | | | | |
| (Insured by FHA) | | | 160,000 | | | | 159,334 | | | | |
| 6.000%, 12/21/2052 (Insured by GNMA) | | | 994,530 | | | | 1,029,925 | | | | |
| 6.000%, 02/21/2053 (Insured by GNMA) | | | 996,348 | | | | 1,031,106 | | | | |
| 6.500%, 05/21/2053 (Insured by GNMA) | | | 999,075 | | | | 1,038,310 | | | | |
| 6.000%, 06/21/2053 (Insured by GNMA) | | | 1,500,000 | | | | 1,545,875 | | | | |
| Total Utah | | | | | | | | | | | |
| (Cost $10,034,405) | | | | | | | 9,978,918 | | | | 1.6 | % |
| Vermont | | | | | | | | | | | | |
| Vermont Housing Finance Agency, | | | | | | | | | | | | |
| 5.250%, 11/01/2052 (Callable 05/01/2032) | | | | | | | | | | | | |
| (Insured by HUD) | | | 1,000,000 | | | | 1,044,785 | | | | | |
| Total Vermont | | | | | | | | | | | | |
| (Cost $1,080,110) | | | | | | | 1,044,785 | | | | 0.2 | % |
| Virginia | | | | | | | | | | | | |
| Farmville Industrial Development Authority, | | | | | | | | | | | | |
| 5.375%, 07/01/2053 (Callable 07/01/2028) | | | | | | | | | | | | |
| (Mandatory Tender Date 07/01/2043) | | | | | | | | | | | | |
| (Insured by AGM) | | | 1,500,000 | | | | 1,569,838 | | | | | |
| Federal Home Loan Mortgage Corp. (FHLMC), | | | | | | | | | | | | |
| 2.550%, 06/15/2035 | | | 2,829,768 | | | | 2,356,562 | | | | | |
| Norfolk Redevelopment & Housing Authority: | | | | | | | | | | | | |
| 4.000%, 01/01/2025 (Callable 07/31/2023) | | | 1,200,000 | | | | 1,169,768 | | | | | |
| 5.000%, 05/01/2043 (Mandatory Tender | | | | | | | | | | | | |
Date 05/01/2026) (Insured by HUD)(1) | | | 3,000,000 | | | | 3,086,881 | | | | | |
| Portsmouth Redevelopment | | | | | | | | | | | | |
| & Housing Authority, | | | | | | | | | | | | |
| 3.500%, 07/01/2025 (Mandatory Tender | | | | | | | | | | | | |
Date 07/01/2024) (Insured by HUD)(1) | | | 1,000,000 | | | | 993,433 | | | | | |
| Toll Road Investors Partnership II LP: | | | | | | | | | | | | |
0.000%, 02/15/2025 (Insured by NATL)(3) | | | 2,000,000 | | | | 1,777,582 | | | | | |
0.000%, 02/15/2027 (Insured by NATL)(3) | | | 1,299,000 | | | | 1,011,569 | | | | | |
0.000%, 02/15/2028 (Insured by NATL)(3) | | | 740,000 | | | | 536,092 | | | | | |
| Virginia Port Authority, | | | | | | | | | | | | |
| 5.000%, 07/01/2030 (Callable 07/01/2026) | | | 750,000 | | | | 777,851 | | | | | |
| Virginia Small Business Financing Authority, | | | | | | | | | | | | |
| 4.000%, 01/01/2029 | | | 125,000 | | | | 125,175 | | | | | |
| York County Economic Development Authority, | | | | | | | | | | | | |
| 3.650%, 05/01/2033 | | | | | | | | | | | | |
(Mandatory Tender Date 10/01/2027)(1) | | | 1,925,000 | | | | 1,917,302 | | | | | |
| Total Virginia | | | | | | | | | | | | |
| (Cost $15,688,366) | | | | | | | 15,322,053 | | | | 2.4 | % |
| Washington | | | | | | | | | | | | |
| Clark County Public Utility District No. 1, | | | | | | | | | | | | |
| 5.000%, 01/01/2024 | | | 500,000 | | | | 504,129 | | | | | |
| County of Lewis WA, | | | | | | | | | | | | |
| 3.000%, 12/01/2026 (Callable 07/21/2023) | | | 100,000 | | | | 99,271 | | | | | |
| King County Housing Authority: | | | | | | | | | | | | |
| 5.160%, 11/01/2025 | | | 2,024,766 | | | | 2,031,085 | | | | | |
| 5.000%, 12/01/2030 (Callable 12/01/2026) | | | 400,000 | | | | 421,363 | | | | | |
| Pend Oreille County Public | | | | | | | | | | | | |
| Utility District No. 1: | | | | | | | | | | | | |
| 5.000%, 01/01/2028 | | | 220,000 | | | | 230,972 | | | | | |
| 5.000%, 01/01/2029 (Callable 01/01/2028) | | | 165,000 | | | | 173,508 | | | | | |
| 5.000%, 01/01/2038 (Callable 01/01/2029) | | | 300,000 | | | | 307,571 | | | | | |
| 5.000%, 01/01/2039 (Callable 01/01/2028) | | | 500,000 | | | | 510,337 | | | | | |
| Port of Seattle WA: | | | | | | | | | | | | |
| 4.000%, 08/01/2036 (Callable 08/01/2031) | | | 1,755,000 | | | | 1,740,221 | | | | | |
| 5.500%, 08/01/2047 (Callable 08/01/2032) | | | 1,750,000 | | | | 1,900,295 | | | | | |
| Seattle Housing Authority, | | | | | | | | | | | | |
| 4.000%, 09/01/2025 (Callable 03/01/2025) | | | 3,000,000 | | | | 3,006,188 | | | | | |
| Snohomish County Housing Authority, | | | | | | | | | | | | |
| 4.000%, 04/01/2033 (Callable 04/01/2031) | | | 2,500,000 | | | | 2,564,965 | | | | | |
| Tacoma Metropolitan Park District: | | | | | | | | | | | | |
| 5.000%, 12/01/2025 (Callable 12/01/2024) | | | 215,000 | | | | 217,967 | | | | | |
| 5.000%, 12/01/2025 | | | 2,060,000 | | | | 2,106,126 | | | | | |
| 4.000%, 12/01/2027 (Callable 12/01/2026) | | | 605,000 | | | | 605,781 | | | | | |
| Vancouver Housing Authority, | | | | | | | | | | | | |
| 1.700%, 12/01/2024 | | | 140,000 | | | | 136,276 | | | | | |
| Washington Health Care Facilities Authority: | | | | | | | | | | | | |
| 3.600%, 01/01/2035 (SIFMA Municipal | | | | | | | | | | | | |
| Swap Index + 1.400%) (Callable 07/01/2024) | | | | | | | | | | | | |
(Mandatory Tender Date 01/01/2025)(2) | | | 150,000 | | | | 150,058 | | | | | |
| 5.000%, 08/15/2037 (Callable 02/15/2028) | | | 1,500,000 | | | | 1,533,152 | | | | | |
| 5.000%, 08/01/2049 (Callable 08/01/2029) | | | 2,640,000 | | | | 2,704,220 | | | | | |
| Washington State Housing Finance Commission, | | | | | | | | | | | | |
| 4.000%, 06/01/2050 (Callable 06/01/2029) | | | | | | | | | | | | |
| (Insured by GNMA) | | | 330,000 | | | | 327,479 | | | | | |
| Total Washington | | | | | | | | | | | | |
| (Cost $21,613,309) | | | | | | | 21,270,964 | | | | 3.4 | % |
| West Virginia | | | | | | | | | | | | |
| Glenville State University, | | | | | | | | | | | | |
| 4.000%, 06/01/2027 | | | 815,000 | | | | 778,028 | | | | | |
| Total West Virginia | | | | | | | | | | | | |
| (Cost $780,351) | | | | | | | 778,028 | | | | 0.1 | % |
| Wisconsin | | | | | | | | | | | | |
| Boscobel Area School District, | | | | | | | | | | | | |
| 5.000%, 03/01/2036 (Callable 03/01/2031) | | | | | | | | | | | | |
(Insured by BAM)(6) | | | 720,000 | | | | 794,140 | | | | | |
| City of Milwaukee WI, | | | | | | | | | | | | |
| 3.000%, 04/01/2034 (Callable 04/01/2031) | | | | | | | | | | | | |
| (Insured by BAM) | | | 410,000 | | | | 381,882 | | | | | |
| Howard-Suamico School District, | | | | | | | | | | | | |
| 1.625%, 03/01/2031 (Callable 03/01/2028) | | | 3,250,000 | | | | 2,746,510 | | | | | |
| Hudson School District, | | | | | | | | | | | | |
| 2.500%, 03/01/2025 | | | 1,305,000 | | | | 1,284,660 | | | | | |
| Palmyra-Eagle Area School District: | | | | | | | | | | | | |
| 3.000%, 03/01/2025 (Callable 07/31/2023) | | | 100,000 | | | | 95,951 | | | | | |
| 3.000%, 03/01/2027 (Callable 07/31/2023) | | | 500,000 | | | | 461,508 | | | | | |
| Public Finance Authority: | | | | | | | | | | | | |
5.000%, 10/01/2023(3) | | | 100,000 | | | | 99,937 | | | | | |
3.000%, 03/01/2026 (Callable 07/31/2023)(3) | | | 700,000 | | | | 679,247 | | | | | |
5.000%, 05/15/2026 (Callable 05/15/2025)(3) | | | 1,660,000 | | | | 1,643,799 | | | | | |
| 0.000%, 12/15/2027 (Callable 07/31/2023) | | | 565,000 | | | | 441,881 | | | | | |
0.000%, 09/01/2029 (Callable 09/01/2026)(3) | | | 2,250,000 | | | | 1,408,173 | | | | | |
5.000%, 09/01/2030(3) | | | 1,250,000 | | | | 1,097,069 | | | | | |
4.850%, 07/01/2031(3) | | | 475,000 | | | | 413,195 | | | | | |
| 5.000%, 07/01/2031 | | | 1,875,000 | | | | 1,983,475 | | | | | |
| 4.000%, 01/01/2033 (Callable 07/01/2029) | | | 605,000 | | | | 586,965 | | | | | |
| 4.000%, 01/01/2034 (Callable 07/01/2029) | | | 1,150,000 | | | | 1,115,500 | | | | | |
5.000%, 10/01/2034 (Callable 10/01/2029)(3) | | | 1,000,000 | | | | 1,004,711 | | | | | |
| 5.250%, 07/01/2053 (Callable 07/01/2033) | | | 620,000 | | | | 619,065 | | | | | |
| Waunakee Community School District, | | | | | | | | | | | | |
| 2.500%, 04/01/2025 (Callable 07/31/2023) | | | 250,000 | | | | 244,167 | | | | | |
| Wisconsin Center District, | | | | | | | | | | | | |
5.250%, 12/15/2061 (Callable 12/15/2030)(3) | | | 1,000,000 | | | | 1,001,190 | | | | | |
The accompanying notes are an integral part of these financial statements.
Baird Strategic Municipal Bond Fund
Schedule of Investments, June 30, 2023 (Unaudited)
Long-Term Investments (cont.)
| | | Principal | | | | | | % of | |
| | | Amount | | | Value | | | Net Assets | |
| Wisconsin Health & Educational | | | | | | | | | |
| Facilities Authority: | | | | | | | | | |
| 4.000%, 08/15/2024 | | $ | 160,000 | | | $ | 158,454 | | | | |
| 4.000%, 08/15/2025 | | | 230,000 | | | | 225,661 | | | | |
| 5.000%, 11/01/2027 (Callable 11/01/2026) | | | 745,000 | | | | 715,845 | | | | |
| 5.000%, 09/15/2028 | | | | | | | | | | | |
| (Pre-refunded to 09/15/2023) | | | 45,000 | | | | 45,138 | | | | |
| 5.000%, 11/01/2029 (Callable 11/01/2026) | | | 430,000 | | | | 406,317 | | | | |
| 5.000%, 11/15/2039 (Callable 05/15/2026) | | | 2,000,000 | | | | 2,048,234 | | | | |
| 5.000%, 02/15/2051 (Callable 08/15/2026) | | | | | | | | | | | |
(Mandatory Tender Date 02/15/2027)(1) | | | 345,000 | | | | 354,730 | | | | |
| 5.500%, 12/01/2052 (Callable 12/01/2032) | | | 1,750,000 | | | | 1,896,015 | | | | |
| 3.490%, 02/15/2053 (Callable 07/03/2023) | | | | | | | | | | | |
(Optional Put Date 07/05/2023)(1) | | | 3,000,000 | | | | 3,000,000 | | | | |
| Wisconsin Housing & Economic | | | | | | | | | | | |
| Development Authority: | | | | | | | | | | | |
| 4.000%, 07/01/2030 (Callable 07/01/2028) | | | | | | | | | | | |
(Insured by HUD)(3) | | | 135,000 | | | | 120,195 | | | | |
| 4.375%, 07/01/2037 (Callable 07/01/2028) | | | | | | | | | | | |
(Insured by HUD)(3) | | | 500,000 | | | | 410,560 | | | | |
| 3.750%, 05/01/2054 (Callable 05/01/2025) | | | | | | | | | | | |
| (Mandatory Tender Date 11/01/2026) | | | | | | | | | | | |
(Insured by HUD)(1) | | | 1,000,000 | | | | 999,996 | | | | |
| Total Wisconsin | | | | | | | | | | | |
| (Cost $28,696,391) | | | | | | | 28,484,170 | | | | 4.5 | % |
| Total Long-Term Investments | | | | | | | | | | | | |
| (Cost $633,134,379) | | | | | | | 624,222,384 | | | | 99.0 | % |
| Short-Term Investments | | | | | | | | | | | | |
| | | Shares | | | | | | | | | |
| Money Market Mutual Funds | | | | | | | | | | | | |
| Federated Hermes Institutional Tax-Free | | | | | | | | | | | | |
Cash Trust, Premier Shares, 4.04%(4) | | | 5,289,085 | | | | 5,289,085 | | | | | |
| First American Government Obligations | | | | | | | | | | | | |
Fund, Class U, 5.03%(4) | | | 1,483,736 | | | | 1,483,736 | | | | | |
| Total Short-Term Investments | | | | | | | | | | | | |
| (Cost $6,772,821) | | | | | | | 6,772,821 | | | | 1.1 | % |
| Total Investments | | | | | | | | | | | | |
| (Cost $639,907,200) | | | | | | | 630,995,205 | | | | 100.1 | % |
| Liabilities in Excess of Other Assets | | | | | | | (825,497 | ) | | | (0.1 | )% |
| TOTAL NET ASSETS | | | | | | $ | 630,169,708 | | | | 100.0 | % |
Notes to Schedule of Investments
AGC – Assured Guaranty Corp.
AGM – Assured Guaranty Municipal
AMBAC – Ambac Assurance Corp.
BAM – Build America Mutual Assurance Co.
BHAC – Berkshire Hathaway Assurance Corp.
FHA – Federal Housing Administration
FHLMC – Federal Home Loan Mortgage Corporation
FNMA – Federal National Mortgage Association
GNMA – Government National Mortgage Association
HUD – US Department of Housing and Development
NATL – National Public Finance Guarantee Corp.
Q-SBLF – Qualified School Building Loan Fund
SCH BD GTY – School Board Guaranty
SD CRED PROG – State Credit Enhancement Program
SONYMA – State of New York Mortgage Agency
SCSDE – South Carolina School District
ST AID – State Aid Intercept/Withholding
UT CSCE – Utah Charter School Credit Enhancement Program
XLCA – XL Capital Assurance, Inc.
CPI YOY – Consumer Price Index – Year-Over-Year
ETM – Escrowed to Maturity
LIBOR – London Inter-bank Offered Rate
PSF – Permanent School Fund
SIFMA – Securities Industry and Financial Markets Association
SOFR – Secured Overnight Financing Rate
(1) | Variable rate security. The rate reported is the rate in effect as of June 30, 2023. |
(2) | Variable rate security based on a reference index and spread. The rate reported is the rate as of the last reset date in effect as of June 30, 2023. |
(3) | Includes securities exempt from registration under Rule 144A of the Securities Act of 1933. These securities may be resold in transactions exempt from registration to qualified institutional buyers. At June 30, 2023, the value of these securities totaled $46,897,670, which represented 7.44% of total net assets. |
(4) | Seven-day yield. |
(5) | Step-up bond; the interest rate shown is the rate in effect as of June 30, 2023. |
(6) | Security or a portion of the security purchased on a when-issued or delayed delivery basis. |
The accompanying notes are an integral part of these financial statements.
Baird Strategic Municipal Bond Fund
Schedule of Open Futures Contracts, June 30, 2023 (Unaudited)
| | | | | | | | | | | Value | |
| | | Number of Contracts | | Settlement | | Current | | Value at | | Unrealized | | Unrealized | |
| Description | | Purchased (Sold) | | Month-Year | | Notional Amount | | Trade Date | | Appreciation | | (Depreciation) | |
| Purchase Contracts: | | | | | | | | | | | | | |
| U.S. 5 Yr Note | | 150 | | Sep-23 | | $16,064,063 | | $16,165,369 | | $ | — | | $ | (101,306 | ) |
| Total Futures Contracts | | | | | | | | | | $ | — | | $ | (101,306 | ) |
| Net Unrealized Depreciation | | | | | | | | | | | | | $ | (101,306 | ) |
Summary of Fair Value Exposure at June 30, 2023 (Unaudited)
The Fund has adopted authoritative fair valuation accounting standards which establish a definition of fair value and set out a hierarchy for measuring fair value. These standards require additional disclosures about the various inputs and valuation techniques used to develop the measurements of fair value and a discussion on changes in valuation techniques and related inputs during the period. These standards define fair value as the price that would be received to sell an asset or paid to transfer a liability in an orderly transaction between market participants at the measurement date.
The fair value hierarchy is organized into three levels based upon the assumptions (referred to as “inputs”) used in pricing the asset or liability. These standards state that “observable inputs” reflect the assumptions market participants would use in pricing the asset or liability based on market data obtained from independent sources and “unobservable inputs” reflect an entity’s own assumptions about the assumptions market participants would use in pricing the asset or liability. These inputs are summarized into three broad levels and described below:
Level 1 – Quoted prices (unadjusted) in active markets for identical assets or liabilities that the reporting entity can access at the measurement date.
Level 2 – Inputs other than quoted prices included within Level 1 that are observable for the asset or liability, either directly or indirectly.
Level 3 – Unobservable inputs for the asset or liability.
The inputs or methodology used for valuing securities are not necessarily an indication of the risk associated with investing in those securities.
The following is a summary of the inputs used to value the Fund’s investments as of June 30, 2023:
| | | Level 1 | | | Level 2 | | | Level 3 | | | Total | |
| Long-Term Investments | | | | | | | | | | | | |
| Municipal Bonds | | $ | — | | | $ | 624,222,384 | | | $ | — | | | $ | 624,222,384 | |
| Total Long-Term Investments | | | — | | | | 624,222,384 | | | | — | | | | 624,222,384 | |
| Short-Term Investments | | | | | | | | | | | | | | | | |
| Money Market Mutual Funds | | | 6,772,821 | | | | — | | | | — | | | | 6,772,821 | |
| Total Short-Term Investments | | | 6,772,821 | | | | — | | | | — | | | | 6,772,821 | |
| Total Investments | | $ | 6,772,821 | | | $ | 624,222,384 | | | $ | — | | | $ | 630,995,205 | |
| Futures Contracts* | | | | | | | | | | | | | | | | |
| Purchase Contracts | | $ | (101,306 | ) | | $ | — | | | $ | — | | | $ | (101,306 | ) |
| Total Futures Contracts | | $ | (101,306 | ) | | $ | — | | | $ | — | | | $ | (101,306 | ) |
* The fair value of the Fund’s futures contracts represent the net unrealized depreciation at June 30, 2023.
Changes in valuation techniques may result in transfers into or out of assigned levels within the fair value hierarchy. There were no transfers into or out of Level 3 during the reporting period, as compared to the security classifications from the prior year’s annual report. See the Fund’s Valuation Policy in Note 2a to the financial statements.
The accompanying notes are an integral part of these financial statements.
Baird Quality Intermediate Municipal Bond Fund
June 30, 2023 (Unaudited)
Portfolio Characteristics
Quality Distribution(1)(2)
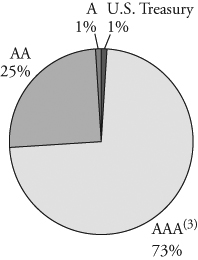
| | Net Assets | $1,089,474,671 | |
| | | | |
| | SEC 30-Day Yield(4) | | |
| | Institutional Class | 3.13% | |
| | Investor Class | 2.88% | |
| | | | |
| | Average Effective Duration | 4.13 years | |
| | | | |
| | Average Effective Maturity | 4.37 years | |
| | | | |
| | Annualized Expense Ratio(5) | | |
| | Institutional Class | 0.30% | |
| | Investor Class | 0.55% | (6) |
| | | | |
| | Portfolio Turnover Rate | 17% | (7) |
| | | | |
| | | Number of Holdings | 601 | |
Sector Weightings(1) | | | | |
| | | | | |
 | | | | |
| | | | |
| | | | |
| | | | |
| | | | |
| | | | |
| | | | |
| | | | |
| | | | |
| | | | |
| | | | |
| | | | |
| | | | |
| | | | |
| | | | | |
(1) | Percentages shown are based on the Fund’s total investments. |
(2) | The quality profile is calculated on a market value-weighted basis using the highest credit quality rating for each security held by the Fund given by S&P, Moody’s or Fitch, each of which is a Nationally Recognized Statistical Rating Organization (NRSRO). NRSROs rate the credit quality of securities using a scale that generally ranges from AAA (highest) to D (lowest). |
(3) | Includes pre-refunded and escrowed-to-maturity (ETM) bonds. |
(4) | SEC yields are based on SEC guidelines and are calculated for the 30 days ended June 30, 2023. |
(5) | Reflects expense ratios as stated in the Fund’s current prospectus dated May 1, 2023. |
(6) | Includes 0.25% 12b-1 fee. |
(7) | Not annualized. |
Baird Quality Intermediate Municipal Bond Fund
June 30, 2023 (Unaudited)
Total Returns
| | | | Average Annual |
| | Six | One | Five | Ten | Since |
| For the Periods Ended June 30, 2023 | Months | Year | Years | Years | Inception(1) |
| Institutional Class Shares | 1.29% | 1.76% | 1.39% | 1.70% | 3.33% |
| Investor Class Shares | 1.14% | 1.55% | 1.14% | 1.45% | 3.07% |
Bloomberg Quality Intermediate Municipal Index(2) | 1.42% | 2.33% | 1.66% | 2.08% | 3.42% |
(1) | For the period from March 30, 2001 (inception date) through June 30, 2023. |
(2) | The Bloomberg Quality Intermediate Municipal Index is an unmanaged, market value weighted index consisting of tax-exempt, fixed-rate securities that are rated A3 or better, with maturities between 2 and 12 years. Securities must have an outstanding par value of at least $7 million and be issued as part of a transaction of at least $75 million. The bonds must be fixed rate and have a dated-date after December 31, 1990, and must be at least one year from their maturity date. This Index does not reflect any deduction for fees, expenses or taxes. A direct investment in an index is not possible. |
The returns table shown above reflects reinvestment of dividends and/or capital gains distributions in additional shares. The returns in the table do not reflect the deduction of taxes that a shareholder would pay on Fund distributions or the redemption of Fund shares. The returns reflect the actual performance for each period and do not include the impact of trades executed on the last business day of the period that were recorded on the first business day of the next period.
The Fund’s expense ratio for each Class, as reflected in the Fund’s current prospectus, is set forth under “Portfolio Characteristics”.
The Fund may invest up to 25% of its total assets in municipal obligations issued by persons in the same state. As a result, changes in economic, business or political conditions of a particular state may have a disproportionate impact on the Fund’s share price. Municipal securities investments are not appropriate for all investors, especially those taxed at lower rates. U.S. and international markets have experienced significant periods of volatility in recent years and months due to a number of economic, political and global macro factors. Russia’s ongoing war with Ukraine has heightened global geopolitical tensions, resulting in an elevated risk environment and increased volatility in asset prices. The uncertain course of the war may have a significant negative impact on the global economy. U.S. relations with China have become increasingly strained, and tension between the U.S. and China may have a significant negative impact on the global economy and asset prices. Measures of inflation reached levels not experienced in several decades, leading the Federal Reserve to raise short term interest rates significantly over the last year, with the potential for further rate increases in 2023. Uncertainty regarding the ability of the Federal Reserve to successfully control inflation, the potential for incremental rate increases, and the full impact of prior rate increases on the economy may negatively impact asset prices and increase market volatility. The possibility of a U.S. or global recession may also contribute to market volatility. The coronavirus (COVID-19) pandemic caused significant economic disruption in recent years as countries worked to limit the negative health impacts of the virus. While the virus has entered an endemic stage, significant outbreaks or new variants present a continued risk to the global economy. These and other geopolitical events may cause market disruptions and could have an adverse effect on the value of the Fund’s investments.
Past performance does not guarantee future results. Investment return and principal value will fluctuate so that an investor’s shares, when redeemed, may be worth more or less than their original cost.
For information about the performance of the Fund as of the most recent month-end, please call 1-866-442-2473 or visit www.bairdfunds.com. Mutual fund performance changes over time and current performance may be lower or higher than that stated.
Baird Quality Intermediate Municipal Bond Fund
Schedule of Investments, June 30, 2023 (Unaudited)
Long-Term Investments
| | | Principal | | | | | | % of | |
| | | Amount | | | Value | | | Net Assets | |
| U.S. Treasury Security | | | | | | | | | |
| U.S. Treasury Bonds, | | | | | | | | | |
| 3.875%, 03/31/2025 | | $ | 11,000,000 | | | $ | 10,783,867 | | | | |
| Total U.S. Treasury Security | | | | | | | | | | | |
| (Cost $10,974,649) | | | | | | | 10,783,867 | | | | 1.0 | % |
| Municipal Bonds | | | | | | | | | | | | |
| Alabama | | | | | | | | | | | | |
| Alabama Housing Finance Authority, | | | | | | | | | | | | |
| 3.500%, 08/01/2025 (Mandatory Tender | | | | | | | | | | | | |
Date 08/01/2024) (Insured by HUD)(1) | | | 4,855,000 | | | | 4,828,199 | | | | | |
| Black Belt Energy Gas District, | | | | | | | | | | | | |
| 5.000%, 05/01/2053 | | | | | | | | | | | | |
(Mandatory Tender Date 06/01/2028)(1) | | | 4,000,000 | | | | 4,187,322 | | | | | |
| City of Oxford AL, | | | | | | | | | | | | |
| 2.600%, 09/01/2041 (Callable 07/03/2023) | | | | | | | | | | | | |
(Optional Put Date 07/07/2023)(1) | | | 3,300,000 | | | | 3,300,000 | | | | | |
| Total Alabama | | | | | | | | | | | | |
| (Cost $12,459,270) | | | | | | | 12,315,521 | | | | 1.1 | % |
| Alaska | | | | | | | | | | | | |
| Alaska Housing Finance Corp.: | | | | | | | | | | | | |
| 4.000%, 06/01/2036 | | | | | | | | | | | | |
| (Pre-refunded to 06/01/2025) | | | 290,000 | | | | 295,021 | | | | | |
| 4.000%, 06/01/2036 | | | | | | | | | | | | |
| (Callable 06/01/2025) | | | 710,000 | | | | 711,186 | | | | | |
| 4.000%, 12/01/2048 | | | | | | | | | | | | |
| (Callable 06/01/2027) | | | 610,000 | | | | 605,162 | | | | | |
| City of Valdez AK, | | | | | | | | | | | | |
| 5.000%, 06/30/2029 | | | | | | | | | | | | |
| (Callable 07/21/2023) | | | 1,225,000 | | | | 1,225,994 | | | | | |
| Total Alaska | | | | | | | | | | | | |
| (Cost $2,898,562) | | | | | | | 2,837,363 | | | | 0.3 | % |
| Arizona | | | | | | | | | | | | |
| City of Tempe AZ: | | | | | | | | | | | | |
| 5.000%, 07/01/2033 | | | | | | | | | | | | |
| (Pre-refunded to 07/01/2028) | | | 40,000 | | | | 44,167 | | | | | |
| 5.000%, 07/01/2034 | | | | | | | | | | | | |
| (Pre-refunded to 07/01/2027) | | | 165,000 | | | | 178,401 | | | | | |
| 5.000%, 07/01/2034 | | | | | | | | | | | | |
| (Pre-refunded to 07/01/2028) | | | 325,000 | | | | 358,858 | | | | | |
| 5.000%, 07/01/2035 | | | | | | | | | | | | |
| (Pre-refunded to 07/01/2027) | | | 185,000 | | | | 200,026 | | | | | |
| 5.000%, 07/01/2037 | | | | | | | | | | | | |
| (Pre-refunded to 07/01/2028) | | | 215,000 | | | | 237,398 | | | | | |
| 5.000%, 07/01/2038 | | | | | | | | | | | | |
| (Pre-refunded to 07/01/2028) | | | 350,000 | | | | 386,463 | | | | | |
| Maricopa County Industrial | | | | | | | | | | | | |
| Development Authority, | | | | | | | | | | | | |
| 4.000%, 01/01/2045 | | | | | | | | | | | | |
| (Callable 07/01/2030) | | | 2,000,000 | | | | 1,929,527 | | | | | |
| Total Arizona | | | | | | | | | | | | |
| (Cost $3,309,777) | | | | | | | 3,334,840 | | | | 0.3 | % |
| Arkansas | | | | | | | | | | | | |
| City of Little Rock AR, | | | | | | | | | | | | |
| 5.000%, 10/01/2034 | | | | | | | | | | | | |
| (Pre-refunded to 04/01/2025) | | | 5,000,000 | | | | 5,166,513 | | | | | |
| City of Pine Bluff AR, | | | | | | | | | | | | |
| 3.000%, 02/01/2047 | | | | | | | | | | | | |
| (Callable 08/01/2027) (Insured by BAM) | | | 1,365,000 | | | | 1,303,904 | | | | | |
| University of Arkansas: | | | | | | | | | | | | |
| 5.000%, 11/01/2035 | | | | | | | | | | | | |
| (Pre-refunded to 11/01/2024) | | | 665,000 | | | | 680,405 | | | | | |
| 4.000%, 04/01/2037 | | | | | | | | | | | | |
| (Callable 04/01/2029) | | | 160,000 | | | | 160,993 | | | | | |
| 4.000%, 04/01/2039 | | | | | | | | | | | | |
| (Callable 04/01/2029) | | | 245,000 | | | | 243,518 | | | | | |
| Total Arkansas | | | | | | | | | | | | |
| (Cost $7,665,034) | | | | | | | 7,555,333 | | | | 0.7 | % |
| California | | | | | | | | | | | | |
| Anaheim Public Financing Authority, | | | | | | | | | | | | |
| 0.000%, 09/01/2036 | | | | | | | | | | | | |
| (ETM) (Insured by AGM) | | | 11,100,000 | | | | 7,042,639 | | | | | |
| Antelope Valley Community College District, | | | | | | | | | | | | |
| 0.000%, 08/01/2034 | | | | | | | | | | | | |
| (Pre-refunded to 02/01/2025) | | | 150,000 | | | | 95,016 | | | | | |
| Brea Redevelopment Agency: | | | | | | | | | | | | |
| 0.000%, 08/01/2033 | | | | | | | | | | | | |
(Callable 08/01/2027)(5) | | | 1,500,000 | | | | 1,609,427 | | | | | |
| 0.000%, 08/01/2034 | | | | | | | | | | | | |
(Callable 08/01/2027)(5) | | | 1,750,000 | | | | 1,880,147 | | | | | |
| Buellton Union School District, | | | | | | | | | | | | |
| 0.000%, 02/01/2034 (Insured by AGC) | | | 2,000,000 | | | | 1,323,906 | | | | | |
| California Housing Finance Agency, | | | | | | | | | | | | |
| 3.750%, 03/25/2035 (Insured by FHLMC) | | | 4,892,817 | | | | 4,755,074 | | | | | |
| California School Finance Authority, | | | | | | | | | | | | |
| 6.400%, 08/01/2034 | | | | | | | | | | | | |
(Pre-refunded to 02/01/2024)(3) | | | 1,000,000 | | | | 1,015,382 | | | | | |
| Carlsbad Unified School District, | | | | | | | | | | | | |
0.000%, 08/01/2035(5) | | | 125,000 | | | | 136,257 | | | | | |
| Central Basin Municipal Water District, | | | | | | | | | | | | |
| 5.000%, 08/01/2044 | | | | | | | | | | | | |
| (Pre-refunded to 08/01/2028) | | | 70,000 | | | | 78,125 | | | | | |
| Citrus Community College District, | | | | | | | | | | | | |
| 5.000%, 08/01/2034 | | | | | | | | | | | | |
(Pre-refunded to 02/01/2024)(5) | | | 885,000 | | | | 894,580 | | | | | |
| City of Richmond CA, | | | | | | | | | | | | |
| 0.000%, 08/01/2028 | | | | | | | | | | | | |
| (ETM) (Insured by FGIC) | | | 180,000 | | | | 155,419 | | | | | |
| Department of Veterans Affairs Veteran’s | | | | | | | | | | | | |
| Farm & Home Purchase Program, | | | | | | | | | | | | |
| 4.000%, 12/01/2049 | | | | | | | | | | | | |
| (Callable 06/01/2028) | | | 1,005,000 | | | | 1,000,028 | | | | | |
| El Rancho Unified School District, | | | | | | | | | | | | |
| 0.000%, 08/01/2035 (Pre-refunded to | | | | | | | | | | | | |
| 08/01/2023) (Insured by BAM) | | | 300,000 | | | | 145,532 | | | | | |
| Fontana Unified School District, | | | | | | | | | | | | |
| 0.000%, 02/01/2033 | | | | | | | | | | | | |
| (ETM) (Insured by AGM) | | | 460,000 | | | | 343,032 | | | | | |
| Foothill-Eastern Transportation | | | | | | | | | | | | |
| Corridor Agency: | | | | | | | | | | | | |
| 0.000%, 01/01/2026 (ETM) | | | 4,695,000 | | | | 4,358,459 | | | | | |
| 0.000%, 01/01/2028 (ETM) | | | 3,260,000 | | | | 2,876,004 | | | | | |
| 0.000%, 01/01/2030 (ETM) | | | 95,000 | | | | 79,194 | | | | | |
| Freddie Mac Multifamily ML Certificates, | | | | | | | | | | | | |
4.140%, 01/25/2040(5) | | | 2,998,042 | | | | 2,786,194 | | | | | |
| Freddie Mac Multifamily | | | | | | | | | | | | |
| Variable Rate Certificate, | | | | | | | | | | | | |
| 2.875%, 07/25/2036 | | | 7,413,309 | | | | 6,482,583 | | | | | |
| Fresno Unified School District, | | | | | | | | | | | | |
| 0.000%, 08/01/2033 | | | | | | | | | | | | |
| (Pre-refunded to 08/01/2026) | | | 195,000 | | | | 134,127 | | | | | |
| Gateway Unified School District, | | | | | | | | | | | | |
| 0.000%, 03/01/2037 | | | | | | | | | | | | |
| (ETM) (Insured by AGM) | | | 100,000 | | | | 63,179 | | | | | |
The accompanying notes are an integral part of these financial statements.
Baird Quality Intermediate Municipal Bond Fund
Schedule of Investments, June 30, 2023 (Unaudited)
Long-Term Investments (cont.)
| | | Principal | | | | | | % of | |
| | | Amount | | | Value | | | Net Assets | |
| Golden State Tobacco Securitization Corp.: | | | | | | | | | |
| 0.000%, 06/01/2026 | | | | | | | | | |
| (ETM) (Insured by AGM) | | $ | 240,000 | | | $ | 220,407 | | | |
| |
| 0.000%, 06/01/2028 | | | | | | | | | | | | |
| (ETM) (Insured by AGC) | | | 605,000 | | | | 528,431 | | | | | |
| 5.000%, 06/01/2028 | | | | | | | | | | | | |
| (Pre-refunded to 06/01/2027) | | | 425,000 | | | | 461,933 | | | | | |
| 3.250%, 06/01/2034 (Pre-refunded to | | | | | | | | | | | | |
| 06/01/2025) (Insured by ST AID) | | | 160,000 | | | | 161,157 | | | | | |
| Imperial Community College District, | | | | | | | | | | | | |
| 7.000%, 08/01/2040 (Pre-refunded to | | | | | | | | | | | | |
08/01/2030) (Insured by AGM)(5) | | | 180,000 | | | | 230,776 | | | | | |
| Kingsburg Joint Union High School District, | | | | | | | | | | | | |
| 5.000%, 08/01/2044 | | | | | | | | | | | | |
| (Callable 08/01/2026) (Insured by AGM) | | | 150,000 | | | | 155,919 | | | | | |
| Long Beach Community College District: | | | | | | | | | | | | |
| 0.000%, 06/01/2032 | | | | | | | | | | | | |
| (ETM) (Insured by AGM) | | | 1,540,000 | | | | 1,178,396 | | | | | |
| 0.000%, 06/01/2033 | | | | | | | | | | | | |
| (ETM) (Insured by AGM) | | | 1,560,000 | | | | 1,150,897 | | | | | |
| Merced Union High School District, | | | | | | | | | | | | |
| 0.000%, 08/01/2048 (Pre-refunded to | | | | | | | | | | | | |
| 02/01/2025) (Insured by AGM) | | | 850,000 | | | | 228,947 | | | | | |
| Moreno Valley Unified School District, | | | | | | | | | | | | |
| 0.000%, 07/01/2029 | | | | | | | | | | | | |
| (ETM) (Insured by AGM) | | | 75,000 | | | | 63,226 | | | | | |
| Morongo Unified School District, | | | | | | | | | | | | |
| 0.000%, 08/01/2041 | | | | | | | | | | | | |
(Callable 08/01/2030)(5) | | | 260,000 | | | | 256,237 | | | | | |
| Pacheco Union Elementary School District: | | | | | | | | | | | | |
| 0.000%, 02/01/2028 | | | | | | | | | | | | |
| (ETM) (Insured by AGM) | | | 25,000 | | | | 21,764 | | | | | |
| 0.000%, 02/01/2028 | | | | | | | | | | | | |
| (ETM) (Insured by AGM) | | | 40,000 | | | | 34,823 | | | | | |
| 0.000%, 02/01/2037 | | | | | | | | | | | | |
| (ETM) (Insured by AGM) | | | 300,000 | | | | 192,395 | | | | | |
| Pajaro Valley Unified School District, | | | | | | | | | | | | |
| 0.000%, 08/01/2027 | | | | | | | | | | | | |
| (ETM) (Insured by AGM) | | | 25,000 | | | | 22,194 | | | | | |
| Palmdale Elementary School District, | | | | | | | | | | | | |
| 0.000%, 08/01/2031 | | | | | | | | | | | | |
| (ETM) (Insured by AGM) | | | 30,000 | | | | 23,565 | | | | | |
| Paramount Unified School District, | | | | | | | | | | | | |
| 6.375%, 08/01/2045 (Callable | | | | | | | | | | | | |
02/01/2033) (Insured by AGM)(5) | | | 325,000 | | | | 388,111 | | | | | |
| Peralta Community College District, | | | | | | | | | | | | |
| 3.500%, 08/01/2032 | | | | | | | | | | | | |
| (Callable 08/01/2025) | | | 1,715,000 | | | | 1,726,951 | | | | | |
| Rio Hondo Community College District, | | | | | | | | | | | | |
| 0.000%, 08/01/2042 | | | | | | | | | | | | |
(Callable 08/01/2034)(5) | | | 7,010,000 | | | | 8,321,587 | | | | | |
| Riverside County | | | | | | | | | | | | |
| Redevelopment Successor Agency, | | | | | | | | | | | | |
| 8.250%, 10/01/2031 | | | | | | | | | | | | |
(Pre-refunded to 10/01/2026)(5) | | | 650,000 | | | | 754,779 | | | | | |
| Roseville Joint Union High School District, | | | | | | | | | | | | |
| 0.000%, 08/01/2034 | | | | | | | | | | | | |
| (Callable 08/01/2026) | | | 85,000 | | | | 57,488 | | | | | |
| San Diego Unified School District: | | | | | | | | | | | | |
| 0.000%, 07/01/2030 (ETM) | | | 95,000 | | | | 77,596 | | | | | |
| 0.000%, 07/01/2034 | | | | | | | | | | | | |
| (Callable 07/01/2025) | | | 2,000,000 | | | | 1,301,226 | | | | | |
| 4.000%, 07/01/2034 | | | | | | | | | | | | |
| (Callable 07/01/2027) | | | 1,000,000 | | | | 1,042,903 | | | | | |
| 0.000%, 07/01/2039 | | | | | | | | | | | | |
| (Callable 07/01/2025) | | | 75,000 | | | | 38,398 | | | | | |
| San Joaquin Hills Transportation | | | | | | | | | | | | |
| Corridor Agency: | | | | | | | | | | | | |
| 0.000%, 01/01/2027 (ETM) | | | 1,380,000 | | | | 1,249,123 | | | | | |
| 0.000%, 01/01/2028 (ETM) | | | 1,010,000 | | | | 889,062 | | | | | |
| San Marcos Unified School District, | | | | | | | | | | | | |
| 0.000%, 08/01/2036 | | | | | | | | | | | | |
| (Pre-refunded to 02/01/2024) | | | 55,000 | | | | 28,311 | | | | | |
| San Mateo Union High School District: | | | | | | | | | | | | |
| 0.000%, 09/01/2041 | | | | | | | | | | | | |
(Callable 09/01/2036)(5) | | | 1,050,000 | | | | 1,013,670 | | | | | |
| 5.000%, 12/15/2043 (Pre-refunded to | | | | | | | | | | | | |
12/15/2024) (Insured by AMBAC)(5) | | | 1,635,000 | | | | 1,679,969 | | | | | |
| Solano County Community College District: | | | | | | | | | | | | |
0.000%, 08/01/2024(5) | | | 180,000 | | | | 182,972 | | | | | |
| 0.000%, 08/01/2028 | | | | | | | | | | | | |
(Callable 08/01/2025)(5) | | | 250,000 | | | | 253,898 | | | | | |
| St. Helena Unified School District: | | | | | | | | | | | | |
0.000%, 08/01/2028(5) | | | 130,000 | | | | 135,539 | | | | | |
| 0.000%, 08/01/2037 (Callable 08/01/2023) | | | 25,000 | | | | 12,745 | | | | | |
| State of California, | | | | | | | | | | | | |
| 5.000%, 04/01/2042 (Callable 10/01/2027) | | | 2,250,000 | | | | 2,404,878 | | | | | |
| Sutter Union High School District: | | | | | | | | | | | | |
| 0.000%, 08/01/2030 | | | | | | | | | | | | |
| (Pre-refunded to 08/01/2025) | | | 185,000 | | | | 123,720 | | | | | |
| 0.000%, 08/01/2036 | | | | | | | | | | | | |
| (Pre-refunded to 08/01/2025) | | | 75,000 | | | | 32,432 | | | | | |
| 0.000%, 08/01/2037 | | | | | | | | | | | | |
| (Pre-refunded to 08/01/2025) | | | 50,000 | | | | 20,131 | | | | | |
| 0.000%, 08/01/2041 | | | | | | | | | | | | |
| (Pre-refunded to 08/01/2025) | | | 50,000 | | | | 15,077 | | | | | |
| 0.000%, 08/01/2043 | | | | | | | | | | | | |
| (Pre-refunded to 08/01/2025) | | | 200,000 | | | | 51,980 | | | | | |
| 0.000%, 08/01/2044 | | | | | | | | | | | | |
| (Pre-refunded to 08/01/2025) | | | 1,065,000 | | | | 256,820 | | | | | |
| 0.000%, 06/01/2050 | | | | | | | | | | | | |
| (Pre-refunded to 08/01/2025) | | | 700,000 | | | | 107,881 | | | | | |
| Woodlake Union High School District, | | | | | | | | | | | | |
| 0.000%, 08/01/2033 (Insured by AGM) | | | 1,000,000 | | | | 633,419 | | | | | |
| Total California | | | | | | | | | | | | |
| (Cost $66,751,725) | | | | | | | 64,986,037 | | | | 6.0 | % |
| Colorado | | | | | | | | | | | | |
| Boulder Valley School District No. Re-2, | | | | | | | | | | | | |
| 5.000%, 12/01/2038 (Callable | | | | | | | | | | | | |
| 06/01/2025) (Insured by ST AID) | | | 1,225,000 | | | | 1,255,898 | | | | | |
| Brush School District No. RE-2J: | | | | | | | | | | | | |
| 5.000%, 12/01/2031 | | | | | | | | | | | | |
| (Callable 12/01/2027) (Insured by BAM) | | | 380,000 | | | | 409,373 | | | | | |
| 5.000%, 12/01/2032 | | | | | | | | | | | | |
| (Callable 12/01/2027) (Insured by BAM) | | | 395,000 | | | | 424,522 | | | | | |
| 5.000%, 12/01/2035 | | | | | | | | | | | | |
| (Callable 12/01/2027) (Insured by BAM) | | | 460,000 | | | | 493,011 | | | | | |
| City of Fort Lupton CO, | | | | | | | | | | | | |
| 4.000%, 12/01/2042 | | | | | | | | | | | | |
| (Callable 12/01/2027) (Insured by AGM) | | | 850,000 | | | | 851,638 | | | | | |
| Colorado Health Facilities Authority: | | | | | | | | | | | | |
| 0.000%, 07/15/2024 (ETM) | | | 1,975,000 | | | | 1,909,968 | | | | | |
| 5.000%, 06/01/2047 | | | | | | | | | | | | |
| (Pre-refunded to 06/01/2027) | | | 5,800,000 | | | | 6,259,267 | | | | | |
| 2.750%, 05/15/2061 | | | | | | | | | | | | |
| (SIFMA Municipal Swap Index + 0.550%) | | | | | | | | | | | | |
| (Callable 02/17/2026) | | | | | | | | | | | | |
(Mandatory Tender Date 08/17/2026)(2) | | | 10,000,000 | | | | 9,906,424 | | | | | |
The accompanying notes are an integral part of these financial statements.
Baird Quality Intermediate Municipal Bond Fund
Schedule of Investments, June 30, 2023 (Unaudited)
Long-Term Investments (cont.)
| | | Principal | | | | | | % of | |
| | | Amount | | | Value | | | Net Assets | |
| Mesa County Valley School District No. 51, | | | | | | | | | |
| 5.500%, 12/01/2037(Callable | | | | | | | | | |
| 12/01/2027) (Insured by ST AID) | | $ | 1,000,000 | | | $ | 1,087,851 | | | | |
| University of Colorado, | | | | | | | | | | | |
| 5.000%, 06/01/2044 | | | | | | | | | | | |
| (Callable 06/01/2029) | | | 285,000 | | | | 305,469 | | | | |
| Wiggins School District No. RE-50J, | | | | | | | | | | | |
| 4.000%, 12/01/2039 | | | | | | | | | | | |
| (Callable 12/01/2031) (Insured by BAM) | | | 500,000 | | | | 509,378 | | | | |
| Total Colorado | | | | | | | | | | | |
| (Cost $23,938,454) | | | | | | | 23,412,799 | | | | 2.1 | % |
| Connecticut | | | | | | | | | | | | |
| City of Norwalk CT: | | | | | | | | | | | | |
| 5.000%, 08/15/2035 | | | | | | | | | | | | |
| (Callable 08/15/2030) | | | 3,465,000 | | | | 3,966,490 | | | | | |
| 5.000%, 08/15/2036 | | | | | | | | | | | | |
| (Callable 08/15/2030) | | | 2,555,000 | | | | 2,902,223 | | | | | |
| Connecticut Housing Finance Authority: | | | | | | | | | | | | |
| 2.875%, 11/15/2030 | | | | | | | | | | | | |
| (Callable 05/15/2025) | | | 1,325,000 | | | | 1,254,696 | | | | | |
| 4.000%, 11/15/2045 | | | | | | | | | | | | |
| (Callable 05/15/2028) | | | 3,925,000 | | | | 3,892,728 | | | | | |
| 4.000%, 11/15/2047 | | | | | | | | | | | | |
| (Callable 11/15/2026) | | | 610,000 | | | | 605,690 | | | | | |
| 4.000%, 05/15/2049 | | | | | | | | | | | | |
| (Callable 11/15/2028) | | | 1,625,000 | | | | 1,613,958 | | | | | |
| Connecticut State Health & | | | | | | | | | | | | |
| Educational Facilities Authority: | | | | | | | | | | | | |
| 5.250%, 03/01/2032 | | | | | | | | | | | | |
| (ETM) (Insured by AGM) | | | 100,000 | | | | 113,715 | | | | | |
| 3.200%, 07/01/2037 (Mandatory Tender | | | | | | | | | | | | |
Date 07/01/2026)(1)(6) | | | 2,000,000 | | | | 2,001,450 | | | | | |
| 2.800%, 07/01/2057 (Mandatory Tender | | | | | | | | | | | | |
Date 02/03/2026)(1) | | | 6,000,000 | | | | 5,880,137 | | | | | |
| State of Connecticut, | | | | | | | | | | | | |
| 5.000%, 11/15/2036 | | | | | | | | | | | | |
| (Callable 11/15/2032) | | | 180,000 | | | | 206,731 | | | | | |
| University of Connecticut, | | | | | | | | | | | | |
| 5.000%, 01/15/2031 | | | | | | | | | | | | |
| (Callable 01/15/2027) (Insured by AGM) | | | 1,250,000 | | | | 1,336,806 | | | | | |
| Total Connecticut | | | | | | | | | | | | |
| (Cost $24,209,249) | | | | | | | 23,774,624 | | | | 2.2 | % |
| District of Columbia | | | | | | | | | | | | |
| District of Columbia Water | | | | | | | | | | | | |
| & Sewer Authority, | | | | | | | | | | | | |
| 2.210%, 10/01/2050 | | | | | | | | | | | | |
| (Callable 07/03/2023) | | | | | | | | | | | | |
(Optional Put Date 07/07/2023)(1) | | | 3,000,000 | | | | 3,000,000 | | | | | |
| Total District of Columbia | | | | | | | | | | | | |
| (Cost $3,000,000) | | | | | | | 3,000,000 | | | | 0.3 | % |
| Florida | | | | | | | | | | | | |
| Broward County Housing Finance Authority, | | | | | | | | | | | | |
| 3.500%, 04/01/2041(Callable 10/01/2025) | | | | | | | | | | | | |
| (Mandatory Tender Date 04/01/2026) | | | | | | | | | | | | |
(Insured by HUD)(1) | | | 1,000,000 | | | | 1,002,833 | | | | | |
| City of Fort Myers FL, | | | | | | | | | | | | |
| 4.000%, 12/01/2037 | | | | | | | | | | | | |
| (Callable 12/01/2025) | | | 480,000 | | | | 481,389 | | | | | |
| City of Melbourne FL, | | | | | | | | | | | | |
| 0.000%, 10/01/2026 | | | | | | | | | | | | |
| (ETM) (Insured by FGIC) | | | 40,000 | | | | 36,197 | | | | | |
| City of Miramar FL: | | | | | | | | | | | | |
| 5.000%, 10/01/2034 | | | | | | | | | | | | |
| (Callable 10/01/2027) | | | 1,000,000 | | | | 1,081,703 | | | | | |
| 5.000%, 10/01/2035 (Callable 10/01/2027) | | | 1,030,000 | | | | 1,114,305 | | | | | |
| City of Orlando FL, | | | | | | | | | | | | |
| 5.000%, 11/01/2034 | | | | | | | | | | | | |
| (Callable 11/01/2027) (Insured by AGM) | | | 1,000,000 | | | | 1,059,824 | | | | | |
| City of Tallahassee FL, | | | | | | | | | | | | |
| 5.000%, 10/01/2035 (Callable 10/01/2024) | | | 825,000 | | | | 839,947 | | | | | |
| County of Miami-Dade FL: | | | | | | | | | | | | |
| 0.000%, 10/01/2026 | | | | | | | | | | | | |
| (ETM) (Insured by NATL) | | | 50,000 | | | | 45,246 | | | | | |
| 0.000%, 10/01/2027 | | | | | | | | | | | | |
| (ETM) (Insured by NATL) | | | 330,000 | | | | 290,482 | | | | | |
| 5.250%, 10/01/2030 | | | | | | | | | | | | |
| (ETM) (Insured by NATL) | | | 4,610,000 | | | | 5,231,716 | | | | | |
| Florida Housing Finance Corp.: | | | | | | | | | | | | |
| 5.000%, 12/01/2026 (Mandatory Tender | | | | | | | | | | | | |
Date 12/01/2025) (Insured by HUD)(1) | | | 2,500,000 | | | | 2,565,793 | | | | | |
| 1.940%, 08/01/2036 (Insured by FNMA) | | | 5,000,000 | | | | 4,103,900 | | | | | |
| 4.200%, 01/01/2045 | | | | | | | | | | | | |
| (Callable 01/01/2028) (Insured by GNMA) | | | 2,195,000 | | | | 2,153,251 | | | | | |
| 3.500%, 07/01/2051 | | | | | | | | | | | | |
| (Callable 07/01/2029) (Insured by GNMA) | | | 875,000 | | | | 857,099 | | | | | |
| Highlands County Health Facilities Authority, | | | | | | | | | | | | |
| 2.200%, 11/15/2035 (Callable 07/03/2023) | | | | | | | | | | | | |
(Optional Put Date 07/07/2023)(1) | | | 1,000,000 | | | | 1,000,000 | | | | | |
| Leon County – City of Tallahassee | | | | | | | | | | | | |
| Blueprint Intergovernmental Agency, | | | | | | | | | | | | |
| 4.000%, 10/01/2038 | | | | | | | | | | | | |
| (Callable 10/01/2031) | | | 4,805,000 | | | | 4,849,905 | | | | | |
| Osceola County Expressway Authority: | | | | | | | | | | | | |
0.000%, 10/01/2028 (ETM)(5) | | | 150,000 | | | | 163,149 | | | | | |
0.000%, 10/01/2031 (ETM)(5) | | | 55,000 | | | | 65,092 | | | | | |
| Reedy Creek Improvement District, | | | | | | | | | | | | |
| 5.000%, 10/01/2031 | | | | | | | | | | | | |
| (Callable 10/01/2028) | | | 310,000 | | | | 344,822 | | | | | |
| RIB Floater Trust, | | | | | | | | | | | | |
| 2.550%, 10/01/2054 | | | | | | | | | | | | |
(Optional Put Date 07/07/2023)(1)(3) | | | 3,000,000 | | | | 3,000,000 | | | | | |
| Seminole County School Board, | | | | | | | | | | | | |
| 5.000%, 07/01/2035 | | | | | | | | | | | | |
| (Callable 07/01/2026) | | | 145,000 | | | | 150,449 | | | | | |
| Total Florida | | | | | | | | | | | | |
| (Cost $31,630,057) | | | | | | | 30,437,102 | | | | 2.8 | % |
| Georgia | | | | | | | | | | | | |
| Atlanta Development Authority: | | | | | | | | | | | | |
| 5.000%, 09/01/2023 (ETM) | | | 2,450,000 | | | | 2,456,361 | | | | | |
| 5.000%, 09/01/2024 | | | | | | | | | | | | |
| (Pre-refunded to 09/01/2023) | | | 910,000 | | | | 912,363 | | | | | |
| 5.000%, 09/01/2032 | | | | | | | | | | | | |
| (Pre-refunded to 09/01/2023) | | | 1,315,000 | | | | 1,318,414 | | | | | |
| City of Decatur GA, | | | | | | | | | | | | |
| 3.000%, 08/01/2038 (Callable | | | | | | | | | | | | |
| 08/01/2025) (Insured by ST AID) | | | 500,000 | | | | 439,801 | | | | | |
| Forsyth County Hospital Authority, | | | | | | | | | | | | |
| 6.375%, 10/01/2028 (ETM) | | | 5,820,000 | | | | 6,364,932 | | | | | |
| Gainesville & Hall County | | | | | | | | | | | | |
| Development Authority, | | | | | | | | | | | | |
| 2.050%, 11/15/2033 (Callable 07/01/2023) | | | | | | | | | | | | |
| (Optional Put Date 07/03/2023) | | | | | | | | | | | | |
(Insured by AGC)(1) | | | 4,500,000 | | | | 4,500,000 | | | | | |
| Georgia Housing & Finance Authority, | | | | | | | | | | | | |
| 3.500%, 12/01/2046 | | | | | | | | | | | | |
| (Callable 12/01/2025) | | | 265,000 | | | | 262,236 | | | | | |
The accompanying notes are an integral part of these financial statements.
Baird Quality Intermediate Municipal Bond Fund
Schedule of Investments, June 30, 2023 (Unaudited)
Long-Term Investments (cont.)
| | | Principal | | | | | | % of | |
| | | Amount | | | Value | | | Net Assets | |
| Houston Healthcare System, Inc., | | | | | | | | | |
| 5.000%, 10/01/2031 | | | | | | | | | |
(Pre-refunded to 04/01/2024)(5) | | $ | 23,000,000 | | | $ | 23,200,999 | | | | |
| Main Street Natural Gas, Inc.: | | | | | | | | | | | |
| 4.317%, 08/01/2048 | | | | | | | | | | | |
| (1 Month LIBOR USD + 0.830%) | | | | | | | | | | | |
| (Callable 09/01/2023) | | | | | | | | | | | |
(Mandatory Tender Date 12/01/2023)(2) | | | 1,400,000 | | | | 1,399,106 | | | | |
| 4.000%, 08/01/2049 (Callable 09/01/2024) | | | | | | | | | | | |
(Mandatory Tender Date 12/02/2024)(1) | | | 1,000,000 | | | | 1,002,867 | | | | |
| 4.000%, 07/01/2052 (Callable 06/01/2027) | | | | | | | | | | | |
(Mandatory Tender Date 09/01/2027)(1) | | | 1,615,000 | | | | 1,609,658 | | | | |
| 5.000%, 07/01/2053 (Callable 12/01/2029) | | | | | | | | | | | |
(Mandatory Tender Date 03/01/2030)(1) | | | 8,000,000 | | | | 8,358,390 | | | | |
| Total Georgia | | | | | | | | | | | |
| (Cost $52,297,197) | | | | | | | 51,825,127 | | | | 4.8 | % |
| Illinois | | | | | | | | | | | | |
| Boone & Winnebago Counties | | | | | | | | | | | | |
| Community Unit School District No. 200, | | | | | | | | | | | | |
| 0.000%, 01/01/2024 | | | | | | | | | | | | |
| (ETM) (Insured by AGM) | | | 815,000 | | | | 799,360 | | | | | |
| City of Chicago IL, | | | | | | | | | | | | |
| 5.000%, 01/01/2034 | | | | | | | | | | | | |
| (Pre-refunded to 01/01/2025) | | | 2,170,000 | | | | 2,225,300 | | | | | |
| City of Springfield IL, | | | | | | | | | | | | |
| 5.000%, 12/01/2031 (Callable 12/01/2025) | | | 500,000 | | | | 517,230 | | | | | |
| City of Woodstock IL, | | | | | | | | | | | | |
| 4.000%, 01/01/2037 (Callable 01/01/2031) | | | 675,000 | | | | 688,101 | | | | | |
| Community Unit School District No. 427, | | | | | | | | | | | | |
| 0.000%, 01/01/2026 | | | | | | | | | | | | |
| (ETM) (Insured by AGM) | | | 2,785,000 | | | | 2,563,296 | | | | | |
| Cook County School District No. 130, | | | | | | | | | | | | |
| 5.000%, 12/01/2026 | | | | | | | | | | | | |
| (Callable 12/01/2025) (Insured by AGM) | | | 1,140,000 | | | | 1,185,702 | | | | | |
| Cook County School District No. 144, | | | | | | | | | | | | |
| 4.500%, 12/01/2025 | | | | | | | | | | | | |
| (ETM) (Insured by AGM) | | | 5,000 | | | | 5,040 | | | | | |
| Cook County School District No. 159: | | | | | | | | | | | | |
| 0.000%, 12/01/2025 | | | | | | | | | | | | |
| (ETM) (Insured by AGM) | | | 230,000 | | | | 212,875 | | | | | |
| 0.000%, 12/01/2025 | | | | | | | | | | | | |
| (ETM) (Insured by FGIC) | | | 475,000 | | | | 439,632 | | | | | |
| 0.000%, 12/01/2026 | | | | | | | | | | | | |
| (ETM) (Insured by FGIC) | | | 275,000 | | | | 247,339 | | | | | |
| 0.000%, 12/01/2028 | | | | | | | | | | | | |
| (ETM) (Insured by FGIC) | | | 475,000 | | | | 404,460 | | | | | |
| Cook County School District No. 163, | | | | | | | | | | | | |
| 5.000%, 12/15/2028 (Insured by BAM) | | | 1,305,000 | | | | 1,439,053 | | | | | |
| Cook County School District No. 23, | | | | | | | | | | | | |
| 4.000%, 12/15/2023 | | | 160,000 | | | | 160,145 | | | | | |
| County of Cook IL, | | | | | | | | | | | | |
| 5.000%, 11/15/2033 (Callable 11/15/2027) | | | 3,000,000 | | | | 3,206,285 | | | | | |
| DuPage County Community | | | | | | | | | | | | |
| High School District No. 100, | | | | | | | | | | | | |
| 5.000%, 07/15/2037 | | | | | | | | | | | | |
(Callable 07/15/2032)(6) | | | 575,000 | | | | 636,032 | | | | | |
| Hoffman Estates Park District, | | | | | | | | | | | | |
| 5.000%, 12/01/2040 | | | | | | | | | | | | |
| (Callable 12/01/2030) (Insured by BAM) | | | 1,415,000 | | | | 1,521,081 | | | | | |
| Illinois Development Finance Authority: | | | | | | | | | | | | |
| 0.000%, 07/15/2023 (ETM) | | | 600,000 | | | | 599,418 | | | | | |
| 0.000%, 07/15/2025 (ETM) | | | 84,115,000 | | | | 78,398,738 | | | | | |
| 2.450%, 11/15/2039 | | | | | | | | | | | | |
(Mandatory Tender Date 03/03/2026)(1) | | | 2,230,000 | | | | 2,168,930 | | | | | |
| Illinois Finance Authority: | | | | | | | | | | | | |
| 5.000%, 07/01/2031 | | | | | | | | | | | | |
| (Callable 01/01/2026) | | | 1,200,000 | | | | 1,252,713 | | | | | |
| 5.250%, 08/15/2031 | | | | | | | | | | | | |
| (Pre-refunded to 08/15/2026) | | | 1,830,000 | | | | 1,945,763 | | | | | |
| 5.000%, 08/01/2033 | | | | | | | | | | | | |
| (Pre-refunded to 08/01/2024) | | | 700,000 | | | | 711,980 | | | | | |
| 4.000%, 01/01/2034 (Callable 01/01/2026) | | | 1,030,000 | | | | 1,053,543 | | | | | |
| 5.000%, 02/15/2036 (Callable 02/15/2027) | | | 215,000 | | | | 225,475 | | | | | |
| 4.000%, 12/01/2036 (Callable 12/01/2028) | | | 1,000,000 | | | | 1,025,882 | | | | | |
| 6.000%, 07/01/2043 (Callable 07/01/2023) | | | 1,745,000 | | | | 1,745,000 | | | | | |
| 4.000%, 05/01/2044 (Callable 05/01/2025) | | | 135,000 | | | | 136,984 | | | | | |
| Illinois Housing Development Authority: | | | | | | | | | | | | |
| 2.550%, 04/01/2025 (Insured by GNMA) | | | 590,000 | | | | 581,381 | | | | | |
| 4.000%, 06/01/2026 (Mandatory Tender | | | | | | | | | | | | |
Date 06/01/2025) (Insured by FHA)(1) | | | 1,300,000 | | | | 1,301,701 | | | | | |
| 3.100%, 02/01/2035 (Callable 02/01/2026) | | | 875,000 | | | | 838,086 | | | | | |
| 2.200%, 04/01/2045 (Callable 07/03/2023) | | | | | | | | | | | | |
| (Optional Put Date 07/07/2023) | | | | | | | | | | | | |
(Insured by GNMA)(1) | | | 3,000,000 | | | | 3,000,000 | | | | | |
| 3.500%, 08/01/2046 (Callable 02/01/2026) | | | 725,000 | | | | 714,298 | | | | | |
| 4.000%, 08/01/2048 | | | | | | | | | | | | |
| (Callable 08/01/2027) (Insured by GNMA) | | | 445,000 | | | | 441,344 | | | | | |
| Illinois Municipal Electric Agency, | | | | | | | | | | | | |
| 4.000%, 02/01/2034 (Callable 08/01/2025) | | | 160,000 | | | | 160,779 | | | | | |
| Kane McHenry Cook & De Kalb | | | | | | | | | | | | |
| Counties Unit School District No. 300, | | | | | | | | | | | | |
| 5.000%, 01/01/2032 (Callable 01/01/2027) | | | 2,085,000 | | | | 2,199,449 | | | | | |
| Kankakee & Will Counties Community | | | | | | | | | | | | |
| Unit School District No. 5, | | | | | | | | | | | | |
| 4.000%, 05/01/2025 (Callable 05/01/2024) | | | 700,000 | | | | 699,338 | | | | | |
| Knox & Warren Counties Community | | | | | | | | | | | | |
| Unit School District No. 205: | | | | | | | | | | | | |
| 4.000%, 12/01/2034 | | | | | | | | | | | | |
| (Callable 12/01/2027) (Insured by BAM) | | | 425,000 | | | | 435,182 | | | | | |
| 4.000%, 12/01/2039 | | | | | | | | | | | | |
| (Callable 12/01/2027) (Insured by BAM) | | | 1,305,000 | | | | 1,299,129 | | | | | |
| McHenry County Community | | | | | | | | | | | | |
| Consolidated School District No. 47, | | | | | | | | | | | | |
| 4.000%, 02/01/2032 (Callable 02/01/2028) | | | 850,000 | | | | 893,398 | | | | | |
| Metropolitan Water Reclamation | | | | | | | | | | | | |
| District of Greater Chicago, | | | | | | | | | | | | |
| 5.000%, 12/01/2034 (Callable 12/01/2026) | | | 295,000 | | | | 309,398 | | | | | |
| Regional Transportation Authority, | | | | | | | | | | | | |
| 6.000%, 07/01/2027 (Insured by AGM) | | | 1,000,000 | | | | 1,119,890 | | | | | |
| State of Illinois, | | | | | | | | | | | | |
| 4.000%, 06/15/2038 | | | | | | | | | | | | |
| (Callable 06/15/2028) (Insured by BAM) | | | 1,850,000 | | | | 1,832,256 | | | | | |
| Village of Manhattan IL, | | | | | | | | | | | | |
| 4.000%, 01/01/2030 | | | | | | | | | | | | |
| (Callable 01/01/2027) | | | 250,000 | | | | 253,216 | | | | | |
| Village of Schaumburg IL, | | | | | | | | | | | | |
| 4.000%, 12/01/2028 | | | 470,000 | | | | 496,740 | | | | | |
| Will County Community | | | | | | | | | | | | |
| High School District No. 210: | | | | | | | | | | | | |
| 0.000%, 01/01/2024 | | | | | | | | | | | | |
| (ETM) (Insured by AGM) | | | 1,355,000 | | | | 1,332,832 | | | | | |
| 0.000%, 01/01/2025 | | | | | | | | | | | | |
| (ETM) (Insured by AGM) | | | 350,000 | | | | 333,192 | | | | | |
| Will County Community | | | | | | | | | | | | |
| Unit School District No. 201-U, | | | | | | | | | | | | |
| 0.000%, 11/01/2024 | | | | | | | | | | | | |
| (ETM) (Insured by NATL) | | | 1,410,000 | | | | 1,347,416 | | | | | |
The accompanying notes are an integral part of these financial statements.
Baird Quality Intermediate Municipal Bond Fund
Schedule of Investments, June 30, 2023 (Unaudited)
Long-Term Investments (cont.)
| | | Principal | | | | | | % of | |
| | | Amount | | | Value | | | Net Assets | |
| Will County Elementary | | | | | | | | | |
| School District No. 122, | | | | | | | | | |
| 0.000%, 10/01/2027 | | | | | | | | | |
| (ETM) (Insured by AGM) | | $ | 470,000 | | | $ | 413,716 | | | | |
| Total Illinois | | | | | | | | | | | |
| (Cost $126,974,276) | | | | | | | 125,518,098 | | | | 11.5 | % |
| Indiana | | | | | | | | | | | | |
| City of Evansville IN, | | | | | | | | | | | | |
| 5.000%, 02/01/2029 | | | | | | | | | | | | |
| (Callable 02/01/2026) (Insured by BAM) | | | 735,000 | | | | 760,059 | | | | | |
| City of Indianapolis IN, | | | | | | | | | | | | |
| 3.000%, 05/01/2027 (Mandatory Tender | | | | | | | | | | | | |
Date 11/01/2024) (Insured by HUD)(1) | | | 325,000 | | | | 323,310 | | | | | |
| Fishers Town Hall Building Corp., | | | | | | | | | | | | |
| 5.500%, 07/15/2040 | | | | | | | | | | | | |
| (Callable 07/15/2032) | | | 1,000,000 | | | | 1,138,114 | | | | | |
| Hammond Multi-School Building Corp., | | | | | | | | | | | | |
| 5.000%, 07/15/2033 (Callable | | | | | | | | | | | | |
| 01/15/2028) (Insured by ST AID) | | | 820,000 | | | | 872,938 | | | | | |
| Indiana Housing & Community | | | | | | | | | | | | |
| Development Authority, | | | | | | | | | | | | |
| 5.750%, 07/01/2053 | | | | | | | | | | | | |
| (Callable 07/01/2032) (Insured by GNMA) | | | 850,000 | | | | 904,995 | | | | | |
| Indianapolis Local Public | | | | | | | | | | | | |
| Improvement Bond Bank, | | | | | | | | | | | | |
| 5.000%, 01/01/2033 | | | | | | | | | | | | |
| (Pre-refunded to 01/01/2025) | | | 1,780,000 | | | | 1,830,595 | | | | | |
| Kankakee Valley Middle | | | | | | | | | | | | |
| School Building Corp.: | | | | | | | | | | | | |
| 5.000%, 01/15/2029 (Insured by ST AID) | | | 475,000 | | | | 526,144 | | | | | |
| 5.000%, 07/15/2029 (Insured by ST AID) | | | 1,180,000 | | | | 1,319,501 | | | | | |
| Kokomo-Center School Building Corp., | | | | | | | | | | | | |
| 5.000%, 01/15/2037 | | | | | | | | | | | | |
| (Callable 07/15/2027) (Insured by ST AID) | | | 500,000 | | | | 534,418 | | | | | |
| Lake Ridge Multi-School Building Corp., | | | | | | | | | | | | |
| 5.500%, 01/15/2042 | | | | | | | | | | | | |
| (Callable 07/15/2032) (Insured by ST AID) | | | 2,000,000 | | | | 2,256,556 | | | | | |
| Northern Wells Multi-School Building Corp., | | | | | | | | | | | | |
| 4.000%, 07/15/2035 | | | | | | | | | | | | |
| (Callable 07/15/2027) (Insured by ST AID) | | | 160,000 | | | | 163,798 | | | | | |
| Northwestern School Building Corp., | | | | | | | | | | | | |
| 6.000%, 07/15/2040 | | | | | | | | | | | | |
| (Callable 07/15/2031) (Insured by ST AID) | | | 700,000 | | | | 806,873 | | | | | |
| Perry Central Multi-School Building Corp., | | | | | | | | | | | | |
| 5.000%, 07/15/2038 | | | | | | | | | | | | |
| (Callable 07/15/2033) (Insured by ST AID) | | | 375,000 | | | | 419,656 | | | | | |
| Purdue University, | | | | | | | | | | | | |
| 5.000%, 07/01/2031 | | | | | | | | | | | | |
| (Callable 07/01/2026) | | | 1,415,000 | | | | 1,494,042 | | | | | |
| Total Indiana | | | | | | | | | | | | |
| (Cost $13,395,991) | | | | | | | 13,350,999 | | | | 1.2 | % |
| Iowa | | | | | | | | | | | | |
| Clinton Community School District, | | | | | | | | | | | | |
| 4.375%, 07/01/2036 | | | | | | | | | | | | |
| (Callable 07/01/2028) (Insured by AGM) | | | 2,100,000 | | | | 2,173,035 | | | | | |
| Iowa Finance Authority: | | | | | | | | | | | | |
| 5.000%, 08/01/2035 | | | | | | | | | | | | |
| (Pre-refunded to 08/01/2025) | | | 950,000 | | | | 988,085 | | | | | |
| 4.000%, 07/01/2047 | | | | | | | | | | | | |
| (Callable 07/01/2027) (Insured by GNMA) | | | 400,000 | | | | 397,059 | | | | | |
| 4.000%, 07/01/2047 | | | | | | | | | | | | |
| (Callable 07/01/2028) (Insured by GNMA) | | | 1,060,000 | | | | 1,052,628 | | | | | |
| 5.500%, 07/01/2053 (Callable | | | | | | | | | | | | |
| 01/01/2033) (Insured by GNMA) | | | 3,000,000 | | | | 3,194,088 | | | | | |
| Total Iowa | | | | | | | | | | | | |
| (Cost $7,858,707) | | | | | | | 7,804,895 | | | | 0.7 | % |
| Kansas | | | | | | | | | | | | |
| Crawford County Unified | | | | | | | | | | | | |
| School District No. 250: | | | | | | | | | | | | |
| 5.000%, 09/01/2035 (Pre-refunded to | | | | | | | | | | | | |
| 09/01/2027) (Insured by BAM) | | | 60,000 | | | | 65,219 | | | | | |
| 5.000%, 09/01/2035 | | | | | | | | | | | | |
| (Callable 09/01/2027) (Insured by BAM) | | | 385,000 | | | | 420,038 | | | | | |
| Johnson County Unified | | | | | | | | | | | | |
| School District No. 512, | | | | | | | | | | | | |
| 4.000%, 10/01/2035 | | | | | | | | | | | | |
| (Pre-refunded to 10/01/2025) | | | 300,000 | | | | 306,334 | | | | | |
| Total Kansas | | | | | | | | | | | | |
| (Cost $810,822) | | | | | | | 791,591 | | | | 0.1 | % |
| Kentucky | | | | | | | | | | | | |
| City of Versailles KY, | | | | | | | | | | | | |
| 3.000%, 08/15/2026 (Callable 08/15/2024) | | | 2,000,000 | | | | 1,943,844 | | | | | |
| Kentucky Bond Development Corp., | | | | | | | | | | | | |
| 3.000%, 05/01/2034 (Callable 05/01/2026) | | | 695,000 | | | | 682,385 | | | | | |
| Total Kentucky | | | | | | | | | | | | |
| (Cost $2,743,125) | | | | | | | 2,626,229 | | | | 0.2 | % |
| Louisiana | | | | | | | | | | | | |
| Louisiana Public Facilities Authority: | | | | | | | | | | | | |
| 5.500%, 05/15/2027 | | | | | | | | | | | | |
| (Pre-refunded to 05/15/2026) | | | 26,700,000 | | | | 27,920,259 | | | | | |
| 5.500%, 05/15/2032 | | | | | | | | | | | | |
| (Pre-refunded to 05/15/2026) | | | 22,190,000 | | | | 23,677,753 | | | | | |
| Webster Parish School District No. 6, | | | | | | | | | | | | |
| 4.000%, 03/01/2031 | | | | | | | | | | | | |
| (Callable 03/01/2029) (Insured by AGM) | | | 840,000 | | | | 875,036 | | | | | |
| Total Louisiana | | | | | | | | | | | | |
| (Cost $52,987,075) | | | | | | | 52,473,048 | | | | 4.8 | % |
| Maryland | | | | | | | | | | | | |
| City of Baltimore MD: | | | | | | | | | | | | |
| 5.000%, 07/01/2024 | | | | | | | | | | | | |
| (ETM) (Insured by FGIC) | | | 790,000 | | | | 794,126 | | | | | |
| 5.000%, 07/01/2028 | | | | | | | | | | | | |
| (ETM) (Insured by FGIC) | | | 230,000 | | | | 239,176 | | | | | |
| Maryland Community | | | | | | | | | | | | |
| Development Administration: | | | | | | | | | | | | |
| 3.250%, 08/01/2024 (Insured by GNMA) | | | 7,000,000 | | | | 6,864,430 | | | | | |
| 3.850%, 03/01/2025 | | | 2,445,000 | | | | 2,414,357 | | | | | |
| Maryland Health & Higher | | | | | | | | | | | | |
| Educational Facilities Authority, | | | | | | | | | | | | |
| 5.000%, 07/01/2027 | | | | | | | | | | | | |
| (ETM) (Insured by AMBAC) | | | 1,410,000 | | | | 1,460,947 | | | | | |
| Total Maryland | | | | | | | | | | | | |
| (Cost $12,006,955) | | | | | | | 11,773,036 | | | | 1.1 | % |
| Massachusetts | | | | | | | | | | | | |
| Massachusetts Bay Transportation Authority, | | | | | | | | | | | | |
| 0.000%, 07/01/2030 | | | | | | | | | | | | |
| (Callable 07/01/2026) | | | 1,400,000 | | | | 1,086,793 | | | | | |
| Massachusetts Development Finance Agency, | | | | | | | | | | | | |
| 6.500%, 11/15/2043 | | | | | | | | | | | | |
(Pre-refunded to 11/15/2023)(3) | | | 240,000 | | | | 242,547 | | | | | |
| Massachusetts Housing Finance Agency: | | | | | | | | | | | | |
| 0.875%, 12/01/2023 | | | | | | | | | | | | |
| (Callable 07/21/2023) (Insured by FHA) | | | 610,000 | | | | 604,033 | | | | | |
The accompanying notes are an integral part of these financial statements.
Baird Quality Intermediate Municipal Bond Fund
Schedule of Investments, June 30, 2023 (Unaudited)
Long-Term Investments (cont.)
| | | Principal | | | | | | % of | |
| | | Amount | | | Value | | | Net Assets | |
| Massachusetts Housing | | | | | | | | | |
| Finance Agency: (cont.) | | | | | | | | | |
| 4.000%, 12/01/2044 | | | | | | | | | |
| (Callable 06/01/2025) | | $ | 255,000 | | | $ | 254,081 | | | | |
| 4.000%, 12/01/2048 | | | | | | | | | | | |
| (Callable 06/01/2027) (Insured by GNMA) | | | 705,000 | | | | 699,375 | | | | |
| 4.000%, 06/01/2049 | | | | | | | | | | | |
| (Callable 12/01/2028) | | | 380,000 | | | | 376,879 | | | | |
| 3.000%, 12/01/2050 | | | | | | | | | | | |
| (Callable 12/01/2029) | | | 125,000 | | | | 120,627 | | | | |
| Massachusetts State College Building Authority: | | | | | | | | | | | |
| 0.000%, 05/01/2027 | | | | | | | | | | | |
| (ETM) (Insured by NATL) | | | 455,000 | | | | 402,651 | | | | |
| 0.000%, 05/01/2028 | | | | | | | | | | | |
| (ETM) (Insured by NATL) | | | 5,790,000 | | | | 4,983,635 | | | | |
| Total Massachusetts | | | | | | | | | | | |
| (Cost $9,395,024) | | | | | | | 8,770,621 | | | | 0.8 | % |
| Michigan | | | | | | | | | | | | |
| Algonac Community Schools, | | | | | | | | | | | | |
| 4.000%, 05/01/2029 | | | | | | | | | | | | |
| (Callable 05/01/2027) (Insured by Q-SBLF) | | | 370,000 | | | | 382,962 | | | | | |
| Clarkston Community Schools: | | | | | | | | | | | | |
| 5.000%, 05/01/2032 (Pre-refunded to | | | | | | | | | | | | |
| 05/01/2026) (Insured by Q-SBLF) | | | 445,000 | | | | 470,326 | | | | | |
| 5.000%, 05/01/2037 (Pre-refunded to | | | | | | | | | | | | |
| 05/01/2026) (Insured by Q-SBLF) | | | 100,000 | | | | 105,691 | | | | | |
| Ecorse Public School District, | | | | | | | | | | | | |
| 5.000%, 05/01/2027 (Insured by Q-SBLF) | | | 515,000 | | | | 552,423 | | | | | |
| Fraser Public School District, | | | | | | | | | | | | |
| 5.000%, 05/01/2024 (Insured by Q-SBLF) | | | 1,000,000 | | | | 1,014,866 | | | | | |
| Michigan Finance Authority, | | | | | | | | | | | | |
| 6.750%, 07/01/2044 | | | | | | | | | | | | |
(Pre-refunded to 07/01/2024)(3) | | | 6,700,000 | | | | 6,893,677 | | | | | |
| Michigan State Housing | | | | | | | | | | | | |
| Development Authority: | | | | | | | | | | | | |
| 2.700%, 12/01/2034 | | | | | | | | | | | | |
| (Callable 12/01/2028) | | | 4,700,000 | | | | 4,146,327 | | | | | |
| 3.250%, 10/01/2037 | | | | | | | | | | | | |
| (Callable 10/01/2025) | | | 755,000 | | | | 671,774 | | | | | |
| 4.250%, 12/01/2049 | | | | | | | | | | | | |
| (Callable 06/01/2028) | | | 2,520,000 | | | | 2,514,878 | | | | | |
| 5.000%, 06/01/2053 | | | | | | | | | | | | |
| (Callable 12/01/2031) | | | 945,000 | | | | 976,415 | | | | | |
| 5.500%, 06/01/2053 | | | | | | | | | | | | |
| (Callable 12/01/2031) | | | 1,980,000 | | | | 2,087,896 | | | | | |
| Utica Community Schools, | | | | | | | | | | | | |
| 5.000%, 05/01/2034 (Callable | | | | | | | | | | | | |
| 05/01/2029) (Insured by Q-SBLF) | | | 305,000 | | | | 340,542 | | | | | |
| Warren Consolidated Schools: | | | | | | | | | | | | |
| 5.000%, 05/01/2033 (Callable | | | | | | | | | | | | |
| 05/01/2026) (Insured by Q-SBLF) | | | 2,595,000 | | | | 2,698,315 | | | | | |
| 5.000%, 05/01/2033 (Callable | | | | | | | | | | | | |
| 05/01/2026) (Insured by Q-SBLF) | | | 4,660,000 | | | | 4,845,529 | | | | | |
| 5.000%, 05/01/2035 (Callable | | | | | | | | | | | | |
| 05/01/2026) (Insured by Q-SBLF) | | | 950,000 | | | | 983,167 | | | | | |
| Total Michigan | | | | | | | | | | | | |
| (Cost $29,537,919) | | | | | | | 28,684,788 | | | | 2.6 | % |
| Minnesota | | | | | | | | | | | | |
| County of Hennepin MN, | | | | | | | | | | | | |
| 5.000%, 12/01/2030 | | | | | | | | | | | | |
| (Callable 12/01/2026) | | | 1,000,000 | | | | 1,060,027 | | | | | |
| County of Washington MN, | | | | | | | | | | | | |
| 2.125%, 02/01/2033 | | | 1,495,000 | | | | 1,306,505 | | | | | |
| Housing & Redevelopment Authority | | | | | | | | | | | | |
| of the City of St. Paul MN: | | | | | | | | | | | | |
| 4.500%, 07/01/2028 | | | | | | | | | | | | |
| (Pre-refunded to 07/01/2026) | | | 375,000 | | | | 381,131 | | | | | |
| 5.000%, 07/01/2036 | | | | | | | | | | | | |
| (Pre-refunded to 07/01/2026) | | | 1,315,000 | | | | 1,383,455 | | | | | |
| Minnesota Housing Finance Agency: | | | | | | | | | | | | |
| 4.000%, 07/01/2047 | | | | | | | | | | | | |
| (Callable 01/01/2027) (Insured by GNMA) | | | 150,000 | | | | 149,256 | | | | | |
| 4.250%, 07/01/2049 | | | | | | | | | | | | |
| (Callable 07/01/2028) (Insured by GNMA) | | | 845,000 | | | | 842,986 | | | | | |
| Pipestone-Jasper Independent | | | | | | | | | | | | |
| School District No. 2689, | | | | | | | | | | | | |
| 4.000%, 02/01/2032 (Callable 02/01/2029) | | | | | | | | | | | | |
| (Insured by SD CRED PROG) | | | 580,000 | | | | 618,691 | | | | | |
| University of Minnesota, | | | | | | | | | | | | |
| 4.000%, 02/01/2031 (Callable 07/31/2023) | | | 200,000 | | | | 200,094 | | | | | |
| Total Minnesota | | | | | | | | | | | | |
| (Cost $6,055,771) | | | | | | | 5,942,145 | | | | 0.5 | % |
| Mississippi | | | | | | | | | | | | |
| Mississippi Development Bank, | | | | | | | | | | | | |
| 5.250%, 03/01/2035 | | | | | | | | | | | | |
| (Callable 03/01/2028) | | | 495,000 | | | | 517,650 | | | | | |
| Mississippi Home Corp., | | | | | | | | | | | | |
| 4.400%, 12/01/2043 (Callable | | | | | | | | | | | | |
| 12/01/2031) (Insured by GNMA) | | | 2,250,000 | | | | 2,254,584 | | | | | |
| Oxford School District, | | | | | | | | | | | | |
| 4.000%, 05/01/2027 | | | 500,000 | | | | 518,397 | | | | | |
| West Rankin Utility Authority: | | | | | | | | | | | | |
| 5.000%, 01/01/2038 (Pre-refunded to | | | | | | | | | | | | |
| 01/01/2025) (Insured by AGM) | | | 550,000 | | | | 564,420 | | | | | |
| 5.000%, 01/01/2043 (Pre-refunded to | | | | | | | | | | | | |
| 01/01/2028) (Insured by AGM) | | | 5,500,000 | | | | 5,997,004 | | | | | |
| Total Mississippi | | | | | | | | | | | | |
| (Cost $10,399,516) | | | | | | | 9,852,055 | | | | 0.9 | % |
| Missouri | | | | | | | | | | | | |
| Jackson County School District No. R-IV, | | | | | | | | | | | | |
| 5.500%, 03/01/2037 (Callable | | | | | | | | | | | | |
| 03/01/2029) (Insured by ST AID) | | | 1,040,000 | | | | 1,164,972 | | | | | |
| Metropolitan St. Louis Sewer District: | | | | | | | | | | | | |
| 5.000%, 05/01/2036 | | | | | | | | | | | | |
| (Callable 05/01/2025) | | | 1,275,000 | | | | 1,312,702 | | | | | |
| 5.000%, 05/01/2045 | | | | | | | | | | | | |
| (Callable 05/01/2025) | | | 2,335,000 | | | | 2,404,047 | | | | | |
| Missouri Housing Development Commission: | | | | | | | | | | | | |
| 1.950%, 05/01/2025 (Insured by GNMA) | | | 45,000 | | | | 43,599 | | | | | |
| 3.950%, 11/01/2040 | | | | | | | | | | | | |
| (Callable 05/01/2025) (Insured by GNMA) | | | 250,000 | | | | 247,132 | | | | | |
| Normandy Schools Collaborative: | | | | | | | | | | | | |
| 3.000%, 03/01/2038 | | | | | | | | | | | | |
| (Callable 03/01/2028) (Insured by ST AID) | | | 1,950,000 | | | | 1,751,010 | | | | | |
| 3.000%, 03/01/2039 | | | | | | | | | | | | |
| (Callable 03/01/2028) (Insured by ST AID) | | | 2,000,000 | | | | 1,768,784 | | | | | |
| St. Louis County School District, | | | | | | | | | | | | |
| 4.000%, 03/01/2031 | | | | | | | | | | | | |
| (Callable 03/01/2025) | | | 1,480,000 | | | | 1,505,523 | | | | | |
| St. Louis County Special School District, | | | | | | | | | | | | |
| 4.000%, 04/01/2034 | | | | | | | | | | | | |
| (Callable 04/01/2029) | | | 400,000 | | | | 416,703 | | | | | |
| Total Missouri | | | | | | | | | | | | |
| (Cost $11,349,229) | | | | | | | 10,614,472 | | | | 1.0 | % |
The accompanying notes are an integral part of these financial statements.
Baird Quality Intermediate Municipal Bond Fund
Schedule of Investments, June 30, 2023 (Unaudited)
Long-Term Investments (cont.)
| | | Principal | | | | | | % of | |
| | | Amount | | | Value | | | Net Assets | |
| Montana | | | | | | | | | |
| City of Belgrade MT, | | | | | | | | | |
| 5.250%, 07/01/2043 | | | | | | | | | |
| (Callable 07/01/2032) | | $ | 2,000,000 | | | $ | 2,223,856 | | | | |
| Flathead County School District No. 44, | | | | | | | | | | | |
| 4.000%, 07/01/2036 | | | | | | | | | | | |
| (Callable 07/01/2028) | | | 210,000 | | | | 216,607 | | | | |
| Montana Board of Housing: | | | | | | | | | | | |
| 3.000%, 12/01/2045 | | | | | | | | | | | |
| (Callable 06/01/2029) | | | 535,000 | | | | 470,925 | | | | |
| 3.050%, 06/01/2050 | | | | | | | | | | | |
| (Callable 06/01/2029) | | | 265,000 | | | | 232,715 | | | | |
| Montana Facility Finance Authority: | | | | | | | | | | | |
| 5.000%, 07/01/2028 (Callable | | | | | | | | | | | |
| 07/01/2027) (Insured by MT BRD) | | | 430,000 | | | | 462,928 | | | | |
| 5.000%, 07/01/2029 (Callable | | | | | | | | | | | |
| 07/01/2027) (Insured by MT BRD) | | | 535,000 | | | | 577,201 | | | | |
| Total Montana | | | | | | | | | | | |
| (Cost $4,329,651) | | | | | | | 4,184,232 | | | | 0.4 | % |
| Nebraska | | | | | | | | | | | | |
| Nebraska Educational Health Cultural | | | | | | | | | | | | |
| & Social Services Finance Authority: | | | | | | | | | | | | |
| 4.000%, 01/01/2033 | | | | | | | | | | | | |
| (Callable 01/01/2026) | | | 400,000 | | | | 408,956 | | | | | |
| 4.000%, 01/01/2034 | | | | | | | | | | | | |
| (Callable 01/01/2026) | | | 2,000,000 | | | | 2,049,602 | | | | | |
| 4.000%, 01/01/2035 | | | | | | | | | | | | |
| (Callable 01/01/2026) | | | 1,000,000 | | | | 1,021,438 | | | | | |
| Nebraska Investment Finance Authority, | | | | | | | | | | | | |
| 3.500%, 09/01/2050 (Callable | | | | | | | | | | | | |
| 03/01/2029) (Insured by GNMA) | | | 1,525,000 | | | | 1,492,297 | | | | | |
| University of Nebraska: | | | | | | | | | | | | |
| 3.000%, 07/01/2028 | | | | | | | | | | | | |
| (Pre-refunded to 07/01/2026) | | | 30,000 | | | | 30,008 | | | | | |
| 3.000%, 05/15/2035 | | | | | | | | | | | | |
| (Pre-refunded to 05/15/2026) | | | 20,000 | | | | 20,046 | | | | | |
| 3.000%, 07/01/2039 | | | | | | | | | | | | |
| (Pre-refunded to 07/01/2026) | | | 15,000 | | | | 15,004 | | | | | |
| Total Nebraska | | | | | | | | | | | | |
| (Cost $5,290,863) | | | | | | | 5,037,351 | | | | 0.5 | % |
| Nevada | | | | | | | | | | | | |
| County of Clark NV, | | | | | | | | | | | | |
| 5.000%, 07/01/2033 | | | | | | | | | | | | |
| (Callable 07/01/2024) | | | 1,925,000 | | | | 1,957,810 | | | | | |
| Total Nevada | | | | | | | | | | | | |
| (Cost $1,965,708) | | | | | | | 1,957,810 | | | | 0.2 | % |
| New Jersey | | | | | | | | | | | | |
| New Jersey Economic Development Authority, | | | | | | | | | | | | |
| 0.000%, 07/01/2025 | | | | | | | | | | | | |
| (ETM) (Insured by NATL) | | | 135,000 | | | | 126,490 | | | | | |
| New Jersey Health Care | | | | | | | | | | | | |
| Facilities Financing Authority: | | | | | | | | | | | | |
| 0.000%, 07/01/2023 | | | | | | | | | | | | |
| (ETM) (Insured by NATL) | | | 10,000 | | | | 10,000 | | | | | |
| 3.750%, 07/01/2027 (ETM) | | | 220,000 | | | | 221,910 | | | | | |
| New Jersey Housing & | | | | | | | | | | | | |
| Mortgage Finance Agency: | | | | | | | | | | | | |
| 4.500%, 10/01/2048 (Callable 10/01/2027) | | | 780,000 | | | | 783,268 | | | | | |
| 2.450%, 10/01/2050 (Callable 04/01/2029) | | | 525,000 | | | | 383,184 | | | | | |
| New Jersey Transportation | | | | | | | | | | | | |
| Trust Fund Authority, | | | | | | | | | | | | |
| 0.000%, 12/15/2030 (Insured by BHAC) | | | 960,000 | | | | 755,474 | | | | | |
| North Hudson Sewerage Authority, | | | | | | | | | | | | |
| 0.000%, 08/01/2024 | | | | | | | | | | | | |
| (ETM) (Insured by NATL) | | | 500,000 | | | | 482,100 | | | | | |
| Total New Jersey | | | | | | | | | | | | |
| (Cost $3,002,177) | | | | | | | 2,762,426 | | | | 0.3 | % |
| New Mexico | | | | | | | | | | | | |
| New Mexico Hospital | | | | | | | | | | | | |
| Equipment Loan Council, | | | | | | | | | | | | |
| 4.125%, 08/01/2044 | | | | | | | | | | | | |
| (Pre-refunded to 08/01/2025) | | | 210,000 | | �� | | 213,484 | | | | | |
| New Mexico Mortgage Finance Authority: | | | | | | | | | | | | |
| 3.500%, 07/01/2033 | | | | | | | | | | | | |
| (Callable 01/01/2028) (Insured by GNMA) | | | 685,000 | | | | 677,843 | | | | | |
| 3.950%, 09/01/2040 | | | | | | | | | | | | |
| (Callable 09/01/2024) (Insured by GNMA) | | | 775,000 | | | | 768,444 | | | | | |
| 5.250%, 03/01/2053 | | | | | | | | | | | | |
| (Callable 03/01/2032) (Insured by GNMA) | | | 2,100,000 | | | | 2,199,285 | | | | | |
| New Mexico Mortgage Financial Authority, | | | | | | | | | | | | |
| 3.550%, 09/01/2037 | | | | | | | | | | | | |
| (Callable 03/01/2027) (Insured by GNMA) | | | 685,000 | | | | 672,818 | | | | | |
| Ruidoso Municipal School District No. 3, | | | | | | | | | | | | |
| 4.000%, 08/01/2032 | | | | | | | | | | | | |
| (Callable 08/01/2026) (Insured by ST AID) | | | 115,000 | | | | 118,483 | | | | | |
| Total New Mexico | | | | | | | | | | | | |
| (Cost $4,785,898) | | | | | | | 4,650,357 | | | | 0.4 | % |
| New York | | | | | | | | | | | | |
| City of New York NY: | | | | | | | | | | | | |
| 5.000%, 08/01/2028 | | | 1,000,000 | | | | 1,103,537 | | | | | |
| 2.370%, 04/01/2042 (Callable 07/03/2023) | | | | | | | | | | | | |
(Optional Put Date 07/07/2023)(1) | | | 3,400,000 | | | | 3,400,000 | | | | | |
| Monroe County Industrial | | | | | | | | | | | | |
| Development Corp., | | | | | | | | | | | | |
| 4.840%, 11/01/2040 (Insured by FNMA) | | | 3,089,825 | | | | 3,150,648 | | | | | |
| New York City Housing Development Corp., | | | | | | | | | | | | |
| 0.700%, 11/01/2060 | | | | | | | | | | | | |
| (Callable 07/21/2023) | | | | | | | | | | | | |
(Mandatory Tender Date 07/01/2025)(1) | | | 2,150,000 | | | | 2,007,026 | | | | | |
| New York City Municipal | | | | | | | | | | | | |
| Water Finance Authority, | | | | | | | | | | | | |
| 4.000%, 06/15/2040 | | | | | | | | | | | | |
| (Callable 12/15/2029) | | | 500,000 | | | | 501,760 | | | | | |
| New York City Transitional | | | | | | | | | | | | |
| Finance Authority, | | | | | | | | | | | | |
| 5.000%, 08/01/2033 (Callable 08/01/2026) | | | 2,835,000 | | | | 2,989,059 | | | | | |
| New York State Dormitory Authority: | | | | | | | | | | | | |
| 0.000%, 07/01/2028 | | | | | | | | | | | | |
| (ETM) (Insured by NATL) | | | 65,000 | | | | 56,135 | | | | | |
| 0.000%, 07/01/2029 | | | | | | | | | | | | |
| (ETM) (Insured by NATL) | | | 430,000 | | | | 361,641 | | | | | |
| 5.000%, 03/15/2037 (Callable 09/15/2025) | | | 155,000 | | | | 160,221 | | | | | |
| 5.250%, 03/15/2039 (Callable 09/15/2028) | | | 3,750,000 | | | | 4,085,756 | | | | | |
| 5.000%, 03/15/2048 (Callable 09/15/2028) | | | 2,000,000 | | | | 2,122,990 | | | | | |
| New York State | | | | | | | | | | | | |
| Environmental Facilities Corp.: | | | | | | | | | | | | |
| 5.500%, 10/15/2029 (ETM) | | | 185,000 | | | | 212,532 | | | | | |
| 5.500%, 10/15/2030 (ETM) | | | 390,000 | | | | 457,070 | | | | | |
| New York State Housing Finance Agency: | | | | | | | | | | | | |
| 1.600%, 11/01/2024 (Callable 07/21/2023) | | | 4,595,000 | | | | 4,456,362 | | | | | |
| 3.600%, 11/01/2062 (Callable 06/01/2025) | | | | | | | | | | | | |
| (Mandatory Tender Date 05/01/2027) | | | | | | | | | | | | |
(Insured by SONYMA)(1) | | | 2,920,000 | | | | 2,916,427 | | | | | |
The accompanying notes are an integral part of these financial statements.
Baird Quality Intermediate Municipal Bond Fund
Schedule of Investments, June 30, 2023 (Unaudited)
Long-Term Investments (cont.)
| | | Principal | | | | | | % of | |
| | | Amount | | | Value | | | Net Assets | |
| State of New York Mortgage Agency, | | | | | | | | | |
| 4.000%, 10/01/2049 | | | | | | | | | |
| (Callable 04/01/2028) | | $ | 3,160,000 | | | $ | 3,134,326 | | | | |
| Total New York | | | | | | | | | | | |
| (Cost $31,836,042) | | | | | | | 31,115,490 | | | | 2.9 | % |
| North Carolina | | | | | | | | | | | | |
| County of Wake NC, | | | | | | | | | | | | |
| 5.125%, 10/01/2026 | | | | | | | | | | | | |
| (ETM) (Insured by NATL) | | | 1,040,000 | | | | 1,068,622 | | | | | |
| Inlivian: | | | | | | | | | | | | |
| 2.550%, 05/01/2037 (Insured by FNMA) | | | 4,780,856 | | | | 3,976,706 | | | | | |
| 5.000%, 06/01/2043 | | | | | | | | | | | | |
| (Callable 12/01/2025) (Mandatory Tender | | | | | | | | | | | | |
Date 06/01/2026) (Insured by HUD)(1) | | | 2,000,000 | | | | 2,050,785 | | | | | |
| North Carolina Housing Finance Agency, | | | | | | | | | | | | |
| 4.000%, 07/01/2050 | | | | | | | | | | | | |
| (Callable 07/01/2029) | | | 1,465,000 | | | | 1,453,339 | | | | | |
| Raleigh Housing Authority: | | | | | | | | | | | | |
| 5.000%, 10/01/2026 | | | | | | | | | | | | |
(Mandatory Tender Date 10/01/2025)(1) | | | 5,500,000 | | | | 5,595,570 | | | | | |
| 5.000%, 12/01/2026 (Mandatory Tender | | | | | | | | | | | | |
Date 12/01/2025) (Insured by FHA)(1) | | | 7,850,000 | | | | 8,027,579 | | | | | |
| University of North Carolina at Chapel Hill, | | | | | | | | | | | | |
| 4.034%, 12/01/2041 (SOFR + 0.650%) | | | | | | | | | | | | |
| (Callable 12/01/2024) | | | | | | | | | | | | |
(Mandatory Tender Date 06/01/2025)(2) | | | 1,000,000 | | | | 1,000,779 | | | | | |
| Total North Carolina | | | | | | | | | | | | |
| (Cost $24,152,984) | | | | | | | 23,173,380 | | | | 2.1 | % |
| North Dakota | | | | | | | | | | | | |
| North Dakota Housing Finance Agency: | | | | | | | | | | | | |
| 3.550%, 07/01/2033 | | | | | | | | | | | | |
| (Callable 01/01/2028) | | | 1,140,000 | | | | 1,118,437 | | | | | |
| 3.450%, 07/01/2037 | | | | | | | | | | | | |
| (Callable 07/01/2026) (Insured by FHA) | | | 900,000 | | | | 889,336 | | | | | |
| 3.500%, 07/01/2046 | | | | | | | | | | | | |
| (Callable 01/01/2026) | | | 540,000 | | | | 532,277 | | | | | |
| 4.000%, 01/01/2050 | | | | | | | | | | | | |
| (Callable 07/01/2028) | | | 905,000 | | | | 898,536 | | | | | |
| Total North Dakota | | | | | | | | | | | | |
| (Cost $3,620,972) | | | | | | | 3,438,586 | | | | 0.3 | % |
| Ohio | | | | | | | | | | | | |
| City of Cleveland OH, | | | | | | | | | | | | |
| 5.000%, 12/01/2029 (Callable 07/31/2023) | | | 10,000 | | | | 10,012 | | | | | |
| County of Montgomery OH: | | | | | | | | | | | | |
| 5.250%, 05/01/2029 | | | | | | | | | | | | |
| (Pre-refunded to 11/12/2023) | | | 915,000 | | | | 921,164 | | | | | |
| 5.250%, 05/01/2029 | | | | | | | | | | | | |
| (Pre-refunded to 11/13/2023) | | | 1,380,000 | | | | 1,389,370 | | | | | |
| County of Van Wert OH, | | | | | | | | | | | | |
| 6.125%, 12/01/2049 | | | | | | | | | | | | |
| (Pre-refunded to 12/01/2029) | | | 7,000,000 | | | | 8,171,205 | | | | | |
| Lucas-Plaza Housing Development Corp., | | | | | | | | | | | | |
| 0.000%, 06/01/2024 | | | | | | | | | | | | |
| (ETM) (Insured by FHA) | | | 1,660,000 | | | | 1,609,408 | | | | | |
| Ohio Housing Finance Agency: | | | | | | | | | | | | |
| 3.950%, 09/01/2043 | | | | | | | | | | | | |
| (Callable 09/01/2027) (Insured by GNMA) | | | 165,000 | | | | 162,551 | | | | | |
| 3.500%, 09/01/2046 | | | | | | | | | | | | |
| (Callable 09/01/2025) (Insured by GNMA) | | | 500,000 | | | | 491,971 | | | | | |
| 3.250%, 09/01/2052 | | | | | | | | | | | | |
| (Callable 09/01/2031) (Insured by GNMA) | | | 3,070,000 | | | | 2,971,903 | | | | | |
| State of Ohio: | | | | | | | | | | | | |
| 5.000%, 02/01/2025 | | | 1,200,000 | | | | 1,235,675 | | | | | |
| 5.000%, 01/01/2036 (Callable 01/01/2032) | | | 540,000 | | | | 609,471 | | | | | |
| 5.000%, 01/01/2038 (Callable 01/01/2032) | | | 430,000 | | | | 475,145 | | | | | |
| 2.750%, 01/01/2052 | | | | | | | | | | | | |
(Mandatory Tender Date 05/01/2028)(1) | | | 1,000,000 | | | | 977,197 | | | | | |
| University of Akron, | | | | | | | | | | | | |
| 5.000%, 01/01/2033 (Callable 07/01/2026) | | | 335,000 | | | | 342,161 | | | | | |
| Total Ohio | | | | | | | | | | | | |
| (Cost $19,839,290) | | | | | | | 19,367,233 | | | | 1.8 | % |
| Oklahoma | | | | | | | | | | | | |
| Oklahoma Water Resources Board, | | | | | | | | | | | | |
| 4.000%, 04/01/2037 (Callable 04/01/2030) | | | 560,000 | | | | 575,888 | | | | | |
| Total Oklahoma | | | | | | | | | | | | |
| (Cost $576,702) | | | | | | | 575,888 | | | | 0.1 | % |
| Oregon | | | | | | | | | | | | |
| Clackamas Community College: | | | | | | | | | | | | |
| 0.000%, 06/15/2028 (Callable 06/15/2025) | | | | | | | | | | | | |
| (Insured by SCH BD GTY) | | | 1,375,000 | | | | 1,130,366 | | | | | |
| 0.000%, 06/15/2029 (Callable 06/15/2025) | | | | | | | | | | | | |
| (Insured by SCH BD GTY) | | | 1,000,000 | | | | 785,417 | | | | | |
| Hillsboro School District No. 1J, | | | | | | | | | | | | |
| 5.000%, 06/15/2035 (Callable 06/15/2027) | | | | | | | | | | | | |
| (Insured by SCH BD GTY) | | | 600,000 | | | | 640,687 | | | | | |
| State of Oregon: | | | | | | | | | | | | |
| 4.000%, 12/01/2045 (Callable 06/01/2025) | | | 910,000 | | | | 905,971 | | | | | |
| 4.000%, 12/01/2048 (Callable 12/01/2026) | | | 1,250,000 | | | | 1,240,993 | | | | | |
| State of Oregon Housing & | | | | | | | | | | | | |
| Community Services Department: | | | | | | | | | | | | |
| 3.550%, 07/01/2033 (Callable 07/01/2027) | | | 1,045,000 | | | | 1,026,249 | | | | | |
| 2.900%, 07/01/2043 (Callable 07/01/2027) | | | 1,000,000 | | | | 901,283 | | | | | |
| 4.000%, 01/01/2047 (Callable 07/01/2025) | | | 515,000 | | | | 513,185 | | | | | |
| 3.750%, 07/01/2048 (Callable 01/01/2027) | | | 1,020,000 | | | | 997,690 | | | | | |
| Total Oregon | | | | | | | | | | | | |
| (Cost $8,273,664) | | | | | | | 8,141,841 | | | | 0.7 | % |
| Pennsylvania | | | | | | | | | | | | |
| City of Sharon PA, | | | | | | | | | | | | |
| 0.000%, 05/01/2024 | | | | | | | | | | | | |
| (ETM) (Insured by NATL) | | | 250,000 | | | | 243,246 | | | | | |
| Commonwealth Financing Authority, | | | | | | | | | | | | |
| 4.000%, 06/01/2039 | | | | | | | | | | | | |
| (Callable 06/01/2028) (Insured by AGM) | | | 1,500,000 | | | | 1,474,592 | | | | | |
| Mckeesport Area School District, | | | | | | | | | | | | |
| 0.000%, 10/01/2025 | | | | | | | | | | | | |
| (ETM) (Insured by AMBAC) | | | 110,000 | | | | 102,417 | | | | | |
| Pennsylvania Housing Finance Agency: | | | | | | | | | | | | |
| 3.500%, 10/01/2046 (Callable 10/01/2025) | | | 340,000 | | | | 336,970 | | | | | |
| 3.500%, 04/01/2051 (Callable 10/01/2029) | | | 2,950,000 | | | | 2,905,330 | | | | | |
| 5.500%, 10/01/2053 (Callable 10/01/2032) | | | 2,000,000 | | | | 2,125,861 | | | | | |
| 5.750%, 10/01/2053 (Callable 10/01/2032) | | | 1,275,000 | | | | 1,358,702 | | | | | |
| Pittsburgh Water & Sewer Authority: | | | | | | | | | | | | |
| 0.000%, 09/01/2026 | | | | | | | | | | | | |
| (ETM) (Insured by NATL) | | | 890,000 | | | | 807,682 | | | | | |
| 0.000%, 09/01/2027 | | | | | | | | | | | | |
| (ETM) (Insured by FGIC) | | | 1,110,000 | | | | 979,256 | | | | | |
| 0.000%, 09/01/2028 | | | | | | | | | | | | |
| (ETM) (Insured by FGIC) | | | 370,000 | | | | 317,973 | | | | | |
| Pottsville Hospital Authority, | | | | | | | | | | | | |
| 6.500%, 07/01/2028 | | | | | | | | | | | | |
(Pre-refunded to 07/01/2024)(3) | | | 1,260,000 | | | | 1,292,157 | | | | | |
| Total Pennsylvania | | | | | | | | | | | | |
| (Cost $12,292,690) | | | | | | | 11,944,186 | | | | 1.1 | % |
The accompanying notes are an integral part of these financial statements.
Baird Quality Intermediate Municipal Bond Fund
Schedule of Investments, June 30, 2023 (Unaudited)
Long-Term Investments (cont.)
| | | Principal | | | | | | % of | |
| | | Amount | | | Value | | | Net Assets | |
| Puerto Rico | | | | | | | | | |
| Puerto Rico Public Finance Corp.: | | | | | | | | | |
| 5.125%, 06/01/2024 | | | | | | | | | |
| (Insured by AMBAC) | | $ | 795,000 | | | $ | 807,976 | | | | |
| 6.000%, 08/01/2026 (ETM) | | | 3,415,000 | | | | 3,693,602 | | | | |
| 6.000%, 08/01/2026 | | | | | | | | | | | |
| (ETM) (Insured by AGC) | | | 1,565,000 | | | | 1,692,676 | | | | |
| 6.000%, 08/01/2026 | | | | | | | | | | | |
| (ETM) (Insured by AGC) | | | 1,440,000 | | | | 1,557,478 | | | | |
| 6.000%, 08/01/2026 | | | | | | | | | | | |
| (ETM) (Insured by AGC) | | | 1,825,000 | | | | 1,973,887 | | | | |
| 6.000%, 08/01/2026 | | | | | | | | | | | |
| (ETM) (Insured by AGC) | | | 1,910,000 | | | | 2,065,821 | | | | |
| 5.500%, 08/01/2027 | | | | | | | | | | | |
| (ETM) (Insured by AMBAC) | | | 7,665,000 | | | | 8,386,411 | | | | |
| Total Puerto Rico | | | | | | | | | | | |
| (Cost $20,764,262) | | | | | | | 20,177,851 | | | | 1.9 | % |
| Rhode Island | | | | | | | | | | | | |
| Rhode Island Housing & | | | | | | | | | | | | |
| Mortgage Finance Corp., | | | | | | | | | | | | |
| 3.500%, 10/01/2050 (Callable 10/01/2029) | | | 1,160,000 | | | | 1,136,526 | | | | | |
| Total Rhode Island | | | | | | | | | | | | |
| (Cost $1,225,828) | | | | | | | 1,136,526 | | | | 0.1 | % |
| South Carolina | | | | | | | | | | | | |
| City of Columbia SC, | | | | | | | | | | | | |
| 5.000%, 02/01/2049 | | | | | | | | | | | | |
| (Pre-refunded to 02/01/2029) | | | 10,680,000 | | | | 11,956,515 | | | | | |
| Piedmont Municipal Power Agency, | | | | | | | | | | | | |
| 5.375%, 01/01/2025 | | | | | | | | | | | | |
| (ETM) (Insured by NATL) | | | 5,330,000 | | | | 5,483,738 | | | | | |
| South Carolina Jobs-Economic | | | | | | | | | | | | |
| Development Authority: | | | | | | | | | | | | |
| 5.000%, 08/15/2036 | | | | | | | | | | | | |
(Pre-refunded to 08/15/2026)(3)(5) | | | 7,500,000 | | | | 7,976,561 | | | | | |
| 5.000%, 08/15/2041 | | | | | | | | | | | | |
(Pre-refunded to 08/15/2026)(3)(5) | | | 4,165,000 | | | | 4,429,651 | | | | | |
| Tobacco Settlement Revenue | | | | | | | | | | | | |
| Management Authority, | | | | | | | | | | | | |
| 6.375%, 05/15/2030 (ETM) | | | 1,750,000 | | | | 2,084,203 | | | | | |
| Total South Carolina | | | | | | | | | | | | |
| (Cost $33,239,232) | | | | | | | 31,930,668 | | | | 2.9 | % |
| South Dakota | | | | | | | | | | | | |
| County of Clay SD, | | | | | | | | | | | | |
| 5.000%, 12/01/2038 (Callable 12/01/2031) | | | 1,000,000 | | | | 1,094,944 | | | | | |
| Harrisburg School District No. 41-2, | | | | | | | | | | | | |
| 2.375%, 08/01/2026 (Insured by ST AID) | | | 335,000 | | | | 327,310 | | | | | |
| Total South Dakota | | | | | | | | | | | | |
| (Cost $1,418,910) | | | | | | | 1,422,254 | | | | 0.1 | % |
| Tennessee | | | | | | | | | | | | |
| Nashville & Davidson County | | | | | | | | | | | | |
| Metropolitan Government: | | | | | | | | | | | | |
| 4.875%, 11/01/2028 | | | | | | | | | | | | |
| (ETM) (Insured by NATL) | | | 1,700,000 | | | | 1,782,053 | | | | | |
| 3.850%, 02/01/2048 (Mandatory Tender | | | | | | | | | | | | |
Date 02/01/2026) (Insured by FNMA)(1) | | | 1,000,000 | | | | 999,147 | | | | | |
| Tennessee Housing Development Agency: | | | | | | | | | | | | |
| 1.750%, 07/01/2028 | | | 350,000 | | | | 316,616 | | | | | |
| 1.950%, 07/01/2030 | | | | | | | | | | | | |
| (Callable 07/01/2029) | | | 550,000 | | | | 464,733 | | | | | |
| 3.850%, 01/01/2035 | | | | | | | | | | | | |
| (Callable 01/01/2025) | | | 240,000 | | | | 239,431 | | | | | |
| 3.900%, 07/01/2042 | | | | | | | | | | | | |
| (Callable 07/01/2027) | | | 350,000 | | | | 343,039 | | | | | |
| 4.000%, 01/01/2043 | | | | | | | | | | | | |
| (Callable 07/01/2027) | | | 525,000 | | | | 521,082 | | | | | |
| 3.850%, 07/01/2043 | | | | | | | | | | | | |
| (Callable 07/01/2027) | | | 1,810,000 | | | | 1,808,914 | | | | | |
| 3.650%, 07/01/2047 | | | | | | | | | | | | |
| (Callable 01/01/2027) | | | 705,000 | | | | 686,553 | | | | | |
| 4.050%, 01/01/2049 | | | | | | | | | | | | |
| (Callable 01/01/2028) | | | 1,645,000 | | | | 1,618,775 | | | | | |
| 4.250%, 01/01/2050 | | | | | | | | | | | | |
| (Callable 07/01/2028) | | | 925,000 | | | | 922,086 | | | | | |
| Total Tennessee | | | | | | | | | | | | |
| (Cost $10,127,579) | | | | | | | 9,702,429 | | | | 0.9 | % |
| Texas | | | | | | | | | | | | |
| Alvarado Independent School District, | | | | | | | | | | | | |
| 2.750%, 02/15/2052 (Mandatory Tender | | | | | | | | | | | | |
Date 08/15/2025) (PSF Guaranteed)(1) | | | 1,500,000 | | | | 1,498,869 | | | | | |
| Anna Independent School District, | | | | | | | | | | | | |
| 5.000%, 08/15/2035 | | | | | | | | | | | | |
| (Callable 08/15/2026) (PSF Guaranteed) | | | 910,000 | | | | 960,736 | | | | | |
| Arlington Higher Education Finance Corp.: | | | | | | | | | | | | |
| 4.000%, 08/15/2024 (PSF Guaranteed) | | | 1,025,000 | | | | 1,032,439 | | | | | |
| 5.000%, 08/15/2024 | | | | | | | | | | | | |
| (ETM) (PSF Guaranteed) | | | 1,010,000 | | | | 1,028,002 | | | | | |
| 5.000%, 08/15/2025 (PSF Guaranteed) | | | 195,000 | | | | 201,766 | | | | | |
| 5.000%, 08/15/2026 (PSF Guaranteed) | | | 500,000 | | | | 527,269 | | | | | |
| 4.000%, 08/15/2027 | | | | | | | | | | | | |
| (Callable 08/15/2026) (PSF Guaranteed) | | | 875,000 | | | | 890,879 | | | | | |
| 5.000%, 08/15/2027 (PSF Guaranteed) | | | 240,000 | | | | 258,215 | | | | | |
| 4.000%, 08/15/2028 | | | | | | | | | | | | |
| (Callable 08/15/2026) (PSF Guaranteed) | | | 850,000 | | | | 865,917 | | | | | |
| 5.000%, 08/15/2028 (Pre-refunded to | | | | | | | | | | | | |
| 08/15/2024) (PSF Guaranteed) | | | 555,000 | | | | 564,892 | | | | | |
| 5.000%, 08/15/2029 (PSF Guaranteed) | | | 130,000 | | | | 144,722 | | | | | |
| 5.000%, 02/15/2030 | | | | | | | | | | | | |
| (Callable 02/15/2026) (PSF Guaranteed) | | | 125,000 | | | | 129,848 | | | | | |
| 3.000%, 08/15/2032 | | | | | | | | | | | | |
| (Callable 08/15/2031) (PSF Guaranteed) | | | 835,000 | | | | 797,561 | | | | | |
| 3.000%, 08/15/2033 | | | | | | | | | | | | |
| (Callable 08/15/2031) (PSF Guaranteed) | | | 1,070,000 | | | | 1,008,077 | | | | | |
| 3.000%, 08/15/2033 | | | | | | | | | | | | |
| (Callable 08/15/2031) (PSF Guaranteed) | | | 500,000 | | | | 470,527 | | | | | |
| 4.000%, 08/15/2033 | | | | | | | | | | | | |
| (Callable 08/15/2026) (PSF Guaranteed) | | | 475,000 | | | | 481,246 | | | | | |
| 5.000%, 08/15/2033 (Pre-refunded to | | | | | | | | | | | | |
| 08/15/2024) (PSF Guaranteed) | | | 1,460,000 | | | | 1,486,023 | | | | | |
| 3.000%, 08/15/2034 | | | | | | | | | | | | |
| (Callable 08/15/2031) (PSF Guaranteed) | | | 500,000 | | | | 460,001 | | | | | |
| 4.000%, 08/15/2034 | | | | | | | | | | | | |
| (Callable 08/15/2026) (PSF Guaranteed) | | | 195,000 | | | | 197,110 | | | | | |
| 4.000%, 08/15/2035 | | | | | | | | | | | | |
| (Callable 08/15/2026) (PSF Guaranteed) | | | 480,000 | | | | 483,545 | | | | | |
| 4.000%, 12/01/2035 | | | | | | | | | | | | |
| (Callable 06/01/2027) (PSF Guaranteed) | | | 450,000 | | | | 454,194 | | | | | |
| 4.000%, 08/15/2036 | | | | | | | | | | | | |
| (Callable 08/15/2030) (PSF Guaranteed) | | | 510,000 | | | | 515,343 | | | | | |
| 4.000%, 08/15/2036 | | | | | | | | | | | | |
| (Callable 08/15/2031) (PSF Guaranteed) | | | 1,000,000 | | | | 1,011,740 | | | | | |
| 5.000%, 08/15/2037 | | | | | | | | | | | | |
| (Callable 08/15/2032) (PSF Guaranteed) | | | 510,000 | | | | 564,890 | | | | | |
The accompanying notes are an integral part of these financial statements.
Baird Quality Intermediate Municipal Bond Fund
Schedule of Investments, June 30, 2023 (Unaudited)
Long-Term Investments (cont.)
| | | Principal | | | | | | % of | |
| | | Amount | | | Value | | | Net Assets | |
| Arlington Higher Education | | | | | | | | | |
| Finance Corp.: (cont.) | | | | | | | | | |
| 4.000%, 08/15/2038 | | | | | | | | | |
| (Callable 08/15/2030) (PSF Guaranteed) | | $ | 550,000 | | | $ | 549,486 | | | |
| |
| 4.000%, 08/15/2039 | | | | | | | | | | | | |
| (Callable 08/15/2025) (PSF Guaranteed) | | | 495,000 | | | | 490,760 | | | | | |
| 3.000%, 08/15/2040 | | | | | | | | | | | | |
| (Callable 08/15/2031) (PSF Guaranteed) | | | 290,000 | | | | 237,958 | | | | | |
| 3.000%, 08/15/2041 | | | | | | | | | | | | |
| (Callable 08/15/2031) (PSF Guaranteed) | | | 300,000 | | | | 241,792 | | | | | |
| 3.000%, 08/15/2042 | | | | | | | | | | | | |
| (Callable 08/15/2031) (PSF Guaranteed) | | | 265,000 | | | | 210,268 | | | | | |
| 3.000%, 08/15/2043 | | | | | | | | | | | | |
| (Callable 08/15/2031) (PSF Guaranteed) | | | 210,000 | | | | 165,027 | | | | | |
| 3.000%, 08/15/2044 | | | | | | | | | | | | |
| (Callable 08/15/2031) (PSF Guaranteed) | | | 245,000 | | | | 190,110 | | | | | |
| Austin Community College | | | | | | | | | | | | |
| District Public Facility Corp., | | | | | | | | | | | | |
| 5.000%, 08/01/2033 (Callable 08/01/2025) | | | 750,000 | | | | 772,741 | | | | | |
| Balmorhea Independent School District, | | | | | | | | | | | | |
| 5.000%, 02/15/2034 | | | | | | | | | | | | |
| (Callable 02/15/2031) (PSF Guaranteed) | | | 335,000 | | | | 380,634 | | | | | |
| Bexar Metropolitan Water District, | | | | | | | | | | | | |
| 0.000%, 05/01/2027 | | | | | | | | | | | | |
| (ETM) (Insured by NATL) | | | 50,000 | | | | 44,515 | | | | | |
| Brazoria County Toll Road Authority: | | | | | | | | | | | | |
| 0.000%, 03/01/2039 (Callable | | | | | | | | | | | | |
03/01/2030) (County Guaranteed)(5) | | | 200,000 | | | | 185,572 | | | | | |
| 0.000%, 03/01/2042 (Callable | | | | | | | | | | | | |
03/01/2030) (County Guaranteed)(5) | | | 205,000 | | | | 184,577 | | | | | |
| 0.000%, 03/01/2044 (Callable | | | | | | | | | | | | |
03/01/2030) (County Guaranteed)(5) | | | 255,000 | | | | 228,464 | | | | | |
| Burleson Independent School District, | | | | | | | | | | | | |
| 5.000%, 08/01/2025 (PSF Guaranteed) | | | 1,260,000 | | | | 1,309,225 | | | | | |
| City of Denton TX, | | | | | | | | | | | | |
| 5.000%, 02/15/2035 (Callable 02/15/2031) | | | 3,055,000 | | | | 3,471,801 | | | | | |
| City of Houston TX: | | | | | | | | | | | | |
| 5.500%, 12/01/2024 | | | | | | | | | | | | |
| (ETM) (Insured by NATL) | | | 1,255,000 | | | | 1,273,320 | | | | | |
| 0.000%, 12/01/2026 | | | | | | | | | | | | |
| (ETM) (Insured by AGM) | | | 735,000 | | | | 660,184 | | | | | |
| 0.000%, 12/01/2027 | | | | | | | | | | | | |
| (ETM) (Insured by AGM) | | | 220,000 | | | | 192,048 | | | | | |
| 0.000%, 12/01/2028 | | | | | | | | | | | | |
| (ETM) (Insured by AGM) | | | 3,770,000 | | | | 3,203,305 | | | | | |
| 5.500%, 12/01/2029 | | | | | | | | | | | | |
| (ETM) (Insured by NATL) | | | 16,050,000 | | | | 17,857,036 | | | | | |
| 5.750%, 12/01/2032 | | | | | | | | | | | | |
| (ETM) (Insured by AGM) | | | 24,965,000 | | | | 31,450,338 | | | | | |
| City of San Antonio TX: | | | | | | | | | | | | |
| 5.000%, 02/01/2025 (ETM) | | | 205,000 | | | | 210,713 | | | | | |
| 4.000%, 02/01/2029 (Callable 07/31/2023) | | | 2,205,000 | | | | 2,205,753 | | | | | |
| Clifton Higher Education Finance Corp.: | | | | | | | | | | | | |
| 5.000%, 08/15/2025 (PSF Guaranteed) | | | 460,000 | | | | 474,821 | | | | | |
| 5.000%, 08/15/2027 (PSF Guaranteed) | | | 235,000 | | | | 250,772 | | | | | |
| 5.000%, 08/15/2029 | | | | | | | | | | | | |
| (Callable 08/15/2024) (PSF Guaranteed) | | | 215,000 | | | | 218,980 | | | | | |
| 5.000%, 08/15/2029 (PSF Guaranteed) | | | 295,000 | | | | 324,081 | | | | | |
| 4.000%, 08/15/2031 | | | | | | | | | | | | |
| (Callable 08/15/2026) (PSF Guaranteed) | | | 170,000 | | | | 172,527 | | | | | |
| 4.000%, 08/15/2031 | | | | | | | | | | | | |
| (Callable 08/15/2027) (PSF Guaranteed) | | | 2,000,000 | | | | 2,051,758 | | | | | |
| 4.000%, 08/15/2034 | | | | | | | | | | | | |
| (Callable 08/15/2032) (PSF Guaranteed) | | | 160,000 | | | | 165,835 | | | | | |
| 4.000%, 08/15/2043 | | | | | | | | | | | | |
| (Callable 08/15/2028) (PSF Guaranteed) | | | 250,000 | | | | 245,762 | | | | | |
| County of Bexar TX: | | | | | | | | | | | | |
| 4.000%, 06/15/2030 | | | | | | | | | | | | |
| (Callable 06/15/2026) | | | 150,000 | | | | 153,389 | | | | | |
| 4.000%, 06/15/2033 | | | | | | | | | | | | |
| (Pre-refunded to 06/15/2025) | | | 3,795,000 | | | | 3,855,578 | | | | | |
| 5.000%, 06/15/2036 | | | | | | | | | | | | |
| (Pre-refunded to 06/15/2026) | | | 2,145,000 | | | | 2,270,435 | | | | | |
| County of Williamson TX, | | | | | | | | | | | | |
| 4.000%, 02/15/2039 (Callable 02/15/2029) | | | 1,350,000 | | | | 1,375,585 | | | | | |
| Crowley Independent School District, | | | | | | | | | | | | |
| 5.000%, 08/01/2036 (Pre-refunded to | | | | | | | | | | | | |
| 08/01/2025) (PSF Guaranteed) | | | 2,000,000 | | | | 2,076,501 | | | | | |
| Dallas Independent School District, | | | | | | | | | | | | |
| 4.000%, 02/15/2034 (Pre-refunded to | | | | | | | | | | | | |
| 02/15/2025) (PSF Guaranteed) | | | 20,715,000 | | | | 20,983,236 | | | | | |
| Decatur Hospital Authority, | | | | | | | | | | | | |
| 5.750%, 09/01/2029 (ETM) | | | 380,000 | | | | 412,165 | | | | | |
| DeSoto Independent School District, | | | | | | | | | | | | |
| 5.000%, 08/15/2032 | | | | | | | | | | | | |
| (Callable 08/15/2024) (PSF Guaranteed) | | | 1,825,000 | | | | 1,854,180 | | | | | |
| Eagle Mountain & Saginaw | | | | | | | | | | | | |
| Independent School District, | | | | | | | | | | | | |
| 4.000%, 08/15/2045 | | | | | | | | | | | | |
| (Callable 08/15/2025) (PSF Guaranteed) | | | 675,000 | | | | 675,699 | | | | | |
| Ennis Independent School District, | | | | | | | | | | | | |
| 5.000%, 08/15/2025 (PSF Guaranteed) | | | 1,145,000 | | | | 1,189,716 | | | | | |
| Forney Independent School District, | | | | | | | | | | | | |
| 5.000%, 08/15/2034 | | | | | | | | | | | | |
| (Callable 08/15/2025) (PSF Guaranteed) | | | 525,000 | | | | 541,590 | | | | | |
| Grand Parkway Transportation Corp.: | | | | | | | | | | | | |
| 0.000%, 10/01/2031 | | | | | | | | | | | | |
(Callable 10/01/2028)(5) | | | 405,000 | | | | 442,781 | | | | | |
| 5.000%, 10/01/2043 (Callable 04/01/2028) | | | 3,680,000 | | | | 3,882,677 | | | | | |
| 0.000%, 10/01/2045 | | | | | | | | | | | | |
(Callable 10/01/2028)(5) | | | 300,000 | | | | 319,836 | | | | | |
| 0.000%, 10/01/2048 | | | | | | | | | | | | |
(Callable 10/01/2028)(5) | | | 575,000 | | | | 612,176 | | | | | |
| Harlingen Consolidated | | | | | | | | | | | | |
| Independent School District, | | | | | | | | | | | | |
| 5.000%, 08/15/2025 (PSF Guaranteed) | | | 1,445,000 | | | | 1,499,931 | | | | | |
| Harris County Health | | | | | | | | | | | | |
| Facilities Development Corp.: | | | | | | | | | | | | |
| 5.750%, 07/01/2027 (ETM) | | | 7,870,000 | | | | 8,286,109 | | | | | |
| 6.250%, 07/01/2027 (ETM) | | | 6,765,000 | | | | 7,175,753 | | | | | |
| Harris County-Houston Sports Authority, | | | | | | | | | | | | |
| 0.000%, 11/15/2030 | | | | | | | | | | | | |
| (ETM) (Insured by NATL) | | | 2,150,000 | | | | 1,676,879 | | | | | |
| Hays Consolidated | | | | | | | | | | | | |
| Independent School District, | | | | | | | | | | | | |
| 4.000%, 02/15/2033 | | | | | | | | | | | | |
| (Callable 02/15/2027) (PSF Guaranteed) | | | 880,000 | | | | 900,859 | | | | | |
| Honda Auto Receivables Owner Trust, | | | | | | | | | | | | |
| 5.000%, 02/15/2026 | | | | | | | | | | | | |
| (Callable 02/15/2024) (PSF Guaranteed) | | | 1,030,000 | | | | 1,040,368 | | | | | |
| Houston Higher Education Finance Corp., | | | | | | | | | | | | |
| 5.000%, 02/15/2034 | | | | | | | | | | | | |
| (Callable 02/15/2024) (PSF Guaranteed) | | | 1,795,000 | | | | 1,812,088 | | | | | |
| Katy Independent School District, | | | | | | | | | | | | |
| 4.000%, 02/15/2053 | | | | | | | | | | | | |
| (Callable 02/15/2032) (PSF Guaranteed) | | | 5,250,000 | | | | 5,072,871 | | | | | |
| Kemp Independent School District, | | | | | | | | | | | | |
| 0.000%, 02/15/2027 (Pre-refunded to | | | | | | | | | | | | |
| 02/15/2024) (PSF Guaranteed) | | | 715,000 | | | | 638,049 | | | | | |
The accompanying notes are an integral part of these financial statements.
Baird Quality Intermediate Municipal Bond Fund
Schedule of Investments, June 30, 2023 (Unaudited)
Long-Term Investments (cont.)
| | | Principal | | | | | | % of | |
| | | Amount | | | Value | | | Net Assets | |
| Kenedy Independent School District, | | | | | | | | | |
| 4.000%, 08/15/2031 (Pre-refunded to | | | | | | | | | |
| 08/15/2023) (PSF Guaranteed) | | $ | 100,000 | | | $ | 100,069 | | | |
| |
| Kilgore Independent School District, | | | | | | | | | | | | |
| 2.000%, 02/15/2052 (Mandatory Tender | | | | | | | | | | | | |
Date 08/15/2025) (PSF Guaranteed)(1) | | | 890,000 | | | | 860,871 | | | | | |
| Klein Independent School District, | | | | | | | | | | | | |
| 4.000%, 08/01/2031 | | | | | | | | | | | | |
| (Callable 08/01/2025) (PSF Guaranteed) | | | 1,000,000 | | | | 1,014,223 | | | | | |
| La Porte Independent School District, | | | | | | | | | | | | |
| 5.000%, 02/15/2025 (PSF Guaranteed) | | | 1,080,000 | | | | 1,111,547 | | | | | |
| Leander Independent School District: | | | | | | | | | | | | |
| 0.000%, 08/15/2034 (Pre-refunded to | | | | | | | | | | | | |
| 08/15/2024) (PSF Guaranteed) | | | 175,000 | | | | 103,250 | | | | | |
| 0.000%, 08/15/2035 (Pre-refunded to | | | | | | | | | | | | |
| 08/15/2024) (PSF Guaranteed) | | | 395,000 | | | | 219,110 | | | | | |
| 0.000%, 08/15/2036 (Pre-refunded to | | | | | | | | | | | | |
| 08/15/2024) (PSF Guaranteed) | | | 750,000 | | | | 391,608 | | | | | |
| 0.000%, 08/15/2037 (Pre-refunded to | | | | | | | | | | | | |
| 08/15/2024) (PSF Guaranteed) | | | 700,000 | | | | 364,605 | | | | | |
| 0.000%, 08/15/2039 (Pre-refunded to | | | | | | | | | | | | |
| 08/15/2024) (PSF Guaranteed) | | | 570,000 | | | | 250,339 | | | | | |
| 0.000%, 08/15/2040 (Pre-refunded to | | | | | | | | | | | | |
| 08/15/2024) (PSF Guaranteed) | | | 1,030,000 | | | | 460,405 | | | | | |
| 0.000%, 08/15/2040 (Pre-refunded to | | | | | | | | | | | | |
| 08/15/2024) (PSF Guaranteed) | | | 35,000 | | | | 15,645 | | | | | |
| 0.000%, 08/15/2041 (Pre-refunded to | | | | | | | | | | | | |
| 08/15/2024) (PSF Guaranteed) | | | 8,965,000 | | | | 3,517,678 | | | | | |
| 0.000%, 08/15/2041 (Pre-refunded to | | | | | | | | | | | | |
| 08/15/2024) (PSF Guaranteed) | | | 220,000 | | | | 93,573 | | | | | |
| 0.000%, 08/15/2042 (Pre-refunded to | | | | | | | | | | | | |
| 08/15/2024) (PSF Guaranteed) | | | 1,500,000 | | | | 556,400 | | | | | |
| 0.000%, 08/15/2043 (Pre-refunded to | | | | | | | | | | | | |
| 08/15/2024) (PSF Guaranteed) | | | 700,000 | | | | 245,821 | | | | | |
| 0.000%, 08/15/2045 (Pre-refunded to | | | | | | | | | | | | |
| 08/15/2024) (PSF Guaranteed) | | | 2,000,000 | | | | 622,740 | | | | | |
| 0.000%, 08/15/2046 (Pre-refunded to | | | | | | | | | | | | |
| 08/15/2024) (PSF Guaranteed) | | | 250,000 | | | | 73,145 | | | | | |
| 0.000%, 08/15/2047 (Pre-refunded to | | | | | | | | | | | | |
| 08/15/2024) (PSF Guaranteed) | | | 540,000 | | | | 148,345 | | | | | |
| 0.000%, 08/15/2048 (Pre-refunded to | | | | | | | | | | | | |
| 08/15/2024) (PSF Guaranteed) | | | 920,000 | | | | 237,671 | | | | | |
| Lower Colorado River Authority, | | | | | | | | | | | | |
| 4.750%, 01/01/2028 | | | | | | | | | | | | |
| (ETM) (Insured by AGM) | | | 730,000 | | | | 757,253 | | | | | |
| Luling Independent School District, | | | | | | | | | | | | |
| 4.000%, 02/15/2029 | | | | | | | | | | | | |
| (Callable 02/15/2028) (PSF Guaranteed) | | | 90,000 | | | | 94,306 | | | | | |
| McKinney Independent School District, | | | | | | | | | | | | |
| 4.000%, 02/15/2034 | | | | | | | | | | | | |
| (Callable 02/15/2026) (PSF Guaranteed) | | | 1,325,000 | | | | 1,347,471 | | | | | |
| Melissa Independent School District, | | | | | | | | | | | | |
| 5.000%, 08/01/2036 | | | | | | | | | | | | |
| (Callable 08/01/2026) (PSF Guaranteed) | | | 1,020,000 | | | | 1,056,042 | | | | | |
| Mesquite Independent School District: | | | | | | | | | | | | |
| 5.000%, 08/15/2025 (PSF Guaranteed) | | | 5,000 | | | | 5,200 | | | | | |
| 5.000%, 08/15/2025 (PSF Guaranteed) | | | 1,500,000 | | | | 1,559,829 | | | | | |
| Midland County Fresh Water | | | | | | | | | | | | |
| Supply District No. 1: | | | | | | | | | | | | |
| 0.000%, 09/15/2033 | | | | | | | | | | | | |
| (Pre-refunded to 09/15/2027) | | | 690,000 | | | | 451,397 | | | | | |
| 0.000%, 09/15/2034 | | | | | | | | | | | | |
| (Pre-refunded to 09/15/2027) | | | 570,000 | | | | 353,436 | | | | | |
| 0.000%, 09/15/2035 | | | | | | | | | | | | |
| (Pre-refunded to 09/15/2027) | | | 680,000 | | | | 399,099 | | | | | |
| 0.000%, 09/15/2036 | | | | | | | | | | | | |
| (Pre-refunded to 09/15/2027) | | | 460,000 | | | | 255,718 | | | | | |
| 0.000%, 09/15/2037 | | | | | | | | | | | | |
| (Pre-refunded to 09/15/2027) | | | 110,000 | | | | 57,898 | | | | | |
| Millsap Independent School District, | | | | | | | | | | | | |
| 4.000%, 02/15/2026 (Pre-refunded to | | | | | | | | | | | | |
| 02/15/2024) (PSF Guaranteed) | | | 15,000 | | | | 15,048 | | | | | |
| Montgomery County Health | | | | | | | | | | | | |
| Facilities Development Corp., | | | | | | | | | | | | |
| 0.000%, 07/15/2023 (ETM) | | | 200,000 | | | | 199,801 | | | | | |
| Moulton Independent School District: | | | | | | | | | | | | |
| 4.000%, 08/15/2035 | | | | | | | | | | | | |
| (Callable 08/15/2027) (PSF Guaranteed) | | | 545,000 | | | | 555,644 | | | | | |
| 4.000%, 08/15/2036 | | | | | | | | | | | | |
| (Callable 08/15/2027) (PSF Guaranteed) | | | 285,000 | | | | 289,532 | | | | | |
| Navasota Independent School District, | | | | | | | | | | | | |
| 5.000%, 02/15/2048 (Pre-refunded to | | | | | | | | | | | | |
| 02/15/2025) (PSF Guaranteed) | | | 6,785,000 | | | | 6,983,964 | | | | | |
| New Caney Independent School District: | | | | | | | | | | | | |
| 5.000%, 02/15/2039 | | | | | | | | | | | | |
| (Callable 08/15/2027) (PSF Guaranteed) | | | 500,000 | | | | 530,312 | | | | | |
| 1.250%, 02/15/2050 (Mandatory Tender | | | | | | | | | | | | |
Date 08/15/2024) (PSF Guaranteed)(1) | | | 675,000 | | | | 656,249 | | | | | |
| New Hope Cultural Education | | | | | | | | | | | | |
| Facilities Finance Corp.: | | | | | | | | | | | | |
| 5.000%, 04/01/2025 (ETM) | | | 715,000 | | | | 737,093 | | | | | |
| 5.000%, 04/01/2030 | | | | | | | | | | | | |
| (Pre-refunded to 04/01/2027) | | | 1,150,000 | | | | 1,230,543 | | | | | |
| 5.000%, 04/01/2031 | | | | | | | | | | | | |
| (Pre-refunded to 04/01/2027) | | | 1,180,000 | | | | 1,262,644 | | | | | |
| 5.000%, 04/01/2042 | | | | | | | | | | | | |
| (Pre-refunded to 04/01/2027) | | | 7,755,000 | | | | 8,298,139 | | | | | |
| North Texas Tollway Authority: | | | | | | | | | | | | |
| 0.000%, 09/01/2037 | | | | | | | | | | | | |
| (Pre-refunded to 09/01/2031) | | | 7,175,000 | | | | 3,498,038 | | | | | |
| 0.000%, 09/01/2043 | | | | | | | | | | | | |
| (Pre-refunded to 09/01/2031) | | | 31,895,000 | | | | 9,910,637 | | | | | |
| 0.000%, 09/01/2043 | | | | | | | | | | | | |
(Pre-refunded to 09/01/2031)(5) | | | 8,260,000 | | | | 10,283,374 | | | | | |
| 6.750%, 09/01/2045 | | | | | | | | | | | | |
(Pre-refunded to 09/01/2031)(5) | | | 16,440,000 | | | | 21,082,804 | | | | | |
| Northside Independent School District, | | | | | | | | | | | | |
| 2.000%, 06/01/2052 (Mandatory Tender | | | | | | | | | | | | |
Date 06/01/2027) (PSF Guaranteed)(1) | | | 2,000,000 | | | | 1,884,154 | | | | | |
| Onalaska Independent School District, | | | | | | | | | | | | |
| 4.000%, 08/15/2030 | | | | | | | | | | | | |
| (Callable 08/15/2024) (PSF Guaranteed) | | | 340,000 | | | | 341,657 | | | | | |
| Pasadena Independent School District, | | | | | | | | | | | | |
| 1.500%, 02/15/2044 (Mandatory Tender | | | | | | | | | | | | |
Date 08/15/2024) (PSF Guaranteed)(1) | | | 1,710,000 | | | | 1,665,293 | | | | | |
| Prosper Independent School District, | | | | | | | | | | | | |
| 5.000%, 02/15/2031 | | | | | | | | | | | | |
| (Callable 02/15/2028) (PSF Guaranteed) | | | 1,020,000 | | | | 1,119,949 | | | | | |
| Rockwall Independent School District, | | | | | | | | | | | | |
| 5.000%, 02/15/2038 | | | | | | | | | | | | |
| (Callable 07/31/2023) (PSF Guaranteed) | | | 745,000 | | | | 746,044 | | | | | |
| Sherman Independent School District, | | | | | | | | | | | | |
| 5.000%, 02/15/2026 (Pre-refunded to | | | | | | | | | | | | |
| 02/15/2024) (PSF Guaranteed) | | | 1,775,000 | | | | 1,793,445 | | | | | |
The accompanying notes are an integral part of these financial statements.
Baird Quality Intermediate Municipal Bond Fund
Schedule of Investments, June 30, 2023 (Unaudited)
Long-Term Investments (cont.)
| | | Principal | | | | | | % of | |
| | | Amount | | | Value | | | Net Assets | |
| Smithville Independent School District, | | | | | | | | | |
| 4.000%, 08/15/2033 | | | | | | | | | |
| (Callable 08/15/2028) (PSF Guaranteed) | | $ | 110,000 | | | $ | 113,688 | | | | |
| Socorro Independent School District, | | | | | | | | | | | |
| 4.000%, 08/15/2033 | | | | | | | | | | | |
| (Callable 02/15/2027) (PSF Guaranteed) | | | 900,000 | | | | 920,197 | | | | |
| Sundown Independent School District, | | | | | | | | | | | |
| 5.000%, 08/15/2023 (PSF Guaranteed) | | | 570,000 | | | | 570,972 | | | | |
| Tarrant County Health | | | | | | | | | | | |
| Facilities Development Corp., | | | | | | | | | | | |
| 6.000%, 09/01/2024 (ETM) | | | 2,040,000 | | | | 2,074,853 | | | | |
| Tarrant County Hospital District, | | | | | | | | | | | |
| 5.250%, 08/15/2038 | | | | | | | | | | | |
| (Callable 08/15/2032) | | | 1,200,000 | | | | 1,365,966 | | | | |
| Terrell Independent School District, | | | | | | | | | | | |
| 4.000%, 08/01/2037 | | | | | | | | | | | |
| (Callable 08/01/2026) (PSF Guaranteed) | | | 510,000 | | | | 512,572 | | | | |
| Texas Department of Housing | | | | | | | | | | | |
| & Community Affairs: | | | | | | | | | | | |
| 3.400%, 03/01/2035 | | | | | | | | | | | |
| (Callable 09/01/2034) (Insured by FNMA) | | | 4,611,035 | | | | 4,380,743 | | | | |
| 2.150%, 09/01/2035 | | | | | | | | | | | |
| (Callable 03/01/2029) (Insured by GNMA) | | | 545,000 | | | | 488,320 | | | | |
| 4.000%, 03/01/2050 | | | | | | | | | | | |
| (Callable 09/01/2028) (Insured by GNMA) | | | 815,000 | | | | 809,384 | | | | |
| 5.500%, 09/01/2052 | | | | | | | | | | | |
| (Callable 03/01/2032) (Insured by GNMA) | | | 2,975,000 | | | | 3,153,779 | | | | |
| Texas Municipal Gas Acquisition | | | | | | | | | | | |
| & Supply Corp. II, | | | | | | | | | | | |
| 4.130%, 09/15/2027 | | | | | | | | | | | |
(3 Month LIBOR USD + 0.870%)(2) | | | 4,225,000 | | | | 4,226,106 | | | | |
| Texas State Affordable Housing Corp.: | | | | | | | | | | | |
| 4.250%, 03/01/2049 | | | | | | | | | | | |
| (Callable 03/01/2029) (Insured by GNMA) | | | 160,000 | | | | 159,505 | | | | |
| 5.500%, 09/01/2053 | | | | | | | | | | | |
| (Callable 03/01/2033) (Insured by GNMA) | | | 2,000,000 | | | | 2,111,370 | | | | |
| Texas Water Development Board: | | | | | | | | | | | |
| 4.000%, 10/15/2033 | | | | | | | | | | | |
| (Callable 10/15/2027) | | | 600,000 | | | | 617,432 | | | | |
| 4.000%, 10/15/2036 | | | | | | | | | | | |
| (Callable 10/15/2028) | | | 3,940,000 | | | | 4,022,632 | | | | |
| United Independent School District, | | | | | | | | | | | |
| 5.000%, 08/15/2038 | | | | | | | | | | | |
| (Callable 08/15/2027) (PSF Guaranteed) | | | 225,000 | | | | 236,875 | | | | |
| Webb Consolidated | | | | | | | | | | | |
| Independent School District: | | | | | | | | | | | |
| 4.000%, 02/15/2033 (Pre-refunded to | | | | | | | | | | | |
| 02/15/2025) (PSF Guaranteed) | | | 175,000 | | | | 177,129 | | | | |
| 4.000%, 02/15/2033 (Pre-refunded to | | | | | | | | | | | |
| 02/15/2025) (PSF Guaranteed) | | | 75,000 | | | | 75,912 | | | | |
| Whitehouse Independent School District, | | | | | | | | | | | |
| 5.000%, 02/15/2037 | | | | | | | | | | | |
| (Callable 02/15/2027) (PSF Guaranteed) | | | 1,200,000 | | | | 1,271,090 | | | | |
| Total Texas | | | | | | | | | | | |
| (Cost $280,641,458) | | | | | | | 271,500,008 | | | | 24.9 | % |
| Utah | | | | | | | | | | | | |
| Davis School District, | | | | | | | | | | | | |
| 3.500%, 06/01/2034 (Callable | | | | | | | | | | | | |
| 12/01/2024) (Insured by SCH BD GTY) | | | 2,000,000 | | | | 2,002,154 | | | | | |
| Utah Charter School Finance Authority: | | | | | | | | | | | | |
| 5.000%, 04/15/2024 (Insured by UT CSCE) | | | 235,000 | | | | 237,553 | | | | | |
| 5.000%, 04/15/2037 (Callable | | | | | | | | | | | | |
| 04/15/2026) (Insured by UT CSCE) | | | 500,000 | | | | 511,038 | | | | | |
| Utah Housing Corp., | | | | | | | | | | | | |
| 4.000%, 01/01/2045 Callable | | | | | | | | | | | | |
| (01/01/2026) (Insured by FHA) | | | 2,090,000 | | | | 2,081,296 | | | | | |
| Utah Telecommunication | | | | | | | | | | | | |
| Open Infrastructure Agency, | | | | | | | | | | | | |
| 5.500%, 06/01/2040 (Callable 06/01/2032) | | | 500,000 | | | | 565,820 | | | | | |
| Total Utah | | | | | | | | | | | | |
| (Cost $5,451,675) | | | | | | | 5,397,861 | | | | 0.5 | % |
| Vermont | | | | | | | | | | | | |
| Vermont Housing Finance Agency: | | | | | | | | | | | | |
| 3.600%, 11/01/2036 (Callable 11/01/2025) | | | 1,255,000 | | | | 1,219,986 | | | | | |
| 4.000%, 05/01/2048 | | | | | | | | | | | | |
| (Callable 11/01/2026) (Insured by GNMA) | | | 375,000 | | | | 373,354 | | | | | |
| 4.000%, 11/01/2048 (Callable 05/01/2027) | | | 295,000 | | | | 292,824 | | | | | |
| Total Vermont | | | | | | | | | | | | |
| (Cost $1,954,934) | | | | | | | 1,886,164 | | | | 0.2 | % |
| Virginia | | | | | | | | | | | | |
| Chesapeake Redevelopment | | | | | | | | | | | | |
| & Housing Authority, | | | | | | | | | | | | |
| 5.000%, 05/01/2043 (Mandatory Tender | | | | | | | | | | | | |
Date 05/01/2026) (Insured by HUD)(1) | | | 2,295,000 | | | | 2,360,845 | | | | | |
| Danville Industrial Development Authority, | | | | | | | | | | | | |
| 5.250%, 10/01/2028 | | | | | | | | | | | | |
| (ETM) (Insured by AMBAC) | | | 635,000 | | | | 652,274 | | | | | |
| Federal Home Loan | | | | | | | | | | | | |
| Mortgage Corp. (FHLMC), | | | | | | | | | | | | |
| 2.550%, 06/15/2035 | | | 3,679,923 | | | | 3,064,550 | | | | | |
| Hampton Roads Transportation | | | | | | | | | | | | |
| Accountability Commission, | | | | | | | | | | | | |
| 5.500%, 07/01/2057 | | | | | | | | | | | | |
| (Pre-refunded to 01/01/2028) | | | 15,000,000 | | | | 16,770,057 | | | | | |
| Virginia Resources Authority, | | | | | | | | | | | | |
| 0.000%, 11/01/2027 (ETM) | | | 520,000 | | | | 456,714 | | | | | |
| Virginia Small Business Financing Authority, | | | | | | | | | | | | |
| 5.250%, 10/01/2029 | | | | | | | | | | | | |
| (Callable 10/01/2024) | | | 1,000,000 | | | | 1,017,221 | | | | | |
| Total Virginia | | | | | | | | | | | | |
| (Cost $24,404,172) | | | | | | | 24,321,661 | | | | 2.2 | % |
| Washington | | | | | | | | | | | | |
| Central Puget Sound | | | | | | | | | | | | |
| Regional Transit Authority, | | | | | | | | | | | | |
| 5.000%, 11/01/2032 | | | | | | | | | | | | |
| (Pre-refunded to 11/01/2025) | | | 2,725,000 | | | | 2,850,366 | | | | | |
| Clark County School District No. 114: | | | | | | | | | | | | |
| 4.000%, 12/01/2038 (Callable | | | | | | | | | | | | |
| 06/01/2030) (Insured by SCH BD GTY) | | | 1,000,000 | | | | 1,013,463 | | | | | |
| 5.250%, 12/01/2040 (Callable | | | | | | | | | | | | |
| 06/01/2032) (Insured by SCH BD GTY) | | | 9,400,000 | | | | 10,651,113 | | | | | |
| County of King WA, | | | | | | | | | | | | |
| 5.000%, 07/01/2034 | | | | | | | | | | | | |
| (Pre-refunded to 01/01/2025) | | | 705,000 | | | | 725,039 | | | | | |
| King County Housing Authority: | | | | | | | | | | | | |
| 3.250%, 05/01/2033(Callable | | | | | | | | | | | | |
| 05/01/2028) (County Guaranteed) | | | 1,500,000 | | | | 1,454,080 | | | | | |
| 4.000%, 11/01/2034 (Callable | | | | | | | | | | | | |
| 11/01/2029) (County Guaranteed) | | | 1,520,000 | | | | 1,538,122 | | | | | |
| 4.000%, 11/01/2036 (Callable | | | | | | | | | | | | |
| 11/01/2029) (County Guaranteed) | | | 3,250,000 | | | | 3,243,327 | | | | | |
| State of Washington: | | | | | | | | | | | | |
| 5.000%, 06/01/2035 (Callable 06/01/2028) | | | 1,000,000 | | | | 1,093,490 | | | | | |
| 5.000%, 08/01/2038 (Callable 08/01/2026) | | | 1,225,000 | | | | 1,280,591 | | | | | |
| 4.000%, 07/01/2039 (Callable 07/01/2031) | | | 940,000 | | | | 956,986 | | | | | |
The accompanying notes are an integral part of these financial statements.
Baird Quality Intermediate Municipal Bond Fund
Schedule of Investments, June 30, 2023 (Unaudited)
Long-Term Investments (cont.)
| | | Principal | | | | | | % of | |
| | | Amount | | | Value | | | Net Assets | |
| Washington Health Care Facilities Authority: | | | | | | | | | |
| 5.000%, 09/01/2030 | | $ | 300,000 | | | $ | 327,743 | | | | |
| 5.000%, 09/01/2031 (Callable 09/01/2030) | | | 175,000 | | | | 191,657 | | | | |
| 5.000%, 09/01/2032 (Callable 09/01/2030) | | | 465,000 | | | | 508,731 | | | | |
| 5.000%, 09/01/2033 (Callable 09/01/2030) | | | 190,000 | | | | 207,598 | | | | |
| Washington State Housing | | | | | | | | | | | |
| Finance Commission: | | | | | | | | | | | |
| 6.750%, 07/01/2035 | | | | | | | | | | | |
(Pre-refunded to 07/01/2025)(3) | | | 1,850,000 | | | | 1,956,100 | | | | |
| 2.650%, 12/01/2040 | | | | | | | | | | | |
| (Callable 06/01/2029) (Insured by GNMA) | | | 1,800,000 | | | | 1,425,852 | | | | |
| 2.750%, 12/01/2048 | | | | | | | | | | | |
| (SIFMA Municipal Swap Index + 0.550%) | | | | | | | | | | | |
| (Callable 07/21/2023) | | | | | | | | | | | |
(Mandatory Tender Date 10/01/2023)(2) | | | 4,465,000 | | | | 4,463,474 | | | | |
| 4.000%, 06/01/2049 | | | | | | | | | | | |
| (Callable 06/01/2028) | | | 345,000 | | | | 342,163 | | | | |
| 4.000%, 06/01/2050 | | | | | | | | | | | |
| (Callable 06/01/2029) (Insured by GNMA) | | | 1,345,000 | | | | 1,334,727 | | | | |
| 7.000%, 07/01/2050 | | | | | | | | | | | |
(Pre-refunded to 07/01/2025)(3) | | | 1,845,000 | | | | 1,958,483 | | | | |
| Total Washington | | | | | | | | | | | |
| (Cost $37,460,111) | | | | | | | 37,523,105 | | | | 3.4 | % |
| Wisconsin | | | | | | | | | | | | |
| Baraboo School District, | | | | | | | | | | | | |
| 3.000%, 04/01/2033 | | | | | | | | | | | | |
| (Callable 04/01/2026) (Insured by BAM) | | | 650,000 | | | | 625,238 | | | | | |
| Big Foot Union High School District, | | | | | | | | | | | | |
| 3.000%, 03/01/2032 (Pre-refunded to | | | | | | | | | | | | |
| 03/01/2027) (Insured by BAM) | | | 430,000 | | | | 426,971 | | | | | |
| City of Milwaukee WI, | | | | | | | | | | | | |
| 3.000%, 06/01/2033 (Callable 06/01/2026) | | | 2,500,000 | | | | 2,355,785 | | | | | |
| City of Oshkosh WI, | | | | | | | | | | | | |
| 4.000%, 05/01/2029 (Callable 07/31/2023) | | | 25,000 | | | | 25,017 | | | | | |
| County of Kenosha WI, | | | | | | | | | | | | |
| 3.500%, 09/01/2028 (Callable 09/01/2024) | | | 820,000 | | | | 824,498 | | | | | |
| Lodi School District, | | | | | | | | | | | | |
| 3.750%, 03/01/2037 | | | | | | | | | | | | |
| (Pre-refunded to 03/01/2025) | | | 135,000 | | | | 136,179 | | | | | |
| Public Finance Authority: | | | | | | | | | | | | |
| 5.000%, 03/01/2025 | | | 535,000 | | | | 550,453 | | | | | |
| 5.750%, 11/15/2044 | | | | | | | | | | | | |
(Pre-refunded to 11/15/2024)(3) | | | 1,100,000 | | | | 1,131,184 | | | | | |
| Southeast Wisconsin Professional | | | | | | | | | | | | |
| Baseball Park District: | | | | | | | | | | | | |
| 5.500%, 12/15/2026 (Insured by NATL) | | | 1,630,000 | | | | 1,712,076 | | | | | |
| 0.000%, 12/15/2027 | | | | | | | | | | | | |
| (ETM) (Insured by NATL) | | | 820,000 | | | | 717,779 | | | | | |
| 0.000%, 12/15/2028 | | | | | | | | | | | | |
| (ETM) (Insured by NATL) | | | 800,000 | | | | 682,236 | | | | | |
| 0.000%, 12/15/2029 | | | | | | | | | | | | |
| (ETM) (Insured by NATL) | | | 800,000 | | | | 659,665 | | | | | |
| State of Wisconsin, | | | | | | | | | | | | |
| 5.000%, 05/01/2032 | | | | | | | | | | | | |
| (Pre-refunded to 05/01/2026) | | | 1,000,000 | | | | 1,054,131 | | | | | |
| State of Wisconsin Clean Water | | | | | | | | | | | | |
| Fund Leveraged Loan Portfolio: | | | | | | | | | | | | |
| 5.000%, 06/01/2028 | | | | | | | | | | | | |
| (Pre-refunded to 06/01/2024) | | | 5,430,000 | | | | 5,519,937 | | | | | |
| 5.000%, 06/01/2031 | | | | | | | | | | | | |
| (Pre-refunded to 06/01/2024) | | | 5,475,000 | | | | 5,565,683 | | | | | |
| Town of Ledgeview WI, | | | | | | | | | | | | |
| 5.000%, 12/01/2030 | | | | | | | | | | | | |
| (Callable 12/01/2029) | | | 630,000 | | | | 693,482 | | | | | |
| Village of Mount Pleasant WI: | | | | | | | | | | | | |
| 5.000%, 04/01/2036 | | | | | | | | | | | | |
| (Callable 04/01/2028) | | | 275,000 | | | | 294,526 | | | | | |
| 4.000%, 04/01/2037 (Callable 04/01/2028) | | | 2,400,000 | | | | 2,427,028 | | | | | |
| 5.000%, 04/01/2048 | | | | | | | | | | | | |
| (Callable 04/01/2028) (Insured by BAM) | | | 1,500,000 | | | | 1,542,727 | | | | | |
| Waterford Union High School District, | | | | | | | | | | | | |
| 3.000%, 03/01/2039 | | | | | | | | | | | | |
| (Pre-refunded to 03/01/2029) | | | 665,000 | | | | 658,102 | | | | | |
| West De Pere School District, | | | | | | | | | | | | |
| 2.500%, 04/01/2040 | | | | | | | | | | | | |
| (Pre-refunded to 04/01/2030) | | | 2,500,000 | | | | 2,413,739 | | | | | |
| Wisconsin Center District: | | | | | | | | | | | | |
| 4.000%, 12/15/2029 (Callable 06/15/2026) | | | 1,480,000 | | | | 1,527,671 | | | | | |
| 5.000%, 12/15/2030 (Callable 06/15/2026) | | | 775,000 | | | | 815,076 | | | | | |
| 0.000%, 12/15/2034 | | | | | | | | | | | | |
| (Callable 12/15/2030) (Insured by AGM) | | | 1,810,000 | | | | 1,139,944 | | | | | |
| Wisconsin Health & | | | | | | | | | | | | |
| Educational Facilities Authority: | | | | | | | | | | | | |
| 5.000%, 02/15/2028 | | | | | | | | | | | | |
| (Pre-refunded to 08/15/2025) | | | 20,000 | | | | 20,733 | | | | | |
| 4.000%, 02/15/2033 | | | | | | | | | | | | |
| (Pre-refunded to 08/15/2025) | | | 100,000 | | | | 101,640 | | | | | |
| 5.000%, 11/15/2036 | | | | | | | | | | | | |
| (Callable 05/15/2026) | | | 205,000 | | | | 212,136 | | | | | |
| 4.000%, 02/15/2038 | | | | | | | | | | | | |
| (Pre-refunded to 08/15/2025) | | | 575,000 | | | | 584,429 | | | | | |
| 5.000%, 07/01/2042 | | | | | | | | | | | | |
| (Callable 07/01/2027) | | | 2,000,000 | | | | 2,046,584 | | | | | |
| 5.000%, 09/15/2045 | | | | | | | | | | | | |
| (Pre-refunded to 09/15/2023) | | | 2,545,000 | | | | 2,552,779 | | | | | |
| 4.000%, 11/15/2046 | | | | | | | | | | | | |
| (Pre-refunded to 05/15/2026) | | | 1,470,000 | | | | 1,502,501 | | | | | |
| Wisconsin Housing & | | | | | | | | | | | | |
| Economic Development Authority: | | | | | | | | | | | | |
| 4.625%, 11/01/2043 | | | | | | | | | | | | |
| (Callable 05/01/2032) (Insured by HUD) | | | 435,000 | | | | 438,259 | | | | | |
| 3.500%, 09/01/2046 | | | | | | | | | | | | |
| (Callable 09/01/2025) (Insured by FNMA) | | | 510,000 | | | | 502,549 | | | | | |
| 4.000%, 03/01/2048 | | | | | | | | | | | | |
| (Callable 03/01/2027) (Insured by FNMA) | | | 1,665,000 | | | | 1,654,238 | | | | | |
| 4.000%, 03/01/2048 | | | | | | | | | | | | |
| (Callable 03/01/2027) | | | 310,000 | | | | 307,896 | | | | | |
| 4.250%, 03/01/2049 | | | | | | | | | | | | |
| (Callable 09/01/2028) (Insured by FNMA) | | | 1,265,000 | | | | 1,262,803 | | | | | |
| Total Wisconsin | | | | | | | | | | | | |
| (Cost $45,726,254) | | | | | | | 44,685,674 | | | | 4.1 | % |
| Wyoming | | | | | | | | | | | | |
| Wyoming Community | | | | | | | | | | | | |
| Development Authority: | | | | | | | | | | | | |
| 4.000%, 12/01/2043 (Callable 06/01/2027) | | | 175,000 | | | | 174,396 | | | | | |
| 4.000%, 12/01/2048 (Callable 06/01/2028) | | | 1,645,000 | | | | 1,631,473 | | | | | |
| Total Wyoming | | | | | | | | | | | | |
| (Cost $1,886,455) | | | | | | | 1,805,869 | | | | 0.2 | % |
| Total Municipal Bonds | | | | | | | | | | | | |
| (Cost $1,095,941,246) | | | | | | | 1,069,519,573 | | | | 98.2 | % |
| Total Long-Term Investments | | | | | | | | | | | | |
| (Cost $1,106,915,895) | | | | | | | 1,080,303,440 | | | | 99.2 | % |
The accompanying notes are an integral part of these financial statements.
Baird Quality Intermediate Municipal Bond Fund
Schedule of Investments, June 30, 2023 (Unaudited)
Short-Term Investment
| | | | | | | | | % of | |
| | | Shares | | | Value | | | Net Assets | |
| Money Market Mutual Fund | | | | | | | | | |
| Federated Hermes Institutional Tax-Free | | | | | | | | | |
Cash Trust, Premier Shares, 4.04%(4) | | | 3,341,385 | | | $ | 3,341,385 | | | | |
| Total Short-Term Investment | | | | | | | | | | | |
| (Cost $3,341,385) | | | | | | | 3,341,385 | | | | 0.3 | % |
| Total Investments | | | | | | | | | | | | |
| (Cost $1,110,257,280) | | | | | | | 1,083,644,825 | | | | 99.5 | % |
| Other Assets in Excess of Liabilities | | | | | | | 5,829,846 | | | | 0.5 | % |
| TOTAL NET ASSETS | | | | | | $ | 1,089,474,671 | | | | 100.0 | % |
Notes to Schedule of Investments
AGC – Assured Guaranty Corp.
AGM – Assured Guaranty Municipal
AMBAC – Ambac Assurance Corp.
BAM – Build America Mutual Assurance Co.
BHAC – Berkshire Hathaway Assurance Corp.
FGIC – Financial Guaranty Insurance Company
FHA – Federal Housing Administration
FHLMC – Federal Home Loan Mortgage Corporation
FNMA – Federal National Mortgage Association
GNMA – Government National Mortgage Association
HUD – US Department of Housing and Development
MT BRD – Montana Board of Investments
NATL – National Public Finance Guarantee Corp.
Q-SBLF – Qualified School Building Loan Fund
SCH BD GTY – School Board Guaranty
SD CRED PROG – State Credit Enhancement Program
SONYMA – State of New York Mortgage Agency
ST AID – State Aid Intercept/Withholding
UT CSCE – Utah Charter School Credit Enhancement Program
ETM – Escrowed to Maturity
LIBOR – London Inter-bank Offered Rate
PSF – Permanent School Fund
SIFMA – Securities Industry and Financial Markets Association
SOFR – Secured Overnight Financing Rate
(1) | Variable rate security. The rate reported is the rate in effect as of June 30, 2023. |
(2) | Variable rate security based on a reference index and spread. The rate reported is the rate as of the last reset date in effect as of June 30, 2023. |
(3) | Includes securities exempt from registration under Rule 144A of the Securities Act of 1933. These securities may be resold in transactions exempt from registration to qualified institutional buyers. At June 30, 2023, the value of these securities totaled $29,895,742, which represented 2.74% of total net assets. |
(4) | Seven-day yield. |
(5) | Step-up bond; the interest rate shown is the rate in effect as of June 30, 2023. |
(6) | Security or a portion of the security purchased on a when-issued or delayed delivery basis. |
The accompanying notes are an integral part of these financial statements.
Baird Quality Intermediate Municipal Bond Fund
Schedule of Investments, June 30, 2023 (Unaudited)
Summary of Fair Value Exposure at June 30, 2023 (Unaudited)
The Fund has adopted authoritative fair valuation accounting standards which establish a definition of fair value and set out a hierarchy for measuring fair value. These standards require additional disclosures about the various inputs and valuation techniques used to develop the measurements of fair value and a discussion on changes in valuation techniques and related inputs during the period. These standards define fair value as the price that would be received to sell an asset or paid to transfer a liability in an orderly transaction between market participants at the measurement date.
The fair value hierarchy is organized into three levels based upon the assumptions (referred to as “inputs”) used in pricing the asset or liability. These standards state that “observable inputs” reflect the assumptions market participants would use in pricing the asset or liability based on market data obtained from independent sources and “unobservable inputs” reflect an entity’s own assumptions about the assumptions market participants would use in pricing the asset or liability. These inputs are summarized into three broad levels and described below:
Level 1 – Quoted prices (unadjusted) in active markets for identical assets or liabilities that the reporting entity can access at the measurement date.
Level 2 – Inputs other than quoted prices included within Level 1 that are observable for the asset or liability, either directly or indirectly.
Level 3 – Unobservable inputs for the asset or liability.
The inputs or methodology used for valuing securities are not necessarily an indication of the risk associated with investing in those securities.
The following is a summary of the inputs used to value the Fund’s investments as of June 30, 2023:
| | | Level 1 | | | Level 2 | | | Level 3 | | | Total | |
| Long-Term Investments | | | | | | | | | | | | |
| U.S. Treasury Security | | $ | — | | | $ | 10,783,867 | | | $ | — | | | $ | 10,783,867 | |
| Municipal Bonds | | | — | | | | 1,069,519,573 | | | | — | | | | 1,069,519,573 | |
| Total Long-Term Investments | | | — | | | | 1,080,303,440 | | | | — | | | | 1,080,303,440 | |
| Short-Term Investment | | | | | | | | | | | | | | | | |
| Money Market Mutual Fund | | | 3,341,385 | | | | — | | | | — | | | | 3,341,385 | |
| Total Short-Term Investment | | | 3,341,385 | | | | — | | | | — | | | | 3,341,385 | |
| Total Investments | | $ | 3,341,385 | | | $ | 1,080,303,440 | | | $ | — | | | $ | 1,083,644,825 | |
Changes in valuation techniques may result in transfers into or out of assigned levels within the fair value hierarchy. There were no transfers into or out of Level 3 during the reporting period, as compared to the security classifications from the prior year’s annual report. See the Fund’s Valuation Policy in Note 2a to the financial statements.
The accompanying notes are an integral part of these financial statements.
Baird Core Intermediate Municipal Bond Fund
June 30, 2023 (Unaudited)
Portfolio Characteristics
Quality Distribution(1)(2)
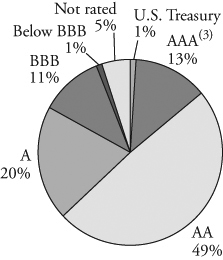
| | Net Assets | $2,628,272,570 | |
| | | | |
| | SEC 30-Day Yield(4) | | |
| | Institutional Class | 3.50% | |
| | Investor Class | 3.25% | |
| | | | |
| | Average Effective Duration | 4.60 years | |
| | | | |
| | Average Effective Maturity | 4.94 years | |
| | | | |
| | Annualized Expense Ratio(5) | | |
| | Institutional Class | 0.30% | |
| | Investor Class | 0.55% | (6) |
| | | | |
| | Portfolio Turnover Rate | 12% | (7) |
| | | | |
| | | Number of Holdings | 2,008 | |
| | | | | |
Sector Weightings(1) | | | | |
| | | | | |
 | | | | |
| | | | |
| | | | |
| | | | |
| | | | |
| | | | |
| | | | |
| | | | |
| | | | |
| | | | |
| | | | |
| | | | |
| | | | |
| | | | |
| | | | | |
(1) | Percentages shown are based on the Fund’s total investments. |
(2) | The quality profile is calculated on a market value-weighted basis using the highest credit quality rating for each security held by the Fund given by S&P, Moody’s or Fitch, each of which is a Nationally Recognized Statistical Rating Organization (NRSRO). NRSROs rate the credit quality of securities using a scale that generally ranges from AAA (highest) to D (lowest). |
(3) | Includes pre-refunded and escrowed-to-maturity (ETM) bonds. |
(4) | SEC yields are based on SEC guidelines and are calculated for the 30 days ended June 30, 2023. |
(5) | Reflects expense ratios as stated in the Fund’s current prospectus dated May 1, 2023. |
(6) | Includes 0.25% 12b-1 fee. |
(7) | Not annualized. |
Baird Core Intermediate Municipal Bond Fund
June 30, 2023 (Unaudited)
Total Returns
| | | | Average Annual |
| | Six | One | Three | Five | Since |
| For the Periods Ended June 30, 2023 | Months | Year | Years | Years | Inception(1) |
| Institutional Class Shares | 2.02% | 2.93% | 0.05% | 2.12% | 2.39% |
| Investor Class Shares | 1.90% | 2.67% | -0.23% | 1.85% | 2.13% |
Bloomberg 1-15 Year Municipal Index(2) | 1.85% | 2.78% | -0.32% | 1.83% | 1.94% |
(1) | For the period from August 31, 2015 (inception date) through June 30, 2023. |
(2) | The Bloomberg 1-15 Year Municipal Index is an unmanaged, market value weighted index of investment-grade, tax-exempt, and fixed-rate securities with maturities between 1 and 17 years. Securities must have an outstanding par value of at least $7 million and be issued as part of a transaction of at least $75 million. The bonds must be fixed rate, have a dated-date after December 31, 1990, and must be at least one year from their maturity date. This Index does not reflect any deduction for fees, expenses or taxes. A direct investment in an index is not possible. |
The returns table shown above reflects reinvestment of dividends and/or capital gains distributions in additional shares. The returns in the table do not reflect the deduction of taxes that a shareholder would pay on Fund distributions or the redemption of Fund shares. The returns reflect the actual performance for each period and do not include the impact of trades executed on the last business day of the period that were recorded on the first business day of the next period.
The Fund’s expense ratio for each Class, as reflected in the Fund’s current prospectus, is set forth under “Portfolio Characteristics”.
The Fund may invest up to 10% of its net assets in non-investment grade debt securities (commonly referred to as “high yield” bonds). While these types of debt securities typically offer higher yields than investment grade securities, they also include greater risks including increased credit risk and the increased risk of default or bankruptcy. The Fund may invest up to 25% of its total assets in municipal obligations issued by persons in the same state. As a result, changes in economic, business or political conditions of a particular state may have a disproportionate impact on the Fund’s share price. Municipal securities investments are not appropriate for all investors, especially those taxed at lower rates. U.S. and international markets have experienced significant periods of volatility in recent years and months due to a number of economic, political and global macro factors. Russia’s ongoing war with Ukraine has heightened global geopolitical tensions, resulting in an elevated risk environment and increased volatility in asset prices. The uncertain course of the war may have a significant negative impact on the global economy. U.S. relations with China have become increasingly strained, and tension between the U.S. and China may have a significant negative impact on the global economy and asset prices. Measures of inflation reached levels not experienced in several decades, leading the Federal Reserve to raise short term interest rates significantly over the last year, with the potential for further rate increases in 2023. Uncertainty regarding the ability of the Federal Reserve to successfully control inflation, the potential for incremental rate increases, and the full impact of prior rate increases on the economy may negatively impact asset prices and increase market volatility. The possibility of a U.S. or global recession may also contribute to market volatility. The coronavirus (COVID-19) pandemic caused significant economic disruption in recent years as countries worked to limit the negative health impacts of the virus. While the virus has entered an endemic stage, significant outbreaks or new variants present a continued risk to the global economy. These and other geopolitical events may cause market disruptions and could have an adverse effect on the value of the Fund’s investments.
Past performance does not guarantee future results. Investment return and principal value will fluctuate so that an investor’s shares, when redeemed, may be worth more or less than their original cost.
For information about the performance of the Fund as of the most recent month-end, please call 1-866-442-2473 or visit www.bairdfunds.com. Mutual fund performance changes over time and current performance may be lower or higher than that stated.
Baird Core Intermediate Municipal Bond Fund
Schedule of Investments, June 30, 2023 (Unaudited)
Long-Term Investments
| | | Principal | | | | | | % of | |
| | | Amount | | | Value | | | Net Assets | |
| U.S. Treasury Security | | | | | | | | | |
| U.S. Treasury Bonds, | | | | | | | | | |
| 3.875%, 03/31/2025 | | $ | 25,000,000 | | | $ | 24,508,789 | | | | |
| Total U.S. Treasury Security | | | | | | | | | | | |
| (Cost $24,942,383) | | | | | | | 24,508,789 | | | | 0.9 | % |
| Municipal Bonds | | | | | | | | | | | | |
| Alabama | | | | | | | | | | | | |
| Alabama Community College System: | | | | | | | | | | | | |
| 3.500%, 11/01/2024 (Insured by BAM) | | | 1,010,000 | | | | 1,013,104 | | | | | |
| 3.500%, 11/01/2025 (Insured by BAM) | | | 1,100,000 | | | | 1,099,300 | | | | | |
| 5.000%, 10/01/2028 | | | | | | | | | | | | |
| (Callable 10/01/2026) (Insured by AGM) | | | 310,000 | | | | 324,796 | | | | | |
| Alabama Economic Settlement Authority, | | | | | | | | | | | | |
| 4.000%, 09/15/2033 (Callable 09/15/2026) | | | 5,810,000 | | | | 5,821,829 | | | | | |
| Alabama Housing Finance Authority, | | | | | | | | | | | | |
| 3.500%, 08/01/2025 (Mandatory Tender | | | | | | | | | | | | |
Date 08/01/2024) (Insured by HUD)(1) | | | 5,000,000 | | | | 4,972,399 | | | | | |
| Birmingham Airport Authority: | | | | | | | | | | | | |
| 5.000%, 07/01/2027 (Insured by BAM) | | | 500,000 | | | | 538,067 | | | | | |
| 4.000%, 07/01/2036 | | | | | | | | | | | | |
| (Callable 07/01/2030) (Insured by BAM) | | | 360,000 | | | | 368,218 | | | | | |
| 4.000%, 07/01/2037 | | | | | | | | | | | | |
| (Callable 07/01/2030) (Insured by BAM) | | | 500,000 | | | | 507,489 | | | | | |
| Black Belt Energy Gas District: | | | | | | | | | | | | |
| 5.000%, 06/01/2024 | | | 200,000 | | | | 201,990 | | | | | |
| 5.000%, 12/01/2024 | | | 375,000 | | | | 380,739 | | | | | |
| 5.000%, 12/01/2025 | | | 200,000 | | | | 204,893 | | | | | |
| 5.000%, 06/01/2026 | | | 250,000 | | | | 257,112 | | | | | |
| 5.000%, 12/01/2026 | | | 400,000 | | | | 413,540 | | | | | |
| 4.000%, 12/01/2049 (Callable 09/01/2025) | | | | | | | | | | | | |
(Mandatory Tender Date 12/01/2025)(1) | | | 625,000 | | | | 621,351 | | | | | |
| 4.000%, 07/01/2052 (Callable 03/01/2027) | | | | | | | | | | | | |
(Mandatory Tender Date 06/01/2027)(1) | | | 4,000,000 | | | | 3,987,544 | | | | | |
| 2.550%, 10/01/2052 | | | | | | | | | | | | |
| (SIFMA Municipal Swap Index + 0.350%) | | | | | | | | | | | | |
| (Callable 09/01/2026) | | | | | | | | | | | | |
(Mandatory Tender Date 12/01/2026)(2) | | | 3,000,000 | | | | 2,916,939 | | | | | |
| 5.000%, 05/01/2053 | | | | | | | | | | | | |
(Mandatory Tender Date 06/01/2028)(1) | | | 12,500,000 | | | | 13,085,380 | | | | | |
| 5.500%, 11/01/2053 (Callable 09/01/2028) | | | | | | | | | | | | |
(Mandatory Tender Date 12/01/2028)(1) | | | 2,000,000 | | | | 2,111,235 | | | | | |
| Chatom Industrial Development Board, | | | | | | | | | | | | |
| 3.250%, 08/01/2037 | | | 3,750,000 | | | | 3,732,853 | | | | | |
| Chilton County Health Care Authority, | | | | | | | | | | | | |
| 4.000%, 11/01/2045 | | | | | | | | | | | | |
| (Callable 11/01/2025) | | | 205,000 | | | | 197,598 | | | | | |
| City of Birmingham AL: | | | | | | | | | | | | |
| 5.000%, 03/01/2040 | | | | | | | | | | | | |
(Pre-refunded to 09/01/2025)(5) | | | 205,000 | | | | 213,368 | | | | | |
| 5.000%, 03/01/2045 | | | | | | | | | | | | |
(Pre-refunded to 09/01/2025)(5) | | | 1,205,000 | | | | 1,254,188 | | | | | |
| City of Troy AL, | | | | | | | | | | | | |
| 5.000%, 07/01/2031 | | | | | | | | | | | | |
| (Callable 07/01/2025) (Insured by BAM) | | | 555,000 | | | | 573,645 | | | | | |
| County of Elmore AL: | | | | | | | | | | | | |
| 4.000%, 05/01/2024 (Insured by BAM) | | | 420,000 | | | | 421,370 | | | | | |
| 4.000%, 05/01/2025 (Insured by BAM) | | | 540,000 | | | | 543,264 | | | | | |
| 4.000%, 05/01/2026 (Insured by BAM) | | | 400,000 | | | | 404,089 | | | | | |
| 4.200%, 05/01/2042 | | | | | | | | | | | | |
| (Callable 05/01/2032) (Insured by BAM) | | | 1,625,000 | | | | 1,563,985 | | | | | |
| 5.000%, 05/01/2047 | | | | | | | | | | | | |
| (Callable 05/01/2032) (Insured by BAM) | | | 1,000,000 | | | | 1,061,141 | | | | | |
| County of Jefferson AL: | | | | | | | | | | | | |
| 0.000%, 10/01/2025 (Callable 10/01/2023) | | | | | | | | | | | | |
| (Insured by AGM) | | | 1,000,000 | | | | 890,726 | | | | | |
| 5.000%, 09/15/2029 (Callable 03/15/2027) | | | 570,000 | | | | 602,223 | | | | | |
| 0.000%, 10/01/2034 | | | | | | | | | | | | |
| (Callable 10/01/2023) (Insured by AGM) | | | 480,000 | | | | 242,789 | | | | | |
| 5.250%, 10/01/2048 | | | | | | | | | | | | |
| (Callable 10/01/2023) (Insured by AGM) | | | 125,000 | | | | 127,588 | | | | | |
| Homewood Educational Building Authority: | | | | | | | | | | | | |
| 4.000%, 12/01/2033 (Callable 12/01/2029) | | | 785,000 | | | | 797,609 | | | | | |
| 4.000%, 12/01/2034 (Callable 12/01/2029) | | | 255,000 | | | | 257,783 | | | | | |
| Industrial Development Board | | | | | | | | | | | | |
| of the City of Mobile, | | | | | | | | | | | | |
| 3.920%, 06/01/2034 | | | | | | | | | | | | |
(Mandatory Tender Date 06/02/2026)(1) | | | 13,000,000 | | | | 13,000,000 | | | | | |
| Jefferson County Board of Education, | | | | | | | | | | | | |
| 5.000%, 02/01/2042 (Callable 02/01/2028) | | | 825,000 | | | | 864,498 | | | | | |
| Leeds Public Educational Building Authority, | | | | | | | | | | | | |
| 4.000%, 04/01/2034 | | | | | | | | | | | | |
| (Callable 10/01/2025) (Insured by AGM) | | | 450,000 | | | | 458,861 | | | | | |
| Madison Water & Wastewater Board, | | | | | | | | | | | | |
| 4.000%, 12/01/2037 (Callable 12/01/2029) | | | 530,000 | | | | 538,243 | | | | | |
| Orange Beach Water Sewer | | | | | | | | | | | | |
| & Fire Protection Authority, | | | | | | | | | | | | |
| 4.125%, 05/15/2052 (Callable 05/15/2032) | | | 2,250,000 | | | | 2,175,680 | | | | | |
| Southeast Alabama Gas Supply District, | | | | | | | | | | | | |
| 4.337%, 06/01/2049 (1 Month LIBOR | | | | | | | | | | | | |
| USD + 0.850%) (Callable 03/01/2024) | | | | | | | | | | | | |
(Mandatory Tender Date 06/01/2024)(2) | | | 5,140,000 | | | | 5,140,095 | | | | | |
| Southeast Energy Authority | | | | | | | | | | | | |
| A Cooperative District: | | | | | | | | | | | | |
| 5.000%, 07/01/2025 | | | 650,000 | | | | 661,174 | | | | | |
| 5.500%, 01/01/2053 (Callable 09/01/2029) | | | | | | | | | | | | |
(Mandatory Tender Date 12/01/2029)(1) | | | 7,000,000 | | | | 7,443,427 | | | | | |
| 5.000%, 05/01/2053 (Callable 05/01/2028) | | | | | | | | | | | | |
(Mandatory Tender Date 08/01/2028)(1) | | | 2,000,000 | | | | 2,067,738 | | | | | |
| 5.250%, 01/01/2054 (Callable 04/01/2029) | | | | | | | | | | | | |
(Mandatory Tender Date 07/01/2029)(1) | | | 12,490,000 | | | | 13,059,488 | | | | | |
| Tallassee Board of Education: | | | | | | | | | | | | |
| 4.000%, 08/01/2030 (Insured by AGM) | | | 435,000 | | | | 456,970 | | | | | |
| 4.000%, 08/01/2031 | | | | | | | | | | | | |
| (Callable 08/01/2030) (Insured by AGM) | | | 455,000 | | | | 475,128 | | | | | |
| 4.000%, 08/01/2032 | | | | | | | | | | | | |
| (Callable 08/01/2030) (Insured by AGM) | | | 470,000 | | | | 485,772 | | | | | |
| Total Alabama | | | | | | | | | | | | |
| (Cost $99,665,920) | | | | | | | 98,537,218 | | | | 3.8 | % |
| Alaska | | | | | | | | | | | | |
| Alaska Housing Finance Corp.: | | | | | | | | | | | | |
| 5.000%, 12/01/2029 | | | | | | | | | | | | |
| (Pre-refunded to 06/01/2024) | | | 225,000 | | | | 228,727 | | | | | |
| 4.000%, 06/01/2036 | | | | | | | | | | | | |
| (Pre-refunded to 06/01/2025) | | | 505,000 | | | | 513,744 | | | | | |
| 4.000%, 06/01/2036 (Callable 06/01/2025) | | | 1,245,000 | | | | 1,247,080 | | | | | |
| Alaska Industrial Development | | | | | | | | | | | | |
| & Export Authority: | | | | | | | | | | | | |
| 4.000%, 04/01/2030 (Callable 04/01/2029) | | | 2,745,000 | | | | 2,760,219 | | | | | |
| 4.000%, 10/01/2034 (Callable 10/01/2029) | | | 1,585,000 | | | | 1,600,199 | | | | | |
| Alaska Municipal Bond Bank Authority, | | | | | | | | | | | | |
| 5.000%, 08/01/2027 | | | | | | | | | | | | |
| (Pre-refunded to 08/01/2023) | | | 500,000 | | | | 500,575 | | | | | |
| University of Alaska, | | | | | | | | | | | | |
| 4.000%, 10/01/2026 | | | | | | | | | | | | |
| (Callable 10/01/2023) | | | 650,000 | | | | 650,638 | | | | | |
| Total Alaska | | | | | | | | | | | | |
| (Cost $7,650,288) | | | | | | | 7,501,182 | | | | 0.3 | % |
The accompanying notes are an integral part of these financial statements.
Baird Core Intermediate Municipal Bond Fund
Schedule of Investments, June 30, 2023 (Unaudited)
Long-Term Investments (cont.)
| | | Principal | | | | | | % of | |
| | | Amount | | | Value | | | Net Assets | |
| Arizona | | | | | | | | | |
| Apache County Unified School District No. 8, | | | | | | | | | |
| 4.125%, 07/01/2042 | | | | | | | | | |
| (Callable 07/01/2032) | | $ | 1,625,000 | | | $ | 1,563,344 | | | | |
| Arizona Industrial Development Authority: | | | | | | | | | | | |
| 5.000%, 05/01/2028 | | | 270,000 | | | | 189,000 | | | | |
4.625%, 08/01/2028(3) | | | 1,160,000 | | | | 1,127,032 | | | | |
| 3.550%, 07/15/2029 (Callable 07/15/2027) | | | 1,155,000 | | | | 1,085,311 | | | | |
| 5.000%, 07/01/2032 (Callable 07/01/2026) | | | 205,000 | | | | 211,424 | | | | |
| 3.625%, 05/20/2033 | | | 6,074,971 | | | | 5,655,341 | | | | |
| 5.000%, 07/01/2033 (Callable 07/01/2026) | | | 340,000 | | | | 350,110 | | | | |
| 4.000%, 07/01/2034 (Callable 07/01/2026) | | | 230,000 | | | | 223,155 | | | | |
| 4.000%, 07/01/2035 (Callable 07/01/2026) | | | 475,000 | | | | 455,753 | | | | |
| BluePath TE Trust, | | | | | | | | | | | |
| 2.750%, 09/01/2026 | | | | | | | | | | | |
(Callable 07/31/2023)(3) | | | 2,024,500 | | | | 2,025,775 | | | | |
| Chandler Industrial Development Authority, | | | | | | | | | | | |
| 5.000%, 06/01/2049 | | | | | | | | | | | |
(Mandatory Tender Date 06/03/2024)(1) | | | 1,500,000 | | | | 1,511,550 | | | | |
| City of Phoenix Civic Improvement Corp.: | | | | | | | | | | | |
| 5.000%, 07/01/2028 | | | 1,800,000 | | | | 1,926,791 | | | | |
| 5.000%, 07/01/2034 (Callable 07/01/2027) | | | 250,000 | | | | 268,049 | | | | |
| City of Tucson AZ, | | | | | | | | | | | |
| 5.000%, 07/01/2032 (Callable 07/01/2025) | | | 500,000 | | | | 517,785 | | | | |
| Industrial Development Authority | | | | | | | | | | | |
| of the City of Phoenix, | | | | | | | | | | | |
| 4.000%, 10/01/2047 (Callable 10/01/2026) | | | 115,000 | | | | 104,894 | | | | |
| Maricopa County Department | | | | | | | | | | | |
| of Public Health, | | | | | | | | | | | |
| 5.000%, 07/01/2033 (Callable 07/01/2028) | | | 300,000 | | | | 328,692 | | | | |
| Maricopa County Industrial | | | | | | | | | | | |
| Development Authority: | | | | | | | | | | | |
| 5.000%, 07/01/2028 | | | | | | | | | | | |
| (Insured by SD CRED PROG) | | | 755,000 | | | | 796,140 | | | | |
| 5.000%, 01/01/2040 | | | | | | | | | | | |
| (Pre-refunded to 01/01/2025) | | | 3,740,000 | | | | 3,887,117 | | | | |
| 4.000%, 01/01/2045 (Callable 07/01/2030) | | | 7,000,000 | | | | 6,753,343 | | | | |
| Maricopa County Unified | | | | | | | | | | | |
| School District No. 4: | | | | | | | | | | | |
| 5.000%, 07/01/2024 | | | 450,000 | | | | 458,331 | | | | |
| 5.000%, 07/01/2026 | | | 1,000,000 | | | | 1,059,385 | | | | |
| Salt Verde Financial Corp., | | | | | | | | | | | |
| 5.250%, 12/01/2023 | | | 200,000 | | | | 200,695 | | | | |
| Total Arizona | | | | | | | | | | | |
| (Cost $30,718,439) | | | | | | | 30,699,017 | | | | 1.2 | % |
| Arkansas | | | | | | | | | | | | |
| Arkansas Development Finance Authority: | | | | | | | | | | | | |
| 4.000%, 12/01/2031 (Callable 12/01/2027) | | | 380,000 | | | | 390,993 | | | | | |
| 4.000%, 12/01/2032 (Callable 12/01/2027) | | | 400,000 | | | | 411,659 | | | | | |
| 4.000%, 12/01/2035 (Callable 12/01/2027) | | | 445,000 | | | | 452,898 | | | | | |
| 4.000%, 12/01/2038 (Callable 12/01/2027) | | | 250,000 | | | | 248,903 | | | | | |
| 4.250%, 07/01/2041 (Callable 07/01/2028) | | | 500,000 | | | | 445,781 | | | | | |
| 3.490%, 09/01/2044 (Callable 07/03/2023) | | | | | | | | | | | | |
(Optional Put Date 07/07/2023)(1) | | | 3,000,000 | | | | 3,000,000 | | | | | |
| Arkansas Technical University, | | | | | | | | | | | | |
| 4.000%, 06/01/2028 (Callable 07/31/2023) | | | 1,025,000 | | | | 1,025,533 | | | | | |
| Benton Washington Regional | | | | | | | | | | | | |
| Public Water Authority: | | | | | | | | | | | | |
| 4.000%, 10/01/2033 | | | | | | | | | | | | |
| (Callable 10/01/2029) (Insured by BAM) | | | 250,000 | | | | 260,458 | | | | | |
| 3.000%, 10/01/2041 | | | | | | | | | | | | |
| (Callable 10/01/2028) (Insured by BAM) | | | 510,000 | | | | 433,761 | | | | | |
| Carroll-Boone Water District: | | | | | | | | | | | | |
| 3.000%, 12/01/2028 | | | | | | | | | | | | |
| (Callable 12/01/2025) | | | 780,000 | | | | 759,790 | | | | | |
| 3.000%, 12/01/2029 (Callable 12/01/2025) | | | 505,000 | | | | 493,209 | | | | | |
| 3.000%, 12/01/2030 (Callable 12/01/2025) | | | 630,000 | | | | 618,898 | | | | | |
| City of Beebe AR, | | | | | | | | | | | | |
| 3.000%, 08/01/2041 | | | | | | | | | | | | |
| (Callable 08/01/2028) (Insured by AGM) | | | 1,500,000 | | | | 1,260,908 | | | | | |
| City of Cabot AR, | | | | | | | | | | | | |
| 3.000%, 12/01/2056 (Callable 12/01/2028) | | | 2,000,000 | | | | 1,460,439 | | | | | |
| City of Fayetteville AR, | | | | | | | | | | | | |
| 3.050%, 01/01/2047 (Callable 01/01/2027) | | | 560,000 | | | | 543,064 | | | | | |
| City of Heber Springs AR, | | | | | | | | | | | | |
| 3.000%, 11/01/2034 | | | | | | | | | | | | |
| (Callable 11/01/2024) (Insured by BAM) | | | 685,000 | | | | 647,584 | | | | | |
| City of Magnolia AR, | | | | | | | | | | | | |
| 3.200%, 08/01/2033 | | | | | | | | | | | | |
| (Callable 08/01/2023) (Insured by BAM) | | | 105,000 | | | | 104,988 | | | | | |
| City of Maumelle AR: | | | | | | | | | | | | |
| 4.000%, 08/01/2026 (Callable 08/01/2025) | | | 25,000 | | | | 25,134 | | | | | |
| 4.000%, 08/01/2028 (Callable 08/01/2025) | | | 290,000 | | | | 291,877 | | | | | |
| 4.000%, 08/01/2029 (Callable 08/01/2025) | | | 700,000 | | | | 704,760 | | | | | |
| City of North Little Rock AR: | | | | | | | | | | | | |
| 4.000%, 11/01/2028 (Callable 05/01/2027) | | | 645,000 | | | | 667,358 | | | | | |
| 4.000%, 11/01/2030 (Callable 05/01/2027) | | | 650,000 | | | | 673,058 | | | | | |
| City of Pine Bluff AR, | | | | | | �� | | | | | | |
| 3.000%, 02/01/2047 | | | | | | | | | | | | |
| (Callable 08/01/2027) (Insured by BAM) | | | 565,000 | | | | 539,711 | | | | | |
| City of Rogers AR, | | | | | | | | | | | | |
| 3.250%, 11/01/2043 (Callable 11/01/2026) | | | 120,000 | | | | 119,798 | | | | | |
| City of Russellville AR, | | | | | | | | | | | | |
| 4.000%, 07/01/2028 | | | | | | | | | | | | |
| (Callable 07/01/2025) (Insured by AGM) | | | 325,000 | | | | 331,026 | | | | | |
| City of Springdale AR, | | | | | | | | | | | | |
| 5.000%, 08/01/2038 | | | | | | | | | | | | |
(Callable 02/01/2030) (Insured by BAM)(6) | | | 240,000 | | | | 256,587 | | | | | |
| City of West Memphis AR, | | | | | | | | | | | | |
| 3.000%, 12/01/2041 | | | | | | | | | | | | |
| (Callable 12/01/2028) (Insured by BAM) | | | 1,750,000 | | | | 1,441,692 | | | | | |
| Conway Health Facilities Board, | | | | | | | | | | | | |
| 5.000%, 08/01/2029 (Callable 08/01/2026) | | | 360,000 | | | | 373,245 | | | | | |
| Jackson County Special School District, | | | | | | | | | | | | |
| 1.500%, 02/01/2024 | | | | | | | | | | | | |
| (Callable 07/31/2023) (Insured by ST AID) | | | 60,000 | | | | 59,192 | | | | | |
| National Park College District, | | | | | | | | | | | | |
| 3.000%, 05/01/2025 (Callable 11/01/2024) | | | 235,000 | | | | 231,028 | | | | | |
| Salem Public Water Authority: | | | | | | | | | | | | |
| 5.000%, 01/01/2028 (Insured by BAM) | | | 120,000 | | | | 128,957 | | | | | |
| 3.000%, 01/01/2030 | | | | | | | | | | | | |
| (Callable 01/01/2028) (Insured by BAM) | | | 340,000 | | | | 335,922 | | | | | |
| 3.000%, 01/01/2032 | | | | | | | | | | | | |
| (Callable 01/01/2028) (Insured by BAM) | | | 255,000 | | | | 247,213 | | | | | |
| Southern Arkansas University: | | | | | | | | | | | | |
| 4.000%, 03/01/2025 (Insured by AGM) | | | 415,000 | | | | 419,603 | | | | | |
| 4.000%, 03/01/2026 | | | | | | | | | | | | |
| (Callable 03/01/2025) (Insured by AGM) | | | 520,000 | | | | 524,923 | | | | | |
| 4.000%, 03/01/2026 | | | | | | | | | | | | |
| (Callable 03/01/2025) (Insured by AGM) | | | 270,000 | | | | 273,121 | | | | | |
| 4.000%, 03/01/2027 | | | | | | | | | | | | |
| (Callable 03/01/2025) (Insured by AGM) | | | 545,000 | | | | 550,020 | | | | | |
| 4.000%, 03/01/2027 | | | | | | | | | | | | |
| (Callable 03/01/2025) (Insured by AGM) | | | 275,000 | | | | 278,374 | | | | | |
The accompanying notes are an integral part of these financial statements.
Baird Core Intermediate Municipal Bond Fund
Schedule of Investments, June 30, 2023 (Unaudited)
Long-Term Investments (cont.)
| | | Principal | | | | | | % of | |
| | | Amount | | | Value | | | Net Assets | |
| University of Central Arkansas: | | | | | | | | | |
| 4.000%, 11/01/2027 | | | | | | | | | |
| (Callable 11/01/2025) (Insured by BAM) | | $ | 340,000 | | | $ | 346,219 | | | | |
| 4.000%, 11/01/2028 | | | | | | | | | | | |
| (Callable 11/01/2025) (Insured by BAM) | | | 250,000 | | | | 254,708 | | | | |
| Total Arkansas | | | | | | | | | | | |
| (Cost $23,618,905) | | | | | | | 21,632,392 | | | | 0.8 | % |
| California | | | | | | | | | | | | |
| Acalanes Union High School District: | | | | | | | | | | | | |
0.000%, 08/01/2028(5) | | | 130,000 | | | | 133,928 | | | | | |
0.000%, 08/01/2032(5) | | | 655,000 | | | | 743,360 | | | | | |
| 0.000%, 08/01/2035 | | | | | | | | | | | | |
(Callable 08/01/2029)(5) | | | 470,000 | | | | 516,143 | | | | | |
| 0.000%, 08/01/2039 | | | | | | | | | | | | |
(Callable 08/01/2029)(5) | | | 350,000 | | | | 374,730 | | | | | |
| Alameda Corridor Transportation Authority, | | | | | | | | | | | | |
| 5.000%, 10/01/2037 (Callable 10/01/2026) | | | 500,000 | | | | 510,258 | | | | | |
| Alisal Union School District, | | | | | | | | | | | | |
| 4.000%, 05/01/2036 | | | | | | | | | | | | |
| (Callable 05/01/2029) (Insured by BAM) | | | 650,000 | | | | 665,380 | | | | | |
| Antelope Valley Community College District: | | | | | | | | | | | | |
| 0.000%, 08/01/2029 | | | 650,000 | | | | 535,914 | | | | | |
| 0.000%, 08/01/2031 | | | 1,000,000 | | | | 765,084 | | | | | |
| Bakersfield City School District, | | | | | | | | | | | | |
| 5.000%, 11/01/2023 (Insured by BAM) | | | 1,030,000 | | | | 1,035,843 | | | | | |
| Bay Area Toll Authority: | | | | | | | | | | | | |
| 3.300%, 04/01/2045 | | | | | | | | | | | | |
| (SIFMA Municipal Swap Index + 1.100%) | | | | | | | | | | | | |
| (Callable 10/01/2023) | | | | | | | | | | | | |
(Mandatory Tender Date 04/01/2024)(2) | | | 1,375,000 | | | | 1,376,877 | | | | | |
| 3.300%, 04/01/2045 | | | | | | | | | | | | |
| (SIFMA Municipal Swap Index + 1.100%) | | | | | | | | | | | | |
| (Callable 10/01/2023) | | | | | | | | | | | | |
(Mandatory Tender Date 04/01/2024)(2) | | | 3,500,000 | | | | 3,504,779 | | | | | |
| Burbank Unified School District, | | | | | | | | | | | | |
| 0.000%, 02/01/2038 | | | | | | | | | | | | |
(Callable 08/01/2028)(5) | | | 210,000 | | | | 216,855 | | | | | |
| California Community Choice | | | | | | | | | | | | |
| Financing Authority, | | | | | | | | | | | | |
| 5.250%, 01/01/2054 (Callable 10/01/2030) | | | | | | | | | | | | |
(Mandatory Tender Date 10/01/2031)(1) | | | 7,325,000 | | | | 7,662,674 | | | | | |
| California Housing Finance Agency, | | | | | | | | | | | | |
| 3.750%, 03/25/2035 (Insured by FHLMC) | | | 4,403,536 | | | | 4,279,566 | | | | | |
| California Infrastructure & | | | | | | | | | | | | |
| Economic Development Bank: | | | | | | | | | | | | |
| 2.550%, 08/01/2047 | | | | | | | | | | | | |
| (SIFMA Municipal Swap Index + 0.350%) | | | | | | | | | | | | |
| (Callable 08/01/2023) | | | | | | | | | | | | |
(Mandatory Tender Date 08/01/2024)(2) | | | 360,000 | | | | 355,897 | | | | | |
| 2.900%, 12/01/2050 | | | | | | | | | | | | |
| (SIFMA Municipal Swap Index + 0.700%) | | | | | | | | | | | | |
| (Callable 06/01/2025) | | | | | | | | | | | | |
(Mandatory Tender Date 06/01/2026)(2) | | | 250,000 | | | | 243,064 | | | | | |
| California Municipal Finance Authority: | | | | | | | | | | | | |
5.000%, 08/01/2023(3) | | | 400,000 | | | | 400,046 | | | | | |
5.000%, 08/01/2024(3) | | | 400,000 | | | | 400,646 | | | | | |
| 5.000%, 10/01/2026 | | | 300,000 | | | | 310,221 | | | | | |
| 2.125%, 11/15/2026 (Callable 07/21/2023) | | | 1,640,000 | | | | 1,548,470 | | | | | |
| 5.000%, 05/15/2031 (Insured by BAM) | | | 470,000 | | | | 517,643 | | | | | |
| 5.000%, 05/15/2036 | | | | | | | | | | | | |
| (Callable 11/15/2028) (Insured by BAM) | | | 1,000,000 | | | | 1,061,597 | | | | | |
| 1.300%, 02/01/2039 | | | | | | | | | | | | |
(Mandatory Tender Date 02/03/2025)(1)(3) | | | 1,500,000 | | | | 1,442,639 | | | | | |
| 4.000%, 05/15/2039 | | | | | | | | | | | | |
| (Callable 05/15/2031) (Insured by BAM) | | | 175,000 | | | | 170,846 | | | | | |
| California Pollution Control | | | | | | | | | | | | |
| Financing Authority, | | | | | | | | | | | | |
5.000%, 07/01/2023(3) | | | 1,085,000 | | | | 1,085,000 | | | | | |
| California Public Finance Authority: | | | | | | | | | | | | |
| 2.125%, 11/15/2027 | | | | | | | | | | | | |
(Callable 07/21/2023)(3) | | | 2,800,000 | | | | 2,698,273 | | | | | |
| 2.375%, 11/15/2028 | | | | | | | | | | | | |
(Callable 07/21/2023)(3) | | | 3,385,000 | | | | 3,241,896 | | | | | |
| 3.125%, 05/15/2029 | | | | | | | | | | | | |
(Callable 11/15/2023)(3) | | | 2,010,000 | | | | 1,888,716 | | | | | |
| California Statewide Communities | | | | | | | | | | | | |
| Development Authority, | | | | | | | | | | | | |
| 5.000%, 09/01/2026 (Callable 03/01/2024) | | | | | | | | | | | | |
| (Mandatory Tender Date 09/01/2024) | | | | | | | | | | | | |
(Insured by HUD)(1)(3) | | | 5,150,000 | | | | 5,150,000 | | | | | |
| Campbell Union School District, | | | | | | | | | | | | |
| 5.800%, 08/01/2035 | | | | | | | | | | | | |
(Callable 08/01/2026)(5) | | | 785,000 | | | | 854,327 | | | | | |
| Carlsbad Unified School District, | | | | | | | | | | | | |
6.125%, 08/01/2031(5) | | | 125,000 | | | | 151,393 | | | | | |
| Chawanakee Unified School District: | | | | | | | | | | | | |
4.000%, 08/01/2026 (Insured by BAM)(5) | | | 110,000 | | | | 112,830 | | | | | |
| 4.000%, 08/01/2027 | | | | | | | | | | | | |
(Callable 08/01/2026) (Insured by BAM)(5) | | | 100,000 | | | | 103,132 | | | | | |
| 4.000%, 08/01/2028 | | | | | | | | | | | | |
(Callable 08/01/2026) (Insured by BAM)(5) | | | 75,000 | | | | 77,407 | | | | | |
| 4.000%, 08/01/2029 | | | | | | | | | | | | |
(Callable 08/01/2026) (Insured by BAM)(5) | | | 80,000 | | | | 82,585 | | | | | |
| Citrus Community College District, | | | | | | | | | | | | |
| 5.000%, 08/01/2037 | | | | | | | | | | | | |
(Pre-refunded to 02/01/2024)(5) | | | 460,000 | | | | 464,979 | | | | | |
| City & County of San Francisco CA, | | | | | | | | | | | | |
| 4.000%, 06/15/2039 (Callable 06/15/2028) | | | 1,080,000 | | | | 1,103,013 | | | | | |
| City of Palo Alto CA, | | | | | | | | | | | | |
| 5.000%, 11/01/2036 (Callable 11/01/2028) | | | 1,295,000 | | | | 1,418,832 | | | | | |
| City of San Mateo CA, | | | | | | | | | | | | |
| 5.250%, 09/01/2040 | | | | | | | | | | | | |
| (Callable 09/01/2032) (Insured by BAM) | | | 1,250,000 | | | | 1,351,081 | | | | | |
| City of Tulare CA, | | | | | | | | | | | | |
| 2.750%, 11/15/2044 | | | | | | | | | | | | |
(Callable 07/31/2023) (Insured by AGM)(1) | | | 290,000 | | | | 227,825 | | | | | |
| City of Vernon CA: | | | | | | | | | | | | |
| 5.000%, 04/01/2024 | | | 2,000,000 | | | | 2,014,438 | | | | | |
| 5.000%, 08/01/2024 | | | 700,000 | | | | 706,967 | | | | | |
| 5.000%, 10/01/2025 | | | 2,250,000 | | | | 2,291,507 | | | | | |
| Colton Joint Unified School District, | | | | | | | | | | | | |
| 5.800%, 08/01/2035 (Pre-refunded to | | | | | | | | | | | | |
08/01/2026) (Insured by AGM)(5) | | | 300,000 | | | | 325,354 | | | | | |
| Compton Community College District, | | | | | | | | | | | | |
| 0.000%, 08/01/2034 | | | 450,000 | | | | 299,099 | | | | | |
| Del Mar Union School District, | | | | | | | | | | | | |
| 4.000%, 08/01/2046 (Callable 08/01/2032) | | | 2,500,000 | | | | 2,500,122 | | | | | |
| Denair Unified School District, | | | | | | | | | | | | |
6.500%, 08/01/2031 (Insured by AGM)(5) | | | 130,000 | | | | 157,579 | | | | | |
| Desert Hot Springs Redevelopment | | | | | | | | | | | | |
| Agency Successor Agency, | | | | | | | | | | | | |
| 5.000%, 09/01/2029 | | | | | | | | | | | | |
| (Callable 09/01/2027) (Insured by BAM) | | | 300,000 | | | | 324,738 | | | | | |
| Dublin Financing Authority, | | | | | | | | | | | | |
| 4.000%, 06/01/2038 (Callable 06/01/2029) | | | 390,000 | | | | 395,809 | | | | | |
| El Rancho Unified School District, | | | | | | | | | | | | |
| 0.000%, 08/01/2034 | | | | | | | | | | | | |
(Callable 08/01/2028) (Insured by AGM)(5) | | | 755,000 | | | | 891,174 | | | | | |
The accompanying notes are an integral part of these financial statements.
Baird Core Intermediate Municipal Bond Fund
Schedule of Investments, June 30, 2023 (Unaudited)
Long-Term Investments (cont.)
| | | Principal | | | | | | % of | |
| | | Amount | | | Value | | | Net Assets | |
| Encinitas Union School District, | | | | | | | | | |
6.375%, 08/01/2031(5) | | $ | 325,000 | | | $ | 396,053 | | | |
| |
| Enterprise Elementary School District, | | | | | | | | | | | | |
| 6.200%, 08/01/2035 | | | | | | | | | | | | |
(Callable 08/01/2031)(5) | | | 155,000 | | | | 190,195 | | | | | |
| Escondido Union High School District, | | | | | | | | | | | | |
6.875%, 08/01/2034 (Insured by AGC)(5) | | | 330,000 | | | | 451,809 | | | | | |
| Freddie Mac Multifamily ML Certificates, | | | | | | | | | | | | |
4.140%, 01/25/2040(5) | | | 5,496,410 | | | | 5,108,022 | | | | | |
| Freddie Mac Multifamily | | | | | | | | | | | | |
| Variable Rate Certificate, | | | | | | | | | | | | |
| 2.875%, 07/25/2036 | | | 7,393,593 | | | | 6,465,343 | | | | | |
| Grossmont Union High School District, | | | | | | | | | | | | |
| 0.000%, 08/01/2039 | | | | | | | | | | | | |
| (Callable 02/01/2025) (Insured by AGM) | | | 500,000 | | | | 225,202 | | | | | |
| Hueneme Elementary School District, | | | | | | | | | | | | |
| 4.000%, 08/01/2037 | | | | | | | | | | | | |
| (Callable 08/01/2028) (Insured by AGM) | | | 500,000 | | | | 504,709 | | | | | |
| Indio Finance Authority, | | | | | | | | | | | | |
| 5.250%, 11/01/2042 | | | | | | | | | | | | |
| (Callable 11/01/2032) (Insured by BAM) | | | 1,000,000 | | | | 1,115,589 | | | | | |
| Inglewood Unified School District | | | | | | | | | | | | |
| School Facilities Financing Authority, | | | | | | | | | | | | |
| 5.250%, 10/15/2026 (Insured by AGM) | | | 2,265,000 | | | | 2,335,569 | | | | | |
| Irvine Facilities Financing Authority, | | | | | | | | | | | | |
| �� 5.250%, 05/01/2043 (Callable 05/01/2026) | | | 4,300,000 | | | | 4,505,020 | | | | | |
| Jefferson Elementary School District, | | | | | | | | | | | | |
| 4.500%, 09/01/2049 (Callable 09/01/2032) | | | 1,520,000 | | | | 1,568,701 | | | | | |
| King Union School District, | | | | | | | | | | | | |
| 0.000%, 08/01/2028 (Insured by AMBAC) | | | 400,000 | | | | 335,654 | | | | | |
| Lake Elsinore Redevelopment | | | | | | | | | | | | |
| Agency Successor Agency, | | | | | | | | | | | | |
| 5.000%, 09/01/2027 | | | | | | | | | | | | |
| (Callable 09/01/2025) (Insured by BAM) | | | 275,000 | | | | 286,103 | | | | | |
| Lathrop-Manteca Fire Protection District, | | | | | | | | | | | | |
| 4.000%, 05/01/2051 | | | | | | | | | | | | |
| (Callable 05/01/2029) (Insured by AGM) | | | 795,000 | | | | 781,438 | | | | | |
| Long Beach Bond Finance Authority: | | | | | | | | | | | | |
| 5.250%, 11/15/2023 | | | 90,000 | | | | 90,329 | | | | | |
| 5.000%, 11/15/2029 | | | 50,000 | | | | 52,764 | | | | | |
| Los Alamitos Unified School District, | | | | | | | | | | | | |
| 0.000%, 08/01/2041 | | | | | | | | | | | | |
(Callable 08/01/2031)(5) | | | 615,000 | | | | 598,585 | | | | | |
| Los Angeles County Development Authority, | | | | | | | | | | | | |
| 3.750%, 12/01/2046 (Callable 02/01/2026) | | | | | | | | | | | | |
| (Mandatory Tender Date 12/01/2026) | | | | | | | | | | | | |
(Insured by HUD)(1) | | | 1,100,000 | | | | 1,101,925 | | | | | |
| Los Angeles County Facilities, Inc., | | | | | | | | | | | | |
| 5.000%, 12/01/2043 (Callable 12/01/2028) | | | 110,000 | | | | 117,889 | | | | | |
| Manteca Unified School District, | | | | | | | | | | | | |
| 0.000%, 09/01/2025 (Insured by NATL) | | | 225,000 | | | | 208,082 | | | | | |
| Mayers Memorial Hospital District: | | | | | | | | | | | | |
| 0.000%, 08/01/2027 | | | 260,000 | | | | 215,396 | | | | | |
| 0.000%, 08/01/2028 | | | 290,000 | | | | 230,305 | | | | | |
| Modesto High School District, | | | | | | | | | | | | |
| 0.000%, 08/01/2024 (Insured by NATL) | | | 3,625,000 | | | | 3,495,073 | | | | | |
| Mount Diablo Unified School District, | | | | | | | | | | | | |
| 5.750%, 08/01/2035 | | | | | | | | | | | | |
(Callable 08/01/2025) (Insured by AGM)(5) | | | 340,000 | | | | 359,273 | | | | | |
| Mount San Antonio | | | | | | | | | | | | |
| Community College District, | | | | | | | | | | | | |
| 0.000%, 08/01/2043 | | | | | | | | | | | | |
(Callable 08/01/2035)(5) | | | 350,000 | | | | 320,442 | | | | | |
| Mountain Empire Unified School District, | | | | | | | | | | | | |
| 6.250%, 08/01/2048 | | | | | | | | | | | | |
| (Callable 08/01/2032) (Insured by BAM) | | | 500,000 | | | | 587,488 | | | | | |
| Napa Valley Unified School District, | | | | | | | | | | | | |
| 4.000%, 08/01/2035 | | | | | | | | | | | | |
| (Callable 08/01/2026) | | | 3,000,000 | | | | 3,067,391 | | | | | |
| Newman-Crows Landing | | | | | | | | | | | | |
| Unified School District, | | | | | | | | | | | | |
| 0.000%, 08/01/2025 | | | 1,850,000 | | | | 1,717,669 | | | | | |
| Oak Park Unified School District, | | | | | | | | | | | | |
| 7.100%, 08/01/2038 | | | | | | | | | | | | |
(Callable 08/01/2031) (Insured by AGM)(5) | | | 110,000 | | | | 136,530 | | | | | |
| Ontario Public Financing Authority, | | | | | | | | | | | | |
| 5.000%, 11/01/2047 | | | | | | | | | | | | |
| (Callable 11/01/2032) (Insured by AGM) | | | 1,140,000 | | | | 1,254,572 | | | | | |
| Oxnard School District, | | | | | | | | | | | | |
| 5.875%, 08/01/2045 | | | | | | | | | | | | |
(Callable 08/01/2026) (Insured by BAM)(5) | | | 300,000 | | | | 313,244 | | | | | |
| Palomar Community College District, | | | | | | | | | | | | |
| 0.000%, 08/01/2039 | | | | | | | | | | | | |
(Callable 08/01/2035)(5) | | | 385,000 | | | | 428,484 | | | | | |
| Peralta Community College District, | | | | | | | | | | | | |
| 3.500%, 08/01/2033 (Callable 08/01/2025) | | | 1,325,000 | | | | 1,330,352 | | | | | |
| Perris Union High School District: | | | | | | | | | | | | |
| 3.000%, 09/01/2036 (Callable 09/01/2029) | | | 635,000 | | | | 584,416 | | | | | |
| 3.000%, 09/01/2037 (Callable 09/01/2029) | | | 800,000 | | | | 722,473 | | | | | |
| 3.000%, 09/01/2038 (Callable 09/01/2029) | | | 700,000 | | | | 621,223 | | | | | |
| 3.000%, 09/01/2039 (Callable 09/01/2029) | | | 775,000 | | | | 682,985 | | | | | |
| Pleasanton Unified School District: | | | | | | | | | | | | |
| 5.000%, 06/01/2032 | | | | | | | | | | | | |
| (Callable 06/01/2025) (Insured by AGM) | | | 355,000 | | | | 370,005 | | | | | |
| 5.375%, 06/01/2047 | | | | | | | | | | | | |
| (Callable 06/01/2025) (Insured by AGM) | | | 600,000 | | | | 618,484 | | | | | |
| 5.500%, 06/01/2052 | | | | | | | | | | | | |
| (Callable 06/01/2025) (Insured by AGM) | | | 1,000,000 | | | | 1,031,369 | | | | | |
| Rialto Unified School District: | | | | | | | | | | | | |
| 0.000%, 08/01/2040 | | | | | | | | | | | | |
(Callable 02/01/2033) (Insured by BAM)(6) | | | 600,000 | | | | 275,395 | | | | | |
| 0.000%, 08/01/2041 | | | | | | | | | | | | |
(Callable 02/01/2033) (Insured by BAM)(6) | | | 630,000 | | | | 273,139 | | | | | |
| 0.000%, 08/01/2042 | | | | | | | | | | | | |
(Callable 02/01/2033) (Insured by BAM)(6) | | | 700,000 | | | | 287,523 | | | | | |
| Rio Hondo Community College District: | | | | | | | | | | | | |
| 0.000%, 08/01/2042 | | | | | | | | | | | | |
(Callable 08/01/2034)(5) | | | 230,000 | | | | 268,966 | | | | | |
| 0.000%, 08/01/2042 | | | | | | | | | | | | |
(Callable 08/01/2034)(5) | | | 1,200,000 | | | | 1,424,523 | | | | | |
| River Islands Public Financing Authority: | | | | | | | | | | | | |
| 4.250%, 09/01/2042 | | | | | | | | | | | | |
| (Callable 09/01/2029) (Insured by AGM) | | | 1,000,000 | | | | 1,025,371 | | | | | |
| 5.000%, 09/01/2042 | | | | | | | | | | | | |
| (Callable 09/01/2029) (Insured by AGM) | | | 3,250,000 | | | | 3,581,654 | | | | | |
| 4.500%, 09/01/2047 | | | | | | | | | | | | |
| (Callable 09/01/2029) (Insured by AGM) | | | 1,250,000 | | | | 1,291,946 | | | | | |
| Riverside County Redevelopment | | | | | | | | | | | | |
| Successor Agency, | | | | | | | | | | | | |
| 5.000%, 10/01/2041 | | | | | | | | | | | | |
(Callable 10/01/2026) (Insured by BAM)(5) | | | 100,000 | | | | 104,568 | | | | | |
| Ross Valley School District, | | | | | | | | | | | | |
| 0.000%, 07/01/2026 (Insured by AGM) | | | 575,000 | | | | 505,020 | | | | | |
| Sacramento City Unified School District: | | | | | | | | | | | | |
| 5.000%, 07/01/2025 (Callable 07/01/2024) | | | 505,000 | | | | 512,293 | | | | | |
| 5.500%, 08/01/2047 | | | | | | | | | | | | |
| (Callable 08/01/2030) (Insured by BAM) | | | 2,000,000 | | | | 2,221,635 | | | | | |
| San Jacinto Unified School District, | | | | | | | | | | | | |
| 3.000%, 09/01/2028 (Insured by BAM) | | | 310,000 | | | | 309,198 | | | | | |
The accompanying notes are an integral part of these financial statements.
Baird Core Intermediate Municipal Bond Fund
Schedule of Investments, June 30, 2023 (Unaudited)
Long-Term Investments (cont.)
| | | Principal | | | | | | % of | |
| | | Amount | | | Value | | | Net Assets | |
| San Mateo Foster City School District, | | | | | | | | | |
0.000%, 08/01/2026(5) | | $ | 75,000 | | | $ | 80,297 | | | | |
| San Mateo Union High School District, | | | | | | | | | | | |
| 0.000%, 09/01/2041 | | | | | | | | | | | |
(Callable 09/01/2036)(5) | | | 5,940,000 | | | | 5,734,474 | | | | |
| Santa Barbara Unified School District, | | | | | | | | | | | |
| 0.000%, 08/01/2036 | | | | | | | | | | | |
(Callable 08/01/2033)(5) | | | 540,000 | | | | 700,954 | | | | |
| Saugus Union School | | | | | | | | | | | |
| District Financing Authority: | | | | | | | | | | | |
| 4.000%, 09/01/2032 | | | | | | | | | | | |
| (Callable 09/01/2027) (Insured by BAM) | | | 600,000 | | | | 633,522 | | | | |
| 4.000%, 09/01/2037 | | | | | | | | | | | |
| (Callable 09/01/2027) (Insured by BAM) | | | 625,000 | | | | 632,621 | | | | |
| Savanna School District, | | | | | | | | | | | |
| 0.000%, 08/01/2047 | | | | | | | | | | | |
(Callable 08/01/2029) (Insured by AGM)(5) | | | 1,155,000 | | | | 1,193,823 | | | | |
| School District of | | | | | | | | | | | |
| Belmont-Redwood Shores CA, | | | | | | | | | | | |
| 5.900%, 08/01/2031 | | | | | | | | | | | |
(Pre-refunded to 08/01/2026)(5) | | | 100,000 | | | | 109,216 | | | | |
| Solano County Community College District: | | | | | | | | | | | |
| 0.000%, 08/01/2027 | | | | | | | | | | | |
(Callable 08/01/2025)(5) | | | 440,000 | | | | 446,861 | | | | |
| 0.000%, 08/01/2028 | | | | | | | | | | | |
(Callable 08/01/2025)(5) | | | 115,000 | | | | 116,793 | | | | |
| 0.000%, 08/01/2030 | | | | | | | | | | | |
(Callable 08/01/2025)(5) | | | 695,000 | | | | 705,836 | | | | |
| 0.000%, 08/01/2041 | | | | | | | | | | | |
(Callable 08/01/2028)(5) | | | 655,000 | | | | 716,465 | | | | |
| South Placer Wastewater Authority, | | | | | | | | | | | |
| 5.000%, 11/01/2034 | | | 500,000 | | | | 601,483 | | | | |
| Southern Kern Unified School District, | | | | | | | | | | | |
| 0.000%, 11/01/2034 (Insured by AGM) | | | 425,000 | | | | 279,225 | | | | |
| State of California, | | | | | | | | | | | |
| 5.000%, 08/01/2032 (Callable 08/01/2025) | | | 880,000 | | | | 916,155 | | | | |
| Temecula Valley Unified School District, | | | | | | | | | | | |
| 4.500%, 08/01/2035 (Pre-refunded to | | | | | | | | | | | |
08/01/2024) (Insured by BAM)(5) | | | 200,000 | | | | 203,225 | | | | |
| Tulare Union High School District, | | | | | | | | | | | |
| 0.000%, 08/01/2025 (Insured by NATL) | | | 1,745,000 | | | | 1,622,820 | | | | |
| Tuolumne Utilities District, | | | | | | | | | | | |
| 1.250%, 08/15/2024 (Callable 08/15/2023) | | | 7,520,000 | | | | 7,227,694 | | | | |
| Waterford Unified School District, | | | | | | | | | | | |
| 4.000%, 08/01/2042 | | | | | | | | | | | |
| (Callable 08/01/2032) (Insured by BAM) | | | 1,455,000 | | | | 1,463,161 | | | | |
| West Hills Community College District, | | | | | | | | | | | |
| 5.100%, 08/01/2035 | | | | | | | | | | | |
(Callable 08/01/2027) (Insured by AGM)(5) | | | 50,000 | | | | 53,520 | | | | |
| Wiseburn School District, | | | | | | | | | | | |
| 0.000%, 08/01/2036 | | | | | | | | | | | |
(Callable 08/01/2031) (Insured by AGM)(5) | | | 80,000 | | | | 84,853 | | | | |
| Woodlake Union High School District, | | | | | | | | | | | |
| 0.000%, 08/01/2033 (Insured by AGM) | | | 1,880,000 | | | | 1,190,828 | | | | |
| Yorba Linda Redevelopment | | | | | | | | | | | |
| Agency Successor Agency, | | | | | | | | | | | |
| 0.000%, 09/01/2028 (Insured by NATL) | | | 560,000 | | | | 463,327 | | | | |
| Total California | | | | | | | | | | | |
| (Cost $141,994,859) | | | | | | | 140,475,075 | | | | 5.4 | % |
| Colorado | | | | | | | | | | | | |
| Arkansas River Power Authority: | | | | | | | | | | | | |
| 5.000%, 10/01/2026 | | | 610,000 | | | | 619,631 | | | | | |
| 5.875%, 10/01/2026 | | | | | | | | | | | | |
| (ETM) (Insured by XLCA) | | | 4,555,000 | | | | 4,739,546 | | | | | |
| Boulder Valley School District No. Re-2, | | | | | | | | | | | | |
| 5.000%, 12/01/2038( Callable | | | | | | | | | | | | |
| 06/01/2025) (Insured by ST AID) | | | 2,000,000 | | | | 2,050,445 | | | | | |
| Bromley Park Metropolitan District No. 2, | | | | | | | | | | | | |
| 5.000%, 12/01/2023 (Insured by BAM) | | | 225,000 | | | | 226,283 | | | | | |
| Canterberry Crossing Metropolitan District II: | | | | | | | | | | | | |
| 5.000%, 12/01/2030 | | | | | | | | | | | | |
| (Callable 12/01/2028) (Insured by AGM) | | | 235,000 | | | | 262,328 | | | | | |
| 5.000%, 12/01/2031 | | | | | | | | | | | | |
| (Callable 12/01/2028) (Insured by AGM) | | | 250,000 | | | | 279,145 | | | | | |
| 5.000%, 12/01/2032 | | | | | | | | | | | | |
| (Callable 12/01/2028) (Insured by AGM) | | | 530,000 | | | | 591,593 | | | | | |
| City & County of Denver CO: | | | | | | | | | | | | |
| 5.250%, 11/15/2027 | | | 1,000,000 | | | | 1,070,934 | | | | | |
| 5.500%, 11/15/2027 (Callable 11/15/2023) | | | 1,500,000 | | | | 1,507,188 | | | | | |
| 5.000%, 12/01/2028 | | | 2,000,000 | | | | 2,142,834 | | | | | |
| 5.500%, 11/15/2029 | | | 1,905,000 | | | | 2,137,105 | | | | | |
| 0.000%, 08/01/2030 (Callable 08/01/2026) | | | 500,000 | | | | 383,247 | | | | | |
| 0.000%, 08/01/2032 (Callable 08/01/2026) | | | 365,000 | | | | 255,750 | | | | | |
| 5.500%, 11/15/2038 (Callable 11/15/2032) | | | 1,040,000 | | | | 1,167,130 | | | | | |
| City of Commerce City CO: | | | | | | | | | | | | |
| 5.000%, 12/15/2029 | | | | | | | | | | | | |
| (Callable 12/15/2027) (Insured by AGM) | | | 310,000 | | | | 335,277 | | | | | |
| 5.000%, 12/15/2030 | | | | | | | | | | | | |
| (Callable 12/15/2027) (Insured by AGM) | | | 500,000 | | | | 539,475 | | | | | |
| City of Fort Lupton CO: | | | | | | | | | | | | |
| 5.000%, 12/01/2029 | | | | | | | | | | | | |
| (Callable 12/01/2027) (Insured by AGM) | | | 250,000 | | | | 269,111 | | | | | |
| 5.000%, 12/01/2030 | | | | | | | | | | | | |
| (Callable 12/01/2027) (Insured by AGM) | | | 350,000 | | | | 375,563 | | | | | |
| City of Sheridan CO, | | | | | | | | | | | | |
| 5.000%, 12/01/2042 (Callable 12/01/2025) | | | 1,130,000 | | | | 1,160,000 | | | | | |
| Colorado Educational & | | | | | | | | | | | | |
| Cultural Facilities Authority: | | | | | | | | | | | | |
| 5.000%, 10/01/2023 (ETM) | | | 700,000 | | | | 702,656 | | | | | |
4.000%, 12/15/2025(3) | | | 910,000 | | | | 902,526 | | | | | |
| 4.000%, 04/01/2028 | | | 735,000 | | | | 734,614 | | | | | |
| 5.000%, 06/01/2029 (Callable 06/01/2024) | | | 120,000 | | | | 121,579 | | | | | |
| 5.000%, 08/15/2030 (Callable 08/15/2024) | | | 1,110,000 | | | | 1,128,120 | | | | | |
| 2.000%, 09/01/2030 | | | | | | | | | | | | |
| (Callable 09/01/2028) (Insured by BAM) | | | 270,000 | | | | 245,427 | | | | | |
| 5.000%, 06/01/2031 (Callable 06/01/2024) | | | 40,000 | | | | 40,503 | | | | | |
| 4.000%, 07/01/2032 | | | 45,000 | | | | 46,760 | | | | | |
| 5.000%, 08/15/2034 (Callable 08/15/2024) | | | 1,000,000 | | | | 1,015,525 | | | | | |
| 4.000%, 07/01/2042 (Callable 07/01/2032) | | | 500,000 | | | | 485,257 | | | | | |
| Colorado Health Facilities Authority: | | | | | | | | | | | | |
| 5.000%, 12/01/2023 | | | 140,000 | | | | 140,213 | | | | | |
| 5.000%, 06/01/2027 (ETM) | | | 750,000 | | | | 809,388 | | | | | |
| 5.000%, 08/01/2028 | | | 5,575,000 | | | | 5,958,843 | | | | | |
| 2.625%, 05/15/2029 (Callable 07/31/2023) | | | 3,545,000 | | | | 3,160,051 | | | | | |
| 5.000%, 12/01/2030 (Callable 06/01/2025) | | | 405,000 | | | | 408,387 | | | | | |
| 5.250%, 11/01/2035 (Callable 11/01/2032) | | | 1,100,000 | | | | 1,222,152 | | | | | |
| 5.000%, 08/01/2036 (Callable 08/01/2029) | | | 150,000 | | | | 158,526 | | | | | |
| 5.250%, 11/01/2036 (Callable 11/01/2032) | | | 1,100,000 | | | | 1,210,588 | | | | | |
| 4.000%, 10/01/2037 (Callable 10/01/2030) | | | 320,000 | | | | 315,800 | | | | | |
| 4.000%, 12/01/2042 (Callable 07/31/2023) | | | 375,000 | | | | 364,259 | | | | | |
| 4.000%, 01/15/2045 (Callable 01/15/2026) | | | 120,000 | | | | 110,281 | | | | | |
| 5.000%, 08/01/2049 (Callable 02/01/2025) | | | | | | | | | | | | |
(Mandatory Tender Date 08/01/2025)(1) | | | 2,000,000 | | | | 2,040,607 | | | | | |
| 2.750%, 05/15/2061 | | | | | | | | | | | | |
| (SIFMA Municipal Swap Index + 0.550%) | | | | | | | | | | | | |
| (Callable 02/17/2026) | | | | | | | | | | | | |
(Mandatory Tender Date 08/17/2026)(2) | | | 10,000,000 | | | | 9,906,424 | | | | | |
The accompanying notes are an integral part of these financial statements.
Baird Core Intermediate Municipal Bond Fund
Schedule of Investments, June 30, 2023 (Unaudited)
Long-Term Investments (cont.)
| | | Principal | | | | | | % of | |
| | | Amount | | | Value | | | Net Assets | |
| Colorado Housing & Finance Authority: | | | | | | | | | |
| 4.000%, 05/01/2048 (Callable 11/01/2026) | | | | | | | | | |
| (Insured by GNMA) | | $ | 165,000 | | | $ | 163,735 | | | | |
| 4.250%, 11/01/2049 | | | | | | | | | | | |
| (Callable 11/01/2028) (Insured by GNMA) | | | 1,465,000 | | | | 1,461,928 | | | | |
| 5.250%, 11/01/2052 | | | | | | | | | | | |
| (Callable 11/01/2031) (Insured by GNMA) | | | 3,980,000 | | | | 4,123,223 | | | | |
| 6.000%, 11/01/2052 | | | | | | | | | | | |
| (Callable 11/01/2031) (Insured by GNMA) | | | 1,000,000 | | | | 1,082,153 | | | | |
| Colorado School of Mines, | | | | | | | | | | | |
| 3.070%, 12/01/2025 | | | | | | | | | | | |
| (SIFMA Municipal Swap Index + 0.870%) | | | | | | | | | | | |
(Callable 06/01/2025)(2) | | | 5,000,000 | | | | 5,000,236 | | | | |
| Crystal Valley Metropolitan District No. 2: | | | | | | | | | | | |
| 4.000%, 12/01/2037 | | | | | | | | | | | |
| (Callable 12/01/2030) (Insured by AGM) | | | 800,000 | | | | 820,246 | | | | |
| 4.000%, 12/01/2038 | | | | | | | | | | | |
| (Callable 12/01/2030) (Insured by AGM) | | | 1,000,000 | | | | 1,010,955 | | | | |
| 4.000%, 12/01/2039 | | | | | | | | | | | |
| (Callable 12/01/2030) (Insured by AGM) | | | 1,785,000 | | | | 1,785,363 | | | | |
| Denver City & County Housing Authority, | | | | | | | | | | | |
| 0.600%, 08/01/2024 (Insured by HUD) | | | 400,000 | | | | 387,165 | | | | |
| Denver Health & Hospital Authority: | | | | | | | | | | | |
| 5.000%, 12/01/2025 | | | 400,000 | | | | 410,064 | | | | |
| 5.000%, 12/01/2027 | | | 340,000 | | | | 357,124 | | | | |
| 4.000%, 12/01/2040 (Callable 12/01/2029) | | | 750,000 | | | | 664,492 | | | | |
| 5.250%, 12/01/2045 (Callable 12/01/2023) | | | 485,000 | | | | 486,344 | | | | |
| Denver Housing Authority, | | | | | | | | | | | |
5.000%, 07/01/2027(6) | | | 3,750,000 | | | | 3,899,677 | | | | |
| Denver Urban Renewal Authority, | | | | | | | | | | | |
| 5.000%, 12/01/2025 (Callable 07/31/2023) | | | 200,000 | | | | 200,145 | | | | |
| E-470 Public Highway Authority: | | | | | | | | | | | |
| 0.000%, 09/01/2029 (Insured by NATL) | | | 2,550,000 | | | | 2,064,675 | | | | |
| 0.000%, 09/01/2031 (Insured by NATL) | | | 3,500,000 | | | | 2,617,418 | | | | |
| 3.734%, 09/01/2039 (SOFR + 0.350%) | | | | | | | | | | | |
| (Callable 06/01/2024) | | | | | | | | | | | |
(Mandatory Tender Date 09/01/2024)(2) | | | 1,000,000 | | | | 995,804 | | | | |
| Fort Collins Housing Authority, | | | | | | | | | | | |
| 1.250%, 07/01/2024 (Callable 01/01/2024) | | | 2,000,000 | | | | 1,947,480 | | | | |
| Glen Metropolitan District No. 2, | | | | | | | | | | | |
| 2.000%, 12/01/2030 (Insured by BAM) | | | 245,000 | | | | 217,793 | | | | |
| Grand River Hospital District: | | | | | | | | | | | |
| 5.250%, 12/01/2030 | | | | | | | | | | | |
| (Callable 12/01/2028) (Insured by AGM) | | | 350,000 | | | | 380,913 | | | | |
| 5.250%, 12/01/2031 | | | | | | | | | | | |
| (Callable 12/01/2028) (Insured by AGM) | | | 1,190,000 | | | | 1,291,765 | | | | |
| Gunnison County Crested | | | | | | | | | | | |
| Butte Fire Protection District: | | | | | | | | | | | |
| 4.000%, 12/01/2029 | | | 790,000 | | | | 832,680 | | | | |
| 4.000%, 12/01/2030 | | | 820,000 | | | | 868,270 | | | | |
| 4.000%, 12/01/2031 | | | 855,000 | | | | 906,424 | | | | |
| 4.000%, 12/01/2032 | | | 890,000 | | | | 944,935 | | | | |
| Mizuho Floater/Residual Trust, | | | | | | | | | | | |
| 4.510%, 07/01/2034 | | | | | | | | | | | |
(Optional Put Date 08/04/2023)(1)(3) | | | 3,746 | | | | 3,746 | | | | |
| Prairie Center Metropolitan District No. 7, | | | | | | | | | | | |
| 4.125%, 12/15/2036 | | | | | | | | | | | |
| (Callable 12/15/2025) | | | 275,000 | | | | 243,036 | | | | |
| Regional Transportation District: | | | | | | | | | | | |
| 5.000%, 01/15/2028 | | | 1,500,000 | | | | 1,593,560 | | | | |
| 5.000%, 01/15/2031 | | | 1,715,000 | | | | 1,894,204 | | | | |
| 5.000%, 11/01/2033 (Callable 11/01/2027) | | | 500,000 | | | | 541,393 | | | | |
| State of Colorado, | | | | | | | | | | | |
| 4.000%, 12/15/2037 (Callable 12/15/2028) | | | 705,000 | | | | 715,814 | | | | |
| Stetson Ridge Metropolitan District No. 3, | | | | | | | | | | | |
| 2.000%, 12/01/2030 (Insured by AGM) | | | 790,000 | | | | 711,363 | | | | |
| Vauxmont Metropolitan District: | | | | | | | | | | | |
| 5.000%, 12/15/2028 | | | | | | | | | | | |
| (Callable 12/15/2024) (Insured by AGM) | | | 125,000 | | | | 131,841 | | | | |
| 5.000%, 12/15/2029 | | | | | | | | | | | |
| (Callable 12/15/2024) (Insured by AGM) | | | 125,000 | | | | 131,786 | | | | |
| 5.000%, 12/15/2030 | | | | | | | | | | | |
| (Callable 12/15/2024) (Insured by AGM) | | | 125,000 | | | | 131,805 | | | | |
| 5.000%, 12/15/2031 | | | | | | | | | | | |
| (Callable 12/15/2024) (Insured by AGM) | | | 135,000 | | | | 142,309 | | | | |
| 3.250%, 12/15/2050 | | | | | | | | | | | |
| (Callable 12/15/2024) (Insured by AGM) | | | 4,775,000 | | | | 4,092,443 | | | | |
| Vista Ridge Metropolitan District: | | | | | | | | | | | |
| 5.000%, 12/01/2025 (Insured by BAM) | | | 600,000 | | | | 624,619 | | | | |
| 5.000%, 12/01/2026 (Insured by BAM) | | | 460,000 | | | | 488,377 | | | | |
| Total Colorado | | | | | | | | | | | |
| (Cost $99,666,701) | | | | | | | 97,708,374 | | | | 3.7 | % |
| Connecticut | | | | | | | | | | | | |
| City of Norwalk CT: | | | | | | | | | | | | |
| 5.000%, 08/15/2037 (Callable 08/15/2030) | | | 3,155,000 | | | | 3,553,440 | | | | | |
| 5.000%, 08/15/2038 (Callable 08/15/2030) | | | 2,770,000 | | | | 3,102,315 | | | | | |
| Connecticut Housing Finance Authority: | | | | | | | | | | | | |
| 5.000%, 11/15/2026 | | | 395,000 | | | | 417,051 | | | | | |
| 5.000%, 05/15/2027 | | | 440,000 | | | | 468,233 | | | | | |
| 5.000%, 11/15/2027 | | | 445,000 | | | | 477,878 | | | | | |
| 5.000%, 05/15/2028 | | | 210,000 | | | | 227,070 | | | | | |
| 5.000%, 11/15/2028 | | | 225,000 | | | | 244,814 | | | | | |
| 5.000%, 05/15/2029 | | | 230,000 | | | | 252,353 | | | | | |
| 5.000%, 11/15/2029 | | | 125,000 | | | | 137,579 | | | | | |
| 5.000%, 11/15/2030 | | | 160,000 | | | | 178,252 | | | | | |
| 4.000%, 11/15/2047 (Callable 11/15/2026) | | | 75,000 | | | | 74,470 | | | | | |
| 4.000%, 05/15/2049 (Callable 11/15/2028) | | | 980,000 | | | | 973,341 | | | | | |
| 3.500%, 11/15/2051 (Callable 05/15/2031) | | | 3,810,000 | | | | 3,704,716 | | | | | |
| Connecticut State Health & | | | | | | | | | �� | | | |
| Educational Facilities Authority: | | | | | | | | | | | | |
| 4.000%, 07/01/2038 (Callable 07/01/2032) | | | 1,975,000 | | | | 1,879,315 | | | | | |
| 2.800%, 07/01/2057 | | | | | | | | | | | | |
(Mandatory Tender Date 02/03/2026)(1) | | | 5,000,000 | | | | 4,900,115 | | | | | |
| East Hartford Housing Authority, | | | | | | | | | | | | |
| 4.250%, 02/01/2027(Callable 08/01/2024) | | | | | | | | | | | | |
| (Mandatory Tender Date 02/01/2025) | | | | | | | | | | | | |
(Insured by HUD)(1) | | | 2,000,000 | | | | 2,003,947 | | | | | |
| State of Connecticut: | | | | | | | | | | | | |
| 3.190%, 03/01/2025 (SIFMA Municipal | | | | | | | | | | | | |
Swap Index + 0.990%)(2) | | | 375,000 | | | | 372,765 | | | | | |
| 5.000%, 09/15/2025 | | | 1,000,000 | | | | 1,040,790 | | | | | |
| 5.000%, 06/15/2026 | | | 1,000,000 | | | | 1,056,907 | | | | | |
| 5.000%, 10/01/2027 | | | | | | | | | | | | |
| (Callable 10/01/2023) | | | 685,000 | | | | 687,720 | | | | | |
| 5.000%, 03/15/2031 | | | | | | | | | | | | |
| (Callable 03/15/2025) | | | 1,000,000 | | | | 1,029,525 | | | | | |
| Town of Hamden CT: | | | | | | | | | | | | |
| 5.000%, 08/15/2026 (Insured by AGM) | | | 125,000 | | | | 130,872 | | | | | |
| 5.000%, 08/15/2028 (Insured by AGM) | | | 365,000 | | | | 393,533 | | | | | |
| 5.000%, 08/15/2029 (Insured by AGM) | | | 575,000 | | | | 627,017 | | | | | |
| 5.000%, 08/15/2032 (Insured by BAM) | | | 1,000,000 | | | | 1,130,169 | | | | | |
| University of Connecticut, | | | | | | | | | | | | |
| 5.000%, 01/15/2031 | | | | | | | | | | | | |
| (Callable 01/15/2027) (Insured by AGM) | | | 1,000,000 | | | | 1,069,444 | | | | | |
| Total Connecticut | | | | | | | | | | | | |
| (Cost $31,041,622) | | | | | | | 30,133,631 | | | | 1.2 | % |
The accompanying notes are an integral part of these financial statements.
Baird Core Intermediate Municipal Bond Fund
Schedule of Investments, June 30, 2023 (Unaudited)
Long-Term Investments (cont.)
| | | Principal | | | | | | % of | |
| | | Amount | | | Value | | | Net Assets | |
| Delaware | | | | | | | | | |
| Delaware Municipal Electric Corp.: | | | | | | | | | |
| 4.000%, 07/01/2035 | | | | | | | | | |
| (Callable 07/01/2031) | | $ | 300,000 | | | $ | 311,943 | | | | |
| 4.000%, 07/01/2036 | | | | | | | | | | | |
| (Callable 07/01/2031) | | | 330,000 | | | | 337,926 | | | | |
| Total Delaware | | | | | | | | | | | |
| (Cost $733,277) | | | | | | | 649,869 | | | | 0.0 | % |
| District of Columbia | | | | | | | | | | | | |
| District of Columbia, | | | | | | | | | | | | |
| 4.000%, 03/01/2037 (Callable 09/01/2029) | | | 795,000 | | | | 813,181 | | | | | |
| District of Columbia | | | | | | | | | | | | |
| Housing Finance Agency: | | | | | | | | | | | | |
| 0.350%, 04/01/2025 (Mandatory Tender | | | | | | | | | | | | |
Date 04/01/2024) (Insured by FNMA)(1) | | | 6,000,000 | | | | 5,811,735 | | | | | |
| 5.000%, 12/01/2026 (Mandatory Tender | | | | | | | | | | | | |
Date 12/01/2025) (Insured by FHA)(1) | | | 5,090,000 | | | | 5,214,539 | | | | | |
| 0.500%, 03/01/2027 | | | | | | | | | | | | |
| (Callable 04/01/2024) (Mandatory Tender | | | | | | | | | | | | |
Date 10/01/2024) (Insured by FHA)(1) | | | 2,675,000 | | | | 2,542,251 | | | | | |
| 4.000%, 09/01/2040 (Callable 03/01/2025) | | | | | | | | | | | | |
(Mandatory Tender Date 09/01/2025)(1) | | | 3,250,000 | | | | 3,262,920 | | | | | |
| District of Columbia Water & Sewer Authority, | | | | | | | | | | | | |
| 3.000%, 10/01/2057 (Callable 07/01/2027) | | | | | | | | | | | | |
(Mandatory Tender Date 10/01/2027)(1) | | | 7,500,000 | | | | 7,347,435 | | | | | |
| Metropolitan Washington Airports Authority: | | | | | | | | | | | | |
| 0.000%, 10/01/2023 (Insured by AGC) | | | 500,000 | | | | 495,613 | | | | | |
| 0.000%, 10/01/2029 (Insured by AGC) | | | 110,000 | | | | 88,926 | | | | | |
| 5.000%, 10/01/2033 (Callable 10/01/2025) | | | 250,000 | | | | 259,705 | | | | | |
| 5.000%, 10/01/2038 (Callable 10/01/2028) | | | 330,000 | | | | 347,571 | | | | | |
| 6.500%, 10/01/2041 (Pre-refunded to | | | | | | | | | | | | |
10/01/2026) (Insured by AGC)(5) | | | 705,000 | | | | 783,374 | | | | | |
| 6.500%, 10/01/2044 | | | | | | | | | | | | |
(Callable 10/01/2028)(5) | | | 3,015,000 | | | | 3,397,139 | | | | | |
| 6.500%, 10/01/2044 | | | | | | | | | | | | |
(Callable 10/01/2028) (Insured by AGM)(5) | | | 1,670,000 | | | | 1,936,662 | | | | | |
| Total District of Columbia | | | | | | | | | | | | |
| (Cost $32,950,210) | | | | | | | 32,301,051 | | | | 1.2 | % |
| Florida | | | | | | | | | | | | |
| Alachua County Health Facilities Authority, | | | | | | | | | | | | |
| 5.000%, 12/01/2027 (Callable 12/01/2024) | | | 815,000 | | | | 831,956 | | | | | |
| Broward County Housing Finance Authority, | | | | | | | | | | | | |
| 3.500%, 04/01/2041 | | | | | | | | | | | | |
| (Callable 10/01/2025) (Mandatory Tender | | | | | | | | | | | | |
Date 04/01/2026) (Insured by HUD)(1) | | | 3,000,000 | | | | 3,008,498 | | | | | |
| Capital Trust Agency, Inc.: | | | | | | | | | | | | |
| 5.000%, 12/15/2029 (Callable 06/15/2026) | | | 800,000 | | | | 812,110 | | | | | |
| 4.000%, 06/01/2041 (Callable 06/01/2028) | | | 330,000 | | | | 310,077 | | | | | |
| 4.000%, 06/01/2056 (Callable 06/01/2028) | | | 485,000 | | | | 423,292 | | | | | |
| City of Fort Myers FL: | | | | | | | | | | | | |
| 5.000%, 12/01/2029 (Callable 12/01/2025) | | | 475,000 | | | | 492,814 | | | | | |
| 4.000%, 12/01/2037 (Callable 12/01/2025) | | | 1,000,000 | | | | 1,002,895 | | | | | |
| 4.000%, 12/01/2038 (Callable 12/01/2025) | | | 500,000 | | | | 501,490 | | | | | |
| City of Jacksonville FL: | | | | | | | | | | | | |
| 4.000%, 11/01/2032 (Callable 11/01/2029) | | | 375,000 | | | | 378,855 | | | | | |
| 2.200%, 08/01/2036 (Callable 07/03/2023) | | | | | | | | | | | | |
(Optional Put Date 07/07/2023)(1) | | | 2,300,000 | | | | 2,300,000 | | | | | |
| 4.000%, 11/01/2040 (Callable 11/01/2024) | | | 65,000 | | | | 61,511 | | | | | |
| City of Orlando FL, | | | | | | | | | | | | |
| 5.000%, 11/01/2034 | | | | | | | | | | | | |
| (Callable 11/01/2027) (Insured by AGM) | | | 775,000 | | | | 821,364 | | | | | |
| City of St. Petersburg FL, | | | | | | | | | | | | |
| 5.000%, 10/01/2042 (Callable 10/01/2029) | | | 900,000 | | | | 970,979 | | | | | |
| City of Tallahassee FL: | | | | | | | | | | | | |
| 5.000%, 12/01/2023 | | | 400,000 | | | | 401,636 | | | | | |
| 5.000%, 12/01/2024 | | | 1,525,000 | | | | 1,547,504 | | | | | |
| 5.000%, 12/01/2029 (Callable 12/01/2025) | | | 610,000 | | | | 627,710 | | | | | |
| 5.000%, 12/01/2040 (Callable 06/01/2025) | | | 1,260,000 | | | | 1,260,229 | | | | | |
| County of Collier FL: | | | | | | | | | | | | |
| 5.000%, 06/01/2024 | | | 255,000 | | | | 255,912 | | | | | |
| 5.000%, 06/01/2026 | | | 1,840,000 | | | | 1,870,606 | | | | | |
| County of Miami-Dade FL: | | | | | | | | | | | | |
| 5.000%, 06/01/2027 (Callable 06/01/2025) | | | 2,500,000 | | | | 2,571,596 | | | | | |
| 5.000%, 10/01/2032 (Callable 10/01/2026) | | | 335,000 | | | | 352,201 | | | | | |
| 6.875%, 10/01/2034 | | | | | | | | | | | | |
(Callable 10/01/2029) (Insured by AGC)(5) | | | 255,000 | | | | 312,536 | | | | | |
| 7.000%, 10/01/2039 | | | | | | | | | | | | |
(Callable 10/01/2029) (Insured by AGC)(5) | | | 390,000 | | | | 473,773 | | | | | |
| County of Osceola FL, | | | | | | | | | | | | |
| 5.000%, 10/01/2031 (Callable 10/01/2029) | | | 550,000 | | | | 588,786 | | | | | |
| County of Palm Beach FL: | | | | | | | | | | | | |
| 4.000%, 12/01/2036 (Callable 12/01/2030) | | | 1,165,000 | | | | 1,199,596 | | | | | |
| 4.000%, 12/01/2037 (Callable 12/01/2030) | | | 1,295,000 | | | | 1,324,623 | | | | | |
| County of Sarasota FL, | | | | | | | | | | | | |
| 5.000%, 10/01/2045 (Callable 10/01/2030) | | | 2,000,000 | | | | 2,166,095 | | | | | |
| County of Seminole FL, | | | | | | | | | | | | |
| 5.000%, 10/01/2052 (Callable 10/01/2032) | | | 2,500,000 | | | | 2,692,125 | | | | | |
| Escambia County Health Facilities Authority, | | | | | | | | | | | | |
| 5.000%, 08/15/2035 (Callable 02/15/2030) | | | 820,000 | | | | 856,275 | | | | | |
| Florida Department of Management Services, | | | | | | | | | | | | |
| 5.000%, 11/01/2029 | | | 2,000,000 | | | | 2,256,121 | | | | | |
| Florida Development Finance Corp.: | | | | | | | | | | | | |
4.000%, 06/01/2025(3) | | | 110,000 | | | | 107,242 | | | | | |
4.000%, 06/01/2026(3) | | | 115,000 | | | | 110,570 | | | | | |
| 5.000%, 04/01/2028 | | | 400,000 | | | | 426,130 | | | | | |
| 5.000%, 04/01/2029 | | | 250,000 | | | | 269,378 | | | | | |
| 6.125%, 07/01/2032 (Callable 04/02/2026) | | | | | | | | | | | | |
(Mandatory Tender Date 07/01/2026)(1)(3) | | | 3,000,000 | | | | 3,018,784 | | | | | |
| 5.250%, 06/15/2034 (Callable 06/15/2032) | | | 1,250,000 | | | | 1,310,742 | | | | | |
| 5.000%, 06/15/2040 (Callable 06/15/2027) | | | 1,650,000 | | | | 1,651,863 | | | | | |
| Florida Gulf Coast University | | | | | | | | | | | | |
| Financing Corp., | | | | | | | | | | | | |
| 5.000%, 08/01/2029 (Callable 02/01/2028) | | | 600,000 | | | | 641,615 | | | | | |
| Florida Higher Educational | | | | | | | | | | | | |
| Facilities Financial Authority, | | | | | | | | | | | | |
| 5.000%, 10/01/2023 | | | 500,000 | | | | 500,851 | | | | | |
| Florida Housing Finance Corp.: | | | | | | | | | | | | |
| 1.000%, 02/01/2025 (Mandatory Tender | | | | | | | | | | | | |
Date 08/01/2024) (Insured by FNMA)(1) | | | 4,550,000 | | | | 4,399,826 | | | | | |
| 5.000%, 12/01/2026 (Mandatory Tender | | | | | | | | | | | | |
Date 12/01/2025) (Insured by HUD)(1) | | | 3,000,000 | | | | 3,078,952 | | | | | |
| 4.200%, 01/01/2045 | | | | | | | | | | | | |
| (Callable 01/01/2028) (Insured by GNMA) | | | 595,000 | | | | 583,683 | | | | | |
| 4.000%, 07/01/2047 | | | | | | | | | | | | |
| (Callable 07/01/2025) (Insured by GNMA) | | | 80,000 | | | | 79,747 | | | | | |
| 3.000%, 01/01/2052 | | | | | | | | | | | | |
| (Callable 01/01/2030) (Insured by GNMA) | | | 1,095,000 | | | | 1,056,667 | | | | | |
| 5.500%, 01/01/2054 | | | | | | | | | | | | |
| (Callable 01/01/2032) (Insured by GNMA) | | | 2,500,000 | | | | 2,633,529 | | | | | |
| Florida Municipal Power Agency, | | | | | | | | | | | | |
| 4.000%, 10/01/2030 (Callable 10/01/2027) | | | 500,000 | | | | 521,052 | | | | | |
| Florida State Turnpike Authority, | | | | | | | | | | | | |
| 4.500%, 07/01/2041 (Callable 07/01/2023) | | | 500,000 | | | | 500,000 | | | | | |
| Greater Orlando Aviation Authority, | | | | | | | | | | | | |
| 5.000%, 10/01/2027 | | | 2,665,000 | | | | 2,821,950 | | | | | |
| Highlands County Health Facilities Authority, | | | | | | | | | | | | |
| 2.200%, 11/15/2035 (Callable 07/03/2023) | | | | | | | | | | | | |
(Optional Put Date 07/07/2023)(1) | | | 7,135,000 | | | | 7,135,000 | | | | | |
The accompanying notes are an integral part of these financial statements.
Baird Core Intermediate Municipal Bond Fund
Schedule of Investments, June 30, 2023 (Unaudited)
Long-Term Investments (cont.)
| | | Principal | | | | | | % of | |
| | | Amount | | | Value | | | Net Assets | |
| Hillsborough County Aviation Authority, | | | | | | | | | |
| 5.000%, 10/01/2035 | | | | | | | | | |
| (Pre-refunded to 10/01/2024) | | $ | 500,000 | | | $ | 511,444 | | | | |
| Jacksonville Electric Authority: | | | | | | | | | | | |
| 5.000%, 10/01/2028 (Callable 10/01/2027) | | | 700,000 | | | | 762,406 | | | | |
| 5.000%, 10/01/2032 (Callable 10/01/2027) | | | 700,000 | | | | 763,071 | | | | |
| Lee County Industrial | | | | | | | | | | | |
| Development Authority, | | | | | | | | | | | |
| 3.750%, 10/01/2027 (Callable 10/01/2023) | | | 1,710,000 | | | | 1,637,976 | | | | |
| Miami-Dade County | | | | | | | | | | | |
| Educational Facilities Authority: | | | | | | | | | | | |
| 4.000%, 04/01/2032 (Callable 07/31/2023) | | | 200,000 | | | | 200,019 | | | | |
| 4.000%, 04/01/2037 (Callable 07/31/2023) | | | 200,000 | | | | 194,773 | | | | |
| Orange County Health Facilities Authority, | | | | | | | | | | | |
| 5.000%, 08/01/2028 (Callable 08/01/2024) | | | 2,500,000 | | | | 2,516,087 | | | | |
| Palm Beach County | | | | | | | | | | | |
| Health Facilities Authority: | | | | | | | | | | | |
| 4.000%, 05/15/2024 | | | 320,000 | | | | 313,305 | | | | |
| 5.000%, 11/01/2032 | | | 200,000 | | | | 213,903 | | | | |
| 4.000%, 05/15/2035 (Callable 05/15/2025) | | | 175,000 | | | | 135,892 | | | | |
| Palm Beach County Housing Authority, | | | | | | | | | | | |
| 5.000%, 04/01/2026 | | | | | | | | | | | |
(Mandatory Tender Date 04/01/2025)(1) | | | 2,600,000 | | | | 2,646,735 | | | | |
| Pinellas County Housing Finance Authority, | | | | | | | | | | | |
| 6.000%, 03/01/2054 | | | | | | | | | | | |
| (Callable 03/01/2032) (Insured by GNMA) | | | 2,325,000 | | | | 2,501,293 | | | | |
| Pinellas County School Board, | | | | | | | | | | | |
| 5.000%, 07/01/2033 (Callable 07/01/2027) | | | 515,000 | | | | 554,945 | | | | |
| Reedy Creek Improvement District, | | | | | | | | | | | |
| 4.000%, 06/01/2035 (Callable 06/01/2027) | | | 1,000,000 | | | | 1,012,358 | | | | |
| Sarasota County Public Hospital District, | | | | | | | | | | | |
| 5.500%, 07/01/2028 (Insured by NATL) | | | 5,000,000 | | | | 5,325,590 | | | | |
| School Board of Miami-Dade County: | | | | | | | | | | | |
| 5.000%, 02/01/2028 (Callable 02/01/2026) | | | 3,500,000 | | | | 3,639,421 | | | | |
| 5.000%, 11/01/2030 (Callable 11/01/2024) | | | 660,000 | | | | 672,708 | | | | |
| School District of Broward County, | | | | | | | | | | | |
| 5.000%, 07/01/2036 (Callable 07/01/2032) | | | 3,000,000 | | | | 3,409,592 | | | | |
| Seminole County Industrial | | | | | | | | | | | |
| Development Authority: | | | | | | | | | | | |
4.000%, 06/15/2028(3) | | | 245,000 | | | | 235,000 | | | | |
4.000%, 06/15/2029(3) | | | 260,000 | | | | 247,794 | | | | |
4.000%, 06/15/2030(3) | | | 535,000 | | | | 505,725 | | | | |
| 4.000%, 06/15/2036 | | | | | | | | | | | |
(Callable 06/15/2031)(3) | | | 315,000 | | | | 275,906 | | | | |
| 4.000%, 06/15/2041 | | | | | | | | | | | |
(Callable 06/15/2031)(3) | | | 420,000 | | | | 344,530 | | | | |
| Village Community | | | | | | | | | | | |
| Development District No. 10, | | | | | | | | | | | |
| 5.000%, 05/01/2035 | | | | | | | | | | | |
| (Callable 05/01/2033) (Insured by AGM) | | | 1,125,000 | | | | 1,287,487 | | | | |
| Village Community | | | | | | | | | | | |
| Development District No. 13, | | | | | | | | | | | |
| 2.625%, 05/01/2024 | | | 125,000 | | | | 123,475 | | | | |
| Total Florida | | | | | | | | | | | |
| (Cost $94,857,149) | | | | | | | 93,552,181 | | | | 3.6 | % |
| Georgia | | | | | | | | | | | | |
| Atlanta Urban Residential Finance Authority, | | | | | | | | | | | | |
| 2.000%, 09/01/2025 | | | | | | | | | | | | |
(Mandatory Tender Date 09/01/2024)(1) | | | 5,025,000 | | | | 4,885,837 | | | | | |
| Bartow County Development Authority: | | | | | | | | | | | | |
| 1.800%, 09/01/2029 | | | | | | | | | | | | |
(Callable 11/19/2026)(1) | | | 4,810,000 | | | | 4,037,330 | | | | | |
| 3.950%, 12/01/2032 | | | | | | | | | | | | |
(Mandatory Tender Date 03/08/2028)(1) | | | 2,750,000 | | | | 2,743,352 | | | | | |
| Burke County Development Authority, | | | | | | | | | | | | |
| 2.200%, 10/01/2032 | | | | | | | | | | | | |
| (Callable 11/19/2026) | | | 1,250,000 | | | | 1,003,737 | | | | | |
| Carrollton Payroll Development Authority, | | | | | | | | | | | | |
| 5.000%, 07/01/2029 | | | 1,175,000 | | | | 1,302,133 | | | | | |
| City of Atlanta GA: | | | | | | | | | | | | |
| 5.000%, 01/01/2025 (Callable 07/31/2023) | | | 225,000 | | | | 225,247 | | | | | |
| 5.000%, 01/01/2028 (Callable 07/31/2023) | | | 1,000,000 | | | | 1,001,092 | | | | | |
| City of Kingsland GA, | | | | | | | | | | | | |
| 4.000%, 09/01/2043 | | | | | | | | | | | | |
(Callable 09/01/2033)(6) | | | 1,000,000 | | | | 984,956 | | | | | |
| City of Monroe GA: | | | | | | | | | | | | |
| 4.000%, 12/01/2036 | | | | | | | | | | | | |
| (Callable 12/01/2030) (Insured by AGM) | | | 500,000 | | | | 507,673 | | | | | |
| 4.000%, 12/01/2037 | | | | | | | | | | | | |
| (Callable 12/01/2030) (Insured by AGM) | | | 750,000 | | | | 755,034 | | | | | |
| Clayton County Development Authority, | | | | | | | | | | | | |
| 4.000%, 07/01/2031 (Callable 07/01/2027) | | | 495,000 | | | | 507,069 | | | | | |
| Cobb County Kennestone Hospital Authority, | | | | | | | | | | | | |
| 5.000%, 04/01/2042 (Callable 04/01/2027) | | | 450,000 | | | | 462,192 | | | | | |
| Development Authority for Fulton County: | | | | | | | | | | | | |
| 5.000%, 09/01/2026 | | | 575,000 | | | | 605,463 | | | | | |
| 5.000%, 09/01/2027 | | | 565,000 | | | | 606,335 | | | | | |
| 5.000%, 09/01/2028 | | | 625,000 | | | | 682,681 | | | | | |
| 5.000%, 09/01/2029 | | | 500,000 | | | | 554,343 | | | | | |
| 5.000%, 10/01/2029 | | | 1,710,000 | | | | 1,887,016 | | | | | |
| Development Authority of Bulloch County: | | | | | | | | | | | | |
| 5.000%, 07/01/2030 | | | 405,000 | | | | 455,821 | | | | | |
| 5.000%, 07/01/2031 (Callable 07/01/2030) | | | 420,000 | | | | 471,425 | | | | | |
| 5.000%, 07/01/2032 (Callable 07/01/2030) | | | 445,000 | | | | 497,781 | | | | | |
| 5.000%, 07/01/2033 (Callable 07/01/2030) | | | 465,000 | | | | 519,032 | | | | | |
| 4.000%, 07/01/2039 (Callable 07/01/2030) | | | 305,000 | | | | 304,419 | | | | | |
| Development Authority of Cobb County, | | | | | | | | | | | | |
| 5.000%, 07/15/2028 (Callable 07/15/2027) | | | 305,000 | | | | 329,561 | | | | | |
| Development Authority of Monroe County, | | | | | | | | | | | | |
| 1.500%, 01/01/2039 | | | | | | | | | | | | |
(Mandatory Tender Date 02/03/2025)(1) | | | 5,240,000 | | | | 4,950,836 | | | | | |
| Fayette County Hospital Authority, | | | | | | | | | | | | |
| 5.000%, 07/01/2054 (Callable 01/01/2024) | | | | | | | | | | | | |
(Mandatory Tender Date 07/01/2024)(1) | | | 975,000 | | | | 981,161 | | | | | |
| Gainesville & Hall County | | | | | | | | | | | | |
| Development Authority, | | | | | | | | | | | | |
| 2.050%, 11/15/2033 (Callable 07/01/2023) | | | | | | | | | | | | |
| (Optional Put Date 07/03/2023) | | | | | | | | | | | | |
(Insured by AGC)(1) | | | 6,000,000 | | | | 6,000,000 | | | | | |
| Gainesville & Hall County | | | | | | | | | | | | |
| Hospital Authority, | | | | | | | | | | | | |
| 5.000%, 02/15/2029 (Callable 02/15/2027) | | | 485,000 | | | | 514,639 | | | | | |
| Georgia Housing & Finance Authority, | | | | | | | | | | | | |
| 3.600%, 12/01/2033 (Callable 06/01/2027) | | | 225,000 | | | | 221,158 | | | | | |
| Georgia Local Government, | | | | | | | | | | | | |
| 4.750%, 06/01/2028 (Insured by NATL) | | | 2,231,000 | | | | 2,297,013 | | | | | |
| Main Street Natural Gas, Inc.: | | | | | | | | | | | | |
4.000%, 11/01/2023(3) | | | 2,055,000 | | | | 2,052,099 | | | | | |
| 5.000%, 05/15/2026 | | | 1,470,000 | | | | 1,496,612 | | | | | |
| 5.000%, 05/15/2034 | | | | | | | | | | | | |
| (Callable 05/15/2029) | | | 1,530,000 | | | | 1,569,169 | | | | | |
| 4.237%, 04/01/2048 | | | | | | | | | | | | |
(1 Month LIBOR USD + 0.750%)(2) | | | 2,270,000 | | | | 2,269,364 | | | | | |
| 4.317%, 08/01/2048 (1 Month LIBOR | | | | | | | | | | | | |
| USD + 0.830%) (Callable 09/01/2023) | | | | | | | | | | | | |
(Mandatory Tender Date 12/01/2023)(2) | | | 3,625,000 | | | | 3,622,684 | | | | | |
| 4.000%, 03/01/2050 (Callable 06/01/2026) | | | | | | | | | | | | |
(Mandatory Tender Date 09/01/2026)(1) | | | 10,525,000 | | | | 10,461,679 | | | | | |
The accompanying notes are an integral part of these financial statements.
Baird Core Intermediate Municipal Bond Fund
Schedule of Investments, June 30, 2023 (Unaudited)
Long-Term Investments (cont.)
| | | Principal | | | | | | % of | |
| | | Amount | | | Value | | | Net Assets | |
| Main Street Natural Gas, Inc.: (cont.) | | | | | | | | | |
| 4.000%, 07/01/2052 (Callable 06/01/2027) | | | | | | | | | |
(Mandatory Tender Date 09/01/2027)(1) | | $ | 6,515,000 | | | $ | 6,493,450 | | | | |
| 4.000%, 08/01/2052 (Callable 05/01/2027) | | | | | | | | | | | |
(Mandatory Tender Date 11/01/2027)(1)(3) | | | 13,000,000 | | | | 12,565,075 | | | | |
| 5.000%, 12/01/2052 (Callable 03/01/2029) | | | | | | | | | | | |
(Mandatory Tender Date 06/01/2029)(1) | | | 1,100,000 | | | | 1,134,748 | | | | |
| Private Colleges & Universities Authority: | | | | | | | | | | | |
| 5.000%, 06/01/2027 | | | 420,000 | | | | 442,754 | | | | |
| 5.000%, 06/01/2028 | | | 495,000 | | | | 529,625 | | | | |
| 5.000%, 06/01/2029 | | | 400,000 | | | | 434,489 | | | | |
| 4.000%, 06/01/2034 (Callable 06/01/2031) | | | 395,000 | | | | 404,977 | | | | |
| 4.000%, 06/01/2035 (Callable 06/01/2031) | | | 500,000 | | | | 505,772 | | | | |
| Valdosta Housing Authority, | | | | | | | | | | | |
| 1.250%, 02/01/2025 | | | | | | | | | | | |
(Mandatory Tender Date 02/01/2024)(1) | | | 5,285,000 | | | | 5,196,461 | | | | |
| Total Georgia | | | | | | | | | | | |
| (Cost $93,578,221) | | | | | | | 89,473,294 | | | | 3.4 | % |
| Hawaii | | | | | | | | | | | | |
| State of Hawaii: | | | | | | | | | | | | |
| 5.250%, 08/01/2025 (Callable 08/01/2023) | | | 2,500,000 | | | | 2,501,887 | | | | | |
| 5.000%, 08/01/2027 (Callable 08/01/2023) | | | 1,000,000 | | | | 1,000,552 | | | | | |
| Total Hawaii | | | | | | | | | | | | |
| (Cost $3,505,008) | | | | | | | 3,502,439 | | | | 0.1 | % |
| Idaho | | | | | | | | | | | | |
| County of Nez Perce ID, | | | | | | | | | | | | |
| 5.500%, 03/01/2042 (Callable 03/01/2032) | | | 680,000 | | | | 746,279 | | | | | |
| Idaho Housing & Finance Association, | | | | | | | | | | | | |
| 5.000%, 08/15/2026 | | | 1,000,000 | | | | 1,060,942 | | | | | |
| Total Idaho | | | | | | | | | | | | |
| (Cost $1,830,280) | | | | | | | 1,807,221 | | | | 0.1 | % |
| Illinois | | | | | | | | | | | | |
| Adams & Hancock Counties Community | | | | | | | | | | | | |
| Unit School District No. 4: | | | | | | | | | | | | |
| 4.000%, 12/01/2027 | | | | | | | | | | | | |
| (Callable 12/01/2025) (Insured by BAM) | | | 290,000 | | | | 296,891 | | | | | |
| 4.000%, 12/01/2029 | | | | | | | | | | | | |
| (Callable 12/01/2025) (Insured by BAM) | | | 310,000 | | | | 318,622 | | | | | |
| 4.000%, 12/01/2030 | | | | | | | | | | | | |
| (Callable 12/01/2025) (Insured by BAM) | | | 325,000 | | | | 334,199 | | | | | |
| 4.000%, 12/01/2032 | | | | | | | | | | | | |
| (Callable 12/01/2025) (Insured by BAM) | | | 350,000 | | | | 357,517 | | | | | |
| Bourbonnais Township Park District, | | | | | | | | | | | | |
| 4.000%, 12/15/2023 (Insured by BAM) | | | 100,000 | | | | 100,016 | | | | | |
| Bureau County Township | | | | | | | | | | | | |
| High School District No. 502, | | | | | | | | | | | | |
| 4.000%, 12/01/2031(Pre-refunded to | | | | | | | | | | | | |
| 12/01/2027) (Insured by BAM) | | | 1,330,000 | | | | 1,395,787 | | | | | |
| Channahon Park District: | | | | | | | | | | | | |
| 4.000%, 12/15/2031 | | | | | | | | | | | | |
| (Callable 12/15/2029) (Insured by BAM) | | | 460,000 | | | | 480,852 | | | | | |
| 4.000%, 12/15/2034 | | | | | | | | | | | | |
| (Callable 12/15/2029) (Insured by BAM) | | | 510,000 | | | | 528,903 | | | | | |
| 4.000%, 12/15/2036 | | | | | | | | | | | | |
| (Callable 12/15/2029) (Insured by BAM) | | | 950,000 | | | | 961,607 | | | | | |
| 4.000%, 12/15/2038 | | | | | | | | | | | | |
| (Callable 12/15/2029) (Insured by BAM) | | | 595,000 | | | | 594,258 | | | | | |
| Chicago Board of Education: | | | | | | | | | | | | |
| 5.000%, 12/01/2023 (Insured by AGM) | | | 1,000,000 | | | | 1,003,768 | | | | | |
| 0.000%, 12/01/2025 (Insured by NATL) | | | 2,280,000 | | | | 2,066,824 | | | | | |
| 0.000%, 12/01/2025 (Insured by NATL) | | | 500,000 | | | | 453,251 | | | | | |
| 5.000%, 12/01/2025 (Insured by AGM) | | | 600,000 | | | | 614,126 | | | | | |
| 5.000%, 12/01/2029 | | | | | | | | | | | | |
| (Callable 12/01/2028) (Insured by AGM) | | | 1,000,000 | | | | 1,061,344 | | | | | |
| 5.250%, 04/01/2033 | | | 1,000,000 | | | | 1,123,851 | | | | | |
| 5.250%, 04/01/2035 (Callable 04/01/2033) | | | 1,500,000 | | | | 1,663,372 | | | | | |
| 7.000%, 12/01/2044 (Callable 12/01/2025) | | | 1,375,000 | | | | 1,443,776 | | | | | |
| 6.500%, 12/01/2046 (Callable 12/01/2026) | | | 1,000,000 | | | | 1,047,517 | | | | | |
| Chicago Midway International Airport: | | | | | | | | | | | | |
| 5.000%, 01/01/2024 | | | 3,240,000 | | | | 3,257,501 | | | | | |
| 5.000%, 01/01/2029 (Callable 01/01/2026) | | | 2,000,000 | | | | 2,052,108 | | | | | |
| Chicago O’Hare International Airport: | | | | | | | | | | | | |
| 5.000%, 01/01/2026 | | | 3,500,000 | | | | 3,594,569 | | | | | |
| 5.000%, 01/01/2029 (Insured by AGM) | | | 660,000 | | | | 707,641 | | | | | |
| 5.000%, 01/01/2035 (Callable 01/01/2026) | | | 1,540,000 | | | | 1,600,322 | | | | | |
| 5.000%, 01/01/2036 (Callable 01/01/2032) | | | 335,000 | | | | 364,865 | | | | | |
| Chicago Park District: | | | | | | | | | | | | |
| 5.000%, 01/01/2024 | | | 580,000 | | | | 584,030 | | | | | |
| 5.000%, 01/01/2027 (Callable 01/01/2024) | | | 1,000,000 | | | | 1,006,443 | | | | | |
| 5.000%, 01/01/2028 (Callable 01/01/2024) | | | 3,735,000 | | | | 3,759,698 | | | | | |
| 5.250%, 01/01/2043 (Callable 01/01/2033) | | | 1,000,000 | | | | 1,090,445 | | | | | |
| 5.250%, 01/01/2044 (Callable 01/01/2033) | | | 1,730,000 | | | | 1,878,440 | | | | | |
| 5.250%, 01/01/2046 (Callable 01/01/2033) | | | 2,500,000 | | | | 2,714,074 | | | | | |
| Chicago Transit Authority, | | | | | | | | | | | | |
| 5.250%, 12/01/2049 (Callable 12/01/2024) | | | 6,700,000 | | | | 6,796,006 | | | | | |
| City of Chicago Heights IL: | | | | | | | | | | | | |
| 4.000%, 12/01/2028 (Insured by BAM) | | | 200,000 | | | | 209,703 | | | | | |
| 4.000%, 12/01/2029 (Insured by BAM) | | | 250,000 | | | | 264,744 | | | | | |
| 4.000%, 12/01/2030 | | | | | | | | | | | | |
| (Callable 12/01/2029) (Insured by BAM) | | | 350,000 | | | | 370,185 | | | | | |
| 4.000%, 12/01/2031 | | | | | | | | | | | | |
| (Callable 12/01/2029) (Insured by BAM) | | | 365,000 | | | | 384,534 | | | | | |
| City of Chicago IL: | | | | | | | | | | | | |
| 5.000%, 01/01/2024 | | | 250,000 | | | | 251,385 | | | | | |
| 4.000%, 09/01/2025 (Mandatory Tender | | | | | | | | | | | | |
Date 09/01/2024) (Insured by HUD)(1) | | | 1,750,000 | | | | 1,752,596 | | | | | |
| 0.000%, 01/01/2027 | | | | | | | | | | | | |
| (ETM) (Insured by NATL) | | | 195,000 | | | | 174,456 | | | | | |
| 5.000%, 11/01/2027 | | | | | | | | | | | | |
| (Callable 11/01/2024) | | | 265,000 | | | | 269,856 | | | | | |
| 0.000%, 01/01/2028 | | | | | | | | | | | | |
| (ETM) (Insured by NATL) | | | 2,195,000 | | | | 1,910,923 | | | | | |
| 5.000%, 11/01/2028 | | | | | | | | | | | | |
| (Callable 11/01/2027) (Insured by AGM) | | | 625,000 | | | | 661,471 | | | | | |
| 5.000%, 11/01/2029 (Callable 11/01/2026) | | | 1,810,000 | | | | 1,895,713 | | | | | |
| 5.000%, 01/01/2030 | | | | | | | | | | | | |
| (Callable 01/01/2024) (Insured by AGM) | | | 445,000 | | | | 449,427 | | | | | |
| 5.500%, 01/01/2030 (Insured by NATL) | | | 765,000 | | | | 825,979 | | | | | |
| 4.000%, 11/01/2032 | | | | | | | | | | | | |
| (Callable 11/01/2024) (Insured by BAM) | | | 200,000 | | | | 202,173 | | | | | |
| 5.000%, 11/01/2033 | | | | | | | | | | | | |
| (Callable 11/01/2027) (Insured by AGM) | | | 525,000 | | | | 559,314 | | | | | |
| 5.000%, 01/01/2034 (Callable 01/01/2024) | | | 1,000,000 | | | | 1,003,536 | | | | | |
| 5.000%, 11/01/2036 | | | | | | | | | | | | |
| (Callable 05/01/2032) (Insured by AGM) | | | 1,000,000 | | | | 1,108,188 | | | | | |
| 5.000%, 11/01/2036 | | | | | | | | | | | | |
| (Callable 11/01/2027) (Insured by AGM) | | | 260,000 | | | | 268,028 | | | | | |
| 5.000%, 01/01/2039 | | | | | | | | | | | | |
| (Callable 01/01/2024) (Insured by AGM) | | | 3,220,000 | | | | 3,227,258 | | | | | |
| 5.000%, 01/01/2039 (Callable 01/01/2024) | | | 4,205,000 | | | | 4,218,314 | | | | | |
| 5.250%, 01/01/2042 | | | | | | | | | | | | |
| (Callable 07/01/2032) (Insured by AGM) | | | 2,420,000 | | | | 2,658,512 | | | | | |
| 5.250%, 01/01/2043 | | | | | | | | | | | | |
| (Callable 07/01/2032) (Insured by AGM) | | | 6,490,000 | | | | 7,123,008 | | | | | |
| 5.000%, 01/01/2044 | | | | | | | | | | | | |
| (Callable 01/01/2024) (Insured by BAM) | | | 1,000,000 | | | | 1,002,827 | | | | | |
The accompanying notes are an integral part of these financial statements.
Baird Core Intermediate Municipal Bond Fund
Schedule of Investments, June 30, 2023 (Unaudited)
Long-Term Investments (cont.)
| | | Principal | | | | | | % of | |
| | | Amount | | | Value | | | Net Assets | |
| City of Decatur IL: | | | | | | | | | |
| 4.250%, 03/01/2030 (Callable 03/01/2024) | | | | | | | | | |
| (Insured by BAM) | | $ | 250,000 | | | $ | 252,086 | | | |
| |
| 5.000%, 03/01/2034 | | | | | | | | | | | | |
| (Callable 03/01/2026) (Insured by BAM) | | | 905,000 | | | | 944,297 | | | | | |
| City of Springfield IL, | | | | | | | | | | | | |
| 5.000%, 03/01/2029 (Callable 03/01/2025) | | | 4,500,000 | | | | 4,597,817 | | | | | |
| Clinton, Bond, Fayette, Etc. Counties | | | | | | | | | | | | |
| Community College District No. 501, | | | | | | | | | | | | |
| 5.000%, 12/01/2028 (Insured by AGM) | | | 500,000 | | | | 550,955 | | | | | |
| Community Unit School District No. 427, | | | | | | | | | | | | |
| 0.000%, 01/01/2026 (Insured by AGM) | | | 1,340,000 | | | | 1,221,621 | | | | | |
| Cook County Community | | | | | | | | | | | | |
| Consolidated School District No. 65, | | | | | | | | | | | | |
| 0.000%, 12/01/2023 | | | 200,000 | | | | 197,007 | | | | | |
| Cook County Community | | | | | | | | | | | | |
| High School District No. 217, | | | | | | | | | | | | |
| 4.500%, 12/01/2039 (Callable 12/01/2031) | | | 1,495,000 | | | | 1,543,818 | | | | | |
| Cook County School District No. 111, | | | | | | | | | | | | |
| 4.000%, 12/01/2025 (Insured by AGM) | | | 1,000,000 | | | | 1,019,776 | | | | | |
| Cook County School District No. 130: | | | | | | | | | | | | |
| 5.000%, 12/01/2027 | | | | | | | | | | | | |
| (Callable 12/01/2025) (Insured by AGM) | | | 1,210,000 | | | | 1,259,363 | | | | | |
| 5.000%, 12/01/2028 | | | | | | | | | | | | |
| (Callable 12/01/2025) (Insured by AGM) | | | 1,000,000 | | | | 1,041,738 | | | | | |
| Cook County School District No. 135, | | | | | | | | | | | | |
| 5.000%, 12/01/2024 | | | 930,000 | | | | 950,636 | | | | | |
| Cook County School District No. 163: | | | | | | | | | | | | |
| 6.000%, 12/15/2025 (Insured by BAM) | | | 430,000 | | | | 458,011 | | | | | |
| 6.000%, 12/15/2027 (Insured by BAM) | | | 1,150,000 | | | | 1,291,766 | | | | | |
| Cook County School District No. 83, | | | | | | | | | | | | |
| 5.625%, 06/01/2033 | | | 815,000 | | | | 953,725 | | | | | |
| Cook County School District No. 99: | | | | | | | | | | | | |
| 4.000%, 12/01/2029 (Insured by BAM) | | | 2,425,000 | | | | 2,513,517 | | | | | |
| 4.000%, 12/01/2030 (Insured by BAM) | | | 250,000 | | | | 260,020 | | | | | |
| County of Cook IL: | | | | | | | | | | | | |
| 5.000%, 11/15/2033 (Callable 11/15/2030) | | | 1,500,000 | | | | 1,673,333 | | | | | |
| 4.000%, 11/15/2038 (Callable 11/15/2027) | | | 1,675,000 | | | | 1,672,108 | | | | | |
| 5.000%, 11/15/2041 (Callable 11/15/2032) | | | 1,890,000 | | | | 2,018,897 | | | | | |
| County of Sangamon IL: | | | | | | | | | | | | |
| 3.000%, 12/15/2038 | | | | | | | | | | | | |
| (Callable 12/15/2029) (Insured by BAM) | | | 825,000 | | | | 709,664 | | | | | |
| 3.000%, 12/15/2039 | | | | | | | | | | | | |
| (Callable 12/15/2029) (Insured by BAM) | | | 700,000 | | | | 589,881 | | | | | |
| 3.000%, 12/15/2041 | | | | | | | | | | | | |
| (Callable 12/15/2029) (Insured by BAM) | | | 600,000 | | | | 490,795 | | | | | |
| Crawford Hospital District, | | | | | | | | | | | | |
| 4.000%, 01/01/2031 | | | | | | | | | | | | |
| (Callable 01/01/2029) (Insured by AGM) | | | 345,000 | | | | 354,515 | | | | | |
| DuPage County High School District No. 87, | | | | | | | | | | | | |
| 5.000%, 01/01/2029 (Callable 01/01/2025) | | | 315,000 | | | | 322,750 | | | | | |
| DuPage County School District No. 60, | | | | | | | | | | | | |
| 4.000%, 12/30/2036 (Callable 12/30/2027) | | | 1,000,000 | | | | 1,008,564 | | | | | |
| Eastern Illinois Economic | | | | | | | | | | | | |
| Development Authority, | | | | | | | | | | | | |
| 5.000%, 11/01/2033 (Callable 11/01/2028) | | | 1,000,000 | | | | 981,759 | | | | | |
| Exceptional Children Have Opportunities: | | | | | | | | | | | | |
| 4.000%, 12/01/2034 | | | | | | | | | | | | |
| (Callable 12/01/2029) | | | 765,000 | | | | 784,589 | | | | | |
| 4.000%, 12/01/2035 | | | | | | | | | | | | |
| (Callable 12/01/2029) | | | 645,000 | | | | 661,191 | | | | | |
| Ford, Champaign Counties Community | | | | | | | | | | | | |
| Unit School District No. 10, | | | | | | | | | | | | |
| 5.000%, 12/01/2027 | | | | | | | | | | | | |
| (Callable 12/01/2026) (Insured by AGM) | | | 600,000 | | | | 636,814 | | | | | |
| Hampshire Special Service Area No. 13: | | | | | | | | | | | | |
| 3.250%, 03/01/2032 | | | | | | | | | | | | |
| (Callable 03/01/2027) (Insured by BAM) | | | 165,000 | | | | 157,128 | | | | | |
| 3.300%, 03/01/2033 | | | | | | | | | | | | |
| (Callable 03/01/2027) (Insured by BAM) | | | 175,000 | | | | 166,251 | | | | | |
| 3.350%, 03/01/2034 | | | | | | | | | | | | |
| (Callable 03/01/2027) (Insured by BAM) | | | 185,000 | | | | 176,299 | | | | | |
| 3.400%, 03/01/2035 | | | | | | | | | | | | |
| (Callable 03/01/2027) (Insured by BAM) | | | 195,000 | | | | 184,160 | | | | | |
| 3.450%, 03/01/2036 | | | | | | | | | | | | |
| (Callable 03/01/2027) (Insured by BAM) | | | 205,000 | | | | 191,624 | | | | | |
| 3.500%, 03/01/2037 | | | | | | | | | | | | |
| (Callable 03/01/2027) (Insured by BAM) | | | 100,000 | | | | 92,353 | | | | | |
| Henry & Whiteside Counties Community | | | | | | | | | | | | |
| Unit School District No. 228, | | | | | | | | | | | | |
| 5.000%, 08/15/2031 | | | | | | | | | | | | |
| (Callable 08/15/2025) (Insured by AGM) | | | 270,000 | | | | 279,368 | | | | | |
| Hoffman Estates Park District, | | | | | | | | | | | | |
| 5.000%, 12/01/2040 | | | | | | | | | | | | |
| (Callable 12/01/2030) (Insured by BAM) | | | 5,000,000 | | | | 5,374,845 | | | | | |
| Huntley Area Public Library District, | | | | | | | | | | | | |
| 5.000%, 02/01/2037 | | | | | | | | | | | | |
| (Callable 02/01/2029) | | | 500,000 | | | | 544,219 | | | | | |
| Illinois Development Finance Authority: | | | | | | | | | | | | |
| 0.000%, 07/15/2025 (ETM) | | | 2,000,000 | | | | 1,864,085 | | | | | |
| 2.450%, 11/15/2039 | | | | | | | | | | | | |
(Mandatory Tender Date 03/03/2026)(1) | | | 1,125,000 | | | | 1,094,191 | | | | | |
| Illinois Educational Facilities Authority, | | | | | | | | | | | | |
| 4.000%, 11/01/2036 (Callable 07/31/2023) | | | 1,065,000 | | | | 1,067,917 | | | | | |
| Illinois Finance Authority: | | | | | | | | | | | | |
| 5.000%, 10/01/2023 | | | 105,000 | | | | 104,978 | | | | | |
| 5.000%, 07/01/2024 | | | 2,870,000 | | | | 2,908,836 | | | | | |
| 5.000%, 11/01/2024 | | | 1,100,000 | | | | 1,108,977 | | | | | |
| 5.000%, 07/01/2025 | | | 3,140,000 | | | | 3,224,794 | | | | | |
| 5.000%, 05/15/2029 (Callable 05/15/2026) | | | 375,000 | | | | 390,180 | | | | | |
| 5.000%, 10/01/2030 (Callable 10/01/2026) | | | 140,000 | | | | 147,576 | | | | | |
| 5.000%, 02/15/2031 (Callable 08/15/2027) | | | 500,000 | | | | 508,326 | | | | | |
| 5.000%, 11/15/2031 (Callable 11/15/2025) | | | 1,000,000 | | | | 1,031,868 | | | | | |
| 4.000%, 12/15/2032 (Callable 12/15/2029) | | | 625,000 | | | | 649,219 | | | | | |
4.500%, 08/01/2033(3) | | | 1,275,000 | | | | 1,263,760 | | | | | |
| 4.000%, 05/15/2034 (Callable 05/15/2026) | | | 300,000 | | | | 301,300 | | | | | |
| 4.735%, 11/01/2034 (SOFR + 1.200%) | | | | | | | | | | | | |
| (Callable 03/01/2025) | | | | | | | | | | | | |
(Mandatory Tender Date 09/01/2025)(2) | | | 7,890,000 | | | | 7,884,019 | | | | | |
| 5.000%, 02/15/2036 (Callable 02/15/2027) | | | 1,405,000 | | | | 1,473,451 | | | | | |
| 5.250%, 08/01/2038 | | | | | | | | | | | | |
(Callable 08/01/2033)(3) | | | 1,295,000 | | | | 1,308,067 | | | | | |
| 5.000%, 11/15/2039 (Callable 05/15/2025) | | | 5,600,000 | | | | 5,660,485 | | | | | |
| 4.000%, 12/01/2040 (Callable 12/01/2027) | | | 270,000 | | | | 268,287 | | | | | |
| 4.000%, 09/01/2041 (Callable 09/01/2026) | | | 240,000 | | | | 223,052 | | | | | |
| 5.000%, 10/01/2041 (Callable 10/01/2026) | | | 1,400,000 | | | | 1,441,014 | | | | | |
| 4.000%, 12/01/2042 (Callable 12/01/2027) | | | 275,000 | | | | 273,846 | | | | | |
| 6.000%, 07/01/2043 (Callable 07/01/2023) | | | 1,000,000 | | | | 1,000,000 | | | | | |
| Illinois Housing Development Authority: | | | | | | | | | | | | |
| 2.375%, 04/01/2025 (Mandatory Tender | | | | | | | | | | | | |
Date 04/01/2024) (Insured by HUD)(1) | | | 3,535,000 | | | | 3,500,558 | | | | | |
| 4.000%, 09/01/2025 (Mandatory Tender | | | | | | | | | | | | |
Date 09/01/2024) (Insured by HUD)(1) | | | 1,000,000 | | | | 1,000,810 | | | | | |
| 4.000%, 06/01/2026 (Mandatory Tender | | | | | | | | | | | | |
Date 06/01/2025) (Insured by FHA)(1) | | | 2,800,000 | | | | 2,803,664 | | | | | |
| 3.100%, 02/01/2035 (Callable 02/01/2026) | | | 580,000 | | | | 555,531 | | | | | |
| 4.000%, 03/01/2043 (Callable 08/01/2024) | | | | | | | | | | | | |
(Mandatory Tender Date 12/01/2024)(1) | | | 2,800,000 | | | | 2,796,201 | | | | | |
| 2.450%, 06/01/2043 | | | | | | | | | | | | |
| (Callable 07/31/2023) (Insured by GNMA) | | | 303,997 | | | | 247,864 | | | | | |
The accompanying notes are an integral part of these financial statements.
Baird Core Intermediate Municipal Bond Fund
Schedule of Investments, June 30, 2023 (Unaudited)
Long-Term Investments (cont.)
| | | Principal | | | | | | % of | |
| | | Amount | | | Value | | | Net Assets | |
| Illinois Housing Development Authority: (cont.) | | | | | | | | | |
| 4.000%, 07/01/2043 | | | | | | | | | |
| (Callable 01/01/2025) (Mandatory Tender | | | | | | | | | |
Date 07/01/2025) (Insured by HUD)(1) | | $ | 2,500,000 | | | $ | 2,502,104 | | | |
| |
| 4.000%, 10/01/2048 | | | | | | | | | | | | |
| (Callable 04/01/2027) (Insured by GNMA) | | | 4,170,000 | | | | 4,137,204 | | | | | |
| 2.830%, 05/15/2050 | | | | | | | | | | | | |
| (SIFMA Municipal Swap Index + 1.000%) | | | | | | | | | | | | |
| (Callable 11/15/2024) | | | | | | | | | | | | |
(Mandatory Tender Date 05/15/2025)(2) | | | 425,000 | | | | 425,654 | | | | | |
| 6.250%, 10/01/2052 | | | | | | | | | | | | |
| (Callable 04/01/2032) (Insured by GNMA) | | | 7,245,000 | | | | 7,861,136 | | | | | |
| Illinois Sports Facilities Authority: | | | | | | | | | | | | |
| 5.000%, 06/15/2028 | | | 1,900,000 | | | | 1,950,522 | | | | | |
| 5.000%, 06/15/2029 | | | 1,750,000 | | | | 1,799,250 | | | | | |
| 5.000%, 06/15/2029 (Insured by BAM) | | | 3,780,000 | | | | 3,985,441 | | | | | |
| 5.000%, 06/15/2032 (Callable 06/15/2031) | | | 480,000 | | | | 486,809 | | | | | |
| Illinois State Toll Highway Authority: | | | | | | | | | | | | |
| 5.000%, 12/01/2032 (Callable 01/01/2026) | | | 645,000 | | | | 671,211 | | | | | |
| 5.000%, 01/01/2036 (Callable 01/01/2025) | | | 2,100,000 | | | | 2,146,122 | | | | | |
| 5.000%, 01/01/2038 (Callable 01/01/2025) | | | 2,750,000 | | | | 2,803,466 | | | | | |
| 5.000%, 01/01/2045 (Callable 01/01/2031) | | | 1,895,000 | | | | 2,021,416 | | | | | |
| Illinois State University, | | | | | | | | | | | | |
| 5.000%, 04/01/2031 | | | | | | | | | | | | |
| (Callable 04/01/2028) (Insured by AGM) | | | 500,000 | | | | 541,248 | | | | | |
| Jo Daviess County Community | | | | | | | | | | | | |
| Unit School District No. 119: | | | | | | | | | | | | |
| 4.000%, 12/01/2034 | | | | | | | | | | | | |
| (Callable 12/01/2028) (Insured by AGM) | | | 345,000 | | | | 359,534 | | | | | |
| 4.000%, 12/01/2034 | | | | | | | | | | | | |
| (Callable 12/01/2028) (Insured by AGM) | | | 280,000 | | | | 291,796 | | | | | |
| 4.000%, 12/01/2037 | | | | | | | | | | | | |
| (Callable 12/01/2028) (Insured by AGM) | | | 380,000 | | | | 387,689 | | | | | |
| 4.000%, 12/01/2037 | | | | | | | | | | | | |
| (Callable 12/01/2028) (Insured by AGM) | | | 310,000 | | | | 317,653 | | | | | |
| 4.000%, 12/01/2039 | | | | | | | | | | | | |
| (Callable 12/01/2028) (Insured by AGM) | | | 285,000 | | | | 287,251 | | | | | |
| 4.000%, 12/01/2039 | | | | | | | | | | | | |
| (Callable 12/01/2028) (Insured by AGM) | | | 230,000 | | | | 232,713 | | | | | |
| Joliet Park District: | | | | | | | | | | | | |
| 4.000%, 02/01/2030 | | | | | | | | | | | | |
| (Callable 02/01/2024) (Insured by BAM) | | | 250,000 | | | | 251,484 | | | | | |
| 4.000%, 02/01/2033 | | | | | | | | | | | | |
| (Callable 07/31/2023) (Insured by AGM) | | | 315,000 | | | | 315,200 | | | | | |
| Kane & DeKalb Counties Community | | | | | | | | | | | | |
| Unit School District No. 301: | | | | | | | | | | | | |
| 0.000%, 12/01/2023 (Insured by NATL) | | | 1,835,000 | | | | 1,805,084 | | | | | |
| 0.000%, 12/01/2025 | | | 1,625,000 | | | | 1,475,498 | | | | | |
| 5.000%, 01/01/2031 (Callable 01/01/2027) | | | 565,000 | | | | 604,600 | | | | | |
| Kankakee County School District No. 111, | | | | | | | | | | | | |
| 4.000%, 01/01/2025 (Insured by BAM) | | | 480,000 | | | | 484,822 | | | | | |
| Kendall Kane & Will Counties Community | | | | | | | | | | | | |
| Unit School District No. 308, | | | | | | | | | | | | |
| 4.750%, 10/01/2031 (Callable 10/01/2023) | | | 1,000,000 | | | | 1,001,405 | | | | | |
| Knox & Warren Counties Community | | | | | | | | | | | | |
| Unit School District No. 205: | | | | | | | | | | | | |
| 4.000%, 01/01/2034 | | | | | | | | | | | | |
| (Callable 01/01/2028) (Insured by BAM) | | | 855,000 | | | | 876,903 | | | | | |
| 4.000%, 01/01/2036 | | | | | | | | | | | | |
| (Callable 01/01/2028) (Insured by BAM) | | | 920,000 | | | | 932,706 | | | | | |
| Lake County Community | | | | | | | | | | | | |
| Unit School District No. 187, | | | | | | | | | | | | |
| 4.000%, 01/01/2035 | | | | | | | | | | | | |
| (Callable 01/01/2027) (Insured by BAM) | | | 1,190,000 | | | | 1,213,047 | | | | | |
| Lake County Consolidated | | | | | | | | | | | | |
| High School District No. 120: | | | | | | | | | | | | |
| 5.500%, 12/01/2037 | | | | | | | | | | | | |
| (Callable 12/01/2032) | | | 750,000 | | | | 854,191 | | | | | |
| 5.500%, 12/01/2038 (Callable 12/01/2032) | | | 840,000 | | | | 950,154 | | | | | |
| 5.500%, 12/01/2040 (Callable 12/01/2032) | | | 1,510,000 | | | | 1,686,381 | | | | | |
| 5.500%, 12/01/2041 (Callable 12/01/2032) | | | 890,000 | | | | 990,500 | | | | | |
| Lake County School District No. 33: | | | | | | | | | | | | |
| 0.000%, 12/01/2026 (Insured by XLCA) | | | 525,000 | | | | 459,106 | | | | | |
| 0.000%, 12/01/2028 (Insured by XLCA) | | | 335,000 | | | | 272,074 | | | | | |
| Lake County Township | | | | | | | | | | | | |
| High School District No. 113, | | | | | | | | | | | | |
| 4.000%, 01/01/2032 (Callable 01/01/2029) | | | 4,130,000 | | | | 4,290,747 | | | | | |
| Macon & De Witt Counties Community | | | | | | | | | | | | |
| Unit School District No. 2: | | | | | | | | | | | | |
| 4.000%, 12/01/2036 | | | | | | | | | | | | |
| (Callable 12/01/2030) (Insured by AGM) | | | 835,000 | | | | 846,837 | | | | | |
| 4.000%, 12/01/2037 | | | | | | | | | | | | |
| (Callable 12/01/2030) (Insured by AGM) | | | 400,000 | | | | 400,713 | | | | | |
| 4.000%, 12/01/2044 | | | | | | | | | | | | |
| (Callable 12/01/2030) (Insured by AGM) | | | 2,650,000 | | | | 2,627,225 | | | | | |
| Macon County School District No. 61: | | | | | | | | | | | | |
| 4.000%, 12/01/2034 | | | | | | | | | | | | |
| (Callable 12/01/2028) (Insured by AGM) | | | 150,000 | | | | 154,937 | | | | | |
| 4.000%, 12/01/2037 | | | | | | | | | | | | |
| (Callable 12/01/2028) (Insured by AGM) | | | 200,000 | | | | 200,269 | | | | | |
| 5.000%, 12/01/2037 | | | | | | | | | | | | |
| (Callable 12/01/2028) (Insured by AGM) | | | 1,500,000 | | | | 1,585,332 | | | | | |
| 4.000%, 01/01/2045 | | | | | | | | | | | | |
| (Callable 01/01/2027) (Insured by AGM) | | | 3,000,000 | | | | 2,977,716 | | | | | |
| Madison & Jersey Counties | | | | | | | | | | | | |
| Unit School District No. 11, | | | | | | | | | | | | |
| 5.000%, 03/01/2028 | | | | | | | | | | | | |
| (Callable 03/01/2027) (Insured by BAM) | | | 1,185,000 | | | | 1,262,288 | | | | | |
| Madison County Community | | | | | | | | | | | | |
| Unit School District No. 8: | | | | | | | | | | | | |
| 4.000%, 12/01/2038 | | | | | | | | | | | | |
| (Callable 12/01/2028) (Insured by BAM) | | | 1,140,000 | | | | 1,128,603 | | | | | |
| 4.000%, 12/01/2039 | | | | | | | | | | | | |
| (Callable 12/01/2028) (Insured by BAM) | | | 1,000,000 | | | | 989,583 | | | | | |
| Madison, Bond, Etc. Counties Community | | | | | | | | | | | | |
| Unit School District No. 5: | | | | | | | | | | | | |
| 5.500%, 02/01/2036 | | | | | | | | | | | | |
| (Callable 02/01/2030) (Insured by AGM) | | | 975,000 | | | | 1,099,309 | | | | | |
| 5.500%, 02/01/2037 | | | | | | | | | | | | |
| (Callable 02/01/2030) (Insured by AGM) | | | 380,000 | | | | 424,232 | | | | | |
| 5.500%, 02/01/2041 | | | | | | | | | | | | |
| (Callable 02/01/2030) (Insured by AGM) | | | 1,720,000 | | | | 1,885,017 | | | | | |
| 5.500%, 02/01/2042 | | | | | | | | | | | | |
| (Callable 02/01/2030) (Insured by AGM) | | | 550,000 | | | | 601,990 | | | | | |
| Metropolitan Pier & Exposition Authority: | | | | | | | | | | | | |
| 5.500%, 12/15/2023 (Insured by NATL) | | | 35,000 | | | | 35,227 | | | | | |
| 0.000%, 06/15/2029 (Insured by NATL) | | | 1,400,000 | | | | 1,118,365 | | | | | |
| 0.000%, 12/15/2034 (Insured by NATL) | | | 9,555,000 | | | | 6,024,528 | | | | | |
| Northern Illinois Municipal Power Agency, | | | | | | | | | | | | |
| 4.000%, 12/01/2031 | | | | | | | | | | | | |
| (Callable 12/01/2026) | | | 1,000,000 | | | | 987,415 | | | | | |
| Northern Illinois University: | | | | | | | | | | | | |
| 5.000%, 04/01/2025 (Insured by BAM) | | | 1,250,000 | | | | 1,277,330 | | | | | |
| 5.000%, 10/01/2029 (Insured by BAM) | | | 300,000 | | | | 323,126 | | | | | |
| 4.000%, 10/01/2033 | | | | | | | | | | | | |
| (Callable 04/01/2031) (Insured by BAM) | | | 1,000,000 | | | | 1,010,746 | | | | | |
| 4.000%, 10/01/2034 | | | | | | | | | | | | |
| (Callable 04/01/2031) (Insured by BAM) | | | 1,435,000 | | | | 1,446,835 | | | | | |
The accompanying notes are an integral part of these financial statements.
Baird Core Intermediate Municipal Bond Fund
Schedule of Investments, June 30, 2023 (Unaudited)
Long-Term Investments (cont.)
| | | Principal | | | | | | % of | |
| | | Amount | | | Value | | | Net Assets | |
| Northern Illinois University: (cont.) | | | | | | | | | |
| 4.000%, 10/01/2035 | | | | | | | | | |
| (Callable 04/01/2031) (Insured by BAM) | | $ | 1,000,000 | | | $ | 996,940 | | | |
| |
| 4.000%, 10/01/2038 | | | | | | | | | | | | |
| (Callable 04/01/2031) (Insured by BAM) | | | 1,000,000 | | | | 963,819 | | | | | |
| 4.000%, 10/01/2039 | | | | | | | | | | | | |
| (Callable 04/01/2031) (Insured by BAM) | | | 1,700,000 | | | | 1,608,739 | | | | | |
| 4.000%, 10/01/2040 | | | | | | | | | | | | |
| (Callable 04/01/2031) (Insured by BAM) | | | 400,000 | | | | 374,482 | | | | | |
| 4.000%, 10/01/2041 | | | | | | | | | | | | |
| (Callable 04/01/2031) (Insured by BAM) | | | 425,000 | | | | 394,326 | | | | | |
| 4.000%, 10/01/2043 | | | | | | | | | | | | |
| (Callable 04/01/2031) (Insured by BAM) | | | 625,000 | | | | 573,399 | | | | | |
| Ogle & Winnebago Counties Community | | | | | | | | | | | | |
| Unit School District No. 223, | | | | | | | | | | | | |
| 5.000%, 12/01/2023 (Insured by BAM) | | | 415,000 | | | | 417,283 | | | | | |
| Peoria City School District No. 150, | | | | | | | | | | | | |
| 5.000%, 01/01/2026 (Insured by BAM) | | | 330,000 | | | | 344,335 | | | | | |
| Regional Transportation Authority, | | | | | | | | | | | | |
| 5.750%, 06/01/2029 (Insured by AGM) | | | 5,000,000 | | | | 5,697,198 | | | | | |
| Richland County Community | | | | | | | | | | | | |
| Unit School District No. 1, | | | | | | | | | | | | |
| 5.000%, 12/01/2030 (Pre-refunded to | | | | | | | | | | | | |
| 12/01/2024) (Insured by AGM) | | | 155,000 | | | | 158,934 | | | | | |
| Rock Island County School District No. 41: | | | | | | | | | | | | |
| 5.500%, 12/01/2038 | | | | | | | | | | | | |
| (Callable 12/01/2031) (Insured by AGM) | | | 1,405,000 | | | | 1,580,145 | | | | | |
| 5.500%, 12/01/2039 | | | | | | | | | | | | |
| (Callable 12/01/2031) (Insured by AGM) | | | 1,645,000 | | | | 1,841,254 | | | | | |
| 5.500%, 12/01/2040 | | | | | | | | | | | | |
| (Callable 12/01/2031) (Insured by AGM) | | | 1,665,000 | | | | 1,855,907 | | | | | |
| Sangamon & Christian Counties Community | | | | | | | | | | | | |
| Unit School District No. 3A, | | | | | | | | | | | | |
| 5.500%, 02/01/2040 | | | | | | | | | | | | |
| (Callable 02/01/2032) (Insured by BAM) | | | 500,000 | | | | 553,682 | | | | | |
| Sangamon & Morgan Counties Community | | | | | | | | | | | | |
| Unit School District No. 16, | | | | | | | | | | | | |
| 5.500%, 12/01/2042 | | | | | | | | | | | | |
| (Callable 12/01/2030) (Insured by AGM) | | | 895,000 | | | | 978,637 | | | | | |
| Sangamon County School District No. 186, | | | | | | | | | | | | |
| 4.000%, 02/01/2035 | | | | | | | | | | | | |
| (Callable 02/01/2032) (Insured by AGM) | | | 1,500,000 | | | | 1,561,309 | | | | | |
| Southwestern Illinois Development Authority: | | | | | | | | | | | | |
| 0.000%, 12/01/2023 (Insured by AGM) | | | 100,000 | | | | 98,432 | | | | | |
| 5.500%, 12/01/2040 | | | | | | | | | | | | |
| (Callable 12/01/2031) (Insured by BAM) | | | 2,305,000 | | | | 2,581,569 | | | | | |
| 4.125%, 12/01/2041 | | | | | | | | | | | | |
| (Callable 12/01/2031) (Insured by BAM) | | | 1,610,000 | | | | 1,592,692 | | | | | |
| St. Clair County Community | | | | | | | | | | | | |
| Unit School District No. 187, | | | | | | | | | | | | |
| 4.000%, 01/01/2028 | | | | | | | | | | | | |
| (ETM) (Insured by AGM) | | | 70,000 | | | | 73,546 | | | | | |
| St. Clair County High School | | | | | | | | | | | | |
| District No. 201: | | | | | | | | | | | | |
| 4.000%, 02/01/2029 | | | | | | | | | | | | |
| (Callable 02/01/2028) (Insured by BAM) | | | 1,375,000 | | | | 1,433,605 | | | | | |
| 4.000%, 02/01/2030 | | | | | | | | | | | | |
| (Callable 02/01/2028) (Insured by BAM) | | | 1,335,000 | | | | 1,392,736 | | | | | |
| 4.000%, 02/01/2031 | | | | | | | | | | | | |
| (Callable 02/01/2028) (Insured by BAM) | | | 1,475,000 | | | | 1,536,097 | | | | | |
| State of Illinois: | | | | | | | | | | | | |
| 5.000%, 04/01/2024 | | | | | | | | | | | | |
| (Callable 08/08/2023) | | | 3,350,000 | | | | 3,355,058 | | | | | |
| 5.000%, 05/01/2024 | | | 285,000 | | | | 288,116 | | | | | |
| 5.000%, 03/01/2025 | | | 7,000,000 | | | | 7,157,800 | | | | | |
| 5.000%, 10/01/2025 | | | 5,000,000 | | | | 5,155,567 | | | | | |
| 5.000%, 11/01/2026 | | | 3,000,000 | | | | 3,147,277 | | | | | |
| 5.000%, 01/01/2029 (Callable 01/01/2026) | | | 5,000 | | | | 5,177 | | | | | |
| 5.500%, 07/01/2033 (Callable 07/10/2023) | | | 410,000 | | | | 410,121 | | | | | |
| 4.000%, 06/15/2038 | | | | | | | | | | | | |
| (Callable 06/15/2028) (Insured by BAM) | | | 2,500,000 | | | | 2,476,022 | | | | | |
| Tazewell County School District No. 51, | | | | | | | | | | | | |
| 9.000%, 12/01/2026 (Insured by NATL) | | | 1,060,000 | | | | 1,263,357 | | | | | |
| Town of Cicero IL: | | | | | | | | | | | | |
| 4.000%, 01/01/2028 (Insured by BAM) | | | 1,265,000 | | | | 1,285,719 | | | | | |
| 4.000%, 01/01/2029 (Insured by BAM) | | | 815,000 | | | | 827,394 | | | | | |
| University of Illinois, | | | | | | | | | | | | |
| 5.000%, 04/01/2044 (Callable 04/01/2024) | | | 685,000 | | | | 686,474 | | | | | |
| Upper Illinois River Valley | | | | | | | | | | | | |
| Development Authority: | | | | | | | | | | | | |
| 5.000%, 12/01/2023 | | | 770,000 | | | | 772,716 | | | | | |
| 5.000%, 12/01/2024 | | | 585,000 | | | | 592,433 | | | | | |
| 4.000%, 01/01/2031 | | | | | | | | | | | | |
(Callable 01/01/2027)(3) | | | 245,000 | | | | 231,315 | | | | | |
| 5.000%, 01/01/2045 | | | | | | | | | | | | |
(Callable 01/01/2027)(3) | | | 615,000 | | | | 567,047 | | | | | |
| Village of Bartlett IL, | | | | | | | | | | | | |
| 3.000%, 12/01/2033 (Callable 12/01/2028) | | | 450,000 | | | | 445,012 | | | | | |
| Village of Buffalo Grove IL, | | | | | | | | | | | | |
| 4.000%, 12/30/2042 (Callable 12/30/2032) | | | 1,170,000 | | | | 1,154,803 | | | | | |
| Village of Cary IL, | | | | | | | | | | | | |
| 4.000%, 12/15/2038 (Callable 12/15/2029) | | | 750,000 | | | | 749,064 | | | | | |
| Village of Crestwood IL, | | | | | | | | | | | | |
| 5.000%, 12/15/2031 | | | | | | | | | | | | |
| (Callable 12/15/2023) (Insured by BAM) | | | 605,000 | | | | 607,867 | | | | | |
| Village of Franklin Park IL, | | | | | | | | | | | | |
| 4.000%, 07/01/2029 | | | | | | | | | | | | |
| (Callable 07/01/2025) (Insured by AGM) | | | 450,000 | | | | 455,911 | | | | | |
| Village of Hillside IL, | | | | | | | | | | | | |
| 5.000%, 01/01/2030 (Callable 01/01/2027) | | | 2,690,000 | | | | 2,685,414 | | | | | |
| Village of Matteson IL: | | | | | | | | | | | | |
| 4.000%, 12/01/2028 (Insured by BAM) | | | 300,000 | | | | 311,273 | | | | | |
| 4.000%, 12/01/2030 (Insured by BAM) | | | 300,000 | | | | 315,411 | | | | | |
| Village of McCook IL, | | | | | | | | | | | | |
| 5.000%, 12/01/2027 | | | | | | | | | | | | |
| (Callable 12/01/2026) (Insured by AGM) | | | 1,865,000 | | | | 1,946,810 | | | | | |
| Village of Minooka IL, | | | | | | | | | | | | |
| 2.540%, 12/01/2034 | | | | | | | | | | | | |
| (Callable 12/01/2029) (Insured by AGM) | | | 220,000 | | | | 187,171 | | | | | |
| Village of North Aurora IL, | | | | | | | | | | | | |
| 3.000%, 01/01/2024 | | | 370,000 | | | | 368,647 | | | | | |
| Village of River Grove IL: | | | | | | | | | | | | |
| 4.000%, 12/15/2027 | | | | | | | | | | | | |
| (Callable 12/15/2026) (Insured by BAM) | | | 135,000 | | | | 137,280 | | | | | |
| 4.000%, 12/15/2028 | | | | | | | | | | | | |
| (Callable 12/15/2026) (Insured by BAM) | | | 205,000 | | | | 208,870 | | | | | |
| 4.000%, 12/15/2035 | | | | | | | | | | | | |
| (Callable 12/15/2030) (Insured by BAM) | | | 250,000 | | | | 256,347 | | | | | |
| 4.000%, 12/15/2038 | | | | | | | | | | | | |
| (Callable 12/15/2030) (Insured by BAM) | | | 795,000 | | | | 801,296 | | | | | |
| Village of Romeoville IL: | | | | | | | | | | | | |
| 5.000%, 10/01/2035 (Callable 04/01/2025) | | | 1,445,000 | | | | 1,452,739 | | | | | |
| 5.000%, 10/01/2042 (Callable 04/01/2025) | | | 100,000 | | | | 97,728 | | | | | |
| Village of Rosemont IL, | | | | | | | | | | | | |
| 5.000%, 12/01/2046 | | | | | | | | | | | | |
| (Callable 12/01/2026) (Insured by AGM) | | | 130,000 | | | | 134,568 | | | | | |
The accompanying notes are an integral part of these financial statements.
Baird Core Intermediate Municipal Bond Fund
Schedule of Investments, June 30, 2023 (Unaudited)
Long-Term Investments (cont.)
| | | Principal | | | | | | % of | |
| | | Amount | | | Value | | | Net Assets | |
| Village of Stone Park IL: | | | | | | | | | |
| 4.750%, 02/01/2029 (Callable 07/31/2023) | | | | | | | | | |
| (Insured by BAM) | | $ | 230,000 | | | $ | 230,276 | | | | |
| 4.750%, 02/01/2031 | | | | | | | | | | | |
| (Callable 07/31/2023) (Insured by BAM) | | | 310,000 | | | | 310,386 | | | | |
| 4.750%, 02/01/2032 | | | | | | | | | | | |
| (Callable 07/31/2023) (Insured by BAM) | | | 275,000 | | | | 275,324 | | | | |
| 4.750%, 02/01/2033 | | | | | | | | | | | |
| (Callable 07/31/2023) (Insured by BAM) | | | 190,000 | | | | 190,222 | | | | |
| 5.000%, 02/01/2035 | | | | | | | | | | | |
| (Callable 02/01/2029) (Insured by BAM) | | | 300,000 | | | | 328,203 | | | | |
| 5.000%, 02/01/2036 | | | | | | | | | | | |
| (Callable 02/01/2029) (Insured by BAM) | | | 225,000 | | | | 244,629 | | | | |
| 4.000%, 02/01/2038 | | | | | | | | | | | |
| (Callable 02/01/2029) (Insured by BAM) | | | 150,000 | | | | 147,938 | | | | |
| Whiteside & Lee Counties Community | | | | | | | | | | | |
| Unit School District No. 5: | | | | | | | | | | | |
| 4.000%, 12/01/2028 (Insured by AGM) | | | 535,000 | | | | 560,956 | | | | |
| 4.000%, 12/01/2031 | | | | | | | | | | | |
| (Callable 12/01/2029) (Insured by AGM) | | | 630,000 | | | | 664,092 | | | | |
| 4.000%, 12/01/2032 | | | | | | | | | | | |
| (Callable 12/01/2029) (Insured by AGM) | | | 500,000 | | | | 525,911 | | | | |
| 4.000%, 12/01/2033 | | | | | | | | | | | |
| (Callable 12/01/2029) (Insured by AGM) | | | 685,000 | | | | 717,938 | | | | |
| Will County Community | | | | | | | | | | | |
| High School District No. 210: | | | | | | | | | | | |
| 0.000%, 01/01/2026 (Insured by AGM) | | | 265,000 | | | | 240,647 | | | | |
| 0.000%, 01/01/2027 (Insured by BAM) | | | 1,120,000 | | | | 981,266 | | | | |
| 0.000%, 01/01/2027 (Insured by AGM) | | | 115,000 | | | | 100,755 | | | | |
| 0.000%, 01/01/2028 (Insured by BAM) | | | 1,140,000 | | | | 963,972 | | | | |
| 0.000%, 01/01/2028 (Insured by AGM) | | | 180,000 | | | | 152,206 | | | | |
| 0.000%, 01/01/2028 | | | 60,000 | | | | 50,290 | | | | |
| 0.000%, 01/01/2029 | | | 145,000 | | | | 116,976 | | | | |
| 0.000%, 01/01/2032 | | | 110,000 | | | | 78,197 | | | | |
| 0.000%, 01/01/2033 (Insured by BAM) | | | 825,000 | | | | 570,395 | | | | |
| 4.000%, 01/01/2034 | | | | | | | | | | | |
| (Callable 01/01/2029) (Insured by AGM) | | | 410,000 | | | | 418,319 | | | | |
| Will County Community | | | | | | | | | | | |
| Unit School District No. 201-U: | | | | | | | | | | | |
| 4.000%, 01/01/2033 | | | | | | | | | | | |
| (Callable 01/01/2028) (Insured by AGM) | | | 745,000 | | | | 773,601 | | | | |
| 4.000%, 01/01/2034 | | | | | | | | | | | |
| (Callable 01/01/2028) (Insured by AGM) | | | 785,000 | | | | 809,403 | | | | |
| 4.000%, 01/01/2035 | | | | | | | | | | | |
| (Callable 01/01/2028) (Insured by AGM) | | | 480,000 | | | | 491,251 | | | | |
| Winnebago & Boone Counties Community | | | | | | | | | | | |
| High School District No. 207, | | | | | | | | | | | |
| 4.000%, 02/01/2036 | | | | | | | | | | | |
| (Callable 02/01/2027) (Insured by BAM) | | | 1,000,000 | | | | 1,007,465 | | | | |
| Total Illinois | | | | | | | | | | | |
| (Cost $324,072,057) | | | | | | | 320,452,101 | | | | 12.2 | % |
| Indiana | | | | | | | | | | | | |
| Ball State University, | | | | | | | | | | | | |
| 5.000%, 07/01/2035 (Callable 07/01/2028) | | | 500,000 | | | | 540,728 | | | | | |
| Bloomington Redevelopment District: | | | | | | | | | | | | |
| 5.000%, 02/01/2025 | | | 325,000 | | | | 331,998 | | | | | |
| 5.000%, 08/01/2025 | | | 335,000 | | | | 346,245 | | | | | |
| 5.250%, 08/01/2036 (Callable 08/01/2029) | | | 3,450,000 | | | | 3,760,313 | | | | | |
| City of Jeffersonville IN, | | | | | | | | | | | | |
| 5.000%, 01/01/2030 | | | | | | | | | | | | |
| (Callable 01/01/2028) (Insured by BAM) | | | 325,000 | | | | 357,062 | | | | | |
| City of Kendallville IN, | | | | | | | | | | | | |
| 3.500%, 11/01/2024 (Mandatory Tender | | | | | | | | | | | | |
Date 11/01/2023) (Insured by HUD)(1) | | | 5,000,000 | | | | 4,989,049 | | | | | |
| City of Rockport IN: | | | | | | | | | | | | |
| 3.050%, 06/01/2025 | | | 1,475,000 | | | | 1,451,719 | | | | | |
| 3.125%, 07/01/2025 | | | 2,750,000 | | | | 2,688,973 | | | | | |
| Evansville Waterworks District: | | | | | | | | | | | | |
| 5.000%, 07/01/2042 | | | | | | | | | | | | |
| (Callable 01/01/2032) (Insured by BAM) | | | 900,000 | | | | 976,553 | | | | | |
| 5.000%, 07/01/2047 | | | | | | | | | | | | |
| (Callable 01/01/2032) (Insured by BAM) | | | 2,150,000 | | | | 2,301,223 | | | | | |
| 4.250%, 01/01/2049 | | | | | | | | | | | | |
| (Callable 01/01/2032) (Insured by BAM) | | | 750,000 | | | | 758,234 | | | | | |
| Fishers Town Hall Building Corp.: | | | | | | | | | | | | |
| 5.500%, 07/15/2038 (Callable 07/15/2032) | | | 1,000,000 | | | | 1,148,134 | | | | | |
| 5.500%, 01/15/2042 (Callable 07/15/2032) | | | 970,000 | | | | 1,099,184 | | | | | |
| Greater Clark Building Corp.: | | | | | | | | | | | | |
| 6.000%, 07/15/2034 | | | | | | | | | | | | |
| (Callable 07/15/2032) (Insured by ST AID) | | | 1,120,000 | | | | 1,373,211 | | | | | |
| 6.000%, 07/15/2036 | | | | | | | | | | | | |
| (Callable 07/15/2033) (Insured by ST AID) | | | 500,000 | | | | 616,266 | | | | | |
| 6.000%, 07/15/2038 | | | | | | | | | | | | |
| (Callable 07/15/2033) (Insured by ST AID) | | | 250,000 | | | | 302,560 | | | | | |
| 6.000%, 07/15/2039 | | | | | | | | | | | | |
| (Callable 07/15/2033) (Insured by ST AID) | | | 500,000 | | | | 600,429 | | | | | |
| 6.000%, 07/15/2040 | | | | | | | | | | | | |
| (Callable 07/15/2033) (Insured by ST AID) | | | 500,000 | | | | 596,197 | | | | | |
| 6.000%, 07/15/2041 | | | | | | | | | | | | |
| (Callable 07/15/2033) (Insured by ST AID) | | | 1,000,000 | | | | 1,188,064 | | | | | |
| 6.000%, 01/15/2042 | | | | | | | | | | | | |
| (Callable 07/15/2032) (Insured by ST AID) | | | 1,000,000 | | | | 1,195,722 | | | | | |
| Hammond Local Public | | | | | | | | | | | | |
| Improvement Bond Bank: | | | | | | | | | | | | |
| 4.500%, 07/15/2037 (Callable 07/15/2030) | | | 455,000 | | | | 439,499 | | | | | |
| 5.000%, 01/15/2043 (Callable 07/15/2030) | | | 2,315,000 | | | | 2,316,285 | | | | | |
| Hammond Multi-School Building Corp.: | | | | | | | | | | | | |
| 4.500%, 07/15/2026 | | | | | | | | | | | | |
| (Callable 01/15/2024) (Insured by ST AID) | | | 625,000 | | | | 629,783 | | | | | |
| 5.000%, 07/15/2034 | | | | | | | | | | | | |
| (Callable 01/15/2028) (Insured by ST AID) | | | 2,000,000 | | | | 2,124,722 | | | | | |
| 5.000%, 07/15/2038 | | | | | | | | | | | | |
| (Callable 01/15/2028) (Insured by ST AID) | | | 3,105,000 | | | | 3,239,421 | | | | | |
| Hammond Sanitary District: | | | | | | | | | | | | |
| 5.000%, 07/15/2026 (Insured by BAM) | | | 610,000 | | | | 643,683 | | | | | |
| 5.000%, 01/15/2028 | | | | | | | | | | | | |
| (Callable 07/15/2027) (Insured by BAM) | | | 315,000 | | | | 341,243 | | | | | |
| Indiana Finance Authority: | | | | | | | | | | | | |
| 5.000%, 10/01/2023 | | | 180,000 | | | | 180,242 | | | | | |
| 3.500%, 03/01/2024 | | | 8,000,000 | | | | 7,984,998 | | | | | |
| 5.000%, 07/01/2027 | | | 1,445,000 | | | | 1,499,824 | | | | | |
| 5.000%, 09/01/2027 | | | 1,595,000 | | | | 1,621,283 | | | | | |
| 5.000%, 10/01/2027 | | | 245,000 | | | | 253,563 | | | | | |
| 5.000%, 07/01/2028 | | | 1,515,000 | | | | 1,587,727 | | | | | |
| 5.000%, 09/01/2028 | | | 1,675,000 | | | | 1,707,574 | | | | | |
| 5.000%, 10/01/2028 (Callable 10/01/2027) | | | 1,000,000 | | | | 1,037,150 | | | | | |
| 5.000%, 10/01/2029 | | | 220,000 | | | | 231,308 | | | | | |
| 5.250%, 02/01/2030 (Callable 08/01/2025) | | | 525,000 | | | | 545,658 | | | | | |
| 2.500%, 11/01/2030 | | | 2,825,000 | | | | 2,470,106 | | | | | |
| 4.250%, 11/01/2030 | | | 3,000,000 | | | | 2,983,998 | | | | | |
| 5.000%, 10/01/2031 | | | 250,000 | | | | 265,828 | | | | | |
| 5.000%, 10/01/2033 (Callable 10/01/2031) | | | 230,000 | | | | 243,387 | | | | | |
| 7.000%, 11/15/2043 (Callable 11/15/2023) | | | 2,750,000 | | | | 2,777,660 | | | | | |
| 4.000%, 10/01/2052 (Callable 04/01/2032) | | | 2,500,000 | | | | 2,399,984 | | | | | |
| Indiana Housing & Community | | | | | | | | | | | | |
| Development Authority: | | | | | | | | | | | | |
| 2.000%, 04/01/2025 | | | | | | | | | | | | |
(Mandatory Tender Date 04/01/2024)(1) | | | 3,250,000 | | | | 3,207,224 | | | | | |
| 5.000%, 07/01/2053 | | | | | | | | | | | | |
| (Callable 01/01/2032) (Insured by GNMA) | | | 2,080,000 | | | | 2,149,207 | | | | | |
The accompanying notes are an integral part of these financial statements.
Baird Core Intermediate Municipal Bond Fund
Schedule of Investments, June 30, 2023 (Unaudited)
Long-Term Investments (cont.)
| | | Principal | | | | | | % of | |
| | | Amount | | | Value | | | Net Assets | |
| Indiana Municipal Power Agency, | | | | | | | | | |
| 5.000%, 01/01/2032 | | | | | | | | | |
| (Callable 01/01/2025) | | $ | 1,000,000 | | | $ | 1,019,929 | | | | |
| Indianapolis Board of School Commissioners: | | | | | | | | | | | |
| 5.000%, 01/15/2024 (Insured by ST AID) | | | 325,000 | | | | 327,698 | | | | |
| 5.000%, 01/15/2025 (Insured by ST AID) | | | 515,000 | | | | 527,933 | | | | |
| 5.000%, 01/15/2026 (Insured by ST AID) | | | 875,000 | | | | 917,390 | | | | |
| Indianapolis Local Public | | | | | | | | | | | |
| Improvement Bond Bank: | | | | | | | | | | | |
| 5.000%, 01/01/2033 | | | | | | | | | | | |
| (Pre-refunded to 01/01/2025) | | | 500,000 | | | | 514,212 | | | | |
| 5.000%, 02/01/2049 (Callable 02/01/2029) | | | 1,000,000 | | | | 1,051,185 | | | | |
| 5.000%, 02/01/2054 (Callable 02/01/2029) | | | 1,885,000 | | | | 1,970,606 | | | | |
| IPS Multi-School Building Corp., | | | | | | | | | | | |
| 5.000%, 07/15/2026 | | | | | | | | | | | |
| (Callable 01/15/2025) (Insured by ST AID) | | | 925,000 | | | | 947,673 | | | | |
| Kankakee Valley Middle | | | | | | | | | | | |
| School Building Corp., | | | | | | | | | | | |
| 5.000%, 01/15/2029 (Insured by ST AID) | | | 1,000,000 | | | | 1,107,672 | | | | |
| Merrillville Multi School Building Corp.: | | | | | | | | | | | |
| 5.000%, 01/15/2024 (Insured by ST AID) | | | 500,000 | | | | 504,412 | | | | |
| 5.000%, 07/15/2024 (Insured by ST AID) | | | 450,000 | | | | 457,976 | | | | |
| 5.000%, 01/15/2025 (Insured by ST AID) | | | 820,000 | | | | 841,826 | | | | |
| 5.000%, 07/15/2025 (Insured by ST AID) | | | 500,000 | | | | 517,477 | | | | |
| Mount Vernon of Hancock County | | | | | | | | | | | |
| Multi-School Building Corp.: | | | | | | | | | | | |
| 5.500%, 07/15/2032 | | | | | | | | | | | |
| (Callable 07/15/2031) (Insured by ST AID) | | | 700,000 | | | | 821,297 | | | | |
| 5.500%, 07/15/2034 | | | | | | | | | | | |
| (Callable 07/15/2031) (Insured by ST AID) | | | 200,000 | | | | 234,059 | | | | |
| 5.500%, 07/15/2035 | | | | | | | | | | | |
| (Callable 07/15/2031) (Insured by ST AID) | | | 400,000 | | | | 464,840 | | | | |
| 5.500%, 07/15/2036 | | | | | | | | | | | |
| (Callable 07/15/2031) (Insured by ST AID) | | | 750,000 | | | | 863,680 | | | | |
| 5.500%, 07/15/2038 | | | | | | | | | | | |
| (Callable 07/15/2031) (Insured by ST AID) | | | 840,000 | | | | 953,777 | | | | |
| 5.500%, 07/15/2039 | | | | | | | | | | | |
| (Callable 07/15/2031) (Insured by ST AID) | | | 1,655,000 | | | | 1,871,758 | | | | |
| 5.500%, 07/15/2040 | | | | | | | | | | | |
| (Callable 07/15/2031) (Insured by ST AID) | | | 750,000 | | | | 844,830 | | | | |
| 5.500%, 01/15/2042 | | | | | | | | | | | |
| (Callable 07/15/2031) (Insured by ST AID) | | | 1,000,000 | | | | 1,123,475 | | | | |
| Northwestern School Building Corp.: | | | | | | | | | | | |
| 6.000%, 07/15/2038 | | | | | | | | | | | |
| (Callable 07/15/2031) (Insured by ST AID) | | | 1,000,000 | | | | 1,167,831 | | | | |
| 6.000%, 07/15/2041 | | | | | | | | | | | |
| (Callable 07/15/2031) (Insured by ST AID) | | | 900,000 | | | | 1,034,930 | | | | |
| Plainfield Redevelopment Authority: | | | | | | | | | | | |
| 3.000%, 08/01/2024 (Insured by ST AID) | | | 360,000 | | | | 355,805 | | | | |
| 5.000%, 02/01/2027 (Insured by ST AID) | | | 500,000 | | | | 522,474 | | | | |
| South Montgomery | | | | | | | | | | | |
| Community School Corp.: | | | | | | | | | | | |
| 5.000%, 01/15/2024 (Insured by ST AID) | | | 475,000 | | | | 477,456 | | | | |
| 5.000%, 07/15/2024 (Insured by ST AID) | | | 585,000 | | | | 590,991 | | | | |
| 5.000%, 01/15/2025 (Insured by ST AID) | | | 300,000 | | | | 304,399 | | | | |
| 5.000%, 07/15/2025 (Insured by ST AID) | | | 335,000 | | | | 341,359 | | | | |
| 5.000%, 01/15/2026 (Insured by ST AID) | | | 250,000 | | | | 255,738 | | | | |
| Taylor Community School Building Corp., | | | | | | | | | | | |
| 0.000%, 07/15/2029 | | | | | | | | | | | |
| (Callable 07/15/2025) (Insured by ST AID) | | | 360,000 | | | | 280,053 | | | | |
| Tippecanoe County School Building Corp.: | | | | | | | | | | | |
| 6.000%, 07/15/2039 | | | | | | | | | | | |
| (Callable 07/15/2033) (Insured by ST AID) | | | 1,000,000 | | | | 1,213,070 | | | | |
| 6.000%, 01/15/2043 | | | | | | | | | | | |
| (Callable 07/15/2033) (Insured by ST AID) | | | 1,000,000 | | | | 1,195,826 | | | | |
| Tri-Creek 2002 High School Building Corp., | | | | | | | | | | | |
| 4.000%, 07/15/2039 (Callable 07/15/2028) | | | | | | | | | | | |
| (Insured by ST AID) | | | 345,000 | | | | 349,923 | | | | |
| Westfield High School Building Corp.: | | | | | | | | | | | |
| 5.000%, 01/15/2029 | | | | | | | | | | | |
| (Callable 01/15/2026) (Insured by ST AID) | | | 250,000 | | | | 260,685 | | | | |
| 5.000%, 01/15/2030 | | | | | | | | | | | |
| (Callable 01/15/2026) (Insured by ST AID) | | | 300,000 | | | | 312,748 | | | | |
| Westfield-Washington | | | | | | | | | | | |
| Multi-School Building Corp.: | | | | | | | | | | | |
| 5.500%, 07/15/2040 | | | | | | | | | | | |
| (Callable 07/15/2031) (Insured by ST AID) | | | 745,000 | | | | 822,840 | | | | |
| 5.500%, 01/15/2043 | | | | | | | | | | | |
| (Callable 07/15/2031) (Insured by ST AID) | | | 565,000 | | | | 622,686 | | | | |
| Wheeler-Union Township | | | | | | | | | | | |
| School Building Corp., | | | | | | | | | | | |
| 5.000%, 01/15/2042 | | | | | | | | | | | |
| (Callable 07/15/2030) (Insured by ST AID) | | | 1,225,000 | | | | 1,317,458 | | | | |
| Total Indiana | | | | | | | | | | | |
| (Cost $100,308,730) | | | | | | | 98,813,198 | | | | 3.8 | % |
| Iowa | | | | | | | | | | | | |
| City of Ames IA, | | | | | | | | | | | | |
| 4.000%, 06/15/2035 (Callable 06/15/2026) | | | 1,510,000 | | | | 1,523,584 | | | | | |
| City of Coralville IA: | | | | | | | | | | | | |
| 4.000%, 05/01/2024 | | | 560,000 | | | | 555,163 | | | | | |
| 3.000%, 06/01/2024 | | | 290,000 | | | | 284,500 | | | | | |
| 4.000%, 05/01/2030 (Callable 05/01/2029) | | | 1,000,000 | | | | 998,828 | | | | | |
| 3.000%, 05/01/2033 (Callable 05/01/2029) | | | 1,000,000 | | | | 897,239 | | | | | |
| 5.000%, 05/01/2035 | | | | | | | | | | | | |
| (Callable 05/01/2031) (Insured by AGM) | | | 650,000 | | | | 706,977 | | | | | |
| 5.000%, 05/01/2036 | | | | | | | | | | | | |
| (Callable 05/01/2031) (Insured by AGM) | | | 685,000 | | | | 737,931 | | | | | |
| 5.000%, 05/01/2037 | | | | | | | | | | | | |
| (Callable 05/01/2031) (Insured by AGM) | | | 725,000 | | | | 773,585 | | | | | |
| College Community School District, | | | | | | | | | | | | |
| 4.000%, 06/01/2033 | | | | | | | | | | | | |
| (Callable 06/01/2030) (Insured by BAM) | | | 1,820,000 | | | | 1,886,431 | | | | | |
| County of Carroll IA, | | | | | | | | | | | | |
| 5.000%, 06/01/2035 (Callable 06/01/2027) | | | 645,000 | | | | 701,397 | | | | | |
| Iowa Finance Authority: | | | | | | | | | | | | |
| 4.000%, 05/15/2024 | | | 250,000 | | | | 244,588 | | | | | |
| 5.000%, 01/01/2028 (Insured by GNMA) | | | 930,000 | | | | 1,003,049 | | | | | |
| 7.500%, 01/01/2032 | | | | | | | | | | | | |
(Callable 01/01/2030)(3) | | | 2,500,000 | | | | 2,378,360 | | | | | |
| 3.500%, 01/01/2047 | | | | | | | | | | | | |
| (Callable 07/01/2026) (Insured by GNMA) | | | 1,000,000 | | | | 988,016 | | | | | |
| 4.000%, 07/01/2047 | | | | | | | | | | | | |
| (Callable 07/01/2028) (Insured by GNMA) | | | 1,400,000 | | | | 1,390,263 | | | | | |
| Iowa Higher Education Loan Authority: | | | | | | | | | | | | |
| 3.000%, 04/01/2029 | | | 870,000 | | | | 844,217 | | | | | |
| 5.000%, 10/01/2029 | | | 1,160,000 | | | | 1,238,065 | | | | | |
| 3.000%, 04/01/2030 | | | 650,000 | | | | 627,871 | | | | | |
| 3.000%, 04/01/2031 | | | 525,000 | | | | 502,729 | | | | | |
| 5.000%, 10/01/2034 (Callable 10/01/2030) | | | 300,000 | | | | 318,387 | | | | | |
| 5.000%, 10/01/2035 (Callable 10/01/2030) | | | 360,000 | | | | 379,601 | | | | | |
| 5.000%, 10/01/2036 (Callable 10/01/2030) | | | 365,000 | | | | 381,904 | | | | | |
| 4.750%, 10/01/2042 (Callable 10/01/2030) | | | 750,000 | | | | 751,434 | | | | | |
| PEFA, Inc., | | | | | | | | | | | | |
| 5.000%, 09/01/2049 (Callable 06/01/2026) | | | | | | | | | | | | |
(Mandatory Tender Date 09/01/2026)(1) | | | 8,750,000 | | | | 8,921,585 | | | | | |
| Southern Iowa Rural Water Association, | | | | | | | | | | | | |
| 3.000%, 12/01/2032 | | | | | | | | | | | | |
| (Callable 12/01/2028) (Insured by AGM) | | | 1,030,000 | | | | 995,628 | | | | | |
| Total Iowa | | | | | | | | | | | | |
| (Cost $30,937,114) | | | | | | | 30,031,332 | | | | 1.2 | % |
The accompanying notes are an integral part of these financial statements.
Baird Core Intermediate Municipal Bond Fund
Schedule of Investments, June 30, 2023 (Unaudited)
Long-Term Investments (cont.)
| | | Principal | | | | | | % of | |
| | | Amount | | | Value | | | Net Assets | |
| Kansas | | | | | | | | | |
| City of Derby KS, | | | | | | | | | |
| 3.900%, 03/01/2037 | | | | | | | | | |
| (Callable 03/01/2025) | | $ | 200,000 | | | $ | 200,151 | | | | |
| City of Goddard KS, | | | | | | | | | | | |
| 3.500%, 06/01/2034 (Callable 07/21/2023) | | | 1,420,000 | | | | 1,254,644 | | | | |
| City of Manhattan KS, | | | | | | | | | | | |
| 4.000%, 06/01/2027 (Callable 06/01/2025) | | | 1,000,000 | | | | 997,397 | | | | |
| City of Wamego KS, | | | | | | | | | | | |
| 4.000%, 03/01/2027 (Callable 03/01/2024) | | | 1,540,000 | | | | 1,543,054 | | | | |
| City of Wichita KS, | | | | | | | | | | | |
| 4.000%, 09/01/2038 (Callable 09/01/2027) | | | 1,540,000 | | | | 1,534,309 | | | | |
| County of Pottawatomie KS, | | | | | | | | | | | |
| 2.750%, 10/01/2023(Callable 07/31/2023) | | | 7,800,000 | | | | 7,781,209 | | | | |
| Johnson County Unified | | | | | | | | | | | |
| School District No. 512, | | | | | | | | | | | |
| 4.000%, 10/01/2043 (Callable 10/01/2033) | | | 3,685,000 | | | | 3,644,334 | | | | |
| Kansas Power Pool: | | | | | | | | | | | |
| 4.000%, 12/01/2038 (Callable 12/01/2029) | | | 700,000 | | | | 696,929 | | | | |
| 4.000%, 12/01/2040 (Callable 12/01/2029) | | | 1,095,000 | | | | 1,071,704 | | | | |
| Wabaunsee County Unified | | | | | | | | | | | |
| School District No. 330: | | | | | | | | | | | |
| 5.500%, 09/01/2042 | | | | | | | | | | | |
| (Callable 09/01/2031) (Insured by BAM) | | | 750,000 | | | | 842,157 | | | | |
| 5.500%, 09/01/2047 | | | | | | | | | | | |
| (Callable 09/01/2031) (Insured by BAM) | | | 750,000 | | | | 833,433 | | | | |
| Wyandotte County-Kansas | | | | | | | | | | | |
| City Unified Government, | | | | | | | | | | | |
| 5.000%, 09/01/2044 (Callable 09/01/2024) | | | 1,740,000 | | | | 1,752,437 | | | | |
| Total Kansas | | | | | | | | | | | |
| (Cost $22,649,436) | | | | | | | 22,151,758 | | | | 0.8 | % |
| Kentucky | | | | | | | | | | | | |
| City of Versailles KY, | | | | | | | | | | | | |
| 3.000%, 08/15/2026 (Callable 08/15/2024) | | | 3,000,000 | | | | 2,915,765 | | | | | |
| County of Leslie KY, | | | | | | | | | | | | |
| 4.000%, 02/01/2052 (Callable 02/01/2030) | | | 1,485,000 | | | | 1,297,691 | | | | | |
| Kentucky Economic | | | | | | | | | | | | |
| Development Finance Authority: | | | | | | | | | | | | |
| 0.000%, 10/01/2025 (Insured by NATL) | | | 520,000 | | | | 476,128 | | | | | |
| 0.000%, 10/01/2026 (Insured by NATL) | | | 665,000 | | | | 587,012 | | | | | |
| 0.000%, 10/01/2027 (Insured by NATL) | | | 735,000 | | | | 626,028 | | | | | |
| 0.000%, 10/01/2028 (Insured by NATL) | | | 990,000 | | | | 813,809 | | | | | |
| 5.000%, 07/01/2033 | | | | | | | | | | | | |
| (Callable 07/01/2025) | | | 1,295,000 | | | | 1,313,040 | | | | | |
| Kentucky Housing Corp., | | | | | | | | | | | | |
5.850%, 04/01/2048(1) | | | 1,609,485 | | | | 1,572,287 | | | | | |
| Kentucky Public Energy Authority: | | | | | | | | | | | | |
| 4.000%, 08/01/2027 | | | 550,000 | | | | 546,001 | | | | | |
| 4.000%, 01/01/2049 (Callable 10/01/2024) | | | | | | | | | | | | |
(Mandatory Tender Date 01/01/2025)(1) | | | 1,395,000 | | | | 1,394,864 | | | | | |
| 4.000%, 12/01/2050 (Callable 03/01/2026) | | | | | | | | | | | | |
(Mandatory Tender Date 06/01/2026)(1) | | | 1,715,000 | | | | 1,711,500 | | | | | |
| Kentucky Public Transportation | | | | | | | | | | | | |
| Infrastructure Authority, | | | | | | | | | | | | |
| 6.000%, 07/01/2053 | | | | | | | | | | | | |
| (Pre-refunded to 07/01/2023) | | | 1,500,000 | | | | 1,500,000 | | | | | |
| Kentucky State University: | | | | | | | | | | | | |
| 5.000%, 11/01/2031 (Insured by BAM) | | | 365,000 | | | | 421,075 | | | | | |
| 4.000%, 11/01/2033 | | | | | | | | | | | | |
| (Callable 11/01/2031) (Insured by BAM) | | | 260,000 | | | | 274,913 | | | | | |
| 4.000%, 11/01/2035 | | | | | | | | | | | | |
| (Callable 11/01/2031) (Insured by BAM) | | | 270,000 | | | | 282,001 | | | | | |
| 4.000%, 11/01/2038 | | | | | | | | | | | | |
| (Callable 11/01/2031) (Insured by BAM) | | | 325,000 | | | | 324,919 | | | | | |
| 4.000%, 11/01/2041 (Callable 11/01/2031) | | | | | | | | | | | | |
| (Insured by BAM) | | | 250,000 | | | | 247,609 | | | | | |
| 4.000%, 11/01/2051 | | | | | | | | | | | | |
| (Callable 11/01/2031) (Insured by BAM) | | | 525,000 | | | | 508,296 | | | | | |
| Louisville & Jefferson County | | | | | | | | | | | | |
| Metropolitan Government, | | | | | | | | | | | | |
| 5.750%, 10/01/2038 (Callable 10/01/2023) | | | 11,770,000 | | | | 11,803,024 | | | | | |
| Paducah Electric Plant Board, | | | | | | | | | | | | |
| 5.000%, 10/01/2032 | | | | | | | | | | | | |
| (Callable 10/01/2026) (Insured by AGM) | | | 1,000,000 | | | | 1,041,184 | | | | | |
| Paducah Independent School | | | | | | | | | | | | |
| District Finance Corp., | | | | | | | | | | | | |
| 3.500%, 09/01/2033 | | | | | | | | | | | | |
| (Callable 09/01/2026) (Insured by ST AID) | | | 300,000 | | | | 300,151 | | | | | |
| Rural Water Financing Agency, | | | | | | | | | | | | |
| 3.100%, 11/01/2024 (Callable 07/17/2023) | | | 1,700,000 | | | | 1,670,372 | | | | | |
| Total Kentucky | | | | | | | | | | | | |
| (Cost $32,662,185) | | | | | | | 31,627,669 | | | | 1.2 | % |
| Louisiana | | | | | | | | | | | | |
| City of Pineville LA: | | | | | | | | | | | | |
| 4.000%, 05/01/2027 (Insured by BAM) | | | 240,000 | | | | 248,287 | | | | | |
| 4.000%, 05/01/2032 (Insured by BAM) | | | 290,000 | | | | 307,379 | | | | | |
| 4.000%, 05/01/2034 | | | | | | | | | | | | |
| (Callable 05/01/2032) (Insured by BAM) | | | 400,000 | | | | 418,060 | | | | | |
| 4.000%, 05/01/2037 | | | | | | | | | | | | |
| (Callable 05/01/2032) (Insured by BAM) | | | 325,000 | | | | 329,584 | | | | | |
| 4.000%, 05/01/2047 | | | | | | | | | | | | |
| (Callable 05/01/2032) (Insured by BAM) | | | 1,000,000 | | | | 989,520 | | | | | |
| 4.000%, 05/01/2051 | | | | | | | | | | | | |
| (Callable 05/01/2032) (Insured by BAM) | | | 1,550,000 | | | | 1,516,002 | | | | | |
| City of Shreveport LA: | | | | | | | | | | | | |
| 5.000%, 08/01/2023 (Insured by BAM) | | | 350,000 | | | | 350,369 | | | | | |
| 4.000%, 12/01/2034 | | | | | | | | | | | | |
| (Callable 12/01/2028) (Insured by BAM) | | | 1,225,000 | | | | 1,229,158 | | | | | |
| Ernest N. Morial New Orleans | | | | | | | | | | | | |
| Exhibition Hall Authority, | | | | | | | | | | | | |
| 5.000%, 07/15/2037 (Callable 07/15/2033) | | | 2,875,000 | | | | 3,222,262 | | | | | |
| Louisiana Housing Corp.: | | | | | | | | | | | | |
| 3.500%, 07/01/2025 (Mandatory Tender | | | | | | | | | | | | |
Date 07/01/2024) (Insured by HUD)(1) | | | 3,274,000 | | | | 3,255,627 | | | | | |
| 4.500%, 12/01/2047 (Callable 12/01/2027) | | | 110,000 | | | | 110,202 | | | | | |
| Louisiana Local Government | | | | | | | | | | | | |
| Environmental Facilities & | | | | | | | | | | | | |
| Community Development Authority: | | | | | | | | | | | | |
| 5.000%, 10/01/2023 (Insured by BAM) | | | 200,000 | | | | 200,802 | | | | | |
| 5.000%, 10/01/2024 (Insured by BAM) | | | 100,000 | | | | 102,081 | | | | | |
| 4.250%, 04/01/2043 | | | | | | | | | | | | |
| (Callable 04/01/2033) (Insured by AGM) | | | 100,000 | | | | 100,099 | | | | | |
| 5.000%, 04/01/2048 | | | | | | | | | | | | |
| (Callable 04/01/2033) (Insured by AGM) | | | 800,000 | | | | 849,546 | | | | | |
| 4.500%, 04/01/2053 | | | | | | | | | | | | |
| (Callable 04/01/2033) (Insured by AGM) | | | 350,000 | | | | 349,504 | | | | | |
| 5.000%, 04/01/2053 | | | | | | | | | | | | |
| (Callable 04/01/2033) (Insured by AGM) | | | 800,000 | | | | 846,086 | | | | | |
| Louisiana Public Facilities Authority: | | | | | | | | | | | | |
0.000%, 10/01/2024(5) | | | 180,000 | | | | 177,389 | | | | | |
0.000%, 10/01/2031(5) | | | 2,105,000 | | | | 2,216,953 | | | | | |
0.000%, 10/01/2033(5) | | | 2,000,000 | | | | 2,116,253 | | | | | |
| 5.000%, 07/01/2051 (Callable 07/01/2026) | | | 2,500,000 | | | | 2,522,675 | | | | | |
| Louisiana Stadium & Exposition District, | | | | | | | | | | | | |
| 5.000%, 07/01/2028 (Callable 07/01/2023) | | | 1,000,000 | | | | 1,000,000 | | | | | |
The accompanying notes are an integral part of these financial statements.
Baird Core Intermediate Municipal Bond Fund
Schedule of Investments, June 30, 2023 (Unaudited)
Long-Term Investments (cont.)
| | | Principal | | | | | | % of | |
| | | Amount | | | Value | | | Net Assets | |
| Louisiana State University & | | | | | | | | | |
| Agricultural & Mechanical College: | | | | | | | | | |
| 5.000%, 07/01/2028 | | | | | | | | | |
| (Callable 07/01/2026) | | $ | 4,200,000 | | | $ | 4,392,990 | | | | |
| 5.000%, 07/01/2030 | | | | | | | | | | | |
| (Callable 07/01/2026) (Insured by BAM) | | | 380,000 | | | | 400,496 | | | | |
| Morehouse Parish Hospital | | | | | | | | | | | |
| Service District No. 1, | | | | | | | | | | | |
| 4.000%, 10/01/2028 (Callable 10/01/2027) | | | 660,000 | | | | 637,490 | | | | |
| Parish of St. John the Baptist LA: | | | | | | | | | | | |
| 5.000%, 03/01/2031 (Callable 03/01/2029) | | | 385,000 | | | | 422,802 | | | | |
| 5.000%, 03/01/2032 (Callable 03/01/2029) | | | 500,000 | | | | 548,004 | | | | |
| Plaquemines Port Harbor & Terminal District, | | | | | | | | | | | |
| 4.000%, 03/15/2025 | | | | | | | | | | | |
(Mandatory Tender Date 03/15/2024)(1) | | | 5,000,000 | | | | 4,994,143 | | | | |
| St. Tammany Parish Hospital | | | | | | | | | | | |
| Service District No. 1: | | | | | | | | | | | |
| 5.000%, 07/01/2036 (Callable 07/01/2028) | | | 1,745,000 | | | | 1,837,138 | | | | |
| 5.000%, 07/01/2038 (Callable 07/01/2028) | | | 855,000 | | | | 888,371 | | | | |
| Tangipahoa Parish School Board, | | | | | | | | | | | |
| 4.000%, 03/01/2041 | | | | | | | | | | | |
| (Callable 03/01/2031) (Insured by AGM) | | | 500,000 | | | | 498,130 | | | | |
| Terrebonne Parish Consolidated Government, | | | | | | | | | | | |
| 0.000%, 04/01/2034 (Insured by AGM) | | | 715,000 | | | | 485,300 | | | | |
| Total Louisiana | | | | | | | | | | | |
| (Cost $38,025,722) | | | | | | | 37,562,702 | | | | 1.4 | % |
| Maine | | | | | | | | | | | | |
| City of Lewiston ME: | | | | | | | | | | | | |
| 1.375%, 02/15/2033 (Callable 02/15/2028) | | | 1,000,000 | | | | 772,459 | | | | | |
| 1.625%, 02/15/2036 (Callable 02/15/2028) | | | 1,435,000 | | | | 1,043,006 | | | | | |
| City of Portland ME, | | | | | | | | | | | | |
| 5.000%, 01/01/2031 (Callable 01/01/2026) | | | 1,090,000 | | | | 1,133,549 | | | | | |
| Maine Health & Higher Educational | | | | | | | | | | | | |
| Facilities Authority: | | | | | | | | | | | | |
| 4.000%, 07/01/2037 | | | | | | | | | | | | |
| (Callable 07/01/2029) (Insured by ST AID) | | | 230,000 | | | | 229,650 | | | | | |
| 5.000%, 07/01/2038 | | | | | | | | | | | | |
| (Callable 07/01/2030) (Insured by ST AID) | | | 1,530,000 | | | | 1,608,550 | | | | | |
| 5.000%, 07/01/2046 | | | | | | | | | | | | |
| (Callable 07/01/2026) | | | 250,000 | | | | 229,256 | | | | | |
| Maine State Housing Authority: | | | | | | | | | | | | |
| 3.625%, 11/15/2039 (Callable 11/15/2024) | | | 2,255,000 | | | | 2,121,409 | | | | | |
| 3.500%, 11/15/2045 (Callable 05/15/2025) | | | 40,000 | | | | 39,729 | | | | | |
| 4.000%, 11/15/2045 (Callable 11/15/2025) | | | 95,000 | | | | 94,717 | | | | | |
| 3.500%, 11/15/2046 (Callable 11/15/2025) | | | 5,000 | | | | 4,975 | | | | | |
| 3.500%, 11/15/2047 (Callable 11/15/2026) | | | 350,000 | | | | 344,887 | | | | | |
| 4.000%, 11/15/2049 (Callable 05/15/2028) | | | 280,000 | | | | 277,729 | | | | | |
| 4.000%, 11/15/2050 (Callable 05/15/2029) | | | 755,000 | | | | 749,047 | | | | | |
| 5.000%, 11/15/2052 (Callable 11/15/2031) | | | 3,965,000 | | | | 4,088,728 | | | | | |
| 5.000%, 11/15/2052 (Callable 11/15/2031) | | | 1,515,000 | | | | 1,563,978 | | | | | |
| Total Maine | | | | | | | | | | | | |
| (Cost $14,843,764) | | | | | | | 14,301,669 | | | | 0.5 | % |
| Maryland | | | | | | | | | | | | |
| County of Baltimore MD: | | | | | | | | | | | | |
| 4.000%, 09/01/2032 (Callable 09/01/2031) | | | 350,000 | | | | 373,523 | | | | | |
| 4.000%, 09/01/2033 (Callable 09/01/2031) | | | 230,000 | | | | 244,238 | | | | | |
| 4.000%, 09/01/2036 (Callable 09/01/2031) | | | 135,000 | | | | 139,280 | | | | | |
| Maryland Community | | | | | | | | | | | | |
| Development Administration: | | | | | | | | | | | | |
| 3.250%, 08/01/2024 (Insured by GNMA) | | | 5,970,000 | | | | 5,854,378 | | | | | |
| 4.050%, 10/01/2024 | | | 4,000,000 | | | | 3,989,344 | | | | | |
| 4.600%, 12/01/2024 | | | 10,000,000 | | | | 9,946,584 | | | | | |
| 3.850%, 03/01/2025 | | | 5,000,000 | | | | 4,937,335 | | | | | |
| 4.700%, 03/01/2046 | | | | | | | | | | | | |
| (Callable 03/01/2031) (Insured by GNMA) | | | 2,250,000 | | | | 2,261,507 | | | | | |
| 3.500%, 03/01/2050 (Callable 03/01/2029) | | | 815,000 | | | | 798,488 | | | | | |
| 5.000%, 09/01/2052 | | | | | | | | | | | | |
| (Callable 03/01/2031) (Insured by GNMA) | | | 7,900,000 | | | | 8,139,651 | | | | | |
| Maryland Health & Higher | | | | | | | | | | | | |
| Educational Facilities Authority: | | | | | | | | | | | | |
| 5.000%, 01/01/2028 | | | 300,000 | | | | 314,961 | | | | | |
| 5.000%, 07/01/2028 | | | 370,000 | | | | 396,939 | | | | | |
| 4.000%, 01/01/2029 | | | 980,000 | | | | 991,500 | | | | | |
| 5.000%, 01/01/2029 | | | 290,000 | | | | 307,665 | | | | | |
| 5.000%, 01/01/2030 | | | 185,000 | | | | 197,943 | | | | | |
| 5.000%, 07/01/2045 (Callable 01/01/2027) | | | | | | | | | | | | |
(Mandatory Tender Date 07/01/2027)(1) | | | 780,000 | | | | 818,202 | | | | | |
| Maryland Stadium Authority, | | | | | | | | | | | | |
| 5.000%, 06/01/2026 | | | 750,000 | | | | 789,441 | | | | | |
| Total Maryland | | | | | | | | | | | | |
| (Cost $41,233,025) | | | | | | | 40,500,979 | | | | 1.5 | % |
| Massachusetts | | | | | | | | | | | | |
| Commonwealth of Massachusetts, | | | | | | | | | | | | |
| 4.000%, 04/01/2042 | | | | | | | | | | | | |
| (Callable 04/01/2025) | | | 30,000 | | | | 29,891 | | | | | |
| Massachusetts Bay Transportation Authority, | | | | | | | | | | | | |
| 0.000%, 07/01/2030 (Callable 07/01/2026) | | | 5,800,000 | | | | 4,502,428 | | | | | |
| Massachusetts Clean Water Trust, | | | | | | | | | | | | |
| 5.000%, 08/01/2038 (Callable 08/01/2029) | | | 630,000 | | | | 698,122 | | | | | |
| Massachusetts Development Finance Agency: | | | | | | | | | | | | |
| 5.000%, 10/01/2025 (Insured by AGM) | | | 575,000 | | | | 591,812 | | | | | |
| 5.000%, 01/01/2031 (Callable 01/01/2027) | | | 475,000 | | | | 490,726 | | | | | |
| Massachusetts Housing Finance Agency: | | | | | | | | | | | | |
| 3.300%, 12/01/2026 | | | | | | | | | | | | |
| (Callable 06/01/2025) (Insured by FHA) | | | 1,000,000 | | | | 992,747 | | | | | |
| 3.350%, 06/01/2027 | | | | | | | | | | | | |
| (Callable 12/01/2025) (Insured by FHA) | | | 2,600,000 | | | | 2,589,316 | | | | | |
| 4.000%, 12/01/2028 (Callable 07/21/2023) | | | 1,000,000 | | | | 1,000,240 | | | | | |
| 3.500%, 06/01/2042 (Callable 06/01/2025) | | | 780,000 | | | | 772,320 | | | | | |
| 4.500%, 12/01/2048 (Callable 12/01/2027) | | | 1,030,000 | | | | 1,031,826 | | | | | |
| 4.000%, 06/01/2049 (Callable 12/01/2028) | | | 565,000 | | | | 560,360 | | | | | |
| 5.000%, 06/01/2050 | | | | | | | | | | | | |
| (Callable 06/01/2032) (Insured by GNMA) | | | 1,860,000 | | | | 1,916,487 | | | | | |
| Total Massachusetts | | | | | | | | | | | | |
| (Cost $15,609,438) | | | | | | | 15,176,275 | | | | 0.6 | % |
| Michigan | | | | | | | | | | | | |
| Allegan Public School District: | | | | | | | | | | | | |
| 5.000%, 05/01/2035 | | | | | | | | | | | | |
| (Callable 05/01/2033) (Insured by Q-SBLF) | | | 900,000 | | | | 1,038,988 | | | | | |
| 5.000%, 05/01/2036 | | | | | | | | | | | | |
| (Callable 05/01/2033) (Insured by Q-SBLF) | | | 935,000 | | | | 1,066,883 | | | | | |
| 5.000%, 05/01/2037 | | | | | | | | | | | | |
| (Callable 05/01/2033) (Insured by Q-SBLF) | | | 725,000 | | | | 815,775 | | | | | |
| 5.000%, 05/01/2038 | | | | | | | | | | | | |
| (Callable 05/01/2033) (Insured by Q-SBLF) | | | 1,025,000 | | | | 1,138,648 | | | | | |
| 5.000%, 05/01/2039 | | | | | | | | | | | | |
| (Callable 05/01/2033) (Insured by Q-SBLF) | | | 1,075,000 | | | | 1,181,143 | | | | | |
| City of Wyandotte MI, | | | | | | | | | | | | |
| 5.000%, 10/01/2023 (Insured by BAM) | | | 25,000 | | | | 25,076 | | | | | |
| Clarkston Community Schools, | | | | | | | | | | | | |
| 5.000%, 05/01/2039 | | | | | | | | | | | | |
| (Callable 05/01/2029) (Insured by Q-SBLF) | | | 500,000 | | | | 542,290 | | | | | |
The accompanying notes are an integral part of these financial statements.
Baird Core Intermediate Municipal Bond Fund
Schedule of Investments, June 30, 2023 (Unaudited)
Long-Term Investments (cont.)
| | | Principal | | | | | | % of | |
| | | Amount | | | Value | | | Net Assets | |
| Clio Area School District: | | | | | | | | | |
| 4.000%, 05/01/2038 (Callable 05/01/2032) | | | | | | | | | |
| (Insured by Q-SBLF) | | $ | 635,000 | | | $ | 653,726 | | | |
| |
| 4.000%, 05/01/2040 (Callable 05/01/2032) | | | | | | | | | | | | |
| (Insured by Q-SBLF) | | | 885,000 | | | | 901,633 | | | | | |
| 4.000%, 05/01/2041 (Callable 05/01/2032) | | | | | | | | | | | | |
| (Insured by Q-SBLF) | | | 895,000 | | | | 912,032 | | | | | |
| 4.000%, 05/01/2042 (Callable 05/01/2032) | | | | | | | | | | | | |
| (Insured by Q-SBLF) | | | 885,000 | | | | 890,371 | | | | | |
| 4.000%, 05/01/2043 (Callable 05/01/2032) | | | | | | | | | | | | |
| (Insured by Q-SBLF) | | | 900,000 | | | | 905,938 | | | | | |
| 4.000%, 05/01/2044 (Callable 05/01/2032) | | | | | | | | | | | | |
| (Insured by Q-SBLF) | | | 800,000 | | | | 803,103 | | | | | |
| Coopersville Area Public Schools: | | | | | | | | | | | | |
| 4.000%, 05/01/2039 (Callable 05/01/2032) | | | | | | | | | | | | |
| (Insured by Q-SBLF) | | | 300,000 | | | | 302,254 | | | | | |
| 4.500%, 05/01/2041 (Callable 05/01/2032) | | | | | | | | | | | | |
| (Insured by Q-SBLF) | | | 310,000 | | | | 322,303 | | | | | |
| 4.500%, 05/01/2043 (Callable 05/01/2032) | | | | | | | | | | | | |
| (Insured by Q-SBLF) | | | 300,000 | | | | 311,312 | | | | | |
| 4.000%, 05/01/2045 (Callable 05/01/2032) | | | | | | | | | | | | |
| (Insured by Q-SBLF) | | | 850,000 | | | | 842,708 | | | | | |
| Detroit City School District, | | | | | | | | | | | | |
| 5.250%, 05/01/2025 (Insured by BHAC) | | | 525,000 | | | | 539,001 | | | | | |
| Eastern Michigan University, | | | | | | | | | | | | |
| 4.000%, 03/01/2034 | | | | | | | | | | | | |
| (Callable 03/01/2027) (Insured by BAM) | | | 985,000 | | | | 1,007,936 | | | | | |
| Flat Rock Community School District: | | | | | | | | | | | | |
| 5.000%, 05/01/2036 (Callable 05/01/2032) | | | | | | | | | | | | |
| (Insured by Q-SBLF) | | | 670,000 | | | | 756,212 | | | | | |
| 5.000%, 05/01/2037 (Callable 05/01/2032) | | | | | | | | | | | | |
| (Insured by Q-SBLF) | | | 725,000 | | | | 810,209 | | | | | |
| 5.000%, 05/01/2038 (Callable 05/01/2032) | | | | | | | | | | | | |
| (Insured by Q-SBLF) | | | 575,000 | | | | 636,446 | | | | | |
| 5.000%, 05/01/2039 (Callable 05/01/2032) | | | | | | | | | | | | |
| (Insured by Q-SBLF) | | | 805,000 | | | | 882,722 | | | | | |
| 5.000%, 05/01/2041 (Callable 05/01/2032) | | | | | | | | | | | | |
| (Insured by Q-SBLF) | | | 1,385,000 | | | | 1,500,509 | | | | | |
| 5.000%, 05/01/2044 (Callable 05/01/2032) | | | | | | | | | | | | |
| (Insured by Q-SBLF) | | | 1,485,000 | | | | 1,586,775 | | | | | |
| Flint Hospital Building Authority, | | | | | | | | | | | | |
| 4.750%, 07/01/2023 | | | 300,000 | | | | 300,000 | | | | | |
| Fraser Public School District, | | | | | | | | | | | | |
| 5.000%, 05/01/2048 (Callable 05/01/2033) | | | | | | | | | | | | |
| (Insured by Q-SBLF) | | | 1,000,000 | | | | 1,064,852 | | | | | |
| Grand Ledge Public Schools, | | | | | | | | | | | | |
| 5.000%, 05/01/2044 (Callable 05/01/2029) | | | | | | | | | | | | |
| (Insured by Q-SBLF) | | | 250,000 | | | | 264,629 | | | | | |
| Great Lakes Water Authority: | | | | | | | | | | | | |
| 5.000%, 07/01/2033 (Callable 07/01/2028) | | | 1,000,000 | | | | 1,101,496 | | | | | |
| 5.000%, 07/01/2036 (Callable 07/01/2026) | | | 5,000,000 | | | | 5,220,141 | | | | | |
| Lake Orion Community School District: | | | | | | | | | | | | |
| 4.000%, 05/01/2024 (Insured by Q-SBLF) | | | 275,000 | | | | 277,009 | | | | | |
| 4.000%, 05/01/2025 (Insured by Q-SBLF) | | | 325,000 | | | | 328,970 | | | | | |
| 4.000%, 05/01/2026 (Insured by Q-SBLF) | | | 350,000 | | | | 358,642 | | | | | |
| 4.000%, 05/01/2027 (Insured by Q-SBLF) | | | 275,000 | | | | 285,302 | | | | | |
| Lake Superior State University, | | | | | | | | | | | | |
| 4.000%, 11/15/2028 (Insured by AGM) | | | 620,000 | | | | 641,495 | | | | | |
| Lincoln Consolidated School District, | | | | | | | | | | | | |
| 5.000%, 05/01/2042 (Callable 05/01/2028) | | | | | | | | | | | | |
| (Insured by Q-SBLF) | | | 2,000,000 | | | | 2,127,634 | | | | | |
| Michigan Finance Authority: | | | | | | | | | | | | |
| 4.000%, 10/01/2024 | | | 650,000 | | | | 646,565 | | | | | |
| 5.250%, 02/01/2027 | | | 2,000,000 | | | | 2,012,871 | | | | | |
| 5.000%, 09/01/2029 | | | 400,000 | | | | 427,479 | | | | | |
| 4.500%, 10/01/2029 (Callable 10/01/2024) | | | 6,900,000 | | | | 6,896,578 | | | | | |
| 5.000%, 09/01/2030 (Callable 03/01/2030) | | | 440,000 | | | | 470,351 | | | | | |
| 5.250%, 02/01/2032 (Callable 02/01/2027) | | | 590,000 | | | | 598,172 | | | | | |
| 5.000%, 07/01/2032 | | | | | | | | | | | | |
| (Callable 07/01/2024) (Insured by AGM) | | | 5,000,000 | | | | 5,074,477 | | | | | |
| 5.000%, 12/01/2035 (Callable 12/01/2027) | | | 1,000,000 | | | | 1,061,024 | | | | | |
| 5.000%, 07/01/2044 (Callable 07/01/2024) | | | 3,910,000 | | | | 3,911,208 | | | | | |
| 6.750%, 07/01/2044 | | | | | | | | | | | | |
(Pre-refunded to 07/01/2024)(3) | | | 2,735,000 | | | | 2,814,061 | | | | | |
| 5.000%, 11/15/2044 (Callable 05/16/2026) | | | | | | | | | | | | |
(Mandatory Tender Date 11/16/2026)(1) | | | 4,950,000 | | | | 5,143,268 | | | | | |
| Michigan State Hospital Finance Authority, | | | | | | | | | | | | |
| 4.000%, 11/15/2047 (Callable 11/15/2026) | | | 595,000 | | | | 562,685 | | | | | |
| Michigan State Housing | | | | | | | | | | | | |
| Development Authority: | | | | | | | | | | | | |
| 3.500%, 06/01/2024 (Mandatory Tender | | | | | | | | | | | | |
Date 12/01/2023) (Insured by HUD)(1) | | | 5,000,000 | | | | 4,982,646 | | | | | |
| 4.250%, 06/01/2049 (Callable 12/01/2027) | | | 1,190,000 | | | | 1,186,577 | | | | | |
| 4.250%, 12/01/2049 (Callable 06/01/2028) | | | 1,190,000 | | | | 1,187,581 | | | | | |
| 3.500%, 12/01/2050 (Callable 06/01/2029) | | | 4,090,000 | | | | 4,001,804 | | | | | |
| 5.000%, 06/01/2053 (Callable 12/01/2031) | | | 2,840,000 | | | | 2,934,413 | | | | | |
| 5.500%, 06/01/2053 (Callable 12/01/2031) | | | 2,475,000 | | | | 2,609,869 | | | | | |
| Michigan State University, | | | | | | | | | | | | |
| 5.000%, 02/15/2037 (Callable 08/15/2029) | | | 525,000 | | | | 571,069 | | | | | |
| Pinckney Community Schools, | | | | | | | | | | | | |
| 5.000%, 05/01/2035 (Callable 05/01/2026) | | | | | | | | | | | | |
| (Insured by Q-SBLF) | | | 1,500,000 | | | | 1,551,961 | | | | | |
| Rockford Public Schools: | | | | | | | | | | | | |
| 5.000%, 05/01/2036 (Callable 05/01/2033) | | | | | | | | | | | | |
| (Insured by Q-SBLF) | | | 1,000,000 | | | | 1,147,380 | | | | | |
| 5.000%, 05/01/2037 (Callable 05/01/2033) | | | | | | | | | | | | |
| (Insured by Q-SBLF) | | | 800,000 | | | | 908,004 | | | | | |
| 5.000%, 05/01/2040 (Callable 05/01/2033) | | | | | | | | | | | | |
| (Insured by Q-SBLF) | | | 1,230,000 | | | | 1,353,457 | | | | | |
| Romeo Community School District, | | | | | | | | | | | | |
| 5.000%, 05/01/2029 (Callable 05/01/2026) | | | | | | | | | | | | |
| (Insured by Q-SBLF) | | | 1,000,000 | | | | 1,050,806 | | | | | |
| Roseville Community Schools, | | | | | | | | | | | | |
| 5.000%, 05/01/2026 (Insured by Q-SBLF) | | | 400,000 | | | | 422,320 | | | | | |
| Swartz Creek Community Schools, | | | | | | | | | | | | |
| 5.000%, 05/01/2039 (Callable 05/01/2029) | | | | | | | | | | | | |
| (Insured by Q-SBLF) | | | 815,000 | | | | 882,142 | | | | | |
| Thornapple Kellogg School District, | | | | | | | | | | | | |
| 5.000%, 05/01/2036 (Callable 05/01/2033) | | | | | | | | | | | | |
| (Insured by Q-SBLF) | | | 1,320,000 | | | | 1,480,292 | | | | | |
| Trenton Public Schools School District, | | | | | | | | | | | | |
| 5.000%, 05/01/2030 (Callable 05/01/2028) | | | | | | | | | | | | |
| (Insured by Q-SBLF) | | | 300,000 | | | | 333,155 | | | | | |
| Wayne County Airport Authority: | | | | | | | | | | | | |
| 5.000%, 12/01/2026 | | | 185,000 | | | | 197,029 | | | | | |
| 5.000%, 12/01/2031 | | | | | | | | | | | | |
| (Callable 12/01/2027) | | | 375,000 | | | | 401,737 | | | | | |
| Wayne State University, | | | | | | | | | | | | |
| 5.000%, 11/15/2030 | | | | | | | | | | | | |
| (Callable 11/15/2025) | | | 1,025,000 | | | | 1,059,076 | | | | | |
| Western Michigan University: | | | | | | | | | | | | |
| 5.000%, 11/15/2029 | | | | | | | | | | | | |
| (Callable 05/15/2025) | | | 250,000 | | | | 256,103 | | | | | |
| 5.000%, 11/15/2030 (Insured by AGM) | | | 300,000 | | | | 339,255 | | | | | |
| 5.000%, 11/15/2038 | | | | | | | | | | | | |
| (Callable 05/15/2031) (Insured by AGM) | | | 375,000 | | | | 405,152 | | | | | |
The accompanying notes are an integral part of these financial statements.
Baird Core Intermediate Municipal Bond Fund
Schedule of Investments, June 30, 2023 (Unaudited)
Long-Term Investments (cont.)
| | | Principal | | | | | | % of | |
| | | Amount | | | Value | | | Net Assets | |
| Western Michigan University: (cont.) | | | | | | | | | |
| 5.000%, 11/15/2039 (Callable 05/15/2031) | | | | | | | | | |
| (Insured by AGM) | | $ | 400,000 | | | $ | 430,472 | | | | |
| 5.000%, 11/15/2040 | | | | | | | | | | | |
| (Callable 05/15/2031) (Insured by AGM) | | | 420,000 | | | | 449,612 | | | | |
| Total Michigan | | | | | | | | | | | |
| (Cost $94,216,202) | | | | | | | 92,104,814 | | | | 3.5 | % |
| Minnesota | | | | | | | | | | | | |
| City of Maple Grove MN: | | | | | | | | | | | | |
| 5.000%, 05/01/2027 | | | 200,000 | | | | 208,789 | | | | | |
| 5.000%, 05/01/2031 (Callable 05/01/2027) | | | 525,000 | | | | 548,089 | | | | | |
| City of Minneapolis MN: | | | | | | | | | | | | |
| 5.000%, 11/15/2033 (Callable 11/15/2028) | | | 2,065,000 | | | | 2,199,184 | | | | | |
| 5.000%, 11/15/2034 (Callable 11/15/2025) | | | 680,000 | | | | 698,220 | | | | | |
| 5.000%, 11/15/2034 (Callable 11/15/2028) | | | 2,240,000 | | | | 2,380,258 | | | | | |
| 4.000%, 11/15/2036 (Callable 11/15/2031) | | | 1,090,000 | | | | 1,090,348 | | | | | |
| County of Washington MN, | | | | | | | | | | | | |
| 2.250%, 02/01/2034 | | | 1,525,000 | | | | 1,325,558 | | | | | |
| Duluth Economic Development Authority: | | | | | | | | | | | | |
| 5.000%, 06/15/2027 | | | 300,000 | | | | 308,112 | | | | | |
| 5.000%, 06/15/2028 | | | 450,000 | | | | 466,640 | | | | | |
| Forest Lake Independent | | | | | | | | | | | | |
| School District No. 831, | | | | | | | | | | | | |
| 3.125%, 02/01/2039 (Callable 02/01/2026) | | | | | | | | | | | | |
| (Insured by SD CRED PROG) | | | 400,000 | | | | 366,405 | | | | | |
| Housing & Redevelopment Authority | | | | | | | | | | | | |
| of the City of St. Paul MN: | | | | | | | | | | | | |
| 5.000%, 12/01/2028 | | | 1,115,000 | | | | 1,134,482 | | | | | |
| 5.000%, 11/15/2029 (Callable 11/15/2027) | | | 705,000 | | | | 740,521 | | | | | |
| 5.000%, 12/01/2030 | | | 300,000 | | | | 304,436 | | | | | |
| 5.000%, 11/15/2034(Callable 11/15/2027) | | | 1,900,000 | | | | 1,989,143 | | | | | |
| 5.000%, 12/01/2036 (Callable 12/01/2030) | | | 1,600,000 | | | | 1,584,522 | | | | | |
| Maple River Independent | | | | | | | | | | | | |
| School District No. 2135: | | | | | | | | | | | | |
| 4.000%, 02/01/2037 (Callable 02/01/2030) | | | | | | | | | | | | |
| (Insured by SD CRED PROG) | | | 970,000 | | | | 1,007,395 | | | | | |
| 4.000%, 02/01/2038 (Callable 02/01/2030) | | | | | | | | | | | | |
| (Insured by SD CRED PROG) | | | 700,000 | | | | 721,363 | | | | | |
| Minnesota Higher Education | | | | | | | | | | | | |
| Facilities Authority: | | | | | | | | | | | | |
| 5.000%, 10/01/2039 (Callable 10/01/2030) | | | 2,040,000 | | | | 2,171,452 | | | | | |
| 4.000%, 10/01/2040 (Callable 10/01/2030) | | | 1,030,000 | | | | 1,000,264 | | | | | |
| 4.125%, 10/01/2041 (Callable 10/01/2030) | | | 1,000,000 | | | | 979,944 | | | | | |
| 4.125%, 10/01/2042 (Callable 10/01/2030) | | | 1,000,000 | | | | 977,535 | | | | | |
| Minnesota Housing Finance Agency: | | | | | | | | | | | | |
| 3.300%, 02/01/2025 | | | | | | | | | | | | |
| (Callable 08/01/2024) (Insured by HUD) | | | 2,000,000 | | | | 1,979,442 | | | | | |
| 3.800%, 02/01/2025 (Callable 08/01/2024) | | | 2,040,000 | | | | 2,040,433 | | | | | |
| 3.600%, 07/01/2033 | | | | | | | | | | | | |
| (Callable 07/31/2023) (Insured by GNMA) | | | 485,000 | | | | 478,772 | | | | | |
| 3.100%, 07/01/2035 | | | | | | | | | | | | |
| (Callable 07/01/2025) (Insured by GNMA) | | | 1,485,000 | | | | 1,450,102 | | | | | |
| 4.000%, 01/01/2038 (Callable 01/01/2024) | | | 210,000 | | | | 209,257 | | | | | |
| 3.800%, 07/01/2038 | | | | | | | | | | | | |
| (Callable 07/31/2023) (Insured by GNMA) | | | 160,000 | | | | 157,856 | | | | | |
| 3.200%, 01/01/2045 | | | | | | | | | | | | |
| (SIFMA Municipal Swap Index + 0.430%) | | | | | | | | | | | | |
(Insured by GNMA)(2) | | | 95,000 | | | | 95,000 | | | | | |
| 4.000%, 01/01/2047 | | | | | | | | | | | | |
| (Callable 01/01/2026) (Insured by GNMA) | | | 180,000 | | | | 179,269 | | | | | |
| 3.750%, 01/01/2050 | | | | | | | | | | | | |
| (Callable 01/01/2029) (Insured by GNMA) | | | 1,535,000 | | | | 1,514,382 | | | | | |
| 3.500%, 07/01/2050 (Callable 07/01/2029) | | | | | | | | | | | | |
| (Insured by GNMA) | | | 2,560,000 | | | | 2,507,246 | | | | | |
| 5.750%, 07/01/2053(Callable 01/01/2033) | | | | | | | | | | | | |
(Insured by GNMA)(6) | | | 3,000,000 | | | | 3,217,865 | | | | | |
| Plymouth Intermediate District No. 287, | | | | | | | | | | | | |
| 4.000%, 02/01/2028 | | | | | | | | | | | | |
| (Callable 02/01/2027) | | | 350,000 | | | | 361,011 | | | | | |
| Robbinsdale Independent | | | | | | | | | | | | |
| School District No. 281, | | | | | | | | | | | | |
| 5.000%, 02/01/2030 | | | | | | | | | | | | |
| (Insured by SD CRED PROG) | | | 750,000 | | | | 859,408 | | | | | |
| St. Paul Port Authority, | | | | | | | | | | | | |
| 4.000%, 10/01/2041 (Callable 10/01/2027) | | | 400,000 | | | | 391,150 | | | | | |
| Zumbro Education District: | | | | | | | | | | | | |
| 4.000%, 02/01/2029 | | | 350,000 | | | | 349,535 | | | | | |
| 4.000%, 02/01/2038 (Callable 02/01/2031) | | | 385,000 | | | | 361,975 | | | | | |
| Total Minnesota | | | | | | | | | | | | |
| (Cost $39,137,194) | | | | | | | 38,355,363 | | | | 1.5 | % |
| Mississippi | | | | | | | | | | | | |
| Biloxi Public School District, | | | | | | | | | | | | |
| 5.000%, 04/01/2026 (Insured by BAM) | | | 500,000 | | | | 521,848 | | | | | |
| City of Flowood MS, | | | | | | | | | | | | |
| 3.500%, 10/01/2026 (Callable 10/01/2024) | | | 610,000 | | | | 614,413 | | | | | |
| City of Gluckstadt MS: | | | | | | | | | | | | |
| 6.000%, 06/01/2025 | | | 100,000 | | | | 103,414 | | | | | |
| 6.000%, 06/01/2027 | | | 285,000 | | | | 302,416 | | | | | |
| 6.000%, 06/01/2029 (Callable 06/01/2028) | | | 370,000 | | | | 394,559 | | | | | |
| 6.000%, 06/01/2031 (Callable 06/01/2028) | | | 405,000 | | | | 427,948 | | | | | |
| 6.000%, 06/01/2032 (Callable 06/01/2028) | | | 100,000 | | | | 105,239 | | | | | |
| 5.000%, 06/01/2034 (Callable 06/01/2028) | | | 100,000 | | | | 99,752 | | | | | |
| 5.000%, 06/01/2035 (Callable 06/01/2028) | | | 490,000 | | | | 486,552 | | | | | |
| City of Gulfport MS: | | | | | | | | | | | | |
| 5.000%, 07/01/2024 | | | 485,000 | | | | 490,197 | | | | | |
| 5.000%, 07/01/2027 (Callable 07/01/2026) | | | 500,000 | | | | 506,189 | | | | | |
| City of Ridgeland MS: | | | | | | | | | | | | |
| 3.000%, 10/01/2025 | | | 1,000,000 | | | | 984,510 | | | | | |
| 3.000%, 10/01/2026 | | | 1,100,000 | | | | 1,079,998 | | | | | |
| 3.000%, 10/01/2028 (Callable 10/01/2027) | | | 690,000 | | | | 675,989 | | | | | |
| 3.000%, 10/01/2029 (Callable 10/01/2027) | | | 540,000 | | | | 529,480 | | | | | |
| County of Lowndes MS, | | | | | | | | | | | | |
| 2.650%, 04/01/2037 | | | | | | | | | | | | |
(Mandatory Tender Date 04/01/2027)(1) | | | 2,500,000 | | | | 2,386,299 | | | | | |
| Medical Center Educational Building Corp.: | | | | | | | | | | | | |
| 5.000%, 06/01/2042 (Callable 06/01/2027) | | | 500,000 | | | | 521,618 | | | | | |
| 4.000%, 06/01/2048 (Callable 06/01/2033) | | | 1,500,000 | | | | 1,438,852 | | | | | |
| Mississippi Business Finance Corp., | | | | | | | | | | | | |
| 3.200%, 09/01/2028 (Callable 03/13/2024) | | | 2,100,000 | | | | 2,063,546 | | | | | |
| Mississippi Development Bank: | | | | | | | | | | | | |
| 5.000%, 11/01/2027 | | | 475,000 | | | | 486,546 | | | | | |
| 5.000%, 09/01/2029 | | | 1,900,000 | | | | 2,002,736 | | | | | |
| 5.000%, 09/01/2030 | | | 865,000 | | | | 913,045 | | | | | |
| 4.000%, 03/01/2032 (Callable 03/01/2028) | | | 200,000 | | | | 205,523 | | | | | |
| 4.000%, 07/01/2032 (Callable 07/01/2031) | | | 150,000 | | | | 154,035 | | | | | |
| 4.000%, 03/01/2033 (Callable 03/01/2028) | | | 300,000 | | | | 307,418 | | | | | |
| 5.250%, 03/01/2034 (Callable 03/01/2028) | | | 490,000 | | | | 514,116 | | | | | |
| 4.000%, 07/01/2034 (Callable 07/01/2031) | | | 285,000 | | | | 289,614 | | | | | |
| 4.000%, 07/01/2035 (Callable 07/01/2031) | | | 405,000 | | | | 409,992 | | | | | |
| 4.000%, 03/01/2036 (Callable 03/01/2028) | | | 300,000 | | | | 302,340 | | | | | |
| 4.000%, 07/01/2036 (Callable 07/01/2031) | | | 250,000 | | | | 250,386 | | | | | |
| 4.000%, 07/01/2038 (Callable 07/01/2031) | | | 245,000 | | | | 242,378 | | | | | |
| 4.000%, 04/01/2039 (Callable 04/01/2033) | | | | | | | | | | | | |
| (Insured by BAM) | | | 1,345,000 | | | | 1,331,565 | | | | | |
| 4.000%, 07/01/2039 (Callable 07/01/2031) | | | 390,000 | | | | 383,380 | | | | | |
| 4.000%, 06/01/2043 (Callable 06/01/2027) | | | 105,000 | | | | 101,628 | | | | | |
| 5.250%, 03/01/2045 (Callable 03/01/2028) | | | 1,345,000 | | | | 1,367,555 | | | | | |
| 5.000%, 03/01/2048 (Callable 03/01/2029) | | | | | | | | | | | | |
| (Insured by BAM) | | | 1,070,000 | | | | 1,099,770 | | | | | |
The accompanying notes are an integral part of these financial statements.
Baird Core Intermediate Municipal Bond Fund
Schedule of Investments, June 30, 2023 (Unaudited)
Long-Term Investments (cont.)
| | | Principal | | | | | | % of | |
| | | Amount | | | Value | | | Net Assets | |
| Mississippi Home Corp., | | | | | | | | | |
| 4.050%, 12/01/2047 (Callable 06/01/2031) | | | | | | | | | |
| (Insured by GNMA) | | $ | 500,000 | | | $ | 458,941 | | | | |
| Mississippi Hospital Equipment | | | | | | | | | | | |
| & Facilities Authority: | | | | | | | | | | | |
| 5.000%, 10/01/2034 | | | | | | | | | | | |
| (Callable 10/01/2029) | | | 725,000 | | | | 780,181 | | | | |
| 5.000%, 10/01/2040 (Callable 12/01/2026) | | | | | | | | | | | |
(Mandatory Tender Date 03/01/2027)(1) | | | 2,000,000 | | | | 2,088,453 | | | | |
| Natchez-Adams School District, | | | | | | | | | | | |
| 5.000%, 02/01/2030 | | | 645,000 | | | | 709,179 | | | | |
| State of Mississippi: | | | | | | | | | | | |
| 5.000%, 10/15/2028 (Callable 10/15/2025) | | | 1,260,000 | | | | 1,305,062 | | | | |
| 5.000%, 10/15/2034 (Callable 10/15/2025) | | | 1,000,000 | | | | 1,030,742 | | | | |
| 5.000%, 10/15/2035 (Callable 10/15/2028) | | | 3,000,000 | | | | 3,194,659 | | | | |
| Sunflower County | | | | | | | | | | | |
| Consolidated School District, | | | | | | | | | | | |
| 4.000%, 06/01/2042 | | | | | | | | | | | |
| (Callable 06/01/2032) (Insured by BAM) | | | 1,620,000 | | | | 1,568,221 | | | | |
| University of Mississippi | | | | | | | | | | | |
| Educational Building Corp.: | | | | | | | | | | | |
| 5.000%, 10/01/2047 (Callable 10/01/2032) | | | 800,000 | | | | 869,355 | | | | |
| 4.500%, 10/01/2052 (Callable 10/01/2032) | | | 1,000,000 | | | | 1,025,827 | | | | |
| University of Southern Mississippi, | | | | | | | | | | | |
| 5.000%, 09/01/2035 (Callable 09/01/2026) | | | 385,000 | | | | 399,649 | | | | |
| Vicksburg Warren School District, | | | | | | | | | | | |
| 5.000%, 03/01/2029 | | | 150,000 | | | | 159,457 | | | | |
| West Rankin Utility Authority: | | | | | | | | | | | |
| 5.000%, 01/01/2028 (Pre-refunded to | | | | | | | | | | | |
| 01/01/2025) (Insured by AGM) | | | 110,000 | | | | 112,884 | | | | |
| 5.000%, 01/01/2029 (Pre-refunded to | | | | | | | | | | | |
| 01/01/2025) (Insured by AGM) | | | 300,000 | | | | 307,865 | | | | |
| 5.000%, 01/01/2030 (Pre-refunded to | | | | | | | | | | | |
| 01/01/2025) (Insured by AGM) | | | 590,000 | | | | 605,469 | | | | |
| Total Mississippi | | | | | | | | | | | |
| (Cost $40,022,504) | | | | | | | 38,710,790 | | | | 1.5 | % |
| Missouri | | | | | | | | | | | | |
| Boone County Reorganized | | | | | | | | | | | | |
| School District No. R-1, | | | | | | | | | | | | |
| 5.750%, 03/01/2042 | | | | | | | | | | | | |
| (Callable 09/01/2031) (Insured by BAM) | | | 1,750,000 | | | | 2,027,529 | | | | | |
| Center School District No. 58, | | | | | | | | | | | | |
| 4.000%, 04/15/2031 (Callable 04/15/2027) | | | 170,000 | | | | 173,990 | | | | | |
| City of St. Charles MO, | | | | | | | | | | | | |
| 4.000%, 02/01/2026 | | | 500,000 | | | | 508,890 | | | | | |
| City of St. Louis MO, | | | | | | | | | | | | |
| 5.000%, 07/01/2039 (Callable 07/01/2029) | | | 425,000 | | | | 451,473 | | | | | |
| County of Cape Girardeau MO, | | | | | | | | | | | | |
| 5.000%, 06/01/2024 | | | 825,000 | | | | 835,560 | | | | | |
| Dunklin R-V School District, | | | | | | | | | | | | |
| 4.000%, 03/01/2043 | | | | | | | | | | | | |
| (Callable 03/01/2031) (Insured by ST AID) | | | 1,900,000 | | | | 1,869,338 | | | | | |
| Fort Zumwalt School District, | | | | | | | | | | | | |
| 5.250%, 03/01/2042 | | | | | | | | | | | | |
| (Callable 03/01/2030) (Insured by BAM) | | | 1,730,000 | | | | 1,889,239 | | | | | |
| Hazelwood School District, | | | | | | | | | | | | |
| 4.000%, 03/01/2031 | | | | | | | | | | | | |
| (Callable 03/01/2028) (Insured by ST AID) | | | 520,000 | | | | 538,222 | | | | | |
| Health & Educational Facilities | | | | | | | | | | | | |
| Authority of the State of Missouri: | | | | | | | | | | | | |
| 5.000%, 08/01/2024 | | | 330,000 | | | | 329,511 | | | | | |
| 5.000%, 02/01/2025 (Callable 02/01/2024) | | | 45,000 | | | | 45,076 | | | | | |
| 5.000%, 09/01/2025 | | | 365,000 | | | | 369,379 | | | | | |
| 5.000%, 09/01/2026 | | | 410,000 | | | | 417,278 | | | | | |
| 5.000%, 09/01/2027 | | | 280,000 | | | | 286,636 | | | | | |
| 5.000%, 11/15/2027 (Callable 11/15/2025) | | | 585,000 | | | | 603,466 | | | | | |
| 5.000%, 02/01/2034 (Callable 02/01/2024) | | | 950,000 | | | | 931,634 | | | | | |
| 5.000%, 02/01/2035 (Callable 02/01/2024) | | | 385,000 | | | | 375,413 | | | | | |
| 5.000%, 11/15/2035 (Callable 11/15/2025) | | | 1,950,000 | | | | 1,992,658 | | | | | |
| 5.000%, 02/15/2036 (Callable 02/15/2029) | | | 425,000 | | | | 453,647 | | | | | |
| Industrial Development | | | | | | | | | | | | |
| Authority of University City, | | | | | | | | | | | | |
| 4.875%, 06/15/2036 (Callable 06/15/2033) | | | 2,400,000 | | | | 2,400,868 | | | | | |
| Jackson County School District No. R-IV, | | | | | | | | | | | | |
| 6.000%, 03/01/2038 | | | | | | | | | | | | |
| (Callable 03/01/2029) (Insured by ST AID) | | | 1,005,000 | | | | 1,166,873 | | | | | |
| Jefferson County Consolidated | | | | | | | | | | | | |
| School District No. 6: | | | | | | | | | | | | |
| 3.000%, 03/01/2034 | | | | | | | | | | | | |
| (Callable 03/01/2028) (Insured by ST AID) | | | 700,000 | | | | 690,084 | | | | | |
| 3.000%, 03/01/2039 | | | | | | | | | | | | |
| (Callable 03/01/2028) (Insured by ST AID) | | | 1,300,000 | | | | 1,136,001 | | | | | |
| Kansas City Industrial | | | | | | | | | | | | |
| Development Authority, | | | | | | | | | | | | |
| 4.000%, 03/01/2035 (Callable 03/01/2030) | | | 455,000 | | | | 465,197 | | | | | |
| Meramec Valley School District No. R-III: | | | | | | | | | | | | |
| 3.000%, 03/01/2037 | | | | | | | | | | | | |
| (Callable 03/01/2028) (Insured by ST AID) | | | 360,000 | | | | 330,978 | | | | | |
| 3.000%, 03/01/2038 | | | | | | | | | | | | |
| (Callable 03/01/2028) (Insured by ST AID) | | | 500,000 | | | | 448,977 | | | | | |
| Missouri Housing Development Commission: | | | | | | | | | | | | |
| 3.950%, 11/01/2040 | | | | | | | | | | | | |
| (Callable 05/01/2025) (Insured by GNMA) | | | 105,000 | | | | 103,795 | | | | | |
| 3.250%, 11/01/2052 | | | | | | | | | | | | |
| (Callable 11/01/2030) (Insured by GNMA) | | | 4,895,000 | | | | 4,738,536 | | | | | |
| Missouri Joint Municipal | | | | | | | | | | | | |
| Electric Utility Commission, | | | | | | | | | | | | |
| 5.000%, 12/01/2040 (Callable 06/01/2026) | | | 1,000,000 | | | | 1,018,546 | | | | | |
| Missouri Southern State University: | | | | | | | | | | | | |
| 4.000%, 10/01/2035 | | | | | | | | | | | | |
| (Callable 10/01/2029) (Insured by AGM) | | | 100,000 | | | | 102,374 | | | | | |
| 4.000%, 10/01/2036 | | | | | | | | | | | | |
| (Callable 10/01/2029) (Insured by AGM) | | | 110,000 | | | | 111,824 | | | | | |
| 4.000%, 10/01/2039 | | | | | | | | | | | | |
| (Callable 10/01/2029) (Insured by AGM) | | | 110,000 | | | | 109,135 | | | | | |
| Move Rolla Transportation | | | | | | | | | | | | |
| Development District, | | | | | | | | | | | | |
| 3.750%, 06/01/2029 (Callable 06/01/2026) | | | 10,000 | | | | 9,706 | | | | | |
| Normandy Schools Collaborative: | | | | | | | | | | | | |
| 3.000%, 03/01/2036 | | | | | | | | | | | | |
| (Callable 03/01/2028) (Insured by ST AID) | | | 1,525,000 | | | | 1,441,797 | | | | | |
| 3.000%, 03/01/2037 | | | | | | | | | | | | |
| (Callable 03/01/2028) (Insured by ST AID) | | | 1,325,000 | | | | 1,218,185 | | | | | |
| Northwest Missouri State University: | | | | | | | | | | | | |
| 5.000%, 06/01/2027 (Insured by BAM) | | | 560,000 | | | | 590,757 | | | | | |
| 5.000%, 06/01/2028 (Insured by BAM) | | | 1,595,000 | | | | 1,707,313 | | | | | |
| 5.000%, 06/01/2029 (Insured by BAM) | | | 500,000 | | | | 542,554 | | | | | |
| St. Louis Land Clearance | | | | | | | | | | | | |
| for Redevelopment Authority: | | | | | | | | | | | | |
| 5.000%, 06/01/2028 (Callable 12/01/2026) | | | 4,000,000 | | | | 4,116,068 | | | | | |
| 3.875%, 10/01/2035 (Callable 10/01/2029) | | | 330,000 | | | | 269,862 | | | | | |
| 5.000%, 04/01/2038 (Callable 04/01/2027) | | | 1,500,000 | | | | 1,543,841 | | | | | |
| St. Louis Municipal Finance Corp., | | | | | | | | | | | | |
| 5.000%, 10/01/2045 | | | | | | | | | | | | |
| (Callable 10/01/2030) (Insured by AGM) | | | 1,330,000 | | | | 1,396,440 | | | | | |
| Total Missouri | | | | | | | | | | | | |
| (Cost $41,044,214) | | | | | | | 39,758,650 | | | | 1.5 | % |
The accompanying notes are an integral part of these financial statements.
Baird Core Intermediate Municipal Bond Fund
Schedule of Investments, June 30, 2023 (Unaudited)
Long-Term Investments (cont.)
| | | Principal | | | | | | % of | |
| | | Amount | | | Value | | | Net Assets | |
| Montana | | | | | | | | | |
| City of Forsyth MT: | | | | | | | | | |
| 3.875%, 07/01/2028 | | | | | | | | | |
| (Callable 04/02/2028) | | $ | 1,600,000 | | | $ | 1,605,032 | | | | |
| 3.900%, 03/01/2031 | | | | | | | | | | | |
(Callable 07/31/2023)(1) | | | 7,395,000 | | | | 7,165,579 | | | | |
| Montana Board of Housing: | | | | | | | | | | | |
| 3.500%, 08/01/2025 | | | | | | | | | | | |
(Mandatory Tender Date 08/01/2024)(1) | | | 3,385,000 | | | | 3,366,314 | | | | |
| 4.750%, 12/01/2025 | | | | | | | | | | | |
(Mandatory Tender Date 12/01/2024)(1) | | | 4,862,000 | | | | 4,910,653 | | | | |
| 3.600%, 12/01/2030 (Callable 07/21/2023) | | | 290,000 | | | | 290,036 | | | | |
| 3.750%, 12/01/2038 | | | | | | | | | | | |
| (Callable 12/01/2027) (Insured by FHA) | | | 305,000 | | | | 295,390 | | | | |
| 4.000%, 06/01/2049 | | | | | | | | | | | |
| (Callable 12/01/2027) (Insured by FHA) | | | 945,000 | | | | 937,832 | | | | |
| 3.000%, 06/01/2052 (Callable 06/01/2031) | | | 1,930,000 | | | | 1,851,442 | | | | |
| Montana Facility Finance Authority: | | | | | | | | | | | |
| 5.000%, 06/01/2026 (Callable 12/01/2024) | | | 765,000 | | | | 778,867 | | | | |
| 5.000%, 06/01/2029 (Callable 12/01/2024) | | | 715,000 | | | | 729,397 | | | | |
| 5.000%, 06/01/2033 (Callable 06/01/2028) | | | 310,000 | | | | 326,862 | | | | |
| 4.000%, 01/01/2037 (Callable 01/01/2030) | | | 700,000 | | | | 708,351 | | | | |
| Total Montana | | | | | | | | | | | |
| (Cost $23,475,301) | | | | | | | 22,965,755 | | | | 0.9 | % |
| Nebraska | | | | | | | | | | | | |
| Central Plains Energy Project, | | | | | | | | | | | | |
| 5.000%, 03/01/2050 (Callable 10/01/2023) | | | | | | | | | | | | |
(Mandatory Tender Date 01/01/2024)(1) | | | 835,000 | | | | 838,456 | | | | | |
| City of Fremont NE, | | | | | | | | | | | | |
| 1.750%, 07/15/2034 (Callable 07/08/2028) | | | 3,000,000 | | | | 2,421,557 | | | | | |
| County of Douglas NE, | | | | | | | | | | | | |
| 5.000%, 07/01/2036 (Callable 07/01/2027) | | | 200,000 | | | | 211,328 | | | | | |
| Douglas County Hospital Authority No. 2, | | | | | | | | | | | | |
| 5.000%, 05/15/2029 (Callable 05/15/2024) | | | 2,125,000 | | | | 2,136,987 | | | | | |
| Nebraska Investment Finance Authority: | | | | | | | | | | | | |
| 3.500%, 09/01/2036 (Callable 03/01/2025) | | | 275,000 | | | | 267,668 | | | | | |
| 3.500%, 09/01/2046 (Callable 03/01/2025) | | | 95,000 | | | | 93,878 | | | | | |
| 5.500%, 03/01/2052 (Callable 03/01/2032) | | | | | | | | | | | | |
| (Insured by GNMA) | | | 4,950,000 | | | | 5,220,979 | | | | | |
| Papio-Missouri River | | | | | | | | | | | | |
| Natural Resources District: | | | | | | | | | | | | |
| 3.000%, 12/01/2031 (Callable 10/12/2026) | | | 540,000 | | | | 532,887 | | | | | |
| 3.000%, 12/01/2032 (Callable 10/12/2026) | | | 385,000 | | | | 372,152 | | | | | |
| Village of Boys Town NE, | | | | | | | | | | | | |
| 3.000%, 09/01/2028 | | | 2,125,000 | | | | 2,121,827 | | | | | |
| Total Nebraska | | | | | | | | | | | | |
| (Cost $14,288,471) | | | | | | | 14,217,719 | | | | 0.5 | % |
| Nevada | | | | | | | | | | | | |
| City of Carson City NV, | | | | | | | | | | | | |
| 5.000%, 09/01/2033 (Callable 09/01/2027) | | | 250,000 | | | | 262,268 | | | | | |
| City of Yerington NV, | | | | | | | | | | | | |
| 1.625%, 11/01/2023 | | | | | | | | | | | | |
| (Callable 07/31/2023) (Insured by USDA) | | | 2,000,000 | | | | 1,982,150 | | | | | |
| Clark County School District, | | | | | | | | | | | | |
| 5.000%, 06/15/2032 | | | | | | | | | | | | |
| (Callable 06/15/2027) (Insured by BAM) | | | 450,000 | | | | 481,723 | | | | | |
| County of Clark NV, | | | | | | | | | | | | |
| 3.750%, 01/01/2036 | | | | | | | | | | | | |
(Mandatory Tender Date 03/31/2026)(1) | | | 1,500,000 | | | | 1,505,238 | | | | | |
| Henderson Public Improvement Trust, | | | | | | | | | | | | |
| 5.500%, 01/01/2044 | | | | | | | | | | | | |
| (Pre-refunded to 07/01/2024) | | | 1,000,000 | | | | 1,021,577 | | | | | |
| Las Vegas Redevelopment Agency: | | | | | | | | | | | | |
| 5.000%, 06/15/2027 | | | | | | | | | | | | |
| (Callable 06/15/2026) | | | 1,210,000 | | | | 1,248,444 | | | | | |
| 5.000%, 06/15/2029 (Callable 06/15/2026) | | | 200,000 | | | | 207,105 | | | | | |
| 3.000%, 06/15/2032 (Callable 06/15/2026) | | | 1,000,000 | | | | 919,117 | | | | | |
| Nevada Housing Division: | | | | | | | | | | | | |
| 5.000%, 12/01/2025 (Mandatory Tender | | | | | | | | | | | | |
Date 12/01/2024) (Insured by FHA)(1) | | | 2,725,000 | | | | 2,761,112 | | | | | |
| 4.000%, 04/01/2049 | | | | | | | | | | | | |
| (Callable 10/01/2028) (Insured by GNMA) | | | 1,365,000 | | | | 1,353,800 | | | | | |
| 4.000%, 10/01/2049 | | | | | | | | | | | | |
| (Callable 10/01/2028) (Insured by GNMA) | | | 280,000 | | | | 277,770 | | | | | |
| State of Nevada, | | | | | | | | | | | | |
| 5.000%, 06/01/2033 (Callable 12/01/2023) | | | 300,000 | | | | 301,808 | | | | | |
| Washoe County School District, | | | | | | | | | | | | |
| 5.000%, 05/01/2030 (Callable 05/01/2027) | | | 525,000 | | | | 563,739 | | | | | |
| Total Nevada | | | | | | | | | | | | |
| (Cost $13,168,174) | | | | | | | 12,885,851 | | | | 0.5 | % |
| New Hampshire | | | | | | | | | | | | |
| New Hampshire Business Finance Authority: | | | | | | | | | | | | |
| 4.000%, 10/20/2036 | | | 2,972,703 | | | | 2,815,338 | | | | | |
| 4.000%, 12/01/2040 | | | | | | | | | | | | |
| (Callable 06/01/2033) (Insured by BAM) | | | 630,000 | | | | 611,706 | | | | | |
| New Hampshire Health and | | | | | | | | | | | | |
| Education Facilities Authority, | | | | | | | | | | | | |
| 5.000%, 10/01/2032 (Callable 10/01/2027) | | | 275,000 | | | | 290,845 | | | | | |
| Total New Hampshire | | | | | | | | | | | | |
| (Cost $3,604,296) | | | | | | | 3,717,889 | | | | 0.1 | % |
| New Jersey | | | | | | | | | | | | |
| Atlantic City Board of Education, | | | | | | | | | | | | |
3.400%, 08/15/2027 (Insured by BAM)(3) | | | 3,293,000 | | | | 3,319,826 | | | | | |
| City of Somers Point NJ, | | | | | | | | | | | | |
| 4.000%, 10/01/2028 (Callable 10/01/2026) | | | 1,100,000 | | | | 1,133,160 | | | | | |
| City of Trenton NJ, | | | | | | | | | | | | |
| 4.000%, 07/15/2023 (Insured by AGM) | | | 400,000 | | | | 400,084 | | | | | |
| City of Union City NJ, | | | | | | | | | | | | |
| 5.000%, 11/01/2023 (Insured by ST AID) | | | 640,000 | | | | 642,555 | | | | | |
| County of Gloucester NJ, | | | | | | | | | | | | |
| 5.000%, 12/01/2024 (ETM) | | | 640,000 | | | | 645,637 | | | | | |
| Gloucester County Improvement Authority, | | | | | | | | | | | | |
| 0.600%, 03/01/2024 | | | | | | | | | | | | |
| (Callable 07/31/2023) | | | 2,325,000 | | | | 2,260,846 | | | | | |
| New Jersey Economic | | | | | | | | | | | | |
| Development Authority: | | | | | | | | | | | | |
| 4.000%, 11/01/2027 | | | 1,100,000 | | | | 1,122,947 | | | | | |
| 3.125%, 07/01/2029 (Callable 07/01/2027) | | | 90,000 | | | | 85,912 | | | | | |
| New Jersey Health Care | | | | | | | | | | | | |
| Facilities Financing Authority, | | | | | | | | | | | | |
| 5.000%, 07/01/2043 (Callable 04/01/2024) | | | | | | | | | | | | |
(Mandatory Tender Date 07/01/2024)(1) | | | 2,250,000 | | | | 2,285,271 | | | | | |
| New Jersey Higher Education | | | | | | | | | | | | |
| Student Assistance Authority: | | | | | | | | | | | | |
| 5.000%, 12/01/2025 | | | 1,850,000 | | | | 1,899,544 | | | | | |
| 5.000%, 12/01/2027 | | | 375,000 | | | | 392,800 | | | | | |
| New Jersey Housing & | | | | | | | | | | | | |
| Mortgage Finance Agency: | | | | | | | | | | | | |
| 3.125%, 02/01/2025 (Callable 02/01/2024) | | | | | | | | | | | | |
| (Mandatory Tender Date 08/01/2024) | | | | | | | | | | | | |
(Insured by HUD)(1) | | | 2,300,000 | | | | 2,266,843 | | | | | |
| 4.500%, 10/01/2048 (Callable 10/01/2027) | | | 1,515,000 | | | | 1,521,347 | | | | | |
| 4.750%, 10/01/2050 (Callable 04/01/2028) | | | 285,000 | | | | 287,615 | | | | | |
| 5.000%, 10/01/2053 (Callable 04/01/2031) | | | 2,475,000 | | | | 2,558,704 | | | | | |
The accompanying notes are an integral part of these financial statements.
Baird Core Intermediate Municipal Bond Fund
Schedule of Investments, June 30, 2023 (Unaudited)
Long-Term Investments (cont.)
| | | Principal | | | | | | % of | |
| | | Amount | | | Value | | | Net Assets | |
| New Jersey Transportation | | | | | | | | | |
| Trust Fund Authority: | | | | | | | | | |
| 0.000%, 12/15/2024 (Insured by AMBAC) | | $ | 4,220,000 | | | $ | 4,005,435 | | | | |
| 0.000%, 12/15/2026 | | | 6,410,000 | | | | 5,670,244 | | | | |
| 0.000%, 12/15/2027 (Insured by BAM) | | | 3,000,000 | | | | 2,574,087 | | | | |
| 5.000%, 06/15/2029 (Callable 06/15/2026) | | | 1,465,000 | | | | 1,533,709 | | | | |
| 5.250%, 06/15/2031 (Callable 07/03/2023) | | | 1,600,000 | | | | 1,600,000 | | | | |
| 5.000%, 06/15/2034 (Callable 12/15/2028) | | | 900,000 | | | | 971,873 | | | | |
| 4.000%, 06/15/2035 (Callable 12/15/2030) | | | 1,455,000 | | | | 1,486,556 | | | | |
| 4.000%, 12/15/2037 | | | | | | | | | | | |
| (Callable 12/15/2028) (Insured by BAM) | | | 500,000 | | | | 503,710 | | | | |
| 0.000%, 12/15/2038 (Insured by BAM) | | | 5,145,000 | | | | 2,688,776 | | | | |
| 5.000%, 06/15/2044 (Callable 07/03/2023) | | | 145,000 | | | | 145,000 | | | | |
| 5.000%, 06/15/2044 (Callable 06/15/2024) | | | 370,000 | | | | 372,032 | | | | |
| New Jersey Turnpike Authority, | | | | | | | | | | | |
| 4.344%, 01/01/2024 | | | | | | | | | | | |
(1 Month LIBOR USD + 0.700%)(2) | | | 825,000 | | | | 825,249 | | | | |
| Newark Housing Authority, | | | | | | | | | | | |
| 5.000%, 01/01/2032 (Insured by NATL) | | | 525,000 | | | | 566,643 | | | | |
| South Jersey Port Corp., | | | | | | | | | | | |
| 3.000%, 01/01/2024 | | | | | | | | | | | |
| (Callable 07/26/2023) | | | 100,000 | | | | 99,758 | | | | |
| South Jersey Transportation Authority, | | | | | | | | | | | |
| 5.000%, 11/01/2041 | | | | | | | | | | | |
| (Callable 11/01/2030) (Insured by BAM) | | | 2,350,000 | | | | 2,532,680 | | | | |
| Township of Union NJ, | | | | | | | | | | | |
| 3.000%, 01/15/2026 | | | 465,000 | | | | 463,928 | | | | |
| Total New Jersey | | | | | | | | | | | |
| (Cost $47,539,045) | | | | | | | 46,862,771 | | | | 1.8 | % |
| New Mexico | | | | | | | | | | | | |
| Loving Municipal School District No. 10: | | | | | | | | | | | | |
| 5.000%, 09/15/2025 (Insured by ST AID) | | | 500,000 | | | | 518,992 | | | | | |
| 5.000%, 09/15/2026 (Insured by ST AID) | | | 500,000 | | | | 529,377 | | | | | |
| 5.000%, 09/15/2027 (Insured by ST AID) | | | 400,000 | | | | 432,355 | | | | | |
| New Mexico Finance Authority, | | | | | | | | | | | | |
| 5.000%, 06/15/2035 | | | | | | | | | | | | |
| (Callable 06/15/2028) | | | 305,000 | | | | 332,917 | | | | | |
| New Mexico Institute of Mining & Technology: | | | | | | | | | | | | |
| 4.000%, 12/01/2028 (Insured by AGM) | | | 300,000 | | | | 311,574 | | | | | |
| 4.000%, 12/01/2029 (Insured by AGM) | | | 335,000 | | | | 347,432 | | | | | |
| New Mexico Mortgage Finance Authority: | | | | | | | | | | | | |
| 3.500%, 09/01/2041 (Callable 03/01/2026) | | | 460,000 | | | | 445,214 | | | | | |
| 3.700%, 09/01/2042 | | | | | | | | | | | | |
| (Callable 03/01/2027) (Insured by GNMA) | | | 1,485,000 | | | | 1,458,308 | | | | | |
| 3.600%, 07/01/2044 | | | | | | | | | | | | |
| (Callable 07/01/2028) (Insured by GNMA) | | | 935,000 | | | | 869,756 | | | | | |
| 3.500%, 07/01/2050 | | | | | | | | | | | | |
| (Callable 01/01/2029) (Insured by GNMA) | | | 735,000 | | | | 719,765 | | | | | |
| 5.250%, 03/01/2053 | | | | | | | | | | | | |
| (Callable 03/01/2032) (Insured by GNMA) | | | 3,455,000 | | | | 3,618,348 | | | | | |
| New Mexico State University, | | | | | | | | | | | | |
| 4.000%, 04/01/2035 (Callable 04/01/2027) | | | 520,000 | | | | 527,826 | | | | | |
| Village of Los Ranchos de Albuquerque NM: | | | | | | | | | | | | |
| 4.000%, 09/01/2024 | | | 100,000 | | | | 100,418 | | | | | |
| 4.000%, 09/01/2025 | | | 150,000 | | | | 151,424 | | | | | |
| 5.000%, 09/01/2026 | | | 150,000 | | | | 156,845 | | | | | |
| 5.000%, 09/01/2030 | | | 125,000 | | | | 138,897 | | | | | |
| Total New Mexico | | | | | | | | | | | | |
| (Cost $11,006,362) | | | | | | | 10,659,448 | | | | 0.4 | % |
| New York | | | | | | | | | | | | |
| Albany County Airport Authority, | | | | | | | | | | | | |
| 5.000%, 12/15/2025 | | | 1,000,000 | | | | 1,026,399 | | | | | |
| Albany County Capital Resource Corp., | | | | | | | | | | | | |
| 3.100%, 07/01/2030 | | | 755,000 | | | | 657,803 | | | | | |
| Amherst Development Corp., | | | | | | | | | | | | |
| 5.000%, 10/01/2032 | | | | | | | | | | | | |
| (Callable 10/01/2027) (Insured by AGM) | | | 240,000 | | | | 261,223 | | | | | |
| Amherst Industrial Development Agency, | | | | | | | | | | | | |
| 3.900%, 04/01/2026 (Mandatory Tender | | | | | | | | | | | | |
Date 04/01/2025) (Insured by FHA)(1) | | | 9,350,000 | | | | 9,351,592 | | | | | |
| City of Long Beach NY, | | | | | | | | | | | | |
| 5.250%, 07/15/2042 | | | | | | | | | | | | |
| (Callable 07/15/2030) (Insured by BAM) | | | 1,800,000 | | | | 1,908,640 | | | | | |
| City of New York NY: | | | | | | | | | | | | |
| 5.250%, 07/01/2029 | | | | | | | | | | | | |
| (Pre-refunded to 07/03/2023) | | | 250,000 | | | | 250,000 | | | | | |
| 5.250%, 10/01/2043 (Callable 10/01/2032) | | | 1,200,000 | | | | 1,358,387 | | | | | |
| 5.000%, 03/01/2044 (Callable 03/01/2028) | | | 350,000 | | | | 369,786 | | | | | |
| 5.000%, 06/01/2044 (Callable 06/01/2025) | | | | | | | | | | | | |
(Mandatory Tender Date 12/01/2025)(1) | | | 2,000,000 | | | | 2,062,368 | | | | | |
| 5.000%, 12/01/2044 (Callable 12/01/2028) | | | 1,655,000 | | | | 1,762,242 | | | | | |
| 4.000%, 09/01/2046 (Callable 09/01/2032) | | | 1,000,000 | | | | 983,890 | | | | | |
| City of Schenectady NY, | | | | | | | | | | | | |
| 4.750%, 05/03/2024 | | | 1,000,000 | | | | 1,009,416 | | | | | |
| Dutchess County Local Development Corp., | | | | | | | | | | | | |
| 5.000%, 07/01/2027 (Callable 07/01/2026) | | | 1,125,000 | | | | 1,149,324 | | | | | |
| Guilderland Central School District, | | | | | | | | | | | | |
| 4.000%, 07/28/2023 (Insured by ST AID) | | | 9,528,300 | | | | 9,530,112 | | | | | |
| Huntington Local Development Corp., | | | | | | | | | | | | |
| 4.000%, 07/01/2027 | | | 2,450,000 | | | | 2,340,201 | | | | | |
| Long Island Power Authority: | | | | | | | | | | | | |
| 4.000%, 09/01/2034 (Callable 09/01/2028) | | | 325,000 | | | | 339,405 | | | | | |
| 3.000%, 09/01/2040 (Callable 09/01/2031) | | | 1,000,000 | | | | 822,428 | | | | | |
| Monroe County Industrial | | | | | | | | | | | | |
| Development Corp., | | | | | | | | | | | | |
| 4.840%, 11/01/2040 (Insured by FNMA) | | | 4,983,588 | | | | 5,081,690 | | | | | |
| New York City Housing Development Corp.: | | | | | | | | | | | | |
| 2.250%, 11/01/2041 (Callable 05/01/2029) | | | 2,000,000 | | | | 1,395,775 | | | | | |
| 3.000%, 02/15/2048 (Callable 05/15/2024) | | | 9,250,000 | | | | 9,067,077 | | | | | |
| 3.500%, 02/15/2048 (Callable 05/15/2024) | | | 3,820,000 | | | | 3,747,799 | | | | | |
| 3.400%, 11/01/2062 (Callable 05/01/2025) | | | | | | | | | | | | |
| (Mandatory Tender Date 12/22/2026) | | | | | | | | | | | | |
(Insured by FHA)(1) | | | 6,000,000 | | | | 5,911,449 | | | | | |
| New York City Industrial | | | | | | | | | | | | |
| Development Agency: | | | | | | | | | | | | |
| 5.000%, 03/01/2029 (Insured by AGM) | | | 250,000 | | | | 273,352 | | | | | |
| 5.000%, 03/01/2030 (Insured by AGM) | | | 250,000 | | | | 277,538 | | | | | |
| New York City Transitional Finance Authority: | | | | | | | | | | | | |
| 5.000%, 08/01/2034 (Callable 08/01/2026) | | | 650,000 | | | | 685,127 | | | | | |
| 5.000%, 11/01/2035 (Callable 05/01/2029) | | | 715,000 | | | | 787,949 | | | | | |
| 5.000%, 08/01/2038 (Callable 08/01/2028) | | | 1,295,000 | | | | 1,392,242 | | | | | |
| 4.000%, 11/01/2038 (Callable 05/01/2031) | | | 1,055,000 | | | | 1,075,836 | | | | | |
| 4.000%, 05/01/2039 (Callable 11/01/2030) | | | 1,000,000 | | | | 1,009,052 | | | | | |
| New York Convention Center | | | | | | | | | | | | |
| Development Corp., | | | | | | | | | | | | |
| 0.000%, 11/15/2055 (Insured by BAM) | | | 3,665,000 | | | | 820,200 | | | | | |
| New York State Dormitory Authority: | | | | | | | | | | | | |
| 5.000%, 02/15/2031 (Callable 08/15/2027) | | | 730,000 | | | | 787,412 | | | | | |
| 5.000%, 03/15/2040 (Callable 03/15/2029) | | | 3,275,000 | | | | 3,530,458 | | | | | |
| 5.000%, 03/15/2041 (Callable 03/15/2029) | | | 2,965,000 | | | | 3,188,841 | | | | | |
| 5.000%, 03/15/2044 (Callable 03/15/2024) | | | 2,800,000 | | | | 2,823,317 | | | | | |
| 5.000%, 02/15/2048 (Callable 02/15/2030) | | | 1,925,000 | | | | 2,055,700 | | | | | |
| New York State Housing Finance Agency: | | | | | | | | | | | | |
| 0.700%, 11/01/2024 (Callable 07/21/2023) | | | | | | | | | | | | |
| (Insured by SONYMA) | | | 5,000,000 | | | | 4,801,083 | | | | | |
The accompanying notes are an integral part of these financial statements.
Baird Core Intermediate Municipal Bond Fund
Schedule of Investments, June 30, 2023 (Unaudited)
Long-Term Investments (cont.)
| | | Principal | | | | | | % of | |
| | | Amount | | | Value | | | Net Assets | |
| New York State Housing | | | | | | | | | |
| Finance Agency: (cont.) | | | | | | | | | |
| 1.600%, 11/01/2024 | | | | | | | | | |
| (Callable 07/21/2023) | | $ | 9,375,000 | | | $ | 9,092,142 | | | | |
| 0.650%, 11/01/2056 (Callable 07/21/2023) | | | | | | | | | | | |
| (Mandatory Tender Date 11/01/2025) | | | | | | | | | | | |
(Insured by SONYMA)(1) | | | 2,500,000 | | | | 2,293,900 | | | | |
| 1.000%, 11/01/2061 (Callable 09/01/2023) | | | | | | | | | | | |
| (Mandatory Tender Date 11/01/2026) | | | | | | | | | | | |
(Insured by SONYMA)(1) | | | 1,825,000 | | | | 1,659,530 | | | | |
| 3.600%, 11/01/2062 (Callable 06/01/2025) | | | | | | | | | | | |
| (Mandatory Tender Date 05/01/2027) | | | | | | | | | | | |
(Insured by SONYMA)(1) | | | 2,000,000 | | | | 1,997,553 | | | | |
| New York Transportation Development Corp., | | | | | | | | | | | |
| 5.000%, 12/01/2031 (Callable 12/01/2030) | | | 1,250,000 | | | | 1,379,998 | | | | |
| Onondaga Civic Development Corp.: | | | | | | | | | | | |
| 3.375%, 10/01/2026 (Callable 10/01/2025) | | | 50,000 | | | | 47,481 | | | | |
| 5.000%, 10/01/2040 (Callable 10/01/2025) | | | 95,000 | | | | 87,459 | | | | |
| Port Authority of New York & New Jersey: | | | | | | | | | | | |
| 3.000%, 10/01/2028 | | | 5,000,000 | | | | 4,815,241 | | | | |
| 5.000%, 09/01/2031 (Callable 09/01/2024) | | | 805,000 | | | | 820,873 | | | | |
| Rome City School District, | | | | | | | | | | | |
| 3.750%, 07/26/2023 (Insured by ST AID) | | | 6,000,000 | | | | 6,000,202 | | | | |
| Salmon River Central School District, | | | | | | | | | | | |
| 3.750%, 08/04/2023 (Insured by ST AID) | | | 9,439,275 | | | | 9,437,543 | | | | |
| St. Lawrence County | | | | | | | | | | | |
| Industrial Development Agency, | | | | | | | | | | | |
| 5.000%, 07/01/2034 (Callable 07/01/2026) | | | 345,000 | | | | 361,628 | | | | |
| State of New York Mortgage Agency, | | | | | | | | | | | |
| 3.500%, 10/01/2043 (Callable 07/17/2023) | | | 20,000 | | | | 19,885 | | | | |
| Town of Byron NY, | | | | | | | | | | | |
| 4.500%, 04/03/2024 (Callable 10/04/2023) | | | 2,224,000 | | | | 2,224,000 | | | | |
| Village of Johnson City NY, | | | | | | | | | | | |
| 5.250%, 09/29/2023 | | | 2,550,000 | | | | 2,549,552 | | | | |
| Westchester County Local Development Corp., | | | | | | | | | | | |
2.875%, 07/01/2026(3) | | | 6,110,000 | | | | 5,825,495 | | | | |
| Total New York | | | | | | | | | | | |
| (Cost $134,197,739) | | | | | | | 132,507,595 | | | | 5.1 | % |
| North Carolina | | | | | | | | | | | | |
| Charlotte-Mecklenburg Hospital Authority, | | | | | | | | | | | | |
| 5.000%, 01/15/2050 | | | | | | | | | | | | |
(Mandatory Tender Date 12/01/2028)(1) | | | 1,930,000 | | | | 2,112,545 | | | | | |
| City of Monroe NC, | | | | | | | | | | | | |
| 5.000%, 03/01/2043 (Callable 03/01/2027) | | | 305,000 | | | | 317,576 | | | | | |
| County of New Hanover NC, | | | | | | | | | | | | |
| 5.000%, 10/01/2027 (ETM) | | | 275,000 | | | | 299,450 | | | | | |
| Inlivian: | | | | | | | | | | | | |
| 2.375%, 04/01/2025 | | | | | | | | | | | | |
(Mandatory Tender Date 04/01/2024)(1) | | | 5,000,000 | | | | 4,951,285 | | | | | |
| 5.000%, 06/01/2043 (Callable 12/01/2025) | | | | | | | | | | | | |
| (Mandatory Tender Date 06/01/2026) | | | | | | | | | | | | |
(Insured by HUD)(1) | | | 9,000,000 | | | | 9,228,533 | | | | | |
| North Carolina Housing Finance Agency: | | | | | | | | | | | | |
| 4.000%, 07/01/2047 (Callable 01/01/2027) | | | 355,000 | | | | 352,660 | | | | | |
| 3.750%, 07/01/2052 (Callable 01/01/2031) | | | | | | | | | | | | |
| (Insured by GNMA) | | | 3,520,000 | | | | 3,467,806 | | | | | |
| North Carolina Medical Care Commission, | | | | | | | | | | | | |
| 5.000%, 01/01/2038 (Callable 01/01/2026) | | | 1,090,000 | | | | 1,084,440 | | | | | |
| North Carolina Turnpike Authority: | | | | | | | | | | | | |
| 5.000%, 01/01/2028 | | | 250,000 | | | | 265,650 | | | | | |
| 4.000%, 01/01/2041 | | | | | | | | | | | | |
| (Callable 01/01/2029) (Insured by AGM) | | | 1,105,000 | | | | 1,092,093 | | | | | |
| Raleigh Housing Authority, | | | | | | | | | | | | |
| 5.000%, 10/01/2026 | | | | | | | | | | | | |
(Mandatory Tender Date 10/01/2025)(1) | | | 3,500,000 | | | | 3,560,817 | | | | | |
| University of North Carolina at Chapel Hill, | | | | | | | | | | | | |
| 4.034%, 12/01/2041 (SOFR + 0.650%) | | | | | | | | | | | | |
| (Callable 12/01/2024) | | | | | | | | | | | | |
(Mandatory Tender Date 06/01/2025)(2) | | | 5,000,000 | | | | 5,003,901 | | | | | |
| Total North Carolina | | | | | | | | | | | | |
| (Cost $32,160,770) | | | | | | | 31,736,756 | | | | 1.2 | % |
| North Dakota | | | | | | | | | | | | |
| City of Horace ND: | | | | | | | | | | | | |
| 3.250%, 08/01/2024 (Callable 08/01/2023) | | | 2,475,000 | | | | 2,434,321 | | | | | |
| 4.000%, 01/01/2025 (Callable 01/01/2024) | | | 2,500,000 | | | | 2,501,265 | | | | | |
| 3.000%, 05/01/2029 (Callable 05/01/2027) | | | 430,000 | | | | 395,483 | | | | | |
| 3.000%, 05/01/2030 (Callable 05/01/2027) | | | 425,000 | | | | 387,095 | | | | | |
| 3.000%, 05/01/2031 (Callable 05/01/2027) | | | 380,000 | | | | 343,251 | | | | | |
| 5.000%, 05/01/2033 (Callable 05/01/2031) | | | 630,000 | | | | 668,759 | | | | | |
| 3.000%, 05/01/2037 (Callable 05/01/2026) | | | 2,495,000 | | | | 2,062,605 | | | | | |
| 5.000%, 05/01/2038 (Callable 05/01/2031) | | | 2,645,000 | | | | 2,700,395 | | | | | |
| 5.000%, 05/01/2048 (Callable 05/01/2031) | | | 250,000 | | | | 246,237 | | | | | |
| City of Mayville ND, | | | | | | | | | | | | |
| 3.750%, 08/01/2025 (Callable 08/01/2023) | | | 3,500,000 | | | | 3,379,803 | | | | | |
| City of Williston ND, | | | | | | | | | | | | |
| 5.000%, 05/01/2028 (Callable 07/31/2023) | | | 480,000 | | | | 480,199 | | | | | |
| County of McKenzie ND: | | | | | | | | | | | | |
| 5.000%, 08/01/2023 | | | 1,225,000 | | | | 1,225,670 | | | | | |
| 4.000%, 08/01/2026 (Callable 08/01/2023) | | | 250,000 | | | | 249,990 | | | | | |
| Jamestown Park District, | | | | | | | | | | | | |
| 2.900%, 07/01/2035 (Callable 07/01/2023) | | | 120,000 | | | | 120,000 | | | | | |
| Nesson Public School District No. 2, | | | | | | | | | | | | |
| 4.000%, 08/01/2031 (Callable 08/01/2027) | | | | | | | | | | | | |
| (Insured by SD CRED PROG) | | | 525,000 | | | | 541,476 | | | | | |
| North Dakota Housing Finance Agency: | | | | | | | | | | | | |
| 3.000%, 07/01/2034 (Callable 07/01/2028) | | | 90,000 | | | | 79,393 | | | | | |
| 3.500%, 07/01/2046 (Callable 01/01/2026) | | | 175,000 | | | | 172,497 | | | | | |
| 4.000%, 01/01/2050 (Callable 07/01/2028) | | | 720,000 | | | | 714,857 | | | | | |
| State Board of Higher Education | | | | | | | | | | | | |
| of the State of North Dakota: | | | | | | | | | | | | |
| 5.000%, 04/01/2028 (Insured by AGM) | | | 100,000 | | | | 108,350 | | | | | |
| 4.000%, 04/01/2037 | | | | | | | | | | | | |
| (Callable 04/01/2029) (Insured by AGM) | | | 400,000 | | | | 398,414 | | | | | |
| University of North Dakota, | | | | | | | | | | | | |
| 4.000%, 06/01/2046 | | | | | | | | | | | | |
| (Callable 06/01/2030) (Insured by AGM) | | | 1,275,000 | | | | 1,239,408 | | | | | |
| Williston Parks & Recreation District, | | | | | | | | | | | | |
| 4.500%, 03/01/2025 (Callable 07/17/2023) | | | 1,700,000 | | | | 1,671,863 | | | | | |
| Total North Dakota | | | | | | | | | | | | |
| (Cost $23,301,610) | | | | | | | 22,121,331 | | | | 0.8 | % |
| Ohio | | | | | | | | | | | | |
| Akron Bath Copley Joint | | | | | | | | | | | | |
| Township Hospital District: | | | | | | | | | | | | |
| 5.000%, 11/15/2026 | | | 600,000 | | | | 634,083 | | | | | |
| 5.000%, 11/15/2032 (Callable 11/15/2030) | | | 1,160,000 | | | | 1,237,442 | | | | | |
| 4.000%, 11/15/2033 (Callable 11/15/2030) | | | 400,000 | | | | 392,217 | | | | | |
| American Municipal Power, Inc.: | | | | | | | | | | | | |
| 3.000%, 08/10/2023 | | | 765,000 | | | | 764,162 | | | | | |
| 4.625%, 04/12/2024 (Insured by ST AID) | | | 800,000 | | | | 804,061 | | | | | |
| City of Akron OH: | | | | | | | | | | | | |
| 4.000%, 12/01/2031 (Callable 12/01/2029) | | | 1,665,000 | | | | 1,738,335 | | | | | |
| 4.000%, 12/01/2032 (Callable 12/01/2029) | | | 5,000 | | | | 5,194 | | | | | |
| City of Gahanna OH, | | | | | | | | | | | | |
| 5.000%, 11/02/2023 | | | 3,400,000 | | | | 3,408,533 | | | | | |
| City of Middleburg Heights OH, | | | | | | | | | | | | |
| 5.000%, 08/01/2033 (Callable 08/01/2031) | | | 645,000 | | | | 703,998 | | | | | |
| City of Troy OH, | | | | | | | | | | | | |
| 3.000%, 12/01/2041 (Callable 06/01/2025) | | | 355,000 | | | | 305,032 | | | | | |
The accompanying notes are an integral part of these financial statements.
Baird Core Intermediate Municipal Bond Fund
Schedule of Investments, June 30, 2023 (Unaudited)
Long-Term Investments (cont.)
| | | Principal | | | | | | % of | |
| | | Amount | | | Value | | | Net Assets | |
| Cleveland-Cuyahoga County Port Authority: | | | | | | | | | |
| 5.000%, 07/01/2034 | | | | | | | | | |
| (Callable 07/01/2031) | | $ | 400,000 | | | $ | 452,105 | | | |
| |
| 5.000%, 07/01/2036 (Callable 07/01/2031) | | | 600,000 | | | | 667,677 | | | | | |
| 4.000%, 07/01/2038 (Callable 07/01/2031) | | | 500,000 | | | | 502,540 | | | | | |
| Columbus Metropolitan Housing Authority, | | | | | | | | | | | | |
| 1.000%, 11/01/2024 (Callable 09/01/2023) | | | 600,000 | | | | 580,676 | | | | | |
| Columbus-Franklin County Finance Authority: | | | | | | | | | | | | |
| 2.000%, 11/15/2031 | | | 740,000 | | | | 649,551 | | | | | |
| 3.820%, 11/15/2036 (Callable 07/31/2023) | | | 405,000 | | | | 405,020 | | | | | |
| 4.000%, 11/15/2038 (Callable 07/31/2023) | | | 320,000 | | | | 320,014 | | | | | |
| Copley-Fairlawn City School District: | | | | | | | | | | | | |
| 5.000%, 12/01/2036 (Callable 06/01/2028) | | | 375,000 | | | | 403,993 | | | | | |
| 5.000%, 12/01/2037 (Callable 06/01/2028) | | | 300,000 | | | | 321,730 | | | | | |
| 5.000%, 12/01/2038 (Callable 06/01/2028) | | | 250,000 | | | | 267,620 | | | | | |
| 5.000%, 12/01/2039 (Callable 06/01/2028) | | | 430,000 | | | | 458,105 | | | | | |
| 5.000%, 12/01/2040 (Callable 06/01/2028) | | | 275,000 | | | | 291,562 | | | | | |
| County of Franklin OH, | | | | | | | | | | | | |
| 5.000%, 06/01/2048 (Callable 06/01/2028) | | | 1,000,000 | | | | 1,057,009 | | | | | |
| County of Lake OH, | | | | | | | | | | | | |
| 4.000%, 12/28/2023 (Insured by ST AID) | | | 1,850,000 | | | | 1,849,793 | | | | | |
| County of Lorain OH: | | | | | | | | | | | | |
| 5.000%, 12/01/2031 (Callable 12/01/2023) | | | 480,000 | | | | 482,970 | | | | | |
| 3.000%, 12/01/2036 (Callable 12/01/2025) | | | 400,000 | | | | 367,528 | | | | | |
| County of Medina OH: | | | | | | | | | | | | |
| 3.000%, 12/01/2033 (Callable 06/01/2026) | | | 590,000 | | | | 577,290 | | | | | |
| 3.000%, 12/01/2037 (Callable 06/01/2026) | | | 545,000 | | | | 492,936 | | | | | |
| County of Montgomery OH: | | | | | | | | | | | | |
| 4.000%, 08/01/2037 (Callable 02/01/2031) | | | 400,000 | | | | 397,424 | | | | | |
| 5.000%, 08/01/2039 (Callable 02/01/2031) | | | 825,000 | | | | 862,708 | | | | | |
| Cuyahoga Metropolitan Housing Authority: | | | | | | | | | | | | |
| 4.000%, 06/01/2026 (Mandatory Tender | | | | | | | | | | | | |
Date 06/01/2025) (Insured by FHA)(1) | | | 3,012,000 | | | | 3,013,200 | | | | | |
| 4.750%, 12/01/2027 (Mandatory Tender | | | | | | | | | | | | |
Date 12/01/2025) (Insured by FHA)(1) | | | 2,280,000 | | | | 2,315,493 | | | | | |
| Euclid City School District, | | | | | | | | | | | | |
| 4.000%, 12/01/2037 | | | | | | | | | | | | |
| (Callable 06/01/2027) (Insured by BAM) | | | 160,000 | | | | 161,685 | | | | | |
| Franklin County Convention | | | | | | | | | | | | |
| Facilities Authority, | | | | | | | | | | | | |
| 5.000%, 12/01/2032 (Callable 12/01/2029) | | | 500,000 | | | | 555,836 | | | | | |
| Hamilton County Convention | | | | | | | | | | | | |
| Facilities Authority, | | | | | | | | | | | | |
| 5.000%, 12/01/2026 (Callable 12/01/2023) | | | 2,570,000 | | | | 2,574,833 | | | | | |
| Hopewell-Loudon Local School District, | | | | | | | | | | | | |
| 4.000%, 11/01/2036 | | | | | | | | | | | | |
| (Callable 11/01/2026) (Insured by AGM) | | | 1,055,000 | | | | 1,063,792 | | | | | |
| Licking Heights Local School District, | | | | | | | | | | | | |
| 6.400%, 12/01/2028 (Insured by NATL) | | | 815,000 | | | | 885,800 | | | | | |
| Miami University: | | | | | | | | | | | | |
| 5.000%, 09/01/2028 | | | 520,000 | | | | 573,732 | | | | | |
| 5.000%, 09/01/2029 | | | 540,000 | | | | 607,398 | | | | | |
| 5.000%, 09/01/2030 | | | 500,000 | | | | 572,056 | | | | | |
| Ohio Air Quality Development Authority: | | | | | | | | | | | | |
| 3.250%, 09/01/2029 | | | 1,000,000 | | | | 932,413 | | | | | |
| 4.000%, 09/01/2030 | | | | | | | | | | | | |
(Mandatory Tender Date 06/01/2027)(1) | | | 5,000,000 | | | | 4,956,567 | | | | | |
| 4.000%, 01/01/2034 | | | | | | | | | | | | |
(Mandatory Tender Date 06/01/2027)(1) | | | 2,000,000 | | | | 1,991,875 | | | | | |
| 2.400%, 12/01/2038 (Callable 10/01/2024) | | | | | | | | | | | | |
(Mandatory Tender Date 10/01/2029)(1) | | | 645,000 | | | | 560,838 | | | | | |
| Ohio Higher Educational | | | | | | | | | | | | |
| Facility Commission: | | | | | | | | | | | | |
| 5.000%, 03/01/2025 | | | 585,000 | | | | 587,082 | | | | | |
| 5.000%, 05/01/2026 | | | 200,000 | | | | 208,345 | | | | | |
| 5.000%, 05/01/2027 | | | | | | | | | | | | |
| (Callable 05/01/2026) | | | 610,000 | | | | 635,632 | | | | | |
| 5.000%, 05/01/2028 (Callable 05/01/2026) | | | 475,000 | | | | 496,121 | | | | | |
| Ohio Housing Finance Agency: | | | | | | | | | | | | |
| 5.000%, 05/01/2025 (Mandatory Tender | | | | | | | | | | | | |
Date 05/01/2024) (Insured by HUD)(1) | | | 2,340,000 | | | | 2,357,313 | | | | | |
| 3.350%, 07/01/2025 (Mandatory Tender | | | | | | | | | | | | |
Date 07/01/2024) (Insured by HUD)(1) | | | 2,240,000 | | | | 2,215,368 | | | | | |
| 4.000%, 11/01/2025 (Mandatory Tender | | | | | | | | | | | | |
Date 11/01/2024)(1) | | | 4,300,000 | | | | 4,298,526 | | | | | |
| 5.000%, 12/01/2026 (Mandatory Tender | | | | | | | | | | | | |
Date 12/01/2025) (Insured by FHA)(1) | | | 1,665,000 | | | | 1,706,507 | | | | | |
| 3.200%, 09/01/2036 | | | | | | | | | | | | |
| (Callable 09/01/2025) (Insured by GNMA) | | | 585,000 | | | | 558,097 | | | | | |
| 2.900%, 09/01/2045 | | | | | | | | | | | | |
| (Callable 03/01/2029) (Insured by GNMA) | | | 6,510,000 | | | | 5,764,315 | | | | | |
| 4.000%, 03/01/2047 | | | | | | | | | | | | |
| (Callable 09/01/2025) (Insured by GNMA) | | | 130,000 | | | | 129,154 | | | | | |
| 3.350%, 09/01/2049 (Callable 09/01/2028) | | | 1,000,000 | | | | 859,474 | | | | | |
| 3.250%, 09/01/2052 | | | | | | | | | | | | |
| (Callable 09/01/2031) (Insured by GNMA) | | | 1,980,000 | | | | 1,916,732 | | | | | |
| Ohio Turnpike & Infrastructure Commission: | | | | | | | | | | | | |
| 5.700%, 02/15/2034 | | | | | | | | | | | | |
(Callable 02/15/2031)(5) | | | 2,350,000 | | | | 2,804,307 | | | | | |
| 5.800%, 02/15/2036 | | | | | | | | | | | | |
(Callable 02/15/2031)(5) | | | 410,000 | | | | 485,152 | | | | | |
| Port of Greater Cincinnati | | | | | | | | | | | | |
| Development Authority, | | | | | | | | | | | | |
| 5.000%, 05/01/2025 | | | | | | | | | | | | |
(Callable 11/01/2023)(3) | | | 13,000,000 | | | | 12,931,747 | | | | | |
| State of Ohio: | | | | | | | | | | | | |
| 5.000%, 11/15/2035 (Callable 11/15/2030) | | | 605,000 | | | | 630,388 | | | | | |
| 5.000%, 12/31/2035 | | | | | | | | | | | | |
| (Callable 06/30/2025) (Insured by AGM) | | | 7,865,000 | | | | 7,943,130 | | | | | |
| 4.000%, 11/15/2036 (Callable 11/15/2030) | | | 635,000 | | | | 603,047 | | | | | |
| Township of Miami OH, | | | | | | | | | | | | |
| 3.000%, 12/01/2033 (Callable 12/01/2029) | | | 80,000 | | | | 78,157 | | | | | |
| Triway Local School District, | | | | | | | | | | | | |
| 4.000%, 12/01/2038 | | | | | | | | | | | | |
| (Callable 12/01/2028) (Insured by BAM) | | | 1,580,000 | | | | 1,592,356 | | | | | |
| Village of Bluffton OH: | | | | | | | | | | | | |
| 5.000%, 12/01/2026 | | | 1,890,000 | | | | 1,962,527 | | | | | |
| 5.000%, 12/01/2027 | | | 1,340,000 | | | | 1,408,044 | | | | | |
| Village of Woodmere OH, | | | | | | | | | | | | |
| 4.000%, 09/28/2023 (Insured by ST AID) | | | 1,035,000 | | | | 1,034,893 | | | | | |
| Warren City School District, | | | | | | | | | | | | |
| 4.000%, 12/01/2030 (Callable 12/01/2026) | | | | | | | | | | | | |
| (Insured by SD CRED PROG) | | | 1,215,000 | | | | 1,256,692 | | | | | |
| Warren County Port Authority, | | | | | | | | | | | | |
| 4.000%, 12/01/2053 (Callable 12/01/2031) | | | 1,070,000 | | | | 846,109 | | | | | |
| Warrensville Heights City School District, | | | | | | | | | | | | |
| 4.000%, 11/01/2037 | | | | | | | | | | | | |
| (Callable 11/01/2024) (Insured by BAM) | | | 500,000 | | | | 482,396 | | | | | |
| Total Ohio | | | | | | | | | | | | |
| (Cost $100,913,484) | | | | | | | 97,958,437 | | | | 3.7 | % |
| Oklahoma | | | | | | | | | | | | |
| Catoosa Industrial Authority, | | | | | | | | | | | | |
| 4.000%, 10/01/2028 | | | | | | | | | | | | |
| (Callable 10/01/2026) | | | 60,000 | | | | 57,985 | | | | | |
| Cleveland County Educational | | | | | | | | | | | | |
| Facilities Authority, | | | | | | | | | | | | |
| 5.000%, 06/01/2033 | | | 390,000 | | | | 439,850 | | | | | |
The accompanying notes are an integral part of these financial statements.
Baird Core Intermediate Municipal Bond Fund
Schedule of Investments, June 30, 2023 (Unaudited)
Long-Term Investments (cont.)
| | | Principal | | | | | | % of | |
| | | Amount | | | Value | | | Net Assets | |
| Edmond Public Works Authority: | | | | | | | | | |
| 5.000%, 07/01/2031 | | | | | | | | | |
| (Callable 07/01/2027) | | $ | 680,000 | | | $ | 740,327 | | | | |
| 5.000%, 07/01/2032 (Callable 07/01/2027) | | | 300,000 | | | | 326,409 | | | | |
| Garfield County Educational | | | | | | | | | | | |
| Facilities Authority, | | | | | | | | | | | |
| 5.000%, 09/01/2029 (Callable 09/01/2026) | | | 2,620,000 | | | | 2,729,209 | | | | |
| Mcintosh County Educational | | | | | | | | | | | |
| Facilities Authority, | | | | | | | | | | | |
| 2.000%, 09/01/2023 | | | 550,000 | | | | 547,841 | | | | |
| Norman Regional Hospital Authority, | | | | | | | | | | | |
| 5.000%, 09/01/2031 (Callable 09/01/2026) | | | 1,700,000 | | | | 1,707,031 | | | | |
| Oklahoma Development Finance Authority, | | | | | | | | | | | |
| 2.600%, 03/01/2024 | | | 145,000 | | | | 143,566 | | | | |
| Oklahoma Housing Finance Agency: | | | | | | | | | | | |
| 3.000%, 09/01/2039 | | | | | | | | | | | |
| (Callable 03/01/2028) (Insured by GNMA) | | | 130,000 | | | | 120,475 | | | | |
| 5.000%, 03/01/2052 | | | | | | | | | | | |
| (Callable 03/01/2031) (Insured by GNMA) | | | 2,965,000 | | | | 3,056,356 | | | | |
| Oklahoma Turnpike Authority, | | | | | | | | | | | |
| 5.000%, 01/01/2037 (Callable 01/01/2026) | | | 400,000 | | | | 413,304 | | | | |
| Tulsa County Independent | | | | | | | | | | | |
| School District No. 3, | | | | | | | | | | | |
| 4.500%, 03/01/2025 | | | 4,800,000 | | | | 4,872,316 | | | | |
| University of Oklahoma, | | | | | | | | | | | |
| 5.000%, 07/01/2033 (Callable 07/01/2025) | | | 1,500,000 | | | | 1,545,746 | | | | |
| Total Oklahoma | | | | | | | | | | | |
| (Cost $16,917,718) | | | | | | | 16,700,415 | | | | 0.6 | % |
| Oregon | | | | | | | | | | | | |
| Clackamas Community College District, | | | | | | | | | | | | |
| 5.000%, 06/15/2040 | | | | | | | | | | | | |
(Callable 06/15/2027)(5) | | | 475,000 | | | | 499,999 | | | | | |
| Clatsop County School District No. 30, | | | | | | | | | | | | |
| 0.000%, 06/15/2038 (Callable 06/15/2029) | | | | | | | | | | | | |
| (Insured by SCH BD GTY) | | | 425,000 | | | | 222,222 | | | | | |
| County of Benton OR, | | | | | | | | | | | | |
| 4.125%, 06/01/2053 | | | | | | | | | | | | |
| (Callable 06/01/2033) | | | 825,000 | | | | 813,115 | | | | | |
| County of Crook OR: | | | | | | | | | | | | |
0.000%, 06/01/2032(5) | | | 1,045,000 | | | | 998,707 | | | | | |
| 0.000%, 06/01/2034 | | | | | | | | | | | | |
(Callable 06/01/2032)(5) | | | 1,345,000 | | | | 1,276,790 | | | | | |
| 0.000%, 06/01/2035 | | | | | | | | | | | | |
(Callable 06/01/2032)(5) | | | 1,510,000 | | | | 1,415,773 | | | | | |
| Multnomah & Clackamas | | | | | | | | | | | | |
| Counties School District No. 10JT, | | | | | | | | | | | | |
| 0.000%, 06/15/2031 (Callable 06/15/2029) | | | | | | | | | | | | |
| (Insured by SCH BD GTY) | | | 110,000 | | | | 82,385 | | | | | |
| Multnomah County School District No. 40, | | | | | | | | | | | | |
| 0.000%, 06/15/2035 (Callable 06/15/2033) | | | | | | | | | | | | |
| (Insured by SCH BD GTY) | | | 1,000,000 | | | | 621,004 | | | | | |
| Oregon City School District No. 62, | | | | | | | | | | | | |
| 5.000%, 06/15/2043 (Callable 06/15/2028) | | | | | | | | | | | | |
| (Insured by SCH BD GTY) | | | 1,000,000 | | | | 1,066,595 | | | | | |
| Oregon State Facilities Authority: | | | | | | | | | | | | |
| 5.000%, 10/01/2027 | | | 125,000 | | | | 130,209 | | | | | |
| 4.125%, 06/01/2052 (Callable 06/01/2032) | | | 600,000 | | | | 565,068 | | | | | |
| Salem Hospital Facility Authority: | | | | | | | | | | | | |
| 5.000%, 05/15/2024 | | | 120,000 | | | | 120,253 | | | | | |
| 5.000%, 05/15/2025 | | | 130,000 | | | | 130,588 | | | | | |
| 5.000%, 05/15/2026 | | | 135,000 | | | | 135,921 | | | | | |
| 5.000%, 05/15/2035 (Callable 05/15/2026) | | | 500,000 | | | | 520,319 | | | | | |
| State of Oregon Housing & | | | | | | | | | | | | |
| Community Services Department: | | | | | | | | | | | | |
| 2.900%, 07/01/2043 | | | | | | | | | | | | |
| (Callable 07/01/2027) | | | 3,000,000 | | | | 2,703,850 | | | | | |
| 4.000%, 07/01/2051 (Callable 01/01/2031) | | | 5,820,000 | | | | 5,786,564 | | | | | |
| Umatilla County School District No. 6R, | | | | | | | | | | | | |
| 5.000%, 06/15/2035 (Callable 06/15/2027) | | | | | | | | | | | | |
(Insured by SCH BD GTY)(5) | | | 540,000 | | | | 578,966 | | | | | |
| Washington & Clackamas Counties | | | | | | | | | | | | |
| School District No. 23J, | | | | | | | | | | | | |
| 5.000%, 06/15/2040 (Callable 06/15/2029) | | | | | | | | | | | | |
| (Insured by SCH BD GTY) | | | 500,000 | | | | 542,797 | | | | | |
| Total Oregon | | | | | | | | | | | | |
| (Cost $18,642,495) | | | | | | | 18,211,125 | | | | 0.7 | % |
| Pennsylvania | | | | | | | | | | | | |
| Allegheny County Higher Education | | | | | | | | | | | | |
| Building Authority: | | | | | | | | | | | | |
| 5.000%, 09/01/2024 | | | 260,000 | | | | 261,305 | | | | | |
| 5.000%, 09/01/2025 | | | 450,000 | | | | 453,465 | | | | | |
| 5.000%, 09/01/2026 | | | 400,000 | | | | 406,276 | | | | | |
| 5.000%, 09/01/2027 | | | 500,000 | | | | 510,326 | | | | | |
| Bloomsburg PA Area School District, | | | | | | | | | | | | |
| 4.000%, 09/01/2030 | | | | | | | | | | | | |
| (Callable 03/01/2024) (Insured by BAM) | | | 250,000 | | | | 250,157 | | | | | |
| Chester County Industrial | | | | | | | | | | | | |
| Development Authority, | | | | | | | | | | | | |
| 5.000%, 08/01/2045 (Callable 08/01/2023) | | | 750,000 | | | | 707,839 | | | | | |
| City of Erie Higher Education | | | | | | | | | | | | |
| Building Authority: | | | | | | | | | | | | |
| 5.000%, 05/01/2031 | | | 175,000 | | | | 180,674 | | | | | |
| 4.000%, 05/01/2036 (Callable 05/01/2031) | | | 500,000 | | | | 456,347 | | | | | |
| City of Oil City PA: | | | | | | | | | | | | |
| 4.000%, 12/01/2031 | | | | | | | | | | | | |
| (Callable 12/01/2029) (Insured by AGM) | | | 100,000 | | | | 105,471 | | | | | |
| 4.000%, 12/01/2035 | | | | | | | | | | | | |
| (Callable 12/01/2029) (Insured by AGM) | | | 275,000 | | | | 284,935 | | | | | |
| 4.000%, 12/01/2036 | | | | | | | | | | | | |
| (Callable 12/01/2029) (Insured by AGM) | | | 850,000 | | | | 874,752 | | | | | |
| Commonwealth Financing Authority, | | | | | | | | | | | | |
| 4.000%, 06/01/2039 | | | | | | | | | | | | |
| (Callable 06/01/2028) (Insured by AGM) | | | 1,670,000 | | | | 1,641,713 | | | | | |
| County of Montgomery PA, | | | | | | | | | | | | |
| 5.000%, 07/01/2038 (Callable 07/01/2029) | | | 1,845,000 | | | | 2,034,599 | | | | | |
| Dallas Area Municipal Authority, | | | | | | | | | | | | |
| 5.000%, 05/01/2029 (Callable 05/01/2024) | | | 2,855,000 | | | | 2,860,689 | | | | | |
| Dauphin County General Authority, | | | | | | | | | | | | |
| 5.000%, 06/01/2029 (Callable 06/01/2026) | | | 690,000 | | | | 718,400 | | | | | |
| Delaware County Authority: | | | | | | | | | | | | |
| 5.000%, 10/01/2023 | | | 240,000 | | | | 240,178 | | | | | |
| 5.000%, 10/01/2035 (Callable 04/01/2027) | | | 485,000 | | | | 516,719 | | | | | |
| Delaware Valley Regional Finance Authority, | | | | | | | | | | | | |
| 4.367%, 09/01/2048 | | | | | | | | | | | | |
| (1 Month LIBOR USD + 0.880%) | | | | | | | | | | | | |
| (Callable 09/01/2024) | | | | | | | | | | | | |
(Mandatory Tender Date 09/01/2025)(2) | | | 1,000,000 | | | | 998,988 | | | | | |
| East Hempfield Township Industrial | | | | | | | | | | | | |
| Development Authority, | | | | | | | | | | | | |
| 5.000%, 12/01/2025 | | | 225,000 | | | | 231,078 | | | | | |
| Hamburg Area School District: | | | | | | | | | | | | |
| 3.000%, 04/01/2034 | | | | | | | | | | | | |
| (Callable 10/01/2026) (Insured by ST AID) | | | 1,000,000 | | | | 940,413 | | | | | |
| 3.000%, 04/01/2036 | | | | | | | | | | | | |
| (Callable 10/01/2026) (Insured by ST AID) | | | 1,400,000 | | | | 1,281,302 | | | | | |
The accompanying notes are an integral part of these financial statements.
Baird Core Intermediate Municipal Bond Fund
Schedule of Investments, June 30, 2023 (Unaudited)
Long-Term Investments (cont.)
| | | Principal | | | | | | % of | |
| | | Amount | | | Value | | | Net Assets | |
| Indiana County Industrial | | | | | | | | | |
| Development Authority: | | | | | | | | | |
| 5.000%, 05/01/2030 (Insured by BAM) | | $ | 1,040,000 | | | $ | 1,130,013 | | | |
| |
| 5.000%, 05/01/2032 | | | | | | | | | | | | |
| (Callable 11/01/2031) (Insured by BAM) | | | 920,000 | | | | 1,005,197 | | | | | |
| Lancaster County Convention | | | | | | | | | | | | |
| Center Authority: | | | | | | | | | | | | |
| 4.000%, 05/01/2038 (Callable 05/01/2032) | | | 1,645,000 | | | | 1,667,067 | | | | | |
| 4.375%, 05/01/2042 (Callable 05/01/2032) | | | 1,000,000 | | | | 1,024,283 | | | | | |
| 4.000%, 05/01/2049 (Callable 05/01/2032) | | | 1,500,000 | | | | 1,464,942 | | | | | |
| Lancaster County Hospital Authority: | | | | | | | | | | | | |
| 5.000%, 11/01/2037 (Callable 11/01/2029) | | | 600,000 | | | | 638,766 | | | | | |
| 5.000%, 11/01/2040 (Callable 11/01/2029) | | | 3,100,000 | | | | 3,270,202 | | | | | |
| Lancaster Higher Education Authority: | | | | | | | | | | | | |
| 4.000%, 10/01/2030 | | | | | | | | | | | | |
| (Callable 10/01/2028) (Insured by BAM) | | | 1,225,000 | | | | 1,269,264 | | | | | |
| 4.000%, 10/01/2031 | | | | | | | | | | | | |
| (Callable 10/01/2028) (Insured by BAM) | | | 1,000,000 | | | | 1,034,244 | | | | | |
| Latrobe Industrial Development Authority: | | | | | | | | | | | | |
| 5.000%, 03/01/2031 | | | 175,000 | | | | 180,336 | | | | | |
| 5.000%, 03/01/2032 (Callable 03/01/2031) | | | 265,000 | | | | 272,732 | | | | | |
| 5.000%, 03/01/2033 (Callable 03/01/2031) | | | 290,000 | | | | 298,716 | | | | | |
| 5.000%, 03/01/2034 (Callable 03/01/2031) | | | 300,000 | | | | 308,484 | | | | | |
| Lycoming County Authority, | | | | | | | | | | | | |
| 4.000%, 11/01/2043 | | | | | | | | | | | | |
(Mandatory Tender Date 05/01/2024)(1) | | | 525,000 | | | | 524,224 | | | | | |
| Montgomery County Higher | | | | | | | | | | | | |
| Education & Health Authority, | | | | | | | | | | | | |
| 5.000%, 09/01/2037 (Callable 09/01/2028) | | | 1,000,000 | | | | 1,046,769 | | | | | |
| Montgomery County Industrial | | | | | | | | | | | | |
| Development Authority, | | | | | | | | | | | | |
| 4.100%, 04/01/2053 | | | | | | | | | | | | |
(Mandatory Tender Date 04/03/2028)(1) | | | 5,000,000 | | | | 5,092,608 | | | | | |
| Old Forge School District, | | | | | | | | | | | | |
| 4.000%, 05/01/2045 | | | | | | | | | | | | |
| (Callable 05/01/2027) (Insured by BAM) | | | 530,000 | | | | 522,250 | | | | | |
| Panther Valley School District: | | | | | | | | | | | | |
| 4.000%, 10/15/2031 | | | | | | | | | | | | |
| (Callable 10/15/2028) (Insured by BAM) | | | 730,000 | | | | 759,030 | | | | | |
| 4.000%, 10/15/2032 | | | | | | | | | | | | |
| (Callable 10/15/2028) (Insured by BAM) | | | 350,000 | | | | 362,767 | | | | | |
| 4.000%, 10/15/2033 | | | | | | | | | | | | |
| (Callable 10/15/2028) (Insured by BAM) | | | 185,000 | | | | 191,076 | | | | | |
| Pennsylvania Economic Development | | | | | | | | | | | | |
| Financing Authority: | | | | | | | | | | | | |
| 5.000%, 06/30/2030 | | | 1,245,000 | | | | 1,353,166 | | | | | |
| 5.000%, 12/31/2030 | | | 1,000,000 | | | | 1,092,447 | | | | | |
| 0.000%, 01/01/2034 (County Guaranteed) | | | 3,410,000 | | | | 2,216,529 | | | | | |
| 0.000%, 01/01/2034 (Insured by AGM) | | | 1,680,000 | | | | 1,114,700 | | | | | |
| 4.000%, 11/15/2034 (Callable 11/15/2027) | | | 1,000,000 | | | | 1,011,113 | | | | | |
| 5.500%, 06/30/2038 (Callable 12/31/2032) | | | 2,000,000 | | | | 2,209,989 | | | | | |
| 0.000%, 01/01/2039 (Insured by AGM) | | | 3,640,000 | | | | 1,806,089 | | | | | |
| 0.000%, 01/01/2047 (Insured by BAM) | | | 440,000 | | | | 138,758 | | | | | |
| 5.000%, 12/31/2057 | | | | | | | | | | | | |
| (Callable 12/31/2032) (Insured by AGM) | | | 3,000,000 | | | | 3,068,245 | | | | | |
| Pennsylvania Higher Educational | | | | | | | | | | | | |
| Facilities Authority, | | | | | | | | | | | | |
| 5.000%, 07/01/2035 (Callable 07/01/2026) | | | 300,000 | | | | 292,346 | | | | | |
| Pennsylvania Housing Finance Agency: | | | | | | | | | | | | |
| 3.500%, 10/01/2046 (Callable 10/01/2025) | | | 130,000 | | | | 128,841 | | | | | |
| 4.000%, 10/01/2049 (Callable 10/01/2028) | | | 1,045,000 | | | | 1,039,233 | | | | | |
| 4.250%, 10/01/2052 (Callable 04/01/2032) | | | 5,185,000 | | | | 5,202,670 | | | | | |
| Pennsylvania Turnpike Commission: | | | | | | | | | | | | |
| 6.000%, 12/01/2030 | | | | | | | | | | | | |
(Callable 12/01/2027) (Insured by BAM)(5) | | | 205,000 | | | | 232,236 | | | | | |
| 0.000%, 12/01/2037 | | | | | | | | | | | | |
(Callable 12/01/2035)(5) | | | 100,000 | | | | 90,859 | | | | | |
| 4.750%, 12/01/2037 | | | | | | | | | | | | |
(Callable 12/01/2026)(5) | | | 600,000 | | | | 618,524 | | | | | |
| 5.000%, 12/01/2038 | | | | | | | | | | | | |
(Callable 12/01/2028)(5) | | | 2,480,000 | | | | 2,602,319 | | | | | |
| 6.375%, 12/01/2038 | | | | | | | | | | | | |
(Callable 12/01/2027)(5) | | | 190,000 | | | | 210,103 | | | | | |
| 4.000%, 12/01/2039 (Callable 12/01/2031) | | | 1,975,000 | | | | 2,003,661 | | | | | |
| 0.000%, 12/01/2040 | | | | | | | | | | | | |
(Callable 06/01/2029)(5) | | | 745,000 | | | | 748,424 | | | | | |
| 4.000%, 12/01/2040 (Callable 12/01/2031) | | | 2,555,000 | | | | 2,579,863 | | | | | |
| Philadelphia Municipal Authority, | | | | | | | | | | | | |
| 5.000%, 04/01/2030 (Callable 04/01/2027) | | | 375,000 | | | | 404,211 | | | | | |
| Pittsburgh Water & Sewer Authority, | | | | | | | | | | | | |
| 3.880%, 09/01/2040 | | | | | | | | | | | | |
| (SIFMA Municipal Swap Index + 0.650%) | | | | | | | | | | | | |
| (Callable 07/03/2023) (Mandatory Tender | | | | | | | | | | | | |
Date 12/01/2023) (Insured by AGM)(2) | | | 3,355,000 | | | | 3,355,211 | | | | | |
| Ridley School District: | | | | | | | | | | | | |
| 4.000%, 09/15/2031 | | | | | | | | | | | | |
| (Callable 03/15/2025) (Insured by ST AID) | | | 830,000 | | | | 836,797 | | | | | |
| 4.000%, 11/15/2036 | | | | | | | | | | | | |
| (Callable 11/15/2029) (Insured by AGM) | | | 1,000,000 | | | | 1,025,836 | | | | | |
| 4.000%, 11/15/2037 | | | | | | | | | | | | |
| (Callable 11/15/2029) (Insured by AGM) | | | 325,000 | | | | 330,529 | | | | | |
| School District of Philadelphia: | | | | | | | | | | | | |
| 5.000%, 09/01/2024 (Insured by ST AID) | | | 600,000 | | | | 609,915 | | | | | |
| 4.000%, 09/01/2037 (Callable 09/01/2029) | | | | | | | | | | | | |
| (Insured by ST AID) | | | 1,000,000 | | | | 991,186 | | | | | |
| Sports & Exhibition Authority of | | | | | | | | | | | | |
| Pittsburgh and Allegheny County: | | | | | | | | | | | | |
| 5.000%, 12/15/2028 | | | | | | | | | | | | |
| (Callable 12/15/2027) (Insured by BAM) | | | 500,000 | | | | 543,180 | | | | | |
| 5.000%, 02/01/2031 (Insured by AGM) | | | 3,175,000 | | | | 3,610,551 | | | | | |
| 5.000%, 02/01/2034 | | | | | | | | | | | | |
| (Callable 02/01/2032) (Insured by AGM) | | | 4,000,000 | | | | 4,538,106 | | | | | |
| State Public School Building Authority: | | | | | | | | | | | | |
| 0.000%, 05/15/2027 (Insured by NATL) | | | 160,000 | | | | 138,574 | | | | | |
| 0.000%, 05/15/2030 (Insured by NATL) | | | 1,780,000 | | | | 1,388,013 | | | | | |
| Swarthmore Borough Authority, | | | | | | | | | | | | |
| 5.000%, 09/15/2039 (Callable 09/15/2028) | | | 3,680,000 | | | | 3,964,157 | | | | | |
| Upper Moreland Township School District, | | | | | | | | | | | | |
| 5.000%, 10/01/2030 (Callable 04/01/2025) | | | | | | | | | | | | |
| (Insured by ST AID) | | | 250,000 | | | | 257,254 | | | | | |
| Westmoreland County Industrial | | | | | | | | | | | | |
| Development Authority: | | | | | | | | | | | | |
| 5.000%, 07/01/2029 | | | 725,000 | | | | 754,574 | | | | | |
| 5.000%, 07/01/2030 | | | 550,000 | | | | 576,187 | | | | | |
| York Suburban School District, | | | | | | | | | | | | |
| 4.000%, 05/01/2030 | | | | | | | | | | | | |
| (Callable 05/01/2024) (Insured by BAM) | | | 1,780,000 | | | | 1,781,362 | | | | | |
| Total Pennsylvania | | | | | | | | | | | | |
| (Cost $94,589,606) | | | | | | �� | 92,884,354 | | | | 3.5 | % |
| Puerto Rico | | | | | | | | | | | | |
| Commonwealth of Puerto Rico: | | | | | | | | | | | | |
| 0.000%, 07/01/2024 | | | 4,318,000 | | | | 4,136,099 | | | | | |
| 5.375%, 07/01/2025 | | | 3,570,469 | | | | 3,658,609 | | | | | |
| Puerto Rico Highway & | | | | | | | | | | | | |
| Transportation Authority, | | | | | | | | | | | | |
| 5.000%, 07/01/2062 (Callable 07/01/2032) | | | 3,000,000 | | | | 2,917,500 | | | | | |
The accompanying notes are an integral part of these financial statements.
Baird Core Intermediate Municipal Bond Fund
Schedule of Investments, June 30, 2023 (Unaudited)
Long-Term Investments (cont.)
| | | Principal | | | | | | % of | |
| | | Amount | | | Value | | | Net Assets | |
| Puerto Rico Industrial Tourist Educational | | | | | | | | | |
| Medical & Environmental Control Facilities: | | | | | | | | | |
| 5.000%, 07/01/2028 | | $ | 125,000 | | | $ | 132,921 | | | | |
| 5.000%, 07/01/2034 (Callable 07/01/2031) | | | 200,000 | | | | 218,659 | | | | |
| 5.000%, 07/01/2035 (Callable 07/01/2031) | | | 200,000 | | | | 217,128 | | | | |
| Puerto Rico Sales Tax Financing Corp.: | | | | | | | | | | | |
| 4.329%, 07/01/2040 (Callable 07/01/2028) | | | 5,000,000 | | | | 4,755,153 | | | | |
| 4.750%, 07/01/2053 (Callable 07/01/2028) | | | 2,450,000 | | | | 2,334,572 | | | | |
| Total Puerto Rico | | | | | | | | | | | |
| (Cost $18,018,404) | | | | | | | 18,370,641 | | | | 0.7 | % |
| Rhode Island | | | | | | | | | | | | |
| Rhode Island Commerce Corp., | | | | | | | | | | | | |
| 5.000%, 07/01/2033 | | | | | | | | | | | | |
| (Callable 07/01/2028) (Insured by BAM) | | | 950,000 | | | | 1,018,054 | | | | | |
| Rhode Island Health and | | | | | | | | | | | | |
| Educational Building Corp., | | | | | | | | | | | | |
| 4.000%, 09/15/2031 (Callable 09/15/2026) | | | 125,000 | | | | 127,301 | | | | | |
| Rhode Island Housing & | | | | | | | | | | | | |
| Mortgage Finance Corp., | | | | | | | | | | | | |
| 3.000%, 10/01/2051 (Callable 04/01/2030) | | | 2,800,000 | | | | 2,691,956 | | | | | |
| Rhode Island Student Loan Authority: | | | | | | | | | | | | |
| 5.000%, 12/01/2027 | | | 1,000,000 | | | | 1,057,859 | | | | | |
| 5.000%, 12/01/2028 | | | 1,000,000 | | | | 1,068,372 | | | | | |
| Total Rhode Island | | | | | | | | | | | | |
| (Cost $6,117,315) | | | | | | | 5,963,542 | | | | 0.2 | % |
| South Carolina | | | | | | | | | | | | |
| City of Newberry SC: | | | | | | | | | | | | |
| 5.000%, 09/01/2028 (Insured by AGM) | | | 250,000 | | | | 275,454 | | | | | |
| 5.000%, 09/01/2029 (Insured by AGM) | | | 100,000 | | | | 112,301 | | | | | |
| County of Florence SC, | | | | | | | | | | | | |
| 5.000%, 11/01/2033 (Callable 11/01/2024) | | | 250,000 | | | | 253,686 | | | | | |
| Patriots Energy Group Financing Agency, | | | | | | | | | | | | |
| 4.000%, 10/01/2048 (Callable 11/01/2023) | | | | | | | | | | | | |
(Mandatory Tender Date 02/01/2024)(1) | | | 2,015,000 | | | | 2,015,209 | | | | | |
| Scago Educational Facilities Corp. | | | | | | | | | | | | |
| for Cherokee School District No. 1, | | | | | | | | | | | | |
| 5.000%, 12/01/2028 (Callable 06/01/2025) | | | 1,230,000 | | | | 1,260,116 | | | | | |
| Scago Educational Facilities Corp. | | | | | | | | | | | | |
| for Union School District, | | | | | | | | | | | | |
| 5.000%, 12/01/2023 (Insured by BAM) | | | 500,000 | | | | 503,458 | | | | | |
| South Carolina Jobs-Economic | | | | | | | | | | | | |
| Development Authority: | | | | | | | | | | | | |
| 5.000%, 05/01/2029 (Callable 05/01/2028) | | | 1,080,000 | | | | 1,139,889 | | | | | |
| 4.000%, 08/15/2030 (Callable 08/15/2026) | | | 270,000 | | | | 269,892 | | | | | |
| 5.250%, 08/15/2033 (Callable 08/15/2026) | | | 2,500,000 | | | | 2,598,510 | | | | | |
| 5.250%, 07/01/2037 (Callable 07/01/2026) | | | 100,000 | | | | 102,259 | | | | | |
| South Carolina State Housing | | | | | | | | | | | | |
| Finance & Development Authority: | | | | | | | | | | | | |
| 2.000%, 09/01/2024 | | | | | | | | | | | | |
(Mandatory Tender Date 03/01/2024)(1) | | | 2,219,000 | | | | 2,194,312 | | | | | |
| 3.800%, 01/01/2049 (Callable 07/01/2027) | | | 140,000 | | | | 137,028 | | | | | |
| 4.000%, 07/01/2050 (Callable 07/01/2029) | | | 2,345,000 | | | | 2,326,701 | | | | | |
| 3.000%, 01/01/2052 (Callable 07/01/2030) | | | 8,390,000 | | | | 8,070,985 | | | | | |
| Spartanburg County School District No. 7, | | | | | | | | | | | | |
| 5.000%, 03/01/2048 | | | | | | | | | | | | |
| (Callable 03/01/2029) (Insured by SCSDE) | | | 350,000 | | | | 371,778 | | | | | |
| Spartanburg Regional Health Services District: | | | | | | | | | | | | |
| 4.000%, 04/15/2036 | | | | | | | | | | | | |
| (Callable 04/15/2030) (Insured by AGM) | | | 445,000 | | | | 452,903 | | | | | |
| 4.000%, 04/15/2037 | | | | | | | | | | | | |
| (Callable 04/15/2030) (Insured by AGM) | | | 500,000 | | | | 503,880 | | | | | |
| 4.000%, 04/15/2038 | | | | | | | | | | | | |
| (Callable 04/15/2030) (Insured by AGM) | | | 500,000 | | | | 500,382 | | | | | |
| Sumter Two School Facilities, Inc., | | | | | | | | | | | | |
| 5.000%, 12/01/2023 (Insured by BAM) | | | 200,000 | | | | 201,343 | | | | | |
| Total South Carolina | | | | | | | | | | | | |
| (Cost $24,122,799) | | | | | | | 23,290,086 | | | | 0.9 | % |
| South Dakota | | | | | | | | | | | | |
| City of Brandon SD, | | | | | | | | | | | | |
| 5.000%, 08/01/2037 | | | | | | | | | | | | |
| (Callable 08/01/2030) (Insured by AGM) | | | 1,880,000 | | | | 2,009,052 | | | | | |
| City of Rapid City SD, | | | | | | | | | | | | |
| 4.000%, 12/01/2035 (Callable 12/01/2029) | | | 3,260,000 | | | | 3,153,613 | | | | | |
| County of Minnehaha SD, | | | | | | | | | | | | |
| 5.000%, 12/01/2041 (Callable 12/01/2032) | | | 1,000,000 | | | | 1,111,325 | | | | | |
| Milbank School District No. 25-4: | | | | | | | | | | | | |
| 4.000%, 08/01/2029 | | | | | | | | | | | | |
| (Callable 08/01/2026) (Insured by ST AID) | | | 750,000 | | | | 774,279 | | | | | |
| 5.000%, 08/01/2030 | | | | | | | | | | | | |
| (Callable 08/01/2026) (Insured by ST AID) | | | 785,000 | | | | 827,187 | | | | | |
| 5.000%, 08/01/2031 | | | | | | | | | | | | |
| (Callable 08/01/2026) (Insured by ST AID) | | | 820,000 | | | | 862,593 | | | | | |
| South Dakota Health & | | | | | | | | | | | | |
| Educational Facilities Authority: | | | | | | | | | | | | |
| 3.000%, 09/01/2029 (Callable 09/01/2028) | | | 380,000 | | | | 357,266 | | | | | |
| 3.000%, 09/01/2030 (Callable 09/01/2028) | | | 175,000 | | | | 162,792 | | | | | |
| 4.000%, 11/01/2034 (Callable 11/01/2024) | | | 4,390,000 | | | | 4,336,479 | | | | | |
| 4.000%, 11/01/2040 (Callable 11/01/2025) | | | 325,000 | | | | 307,554 | | | | | |
| 3.000%, 09/01/2041 (Callable 09/01/2028) | | | 250,000 | | | | 188,204 | | | | | |
| South Dakota Housing | | | | | | | | | | | | |
| Development Authority: | | | | | | | | | | | | |
| 4.000%, 05/01/2049 (Callable 05/01/2028) | | | 1,410,000 | | | | 1,398,422 | | | | | |
| 5.000%, 05/01/2053 (Callable 11/01/2031) | | | 2,975,000 | | | | 3,066,055 | | | | | |
| South Dakota State Building Authority, | | | | | | | | | | | | |
| 5.000%, 06/01/2036 (Callable 06/01/2028) | | | 100,000 | | | | 108,741 | | | | | |
| Total South Dakota | | | | | | | | | | | | |
| (Cost $19,432,408) | | | | | | | 18,663,562 | | | | 0.7 | % |
| Tennessee | | | | | | | | | | | | |
| City of Clarksville TN: | | | | | | | | | | | | |
| 5.000%, 02/01/2032 | | | | | | | | | | | | |
| (Pre-refunded to 02/01/2026) | | | 1,000,000 | | | | 1,049,912 | | | | | |
| 4.125%, 09/01/2039 (Callable 09/01/2032) | | | 1,000,000 | | | | 1,024,407 | | | | | |
| City of Jackson TN: | | | | | | | | | | | | |
| 5.000%, 04/01/2029 | | | | | | | | | | | | |
| (Pre-refunded to 04/01/2025) | | | 30,000 | | | | 30,896 | | | | | |
| 5.000%, 04/01/2029 (Callable 04/01/2025) | | | 1,125,000 | | | | 1,151,896 | | | | | |
| 5.000%, 04/01/2036 | | | | | | | | | | | | |
| (Pre-refunded to 04/01/2025) | | | 60,000 | | | | 61,792 | | | | | |
| 5.000%, 04/01/2036 (Callable 04/01/2025) | | | 3,205,000 | | | | 3,240,639 | | | | | |
| City of Memphis TN: | | | | | | | | | | | | |
| 5.000%, 12/01/2032 | | | | | | | | | | | | |
| (Pre-refunded to 12/01/2024) | | | 530,000 | | | | 543,450 | | | | | |
| 4.000%, 12/01/2033 (Callable 12/01/2026) | | | 1,300,000 | | | | 1,322,948 | | | | | |
| 4.000%, 12/01/2033 (Callable 12/01/2027) | | | 480,000 | | | | 494,746 | | | | | |
| 4.000%, 12/01/2034 (Callable 12/01/2026) | | | 1,310,000 | | | | 1,331,837 | | | | | |
| Cleveland Housing Authority, | | | | | | | | | | | | |
| 4.000%, 08/01/2026 | | | | | | | | | | | | |
(Mandatory Tender Date 08/01/2025)(1)(3) | | | 3,380,000 | | | | 3,343,481 | | | | | |
| County of Putnam TN, | | | | | | | | | | | | |
| 2.000%, 04/01/2035 (Callable 04/01/2030) | | | 3,875,000 | | | | 3,165,077 | | | | | |
| Greeneville Health & | | | | | | | | | | | | |
| Educational Facilities Board, | | | | | | | | | | | | |
| 5.000%, 07/01/2034 (Callable 07/01/2023) | | | 4,670,000 | | | | 4,670,000 | | | | | |
| Knox County Health Educational & | | | | | | | | | | | | |
| Housing Facility Board: | | | | | | | | | | | | |
| 5.000%, 01/01/2025 (Callable 07/31/2023) | | | 1,190,000 | | | | 1,191,132 | | | | | |
The accompanying notes are an integral part of these financial statements.
Baird Core Intermediate Municipal Bond Fund
Schedule of Investments, June 30, 2023 (Unaudited)
Long-Term Investments (cont.)
| | | Principal | | | | | | % of | |
| | | Amount | | | Value | | | Net Assets | |
| Knox County Health Educational & | | | | | | | | | |
| Housing Facility Board: (cont.) | | | | | | | | | |
| 5.000%, 01/01/2026 | | | | | | | | | |
| (Callable 07/31/2023) | | $ | 145,000 | | | $ | 146,301 | | | | |
| 0.650%, 12/01/2026 | | | | | | | | | | | |
(Mandatory Tender Date 12/01/2024)(1) | | | 1,200,000 | | | | 1,119,115 | | | | |
| 3.950%, 12/01/2027 (Mandatory Tender | | | | | | | | | | | |
Date 12/01/2025) (Insured by HUD)(1) | | | 2,175,000 | | | | 2,167,898 | | | | |
| Memphis-Shelby County | | | | | | | | | | | |
| Industrial Development Board, | | | | | | | | | | | |
| 4.000%, 04/01/2038 | | | | | | | | | | | |
| (Callable 04/01/2031) (Insured by AGM) | | | 535,000 | | | | 543,664 | | | | |
| Nashville & Davidson County | | | | | | | | | | | |
| Metropolitan Government: | | | | | | | | | | | |
| 3.000%, 10/01/2024 | | | 140,000 | | | | 137,082 | | | | |
| 5.000%, 05/15/2029 (Callable 05/15/2025) | | | 1,000,000 | | | | 1,036,469 | | | | |
| Tennergy Corp.: | | | | | | | | | | | |
| 5.500%, 12/01/2030 | | | 3,470,000 | | | | 3,701,054 | | | | |
| 5.500%, 10/01/2053 (Callable 09/01/2030) | | | | | | | | | | | |
(Mandatory Tender Date 12/01/2030)(1) | | | 11,550,000 | | | | 12,227,940 | | | | |
| Tennessee Energy Acquisition Corp., | | | | | | | | | | | |
| 5.000%, 02/01/2027 | | | 195,000 | | | | 196,541 | | | | |
| Tennessee Housing Development Agency: | | | | | | | | | | | |
| 3.600%, 01/01/2031 (Callable 07/21/2023) | | | 1,105,000 | | | | 1,105,099 | | | | |
| 3.100%, 07/01/2036 (Callable 01/01/2026) | | | 245,000 | | | | 235,829 | | | | |
| 3.550%, 07/01/2039 (Callable 07/01/2024) | | | 180,000 | | | | 174,909 | | | | |
| 4.000%, 01/01/2042 (Callable 07/01/2026) | | | 90,000 | | | | 89,341 | | | | |
| 3.600%, 07/01/2042 (Callable 01/01/2027) | | | 205,000 | | | | 200,389 | | | | |
| 4.000%, 07/01/2043 (Callable 07/21/2023) | | | 100,000 | | | | 100,137 | | | | |
| 4.450%, 07/01/2043 | | | | | | | | | | | |
(Callable 07/01/2032)(6) | | | 1,000,000 | | | | 997,317 | | | | |
| 3.500%, 07/01/2045 (Callable 01/01/2025) | | | 2,490,000 | | | | 2,462,661 | | | | |
| 4.000%, 07/01/2045 (Callable 01/01/2025) | | | 35,000 | | | | 34,881 | | | | |
| 3.500%, 01/01/2047 (Callable 01/01/2026) | | | 25,000 | | | | 24,712 | | | | |
| 4.500%, 07/01/2049 (Callable 01/01/2028) | | | 520,000 | | | | 521,066 | | | | |
| 3.750%, 01/01/2050 (Callable 01/01/2029) | | | 445,000 | | | | 438,590 | | | | |
| 4.250%, 01/01/2050 (Callable 07/01/2028) | | | 545,000 | | | | 543,283 | | | | |
| 5.000%, 01/01/2053 (Callable 07/01/2031) | | | 3,000,000 | | | | 3,091,718 | | | | |
| Total Tennessee | | | | | | | | | | | |
| (Cost $54,128,815) | | | | | | | 53,918,209 | | | | 2.1 | % |
| Texas | | | | | | | | | | | | |
| Abilene Convention Center Hotel | | | | | | | | | | | | |
| Development Corp., | | | | | | | | | | | | |
| 4.000%, 10/01/2050 (Callable 10/01/2031) | | | 2,850,000 | | | | 2,131,507 | | | | | |
| Alamo Community College District: | | | | | | | | | | | | |
| 5.000%, 08/15/2038 (Callable 08/15/2027) | | | 1,040,000 | | | | 1,102,640 | | | | | |
| 4.500%, 08/15/2042 (Callable 08/15/2031) | | | 750,000 | | | | 783,327 | | | | | |
| Arlington Higher Education Finance Corp.: | | | | | | | | | | | | |
| 4.000%, 08/15/2028 | | | | | | | | | | | | |
| (Callable 08/15/2026) (PSF Guaranteed) | | | 250,000 | | | | 254,682 | | | | | |
| 5.000%, 08/15/2028 (PSF Guaranteed) | | | 980,000 | | | | 1,073,493 | | | | | |
| 4.000%, 08/15/2029 (PSF Guaranteed) | | | 325,000 | | | | 337,579 | | | | | |
| 5.000%, 08/15/2029 (PSF Guaranteed) | | | 560,000 | | | | 623,418 | | | | | |
| 4.000%, 08/15/2030 (PSF Guaranteed) | | | 415,000 | | | | 432,222 | | | | | |
| 5.000%, 08/15/2030 (PSF Guaranteed) | | | 605,000 | | | | 682,531 | | | | | |
| 4.000%, 08/15/2031 | | | | | | | | | | | | |
| (Callable 08/15/2029) (PSF Guaranteed) | | | 510,000 | | | | 527,295 | | | | | |
| 5.000%, 08/15/2031 (PSF Guaranteed) | | | 585,000 | | | | 668,932 | | | | | |
| 5.000%, 08/15/2032 (PSF Guaranteed) | | | 660,000 | | | | 761,042 | | | | | |
| 4.000%, 08/15/2033 | | | | | | | | | | | | |
| (Callable 08/15/2031) (PSF Guaranteed) | | | 355,000 | | | | 367,460 | | | | | |
| 4.000%, 08/15/2036 | | | | | | | | | | | | |
| (Callable 08/15/2031) (PSF Guaranteed) | | | 1,370,000 | | | | 1,386,083 | | | | | |
| Arlington Higher Education | | | | | | | | | | | | |
| Finance Corp. (cont.): | | | | | | | | | | | | |
| 4.000%, 08/15/2037 | | | | | | | | | | | | |
| (Callable 08/15/2031) (PSF Guaranteed) | | | 765,000 | | | | 767,717 | | | | | |
| 4.000%, 02/15/2040 | | | | | | | | | | | | |
| (Callable 02/15/2025) (PSF Guaranteed) | | | 805,000 | | | | 792,445 | | | | | |
| 4.125%, 08/15/2042 | | | | | | | | | | | | |
| (Callable 08/15/2031) (PSF Guaranteed) | | | 2,920,000 | | | | 2,877,289 | | | | | |
| 4.250%, 08/15/2047 | | | | | | | | | | | | |
| (Callable 08/15/2031) (PSF Guaranteed) | | | 2,405,000 | | | | 2,379,920 | | | | | |
| Arlington Housing Finance Corp.: | | | | | | | | | | | | |
| 4.500%, 04/01/2041 (Callable 04/01/2026) | | | | | | | | | | | | |
(Mandatory Tender Date 04/01/2027)(1) | | | 5,000,000 | | | | 5,089,410 | | | | | |
| 3.500%, 11/01/2043 (Callable 05/01/2025) | | | | | | | | | | | | |
(Mandatory Tender Date 11/01/2025)(1) | | | 5,000,000 | | | | 4,991,619 | | | | | |
| Austin-Bergstrom Landhost Enterprises, Inc.: | | | | | | | | | | | | |
| 5.000%, 10/01/2035 (Callable 10/01/2027) | | | 1,250,000 | | | | 1,288,803 | | | | | |
| 5.000%, 10/01/2036 (Callable 10/01/2027) | | | 885,000 | | | | 908,059 | | | | | |
| Baytown Municipal Development District: | | | | | | | | | | | | |
| 2.500%, 10/01/2031 | | | 500,000 | | | | 425,051 | | | | | |
3.500%, 10/01/2031(3) | | | 1,020,000 | | | | 873,038 | | | | | |
| Central Texas Regional Mobility Authority: | | | | | | | | | | | | |
| 4.000%, 01/01/2040 (Callable 01/01/2031) | | | 1,250,000 | | | | 1,238,481 | | | | | |
| 5.000%, 01/01/2045 | | | | | | | | | | | | |
| (Pre-refunded to 07/01/2025) | | | 500,000 | | | | 518,274 | | | | | |
| Central Texas Turnpike System: | | | | | | | | | | | | |
| 0.000%, 08/15/2026 (Insured by BHAC) | | | 5,000,000 | | | | 4,516,616 | | | | | |
| 0.000%, 08/15/2036 (Callable 08/15/2024) | | | 1,000,000 | | | | 544,337 | | | | | |
| City of Austin TX, | | | | | | | | | | | | |
| 5.000%, 11/15/2025 | | | 1,000,000 | | | | 1,028,669 | | | | | |
| City of Bryan TX, | | | | | | | | | | | | |
| 4.000%, 07/01/2040 (Callable 07/01/2027) | | | 250,000 | | | | 240,640 | | | | | |
| City of Conroe TX, | | | | | | | | | | | | |
| 5.000%, 11/15/2036 (Callable 11/15/2028) | | | 500,000 | | | | 541,564 | | | | | |
| City of Dallas Housing Finance Corp., | | | | | | | | | | | | |
| 3.500%, 02/01/2044 (Callable 06/01/2025) | | | | | | | | | | | | |
(Mandatory Tender Date 02/01/2026)(1) | | | 1,000,000 | | | | 986,929 | | | | | |
| City of Decatur TX: | | | | | | | | | | | | |
| 5.000%, 03/01/2024 (Insured by BAM) | | | 300,000 | | | | 303,110 | | | | | |
| 5.000%, 03/01/2025 (Insured by BAM) | | | 280,000 | | | | 287,905 | | | | | |
| City of Houston TX: | | | | | | | | | | | | |
| 5.000%, 11/15/2028 (Callable 11/15/2024) | | | 715,000 | | | | 730,150 | | | | | |
| 5.500%, 12/01/2029 | | | | | | | | | | | | |
| (ETM) (Insured by NATL) | | | 500,000 | | | | 556,294 | | | | | |
| City of Hutto TX, | | | | | | | | | | | | |
| 4.250%, 08/01/2047 (Callable 08/01/2032) | | | 1,205,000 | | | | 1,195,020 | | | | | |
| City of Magnolia TX, | | | | | | | | | | | | |
5.700%, 09/01/2046(3) | | | 975,000 | | | | 951,422 | | | | | |
| City of Mesquite TX: | | | | | | | | | | | | |
| 5.000%, 03/01/2039 (Callable 03/01/2032) | | | 500,000 | | | | 547,501 | | | | | |
| 5.000%, 03/01/2040 (Callable 03/01/2032) | | | 500,000 | | | | 545,527 | | | | | |
| 5.000%, 03/01/2041 (Callable 03/01/2032) | | | 500,000 | | | | 545,262 | | | | | |
| 5.000%, 03/01/2042 (Callable 03/01/2032) | | | 500,000 | | | | 545,523 | | | | | |
| City of San Antonio TX, | | | | | | | | | | | | |
| 2.000%, 02/01/2049 | | | | | | | | | | | | |
(Mandatory Tender Date 12/01/2027)(1) | | | 7,500,000 | | | | 6,862,884 | | | | | |
| City of Temple TX: | | | | | | | | | | | | |
| 4.000%, 08/01/2035 | | | | | | | | | | | | |
| (Callable 08/01/2030) (Insured by BAM) | | | 650,000 | | | | 672,028 | | | | | |
| 4.000%, 08/01/2037 | | | | | | | | | | | | |
| (Callable 08/01/2030) (Insured by BAM) | | | 200,000 | | | | 202,783 | | | | | |
| 4.000%, 08/01/2038 | | | | | | | | | | | | |
| (Callable 08/01/2030) (Insured by BAM) | | | 165,000 | | | | 164,741 | | | | | |
| 4.000%, 08/01/2039 | | | | | | | | | | | | |
| (Callable 08/01/2030) (Insured by BAM) | | | 435,000 | | | | 435,853 | | | | | |
The accompanying notes are an integral part of these financial statements.
Baird Core Intermediate Municipal Bond Fund
Schedule of Investments, June 30, 2023 (Unaudited)
Long-Term Investments (cont.)
| | | Principal | | | | | | % of | |
| | | Amount | | | Value | | | Net Assets | |
| City of Temple TX: (cont.) | | | | | | | | | |
| 4.000%, 08/01/2041 | | | | | | | | | |
| (Callable 08/01/2030) (Insured by BAM) | | $ | 200,000 | | | $ | 196,977 | | | |
| |
| Clifton Higher Education Finance Corp.: | | | | | | | | | | | | |
| 5.000%, 08/15/2025 (PSF Guaranteed) | | | 360,000 | | | | 371,599 | | | | | |
| 6.000%, 03/01/2029 | | | | | | | | | | | | |
(Callable 03/01/2024)(5) | | | 1,475,000 | | | | 1,483,902 | | | | | |
| 4.000%, 08/15/2030 | | | | | | | | | | | | |
| (Callable 08/15/2026) (PSF Guaranteed) | | | 800,000 | | | | 812,872 | | | | | |
| 4.000%, 08/15/2032 | | | | | | | | | | | | |
| (Callable 08/15/2026) (PSF Guaranteed) | | | 600,000 | | | | 608,574 | | | | | |
| 4.000%, 08/15/2033 | | | | | | | | | | | | |
| (Callable 08/15/2028) (PSF Guaranteed) | | | 2,000,000 | | | | 2,052,139 | | | | | |
| 4.000%, 04/01/2034 | | | | | | | | | | | | |
| (Callable 04/01/2030) (PSF Guaranteed) | | | 325,000 | | | | 334,775 | | | | | |
| 5.000%, 08/15/2034 | | | | | | | | | | | | |
| (Callable 08/15/2026) (PSF Guaranteed) | | | 1,000,000 | | | | 1,042,168 | | | | | |
| 4.000%, 04/01/2035 | | | | | | | | | | | | |
| (Callable 04/01/2030) (PSF Guaranteed) | | | 250,000 | | | | 256,450 | | | | | |
| 4.000%, 08/15/2035 | | | | | | | | | | | | |
| (Callable 08/15/2029) (PSF Guaranteed) | | | 1,380,000 | | | | 1,397,497 | | | | | |
| 5.000%, 08/15/2042 (Callable 07/31/2023) | | | 3,225,000 | | | | 3,226,133 | | | | | |
| Comal County Water Control & | | | | | | | | | | | | |
| Improvement District No. 6: | | | | | | | | | | | | |
| 4.000%, 03/01/2031 | | | | | | | | | | | | |
| (Callable 03/01/2028) (Insured by BAM) | | | 560,000 | | | | 572,456 | | | | | |
| 4.000%, 03/01/2032 | | | | | | | | | | | | |
| (Callable 03/01/2028) (Insured by BAM) | | | 690,000 | | | | 702,939 | | | | | |
| 4.000%, 03/01/2033 | | | | | | | | | | | | |
| (Callable 03/01/2028) (Insured by BAM) | | | 720,000 | | | | 731,275 | | | | | |
| 4.375%, 03/01/2033 | | | | | | | | | | | | |
| (Callable 03/01/2028) (Insured by AGM) | | | 425,000 | | | | 438,424 | | | | | |
| 4.000%, 03/01/2034 | | | | | | | | | | | | |
| (Callable 03/01/2028) (Insured by BAM) | | | 750,000 | | | | 760,751 | | | | | |
| 4.375%, 03/01/2034 | | | | | | | | | | | | |
| (Callable 03/01/2028) (Insured by AGM) | | | 445,000 | | | | 458,461 | | | | | |
| 4.375%, 03/01/2035 | | | | | | | | | | | | |
| (Callable 03/01/2028) (Insured by AGM) | | | 475,000 | | | | 487,392 | | | | | |
| 4.375%, 03/01/2036 | | | | | | | | | | | | |
| (Callable 03/01/2028) (Insured by AGM) | | | 500,000 | | | | 511,183 | | | | | |
| 4.375%, 03/01/2037 | | | | | | | | | | | | |
| (Callable 03/01/2028) (Insured by AGM) | | | 530,000 | | | | 538,902 | | | | | |
| 4.375%, 03/01/2038 | | | | | | | | | | | | |
| (Callable 03/01/2028) (Insured by AGM) | | | 560,000 | | | | 566,916 | | | | | |
| 4.375%, 03/01/2042 | | | | | | | | | | | | |
| (Callable 03/01/2028) (Insured by AGM) | | | 1,250,000 | | | | 1,259,403 | | | | | |
| 4.375%, 03/01/2045 | | | | | | | | | | | | |
| (Callable 03/01/2028) (Insured by AGM) | | | 2,330,000 | | | | 2,338,582 | | | | | |
| County of Wise TX: | | | | | | | | | | | | |
| 5.000%, 08/15/2029 | | | 880,000 | | | | 935,592 | | | | | |
| 5.000%, 08/15/2033 (Callable 08/15/2031) | | | 930,000 | | | | 991,186 | | | | | |
| Danbury Higher Education Authority, Inc.: | | | | | | | | | | | | |
| 4.000%, 02/15/2028 | | | | | | | | | | | | |
| (Callable 02/15/2027) (PSF Guaranteed) | | | 250,000 | | | | 256,984 | | | | | |
| 4.000%, 02/15/2031 | | | | | | | | | | | | |
| (Callable 02/15/2027) (PSF Guaranteed) | | | 200,000 | | | | 206,970 | | | | | |
| Deaf Smith County Hospital District: | | | | | | | | | | | | |
| 5.000%, 03/01/2034 (Callable 03/01/2027) | | | 475,000 | | | | 485,670 | | | | | |
| 4.000%, 03/01/2040 (Callable 03/01/2027) | | | 2,045,000 | | | | 1,753,912 | | | | | |
| El Paso Housing Finance Corp., | | | | | | | | | | | | |
| 4.500%, 03/01/2026 (Mandatory Tender | | | | | | �� | | | | | | |
Date 03/01/2025) (Insured by HUD)(1) | | | 1,500,000 | | | | 1,515,611 | | | | | |
| Ferris Independent School District, | | | | | | | | | | | | |
| 5.000%, 08/15/2029 | | | | | | | | | | | | |
| (Callable 08/15/2026) (PSF Guaranteed) | | | 560,000 | | | | 592,246 | | | | | |
| Fort Bend County Municipal Utility | | | | | | | | | | | | |
| District No. 184: | | | | | | | | | | | | |
| 4.250%, 04/01/2038 | | | | | | | | | | | | |
| (Callable 04/01/2027) (Insured by BAM) | | | 630,000 | | | | 616,035 | | | | | |
| 4.500%, 04/01/2040 | | | | | | | | | | | | |
| (Callable 04/01/2027) (Insured by BAM) | | | 1,055,000 | | | | 1,055,032 | | | | | |
| 4.500%, 04/01/2042 | | | | | | | | | | | | |
| (Callable 04/01/2027) (Insured by BAM) | | | 1,130,000 | | | | 1,121,817 | | | | | |
| Fort Bend County Municipal | | | | | | | | | | | | |
| Utility District No. 30, | | | | | | | | | | | | |
| 4.000%, 09/01/2023 (Insured by BAM) | | | 295,000 | | | | 295,236 | | | | | |
| Fort Bend County Municipal | | | | | | | | | | | | |
| Utility District No. 5, | | | | | | | | | | | | |
| 5.750%, 09/01/2025 (Insured by AGM) | | | 325,000 | | | | 339,023 | | | | | |
| Fort Bend County Municipal | | | | | | | | | | | | |
| Utility District No. 58: | | | | | | | | | | | | |
| 3.000%, 04/01/2033 | | | | | | | | | | | | |
| (Callable 04/01/2029) (Insured by BAM) | | | 800,000 | | | | 766,094 | | | | | |
| 3.000%, 04/01/2034 | | | | | | | | | | | | |
| (Callable 04/01/2029) (Insured by BAM) | | | 450,000 | | | | 430,283 | | | | | |
| 3.000%, 04/01/2035 | | | | | | | | | | | | |
| (Callable 04/01/2029) (Insured by BAM) | | | 430,000 | | | | 404,551 | | | | | |
| 3.000%, 04/01/2037 | | | | | | | | | | | | |
| (Callable 04/01/2029) (Insured by BAM) | | | 825,000 | | | | 740,664 | | | | | |
| Grand Parkway Transportation Corp.: | | | | | | | | | | | | |
| 0.000%, 10/01/2034 | | | | | | | | | | | | |
(Callable 10/01/2028)(5) | | | 40,000 | | | | 43,844 | | | | | |
| 0.000%, 10/01/2035 | | | | | | | | | | | | |
(Callable 10/01/2028)(5) | | | 100,000 | | | | 109,045 | | | | | |
| 0.000%, 10/01/2036 | | | | | | | | | | | | |
(Callable 10/01/2028)(5) | | | 450,000 | | | | 487,132 | | | | | |
| 0.000%, 10/01/2045 | | | | | | | | | | | | |
(Callable 10/01/2028)(5) | | | 1,795,000 | | | | 1,913,684 | | | | | |
| 0.000%, 10/01/2046 | | | | | | | | | | | | |
(Callable 10/01/2028)(5) | | | 1,080,000 | | | | 1,149,968 | | | | | |
| 0.000%, 10/01/2047 | | | | | | | | | | | | |
(Callable 10/01/2028)(5) | | | 5,205,000 | | | | 5,547,404 | | | | | |
| 0.000%, 10/01/2048 | | | | | | | | | | | | |
(Callable 10/01/2028)(5) | | | 1,155,000 | | | | 1,229,675 | | | | | |
| Harris County Cultural Education | | | | | | | | | | | | |
| Facilities Finance Corp.: | | | | | | | | | | | | |
| 5.000%, 12/01/2026 (Callable 12/01/2024) | | | 635,000 | | | | 650,769 | | | | | |
| 4.272%, 11/15/2046 | | | | | | | | | | | | |
| (1 Month LIBOR USD + 0.650%) | | | | | | | | | | | | |
| (Callable 07/17/2023) | | | | | | | | | | | | |
(Mandatory Tender Date 07/01/2024)(2) | | | 2,000,000 | | | | 1,999,811 | | | | | |
| Harris County Municipal | | | | | | | | | | | | |
| Utility District No. 368, | | | | | | | | | | | | |
| 4.000%, 09/01/2025 | | | | | | | | | | | | |
| (Callable 09/01/2024) (Insured by NATL) | | | 1,000,000 | | | | 1,003,914 | | | | | |
| Harris County Municipal | | | | | | | | | | | | |
| Utility District No. 423: | | | | | | | | | | | | |
| 5.500%, 04/01/2025 (Insured by AGM) | | | 425,000 | | | | 439,580 | | | | | |
| 5.500%, 04/01/2026 (Insured by AGM) | | | 450,000 | | | | 474,419 | | | | | |
| 5.500%, 04/01/2027 (Insured by AGM) | | | 450,000 | | | | 483,312 | | | | | |
| 5.500%, 04/01/2028 (Insured by AGM) | | | 450,000 | | | | 494,090 | | | | | |
| 5.500%, 04/01/2029 (Insured by AGM) | | | 475,000 | | | | 532,723 | | | | | |
| 5.500%, 04/01/2030 | | | | | | | | | | | | |
| (Callable 04/01/2029) (Insured by AGM) | | | 500,000 | | | | 562,051 | | | | | |
| Harris County Municipal | | | | | | | | | | | | |
| Utility District No. 71, | | | | | | | | | | | | |
| 4.000%, 09/01/2028 | | | | | | | | | | | | |
| (Callable 09/01/2023) (Insured by BAM) | | | 250,000 | | | | 250,364 | | | | | |
The accompanying notes are an integral part of these financial statements.
Baird Core Intermediate Municipal Bond Fund
Schedule of Investments, June 30, 2023 (Unaudited)
Long-Term Investments (cont.)
| | | Principal | | | | | | % of | |
| | | Amount | | | Value | | | Net Assets | |
| Harris County Toll Road Authority, | | | | | | | | | |
| 5.000%, 08/15/2043 | | | | | | | | | |
| (Callable 02/15/2028) | | $ | 500,000 | | | $ | 525,134 | | | |
| |
| Harris County-Houston Sports Authority: | | | | | | | | | | | | |
| 0.000%, 11/15/2025 (Insured by NATL) | | | 11,185,000 | | | | 10,170,362 | | | | | |
| 5.000%, 11/15/2026 | | | | | | | | | | | | |
| (Callable 11/15/2024) (Insured by AGM) | | | 310,000 | | | | 317,435 | | | | | |
| 5.000%, 11/15/2053 (Callable 11/15/2024) | | | 2,220,000 | | | | 2,231,462 | | | | | |
| Harris-Waller Counties Municipal | | | | | | | | | | | | |
| Utility District No. 3: | | | | | | | | | | | | |
| 6.000%, 09/01/2024 (Insured by AGM) | | | 290,000 | | | | 297,647 | | | | | |
| 6.000%, 09/01/2025 (Insured by AGM) | | | 315,000 | | | | 331,012 | | | | | |
| 6.000%, 09/01/2026 (Insured by AGM) | | | 335,000 | | | | 360,738 | | | | | |
| 6.000%, 09/01/2027 (Insured by AGM) | | | 365,000 | | | | 401,787 | | | | | |
| 6.000%, 09/01/2028 (Insured by AGM) | | | 390,000 | | | | 439,113 | | | | | |
| Housing Options, Inc., | | | | | | | | | | | | |
| 3.900%, 02/01/2026 (Mandatory Tender | | | | | | | | | | | | |
Date 02/01/2025) (Insured by HUD)(1) | | | 4,000,000 | | | | 3,990,400 | | | | | |
| Houston Higher Education Finance Corp., | | | | | | | | | | | | |
| 3.375%, 10/01/2037 (Callable 07/31/2023) | | | 770,000 | | | | 656,831 | | | | | |
| Hunt Memorial Hospital District: | | | | | | | | | | | | |
| 5.000%, 02/15/2028 | | | 525,000 | | | | 558,449 | | | | | |
| 5.000%, 02/15/2030 | | | 1,015,000 | | | | 1,108,372 | | | | | |
| Joshua Independent School District, | | | | | | | | | | | | |
| 5.500%, 02/15/2026 (PSF Guaranteed) | | | 1,865,000 | | | | 1,939,586 | | | | | |
| Katy Development Authority: | | | | | | | | | | | | |
| 3.000%, 06/01/2032 | | | | | | | | | | | | |
| (Callable 06/01/2027) (Insured by BAM) | | | 485,000 | | | | 459,332 | | | | | |
| 3.000%, 06/01/2033 | | | | | | | | | | | | |
| (Callable 06/01/2027) (Insured by BAM) | | | 420,000 | | | | 391,608 | | | | | |
| 3.000%, 06/01/2034 | | | | | | | | | | | | |
| (Callable 06/01/2027) (Insured by BAM) | | | 575,000 | | | | 531,655 | | | | | |
| 3.000%, 06/01/2035 | | | | | | | | | | | | |
| (Callable 06/01/2027) (Insured by BAM) | | | 500,000 | | | | 451,809 | | | | | |
| 3.000%, 06/01/2039 | | | | | | | | | | | | |
| (Callable 06/01/2027) (Insured by BAM) | | | 1,125,000 | | | | 943,229 | | | | | |
| Kilgore Independent School District, | | | | | | | | | | | | |
| 2.000%, 02/15/2052 (Mandatory Tender | | | | | | | | | | | | |
Date 08/15/2025) (PSF Guaranteed)(1) | | | 4,190,000 | | | | 4,052,864 | | | | | |
| Lakes Fresh Water Supply | | | | | | | | | | | | |
| District of Denton County, | | | | | | | | | | | | |
| 4.000%, 09/01/2031 | | | | | | | | | | | | |
| (Callable 09/01/2029) (Insured by AGM) | | | 680,000 | | | | 700,667 | | | | | |
| Laredo Community College District, | | | | | | | | | | | | |
| 5.000%, 08/01/2028 | | | | | | | | | | | | |
| (Callable 08/01/2027) (Insured by BAM) | | | 350,000 | | | | 379,912 | | | | | |
| Las Varas Public Facility Corp., | | | | | | | | | | | | |
| 0.400%, 05/01/2025 (Callable 11/01/2023) | | | | | | | | | | | | |
(Mandatory Tender Date 05/01/2024)(1) | | | 1,000,000 | | | | 956,255 | | | | | |
| Lazy Nine Municipal Utility District No. 1B: | | | | | | | | | | | | |
| 2.000%, 03/01/2035 | | | | | | | | | | | | |
| (Callable 03/01/2027) (Insured by AGM) | | | 525,000 | | | | 406,937 | | | | | |
| 2.000%, 03/01/2037 | | | | | | | | | | | | |
| (Callable 03/01/2027) (Insured by AGM) | | | 530,000 | | | | 386,034 | | | | | |
| Leander Independent School District: | | | | | | | | | | | | |
| 0.000%, 08/15/2040 (Pre-refunded to | | | | | | | | | | | | |
| 08/15/2024) (PSF Guaranteed) | | | 20,000 | | | | 8,940 | | | | | |
| 5.000%, 08/15/2040 | | | | | | | | | | | | |
| (Callable 08/15/2025) (PSF Guaranteed) | | | 500,000 | | | | 512,618 | | | | | |
| Martin County Hospital District: | | | | | | | | | | | | |
| 4.000%, 04/01/2027 | | | 225,000 | | | | 230,323 | | | | | |
| 4.000%, 04/01/2028 | | | 430,000 | | | | 443,128 | | | | | |
| 4.000%, 04/01/2031 (Callable 04/01/2030) | | | 235,000 | | | | 244,706 | | | | | |
| 4.000%, 04/01/2033 (Callable 04/01/2030) | | | 375,000 | | | | 387,100 | | | | | |
| 4.000%, 04/01/2034 (Callable 04/01/2030) | | | 500,000 | | | | 513,828 | | | | | |
| Matagorda County Navigation District No. 1: | | | | | | | | | | | | |
| 4.400%, 05/01/2030 | | | | | | | | | | | | |
| (Insured by AMBAC) | | | 3,430,000 | | | | 3,488,676 | | | | | |
| 4.000%, 06/01/2030 (Callable 07/31/2023) | | | 1,900,000 | | | | 1,887,739 | | | | | |
| Mckinney Municipal Utility District No. 1: | | | | | | | | | | | | |
| 3.125%, 09/01/2032 | | | | | | | | | | | | |
| (Callable 05/01/2030) (Insured by BAM) | | | 155,000 | | | | 149,153 | | | | | |
| 3.250%, 09/01/2033 | | | | | | | | | | | | |
| (Callable 05/01/2030) (Insured by BAM) | | | 85,000 | | | | 81,918 | | | | | |
| 3.250%, 09/01/2033 | | | | | | | | | | | | |
| (Callable 05/01/2030) (Insured by BAM) | | | 250,000 | | | | 242,590 | | | | | |
| Metropolitan Transit Authority | | | | | | | | | | | | |
| of Harris County, | | | | | | | | | | | | |
| 5.000%, 11/01/2034 (Callable 11/01/2029) | | | 560,000 | | | | 620,115 | | | | | |
| Montgomery County Municipal | | | | | | | | | | | | |
| Utility District No. 165: | | | | | | | | | | | | |
| 6.500%, 09/01/2027 (Insured by BAM) | | | 250,000 | | | | 278,567 | | | | | |
| 6.500%, 09/01/2028 (Insured by BAM) | | | 260,000 | | | | 295,949 | | | | | |
| 6.500%, 09/01/2029 (Insured by BAM) | | | 250,000 | | | | 290,304 | | | | | |
| 6.000%, 09/01/2030 | | | | | | | | | | | | |
| (Callable 06/01/2029) (Insured by BAM) | | | 200,000 | | | | 226,281 | | | | | |
| 6.000%, 09/01/2031 | | | | | | | | | | | | |
| (Callable 06/01/2029) (Insured by BAM) | | | 300,000 | | | | 340,292 | | | | | |
| Montgomery County Municipal | | | | | | | | | | | | |
| Utility District No. 88, | | | | | | | | | | | | |
| 4.250%, 09/01/2047 | | | | | | | | | | | | |
| (Callable 09/01/2029) (Insured by AGM) | | | 1,400,000 | | | | 1,365,443 | | | | | |
| New Hope Cultural Education | | | | | | | | | | | | |
| Facilities Finance Corp., | | | �� | | | | | | | | | |
| 2.000%, 01/01/2026 | | | 1,020,000 | | | | 936,448 | | | | | |
| Newark Higher Education Finance Corp., | | | | | | | | | | | | |
| 4.000%, 08/15/2035 | | | | | | | | | | | | |
| (Callable 08/15/2025) (PSF Guaranteed) | | | 425,000 | | | | 426,051 | | | | | |
| North Lamar Independent School District: | | | | | | | | | | | | |
| 4.000%, 02/15/2036 | | | | | | | | | | | | |
| (Callable 02/15/2031) (PSF Guaranteed) | | | 715,000 | | | | 746,812 | | | | | |
| 4.000%, 02/15/2037 | | | | | | | | | | | | |
| (Callable 02/15/2031) (PSF Guaranteed) | | | 625,000 | | | | 646,210 | | | | | |
| 4.000%, 02/15/2038 | | | | | | | | | | | | |
| (Callable 02/15/2031) (PSF Guaranteed) | | | 650,000 | | | | 667,236 | | | | | |
| North Texas Tollway Authority: | | | | | | | | | | | | |
| 5.000%, 01/01/2033 (Callable 01/01/2026) | | | 675,000 | | | | 704,380 | | | | | |
| 6.750%, 09/01/2045 | | | | | | | | | | | | |
(Pre-refunded to 09/01/2031)(5) | | | 40,000 | | | | 51,296 | | | | | |
| Northeast Travis County Utility District, | | | | | | | | | | | | |
| 0.000%, 09/01/2023 (Insured by BAM) | | | 275,000 | | | | 273,175 | | | | | |
| Northside Independent School District, | | | | | | | | | | | | |
| 1.600%, 08/01/2049 (Mandatory Tender | | | | | | | | | | | | |
Date 08/01/2024) (PSF Guaranteed)(1) | | | 740,000 | | | | 720,106 | | | | | |
| Northwest Harris County Municipal | | | | | | | | | | | | |
| Utility District No. 10: | | | | | | | | | | | | |
| 5.000%, 04/01/2024 (Insured by BAM) | | | 640,000 | | | | 647,047 | | | | | |
| 5.000%, 04/01/2025 (Insured by BAM) | | | 650,000 | | | | 664,763 | | | | | |
| 5.000%, 04/01/2026 (Insured by BAM) | | | 725,000 | | | | 750,904 | | | | | |
| Port Beaumont Navigation District, | | | | | | | | | | | | |
| 2.875%, 01/01/2041 | | | | | | | | | | | | |
(Callable 07/31/2023)(3) | | | 1,200,000 | | | | 781,534 | | | | | |
| Port of Beaumont Industrial | | | | | | | | | | | | |
| Development Authority, | | | | | | | | | | | | |
| 4.100%, 01/01/2028 | | | | | | | | | | | | |
(Callable 07/31/2023)(3) | | | 4,000,000 | | | | 3,163,782 | | | | | |
| Red River Health Facilities Development Corp., | | | | | | | | | | | | |
| 8.000%, 11/15/2049 | | | | | | | | | | | | |
| (Pre-refunded to 11/15/2024) | | | 2,425,000 | | | | 2,575,889 | | | | | |
The accompanying notes are an integral part of these financial statements.
Baird Core Intermediate Municipal Bond Fund
Schedule of Investments, June 30, 2023 (Unaudited)
Long-Term Investments (cont.)
| | | Principal | | | | | | % of | |
| | | Amount | | | Value | | | Net Assets | |
| Remington Municipal Utility District No. 1, | | | | | | | | | |
| 3.000%, 09/01/2025 | | | | | | | | | |
| (Callable 09/01/2024) (Insured by AGM) | | $ | 540,000 | | | $ | 535,100 | | | | |
| Sabine-Neches Navigation District, | | | | | | | | | | | |
| 4.625%, 02/15/2047 (Callable 02/15/2031) | | | 2,000,000 | | | | 2,057,106 | | | | |
| Seminole Hospital District, | | | | | | | | | | | |
| 3.000%, 02/15/2034 (Callable 02/15/2026) | | | 1,125,000 | | | | 882,597 | | | | |
| Southwest Houston | | | | | | | | | | | |
| Redevelopment Authority, | | | | | | | | | | | |
| 5.000%, 09/01/2027 (Insured by AGM) | | | 250,000 | | | | 264,587 | | | | |
| Spring Meadows Municipal Utility District, | | | | | | | | | | | |
| 4.000%, 09/01/2026 | | | | | | | | | | | |
| (Callable 09/01/2023) (Insured by AGM) | | | 275,000 | | | | 275,145 | | | | |
| Sugar Land 4B Corp., | | | | | | | | | | | |
| 4.000%, 02/15/2030 | | | | | | | | | | | |
| (Callable 02/15/2028) (Insured by BAM) | | | 1,045,000 | | | | 1,092,848 | | | | |
| Tarrant County Cultural Education | | | | | | | | | | | |
| Facilities Finance Corp.: | | | | | | | | | | | |
| 5.000%, 11/15/2029 (Callable 11/15/2026) | | | 1,665,000 | | | | 1,689,254 | | | | |
| 5.000%, 11/15/2030 (Callable 11/15/2026) | | | 1,750,000 | | | | 1,775,021 | | | | |
| 2.750%, 02/15/2036 | | | | | | | | | | | |
(Callable 07/21/2023)(1) | | | 2,730,000 | | | | 2,707,548 | | | | |
| 5.000%, 11/15/2037 (Callable 11/15/2027) | | | 850,000 | | | | 854,200 | | | | |
| 5.000%, 12/01/2039 (Callable 12/01/2023) | | | 1,015,000 | | | | 1,017,438 | | | | |
| 5.000%, 11/15/2040 (Callable 11/15/2026) | | | 400,000 | | | | 398,721 | | | | |
| 4.000%, 11/15/2042 (Callable 05/15/2026) | | | 500,000 | | | | 481,844 | | | | |
| Tarrant County Hospital District, | | | | | | | | | | | |
| 4.000%, 08/15/2043 (Callable 08/15/2032) | | | 1,750,000 | | | | 1,719,717 | | | | |
| Texas Department of Housing | | | | | | | | | | | |
| & Community Affairs: | | | | | | | | | | | |
| 4.000%, 08/01/2025 (Mandatory Tender | | | | | | | | | | | |
Date 08/01/2024) (Insured by HUD)(1) | | | 2,000,000 | | | | 1,999,345 | | | | |
| 5.000%, 01/01/2029 (Insured by GNMA) | | | 215,000 | | | | 233,647 | | | | |
| 5.000%, 07/01/2029 (Insured by GNMA) | | | 175,000 | | | | 191,426 | | | | |
| 5.000%, 01/01/2030 (Insured by GNMA) | | | 450,000 | | | | 495,621 | | | | |
| 4.750%, 01/01/2049 | | | | | | | | | | | |
| (Callable 07/01/2028) (Insured by GNMA) | | | 2,690,000 | | | | 2,706,391 | | | | |
| 3.750%, 09/01/2049 | | | | | | | | | | | |
| (Callable 09/01/2028) (Insured by GNMA) | | | 1,290,000 | | | | 1,210,380 | | | | |
| 5.500%, 09/01/2052 | | | | | | | | | | | |
| (Callable 03/01/2032) (Insured by GNMA) | | | 5,965,000 | | | | 6,323,461 | | | | |
| 6.000%, 03/01/2053 | | | | | | | | | | | |
| (Callable 03/01/2032) (Insured by GNMA) | | | 995,000 | | | | 1,085,988 | | | | |
| Texas Municipal Gas Acquisition | | | | | | | | | | | |
| & Supply Corp. I: | | | | | | | | | | | |
| 4.710%, 12/15/2026 (3 Month LIBOR | | | | | | | | | | | |
USD + 1.450%) (Callable 07/03/2023)(2) | | | 4,100,000 | | | | 4,039,349 | | | | |
| 6.250%, 12/15/2026 | | | 1,125,000 | | | | 1,172,244 | | | | |
| Texas Municipal Gas Acquisition | | | | | | | | | | | |
| & Supply Corp. II, | | | | | | | | | | | |
| 4.130%, 09/15/2027 (3 Month LIBOR | | | | | | | | | | | |
USD + 0.870%)(2) | | | 11,170,000 | | | | 11,172,923 | | | | |
| Texas Municipal Gas Acquisition | | | | | | | | | | | |
| & Supply Corp. III: | | | | | | | | | | | |
| 5.000%, 12/15/2025 | | | 875,000 | | | | 889,515 | | | | |
| 5.000%, 12/15/2027 | | | 1,500,000 | | | | 1,537,457 | | | | |
| 5.000%, 12/15/2028 | | | 3,000,000 | | | | 3,081,282 | | | | |
| 5.000%, 12/15/2032 | | | 2,180,000 | | | | 2,277,272 | | | | |
| Texas Municipal Power Agency, | | | | | | | | | | | |
| 3.000%, 09/01/2029 | | | | | | | | | | | |
| (Callable 09/01/2026) (Insured by AGM) | | | 2,080,000 | | | | 2,024,567 | | | | |
| Texas State Affordable Housing Corp.: | | | | | | | | | | | |
| 4.625%, 03/01/2043 | | | | | | | | | | | |
| (Callable 03/01/2033) (Insured by GNMA) | | | 3,690,000 | | | | 3,696,845 | | | | |
| 4.750%, 03/01/2048 | | | | | | | | | | | |
| (Callable 03/01/2033) (Insured by GNMA) | | | 2,750,000 | | | | 2,767,386 | | | | |
| Texas State Technical College, | | | | | | | | | | | |
| 5.750%, 08/01/2047 | | | | | | | | | | | |
| (Callable 08/01/2032) (Insured by AGM) | | | 4,000,000 | | | | 4,546,344 | | | | |
| THF Public Facility Corp., | | | | | | | | | | | |
| 3.250%, 03/01/2040 (Callable 09/01/2024) | | | | | | | | | | | |
(Mandatory Tender Date 09/01/2025)(1) | | | 1,500,000 | | | | 1,470,942 | | | | |
| Tioga Independent School | | | | | | | | | | | |
| District Public Facility Corp., | | | | | | | | | | | |
| 3.250%, 08/15/2027 (Callable 08/15/2024) | | | 200,000 | | | | 187,131 | | | | |
| Travis County Municipal | | | | | | | | | | | |
| Utility District No. 4, | | | | | | | | | | | |
| 4.000%, 09/01/2035 | | | | | | | | | | | |
| (Callable 07/31/2023) (Insured by AGM) | | | 615,000 | | | | 615,240 | | | | |
| Upper Trinity Regional Water District, | | | | | | | | | | | |
| 5.000%, 08/01/2032 | | | | | | | | | | | |
| (Callable 08/01/2028) (Insured by BAM) | | | 265,000 | | | | 291,585 | | | | |
| Viridian Municipal Management District: | | | | | | | | | | | |
| 4.000%, 12/01/2027 | | | | | | | | | | | |
| (Callable 12/01/2023) (Insured by AGM) | | | 315,000 | | | | 315,423 | | | | |
| 4.000%, 12/01/2028 | | | | | | | | | | | |
| (Callable 12/01/2023) (Insured by AGM) | | | 470,000 | | | | 470,669 | | | | |
| 5.500%, 12/01/2032 (Callable 12/01/2029) | | | 415,000 | | | | 428,758 | | | | |
| 4.000%, 12/01/2037 | | | | | | | | | | | |
| (Callable 12/01/2027) (Insured by BAM) | | | 865,000 | | | | 865,268 | | | | |
| 5.750%, 12/01/2037 (Callable 12/01/2029) | | | 690,000 | | | | 710,034 | | | | |
| 6.000%, 12/01/2043 (Callable 12/01/2029) | | | 1,260,000 | | | | 1,292,867 | | | | |
| 6.250%, 12/01/2049 (Callable 12/01/2029) | | | 1,300,000 | | | | 1,340,647 | | | | |
| Washington County Junior College District, | | | | | | | | | | | |
| 5.000%, 10/01/2028 | | | | | | | | | | | |
| (Callable 04/01/2026) (Insured by BAM) | | | 500,000 | | | | 521,049 | | | | |
| White Settlement Independent School District, | | | | | | | | | | | |
| 0.000%, 08/15/2040 (Pre-refunded to | | | | | | | | | | | |
| 08/15/2023) (PSF Guaranteed) | | | 1,370,000 | | | | 653,412 | | | | |
| Wimberley Independent School District, | | | | | | | | | | | |
| 4.000%, 08/15/2031 | | | | | | | | | | | |
| (Callable 08/15/2027) (PSF Guaranteed) | | | 355,000 | | | | 367,920 | | | | |
| Total Texas | | | | | | | | | | | |
| (Cost $249,605,132) | | | | | | | 241,800,983 | | | | 9.2 | % |
| Utah | | | | | | | | | | | | |
| City of Herriman City UT, | | | | | | | | | | | | |
| 4.000%, 01/01/2041 | | | | | | | | | | | | |
| (Callable 01/01/2031) (Insured by AGM) | | | 500,000 | | | | 502,286 | | | | | |
| City of Salt Lake City UT: | | | | | | | | | | | | |
| 5.000%, 07/01/2028 | | | 1,000,000 | | | | 1,064,778 | | | | | |
| 5.000%, 07/01/2030 (Callable 07/01/2027) | | | 155,000 | | | | 165,092 | | | | | |
| 5.000%, 07/01/2042 (Callable 07/01/2027) | | | 4,140,000 | | | | 4,288,543 | | | | | |
| Grand County School District, | | | | | | | | | | | | |
| 5.000%, 12/15/2037 | | | | | | | | | | | | |
| (Callable 12/15/2025) (Insured by AGM) | | | 870,000 | | | | 893,581 | | | | | |
| Jordan Valley Water Conservancy District: | | | | | | | | | | | | |
| 5.000%, 10/01/2032 (Callable 10/01/2026) | | | 250,000 | | | | 265,084 | | | | | |
| 5.000%, 10/01/2033 (Callable 10/01/2026) | | | 350,000 | | | | 370,563 | | | | | |
| Midvale Utah Redevelopment Agency, | | | | | | | | | | | | |
| 5.000%, 05/01/2027 | | | 290,000 | | | | 309,990 | | | | | |
| University of Utah, | | | | | | | | | | | | |
| 4.000%, 08/01/2039 (Callable 08/01/2030) | | | 1,760,000 | | | | 1,776,577 | | | | | |
| Utah Charter School Finance Authority: | | | | | | | | | | | | |
| 0.000%, 04/15/2025 (Insured by UT CSCE) | | | 410,000 | | | | 377,667 | | | | | |
| 3.000%, 04/15/2027 (Insured by UT CSCE) | | | 310,000 | | | | 299,759 | | | | | |
| 5.000%, 04/15/2027 (Callable 04/15/2026) | | | | | | | | | | | | |
| (Insured by UT CSCE) | | | 365,000 | | | | 378,972 | | | | | |
| 5.000%, 04/15/2028 (Callable 04/15/2026) | | | | | | | | | | | | |
| (Insured by UT CSCE) | | | 720,000 | | | | 748,164 | | | | | |
The accompanying notes are an integral part of these financial statements.
Baird Core Intermediate Municipal Bond Fund
Schedule of Investments, June 30, 2023 (Unaudited)
Long-Term Investments (cont.)
| | | Principal | | | | | | % of | |
| | | Amount | | | Value | | | Net Assets | |
| Utah Charter School Finance Authority: (cont.) | | | | | | | | | |
| 4.000%, 04/15/2029 | | | | | | | | | |
| (Insured by UT CSCE) | | $ | 175,000 | | | $ | 176,303 | | | | |
| 4.000%, 04/15/2030 | | | | | | | | | | | |
| (Insured by UT CSCE) | | | 1,120,000 | | | | 1,131,808 | | | | |
| 5.000%, 10/15/2032(Callable 10/15/2027) | | | | | | | | | | | |
| (Insured by UT CSCE) | | | 310,000 | | | | 325,867 | | | | |
| 5.000%, 10/15/2036 (Callable 07/21/2023) | | | | | | | | | | | |
| (Insured by UT CSCE) | | | 700,000 | | | | 700,462 | | | | |
| 4.000%, 04/15/2037 (Callable 04/15/2032) | | | | | | | | | | | |
| (Insured by UT CSCE) | | | 500,000 | | | | 484,100 | | | | |
| 5.000%, 04/15/2037 (Callable 04/15/2026) | | | | | | | | | | | |
| (Insured by UT CSCE) | | | 520,000 | | | | 531,480 | | | | |
| 4.000%, 04/15/2042 (Callable 04/15/2032) | | | | | | | | | | | |
| (Insured by UT CSCE) | | | 480,000 | | | | 442,460 | | | | |
| 5.000%, 10/15/2043 (Callable 10/15/2027) | | | | | | | | | | | |
| (Insured by UT CSCE) | | | 1,000,000 | | | | 1,019,572 | | | | |
| Utah Housing Corp.: | | | | | | | | | | | |
| 4.000%, 01/01/2045 | | | | | | | | | | | |
| (Callable 01/01/2026) (Insured by FHA) | | | 125,000 | | | | 124,480 | | | | |
| 6.000%, 12/21/2052 (Insured by GNMA) | | | 2,237,692 | | | | 2,317,330 | | | | |
| 6.000%, 02/21/2053 (Insured by GNMA) | | | 2,989,043 | | | | 3,093,319 | | | | |
| 6.500%, 05/21/2053 (Insured by GNMA) | | | 1,548,567 | | | | 1,609,381 | | | | |
| 6.000%, 06/21/2053 (Insured by GNMA) | | | 2,000,000 | | | | 2,061,166 | | | | |
| Utah Infrastructure Agency, | | | | | | | | | | | |
| 4.000%, 10/15/2023 | | | 755,000 | | | | 753,486 | | | | |
| Utah Telecommunication Open | | | | | | | | | | | |
| Infrastructure Agency: | | | | | | | | | | | |
| 4.375%, 06/01/2040 (Callable 06/01/2032) | | | 1,750,000 | | | | 1,793,099 | | | | |
| 5.500%, 06/01/2040 (Callable 06/01/2032) | | | 1,000,000 | | | | 1,131,641 | | | | |
| Utah Water Finance Agency, | | | | | | | | | | | |
| 4.000%, 03/01/2031 (Callable 03/01/2027) | | | 925,000 | | | | 959,126 | | | | |
| Total Utah | | | | | | | | | | | |
| (Cost $30,910,024) | | | | | | | 30,096,136 | | | | 1.1 | % |
| Vermont | | | | | | | | | | | | |
| City of Burlington VT, | | | | | | | | | | | | |
| 5.000%, 07/01/2028 (Callable 07/01/2027) | | | 275,000 | | | | 296,273 | | | | | |
| Vermont Educational & Health | | | | | | | | | | | | |
| Buildings Financing Agency: | | | | | | | | | | | | |
| 5.000%, 10/15/2024 | | | 1,400,000 | | | | 1,396,539 | | | | | |
| 5.000%, 10/15/2025 | | | 615,000 | | | | 613,250 | | | | | |
| 5.000%, 12/01/2039 (Callable 06/01/2026) | | | 500,000 | | | | 513,897 | | | | | |
| Vermont Housing Finance Agency, | | | | | | | | | | | | |
| 3.650%, 11/01/2032 (Callable 11/01/2024) | | | 95,000 | | | | 95,088 | | | | | |
| Vermont Public Power Supply Authority, | | | | | | | | | | | | |
| 5.000%, 07/01/2028 (Callable 07/01/2027) | | | 500,000 | | | | 524,450 | | | | | |
| Total Vermont | | | | | | | | | | | | |
| (Cost $3,532,876) | | | | | | | 3,439,497 | | | | 0.1 | % |
| Virginia | | | | | | | | | | | | |
| Arlington County Industrial | | | | | | | | | | | | |
| Development Authority, | | | | | | | | | | | | |
| 5.000%, 01/01/2026 | | | 5,000,000 | | | | 5,157,876 | | | | | |
| Charles City County Economic | | | | | | | | | | | | |
| Development Authority, | | | | | | | | | | | | |
| 2.875%, 02/01/2029 | | | | | | | | | | | | |
(Callable 11/01/2026)(5) | | | 2,330,000 | | | | 2,169,180 | | | | | |
| Chesapeake Bay Bridge & Tunnel District, | | | | | | | | | | | | |
| 5.000%, 11/01/2023 | | | 9,720,000 | | | | 9,756,933 | | | | | |
| City of Virginia Beach VA, | | | | | | | | | | | | |
| 3.000%, 03/01/2031 | | | | | | | | | | | | |
| (Callable 03/01/2028) (Insured by ST AID) | | | 1,350,000 | | | | 1,342,340 | | | | | |
| County of James City VA, | | | | | | | | | | | | |
| 3.000%, 06/15/2029 | | | | | | | | | | | | |
| (Callable 06/15/2025) (Insured by ST AID) | | | 1,000,000 | | | | 1,000,283 | | | | | |
| Farmville Industrial Development Authority, | | | | | | | | | | | | |
| 5.375%, 07/01/2053 | | | | | | | | | | | | |
| (Callable 07/01/2028) (Mandatory Tender | | | | | | | | | | | | |
| Date 07/01/2043) (Insured by AGM) | | | 7,950,000 | | | | 8,320,141 | | | | | |
| Federal Home Loan | | | | | | | | | | | | |
| Mortgage Corp. (FHLMC), | | | | | | | | | | | | |
| 2.550%, 06/15/2035 | | | 4,242,152 | | | | 3,532,760 | | | | | |
| Fredericksburg Economic | | | | | | | | | | | | |
| Development Authority, | | | | | | | | | | | | |
| 5.000%, 06/15/2030 (Callable 06/15/2024) | | | 1,000,000 | | | | 1,009,366 | | | | | |
| Hampton Roads Transportation | | | | | | | | | | | | |
| Accountability Commission, | | | | | | | | | | | | |
| 5.000%, 07/01/2042 (Callable 01/01/2028) | | | 305,000 | | | | 323,235 | | | | | |
| Louisa Industrial Development Authority, | | | | | | | | | | | | |
| 3.650%, 11/01/2035 | | | | | | | | | | | | |
(Mandatory Tender Date 10/01/2027)(1) | | | 3,800,000 | | | | 3,784,804 | | | | | |
| Norfolk Redevelopment & Housing Authority, | | | | | | | | | | | | |
| 5.000%, 05/01/2043 (Mandatory Tender | | | | | | | | | | | | |
Date 05/01/2026) (Insured by HUD)(1) | | | 1,500,000 | | | | 1,543,441 | | | | | |
| Portsmouth Redevelopment & | | | | | | | | | | | | |
| Housing Authority, | | | | | | | | | | | | |
| 3.500%, 07/01/2025 (Mandatory Tender | | | | | | | | | | | | |
Date 07/01/2024) (Insured by HUD)(1) | | | 3,500,000 | | | | 3,477,017 | | | | | |
| Richmond Redevelopment & | | | | | | | | | | | | |
| Housing Authority, | | | | | | | | | | | | |
| 4.250%, 03/01/2026 (Mandatory Tender | | | | | | | | | | | | |
Date 03/01/2025) (Insured by HUD)(1) | | | 2,650,000 | | | | 2,666,212 | | | | | |
| Toll Road Investors Partnership II LP, | | | | | | | | | | | | |
0.000%, 02/15/2025 (Insured by NATL)(3) | | | 3,950,000 | | | | 3,510,724 | | | | | |
| Virginia College Building Authority: | | | | | | | | | | | | |
| 5.250%, 01/01/2026 (Insured by NATL) | | | 1,455,000 | | | | 1,490,716 | | | | | |
| 5.000%, 06/01/2027 | | | 300,000 | | | | 308,302 | | | | | |
| 4.000%, 02/01/2034 (Callable 02/01/2031) | | | 2,000,000 | | | | 2,117,384 | | | | | |
| Virginia Housing Development Authority, | | | | | | | | | | | | |
| 3.450%, 04/01/2038 (Callable 07/21/2023) | | | 2,570,000 | | | | 2,470,163 | | | | | |
| Virginia Resources Authority, | | | | | | | | | | | | |
| 3.000%, 11/01/2031 (Callable 11/01/2028) | | | 1,200,000 | | | | 1,205,983 | | | | | |
| Virginia Small Business Financing Authority: | | | | | | | | | | | | |
| 5.250%, 10/01/2029 (Callable 10/01/2024) | | | 2,500,000 | | | | 2,543,052 | | | | | |
| 5.000%, 10/01/2042 (Callable 10/01/2032) | | | 1,105,000 | | | | 1,194,251 | | | | | |
| Total Virginia | | | | | | | | | | | | |
| (Cost $59,977,691) | | | | | | | 58,924,163 | | | | 2.2 | % |
| Washington | | | | | | | | | | | | |
| Eastern Washington University, | | | | | | | | | | | | |
| 3.000%, 10/01/2033 (Callable 10/01/2026) | | | 600,000 | | | | 553,811 | | | | | |
| Energy Northwest, | | | | | | | | | | | | |
| 5.000%, 07/01/2030 (Callable 07/01/2028) | | | 600,000 | | | | 662,635 | | | | | |
| FYI Properties, | | | | | | | | | | | | |
| 5.000%, 06/01/2038 (Callable 06/01/2028) | | | 1,500,000 | | | | 1,598,739 | | | | | |
| Grant County Public Utility District No. 2, | | | | | | | | | | | | |
| 2.000%, 01/01/2044 (Callable 09/01/2025) | | | | | | | | | | | | |
(Mandatory Tender Date 12/01/2025)(1) | | | 350,000 | | | | 335,001 | | | | | |
| King County Housing Authority: | | | | | | | | | | | | |
| 4.000%, 06/01/2029 | | | 800,000 | | | | 822,586 | | | | | |
| 5.000%, 12/01/2030 (Callable 12/01/2026) | | | 1,650,000 | | | | 1,738,124 | | | | | |
| King County Public Hospital District No. 1: | | | | | | | | | | | | |
| 5.000%, 12/01/2029 (Callable 12/01/2028) | | | 1,050,000 | | | | 1,145,529 | | | | | |
| 5.000%, 12/01/2036 (Callable 12/01/2026) | | | 550,000 | | | | 566,142 | | | | | |
| Pend Oreille County Public | | | | | | | | | | | | |
| Utility District No. 1: | | | | | | | | | | | | |
| 5.000%, 01/01/2028 | | | 220,000 | | | | 230,971 | | | | | |
| 5.000%, 01/01/2031 (Callable 01/01/2028) | | | 100,000 | | | | 105,102 | | | | | |
| 5.000%, 01/01/2038 (Callable 01/01/2029) | | | 2,500,000 | | | | 2,563,091 | | | | | |
| 5.000%, 01/01/2039 (Callable 01/01/2028) | | | 1,500,000 | | | | 1,531,011 | | | | | |
The accompanying notes are an integral part of these financial statements.
Baird Core Intermediate Municipal Bond Fund
Schedule of Investments, June 30, 2023 (Unaudited)
Long-Term Investments (cont.)
| | | Principal | | | | | | % of | |
| | | Amount | | | Value | | | Net Assets | |
| Pike Place Market Preservation & | | | | | | | | | |
| Development Authority, | | | | | | | | | |
| 5.000%, 12/01/2040 | | | | | | | | | |
| (Callable 12/01/2025) | | $ | 500,000 | | | $ | 505,817 | | | | |
| Seattle Housing Authority, | | | | | | | | | | | |
| 4.000%, 09/01/2025 (Callable 03/01/2025) | | | 5,000,000 | | | | 5,010,313 | | | | |
| State of Washington: | | | | | | | | | | | |
| 5.000%, 07/01/2035 (Callable 07/01/2028) | | | 805,000 | | | | 871,343 | | | | |
| 5.000%, 06/01/2039 (Callable 06/01/2029) | | | 800,000 | | | | 870,787 | | | | |
| 5.000%, 07/01/2042 (Callable 07/01/2028) | | | 1,330,000 | | | | 1,402,067 | | | | |
| Tacoma Metropolitan Park District: | | | | | | | | | | | |
| 4.000%, 12/01/2024 | | | 1,175,000 | | | | 1,172,453 | | | | |
| 5.000%, 12/01/2024 | | | 1,485,000 | | | | 1,501,842 | | | | |
| 5.000%, 12/01/2024 | | | 570,000 | | | | 576,465 | | | | |
| 5.000%, 12/01/2024 | | | 265,000 | | | | 268,005 | | | | |
| 5.000%, 12/01/2025 | | | 215,000 | | | | 219,814 | | | | |
| 4.000%, 12/01/2028 | | | 2,440,000 | | | | 2,451,905 | | | | |
| 4.000%, 12/01/2029 (Callable 12/01/2028) | | | 1,735,000 | | | | 1,747,180 | | | | |
| 4.000%, 12/01/2030 (Callable 12/01/2026) | | | 550,000 | | | | 552,702 | | | | |
| 4.000%, 12/01/2030 (Callable 12/01/2028) | | | 795,000 | | | | 800,987 | | | | |
| 5.000%, 12/01/2033 (Callable 12/01/2026) | | | 500,000 | | | | 517,893 | | | | |
| 5.000%, 12/01/2033 (Callable 12/01/2027) | | | 385,000 | | | | 402,639 | | | | |
| 5.000%, 12/01/2035 (Callable 12/01/2027) | | | 335,000 | | | | 346,096 | | | | |
| 5.000%, 12/01/2036 (Callable 12/01/2027) | | | 500,000 | | | | 513,926 | | | | |
| Washington Health Care Facilities Authority: | | | | | | | | | | | |
| 5.000%, 10/01/2027 | | | 2,510,000 | | | | 2,654,778 | | | | |
| 5.000%, 07/01/2032 (Callable 01/01/2028) | | | 895,000 | | | | 899,660 | | | | |
| 5.000%, 08/15/2037 (Callable 02/15/2028) | | | 3,015,000 | | | | 3,081,636 | | | | |
| Washington State Housing | | | | | | | | | | | |
| Finance Commission: | | | | | | | | | | | |
| 2.400%, 06/01/2025 (Insured by GNMA) | | | 810,000 | | | | 791,126 | | | | |
| 3.700%, 12/01/2033 (Callable 06/01/2024) | | | 20,000 | | | | 19,896 | | | | |
| 4.000%, 06/01/2049 (Callable 06/01/2028) | | | 385,000 | | | | 381,834 | | | | |
| Western Washington University: | | | | | | | | | | | |
| 4.000%, 05/01/2028 (Insured by BAM) | | | 320,000 | | | | 330,619 | | | | |
| 4.000%, 05/01/2029 (Insured by BAM) | | | 345,000 | | | | 357,539 | | | | |
| 4.000%, 05/01/2030 (Insured by BAM) | | | 530,000 | | | | 551,829 | | | | |
| Total Washington | | | | | | | | | | | |
| (Cost $41,994,964) | | | | | | | 40,653,893 | | | | 1.6 | % |
| West Virginia | | | | | | | | | | | | |
| Glenville State University, | | | | | | | | | | | | |
| 4.000%, 06/01/2027 | | | 1,220,000 | | | | 1,164,656 | | | | | |
| West Virginia Economic | | | | | | | | | | | | |
| Development Authority, | | | | | | | | | | | | |
| 3.750%, 12/01/2042 | | | | | | | | | | | | |
(Mandatory Tender Date 06/01/2025)(1) | | | 2,500,000 | | | | 2,486,016 | | | | | |
| West Virginia Hospital Finance Authority, | | | | | | | | | | | | |
| 4.000%, 06/01/2029 | | | | | | | | | | | | |
| (Callable 06/01/2026) | | | 445,000 | | | | 452,604 | | | | | |
| Total West Virginia | | | | | | | | | | | | |
| (Cost $4,125,096) | | | | | | | 4,103,276 | | | | 0.2 | % |
| Wisconsin | | | | | | | | | | | | |
| City of Milwaukee WI, | | | | | | | | | | | | |
| 5.000%, 04/01/2024 | | | 3,695,000 | | | | 3,726,245 | | | | | |
| County of Waushara WI, | | | | | | | | | | | | |
| 4.500%, 06/01/2027 (Callable 06/01/2025) | | | 2,260,000 | | | | 2,312,824 | | | | | |
| Oak Creek-Franklin Joint School District, | | | | | | | | | | | | |
| 3.150%, 04/01/2028 (Callable 04/01/2025) | | | 5,140,000 | | | | 5,138,917 | | | | | |
| Prescott School District, | | | | | | | | | | | | |
| 4.000%, 03/01/2037 (Callable 03/01/2030) | | | 1,500,000 | | | | 1,521,393 | | | | | |
| Public Finance Authority: | | | | | | | | | | | | |
5.000%, 10/01/2023(3) | | | 2,125,000 | | | | 2,123,657 | | | | | |
5.000%, 10/01/2024(3) | | | 2,725,000 | | | | 2,721,554 | | | | | |
3.000%, 04/01/2025(3) | | | 135,000 | | | | 130,702 | | | | | |
| 5.000%, 06/15/2025 | | | 220,000 | | | | 222,087 | | | | | |
| 3.000%, 03/01/2026 | | | | | | | | | | | | |
(Callable 07/31/2023)(3) | | | 1,250,000 | | | | 1,212,940 | | | | | |
| 0.000%, 09/01/2028 | | | | | | | | | | | | |
| (Pre-refunded to 09/01/2026) | | | 130,000 | | | | 108,629 | | | | | |
5.000%, 10/01/2029(3) | | | 1,000,000 | | | | 1,011,137 | | | | | |
| 5.000%, 07/01/2030 | | | 1,110,000 | | | | 1,169,032 | | | | | |
| 5.000%, 03/01/2031 (Callable 03/01/2026) | | | 440,000 | | | | 458,764 | | | | | |
4.000%, 04/01/2032(3) | | | 900,000 | | | | 858,329 | | | | | |
| 5.000%, 10/01/2034 | | | | | | | | | | | | |
(Callable 10/01/2029)(3) | | | 2,750,000 | | | | 2,762,955 | | | | | |
| 5.000%, 07/01/2035 | | | | | | | | | | | | |
| (Callable 07/01/2028) (Insured by AGM) | | | 400,000 | | | | 422,566 | | | | | |
| 4.000%, 04/01/2042 | | | | | | | | | | | | |
(Callable 04/01/2032)(3) | | | 800,000 | | | | 670,624 | | | | | |
| 4.000%, 04/01/2042 | | | | | | | | | | | | |
(Pre-refunded to 04/01/2032)(3) | | | 50,000 | | | | 55,008 | | | | | |
| 5.000%, 10/01/2044 (Callable 04/01/2029) | | | 1,750,000 | | | | 1,806,487 | | | | | |
| 4.000%, 04/01/2052 | | | | | | | | | | | | |
(Callable 04/01/2032)(3) | | | 955,000 | | | | 735,627 | | | | | |
| 4.000%, 04/01/2052 | | | | | | | | | | | | |
(Pre-refunded to 04/01/2032)(3) | | | 45,000 | | | | 49,507 | | | | | |
| University of Wisconsin Hospitals & Clinics: | | | | | | | | | | | | |
| 5.000%, 04/01/2036 (Callable 10/01/2028) | | | 465,000 | | | | 501,208 | | | | | |
| 5.000%, 04/01/2043 (Callable 10/01/2028) | | | 2,140,000 | | | | 2,216,542 | | | | | |
| Village of Mount Pleasant WI: | | | | | | | | | | | | |
| 4.000%, 04/01/2035 (Callable 04/01/2028) | | | 1,795,000 | | | | 1,850,358 | | | | | |
| 5.000%, 04/01/2036 (Callable 04/01/2028) | | | 1,000,000 | | | | 1,071,005 | | | | | |
| 4.000%, 04/01/2037 (Callable 04/01/2028) | | | 1,000,000 | | | | 1,011,262 | | | | | |
| 5.000%, 04/01/2038 (Callable 04/01/2028) | | | 1,000,000 | | | | 1,065,096 | | | | | |
| 5.000%, 04/01/2048 (Callable 04/01/2028) | | | 565,000 | | | | 578,661 | | | | | |
| 5.000%, 04/01/2048 | | | | | | | | | | | | |
| (Callable 04/01/2028) (Insured by BAM) | | | 2,875,000 | | | | 2,956,893 | | | | | |
| Whitehall School District, | | | | | | | | | | | | |
| 4.000%, 03/01/2031 | | | | | | | | | | | | |
| (Callable 03/01/2030) (Insured by AGM) | | | 600,000 | | | | 620,052 | | | | | |
| Wisconsin Center District: | | | | | | | | | | | | |
| 5.250%, 12/15/2023 | | | | | | | | | | | | |
| (ETM) (Insured by AGM) | | | 40,000 | | | | 40,116 | | | | | |
| 5.250%, 12/15/2023 (Insured by AGM) | | | 630,000 | | | | 634,367 | | | | | |
| 0.000%, 12/15/2027 (Insured by AGM) | | | 525,000 | | | | 447,720 | | | | | |
| 0.000%, 12/15/2027 (Insured by NATL) | | | 220,000 | | | | 186,799 | | | | | |
| 5.000%, 12/15/2027 | | | | | | | | | | | | |
| (Callable 06/15/2026) | | | 500,000 | | | | 525,280 | | | | | |
| 0.000%, 12/15/2028 (Insured by AGM) | | | 1,045,000 | | | | 860,785 | | | | | |
| 0.000%, 12/15/2028 (Insured by AGM) | | | 255,000 | | | | 210,048 | | | | | |
| 5.000%, 12/15/2028 | | | | | | | | | | | | |
| (Callable 06/15/2026) | | | 345,000 | | | | 362,840 | | | | | |
| 0.000%, 12/15/2029 (Insured by AGM) | | | 315,000 | | | | 249,426 | | | | | |
| 0.000%, 12/15/2030 (Insured by AGM) | | | 1,325,000 | | | | 1,005,255 | | | | | |
| 0.000%, 12/15/2030 (Insured by AGM) | | | 460,000 | | | | 348,994 | | | | | |
| 5.000%, 12/15/2030 (Callable 06/15/2026) | | | 500,000 | | | | 525,855 | | | | | |
| 0.000%, 12/15/2031 | | | 50,000 | | | | 36,295 | | | | | |
| 5.000%, 12/15/2031 (Callable 06/15/2026) | | | 440,000 | | | | 462,753 | | | | | |
| 0.000%, 12/15/2034 | | | | | | | | | | | | |
| (Callable 12/15/2030) (Insured by AGM) | | | 615,000 | | | | 387,329 | | | | | |
| 0.000%, 12/15/2035 | | | | | | | | | | | | |
| (Callable 06/15/2026) (Insured by BAM) | | | 300,000 | | | | 179,112 | | | | | |
| 0.000%, 12/15/2035 | | | | | | | | | | | | |
| (Callable 12/15/2030) (Insured by AGM) | | | 2,780,000 | | | | 1,659,770 | | | | | |
| 5.250%, 12/15/2061 | | | | | | | | | | | | |
(Callable 12/15/2030)(3) | | | 1,000,000 | | | | 1,001,190 | | | | | |
The accompanying notes are an integral part of these financial statements.
Baird Core Intermediate Municipal Bond Fund
Schedule of Investments, June 30, 2023 (Unaudited)
Long-Term Investments (cont.)
| | | Principal | | | | | | % of | |
| | | Amount | | | Value | | | Net Assets | |
| Wisconsin Health & Educational | | | | | | | | | |
| Facilities Authority: | | | | | | | | | |
| 5.000%, 07/01/2023 | | $ | 165,000 | | | $ | 165,000 | | | | |
| 5.000%, 11/01/2023 | | | 125,000 | | | | 124,635 | | | | |
| 5.000%, 03/01/2024 | | | 945,000 | | | | 938,859 | | | | |
| 5.000%, 07/01/2024 | | | 250,000 | | | | 253,237 | | | | |
| 5.000%, 11/01/2024 | | | 155,000 | | | | 153,199 | | | | |
| 5.000%, 03/01/2025 (Callable 03/01/2024) | | | 840,000 | | | | 828,756 | | | | |
| 5.000%, 11/01/2025 | | | 245,000 | | | | 239,896 | | | | |
| 5.000%, 12/01/2025 | | | 135,000 | | | | 139,589 | | | | |
| 5.000%, 03/01/2026 (Callable 03/01/2024) | | | 820,000 | | | | 801,496 | | | | |
| 5.000%, 07/01/2026 (Callable 07/01/2024) | | | 50,000 | | | | 50,756 | | | | |
| 5.000%, 12/01/2026 (Callable 11/01/2024) | | | 1,190,000 | | | | 1,209,765 | | | | |
| 5.000%, 03/01/2027 (Callable 03/01/2024) | | | 1,095,000 | | | | 1,076,479 | | | | |
| 5.000%, 10/01/2027 | | | 250,000 | | | | 269,320 | | | | |
| 5.000%, 02/15/2028 (Callable 02/15/2027) | | | 575,000 | | | | 596,459 | | | | |
| 5.000%, 02/15/2028 (Insured by AGM) | | | 3,205,000 | | | | 3,437,430 | | | | |
| 5.000%, 03/01/2028 (Callable 03/01/2024) | | | 830,000 | | | | 815,835 | | | | |
| 5.000%, 08/15/2028 (Callable 08/15/2023) | | | 1,025,000 | | | | 1,026,053 | | | | |
| 5.000%, 11/01/2028 (Callable 11/01/2026) | | | 470,000 | | | | 447,787 | | | | |
| 5.000%, 12/01/2028 (Callable 11/01/2026) | | | 395,000 | | | | 414,323 | | | | |
| 5.000%, 10/01/2029 | | | 555,000 | | | | 615,769 | | | | |
| 5.000%, 11/01/2030 (Callable 11/01/2026) | | | 515,000 | | | | 482,766 | | | | |
| 5.000%, 12/15/2030 (Callable 12/15/2024) | | | 480,000 | | | | 488,387 | | | | |
| 5.000%, 04/01/2031 (Callable 04/01/2027) | | | 250,000 | | | | 265,337 | | | | |
| 5.000%, 10/01/2031 (Callable 10/01/2029) | | | 250,000 | | | | 273,830 | | | | |
| 4.000%, 11/15/2034 (Callable 05/15/2026) | | | 1,000,000 | | | | 1,011,544 | | | | |
| 4.000%, 08/15/2037 (Callable 08/15/2027) | | | 1,905,000 | | | | 1,910,441 | | | | |
| 4.375%, 06/01/2039 (Callable 07/31/2023) | | | 230,000 | | | | 227,362 | | | | |
| 5.000%, 12/15/2039 (Callable 12/15/2024) | | | 1,450,000 | | | | 1,462,691 | | | | |
| 5.000%, 12/15/2044 (Callable 12/15/2024) | | | 675,000 | | | | 678,836 | | | | |
| 5.000%, 12/01/2045 (Callable 12/01/2032) | | | 2,000,000 | | | | 2,078,759 | | | | |
| 4.000%, 11/15/2046 (Callable 05/15/2026) | | | 475,000 | | | | 451,481 | | | | |
| 5.250%, 12/01/2048 (Callable 12/01/2032) | | | 3,000,000 | | | | 3,180,990 | | | | |
| 5.000%, 02/15/2051 (Callable 08/15/2026) | | | | | | | | | | | |
(Mandatory Tender Date 02/15/2027)(1) | | | 2,300,000 | | | | 2,364,867 | | | | |
| 5.000%, 02/15/2052(Callable 08/15/2024) | | | | | | | | | | | |
(Mandatory Tender Date 02/15/2025)(1) | | | 1,000,000 | | | | 1,010,866 | | | | |
| Wisconsin Housing & Economic | | | | | | | | | | | |
| Development Authority: | | | | | | | | | | | |
| 4.000%, 03/01/2048 | | | | | | | | | | | |
| (Callable 03/01/2027) (Insured by FNMA) | | | 2,805,000 | | | | 2,786,869 | | | | |
| 4.250%, 03/01/2049 | | | | | | | | | | | |
| (Callable 09/01/2028) (Insured by FNMA) | | | 1,130,000 | | | | 1,128,038 | | | | |
| 0.500%, 11/01/2050 | | | | | | | | | | | |
| (Callable 07/21/2023) (Mandatory Tender | | | | | | | | | | | |
Date 11/01/2024) (Insured by HUD)(1) | | | 1,185,000 | | | | 1,120,411 | | | | |
| 3.750%, 05/01/2054 | | | | | | | | | | | |
| (Callable 05/01/2025) (Mandatory Tender | | | | | | | | | | | |
Date 11/01/2026) (Insured by HUD)(1) | | | 2,000,000 | | | | 1,999,992 | | | | |
| Total Wisconsin | | | | | | | | | | | |
| (Cost $89,572,200) | | | | | | | 86,742,105 | | | | 3.3 | % |
| Wyoming | | | | | | | | | | | | |
| County of Laramie WY: | | | | | | | | | | | | |
| 4.000%, 05/01/2030 | | | 720,000 | | | | 752,821 | | | | | |
| 4.000%, 05/01/2032 (Callable 05/01/2031) | | | 525,000 | | | | 540,759 | | | | | |
| 4.000%, 05/01/2034 (Callable 05/01/2031) | | | 500,000 | | | | 511,958 | | | | | |
| 4.000%, 05/01/2036 (Callable 05/01/2031) | | | 600,000 | | | | 606,978 | | | | | |
| 4.000%, 05/01/2037 (Callable 05/01/2031) | | | 225,000 | | | | 223,967 | | | | | |
| Sublette County Hospital District, | | | | | | | | | | | | |
5.000%, 06/15/2026(6) | | | 4,500,000 | | | | 4,500,232 | | | | | |
| Wyoming Community | | | | | | | | | | | | |
| Development Authority: | | | | | | | | | | | | |
| 3.000%, 12/01/2044 | | | | | | | | | | | | |
| (Callable 06/01/2024) | | | 15,000 | | | | 14,866 | | | | | |
| 4.000%, 12/01/2048(Callable 06/01/2028) | | | 1,025,000 | | | | 1,016,571 | | | | | |
| Total Wyoming | | | | | | | | | | | | |
| (Cost $8,560,070) | | | | | | | 8,168,152 | | | | 0.3 | % |
| Total Municipal Bonds | | | | | | | | | | | | |
| (Cost $2,640,475,329) | | | | | | | 2,585,083,935 | | | | 98.4 | % |
| Total Long-Term Investments | | | | | | | | | | | | |
| (Cost $2,665,417,712) | | | | | | | 2,609,592,724 | | | | 99.3 | % |
| Short-Term Investments | | | | | | | | | | | | |
| | | Shares | | | | | | | | | |
| Money Market Mutual Funds | | | | | | | | | | | | |
| Federated Hermes Institutional Tax-Free | | | | | | | | | | | | |
Cash Trust, Premier Shares, 4.04%(4) | | | 4,787,870 | | | | 4,787,870 | | | | | |
| First American Government Obligations | | | | | | | | | | | | |
Fund, Class U, 5.03%(4) | | | 372,292 | | | | 372,292 | | | | | |
| Total Short-Term Investments | | | | | | | | | | | | |
| (Cost $5,160,162) | | | | | | | 5,160,162 | | | | 0.2 | % |
| Total Investments | | | | | | | | | | | | |
| (Cost $2,670,577,874) | | | | | | | 2,614,752,886 | | | | 99.5 | % |
| Other Assets in Excess of Liabilities | | | | | | | 13,519,684 | | | | 0.5 | % |
| TOTAL NET ASSETS | | | | | | $ | 2,628,272,570 | | | | 100.0 | % |
Notes to Schedule of Investments
AGC – Assured Guaranty Corp.
AGM – Assured Guaranty Municipal
AMBAC – Ambac Assurance Corp.
BAM – Build America Mutual Assurance Co.
BHAC – Berkshire Hathaway Assurance Corp.
FHA – Federal Housing Administration
FHLMC – Federal Home Loan Mortgage Corporation
FNMA – Federal National Mortgage Association
GNMA – Government National Mortgage Association
HUD – US Department of Housing and Development
NATL – National Public Finance Guarantee Corp.
Q-SBLF – Qualified School Building Loan Fund
SCH BD GTY – School Board Guaranty
SD CRED PROG – State Credit Enhancement Program
SONYMA – State of New York Mortgage Agency
SCSDE – South Carolina School District
ST AID – State Aid Intercept/Withholding
USDA – USDA OneRD Guarantee
UT CSCE – Utah Charter School Credit Enhancement Program
XLCA – XL Capital Assurance, Inc.
ETM – Escrowed to Maturity
LIBOR – London Inter-bank Offered Rate
PSF – Permanent School Fund
SIFMA – Securities Industry and Financial Markets Association
SOFR – Secured Overnight Financing Rate
(1) | Variable rate security. The rate reported is the rate in effect as of June 30, 2023. |
(2) | Variable rate security based on a reference index and spread. The rate reported is the rate as of the last reset date in effect as of June 30, 2023. |
(3) | Includes securities exempt from registration under Rule 144A of the Securities Act of 1933. These securities may be resold in transactions exempt from registration to qualified institutional buyers. At June 30, 2023, the value of these securities totaled $96,425,909, which represented 3.67% of total net assets. |
(4) | Seven-day yield. |
(5) | Step-up bond; the interest rate shown is the rate in effect as of June 30, 2023. |
(6) | Security or a portion of the security purchased on a when-issued or delayed delivery basis. |
The accompanying notes are an integral part of these financial statements.
Baird Core Intermediate Municipal Bond Fund
Schedule of Investments, June 30, 2023 (Unaudited)
Summary of Fair Value Exposure at June 30, 2023 (Unaudited)
The Fund has adopted authoritative fair valuation accounting standards which establish a definition of fair value and set out a hierarchy for measuring fair value. These standards require additional disclosures about the various inputs and valuation techniques used to develop the measurements of fair value and a discussion on changes in valuation techniques and related inputs during the period. These standards define fair value as the price that would be received to sell an asset or paid to transfer a liability in an orderly transaction between market participants at the measurement date.
The fair value hierarchy is organized into three levels based upon the assumptions (referred to as “inputs”) used in pricing the asset or liability. These standards state that “observable inputs” reflect the assumptions market participants would use in pricing the asset or liability based on market data obtained from independent sources and “unobservable inputs” reflect an entity’s own assumptions about the assumptions market participants would use in pricing the asset or liability. These inputs are summarized into three broad levels and described below:
Level 1 – Quoted prices (unadjusted) in active markets for identical assets or liabilities that the reporting entity can access at the measurement date.
Level 2 – Inputs other than quoted prices included within Level 1 that are observable for the asset or liability, either directly or indirectly.
Level 3 – Unobservable inputs for the asset or liability.
The inputs or methodology used for valuing securities are not necessarily an indication of the risk associated with investing in those securities.
The following is a summary of the inputs used to value the Fund’s investments as of June 30, 2023:
| | | Level 1 | | | Level 2 | | | Level 3 | | | Total | |
| Long-Term Investments | | | | | | | | | | | | |
| U.S. Treasury Security | | $ | — | | | $ | 24,508,789 | | | $ | — | | | $ | 24,508,789 | |
| Municipal Bonds | | | — | | | | 2,585,083,935 | | | | — | | | | 2,585,083,935 | |
| Total Long-Term Investments | | | — | | | | 2,609,592,724 | | | | — | | | | 2,609,592,724 | |
| Short-Term Investments | | | | | | | | | | | | | | | | |
| Money Market Mutual Funds | | | 5,160,162 | | | | — | | | | — | | | | 5,160,162 | |
| Total Short-Term Investments | | | 5,160,162 | | | | — | | | | — | | | | 5,160,162 | |
| Total Investments | | $ | 5,160,162 | | | $ | 2,609,592,724 | | | $ | — | | | $ | 2,614,752,886 | |
Changes in valuation techniques may result in transfers into or out of assigned levels within the fair value hierarchy. There were no transfers into or out of Level 3 during the reporting period, as compared to the security classifications from the prior year’s annual report. See the Fund’s Valuation Policy in Note 2a to the financial statements.
The accompanying notes are an integral part of these financial statements.
Baird Municipal Bond Fund
June 30, 2023 (Unaudited)
Portfolio Characteristics
Quality Distribution(1)(2)

| | Net Assets | $125,828,261 | |
| | | | |
| | SEC 30-Day Yield(4) | | |
| | Institutional Class | 3.80% | |
| | Investor Class | 3.55% | |
| | | | |
| | Average Effective Duration | 6.15 years | |
| | | | |
| | Average Effective Maturity | 7.31 years | |
| | | | |
| | Annualized Expense Ratio(5) | | |
| | Institutional Class | 0.30% | |
| | Investor Class | 0.55% | (6) |
| | | | |
| | Portfolio Turnover Rate | 39% | (7) |
| | | | | |
Sector Weightings(1) | | Number of Holdings | 349 | |
| | | | | |
 | | | | |
 |
(1) | Percentages shown are based on the Fund’s total investments. |
(2) | The quality profile is calculated on a market value-weighted basis using the highest credit quality rating for each security held by the Fund given by S&P, Moody’s or Fitch, each of which is a Nationally Recognized Statistical Rating Organization (NRSRO). NRSROs rate the credit quality of securities using a scale that generally ranges from AAA (highest) to D (lowest). |
(3) | Includes pre-refunded and escrowed-to-maturity (ETM) bonds. |
(4) | SEC yields are based on SEC guidelines and are calculated for the 30 days ended June 30, 2023. |
(5) | Reflects expense ratios as stated in the Fund’s current prospectus dated May 1, 2023. |
(6) | Includes 0.25% 12b-1 fee. |
(7) | Not annualized. |
Baird Municipal Bond Fund
June 30, 2023 (Unaudited)
Total Returns
| | | | Average Annual |
| | Six | One | Three | Since |
| For the Periods Ended June 30, 2023 | Months | Year | Years | Inception(1) |
| Institutional Class Shares | 3.00% | 3.72% | 0.98% | 2.51% |
| Investor Class Shares | 2.88% | 3.57% | 0.74% | 2.26% |
Bloomberg Municipal Index(2) | 2.67% | 3.19% | -0.58%
| 0.32% |
(1) | For the period from November 15, 2019 (inception date) through June 30, 2023. |
(2) | The Bloomberg Municipal Index is considered representative of the broad market for investment grade, tax-exempt bonds with a maturity of at least one year. The Index has four main sectors: state and local general obligation bonds, revenue bonds, insured bonds and pre-refunded bonds. This Index does not reflect any deduction for fees, expenses or taxes. A direct investment in an index is not possible. |
The returns table shown above reflects reinvestment of dividends and/or capital gains distributions in additional shares. The returns in the table do not reflect the deduction of taxes that a shareholder would pay on Fund distributions or the redemption of Fund shares. The returns reflect the actual performance for each period and do not include the impact of trades executed on the last business day of the period that were recorded on the first business day of the next period.
The Fund’s expense ratio for each Class, as reflected in the Fund’s current prospectus, is set forth under “Portfolio Characteristics”.
The Fund may invest up to 15% of its net assets in non-investment grade debt securities (commonly referred to as “high yield” bonds). While these types of debt securities typically offer higher yields than investment grade securities, they also include greater risks including increased credit risk and the increased risk of default or bankruptcy. The Fund may invest up to 25% of its total assets in municipal obligations issued by persons in the same state. As a result, changes in economic, business or political conditions of a particular state may have a disproportionate impact on the Fund’s share price. Municipal securities investments are not appropriate for all investors, especially those taxed at lower rates.
U.S. and international markets have experienced significant periods of volatility in recent years and months due to a number of economic, political and global macro factors. Russia’s ongoing war with Ukraine has heightened global geopolitical tensions, resulting in an elevated risk environment and increased volatility in asset prices. The uncertain course of the war may have a significant negative impact on the global economy. U.S. relations with China have become increasingly strained, and tension between the U.S. and China may have a significant negative impact on the global economy and asset prices. Measures of inflation reached levels not experienced in several decades, leading the Federal Reserve to raise short term interest rates significantly over the last year, with the potential for further rate increases in 2023. Uncertainty regarding the ability of the Federal Reserve to successfully control inflation, the potential for incremental rate increases, and the full impact of prior rate increases on the economy may negatively impact asset prices and increase market volatility. The possibility of a U.S. or global recession may also contribute to market volatility. The coronavirus (COVID-19) pandemic caused significant economic disruption in recent years as countries worked to limit the negative health impacts of the virus. While the virus has entered an endemic stage, significant outbreaks or new variants present a continued risk to the global economy. These and other geopolitical events may cause market disruptions and could have an adverse effect on the value of the Fund’s investments.
Past performance does not guarantee future results. Investment return and principal value will fluctuate so that an investor’s shares, when redeemed, may be worth more or less than their original cost.
For information about the performance of the Fund as of the most recent month-end, please call 1-866-442-2473 or visit www.bairdfunds.com. Mutual fund performance changes over time and current performance may be lower or higher than that stated.
Baird Municipal Bond Fund
Schedule of Investments, June 30, 2023 (Unaudited)
Long-Term Investments
| | | Principal | | | | | | % of | |
| | | Amount | | | Value | | | Net Assets | |
| Municipal Bonds | | | | | | | | | |
| Alabama | | | | | | | | | |
| Alabama Corrections Institution | | | | | | | | | |
| Finance Authority, | | | | | | | | | |
| 5.000%, 07/01/2037 | | | | | | | | | |
| (Callable 07/01/2032) | | $ | 500,000 | | | $ | 551,156 | | | | |
| Alabama Special Care Facilities | | | | | | | | | | | |
| Financing Authority, | | | | | | | | | | | |
| 5.000%, 06/01/2026 (Callable 06/01/2025) | | | 110,000 | | | | 112,946 | | | | |
| Black Belt Energy Gas District: | | | | | | | | | | | |
| 4.000%, 12/01/2049 (Callable 09/01/2025) | | | | | | | | | | | |
(Mandatory Tender Date 12/01/2025)(1) | | | 100,000 | | | | 99,416 | | | | |
| 5.000%, 05/01/2053 | | | | | | | | | | | |
(Mandatory Tender Date 06/01/2028)(1) | | | 750,000 | | | | 785,123 | | | | |
| Chilton County Health Care Authority, | | | | | | | | | | | |
| 3.000%, 11/01/2027 (Callable 11/01/2025) | | | 100,000 | | | | 96,914 | | | | |
| Industrial Development | | | | | | | | | | | |
| Board of the City of Mobile, | | | | | | | | | | | |
| 3.920%, 06/01/2034 | | | | | | | | | | | |
(Mandatory Tender Date 06/02/2026)(1) | | | 600,000 | | | | 600,000 | | | | |
| Jacksonville State University, | | | | | | | | | | | |
| 5.000%, 12/01/2036 | | | | | | | | | | | |
| (Callable 12/01/2027) (Insured by AGM) | | | 500,000 | | | | 537,967 | | | | |
| Southeast Alabama Gas Supply District, | | | | | | | | | | | |
| 4.000%, 06/01/2049(Callable 03/01/2024) | | | | | | | | | | | |
(Mandatory Tender Date 06/01/2024)(1) | | | 370,000 | | | | 369,284 | | | | |
| Southeast Energy Authority | | | | | | | | | | | |
| A Cooperative District: | | | | | | | | | | | |
| 5.500%, 01/01/2053(Callable 09/01/2029) | | | | | | | | | | | |
(Mandatory Tender Date 12/01/2029)(1) | | | 250,000 | | | | 265,837 | | | | |
| 5.000%, 05/01/2053(Callable 05/01/2028) | | | | | | | | | | | |
(Mandatory Tender Date 08/01/2028)(1) | | | 250,000 | | | | 258,467 | | | | |
| 5.250%, 01/01/2054(Callable 04/01/2029) | | | | | | | | | | | |
(Mandatory Tender Date 07/01/2029)(1) | | | 500,000 | | | | 522,798 | | | | |
| Total Alabama | | | | | | | | | | | |
| (Cost $4,167,222) | | | | | | | 4,199,908 | | | | 3.3 | % |
| Alaska | | | | | | | | | | | | |
| CIVIC Ventures, | | | | | | | | | | | | |
| 5.000%, 09/01/2027 (Callable 09/01/2025) | | | 200,000 | | | | 202,112 | | | | | |
| Total Alaska | | | | | | | | | | | | |
| (Cost $207,433) | | | | | | | 202,112 | | | | 0.2 | % |
| Arizona | | | | | | | | | | | | |
| Arizona Industrial Development Authority: | | | | | | | | | | | | |
5.000%, 07/01/2026(3) | | | 415,000 | | | | 416,216 | | | | | |
| 5.000%, 10/01/2030 | | | | | | | | | | | | |
(Callable 10/01/2026)(3) | | | 100,000 | | | | 93,408 | | | | | |
| 4.000%, 07/01/2032 (Callable 01/01/2028) | | | | | | | | | | | | |
| (Insured by SD CRED PROG) | | | 100,000 | | | | 99,185 | | | | | |
| 3.625%, 05/20/2033 | | | 700,958 | | | | 652,539 | | | | | |
| Glendale Industrial Development Authority: | | | | | | | | | | | | |
| 4.000%, 05/15/2027 (Callable 05/15/2024) | | | 175,000 | | | | 168,084 | | | | | |
| 2.125%, 07/01/2033 (Callable 07/01/2029) | | | 685,000 | | | | 562,738 | | | | | |
| Industrial Development | | | | | | | | | | | | |
| Authority of the County of Pima, | | | | | | | | | | | | |
| 4.000%, 07/01/2029 | | | 25,000 | | | | 24,631 | | | | | |
| Maricopa County Industrial | | | | | | | | | | | | |
| Development Authority, | | | | | | | | | | | | |
| 6.000%, 07/01/2043 | | | | | | | | | | | | |
(Callable 07/01/2030)(3) | | | 500,000 | | | | 502,254 | | | | | |
| Salt Verde Financial Corp., | | | | | | | | | | | | |
| 5.250%, 12/01/2023 | | | 290,000 | | | | 291,008 | | | | | |
| Total Arizona | | | | | | | | | | | | |
| (Cost $2,873,092) | | | | | | | 2,810,063 | | | | 2.2 | % |
| Arkansas | | | | | | | | | | | | |
| Arkansas Development Finance Authority, | | | | | | | | | | | | |
| 3.490%, 09/01/2044 (Callable 07/03/2023) | | | | | | | | | | | | |
(Optional Put Date 07/07/2023)(1) | | | 500,000 | | | | 500,000 | | | | | |
| Batesville Public Facilities Board, | | | | | | | | | | | | |
| 5.000%, 06/01/2026 | | | 150,000 | | | | 154,102 | | | | | |
| City of Heber Springs AR, | | | | | | | | | | | | |
| 1.625%, 06/01/2047 (Callable 06/01/2028) | | | 190,000 | | | | 171,525 | | | | | |
| City of West Memphis AR, | | | | | | | | | | | | |
| 3.000%, 12/01/2041 | | | | | | | | | | | | |
| (Callable 12/01/2028) (Insured by BAM) | | | 380,000 | | | | 313,053 | | | | | |
| Total Arkansas | | | | | | | | | | | | |
| (Cost $1,159,441) | | | | | | | 1,138,680 | | | | 0.9 | % |
| California | | | | | | | | | | | | |
| Brea Redevelopment Agency, | | | | | | | | | | | | |
| 0.000%, 08/01/2036 | | | | | | | | | | | | |
(Callable 08/01/2027)(5) | | | 145,000 | | | | 153,301 | | | | | |
| California Community | | | | | | | | | | | | |
| Choice Financing Authority, | | | | | | | | | | | | |
| 5.250%, 01/01/2054 (Callable 10/01/2030) | | | | | | | | | | | | |
(Mandatory Tender Date 10/01/2031)(1) | | | 200,000 | | | | 209,220 | | | | | |
| California Community | | | | | | | | | | | | |
| College Financing Authority, | | | | | | | | | | | | |
| 5.750%, 07/01/2060 | | | | | | | | | | | | |
(Callable 07/01/2032)(3) | | | 350,000 | | | | 342,567 | | | | | |
| California Housing Finance Agency: | | | | | | | | | | | | |
| 3.750%, 03/25/2035 (Insured by FHLMC) | | | 489,282 | | | | 475,507 | | | | | |
| 4.375%, 09/20/2036 | | | 499,737 | | | | 498,702 | | | | | |
| California Pollution Control Financing Authority, | | | | | | | | | | | | |
5.000%, 07/01/2029(3) | | | 250,000 | | | | 261,319 | | | | | |
| California Public Finance Authority, | | | | | | | | | | | | |
| 2.375%, 11/15/2028 | | | | | | | | | | | | |
(Callable 07/21/2023)(3) | | | 275,000 | | | | 263,374 | | | | | |
| California Statewide Communities | | | | | | | | | | | | |
| Development Authority, | | | | | | | | | | | | |
| 4.000%, 04/01/2036 (Callable 04/01/2030) | | | 500,000 | | | | 502,759 | | | | | |
| City of Los Angeles Department of Airports, | | | | | | | | | | | | |
| 5.000%, 05/15/2033 (Callable 05/15/2029) | | | 500,000 | | | | 540,417 | | | | | |
| City of Vernon CA, | | | | | | | | | | | | |
| 5.000%, 08/01/2025 | | | 500,000 | | | | 508,646 | | | | | |
| El Rancho Unified School District, | | | | | | | | | | | | |
| 0.000%, 08/01/2031 | | | | | | | | | | | | |
(Callable 08/01/2028) (Insured by AGM)(5) | | | 115,000 | | | | 135,249 | | | | | |
| Freddie Mac Multifamily ML Certificates, | | | | | | | | | | | | |
4.140%, 01/25/2040(5) | | | 499,674 | | | | 464,366 | | | | | |
| Freddie Mac Multifamily | | | | | | | | | | | | |
| Variable Rate Certificate, | | | | | | | | | | | | |
| 2.875%, 07/25/2036 | | | 739,359 | | | | 646,534 | | | | | |
| Grossmont Union High School District, | | | | | | | | | | | | |
| 0.000%, 08/01/2032 | | | 320,000 | | | | 231,339 | | | | | |
| Los Alamitos Unified School District, | | | | | | | | | | | | |
| 0.000%, 08/01/2042 | | | | | | | | | | | | |
(Callable 08/01/2029)(5) | | | 270,000 | | | | 284,167 | | | | | |
| Los Angeles County Development Authority, | | | | | | | | | | | | |
| 5.000%, 07/01/2043 (Callable 04/01/2026) | | | | | | | | | | | | |
| (Mandatory Tender Date 07/01/2026) | | | | | | | | | | | | |
(Insured by HUD)(1) | | | 600,000 | | | | 621,200 | | | | | |
| Los Angeles County Schools Regionalized | | | | | | | | | | | | |
| Business Services Corp., | | | | | | | | | | | | |
| 0.000%, 08/01/2029 (Insured by AMBAC) | | | 35,000 | | | | 27,825 | | | | | |
| Mayers Memorial Hospital District: | | | | | | | | | | | | |
| 0.000%, 08/01/2029 | | | 160,000 | | | | 121,819 | | | | | |
| 0.000%, 08/01/2030 | | | 360,000 | | | | 262,323 | | | | | |
The accompanying notes are an integral part of these financial statements.
Baird Municipal Bond Fund
Schedule of Investments, June 30, 2023 (Unaudited)
Long-Term Investments (cont.)
| | | Principal | | | | | | % of | |
| | | Amount | | | Value | | | Net Assets | |
| Morongo Unified School District, | | | | | | | | | |
| 0.000%, 08/01/2041 | | | | | | | | | |
(Callable 08/01/2030)(5) | | $ | 175,000 | | | $ | 172,467 | | | | |
| Newport Mesa Unified School District, | | | | | | | | | | | |
| 6.300%, 08/01/2042 | | | | | | | | | | | |
(Callable 08/01/2031)(5) | | | 35,000 | | | | 42,449 | | | | |
| Oak Park Unified School District, | | | | | | | | | | | |
| 7.100%, 08/01/2038 | | | | | | | | | | | |
(Callable 08/01/2031) (Insured by AGM)(5) | | | 50,000 | | | | 62,059 | | | | |
| Pacifica School District, | | | | | | | | | | | |
| 0.000%, 08/01/2028 (Insured by NATL) | | | 950,000 | | | | 797,178 | | | | |
| Rialto Unified School District: | | | | | | | | | | | |
| 0.000%, 08/01/2043 | | | | | | | | | | | |
(Callable 02/01/2033) (Insured by BAM)(6) | | | 1,045,000 | | | | 406,837 | | | | |
| 0.000%, 08/01/2044 | | | | | | | | | | | |
(Callable 02/01/2033) (Insured by BAM)(6) | | | 1,000,000 | | | | 368,030 | | | | |
| Solano County Community College District, | | | | | | | | | | | |
| 0.000%, 08/01/2030 | | | | | | | | | | | |
(Callable 08/01/2025)(5) | | | 150,000 | | | | 152,339 | | | | |
| Total California | | | | | | | | | | | |
| (Cost $8,562,271) | | | | | | | 8,551,993 | | | | 6.8 | % |
| Colorado | | | | | | | | | | | | |
| Colorado Bridge Enterprise: | | | | | | | | | | | | |
| 4.000%, 12/31/2030 (Callable 12/31/2027) | | | 750,000 | | | | 756,506 | | | | | |
| 4.000%, 06/30/2031 (Callable 12/31/2027) | | | 250,000 | | | | 252,118 | | | | | |
| Colorado Educational & | | | | | | | | | | | | |
| Cultural Facilities Authority: | | | | | | | | | | | | |
| 5.000%, 10/01/2028 (Callable 10/01/2025) | | | 350,000 | | | | 353,173 | | | | | |
| 2.000%, 09/01/2030 (Callable 09/01/2028) | | | 100,000 | | | | 90,305 | | | | | |
| 5.000%, 12/01/2038 (Callable 12/01/2028) | | | 75,000 | | | | 77,996 | | | | | |
| Denver Convention Center Hotel Authority, | | | | | | | | | | | | |
| 5.000%, 12/01/2024 | | | 300,000 | | | | 303,402 | | | | | |
| Denver Housing Authority, | | | | | | | | | | | | |
5.000%, 07/01/2027(6) | | | 500,000 | | | | 519,957 | | | | | |
| Grand River Hospital District, | | | | | | | | | | | | |
| 5.250%, 12/01/2031 | | | | | | | | | | | | |
| (Callable 12/01/2028) (Insured by AGM) | | | 75,000 | | | | 81,414 | | | | | |
| Pueblo Urban Renewal Authority, | | | | | | | | | | | | |
0.000%, 12/01/2025(3) | | | 200,000 | | | | 161,450 | | | | | |
| Regional Transportation District, | | | | | | | | | | | | |
| 4.000%, 07/15/2039 | | | 110,000 | | | | 108,764 | | | | | |
| Vauxmont Metropolitan District: | | | | | | | | | | | | |
| 5.000%, 12/15/2032 | | | | | | | | | | | | |
| (Callable 12/15/2024) (Insured by AGM) | | | 25,000 | | | | 26,343 | | | | | |
| 3.250%, 12/15/2050 | | | | | | | | | | | | |
| (Callable 12/15/2024) (Insured by AGM) | | | 150,000 | | | | 128,558 | | | | | |
| Total Colorado | | | | | | | | | | | | |
| (Cost $2,890,265) | | | | | | | 2,859,986 | | | | 2.3 | % |
| Connecticut | | | | | | | | | | | | |
| Connecticut State Health & | | | | | | | | | | | | |
| Educational Facilities Authority, | | | | | | | | | | | | |
| 4.000%, 07/01/2031 (Callable 07/01/2028) | | | 30,000 | | | | 27,891 | | | | | |
| Total Connecticut | | | | | | | | | | | | |
| (Cost $25,546) | | | | | | | 27,891 | | | | 0.0 | % |
| Florida | | | | | | | | | | | | |
| Brevard County Health Facilities Authority, | | | | | | | | | | | | |
| 5.000%, 04/01/2052 (Callable 04/01/2032) | | | 750,000 | | | | 780,305 | | | | | |
| Capital Trust Agency, Inc.: | | | | | | | | | | | | |
3.375%, 07/01/2031(3) | | | 395,000 | | | | 369,496 | | | | | |
| 6.375%, 05/01/2053 | | | | | | | | | | | | |
(Callable 05/01/2033)(3)(6) | | | 250,000 | | | | 249,639 | | | | | |
| City of Gainesville FL, | | | | | | | | | | | | |
| 5.000%, 10/01/2051 | | | | | | | | | | | | |
| (Callable 10/01/2031) | | | 1,000,000 | | | | 1,066,567 | | | | | |
| City of Sunrise FL, | | | | | | | | | | | | |
| 3.000%, 10/01/2050 (Callable 10/01/2030) | | | 1,000,000 | | | | 729,448 | | | | | |
| City of Tampa FL, | | | | | | | | | | | | |
| 5.000%, 10/01/2047 (Callable 10/01/2032) | | | 1,000,000 | | | | 1,103,033 | | | | | |
| County of Broward FL, | | | | | | | | | | | | |
| 5.000%, 10/01/2026 (Callable 10/01/2025) | | | 350,000 | | | | 357,790 | | | | | |
| County of Pasco FL, | | | | | | | | | | | | |
| 5.000%, 09/01/2048 | | | | | | | | | | | | |
| (Callable 03/01/2033) (Insured by AGM) | | | 500,000 | | | | 535,674 | | | | | |
| Florida Development Finance Corp.: | | | | | | | | | | | | |
| 5.250%, 06/15/2029 | | | | | | | | | | | | |
(Callable 06/15/2027)(3) | | | 500,000 | | | | 494,464 | | | | | |
| 3.000%, 06/01/2032 (Callable 06/01/2024) | | | 500,000 | | | | 397,058 | | | | | |
5.000%, 08/15/2032(3) | | | 455,000 | | | | 450,713 | | | | | |
| Florida Housing Finance Corp., | | | | | | | | | | | | |
| 4.200%, 01/01/2045 | | | | | | | | | | | | |
| (Callable 01/01/2028) (Insured by GNMA) | | | 40,000 | | | | 39,239 | | | | | |
| Mid-Bay Bridge Authority, | | | | | | | | | | | | |
| 5.000%, 10/01/2024 | | | 545,000 | | | | 554,343 | | | | | |
| Orange County Health Facilities Authority, | | | | | | | | | | | | |
| 5.000%, 08/01/2028 | | | | | | | | | | | | |
| (Callable 08/01/2024) | | | 200,000 | | | | 201,287 | | | | | |
| Palm Beach County Educational | | | | | | | | | | | | |
| Facilities Authority: | | | | | | | | | | | | |
| 4.000%, 10/01/2027 | | | 260,000 | | | | 259,166 | | | | | |
| 4.000%, 10/01/2028 | | | 270,000 | | | | 269,657 | | | | | |
| Total Florida | | | | | | | | | | | | |
| (Cost $7,805,286) | | | | | | | 7,857,879 | | | | 6.3 | % |
| Georgia | | | | | | | | | | | | |
| Atlanta Urban Residential Finance Authority, | | | | | | | | | | | | |
| 2.000%, 09/01/2025 | | | | | | | | | | | | |
(Mandatory Tender Date 09/01/2024)(1) | | | 200,000 | | | | 194,461 | | | | | |
| Bartow County Development Authority, | | | | | | | | | | | | |
| 3.950%, 12/01/2032 | | | | | | | | | | | | |
(Mandatory Tender Date 03/08/2028)(1) | | | 500,000 | | | | 498,791 | | | | | |
| Burke County Development Authority: | | | | | | | | | | | | |
| 2.200%, 10/01/2032 (Callable 11/19/2026) | | | 250,000 | | | | 200,747 | | | | | |
2.750%, 01/01/2052 (Callable 05/03/2031)(5) | | | 500,000 | | | | 329,932 | | | | | |
| Development Authority of Monroe County, | | | | | | | | | | | | |
| 1.500%, 01/01/2039 | | | | | | | | | | | | |
(Mandatory Tender Date 02/03/2025)(1) | | | 500,000 | | | | 472,408 | | | | | |
| Gainesville & Hall County | | | | | | | | | | | | |
| Development Authority, | | | | | | | | | | | | |
| 2.050%, 11/15/2033 (Callable 07/01/2023) | | | | | | | | | | | | |
| (Optional Put Date 07/03/2023) | | | | | | | | | | | | |
(Insured by AGC)(1) | | | 1,500,000 | | | | 1,500,000 | | | | | |
| Main Street Natural Gas, Inc.: | | | | | | | | | | | | |
4.000%, 11/01/2023(3) | | | 200,000 | | | | 199,718 | | | | | |
| 4.000%, 08/01/2049 (Callable 09/01/2024) | | | | | | | | | | | | |
(Mandatory Tender Date 12/02/2024)(1) | | | 525,000 | | | | 526,505 | | | | | |
| 4.000%, 03/01/2050 (Callable 06/01/2026) | | | | | | | | | | | | |
(Mandatory Tender Date 09/01/2026)(1) | | | 350,000 | | | | 347,894 | | | | | |
| 4.000%, 08/01/2052 (Callable 05/01/2027) | | | | | | | | | | | | |
(Mandatory Tender Date 11/01/2027)(1)(3) | | | 400,000 | | | | 386,618 | | | | | |
| Total Georgia | | | | | | | | | | | | |
| (Cost $4,671,730) | | | | | | | 4,657,074 | | | | 3.7 | % |
The accompanying notes are an integral part of these financial statements.
Baird Municipal Bond Fund
Schedule of Investments, June 30, 2023 (Unaudited)
Long-Term Investments (cont.)
| | | Principal | | | | | | % of | |
| | | Amount | | | Value | | | Net Assets | |
| Idaho | | | | | | | | | |
| Idaho Housing & Finance Association, | | | | | | | | | |
| 3.000%, 05/01/2042 (Callable 05/01/2032) | | | | | | | | | |
| (Insured by SCH BD GTY) | | $ | 500,000 | | | $ | 372,025 | | | | |
| Total Idaho | | | | | | | | | | | |
| (Cost $375,468) | | | | | | | 372,025 | | | | 0.3 | % |
| Illinois | | | | | | | | | | | | |
| Chicago Board of Education: | | | | | | | | | | | | |
| 0.000%, 12/01/2023 (Insured by NATL) | | | 300,000 | | | | 295,074 | | | | | |
| 0.000%, 12/01/2025 (Insured by NATL) | | | 500,000 | | | | 453,251 | | | | | |
| 5.500%, 12/01/2026 (Insured by NATL) | | | 60,000 | | | | 62,088 | | | | | |
| 5.250%, 04/01/2034 (Callable 04/01/2033) | | | 375,000 | | | | 419,524 | | | | | |
| Chicago Midway International Airport, | | | | | | | | | | | | |
| 5.000%, 01/01/2029 (Callable 01/01/2026) | | | 365,000 | | | | 374,510 | | | | | |
| Chicago O’Hare International Airport: | | | | | | | | | | | | |
| 5.750%, 01/01/2038 (Callable 07/31/2023) | | | 150,000 | | | | 150,580 | | | | | |
| 5.500%, 01/01/2055 (Callable 01/01/2032) | | | 300,000 | | | | 322,067 | | | | | |
| Chicago Transit Authority, | | | | | | | | | | | | |
| 5.250%, 12/01/2049 (Callable 12/01/2024) | | | 500,000 | | | | 507,165 | | | | | |
| City of Chicago IL: | | | | | | | | | | | | |
| 0.000%, 01/01/2027 | | | | | | | | | | | | |
| (ETM) (Insured by NATL) | | | 100,000 | | | | 89,465 | | | | | |
| 5.000%, 11/01/2029 (Callable 11/01/2026) | | | 1,050,000 | | | | 1,099,723 | | | | | |
| Cook County Community | | | | | | | | | | | | |
| College District No. 508: | | | | | | | | | | | | |
| 5.250%, 12/01/2026 (Callable 12/01/2023) | | | 400,000 | | | | 401,424 | | | | | |
| 5.250%, 12/01/2028 (Callable 12/01/2023) | | | 75,000 | | | | 75,227 | | | | | |
| County of Du Page IL, | | | | | | | | | | | | |
| 3.000%, 05/15/2047 (Callable 05/15/2030) | | | 1,100,000 | | | | 797,892 | | | | | |
| Exceptional Children Have Opportunities, | | | | | | | | | | | | |
| 4.000%, 12/01/2035 (Callable 12/01/2029) | | | 150,000 | | | | 153,765 | | | | | |
| Illinois Finance Authority: | | | | | | | | | | | | |
| 5.000%, 11/01/2031 (Callable 11/01/2026) | | | 135,000 | | | | 137,772 | | | | | |
| 5.000%, 02/15/2036 (Callable 02/15/2027) | | | 400,000 | | | | 419,488 | | | | | |
| 5.000%, 02/15/2037 (Callable 08/15/2027) | | | 775,000 | | | | 769,355 | | | | | |
| 4.125%, 11/15/2037 (Callable 11/15/2025) | | | 60,000 | | | | 57,936 | | | | | |
| 5.000%, 11/15/2039 (Callable 05/15/2025) | | | 300,000 | | | | 303,240 | | | | | |
5.625%, 08/01/2053 (Callable 08/01/2033)(3) | | | 500,000 | | | | 500,928 | | | | | |
| Illinois Sports Facilities Authority, | | | | | | | | | | | | |
| 5.000%, 06/15/2030 | | | 500,000 | | | | 510,199 | | | | | |
| Illinois State Toll Highway Authority: | | | | | | | | | | | | |
| 5.000%, 01/01/2041 (Callable 07/01/2033) | | | 250,000 | | | | 277,063 | | | | | |
| 5.000%, 01/01/2045 (Callable 01/01/2031) | | | 580,000 | | | | 618,692 | | | | | |
| Joliet Park District, | | | | | | | | | | | | |
| 4.000%, 02/01/2033 | | | | | | | | | | | | |
| (Callable 07/31/2023) (Insured by AGM) | | | 100,000 | | | | 100,063 | | | | | |
| Metropolitan Pier & Exposition Authority: | | | | | | | | | | | | |
| 0.000%, 06/15/2029 (Insured by NATL) | | | 100,000 | | | | 79,883 | | | | | |
| 0.000%, 12/15/2034 (Insured by NATL) | | | 500,000 | | | | 315,255 | | | | | |
| Sangamon & Christian Counties | | | | | | | | | | | | |
| Community Unit School District No. 3A, | | | | | | | | | | | | |
| 5.500%, 02/01/2038 | | | | | | | | | | | | |
| (Callable 02/01/2032) (Insured by BAM) | | | 450,000 | | | | 500,420 | | | | | |
| State of Illinois, | | | | | | | | | | | | |
| 5.000%, 03/01/2027 | | | 200,000 | | | | 210,979 | | | | | |
| Upper Illinois River Valley | | | | | | | | | | | | |
| Development Authority, | | | | | | | | | | | | |
5.000%, 01/01/2045 (Callable 01/01/2027)(3) | | | 200,000 | | | | 184,406 | | | | | |
| Village of Romeoville IL, | | | | | | | | | | | | |
| 5.000%, 10/01/2035 (Callable 04/01/2025) | | | 300,000 | | | | 301,607 | | | | | |
| Will County Community | | | | | | | | | | | | |
| High School District No. 210: | | | | | | | | | | | | |
| 0.000%, 01/01/2027 | | | 95,000 | | | | 82,665 | | | | | |
| 4.000%, 01/01/2034 | | | | | | | | | | | | |
| (Callable 01/01/2029) (Insured by AGM) | | | 100,000 | | | | 102,029 | | | | | |
| Winnebago County Community | | | | | | | | | | | | |
| Unit School District No. 320, | | | | | | | | | | | | |
| 5.000%, 02/01/2032 (Insured by AGM) | | | 400,000 | | | | 442,468 | | | | | |
| Total Illinois | | | | | | | | | | | | |
| (Cost $11,023,422) | | | | | | | 11,116,203 | | | | 8.8 | % |
| Indiana | | | | | | | | | | | | |
| Indiana Finance Authority, | | | | | | | | | | | | |
| 2.500%, 11/01/2030 | | | 100,000 | | | | 87,438 | | | | | |
| Indiana Health & Educational | | | | | | | | | | | | |
| Facilities Financing Authority, | | | | | | | | | | | | |
| 5.000%, 11/15/2046 (Callable 11/15/2026) | | | 100,000 | | | | 101,916 | | | | | |
| Indianapolis Local Public | | | | | | | | | | | | |
| Improvement Bond Bank, | | | | | | | | | | | | |
| 5.250%, 02/01/2048 (Callable 08/01/2033) | | | 1,000,000 | | | | 1,111,781 | | | | | |
| St. Joseph County Airport Authority, | | | | | | | | | | | | |
| 0.010%, 07/01/2028 (Insured by BAM) | | | 155,000 | | | | 128,721 | | | | | |
| Total Indiana | | | | | | | | | | | | |
| (Cost $1,446,426) | | | | | | | 1,429,856 | | | | 1.1 | % |
| Iowa | | | | | | | | | | | | |
| City of Coralville IA, | | | | | | | | | | | | |
| 4.000%, 06/01/2025 (Callable 06/01/2024) | | | 100,000 | | | | 98,420 | | | | | |
| City of Stuart IA, | | | | | | | | | | | | |
| 4.750%, 06/01/2026 (Callable 06/01/2025) | | | 680,000 | | | | 679,924 | | | | | |
| Iowa Finance Authority, | | | | | | | | | | | | |
| 7.500%, 01/01/2032 | | | | | | | | | | | | |
(Callable 01/01/2030)(3) | | | 250,000 | | | | 237,836 | | | | | |
| Iowa Higher Education Loan Authority, | | | | | | | | | | | | |
| 5.375%, 10/01/2052 (Callable 10/01/2030) | | | 500,000 | | | | 516,558 | | | | | |
| PEFA, Inc., | | | | | | | | | | | | |
| 5.000%, 09/01/2049 (Callable 06/01/2026) | | | | | | | | | | | | |
(Mandatory Tender Date 09/01/2026)(1) | | | 230,000 | | | | 234,510 | | | | | |
| Total Iowa | | | | | | | | | | | | |
| (Cost $1,766,587) | | | | | | | 1,767,248 | | | | 1.4 | % |
| Kansas | | | | | | | | | | | | |
| City of Coffeyville KS, | | | | | | | | | | | | |
5.000%, 06/01/2025 (Insured by NATL)(3) | | | 100,000 | | | | 99,643 | | | | | |
| Wyandotte County-Kansas | | | | | | | | | | | | |
| City Unified Government, | | | | | | | | | | | | |
| 0.000%, 12/01/2027 (Insured by NATL) | | | 285,000 | | | | 236,948 | | | | | |
| Total Kansas | | | | | | | | | | | | |
| (Cost $346,958) | | | | | | | 336,591 | | | | 0.3 | % |
| Kentucky | | | | | | | | | | | | |
| Garrard County School District Finance Corp., | | | | | | | | | | | | |
| 5.000%, 08/01/2037 | | | | | | | | | | | | |
| (Callable 08/01/2031) (Insured by BAM) | | | 810,000 | | | | 882,274 | | | | | |
| Kentucky Economic | | | | | | | | | | | | |
| Development Finance Authority: | | | | | | | | | | | | |
| 0.000%, 10/01/2027 (Insured by NATL) | | | 125,000 | | | | 106,467 | | | | | |
| 4.000%, 07/01/2031 (Callable 07/01/2025) | | | 100,000 | | | | 98,034 | | | | | |
| 5.000%, 07/01/2033 (Callable 07/01/2025) | | | 200,000 | | | | 202,786 | | | | | |
| 5.000%, 01/01/2045 (Callable 07/01/2025) | | | 200,000 | | | | 200,031 | | | | | |
The accompanying notes are an integral part of these financial statements.
Baird Municipal Bond Fund
Schedule of Investments, June 30, 2023 (Unaudited)
Long-Term Investments (cont.)
| | | Principal | | | | | | % of | |
| | | Amount | | | Value | | | Net Assets | |
| Kentucky Public Energy Authority: | | | | | | | | | |
| 4.000%, 01/01/2049 (Callable 10/01/2024) | | | | | | | | | |
(Mandatory Tender Date 01/01/2025)(1) | | $ | 500,000 | | | $ | 499,951 | | | | |
| 4.607%, 12/01/2049 (1 Month LIBOR | | | | | | | | | | | |
| USD + 1.120%) (Callable 03/01/2025) | | | | | | | | | | | |
(Mandatory Tender Date 06/01/2025)(2) | | | 50,000 | | | | 49,730 | | | | |
| Total Kentucky | | | | | | | | | | | |
| (Cost $2,074,510) | | | | | | | 2,039,273 | | | | 1.6 | % |
| Louisiana | | | | | | | | | | | | |
| Plaquemines Port Harbor & Terminal District, | | | | | | | | | | | | |
| 4.000%, 03/15/2025 | | | | | | | | | | | | |
(Mandatory Tender Date 03/15/2024)(1) | | | 250,000 | | | | 249,707 | | | | | |
| Total Louisiana | | | | | | | | | | | | |
| (Cost $250,000) | | | | | | | 249,707 | | | | 0.2 | % |
| Maine | | | | | | | | | | | | |
| City of Lewiston ME, | | | | | | | | | | | | |
| 1.375%, 02/15/2033 (Callable 02/15/2028) | | | 345,000 | | | | 266,499 | | | | | |
| Maine Health & Higher | | | | | | | | | | | | |
| Educational Facilities Authority, | | | | | | | | | | | | |
| 5.000%, 07/01/2037 | | | | | | | | | | | | |
| (Callable 07/01/2030) (Insured by ST AID) | | | 600,000 | | | | 634,605 | | | | | |
| Total Maine | | | | | | | | | | | | |
| (Cost $904,342) | | | | | | | 901,104 | | | | 0.7 | % |
| Maryland | | | | | | | | | | | | |
| Maryland Community | | | | | | | | | | | | |
| Development Administration, | | | | | | | | | | | | |
| 4.700%, 03/01/2046 | | | | | | | | | | | | |
| (Callable 03/01/2031) (Insured by GNMA) | | | 400,000 | | | | 402,046 | | | | | |
| Maryland Economic Development Corp., | | | | | | | | | | | | |
| 5.000%, 06/01/2030 (Callable 06/01/2028) | | | 500,000 | | | | 526,199 | | | | | |
| Maryland Health & Higher | | | | | | | | | | | | |
| Educational Facilities Authority: | | | | | | | | | | | | |
| 5.000%, 01/01/2030 | | | 100,000 | | | | 106,997 | | | | | |
| 5.250%, 07/01/2033 | | | | | | | | | | | | |
(Callable 07/01/2030)(3)(6) | | | 590,000 | | | | 591,692 | | | | | |
| Total Maryland | | | | | | | | | | | | |
| (Cost $1,627,527) | | | | | | | 1,626,934 | | | | 1.3 | % |
| Massachusetts | | | | | | | | | | | | |
| Massachusetts Development Finance Agency: | | | | | | | | | | | | |
| 5.000%, 10/01/2024 | | | 150,000 | | | | 150,686 | | | | | |
5.000%, 07/15/2025(3) | | | 50,000 | | | | 49,956 | | | | | |
| 5.000%, 07/01/2028 (Callable 07/01/2026) | | | 500,000 | | | | 513,515 | | | | | |
| 5.000%, 07/01/2044 (Callable 07/01/2027) | | | 500,000 | | | | 505,270 | | | | | |
| Massachusetts Educational Financing Authority: | | | | | | | | | | | | |
| 2.000%, 07/01/2037 (Callable 07/01/2031) | | | 400,000 | | | | 337,341 | | | | | |
| 4.250%, 07/01/2044 (Callable 07/01/2033) | | | 400,000 | | | | 395,711 | | | | | |
| Town of Middleton MA, | | | | | | | | | | | | |
| 2.000%, 12/15/2038 (Callable 12/15/2030) | | | 1,520,000 | | | | 1,112,318 | | | | | |
| Total Massachusetts | | | | | | | | | | | | |
| (Cost $3,142,555) | | | | | | | 3,064,797 | | | | 2.4 | % |
| Michigan | | | | | | | | | | | | |
| Allegan Public School District, | | | | | | | | | | | | |
| 5.000%, 05/01/2037 | | | | | | | | | | | | |
| (Callable 05/01/2033) (Insured by Q-SBLF) | | | 250,000 | | | | 281,302 | | | | | |
| Flat Rock Community School District, | | | | | | | | | | | | |
| 5.000%, 05/01/2041 | | | | | | | | | | | | |
| (Callable 05/01/2032) (Insured by Q-SBLF) | | | 350,000 | | | | 379,190 | | | | | |
| Flint Hospital Building Authority, | | | | | | | | | | | | |
| 5.000%, 07/01/2023 | | | 345,000 | | | | 345,000 | | | | | |
| Fraser Public School District: | | | | | | | | | | | | |
| 5.000%, 05/01/2038 | | | | | | | | | | | | |
| (Callable 05/01/2033) (Insured by Q-SBLF) | | | 400,000 | | | | 445,049 | | | | | |
| 5.000%, 05/01/2039 | | | | | | | | | | | | |
| (Callable 05/01/2033) (Insured by Q-SBLF) | | | 180,000 | | | | 197,308 | | | | | |
| 5.000%, 05/01/2048 | | | | | | | | | | | | |
| (Callable 05/01/2033) (Insured by Q-SBLF) | | | 475,000 | | | | 505,805 | | | | | |
| Michigan Finance Authority: | | | | | | | | | | | | |
| 4.500%, 10/01/2029 (Callable 10/01/2024) | | | 370,000 | | | | 369,816 | | | | | |
| 5.000%, 07/01/2044 (Callable 07/01/2024) | | | 300,000 | | | | 300,093 | | | | | |
| Michigan Strategic Fund, | | | | | | | | | | | | |
| 5.000%, 12/31/2043 (Callable 12/31/2028) | | | 305,000 | | | | 307,615 | | | | | |
| Rockford Public Schools, | | | | | | | | | | | | |
| 5.000%, 05/01/2040 | | | | | | | | | | | | |
| (Callable 05/01/2033) (Insured by Q-SBLF) | | | 500,000 | | | | 550,186 | | | | | |
| Walled Lake Consolidated School District, | | | | | | | | | | | | |
| 5.000%, 05/01/2047 | | | | | | | | | | | | |
| (Callable 05/01/2032) (Insured by Q-SBLF) | | | 1,000,000 | | | | 1,075,670 | | | | | |
| Total Michigan | | | | | | | | | | | | |
| (Cost $4,752,050) | | | | | | | 4,757,034 | | | | 3.8 | % |
| Minnesota | | | | | | | | | | | | |
| Housing & Redevelopment | | | | | | | | | | | | |
| Authority of the City of St. Paul MN, | | | | | | | | | | | | |
| 5.000%, 12/01/2036 (Callable 12/01/2030) | | | 150,000 | | | | 148,549 | | | | | |
| Minnesota Higher Education | | | | | | | | | | | | |
| Facilities Authority, | | | | | | | | | | | | |
| 4.000%, 10/01/2040 (Callable 10/01/2030) | | | 105,000 | | | | 101,969 | | | | | |
| Minnesota Housing Finance Agency: | | | | | | | | | | | | |
| 4.500%, 01/01/2043 | | | | | | | | | | | | |
(Callable 01/01/2033) (Insured by GNMA)(6) | | | 500,000 | | | | 501,889 | | | | | |
| 4.250%, 01/01/2049 | | | | | | | | | | | | |
| (Callable 01/01/2028) (Insured by GNMA) | | | 160,000 | | | | 159,551 | | | | | |
| Roseville Independent School District No. 623, | | | | | | | | | | | | |
| 4.000%, 04/01/2032 (Callable 04/01/2030) | | | 200,000 | | | | 201,579 | | | | | |
| Total Minnesota | | | | | | | | | | | | |
| (Cost $1,150,432) | | | | | | | 1,113,537 | | | | 0.9 | % |
| Mississippi | | | | | | | | | | | | |
| City of Gulfport MS, | | | | | | | | | | | | |
| 5.000%, 07/01/2026 | | | 100,000 | | | | 102,731 | | | | | |
| County of Hinds MS, | | | | | | | | | | | | |
| 4.000%, 11/01/2034 (Callable 11/01/2025) | | | 100,000 | | | | 100,912 | | | | | |
| County of Lafayette MS, | | | | | | | | | | | | |
| 4.000%, 06/01/2028 (Callable 06/01/2027) | | | 135,000 | | | | 135,833 | | | | | |
| Mississippi Development Bank: | | | | | | | | | | | | |
| 5.000%, 11/01/2030 (Callable 11/01/2027) | | | 100,000 | | | | 102,155 | | | | | |
| 5.250%, 03/01/2045 (Callable 03/01/2028) | | | 150,000 | | | | 152,515 | | | | | |
| Total Mississippi | | | | | | | | | | | | |
| (Cost $631,520) | | | | | | | 594,146 | | | | 0.5 | % |
| Missouri | | | | | | | | | | | | |
| City of Kansas City MO, | | | | | | | | | | | | |
| 0.000%, 02/01/2029 | | | 210,000 | | | | 171,232 | | | | | |
| City of St. Louis MO, | | | | | | | | | | | | |
| 5.000%, 07/01/2039 (Callable 07/01/2029) | | | 300,000 | | | | 318,687 | | | | | |
| Clay County School District No. 40, | | | | | | | | | | | | |
| 5.000%, 04/01/2039 (Callable 04/01/2033) | | | 600,000 | | | | 637,205 | | | | | |
| Health & Educational Facilities | | | | | | | | | | | | |
| Authority of the State of Missouri: | | | | | | | | | | | | |
| 5.000%, 02/01/2025 (Callable 02/01/2024) | | | 30,000 | | | | 30,051 | | | | | |
| 4.000%, 08/01/2025 | | | 150,000 | | | | 146,530 | | | | | |
| 5.000%, 11/15/2033 (Callable 11/15/2030) | | | 360,000 | | | | 391,026 | | | | | |
The accompanying notes are an integral part of these financial statements.
Baird Municipal Bond Fund
Schedule of Investments, June 30, 2023 (Unaudited)
Long-Term Investments (cont.)
| | | Principal | | | | | | % of | |
| | | Amount | | | Value | | | Net Assets | |
| Industrial Development | | | | | | | | | |
| Authority of University City, | | | | | | | | | |
| 5.500%, 06/15/2042 (Callable 06/15/2033) | | $ | 500,000 | | | $ | 499,982 | | | | |
| Joplin Schools, | | | | | | | | | | | |
| 2.000%, 03/01/2032 | | | | | | | | | | | |
| (Callable 03/01/2029) (Insured by BAM) | | | 600,000 | | | | 513,137 | | | | |
| Missouri Housing Development Commission, | | | | | | | | | | | |
| 2.350%, 11/01/2046 | | | | | | | | | | | |
| (Callable 05/01/2030) (Insured by GNMA) | | | 1,000,000 | | | | 695,889 | | | | |
| St. Louis Land Clearance | | | | | | | | | | | |
| for Redevelopment Authority: | | | | | | | | | | | |
| 4.250%, 06/01/2026 | | | 80,000 | | | | 79,884 | | | | |
| 3.875%, 10/01/2035 (Callable 10/01/2029) | | | 440,000 | | | | 359,816 | | | | |
| 5.000%, 04/01/2038 (Callable 04/01/2027) | | | 1,000,000 | | | | 1,029,227 | | | | |
| St. Louis Municipal Finance Corp., | | | | | | | | | | | |
| 5.000%, 10/01/2045 | | | | | | | | | | | |
| (Callable 10/01/2030) (Insured by AGM) | | | 1,000,000 | | | | 1,049,955 | | | | |
| Total Missouri | | | | | | | | | | | |
| (Cost $5,991,225) | | | | | | | 5,922,621 | | | | 4.7 | % |
| Montana | | | | | | | | | | | | |
| Montana Facility Finance Authority, | | | | | | | | | | | | |
| 5.000%, 07/01/2030 (Callable 07/01/2028) | | | 500,000 | | | | 522,949 | | | | | |
| Total Montana | | | | | | | | | | | | |
| (Cost $530,593) | | | | | | | 522,949 | | | | 0.4 | % |
| Nevada | | | | | | | | | | | | |
| Carson City NV, | | | | | | | | | | | | |
| 5.000%, 09/01/2031 (Callable 09/01/2027) | | | 495,000 | | | | 520,043 | | | | | |
| Total Nevada | | | | | | | | | | | | |
| (Cost $516,333) | | | | | | | 520,043 | | | | 0.4 | % |
| New Hampshire | | | | | | | | | | | | |
| New Hampshire Business Finance Authority: | | | | | | | | | | | | |
| 4.375%, 09/20/2036 | | | 493,740 | | | | 483,583 | | | | | |
| 4.500%, 06/01/2053 | | | | | | | | | | | | |
| (Callable 06/01/2033) (Insured by BAM) | | | 500,000 | | | | 492,704 | | | | | |
| Total New Hampshire | | | | | | | | | | | | |
| (Cost $958,039) | | | | | | | 976,287 | | | | 0.8 | % |
| New Jersey | | | | | | | | | | | | |
| Atlantic City Board of Education, | | | | | | | | | | | | |
3.400%, 08/15/2024(3) | | | 85,000 | | | | 84,413 | | | | | |
| Borough of Woodbury Heights NJ, | | | | | | | | | | | | |
| 4.000%, 12/01/2024 | | | | | | | | | | | | |
| (Callable 07/31/2023) (Insured by AGC) | | | 20,000 | | | | 20,012 | | | | | |
| New Jersey Economic Development Authority, | | | | | | | | | | | | |
| 5.250%, 07/01/2026 (Insured by NATL) | | | 500,000 | | | | 523,166 | | | | | |
| New Jersey Housing & | | | | | | | | | | | | |
| Mortgage Finance Agency, | | | | | | | | | | | | |
| 5.000%, 10/01/2063 (Insured by HUD) | | | 500,000 | | | | 495,721 | | | | | |
| South Jersey Transportation Authority, | | | | | | | | | | | | |
| 5.250%, 11/01/2052 | | | | | | | | | | | | |
| (Callable 11/01/2032) (Insured by BAM) | | | 500,000 | | | | 548,770 | | | | | |
| Township of Willingboro NJ, | | | | | | | | | | | | |
| 2.125%, 09/01/2033 (Callable 09/01/2028) | | | 225,000 | | | | 192,655 | | | | | |
| Total New Jersey | | | | | | | | | | | | |
| (Cost $1,848,133) | | | | | | | 1,864,737 | | | | 1.5 | % |
| New York | | | | | | | | | | | | |
| Albany County Capital Resource Corp., | | | | | | | | | | | | |
| 3.100%, 07/01/2030 | | | 100,000 | | | | 87,126 | | | | | |
| Amherst Industrial Development Agency, | | | | | | | | | | | | |
| 3.900%, 04/01/2026 (Mandatory Tender | | | | | | | | | | | | |
Date 04/01/2025) (Insured by FHA)(1) | | | 400,000 | | | | 400,068 | | | | | |
| Brookhaven Local Development Corp.: | | | | | | | | | | | | |
| 5.000%, 11/01/2024 | | | 45,000 | | | | 45,237 | | | | | |
| 1.625%, 11/01/2025 | | | 25,000 | | | | 23,368 | | | | | |
| City of New York NY, | | | | | | | | | | | | |
| 2.350%, 10/01/2046 | | | | | | | | | | | | |
(Optional Put Date 07/03/2023)(1) | | | 1,000,000 | | | | 1,000,000 | | | | | |
| Huntington Local Development Corp., | | | | | | | | | | | | |
| 4.000%, 07/01/2027 | | | 250,000 | | | | 238,796 | | | | | |
| Monroe County Industrial Development Corp., | | | | | | | | | | | | |
| 4.840%, 11/01/2040 (Insured by FNMA) | | | 996,891 | | | | 1,016,515 | | | | | |
| New York City Housing Development Corp., | | | | | | | | | | | | |
| 3.000%, 02/15/2048 (Callable 05/15/2024) | | | 500,000 | | | | 490,112 | | | | | |
| New York City Industrial Development Agency, | | | | | | | | | | | | |
| 4.918%, 03/01/2025 (CPI YOY + 0.870%) | | | | | | | | | | | | |
(Insured by FGIC)(2) | | | 100,000 | | | | 100,768 | | | | | |
| New York State Dormitory Authority, | | | | | | | | | | | | |
| 5.000%, 03/15/2048 (Callable 09/15/2028) | | | 250,000 | | | | 265,374 | | | | | |
| New York State Housing Finance Agency, | | | | | | | | | | | | |
| 3.600%, 11/01/2062 (Callable 06/01/2025) | | | | | | | | | | | | |
| (Mandatory Tender Date 05/01/2027) | | | | | | | | | | | | |
(Insured by SONYMA)(1) | | | 500,000 | | | | 499,388 | | | | | |
| New York Transportation Development Corp., | | | | | | | | | | | | |
| 4.000%, 10/01/2030 | | | 600,000 | | | | 598,132 | | | | | |
| Onondaga Civic Development Corp.: | | | | | | | | | | | | |
| 5.000%, 10/01/2023 | | | 100,000 | | | | 100,109 | | | | | |
| 5.000%, 10/01/2040 (Callable 10/01/2025) | | | 75,000 | | | | 69,047 | | | | | |
| Schenectady County Capital Resource Corp., | | | | | | | | | | | | |
| 5.250%, 07/01/2052 (Callable 07/01/2032) | | | 350,000 | | | | 385,642 | | | | | |
| Town of Hempstead NY, | | | | | | | | | | | | |
| 2.125%, 06/15/2041 (Callable 06/15/2029) | | | 1,000,000 | | | | 725,935 | | | | | |
| Town of Ramapo NY, | | | | | | | | | | | | |
| 3.750%, 03/01/2030 (Callable 07/21/2023) | | | 50,000 | | | | 45,479 | | | | | |
| Triborough Bridge & Tunnel Authority, | | | | | | | | | | | | |
| 4.500%, 05/15/2047 (Callable 11/15/2032) | | | 500,000 | | | | 513,673 | | | | | |
| Westchester County Local Development Corp., | | | | | | | | | | | | |
2.875%, 07/01/2026(3) | | | 500,000 | | | | 476,718 | | | | | |
| Total New York | | | | | | | | | | | | |
| (Cost $7,070,021) | | | | | | | 7,081,487 | | | | 5.6 | % |
| North Carolina | | | | | | | | | | | | |
| Greater Asheville Regional Airport Authority: | | | | | | | | | | | | |
| 5.250%, 07/01/2038 | | | | | | | | | | | | |
| (Callable 07/01/2032) (Insured by AGM) | | | 350,000 | | | | 383,418 | | | | | |
| 5.500%, 07/01/2047 | | | | | | | | | | | | |
| (Callable 07/01/2032) (Insured by AGM) | | | 500,000 | | | | 546,524 | | | | | |
| North Carolina Housing Finance Agency, | | | | | | | | | | | | |
| 2.850%, 07/01/2040 (Callable 07/01/2029) | | | 460,000 | | | | 373,040 | | | | | |
| North Carolina Medical Care Commission, | | | | | | | | | | | | |
| 5.000%, 01/01/2038 (Callable 01/01/2026) | | | 250,000 | | | | 248,725 | | | | | |
| Winston-Salem State University, | | | | | | | | | | | | |
| 4.250%, 06/01/2032 (Callable 06/01/2024) | | | 50,000 | | | | 49,270 | | | | | |
| Total North Carolina | | | | | | | | | | | | |
| (Cost $1,577,250) | | | | | | | 1,600,977 | | | | 1.3 | % |
| North Dakota | | | | | | | | | | | | |
| City of Horace ND, | | | | | | | | | | | | |
| 5.000%, 05/01/2048 (Callable 05/01/2031) | | | 500,000 | | | | 492,474 | | | | | |
| City of Mandan ND, | | | | | | | | | | | | |
| 3.000%, 09/01/2036 (Callable 09/01/2024) | | | 200,000 | | | | 174,217 | | | | | |
| County of Ward ND: | | | | | | | | | | | | |
| 5.000%, 06/01/2029 (Callable 06/01/2028) | | | 200,000 | | | | 193,473 | | | | | |
| 5.000%, 06/01/2031 (Callable 06/01/2028) | | | 300,000 | | | | 286,909 | | | | | |
The accompanying notes are an integral part of these financial statements.
Baird Municipal Bond Fund
Schedule of Investments, June 30, 2023 (Unaudited)
Long-Term Investments (cont.)
| | | Principal | | | | | | % of | |
| | | Amount | | | Value | | | Net Assets | |
| Williston Parks & Recreation District, | | | | | | | | | |
| 4.500%, 03/01/2025 (Callable 07/17/2023) | | $ | 50,000 | | | $ | 49,172 | | | | |
| Total North Dakota | | | | | | | | | | | |
| (Cost $1,230,843) | | | | | | | 1,196,245 | | | | 1.0 | % |
| Ohio | | | | | | | | | | | | |
| Akron Bath Copley Joint | | | | | | | | | | | | |
| Township Hospital District, | | | | | | | | | | | | |
| 5.000%, 11/15/2031 (Callable 11/15/2030) | | | 100,000 | | | | 106,787 | | | | | |
| Cleveland-Cuyahoga County Port Authority, | | | | | | | | | | | | |
| 5.500%, 08/01/2052 (Callable 08/01/2032) | | | 350,000 | | | | 370,840 | | | | | |
| County of Hamilton OH, | | | | | | | | | | | | |
| 5.000%, 02/01/2028 (Callable 02/01/2024) | | | 550,000 | | | | 550,302 | | | | | |
| County of Montgomery OH, | | | | | | | | | | | | |
| 3.000%, 08/01/2034 (Callable 02/01/2031) | | | 100,000 | | | | 92,105 | | | | | |
| Ohio Air Quality Development Authority, | | | | | | | | | | | | |
| 4.000%, 09/01/2030 | | | | | | | | | | | | |
(Mandatory Tender Date 06/01/2027)(1) | | | 520,000 | | | | 515,483 | | | | | |
| Ohio Higher Educational Facility Commission, | | | | | | | | | | | | |
| 6.510%, 12/01/2023 (CPI YOY + 1.120%) | | | | | | | | | | | | |
(Insured by FGIC)(2) | | | 170,000 | | | | 171,832 | | | | | |
| Ohio Housing Finance Agency: | | | | | | | | | | | | |
| 2.900%, 09/01/2045 | | | | | | | | | | | | |
| (Callable 03/01/2029) (Insured by GNMA) | | | 800,000 | | | | 708,364 | | | | | |
| 3.750%, 09/01/2050 | | | | | | | | | | | | |
| (Callable 03/01/2029) (Insured by GNMA) | | | 55,000 | | | | 54,195 | | | | | |
| Ohio Turnpike & Infrastructure Commission, | | | | | | | | | | | | |
| 5.700%, 02/15/2034 | | | | | | | | | | | | |
(Callable 02/15/2031)(5) | | | 95,000 | | | | 113,366 | | | | | |
| Port of Greater Cincinnati | | | | | | | | | | | | |
| Development Authority, | | | | | | | | | | | | |
| 5.000%, 05/01/2025 | | | | | | | | | | | | |
(Callable 11/01/2023)(3) | | | 600,000 | | | | 596,850 | | | | | |
| State of Ohio, | | | | | | | | | | | | |
| 2.450%, 01/15/2051 | | | | | | | | | | | | |
(Optional Put Date 07/03/2023)(1) | | | 500,000 | | | | 500,000 | | | | | |
| Warren County Port Authority, | | | | | | | | | | | | |
| 4.000%, 12/01/2053 (Callable 12/01/2031) | | | 100,000 | | | | 79,076 | | | | | |
| Total Ohio | | | | | | | | | | | | |
| (Cost $3,947,890) | | | | | | | 3,859,200 | | | | 3.1 | % |
| Oklahoma | | | | | | | | | | | | |
| Tulsa Industrial Authority, | | | | | | | | | | | | |
| 5.000%, 10/01/2023 | | | 25,000 | | | | 24,990 | | | | | |
| Total Oklahoma | | | | | | | | | | | | |
| (Cost $25,136) | | | | | | | 24,990 | | | | 0.0 | % |
| Oregon | | | | | | | | | | | | |
| Clackamas County Hospital Facility Authority, | | | | | | | | | | | | |
| 5.000%, 05/15/2024 | | | 165,000 | | | | 164,619 | | | | | |
| Deschutes County Administrative | | | | | | | | | | | | |
| School District No. 1, | | | | | | | | | | | | |
| 5.000%, 06/15/2040 (Callable 06/15/2033) | | | | | | | | | | | | |
| (Insured by SCH BD GTY) | | | 1,175,000 | | | | 1,332,773 | | | | | |
| Port of Portland OR, | | | | | | | | | | | | |
| 5.000%, 07/01/2028 | | | 425,000 | | | | 452,531 | | | | | |
| Salem Hospital Facility Authority, | | | | | | | | | | | | |
| 5.000%, 05/15/2034 (Callable 05/15/2029) | | | 50,000 | | | | 54,114 | | | | | |
| Yamhill County Hospital Authority: | | | | | | | | | | | | |
| 1.750%, 11/15/2026 (Callable 07/21/2023) | | | 210,000 | | | | 196,785 | | | | | |
| 2.500%, 11/15/2028 (Callable 07/21/2023) | | | 250,000 | | | | 213,896 | | | | | |
| Total Oregon | | | | | | | | | | | | |
| (Cost $2,396,511) | | | | | | | 2,414,718 | | | | 1.9 | % |
| Pennsylvania | | | | | | | | | | | | |
| Chester County Industrial | | | | | | | | | | | | |
| Development Authority, | | | | | | | | | | | | |
| 5.000%, 08/01/2035 (Callable 08/01/2023) | | | 135,000 | | | | 133,191 | | | | | |
| East Hempfield Township Industrial | | | | | | | | | | | | |
| Development Authority, | | | | | | | | | | | | |
| 5.000%, 12/01/2027 (Callable 12/01/2025) | | | 400,000 | | | | 412,610 | | | | | |
| Highlands School District, | | | | | | | | | | | | |
| 5.000%, 04/15/2032 (Insured by AGM) | | | 610,000 | | | | 686,673 | | | | | |
| Lancaster County Hospital Authority, | | | | | | | | | | | | |
| 5.000%, 11/01/2040 | | | | | | | | | | | | |
| (Callable 11/01/2029) | | | 275,000 | | | | 290,099 | | | | | |
| Mckeesport Area School District, | | | | | | | | | | | | |
| 0.000%, 10/01/2033 (Insured by AGM) | | | 400,000 | | | | 268,872 | | | | | |
| Montgomery County Industrial | | | | | | | | | | | | |
| Development Authority, | | | | | | | | | | | | |
| 4.100%, 04/01/2053 | | | | | | | | | | | | |
(Mandatory Tender Date 04/03/2028)(1) | | | 250,000 | | | | 254,630 | | | | | |
| Pennsylvania Economic Development | | | | | | | | | | | | |
| Financing Authority: | | | | | | | | | | | | |
| 0.000%, 01/01/2039 (County Guaranteed) | | | 140,000 | | | | 67,700 | | | | | |
| 5.000%, 06/30/2042 (Callable 06/30/2026) | | | 300,000 | | | | 301,588 | | | | | |
| Pennsylvania Higher Educational | | | | | | | | | | | | |
| Facilities Authority, | | | | | | | | | | | | |
| 5.000%, 07/01/2035 (Callable 07/01/2026) | | | 150,000 | | | | 146,173 | | | | | |
| Pennsylvania Turnpike Commission: | | | | | | | | | | | | |
| 0.000%, 12/01/2040 | | | | | | | | | | | | |
(Callable 06/01/2029)(5) | | | 75,000 | | | | 75,345 | | | | | |
| 5.000%, 12/01/2048 (Callable 12/01/2028) | | | 40,000 | | | | 41,852 | | | | | |
| Philadelphia Authority for | | | | | | | | | | | | |
| Industrial Development: | | | | | | | | | | | | |
| 5.000%, 06/15/2032 (Callable 06/15/2030) | | | 340,000 | | | | 339,504 | | | | | |
| 5.250%, 11/01/2052 (Callable 11/01/2032) | | | 250,000 | | | | 265,576 | | | | | |
| Sayre Health Care Facilities Authority, | | | | | | | | | | | | |
| 4.155%, 12/01/2031 (3 Month LIBOR | | | | | | | | | | | | |
USD + 0.830%) (Callable 07/31/2023)(2) | | | 500,000 | | | | 472,108 | | | | | |
| State Public School Building Authority: | | | | | | | | | | | | |
| 5.000%, 12/01/2029 | | | | | | | | | | | | |
| (Callable 12/01/2026) (Insured by AGM) | | | 925,000 | | | | 977,152 | | | | | |
| 0.000%, 05/15/2030 (Insured by NATL) | | | 200,000 | | | | 155,956 | | | | | |
| Total Pennsylvania | | | | | | | | | | | | |
| (Cost $4,982,193) | | | | | | | 4,889,029 | | | | 3.9 | % |
| Puerto Rico | | | | | | | | | | | | |
| Puerto Rico Sales Tax Financing Corp., | | | | | | | | | | | | |
| 4.750%, 07/01/2053 (Callable 07/01/2028) | | | 300,000 | | | | 285,866 | | | | | |
| Total Puerto Rico | | | | | | | | | | | | |
| (Cost $292,860) | | | | | | | 285,866 | | | | 0.2 | % |
| Rhode Island | | | | | | | | | | | | |
| Providence Redevelopment Agency, | | | | | | | | | | | | |
| 5.000%, 04/01/2027 (Callable 04/01/2025) | | | 410,000 | | | | 416,146 | | | | | |
| Total Rhode Island | | | | | | | | | | | | |
| (Cost $421,056) | | | | | | | 416,146 | | | | 0.3 | % |
| South Carolina | | | | | | | | | | | | |
| Patriots Energy Group Financing Agency, | | | | | | | | | | | | |
| 4.000%, 10/01/2048 (Callable 11/01/2023) | | | | | | | | | | | | |
(Mandatory Tender Date 02/01/2024)(1) | | | 605,000 | | | | 605,063 | | | | | |
| Scago Educational Facilities Corp. | | | | | | | | | | | | |
| for Colleton School District, | | | | | | | | | | | | |
| 5.000%, 12/01/2023 | | | 740,000 | | | | 743,235 | | | | | |
| Scago Educational Facilities Corp. | | | | | | | | | | | | |
| for Spartanburg School District No. 1, | | | | | | | | | | | | |
| 3.375%, 06/01/2030 (Callable 06/01/2025) | | | 100,000 | | | | 98,948 | | | | | |
The accompanying notes are an integral part of these financial statements.
Baird Municipal Bond Fund
Schedule of Investments, June 30, 2023 (Unaudited)
Long-Term Investments (cont.)
| | | Principal | | | | | | % of | |
| | | Amount | | | Value | | | Net Assets | |
| South Carolina Jobs-Economic | | | | | | | | | |
| Development Authority: | | | | | | | | | |
| 4.000%, 08/15/2030 (Callable 08/15/2026) | | $ | 100,000 | | | $ | 99,960 | | | | |
| 5.250%, 08/15/2033 (Callable 08/15/2026) | | | 150,000 | | | | 155,911 | | | | |
| Spartanburg County School District No. 4, | | | | | | | | | | | |
| 5.250%, 03/01/2052 | | | | | | | | | | | |
| (Callable 03/01/2032) (Insured by SCSDE) | | | 1,000,000 | | | | 1,107,124 | | | | |
| Three Rivers Solid Waste Authority, | | | | | | | | | | | |
| 0.000%, 10/01/2025 | | | 750,000 | | | | 688,988 | | | | |
| Total South Carolina | | | | | | | | | | | |
| (Cost $3,511,729) | | | | | | | 3,499,229 | | | | 2.8 | % |
| South Dakota | | | | | | | | | | | | |
| City of Rapid City SD: | | | | | | | | | | | | |
| 5.000%, 12/01/2026 | | | 220,000 | | | | 224,631 | | | | | |
| 4.000%, 12/01/2035 (Callable 12/01/2029) | | | 125,000 | | | | 120,921 | | | | | |
| South Dakota Health & | | | | | | | | | | | | |
| Educational Facilities Authority, | | | | | | | | | | | | |
| 4.000%, 11/01/2034 (Callable 11/01/2024) | | | 600,000 | | | | 592,685 | | | | | |
| Total South Dakota | | | | | | | | | | | | |
| (Cost $956,681) | | | | | | | 938,237 | | | | 0.7 | % |
| Tennessee | | | | | | | | | | | | |
| Chattanooga Health Educational | | | | | | | | | | | | |
| & Housing Facility Board, | | | | | | | | | | | | |
| 5.000%, 08/01/2033 (Callable 08/01/2029) | | | 250,000 | | | | 268,515 | | | | | |
| Tennessee Housing Development Agency, | | | | | | | | | | | | |
| 3.850%, 07/01/2043 (Callable 07/01/2027) | | | 220,000 | | | | 219,868 | | | | | |
| Total Tennessee | | | | | | | | | | | | |
| (Cost $484,753) | | | | | | | 488,383 | | | | 0.4 | % |
| Texas | | | | | | | | | | | | |
| Abilene Convention Center | | | | | | | | | | | | |
| Hotel Development Corp., | | | | | | | | | | | | |
| 4.000%, 10/01/2050 (Callable 10/01/2031) | | | 220,000 | | | | 164,537 | | | | | |
| Arlington Higher Education Finance Corp.: | | | | | | | | | | | | |
| 4.000%, 08/01/2033 | | | | | | | | | | | | |
| (Callable 08/01/2028) (PSF Guaranteed) | | | 125,000 | | | | 127,903 | | | | | |
| 4.000%, 08/15/2036 | | | | | | | | | | | | |
| (Callable 08/15/2031) (PSF Guaranteed) | | | 440,000 | | | | 445,165 | | | | | |
| Arlington Housing Finance Corp., | | | | | | | | | | | | |
| 4.500%, 04/01/2041 (Callable 04/01/2026) | | | | | | | | | | | | |
(Mandatory Tender Date 04/01/2027)(1) | | | 1,015,000 | | | | 1,033,150 | | | | | |
| Austin-Bergstrom Landhost Enterprises, Inc., | | | | | | | | | | | | |
| 5.000%, 10/01/2035 (Callable 10/01/2027) | | | 100,000 | | | | 103,104 | | | | | |
| Brazoria County Toll Road Authority, | | | | | | | | | | | | |
| 0.000%, 03/01/2038 (Callable 03/01/2030) | | | | | | | | | | | | |
(County Guaranteed)(5) | | | 55,000 | | | | 51,646 | | | | | |
| Brazos Higher Education Authority, Inc., | | | | | | | | | | | | |
| 2.350%, 04/01/2040 (Callable 04/01/2030) | | | 5,000 | | | | 4,962 | | | | | |
| Brushy Creek Regional Utility Authority, Inc., | | | | | | | | | | | | |
| 4.000%, 08/01/2031 (Callable 08/01/2026) | | | 400,000 | | | | 407,735 | | | | | |
| City of Magnolia TX, | | | | | | | | | | | | |
5.700%, 09/01/2046(3) | | | 50,000 | | | | 48,791 | | | | | |
| Clifton Higher Education Finance Corp.: | | | | | | | | | | | | |
| 6.000%, 03/01/2029 | | | | | | | | | | | | |
(Callable 03/01/2024)(5) | | | 385,000 | | | | 387,323 | | | | | |
| 5.750%, 08/15/2038 (Callable 08/15/2025) | | | 10,000 | | | | 10,055 | | | | | |
| El Paso Housing Finance Corp., | | | | | | | | | | | | |
| 4.500%, 03/01/2026 (Mandatory Tender | | | | | | | | | | | | |
Date 03/01/2025) (Insured by HUD)(1) | | | 500,000 | | | | 505,204 | | | | | |
| Far North Fort Worth Municipal | | | | | | | | | | | | |
| Utility District No. 1, | | | | | | | | | | | | |
| 4.000%, 09/01/2037 | | | | | | | | | | | | |
| (Callable 10/01/2029) (Insured by BAM) | | | 350,000 | | | | 342,093 | | | | | |
| Harris County Cultural Education | | | | | | | | | | | | |
| Facilities Finance Corp., | | | | | | | | | | | | |
| 2.770%, 12/01/2049 (SIFMA Municipal | | | | | | | | | | | | |
| Swap Index + 0.570%) (Callable 06/01/2024) | | | | | | | | | | | | |
(Mandatory Tender Date 12/04/2024)(2) | | | 40,000 | | | | 40,064 | | | | | |
| Harris County-Houston Sports Authority, | | | | | | | | | | | | |
| 0.000%, 11/15/2025 (Insured by NATL) | | | 500,000 | | | | 454,643 | | | | | |
| Katy Independent School District, | | | | | | | | | | | | |
| 4.000%, 02/15/2053 | | | | | | | | | | | | |
| (Callable 02/15/2032) (PSF Guaranteed) | | | 750,000 | | | | 724,696 | | | | | |
| Love Field Airport Modernization Corp., | | | | | | | | | | | | |
| 4.000%, 11/01/2035 | | | | | | | | | | | | |
| (Callable 11/01/2031) (Insured by AGM) | | | 500,000 | | | | 500,960 | | | | | |
| Matagorda County Navigation District No. 1: | | | | | | | | | | | | |
| 2.600%, 11/01/2029 | | | 575,000 | | | | 518,493 | | | | | |
| 4.400%, 05/01/2030 (Insured by AMBAC) | | | 70,000 | | | | 71,198 | | | | | |
| Mckinney Municipal Utility District No. 1, | | | | | | | | | | | | |
| 3.375%, 09/01/2034 | | | | | | | | | | | | |
| (Callable 05/01/2030) (Insured by BAM) | | | 260,000 | | | | 253,561 | | | | | |
| Montgomery County Municipal | | | | | | | | | | | | |
| Utility District No. 88, | | | | | | | | | | | | |
| 4.250%, 09/01/2047 | | | | | | | | | | | | |
| (Callable 09/01/2029) (Insured by AGM) | | | 500,000 | | | | 487,658 | | | | | |
| Northwest Harris County | | | | | | | | | | | | |
| Municipal Utility District No. 5, | | | | | | | | | | | | |
| 2.500%, 05/01/2028 | | | | | | | | | | | | |
| (Callable 05/01/2024) (Insured by BAM) | | | 350,000 | | | | 331,537 | | | | | |
| Port Beaumont Navigation District, | | | | | | | | | | | | |
| 4.000%, 01/01/2050 | | | | | | | | | | | | |
(Callable 07/31/2023)(3) | | | 500,000 | | | | 356,768 | | | | | |
| Port of Port Arthur Navigation District, | | | | | | | | | | | | |
| 3.050%, 04/01/2040 | | | | | | | | | | | | |
(Optional Put Date 07/03/2023)(1) | | | 1,000,000 | | | | 1,000,000 | | | | | |
| Tarrant County Cultural | | | | | | | | | | | | |
| Education Facilities Finance Corp.: | | | | | | | | | | | | |
| 2.250%, 11/15/2025 | | | 150,000 | | | | 141,494 | | | | | |
| 5.000%, 11/15/2027 (Callable 11/15/2026) | | | 510,000 | | | | 516,390 | | | | | |
| Tarrant County Hospital District, | | | | | | | | | | | | |
| 4.000%, 08/15/2043 (Callable 08/15/2032) | | | 250,000 | | | | 245,674 | | | | | |
| Texas Department of Housing | | | | | | | | | | | | |
| & Community Affairs, | | | | | | | | | | | | |
| 3.750%, 09/01/2049 | | | | | | | | | | | | |
| (Callable 09/01/2028) (Insured by GNMA) | | | 655,000 | | | | 614,573 | | | | | |
| Texas Municipal Gas Acquisition | | | | | | | | | | | | |
| & Supply Corp. I, | | | | | | | | | | | | |
| 6.250%, 12/15/2026 | | | 65,000 | | | | 67,730 | | | | | |
| Texas Municipal Gas Acquisition | | | | | | | | | | | | |
| & Supply Corp. II, | | | | | | | | | | | | |
| 4.130%, 09/15/2027 | | | | | | | | | | | | |
(3 Month LIBOR USD + 0.870%)(2) | | | 220,000 | | | | 220,057 | | | | | |
| Texas Municipal Gas Acquisition | | | | | | | | | | | | |
| & Supply Corp. III, | | | | | | | | | | | | |
| 5.000%, 12/15/2024 | | | 625,000 | | | | 632,135 | | | | | |
| Viridian Municipal Management District, | | | | | | | | | | | | |
| 6.250%, 12/01/2049 | | | | | | | | | | | | |
| (Callable 12/01/2029) | | | 375,000 | | | | 386,725 | | | | | |
| Total Texas | | | | | | | | | | | | |
| (Cost $11,255,653) | | | | | | | 11,196,024 | | | | 8.9 | % |
| Utah | | | | | | | | | | | | |
| City of Salt Lake City UT: | | | | | | | | | | | | |
| 5.000%, 07/01/2034 (Callable 07/01/2027) | | | 500,000 | | | | 525,348 | | | | | |
| 5.000%, 07/01/2043 (Callable 07/01/2028) | | | 455,000 | | | | 468,745 | | | | | |
The accompanying notes are an integral part of these financial statements.
Baird Municipal Bond Fund
Schedule of Investments, June 30, 2023 (Unaudited)
Long-Term Investments (cont.)
| | | Principal | | | | | | % of | |
| | | Amount | | | Value | | | Net Assets | |
| Utah Charter School Finance Authority, | | | | | | | | | |
| 4.000%, 10/15/2051 (Callable 10/15/2031) | | | | | | | | | |
| (Insured by UT CSCE) | | $ | 790,000 | | | $ | 697,045 | | | | |
| Utah Housing Corp.: | | | | | | | | | | | |
| 6.000%, 12/21/2052 (Insured by GNMA) | | | 745,897 | | | | 772,444 | | | | |
| 6.500%, 05/21/2053 (Insured by GNMA) | | | 499,538 | | | | 519,155 | | | | |
| Total Utah | | | | | | | | | | | |
| (Cost $2,999,472) | | | | | | | 2,982,737 | | | | 2.4 | % |
| Vermont | | | | | | | | | | | | |
| Vermont Student Assistance Corp., | | | | | | | | | | | | |
| 5.000%, 06/15/2026 | | | 500,000 | | | | 516,741 | | | | | |
| Total Vermont | | | | | | | | | | | | |
| (Cost $513,949) | | | | | | | 516,741 | | | | 0.4 | % |
| Virginia | | | | | | | | | | | | |
| Chesapeake Bay Bridge & Tunnel District, | | | | | | | | | | | | |
| 5.500%, 07/01/2025 | | | | | | | | | | | | |
| (ETM) (Insured by NATL) | | | 1,000,000 | | | | 1,014,684 | | | | | |
| Farmville Industrial Development Authority, | | | | | | | | | | | | |
| 5.375%, 07/01/2053 (Callable 07/01/2028) | | | | | | | | | | | | |
| (Mandatory Tender Date 07/01/2043) | | | | | | | | | | | | |
| (Insured by AGM) | | | 150,000 | | | | 156,984 | | | | | |
| Federal Home Loan Mortgage Corp. (FHLMC), | | | | | | | | | | | | |
| 2.550%, 06/15/2035 | | | 472,461 | | | | 393,454 | | | | | |
| Toll Road Investors Partnership II LP, | | | | | | | | | | | | |
0.000%, 02/15/2025 (Insured by NATL)(3) | | | 500,000 | | | | 444,396 | | | | | |
| Virginia Port Authority, | | | | | | | | | | | | |
| 5.000%, 07/01/2030 (Callable 07/01/2026) | | | 750,000 | | | | 777,851 | | | | | |
| Virginia Small Business Financing Authority, | | | | | | | | | | | | |
| 5.250%, 10/01/2029 (Callable 10/01/2024) | | | 520,000 | | | | 528,955 | | | | | |
| Total Virginia | | | | | | | | | | | | |
| (Cost $3,347,643) | | | | | | | 3,316,324 | | | | 2.6 | % |
| Washington | | | | | | | | | | | | |
| City of Lynnwood WA, | | | | | | | | | | | | |
| 4.750%, 12/01/2042 (Callable 12/01/2032) | | | 435,000 | | | | 460,442 | | | | | |
| King County Housing Authority, | | | | | | | | | | | | |
| 4.000%, 11/01/2036 | | | | | | | | | | | | |
| (Callable 11/01/2029) (County Guaranteed) | | | 600,000 | | | | 598,768 | | | | | |
| Pend Oreille County Public | | | | | | | | | | | | |
| Utility District No. 1, | | | | | | | | | | | | |
| 5.000%, 01/01/2038 (Callable 01/01/2029) | | | 150,000 | | | | 153,785 | | | | | |
| Port of Seattle WA: | | | | | | | | | | | | |
| 4.000%, 08/01/2036 (Callable 08/01/2031) | | | 300,000 | | | | 297,474 | | | | | |
| 5.500%, 08/01/2047 (Callable 08/01/2032) | | | 250,000 | | | | 271,470 | | | | | |
| Snohomish County Housing Authority, | | | | | | | | | | | | |
| 4.000%, 04/01/2033 (Callable 04/01/2031) | | | 500,000 | | | | 512,993 | | | | | |
| State of Washington, | | | | | | | | | | | | |
| 5.000%, 02/01/2045 (Callable 02/01/2033) | | | 1,000,000 | | | | 1,108,920 | | | | | |
| Tacoma Metropolitan Park District, | | | | | | | | | | | | |
| 5.000%, 12/01/2024 | | | 1,000,000 | | | | 1,011,341 | | | | | |
| Washington Health Care Facilities Authority: | | | | | | | | | | | | |
| 3.600%, 01/01/2035 (SIFMA Municipal | | | | | | | | | | | | |
| Swap Index + 1.400%) (Callable 07/01/2024) | | | | | | | | | | | | |
(Mandatory Tender Date 01/01/2025)(2) | | | 90,000 | | | | 90,035 | | | | | |
| 5.000%, 08/15/2037 (Callable 02/15/2028) | | | 300,000 | | | | 306,631 | | | | | |
| 5.000%, 08/01/2049 (Callable 08/01/2029) | | | 250,000 | | | | 256,081 | | | | | |
| Total Washington | | | | | | | | | | | | |
| (Cost $5,106,641) | | | | | | | 5,067,940 | | | | 4.0 | % |
| Wisconsin | | | | | | | | | | | | |
| Boscobel Area School District, | | | | | | | | | | | | |
| 5.000%, 03/01/2038 | | | | | | | | | | | | |
(Callable 03/01/2031) (Insured by BAM)(6) | | | 735,000 | | | | 796,221 | | | | | |
| County of Waushara WI, | | | | | | | | | | | | |
| 4.500%, 06/01/2027 (Callable 06/01/2025) | | | 500,000 | | | | 511,687 | | | | | |
| Howard-Suamico School District, | | | | | | | | | | | | |
| 1.625%, 03/01/2031 (Callable 03/01/2028) | | | 750,000 | | | | 633,810 | | | | | |
| Palmyra-Eagle Area School District, | | | | | | | | | | | | |
| 3.000%, 03/01/2025 (Callable 07/31/2023) | | | 75,000 | | | | 71,963 | | | | | |
| Public Finance Authority: | | | | | | | | | | | | |
5.000%, 10/01/2023(3) | | | 75,000 | | | | 74,953 | | | | | |
| 5.000%, 05/15/2026 | | | | | | | | | | | | |
(Callable 05/15/2025)(3) | | | 250,000 | | | | 247,560 | | | | | |
| 3.250%, 01/01/2029 | | | 130,000 | | | | 120,199 | | | | | |
| 0.000%, 09/01/2029 | | | | | | | | | | | | |
(Callable 09/01/2026)(3) | | | 750,000 | | | | 469,391 | | | | | |
| 5.000%, 10/01/2044 (Callable 04/01/2029) | | | 250,000 | | | | 258,069 | | | | | |
| 5.250%, 07/01/2053 (Callable 07/01/2033) | | | 300,000 | | | | 299,548 | | | | | |
| Wisconsin Health & | | | | | | | | | | | | |
| Educational Facilities Authority: | | | | | | | | | | | | |
| 5.000%, 03/01/2028 (Callable 03/01/2024) | | | 300,000 | | | | 294,880 | | | | | |
| 5.500%, 12/01/2052 (Callable 12/01/2032) | | | 250,000 | | | | 270,859 | | | | | |
| Wisconsin Housing & Economic | | | | | | | | | | | | |
| Development Authority: | | | | | | | | | | | | |
3.500%, 07/01/2025 (Insured by HUD)(3) | | | 50,000 | | | | 47,887 | | | | | |
| 2.450%, 11/01/2046 | | | | | | | | | | | | |
| (Callable 05/01/2030) (Insured by HUD) | | | 1,500,000 | | | | 1,008,663 | | | | | |
| Total Wisconsin | | | | | | | | | | | | |
| (Cost $5,083,418) | | | | | | | 5,105,690 | | | | 4.1 | % |
| Wyoming | | | | | | | | | | | | |
| Carbon County Specific Purpose | | | | | | | | | | | | |
| Tax Joint Powers Board, | | | | | | | | | | | | |
| 5.000%, 06/15/2025 | | | 100,000 | | | | 102,529 | | | | | |
| Sublette County Hospital District, | | | | | | | | | | | | |
5.000%, 06/15/2026(6) | | | 500,000 | | | | 500,026 | | | | | |
| Total Wyoming | | | | | | | | | | | | |
| (Cost $605,746) | | | | | | | 602,555 | | | | 0.5 | % |
| Total Long-Term Investments | | | | | | | | | | | | |
| (Cost $127,507,851) | | | | | | | 126,963,196 | | | | 100.9 | % |
The accompanying notes are an integral part of these financial statements.
Baird Municipal Bond Fund
Schedule of Investments, June 30, 2023 (Unaudited)
Short-Term Investments
| | | | | | | | | % of | |
| | | Shares | | | Value | | | Net Assets | |
| Money Market Mutual Funds | | | | | | | | | |
| Federated Hermes Institutional Tax-Free | | | | | | | | | |
Cash Trust, Premier Shares, 4.04%(4) | | | 1,309,280 | | | $ | 1,309,280 | | | | |
| First American Government Obligations | | | | | | | | | | | |
Fund, Class U, 5.03%(4) | | | 17,944 | | | | 17,944 | | | | |
| Total Short-Term Investments | | | | | | | | | | | |
| (Cost $1,327,224) | | | | | | | 1,327,224 | | | | 1.1 | % |
| Total Investments | | | | | | | | | | | | |
| (Cost $128,835,075) | | | | | | | 128,290,420 | | | | 102.0 | % |
| Liabilities in Excess of Other Assets | | | | | | | (2,462,159 | ) | | | (2.0 | )% |
| TOTAL NET ASSETS | | | | | | $ | 125,828,261 | | | | 100.0 | % |
Notes to Schedule of Investments
AGC – Assured Guaranty Corp.
AGM – Assured Guaranty Municipal
AMBAC – Ambac Assurance Corp.
BAM – Build America Mutual Assurance Co.
FGIC – Financial Guaranty Insurance Company
FHA – Federal Housing Administration
FHLMC – Federal Home Loan Mortgage Corporation
FNMA – Federal National Mortgage Association
GNMA – Government National Mortgage Association
HUD – US Department of Housing and Development
NATL – National Public Finance Guarantee Corp.
Q-SBLF – Qualified School Building Loan Fund
SCH BD GTY – School Board Guaranty
SD CRED PROG – State Credit Enhancement Program
SONYMA – State of New York Mortgage Agency
SCSDE – South Carolina School District
ST AID – State Aid Intercept/Withholding
UT CSCE – Utah Charter School Credit Enhancement Program
CPI YOY – Consumer Price Index – Year-Over-Year
ETM – Escrowed to Maturity
LIBOR – London Inter-bank Offered Rate
PSF – Permanent School Fund
SIFMA – Securities Industry and Financial Markets Association
(1) | Variable rate security. The rate reported is the rate in effect as of June 30, 2023. |
(2) | Variable rate security based on a reference index and spread. The rate reported is the rate as of the last reset date in effect as of June 30, 2023. |
(3) | Includes securities exempt from registration under Rule 144A of the Securities Act of 1933. These securities may be resold in transactions exempt from registration to qualified institutional buyers. At June 30, 2023, the value of these securities totaled $8,703,424, which represented 6.92% of total net assets. |
(4) | Seven-day yield. |
(5) | Step-up bond; the interest rate shown is the rate in effect as of June 30, 2023. |
(6) | Security or a portion of the security purchased on a when-issued or delayed delivery basis. |
The accompanying notes are an integral part of these financial statements.
Baird Municipal Bond Fund
Schedule of Investments, June 30, 2023 (Unaudited)
Summary of Fair Value Exposure at June 30, 2023 (Unaudited)
The Fund has adopted authoritative fair valuation accounting standards which establish a definition of fair value and set out a hierarchy for measuring fair value. These standards require additional disclosures about the various inputs and valuation techniques used to develop the measurements of fair value and a discussion on changes in valuation techniques and related inputs during the period. These standards define fair value as the price that would be received to sell an asset or paid to transfer a liability in an orderly transaction between market participants at the measurement date.
The fair value hierarchy is organized into three levels based upon the assumptions (referred to as “inputs”) used in pricing the asset or liability. These standards state that “observable inputs” reflect the assumptions market participants would use in pricing the asset or liability based on market data obtained from independent sources and “unobservable inputs” reflect an entity’s own assumptions about the assumptions market participants would use in pricing the asset or liability. These inputs are summarized into three broad levels and described below:
Level 1 – Quoted prices (unadjusted) in active markets for identical assets or liabilities that the reporting entity can access at the measurement date.
Level 2 – Inputs other than quoted prices included within Level 1 that are observable for the asset or liability, either directly or indirectly.
Level 3 – Unobservable inputs for the asset or liability.
The inputs or methodology used for valuing securities are not necessarily an indication of the risk associated with investing in those securities.
The following is a summary of the inputs used to value the Fund’s investments as of June 30, 2023:
| | | Level 1 | | | Level 2 | | | Level 3 | | | Total | |
| Long-Term Investments | | | | | | | | | | | | |
| Municipal Bonds | | $ | — | | | $ | 126,963,196 | | | $ | — | | | $ | 126,963,196 | |
| Total Long-Term Investments | | | — | | | | 126,963,196 | | | | — | | | | 126,963,196 | |
| Short-Term Investments | | | | | | | | | | | | | | | | |
| Money Market Mutual Funds | | | 1,327,224 | | | | — | | | | — | | | | 1,327,224 | |
| Total Short-Term Investments | | | 1,327,224 | | | | — | | | | — | | | | 1,327,224 | |
| Total Investments | | $ | 1,327,224 | | | $ | 126,963,196 | | | $ | — | | | $ | 128,290,420 | |
Changes in valuation techniques may result in transfers into or out of assigned levels within the fair value hierarchy. There were no transfers into or out of Level 3 during the reporting period, as compared to the security classifications from the prior year’s annual report. See the Fund’s Valuation Policy in Note 2a to the financial statements.
The accompanying notes are an integral part of these financial statements.
Additional Information on Fund Expenses
June 30, 2023 (Unaudited)
Expense ExampleAs a shareholder of the Funds, you incur ongoing costs, such as management fees; distribution and/or service (12b-1) fees; and other fund expenses. Although the Funds do not charge any sales loads, redemption fees, or other transaction fees, you will be assessed fees for outgoing wire transfers, returned checks and stop payment orders at prevailing rates charged by U.S. Bancorp Fund Services, LLC, doing business as U.S. Bank Global Fund Services, the Funds’ transfer agent. If you request that a redemption be made by wire transfer, currently the Funds’ transfer agent charges a $15.00 fee.
This Example is intended to help you understand your ongoing costs (in dollars) of investing in each Fund and to compare these costs with the ongoing costs of investing in other mutual funds. The Example is based on an investment of $1,000 invested at the beginning of the period and held for the entire period (1/1/23 – 6/30/23).
Actual Expenses
The third and fourth columns of the following tables provide information about account values and actual expenses. You may use the information in these columns, together with the amount you invested, to estimate the expenses that you paid over the period. Simply divide your account value by $1,000 (for example, an $8,600 account value divided by $1,000 = 8.6), then multiply the result by the number in the fourth column entitled “Expenses Paid During Period’’ to estimate the expenses you paid on your account during this period.
Hypothetical Example for Comparison Purposes
The fifth and sixth columns of the following tables provide information about hypothetical account values and hypothetical expenses based on each Fund’s actual expense ratio and an assumed rate of return of 5% per year before expenses, which is not each Fund’s actual return. The hypothetical account values and expenses may not be used to estimate the actual ending account balance or expenses you paid for the period. You may use this information to compare the ongoing costs of investing in the Funds and other mutual funds. To do so, compare this 5% hypothetical example with the 5% hypothetical examples that appear in the shareholder reports of the other mutual funds. Please note that the expenses shown in the table are meant to highlight your ongoing costs only. Therefore, the sixth column of the tables (entitled “Expenses Paid During Period”) is useful in comparing ongoing costs only, and will not help you determine the relative total costs of owning different mutual funds.
Actual vs. Hypothetical Returns
| | | | | | Hypothetical (5% return |
| | | | Actual | before expenses) |
| | | Beginning | Ending | | Ending | |
| | Fund’s Annualized | Account Value | Account Value | Expenses Paid | Account Value | Expenses Paid |
| | Expense Ratio(1) | 1/1/23 | 6/30/23 | During Period(1) | 6/30/23 | During Period(1) |
| Baird Ultra Short Bond Fund | | | | | | |
| Institutional Class | 0.15% | $1,000.00 | $1,024.40 | $0.75 | $1,024.05 | $0.75 |
| Investor Class | 0.40% | $1,000.00 | $1,023.00 | $2.01 | $1,022.81 | $2.01 |
| | | | | | | |
| Baird Short-Term Bond Fund | | | | | | |
| Institutional Class | 0.30% | $1,000.00 | $1,015.50 | $1.50 | $1,023.31 | $1.51 |
| Investor Class | 0.55% | $1,000.00 | $1,014.30 | $2.75 | $1,022.07 | $2.76 |
| | | | | | | |
| Baird Intermediate Bond Fund | | | | | | |
| Institutional Class | 0.30% | $1,000.00 | $1,017.70 | $1.50 | $1,023.31 | $1.51 |
| Investor Class | 0.55% | $1,000.00 | $1,015.70 | $2.75 | $1,022.07 | $2.76 |
| | | | | | | |
| Baird Aggregate Bond Fund | | | | | | |
| Institutional Class | 0.30% | $1,000.00 | $1,024.30 | $1.51 | $1,023.31 | $1.51 |
| Investor Class | 0.55% | $1,000.00 | $1,022.20 | $2.76 | $1,022.07 | $2.76 |
| | | | | | | |
| Baird Core Plus Bond Fund | | | | | | |
| Institutional Class | 0.30% | $1,000.00 | $1,025.90 | $1.51 | $1,023.31 | $1.51 |
| Investor Class | 0.55% | $1,000.00 | $1,024.40 | $2.76 | $1,022.07 | $2.76 |
| | | | | | | |
| Baird Short-Term Municipal Bond Fund | | | | | | |
| Institutional Class | 0.30% | $1,000.00 | $1,013.60 | $1.50 | $1,023.31 | $1.51 |
| Investor Class | 0.55% | $1,000.00 | $1,012.40 | $2.74 | $1,022.07 | $2.76 |
| | | | | | | |
| Baird Strategic Municipal Bond Fund | | | | | | |
| Institutional Class | 0.30% | $1,000.00 | $1,028.70 | $1.51 | $1,023.31 | $1.51 |
| Investor Class | 0.55% | $1,000.00 | $1,027.50 | $2.76 | $1,022.07 | $2.76 |
| | | | | | | |
| Baird Quality Intermediate Municipal | | | | | | |
| Bond Fund | | | | | | |
| Institutional Class | 0.30% | $1,000.00 | $1,012.90 | $1.50 | $1,023.31 | $1.51 |
| Investor Class | 0.55% | $1,000.00 | $1,011.40 | $2.74 | $1,022.07 | $2.76 |
| | | | | | | |
| Baird Core Intermediate Municipal | | | | | | |
| Bond Fund | | | | | | |
| Institutional Class | 0.30% | $1,000.00 | $1,020.20 | $1.50 | $1,023.31 | $1.51 |
| Investor Class | 0.55% | $1,000.00 | $1,019.00 | $2.75 | $1,022.07 | $2.76 |
| | | | | | | |
| Baird Municipal Bond Fund | | | | | | |
| Institutional Class | 0.30% | $1,000.00 | $1,030.00 | $1.51 | $1,023.31 | $1.51 |
| Investor Class | 0.55% | $1,000.00 | $1,028.80 | $2.77 | $1,022.07 | $2.76 |
(1) | Expenses are equal to the Fund’s annualized net expense ratio multiplied by the average account value over the period, 181 days and divided by 365 to reflect the one-half year period. |
Statements of Assets and Liabilities
June 30, 2023 (Unaudited)
| | | Baird | | | Baird | | | Baird | | | Baird | | | Baird | |
| | | Ultra Short | | | Short-Term | | | Intermediate | | | Aggregate | | | Core Plus | |
| | | Bond Fund | | | Bond Fund | | | Bond Fund | | | Bond Fund | | | Bond Fund | |
| ASSETS: | | | | | | | | | | | | | | | |
| Investments, at value (Cost $6,064,439,614, $9,708,585,021, | | | | | | | | | | | | | | | |
| $7,982,001,561, $43,801,663,094 and $27,020,188,172, respectively) | | $ | 6,049,766,710 | | | $ | 9,417,396,412 | | | $ | 7,534,811,561 | | | $ | 39,716,140,181 | | | $ | 24,388,312,847 | |
| Interest receivable | | | 31,824,029 | | | | 80,340,303 | | | | 52,507,775 | | | | 261,243,013 | | | | 189,238,729 | |
| Receivable for investments sold | | | — | | | | 39,816,278 | | | | — | | | | 245,911,710 | | | | — | |
| Receivable for Fund shares sold | | | 339,347,366 | | | | 9,234,559 | | | | 22,439,314 | | | | 106,258,230 | | | | 55,255,522 | |
| Uninvested cash | | | 366,508 | | | | — | | | | — | | | | — | | | | 1,550 | |
| Prepaid expenses and other assets | | | — | | | | — | | | | 141,816 | | | | 137,551 | | | | 7,519 | |
| Total assets | | | 6,421,304,613 | | | | 9,546,787,552 | | | | 7,609,900,466 | | | | 40,329,690,685 | | | | 24,632,816,167 | |
| LIABILITIES: | | | | | | | | | | | | | | | | | | | | |
| Payable for investments purchased | | | 215,067,925 | | | | 371,768,379 | | | | 161,793,658 | | | | 969,023,699 | | | | 162,519,821 | |
| Payable for Fund shares redeemed | | | 4,958,285 | | | | 23,735,808 | | | | 6,110,069 | | | | 28,204,189 | | | | 163,660,496 | |
| Payable to Advisor, net (Note 5) | | | 483,914 | | | | 1,898,908 | | | | 1,520,346 | | | | 7,945,647 | | | | 4,994,694 | |
| Accrued administration fees (Note 5) | | | 241,990 | | | | 383,898 | | | | 304,634 | | | | 1,589,894 | | | | 998,950 | |
| Accrued Rule 12b-1 fees (Note 7) | | | 13,336 | | | | 71,008 | | | | 28,535 | | | | 335,484 | | | | 379,853 | |
| Total liabilities | | | 220,765,450 | | | | 397,858,001 | | | | 169,757,242 | | | | 1,007,098,913 | | | | 332,553,814 | |
| NET ASSETS | | $ | 6,200,539,163 | | | $ | 9,148,929,551 | | | $ | 7,440,143,224 | | | $ | 39,322,591,772 | | | $ | 24,300,262,353 | |
| NET ASSETS CONSIST OF: | | | | | | | | | | | | | | | | | | | | |
| Paid-in capital | | $ | 6,232,504,520 | | | $ | 9,751,128,199 | | | $ | 8,161,339,787 | | | $ | 44,653,182,701 | | | $ | 27,577,239,181 | |
| Total accumulated deficit | | | (31,965,357 | ) | | | (602,198,648 | ) | | | (721,196,563 | ) | | | (5,330,590,929 | ) | | | (3,276,976,828 | ) |
| NET ASSETS | | $ | 6,200,539,163 | | | $ | 9,148,929,551 | | | $ | 7,440,143,224 | | | $ | 39,322,591,772 | | | $ | 24,300,262,353 | |
| INSTITUTIONAL CLASS SHARES | | | | | | | | | | | | | | | | | | | | |
| Net Assets | | $ | 6,127,487,371 | | | $ | 8,983,143,771 | | | $ | 7,373,770,914 | | | $ | 38,408,472,482 | | | $ | 23,245,923,470 | |
| Shares outstanding ($0.01 par value, unlimited shares authorized) | | | 610,514,872 | | | | 973,856,873 | | | | 729,657,464 | | | | 3,968,345,409 | | | | 2,333,604,461 | |
| Net asset value, offering and redemption price per share | | $ | 10.04 | | | $ | 9.22 | | | $ | 10.11 | | | $ | 9.68 | | | $ | 9.96 | |
| INVESTOR CLASS SHARES | | | | | | | | | | | | | | | | | | | | |
| Net Assets | | $ | 73,051,792 | | | $ | 165,785,780 | | | $ | 66,372,310 | | | $ | 914,119,290 | | | $ | 1,054,338,883 | |
| Shares outstanding ($0.01 par value, unlimited shares authorized) | | | 7,259,728 | | | | 17,978,011 | | | | 6,249,098 | | | | 90,930,951 | | | | 100,975,923 | |
| Net asset value, offering and redemption price per share | | $ | 10.06 | | | $ | 9.22 | | | $ | 10.62 | | | $ | 10.05 | | | $ | 10.44 | |
The accompanying notes are an integral part of these financial statements.
Statements of Assets and Liabilities
June 30, 2023 (Unaudited)
| | | | | | | | | Baird | | | Baird | | | | |
| | | Baird | | | Baird | | | Quality | | | Core | | | | |
| | | Short-Term | | | Strategic | | | Intermediate | | | Intermediate | | | Baird | |
| | | Municipal | | | Municipal | | | Municipal | | | Municipal | | | Municipal | |
| | | Bond Fund | | | Bond Fund | | | Bond Fund | | | Bond Fund | | | Bond Fund | |
| ASSETS: | | | | | | | | | | | | | | | |
| Investments, at value (Cost $1,706,692,664, $639,907,200, | | | | | | | | | | | | | | | |
| $1,110,257,280, $2,670,577,874 and $128,835,075, respectively) | | $ | 1,665,907,749 | | | $ | 630,995,205 | | | $ | 1,083,644,825 | | | $ | 2,614,752,886 | | | $ | 128,290,420 | |
| Interest receivable | | | 15,268,243 | | | | 6,255,267 | | | | 10,600,396 | | | | 27,530,593 | | | | 1,243,107 | |
| Receivable for investments sold | | | 14,671,642 | | | | 1,734,444 | | | | 2,801,967 | | | | 145,367 | | | | 225,528 | |
| Receivable for Fund shares sold | | | 5,877,915 | | | | 3,511,484 | | | | 1,142,316 | | | | 5,592,212 | | | | 757,447 | |
| Receivable for matured bonds | | | 1,250,000 | | | | 2,375,000 | | | | — | | | | — | | | | 500,000 | |
| Deposits with broker for futures contracts | | | — | | | | 147,501 | | | | — | | | | — | | | | — | |
| Uninvested cash | | | — | | | | — | | | | — | | | | 1,644 | | | | — | |
| Prepaid expenses and other assets | | | 4,732 | | | | — | | | | 3 | | | | 12,569 | | | | 28 | |
| Total assets | | | 1,702,980,281 | | | | 645,018,901 | | | | 1,098,189,507 | | | | 2,648,035,271 | | | | 131,016,530 | |
| LIABILITIES: | | | | | | | | | | | | | | | | | | | | |
| Payable for investments purchased | | | 31,300,133 | | | | 13,476,128 | | | | 6,797,485 | | | | 16,101,091 | | | | 5,146,307 | |
| Payable for Fund shares redeemed | | | 5,423,529 | | | | 1,119,883 | | | | 1,579,248 | | | | 3,007,609 | | | | 9,227 | |
| Payable to Advisor, net (Note 5) | | | 345,334 | | | | 128,323 | | | | 225,405 | | | | 537,439 | | | | 24,674 | |
| Accrued administration fees (Note 5) | | | 69,067 | | | | 118,663 | | | | 45,081 | | | | 107,500 | | | | 4,935 | |
| Accrued Rule 12b-1 fees (Note 7) | | | 27,120 | | | | 6,196 | | | | 67,617 | | | | 9,062 | | | | 3,126 | |
| Total liabilities | | | 37,165,183 | | | | 14,849,193 | | | | 8,714,836 | | | | 19,762,701 | | | | 5,188,269 | |
| NET ASSETS | | $ | 1,665,815,098 | | | $ | 630,169,708 | | | $ | 1,089,474,671 | | | $ | 2,628,272,570 | | | $ | 125,828,261 | |
| NET ASSETS CONSIST OF: | | | | | | | | | | | | | | | | | | | | |
| Paid-in capital | | $ | 1,764,273,837 | | | $ | 651,125,308 | | | $ | 1,163,056,054 | | | $ | 2,730,249,375 | | | $ | 128,608,581 | |
| Total accumulated deficit | | | (98,458,739 | ) | | | (20,955,600 | ) | | | (73,581,383 | ) | | | (101,976,805 | ) | | | (2,780,320 | ) |
| NET ASSETS | | $ | 1,665,815,098 | | | $ | 630,169,708 | | | $ | 1,089,474,671 | | | $ | 2,628,272,570 | | | $ | 125,828,261 | |
| INSTITUTIONAL CLASS SHARES | | | | | | | | | | | | | | | | | | | | |
| Net Assets | | $ | 1,603,414,782 | | | $ | 612,844,049 | | | $ | 1,041,234,849 | | | $ | 2,590,100,863 | | | $ | 119,970,576 | |
| Shares outstanding ($0.01 par value, unlimited shares authorized) | | | 162,674,506 | | | | 60,722,766 | | | | 94,986,433 | | | | 254,962,233 | | | | 12,223,357 | |
| Net asset value, offering and redemption price per share | | $ | 9.86 | | | $ | 10.09 | | | $ | 10.96 | | | $ | 10.16 | | | $ | 9.81 | |
| INVESTOR CLASS SHARES | | | | | | | | | | | | | | | | | | | | |
| Net Assets | | $ | 62,400,316 | | | $ | 17,325,659 | | | $ | 48,239,822 | | | $ | 38,171,707 | | | $ | 5,857,685 | |
| Shares outstanding ($0.01 par value, unlimited shares authorized) | | | 6,341,530 | | | | 1,716,984 | | | | 4,286,714 | | | | 3,759,527 | | | | 597,248 | |
| Net asset value, offering and redemption price per share | | $ | 9.84 | | | $ | 10.09 | | | $ | 11.25 | | | $ | 10.15 | | | $ | 9.81 | |
The accompanying notes are an integral part of these financial statements.
Statements of Operations
Period Ended June 30, 2023 (Unaudited)
| | | Baird | | | Baird | | | Baird | | | Baird | | | Baird | |
| | | Ultra Short | | | Short-Term | | | Intermediate | | | Aggregate | | | Core Plus | |
| | | Bond Fund | | | Bond Fund | | | Bond Fund | | | Bond Fund | | | Bond Fund | |
| INVESTMENT INCOME: | | | | | | | | | | | | | | | |
| Interest income, net of paydowns | | $ | 122,114,888 | | | $ | 158,617,717 | | | $ | 119,355,909 | | | $ | 672,047,726 | | | $ | 443,715,964 | |
| Other income | | | 40,195 | | | | 328,042 | | | | 298,500 | | | | 648,913 | | | | 287,709 | |
| Total investment income | | | 122,155,083 | | | | 158,945,759 | | | | 119,654,409 | | | | 672,696,639 | | | | 444,003,673 | |
| | | | | | | | | | | | | | | | | | | | | |
| EXPENSES: | | | | | | | | | | | | | | | | | | | | |
| Investment advisory fees (Note 5) | | | 7,090,545 | | | | 11,349,403 | | | | 8,913,818 | | | | 46,280,668 | | | | 29,319,782 | |
| Administration fees (Note 5) | | | 1,418,109 | | | | 2,269,881 | | | | 1,782,763 | | | | 9,256,133 | | | | 5,863,956 | |
| Rule 12b-1 fees – Investor Class Shares (Note 7) | | | 105,590 | | | | 246,033 | | | | 79,411 | | | | 1,043,776 | | | | 1,308,387 | |
| Total expenses | | | 8,614,244 | | | | 13,865,317 | | | | 10,775,992 | | | | 56,580,577 | | | | 36,492,125 | |
| Fee waiver by Advisor (Note 5) | | | (4,254,327 | ) | | | — | | | | — | | | | — | | | | — | |
| Net expenses | | | 4,359,917 | | | | — | | | | — | | | | — | | | | — | |
| NET INVESTMENT INCOME | | | 117,795,166 | | | | 145,080,442 | | | | 108,878,417 | | | | 616,116,062 | | | | 407,511,548 | |
| | | | | | | | | | | | | | | | | | | | | |
| REALIZED AND UNREALIZED GAIN (LOSS) ON INVESTMENTS: | | | | | | | | | | | | | | | | | | | |
| Net realized loss on investments | | | (3,163,988 | ) | | | (55,778,892 | ) | | | (71,547,601 | ) | | | (252,872,784 | ) | | | (111,536,656 | ) |
| Net change in unrealized appreciation on investments | | | 22,555,208 | | | | 54,115,707 | | | | 77,655,966 | | | | 463,749,921 | | | | 295,464,956 | |
| Net realized and unrealized gain (loss) on investments | | | 19,391,220 | | | | (1,663,185 | ) | | | 6,108,365 | | | | 210,877,137 | | | | 183,928,300 | |
| NET INCREASE IN NET ASSETS RESULTING FROM OPERATIONS | $ | 137,186,386 | | | $ | 143,417,257 | | | $ | 114,986,782 | | | $ | 826,993,199 | | | $ | 591,439,848 | |
The accompanying notes are an integral part of these financial statements.
Statements of Operations
Period Ended June 30, 2023 (Unaudited)
| | | | | | | | | Baird | | | Baird | | | | |
| | | Baird | | | Baird | | | Quality | | | Core | | | | |
| | | Short-Term | | | Strategic | | | Intermediate | | | Intermediate | | | Baird | |
| | | Municipal | | | Municipal | | | Municipal | | | Municipal | | | Municipal | |
| | | Bond Fund | | | Bond Fund | | | Bond Fund | | | Bond Fund | | | Bond Fund | |
| INVESTMENT INCOME: | | | | | | | | | | | | | | | |
| Interest income | | $ | 24,248,034 | | | $ | 9,810,077 | | | $ | 15,207,122 | | | $ | 40,422,655 | | | $ | 1,814,462 | |
| Total investment income | | | 24,248,034 | | | | 9,810,077 | | | | 15,207,122 | | | | 40,422,655 | | | | 1,814,462 | |
| | | | | | | | | | | | | | | | | | | | | |
| EXPENSES: | | | | | | | | | | | | | | | | | | | | |
| Investment advisory fees (Note 5) | | | 2,107,071 | | | | 689,476 | | | | 1,387,330 | | | | 3,128,388 | | | | 115,822 | |
| Administration fees (Note 5) | | | 421,414 | | | | 137,895 | | | | 277,466 | | | | 625,677 | | | | 23,165 | |
| Interest expense (Note 6) | | | — | | | | 25 | | | | — | | | | — | | | | — | |
| Rule 12b-1 fees – Investor Class Shares (Note 7) | | | 82,220 | | | | 18,936 | | | | 51,032 | | | | 52,287 | | | | 6,415 | |
| Total expenses | | | 2,610,705 | | | | 846,332 | | | | 1,715,828 | | | | 3,806,352 | | | | 145,402 | |
| NET INVESTMENT INCOME | | | 21,637,329 | | | | 8,963,745 | | | | 13,491,294 | | | | 36,616,303 | | | | 1,669,060 | |
| | | | | | | | | | | | | | | | | | | | | |
| REALIZED AND UNREALIZED GAIN (LOSS) ON INVESTMENTS: | | | | | | | | | | | | | | | | | | | |
| Net realized gain (loss) on: | | | | | | | | | | | | | | | | | | | | |
| Investments | | | (11,040,069 | ) | | | 577,244 | | | | (6,619,753 | ) | | | (8,170,476 | ) | | | (346,247 | ) |
| Futures contracts | | | — | | | | 354,259 | | | | — | | | | — | | | | — | |
| Net change in unrealized appreciation (depreciation) on: | | | | | | | | | | | | | | | | | | | | |
| Investments | | | 12,400,986 | | | | 4,829,280 | | | | 6,888,686 | | | | 20,463,339 | | | | 1,093,175 | |
| Futures contracts | | | — | | | | (101,306 | ) | | | — | | | | — | | | | — | |
| Net realized and unrealized gain on investments | | | 1,360,917 | | | | 5,659,477 | | | | 268,933 | | | | 12,292,863 | | | | 746,928 | |
| NET INCREASE IN NET ASSETS RESULTING FROM OPERATIONS | $ | 22,998,246 | | | $ | 14,623,222 | | | $ | 13,760,227 | | | $ | 48,909,166 | | | $ | 2,415,988 | |
The accompanying notes are an integral part of these financial statements.
Statements of Changes in Net Assets
| | | Baird Ultra Short Bond Fund | | | Baird Short-Term Bond Fund | |
| | | Six Months Ended | | | | | | Six Months Ended | | | | |
| | | June 30, 2023 | | | Year Ended | | | June 30, 2023 | | | Year Ended | |
| | | (Unaudited) | | | December 31, 2022 | | | (Unaudited) | | | December 31, 2022 | |
| OPERATIONS: | | | | | | | | | | | | |
| Net investment income | | $ | 117,795,166 | | | $ | 81,273,584 | | | $ | 145,080,442 | | | $ | 165,908,820 | |
| Net realized loss on investments | | | (3,163,988 | ) | | | (9,717,166 | ) | | | (55,778,892 | ) | | | (254,007,629 | ) |
| Net change in unrealized appreciation (depreciation) on investments | | | 22,555,208 | | | | (26,291,187 | ) | | | 54,115,707 | | | | (309,605,768 | ) |
| Net increase (decrease) in net assets resulting from operations | | | 137,186,386 | | | | 45,265,231 | | | | 143,417,257 | | | | (397,704,577 | ) |
| | | | | | | | | | | | | | | | | |
| CAPITAL SHARE TRANSACTIONS: | | | | | | | | | | | | | | | | |
| Proceeds from shares sold | | | 2,372,791,666 | | | | 5,151,744,331 | | | | 1,655,788,825 | | | | 3,778,175,889 | |
| Shares issued to holders in reinvestment of distributions | | | 102,605,826 | | | | 81,671,057 | | | | 128,588,094 | | | | 152,694,426 | |
| Cost of shares redeemed | | | (1,910,157,073 | ) | | | (6,635,885,368 | ) | | | (1,602,071,459 | ) | | | (5,136,435,328 | ) |
| Net increase (decrease) in net assets resulting from capital share transactions | | | 565,240,419 | | | | (1,402,469,980 | ) | | | 182,305,460 | | | | (1,205,565,013 | ) |
| | | | | | | | | | | | | | | | | |
| DISTRIBUTIONS TO SHAREHOLDERS: | | | | | | | | | | | | | | | | |
| Net distributions to shareholders: | | | | | | | | | | | | | | | | |
| Institutional Class | | | (108,034,426 | ) | | | (87,591,687 | ) | | | (138,374,693 | ) | | | (167,714,327 | ) |
| Investor Class | | | (1,463,529 | ) | | | (1,276,605 | ) | | | (2,774,178 | ) | | | (3,523,701 | ) |
| Total net distributions to shareholders | | | (109,497,955 | ) | | | (88,868,292 | ) | | | (141,148,871 | ) | | | (171,238,028 | ) |
| | | | | | | | | | | | | | | | | |
| TOTAL INCREASE (DECREASE) IN NET ASSETS | | | 592,928,850 | | | | (1,446,073,041 | ) | | | 184,573,846 | | | | (1,774,507,618 | ) |
| | | | | | | | | | | | | | | | | |
| NET ASSETS: | | | | | | | | | | | | | | | | |
| Beginning of period | | | 5,607,610,313 | | | | 7,053,683,354 | | | | 8,964,355,705 | | | | 10,738,863,323 | |
| End of period | | $ | 6,200,539,163 | | | $ | 5,607,610,313 | | | $ | 9,148,929,551 | | | $ | 8,964,355,705 | |
The accompanying notes are an integral part of these financial statements.
Statements of Changes in Net Assets
| | | Baird Intermediate Bond Fund | | | Baird Aggregate Bond Fund | |
| | | Six Months Ended | | | | | | Six Months Ended | | | | |
| | | June 30, 2023 | | | Year Ended | | | June 30, 2023 | | | Year Ended | |
| | | (Unaudited) | | | December 31, 2022 | | | (Unaudited) | | | December 31, 2022 | |
| OPERATIONS: | | | | | | | | | | | | |
| Net investment income | | $ | 108,878,417 | | | $ | 145,373,769 | | | $ | 616,116,062 | | | $ | 884,588,943 | |
| Net realized loss on investments | | | (71,547,601 | ) | | | (201,837,334 | ) | | | (252,872,784 | ) | | | (895,602,951 | ) |
| Net change in unrealized appreciation (depreciation) on investments | | | 77,655,966 | | | | (563,129,596 | ) | | | 463,749,921 | | | | (5,301,736,772 | ) |
| Net increase (decrease) in net assets resulting from operations | | | 114,986,782 | | | | (619,593,161 | ) | | | 826,993,199 | | | | (5,312,750,780 | ) |
| | | | | | | | | | | | | | | | | |
| CAPITAL SHARE TRANSACTIONS: | | | | | | | | | | | | | | | | |
| Proceeds from shares sold | | | 1,110,276,766 | | | | 3,016,470,885 | | | | 7,344,842,389 | | | | 11,664,210,933 | |
| Shares issued to holders in reinvestment of distributions | | | 94,126,749 | | | | 126,726,838 | | | | 532,896,574 | | | | 831,583,616 | |
| Cost of shares redeemed | | | (813,841,961 | ) | | | (2,018,763,028 | ) | | | (3,578,007,020 | ) | | | (11,436,828,390 | ) |
| Net increase in net assets resulting from capital share transactions | | | 390,561,554 | | | | 1,124,434,695 | | | | 4,299,731,943 | | | | 1,058,966,159 | |
| | | | | | | | | | | | | | | | | |
| DISTRIBUTIONS TO SHAREHOLDERS: | | | | | | | | | | | | | | | | |
| Net distributions to shareholders: | | | | | | | | | | | | | | | | |
| Institutional Class | | | (104,536,129 | ) | | | (145,267,678 | ) | | | (575,892,714 | ) | | | (900,625,260 | ) |
| Investor Class | | | (823,795 | ) | | | (825,985 | ) | | | (11,888,192 | ) | | | (16,400,637 | ) |
| Total net distributions to shareholders | | | (105,359,924 | ) | | | (146,093,663 | ) | | | (587,780,906 | ) | | | (917,025,897 | ) |
| | | | | | | | | | | | | | | | | |
| TOTAL INCREASE (DECREASE) IN NET ASSETS | | | 400,188,412 | | | | 358,747,871 | | | | 4,538,944,236 | | | | (5,170,810,518 | ) |
| | | | | | | | | | | | | | | | | |
| NET ASSETS: | | | | | | | | | | | | | | | | |
| Beginning of period | | | 7,039,954,812 | | | | 6,681,206,941 | | | | 34,783,647,536 | | | | 39,954,458,054 | |
| End of period | | $ | 7,440,143,224 | | | $ | 7,039,954,812 | | | $ | 39,322,591,772 | | | $ | 34,783,647,536 | |
The accompanying notes are an integral part of these financial statements.
Statements of Changes in Net Assets
| | | Baird Core Plus Bond Fund | | | Baird Short-Term Municipal Bond Fund | |
| | | Six Months Ended | | | | | | Six Months Ended | | | | |
| | | June 30, 2023 | | | Year Ended | | | June 30, 2023 | | | Year Ended | |
| | | (Unaudited) | | | December 31, 2022 | | | (Unaudited) | | | December 31, 2022 | |
| OPERATIONS: | | | | | | | | | | | | |
| Net investment income | | $ | 407,511,548 | | | $ | 685,346,165 | | | $ | 21,637,329 | | | $ | 32,143,881 | |
| Net realized loss on investments | | | (111,536,656 | ) | | | (487,341,184 | ) | | | (11,040,069 | ) | | | (47,128,258 | ) |
| Net change in unrealized appreciation (depreciation) on investments | | | 295,464,956 | | | | (3,821,826,740 | ) | | | 12,400,986 | | | | (72,671,094 | ) |
| Net increase (decrease) in net assets resulting from operations | | | 591,439,848 | | | | (3,623,821,759 | ) | | | 22,998,246 | | | | (87,655,471 | ) |
| | | | | | | | | | | | | | | | | |
| CAPITAL SHARE TRANSACTIONS: | | | | | | | | | | | | | | | | |
| Proceeds from shares sold | | | 3,539,760,158 | | | | 5,516,171,299 | | | | 343,259,949 | | | | 1,692,061,716 | |
| Shares issued to holders in reinvestment of distributions | | | 360,869,511 | | | | 651,747,060 | | | | 15,139,587 | | | | 23,012,924 | |
| Cost of shares redeemed | | | (2,137,180,188 | ) | | | (8,771,298,217 | ) | | | (461,735,069 | ) | | | (2,128,711,604 | ) |
| Net increase (decrease) in net assets resulting from capital share transactions | | | 1,763,449,481 | | | | (2,603,379,858 | ) | | | (103,335,533 | ) | | | (413,636,964 | ) |
| | | | | | | | | | | | | | | | | |
| DISTRIBUTIONS TO SHAREHOLDERS: | | | | | | | | | | | | | | | | |
| Net distributions to shareholders: | | | | | | | | | | | | | | | | |
| Institutional Class | | | (372,868,238 | ) | | | (675,060,211 | ) | | | (20,325,475 | ) | | | (30,930,374 | ) |
| Investor Class | | | (15,330,549 | ) | | | (31,303,480 | ) | | | (741,603 | ) | | | (1,121,192 | ) |
| Total net distributions to shareholders | | | (388,198,787 | ) | | | (706,363,691 | ) | | | (21,067,078 | ) | | | (32,051,566 | ) |
| | | | | | | | | | | | | | | | | |
| TOTAL INCREASE (DECREASE) IN NET ASSETS | | | 1,966,690,542 | | | | (6,933,565,308 | ) | | | (101,404,365 | ) | | | (533,344,001 | ) |
| | | | | | | | | | | | | | | | | |
| NET ASSETS: | | | | | | | | | | | | | | | | |
| Beginning of period | | | 22,333,571,811 | | | | 29,267,137,119 | | | | 1,767,219,463 | | | | 2,300,563,464 | |
| End of period | | $ | 24,300,262,353 | | | $ | 22,333,571,811 | | | $ | 1,665,815,098 | | | $ | 1,767,219,463 | |
The accompanying notes are an integral part of these financial statements.
Statements of Changes in Net Assets
| | | | | | | | | Baird Quality Intermediate | |
| | | Baird Strategic Municipal Bond Fund | | | Municipal Bond Fund | |
| | | Six Months Ended | | | | | | Six Months Ended | | | | |
| | | June 30, 2023 | | | Year Ended | | | June 30, 2023 | | | Year Ended | |
| | | (Unaudited) | | | December 31, 2022 | | | (Unaudited) | | | December 31, 2022 | |
| OPERATIONS: | | | | | | | | | | | | |
| Net investment income | | $ | 8,963,745 | | | $ | 8,624,615 | | | $ | 13,491,294 | | | $ | 25,687,671 | |
| Net realized gain (loss) on investments and futures | | | 931,503 | | | | (13,302,908 | ) | | | (6,619,753 | ) | | | (28,730,038 | ) |
| Net change in unrealized appreciation (depreciation) | | | | | | | | | | | | | | | | |
| on investments and futures | | | 4,727,974 | | | | (17,057,248 | ) | | | 6,888,686 | | | | (90,334,500 | ) |
| Net increase (decrease) in net assets resulting from operations | | | 14,623,222 | | | | (21,735,541 | ) | | | 13,760,227 | | | | (93,376,867 | ) |
| | | | | | | | | | | | | | | | | |
| CAPITAL SHARE TRANSACTIONS: | | | | | | | | | | | | | | | | |
| Proceeds from shares sold | | | 188,433,822 | | | | 475,706,389 | | | | 160,647,906 | | | | 813,043,520 | |
| Shares issued to holders in reinvestment of distributions | | | 8,167,802 | | | | 8,250,455 | | | | 11,742,205 | | | | 22,811,318 | |
| Cost of shares redeemed | | | (53,838,250 | ) | | | (325,367,747 | ) | | | (197,119,357 | ) | | | (1,188,546,488 | ) |
| Net increase (decrease) in net assets resulting from capital share transactions | | | 142,763,374 | | | | 158,589,097 | | | | (24,729,246 | ) | | | (352,691,650 | ) |
| | | | | | | | | | | | | | | | | |
| DISTRIBUTIONS TO SHAREHOLDERS: | | | | | | | | | | | | | | | | |
| Net distributions to shareholders: | | | | | | | | | | | | | | | | |
| Institutional Class | | | (8,453,939 | ) | | | (8,469,135 | ) | | | (12,742,204 | ) | | | (24,886,321 | ) |
| Investor Class | | | (223,021 | ) | | | (157,066 | ) | | | (443,346 | ) | | | (864,715 | ) |
| Total net distributions to shareholders | | | (8,676,960 | ) | | | (8,626,201 | ) | | | (13,185,550 | ) | | | (25,751,036 | ) |
| | | | | | | | | | | | | | | | | |
| TOTAL INCREASE (DECREASE) IN NET ASSETS | | | 148,709,636 | | | | 128,227,355 | | | | (24,154,569 | ) | | | (471,819,553 | ) |
| | | | | | | | | | | | | | | | | |
| NET ASSETS: | | | | | | | | | | | | | | | | |
| Beginning of period | | | 481,460,072 | | | | 353,232,717 | | | | 1,113,629,240 | | | | 1,585,448,793 | |
| End of period | | $ | 630,169,708 | | | $ | 481,460,072 | | | $ | 1,089,474,671 | | | $ | 1,113,629,240 | |
The accompanying notes are an integral part of these financial statements.
Statements of Changes in Net Assets
| | | Baird Core Intermediate | | | | | | | |
| | | Municipal Bond Fund | | | Baird Municipal Bond Fund | |
| | | Six Months Ended | | | | | | Six Months Ended | | | | |
| | | June 30, 2023 | | | Year Ended | | | June 30, 2023 | | | Year Ended | |
| | | (Unaudited) | | | December 31, 2022 | | | (Unaudited) | | | December 31, 2022 | |
| OPERATIONS: | | | | | | | | | | | | |
| Net investment income | | $ | 36,616,303 | | | $ | 40,069,912 | | | $ | 1,669,060 | | | $ | 1,314,034 | |
| Net realized loss on investments | | | (8,170,476 | ) | | | (39,517,721 | ) | | | (346,247 | ) | | | (1,980,641 | ) |
| Net change in unrealized appreciation (depreciation) on investments | | | 20,463,339 | | | | (111,608,035 | ) | | | 1,093,175 | | | | (2,574,152 | ) |
| Net increase (decrease) in net assets resulting from operations | | | 48,909,166 | | | | (111,055,844 | ) | | | 2,415,988 | | | | (3,240,759 | ) |
| | | | | | | | | | | | | | | | | |
| CAPITAL SHARE TRANSACTIONS: | | | | | | | | | | | | | | | | |
| Proceeds from shares sold | | | 581,217,280 | | | | 2,707,781,167 | | | | 74,487,248 | | | | 57,743,925 | |
| Shares issued to holders in reinvestment of distributions | | | 30,062,574 | | | | 30,661,901 | | | | 1,368,587 | | | | 1,126,834 | |
| Cost of shares redeemed | | | (484,738,934 | ) | | | (1,672,955,500 | ) | | | (10,603,628 | ) | | | (32,272,377 | ) |
| Net increase in net assets resulting from capital share transactions | | | 126,540,920 | | | | 1,065,487,568 | | | | 65,252,207 | | | | 26,598,382 | |
| | | | | | | | | | | | | | | | | |
| DISTRIBUTIONS TO SHAREHOLDERS: | | | | | | | | | | | | | | | | |
| Net distributions to shareholders: | | | | | | | | | | | | | | | | |
| Institutional Class | | | (35,115,927 | ) | | | (39,031,327 | ) | | | (1,516,263 | ) | | | (1,223,767 | ) |
| Investor Class | | | (541,671 | ) | | | (663,365 | ) | | | (78,883 | ) | | | (81,592 | ) |
| Total net distributions to shareholders | | | (35,657,598 | ) | | | (39,694,692 | ) | | | (1,595,146 | ) | | | (1,305,359 | ) |
| | | | | | | | | | | | | | | | | |
| TOTAL INCREASE IN NET ASSETS | | | 139,792,488 | | | | 914,737,032 | | | | 66,073,049 | | | | 22,052,264 | |
| | | | | | | | | | | | | | | | | |
| NET ASSETS: | | | | | | | | | | | | | | | | |
| Beginning of period | | | 2,488,480,082 | | | | 1,573,743,050 | | | | 59,755,212 | | | | 37,702,948 | |
| End of period | | $ | 2,628,272,570 | | | $ | 2,488,480,082 | | | $ | 125,828,261 | | | $ | 59,755,212 | |
The accompanying notes are an integral part of these financial statements.
Financial Highlights
Baird Ultra Short Bond Fund – Institutional Class
| | | Six Months Ended | | | | | | | | | | | | | | | | |
| | | June 30, 2023 | | | Year Ended December 31, | |
| | | (Unaudited) | | | 2022 | | | 2021 | | | 2020 | | | 2019 | | | 2018 | |
| Per Share Data: | | | | | | | | | | | | | | | | | | |
| Net asset value, beginning of period | | $ | 9.99 | | | $ | 10.05 | | | $ | 10.08 | | | $ | 10.06 | | | $ | 10.01 | | | $ | 10.03 | |
| Income from investment operations: | | | | | | | | | | | | | | | | | | | | | | | | |
Net investment income(1) | | | 0.21 | | | | 0.13 | | | | 0.04 | | | | 0.12 | | | | 0.26 | | | | 0.23 | |
Net realized and unrealized gains (losses) on investments | | 0.03 | | | | (0.03 | ) | | | (0.02 | ) | | | 0.05 | (2) | | | 0.05 | | | | (0.04 | ) |
| Total from investment operations | | | 0.24 | | | | 0.10 | | | | 0.02 | | | | 0.17 | | | | 0.31 | | | | 0.19 | |
| Less distributions: | | | | | | | | | | | | | | | | | | | | | | | | |
| Distributions from net investment income | | | (0.19 | ) | | | (0.16 | ) | | | (0.05 | ) | | | (0.14 | ) | | | (0.26 | ) | | | (0.21 | ) |
| Distributions from net realized gains | | | — | | | | — | | | | (0.00 | )(3) | | | (0.01 | ) | | | (0.00 | )(3) | | | — | |
| Total distributions | | | (0.19 | ) | | | (0.16 | ) | | | (0.05 | ) | | | (0.15 | ) | | | (0.26 | ) | | | (0.21 | ) |
| Net asset value, end of period | | $ | 10.04 | | | $ | 9.99 | | | $ | 10.05 | | | $ | 10.08 | | | $ | 10.06 | | | $ | 10.01 | |
| Total return | | | 2.44 | %(4) | | | 0.96 | % | | | 0.20 | % | | | 1.66 | % | | | 3.11 | % | | | 1.95 | % |
| Supplemental data and ratios: | | | | | | | | | | | | | | | | | | | | | | | | |
| Net assets, end of period (millions) | | $ | 6,127.5 | | | $ | 5,515.0 | | | $ | 6,889.5 | | | $ | 4,456.4 | | | $ | 1,701.0 | | | $ | 1,031.5 | |
| Ratio of expenses to average net assets | | | 0.15 | %(5) | | | 0.15 | % | | | 0.15 | % | | | 0.15 | % | | | 0.15 | % | | | 0.15 | % |
Ratio of expenses to average net assets (before waivers) | | 0.30 | %(5) | | | 0.30 | % | | | 0.30 | % | | | 0.30 | % | | | 0.30 | % | | | 0.30 | % |
Ratio of net investment income to average net assets | | | 4.16 | %(5) | | | 1.34 | % | | | 0.38 | % | | | 1.24 | % | | | 2.61 | % | | | 2.24 | % |
Ratio of net investment income to average net assets (before waivers) | 4.01 | %(5) | | | 1.19 | % | | | 0.23 | % | | | 1.09 | % | | | 2.46 | % | | | 2.09 | % |
Portfolio turnover rate(6) | | | 58 | %(4) | | | 104 | % | | | 96 | % | | | 92 | % | | | 70 | % | | | 66 | % |
(1) | Calculated using average shares outstanding during the period. |
(2) | Due to timing of capital share transactions, the per share amount of net realized and unrealized gain (loss) on investments varies from the amounts shown in the Statement of Operations. |
(3) | Amount is less than $0.005. |
(4) | Not annualized. |
(5) | Annualized. |
(6) | Portfolio turnover is calculated on the basis of the Fund as a whole without distinguishing between the classes of shares issued and excludes in-kind transactions, where applicable. |
The accompanying notes are an integral part of these financial statements.
Financial Highlights
Baird Ultra Short Bond Fund – Investor Class
| | | Six Months Ended | | | | | | | | | | | | | | | | |
| | | June 30, 2023 | | | Year Ended December 31, | |
| | | (Unaudited) | | | 2022 | | | 2021 | | | 2020 | | | 2019 | | | 2018 | |
| Per Share Data: | | | | | | | | | | | | | | | | | | |
| Net asset value, beginning of period | | $ | 10.01 | | | $ | 10.07 | | | $ | 10.10 | | | $ | 10.05 | | | $ | 10.00 | | | $ | 10.03 | |
| Income from investment operations: | | | | | | | | | | | | | | | | | | | | | | | | |
Net investment income(1) | | | 0.19 | | | | 0.11 | | | | 0.01 | | | | 0.10 | | | | 0.24 | | | | 0.20 | |
Net realized and unrealized gains (losses) on investments | | | 0.04 | | | | (0.04 | ) | | | (0.01 | ) | | | 0.07 | (2) | | | 0.04 | | | | (0.04 | ) |
| Total from investment operations | | | 0.23 | | | | 0.07 | | | | — | | | | 0.17 | | | | 0.28 | | | | 0.16 | |
| Less distributions: | | | | | | | | | | | | | | | | | | | | | | | | |
| Distributions from net investment income | | | (0.18 | ) | | | (0.13 | ) | | | (0.03 | ) | | | (0.11 | ) | | | (0.23 | ) | | | (0.19 | ) |
| Distributions from net realized gains | | | — | | | | — | | | | (0.00 | )(3) | | | (0.01 | ) | | | (0.00 | )(3) | | | — | |
| Total distributions | | | (0.18 | ) | | | (0.13 | ) | | | (0.03 | ) | | | (0.12 | ) | | | (0.23 | ) | | | (0.19 | ) |
| Net asset value, end of period | | $ | 10.06 | | | $ | 10.01 | | | $ | 10.07 | | | $ | 10.10 | | | $ | 10.05 | | | $ | 10.00 | |
| Total return | | | 2.30 | %(4) | | | 0.70 | % | | | (0.05 | )% | | | 1.66 | % | | | 2.87 | % | | | 1.60 | % |
| Supplemental data and ratios: | | | | | | | | | | | | | | | | | | | | | | | | |
| Net assets, end of period (millions) | | $ | 73.1 | | | $ | 92.7 | | | $ | 164.2 | | | $ | 122.7 | | | $ | 32.5 | | | $ | 15.6 | |
| Ratio of expenses to average net assets | | | 0.40 | %(5) | | | 0.40 | % | | | 0.40 | % | | | 0.40 | % | | | 0.40 | % | | | 0.40 | % |
Ratio of expenses to average net assets (before waivers) | | | 0.55 | %(5) | | | 0.55 | % | | | 0.55 | % | | | 0.55 | % | | | 0.55 | % | | | 0.55 | % |
Ratio of net investment income to average net assets | | | 3.91 | %(5) | | | 1.09 | % | | | 0.13 | % | | | 0.99 | % | | | 2.36 | % | | | 1.99 | % |
Ratio of net investment income (loss) to average net assets (before waivers) | | | 3.76 | %(5) | | | 0.94 | % | | | (0.02 | )% | | | 0.84 | % | | | 2.21 | % | | | 1.84 | % |
Portfolio turnover rate(6) | | | 58 | %(4) | | | 104 | % | | | 96 | % | | | 92 | % | | | 70 | % | | | 66 | % |
(1) | Calculated using average shares outstanding during the period. |
(2) | Due to timing of capital share transactions, the per share amount of net realized and unrealized gain (loss) on investments varies from the amounts shown in the Statement of Operations. |
(3) | Amount is less than $0.005. |
(4) | Not annualized. |
(5) | Annualized. |
(6) | Portfolio turnover is calculated on the basis of the Fund as a whole without distinguishing between the classes of shares issued and excludes in-kind transactions, where applicable. |
The accompanying notes are an integral part of these financial statements.
Financial Highlights
Baird Short-Term Bond Fund – Institutional Class
| | | Six Months Ended | | | | | | | | | | | | | | | | |
| | | June 30, 2023 | | | Year Ended December 31, | |
| | | (Unaudited) | | | 2022 | | | 2021 | | | 2020 | | | 2019 | | | 2018 | |
| Per Share Data: | | | | | | | | | | | | | | | | | | |
| Net asset value, beginning of period | | $ | 9.22 | | | $ | 9.74 | | | $ | 9.92 | | | $ | 9.77 | | | $ | 9.57 | | | $ | 9.64 | |
| Income from investment operations: | | | | | | | | | | | | | | | | | | | | | | | | |
Net investment income(1) | | | 0.15 | | | | 0.16 | | | | 0.10 | | | | 0.18 | | | | 0.24 | | | | 0.21 | |
Net realized and unrealized gains (losses) on investments | | | (0.01 | ) | | | (0.51 | ) | | | (0.14 | ) | | | 0.23 | | | | 0.20 | | | | (0.07 | ) |
| Total from investment operations | | | 0.14 | | | | (0.35 | ) | | | (0.04 | ) | | | 0.41 | | | | 0.44 | | | | 0.14 | |
| Less distributions: | | | | | | | | | | | | | | | | | | | | | | | | |
| Distributions from net investment income | | | (0.14 | ) | | | (0.17 | ) | | | (0.11 | ) | | | (0.19 | ) | | | (0.24 | ) | | �� | (0.21 | ) |
| Distributions from net realized gains | | | — | | | | (0.00 | )(2) | | | (0.03 | ) | | | (0.07 | ) | | | — | | | | — | |
| Total distributions | | | (0.14 | ) | | | (0.17 | ) | | | (0.14 | ) | | | (0.26 | ) | | | (0.24 | ) | | | (0.21 | ) |
| Net asset value, end of period | | $ | 9.22 | | | $ | 9.22 | | | $ | 9.74 | | | $ | 9.92 | | | $ | 9.77 | | | $ | 9.57 | |
| Total return | | | 1.55 | %(3) | | | (3.64 | )% | | | (0.42 | )% | | | 4.23 | % | | | 4.68 | % | | | 1.49 | % |
| Supplemental data and ratios: | | | | | | | | | | | | | | | | | | | | | | | | |
| Net assets, end of period (millions) | | $ | 8,983.1 | | | $ | 8,747.4 | | | $ | 10,486.4 | | | $ | 8,790.5 | | | $ | 6,469.1 | | | $ | 5,596.2 | |
| Ratio of expenses to average net assets | | | 0.30 | %(4) | | | 0.30 | % | | | 0.30 | % | | | 0.30 | % | | | 0.30 | % | | | 0.30 | % |
Ratio of net investment income to average net assets | | | 3.20 | %(4) | | | 1.67 | % | | | 1.05 | % | | | 1.87 | % | | | 2.50 | % | | | 2.21 | % |
Portfolio turnover rate(5) | | | 49 | %(3) | | | 77 | % | | | 67 | % | | | 64 | % | | | 64 | % | | | 58 | % |
(1) | Calculated using average shares outstanding during the period. |
(2) | Amount is less than $0.005. |
(3) | Not annualized. |
(4) | Annualized. |
(5) | Portfolio turnover is calculated on the basis of the Fund as a whole without distinguishing between the classes of shares issued and excludes in-kind transactions, where applicable. |
The accompanying notes are an integral part of these financial statements.
Financial Highlights
Baird Short-Term Bond Fund – Investor Class
| | | Six Months Ended | | | | | | | | | | | | | | | | |
| | | June 30, 2023 | | | Year Ended December 31, | |
| | | (Unaudited) | | | 2022 | | | 2021 | | | 2020 | | | 2019 | | | 2018 | |
| Per Share Data: | | | | | | | | | | | | | | | | | | |
| Net asset value, beginning of period | | $ | 9.22 | | | $ | 9.74 | | | $ | 9.91 | | | $ | 9.77 | | | $ | 9.57 | | | $ | 9.64 | |
| Income from investment operations: | | | | | | | | | | | | | | | | | | | | | | | | |
Net investment income(1) | | | 0.14 | | | | 0.13 | | | | 0.08 | | | | 0.16 | | | | 0.22 | | | | 0.19 | |
Net realized and unrealized gains (losses) on investments | | | (0.01 | ) | | | (0.51 | ) | | | (0.13 | ) | | | 0.21 | | | | 0.20 | | | | (0.07 | ) |
| Total from investment operations | | | 0.13 | | | | (0.38 | ) | | | (0.05 | ) | | | 0.37 | | | | 0.42 | | | | 0.12 | |
| Less distributions: | | | | | | | | | | | | | | | | | | | | | | | | |
| Distributions from net investment income | | | (0.13 | ) | | | (0.14 | ) | | | (0.09 | ) | | | (0.16 | ) | | | (0.22 | ) | | | (0.19 | ) |
| Distributions from net realized gains | | | — | | | | (0.00 | )(2) | | | (0.03 | ) | | | (0.07 | ) | | | — | | | | — | |
| Total distributions | | | (0.13 | ) | | | (0.14 | ) | | | (0.12 | ) | | | (0.23 | ) | | | (0.22 | ) | | | (0.19 | ) |
| Net asset value, end of period | | $ | 9.22 | | | $ | 9.22 | | | $ | 9.74 | | | $ | 9.91 | | | $ | 9.77 | | | $ | 9.57 | |
| Total return | | | 1.43 | %(3) | | | (3.88 | )% | | | (0.57 | )% | | | 3.86 | % | | | 4.42 | % | | | 1.24 | % |
| Supplemental data and ratios: | | | | | | | | | | | | | | | | | | | | | | | | |
| Net assets, end of period (millions) | | $ | 165.8 | | | $ | 216.9 | | | $ | 252.5 | | | $ | 192.7 | | | $ | 182.4 | | | $ | 145.0 | |
| Ratio of expenses to average net assets | | | 0.55 | %(4) | | | 0.55 | % | | | 0.55 | % | | | 0.55 | % | | | 0.55 | % | | | 0.55 | % |
Ratio of net investment income to average net assets | | | 2.95 | %(4) | | | 1.42 | % | | | 0.80 | % | | | 1.62 | % | | | 2.25 | % | | | 1.96 | % |
Portfolio turnover rate(5) | | | 49 | %(3) | | | 77 | % | | | 67 | % | | | 64 | % | | | 64 | % | | | 58 | % |
(1) | Calculated using average shares outstanding during the period. |
(2) | Amount is less than $0.005. |
(3) | Not annualized. |
(4) | Annualized. |
(5) | Portfolio turnover is calculated on the basis of the Fund as a whole without distinguishing between the classes of shares issued and excludes in-kind transactions, where applicable. |
The accompanying notes are an integral part of these financial statements.
Financial Highlights
Baird Intermediate Bond Fund – Institutional Class
| | | Six Months Ended | | | | | | | | | | | | | | | | |
| | | June 30, 2023 | | | Year Ended December 31, | |
| | | (Unaudited) | | | 2022 | | | 2021 | | | 2020 | | | 2019 | | | 2018 | |
| Per Share Data: | | | | | | | | | | | | | | | | | | |
| Net asset value, beginning of period | | $ | 10.08 | | | $ | 11.27 | | | $ | 11.69 | | | $ | 11.27 | | | $ | 10.80 | | | $ | 11.01 | |
| Income from investment operations: | | | | | | | | | | | | | | | | | | | | | | | | |
Net investment income(1) | | | 0.15 | | | | 0.22 | | | | 0.18 | | | | 0.25 | | | | 0.29 | | | | 0.27 | |
Net realized and unrealized gains (losses) on investments | | | 0.03 | | | | (1.19 | ) | | | (0.34 | ) | | | 0.58 | | | | 0.46 | | | | (0.21 | ) |
| Total from investment operations | | | 0.18 | | | | (0.97 | ) | | | (0.16 | ) | | | 0.83 | | | | 0.75 | | | | 0.06 | |
| Less distributions: | | | | | | | | | | | | | | | | | | | | | | | | |
| Distributions from net investment income | | | (0.15 | ) | | | (0.22 | ) | | | (0.18 | ) | | | (0.25 | ) | | | (0.28 | ) | | | (0.27 | ) |
| Distributions from net realized gains | | | — | | | | — | | | | (0.08 | ) | | | (0.16 | ) | | | — | | | | — | |
| Total distributions | | | (0.15 | ) | | | (0.22 | ) | | | (0.26 | ) | | | (0.41 | ) | | | (0.28 | ) | | | (0.27 | ) |
| Net asset value, end of period | | $ | 10.11 | | | $ | 10.08 | | | $ | 11.27 | | | $ | 11.69 | | | $ | 11.27 | | | $ | 10.80 | |
| Total return | | | 1.77 | %(2) | | | (8.64 | )% | | | (1.41 | )% | | | 7.42 | % | | | 7.05 | % | | | 0.58 | % |
| Supplemental data and ratios: | | | | | | | | | | | | | | | | | | | | | | | | |
| Net assets, end of period (millions) | | $ | 7,373.8 | | | $ | 6,980.6 | | | $ | 6,639.0 | | | $ | 5,264.4 | | | $ | 4,342.1 | | | $ | 3,264.9 | |
| Ratio of expenses to average net assets | | | 0.30 | %(3) | | | 0.30 | % | | | 0.30 | % | | | 0.30 | % | | | 0.30 | % | | | 0.30 | % |
Ratio of net investment income to average net assets | | | 3.06 | %(3) | | | 2.11 | % | | | 1.54 | % | | | 2.17 | % | | | 2.57 | % | | | 2.51 | % |
Portfolio turnover rate(4) | | | 25 | %(2) | | | 47 | % | | | 51 | % | | | 37 | % | | | 26 | % | | | 32 | % |
(1) | Calculated using average shares outstanding during the period. |
(2) | Not annualized. |
(3) | Annualized. |
(4) | Portfolio turnover is calculated on the basis of the Fund as a whole without distinguishing between the classes of shares issued and excludes in-kind transactions, where applicable. |
The accompanying notes are an integral part of these financial statements.
Financial Highlights
Baird Intermediate Bond Fund – Investor Class
| | | Six Months Ended | | | | | | | | | | | | | | | | |
| | | June 30, 2023 | | | Year Ended December 31, | |
| | | (Unaudited) | | | 2022 | | | 2021 | | | 2020 | | | 2019 | | | 2018 | |
| Per Share Data: | | | | | | | | | | | | | | | | | | |
| Net asset value, beginning of period | | $ | 10.59 | | | $ | 11.83 | | | $ | 12.26 | | | $ | 11.80 | | | $ | 11.29 | | | $ | 11.50 | |
| Income from investment operations: | | | | | | | | | | | | | | | | | | | | | | | | |
Net investment income(1) | | | 0.15 | | | | 0.20 | | | | 0.16 | | | | 0.23 | | | | 0.27 | | | | 0.25 | |
Net realized and unrealized gains (losses) on investments | | | 0.02 | | | | (1.25 | ) | | | (0.36 | ) | | | 0.61 | | | | 0.50 | | | | (0.22 | ) |
| Total from investment operations | | | 0.17 | | | | (1.05 | ) | | | (0.20 | ) | | | 0.84 | | | | 0.77 | | | | 0.03 | |
| Less distributions: | | | | | | | | | | | | | | | | | | | | | | | | |
| Distributions from net investment income | | | (0.14 | ) | | | (0.19 | ) | | | (0.15 | ) | | | (0.22 | ) | | | (0.26 | ) | | | (0.24 | ) |
| Distributions from net realized gains | | | — | | | | — | | | | (0.08 | ) | | | (0.16 | ) | | | — | | | | — | |
| Total distributions | | | (0.14 | ) | | | (0.19 | ) | | | (0.23 | ) | | | (0.38 | ) | | | (0.26 | ) | | | (0.24 | ) |
| Net asset value, end of period | | $ | 10.62 | | | $ | 10.59 | | | $ | 11.83 | | | $ | 12.26 | | | $ | 11.80 | | | $ | 11.29 | |
| Total return | | | 1.57 | %(2) | | | (8.88 | )% | | | (1.68 | )% | | | 7.16 | % | | | 6.83 | % | | | 0.30 | % |
| Supplemental data and ratios: | | | | | | | | | | | | | | | | | | | | | | | | |
| Net assets, end of period (millions) | | $ | 66.4 | | | $ | 59.3 | | | $ | 42.2 | | | $ | 55.2 | | | $ | 52.2 | | | $ | 47.3 | |
| Ratio of expenses to average net assets | | | 0.55 | %(3) | | | 0.55 | % | | | 0.55 | % | | | 0.55 | % | | | 0.55 | % | | | 0.55 | % |
Ratio of net investment income to average net assets | | | 2.81 | %(3) | | | 1.86 | % | | | 1.29 | % | | | 1.92 | % | | | 2.32 | % | | | 2.26 | % |
Portfolio turnover rate(4) | | | 25 | %(2) | | | 47 | % | | | 51 | % | | | 37 | % | | | 26 | % | | | 32 | % |
(1) | Calculated using average shares outstanding during the period. |
(2) | Not annualized. |
(3) | Annualized. |
(4) | Portfolio turnover is calculated on the basis of the Fund as a whole without distinguishing between the classes of shares issued and excludes in-kind transactions, where applicable. |
The accompanying notes are an integral part of these financial statements.
Financial Highlights
Baird Aggregate Bond Fund – Institutional Class
| | | Six Months Ended | | | | | | | | | | | | | | | | |
| | | June 30, 2023 | | | Year Ended December 31, | |
| | | (Unaudited) | | | 2022 | | | 2021 | | | 2020 | | | 2019 | | | 2018 | |
| Per Share Data: | | | | | | | | | | | | | | | | | | |
| Net asset value, beginning of period | | $ | 9.60 | | | $ | 11.37 | | | $ | 11.77 | | | $ | 11.21 | | | $ | 10.53 | | | $ | 10.87 | |
| Income from investment operations: | | | | | | | | | | | | | | | | | | | | | | | | |
Net investment income(1) | | | 0.16 | | | | 0.25 | | | | 0.19 | | | | 0.25 | | | | 0.30 | | | | 0.29 | |
Net realized and unrealized gains (losses) on investments | | | 0.07 | | | | (1.76 | ) | | | (0.36 | ) | | | 0.71 | | | | 0.69 | | | | (0.33 | ) |
| Total from investment operations | | | 0.23 | | | | (1.51 | ) | | | (0.17 | ) | | | 0.96 | | | | 0.99 | | | | (0.04 | ) |
| Less distributions: | | | | | | | | | | | | | | | | | | | | | | | | |
| Distributions from net investment income | | | (0.15 | ) | | | (0.26 | ) | | | (0.22 | ) | | | (0.27 | ) | | | (0.31 | ) | | | (0.30 | ) |
| Distributions from net realized gains | | | — | | | | — | | | | (0.01 | ) | | | (0.13 | ) | | | — | | | | — | |
| Total distributions | | | (0.15 | ) | | | (0.26 | ) | | | (0.23 | ) | | | (0.40 | ) | | | (0.31 | ) | | | (0.30 | ) |
| Net asset value, end of period | | $ | 9.68 | | | $ | 9.60 | | | $ | 11.37 | | | $ | 11.77 | | | $ | 11.21 | | | $ | 10.53 | |
| Total return | | | 2.43 | %(2) | | | (13.35 | )% | | | (1.46 | )% | | | 8.63 | % | | | 9.48 | % | | | (0.30 | )% |
| Supplemental data and ratios: | | | | | | | | | | | | | | | | | | | | | | | | |
| Net assets, end of period (millions) | | $ | 38,408.5 | | | $ | 34,102.5 | | | $ | 39,050.1 | | | $ | 31,874.6 | | | $ | 21,857.4 | | | $ | 14,897.5 | |
| Ratio of expenses to average net assets | | | 0.30 | %(3) | | | 0.30 | % | | | 0.30 | % | | | 0.30 | % | | | 0.30 | % | | | 0.30 | % |
Ratio of net investment income to average net assets | | | 3.33 | %(3) | | | 2.46 | % | | | 1.66 | % | | | 2.13 | % | | | 2.74 | % | | | 2.77 | % |
Portfolio turnover rate(4) | | | 20 | %(2) | | | 43 | % | | | 39 | % | | | 35 | % | | | 31 | % | | | 24 | % |
(1) | Calculated using average shares outstanding during the period. |
(2) | Not annualized. |
(3) | Annualized. |
(4) | Portfolio turnover is calculated on the basis of the Fund as a whole without distinguishing between the classes of shares issued and excludes in-kind transactions, where applicable. |
The accompanying notes are an integral part of these financial statements.
Financial Highlights
Baird Aggregate Bond Fund – Investor Class
| | | Six Months Ended | | | | | | | | | | | | | | | | |
| | | June 30, 2023 | | | Year Ended December 31, | |
| | | (Unaudited) | | | 2022 | | | 2021 | | | 2020 | | | 2019 | | | 2018 | |
| Per Share Data: | | | | | | | | | | | | | | | | | | |
| Net asset value, beginning of period | | $ | 9.97 | | | $ | 11.79 | | | $ | 12.20 | | | $ | 11.60 | | | $ | 10.89 | | | $ | 11.23 | |
| Income from investment operations: | | | | | | | | | | | | | | | | | | | | | | | | |
Net investment income(1) | | | 0.16 | | | | 0.23 | | | | 0.17 | | | | 0.23 | | | | 0.28 | | | | 0.27 | |
Net realized and unrealized gains (losses) on investments | | | 0.06 | | | | (1.82 | ) | | | (0.38 | ) | | | 0.74 | | | | 0.71 | | | | (0.33 | ) |
| Total from investment operations | | | 0.22 | | | | (1.59 | ) | | | (0.21 | ) | | | 0.97 | | | | 0.99 | | | | (0.06 | ) |
| Less distributions: | | | | | | | | | | | | | | | | | | | | | | | | |
| Distributions from net investment income | | | (0.14 | ) | | | (0.23 | ) | | | (0.19 | ) | | | (0.24 | ) | | | (0.28 | ) | | | (0.28 | ) |
| Distributions from net realized gains | | | — | | | | — | | | | (0.01 | ) | | | (0.13 | ) | | | — | | | | — | |
| Total distributions | | | (0.14 | ) | | | (0.23 | ) | | | (0.20 | ) | | | (0.37 | ) | | | (0.28 | ) | | | (0.28 | ) |
| Net asset value, end of period | | $ | 10.05 | | | $ | 9.97 | | | $ | 11.79 | | | $ | 12.20 | | | $ | 11.60 | | | $ | 10.89 | |
| Total return | | | 2.22 | %(2) | | | (13.52 | )% | | | (1.74 | )% | | | 8.42 | % | | | 9.17 | % | | | (0.54 | )% |
| Supplemental data and ratios: | | | | | | | | | | | | | | | | | | | | | | | | |
| Net assets, end of period (millions) | | $ | 914.1 | | | $ | 681.1 | | | $ | 904.3 | | | $ | 1,029.0 | | | $ | 786.4 | | | $ | 718.2 | |
| Ratio of expenses to average net assets | | | 0.55 | %(3) | | | 0.55 | % | | | 0.55 | % | | | 0.55 | % | | | 0.55 | % | | | 0.55 | % |
Ratio of net investment income to average net assets | | | 3.08 | %(3) | | | 2.21 | % | | | 1.41 | % | | | 1.88 | % | | | 2.49 | % | | | 2.52 | % |
Portfolio turnover rate(4) | | | 20 | %(2) | | | 43 | % | | | 39 | % | | | 35 | % | | | 31 | % | | | 24 | % |
(1) | Calculated using average shares outstanding during the period. |
(2) | Not annualized. |
(3) | Annualized. |
(4) | Portfolio turnover is calculated on the basis of the Fund as a whole without distinguishing between the classes of shares issued and excludes in-kind transactions, where applicable. |
The accompanying notes are an integral part of these financial statements.
Financial Highlights
Baird Core Plus Bond Fund – Institutional Class
| | | Six Months Ended | | | | | | | | | | | | | | | | |
| | | June 30, 2023 | | | Year Ended December 31, | |
| | | (Unaudited) | | | 2022 | | | 2021 | | | 2020 | | | 2019 | | | 2018 | |
| Per Share Data: | | | | | | | | | | | | | | | | | | |
| Net asset value, beginning of period | | $ | 9.87 | | | $ | 11.67 | | | $ | 12.14 | | | $ | 11.56 | | | $ | 10.82 | | | $ | 11.22 | |
| Income from investment operations: | | | | | | | | | | | | | | | | | | | | | | | | |
Net investment income(1) | | | 0.17 | | | | 0.29 | | | | 0.26 | | | | 0.29 | | | | 0.33 | | | | 0.33 | |
Net realized and unrealized gains (losses) on investments | | | 0.08 | | | | (1.79 | ) | | | (0.38 | ) | | | 0.72 | | | | 0.75 | | | | (0.39 | ) |
| Total from investment operations | | | 0.25 | | | | (1.50 | ) | | | (0.12 | ) | | | 1.01 | | | | 1.08 | | | | (0.06 | ) |
| Less distributions: | | | | | | | | | | | | | | | | | | | | | | | | |
| Distributions from net investment income | | | (0.16 | ) | | | (0.30 | ) | | | (0.28 | ) | | | (0.31 | ) | | | (0.34 | ) | | | (0.34 | ) |
| Distributions from net realized gains | | | — | | | | (0.00 | )(2) | | | (0.07 | ) | | | (0.12 | ) | | | — | | | | — | |
| Total distributions | | | (0.16 | ) | | | (0.30 | ) | | | (0.35 | ) | | | (0.43 | ) | | | (0.34 | ) | | | (0.34 | ) |
| Net asset value, end of period | | $ | 9.96 | | | $ | 9.87 | | | $ | 11.67 | | | $ | 12.14 | | | $ | 11.56 | | | $ | 10.82 | |
| Total return | | | 2.59 | %(3) | | | (12.87 | )% | | | (1.02 | )% | | | 8.80 | % | | | 10.11 | % | | | (0.51 | )% |
| Supplemental data and ratios: | | | | | | | | | | | | | | | | | | | | | | | | |
| Net assets, end of period (millions) | | $ | 23,245.9 | | | $ | 21,288.5 | | | $ | 27,654.9 | | | $ | 26,805.5 | | | $ | 21,424.9 | | | $ | 15,635.3 | |
| Ratio of expenses to average net assets | | | 0.30 | %(4) | | | 0.30 | % | | | 0.30 | % | | | 0.30 | % | | | 0.30 | % | | | 0.30 | % |
Ratio of net investment income to average net assets | | | 3.49 | %(4) | | | 2.82 | % | | | 2.16 | % | | | 2.46 | % | | | 2.95 | % | | | 3.01 | % |
Portfolio turnover rate(5) | | | 18 | %(3) | | | 29 | % | | | 45 | % | | | 33 | % | | | 26 | % | | | 26 | % |
(1) | Calculated using average shares outstanding during the period. |
(2) | Amount is less than $0.005. |
(3) | Not annualized. |
(4) | Annualized. |
(5) | Portfolio turnover is calculated on the basis of the Fund as a whole without distinguishing between the classes of shares issued and excludes in-kind transactions, where applicable. |
The accompanying notes are an integral part of these financial statements.
Financial Highlights
Baird Core Plus Bond Fund – Investor Class
| | | Six Months Ended | | | | | | | | | | | | | | | | |
| | | June 30, 2023 | | | Year Ended December 31, | |
| | | (Unaudited) | | | 2022 | | | 2021 | | | 2020 | | | 2019 | | | 2018 | |
| Per Share Data: | | | | | | | | | | | | | | | | | | |
| Net asset value, beginning of period | | $ | 10.34 | | | $ | 12.21 | | | $ | 12.68 | | | $ | 12.05 | | | $ | 11.28 | | | $ | 11.68 | |
| Income from investment operations: | | | | | | | | | | | | | | | | | | | | | | | | |
Net investment income(1) | | | 0.17 | | | | 0.28 | | | | 0.24 | | | | 0.28 | | | | 0.32 | | | | 0.31 | |
Net realized and unrealized gains (losses) on investments | | | 0.08 | | | | (1.87 | ) | | | (0.39 | ) | | | 0.74 | | | | 0.76 | | | | (0.40 | ) |
| Total from investment operations | | | 0.25 | | | | (1.59 | ) | | | (0.15 | ) | | | 1.02 | | | | 1.08 | | | | (0.09 | ) |
| Less distributions: | | | | | | | | | | | | | | | | | | | | | | | | |
| Distributions from net investment income | | | (0.15 | ) | | | (0.28 | ) | | | (0.25 | ) | | | (0.28 | ) | | | (0.31 | ) | | | (0.31 | ) |
| Distributions from net realized gains | | | — | | | | (0.00 | )(2) | | | (0.07 | ) | | | (0.11 | ) | | | — | | | | — | |
| Total distributions | | | (0.15 | ) | | | (0.28 | ) | | | (0.32 | ) | | | (0.39 | ) | | | (0.31 | ) | | | (0.31 | ) |
| Net asset value, end of period | | $ | 10.44 | | | $ | 10.34 | | | $ | 12.21 | | | $ | 12.68 | | | $ | 12.05 | | | $ | 11.28 | |
| Total return | | | 2.44 | %(3) | | | (13.09 | )% | | | (1.23 | )% | | | 8.58 | % | | | 9.69 | % | | | (0.74 | )% |
| Supplemental data and ratios: | | | | | | | | | | | | | | | | | | | | | | | | |
| Net assets, end of period (millions) | | $ | 1,054.3 | | | $ | 1,045.0 | | | $ | 1,612.2 | | | $ | 2,684.3 | | | $ | 2,500.0 | | | $ | 2,171.0 | |
| Ratio of expenses to average net assets | | | 0.55 | %(4) | | | 0.55 | % | | | 0.55 | % | | | 0.55 | % | | | 0.55 | % | | | 0.55 | % |
Ratio of net investment income to average net assets | | | 3.24 | %(4) | | | 2.57 | % | | | 1.91 | % | | | 2.21 | % | | | 2.70 | % | | | 2.76 | % |
Portfolio turnover rate(5) | | | 18 | %(3) | | | 29 | % | | | 45 | % | | | 33 | % | | | 26 | % | | | 26 | % |
(1) | Calculated using average shares outstanding during the period. |
(2) | Amount is less than $0.005. |
(3) | Not annualized. |
(4) | Annualized. |
(5) | Portfolio turnover is calculated on the basis of the Fund as a whole without distinguishing between the classes of shares issued and excludes in-kind transactions, where applicable. |
The accompanying notes are an integral part of these financial statements.
Financial Highlights
Baird Short-Term Municipal Bond Fund – Institutional Class
| | | Six Months Ended | | | | | | | | | | | | | | | | |
| | | June 30, 2023 | | | Year Ended December 31, | |
| | | (Unaudited) | | | 2022 | | | 2021 | | | 2020 | | | 2019 | | | 2018 | |
| Per Share Data: | | | | | | | | | | | | | | | | | | |
| Net asset value, beginning of period | | $ | 9.85 | | | $ | 10.39 | | | $ | 10.43 | | | $ | 10.26 | | | $ | 10.06 | | | $ | 10.08 | |
| Income from investment operations: | | | | | | | | | | | | | | | | | | | | | | | | |
Net investment income(1) | | | 0.13 | | | | 0.16 | | | | 0.12 | | | | 0.17 | | | | 0.20 | | | | 0.20 | |
Net realized and unrealized gains (losses) on investments | | | — | | | | (0.54 | ) | | | (0.04 | ) | | | 0.16 | | | | 0.20 | | | | (0.03 | ) |
| Total from investment operations | | | 0.13 | | | | (0.38 | ) | | | 0.08 | | | | 0.33 | | | | 0.40 | | | | 0.17 | |
| Less distributions: | | | | | | | | | | | | | | | | | | | | | | | | |
| Distributions from net investment income | | | (0.12 | ) | | | (0.16 | ) | | | (0.12 | ) | | | (0.16 | ) | | | (0.20 | ) | | | (0.19 | ) |
| Distributions from net realized gains | | | — | | | | — | | | | (0.00 | )(2) | | | — | | | | — | | | | (0.00 | )(2) |
| Total distributions | | | (0.12 | ) | | | (0.16 | ) | | | (0.12 | ) | | | (0.16 | ) | | | (0.20 | ) | | | (0.19 | ) |
| Net asset value, end of period | | $ | 9.86 | | | $ | 9.85 | | | $ | 10.39 | | | $ | 10.43 | | | $ | 10.26 | | | $ | 10.06 | |
| Total return | | | 1.36 | %(3) | | | (3.66 | )% | | | 0.74 | % | | | 3.25 | % | | | 3.96 | % | | | 1.75 | % |
| Supplemental data and ratios: | | | | | | | | | | | | | | | | | | | | | | | | |
| Net assets, end of period (millions) | | $ | 1,603.4 | | | $ | 1,695.5 | | | $ | 2,190.2 | | | $ | 1,520.0 | | | $ | 926.1 | | | $ | 281.2 | |
| Ratio of expenses to average net assets | | | 0.30 | %(4) | | | 0.30 | % | | | 0.30 | % | | | 0.30 | % | | | 0.30 | % | | | 0.30 | % |
Ratio of net investment income to average net assets | | | 2.58 | %(4) | | | 1.56 | % | | | 1.10 | % | | | 1.61 | % | | | 1.96 | % | | | 2.03 | % |
Portfolio turnover rate(5) | | | 20 | %(3) | | | 64 | % | | | 44 | % | | | 32 | % | | | 34 | % | | | 107 | % |
(1) | Calculated using average shares outstanding during the period. |
(2) | Amount is less than $0.005. |
(3) | Not annualized. |
(4) | Annualized. |
(5) | Portfolio turnover is calculated on the basis of the Fund as a whole without distinguishing between the classes of shares issued and excludes in-kind transactions, where applicable. |
The accompanying notes are an integral part of these financial statements.
Financial Highlights
Baird Short-Term Municipal Bond Fund – Investor Class
| | | Six Months Ended | | | | | | | | | | | | | | | | |
| | | June 30, 2023 | | | Year Ended December 31, | |
| | | (Unaudited) | | | 2022 | | | 2021 | | | 2020 | | | 2019 | | | 2018 | |
| Per Share Data: | | | | | | | | | | | | | | | | | | |
| Net asset value, beginning of period | | $ | 9.83 | | | $ | 10.38 | | | $ | 10.41 | | | $ | 10.25 | | | $ | 10.04 | | | $ | 10.06 | |
| Income from investment operations: | | | | | | | | | | | | | | | | | | | | | | | | |
Net investment income(1) | | | 0.11 | | | | 0.13 | | | | 0.09 | | | | 0.14 | | | | 0.17 | | | | 0.18 | |
Net realized and unrealized gains (losses) on investments | | | 0.01 | | | | (0.55 | ) | | | (0.03 | ) | | | 0.15 | | | | 0.21 | | | | (0.03 | ) |
| Total from investment operations | | | 0.12 | | | | (0.42 | ) | | | 0.06 | | | | 0.29 | | | | 0.38 | | | | 0.15 | |
| Less distributions: | | | | | | | | | | | | | | | | | | | | | | | | |
| Distributions from net investment income | | | (0.11 | ) | | | (0.13 | ) | | | (0.09 | ) | | | (0.13 | ) | | | (0.17 | ) | | | (0.17 | ) |
| Distributions from net realized gains | | | — | | | | — | | | | (0.00 | )(2) | | | — | | | | — | | | | (0.00 | )(2) |
| Total distributions | | | (0.11 | ) | | | (0.13 | ) | | | (0.09 | ) | | | (0.13 | ) | | | (0.17 | ) | | | (0.17 | ) |
| Net asset value, end of period | | $ | 9.84 | | | $ | 9.83 | | | $ | 10.38 | | | $ | 10.41 | | | $ | 10.25 | | | $ | 10.04 | |
| Total return | | | 1.24 | %(3) | | | (4.01 | )% | | | 0.59 | % | | | 2.90 | % | | | 3.81 | % | | | 1.52 | % |
| Supplemental data and ratios: | | | | | | | | | | | | | | | | | | | | | | | | |
| Net assets, end of period (millions) | | $ | 62.4 | | | $ | 71.7 | | | $ | 110.4 | | | $ | 92.2 | | | $ | 89.6 | | | $ | 64.0 | |
| Ratio of expenses to average net assets | | | 0.55 | %(4) | | | 0.55 | % | | | 0.55 | % | | | 0.55 | % | | | 0.55 | % | | | 0.55 | % |
Ratio of net investment income to average net assets | | | 2.33 | %(4) | | | 1.31 | % | | | 0.85 | % | | | 1.36 | % | | | 1.71 | % | | | 1.78 | % |
Portfolio turnover rate(5) | | | 20 | %(3) | | | 64 | % | | | 44 | % | | | 32 | % | | | 34 | % | | | 107 | % |
(1) | Calculated using average shares outstanding during the period. |
(2) | Amount is less than $0.005. |
(3) | Not annualized. |
(4) | Annualized. |
(5) | Portfolio turnover is calculated on the basis of the Fund as a whole without distinguishing between the classes of shares issued and excludes in-kind transactions, where applicable. |
The accompanying notes are an integral part of these financial statements.
Financial Highlights
Baird Strategic Municipal Bond Fund – Institutional Class
| | | Six Months Ended | | | | | | | | | | | | Period Ended | |
| | | June 30, 2023 | | | Year Ended December 31, | | | December 31, | |
| | | (Unaudited) | | | 2022 | | | 2021 | | | 2020 | | | 2019(1) | |
| Per Share Data: | | | | | | | | | | | | | | | |
| Net asset value, beginning of period | | $ | 9.96 | | | $ | 10.74 | | | $ | 10.67 | | | $ | 10.07 | | | $ | 10.00 | |
| Income from investment operations: | | | | | | | | | | | | | | | | | | | | |
Net investment income(2) | | | 0.16 | | | | 0.22 | | | | 0.11 | | | | 0.18 | | | | 0.02 | |
| Net realized and unrealized gains (losses) on investments | | | 0.12 | | | | (0.79 | ) | | | 0.14 | | | | 0.66 | | | | 0.07 | |
| Total from investment operations | | | 0.28 | | | | (0.57 | ) | | | 0.25 | | | | 0.84 | | | | 0.09 | |
| Less distributions: | | | | | | | | | | | | | | | | | | | | |
| Distributions from net investment income | | | (0.15 | ) | | | (0.21 | ) | | | (0.12 | ) | | | (0.17 | ) | | | (0.02 | ) |
| Distributions from net realized gains | | | — | | | | (0.00 | )(3) | | | (0.06 | ) | | | (0.07 | ) | | | — | |
| Total distributions | | | (0.15 | ) | | | (0.21 | ) | | | (0.18 | ) | | | (0.24 | ) | | | (0.02 | ) |
| Net asset value, end of period | | $ | 10.09 | | | $ | 9.96 | | | $ | 10.74 | | | $ | 10.67 | | | $ | 10.07 | |
| Total return | | | 2.87 | %(4) | | | (5.31 | )% | | | 2.26 | % | | | 8.39 | % | | | 0.88 | %(4) |
| Supplemental data and ratios: | | | | | | | | | | | | | | | | | | | | |
| Net assets, end of period (millions) | | $ | 612.8 | | | $ | 470.8 | | | $ | 345.0 | | | $ | 164.3 | | | $ | 12.0 | |
| Ratio of expenses to average net assets | | | 0.30 | %(5) | | | 0.30 | % | | | 0.30 | % | | | 0.30 | % | | | 0.30 | %(5) |
| Ratio of net investment income to average net assets | | | 3.26 | %(5) | | | 2.18 | % | | | 1.07 | % | | | 1.72 | % | | | 1.60 | %(5) |
Portfolio turnover rate(6) | | | 32 | %(4) | | | 89 | % | | | 55 | % | | | 119 | % | | | 47 | %(4) |
(1) | Inception was close of business on November 15, 2019. |
(2) | Calculated using average shares outstanding during the period. |
(3) | Amount is less than $0.005. |
(4) | Not annualized. |
(5) | Annualized. |
(6) | Portfolio turnover is calculated on the basis of the Fund as a whole without distinguishing between the classes of shares issued and excludes in-kind transactions, where applicable. |
The accompanying notes are an integral part of these financial statements.
Financial Highlights
Baird Strategic Municipal Bond Fund – Investor Class
| | | Six Months Ended | | | | | | | | | | | | Period Ended | |
| | | June 30, 2023 | | | Year Ended December 31, | | | December 31, | |
| | | (Unaudited) | | | 2022 | | | 2021 | | | 2020 | | | 2019(1) | |
| Per Share Data: | | | | | | | | | | | | | | | |
| Net asset value, beginning of period | | $ | 9.96 | | | $ | 10.74 | | | $ | 10.67 | | | $ | 10.07 | | | $ | 10.00 | |
| Income from investment operations: | | | | | | | | | | | | | | | | | | | | |
Net investment income(2) | | | 0.15 | | | | 0.19 | | | | 0.09 | | | | 0.15 | | | | 0.02 | |
| Net realized and unrealized gains (losses) on investments | | | 0.12 | | | | (0.79 | ) | | | 0.13 | | | | 0.67 | | | | 0.06 | |
| Total from investment operations | | | 0.27 | | | | (0.60 | ) | | | 0.22 | | | | 0.82 | | | | 0.08 | |
| Less distributions: | | | | | | | | | | | | | | | | | | | | |
| Distributions from net investment income | | | (0.14 | ) | | | (0.18 | ) | | | (0.09 | ) | | | (0.15 | ) | | | (0.01 | ) |
| Distributions from net realized gains | | | — | | | | (0.00 | )(3) | | | (0.06 | ) | | | (0.07 | ) | | | — | |
| Total distributions | | | (0.14 | ) | | | (0.18 | ) | | | (0.15 | ) | | | (0.22 | ) | | | (0.01 | ) |
| Net asset value, end of period | | $ | 10.09 | | | $ | 9.96 | | | $ | 10.74 | | | $ | 10.67 | | | $ | 10.07 | |
| Total return | | | 2.75 | %(4) | | | (5.55 | )% | | | 2.00 | % | | | 8.13 | % | | | 0.85 | %(4) |
| Supplemental data and ratios: | | | | | | | | | | | | | | | | | | | | |
| Net assets, end of period (thousands) | | $ | 17,325.7 | | | $ | 10,660.1 | | | $ | 8,262.3 | | | $ | 6,976.1 | | | $ | 27.4 | |
| Ratio of expenses to average net assets | | | 0.55 | %(5) | | | 0.55 | % | | | 0.55 | % | | | 0.55 | % | | | 0.55 | %(5) |
| Ratio of net investment income to average net assets | | | 3.01 | %(5) | | | 1.93 | % | | | 0.82 | % | | | 1.47 | % | | | 1.35 | %(5) |
Portfolio turnover rate(6) | | | 32 | %(4) | | | 89 | % | | | 55 | % | | | 119 | % | | | 47 | %(4) |
(1) | Inception was close of business on November 15, 2019. |
(2) | Calculated using average shares outstanding during the period. |
(3) | Amount is less than $0.005. |
(4) | Not annualized. |
(5) | Annualized. |
(6) | Portfolio turnover is calculated on the basis of the Fund as a whole without distinguishing between the classes of shares issued and excludes in-kind transactions, where applicable. |
The accompanying notes are an integral part of these financial statements.
Financial Highlights
Baird Quality Intermediate Municipal Bond Fund – Institutional Class
| | | Six Months Ended | | | | | | | | | | | | | | | | |
| | | June 30, 2023 | | | Year Ended December 31, | |
| | | (Unaudited) | | | 2022 | | | 2021 | | | 2020 | | | 2019 | | | 2018 | |
| Per Share Data: | | | | | | | | | | | | | | | | | | |
| Net asset value, beginning of period | | $ | 10.95 | | | $ | 11.85 | | | $ | 12.03 | | | $ | 11.75 | | | $ | 11.38 | | | $ | 11.52 | |
| Income from investment operations: | | | | | | | | | | | | | | | | | | | | | | | | |
Net investment income(1) | | | 0.13 | | | | 0.22 | | | | 0.21 | | | | 0.24 | | | | 0.27 | | | | 0.27 | |
Net realized and unrealized gains (losses) on investments | | | 0.01 | | | | (0.90 | ) | | | (0.17 | ) | | | 0.28 | | | | 0.37 | | | | (0.14 | ) |
| Total from investment operations | | | 0.14 | | | | (0.68 | ) | | | 0.04 | | | | 0.52 | | | | 0.64 | | | | 0.13 | |
| Less distributions: | | | | | | | | | | | | | | | | | | | | | | | | |
| Distributions from net investment income | | | (0.13 | ) | | | (0.22 | ) | | | (0.22 | ) | | | (0.24 | ) | | | (0.27 | ) | | | (0.27 | ) |
| Total distributions | | | (0.13 | ) | | | (0.22 | ) | | | (0.22 | ) | | | (0.24 | ) | | | (0.27 | ) | | | (0.27 | ) |
| Net asset value, end of period | | $ | 10.96 | | | $ | 10.95 | | | $ | 11.85 | | | $ | 12.03 | | | $ | 11.75 | | | $ | 11.38 | |
| Total return | | | 1.29 | %(2) | | | (5.74 | )% | | | 0.27 | % | | | 4.43 | % | | | 5.65 | % | | | 1.19 | % |
| Supplemental data and ratios: | | | | | | | | | | | | | | | | | | | | | | | | |
| Net assets, end of period (millions) | | $ | 1,041.2 | | | $ | 1,083.0 | | | $ | 1,526.2 | | | $ | 1,449.2 | | | $ | 1,257.4 | | | $ | 1,009.2 | |
| Ratio of expenses to average net assets | | | 0.30 | %(3) | | | 0.30 | % | | | 0.30 | % | | | 0.30 | % | | | 0.30 | % | | | 0.30 | % |
Ratio of net investment income
to average net assets | | | 2.44 | %(3) | | | 1.94 | % | | | 1.75 | % | | | 2.03 | % | | | 2.30 | % | | | 2.39 | % |
Portfolio turnover rate(4) | | | 17 | %(2) | | | 33 | % | | | 18 | % | | | 15 | % | | | 20 | % | | | 40 | % |
(1) | Calculated using average shares outstanding during the period. |
(2) | Not annualized. |
(3) | Annualized. |
(4) | Portfolio turnover is calculated on the basis of the Fund as a whole without distinguishing between the classes of shares issued and excludes in-kind transactions, where applicable. |
The accompanying notes are an integral part of these financial statements.
Financial Highlights
Baird Quality Intermediate Municipal Bond Fund – Investor Class
| | | Six Months Ended | | | | | | | | | | | | | | | | |
| | | June 30, 2023 | | | Year Ended December 31, | |
| | | (Unaudited) | | | 2022 | | | 2021 | | | 2020 | | | 2019 | | | 2018 | |
| Per Share Data: | | | | | | | | | | | | | | | | | | |
| Net asset value, beginning of period | | $ | 11.24 | | | $ | 12.16 | | | $ | 12.34 | | | $ | 12.04 | | | $ | 11.66 | | | $ | 11.80 | |
| Income from investment operations: | | | | | | | | | | | | | | | | | | | | | | | | |
Net investment income(1) | | | 0.12 | | | | 0.19 | | | | 0.18 | | | | 0.22 | | | | 0.24 | | | | 0.25 | |
Net realized and unrealized gains (losses) on investments | | | 0.01 | | | | (0.92 | ) | | | (0.18 | ) | | | 0.29 | | | | 0.38 | | | | (0.15 | ) |
| Total from investment operations | | | 0.13 | | | | (0.73 | ) | | | — | | | | 0.51 | | | | 0.62 | | | | 0.10 | |
| Less distributions: | | | | | | | | | | | | | | | | | | | | | | | | |
| Distributions from net investment income | | | (0.12 | ) | | | (0.19 | ) | | | (0.18 | ) | | | (0.21 | ) | | | (0.24 | ) | | | (0.24 | ) |
| Total distributions | | | (0.12 | ) | | | (0.19 | ) | | | (0.18 | ) | | | (0.21 | ) | | | (0.24 | ) | | | (0.24 | ) |
| Net asset value, end of period | | $ | 11.25 | | | $ | 11.24 | | | $ | 12.16 | | | $ | 12.34 | | | $ | 12.04 | | | $ | 11.66 | |
| Total return | | | 1.14 | %(2) | | | (5.99 | )% | | | 0.02 | % | | | 4.23 | % | | | 5.33 | % | | | 0.90 | % |
| Supplemental data and ratios: | | | | | | | | | | | | | | | | | | | | | | | | |
| Net assets, end of period (millions) | | $ | 48.2 | | | $ | 30.6 | | | $ | 59.2 | | | $ | 52.4 | | | $ | 85.1 | | | $ | 110.8 | |
| Ratio of expenses to average net assets | | | 0.55 | %(3) | | | 0.55 | % | | | 0.55 | % | | | 0.55 | % | | | 0.55 | % | | | 0.55 | % |
Ratio of net investment income to average net assets | | | 2.19 | %(3) | | | 1.69 | % | | | 1.50 | % | | | 1.78 | % | | | 2.05 | % | | | 2.14 | % |
Portfolio turnover rate(4) | | | 17 | %(2) | | | 33 | % | | | 18 | % | | | 15 | % | | | 20 | % | | | 40 | % |
(1) | Calculated using average shares outstanding during the period. |
(2) | Not annualized. |
(3) | Annualized. |
(4) | Portfolio turnover is calculated on the basis of the Fund as a whole without distinguishing between the classes of shares issued and excludes in-kind transactions, where applicable. |
The accompanying notes are an integral part of these financial statements.
Financial Highlights
Baird Core Intermediate Municipal Bond Fund – Institutional Class
| | | Six Months Ended | | | | | | | | | | | | | | | | |
| | | June 30, 2023 | | | Year Ended December 31, | |
| | | (Unaudited) | | | 2022 | | | 2021 | | | 2020 | | | 2019 | | | 2018 | |
| Per Share Data: | | | | | | | | | | | | | | | | | | |
| Net asset value, beginning of period | | $ | 10.10 | | | $ | 10.96 | | | $ | 10.96 | | | $ | 10.65 | | | $ | 10.22 | | | $ | 10.32 | |
| Income from investment operations: | | | | | | | | | | | | | | | | | | | | | | | | |
Net investment income(1) | | | 0.15 | | | | 0.21 | | | | 0.16 | | | | 0.23 | | | | 0.25 | | | | 0.23 | |
Net realized and unrealized
gains (losses) on investments | | | 0.05 | | | | (0.88 | ) | | | 0.02 | (2) | | | 0.33 | | | | 0.43 | | | | (0.10 | ) |
| Total from investment operations | | | 0.20 | | | | (0.67 | ) | | | 0.18 | | | | 0.56 | | | | 0.68 | | | | 0.13 | |
| Less distributions: | | | | | | | | | | | | | | | | | | | | | | | | |
| Distributions from net investment income | | | (0.14 | ) | | | (0.19 | ) | | | (0.17 | ) | | | (0.22 | ) | | | (0.24 | ) | | | (0.23 | ) |
| Distributions from net realized gains | | | — | | | | (0.00 | )(3) | | | (0.01 | ) | | | (0.03 | ) | | | (0.01 | ) | | | — | |
| Total distributions | | | (0.14 | ) | | | (0.19 | ) | | | (0.18 | ) | | | (0.25 | ) | | | (0.25 | ) | | | (0.23 | ) |
| Net asset value, end of period | | $ | 10.16 | | | $ | 10.10 | | | $ | 10.96 | | | $ | 10.96 | | | $ | 10.65 | | | $ | 10.22 | |
| Total return | | | 2.02 | %(4) | | | (6.07 | )% | | | 1.60 | % | | | 5.26 | % | | | 6.75 | % | | | 1.30 | % |
| Supplemental data and ratios: | | | | | | | | | | | | | | | | | | | | | | | | |
| Net assets, end of period (millions) | | $ | 2,590.1 | | | $ | 2,449.7 | | | $ | 1,531.2 | | | $ | 842.2 | | | $ | 535.5 | | | $ | 378.1 | |
| Ratio of expenses to average net assets | | | 0.30 | %(5) | | | 0.30 | % | | | 0.30 | % | | | 0.30 | % | | | 0.30 | % | | | 0.30 | % |
Ratio of net investment income to average net assets | | | 2.93 | %(5) | | | 2.01 | % | | | 1.47 | % | | | 2.09 | % | | | 2.36 | % | | | 2.30 | % |
Portfolio turnover rate(6) | | | 12 | %(4) | | | 59 | % | | | 31 | % | | | 35 | % | | | 38 | % | | | 70 | % |
(1) | Calculated using average shares outstanding during the period. |
(2) | Due to timing of capital share transactions, the per share amount of net realized and unrealized gain (loss) on investments varies from the amounts shown in the Statement of Operations |
(3) | Amount is less than $0.005. |
(4) | Not annualized. |
(5) | Annualized. |
(6) | Portfolio turnover is calculated on the basis of the Fund as a whole without distinguishing between the classes of shares issued and excludes in-kind transactions, where applicable. |
The accompanying notes are an integral part of these financial statements.
Financial Highlights
Baird Core Intermediate Municipal Bond Fund – Investor Class
| | | Six Months Ended | | | | | | | | | | | | | | | | |
| | | June 30, 2023 | | | Year Ended December 31, | |
| | | (Unaudited) | | | 2022 | | | 2021 | | | 2020 | | | 2019 | | | 2018 | |
| Per Share Data: | | | | | | | | | | | | | | | | | | |
| Net asset value, beginning of period | | $ | 10.09 | | | $ | 10.96 | | | $ | 10.95 | | | $ | 10.64 | | | $ | 10.22 | | | $ | 10.32 | |
| Income from investment operations: | | | | | | | | | | | | | | | | | | | | | | | | |
Net investment income(1) | | | 0.14 | | | | 0.18 | | | | 0.13 | | | | 0.20 | | | | 0.22 | | | | 0.21 | |
Net realized and unrealized gains (losses) on investments | | | 0.05 | | | | (0.88 | ) | | | 0.03 | (2) | | | 0.33 | | | | 0.43 | | | | (0.11 | ) |
| Total from investment operations | | | 0.19 | | | | (0.70 | ) | | | 0.16 | | | | 0.53 | | | | 0.65 | | | | 0.10 | |
| Less distributions: | | | | | | | | | | | | | | | | | | | | | | | | |
| Distributions from net investment income | | | (0.13 | ) | | | (0.17 | ) | | | (0.14 | ) | | | (0.19 | ) | | | (0.22 | ) | | | (0.20 | ) |
| Distributions from net realized gains | | | — | | | | (0.00 | )(3) | | | (0.01 | ) | | | (0.03 | ) | | | (0.01 | ) | | | — | |
| Total distributions | | | (0.13 | ) | | | (0.17 | ) | | | (0.15 | ) | | | (0.22 | ) | | | (0.23 | ) | | | (0.20 | ) |
| Net asset value, end of period | | $ | 10.15 | | | $ | 10.09 | | | $ | 10.96 | | | $ | 10.95 | | | $ | 10.64 | | | $ | 10.22 | |
| Total return | | | 1.90 | %(4) | | | (6.40 | )% | | | 1.44 | % | | | 5.01 | % | | | 6.40 | % | | | 1.05 | % |
| Supplemental data and ratios: | | | | | | | | | | | | | | | | | | | | | | | | |
| Net assets, end of period (millions) | | $ | 38.2 | | | $ | 38.8 | | | $ | 42.5 | | | $ | 22.3 | | | $ | 5.9 | | | $ | 2.0 | |
| Ratio of expenses to average net assets | | | 0.55 | %(5) | | | 0.55 | % | | | 0.55 | % | | | 0.55 | % | | | 0.55 | % | | | 0.55 | % |
Ratio of net investment income to average net assets | | | 2.68 | %(5) | | | 1.76 | % | | | 1.22 | % | | | 1.84 | % | | | 2.11 | % | | | 2.05 | % |
Portfolio turnover rate(6) | | | 12 | %(4) | | | 59 | % | | | 31 | % | | | 35 | % | | | 38 | % | | | 70 | % |
(1) | Calculated using average shares outstanding during the period. |
(2) | Due to timing of capital share transactions, the per share amount of net realized and unrealized gain (loss) on investments varies from the amounts shown in the Statement of Operations |
(3) | Amount is less than $0.005. |
(4) | Not annualized. |
(5) | Annualized. |
(6) | Portfolio turnover is calculated on the basis of the Fund as a whole without distinguishing between the classes of shares issued and excludes in-kind transactions, where applicable. |
The accompanying notes are an integral part of these financial statements.
Financial Highlights
Baird Municipal Bond Fund – Institutional Class
| | | Six Months Ended | | | | | | | | | | | | Period Ended | |
| | | June 30, 2023 | | | Year Ended December 31, | | | December 31, | |
| | | (Unaudited) | | | 2022 | | | 2021 | | | 2020 | | | 2019(1) | |
| Per Share Data: | | | | | | | | | | | | | | | |
| Net asset value, beginning of period | | $ | 9.68 | | | $ | 10.76 | | | $ | 10.67 | | | $ | 10.10 | | | $ | 10.00 | |
| Income from investment operations: | | | | | | | | | | | | | | | | | | | | |
Net investment income(2) | | | 0.18 | | | | 0.26 | | | | 0.20 | | | | 0.23 | | | | 0.02 | |
Net realized and unrealized gains (losses) on investments | | | 0.11 | | | | (1.09 | ) | | | 0.17 | | | | 0.76 | | | | 0.10 | |
| Total from investment operations | | | 0.29 | | | | (0.83 | ) | | | 0.37 | | | | 0.99 | | | | 0.12 | |
| Less distributions: | | | | | | | | | | | | | | | | | | | | |
| Distributions from net investment income | | | (0.16 | ) | | | (0.25 | ) | | | (0.20 | ) | | | (0.21 | ) | | | (0.02 | ) |
| Distributions from net realized gains | | | — | | | | — | | | | (0.08 | ) | | | (0.21 | ) | | | — | |
| Total distributions | | | (0.16 | ) | | | (0.25 | ) | | | (0.28 | ) | | | (0.42 | ) | | | (0.02 | ) |
| Net asset value, end of period | | $ | 9.81 | | | $ | 9.68 | | | $ | 10.76 | | | $ | 10.67 | | | $ | 10.10 | |
| Total return | | | 3.00 | %(3) | | | (7.73 | )% | | | 3.46 | % | | | 9.95 | % | | | 1.19 | %(3) |
| Supplemental data and ratios: | | | | | | | | | | | | | | | | | | | | |
| Net assets, end of period (millions) | | $ | 120.0 | | | $ | 55.7 | | | $ | 34.5 | | | $ | 20.3 | | | $ | 7.4 | |
| Ratio of expenses to average net assets | | | 0.30 | %(4) | | | 0.30 | % | | | 0.30 | % | | | 0.30 | % | | | 0.30 | %(4) |
Ratio of net investment income to average net assets | | | 3.62 | %(4) | | | 2.63 | % | | | 1.83 | % | | | 2.20 | % | | | 1.69 | %(4) |
Portfolio turnover rate(5) | | | 39 | %(3) | | | 76 | % | | | 38 | % | | | 124 | % | | | 46 | %(3) |
(1) | Inception was close of business on November 15, 2019. |
(2) | Calculated using average shares outstanding during the period. |
(3) | Not annualized. |
(4) | Annualized. |
(5) | Portfolio turnover is calculated on the basis of the Fund as a whole without distinguishing between the classes of shares issued and excludes in-kind transactions, where applicable. |
The accompanying notes are an integral part of these financial statements.
Financial Highlights
Baird Municipal Bond Fund – Investor Class
| | | Six Months Ended | | | | | | | | | | | | Period Ended | |
| | | June 30, 2023 | | | Year Ended December 31, | | | December 31, | |
| | | (Unaudited) | | | 2022 | | | 2021 | | | 2020 | | | 2019(1) | |
| Per Share Data: | | | | | | | | | | | | | | | |
| Net asset value, beginning of period | | $ | 9.68 | | | $ | 10.74 | | | $ | 10.66 | | | $ | 10.10 | | | $ | 10.00 | |
| Income from investment operations: | | | | | | | | | | | | | | | | | | | | |
Net investment income(2) | | | 0.16 | | | | 0.24 | | | | 0.17 | | | | 0.21 | | | | 0.02 | |
Net realized and unrealized gains (losses) on investments | | | 0.12 | | | | (1.08 | ) | | | 0.16 | | | | 0.75 | | | | 0.10 | |
| Total from investment operations | | | 0.28 | | | | (0.84 | ) | | | 0.33 | | | | 0.96 | | | | 0.12 | |
| Less distributions: | | | | | | | | | | | | | | | | | | | | |
| Distributions from net investment income | | | (0.15 | ) | | | (0.22 | ) | | | (0.17 | ) | | | (0.19 | ) | | | (0.02 | ) |
| Distributions from net realized gains | | | — | | | | — | | | | (0.08 | ) | | | (0.21 | ) | | | — | |
| Total distributions | | | (0.15 | ) | | | (0.22 | ) | | | (0.25 | ) | | | (0.40 | ) | | | (0.02 | ) |
| Net asset value, end of period | | $ | 9.81 | | | $ | 9.68 | | | $ | 10.74 | | | $ | 10.66 | | | $ | 10.10 | |
| Total return | | | 2.88 | %(3) | | | (7.78 | )% | | | 3.12 | % | | | 9.58 | % | | | 1.16 | %(3) |
| Supplemental data and ratios: | | | | | | | | | | | | | | | | | | | | |
| Net assets, end of period (thousands) | | $ | 5,857.7 | | | $ | 4,055.6 | | | $ | 3,193.3 | | | $ | 1,624.8 | | | $ | 29.1 | |
| Ratio of expenses to average net assets | | | 0.55 | %(4) | | | 0.55 | % | | | 0.55 | % | | | 0.55 | % | | | 0.55 | %(4) |
Ratio of net investment income to average net assets | | | 3.37 | %(4) | | | 2.38 | % | | | 1.58 | % | | | 1.95 | % | | | 1.44 | %(4) |
Portfolio turnover rate(5) | | | 39 | %(3) | | | 76 | % | | | 38 | % | | | 124 | % | | | 46 | %(3) |
(1) | Inception was close of business on November 15, 2019. |
(2) | Calculated using average shares outstanding during the period. |
(3) | Not annualized. |
(4) | Annualized. |
(5) | Portfolio turnover is calculated on the basis of the Fund as a whole without distinguishing between the classes of shares issued and excludes in-kind transactions, where applicable. |
The accompanying notes are an integral part of these financial statements.
Notes to the Financial Statements
June 30, 2023 (Unaudited)
Baird Funds, Inc. (the “Company”) was incorporated on June 9, 2000, as a Wisconsin corporation and is registered as an open-end investment management company under the Investment Company Act of 1940, as amended (the “1940 Act”). The accompanying financial statements include the Baird Ultra Short Bond Fund, Baird Short-Term Bond Fund, Baird Intermediate Bond Fund, Baird Aggregate Bond Fund, Baird Core Plus Bond Fund, Baird Short-Term Municipal Bond Fund, Baird Strategic Municipal Bond Fund, Baird Quality Intermediate Municipal Bond Fund, Baird Core Intermediate Municipal Bond Fund, and Baird Municipal Bond Fund (each, a “Fund” and collectively, the “Funds”), ten of the fifteen active funds in the series comprising the Company. Pursuant to the 1940 Act, the Funds in this report are “diversified” series of the Company. Robert W. Baird & Co. Incorporated (“Baird” or the “Advisor”) serves as investment advisor to the Funds.
The following table presents the class-specific inception dates for each of the Funds:
| | Inception Date |
Fund | Institutional Class
| | Investor Class
|
| Baird Ultra Short Bond Fund | December 31, 2013 | | December 31, 2013 |
| Baird Short-Term Bond Fund | August 31, 2004 | | September 19, 2012 |
| Baird Intermediate Bond Fund | September 29, 2000 | | September 29, 2000 |
| Baird Aggregate Bond Fund | September 29, 2000 | | September 29, 2000 |
| Baird Core Plus Bond Fund | September 29, 2000 | | September 29, 2000 |
| Baird Short-Term Municipal Bond Fund | August 31, 2015 | | August 31, 2015 |
| Baird Strategic Municipal Bond Fund | November 15, 2019 | | November 15, 2019 |
| Baird Quality Intermediate Municipal Bond Fund | March 30, 2001 | | March 30, 2001 |
| Baird Core Intermediate Municipal Bond Fund | August 31, 2015 | | August 31, 2015 |
| Baird Municipal Bond Fund | November 15, 2019 | | November 15, 2019 |
Institutional Class shares are not subject to a distribution and service (12b-1) fee, while Investor Class shares are subject to a distribution and service (12b-1) fee of 0.25%. See Note 7.
The investment objective of the Baird Ultra Short Bond Fund is to seek current income consistent with preservation of capital.
The investment objective of the Baird Short-Term Bond Fund is to seek an annual rate of total return, before Fund expenses, greater than the annual rate of total return of the Bloomberg 1-3 Year U.S. Government/Credit Index. The Fund’s benchmark index, the Bloomberg 1-3 Year U.S. Government/Credit Index, is an unmanaged, market value weighted index of investment grade, fixed-rate debt issues, including government and corporate securities, with maturities between one and three years.
The investment objective of the Baird Intermediate Bond Fund is to seek an annual rate of total return, before Fund expenses, greater than the annual rate of total return of the Bloomberg Intermediate U.S. Government/Credit Index. The Fund’s benchmark index, the Bloomberg Intermediate U.S. Government/Credit Index, is an unmanaged, market value weighted index of investment grade, fixed-rate debt issues, including government and corporate securities, with maturities between one and ten years.
The investment objective of the Baird Aggregate Bond Fund is to seek an annual rate of total return, before Fund expenses, greater than the annual rate of total return of the Bloomberg U.S. Aggregate Index. The Fund’s benchmark index, the Bloomberg U.S. Aggregate Index, is an unmanaged, market value weighted index of investment grade, fixed-rate debt issues, including government, corporate, asset-backed and mortgage-backed debt obligations, with maturities of at least one year.
The investment objective of the Baird Core Plus Bond Fund is to seek an annual rate of total return, before Fund expenses, greater than the annual rate of total return of the Bloomberg U.S. Universal Index. The Fund’s benchmark index, the Bloomberg U.S. Universal Index, is an unmanaged, market value weighted index of fixed income debt obligations issued in U.S. dollars, including U.S. government and investment grade debt, non-investment grade debt, asset-backed and mortgage-backed debt obligations, Eurobonds, 144A securities and emerging market debt, with maturities of at least one year.
The investment objective of the Baird Short-Term Municipal Bond Fund is to seek current income that is exempt from federal income tax and is consistent with the preservation of capital.
The investment objective of the Baird Strategic Municipal Bond Fund is to seek a high level of current income that is exempt from federal income tax and is consistent with preservation of capital.
The primary investment objective of the Baird Quality Intermediate Municipal Bond Fund is to seek current income that is substantially exempt from federal income tax. A secondary objective is to seek total return with relatively low volatility of principal.
The investment objective of the Baird Core Intermediate Municipal Bond Fund is to seek a high level of current income that is exempt from federal income tax and is consistent with preservation of capital.
The investment objective of the Baird Municipal Bond Fund is to seek a high level of current income that is exempt from federal income tax and is consistent with preservation of capital.
| 2. | Significant Accounting Policies |
The following is a summary of significant accounting policies consistently followed by the Funds in the preparation of their financial statements. These policies are in conformity with accounting principles generally accepted in the United States of America (“GAAP”). The Funds are investment companies and therefore follow the investment company accounting and reporting guidance of the Financial Accounting Standards Board (“FASB”) Accounting Standards Codification Topic 946, Financial Services – Investment Companies.
| a) | Investment Valuation – Section 2(a)(41) of the 1940 Act, together with the rules and interpretations of the U.S. Securities and Exchange Commission (the “SEC”), require the Funds, in computing net asset value (“NAV”), to value their portfolio securities using market quotations when they are “readily available.” When market quotations are not readily available (e.g., because there is no regular market quotation for such securities, the securities are valued at fair value using methods determined by the Advisor as the valuation designee of the Board of Directors of the Company (the “Board”) in accordance with policies and procedures adopted pursuant to Rule 2a-5 of the 1940 Act. Per GAAP, the “fair value” of a security means the price that would be received to sell a security in an orderly transaction between market participants at the measurement date. |
| | |
| | The Funds determine the fair value of their investments and compute their NAV per share as of the close of regular trading of the New York Stock Exchange (generally, 4:00 p.m. ET). |
Notes to the Financial Statements
June 30, 2023 (Unaudited)
| 2. | Significant Accounting Policies (cont.) |
| | Consistent with Section 2(a)(41) of the 1940 Act, the Funds price their securities as follows: debt securities are valued at their evaluated bid prices as provided by an independent pricing service based on various market inputs such as benchmark yields, market transactions and dealer quotations. Investments in mutual funds, including money market funds, are valued at their stated NAV. Common stocks that are listed on a securities exchange (other than NASDAQ) are valued at the last quoted sales price. Securities traded on NASDAQ are valued at the NASDAQ Official Closing Price. Price information on listed stocks is taken from the exchange where the security is primarily traded. Securities, other than debt securities, that were not traded on the valuation date, as well as stocks that are not listed on an exchange, including NASDAQ, are valued at the average of the current bid and ask price. Other assets and securities for which market quotations are not readily available are valued at fair value as determined in good faith by the Advisor in accordance with the Funds’ fair value procedures. In accordance with such procedures, the Advisor may, under certain circumstances, use alternative valuation methodologies, such as broker quotes. If prices are unavailable or deemed to be unreliable, fair value will be determined by the Advisor. The Advisor has designated its valuation committee to be responsible for fair value determinations. In determining fair value, the valuation committee takes into account factors deemed relevant by the valuation committee and available information. Consequently, the price of the security used by a Fund to calculate its NAV may differ from quoted or published prices for the same security. Fair value pricing involves subjective judgments and there is no single standard for determining a security’s fair value. As a result, different mutual funds could reasonably arrive at a different fair value for the same security. It is possible that the fair value determined for a security is materially different from the value that could be realized upon the sale of that security or from the values that other mutual funds may determine. The prices determined for any individual security on any given day may vary significantly from the amount that can be obtained in an actual sale of that security, and the Funds’ NAVs may fluctuate significantly from day to day or from period to period. |
| | |
| b) | Securities Purchased on a When-Issued, Delayed Delivery or Forward Commitment Basis – Each Fund may purchase securities on a when-issued, delayed delivery or forward commitment basis. When-issued, delayed delivery and forward commitment transactions involve the risk that the price or yield obtained in a transaction may be more or less favorable than the price or yield available in the market when delivery takes place. At the time a Fund makes a commitment to purchase a security, the Fund records the transaction and reflects the value of the security in determining net asset value. Certain when-issued, delayed delivery or forward commitment securities are considered derivatives. |
| | |
| c) | Unregistered Securities – The Funds own certain investment securities which are unregistered. All of the unregistered securities held by the Funds as of June 30, 2023 consisted of securities issued pursuant to Rule 144A under the Securities Act of 1933 which may be resold in transactions exempt from registration to qualified institutional buyers. |
| | |
| | The value of such securities held by the Funds was as follows: |
| | Fund | | Value | | | % of Net Assets | |
| | Baird Ultra Short Bond Fund | | $ | 1,502,036,401 | | | | 24.22 | % |
| | Baird Short-Term Bond Fund | | | 3,094,180,824 | | | | 33.82 | % |
| | Baird Intermediate Bond Fund | | | 1,490,971,995 | | | | 20.04 | % |
| | Baird Aggregate Bond Fund | | | 7,737,807,258 | | | | 19.68 | % |
| | Baird Core Plus Bond Fund | | | 5,693,754,987 | | | | 23.43 | % |
| | Baird Short-Term Municipal Bond Fund | | | 97,569,442 | | | | 5.86 | % |
| | Baird Strategic Municipal Bond Fund | | | 46,897,670 | | | | 7.44 | % |
| | Baird Quality Intermediate Municipal Bond Fund | | | 29,895,742 | | | | 2.74 | % |
| | Baird Core Intermediate Municipal Bond Fund | | | 96,425,909 | | | | 3.67 | % |
| | Baird Municipal Bond Fund | | | 8,703,424 | | | | 6.92 | % |
| d) | Foreign Securities – The Baird Ultra Short Bond Fund, Baird Short-Term Bond Fund, Baird Intermediate Bond Fund, Baird Aggregate Bond Fund, and Baird Core Plus Bond Fund may invest in U.S. dollar-denominated debt obligations of foreign companies and foreign governments. Investing in securities of foreign companies and foreign governments involves special risks and considerations not typically associated with investing in U.S. companies and the U.S. government. These risks include foreign currency fluctuations, political and economic instability, differences in financial reporting standards and less strict regulation of securities markets. Moreover, securities of many foreign companies and foreign governments and their markets may be less liquid and their prices more volatile than those of securities of comparable U.S. companies and the U.S. government. Occasionally, events that affect these values and exchange rates may occur after the close of the exchange on which such securities are traded. If such events materially affect the value of a Fund’s securities, these securities may be valued at their fair value pursuant to the Advisor's fair value procedures. |
| | |
| e) | Financial Derivatives Instruments – Financial derivatives instruments, such as futures contracts, derive their value from the performance of underlying asset prices, indices, reference rates and other inputs or a combination of these factors. These contracts are normally valued on the basis of broker-dealer quotations or by a pricing service at the settlement price determined by the relevant exchange. Depending on the product and the terms of the transaction, the value of the derivatives contracts can be estimated by a pricing service provider using a series of techniques, including simulation pricing models. The pricing models use inputs that are observed from actively quoted markets such as issuer details, indices, spreads, interest rates, curves, dividends and exchange rates. Futures contracts are carried at fair value using the primary exchange’s closing (settlement) price and are generally categorized in Level 1. |
| | |
| f) | Deposits with Broker – When trading derivatives instruments, such as futures contracts, a Fund is only required to post initial or variation margin with the exchange or clearing broker. The use of margin in trading these instruments has the effect of creating leverage, which can expose the Fund to substantial gains or losses occurring from relatively small price changes in the value of the underlying instrument and can increase the volatility of the Fund’s returns. |
| | |
| | Upon entering into a futures contract, and to maintain the Fund’s open positions in futures contracts, the Fund is required to deposit with its custodian or futures broker in a segregated account in the name of the futures broker an amount of cash, U.S. government securities, suitable money market instruments, or other liquid securities, known as “initial margin.” The margin required for a particular futures contract is set by the exchange on which the contract is traded and may be significantly modified from time to time by the exchange during the term of the contract. Futures contracts are customarily purchased and sold on margins that may range upward from less than 5% of the value of the contract being traded. |
| | |
| | At June 30, 2023, the Baird Strategic Municipal Bond Fund had $260,001 in cash and cash equivalents on deposit with the broker for futures contracts, which is presented on the Fund’s Statement of Assets and Liabilities. |
| | |
| | If the price of an open futures contract changes (by increase in underlying instrument or index in the case of a sale or by decrease in the case of a purchase) so that the loss on the futures contract reaches a point at which the margin on deposit does not satisfy margin requirements, the broker will require an increase in the margin. However, if the value of a position increases because of favorable price changes in the futures contract so that the margin deposit exceeds the required margin, the broker will pay the excess to the Fund. |
Notes to the Financial Statements
June 30, 2023 (Unaudited)
| 2. | Significant Accounting Policies (cont.) |
| | These subsequent payments, called “variation margin,” to and from the futures broker are made on a daily basis as the price of the underlying assets fluctuate making the long and short positions in the futures contract more or less valuable, a process known as “marking to the market.” At period end, the variation margin may be shown as either a receivable or payable on the Fund’s Statement of Assets and Liabilities. The Fund expects to earn interest income on any margin deposits. |
| | |
| g) | Income Tax Status – The Funds intend to continue to qualify as regulated investment companies as provided in Subchapter M of the Internal Revenue Code and to distribute substantially all of their taxable income to their shareholders in a manner which results in no tax expense to the Funds. Therefore, no federal income or excise tax provision is recorded. |
| | |
| | There is no tax liability resulting from unrecognized tax benefits relating to uncertain income tax positions taken or expected to be taken on the tax return for the fiscal year ended December 31, 2022, or for any other tax years which are open for exam. As of December 31, 2022, open tax years include the tax years ended December 31, 2019 through 2022. The Funds are not aware of any tax positions for which it is reasonably possible that the total amounts of unrecognized tax benefits will significantly change in the next 12 months. The Funds recognize interest and penalties, if any, related to unrecognized tax benefits as interest and other expense, respectively, in the Statement of Operations. During the period, the Funds did not incur any interest or penalties. |
| | |
| h) | Allocation of Income and Expenses – Each Fund is charged for those expenses directly attributable to it. Expenses directly attributable to a class of shares, such as Rule 12b-1 distribution fees, are charged to that class of shares. Income, expenses and realized and unrealized gains and losses are allocated to the classes based on their respective net assets. Expenses that are not directly attributable to a Fund are allocated among the Funds in the series in proportion to their assets or are divided equally amongst the Funds. |
| | |
| i) | Shareholder Transactions and Distributions – Shareholder transactions are recorded on the trade date. Dividends from net investment income are declared and paid monthly. Distributions of net realized capital gains, if any, are declared and paid at least annually. All distributions to shareholders are recorded on the ex-dividend date. The book basis character of distributions may differ from their ultimate characterization for Federal income tax purposes. GAAP requires that permanent financial reporting and tax differences be reclassified in the capital accounts. |
| | |
| j) | Use of Estimates – The preparation of financial statements in conformity with GAAP requires management to make estimates and assumptions that affect the reported amounts of assets and liabilities and disclosure of contingent assets and liabilities at the date of the financial statements and the reported amounts of income and expenses during the reporting period. Actual results could differ from those estimates. |
| | |
| k) | Securities Transactions and Investment Income – Investment transactions are recorded on the trade date. The Funds determine the gain or loss realized from investment transactions using the identified cost basis. Dividend income is recognized on the ex-dividend date and interest income is recognized on an accrual basis. Premiums and discounts on the purchase of securities are amortized/accreted using the effective interest method. Paydown gains and losses are recorded as interest income on the Statements of Operations for financial reporting purposes. |
| | |
| l) | Guarantees and Indemnifications – In the normal course of business, the Funds enter into contracts with service providers that contain general indemnification clauses. The Funds’ maximum exposure under these arrangements is unknown and would involve future claims against the Funds that have not yet occurred. Based on experience, the Funds would expect the risk of loss to be low. |
| | |
| m) | New Regulatory and Accounting Pronouncements – In March 2020, FASB issued Accounting Standards Update 2020-04, Reference Rate Reform: Facilitation of the Effects of Reference Rate Reform on Financial Reporting (“ASU 2020-04”), in January 2021, the FASB issued Accounting Standards Update 2021-01, Reference Rate Reform (Topic 848): Scope (“ASU 2021-01”), and in December 2022, the FASB issued Accounting Standards Update ASU 2022-06, Reference Rate Reform (Topic 848): Deferral of the Sunset Date of Topic 848 (“ASU 2022-06”), which provides optional, temporary relief with respect to the financial reporting of contracts subject to certain types of modifications due to the planned discontinuation of the London Interbank Offered Rate (“LIBOR”) and other interbank offered rates as of the end of 2021. The temporary relief provided by ASU 2020-04, ASU 2021-01, and ASU 2022-06 is effective for certain reference rate-related contract modifications that occur during the period from March 12, 2020 through December 31, 2024. Management is evaluating the impact of ASU 2020-04, ASU 2021-01, and ASU 2022-06 on the Funds’ investments, derivatives, debt, and other contracts that will undergo reference rate-related modifications as a result of the reference rate reform. Management is also actively working with other financial institutions and counterparties to modify contracts as required by applicable regulation and within the regulatory deadlines. |
| | |
| | In October 2022, the Securities and Exchange Commission (the “SEC”) adopted a final rule relating to Tailored Shareholder Reports for Mutual Funds and Exchange-Traded Funds; Fee Information in Investment Company Advertisements. The rule and form amendments will, among other things, require the Fund to transmit concise and visually engaging shareholder reports that highlight key information. The amendments will require that funds tag information in a structured data format and that certain more in-depth information be made available online and available for delivery free of charge to investors on request. The amendments became effective January 24, 2023. There is an 18-month transition period after the effective date of the amendment. |
| | |
| 3. | Capital Share Transactions |
The following table summarizes the capital share transactions of each Fund for the past two fiscal periods:
Baird Ultra Short Bond Fund
| | | Six Months Ended | | | Year Ended | |
| | | June 30, 2023 | | | December 31, 2022 | |
| Institutional Class Shares | | Shares | | | Amount | | | Shares | | | Amount | |
| Shares sold | | | 234,125,793 | | | $ | 2,348,500,255 | | | | 510,778,406 | | | $ | 5,106,885,871 | |
| Shares issued to shareholders in reinvestment of distributions | | | 10,094,856 | | | | 101,144,386 | | | | 8,061,269 | | | | 80,399,650 | |
| Shares redeemed | | | (185,884,510 | ) | | | (1,864,313,930 | ) | | | (652,378,673 | ) | | | (6,519,104,866 | ) |
| Net increase (decrease) | | | 58,336,139 | | | $ | 585,330,711 | | | | (133,538,998 | ) | | $ | (1,331,819,345 | ) |
| Shares Outstanding: | | | | | | | | | | | | | | | | |
| Beginning of period | | | 552,178,733 | | | | | | | | 685,717,731 | | | | | |
| End of period | | | 610,514,872 | | | | | | | | 552,178,733 | | | | | |
Notes to the Financial Statements
June 30, 2023 (Unaudited)
| 3. | Capital Share Transactions (cont.) |
Baird Ultra Short Bond Fund (cont.)
| | | Six Months Ended | | | Year Ended | |
| | | June 30, 2023 | | | December 31, 2022 | |
| Investor Class Shares | | Shares | | | Amount | | | Shares | | | Amount | |
| Shares sold | | | 2,415,830 | | | $ | 24,291,411 | | | | 4,481,615 | | | $ | 44,858,460 | |
| Shares issued to shareholders in reinvestment of distributions | | | 145,463 | | | | 1,461,440 | | | | 127,158 | | | | 1,271,407 | |
| Shares redeemed | | | (4,554,277 | ) | | | (45,843,143 | ) | | | (11,658,271 | ) | | | (116,780,502 | ) |
| Net decrease | | | (1,992,984 | ) | | $ | (20,090,292 | ) | | | (7,049,498 | ) | | $ | (70,650,635 | ) |
| Shares Outstanding: | | | | | | | | | | | | | | | | |
| Beginning of period | | | 9,252,712 | | | | | | | | 16,302,210 | | | | | |
| End of period | | | 7,259,728 | | | | | | | | 9,252,712 | | | | | |
| Total net increase (decrease) | | | | | | $ | 565,240,419 | | | | | | | $ | (1,402,469,980 | ) |
| | | | | | | | | | | | | | | | | |
| Baird Short-Term Bond Fund | | | | | | | | | | | | | | | | |
| | | Six Months Ended | | | Year Ended | |
| | | June 30, 2023 | | | December 31, 2022 | |
| Institutional Class Shares | | Shares | | | Amount | | | Shares | | | Amount | |
| Shares sold | | | 174,621,272 | | | $ | 1,621,032,773 | | | | 391,080,943 | | | $ | 3,673,283,683 | |
| Shares issued to shareholders in reinvestment of distributions | | | 13,586,705 | | | | 125,878,832 | | | | 16,033,899 | | | | 149,270,614 | |
| Shares redeemed | | | (163,018,761 | ) | | | (1,513,111,800 | ) | | | (535,281,625 | ) | | | (5,005,563,954 | ) |
| Net increase (decrease) | | | 25,189,216 | | | $ | 233,799,805 | | | | (128,166,783 | ) | | $ | (1,183,009,657 | ) |
| Shares Outstanding: | | | | | | | | | | | | | | | | |
| Beginning of period | | | 948,667,657 | | | | | | | | 1,076,834,440 | | | | | |
| End of period | | | 973,856,873 | | | | | | | | 948,667,657 | | | | | |
| | | | | | | | | | | | | | | | | |
| | | Six Months Ended | | | Year Ended | |
| | | June 30, 2023 | | | December 31, 2022 | |
| Investor Class Shares | | Shares | | | Amount | | | Shares | | | Amount | |
| Shares sold | | | 3,742,037 | | | $ | 34,756,052 | | | | 11,154,652 | | | $ | 104,892,206 | |
| Shares issued to shareholders in reinvestment of distributions | | | 292,428 | | | | 2,709,262 | | | | 368,325 | | | | 3,423,812 | |
| Shares redeemed | | | (9,587,625 | ) | | | (88,959,659 | ) | | | (13,924,914 | ) | | | (130,871,374 | ) |
| Net decrease | | | (5,553,160 | ) | | $ | (51,494,345 | ) | | | (2,401,937 | ) | | $ | (22,555,356 | ) |
| Shares Outstanding: | | | | | | | | | | | | | | | | |
| Beginning of period | | | 23,531,171 | | | | | | | | 25,933,108 | | | | | |
| End of period | | | 17,978,011 | | | | | | | | 23,531,171 | | | | | |
| Total net increase (decrease) | | | | | | $ | 182,305,460 | | | | | | | $ | (1,205,565,013 | ) |
| | | | | | | | | | | | | | | | | |
| Baird Intermediate Bond Fund | | | | | | | | | | | | | | | | |
| | | Six Months Ended | | | Year Ended | |
| | | June 30, 2023 | | | December 31, 2022 | |
| Institutional Class Shares | | Shares | | | Amount | | | Shares | | | Amount | |
| Shares sold | | | 106,524,192 | | | $ | 1,087,853,981 | | | | 283,794,838 | (1) | | $ | 2,977,433,440 | (1) |
| Shares issued to shareholders in reinvestment of distributions | | | 9,158,011 | | | | 93,305,694 | | | | 12,209,851 | | | | 125,904,456 | |
| Shares redeemed | | | (78,385,974 | ) | | | (797,582,867 | ) | | | (192,704,900 | ) | | | (2,000,544,006 | ) |
| Net increase | | | 37,296,229 | | | $ | 383,576,808 | | | | 103,299,789 | | | $ | 1,102,793,890 | |
| Shares Outstanding: | | | | | | | | | | | | | | | | |
| Beginning of period | | | 692,361,235 | | | | | | | | 589,061,446 | | | | | |
| End of period | | | 729,657,464 | | | | | | | | 692,361,235 | | | | | |
| | | | | | | | | | | | | | | | | |
| | | Six Months Ended | | | Year Ended | |
| | | June 30, 2023 | | | December 31, 2022 | |
| Investor Class Shares | | Shares | | | Amount | | | Shares | | | Amount | |
| Shares sold | | | 2,093,708 | | | $ | 22,422,785 | | | | 3,627,892 | | | $ | 39,037,445 | |
| Shares issued to shareholders in reinvestment of distributions | | | 76,714 | | | | 821,055 | | | | 76,180 | | | | 822,382 | |
| Shares redeemed | | | (1,524,795 | ) | | | (16,259,094 | ) | | | (1,669,780 | ) | | | (18,219,022 | ) |
| Net increase | | | 645,627 | | | $ | 6,984,746 | | | | 2,034,292 | | | $ | 21,640,805 | |
| Shares Outstanding: | | | | | | | | | | | | | | | | |
| Beginning of period | | | 5,603,471 | | | | | | | | 3,569,179 | | | | | |
| End of period | | | 6,249,098 | | | | | | | | 5,603,471 | | | | | |
| Total net increase | | | | | | $ | 390,561,554 | | | | | | | $ | 1,124,434,695 | |
(1) Includes purchase in-kind transactions. See additional information contained in this Note.
Notes to the Financial Statements
June 30, 2023 (Unaudited)
| 3. | Capital Share Transactions (cont.) |
Baird Aggregate Bond Fund
| | | Six Months Ended | | | Year Ended | |
| | | June 30, 2023 | | | December 31, 2022 | |
| Institutional Class Shares | | Shares | | | Amount | | | Shares | | | Amount | |
| Shares sold | | | 715,987,380 | | | $ | 6,998,098,019 | | | | 1,132,790,635 | | | $ | 11,448,888,258 | |
| Shares issued to shareholders in reinvestment of distributions | | | 53,482,701 | | | | 521,053,964 | | | | 81,727,428 | | | | 815,301,963 | |
| Shares redeemed | | | (352,887,518 | ) | | | (3,450,225,239 | ) | | | (1,098,175,721 | ) | | | (11,116,504,107 | ) |
| Net increase | | | 416,582,563 | | | $ | 4,068,926,744 | | | | 116,342,342 | | | $ | 1,147,686,114 | |
| Shares Outstanding: | | | | | | | | | | | | | | | | |
| Beginning of period | | | 3,551,762,846 | | | | | | | | 3,435,420,504 | | | | | |
| End of period | | | 3,968,345,409 | | | | | | | | 3,551,762,846 | | | | | |
| | | | | | | | | | | | | | | | | |
| | | Six Months Ended | | | Year Ended | |
| | | June 30, 2023 | | | December 31, 2022 | |
| Investor Class Shares | | Shares | | | Amount | | | Shares | | | Amount | |
| Shares sold | | | 34,017,298 | | | $ | 346,744,370 | | | | 20,420,963 | | | $ | 215,322,675 | |
| Shares issued to shareholders in reinvestment of distributions | | | 1,171,027 | | | | 11,842,610 | | | | 1,570,967 | | | | 16,281,653 | |
| Shares redeemed | | | (12,590,786 | ) | | | (127,781,781 | ) | | | (30,367,979 | ) | | | (320,324,283 | ) |
| Net increase (decrease) | | | 22,597,539 | | | $ | 230,805,199 | | | | (8,376,049 | ) | | $ | (88,719,955 | ) |
| Shares Outstanding: | | | | | | | | | | | | | | | | |
| Beginning of period | | | 68,333,412 | | | | | | | | 76,709,461 | | | | | |
| End of period | | | 90,930,951 | | | | | | | | 68,333,412 | | | | | |
| Total net increase | | | | | | $ | 4,299,731,943 | | | | | | | $ | 1,058,966,159 | |
| | | | | | | | | | | | | | | | | |
| Baird Core Plus Bond Fund | | | | | | | | | | | | | | | | |
| | | Six Months Ended | | | Year Ended | |
| | | June 30, 2023 | | | December 31, 2022 | |
| Institutional Class Shares | | Shares | | | Amount | | | Shares | | | Amount | |
| Shares sold | | | 338,247,172 | | | $ | 3,391,875,981 | | | | 504,649,661 | | | $ | 5,264,617,388 | |
| Shares issued to shareholders in reinvestment of distributions | | | 34,513,793 | | | | 345,676,831 | | | | 60,377,638 | | | | 620,675,811 | |
| Shares redeemed | | | (196,427,634 | ) | | | (1,972,091,147 | ) | | | (777,453,867 | ) | | | (8,149,147,748 | ) |
| Net increase (decrease) | | | 176,333,331 | | | $ | 1,765,461,665 | | | | (212,426,568 | ) | | $ | (2,263,854,549 | ) |
| Shares Outstanding: | | | | | | | | | | | | | | | | |
| Beginning of period | | | 2,157,271,130 | | | | | | | | 2,369,697,698 | | | | | |
| End of period | | | 2,333,604,461 | | | | | | | | 2,157,271,130 | | | | | |
| | | | | | | | | | | | | | | | | |
| | | Six Months Ended | | | Year Ended | |
| | | June 30, 2023 | | | December 31, 2022 | |
| Investor Class Shares | | Shares | | | Amount | | | Shares | | | Amount | |
| Shares sold | | | 14,055,988 | | | $ | 147,884,177 | | | | 22,790,115 | | | $ | 251,553,911 | |
| Shares issued to shareholders in reinvestment of distributions | | | 1,447,556 | | | | 15,192,680 | | | | 2,880,904 | | | | 31,071,249 | |
| Shares redeemed | | | (15,630,330 | ) | | | (165,089,041 | ) | | | (56,639,771 | ) | | | (622,150,469 | ) |
| Net decrease | | | (126,786 | ) | | $ | (2,012,184 | ) | | | (30,968,752 | ) | | $ | (339,525,309 | ) |
| Shares Outstanding: | | | | | | | | | | | | | | | | |
| Beginning of period | | | 101,102,709 | | | | | | | | 132,071,461 | | | | | |
| End of period | | | 100,975,923 | | | | | | | | 101,102,709 | | | | | |
| Total net increase (decrease) | | | | | | $ | 1,763,449,481 | | | | | | | $ | (2,603,379,858 | ) |
| | | | | | | | | | | | | | | | | |
| Baird Short-Term Municipal Bond Fund | | | | | | | | | | | | | | | | |
| | | Six Months Ended | | | Year Ended | |
| | | June 30, 2023 | | | December 31, 2022 | |
| Institutional Class Shares | | Shares | | | Amount | | | Shares | | | Amount | |
| Shares sold | | | 33,919,695 | | | $ | 335,304,571 | | | | 167,243,863 | | | $ | 1,663,156,971 | |
| Shares issued to shareholders in reinvestment of distributions | | | 1,468,188 | | | | 14,491,070 | | | | 2,226,981 | | | | 22,051,002 | |
| Shares redeemed | | | (44,840,577 | ) | | | (443,699,772 | ) | | | (208,046,440 | ) | | | (2,065,552,673 | ) |
| Net decrease | | | (9,452,694 | ) | | $ | (93,904,131 | ) | | | (38,575,596 | ) | | $ | (380,344,700 | ) |
| Shares Outstanding: | | | | | | | | | | | | | | | | |
| Beginning of period | | | 172,127,200 | | | | | | | | 210,702,796 | | | | | |
| End of period | | | 162,674,506 | | | | | | | | 172,127,200 | | | | | |
Notes to the Financial Statements
June 30, 2023 (Unaudited)
| 3. | Capital Share Transactions (cont.) |
Baird Short-Term Municipal Bond Fund (cont.)
| | | Six Months Ended | | | Year Ended | |
| | | June 30, 2023 | | | December 31, 2022 | |
| Investor Class Shares | | Shares | | | Amount | | | Shares | | | Amount | |
| Shares sold | | | 804,225 | | | $ | 7,955,378 | | | | 2,906,247 | | | $ | 28,904,745 | |
| Shares issued to shareholders in reinvestment of distributions | | | 65,813 | | | | 648,517 | | | | 97,420 | | | | 961,922 | |
| Shares redeemed | | | (1,822,994 | ) | | | (18,035,297 | ) | | | (6,344,406 | ) | | | (63,158,931 | ) |
| Net decrease | | | (952,956 | ) | | $ | (9,431,402 | ) | | | (3,340,739 | ) | | $ | (33,292,264 | ) |
| Shares Outstanding: | | | | | | | | | | | | | | | | |
| Beginning of period | | | 7,294,486 | | | | | | | | 10,635,225 | | | | | |
| End of period | | | 6,341,530 | | | | | | | | 7,294,486 | | | | | |
| Total net decrease | | | | | | $ | (103,335,533 | ) | | | | | | $ | (413,636,964 | ) |
| | | | | | | | | | | | | | | | | |
| Baird Strategic Municipal Bond Fund | | | | | | | | | | | | | | | | |
| | | Six Months Ended | | | Year Ended | |
| | | June 30, 2023 | | | December 31, 2022 | |
| Institutional Class Shares | | Shares | | | Amount | | | Shares | | | Amount | |
| Shares sold | | | 17,684,884 | | | $ | 178,922,133 | | | | 46,538,898 | | | $ | 469,432,787 | |
| Shares issued to shareholders in reinvestment of distributions | | | 794,534 | | | | 8,010,530 | | | | 820,672 | | | | 8,177,741 | |
| Shares redeemed | | | (5,020,286 | ) | | | (50,713,331 | ) | | | (32,225,708 | ) | | | (322,083,246 | ) |
| Net increase | | | 13,459,132 | | | $ | 136,219,332 | | | | 15,133,862 | | | $ | 155,527,282 | |
| Shares Outstanding: | | | | | | | | | | | | | | | | |
| Beginning of period | | | 47,263,634 | | | | | | | | 32,129,772 | | | | | |
| End of period | | | 60,722,766 | | | | | | | | 47,263,634 | | | | | |
| | | | | | | | | | | | | | | | | |
| | | Six Months Ended | | | Year Ended | |
| | | June 30, 2023 | | | December 31, 2022 | |
| Investor Class Shares | | Shares | | | Amount | | | Shares | | | Amount | |
| Shares sold | | | 940,115 | | | $ | 9,511,689 | | | | 620,372 | | | $ | 6,273,602 | |
| Shares issued to shareholders in reinvestment of distributions | | | 15,603 | | | | 157,272 | | | | 7,297 | | | | 72,714 | |
| Shares redeemed | | | (308,981 | ) | | | (3,124,919 | ) | | | (327,044 | ) | | | (3,284,501 | ) |
| Net increase | | | 646,737 | | | $ | 6,544,042 | | | | 300,625 | | | $ | 3,061,815 | |
| Shares Outstanding: | | | | | | | | | | | | | | | | |
| Beginning of period | | | 1,070,247 | | | | | | | | 769,622 | | | | | |
| End of period | | | 1,716,984 | | | | | | | | 1,070,247 | | | | | |
| Total net increase | | | | | | $ | 142,763,374 | | | | | | | $ | 158,589,097 | |
| | | | | | | | | | | | | | | | | |
| Baird Quality Intermediate Municipal Bond Fund | | | | | | | | | | | | | | | | |
| | | Six Months Ended | | | Year Ended | |
| | | June 30, 2023 | | | December 31, 2022 | |
| Institutional Class Shares | | Shares | | | Amount | | | Shares | | | Amount | |
| Shares sold | | | 12,403,977 | | | $ | 136,920,272 | | | | 69,927,672 | | | $ | 772,989,941 | |
| Shares issued to shareholders in reinvestment of distributions | | | 1,028,462 | | | | 11,306,425 | | | | 1,987,985 | | | | 21,982,125 | |
| Shares redeemed | | | (17,321,957 | ) | | | (190,567,299 | ) | | | (101,791,866 | ) | | | (1,123,505,420 | ) |
| Net decrease | | | (3,889,518 | ) | | $ | (42,340,602 | ) | | | (29,876,209 | ) | | $ | (328,533,354 | ) |
| Shares Outstanding: | | | | | | | | | | | | | | | | |
| Beginning of period | | | 98,875,951 | | | | | | | | 128,752,160 | | | | | |
| End of period | | | 94,986,433 | | | | | | | | 98,875,951 | | | | | |
| | | | | | | | | | | | | | | | | |
| | | Six Months Ended | | | Year Ended | |
| | | June 30, 2023 | | | December 31, 2022 | |
| Investor Class Shares | | Shares | | | Amount | | | Shares | | | Amount | |
| Shares sold | | | 2,104,949 | | | $ | 23,727,634 | | | | 3,517,749 | | | $ | 40,053,579 | |
| Shares issued to shareholders in reinvestment of distributions | | | 38,618 | | | | 435,780 | | | | 73,270 | | | | 829,193 | |
| Shares redeemed | | | (580,393 | ) | | | (6,552,058 | ) | | | (5,738,401 | ) | | | (65,041,068 | ) |
| Net increase (decrease) | | | 1,563,174 | | | $ | 17,611,356 | | | | (2,147,382 | ) | | $ | (24,158,296 | ) |
| Shares Outstanding: | | | | | | | | | | | | | | | | |
| Beginning of period | | | 2,723,540 | | | | | | | | 4,870,922 | | | | | |
| End of period | | | 4,286,714 | | | | | | | | 2,723,540 | | | | | |
| Total net decrease | | | | | | $ | (24,729,246 | ) | | | | | | $ | (352,691,650 | ) |
Notes to the Financial Statements
June 30, 2023 (Unaudited)
| 3. | Capital Share Transactions (cont.) |
Baird Core Intermediate Municipal Bond Fund
| | | Six Months Ended | | | Year Ended | |
| | | June 30, 2023 | | | December 31, 2022 | |
| Institutional Class Shares | | Shares | | | Amount | | | Shares | | | Amount | |
| Shares sold | | | 56,015,480 | | | $ | 571,299,861 | | | | 260,786,481 | | | $ | 2,665,957,218 | |
| Shares issued to shareholders in reinvestment of distributions | | | 2,904,913 | | | | 29,522,590 | | | | 2,967,412 | | | | 30,034,377 | |
| Shares redeemed | | | (46,527,635 | ) | | | (473,450,521 | ) | | | (160,863,049 | ) | | | (1,630,020,249 | ) |
| Net increase | | | 12,392,758 | | | $ | 127,371,930 | | | | 102,890,844 | | | $ | 1,065,971,346 | |
| Shares Outstanding: | | | | | | | | | | | | | | | | |
| Beginning of period | | | 242,569,475 | | | | | | | | 139,678,631 | | | | | |
| End of period | | | 254,962,233 | | | | | | | | 242,569,475 | | | | | |
| | | | | | | | | | | | | | | | | |
| | | Six Months Ended | | | Year Ended | |
| | | June 30, 2023 | | | December 31, 2022 | |
| Investor Class Shares | | Shares | | | Amount | | | Shares | | | Amount | |
| Shares sold | | | 971,704 | | | $ | 9,917,419 | | | | 4,085,710 | | | $ | 41,823,949 | |
| Shares issued to shareholders in reinvestment of distributions | | | 53,158 | | | | 539,984 | | | | 62,064 | | | | 627,524 | |
| Shares redeemed | | | (1,111,223 | ) | | | (11,288,413 | ) | | | (4,181,317 | ) | | | (42,935,251 | ) |
| Net decrease | | | (86,361 | ) | | $ | (831,010 | ) | | | (33,543 | ) | | $ | (483,778 | ) |
| Shares Outstanding: | | | | | | | | | | | | | | | | |
| Beginning of period | | | 3,845,888 | | | | | | | | 3,879,431 | | | | | |
| End of period | | | 3,759,527 | | | | | | | | 3,845,888 | | | | | |
| Total net increase | | | | | | $ | 126,540,920 | | | | | | | $ | 1,065,487,568 | |
| | | | | | | | | | | | | | | | | |
| Baird Municipal Bond Fund | | | | | | | | | | | | | | | | |
| | | Six Months Ended | | | Year Ended | |
| | | June 30, 2023 | | | December 31, 2022 | |
| Institutional Class Shares | | Shares | | | Amount | | | Shares | | | Amount | |
| Shares sold | | | 7,337,582 | | | $ | 71,991,983 | | | | 5,433,325 | | | $ | 53,876,656 | |
| Shares issued to shareholders in reinvestment of distributions | | | 136,436 | | | | 1,336,985 | | | | 112,936 | | | | 1,101,451 | |
| Shares redeemed | | | (1,002,262 | ) | | | (9,833,638 | ) | | | (3,002,030 | ) | | | (29,485,764 | ) |
| Net increase | | | 6,471,756 | | | $ | 63,495,330 | | | | 2,544,231 | | | $ | 25,492,343 | |
| Shares Outstanding: | | | | | | | | | | | | | | | | |
| Beginning of period | | | 5,751,601 | | | | | | | | 3,207,370 | | | | | |
| End of period | | | 12,223,357 | | | | | | | | 5,751,601 | | | | | |
| | | | | | | | | | | | | | | | | |
| | | Six Months Ended | | | Year Ended | |
| | | June 30, 2023 | | | December 31, 2022 | |
| Investor Class Shares | | Shares | | | Amount | | | Shares | | | Amount | |
| Shares sold | | | 253,425 | | | $ | 2,495,265 | | | | 396,064 | | | $ | 3,867,269 | |
| Shares issued to shareholders in reinvestment of distributions | | | 3,228 | | | | 31,602 | | | | 2,621 | | | | 25,383 | |
| Shares redeemed | | | (78,449 | ) | | | (769,990 | ) | | | (276,876 | ) | | | (2,786,613 | ) |
| Net increase | | | 178,204 | | | $ | 1,756,877 | | | | 121,809 | | | $ | 1,106,039 | |
| Shares Outstanding: | | | | | | | | | | | | | | | | |
| Beginning of period | | | 419,044 | | | | | | | | 297,235 | | | | | |
| End of period | | | 597,248 | | | | | | | | 419,044 | | | | | |
| Total net increase | | | | | | $ | 65,252,207 | | | | | | | $ | 26,598,382 | |
Notes to the Financial Statements
June 30, 2023 (Unaudited)
| 3. | Capital Share Transactions (cont.) |
Purchase In-Kind Transactions
During the year ended December 31, 2022, the Funds satisfied purchase in-kind requests made by large institutional shareholders by transferring cash and securities into the Funds. The transfers were effected in accordance with policies and procedures approved by the Board. Consideration received and shares sold were as follows:
| | Year Ended December 31, 2022 | |
| | | | Value of Cash and | | | | |
Fund | Effective Date | Securities Received | | Shares Sold | |
| Baird Intermediate Bond Fund – Institutional Class | March 29, 2022 | | $ | 105,831,914 | | | | 9,909,355 | |
| Baird Intermediate Bond Fund – Institutional Class | March 30, 2022 | | | 512,255 | | | | 47,874 | |
| Baird Intermediate Bond Fund – Institutional Class | April 27, 2022 | | | 60,581,686 | | | | 5,764,195 | |
| Baird Intermediate Bond Fund – Institutional Class | May 17, 2022 | | | 253,996 | | | | 24,329 | |
| Total | | | $ | 167,179,851 | | | | | |
| 4. | Investment Transactions and Income Tax Information |
During the six months ended June 30, 2023, purchases and sales of investment securities (excluding short-term investments and any in-kind transactions) were as follows:
| | | U.S. Government Obligations | | | All Other | |
| | | Purchases | | | Sales | | | Purchases | | | Sales | |
| Baird Ultra Short Bond Fund | | $ | — | | | $ | 411,981,797 | | | $ | 2,041,324,303 | | | $ | 1,928,997,587 | |
| Baird Short-Term Bond Fund | | | 2,560,791,789 | | | | 2,947,642,505 | | | | 2,077,110,366 | | | | 1,442,437,853 | |
| Baird Intermediate Bond Fund | | | 1,507,963,181 | | | | 1,398,823,534 | | | | 695,092,791 | | | | 357,608,797 | |
| Baird Aggregate Bond Fund | | | 6,593,418,162 | | | | 5,499,238,954 | | | | 5,143,119,565 | | | | 1,905,885,384 | |
| Baird Core Plus Bond Fund | | | 3,357,841,070 | | | | 2,672,304,002 | | | | 2,601,670,671 | | | | 1,521,195,576 | |
| Baird Short-Term Municipal Bond Fund | | | 14,965,430 | | | | 15,031,641 | | | | 317,728,151 | | | | 415,475,826 | |
| Baird Strategic Municipal Bond Fund | | | — | | | | — | | | | 311,337,065 | | | | 165,323,857 | |
| Baird Quality Intermediate Municipal Bond Fund | | | 39,907,813 | | | | 28,842,969 | | | | 142,412,191 | | | | 169,410,001 | |
| Baird Core Intermediate Municipal Bond Fund | | | 39,907,813 | | | | 15,031,641 | | | | 544,394,863 | | | | 265,152,074 | |
| Baird Municipal Bond Fund | | | — | | | | — | | | | 97,174,515 | | | | 34,686,294 | |
As of December 31, 2022, the components of distributable earnings (accumulated losses) for income tax purposes were as follows:
| | | Baird | | | Baird | | | Baird | | | Baird | | | Baird | |
| | | Ultra Short | | | Short-Term | | | Intermediate | | | Aggregate | | | Core Plus | |
| | | Bond Fund | | | Bond Fund | | | Bond Fund | | | Bond Fund | | | Bond Fund | |
| Cost of investments | | $ | 5,713,773,120 | | | $ | 9,438,354,774 | | | $ | 7,563,724,095 | | | $ | 39,433,006,077 | | | $ | 25,312,042,354 | |
| Gross unrealized appreciation | | | 2,687,300 | | | | 7,123,615 | | | | 5,498,610 | | | | 50,529,382 | | | | 37,031,438 | |
| Gross unrealized depreciation | | | (39,954,405 | ) | | | (361,881,105 | ) | | | (556,285,850 | ) | | | (4,783,163,033 | ) | | | (3,023,385,758 | ) |
| Net unrealized depreciation | | | (37,267,105 | ) | | | (354,757,490 | ) | | | (550,787,240 | ) | | | (4,732,633,651 | ) | | | (2,986,354,320 | ) |
| Undistributed ordinary income | | | 85,650 | | | | 1,621,607 | | | | 321,883 | | | | 1,073,764 | | | | 1,165,596 | |
| Distributable earnings | | | 85,650 | | | | 1,621,607 | | | | 321,883 | | | | 1,073,764 | | | | 1,165,596 | |
| Other accumulated losses | | | (22,472,333 | ) | | | (251,331,151 | ) | | | (180,358,064 | ) | | | (838,243,335 | ) | | | (495,029,165 | ) |
| Total accumulated deficit | | $ | (59,653,788 | ) | | $ | (604,467,034 | ) | | $ | (730,823,421 | ) | | $ | (5,569,803,222 | ) | | $ | (3,480,217,889 | ) |
| | | | | | | | | | | | | | | | | | | | | |
| | | Baird | | | Baird | | | Baird Quality | | | Baird Core | | | | | |
| | | Short-Term | | | Strategic | | | Intermediate | | | Intermediate | | | Baird | |
| | | Municipal | | | Municipal | | | Municipal | | | Municipal | | | Municipal | |
| | | Bond Fund | | | Bond Fund | | | Bond Fund | | | Bond Fund | | | Bond Fund | |
| Cost of investments | | $ | 1,800,023,698 | | | $ | 493,728,685 | | | $ | 1,130,702,886 | | | $ | 2,522,370,846 | | | $ | 59,449,382 | |
| Gross unrealized appreciation | | | 2,700,789 | | | | 2,130,820 | | | | 4,989,403 | | | | 10,606,952 | | | | 446,419 | |
| Gross unrealized depreciation | | | (56,252,122 | ) | | | (15,872,202 | ) | | | (38,532,784 | ) | | | (86,974,482 | ) | | | (2,084,287 | ) |
| Net unrealized depreciation | | | (53,551,333 | ) | | | (13,741,382 | ) | | | (33,543,381 | ) | | | (76,367,530 | ) | | | (1,637,868 | ) |
| Undistributed tax-exempt income | | | 343,060 | | | | 142,730 | | | | 229,182 | | | | 616,381 | | | | 17,397 | |
| Distributable earnings | | | 343,060 | | | | 142,730 | | | | 229,182 | | | | 616,381 | | | | 17,397 | |
| Other accumulated losses | | | (47,181,634 | ) | | | (13,303,210 | ) | | | (40,841,861 | ) | | | (39,477,224 | ) | | | (1,980,691 | ) |
| Total accumulated deficit | | $ | (100,389,907 | ) | | $ | (26,901,862 | ) | | $ | (74,156,060 | ) | | $ | (115,228,373 | ) | | $ | (3,601,162 | ) |
The difference between book-basis and tax-basis unrealized appreciation is attributable primarily to the tax deferral of losses on wash sales.
Additionally, GAAP requires that certain components of net assets relating to permanent differences be reclassified between financial and tax reporting. These reclassifications have no effect on net assets or NAV per share. There were no reclassifications made for the year ended December 31, 2022.
Distributions to Shareholders
Each Fund generally pays dividends from net investment income monthly and distributes net realized capital gains annually. Income and capital gain distributions are determined in accordance with income tax regulations, which may differ from GAAP. Certain Funds also utilize earnings and profits distributed to shareholders on redemptions of shares as part of the dividends paid deduction. Distributions to shareholders are recorded on the ex-dividend date.
Notes to the Financial Statements
June 30, 2023 (Unaudited)
| 4. | Investment Transactions and Income Tax Information (cont.) |
The tax components of distributions paid during the periods shown below were as follows:
| | | Six Months Ended June 30, 2023 | |
| | | Ordinary | | | Tax-Exempt | | | | |
Fund | | Income | | | Income | | | Total | |
| Baird Ultra Short Bond Fund | | $ | 109,497,955 | | | $ | — | | | $ | 109,497,955 | |
| Baird Short-Term Bond Fund | | | 141,148,871 | | | | — | | | | 141,148,871 | |
| Baird Intermediate Bond Fund | | | 105,359,924 | | | | — | | | | 105,359,924 | |
| Baird Aggregate Bond Fund | | | 587,758,831 | | | | — | | | | 587,758,831 | |
| Baird Core Plus Bond Fund | | | 388,173,787 | | | | — | | | | 388,173,787 | |
| Baird Short-Term Municipal Bond Fund | | | — | | | | 21,067,078 | | | | 21,067,078 | |
| Baird Strategic Municipal Bond Fund | | | — | | | | 8,676,960 | | | | 8,676,960 | |
| Baird Quality Intermediate Municipal Bond Fund | | | — | | | | 13,185,550 | | | | 13,185,550 | |
| Baird Core Intermediate Municipal Bond Fund | | | — | | | | 35,657,598 | | | | 35,657,598 | |
| Baird Municipal Bond Fund | | | — | | | | 1,595,146 | | | | 1,595,146 | |
For the six months ended June 30, 2023, the table above reflects the estimated characterization of the distributions paid based on each Fund’s operating results for the period. The actual characterization of the distributions made during the period is not determined until after the end of the fiscal year.
| | | Year Ended December 31, 2022 | |
| | | Ordinary | | | Long-Term | | | Tax-Exempt | | | | |
Fund | | Income | | | Capital Gains | | | Income | | | Total | |
| Baird Ultra Short Bond Fund | | $ | 88,868,292 | | | $ | — | | | $ | — | | | $ | 88,868,292 | |
| Baird Short-Term Bond Fund | | | 167,037,340 | | | | 4,200,688 | | | | — | | | | 171,238,028 | |
| Baird Intermediate Bond Fund | | | 146,093,663 | | | | — | | | | — | | | | 146,093,663 | |
| Baird Aggregate Bond Fund | | | 917,025,897 | | | | — | | | | — | | | | 917,025,897 | |
| Baird Core Plus Bond Fund | | | 702,114,693 | | | | 4,248,998 | | | | — | | | | 706,363,691 | |
| Baird Short-Term Municipal Bond Fund | | | 341,883 | | | | — | | | | 31,709,683 | | | | 32,051,566 | |
| Baird Strategic Municipal Bond Fund | | | 827,054 | | | | — | | | | 7,799,147 | | | | 8,626,201 | |
| Baird Quality Intermediate Municipal Bond Fund | | | 10,535 | | | | — | | | | 25,740,501 | | | | 25,751,036 | |
| Baird Core Intermediate Municipal Bond Fund | | | 499,131 | | | | — | | | | 39,195,561 | | | | 39,694,692 | |
| Baird Municipal Bond Fund | | | 23,809 | | | | — | | | | 1,281,550 | | | | 1,305,359 | |
The Funds in the table above designated as long-term capital gain dividends, pursuant to Internal Revenue Code Section 852(b)(3), the amount necessary to reduce the earnings and profits of the Funds related to net capital gain to zero for the tax year ended December 31, 2022. To the extent necessary to fully distribute such capital gains, the Funds also designate earnings and profits distributed to shareholders on the redemption of shares.
At December 31, 2022, no Funds deferred, on a tax basis, qualified late year losses.
At December 31, 2022, accumulated net realized capital loss carryovers were:
| | | Capital Loss Carryover | | Year of Expiration |
Fund | | Short-term | | | Long-term | | Short-term | | Long-term |
| Baird Ultra Short Bond Fund | | $ | 20,191,287 | | | $ | 2,281,046 | | Indefinitely | | Indefinitely |
| Baird Short-Term Bond Fund | | | 167,710,572 | | | | 83,620,579 | | Indefinitely | | Indefinitely |
| Baird Intermediate Bond Fund | | | 59,857,275 | | | | 120,500,789 | | Indefinitely | | Indefinitely |
| Baird Aggregate Bond Fund | | | 395,273,909 | | | | 442,969,426 | | Indefinitely | | Indefinitely |
| Baird Core Plus Bond Fund | | | 208,612,464 | | | | 286,416,701 | | Indefinitely | | Indefinitely |
| Baird Short-Term Municipal Bond Fund | | | 25,121,911 | | | | 22,059,723 | | Indefinitely | | Indefinitely |
| Baird Strategic Municipal Bond Fund | | | 8,988,227 | | | | 4,314,983 | | Indefinitely | | Indefinitely |
| Baird Quality Intermediate Municipal Bond Fund | | | 11,352,420 | | | | 29,489,441 | | Indefinitely | | Indefinitely |
| Baird Core Intermediate Municipal Bond Fund | | | 23,842,011 | | | | 15,635,213 | | Indefinitely | | Indefinitely |
| Baird Municipal Bond Fund | | | 1,051,468 | | | | 929,223 | | Indefinitely | | Indefinitely |
During the year ended December 31, 2022, the Funds did not utilize short-term or long-term capital loss carryover.
| 5. | Investment Advisory, Other Agreements and Related Party Transactions |
The Funds have entered into an Investment Advisory Agreement with Baird for the provision of investment advisory services. Pursuant to the Investment Advisory Agreement, the Advisor is entitled to receive a fee, calculated daily and payable monthly, at the annual rate of 0.25% for each Fund as applied to the respective Fund’s average daily net assets. Certain officers and employees of the Advisor are also officers of the Funds.
For the Baird Ultra Short Bond Fund, the Advisor has contractually agreed to waive management fees in an amount equal to an annual rate of 0.15% of average daily net assets for the Fund, at least through April 30, 2024. The agreement may only be terminated prior to the end of this term by or with the consent of the Board.
For the six months ended June 30, 2023, the Advisor waived the following amount pursuant to the fee waiver agreement between the Advisor and the Company on behalf of the Baird Ultra Short Bond Fund:
Fund | Waived Amount |
| Baird Ultra Short Bond Fund | $4,254,327 |
These fees are not subject to recoupment by the Advisor.
Notes to the Financial Statements
June 30, 2023 (Unaudited)
| 5. | Investment Advisory, Other Agreements and Related Party Transactions (cont.) |
The Funds have entered into an Administration Agreement with Baird. Under the Administration Agreement, the Advisor assumes and pays all expenses of the applicable Fund other than the investment advisory fees, fees under the 12b-1 plan, costs related to portfolio securities transactions and other excluded expenses, such as borrowing costs and extraordinary or non-recurring expenses. Pursuant to the Administration Agreement, the Advisor is entitled to receive a fee, calculated daily and payable monthly, at the annual rate of 0.05% for each Fund as applied to the respective Fund’s average daily net assets.
U.S. Bancorp Fund Services, LLC, doing business as U.S. Bank Global Fund Services, serves as transfer agent, administrator, and accounting services agent for the Funds. U.S. Bank, N.A. (“U.S. Bank”) serves as custodian for the Funds.
Robert W. Baird & Co. Incorporated (the “Distributor”) is the sole distributor of the Funds pursuant to a distribution agreement.
No commissions were earned by the Distributor for services rendered as a registered broker-dealer in securities transactions for the six months ended June 30, 2023 for the Funds.
The Funds may use related party broker-dealers. For the six months ended June 30, 2023, there were no brokerage commissions paid to broker-dealers affiliated with the Advisor. The Advisor or its affiliates may have lending, banking, brokerage, underwriting, or other business relationships with the issuers of the securities in which the Funds invest.
The Funds may purchase securities from an underwriting syndicate in which the principal underwriter or members of the syndicate are affiliated with the Advisor. For the six months ended June 30, 2023, the Funds purchased the following amounts of such securities:
Fund | | Purchases | |
| Baird Quality Intermediate Municipal Bond Fund | | $ | 5,250,000 | |
| Baird Municipal Bond Fund | | | 750,000 | |
The Company maintains an uncommitted line of credit (“LOC”) with U.S. Bank to provide the fifteen Funds comprising the Company a temporary liquidity source to meet unanticipated redemptions or other permissible borrowing needs. The LOC is unsecured at all times and is subject to certain restrictions and covenants. Under the terms of the LOC, borrowings for each Fund are limited to one third of the total eligible net assets (including the amount borrowed) of the respective Fund, or $850,000,000 of total borrowings for the Funds comprising the Company, whichever is less. U.S. Bank charges annualized interest at the greater of 1.00% or the Prime Rate minus 2.00%. As of June 30, 2023, the Prime Rate was 8.25%. The LOC matures on May 20, 2024, unless renewed. The Company has authorized U.S. Bank to charge any of the accounts of the borrowing Fund subject to the agreement for any missed payments.
During the six months ended June 30, 2023, the Baird Strategic Municipal Bond Fund incurred broker interest charges of $25 related to its trading of futures contracts.
No other borrowings occurred during the six months ended June 30, 2023, nor were any other borrowings outstanding under the LOC as of June 30, 2023.
| 7. | Distribution and Shareholder Service Plan |
The Funds have adopted a distribution and shareholder service plan (the “Plan”) pursuant to Rule 12b-1 under the 1940 Act. The Plan allows the Funds to compensate the Distributor for the costs incurred in distributing the Funds’ Investor Class shares, including amounts paid to brokers or dealers, at an annual rate of 0.25% of the average daily net assets of the Funds’ Investor Class shares.
For the six months ended June 30, 2023, the Funds’ Investor Class shares incurred fees pursuant to the Plan as follows:
Fund | | | |
| Baird Ultra Short Bond Fund | |
| $ 105,590 | |
| Baird Short-Term Bond Fund | | | 246,033 | |
| Baird Intermediate Bond Fund | | | 79,411 | |
| Baird Aggregate Bond Fund | | | 1,043,776 | |
| Baird Core Plus Bond Fund | | | 1,308,387 | |
| Baird Short-Term Municipal Bond Fund | | | 82,220 | |
| Baird Strategic Municipal Bond Fund | | | 18,936 | |
| Baird Quality Intermediate Municipal Bond Fund | | | 51,032 | |
| Baird Core Intermediate Municipal Bond Fund | | | 52,287 | |
| Baird Municipal Bond Fund | | | 6,415 | |
| 8. | Other Derivatives Information |
As a principal investment strategy, the Baird Strategic Municipal Bond Fund may invest in U.S. Treasury futures contracts for duration and yield curve management or to manage market and interest rate risk. The Fund’s market risk related to its derivatives trading is influenced by a wide variety of factors, including the level and volatility of interest rates, the market value of futures contracts, the diversification effects among the Fund’s open positions and the liquidity of the markets in which it trades.
Management has adopted authoritative standards regarding disclosure about derivatives and hedging activities and how they affect a Fund’s Statement of Assets and Liabilities and Statement of Operations. Since the derivatives may be held for speculative trading purposes, the derivative instruments are not designated as hedging instruments. Accordingly, all realized gains and losses, as well as any change in net unrealized gains or losses on open contracts from the preceding period, are recognized as part of realized and unrealized gain (loss) in the Statement of Operations. These contracts are not subject to a master netting agreement.
Notes to the Financial Statements
June 30, 2023 (Unaudited)
| 8. | Other Derivatives Information (cont.) |
The following table presents the fair value of derivative instruments for the Baird Strategic Municipal Bond Fund as of June 30, 2023 as presented on the Fund’s Statement of Assets and Liabilities:
| |
| | Fair Value | | | Net Unrealized | |
| | | | | | | | | | Loss on Open | |
Derivatives Not Accounted for as Hedging Instruments | | | Assets | | | Liabilities | | | Positions | |
| Baird Strategic Municipal Bond Fund | | | | | | | | | | |
U.S. Treasury futures contracts(a) | | | | | | | | | | |
| Purchase contracts | | | | | | | | | | |
| Interest rate | | | $ | — | | | $ | 101,306 | | | $ | (101,306 | ) |
| Total U.S. Treasury futures contracts | | | $ | — | | | $ | 101,306 | | | $ | (101,306 | ) |
(a) | Reflects the cumulative unrealized depreciation of futures contracts as reported in the Fund’s schedule of open futures contracts. Only the current day variation margin for futures contracts may be separately reported within the Fund’s Statement of Assets and Liabilities. |
The following table presents the results of the derivatives trading and information related to volume for the six months ended June 30, 2023 for the Baird Strategic Municipal Bond Fund. The below captions of “Net Realized” and “Net Change in Unrealized” correspond to the captions in the Fund’s Statement of Operations.
| | | Gain (Loss) from Trading | |
| | | Net | | | Net Change | |
Fund and Type of Derivatives Instrument | | Realized | | | in Unrealized | |
| Baird Strategic Municipal Bond Fund | | | | | | |
| U.S. Treasury futures contracts | | | | | | |
| Interest rate | | $ | 354,259 | | | $ | (101,306 | ) |
| Total U.S. Treasury futures contracts | | $ | 354,259 | | | $ | (101,306 | ) |
The average monthly notional amount is shown as an indicator of volume. The average monthly notional amounts during the six months ended June 30, 2023 were:
| | | Average Notional Amount | |
| | | Long Contracts | | | Short Contracts | |
| Baird Strategic Municipal Bond Fund | | | | | | |
| U.S. Treasury futures contracts | | $ | 2,294,866 | | | $ | 9,019,085 | |
Please refer to the Fund’s prospectus for a full listing of risks associated with these investments.
In preparing these financial statements, management has evaluated events after June 30, 2023. There were no subsequent events since June 30, 2023, through the date the financial statements were issued that would warrant adjustment to or additional disclosure in these financial statements.
Statement Regarding Liquidity Risk Management Program
June 30, 2023 (Unaudited)
In accordance with Rule 22e-4 under the Investment Company Act of 1940 (the “Rule”), Baird Funds, Inc. (the “Company”) has adopted and implemented a liquidity risk management program (the “Program”). The Program seeks to promote effective liquidity risk management for each series of the Company (each a “Fund” and collectively, the “Funds”) and to protect Fund shareholders from dilution of their interests. The Board of Directors (the “Board”) of the Company has appointed Robert W. Baird & Co. Incorporated (“Baird”), the Funds’ investment adviser, as the administrator of the Program. Baird has further delegated administration of the Program to its Liquidity Risk Management Committee (the “Committee”), consisting of certain officers of the Funds, senior portfolio managers of the Funds and officers of the Advisor. The Program requires the Committee to provide an annual written report to the Board regarding the adequacy and effectiveness of the Program, including the operation of each Fund’s highly liquid investment minimum (“HLIM”), if applicable, and any material changes made to the Program during the review period.
On February 27, 2023, the Board reviewed the Committee’s annual written report (the “Report”) for the period January 1, 2022 to December 31, 2022 (the “review period”). The Report provided a summary of the Committee’s assessment of each Fund’s liquidity risk, which is the risk that a Fund could not meet requests to redeem shares issued by the Fund without significant dilution of the remaining investors’ interests in the Fund. The Committee’s assessment considered each Fund’s liquidity risk under both normal and reasonably foreseeable stressed market conditions using certain factors required by the Rule and the Program, to the extent deemed appropriate by the Committee. The Committee concluded that the risk of a Fund experiencing a material liquidity event continues to be low.
The Funds have retained ICE Data Services (“ICE”), a third-party vendor, to provide a liquidity risk classification specified by the Rule (highly liquid, moderately liquid, less liquid or illiquid) for each portfolio investment held by the Funds, except with respect to any investments that are unclassified by ICE or that are classified by ICE but are overridden by Baird, for which classifications are provided by the Committee as permitted by the Program. The Report noted that each Fund primarily held investments that were classified as highly liquid during the review period and that each Fund’s portfolio is expected to continue to primarily hold highly liquid investments. Thus, the Committee concluded in the Report that each Fund is considered a “primarily highly liquid fund” (as defined in the Program) and each Fund can therefore rely on the exclusion in the Rule from the requirements to establish an HLIM and to adopt policies and procedures for responding to an HLIM shortfall. The Report further noted that none of the Funds exceeded the 15% limitation on illiquid investments during the review period and the Company has established procedures to file the Funds’ Forms N-PORT on a timely basis. The Report stated that no material changes had been made to the Program during the review period.
The Committee concluded in the Report that the Program is adequately designed, has been effectively implemented, and is operating as intended to manage the liquidity risk of each Fund.
Additional Information (Unaudited)
Proxy Voting
A description of the policies and procedures that the Funds use to determine how to vote proxies relating to portfolio securities is available without charge, upon request, by calling toll free, 1-866-442-2473, by accessing the Funds’ website at www.bairdfunds.com or by accessing the SEC’s website at www.sec.gov.
Each Fund’s proxy voting record for the most recent 12-month period ended June 30, if applicable, is available without charge, upon request, by calling toll free, 1-866-442-2473, by accessing the Funds’ website at www.bairdfunds.com or by accessing the SEC’s website at www.sec.gov. The Funds generally do not vote proxies because the securities held in their portfolios, consisting of bonds and other fixed-income securities, are not entitled to vote.
Portfolio Holdings Disclosure
The Funds file a complete schedule of portfolio holdings with the SEC for the first and third quarters of each fiscal year on Part F of Form N-PORT. The Funds’ filings on Part F of Form N-PORT are available on the SEC’s website at www.sec.gov. The Funds’ Form N-PORT reports may also be obtained by calling toll-free 1-866-442-2473 or by accessing the Funds’ website at www.bairdfunds.com.
Baird Funds, Inc.
c/o U.S. Bancorp Fund Services, LLC
P.O. Box 701
Milwaukee, WI 53201-0701
1-866-442-2473
Board of Directors
John W. Feldt
Darren R. Jackson
David J. Lubar
Cory L. Nettles
Marlyn J. Spear (Chair)
Frederick P. Stratton, Jr.
Investment Advisor and Distributor
Robert W. Baird & Co. Incorporated
777 East Wisconsin Avenue
Milwaukee, WI 53202
Administrator and Transfer Agent
U.S. Bancorp Fund Services, LLC
P.O. Box 701
615 East Michigan Street
Milwaukee, WI 53202
Custodian
U.S. Bank, N.A.
1555 N. RiverCenter Drive, Suite 302
Milwaukee, WI 53212
Legal Counsel
Godfrey & Kahn, S.C.
833 East Michigan Street, Suite 1800
Milwaukee, WI 53202
Independent Registered Public
Accounting Firm
Cohen & Company, Ltd.
342 North Water Street, Suite 830
Milwaukee, WI 53202
Semi-Annual Report –
Baird Funds
June 30, 2023
Baird Mid Cap Growth Fund
Baird Small/Mid Cap Growth Fund
Baird Equity Opportunity Fund
Baird Chautauqua International Growth Fund
Baird Chautauqua Global Growth Fund
| Go Green. | | Go Paperless. |
Sign up to receive your Baird Funds’ prospectuses and reports online.
Table of Contents
| Baird Mid Cap Growth Fund | | 1 |
| Baird Small/Mid Cap Growth Fund | | 5 |
| Baird Equity Opportunity Fund | | 9 |
| Baird Chautauqua International Growth Fund | | 13 |
| Baird Chautauqua Global Growth Fund | | 17 |
| Additional Information on Fund Expenses | | 21 |
| Statements of Assets and Liabilities | | 22 |
| Statements of Operations | | 24 |
| Statements of Changes in Net Assets | | 26 |
| Financial Highlights | | 29 |
| Notes to the Financial Statements | | 39 |
| Statement Regarding Liquidity Risk Management Program | | 47 |
| Additional Information | | 48 |
This report has been prepared for shareholders and may be distributed to others only if preceded or accompanied by a current prospectus.
Baird Mid Cap Growth Fund
June 30, 2023 (Unaudited)
Portfolio Characteristics
A June 30, 2023 summary of the Fund’s top 10 holdings and equity sector analysis compared to the Russell Midcap® Growth Index is shown below.
Top 10 Holdings(1) | | | Equity Sector Analysis(2) |
| | | | 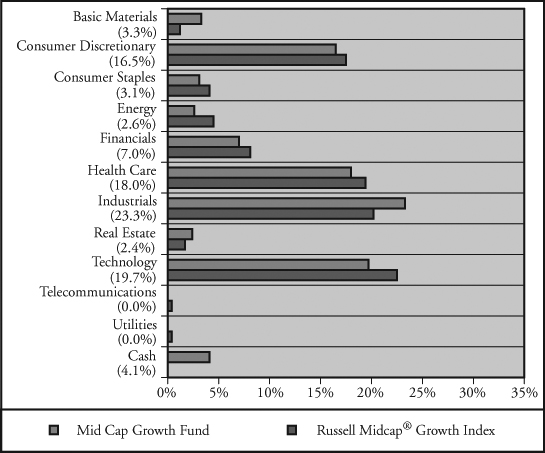
|
| IDEXX Laboratories, Inc. | 2.8% | |
| DexCom, Inc. | 2.6% | |
| Copart, Inc. | 2.6% | |
| Floor & Decor Holdings, Inc. | 2.5% | |
| HEICO Corp. | 2.4% | |
| CoStar Group, Inc. | 2.4% | |
| ICON PLC | 2.4% | |
| Pool Corp. | 2.3% | |
| Insulet Corp. | 2.3% | |
| PTC, Inc. | 2.2% | |
| | | |
| Net Assets: | $2,321,586,311 | |
| Portfolio Turnover Rate: | 26% | (5) |
| Number of Equity Holdings: | 55 | |
| | | |
Annualized Portfolio Expense Ratio(3): | | |
| Institutional Class: | 0.82% | |
| Investor Class: | 1.07% | (4) |
| | | |
| | | |
| | | |
| | | |
| | | |
| | | |
(1) | The Fund’s portfolio composition is subject to change and there is no assurance that the Fund will continue to hold any particular security. Percentages shown relate to the Fund’s total net assets as of June 30, 2023. |
(2) | Percentages shown in parentheses relate to the Fund’s total value of investments as of June 30, 2023, and may not add up to 100% due to rounding. |
(3) | Reflects expense ratios as stated in the Fund’s current prospectus dated May 1, 2023. The Advisor has contractually agreed to limit the Fund’s total annual fund operating expenses to 0.85% of average daily net assets for the Institutional Class shares and 1.10% of average daily net assets for the Investor Class shares, at least through April 30, 2024. |
(4) | Includes 0.25% 12b-1 fee. |
(5) | Not annualized. |
Baird Mid Cap Growth Fund
June 30, 2023 (Unaudited)
Total Returns
| | | | Average Annual |
| | Six | One | Five | Ten | Since |
| For the Periods Ended June 30, 2023 | Months | Year | Years | Years | Inception(1) |
| Institutional Class Shares | 16.56% | 21.68% | 11.82% | 11.67% | 8.48% |
| Investor Class Shares | 16.37% | 21.33% | 11.51% | 11.39% | 8.22% |
Russell Midcap® Growth Index(2) | 15.94% | 23.13% | 9.71% | 11.53% | 7.68% |
(1) | For the period from December 29, 2000 (inception date) through June 30, 2023. |
(2) | The Russell Midcap® Growth Index measures the performance of the mid-capitalization growth segment of the U.S. equity universe. It includes those Russell Midcap® Index companies with higher price-to-book ratios and higher forecasted growth values. This index does not reflect any deduction for fees, expenses or taxes. A direct investment in the index is not possible. |
The returns table shown above reflects reinvestment of dividends and/or capital gains distributions in additional shares. The returns in the table do not reflect the deduction of taxes that a shareholder would pay on Fund distributions or the redemption of Fund shares. The returns reflect the actual performance for each period and do not include the impact of trades executed on the last business day of the period that were recorded on the first business day of the next period.
The expense ratio for each Class, as reflected in the Fund’s current prospectus, is set forth under “Portfolio Characteristics”.
The Fund focuses on growth-style stocks and therefore the performance of the Fund will typically be more volatile than the performance of funds that focus on types of stocks that have a broader investment style. The Fund may invest up to 15% of its total assets in equity securities (consisting of common stock, ordinary shares and ADRs) of foreign companies. Foreign investments involve additional risks such as currency rate fluctuations, political and economic instability, and different and sometimes less strict financial reporting standards and regulation. The Fund invests a substantial portion of its assets in the stocks of mid-capitalization companies. Mid-capitalization companies often are more volatile and face greater risks than larger, more established companies. U.S. and international markets have experienced significant periods of volatility in recent years and months due to a number of economic, political and global macro factors. Russia’s ongoing war with Ukraine has heightened global geopolitical tensions, resulting in an elevated risk environment and increased volatility in asset prices. The uncertain course of the war may have a significant negative impact on the global economy. U.S. relations with China have become increasingly strained, and tension between the U.S. and China may have a significant negative impact on the global economy and asset prices. Measures of inflation reached levels not experienced in several decades, leading the Federal Reserve to raise short term interest rates significantly over the last year, with the potential for further rate increases in 2023. Uncertainty regarding the ability of the Federal Reserve to successfully control inflation, the potential for incremental rate increases, and the full impact of prior rate increases on the economy may negatively impact asset prices and increase market volatility. The possibility of a U.S. or global recession may also contribute to market volatility. The coronavirus (COVID-19) pandemic caused significant economic disruption in recent years as countries worked to limit the negative health impacts of the virus. While the virus has entered an endemic stage, significant outbreaks or new variants present a continued risk to the global economy. These and other geopolitical events may cause market disruptions and could have an adverse effect on the value of the Fund’s investments.
Past performance does not guarantee future results. Investment return and principal value will fluctuate so that an investor’s shares, when redeemed, may be worth more or less than their original cost.
For information about the performance of the Fund as of the most recent month-end, please call 1-866-442-2473 or visit www.bairdfunds.com. Mutual fund performance changes over time and current performance may be lower or higher than that stated.
Baird Mid Cap Growth Fund
Schedule of Investments, June 30, 2023 (Unaudited)
Common Stocks
| | | | | | | | | % of | |
| | | Shares | | | Value | | | Net Assets | |
| Aerospace & Defense | | | | | | | | | |
| HEICO Corp. | | | 315,379 | | | $ | 55,803,160 | | | | 2.4 | % |
| Air Freight & Logistics | | | | | | | | | | | | |
GXO Logistics, Inc.(1) | | | 588,059 | | | | 36,941,866 | | | | 1.6 | % |
| Automobile Components | | | | | | | | | | | | |
Aptiv PLC(1) | | | 284,618 | | | | 29,056,652 | | | | 1.3 | % |
| Beverages | | | | | | | | | | | | |
Boston Beer Co., Inc.(1) | | | 93,107 | | | | 28,717,923 | | | | 1.2 | % |
| Building Products | | | | | | | | | | | | |
Trex Co., Inc.(1) | | | 619,248 | | | | 40,597,899 | | | | 1.7 | % |
| Capital Markets | | | | | | | | | | | | |
| MarketAxess Holdings, Inc. | | | 85,821 | | | | 22,435,326 | | | | 1.0 | % |
| MSCI, Inc. | | | 93,686 | | | | 43,965,903 | | | | 1.9 | % |
| | | | | | | | 66,401,229 | | | | 2.9 | % |
| Commercial Services & Supplies | | | | | | | | | | | | |
Copart, Inc.(1) | | | 654,063 | | | | 59,657,086 | | | | 2.6 | % |
Consumer Staples Distribution & Retail
| | | | | | | | | | | | |
Dollar Tree, Inc.(1) | | | 251,267 | | | | 36,056,815 | | | | 1.6 | % |
| Distributors | | | | | | | | | | | | |
| Pool Corp. | | | 141,235 | | | | 52,912,280 | | | | 2.3 | % |
| Electrical Equipment | | | | | | | | | | | | |
Generac Holdings, Inc.(1) | | | 191,934 | | | | 28,623,117 | | | | 1.2 | % |
| Electronic Equipment, | | | | | | | | | | | | |
| Instruments, & Components | | | | | | | | | | | | |
| CDW Corp. | | | 254,197 | | | | 46,645,149 | | | | 2.0 | % |
| Financial Services | | | | | | | | | | | | |
Euronet Worldwide, Inc.(1) | | | 340,944 | | | | 40,016,597 | | | | 1.7 | % |
| Jack Henry & Associates, Inc. | | | 219,981 | | | | 36,809,421 | | | | 1.6 | % |
| | | | | | | | 76,826,018 | | | | 3.3 | % |
| Food Products | | | | | | | | | | | | |
| Lamb Weston Holdings, Inc. | | | 366,325 | | | | 42,109,059 | | | | 1.8 | % |
| Ground Transportation | | | | | | | | | | | | |
| J.B. Hunt Transport Services, Inc. | | | 197,095 | | | | 35,680,108 | | | | 1.5 | % |
| Health Care Equipment & Supplies | | | | | | | | | | | | |
Align Technology, Inc.(1) | | | 136,106 | | | | 48,132,526 | | | | 2.1 | % |
DexCom, Inc.(1) | | | 477,360 | | | | 61,345,534 | | | | 2.6 | % |
IDEXX Laboratories, Inc.(1) | | | 129,880 | | | | 65,229,632 | | | | 2.8 | % |
Insulet Corp.(1) | | | 181,755 | | | | 52,407,237 | | | | 2.3 | % |
| ResMed, Inc. | | | 197,330 | | | | 43,116,605 | | | | 1.9 | % |
| | | | | | | | 270,231,534 | | | | 11.7 | % |
| Health Care Technology | | | | | | | | | | | | |
Doximity, Inc.(1) | | | 918,738 | | | | 31,255,467 | | | | 1.3 | % |
Veeva Systems, Inc.(1) | | | 167,662 | | | | 33,151,807 | | | | 1.4 | % |
| | | | | | | | 64,407,274 | | | | 2.7 | % |
| Hotels, Restaurants & Leisure | | | | | | | | | | | | |
| Churchill Downs, Inc. | | | 166,481 | | | | 23,169,161 | | | | 1.0 | % |
| Household Durables | | | | | | | | | | | | |
| DR Horton, Inc. | | | 264,543 | | | | 32,192,238 | | | | 1.4 | % |
| Insurance | | | | | | | | | | | | |
| Kinsale Capital Group, Inc. | | | 122,151 | | | | 45,708,904 | | | | 2.0 | % |
| Interactive Media & Services | | | | | | | | | | | | |
ZoomInfo Technologies, Inc.(1) | | | 951,325 | | | | 24,154,142 | | | | 1.0 | % |
| IT Services | | | | | | | | | | | | |
EPAM Systems, Inc.(1) | | | 128,705 | | | | 28,926,449 | | | | 1.2 | % |
Globant SA(1) | | | 277,134 | | | | 49,806,522 | | | | 2.1 | % |
| | | | | | | | 78,732,971 | | | | 3.3 | % |
| Life Sciences Tools & Services | | | | | | | | | | | | |
ICON PLC(1) | | | 219,822 | | | | 54,999,464 | | | | 2.4 | % |
Repligen Corp.(1) | | | 199,837 | | | | 28,268,942 | | | | 1.2 | % |
| | | | | | | | 83,268,406 | | | | 3.6 | % |
| Machinery | | | | | | | | | | | | |
| Graco, Inc. | | | 494,944 | | | | 42,738,414 | | | | 1.8 | % |
| IDEX Corp. | | | 203,756 | | | | 43,860,517 | | | | 1.9 | % |
| Ingersoll Rand, Inc. | | | 616,512 | | | | 40,295,224 | | | | 1.7 | % |
RBC Bearings, Inc.(1) | | | 168,223 | | | | 36,583,456 | | | | 1.6 | % |
| Toro Co. | | | 226,146 | | | | 22,987,741 | | | | 1.0 | % |
| | | | | | | | 186,465,352 | | | | 8.0 | % |
| Oil, Gas, & Consumable Fuels | | | | | | | | | | | | |
| Diamondback Energy, Inc. | | | 262,037 | | | | 34,421,180 | | | | 1.5 | % |
| Professional Services | | | | | | | | | | | | |
| Broadridge Financial Solutions, Inc. | | | 310,937 | | | | 51,500,495 | | | | 2.2 | % |
CoStar Group, Inc.(1) | | | 619,476 | | | | 55,133,364 | | | | 2.4 | % |
| Equifax, Inc. | | | 150,411 | | | | 35,391,708 | | | | 1.5 | % |
| Paycom Software, Inc. | | | 137,724 | | | | 44,242,458 | | | | 1.9 | % |
| | | | | | | | 186,268,025 | | | | 8.0 | % |
| Semiconductors & | | | | | | | | | | | | |
| Semiconductor Equipment | | | | | | | | | | | | |
Lattice Semiconductor Corp.(1) | | | 494,544 | | | | 47,510,842 | | | | 2.0 | % |
| Monolithic Power Systems, Inc. | | | 71,635 | | | | 38,699,376 | | | | 1.7 | % |
SolarEdge Technologies, Inc.(1) | | | 96,964 | | | | 26,088,164 | | | | 1.1 | % |
| | | | | | | | 112,298,382 | | | | 4.8 | % |
| Software | | | | | | | | | | | | |
ANSYS, Inc.(1) | | | 130,183 | | | | 42,995,539 | | | | 1.9 | % |
| Bentley Systems, Inc. | | | 447,311 | | | | 24,257,676 | | | | 1.0 | % |
Descartes Systems Group, Inc.(1)(2) | | | 161,182 | | | | 12,912,290 | | | | 0.6 | % |
PTC, Inc.(1) | | | 363,336 | | | | 51,702,713 | | | | 2.2 | % |
Tyler Technologies, Inc.(1) | | | 110,457 | | | | 46,002,027 | | | | 2.0 | % |
| | | | | | | | 177,870,245 | | | | 7.7 | % |
| Specialty Retail | | | | | | | | | | | | |
Five Below, Inc.(1) | | | 217,637 | | | | 42,774,376 | | | | 1.8 | % |
Floor & Decor Holdings, Inc.(1) | | | 553,999 | | | | 57,593,736 | | | | 2.5 | % |
| Tractor Supply Co. | | | 227,898 | | | | 50,388,248 | | | | 2.2 | % |
| | | | | | | | 150,756,360 | | | | 6.5 | % |
| Trading Companies & Distributors | | | | | | | | | | | | |
| Fastenal Co. | | | 697,117 | | | | 41,122,932 | | | | 1.8 | % |
| Ferguson PLC | | | 193,295 | | | | 30,407,237 | | | | 1.3 | % |
| Watsco, Inc. | | | 133,141 | | | | 50,789,297 | | | | 2.2 | % |
| | | | | | | | 122,319,466 | | | | 5.3 | % |
| Total Common Stocks | | | | | | | | | | | | |
| (Cost $1,611,948,296) | | | | | | | 2,228,292,001 | | | | 95.9 | % |
The accompanying notes are an integral part of these financial statements.
Baird Mid Cap Growth Fund
Schedule of Investments, June 30, 2023 (Unaudited)
Short-Term Investment
| | | | | | | | | % of | |
| | | Shares | | | Value | | | Net Assets | |
| Money Market Mutual Fund | | | | | | | | | |
| First American Government Obligations | | | | | | | | | |
Fund, Class U, 5.03%(3) | | | 96,540,527 | | | $ | 96,540,527 | | | | 4.2 | % |
| Total Short-Term Investment | | | | | | | | | | | | |
| (Cost $96,540,527) | | | | | | | 96,540,527 | | | | 4.2 | % |
| Total Investments | | | | | | | | | | | | |
| (Cost $1,708,488,823) | | | | | | | 2,324,832,528 | | | | 100.1 | % |
| Liabilities in Excess of Other Assets | | | | | | | (3,246,217 | ) | | | (0.1 | )% |
| TOTAL NET ASSETS | | | | | | $ | 2,321,586,311 | | | | 100.0 | % |
Notes to Schedule of Investments
(1) | Non-Income Producing. |
(2) | Foreign Security. |
(3) | Seven-Day Yield. |
Industry classifications shown in the Schedule of Investments are based off of the Global Industry Classification Standard (GICS®). GICS® was developed by and/or is the exclusive property of MSCI, Inc. (“MSCI”) and Standard & Poor’s Financial Services LLC (“S&P”). GICS® is a service mark of MSCI and S&P and has been licensed for use by U.S. Bancorp Fund Services, LLC.
Summary of Fair Value Exposure at June 30, 2023 (Unaudited)
The Fund has adopted authoritative fair valuation accounting standards which establish a definition of fair value and set out a hierarchy for measuring fair value. These standards require additional disclosures about the various inputs and valuation techniques used to develop the measurements of fair value and a discussion on changes in valuation techniques and related inputs during the period. These standards define fair value as the price that would be received to sell an asset or paid to transfer a liability in an orderly transaction between market participants at the measurement date.
The fair value hierarchy is organized into three levels based upon the assumptions (referred to as “inputs”) used in pricing the asset or liability. These standards state that “observable inputs” reflect the assumptions market participants would use in pricing the asset or liability based on market data obtained from independent sources and “unobservable inputs” reflect an entity’s own assumptions about the assumptions market participants would use in pricing the asset or liability. These inputs are summarized into three broad levels and described below:
Level 1 – Quoted prices (unadjusted) in active markets for identical assets or liabilities that the reporting entity can access at the measurement date.
Level 2 – Inputs other than quoted prices included within Level 1 that are observable for the asset or liability, either directly or indirectly.
Level 3 – Unobservable inputs for the asset or liability.
The inputs or methodology used for valuing securities are not necessarily an indication of the risk associated with investing in those securities.
The following is a summary of the inputs used to value the Fund’s investments as of June 30, 2023:
| | | Level 1 | | | Level 2 | | | Level 3 | | | Total | |
| Equity | | | | | | | | | | | | |
| Common Stocks | | $ | 2,228,292,001 | | | $ | — | | | $ | — | | | $ | 2,228,292,001 | |
| Total Equity | | | 2,228,292,001 | | | | — | | | | — | | | | 2,228,292,001 | |
| Short-Term Investment | | | | | | | | | | | | | | | | |
| Money Market Mutual Fund | | | 96,540,527 | | | | — | | | | — | | | | 96,540,527 | |
| Total Short-Term Investment | | | 96,540,527 | | | | — | | | | — | | | | 96,540,527 | |
| Total Investments* | | $ | 2,324,832,528 | | | $ | — | | | $ | — | | | $ | 2,324,832,528 | |
| * | Additional information regarding the industry classifications of these investments is disclosed in the Schedule of Investments. |
Changes in valuation techniques may result in transfers into or out of assigned levels within the fair value hierarchy. There were no transfers into or out of Level 3 during the reporting period, as compared to the security classifications from the prior year’s annual report. See the Fund’s Valuation Policy in Note 2a to the financial statements.
The accompanying notes are an integral part of these financial statements.
Baird Small/Mid Cap Growth Fund
June 30, 2023 (Unaudited)
Portfolio Characteristics
A June 30, 2023 summary of the Fund’s top 10 holdings and equity sector analysis compared to the Russell 2500® Growth Index is shown below.
Top 10 Holdings(1) | | | Equity Sector Analysis(2) |
| | | | 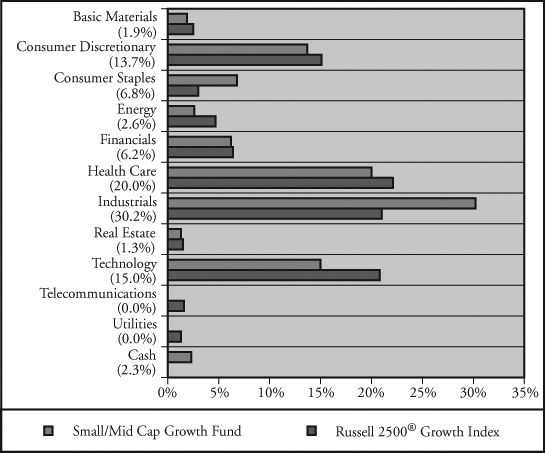
|
| Pool Corp. | 3.1% | |
| PTC, Inc. | 3.1% | |
| Watsco, Inc. | 3.0% | |
| Five Below, Inc. | 2.5% | |
| ICON PLC | 2.4% | |
| Inspire Medical Systems, Inc. | 2.4% | |
| Lamb Weston Holdings, Inc. | 2.3% | |
| Deckers Outdoor Corp. | 2.3% | |
| BWX Technologies, Inc. | 2.2% | |
| Vita Coco Co., Inc. | 2.2% | |
| | | |
| Net Assets: | $177,365,939 | |
| Portfolio Turnover Rate: | 26% | (5) |
| Number of Equity Holdings: | 58 | |
| | | |
Annualized Portfolio Expense Ratio(3): | | |
Gross | | |
| Institutional Class: | 0.98% | |
| Investor Class: | 1.23% | (4) |
| | | |
Net | | |
| Institutional Class: | 0.85% | |
| Investor Class: | 1.10% | (4) |
| | | |
(1) | The Fund’s portfolio composition is subject to change and there is no assurance that the Fund will continue to hold any particular security. Percentages shown relate to the Fund’s total net assets as of June 30, 2023. |
(2) | Percentages shown in parentheses relate to the Fund’s total value of investments as of June 30, 2023, and may not add up to 100% due to rounding. |
(3) | Reflects expense ratios as stated in the Fund’s current prospectus dated May 1, 2023. The Advisor has contractually agreed to limit the Fund’s total annual fund operating expenses to 0.85% of average daily net assets for the Institutional Class shares and 1.10% of average daily net assets for the Investor Class shares, at least through April 30, 2024. |
(4) | Includes 0.25% 12b-1 fee. |
(5) | Not annualized. |
Baird Small/Mid Cap Growth Fund
June 30, 2023 (Unaudited)
Total Returns
| | | | Average Annual |
| | Six | One | Three | Since |
| For the Periods Ended June 30, 2023 | Months | Year | Years | Inception(1) |
| Institutional Class Shares | 12.89% | 15.01% | 9.00% | 12.42% |
| Investor Class Shares | 12.78% | 14.76% | 8.67% | 12.09% |
Russell 2500® Growth Index(2) | 13.38% | 18.58% | 6.56% | 8.89% |
(1) | For the period from October 31, 2018 (inception date) through June 30, 2023. |
(2) | The Russell 2500® Growth Index measures the performance of the small- to mid-capitalization growth segment of the U.S. equity universe. It includes those Russell 2500® Index companies with higher price-to-book ratios and higher forecasted growth values. This index does not reflect any deduction for fees, expenses or taxes. A direct investment in the index is not possible. |
The returns table shown above reflects reinvestment of dividends and/or capital gains distributions in additional shares. The returns in the table do not reflect the deduction of taxes that a shareholder would pay on Fund distributions or the redemption of Fund shares. The returns reflect the actual performance for each period and do not include the impact of trades executed on the last business day of the period that were recorded on the first business day of the next period.
The gross and net expense ratio for each Class, as reflected in the Fund’s current prospectus, is set forth under “Portfolio Characteristics”.
The Fund focuses on growth-style stocks and therefore the performance of the Fund will typically be more volatile than the performance of funds that focus on types of stocks that have a broader investment style. The Fund may invest up to 15% of its total assets in equity securities (consisting of common stock, ordinary shares and ADRs) of foreign companies. Foreign investments involve additional risks such as currency rate fluctuations, political and economic instability, and different and sometimes less strict financial reporting standards and regulation. The Fund invests a substantial portion of its assets in the stocks of small- and mid-capitalization companies. Small- and mid-capitalization companies often are more volatile and face greater risks than larger, more established companies. U.S. and international markets have experienced significant periods of volatility in recent years and months due to a number of economic, political and global macro factors. Russia’s ongoing war with Ukraine has heightened global geopolitical tensions, resulting in an elevated risk environment and increased volatility in asset prices. The uncertain course of the war may have a significant negative impact on the global economy. U.S. relations with China have become increasingly strained, and tension between the U.S. and China may have a significant negative impact on the global economy and asset prices. Measures of inflation reached levels not experienced in several decades, leading the Federal Reserve to raise short term interest rates significantly over the last year, with the potential for further rate increases in 2023. Uncertainty regarding the ability of the Federal Reserve to successfully control inflation, the potential for incremental rate increases, and the full impact of prior rate increases on the economy may negatively impact asset prices and increase market volatility. The possibility of a U.S. or global recession may also contribute to market volatility. The coronavirus (COVID-19) pandemic caused significant economic disruption in recent years as countries worked to limit the negative health impacts of the virus. While the virus has entered an endemic stage, significant outbreaks or new variants present a continued risk to the global economy. These and other geopolitical events may cause market disruptions and could have an adverse effect on the value of the Fund’s investments.
Past performance does not guarantee future results. Investment return and principal value will fluctuate so that an investor’s shares, when redeemed, may be worth more or less than their original cost.
For information about the performance of the Fund as of the most recent month-end, please call 1-866-442-2473 or visit www.bairdfunds.com. Mutual fund performance changes over time and current performance may be lower or higher than that stated.
Baird Small/Mid Cap Growth Fund
Schedule of Investments, June 30, 2023 (Unaudited)
Common Stocks
| | | | | | | | | % of | |
| | | Shares | | | Value | | | Net Assets | |
| Aerospace & Defense | | | | | | | | | |
| BWX Technologies, Inc. | | | 55,285 | | | $ | 3,956,748 | | | | 2.2 | % |
| HEICO Corp. | | | 20,180 | | | | 3,570,649 | | | | 2.0 | % |
| | | | | | | | 7,527,397 | | | | 4.2 | % |
| Air Freight & Logistics | | | | | | | | | | | | |
GXO Logistics, Inc.(1) | | | 39,842 | | | | 2,502,874 | | | | 1.4 | % |
| Beverages | | | | | | | | | | | | |
Boston Beer Co., Inc.(1) | | | 6,918 | | | | 2,133,788 | | | | 1.2 | % |
Vita Coco Co., Inc.(1) | | | 147,106 | | | | 3,952,738 | | | | 2.2 | % |
| | | | | | | | 6,086,526 | | | | 3.4 | % |
| Biotechnology | | | | | | | | | | | | |
Exact Sciences Corp.(1) | | | 31,620 | | | | 2,969,118 | | | | 1.7 | % |
Halozyme Therapeutics, Inc.(1) | | | 72,766 | | | | 2,624,670 | | | | 1.5 | % |
| | | | | | | | 5,593,788 | | | | 3.2 | % |
| Building Products | | | | | | | | | | | | |
Trex Co., Inc.(1) | | | 45,278 | | | | 2,968,426 | | | | 1.7 | % |
| Capital Markets | | | | | | | | | | | | |
Focus Financial Partners, Inc.(1) | | | 69,121 | | | | 3,629,543 | | | | 2.1 | % |
| MarketAxess Holdings, Inc. | | | 6,375 | | | | 1,666,553 | | | | 0.9 | % |
| | | | | | | | 5,296,096 | | | | 3.0 | % |
| Construction & Engineering | | | | | | | | | | | | |
MasTec, Inc.(1) | | | 26,376 | | | | 3,111,577 | | | | 1.8 | % |
WillScot Mobile Mini Holdings Corp.(1) | | | 56,971 | | | | 2,722,644 | | | | 1.5 | % |
| | | | | | | | 5,834,221 | | | | 3.3 | % |
| Distributors | | | | | | | | | | | | |
| Pool Corp. | | | 14,720 | | | | 5,514,701 | | | | 3.1 | % |
| Electronic Equipment, | | | | | | | | | | | | |
| Instruments, & Components | | | | | | | | | | | | |
| Littelfuse, Inc. | | | 12,360 | | | | 3,600,592 | | | | 2.0 | % |
| Energy Equipment & Services | | | | | | | | | | | | |
| ChampionX Corp. | | | 58,898 | | | | 1,828,194 | | | | 1.0 | % |
| Financial Services | | | | | | | | | | | | |
| Jack Henry & Associates, Inc. | | | 14,862 | | | | 2,486,858 | | | | 1.4 | % |
Shift4 Payments, Inc.(1) | | | 48,243 | | | | 3,276,182 | | | | 1.8 | % |
| | | | | | | | 5,763,040 | | | | 3.2 | % |
| Food Products | | | | | | | | | | | | |
| Lamb Weston Holdings, Inc. | | | 36,012 | | | | 4,139,579 | | | | 2.3 | % |
Simply Good Foods Co.(1) | | | 47,718 | | | | 1,746,002 | | | | 1.0 | % |
| | | | | | | | 5,885,581 | | | | 3.3 | % |
| Ground Transportation | | | | | | | | | | | | |
| Knight-Swift Transportation Holdings, Inc. | | | 39,564 | | | | 2,198,176 | | | | 1.2 | % |
| Health Care Equipment & Supplies | | | | | | | | | | | | |
| CONMED Corp. | | | 28,013 | | | | 3,806,687 | | | | 2.1 | % |
Inspire Medical Systems, Inc.(1) | | | 12,929 | | | | 4,197,270 | | | | 2.4 | % |
Insulet Corp.(1) | | | 11,526 | | | | 3,323,407 | | | | 1.9 | % |
iRhythm Technologies, Inc.(1) | | | 17,654 | | | | 1,841,665 | | | | 1.0 | % |
QuidelOrtho Corp.(1) | | | 15,047 | | | | 1,246,794 | | | | 0.7 | % |
Shockwave Medical, Inc.(1) | | | 10,674 | | | | 3,046,466 | | | | 1.7 | % |
| | | | | | | | 17,462,289 | | | | 9.8 | % |
| Health Care Technology | | | | | | | | | | | | |
Doximity, Inc.(1) | | | 64,235 | | | | 2,185,275 | | | | 1.2 | % |
| Hotels, Restaurants & Leisure | | | | | | | | | | | | |
| Churchill Downs, Inc. | | | 12,910 | | | | 1,796,685 | | | | 1.0 | % |
| Household Durables | | | | | | | | | | | | |
LGI Homes, Inc.(1) | | | 19,421 | | | | 2,619,699 | | | | 1.5 | % |
| Insurance | | | | | | | | | | | | |
| Kinsale Capital Group, Inc. | | | 10,309 | | | | 3,857,628 | | | | 2.2 | % |
| Interactive Media & Services | | | | | | | | | | | | |
ZoomInfo Technologies, Inc.(1) | | | 71,524 | | | | 1,815,994 | | | | 1.0 | % |
| IT Services | | | | | | | | | | | | |
DigitalOcean Holdings, Inc.(1) | | | 46,359 | | | | 1,860,850 | | | | 1.1 | % |
Globant SA(1) | | | 11,298 | | | | 2,030,477 | | | | 1.1 | % |
| | | | | | | | 3,891,327 | | | | 2.2 | % |
| Life Sciences Tools & Services | | | | | | | | | | | | |
| Bio-Techne Corp. | | | 34,561 | | | | 2,821,214 | | | | 1.6 | % |
ICON PLC(1) | | | 16,931 | | | | 4,236,137 | | | | 2.4 | % |
Repligen Corp.(1) | | | 11,452 | | | | 1,620,000 | | | | 0.9 | % |
| | | | | | | | 8,677,351 | | | | 4.9 | % |
| Machinery | | | | | | | | | | | | |
Chart Industries, Inc.(1) | | | 11,736 | | | | 1,875,295 | | | | 1.1 | % |
| IDEX Corp. | | | 18,018 | | | | 3,878,555 | | | | 2.2 | % |
| Kadant, Inc. | | | 17,030 | | | | 3,782,363 | | | | 2.1 | % |
RBC Bearings, Inc.(1) | | | 15,233 | | | | 3,312,721 | | | | 1.9 | % |
| Toro Co. | | | 29,495 | | | | 2,998,167 | | | | 1.7 | % |
| | | | | | | | 15,847,101 | | | | 9.0 | % |
| Oil, Gas & Consumable Fuels | | | | | | | | | | | | |
| Matador Resources Co. | | | 52,876 | | | | 2,766,472 | | | | 1.6 | % |
| Pharmaceuticals | | | | | | | | | | | | |
Revance Therapeutics, Inc.(1) | | | 59,207 | | | | 1,498,529 | | | | 0.8 | % |
| Professional Services | | | | | | | | | | | | |
Paylocity Holding Corp.(1) | | | 11,360 | | | | 2,096,261 | | | | 1.2 | % |
WNS Holdings Ltd. – ADR(1)(2) | | | 42,405 | | | | 3,126,096 | | | | 1.8 | % |
| | | | | | | | 5,222,357 | | | | 3.0 | % |
| Semiconductors & | | | | | | | | | | | | |
| Semiconductor Equipment | | | | | | | | | | | | |
Lattice Semiconductor Corp.(1) | | | 41,108 | | | | 3,949,245 | | | | 2.2 | % |
SiTime Corp.(1) | | | 17,049 | | | | 2,011,271 | | | | 1.2 | % |
| | | | | | | | 5,960,516 | | | | 3.4 | % |
| Software | | | | | | | | | | | | |
Clearwater Analytics Holdings, Inc.(1) | | | 109,883 | | | | 1,743,843 | | | | 1.0 | % |
Descartes Systems Group, Inc.(1)(2) | | | 46,544 | | | | 3,728,640 | | | | 2.1 | % |
PTC, Inc.(1) | | | 38,489 | | | | 5,476,985 | | | | 3.1 | % |
Sprout Social, Inc.(1) | | | 45,173 | | | | 2,085,186 | | | | 1.2 | % |
Tyler Technologies, Inc.(1) | | | 8,475 | | | | 3,529,583 | | | | 2.0 | % |
| | | | | | | | 16,564,237 | | | | 9.4 | % |
| Specialized REITs | | | | | | | | | | | | |
| National Storage Affiliates Trust | | | 64,705 | | | | 2,253,675 | | | | 1.3 | % |
| Specialty Retail | | | | | | | | | | | | |
Boot Barn Holdings, Inc.(1) | | | 21,953 | | | | 1,859,200 | | | | 1.0 | % |
Five Below, Inc.(1) | | | 22,911 | | | | 4,502,927 | | | | 2.5 | % |
Floor & Decor Holdings, Inc.(1) | | | 36,123 | | | | 3,755,347 | | | | 2.1 | % |
| | | | | | | | 10,117,474 | | | | 5.6 | % |
| Textiles, Apparel, & Luxury Goods | | | | | | | | | | | | |
Deckers Outdoor Corp.(1) | | | 7,721 | | | | 4,074,063 | | | | 2.3 | % |
| Trading Companies & Distributors | | | | | | | | | | | | |
| Watsco, Inc. | | | 13,818 | | | | 5,271,152 | | | | 3.0 | % |
| Total Common Stocks | | | | | | | | | | | | |
| (Cost $147,567,058) | | | | | | | 172,481,436 | | | | 97.2 | % |
The accompanying notes are an integral part of these financial statements.
Baird Small/Mid Cap Growth Fund
Schedule of Investments, June 30, 2023 (Unaudited)
Short-Term Investment
| | | | | | | | | % of | |
| | | Shares | | | Value | | | Net Assets | |
| Money Market Mutual Fund | | | | | | | | | |
| First American Government Obligations | | | | | | | | | |
Fund, Class U, 5.03%(3) | | | 6,545,884 | | | $ | 6,545,884 | | | | 3.7 | % |
| Total Short-Term Investment | | | | | | | | | | | | |
| (Cost $6,545,884) | | | | | | | 6,545,884 | | | | 3.7 | % |
| Total Investments | | | | | | | | | | | | |
| (Cost $154,112,942) | | | | | | | 179,027,320 | | | | 100.9 | % |
| Liabilities in Excess of Other Assets | | | | | | | (1,661,381 | ) | | | (0.9 | )% |
| TOTAL NET ASSETS | | | | | | $ | 177,365,939 | | | | 100.0 | % |
Notes to Schedule of Investments
(1) | Non-Income Producing. |
(2) | Foreign Security. |
(3) | Seven-Day Yield. |
ADR – American Depositary Receipt
Industry classifications shown in the Schedule of Investments are based off of the Global Industry Classification Standard (GICS®). GICS® was developed by and/or is the exclusive property of MSCI, Inc. (“MSCI”) and Standard & Poor’s Financial Services LLC (“S&P”). GICS® is a service mark of MSCI and S&P and has been licensed for use by U.S. Bancorp Fund Services, LLC.
Summary of Fair Value Exposure at June 30, 2023 (Unaudited)
The Fund has adopted authoritative fair valuation accounting standards which establish a definition of fair value and set out a hierarchy for measuring fair value. These standards require additional disclosures about the various inputs and valuation techniques used to develop the measurements of fair value and a discussion on changes in valuation techniques and related inputs during the period. These standards define fair value as the price that would be received to sell an asset or paid to transfer a liability in an orderly transaction between market participants at the measurement date.
The fair value hierarchy is organized into three levels based upon the assumptions (referred to as “inputs”) used in pricing the asset or liability. These standards state that “observable inputs” reflect the assumptions market participants would use in pricing the asset or liability based on market data obtained from independent sources and “unobservable inputs” reflect an entity’s own assumptions about the assumptions market participants would use in pricing the asset or liability. These inputs are summarized into three broad levels and described below:
Level 1 – Quoted prices (unadjusted) in active markets for identical assets or liabilities that the reporting entity can access at the measurement date.
Level 2 – Inputs other than quoted prices included within Level 1 that are observable for the asset or liability, either directly or indirectly.
Level 3 – Unobservable inputs for the asset or liability.
The inputs or methodology used for valuing securities are not necessarily an indication of the risk associated with investing in those securities.
The following is a summary of the inputs used to value the Fund’s investments as of June 30, 2023:
| | | Level 1 | | | Level 2 | | | Level 3 | | | Total | |
| Equity | | | | | | | | | | | | |
| Common Stocks | | $ | 172,481,436 | | | $ | — | | | $ | — | | | $ | 172,481,436 | |
| Total Equity | | | 172,481,436 | | | | — | | | | — | | | | 172,481,436 | |
| Short-Term Investment | | | | | | | | | | | | | | | | |
| Money Market Mutual Fund | | | 6,545,884 | | | | — | | | | — | | | | 6,545,884 | |
| Total Short-Term Investment | | | 6,545,884 | | | | — | | | | — | | | | 6,545,884 | |
| Total Investments* | | $ | 179,027,320 | | | $ | — | | | $ | — | | | $ | 179,027,320 | |
| * | Additional information regarding the industry classifications of these investments is disclosed in the Schedule of Investments. |
Changes in valuation techniques may result in transfers into or out of assigned levels within the fair value hierarchy. There were no transfers into or out of Level 3 during the reporting period, as compared to the security classifications from the prior year’s annual report. See the Fund’s Valuation Policy in Note 2a to the financial statements.
The accompanying notes are an integral part of these financial statements.
Baird Equity Opportunity Fund
June 30, 2023 (Unaudited)
Portfolio Characteristics
A June 30, 2023 summary of the Fund’s top 10 holdings and equity sector analysis compared to the Russell 2000® Index is shown below.
Top 10 Holdings(1) | | | Equity Sector Analysis(2) |
| | | | 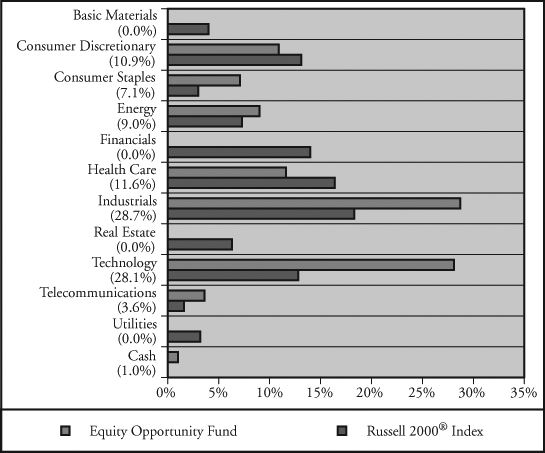
|
| Chefs’ Warehouse Inc. | 7.1% | |
| Blackbaud, Inc. | 6.8% | |
| Global Payments, Inc. | 5.6% | |
| Madison Square Garden Sports Corp. | 5.0% | |
| nVent Electric PLC | 4.6% | |
| NeoGenomics, Inc. | 4.2% | |
| Sportradar Holding AG | 4.1% | |
| Euronet Worldwide, Inc. | 4.0% | |
| NexTier Oilfield Solutions, Inc. | 3.8% | |
| ZoomInfo Technologies, Inc. | 3.7% | |
| | | |
| Net Assets: | $62,233,092 | |
| Portfolio Turnover Rate: | 31% | (5) |
| Number of Equity Holdings: | 31 | |
| | | |
Annualized Portfolio Expense Ratio(3): | | |
Gross | | |
| Institutional Class: | 1.73% | |
| Investor Class: | 1.98% | (4) |
| | | |
Net | | |
| Institutional Class: | 1.25% | |
| Investor Class: | 1.50% | (4) |
| | | |
(1) | The Fund’s portfolio composition is subject to change and there is no assurance that the Fund will continue to hold any particular security. Percentages shown relate to the Fund’s total net assets as of June 30, 2023. |
(2) | Percentages shown in parentheses relate to the Fund’s total value of investments as of June 30, 2023, and may not add up to 100% due to rounding. |
(3) | Reflects expense ratios as stated in the Fund’s current prospectus dated May 1, 2023. The Advisor has contractually agreed to limit the Fund’s total annual fund operating expenses to 1.25% of average daily net assets for the Institutional Class shares and 1.50% of average daily net assets for the Investor Class shares, at least through April 30, 2025. |
(4) | Includes 0.25% 12b-1 fee. |
(5) | Not annualized. |
Baird Equity Opportunity Fund
June 30, 2023 (Unaudited)
Total Returns
| | | | Average Annual |
| | Six | One | Five | Ten | Since |
| For the Periods Ended June 30, 2023 | Months | Year | Years | Years | Inception(1) |
| Institutional Class Shares | 9.90% | 17.37% | 3.09% | 6.34% | 7.37% |
| Investor Class Shares | 9.87% | 17.19% | 2.85% | 6.09% | 7.12% |
Russell 2000® Index(2) | 8.09% | 12.31% | 4.21% | 8.26% | 9.27% |
(1) | For the period from May 1, 2012 (inception date) through June 30, 2023. |
(2) | The Russell 2000® Index measures the performance of the small-capitalization segment of the U.S. equity universe. The Russell 2000® Index is a subset of the Russell 3000® Index representing approximately 10% of the total market capitalization of that index. It includes approximately 2,000 of the smallest securities based on a combination of their market capitalization and current index membership. The Russell 2000® is constructed to provide a comprehensive and unbiased small-capitalization barometer and is completely reconstituted annually to ensure larger stocks do not distort the performance and characteristics of the true small-capitalization opportunity set. This index does not reflect any deduction for fees, expenses or taxes. A direct investment in the index is not possible. |
The returns table shown above reflects reinvestment of dividends and/or capital gains distributions in additional shares. The returns in the table do not reflect the deduction of taxes that a shareholder would pay on Fund distributions or the redemption of Fund shares. The returns reflect the actual performance for each period and do not include the impact of trades executed on the last business day of the period that were recorded on the first business day of the next period.
The gross and net expense ratio for each Class, as reflected in the Fund’s current prospectus, is set forth under “Portfolio Characteristics”.
The Fund invests primarily in a select portfolio of equity securities of companies with small- to medium-market capitalizations (those with market capitalizations, at the time of purchase, of less than $20 billion). The Fund may invest up to 15% of its total assets in equity securities of foreign companies. Foreign investments involve additional risks such as currency rate fluctuations and the potential for political and economic instability, and different and sometimes less strict financial reporting standards and regulation. The Fund invests a substantial portion of its assets in the stocks of smaller-capitalization companies. Smaller-capitalization companies often are more volatile and face greater risks than larger, more established companies. U.S. and international markets have experienced significant periods of volatility in recent years and months due to a number of economic, political and global macro factors. Russia’s ongoing war with Ukraine has heightened global geopolitical tensions, resulting in an elevated risk environment and increased volatility in asset prices. The uncertain course of the war may have a significant negative impact on the global economy. U.S. relations with China have become increasingly strained, and tension between the U.S. and China may have a significant negative impact on the global economy and asset prices. Measures of inflation reached levels not experienced in several decades, leading the Federal Reserve to raise short term interest rates significantly over the last year, with the potential for further rate increases in 2023. Uncertainty regarding the ability of the Federal Reserve to successfully control inflation, the potential for incremental rate increases, and the full impact of prior rate increases on the economy may negatively impact asset prices and increase market volatility. The possibility of a U.S. or global recession may also contribute to market volatility. The coronavirus (COVID-19) pandemic caused significant economic disruption in recent years as countries worked to limit the negative health impacts of the virus. While the virus has entered an endemic stage, significant outbreaks or new variants present a continued risk to the global economy. These and other geopolitical events may cause market disruptions and could have an adverse effect on the value of the Fund’s investments.
The Fund is “non-diversified,” meaning that it may invest a greater percentage of its assets in a smaller number of companies than a diversified mutual fund. Given Greenhouse Funds LLLP’s (“Greenhouse”) opportunistic investment strategy, the Fund will generally be overweight in certain sectors and underweight in other sectors, as compared to the sector weightings in the Russell 2000® Index (the Fund’s benchmark index), based on Greenhouse’s judgment of the sectors’ relative attractiveness and its individual securities selection.
The Fund may purchase and sell (or write) call and put options. Options are subject to various types of risks, including market risk, liquidity risk, volatility risk, counterparty risk, legal risk and operations risk. With options purchased by the Fund, the risk is limited to the premium paid for the option if the underlying stock price moves in the opposite direction from desired and the option expires worthless. For options sold or written by the Fund, the primary risk is that the underlying stock price may move directionally away from the exercise price resulting in the option holder exercising the option and requiring the Fund to either deliver the securities (in the case of a call option) or pay for the securities (in the case of a put option) and recognize a significant loss.
Past performance does not guarantee future results. Investment return and principal value will fluctuate so that an investor’s shares, when redeemed, may be worth more or less than their original cost.
For information about the performance of the Fund as of the most recent month-end, please call 1-866-442-2473 or visit www.bairdfunds.com. Mutual fund performance changes over time and current performance may be lower or higher than that stated.
Baird Equity Opportunity Fund
Schedule of Investments, June 30, 2023 (Unaudited)
Common Stocks
| | | | | | | | | % of | |
| | | Shares | | | Value | | | Net Assets | |
| Aerospace & Defense | | | | | | | | | |
| Cadre Holdings, Inc. | | | 105,300 | | | $ | 2,295,540 | | | | 3.7 | % |
| Communications Equipment | | | | | | | | | | | | |
Infinera Corp.(1) | | | 465,172 | | | | 2,246,781 | | | | 3.6 | % |
| Construction & Engineering | | | | | | | | | | | | |
Fluor Corporation(1) | | | 45,519 | | | | 1,347,363 | | | | 2.2 | % |
| Valmont Industries, Inc. | | | 7,947 | | | | 2,312,974 | | | | 3.7 | % |
| | | | | | | | 3,660,337 | | | | 5.9 | % |
| Consumer Staples Distribution | | | | | | | | | | | | |
Chefs’ Warehouse Inc.(1) | | | 122,816 | | | | 4,391,900 | | | | 7.1 | % |
| Diversified Consumer Services | | | | | | | | | | | | |
Mister Car Wash, Inc.(1) | | | 158,397 | | | | 1,528,531 | | | | 2.4 | % |
| Electrical Equipment | | | | | | | | | | | | |
nVent Electric PLC(4) | | | 55,628 | | | | 2,874,299 | | | | 4.6 | % |
| Energy Equipment & Services | | | | | | | | | | | | |
NexTier Oilfield Solutions, Inc.(1) | | | 265,991 | | | | 2,377,959 | | | | 3.8 | % |
Oceaneering International, Inc.(1) | | | 75,751 | | | | 1,416,544 | | | | 2.3 | % |
| | | | | | | | 3,794,503 | | | | 6.1 | % |
| Entertainment | | | | | | | | | | | | |
| Madison Square Garden Sports Corp. | | | 16,579 | | | | 3,117,681 | | | | 5.0 | % |
| Financial Services | | | | | | | | | | | | |
Euronet Worldwide, Inc.(1) | | | 21,178 | | | | 2,485,662 | | | | 4.0 | % |
| Global Payments, Inc. | | | 35,529 | | | | 3,500,317 | | | | 5.6 | % |
| | | | | | | | 5,985,979 | | | | 9.6 | % |
| Health Care Equipment & Supplies | | | | | | | | | | | | |
Merit Medical Systems, Inc.(1) | | | 14,852 | | | | 1,242,221 | | | | 2.0 | % |
Paragon 28, Inc.(1) | | | 64,537 | | | | 1,144,887 | | | | 1.8 | % |
| | | | | | | | 2,387,108 | | | | 3.8 | % |
| Health Care Providers & Services | | | | | | | | | | | | |
Castle Biosciences, Inc.(1) | | | 7,071 | | | | 97,014 | | | | 0.1 | % |
NeoGenomics, Inc.(1) | | | 161,499 | | | | 2,595,289 | | | | 4.2 | % |
| | | | | | | | 2,692,303 | | | | 4.3 | % |
| Health Care Technology | | | | | | | | | | | | |
Evolent Health, Inc.(1) | | | 69,978 | | | | 2,120,333 | | | | 3.4 | % |
| Hotels, Restaurants, & Leisure | | | | | | | | | | | | |
Sportradar Holding AG(1)(2) | | | 198,690 | | | | 2,563,101 | | | | 4.1 | % |
| Interactive Media & Services | | | | | | | | | | | | |
ZoomInfo Technologies, Inc.(1) | | | 91,614 | | | | 2,326,079 | | | | 3.7 | % |
| Leisure Products | | | | | | | | | | | | |
| Clarus Corp. | | | 230,232 | | | | 2,104,320 | | | | 3.4 | % |
| Machinery | | | | | | | | | | | | |
| Ingersoll Rand, Inc. | | | 20,965 | | | | 1,370,272 | | | | 2.2 | % |
| Oil, Gas, & Consumable Fuels | | | | | | | | | | | | |
| Devon Energy Corp. | | | 10,000 | | | | 483,400 | | | | 0.8 | % |
| Diamondback Energy, Inc. | | | 10,252 | | | | 1,346,703 | | | | 2.2 | % |
| | | | | | | | 1,830,103 | | | | 3.0 | % |
| Professional Services | | | | | | | | | | | | |
| Equifax, Inc. | | | 2,820 | | | | 663,546 | | | | 1.1 | % |
| Semiconductors & | | | | | | | | | | | | |
| Semiconductor Equipment | | | | | | | | | | | | |
| Universal Display Corp. | | | 13,217 | | | | 1,904,966 | | | | 3.1 | % |
| Software | | | | | | | | | | | | |
Bill.com Holdings, Inc.(1) | | | 8,776 | | | | 1,025,476 | | | | 1.6 | % |
Blackbaud, Inc.(1) | | | 59,232 | | | | 4,216,134 | | | | 6.8 | % |
| Clear Secure, Inc. | | | 57,003 | | | | 1,320,759 | | | | 2.1 | % |
| ON24, Inc. | | | 136,221 | | | | 1,106,115 | | | | 1.8 | % |
Opera Ltd. – ADR(2) | | | 116,116 | | | | 2,307,225 | | | | 3.7 | % |
RingCentral, Inc.(1) | | | 52,684 | | | | 1,724,347 | | | | 2.8 | % |
| | | | | | | | 11,700,056 | | | | 18.8 | % |
| Total Common Stocks | | | | | | | | | | | | |
| (Cost $57,811,077) | | | | | | | 61,557,738 | | | | 98.9 | % |
Purchased Option Contracts
| | | Notional | | | Number of | | | | | | | |
| | | Amount | | | Contracts(5) | | | | | | | |
| Call Option Contracts | | | | | | | | | | | | |
| Global Payments, Inc., | | | | | | | | | | | | |
| Exercise Price: $105.00, | | | | | | | | | | | | |
| Expiration: 08/18/2023 | | $ | 1,054,164 | | | | 107 | | | | 24,075 | | | | 0.0 | % |
| Infinera Corp., | | | | | | | | | | | | | | | | |
| Exercise Price: $8.00, | | | | | | | | | | | | | | | | |
| Expiration: 07/21/2023 | | | 66,171 | | | | 137 | | | | 685 | | | | 0.0 | % |
| PayPal Holdings, Inc., | | | | | | | | | | | | | | | | |
| Exercise Price: $80.00, | | | | | | | | | | | | | | | | |
Expiration: 01/19/2024(6) | | | 3,042,888 | | | | 456 | | | | 157,320 | | | | 0.3 | % |
| Total Purchased | | | | | | | | | | | | | | | | |
| Option Contracts | | | | | | | | | | | | | | | | |
| (Cost $163,788) | | | | | | | | | | | 182,080 | | | | 0.3 | % |
| Total Long-Term Investments | | | | | | | | | | | | | | | | |
| (Cost $57,974,865) | | | | | | | | | | | | | | | 99.2 | % |
| Short-Term Investment | | | | | | | | | |
| | | Shares | | | | | | | |
| Money Market Mutual Fund | | | | | | | | | |
| First American Government Obligations | | | | | | | | | |
Fund, Class U, 5.03%(3) | | | 602,386 | | | | 602,386 | | | | 1.0 | % |
| Total Short-Term Investment | | | | | | | | | | | | |
| (Cost $602,386) | | | | | | | 602,386 | | | | 1.0 | % |
| Total Investments | | | | | | | | | | | | |
| (Cost $58,577,251) | | | | | | | 62,342,204 | | | | 100.2 | % |
| Liabilities in Excess of Other Assets | | | | | | | (109,112 | ) | | | (0.2 | )% |
| TOTAL NET ASSETS | | | | | | $ | 62,233,092 | | | | 100.0 | % |
Notes to Schedule of Investments
(1) | Non-Income Producing. |
(2) | Foreign Security. |
(3) | Seven-Day Yield. |
(4) | All or a portion of this security was held as collateral for options written. At June 30, 2023, the value of this collateral was $2,712,675. |
(5) | Each contract is equivalent to 100 shares of common stock. |
(6) | Held in connection with written option contracts. See Schedule of Written Option Contracts for further information. |
ADR – American Depositary Receipt
Industry classifications shown in the Schedule of Investments are based off of the Global Industry Classification Standard (GICS®). GICS® was developed by and/or is the exclusive property of MSCI, Inc. (“MSCI”) and Standard & Poor’s Financial Services LLC (“S&P”). GICS® is a service mark of MSCI and S&P and has been licensed for use by U.S. Bancorp Fund Services, LLC.
The accompanying notes are an integral part of these financial statements.
Baird Equity Opportunity Fund
Schedule of Written Option Contracts, June 30, 2023 (Unaudited)
| | | Notional | | | Number of | | | | |
Written Option Contracts | | Amount | | | Contracts(a) | | | Value | |
| Call Option Contracts | | | | | | | | | |
| Oceaneering International, Inc., (Exercise Price: $25.00, Expiration: 07/21/2023) | | $ | 110,330 | | | | (59 | ) | | $ | (4,278 | ) |
| Total Call Option Contracts (Premiums Received $7,893) | | | | | | | | | | | (4,278 | ) |
| Put Option Contracts | | | | | | | | | | | | |
| PayPal Holdings, Inc., (Exercise Price: $50.00, Expiration: 01/19/2024 | | | 3,042,888 | | | | (456 | ) | | | (72,048 | ) |
| Clear Secure, Inc., (Exercise Price: $22.30, Expiration: 08/18/2023 | | | 523,642 | | | | (226 | ) | | | (22,826 | ) |
| Total Put Option Contracts (Premium Received $190,200) | | | | | | | | | | | (94,874 | ) |
| Total Written Option Contracts (Premiums Received $198,093) | | | | | | | | | | $ | (99,152 | ) |
(a) | Each contract is equivalent to 100 shares of common stock. |
Summary of Fair Value Exposure at June 30, 2023 (Unaudited)
The Fund has adopted authoritative fair valuation accounting standards which establish a definition of fair value and set out a hierarchy for measuring fair value. These standards require additional disclosures about the various inputs and valuation techniques used to develop the measurements of fair value and a discussion on changes in valuation techniques and related inputs during the period. These standards define fair value as the price that would be received to sell an asset or paid to transfer a liability in an orderly transaction between market participants at the measurement date.
The fair value hierarchy is organized into three levels based upon the assumptions (referred to as “inputs”) used in pricing the asset or liability. These standards state that “observable inputs” reflect the assumptions market participants would use in pricing the asset or liability based on market data obtained from independent sources and “unobservable inputs” reflect an entity’s own assumptions about the assumptions market participants would use in pricing the asset or liability. These inputs are summarized into three broad levels and described below:
Level 1 – Quoted prices (unadjusted) in active markets for identical assets or liabilities that the reporting entity can access at the measurement date.
Level 2 – Inputs other than quoted prices included within Level 1 that are observable for the asset or liability, either directly or indirectly.
Level 3 – Unobservable inputs for the asset or liability.
The inputs or methodology used for valuing securities are not necessarily an indication of the risk associated with investing in those securities.
The following is a summary of the inputs used to value the Fund’s investments as of June 30, 2023:
| | | Level 1 | | | Level 2 | | | Level 3 | | | Total | |
| Equity | | | | | | | | | | | | |
| Common Stocks | | $ | 61,557,738 | | | $ | — | | | $ | — | | | $ | 61,557,738 | |
| Total Equity | | | 61,557,738 | | | | — | | | | — | | | | 61,557,738 | |
| Purchased Option Contracts | | | | | | | | | | | | | | | | |
| Call Option Contracts | | | 181,395 | | | | 685 | | | | — | | | | 182,080 | |
| Total Purchased Option Contracts | | | 181,395 | | | | 685 | | | | — | | | | 182,080 | |
| Short-Term Investment | | | | | | | | | | | | | | | | |
| Money Market Mutual Fund | | | 602,386 | | | | — | | | | — | | | | 602,386 | |
| Total Short-Term Investment | | | 602,386 | | | | — | | | | — | | | | 602,386 | |
| Total Investments* | | $ | 62,341,519 | | | $ | 685 | | | $ | — | | | $ | 62,342,204 | |
| Written Option Contracts | | | | | | | | | | | | | | | | |
| Call Option Contracts | | $ | — | | | $ | (4,278 | ) | | $ | — | | | $ | (4,278 | ) |
| Put Option Contracts | | | (94,874 | ) | | | — | | | | — | | | | (94,874 | ) |
| Total Written Option Contracts | | $ | (94,874 | ) | | $ | (4,278 | ) | | $ | — | | | $ | (99,152 | ) |
| * | Additional information regarding the industry classifications of these investments is disclosed in the Schedule of Investments. |
Changes in valuation techniques may result in transfers into or out of assigned levels within the fair value hierarchy. There were no transfers into or out of Level 3 during the reporting period, as compared to the security classifications from the prior year’s annual report. See the Fund’s Valuation Policy in Note 2a to the financial statements.
The accompanying notes are an integral part of these financial statements.
Baird Chautauqua International Growth Fund
June 30, 2023 (Unaudited)
Portfolio Characteristics
A June 30, 2023 summary of the Fund’s top 10 holdings and equity sector analysis compared to the MSCI ACWI ex USA Index is shown below.
Top 10 Holdings(1) | | | | | |
| | | | | | |
| Fairfax Financial Holdings Ltd. | 4.8% | | Net Assets: | $662,985,811 | |
| ASML Holding NV | 4.7% | | Portfolio Turnover Rate: | 4% | (5) |
| Novo Nordisk A/S | 4.6% | | Number of Equity Holdings: | 31 | |
| Taiwan Semiconductor Manufacturing Co. Ltd. | 4.4% | | | | |
| Adyen NV | 4.4% | | Annualized Portfolio Expense Ratio(3): | | |
| Constellation Software, Inc. | 4.3% | | Gross | | |
| Waste Connections, Inc. | 4.1% | | Institutional Class: | 0.87% | |
| Bank Rakyat Indonesia Persero Tbk PT | 4.1% | | Investor Class: | 1.12% | (4) |
| HDFC Bank Ltd. | 4.1% | | | | |
| Safran SA | 4.0% | | Net | | |
| | | | Institutional Class: | 0.80% | |
| | | | Investor Class: | 1.05% | (4) |
| | | | | | |
Equity Sector Analysis(2) | | | Country Allocation(2) | | |
 | 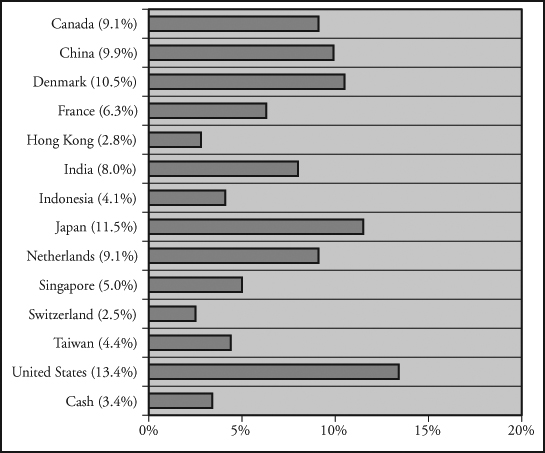 |
| | | | | | |
(1) | The Fund’s portfolio composition is subject to change and there is no assurance that the Fund will continue to hold any particular security. Percentages shown relate to the Fund’s total net assets as of June 30, 2023. |
(2) | Percentages shown in parentheses relate to the Fund’s total value of investments as of June 30, 2023, and may not add up to 100% due to rounding. |
(3) | Reflects expense ratios as stated in the Fund’s current prospectus dated May 1, 2023. The Advisor has contractually agreed to limit the Fund’s total annual fund operating expenses to 0.80% of average daily net assets for the Institutional Class shares and 1.05% of average daily net assets for the Investor Class shares, at least through April 30, 2024. |
(4) | Includes 0.25% 12b-1 fee. |
(5) | Not annualized. |
Baird Chautauqua International Growth Fund(1)
June 30, 2023 (Unaudited)
Total Returns
| | | | Average Annual |
| | Six | One | Three | Five | Since |
| For the Periods Ended June 30, 2023 | Months | Year | Years | Years | Inception(2) |
| Institutional Class Shares | 12.05% | 16.96% | 9.55% | 7.52% | 9.21% |
| Investor Class Shares | 11.91% | 16.74% | 9.25% | 7.23% | 8.93% |
MSCI ACWI ex USA Index(3) | 9.47% | 12.72% | 7.22% | 3.52% | 5.77% |
(1) | Effective April 30, 2023, the Fund changed its name from the Chautauqua International Growth Fund to the Baird Chautauqua International Growth Fund. |
(2) | For the period from April 15, 2016 (inception date) through June 30, 2023. |
(3) | The MSCI ACWI ex USA Index is a market-capitalization-weighted index maintained by MSCI, Inc. and designed to provide a broad measure of stock performance throughout the world, with the exception of U.S. based companies. The MSCI ACWI ex USA Index includes both developed and emerging markets. This index does not reflect any deduction for fees, expenses or taxes. A direct investment in the index is not possible. |
The returns table shown above reflects reinvestment of dividends and/or capital gains distributions in additional shares. The returns in the table do not reflect the deduction of taxes that a shareholder would pay on Fund distributions or the redemption of Fund shares. The returns reflect the actual performance for each period and do not include the impact of trades executed on the last business day of the period that were recorded on the first business day of the next period.
The gross and net expense ratio for each Class, as reflected in the Fund’s current prospectus, is set forth under “Portfolio Characteristics”.
The Fund focuses primarily on non-U.S. stocks with medium to large market capitalizations and therefore the performance of the Fund may be more volatile than the performance of funds that focus on types of stocks that have a broader investment style. Under normal market conditions, the Fund will invest at least 65% of its total assets at the time of purchase in non-U.S. companies. Foreign investments involve additional risks such as currency rate fluctuations and the potential for political and economic instability, and different and sometimes less strict financial reporting standards and regulation. U.S. and international markets have experienced significant periods of volatility in recent years and months due to a number of economic, political and global macro factors. Russia’s ongoing war with Ukraine has heightened global geopolitical tensions, resulting in an elevated risk environment and increased volatility in asset prices. The uncertain course of the war may have a significant negative impact on the global economy. U.S. relations with China have become increasingly strained, and tension between the U.S. and China may have a significant negative impact on the global economy and asset prices. Measures of inflation reached levels not experienced in several decades, leading the Federal Reserve to raise short term interest rates significantly over the last year, with the potential for further rate increases in 2023. Uncertainty regarding the ability of the Federal Reserve to successfully control inflation, the potential for incremental rate increases, and the full impact of prior rate increases on the economy may negatively impact asset prices and increase market volatility. The possibility of a U.S. or global recession may also contribute to market volatility. The coronavirus (COVID-19) pandemic caused significant economic disruption in recent years as countries worked to limit the negative health impacts of the virus. While the virus has entered an endemic stage, significant outbreaks or new variants present a continued risk to the global economy. These and other geopolitical events may cause market disruptions and could have an adverse effect on the value of the Fund’s investments.
Past performance does not guarantee future results. Investment return and principal value will fluctuate so that an investor’s shares, when redeemed, may be worth more or less than their original cost.
For information about the performance of the Fund as of the most recent month-end, please call 1-866-442-2473 or visit www.bairdfunds.com. Mutual fund performance changes over time and current performance may be lower or higher than that stated.
Baird Chautauqua International Growth Fund
Schedule of Investments, June 30, 2023 (Unaudited)
Common Stocks
| | | | | | | | | % of | |
| | | Shares | | | Value | | | Net Assets | |
| Aerospace & Defense | | | | | | | | | |
Safran SA (France)(2) | | | 169,203 | | | $ | 26,515,821 | | | | 4.0 | % |
| Automobile Components | | | | | | | | | | | | |
Aptiv PLC (United States)(1) | | | 139,103 | | | | 14,201,025 | | | | 2.1 | % |
| Automobiles | | | | | | | | | | | | |
Suzuki Motor Corp. (Japan)(2) | | | 593,262 | | | | 21,513,342 | | | | 3.2 | % |
| Banks | | | | | | | | | | | | |
| Bank Rakyat Indonesia Persero | | | | | | | | | | | | |
Tbk PT (Indonesia)(2) | | | 74,462,298 | | | | 27,185,564 | | | | 4.1 | % |
| DBS Group Holdings | | | | | | | | | | | | |
Ltd. (Singapore)(2) | | | 835,146 | | | | 19,502,983 | | | | 2.9 | % |
| HDFC Bank Ltd. – ADR (India) | | | 388,145 | | | | 27,053,706 | | | | 4.1 | % |
| | | | | | | | 73,742,253 | | | | 11.1 | % |
| Biotechnology | | | | | | | | | | | | |
BeiGene Ltd. – ADR (China)(1) | | | 71,134 | | | | 12,683,192 | | | | 1.9 | % |
Genmab A/S (Denmark)(1)(2) | | | 63,463 | | | | 24,049,793 | | | | 3.6 | % |
| | | | | | | | 36,732,985 | | | | 5.5 | % |
| Broadline Retail | | | | | | | | | | | | |
| Alibaba Group Holding | | | | | | | | | | | | |
Ltd. – ADR (China)(1) | | | 136,966 | | | | 11,416,116 | | | | 1.7 | % |
Prosus NV (China)(2) | | | 258,680 | | | | 18,944,258 | | | | 2.9 | % |
| | | | | | | | 30,360,374 | | | | 4.6 | % |
| Capital Markets | | | | | | | | | | | | |
| Hong Kong Exchanges & Clearing | | | | | | | | | | | | |
Ltd. (Hong Kong)(2) | | | 490,063 | | | | 18,568,002 | | | | 2.8 | % |
| Commercial Services & Supplies | | | | | | | | | | | | |
| Waste Connections, Inc. (United States) | | | 191,101 | | | | 27,314,066 | | | | 4.1 | % |
| Electronic Equipment, | | | | | | | | | | | | |
| Instruments, & Components | | | | | | | | | | | | |
Keyence Corp. (Japan)(2) | | | 47,363 | | | | 22,504,847 | | | | 3.4 | % |
| Entertainment | | | | | | | | | | | | |
Sea Ltd. – ADR (Singapore)(1) | | | 237,827 | | | | 13,803,479 | | | | 2.1 | % |
| Financial Services | | | | | | | | | | | | |
Adyen NV (Netherlands)(1)(2) | | | 16,687 | | | | 28,896,412 | | | | 4.4 | % |
| Health Care Equipment & Supplies | | | | | | | | | | | | |
Coloplast A/S (Denmark)(2) | | | 119,293 | | | | 14,927,874 | | | | 2.3 | % |
| Health Care Providers & Services | | | | | | | | | | | | |
Sinopharm Group Co. Ltd. (China)(2) | | | 4,359,335 | | | | 13,646,874 | | | | 2.1 | % |
| Independent Power and | | | | | | | | | | | | |
| Renewable Electricity Producers | | | | | | | | | | | | |
| Brookfield Renewable Corp. | | | | | | | | | | | | |
| (United States) | | | 375,560 | | | | 11,837,651 | | | | 1.8 | % |
| Insurance | | | | | | | | | | | | |
| Fairfax Financial Holdings Ltd. (Canada) | | | 42,448 | | | | 31,795,226 | | | | 4.8 | % |
| IT Services | | | | | | | | | | | | |
Tata Consultancy Services Ltd. (India)(2) | | | 639,522 | | | | 25,841,388 | | | | 3.9 | % |
| Life Sciences Tools & Services | | | | | | | | | | | | |
| Wuxi Biologics Cayman, Inc. | | | | | | | | | | | | |
(China)(1)(2) | | | 1,757,285 | | | | 8,445,607 | | | | 1.3 | % |
| Machinery | | | | | | | | | | | | |
FANUC Corp. (Japan)(2) | | | 466,707 | | | | 16,384,052 | | | | 2.5 | % |
| Pharmaceuticals | | | | | | | | | | | | |
| Novo Nordisk A/S – ADR (Denmark) | | | 189,060 | | | | 30,595,580 | | | | 4.6 | % |
| Professional Services | | | | | | | | | | | | |
Recruit Holdings Co. Ltd. (Japan)(2) | | | 486,447 | | | | 15,525,124 | | | | 2.3 | % |
| Semiconductors & | | | | | | | | | | | | |
| Semiconductor Equipment | | | | | | | | | | | | |
| ASML Holding NV (Netherlands) | | | 43,209 | | | | 31,315,722 | | | | 4.7 | % |
| SolarEdge Technologies, Inc. | | | | | | | | | | | | |
(United States)(1) | | | 75,031 | | | | 20,187,091 | | | | 3.0 | % |
| Taiwan Semiconductor | | | | | | | | | | | | |
| Manufacturing Co. Ltd. – ADR (Taiwan) | | | 287,537 | | | | 29,018,234 | | | | 4.4 | % |
| | | | | | | | 80,521,047 | | | | 12.1 | % |
| Software | | | | | | | | | | | | |
Atlassian Corp. (United States)(1) | | | 90,510 | | | | 15,188,483 | | | | 2.3 | % |
| Constellation Software, Inc. (Canada) | | | 13,595 | | | | 28,167,588 | | | | 4.3 | % |
Temenos Group AG (Switzerland)(2) | | | 210,002 | | | | 16,721,548 | | | | 2.5 | % |
| | | | | | | | 60,077,619 | | | | 9.1 | % |
| Textiles, Apparel, & Luxury Goods | | | | | | | | | | | | |
Kering SA (France)(2) | | | 26,802 | | | | 14,800,076 | | | | 2.2 | % |
| Total Common Stocks | | | | | | | | | | | | |
| (Cost $530,750,224) | | | | | | | 638,550,724 | | | | 96.3 | % |
| | | | | | | | | | | | | |
| Short-Term Investment | | | | | | | | | | | | |
| | | | | | | | | | | | | |
| Money Market Mutual Fund | | | | | | | | | | | | |
| First American Government | | | | | | | | | | | | |
Obligations Fund, Class U, 5.03%(3) | | | 21,155,617 | | | | 21,155,617 | | | | 3.2 | % |
| Total Short-Term Investment | | | | | | | | | | | | |
| (Cost $21,155,617) | | | | | | | 21,155,617 | | | | 3.2 | % |
| Total Investments | | | | | | | | | | | | |
| (Cost $551,905,841) | | | | | | | 659,706,341 | | | | 99.5 | % |
| Other Assets in Excess of Liabilities | | | | | | | 3,279,470 | | | | 0.5 | % |
| TOTAL NET ASSETS | | | | | | $ | 662,985,811 | | | | 100.0 | % |
Notes to Schedule of Investments
(1) | Non-Income Producing. |
(2) | Level 2 Security – See Note 2a to the financial statements. |
(3) | Seven-Day Yield. |
ADR – American Depositary Receipt
Industry classifications shown in the Schedule of Investments are based off of the Global Industry Classification Standard (GICS®). GICS® was developed by and/or is the exclusive property of MSCI, Inc. (“MSCI”) and Standard & Poor’s Financial Services LLC (“S&P”). GICS® is a service mark of MSCI and S&P and has been licensed for use by U.S. Bancorp Fund Services, LLC.
The accompanying notes are an integral part of these financial statements.
Baird Chautauqua International Growth Fund
Schedule of Investments, June 30, 2023 (Unaudited)
Summary of Fair Value Exposure at June 30, 2023 (Unaudited)
The Fund has adopted authoritative fair valuation accounting standards which establish a definition of fair value and set out a hierarchy for measuring fair value. These standards require additional disclosures about the various inputs and valuation techniques used to develop the measurements of fair value and a discussion on changes in valuation techniques and related inputs during the period. These standards define fair value as the price that would be received to sell an asset or paid to transfer a liability in an orderly transaction between market participants at the measurement date.
The fair value hierarchy is organized into three levels based upon the assumptions (referred to as “inputs”) used in pricing the asset or liability. These standards state that “observable inputs” reflect the assumptions market participants would use in pricing the asset or liability based on market data obtained from independent sources and “unobservable inputs” reflect an entity’s own assumptions about the assumptions market participants would use in pricing the asset or liability. These inputs are summarized into three broad levels and described below:
Level 1 – Quoted prices (unadjusted) in active markets for identical assets or liabilities that the reporting entity can access at the measurement date.
Level 2 – Inputs other than quoted prices included within Level 1 that are observable for the asset or liability, either directly or indirectly.
Level 3 – Unobservable inputs for the asset or liability.
The inputs or methodology used for valuing securities are not necessarily an indication of the risk associated with investing in those securities.
The following is a summary of the inputs used to value the Fund’s investments as of June 30, 2023:
| | | Level 1 | | | Level 2 | | | Level 3 | | | Total | |
| Equity | | | | | | | | | | | | |
| Common Stocks | | $ | 304,577,159 | | | $ | 333,973,565 | | | $ | — | | | $ | 638,550,724 | |
| Total Equity | | | 304,577,159 | | | | 333,973,565 | | | | — | | | | 638,550,724 | |
| Short-Term Investment | | | | | | | | | | | | | | | | |
| Money Market Mutual Fund | | | 21,155,617 | | | | — | | | | — | | | | 21,155,617 | |
| Total Short-Term Investment | | | 21,155,617 | | | | — | | | | — | | | | 21,155,617 | |
| Total Investments* | | $ | 325,732,776 | | | $ | 333,973,565 | | | $ | — | | | $ | 659,706,341 | |
| * | Additional information regarding the industry classifications of these investments is disclosed in the Schedule of Investments. |
Changes in valuation techniques may result in transfers into or out of assigned levels within the fair value hierarchy. There were no transfers into or out of Level 3 during the reporting period, as compared to the security classifications from the prior year’s annual report. See the Fund’s Valuation Policy in Note 2a to the financial statements.
The accompanying notes are an integral part of these financial statements.
Baird Chautauqua Global Growth Fund
June 30, 2023 (Unaudited)
Portfolio Characteristics
A June 30, 2023 summary of the Fund’s top 10 holdings and equity sector analysis compared to the MSCI ACWI Index is shown below.
Top 10 Holdings(1) | | | | | |
| | | | | | |
| Novo Nordisk A/S | 4.2% | | Net Assets: | $304,954,519 | |
| Fairfax Financial Holdings Ltd. | 3.8% | | Portfolio Turnover Rate: | 7% | (5) |
| MasterCard, Inc. – Class A | 3.8% | | Number of Equity Holdings: | 43 | |
| Constellation Software, Inc. | 3.4% | | | | |
| Adyen NV | 3.4% | | Annualized Portfolio Expense Ratio(3): | | |
| Alphabet, Inc. – Class A | 3.3% | | Gross | | |
| TJX Companies, Inc. | 3.2% | | Institutional Class: | 0.92% | |
| Nvidia Corp. | 3.1% | | Investor Class: | 1.17% | (4) |
| ASML Holding NV | 3.1% | | | | |
| Waste Connections, Inc. | 3.1% | | Net | | |
| | | | Institutional Class: | 0.80% | |
| | | | Investor Class: | 1.05% | (4) |
| | | | | | |
Equity Sector Analysis(2) | | | Country Allocation(2) | | |
 | 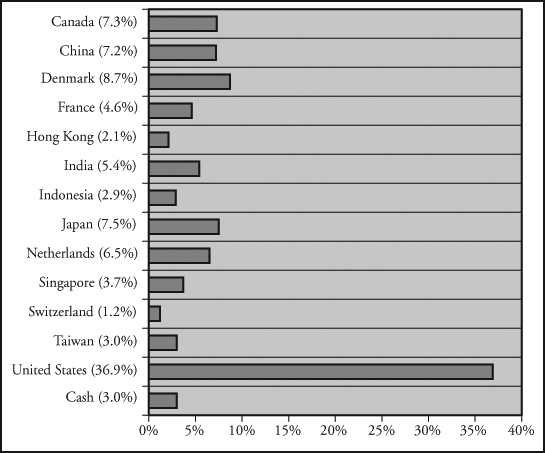 |
(1) | The Fund’s portfolio composition is subject to change and there is no assurance that the Fund will continue to hold any particular security. Percentages shown relate to the Fund’s total net assets as of June 30, 2023. |
(2) | Percentages shown in parentheses relate to the Fund’s total value of investments as of June 30, 2023, and may not add up to 100% due to rounding. |
(3) | Reflects expense ratios as stated in the Fund’s current prospectus dated May 1, 2023. The Advisor has contractually agreed to limit the Fund’s total annual fund operating expenses to 0.80% of average daily net assets for the Institutional Class shares and 1.05% of average daily net assets for the Investor Class shares, at least through April 30, 2024. |
(4) | Includes 0.25% 12b-1 fee. |
(5) | Not annualized. |
Baird Chautauqua Global Growth Fund(1)
June 30, 2023 (Unaudited)
Total Returns
| | | | Average Annual |
| | Six | One | Three | Five | Since |
| For the Periods Ended June 30, 2023 | Months | Year | Years | Years | Inception(2) |
| Institutional Class Shares | 11.88% | 16.74% | 9.40% | 8.94% | 11.20% |
| Investor Class Shares | 11.73% | 16.42% | 9.09% | 8.72% | 10.95% |
MSCI ACWI Index(3) | 13.93% | 16.53% | 10.99% | 8.10% | 9.57% |
(1) | Effective April 30, 2023, the Fund changed its name from the Chautauqua Global Growth Fund to the Baird Chautauqua Global Growth Fund. |
(2) | For the period from April 15, 2016 (inception date) through June 30, 2023. |
(3) | The MSCI ACWI Index is a market-capitalization-weighted index maintained by MSCI, Inc. and designed to provide a broad measure of stock performance throughout the world. The MSCI ACWI Index includes both developed and emerging markets. This index does not reflect any deduction for fees, expenses or taxes. A direct investment in the index is not possible. |
The returns table shown above reflects reinvestment of dividends and/or capital gains distributions in additional shares. The returns in the table do not reflect the deduction of taxes that a shareholder would pay on Fund distributions or the redemption of Fund shares. The returns reflect the actual performance for each period and do not include the impact of trades executed on the last business day of the period that were recorded on the first business day of the next period.
The gross and net expense ratio for each Class, as reflected in the Fund’s current prospectus, is set forth under “Portfolio Characteristics”.
The Fund focuses on both U.S. and non-U.S. stocks with medium to large market capitalizations and therefore the performance of the Fund may be more volatile than the performance of funds that focus on types of stocks that have a broader investment style. Under normal market conditions, the Fund will invest at least 40% of its total assets at the time of purchase in non-U.S. companies. Foreign investments involve additional risks such as currency rate fluctuations and the potential for political and economic instability, and different and sometimes less strict financial reporting standards and regulation. U.S. and international markets have experienced significant periods of volatility in recent years and months due to a number of economic, political and global macro factors. Russia’s ongoing war with Ukraine has heightened global geopolitical tensions, resulting in an elevated risk environment and increased volatility in asset prices. The uncertain course of the war may have a significant negative impact on the global economy. U.S. relations with China have become increasingly strained, and tension between the U.S. and China may have a significant negative impact on the global economy and asset prices. Measures of inflation reached levels not experienced in several decades, leading the Federal Reserve to raise short term interest rates significantly over the last year, with the potential for further rate increases in 2023. Uncertainty regarding the ability of the Federal Reserve to successfully control inflation, the potential for incremental rate increases, and the full impact of prior rate increases on the economy may negatively impact asset prices and increase market volatility. The possibility of a U.S. or global recession may also contribute to market volatility. The coronavirus (COVID-19) pandemic caused significant economic disruption in recent years as countries worked to limit the negative health impacts of the virus. While the virus has entered an endemic stage, significant outbreaks or new variants present a continued risk to the global economy. These and other geopolitical events may cause market disruptions and could have an adverse effect on the value of the Fund’s investments.
Past performance does not guarantee future results. Investment return and principal value will fluctuate so that an investor’s shares, when redeemed, may be worth more or less than their original cost.
For information about the performance of the Fund as of the most recent month-end, please call 1-866-442-2473 or visit www.bairdfunds.com. Mutual fund performance changes over time and current performance may be lower or higher than that stated.
Baird Chautauqua Global Growth Fund
Schedule of Investments, June 30, 2023 (Unaudited)
Common Stocks
| | | | | | | | | % of | |
| | | Shares | | | Value | | | Net Assets | |
| Aerospace & Defense | | | | | | | | | |
Safran SA (France)(2) | | | 54,891 | | | $ | 8,601,975 | | | | 2.8 | % |
| Automobile Components | | | | | | | | | | | | |
Aptiv PLC (United States)(1) | | | 45,575 | | | | 4,652,752 | | | | 1.5 | % |
| Automobiles | | | | | | | | | | | | |
Suzuki Motor Corp. (Japan)(2) | | | 179,862 | | | | 6,522,300 | | | | 2.1 | % |
| Banks | | | | | | | | | | | | |
| Bank Rakyat Indonesia Persero | | | | | | | | | | | | |
Tbk PT (Indonesia)(2) | | | 24,226,155 | | | | 8,844,767 | | | | 2.9 | % |
DBS Group Holdings Ltd. (Singapore)(2) | | | 284,176 | | | | 6,636,300 | | | | 2.2 | % |
| HDFC Bank Ltd. – ADR (India) | | | 129,065 | | | | 8,995,832 | | | | 2.9 | % |
| | | | | | | | 24,476,899 | | | | 8.0 | % |
| Biotechnology | | | | | | | | | | | | |
BeiGene Ltd. – ADR (China)(1) | | | 19,119 | | | | 3,408,918 | | | | 1.1 | % |
Genmab A/S (Denmark)(1)(2) | | | 24,177 | | | | 9,162,059 | | | | 3.0 | % |
Incyte Corp. (United States)(1) | | | 102,114 | | | | 6,356,597 | | | | 2.1 | % |
| Regeneron Pharmaceuticals, Inc. | | | | | | | | | | | | |
(United States)(1) | | | 11,046 | | | | 7,936,993 | | | | 2.6 | % |
| | | | | | | | 26,864,567 | | | | 8.8 | % |
| Broadline Retail | | | | | | | | | | | | |
| Alibaba Group Holding | | | | | | | | | | | | |
Ltd. – ADR (China)(1) | | | 35,359 | | | | 2,947,173 | | | | 1.0 | % |
Amazon.com, Inc. (United States)(1) | | | 56,418 | | | | 7,354,651 | | | | 2.4 | % |
Prosus NV (China)(2) | | | 84,248 | | | | 6,169,846 | | | | 2.0 | % |
| | | | | | | | 16,471,670 | | | | 5.4 | % |
| Capital Markets | | | | | | | | | | | | |
| Charles Schwab Corp. (United States) | | | 98,261 | | | | 5,569,433 | | | | 1.8 | % |
| Hong Kong Exchanges & | | | | | | | | | | | | |
Clearing Ltd. (Hong Kong)(2) | | | 164,764 | | | | 6,242,745 | | | | 2.0 | % |
| | | | | | | | 11,812,178 | | | | 3.8 | % |
| Commercial Services & Supplies | | | | | | | | | | | | |
| Waste Connections, Inc. (United States) | | | 65,393 | | | | 9,346,621 | | | | 3.1 | % |
| Electronic Equipment, | | | | | | | | | | | | |
| Instruments, & Components | | | | | | | | | | | | |
Keyence Corp. (Japan)(2) | | | 12,438 | | | | 5,909,999 | | | | 1.9 | % |
| Entertainment | | | | | | | | | | | | |
Sea Ltd. – ADR (Singapore)(1) | | | 80,394 | | | | 4,666,068 | | | | 1.5 | % |
| Financial Services | | | | | | | | | | | | |
Adyen NV (Netherlands)(1)(2) | | | 5,897 | | | | 10,211,670 | | | | 3.4 | % |
| MasterCard, Inc. – Class A (United States) | | | 29,426 | | | | 11,573,246 | | | | 3.8 | % |
| | | | | | | | 21,784,916 | | | | 7.2 | % |
| Health Care Equipment & Supplies | | | | | | | | | | | | |
Coloplast A/S (Denmark)(2) | | | 38,007 | | | | 4,756,052 | | | | 1.6 | % |
| Health Care Providers & Services | | | | | | | | | | | | |
Sinopharm Group Co. Ltd. (China)(2) | | | 2,026,216 | | | | 6,343,058 | | | | 2.1 | % |
| Independent Power and | | | | | | | | | | | | |
| Renewable Electricity Producers | | | | | | | | | | | | |
| Brookfield Renewable Corp. | | | | | | | | | | | | |
| (United States) | | | 162,766 | | | | 5,130,384 | | | | 1.7 | % |
| Insurance | | | | | | | | | | | | |
| Fairfax Financial Holdings Ltd. (Canada) | | | 15,498 | | | | 11,608,613 | | | | 3.8 | % |
| Interactive Media & Services | | | | | | | | | | | | |
Alphabet, Inc. – Class A (United States)(1) | | | 83,344 | | | | 9,976,277 | | | | 3.3 | % |
| IT Services | | | | | | | | | | | | |
Tata Consultancy Services Ltd. (India)(2) | | | 187,315 | | | | 7,568,902 | | | | 2.5 | % |
| Life Sciences Tools & Services | | | | | | | | | | | | |
Illumina, Inc. (United States)(1) | | | 19,945 | | | | 3,739,488 | | | | 1.2 | % |
| Wuxi Biologics Cayman, Inc. | | | | | | | | | | | | |
(China)(1)(2) | | | 628,278 | | | | 3,019,538 | | | | 1.0 | % |
| | | | | | | | 6,759,026 | | | | 2.2 | % |
| Machinery | | | | | | | | | | | | |
FANUC Corp. (Japan)(2) | | | 146,842 | | | | 5,154,984 | | | | 1.7 | % |
| Office REITs | | | | | | | | | | | | |
| Alexandria Real Estate | | | | | | | | | | | | |
| Equities, Inc. (United States) | | | 20,698 | | | | 2,349,016 | | | | 0.8 | % |
| Pharmaceuticals | | | | | | | | | | | | |
| Novo Nordisk A/S – ADR (Denmark) | | | 78,543 | | | | 12,710,614 | | | | 4.2 | % |
| Professional Services | | | | | | | | | | | | |
Recruit Holdings Co. Ltd. (Japan)(2) | | | 160,406 | | | | 5,119,413 | | | | 1.7 | % |
| Semiconductors & | | | | | | | | | | | | |
| Semiconductor Equipment | | | | | | | | | | | | |
| ASML Holding NV (Netherlands) | | | 13,072 | | | | 9,473,931 | | | | 3.1 | % |
| Micron Technology, Inc. (United States) | | | 71,362 | | | | 4,503,656 | | | | 1.5 | % |
| Nvidia Corp. (United States) | | | 22,528 | | | | 9,529,794 | | | | 3.1 | % |
| SolarEdge Technologies, Inc. | | | | | | | | | | | | |
(United States)(1) | | | 24,051 | | | | 6,470,922 | | | | 2.1 | % |
| Taiwan Semiconductor | | | | | | | | | | | | |
| Manufacturing Co. Ltd. – ADR (Taiwan) | | | 91,914 | | | | 9,275,961 | | | | 3.1 | % |
| Universal Display Corp. (United States) | | | 24,052 | | | | 3,466,615 | | | | 1.1 | % |
| | | | | | | | 42,720,879 | | | | 14.0 | % |
| Software | | | | | | | | | | | | |
Atlassian Corp. (United States)(1) | | | 27,447 | | | | 4,605,881 | | | | 1.5 | % |
| Constellation Software, Inc. (Canada) | | | 5,055 | | | | 10,473,493 | | | | 3.4 | % |
Temenos Group AG (Switzerland)(2) | | | 47,717 | | | | 3,799,498 | | | | 1.3 | % |
| | | | | | | | 18,878,872 | | | | 6.2 | % |
| Specialty Retail | | | | | | | | | | | | |
| TJX Companies, Inc. (United States) | | | 116,451 | | | | 9,873,880 | | | | 3.2 | % |
| Textiles, Apparel, & Luxury Goods | | | | | | | | | | | | |
Kering SA (France)(2) | | | 10,044 | | | | 5,546,301 | | | | 1.8 | % |
| Total Common Stocks | | | | | | | | | | | | |
| (Cost $261,052,142) | | | | | | | 295,606,216 | | | | 96.9 | % |
The accompanying notes are an integral part of these financial statements.
Baird Chautauqua Global Growth Fund
Schedule of Investments, June 30, 2023 (Unaudited)
Short-Term Investment
| | | | | | | | | % of | |
| | | Shares | | | Value | | | Net Assets | |
| Money Market Mutual Fund | | | | | | | | | |
| First American Government | | | | | | | | | |
Obligations Fund, Class U, 5.03%(3) | | | 8,394,849 | | | $ | 8,394,849 | | | | 2.8 | % |
| Total Short-Term Investment | | | | | | | | | | | | |
| (Cost $8,394,849) | | | | | | | 8,394,849 | | | | 2.8 | % |
| Total Investments | | | | | | | | | | | | |
| (Cost $269,446,991) | | | | | | | 304,001,065 | | | | 99.7 | % |
| Other Assets in Excess of Liabilities | | | | | | | 953,454 | | | | 0.3 | % |
| TOTAL NET ASSETS | | | | | | $ | 304,954,519 | | | | 100.0 | % |
Notes to Schedule of Investments
(1) | Non-Income Producing. |
(2) | Level 2 Security – See Note 2a to the financial statements. |
(3) | Seven-Day Yield. |
ADR – American Depositary Receipt
Industry classifications shown in the Schedule of Investments are based off of the Global Industry Classification Standard (GICS®). GICS® was developed by and/or is the exclusive property of MSCI, Inc. (“MSCI”) and Standard & Poor’s Financial Services LLC (“S&P”). GICS® is a service mark of MSCI and S&P and has been licensed for use by U.S. Bancorp Fund Services, LLC.
Summary of Fair Value Exposure at June 30, 2023 (Unaudited)
The Fund has adopted authoritative fair valuation accounting standards which establish a definition of fair value and set out a hierarchy for measuring fair value. These standards require additional disclosures about the various inputs and valuation techniques used to develop the measurements of fair value and a discussion on changes in valuation techniques and related inputs during the period. These standards define fair value as the price that would be received to sell an asset or paid to transfer a liability in an orderly transaction between market participants at the measurement date.
The fair value hierarchy is organized into three levels based upon the assumptions (referred to as “inputs”) used in pricing the asset or liability. These standards state that “observable inputs” reflect the assumptions market participants would use in pricing the asset or liability based on market data obtained from independent sources and “unobservable inputs” reflect an entity’s own assumptions about the assumptions market participants would use in pricing the asset or liability. These inputs are summarized into three broad levels and described below:
Level 1 – Quoted prices (unadjusted) in active markets for identical assets or liabilities that the reporting entity can access at the measurement date.
Level 2 – Inputs other than quoted prices included within Level 1 that are observable for the asset or liability, either directly or indirectly.
Level 3 – Unobservable inputs for the asset or liability.
The inputs or methodology used for valuing securities are not necessarily an indication of the risk associated with investing in those securities.
The following is a summary of the inputs used to value the Fund’s investments as of June 30, 2023:
| | | Level 1 | | | Level 2 | | | Level 3 | | | Total | |
| Equity | | | | | | | | | | | | |
| Common Stocks | | $ | 185,996,809 | | | $ | 109,609,407 | | | $ | — | | | $ | 295,606,216 | |
| Total Equity | | | 185,996,809 | | | | 109,609,407 | | | | — | | | | 295,606,216 | |
| Short-Term Investment | | | | | | | | | | | | | | | | |
| Money Market Mutual Fund | | | 8,394,849 | | | | — | | | | — | | | | 8,394,849 | |
| Total Short-Term Investment | | | 8,394,849 | | | | — | | | | — | | | | 8,394,849 | |
| Total Investments* | | $ | 194,391,658 | | | $ | 109,609,407 | | | $ | — | | | $ | 304,001,065 | |
| * | Additional information regarding the industry classifications of these investments is disclosed in the Schedule of Investments. |
Changes in valuation techniques may result in transfers into or out of assigned levels within the fair value hierarchy. There were no transfers into or out of Level 3 during the reporting period, as compared to the security classifications from the prior year’s annual report. See the Fund’s Valuation Policy in Note 2a to the financial statements.
The accompanying notes are an integral part of these financial statements.
Additional Information on Fund Expenses
June 30, 2023 (Unaudited)
Expense Example
As a shareholder of the Funds, you incur ongoing costs, such as management fees; distribution and/or service (12b-1) fees; and other fund expenses. The Funds do not charge any sales loads, redemption fees or other transaction fees; however, you will be assessed fees for outgoing wire transfers, returned checks and stop payment orders at prevailing rates charged by U.S. Bancorp Fund Services, LLC, doing business as U.S. Bank Global Fund Services, the Funds’ transfer agent. If you request that a redemption be made by wire transfer, currently the Funds’ transfer agent charges a $15.00 fee.
This Example is intended to help you understand your ongoing costs (in dollars) of investing in each Fund and to compare these costs with the ongoing costs of investing in other mutual funds. The Example is based on an investment of $1,000 invested at the beginning of the period and held for the entire period (1/1/23 – 6/30/23).
Actual Expenses
The third and fourth columns of the following table provide information about account values and actual expenses. You may use the information in these columns, together with the amount you invested, to estimate the expenses that you paid over the period. Simply divide your account value by $1,000 (for example, an $8,600 account value divided by $1,000 = 8.6), then multiply the result by the number in the fourth column entitled “Expenses Paid During Period” to estimate the expenses you paid on your account during this period.
Hypothetical Example for Comparison Purposes
The fifth and sixth columns of the following table provide information about hypothetical account values and hypothetical expenses based on the Funds’ actual expense ratios and an assumed rate of return of 5% per year before expenses, which is not the Funds’ actual returns. The hypothetical account values and expenses may not be used to estimate the actual ending account balance or expenses you paid for the period. You may use this information to compare the ongoing costs of investing in the Funds and other mutual funds. To do so, compare this 5% hypothetical example with the 5% hypothetical examples that appear in the shareholder reports of the other mutual funds. Please note that the expenses shown in the table are meant to highlight your ongoing costs only. Therefore, the sixth column of the table (entitled “Expenses Paid During Period”) is useful in comparing ongoing costs only, and will not help you determine the relative total costs of owning different mutual funds.
Actual vs. Hypothetical Returns
| | | | | | | Hypothetical (5% return |
| | | | Actual | | before expenses) |
| | | Beginning | Ending | | | Ending | |
| | Fund’s Annualized | Account Value | Account Value | Expenses Paid | | Account Value | Expenses Paid |
| | Expense Ratio(1) | 1/1/23 | 6/30/23 | During Period(1) | | 6/30/23 | During Period(1) |
| Baird Mid Cap Growth Fund | | | | | | | |
| Institutional Class | 0.81% | $1,000.00 | $1,165.60 | $4.35 | | $1,020.78 | $4.06 |
| Investor Class | 1.06% | $1,000.00 | $1,163.70 | $5.69 | | $1,019.54 | $5.31 |
| | | | | | | | |
| Baird Small/Mid Cap Growth Fund | | | | | | | |
| Institutional Class | 0.85% | $1,000.00 | $1,128.90 | $4.49 | | $1,020.58 | $4.26 |
| Investor Class | 1.10% | $1,000.00 | $1,127.80 | $5.80 | | $1,019.34 | $5.51 |
| | | | | | | | |
| Baird Equity Opportunity Fund | | | | | | | |
| Institutional Class | 1.25% | $1,000.00 | $1,099.00 | $6.51 | | $1,018.60 | $6.26 |
| Investor Class | 1.50% | $1,000.00 | $1,098.70 | $7.81 | | $1,017.36 | $7.50 |
| | | | | | | | |
| Baird Chautauqua International Growth Fund | | | | | | |
| Institutional Class | 0.80% | $1,000.00 | $1,120.50 | $4.21 | | $1,020.83 | $4.01 |
| Investor Class | 1.05% | $1,000.00 | $1,119.10 | $5.52 | | $1,019.59 | $5.26 |
| | | | | | | | |
| Baird Chautauqua Global Growth Fund | | | | | | | |
| Institutional Class | 0.80% | $1,000.00 | $1,118.80 | $4.20 | | $1,020.83 | $4.01 |
| Investor Class | 1.05% | $1,000.00 | $1,117.30 | $5.51 | | $1,019.59 | $5.26 |
(1) | Expenses are equal to the Fund’s annualized net expense ratio multiplied by the average account value over the period, 181 days and divided by 365 to reflect the one-half year period. |
Statements of Assets and Liabilities
June 30, 2023 (Unaudited)
| | | Baird Mid Cap | | | Baird Small/Mid | | | Baird Equity | |
| | | Growth Fund | | | Cap Growth Fund | | | Opportunity Fund | |
| ASSETS: | | | | | | | | | |
| Investments, at value (cost $1,708,488,823, $154,112,942, and $58,577,251, respectively) | | $ | 2,324,832,528 | | | $ | 179,027,320 | | | $ | 62,342,204 | |
| Dividends receivable | | | 473,573 | | | | 17,364 | | | | 51,215 | |
| Interest receivable | | | 390,677 | | | | 34,456 | | | | 1,989 | |
| Receivable for investments sold | | | — | | | | — | | | | 72,342 | |
| Receivable for Fund shares sold | | | 3,838,665 | | | | 1,285,848 | | | | 1,877 | |
| Prepaid expenses and other assets | | | 63,464 | | | | 31,268 | | | | 33,402 | |
| Total assets | | | 2,329,598,907 | | | | 180,396,256 | | | | 62,503,029 | |
| LIABILITIES: | | | | | | | | | | | | |
| Written option contracts, at value (premiums received $0, $0, and $198,093, respectively) | | | — | | | | — | | | | 99,152 | |
| Payable for investments purchased | | | 2,745,525 | | | | 2,576,494 | | | | 66,310 | |
| Payable for Fund shares redeemed | | | 3,662,557 | | | | 307,660 | | | | 20,092 | |
| Payable to Advisor, net (Note 5) | | | 1,374,307 | | | | 97,023 | | | | 41,568 | |
| Payable to Directors | | | 23,245 | | | | 23,207 | | | | 23,207 | |
| Accrued shareholder servicing fees | | | 80,719 | | | | 5,170 | | | | 4,462 | |
| Accrued fund accounting and administration fees | | | 22,607 | | | | 6,209 | | | | 4,791 | |
| Accrued professional fees | | | 7,513 | | | | 7,514 | | | | 8,009 | |
| Accrued custody fees | | | 3,374 | | | | 878 | | | | 472 | |
| Accrued Rule 12b-1 fees (Note 7) | | | 69,029 | | | | 828 | | | | 461 | |
| Accrued expenses and other liabilities | | | 23,720 | | | | 5,334 | | | | 1,413 | |
| Total liabilities | | | 8,012,596 | | | | 3,030,317 | | | | 269,937 | |
| NET ASSETS | | $ | 2,321,586,311 | | | $ | 177,365,939 | | | $ | 62,233,092 | |
| NET ASSETS CONSIST OF: | | | | | | | | | | | | |
| Paid-in capital | | $ | 1,623,157,605 | | | $ | 179,944,117 | | | $ | 60,302,420 | |
| Total distributable earnings (accumulated deficit) | | | 698,428,706 | | | | (2,578,178 | ) | | | 1,930,672 | |
| NET ASSETS | | $ | 2,321,586,311 | | | $ | 177,365,939 | | | $ | 62,233,092 | |
| INSTITUTIONAL CLASS SHARES | | | | | | | | | | | | |
| Net Assets | | $ | 2,139,896,890 | | | $ | 176,341,019 | | | $ | 62,230,604 | |
| Shares outstanding ($0.01 par value, unlimited shares authorized) | | | 87,393,480 | | | | 10,823,140 | | | | 4,830,060 | |
| Net asset value, offering and redemption price per share | | $ | 24.49 | | | $ | 16.29 | | | $ | 12.88 | |
| INVESTOR CLASS SHARES | | | | | | | | | | | | |
| Net Assets | | $ | 181,689,421 | | | $ | 1,024,920 | | | $ | 2,488 | |
| Shares outstanding ($0.01 par value, unlimited shares authorized) | | | 8,138,519 | | | | 63,832 | | | | 194 | |
| Net asset value, offering and redemption price per share | | $ | 22.32 | | | $ | 16.06 | | | $ | 12.80 | |
The accompanying notes are an integral part of these financial statements.
Statements of Assets and Liabilities
June 30, 2023 (Unaudited)
| | | Baird Chautauqua | | | Baird Chautauqua | |
| | | International | | | Global | |
| | | Growth Fund | | | Growth Fund | |
| ASSETS: | | | | | | |
| Investments, at value (cost $551,905,841 and $269,446,991, respectively) | | $ | 659,706,341 | | | $ | 304,001,065 | |
| Foreign currency, at value (cost $1,128,827 and $679,407, respectively) | | | 1,119,326 | | | | 676,975 | |
| Dividends receivable | | | 1,350,564 | | | | 479,508 | |
| Interest receivable | | | 75,279 | | | | 32,248 | |
| Receivable for Fund shares sold | | | 1,707,695 | | | | 388,577 | |
| Uninvested cash | | | 107,739 | | | | 46,694 | |
| Prepaid expenses and other assets | | | 45,037 | | | | 38,090 | |
| Total assets | | | 664,111,981 | | | | 305,663,157 | |
| LIABILITIES: | | | | | | | | |
| Payable for Fund shares redeemed | | | 404,787 | | | | 379,373 | |
| Payable to Advisor, net (Note 5) | | | 384,704 | | | | 170,019 | |
| Payable to Directors | | | 23,207 | | | | 23,207 | |
| Accrued shareholder servicing fees | | | 22,247 | | | | 9,754 | |
| Accrued fund accounting and administration fees | | | 12,744 | | | | 10,596 | |
| Accrued custody fees | | | 13,163 | | | | 6,000 | |
| Accrued professional fees | | | 8,554 | | | | 8,554 | |
| Accrued Rule 12b-1 fees (Note 7) | | | 9,678 | | | | 840 | |
| Deferred tax | | | 213,343 | | | | 85,628 | |
| Accrued expenses and other liabilities | | | 33,743 | | | | 14,667 | |
| Total liabilities | | | 1,126,170 | | | | 708,638 | |
| NET ASSETS | | $ | 662,985,811 | | | $ | 304,954,519 | |
| NET ASSETS CONSIST OF: | | | | | | | | |
| Paid-in capital | | $ | 577,081,130 | | | $ | 275,357,894 | |
| Total distributable earnings | | | 85,904,681 | | | | 29,596,625 | |
| NET ASSETS | | $ | 662,985,811 | | | $ | 304,954,519 | |
| INSTITUTIONAL CLASS SHARES | | | | | | | | |
| Net Assets | | $ | 645,358,632 | | | $ | 303,898,686 | |
| Shares outstanding ($0.01 par value, unlimited shares authorized) | | | 37,922,292 | | | | 15,225,336 | |
| Net asset value, offering and redemption price per share | | $ | 17.02 | | | $ | 19.96 | |
| INVESTOR CLASS SHARES | | | | | | | | |
| Net Assets | | $ | 17,627,179 | | | $ | 1,055,833 | |
| Shares outstanding ($0.01 par value, unlimited shares authorized) | | | 1,042,625 | | | | 53,533 | |
| Net asset value, offering and redemption price per share | | $ | 16.91 | | | $ | 19.72 | |
The accompanying notes are an integral part of these financial statements.
Statements of Operations
Six Months Ended June 30, 2023 (Unaudited)
| | | Baird Mid Cap | | | Baird Small/Mid | | | Baird Equity | |
| | | Growth Fund | | | Cap Growth Fund | | | Opportunity Fund | |
| INVESTMENT INCOME: | | | | | | | | | |
| Dividends (net of issuance fees and/or foreign taxes withheld of $0, $440, and $3,384, respectively) | | $ | 6,323,653 | | | $ | 375,947 | | | $ | 483,463 | |
| Interest | | | 1,570,582 | | | | 149,794 | | | | 45,353 | |
| Total investment income | | | 7,894,235 | | | | 525,741 | | | | 528,816 | |
| | | | | | | | | | | | | |
| EXPENSES: | | | | | | | | | | | | |
| Investment advisory fees (Note 5) | | | 7,939,785 | | | | 606,650 | | | | 381,322 | |
| Shareholder servicing fees | | | 409,051 | | | | 14,939 | | | | 11,517 | |
| Directors fees | | | 48,073 | | | | 48,034 | | | | 48,034 | |
| Fund accounting and administration fees | | | 70,262 | | | | 20,753 | | | | 17,615 | |
| Federal and state registration | | | 54,486 | | | | 28,954 | | | | 25,110 | |
| Professional fees | | | 17,708 | | | | 17,540 | | | | 21,775 | |
| Reports to shareholders | | | 36,999 | | | | 3,193 | | | | 2,174 | |
| Custody fees | | | 10,045 | | | | 1,560 | | | | 2,789 | |
| Interest expense (Note 6) | | | — | | | | 47 | | | | 81 | |
| Miscellaneous expenses | | | 1,403 | | | | 194 | | | | 168 | |
| Rule 12b-1 fees – Investor Class Shares (Note 7) | | | 210,106 | | | | 1,144 | | | | 4 | |
| Total expenses | | | 8,797,918 | | | | 743,008 | | | | 510,589 | |
| Fee waiver by Advisor (Note 5) | | | — | | | | (54,280 | ) | | | (129,183 | ) |
| Net expenses | | | 8,797,918 | | | | 688,728 | | | | 381,406 | |
| NET INVESTMENT INCOME (LOSS) | | | (903,683 | ) | | | (162,987 | ) | | | 147,410 | |
| | | | | | | | | | | | | |
| REALIZED AND UNREALIZED GAIN (LOSS) ON INVESTMENTS: | | | | | | | | | | | | |
| Net realized gain (loss) on: | | | | | | | | | | | | |
| Investments | | | 132,581,727 | | | | (7,523,269 | ) | | | (1,245,915 | ) |
| Written option contracts | | | — | | | | — | | | | 119,165 | |
| Net change in unrealized appreciation on: | | | | | | | | | | | | |
| Investments | | | 188,720,520 | | | | 27,188,451 | | | | 6,534,469 | |
| Written option contracts | | | — | | | | — | | | | 15,179 | |
| Net realized and unrealized gain on investments | | | 321,302,247 | | | | 19,665,182 | | | | 5,422,898 | |
| NET INCREASE IN NET ASSETS RESULTING FROM OPERATIONS | | $ | 320,398,564 | | | $ | 19,502,195 | | | $ | 5,570,308 | |
The accompanying notes are an integral part of these financial statements.
Statements of Operations
Six Months Ended June 30, 2023 (Unaudited)
| | | Baird Chautauqua | | | Baird Chautauqua | |
| | | International | | | Global | |
| | | Growth Fund | | | Growth Fund | |
| INVESTMENT INCOME: | | | | | | |
| Dividends (net of issuance fees and/or foreign taxes withheld of $847,161 and $304,225, respectively) | | $ | 6,116,849 | | | $ | 2,430,974 | |
| Interest | | | 394,800 | | | | 157,372 | |
| Total investment income | | | 6,511,649 | | | | 2,588,346 | |
| | | | | | | | | |
| EXPENSES: | | | | | | | | |
| Investment advisory fees (Note 5) | | | 2,203,731 | | | | 1,084,455 | |
| Shareholder servicing fees | | | 83,549 | | | | 29,151 | |
| Directors fees | | | 48,034 | | | | 48,034 | |
| Custody fees | | | 42,131 | | | | 18,036 | |
| Federal and state registration | | | 45,431 | | | | 39,418 | |
| Fund accounting and administration fees | | | 36,126 | | | | 28,000 | |
| Professional fees | | | 18,584 | | | | 18,584 | |
| Reports to shareholders | | | 10,702 | | | | 4,253 | |
| Miscellaneous expenses | | | 4,564 | | | | 4,587 | |
| Rule 12b-1 fees – Investor Class Shares (Note 7) | | | 20,341 | | | | 1,294 | |
| Total expenses | | | 2,513,193 | | | | 1,275,812 | |
| Fee waiver by Advisor (Note 5) | | | (142,206 | ) | | | (117,766 | ) |
| Net expenses | | | 2,370,987 | | | | 1,158,046 | |
| NET INVESTMENT INCOME | | | 4,140,662 | | | | 1,430,300 | |
| | | | | | | | | |
| REALIZED AND UNREALIZED GAIN (LOSS) ON INVESTMENTS AND FOREIGN CURRENCY TRANSLATION: | | | | | | | | |
| Net realized gain (loss) on: | | | | | | | | |
| Investments (net of foreign taxes withheld of $18 and $856, respectively) | | | 412,334 | | | | (2,066,754 | ) |
| Foreign currency translation | | | (131,082 | ) | | | (27,322 | ) |
| Net change in unrealized appreciation (depreciation) on: | | | | | | | | |
| Investments | | | 56,211,994 | | | | 32,410,182 | |
| Foreign currency translation | | | (8,590 | ) | | | (2,217 | ) |
| Net realized and unrealized gain on investments and foreign currency translation | | | 56,484,656 | | | | 30,313,889 | |
| NET INCREASE IN NET ASSETS RESULTING FROM OPERATIONS | | $ | 60,625,318 | | | $ | 31,744,189 | |
The accompanying notes are an integral part of these financial statements.
Statements of Changes in Net Assets
| | | Baird Mid Cap Growth Fund | | | Baird Small/Mid Cap Growth Fund | |
| | | Six Months Ended | | | | | | Six Months Ended | | | | |
| | | June 30, 2023 | | | Year Ended | | | June 30, 2023 | | | Year Ended | |
| | | (Unaudited) | | | December 31, 2022 | | | (Unaudited) | | | December 31, 2022 | |
| OPERATIONS: | | | | | | | | | | | | |
| Net investment loss | | $ | (903,683 | ) | | $ | (6,399,901 | ) | | $ | (162,987 | ) | | $ | (522,310 | ) |
| Net realized gain (loss) on investments | | | 132,581,727 | | | | (45,618,233 | ) | | | (7,523,269 | ) | | | (19,684,321 | ) |
| Net change in unrealized appreciation (depreciation) on investments | | | 188,720,520 | | | | (676,294,509 | ) | | | 27,188,451 | | | | (28,001,622 | ) |
| Net increase (decrease) in net assets resulting from operations | | | 320,398,564 | | | | (728,312,643 | ) | | | 19,502,195 | | | | (48,208,253 | ) |
| | | | | | | | | | | | | | | | | |
| CAPITAL SHARE TRANSACTIONS: | | | | | | | | | | | | | | | | |
| Proceeds from shares sold | | | 286,617,494 | | | | 630,389,326 | | | | 19,963,915 | | | | 46,431,461 | |
| Shares issued to holders in reinvestment of distributions | | | — | | | | 26,758,497 | | | | — | | | | 993,301 | |
| Cost of shares redeemed | | | (201,836,728 | ) | | | (549,380,616 | ) | | | (9,963,912 | ) | | | (15,543,812 | ) |
| Net increase in net assets resulting from capital share transactions | | | 84,780,766 | | | | 107,767,207 | | | | 10,000,003 | | | | 31,880,950 | |
| | | | | | | | | | | | | | | | | |
| DISTRIBUTIONS TO SHAREHOLDERS: | | | | | | | | | | | | | | | | |
| Net distributions to shareholders: | | | | | | | | | | | | | | | | |
| Institutional Class | | | — | | | | (28,370,957 | ) | | | — | | | | (994,847 | ) |
| Investor Class | | | — | | | | (2,701,934 | ) | | | — | | | | (5,385 | ) |
| Total net distributions to shareholders | | | — | | | | (31,072,891 | ) | | | — | | | | (1,000,232 | ) |
| | | | | | | | | | | | | | | | | |
| TOTAL INCREASE (DECREASE) IN NET ASSETS | | | 405,179,330 | | | | (651,618,327 | ) | | | 29,502,198 | | | | (17,327,535 | ) |
| | | | | | | | | | | | | | | | | |
| NET ASSETS: | | | | | | | | | | | | | | | | |
| Beginning of period | | | 1,916,406,981 | | | | 2,568,025,308 | | | | 147,863,741 | | | | 165,191,276 | |
| End of period | | $ | 2,321,586,311 | | | $ | 1,916,406,981 | | | $ | 177,365,939 | | | $ | 147,863,741 | |
The accompanying notes are an integral part of these financial statements.
Statements of Changes in Net Assets
| | | Baird Equity Opportunity Fund | |
| | | Six Months Ended | | | | |
| | | June 30, 2023 | | | Year Ended | |
| | | (Unaudited) | | | December 31, 2022 | |
| OPERATIONS: | | | | | | |
| Net investment income (loss) | | $ | 147,410 | | | $ | (314,797 | ) |
| Net realized gain (loss) on investments and written option contracts | | | (1,126,750 | ) | | | 628,660 | |
| Net change in unrealized appreciation (depreciation) on investments and written option contracts | | | 6,549,648 | | | | (7,300,490 | ) |
| Net increase (decrease) in net assets resulting from operations | | | 5,570,308 | | | | (6,986,627 | ) |
| | | | | | | | | |
| CAPITAL SHARE TRANSACTIONS: | | | | | | | | |
| Proceeds from shares sold | | | 4,081,551 | | | | 12,850,612 | |
| Shares issued to holders in reinvestment of distributions | | | — | | | | 14,261,145 | |
| Cost of shares redeemed | | | (5,233,270 | ) | | | (8,777,787 | ) |
| Net increase (decrease) in net assets resulting from capital share transactions | | | (1,151,719 | ) | | | 18,333,970 | |
| | | | | | | | | |
| DISTRIBUTIONS TO SHAREHOLDERS: | | | | | | | | |
| Net distributions to shareholders: | | | | | | | | |
| Institutional Class | | | — | | | | (14,495,880 | ) |
| Investor Class | | | — | | | | (570 | ) |
| Total net distributions to shareholders | | | — | | | | (14,496,450 | ) |
| | | | | | | | | |
| TOTAL INCREASE (DECREASE) IN NET ASSETS | | | 4,418,589 | | | | (3,149,107 | ) |
| | | | | | | | | |
| NET ASSETS: | | | | | | | | |
| Beginning of period | | | 57,814,503 | | | | 60,963,610 | |
| End of period | | $ | 62,233,092 | | | $ | 57,814,503 | |
The accompanying notes are an integral part of these financial statements.
Statements of Changes in Net Assets
| | Baird Chautauqua International Growth Fund | | Baird Chautauqua Global Growth Fund | |
| | | Six Months Ended | | | | | | Six Months Ended | | | | |
| | | June 30, 2023 | | | Year Ended | | | June 30, 2023 | | | Year Ended | |
| | | (Unaudited) | | | December 31, 2022 | | | (Unaudited) | | | December 31, 2022 | |
| OPERATIONS: | | | | | | | | | | | | |
| Net investment income | | $ | 4,140,662 | | | $ | 1,716,204 | | | $ | 1,430,300 | | | $ | 548,276 | |
| Net realized gain (loss) on investments and foreign currency translation | | | 281,252 | | | | (22,963,179 | ) | | | (2,094,076 | ) | | | (3,016,153 | ) |
| Net change in unrealized appreciation (depreciation) on | | | | | | | | | | | | | | | | |
| investments and foreign currency translation | | | 56,203,404 | | | | (71,271,860 | ) | | | 32,407,965 | | | | (62,326,005 | ) |
| Net increase (decrease) in net assets resulting from operations | | | 60,625,318 | | | | (92,518,835 | ) | | | 31,744,189 | | | | (64,793,882 | ) |
| | | | | | | | | | | | | | | | | |
| CAPITAL SHARE TRANSACTIONS: | | | | | | | | | | | | | | | | |
| Proceeds from shares sold | | | 162,709,464 | | | | 284,419,533 | | | | 19,090,583 | | | | 56,027,768 | |
| Shares issued to holders in reinvestment of distributions | | | — | | | | 3,796,060 | | | | — | | | | 326,779 | |
| Cost of shares redeemed | | | (53,414,666 | ) | | | (167,135,571 | ) | | | (11,748,438 | ) | | | (41,676,691 | ) |
| Net increase in net assets resulting from capital share transactions | | | 109,294,798 | | | | 121,080,022 | | | | 7,342,145 | | | | 14,677,856 | |
| | | | | | | | | | | | | | | | | |
| DISTRIBUTIONS TO SHAREHOLDERS: | | | | | | | | | | | | | | | | |
| Net distributions to shareholders: | | | | | | | | | | | | | | | | |
| Institutional Class | | | — | | | | (4,214,970 | ) | | | — | | | | (343,463 | ) |
| Investor Class | | | — | | | | (110,964 | ) | | | — | | | | (1,217 | ) |
| Total net distributions to shareholders | | | — | | | | (4,325,934 | ) | | | — | | | | (344,680 | ) |
| | | | | | | | | | | | | | | | | |
| TOTAL INCREASE (DECREASE) IN NET ASSETS | | | 169,920,116 | | | | 24,235,253 | | | | 39,086,334 | | | | (50,460,706 | ) |
| | | | | | | | | | | | | | | | | |
| NET ASSETS: | | | | | | | | | | | | | | | | |
| Beginning of period | | | 493,065,695 | | | | 468,830,442 | | | | 265,868,185 | | | | 316,328,891 | |
| End of period | | $ | 662,985,811 | | | $ | 493,065,695 | | | $ | 304,954,519 | | | $ | 265,868,185 | |
The accompanying notes are an integral part of these financial statements.
Financial Highlights
Baird Mid Cap Growth Fund – Institutional Class
| | | Six Months Ended | | | | | | | | | | | | | | | | |
| | | June 30, 2023 | | | Year Ended December 31, | |
| | | (Unaudited) | | | 2022 | | | 2021 | | | 2020 | | | 2019 | | | 2018 | |
| Per Share Data: | | | | | | | | | | | | | | | | | | |
| Net asset value, beginning of period | | $ | 21.01 | | | $ | 29.50 | | | $ | 28.17 | | | $ | 22.90 | | | $ | 17.72 | | | $ | 19.16 | |
| Income from investment operations: | | | | | | | | | | | | | | | | | | | | | | | | |
Net investment loss(1) | | | (0.01 | ) | | | (0.07 | ) | | | (0.15 | ) | | | (0.08 | ) | | | (0.02 | ) | | | (0.03 | ) |
Net realized and unrealized gains (losses) on investments | | | 3.49 | | | | (8.08 | ) | | | 6.30 | | | | 7.99 | | | | 6.44 | | | | (0.30 | ) |
| Total from investment operations | | | 3.48 | | | | (8.15 | ) | | | 6.15 | | | | 7.91 | | | | 6.42 | | | | (0.33 | ) |
| Less distributions: | | | | | | | | | | | | | | | | | | | | | | | | |
| Distributions from net realized gains | | | — | | | | (0.34 | ) | | | (4.82 | ) | | | (2.64 | ) | | | (1.24 | ) | | | (1.11 | ) |
| Total distributions | | | — | | | | (0.34 | ) | | | (4.82 | ) | | | (2.64 | ) | | | (1.24 | ) | | | (1.11 | ) |
| Net asset value, end of period | | $ | 24.49 | | | $ | 21.01 | | | $ | 29.50 | | | $ | 28.17 | | | $ | 22.90 | | | $ | 17.72 | |
| Total return | | | 16.56 | %(2) | | | (27.64 | )% | | | 22.51 | % | | | 34.81 | % | | | 36.31 | % | | | (1.61 | )% |
| | | | | | | | | | | | | | | | | | | | | | | | | |
| Supplemental data and ratios: | | | | | | | | | | | | | | | | | | | | | | | | |
| Net assets, end of period (millions) | | $ | 2,139.9 | | | $ | 1,762.8 | | | $ | 2,334.3 | | | $ | 2,065.5 | | | $ | 1,825.8 | | | $ | 1,337.4 | |
| Ratio of expenses to average net assets | | | 0.81 | %(3) | | | 0.81 | % | | | 0.80 | % | | | 0.82 | % | | | 0.82 | % | | | 0.81 | % |
| Ratio of net investment loss to average net assets | | | (0.07 | )%(3) | | | (0.29 | )% | | | (0.49 | )% | | | (0.35 | )% | | | (0.07 | )% | | | (0.15 | )% |
Portfolio turnover rate(4) | | | 26 | %(2) | | | 26 | % | | | 31 | % | | | 47 | % | | | 43 | % | | | 38 | % |
(1) Calculated using average shares outstanding during the period.
(2) Not annualized.
(3) Annualized.
(4) Portfolio turnover is calculated on the basis of the Fund as a whole without distinguishing between the classes of shares issued and excludes in-kind transactions, where applicable.
The accompanying notes are an integral part of these financial statements.
Financial Highlights
Baird Mid Cap Growth Fund – Investor Class
| | | Six Months Ended | | | | | | | | | | | | | | | | |
| | | June 30, 2023 | | | Year Ended December 31, | |
| | | (Unaudited) | | | 2022 | | | 2021 | | | 2020 | | | 2019 | | | 2018 | |
| Per Share Data: | | | | | | | | | | | | | | | | | | |
| Net asset value, beginning of period | | $ | 19.18 | | | $ | 27.04 | | | $ | 26.22 | | | $ | 21.53 | | | $ | 16.76 | | | $ | 18.23 | |
| Income from investment operations: | | | | | | | | | | | | | | | | | | | | | | | | |
Net investment loss(1) | | | (0.03 | ) | | | (0.11 | ) | | | (0.21 | ) | | | (0.14 | ) | | | (0.07 | ) | | | (0.08 | ) |
Net realized and unrealized gains (losses) on investments | | | 3.17 | | | | (7.41 | ) | | | 5.85 | | | | 7.47 | | | | 6.08 | | | | (0.28 | ) |
| Total from investment operations | | | 3.14 | | | | (7.52 | ) | | | 5.64 | | | | 7.33 | | | | 6.01 | | | | (0.36 | ) |
| Less distributions: | | | | | | | | | | | | | | | | | | | | | | | | |
| Distributions from net realized gains | | | — | | | | (0.34 | ) | | | (4.82 | ) | | | (2.64 | ) | | | (1.24 | ) | | | (1.11 | ) |
| Total distributions | | | — | | | | (0.34 | ) | | | (4.82 | ) | | | (2.64 | ) | | | (1.24 | ) | | | (1.11 | ) |
| Net asset value, end of period | | $ | 22.32 | | | $ | 19.18 | | | $ | 27.04 | | | $ | 26.22 | | | $ | 21.53 | | | $ | 16.76 | |
| Total return | | | 16.37 | %(2) | | | (27.82 | )% | | | 22.25 | % | | | 34.32 | % | | | 35.94 | % | | | (1.86 | )% |
| | | | | | | | | | | | | | | | | | | | | | | | | |
| Supplemental data and ratios: | | | | | | | | | | | | | | | | | | | | | | | | |
| Net assets, end of period (millions) | | $ | 181.7 | | | $ | 153.6 | | | $ | 233.7 | | | $ | 200.3 | | | $ | 148.3 | | | $ | 95.5 | |
| Ratio of expenses to average net assets | | | 1.06 | %(3) | | | 1.06 | % | | | 1.05 | % | | | 1.07 | % | | | 1.07 | % | | | 1.06 | % |
| Ratio of net investment loss to average net assets | | | (0.32 | )%(3) | | | (0.54 | )% | | | (0.74 | )% | | | (0.60 | )% | | | (0.32 | )% | | | (0.40 | )% |
Portfolio turnover rate(4) | | | 26 | %(2) | | | 26 | % | | | 31 | % | | | 47 | % | | | 43 | % | | | 38 | % |
(1) Calculated using average shares outstanding during the period.
(2) Not annualized.
(3) Annualized.
(4) Portfolio turnover is calculated on the basis of the Fund as a whole without distinguishing between the classes of shares issued and excludes in-kind transactions, where applicable.
The accompanying notes are an integral part of these financial statements.
Financial Highlights
Baird Small/Mid Cap Growth Fund – Institutional Class
| | | Six Months Ended | | | | | | | | | | | | | | | Period Ended | |
| | | June 30, 2023 | | | Year Ended December 31, | | | December 31, | |
| | | (Unaudited) | | | 2022 | | | 2021 | | | 2020 | | | 2019 | | | 2018(1) | |
| Per Share Data: | | | | | | | | | | | | | | | | | | |
| Net asset value, beginning of period | | $ | 14.43 | | | $ | 19.94 | | | $ | 17.39 | | | $ | 12.26 | | | $ | 8.95 | | | $ | 10.00 | |
| Income from investment operations: | | | | | | | | | | | | | | | | | | | | | | | | |
Net investment loss(2) | | | (0.02 | ) | | | (0.05 | ) | | | (0.12 | ) | | | (0.06 | ) | | | (0.03 | ) | | | (0.00 | )(3) |
Net realized and unrealized gains (losses) on investments | | | 1.88 | | | | (5.36 | ) | | | 3.29 | | | | 5.52 | | | | 3.34 | | | | (1.05 | ) |
| Total from investment operations | | | 1.86 | | | | (5.41 | ) | | | 3.17 | | | | 5.46 | | | | 3.31 | | | | (1.05 | ) |
| Less distributions: | | | | | | | | | | | | | | | | | | | | | | | | |
| Distributions from net realized gains | | | — | | | | (0.10 | ) | | | (0.62 | ) | | | (0.33 | ) | | | — | | | | — | |
| Total distributions | | | — | | | | (0.10 | ) | | | (0.62 | ) | | | (0.33 | ) | | | — | | | | — | |
| Net asset value, end of period | | $ | 16.29 | | | $ | 14.43 | | | $ | 19.94 | | | $ | 17.39 | | | $ | 12.26 | | | $ | 8.95 | |
| Total return | | | 12.89 | %(4) | | | (27.14 | )% | | | 18.42 | % | | | 44.57 | % | | | 36.98 | % | | | (10.50 | )%(4) |
| | | | | | | | | | | | | | | | | | | | | | | | | |
| Supplemental data and ratios: | | | | | | | | | | | | | | | | | | | | | | | | |
| Net assets, end of period (millions) | | $ | 176.3 | | | $ | 147.1 | | | $ | 164.3 | | | $ | 51.2 | | | $ | 18.3 | | | $ | 7.3 | |
| Ratio of expenses to average net assets | | | 0.85 | %(5) | | | 0.85 | % | | | 0.85 | % | | | 0.85 | % | | | 0.85 | % | | | 0.85 | %(5) |
| Ratio of expenses to average net assets (before waivers) | 0.92 | %(5) | | | 0.98 | % | | | 1.00 | % | | | 1.43 | % | | | 2.10 | % | | | 3.88 | %(5) |
| Ratio of net investment loss to average net assets | | | (0.20 | )%(5) | | | (0.33 | )% | | | (0.63 | )% | | | (0.41 | )% | | | (0.25 | )% | | | (0.03 | )%(5) |
| Ratio of net investment loss to average net assets (before waivers) | (0.27 | )%(5) | | | (0.45 | )% | | | (0.78 | )% | | | (0.99 | )% | | | (1.50 | )% | | | (3.06 | )%(5) |
Portfolio turnover rate(6) | | | 26 | %(4) | | | 39 | % | | | 50 | % | | | 65 | % | | | 60 | % | | | 9 | %(4) |
(1) | Inception was close of business on October 31, 2018. |
(2) | Calculated using average shares outstanding during the period. |
(3) | Amount is less than $0.005. |
(4) | Not annualized. |
(5) | Annualized. |
(6) | Portfolio turnover is calculated on the basis of the Fund as a whole without distinguishing between the classes of shares issued and excludes in-kind transactions, where applicable. |
The accompanying notes are an integral part of these financial statements.
Financial Highlights
Baird Small/Mid Cap Growth Fund – Investor Class
| | | Six Months Ended | | | | | | | | | | | | | | | Period Ended | |
| | | June 30, 2023 | | | Year Ended December 31, | | | December 31, | |
| | | (Unaudited) | | | 2022 | | | 2021 | | | 2020 | | | 2019 | | | 2018(1) | |
| Per Share Data: | | | | | | | | | | | | | | | | | | |
| Net asset value, beginning of period | | $ | 14.24 | | | $ | 19.72 | | | $ | 17.25 | | | $ | 12.21 | | | $ | 8.94 | | | $ | 10.00 | |
| Income from investment operations: | | | | | | | | | | | | | | | | | | | | | | | | |
Net investment loss(2) | | | (0.03 | ) | | | (0.09 | ) | | | (0.17 | ) | | | (0.09 | ) | | | (0.06 | ) | | | (0.00 | )(3) |
Net realized and unrealized gains (losses) on investments | | | 1.85 | | | | (5.29 | ) | | | 3.26 | | | | 5.46 | | | | 3.33 | | | | (1.06 | ) |
| Total from investment operations | | | 1.82 | | | | (5.38 | ) | | | 3.09 | | | | 5.37 | | | | 3.27 | | | | (1.06 | ) |
| Less distributions: | | | | | | | | | | | | | | | | | | | | | | | | |
| Distributions from net realized gains | | | — | | | | (0.10 | ) | | | (0.62 | ) | | | (0.33 | ) | | | — | | | | — | |
| Total distributions | | | — | | | | (0.10 | ) | | | (0.62 | ) | | | (0.33 | ) | | | — | | | | — | |
| Net asset value, end of period | | $ | 16.06 | | | $ | 14.24 | | | $ | 19.72 | | | $ | 17.25 | | | $ | 12.21 | | | $ | 8.94 | |
| Total return | | | 12.78 | %(4) | �� | | (27.29 | )% | | | 18.10 | % | | | 43.89 | % | | | 36.69 | % | | | (10.60 | )%(4) |
| | | | | | | | | | | | | | | | | | | | | | | | | |
| Supplemental data and ratios: | | | | | | | | | | | | | | | | | | | | | | | | |
| Net assets, end of period (thousands) | | $ | 1,024.9 | | | $ | 779.4 | | | $ | 863.7 | | | $ | 661.0 | | | $ | 287.3 | | | $ | 8.9 | |
| Ratio of expenses to average net assets | | | 1.10 | %(5) | | | 1.10 | % | | | 1.10 | % | | | 1.10 | % | | | 1.10 | % | | | 1.10 | %(5) |
| Ratio of expenses to average net assets (before waivers) | | | 1.17 | %(5) | | | 1.23 | % | | | 1.25 | % | | | 1.68 | % | | | 2.35 | % | | | 4.13 | %(5) |
| Ratio of net investment loss to average net assets | | | (0.45 | )%(5) | | | (0.58 | )% | | | (0.88 | )% | | | (0.66 | )% | | | (0.50 | )% | | | (0.28 | )%(5) |
| Ratio of net investment loss to average net assets (before waivers) | (0.52 | )%(5) | | | (0.70 | )% | | | (1.03 | )% | | | (1.24 | )% | | | (1.75 | )% | | | (3.31 | )%(5) |
Portfolio turnover rate(6) | | | 26 | %(4) | | | 39 | % | | | 50 | % | | | 65 | % | | | 60 | % | | | 9 | %(4) |
(1) | Inception was close of business on October 31, 2018. |
(2) | Calculated using average shares outstanding during the period. |
(3) | Amount is less than $0.005. |
(4) | Not annualized. |
(5) | Annualized. |
(6) | Portfolio turnover is calculated on the basis of the Fund as a whole without distinguishing between the classes of shares issued and excludes in-kind transactions, where applicable. |
The accompanying notes are an integral part of these financial statements.
Financial Highlights
Baird Equity Opportunity Fund – Institutional Class
| | | Six Months Ended | | | | | | | | | | | | | | | | |
| | | June 30, 2023 | | | Year Ended December 31, | |
| | | (Unaudited) | | | 2022 | | | 2021 | | | 2020 | | | 2019 | | | 2018 | |
| Per Share Data: | | | | | | | | | | | | | | | | | | |
| Net asset value, beginning of period | | $ | 11.72 | | | $ | 17.68 | | | $ | 15.56 | | | $ | 15.96 | | | $ | 13.58 | | | $ | 16.99 | |
| Income from investment operations: | | | | | | | | | | | | | | | | | | | | | | | | |
Net investment income (loss)(1) | | | 0.03 | | | | (0.09 | ) | | | 0.14 | | | | 0.03 | | | | 0.13 | | | | 0.05 | |
Net realized and unrealized gains (losses) on investments | | | 1.13 | | | | (1.95 | ) | | | 2.82 | | | | 0.43 | (2) | | | 2.36 | | | | (2.85 | ) |
| Total from investment operations | | | 1.16 | | | | (2.04 | ) | | | 2.96 | | | | 0.46 | | | | 2.49 | | | | (2.80 | ) |
| Less distributions: | | | | | | | | | | | | | | | | | | | | | | | | |
| Distributions from net investment income | | | — | | | | — | | | | (0.17 | ) | | | (0.03 | ) | | | (0.11 | ) | | | (0.06 | ) |
| Distributions from net realized gains | | | — | | | | (3.92 | ) | | | (0.67 | ) | | | (0.83 | ) | | | — | | | | (0.55 | ) |
| Total distributions | | | — | | | | (3.92 | ) | | | (0.84 | ) | | | (0.86 | ) | | | (0.11 | ) | | | (0.61 | ) |
| Net asset value, end of period | | $ | 12.88 | | | $ | 11.72 | | | $ | 17.68 | | | $ | 15.56 | | | $ | 15.96 | | | $ | 13.58 | |
| Total return | | | 9.90 | %(3) | | | (11.56 | )% | | | 19.40 | % | | | 2.85 | % | | | 18.40 | % | | | (16.45 | )% |
| | | | | | | | | | | | | | | | | | | | | | | | | |
| Supplemental data and ratios: | | | | | | | | | | | | | | | | | | | | | | | | |
| Net assets, end of period (millions) | | $ | 62.2 | | | $ | 57.8 | | | $ | 61.0 | | | $ | 30.4 | | | $ | 33.0 | | | $ | 28.8 | |
| Ratio of expenses to average net assets | | | 1.25 | %(4) | | | 1.25 | % | | | 0.98 | %(6) | | | 0.95 | % | | | 0.95 | % | | | 1.00 | %(5) |
| Ratio of expenses to average net assets (before waivers) | 1.67 | %(4) | | | 1.73 | % | | | 1.53 | % | | | 1.64 | % | | | 1.44 | % | | | 1.38 | % |
Ratio of net investment income (loss) to average net assets | 0.48 | %(4) | | | (0.55 | )% | | | 0.82 | % | | | 0.21 | % | | | 0.87 | % | | | 0.29 | % |
Ratio of net investment income (loss) to average net assets (before waivers) | 0.06 | %(4) | | | (1.02 | )% | | | 0.27 | % | | | (0.48 | )% | | | 0.38 | % | | | (0.09 | )% |
Portfolio turnover rate(8) | | | 31 | %(3) | | | 72 | % | | | 67 | %(7) | | | 61 | % | | | 55 | % | | | 36 | % |
(1) | Calculated using average shares outstanding during the period. |
(2) | Due to timing of capital share transactions, the per share amount of net realized and unrealized gain (loss) on investments varies from the amounts shown in the Statement of Operations. |
(3) | Not annualized. |
(4) | Annualized. |
(5) | Blended rate. Pursuant to the Expense Cap/Reimbursement Agreement effective December 1, 2018, the expense cap decreased to 0.95%. Prior to December 1, 2018, the expense cap was 1.00%. |
(6) | Blended rate. Pursuant to the Expense Cap/Reimbursement Agreement effective December 12, 2021, the expense cap increased to 1.25%. Prior to December 12, 2021, the expense cap was 0.95%. |
(7) | The cost of purchases and proceeds from sales of securities that were incurred by the Fund subsequent to Greenhouse’s appointment as subadvisor to the Baird Equity Opportunity Fund that related to the alignment of the Fund’s portfolio with Greenhouse’s investment style are excluded from the portfolio turnover rate calculation. If such amounts had not been excluded, the portfolio turnover rate would have been 189% for the year ended December 31, 2021. |
(8) | Portfolio turnover is calculated on the basis of the Fund as a whole without distinguishing between the classes of shares issued and excludes in-kind transactions, where applicable. |
The accompanying notes are an integral part of these financial statements.
Financial Highlights
Baird Equity Opportunity Fund – Investor Class
| | | Six Months Ended | | | | | | | | | | | | | | | | |
| | | June 30, 2023 | | | Year Ended December 31, | |
| | | (Unaudited) | | | 2022 | | | 2021 | | | 2020 | | | 2019 | | | 2018 | |
| Per Share Data: | | | | | | | | | | | | | | | | | | |
| Net asset value, beginning of period | | $ | 11.65 | | | $ | 17.65 | | | $ | 15.52 | | | $ | 15.97 | | | $ | 13.58 | | | $ | 16.97 | |
| Income from investment operations: | | | | | | | | | | | | | | | | | | | | | | | | |
Net investment income (loss)(1) | | | 0.01 | | | | (0.13 | ) | | | 0.10 | | | | (0.01 | ) | | | 0.09 | | | | 0.01 | |
Net realized and unrealized gains (losses) on investments | | | 1.14 | | | | (1.95 | ) | | | 2.83 | | | | 0.42 | (2) | | | 2.37 | | | | (2.85 | ) |
| Total from investment operations | | | 1.15 | | | | (2.08 | ) | | | 2.93 | | | | 0.41 | | | | 2.46 | | | | (2.84 | ) |
| Less distributions: | | | | | | | | | | | | | | | | | | | | | | | | |
| Distributions from net investment income | | | — | | | | — | | | | (0.13 | ) | | | (0.03 | ) | | | (0.07 | ) | | | — | |
| Distributions from net realized gains | | | — | | | | (3.92 | ) | | | (0.67 | ) | | | (0.83 | ) | | | — | | | | (0.55 | ) |
| Total distributions | | | — | | | | (3.92 | ) | | | (0.80 | ) | | | (0.86 | ) | | | (0.07 | ) | | | (0.55 | ) |
| Net asset value, end of period | | $ | 12.80 | | | $ | 11.65 | | | $ | 17.65 | | | $ | 15.52 | | | $ | 15.97 | | | $ | 13.58 | |
| Total return | | | 9.87 | %(3) | | | (11.77 | )% | | | 19.16 | % | | | 2.54 | % | | | 18.19 | % | | | (16.71 | )% |
| | | | | | | | | | | | | | | | | | | | | | | | | |
| Supplemental data and ratios: | | | | | | | | | | | | | | | | | | | | | | | | |
| Net assets, end of period (thousands) | | $ | 2.5 | | | $ | 2.3 | | | $ | 2.6 | | | $ | 295.7 | | | $ | 883.8 | | | $ | 758.6 | |
| Ratio of expenses to average net assets | | | 1.50 | %(4) | | | 1.50 | % | | | 1.23 | %(6) | | | 1.20 | % | | | 1.20 | % | | | 1.25 | %(5) |
| Ratio of expenses to average net assets (before waivers) | 1.92 | %(4) | | | 1.98 | % | | | 1.78 | % | | | 1.89 | % | | | 1.69 | % | | | 1.63 | % |
Ratio of net investment income (loss) to average net assets | | | 0.23 | %(4) | | | (0.80 | )% | | | 0.57 | % | | | (0.04 | )% | | | 0.62 | % | | | 0.04 | % |
Ratio of net investment income (loss) to average net assets (before waivers) | | | (0.19 | )%(4) | | | (1.27 | )% | | | 0.02 | % | | | (0.73 | )% | | | 0.13 | % | | | (0.34 | )% |
Portfolio turnover rate(8) | | | 31 | %(3) | | | 72 | % | | | 67 | %(7) | | | 61 | % | | | 55 | % | | | 36 | % |
(1) | Calculated using average shares outstanding during the period. |
(2) | Due to timing of capital share transactions, the per share amount of net realized and unrealized gain (loss) on investments varies from the amounts shown in the Statement of Operations. |
(3) | Not annualized. |
(4) | Annualized. |
(5) | Blended rate. Pursuant to the Expense Cap/Reimbursement Agreement effective December 1, 2018, the expense cap decreased to 1.20%. Prior to December 1, 2018, the expense cap was 1.25%. |
(6) | Blended rate. Pursuant to the Expense Cap/Reimbursement Agreement effective December 12, 2021, the expense cap increased to 1.50%. Prior to December 12, 2021, the expense cap was 1.20%. |
(7) | The cost of purchases and proceeds from sales of securities that were incurred by the Fund subsequent to Greenhouse’s appointment as subadvisor to the Baird Equity Opportunity Fund that related to the alignment of the Fund’s portfolio with Greenhouse’s investment style are excluded from the portfolio turnover rate calculation. If such amounts had not been excluded, the portfolio turnover rate would have been 189% for the year ended December 31, 2021. |
(8) | Portfolio turnover is calculated on the basis of the Fund as a whole without distinguishing between the classes of shares issued and excludes in-kind transactions, where applicable. |
The accompanying notes are an integral part of these financial statements.
Financial Highlights
Baird Chautauqua International Growth Fund – Institutional Class
| | | Six Months Ended | | | | | | | | | | | | | | | | |
| | | June 30, 2023 | | | Year Ended December 31, | |
| | | (Unaudited) | | | 2022 | | | 2021 | | | 2020 | | | 2019 | | | 2018 | |
| Per Share Data: | | | | | | | | | | | | | | | | | | |
| Net asset value, beginning of period | | $ | 15.19 | | | $ | 18.65 | | | $ | 17.51 | | | $ | 12.62 | | | $ | 10.17 | | | $ | 12.59 | |
| Income from investment operations: | | | | | | | | | | | | | | | | | | | | | | | | |
Net investment income(1) | | | 0.12 | | | | 0.06 | | | | 0.04 | | | | 0.01 | | | | 0.30 | | | | 0.06 | |
| Net realized and unrealized gains (losses) | | | | | | | | | | | | | | | | | | | | | | | | |
| on investments and foreign currency translation | | | 1.71 | | | | (3.38 | ) | | | 1.19 | | | | 5.00 | | | | 2.42 | | | | (2.19 | ) |
| Total from investment operations | | | 1.83 | | | | (3.32 | ) | | | 1.23 | | | | 5.01 | | | | 2.72 | | | | (2.13 | ) |
| Less distributions: | | | | | | | | | | | | | | | | | | | | | | | | |
| Distributions from net investment income | | | — | | | | (0.03 | ) | | | (0.09 | ) | | | (0.12 | ) | | | (0.27 | ) | | | (0.06 | ) |
| Distributions from net realized gains | | | — | | | | (0.11 | ) | | | — | | | | — | | | | — | | | | (0.23 | ) |
| Total distributions | | | — | | | | (0.14 | ) | | | (0.09 | ) | | | (0.12 | ) | | | (0.27 | ) | | | (0.29 | ) |
Paid in capital from redemption fees(2) | | | — | | | | — | | | | 0.00 | (3) | | | 0.00 | (3) | | | 0.00 | (3) | | | 0.00 | (3) |
| Net asset value, end of period | | $ | 17.02 | | | $ | 15.19 | | | $ | 18.65 | | | $ | 17.51 | | | $ | 12.62 | | | $ | 10.17 | |
| Total return | | | 12.05 | %(4) | | | (17.84 | )% | | | 6.90 | % | | | 39.84 | % | | | 26.72 | % | | | (16.94 | )% |
| | | | | | | | | | | | | | | | | | | | | | | | | |
| Supplemental data and ratios: | | | | | | | | | | | | | | | | | | | | | | | | |
| Net assets, end of period (millions) | | $ | 645.4 | | | $ | 479.1 | | | $ | 468.2 | | | $ | 321.8 | | | $ | 172.7 | | | $ | 85.4 | |
| Ratio of expenses to average net assets | | | 0.80 | %(5) | | | 0.80 | % | | | 0.80 | % | | | 0.80 | % | | | 0.80 | % | | | 0.94 | %(6) |
| Ratio of expenses to average net assets (before waivers) | 0.85 | %(5) | | | 0.87 | % | | | 0.86 | % | | | 0.90 | % | | | 0.96 | % | | | 1.07 | % |
| Ratio of net investment income to average net assets | | | 1.42 | %(5) | | | 0.37 | % | | | 0.20 | % | | | 0.07 | % | | | 2.56 | % | | | 0.51 | % |
Ratio of net investment income (loss) to average net assets (before waivers) | | | 1.37 | %(5) | | | 0.31 | % | | | 0.14 | % | | | (0.03 | )% | | | 2.40 | % | | | 0.38 | % |
Portfolio turnover rate(7) | | | 4 | %(4) | | | 23 | % | | | 14 | % | | | 31 | % | | | 31 | % | | | 42 | % |
(1) | Calculated using average shares outstanding during the period. |
(2) | Effective December 1, 2021, the Fund eliminated the 2.00% redemption fee charged on amounts redeemed for shares held 90 days or less. |
(3) | Amount is less than $0.005. |
(4) | Not annualized. |
(5) | Annualized. |
(6) | Blended rate. Pursuant to the Expense Cap/Reimbursement Agreement effective December 1, 2018, the expense cap decreased to 0.80%. Prior to December 1, 2018, the expense cap was 0.95%. |
(7) | Portfolio turnover is calculated on the basis of the Fund as a whole without distinguishing between the classes of shares issued and excludes in-kind transactions, where applicable. |
The accompanying notes are an integral part of these financial statements.
Financial Highlights
Baird Chautauqua International Growth Fund – Investor Class
| | | Six Months Ended | | | | | | | | | | | | | | | | |
| | | June 30, 2023 | | | Year Ended December 31, | |
| | | (Unaudited) | | | 2022 | | | 2021 | | | 2020 | | | 2019 | | | 2018 | |
| Per Share Data: | | | | | | | | | | | | | | | | | | |
| Net asset value, beginning of period | | $ | 15.11 | | | $ | 18.58 | | | $ | 17.48 | | | $ | 12.60 | | | $ | 10.15 | | | $ | 12.57 | |
| Income from investment operations: | | | | | | | | | | | | | | | | | | | | | | | | |
Net investment income (loss)(1) | | | 0.10 | | | | 0.02 | | | | (0.01 | ) | | | (0.02 | ) | | | 0.27 | | | | 0.03 | |
| Net realized and unrealized gains (losses) | | | | | | | | | | | | | | | | | | | | | | | | |
| on investments and foreign currency translation | | | 1.70 | | | | (3.37 | ) | | | 1.20 | | | | 4.95 | (2) | | | 2.41 | | | | (2.19 | ) |
| Total from investment operations | | | 1.80 | | | | (3.35 | ) | | | 1.19 | | | | 4.93 | | | | 2.68 | | | | (2.16 | ) |
| Less distributions: | | | | | | | | | | | | | | | | | | | | | | | | |
| Distributions from net investment income | | | — | | | | (0.01 | ) | | | (0.09 | ) | | | (0.05 | ) | | | (0.23 | ) | | | (0.03 | ) |
| Distributions from net realized gains | | | — | | | | (0.11 | ) | | | — | | | | — | | | | — | | | | (0.23 | ) |
| Total distributions | | | — | | | | (0.12 | ) | | | (0.09 | ) | | | (0.05 | ) | | | (0.23 | ) | | | (0.26 | ) |
Paid in capital from redemption fees(3) | | | — | | | | — | | | | 0.00 | (4) | | | 0.00 | (4) | | | 0.00 | (4) | | | 0.00 | (4) |
| Net asset value, end of period | | $ | 16.91 | | | $ | 15.11 | | | $ | 18.58 | | | $ | 17.48 | | | $ | 12.60 | | | $ | 10.15 | |
| Total return | | | 11.91 | %(5) | | | (18.03 | )% | | | 6.62 | % | | | 39.37 | % | | | 26.42 | % | | | (17.21 | )% |
| | | | | | | | | | | | | | | | | | | | | | | | | |
| Supplemental data and ratios: | | | | | | | | | | | | | | | | | | | | | | | | |
| Net assets, end of period (thousands) | | $ | 17,627.2 | | | $ | 13,993.5 | | | $ | 608.0 | | | $ | 697.4 | | | $ | 1,494.8 | | | $ | 2,147.0 | |
| Ratio of expenses to average net assets | | | 1.05 | %(6) | | | 1.05 | % | | | 1.05 | % | | | 1.05 | % | | | 1.05 | % | | | 1.19 | %(7) |
| Ratio of expenses to average net assets (before waivers) | 1.10 | %(6) | | | 1.12 | % | | | 1.11 | % | | | 1.15 | % | | | 1.21 | % | | | 1.32 | % |
Ratio of net investment income (loss) to average net assets | | | 1.17 | %(6) | | | 0.12 | % | | | (0.05 | )% | | | (0.18 | )% | | | 2.31 | % | | | 0.26 | % |
Ratio of net investment income (loss) to average net assets (before waivers) | | | 1.12 | %(6) | | | 0.06 | % | | | (0.11 | )% | | | (0.28 | )% | | | 2.15 | % | | | 0.13 | % |
Portfolio turnover rate(8) | | | 4 | %(5) | | | 23 | % | | | 14 | % | | | 31 | % | | | 31 | % | | | 42 | % |
(1) | Calculated using average shares outstanding during the period. |
(2) | Due to timing of capital share transactions, the per share amount of net realized and unrealized gain (loss) on investments varies from the amounts shown in the Statement of Operations. |
(3) | Effective December 1, 2021, the Fund eliminated the 2.00% redemption fee charged on amounts redeemed for shares held 90 days or less. |
(4) | Amount is less than $0.005. |
(5) | Not annualized. |
(6) | Annualized. |
(7) | Blended rate. Pursuant to the Expense Cap/Reimbursement Agreement effective December 1, 2018, the expense cap decreased to 1.05%. Prior to December 1, 2018, the expense cap was 1.20%. |
(8) | Portfolio turnover is calculated on the basis of the Fund as a whole without distinguishing between the classes of shares issued and excludes in-kind transactions, where applicable. |
The accompanying notes are an integral part of these financial statements.
Financial Highlights
Baird Chautauqua Global Growth Fund – Institutional Class
| | | Six Months Ended | | | | | | | | | | | | | | | | |
| | | June 30, 2023 | | | Year Ended December 31, | |
| | | (Unaudited) | | | 2022 | | | 2021 | | | 2020 | | | 2019 | | | 2018 | |
| Per Share Data: | | | | | | | | | | | | | | | | | | |
| Net asset value, beginning of period | | $ | 17.84 | | | $ | 22.36 | | | $ | 19.85 | | | $ | 14.47 | | | $ | 11.29 | | | $ | 13.43 | |
| Income from investment operations: | | | | | | | | | | | | | | | | | | | | | | | | |
Net investment income (loss)(1) | | | 0.09 | | | | 0.04 | | | | 0.00 | (3) | | | (0.03 | ) | | | 0.22 | | | | 0.00 | (3) |
| Net realized and unrealized gains (losses) | | | | | | | | | | | | | | | | | | | | | | | | |
| on investments and foreign currency translation | | | 2.03 | | | | (4.54 | ) | | | 2.59 | | | | 5.49 | | | | 3.18 | | | | (1.98 | ) |
| Total from investment operations | | | 2.12 | | | | (4.50 | ) | | | 2.59 | | | | 5.46 | | | | 3.40 | | | | (1.98 | ) |
| Less distributions: | | | | | | | | | | | | | | | | | | | | | | | | |
| Distributions from net investment income | | | — | | | | — | | | | (0.08 | ) | | | (0.09 | ) | | | (0.16 | ) | | | (0.00 | )(3) |
| Distributions from net realized gains | | | — | | | | (0.02 | ) | | | — | | | | — | | | | (0.06 | ) | | | (0.16 | ) |
| Total distributions | | | — | | | | (0.02 | ) | | | (0.08 | ) | | | (0.09 | ) | | | (0.22 | ) | | | (0.16 | ) |
Paid in capital from redemption fees(2) | | | — | | | | — | | | | 0.00 | (3) | | | 0.01 | | | | 0.00 | (3) | | | 0.00 | (3) |
| Net asset value, end of period | | $ | 19.96 | | | $ | 17.84 | | | $ | 22.36 | | | $ | 19.85 | | | $ | 14.47 | | | $ | 11.29 | |
| Total return | | | 11.88 | %(4) | | | (20.11 | )% | | | 12.93 | % | | | 37.97 | % | | | 30.14 | % | | | (14.70 | )% |
| | | | | | | | | | | | | | | | | | | | | | | | | |
| Supplemental data and ratios: | | | | | | | | | | | | | | | | | | | | | | | | |
| Net assets, end of period (millions) | | $ | 303.9 | | | $ | 264.9 | | | $ | 314.7 | | | $ | 137.3 | | | $ | 55.8 | | | $ | 36.8 | |
| Ratio of expenses to average net assets | | | 0.80 | %(5) | | | 0.80 | % | | | 0.80 | % | | | 0.80 | % | | | 0.80 | % | | | 0.94 | %(6) |
| Ratio of expenses to average net assets (before waivers) | 0.88 | %(5) | | | 0.92 | % | | | 0.92 | % | | | 1.04 | % | | | 1.23 | % | | | 1.34 | % |
Ratio of net investment income (loss) to
average net assets | | | 0.99 | %(5) | | | 0.20 | % | | | 0.01 | % | | | (0.17 | )% | | | 1.64 | % | | | 0.01 | % |
Ratio of net investment income (loss) to average net assets (before waivers) | | | 0.91 | %(5) | | | 0.09 | % | | | (0.11 | )% | | | (0.41 | )% | | | 1.21 | % | | | (0.39 | )% |
Portfolio turnover rate(7) | | | 7 | %(4) | | | 12 | % | | | 13 | % | | | 24 | % | | | 26 | % | | | 38 | % |
(1) | Calculated using average shares outstanding during the period. |
(2) | Effective December 1, 2021, the Fund eliminated the 2.00% redemption fee charged on amounts redeemed for shares held 90 days or less. |
(3) | Amount is less than $0.005. |
(4) | Not annualized. |
(5) | Annualized. |
(6) | Blended rate. Pursuant to the Expense Cap/Reimbursement Agreement effective December 1, 2018, the expense cap decreased to 0.80%. Prior to December 1, 2018, the expense cap was 0.95%. |
(7) | Portfolio turnover is calculated on the basis of the Fund as a whole without distinguishing between the classes of shares issued and excludes in-kind transactions, where applicable. |
The accompanying notes are an integral part of these financial statements.
Financial Highlights
Baird Chautauqua Global Growth Fund – Investor Class
| | | Six Months Ended | | | | | | | | | | | | | | | | |
| | | June 30, 2023 | | | Year Ended December 31, | |
| | | (Unaudited) | | | 2022 | | | 2021 | | | 2020 | | | 2019 | | | 2018 | |
| Per Share Data: | | | | | | | | | | | | | | | | | | |
| Net asset value, beginning of period | | $ | 17.65 | | | $ | 22.18 | | | $ | 19.74 | | | $ | 14.36 | | | $ | 11.22 | | | $ | 13.37 | |
| Income from investment operations: | | | | | | | | | | | | | | | | | | | | | | | | |
Net investment income (loss)(1) | | | 0.07 | | | | (0.01 | ) | | | (0.05 | ) | | | (0.06 | ) | | | 0.19 | | | | (0.03 | ) |
| Net realized and unrealized gains (losses) | | | | | | | | | | | | | | | | | | | | | | | | |
| on investments and foreign currency translation | | | 2.00 | | | | (4.50 | ) | | | 2.57 | | | | 5.44 | | | | 3.15 | | | | (1.96 | ) |
| Total from investment operations | | | 2.07 | | | | (4.51 | ) | | | 2.52 | | | | 5.38 | | | | 3.34 | | | | (1.99 | ) |
| Less distributions: | | | | | | | | | | | | | | | | | | | | | | | | |
| Distributions from net investment income | | | — | | | | — | | | | (0.08 | ) | | | (0.05 | ) | | | (0.14 | ) | | | — | |
| Distributions from net realized gains | | | — | | | | (0.02 | ) | | | — | | | | — | | | | (0.06 | ) | | | (0.16 | ) |
| Total distributions | | | — | | | | (0.02 | ) | | | (0.08 | ) | | | (0.05 | ) | | | (0.20 | ) | | | (0.16 | ) |
Paid in capital from redemption fees(2) | | | — | | | | — | | | | 0.00 | (3) | | | 0.05 | | | | 0.00 | (3) | | | 0.00 | (3) |
| Net asset value, end of period | | $ | 19.72 | | | $ | 17.65 | | | $ | 22.18 | | | $ | 19.74 | | | $ | 14.36 | | | $ | 11.22 | |
| Total return | | | 11.73 | %(4) | | | (20.32 | )% | | | 12.64 | % | | | 37.94 | % | | | 29.73 | % | | | (14.86 | )% |
| | | | | | | | | | | | | | | | | | | | | | | | | |
| Supplemental data and ratios: | | | | | | | | | | | | | | | | | | | | | | | | |
| Net assets, end of period (thousands) | | $ | 1,055.8 | | | $ | 931.8 | | | $ | 1,590.1 | | | $ | 1,676.7 | | | $ | 1,606.9 | | | $ | 713.9 | |
| Ratio of expenses to average net assets | | | 1.05 | %(5) | | | 1.05 | % | | | 1.05 | % | | | 1.05 | % | | | 1.05 | % | | | 1.19 | %(6) |
| Ratio of expenses to average net assets (before waivers) | 1.13 | %(5) | | | 1.17 | % | | | 1.17 | % | | | 1.29 | % | | | 1.48 | % | | | 1.59 | % |
Ratio of net investment income (loss) to average net assets | | | 0.74 | %(5) | | | (0.05 | )% | | | (0.24 | )% | | | (0.42 | )% | | | 1.39 | % | | | (0.24 | )% |
Ratio of net investment income (loss) to average net assets (before waivers) | | | 0.66 | %(5) | | | (0.16 | )% | | | (0.36 | )% | | | (0.66 | )% | | | 0.96 | % | | | (0.64 | )% |
Portfolio turnover rate(7) | | | 7 | %(4) | | | 12 | % | | | 13 | % | | | 24 | % | | | 26 | % | | | 38 | % |
(1) | Calculated using average shares outstanding during the period. |
(2) | Effective December 1, 2021, the Fund eliminated the 2.00% redemption fee charged on amounts redeemed for shares held 90 days or less. |
(3) | Amount is less than $0.005. |
(4) | Not annualized. |
(5) | Annualized. |
(6) | Blended rate. Pursuant to the Expense Cap/Reimbursement Agreement effective December 1, 2018, the expense cap decreased to 1.05%. Prior to December 1, 2018, the expense cap was 1.20%. |
(7) | Portfolio turnover is calculated on the basis of the Fund as a whole without distinguishing between the classes of shares issued and excludes in-kind transactions, where applicable. |
The accompanying notes are an integral part of these financial statements.
Notes to the Financial Statements
June 30, 2023 (Unaudited)
Baird Funds, Inc. (the “Company”) was incorporated on June 9, 2000, as a Wisconsin corporation and is registered as an open-end management investment company under the Investment Company Act of 1940, as amended (the “1940 Act”). The accompanying financial statements include the Baird Mid Cap Growth Fund, the Baird Small/Mid Cap Growth Fund, the Baird Equity Opportunity Fund, the Baird Chautauqua International Growth Fund and the Baird Chautauqua Global Growth Fund (each a “Fund” and collectively the “Funds”), five of the fifteen active funds in the series comprising the Company. Pursuant to the 1940 Act, the Funds are “diversified” series of the Company except for the Baird Equity Opportunity Fund, which is a non-diversified fund. The investment advisor to the Funds is Robert W. Baird & Co. Incorporated (“Baird” or the “Advisor”). The investment subadvisor to the Baird Equity Opportunity Fund is Greenhouse Funds LLLP (“Greenhouse” or the “Subadvisor”).
The following table presents the class-specific inception dates for each of the Funds:
| | Inception Date | |
Fund | Institutional Class | Investor Class
| |
| Baird Mid Cap Growth Fund | December 29, 2000 | December 29, 2000 | |
| Baird Small/Mid Cap Growth Fund | October 31, 2018 | October 31, 2018 | |
| Baird Equity Opportunity Fund | May 1, 2012 | May 1, 2012 | |
Baird Chautauqua International Growth Fund(1) | April 15, 2016 | April 15, 2016 | |
Baird Chautauqua Global Growth Fund(2) | April 15, 2016 | April 15, 2016 | |
(1) | Effective April 30, 2023, the Fund changed its name from the Chautauqua International Growth Fund to the Baird Chautauqua International Growth Fund. |
(2) | Effective April 30, 2023, the Fund changed its name from the Chautauqua Global Growth Fund to the Baird Chautauqua Global Growth Fund. |
Institutional Class shares are not subject to a distribution and service (12b-1) fee, while Investor Class shares are subject to a distribution and service (12b-1) fee up to 0.25%. See Note 7.
The Baird Mid Cap Growth Fund seeks to provide long-term growth of capital through investments in equity securities of mid-capitalization companies.
The Baird Small/Mid Cap Growth Fund seeks to provide long-term growth of capital through investments in equity securities of small- and mid-capitalization companies.
The Baird Equity Opportunity Fund seeks to provide long-term capital appreciation through investments in equity securities of small- and mid-capitalization companies.
The Baird Chautauqua International Growth Fund seeks to provide long-term capital appreciation. The Fund invests primarily in equity securities of non-U.S. companies with medium to large market capitalizations.
The Baird Chautauqua Global Growth Fund seeks to provide long-term capital appreciation. The Fund invests primarily in equity securities of both U.S. and non-U.S. companies with medium to large market capitalizations.
The beneficial ownership, either directly or indirectly, of more than 25% of the voting securities of a fund creates a presumption of control of the fund, under Section 2(a)(9) of the 1940 Act. As of June 30, 2023, the Advisor, in its capacity as sponsor of the Baird Profit Sharing & Savings Plan and the Baird Non-Qualified Compensation Plan, and the Baird Foundation, an entity related to the Advisor, on a combined basis, owned a controlling ownership in the Baird Equity Opportunity Fund.
| 2. | Significant Accounting Policies |
The following is a summary of significant accounting policies consistently followed by the Funds in the preparation of their financial statements. These policies are in conformity with accounting principles generally accepted in the United States of America (“GAAP”). The Funds are investment companies and therefore follow the investment company accounting and reporting guidance of the Financial Accounting Standards Board (“FASB”) Accounting Standards Codification Topic 946, Financial Services – Investment Companies.
| a) | Investment Valuation – Section 2(a)(41) of the 1940 Act, together with the rules and interpretations of the U.S. Securities and Exchange Commission (the “SEC”), require the Funds, in computing net asset value (“NAV”), to value their portfolio securities using market quotations when they are “readily available.” When market quotations are not readily available (e.g., because there is no regular market quotation for such securities), the securities are valued at fair value using methods determined by the Advisor as the valuation designee of the Board of Directors of the Company (the “Board”) in accordance with policies and procedures adopted pursuant to Rule 2a-5 of the 1940 Act. Per GAAP, the “fair value” of a security means the price that would be received to sell a security in an orderly transaction between market participants at the measurement date. |
| | |
| | The Funds determine the fair value of their investments and compute their NAV per share as of the close of regular trading of the New York Stock Exchange (generally, 4:00 p.m. ET). |
| | |
| | Consistent with Section 2(a)(41) of the 1940 Act, the Funds price their securities as follows: common stocks that are listed on a securities exchange (other than NASDAQ) are valued at the last quoted sales price. Securities traded on NASDAQ are valued at the NASDAQ Official Closing Price. Price information on listed stocks is taken from the exchange where the security is primarily traded. Securities that were not traded on the valuation date, as well as stocks that are not listed on an exchange, including NASDAQ, are valued at the average of the current bid and ask price. Debt securities are valued at their evaluated bid prices as provided by an independent pricing service based on various market inputs such as benchmark yields, market transactions and dealer quotations. Investments in mutual funds, including money market funds, are valued at their stated NAV. Other assets and securities for which market quotations are not readily available are valued at fair value as determined in good faith by the Advisor in accordance with the Funds’ fair value procedures. In accordance with such procedures, the Advisor may, under certain circumstances, use alternative valuation methodologies, such as broker quotes. If prices are unavailable or deemed to be unreliable, fair value will be determined by the Advisor. The Advisor has designated its valuation committee to be responsible for fair value determinations. In determining fair value, the valuation committee takes into account factors deemed relevant by the valuation committee and available information. Consequently, the price of the security used by a Fund to calculate its NAV may differ from quoted or published prices for the same security. Fair value pricing involves subjective judgments and there is no single standard for determining a security’s fair value. As a result, different mutual funds could reasonably arrive at a different fair value for the same security. It is possible that the fair value determined for a security is materially different from the value that could be realized upon the sale of that security or from the values that other mutual funds may determine. The prices determined for any individual security on any given day may vary significantly from the amount that can be obtained in an actual sale of that security, and the Funds’ NAVs may fluctuate significantly from day to day or from period to period. |
| | |
| | Put and call options will be valued at the last sale price or, in the absence of such a price, at the mean between bid and asked prices. See Note 2(d) for additional information regarding financial derivative instruments. |
Notes to the Financial Statements
June 30, 2023 (Unaudited)
| 2. | Significant Accounting Policies (cont.) |
| | The Baird Chautauqua International Growth, Baird Chautauqua Global Growth, and Baird Equity Opportunity Funds have retained an independent fair value pricing service to assist in valuing foreign securities in order to adjust for possible changes in value that may occur between the close of the foreign exchange and the time at which the Funds calculate their NAVs. The fair value pricing service uses statistical data based on historical performance of securities and markets, and other data in developing factors used to estimate fair value for that day. |
| | |
| b) | Foreign Securities – Investing in securities of foreign companies and foreign governments involves special risks and considerations not typically associated with investing in U.S. companies and the U.S. government. These risks include foreign currency fluctuations and adverse political and economic developments. Moreover, securities of many foreign companies and foreign governments and their markets may be less liquid and their prices more volatile than those of securities of comparable U.S. companies and the U.S. government. Occasionally, events that affect these values and exchange rates may occur after the close of the exchange on which such securities are traded. If such events materially affect the value of a Fund’s securities, these securities may be valued at their fair value pursuant to the Advisor’s fair value procedures. |
| | |
| c) | Foreign Currency Translation – Portfolio securities and other assets and liabilities denominated in foreign currencies are translated into U.S. dollar amounts at date of valuation. Purchases and sales of portfolio securities and income items denominated in foreign currencies are translated into U.S. dollar amounts on the respective dates of such transactions. When a Fund purchases or sells a foreign security, it will customarily enter into a foreign exchange contract to minimize foreign exchange risk from the trade date to the settlement date of such transaction. The Funds do not isolate the portion of the results of operations resulting from changes in foreign exchange rates on investments from the fluctuations arising from changes in market prices of securities held nor currency gains or losses realized between the trade and settlement dates on securities transactions. Such fluctuations are included with the net realized and unrealized gain or loss from investments. Net realized gain (loss) on foreign currency translations include those gains and losses arising from the sale of foreign currencies, currency gains or losses realized between the trade and settlement dates on foreign currency transactions, the differences between the amounts of dividends, and foreign withholding taxes recorded on a Fund’s books, and the U.S. dollar equivalent of the amounts actually received or paid. Net unrealized appreciation (depreciation) on investments includes changes in the value of investments resulting from exchange rates. |
| | |
| d) | Financial Derivatives Instruments – Financial derivatives instruments, such as option contracts, derive their value from the performance of an underlying asset or index. The Baird Equity Opportunity Fund (the “Fund”) may purchase and sell (write) put options and call options on securities or indices in standardized contracts listed on securities exchanges. The Fund may also purchase and sell (write) over-the-counter (“OTC”) put options and call options. The Fund qualifies as a “limited derivatives user” under Rule 18f-4 and limits its derivatives exposure to 10% of its net assets. |
| | |
| | A call option gives the purchaser of the option the right to buy, and a writer the obligation to sell, the underlying security or index at the stated exercise price at any time prior to the expiration of the option, regardless of the market price of the security. The premium paid to the writer is in consideration for undertaking the obligations under the option contract. A put option gives the purchaser the right to sell the underlying security or index at the stated exercise price at any time prior to the expiration date of the option, regardless of the market price of the security or index. In contrast to an option on a particular security, an option on an index provides the holder with the right to make or receive a cash settlement upon exercise of the option. The amount of this settlement will be equal to the difference between the closing price of the index at the time of exercise and the exercise price of the option expressed in dollars, times a specified multiple. |
| | |
| | Writing Put and Call Options |
| | As the writer of a put option, the Fund has a risk of loss should the underlying reference instrument decline in value. If the value of the underlying reference instrument declines below the exercise price of the put option and the put option is exercised, the Fund, as the writer of the put option, will be required to buy the instrument at the exercise price, which will exceed the market value of the underlying reference instrument at that time. The Fund will incur a loss to the extent that the current market value of the underlying reference instrument is less than the exercise price of the put option. However, the loss will be offset in part by the premium received from the buyer of the put. If a put option written by the Fund expires unexercised, the Fund will realize a gain in the amount of the premium received. |
| | |
| | By writing a call option on a security, the Fund foregoes the opportunity to profit from an increase in the market price of the underlying security above the exercise price except insofar as the premium represents such a profit, and it is not able to sell the underlying security until the option expires or is exercised or the Fund effects a closing purchase transaction by purchasing an option of the same series. Except to the extent that a written call option on an index is covered by an option on the same index purchased by the Fund, movements in the index may result in a loss to the Fund; however, such losses may be mitigated by changes in the value of securities held by the Fund during the period the option was outstanding. |
| | |
| | If a call option on a security is exercised, the Fund may deliver the underlying security held by the Fund or purchase the underlying security in the open market. In either event, the proceeds of the sale will be increased by the net premium originally received, and the Fund will realize a gain or loss. |
| | |
| | At June 30, 2023, the Baird Equity Opportunity Fund pledged securities with a fair value of $2,712,675 as collateral for option contracts. See the Fund’s Schedule of Investments for the securities pledged as collateral. |
| | |
| e) | Income Tax Status – The Funds intend to continue to qualify as regulated investment companies as provided in Subchapter M of the Internal Revenue Code and to distribute substantially all of their taxable income to their shareholders in a manner which results in no tax expense to the Funds. Therefore, no federal income or excise tax provision is recorded. |
| | |
| | There is no tax liability resulting from unrecognized tax benefits relating to uncertain income tax positions taken or expected to be taken on the tax return for the year ended December 31, 2022, or for any other tax years which are open for exam. As of December 31, 2022, open tax years include the tax years ended December 31, 2019 through 2022. The Funds are not aware of any tax positions for which it is reasonably possible that the total amounts of unrecognized tax benefits will significantly change in the next 12 months. The Funds recognize interest and penalties, if any, related to unrecognized tax benefits as interest expense and other expense, respectively, in the Statement of Operations. During the period, the Funds did not incur any interest or penalties. |
| | |
| f) | Allocation of Income and Expenses – Each Fund is charged for those expenses directly attributable to it. Expenses directly attributable to a class of shares, such as Rule 12b-1 distribution fees, are charged to that class of shares. Income, expenses and realized and unrealized gains and losses are allocated to the classes based on their respective net assets. Expenses that are not directly attributable to a Fund are allocated among the Funds in the series in proportion to their respective assets or are divided equally amongst the Funds. |
| | |
| g) | Shareholder Transactions and Distributions – Shareholder transactions are recorded on trade date. Dividends from net investment income, if any, are declared and paid annually. Distributions of net realized capital gains, if any, are declared and paid at least annually. All distributions to shareholders are recorded on the ex-dividend date. The book basis character of distributions may differ from their ultimate characterization for Federal income tax purposes. GAAP requires that permanent financial reporting and tax differences be reclassified in the capital accounts. |
| | |
| h) | Use of Estimates – The preparation of financial statements in conformity with GAAP requires management to make estimates and assumptions that affect the reported amounts of assets and liabilities and disclosure of contingent assets and liabilities at the date of the financial statements and the reported amounts of income and expenses during the reporting period. Actual results could differ from those estimates. |
Notes to the Financial Statements
June 30, 2023 (Unaudited)
| 2. | Significant Accounting Policies (cont.) |
| i) | Securities Transactions and Investment Income – Investment transactions are recorded on trade date. The Funds determine the gain or loss realized from investment transactions using the identified cost basis. For financial reporting purposes, investment transactions are recorded on the trade date. When a capital gain tax is determined to apply, the Funds may record an estimated deferred tax liability in an amount that would be payable if the securities were disposed of on the valuation date. Dividend income is recognized on the ex-dividend date net of withholding taxes, if any, and interest income is recognized on an accrual basis. Withholding taxes on foreign dividends have been accounted for in accordance with the Funds’ interpretation of applicable tax laws of the countries in which they invest. Distributions received from underlying investments in real estate investment trusts (“REITs”) may be classified as dividends, capital gains or return of capital. |
| | |
| j) | Guarantees and Indemnifications – In the normal course of business, the Funds enter into contracts with service providers that contain general indemnification clauses. The Funds’ maximum exposure under these arrangements is unknown and would involve future claims against the Funds that have not yet occurred. Based on experience, the Funds would expect the risk of loss to be low. |
| | |
| k) | New Regulatory and Accounting Pronouncements – In March 2020, FASB issued Accounting Standards Update 2020-04, Reference Rate Reform: Facilitation of the Effects of Reference Rate Reform on Financial Reporting (“ASU 2020-04”), in January 2021, the FASB issued Accounting Standards Update 2021-01, Reference Rate Reform (Topic 848): Scope (“ASU 2021-01”), and in December 2022, the FASB issued Accounting Standards Update ASU 2022-06, Reference Rate Reform (Topic 848): Deferral of the Sunset Date of Topic 848 (“ASU 2022-06”), which provides optional, temporary relief with respect to the financial reporting of contracts subject to certain types of modifications due to the planned discontinuation of the London Interbank Offered Rate (“LIBOR”) and other interbank offered rates as of the end of 2021. The temporary relief provided by ASU 2020-04, ASU 2021-01, and ASU 2022-06 is effective for certain reference rate-related contract modifications that occur during the period from March 12, 2020 through December 31, 2024. Management is evaluating the impact of ASU 2020-04, ASU 2021-01, and ASU 2022-06 on the Funds’ investments, derivatives, debt, and other contracts that will undergo reference rate-related modifications as a result of the reference rate reform. Management is also actively working with other financial institutions and counterparties to modify contracts as required by applicable regulation and within the regulatory deadlines. |
| | |
| | In October 2022, the Securities and Exchange Commission (the “SEC”) adopted a final rule relating to Tailored Shareholder Reports for Mutual Funds and Exchange-Traded Funds; Fee Information in Investment Company Advertisements. The rule and form amendments will, among other things, require the Fund to transmit concise and visually engaging shareholder reports that highlight key information. The amendments will require that funds tag information in a structured data format and that certain more in-depth information be made available online and available for delivery free of charge to investors on request. The amendments became effective January 24, 2023. There is an 18-month transition period after the effective date of the amendment. |
| | |
| 3. | Capital Share Transactions |
The following table summarizes the capital share transactions of each Fund for the past two fiscal periods:
| Baird Mid Cap Growth Fund | | | | | | | | | | | | |
| | | Six Months Ended | | | Year Ended | |
| | | June 30, 2023 | | | December 31, 2022 | |
| Institutional Class Shares | | Shares | | | Amount | | | Shares | | | Amount | |
| Shares sold | | | 11,446,972 | | | $ | 263,294,816 | | | | 25,796,351 | | | $ | 593,227,526 | |
| Shares issued to shareholders in reinvestment of distributions | | | — | | | | — | | | | 1,129,988 | | | | 24,102,645 | |
| Shares redeemed | | | (7,944,140 | ) | | | (181,254,672 | ) | | | (22,159,031 | ) | | | (495,135,412 | ) |
| Net increase | | | 3,502,832 | | | $ | 82,040,144 | | | | 4,767,308 | | | $ | 122,194,759 | |
| Shares Outstanding: | | | | | | | | | | | | | | | | |
| Beginning of period | | | 83,890,648 | | | | | | | | 79,123,340 | | | | | |
| End of period | | | 87,393,480 | | | | | | | | 83,890,648 | | | | | |
| | | | | | | | | | | | | | | | | |
| | | Six Months Ended | | | Year Ended | |
| | | June 30, 2023 | | | December 31, 2022 | |
| Investor Class Shares | | Shares | | | Amount | | | Shares | | | Amount | |
| Shares sold | | | 1,109,660 | | | $ | 23,322,678 | | | | 1,757,374 | | | $ | 37,161,800 | |
| Shares issued to shareholders in reinvestment of distributions | | | — | | | | — | | | | 136,407 | | | | 2,655,852 | |
| Shares redeemed | | | (980,913 | ) | | | (20,582,056 | ) | | | (2,528,284 | ) | | | (54,245,204 | ) |
| Net increase (decrease) | | | 128,747 | | | $ | 2,740,622 | | | | (634,503 | ) | | $ | (14,427,552 | ) |
| Shares Outstanding: | | | | | | | | | | | | | | | | |
| Beginning of period | | | 8,009,772 | | | | | | | | 8,644,275 | | | | | |
| End of period | | | 8,138,519 | | | | | | | | 8,009,772 | | | | | |
| Total net increase | | | | | | $ | 84,780,766 | | | | | | | $ | 107,767,207 | |
Notes to the Financial Statements
June 30, 2023 (Unaudited)
| 3. | Capital Share Transactions (cont.) |
Baird Small/Mid Cap Growth Fund
| | | Six Months Ended | | | Year Ended | |
| | | June 30, 2023 | | | December 31, 2022 | |
| Institutional Class Shares | | Shares | | | Amount | | | Shares | | | Amount | |
| Shares sold | | | 1,273,730 | | | $ | 19,818,011 | | | | 2,879,793 | | | $ | 46,228,086 | |
| Shares issued to shareholders in reinvestment of distributions | | | — | | | | — | | | | 67,805 | | | | 987,916 | |
| Shares redeemed | | | (643,835 | ) | | | (9,958,912 | ) | | | (996,638 | ) | | | (15,500,122 | ) |
| Net increase | | | 629,895 | | | $ | 9,859,099 | | | | 1,950,960 | | | $ | 31,715,880 | |
| Shares Outstanding: | | | | | | | | | | | | | | | | |
| Beginning of period | | | 10,193,245 | | | | | | | | 8,242,285 | | | | | |
| End of period | | | 10,823,140 | | | | | | | | 10,193,245 | | | | | |
| | | | | | | | | | | | | | | | | |
| | | Six Months Ended | | | Year Ended | |
| | | June 30, 2023 | | | December 31, 2022 | |
| Investor Class Shares | | Shares | | | Amount | | | Shares | | | Amount | |
| Shares sold | | | 9,420 | | | $ | 145,904 | | | | 13,483 | | | $ | 203,375 | |
| Shares issued to shareholders in reinvestment of distributions | | | — | | | | — | | | | 374 | | | | 5,385 | |
| Shares redeemed | | | (326 | ) | | | (5,000 | ) | | | (2,908 | ) | | | (43,690 | ) |
| Net increase | | | 9,094 | | | $ | 140,904 | | | | 10,949 | | | $ | 165,070 | |
| Shares Outstanding: | | | | | | | | | | | | | | | | |
| Beginning of period | | | 54,738 | | | | | | | | 43,789 | | | | | |
| End of period | | | 63,832 | | | | | | | | 54,738 | | | | | |
| Total net increase | | | | | | $ | 10,000,003 | | | | | | | $ | 31,880,950 | |
| | | | | | | | | | | | | | | | | |
| Baird Equity Opportunity Fund | | | | | | | | | | | | | | | | |
| | | Six Months Ended | | | Year Ended | |
| | | June 30, 2023 | | | December 31, 2022 | |
| Institutional Class Shares | | Shares | | | Amount | | | Shares | | | Amount | |
| Shares sold | | | 320,792 | | | $ | 4,081,551 | | | | 828,640 | | | $ | 12,850,612 | |
| Shares issued to shareholders in reinvestment of distributions | | | — | | | | — | | | | 1,217,811 | | | | 14,260,575 | |
| Shares redeemed | | | (424,018 | ) | | | (5,233,270 | ) | | | (560,334 | ) | | | (8,777,787 | ) |
| Net increase (decrease) | | | (103,226 | ) | | $ | (1,151,719 | ) | | | 1,486,117 | | | $ | 18,333,400 | |
| Shares Outstanding: | | | | | | | | | | | | | | | | |
| Beginning of period | | | 4,933,286 | | | | | | | | 3,447,169 | | | | | |
| End of period | | | 4,830,060 | | | | | | | | 4,933,286 | | | | | |
| | | | | | | | | | | | | | | | | |
| | | Six Months Ended | | | Year Ended | |
| | | June 30, 2023 | | | December 31, 2022 | |
| Investor Class Shares | | Shares | | | Amount | | | Shares | | | Amount | |
| Shares sold | | | — | | | $ | — | | | | — | | | $ | — | |
| Shares issued to shareholders in reinvestment of distributions | | | — | | | | — | | | | 49 | | | | 570 | |
| Shares redeemed | | | — | | | | — | | | | — | | | | — | |
| Net increase | | | — | | | $ | — | | | | 49 | | | $ | 570 | |
| Shares Outstanding: | | | | | | | | | | | | | | | | |
| Beginning of period | | | 194 | | | | | | | | 145 | | | | | |
| End of period | | | 194 | | | | | | | | 194 | | | | | |
| Total net increase (decrease) | | | | | | $ | (1,151,719 | ) | | | | | | $ | 18,333,970 | |
Notes to the Financial Statements
June 30, 2023 (Unaudited)
| 3. | Capital Share Transactions (cont.) |
Baird Chautauqua International Growth Fund
| | | Six Months Ended | | | Year Ended | |
| | | June 30, 2023 | | | December 31, 2022 | |
| Institutional Class Shares | | Shares | | | Amount | | | Shares | | | Amount | |
| Shares sold | | | 9,534,828 | | | $ | 160,233,565 | | | | 17,375,159 | | | $ | 270,605,607 | |
| Shares issued to shareholders in reinvestment of distributions | | | — | | | | — | | | | 239,100 | | | | 3,685,237 | |
| Shares redeemed | | | (3,156,776 | ) | | | (52,875,833 | ) | | | (11,175,681 | ) | | | (166,780,762 | ) |
| Net increase | | | 6,378,052 | | | $ | 107,357,732 | | | | 6,438,578 | | | $ | 107,510,082 | |
| Shares Outstanding: | | | | | | | | | | | | | | | | |
| Beginning of period | | | 31,544,240 | | | | | | | | 25,105,662 | | | | | |
| End of period | | | 37,922,292 | | | | | | | | 31,544,240 | | | | | |
| | | | | | | | | | | | | | | | | |
| | | Six Months Ended | | | Year Ended | |
| | | June 30, 2023 | | | December 31, 2022 | |
| Investor Class Shares | | Shares | | | Amount | | | Shares | | | Amount | |
| Shares sold | | | 149,118 | | | $ | 2,475,899 | | | | 910,520 | | | $ | 13,813,926 | |
| Shares issued to shareholders in reinvestment of distributions | | | — | | | | — | | | | 7,208 | | | | 110,823 | |
| Shares redeemed | | | (32,803 | ) | | | (538,833 | ) | | | (24,147 | ) | | | (354,809 | ) |
| Net increase | | | 116,315 | | | $ | 1,937,066 | | | | 893,581 | | | $ | 13,569,940 | |
| Shares Outstanding: | | | | | | | | | | | | | | | | |
| Beginning of period | | | 926,310 | | | | | | | | 32,729 | | | | | |
| End of period | | | 1,042,625 | | | | | | | | 926,310 | | | | | |
| Total net increase | | | | | | $ | 109,294,798 | | | | | | | $ | 121,080,022 | |
| | | | | | | | | | | | | | | | | |
| Baird Chautauqua Global Growth | | | | | | | | | | | | | | | | |
| | | Six Months Ended | | | Year Ended | |
| | | June 30, 2023 | | | December 31, 2022 | |
| Institutional Class Shares | | Shares | | | Amount | | | Shares | | | Amount | |
| Shares sold | | | 980,118 | | | $ | 18,964,479 | | | | 2,949,098 | | | $ | 55,678,922 | |
| Shares issued to shareholders in reinvestment of distributions | | | — | | | | — | | | | 17,927 | | | | 325,563 | |
| Shares redeemed | | | (601,875 | ) | | | (11,638,339 | ) | | | (2,197,613 | ) | | | (40,872,035 | ) |
| Net increase | | | 378,243 | | | $ | 7,326,140 | | | | 769,412 | | | $ | 15,132,450 | |
| Shares Outstanding: | | | | | | | | | | | | | | | | |
| Beginning of period | | | 14,847,093 | | | | | | | | 14,077,681 | | | | | |
| End of period | | | 15,225,336 | | | | | | | | 14,847,093 | | | | | |
| | | | | | | | | | | | | | | | | |
| | | Six Months Ended | | | Year Ended | |
| | | June 30, 2023 | | | December 31, 2022 | |
| Investor Class Shares | | Shares | | | Amount | | | Shares | | | Amount | |
| Shares sold | | | 6,594 | | | $ | 126,104 | | | | 19,559 | | | $ | 348,846 | |
| Shares issued to shareholders in reinvestment of distributions | | | — | | | | — | | | | 68 | | | | 1,216 | |
| Shares redeemed | | | (5,841 | ) | | | (110,099 | ) | | | (38,552 | ) | | | (804,656 | ) |
| Net increase (decrease) | | | 753 | | | $ | 16,005 | | | | (18,925 | ) | | $ | (454,594 | ) |
| Shares Outstanding: | | | | | | | | | | | | | | | | |
| Beginning of period | | | 52,780 | | | | | | | | 71,705 | | | | | |
| End of period | | | 53,533 | | | | | | | | 52,780 | | | | | |
| Total net increase | | | | | | $ | 7,342,145 | | | | | | | $ | 14,677,856 | |
| 4. | Investment Transactions and Income Tax Information |
During the six months ended June 30, 2023, purchases and sales of investment securities (excluding short-term investments) were as follows:
| | | | | | | | | | | | Baird Chautauqua | | | Baird Chautauqua | |
| | | Baird Mid Cap | | | Baird Small/Mid | | | Baird Equity | | | International | | | Global | |
| | | Growth Fund | | | Cap Growth Fund | | | Opportunity Fund | | | Growth Fund | | | Growth Fund | |
| Purchases: | | $ | 586,415,100 | | | $ | 50,541,382 | | | $ | 18,795,048 | | | $ | 127,970,552 | | | $ | 22,970,070 | |
| Sales: | | | 535,235,204 | | | | 40,468,914 | | | | 20,230,764 | | | | 25,575,099 | | | | 18,563,631 | |
The Funds did not purchase or sell U.S. Government securities during the six months ended June 30, 2023.
Notes to the Financial Statements
June 30, 2023 (Unaudited)
| 4. | Investment Transactions and Income Tax Information (cont.) |
As of December 31, 2022, the components of accumulated earnings (accumulated losses) for income tax purposes were as follows:
| | | | | | | | | | | | Baird | | | Baird | |
| | | Baird | | | Baird | | | Baird Equity | | | Chautauqua | | | Chautauqua | |
| | | Mid Cap | | | Small/Mid Cap | | | Opportunity | | | International | | | Global | |
| | | Growth Fund | | | Growth Fund | | | Fund | | | Growth Fund | | | Growth Fund | |
| Cost of investments | | $ | 1,502,643,294 | | | $ | 150,185,110 | | | $ | 60,785,201 | | | $ | 458,385,277 | | | $ | 266,499,055 | |
| Gross unrealized appreciation | | | 550,513,897 | | | | 15,793,689 | | | | 4,867,830 | | | | 104,543,594 | | | | 47,183,466 | |
| Gross unrealized depreciation | | | (126,896,157 | ) | | | (18,261,075 | ) | | | (7,677,931 | ) | | | (70,966,558 | ) | | | (48,148,408 | ) |
| Net unrealized appreciation (depreciation) | | | 423,617,740 | | | | (2,467,386 | ) | | | (2,810,101 | ) | | | 33,577,036 | | | | (964,942 | ) |
| Undistributed ordinary income | | | — | | | | — | | | | — | | | | 1,276,371 | | | | 392,866 | |
| Distributable earnings | | | — | | | | — | | | | — | | | | 1,276,371 | | | | 392,866 | |
| Other accumulated losses | | | (45,587,598 | ) | | | (19,612,987 | ) | | | (829,535 | ) | | | (9,574,044 | ) | | | (1,575,488 | ) |
| Total distributable earnings (accumulated deficit) | | $ | 378,030,142 | | | $ | (22,080,373 | ) | | $ | (3,639,636 | ) | | $ | 25,279,363 | | | $ | (2,147,564 | ) |
The difference between book-basis and tax-basis unrealized appreciation is attributable primarily to the tax deferral of losses on wash sales and mark-to-market on passive foreign investment companies.
Additionally, GAAP requires that certain components of net assets relating to permanent differences be reclassified between financial and tax reporting. These reclassifications are primarily due to differing treatments for equalization accounting for tax purposes and net operating losses. These reclassifications have no effect on net assets or NAV per share.
For the year ended December 31, 2022, the following table shows the reclassifications made:
Fund | Total Distributable Earnings | | | Paid In Capital | |
| Baird Mid Cap Growth Fund | | $ | 6,401,018 | | | | $ | (6,401,018 | ) |
| Baird Small/Mid Cap Growth Fund | | | 522,385 | | | | | (522,385 | ) |
| Baird Equity Opportunity Fund | | | (800,963 | ) | | | | 800,963 | |
Distributions to Shareholders
Each Fund generally pays dividends from net investment income and distributes net realized capital gains, if any, at least annually. Income and capital gain distributions are determined in accordance with income tax regulations, which may differ from GAAP. Certain Funds also utilize earnings and profits distributed to shareholders on redemptions of shares as part of the dividends paid deduction.
During the six months ended June 30, 2023, the Funds did not pay any distributions. During the year ended December 31, 2022, the tax components of distributions paid were as follows:
| | | Year Ended December 31, 2022 | |
| | | Ordinary | | | Long-Term | | | | |
Fund | | Income | | | Capital Gains | | | Total | |
| Baird Mid Cap Growth Fund | | $ | 5,430,320 | | | $ | 25,642,571 | | | $ | 31,072,891 | |
| Baird Small/Mid Cap Growth Fund | | | — | | | | 1,000,232 | | | | 1,000,232 | |
| Baird Equity Opportunity Fund | | | 449,445 | | | | 14,047,005 | | | | 14,496,450 | |
| Baird Chautauqua International Growth Fund | | | 2,548,180 | | | | 1,777,754 | | | | 4,325,934 | |
| Baird Chautauqua Global Growth Fund | | | 344,680 | | | | — | | | | 344,680 | |
The Funds in the table above designated as long-term capital gain dividend, pursuant to Internal Revenue Code Section 852(b)(3), the amount necessary to reduce the earnings and profits of the Funds related to net capital gain to zero for the tax year ended December 31, 2022.
At December 31, 2022, the following Fund deferred, on a tax basis, post-October losses and specified losses of:
Fund | Loss Deferral |
| Baird Equity Opportunity Fund | $913,297 |
At December 31, 2022, accumulated net realized capital loss carryovers without expiration were:
| | | Capital Loss Carryover | | Year of Expiration | |
Fund | | Short-term | | | Long-term | | Short-term | | Long-term | |
| Baird Mid Cap Growth Fund | | $ | 45,587,598 | | | $ | — | | Indefinitely | | N/A | |
| Baird Small/Mid Cap Growth Fund | | | 11,832,524 | | | | 7,780,463 | | Indefinitely | | Indefinitely | |
| Baird Chautauqua International Growth Fund | | | 5,686,321 | | | | 3,888,629 | | Indefinitely | | Indefinitely | |
| Baird Chautauqua Global Growth Fund | | | 520,040 | | | | 1,055,905 | | Indefinitely | | Indefinitely | |
During the year ended December 31, 2022, the Funds did not utilize short-term or long-term capital loss carryover.
Notes to the Financial Statements
June 30, 2023 (Unaudited)
| 5. | Investment Advisory and Other Agreements |
The Funds have entered into Investment Advisory Agreements with Baird for the provision of investment advisory services. In addition, Baird has entered into a Subadvisory Agreement with Greenhouse related to the Baird Equity Opportunity Fund. Pursuant to the Investment Advisory Agreements, the Advisor is entitled to receive a fee, calculated daily and payable monthly, at the annual rates as follows:
Fund | Investment Advisory Fees |
| Baird Mid Cap Growth Fund | 0.75% |
| Baird Small/Mid Cap Growth Fund | 0.75% |
| Baird Equity Opportunity Fund | 1.25% |
| Baird Chautauqua International Growth Fund | 0.75% |
| Baird Chautauqua Global Growth Fund | 0.75% |
Under the Subadvisory Agreement, Baird is obligated to pay Greenhouse its subadvisory fee out of the advisory fee paid to Baird by the Baird Equity Opportunity Fund.
The Advisor has contractually agreed to waive its investment advisory fee and/or reimburse the Funds’ operating expenses, to the extent necessary to ensure that total operating expenses, including the fees and expenses incurred by the Funds in connection with the Funds’ investments in other investment companies (to the extent, in the aggregate, such fees and expenses on an annual basis exceed 0.0049% of the Fund’s average daily net assets) and interest expense, but excluding taxes, brokerage commissions and extraordinary expenses, do not exceed the following annual percentages of the average daily net assets attributable to the Funds’ Institutional Class and Investor Class shares:
Fund | Institutional Class | Investor Class |
| Baird Mid Cap Growth Fund | 0.85% | 1.10% |
| Baird Small/Mid Cap Growth Fund | 0.85% | 1.10% |
| Baird Equity Opportunity Fund | 1.25% | 1.50% |
| Baird Chautauqua International Growth Fund | 0.80% | 1.05% |
| Baird Chautauqua Global Growth Fund | 0.80% | 1.05% |
The Expense Cap/Reimbursement Agreement is in effect through at least April 30, 2024 for the Baird Mid Cap Growth, Baird Small/Mid Cap Growth, Baird Chautauqua International Growth, and Baird Chautauqua Global Growth Funds. The Expense Cap/Reimbursement Agreement is in effect through at least April 30, 2025 for the Baird Equity Opportunity Fund.
To the extent that the Advisor reimburses or absorbs fees and expenses, it may seek payment of such amounts for three years after the date in which expenses were reimbursed or absorbed for all Funds other than the Baird Equity Opportunity Fund. A Fund will make no such payment, however, if its total annual operating expenses exceed the expense limits in effect at the time the expenses were reimbursed or at the time these payments are proposed. The Advisor is not entitled to recoup any fees waived and/or expenses reimbursed by the Baird Equity Opportunity Fund under the agreement or under prior agreements.
| | | Six Months | | | | | | | | | | |
| | | Ended | | | | | | | | | | |
| | | June 30, | | | Fiscal Year Ended December 31, | |
| Recoverable amounts reimbursed during: | | 2023 | | | 2022 | | | 2021 | | | 2020 | |
| Subject to recovery on or before: | | 2026 | | | 2025 | | | 2024 | | | 2023 | |
Fund: | | | | | | | | | | | | |
| Baird Small/Mid Cap Growth Fund | | $ | 54,280 | | | $ | 189,890 | | | $ | 161,354 | | | $ | 82,828 | |
| Baird Chautauqua International Growth Fund | | | 142,206 | | | | 315,901 | | | | 265,579 | | | | 114,299 | |
| Baird Chautauqua Global Growth Fund | | | 117,766 | | | | 317,746 | | | | 295,197 | | | | 110,732 | |
For the six months ended June 30, 2023, the Advisor waived the following amount pursuant to the Expense Cap/Reimbursement Agreement between the Advisor and the Company on behalf of the Baird Equity Opportunity Fund:
Fund | Waived Amount | |
| Baird Equity Opportunity Fund | $129,183 | |
U.S. Bancorp Fund Services, LLC, doing business as U.S. Bank Global Fund Services, serves as transfer agent, administrator, and accounting services agent for the Funds. U.S. Bank, N.A. (“U.S. Bank”) serves as custodian for the Funds.
Robert W. Baird & Co. Incorporated (the “Distributor”) is the sole distributor of the Funds pursuant to a distribution agreement.
No commissions were earned by the Distributor for services rendered as a registered broker-dealer in securities transactions for the six months ended June 30, 2023 for the Funds.
Certain officers and employees of the Advisor are also officers of the Funds.
The Company maintains an uncommitted line of credit (“LOC”) with U.S. Bank to provide the fifteen Funds comprising the Company a temporary liquidity source to meet unanticipated redemptions or other permissible borrowing needs. The LOC is unsecured at all times and is subject to certain restrictions and covenants. Under the terms of the LOC, borrowings for each Fund are limited to one third of the total eligible net assets (including the amount borrowed) of the respective Fund, or $850,000,000 of total borrowings for the Funds comprising the Company, whichever is less. U.S. Bank charges annualized interest at the greater of 1.00% or the Prime Rate minus 2.00%. As of June 30, 2023, the Prime Rate was 8.25%. The LOC matures on May 20, 2024, unless renewed. The Company has authorized U.S. Bank to charge any of the accounts of the borrowing Fund subject to the agreement for any missed payments.
During the six months ended June 30, 2023, the Funds borrowed from the LOC as follows:
| | | Amount | | | Interest Charges | | | Borrowing | |
Fund | | Borrowed | | | Accrued | | | Rate | |
| Baird Equity Opportunity Fund | | $ | 149,000 | | | $ | 81 | | | | 5.50 | % |
| Baird Small/Mid Cap Growth Fund | | | 282,000 | | | | 47 | | | | 6.00 | % |
No other borrowings occurred during the six months ended June 30, 2023, nor were any other borrowings outstanding under the LOC as of June 30, 2023.
Notes to the Financial Statements
June 30, 2023 (Unaudited)
| 7. | Distribution and Shareholder Service Plan |
The Funds have adopted a distribution and shareholder service plan (the “Plan”) pursuant to Rule 12b-1 under the 1940 Act. The Plan allows the Funds to compensate the Distributor for the costs incurred in distributing the Funds’ Investor Class shares, including amounts paid to brokers or dealers, at an annual rate of 0.25% of the average daily net assets of the Funds’ Investor Class shares.
For the six months ended June 30, 2023, the Funds’ Investor Class shares incurred fees pursuant to the Plan as follows:
Fund | |
| Baird Mid Cap Growth Fund | $210,106 |
| Baird Small/Mid Cap Growth Fund | 1,144 |
| Baird Equity Opportunity Fund | 4 |
| Baird Chautauqua International Growth Fund | 20,341 |
| Baird Chautauqua Global Growth Fund | 1,294 |
| 8. | Other Derivatives Information |
As a principal investment strategy, the Baird Equity Opportunity Fund may purchase and write options to hedge its portfolio and enhance returns. Options are subject to various risks including market risk, liquidity risk, volatility risk, counterparty risk, legal risk, and operations risk.
Management has adopted authoritative standards regarding disclosure about derivatives and hedging activities and how they affect a Fund’s Statement of Assets and Liabilities and Statement of Operations. Since the derivatives may be held for speculative trading purposes, the derivative instruments are not designated as hedging instruments. Accordingly, all realized gains and losses, as well as any change in net unrealized gains or losses on open contracts from the preceding period, are recognized as part of realized and unrealized gain (loss) in the Statement of Operations. These contracts are not subject to a master netting agreement.
The following table presents the fair value of derivative instruments for the Baird Equity Opportunity Fund as of June 30, 2023 as presented on the Fund’s Statement of Assets and Liabilities:
| |
| | | Fair Value | |
| | | Statement of | | | | | | |
| | | Assets and | | | | | | |
| Derivatives Not Accounted for as Hedging Instruments | | Liabilities Location | | Assets | | | Liabilities | |
| Baird Equity Opportunity Fund | | | | | | | | |
| Option Contracts | | | | | | | | |
| Purchased option contracts | | Investments, at value | | $ | 182,080 | | | $ | — | |
| Written option contracts | | Written option contracts, at value | | | — | | | | 99,152 | |
| Total Option Contracts | | | | $ | 182,080 | | | $ | 99,152 | |
The following table presents the results of the derivatives trading and information related to volume for the six months ended June 30, 2023. The below captions of “Net Realized” and “Net Change in Unrealized” correspond to the captions in the Fund’s Statement of Operations.
| | | Gain (Loss) from Trading | |
| | | | | | Net Change | |
| | | | | | in Unrealized | |
| | | Net | | | Appreciation | |
| | | Realized | | | (Depreciation) | |
| Baird Equity Opportunity Fund | | | | | | |
| Option Contracts | | | | | | |
Purchased option contracts(a) | | $ | (150,058 | ) | | $ | 15,390 | |
| Written option contracts | | | 119,165 | | | | 15,179 | |
| Total Option Contracts | | $ | (30,893 | ) | | $ | 30,569 | |
(a) | Purchased options are included in the net realized gain (loss) on investments and net change in unrealized appreciation (depreciation) on investments. |
The average monthly notional amount is shown as an indicator of volume. The average monthly notional amounts during the six months ended June 30, 2023 were:
| | | Average Notional | |
| | | Purchased | | | Written | |
| Baird Equity Opportunity Fund | | | | | | |
| Option contracts | | $ | 2,665,802 | | | $ | 2,469,332 | |
Please refer to the Fund’s prospectus for a full listing of risks associated with these investments.
In preparing these financial statements, management has evaluated events after June 30, 2023. There were no subsequent events since June 30, 2023, through the date the financial statements were issued that would warrant adjustment to or additional disclosure in these financial statements.
Statement Regarding Liquidity Risk Management Program
June 30, 2023 (Unaudited)
In accordance with Rule 22e-4 under the Investment Company Act of 1940 (the “Rule”), Baird Funds, Inc. (the “Company”) has adopted and implemented a liquidity risk management program (the “Program”). The Program seeks to promote effective liquidity risk management for each series of the Company (each a “Fund” and collectively, the “Funds”) and to protect Fund shareholders from dilution of their interests. The Board of Directors (the “Board”) of the Company has appointed Robert W. Baird & Co. Incorporated (“Baird”), the Funds’ investment adviser, as the administrator of the Program. Baird has further delegated administration of the Program to its Liquidity Risk Management Committee (the “Committee”), consisting of certain officers of the Funds, senior portfolio managers of the Funds and officers of the Advisor. The Program requires the Committee to provide an annual written report to the Board regarding the adequacy and effectiveness of the Program, including the operation of each Fund’s highly liquid investment minimum (“HLIM”), if applicable, and any material changes made to the Program during the review period.
On February 27, 2023, the Board reviewed the Committee’s annual written report (the “Report”) for the period January 1, 2022 to December 31, 2022 (the “review period”). The Report provided a summary of the Committee’s assessment of each Fund’s liquidity risk, which is the risk that a Fund could not meet requests to redeem shares issued by the Fund without significant dilution of the remaining investors’ interests in the Fund. The Committee’s assessment considered each Fund’s liquidity risk under both normal and reasonably foreseeable stressed market conditions using certain factors required by the Rule and the Program, to the extent deemed appropriate by the Committee. The Committee concluded that the risk of a Fund experiencing a material liquidity event continues to be low.
The Funds have retained ICE Data Services (“ICE”), a third-party vendor, to provide a liquidity risk classification specified by the Rule (highly liquid, moderately liquid, less liquid or illiquid) for each portfolio investment held by the Funds, except with respect to any investments that are unclassified by ICE or that are classified by ICE but are overridden by Baird, for which classifications are provided by the Committee as permitted by the Program. The Report noted that each Fund primarily held investments that were classified as highly liquid during the review period and that each Fund’s portfolio is expected to continue to primarily hold highly liquid investments. Thus, the Committee concluded in the Report that each Fund is considered a “primarily highly liquid fund” (as defined in the Program) and each Fund can therefore rely on the exclusion in the Rule from the requirements to establish an HLIM and to adopt policies and procedures for responding to an HLIM shortfall. The Report further noted that none of the Funds exceeded the 15% limitation on illiquid investments during the review period and the Company has established procedures to file the Funds’ Forms N-PORT on a timely basis. The Report stated that no material changes had been made to the Program during the review period.
The Committee concluded in the Report that the Program is adequately designed, has been effectively implemented, and is operating as intended to manage the liquidity risk of each Fund.
Additional Information (Unaudited)
Proxy Voting
A description of the policies and procedures that the Funds use to determine how to vote proxies relating to portfolio securities is available without charge, upon request, by calling toll free, 1-866-442-2473, by accessing the Funds’ website at www.bairdfunds.com or by accessing the SEC’s website at www.sec.gov.
Each Fund’s proxy voting record for the most recent 12-month period ended June 30 is available without charge, upon request, by calling toll free, 1-866-442-2473, by accessing the Funds’ website at www.bairdfunds.com or by accessing the SEC’s website at www.sec.gov.
Portfolio Holdings Disclosure
The Funds file a complete schedule of portfolio holdings with the SEC for the first and third quarters of each fiscal year on Part F of Form N-PORT. The Funds’ filings on Part F of Form N-PORT are available on the SEC’s website at www.sec.gov. The Funds’ Form N-PORT reports may also be obtained by calling toll-free 1-866-442-2473 or by accessing the Funds’ website at www.bairdfunds.com.
(This Page Intentionally Left Blank.)
Baird Funds, Inc.
c/o U.S. Bancorp Fund Services, LLC
P.O. Box 701
Milwaukee, WI 53201-0701
1-866-442-2473
Board of Directors
John W. Feldt
Darren R. Jackson
David J. Lubar
Cory L. Nettles
Marlyn J. Spear (Chair)
Frederick P. Stratton, Jr.
Investment Advisor and Distributor
Robert W. Baird & Co. Incorporated
777 East Wisconsin Avenue
Milwaukee, WI 53202
Administrator and Transfer Agent
U.S. Bancorp Fund Services, LLC
P.O. Box 701
615 East Michigan Street
Milwaukee, WI 53202
Custodian
U.S. Bank, N.A.
1555 N. RiverCenter Drive, Suite 302
Milwaukee, WI 53212
Legal Counsel
Godfrey & Kahn, S.C.
833 East Michigan Street, Suite 1800
Milwaukee, WI 53202
Independent Registered Public
Accounting Firm
Cohen & Company, Ltd.
342 North Water Street, Suite 830
Milwaukee, WI 53202
Item 2. Code of Ethics.
Not applicable – only required for annual reports on Form N-CSR
Item 3. Audit Committee Financial Expert.
Not applicable – only required for annual reports on Form N-CSR
Item 4. Principal Accountant Fees and Services.
Not applicable – only required for annual reports on Form N-CSR
Item 5. Audit Committee of Listed Registrants.
Not applicable because the Registrant is not a “listed issuer” within the meaning of Rule 10A-3 under the Securities Exchange Act of 1934.
Item 6. Investments.
| a) | The complete Schedule of Investments in securities of unaffiliated issuers as of the close of the reporting period for the Baird Mid Cap Growth Fund, Baird Small/Mid Cap Growth Fund, Baird Equity Opportunity Fund, Baird Chautauqua International Growth Fund, Baird Chautauqua Global Growth Fund, Baird Ultra Short Bond Fund, Baird Short-Term Bond Fund, Baird Intermediate Bond Fund, Baird Aggregate Bond Fund, Baird Core Plus Bond Fund, Baird Short-Term Municipal Bond Fund, Baird Strategic Municipal Bond Fund, Baird Quality Intermediate Municipal Bond Fund, Baird Core Intermediate Municipal Bond Fund, and Baird Municipal Bond Fund are included as part of the report to shareholders filed under Item 1. |
Item 7. Disclosure of Proxy Voting Policies and Procedures for Closed-End Management Investment Companies.
Not applicable because the Registrant is not a closed-end management investment company.
Item 8. Portfolio Managers of Closed-End Management Investment Companies.
Not applicable because the Registrant is not a closed-end management investment company.
Item 9. Purchases of Equity Securities by Closed‑End Management Investment Company and Affiliated Purchasers.
Not applicable because the Registrant is not a closed-end management investment company.
Item 10. Submission of Matters to a Vote of Security Holders.
There have been no material changes to the procedures by which shareholders may recommend nominees to the Registrant’s board of directors.
Item 11. Controls and Procedures.
| (a) | The Registrant’s management, with the participation of its principal executive and principal financial officers, has evaluated the effectiveness of the Registrant’s disclosure controls and procedures (as defined in Rule 30a-3(c) under the Investment Company Act of 1940 (the “Act”)) as of a date within 90 days prior to the filing date of this Form N-CSR, as required by Rule 30a-3(b) under the Act and Rules 13a-15(b) or 15d‑15(b) under the Securities Exchange Act of 1934. Based on such evaluation, the Registrant’s principal executive and principal financial officers have concluded that the design and operation of the Registrant’s disclosure controls and procedures are effective in providing reasonable assurance that the information required to be disclosed on Form N-CSR is recorded, processed, summarized, and reported within the applicable time periods. |
| (b) | There were no changes in the Registrant's internal control over financial reporting (as defined in Rule 30a-3(d) under the Act) that occurred during the period covered by this report that have materially affected, or are reasonably likely to materially affect, the Registrant's internal control over financial reporting. |
Item 12. Disclosure of Securities Lending Activities for Closed-End Management Investment Companies
Not applicable because the Registrant is not a closed-end management investment company.
Item 13. Exhibits.
(3) Any written solicitation to purchase securities under Rule 23c‑1 under the Act sent or given during the period covered by the report by or on behalf of the Registrant to 10 or more persons. Not applicable because the Registrant is not a closed-end management investment company.
(4) Change in the Registrant’s independent public accountant. There was no change in the Registrant’s independent public accountant for the period covered by this report.
SIGNATURES
Pursuant to the requirements of the Securities Exchange Act of 1934 and the Investment Company Act of 1940, the Registrant has duly caused this report to be signed on its behalf by the undersigned, thereunto duly authorized.
(Registrant) BAIRD FUNDS, INC.
By (Signature and Title) /s/Mary Ellen Stanek
Mary Ellen Stanek, President (Principal Executive Officer)
Date September 5, 2023
Pursuant to the requirements of the Securities Exchange Act of 1934 and the Investment Company Act of 1940, this report has been signed below by the following persons on behalf of the Registrant and in the capacities and on the dates indicated.
By (Signature and Title) /s/Mary Ellen Stanek
Mary Ellen Stanek, President (Principal Executive Officer)
Date September 5, 2023
By (Signature and Title) /s/Dustin J. Hutter
Dustin J. Hutter, Treasurer (Principal Financial Officer)
Date September 5, 2023