Annual Report –
Baird Funds
December 31, 2023
Taxable Bond Funds
Baird Ultra Short Bond Fund
Baird Short-Term Bond Fund
Baird Intermediate Bond Fund
Baird Aggregate Bond Fund
Baird Core Plus Bond Fund
Municipal Bond Funds
Baird Short-Term Municipal Bond Fund
Baird Strategic Municipal Bond Fund
Baird Quality Intermediate Municipal Bond Fund
Baird Core Intermediate Municipal Bond Fund
Baird Municipal Bond Fund
| Go Green. |  | Go Paperless. |
Sign up to receive your Baird Funds’ prospectuses and reports online.
Table of Contents
| Letter to Shareholders | | 1 |
| 2023 Bond Market Overview | | 2 |
| Baird Ultra Short Bond Fund | | 5 |
| Baird Short-Term Bond Fund | | 17 |
| Baird Intermediate Bond Fund | | 31 |
| Baird Aggregate Bond Fund | | 50 |
| Baird Core Plus Bond Fund | | 84 |
| 2023 Municipal Bond Market Overview | | 116 |
| Baird Short-Term Municipal Bond Fund | | 118 |
| Baird Strategic Municipal Bond Fund | | 141 |
| Baird Quality Intermediate Municipal Bond Fund | | 162 |
| Baird Core Intermediate Municipal Bond Fund | | 179 |
| Baird Municipal Bond Fund | | 219 |
| Additional Information on Fund Expenses | | 233 |
| Statements of Assets and Liabilities | | 234 |
| Statements of Operations | | 236 |
| Statements of Changes in Net Assets | | 238 |
| Financial Highlights | | 243 |
| Notes to the Financial Statements | | 253 |
| Report of Independent Registered Public Accounting Firm | | 264 |
| Directors and Officers | | 265 |
| Disclosure Regarding the Board of Directors’ Approval of the Investment Advisory Agreement for Baird Bond Funds | | 267 |
| Additional Information | | 269 |
| Privacy Notice | | A-1 |
This report has been prepared for shareholders and may be distributed to others only if preceded or accompanied by a current prospectus.
Cautionary Note on Analyses, Opinions and Outlooks: In this report we offer analyses and opinions on the performance of individual securities, companies, industries, sectors, markets, interest rates, asset classes, types of fixed income securities and governmental policies, including predictions, forecasts and outlooks regarding possible future events. These can generally be identified as such because the context of the statements may include such words as “believe,” “should,” “will,” “expects,” “anticipates,” “hopes” and words of similar effect. These statements reflect the portfolio managers’ good faith beliefs and judgments and involve risks and uncertainties, including the risk that the portfolio managers’ analyses, opinions and outlooks are or will prove to be inaccurate. It is inherently difficult to correctly assess and explain the performance of particular securities, sectors, markets, interest rate movements, governmental actions or general economic trends and conditions, and many unforeseen factors contribute to the performance of Baird Funds. Investors are, therefore, cautioned not to place undue reliance on subjective judgments contained in this report.

Baird Funds
1-866-442-2473
www.bairdfunds.com
February 26, 2024
Dear Investor,
Despite substantial volatility and uncertainty, 2023 was a very good year for Baird Bond Fund investors. All of the Funds delivered strong nominal and risk-adjusted results and outperformed their respective benchmarks except the Baird Quality Intermediate Municipal Bond Fund which is the highest quality bond fund available in its category and maintains a wealth preservation focus.
Looking at rates at the beginning and end of 2023, it may seem as though the Bond market had a sleepy and uneventful year with rates virtually unchanged, as the 10-year Treasury started and ended the year at 3.88%.
The year was anything but sleepy and uneventful and proved to be an intriguing tug of war between a resilient economy versus a resolute Federal Reserve, declining inflation and a tight labor market, strong investor demand and heavy supply, the Federal Reserve’s steady guidance offsetting the market’s pivot expectations and finally, solid credit fundamentals counterbalancing the fear of recession.
These conflicting forces resulted in substantial market volatility and uncertainty, creating a roller-coaster ride for investors. Trying to be on the right side of all the interest rate movement throughout the course of 2023 would have been very difficult if not impossible. In that market, our time-tested approach was on full display as we continued the risk-controlled, duration-neutral approach we pioneered in 1985, which is founded on the belief that each Fund should begin by matching its benchmark interest rate sensitivity. We then strive to generate added value through sector allocation, yield curve positioning, security selection, liquidity management and trade execution.
We put this bottom-up approach to work for you every day and on every bond we evaluate. It is that disciplined, risk-controlled approach that allowed Baird Bond Fund investors to fully participate during the year, particularly in the final quarter, as rates and yield spreads fell precipitously in November and December.
Our diligent pursuit of this investment philosophy has built and sustained very competitive long-term track records for all the Baird Bond Funds. As we look forward to the year ahead, we are optimistic about the Funds’ portfolio positioning and have confidence that we will continue to deliver added value for investors through the ongoing uncertainty and volatility.
We are proud of our firm, proud of our team, and so very grateful, honored and humbled to serve as your fixed income manager.
Sincerely,
Mary Ellen Stanek, CFA
President
Baird Funds, Inc.
2023 Bond Market Overview
(Unaudited)
The Fed slowed and likely ended its most aggressive tightening campaign since the early 1980s in its fight against inflation. Since the last rate hike in July, which brought the top end of the federal funds target range to the highest level since 2000 (5.50%), inflation slowed at a steady pace even as economic growth remained strong. The Fed’s preferred inflation measure, the Core PCE Index, fell to 3.2% year over year in November from 4.9% to start 2023. In a show of support, investors returned to the bond market in 2023 as fixed income fund/ETF flows were a positive $159 billion, reversing the record outflows of -$345 billion in 2022. Despite the favorable inflation backdrop and the Fed pause after July, the yield curve between the 2-year and 10-year Treasuries remained inverted throughout the year. After starting the year at -55 bps, the inversion deepened to -107 bps in March amid regional bank concerns, the deepest inversion since 1980, before ending the year -37 bps. Yet, the overarching theme for 2023 was rate volatility. After beginning the year at 3.88%, the 10-year Treasury yield fell more than 50 bps to 3.31% in April as Silicon Valley and Signature Bank both failed, each taken into FDIC receivership; the sharp rise in rates since 2021 ultimately exposed poor internal risk management practices at each institution. And while some expected the Fed to cut rates in response, they instead utilized targeted liquidity measures to address banking needs.
From there, resilient economic data and heavy Treasury issuance led to a significant move up in rates. “Who will buy all the debt?” was a common question as rates were rising into October, as foreign demand waned and the Fed’s ongoing balance sheet runoff (QT) efforts leaves them as net sellers; the Fed balance sheet declined by $840 billion in 2023 (including both Treasury and MBS debt). The 10-year Treasury yield rose 168 bps, peaking in mid-October at 4.99%, the highest level since 2007. But the elevated rates were short-lived as one of the strongest year-end market rallies in decades ensued over the final two months. The 10-year Treasury yield fell 111 bps to end the year at 3.88%, the same yield at which it began the year, completing the round trip! Supporting the November/December rally, in addition to the improving inflation data and the Fed signaling a more balanced outlook, the market also responded favorably to a Treasury decision to shift issuance in the quarterly refunding toward bills rather than bonds, easing auction anxiety. Despite the market rally, the favorable Treasury funding adjustment was likely a temporary reprieve as ongoing fiscal deficits are expected to remain unusually high (est. 6.6% of GDP in FY24), which is abnormal during times of economic expansion. Fitch lowered the rating on US government debt to AA+ (the same rating as S&P) in August over deficit and governance concerns while Moody’s opted to maintain the US rating at Aaa but revised the outlook to Negative in November.
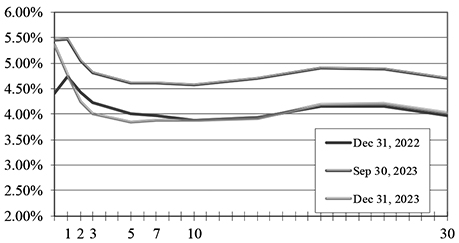
| Treasury Yields |
| |
Maturity | 12/31/22 | 9/30/23 | 12/31/23 | Q4 Change | YTD Change |
| 3 Mo | 4.41% | 5.46% | 5.36% | -0.10% | 0.95% |
| 1 | 4.73% | 5.48% | 4.78% | -0.70% | 0.05% |
| 2 | 4.43% | 5.05% | 4.25% | -0.80% | -0.18% |
| 3 | 4.23% | 4.81% | 4.01% | -0.80% | -0.22% |
| 5 | 4.01% | 4.61% | 3.85% | -0.76% | -0.16% |
| 7 | 3.97% | 4.62% | 3.88% | -0.74% | -0.09% |
| 10 | 3.88% | 4.57% | 3.88% | -0.69% | 0.00% |
| 20 | 4.15% | 4.90% | 4.20% | -0.70% | 0.05% |
| 30 | 3.97% | 4.70% | 4.03% | -0.67% | 0.06% |
Notable Tightening in Corporate and Agency RMBS Spreads in Q4 Result in Spreads Tighter for 2023
Corporate spreads ended 2023 at +99, tighter by 31 bps, driven in large part by notable tightening in Q4 (-22 bps), particularly among the Financials subsector (-28 bps Q4). IG Corporate spreads did exhibit intra-year volatility and reached as high as +163 in the wake of Signature and Silicon Valley Bank’s failures in mid-March before entering a downward trend through year-end as issues for those banks proved to be isolated to a handful of regional banks and not systemic. Spread volatility also remained elevated in the Agency RMBS market. While spreads ended the year at +47 bps, just -4 bps below where they began the year, interim months featured spread tights of +35 bps and a wide of +82 bps in October before embarking on an outsized rally into year-end. Fed balance sheet runoff (QT) and diminished bank buying fostered demand imbalances and spread volatility. Non-Agency CMBS widened for the year by +24 bps (from +179 start to +203 at year-end) driven primarily by subordinate segments of the market amid concerns regarding office demand post-Covid. The fundamental concerns were particularly acute among floating-rate issuers with securities facing the need to refinance. AAA-rated Non-Agency CMBS performed better, just +8 bps wider on the year. Spread tightening in 2023 was greatest for High Yield Corporates (-146 bps) and Emerging Market Debt (-89 bps) on hopes for an economic soft landing.
Robust Income and Massive Q4 Returns Propel Positive Aggregate Results in 2023
A strong Q4 rally of 6.82%, primarily in November/December, helped to produce solid results of 5.53% in 2023 following a challenging 2022 for the Agg Index. Income was a driving factor in total returns given that the 10-year Treasury finished the year exactly where it began, at 3.88%. The Agg Index began 2023 with a yield of 4.68% and ended the year at 4.53%, a function of spread tightening. Excess returns were positive for both the quarter and year across fixed income subsectors. Agency RMBS produced an outsized 1.33% of Q4 excess returns and 0.68% of annual excess returns amid above-average volatility. CMBS also provided positive excess returns for Q4 (+0.67%) and year (+1.14%). IG Corporate returns were particularly strong in Q4 at 8.50% and nearly matched the annual return figure of 8.52%. Its excess return of 4.55% for the calendar year was second to only Taxable Municipals (+5.20% excess returns) among investment grade subsectors. The strong rally in lower quality market segments in Q4 on market hopes for Fed easing and an economic soft landing also propelled HY Corporates and EM debt, which had excess returns of 3.31% and 5.31%, respectively, in the final 3 months of the year.
| Option-Adjusted Spreads (in bps) |
| | | | | Q4 | YTD |
| | 12/31/22 | 9/30/23 | 12/31/23 | Chg | Chg |
| U.S. Aggregate Index | 51 | 52 | 42 | -10 | -9 |
| U.S. Agency (non-mortgage) | 26 | 16 | 17 | 1 | -9 |
| Mortgage and ABS Sectors | | | | | |
| U.S. Agency RMBS (Pass-throughs) | 51 | 66 | 47 | -19 | -4 |
| U.S. Agency CMBS | 52 | 54 | 48 | -6 | -4 |
| U.S. Non-Agency CMBS | 179 | 203 | 203 | 0 | 24 |
| Asset-Backed Securities | 76 | 67 | 68 | 1 | -8 |
| Corporate Sectors | | | | | |
| U.S. Investment Grade | 130 | 121 | 99 | -22 | -31 |
| Industrial | 125 | 110 | 90 | -20 | -35 |
| Utility | 129 | 122 | 105 | -17 | -24 |
| Financial Institutions | 140 | 140 | 112 | -28 | -28 |
| Non-Corporate Credit | 66 | 56 | 55 | -1 | -11 |
| U.S. High Yield Corporates | 469 | 394 | 323 | -71 | -146 |
| Emerging Market Debt | 687 | 648 | 598 | -50 | -89 |
Source: Bloomberg Indices
2023 Bond Market Overview
(Unaudited)
Total Returns of Selected Bloomberg Indices and Subsectors
| | Dec Total | Dec Excess | Q4 Total | Q4 Excess | 2023 Total | 2023 Excess | Effective |
| | Return | Return* | Return | Return* | Return | Return* | Duration (years) |
| U.S. Aggregate Index | 3.83% | 0.26% | 6.82% | 0.88% | 5.53% | 1.40% | 6.24 |
| U.S. Gov’t/Credit Index | 3.68% | 0.11% | 6.63% | 0.72% | 5.72% | 1.69% | 6.44 |
| U.S. Intermediate Gov’t/Credit Index | 2.32% | 0.17% | 4.56% | 0.49% | 5.24% | 0.96% | 3.78 |
| U.S. 1-3 Yr. Gov’t/Credit Index | 1.19% | 0.07% | 2.69% | 0.17% | 4.61% | 0.28% | 1.83 |
| U.S. Treasury | 3.36% | 0.00% | 5.66% | 0.00% | 4.05% | 0.00% | 6.18 |
| U.S. Agency (Non-Mortgage) | 1.90% | 0.06% | 3.68% | 0.14% | 5.13% | 0.64% | 3.21 |
| U.S. Agency RMBS (Pass-Throughs) | 4.31% | 0.64% | 7.48% | 1.33% | 5.05% | 0.68% | 5.89 |
| CMBS (Commercial Mortgage Backed Securities) | 3.03% | 0.53% | 5.25% | 0.67% | 5.42% | 1.14% | 4.42 |
| ABS (Asset-Backed Securities) | 1.91% | 0.35% | 3.48% | 0.37% | 5.54% | 1.24% | 2.70 |
| U.S. Corporate Investment Grade | 4.34% | 0.30% | 8.50% | 2.03% | 8.52% | 4.55% | 7.09 |
| U.S. High Yield Corporates | 3.73% | 1.79% | 7.16% | 3.31% | 13.44% | 8.86% | 3.15 |
| Emerging Market Debt | 4.38% | 1.56% | 9.71% | 5.31% | 13.10% | 9.52% | 4.92 |
| Municipal Bond Index | 2.32% | N/A
| 7.89% | N/A
| 6.40% | N/A
| 6.05 |
| Taxable Municipal Bond: Agg Eligible | 5.82% | 0.32% | 8.98% | 0.57% | 8.85% | 5.20% | 9.55 |
| TIPS (Treasury Inflation Protected Securities) | 2.69% | 0.00% | 4.71% | 0.00% | 3.90% | 0.00% | 6.58 |
* Excess return represents the return of a spread sector versus a like-duration U.S. Treasury.
2024 Outlook
Despite the strong returns in Q4 2023, which may have pulled forward returns from 2024, the outlook for the fixed income markets in 2024 is favorable. This view is supported by an inflationary trend that is moving closer to the Fed’s 2% target and an acknowledgement, by both the Fed and the market, that the odds have shifted in favor of rate cuts over further rate increases. Investors should be encouraged that inflation has slowed even as economic growth, and particularly the labor market, have been relatively firm. That said, signs of slowing are emerging. Monthly nonfarm payroll growth has slowed from a peak of +472k in January of 2023 to a monthly average of less than +200k in the second half of the year. At the same time, the US unemployment rate has risen from the mid- to the high-3% range. Yet, it is noteworthy that the economy grew at more than a 2% pace in each quarter of 2023. Growth, coupled with rising stock and bond prices all seem to align with the Fed’s hope for a soft landing in 2024. Outside of the US, geopolitical risks are elevated. The war between Ukraine and Russia is approaching its 2nd anniversary as the US continues to debate further aid to Ukraine in its upcoming budget negotiations. The October 7 attack by Hamas in Israel only added to global tensions as Israel responded with an aggressive campaign inside Gaza to defeat Hamas. Finally, relations between China and the US remain strained. Chinese economic growth post-Covid has been sluggish and trade relations continue to be impacted by intellectual property disputes, national security concerns on technology and the impacts of near-sourcing for manufacturers. Efforts by President Biden to ease tensions with China’s President Xi were likely only a temporary reprieve to larger, long-term challenges between the two global superpowers.
From a market perspective, we expect there to be a gradual re-shaping of the yield curve to its normal upwardly sloped posture in 2024 as the health of economic data dictates the pace and magnitude of change. If short-term rates fall, as is expected, it is also likely that a portion of the massive stockpile of investor cash currently parked in high-yielding money market funds or other short-term instruments would seek income out along the curve. This would point to a continuation of positive fund flows in the New Year. At 3.88%, the 10-year Treasury yield is still more than 300 bps above the lows of 2020 and above the roughly 3.25% average yield on this market benchmark since the turn of the century. The same favorable comparisons can be said for broad market indices. Spreads on investment grade segments of the bond market such as corporate credit and mortgage-backed securities remain fair following the tightening in Q4 2023 and provide investors reasonable additional income with a solid fundamental foundation. However, spread volatility was visible in 2023 and may continue into 2024, benefitting the patient, active investor. Finally, 2024 is an election year, certain to add to market uncertainty as the year progresses; another key benefit of the income bonds currently offer to help insulate investors from ongoing price volatility.
Disclosures
This is not a complete analysis of every material fact regarding any company, industry or security. The information has been obtained from sources we consider to be reliable, but we cannot guarantee the accuracy.
Fixed income is generally considered to be a more conservative investment than stocks, but bonds and other fixed income investments still carry a variety of risks such as interest rate risk, credit risk, inflation risk, and liquidity risk. In a rising interest rate environment, the value of fixed-income securities generally decline and conversely, in a falling interest rate environment, the value of fixed-income securities generally increase. High yield securities may be subject to heightened market, interest rate or credit risk and should not be purchased solely because of the stated yield.
Indices are unmanaged and are not available for direct investment. Past performance is not a guarantee of future results.
The Bloomberg U.S. Aggregate Index is an index comprised of approximately 6000 publicly traded bonds including U.S. Government, mortgage-backed, corporate, and Yankee bonds with an average maturity of approximately 10 years.
The Bloomberg Government/Credit Index is a combination of the Government Index which measures government-bond general and Treasury funds, and the Credit Bond Index, which is a market value-weighted index which tracks the returns of all publicly issued, fixed-rate, nonconvertible, dollar-denominated, SEC registered, investment grade Corporate Debt.
The Bloomberg Intermediate U.S. Government/Credit Index is a combination of the Government Index which measures government-bond general and Treasury funds, and the Credit Bond Index, which is a market value-weighted index which tracks the returns of all publicly issued, fixed-rate, nonconvertible, dollar-denominated, SEC registered, investment grade Corporate Debt with maturities between one and ten years.
The Bloomberg 1-3 Year U.S. Government/Credit Index is a combination of the Government Index which measures government-bond general and Treasury funds, and the Credit Bond Index, which is a market value-weighted index which tracks the returns of all publicly issued, fixed-rate, nonconvertible, dollar-denominated, SEC registered, investment grade Corporate Debt with maturities between zero and three years.
The Bloomberg U.S. Treasury Index includes public obligations of the U.S. Treasury. Treasury bills are excluded by the maturity constraint of at least one year but are part of a separate Short Treasury Index. In addition, certain special issues, such as state and local government series bonds (SLGs), as well as U.S. Treasury TIPS, are excluded. STRIPS are excluded from the index
2023 Bond Market Overview
(Unaudited)
because their inclusion would result in double-counting. Securities in the Index roll up to the U.S. Aggregate, U.S. Universal, and Global Aggregate Indices. The U.S. Treasury Index was launched on January 1, 1973.
U.S. Agency: This index is the U.S. Agency component of the U.S. Government/Credit index. Publicly issued debt of U.S. Government agencies, quasi-federal corporations, and corporate or foreign debt guaranteed by the U.S. Government (such as USAID securities). The largest issues are Fannie Mae, Freddie Mac, and the Federal Home Loan Bank System (FHLB). The index includes both callable and non-callable agency securities.
U.S Corporate – Investment Grade: This index is the Corporate component of the U.S. Credit index. It includes publicly issued U.S. corporate and specified foreign debentures and secured notes that meet the specified maturity, liquidity, and quality requirements. To qualify, bonds must be SEC-registered.
CMBS (Commercial Mortgage-Backed Securities): This index is the CMBS component of the U.S. Aggregate index. The Bloomberg CMBS ERISA-Eligible Index is the ERISA-eligible component of the Bloomberg CMBS Index. This index, which includes investment grade securities that are ERISA eligible under the underwriter’s exemption, is the only CMBS sector that is included in the U.S. Aggregate Index.
MBS (Mortgage-Backed Securities): This index is the U.S. MBS component of the U.S. Aggregate index. The MBS Index covers the mortgage-backed pass-through securities of Ginnie Mae (GNMA), Fannie Mae (FNMA), and Freddie Mac (FHLMC). The MBS Index is formed by grouping the universe of over 600,000 individual fixed rate MBS pools into approximately 3,500 generic aggregates.
ABS (Asset-Backed Securities): This index is the ABS component of the U.S. Aggregate index. The ABS index has three subsectors: credit and charge cards, autos, and utility. The index includes pass-through, bullet, and controlled amortization structures. The ABS Index includes only the senior class of each ABS issue and the ERISA-eligible B and C tranche. The Manufactured Housing sector was removed as of January 1, 2008, and the Home Equity Loan sector was removed as of October 1, 2009.
Corporate High Yield: The Bloomberg U.S. High Yield Index covers the universe of fixed rate, non-investment grade debt. Eurobonds and debt issues from countries designated as emerging markets (sovereign rating of Baa1/BBB+/BBB+ and below using the middle of Moody’s, S&P, and Fitch) are excluded, but Canadian and global bonds (SEC registered) of issuers in non-EMG countries are included. Original issue zeroes, step-up coupon structures, 144-As and pay-in-kind bonds (PIKs, as of October 1, 2009) are also included.
Emerging Market: Bloomberg uses a fixed list of countries defined as emerging markets countries for index inclusion purposes that is based on World Bank Income group definitions (Low/Middle), IMF country classifications (Non-Advanced Economies), and other advanced economies that may be less accessible or investable for global debt investors.
The Bloomberg Municipal Index is a broad-based, total-return index. The bonds are all investment-grade, tax-exempt, and fixed-rate securities with long-term maturities (greater than 2 years). They are selected from issues larger than $50 million.
The Bloomberg TIPS Index consists of Treasury Inflation Protected Securities (TIPS). TIPS are securities whose principal is tied to the Consumer Price Index. TIPS pay interest semi-annually, based on the fixed rate applied to the adjusted principal.
Ratings are measured on a scale that ranges from AAA or Aaa (highest) to D or C (lowest). Investment grade investments are those rated from highest down to BBB- or Baa3.
Baird Ultra Short Bond Fund
December 31, 2023 (Unaudited)
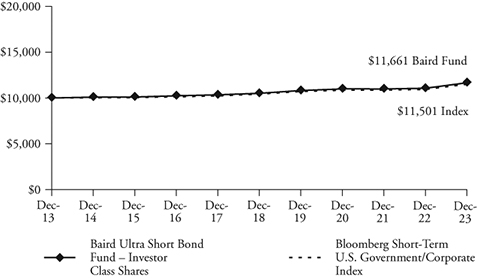
The Baird Ultra Short Bond Fund seeks current income consistent with preservation of capital. The Fund’s primary benchmark index against which it measures performance is the Bloomberg Short-Term U.S. Government/Corporate Index. The Bloomberg Short-Term U.S. Government/Corporate Index is an unmanaged, market value weighted index of investment grade fixed debt, including government and corporate securities, with maturities of less than one year.
In 2023, the Fed slowed and likely ended its aggressive tightening campaign. Investors returned to the bond market as fixed income fund/ETF flows were a positive $159 billion, reversing the record outflows of -$345 billion in 2022. The overarching theme for 2023 was rate and credit spread volatility. After beginning the year at 3.88%, the 10-year Treasury yield fell more than 50 bps to 3.31% in April. From there, resilient economic data and heavy Treasury issuance led to a significant move up in rates. The 10-year Treasury yield rose 168 bps, peaking in mid-October at 4.99%, but the elevated rates were short-lived as one of the strongest year-end market rallies in decades ensued. The 10-year Treasury yield fell 111 bps to end the year at 3.88%, exactly the yield at which it began the year.
During 2023, the Institutional Class Shares of the Fund (BUBIX) posted a net return of 5.71% vs. a 5.19% return for the Bloomberg Short-Term U.S. Government/Corporate Index.
Contributors to the Fund’s relative performance during the year include:
| | | • | Positive – Overweight investment grade credit |
| | | • | Positive – Active positioning within investment grade credit |
| | | | o | Positive – Overweight BBB industrials as well as subsector and security selection decisions within industrials (spread across many subsectors) |
| | | | o | Positive – Overweight banking and security selection within banking |
| | | • | Positive – Overweight non-agency commercial mortgage-backed securities (CMBS) and asset-backed securities (ABS) |
| | Yield Curve – Modest positive |
| | | • | Modest positive – Underweight 3-6 month and overweight 1-2 year, as the 6-month to 2-year portion of the yield curve inverted further |
The outlook for the fixed income markets in 2024 is favorable, thanks to an inflationary trend that is moving closer to the Fed’s 2% target and an acknowledgement, by both the Fed and the market, that the odds have shifted toward rate cuts rather than increases. Signs of economic slowing are emerging as monthly payroll growth has slowed and the U.S. unemployment rate has risen modestly. Outside of the U.S., geopolitical risks are elevated with an ongoing war in Ukraine, Israel’s full-scale campaign inside Gaza to defeat Hamas, non-state actor attacks on shipping in the Red Sea and U.S. interests in the Middle East, and relations between China and the U.S. strained, all of which, combined with the uncertain Fed outlook, will likely lead to continued elevated market volatility. We expect the spread volatility that was visible in 2023 to continue into 2024, benefitting the patient, active investor. Finally, 2024 is an election year, which is certain to add to market uncertainty as the year progresses; this uncertainty is likely to lead to short-term price volatility although the higher income from bonds can insulate investors from this volatility.
The Fund remains duration neutral and continues to maintain an overweight to investment grade corporate credit, favoring the financial sector relative to its benchmark. In addition, we are maintaining the Fund’s overweight to non-agency securitized sub-sectors at the top of the capital structure given the diversification benefit they provide to the overall portfolio and attractive valuations versus U.S. Treasuries and higher-rated segments of investment grade credit.
Baird Ultra Short Bond Fund
December 31, 2023 (Unaudited)
Portfolio Characteristics
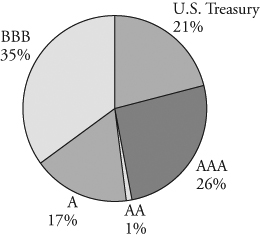
Quality Distribution(1)(2)
| | Net Assets | $6,236,569,413 | |
| | | | |
| | SEC 30-Day Yield(3) | | |
| | Institutional Class (Subsidized) | 5.15% | |
| | Institutional Class (Unsubsidized) | 5.00% | |
| | Investor Class (Subsidized) | 4.90% | |
| | Investor Class (Unsubsidized) | 4.75% | |
| | | | |
| | Average Effective Duration | 0.52 years | |
| | | | |
| | Average Effective Maturity | 0.54 years | |
| | | | |
| | Annualized Expense Ratio(4) | | |
| | Gross | | |
| | | Institutional Class | 0.30% | |
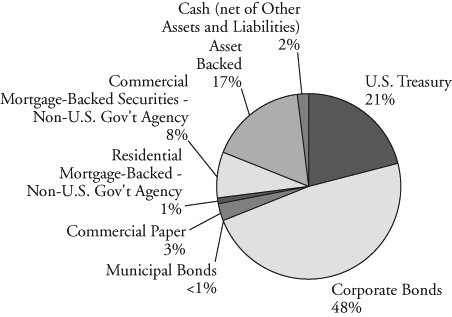
Sector Weightings(6) | | Investor Class | 0.55% | (5) |
| | | | | |
 | | Net | | |
| | Institutional Class | 0.15% | |
| | Investor Class | 0.40% | (5) |
| | | | |
| | Portfolio Turnover Rate | 105% | |
| | | | |
| | Number of Holdings | 324 | |
| | | | |
| | | | |
| | | | |
| | | | |
| | | | |
| | | | |
| | | | |
| | | | |
| | | | |
| | | | |
| | | | |
| | | | | |
(1) | Percentages shown are based on the Fund’s total investments. |
(2) | The quality profile is calculated on a market value-weighted basis using the highest credit quality rating for each security held by the Fund given by S&P, Moody’s or Fitch, each of which is a Nationally Recognized Statistical Rating Organization (NRSRO). NRSROs rate the credit quality of securities using a scale that generally ranges from AAA (highest) to D (lowest). |
(3) | SEC yields are based on SEC guidelines and are calculated for the 30 days ended December 31, 2023. |
(4) | Reflects expense ratios as stated in the Fund’s current prospectus dated May 1, 2023. The Advisor has contractually agreed to waive management fees in an amount equal to an annual rate of 0.15% of average daily net assets for the Fund, at least through April 30, 2025. The agreement may only be terminated prior to the end of this term by or with the consent of the Board of Directors of Baird Funds, Inc. |
(5) | Includes 0.25% 12b-1 fee. |
(6) | Percentages shown are based on the Fund’s total net assets. |
Baird Ultra Short Bond Fund
December 31, 2023 (Unaudited)
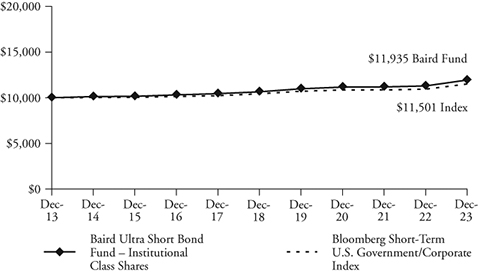
| Institutional Class | Investor Class |
| Value of a $10,000 Investment | Value of a $10,000 Investment |
| | |
 |  |
| | |
| Growth of a hypothetical investment of $10,000 made on 12/31/13, assuming | Growth of a hypothetical investment of $10,000 made on 12/31/13, assuming |
| reinvestment of all distributions. | reinvestment of all distributions. |
| Total Returns | | | | |
| | | Average Annual |
| | One | Five | Ten | Since |
| For the Periods Ended December 31, 2023 | Year | Years | Years | Inception(1) |
| Institutional Class Shares | 5.71% | 2.31% | 1.79% | 1.79% |
| Investor Class Shares | 5.43% | 2.10% | 1.55% | 1.55% |
Bloomberg Short-Term U.S. Government/Corporate Index(2) | 5.19% | 1.98% | 1.41% | 1.41% |
(1) | For the period from December 31, 2013 (inception date) through December 31, 2023. |
(2) | The Bloomberg Short-Term U.S. Government/Corporate Index is an unmanaged, market value weighted index of investment grade, fixed-rate debt issues, including government and corporate securities, with maturities less than one year. This Index does not reflect any deduction for fees, expenses or taxes. A direct investment in an index is not possible. |
The line graphs and the returns table shown above reflect reinvestment of dividends and/or capital gains distributions in additional shares. The returns in the graphs and table do not reflect the deduction of taxes that a shareholder would pay on Fund distributions or the redemption of Fund shares. The returns reflect the actual performance for each period and do not include the impact of trades executed on the last business day of the period that were recorded on the first business day of the next period.
The Fund’s gross and net expense ratio for each Class, as reflected in the Fund’s current prospectus, are set forth under “Portfolio Characteristics”.
The Fund may invest up to 10% of its net assets in non-investment grade debt securities (commonly referred to as “high yield” bonds). While these types of securities may offer higher yields than investment grade securities, they also include greater risks including increased credit risk and the increased risk of default or bankruptcy. The Fund may also invest in U.S. dollar denominated foreign securities which involve additional risks such as political and economic instability, and different and sometimes less strict financial reporting standards and regulation. The Fund may also invest in mortgage- and asset-backed securities, which include interest rate and prepayment risks more pronounced than those of other fixed income securities. U.S. and international markets have experienced significant periods of volatility due to a number of economic, political and other global macro factors. The war between Ukraine and Russia is approaching its 2nd anniversary and the October 7th attack by Hamas and Israel’s response only added to global tensions. US/China relations remain strained, impacted by sluggish Chinese economic growth and numerous issues affecting trade relations. Domestically, inflation remains an area of focus since getting to the Fed’s 2% target may prove to be more challenging than the market expects. In addition, 2024 is an election year and the current level of political discord is high. Finally, while the coronavirus (COVID-19) appears to have entered an endemic stage, significant outbreaks present a continued risk to the global economy. These and other events may cause market disruptions and could have an adverse effect on the value of the Fund’s investments.
Past performance does not guarantee future results. Investment return and principal value will fluctuate so that an investor’s shares, when redeemed, may be worth more or less than their original cost.
For information about the performance of the Fund as of the most recent month-end, please call 1-866-442-2473 or visit www.bairdfunds.com. Mutual fund performance changes over time and current performance may be lower or higher than that stated.
Baird Ultra Short Bond Fund
Schedule of Investments, December 31, 2023
Long-Term Investments
| | | Principal | | | | | | % of | |
| | | Amount | | | Value | | | Net Assets | |
| U.S. Treasury Securities | | | | | | | | | |
| U.S. Treasury Bonds: | | | | | | | | | |
| 0.875%, 01/31/2024 | | $ | 245,000,000 | | | $ | 244,131,982 | | | | |
| 1.500%, 02/29/2024 | | | 75,000,000 | | | | 74,544,932 | | | | |
| Total U.S. Treasury Securities | | | | | | | | | | | |
| (Cost $318,787,528) | | | | | | | 318,676,914 | | | | 5.1 | % |
| Corporate Bonds | | | | | | | | | | | | |
| Industrials | | | | | | | | | | | | |
| 7-Eleven, Inc., | | | | | | | | | | | | |
| 0.800%, 02/10/2024 | | | | | | | | | | | | |
(Callable 01/29/2024)(1)(2) | | | 45,668,000 | | | | 45,408,715 | | | | | |
| Adventist Health System, | | | | | | | | | | | | |
| 2.433%, 09/01/2024 | | | | | | | | | | | | |
| (Callable 08/01/2024) | | | 6,380,000 | | | | 6,234,917 | | | | | |
| Allegion US Holding Co., Inc., | | | | | | | | | | | | |
| 3.200%, 10/01/2024 | | | | | | | | | | | | |
| (Callable 08/01/2024) | | | 17,362,000 | | | | 17,012,113 | | | | | |
| Anglo American Capital PLC, | | | | | | | | | | | | |
3.625%, 09/11/2024(1)(2) | | | 9,925,000 | | | | 9,764,294 | | | | | |
| Arrow Electronics, Inc., | | | | | | | | | | | | |
| 3.250%, 09/08/2024 | | | | | | | | | | | | |
| (Callable 07/08/2024) | | | 13,600,000 | | | | 13,354,018 | | | | | |
| AutoNation, Inc., | | | | | | | | | | | | |
| 3.500%, 11/15/2024 | | | | | | | | | | | | |
| (Callable 09/15/2024) | | | 19,759,000 | | | | 19,336,781 | | | | | |
| Baxter International, Inc., | | | | | | | | | | | | |
| 1.322%, 11/29/2024 | | | 3,250,000 | | | | 3,129,716 | | | | | |
| Bayer US Finance LLC, | | | | | | | | | | | | |
3.375%, 10/08/2024(1)(2) | | | 4,400,000 | | | | 4,310,813 | | | | | |
| Berry Global, Inc., | | | | | | | | | | | | |
| 0.950%, 02/15/2024 | | | | | | | | | | | | |
| (Callable 01/16/2024) | | | 48,237,000 | | | | 47,890,947 | | | | | |
| Boardwalk Pipelines LP, | | | | | | | | | | | | |
| 4.950%, 12/15/2024 | | | | | | | | | | | | |
| (Callable 09/15/2024) | | | 29,505,000 | | | | 29,281,803 | | | | | |
| Boeing Co., | | | | | | | | | | | | |
| 1.433%, 02/04/2024 | | | | | | | | | | | | |
| (Callable 01/09/2024) | | | 16,005,000 | | | | 15,936,840 | | | | | |
| Brunswick Corp., | | | | | | | | | | | | |
| 0.850%, 08/18/2024 | | | | | | | | | | | | |
| (Callable 01/16/2024) | | | 46,577,000 | | | | 45,064,784 | | | | | |
| Canadian Natural Resources Ltd., | | | | | | | | | | | | |
| 3.900%, 02/01/2025 | | | | | | | | | | | | |
(Callable 11/01/2024)(1) | | | 2,921,000 | | | | 2,873,991 | | | | | |
| CDW LLC / CDW Finance Corp., | | | | | | | | | | | | |
| 5.500%, 12/01/2024 | | | | | | | | | | | | |
| (Callable 06/01/2024) | | | 4,107,000 | | | | 4,094,145 | | | | | |
| Celanese US Holdings LLC, | | | | | | | | | | | | |
| 3.500%, 05/08/2024 | | | | | | | | | | | | |
| (Callable 04/08/2024) | | | 6,380,000 | | | | 6,320,164 | | | | | |
| Charter Communications Operating LLC, | | | | | | | | | | | | |
| 4.500%, 02/01/2024 | | | | | | | | | | | | |
| (Callable 01/16/2024) | | | 46,800,000 | | | | 46,723,255 | | | | | |
| CNH Industrial Capital LLC, | | | | | | | | | | | | |
4.200%, 01/15/2024(1) | | | 6,700,000 | | | | 6,694,839 | | | | | |
| Continental Resources, Inc., | | | | | | | | | | | | |
| 3.800%, 06/01/2024 | | | | | | | | | | | | |
| (Callable 03/01/2024) | | | 3,800,000 | | | | 3,770,396 | | | | | |
| Cox Communications, Inc., | | | | | | | | | | | | |
| 3.150%, 08/15/2024 | | | | | | | | | | | | |
(Callable 06/15/2024)(2) | | | 22,255,000 | | | | 21,880,897 | | | | | |
| Crown Castle, Inc., | | | | | | | | | | | | |
| 3.200%, 09/01/2024 | | | | | | | | | | | | |
| (Callable 07/01/2024) | | | 8,084,000 | | | | 7,952,055 | | | | | |
| Element Fleet Management Corp., | | | | | | | | | | | | |
| 1.600%, 04/06/2024 | | | | | | | | | | | | |
(Callable 03/06/2024)(1)(2) | | | 21,762,000 | | | | 21,484,577 | | | | | |
| Enbridge, Inc.: | | | | | | | | | | | | |
2.150%, 02/16/2024(1) | | | 19,482,000 | | | | 19,393,715 | | | | | |
| 3.500%, 06/10/2024 | | | | | | | | | | | | |
(Callable 03/10/2024)(1) | | | 2,300,000 | | | | 2,276,556 | | | | | |
| Energy Transfer LP: | | | | | | | | | | | | |
| 5.875%, 01/15/2024 | | | 8,775,000 | | | | 8,772,988 | | | | | |
| 4.900%, 02/01/2024 | | | | | | | | | | | | |
| (Callable 01/29/2024) | | | 13,061,000 | | | | 13,046,644 | | | | | |
| 4.250%, 04/01/2024 | | | | | | | | | | | | |
| (Callable 01/29/2024) | | | 3,055,000 | | | | 3,043,295 | | | | | |
| 4.500%, 04/15/2024 | | | | | | | | | | | | |
| (Callable 03/15/2024) | | | 10,604,000 | | | | 10,564,304 | | | | | |
| 3.900%, 05/15/2024 | | | | | | | | | | | | |
| (Callable 02/15/2024) | | | 2,739,000 | | | | 2,718,105 | | | | | |
| EnLink Midstream Partners LP, | | | | | | | | | | | | |
| 4.400%, 04/01/2024 | | | | | | | | | | | | |
| (Callable 01/29/2024) | | | 2,000,000 | | | | 1,980,000 | | | | | |
| Enterprise Products Operating LLC, | | | | | | | | | | | | |
| 3.900%, 02/15/2024 | | | | | | | | | | | | |
| (Callable 01/29/2024) | | | 6,140,000 | | | | 6,125,942 | | | | | |
| EQT Corp., | | | | | | | | | | | | |
| 6.125%, 02/01/2025 | | | | | | | | | | | | |
| (Callable 01/01/2025) | | | 10,008,000 | | | | 10,052,536 | | | | | |
| Equifax, Inc., | | | | | | | | | | | | |
| 2.600%, 12/01/2024 | | | | | | | | | | | | |
| (Callable 11/01/2024) | | | 6,556,000 | | | | 6,383,012 | | | | | |
| Equinix, Inc., | | | | | | | | | | | | |
| 2.625%, 11/18/2024 | | | | | | | | | | | | |
| (Callable 10/18/2024) | | | 5,908,000 | | | | 5,754,069 | | | | | |
| Ford Motor Credit Co. LLC, | | | | | | | | | | | | |
| 2.300%, 02/10/2025 | | | | | | | | | | | | |
| (Callable 01/10/2025) | | | 46,993,000 | | | | 45,196,505 | | | | | |
| Freeport-McMoRan, Inc., | | | | | | | | | | | | |
| 4.550%, 11/14/2024 | | | | | | | | | | | | |
| (Callable 08/14/2024) | | | 37,172,000 | | | | 36,771,658 | | | | | |
| Fresenius Medical Care US Finance II, Inc., | | | | | | | | | | | | |
| 4.750%, 10/15/2024 | | | | | | | | | | | | |
(Callable 07/17/2024)(1)(2) | | | 15,541,000 | | | | 15,336,390 | | | | | |
| General Motors Financial Co., Inc.: | | | | | | | | | | | | |
| 1.050%, 03/08/2024 | | | 15,684,000 | | | | 15,543,153 | | | | | |
| 1.200%, 10/15/2024 | | | 9,165,000 | | | | 8,843,838 | | | | | |
| 3.500%, 11/07/2024 | | | | | | | | | | | | |
| (Callable 09/07/2024) | | | 7,945,000 | | | | 7,798,180 | | | | | |
| 4.000%, 01/15/2025 | | | | | | | | | | | | |
| (Callable 10/15/2024) | | | 12,525,000 | | | | 12,320,538 | | | | | |
| Genpact Luxembourg Sarl, | | | | | | | | | | | | |
| 3.375%, 12/01/2024 | | | | | | | | | | | | |
| (Callable 11/01/2024) | | | 24,165,000 | | | | 23,540,335 | | | | | |
| Genuine Parts Co., | | | | | | | | | | | | |
| 1.750%, 02/01/2025 | | | | | | | | | | | | |
| (Callable 01/09/2024) | | | 2,916,000 | | | | 2,800,355 | | | | | |
| Glencore Funding LLC: | | | | | | | | | | | | |
| 4.125%, 03/12/2024 | | | | | | | | | | | | |
(Callable 02/12/2024)(1)(2) | | | 5,979,000 | | | | 5,957,065 | | | | | |
4.625%, 04/29/2024(1)(2) | | | 2,574,000 | | | | 2,562,861 | | | | | |
| Global Payments, Inc.: | | | | | | | | | | | | |
| 1.500%, 11/15/2024 | | | | | | | | | | | | |
| (Callable 10/15/2024) | | | 8,217,000 | | | | 7,923,324 | | | | | |
| 2.650%, 02/15/2025 | | | | | | | | | | | | |
| (Callable 01/15/2025) | | | 2,157,000 | | | | 2,090,121 | | | | | |
The accompanying notes are an integral part of these financial statements.
Baird Ultra Short Bond Fund
Schedule of Investments, December 31, 2023
Long-Term Investments (cont.)
| | | Principal | | | | | | % of | |
| | | Amount | | | Value | | | Net Assets | |
| Graphic Packaging International LLC, | | | | | | | | | |
| 0.821%, 04/15/2024 | | | | | | | | | |
(Callable 03/15/2024)(2) | | $ | 42,652,000 | | | $ | 42,076,845 | | | |
| |
| GSK Consumer Healthcare | | | | | | | | | | | | |
| Capital US LLC, | | | | | | | | | | | | |
| 3.024%, 03/24/2024 | | | | | | | | | | | | |
| (Callable 01/16/2024) | | | 22,825,000 | | | | 22,681,313 | | | | | |
| HCA, Inc.: | | | | | | | | | | | | |
| 5.000%, 03/15/2024 | | | 14,010,000 | | | | 13,984,478 | | | | | |
| 5.375%, 02/01/2025 | | | 30,269,000 | | | | 30,228,709 | | | | | |
| Hewlett Packard Enterprise Co., | | | | | | | | | | | | |
| 5.900%, 10/01/2024 | | | 36,450,000 | | | | 36,547,087 | | | | | |
| Howmet Aerospace, Inc., | | | | | | | | | | | | |
| 5.125%, 10/01/2024 | | | | | | | | | | | | |
| (Callable 07/01/2024) | | | 1,030,000 | | | | 1,024,876 | | | | | |
| Hyatt Hotels Corp., | | | | | | | | | | | | |
| 1.800%, 10/01/2024 | | | | | | | | | | | | |
| (Callable 01/16/2024) | | | 27,711,000 | | | | 26,884,171 | | | | | |
| Hyundai Capital America: | | | | | | | | | | | | |
0.800%, 01/08/2024(1)(2) | | | 15,879,000 | | | | 15,867,997 | | | | | |
1.000%, 09/17/2024(1)(2) | | | 23,472,000 | | | | 22,717,769 | | | | | |
| JDE Peet’s NV, | | | | | | | | | | | | |
| 0.800%, 09/24/2024 | | | | | | | | | | | | |
(Callable 01/29/2024)(1)(2) | | | 2,832,000 | | | | 2,723,180 | | | | | |
| Keysight Technologies, Inc., | | | | | | | | | | | | |
| 4.550%, 10/30/2024 | | | | | | | | | | | | |
| (Callable 07/30/2024) | | | 12,755,000 | | | | 12,629,605 | | | | | |
| Kinder Morgan Energy Partners LP: | | | | | | | | | | | | |
| 4.150%, 02/01/2024 | | | 6,407,000 | | | | 6,397,137 | | | | | |
| 4.250%, 09/01/2024 | | | | | | | | | | | | |
| (Callable 06/01/2024) | | | 5,696,000 | | | | 5,642,602 | | | | | |
| Laboratory Corp. of America Holdings, | | | | | | | | | | | | |
| 3.250%, 09/01/2024 | | | | | | | | | | | | |
| (Callable 07/01/2024) | | | 5,501,000 | | | | 5,415,594 | | | | | |
| Lennar Corp., | | | | | | | | | | | | |
| 4.500%, 04/30/2024 | | | | | | | | | | | | |
| (Callable 01/31/2024) | | | 8,743,000 | | | | 8,697,239 | | | | | |
| LyondellBasell Industries NV, | | | | | | | | | | | | |
| 5.750%, 04/15/2024 | | | | | | | | | | | | |
| (Callable 01/29/2024) | | | 554,000 | | | | 554,041 | | | | | |
| Marriott International, Inc., | | | | | | | | | | | | |
| 3.600%, 04/15/2024 | | | | | | | | | | | | |
| (Callable 03/15/2024) | | | 22,663,000 | | | | 22,548,491 | | | | | |
| Microchip Technology, Inc.: | | | | | | | | | | | | |
| 0.972%, 02/15/2024 | | | 1,375,000 | | | | 1,366,780 | | | | | |
| 0.983%, 09/01/2024 | | | 22,056,000 | | | | 21,369,200 | | | | | |
| Midwest Connector Capital Co. LLC, | | | | | | | | | | | | |
| 3.900%, 04/01/2024 | | | | | | | | | | | | |
(Callable 03/01/2024)(2) | | | 44,727,000 | | | | 44,470,316 | | | | | |
| MPLX LP, | | | | | | | | | | | | |
| 4.875%, 12/01/2024 | | | | | | | | | | | | |
| (Callable 09/01/2024) | | | 5,755,000 | | | | 5,721,892 | | | | | |
| Nissan Motor Acceptance Co. LLC: | | | | | | | | | | | | |
1.050%, 03/08/2024(1)(2) | | | 2,600,000 | | | | 2,575,527 | | | | | |
1.125%, 09/16/2024(1)(2) | | | 31,667,000 | | | | 30,541,843 | | | | | |
| Nutrien Ltd., | | | | | | | | | | | | |
5.900%, 11/07/2024(1) | | | 13,613,000 | | | | 13,649,003 | | | | | |
| NXP BV / NXP Funding LLC / | | | | | | | | | | | | |
| NXP USA, Inc., | | | | | | | | | | | | |
| 4.875%, 03/01/2024 | | | | | | | | | | | | |
(Callable 02/01/2024)(1) | | | 15,386,000 | | | | 15,356,226 | | | | | |
| Occidental Petroleum Corp., | | | | | | | | | | | | |
| 2.900%, 08/15/2024 | | | | | | | | | | | | |
| (Callable 07/15/2024) | | | 20,054,000 | | | | 19,714,085 | | | | | |
| ONEOK, Inc., | | | | | | | | | | | | |
| 2.750%, 09/01/2024 | | | | | | | | | | | | |
| (Callable 08/01/2024) | | | 6,388,000 | | | | 6,260,727 | | | | | |
| Owens Corning, | | | | | | | | | | | | |
| 4.200%, 12/01/2024 | | | | | | | | | | | | |
| (Callable 09/01/2024) | | | 7,620,000 | | | | 7,530,097 | | | | | |
| Penske Truck Leasing Co.: | | | | | | | | | | | | |
| 3.900%, 02/01/2024 | | | | | | | | | | | | |
(Callable 01/29/2024)(2) | | | 4,663,000 | | | | 4,653,717 | | | | | |
| 2.700%, 11/01/2024 | | | | | | | | | | | | |
(Callable 10/01/2024)(2) | | | 4,510,000 | | | | 4,386,330 | | | | | |
| 3.950%, 03/10/2025 | | | | | | | | | | | | |
(Callable 01/10/2025)(2) | | | 1,416,000 | | | | 1,390,101 | | | | | |
| Phillips 66 Co., | | | | | | | | | | | | |
| 0.900%, 02/15/2024 | | | | | | | | | | | | |
| (Callable 01/16/2024) | | | 2,505,000 | | | | 2,489,490 | | | | | |
| Plains All American Pipeline LP / | | | | | | | | | | | | |
| PAA Finance Corp., | | | | | | | | | | | | |
| 3.600%, 11/01/2024 | | | | | | | | | | | | |
| (Callable 08/01/2024) | | | 4,350,000 | | | | 4,268,835 | | | | | |
| Qorvo, Inc., | | | | | | | | | | | | |
| 1.750%, 12/15/2024 | | | | | | | | | | | | |
| (Callable 01/09/2024) | | | 12,699,000 | | | | 12,172,178 | | | | | |
| Quanta Services, Inc., | | | | | | | | | | | | |
| 0.950%, 10/01/2024 | | | | | | | | | | | | |
| (Callable 01/29/2024) | | | 10,846,000 | | | | 10,450,724 | | | | | |
| Revvity, Inc., | | | | | | | | | | | | |
| 0.850%, 09/15/2024 | | | | | | | | | | | | |
| (Callable 01/09/2024) | | | 21,068,000 | | | | 20,337,167 | | | | | |
| Ryder System, Inc., | | | | | | | | | | | | |
| 2.500%, 09/01/2024 | | | | | | | | | | | | |
| (Callable 08/01/2024) | | | 29,861,000 | | | | 29,200,622 | | | | | |
| Sabine Pass Liquefaction LLC, | | | | | | | | | | | | |
| 5.750%, 05/15/2024 | | | | | | | | | | | | |
| (Callable 02/15/2024) | | | 5,204,000 | | | | 5,200,974 | | | | | |
| Sprint LLC, | | | | | | | | | | | | |
| 7.125%, 06/15/2024 | | | 3,425,000 | | | | 3,439,810 | | | | | |
| Suntory Holdings Ltd., | | | | | | | | | | | | |
| 2.250%, 10/16/2024 | | | | | | | | | | | | |
(Callable 09/16/2024)(1)(2) | | | 1,330,000 | | | | 1,294,091 | | | | | |
| Synnex Corp., | | | | | | | | | | | | |
| 1.250%, 08/09/2024 | | | | | | | | | | | | |
| (Callable 01/09/2024) | | | 47,494,000 | | | | 46,302,638 | | | | | |
| Teledyne Technologies, Inc., | | | | | | | | | | | | |
| 0.950%, 04/01/2024 | | | | | | | | | | | | |
| (Callable 01/09/2024) | | | 15,746,000 | | | | 15,565,154 | | | | | |
| Thomas Jefferson University, | | | | | | | | | | | | |
| 2.070%, 11/01/2024 | | | 625,000 | | | | 603,570 | | | | | |
| Timken Co., | | | | | | | | | | | | |
| 3.875%, 09/01/2024 | | | | | | | | | | | | |
| (Callable 06/01/2024) | | | 8,723,000 | | | | 8,599,323 | | | | | |
| Toll Road Investors Partnership II LP, | | | | | | | | | | | | |
| 0.000%, 02/15/2024 | | | | | | | | | | | | |
(Insured by NATL)(2) | | | 1,240,000 | | | | 1,229,463 | | | | | |
| TransCanada PipeLines Ltd., | | | | | | | | | | | | |
| 1.000%, 10/12/2024 | | | | | | | | | | | | |
(Callable 09/12/2024)(1) | | | 46,371,000 | | | | 44,711,770 | | | | | |
| Trimble, Inc., | | | | | | | | | | | | |
| 4.750%, 12/01/2024 | | | | | | | | | | | | |
| (Callable 09/01/2024) | | | 5,350,000 | | | | 5,295,275 | | | | | |
| Triton Container International Ltd., | | | | | | | | | | | | |
| 1.150%, 06/07/2024 | | | | | | | | | | | | |
(Callable 05/07/2024)(1)(2) | | | 7,204,000 | | | | 7,029,046 | | | | | |
The accompanying notes are an integral part of these financial statements.
Baird Ultra Short Bond Fund
Schedule of Investments, December 31, 2023
Long-Term Investments (cont.)
| | | Principal | | | | | | % of | |
| | | Amount | | | Value | | | Net Assets | |
| VICI Properties LP, | | | | | | | | | |
| 5.625%, 05/01/2024 | | | | | | | | | |
(Callable 02/01/2024)(2) | | $ | 44,351,000 | | | $ | 44,198,051 | | | | |
| Volkswagen Group of | | | | | | | | | | | |
| America Finance LLC, | | | | | | | | | | | |
2.850%, 09/26/2024(1)(2) | | | 10,432,000 | | | | 10,224,404 | | | | |
| Wabtec Corp., | | | | | | | | | | | |
| 4.150%, 03/15/2024 | | | | | | | | | | | |
| (Callable 02/15/2024) | | | 22,097,000 | | | | 22,003,471 | | | | |
| West Fraser Timber Co. Ltd., | | | | | | | | | | | |
| 4.350%, 10/15/2024 | | | | | | | | | | | |
(Callable 07/15/2024)(1)(2) | | | 2,600,000 | | | | 2,557,659 | | | | |
| Western Midstream Operating LP, | | | | | | | | | | | |
| 3.100%, 02/01/2025 | | | | | | | | | | | |
| (Callable 01/01/2025) | | | 4,095,000 | | | | 3,984,913 | | | | |
| Williams Companies, Inc.: | | | | | | | | | | | |
| 4.550%, 06/24/2024 | | | | | | | | | | | |
| (Callable 03/24/2024) | | | 19,641,000 | | | | 19,532,081 | | | | |
| 3.900%, 01/15/2025 | | | | | | | | | | | |
| (Callable 10/15/2024) | | | 16,940,000 | | | | 16,670,487 | | | | |
| WRKCo, Inc., | | | | | | | | | | | |
| 3.000%, 09/15/2024 | | | | | | | | | | | |
| (Callable 07/15/2024) | | | 6,691,000 | | | | 6,563,156 | | | | |
| Total Industrials | | | | | | | | | | | |
| (Cost $1,452,809,203) | | | | | | | 1,454,846,879 | | | | 23.3 | % |
| Utilities | | | | | | | | | | | | |
| Avangrid, Inc., | | | | | | | | | | | | |
| 3.150%, 12/01/2024 | | | | | | | | | | | | |
(Callable 10/01/2024)(1) | | | 8,605,000 | | | | 8,404,041 | | | | | |
| Black Hills Corp., | | | | | | | | | | | | |
| 1.037%, 08/23/2024 | | | | | | | | | | | | |
| (Callable 01/16/2024) | | | 33,540,000 | | | | 32,548,086 | | | | | |
| CenterPoint Energy, Inc., | | | | | | | | | | | | |
| 2.500%, 09/01/2024 | | | | | | | | | | | | |
| (Callable 08/01/2024) | | | 9,603,000 | | | | 9,398,006 | | | | | |
| CMS Energy Corp., | | | | | | | | | | | | |
| 3.875%, 03/01/2024 | | | | | | | | | | | | |
| (Callable 01/29/2024) | | | 2,909,000 | | | | 2,899,224 | | | | | |
| DTE Energy Company: | | | | | | | | | | | | |
2.529%, 10/01/2024(7) | | | 7,409,000 | | | | 7,234,366 | | | | | |
4.220%, 11/01/2024(7) | | | 23,529,000 | | | | 23,253,786 | | | | | |
| EDP Finance BV, | | | | | | | | | | | | |
3.625%, 07/15/2024(1)(2) | | | 20,778,000 | | | | 20,521,058 | | | | | |
| Evergy, Inc., | | | | | | | | | | | | |
| 2.450%, 09/15/2024 | | | | | | | | | | | | |
| (Callable 08/15/2024) | | | 3,600,000 | | | | 3,518,079 | | | | | |
| IPALCO Enterprises, Inc., | | | | | | | | | | | | |
| 3.700%, 09/01/2024 | | | | | | | | | | | | |
| (Callable 07/01/2024) | | | 10,642,000 | | | | 10,472,815 | | | | | |
| ITC Holdings Corp., | | | | | | | | | | | | |
| 3.650%, 06/15/2024 | | | | | | | | | | | | |
(Callable 03/15/2024)(1) | | | 5,126,000 | | | | 5,065,849 | | | | | |
| Jersey Central Power & Light Co., | | | | | | | | | | | | |
| 4.700%, 04/01/2024 | | | | | | | | | | | | |
(Callable 01/29/2024)(2) | | | 11,438,000 | | | | 11,396,556 | | | | | |
| NextEra Energy Capital Holdings, Inc., | | | | | | | | | | | | |
| 4.200%, 06/20/2024 | | | 5,395,000 | | | | 5,361,832 | | | | | |
| Niagara Mohawk Power Corp., | | | | | | | | | | | | |
| 3.508%, 10/01/2024 | | | | | | | | | | | | |
(Callable 07/01/2024)(1)(2) | | | 1,050,000 | | | | 1,031,075 | | | | | |
| Public Service Enterprise Group, Inc., | | | | | | | | | | | | |
| 2.875%, 06/15/2024 | | | | | | | | | | | | |
| (Callable 05/15/2024) | | | 19,993,000 | | | | 19,735,996 | | | | | |
| Southern Co., | | | | | | | | | | | | |
| 0.600%, 02/26/2024 | | | | | | | | | | | | |
| (Callable 01/26/2024) | | | 17,138,000 | | | | 17,001,252 | | | | | |
| Total Utilities | | | | | | | | | | | | |
| (Cost $177,721,665) | | | | | | | 177,842,021 | | | | 2.9 | % |
| Financials | | | | | | | | | | | | |
| AerCap Holdings NV: | | | | | | | | | | | | |
| 3.150%, 02/15/2024 | | | | | | | | | | | | |
(Callable 01/15/2024)(1) | | | 7,950,000 | | | | 7,918,468 | | | | | |
| 2.875%, 08/14/2024 | | | | | | | | | | | | |
(Callable 07/14/2024)(1) | | | 2,300,000 | | | | 2,255,909 | | | | | |
| 1.650%, 10/29/2024 | | | | | | | | | | | | |
(Callable 09/29/2024)(1) | | | 17,287,000 | | | | 16,681,894 | | | | | |
| 1.750%, 10/29/2024 | | | | | | | | | | | | |
(Callable 01/29/2024)(1) | | | 17,885,000 | | | | 17,267,787 | | | | | |
| 3.500%, 01/15/2025 | | | | | | | | | | | | |
(Callable 11/15/2024)(1) | | | 1,125,000 | | | | 1,099,637 | | | | | |
| AIB Group PLC, | | | | | | | | | | | | |
| 4.263%, 04/10/2025 | | | | | | | | | | | | |
| (3 Month LIBOR USD + 1.874%) | | | | | | | | | | | | |
(Callable 04/10/2024)(1)(2)(3)(8) | | | 43,037,000 | | | | 42,810,702 | | | | | |
| Air Lease Corp.: | | | | | | | | | | | | |
| 0.700%, 02/15/2024 | | | | | | | | | | | | |
| (Callable 01/29/2024) | | | 11,550,000 | | | | 11,478,066 | | | | | |
| 4.250%, 09/15/2024 | | | | | | | | | | | | |
| (Callable 06/15/2024) | | | 27,933,000 | | | | 27,616,221 | | | | | |
| Ally Financial, Inc., | | | | | | | | | | | | |
| 3.875%, 05/21/2024 | | | | | | | | | | | | |
| (Callable 04/21/2024) | | | 8,023,000 | | | | 7,953,503 | | | | | |
| Australia & New Zealand | | | | | | | | | | | | |
| Banking Group Ltd., | | | | | | | | | | | | |
4.500%, 03/19/2024(1)(2) | | | 9,000,000 | | | | 8,973,274 | | | | | |
| Aviation Capital Group LLC: | | | | | | | | | | | | |
| 4.375%, 01/30/2024 | | | | | | | | | | | | |
(Callable 01/29/2024)(1)(2) | | | 3,091,000 | | | | 3,086,055 | | | | | |
| 5.500%, 12/15/2024 | | | | | | | | | | | | |
(Callable 11/15/2024)(1)(2) | | | 21,176,000 | | | | 21,056,972 | | | | | |
| Banco Santander SA, | | | | | | | | | | | | |
| 0.701%, 06/30/2024 | | | | | | | | | | | | |
(1 Year CMT Rate + 0.450%)(1)(3) | | | 8,865,000 | | | | 8,863,633 | | | | | |
| Bank of America Corp.: | | | | | | | | | | | | |
| 0.523%, 06/14/2024 (SOFR + 0.410%) | | | | | | | | | | | | |
(Callable 05/14/2024)(3) | | | 10,000,000 | | | | 9,985,860 | | | | | |
| 3.841%, 04/25/2025 (SOFR + 1.110%) | | | | | | | | | | | | |
(Callable 04/25/2024)(3) | | | 32,100,000 | | | | 31,893,589 | | | | | |
| Barclays PLC, | | | | | | | | | | | | |
| 3.932%, 05/07/2025 | | | | | | | | | | | | |
| (3 Month LIBOR USD + 1.610%) | | | | | | | | | | | | |
(Callable 05/07/2024)(1)(3)(8) | | | 44,025,000 | | | | 43,720,993 | | | | | |
| BGC Group, Inc., | | | | | | | | | | | | |
| 3.750%, 10/01/2024 | | | | | | | | | | | | |
| (Callable 09/01/2024) | | | 13,500,000 | | | | 13,193,791 | | | | | |
| BNP Paribas SA: | | | | | | | | | | | | |
4.250%, 10/15/2024(1) | | | 9,672,000 | | | | 9,559,888 | | | | | |
| 4.705%, 01/10/2025 | | | | | | | | | | | | |
| (3 Month TSFR + 2.497%) | | | | | | | | | | | | |
(Callable 01/10/2024)(1)(2)(3) | | | 23,075,000 | | | | 23,073,015 | | | | | |
| 2.819%, 11/19/2025 | | | | | | | | | | | | |
| (3 Month TSFR + 1.373%) | | | | | | | | | | | | |
(Callable 11/19/2024)(1)(2)(3) | | | 8,940,000 | | | | 8,712,086 | | | | | |
| Boston Properties LP, | | | | | | | | | | | | |
| 3.800%, 02/01/2024 | | | | | | | | | | | | |
| (Callable 01/29/2024) | | | 29,080,000 | | | | 29,025,005 | | | | | |
The accompanying notes are an integral part of these financial statements.
Baird Ultra Short Bond Fund
Schedule of Investments, December 31, 2023
Long-Term Investments (cont.)
| | | Principal | | | | | | % of | |
| | | Amount | | | Value | | | Net Assets | |
| BPCE SA: | | | | | | | | | |
5.150%, 07/21/2024(1)(2) | | $ | 2,735,000 | | | $ | 2,711,123 | | | |
| |
4.500%, 03/15/2025(1)(2) | | | 23,248,000 | | | | 22,806,056 | | | | | |
| Cantor Fitzgerald LP, | | | | | | | | | | | | |
| 4.875%, 05/01/2024 | | | | | | | | | | | | |
(Callable 04/01/2024)(2) | | | 9,156,000 | | | | 9,085,908 | | | | | |
| Capital One Financial Corp., | | | | | | | | | | | | |
| 4.166%, 05/09/2025 (SOFR + 1.370%) | | | | | | | | | | | | |
(Callable 05/09/2024)(3) | | | 39,592,000 | | | | 39,295,250 | | | | | |
| Citigroup, Inc., | | | | | | | | | | | | |
| 0.776%, 10/30/2024 (SOFR + 0.686%) | | | | | | | | | | | | |
(Callable 09/30/2024)(3) | | | 52,580,000 | | | | 52,609,445 | | | | | |
| CNA Financial Corp., | | | | | | | | | | | | |
| 3.950%, 05/15/2024 | | | | | | | | | | | | |
| (Callable 02/15/2024) | | | 32,065,000 | | | | 31,829,812 | | | | | |
| Danske Bank A/S: | | | | | | | | | | | | |
| 3.773%, 03/28/2025 | | | | | | | | | | | | |
| (1 Year CMT Rate + 1.450%) | | | | | | | | | | | | |
(Callable 03/28/2024)(1)(2)(3) | | | 30,166,000 | | | | 30,009,791 | | | | | |
| 3.244%, 12/20/2025 | | | | | | | | | | | | |
| (3 Month LIBOR USD + 1.591%) | | | | | | | | | | | | |
(Callable 12/20/2024)(1)(2)(3)(8) | | | 1,914,000 | | | | 1,864,725 | | | | | |
| 6.466%, 01/09/2026 | | | | | | | | | | | | |
| (1 Year CMT Rate + 2.100%) | | | | | | | | | | | | |
(Callable 01/09/2025)(1)(2)(3) | | | 1,130,000 | | | | 1,138,160 | | | | | |
| Deutsche Bank AG: | | | | | | | | | | | | |
| 1.447%, 04/01/2025 (SOFR + 1.131%) | | | | | | | | | | | | |
(Callable 04/01/2024)(1)(3) | | | 4,900,000 | | | | 4,841,010 | | | | | |
| 3.961%, 11/26/2025 (SOFR + 2.581%) | | | | | | | | | | | | |
(Callable 11/26/2024)(1)(3) | | | 41,239,000 | | | | 40,567,212 | | | | | |
| Discover Bank, | | | | | | | | | | | | |
| 2.450%, 09/12/2024 | | | | | | | | | | | | |
| (Callable 08/12/2024) | | | 31,674,000 | | | | 30,924,099 | | | | | |
| Essex Portfolio LP, | | | | | | | | | | | | |
| 3.875%, 05/01/2024 | | | | | | | | | | | | |
| (Callable 02/01/2024) | | | 15,951,000 | | | | 15,856,339 | | | | | |
| GATX Corp., | | | | | | | | | | | | |
| 4.350%, 02/15/2024 | | | | | | | | | | | | |
| (Callable 01/29/2024) | | | 8,033,000 | | | | 8,007,458 | | | | | |
| Goldman Sachs Group, Inc.: | | | | | | | | | | | | |
| 0.925%, 10/21/2024 (SOFR + 0.486%) | | | | | | | | | | | | |
(Callable 09/21/2024)(3) | | | 16,930,000 | | | | 16,908,668 | | | | | |
| 3.272%, 09/29/2025 | | | | | | | | | | | | |
| (3 Month TSFR + 1.463%) | | | | | | | | | | | | |
(Callable 09/29/2024)(3) | | | 25,767,000 | | | | 25,333,789 | | | | | |
| Host Hotels & Resorts LP, | | | | | | | | | | | | |
| 3.875%, 04/01/2024 | | | | | | | | | | | | |
| (Callable 02/01/2024) | | | 10,803,000 | | | | 10,745,393 | | | | | |
| HSBC Holdings PLC, | | | | | | | | | | | | |
| 3.803%, 03/11/2025 | | | | | | | | | | | | |
| (3 Month TSFR + 1.473%) | | | | | | | | | | | | |
(Callable 03/11/2024)(1)(3) | | | 31,698,000 | | | | 31,569,040 | | | | | |
| Invesco Finance PLC, | | | | | | | | | | | | |
| 4.000%, 01/30/2024 | | | 11,745,000 | | | | 11,729,277 | | | | | |
| Jackson National Life Global Funding: | | | | | | | | | | | | |
3.250%, 01/30/2024(2) | | | 2,136,000 | | | | 2,131,928 | | | | | |
1.750%, 01/12/2025(2) | | | 3,500,000 | | | | 3,355,765 | | | | | |
| JPMorgan Chase & Co., | | | | | | | | | | | | |
| 2.301%, 10/15/2025 (SOFR + 1.160%) | | | | | | | | | | | | |
(Callable 10/15/2024)(3) | | | 1,546,000 | | | | 1,506,605 | | | | | |
| Lloyds Banking Group PLC, | | | | | | | | | | | | |
| 3.870%, 07/09/2025 | | | | | | | | | | | | |
| (1 Year CMT Rate + 3.500%) | | | | | | | | | | | | |
(Callable 07/09/2024)(1)(3) | | | 48,385,000 | | | | 47,930,122 | | | | | |
| LXP Industrial Trust, | | | | | | | | | | | | |
| 4.400%, 06/15/2024 | | | | | | | | | | | | |
| (Callable 03/15/2024) | | | 1,500,000 | | | | 1,483,872 | | | | | |
| Macquarie Group Ltd., | | | | | | | | | | | | |
6.207%, 11/22/2024(1)(2) | | | 7,177,000 | | | | 7,218,604 | | | | | |
| Metropolitan Tower Life Insurance Co., | | | | | | | | | | | | |
7.625%, 01/15/2024(2) | | | 2,760,000 | | | | 2,760,897 | | | | | |
| Mitsubishi UFJ Financial Group, Inc., | | | | | | | | | | | | |
| 4.788%, 07/18/2025 | | | | | | | | | | | | |
| (1 Year CMT Rate + 1.700%) | | | | | | | | | | | | |
(Callable 07/18/2024)(1)(3) | | | 11,011,000 | | | | 10,959,363 | | | | | |
| Mizuho Financial Group, Inc., | | | | | | | | | | | | |
4.600%, 03/27/2024(1)(2) | | | 25,431,000 | | | | 25,334,057 | | | | | |
| Morgan Stanley, | | | | | | | | | | | | |
| 2.720%, 07/22/2025 (SOFR + 1.152%) | | | | | | | | | | | | |
(Callable 07/22/2024)(3) | | | 24,219,000 | | | | 23,820,613 | | | | | |
| National Bank of Canada, | | | | | | | | | | | | |
| 3.750%, 06/09/2025 (SOFR + 1.009%) | | | | | | | | | | | | |
(Callable 06/09/2024)(1)(3) | | | 29,579,000 | | | | 29,316,089 | | | | | |
| NatWest Group PLC, | | | | | | | | | | | | |
| 4.269%, 03/22/2025 | | | | | | | | | | | | |
| (3 Month LIBOR USD + 1.762%) | | | | | | | | | | | | |
(Callable 03/22/2024)(1)(3)(8) | | | 45,825,000 | | | | 45,664,456 | | | | | |
| New England Mutual Life Insurance Co., | | | | | | | | | | | | |
7.875%, 02/15/2024(2) | | | 5,200,000 | | | | 5,205,934 | | | | | |
| NNN REIT, Inc., | | | | | | | | | | | | |
| 3.900%, 06/15/2024 | | | | | | | | | | | | |
| (Callable 03/15/2024) | | | 22,742,000 | | | | 22,509,875 | | | | | |
| Old Republic International Corp., | | | | | | | | | | | | |
| 4.875%, 10/01/2024 | | | | | | | | | | | | |
| (Callable 09/01/2024) | | | 21,360,000 | | | | 21,190,977 | | | | | |
| Omega Healthcare Investors, Inc., | | | | | | | | | | | | |
| 4.500%, 01/15/2025 | | | | | | | | | | | | |
| (Callable 10/15/2024) | | | 16,129,000 | | | | 15,858,339 | | | | | |
| Peachtree Corners Funding Trust, | | | | | | | | | | | | |
3.976%, 02/15/2025(2) | | | 16,873,000 | | | | 16,594,093 | | | | | |
| Reliance Standard Life Global Funding II, | | | | | | | | | | | | |
2.500%, 10/30/2024(1)(2) | | | 3,175,000 | | | | 3,089,867 | | | | | |
| SMBC Aviation Capital Finance DAC, | | | | | | | | | | | | |
| 3.550%, 04/15/2024 | | | | | | | | | | | | |
(Callable 03/15/2024)(1)(2) | | | 4,275,000 | | | | 4,245,627 | | | | | |
| Societe Generale SA: | | | | | | | | | | | | |
5.000%, 01/17/2024(1)(2) | | | 25,160,000 | | | | 25,145,001 | | | | | |
2.625%, 10/16/2024(1)(2) | | | 1,000,000 | | | | 976,199 | | | | | |
| 2.226%, 01/21/2026 | | | | | | | | | | | | |
| (1 Year CMT Rate + 1.050%) | | | | | | | | | | | | |
(Callable 01/21/2025)(1)(2)(3) | | | 19,425,000 | | | | 18,663,354 | | | | | |
| Standard Chartered PLC: | | | | | | | | | | | | |
| 0.991%, 01/12/2025 | | | | | | | | | | | | |
| (1 Year CMT Rate + 0.780%) | | | | | | | | | | | | |
(Callable 01/12/2024)(1)(2)(3) | | | 24,490,000 | | | | 24,454,245 | | | | | |
| 3.785%, 05/21/2025 | | | | | | | | | | | | |
| (3 Month LIBOR USD + 1.560%) | | | | | | | | | | | | |
(Callable 05/21/2024)(1)(2)(3)(8) | | | 16,045,000 | | | | 15,903,580 | | | | | |
| Stifel Financial Corp., | | | | | | | | | | | | |
| 4.250%, 07/18/2024 | | | 25,478,000 | | | | 25,221,707 | | | | | |
| Sumitomo Mitsui Financial Group, Inc., | | | | | | | | | | | | |
4.436%, 04/02/2024(1)(2) | | | 33,150,000 | | | | 33,017,508 | | | | | |
| Synchrony Financial: | | | | | | | | | | | | |
| 4.375%, 03/19/2024 | | | | | | | | | | | | |
| (Callable 02/19/2024) | | | 25,840,000 | | | | 25,747,294 | | | | | |
| 4.250%, 08/15/2024 | | | | | | | | | | | | |
| (Callable 05/15/2024) | | | 3,172,000 | | | | 3,136,967 | | | | | |
The accompanying notes are an integral part of these financial statements.
Baird Ultra Short Bond Fund
Schedule of Investments, December 31, 2023
Long-Term Investments (cont.)
| | | Principal | | | | | | % of | |
| | | Amount | | | Value | | | Net Assets | |
| UBS Group AG, | | | | | | | | | |
| 2.593%, 09/11/2025 (SOFR + 1.560%) | | | | | | | | | |
(Callable 09/11/2024)(1)(2)(3) | | $ | 47,432,000 | | | $ | 46,404,802 | | | | |
| Ventas Realty LP, | | | | | | | | | | | |
| 3.500%, 04/15/2024 | | | | | | | | | | | |
| (Callable 03/15/2024) | | | 2,750,000 | | | | 2,729,024 | | | | |
| Wells Fargo & Co., | | | | | | | | | | | |
| 2.406%, 10/30/2025 | | | | | | | | | | | |
| (3 Month TSFR + 1.087%) | | | | | | | | | | | |
(Callable 10/30/2024)(3) | | | 16,813,000 | | | | 16,356,617 | | | | |
| Willis North America, Inc., | | | | | | | | | | | |
| 3.600%, 05/15/2024 | | | | | | | | | | | |
| (Callable 03/15/2024) | | | 46,000,000 | | | | 45,577,091 | | | | |
| WP Carey, Inc., | | | | | | | | | | | |
| 4.600%, 04/01/2024 | | | | | | | | | | | |
| (Callable 01/29/2024) | | | 27,220,000 | | | | 27,103,057 | | | | |
| Total Financials | | | | | | | | | | | |
| (Cost $1,326,235,306) | | | | | | | 1,334,672,432 | | | | 21.4 | % |
| Total Corporate Bonds | | | | | | | | | | | | |
| (Cost $2,956,766,174) | | | | | | | 2,967,361,332 | | | | 47.6 | % |
| Municipal Bonds | | | | | | | | | | | | |
| Cass County Joint Water Resource District, | | | | | | | | | | | | |
| 0.480%, 05/01/2024 | | | | | | | | | | | | |
| (Callable 01/29/2024) | | | 8,895,000 | | | | 8,739,307 | | | | | |
| City of Painesville OH, | | | | | | | | | | | | |
| 6.250%, 05/03/2024 | | | 1,005,000 | | | | 1,005,970 | | | | | |
| City of West Carrollton OH, | | | | | | | | | | | | |
| 6.000%, 05/01/2024 (Insured by ST AID) | | | 6,150,000 | | | | 6,144,209 | | | | | |
| Illinois Finance Authority, | | | | | | | | | | | | |
| 6.535%, 07/01/2024 | | | | | | | | | | | | |
| (Callable 01/10/2024) | | | 1,000,000 | | | | 1,000,257 | | | | | |
| Maryland Economic Development Corp., | | | | | | | | | | | | |
| 3.550%, 06/01/2024 | | | 1,000,000 | | | | 990,178 | | | | | |
| New York State Housing Finance Agency, | | | | | | | | | | | | |
| 1.600%, 11/01/2024 | | | | | | | | | | | | |
| (Callable 01/19/2024) | | | 3,735,000 | | | | 3,671,779 | | | | | |
| North Dakota Housing Finance Agency, | | | | | | | | | | | | |
| 5.350%, 01/01/2047 | | | | | | | | | | | | |
| (Callable 01/02/2024) | | | | | | | | | | | | |
(Optional Put Date 01/05/2024)(4) | | | 700,000 | | | | 700,000 | | | | | |
| Total Municipal Bonds | | | | | | | | | | | | |
| (Cost $22,277,998) | | | | | | | 22,251,700 | | | | 0.4 | % |
| Residential Mortgage-Backed Securities | | | | | | | | | | | | |
| Non-U.S. Government Agency Issues | | | | | | | | | | | | |
| Arroyo Mortgage Trust: | | | | | | | | | | | | |
| Series 2019-3, Class A1, 2.962%, | | | | | | | | | | | | |
10/25/2048 (Callable 01/25/2024)(2)(4) | | | 12,954,923 | | | | 12,020,915 | | | | | |
| Series 2019-1, Class A1, 3.805%, | | | | | | | | | | | | |
01/25/2049 (Callable 01/25/2024)(2)(4) | | | 4,135,296 | | | | 3,951,133 | | | | | |
| Series 2019-2, Class A1, 3.347%, | | | | | | | | | | | | |
04/25/2049 (Callable 01/25/2024)(2)(4) | | | 6,901,147 | | | | 6,496,122 | | | | | |
| Starwood Mortgage Residential Trust, | | | | | | | | | | | | |
| Series 2021-1, Class A1, 1.219%, | | | | | | | | | | | | |
05/25/2065 (Callable 01/25/2024)(2)(4) | | | 7,561,404 | | | | 6,687,308 | | | | | |
| Towd Point Mortgage Trust: | | | | | | | | | | | | |
| Series 2017-1, Class A1, 2.750%, | | | | | | | | | | | | |
10/25/2056 (Callable 07/25/2031)(2)(4) | | | 441,548 | | | | 438,551 | | | | | |
| Series 2017-3, Class A1, 2.750%, | | | | | | | | | | | | |
06/25/2057 (Callable 11/25/2026)(2)(4) | | | 1,442,931 | | | | 1,416,674 | | | | | |
| Series 2017-4, Class A1, 2.750%, | | | | | | | | | | | | |
06/25/2057 (Callable 12/25/2029)(2)(4) | | | 1,739,420 | | | | 1,667,254 | | | | | |
| Series 2017-6, Class A1, 2.750%, | | | | | | | | | | | | |
10/25/2057 (Callable 10/25/2030)(2)(4) | | | 8,576,695 | | | | 8,208,657 | | | | | |
| Series 2018-6, Class A1A, 3.750%, | | | | | | | | | | | | |
03/25/2058 (Callable 07/25/2034)(2)(4) | | | 10,348,821 | | | | 10,114,487 | | | | | |
| Total Residential | | | | | | | | | | | | |
| Mortgage-Backed Securities | | | | | | | | | | | | |
| (Cost $54,533,288) | | | | | | | 51,001,101 | | | | 0.8 | % |
| Commercial Mortgage-Backed Securities | | | | | | | | | | | | |
| Non-U.S. Government Agency Issues | | | | | | | | | | | | |
| BBCMS Mortgage Trust, | | | | | | | | | | | | |
| Series 2022-C14, Class A1, 1.727%, | | | | | | | | | | | | |
| 02/15/2055 (Callable 02/15/2032) | | | 9,673,522 | | | | 9,141,278 | | | | | |
| Citigroup Commercial Mortgage Trust: | | | | | | | | | | | | |
| Series 2014-GC25, Class A4, 3.635%, | | | | | | | | | | | | |
| 10/10/2047 (Callable 10/10/2024) | | | 13,292,000 | | | | 13,034,684 | | | | | |
| Series 2015-GC27, Class A5, 3.137%, | | | | | | | | | | | | |
| 02/10/2048 (Callable 01/10/2025) | | | 2,260,848 | | | | 2,206,004 | | | | | |
| COMM Mortgage Trust: | | | | | | | | | | | | |
| Series 2013-CR12, Class A4, 4.046%, | | | | | | | | | | | | |
| 10/10/2046 (Callable 01/10/2024) | | | 34,124,838 | | | | 32,745,498 | | | | | |
| Series 2014-LC15, Class A4, 4.006%, | | | | | | | | | | | | |
| 04/10/2047 (Callable 04/10/2024) | | | 3,943,597 | | | | 3,935,675 | | | | | |
| Series 2014-CR16, Class A4, 4.051%, | | | | | | | | | | | | |
| 04/10/2047 (Callable 04/10/2024) | | | 28,852,000 | | | | 28,624,482 | | | | | |
| Series 2014-CR17, Class A5, 3.977%, | | | | | | | | | | | | |
| 05/10/2047 (Callable 05/10/2024) | | | 4,255,000 | | | | 4,219,563 | | | | | |
| Series 2014-UBS3, Class A4, 3.819%, | | | | | | | | | | | | |
| 06/10/2047 (Callable 06/10/2024) | | | 12,483,000 | | | | 12,347,835 | | | | | |
| Series 2014-UBS4, Class A5, 3.694%, | | | | | | | | | | | | |
| 08/10/2047 (Callable 07/10/2029) | | | 16,460,000 | | | | 16,126,043 | | | | | |
| Series 2015-CR23, Class A4, 3.497%, | | | | | | | | | | | | |
| 05/10/2048 (Callable 05/10/2025) | | | 9,775,000 | | | | 9,477,163 | | | | | |
| CSAIL Commercial Mortgage Trust, | | | | | | | | | | | | |
| Series 2015-C3, Class A4, 3.718%, | | | | | | | | | | | | |
| 08/15/2048 (Callable 08/15/2025) | | | 1,000,000 | | | | 965,259 | | | | | |
| GS Mortgage Securities Trust: | | | | | | | | | | | | |
| Series 2014-GC20, Class A5, 3.998%, | | | | | | | | | | | | |
| 04/10/2047 (Callable 04/10/2024) | | | 16,380,338 | | | | 16,328,657 | | | | | |
| Series 2014-GC22, Class A5, 3.862%, | | | | | | | | | | | | |
| 06/10/2047 (Callable 06/10/2024) | | | 9,600,000 | | | | 9,483,239 | | | | | |
| Series 2014-GC24, Class A5, 3.931%, | | | | | | | | | | | | |
| 09/10/2047 (Callable 09/10/2024) | | | 7,516,000 | | | | 7,378,155 | | | | | |
| Series 2014-GC26, Class A5, 3.629%, | | | | | | | | | | | | |
| 11/10/2047 (Callable 12/10/2024) | | | 52,905,000 | | | | 51,515,651 | | | | | |
| J.P. Morgan Chase Commercial | | | | | | | | | | | | |
| Mortgage Securities Trust, | | | | | | | | | | | | |
| Series 2014-C20, Class A5, 3.805%, | | | | | | | | | | | | |
| 07/15/2047 (Callable 06/15/2024) | | | 35,107,000 | | | | 34,702,318 | | | | | |
| JPMBB Commercial | | | | | | | | | | | | |
| Mortgage Securities Trust: | | | | | | | | | | | | |
| Series 2014-C18, Class A5, 4.079%, | | | | | | | | | | | | |
| 02/15/2047 (Callable 01/15/2029) | | | 14,712,694 | | | | 14,628,494 | | | | | |
| Series 2014-C21, Class A5, 3.775%, | | | | | | | | | | | | |
| 08/15/2047 (Callable 07/15/2024) | | | 6,857,000 | | | | 6,767,524 | | | | | |
| Series 2014-C23, Class A5, 3.934%, | | | | | | | | | | | | |
| 09/15/2047 (Callable 10/15/2024) | | | 10,000,000 | | | | 9,829,375 | | | | | |
| Series 2014-C24, Class A5, 3.639%, | | | | | | | | | | | | |
| 11/15/2047 (Callable 10/15/2024) | | | 24,270,000 | | | | 23,670,803 | | | | | |
| Series 2014-C25, Class A5, 3.672%, | | | | | | | | | | | | |
| 11/15/2047 (Callable 11/15/2024) | | | 13,425,000 | | | | 13,094,522 | | | | | |
| Series 2014-C26, Class A4, 3.494%, | | | | | | | | | | | | |
| 01/15/2048 (Callable 01/15/2025) | | | 5,488,000 | | | | 5,349,027 | | | | | |
The accompanying notes are an integral part of these financial statements.
Baird Ultra Short Bond Fund
Schedule of Investments, December 31, 2023
Long-Term Investments (cont.)
| | | Principal | | | | | | % of | |
| | | Amount | | | Value | | | Net Assets | |
| JPMBB Commercial | | | | | | | | | |
| Mortgage Securities Trust: (cont.) | | | | | | | | | |
| Series 2015-C27, Class A4, 3.179%, | | | | | | | | | |
| 02/15/2048 (Callable 09/15/2026) | | $ | 8,575,000 | | | $ | 8,247,593 | | | | |
| Morgan Stanley Bank of | | | | | | | | | | | |
| America Merrill Lynch Trust: | | | | | | | | | | | |
| Series 2014-C16, Class A5, 3.892%, | | | | | | | | | | | |
| 06/15/2047 (Callable 06/15/2026) | | | 11,084,109 | | | | 11,001,722 | | | | |
| Series 2014-C19, Class A4, 3.526%, | | | | | | | | | | | |
| 12/15/2047 (Callable 10/15/2026) | | | 10,700,000 | | | | 10,443,366 | | | | |
| Series 2015-C22, Class A4, 3.306%, | | | | | | | | | | | |
| 04/15/2048 (Callable 04/15/2025) | | | 5,865,000 | | | | 5,655,080 | | | | |
| Series 2015-C23, Class A4, 3.719%, | | | | | | | | | | | |
| 07/15/2050 (Callable 06/15/2025) | | | 31,541,000 | | | | 30,566,856 | | | | |
| Wells Fargo Commercial Mortgage Trust: | | | | | | | | | | | |
| Series 2015-C28, Class A4, 3.540%, | | | | | | | | | | | |
| 05/15/2048 (Callable 05/15/2025) | | | 12,035,000 | | | | 11,635,570 | | | | |
| Series 2015-SG1, Class A4, 3.789%, | | | | | | | | | | | |
| 09/15/2048 (Callable 08/15/2025) | | | 5,590,530 | | | | 5,417,040 | | | | |
| Series 2015-LC20, Class A5, 3.184%, | | | | | | | | | | | |
| 04/15/2050 (Callable 04/15/2025) | | | 4,820,000 | | | | 4,656,805 | | | | |
| Series 2014-LC16, Class A5, 3.817%, | | | | | | | | | | | |
| 08/15/2050 (Callable 06/15/2024) | | | 7,443,000 | | | | 7,340,912 | | | | |
| WFRBS Commercial Mortgage Trust: | | | | | | | | | | | |
| Series 2014-LC14, Class A5, 4.045%, | | | | | | | | | | | |
| 03/15/2047 (Callable 02/15/2024) | | | 710,393 | | | | 708,518 | | | | |
| Series 2014-C20, Class A5, 3.995%, | | | | | | | | | | | |
| 05/15/2047 (Callable 05/15/2024) | | | 30,191,119 | | | | 29,823,518 | | | | |
| Series 2014-C21, Class A5, 3.678%, | | | | | | | | | | | |
| 08/15/2047 (Callable 08/15/2024) | | | 4,000,000 | | | | 3,932,908 | | | | |
| Series 2014-C24, Class A5, 3.607%, | | | | | | | | | | | |
| 11/15/2047 (Callable 11/15/2024) | | | 20,026,000 | | | | 19,557,235 | | | | |
| Series 2014-C25, Class A5, 3.631%, | | | | | | | | | | | |
| 11/15/2047 (Callable 12/15/2024) | | | 10,208,211 | | | | 9,980,025 | | | | |
| Series 2014-C22, Class A5, 3.752%, | | | | | | | | | | | |
| 09/15/2057 (Callable 09/15/2024) | | | 11,336,000 | | | | 11,068,169 | | | | |
| Series 2014-C23, Class A5, 3.917%, | | | | | | | | | | | |
| 10/15/2057 (Callable 09/15/2025) | | | 13,563,000 | | | | 13,241,972 | | | | |
| Total Commercial | | | | | | | | | | | |
| Mortgage-Backed Securities | | | | | | | | | | | |
| (Cost $503,065,547) | | | | | | | 508,848,538 | | | | 8.2 | % |
| Asset Backed Securities | | | | | | | | | | | | |
| Affirm Asset Securitization Trust, | | | | | | | | | | | | |
| Series 2021-Z1, Class A, 1.070%, | | | | | | | | | | | | |
08/15/2025 (Callable 01/15/2024)(2) | | | 7,306,158 | | | | 7,224,205 | | | | | |
| Ally Auto Receivables, | | | | | | | | | | | | |
| Series 2022-3, Class A2, | | | | | | | | | | | | |
| 5.290%, 06/16/2025 | | | 3,312,613 | | | | 3,310,467 | | | | | |
| Bank of America Auto Trust, | | | | | | | | | | | | |
| Series 2023-1A, Class A2, | | | | | | | | | | | | |
5.830%, 05/15/2026(2) | | | 38,450,000 | | | | 38,503,053 | | | | | |
| Capital One Multi-Asset Execution Trust: | | | | | | | | | | | | |
| Series 2021-A1, Class A1, | | | | | | | | | | | | |
| 0.550%, 07/15/2026 | | | 7,650,000 | | | | 7,451,644 | | | | | |
| Series 2021-A3, Class A3, | | | | | | | | | | | | |
| 1.040%, 11/15/2026 | | | 72,033,000 | | | | 69,481,692 | | | | | |
| Capital One Prime Auto Receivables Trust, | | | | | | | | | | | | |
| Series 2022-2, Class A2A, | | | | | | | | | | | | |
| 3.740%, 09/15/2025 | | | 7,439,938 | | | | 7,403,060 | | | | | |
| CarMax Auto Owner Trust: | | | | | | | | | | | | |
| Series 2020-4, Class A3, 0.500%, | | | | | | | | | | | | |
| 08/15/2025 (Callable 12/15/2024) | | | 7,590,486 | | | | 7,510,892 | | | | | |
| Series 2023-1, Class A2A, | | | | | | | | | | | | |
| 5.230%, 01/15/2026 | | | 3,955,842 | | | | 3,948,916 | | | | | |
| Series 2022-1, Class A3, 1.470%, | | | | | | | | | | | | |
| 12/15/2026 (Callable 03/15/2026) | | | 40,858,961 | | | | 39,571,699 | | | | | |
| Series 2023-4, Class A2A, | | | | | | | | | | | | |
| 6.080%, 12/15/2026 | | | 22,000,000 | | | | 22,172,506 | | | | | |
| Chase Auto Credit Linked Notes: | | | | | | | | | | | | |
| Series 2021-1, Class B, 0.875%, | | | | | | | | | | | | |
09/25/2028 (Callable 05/25/2025)(2) | | | 5,677,029 | | | | 5,574,989 | | | | | |
| Series 2021-2, Class B, 0.889%, | | | | | | | | | | | | |
12/26/2028 (Callable 10/25/2025)(2) | | | 1,102,665 | | | | 1,077,915 | | | | | |
| Series 2021-3, Class B, 0.760%, | | | | | | | | | | | | |
02/26/2029 (Callable 06/25/2025)(2) | | | 4,594,669 | | | | 4,433,349 | | | | | |
| Chase Auto Owner Trust, | | | | | | | | | | | | |
| Series 2022-AA, Class A2, | | | | | | | | | | | | |
3.860%, 10/27/2025(2) | | | 2,081,791 | | | | 2,075,031 | | | | | |
| Chesapeake Funding II LLC, | | | | | | | | | | | | |
| Series 2023-2A, Class A1, 6.160%, | | | | | | | | | | | | |
10/15/2035 (Callable 07/15/2026)(2) | | | 16,209,227 | | | | 16,377,824 | | | | | |
| Citizens Auto Receivables Trust, | | | | | | | | | | | | |
| Series 2023-1, Class A2A, | | | | | | | | | | | | |
6.130%, 07/15/2026(2) | | | 55,969,977 | | | | 56,079,522 | | | | | |
| Dell Equipment Finance Trust: | | | | | | | | | | | | |
| Series 2022-2, Class A2, 4.030%, | | | | | | | | | | | | |
07/22/2027 (Callable 03/22/2025)(2) | | | 6,692,764 | | | | 6,670,048 | | | | | |
| Series 2023-1, Class A2, 5.650%, | | | | | | | | | | | | |
09/22/2028 (Callable 10/22/2025)(2) | | | 38,815,090 | | | | 38,819,958 | | | | | |
| Series 2023-2, Class A2, 5.840%, | | | | | | | | | | | | |
01/22/2029 (Callable 02/22/2026)(2) | | | 12,000,000 | | | | 12,027,584 | | | | | |
| Discover Card Execution Note Trust: | | | | | | | | | | | | |
| Series 2021-A1, Class A1, | | | | | | | | | | | | |
| 0.580%, 09/15/2026 | | | 1,875,000 | | | | 1,813,915 | | | | | |
| Series 2017-A4, Class A4, | | | | | | | | | | | | |
| 2.530%, 10/15/2026 | | | 2,400,000 | | | | 2,379,297 | | | | | |
| Series 2022-A2, Class A, | | | | | | | | | | | | |
| 3.320%, 05/15/2027 | | | 41,950,000 | | | | 41,060,841 | | | | | |
| DLLAA 2023-1 LLC, | | | | | | | | | | | | |
| Series 2023-1A, Class A2, | | | | | | | | | | | | |
5.930%, 07/20/2026(2) | | | 6,025,000 | | | | 6,050,818 | | | | | |
| DLLAD LLC, | | | | | | | | | | | | |
| Series 2023-1A, Class A2, | | | | | | | | | | | | |
5.190%, 04/20/2026(2) | | | 6,261,562 | | | | 6,240,328 | | | | | |
| DLLMT 2023-1 LLC, | | | | | | | | | | | | |
| Series 2023-1A, Class A2, | | | | | | | | | | | | |
5.780%, 11/20/2025(2) | | | 35,150,000 | | | | 35,154,998 | | | | | |
| Donlen Fleet Lease Funding 2 LLC, | | | | | | | | | | | | |
| Series 2021-2, Class A2, | | | | | | | | | | | | |
0.560%, 12/11/2034(2) | | | 495,675 | | | | 488,317 | | | | | |
| Fifth Third Auto Trust, | | | | | | | | | | | | |
| Series 2023-1, Class A2A, | | | | | | | | | | | | |
| 5.800%, 11/16/2026 | | | 18,775,000 | | | | 18,805,581 | | | | | |
| Ford Credit Auto Owner Trust: | | | | | | | | | | | | |
| Series 2019-1, Class A, 3.520%, | | | | | | | | | | | | |
07/15/2030 (Callable 01/15/2024)(2) | | | 25,965,000 | | | | 25,941,935 | | | | | |
| Series 2020-1, Class A, 2.040%, | | | | | | | | | | | | |
08/15/2031 (Callable 02/15/2025)(2) | | | 25,673,000 | | | | 24,807,802 | | | | | |
| Ford Credit Floorplan Master Owner Trust: | | | | | | | | | | | | |
| Series 2019-2, Class A, | | | | | | | | | | | | |
| 3.060%, 04/15/2026 | | | 2,634,000 | | | | 2,613,391 | | | | | |
| Series 2019-4, Class A, | | | | | | | | | | | | |
| 2.440%, 09/15/2026 | | | 25,410,000 | | | | 24,878,253 | | | | | |
The accompanying notes are an integral part of these financial statements.
Baird Ultra Short Bond Fund
Schedule of Investments, December 31, 2023
Long-Term Investments (cont.)
| | | Principal | | | | | | % of | |
| | | Amount | | | Value | | | Net Assets | |
| GM Financial Automobile Leasing Trust: | | | | | | | | | |
| Series 2023-1, Class A2A, | | | | | | | | | |
| 5.270%, 06/20/2025 | | $ | 22,346,605 | | | $ | 22,329,175 | | | | |
| Series 2023-2, Class A2A, | | | | | | | | | | | |
| 5.440%, 10/20/2025 | | | 4,462,318 | | | | 4,458,975 | | | | |
| Series 2023-1, Class A3, 5.160%, | | | | | | | | | | | |
| 04/20/2026 (Callable 08/20/2025) | | | 2,055,000 | | | | 2,054,850 | | | | |
| GM Financial Consumer | | | | | | | | | | | |
| Automobile Receivables Trust: | | | | | | | | | | | |
| Series 2023-1, Class A2A, | | | | | | | | | | | |
| 5.190%, 03/16/2026 | | | 12,570,091 | | | | 12,543,100 | | | | |
| Series 2023-2, Class A2A, | | | | | | | | | | | |
| 5.100%, 05/18/2026 | | | 5,704,977 | | | | 5,691,336 | | | | |
| GMF Floorplan Owner Revolving Trust, | | | | | | | | | | | |
| Series 2019-2, Class A, | | | | | | | | | | | |
2.900%, 04/15/2026(2) | | | 53,724,000 | | | | 53,275,415 | | | | |
| Honda Auto Receivables Owner Trust: | | | | | | | | | | | |
| Series 2023-1, Class A2, | | | | | | | | | | | |
| 5.220%, 10/21/2025 | | | 5,596,234 | | | | 5,586,946 | | | | |
| Series 2023-3, Class A2, | | | | | | | | | | | |
| 5.710%, 03/18/2026 | | | 19,600,000 | | | | 19,657,855 | | | | |
| HPEFS Equipment Trust, | | | | | | | | | | | |
| Series 2023-2A, Class A2, 6.040%, | | | | | | | | | | | |
01/21/2031 (Callable 09/20/2026)(2) | | | 11,600,000 | | | | 11,683,682 | | | | |
| Hyundai Auto Lease Securitization Trust, | | | | | | | | | | | |
| Series 2023-A, Class A2A, | | | | | | | | | | | |
5.200%, 04/15/2025(2) | | | 7,298,068 | | | | 7,288,906 | | | | |
| Hyundai Auto Receivables Trust: | | | | | | | | | | | |
| Series 2022-C, Class A2A, | | | | | | | | | | | |
| 5.350%, 11/17/2025 | | | 2,112,338 | | | | 2,110,775 | | | | |
| Series 2023-A, Class A2A, | | | | | | | | | | | |
| 5.190%, 12/15/2025 | | | 10,385,760 | | | | 10,371,129 | | | | |
| Series 2021-B, Class A3, 0.380%, | | | | | | | | | | | |
| 01/15/2026 (Callable 12/15/2025) | | | 4,391,646 | | | | 4,296,077 | | | | |
| Marlette Funding Trust, | | | | | | | | | | | |
| Series 2023-3A, Class A, 6.490%, | | | | | | | | | | | |
09/15/2033 (Callable 12/15/2027)(2) | | | 11,683,983 | | | | 11,696,376 | | | | |
| Master Credit Card Trust, | | | | | | | | | | | |
| Series 2021-1A, Class A, | | | | | | | | | | | |
0.530%, 11/21/2025(1)(2) | | | 13,550,000 | | | | 13,283,791 | | | | |
| Mercedes-Benz Auto Receivables Trust, | | | | | | | | | | | |
| Series 2021-1, Class A3, 0.460%, | | | | | | | | | | | |
| 06/15/2026 (Callable 11/15/2025) | | | 10,279,403 | | | | 9,973,241 | | | | |
| Nissan Auto Lease Trust, | | | | | | | | | | | |
| Series 2023-A, Class A2A, | | | | | | | | | | | |
| 5.100%, 03/17/2025 | | | 9,440,368 | | | | 9,422,000 | | | | |
| Nissan Auto Receivables Owner Trust, | | | | | | | | | | | |
| Series 2022-B, Class A2, | | | | | | | | | | | |
| 4.500%, 08/15/2025 | | | 1,985,764 | | | | 1,979,409 | | | | |
| PFS Financing Corp.: | | | | | | | | | | | |
| Series 2020-G, Class A, | | | | | | | | | | | |
0.970%, 02/15/2026(2) | | | 2,910,000 | | | | 2,892,937 | | | | |
| Series 2021-A, Class A, | | | | | | | | | | | |
0.710%, 04/15/2026(2) | | | 56,678,000 | | | | 55,805,799 | | | | |
| Santander Bank Auto Credit, | | | | | | | | | | | |
| Series 2022-A, Class B, 5.281%, | | | | | | | | | | | |
05/15/2032 (Callable 01/15/2026)(2) | | | 16,185,229 | | | | 16,047,359 | | | | |
| Santander Bank NA, | | | | | | | | | | | |
| Series 2021-1A, Class B, 1.833%, | | | | | | | | | | | |
12/15/2031 (Callable 09/15/2025)(2) | | | 7,832,111 | | | | 7,630,287 | | | | |
| SCF Equipment Leasing 2022-2 LLC, | | | | | | | | | | | |
| Series 2022-2A, Class A2, | | | | | | | | | | | |
6.240%, 07/20/2028(2) | | | 10,361,626 | | | | 10,363,711 | | | | |
| SFS Auto Receivables Securitization Trust, | | | | | | | | | | | |
| Series 2023-1A, Class A2A, | | | | | | | | | | | |
5.890%, 03/22/2027(2) | | | 14,583,761 | | | | 14,608,463 | | | | |
| SoFi Consumer Loan Program Trust, | | | | | | | | | | | |
| Series 2022-1S, Class A, 6.210%, | | | | | | | | | | | |
04/15/2031 (Callable 03/15/2025)(2) | | | 5,914,852 | | | | 5,915,624 | | | | |
| Synchrony Card Funding LLC, | | | | | | | | | | | |
| Series 2022-A1, Class A, 3.370%, | | | | | | | | | | | |
| 04/15/2028 (Callable 04/15/2025) | | | 40,260,000 | | | | 39,374,691 | | | | |
| Towd Point Mortgage Trust: | | | | | | | | | | | |
| Series 2019-MH1, Class A1, 3.000%, | | | | | | | | | | | |
11/25/2058 (Callable 09/25/2024)(2)(4) | | | 123,078 | | | | 122,407 | | | | |
| Series 2020-MH1, Class A1, 2.250%, | | | | | | | | | | | |
02/25/2060 (Callable 01/25/2024)(2)(4) | | | 9,865,454 | | | | 9,395,657 | | | | |
| Toyota Auto Loan Extended Note Trust, | | | | | | | | | | | |
| Series 2019-1A, Class A, 2.560%, | | | | | | | | | | | |
11/25/2031 (Callable 05/25/2024)(2) | | | 61,697,000 | | | | 60,919,932 | | | | |
| US Bank NA, | | | | | | | | | | | |
| Series 2023-1, Class B, 6.789%, | | | | | | | | | | | |
08/25/2032 (Callable 08/25/2026)(2) | | | 6,000,000 | | | | 6,022,295 | | | | |
| Verizon Master Trust: | | | | | | | | | | | |
| Series 2021-1, Class A, 0.500%, | | | | | | | | | | | |
| 05/20/2027 (Callable 05/20/2024) | | | 19,069,000 | | | | 18,691,317 | | | | |
| Series 2022-7, Class A1A, 5.230%, | | | | | | | | | | | |
| 11/22/2027 (Callable 11/20/2024) | | | 45,310,000 | | | | 45,308,904 | | | | |
| World Omni Auto Receivables Trust, | | | | | | | | | | | |
| Series 2022-D, Class A2A, | | | | | | | | | | | |
| 5.510%, 03/16/2026 | | | 6,030,872 | | | | 6,027,800 | | | | |
| Total Asset Backed Securities | | | | | | | | | | | |
| (Cost $1,043,170,134) | | | | | | | 1,046,780,051 | | | | 16.8 | % |
| Total Long-Term Investments | | | | | | | | | | | | |
| (Cost $4,898,600,669) | | | | | | | 4,914,919,636 | | | | 78.9 | % |
| Short-Term Investments | | | | | | | | | | | | |
| Commercial Paper | | | | | | | | | | | | |
| Adventist Health System, | | | | | | | | | | | | |
8.71%(6), 01/04/2024 | | | 38,950,000 | | | | 38,912,293 | | | | | |
| Baptist Memorial Health, | | | | | | | | | | | | |
| 6.80%, 01/09/2024 | | | 25,726,000 | | | | 25,726,963 | | | | | |
Bayer Corp., 6.13%(6), 07/10/2024(1) | | | 25,000,000 | | | | 24,182,514 | | | | | |
| Catholic Health Initiatives, | | | | | | | | | | | | |
6.50%(6), 02/14/2024 | | | 44,600,000 | | | | 44,237,901 | | | | | |
| Glencore Funding LLC, | | | | | | | | | | | | |
5.93%(6), 02/20/2024(1) | | | 22,000,000 | | | | 21,815,113 | | | | | |
| HSBC Bank USA NA, | | | | | | | | | | | | |
5.50%(6), 09/09/2024 | | | 15,450,000 | | | | 14,853,183 | | | | | |
| L3Harris Technologies, Inc., | | | | | | | | | | | | |
5.78%(6), 08/23/2024 | | | 44,100,000 | | | | 42,429,827 | | | | | |
| Total Commercial Paper | | | | | | | | | | | | |
| (Cost $212,149,955) | | | | | | | 212,157,794 | | | | 3.4 | % |
| U.S. Treasury Securities | | | | | | | | | | | | |
| United States Treasury Bills: | | | | | | | | | | | | |
5.09%(6), 02/29/2024 | | | 200,000,000 | | | | 198,303,742 | | | | | |
5.11%(6), 04/16/2024 | | | 125,000,000 | | | | 123,101,129 | | | | | |
5.08%(6), 04/25/2024 | | | 120,000,000 | | | | 118,034,070 | | | | | |
5.07%(6), 05/02/2024 | | | 125,000,000 | | | | 122,833,239 | | | | | |
5.03%(6), 05/23/2024 | | | 50,000,000 | | | | 48,994,199 | | | | | |
4.67%(6), 10/03/2024 | | | 220,000,000 | | | | 212,086,683 | | | | | |
4.51%(6), 12/26/2024 | | | 190,000,000 | | | | 181,414,698 | | | | | |
| Total U.S. Treasury Securities | | | | | | | | | | | | |
| (Cost $1,004,212,021) | | | | | | | 1,004,767,760 | | | | 16.1 | % |
The accompanying notes are an integral part of these financial statements.
Baird Ultra Short Bond Fund
Schedule of Investments, December 31, 2023
Short-Term Investments (cont.)
| | | | | | | | | % of | |
| | | Shares | | | Value | | | Net Assets | |
| Money Market Mutual Fund | | | | | | | | | |
| First American Government Obligations | | | | | | | | | |
Fund, Class U, 5.31%(5) | | | 245,264,492 | | | $ | 245,264,492 | | | | |
| Total Money Market Mutual Fund | | | | | | | | | | | |
| (Cost $245,264,492) | | | | | | | 245,264,492 | | | | 3.9 | % |
| Total Short-Term Investments | | | | | | | | | | | | |
| (Cost $1,461,626,468) | | | | | | | 1,462,190,046 | | | | 23.4 | % |
| Total Investments | | | | | | | | | | | | |
| (Cost $6,360,227,137) | | | | | | | 6,377,109,682 | | | | 102.3 | % |
| Liabilities in Excess of Other Assets | | | | | | | (140,540,269 | ) | | | (2.3 | )% |
| TOTAL NET ASSETS | | | | | | $ | 6,236,569,413 | | | | 100.0 | % |
Notes to Schedule of Investments
NATL – National Public Finance Guarantee Corp.
ST AID – State Aid Intercept/Withholding
CMT – Constant Maturity Treasury
LIBOR – London Inter-bank Offered Rate
SOFR – Secured Overnight Financing Rate
TSFR – Term Secured Overnight Financing Rate
(1) | Foreign security. |
(2) | Includes securities exempt from registration under Rule 144A of the Securities Act of 1933. These securities may be resold in transactions exempt from registration to qualified institutional buyers. At December 31, 2023, the value of these securities totaled $1,432,921,386, which represented 22.98% of total net assets. |
(3) | Variable rate security based on a reference index and spread. The rate reported is the rate as of the last reset date in effect as of December 31, 2023. |
(4) | Variable rate security. The coupon is based on an underlying pool of loans. The rate reported is the rate in effect as of December 31, 2023. |
(5) | Seven-day yield. |
(6) | Effective yield as of December 31, 2023. |
(7) | Step-up bond; the interest rate shown is the rate in effect as of December 31, 2023. |
(8) | Securities referencing LIBOR are expected to transition to an alternative reference rate by the security’s next scheduled coupon reset date. |
The accompanying notes are an integral part of these financial statements.
Baird Ultra Short Bond Fund
Summary of Fair Value Exposure at December 31, 2023The Fund has adopted authoritative fair valuation accounting standards which establish a definition of fair value and set out a hierarchy for measuring fair value. These standards require additional disclosures about the various inputs and valuation techniques used to develop the measurements of fair value and a discussion on changes in valuation techniques and related inputs during the period. These standards define fair value as the price that would be received to sell an asset or paid to transfer a liability in an orderly transaction between market participants at the measurement date.
The fair value hierarchy is organized into three levels based upon the assumptions (referred to as “inputs”) used in pricing the asset or liability. These standards state that “observable inputs” reflect the assumptions market participants would use in pricing the asset or liability based on market data obtained from independent sources and “unobservable inputs” reflect an entity’s own assumptions about the assumptions market participants would use in pricing the asset or liability. These inputs are summarized into three broad levels and described below:
Level 1 – Quoted prices (unadjusted) in active markets for identical assets or liabilities that the reporting entity can access at the measurement date.
Level 2 – Inputs other than quoted prices included within Level 1 that are observable for the asset or liability, either directly or indirectly.
Level 3 – Unobservable inputs for the asset or liability.
The inputs or methodology used for valuing securities are not necessarily an indication of the risk associated with investing in those securities.
The following is a summary of the inputs used to value the Fund’s investments as of December 31, 2023:
| | | Level 1 | | | Level 2 | | | Level 3 | | | Total | |
| Long-Term Investments | | | | | | | | | | | | |
| U.S. Treasury Securities | | $ | — | | | $ | 318,676,914 | | | $ | — | | | $ | 318,676,914 | |
| Corporate Bonds | | | — | | | | 2,967,361,332 | | | | — | | | | 2,967,361,332 | |
| Municipal Bonds | | | — | | | | 22,251,700 | | | | — | | | | 22,251,700 | |
| Residential Mortgage-Backed Securities – Non-U.S. Government Agency Issues | | | — | | | | 51,001,101 | | | | — | | | | 51,001,101 | |
| Commercial Mortgage-Backed Securities – Non-U.S. Government Agency Issues | | | — | | | | 508,848,538 | | | | — | | | | 508,848,538 | |
| Asset Backed Securities | | | — | | | | 1,046,780,051 | | | | — | | | | 1,046,780,051 | |
| Total Long-Term Investments | | | — | | | | 4,914,919,636 | | | | — | | | | 4,914,919,636 | |
| Short-Term Investments | | | | | | | | | | | | | | | | |
| Commercial Paper | | | — | | | | 212,157,794 | | | | — | | | | 212,157,794 | |
| U.S. Treasury Securities | | | — | | | | 1,004,767,760 | | | | — | | | | 1,004,767,760 | |
| Money Market Mutual Fund | | | 245,264,492 | | | | — | | | | — | | | | 245,264,492 | |
| Total Short-Term Investments | | | 245,264,492 | | | | 1,216,925,554 | | | | — | | | | 1,462,190,046 | |
| Total Investments | | $ | 245,264,492 | | | $ | 6,131,845,190 | | | $ | — | | | $ | 6,377,109,682 | |
Changes in valuation techniques may result in transfers into or out of assigned levels within the fair value hierarchy. There were no transfers into or out of Level 3 during the year, as compared to the security classifications from the prior year’s annual report. See the Fund’s Valuation Policy in Note 2a to the financial statements.
The accompanying notes are an integral part of these financial statements.
Baird Short-Term Bond Fund
December 31, 2023 (Unaudited)
The Baird Short-Term Bond Fund seeks an annual rate of total return, before Fund expenses, greater than the annual rate of total return of the Bloomberg 1-3 Year U.S. Government/Credit Index. The Bloomberg 1-3 Year U.S. Government/Credit Index is an unmanaged, market value weighted index of investment grade, fixed rate debt issues, including government and credit securities, with maturities between one and three years.
In 2023, the Fed slowed and likely ended its aggressive tightening campaign. Investors returned to the bond market as fixed income fund/ETF flows were a positive $159 billion, reversing the record outflows of -$345 billion in 2022. The overarching theme for 2023 was rate and credit spread volatility. After beginning the year at 3.88%, the 10-year Treasury yield fell more than 50 bps to 3.31% in April. From there, resilient economic data and heavy Treasury issuance led to a significant move up in rates. The 10-year Treasury yield rose 168 bps, peaking in mid-October at 4.99%, but the elevated rates were short-lived as one of the strongest year-end market rallies in decades ensued. The 10-year Treasury yield fell 111 bps to end the year at 3.88%, exactly the yield at which it began the year.
During 2023, the Institutional Class Shares of the Fund (BSBIX) posted a net return of 5.65% vs. a 4.61% return for the Bloomberg 1-3 Year U.S. Government/Credit Index.
Contributors to the Fund’s relative performance during the year include:
| | | • | Positive – Overweight investment grade credit |
| | | • | Positive – Active positioning within investment grade credit |
| | | | o | Positive – Overweight BBB industrials as well as subsector and security selection decisions within industrials (spread across many subsectors) |
| | | | o | Positive – Subsector and security selection within financials (e.g., insurance, favoring non-U.S. versus U.S. banks) |
| | | | o | Positive – Overweight financials/industrials and underweight non-corporate credit |
| | | • | Positive – Overweight asset-backed securities (ABS), non-agency commercial mortgage-based securities (CMBS), and non-agency residential mortgage-backed securities (RMBS) |
The outlook for the fixed income markets in 2024 is favorable, thanks to an inflationary trend that is moving closer to the Fed’s 2% target and an acknowledgement, by both the Fed and the market, that the odds have shifted toward rate cuts rather than increases. Signs of economic slowing are emerging as monthly payroll growth has slowed and the U.S. unemployment rate has risen modestly. Outside of the U.S., geopolitical risks are elevated with an ongoing war in Ukraine, Israel’s full-scale campaign inside Gaza to defeat Hamas, non-state actor attacks on shipping in the Red Sea and U.S. interests in the Middle East, and relations between China and the U.S. strained, all of which, combined with the uncertain Fed outlook, will likely lead to continued elevated market volatility. We expect the spread volatility that was visible in 2023 to continue into 2024, benefitting the patient, active investor. Finally, 2024 is an election year, which is certain to add to market uncertainty as the year progresses; this uncertainty is likely to lead to short-term price volatility although the higher income from bonds can insulate investors from this volatility.
The Fund remains duration neutral and continues to maintain an overweight to investment grade corporate credit, favoring the financial sector relative to its benchmark. In addition, we are maintaining the Fund’s overweight to non-agency securitized sub-sectors at the top of the capital structure given the diversification benefit they provide to the overall portfolio and attractive valuations versus U.S. Treasuries and higher-rated segments of investment grade credit.
Baird Short-Term Bond Fund
December 31, 2023 (Unaudited)
Portfolio Characteristics
Quality Distribution(1)(2)
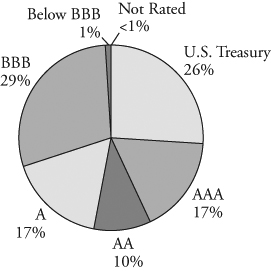
| | Net Assets | $9,483,736,093 | |
| | | | |
| | SEC 30-Day Yield(3) | | |
| | Institutional Class | 4.64% | |
| | Investor Class | 4.39% | |
| | | | |
| | Average Effective Duration | 1.83 years | |
| | | | |
| | Average Effective Maturity | 1.99 years | |
| | | | |
| | Annualized Expense Ratio(4) | | |
| | Institutional Class | 0.30% | |
| | Investor Class | 0.55% | (5) |
| | | | |
| | Portfolio Turnover Rate | 87% | |
| | | | |
| | | Number of Holdings | 459 | |
Sector Weightings(6) | | | | |
| | | | | |
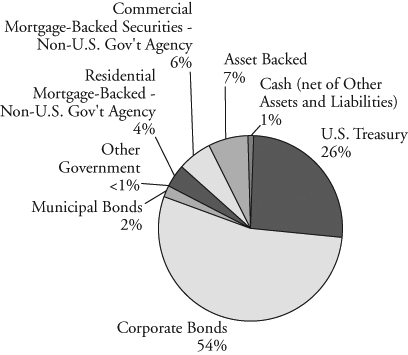
| | | | |
| | | | |
| | | | |
| | | | |
| | | | |
| | | | |
| | | | |
| | | | |
| | | | |
| | | | |
| | | | |
| | | | |
| | | | |
| | | | |
| | | | |
| | | | |
| | | | |
| | | | |
| | | | |
| | | | |
| | | | |
| | | | | |
(1) | Percentages shown are based on the Fund’s total investments. |
(2) | The quality profile is calculated on a market value-weighted basis using the highest credit quality rating for each security held by the Fund given by S&P, Moody’s or Fitch, each of which is a Nationally Recognized Statistical Rating Organization (NRSRO). NRSROs rate the credit quality of securities using a scale that generally ranges from AAA (highest) to D (lowest). |
(3) | SEC yields are based on SEC guidelines and are calculated for the 30 days ended December 31, 2023. |
(4) | Reflects expense ratios as stated in the Fund’s current prospectus dated May 1, 2023. |
(5) | Includes 0.25% 12b-1 fee. |
(6) | Percentages shown are based on the Fund’s total net assets. |
Baird Short-Term Bond Fund
December 31, 2023 (Unaudited)
| Institutional Class | Investor Class |
| Value of a $10,000 Investment | Value of a $10,000 Investment |
| | |
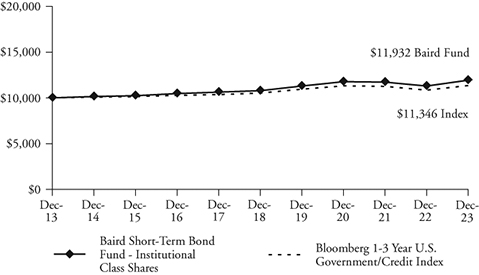 |  |
| | |
| Growth of a hypothetical investment of $10,000 made on 12/31/13, assuming | Growth of a hypothetical investment of $10,000 made on 12/31/13, assuming |
| reinvestment of all distributions. | reinvestment of all distributions. |
| Total Returns | | | | | |
| | | Average Annual |
| | | | | Since | Since |
| | One | Five | Ten | Inception | Inception |
| For the Periods Ended December 31, 2023 | Year | Years | Years | (8/31/04) | (9/19/12)(1) |
| Institutional Class Shares | 5.65% | 2.04% | 1.78% | 2.50% | N/A |
| Investor Class Shares | 5.39% | 1.78% | 1.53% | N/A | 1.52% |
Bloomberg 1-3 Year U.S. Government/Credit Index(2) | 4.61% | 1.51% | 1.27% | 2.09% | 1.20% |
(1) | For the period from September 19, 2012 (inception date) through December 31, 2023. |
(2) | The Bloomberg 1-3 Year U.S. Government/Credit Index is an unmanaged, market value weighted index of investment grade, fixed-rate debt issues, including government and corporate securities, with maturities between one and three years. This Index does not reflect any deduction for fees, expenses or taxes. A direct investment in an index is not possible. |
The line graphs and the returns table shown above reflect reinvestment of dividends and/or capital gains distributions in additional shares. The returns in the graphs and table do not reflect the deduction of taxes that a shareholder would pay on Fund distributions or the redemption of Fund shares. The returns reflect the actual performance for each period and do not include the impact of trades executed on the last business day of the period that were recorded on the first business day of the next period.
The Fund’s expense ratio for each Class, as reflected in the Fund’s current prospectus, is set forth under “Portfolio Characteristics”.
The Fund may invest in U.S. dollar denominated foreign securities which involve additional risks such as political and economic instability, and different and sometimes less strict financial reporting standards and regulation. The Fund may also invest in mortgage- and asset-backed securities, which include interest rate and prepayment risks more pronounced than those of other fixed income securities. U.S. and international markets have experienced significant periods of volatility due to a number of economic, political and other global macro factors. The war between Ukraine and Russia is approaching its 2nd anniversary and the October 7th attack by Hamas and Israel’s response only added to global tensions. US/China relations remain strained, impacted by sluggish Chinese economic growth and numerous issues affecting trade relations. Domestically, inflation remains an area of focus since getting to the Fed’s 2% target may prove to be more challenging than the market expects. In addition, 2024 is an election year and the current level of political discord is high. Finally, while the coronavirus (COVID-19) appears to have entered an endemic stage, significant outbreaks present a continued risk to the global economy. These and other events may cause market disruptions and could have an adverse effect on the value of the Fund’s investments.
Past performance does not guarantee future results. Investment returns and principal value will fluctuate so that an investor’s shares, when redeemed, may be worth more or less than their original cost.
For information about the performance of the Fund as of the most recent month-end, please call 1-866-442-2473 or visit www.bairdfunds.com. Mutual fund performance changes over time and current performance may be lower or higher than that stated.
Baird Short-Term Bond Fund
Schedule of Investments, December 31, 2023
Long-Term Investments
| | | Principal | | | | | | % of | |
| | | Amount | | | Value | | | Net Assets | |
| U.S. Treasury Securities | | | | | | | | | |
| U.S. Treasury Bonds: | | | | | | | | | |
| 3.125%, 08/15/2025 | | $ | 440,100,000 | | | $ | 431,401,151 | | | | |
| 4.000%, 02/15/2026 | | | 1,100,125,000 | | | | 1,095,397,895 | | | | |
| 4.125%, 06/15/2026 | | | 120,000,000 | | | | 120,032,813 | | | | |
| 4.500%, 07/15/2026 | | | 150,575,000 | | | | 152,027,814 | | | | |
| 4.375%, 08/15/2026 | | | 254,975,000 | | | | 256,787,714 | | | | |
| 1.125%, 10/31/2026 | | | 449,500,000 | | | | 414,997,364 | | | | |
| Total U.S. Treasury Securities | | | | | | | | | | | |
| (Cost $2,445,663,280) | | | | | | | 2,470,644,751 | | | | 26.0 | % |
| Other Government Related Security | | | | | | | | | | | | |
| Korea Electric Power Corp., | | | | | | | | | | | | |
5.375%, 04/06/2026(1)(2) | | | 15,000,000 | | | | 15,146,709 | | | | | |
| Total Other Government Related Security | | | | | | | | | | | | |
| (Cost $14,975,850) | | | | | | | 15,146,709 | | | | 0.2 | % |
| Corporate Bonds | | | | | | | | | | | | |
| Industrials | | | | | | | | | | | | |
| Advance Auto Parts, Inc., | | | | | | | | | | | | |
| 5.900%, 03/09/2026 | | | 10,000,000 | | | | 9,962,976 | | | | | |
| Anglo American Capital PLC: | | | | | | | | | | | | |
| 5.375%, 04/01/2025 | | | | | | | | | | | | |
(Callable 03/01/2025)(1)(2) | | | 13,250,000 | | | | 13,184,868 | | | | | |
4.875%, 05/14/2025(1)(2) | | | 956,000 | | | | 948,585 | | | | | |
4.000%, 09/11/2027(1)(2) | | | 3,184,000 | | | | 3,060,699 | | | | | |
| ANR Pipeline Co., | | | | | | | | | | | | |
7.375%, 02/15/2024(1) | | | 13,000,000 | | | | 13,014,817 | | | | | |
| ArcelorMittal: | | | | | | | | | | | | |
6.125%, 06/01/2025(1) | | | 1,413,000 | | | | 1,428,737 | | | | | |
4.550%, 03/11/2026(1) | | | 4,000,000 | | | | 3,939,583 | | | | | |
| Ashtead Capital, Inc.: | | | | | | | | | | | | |
| 1.500%, 08/12/2026 | | | | | | | | | | | | |
(Callable 07/12/2026)(1)(2) | | | 33,034,000 | | | | 29,963,062 | | | | | |
| 4.375%, 08/15/2027 | | | | | | | | | | | | |
(Callable 01/16/2024)(1)(2) | | | 2,052,000 | | | | 1,971,619 | | | | | |
| AT&T, Inc., | | | | | | | | | | | | |
| 4.250%, 03/01/2027 | | | | | | | | | | | | |
| (Callable 12/01/2026) | | | 9,477,000 | | | | 9,376,831 | | | | | |
| AutoNation, Inc., | | | | | | | | | | | | |
| 4.500%, 10/01/2025 | | | | | | | | | | | | |
| (Callable 07/01/2025) | | | 25,000,000 | | | | 24,492,936 | | | | | |
| Bayer US Finance II LLC, | | | | | | | | | | | | |
5.500%, 08/15/2025(1)(2) | | | 4,000,000 | | | | 3,958,097 | | | | | |
| Bayer US Finance LLC, | | | | | | | | | | | | |
| 6.125%, 11/21/2026 | | | | | | | | | | | | |
(Callable 10/21/2026)(1)(2) | | | 10,000,000 | | | | 10,172,585 | | | | | |
| Bayport Polymers LLC, | | | | | | | | | | | | |
| 4.743%, 04/14/2027 | | | | | | | | | | | | |
(Callable 03/14/2027)(2) | | | 2,500,000 | | | | 2,387,806 | | | | | |
| Berry Global, Inc., | | | | | | | | | | | | |
| 4.875%, 07/15/2026 | | | | | | | | | | | | |
(Callable 01/29/2024)(2) | | | 16,968,000 | | | | 16,674,231 | | | | | |
| Boardwalk Pipelines LP, | | | | | | | | | | | | |
| 4.950%, 12/15/2024 | | | | | | | | | | | | |
| (Callable 09/15/2024) | | | 40,966,000 | | | | 40,656,104 | | | | | |
| Brambles USA, Inc., | | | | | | | | | | | | |
| 4.125%, 10/23/2025 | | | | | | | | | | | | |
(Callable 07/25/2025)(1)(2) | | | 30,041,000 | | | | 29,434,327 | | | | | |
| Broadcom, Inc., | | | | | | | | | | | | |
| 3.150%, 11/15/2025 | | | | | | | | | | | | |
| (Callable 10/15/2025) | | | 5,000,000 | | | | 4,844,894 | | | | | |
| Bunge Limited Finance Corp., | | | | | | | | | | | | |
| 1.630%, 08/17/2025 | | | | | | | | | | | | |
| (Callable 07/17/2025) | | | 5,006,000 | | | | 4,732,041 | | | | | |
| CCL Industries, Inc., | | | | | | | | | | | | |
| 3.250%, 10/01/2026 | | | | | | | | | | | | |
(Callable 07/01/2026)(1)(2) | | | 1,560,000 | | | | 1,479,154 | | | | | |
| CDW LLC / CDW Finance Corp.: | | | | | | | | | | | | |
| 5.500%, 12/01/2024 | | | | | | | | | | | | |
| (Callable 06/01/2024) | | | 2,958,000 | | | | 2,948,742 | | | | | |
| 4.125%, 05/01/2025 | | | | | | | | | | | | |
| (Callable 01/29/2024) | | | 19,810,000 | | | | 19,390,820 | | | | | |
| Celanese US Holdings LLC: | | | | | | | | | | | | |
| 6.050%, 03/15/2025 | | | 10,817,000 | | | | 10,884,281 | | | | | |
| 6.165%, 07/15/2027 | | | | | | | | | | | | |
| (Callable 06/15/2027) | | | 10,451,000 | | | | 10,715,633 | | | | | |
| Charter Communications Operating LLC: | | | | | | | | | | | | |
| 4.908%, 07/23/2025 | | | | | | | | | | | | |
| (Callable 04/23/2025) | | | 18,000,000 | | | | 17,832,025 | | | | | |
| 6.150%, 11/10/2026 | | | | | | | | | | | | |
| (Callable 10/10/2026) | | | 13,850,000 | | | | 14,153,593 | | | | | |
| Cheniere Corpus Christi Holdings LLC, | | | | | | | | | | | | |
| 5.875%, 03/31/2025 | | | | | | | | | | | | |
| (Callable 10/02/2024) | | | 6,595,000 | | | | 6,609,721 | | | | | |
| CNH Industrial Capital LLC: | | | | | | | | | | | | |
3.950%, 05/23/2025(1) | | | 10,000,000 | | | | 9,824,169 | | | | | |
5.450%, 10/14/2025(1) | | | 15,000,000 | | | | 15,072,168 | | | | | |
| Columbia Pipelines Holding Co. LLC, | | | | | | | | | | | | |
| 6.055%, 08/15/2026 | | | | | | | | | | | | |
(Callable 07/15/2026)(1)(2) | | | 7,000,000 | | | | 7,168,650 | | | | | |
| Concentrix Corp., | | | | | | | | | | | | |
| 6.650%, 08/02/2026 | | | | | | | | | | | | |
| (Callable 07/02/2026) | | | 45,900,000 | | | | 47,064,808 | | | | | |
| Crestwood Equity Partners LP, | | | | | | | | | | | | |
| 5.625%, 05/01/2027 | | | | | | | | | | | | |
(Callable 01/16/2024)(2) | | | 7,800,000 | | | | 7,773,365 | | | | | |
| Crown Castle, Inc., | | | | | | | | | | | | |
| 1.050%, 07/15/2026 | | | | | | | | | | | | |
| (Callable 06/15/2026) | | | 20,300,000 | | | | 18,321,785 | | | | | |
| CVS Pass-Through Trust: | | | | | | | | | | | | |
| 5.880%, 01/10/2028 | | | 4,166,297 | | | | 4,125,428 | | | | | |
| 6.036%, 12/10/2028 | | | 16,421,436 | | | | 16,594,013 | | | | | |
| Daimler Truck Finance | | | | | | | | | | | | |
| North America LLC, | | | | | | | | | | | | |
5.150%, 01/16/2026(1)(2) | | | 11,825,000 | | | | 11,861,297 | | | | | |
| DCP Midstream LLC, | | | | | | | | | | | | |
| 5.375%, 07/15/2025 | | | | | | | | | | | | |
| (Callable 04/15/2025) | | | 36,000,000 | | | | 36,020,268 | | | | | |
| DXC Technology Co., | | | | | | | | | | | | |
| 1.800%, 09/15/2026 | | | | | | | | | | | | |
| (Callable 08/15/2026) | | | 48,650,000 | | | | 44,457,791 | | | | | |
| eBay, Inc., | | | | | | | | | | | | |
| 5.900%, 11/22/2025 | | | | | | | | | | | | |
| (Callable 10/22/2025) | | | 20,000,000 | | | | 20,331,683 | | | | | |
| Element Fleet Management Corp.: | | | | | | | | | | | | |
| 1.600%, 04/06/2024 | | | | | | | | | | | | |
(Callable 03/06/2024)(1)(2) | | | 25,475,000 | | | | 25,150,244 | | | | | |
| 3.850%, 06/15/2025 | | | | | | | | | | | | |
(Callable 05/15/2025)(1)(2) | | | 14,147,000 | | | | 13,747,030 | | | | | |
| 6.271%, 06/26/2026 | | | | | | | | | | | | |
(Callable 05/26/2026)(1)(2) | | | 14,490,000 | | | | 14,764,436 | | | | | |
| Enbridge, Inc., | | | | | | | | | | | | |
| 5.900%, 11/15/2026 | | | | | | | | | | | | |
(Callable 10/15/2026)(1) | | | 7,000,000 | | | | 7,190,061 | | | | | |
| Energy Transfer LP: | | | | | | | | | | | | |
| 6.050%, 12/01/2026 | | | | | | | | | | | | |
| (Callable 11/01/2026) | | | 7,000,000 | | | | 7,194,138 | | | | | |
| 5.500%, 06/01/2027 | | | | | | | | | | | | |
| (Callable 03/01/2027) | | | 14,000,000 | | | | 14,181,024 | | | | | |
The accompanying notes are an integral part of these financial statements.
Baird Short-Term Bond Fund
Schedule of Investments, December 31, 2023
Long-Term Investments (cont.)
| | | Principal | | | | | | % of | |
| | | Amount | | | Value | | | Net Assets | |
| Energy Transfer Partners LP, | | | | | | | | | |
| 4.200%, 04/15/2027 | | | | | | | | | |
| (Callable 01/15/2027) | | $ | 5,028,000 | | | $ | 4,887,772 | | | |
| |
| Ferguson Finance PLC, | | | | | | | | | | | | |
| 4.250%, 04/20/2027 | | | | | | | | | | | | |
(Callable 03/20/2027)(2) | | | 3,100,000 | | | | 3,042,079 | | | | | |
| Fidelity National | | | | | | | | | | | | |
| Information Services, Inc., | | | | | | | | | | | | |
| 4.500%, 07/15/2025 | | | 18,900,000 | | | | 18,712,604 | | | | | |
| Flex Ltd.: | | | | | | | | | | | | |
| 4.750%, 06/15/2025 | | | | | | | | | | | | |
| (Callable 03/15/2025) | | | 18,999,000 | | | | 18,763,014 | | | | | |
| 3.750%, 02/01/2026 | | | | | | | | | | | | |
| (Callable 01/01/2026) | | | 28,600,000 | | | | 27,686,254 | | | | | |
| FMC Corp., | | | | | | | | | | | | |
| 5.150%, 05/18/2026 | | | | | | | | | | | | |
| (Callable 04/18/2026) | | | 37,735,000 | | | | 37,696,790 | | | | | |
| Ford Motor Credit Co. LLC, | | | | | | | | | | | | |
| 4.542%, 08/01/2026 | | | | | | | | | | | | |
| (Callable 06/01/2026) | | | 26,417,000 | | | | 25,590,315 | | | | | |
| Freeport-McMoRan, Inc., | | | | | | | | | | | | |
| 4.550%, 11/14/2024 | | | | | | | | | | | | |
| (Callable 08/14/2024) | | | 3,547,000 | | | | 3,508,799 | | | | | |
| Fresenius Medical Care | | | | | | | | | | | | |
| US Finance II, Inc., | | | | | | | | | | | | |
| 4.750%, 10/15/2024 | | | | | | | | | | | | |
(Callable 07/17/2024)(1)(2) | | | 18,720,000 | | | | 18,473,536 | | | | | |
| Fresenius Medical Care | | | | | | | | | | | | |
| US Finance III, Inc., | | | | | | | | | | | | |
| 1.875%, 12/01/2026 | | | | | | | | | | | | |
(Callable 11/01/2026)(1)(2) | | | 10,000,000 | | | | 9,038,063 | | | | | |
| General Motors Financial Co., Inc.: | | | | | | | | | | | | |
| 3.800%, 04/07/2025 | | | 30,000,000 | | | | 29,371,808 | | | | | |
| 2.750%, 06/20/2025 | | | | | | | | | | | | |
| (Callable 05/20/2025) | | | 7,302,000 | | | | 7,021,952 | | | | | |
| 5.400%, 04/06/2026 | | | 10,000,000 | | | | 10,068,538 | | | | | |
| Genpact Luxembourg Sarl, | | | | | | | | | | | | |
| 3.375%, 12/01/2024 | | | | | | | | | | | | |
| (Callable 11/01/2024) | | | 1,184,000 | | | | 1,153,394 | | | | | |
| Genuine Parts Co., | | | | | | | | | | | | |
| 1.750%, 02/01/2025 | | | | | | | | | | | | |
| (Callable 01/09/2024) | | | 15,000,000 | | | | 14,405,118 | | | | | |
| Glencore Funding LLC: | | | | | | | | | | | | |
4.000%, 04/16/2025(1)(2) | | | 14,043,000 | | | | 13,803,193 | | | | | |
| 1.625%, 09/01/2025 | | | | | | | | | | | | |
(Callable 08/01/2025)(1)(2) | | | 20,000,000 | | | | 18,887,043 | | | | | |
| Global Payments, Inc.: | | | | | | | | | | | | |
| 2.650%, 02/15/2025 | | | | | | | | | | | | |
| (Callable 01/15/2025) | | | 30,361,000 | | | | 29,419,641 | | | | | |
| 2.150%, 01/15/2027 | | | | | | | | | | | | |
| (Callable 12/15/2026) | | | 10,000,000 | | | | 9,211,454 | | | | | |
| Gray Oak Pipeline LLC, | | | | | | | | | | | | |
| 2.600%, 10/15/2025 | | | | | | | | | | | | |
(Callable 09/15/2025)(1)(2) | | | 30,525,000 | | | | 28,938,114 | | | | | |
| Gulfstream Natural Gas System LLC: | | | | | | | | | | | | |
| 4.600%, 09/15/2025 | | | | | | | | | | | | |
(Callable 06/15/2025)(2) | | | 27,407,000 | | | | 26,901,133 | | | | | |
6.190%, 11/01/2025(2) | | | 13,720,000 | | | | 13,798,558 | | | | | |
| HCA, Inc.: | | | | | | | | | | | | |
| 5.375%, 02/01/2025 | | | 10,000,000 | | | | 9,986,689 | | | | | |
| 5.250%, 04/15/2025 | | | 16,815,000 | | | | 16,797,548 | | | | | |
| 5.375%, 09/01/2026 | | | | | | | | | | | | |
| (Callable 03/01/2026) | | | 4,250,000 | | | | 4,271,771 | | | | | |
| Hexcel Corp., | | | | | | | | | | | | |
| 4.200%, 02/15/2027 | | | | | | | | | | | | |
| (Callable 11/15/2026) | | | 25,000,000 | | | | 24,088,396 | | | | | |
| HF Sinclair Corp., | | | | | | | | | | | | |
| 5.875%, 04/01/2026 | | | | | | | | | | | | |
| (Callable 01/01/2026) | | | 32,216,000 | | | | 32,547,828 | | | | | |
| Huntington Ingalls Industries, Inc., | | | | | | | | | | | | |
| 3.844%, 05/01/2025 | | | | | | | | | | | | |
| (Callable 04/01/2025) | | | 48,626,000 | | | | 47,618,350 | | | | | |
| Hyatt Hotels Corp., | | | | | | | | | | | | |
| 5.750%, 01/30/2027 | | | | | | | | | | | | |
| (Callable 12/30/2026) | | | 20,000,000 | | | | 20,437,101 | | | | | |
| Hyundai Capital America: | | | | | | | | | | | | |
| 1.800%, 10/15/2025 | | | | | | | | | | | | |
(Callable 09/15/2025)(1)(2) | | | 5,557,000 | | | | 5,222,574 | | | | | |
5.500%, 03/30/2026(1)(2) | | | 20,000,000 | | | | 20,112,336 | | | | | |
5.650%, 06/26/2026(1)(2) | | | 20,000,000 | | | | 20,139,296 | | | | | |
| Illumina, Inc., | | | | | | | | | | | | |
| 5.800%, 12/12/2025 | | | | | | | | | | | | |
| (Callable 11/12/2025) | | | 42,700,000 | | | | 42,855,641 | | | | | |
| Infor, Inc., | | | | | | | | | | | | |
| 1.750%, 07/15/2025 | | | | | | | | | | | | |
(Callable 06/15/2025)(2) | | | 8,145,000 | | | | 7,680,062 | | | | | |
| International Flavors & Fragrances, Inc., | | | | | | | | | | | | |
| 1.230%, 10/01/2025 | | | | | | | | | | | | |
(Callable 09/01/2025)(2) | | | 22,000,000 | | | | 20,368,462 | | | | | |
| JBS USA Lux SA, JBS USA Food | | | | | | | | | | | | |
| Company, and JBS USA Finance, | | | | | | | | | | | | |
| 2.500%, 01/15/2027 | | | | | | | | | | | | |
| (Callable 12/15/2026) | | | 7,700,000 | | | | 7,090,738 | | | | | |
| Kimberly-Clark de Mexico SAB de CV, | | | | | | | | | | | | |
3.250%, 03/12/2025(1)(2) | | | 5,000,000 | | | | 4,870,250 | | | | | |
| Kyndryl Holdings, Inc., | | | | | | | | | | | | |
| 2.050%, 10/15/2026 | | | | | | | | | | | | |
| (Callable 09/15/2026) | | | 48,000,000 | | | | 43,710,020 | | | | | |
| L3Harris Technologies, Inc., | | | | | | | | | | | | |
| 5.400%, 01/15/2027 | | | 20,000,000 | | | | 20,425,654 | | | | | |
| Leidos, Inc., | | | | | | | | | | | | |
| 3.625%, 05/15/2025 | | | | | | | | | | | | |
| (Callable 04/15/2025) | | | 10,675,000 | | | | 10,399,794 | | | | | |
| Lennox International, Inc., | | | | | | | | | | | | |
| 1.350%, 08/01/2025 | | | | | | | | | | | | |
| (Callable 07/01/2025) | | | 5,000,000 | | | | 4,704,724 | | | | | |
| Lowe`s Companies, Inc., | | | | | | | | | | | | |
| 4.400%, 09/08/2025 | | | 7,000,000 | | | | 6,947,995 | | | | | |
| Lundin Energy Finance BV, | | | | | | | | | | | | |
| 2.000%, 07/15/2026 | | | | | | | | | | | | |
(Callable 06/15/2026)(1)(2) | | | 538,000 | | | | 496,033 | | | | | |
| Mercedes-Benz Finance | | | | | | | | | | | | |
| North America LLC, | | | | | | | | | | | | |
5.375%, 11/26/2025(1)(2) | | | 10,000,000 | | | | 10,100,970 | | | | | |
| Molex Electronic Technologies LLC, | | | | | | | | | | | | |
| 3.900%, 04/15/2025 | | | | | | | | | | | | |
(Callable 01/15/2025)(2) | | | 2,090,000 | | | | 2,031,393 | | | | | |
| Mondelez International | | | | | | | | | | | | |
| Holdings Netherlands BV, | | | | | | | | | | | | |
4.250%, 09/15/2025(2) | | | 12,000,000 | | | | 11,852,944 | | | | | |
| National Fuel Gas Co.: | | | | | | | | | | | | |
| 5.200%, 07/15/2025 | | | | | | | | | | | | |
| (Callable 04/15/2025) | | | 18,825,000 | | | | 18,745,901 | | | | | |
| 5.500%, 10/01/2026 | | | 18,750,000 | | | | 18,835,543 | | | | | |
| Nissan Motor Acceptance Co. LLC: | | | | | | | | | | | | |
1.125%, 09/16/2024(1)(2) | | | 12,000,000 | | | | 11,573,629 | | | | | |
6.950%, 09/15/2026(1)(2) | | | 5,000,000 | | | | 5,167,030 | | | | | |
The accompanying notes are an integral part of these financial statements.
Baird Short-Term Bond Fund
Schedule of Investments, December 31, 2023
Long-Term Investments (cont.)
| | | Principal | | | | | | % of | |
| | | Amount | | | Value | | | Net Assets | |
| Nissan Motor Co. Ltd., | | | | | | | | | |
| 3.522%, 09/17/2025 | | | | | | | | | |
(Callable 08/17/2025)(1)(2) | | $ | 5,291,000 | | | $ | 5,094,423 | | | |
| |
| Nutrien Ltd., | | | | | | | | | | | | |
5.950%, 11/07/2025(1) | | | 8,000,000 | | | | 8,134,607 | | | | | |
| Occidental Petroleum Corp., | | | | | | | | | | | | |
| 8.500%, 07/15/2027 | | | | | | | | | | | | |
| (Callable 01/15/2027) | | | 22,992,000 | | | | 25,079,060 | | | | | |
| OCI NV, | | | | | | | | | | | | |
| 4.625%, 10/15/2025 | | | | | | | | | | | | |
(Callable 01/29/2024)(1)(2) | | | 16,287,000 | | | | 15,867,490 | | | | | |
| ONEOK, Inc., | | | | | | | | | | | | |
| 5.550%, 11/01/2026 | | | | | | | | | | | | |
| (Callable 10/01/2026) | | | 10,000,000 | | | | 10,178,120 | | | | | |
| Oracle Corp.: | | | | | | | | | | | | |
| 2.950%, 05/15/2025 | | | | | | | | | | | | |
| (Callable 02/15/2025) | | | 5,554,000 | | | | 5,391,383 | | | | | |
| 5.800%, 11/10/2025 | | | 12,000,000 | | | | 12,189,732 | | | | | |
| Ovintiv, Inc., | | | | | | | | | | | | |
| 5.650%, 05/15/2025 | | | 20,000,000 | | | | 20,088,864 | | | | | |
| Penske Truck Leasing Co.: | | | | | | | | | | | | |
| 4.000%, 07/15/2025 | | | | | | | | | | | | |
(Callable 06/15/2025)(2) | | | 8,000,000 | | | | 7,825,505 | | | | | |
| 5.750%, 05/24/2026 | | | | | | | | | | | | |
(Callable 04/24/2026)(2) | | | 14,275,000 | | | | 14,393,825 | | | | | |
| 4.200%, 04/01/2027 | | | | | | | | | | | | |
(Callable 01/01/2027)(2) | | | 1,825,000 | | | | 1,764,726 | | | | | |
| Perrigo Finance Unlimited Co., | | | | | | | | | | | | |
| 3.900%, 12/15/2024 | | | | | | | | | | | | |
| (Callable 09/15/2024) | | | 10,881,000 | | | | 10,556,507 | | | | | |
| Pioneer Natural Resources Co., | | | | | | | | | | | | |
| 5.100%, 03/29/2026 | | | 7,000,000 | | | | 7,053,385 | | | | | |
| POSCO: | | | | | | | | | | | | |
4.375%, 08/04/2025(1)(2) | | | 15,000,000 | | | | 14,784,115 | | | | | |
5.625%, 01/17/2026(1)(2) | | | 10,000,000 | | | | 10,085,859 | | | | | |
| PRA Health Sciences, Inc., | | | | | | | | | | | | |
| 2.875%, 07/15/2026 | | | | | | | | | | | | |
(Callable 01/29/2024)(2) | | | 13,494,000 | | | | 12,654,808 | | | | | |
| Premier Health Partners, | | | | | | | | | | | | |
| 2.911%, 11/15/2026 | | | | | | | | | | | | |
| (Callable 05/15/2026) | | | 1,954,000 | | | | 1,767,032 | | | | | |
| PVH Corp., | | | | | | | | | | | | |
| 4.625%, 07/10/2025 | | | | | | | | | | | | |
| (Callable 06/10/2025) | | | 25,839,000 | | | | 25,349,852 | | | | | |
| Regal Rexnord Corp., | | | | | | | | | | | | |
6.050%, 02/15/2026(2) | | | 30,375,000 | | | | 30,723,573 | | | | | |
| Renesas Electronics Corp.: | | | | | | | | | | | | |
| 1.543%, 11/26/2024 | | | | | | | | | | | | |
(Callable 10/26/2024)(1)(2) | | | 34,180,000 | | | | 32,893,351 | | | | | |
| 2.170%, 11/25/2026 | | | | | | | | | | | | |
(Callable 10/25/2026)(1)(2) | | | 809,000 | | | | 738,867 | | | | | |
| Rogers Communications, Inc., | | | | | | | | | | | | |
| 2.950%, 03/15/2025 | | | | | | | | | | | | |
(Callable 01/09/2024)(1) | | | 46,825,000 | | | | 45,436,255 | | | | | |
| Royalty Pharma PLC, | | | | | | | | | | | | |
| 1.200%, 09/02/2025 | | | | | | | | | | | | |
| (Callable 08/02/2025) | | | 1,000,000 | | | | 933,508 | | | | | |
| RTX Corp., | | | | | | | | | | | | |
| 5.750%, 11/08/2026 | | | | | | | | | | | | |
| (Callable 10/08/2026) | | | 15,000,000 | | | | 15,406,959 | | | | | |
| Sabine Pass Liquefaction LLC, | | | | | | | | | | | | |
| 5.875%, 06/30/2026 | | | | | | | | | | | | |
| (Callable 12/31/2025) | | | 11,000,000 | | | | 11,200,624 | | | | | |
| Sherwin-Williams Co., | | | | | | | | | | | | |
| 4.250%, 08/08/2025 | | | 7,000,000 | | | | 6,917,580 | | | | | |
| Silgan Holdings, Inc., | | | | | | | | | | | | |
| 1.400%, 04/01/2026 | | | | | | | | | | | | |
(Callable 03/01/2026)(2) | | | 7,000,000 | | | | 6,399,108 | | | | | |
| SK Hynix, Inc., | | | | | | | | | | | | |
6.250%, 01/17/2026(1)(2) | | | 13,000,000 | | | | 13,127,140 | | | | | |
| Smurfit Kappa Treasury Funding DAC, | | | | | | | | | | | | |
7.500%, 11/20/2025(1) | | | 5,852,000 | | | | 6,005,548 | | | | | |
| Southern Copper Corp., | | | | | | | | | | | | |
3.875%, 04/23/2025(1) | | | 15,534,000 | | | | 15,261,882 | | | | | |
| Sprint LLC, | | | | | | | | | | | | |
| 7.625%, 03/01/2026 | | | | | | | | | | | | |
| (Callable 11/01/2025) | | | 6,189,000 | | | | 6,462,665 | | | | | |
| Synnex Corp.: | | | | | | | | | | | | |
| 1.250%, 08/09/2024 | | | | | | | | | | | | |
| (Callable 01/09/2024) | | | 46,933,000 | | | | 45,755,710 | | | | | |
| 1.750%, 08/09/2026 | | | | | | | | | | | | |
| (Callable 07/09/2026) | | | 1,500,000 | | | | 1,361,898 | | | | | |
| Tapestry, Inc., | | | | | | | | | | | | |
| 7.050%, 11/27/2025 | | | 4,000,000 | | | | 4,091,512 | | | | | |
| TC PipeLines LP, | | | | | | | | | | | | |
| 4.375%, 03/13/2025 | | | | | | | | | | | | |
(Callable 12/13/2024)(1) | | | 31,166,000 | | | | 30,728,883 | | | | | |
| Timken Co., | | | | | | | | | | | | |
| 3.875%, 09/01/2024 | | | | | | | | | | | | |
| (Callable 06/01/2024) | | | 18,952,000 | | | | 18,683,293 | | | | | |
| T-Mobile USA, Inc., | | | | | | | | | | | | |
| 2.625%, 04/15/2026 | | | | | | | | | | | | |
| (Callable 01/09/2024) | | | 6,000,000 | | | | 5,706,600 | | | | | |
| Toll Road Investors Partnership II LP, | | | | | | | | | | | | |
| 0.000%, 02/15/2024 | | | | | | | | | | | | |
(Insured by NATL)(2) | | | 19,590,000 | | | | 19,423,528 | | | | | |
| Triton Container International Ltd.: | | | | | | | | | | | | |
| 1.150%, 06/07/2024 | | | | | | | | | | | | |
(Callable 05/07/2024)(1)(2) | | | 22,930,000 | | | | 22,373,130 | | | | | |
| 2.050%, 04/15/2026 | | | | | | | | | | | | |
(Callable 03/15/2026)(1)(2) | | | 23,688,000 | | | | 21,671,448 | | | | | |
| Universal Health Services, Inc., | | | | | | | | | | | | |
| 1.650%, 09/01/2026 | | | | | | | | | | | | |
| (Callable 08/01/2026) | | | 2,129,000 | | | | 1,937,888 | | | | | |
| Utah Acquisition Sub, Inc., | | | | | | | | | | | | |
| 3.950%, 06/15/2026 | | | | | | | | | | | | |
| (Callable 03/15/2026) | | | 33,563,000 | | | | 32,444,895 | | | | | |
| VICI Properties LP, | | | | | | | | | | | | |
| 4.375%, 05/15/2025 | | | 10,000,000 | | | | 9,826,745 | | | | | |
| Viterra Finance BV, | | | | | | | | | | | | |
| 2.000%, 04/21/2026 | | | | | | | | | | | | |
(Callable 03/21/2026)(1)(2) | | | 49,121,000 | | | | 45,618,445 | | | | | |
| Volkswagen Group of | | | | | | | | | | | | |
| America Finance LLC: | | | | | | | | | | | | |
3.950%, 06/06/2025(1)(2) | | | 10,800,000 | | | | 10,578,280 | | | | | |
5.700%, 09/12/2026(1)(2) | | | 35,000,000 | | | | 35,510,585 | | | | | |
| Vontier Corp., | | | | | | | | | | | | |
| 1.800%, 04/01/2026 | | | | | | | | | | | | |
| (Callable 03/01/2026) | | | 13,076,000 | | | | 12,035,613 | | | | | |
| Warnermedia Holdings, Inc.: | | | | | | | | | | | | |
| 3.638%, 03/15/2025 | | | 23,150,000 | | | | 22,652,434 | | | | | |
| 3.788%, 03/15/2025 | | | | | | | | | | | | |
| (Callable 01/09/2024) | | | 24,000,000 | | | | 23,520,549 | | | | | |
| Weir Group PLC, | | | | | | | | | | | | |
| 2.200%, 05/13/2026 | | | | | | | | | | | | |
(Callable 04/13/2026)(1)(2) | | | 50,194,000 | | | | 46,681,991 | | | | | |
The accompanying notes are an integral part of these financial statements.
Baird Short-Term Bond Fund
Schedule of Investments, December 31, 2023
Long-Term Investments (cont.)
| | | Principal | | | | | | % of | |
| | | Amount | | | Value | | | Net Assets | |
| Western Digital Corp., | | | | | | | | | |
| 4.750%, 02/15/2026 | | | | | | | | | |
| (Callable 11/15/2025) | | $ | 52,570,000 | | | $ | 51,593,155 | | | | |
| Western Midstream Operating LP, | | | | | | | | | | | |
| 3.100%, 02/01/2025 | | | | | | | | | | | |
| (Callable 01/01/2025) | | | 1,692,000 | | | | 1,646,514 | | | | |
| Westinghouse Air Brake | | | | | | | | | | | |
| Technologies Corp., | | | | | | | | | | | |
| 3.200%, 06/15/2025 | | | | | | | | | | | |
| (Callable 05/15/2025) | | | 30,724,000 | | | | 29,705,835 | | | | |
| Weyerhaeuser Co., | | | | | | | | | | | |
| 4.750%, 05/15/2026 | | | 28,250,000 | | | | 28,124,756 | | | | |
| Woodside Finance Ltd., | | | | | | | | | | | |
| 3.650%, 03/05/2025 | | | | | | | | | | | |
(Callable 12/05/2024)(1)(2) | | | 39,550,000 | | | | 38,680,184 | | | | |
| Total Industrials | | | | | | | | | | | |
| (Cost $2,431,604,818) | | | | | | | 2,408,639,193 | | | | 25.4 | % |
| Utilities | | | | | | | | | | | | |
| Ameren Corp., | | | | | | | | | | | | |
| 5.700%, 12/01/2026 | | | | | | | | | | | | |
| (Callable 11/01/2026) | | | 20,000,000 | | | | 20,475,618 | | | | | |
| Enel Finance International NV: | | | | | | | | | | | | |
4.250%, 06/15/2025(1)(2) | | | 25,000,000 | | | | 24,637,529 | | | | | |
6.800%, 10/14/2025(1)(2) | | | 10,000,000 | | | | 10,253,180 | | | | | |
| Fells Point Funding Trust, | | | | | | | | | | | | |
| 3.046%, 01/31/2027 | | | | | | | | | | | | |
(Callable 12/31/2026)(2) | | | 2,339,000 | | | | 2,206,107 | | | | | |
| KeySpan Gas East Corp., | | | | | | | | | | | | |
| 2.742%, 08/15/2026 | | | | | | | | | | | | |
(Callable 05/15/2026)(1)(2) | | | 21,525,000 | | | | 20,078,450 | | | | | |
| Metropolitan Edison Co., | | | | | | | | | | | | |
4.000%, 04/15/2025(2) | | | 5,173,000 | | | | 5,048,803 | | | | | |
| NextEra Energy Capital Holdings, Inc.: | | | | | | | | | | | | |
| 4.450%, 06/20/2025 | | | 7,000,000 | | | | 6,939,646 | | | | | |
| 5.749%, 09/01/2025 | | | 25,000,000 | | | | 25,245,653 | | | | | |
| Pennsylvania Electric Co., | | | | | | | | | | | | |
5.150%, 03/30/2026(2) | | | 7,000,000 | | | | 6,991,184 | | | | | |
| Pennsylvania-American Water Co., | | | | | | | | | | | | |
7.800%, 09/01/2026(2) | | | 8,000,000 | | | | 8,389,242 | | | | | |
| Puget Energy, Inc., | | | | | | | | | | | | |
| 3.650%, 05/15/2025 | | | | | | | | | | | | |
| (Callable 02/15/2025) | | | 16,855,000 | | | | 16,424,226 | | | | | |
| Transelec SA, | | | | | | | | | | | | |
| 4.250%, 01/14/2025 | | | | | | | | | | | | |
(Callable 10/14/2024)(1)(2) | | | 5,000,000 | | | | 4,903,794 | | | | | |
| Total Utilities | | | | | | | | | | | | |
| (Cost $151,853,604) | | | | | | | 151,593,432 | | | | 1.6 | % |
| Financials | | | | | | | | | | | | |
| ABN AMRO Bank NV: | | | | | | | | | | | | |
4.750%, 07/28/2025(1)(2) | | | 34,188,000 | | | | 33,499,454 | | | | | |
4.800%, 04/18/2026(1)(2) | | | 12,400,000 | | | | 12,120,330 | | | | | |
| 6.575%, 10/13/2026 (1 Year CMT Rate + | | | | | | | | | | | | |
1.550%) (Callable 10/13/2025)(1)(2)(3) | | | 5,000,000 | | | | 5,077,575 | | | | | |
| AerCap Holdings NV: | | | | | | | | | | | | |
| 1.650%, 10/29/2024 | | | | | | | | | | | | |
(Callable 09/29/2024)(1) | | | 6,191,000 | | | | 5,974,293 | | | | | |
| 4.450%, 10/01/2025 | | | | | | | | | | | | |
(Callable 08/01/2025)(1) | | | 18,937,000 | | | | 18,581,354 | | | | | |
| 6.100%, 01/15/2027 | | | | | | | | | | | | |
(Callable 12/15/2026)(1) | | | 5,000,000 | | | | 5,109,150 | | | | | |
| 6.450%, 04/15/2027 | | | | | | | | | | | | |
(Callable 03/15/2027)(1)(2) | | | 15,773,000 | | | | 16,341,536 | | | | | |
| AIB Group PLC, | | | | | | | | | | | | |
| 7.583%, 10/14/2026 (SOFR + 3.456%) | | | | | | | | | | | | |
(Callable 10/14/2025)(1)(2)(3) | | | 7,000,000 | | | | 7,221,486 | | | | | |
| Air Lease Corp., | | | | | | | | | | | | |
| 2.200%, 01/15/2027 | | | | | | | | | | | | |
| (Callable 12/15/2026) | | | 2,817,000 | | | | 2,580,821 | | | | | |
| Ally Financial, Inc., | | | | | | | | | | | | |
| 5.125%, 09/30/2024 | | | 5,000,000 | | | | 4,959,479 | | | | | |
| American Express Co., | | | | | | | | | | | | |
| 4.990%, 05/01/2026 (SOFR + 0.999%) | | | | | | | | | | | | |
(Callable 05/01/2025)(3) | | | 45,300,000 | | | | 45,176,924 | | | | | |
| ASB Bank Ltd., | | | | | | | | | | | | |
5.346%, 06/15/2026(1)(2) | | | 46,375,000 | | | | 46,780,134 | | | | | |
| Assurant, Inc., | | | | | | | | | | | | |
| 6.100%, 02/27/2026 | | | | | | | | | | | | |
| (Callable 01/27/2026) | | | 20,000,000 | | | | 20,324,674 | | | | | |
| Aviation Capital Group LLC, | | | | | | | | | | | | |
| 1.950%, 09/20/2026 | | | | | | | | | | | | |
(Callable 08/20/2026)(1)(2) | | | 4,294,000 | | | | 3,885,088 | | | | | |
| Banco Santander SA: | | | | | | | | | | | | |
2.746%, 05/28/2025(1) | | | 15,423,000 | | | | 14,882,578 | | | | | |
| 4.175%, 03/24/2028 (1 Year CMT Rate + | | | | | | | | | | | | |
2.000%) (Callable 03/24/2027)(1)(3) | | | 15,000,000 | | | | 14,444,317 | | | | | |
| Bank of America Corp.: | | | | | | | | | | | | |
| 0.976%, 04/22/2025 (SOFR + 0.690%) | | | | | | | | | | | | |
(Callable 04/22/2024)(3) | | | 45,000,000 | | | | 44,280,609 | | | | | |
| 1.530%, 12/06/2025 (SOFR + 0.650%) | | | | | | | | | | | | |
(Callable 12/06/2024)(3) | | | 30,000,000 | | | | 28,839,261 | | | | | |
| 3.384%, 04/02/2026 (SOFR + 1.330%) | | | | | | | | | | | | |
(Callable 04/02/2025)(3) | | | 25,000,000 | | | | 24,317,876 | | | | | |
| 4.827%, 07/22/2026 (SOFR + 1.750%) | | | | | | | | | | | | |
(Callable 07/22/2025)(3) | | | 10,000,000 | | | | 9,925,470 | | | | | |
| 5.080%, 01/20/2027 (SOFR + 1.290%) | | | | | | | | | | | | |
(Callable 01/20/2026)(3) | | | 15,000,000 | | | | 14,972,121 | | | | | |
| Bank of Ireland Group PLC: | | | | | | | | | | | | |
| 6.253%, 09/16/2026 (1 Year CMT Rate + | | | | | | | | | | | | |
2.650%) (Callable 09/16/2025)(1)(2)(3) | | | 27,350,000 | | | | 27,638,553 | | | | | |
| 2.029%, 09/30/2027 (1 Year CMT Rate + | | | | | | | | | | | | |
1.100%) (Callable 09/30/2026)(1)(2)(3) | | | 18,084,000 | | | | 16,489,055 | | | | | |
| Bank of New York Mellon Corp., | | | | | | | | | | | | |
| 4.947%, 04/26/2027 (SOFR + 1.026%) | | | | | | | | | | | | |
(Callable 04/26/2026)(3) | | | 7,475,000 | | | | 7,479,107 | | | | | |
| Bank of Nova Scotia, | | | | | | | | | | | | |
4.750%, 02/02/2026(1) | | | 24,600,000 | | | | 24,551,883 | | | | | |
| Banque Federative du Credit Mutuel SA: | | | | | | | | | | | | |
4.524%, 07/13/2025(1)(2) | | | 29,000,000 | | | | 28,731,119 | | | | | |
4.935%, 01/26/2026(1)(2) | | | 16,675,000 | | | | 16,620,937 | | | | | |
| Barclays PLC: | | | | | | | | | | | | |
3.650%, 03/16/2025(1) | | | 8,400,000 | | | | 8,212,220 | | | | | |
| 2.852%, 05/07/2026 (SOFR + 2.714%) | | | | | | | | | | | | |
(Callable 05/07/2025)(1)(3) | | | 27,787,000 | | | | 26,802,554 | | | | | |
| 5.304%, 08/09/2026 (1 Year CMT Rate + | | | | | | | | | | | | |
2.300%) (Callable 08/09/2025)(1)(3) | | | 8,000,000 | | | | 7,968,641 | | | | | |
| 6.496%, 09/13/2027 (SOFR + 1.880%) | | | | | | | | | | | | |
(Callable 09/13/2026)(1)(3) | | | 7,500,000 | | | | 7,721,563 | | | | | |
| BNP Paribas SA: | | | | | | | | | | | | |
| 2.819%, 11/19/2025 (3 Month TSFR + | | | | | | | | | | | | |
1.373%) (Callable 11/19/2024)(1)(2)(3) | | | 16,502,000 | | | | 16,081,303 | | | | | |
| 2.219%, 06/09/2026 (SOFR + 2.074%) | | | | | | | | | | | | |
(Callable 06/09/2025)(1)(2)(3) | | | 12,500,000 | | | | 11,933,841 | | | | | |
| 2.591%, 01/20/2028 (SOFR + 1.228%) | | | | | | | | | | | | |
(Callable 01/20/2027)(1)(2)(3) | | | 7,000,000 | | | | 6,481,332 | | | | | |
The accompanying notes are an integral part of these financial statements.
Baird Short-Term Bond Fund
Schedule of Investments, December 31, 2023
Long-Term Investments (cont.)
| | | Principal | | | | | | % of | |
| | | Amount | | | Value | | | Net Assets | |
| BPCE SA: | | | | | | | | | |
4.625%, 07/11/2024(1)(2) | | $ | 5,294,000 | | | $ | 5,236,137 | | | |
| |
5.150%, 07/21/2024(1)(2) | | | 17,675,000 | | | | 17,520,697 | | | | | |
4.500%, 03/15/2025(1)(2) | | | 6,970,000 | | | | 6,837,500 | | | | | |
| 6.612%, 10/19/2027 (SOFR + 1.980%) | | | | | | | | | | | | |
(Callable 10/19/2026)(1)(2)(3) | | | 15,000,000 | | | | 15,443,105 | | | | | |
| Canadian Imperial Bank of Commerce, | | | | | | | | | | | | |
5.144%, 04/28/2025(1) | | | 47,300,000 | | | | 47,305,083 | | | | | |
| Cantor Fitzgerald LP: | | | | | | | | | | | | |
| 4.875%, 05/01/2024 | | | | | | | | | | | | |
(Callable 04/01/2024)(2) | | | 9,600,000 | | | | 9,526,508 | | | | | |
| 4.500%, 04/14/2027 | | | | | | | | | | | | |
(Callable 01/14/2027)(2) | | | 15,000,000 | | | | 14,407,757 | | | | | |
| Capital One Financial Corp.: | | | | | | | | | | | | |
| 4.166%, 05/09/2025 (SOFR + 1.370%) | | | | | | | | | | | | |
(Callable 05/09/2024)(3) | | | 10,000,000 | | | | 9,925,048 | | | | | |
| 2.636%, 03/03/2026 (SOFR + 1.290%) | | | | | | | | | | | | |
(Callable 03/03/2025)(3) | | | 10,000,000 | | | | 9,583,505 | | | | | |
| 4.985%, 07/24/2026 (SOFR + 2.160%) | | | | | | | | | | | | |
(Callable 07/24/2025)(3) | | | 28,000,000 | | | | 27,681,278 | | | | | |
| Charles Schwab Corp.: | | | | | | | | | | | | |
| 3.000%, 03/10/2025 | | | | | | | | | | | | |
| (Callable 12/10/2024) | | | 6,772,000 | | | | 6,599,843 | | | | | |
| 5.875%, 08/24/2026 | | | | | | | | | | | | |
| (Callable 07/24/2026) | | | 30,000,000 | | | | 30,775,675 | | | | | |
| Citigroup, Inc.: | | | | | | | | | | | | |
| 0.981%, 05/01/2025 (SOFR + 0.669%) | | | | | | | | | | | | |
(Callable 05/01/2024)(3) | | | 15,000,000 | | | | 14,746,219 | | | | | |
| 1.281%, 11/03/2025 (SOFR + 0.528%) | | | | | | | | | | | | |
(Callable 11/03/2024)(3) | | | 15,000,000 | | | | 14,433,435 | | | | | |
| 3.290%, 03/17/2026 (SOFR + 1.528%) | | | | | | | | | | | | |
(Callable 03/17/2025)(3) | | | 17,700,000 | | | | 17,234,088 | | | | | |
| 5.610%, 09/29/2026 (SOFR + 1.546%) | | | | | | | | | | | | |
(Callable 09/29/2025)(3) | | | 15,000,000 | | | | 15,112,868 | | | | | |
| Citizens Bank NA, | | | | | | | | | | | | |
| 4.119%, 05/23/2025 (SOFR + 1.395%) | | | | | | | | | | | | |
(Callable 05/23/2024)(3) | | | 12,230,000 | | | | 11,935,939 | | | | | |
| CNO Global Funding, | | | | | | | | | | | | |
1.650%, 01/06/2025(2) | | | 15,000,000 | | | | 14,332,419 | | | | | |
| Cooperatieve Rabobank UA: | | | | | | | | | | | | |
| 1.980%, 12/15/2027 (1 Year CMT Rate + | | | | | | | | | | | | |
0.730%) (Callable 12/15/2026)(1)(2)(3) | | | 7,000,000 | | | | 6,373,863 | | | | | |
| 3.649%, 04/06/2028 (1 Year CMT Rate + | | | | | | | | | | | | |
1.220%) (Callable 04/06/2027)(1)(2)(3) | | | 6,390,000 | | | | 6,094,301 | | | | | |
| Corebridge Global Funding, | | | | | | | | | | | | |
5.750%, 07/02/2026(2) | | | 37,800,000 | | | | 38,294,634 | | | | | |
| Credit Agricole SA: | | | | | | | | | | | | |
4.375%, 03/17/2025(1)(2) | | | 20,341,000 | | | | 19,986,863 | | | | | |
5.589%, 07/05/2026(1)(2) | | | 26,000,000 | | | | 26,451,629 | | | | | |
| Danske Bank A/S: | | | | | | | | | | | | |
| 3.244%, 12/20/2025 | | | | | | | | | | | | |
| (3 Month LIBOR USD + 1.591%) | | | | | | | | | | | | |
(Callable 12/20/2024)(1)(2)(3)(8) | | | 6,743,000 | | | | 6,569,406 | | | | | |
| 6.466%, 01/09/2026 | | | | | | | | | | | | |
| (1 Year CMT Rate + 2.100%) | | | | | | | | | | | | |
(Callable 01/09/2025)(1)(2)(3) | | | 18,000,000 | | | | 18,129,975 | | | | | |
| 1.621%, 09/11/2026 | | | | | | | | | | | | |
| (1 Year CMT Rate + 1.350%) | | | | | | | | | | | | |
(Callable 09/11/2025)(1)(2)(3) | | | 15,000,000 | | | | 13,999,579 | | | | | |
| 6.259%, 09/22/2026 | | | | | | | | | | | | |
| (1 Year CMT Rate + 1.180%) | | | | | | | | | | | | |
(Callable 09/22/2025)(1)(2)(3) | | | 5,000,000 | | | | 5,086,939 | | | | | |
| Deutsche Bank AG: | | | | | | | | | | | | |
| 1.447%, 04/01/2025 (SOFR + 1.131%) | | | | | | | | | | | | |
(Callable 04/01/2024)(1)(3) | | | 14,500,000 | | | | 14,325,437 | | | | | |
4.162%, 05/13/2025(1) | | | 7,000,000 | | | | 6,906,710 | | | | | |
| 3.961%, 11/26/2025 (SOFR + 2.581%) | | | | | | | | | | | | |
(Callable 11/26/2024)(1)(3) | | | 12,200,000 | | | | 12,001,261 | | | | | |
| 7.146%, 07/13/2027 (SOFR + 2.520%) | | | | | | | | | | | | |
(Callable 07/13/2026)(1)(3) | | | 2,000,000 | | | | 2,076,478 | | | | | |
| 2.311%, 11/16/2027 (SOFR + 1.219%) | | | | | | | | | | | | |
(Callable 11/16/2026)(1)(3) | | | 9,450,000 | | | | 8,645,095 | | | | | |
| Discover Bank, | | | | | | | | | | | | |
| 5.974%, 08/09/2028 (5 Year Mid | | | | | | | | | | | | |
Swap Rate USD + 1.730%)(3) | | | 11,000,000 | | | | 10,594,901 | | | | | |
| Discover Financial Services: | | | | | | | | | | | | |
| 3.750%, 03/04/2025 | | | | | | | | | | | | |
| (Callable 12/04/2024) | | | 13,305,000 | | | | 13,000,345 | | | | | |
| 4.500%, 01/30/2026 | | | | | | | | | | | | |
| (Callable 11/30/2025) | | | 9,500,000 | | | | 9,380,257 | | | | | |
| DNB Bank ASA, | | | | | | | | | | | | |
| 5.896%, 10/09/2026 (SOFRINDX + | | | | | | | | | | | | |
1.950%) (Callable 10/09/2025)(1)(2)(3) | | | 47,550,000 | | | | 48,010,306 | | | | | |
| Federation des Caisses | | | | | | | | | | | | |
| Desjardins du Quebec: | | | | | | | | | | | | |
4.400%, 08/23/2025(1)(2) | | | 34,475,000 | | | | 34,045,916 | | | | | |
| 5.278%, 01/23/2026 (SOFRINDX + | | | | | | | | | | | | |
1.094%) (Callable 01/23/2025)(1)(2)(3) | | | 15,000,000 | | | | 14,942,276 | | | | | |
| First Citizens Bancshares, Inc., | | | | | | | | | | | | |
| 2.969%, 09/27/2025 (3 Month TSFR + | | | | | | | | | | | | |
1.715%) (Callable 09/27/2024)(3) | | | 2,340,000 | | | | 2,284,451 | | | | | |
| FNB Corp., | | | | | | | | | | | | |
| 5.150%, 08/25/2025 | | | | | | | | | | | | |
| (Callable 07/25/2025) | | | 20,000,000 | | | | 19,851,323 | | | | | |
| Goldman Sachs Group, Inc.: | | | | | | | | | | | | |
| 1.757%, 01/24/2025 (SOFR + 0.730%) | | | | | | | | | | | | |
(Callable 01/24/2024)(3) | | | 8,250,000 | | | | 8,221,325 | | | | | |
| 5.798%, 08/10/2026 (SOFR + 1.075%) | | | | | | | | | | | | |
(Callable 08/10/2025)(3) | | | 33,000,000 | | | | 33,325,147 | | | | | |
| Health Care Service Corp. | | | | | | | | | | | | |
| A Mutual Legal Reserve Co., | | | | | | | | | | | | |
| 1.500%, 06/01/2025 | | | | | | | | | | | | |
(Callable 05/01/2025)(2) | | | 6,465,000 | | | | 6,137,192 | | | | | |
| HSBC Holdings PLC: | | | | | | | | | | | | |
| 0.976%, 05/24/2025 (SOFR + 0.708%) | | | | | | | | | | | | |
(Callable 05/24/2024)(1)(3) | | | 9,000,000 | | | | 8,817,116 | | | | | |
| 2.999%, 03/10/2026 (SOFR + 1.430%) | | | | | | | | | | | | |
(Callable 03/10/2025)(1)(3) | | | 7,000,000 | | | | 6,787,893 | | | | | |
| 5.887%, 08/14/2027 (SOFR + 1.570%) | | | | | | | | | | | | |
(Callable 08/14/2026)(1)(3) | | | 16,800,000 | | | | 17,042,616 | | | | | |
| Huntington National Bank, | | | | | | | | | | | | |
| 5.699%, 11/18/2025 (SOFR + 1.215%) | | | | | | | | | | | | |
(Callable 11/18/2024)(3) | | | 37,350,000 | | | | 36,932,961 | | | | | |
| ING Groep NV: | | | | | | | | | | | | |
| 1.726%, 04/01/2027 (SOFR + 1.005%) | | | | | | | | | | | | |
(Callable 04/01/2026)(1)(3) | | | 12,000,000 | | | | 11,104,724 | | | | | |
| 6.083%, 09/11/2027 (SOFR + 1.560%) | | | | | | | | | | | | |
(Callable 09/11/2026)(1)(3) | | | 23,317,000 | | | | 23,806,482 | | | | | |
| 4.017%, 03/28/2028 (SOFR + 1.830%) | | | | | | | | | | | | |
(Callable 03/28/2027)(1)(3) | | | 12,000,000 | | | | 11,646,975 | | | | | |
| Jackson National Life Global Funding: | | | | | | | | | | | | |
1.750%, 01/12/2025(2) | | | 21,850,000 | | | | 20,949,565 | | | | | |
5.500%, 01/09/2026(2) | | | 15,000,000 | | | | 14,982,899 | | | | | |
| Jefferies Group LLC: | | | | | | | | | | | | |
| 4.850%, 01/15/2027 | | | 23,000,000 | | | | 22,905,339 | | | | | |
| 6.450%, 06/08/2027 | | | 2,380,000 | | | | 2,472,733 | | | | | |
The accompanying notes are an integral part of these financial statements.
Baird Short-Term Bond Fund
Schedule of Investments, December 31, 2023
Long-Term Investments (cont.)
| | | Principal | | | | | | % of | |
| | | Amount | | | Value | | | Net Assets | |
| JPMorgan Chase & Co.: | | | | | | | | | |
| 2.005%, 03/13/2026 (3 Month TSFR + | | | | | | | | | |
1.585%) (Callable 03/13/2025)(3) | | $ | 7,947,000 | | | $ | 7,636,128 | | | |
| |
| 4.080%, 04/26/2026 (SOFR + 1.320%) | | | | | | | | | | | | |
(Callable 04/26/2025)(3) | | | 20,000,000 | | | | 19,677,935 | | | | | |
| 1.045%, 11/19/2026 (SOFR + 0.800%) | | | | | | | | | | | | |
(Callable 11/19/2025)(3) | | | 4,300,000 | | | | 3,983,525 | | | | | |
| 6.070%, 10/22/2027 (SOFR + 1.330%) | | | | | | | | | | | | |
(Callable 10/22/2026)(3) | | | 10,000,000 | | | | 10,292,055 | | | | | |
| KeyCorp, | | | | | | | | | | | | |
| 3.878%, 05/23/2025 (SOFRINDX + | | | | | | | | | | | | |
1.250%) (Callable 05/23/2024)(3) | | | 7,000,000 | | | | 6,843,198 | | | | | |
| Kimco Realty Corp., | | | | | | | | | | | | |
| 3.850%, 06/01/2025 | | | | | | | | | | | | |
| (Callable 03/01/2025) | | | 3,950,000 | | | | 3,849,091 | | | | | |
| Liberty Mutual Insurance Co., | | | | | | | | | | | | |
8.500%, 05/15/2025(2) | | | 2,093,000 | | | | 2,154,245 | | | | | |
| Lloyds Banking Group PLC: | | | | | | | | | | | | |
| 3.511%, 03/18/2026 (1 Year CMT Rate + | | | | | | | | | | | | |
1.600%) (Callable 03/18/2025)(1)(3) | | | 15,000,000 | | | | 14,652,513 | | | | | |
| 4.716%, 08/11/2026 (1 Year CMT Rate + | | | | | | | | | | | | |
1.750%) (Callable 08/11/2025)(1)(3) | | | 6,000,000 | | | | 5,921,698 | | | | | |
| 5.985%, 08/07/2027 (1 Year CMT Rate + | | | | | | | | | | | | |
1.480%) (Callable 08/07/2026)(1)(3) | | | 23,000,000 | | | | 23,414,115 | | | | | |
| LPL Holdings, Inc., | | | | | | | | | | | | |
| 4.625%, 11/15/2027 | | | | | | | | | | | | |
(Callable 01/04/2024)(2) | | | 3,000,000 | | | | 2,897,339 | | | | | |
| M&T Bank Corp., | | | | | | | | | | | | |
| 4.000%, 07/15/2024 | | | | | | | | | | | | |
| (Callable 04/16/2024) | | | 14,505,000 | | | | 14,364,392 | | | | | |
| Macquarie Bank Ltd., | | | | | | | | | | | | |
4.875%, 06/10/2025(1)(2) | | | 16,375,000 | | | | 16,171,967 | | | | | |
| Macquarie Group Ltd.: | | | | | | | | | | | | |
| 5.108%, 08/09/2026 (SOFR + 2.208%) | | | | | | | | | | | | |
(Callable 08/09/2025)(1)(2)(3) | | | 12,000,000 | | | | 11,950,422 | | | | | |
| 1.629%, 09/23/2027 (SOFR + 0.910%) | | | | | | | | | | | | |
(Callable 09/23/2026)(1)(2)(3) | | | 25,000,000 | | | | 22,501,796 | | | | | |
| Met Tower Global Funding, | | | | | | | | | | | | |
5.400%, 06/20/2026(2) | | | 47,200,000 | | | | 47,923,877 | | | | | |
| Morgan Stanley: | | | | | | | | | | | | |
| 2.630%, 02/18/2026 (SOFR + 0.940%) | | | | | | | | | | | | |
(Callable 02/18/2025)(3) | | | 20,000,000 | | | | 19,359,186 | | | | | |
| 4.679%, 07/17/2026 (SOFR + 1.669%) | | | | | | | | | | | | |
(Callable 07/17/2025)(3) | | | 15,000,000 | | | | 14,858,818 | | | | | |
| 5.050%, 01/28/2027 (SOFR + 1.295%) | | | | | | | | | | | | |
(Callable 01/28/2026)(3) | | | 19,000,000 | | | | 19,023,124 | | | | | |
| Mutual of Omaha | | | | | | | | | | | | |
| Companies Global Funding, | | | | | | | | | | | | |
5.800%, 07/27/2026(2) | | | 25,000,000 | | | | 25,484,997 | | | | | |
| Nationwide Building Society: | | | | | | | | | | | | |
4.000%, 09/14/2026(1)(2) | | | 34,021,000 | | | | 32,659,895 | | | | | |
| 6.557%, 10/18/2027 (SOFR + 1.910%) | | | | | | | | | | | | |
(Callable 10/18/2026)(1)(2)(3) | | | 18,400,000 | | | | 19,034,956 | | | | | |
| NatWest Group PLC, | | | | | | | | | | | | |
| 5.847%, 03/02/2027 (1 Year CMT Rate + | | | | | | | | | | | | |
1.350%) (Callable 03/02/2026)(1)(3) | | | 30,000,000 | | | | 30,260,914 | | | | | |
| Nomura Holdings, Inc.: | | | | | | | | | | | | |
2.648%, 01/16/2025(1) | | | 7,000,000 | | | | 6,791,276 | | | | | |
5.099%, 07/03/2025(1) | | | 10,000,000 | | | | 9,933,528 | | | | | |
1.851%, 07/16/2025(1) | | | 34,050,000 | | | | 32,244,578 | | | | | |
| Nordea Bank AB, | | | | | | | | | | | | |
4.750%, 09/22/2025(1)(2) | | | 20,000,000 | | | | 19,914,181 | | | | | |
| Old Republic International Corp., | | | | | | | | | | | | |
| 3.875%, 08/26/2026 | | | | | | | | | | | | |
| (Callable 07/26/2026) | | | 7,000,000 | | | | 6,732,358 | | | | | |
| Pricoa Global Funding I, | | | | | | | | | | | | |
5.550%, 08/28/2026(2) | | | 10,000,000 | | | | 10,210,375 | | | | | |
| Protective Life Global Funding: | | | | | | | | | | | | |
5.366%, 01/06/2026(1)(2) | | | 32,500,000 | | | | 32,739,463 | | | | | |
5.209%, 04/14/2026(1)(2) | | | 20,000,000 | | | | 19,978,149 | | | | | |
| Prudential Insurance Co. of America, | | | | | | | | | | | | |
8.300%, 07/01/2025(2) | | | 7,000,000 | | | | 7,228,106 | | | | | |
| Reliance Standard Life Global Funding II: | | | | | | | | | | | | |
2.500%, 10/30/2024(1)(2) | | | 9,418,000 | | | | 9,165,469 | | | | | |
5.243%, 02/02/2026(1)(2) | | | 36,000,000 | | | | 35,689,345 | | | | | |
| Royal Bank of Canada: | | | | | | | | | | | | |
4.875%, 01/12/2026(1) | | | 32,300,000 | | | | 32,372,385 | | | | | |
5.200%, 07/20/2026(1) | | | 20,000,000 | | | | 20,236,511 | | | | | |
| Santander UK Group Holdings PLC: | | | | | | | | | | | | |
| 1.673%, 06/14/2027 (SOFR + 0.989%) | | | | | | | | | | | | |
(Callable 06/14/2026)(1)(3) | | | 8,409,000 | | | | 7,647,148 | | | | | |
| 2.469%, 01/11/2028 (SOFR + 1.220%) | | | | | | | | | | | | |
(Callable 01/11/2027)(1)(3) | | | 5,000,000 | | | | 4,558,414 | | | | | |
| Skandinaviska Enskilda Banken AB, | | | | | | | | | | | | |
3.700%, 06/09/2025(1)(2) | | | 36,675,000 | | | | 36,032,459 | | | | | |
| SMBC Aviation Capital Finance DAC, | | | | | | | | | | | | |
| 1.900%, 10/15/2026 | | | | | | | | | | | | |
(Callable 09/15/2026)(1)(2) | | | 15,400,000 | | | | 13,988,864 | | | | | |
| Societe Generale SA: | | | | | | | | | | | | |
5.000%, 01/17/2024(1)(2) | | | 14,511,000 | | | | 14,502,349 | | | | | |
| 2.226%, 01/21/2026 (1 Year CMT Rate + | | | | | | | | | | | | |
1.050%) (Callable 01/21/2025)(1)(2)(3) | | | 10,000,000 | | | | 9,607,905 | | | | | |
| Standard Chartered PLC: | | | | | | | | | | | | |
| 1.822%, 11/23/2025 (1 Year CMT Rate + | | | | | | | | | | | | |
0.950%) (Callable 11/23/2024)(1)(2)(3) | | | 28,000,000 | | | | 26,966,321 | | | | | |
| 2.819%, 01/30/2026 | | | | | | | | | | | | |
| (3 Month LIBOR USD + 1.209%) | | | | | | | | | | | | |
(Callable 01/30/2025)(1)(2)(3)(8) | | | 8,700,000 | | | | 8,411,918 | | | | | |
| 6.187%, 07/06/2027 (1 Year CMT Rate + | | | | | | | | | | | | |
1.850%) (Callable 07/06/2026)(1)(2)(3) | | | 8,000,000 | | | | 8,131,812 | | | | | |
| State Street Corp., | | | | | | | | | | | | |
| 5.104%, 05/18/2026 (SOFR + 1.130%) | | | | | | | | | | | | |
(Callable 05/18/2025)(3) | | | 15,000,000 | | | | 15,017,759 | | | | | |
| Stifel Financial Corp., | | | | | | | | | | | | |
| 4.250%, 07/18/2024 | | | 3,021,000 | | | | 2,990,611 | | | | | |
| Sumitomo Mitsui Financial Group, Inc.: | | | | | | | | | | | | |
5.464%, 01/13/2026(1) | | | 20,125,000 | | | | 20,331,194 | | | | | |
3.010%, 10/19/2026(1) | | | 12,000,000 | | | | 11,419,034 | | | | | |
| Sumitomo Mitsui Trust Bank Ltd., | | | | | | | | | | | | |
5.650%, 03/09/2026(1)(2) | | | 22,400,000 | | | | 22,701,612 | | | | | |
| Swedbank AB, | | | | | | | | | | | | |
5.472%, 06/15/2026(1)(2) | | | 47,475,000 | | | | 48,132,597 | | | | | |
| Synchrony Bank, | | | | | | | | | | | | |
| 5.400%, 08/22/2025 | | | | | | | | | | | | |
| (Callable 07/22/2025) | | | 5,000,000 | | | | 4,925,545 | | | | | |
| Synchrony Financial: | | | | | | | | | | | | |
| 4.375%, 03/19/2024 | | | | | | | | | | | | |
| (Callable 02/19/2024) | | | 12,000,000 | | | | 11,956,948 | | | | | |
| 4.250%, 08/15/2024 | | | | | | | | | | | | |
| (Callable 05/15/2024) | | | 9,000,000 | | | | 8,900,600 | | | | | |
| 4.875%, 06/13/2025 | | | | | | | | | | | | |
| (Callable 05/13/2025) | | | 15,000,000 | | | | 14,746,182 | | | | | |
| 4.500%, 07/23/2025 | | | | | | | | | | | | |
| (Callable 04/23/2025) | | | 6,367,000 | | | | 6,219,998 | | | | | |
| Synovus Financial Corp., | | | | | | | | | | | | |
| 5.200%, 08/11/2025 | | | | | | | | | | | | |
| (Callable 07/11/2025) | | | 31,353,000 | | | | 30,841,732 | | | | | |
| Toronto-Dominion Bank: | | | | | | | | | | | | |
3.766%, 06/06/2025(1) | | | 27,100,000 | | | | 26,666,510 | | | | | |
5.532%, 07/17/2026(1) | | | 20,000,000 | | | | 20,388,250 | | | | | |
The accompanying notes are an integral part of these financial statements.
Baird Short-Term Bond Fund
Schedule of Investments, December 31, 2023
Long-Term Investments (cont.)
| | | Principal | | | | | | % of | |
| | | Amount | | | Value | | | Net Assets | |
| UBS Group AG: | | | | | | | | | |
| 2.593%, 09/11/2025 (SOFR + 1.560%) | | | | | | | | | |
(Callable 09/11/2024)(1)(2)(3) | | $ | 12,000,000 | | | $ | 11,740,126 | | | | |
| 4.488%, 05/12/2026 (1 Year CMT Rate + | | | | | | | | | | | |
1.550%) (Callable 05/12/2025)(1)(2)(3) | | | 12,000,000 | | | | 11,819,382 | | | | |
| 2.193%, 06/05/2026 (SOFR + 2.044%) | | | | | | | | | | | |
(Callable 06/05/2025)(1)(2)(3) | | | 5,000,000 | | | | 4,755,821 | | | | |
| 5.711%, 01/12/2027 (1 Year CMT Rate + | | | | | | | | | | | |
1.550%) (Callable 01/12/2026)(1)(2)(3) | | | 9,000,000 | | | | 9,053,346 | | | | |
| UBS Group Funding Switzerland AG, | | | | | | | | | | | |
4.125%, 09/24/2025(1)(2) | | | 9,454,000 | | | | 9,248,000 | | | | |
| US Bancorp: | | | | | | | | | | | |
| 5.727%, 10/21/2026 (SOFR + 1.430%) | | | | | | | | | | | |
(Callable 10/21/2025)(3) | | | 20,000,000 | | | | 20,130,038 | | | | |
| 6.787%, 10/26/2027 (SOFR + 1.880%) | | | | | | | | | | | |
(Callable 10/26/2026)(3) | | | 25,000,000 | | | | 26,107,841 | | | | |
| WEA Finance LLC / | | | | | | | | | | | |
| Westfield UK & Europe Finance PLC, | | | | | | | | | | | |
| 3.750%, 09/17/2024 | | | | | | | | | | | |
(Callable 06/17/2024)(1)(2) | | | 6,912,000 | | | | 6,786,048 | | | | |
| Wells Fargo & Co.: | | | | | | | | | | | |
| 3.908%, 04/25/2026 (SOFR + 1.320%) | | | | | | | | | | | |
(Callable 04/25/2025)(3) | | | 25,000,000 | | | | 24,505,733 | | | | |
| 2.188%, 04/30/2026 (SOFR + 2.000%) | | | | | | | | | | | |
(Callable 04/30/2025)(3) | | | 1,500,000 | | | | 1,437,711 | | | | |
| 4.540%, 08/15/2026 (SOFR + 1.560%) | | | | | | | | | | | |
(Callable 08/15/2025)(3) | | | 5,000,000 | | | | 4,947,709 | | | | |
| Total Financials | | | | | | | | | | | |
| (Cost $2,577,346,736) | | | | | | | 2,560,598,081 | | | | 27.0 | % |
| Total Corporate Bonds | | | | | | | | | | | | |
| (Cost $5,160,805,158) | | | | | | | 5,120,830,706 | | | | 54.0 | % |
| Municipal Bonds | | | | | | | | | | | | |
| Alaska Industrial Development | | | | | | | | | | | | |
| & Export Authority, | | | | | | | | | | | | |
| 0.000%, 03/01/2025 (Insured by NATL) | | | 3,200,000 | | | | 2,993,544 | | | | | |
| Arlington Higher | | | | | | | | | | | | |
| Education Finance Corp., | | | | | | | | | | | | |
| 3.000%, 08/15/2044 (Callable | | | | | | | | | | | | |
| 08/15/2024) (Mandatory Tender Date | | | | | | | | | | | | |
08/15/2026) (PSF Guaranteed)(4) | | | 32,010,000 | | | | 30,163,788 | | | | | |
| Bloomington Redevelopment District, | | | | | | | | | | | | |
| 2.400%, 08/01/2024 | | | 200,000 | | | | 198,241 | | | | | |
| City of Brockton MA, | | | | | | | | | | | | |
| 5.410%, 08/01/2027 (Insured by AGM) | | | 35,040,000 | | | | 35,658,428 | | | | | |
| City of Johnson TN, | | | | | | | | | | | | |
| 7.850%, 03/01/2024 (Insured by NATL) | | | 1,440,000 | | | | 1,441,667 | | | | | |
| City of Stockton CA, | | | | | | | | | | | | |
| 5.365%, 09/01/2026 (Insured by AGM) | | | 9,780,000 | | | | 9,855,141 | | | | | |
| County of Broward FL, | | | | | | | | | | | | |
| 5.998%, 09/01/2028 | | | | | | | | | | | | |
| (Insured by AMBAC) | | | 17,495,000 | | | | 18,176,304 | | | | | |
| Illinois Finance Authority, | | | | | | | | | | | | |
| 6.279%, 07/01/2026 | | | | | | | | | | | | |
| (Callable 01/10/2024) | | | 1,700,000 | | | | 1,700,258 | | | | | |
| Illinois Housing Development Authority, | | | | | | | | | | | | |
| 4.000%, 02/01/2034 | | | | | | | | | | | | |
| (Callable 08/01/2025) | | | 1,295,000 | | | | 1,277,825 | | | | | |
| Massachusetts Educational | | | | | | | | | | | | |
| Financing Authority: | | | | | | | | | | | | |
| 1.073%, 07/01/2024 | | | 1,725,000 | | | | 1,690,112 | | | | | |
| 1.338%, 07/01/2025 | | | 5,000,000 | | | | 4,749,851 | | | | | |
| 2.000%, 07/01/2037 | | | | | | | | | | | | |
| (Callable 07/01/2031) | | | 1,000,000 | | | | 877,681 | | | | | |
| New Hampshire Housing | | | | | | | | | | | | |
| Finance Authority, | | | | | | | | | | | | |
| 4.000%, 07/01/2036 | | | | | | | | | | | | |
| (Callable 07/10/2024) | | | 185,000 | | | | 183,313 | | | | | |
| New Jersey Economic | | | | | | | | | | | | |
| Development Authority, | | | | | | | | | | | | |
| 6.310%, 07/01/2026 (Insured by AGC) | | | 4,765,000 | | | | 4,810,056 | | | | | |
| New Jersey Sports & Exposition Authority, | | | | | | | | | | | | |
| 5.976%, 03/01/2024 (Insured by NATL) | | | 345,000 | | | | 344,920 | | | | | |
| Peralta Community College District, | | | | | | | | | | | | |
| 0.000%, 08/05/2031 (Mandatory Tender | | | | | | | | | | | | |
Date 08/05/2025) (Insured by NATL)(7) | | | 27,850,000 | | | | 25,903,480 | | | | | |
| Philadelphia Authority | | | | | | | | | | | | |
| for Industrial Development, | | | | | | | | | | | | |
| 3.964%, 04/15/2026 | | | 3,365,000 | | | | 3,315,030 | | | | | |
| Utah Housing Corp., | | | | | | | | | | | | |
| 3.875%, 01/01/2050 | | | | | | | | | | | | |
| (Callable 07/01/2029) | | | 4,440,000 | | | | 4,264,033 | | | | | |
| Virginia Small Business | | | | | | | | | | | | |
| Financing Authority, | | | | | | | | | | | | |
| 6.500%, 07/01/2050 (Callable | | | | | | | | | | | | |
| 01/29/2024) (Mandatory | | | | | | | | | | | | |
Tender Date 12/31/2024)(2)(4) | | | 10,000,000 | | | | 9,984,808 | | | | | |
| Westvaco Corp., | | | | | | | | | | | | |
7.670%, 01/15/2027(2) | | | 3,900,000 | | | | 4,054,265 | | | | | |
| Total Municipal Bonds | | | | | | | | | | | | |
| (Cost $169,639,557) | | | | | | | 161,642,745 | | | | 1.7 | % |
| Residential Mortgage-Backed Securities | | | | | | | | | | | | |
| Non-U.S. Government Agency Issues | | | | | | | | | | | | |
| Alternative Loan Trust: | | | | | | | | | | | | |
| Series 2004-J2, Class 3A3, 5.500%, | | | | | | | | | | | | |
| 04/25/2034 (Callable 01/25/2024) | | | 27,263 | | | | 26,930 | | | | | |
| Series 2005-73CB, Class 1A7, 5.500%, | | | | | | | | | | | | |
| 01/25/2036 (Callable 01/25/2024) | | | 30,404 | | | | 28,310 | | | | | |
| Series 2006-28CB, Class A17, 6.000%, | | | | | | | | | | | | |
10/25/2036 (Callable 01/25/2024)(6) | | | 396,068 | | | | 203,313 | | | | | |
| Arroyo Mortgage Trust: | | | | | | | | | | | | |
| Series 2019-3, Class A1, 2.962%, | | | | | | | | | | | | |
10/25/2048 (Callable 01/25/2024)(2)(4) | | | 5,381,318 | | | | 4,993,342 | | | | | |
| Series 2019-2, Class A1, 3.347%, | | | | | | | | | | | | |
04/25/2049 (Callable 01/25/2024)(2)(4) | | | 4,093,951 | | | | 3,853,679 | | | | | |
| Series 2020-1, Class A1A, 1.662%, | | | | | | | | | | | | |
03/25/2055 (Callable 01/25/2024)(2) | | | 3,592,520 | | | | 3,329,069 | | | | | |
| Series 2022-1, Class A1A, 2.495%, | | | | | | | | | | | | |
12/25/2056 (Callable 01/25/2025)(2)(7) | | | 11,023,139 | | | | 10,176,369 | | | | | |
| CIM Trust, | | | | | | | | | | | | |
| Series 2023-R4, Class A1, 5.000%, | | | | | | | | | | | | |
05/25/2062 (Callable 04/25/2028)(2)(4) | | | 28,985,217 | | | | 28,736,712 | | | | | |
| Citigroup Mortgage Loan Trust, | | | | | | | | | | | | |
| Series 2018-RP2, Class A1, 2.882%, | | | | | | | | | | | | |
02/25/2058 (Callable 06/25/2056)(2)(4) | | | 4,039,614 | | | | 3,911,857 | | | | | |
| COLT Trust, | | | | | | | | | | | | |
| Series 2020-RPL1, Class A1, 1.390%, | | | | | | | | | | | | |
01/25/2065 (Callable 01/25/2024)(2)(4) | | | 16,903,243 | | | | 14,149,422 | | | | | |
| CSMC Trust, | | | | | | | | | | | | |
| Series 2019-RPL1, Class A1A, 3.650%, | | | | | | | | | | | | |
07/25/2058 (Callable 02/25/2036)(2)(4) | | | 14,214,758 | | | | 13,811,286 | | | | | |
| CWABS Asset-Backed Certificates Trust, | | | | | | | | | | | | |
| Series 2006-9, Class 1AF3, 5.859%, | | | | | | | | | | | | |
10/25/2046 (Callable 01/25/2024)(4)(6) | | | 47,519 | | | | 53,549 | | | | | |
| FirstKey Homes Trust: | | | | | | | | | | | | |
| Series 2020-SFR1, Class A, | | | | | | | | | | | | |
1.339%, 08/17/2037(2) | | | 29,224,973 | | | | 27,242,412 | | | | | |
| Series 2020-SFR2, Class A, | | | | | | | | | | | | |
1.266%, 10/19/2037(2) | | | 73,699,833 | | | | 68,326,430 | | | | | |
The accompanying notes are an integral part of these financial statements.
Baird Short-Term Bond Fund
Schedule of Investments, December 31, 2023
Long-Term Investments (cont.)
| | | Principal | | | | | | % of | |
| | | Amount | | | Value | | | Net Assets | |
| FirstKey Homes Trust: (cont.) | | | | | | | | | |
| Series 2022-SFR3, Class A, | | | | | | | | | |
4.250%, 07/17/2038(2) | | $ | 6,543,797 | | | $ | 6,332,766 | | | |
| |
| GCAT Trust, | | | | | | | | | | | | |
| Series 2022-HX1, Class A1, 2.885%, | | | | | | | | | | | | |
12/27/2066 (Callable 04/25/2039)(2)(4) | | | 28,444,174 | | | | 25,349,258 | | | | | |
| Home Partners of America Trust, | | | | | | | | | | | | |
| Series 2019-2, Class A, 2.703%, | | | | | | | | | | | | |
10/19/2039 (Callable 10/17/2024)(2) | | | 46,096,908 | | | | 41,993,209 | | | | | |
| J.P. Morgan Mortgage Trust, | | | | | | | | | | | | |
| Series 2005-A4, Class 1A1, 5.528%, | | | | | | | | | | | | |
07/25/2035 (Callable 01/25/2024)(4) | | | 18,154 | | | | 18,056 | | | | | |
| MASTR Alternative Loan Trust: | | | | | | | | | | | | |
| Series 2003-5, Class 7A1, 5.000%, | | | | | | | | | | | | |
| 10/01/2031 (Callable 01/25/2024) | | | 30,330 | | | | 9,456 | | | | | |
| Series 2003-5, Class 4A1, 5.500%, | | | | | | | | | | | | |
| 07/25/2033 (Callable 01/25/2024) | | | 1,097,288 | | | | 1,071,252 | | | | | |
| MFA Trust, | | | | | | | | | | | | |
| Series 2022-NQM1, Class A1, 4.112%, | | | | | | | | | | | | |
12/25/2066 (Callable 03/25/2025)(2)(4) | | | 21,699,248 | | | | 20,642,178 | | | | | |
| Mill City Mortgage Loan Trust, | | | | | | | | | | | | |
| Series 2018-2, Class A1, 3.500%, | | | | | | | | | | | | |
05/25/2058 (Callable 01/25/2031)(2)(4) | | | 253,461 | | | | 249,192 | | | | | |
| New Residential Mortgage Loan Trust: | | | | | | | | | | | | |
| Series 2019-RPL3, Class A1, 2.750%, | | | | | | | | | | | | |
07/25/2059 (Callable 09/25/2042)(2)(4) | | | 31,764,614 | | | | 29,893,326 | | | | | |
| Series 2020-RPL1, Class A1, 2.750%, | | | | | | | | | | | | |
11/25/2059 (Callable 12/25/2042)(2)(4) | | | 45,500,255 | | | | 42,590,573 | | | | | |
| Renaissance Home Equity Loan Trust, | | | | | | | | | | | | |
| Series 2007-2, Class AF2, 5.675%, | | | | | | | | | | | | |
06/25/2037 (Callable 07/25/2029)(7) | | | 1,914,212 | | | | 493,918 | | | | | |
| Structured Asset Securities Corp., | | | | | | | | | | | | |
| Series 2004-4XS, Class 1A6, 4.894%, | | | | | | | | | | | | |
02/25/2034 (Callable 01/25/2024)(7) | | | 6,372 | | | | 6,198 | | | | | |
| Thornburg Mortgage Securities Trust, | | | | | | | | | | | | |
| Series 2003-5, Class 3A, 5.058%, | | | | | | | | | | | | |
10/25/2043 (Callable 01/25/2024)(4) | | | 1,365,206 | | | | 1,298,776 | | | | | |
| Towd Point Mortgage Trust: | | | | | | | | | | | | |
| Series 2016-5, Class A1, 2.500%, | | | | | | | | | | | | |
10/25/2056 (Callable 03/25/2034)(2)(4) | | | 951,080 | | | | 943,135 | | | | | |
| Series 2017-1, Class A1, 2.750%, | | | | | | | | | | | | |
10/25/2056 (Callable 07/25/2031)(2)(4) | | | 538,840 | | | | 535,183 | | | | | |
| Series 2017-3, Class A1, 2.750%, | | | | | | | | | | | | |
06/25/2057 (Callable 11/25/2026)(2)(4) | | | 4,907,854 | | | | 4,818,546 | | | | | |
| Series 2017-4, Class A1, 2.750%, | | | | | | | | | | | | |
06/25/2057 (Callable 12/25/2029)(2)(4) | | | 9,820,199 | | | | 9,412,777 | | | | | |
| Series 2017-6, Class A1, 2.750%, | | | | | | | | | | | | |
10/25/2057 (Callable 10/25/2030)(2)(4) | | | 23,904,415 | | | | 22,878,643 | | | | | |
| Series 2018-6, Class A1A, 3.750%, | | | | | | | | | | | | |
03/25/2058 (Callable 07/25/2034)(2)(4) | | | 2,275,607 | | | | 2,224,079 | | | | | |
| Series 2018-3, Class A1, 3.750%, | | | | | | | | | | | | |
05/25/2058 (Callable 08/25/2029)(2)(4) | | | 3,156,182 | | | | 3,048,595 | | | | | |
| Series 2020-1, Class A1, 2.710%, | | | | | | | | | | | | |
01/25/2060 (Callable 10/25/2029)(2)(4) | | | 3,609,171 | | | | 3,379,767 | | | | | |
| Series 2020-4, Class A1, 1.750%, | | | | | | | | | | | | |
10/25/2060 (Callable 11/25/2034)(2) | | | 29,339,907 | | | | 25,808,752 | | | | | |
| WaMu Mortgage Pass-Through | | | | | | | | | | | | |
| Certificates Trust, | | | | | | | | | | | | |
| Series 2004-AR3, Class A1, 4.510%, | | | | | | | | | | | | |
06/25/2034 (Callable 01/25/2024)(4) | | | 1,245,109 | | | | 1,129,544 | | | | | |
| Total Residential | | | | | | | | | | | | |
| Mortgage-Backed Securities | | | | | | | | | | | | |
| (Cost $444,802,546) | | | | | | | 422,969,859 | | | | 4.4 | % |
| Commercial Mortgage-Backed Securities | | | | | | | | | | | | |
| Non-U.S. Government Agency Issues | | | | | | | | | | | | |
| Citigroup Commercial Mortgage Trust: | | | | | | | | | | | | |
| Series 2014-GC23, Class AAB, 3.337%, | | | | | | | | | | | | |
| 07/10/2047 (Callable 07/10/2024) | | | 1,198,853 | | | | 1,190,772 | | | | | |
| Series 2015-GC31, Class A4, 3.762%, | | | | | | | | | | | | |
| 06/10/2048 (Callable 06/10/2025) | | | 41,915,000 | | | | 40,331,271 | | | | | |
| Series 2016-C3, Class AAB, 2.984%, | | | | | | | | | | | | |
| 11/15/2049 (Callable 11/15/2026) | | | 940,021 | | | | 912,430 | | | | | |
| Series 2016-C3, Class A4, 3.154%, | | | | | | | | | | | | |
| 11/15/2049 (Callable 11/15/2026) | | | 9,857,000 | | | | 9,225,517 | | | | | |
| COMM Mortgage Trust: | | | | | | | | | | | | |
| Series 2014-LC17, Class A5, 3.917%, | | | | | | | | | | | | |
| 10/10/2047 (Callable 12/10/2024) | | | 8,600,000 | | | | 8,455,100 | | | | | |
| Series 2015-LC19, Class A4, 3.183%, | | | | | | | | | | | | |
| 02/10/2048 (Callable 01/10/2027) | | | 10,882,530 | | | | 10,584,338 | | | | | |
| Series 2015-DC1, Class A5, 3.350%, | | | | | | | | | | | | |
| 02/10/2048 (Callable 02/10/2025) | | | 11,960,000 | | | | 11,592,190 | | | | | |
| Series 2015-CR23, Class A4, 3.497%, | | | | | | | | | | | | |
| 05/10/2048 (Callable 05/10/2025) | | | 12,400,000 | | | | 12,022,181 | | | | | |
| Series 2015-LC21, Class A4, 3.708%, | | | | | | | | | | | | |
| 07/10/2048 (Callable 01/10/2026) | | | 30,235,955 | | | | 29,329,227 | | | | | |
| Series 2015-PC1, Class A5, 3.902%, | | | | | | | | | | | | |
| 07/10/2050 (Callable 06/10/2025) | | | 23,090,000 | | | | 22,443,780 | | | | | |
| Series 2015-CR24, Class A5, 3.696%, | | | | | | | | | | | | |
| 08/10/2055 (Callable 06/10/2026) | | | 5,170,000 | | | | 4,999,622 | | | | | |
| CSAIL Commercial Mortgage Trust: | | | | | | | | | | | | |
| Series 2015-C3, Class A4, 3.718%, | | | | | | | | | | | | |
| 08/15/2048 (Callable 08/15/2025) | | | 37,619,067 | | | | 36,312,135 | | | | | |
| Series 2015-C2, Class A4, 3.504%, | | | | | | | | | | | | |
| 06/15/2057 (Callable 05/15/2025) | | | 16,723,632 | | | | 16,177,915 | | | | | |
| GS Mortgage Securities Trust: | | | | | | | | | | | | |
| Series 2014-GC22, Class A5, 3.862%, | | | | | | | | | | | | |
| 06/10/2047 (Callable 06/10/2024) | | | 16,470,023 | | | | 16,269,705 | | | | | |
| Series 2015-GS1, Class A2, 3.470%, | | | | | | | | | | | | |
| 11/10/2048 (Callable 11/10/2025) | | | 2,050,000 | | | | 1,980,310 | | | | | |
| Series 2016-GS2, Class A4, 3.050%, | | | | | | | | | | | | |
| 05/10/2049 (Callable 05/10/2026) | | | 5,008,000 | | | | 4,738,407 | | | | | |
| J.P. Morgan Chase Commercial | | | | | | | | | | | | |
| Mortgage Securities Trust, | | | | | | | | | | | | |
| Series 2014-C20, Class A5, 3.805%, | | | | | | | | | | | | |
| 07/15/2047 (Callable 06/15/2024) | | | 11,750,000 | | | | 11,614,557 | | | | | |
| JPMBB Commercial | | | | | | | | | | | | |
| Mortgage Securities Trust: | | | | | | | | | | | | |
| Series 2014-C22, Class A4, 3.801%, | | | | | | | | | | | | |
| 09/15/2047 (Callable 10/15/2024) | | | 23,316,000 | | | | 22,905,990 | | | | | |
| Series 2014-C24, Class A5, 3.639%, | | | | | | | | | | | | |
| 11/15/2047 (Callable 10/15/2024) | | | 10,800,000 | | | | 10,533,361 | | | | | |
| Series 2014-C25, Class A5, 3.672%, | | | | | | | | | | | | |
| 11/15/2047 (Callable 11/15/2024) | | | 9,543,000 | | | | 9,308,084 | | | | | |
| Series 2015-C27, Class A4, 3.179%, | | | | | | | | | | | | |
| 02/15/2048 (Callable 09/15/2026) | | | 28,374,055 | | | | 27,290,688 | | | | | |
| Series 2015-C31, Class ASB, 3.540%, | | | | | | | | | | | | |
| 08/15/2048 (Callable 08/15/2025) | | | 3,012,104 | | | | 2,949,793 | | | | | |
| Series 2015-C31, Class A3, 3.801%, | | | | | | | | | | | | |
| 08/15/2048 (Callable 08/15/2025) | | | 17,494,940 | | | | 16,806,070 | | | | | |
| Series 2015-C28, Class A4, 3.227%, | | | | | | | | | | | | |
| 10/15/2048 (Callable 04/15/2025) | | | 15,000,000 | | | | 14,453,191 | | | | | |
| Series 2015-C33, Class ASB, 3.562%, | | | | | | | | | | | | |
| 12/15/2048 (Callable 11/15/2025) | | | 1,557,463 | | | | 1,524,056 | | | | | |
| Series 2016-C1, Class A5, 3.576%, | | | | | | | | | | | | |
| 03/17/2049 (Callable 02/15/2026) | | | 23,313,790 | | | | 22,304,716 | | | | | |
The accompanying notes are an integral part of these financial statements.
Baird Short-Term Bond Fund
Schedule of Investments, December 31, 2023
Long-Term Investments (cont.)
| | | Principal | | | | | | % of | |
| | | Amount | | | Value | | | Net Assets | |
| JPMDB Commercial | | | | | | | | | |
| Mortgage Securities Trust, | | | | | | | | | |
| Series 2016-C2, Class A4, 3.144%, | | | | | | | | | |
| 06/15/2049 (Callable 05/15/2026) | | $ | 9,010,000 | | | $ | 8,426,808 | | | | |
| Morgan Stanley Bank of | | | | | | | | | | | |
| America Merrill Lynch Trust: | | | | | | | | | | | |
| Series 2014-C18, Class A4, 3.923%, | | | | | | | | | | | |
| 10/15/2047 (Callable 07/15/2026) | | | 17,470,000 | | | | 17,130,726 | | | | |
| Series 2015-C27, Class ASB, 3.557%, | | | | | | | | | | | |
| 12/15/2047 (Callable 11/15/2025) | | | 1,537,670 | | | | 1,509,614 | | | | |
| Series 2015-C21, Class A4, 3.338%, | | | | | | | | | | | |
| 03/15/2048 (Callable 03/15/2031) | | | 10,702,782 | | | | 10,350,214 | | | | |
| Series 2016-C28, Class A4, 3.544%, | | | | | | | | | | | |
| 01/15/2049 (Callable 02/15/2028) | | | 23,200,000 | | | | 22,149,991 | | | | |
| Series 2016-C30, Class ASB, 2.729%, | | | | | | | | | | | |
| 09/15/2049 (Callable 10/15/2026) | | | 1,612,982 | | | | 1,563,111 | | | | |
| Morgan Stanley Capital I Trust, | | | | | | | | | | | |
| Series 2016-UBS9, Class A4, 3.594%, | | | | | | | | | | | |
| 03/15/2049 (Callable 02/15/2031) | | | 10,284,000 | | | | 9,797,113 | | | | |
| Wells Fargo Commercial Mortgage Trust: | | | | | | | | | | | |
| Series 2015-C31, Class ASB, 3.487%, | | | | | | | | | | | |
| 11/15/2048 (Callable 11/15/2025) | | | 945,569 | | | | 925,973 | | | | |
| Series 2015-C31, Class A4, 3.695%, | | | | | | | | | | | |
| 11/15/2048 (Callable 11/15/2025) | | | 24,395,000 | | | | 23,515,685 | | | | |
| Series 2014-LC16, Class ASB, 3.477%, | | | | | | | | | | | |
| 08/15/2050 (Callable 06/15/2024) | | | 574,915 | | | | 572,672 | | | | |
| Series 2014-LC16, Class A5, 3.817%, | | | | | | | | | | | |
| 08/15/2050 (Callable 06/15/2024) | | | 31,850,000 | | | | 31,413,145 | | | | |
| WFRBS Commercial Mortgage Trust: | | | | | | | | | | | |
| Series 2014-C23, Class ASB, 3.636%, | | | | | | | | | | | |
| 10/15/2057 (Callable 09/15/2025) | | | 150,802 | | | | 149,610 | | | | |
| Series 2014-C23, Class A5, 3.917%, | | | | | | | | | | | |
| 10/15/2057 (Callable 09/15/2025) | | | 17,125,000 | | | | 16,719,662 | | | | |
| Total Commercial | | | | | | | | | | | |
| Mortgage-Backed Securities | | | | | | | | | | | |
| (Cost $514,251,912) | | | | | | | 510,479,730 | | | | 5.4 | % |
| Asset Backed Securities | | | | | | | | | | | | |
| Bank of America Auto Trust, | | | | | | | | | | | | |
| Series 2023-1A, Class A3, 5.530%, | | | | | | | | | | | | |
02/15/2028 (Callable 12/15/2026)(2) | | | 47,800,000 | | | | 48,365,120 | | | | | |
| Chase Auto Credit Linked Notes: | | | | | | | | | | | | |
| Series 2020-2, Class B, 0.840%, | | | | | | | | | | | | |
02/25/2028 (Callable 10/25/2024)(2) | | | 130,723 | | | | 130,216 | | | | | |
| Series 2021-1, Class B, 0.875%, | | | | | | | | | | | | |
09/25/2028 (Callable 05/25/2025)(2) | | | 4,506,115 | | | | 4,425,121 | | | | | |
| Series 2021-2, Class B, 0.889%, | | | | | | | | | | | | |
12/26/2028 (Callable 10/25/2025)(2) | | | 4,916,343 | | | | 4,805,990 | | | | | |
| Series 2021-3, Class B, 0.760%, | | | | | | | | | | | | |
02/26/2029 (Callable 06/25/2025)(2) | | | 11,541,372 | | | | 11,136,151 | | | | | |
| Chase Auto Owner Trust, | | | | | | | | | | | | |
| Series 2023-AA, Class A3, 5.680%, | | | | | | | | | | | | |
01/25/2029 (Callable 01/25/2028)(2) | | | 24,285,000 | | | | 24,766,309 | | | | | |
| Citizens Auto Receivables Trust, | | | | | | | | | | | | |
| Series 2023-2, Class A3, 5.830%, | | | | | | | | | | | | |
02/15/2028 (Callable 06/15/2027)(2) | | | 27,275,000 | | | | 27,666,977 | | | | | |
| Dell Equipment Finance Trust, | | | | | | | | | | | | |
| Series 2023-2, Class A3, 5.650%, | | | | | | | | | | | | |
01/22/2029 (Callable 02/22/2026)(2) | | | 16,100,000 | | | | 16,293,540 | | | | | |
| First National Master Note Trust, | | | | | | | | | | | | |
| Series 2023-2, Class A, | | | | | | | | | | | | |
| 5.770%, 09/15/2029 | | | 28,000,000 | | | | 28,629,860 | | | | | |
| Ford Credit Auto Owner Trust, | | | | | | | | | | | | |
| Series 2020-2, Class A, 1.060%, | | | | | | | | | | | | |
04/15/2033 (Callable 10/15/2025)(2) | | | 16,881,000 | | | | 15,740,108 | | | | | |
| Ford Credit Floorplan | | | | | | | | | | | | |
| Master Owner Trust: | | | | | | | | | | | | |
| Series 2020-2, Class A, | | | | | | | | | | | | |
| 1.060%, 09/15/2027 | | | 16,594,000 | | | | 15,532,553 | | | | | |
| Series 2023-1, Class A1, | | | | | | | | | | | | |
4.920%, 05/15/2028(2) | | | 80,365,000 | | | | 80,558,101 | | | | | |
| Genesis Sales Finance Master Trust, | | | | | | | | | | | | |
| Series 2021-AA, Class A, 1.200%, | | | | | | | | | | | | |
12/21/2026 (Callable 03/20/2024)(2) | | | 1,080,000 | | | | 1,033,057 | | | | | |
| GM Financial Consumer | | | | | | | | | | | | |
| Automobile Receivables Trust, | | | | | | | | | | | | |
| Series 2023-1, Class A3, 4.660%, | | | | | | | | | | | | |
| 02/16/2028 (Callable 12/16/2026) | | | 19,000,000 | | | | 18,935,033 | | | | | |
| GMF Floorplan Owner Revolving Trust, | | | | | | | | | | | | |
| Series 2023-1, Class A1, | | | | | | | | | | | | |
5.340%, 06/15/2028(2) | | | 75,897,000 | | | | 76,846,001 | | | | | |
| Golden Credit Card Trust, | | | | | | | | | | | | |
| Series 2022-4A, Class A, | | | | | | | | | | | | |
4.310%, 09/15/2027(1)(2) | | | 34,000,000 | | | | 33,600,520 | | | | | |
| Hyundai Auto Lease Securitization Trust, | | | | | | | | | | | | |
| Series 2023-C, Class A3, 5.800%, | | | | | | | | | | | | |
12/15/2026 (Callable 04/15/2026)(2) | | | 20,000,000 | | | | 20,245,136 | | | | | |
| Hyundai Auto Receivables Trust, | | | | | | | | | | | | |
| Series 2023-B, Class A3, 5.480%, | | | | | | | | | | | | |
| 04/17/2028 (Callable 10/15/2027) | | | 29,000,000 | | | | 29,496,454 | | | | | |
| Louisiana Local Government | | | | | | | | | | | | |
| Environmental Facilities & | | | | | | | | | | | | |
| Community Development Authority, | | | | | | | | | | | | |
| 3.615%, 02/01/2029 | | | 22,021,169 | | | | 21,528,446 | | | | | |
| MMAF Equipment Finance LLC, | | | | | | | | | | | | |
| Series 2023-A, Class A3, | | | | | | | | | | | | |
5.540%, 12/13/2029(2) | | | 6,575,000 | | | | 6,670,513 | | | | | |
| Navient Private Education Refi Loan Trust: | | | | | | | | | | | | |
| Series 2019-EA, Class A2A, 2.640%, | | | | | | | | | | | | |
05/15/2068 (Callable 10/15/2026)(2) | | | 1,993,317 | | | | 1,892,815 | | | | | |
| Series 2019-FA, Class A2, 2.600%, | | | | | | | | | | | | |
08/15/2068 (Callable 02/15/2027)(2) | | | 8,427,277 | | | | 7,848,331 | | | | | |
| Series 2021-A, Class A, 0.840%, | | | | | | | | | | | | |
05/15/2069 (Callable 05/15/2028)(2) | | | 8,846,039 | | | | 7,796,169 | | | | | |
| Series 2021-GA, Class A, 1.580%, | | | | | | | | | | | | |
04/15/2070 (Callable 08/15/2029)(2) | | | 23,106,867 | | | | 20,046,196 | | | | | |
| Navient Student Loan Trust, | | | | | | | | | | | | |
| Series 2019-BA, Class A2A, 3.390%, | | | | | | | | | | | | |
12/15/2059 (Callable 01/15/2030)(2) | | | 3,843,649 | | | | 3,673,883 | | | | | |
| Nelnet Student Loan Trust: | | | | | | | | | | | | |
| Series 2021-A, Class APT1, 1.360%, | | | | | | | | | | | | |
04/20/2062 (Callable 09/20/2029)(2) | | | 7,178,794 | | | | 6,501,163 | | | | | |
| Series 2021-BA, Class AFX, 1.420%, | | | | | | | | | | | | |
04/20/2062 (Callable 07/20/2029)(2) | | | 9,889,395 | | | | 8,983,727 | | | | | |
| Series 2021-DA, Class AFX, 1.630%, | | | | | | | | | | | | |
04/20/2062 (Callable 12/20/2031)(2) | | | 9,968,944 | | | | 9,103,908 | | | | | |
| PFS Financing Corp., | | | | | | | | | | | | |
| Series 2023-A, Class A, | | | | | | | | | | | | |
5.800%, 03/15/2028(2) | | | 24,700,000 | | | | 25,056,666 | | | | | |
| Santander Bank Auto Credit: | | | | | | | | | | | | |
| Series 2022-A, Class B, 5.281%, | | | | | | | | | | | | |
05/15/2032 (Callable 01/15/2026)(2) | | | 4,424,984 | | | | 4,387,291 | | | | | |
| Series 2023-B, Class B, 5.640%, | | | | | | | | | | | | |
12/15/2033 (Callable 02/15/2028)(2) | | | 3,250,000 | | | | 3,263,189 | | | | | |
| SFS Auto Receivables Securitization Trust, | | | | | | | | | | | | |
| Series 2023-1A, Class A3, 5.470%, | | | | | | | | | | | | |
10/20/2028 (Callable 08/20/2027)(2) | | | 27,100,000 | | | | 27,382,501 | | | | | |
| Towd Point Mortgage Trust: | | | | | | | | | | | | |
| Series 2019-MH1, Class A1, 3.000%, | | | | | | | | | | | | |
11/25/2058 (Callable 09/25/2024)(2)(4) | | | 418,312 | | | | 416,033 | | | | | |
The accompanying notes are an integral part of these financial statements.
Baird Short-Term Bond Fund
Schedule of Investments, December 31, 2023
Long-Term Investments (cont.)
| | | Principal | | | | | | % of | |
| | | Amount | | | Value | | | Net Assets | |
| Towd Point Mortgage Trust: (cont.) | | | | | | | | | |
| Series 2020-MH1, Class A1A, 2.184%, | | | | | | | | | |
02/25/2060 (Callable 01/25/2024)(2)(4) | | $ | 7,526,613 | | | $ | 7,162,473 | | | | |
| Series 2020-MH1, Class A1, 2.250%, | | | | | | | | | | | |
02/25/2060 (Callable 01/25/2024)(2)(4) | | | 11,704,572 | | | | 11,147,196 | | | | |
| Verizon Master Trust, | | | | | | | | | | | |
| Series 2023-1, Class A, 4.490%, | | | | | | | | | | | |
| 01/22/2029 (Callable 01/20/2026) | | | 23,150,000 | | | | 23,032,028 | | | | |
| Total Asset Backed Securities | | | | | | | | | | | |
| (Cost $657,628,516) | | | | | | | 654,098,775 | | | | 6.9 | % |
| Total Long-Term Investments | | | | | | | | | | | | |
| (Cost $9,407,766,819) | | | | | | | 9,355,813,275 | | | | 98.6 | % |
| Short-Term Investment | | | | | | | | | | | | |
| | | Shares | | | | | | | | | |
| Money Market Mutual Fund | | | | | | | | | | | | |
| First American Government Obligations | | | | | | | | | | | | |
Fund, Class U, 5.31%(5) | | | 263,379,478 | | | | 263,379,478 | | | | | |
| Total Short-Term Investment | | | | | | | | | | | | |
| (Cost $263,379,478) | | | | | | | 263,379,478 | | | | 2.8 | % |
| Total Investments | | | | | | | | | | | | |
| (Cost $9,671,146,297) | | | | | | | 9,619,192,753 | | | | 101.4 | % |
| Liabilities in Excess of Other Assets | | | | | | | (135,456,660 | ) | | | (1.4 | )% |
| TOTAL NET ASSETS | | | | | | $ | 9,483,736,093 | | | | 100.0 | % |
Notes to Schedule of Investments
AGC – Assured Guaranty Corp.
AGM – Assured Guaranty Municipal
AMBAC – Ambac Assurance Corp.
NATL – National Public Finance Guarantee Corp.
CMT – Constant Maturity Treasury
LIBOR – London Inter-bank Offered Rate
PSF – Permanent School Fund
SOFR – Secured Overnight Financing Rate
SOFRINDX – Secured Overnight Financing Rate Index
TSFR – Term Secured Overnight Financing Rate
(1) | Foreign security. |
(2) | Includes securities exempt from registration under Rule 144A of the Securities Act of 1933. These securities may be resold in transactions exempt from registration to qualified institutional buyers. At December 31, 2023, the value of these securities totaled $3,070,200,514, which represented 32.37% of total net assets. |
(3) | Variable rate security based on a reference index and spread. The rate reported is the rate as of the last reset date in effect as of December 31, 2023. |
(4) | Variable rate security. The coupon is based on an underlying pool of loans. The rate reported is the rate in effect as of December 31, 2023. |
(5) | Seven-day yield. |
(6) | Security that, on the last payment date, missed a partial principal or interest payment. |
(7) | Step-up bond; the interest rate shown is the rate in effect as of December 31, 2023. |
(8) | Securities referencing LIBOR are expected to transition to an alternative reference rate by the security’s next scheduled coupon reset date. |
The accompanying notes are an integral part of these financial statements.
Baird Short-Term Bond Fund
Summary of Fair Value Exposure at December 31, 2023The Fund has adopted authoritative fair valuation accounting standards which establish a definition of fair value and set out a hierarchy for measuring fair value. These standards require additional disclosures about the various inputs and valuation techniques used to develop the measurements of fair value and a discussion on changes in valuation techniques and related inputs during the period. These standards define fair value as the price that would be received to sell an asset or paid to transfer a liability in an orderly transaction between market participants at the measurement date.
The fair value hierarchy is organized into three levels based upon the assumptions (referred to as “inputs”) used in pricing the asset or liability. These standards state that “observable inputs” reflect the assumptions market participants would use in pricing the asset or liability based on market data obtained from independent sources and “unobservable inputs” reflect an entity’s own assumptions about the assumptions market participants would use in pricing the asset or liability. These inputs are summarized into three broad levels and described below:
Level 1 – Quoted prices (unadjusted) in active markets for identical assets or liabilities that the reporting entity can access at the measurement date.
Level 2 – Inputs other than quoted prices included within Level 1 that are observable for the asset or liability, either directly or indirectly.
Level 3 – Unobservable inputs for the asset or liability.
The inputs or methodology used for valuing securities are not necessarily an indication of the risk associated with investing in those securities.
The following is a summary of the inputs used to value the Fund’s investments as of December 31, 2023:
| | | Level 1 | | | Level 2 | | | Level 3 | | | Total | |
| Long-Term Investments | | | | | | | | | | | | |
| U.S. Treasury Securities | | $ | — | | | $ | 2,470,644,751 | | | $ | — | | | $ | 2,470,644,751 | |
| Other Government Related Security | | | — | | | | 15,146,709 | | | | — | | | | 15,146,709 | |
| Corporate Bonds | | | — | | | | 5,120,830,706 | | | | — | | | | 5,120,830,706 | |
| Municipal Bonds | | | — | | | | 161,642,745 | | | | — | | | | 161,642,745 | |
| Residential Mortgage-Backed Securities – Non-U.S. Government Agency Issues | | | — | | | | 422,969,859 | | | | — | | | | 422,969,859 | |
| Commercial Mortgage-Backed Securities – Non-U.S. Government Agency Issues | | | — | | | | 510,479,730 | | | | — | | | | 510,479,730 | |
| Asset Backed Securities | | | — | | | | 654,098,775 | | | | — | | | | 654,098,775 | |
| Total Long-Term Investments | | | — | | | | 9,355,813,275 | | | | — | | | | 9,355,813,275 | |
| Short-Term Investment | | | | | | | | | | | | | | | | |
| Money Market Mutual Fund | | | 263,379,478 | | | | — | | | | — | | | | 263,379,478 | |
| Total Short-Term Investment | | | 263,379,478 | | | | — | | | | — | | | | 263,379,478 | |
| Total Investments | | $ | 263,379,478 | | | $ | 9,355,813,275 | | | $ | — | | | $ | 9,619,192,753 | |
Changes in valuation techniques may result in transfers into or out of assigned levels within the fair value hierarchy. There were no transfers into or out of Level 3 during the year, as compared to the security classifications from the prior year’s annual report. See the Fund’s Valuation Policy in Note 2a to the financial statements.
The accompanying notes are an integral part of these financial statements.
Baird Intermediate Bond Fund
December 31, 2023 (Unaudited)
The Baird Intermediate Bond Fund seeks an annual rate of total return, before Fund expenses, greater than the annual rate of total return of the Bloomberg Intermediate U.S. Government/Credit Index. The Bloomberg Intermediate U.S. Government/Credit Index is an unmanaged, market value weighted index of investment grade, fixed-rate debt issues, including government and credit securities, with maturities between one and ten years.
In 2023, the Fed slowed and likely ended its aggressive tightening campaign. Investors returned to the bond market as fixed income fund/ETF flows were a positive $159 billion, reversing the record outflows of -$345 billion in 2022. The overarching theme for 2023 was rate and credit spread volatility. After beginning the year at 3.88%, the 10-year Treasury yield fell more than 50 bps to 3.31% in April. From there, resilient economic data and heavy Treasury issuance led to a significant move up in rates. The 10-year Treasury yield rose 168 bps, peaking in mid-October at 4.99%, but the elevated rates were short-lived as one of the strongest year-end market rallies in decades ensued. The 10-year Treasury yield fell 111 bps to end the year at 3.88%, exactly the yield at which it began the year.
During 2023, the Institutional Class Shares of the Fund (BIMIX) posted a net return of 5.78% vs. a 5.24% return for the Bloomberg Intermediate U.S. Government/Credit Index.
Contributors to the Fund’s relative performance during the year include:
| | | • | Positive – Overweight investment grade credit |
| | | • | Positive – Active positioning within investment grade credit |
| | | | o | Positive – Overweight BBB industrials as well as subsector and security selection decisions within industrials (spread across many subsectors) |
| | | | o | Positive – Subsector and security selection within financials (e.g., favoring non-U.S. versus U.S. banks) |
| | | | o | Positive – Overweight financials/industrials and underweight non-corporate credit |
| | | • | Positive – Overweight non-agency residential mortgage-backed securities (RMBS), asset-backed securities (ABS), and non-agency commercial mortgage-based securities (CMBS) |
The outlook for the fixed income markets in 2024 is favorable, thanks to an inflationary trend that is moving closer to the Fed’s 2% target and an acknowledgement, by both the Fed and the market, that the odds have shifted toward rate cuts rather than increases. Signs of economic slowing are emerging as monthly payroll growth has slowed and the US unemployment rate has risen modestly. Outside of the U.S., geopolitical risks are elevated with an ongoing war in Ukraine, Israel’s full-scale campaign inside Gaza to defeat Hamas, non-state actor attacks on shipping in the Red Sea and U.S. interests in the Middle East, and relations between China and the U.S. strained, all of which, combined with the uncertain Fed outlook, will likely lead to continued elevated market volatility. We expect the spread volatility that was visible in 2023 to continue into 2024, benefitting the patient, active investor. Finally, 2024 is an election year, which is certain to add to market uncertainty as the year progresses; this uncertainty is likely to lead to short-term price volatility although the higher income from bonds can insulate investors from this volatility.
The Fund remains duration neutral and continues to maintain a modest overweight to investment grade corporate credit, favoring the financial sector relative to its benchmark. In addition, we are maintaining the Fund’s overweight to non-agency securitized sub-sectors at the top of the capital structure given the diversification benefit they provide to the overall portfolio and attractive valuations versus U.S. Treasuries and higher-rated segments of investment grade credit.
Baird Intermediate Bond Fund
December 31, 2023 (Unaudited)
Portfolio Characteristics
Quality Distribution(1)(2)

| | Net Assets | $8,326,417,140 | |
| | | | |
| | SEC 30-Day Yield(3) | | |
| | Institutional Class | 4.35% | |
| | Investor Class | 4.09% | |
| | | | |
| | Average Effective Duration | 3.78 years | |
| | | | |
| | Average Effective Maturity | 4.32 years | |
| | | | |
| | Annualized Expense Ratio(4) | | |
| | Institutional Class | 0.30% | |
| | Investor Class | 0.55% | (5) |
| | | | |
| | Portfolio Turnover Rate | 45% | |
| | | | |
| | Number of Holdings | 691 | |
| | | | | |
Sector Weightings(6) | | | | |
| | | | | |

| | | | |
| | | | |
| | | | |
| | | | |
| | | | |
| | | | |
| | | | |
| | | | |
| | | | |
| | | | |
| | | | |
| | | | |
| | | | |
| | | | |
| | | | |
| | | | |
| | | | |
| | | | |
| | | | |
| | | | |
| | | | |
| | | | | |
(1) | Percentages shown are based on the Fund’s total investments. |
(2) | The quality profile is calculated on a market value-weighted basis using the highest credit quality rating for each security held by the Fund given by S&P, Moody’s or Fitch, each of which is a Nationally Recognized Statistical Rating Organization (NRSRO). NRSROs rate the credit quality of securities using a scale that generally ranges from AAA (highest) to D (lowest). |
(3) | SEC yields are based on SEC guidelines and are calculated for the 30 days ended December 31, 2023. |
(4) | Reflects expense ratios as stated in the Fund’s current prospectus dated May 1, 2023. |
(5) | Includes 0.25% 12b-1 fee. |
(6) | Percentages shown are based on the Fund’s total net assets. |
Baird Intermediate Bond Fund
December 31, 2023 (Unaudited)
| Institutional Class | Investor Class |
| Value of a $10,000 Investment | Value of a $10,000 Investment |
| | |
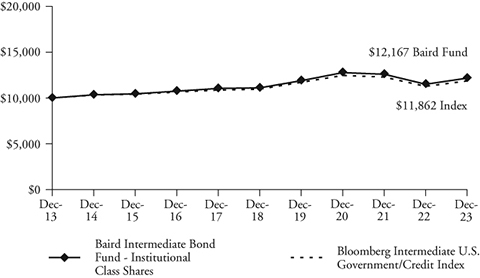 | 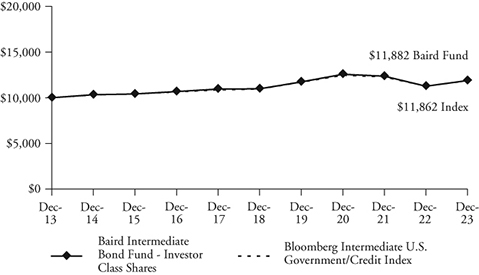 |
| | |
| Growth of a hypothetical investment of $10,000 made on 12/31/13, assuming | Growth of a hypothetical investment of $10,000 made on 12/31/13, assuming |
| reinvestment of all distributions. | reinvestment of all distributions. |
| Total Returns | | | | |
| | | Average Annual |
| | One | Five | Ten | Since |
| For the Periods Ended December 31, 2023 | Year | Years | Years | Inception(1) |
| Institutional Class Shares | 5.78% | 1.84% | 1.98% | 4.03% |
| Investor Class Shares | 5.53% | 1.59% | 1.74% | 3.77% |
Bloomberg Intermediate U.S. Government/Credit Index(2) | 5.24% | 1.59% | 1.72% | 3.63% |
(1) | For the period from September 29, 2000 (inception date) through December 31, 2023. |
(2) | The Bloomberg Intermediate U.S. Government/Credit Index is an unmanaged, market value weighted index of investment grade, fixed-rate debt issues, including government and corporate securities, with maturities between one and ten years. This Index does not reflect any deduction for fees, expenses or taxes. A direct investment in an index is not possible. |
The line graphs and the returns table shown above reflect reinvestment of dividends and/or capital gains distributions in additional shares. The returns in the graphs and table do not reflect the deduction of taxes that a shareholder would pay on Fund distributions or the redemption of Fund shares. The returns reflect the actual performance for each period and do not include the impact of trades executed on the last business day of the period that were recorded on the first business day of the next period.
The Fund’s expense ratio for each Class, as reflected in the Fund’s current prospectus, is set forth under “Portfolio Characteristics”.
The Fund may invest in U.S. dollar denominated foreign securities which involve additional risks such as political and economic instability, and different and sometimes less strict financial reporting standards and regulation. The Fund may also invest in mortgage- and asset-backed securities, which include interest rate and prepayment risks more pronounced than those of other fixed income securities. U.S. and international markets have experienced significant periods of volatility due to a number of economic, political and other global macro factors. The war between Ukraine and Russia is approaching its 2nd anniversary and the October 7th attack by Hamas and Israel’s response only added to global tensions. US/China relations remain strained, impacted by sluggish Chinese economic growth and numerous issues affecting trade relations. Domestically, inflation remains an area of focus since getting to the Fed’s 2% target may prove to be more challenging than the market expects. In addition, 2024 is an election year and the current level of political discord is high. Finally, while the coronavirus (COVID-19) appears to have entered an endemic stage, significant outbreaks present a continued risk to the global economy. These and other events may cause market disruptions and could have an adverse effect on the value of the Fund’s investments.
Past performance does not guarantee future results. Investment return and principal value will fluctuate so that an investor’s shares, when redeemed, may be worth more or less than their original cost.
For information about the performance of the Fund as of the most recent month-end, please call 1-866-442-2473 or visit www.bairdfunds.com. Mutual fund performance changes over time and current performance may be lower or higher than that stated.
Baird Intermediate Bond Fund
Schedule of Investments, December 31, 2023
Long-Term Investments
| | | Principal | | | | | | % of | |
| | | Amount | | | Value | | | Net Assets | |
| U.S. Treasury Securities | | | | | | | | | |
| U.S. Treasury Bonds: | | | | | | | | | |
| 3.125%, 08/15/2025 | | $ | 207,750,000 | | | $ | 203,643,692 | | | | |
| 2.250%, 11/15/2025 | | | 317,925,000 | | | | 306,276,031 | | | | |
| 4.000%, 02/15/2026 | | | 287,225,000 | | | | 285,990,829 | | | | |
| 4.500%, 07/15/2026 | | | 185,950,000 | | | | 187,744,127 | | | | |
| 4.375%, 08/15/2026 | | | 245,725,000 | | | | 247,471,952 | | | | |
| 1.125%, 10/31/2026 | | | 442,270,000 | | | | 408,322,323 | | | | |
| 1.125%, 08/31/2028 | | | 535,550,000 | | | | 473,334,150 | | | | |
| 2.375%, 03/31/2029 | | | 476,275,000 | | | | 442,675,285 | | | | |
| 3.875%, 12/31/2029 | | | 485,225,000 | | | | 484,997,551 | | | | |
| 4.125%, 08/31/2030 | | | 321,475,000 | | | | 325,970,629 | | | | |
| 1.250%, 08/15/2031 | | | 67,775,000 | | | | 56,181,768 | | | | |
| 2.875%, 05/15/2032 | | | 200,750,000 | | | | 186,368,145 | | | | |
| 3.500%, 02/15/2033 | | | 242,900,000 | | | | 236,011,507 | | | | |
| Total U.S. Treasury Securities | | | | | | | | | | | |
| (Cost $3,860,554,180) | | | | | | | 3,844,987,989 | | | | 46.2 | % |
| Other Government Related Security | | | | | | | | | | | | |
| NBN Co. Ltd., | | | | | | | | | | | | |
| 2.625%, 05/05/2031 | | | | | | | | | | | | |
(Callable 02/05/2031)(1)(2) | | | 20,487,000 | | | | 17,596,939 | | | | | |
| Total Other Government Related Security | | | | | | | | | | | | |
| (Cost $19,768,623) | | | | | | | 17,596,939 | | | | 0.2 | % |
| Corporate Bonds | | | | | | | | | | | | |
| Industrials | | | | | | | | | | | | |
| Adventist Health System, | | | | | | | | | | | | |
| 2.952%, 03/01/2029 | | | | | | | | | | | | |
| (Callable 12/01/2028) | | | 250,000 | | | | 225,955 | | | | | |
| Agilent Technologies, Inc.: | | | | | | | | | | | | |
| 3.050%, 09/22/2026 | | | | | | | | | | | | |
| (Callable 06/22/2026) | | | 1,495,000 | | | | 1,428,768 | | | | | |
| 2.100%, 06/04/2030 | | | | | | | | | | | | |
| (Callable 03/04/2030) | | | 250,000 | | | | 215,669 | | | | | |
| Air Products and Chemicals, Inc., | | | | | | | | | | | | |
| 2.050%, 05/15/2030 | | | | | | | | | | | | |
| (Callable 02/15/2030) | | | 275,000 | | | | 240,642 | | | | | |
| Aker BP ASA, | | | | | | | | | | | | |
| 5.600%, 06/13/2028 | | | | | | | | | | | | |
(Callable 05/13/2028)(1)(2) | | | 2,500,000 | | | | 2,550,696 | | | | | |
| Albemarle Corp., | | | | | | | | | | | | |
| 4.650%, 06/01/2027 | | | | | | | | | | | | |
| (Callable 05/01/2027) | | | 7,000,000 | | | | 6,877,690 | | | | | |
| Allegion PLC, | | | | | | | | | | | | |
| 3.500%, 10/01/2029 | | | | | | | | | | | | |
| (Callable 07/01/2029) | | | 3,160,000 | | | | 2,920,878 | | | | | |
| Allegion US Holding Co., Inc.: | | | | | | | | | | | | |
| 3.200%, 10/01/2024 | | | | | | | | | | | | |
| (Callable 08/01/2024) | | | 4,998,000 | | | | 4,897,278 | | | | | |
| 5.411%, 07/01/2032 | | | | | | | | | | | | |
| (Callable 04/01/2032) | | | 2,000,000 | | | | 2,050,376 | | | | | |
| American Tower Corp., | | | | | | | | | | | | |
| 5.250%, 07/15/2028 | | | | | | | | | | | | |
| (Callable 06/15/2028) | | | 7,800,000 | | | | 7,929,345 | | | | | |
| Amgen, Inc., | | | | | | | | | | | | |
| 5.250%, 03/02/2033 | | | | | | | | | | | | |
| (Callable 12/02/2032) | | | 11,600,000 | | | | 11,909,591 | | | | | |
| Anglo American Capital PLC: | | | | | | | | | | | | |
4.000%, 09/11/2027(1)(2) | | | 1,497,000 | | | | 1,439,028 | | | | | |
| 2.250%, 03/17/2028 | | | | | | | | | | | | |
(Callable 01/17/2028)(1)(2) | | | 6,500,000 | | | | 5,797,367 | | | | | |
| 2.625%, 09/10/2030 | | | | | | | | | | | | |
(Callable 06/10/2030)(1)(2) | | | 300,000 | | | | 255,610 | | | | | |
| 5.500%, 05/02/2033 | | | | | | | | | | | | |
(Callable 02/02/2033)(1)(2) | | | 4,500,000 | | | | 4,556,937 | | | | | |
| Anheuser-Busch InBev Worldwide, Inc., | | | | | | | | | | | | |
6.625%, 08/15/2033(1) | | | 8,085,000 | | | | 9,158,324 | | | | | |
| AP Moller - Maersk A/S, | | | | | | | | | | | | |
| 4.500%, 06/20/2029 | | | | | | | | | | | | |
(Callable 03/20/2029)(1)(2) | | | 4,207,000 | | | | 4,146,002 | | | | | |
| ArcelorMittal: | | | | | | | | | | | | |
4.550%, 03/11/2026(1) | | | 11,355,000 | | | | 11,183,491 | | | | | |
| 6.550%, 11/29/2027 | | | | | | | | | | | | |
(Callable 10/29/2027)(1) | | | 10,000,000 | | | | 10,507,561 | | | | | |
| Ashtead Capital, Inc.: | | | | | | | | | | | | |
| 1.500%, 08/12/2026 | | | | | | | | | | | | |
(Callable 07/12/2026)(1)(2) | | | 10,075,000 | | | | 9,138,398 | | | | | |
| 4.000%, 05/01/2028 | | | | | | | | | | | | |
(Callable 01/09/2024)(1)(2) | | | 7,166,000 | | | | 6,748,663 | | | | | |
| 4.250%, 11/01/2029 | | | | | | | | | | | | |
(Callable 11/01/2024)(1)(2) | | | 2,000,000 | | | | 1,869,644 | | | | | |
| 5.950%, 10/15/2033 | | | | | | | | | | | | |
(Callable 07/15/2033)(1)(2) | | | 3,075,000 | | | | 3,138,742 | | | | | |
| AT&T, Inc.: | | | | | | | | | | | | |
| 4.350%, 03/01/2029 | | | | | | | | | | | | |
| (Callable 12/01/2028) | | | 2,425,000 | | | | 2,395,440 | | | | | |
| 4.300%, 02/15/2030 | | | | | | | | | | | | |
| (Callable 11/15/2029) | | | 9,604,000 | | | | 9,418,959 | | | | | |
| 2.250%, 02/01/2032 | | | | | | | | | | | | |
| (Callable 11/01/2031) | | | 8,975,000 | | | | 7,424,524 | | | | | |
| 2.550%, 12/01/2033 | | | | | | | | | | | | |
| (Callable 09/01/2033) | | | 3,778,000 | | | | 3,082,174 | | | | | |
| Avery Dennison Corp., | | | | | | | | | | | | |
| 5.750%, 03/15/2033 | | | | | | | | | | | | |
| (Callable 12/15/2032) | | | 2,000,000 | | | | 2,115,710 | | | | | |
| Becton Dickinson and Co., | | | | | | | | | | | | |
| 3.734%, 12/15/2024 | | | | | | | | | | | | |
| (Callable 09/15/2024) | | | 82,000 | | | | 80,696 | | | | | |
| Bemis Co., Inc., | | | | | | | | | | | | |
| 2.630%, 06/19/2030 | | | | | | | | | | | | |
| (Callable 03/19/2030) | | | 7,025,000 | | | | 6,087,340 | | | | | |
| Berry Global, Inc., | | | | | | | | | | | | |
| 5.500%, 04/15/2028 | | | | | | | | | | | | |
(Callable 03/15/2028)(2) | | | 2,775,000 | | | | 2,810,660 | | | | | |
| Boardwalk Pipelines LP: | | | | | | | | | | | | |
| 5.950%, 06/01/2026 | | | | | | | | | | | | |
| (Callable 03/01/2026) | | | 12,095,000 | | | | 12,268,375 | | | | | |
| 4.800%, 05/03/2029 | | | | | | | | | | | | |
| (Callable 02/03/2029) | | | 1,750,000 | | | | 1,715,899 | | | | | |
| 3.400%, 02/15/2031 | | | | | | | | | | | | |
| (Callable 11/15/2030) | | | 225,000 | | | | 201,587 | | | | | |
| British Telecommunications PLC, | | | | | | | | | | | | |
9.625%, 12/15/2030(1) | | | 19,931,000 | | | | 24,692,349 | | | | | |
| Broadcom, Inc.: | | | | | | | | | | | | |
| 3.150%, 11/15/2025 | | | | | | | | | | | | |
| (Callable 10/15/2025) | | | 5,000,000 | | | | 4,844,894 | | | | | |
| 3.875%, 01/15/2027 | | | | | | | | | | | | |
| (Callable 10/15/2026) | | | 5,000,000 | | | | 4,879,699 | | | | | |
| 4.750%, 04/15/2029 | | | | | | | | | | | | |
| (Callable 01/15/2029) | | | 250,000 | | | | 250,793 | | | | | |
| 4.150%, 11/15/2030 | | | | | | | | | | | | |
| (Callable 08/15/2030) | | | 8,000,000 | | | | 7,652,508 | | | | | |
| 2.450%, 02/15/2031 | | | | | | | | | | | | |
(Callable 11/15/2030)(2) | | | 10,000,000 | | | | 8,558,820 | | | | | |
The accompanying notes are an integral part of these financial statements.
Baird Intermediate Bond Fund
Schedule of Investments, December 31, 2023
Long-Term Investments (cont.)
| | | Principal | | | | | | % of | |
| | | Amount | | | Value | | | Net Assets | |
| Broadridge Financial Solutions, Inc., | | | | | | | | | |
| 3.400%, 06/27/2026 | | | | | | | | | |
| (Callable 03/27/2026) | | $ | 250,000 | | | $ | 240,840 | | | |
| |
| Bunge Limited Finance Corp., | | | | | | | | | | | | |
| 3.750%, 09/25/2027 | | | | | | | | | | | | |
| (Callable 06/25/2027) | | | 5,225,000 | | | | 5,039,295 | | | | | |
| Campbell Soup Co., | | | | | | | | | | | | |
| 3.950%, 03/15/2025 | | | | | | | | | | | | |
| (Callable 01/15/2025) | | | 3,900,000 | | | | 3,839,331 | | | | | |
| Carlisle Companies, Inc., | | | | | | | | | | | | |
| 3.750%, 12/01/2027 | | | | | | | | | | | | |
| (Callable 09/01/2027) | | | 275,000 | | | | 263,474 | | | | | |
| Carrier Global Corp., | | | | | | | | | | | | |
| 2.242%, 02/15/2025 | | | | | | | | | | | | |
| (Callable 01/15/2025) | | | 1,921,000 | | | | 1,861,798 | | | | | |
| Celanese US Holdings LLC, | | | | | | | | | | | | |
| 6.050%, 03/15/2025 | | | 2,705,000 | | | | 2,721,825 | | | | | |
| CF Industries, Inc., | | | | | | | | | | | | |
4.500%, 12/01/2026(2) | | | 5,950,000 | | | | 5,820,406 | | | | | |
| CH Robinson Worldwide, Inc., | | | | | | | | | | | | |
| 4.200%, 04/15/2028 | | | | | | | | | | | | |
| (Callable 01/15/2028) | | | 12,600,000 | | | | 12,189,266 | | | | | |
| Charter Communications Operating LLC: | | | | | | | | | | | | |
| 4.908%, 07/23/2025 | | | | | | | | | | | | |
| (Callable 04/23/2025) | | | 1,502,000 | | | | 1,487,983 | | | | | |
| 3.750%, 02/15/2028 | | | | | | | | | | | | |
| (Callable 11/15/2027) | | | 6,105,000 | | | | 5,765,850 | | | | | |
| 4.200%, 03/15/2028 | | | | | | | | | | | | |
| (Callable 12/15/2027) | | | 12,070,000 | | | | 11,599,121 | | | | | |
| 2.250%, 01/15/2029 | | | | | | | | | | | | |
| (Callable 11/15/2028) | | | 2,200,000 | | | | 1,910,793 | | | | | |
| 5.050%, 03/30/2029 | | | | | | | | | | | | |
| (Callable 12/30/2028) | | | 4,155,000 | | | | 4,116,754 | | | | | |
| 4.400%, 04/01/2033 | | | | | | | | | | | | |
| (Callable 01/01/2033) | | | 3,710,000 | | | | 3,428,228 | | | | | |
| 6.384%, 10/23/2035 | | | | | | | | | | | | |
| (Callable 04/23/2035) | | | 1,790,000 | | | | 1,820,737 | | | | | |
| Cheniere Energy Partners LP, | | | | | | | | | | | | |
| 5.950%, 06/30/2033 | | | | | | | | | | | | |
(Callable 12/30/2032)(2) | | | 4,000,000 | | | | 4,103,640 | | | | | |
| Cigna Corp., | | | | | | | | | | | | |
| 4.500%, 02/25/2026 | | | | | | | | | | | | |
| (Callable 11/27/2025) | | | 300,000 | | | | 297,926 | | | | | |
| CK Hutchison International Ltd., | | | | | | | | | | | | |
| 2.500%, 04/15/2031 | | | | | | | | | | | | |
(Callable 01/15/2031)(1)(2) | | | 5,000,000 | | | | 4,286,204 | | | | | |
| CNH Industrial Capital LLC: | | | | | | | | | | | | |
| 1.875%, 01/15/2026 | | | | | | | | | | | | |
(Callable 12/15/2025)(1) | | | 250,000 | | | | 234,346 | | | | | |
| 4.550%, 04/10/2028 | | | | | | | | | | | | |
(Callable 03/10/2028)(1) | | | 6,800,000 | | | | 6,714,163 | | | | | |
| CNH Industrial NV, | | | | | | | | | | | | |
| 3.850%, 11/15/2027 | | | | | | | | | | | | |
(Callable 08/15/2027)(1) | | | 2,518,000 | | | | 2,425,819 | | | | | |
| Coca-Cola Femsa SAB de CV, | | | | | | | | | | | | |
| 2.750%, 01/22/2030 | | | | | | | | | | | | |
(Callable 10/22/2029)(1) | | | 8,875,000 | | | | 7,948,450 | | | | | |
| Columbia Pipeline Group, Inc., | | | | | | | | | | | | |
| 4.500%, 06/01/2025 | | | | | | | | | | | | |
(Callable 03/01/2025)(1) | | | 880,000 | | | | 868,873 | | | | | |
| Columbia Pipelines Holding Co. LLC, | | | | | | | | | | | | |
| 6.042%, 08/15/2028 | | | | | | | | | | | | |
(Callable 07/15/2028)(1)(2) | | | 9,125,000 | | | | 9,426,778 | | | | | |
| CommonSpirit Health, | | | | | | | | | | | | |
| 2.760%, 10/01/2024 | | | | | | | | | | | | |
| (Callable 07/01/2024) | | | 525,000 | | | | 513,327 | | | | | |
| Conagra Brands, Inc.: | | | | | | | | | | | | |
| 4.600%, 11/01/2025 | | | | | | | | | | | | |
| (Callable 09/01/2025) | | | 500,000 | | | | 495,130 | | | | | |
| 8.250%, 09/15/2030 | | | 1,140,000 | | | | 1,333,213 | | | | | |
| Constellation Brands, Inc., | | | | | | | | | | | | |
| 3.500%, 05/09/2027 | | | | | | | | | | | | |
| (Callable 02/09/2027) | | | 3,625,000 | | | | 3,493,517 | | | | | |
| Cox Communications, Inc.: | | | | | | | | | | | | |
| 3.850%, 02/01/2025 | | | | | | | | | | | | |
(Callable 11/01/2024)(2) | | | 2,800,000 | | | | 2,751,942 | | | | | |
| 3.350%, 09/15/2026 | | | | | | | | | | | | |
(Callable 06/15/2026)(2) | | | 2,527,000 | | | | 2,426,495 | | | | | |
| 5.700%, 06/15/2033 | | | | | | | | | | | | |
(Callable 03/15/2033)(2) | | | 2,000,000 | | | | 2,083,809 | | | | | |
| Crown Castle, Inc., | | | | | | | | | | | | |
| 5.600%, 06/01/2029 | | | | | | | | | | | | |
| (Callable 05/01/2029) | | | 3,000,000 | | | | 3,070,697 | | | | | |
| CVS Health Corp.: | | | | | | | | | | | | |
| 3.625%, 04/01/2027 | | | | | | | | | | | | |
| (Callable 02/01/2027) | | | 2,500,000 | | | | 2,424,311 | | | | | |
| 4.300%, 03/25/2028 | | | | | | | | | | | | |
| (Callable 12/25/2027) | | | 5,818,000 | | | | 5,726,090 | | | | | |
| 5.250%, 02/21/2033 | | | | | | | | | | | | |
| (Callable 11/21/2032) | | | 8,550,000 | | | | 8,755,237 | | | | | |
| 5.300%, 06/01/2033 | | | | | | | | | | | | |
| (Callable 03/01/2033) | | | 8,475,000 | | | | 8,712,666 | | | | | |
| CVS Pass-Through Trust: | | | | | | | | | | | | |
| 6.036%, 12/10/2028 | | | 6,666,265 | | | | 6,736,322 | | | | | |
5.773%, 01/10/2033(2) | | | 167,023 | | | | 165,982 | | | | | |
5.926%, 01/10/2034(2) | | | 1,681,334 | | | | 1,704,961 | | | | | |
4.163%, 08/11/2036(2) | | | 2,506,756 | | | | 2,236,442 | | | | | |
| Daimler Finance North America LLC, | | | | | | | | | | | | |
3.650%, 04/07/2027(1)(2) | | | 13,825,000 | | | | 13,333,583 | | | | | |
| Dell International LLC / EMC Corp.: | | | | | | | | | | | | |
| 6.020%, 06/15/2026 | | | | | | | | | | | | |
| (Callable 03/15/2026) | | | 4,690,000 | | | | 4,800,855 | | | | | |
| 4.900%, 10/01/2026 | | | | | | | | | | | | |
| (Callable 08/01/2026) | | | 425,000 | | | | 425,809 | | | | | |
| Dentsply Sirona, | | | | | | | | | | | | |
| 3.250%, 06/01/2030 | | | | | | | | | | | | |
| (Callable 03/01/2030) | | | 10,900,000 | | | | 9,653,404 | | | | | |
| Diageo Capital PLC, | | | | | | | | | | | | |
| 2.000%, 04/29/2030 | | | | | | | | | | | | |
(Callable 01/29/2030)(1) | | | 3,275,000 | | | | 2,834,367 | | | | | |
| Dow Chemical Co., | | | | | | | | | | | | |
| 4.550%, 11/30/2025 | | | | | | | | | | | | |
| (Callable 09/30/2025) | | | 165,000 | | | | 162,005 | | | | | |
| DuPont de Nemours, Inc., | | | | | | | | | | | | |
| 4.493%, 11/15/2025 | | | | | | | | | | | | |
| (Callable 09/15/2025) | | | 4,450,000 | | | | 4,417,997 | | | | | |
| DXC Technology Co., | | | | | | | | | | | | |
| 1.800%, 09/15/2026 | | | | | | | | | | | | |
| (Callable 08/15/2026) | | | 12,000,000 | | | | 10,965,951 | | | | | |
| Ecolab, Inc., | | | | | | | | | | | | |
| 4.800%, 03/24/2030 | | | | | | | | | | | | |
| (Callable 12/24/2029) | | | 10,000,000 | | | | 10,274,333 | | | | | |
| EI du Pont de Nemours and Co., | | | | | | | | | | | | |
| 1.700%, 07/15/2025 | | | | | | | | | | | | |
| (Callable 06/15/2025) | | | 10,000,000 | | | | 9,485,726 | | | | | |
The accompanying notes are an integral part of these financial statements.
Baird Intermediate Bond Fund
Schedule of Investments, December 31, 2023
Long-Term Investments (cont.)
| | | Principal | | | | | | % of | |
| | | Amount | | | Value | | | Net Assets | |
| Element Fleet Management Corp., | | | | | | | | | |
| 6.271%, 06/26/2026 | | | | | | | | | |
(Callable 05/26/2026)(1)(2) | | $ | 9,000,000 | | | $ | 9,170,457 | | | |
| |
| Emerson Electric Co., | | | | | | | | | | | | |
| 1.950%, 10/15/2030 | | | | | | | | | | | | |
| (Callable 07/15/2030) | | | 12,600,000 | | | | 10,880,928 | | | | | |
| Energy Transfer LP: | | | | | | | | | | | | |
| 5.500%, 06/01/2027 | | | | | | | | | | | | |
| (Callable 03/01/2027) | | | 18,231,000 | | | | 18,466,732 | | | | | |
| 6.000%, 02/01/2029 | | | | | | | | | | | | |
(Callable 02/01/2024)(2) | | | 4,000,000 | | | | 4,035,935 | | | | | |
| 5.250%, 04/15/2029 | | | | | | | | | | | | |
| (Callable 01/15/2029) | | | 14,264,000 | | | | 14,386,406 | | | | | |
| 8.250%, 11/15/2029 | | | | | | | | | | | | |
| (Callable 08/15/2029) | | | 1,500,000 | | | | 1,708,028 | | | | | |
| 3.750%, 05/15/2030 | | | | | | | | | | | | |
| (Callable 02/15/2030) | | | 275,000 | | | | 255,810 | | | | | |
| 7.375%, 02/01/2031 | | | | | | | | | | | | |
(Callable 02/01/2026)(2) | | | 3,000,000 | | | | 3,152,807 | | | | | |
| Energy Transfer Partners LP, | | | | | | | | | | | | |
| 4.200%, 04/15/2027 | | | | | | | | | | | | |
| (Callable 01/15/2027) | | | 475,000 | | | | 461,753 | | | | | |
| EQT Midstream Partners LP, | | | | | | | | | | | | |
| 4.125%, 12/01/2026 | | | | | | | | | | | | |
| (Callable 09/01/2026) | | | 5,000,000 | | | | 4,830,477 | | | | | |
| Equifax, Inc., | | | | | | | | | | | | |
| 2.600%, 12/01/2024 | | | | | | | | | | | | |
| (Callable 11/01/2024) | | | 5,000,000 | | | | 4,868,069 | | | | | |
| Equinix, Inc.: | | | | | | | | | | | | |
| 1.800%, 07/15/2027 | | | | | | | | | | | | |
| (Callable 05/15/2027) | | | 7,000,000 | | | | 6,343,146 | | | | | |
| 3.900%, 04/15/2032 | | | | | | | | | | | | |
| (Callable 01/15/2032) | | | 11,000,000 | | | | 10,232,118 | | | | | |
| Express Scripts Holding Co., | | | | | | | | | | | | |
| 4.500%, 02/25/2026 | | | | | | | | | | | | |
| (Callable 11/27/2025) | | | 18,000,000 | | | | 17,856,580 | | | | | |
| Exxon Mobil Corp., | | | | | | | | | | | | |
| 2.992%, 03/19/2025 | | | | | | | | | | | | |
| (Callable 02/19/2025) | | | 11,250,000 | | | | 11,019,068 | | | | | |
| Ferguson Finance PLC: | | | | | | | | | | | | |
| 4.500%, 10/24/2028 | | | | | | | | | | | | |
(Callable 07/24/2028)(2) | | | 6,230,000 | | | | 6,136,999 | | | | | |
| 4.650%, 04/20/2032 | | | | | | | | | | | | |
(Callable 01/20/2032)(2) | | | 8,000,000 | | | | 7,741,906 | | | | | |
| Fidelity National Information Services, Inc.: | | | | | | | | | | | | |
| 1.650%, 03/01/2028 | | | | | | | | | | | | |
| (Callable 01/01/2028) | | | 5,000,000 | | | | 4,460,540 | | | | | |
| 5.100%, 07/15/2032 | | | | | | | | | | | | |
| (Callable 04/15/2032) | | | 4,750,000 | | | | 4,859,655 | | | | | |
| Fiserv, Inc.: | | | | | | | | | | | | |
| 2.250%, 06/01/2027 | | | | | | | | | | | | |
| (Callable 04/01/2027) | | | 16,000,000 | | | | 14,799,177 | | | | | |
| 4.200%, 10/01/2028 | | | | | | | | | | | | |
| (Callable 07/01/2028) | | | 1,035,000 | | | | 1,012,145 | | | | | |
| 3.500%, 07/01/2029 | | | | | | | | | | | | |
| (Callable 04/01/2029) | | | 700,000 | | | | 659,167 | | | | | |
| 5.625%, 08/21/2033 | | | | | | | | | | | | |
| (Callable 05/21/2033) | | | 5,325,000 | | | | 5,588,756 | | | | | |
| Flex Intermediate Holdco LLC, | | | | | | | | | | | | |
| 3.363%, 06/30/2031 | | | | | | | | | | | | |
(Callable 12/30/2030)(2) | | | 3,515,000 | | | | 2,877,899 | | | | | |
| Flex Ltd.: | | | | | | | | | | | | |
| 3.750%, 02/01/2026 | | | | | | | | | | | | |
| (Callable 01/01/2026) | | | 6,765,000 | | | | 6,548,864 | | | | | |
| 4.875%, 05/12/2030 | | | | | | | | | | | | |
| (Callable 02/12/2030) | | | 4,073,000 | | | | 3,998,442 | | | | | |
| Florida Gas Transmission Co. LLC: | | | | | | | | | | | | |
| 2.550%, 07/01/2030 | | | | | | | | | | | | |
(Callable 04/01/2030)(2) | | | 7,000,000 | | | | 6,003,331 | | | | | |
| 2.300%, 10/01/2031 | | | | | | | | | | | | |
(Callable 07/01/2031)(2) | | | 10,225,000 | | | | 8,407,218 | | | | | |
| Flowers Foods, Inc., | | | | | | | | | | | | |
| 2.400%, 03/15/2031 | | | | | | | | | | | | |
| (Callable 12/15/2030) | | | 300,000 | | | | 252,157 | | | | | |
| Ford Motor Credit Co. LLC, | | | | | | | | | | | | |
| 6.798%, 11/07/2028 | | | | | | | | | | | | |
| (Callable 10/07/2028) | | | 5,000,000 | | | | 5,236,388 | | | | | |
| Fortune Brands Home & Security, Inc., | | | | | | | | | | | | |
| 3.250%, 09/15/2029 | | | | | | | | | | | | |
| (Callable 06/15/2029) | | | 2,725,000 | | | | 2,521,542 | | | | | |
| Fox Corp., | | | | | | | | | | | | |
| 6.500%, 10/13/2033 | | | | | | | | | | | | |
| (Callable 07/13/2033) | | | 3,000,000 | | | | 3,252,822 | | | | | |
| Freeport-McMoRan, Inc., | | | | | | | | | | | | |
| 5.400%, 11/14/2034 | | | | | | | | | | | | |
| (Callable 05/14/2034) | | | 691,000 | | | | 694,566 | | | | | |
| Fresenius Medical Care US Finance III, Inc.: | | | | | | | | | | | | |
| 1.875%, 12/01/2026 | | | | | | | | | | | | |
(Callable 11/01/2026)(1)(2) | | | 20,000,000 | | | | 18,076,126 | | | | | |
| 3.750%, 06/15/2029 | | | | | | | | | | | | |
(Callable 03/15/2029)(1)(2) | | | 500,000 | | | | 439,138 | | | | | |
| General Motors Co., | | | | | | | | | | | | |
| 6.125%, 10/01/2025 | | | | | | | | | | | | |
| (Callable 09/01/2025) | | | 5,861,000 | | | | 5,940,981 | | | | | |
| General Motors Financial Co., Inc.: | | | | | | | | | | | | |
| 2.900%, 02/26/2025 | | | | | | | | | | | | |
| (Callable 01/26/2025) | | | 4,000,000 | | | | 3,881,350 | | | | | |
| 6.000%, 01/09/2028 | | | | | | | | | | | | |
| (Callable 12/09/2027) | | | 2,475,000 | | | | 2,561,003 | | | | | |
| 5.800%, 01/07/2029 | | | | | | | | | | | | |
| (Callable 12/07/2028) | | | 15,000,000 | | | | 15,357,024 | | | | | |
| Genpact Luxembourg Sarl, | | | | | | | | | | | | |
| 3.375%, 12/01/2024 | | | | | | | | | | | | |
| (Callable 11/01/2024) | | | 7,525,000 | | | | 7,330,479 | | | | | |
| Genpact Luxembourg SARL, | | | | | | | | | | | | |
| 1.750%, 04/10/2026 | | | | | | | | | | | | |
| (Callable 03/10/2026) | | | 21,600,000 | | | | 20,060,537 | | | | | |
| Glencore Funding LLC: | | | | | | | | | | | | |
| 4.000%, 03/27/2027 | | | | | | | | | | | | |
(Callable 12/27/2026)(1)(2) | | | 4,850,000 | | | | 4,712,885 | | | | | |
| 3.875%, 10/27/2027 | | | | | | | | | | | | |
(Callable 07/27/2027)(1)(2) | | | 1,150,000 | | | | 1,105,364 | | | | | |
| 5.400%, 05/08/2028 | | | | | | | | | | | | |
(Callable 04/08/2028)(1)(2) | | | 12,200,000 | | | | 12,435,568 | | | | | |
| 4.875%, 03/12/2029 | | | | | | | | | | | | |
(Callable 12/12/2028)(1)(2) | | | 175,000 | | | | 175,010 | | | | | |
| 2.500%, 09/01/2030 | | | | | | | | | | | | |
(Callable 06/01/2030)(1)(2) | | | 6,343,000 | | | | 5,455,636 | | | | | |
| 6.375%, 10/06/2030 | | | | | | | | | | | | |
(Callable 08/06/2030)(1)(2) | | | 3,725,000 | | | | 4,004,043 | | | | | |
| 2.625%, 09/23/2031 | | | | | | | | | | | | |
(Callable 06/23/2031)(1)(2) | | | 8,350,000 | | | | 7,097,505 | | | | | |
| Global Payments, Inc.: | | | | | | | | | | | | |
| 2.150%, 01/15/2027 | | | | | | | | | | | | |
| (Callable 12/15/2026) | | | 4,535,000 | | | | 4,177,394 | | | | | |
| 2.900%, 05/15/2030 | | | | | | | | | | | | |
| (Callable 02/15/2030) | | | 275,000 | | | | 242,220 | | | | | |
The accompanying notes are an integral part of these financial statements.
Baird Intermediate Bond Fund
Schedule of Investments, December 31, 2023
Long-Term Investments (cont.)
| | | Principal | | | | | | % of | |
| | | Amount | | | Value | | | Net Assets | |
| Graphic Packaging International LLC, | | | | | | | | | |
| 1.512%, 04/15/2026 | | | | | | | | | |
(Callable 03/15/2026)(2) | | $ | 300,000 | | | $ | 272,335 | | | |
| |
| Hexcel Corp., | | | | | | | | | | | | |
| 4.200%, 02/15/2027 | | | | | | | | | | | | |
| (Callable 11/15/2026) | | | 300,000 | | | | 289,061 | | | | | |
| HP, Inc., | | | | | | | | | | | | |
| 2.200%, 06/17/2025 | | | | | | | | | | | | |
| (Callable 05/17/2025) | | | 18,325,000 | | | | 17,552,413 | | | | | |
| Hubbell, Inc., | | | | | | | | | | | | |
| 3.350%, 03/01/2026 | | | | | | | | | | | | |
| (Callable 12/01/2025) | | | 225,000 | | | | 217,997 | | | | | |
| Hyundai Capital America: | | | | | | | | | | | | |
| 2.650%, 02/10/2025 | | | | | | | | | | | | |
(Callable 01/10/2025)(1)(2) | | | 525,000 | | | | 509,356 | | | | | |
| 1.300%, 01/08/2026 | | | | | | | | | | | | |
(Callable 12/08/2025)(1)(2) | | | 5,825,000 | | | | 5,379,430 | | | | | |
| 1.650%, 09/17/2026 | | | | | | | | | | | | |
(Callable 08/17/2026)(1)(2) | | | 15,000,000 | | | | 13,638,087 | | | | | |
| 6.100%, 09/21/2028 | | | | | | | | | | | | |
(Callable 08/21/2028)(1)(2) | | | 7,975,000 | | | | 8,294,597 | | | | | |
| IDEX Corp., | | | | | | | | | | | | |
| 3.000%, 05/01/2030 | | | | | | | | | | | | |
| (Callable 02/01/2030) | | | 1,100,000 | | | | 981,942 | | | | | |
| Ingersoll Rand, Inc., | | | | | | | | | | | | |
| 5.400%, 08/14/2028 | | | | | | | | | | | | |
| (Callable 07/14/2028) | | | 7,000,000 | | | | 7,219,405 | | | | | |
| Ingersoll-Rand Co., | | | | | | | | | | | | |
| 6.391%, 11/15/2027 | | | 1,195,000 | | | | 1,240,578 | | | | | |
| Ingredion, Inc., | | | | | | | | | | | | |
| 2.900%, 06/01/2030 | | | | | | | | | | | | |
| (Callable 03/01/2030) | | | 550,000 | | | | 491,718 | | | | | |
| Intel Corp., | | | | | | | | | | | | |
| 5.200%, 02/10/2033 | | | | | | | | | | | | |
| (Callable 11/10/2032) | | | 5,000,000 | | | | 5,228,963 | | | | | |
| International Business Machines Corp., | | | | | | | | | | | | |
| 3.300%, 05/15/2026 | | | 6,900,000 | | | | 6,695,747 | | | | | |
| International Flavors & Fragrances, Inc., | | | | | | | | | | | | |
| 1.832%, 10/15/2027 | | | | | | | | | | | | |
(Callable 08/15/2027)(2) | | | 10,000,000 | | | | 8,769,889 | | | | | |
| JB Hunt Transport Services, Inc., | | | | | | | | | | | | |
| 3.875%, 03/01/2026 | | | | | | | | | | | | |
| (Callable 01/01/2026) | | | 3,500,000 | | | | 3,431,009 | | | | | |
| JBS USA Lux SA, JBS USA Food Company, | | | | | | | | | | | | |
| and JBS Luxembourg SARL, | | | | | | | | | | | | |
| 6.750%, 03/15/2034 | | | | | | | | | | | | |
(Callable 12/15/2033)(2) | | | 10,275,000 | | | | 10,785,044 | | | | | |
| JBS USA Lux SA, JBS USA Food Company, | | | | | | | | | | | | |
| and JBS USA Finance, | | | | | | | | | | | | |
| 5.750%, 04/01/2033 | | | | | | | | | | | | |
| (Callable 01/01/2033) | | | 8,000,000 | | | | 7,964,881 | | | | | |
| Keurig Dr Pepper, Inc., | | | | | | | | | | | | |
| 3.950%, 04/15/2029 | | | | | | | | | | | | |
| (Callable 02/15/2029) | | | 7,000,000 | | | | 6,831,075 | | | | | |
| Kinder Morgan, Inc.: | | | | | | | | | | | | |
| 4.300%, 06/01/2025 | | | | | | | | | | | | |
| (Callable 03/01/2025) | | | 300,000 | | | | 296,248 | | | | | |
| 7.800%, 08/01/2031 | | | 15,425,000 | | | | 17,657,138 | | | | | |
| Kraft Heinz Foods Co., | | | | | | | | | | | | |
| 3.875%, 05/15/2027 | | | | | | | | | | | | |
| (Callable 02/15/2027) | | | 8,129,000 | | | | 7,978,146 | | | | | |
| Kyndryl Holdings, Inc.: | | | | | | | | | | | | |
| 2.050%, 10/15/2026 | | | | | | | | | | | | |
| (Callable 09/15/2026) | | | 5,900,000 | | | | 5,372,690 | | | | | |
| 2.700%, 10/15/2028 | | | | | | | | | | | | |
| (Callable 08/15/2028) | | | 2,730,000 | | | | 2,408,192 | | | | | |
| Lear Corp., | | | | | | | | | | | | |
| 3.800%, 09/15/2027 | | | | | | | | | | | | |
| (Callable 06/15/2027) | | | 410,000 | | | | 395,325 | | | | | |
| Lennar Corp., | | | | | | | | | | | | |
| 4.750%, 11/29/2027 | | | | | | | | | | | | |
| (Callable 05/29/2027) | | | 4,500,000 | | | | 4,495,102 | | | | | |
| Lennox International, Inc.: | | | | | | | | | | | | |
| 1.350%, 08/01/2025 | | | | | | | | | | | | |
| (Callable 07/01/2025) | | | 7,000,000 | | | | 6,586,613 | | | | | |
| 1.700%, 08/01/2027 | | | | | | | | | | | | |
| (Callable 06/01/2027) | | | 475,000 | | | | 426,794 | | | | | |
| Lundin Energy Finance BV, | | | | | | | | | | | | |
| 2.000%, 07/15/2026 | | | | | | | | | | | | |
(Callable 06/15/2026)(1)(2) | | | 14,122,000 | | | | 13,020,403 | | | | | |
| LYB International Finance III LLC, | | | | | | | | | | | | |
| 2.250%, 10/01/2030 | | | | | | | | | | | | |
| (Callable 07/01/2030) | | | 5,000,000 | | | | 4,271,762 | | | | | |
| Marathon Petroleum Corp., | | | | | | | | | | | | |
| 5.125%, 12/15/2026 | | | | | | | | | | | | |
| (Callable 09/15/2026) | | | 150,000 | | | | 151,700 | | | | | |
| Marriott International, Inc., | | | | | | | | | | | | |
| 5.000%, 10/15/2027 | | | | | | | | | | | | |
| (Callable 09/15/2027) | | | 10,000,000 | | | | 10,124,366 | | | | | |
| Martin Marietta Materials, Inc., | | | | | | | | | | | | |
| 2.500%, 03/15/2030 | | | | | | | | | | | | |
| (Callable 12/15/2029) | | | 200,000 | | | | 176,320 | | | | | |
| Metropolitan Detroit Area | | | | | | | | | | | | |
| Hospital Services, Inc., | | | | | | | | | | | | |
4.480%, 12/01/2029(2) | | | 9,240,000 | | | | 8,990,330 | | | | | |
| Midwest Connector Capital Co. LLC: | | | | | | | | | | | | |
| 3.900%, 04/01/2024 | | | | | | | | | | | | |
(Callable 03/01/2024)(2) | | | 7,450,000 | | | | 7,407,245 | | | | | |
| 4.625%, 04/01/2029 | | | | | | | | | | | | |
(Callable 01/01/2029)(2) | | | 2,975,000 | | | | 2,867,151 | | | | | |
| Mohawk Industries, Inc., | | | | | | | | | | | | |
| 5.850%, 09/18/2028 | | | | | | | | | | | | |
| (Callable 08/18/2028) | | | 7,500,000 | | | | 7,782,530 | | | | | |
| Molex Electronic Technologies LLC, | | | | | | | | | | | | |
| 3.900%, 04/15/2025 | | | | | | | | | | | | |
(Callable 01/15/2025)(2) | | | 1,050,000 | | | | 1,020,556 | | | | | |
| MPLX LP: | | | | | | | | | | | | |
| 4.875%, 06/01/2025 | | | | | | | | | | | | |
| (Callable 03/01/2025) | | | 10,219,000 | | | | 10,154,156 | | | | | |
| 1.750%, 03/01/2026 | | | | | | | | | | | | |
| (Callable 02/01/2026) | | | 300,000 | | | | 280,756 | | | | | |
| 4.125%, 03/01/2027 | | | | | | | | | | | | |
| (Callable 12/01/2026) | | | 275,000 | | | | 269,306 | | | | | |
| 2.650%, 08/15/2030 | | | | | | | | | | | | |
| (Callable 05/15/2030) | | | 3,950,000 | | | | 3,413,714 | | | | | |
| nVent Finance Sarl, | | | | | | | | | | | | |
| 4.550%, 04/15/2028 | | | | | | | | | | | | |
| (Callable 01/15/2028) | | | 250,000 | | | | 243,148 | | | | | |
| NXP BV / NXP Funding LLC / | | | | | | | | | | | | |
| NXP USA, Inc.: | | | | | | | | | | | | |
| 4.875%, 03/01/2024 | | | | | | | | | | | | |
(Callable 02/01/2024)(1) | | | 5,790,000 | | | | 5,778,796 | | | | | |
| 2.700%, 05/01/2025 | | | | | | | | | | | | |
(Callable 04/01/2025)(1) | | | 550,000 | | | | 530,474 | | | | | |
| Occidental Petroleum Corp.: | | | | | | | | | | | | |
| 2.900%, 08/15/2024 | | | | | | | | | | | | |
| (Callable 07/15/2024) | | | 5,000,000 | | | | 4,915,250 | | | | | |
The accompanying notes are an integral part of these financial statements.
Baird Intermediate Bond Fund
Schedule of Investments, December 31, 2023
Long-Term Investments (cont.)
| | | Principal | | | | | | % of | |
| | | Amount | | | Value | | | Net Assets | |
| Occidental Petroleum Corp.: (cont.) | | | | | | | | | |
| 7.500%, 10/15/2026 | | $ | 1,288,000 | | | $ | 1,310,476 | | | |
| |
| 8.875%, 07/15/2030 | | | | | | | | | | | | |
| (Callable 01/15/2030) | | | 1,000,000 | | | | 1,170,204 | | | | | |
| 7.500%, 05/01/2031 | | | 2,000,000 | | | | 2,242,690 | | | | | |
| Ochsner LSU Health System | | | | | | | | | | | | |
| of North Louisiana, | | | | | | | | | | | | |
| 2.510%, 05/15/2031 | | | | | | | | | | | | |
| (Callable 11/15/2030) | | | 5,000,000 | | | | 3,423,250 | | | | | |
| Oracle Corp.: | | | | | | | | | | | | |
| 2.800%, 04/01/2027 | | | | | | | | | | | | |
| (Callable 02/01/2027) | | | 11,050,000 | | | | 10,427,480 | | | | | |
| 2.300%, 03/25/2028 | | | | | | | | | | | | |
| (Callable 01/25/2028) | | | 3,000,000 | | | | 2,735,015 | | | | | |
| 6.150%, 11/09/2029 | | | | | | | | | | | | |
| (Callable 09/09/2029) | | | 3,000,000 | | | | 3,231,525 | | | | | |
| Orange SA, | | | | | | | | | | | | |
9.000%, 03/01/2031(1) | | | 4,125,000 | | | | 5,094,596 | | | | | |
| PeaceHealth Obligated Group, | | | | | | | | | | | | |
| 1.375%, 11/15/2025 | | | | | | | | | | | | |
| (Callable 08/15/2025) | | | 550,000 | | | | 510,984 | | | | | |
| Penske Truck Leasing Co.: | | | | | | | | | | | | |
| 2.700%, 11/01/2024 | | | | | | | | | | | | |
(Callable 10/01/2024)(2) | | | 8,000,000 | | | | 7,780,630 | | | | | |
| 3.950%, 03/10/2025 | | | | | | | | | | | | |
(Callable 01/10/2025)(2) | | | 12,000,000 | | | | 11,780,517 | | | | | |
| 4.000%, 07/15/2025 | | | | | | | | | | | | |
(Callable 06/15/2025)(2) | | | 6,500,000 | | | | 6,358,223 | | | | | |
| 5.875%, 11/15/2027 | | | | | | | | | | | | |
(Callable 10/15/2027)(2) | | | 7,200,000 | | | | 7,364,715 | | | | | |
| 5.700%, 02/01/2028 | | | | | | | | | | | | |
(Callable 01/01/2028)(2) | | | 2,900,000 | | | | 2,964,936 | | | | | |
| 5.550%, 05/01/2028 | | | | | | | | | | | | |
(Callable 04/01/2028)(2) | | | 4,425,000 | | | | 4,496,696 | | | | | |
| Phillips 66 Co.: | | | | | | | | | | | | |
| 3.150%, 12/15/2029 | | | | | | | | | | | | |
| (Callable 09/15/2029) | | | 500,000 | | | | 457,935 | | | | | |
| 2.150%, 12/15/2030 | | | | | | | | | | | | |
| (Callable 09/15/2030) | | | 10,000,000 | | | | 8,435,133 | | | | | |
| Premier Health Partners, | | | | | | | | | | | | |
| 2.911%, 11/15/2026 | | | | | | | | | | | | |
| (Callable 05/15/2026) | | | 17,527,000 | | | | 15,849,932 | | | | | |
| Renesas Electronics Corp., | | | | | | | | | | | | |
| 2.170%, 11/25/2026 | | | | | | | | | | | | |
(Callable 10/25/2026)(1)(2) | | | 5,450,000 | | | | 4,977,530 | | | | | |
| Republic Services, Inc., | | | | | | | | | | | | |
| 4.875%, 04/01/2029 | | | | | | | | | | | | |
| (Callable 03/01/2029) | | | 4,350,000 | | | | 4,434,976 | | | | | |
| Rogers Communications, Inc., | | | | | | | | | | | | |
| 3.800%, 03/15/2032 | | | | | | | | | | | | |
(Callable 12/15/2031)(1) | | | 15,000,000 | | | | 13,819,124 | | | | | |
| Roper Technologies, Inc.: | | | | | | | | | | | | |
| 3.800%, 12/15/2026 | | | | | | | | | | | | |
| (Callable 09/15/2026) | | | 1,450,000 | | | | 1,418,218 | | | | | |
| 2.000%, 06/30/2030 | | | | | | | | | | | | |
| (Callable 03/30/2030) | | | 14,675,000 | | | | 12,477,852 | | | | | |
| Ryder System, Inc.: | | | | | | | | | | | | |
| 2.850%, 03/01/2027 | | | | | | | | | | | | |
| (Callable 02/01/2027) | | | 3,775,000 | | | | 3,551,561 | | | | | |
| 5.250%, 06/01/2028 | | | | | | | | | | | | |
| (Callable 05/01/2028) | | | 6,000,000 | | | | 6,082,359 | | | | | |
| Sabine Pass Liquefaction LLC: | | | | | | | | | | | | |
| 5.875%, 06/30/2026 | | | | | | | | | | | | |
| (Callable 12/31/2025) | | | 10,280,000 | | | | 10,467,492 | | | | | |
| 4.500%, 05/15/2030 | | | | | | | | | | | | |
| (Callable 11/15/2029) | | | 10,450,000 | | | | 10,219,706 | | | | | |
| 5.900%, 09/15/2037 | | | | | | | | | | | | |
| (Callable 03/15/2037) | | | 3,000,000 | | | | 3,166,470 | | | | | |
| Samarco Mineracao SA, | | | | | | | | | | | | |
| 9.500% Cash or 9.000% PIK, | | | | | | | | | | | | |
06/30/2031 (Callable 01/16/2024)(1)(2) | | | 1,737,955 | | | | 1,457,275 | | | | | |
| Sherwin-Williams Co., | | | | | | | | | | | | |
| 3.300%, 02/01/2025 | | | | | | | | | | | | |
| (Callable 11/01/2024) | | | 3,851,000 | | | | 3,752,819 | | | | | |
| Smith & Nephew PLC, | | | | | | | | | | | | |
| 2.032%, 10/14/2030 | | | | | | | | | | | | |
(Callable 07/14/2030)(1) | | | 5,250,000 | | | | 4,353,940 | | | | | |
| Smurfit Kappa Treasury Funding DAC, | | | | | | | | | | | | |
7.500%, 11/20/2025(1) | | | 7,800,000 | | | | 8,004,661 | | | | | |
| Sodexo, Inc., | | | | | | | | | | | | |
| 1.634%, 04/16/2026 | | | | | | | | | | | | |
(Callable 03/16/2026)(1)(2) | | | 15,000,000 | | | | 13,904,430 | | | | | |
| Southern Natural Gas Co. LLC: | | | | | | | | | | | | |
| 7.350%, 02/15/2031 | | | 8,020,000 | | | | 8,536,505 | | | | | |
| 8.000%, 03/01/2032 | | | 2,523,000 | | | | 2,953,206 | | | | | |
| Sprint Capital Corp., | | | | | | | | | | | | |
| 6.875%, 11/15/2028 | | | 13,000,000 | | | | 14,077,141 | | | | | |
| Stanley Black & Decker, Inc., | | | | | | | | | | | | |
| 6.000%, 03/06/2028 | | | | | | | | | | | | |
| (Callable 02/06/2028) | | | 2,000,000 | | | | 2,102,114 | | | | | |
| Steel Dynamics, Inc., | | | | | | | | | | | | |
| 2.800%, 12/15/2024 | | | | | | | | | | | | |
| (Callable 11/15/2024) | | | 325,000 | | | | 316,546 | | | | | |
| Stellantis Finance US, Inc., | | | | | | | | | | | | |
| 1.711%, 01/29/2027 | | | | | | | | | | | | |
(Callable 12/29/2026)(2) | | | 575,000 | | | | 522,470 | | | | | |
| Sysco Corp., | | | | | | | | | | | | |
| 5.950%, 04/01/2030 | | | | | | | | | | | | |
| (Callable 01/01/2030) | | | 4,232,000 | | | | 4,504,236 | | | | | |
| Targa Resources Corp., | | | | | | | | | | | | |
| 5.200%, 07/01/2027 | | | | | | | | | | | | |
| (Callable 06/01/2027) | | | 5,000,000 | | | | 5,024,980 | | | | | |
| TC PipeLines LP: | | | | | | | | | | | | |
| 4.375%, 03/13/2025 | | | | | | | | | | | | |
(Callable 12/13/2024)(1) | | | 5,500,000 | | | | 5,422,860 | | | | | |
| 3.900%, 05/25/2027 | | | | | | | | | | | | |
(Callable 02/25/2027)(1) | | | 13,850,000 | | | | 13,296,941 | | | | | |
| Timken Co.: | | | | | | | | | | | | |
| 4.500%, 12/15/2028 | | | | | | | | | | | | |
| (Callable 09/15/2028) | | | 225,000 | | | | 218,220 | | | | | |
| 4.125%, 04/01/2032 | | | | | | | | | | | | |
| (Callable 01/01/2032) | | | 8,000,000 | | | | 7,370,312 | | | | | |
| T-Mobile USA, Inc.: | | | | | | | | | | | | |
| 3.375%, 04/15/2029 | | | | | | | | | | | | |
| (Callable 04/15/2024) | | | 4,000,000 | | | | 3,716,302 | | | | | |
| 3.875%, 04/15/2030 | | | | | | | | | | | | |
| (Callable 01/15/2030) | | | 23,206,000 | | | | 22,024,858 | | | | | |
| Toll Road Investors Partnership II LP: | | | | | | | | | | | | |
0.000%, 02/15/2026 (Insured by NATL)(2) | | | 5,000,000 | | | | 4,311,389 | | | | | |
0.000%, 02/15/2028 (Insured by NATL)(2) | | | 750,000 | | | | 560,716 | | | | | |
| TransCanada PipeLines Ltd., | | | | | | | | | | | | |
5.600%, 03/31/2034(1) | | | 1,335,000 | | | | 1,347,254 | | | | | |
| Transcontinental Gas Pipe Line Co. LLC, | | | | | | | | | | | | |
| 7.250%, 12/01/2026 | | | 4,748,000 | | | | 4,993,471 | | | | | |
| Triton Container International Ltd., | | | | | | | | | | | | |
| 2.050%, 04/15/2026 | | | | | | | | | | | | |
(Callable 03/15/2026)(1)(2) | | | 10,000,000 | | | | 9,148,703 | | | | | |
The accompanying notes are an integral part of these financial statements.
Baird Intermediate Bond Fund
Schedule of Investments, December 31, 2023
Long-Term Investments (cont.)
| | | Principal | | | | | | % of | |
| | | Amount | | | Value | | | Net Assets | |
| TSMC Arizona Corp., | | | | | | | | | |
| 2.500%, 10/25/2031 | | | | | | | | | |
(Callable 07/25/2031)(1) | | $ | 8,175,000 | | | $ | 7,049,144 | | | | |
| Tyson Foods, Inc., | | | | | | | | | | | |
| 4.000%, 03/01/2026 | | | | | | | | | | | |
| (Callable 01/01/2026) | | | 3,000,000 | | | | 2,942,515 | | | | |
| Vale Overseas Ltd.: | | | | | | | | | | | |
| 3.750%, 07/08/2030 | | | | | | | | | | | |
(Callable 04/08/2030)(1) | | | 9,500,000 | | | | 8,772,870 | | | | |
| 6.125%, 06/12/2033 | | | | | | | | | | | |
(Callable 03/12/2033)(1) | | | 20,000,000 | | | | 20,754,660 | | | | |
| Valero Energy Corp., | | | | | | | | | | | |
| 2.150%, 09/15/2027 | | | | | | | | | | | |
| (Callable 07/15/2027) | | | 300,000 | | | | 273,691 | | | | |
| Var Energi ASA, | | | | | | | | | | | |
| 5.000%, 05/18/2027 | | | | | | | | | | | |
(Callable 04/18/2027)(1)(2) | | | 10,000,000 | | | | 9,754,782 | | | | |
| Verisk Analytics, Inc., | | | | | | | | | | | |
| 4.125%, 03/15/2029 | | | | | | | | | | | |
| (Callable 12/15/2028) | | | 3,000,000 | | | | 2,923,145 | | | | |
| Verizon Communications, Inc.: | | | | | | | | | | | |
| 4.125%, 03/16/2027 | | | 3,196,000 | | | | 3,151,296 | | | | |
| 3.000%, 03/22/2027 | | | | | | | | | | | |
| (Callable 01/22/2027) | | | 13,000,000 | | | | 12,367,610 | | | | |
| 2.100%, 03/22/2028 | | | | | | | | | | | |
| (Callable 01/22/2028) | | | 5,750,000 | | | | 5,206,149 | | | | |
| 4.329%, 09/21/2028 | | | 2,351,000 | | | | 2,328,237 | | | | |
| 4.016%, 12/03/2029 | | | | | | | | | | | |
| (Callable 09/03/2029) | | | 5,628,000 | | | | 5,448,069 | | | | |
| 2.355%, 03/15/2032 | | | | | | | | | | | |
| (Callable 12/15/2031) | | | 2,309,000 | | | | 1,923,674 | | | | |
| Viterra Finance BV: | | | | | | | | | | | |
| 2.000%, 04/21/2026 | | | | | | | | | | | |
(Callable 03/21/2026)(1)(2) | | | 25,000,000 | | | | 23,217,384 | | | | |
| 4.900%, 04/21/2027 | | | | | | | | | | | |
(Callable 03/21/2027)(1)(2) | | | 10,500,000 | | | | 10,409,560 | | | | |
| 3.200%, 04/21/2031 | | | | | | | | | | | |
(Callable 01/21/2031)(1)(2) | | | 1,605,000 | | | | 1,385,424 | | | | |
| VMware, Inc., | | | | | | | | | | | |
| 1.400%, 08/15/2026 | | | | | | | | | | | |
| (Callable 07/15/2026) | | | 900,000 | | | | 823,625 | | | | |
| Volkswagen Group of America Finance LLC, | | | | | | | | | | | |
| 6.200%, 11/16/2028 | | | | | | | | | | | |
(Callable 10/16/2028)(1)(2) | | | 6,000,000 | | | | 6,300,919 | | | | |
| Vontier Corp.: | | | | | | | | | | | |
| 1.800%, 04/01/2026 | | | | | | | | | | | |
| (Callable 03/01/2026) | | | 6,300,000 | | | | 5,798,743 | | | | |
| 2.400%, 04/01/2028 | | | | | | | | | | | |
| (Callable 02/01/2028) | | | 16,375,000 | | | | 14,343,845 | | | | |
| Wabtec Corp.: | | | | | | | | | | | |
| 3.450%, 11/15/2026 | | | | | | | | | | | |
| (Callable 08/15/2026) | | | 11,050,000 | | | | 10,575,270 | | | | |
| 4.700%, 09/15/2028 | | | | | | | | | | | |
| (Callable 06/15/2028) | | | 1,500,000 | | | | 1,484,520 | | | | |
| Walgreens Boots Alliance, Inc.: | | | | | | | | | | | |
| 3.450%, 06/01/2026 | | | | | | | | | | | |
| (Callable 03/01/2026) | | | 106,000 | | | | 100,795 | | | | |
| 3.200%, 04/15/2030 | | | | | | | | | | | |
| (Callable 01/15/2030) | | | 6,335,000 | | | | 5,589,022 | | | | |
| Warnermedia Holdings, Inc.: | | | | | | | | | | | |
| 6.412%, 03/15/2026 | | | | | | | | | | | |
| (Callable 03/15/2024) | | | 6,000,000 | | | | 6,002,590 | | | | |
| 4.054%, 03/15/2029 | | | | | | | | | | | |
| (Callable 01/15/2029) | | | 6,000,000 | | | | 5,695,179 | | | | |
| Waste Connections, Inc., | | | | | | | | | | | |
| 3.200%, 06/01/2032 | | | | | | | | | | | |
| (Callable 03/01/2032) | | | 875,000 | | | | 787,701 | | | | |
| Western Digital Corp., | | | | | | | | | | | |
| 2.850%, 02/01/2029 | | | | | | | | | | | |
| (Callable 12/01/2028) | | | 10,000,000 | | | | 8,608,729 | | | | |
| Western Midstream Operating LP: | | | | | | | | | | | |
| 4.500%, 03/01/2028 | | | | | | | | | | | |
| (Callable 12/01/2027) | | | 7,195,000 | | | | 6,959,307 | | | | |
| 4.050%, 02/01/2030 | | | | | | | | | | | |
| (Callable 11/01/2029) | | | 2,000,000 | | | | 1,875,300 | | | | |
| Westinghouse Air Brake Technologies Corp., | | | | | | | | | | | |
| 3.200%, 06/15/2025 | | | | | | | | | | | |
| (Callable 05/15/2025) | | | 5,000,000 | | | | 4,834,305 | | | | |
| Williams Companies, Inc., | | | | | | | | | | | |
| 7.500%, 01/15/2031 | | | 6,650,000 | | | | 7,534,398 | | | | |
| Wipro IT Services LLC, | | | | | | | | | | | |
| 1.500%, 06/23/2026 | | | | | | | | | | | |
(Callable 05/23/2026)(1)(2) | | | 9,000,000 | | | | 8,246,002 | | | | |
| Woodside Finance Ltd., | | | | | | | | | | | |
| 4.500%, 03/04/2029 | | | | | | | | | | | |
(Callable 12/04/2028)(1)(2) | | | 10,000,000 | | | | 9,614,691 | | | | |
| WRKCo, Inc.: | | | | | | | | | | | |
| 4.650%, 03/15/2026 | | | | | | | | | | | |
| (Callable 01/15/2026) | | | 275,000 | | | | 273,199 | | | | |
| 3.900%, 06/01/2028 | | | | | | | | | | | |
| (Callable 03/01/2028) | | | 8,275,000 | | | | 7,904,026 | | | | |
| Yara International ASA, | | | | | | | | | | | |
| 3.800%, 06/06/2026 | | | | | | | | | | | |
(Callable 03/06/2026)(1)(2) | | | 1,150,000 | | | | 1,110,416 | | | | |
| Zoetis, Inc., | | | | | | | | | | | |
| 4.500%, 11/13/2025 | | | | | | | | | | | |
| (Callable 08/13/2025) | | | 2,000,000 | | | | 1,989,007 | | | | |
| Total Industrials | | | | | | | | | | | |
| (Cost $1,583,912,105) | | | | | | | 1,516,174,415 | | | | 18.2 | % |
| Utilities | | | | | | | | | | | | |
| Alliant Energy Finance LLC, | | | | | | | | | | | | |
| 5.950%, 03/30/2029 | | | | | | | | | | | | |
(Callable 02/28/2029)(2) | | | 7,000,000 | | | | 7,285,917 | | | | | |
| Ausgrid Finance Pty Ltd., | | | | | | | | | | | | |
| 4.350%, 08/01/2028 | | | | | | | | | | | | |
(Callable 05/01/2028)(1)(2) | | | 4,400,000 | | | | 4,247,260 | | | | | |
| Avangrid, Inc., | | | | | | | | | | | | |
| 3.800%, 06/01/2029 | | | | | | | | | | | | |
(Callable 03/01/2029)(1) | | | 10,975,000 | | | | 10,347,014 | | | | | |
| DTE Electric Company, | | | | | | | | | | | | |
| 2.625%, 03/01/2031 | | | | | | | | | | | | |
| (Callable 12/01/2030) | | | 275,000 | | | | 240,943 | | | | | |
| DTE Energy Company, | | | | | | | | | | | | |
| 4.875%, 06/01/2028 | | | | | | | | | | | | |
| (Callable 05/01/2028) | | | 18,000,000 | | | | 18,149,224 | | | | | |
| Duquesne Light Holdings, Inc., | | | | | | | | | | | | |
| 2.775%, 01/07/2032 | | | | | | | | | | | | |
(Callable 10/07/2031)(2) | | | 12,400,000 | | | | 9,920,067 | | | | | |
| East Ohio Gas Co., | | | | | | | | | | | | |
| 2.000%, 06/15/2030 | | | | | | | | | | | | |
(Callable 03/15/2030)(2) | | | 550,000 | | | | 457,772 | | | | | |
| Enel Finance International NV: | | | | | | | | | | | | |
| 4.625%, 06/15/2027 | | | | | | | | | | | | |
(Callable 05/15/2027)(1)(2) | | | 10,000,000 | | | | 9,904,184 | | | | | |
3.500%, 04/06/2028(1)(2) | | | 14,675,000 | | | | 13,761,818 | | | | | |
| Entergy Corp., | | | | | | | | | | | | |
| 2.800%, 06/15/2030 | | | | | | | | | | | | |
| (Callable 03/15/2030) | | | 13,250,000 | | | | 11,676,550 | | | | | |
The accompanying notes are an integral part of these financial statements.
Baird Intermediate Bond Fund
Schedule of Investments, December 31, 2023
Long-Term Investments (cont.)
| | | Principal | | | | | | % of | |
| | | Amount | | | Value | | | Net Assets | |
| Eversource Energy, | | | | | | | | | |
| 1.650%, 08/15/2030 | | | | | | | | | |
| (Callable 05/15/2030) | | $ | 275,000 | | | $ | 223,409 | | | | |
| Fells Point Funding Trust, | | | | | | | | | | | |
| 3.046%, 01/31/2027 | | | | | | | | | | | |
(Callable 12/31/2026)(2) | | | 325,000 | | | | 306,535 | | | | |
| FirstEnergy Corp., | | | | | | | | | | | |
| 2.050%, 03/01/2025 | | | | | | | | | | | |
| (Callable 02/01/2025) | | | 6,450,000 | | | | 6,224,250 | | | | |
| ITC Holdings Corp.: | | | | | | | | | | | |
| 3.350%, 11/15/2027 | | | | | | | | | | | |
(Callable 08/15/2027)(1) | | | 275,000 | | | | 261,045 | | | | |
| 2.950%, 05/14/2030 | | | | | | | | | | | |
(Callable 02/14/2030)(1)(2) | | | 15,717,000 | | | | 13,830,529 | | | | |
| 5.400%, 06/01/2033 | | | | | | | | | | | |
(Callable 03/01/2033)(1)(2) | | | 4,275,000 | | | | 4,376,514 | | | | |
| KeySpan Corp., | | | | | | | | | | | |
8.000%, 11/15/2030(1) | | | 2,000,000 | | | | 2,289,778 | | | | |
| National Grid PLC, | | | | | | | | | | | |
| 5.602%, 06/12/2028 | | | | | | | | | | | |
(Callable 05/12/2028)(1) | | | 5,000,000 | | | | 5,155,512 | | | | |
| Oncor Electric Delivery Co. LLC, | | | | | | | | | | | |
| 2.750%, 05/15/2030 | | | | | | | | | | | |
| (Callable 02/15/2030) | | | 6,000,000 | | | | 5,373,964 | | | | |
| Pacific Gas and Electric Co.: | | | | | | | | | | | |
| 3.450%, 07/01/2025 | | | 259,500 | | | | 251,172 | | | | |
| 3.750%, 07/01/2028 | | | 259,500 | | | | 243,260 | | | | |
| Puget Energy, Inc., | | | | | | | | | | | |
| 2.379%, 06/15/2028 | | | | | | | | | | | |
| (Callable 04/15/2028) | | | 325,000 | | | | 290,767 | | | | |
| Southern Co., | | | | | | | | | | | |
| 5.700%, 03/15/2034 | | | | | | | | | | | |
| (Callable 09/15/2033) | | | 8,100,000 | | | | 8,528,715 | | | | |
| Total Utilities | | | | | | | | | | | |
| (Cost $141,050,261) | | | | | | | 133,346,199 | | | | 1.6 | % |
| Financials | | | | | | | | | | | | |
| ABN AMRO Bank NV: | | | | | | | | | | | | |
4.750%, 07/28/2025(1)(2) | | | 26,048,000 | | | | 25,523,393 | | | | | |
| 1.542%, 06/16/2027 | | | | | | | | | | | | |
| (1 Year CMT Rate + 0.800%) | | | | | | | | | | | | |
(Callable 06/16/2026)(1)(2)(3) | | | 12,200,000 | | | | 11,076,804 | | | | | |
| 6.339%, 09/18/2027 | | | | | | | | | | | | |
| (1 Year CMT Rate + 1.650%) | | | | | | | | | | | | |
(Callable 09/18/2026)(1)(2)(3) | | | 5,000,000 | | | | 5,113,448 | | | | | |
| AerCap Holdings NV: | | | | | | | | | | | | |
| 2.450%, 10/29/2026 | | | | | | | | | | | | |
(Callable 09/29/2026)(1) | | | 10,000,000 | | | | 9,260,179 | | | | | |
| 6.450%, 04/15/2027 | | | | | | | | | | | | |
(Callable 03/15/2027)(1)(2) | | | 5,399,000 | | | | 5,593,606 | | | | | |
| AIB Group PLC, | | | | | | | | | | | | |
| 6.608%, 09/13/2029 (SOFR + 2.330%) | | | | | | | | | | | | |
(Callable 09/13/2028)(1)(2)(3) | | | 5,000,000 | | | | 5,270,790 | | | | | |
| AIG SunAmerica Global Financing X, | | | | | | | | | | | | |
6.900%, 03/15/2032(2) | | | 14,000,000 | | | | 15,354,942 | | | | | |
| Air Lease Corp., | | | | | | | | | | | | |
| 4.250%, 02/01/2024 | | | | | | | | | | | | |
| (Callable 01/29/2024) | | | 525,000 | | | | 524,158 | | | | | |
| American Express Co., | | | | | | | | | | | | |
| 4.990%, 05/01/2026 (SOFR + 0.999%) | | | | | | | | | | | | |
(Callable 05/01/2025)(3) | | | 12,000,000 | | | | 11,967,397 | | | | | |
| American International Group, Inc., | | | | | | | | | | | | |
| 5.125%, 03/27/2033 | | | | | | | | | | | | |
| (Callable 12/27/2032) | | | 1,250,000 | | | | 1,271,398 | | | | | |
| AmFam Holdings, Inc., | | | | | | | | | | | | |
| 2.805%, 03/11/2031 | | | | | | | | | | | | |
(Callable 12/11/2030)(2) | | | 9,000,000 | | | | 6,905,030 | | | | | |
| Arthur J Gallagher & Co., | | | | | | | | | | | | |
| 6.500%, 02/15/2034 | | | | | | | | | | | | |
| (Callable 11/15/2033) | | | 7,000,000 | | | | 7,662,315 | | | | | |
| Australia & New Zealand | | | | | | | | | | | | |
| Banking Group Ltd., | | | | | | | | | | | | |
6.742%, 12/08/2032(1)(2) | | | 5,000,000 | | | | 5,353,066 | | | | | |
| Banco Santander SA: | | | | | | | | | | | | |
5.179%, 11/19/2025(1) | | | 5,000,000 | | | | 4,959,887 | | | | | |
| 1.722%, 09/14/2027 | | | | | | | | | | | | |
| (1 Year CMT Rate + 0.900%) | | | | | | | | | | | | |
(Callable 09/14/2026)(1)(3) | | | 4,500,000 | | | | 4,071,315 | | | | | |
6.607%, 11/07/2028(1) | | | 6,600,000 | | | | 7,034,435 | | | | | |
2.749%, 12/03/2030(1) | | | 4,000,000 | | | | 3,329,065 | | | | | |
| 3.225%, 11/22/2032 | | | | | | | | | | | | |
| (1 Year CMT Rate + 1.600%) | | | | | | | | | | | | |
(Callable 08/22/2031)(1)(3) | | | 2,000,000 | | | | 1,678,124 | | | | | |
6.921%, 08/08/2033(1) | | | 4,000,000 | | | | 4,273,505 | | | | | |
| Bank of America Corp.: | | | | | | | | | | | | |
| 3.093%, 10/01/2025 | | | | | | | | | | | | |
| (3 Month TSFR + 1.352%) | | | | | | | | | | | | |
(Callable 10/01/2024)(3) | | | 3,295,000 | | | | 3,230,521 | | | | | |
| 5.080%, 01/20/2027 (SOFR + 1.290%) | | | | | | | | | | | | |
(Callable 01/20/2026)(3) | | | 7,500,000 | | | | 7,486,060 | | | | | |
| 1.734%, 07/22/2027 (SOFR + 0.960%) | | | | | | | | | | | | |
(Callable 07/22/2026)(3) | | | 5,000,000 | | | | 4,582,712 | | | | | |
| 3.824%, 01/20/2028 | | | | | | | | | | | | |
| (3 Month TSFR + 1.837%) | | | | | | | | | | | | |
(Callable 01/20/2027)(3) | | | 375,000 | | | | 360,524 | | | | | |
| 3.705%, 04/24/2028 | | | | | | | | | | | | |
| (3 Month TSFR + 1.774%) | | | | | | | | | | | | |
(Callable 04/24/2027)(3) | | | 5,050,000 | | | | 4,826,200 | | | | | |
| 4.376%, 04/27/2028 (SOFR + 1.580%) | | | | | | | | | | | | |
(Callable 04/27/2027)(3) | | | 7,675,000 | | | | 7,504,675 | | | | | |
| 4.948%, 07/22/2028 (SOFR + 2.040%) | | | | | | | | | | | | |
(Callable 07/22/2027)(3) | | | 10,000,000 | | | | 10,006,457 | | | | | |
| 6.204%, 11/10/2028 (SOFR + 1.990%) | | | | | | | | | | | | |
(Callable 11/10/2027)(3) | | | 5,000,000 | | | | 5,218,830 | | | | | |
| 3.419%, 12/20/2028 | | | | | | | | | | | | |
| (3 Month TSFR + 1.302%) | | | | | | | | | | | | |
(Callable 12/20/2027)(3) | | | 1,689,000 | | | | 1,590,274 | | | | | |
| 3.970%, 03/05/2029 | | | | | | | | | | | | |
| (3 Month TSFR + 1.332%) | | | | | | | | | | | | |
(Callable 03/05/2028)(3) | | | 10,568,000 | | | | 10,097,293 | | | | | |
| 2.087%, 06/14/2029 (SOFR + 1.060%) | | | | | | | | | | | | |
(Callable 06/14/2028)(3) | | | 4,350,000 | | | | 3,837,383 | | | | | |
| 4.271%, 07/23/2029 | | | | | | | | | | | | |
| (3 Month TSFR + 1.572%) | | | | | | | | | | | | |
(Callable 07/23/2028)(3) | | | 5,295,000 | | | | 5,118,367 | | | | | |
| 5.288%, 04/25/2034 (SOFR + 1.910%) | | | | | | | | | | | | |
(Callable 04/25/2033)(3) | | | 10,650,000 | | | | 10,706,233 | | | | | |
| Bank of Ireland Group PLC, | | | | | | | | | | | | |
| 2.029%, 09/30/2027 | | | | | | | | | | | | |
| (1 Year CMT Rate + 1.100%) | | | | | | | | | | | | |
(Callable 09/30/2026)(1)(2)(3) | | | 11,243,000 | | | | 10,251,407 | | | | | |
| Bank of Nova Scotia: | | | | | | | | | | | | |
4.500%, 12/16/2025(1) | | | 7,000,000 | | | | 6,886,458 | | | | | |
5.250%, 06/12/2028(1) | | | 5,000,000 | | | | 5,079,721 | | | | | |
| Banque Federative du Credit Mutuel SA: | | | | | | | | | | | | |
4.753%, 07/13/2027(1)(2) | | | 14,850,000 | | | | 14,758,562 | | | | | |
5.790%, 07/13/2028(1)(2) | | | 2,500,000 | | | | 2,583,669 | | | | | |
The accompanying notes are an integral part of these financial statements.
Baird Intermediate Bond Fund
Schedule of Investments, December 31, 2023
Long-Term Investments (cont.)
| | | Principal | | | | | | % of | |
| | | Amount | | | Value | | | Net Assets | |
| Barclays PLC: | | | | | | | | | |
3.650%, 03/16/2025(1) | | $ | 275,000 | | | $ | 268,852 | | | |
| |
| 3.932%, 05/07/2025 | | | | | | | | | | | | |
| (3 Month LIBOR USD + 1.610%) | | | | | | | | | | | | |
(Callable 05/07/2024)(1)(3)(9) | | | 4,500,000 | | | | 4,468,926 | | | | | |
| 4.337%, 01/10/2028 | | | | | | | | | | | | |
(Callable 01/10/2027)(1) | | | 8,790,000 | | | | 8,545,611 | | | | | |
| 6.490%, 09/13/2029 (SOFR + 2.220%) | | | | | | | | | | | | |
(Callable 09/13/2028)(1)(3) | | | 10,000,000 | | | | 10,419,750 | | | | | |
| 6.224%, 05/09/2034 (SOFR + 2.980%) | | | | | | | | | | | | |
(Callable 05/09/2033)(1)(3) | | | 6,500,000 | | | | 6,754,910 | | | | | |
| BBVA USA, | | | | | | | | | | | | |
| 3.875%, 04/10/2025 | | | | | | | | | | | | |
| (Callable 03/10/2025) | | | 4,700,000 | | | | 4,602,208 | | | | | |
| BNP Paribas SA: | | | | | | | | | | | | |
| 2.819%, 11/19/2025 | | | | | | | | | | | | |
| (3 Month TSFR + 1.373%) | | | | | | | | | | | | |
(Callable 11/19/2024)(1)(2)(3) | | | 5,000,000 | | | | 4,872,531 | | | | | |
4.375%, 05/12/2026(1)(2) | | | 8,288,000 | | | | 8,074,499 | | | | | |
| 1.323%, 01/13/2027 (SOFR + 1.004%) | | | | | | | | | | | | |
(Callable 01/13/2026)(1)(2)(3) | | | 4,250,000 | | | | 3,920,352 | | | | | |
| 5.335%, 06/12/2029 | | | | | | | | | | | | |
| (1 Year CMT Rate + 1.500%) | | | | | | | | | | | | |
(Callable 06/12/2028)(1)(2)(3) | | | 5,000,000 | | | | 5,076,422 | | | | | |
| 2.159%, 09/15/2029 (SOFR + 1.218%) | | | | | | | | | | | | |
(Callable 09/15/2028)(1)(2)(3) | | | 2,000,000 | | | | 1,741,161 | | | | | |
| 2.871%, 04/19/2032 | | | | | | | | | | | | |
| (3 Month TSFR + 1.387%) | | | | | | | | | | | | |
(Callable 04/19/2031)(1)(2)(3) | | | 5,000,000 | | | | 4,236,306 | | | | | |
| 3.132%, 01/20/2033 (SOFR + 1.561%) | | | | | | | | | | | | |
(Callable 01/20/2032)(1)(2)(3) | | | 7,000,000 | | | | 5,962,416 | | | | | |
| Boston Properties LP, | | | | | | | | | | | | |
| 3.200%, 01/15/2025 | | | | | | | | | | | | |
| (Callable 10/15/2024) | | | 12,400,000 | | | | 12,054,553 | | | | | |
| BPCE SA: | | | | | | | | | | | | |
4.625%, 07/11/2024(1)(2) | | | 10,500,000 | | | | 10,385,235 | | | | | |
4.875%, 04/01/2026(1)(2) | | | 3,386,000 | | | | 3,318,554 | | | | | |
| 6.714%, 10/19/2029 (SOFR + 2.270%) | | | | | | | | | | | | |
(Callable 10/19/2028)(1)(2)(3) | | | 5,000,000 | | | | 5,269,359 | | | | | |
| 3.116%, 10/19/2032 (SOFR + 1.730%) | | | | | | | | | | | | |
(Callable 10/19/2031)(1)(2)(3) | | | 11,500,000 | | | | 9,393,377 | | | | | |
| 5.748%, 07/19/2033 (SOFR + 2.865%) | | | | | | | | | | | | |
(Callable 07/19/2032)(1)(2)(3) | | | 6,200,000 | | | | 6,234,572 | | | | | |
| Brown & Brown, Inc.: | | | | | | | | | | | | |
| 4.200%, 09/15/2024 | | | | | | | | | | | | |
| (Callable 06/15/2024) | | | 10,461,000 | | | | 10,347,060 | | | | | |
| 4.500%, 03/15/2029 | | | | | | | | | | | | |
| (Callable 12/15/2028) | | | 8,747,000 | | | | 8,469,513 | | | | | |
| 2.375%, 03/15/2031 | | | | | | | | | | | | |
| (Callable 12/15/2030) | | | 3,500,000 | | | | 2,874,050 | | | | | |
| 4.200%, 03/17/2032 | | | | | | | | | | | | |
| (Callable 12/17/2031) | | | 10,000,000 | | | | 9,127,043 | | | | | |
| Canadian Imperial Bank of Commerce: | | | | | | | | | | | | |
5.615%, 07/17/2026(1) | | | 15,525,000 | | | | 15,841,320 | | | | | |
| 6.092%, 10/03/2033 | | | | | | | | | | | | |
(Callable 07/03/2033)(1) | | | 13,375,000 | | | | 14,301,679 | | | | | |
| Cantor Fitzgerald LP, | | | | | | | | | | | | |
| 4.500%, 04/14/2027 | | | | | | | | | | | | |
(Callable 01/14/2027)(2) | | | 5,000,000 | | | | 4,802,586 | | | | | |
| Capital One Financial Corp.: | | | | | | | | | | | | |
| 3.650%, 05/11/2027 | | | | | | | | | | | | |
| (Callable 04/11/2027) | | | 3,275,000 | | | | 3,126,889 | | | | | |
| 5.468%, 02/01/2029 (SOFR + 2.080%) | | | | | | | | | | | | |
(Callable 02/01/2028)(3) | | | 3,000,000 | | | | 2,992,530 | | | | | |
| 7.624%, 10/30/2031 (SOFR + 3.070%) | | | | | | | | | | | | |
(Callable 10/30/2030)(3) | | | 12,000,000 | | | | 13,205,709 | | | | | |
| Centene Corp., | | | | | | | | | | | | |
| 2.450%, 07/15/2028 | | | | | | | | | | | | |
| (Callable 05/15/2028) | | | 5,450,000 | | | | 4,863,307 | | | | | |
| Citigroup, Inc.: | | | | | | | | | | | | |
| 3.352%, 04/24/2025 | | | | | | | | | | | | |
| (3 Month TSFR + 1.158%) | | | | | | | | | | | | |
(Callable 04/24/2024)(3) | | | 10,590,000 | | | | 10,509,428 | | | | | |
| 3.887%, 01/10/2028 | | | | | | | | | | | | |
| (3 Month TSFR + 1.825%) | | | | | | | | | | | | |
(Callable 01/10/2027)(3) | | | 14,000,000 | | | | 13,550,304 | | | | | |
| 3.520%, 10/27/2028 | | | | | | | | | | | | |
| (3 Month TSFR + 1.413%) | | | | | | | | | | | | |
(Callable 10/27/2027)(3) | | | 3,000,000 | | | | 2,839,534 | | | | | |
| 3.057%, 01/25/2033 (SOFR + 1.351%) | | | | | | | | | | | | |
(Callable 01/25/2032)(3) | | | 10,000,000 | | | | 8,546,319 | | | | | |
| 3.785%, 03/17/2033 (SOFR + 1.939%) | | | | | | | | | | | | |
(Callable 03/17/2032)(3) | | | 7,425,000 | | | | 6,689,462 | | | | | |
| 6.270%, 11/17/2033 (SOFR + 2.338%) | | | | | | | | | | | | |
(Callable 11/17/2032)(3) | | | 5,000,000 | | | | 5,359,426 | | | | | |
| Citizens Bank NA, | | | | | | | | | | | | |
| 2.250%, 04/28/2025 | | | | | | | | | | | | |
| (Callable 03/28/2025) | | | 19,275,000 | | | | 18,427,812 | | | | | |
| Citizens Financial Group, Inc., | | | | | | | | | | | | |
| 2.850%, 07/27/2026 | | | | | | | | | | | | |
| (Callable 04/27/2026) | | | 300,000 | | | | 279,642 | | | | | |
| CNA Financial Corp.: | | | | | | | | | | | | |
| 4.500%, 03/01/2026 | | | | | | | | | | | | |
| (Callable 12/01/2025) | | | 5,370,000 | | | | 5,310,345 | | | | | |
| 2.050%, 08/15/2030 | | | | | | | | | | | | |
| (Callable 05/15/2030) | | | 4,875,000 | | | | 4,061,528 | | | | | |
| CNO Global Funding, | | | | | | | | | | | | |
2.650%, 01/06/2029(2) | | | 15,000,000 | | | | 13,007,373 | | | | | |
| Commonwealth Bank of Australia, | | | | | | | | | | | | |
3.784%, 03/14/2032(1)(2) | | | 20,000,000 | | | | 17,527,678 | | | | | |
| Cooperatieve Rabobank UA: | | | | | | | | | | | | |
4.375%, 08/04/2025(1) | | | 7,700,000 | | | | 7,561,969 | | | | | |
3.750%, 07/21/2026(1) | | | 1,826,000 | | | | 1,749,050 | | | | | |
| 3.649%, 04/06/2028 | | | | | | | | | | | | |
| (1 Year CMT Rate + 1.220%) | | | | | | | | | | | | |
(Callable 04/06/2027)(1)(2)(3) | | | 7,700,000 | | | | 7,343,680 | | | | | |
| Corebridge Financial, Inc., | | | | | | | | | | | | |
| 3.850%, 04/05/2029 | | | | | | | | | | | | |
| (Callable 02/05/2029) | | | 13,825,000 | | | | 13,031,431 | | | | | |
| Credit Agricole SA: | | | | | | | | | | | | |
5.589%, 07/05/2026(1)(2) | | | 8,200,000 | | | | 8,342,437 | | | | | |
| 1.247%, 01/26/2027 (SOFR + 0.892%) | | | | | | | | | | | | |
(Callable 01/26/2026)(1)(2)(3) | | | 4,000,000 | | | | 3,684,267 | | | | | |
| 6.316%, 10/03/2029 (SOFR + 1.860%) | | | | | | | | | | | | |
(Callable 10/03/2028)(1)(2)(3) | | | 14,250,000 | | | | 14,947,495 | | | | | |
| Danske Bank A/S: | | | | | | | | | | | | |
| 1.621%, 09/11/2026 | | | | | | | | | | | | |
| (1 Year CMT Rate + 1.350%) | | | | | | | | | | | | |
(Callable 09/11/2025)(1)(2)(3) | | | 5,000,000 | | | | 4,666,526 | | | | | |
| 4.298%, 04/01/2028 | | | | | | | | | | | | |
| (1 Year CMT Rate + 1.750%) | | | | | | | | | | | | |
(Callable 04/01/2027)(1)(2)(3) | | | 25,000,000 | | | | 24,243,784 | | | | | |
| Deutsche Bank AG: | | | | | | | | | | | | |
| 7.146%, 07/13/2027 (SOFR + 2.520%) | | | | | | | | | | | | |
(Callable 07/13/2026)(1)(3) | | | 10,000,000 | | | | 10,382,388 | | | | | |
| 2.311%, 11/16/2027 (SOFR + 1.219%) | | | | | | | | | | | | |
(Callable 11/16/2026)(1)(3) | | | 3,450,000 | | | | 3,156,146 | | | | | |
The accompanying notes are an integral part of these financial statements.
Baird Intermediate Bond Fund
Schedule of Investments, December 31, 2023
Long-Term Investments (cont.)
| | | Principal | | | | | | % of | |
| | | Amount | | | Value | | | Net Assets | |
| Deutsche Bank AG: (cont.) | | | | | | | | | |
| 6.819%, 11/20/2029 (SOFR + 2.510%) | | | | | | | | | |
(Callable 11/20/2028)(1)(3) | | $ | 5,000,000 | | | $ | 5,269,260 | | | |
| |
| 3.035%, 05/28/2032 (SOFR + 1.718%) | | | | | | | | | | | | |
(Callable 05/28/2031)(1)(3) | | | 5,000,000 | | | | 4,185,694 | | | | | |
| Discover Bank: | | | | | | | | | | | | |
| 3.450%, 07/27/2026 | | | | | | | | | | | | |
| (Callable 04/27/2026) | | | 300,000 | | | | 283,721 | | | | | |
| 4.650%, 09/13/2028 | | | | | | | | | | | | |
| (Callable 06/13/2028) | | | 10,000,000 | | | | 9,537,320 | | | | | |
| Discover Financial Services: | | | | | | | | | | | | |
| 3.950%, 11/06/2024 | | | | | | | | | | | | |
| (Callable 08/06/2024) | | | 4,200,000 | | | | 4,127,302 | | | | | |
| 3.750%, 03/04/2025 | | | | | | | | | | | | |
| (Callable 12/04/2024) | | | 250,000 | | | | 244,275 | | | | | |
| 4.100%, 02/09/2027 | | | | | | | | | | | | |
| (Callable 11/09/2026) | | | 12,000,000 | | | | 11,519,079 | | | | | |
| 6.700%, 11/29/2032 | | | | | | | | | | | | |
| (Callable 08/29/2032) | | | 6,275,000 | | | | 6,583,224 | | | | | |
| 7.964%, 11/02/2034 | | | | | | | | | | | | |
| (SOFRINDX + 3.370%) | | | | | | | | | | | | |
(Callable 11/02/2033)(3) | | | 5,000,000 | | | | 5,570,798 | | | | | |
| Equitable Financial Life Global Funding, | | | | | | | | | | | | |
1.400%, 07/07/2025(2) | | | 225,000 | | | | 212,896 | | | | | |
| Extra Space Storage LP: | | | | | | | | | | | | |
| 3.875%, 12/15/2027 | | | | | | | | | | | | |
| (Callable 09/15/2027) | | | 8,000,000 | | | | 7,642,585 | | | | | |
| 4.000%, 06/15/2029 | | | | | | | | | | | | |
| (Callable 03/15/2029) | | | 1,500,000 | | | | 1,431,328 | | | | | |
| 5.500%, 07/01/2030 | | | | | | | | | | | | |
| (Callable 05/01/2030) | | | 7,000,000 | | | | 7,168,621 | | | | | |
| Federation des Caisses | | | | | | | | | | | | |
| Desjardins du Quebec: | | | | | | | | | | | | |
2.050%, 02/10/2025(1)(2) | | | 500,000 | | | | 482,257 | | | | | |
5.700%, 03/14/2028(1)(2) | | | 3,275,000 | | | | 3,373,093 | | | | | |
| Fifth Third Bancorp: | | | | | | | | | | | | |
| 6.339%, 07/27/2029 (SOFR + 2.340%) | | | | | | | | | | | | |
(Callable 07/27/2028)(3) | | | 5,000,000 | | | | 5,210,414 | | | | | |
| 4.772%, 07/28/2030 | | | | | | | | | | | | |
| (SOFRINDX + 2.127%) | | | | | | | | | | | | |
(Callable 07/28/2029)(3) | | | 3,000,000 | | | | 2,934,187 | | | | | |
| FirstMerit Bank NA, | | | | | | | | | | | | |
| 4.270%, 11/25/2026 | | | 5,450,000 | | | | 5,223,936 | | | | | |
| Goldman Sachs Group, Inc.: | | | | | | | | | | | | |
| 3.272%, 09/29/2025 | | | | | | | | | | | | |
| (3 Month TSFR + 1.463%) | | | | | | | | | | | | |
(Callable 09/29/2024)(3) | | | 3,500,000 | | | | 3,441,156 | | | | | |
| 1.093%, 12/09/2026 (SOFR + 0.789%) | | | | | | | | | | | | |
(Callable 12/09/2025)(3) | | | 2,000,000 | | | | 1,842,032 | | | | | |
| 1.948%, 10/21/2027 (SOFR + 0.913%) | | | | | | | | | | | | |
(Callable 10/21/2026)(3) | | | 15,700,000 | | | | 14,368,374 | | | | | |
| 2.640%, 02/24/2028 (SOFR + 1.114%) | | | | | | | | | | | | |
(Callable 02/24/2027)(3) | | | 2,000,000 | | | | 1,854,581 | | | | | |
| 3.615%, 03/15/2028 (SOFR + 1.846%) | | | | | | | | | | | | |
(Callable 03/15/2027)(3) | | | 26,125,000 | | | | 25,072,314 | | | | | |
| 3.691%, 06/05/2028 | | | | | | | | | | | | |
| (3 Month TSFR + 1.772%) | | | | | | | | | | | | |
(Callable 06/05/2027)(3) | | | 5,025,000 | | | | 4,804,517 | | | | | |
| 4.223%, 05/01/2029 | | | | | | | | | | | | |
| (3 Month TSFR + 1.563%) | | | | | | | | | | | | |
(Callable 05/01/2028)(3) | | | 3,100,000 | | | | 3,001,889 | | | | | |
| 2.383%, 07/21/2032 (SOFR + 1.248%) | | | | | | | | | | | | |
(Callable 07/21/2031)(3) | | | 5,000,000 | | | | 4,110,516 | | | | | |
| Guardian Life Global Funding: | | | | | | | | | | | | |
5.550%, 10/28/2027(2) | | | 15,000,000 | | | | 15,576,980 | | | | | |
5.737%, 10/02/2028(2) | | | 22,200,000 | | | | 23,309,735 | | | | | |
| Hartford Financial Services Group, Inc., | | | | | | | | | | | | |
| 2.800%, 08/19/2029 | | | | | | | | | | | | |
| (Callable 05/19/2029) | | | 4,600,000 | | | | 4,179,177 | | | | | |
| Health Care Service Corp. | | | | | | | | | | | | |
| A Mutual Legal Reserve Co., | | | | | | | | | | | | |
| 2.200%, 06/01/2030 | | | | | | | | | | | | |
(Callable 03/01/2030)(2) | | | 10,275,000 | | | | 8,766,579 | | | | | |
| High Street Funding Trust I, | | | | | | | | | | | | |
| 4.111%, 02/15/2028 | | | | | | | | | | | | |
(Callable 11/15/2027)(2) | | | 5,000,000 | | | | 4,733,943 | | | | | |
| HSBC Holdings PLC: | | | | | | | | | | | | |
| 3.803%, 03/11/2025 | | | | | | | | | | | | |
| (3 Month TSFR + 1.473%) | | | | | | | | | | | | |
(Callable 03/11/2024)(1)(3) | | | 3,000,000 | | | | 2,987,795 | | | | | |
| 4.292%, 09/12/2026 | | | | | | | | | | | | |
| (3 Month TSFR + 1.609%) | | | | | | | | | | | | |
(Callable 09/12/2025)(1)(3) | | | 7,485,000 | | | | 7,328,173 | | | | | |
| 5.887%, 08/14/2027 (SOFR + 1.570%) | | | | | | | | | | | | |
(Callable 08/14/2026)(1)(3) | | | 15,000,000 | | | | 15,216,621 | | | | | |
| 4.583%, 06/19/2029 | | | | | | | | | | | | |
| (3 Month TSFR + 1.796%) | | | | | | | | | | | | |
(Callable 06/19/2028)(1)(3) | | | 10,000,000 | | | | 9,705,811 | | | | | |
| 3.973%, 05/22/2030 | | | | | | | | | | | | |
| (3 Month TSFR + 1.872%) | | | | | | | | | | | | |
(Callable 05/22/2029)(1)(3) | | | 1,500,000 | | | | 1,402,461 | | | | | |
| Huntington Bancshares, Inc., | | | | | | | | | | | | |
| 4.443%, 08/04/2028 (SOFR + 1.970%) | | | | | | | | | | | | |
(Callable 08/04/2027)(3) | | | 4,837,000 | | | | 4,692,130 | | | | | |
| ING Groep NV: | | | | | | | | | | | | |
| 4.017%, 03/28/2028 (SOFR + 1.830%) | | | | | | | | | | | | |
(Callable 03/28/2027)(1)(3) | | | 3,833,000 | | | | 3,720,238 | | | | | |
| 6.114%, 09/11/2034 (SOFR + 2.090%) | | | | | | | | | | | | |
(Callable 09/11/2033)(1)(3) | | | 10,000,000 | | | | 10,502,613 | | | | | |
| Invesco Finance PLC, | | | | | | | | | | | | |
| 3.750%, 01/15/2026 | | | 300,000 | | | | 292,184 | | | | | |
| Jackson National Life Global Funding, | | | | | | | | | | | | |
5.250%, 04/12/2028(2) | | | 6,000,000 | | | | 5,850,562 | | | | | |
| Jefferies Group LLC: | | | | | | | | | | | | |
| 4.850%, 01/15/2027 | | | 1,700,000 | | | | 1,693,003 | | | | | |
| 6.450%, 06/08/2027 | | | 3,325,000 | | | | 3,454,554 | | | | | |
| JPMorgan Chase & Co.: | | | | | | | | | | | | |
| 2.301%, 10/15/2025 (SOFR + 1.160%) | | | | | | | | | | | | |
(Callable 10/15/2024)(3) | | | 13,000,000 | | | | 12,668,737 | | | | | |
| 2.005%, 03/13/2026 | | | | | | | | | | | | |
| (3 Month TSFR + 1.585%) | | | | | | | | | | | | |
(Callable 03/13/2025)(3) | | | 7,625,000 | | | | 7,326,724 | | | | | |
| 2.083%, 04/22/2026 (SOFR + 1.850%) | | | | | | | | | | | | |
(Callable 04/22/2025)(3) | | | 3,000,000 | | | | 2,874,016 | | | | | |
| 1.045%, 11/19/2026 (SOFR + 0.800%) | | | | | | | | | | | | |
(Callable 11/19/2025)(3) | | | 5,000,000 | | | | 4,632,005 | | | | | |
| 1.578%, 04/22/2027 (SOFR + 0.885%) | | | | | | | | | | | | |
(Callable 04/22/2026)(3) | | | 7,000,000 | | | | 6,461,752 | | | | | |
| 1.470%, 09/22/2027 (SOFR + 0.765%) | | | | | | | | | | | | |
(Callable 09/22/2026)(3) | | | 5,000,000 | | | | 4,530,845 | | | | | |
| 3.509%, 01/23/2029 | | | | | | | | | | | | |
| (3 Month TSFR + 1.207%) | | | | | | | | | | | | |
(Callable 01/23/2028)(3) | | | 13,150,000 | | | | 12,472,883 | | | | | |
| 6.087%, 10/23/2029 (SOFR + 1.570%) | | | | | | | | | | | | |
(Callable 10/23/2028)(3) | | | 10,000,000 | | | | 10,522,403 | | | | | |
| 2.522%, 04/22/2031 (SOFR + 2.040%) | | | | | | | | | | | | |
(Callable 04/22/2030)(3) | | | 1,500,000 | | | | 1,299,171 | | | | | |
The accompanying notes are an integral part of these financial statements.
Baird Intermediate Bond Fund
Schedule of Investments, December 31, 2023
Long-Term Investments (cont.)
| | | Principal | | | | | | % of | |
| | | Amount | | | Value | | | Net Assets | |
| JPMorgan Chase & Co.: (cont.) | | | | | | | | | |
| 1.953%, 02/04/2032 (SOFR + 1.065%) | | | | | | | | | |
(Callable 02/04/2031)(3) | | $ | 150,000 | | | $ | 122,138 | | | |
| |
| 2.580%, 04/22/2032 | | | | | | | | | | | | |
| (3 Month TSFR + 1.250%) | | | | | | | | | | | | |
(Callable 04/22/2031)(3) | | | 5,000,000 | | | | 4,237,160 | | | | | |
| 5.350%, 06/01/2034 (SOFR + 1.845%) | | | | | | | | | | | | |
(Callable 06/01/2033)(3) | | | 7,000,000 | | | | 7,106,790 | | | | | |
| Kemper Corp., | | | | | | | | | | | | |
| 3.800%, 02/23/2032 | | | | | | | | | | | | |
| (Callable 11/23/2031) | | | 4,000,000 | | | | 3,360,601 | | | | | |
| KeyBank NA, | | | | | | | | | | | | |
| 3.400%, 05/20/2026 | | | 2,200,000 | | | | 2,063,761 | | | | | |
| LeasePlan Corp. NV, | | | | | | | | | | | | |
2.875%, 10/24/2024(1)(2) | | | 10,250,000 | | | | 10,015,584 | | | | | |
| Liberty Mutual Group, Inc., | | | | | | | | | | | | |
4.569%, 02/01/2029(2) | | | 1,559,000 | | | | 1,525,096 | | | | | |
| Lloyds Banking Group PLC: | | | | | | | | | | | | |
| 1.627%, 05/11/2027 | | | | | | | | | | | | |
| (1 Year CMT Rate + 0.850%) | | | | | | | | | | | | |
(Callable 05/11/2026)(1)(3) | | | 8,850,000 | | | | 8,112,336 | | | | | |
| 3.750%, 03/18/2028 | | | | | | | | | | | | |
| (1 Year CMT Rate + 1.800%) | | | | | | | | | | | | |
(Callable 03/18/2027)(1)(3) | | | 10,000,000 | | | | 9,573,018 | | | | | |
| LPL Holdings, Inc., | | | | | | | | | | | | |
| 4.625%, 11/15/2027 | | | | | | | | | | | | |
(Callable 01/04/2024)(2) | | | 10,800,000 | | | | 10,430,422 | | | | | |
| M&T Bank Corp., | | | | | | | | | | | | |
| 4.000%, 07/15/2024 | | | | | | | | | | | | |
| (Callable 04/16/2024) | | | 5,000,000 | | | | 4,951,531 | | | | | |
| Macquarie Group Ltd.: | | | | | | | | | | | | |
| 5.108%, 08/09/2026 (SOFR + 2.208%) | | | | | | | | | | | | |
(Callable 08/09/2025)(1)(2)(3) | | | 5,000,000 | | | | 4,979,342 | | | | | |
| 2.691%, 06/23/2032 (SOFR + 1.440%) | | | | | | | | | | | | |
(Callable 06/23/2031)(1)(2)(3) | | | 5,000,000 | | | | 4,108,704 | | | | | |
| 2.871%, 01/14/2033 (SOFR + 1.532%) | | | | | | | | | | | | |
(Callable 01/14/2032)(1)(2)(3) | | | 4,350,000 | | | | 3,582,269 | | | | | |
| 4.442%, 06/21/2033 (SOFR + 2.405%) | | | | | | | | | | | | |
(Callable 06/21/2032)(1)(2)(3) | | | 5,000,000 | | | | 4,572,733 | | | | | |
| Marsh & McLennan Companies, Inc., | | | | | | | | | | | | |
| 2.250%, 11/15/2030 | | | | | | | | | | | | |
| (Callable 08/15/2030) | | | 550,000 | | | | 474,155 | | | | | |
| Massachusetts Mutual Life Insurance Co., | | | | | | | | | | | | |
5.625%, 05/15/2033(2) | | | 10,000,000 | | | | 9,918,198 | | | | | |
| MBIA Insurance Corp., | | | | | | | | | | | | |
| 16.915%, 01/15/2033 | | | | | | | | | | | | |
| (3 Month TSFR + 11.522%) | | | | | | | | | | | | |
(Callable 01/15/2028)(2)(3)(8) | | | 500,000 | | | | 17,500 | | | | | |
| Metropolitan Life Insurance Co., | | | | | | | | | | | | |
7.800%, 11/01/2025(2) | | | 390,000 | | | | 407,382 | | | | | |
| Mitsubishi UFJ Financial Group, Inc.: | | | | | | | | | | | | |
2.193%, 02/25/2025(1) | | | 5,000,000 | | | | 4,829,826 | | | | | |
| 1.538%, 07/20/2027 | | | | | | | | | | | | |
| (1 Year CMT Rate + 0.750%) | | | | | | | | | | | | |
(Callable 07/20/2026)(1)(3) | | | 5,000,000 | | | | 4,570,793 | | | | | |
| 5.354%, 09/13/2028 | | | | | | | | | | | | |
| (1 Year CMT Rate + 1.900%) | | | | | | | | | | | | |
(Callable 09/13/2027)(1)(3) | | | 5,000,000 | | | | 5,070,715 | | | | | |
| 2.494%, 10/13/2032 | | | | | | | | | | | | |
| (1 Year CMT Rate + 0.970%) | | | | | | | | | | | | |
(Callable 10/13/2031)(1)(3) | | | 6,000,000 | | | | 5,041,661 | | | | | |
| Mizuho Financial Group, Inc.: | | | | | | | | | | | | |
4.600%, 03/27/2024(1)(2) | | | 7,000,000 | | | | 6,973,316 | | | | | |
| 5.414%, 09/13/2028 | | | | | | | | | | | | |
| (1 Year CMT Rate + 2.050%) | | | | | | | | | | | | |
(Callable 09/13/2027)(1)(3) | | | 7,000,000 | | | | 7,098,487 | | | | | |
| Morgan Stanley: | | | | | | | | | | | | |
| 2.188%, 04/28/2026 (SOFR + 1.990%) | | | | | | | | | | | | |
(Callable 04/28/2025)(3) | | | 10,000,000 | | | | 9,607,906 | | | | | |
| 3.125%, 07/27/2026 | | | 4,750,000 | | | | 4,549,811 | | | | | |
| 6.296%, 10/18/2028 (SOFR + 2.240%) | | | | | | | | | | | | |
(Callable 10/18/2027)(3) | | | 15,000,000 | | | | 15,723,536 | | | | | |
| 3.622%, 04/01/2031 (SOFR + 3.120%) | | | | | | | | | | | | |
(Callable 04/01/2030)(3) | | | 525,000 | | | | 483,989 | | | | | |
| 2.239%, 07/21/2032 (SOFR + 1.178%) | | | | | | | | | | | | |
(Callable 07/21/2031)(3) | | | 18,750,000 | | | | 15,308,836 | | | | | |
| 2.511%, 10/20/2032 (SOFR + 1.200%) | | | | | | | | | | | | |
(Callable 10/20/2031)(3) | | | 8,200,000 | | | | 6,805,693 | | | | | |
| National Australia Bank Ltd.: | | | | | | | | | | | | |
3.375%, 01/14/2026(1) | | | 500,000 | | | | 487,095 | | | | | |
2.332%, 08/21/2030(1)(2) | | | 7,850,000 | | | | 6,403,939 | | | | | |
| National Securities Clearing Corp., | | | | | | | | | | | | |
| 5.100%, 11/21/2027 | | | | | | | | | | | | |
(Callable 10/21/2027)(2) | | | 6,825,000 | | | | 6,969,365 | | | | | |
| Nationwide Building Society, | | | | | | | | | | | | |
4.000%, 09/14/2026(1)(2) | | | 20,675,000 | | | | 19,847,839 | | | | | |
| Nationwide Mutual Insurance Co., | | | | | | | | | | | | |
8.250%, 12/01/2031(2) | | | 2,195,000 | | | | 2,498,214 | | | | | |
| NatWest Group PLC: | | | | | | | | | | | | |
| 4.269%, 03/22/2025 | | | | | | | | | | | | |
| (3 Month LIBOR USD + 1.762%) | | | | | | | | | | | | |
(Callable 03/22/2024)(1)(3)(9) | | | 7,454,000 | | | | 7,427,886 | | | | | |
| 5.808%, 09/13/2029 | | | | | | | | | | | | |
| (1 Year CMT Rate + 1.950%) | | | | | | | | | | | | |
(Callable 09/13/2028)(1)(3) | | | 2,000,000 | | | | 2,052,523 | | | | | |
| 5.076%, 01/27/2030 | | | | | | | | | | | | |
| (3 Month LIBOR USD + 1.905%) | | | | | | | | | | | | |
(Callable 01/27/2029)(1)(3)(9) | | | 4,700,000 | | | | 4,631,327 | | | | | |
| 4.445%, 05/08/2030 | | | | | | | | | | | | |
| (3 Month LIBOR USD + 1.871%) | | | | | | | | | | | | |
(Callable 05/08/2029)(1)(3)(9) | | | 6,850,000 | | | | 6,571,952 | | | | | |
| Nomura Holdings, Inc.: | | | | | | | | | | | | |
1.653%, 07/14/2026(1) | | | 13,725,000 | | | | 12,552,619 | | | | | |
3.103%, 01/16/2030(1) | | | 5,000,000 | | | | 4,422,934 | | | | | |
| Peachtree Corners Funding Trust, | | | | | | | | | | | | |
3.976%, 02/15/2025(2) | | | 6,556,000 | | | | 6,447,631 | | | | | |
| Pine Street Trust I, | | | | | | | | | | | | |
| 4.572%, 02/15/2029 | | | | | | | | | | | | |
(Callable 11/15/2028)(2) | | | 5,000,000 | | | | 4,759,328 | | | | | |
| Principal Financial Group, Inc., | | | | | | | | | | | | |
| 3.100%, 11/15/2026 | | | | | | | | | | | | |
| (Callable 08/15/2026) | | | 850,000 | | | | 809,739 | | | | | |
| Principal Life Global Funding II, | | | | | | | | | | | | |
3.000%, 04/18/2026(2) | | | 7,000,000 | | | | 6,667,891 | | | | | |
| Prologis LP, | | | | | | | | | | | | |
| 4.750%, 06/15/2033 | | | | | | | | | | | | |
| (Callable 03/15/2033) | | | 5,000,000 | | | | 5,074,773 | | | | | |
| Protective Life Corp., | | | | | | | | | | | | |
| 3.400%, 01/15/2030 | | | | | | | | | | | | |
(Callable 10/15/2029)(1)(2) | | | 1,400,000 | | | | 1,238,499 | | | | | |
| Protective Life Global Funding, | | | | | | | | | | | | |
5.209%, 04/14/2026(1)(2) | | | 9,775,000 | | | | 9,764,321 | | | | | |
| Prudential Insurance Co. of America, | | | | | | | | | | | | |
8.300%, 07/01/2025(2) | | | 8,600,000 | | | | 8,880,244 | | | | | |
| Reliance Standard Life Global Funding II, | | | | | | | | | | | | |
2.750%, 01/21/2027(1)(2) | | | 11,775,000 | | | | 10,821,549 | | | | | |
The accompanying notes are an integral part of these financial statements.
Baird Intermediate Bond Fund
Schedule of Investments, December 31, 2023
Long-Term Investments (cont.)
| | | Principal | | | | | | % of | |
| | | Amount | | | Value | | | Net Assets | |
| Sammons Financial Group, Inc., | | | | | | | | | |
| 4.750%, 04/08/2032 | | | | | | | | | |
(Callable 01/08/2032)(2) | | $ | 14,000,000 | | | $ | 12,297,935 | | | |
| |
| Santander UK Group Holdings PLC, | | | | | | | | | | | | |
| 6.534%, 01/10/2029 (SOFR + 2.600%) | | | | | | | | | | | | |
(Callable 01/10/2028)(1)(3) | | | 5,000,000 | | | | 5,176,756 | | | | | |
| SMBC Aviation Capital Finance DAC, | | | | | | | | | | | | |
| 1.900%, 10/15/2026 | | | | | | | | | | | | |
(Callable 09/15/2026)(1)(2) | | | 2,000,000 | | | | 1,816,736 | | | | | |
| Societe Generale SA: | | | | | | | | | | | | |
5.000%, 01/17/2024(1)(2) | | | 3,350,000 | | | | 3,348,003 | | | | | |
2.625%, 01/22/2025(1)(2) | | | 3,355,000 | | | | 3,251,140 | | | | | |
4.250%, 04/14/2025(1)(2) | | | 5,846,000 | | | | 5,711,933 | | | | | |
| 2.226%, 01/21/2026 | | | | | | | | | | | | |
| (1 Year CMT Rate + 1.050%) | | | | | | | | | | | | |
(Callable 01/21/2025)(1)(2)(3) | | | 3,968,000 | | | | 3,812,416 | | | | | |
| 1.488%, 12/14/2026 | | | | | | | | | | | | |
| (1 Year CMT Rate + 1.100%) | | | | | | | | | | | | |
(Callable 12/14/2025)(1)(2)(3) | | | 7,415,000 | | | | 6,827,073 | | | | | |
| 1.792%, 06/09/2027 | | | | | | | | | | | | |
| (1 Year CMT Rate + 1.000%) | | | | | | | | | | | | |
(Callable 06/09/2026)(1)(2)(3) | | | 10,000,000 | | | | 9,105,015 | | | | | |
| 6.446%, 01/10/2029 | | | | | | | | | | | | |
| (1 Year CMT Rate + 2.550%) | | | | | | | | | | | | |
(Callable 01/10/2028)(1)(2)(3) | | | 2,000,000 | | | | 2,070,545 | | | | | |
| Standard Chartered PLC: | | | | | | | | | | | | |
| 2.819%, 01/30/2026 | | | | | | | | | | | | |
| (3 Month LIBOR USD + 1.209%) | | | | | | | | | | | | |
(Callable 01/30/2025)(1)(2)(3)(9) | | | 19,825,000 | | | | 19,168,537 | | | | | |
| 3.971%, 03/30/2026 | | | | | | | | | | | | |
| (1 Year CMT Rate + 1.650%) | | | | | | | | | | | | |
(Callable 03/30/2025)(1)(2)(3) | | | 4,500,000 | | | | 4,387,009 | | | | | |
| 1.456%, 01/14/2027 | | | | | | | | | | | | |
| (1 Year CMT Rate + 1.000%) | | | | | | | | | | | | |
(Callable 01/14/2026)(1)(2)(3) | | | 4,500,000 | | | | 4,120,659 | | | | | |
| 2.608%, 01/12/2028 | | | | | | | | | | | | |
| (1 Year CMT Rate + 1.180%) | | | | | | | | | | | | |
(Callable 01/12/2027)(1)(2)(3) | | | 5,000,000 | | | | 4,572,363 | | | | | |
| State Street Corp., | | | | | | | | | | | | |
| 2.901%, 03/30/2026 (SOFR + 2.600%) | | | | | | | | | | | | |
(Callable 03/30/2025)(3) | | | 275,000 | | | | 267,224 | | | | | |
| Stifel Financial Corp.: | | | | | | | | | | | | |
| 4.250%, 07/18/2024 | | | 10,139,000 | | | | 10,037,008 | | | | | |
| 4.000%, 05/15/2030 | | | | | | | | | | | | |
| (Callable 02/15/2030) | | | 15,245,000 | | | | 13,851,459 | | | | | |
| Sumitomo Mitsui Financial Group, Inc.: | | | | | | | | | | | | |
1.474%, 07/08/2025(1) | | | 250,000 | | | | 236,627 | | | | | |
5.464%, 01/13/2026(1) | | | 8,100,000 | | | | 8,182,990 | | | | | |
3.544%, 01/17/2028(1) | | | 2,094,000 | | | | 1,996,217 | | | | | |
5.852%, 07/13/2030(1) | | | 12,000,000 | | | | 12,593,703 | | | | | |
| Svenska Handelsbanken AB, | | | | | | | | | | | | |
5.500%, 06/15/2028(1)(2) | | | 4,000,000 | | | | 4,068,154 | | | | | |
| Synchrony Financial: | | | | | | | | | | | | |
| 4.250%, 08/15/2024 | | | | | | | | | | | | |
| (Callable 05/15/2024) | | | 5,275,000 | | | | 5,216,741 | | | | | |
| 4.500%, 07/23/2025 | | | | | | | | | | | | |
| (Callable 04/23/2025) | | | 775,000 | | | | 757,107 | | | | | |
| 3.700%, 08/04/2026 | | | | | | | | | | | | |
| (Callable 05/04/2026) | | | 3,000,000 | | | | 2,823,680 | | | | | |
| Toronto-Dominion Bank, | | | | | | | | | | | | |
4.456%, 06/08/2032(1) | | | 13,000,000 | | | | 12,652,246 | | | | | |
| Trinity Acquisition PLC, | | | | | | | | | | | | |
| 4.400%, 03/15/2026 | | | | | | | | | | | | |
| (Callable 12/15/2025) | | | 1,125,000 | | | | 1,110,850 | | | | | |
| Truist Financial Corp., | | | | | | | | | | | | |
| 7.161%, 10/30/2029 (SOFR + 2.446%) | | | | | | | | | | | | |
(Callable 10/30/2028)(3) | | | 4,000,000 | | | | 4,324,639 | | | | | |
| Trustage Financial Group, Inc., | | | | | | | | | | | | |
| 4.625%, 04/15/2032 | | | | | | | | | | | | |
(Callable 01/15/2032)(2) | | | 15,000,000 | | | | 13,086,420 | | | | | |
| UBS Group AG: | | | | | | | | | | | | |
| 4.490%, 08/05/2025 | | | | | | | | | | | | |
| (1 Year CMT Rate + 1.600%) | | | | | | | | | | | | |
(Callable 08/05/2024)(1)(2)(3) | | | 5,000,000 | | | | 4,962,716 | | | | | |
| 2.593%, 09/11/2025 (SOFR + 1.560%) | | | | | | | | | | | | |
(Callable 09/11/2024)(1)(2)(3) | | | 12,395,000 | | | | 12,126,571 | | | | | |
| 5.711%, 01/12/2027 | | | | | | | | | | | | |
| (1 Year CMT Rate + 1.550%) | | | | | | | | | | | | |
(Callable 01/12/2026)(1)(2)(3) | | | 12,400,000 | | | | 12,473,499 | | | | | |
| 1.494%, 08/10/2027 | | | | | | | | | | | | |
| (1 Year CMT Rate + 0.850%) | | | | | | | | | | | | |
(Callable 08/10/2026)(1)(2)(3) | | | 5,000,000 | | | | 4,519,682 | | | | | |
| 4.282%, 01/09/2028 | | | | | | | | | | | | |
(Callable 01/09/2027)(1)(2) | | | 500,000 | | | | 484,291 | | | | | |
| 4.751%, 05/12/2028 | | | | | | | | | | | | |
| (1 Year CMT Rate + 1.750%) | | | | | | | | | | | | |
(Callable 05/12/2027)(1)(2)(3) | | | 1,500,000 | | | | 1,478,204 | | | | | |
| 3.869%, 01/12/2029 | | | | | | | | | | | | |
| (3 Month LIBOR USD + 1.410%) | | | | | | | | | | | | |
(Callable 01/12/2028)(1)(2)(3)(9) | | | 7,750,000 | | | | 7,311,493 | | | | | |
| Voya Financial, Inc., | | | | | | | | | | | | |
| 3.650%, 06/15/2026 | | | 2,910,000 | | | | 2,814,704 | | | | | |
| Wells Fargo & Co.: | | | | | | | | | | | | |
| 2.406%, 10/30/2025 | | | | | | | | | | | | |
| (3 Month TSFR + 1.087%) | | | | | | | | | | | | |
(Callable 10/30/2024)(3) | | | 500,000 | | | | 486,428 | | | | | |
| 2.164%, 02/11/2026 | | | | | | | | | | | | |
| (3 Month TSFR + 1.012%) | | | | | | | | | | | | |
(Callable 02/11/2025)(3) | | | 5,000,000 | | | | 4,812,587 | | | | | |
| 2.188%, 04/30/2026 (SOFR + 2.000%) | | | | | | | | | | | | |
(Callable 04/30/2025)(3) | | | 16,000,000 | | | | 15,335,580 | | | | | |
| 3.196%, 06/17/2027 | | | | | | | | | | | | |
| (3 Month TSFR + 1.432%) | | | | | | | | | | | | |
(Callable 06/17/2026)(3) | | | 600,000 | | | | 573,560 | | | | | |
| 3.526%, 03/24/2028 (SOFR + 1.510%) | | | | | | | | | | | | |
(Callable 03/24/2027)(3) | | | 15,000,000 | | | | 14,318,693 | | | | | |
| 2.393%, 06/02/2028 (SOFR + 2.100%) | | | | | | | | | | | | |
(Callable 06/02/2027)(3) | | | 10,864,000 | | | | 9,957,177 | | | | | |
| 4.808%, 07/25/2028 (SOFR + 1.980%) | | | | | | | | | | | | |
(Callable 07/25/2027)(3) | | | 5,000,000 | | | | 4,965,248 | | | | | |
| 5.574%, 07/25/2029 (SOFR + 1.740%) | | | | | | | | | | | | |
(Callable 07/25/2028)(3) | | | 8,000,000 | | | | 8,176,763 | | | | | |
| 6.303%, 10/23/2029 (SOFR + 1.790%) | | | | | | | | | | | | |
(Callable 10/23/2028)(3) | | | 8,000,000 | | | | 8,439,040 | | | | | |
| 5.389%, 04/24/2034 (SOFR + 2.020%) | | | | | | | | | | | | |
(Callable 04/24/2033)(3) | | | 5,175,000 | | | | 5,206,623 | | | | | |
| Western & Southern Financial Group, Inc., | | | | | | | | | | | | |
5.750%, 07/15/2033(2) | | | 4,250,000 | | | | 4,379,145 | | | | | |
| Westpac Banking Corp.: | | | | | | | | | | | | |
| 2.894%, 02/04/2030 | | | | | | | | | | | | |
| (5 Year CMT Rate + 1.350%) | | | | | | | | | | | | |
(Callable 02/04/2025)(1)(3) | | | 2,300,000 | | | | 2,215,602 | | | | | |
| 5.405%, 08/10/2033 | | | | | | | | | | | | |
| (1 Year CMT Rate + 2.680%) | | | | | | | | | | | | |
(Callable 08/10/2032)(1)(3) | | | 4,000,000 | | | | 3,984,409 | | | | | |
| Willis North America, Inc.: | | | | | | | | | | | | |
| 3.600%, 05/15/2024 | | | | | | | | | | | | |
| (Callable 03/15/2024) | | | 8,150,000 | | | | 8,075,071 | | | | | |
The accompanying notes are an integral part of these financial statements.
Baird Intermediate Bond Fund
Schedule of Investments, December 31, 2023
Long-Term Investments (cont.)
| | | Principal | | | | | | % of | |
| | | Amount | | | Value | | | Net Assets | |
| Willis North America, Inc.: (cont.) | | | | | | | | | |
| 4.650%, 06/15/2027 | | | | | | | | | |
| (Callable 05/15/2027) | | $ | 8,000,000 | | | $ | 7,917,163 | | | | |
| 4.500%, 09/15/2028 | | | | | | | | | | | |
| (Callable 06/15/2028) | | | 8,800,000 | | | | 8,573,488 | | | | |
| 2.950%, 09/15/2029 | | | | | | | | | | | |
| (Callable 06/15/2029) | | | 2,000,000 | | | | 1,790,644 | | | | |
| Total Financials | | | | | | | | | | | |
| (Cost $1,675,263,790) | | | | | | | 1,623,016,494 | | | | 19.5 | % |
| Total Corporate Bonds | | | | | | | | | | | | |
| (Cost $3,400,226,156) | | | | | | | 3,272,537,108 | | | | 39.3 | % |
| Municipal Bonds | | | | | | | | | | | | |
| California Community | | | | | | | | | | | | |
| Choice Financing Authority, | | | | | | | | | | | | |
| 6.125%, 04/01/2030 | | | 2,510,000 | | | | 2,566,506 | | | | | |
| City of College Park GA, | | | | | | | | | | | | |
| 5.965%, 01/01/2031 (Insured by NATL) | | | 2,335,000 | | | | 2,401,047 | | | | | |
| County of Miami-Dade FL, | | | | | | | | | | | | |
| 2.536%, 10/01/2033 | | | | | | | | | | | | |
| (Callable 10/01/2030) | | | 2,800,000 | | | | 2,280,252 | | | | | |
| Dallas/Fort Worth International Airport, | | | | | | | | | | | | |
| 1.329%, 11/01/2025 | | | 525,000 | | | | 494,049 | | | | | |
| Florida Development Finance Corp., | | | | | | | | | | | | |
| 3.223%, 02/01/2032 | | | | | | | | | | | | |
| (Callable 08/01/2031) (Insured by AGM) | | | 5,250,000 | | | | 4,444,808 | | | | | |
| GBG LLC, | | | | | | | | | | | | |
2.250%, 09/01/2030(2) | | | 817,416 | | | | 721,771 | | | | | |
| Illinois Housing Development Authority, | | | | | | | | | | | | |
| 6.500%, 04/01/2054 | | | | | | | | | | | | |
| (Callable 01/19/2024) | | | | | | | | | | | | |
| (Insured by GNMA) | | | 18,420,000 | | | | 19,295,633 | | | | | |
| Massachusetts Educational | | | | | | | | | | | | |
| Financing Authority: | | | | | | | | | | | | |
| 1.921%, 07/01/2027 | | | 10,000,000 | | | | 9,110,928 | | | | | |
| 2.161%, 07/01/2028 | | | 10,000,000 | | | | 8,965,859 | | | | | |
| Minnesota Housing Finance Agency, | | | | | | | | | | | | |
| 6.500%, 07/01/2054 | | | | | | | | | | | | |
| (Callable 01/01/2033) | | | | | | | | | | | | |
| (Insured by GNMA) | | | 4,125,000 | | | | 4,410,453 | | | | | |
| New Hampshire Business Finance Authority: | | | | | | | | | | | | |
| 3.250%, 04/01/2028 | | | | | | | | | | | | |
| (Callable 01/01/2028) | | | 7,000,000 | | | | 6,088,632 | | | | | |
| 3.300%, 04/01/2032 | | | | | | | | | | | | |
| (Callable 01/01/2032) | | | 13,600,000 | | | | 10,636,158 | | | | | |
| New Jersey Higher Education | | | | | | | | | | | | |
| Student Assistance Authority: | | | | | | | | | | | | |
| 5.000%, 12/01/2027 | | | 1,600,000 | | | | 1,689,620 | | | | | |
| 5.000%, 12/01/2028 | | | 1,225,000 | | | | 1,311,628 | | | | | |
| 5.000%, 12/01/2028 | | | 1,205,000 | | | | 1,290,214 | | | | | |
| New York State Dormitory Authority, | | | | | | | | | | | | |
| 3.000%, 08/01/2036 | | | | | | | | | | | | |
| (Callable 08/01/2031) (Insured by BAM) | | | 3,480,000 | | | | 2,844,309 | | | | | |
| Niagara Area Development Corp.: | | | | | | | | | | | | |
| 3.004%, 05/01/2025 | | | 1,000,000 | | | | 969,658 | | | | | |
| 3.204%, 05/01/2026 | | | 1,995,000 | | | | 1,910,491 | | | | | |
| 3.272%, 05/01/2027 | | | 2,060,000 | | | | 1,947,923 | | | | | |
| 3.372%, 05/01/2028 | | | 2,130,000 | | | | 1,989,482 | | | | | |
| 3.422%, 05/01/2029 | | | 2,200,000 | | | | 2,018,306 | | | | | |
| San Diego Convention Center | | | | | | | | | | | | |
| Expansion Financing Authority: | | | | | | | | | | | | |
| 1.987%, 04/15/2026 | | | 3,440,000 | | | | 3,223,630 | | | | | |
| 2.363%, 04/15/2028 | | | 1,325,000 | | | | 1,207,205 | | | | | |
| South Dakota Housing | | | | | | | | | | | | |
| Development Authority, | | | | | | | | | | | | |
| 2.700%, 11/01/2036 | | | | | | | | | | | | |
| (Callable 11/01/2025) | | | 290,000 | | | | 282,982 | | | | | |
| Westvaco Corp., | | | | | | | | | | | | |
7.670%, 01/15/2027(2) | | | 8,400,000 | | | | 8,732,262 | | | | | |
| Total Municipal Bonds | | | | | | | | | | | | |
| (Cost $109,672,297) | | | | | | | 100,833,806 | | | | 1.2 | % |
| Residential Mortgage-Backed Securities | | | | | | | | | | | | |
| U.S. Government Agency Issue | | | | | | | | | | | | |
| Federal Gold Loan | | | | | | | | | | | | |
| Mortgage Corp. (FGLMC), | | | | | | | | | | | | |
| 6.000%, 07/01/2028 | | | 906 | | | | 939 | | | | | |
| Total U.S. Government Agency Issue | | | | | | | | | | | | |
| (Cost $889) | | | | | | | 939 | | | | 0.0 | % |
| Non-U.S. Government Agency Issues | | | | | | | | | | | | |
| Arroyo Mortgage Trust: | | | | | | | | | | | | |
| Series 2019-2, Class A1, 3.347%, | | | | | | | | | | | | |
04/25/2049 (Callable 01/25/2024)(2)(4) | | | 1,174,098 | | | | 1,105,190 | | | | | |
| Series 2022-1, Class A1A, 2.495%, | | | | | | | | | | | | |
12/25/2056 (Callable 01/25/2025)(2)(7) | | | 17,972,096 | | | | 16,591,524 | | | | | |
| Banc of America Funding Trust, | | | | | | | | | | | | |
| Series 2004-2, Class 1CB1, 5.750%, | | | | | | | | | | | | |
| 09/20/2034 (Callable 01/20/2025) | | | 530,560 | | | | 483,109 | | | | | |
| Bear Stearns ARM Trust, | | | | | | | | | | | | |
| Series 2004-5, Class 2A, 3.671%, | | | | | | | | | | | | |
07/25/2034 (Callable 01/25/2024)(4) | | | 345,671 | | | | 309,369 | | | | | |
| BRAVO Residential Funding Trust, | | | | | | | | | | | | |
| Series 2023-RPL1, Class A1, 5.000%, | | | | | | | | | | | | |
05/25/2063 (Callable 02/25/2043)(2)(4) | | | 31,044,427 | | | | 30,623,989 | | | | | |
| CIM Trust, | | | | | | | | | | | | |
| Series 2023-R4, Class A1, 5.000%, | | | | | | | | | | | | |
05/25/2062 (Callable 04/25/2028)(2)(4) | | | 34,408,406 | | | | 34,113,406 | | | | | |
| CWABS Asset-Backed Certificates Trust, | | | | | | | | | | | | |
| Series 2006-9, Class 1AF3, 5.859%, | | | | | | | | | | | | |
10/25/2046 (Callable 01/25/2024)(4)(6) | | | 43,718 | | | | 49,265 | | | | | |
| FirstKey Homes Trust: | | | | | | | | | | | | |
| Series 2020-SFR2, Class A, | | | | | | | | | | | | |
1.266%, 10/19/2037(2) | | | 40,087,796 | | | | 37,165,023 | | | | | |
| Series 2022-SFR3, Class A, | | | | | | | | | | | | |
4.250%, 07/17/2038(2) | | | 21,754,378 | | | | 21,052,821 | | | | | |
| Series 2021-SFR2, Class A, | | | | | | | | | | | | |
1.376%, 09/17/2038(2) | | | 21,844,872 | | | | 19,533,045 | | | | | |
| Series 2022-SFR1, Class A, | | | | | | | | | | | | |
4.145%, 05/19/2039(2) | | | 21,108,317 | | | | 20,271,380 | | | | | |
| Home Partners of America Trust: | | | | | | | | | | | | |
| Series 2019-1, Class A, 2.908%, | | | | | | | | | | | | |
09/17/2039 (Callable 09/17/2024)(2) | | | 16,345,049 | | | | 15,008,492 | | | | | |
| Series 2021-3, Class A, | | | | | | | | | | | | |
2.200%, 01/17/2041(2) | | | 31,899,521 | | | | 27,757,901 | | | | | |
| IMC Home Equity Loan Trust, | | | | | | | | | | | | |
| Series 1998-1, Class A6, | | | | | | | | | | | | |
7.020%, 06/20/2029(7) | | | 20 | | | | 19 | | | | | |
| J.P. Morgan Alternative Loan Trust, | | | | | | | | | | | | |
| Series 2006-A1, Class 2A1, 4.415%, | | | | | | | | | | | | |
03/25/2036 (Callable 01/25/2024)(4) | | | 134,991 | | | | 104,215 | | | | | |
| MASTR Alternative Loan Trust, | | | | | | | | | | | | |
| Series 2003-5, Class 4A1, 5.500%, | | | | | | | | | | | | |
| 07/25/2033 (Callable 01/25/2024) | | | 143,167 | | | | 139,770 | | | | | |
| MFA Trust, | | | | | | | | | | | | |
| Series 2022-NQM1, Class A1, 4.112%, | | | | | | | | | | | | |
12/25/2066 (Callable 03/25/2025)(2)(4) | | | 26,669,965 | | | | 25,370,748 | | | | | |
The accompanying notes are an integral part of these financial statements.
Baird Intermediate Bond Fund
Schedule of Investments, December 31, 2023
Long-Term Investments (cont.)
| | | Principal | | | | | | % of | |
| | | Amount | | | Value | | | Net Assets | |
| Mill City Mortgage Loan Trust: | | | | | | | | | |
| Series 2018-3, Class A1, 3.500%, | | | | | | | | | |
08/25/2058 (Callable 06/25/2039)(2)(4) | | $ | 135,070 | | | $ | 130,943 | | | | |
| Series 2019-1, Class A1, 3.250%, | | | | | | | | | | | |
10/25/2069 (Callable 04/25/2041)(2)(4) | | | 182,644 | | | | 174,988 | | | | |
| New Residential Mortgage Loan Trust, | | | | | | | | | | | |
| Series 2017-2A, Class A3, 4.000%, | | | | | | | | | | | |
03/25/2057 (Callable 10/25/2030)(2)(4) | | | 1,194,101 | | | | 1,130,376 | | | | |
| RALI Series Trust, | | | | | | | | | | | |
| Series 2004-QS6, Class A1, 5.000%, | | | | | | | | | | | |
| 10/25/2063 (Callable 01/25/2024) | | | 1,182 | | | | 1,095 | | | | |
| Thornburg Mortgage Securities Trust, | | | | | | | | | | | |
| Series 2003-5, Class 3A, 5.058%, | | | | | | | | | | | |
10/25/2043 (Callable 01/25/2024)(4) | | | 819,124 | | | | 779,266 | | | | |
| Towd Point Mortgage Trust: | | | | | | | | | | | |
| Series 2017-1, Class A1, 2.750%, | | | | | | | | | | | |
10/25/2056 (Callable 07/25/2031)(2)(4) | | | 352,361 | | | | 349,969 | | | | |
| Series 2017-6, Class A1, 2.750%, | | | | | | | | | | | |
10/25/2057 (Callable 10/25/2030)(2)(4) | | | 31,330 | | | | 29,986 | | | | |
| Series 2018-6, Class A1A, 3.750%, | | | | | | | | | | | |
03/25/2058 (Callable 07/25/2034)(2)(4) | | | 103,800 | | | | 101,449 | | | | |
| Series 2019-1, Class A1, 3.750%, | | | | | | | | | | | |
03/25/2058 (Callable 06/25/2033)(2)(4) | | | 3,583,024 | | | | 3,421,257 | | | | |
| Series 2018-4, Class A1, 3.000%, | | | | | | | | | | | |
06/25/2058 (Callable 12/25/2032)(2)(4) | | | 142,399 | | | | 132,560 | | | | |
| Series 2019-4, Class A1, 2.900%, | | | | | | | | | | | |
10/25/2059 (Callable 05/25/2033)(2)(4) | | | 8,761,183 | | | | 8,231,200 | | | | |
| Series 2020-4, Class A1, 1.750%, | | | | | | | | | | | |
10/25/2060 (Callable 11/25/2034)(2) | | | 11,404,038 | | | | 10,031,524 | | | | |
| Series 2022-2, Class A1, 3.750%, | | | | | | | | | | | |
07/01/2062 (Callable 01/25/2034)(2)(4) | | | 5,580,187 | | | | 5,204,304 | | | | |
| Series 2022-3, Class A1, 3.750%, | | | | | | | | | | | |
08/01/2062 (Callable 09/25/2030)(2)(4) | | | 9,665,430 | | | | 9,122,428 | | | | |
| WaMu Mortgage Pass-Through | | | | | | | | | | | |
| Certificates Trust: | | | | | | | | | | | |
| Series 2004-AR3, Class A1, 4.510%, | | | | | | | | | | | |
06/25/2034 (Callable 01/25/2024)(4) | | | 753,706 | | | | 683,751 | | | | |
| Series 2004-CB2, Class 3A, 6.000%, | | | | | | | | | | | |
| 08/25/2034 (Callable 01/25/2024) | | | 939,641 | | | | 932,886 | | | | |
| Total Non-U.S. Government Agency Issues | | | | | | | | | | | |
| (Cost $302,399,949) | | | | | | | 290,137,248 | | | | 3.5 | % |
| Total Residential Mortgage-Backed Securities | | | | | | | | | | | | |
| (Cost $302,400,838) | | | | | | | 290,138,187 | | | | 3.5 | % |
| Commercial Mortgage-Backed Securities | | | | | | | | | | | | |
| U.S. Government Agency Issues | | | | | | | | | | | | |
| Freddie Mac Multifamily | | | | | | | | | | | | |
| Structured Pass Through Certificates: | | | | | | | | | | | | |
| Series K069, Class A2, | | | | | | | | | | | | |
3.187%, 09/25/2027(4) | | | 1,075,000 | | | | 1,032,004 | | | | | |
| Series K071, Class A2, | | | | | | | | | | | | |
| 3.286%, 11/25/2027 | | | 7,375,000 | | | | 7,088,312 | | | | | |
| Series K076, Class A2, | | | | | | | | | | | | |
| 3.900%, 04/25/2028 | | | 22,525,000 | | | | 22,120,424 | | | | | |
| Series K092, Class A2, | | | | | | | | | | | | |
| 3.298%, 04/25/2029 | | | 11,943,000 | | | | 11,368,885 | | | | | |
| Total U.S. Government Agency Issues | | | | | | | | | | | | |
| (Cost $42,299,954) | | | | | | | 41,609,625 | | | | 0.5 | % |
| Non-U.S. Government Agency Issues | | | | | | | | | | | | |
| BANK: | | | | | | | | | | | | |
| Series 2017-BNK4, Class A4, 3.625%, | | | | | | | | | | | | |
| 05/15/2050 (Callable 04/15/2027) | | | 575,000 | | | | 542,920 | | | | | |
| Series 2017-BNK8, Class A4, 3.488%, | | | | | | | | | | | | |
| 11/15/2050 (Callable 11/15/2027) | | | 575,000 | | | | 531,658 | | | | | |
| Series 2017-BNK9, Class A4, 3.538%, | | | | | | | | | | | | |
| 11/15/2054 (Callable 12/15/2029) | | | 9,275,000 | | | | 8,746,356 | | | | | |
| Series 2022-BNK44, Class A5, 5.745%, | | | | | | | | | | | | |
11/15/2055 (Callable 11/15/2032)(4) | | | 13,475,000 | | | | 14,239,658 | | | | | |
| Series 2017-BNK5, Class A5, 3.390%, | | | | | | | | | | | | |
| 06/15/2060 (Callable 07/15/2027) | | | 2,665,000 | | | | 2,514,920 | | | | | |
| Series 2017-BNK7, Class ASB, 3.265%, | | | | | | | | | | | | |
| 09/15/2060 (Callable 09/15/2027) | | | 907,158 | | | | 879,721 | | | | | |
| Series 2017-BNK7, Class A5, 3.435%, | | | | | | | | | | | | |
| 09/15/2060 (Callable 09/15/2027) | | | 950,000 | | | | 895,571 | | | | | |
| Series 2018-BN10, Class A5, 3.688%, | | | | | | | | | | | | |
| 02/15/2061 (Callable 02/15/2028) | | | 895,000 | | | | 848,003 | | | | | |
| Series 2022-BNK40, Class ASB, 3.393%, | | | | | | | | | | | | |
03/15/2064 (Callable 03/15/2032)(4) | | | 16,205,000 | | | | 15,089,324 | | | | | |
| Benchmark Mortgage Trust, | | | | | | | | | | | | |
| Series 2022-B33, Class ASB, 3.469%, | | | | | | | | | | | | |
| 03/15/2055 (Callable 03/15/2032) | | | 6,407,000 | | | | 5,928,582 | | | | | |
| CD Mortgage Trust, | | | | | | | | | | | | |
| Series 2018-CD7, Class A4, 4.279%, | | | | | | | | | | | | |
| 08/15/2051 (Callable 08/15/2028) | | | 2,495,000 | | | | 2,347,208 | | | | | |
| CFCRE Commercial Mortgage Trust, | | | | | | | | | | | | |
| Series 2016-C4, Class ASB, 3.091%, | | | | | | | | | | | | |
| 05/10/2058 (Callable 05/10/2026) | | | 147,530 | | | | 143,850 | | | | | |
| Citigroup Commercial Mortgage Trust: | | | | | | | | | | | | |
| Series 2014-GC23, Class A4, 3.622%, | | | | | | | | | | | | |
| 07/10/2047 (Callable 07/10/2024) | | | 5,285,000 | | | | 5,207,197 | | | | | |
| Series 2015-GC27, Class A5, 3.137%, | | | | | | | | | | | | |
| 02/10/2048 (Callable 01/10/2025) | | | 14,085,576 | | | | 13,743,887 | | | | | |
| Series 2015-GC35, Class A4, 3.818%, | | | | | | | | | | | | |
| 11/10/2048 (Callable 11/10/2025) | | | 15,860,000 | | | | 15,274,328 | | | | | |
| Series 2017-P8, Class A3, 3.203%, | | | | | | | | | | | | |
| 09/15/2050 (Callable 09/15/2027) | | | 2,350,000 | | | | 2,196,248 | | | | | |
| Series 2017-P8, Class A4, 3.465%, | | | | | | | | | | | | |
| 09/15/2050 (Callable 09/15/2027) | | | 350,000 | | | | 328,641 | | | | | |
| Series 2017-C4, Class A3, 3.209%, | | | | | | | | | | | | |
| 10/12/2050 (Callable 11/12/2027) | | | 6,121,353 | | | | 5,709,844 | | | | | |
| COMM Mortgage Trust, | | | | | | | | | | | | |
| Series 2017-COR2, Class A3, 3.510%, | | | | | | | | | | | | |
| 09/10/2050 (Callable 09/10/2027) | | | 16,210,172 | | | | 15,102,636 | | | | | |
| CSAIL Commercial Mortgage Trust: | | | | | | | | | | | | |
| Series 2016-C6, Class A5, 3.090%, | | | | | | | | | | | | |
| 01/15/2049 (Callable 05/15/2026) | | | 7,545,000 | | | | 7,128,872 | | | | | |
| Series 2016-C7, Class A5, 3.502%, | | | | | | | | | | | | |
| 11/15/2049 (Callable 11/15/2026) | | | 1,640,000 | | | | 1,557,069 | | | | | |
| Series 2018-CX12, Class A3, 3.959%, | | | | | | | | | | | | |
| 08/15/2051 (Callable 08/15/2028) | | | 5,025,000 | | | | 4,764,231 | | | | | |
| Series 2021-C20, Class ASB, 2.436%, | | | | | | | | | | | | |
| 03/15/2054 (Callable 03/15/2031) | | | 6,866,000 | | | | 6,206,008 | | | | | |
| GS Mortgage Securities Trust, | | | | | | | | | | | | |
| Series 2018-GS10, Class A5, 4.155%, | | | | | | | | | | | | |
07/10/2051 (Callable 07/10/2028)(4) | | | 9,372,252 | | | | 8,822,889 | | | | | |
| JP Morgan Chase Commercial | | | | | | | | | | | | |
| Mortgage Securities Trust, | | | | | | | | | | | | |
| Series 2016-JP2, Class A4, 2.822%, | | | | | | | | | | | | |
| 08/15/2049 (Callable 07/15/2026) | | | 7,168,000 | | | | 6,673,214 | | | | | |
| JPMBB Commercial | | | | | | | | | | | | |
| Mortgage Securities Trust: | | | | | | | | | | | | |
| Series 2014-C23, Class A5, 3.934%, | | | | | | | | | | | | |
| 09/15/2047 (Callable 10/15/2024) | | | 600,000 | | | | 589,763 | | | | | |
| Series 2014-C25, Class ASB, 3.407%, | | | | | | | | | | | | |
| 11/15/2047 (Callable 11/15/2024) | | | 39,864 | | | | 39,401 | | | | | |
| Series 2014-C26, Class A4, 3.494%, | | | | | | | | | | | | |
| 01/15/2048 (Callable 01/15/2025) | | | 14,480,202 | | | | 14,113,518 | | | | | |
The accompanying notes are an integral part of these financial statements.
Baird Intermediate Bond Fund
Schedule of Investments, December 31, 2023
Long-Term Investments (cont.)
| | | Principal | | | | | | % of | |
| | | Amount | | | Value | | | Net Assets | |
| JPMBB Commercial | | | | | | | | | |
| Mortgage Securities Trust: (cont.) | | | | | | | | | |
| Series 2015-C30, Class A5, 3.822%, | | | | | | | | | |
| 07/15/2048 (Callable 07/15/2025) | | $ | 250,000 | | | $ | 239,090 | | | | |
| Series 2016-C4, Class A3, 3.141%, | | | | | | | | | | | |
| 12/15/2049 (Callable 04/15/2027) | | | 17,200,000 | | | | 15,795,197 | | | | |
| JPMCC Commercial | | | | | | | | | | | |
| Mortgage Securities Trust: | | | | | | | | | | | |
| Series 2017-JP6, Class A5, 3.490%, | | | | | | | | | | | |
| 07/15/2050 (Callable 06/15/2027) | | | 18,900,000 | | | | 17,466,401 | | | | |
| Series 2017-C7, Class A5, 3.409%, | | | | | | | | | | | |
| 10/15/2050 (Callable 11/15/2027) | | | 5,300,000 | | | | 4,913,778 | | | | |
| Morgan Stanley Bank of | | | | | | | | | | | |
| America Merrill Lynch Trust: | | | | | | | | | | | |
| Series 2015-C27, Class A4, 3.753%, | | | | | | | | | | | |
| 12/15/2047 (Callable 11/15/2025) | | | 29,745,000 | | | | 28,744,158 | | | | |
| Series 2017-C34, Class A4, 3.536%, | | | | | | | | | | | |
| 11/15/2052 (Callable 10/15/2027) | | | 14,450,000 | | | | 13,475,549 | | | | |
| Morgan Stanley Capital I Trust: | | | | | | | | | | | |
| Series 2016-BNK2, Class A4, 3.049%, | | | | | | | | | | | |
| 11/15/2049 (Callable 11/15/2026) | | | 9,221,000 | | | | 8,560,917 | | | | |
| Series 2016-UB12, Class A4, 3.596%, | | | | | | | | | | | |
| 12/15/2049 (Callable 12/15/2026) | | | 9,607,210 | | | | 9,052,427 | | | | |
| Morgan Stanley Capital I, Inc., | | | | | | | | | | | |
| Series 2022-L8, Class ASB, 3.794%, | | | | | | | | | | | |
04/15/2055 (Callable 04/15/2032)(4) | | | 9,422,000 | | | | 8,967,702 | | | | |
| UBS Commercial Mortgage Trust, | | | | | | | | | | | |
| Series 2018-C13, Class A3, 4.069%, | | | | | | | | | | | |
| 10/15/2051 (Callable 10/15/2028) | | | 4,719,768 | | | | 4,568,819 | | | | |
| Wells Fargo Commercial Mortgage Trust: | | | | | | | | | | | |
| Series 2014-LC18, Class ASB, 3.244%, | | | | | | | | | | | |
| 12/15/2047 (Callable 01/15/2025) | | | 2,794,730 | | | | 2,756,781 | | | | |
| Series 2015-C26, Class ASB, 2.991%, | | | | | | | | | | | |
| 02/15/2048 (Callable 02/15/2025) | | | 19,719 | | | | 19,428 | | | | |
| Series 2015-C31, Class A4, 3.695%, | | | | | | | | | | | |
| 11/15/2048 (Callable 11/15/2025) | | | 18,194,000 | | | | 17,538,199 | | | | |
| Series 2015-P2, Class ASB, 3.656%, | | | | | | | | | | | |
| 12/15/2048 (Callable 12/15/2025) | | | 4,867,125 | | | | 4,765,781 | | | | |
| Series 2015-P2, Class A4, 3.809%, | | | | | | | | | | | |
| 12/15/2048 (Callable 12/15/2025) | | | 34,843,144 | | | | 33,623,198 | | | | |
| Series 2017-C40, Class A3, 3.317%, | | | | | | | | | | | |
| 10/15/2050 (Callable 10/15/2027) | | | 8,800,000 | | | | 8,299,796 | | | | |
| Series 2019-C50, Class ASB, 3.635%, | | | | | | | | | | | |
| 05/15/2052 (Callable 05/15/2029) | | | 4,100,000 | | | | 3,970,983 | | | | |
| Series 2019-C54, Class A4, 3.146%, | | | | | | | | | | | |
| 12/15/2052 (Callable 11/15/2029) | | | 14,625,000 | | | | 13,135,217 | | | | |
| Series 2016-C36, Class A4, 3.065%, | | | | | | | | | | | |
| 11/15/2059 (Callable 10/15/2026) | | | 4,966,000 | | | | 4,610,388 | | | | |
| WFRBS Commercial Mortgage Trust, | | | | | | | | | | | |
| Series 2014-C24, Class ASB, 3.324%, | | | | | | | | | | | |
| 11/15/2047 (Callable 11/15/2024) | | | 1,574,348 | | | | 1,557,574 | | | | |
| Total Non-U.S. Government Agency Issues | | | | | | | | | | | |
| (Cost $382,850,786) | | | | | | | 362,226,900 | | | | 4.4 | % |
| Total Commercial | | | | | | | | | | | | |
| Mortgage-Backed Securities | | | | | | | | | | | | |
| (Cost $425,150,740) | | | | | | | 403,836,525 | | | | 4.9 | % |
| Asset Backed Securities | | | | | | | | | | | | |
| Chase Auto Owner Trust, | | | | | | | | | | | | |
| Series 2023-AA, Class A3, 5.680%, | | | | | | | | | | | | |
01/25/2029 (Callable 01/25/2028)(2) | | | 27,475,000 | | | | 28,019,532 | | | | | |
| DLLAD LLC, | | | | | | | | | | | | |
| Series 2023-1A, Class A3, 4.790%, | | | | | | | | | | | | |
01/20/2028 (Callable 12/20/2027)(2) | | | 29,500,000 | | | | 29,313,601 | | | | | |
| First National Master Note Trust, | | | | | | | | | | | | |
| Series 2023-2, Class A, | | | | | | | | | | | | |
| 5.770%, 09/15/2029 | | | 23,275,000 | | | | 23,798,571 | | | | | |
| Ford Credit Auto Owner Trust, | | | | | | | | | | | | |
| Series 2018-1, Class A, 3.190%, | | | | | | | | | | | | |
07/15/2031 (Callable 01/15/2025)(2) | | | 12,375,000 | | | | 12,119,288 | | | | | |
| Golden Credit Card Trust, | | | | | | | | | | | | |
| Series 2022-4A, Class A, 4.310%, | | | | | | | | | | | | |
09/15/2027(1)(2) | | | 24,675,000 | | | | 24,385,083 | | | | | |
| Hyundai Auto Lease Securitization Trust, | | | | | | | | | | | | |
| Series 2023-C, Class A3, 5.800%, | | | | | | | | | | | | |
12/15/2026 (Callable 04/15/2026)(2) | | | 15,000,000 | | | | 15,183,852 | | | | | |
| Louisiana Local Government | | | | | | | | | | | | |
| Environmental Facilities & | | | | | | | | | | | | |
| Community Development Authority, | | | | | | | | | | | | |
| 3.615%, 02/01/2029 | | | 22,140,310 | | | | 21,644,921 | | | | | |
| MMAF Equipment Finance LLC, | | | | | | | | | | | | |
| Series 2020-A, Class A3, | | | | | | | | | | | | |
0.970%, 04/09/2027(2) | | | 5,555,607 | | | | 5,294,280 | | | | | |
| Navient Private Education Refi Loan Trust: | | | | | | | | | | | | |
| Series 2021-GA, Class A, 1.580%, | | | | | | | | | | | | |
04/15/2070 (Callable 08/15/2029)(2) | | | 14,887,398 | | | | 12,915,455 | | | | | |
| Series 2022-BA, Class A, 4.160%, | | | | | | | | | | | | |
10/15/2070 (Callable 01/15/2030)(2) | | | 16,746,316 | | | | 16,004,973 | | | | | |
| Nelnet Student Loan Trust: | | | | | | | | | | | | |
| Series 2021-A, Class APT1, 1.360%, | | | | | | | | | | | | |
04/20/2062 (Callable 09/20/2029)(2) | | | 4,614,939 | | | | 4,179,319 | | | | | |
| Series 2021-DA, Class AFX, 1.630%, | | | | | | | | | | | | |
04/20/2062 (Callable 12/20/2031)(2) | | | 1,070,195 | | | | 977,331 | | | | | |
| PFS Financing Corp., | | | | | | | | | | | | |
| Series 2023-C, Class A, | | | | | | | | | | | | |
5.520%, 10/15/2028(2) | | | 16,975,000 | | | | 17,168,046 | | | | | |
| SBA Tower Trust, | | | | | | | | | | | | |
| 1.840%, 10/15/2051 | | | | | | | | | | | | |
(Callable 04/15/2026)(2) | | | 16,200,000 | | | | 14,345,826 | | | | | |
| SBNA Auto Lease Trust, | | | | | | | | | | | | |
| Series 2023-A, Class A3, 6.510%, | | | | | | | | | | | | |
04/20/2027 (Callable 08/20/2026)(2) | | | 17,375,000 | | | | 17,711,950 | | | | | |
| Synchrony Card Funding LLC, | | | | | | | | | | | | |
| Series 2022-A2, Class A, | | | | | | | | | | | | |
| 3.860%, 07/15/2028 | | | 13,200,000 | | | | 12,972,411 | | | | | |
| Texas Electric Market | | | | | | | | | | | | |
| Stabilization Funding N LLC, | | | | | | | | | | | | |
4.265%, 08/01/2034(2) | | | 15,311,202 | | | | 14,803,405 | | | | | |
| Towd Point Mortgage Trust, | | | | | | | | | | | | |
| Series 2020-MH1, Class A1, 2.250%, | | | | | | | | | | | | |
02/25/2060 (Callable 01/25/2024)(2)(4) | | | 4,861,106 | | | | 4,629,619 | | | | | |
| Toyota Auto Loan Extended Note Trust, | | | | | | | | | | | | |
| Series 2020-1A, Class A, 1.350%, | | | | | | | | | | | | |
05/25/2033 (Callable 05/25/2025)(2) | | | 225,000 | | | | 213,575 | | | | | |
| Verizon Master Trust, | | | | | | | | | | | | |
| Series 2023-1, Class A, 4.490%, | | | | | | | | | | | | |
| 01/22/2029 (Callable 01/20/2026) | | | 9,327,000 | | | | 9,279,470 | | | | | |
| Total Asset Backed Securities | | | | | | | | | | | | |
| (Cost $290,157,535) | | | | | | | 284,960,508 | | | | 3.4 | % |
| Total Long-Term Investments | | | | | | | | | | | | |
| (Cost $8,407,930,369) | | | | | | | 8,214,891,062 | | | | 98.7 | % |
The accompanying notes are an integral part of these financial statements.
Baird Intermediate Bond Fund
Schedule of Investments, December 31, 2023
Short-Term Investment
| | | | | | | | | % of | |
| | | Shares | | | Value | | | Net Assets | |
| Money Market Mutual Fund | | | | | | | | | |
| First American Government Obligations | | | | | | | | | |
Fund, Class U, 5.31%(5) | | | 129,022,442 | | | $ | 129,022,442 | | | | |
| Total Short-Term Investment | | | | | | | | | | | |
| (Cost $129,022,442) | | | | | | | 129,022,442 | | | | 1.5 | % |
| Total Investments | | | | | | | | | | | | |
| (Cost $8,536,952,811) | | | | | | | 8,343,913,504 | | | | 100.2 | % |
| Liabilities in Excess of Other Assets | | | | | | | (17,496,364 | ) | | | (0.2 | )% |
| TOTAL NET ASSETS | | | | | | $ | 8,326,417,140 | | | | 100.0 | % |
Notes to Schedule of Investments
AGM– Assured Guaranty Municipal
BAM – Build America Mutual Assurance Co.
GNMA – Government National Mortgage Association
NATL – National Public Finance Guarantee Corp.
CMT – Constant Maturity Treasury
LIBOR – London Inter-bank Offered Rate
SOFR – Secured Overnight Financing Rate
SOFRINDX – Secured Overnight Financing Rate Index
TSFR – Term Secured Overnight Financing Rate
(1) | Foreign security. |
(2) | Includes securities exempt from registration under Rule 144A of the Securities Act of 1933. These securities may be resold in transactions exempt from registration to qualified institutional buyers. At December 31, 2023, the value of these securities totaled $1,645,411,950, which represented 19.76% of total net assets. |
(3) | Variable rate security based on a reference index and spread. The rate reported is the rate as of the last reset date in effect as of December 31, 2023. |
(4) | Variable rate security. The coupon is based on an underlying pool of loans. The rate reported is the rate in effect as of December 31, 2023. |
(5) | Seven-day yield. |
(6) | Security that, on the last payment date, missed a partial principal or interest payment. |
(7) | Step-up bond; the interest rate shown is the rate in effect as of December 31, 2023. |
(8) | Security in default. |
(9) | Securities referencing LIBOR are expected to transition to an alternative reference rate by the security’s next scheduled coupon reset date. |
The accompanying notes are an integral part of these financial statements.
Baird Intermediate Bond Fund
Summary of Fair Value Exposure at December 31, 2023
The Fund has adopted authoritative fair valuation accounting standards which establish a definition of fair value and set out a hierarchy for measuring fair value. These standards require additional disclosures about the various inputs and valuation techniques used to develop the measurements of fair value and a discussion on changes in valuation techniques and related inputs during the period. These standards define fair value as the price that would be received to sell an asset or paid to transfer a liability in an orderly transaction between market participants at the measurement date.
The fair value hierarchy is organized into three levels based upon the assumptions (referred to as “inputs”) used in pricing the asset or liability. These standards state that “observable inputs” reflect the assumptions market participants would use in pricing the asset or liability based on market data obtained from independent sources and “unobservable inputs” reflect an entity’s own assumptions about the assumptions market participants would use in pricing the asset or liability. These inputs are summarized into three broad levels and described below:
Level 1 – Quoted prices (unadjusted) in active markets for identical assets or liabilities that the reporting entity can access at the measurement date.
Level 2 – Inputs other than quoted prices included within Level 1 that are observable for the asset or liability, either directly or indirectly.
Level 3 – Unobservable inputs for the asset or liability.
The inputs or methodology used for valuing securities are not necessarily an indication of the risk associated with investing in those securities.
The following is a summary of the inputs used to value the Fund’s investments as of December 31, 2023:
| | | Level 1 | | | Level 2 | | | Level 3 | | | Total | |
| Long-Term Investments | | | | | | | | | | | | |
| U.S. Treasury Securities | | $ | — | | | $ | 3,844,987,989 | | | $ | — | | | $ | 3,844,987,989 | |
| Other Government Related Security | | | — | | | | 17,596,939 | | | | — | | | | 17,596,939 | |
| Corporate Bonds | | | — | | | | 3,272,537,108 | | | | — | | | | 3,272,537,108 | |
| Municipal Bonds | | | — | | | | 100,833,806 | | | | — | | | | 100,833,806 | |
| Residential Mortgage-Backed Securities – U.S. Government Agency Issue | | | — | | | | 939 | | | | — | | | | 939 | |
| Residential Mortgage-Backed Securities – Non-U.S. Government Agency Issues | | | — | | | | 290,137,248 | | | | — | | | | 290,137,248 | |
| Commercial Mortgage-Backed Securities – U.S. Government Agency Issues | | | — | | | | 41,609,625 | | | | — | | | | 41,609,625 | |
| Commercial Mortgage-Backed Securities – Non-U.S. Government Agency Issues | | | — | | | | 362,226,900 | | | | — | | | | 362,226,900 | |
| Asset Backed Securities | | | — | | | | 284,960,508 | | | | — | | | | 284,960,508 | |
| Total Long-Term Investments | | | — | | | | 8,214,891,062 | | | | — | | | | 8,214,891,062 | |
| Short-Term Investment | | | | | | | | | | | | | | | | |
| Money Market Mutual Fund | | | 129,022,442 | | | | — | | | | — | | | | 129,022,442 | |
| Total Short-Term Investment | | | 129,022,442 | | | | — | | | | — | | | | 129,022,442 | |
| Total Investments | | $ | 129,022,442 | | | $ | 8,214,891,062 | | | $ | — | | | $ | 8,343,913,504 | |
Changes in valuation techniques may result in transfers into or out of assigned levels within the fair value hierarchy. There were no transfers into or out of Level 3 during the year, as compared to the security classifications from the prior year’s annual report. See the Fund’s Valuation Policy in Note 2a to the financial statements.
The accompanying notes are an integral part of these financial statements.
Baird Aggregate Bond Fund
December 31, 2023 (Unaudited)
The Baird Aggregate Bond Fund seeks an annual rate of total return, before Fund expenses, greater than the annual rate of total return of the Bloomberg U.S. Aggregate Index. The Bloomberg U.S. Aggregate Index is an unmanaged, market value weighted index of investment grade, fixed-rate debt issues, including government, credit, asset-backed (ABS), mortgage-backed (MBS) and commercial mortgage-backed (CMBS) securities with maturities of at least one year.
In 2023, the Fed slowed and likely ended its aggressive tightening campaign. Investors returned to the bond market as fixed income fund/ETF flows were a positive $159 billion, reversing the record outflows of -$345 billion in 2022. The overarching theme for 2023 was rate and credit spread volatility. After beginning the year at 3.88%, the 10-year Treasury yield fell more than 50 bps to 3.31% in April. From there, resilient economic data and heavy Treasury issuance led to a significant move up in rates. The 10 year Treasury yield rose 168 bps, peaking in mid-October at 4.99%, but the elevated rates were short-lived as one of the strongest year-end market rallies in decades ensued. The 10-year Treasury yield fell 111 bps to end the year at 3.88%, exactly the yield at which it began the year.
During 2023, the Institutional Class Shares of the Fund (BAGIX) posted a net return of 6.43% vs. a 5.53% return for the Bloomberg U.S. Aggregate Index.
Contributors to the Fund’s relative performance during the year include:
| | | • | Positive – Overweight investment grade credit |
| | | • | Positive – Active positioning within investment grade credit |
| | | | o | Positive – Overweight BBB industrials as well as subsector and security selection decisions within industrials (spread across many subsectors) |
| | | | o | Positive – Subsector and security selection within financials (e.g., favoring non-U.S. versus U.S. banks) |
| | | | o | Positive – Overweight financials/industrials and underweight non-corporate credit |
| | Securitized – Positive overall |
| | | • | Positive – Overweight non-agency RMBS, non-agency CMBS and ABS |
| | | • | Positive – Agency RMBS positioning |
| | | | o | Positive – Subsector and security selection decisions (e.g., favoring 20-year versus 30-year mortgages in lower coupon rates) |
| | | | o | Modest negative – Underweight agency RMBS, mitigated by increasing Fund exposure after spreads widened |
| | Yield Curve and Convexity – Positive |
| | | • | Positive – Positive convexity tilt of overall portfolio versus the benchmark |
| | | • | Neutral – Yield curve positioning |
The outlook for the fixed income markets in 2024 is favorable, thanks to an inflationary trend that is moving closer to the Fed’s 2% target and an acknowledgement, by both the Fed and the market, that the odds have shifted toward rate cuts rather than increases. Signs of economic slowing are emerging as monthly payroll growth has slowed and the U.S. unemployment rate has risen modestly. Outside of the U.S., geopolitical risks are elevated with an ongoing war in Ukraine, Israel’s full-scale campaign inside Gaza to defeat Hamas, non-state actor attacks on shipping in the Red Sea and U.S. interests in the Middle East, and relations between China and the U.S. strained, all of which, combined with the uncertain Fed outlook, will likely lead to continued elevated market volatility. We expect the spread volatility that was visible in 2023 to continue into 2024, benefitting the patient, active investor. Finally, 2024 is an election year, which is certain to add to market uncertainty as the year progresses; this uncertainty is likely to lead to short-term price volatility although the higher income from bonds can insulate investors from this volatility.
The Fund remains duration neutral and continues to maintain a modest overweight to investment grade corporate credit, favoring the financial sector relative to its benchmark. The Fund has a modest underweight to agency RMBS and we are maintaining the Fund’s overweight within non-agency securitized sub-sectors at the top of the capital structure given attractive valuations versus both agency RMBS and higher-rated segments of investment grade credit.
Baird Aggregate Bond Fund
December 31, 2023 (Unaudited)
Portfolio Characteristics
Quality Distribution(1)(2)
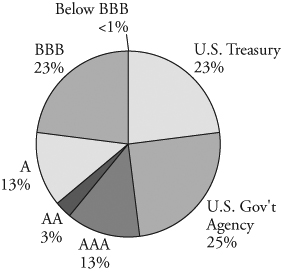
| | Net Assets | $42,905,521,032 | |
| | | | |
| | SEC 30-Day Yield(3) | | |
| | Institutional Class | 4.27% | |
| | Investor Class | 4.02% | |
| | | | |
| | Average Effective Duration | 6.24 years | |
| | | | |
| | Average Effective Maturity | 8.27 years | |
| | | | |
| | Annualized Expense Ratio(4) | | |
| | Institutional Class | 0.30% | |
| | Investor Class | 0.55% | (5) |
| | | | |
| | Portfolio Turnover Rate | 38% | |
| | | | |
| | | Number of Holdings | 1,757 | |
Sector Weightings(6) | | | | |
| | | | | |
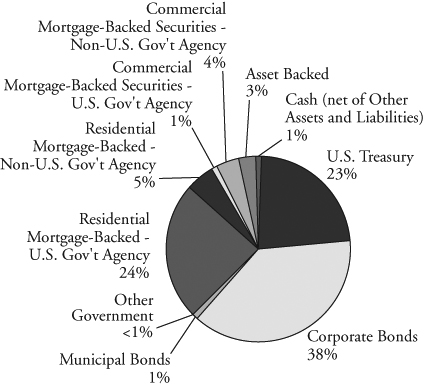
| | | | |
| | | | |
| | | | |
| | | | |
| | | | |
| | | | |
| | | | |
| | | | |
| | | | |
| | | | |
| | | | |
| | | | |
| | | | |
| | | | |
| | | | |
| | | | |
| | | | |
| | | | |
| | | | |
| | | | |
| | | | |
| | | | |
| | | | |
| | | | | |
(1) | Percentages shown are based on the Fund’s total investments. |
(2) | The quality profile is calculated on a market value-weighted basis using the highest credit quality rating for each security held by the Fund given by S&P, Moody’s or Fitch, each of which is a Nationally Recognized Statistical Rating Organization (NRSRO). NRSROs rate the credit quality of securities using a scale that generally ranges from AAA (highest) to D (lowest). |
(3) | SEC yields are based on SEC guidelines and are calculated for the 30 days ended December 31, 2023. |
(4) | Reflects expense ratios as stated in the Fund’s current prospectus dated May 1, 2023. |
(5) | Includes 0.25% 12b-1 fee. |
(6) | Percentages shown are based on the Fund’s total net assets. |
Baird Aggregate Bond Fund
December 31, 2023 (Unaudited)
| Institutional Class | Investor Class |
| Value of a $10,000 Investment | Value of a $10,000 Investment |
| | |
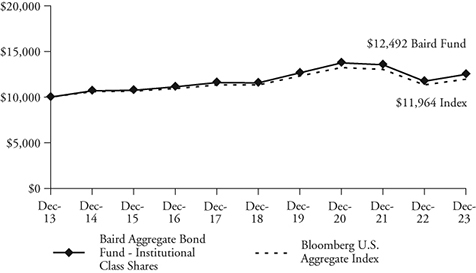 | 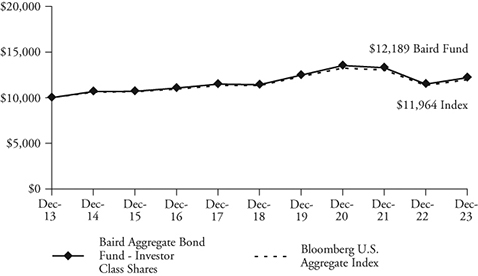 |
| | |
| Growth of a hypothetical investment of $10,000 made on 12/31/13, assuming | Growth of a hypothetical investment of $10,000 made on 12/31/13, assuming |
| reinvestment of all distributions. | reinvestment of all distributions. |
| Total Returns | | | | |
| | | Average Annual |
| | One | Five | Ten | Since |
| For the Periods Ended December 31, 2023 | Year | Years | Years | Inception(1) |
| Institutional Class Shares | 6.43% | 1.56% | 2.25% | 4.34% |
| Investor Class Shares | 6.13% | 1.31% | 2.00% | 4.09% |
Bloomberg U.S. Aggregate Index(2) | 5.53% | 1.10% | 1.81% | 3.87% |
(1) | For the period from September 29, 2000 (inception date) through December 31, 2023. |
(2) | The Bloomberg U.S. Aggregate Index is an unmanaged, market value weighted index of investment grade, fixed-rate debt issues, including government, corporate, asset-backed, mortgage-backed and commercial mortgage-backed securities, with maturities of at least one year. This Index does not reflect any deduction for fees, expenses or taxes. A direct investment in an index is not possible. |
The line graphs and the returns table shown above reflect reinvestment of dividends and/or capital gains distributions in additional shares. The returns in the graphs and table do not reflect the deduction of taxes that a shareholder would pay on Fund distributions or the redemption of Fund shares. The returns reflect the actual performance for each period and do not include the impact of trades executed on the last business day of the period that were recorded on the first business day of the next period.
The Fund’s expense ratio for each Class, as reflected in the Fund’s current prospectus, is set forth under “Portfolio Characteristics”.
The Fund maintains securities with longer maturities in order to provide a greater potential for return. Generally, the longer a bond’s maturity, the greater the interest rate risk. The Fund may also invest in U.S. dollar denominated foreign securities which involve additional risks such as political and economic instability, and different and sometimes less strict financial reporting standards and regulation. The Fund may also invest in mortgage- and asset-backed securities, which include interest rate and prepayment risks more pronounced than those of other fixed income securities. U.S. and international markets have experienced significant periods of volatility due to a number of economic, political and other global macro factors. The war between Ukraine and Russia is approaching its 2nd anniversary and the October 7th attack by Hamas and Israel’s response only added to global tensions. US/China relations remain strained, impacted by sluggish Chinese economic growth and numerous issues affecting trade relations. Domestically, inflation remains an area of focus since getting to the Fed’s 2% target may prove to be more challenging than the market expects. In addition, 2024 is an election year and the current level of political discord is high. Finally, while the coronavirus (COVID-19) appears to have entered an endemic stage, significant outbreaks present a continued risk to the global economy. These and other events may cause market disruptions and could have an adverse effect on the value of the Fund’s investments.
Past performance does not guarantee future results. Investment return and principal value will fluctuate so that an investor’s shares, when redeemed, may be worth more or less than their original cost.
For information about the performance of the Fund as of the most recent month-end, please call 1-866-442-2473 or visit www.bairdfunds.com. Mutual fund performance changes over time and current performance may be lower or higher than that stated.
Baird Aggregate Bond Fund
Schedule of Investments, December 31, 2023
Long-Term Investments
| | | Principal | | | | | | % of | |
| | | Amount | | | Value | | | Net Assets | |
| U.S. Treasury Securities | | | | | | | | | |
| U.S. Treasury Bonds: | | | | | | | | | |
| 4.125%, 06/15/2026 | | $ | 90,000,000 | | | $ | 90,024,610 | | | | |
| 4.500%, 07/15/2026 | | | 45,000,000 | | | | 45,434,180 | | | | |
| 4.375%, 08/15/2026 | | | 275,450,000 | | | | 277,408,279 | | | | |
| 1.125%, 10/31/2026 | | | 1,958,025,000 | | | | 1,807,731,289 | | | | |
| 1.125%, 08/31/2028 | | | 443,625,000 | | | | 392,088,250 | | | | |
| 2.375%, 03/31/2029 | | | 910,400,000 | | | | 846,174,120 | | | | |
| 3.875%, 12/31/2029 | | | 376,825,000 | | | | 376,648,363 | | | | |
| 4.125%, 08/31/2030 | | | 649,125,000 | | | | 658,202,611 | | | | |
| 1.250%, 08/15/2031 | | | 75,250,000 | | | | 62,378,135 | | | | |
| 2.875%, 05/15/2032 | | | 139,650,000 | | | | 129,645,387 | | | | |
| 3.500%, 02/15/2033 | | | 242,650,000 | | | | 235,768,596 | | | | |
| 1.375%, 11/15/2040 | | | 1,018,650,000 | | | | 678,675,563 | | | | |
| 2.250%, 05/15/2041 | | | 396,825,000 | | | | 303,447,117 | | | | |
| 2.375%, 02/15/2042 | | | 832,225,000 | | | | 641,073,320 | | | | |
| 3.375%, 08/15/2042 | | | 300,250,000 | | | | 268,735,478 | | | | |
| 2.875%, 05/15/2043 | | | 1,045,495,000 | | | | 861,594,060 | | | | |
| 2.500%, 02/15/2045 | | | 1,580,750,000 | | | | 1,201,987,473 | | | | |
| 1.250%, 05/15/2050 | | | 162,675,000 | | | | 88,162,224 | | | | |
| 1.375%, 08/15/2050 | | | 334,325,000 | | | | 187,352,594 | | | | |
| 2.875%, 05/15/2052 | | | 813,000,000 | | | | 650,527,031 | | | | |
| Total U.S. Treasury Securities | | | | | | | | | | | |
| (Cost $10,768,794,635) | | | | | | | 9,803,058,680 | | | | 22.9 | % |
| Other Government Related Securities | | | | | | | | | | | | |
| Freeport Indonesia PT, | | | | | | | | | | | | |
| 5.315%, 04/14/2032 | | | | | | | | | | | | |
(Callable 01/01/2032)(1)(2) | | | 15,000,000 | | | | 14,708,700 | | | | | |
| NBN Co. Ltd.: | | | | | | | | | | | | |
| 2.625%, 05/05/2031 | | | | | | | | | | | | |
(Callable 02/05/2031)(1)(2) | | | 18,625,000 | | | | 15,997,608 | | | | | |
| 2.500%, 01/08/2032 | | | | | | | | | | | | |
(Callable 10/08/2031)(1)(2) | | | 46,650,000 | | | | 39,138,447 | | | | | |
| Petroleos Mexicanos: | | | | | | | | | | | | |
| 5.950%, 01/28/2031 | | | | | | | | | | | | |
(Callable 10/28/2030)(1) | | | 558,000 | | | | 445,563 | | | | | |
| 6.700%, 02/16/2032 | | | | | | | | | | | | |
(Callable 11/16/2031)(1) | | | 1,020,000 | | | | 846,535 | | | | | |
6.350%, 02/12/2048(1) | | | 8,500,000 | | | | 5,385,979 | | | | | |
| Total Other Government | | | | | | | | | | | | |
| Related Securities | | | | | | | | | | | | |
| (Cost $89,295,137) | | | | | | | 76,522,832 | | | | 0.2 | % |
| Corporate Bonds | | | | | | | | | | | | |
| Industrials | | | | | | | | | | | | |
| AbbVie, Inc.: | | | | | | | | | | | | |
| 2.950%, 11/21/2026 | | | | | | | | | | | | |
| (Callable 09/21/2026) | | | 9,625,000 | | | | 9,234,081 | | | | | |
| 4.550%, 03/15/2035 | | | | | | | | | | | | |
| (Callable 09/15/2034) | | | 26,098,000 | | | | 25,638,851 | | | | | |
| 4.500%, 05/14/2035 | | | | | | | | | | | | |
| (Callable 11/14/2034) | | | 17,395,000 | | | | 17,051,936 | | | | | |
| 4.300%, 05/14/2036 | | | | | | | | | | | | |
| (Callable 11/14/2035) | | | 6,000,000 | | | | 5,761,046 | | | | | |
| 4.050%, 11/21/2039 | | | | | | | | | | | | |
| (Callable 05/21/2039) | | | 12,700,000 | | | | 11,510,405 | | | | | |
| Adventist Health System: | | | | | | | | | | | | |
| 2.952%, 03/01/2029 | | | | | | | | | | | | |
| (Callable 12/01/2028) | | | 19,250,000 | | | | 17,398,566 | | | | | |
| 3.630%, 03/01/2049 | | | | | | | | | | | | |
| (Callable 09/01/2048) | | | 9,000,000 | | | | 6,837,242 | | | | | |
| Agilent Technologies, Inc., | | | | | | | | | | | | |
| 2.100%, 06/04/2030 | | | | | | | | | | | | |
| (Callable 03/04/2030) | | | 14,000,000 | | | | 12,077,481 | | | | | |
| Air Products and Chemicals, Inc., | | | | | | | | | | | | |
| 2.700%, 05/15/2040 | | | | | | | | | | | | |
| (Callable 11/15/2039) | | | 10,425,000 | | | | 7,962,116 | | | | | |
| Aker BP ASA: | | | | | | | | | | | | |
| 5.600%, 06/13/2028 | | | | | | | | | | | | |
(Callable 05/13/2028)(1)(2) | | | 15,500,000 | | | | 15,814,317 | | | | | |
| 6.000%, 06/13/2033 | | | | | | | | | | | | |
(Callable 03/13/2033)(1)(2) | | | 16,500,000 | | | | 17,170,232 | | | | | |
| Alcon Finance Corp.: | | | | | | | | | | | | |
| 2.750%, 09/23/2026 | | | | | | | | | | | | |
(Callable 07/23/2026)(1)(2) | | | 14,770,000 | | | | 13,883,457 | | | | | |
| 3.800%, 09/23/2049 | | | | | | | | | | | | |
(Callable 03/23/2049)(1)(2) | | | 7,000,000 | | | | 5,669,371 | | | | | |
| Allegion PLC, | | | | | | | | | | | | |
| 3.500%, 10/01/2029 | | | | | | | | | | | | |
| (Callable 07/01/2029) | | | 21,494,000 | | | | 19,867,518 | | | | | |
| Allegion US Holding Co., Inc.: | | | | | | | | | | | | |
| 3.200%, 10/01/2024 | | | | | | | | | | | | |
| (Callable 08/01/2024) | | | 29,750,000 | | | | 29,150,464 | | | | | |
| 3.550%, 10/01/2027 | | | | | | | | | | | | |
| (Callable 07/01/2027) | | | 11,975,000 | | | | 11,385,443 | | | | | |
| 5.411%, 07/01/2032 | | | | | | | | | | | | |
| (Callable 04/01/2032) | | | 12,675,000 | | | | 12,994,261 | | | | | |
| Amgen, Inc.: | | | | | | | | | | | | |
| 3.150%, 02/21/2040 | | | | | | | | | | | | |
| (Callable 08/21/2039) | | | 13,350,000 | | | | 10,416,489 | | | | | |
| 4.400%, 05/01/2045 | | | | | | | | | | | | |
| (Callable 11/01/2044) | | | 12,300,000 | | | | 10,952,078 | | | | | |
| 4.200%, 02/22/2052 | | | | | | | | | | | | |
| (Callable 08/22/2051) | | | 4,000,000 | | | | 3,398,988 | | | | | |
| 5.650%, 03/02/2053 | | | | | | | | | | | | |
| (Callable 09/02/2052) | | | 36,925,000 | | | | 39,022,190 | | | | | |
| Anglo American Capital PLC: | | | | | | | | | | | | |
4.875%, 05/14/2025(1)(2) | | | 3,376,000 | | | | 3,349,816 | | | | | |
4.750%, 04/10/2027(1)(2) | | | 10,000,000 | | | | 9,874,503 | | | | | |
| 4.500%, 03/15/2028 | | | | | | | | | | | | |
(Callable 12/15/2027)(1)(2) | | | 2,570,000 | | | | 2,502,832 | | | | | |
| 5.625%, 04/01/2030 | | | | | | | | | | | | |
(Callable 01/01/2030)(1)(2) | | | 10,439,000 | | | | 10,610,977 | | | | | |
| 2.625%, 09/10/2030 | | | | | | | | | | | | |
(Callable 06/10/2030)(1)(2) | | | 35,000,000 | | | | 29,821,191 | | | | | |
| Anheuser-Busch InBev Worldwide, Inc.: | | | | | | | | | | | | |
| 4.750%, 01/23/2029 | | | | | | | | | | | | |
(Callable 10/23/2028)(1) | | | 4,075,000 | | | | 4,141,965 | | | | | |
| 4.375%, 04/15/2038 | | | | | | | | | | | | |
(Callable 10/15/2037)(1) | | | 7,000,000 | | | | 6,656,149 | | | | | |
| 5.450%, 01/23/2039 | | | | | | | | | | | | |
(Callable 07/23/2038)(1) | | | 20,000,000 | | | | 21,131,915 | | | | | |
| 4.900%, 02/01/2046 | | | | | | | | | | | | |
(Callable 08/01/2045)(1) | | | 52,184,000 | | | | 51,181,558 | | | | | |
| AP Moller - Maersk A/S, | | | | | | | | | | | | |
| 4.500%, 06/20/2029 | | | | | | | | | | | | |
(Callable 03/20/2029)(1)(2) | | | 8,000,000 | | | | 7,884,006 | | | | | |
| Apple, Inc., | | | | | | | | | | | | |
| 2.650%, 05/11/2050 | | | | | | | | | | | | |
| (Callable 11/11/2049) | | | 10,000,000 | | | | 6,911,030 | | | | | |
| AptarGroup, Inc., | | | | | | | | | | | | |
| 3.600%, 03/15/2032 | | | | | | | | | | | | |
| (Callable 12/15/2031) | | | 7,500,000 | | | | 6,762,107 | | | | | |
| ArcelorMittal: | | | | | | | | | | | | |
4.550%, 03/11/2026(1) | | | 13,000,000 | | | | 12,803,645 | | | | | |
| 6.550%, 11/29/2027 | | | | | | | | | | | | |
(Callable 10/29/2027)(1) | | | 14,600,000 | | | | 15,341,039 | | | | | |
The accompanying notes are an integral part of these financial statements.
Baird Aggregate Bond Fund
Schedule of Investments, December 31, 2023
Long-Term Investments (cont.)
| | | Principal | | | | | | % of | |
| | | Amount | | | Value | | | Net Assets | |
| ArcelorMittal: (cont.) | | | | | | | | | |
| 6.800%, 11/29/2032 | | | | | | | | | |
(Callable 08/29/2032)(1) | | $ | 25,000,000 | | | $ | 27,082,639 | | | |
| |
7.000%, 10/15/2039(1) | | | 15,906,000 | | | | 17,257,492 | | | | | |
| Ashtead Capital, Inc.: | | | | | | | | | | | | |
| 4.000%, 05/01/2028 | | | | | | | | | | | | |
(Callable 01/09/2024)(1)(2) | | | 8,010,000 | | | | 7,543,510 | | | | | |
| 5.500%, 08/11/2032 | | | | | | | | | | | | |
(Callable 05/11/2032)(1)(2) | | | 28,369,000 | | | | 28,074,548 | | | | | |
| 5.550%, 05/30/2033 | | | | | | | | | | | | |
(Callable 02/28/2033)(1)(2) | | | 15,000,000 | | | | 14,874,768 | | | | | |
| 5.950%, 10/15/2033 | | | | | | | | | | | | |
(Callable 07/15/2033)(1)(2) | | | 10,000,000 | | | | 10,207,290 | | | | | |
| AT&T, Inc.: | | | | | | | | | | | | |
| 2.550%, 12/01/2033 | | | | | | | | | | | | |
| (Callable 09/01/2033) | | | 22,965,000 | | | | 18,735,347 | | | | | |
| 5.400%, 02/15/2034 | | | | | | | | | | | | |
| (Callable 11/15/2033) | | | 12,000,000 | | | | 12,400,748 | | | | | |
| 4.900%, 08/15/2037 | | | | | | | | | | | | |
| (Callable 02/14/2037) | | | 20,000,000 | | | | 19,367,876 | | | | | |
| 3.500%, 09/15/2053 | | | | | | | | | | | | |
| (Callable 03/15/2053) | | | 10,000,000 | | | | 7,289,926 | | | | | |
| 3.550%, 09/15/2055 | | | | | | | | | | | | |
| (Callable 03/15/2055) | | | 60,110,000 | | | | 43,458,051 | | | | | |
| 3.800%, 12/01/2057 | | | | | | | | | | | | |
| (Callable 06/01/2057) | | | 19,423,000 | | | | 14,502,870 | | | | | |
| 3.650%, 09/15/2059 | | | | | | | | | | | | |
| (Callable 03/15/2059) | | | 49,359,000 | | | | 35,527,911 | | | | | |
| Bacardi Ltd., | | | | | | | | | | | | |
| 5.400%, 06/15/2033 | | | | | | | | | | | | |
(Callable 03/15/2033)(1)(2) | | | 15,000,000 | | | | 15,119,377 | | | | | |
| BAE Systems PLC, | | | | | | | | | | | | |
| 1.900%, 02/15/2031 | | | | | | | | | | | | |
(Callable 11/15/2030)(1)(2) | | | 18,500,000 | | | | 15,230,568 | | | | | |
| Bayer US Finance II LLC: | | | | | | | | | | | | |
5.500%, 08/15/2025(1)(2) | | | 14,400,000 | | | | 14,249,149 | | | | | |
| 4.250%, 12/15/2025 | | | | | | | | | | | | |
(Callable 10/15/2025)(1)(2) | | | 14,440,000 | | | | 14,073,709 | | | | | |
| Bayer US Finance LLC, | | | | | | | | | | | | |
| 6.250%, 01/21/2029 | | | | | | | | | | | | |
(Callable 12/21/2028)(1)(2) | | | 15,000,000 | | | | 15,347,070 | | | | | |
| Bayport Polymers LLC, | | | | | | | | | | | | |
| 4.743%, 04/14/2027 | | | | | | | | | | | | |
(Callable 03/14/2027)(2) | | | 61,325,000 | | | | 58,572,892 | | | | | |
| Becle SAB de, | | | | | | | | | | | | |
| 2.500%, 10/14/2031 | | | | | | | | | | | | |
(Callable 07/14/2031)(1)(2) | | | 39,193,000 | | | | 31,539,783 | | | | | |
| Becton Dickinson and Co.: | | | | | | | | | | | | |
| 3.734%, 12/15/2024 | | | | | | | | | | | | |
| (Callable 09/15/2024) | | | 1,094,000 | | | | 1,076,608 | | | | | |
| 2.823%, 05/20/2030 | | | | | | | | | | | | |
| (Callable 02/20/2030) | | | 15,000,000 | | | | 13,422,715 | | | | | |
| 4.875%, 05/15/2044 | | | | | | | | | | | | |
| (Callable 11/15/2043) | | | 6,815,000 | | | | 6,154,523 | | | | | |
| Bell Canada, Inc.: | | | | | | | | | | | | |
| 5.100%, 05/11/2033 | | | | | | | | | | | | |
(Callable 02/11/2033)(1) | | | 11,000,000 | | | | 11,306,665 | | | | | |
| 4.464%, 04/01/2048 | | | | | | | | | | | | |
(Callable 10/01/2047)(1) | | | 1,225,000 | | | | 1,104,766 | | | | | |
| 4.300%, 07/29/2049 | | | | | | | | | | | | |
(Callable 01/29/2049)(1) | | | 4,123,000 | | | | 3,539,528 | | | | | |
| Berry Global, Inc., | | | | | | | | | | | | |
| 5.500%, 04/15/2028 | | | | | | | | | | | | |
(Callable 03/15/2028)(2) | | | 19,345,000 | | | | 19,593,593 | | | | | |
| Bimbo Bakeries USA, Inc., | | | | | | | | | | | | |
| 4.000%, 05/17/2051 | | | | | | | | | | | | |
(Callable 11/17/2050)(1)(2) | | | 20,009,000 | | | | 16,086,231 | | | | | |
| Boardwalk Pipelines LP: | | | | | | | | | | | | |
| 4.950%, 12/15/2024 | | | | | | | | | | | | |
| (Callable 09/15/2024) | | | 27,631,000 | | | | 27,421,979 | | | | | |
| 5.950%, 06/01/2026 | | | | | | | | | | | | |
| (Callable 03/01/2026) | | | 28,506,000 | | | | 28,914,618 | | | | | |
| 4.450%, 07/15/2027 | | | | | | | | | | | | |
| (Callable 04/15/2027) | | | 14,877,000 | | | | 14,596,399 | | | | | |
| 4.800%, 05/03/2029 | | | | | | | | | | | | |
| (Callable 02/03/2029) | | | 16,918,000 | | | | 16,588,336 | | | | | |
| 3.400%, 02/15/2031 | | | | | | | | | | | | |
| (Callable 11/15/2030) | | | 5,825,000 | | | | 5,218,852 | | | | | |
| 3.600%, 09/01/2032 | | | | | | | | | | | | |
| (Callable 06/01/2032) | | | 25,550,000 | | | | 22,722,692 | | | | | |
| Boeing Co.: | | | | | | | | | | | | |
| 2.196%, 02/04/2026 | | | | | | | | | | | | |
| (Callable 01/09/2024) | | | 47,500,000 | | | | 44,897,284 | | | | | |
| 5.040%, 05/01/2027 | | | | | | | | | | | | |
| (Callable 03/01/2027) | | | 5,140,000 | | | | 5,188,199 | | | | | |
| 5.150%, 05/01/2030 | | | | | | | | | | | | |
| (Callable 02/01/2030) | | | 26,150,000 | | | | 26,655,678 | | | | | |
| Bon Secours Mercy Health, Inc.: | | | | | | | | | | | | |
| 3.464%, 06/01/2030 | | | | | | | | | | | | |
| (Callable 12/01/2029) | | | 8,000,000 | | | | 7,312,519 | | | | | |
| 3.205%, 06/01/2050 | | | | | | | | | | | | |
| (Callable 12/01/2049) | | | 10,800,000 | | | | 7,666,166 | | | | | |
| BP Capital Markets America, Inc.: | | | | | | | | | | | | |
| 4.812%, 02/13/2033 | | | | | | | | | | | | |
(Callable 11/13/2032)(1) | | | 7,600,000 | | | | 7,677,578 | | | | | |
| 4.893%, 09/11/2033 | | | | | | | | | | | | |
(Callable 06/11/2033)(1) | | | 8,350,000 | | | | 8,509,961 | | | | | |
| Bristol-Myers Squibb Co., | | | | | | | | | | | | |
| 3.700%, 03/15/2052 | | | | | | | | | | | | |
| (Callable 09/15/2051) | | | 10,000,000 | | | | 7,891,425 | | | | | |
| British Telecommunications PLC, | | | | | | | | | | | | |
9.625%, 12/15/2030(1) | | | 47,015,000 | | | | 58,246,489 | | | | | |
| Broadcom, Inc.: | | | | | | | | | | | | |
| 3.150%, 11/15/2025 | | | | | | | | | | | | |
| (Callable 10/15/2025) | | | 23,600,000 | | | | 22,867,901 | | | | | |
| 4.000%, 04/15/2029 | | | | | | | | | | | | |
(Callable 02/15/2029)(2) | | | 6,000,000 | | | | 5,797,204 | | | | | |
| 4.750%, 04/15/2029 | | | | | | | | | | | | |
| (Callable 01/15/2029) | | | 43,900,000 | | | | 44,039,305 | | | | | |
| 5.000%, 04/15/2030 | | | | | | | | | | | | |
| (Callable 01/15/2030) | | | 11,000,000 | | | | 11,173,813 | | | | | |
| 4.150%, 11/15/2030 | | | | | | | | | | | | |
| (Callable 08/15/2030) | | | 6,000,000 | | | | 5,739,381 | | | | | |
| 4.150%, 04/15/2032 | | | | | | | | | | | | |
(Callable 01/15/2032)(2) | | | 18,000,000 | | | | 17,007,146 | | | | | |
| 3.469%, 04/15/2034 | | | | | | | | | | | | |
(Callable 01/15/2034)(2) | | | 15,000,000 | | | | 13,073,072 | | | | | |
| 3.137%, 11/15/2035 | | | | | | | | | | | | |
(Callable 08/15/2035)(2) | | | 12,000,000 | | | | 9,875,434 | | | | | |
| 3.500%, 02/15/2041 | | | | | | | | | | | | |
(Callable 08/15/2040)(2) | | | 21,000,000 | | | | 16,704,793 | | | | | |
| Broadridge Financial Solutions, Inc., | | | | | | | | | | | | |
| 2.900%, 12/01/2029 | | | | | | | | | | | | |
| (Callable 09/01/2029) | | | 11,300,000 | | | | 10,128,692 | | | | | |
| Bunge Limited Finance Corp.: | | | | | | | | | | | | |
| 1.630%, 08/17/2025 | | | | | | | | | | | | |
| (Callable 07/17/2025) | | | 10,000,000 | | | | 9,452,739 | | | | | |
The accompanying notes are an integral part of these financial statements.
Baird Aggregate Bond Fund
Schedule of Investments, December 31, 2023
Long-Term Investments (cont.)
| | | Principal | | | | | | % of | |
| | | Amount | | | Value | | | Net Assets | |
| Bunge Limited Finance Corp.: (cont.) | | | | | | | | | |
| 3.250%, 08/15/2026 | | | | | | | | | |
| (Callable 05/15/2026) | | $ | 11,550,000 | | | $ | 11,092,705 | | | |
| |
| Burlington Northern Santa Fe LLC, | | | | | | | | | | | | |
| 4.150%, 04/01/2045 | | | | | | | | | | | | |
| (Callable 10/01/2044) | | | 3,000,000 | | | | 2,673,488 | | | | | |
| Cameron LNG LLC, | | | | | | | | | | | | |
| 3.302%, 01/15/2035 | | | | | | | | | | | | |
(Callable 09/15/2034)(2) | | | 20,000,000 | | | | 17,049,442 | | | | | |
| Campbell Soup Co., | | | | | | | | | | | | |
| 3.950%, 03/15/2025 | | | | | | | | | | | | |
| (Callable 01/15/2025) | | | 10,425,000 | | | | 10,262,828 | | | | | |
| Canadian Natural Resources Ltd., | | | | | | | | | | | | |
6.500%, 02/15/2037(1) | | | 982,000 | | | | 1,045,907 | | | | | |
| Canadian Pacific Railway Co.: | | | | | | | | | | | | |
| 4.700%, 05/01/2048 | | | | | | | | | | | | |
(Callable 11/01/2047)(1) | | | 10,075,000 | | | | 9,187,545 | | | | | |
| 3.500%, 05/01/2050 | | | | | | | | | | | | |
(Callable 11/01/2049)(1) | | | 12,000,000 | | | | 9,251,425 | | | | | |
| Cargill, Inc., | | | | | | | | | | | | |
| 4.750%, 04/24/2033 | | | | | | | | | | | | |
(Callable 01/24/2033)(2) | | | 10,200,000 | | | | 10,259,643 | | | | | |
| Carlisle Companies, Inc.: | | | | | | | | | | | | |
| 3.500%, 12/01/2024 | | | | | | | | | | | | |
| (Callable 10/01/2024) | | | 5,000,000 | | | | 4,903,727 | | | | | |
| 2.750%, 03/01/2030 | | | | | | | | | | | | |
| (Callable 12/01/2029) | | | 16,000,000 | | | | 14,198,102 | | | | | |
| Carrier Global Corp.: | | | | | | | | | | | | |
| 2.242%, 02/15/2025 | | | | | | | | | | | | |
| (Callable 01/15/2025) | | | 1,130,000 | | | | 1,095,176 | | | | | |
| 2.493%, 02/15/2027 | | | | | | | | | | | | |
| (Callable 12/15/2026) | | | 25,975,000 | | | | 24,436,889 | | | | | |
| 2.722%, 02/15/2030 | | | | | | | | | | | | |
| (Callable 11/15/2029) | | | 6,861,000 | | | | 6,147,123 | | | | | |
| 2.700%, 02/15/2031 | | | | | | | | | | | | |
| (Callable 11/15/2030) | | | 18,500,000 | | | | 16,190,677 | | | | | |
| 5.900%, 03/15/2034 | | | | | | | | | | | | |
(Callable 12/15/2033)(2) | | | 15,000,000 | | | | 16,262,403 | | | | | |
| 3.377%, 04/05/2040 | | | | | | | | | | | | |
| (Callable 10/05/2039) | | | 10,000,000 | | | | 8,049,880 | | | | | |
| 6.200%, 03/15/2054 | | | | | | | | | | | | |
(Callable 09/15/2053)(2) | | | 4,950,000 | | | | 5,750,137 | | | | | |
| CBRE Services, Inc., | | | | | | | | | | | | |
| 5.950%, 08/15/2034 | | | | | | | | | | | | |
| (Callable 05/15/2034) | | | 20,000,000 | | | | 20,978,140 | | | | | |
| CCL Industries, Inc., | | | | | | | | | | | | |
| 3.050%, 06/01/2030 | | | | | | | | | | | | |
(Callable 03/01/2030)(1)(2) | | | 20,000,000 | | | | 17,567,274 | | | | | |
| CDW LLC / CDW Finance Corp., | | | | | | | | | | | | |
| 2.670%, 12/01/2026 | | | | | | | | | | | | |
| (Callable 11/01/2026) | | | 9,000,000 | | | | 8,416,440 | | | | | |
| Celanese US Holdings LLC: | | | | | | | | | | | | |
| 3.500%, 05/08/2024 | | | | | | | | | | | | |
| (Callable 04/08/2024) | | | 9,372,000 | | | | 9,284,103 | | | | | |
| 6.330%, 07/15/2029 | | | | | | | | | | | | |
| (Callable 05/15/2029) | | | 8,675,000 | | | | 9,099,549 | | | | | |
| 6.550%, 11/15/2030 | | | | | | | | | | | | |
| (Callable 09/15/2030) | | | 15,000,000 | | | | 15,878,406 | | | | | |
| Cellnex Finance Co., | | | | | | | | | | | | |
| 3.875%, 07/07/2041 | | | | | | | | | | | | |
(Callable 04/07/2041)(1)(2) | | | 51,774,000 | | | | 40,102,587 | | | | | |
| Celulosa Arauco y Constitucion SA, | | | | | | | | | | | | |
| 3.875%, 11/02/2027 | | | | | | | | | | | | |
(Callable 08/02/2027)(1) | | | 12,000,000 | | | | 11,229,928 | | | | | |
| CF Industries, Inc., | | | | | | | | | | | | |
| 5.150%, 03/15/2034 | | | 3,000,000 | | | | 2,973,504 | | | | | |
| Charter Communications | | | | | | | | | | | | |
| Operating LLC: | | | | | | | | | | | | |
| 4.908%, 07/23/2025 | | | | | | | | | | | | |
| (Callable 04/23/2025) | | | 54,750,000 | | | | 54,239,075 | | | | | |
| 3.750%, 02/15/2028 | | | | | | | | | | | | |
| (Callable 11/15/2027) | | | 5,000,000 | | | | 4,722,236 | | | | | |
| 5.050%, 03/30/2029 | | | | | | | | | | | | |
| (Callable 12/30/2028) | | | 36,857,000 | | | | 36,517,738 | | | | | |
| 2.300%, 02/01/2032 | | | | | | | | | | | | |
| (Callable 11/01/2031) | | | 15,525,000 | | | | 12,374,997 | | | | | |
| 6.650%, 02/01/2034 | | | | | | | | | | | | |
| (Callable 11/01/2033) | | | 14,575,000 | | | | 15,405,345 | | | | | |
| 6.384%, 10/23/2035 | | | | | | | | | | | | |
| (Callable 04/23/2035) | | | 40,506,000 | | | | 41,201,545 | | | | | |
| 3.500%, 06/01/2041 | | | | | | | | | | | | |
| (Callable 12/01/2040) | | | 22,225,000 | | | | 15,755,509 | | | | | |
| 3.500%, 03/01/2042 | | | | | | | | | | | | |
| (Callable 09/01/2041) | | | 11,050,000 | | | | 7,711,333 | | | | | |
| 4.400%, 12/01/2061 | | | | | | | | | | | | |
| (Callable 06/01/2061) | | | 24,375,000 | | | | 16,913,690 | | | | | |
| Cheniere Corpus Christi Holdings LLC, | | | | | | | | | | | | |
| 5.875%, 03/31/2025 | | | | | | | | | | | | |
| (Callable 10/02/2024) | | | 5,646,000 | | | | 5,658,603 | | | | | |
| Cheniere Energy Partners LP, | | | | | | | | | | | | |
| 5.950%, 06/30/2033 | | | | | | | | | | | | |
(Callable 12/30/2032)(2) | | | 26,000,000 | | | | 26,673,660 | | | | | |
| Church & Dwight Co., Inc., | | | | | | | | | | | | |
| 5.000%, 06/15/2052 | | | | | | | | | | | | |
| (Callable 12/15/2051) | | | 6,725,000 | | | | 6,763,497 | | | | | |
| Cia Cervecerias Unidas SA, | | | | | | | | | | | | |
| 3.350%, 01/19/2032 | | | | | | | | | | | | |
(Callable 10/19/2031)(1)(2) | | | 25,000,000 | | | | 21,525,000 | | | | | |
| Cigna Corp.: | | | | | | | | | | | | |
| 4.125%, 11/15/2025 | | | | | | | | | | | | |
| (Callable 09/15/2025) | | | 3,190,000 | | | | 3,149,330 | | | | | |
| 4.500%, 02/25/2026 | | | | | | | | | | | | |
| (Callable 11/27/2025) | | | 9,810,000 | | | | 9,742,174 | | | | | |
| 2.400%, 03/15/2030 | | | | | | | | | | | | |
| (Callable 12/15/2029) | | | 15,000,000 | | | | 13,153,148 | | | | | |
| 4.800%, 08/15/2038 | | | | | | | | | | | | |
| (Callable 02/15/2038) | | | 5,000,000 | | | | 4,846,444 | | | | | |
| CNH Industrial Capital LLC, | | | | | | | | | | | | |
| 1.875%, 01/15/2026 | | | | | | | | | | | | |
(Callable 12/15/2025)(1) | | | 20,000,000 | | | | 18,747,706 | | | | | |
| CNH Industrial NV, | | | | | | | | | | | | |
| 3.850%, 11/15/2027 | | | | | | | | | | | | |
(Callable 08/15/2027)(1) | | | 23,656,000 | | | | 22,789,978 | | | | | |
| Columbia Pipeline Group, Inc.: | | | | | | | | | | | | |
| 4.500%, 06/01/2025 | | | | | | | | | | | | |
(Callable 03/01/2025)(1) | | | 6,199,000 | | | | 6,120,615 | | | | | |
| 5.800%, 06/01/2045 | | | | | | | | | | | | |
(Callable 12/01/2044)(1) | | | 10,776,000 | | | | 10,759,407 | | | | | |
| Columbia Pipelines Operating Co. LLC: | | | | | | | | | | | | |
| 6.036%, 11/15/2033 | | | | | | | | | | | | |
(Callable 08/15/2033)(1)(2) | | | 17,300,000 | | | | 18,146,995 | | | | | |
| 6.497%, 08/15/2043 | | | | | | | | | | | | |
(Callable 02/15/2043)(1)(2) | | | 10,000,000 | | | | 10,743,053 | | | | | |
| Comcast Corp.: | | | | | | | | | | | | |
| 3.300%, 04/01/2027 | | | | | | | | | | | | |
| (Callable 02/01/2027) | | | 9,125,000 | | | | 8,803,346 | | | | | |
| 3.200%, 07/15/2036 | | | | | | | | | | | | |
| (Callable 01/15/2036) | | | 6,000,000 | | | | 5,058,418 | | | | | |
The accompanying notes are an integral part of these financial statements.
Baird Aggregate Bond Fund
Schedule of Investments, December 31, 2023
Long-Term Investments (cont.)
| | | Principal | | | | | | % of | |
| | | Amount | | | Value | | | Net Assets | |
| Comcast Corp.: (cont.) | | | | | | | | | |
| 3.969%, 11/01/2047 | | | | | | | | | |
| (Callable 05/01/2047) | | $ | 8,622,000 | | | $ | 7,263,913 | | | |
| |
| 5.350%, 05/15/2053 | | | | | | | | | | | | |
| (Callable 11/15/2052) | | | 19,000,000 | | | | 19,741,549 | | | | | |
| 2.987%, 11/01/2063 | | | | | | | | | | | | |
| (Callable 05/01/2063) | | | 14,646,000 | | | | 9,493,845 | | | | | |
| CommonSpirit Health, | | | | | | | | | | | | |
| 3.347%, 10/01/2029 | | | | | | | | | | | | |
| (Callable 04/01/2029) | | | 17,635,000 | | | | 16,120,557 | | | | | |
| Conagra Brands, Inc.: | | | | | | | | | | | | |
| 7.125%, 10/01/2026 | | | 6,441,000 | | | | 6,798,930 | | | | | |
| 7.000%, 10/01/2028 | | | 4,300,000 | | | | 4,637,409 | | | | | |
| 5.300%, 11/01/2038 | | | | | | | | | | | | |
| (Callable 05/01/2038) | | | 5,000,000 | | | | 4,905,126 | | | | | |
| Concentrix Corp., | | | | | | | | | | | | |
| 6.600%, 08/02/2028 | | | | | | | | | | | | |
| (Callable 07/02/2028) | | | 15,000,000 | | | | 15,438,074 | | | | | |
| Constellation Brands, Inc., | | | | | | | | | | | | |
| 4.900%, 05/01/2033 | | | | | | | | | | | | |
| (Callable 02/01/2033) | | | 7,950,000 | | | | 8,012,234 | | | | | |
| Corning, Inc., | | | | | | | | | | | | |
| 4.375%, 11/15/2057 | | | | | | | | | | | | |
| (Callable 05/15/2057) | | | 9,000,000 | | | | 7,904,259 | | | | | |
| Cox Communications, Inc.: | | | | | | | | | | | | |
| 3.850%, 02/01/2025 | | | | | | | | | | | | |
(Callable 11/01/2024)(2) | | | 4,725,000 | | | | 4,643,903 | | | | | |
| 3.350%, 09/15/2026 | | | | | | | | | | | | |
(Callable 06/15/2026)(2) | | | 25,300,000 | | | | 24,293,751 | | | | | |
| 5.700%, 06/15/2033 | | | | | | | | | | | | |
(Callable 03/15/2033)(2) | | | 5,900,000 | | | | 6,147,237 | | | | | |
| 4.800%, 02/01/2035 | | | | | | | | | | | | |
(Callable 08/01/2034)(2) | | | 14,000,000 | | | | 13,143,869 | | | | | |
| 3.600%, 06/15/2051 | | | | | | | | | | | | |
(Callable 12/15/2050)(2) | | | 21,000,000 | | | | 15,348,045 | | | | | |
| Crown Castle, Inc., | | | | | | | | | | | | |
| 5.100%, 05/01/2033 | | | | | | | | | | | | |
| (Callable 02/01/2033) | | | 20,400,000 | | | | 20,265,737 | | | | | |
| CSL Finance PLC, | | | | | | | | | | | | |
| 4.050%, 04/27/2029 | | | | | | | | | | | | |
(Callable 02/27/2029)(2) | | | 7,500,000 | | | | 7,297,389 | | | | | |
| CSX Corp., | | | | | | | | | | | | |
| 4.650%, 03/01/2068 | | | | | | | | | | | | |
| (Callable 09/01/2067) | | | 9,000,000 | | | | 8,291,147 | | | | | |
| CVS Health Corp.: | | | | | | | | | | | | |
| 3.625%, 04/01/2027 | | | | | | | | | | | | |
| (Callable 02/01/2027) | | | 3,000,000 | | | | 2,909,174 | | | | | |
| 3.250%, 08/15/2029 | | | | | | | | | | | | |
| (Callable 05/15/2029) | | | 8,000,000 | | | | 7,458,086 | | | | | |
| 5.300%, 06/01/2033 | | | | | | | | | | | | |
| (Callable 03/01/2033) | | | 6,500,000 | | | | 6,682,281 | | | | | |
| 4.780%, 03/25/2038 | | | | | | | | | | | | |
| (Callable 09/25/2037) | | | 40,059,000 | | | | 38,050,829 | | | | | |
| 2.700%, 08/21/2040 | | | | | | | | | | | | |
| (Callable 02/21/2040) | | | 5,000,000 | | | | 3,577,012 | | | | | |
| 5.125%, 07/20/2045 | | | | | | | | | | | | |
| (Callable 01/20/2045) | | | 44,155,000 | | | | 41,907,350 | | | | | |
| 5.050%, 03/25/2048 | | | | | | | | | | | | |
| (Callable 09/25/2047) | | | 42,300,000 | | | | 39,746,247 | | | | | |
| 5.875%, 06/01/2053 | | | | | | | | | | | | |
| (Callable 12/01/2052) | | | 9,000,000 | | | | 9,500,920 | | | | | |
| Dell International LLC / EMC Corp.: | | | | | | | | | | | | |
| 6.020%, 06/15/2026 | | | | | | | | | | | | |
| (Callable 03/15/2026) | | | 41,995,000 | | | | 42,987,611 | | | | | |
| Dell International LLC / | | | | | | | | | | | | |
| EMC Corp.: (cont.) | | | | | | | | | | | | |
| 5.300%, 10/01/2029 | | | | | | | | | | | | |
| (Callable 07/01/2029) | | | 6,000,000 | | | | 6,184,147 | | | | | |
| Dentsply Sirona, | | | | | | | | | | | | |
| 3.250%, 06/01/2030 | | | | | | | | | | | | |
| (Callable 03/01/2030) | | | 27,000,000 | | | | 23,912,102 | | | | | |
| Deutsche Telekom | | | | | | | | | | | | |
| International Finance BV, | | | | | | | | | | | | |
8.750%, 06/15/2030(1) | | | 8,661,000 | | | | 10,453,744 | | | | | |
| Dignity Health, | | | | | | | | | | | | |
| 5.267%, 11/01/2064 | | | 2,921,000 | | | | 2,710,867 | | | | | |
| Dollar General Corp., | | | | | | | | | | | | |
| 3.500%, 04/03/2030 | | | | | | | | | | | | |
| (Callable 01/03/2030) | | | 7,000,000 | | | | 6,455,654 | | | | | |
| DuPont de Nemours, Inc.: | | | | | | | | | | | | |
| 4.493%, 11/15/2025 | | | | | | | | | | | | |
| (Callable 09/15/2025) | | | 10,000,000 | | | | 9,928,084 | | | | | |
| 5.319%, 11/15/2038 | | | | | | | | | | | | |
| (Callable 05/15/2038) | | | 29,000,000 | | | | 29,851,100 | | | | | |
| DXC Technology Co.: | | | | | | | | | | | | |
| 1.800%, 09/15/2026 | | | | | | | | | | | | |
| (Callable 08/15/2026) | | | 29,000,000 | | | | 26,501,047 | | | | | |
| 2.375%, 09/15/2028 | | | | | | | | | | | | |
| (Callable 07/15/2028) | | | 79,050,000 | | | | 69,236,693 | | | | | |
| Eagle Materials, Inc., | | | | | | | | | | | | |
| 2.500%, 07/01/2031 | | | | | | | | | | | | |
| (Callable 04/01/2031) | | | 8,700,000 | | | | 7,405,633 | | | | | |
| Eastern Gas Transmission | | | | | | | | | | | | |
| & Storage, Inc.: | | | | | | | | | | | | |
| 4.800%, 11/01/2043 | | | | | | | | | | | | |
| (Callable 05/01/2043) | | | 4,017,000 | | | | 3,633,752 | | | | | |
| 4.600%, 12/15/2044 | | | | | | | | | | | | |
| (Callable 06/15/2044) | | | 3,674,000 | | | | 3,131,781 | | | | | |
| Eaton Corp., | | | | | | | | | | | | |
| 4.700%, 08/23/2052 | | | | | | | | | | | | |
| (Callable 02/23/2052) | | | 6,325,000 | | | | 6,254,623 | | | | | |
| Element Fleet Management Corp.: | | | | | | | | | | | | |
| 3.850%, 06/15/2025 | | | | | | | | | | | | |
(Callable 05/15/2025)(1)(2) | | | 18,492,000 | | | | 17,969,187 | | | | | |
| 6.271%, 06/26/2026 | | | | | | | | | | | | |
(Callable 05/26/2026)(1)(2) | | | 40,000,000 | | | | 40,757,588 | | | | | |
| 6.319%, 12/04/2028 | | | | | | | | | | | | |
(Callable 11/04/2028)(1)(2) | | | 9,225,000 | | | | 9,535,836 | | | | | |
| Enbridge Energy Partners LP: | | | | | | | | | | | | |
7.500%, 04/15/2038(1) | | | 4,500,000 | | | | 5,242,663 | | | | | |
| 7.375%, 10/15/2045 | | | | | | | | | | | | |
(Callable 04/15/2045)(1) | | | 20,000,000 | | | | 23,589,716 | | | | | |
| Enbridge, Inc., | | | | | | | | | | | | |
| 6.200%, 11/15/2030 | | | | | | | | | | | | |
(Callable 09/15/2030)(1) | | | 8,725,000 | | | | 9,348,107 | | | | | |
| Energy Transfer LP: | | | | | | | | | | | | |
| 3.900%, 07/15/2026 | | | | | | | | | | | | |
| (Callable 04/15/2026) | | | 10,000,000 | | | | 9,723,005 | | | | | |
| 5.500%, 06/01/2027 | | | | | | | | | | | | |
| (Callable 03/01/2027) | | | 7,019,000 | | | | 7,109,758 | | | | | |
| 4.000%, 10/01/2027 | | | | | | | | | | | | |
| (Callable 07/01/2027) | | | 2,000,000 | | | | 1,926,532 | | | | | |
| 6.000%, 02/01/2029 | | | | | | | | | | | | |
(Callable 02/01/2024)(2) | | | 44,900,000 | | | | 45,303,368 | | | | | |
| 5.250%, 04/15/2029 | | | | | | | | | | | | |
| (Callable 01/15/2029) | | | 22,666,000 | | | | 22,860,507 | | | | | |
| 3.750%, 05/15/2030 | | | | | | | | | | | | |
| (Callable 02/15/2030) | | | 2,775,000 | | | | 2,581,362 | | | | | |
The accompanying notes are an integral part of these financial statements.
Baird Aggregate Bond Fund
Schedule of Investments, December 31, 2023
Long-Term Investments (cont.)
| | | Principal | | | | | | % of | |
| | | Amount | | | Value | | | Net Assets | |
| Energy Transfer LP: (cont.) | | | | | | | | | |
| 7.375%, 02/01/2031 | | | | | | | | | |
(Callable 02/01/2026)(2) | | $ | 10,450,000 | | | $ | 10,982,278 | | | |
| |
| 4.900%, 03/15/2035 | | | | | | | | | | | | |
| (Callable 09/15/2034) | | | 4,550,000 | | | | 4,340,533 | | | | | |
| 6.625%, 10/15/2036 | | | 15,094,000 | | | | 16,263,351 | | | | | |
| 5.800%, 06/15/2038 | | | | | | | | | | | | |
| (Callable 12/15/2037) | | | 9,539,000 | | | | 9,541,706 | | | | | |
| 7.500%, 07/01/2038 | | | 20,729,000 | | | | 24,043,488 | | | | | |
| 6.050%, 06/01/2041 | | | | | | | | | | | | |
| (Callable 12/01/2040) | | | 1,611,000 | | | | 1,622,096 | | | | | |
| 6.500%, 02/01/2042 | | | | | | | | | | | | |
| (Callable 08/01/2041) | | | 7,603,000 | | | | 8,052,498 | | | | | |
| 5.950%, 10/01/2043 | | | | | | | | | | | | |
| (Callable 04/01/2043) | | | 3,550,000 | | | | 3,504,671 | | | | | |
| 6.125%, 12/15/2045 | | | | | | | | | | | | |
| (Callable 06/15/2045) | | | 5,797,000 | | | | 5,854,654 | | | | | |
| 5.400%, 10/01/2047 | | | | | | | | | | | | |
| (Callable 04/01/2047) | | | 7,425,000 | | | | 6,945,111 | | | | | |
| 6.000%, 06/15/2048 | | | | | | | | | | | | |
| (Callable 12/15/2047) | | | 10,000,000 | | | | 10,106,910 | | | | | |
| 6.250%, 04/15/2049 | | | | | | | | | | | | |
| (Callable 10/15/2048) | | | 3,850,000 | | | | 3,990,832 | | | | | |
| Energy Transfer Partners LP, | | | | | | | | | | | | |
| 4.050%, 03/15/2025 | | | | | | | | | | | | |
| (Callable 12/15/2024) | | | 21,190,000 | | | | 20,847,951 | | | | | |
| Eni SpA, | | | | | | | | | | | | |
| 4.250%, 05/09/2029 | | | | | | | | | | | | |
(Callable 02/09/2029)(1)(2) | | | 18,250,000 | | | | 17,789,666 | | | | | |
| Enterprise Products Operating LLC, | | | | | | | | | | | | |
| 5.750%, 03/01/2035 | | | 4,930,000 | | | | 5,158,536 | | | | | |
| EQT Corp.: | | | | | | | | | | | | |
| 5.700%, 04/01/2028 | | | | | | | | | | | | |
| (Callable 03/01/2028) | | | 10,000,000 | | | | 10,148,516 | | | | | |
| 7.000%, 02/01/2030 | | | | | | | | | | | | |
| (Callable 11/01/2029) | | | 5,493,000 | | | | 5,895,307 | | | | | |
| EQT Midstream Partners LP: | | | | | | | | | | | | |
| 4.000%, 08/01/2024 | | | | | | | | | | | | |
| (Callable 05/01/2024) | | | 1,123,000 | | | | 1,112,437 | | | | | |
| 4.125%, 12/01/2026 | | | | | | | | | | | | |
| (Callable 09/01/2026) | | | 10,000,000 | | | | 9,660,953 | | | | | |
| Equifax, Inc., | | | | | | | | | | | | |
| 5.100%, 06/01/2028 | | | | | | | | | | | | |
| (Callable 05/01/2028) | | | 15,000,000 | | | | 15,143,903 | | | | | |
| Equinix, Inc.: | | | | | | | | | | | | |
| 3.200%, 11/18/2029 | | | | | | | | | | | | |
| (Callable 08/18/2029) | | | 2,000,000 | | | | 1,839,372 | | | | | |
| 2.150%, 07/15/2030 | | | | | | | | | | | | |
| (Callable 04/15/2030) | | | 7,675,000 | | | | 6,508,422 | | | | | |
| ERAC USA Finance LLC, | | | | | | | | | | | | |
| 3.300%, 12/01/2026 | | | | | | | | | | | | |
(Callable 09/01/2026)(2) | | | 20,225,000 | | | | 19,373,799 | | | | | |
| Exxon Mobil Corp., | | | | | | | | | | | | |
| 2.992%, 03/19/2025 | | | | | | | | | | | | |
| (Callable 02/19/2025) | | | 8,700,000 | | | | 8,521,413 | | | | | |
| FedEx Corp., | | | | | | | | | | | | |
| 4.950%, 10/17/2048 | | | | | | | | | | | | |
| (Callable 04/17/2048) | | | 15,000,000 | | | | 14,283,566 | | | | | |
| Ferguson Finance PLC: | | | | | | | | | | | | |
| 4.500%, 10/24/2028 | | | | | | | | | | | | |
(Callable 07/24/2028)(2) | | | 43,025,000 | | | | 42,382,728 | | | | | |
| 3.250%, 06/02/2030 | | | | | | | | | | | | |
(Callable 03/02/2030)(2) | | | 28,100,000 | | | | 25,146,184 | | | | | |
| 4.650%, 04/20/2032 | | | | | | | | | | | | |
(Callable 01/20/2032)(2) | | | 28,125,000 | | | | 27,217,638 | | | | | |
| Fidelity National | | | | | | | | | | | | |
| Information Services, Inc.: | | | | | | | | | | | | |
| 5.100%, 07/15/2032 | | | | | | | | | | | | |
| (Callable 04/15/2032) | | | 4,500,000 | | | | 4,603,884 | | | | | |
| 3.100%, 03/01/2041 | | | | | | | | | | | | |
| (Callable 09/01/2040) | | | 7,100,000 | | | | 5,280,364 | | | | | |
| 4.500%, 08/15/2046 | | | | | | | | | | | | |
| (Callable 02/15/2046) | | | 23,740,000 | | | | 20,133,082 | | | | | |
| Fiserv, Inc.: | | | | | | | | | | | | |
| 3.200%, 07/01/2026 | | | | | | | | | | | | |
| (Callable 05/01/2026) | | | 11,650,000 | | | | 11,218,287 | | | | | |
| 4.200%, 10/01/2028 | | | | | | | | | | | | |
| (Callable 07/01/2028) | | | 5,000,000 | | | | 4,889,590 | | | | | |
| 3.500%, 07/01/2029 | | | | | | | | | | | | |
| (Callable 04/01/2029) | | | 4,307,000 | | | | 4,055,761 | | | | | |
| 2.650%, 06/01/2030 | | | | | | | | | | | | |
| (Callable 03/01/2030) | | | 28,900,000 | | | | 25,445,793 | | | | | |
| 5.625%, 08/21/2033 | | | | | | | | | | | | |
| (Callable 05/21/2033) | | | 17,000,000 | | | | 17,842,039 | | | | | |
| 4.400%, 07/01/2049 | | | | | | | | | | | | |
| (Callable 01/01/2049) | | | 11,000,000 | | | | 9,727,154 | | | | | |
| Flex Intermediate Holdco LLC, | | | | | | | | | | | | |
| 3.363%, 06/30/2031 | | | | | | | | | | | | |
(Callable 12/30/2030)(2) | | | 16,000,000 | | | | 13,099,966 | | | | | |
| Flex Ltd.: | | | | | | | | | | | | |
| 3.750%, 02/01/2026 | | | | | | | | | | | | |
| (Callable 01/01/2026) | | | 15,000,000 | | | | 14,520,763 | | | | | |
| 6.000%, 01/15/2028 | | | | | | | | | | | | |
| (Callable 12/15/2027) | | | 20,000,000 | | | | 20,673,636 | | | | | |
| 4.875%, 06/15/2029 | | | | | | | | | | | | |
| (Callable 03/15/2029) | | | 30,627,000 | | | | 30,084,735 | | | | | |
| 4.875%, 05/12/2030 | | | | | | | | | | | | |
| (Callable 02/12/2030) | | | 21,830,000 | | | | 21,430,392 | | | | | |
| FLIR Systems, Inc., | | | | | | | | | | | | |
| 2.500%, 08/01/2030 | | | | | | | | | | | | |
| (Callable 05/01/2030) | | | 7,000,000 | | | | 6,029,055 | | | | | |
| Florida Gas Transmission Co. LLC, | | | | | | | | | | | | |
| 2.550%, 07/01/2030 | | | | | | | | | | | | |
(Callable 04/01/2030)(2) | | | 18,500,000 | | | | 15,865,945 | | | | | |
| Flowserve Corp., | | | | | | | | | | | | |
| 2.800%, 01/15/2032 | | | | | | | | | | | | |
| (Callable 10/15/2031) | | | 9,625,000 | | | | 7,972,338 | | | | | |
| FMC Corp., | | | | | | | | | | | | |
| 3.200%, 10/01/2026 | | | | | | | | | | | | |
| (Callable 08/01/2026) | | | 5,000,000 | | | | 4,730,778 | | | | | |
| Ford Motor Credit Co. LLC: | | | | | | | | | | | | |
| 5.584%, 03/18/2024 | | | | | | | | | | | | |
| (Callable 02/18/2024) | | | 9,350,000 | | | | 9,337,156 | | | | | |
| 3.664%, 09/08/2024 | | | 5,565,000 | | | | 5,475,887 | | | | | |
| 6.798%, 11/07/2028 | | | | | | | | | | | | |
| (Callable 10/07/2028) | | | 15,000,000 | | | | 15,709,163 | | | | | |
| Fortune Brands Home & Security, Inc., | | | | | | | | | | | | |
| 3.250%, 09/15/2029 | | | | | | | | | | | | |
| (Callable 06/15/2029) | | | 15,000,000 | | | | 13,880,046 | | | | | |
| Fortune Brands Innovations, Inc., | | | | | | | | | | | | |
| 5.875%, 06/01/2033 | | | | | | | | | | | | |
| (Callable 03/01/2033) | | | 24,000,000 | | | | 25,123,647 | | | | | |
| Fox Corp., | | | | | | | | | | | | |
| 6.500%, 10/13/2033 | | | | | | | | | | | | |
| (Callable 07/13/2033) | | | 7,000,000 | | | | 7,589,918 | | | | | |
The accompanying notes are an integral part of these financial statements.
Baird Aggregate Bond Fund
Schedule of Investments, December 31, 2023
Long-Term Investments (cont.)
| | | Principal | | | | | | % of | |
| | | Amount | | | Value | | | Net Assets | |
| Freeport-McMoRan, Inc.: | | | | | | | | | |
| 4.250%, 03/01/2030 | | | | | | | | | |
| (Callable 03/01/2025) | | $ | 8,000,000 | | | $ | 7,509,573 | | | |
| |
| 4.625%, 08/01/2030 | | | | | | | | | | | | |
| (Callable 08/01/2025) | | | 5,000,000 | | | | 4,880,816 | | | | | |
| 5.450%, 03/15/2043 | | | | | | | | | | | | |
| (Callable 09/15/2042) | | | 21,975,000 | | | | 21,375,019 | | | | | |
| Fresenius Medical Care | | | | | | | | | | | | |
| US Finance II, Inc., | | | | | | | | | | | | |
| 4.750%, 10/15/2024 | | | | | | | | | | | | |
(Callable 07/17/2024)(1)(2) | | | 14,530,000 | | | | 14,338,701 | | | | | |
| Fresenius Medical Care | | | | | | | | | | | | |
| US Finance III, Inc.: | | | | | | | | | | | | |
| 1.875%, 12/01/2026 | | | | | | | | | | | | |
(Callable 11/01/2026)(1)(2) | | | 4,200,000 | | | | 3,795,986 | | | | | |
| 3.750%, 06/15/2029 | | | | | | | | | | | | |
(Callable 03/15/2029)(1)(2) | | | 24,200,000 | | | | 21,254,273 | | | | | |
| 2.375%, 02/16/2031 | | | | | | | | | | | | |
(Callable 11/16/2030)(1)(2) | | | 25,000,000 | | | | 19,361,940 | | | | | |
| 3.000%, 12/01/2031 | | | | | | | | | | | | |
(Callable 09/01/2031)(1)(2) | | | 10,000,000 | | | | 7,885,082 | | | | | |
| GE Capital Funding LLC, | | | | | | | | | | | | |
| 4.550%, 05/15/2032 | | | | | | | | | | | | |
| (Callable 02/15/2032) | | | 10,716,000 | | | | 10,506,649 | | | | | |
| General Motors Co., | | | | | | | | | | | | |
| 6.125%, 10/01/2025 | | | | | | | | | | | | |
| (Callable 09/01/2025) | | | 21,479,000 | | | | 21,772,109 | | | | | |
| General Motors Financial Co., Inc.: | | | | | | | | | | | | |
| 2.900%, 02/26/2025 | | | | | | | | | | | | |
| (Callable 01/26/2025) | | | 13,000,000 | | | | 12,614,388 | | | | | |
| 6.050%, 10/10/2025 | | | 22,125,000 | | | | 22,381,543 | | | | | |
| 1.250%, 01/08/2026 | | | | | | | | | | | | |
| (Callable 12/08/2025) | | | 19,000,000 | | | | 17,585,168 | | | | | |
| 5.400%, 04/06/2026 | | | 20,000,000 | | | | 20,137,076 | | | | | |
| 2.350%, 02/26/2027 | | | | | | | | | | | | |
| (Callable 01/26/2027) | | | 11,000,000 | | | | 10,132,123 | | | | | |
| 5.800%, 06/23/2028 | | | | | | | | | | | | |
| (Callable 05/23/2028) | | | 30,000,000 | | | | 30,853,199 | | | | | |
| 5.800%, 01/07/2029 | | | | | | | | | | | | |
| (Callable 12/07/2028) | | | 10,000,000 | | | | 10,238,016 | | | | | |
| Genpact Luxembourg Sarl, | | | | | | | | | | | | |
| 3.375%, 12/01/2024 | | | | | | | | | | | | |
| (Callable 11/01/2024) | | | 59,575,000 | | | | 58,034,986 | | | | | |
| Genpact Luxembourg SARL, | | | | | | | | | | | | |
| 1.750%, 04/10/2026 | | | | | | | | | | | | |
| (Callable 03/10/2026) | | | 25,000,000 | | | | 23,218,214 | | | | | |
| Genuine Parts Co., | | | | | | | | | | | | |
| 6.875%, 11/01/2033 | | | | | | | | | | | | |
| (Callable 08/01/2033) | | | 26,375,000 | | | | 29,345,855 | | | | | |
| Gilead Sciences, Inc., | | | | | | | | | | | | |
| 4.600%, 09/01/2035 | | | | | | | | | | | | |
| (Callable 03/01/2035) | | | 4,600,000 | | | | 4,555,041 | | | | | |
| Glencore Finance (Canada) Ltd., | | | | | | | | | | | | |
5.550%, 10/25/2042(1)(2) | | | 5,000,000 | | | | 4,868,580 | | | | | |
| Glencore Funding LLC: | | | | | | | | | | | | |
4.000%, 04/16/2025(1)(2) | | | 4,450,000 | | | | 4,374,009 | | | | | |
| 4.000%, 03/27/2027 | | | | | | | | | | | | |
(Callable 12/27/2026)(1)(2) | | | 25,550,000 | | | | 24,827,674 | | | | | |
| 3.875%, 10/27/2027 | | | | | | | | | | | | |
(Callable 07/27/2027)(1)(2) | | | 2,000,000 | | | | 1,922,372 | | | | | |
| 4.875%, 03/12/2029 | | | | | | | | | | | | |
(Callable 12/12/2028)(1)(2) | | | 11,000,000 | | | | 11,000,616 | | | | | |
| 2.500%, 09/01/2030 | | | | | | | | | | | | |
(Callable 06/01/2030)(1)(2) | | | 61,437,000 | | | | 52,842,169 | | | | | |
| 5.700%, 05/08/2033 | | | | | | | | | | | | |
(Callable 02/08/2033)(1)(2) | | | 20,000,000 | | | | 20,792,285 | | | | | |
| 3.875%, 04/27/2051 | | | | | | | | | | | | |
(Callable 10/27/2050)(1)(2) | | | 6,000,000 | | | | 4,649,858 | | | | | |
| 3.375%, 09/23/2051 | | | | | | | | | | | | |
(Callable 03/23/2051)(1)(2) | | | 6,000,000 | | | | 4,238,878 | | | | | |
| Global Payments, Inc.: | | | | | | | | | | | | |
| 4.800%, 04/01/2026 | | | | | | | | | | | | |
| (Callable 01/01/2026) | | | 6,990,000 | | | | 6,930,686 | | | | | |
| 2.150%, 01/15/2027 | | | | | | | | | | | | |
| (Callable 12/15/2026) | | | 6,840,000 | | | | 6,300,634 | | | | | |
| 3.200%, 08/15/2029 | | | | | | | | | | | | |
| (Callable 05/15/2029) | | | 7,500,000 | | | | 6,804,452 | | | | | |
| 2.900%, 05/15/2030 | | | | | | | | | | | | |
| (Callable 02/15/2030) | | | 14,467,000 | | | | 12,742,518 | | | | | |
| Grupo Bimbo SAB de CV: | | | | | | | | | | | | |
4.875%, 06/27/2044(1)(2) | | | 8,250,000 | | | | 7,684,104 | | | | | |
| 4.700%, 11/10/2047 | | | | | | | | | | | | |
(Callable 05/10/2047)(1)(2) | | | 25,000,000 | | | | 22,304,662 | | | | | |
4.000%, 09/06/2049(1)(2) | | | 7,300,000 | | | | 5,859,844 | | | | | |
| Gulfstream Natural Gas System LLC, | | | | | | | | | | | | |
| 4.600%, 09/15/2025 | | | | | | | | | | | | |
(Callable 06/15/2025)(2) | | | 5,000,000 | | | | 4,907,712 | | | | | |
| HCA, Inc.: | | | | | | | | | | | | |
| 5.250%, 04/15/2025 | | | 30,686,000 | | | | 30,654,152 | | | | | |
| 4.500%, 02/15/2027 | | | | | | | | | | | | |
| (Callable 08/15/2026) | | | 15,000,000 | | | | 14,803,132 | | | | | |
| 4.125%, 06/15/2029 | | | | | | | | | | | | |
| (Callable 03/15/2029) | | | 15,000,000 | | | | 14,341,072 | | | | | |
| 3.500%, 09/01/2030 | | | | | | | | | | | | |
| (Callable 03/01/2030) | | | 14,405,000 | | | | 13,070,248 | | | | | |
| 3.625%, 03/15/2032 | | | | | | | | | | | | |
| (Callable 12/15/2031) | | | 16,000,000 | | | | 14,325,327 | | | | | |
| 4.625%, 03/15/2052 | | | | | | | | | | | | |
| (Callable 09/15/2051) | | | 20,000,000 | | | | 17,074,201 | | | | | |
| 5.900%, 06/01/2053 | | | | | | | | | | | | |
| (Callable 12/01/2052) | | | 8,275,000 | | | | 8,509,572 | | | | | |
| HF Sinclair Corp., | | | | | | | | | | | | |
| 4.500%, 10/01/2030 | | | | | | | | | | | | |
| (Callable 07/01/2030) | | | 8,000,000 | | | | 7,472,499 | | | | | |
| HP, Inc.: | | | | | | | | | | | | |
| 2.200%, 06/17/2025 | | | | | | | | | | | | |
| (Callable 05/17/2025) | | | 15,000,000 | | | | 14,367,596 | | | | | |
| 3.000%, 06/17/2027 | | | | | | | | | | | | |
| (Callable 04/17/2027) | | | 35,000,000 | | | | 33,081,156 | | | | | |
| Hubbell, Inc., | | | | | | | | | | | | |
| 3.150%, 08/15/2027 | | | | | | | | | | | | |
| (Callable 05/15/2027) | | | 11,700,000 | | | | 11,058,144 | | | | | |
| Huntington Ingalls Industries, Inc., | | | | | | | | | | | | |
| 2.043%, 08/16/2028 | | | | | | | | | | | | |
| (Callable 06/16/2028) | | | 35,513,000 | | | | 31,243,565 | | | | | |
| Hutchison Whampoa International Ltd., | | | | | | | | | | | | |
3.625%, 10/31/2024(1)(2) | | | 7,850,000 | | | | 7,743,470 | | | | | |
| Hyundai Capital America: | | | | | | | | | | | | |
| 1.800%, 10/15/2025 | | | | | | | | | | | | |
(Callable 09/15/2025)(1)(2) | | | 3,000,000 | | | | 2,819,457 | | | | | |
| 1.300%, 01/08/2026 | | | | | | | | | | | | |
(Callable 12/08/2025)(1)(2) | | | 10,000,000 | | | | 9,235,072 | | | | | |
| 1.650%, 09/17/2026 | | | | | | | | | | | | |
(Callable 08/17/2026)(1)(2) | | | 22,550,000 | | | | 20,502,591 | | | | | |
| 5.680%, 06/26/2028 | | | | | | | | | | | | |
(Callable 05/26/2028)(1)(2) | | | 36,375,000 | | | | 37,107,892 | | | | | |
The accompanying notes are an integral part of these financial statements.
Baird Aggregate Bond Fund
Schedule of Investments, December 31, 2023
Long-Term Investments (cont.)
| | | Principal | | | | | | % of | |
| | | Amount | | | Value | | | Net Assets | |
| Hyundai Capital America: (cont.) | | | | | | | | | |
| 6.100%, 09/21/2028 | | | | | | | | | |
(Callable 08/21/2028)(1)(2) | | $ | 40,000,000 | | | $ | 41,602,996 | | | |
| |
| Infor, Inc., | | | | | | | | | | | | |
| 1.750%, 07/15/2025 | | | | | | | | | | | | |
(Callable 06/15/2025)(2) | | | 17,375,000 | | | | 16,383,189 | | | | | |
| Ingersoll-Rand Luxembourg Finance SA, | | | | | | | | | | | | |
| 4.500%, 03/21/2049 | | | | | | | | | | | | |
| (Callable 09/21/2048) | | | 10,000,000 | | | | 9,282,462 | | | | | |
| Ingredion, Inc., | | | | | | | | | | | | |
| 2.900%, 06/01/2030 | | | | | | | | | | | | |
| (Callable 03/01/2030) | | | 26,775,000 | | | | 23,937,726 | | | | | |
| Intel Corp.: | | | | | | | | | | | | |
| 5.200%, 02/10/2033 | | | | | | | | | | | | |
| (Callable 11/10/2032) | | | 5,000,000 | | | | 5,228,962 | | | | | |
| 4.900%, 08/05/2052 | | | | | | | | | | | | |
| (Callable 02/05/2052) | | | 10,000,000 | | | | 9,829,796 | | | | | |
| 5.700%, 02/10/2053 | | | | | | | | | | | | |
| (Callable 08/10/2052) | | | 7,175,000 | | | | 7,785,562 | | | | | |
| International Business Machines Corp., | | | | | | | | | | | | |
| 4.150%, 05/15/2039 | | | 11,325,000 | | | | 10,314,764 | | | | | |
| International Flavors & Fragrances, Inc., | | | | | | | | | | | | |
| 1.832%, 10/15/2027 | | | | | | | | | | | | |
(Callable 08/15/2027)(2) | | | 10,000,000 | | | | 8,769,889 | | | | | |
| IQVIA, Inc., | | | | | | | | | | | | |
| 5.700%, 05/15/2028 | | | | | | | | | | | | |
(Callable 04/15/2028)(2) | | | 8,475,000 | | | | 8,604,039 | | | | | |
| JAB Holdings BV: | | | | | | | | | | | | |
| 2.200%, 11/23/2030 | | | | | | | | | | | | |
(Callable 08/23/2030)(1)(2) | | | 6,326,000 | | | | 5,091,292 | | | | | |
| 4.500%, 04/08/2052 | | | | | | | | | | | | |
(Callable 10/08/2051)(1)(2) | | | 20,750,000 | | | | 16,258,546 | | | | | |
| Jacobs Engineering Group, Inc.: | | | | | | | | | | | | |
| 6.350%, 08/18/2028 | | | | | | | | | | | | |
| (Callable 07/18/2028) | | | 21,000,000 | | | | 21,931,708 | | | | | |
| 5.900%, 03/01/2033 | | | | | | | | | | | | |
| (Callable 12/01/2032) | | | 16,784,000 | | | | 17,168,101 | | | | | |
| JBS USA Lux SA, JBS USA Food | | | | | | | | | | | | |
| Company, and JBS Luxembourg SARL, | | | | | | | | | | | | |
| 6.750%, 03/15/2034 | | | | | | | | | | | | |
(Callable 12/15/2033)(2) | | | 12,750,000 | | | | 13,382,901 | | | | | |
| JBS USA Lux SA, JBS USA Food | | | | | | | | | | | | |
| Company, and JBS USA Finance: | | | | | | | | | | | | |
| 3.000%, 02/02/2029 | | | | | | | | | | | | |
| (Callable 12/02/2028) | | | 10,000,000 | | | | 8,793,113 | | | | | |
| 3.000%, 05/15/2032 | | | | | | | | | | | | |
| (Callable 02/15/2032) | | | 18,525,000 | | | | 15,085,210 | | | | | |
| 5.750%, 04/01/2033 | | | | | | | | | | | | |
| (Callable 01/01/2033) | | | 35,975,000 | | | | 35,817,073 | | | | | |
| JM Smucker Co.: | | | | | | | | | | | | |
| 2.375%, 03/15/2030 | | | | | | | | | | | | |
| (Callable 12/15/2029) | | | 9,125,000 | | | | 7,888,134 | | | | | |
| 6.500%, 11/15/2053 | | | | | | | | | | | | |
| (Callable 05/15/2053) | | | 3,950,000 | | | | 4,576,688 | | | | | |
| Johnson Controls International PLC: | | | | | | | | | | | | |
| 3.900%, 02/14/2026 | | | | | | | | | | | | |
| (Callable 11/14/2025) | | | 3,645,000 | | | | 3,561,849 | | | | | |
| 6.000%, 01/15/2036 | | | 892,000 | | | | 956,965 | | | | | |
| 4.500%, 02/15/2047 | | | | | | | | | | | | |
| (Callable 08/15/2046) | | | 4,400,000 | | | | 3,935,051 | | | | | |
| 4.950%, 07/02/2064 | | | | | | | | | | | | |
(Callable 01/02/2064)(7) | | | 4,029,000 | | | | 3,679,841 | | | | | |
| Jones Lang LaSalle, Inc., | | | | | | | | | | | | |
| 6.875%, 12/01/2028 | | | | | | | | | | | | |
| (Callable 11/01/2028) | | | 8,000,000 | | | | 8,454,630 | | | | | |
| Kellogg Co., | | | | | | | | | | | | |
| 2.100%, 06/01/2030 | | | | | | | | | | | | |
| (Callable 03/01/2030) | | | 20,000,000 | | | | 17,202,308 | | | | | |
| Keurig Dr Pepper, Inc., | | | | | | | | | | | | |
| 3.950%, 04/15/2029 | | | | | | | | | | | | |
| (Callable 02/15/2029) | | | 17,650,000 | | | | 17,224,069 | | | | | |
| Keysight Technologies, Inc., | | | | | | | | | | | | |
| 4.600%, 04/06/2027 | | | | | | | | | | | | |
| (Callable 01/06/2027) | | | 36,562,000 | | | | 36,452,370 | | | | | |
| Kimberly-Clark de Mexico SAB de CV, | | | | | | | | | | | | |
| 2.431%, 07/01/2031 | | | | | | | | | | | | |
(Callable 04/01/2031)(1)(2) | | | 19,321,000 | | | | 16,585,120 | | | | | |
| Kinder Morgan Energy Partners LP: | | | | | | | | | | | | |
| 7.300%, 08/15/2033 | | | 8,103,000 | | | | 9,191,616 | | | | | |
| 5.800%, 03/15/2035 | | | 2,150,000 | | | | 2,196,029 | | | | | |
| 6.500%, 02/01/2037 | | | 6,400,000 | | | | 6,747,261 | | | | | |
| 6.950%, 01/15/2038 | | | 14,008,000 | | | | 15,410,152 | | | | | |
| 6.500%, 09/01/2039 | | | 5,359,000 | | | | 5,643,762 | | | | | |
| 7.500%, 11/15/2040 | | | 7,917,000 | | | | 8,959,199 | | | | | |
| Kinder Morgan, Inc.: | | | | | | | | | | | | |
| 8.050%, 10/15/2030 | | | 3,670,000 | | | | 4,234,669 | | | | | |
| 7.800%, 08/01/2031 | | | 16,745,000 | | | | 19,168,154 | | | | | |
| 7.750%, 01/15/2032 | | | 44,035,000 | | | | 50,169,677 | | | | | |
| Kinross Gold Corp., | | | | | | | | | | | | |
| 6.875%, 09/01/2041 | | | | | | | | | | | | |
(Callable 03/01/2041)(1) | | | 3,000,000 | | | | 3,172,588 | | | | | |
| Kraft Heinz Foods Co.: | | | | | | | | | | | | |
| 3.000%, 06/01/2026 | | | | | | | | | | | | |
| (Callable 03/01/2026) | | | 9,249,000 | | | | 8,889,499 | | | | | |
| 5.000%, 07/15/2035 | | | | | | | | | | | | |
| (Callable 01/15/2035) | | | 10,613,000 | | | | 10,691,836 | | | | | |
7.125%, 08/01/2039(2) | | | 1,425,000 | | | | 1,693,612 | | | | | |
| Kyndryl Holdings, Inc.: | | | | | | | | | | | | |
| 2.050%, 10/15/2026 | | | | | | | | | | | | |
| (Callable 09/15/2026) | | | 17,000,000 | | | | 15,480,632 | | | | | |
| 2.700%, 10/15/2028 | | | | | | | | | | | | |
| (Callable 08/15/2028) | | | 50,000,000 | | | | 44,106,084 | | | | | |
| L3Harris Technologies, Inc.: | | | | | | | | | | | | |
| 3.832%, 04/27/2025 | | | | | | | | | | | | |
| (Callable 01/27/2025) | | | 5,000,000 | | | | 4,910,781 | | | | | |
| 5.400%, 07/31/2033 | | | | | | | | | | | | |
| (Callable 04/30/2033) | | | 20,500,000 | | | | 21,356,544 | | | | | |
| Lafarge SA, | | | | | | | | | | | | |
| 7.125%, 07/15/2036 | | | 13,596,000 | | | | 15,635,128 | | | | | |
| Leidos, Inc.: | | | | | | | | | | | | |
| 3.625%, 05/15/2025 | | | | | | | | | | | | |
| (Callable 04/15/2025) | | | 12,925,000 | | | | 12,591,788 | | | | | |
| 4.375%, 05/15/2030 | | | | | | | | | | | | |
| (Callable 02/15/2030) | | | 47,279,000 | | | | 45,332,470 | | | | | |
| 2.300%, 02/15/2031 | | | | | | | | | | | | |
| (Callable 11/15/2030) | | | 8,175,000 | | | | 6,850,703 | | | | | |
| 5.750%, 03/15/2033 | | | | | | | | | | | | |
| (Callable 12/15/2032) | | | 23,000,000 | | | | 24,035,060 | | | | | |
| LKQ Corp., | | | | | | | | | | | | |
| 5.750%, 06/15/2028 | | | | | | | | | | | | |
| (Callable 05/15/2028) | | | 12,000,000 | | | | 12,284,434 | | | | | |
| Lowe`s Companies, Inc., | | | | | | | | | | | | |
| 5.850%, 04/01/2063 | | | | | | | | | | | | |
| (Callable 10/01/2062) | | | 3,450,000 | | | | 3,628,904 | | | | | |
The accompanying notes are an integral part of these financial statements.
Baird Aggregate Bond Fund
Schedule of Investments, December 31, 2023
Long-Term Investments (cont.)
| | | Principal | | | | | | % of | |
| | | Amount | | | Value | | | Net Assets | |
| Lundin Energy Finance BV, | | | | | | | | | |
| 2.000%, 07/15/2026 | | | | | | | | | |
(Callable 06/15/2026)(1)(2) | | $ | 11,348,000 | | | $ | 10,462,791 | | | |
| |
| LYB International Finance III LLC, | | | | | | | | | | | | |
| 2.250%, 10/01/2030 | | | | | | | | | | | | |
| (Callable 07/01/2030) | | | 5,925,000 | | | | 5,062,038 | | | | | |
| Magellan Midstream Partners LP: | | | | | | | | | | | | |
| 3.200%, 03/15/2025 | | | | | | | | | | | | |
| (Callable 12/15/2024) | | | 5,000,000 | | | | 4,859,987 | | | | | |
| 3.950%, 03/01/2050 | | | | | | | | | | | | |
| (Callable 09/01/2049) | | | 5,100,000 | | | | 3,910,371 | | | | | |
| Marathon Petroleum Corp., | | | | | | | | | | | | |
| 4.750%, 09/15/2044 | | | | | | | | | | | | |
| (Callable 03/15/2044) | | | 1,500,000 | | | | 1,341,965 | | | | | |
| Marriott International, Inc.: | | | | | | | | | | | | |
| 5.000%, 10/15/2027 | | | | | | | | | | | | |
| (Callable 09/15/2027) | | | 12,950,000 | | | | 13,111,055 | | | | | |
| 4.900%, 04/15/2029 | | | | | | | | | | | | |
| (Callable 03/15/2029) | | | 10,000,000 | | | | 10,074,525 | | | | | |
| Marshfield Clinic Health System, Inc., | | | | | | | | | | | | |
| 2.703%, 02/15/2030 (Callable | | | | | | | | | | | | |
| 08/15/2029) (Insured by AGM) | | | 23,125,000 | | | | 19,891,226 | | | | | |
| Martin Marietta Materials, Inc.: | | | | | | | | | | | | |
| 2.500%, 03/15/2030 | | | | | | | | | | | | |
| (Callable 12/15/2029) | | | 6,200,000 | | | | 5,465,911 | | | | | |
| 6.250%, 05/01/2037 | | | 893,000 | | | | 954,466 | | | | | |
| Mercedes-Benz Finance | | | | | | | | | | | | |
| North America LLC, | | | | | | | | | | | | |
5.250%, 11/29/2027(1)(2) | | | 8,225,000 | | | | 8,404,434 | | | | | |
| Microsoft Corp.: | | | | | | | | | | | | |
| 2.921%, 03/17/2052 | | | | | | | | | | | | |
| (Callable 09/17/2051) | | | 3,125,000 | | | | 2,317,678 | | | | | |
| 3.950%, 08/08/2056 | | | | | | | | | | | | |
| (Callable 02/08/2056) | | | 9,903,000 | | | | 8,819,464 | | | | | |
| 2.675%, 06/01/2060 | | | | | | | | | | | | |
| (Callable 12/01/2059) | | | 2,097,000 | | | | 1,405,089 | | | | | |
| Midwest Connector Capital Co. LLC, | | | | | | | | | | | | |
| 4.625%, 04/01/2029 | | | | | | | | | | | | |
(Callable 01/01/2029)(2) | | | 26,022,000 | | | | 25,078,654 | | | | | |
| Mohawk Industries, Inc.: | | | | | | | | | | | | |
| 5.850%, 09/18/2028 | | | | | | | | | | | | |
| (Callable 08/18/2028) | | | 12,650,000 | | | | 13,126,534 | | | | | |
| 3.625%, 05/15/2030 | | | | | | | | | | | | |
| (Callable 02/15/2030) | | | 10,000,000 | | | | 9,264,289 | | | | | |
| Molex Electronic Technologies LLC, | | | | | | | | | | | | |
| 3.900%, 04/15/2025 | | | | | | | | | | | | |
(Callable 01/15/2025)(2) | | | 9,365,000 | | | | 9,102,388 | | | | | |
| Molson Coors Beverage Co., | | | | | | | | | | | | |
| 3.000%, 07/15/2026 | | | | | | | | | | | | |
| (Callable 04/15/2026) | | | 9,889,000 | | | | 9,476,072 | | | | | |
| Mosaic Co.: | | | | | | | | | | | | |
| 5.450%, 11/15/2033 | | | | | | | | | | | | |
| (Callable 05/15/2033) | | | 2,000,000 | | | | 2,045,543 | | | | | |
| 4.875%, 11/15/2041 | | | | | | | | | | | | |
| (Callable 05/15/2041) | | | 5,000,000 | | | | 4,470,161 | | | | | |
| MPLX LP: | | | | | | | | | | | | |
| 4.000%, 02/15/2025 | | | | | | | | | | | | |
| (Callable 11/15/2024) | | | 6,000,000 | | | | 5,908,317 | | | | | |
| 4.875%, 06/01/2025 | | | | | | | | | | | | |
| (Callable 03/01/2025) | | | 18,665,000 | | | | 18,546,562 | | | | | |
| 1.750%, 03/01/2026 | | | | | | | | | | | | |
| (Callable 02/01/2026) | | | 17,125,000 | | | | 16,026,495 | | | | | |
| 4.125%, 03/01/2027 | | | | | | | | | | | | |
| (Callable 12/01/2026) | | | 11,700,000 | | | | 11,457,756 | | | | | |
| 2.650%, 08/15/2030 | | | | | | | | | | | | |
| (Callable 05/15/2030) | | | 22,125,000 | | | | 19,121,121 | | | | | |
| 5.000%, 03/01/2033 | | | | | | | | | | | | |
| (Callable 12/01/2032) | | | 10,000,000 | | | | 9,809,366 | | | | | |
| 4.500%, 04/15/2038 | | | | | | | | | | | | |
| (Callable 10/15/2037) | | | 8,725,000 | | | | 7,786,112 | | | | | |
| Mylan, Inc.: | | | | | | | | | | | | |
| 4.550%, 04/15/2028 | | | | | | | | | | | | |
| (Callable 01/15/2028) | | | 16,705,000 | | | | 16,210,255 | | | | | |
| 5.200%, 04/15/2048 | | | | | | | | | | | | |
| (Callable 10/15/2047) | | | 9,000,000 | | | | 7,463,146 | | | | | |
| Norfolk Southern Corp., | | | | | | | | | | | | |
| 3.050%, 05/15/2050 | | | | | | | | | | | | |
| (Callable 11/15/2049) | | | 17,000,000 | | | | 12,129,668 | | | | | |
| Nova Southeastern University, Inc., | | | | | | | | | | | | |
| 4.809%, 04/01/2053 | | | 7,200,000 | | | | 6,370,132 | | | | | |
| Nutrien Ltd., | | | | | | | | | | | | |
| 4.200%, 04/01/2029 | | | | | | | | | | | | |
(Callable 01/01/2029)(1) | | | 7,000,000 | | | | 6,864,777 | | | | | |
| nVent Finance Sarl: | | | | | | | | | | | | |
| 4.550%, 04/15/2028 | | | | | | | | | | | | |
| (Callable 01/15/2028) | | | 32,634,000 | | | | 31,739,526 | | | | | |
| 5.650%, 05/15/2033 | | | | | | | | | | | | |
| (Callable 02/15/2033) | | | 5,000,000 | | | | 5,082,003 | | | | | |
| NXP BV / NXP Funding LLC / | | | | | | | | | | | | |
| NXP USA, Inc., | | | | | | | | | | | | |
| 2.650%, 02/15/2032 | | | | | | | | | | | | |
(Callable 11/15/2031)(1) | | | 10,000,000 | | | | 8,439,872 | | | | | |
| Occidental Petroleum Corp.: | | | | | | | | | | | | |
| 8.875%, 07/15/2030 | | | | | | | | | | | | |
| (Callable 01/15/2030) | | | 29,260,000 | | | | 34,240,169 | | | | | |
| 7.500%, 05/01/2031 | | | 28,703,000 | | | | 32,185,965 | | | | | |
| 7.875%, 09/15/2031 | | | 6,320,000 | | | | 7,189,374 | | | | | |
| Ochsner LSU Health | | | | | | | | | | | | |
| System of North Louisiana, | | | | | | | | | | | | |
| 2.510%, 05/15/2031 | | | | | | | | | | | | |
| (Callable 11/15/2030) | | | 26,620,000 | | | | 18,225,381 | | | | | |
| OCI NV, | | | | | | | | | | | | |
| 6.700%, 03/16/2033 | | | | | | | | | | | | |
(Callable 12/16/2032)(1)(2) | | | 10,000,000 | | | | 10,231,754 | | | | | |
| Oracle Corp.: | | | | | | | | | | | | |
| 2.800%, 04/01/2027 | | | | | | | | | | | | |
| (Callable 02/01/2027) | | | 26,225,000 | | | | 24,747,572 | | | | | |
| 6.250%, 11/09/2032 | | | | | | | | | | | | |
| (Callable 08/09/2032) | | | 18,000,000 | | | | 19,611,717 | | | | | |
| 3.850%, 07/15/2036 | | | | | | | | | | | | |
| (Callable 01/15/2036) | | | 7,500,000 | | | | 6,547,453 | | | | | |
| 4.500%, 07/08/2044 | | | | | | | | | | | | |
| (Callable 01/08/2044) | | | 3,000,000 | | | | 2,623,734 | | | | | |
| 4.000%, 11/15/2047 | | | | | | | | | | | | |
| (Callable 05/15/2047) | | | 10,250,000 | | | | 8,120,571 | | | | | |
| 3.950%, 03/25/2051 | | | | | | | | | | | | |
| (Callable 09/25/2050) | | | 3,300,000 | | | | 2,595,165 | | | | | |
| 6.900%, 11/09/2052 | | | | | | | | | | | | |
| (Callable 05/09/2052) | | | 65,175,000 | | | | 76,523,550 | | | | | |
| Orange SA, | | | | | | | | | | | | |
9.000%, 03/01/2031(1) | | | 29,044,000 | | | | 35,870,898 | | | | | |
| Otis Worldwide Corp., | | | | | | | | | | | | |
| 3.362%, 02/15/2050 | | | | | | | | | | | | |
| (Callable 08/15/2049) | | | 3,025,000 | | | | 2,351,230 | | | | | |
| PeaceHealth Obligated Group, | | | | | | | | | | | | |
| 3.218%, 11/15/2050 | | | | | | | | | | | | |
| (Callable 05/15/2050) | | | 7,200,000 | | | | 4,724,455 | | | | | |
The accompanying notes are an integral part of these financial statements.
Baird Aggregate Bond Fund
Schedule of Investments, December 31, 2023
Long-Term Investments (cont.)
| | | Principal | | | | | | % of | |
| | | Amount | | | Value | | | Net Assets | |
| Penske Truck Leasing Co.: | | | | | | | | | |
| 2.700%, 11/01/2024 | | | | | | | | | |
(Callable 10/01/2024)(2) | | $ | 5,275,000 | | | $ | 5,130,353 | | | |
| |
| 4.000%, 07/15/2025 | | | | | | | | | | | | |
(Callable 06/15/2025)(2) | | | 31,150,000 | | | | 30,470,559 | | | | | |
| 5.875%, 11/15/2027 | | | | | | | | | | | | |
(Callable 10/15/2027)(2) | | | 12,000,000 | | | | 12,274,524 | | | | | |
| 5.550%, 05/01/2028 | | | | | | | | | | | | |
(Callable 04/01/2028)(2) | | | 24,065,000 | | | | 24,454,915 | | | | | |
| 6.050%, 08/01/2028 | | | | | | | | | | | | |
(Callable 07/01/2028)(2) | | | 25,000,000 | | | | 25,949,861 | | | | | |
| 3.350%, 11/01/2029 | | | | | | | | | | | | |
(Callable 08/01/2029)(2) | | | 2,199,000 | | | | 1,969,609 | | | | | |
| Perrigo Finance Unlimited Co.: | | | | | | | | | | | | |
| 4.375%, 03/15/2026 | | | | | | | | | | | | |
| (Callable 12/15/2025) | | | 4,875,000 | | | | 4,711,499 | | | | | |
| 4.650%, 06/15/2030 | | | | | | | | | | | | |
| (Callable 03/15/2030) | | | 10,000,000 | | | | 9,095,316 | | | | | |
| Pfizer Investment Enterprises Pte Ltd., | | | | | | | | | | | | |
| 5.300%, 05/19/2053 | | | | | | | | | | | | |
| (Callable 11/19/2052) | | | 18,650,000 | | | | 19,114,799 | | | | | |
| Phillips 66 Co.: | | | | | | | | | | | | |
| 3.550%, 10/01/2026 | | | | | | | | | | | | |
| (Callable 07/01/2026) | | | 7,000,000 | | | | 6,751,779 | | | | | |
| 3.150%, 12/15/2029 | | | | | | | | | | | | |
| (Callable 09/15/2029) | | | 12,000,000 | | | | 10,990,450 | | | | | |
| 2.150%, 12/15/2030 | | | | | | | | | | | | |
| (Callable 09/15/2030) | | | 12,000,000 | | | | 10,122,160 | | | | | |
| 5.875%, 05/01/2042 | | | 6,000,000 | | | | 6,493,483 | | | | | |
| 4.875%, 11/15/2044 | | | | | | | | | | | | |
| (Callable 05/15/2044) | | | 26,130,000 | | | | 25,108,513 | | | | | |
| Pilgrim’s Pride Corp.: | | | | | | | | | | | | |
| 6.250%, 07/01/2033 | | | | | | | | | | | | |
| (Callable 04/01/2033) | | | 39,117,000 | | | | 40,252,684 | | | | | |
| 6.875%, 05/15/2034 | | | | | | | | | | | | |
| (Callable 02/15/2034) | | | 18,000,000 | | | | 19,441,476 | | | | | |
| Plains All American Pipeline LP / | | | | | | | | | | | | |
| PAA Finance Corp., | | | | | | | | | | | | |
| 3.550%, 12/15/2029 | | | | | | | | | | | | |
| (Callable 09/15/2029) | | | 10,000,000 | | | | 9,217,263 | | | | | |
| Premier Health Partners, | | | | | | | | | | | | |
| 2.911%, 11/15/2026 | | | | | | | | | | | | |
| (Callable 05/15/2026) | | | 33,267,000 | | | | 30,083,852 | | | | | |
| Quanta Services, Inc., | | | | | | | | | | | | |
| 2.900%, 10/01/2030 | | | | | | | | | | | | |
| (Callable 07/01/2030) | | | 8,275,000 | | | | 7,281,219 | | | | | |
| Regal Rexnord Corp.: | | | | | | | | | | | | |
| 6.300%, 02/15/2030 | | | | | | | | | | | | |
(Callable 12/15/2029)(2) | | | 5,000,000 | | | | 5,136,159 | | | | | |
| 6.400%, 04/15/2033 | | | | | | | | | | | | |
(Callable 01/15/2033)(2) | | | 15,129,000 | | | | 15,792,392 | | | | | |
| Reliance Industries Ltd., | | | | | | | | | | | | |
2.875%, 01/12/2032(1)(2) | | | 26,000,000 | | | | 22,279,920 | | | | | |
| Reliance Steel & Aluminum Co.: | | | | | | | | | | | | |
| 2.150%, 08/15/2030 | | | | | | | | | | | | |
| (Callable 05/15/2030) | | | 10,000,000 | | | | 8,488,411 | | | | | |
| 6.850%, 11/15/2036 | | | 6,100,000 | | | | 6,743,331 | | | | | |
| Republic Services, Inc., | | | | | | | | | | | | |
| 5.000%, 04/01/2034 | | | | | | | | | | | | |
| (Callable 01/01/2034) | | | 10,000,000 | | | | 10,257,725 | | | | | |
| Revvity, Inc.: | | | | | | | | | | | | |
| 3.300%, 09/15/2029 | | | | | | | | | | | | |
| (Callable 06/15/2029) | | | 24,200,000 | | | | 21,982,975 | | | | | |
| 3.625%, 03/15/2051 | | | | | | | | | | | | |
| (Callable 09/15/2050) | | | 12,000,000 | | | | 8,668,742 | | | | | |
| Rio Tinto Alcan, Inc., | | | | | | | | | | | | |
5.750%, 06/01/2035(1) | | | 446,000 | | | | 473,580 | | | | | |
| Roche Holdings, Inc., | | | | | | | | | | | | |
| 2.607%, 12/13/2051 | | | | | | | | | | | | |
(Callable 06/13/2051)(2) | | | 7,000,000 | | | | 4,737,486 | | | | | |
| Rogers Communications, Inc.: | | | | | | | | | | | | |
| 3.800%, 03/15/2032 | | | | | | | | | | | | |
(Callable 12/15/2031)(1) | | | 13,000,000 | | | | 11,976,574 | | | | | |
| 4.500%, 03/15/2042 | | | | | | | | | | | | |
(Callable 09/15/2041)(1) | | | 8,750,000 | | | | 7,739,156 | | | | | |
| 5.450%, 10/01/2043 | | | | | | | | | | | | |
(Callable 04/01/2043)(1) | | | 16,560,000 | | | | 16,099,563 | | | | | |
| RPM International, Inc., | | | | | | | | | | | | |
| 2.950%, 01/15/2032 | | | | | | | | | | | | |
| (Callable 10/15/2031) | | | 7,350,000 | | | | 6,202,298 | | | | | |
| RTX Corp.: | | | | | | | | | | | | |
| 3.500%, 03/15/2027 | | | | | | | | | | | | |
| (Callable 12/15/2026) | | | 9,578,000 | | | | 9,235,161 | | | | | |
| 2.250%, 07/01/2030 | | | | | | | | | | | | |
| (Callable 04/01/2030) | | | 24,375,000 | | | | 21,081,163 | | | | | |
| 4.350%, 04/15/2047 | | | | | | | | | | | | |
| (Callable 10/15/2046) | | | 9,175,000 | | | | 8,019,350 | | | | | |
| 3.125%, 07/01/2050 | | | | | | | | | | | | |
| (Callable 01/01/2050) | | | 6,000,000 | | | | 4,244,835 | | | | | |
| Ryder System, Inc.: | | | | | | | | | | | | |
| 5.650%, 03/01/2028 | | | | | | | | | | | | |
| (Callable 02/01/2028) | | | 14,110,000 | | | | 14,546,577 | | | | | |
| 5.250%, 06/01/2028 | | | | | | | | | | | | |
| (Callable 05/01/2028) | | | 12,000,000 | | | | 12,164,717 | | | | | |
| Sabine Pass Liquefaction LLC: | | | | | | | | | | | | |
| 5.625%, 03/01/2025 | | | | | | | | | | | | |
| (Callable 12/01/2024) | | | 32,000,000 | | | | 32,064,822 | | | | | |
| 5.875%, 06/30/2026 | | | | | | | | | | | | |
| (Callable 12/31/2025) | | | 60,000,000 | | | | 61,094,314 | | | | | |
| 4.500%, 05/15/2030 | | | | | | | | | | | | |
| (Callable 11/15/2029) | | | 43,842,000 | | | | 42,875,824 | | | | | |
| 5.900%, 09/15/2037 | | | | | | | | | | | | |
| (Callable 03/15/2037) | | | 10,000,000 | | | | 10,554,899 | | | | | |
| Samarco Mineracao SA, | | | | | | | | | | | | |
| 9.500% Cash or | | | | | | | | | | | | |
| 9.000% PIK, 06/30/2031 | | | | | | | | | | | | |
(Callable 01/16/2024)(1)(2) | | | 4,694,738 | | | | 3,936,538 | | | | | |
| Santos Finance Ltd.: | | | | | | | | | | | | |
| 3.649%, 04/29/2031 | | | | | | | | | | | | |
(Callable 01/29/2031)(1)(2) | | | 9,000,000 | | | | 7,844,073 | | | | | |
| 6.875%, 09/19/2033 | | | | | | | | | | | | |
(Callable 06/19/2033)(1)(2) | | | 19,600,000 | | | | 20,786,860 | | | | | |
| Shell International Finance BV, | | | | | | | | | | | | |
4.125%, 05/11/2035(1) | | | 10,000,000 | | | | 9,536,478 | | | | | |
| Sherwin-Williams Co., | | | | | | | | | | | | |
| 4.500%, 06/01/2047 | | | | | | | | | | | | |
| (Callable 12/01/2046) | | | 9,000,000 | | | | 8,268,615 | | | | | |
| SK Hynix, Inc., | | | | | | | | | | | | |
1.500%, 01/19/2026(1)(2) | | | 21,852,000 | | | | 20,125,890 | | | | | |
| SK Telecom Co. Ltd., | | | | | | | | | | | | |
6.625%, 07/20/2027(1)(2) | | | 1,339,000 | | | | 1,415,982 | | | | | |
| Smith & Nephew PLC, | | | | | | | | | | | | |
| 2.032%, 10/14/2030 | | | | | | | | | | | | |
(Callable 07/14/2030)(1) | | | 27,625,000 | | | | 22,910,020 | | | | | |
The accompanying notes are an integral part of these financial statements.
Baird Aggregate Bond Fund
Schedule of Investments, December 31, 2023
Long-Term Investments (cont.)
| | | Principal | | | | | | % of | |
| | | Amount | | | Value | | | Net Assets | |
| Smithfield Foods, Inc.: | | | | | | | | | |
| 3.000%, 10/15/2030 | | | | | | | | | |
(Callable 07/15/2030)(1)(2) | | $ | 10,000,000 | | | $ | 8,221,927 | | | |
| |
| 2.625%, 09/13/2031 | | | | | | | | | | | | |
(Callable 06/13/2031)(1)(2) | | | 20,000,000 | | | | 15,495,957 | | | | | |
| Sodexo, Inc., | | | | | | | | | | | | |
| 1.634%, 04/16/2026 | | | | | | | | | | | | |
(Callable 03/16/2026)(1)(2) | | | 7,000,000 | | | | 6,488,734 | | | | | |
| Southern Copper Corp., | | | | | | | | | | | | |
7.500%, 07/27/2035(1) | | | 5,000,000 | | | | 5,806,775 | | | | | |
| Spectra Energy Partners LP, | | | | | | | | | | | | |
| 4.500%, 03/15/2045 | | | | | | | | | | | | |
(Callable 09/15/2044)(1) | | | 12,000,000 | | | | 10,315,882 | | | | | |
| Stanley Black & Decker, Inc., | | | | | | | | | | | | |
| 6.000%, 03/06/2028 | | | | | | | | | | | | |
| (Callable 02/06/2028) | | | 2,852,000 | | | | 2,997,614 | | | | | |
| Steel Dynamics, Inc.: | | | | | | | | | | | | |
| 2.400%, 06/15/2025 | | | | | | | | | | | | |
| (Callable 05/15/2025) | | | 5,000,000 | | | | 4,792,349 | | | | | |
| 3.250%, 01/15/2031 | | | | | | | | | | | | |
| (Callable 10/15/2030) | | | 7,000,000 | | | | 6,316,189 | | | | | |
| Stellantis Finance US, Inc., | | | | | | | | | | | | |
| 1.711%, 01/29/2027 | | | | | | | | | | | | |
(Callable 12/29/2026)(2) | | | 13,750,000 | | | | 12,493,858 | | | | | |
| STERIS Irish FinCo Unlimited Co., | | | | | | | | | | | | |
| 3.750%, 03/15/2051 | | | | | | | | | | | | |
| (Callable 09/15/2050) | | | 7,500,000 | | | | 5,834,752 | | | | | |
| Suntory Holdings Ltd., | | | | | | | | | | | | |
| 2.250%, 10/16/2024 | | | | | | | | | | | | |
(Callable 09/16/2024)(1)(2) | | | 8,500,000 | | | | 8,270,509 | | | | | |
| Synnex Corp., | | | | | | | | | | | | |
| 1.750%, 08/09/2026 | | | | | | | | | | | | |
| (Callable 07/09/2026) | | | 34,843,000 | | | | 31,635,079 | | | | | |
| Sysco Corp.: | | | | | | | | | | | | |
| 3.300%, 07/15/2026 | | | | | | | | | | | | |
| (Callable 04/15/2026) | | | 11,550,000 | | | | 11,153,336 | | | | | |
| 5.950%, 04/01/2030 | | | | | | | | | | | | |
| (Callable 01/01/2030) | | | 4,000,000 | | | | 4,257,312 | | | | | |
| 6.600%, 04/01/2050 | | | | | | | | | | | | |
| (Callable 10/01/2049) | | | 12,455,000 | | | | 14,673,584 | | | | | |
| 3.150%, 12/14/2051 | | | | | | | | | | | | |
| (Callable 06/14/2051) | | | 9,000,000 | | | | 6,475,044 | | | | | |
| Takeda Pharmaceutical Co. Ltd., | | | | | | | | | | | | |
| 3.175%, 07/09/2050 | | | | | | | | | | | | |
(Callable 01/09/2050)(1) | | | 10,000,000 | | | | 7,177,068 | | | | | |
| Targa Resources Corp.: | | | | | | | | | | | | |
| 5.200%, 07/01/2027 | | | | | | | | | | | | |
| (Callable 06/01/2027) | | | 15,000,000 | | | | 15,074,939 | | | | | |
| 6.125%, 03/15/2033 | | | | | | | | | | | | |
| (Callable 12/15/2032) | | | 22,200,000 | | | | 23,423,867 | | | | | |
| TC PipeLines LP: | | | | | | | | | | | | |
| 4.375%, 03/13/2025 | | | | | | | | | | | | |
(Callable 12/13/2024)(1) | | | 31,115,000 | | | | 30,678,599 | | | | | |
| 3.900%, 05/25/2027 | | | | | | | | | | | | |
(Callable 02/25/2027)(1) | | | 30,327,000 | | | | 29,115,979 | | | | | |
| Telecom Italia Capital SA, | | | | | | | | | | | | |
7.200%, 07/18/2036(1) | | | 5,475,000 | | | | 5,505,359 | | | | | |
| Telefonica Emisiones SA: | | | | | | | | | | | | |
4.665%, 03/06/2038(1) | | | 10,760,000 | | | | 9,865,386 | | | | | |
5.213%, 03/08/2047(1) | | | 18,100,000 | | | | 16,811,816 | | | | | |
4.895%, 03/06/2048(1) | | | 29,050,000 | | | | 25,772,838 | | | | | |
| 5.520%, 03/01/2049 | | | | | | | | | | | | |
(Callable 09/01/2048)(1) | | | 18,775,000 | | | | 18,173,499 | | | | | |
| Teva Pharmaceutical Finance | | | | | | | | | | | | |
| Netherlands III BV, | | | | | | | | | | | | |
3.150%, 10/01/2026(1) | | | 15,000,000 | | | | 13,889,330 | | | | | |
| Textron, Inc., | | | | | | | | | | | | |
| 3.000%, 06/01/2030 | | | | | | | | | | | | |
| (Callable 03/01/2030) | | | 19,675,000 | | | | 17,642,433 | | | | | |
| Time Warner Cable LLC: | | | | | | | | | | | | |
| 6.550%, 05/01/2037 | | | 893,000 | | | | 881,694 | | | | | |
| 6.750%, 06/15/2039 | | | 2,767,000 | | | | 2,753,184 | | | | | |
| Timken Co.: | | | | | | | | | | | | |
| 3.875%, 09/01/2024 | | | | | | | | | | | | |
| (Callable 06/01/2024) | | | 11,255,000 | | | | 11,095,423 | | | | | |
| 4.500%, 12/15/2028 | | | | | | | | | | | | |
| (Callable 09/15/2028) | | | 6,550,000 | | | | 6,352,610 | | | | | |
| 4.125%, 04/01/2032 | | | | | | | | | | | | |
| (Callable 01/01/2032) | | | 9,185,000 | | | | 8,462,040 | | | | | |
| T-Mobile USA, Inc.: | | | | | | | | | | | | |
| 3.375%, 04/15/2029 | | | | | | | | | | | | |
| (Callable 04/15/2024) | | | 10,350,000 | | | | 9,615,932 | | | | | |
| 3.875%, 04/15/2030 | | | | | | | | | | | | |
| (Callable 01/15/2030) | | | 119,330,000 | | | | 113,256,325 | | | | | |
| 2.550%, 02/15/2031 | | | | | | | | | | | | |
| (Callable 11/15/2030) | | | 20,000,000 | | | | 17,246,596 | | | | | |
| 3.500%, 04/15/2031 | | | | | | | | | | | | |
| (Callable 04/15/2026) | | | 7,000,000 | | | | 6,394,830 | | | | | |
| 4.375%, 04/15/2040 | | | | | | | | | | | | |
| (Callable 10/15/2039) | | | 24,900,000 | | | | 22,534,584 | | | | | |
| 5.650%, 01/15/2053 | | | | | | | | | | | | |
| (Callable 07/15/2052) | | | 13,000,000 | | | | 13,585,819 | | | | | |
| 3.600%, 11/15/2060 | | | | | | | | | | | | |
| (Callable 05/15/2060) | | | 19,500,000 | | | | 14,191,303 | | | | | |
| Trane Technologies Financing Ltd., | | | | | | | | | | | | |
| 5.250%, 03/03/2033 | | | | | | | | | | | | |
| (Callable 12/03/2032) | | | 11,625,000 | | | | 12,058,362 | | | | | |
| TransCanada PipeLines Ltd.: | | | | | | | | | | | | |
6.200%, 10/15/2037(1) | | | 8,400,000 | | | | 8,961,947 | | | | | |
7.625%, 01/15/2039(1) | | | 21,077,000 | | | | 25,294,994 | | | | | |
| Transcontinental Gas Pipe Line Co. LLC: | | | | | | | | | | | | |
| 7.250%, 12/01/2026 | | | 3,500,000 | | | | 3,680,949 | | | | | |
| 4.600%, 03/15/2048 | | | | | | | | | | | | |
| (Callable 09/15/2047) | | | 5,150,000 | | | | 4,653,362 | | | | | |
| Triton Container International Ltd.: | | | | | | | | | | | | |
| 2.050%, 04/15/2026 | | | | | | | | | | | | |
(Callable 03/15/2026)(1)(2) | | | 20,000,000 | | | | 18,297,407 | | | | | |
| 3.250%, 03/15/2032 | | | | | | | | | | | | |
(Callable 12/15/2031)(1) | | | 10,000,000 | | | | 8,005,805 | | | | | |
| TTX Co.: | | | | | | | | | | | | |
| 3.900%, 02/01/2045 | | | | | | | | | | | | |
(Callable 08/01/2044)(2) | | | 13,250,000 | | | | 10,940,746 | | | | | |
| 4.600%, 02/01/2049 | | | | | | | | | | | | |
(Callable 08/01/2048)(2) | | | 8,325,000 | | | | 7,760,400 | | | | | |
| Tyson Foods, Inc., | | | | | | | | | | | | |
| 5.100%, 09/28/2048 | | | | | | | | | | | | |
| (Callable 03/28/2048) | | | 10,000,000 | | | | 9,100,747 | | | | | |
| United Rentals North America, Inc., | | | | | | | | | | | | |
| 6.000%, 12/15/2029 | | | | | | | | | | | | |
(Callable 12/15/2025)(2) | | | 15,000,000 | | | | 15,230,520 | | | | | |
| Universal Health Services, Inc.: | | | | | | | | | | | | |
| 1.650%, 09/01/2026 | | | | | | | | | | | | |
| (Callable 08/01/2026) | | | 24,000,000 | | | | 21,845,612 | | | | | |
| 2.650%, 10/15/2030 | | | | | | | | | | | | |
| (Callable 07/15/2030) | | | 10,000,000 | | | | 8,491,759 | | | | | |
The accompanying notes are an integral part of these financial statements.
Baird Aggregate Bond Fund
Schedule of Investments, December 31, 2023
Long-Term Investments (cont.)
| | | Principal | | | | | | % of | |
| | | Amount | | | Value | | | Net Assets | |
| UPMC: | | | | | | | | | |
| 3.600%, 04/03/2025 | | $ | 45,000,000 | | | $ | 43,968,181 | | | |
| |
| 5.035%, 05/15/2033 | | | | | | | | | | | | |
| (Callable 02/15/2033) | | | 9,275,000 | | | | 9,424,626 | | | | | |
| Utah Acquisition Sub, Inc., | | | | | | | | | | | | |
| 3.950%, 06/15/2026 | | | | | | | | | | | | |
| (Callable 03/15/2026) | | | 37,757,000 | | | | 36,499,178 | | | | | |
| Vale Overseas Ltd.: | | | | | | | | | | | | |
| 3.750%, 07/08/2030 | | | | | | | | | | | | |
(Callable 04/08/2030)(1) | | | 28,721,000 | | | | 26,522,694 | | | | | |
| 6.125%, 06/12/2033 | | | | | | | | | | | | |
(Callable 03/12/2033)(1) | | | 42,450,000 | | | | 44,051,766 | | | | | |
8.250%, 01/17/2034(1) | | | 13,526,000 | | | | 15,884,164 | | | | | |
6.875%, 11/21/2036(1) | | | 45,171,000 | | | | 49,291,002 | | | | | |
6.875%, 11/10/2039(1) | | | 16,643,000 | | | | 18,275,412 | | | | | |
| Valero Energy Corp.: | | | | | | | | | | | | |
| 2.150%, 09/15/2027 | | | | | | | | | | | | |
| (Callable 07/15/2027) | | | 14,150,000 | | | | 12,909,082 | | | | | |
| 4.000%, 04/01/2029 | | | | | | | | | | | | |
| (Callable 01/01/2029) | | | 15,475,000 | | | | 14,904,934 | | | | | |
| 6.625%, 06/15/2037 | | | 2,100,000 | | | | 2,307,369 | | | | | |
| Var Energi ASA: | | | | | | | | | | | | |
| 5.000%, 05/18/2027 | | | | | | | | | | | | |
(Callable 04/18/2027)(1)(2) | | | 23,850,000 | | | | 23,265,155 | | | | | |
| 7.500%, 01/15/2028 | | | | | | | | | | | | |
(Callable 12/15/2027)(1)(2) | | | 65,430,000 | | | | 69,339,707 | | | | | |
| 8.000%, 11/15/2032 | | | | | | | | | | | | |
(Callable 08/15/2032)(1)(2) | | | 15,000,000 | | | | 16,794,000 | | | | | |
| Verizon Communications, Inc.: | | | | | | | | | | | | |
| 3.000%, 03/22/2027 | | | | | | | | | | | | |
| (Callable 01/22/2027) | | | 5,000,000 | | | | 4,756,773 | | | | | |
| 4.329%, 09/21/2028 | | | 3,077,000 | | | | 3,047,207 | | | | | |
| 2.550%, 03/21/2031 | | | | | | | | | | | | |
| (Callable 12/21/2030) | | | 4,430,000 | | | | 3,825,295 | | | | | |
| 4.500%, 08/10/2033 | | | 16,325,000 | | | | 15,949,532 | | | | | |
| 4.272%, 01/15/2036 | | | 17,148,000 | | | | 16,186,097 | | | | | |
| 5.250%, 03/16/2037 | | | 28,793,000 | | | | 29,945,128 | | | | | |
| 4.812%, 03/15/2039 | | | 36,839,000 | | | | 35,717,657 | | | | | |
| 2.650%, 11/20/2040 | | | | | | | | | | | | |
| (Callable 05/20/2040) | | | 10,000,000 | | | | 7,229,232 | | | | | |
| 3.400%, 03/22/2041 | | | | | | | | | | | | |
| (Callable 09/22/2040) | | | 3,850,000 | | | | 3,075,849 | | | | | |
| 4.862%, 08/21/2046 | | | 2,500,000 | | | | 2,394,115 | | | | | |
| 5.500%, 03/16/2047 | | | 5,650,000 | | | | 5,906,991 | | | | | |
| 3.700%, 03/22/2061 | | | | | | | | | | | | |
| (Callable 09/22/2060) | | | 26,725,000 | | | | 20,443,778 | | | | | |
| Viatris, Inc.: | | | | | | | | | | | | |
| 3.850%, 06/22/2040 | | | | | | | | | | | | |
| (Callable 12/22/2039) | | | 13,083,000 | | | | 9,761,357 | | | | | |
| 4.000%, 06/22/2050 | | | | | | | | | | | | |
| (Callable 12/22/2049) | | | 40,600,000 | | | | 28,670,016 | | | | | |
| VICI Properties LP, | | | | | | | | | | | | |
| 4.750%, 02/15/2028 | | | | | | | | | | | | |
| (Callable 01/15/2028) | | | 20,000,000 | | | | 19,587,726 | | | | | |
| Viterra Finance BV: | | | | | | | | | | | | |
| 2.000%, 04/21/2026 | | | | | | | | | | | | |
(Callable 03/21/2026)(1)(2) | | | 23,641,000 | | | | 21,955,287 | | | | | |
| 4.900%, 04/21/2027 | | | | | | | | | | | | |
(Callable 03/21/2027)(1)(2) | | | 45,000,000 | | | | 44,612,400 | | | | | |
| 3.200%, 04/21/2031 | | | | | | | | | | | | |
(Callable 01/21/2031)(1)(2) | | | 80,020,000 | | | | 69,072,672 | | | | | |
| 5.250%, 04/21/2032 | | | | | | | | | | | | |
(Callable 01/21/2032)(1)(2) | | | 16,631,000 | | | | 16,205,554 | | | | | |
| VMware, Inc., | | | | | | | | | | | | |
| 1.400%, 08/15/2026 | | | | | | | | | | | | |
| (Callable 07/15/2026) | | | 18,850,000 | | | | 17,250,370 | | | | | |
| Vodafone Group PLC: | | | | | | | | | | | | |
7.875%, 02/15/2030(1) | | | 3,100,000 | | | | 3,560,778 | | | | | |
5.000%, 05/30/2038(1) | | | 6,800,000 | | | | 6,840,950 | | | | | |
4.375%, 02/19/2043(1) | | | 15,554,000 | | | | 13,606,141 | | | | | |
| 5.625%, 02/10/2053 | | | | | | | | | | | | |
(Callable 08/10/2052)(1) | | | 10,000,000 | | | | 10,134,551 | | | | | |
| 5.750%, 02/10/2063 | | | | | | | | | | | | |
(Callable 08/10/2062)(1) | | | 5,000,000 | | | | 5,094,449 | | | | | |
| Volkswagen Group of | | | | | | | | | | | | |
| America Finance LLC: | | | | | | | | | | | | |
3.350%, 05/13/2025(1)(2) | | | 10,000,000 | | | | 9,737,706 | | | | | |
| 1.250%, 11/24/2025 | | | | | | | | | | | | |
(Callable 10/24/2025)(1)(2) | | | 30,000,000 | | | | 27,858,682 | | | | | |
| 6.200%, 11/16/2028 | | | | | | | | | | | | |
(Callable 10/16/2028)(1)(2) | | | 30,000,000 | | | | 31,504,596 | | | | | |
| Vontier Corp., | | | | | | | | | | | | |
| 2.400%, 04/01/2028 | | | | | | | | | | | | |
| (Callable 02/01/2028) | | | 4,921,000 | | | | 4,310,599 | | | | | |
| Vulcan Materials Co., | | | | | | | | | | | | |
| 4.700%, 03/01/2048 | | | | | | | | | | | | |
| (Callable 09/01/2047) | | | 3,446,000 | | | | 3,220,705 | | | | | |
| Wabtec Corp.: | | | | | | | | | | | | |
| 3.450%, 11/15/2026 | | | | | | | | | | | | |
| (Callable 08/15/2026) | | | 28,315,000 | | | | 27,098,532 | | | | | |
| 4.700%, 09/15/2028 | | | | | | | | | | | | |
| (Callable 06/15/2028) | | | 4,739,000 | | | | 4,690,092 | | | | | |
| Walgreens Boots Alliance, Inc.: | | | | | | | | | | | | |
| 3.450%, 06/01/2026 | | | | | | | | | | | | |
| (Callable 03/01/2026) | | | 2,080,000 | | | | 1,977,860 | | | | | |
| 3.200%, 04/15/2030 | | | | | | | | | | | | |
| (Callable 01/15/2030) | | | 13,575,000 | | | | 11,976,477 | | | | | |
| 4.800%, 11/18/2044 | | | | | | | | | | | | |
| (Callable 05/18/2044) | | | 5,145,000 | | | | 4,278,647 | | | | | |
| 4.650%, 06/01/2046 | | | | | | | | | | | | |
| (Callable 12/01/2045) | | | 4,000,000 | | | | 3,137,175 | | | | | |
| Walmart, Inc., | | | | | | | | | | | | |
| 4.500%, 04/15/2053 | | | | | | | | | | | | |
| (Callable 10/15/2052) | | | 13,925,000 | | | | 13,593,090 | | | | | |
| Warnermedia Holdings, Inc.: | | | | | | | | | | | | |
| 6.412%, 03/15/2026 | | | | | | | | | | | | |
| (Callable 03/15/2024) | | | 7,000,000 | | | | 7,003,022 | | | | | |
| 4.054%, 03/15/2029 | | | | | | | | | | | | |
| (Callable 01/15/2029) | | | 5,000,000 | | | | 4,745,982 | | | | | |
| 4.279%, 03/15/2032 | | | | | | | | | | | | |
| (Callable 12/15/2031) | | | 68,000,000 | | | | 62,316,603 | | | | | |
| 5.050%, 03/15/2042 | | | | | | | | | | | | |
| (Callable 09/15/2041) | | | 9,000,000 | | | | 7,963,611 | | | | | |
| 5.141%, 03/15/2052 | | | | | | | | | | | | |
| (Callable 09/15/2051) | | | 5,000,000 | | | | 4,314,284 | | | | | |
| Weir Group PLC, | | | | | | | | | | | | |
| 2.200%, 05/13/2026 | | | | | | | | | | | | |
(Callable 04/13/2026)(1)(2) | | | 38,555,000 | | | | 35,857,357 | | | | | |
| Western Digital Corp., | | | | | | | | | | | | |
| 4.750%, 02/15/2026 | | | | | | | | | | | | |
| (Callable 11/15/2025) | | | 4,000,000 | | | | 3,925,673 | | | | | |
| Western Gas Partners LP, | | | | | | | | | | | | |
| 3.950%, 06/01/2025 | | | | | | | | | | | | |
| (Callable 03/01/2025) | | | 8,000,000 | | | | 7,799,999 | | | | | |
| Western Midstream Operating LP: | | | | | | | | | | | | |
| 3.100%, 02/01/2025 | | | | | | | | | | | | |
| (Callable 01/01/2025) | | | 20,000,000 | | | | 19,462,336 | | | | | |
The accompanying notes are an integral part of these financial statements.
Baird Aggregate Bond Fund
Schedule of Investments, December 31, 2023
Long-Term Investments (cont.)
| | | Principal | | | | | | % of | |
| | | Amount | | | Value | | | Net Assets | |
| Western Midstream Operating LP: (cont.) | | | | | | | | | |
| 4.050%, 02/01/2030 | | | | | | | | | |
| (Callable 11/01/2029) | | $ | 10,500,000 | | | $ | 9,845,324 | | | | |
| 6.150%, 04/01/2033 | | | | | | | | | | | |
| (Callable 01/01/2033) | | | 4,550,000 | | | | 4,730,016 | | | | |
| Westinghouse Air Brake | | | | | | | | | | | |
| Technologies Corp., | | | | | | | | | | | |
| 3.200%, 06/15/2025 | | | | | | | | | | | |
| (Callable 05/15/2025) | | | 10,295,000 | | | | 9,953,833 | | | | |
| WestRock MWV LLC, | | | | | | | | | | | |
| 8.200%, 01/15/2030 | | | 7,963,000 | | | | 9,181,551 | | | | |
| Williams Companies, Inc.: | | | | | | | | | | | |
| 3.900%, 01/15/2025 | | | | | | | | | | | |
| (Callable 10/15/2024) | | | 3,160,000 | | | | 3,109,725 | | | | |
| 7.750%, 06/15/2031 | | | 3,400,000 | | | | 3,810,268 | | | | |
| 8.750%, 03/15/2032 | | | 5,750,000 | | | | 6,978,327 | | | | |
| 6.300%, 04/15/2040 | | | 8,142,000 | | | | 8,709,477 | | | | |
| 4.850%, 03/01/2048 | | | | | | | | | | | |
| (Callable 09/01/2047) | | | 7,000,000 | | | | 6,382,720 | | | | |
| Woodside Finance Ltd.: | | | | | | | | | | | |
| 3.650%, 03/05/2025 | | | | | | | | | | | |
(Callable 12/05/2024)(1)(2) | | | 12,300,000 | | | | 12,029,488 | | | | |
| 4.500%, 03/04/2029 | | | | | | | | | | | |
(Callable 12/04/2028)(1)(2) | | | 42,480,000 | | | | 40,843,208 | | | | |
| WRKCo, Inc., | | | | | | | | | | | |
| 3.000%, 09/15/2024 | | | | | | | | | | | |
| (Callable 07/15/2024) | | | 14,895,000 | | | | 14,610,404 | | | | |
| Yara International ASA, | | | | | | | | | | | |
| 3.800%, 06/06/2026 | | | | | | | | | | | |
(Callable 03/06/2026)(1)(2) | | | 23,500,000 | | | | 22,691,108 | | | | |
| Zimmer Biomet Holdings, Inc., | | | | | | | | | | | |
| 5.750%, 11/30/2039 | | | 11,967,000 | | | | 12,239,002 | | | | |
| Total Industrials | | | | | | | | | | | |
| (Cost $9,218,741,953) | | | | | | | 8,599,554,172 | | | | 20.0 | % |
| Utilities | | | | | | | | | | | | |
| Ameren Corp., | | | | | | | | | | | | |
| 3.500%, 01/15/2031 | | | | | | | | | | | | |
| (Callable 10/15/2030) | | | 20,000,000 | | | | 18,273,696 | | | | | |
| American Electric Power Co., Inc., | | | | | | | | | | | | |
| 3.250%, 03/01/2050 | | | | | | | | | | | | |
| (Callable 09/01/2049) | | | 10,175,000 | | | | 7,269,940 | | | | | |
| Avangrid, Inc., | | | | | | | | | | | | |
| 3.200%, 04/15/2025 | | | | | | | | | | | | |
(Callable 03/15/2025)(1) | | | 14,000,000 | | | | 13,599,812 | | | | | |
| Berkshire Hathaway Energy Co.: | | | | | | | | | | | | |
| 3.700%, 07/15/2030 | | | | | | | | | | | | |
| (Callable 04/15/2030) | | | 18,425,000 | | | | 17,447,711 | | | | | |
| 2.850%, 05/15/2051 | | | | | | | | | | | | |
| (Callable 11/15/2050) | | | 13,675,000 | | | | 9,279,669 | | | | | |
| 4.600%, 05/01/2053 | | | | | | | | | | | | |
| (Callable 11/01/2052) | | | 21,825,000 | | | | 19,499,099 | | | | | |
| Commonwealth Edison Co., | | | | | | | | | | | | |
| 3.850%, 03/15/2052 | | | | | | | | | | | | |
| (Callable 09/15/2051) | | | 6,050,000 | | | | 4,910,862 | | | | | |
| Constellation Energy Generation LLC: | | | | | | | | | | | | |
| 5.600%, 03/01/2028 | | | | | | | | | | | | |
| (Callable 02/01/2028) | | | 12,600,000 | | | | 12,987,950 | | | | | |
| 5.800%, 03/01/2033 | | | | | | | | | | | | |
| (Callable 12/01/2032) | | | 5,000,000 | | | | 5,264,394 | | | | | |
| Consumers Energy Co., | | | | | | | | | | | | |
| 3.500%, 08/01/2051 | | | | | | | | | | | | |
| (Callable 02/01/2051) | | | 9,400,000 | | | | 7,401,144 | | | | | |
| Dominion Energy, Inc., | | | | | | | | | | | | |
| 3.375%, 04/01/2030 | | | | | | | | | | | | |
| (Callable 01/01/2030) | | | 10,000,000 | | | | 9,219,419 | | | | | |
| DTE Electric Company, | | | | | | | | | | | | |
| 5.400%, 04/01/2053 | | | | | | | | | | | | |
| (Callable 10/01/2052) | | | 9,375,000 | | | | 9,880,480 | | | | | |
| DTE Energy Company, | | | | | | | | | | | | |
| 4.875%, 06/01/2028 | | | | | | | | | | | | |
| (Callable 05/01/2028) | | | 19,000,000 | | | | 19,157,514 | | | | | |
| Duke Energy Corp.: | | | | | | | | | | | | |
| 2.650%, 09/01/2026 | | | | | | | | | | | | |
| (Callable 06/01/2026) | | | 10,000,000 | | | | 9,495,063 | | | | | |
| 6.100%, 09/15/2053 | | | | | | | | | | | | |
| (Callable 03/15/2053) | | | 13,600,000 | | | | 14,787,015 | | | | | |
| Duke Energy Indiana LLC, | | | | | | | | | | | | |
| 5.400%, 04/01/2053 | | | | | | | | | | | | |
| (Callable 10/01/2052) | | | 7,000,000 | | | | 7,155,071 | | | | | |
| Duke Energy Ohio, Inc., | | | | | | | | | | | | |
| 5.250%, 04/01/2033 | | | | | | | | | | | | |
| (Callable 01/01/2033) | | | 5,000,000 | | | | 5,159,275 | | | | | |
| Duke Energy Progress LLC, | | | | | | | | | | | | |
| 4.000%, 04/01/2052 | | | | | | | | | | | | |
| (Callable 10/01/2051) | | | 9,600,000 | | | | 7,922,922 | | | | | |
| Duquesne Light Holdings, Inc.: | | | | | | | | | | | | |
| 3.616%, 08/01/2027 | | | | | | | | | | | | |
(Callable 05/01/2027)(2) | | | 5,000,000 | | | | 4,674,597 | | | | | |
| 2.532%, 10/01/2030 | | | | | | | | | | | | |
(Callable 07/01/2030)(2) | | | 2,550,000 | | | | 2,123,680 | | | | | |
| 2.775%, 01/07/2032 | | | | | | | | | | | | |
(Callable 10/07/2031)(2) | | | 2,810,000 | | | | 2,248,015 | | | | | |
| Enel Finance International NV: | | | | | | | | | | | | |
3.500%, 04/06/2028(1)(2) | | | 8,000,000 | | | | 7,502,184 | | | | | |
6.800%, 09/15/2037(1)(2) | | | 8,440,000 | | | | 9,232,446 | | | | | |
4.750%, 05/25/2047(1)(2) | | | 66,700,000 | | | | 58,188,159 | | | | | |
| Entergy Corp., | | | | | | | | | | | | |
| 2.950%, 09/01/2026 | | | | | | | | | | | | |
| (Callable 06/01/2026) | | | 13,075,000 | | | | 12,419,068 | | | | | |
| Essential Utilities, Inc., | | | | | | | | | | | | |
| 2.704%, 04/15/2030 | | | | | | | | | | | | |
| (Callable 01/15/2030) | | | 14,100,000 | | | | 12,343,199 | | | | | |
| Evergy, Inc., | | | | | | | | | | | | |
| 2.450%, 09/15/2024 | | | | | | | | | | | | |
| (Callable 08/15/2024) | | | 6,675,000 | | | | 6,523,106 | | | | | |
| Eversource Energy, | | | | | | | | | | | | |
| 1.650%, 08/15/2030 | | | | | | | | | | | | |
| (Callable 05/15/2030) | | | 9,925,000 | | | | 8,063,030 | | | | | |
| Exelon Corp.: | | | | | | | | | | | | |
| 4.050%, 04/15/2030 | | | | | | | | | | | | |
| (Callable 01/15/2030) | | | 8,900,000 | | | | 8,511,994 | | | | | |
| 4.950%, 06/15/2035 | | | | | | | | | | | | |
| (Callable 12/15/2034) | | | 3,500,000 | | | | 3,365,429 | | | | | |
| 4.100%, 03/15/2052 | | | | | | | | | | | | |
| (Callable 09/15/2051) | | | 5,000,000 | | | | 4,059,859 | | | | | |
| Fells Point Funding Trust, | | | | | | | | | | | | |
| 3.046%, 01/31/2027 | | | | | | | | | | | | |
(Callable 12/31/2026)(2) | | | 28,100,000 | | | | 26,503,459 | | | | | |
| FirstEnergy Corp.: | | | | | | | | | | | | |
| 2.250%, 09/01/2030 | | | | | | | | | | | | |
| (Callable 06/01/2030) | | | 4,300,000 | | | | 3,622,501 | | | | | |
| 3.400%, 03/01/2050 | | | | | | | | | | | | |
| (Callable 09/01/2049) | | | 15,000,000 | | | | 10,578,439 | | | | | |
| FirstEnergy Transmission LLC, | | | | | | | | | | | | |
| 2.866%, 09/15/2028 | | | | | | | | | | | | |
(Callable 07/15/2028)(2) | | | 10,000,000 | | | | 9,072,104 | | | | | |
The accompanying notes are an integral part of these financial statements.
Baird Aggregate Bond Fund
Schedule of Investments, December 31, 2023
Long-Term Investments (cont.)
| | | Principal | | | | | | % of | |
| | | Amount | | | Value | | | Net Assets | |
| Interstate Power and Light Co., | | | | | | | | | |
| 2.300%, 06/01/2030 | | | | | | | | | |
| (Callable 03/01/2030) | | $ | 9,350,000 | | | $ | 8,003,286 | | | | |
| ITC Holdings Corp.: | | | | | | | | | | | |
| 3.350%, 11/15/2027 | | | | | | | | | | | |
(Callable 08/15/2027)(1) | | | 25,581,000 | | | | 24,282,880 | | | | |
| 2.950%, 05/14/2030 | | | | | | | | | | | |
(Callable 02/14/2030)(1)(2) | | | 10,000,000 | | | | 8,799,726 | | | | |
| KeySpan Corp., | | | | | | | | | | | |
8.000%, 11/15/2030(1) | | | 6,500,000 | | | | 7,441,779 | | | | |
| Liberty Utilities Finance GP 1, | | | | | | | | | | | |
| 2.050%, 09/15/2030 | | | | | | | | | | | |
(Callable 06/15/2030)(1)(2) | | | 10,000,000 | | | | 8,124,220 | | | | |
| Metropolitan Edison Co., | | | | | | | | | | | |
| 5.200%, 04/01/2028 | | | | | | | | | | | |
(Callable 03/01/2028)(2) | | | 8,125,000 | | | | 8,190,793 | | | | |
| MidAmerican Energy Co., | | | | | | | | | | | |
| 5.850%, 09/15/2054 | | | | | | | | | | | |
| (Callable 03/15/2054) | | | 9,850,000 | | | | 10,937,610 | | | | |
| National Grid PLC, | | | | | | | | | | | |
| 5.602%, 06/12/2028 | | | | | | | | | | | |
(Callable 05/12/2028)(1) | | | 10,000,000 | | | | 10,311,024 | | | | |
| National Rural Utilities | | | | | | | | | | | |
| Cooperative Finance Corp., | | | | | | | | | | | |
| 8.000%, 03/01/2032 | | | 4,659,000 | | | | 5,586,737 | | | | |
| NiSource, Inc.: | | | | | | | | | | | |
| 3.600%, 05/01/2030 | | | | | | | | | | | |
| (Callable 02/01/2030) | | | 6,835,000 | | | | 6,367,306 | | | | |
| 5.400%, 06/30/2033 | | | | | | | | | | | |
| (Callable 03/30/2033) | | | 13,475,000 | | | | 13,919,180 | | | | |
| 5.250%, 02/15/2043 | | | | | | | | | | | |
| (Callable 08/15/2042) | | | 5,779,000 | | | | 5,632,417 | | | | |
| 3.950%, 03/30/2048 | | | | | | | | | | | |
| (Callable 09/30/2047) | | | 11,750,000 | | | | 9,535,219 | | | | |
| Oklahoma Gas and Electric Co., | | | | | | | | | | | |
| 5.600%, 04/01/2053 | | | | | | | | | | | |
| (Callable 10/01/2052) | | | 5,550,000 | | | | 5,850,886 | | | | |
| Oncor Electric Delivery Co. LLC, | | | | | | | | | | | |
| 2.750%, 05/15/2030 | | | | | | | | | | | |
| (Callable 02/15/2030) | | | 9,500,000 | | | | 8,508,776 | | | | |
| Southern Co.: | | | | | | | | | | | |
| 5.700%, 10/15/2032 | | | | | | | | | | | |
| (Callable 04/15/2032) | | | 7,000,000 | | | | 7,361,989 | | | | |
| 4.250%, 07/01/2036 | | | | | | | | | | | |
| (Callable 01/01/2036) | | | 5,525,000 | | | | 5,078,403 | | | | |
| Southern Company Gas Capital Corp.: | | | | | | | | | | | |
| 5.150%, 09/15/2032 | | | | | | | | | | | |
| (Callable 03/15/2032) | | | 16,425,000 | | | | 16,685,232 | | | | |
| 3.150%, 09/30/2051 | | | | | | | | | | | |
| (Callable 03/30/2051) | | | 7,850,000 | | | | 5,298,889 | | | | |
| Tucson Electric Power Co., | | | | | | | | | | | |
| 5.500%, 04/15/2053 | | | | | | | | | | | |
(Callable 10/15/2052)(1) | | | 5,400,000 | | | | 5,523,227 | | | | |
| Xcel Energy, Inc., | | | | | | | | | | | |
| 3.400%, 06/01/2030 | | | | | | | | | | | |
| (Callable 12/01/2029) | | | 15,000,000 | | | | 13,903,271 | | | | |
| Total Utilities | | | | | | | | | | | |
| (Cost $644,833,585) | | | | | | | 583,085,155 | | | | 1.4 | % |
| Financials | | | | | | | | | | | | |
| ABN AMRO Bank NV: | | | | | | | | | | | | |
4.750%, 07/28/2025(1)(2) | | | 62,453,000 | | | | 61,195,196 | | | | | |
4.800%, 04/18/2026(1)(2) | | | 42,935,000 | | | | 41,966,644 | | | | | |
| 1.542%, 06/16/2027 | | | | | | | | | | | | |
| (1 Year CMT Rate + 0.800%) | | | | | | | | | | | | |
(Callable 06/16/2026)(1)(2)(3) | | | 16,900,000 | | | | 15,344,097 | | | | | |
| 6.339%, 09/18/2027 | | | | | | | | | | | | |
| (1 Year CMT Rate + 1.650%) | | | | | | | | | | | | |
(Callable 09/18/2026)(1)(2)(3) | | | 31,025,000 | | | | 31,728,948 | | | | | |
| 3.324%, 03/13/2037 | | | | | | | | | | | | |
| (5 Year CMT Rate + 1.900%) | | | | | | | | | | | | |
(Callable 12/13/2031)(1)(2)(3) | | | 5,000,000 | | | | 4,000,222 | | | | | |
| AerCap Holdings NV: | | | | | | | | | | | | |
| 4.875%, 01/16/2024 | | | | | | | | | | | | |
(Callable 01/15/2024)(1) | | | 20,000,000 | | | | 19,987,191 | | | | | |
| 2.450%, 10/29/2026 | | | | | | | | | | | | |
(Callable 09/29/2026)(1) | | | 9,350,000 | | | | 8,658,267 | | | | | |
| 6.450%, 04/15/2027 | | | | | | | | | | | | |
(Callable 03/15/2027)(1)(2) | | | 19,546,000 | | | | 20,250,533 | | | | | |
| 5.750%, 06/06/2028 | | | | | | | | | | | | |
(Callable 05/06/2028)(1) | | | 30,000,000 | | | | 30,725,513 | | | | | |
| 3.000%, 10/29/2028 | | | | | | | | | | | | |
(Callable 08/29/2028)(1) | | | 17,441,000 | | | | 15,941,053 | | | | | |
| 3.300%, 01/30/2032 | | | | | | | | | | | | |
(Callable 10/30/2031)(1) | | | 10,000,000 | | | | 8,713,285 | | | | | |
| Agree LP: | | | | | | | | | | | | |
| 2.900%, 10/01/2030 | | | | | | | | | | | | |
| (Callable 07/01/2030) | | | 5,000,000 | | | | 4,290,312 | | | | | |
| 4.800%, 10/01/2032 | | | | | | | | | | | | |
| (Callable 07/01/2032) | | | 7,000,000 | | | | 6,621,990 | | | | | |
| AIB Group PLC: | | | | | | | | | | | | |
| 7.583%, 10/14/2026 | | | | | | | | | | | | |
| (SOFR + 3.456%) | | | | | | | | | | | | |
(Callable 10/14/2025)(1)(2)(3) | | | 34,199,000 | | | | 35,281,088 | | | | | |
| 6.608%, 09/13/2029 | | | | | | | | | | | | |
| (SOFR + 2.330%) | | | | | | | | | | | | |
(Callable 09/13/2028)(1)(2)(3) | | | 20,885,000 | | | | 22,016,090 | | | | | |
| AIG SunAmerica Global Financing X, | | | | | | | | | | | | |
6.900%, 03/15/2032(2) | | | 25,000,000 | | | | 27,419,540 | | | | | |
| Air Lease Corp.: | | | | | | | | | | | | |
| 2.300%, 02/01/2025 | | | | | | | | | | | | |
| (Callable 01/01/2025) | | | 15,000,000 | | | | 14,472,130 | | | | | |
| 5.850%, 12/15/2027 | | | | | | | | | | | | |
| (Callable 11/15/2027) | | | 10,000,000 | | | | 10,266,622 | | | | | |
| American International Group, Inc.: | | | | | | | | | | | | |
| 5.125%, 03/27/2033 | | | | | | | | | | | | |
| (Callable 12/27/2032) | | | 10,500,000 | | | | 10,679,741 | | | | | |
| 6.820%, 11/15/2037 | | | 1,410,000 | | | | 1,540,007 | | | | | |
| AmFam Holdings, Inc., | | | | | | | | | | | | |
| 2.805%, 03/11/2031 | | | | | | | | | | | | |
(Callable 12/11/2030)(2) | | | 5,000,000 | | | | 3,836,128 | | | | | |
| Aon Corp., | | | | | | | | | | | | |
| 3.900%, 02/28/2052 | | | | | | | | | | | | |
| (Callable 08/28/2051) | | | 5,000,000 | | | | 3,989,971 | | | | | |
| Aon PLC: | | | | | | | | | | | | |
| 3.875%, 12/15/2025 | | | | | | | | | | | | |
| (Callable 09/15/2025) | | | 9,126,000 | | | | 8,938,376 | | | | | |
| 4.450%, 05/24/2043 | | | | | | | | | | | | |
| (Callable 02/24/2043) | | | 1,274,000 | | | | 1,053,113 | | | | | |
| Arthur J Gallagher & Co., | | | | | | | | | | | | |
| 5.750%, 03/02/2053 | | | | | | | | | | | | |
| (Callable 09/02/2052) | | | 5,000,000 | | | | 5,097,407 | | | | | |
| Arthur J. Gallagher & Co., | | | | | | | | | | | | |
| 3.500%, 05/20/2051 | | | | | | | | | | | | |
| (Callable 11/20/2050) | | | 5,625,000 | | | | 4,184,872 | | | | | |
The accompanying notes are an integral part of these financial statements.
Baird Aggregate Bond Fund
Schedule of Investments, December 31, 2023
Long-Term Investments (cont.)
| | | Principal | | | | | | % of | |
| | | Amount | | | Value | | | Net Assets | |
| ASB Bank Ltd.: | | | | | | | | | |
5.346%, 06/15/2026(1)(2) | | $ | 23,625,000 | | | $ | 23,831,389 | | | |
| |
| 5.284%, 06/17/2032 | | | | | | | | | | | | |
| (5 Year CMT Rate + 2.250%) | | | | | | | | | | | | |
(Callable 06/17/2027)(1)(2)(3) | | | 4,000,000 | | | | 3,930,555 | | | | | |
| Australia & New Zealand | | | | | | | | | | | | |
| Banking Group Ltd.: | | | | | | | | | | | | |
4.500%, 03/19/2024(1)(2) | | | 44,423,000 | | | | 44,291,082 | | | | | |
| 2.950%, 07/22/2030 | | | | | | | | | | | | |
| (5 Year CMT Rate + 1.288%) | | | | | | | | | | | | |
(Callable 07/22/2025)(1)(2)(3) | | | 5,000,000 | | | | 4,749,036 | | | | | |
6.742%, 12/08/2032(1)(2) | | | 38,113,000 | | | | 40,804,280 | | | | | |
| 2.570%, 11/25/2035 | | | | | | | | | | | | |
| (5 Year CMT Rate + 1.700%) | | | | | | | | | | | | |
(Callable 11/25/2030)(1)(2)(3) | | | 15,000,000 | | | | 12,117,341 | | | | | |
| Aviation Capital Group LLC: | | | | | | | | | | | | |
| 6.250%, 04/15/2028 | | | | | | | | | | | | |
(Callable 03/15/2028)(1)(2) | | | 10,000,000 | | | | 10,205,194 | | | | | |
| 6.375%, 07/15/2030 | | | | | | | | | | | | |
(Callable 05/15/2030)(1)(2) | | | 6,500,000 | | | | 6,705,529 | | | | | |
| Banco Bilbao Vizcaya Argentaria SA, | | | | | | | | | | | | |
1.125%, 09/18/2025(1) | | | 25,000,000 | | | | 23,325,779 | | | | | |
| Banco Santander SA: | | | | | | | | | | | | |
2.746%, 05/28/2025(1) | | | 7,000,000 | | | | 6,754,720 | | | | | |
5.179%, 11/19/2025(1) | | | 25,983,000 | | | | 25,774,547 | | | | | |
| 1.722%, 09/14/2027 | | | | | | | | | | | | |
| (1 Year CMT Rate + 0.900%) | | | | | | | | | | | | |
(Callable 09/14/2026)(1)(3) | | | 11,325,000 | | | | 10,246,144 | | | | | |
4.379%, 04/12/2028(1) | | | 13,400,000 | | | | 13,022,267 | | | | | |
6.607%, 11/07/2028(1) | | | 15,000,000 | | | | 15,987,352 | | | | | |
3.490%, 05/28/2030(1) | | | 5,000,000 | | | | 4,501,643 | | | | | |
2.749%, 12/03/2030(1) | | | 19,250,000 | | | | 16,021,127 | | | | | |
| 3.225%, 11/22/2032 | | | | | | | | | | | | |
| (1 Year CMT Rate + 1.600%) | | | | | | | | | | | | |
(Callable 08/22/2031)(1)(3) | | | 35,000,000 | | | | 29,367,161 | | | | | |
6.921%, 08/08/2033(1) | | | 9,800,000 | | | | 10,470,088 | | | | | |
| Bank of America Corp.: | | | | | | | | | | | | |
| 3.093%, 10/01/2025 | | | | | | | | | | | | |
| (3 Month TSFR + 1.352%) | | | | | | | | | | | | |
(Callable 10/01/2024)(3) | | | 10,000,000 | | | | 9,804,313 | | | | | |
| 2.456%, 10/22/2025 | | | | | | | | | | | | |
| (3 Month TSFR + 1.132%) | | | | | | | | | | | | |
(Callable 10/22/2024)(3) | | | 17,775,000 | | | | 17,310,319 | | | | | |
| 5.080%, 01/20/2027 (SOFR + 1.290%) | | | | | | | | | | | | |
(Callable 01/20/2026)(3) | | | 12,500,000 | | | | 12,476,767 | | | | | |
| 3.559%, 04/23/2027 | | | | | | | | | | | | |
| (3 Month TSFR + 1.322%) | | | | | | | | | | | | |
(Callable 04/23/2026)(3) | | | 9,000,000 | | | | 8,665,129 | | | | | |
| 1.734%, 07/22/2027 (SOFR + 0.960%) | | | | | | | | | | | | |
(Callable 07/22/2026)(3) | | | 35,000,000 | | | | 32,078,983 | | | | | |
| 4.376%, 04/27/2028 (SOFR + 1.580%) | | | | | | | | | | | | |
(Callable 04/27/2027)(3) | | | 16,000,000 | | | | 15,644,924 | | | | | |
| 6.204%, 11/10/2028 (SOFR + 1.990%) | | | | | | | | | | | | |
(Callable 11/10/2027)(3) | | | 11,425,000 | | | | 11,925,027 | | | | | |
| 3.419%, 12/20/2028 | | | | | | | | | | | | |
| (3 Month TSFR + 1.302%) | | | | | | | | | | | | |
(Callable 12/20/2027)(3) | | | 37,683,000 | | | | 35,480,345 | | | | | |
| 3.970%, 03/05/2029 | | | | | | | | | | | | |
| (3 Month TSFR + 1.332%) | | | | | | | | | | | | |
(Callable 03/05/2028)(3) | | | 14,230,000 | | | | 13,596,185 | | | | | |
| 2.087%, 06/14/2029 (SOFR + 1.060%) | | | | | | | | | | | | |
(Callable 06/14/2028)(3) | | | 15,000,000 | | | | 13,232,356 | | | | | |
| 4.271%, 07/23/2029 | | | | | | | | | | | | |
| (3 Month TSFR + 1.572%) | | | | | | | | | | | | |
(Callable 07/23/2028)(3) | | | 39,571,000 | | | | 38,250,972 | | | | | |
| 3.194%, 07/23/2030 | | | | | | | | | | | | |
| (3 Month TSFR + 1.442%) | | | | | | | | | | | | |
(Callable 07/23/2029)(3) | | | 5,000,000 | | | | 4,538,619 | | | | | |
| 2.496%, 02/13/2031 | | | | | | | | | | | | |
| (3 Month TSFR + 1.252%) | | | | | | | | | | | | |
(Callable 02/13/2030)(3) | | | 13,000,000 | | | | 11,178,744 | | | | | |
| 2.592%, 04/29/2031 (SOFR + 2.150%) | | | | | | | | | | | | |
(Callable 04/29/2030)(3) | | | 60,000,000 | | | | 51,784,562 | | | | | |
| 1.898%, 07/23/2031 (SOFR + 1.530%) | | | | | | | | | | | | |
(Callable 07/23/2030)(3) | | | 10,000,000 | | | | 8,194,480 | | | | | |
| 1.922%, 10/24/2031 (SOFR + 1.370%) | | | | | | | | | | | | |
(Callable 10/24/2030)(3) | | | 5,000,000 | | | | 4,065,657 | | | | | |
| 2.687%, 04/22/2032 (SOFR + 1.320%) | | | | | | | | | | | | |
(Callable 04/22/2031)(3) | | | 15,000,000 | | | | 12,687,833 | | | | | |
| 2.299%, 07/21/2032 (SOFR + 1.220%) | | | | | | | | | | | | |
(Callable 07/21/2031)(3) | | | 5,000,000 | | | | 4,087,936 | | | | | |
| 2.972%, 02/04/2033 (SOFR + 1.330%) | | | | | | | | | | | | |
(Callable 02/04/2032)(3) | | | 10,000,000 | | | | 8,507,768 | | | | | |
| 5.015%, 07/22/2033 (SOFR + 2.160%) | | | | | | | | | | | | |
(Callable 07/22/2032)(3) | | | 5,000,000 | | | | 4,952,827 | | | | | |
| 5.288%, 04/25/2034 (SOFR + 1.910%) | | | | | | | | | | | | |
(Callable 04/25/2033)(3) | | | 16,500,000 | | | | 16,587,122 | | | | | |
| 7.750%, 05/14/2038 | | | 1,138,000 | | | | 1,387,318 | | | | | |
| Bank of Ireland Group PLC: | | | | | | | | | | | | |
| 6.253%, 09/16/2026 | | | | | | | | | | | | |
| (1 Year CMT Rate + 2.650%) | | | | | | | | | | | | |
(Callable 09/16/2025)(1)(2)(3) | | | 8,864,000 | | | | 8,957,519 | | | | | |
| 2.029%, 09/30/2027 | | | | | | | | | | | | |
| (1 Year CMT Rate + 1.100%) | | | | | | | | | | | | |
(Callable 09/30/2026)(1)(2)(3) | | | 20,000,000 | | | | 18,236,070 | | | | | |
| Bank of Montreal, | | | | | | | | | | | | |
1.500%, 01/10/2025(1) | | | 7,000,000 | | | | 6,745,843 | | | | | |
| Bank of Nova Scotia: | | | | | | | | | | | | |
4.500%, 12/16/2025(1) | | | 8,500,000 | | | | 8,362,127 | | | | | |
5.250%, 06/12/2028(1) | | | 10,000,000 | | | | 10,159,443 | | | | | |
| Banque Federative du Credit Mutuel SA: | | | | | | | | | | | | |
4.753%, 07/13/2027(1)(2) | | | 22,290,000 | | | | 22,152,750 | | | | | |
5.790%, 07/13/2028(1)(2) | | | 12,000,000 | | | | 12,401,613 | | | | | |
| Barclays PLC: | | | | | | | | | | | | |
3.650%, 03/16/2025(1) | | | 8,100,000 | | | | 7,918,927 | | | | | |
| 3.932%, 05/07/2025 | | | | | | | | | | | | |
| (3 Month LIBOR USD + 1.610%) | | | | | | | | | | | | |
(Callable 05/07/2024)(1)(3)(9) | | | 34,300,000 | | | | 34,063,147 | | | | | |
| 2.852%, 05/07/2026 (SOFR + 2.714%) | | | | | | | | | | | | |
(Callable 05/07/2025)(1)(3) | | | 10,000,000 | | | | 9,645,717 | | | | | |
| 4.337%, 01/10/2028 | | | | | | | | | | | | |
(Callable 01/10/2027)(1) | | | 20,000,000 | | | | 19,443,939 | | | | | |
| 6.490%, 09/13/2029 (SOFR + 2.220%) | | | | | | | | | | | | |
(Callable 09/13/2028)(1)(3) | | | 17,000,000 | | | | 17,713,575 | | | | | |
| 6.224%, 05/09/2034 (SOFR + 2.980%) | | | | | | | | | | | | |
(Callable 05/09/2033)(1)(3) | | | 34,000,000 | | | | 35,333,375 | | | | | |
| 6.692%, 09/13/2034 (SOFR + 2.620%) | | | | | | | | | | | | |
(Callable 09/13/2033)(1)(3) | | | 18,725,000 | | | | 20,047,637 | | | | | |
| BBVA USA, | | | | | | | | | | | | |
| 3.875%, 04/10/2025 | | | | | | | | | | | | |
| (Callable 03/10/2025) | | | 36,235,000 | | | | 35,481,063 | | | | | |
| Belrose Funding Trust, | | | | | | | | | | | | |
| 2.330%, 08/15/2030 | | | | | | | | | | | | |
(Callable 05/15/2030)(2) | | | 13,950,000 | | | | 11,158,569 | | | | | |
The accompanying notes are an integral part of these financial statements.
Baird Aggregate Bond Fund
Schedule of Investments, December 31, 2023
Long-Term Investments (cont.)
| | | Principal | | | | | | % of | |
| | | Amount | | | Value | | | Net Assets | |
| Berkshire Hathaway Finance Corp., | | | | | | | | | |
| 4.400%, 05/15/2042 | | $ | 3,500,000 | | | $ | 3,381,497 | | | |
| |
| BNP Paribas SA: | | | | | | | | | | | | |
| 2.819%, 11/19/2025 | | | | | | | | | | | | |
| (3 Month TSFR + 1.373%) | | | | | | | | | | | | |
(Callable 11/19/2024)(1)(2)(3) | | | 17,100,000 | | | | 16,664,057 | | | | | |
4.375%, 05/12/2026(1)(2) | | | 45,131,000 | | | | 43,968,411 | | | | | |
| 2.219%, 06/09/2026 (SOFR + 2.074%) | | | | | | | | | | | | |
(Callable 06/09/2025)(1)(2)(3) | | | 15,000,000 | | | | 14,320,610 | | | | | |
| 1.323%, 01/13/2027 (SOFR + 1.004%) | | | | | | | | | | | | |
(Callable 01/13/2026)(1)(2)(3) | | | 28,350,000 | | | | 26,151,055 | | | | | |
4.625%, 03/13/2027(1)(2) | | | 2,325,000 | | | | 2,278,547 | | | | | |
| 2.591%, 01/20/2028 (SOFR + 1.228%) | | | | | | | | | | | | |
(Callable 01/20/2027)(1)(2)(3) | | | 2,175,000 | | | | 2,013,842 | | | | | |
| 1.904%, 09/30/2028 (SOFR + 1.609%) | | | | | | | | | | | | |
(Callable 09/30/2027)(1)(2)(3) | | | 27,000,000 | | | | 24,000,522 | | | | | |
| 5.335%, 06/12/2029 | | | | | | | | | | | | |
| (1 Year CMT Rate + 1.500%) | | | | | | | | | | | | |
(Callable 06/12/2028)(1)(2)(3) | | | 13,025,000 | | | | 13,224,080 | | | | | |
| 2.159%, 09/15/2029 (SOFR + 1.218%) | | | | | | | | | | | | |
(Callable 09/15/2028)(1)(2)(3) | | | 19,538,000 | | | | 17,009,402 | | | | | |
| 2.871%, 04/19/2032 | | | | | | | | | | | | |
| (3 Month TSFR + 1.387%) | | | | | | | | | | | | |
(Callable 04/19/2031)(1)(2)(3) | | | 32,075,000 | | | | 27,175,902 | | | | | |
| 3.132%, 01/20/2033 (SOFR + 1.561%) | | | | | | | | | | | | |
(Callable 01/20/2032)(1)(2)(3) | | | 10,000,000 | | | | 8,517,737 | | | | | |
| 2.588%, 08/12/2035 | | | | | | | | | | | | |
| (5 Year CMT Rate + 2.050%) | | | | | | | | | | | | |
(Callable 08/12/2030)(1)(2)(3) | | | 14,000,000 | | | | 11,510,279 | | | | | |
| BPCE SA: | | | | | | | | | | | | |
5.150%, 07/21/2024(1)(2) | | | 31,285,000 | | | | 31,011,882 | | | | | |
2.375%, 01/14/2025(1)(2) | | | 12,000,000 | | | | 11,602,867 | | | | | |
4.500%, 03/15/2025(1)(2) | | | 55,492,000 | | | | 54,437,097 | | | | | |
| 1.652%, 10/06/2026 (SOFR + 1.520%) | | | | | | | | | | | | |
(Callable 10/06/2025)(1)(2)(3) | | | 25,000,000 | | | | 23,270,450 | | | | | |
| 2.277%, 01/20/2032 (SOFR + 1.312%) | | | | | | | | | | | | |
(Callable 01/20/2031)(1)(2)(3) | | | 12,850,000 | | | | 10,309,171 | | | | | |
| 3.116%, 10/19/2032 (SOFR + 1.730%) | | | | | | | | | | | | |
(Callable 10/19/2031)(1)(2)(3) | | | 43,420,000 | | | | 35,466,123 | | | | | |
| 7.003%, 10/19/2034 (SOFR + 2.590%) | | | | | | | | | | | | |
(Callable 10/19/2033)(1)(2)(3) | | | 10,000,000 | | | | 10,871,067 | | | | | |
| Brown & Brown, Inc.: | | | | | | | | | | | | |
| 4.500%, 03/15/2029 | | | | | | | | | | | | |
| (Callable 12/15/2028) | | | 23,825,000 | | | | 23,069,182 | | | | | |
| 2.375%, 03/15/2031 | | | | | | | | | | | | |
| (Callable 12/15/2030) | | | 36,789,000 | | | | 30,209,550 | | | | | |
| 4.200%, 03/17/2032 | | | | | | | | | | | | |
| (Callable 12/17/2031) | | | 15,000,000 | | | | 13,690,565 | | | | | |
| 4.950%, 03/17/2052 | | | | | | | | | | | | |
| (Callable 09/17/2051) | | | 9,500,000 | | | | 8,453,987 | | | | | |
| Canadian Imperial Bank of Commerce: | | | | | | | | | | | | |
5.615%, 07/17/2026(1) | | | 15,000,000 | | | | 15,305,623 | | | | | |
| 6.092%, 10/03/2033 | | | | | | | | | | | | |
(Callable 07/03/2033)(1) | | | 20,000,000 | | | | 21,385,688 | | | | | |
| Cantor Fitzgerald LP, | | | | | | | | | | | | |
| 4.500%, 04/14/2027 | | | | | | | | | | | | |
(Callable 01/14/2027)(2) | | | 17,450,000 | | | | 16,761,024 | | | | | |
| Capital One Financial Corp.: | | | | | | | | | | | | |
| 3.300%, 10/30/2024 | | | | | | | | | | | | |
| (Callable 09/30/2024) | | | 2,998,000 | | | | 2,947,914 | | | | | |
| 3.650%, 05/11/2027 | | | | | | | | | | | | |
| (Callable 04/11/2027) | | | 26,750,000 | | | | 25,540,238 | | | | | |
| 6.312%, 06/08/2029 (SOFR + 2.640%) | | | | | | | | | | | | |
(Callable 06/08/2028)(3) | | | 36,205,000 | | | | 37,192,715 | | | | | |
| 3.273%, 03/01/2030 | | | | | | | | | | | | |
| (SOFR + 1.790%) | | | | | | | | | | | | |
(Callable 03/01/2029)(3) | | | 10,537,000 | | | | 9,420,060 | | | | | |
| 7.624%, 10/30/2031 | | | | | | | | | | | | |
| (SOFR + 3.070%) | | | | | | | | | | | | |
(Callable 10/30/2030)(3) | | | 8,000,000 | | | | 8,803,806 | | | | | |
| 5.817%, 02/01/2034 | | | | | | | | | | | | |
| (SOFR + 2.600%) | | | | | | | | | | | | |
(Callable 02/01/2033)(3) | | | 12,700,000 | | | | 12,660,990 | | | | | |
| Centene Corp.: | | | | | | | | | | | | |
| 3.000%, 10/15/2030 | | | | | | | | | | | | |
| (Callable 07/15/2030) | | | 13,061,000 | | | | 11,317,793 | | | | | |
| 2.500%, 03/01/2031 | | | | | | | | | | | | |
| (Callable 12/01/2030) | | | 35,000,000 | | | | 29,151,810 | | | | | |
| 2.625%, 08/01/2031 | | | | | | | | | | | | |
| (Callable 05/01/2031) | | | 12,000,000 | | | | 9,989,605 | | | | | |
| Charles Schwab Corp., | | | | | | | | | | | | |
| 2.900%, 03/03/2032 | | | | | | | | | | | | |
| (Callable 12/03/2031) | | | 5,000,000 | | | | 4,306,753 | | | | | |
| Citigroup, Inc.: | | | | | | | | | | | | |
| 3.700%, 01/12/2026 | | | 4,500,000 | | | | 4,394,402 | | | | | |
| 3.106%, 04/08/2026 (SOFR + 2.842%) | | | | | | | | | | | | |
(Callable 04/08/2025)(3) | | | 20,000,000 | | | | 19,440,868 | | | | | |
| 3.887%, 01/10/2028 | | | | | | | | | | | | |
| (3 Month TSFR + 1.825%) | | | | | | | | | | | | |
(Callable 01/10/2027)(3) | | | 40,600,000 | | | | 39,295,881 | | | | | |
| 3.668%, 07/24/2028 | | | | | | | | | | | | |
| (3 Month TSFR + 1.652%) | | | | | | | | | | | | |
(Callable 07/24/2027)(3) | | | 3,142,000 | | | | 2,996,570 | | | | | |
| 3.520%, 10/27/2028 | | | | | | | | | | | | |
| (3 Month TSFR + 1.413%) | | | | | | | | | | | | |
(Callable 10/27/2027)(3) | | | 11,500,000 | | | | 10,884,880 | | | | | |
| 4.412%, 03/31/2031 (SOFR + 3.914%) | | | | | | | | | | | | |
(Callable 03/31/2030)(3) | | | 26,105,000 | | | | 25,001,784 | | | | | |
| 2.572%, 06/03/2031 (SOFR + 2.107%) | | | | | | | | | | | | |
(Callable 06/03/2030)(3) | | | 25,000,000 | | | | 21,385,886 | | | | | |
| 2.561%, 05/01/2032 (SOFR + 1.167%) | | | | | | | | | | | | |
(Callable 05/01/2031)(3) | | | 6,000,000 | | | | 5,014,137 | | | | | |
| 2.520%, 11/03/2032 (SOFR + 1.177%) | | | | | | | | | | | | |
(Callable 11/03/2031)(3) | | | 11,085,000 | | | | 9,154,168 | | | | | |
| 3.785%, 03/17/2033 (SOFR + 1.939%) | | | | | | | | | | | | |
(Callable 03/17/2032)(3) | | | 18,000,000 | | | | 16,216,877 | | | | | |
| 6.270%, 11/17/2033 (SOFR + 2.338%) | | | | | | | | | | | | |
(Callable 11/17/2032)(3) | | | 29,000,000 | | | | 31,084,670 | | | | | |
| Citizens Bank NA: | | | | | | | | | | | | |
| 2.250%, 04/28/2025 | | | | | | | | | | | | |
| (Callable 03/28/2025) | | | 20,000,000 | | | | 19,120,946 | | | | | |
| 3.750%, 02/18/2026 | | | | | | | | | | | | |
| (Callable 11/18/2025) | | | 12,120,000 | | | | 11,541,005 | | | | | |
| Citizens Financial Group, Inc.: | | | | | | | | | | | | |
| 2.850%, 07/27/2026 | | | | | | | | | | | | |
| (Callable 04/27/2026) | | | 10,000,000 | | | | 9,321,390 | | | | | |
| 3.250%, 04/30/2030 | | | | | | | | | | | | |
| (Callable 01/30/2030) | | | 28,025,000 | | | | 24,644,425 | | | | | |
| CNA Financial Corp.: | | | | | | | | | | | | |
| 4.500%, 03/01/2026 | | | | | | | | | | | | |
| (Callable 12/01/2025) | | | 14,000,000 | | | | 13,844,473 | | | | | |
| 3.450%, 08/15/2027 | | | | | | | | | | | | |
| (Callable 05/15/2027) | | | 12,000,000 | | | | 11,491,166 | | | | | |
| 3.900%, 05/01/2029 | | | | | | | | | | | | |
| (Callable 02/01/2029) | | | 7,000,000 | | | | 6,705,076 | | | | | |
| 2.050%, 08/15/2030 | | | | | | | | | | | | |
| (Callable 05/15/2030) | | | 1,000,000 | | | | 833,134 | | | | | |
The accompanying notes are an integral part of these financial statements.
Baird Aggregate Bond Fund
Schedule of Investments, December 31, 2023
Long-Term Investments (cont.)
| | | Principal | | | | | | % of | |
| | | Amount | | | Value | | | Net Assets | |
| CNA Financial Corp.: (cont.) | | | | | | | | | |
| 5.500%, 06/15/2033 | | | | | | | | | |
| (Callable 03/15/2033) | | $ | 14,225,000 | | | $ | 14,694,376 | | | |
| |
| CNO Global Funding, | | | | | | | | | | | | |
2.650%, 01/06/2029(2) | | | 10,000,000 | | | | 8,671,582 | | | | | |
| Comerica Bank: | | | | | | | | | | | | |
| 4.000%, 07/27/2025 | | | 10,000,000 | | | | 9,638,960 | | | | | |
| 5.332%, 08/25/2033 (SOFR + 2.610%) | | | | | | | | | | | | |
(Callable 08/25/2032)(3) | | | 15,325,000 | | | | 14,095,150 | | | | | |
| Commonwealth Bank of Australia: | | | | | | | | | | | | |
2.688%, 03/11/2031(1)(2) | | | 15,000,000 | | | | 12,353,130 | | | | | |
3.784%, 03/14/2032(1)(2) | | | 10,000,000 | | | | 8,763,839 | | | | | |
| 3.610%, 09/12/2034 | | | | | | | | | | | | |
| (5 Year CMT Rate + 2.050%) | | | | | | | | | | | | |
(Callable 09/12/2029)(1)(2)(3) | | | 10,000,000 | | | | 8,931,574 | | | | | |
3.743%, 09/12/2039(1)(2) | | | 23,500,000 | | | | 18,499,550 | | | | | |
| Cooperatieve Rabobank UA: | | | | | | | | | | | | |
4.375%, 08/04/2025(1) | | | 20,397,000 | | | | 20,031,360 | | | | | |
3.750%, 07/21/2026(1) | | | 20,829,000 | | | | 19,951,236 | | | | | |
| Credit Agricole SA: | | | | | | | | | | | | |
4.375%, 03/17/2025(1)(2) | | | 4,204,000 | | | | 4,130,808 | | | | | |
| 1.247%, 01/26/2027 (SOFR + 0.892%) | | | | | | | | | | | | |
(Callable 01/26/2026)(1)(2)(3) | | | 20,000,000 | | | | 18,421,337 | | | | | |
| 6.316%, 10/03/2029 (SOFR + 1.860%) | | | | | | | | | | | | |
(Callable 10/03/2028)(1)(2)(3) | | | 22,000,000 | | | | 23,076,835 | | | | | |
3.250%, 01/14/2030(1)(2) | | | 6,800,000 | | | | 6,010,775 | | | | | |
| 4.000%, 01/10/2033 | | | | | | | | | | | | |
| (5 Year Swap Rate USD + 1.644%) | | | | | | | | | | | | |
(Callable 01/10/2028)(1)(2)(3) | | | 8,000,000 | | | | 7,414,781 | | | | | |
5.514%, 07/05/2033(1)(2) | | | 35,000,000 | | | | 36,348,595 | | | | | |
| Credit Suisse AG, | | | | | | | | | | | | |
3.625%, 09/09/2024(1) | | | 4,325,000 | | | | 4,263,440 | | | | | |
| Credit Suisse USA, Inc., | | | | | | | | | | | | |
7.125%, 07/15/2032(1) | | | 5,063,000 | | | | 5,770,435 | | | | | |
| Danske Bank A/S, | | | | | | | | | | | | |
| 1.621%, 09/11/2026 | | | | | | | | | | | | |
| (1 Year CMT Rate + 1.350%) | | | | | | | | | | | | |
(Callable 09/11/2025)(1)(2)(3) | | | 20,000,000 | | | | 18,666,105 | | | | | |
| Deutsche Bank AG: | | | | | | | | | | | | |
3.700%, 05/30/2024(1) | | | 10,000,000 | | | | 9,896,611 | | | | | |
| 2.129%, 11/24/2026 (SOFR + 1.870%) | | | | | | | | | | | | |
(Callable 11/24/2025)(1)(3) | | | 22,755,000 | | | | 21,333,661 | | | | | |
| 7.146%, 07/13/2027 (SOFR + 2.520%) | | | | | | | | | | | | |
(Callable 07/13/2026)(1)(3) | | | 32,425,000 | | | | 33,664,893 | | | | | |
| 2.311%, 11/16/2027 (SOFR + 1.219%) | | | | | | | | | | | | |
(Callable 11/16/2026)(1)(3) | | | 19,435,000 | | | | 17,779,622 | | | | | |
| 6.720%, 01/18/2029 (SOFR + 3.180%) | | | | | | | | | | | | |
(Callable 01/18/2028)(1)(3) | | | 10,000,000 | | | | 10,481,386 | | | | | |
| 6.819%, 11/20/2029 (SOFR + 2.510%) | | | | | | | | | | | | |
(Callable 11/20/2028)(1)(3) | | | 15,151,000 | | | | 15,966,912 | | | | | |
| 3.035%, 05/28/2032 (SOFR + 1.718%) | | | | | | | | | | | | |
(Callable 05/28/2031)(1)(3) | | | 14,000,000 | | | | 11,719,944 | | | | | |
| 3.742%, 01/07/2033 (SOFR + 2.257%) | | | | | | | | | | | | |
(Callable 10/07/2031)(1)(3) | | | 39,625,000 | | | | 32,560,631 | | | | | |
| Digital Realty Trust LP, | | | | | | | | | | | | |
| 5.550%, 01/15/2028 | | | | | | | | | | | | |
| (Callable 12/15/2027) | | | 9,775,000 | | | | 9,952,543 | | | | | |
| Discover Bank: | | | | | | | | | | | | |
| 3.450%, 07/27/2026 | | | | | | | | | | | | |
| (Callable 04/27/2026) | | | 22,000,000 | | | | 20,806,187 | | | | | |
| 4.650%, 09/13/2028 | | | | | | | | | | | | |
| (Callable 06/13/2028) | | | 32,508,000 | | | | 31,003,922 | | | | | |
| Discover Financial Services: | | | | | | | | | | | | |
| 3.950%, 11/06/2024 | | | | | | | | | | | | |
| (Callable 08/06/2024) | | | 10,000,000 | | | | 9,826,909 | | | | | |
| 4.100%, 02/09/2027 | | | | | | | | | | | | |
| (Callable 11/09/2026) | | | 38,019,000 | | | | 36,495,321 | | | | | |
| 7.964%, 11/02/2034 | | | | | | | | | | | | |
| (SOFRINDX + 3.370%) | | | | | | | | | | | | |
(Callable 11/02/2033)(3) | | | 23,000,000 | | | | 25,625,668 | | | | | |
| DNB Bank ASA: | | | | | | | | | | | | |
| 1.127%, 09/16/2026 | | | | | | | | | | | | |
| (1 Year CMT Rate + 0.850%) | | | | | | | | | | | | |
(Callable 09/16/2025)(1)(2)(3) | | | 2,000,000 | | | | 1,855,481 | | | | | |
| 1.535%, 05/25/2027 | | | | | | | | | | | | |
| (1 Year CMT Rate + 0.720%) | | | | | | | | | | | | |
(Callable 05/25/2026)(1)(2)(3) | | | 15,000,000 | | | | 13,685,054 | | | | | |
| Elevance Health, Inc.: | | | | | | | | | | | | |
| 5.100%, 01/15/2044 | | | 1,584,000 | | | | 1,550,004 | | | | | |
| 4.375%, 12/01/2047 | | | | | | | | | | | | |
| (Callable 06/01/2047) | | | 8,650,000 | | | | 7,736,244 | | | | | |
| 5.125%, 02/15/2053 | | | | | | | | | | | | |
| (Callable 08/15/2052) | | | 8,150,000 | | | | 8,165,843 | | | | | |
| Extra Space Storage LP: | | | | | | | | | | | | |
| 3.500%, 07/01/2026 | | | | | | | | | | | | |
| (Callable 04/01/2026) | | | 6,819,000 | | | | 6,545,452 | | | | | |
| 5.700%, 04/01/2028 | | | | | | | | | | | | |
| (Callable 03/01/2028) | | | 10,000,000 | | | | 10,258,573 | | | | | |
| 5.500%, 07/01/2030 | | | | | | | | | | | | |
| (Callable 05/01/2030) | | | 10,000,000 | | | | 10,240,888 | | | | | |
| 2.550%, 06/01/2031 | | | | | | | | | | | | |
| (Callable 03/01/2031) | | | 10,000,000 | | | | 8,351,319 | | | | | |
| Federation des Caisses | | | | | | | | | | | | |
| Desjardins du Quebec: | | | | | | | | | | | | |
2.050%, 02/10/2025(1)(2) | | | 12,100,000 | | | | 11,670,630 | | | | | |
4.550%, 08/23/2027(1)(2) | | | 11,000,000 | | | | 10,937,639 | | | | | |
5.700%, 03/14/2028(1)(2) | | | 18,000,000 | | | | 18,539,136 | | | | | |
| Fifth Third Bancorp, | | | | | | | | | | | | |
| 4.772%, 07/28/2030 | | | | | | | | | | | | |
| (SOFRINDX + 2.127%) | | | | | | | | | | | | |
(Callable 07/28/2029)(3) | | | 7,525,000 | | | | 7,359,920 | | | | | |
| FirstMerit Bank NA, | | | | | | | | | | | | |
| 4.270%, 11/25/2026 | | | 4,600,000 | | | | 4,409,194 | | | | | |
| Five Corners Funding Trust II, | | | | | | | | | | | | |
| 2.850%, 05/15/2030 | | | | | | | | | | | | |
(Callable 02/15/2030)(2) | | | 30,000,000 | | | | 26,566,330 | | | | | |
| Five Corners Funding Trust III, | | | | | | | | | | | | |
| 5.791%, 02/15/2033 | | | | | | | | | | | | |
(Callable 11/15/2032)(2) | | | 8,000,000 | | | | 8,510,751 | | | | | |
| Five Corners Funding Trust IV, | | | | | | | | | | | | |
| 5.997%, 02/15/2053 | | | | | | | | | | | | |
(Callable 08/15/2052)(2) | | | 10,000,000 | | | | 10,853,414 | | | | | |
| FMR LLC, | | | | | | | | | | | | |
4.950%, 02/01/2033(2) | | | 1,750,000 | | | | 1,685,061 | | | | | |
| Globe Life, Inc., | | | | | | | | | | | | |
| 4.550%, 09/15/2028 | | | | | | | | | | | | |
| (Callable 06/15/2028) | | | 5,000,000 | | | | 4,964,301 | | | | | |
| Goldman Sachs Group, Inc.: | | | | | | | | | | | | |
| 3.500%, 04/01/2025 | | | | | | | | | | | | |
| (Callable 03/01/2025) | | | 5,000,000 | | | | 4,887,274 | | | | | |
| 3.750%, 05/22/2025 | | | | | | | | | | | | |
| (Callable 02/22/2025) | | | 5,000,000 | | | | 4,898,108 | | | | | |
| 3.272%, 09/29/2025 | | | | | | | | | | | | |
| (3 Month TSFR + 1.463%) | | | | | | | | | | | | |
(Callable 09/29/2024)(3) | | | 15,000,000 | | | | 14,747,810 | | | | | |
The accompanying notes are an integral part of these financial statements.
Baird Aggregate Bond Fund
Schedule of Investments, December 31, 2023
Long-Term Investments (cont.)
| | | Principal | | | | | | % of | |
| | | Amount | | | Value | | | Net Assets | |
| Goldman Sachs Group, Inc.: (cont.) | | | | | | | | | |
| 1.093%, 12/09/2026 | | | | | | | | | |
| (SOFR + 0.789%) | | | | | | | | | |
(Callable 12/09/2025)(3) | | $ | 10,000,000 | | | $ | 9,210,162 | | | |
| |
| 2.640%, 02/24/2028 | | | | | | | | | | | | |
| (SOFR + 1.114%) | | | | | | | | | | | | |
(Callable 02/24/2027)(3) | | | 89,350,000 | | | | 82,853,426 | | | | | |
| 3.691%, 06/05/2028 | | | | | | | | | | | | |
| (3 Month TSFR + 1.772%) | | | | | | | | | | | | |
(Callable 06/05/2027)(3) | | | 6,775,000 | | | | 6,477,732 | | | | | |
| 3.814%, 04/23/2029 | | | | | | | | | | | | |
| (3 Month TSFR + 1.420%) | | | | | | | | | | | | |
(Callable 04/23/2028)(3) | | | 10,000,000 | | | | 9,500,130 | | | | | |
| 4.223%, 05/01/2029 | | | | | | | | | | | | |
| (3 Month TSFR + 1.563%) | | | | | | | | | | | | |
(Callable 05/01/2028)(3) | | | 13,348,000 | | | | 12,925,554 | | | | | |
| 3.800%, 03/15/2030 | | | | | | | | | | | | |
| (Callable 12/15/2029) | | | 30,000,000 | | | | 28,218,283 | | | | | |
| 1.992%, 01/27/2032 (SOFR + 1.090%) | | | | | | | | | | | | |
(Callable 01/27/2031)(3) | | | 10,000,000 | | | | 8,094,113 | | | | | |
| 2.615%, 04/22/2032 (SOFR + 1.281%) | | | | | | | | | | | | |
(Callable 04/22/2031)(3) | | | 9,625,000 | | | | 8,093,252 | | | | | |
| 2.383%, 07/21/2032 (SOFR + 1.248%) | | | | | | | | | | | | |
(Callable 07/21/2031)(3) | | | 30,000,000 | | | | 24,663,097 | | | | | |
| 6.345%, 02/15/2034 | | | 1,053,000 | | | | 1,108,448 | | | | | |
| Guardian Life Global Funding, | | | | | | | | | | | | |
5.550%, 10/28/2027(2) | | | 16,350,000 | | | | 16,978,908 | | | | | |
| Guardian Life Insurance Co. of America: | | | | | | | | | | | | |
4.875%, 06/19/2064(2) | | | 5,000,000 | | | | 4,480,861 | | | | | |
| 3.700%, 01/22/2070 | | | | | | | | | | | | |
(Callable 07/22/2069)(2) | | | 15,062,000 | | | | 10,291,614 | | | | | |
4.850%, 01/24/2077(2) | | | 24,727,000 | | | | 21,074,855 | | | | | |
| Hanover Insurance Group, Inc., | | | | | | | | | | | | |
| 2.500%, 09/01/2030 | | | | | | | | | | | | |
| (Callable 06/01/2030) | | | 10,550,000 | | | | 8,662,592 | | | | | |
| Hartford Financial Services Group, Inc., | | | | | | | | | | | | |
| 3.600%, 08/19/2049 | | | | | | | | | | | | |
| (Callable 02/19/2049) | | | 7,000,000 | | | | 5,440,901 | | | | | |
| Health Care Service Corp. | | | | | | | | | | | | |
| A Mutual Legal Reserve Co., | | | | | | | | | | | | |
| 2.200%, 06/01/2030 | | | | | | | | | | | | |
(Callable 03/01/2030)(2) | | | 6,125,000 | | | | 5,225,820 | | | | | |
| Healthpeak OP LLC, | | | | | | | | | | | | |
| 5.250%, 12/15/2032 | | | | | | | | | | | | |
| (Callable 09/15/2032) | | | 4,000,000 | | | | 4,050,992 | | | | | |
| High Street Funding Trust II, | | | | | | | | | | | | |
| 4.682%, 02/15/2048 | | | | | | | | | | | | |
(Callable 11/15/2047)(2) | | | 2,000,000 | | | | 1,672,689 | | | | | |
| HSBC Bank USA NA, | | | | | | | | | | | | |
7.000%, 01/15/2039(1) | | | 4,200,000 | | | | 4,869,054 | | | | | |
| HSBC Holdings PLC: | | | | | | | | | | | | |
| 3.803%, 03/11/2025 | | | | | | | | | | | | |
| (3 Month TSFR + 1.473%) | | | | | | | | | | | | |
(Callable 03/11/2024)(1)(3) | | | 26,550,000 | | | | 26,441,984 | | | | | |
| 1.645%, 04/18/2026 (SOFR + 1.538%) | | | | | | | | | | | | |
(Callable 04/18/2025)(1)(3) | | | 15,000,000 | | | | 14,259,679 | | | | | |
| 4.292%, 09/12/2026 | | | | | | | | | | | | |
| (3 Month TSFR + 1.609%) | | | | | | | | | | | | |
(Callable 09/12/2025)(1)(3) | | | 7,450,000 | | | | 7,293,906 | | | | | |
4.375%, 11/23/2026(1) | | | 5,000,000 | | | | 4,886,610 | | | | | |
| 1.589%, 05/24/2027 (SOFR + 1.290%) | | | | | | | | | | | | |
(Callable 05/24/2026)(1)(3) | | | 22,500,000 | | | | 20,645,401 | | | | | |
| 2.251%, 11/22/2027 (SOFR + 1.100%) | | | | | | | | | | | | |
(Callable 11/22/2026)(1)(3) | | | 10,000,000 | | | | 9,182,866 | | | | | |
| 6.161%, 03/09/2029 | | | | | | | | | | | | |
| (SOFR + 1.970%) | | | | | | | | | | | | |
(Callable 03/09/2028)(1)(3) | | | 8,250,000 | | | | 8,522,821 | | | | | |
| 4.583%, 06/19/2029 | | | | | | | | | | | | |
| (3 Month TSFR + 1.796%) | | | | | | | | | | | | |
(Callable 06/19/2028)(1)(3) | | | 35,000,000 | | | | 33,970,337 | | | | | |
| 2.206%, 08/17/2029 (SOFR + 1.285%) | | | | | | | | | | | | |
(Callable 08/17/2028)(1)(3) | | | 13,200,000 | | | | 11,533,280 | | | | | |
| 3.973%, 05/22/2030 | | | | | | | | | | | | |
| (3 Month TSFR + 1.872%) | | | | | | | | | | | | |
(Callable 05/22/2029)(1)(3) | | | 9,000,000 | | | | 8,414,769 | | | | | |
| 2.804%, 05/24/2032 (SOFR + 1.187%) | | | | | | | | | | | | |
(Callable 05/24/2031)(1)(3) | | | 16,000,000 | | | | 13,379,117 | | | | | |
| Huntington Bancshares, Inc.: | | | | | | | | | | | | |
| 4.443%, 08/04/2028 (SOFR + 1.970%) | | | | | | | | | | | | |
(Callable 08/04/2027)(3) | | | 9,500,000 | | | | 9,215,471 | | | | | |
| 5.023%, 05/17/2033 (SOFR + 2.050%) | | | | | | | | | | | | |
(Callable 05/17/2032)(3) | | | 3,775,000 | | | | 3,673,429 | | | | | |
| Huntington National Bank, | | | | | | | | | | | | |
| 5.650%, 01/10/2030 | | | | | | | | | | | | |
| (Callable 11/10/2029) | | | 1,500,000 | | | | 1,514,109 | | | | | |
| Invesco Finance PLC, | | | | | | | | | | | | |
| 3.750%, 01/15/2026 | | | 4,900,000 | | | | 4,772,334 | | | | | |
| Jefferies Group LLC: | | | | | | | | | | | | |
| 4.150%, 01/23/2030 | | | 10,000,000 | | | | 9,401,417 | | | | | |
| 6.250%, 01/15/2036 | | | 1,390,000 | | | | 1,463,407 | | | | | |
| JPMorgan Chase & Co.: | | | | | | | | | | | | |
| 2.301%, 10/15/2025 (SOFR + 1.160%) | | | | | | | | | | | | |
(Callable 10/15/2024)(3) | | | 10,000,000 | | | | 9,745,182 | | | | | |
| 2.005%, 03/13/2026 | | | | | | | | | | | | |
| (3 Month TSFR + 1.585%) | | | | | | | | | | | | |
(Callable 03/13/2025)(3) | | | 50,000,000 | | | | 48,044,091 | | | | | |
| 2.083%, 04/22/2026 (SOFR + 1.850%) | | | | | | | | | | | | |
(Callable 04/22/2025)(3) | | | 52,000,000 | | | | 49,816,281 | | | | | |
| 1.045%, 11/19/2026 (SOFR + 0.800%) | | | | | | | | | | | | |
(Callable 11/19/2025)(3) | | | 25,000,000 | | | | 23,160,027 | | | | | |
| 1.578%, 04/22/2027 (SOFR + 0.885%) | | | | | | | | | | | | |
(Callable 04/22/2026)(3) | | | 50,000,000 | | | | 46,155,372 | | | | | |
| 1.470%, 09/22/2027 (SOFR + 0.765%) | | | | | | | | | | | | |
(Callable 09/22/2026)(3) | | | 11,875,000 | | | | 10,760,756 | | | | | |
| 4.851%, 07/25/2028 (SOFR + 1.990%) | | | | | | | | | | | | |
(Callable 07/25/2027)(3) | | | 29,000,000 | | | | 29,029,781 | | | | | |
| 5.299%, 07/24/2029 (SOFR + 1.450%) | | | | | | | | | | | | |
(Callable 07/24/2028)(3) | | | 10,000,000 | | | | 10,156,437 | | | | | |
| 6.087%, 10/23/2029 (SOFR + 1.570%) | | | | | | | | | | | | |
(Callable 10/23/2028)(3) | | | 30,000,000 | | | | 31,567,210 | | | | | |
| 3.702%, 05/06/2030 | | | | | | | | | | | | |
| (3 Month TSFR + 1.422%) | | | | | | | | | | | | |
(Callable 05/06/2029)(3) | | | 15,000,000 | | | | 14,116,055 | | | | | |
| 2.522%, 04/22/2031 (SOFR + 2.040%) | | | | | | | | | | | | |
(Callable 04/22/2030)(3) | | | 28,000,000 | | | | 24,251,196 | | | | | |
| 1.953%, 02/04/2032 (SOFR + 1.065%) | | | | | | | | | | | | |
(Callable 02/04/2031)(3) | | | 22,000,000 | | | | 17,913,586 | | | | | |
| 2.580%, 04/22/2032 | | | | | | | | | | | | |
| (3 Month TSFR + 1.250%) | | | | | | | | | | | | |
(Callable 04/22/2031)(3) | | | 10,000,000 | | | | 8,474,321 | | | | | |
| 5.350%, 06/01/2034 (SOFR + 1.845%) | | | | | | | | | | | | |
(Callable 06/01/2033)(3) | | | 15,000,000 | | | | 15,228,835 | | | | | |
| 5.600%, 07/15/2041 | | | 4,106,000 | | | | 4,378,561 | | | | | |
| Kemper Corp., | | | | | | | | | | | | |
| 3.800%, 02/23/2032 | | | | | | | | | | | | |
| (Callable 11/23/2031) | | | 8,000,000 | | | | 6,721,203 | | | | | |
The accompanying notes are an integral part of these financial statements.
Baird Aggregate Bond Fund
Schedule of Investments, December 31, 2023
Long-Term Investments (cont.)
| | | Principal | | | | | | % of | |
| | | Amount | | | Value | | | Net Assets | |
| KeyBank NA: | | | | | | | | | |
| 3.400%, 05/20/2026 | | $ | 18,965,000 | | | $ | 17,790,558 | | | |
| |
| 4.900%, 08/08/2032 | | | 6,000,000 | | | | 5,288,144 | | | | | |
| 5.000%, 01/26/2033 | | | | | | | | | | | | |
| (Callable 10/26/2032) | | | 5,000,000 | | | | 4,683,511 | | | | | |
| LeasePlan Corp. NV, | | | | | | | | | | | | |
2.875%, 10/24/2024(1)(2) | | | 59,600,000 | | | | 58,236,959 | | | | | |
| Liberty Mutual Group, Inc.: | | | | | | | | | | | | |
4.569%, 02/01/2029(2) | | | 2,087,000 | | | | 2,041,613 | | | | | |
| 3.951%, 10/15/2050 | | | | | | | | | | | | |
(Callable 04/15/2050)(2) | | | 2,231,000 | | | | 1,693,742 | | | | | |
| 5.500%, 06/15/2052 | | | | | | | | | | | | |
(Callable 12/15/2051)(2) | | | 5,000,000 | | | | 4,943,262 | | | | | |
| Liberty Mutual Insurance Co., | | | | | | | | | | | | |
7.697%, 10/15/2097(2) | | | 465,000 | | | | 511,139 | | | | | |
| Lincoln National Corp., | | | | | | | | | | | | |
| 3.050%, 01/15/2030 | | | | | | | | | | | | |
| (Callable 10/15/2029) | | | 24,650,000 | | | | 21,804,090 | | | | | |
| Lloyds Banking Group PLC: | | | | | | | | | | | | |
| 2.438%, 02/05/2026 | | | | | | | | | | | | |
| (1 Year CMT Rate + 1.000%) | | | | | | | | | | | | |
(Callable 02/05/2025)(1)(3) | | | 15,725,000 | | | | 15,175,052 | | | | | |
| 1.627%, 05/11/2027 | | | | | | | | | | | | |
| (1 Year CMT Rate + 0.850%) | | | | | | | | | | | | |
(Callable 05/11/2026)(1)(3) | | | 10,000,000 | | | | 9,166,481 | | | | | |
| 3.574%, 11/07/2028 | | | | | | | | | | | | |
| (3 Month LIBOR USD + 1.205%) | | | | | | | | | | | | |
(Callable 11/07/2027)(1)(3)(9) | | | 10,000,000 | | | | 9,401,103 | | | | | |
| LPL Holdings, Inc., | | | | | | | | | | | | |
| 6.750%, 11/17/2028 | | | | | | | | | | | | |
| (Callable 10/17/2028) | | | 10,000,000 | | | | 10,660,200 | | | | | |
| LXP Industrial Trust: | | | | | | | | | | | | |
| 6.750%, 11/15/2028 | | | | | | | | | | | | |
| (Callable 10/15/2028) | | | 10,000,000 | | | | 10,519,002 | | | | | |
| 2.700%, 09/15/2030 | | | | | | | | | | | | |
| (Callable 06/15/2030) | | | 14,800,000 | | | | 12,281,411 | | | | | |
| 2.375%, 10/01/2031 | | | | | | | | | | | | |
| (Callable 07/01/2031) | | | 5,747,000 | | | | 4,623,664 | | | | | |
| M&T Bank Corp., | | | | | | | | | | | | |
| 4.000%, 07/15/2024 | | | | | | | | | | | | |
| (Callable 04/16/2024) | | | 11,400,000 | | | | 11,289,491 | | | | | |
| Macquarie Bank Ltd.: | | | | | | | | | | | | |
4.875%, 06/10/2025(1)(2) | | | 23,717,000 | | | | 23,422,934 | | | | | |
3.624%, 06/03/2030(1)(2) | | | 12,550,000 | | | | 10,918,939 | | | | | |
| Macquarie Group Ltd.: | | | | | | | | | | | | |
| 5.108%, 08/09/2026 (SOFR + 2.208%) | | | | | | | | | | | | |
(Callable 08/09/2025)(1)(2)(3) | | | 22,000,000 | | | | 21,909,106 | | | | | |
| 1.340%, 01/12/2027 (SOFR + 1.069%) | | | | | | | | | | | | |
(Callable 01/12/2026)(1)(2)(3) | | | 19,000,000 | | | | 17,461,687 | | | | | |
| 2.871%, 01/14/2033 (SOFR + 1.532%) | | | | | | | | | | | | |
(Callable 01/14/2032)(1)(2)(3) | | | 25,000,000 | | | | 20,587,754 | | | | | |
| 4.442%, 06/21/2033 (SOFR + 2.405%) | | | | | | | | | | | | |
(Callable 06/21/2032)(1)(2)(3) | | | 9,000,000 | | | | 8,230,919 | | | | | |
| 6.255%, 12/07/2034 (SOFR + 2.303%) | | | | | | | | | | | | |
(Callable 12/07/2033)(1)(2)(3) | | | 12,500,000 | | | | 13,078,423 | | | | | |
| Manulife Financial Corp.: | | | | | | | | | | | | |
4.150%, 03/04/2026(1) | | | 10,000,000 | | | | 9,860,228 | | | | | |
5.375%, 03/04/2046(1) | | | 5,150,000 | | | | 5,231,848 | | | | | |
| Maple Grove Funding Trust I, | | | | | | | | | | | | |
| 4.161%, 08/15/2051 | | | | | | | | | | | | |
(Callable 02/15/2051)(2) | | | 28,600,000 | | | | 20,108,904 | | | | | |
| Marsh & McLennan Companies, Inc.: | | | | | | | | | | | | |
| 2.250%, 11/15/2030 | | | | | | | | | | | | |
| (Callable 08/15/2030) | | | 5,000,000 | | | | 4,310,496 | | | | | |
| 5.875%, 08/01/2033 | | | 8,429,000 | | | | 9,221,647 | | | | | |
| 4.350%, 01/30/2047 | | | | | | | | | | | | |
| (Callable 07/30/2046) | | | 3,450,000 | | | | 3,106,094 | | | | | |
| 5.450%, 03/15/2053 | | | | | | | | | | | | |
| (Callable 09/15/2052) | | | 3,700,000 | | | | 3,886,608 | | | | | |
| Massachusetts Mutual Life Insurance Co.: | | | | | | | | | | | | |
| 5.672%, 12/01/2052 | | | | | | | | | | | | |
(Callable 06/01/2052)(2) | | | 20,000,000 | | | | 20,745,827 | | | | | |
| 5.077%, 02/15/2069 | | | | | | | | | | | | |
| (3 Month LIBOR USD + 3.191%) | | | | | | | | | | | | |
(Callable 02/15/2049)(2)(3)(9) | | | 40,670,000 | | | | 37,034,301 | | | | | |
3.729%, 10/15/2070(2) | | | 16,676,000 | | | | 11,504,983 | | | | | |
4.900%, 04/01/2077(2) | | | 11,175,000 | | | | 9,529,958 | | | | | |
| MBIA Insurance Corp., | | | | | | | | | | | | |
| 16.915%, 01/15/2033 | | | | | | | | | | | | |
| (3 Month TSFR + 11.522%) | | | | | | | | | | | | |
(Callable 01/15/2028)(2)(3)(8) | | | 714,000 | | | | 24,990 | | | | | |
| MetLife, Inc., | | | | | | | | | | | | |
| 4.875%, 11/13/2043 | | | 3,375,000 | | | | 3,300,382 | | | | | |
| Metropolitan Life Global Funding I: | | | | | | | | | | | | |
2.950%, 04/09/2030(2) | | | 22,375,000 | | | | 19,902,758 | | | | | |
1.550%, 01/07/2031(2) | | | 650,000 | | | | 521,899 | | | | | |
5.150%, 03/28/2033(2) | | | 19,475,000 | | | | 19,853,649 | | | | | |
| Metropolitan Life Insurance Co., | | | | | | | | | | | | |
7.800%, 11/01/2025(2) | | | 6,300,000 | | | | 6,580,793 | | | | | |
| Mitsubishi UFJ Financial Group, Inc.: | | | | | | | | | | | | |
2.193%, 02/25/2025(1) | | | 25,000,000 | | | | 24,149,131 | | | | | |
| 1.538%, 07/20/2027 | | | | | | | | | | | | |
| (1 Year CMT Rate + 0.750%) | | | | | | | | | | | | |
(Callable 07/20/2026)(1)(3) | | | 10,000,000 | | | | 9,141,586 | | | | | |
| 5.017%, 07/20/2028 | | | | | | | | | | | | |
| (1 Year CMT Rate + 1.950%) | | | | | | | | | | | | |
(Callable 07/20/2027)(1)(3) | | | 6,700,000 | | | | 6,710,057 | | | | | |
| 5.354%, 09/13/2028 | | | | | | | | | | | | |
| (1 Year CMT Rate + 1.900%) | | | | | | | | | | | | |
(Callable 09/13/2027)(1)(3) | | | 13,600,000 | | | | 13,792,344 | | | | | |
| 5.475%, 02/22/2031 | | | | | | | | | | | | |
| (1 Year CMT Rate + 1.530%) | | | | | | | | | | | | |
(Callable 02/22/2030)(1)(3) | | | 3,525,000 | | | | 3,615,187 | | | | | |
| 5.406%, 04/19/2034 | | | | | | | | | | | | |
| (1 Year CMT Rate + 1.970%) | | | | | | | | | | | | |
(Callable 04/19/2033)(1)(3) | | | 7,000,000 | | | | 7,264,326 | | | | | |
| Mizuho Financial Group, Inc.: | | | | | | | | | | | | |
| 2.555%, 09/13/2025 | | | | | | | | | | | | |
| (3 Month TSFR + 1.362%) | | | | | | | | | | | | |
(Callable 09/13/2024)(1)(3) | | | 20,000,000 | | | | 19,598,476 | | | | | |
| 1.234%, 05/22/2027 | | | | | | | | | | | | |
| (1 Year CMT Rate + 0.670%) | | | | | | | | | | | | |
(Callable 05/22/2026)(1)(3) | | | 8,000,000 | | | | 7,291,505 | | | | | |
| 5.414%, 09/13/2028 | | | | | | | | | | | | |
| (1 Year CMT Rate + 2.050%) | | | | | | | | | | | | |
(Callable 09/13/2027)(1)(3) | | | 6,725,000 | | | | 6,819,618 | | | | | |
| 1.979%, 09/08/2031 | | | | | | | | | | | | |
| (3 Month TSFR + 1.532%) | | | | | | | | | | | | |
(Callable 09/08/2030)(1)(3) | | | 10,000,000 | | | | 8,166,230 | | | | | |
| Morgan Stanley: | | | | | | | | | | | | |
| 2.720%, 07/22/2025 (SOFR + 1.152%) | | | | | | | | | | | | |
(Callable 07/22/2024)(3) | | | 19,000,000 | | | | 18,687,463 | | | | | |
| 3.591%, 07/22/2028 | | | | | | | | | | | | |
| (3 Month LIBOR USD + 1.340%) | | | | | | | | | | | | |
(Callable 07/22/2027)(4)(9) | | | 12,000,000 | | | | 11,466,519 | | | | | |
The accompanying notes are an integral part of these financial statements.
Baird Aggregate Bond Fund
Schedule of Investments, December 31, 2023
Long-Term Investments (cont.)
| | | Principal | | | | | | % of | |
| | | Amount | | | Value | | | Net Assets | |
| Morgan Stanley: (cont.) | | | | | | | | | |
| 6.296%, 10/18/2028 | | | | | | | | | |
| (SOFR + 2.240%) | | | | | | | | | |
(Callable 10/18/2027)(3) | | $ | 62,625,000 | | | $ | 65,645,764 | | | |
| |
| 3.772%, 01/24/2029 | | | | | | | | | | | | |
| (3 Month TSFR + 1.402%) | | | | | | | | | | | | |
(Callable 01/24/2028)(3) | | | 1,000,000 | | | | 954,419 | | | | | |
| 5.123%, 02/01/2029 (SOFR + 1.730%) | | | | | | | | | | | | |
(Callable 02/01/2028)(3) | | | 8,300,000 | | | | 8,344,817 | | | | | |
| 3.622%, 04/01/2031 (SOFR + 3.120%) | | | | | | | | | | | | |
(Callable 04/01/2030)(3) | | | 10,000,000 | | | | 9,218,836 | | | | | |
| 1.928%, 04/28/2032 (SOFR + 1.020%) | | | | | | | | | | | | |
(Callable 04/28/2031)(3) | | | 25,000,000 | | | | 20,146,886 | | | | | |
| 2.239%, 07/21/2032 (SOFR + 1.178%) | | | | | | | | | | | | |
(Callable 07/21/2031)(3) | | | 25,000,000 | | | | 20,411,781 | | | | | |
| 6.342%, 10/18/2033 (SOFR + 2.560%) | | | | | | | | | | | | |
(Callable 10/18/2032)(3) | | | 20,000,000 | | | | 21,604,470 | | | | | |
| 5.424%, 07/21/2034 (SOFR + 1.880%) | | | | | | | | | | | | |
(Callable 07/21/2033)(3) | | | 8,000,000 | | | | 8,135,219 | | | | | |
| National Australia Bank Ltd.: | | | | | | | | | | | | |
2.332%, 08/21/2030(1)(2) | | | 83,282,000 | | | | 67,940,489 | | | | | |
2.990%, 05/21/2031(1)(2) | | | 19,911,000 | | | | 16,689,389 | | | | | |
6.429%, 01/12/2033(1)(2) | | | 28,262,000 | | | | 29,979,060 | | | | | |
| 3.933%, 08/02/2034 | | | | | | | | | | | | |
| (5 Year CMT Rate + 1.880%) | | | | | | | | | | | | |
(Callable 08/02/2029)(1)(2)(3) | | | 10,000,000 | | | | 9,073,725 | | | | | |
| 3.347%, 01/12/2037 | | | | | | | | | | | | |
| (5 Year CMT Rate + 1.700%) | | | | | | | | | | | | |
(Callable 01/12/2032)(1)(2)(3) | | | 10,000,000 | | | | 8,314,934 | | | | | |
| National Bank of Canada, | | | | | | | | | | | | |
5.600%, 12/18/2028(1) | | | 13,000,000 | | | | 13,342,488 | | | | | |
| Nationwide Building Society: | | | | | | | | | | | | |
4.000%, 09/14/2026(1)(2) | | | 73,507,000 | | | | 70,566,146 | | | | | |
| 4.302%, 03/08/2029 | | | | | | | | | | | | |
| (3 Month LIBOR USD + 1.452%) | | | | | | | | | | | | |
(Callable 03/08/2028)(1)(2)(3)(9) | | | 20,000,000 | | | | 19,164,431 | | | | | |
| 3.960%, 07/18/2030 | | | | | | | | | | | | |
| (3 Month LIBOR USD + 1.855%) | | | | | | | | | | | | |
(Callable 07/18/2029)(1)(2)(3)(9) | | | 10,125,000 | | | | 9,447,883 | | | | | |
| Nationwide Financial Services, Inc., | | | | | | | | | | | | |
| 3.900%, 11/30/2049 | | | | | | | | | | | | |
(Callable 05/30/2049)(2) | | | 10,000,000 | | | | 7,953,784 | | | | | |
| Nationwide Mutual Insurance Co.: | | | | | | | | | | | | |
9.375%, 08/15/2039(2) | | | 14,000,000 | | | | 18,524,698 | | | | | |
| 4.350%, 04/30/2050 | | | | | | | | | | | | |
(Callable 10/30/2049)(2) | | | 25,000,000 | | | | 20,124,805 | | | | | |
| NatWest Group PLC: | | | | | | | | | | | | |
| 4.269%, 03/22/2025 | | | | | | | | | | | | |
| (3 Month LIBOR USD + 1.762%) | | | | | | | | | | | | |
(Callable 03/22/2024)(1)(3)(9) | | | 27,351,000 | | | | 27,255,178 | | | | | |
| 5.847%, 03/02/2027 | | | | | | | | | | | | |
| (1 Year CMT Rate + 1.350%) | | | | | | | | | | | | |
(Callable 03/02/2026)(1)(3) | | | 13,000,000 | | | | 13,113,063 | | | | | |
| 1.642%, 06/14/2027 | | | | | | | | | | | | |
| (1 Year CMT Rate + 0.900%) | | | | | | | | | | | | |
(Callable 06/14/2026)(1)(3) | | | 35,000,000 | | | | 31,965,809 | | | | | |
| 3.073%, 05/22/2028 | | | | | | | | | | | | |
| (1 Year CMT Rate + 2.550%) | | | | | | | | | | | | |
(Callable 05/22/2027)(1)(3) | | | 18,301,000 | | | | 17,007,352 | | | | | |
| 5.516%, 09/30/2028 | | | | | | | | | | | | |
| (1 Year CMT Rate + 2.270%) | | | | | | | | | | | | |
(Callable 09/30/2027)(1)(3) | | | 10,000,000 | | | | 10,062,222 | | | | | |
| 4.892%, 05/18/2029 | | | | | | | | | | | | |
| (3 Month LIBOR USD + 1.754%) | | | | | | | | | | | | |
(Callable 05/18/2028)(1)(3)(9) | | | 10,000,000 | | | | 9,827,465 | | | | | |
| 5.808%, 09/13/2029 | | | | | | | | | | | | |
| (1 Year CMT Rate + 1.950%) | | | | | | | | | | | | |
(Callable 09/13/2028)(1)(3) | | | 45,500,000 | | | | 46,694,899 | | | | | |
| 5.076%, 01/27/2030 | | | | | | | | | | | | |
| (3 Month LIBOR USD + 1.905%) | | | | | | | | | | | | |
(Callable 01/27/2029)(1)(3)(9) | | | 7,000,000 | | | | 6,897,721 | | | | | |
| 4.445%, 05/08/2030 | | | | | | | | | | | | |
| (3 Month LIBOR USD + 1.871%) | | | | | | | | | | | | |
(Callable 05/08/2029)(1)(3)(9) | | | 35,000,000 | | | | 33,579,319 | | | | | |
| 6.016%, 03/02/2034 | | | | | | | | | | | | |
| (1 Year CMT Rate + 2.100%) | | | | | | | | | | | | |
(Callable 03/02/2033)(1)(3) | | | 4,700,000 | | | | 4,947,818 | | | | | |
| New York Life Insurance Co.: | | | | | | | | | | | | |
6.750%, 11/15/2039(2) | | | 12,026,000 | | | | 13,864,770 | | | | | |
| 3.750%, 05/15/2050 | | | | | | | | | | | | |
(Callable 11/15/2049)(2) | | | 17,000,000 | | | | 13,656,539 | | | | | |
| 4.450%, 05/15/2069 | | | | | | | | | | | | |
(Callable 11/15/2068)(2) | | | 10,000,000 | | | | 8,600,001 | | | | | |
| Nomura Holdings, Inc.: | | | | | | | | | | | | |
2.648%, 01/16/2025(1) | | | 20,000,000 | | | | 19,403,645 | | | | | |
1.851%, 07/16/2025(1) | | | 19,000,000 | | | | 17,992,569 | | | | | |
1.653%, 07/14/2026(1) | | | 32,975,000 | | | | 30,158,296 | | | | | |
5.386%, 07/06/2027(1) | | | 10,000,000 | | | | 10,043,359 | | | | | |
2.172%, 07/14/2028(1) | | | 16,055,000 | | | | 14,103,196 | | | | | |
2.710%, 01/22/2029(1) | | | 8,000,000 | | | | 7,088,238 | | | | | |
3.103%, 01/16/2030(1) | | | 2,000,000 | | | | 1,769,174 | | | | | |
| Peachtree Corners Funding Trust, | | | | | | | | | | | | |
3.976%, 02/15/2025(2) | | | 12,295,000 | | | | 12,091,767 | | | | | |
| Penn Mutual Life Insurance Co., | | | | | | | | | | | | |
3.800%, 04/29/2061(2) | | | 17,038,000 | | | | 11,487,790 | | | | | |
| Pine Street Trust I, | | | | | | | | | | | | |
| 4.572%, 02/15/2029 | | | | | | | | | | | | |
(Callable 11/15/2028)(2) | | | 7,825,000 | | | | 7,448,349 | | | | | |
| Principal Financial Group, Inc., | | | | | | | | | | | | |
| 4.300%, 11/15/2046 | | | | | | | | | | | | |
| (Callable 05/15/2046) | | | 2,325,000 | | | | 1,973,498 | | | | | |
| Principal Life Global Funding II: | | | | | | | | | | | | |
3.000%, 04/18/2026(2) | | | 13,400,000 | | | | 12,764,249 | | | | | |
5.500%, 06/28/2028(2) | | | 40,500,000 | | | | 41,056,972 | | | | | |
| Prologis LP: | | | | | | | | | | | | |
| 4.750%, 06/15/2033 | | | | | | | | | | | | |
| (Callable 03/15/2033) | | | 19,425,000 | | | | 19,715,492 | | | | | |
| 5.125%, 01/15/2034 | | | | | | | | | | | | |
| (Callable 10/15/2033) | | | 21,575,000 | | | | 22,287,077 | | | | | |
| Protective Life Corp.: | | | | | | | | | | | | |
| 4.300%, 09/30/2028 | | | | | | | | | | | | |
(Callable 06/30/2028)(1)(2) | | | 10,000,000 | | | | 9,718,328 | | | | | |
8.450%, 10/15/2039(1) | | | 2,650,000 | | | | 3,333,932 | | | | | |
| Protective Life Global Funding, | | | | | | | | | | | | |
5.209%, 04/14/2026(1)(2) | | | 32,900,000 | | | | 32,864,056 | | | | | |
| Prudential Financial, Inc.: | | | | | | | | | | | | |
| 6.625%, 12/01/2037 | | | 5,000,000 | | | | 5,784,849 | | | | | |
| 3.935%, 12/07/2049 | | | | | | | | | | | | |
| (Callable 06/07/2049) | | | 11,426,000 | | | | 9,439,801 | | | | | |
| Raymond James Financial, Inc., | | | | | | | | | | | | |
| 4.650%, 04/01/2030 | | | | | | | | | | | | |
| (Callable 01/01/2030) | | | 9,700,000 | | | | 9,788,187 | | | | | |
| Realty Income Corp.: | | | | | | | | | | | | |
| 4.700%, 12/15/2028 | | | | | | | | | | | | |
| (Callable 11/15/2028) | | | 6,625,000 | | | | 6,666,541 | | | | | |
| 5.625%, 10/13/2032 | | | | | | | | | | | | |
| (Callable 07/13/2032) | | | 6,725,000 | | | | 7,086,510 | | | | | |
The accompanying notes are an integral part of these financial statements.
Baird Aggregate Bond Fund
Schedule of Investments, December 31, 2023
Long-Term Investments (cont.)
| | | Principal | | | | | | % of | |
| | | Amount | | | Value | | | Net Assets | |
| Regions Financial Corp., | | | | | | | | | |
| 2.250%, 05/18/2025 | | | | | | | | | |
| (Callable 04/18/2025) | | $ | 21,650,000 | | | $ | 20,636,619 | | | |
| |
| Reliance Standard Life | | | | | | | | | | | | |
| Global Funding II, | | | | | | | | | | | | |
2.500%, 10/30/2024(1)(2) | | | 22,800,000 | | | | 22,188,648 | | | | | |
| Royal Bank of Canada, | | | | | | | | | | | | |
4.650%, 01/27/2026(1) | | | 7,773,000 | | | | 7,709,827 | | | | | |
| Sammons Financial Group, Inc.: | | | | | | | | | | | | |
| 3.350%, 04/16/2031 | | | | | | | | | | | | |
(Callable 01/16/2031)(2) | | | 14,350,000 | | | | 11,534,334 | | | | | |
| 4.750%, 04/08/2032 | | | | | | | | | | | | |
(Callable 01/08/2032)(2) | | | 23,000,000 | | | | 20,203,750 | | | | | |
| Santander Holdings USA, Inc., | | | | | | | | | | | | |
| 3.500%, 06/07/2024 | | | | | | | | | | | | |
(Callable 05/07/2024)(1) | | | 5,695,000 | | | | 5,634,172 | | | | | |
| Santander UK Group Holdings PLC: | | | | | | | | | | | | |
| 1.673%, 06/14/2027 (SOFR + 0.989%) | | | | | | | | | | | | |
(Callable 06/14/2026)(1)(3) | | | 9,500,000 | | | | 8,639,304 | | | | | |
| 6.534%, 01/10/2029 (SOFR + 2.600%) | | | | | | | | | | | | |
(Callable 01/10/2028)(1)(3) | | | 27,600,000 | | | | 28,575,692 | | | | | |
| SMBC Aviation Capital Finance DAC: | | | | | | | | | | | | |
| 1.900%, 10/15/2026 | | | | | | | | | | | | |
(Callable 09/15/2026)(1)(2) | | | 6,725,000 | | | | 6,108,773 | | | | | |
| 5.450%, 05/03/2028 | | | | | | | | | | | | |
(Callable 04/03/2028)(1)(2) | | | 7,000,000 | | | | 7,044,616 | | | | | |
| 5.700%, 07/25/2033 | | | | | | | | | | | | |
(Callable 04/25/2033)(1)(2) | | | 33,475,000 | | | | 33,913,843 | | | | | |
| Societe Generale SA: | | | | | | | | | | | | |
5.000%, 01/17/2024(1)(2) | | | 20,000,000 | | | | 19,988,077 | | | | | |
3.875%, 03/28/2024(1)(2) | | | 15,300,000 | | | | 15,226,510 | | | | | |
2.625%, 10/16/2024(1)(2) | | | 23,000,000 | | | | 22,452,576 | | | | | |
2.625%, 01/22/2025(1)(2) | | | 41,125,000 | | | | 39,851,909 | | | | | |
| 2.226%, 01/21/2026 | | | | | | | | | | | | |
| (1 Year CMT Rate + 1.050%) | | | | | | | | | | | | |
(Callable 01/21/2025)(1)(2)(3) | | | 21,032,000 | | | | 20,207,345 | | | | | |
| 1.488%, 12/14/2026 | | | | | | | | | | | | |
| (1 Year CMT Rate + 1.100%) | | | | | | | | | | | | |
(Callable 12/14/2025)(1)(2)(3) | | | 28,800,000 | | | | 26,516,481 | | | | | |
| 2.797%, 01/19/2028 | | | | | | | | | | | | |
| (1 Year CMT Rate + 1.300%) | | | | | | | | | | | | |
(Callable 01/19/2027)(1)(2)(3) | | | 2,225,000 | | | | 2,051,566 | | | | | |
| 6.446%, 01/10/2029 | | | | | | | | | | | | |
| (1 Year CMT Rate + 2.550%) | | | | | | | | | | | | |
(Callable 01/10/2028)(1)(2)(3) | | | 13,000,000 | | | | 13,458,541 | | | | | |
| 2.889%, 06/09/2032 | | | | | | | | | | | | |
| (1 Year CMT Rate + 1.300%) | | | | | | | | | | | | |
(Callable 06/09/2031)(1)(2)(3) | | | 6,775,000 | | | | 5,599,552 | | | | | |
| 3.337%, 01/21/2033 | | | | | | | | | | | | |
| (1 Year CMT Rate + 1.600%) | | | | | | | | | | | | |
(Callable 01/21/2032)(1)(2)(3) | | | 10,000,000 | | | | 8,400,557 | | | | | |
| 6.221%, 06/15/2033 | | | | | | | | | | | | |
| (1 Year CMT Rate + 3.200%) | | | | | | | | | | | | |
(Callable 06/15/2032)(1)(2)(3) | | | 9,150,000 | | | | 9,145,361 | | | | | |
3.625%, 03/01/2041(1)(2) | | | 12,000,000 | | | | 8,212,743 | | | | | |
| Standard Chartered PLC: | | | | | | | | | | | | |
| 3.785%, 05/21/2025 | | | | | | | | | | | | |
| (3 Month LIBOR USD + 1.560%) | | | | | | | | | | | | |
(Callable 05/21/2024)(1)(2)(3)(9) | | | 36,294,000 | | | | 35,974,107 | | | | | |
| 2.819%, 01/30/2026 | | | | | | | | | | | | |
| (3 Month LIBOR USD + 1.209%) | | | | | | | | | | | | |
(Callable 01/30/2025)(1)(2)(3)(9) | | | 21,000,000 | | | | 20,304,630 | | | | | |
| 1.456%, 01/14/2027 | | | | | | | | | | | | |
| (1 Year CMT Rate + 1.000%) | | | | | | | | | | | | |
(Callable 01/14/2026)(1)(2)(3) | | | 20,658,000 | | | | 18,916,572 | | | | | |
| 2.608%, 01/12/2028 | | | | | | | | | | | | |
| (1 Year CMT Rate + 1.180%) | | | | | | | | | | | | |
(Callable 01/12/2027)(1)(2)(3) | | | 24,000,000 | | | | 21,947,341 | | | | | |
| 7.767%, 11/16/2028 | | | | | | | | | | | | |
| (1 Year CMT Rate + 3.450%) | | | | | | | | | | | | |
(Callable 11/16/2027)(1)(2)(3) | | | 8,000,000 | | | | 8,653,623 | | | | | |
| 6.301%, 01/09/2029 | | | | | | | | | | | | |
| (1 Year CMT Rate + 2.450%) | | | | | | | | | | | | |
(Callable 01/09/2028)(1)(2)(3) | | | 4,000,000 | | | | 4,099,163 | | | | | |
| 4.644%, 04/01/2031 | | | | | | | | | | | | |
| (1 Year CMT Rate + 3.850%) | | | | | | | | | | | | |
(Callable 04/01/2030)(1)(2)(3) | | | 14,700,000 | | | | 13,876,518 | | | | | |
| 6.296%, 07/06/2034 | | | | | | | | | | | | |
| (1 Year CMT Rate + 2.580%) | | | | | | | | | | | | |
(Callable 07/06/2033)(1)(2)(3) | | | 13,850,000 | | | | 14,557,724 | | | | | |
5.700%, 03/26/2044(1)(2) | | | 6,000,000 | | | | 5,883,541 | | | | | |
| Stifel Financial Corp.: | | | | | | | | | | | | |
| 4.250%, 07/18/2024 | | | 17,850,000 | | | | 17,670,440 | | | | | |
| 4.000%, 05/15/2030 | | | | | | | | | | | | |
| (Callable 02/15/2030) | | | 51,140,000 | | | | 46,465,309 | | | | | |
| Sumitomo Mitsui Financial Group, Inc.: | | | | | | | | | | | | |
1.474%, 07/08/2025(1) | | | 8,740,000 | | | | 8,272,463 | | | | | |
2.130%, 07/08/2030(1) | | | 7,575,000 | | | | 6,391,921 | | | | | |
5.852%, 07/13/2030(1) | | | 20,000,000 | | | | 20,989,505 | | | | | |
5.766%, 01/13/2033(1) | | | 33,650,000 | | | | 35,586,879 | | | | | |
| SunTrust Banks, Inc., | | | | | | | | | | | | |
| 3.300%, 05/15/2026 | | | | | | | | | | | | |
| (Callable 04/15/2026) | | | 3,925,000 | | | | 3,747,930 | | | | | |
| Svenska Handelsbanken AB, | | | | | | | | | | | | |
5.500%, 06/15/2028(1)(2) | | | 15,250,000 | | | | 15,509,837 | | | | | |
| Swedbank AB, | | | | | | | | | | | | |
6.136%, 09/12/2026(1)(2) | | | 24,400,000 | | | | 24,882,169 | | | | | |
| Synchrony Bank, | | | | | | | | | | | | |
| 5.625%, 08/23/2027 | | | | | | | | | | | | |
| (Callable 07/23/2027) | | | 8,250,000 | | | | 8,114,837 | | | | | |
| Synchrony Financial: | | | | | | | | | | | | |
| 4.375%, 03/19/2024 | | | | | | | | | | | | |
| (Callable 02/19/2024) | | | 1,538,000 | | | | 1,532,482 | | | | | |
| 4.250%, 08/15/2024 | | | | | | | | | | | | |
| (Callable 05/15/2024) | | | 26,864,000 | | | | 26,567,304 | | | | | |
| 4.500%, 07/23/2025 | | | | | | | | | | | | |
| (Callable 04/23/2025) | | | 23,127,000 | | | | 22,593,041 | | | | | |
| 3.700%, 08/04/2026 | | | | | | | | | | | | |
| (Callable 05/04/2026) | | | 23,023,000 | | | | 21,669,865 | | | | | |
| 3.950%, 12/01/2027 | | | | | | | | | | | | |
| (Callable 09/01/2027) | | | 44,825,000 | | | | 41,920,446 | | | | | |
| 2.875%, 10/28/2031 | | | | | | | | | | | | |
| (Callable 07/28/2031) | | | 5,000,000 | | | | 4,013,192 | | | | | |
| Toronto-Dominion Bank, | | | | | | | | | | | | |
4.456%, 06/08/2032(1) | | | 19,000,000 | | | | 18,491,744 | | | | | |
| Travelers Companies, Inc., | | | | | | | | | | | | |
| 5.450%, 05/25/2053 | | | | | | | | | | | | |
| (Callable 11/25/2052) | | | 4,000,000 | | | | 4,331,037 | | | | | |
| Trinity Acquisition PLC: | | | | | | | | | | | | |
| 4.400%, 03/15/2026 | | | | | | | | | | | | |
| (Callable 12/15/2025) | | | 27,305,000 | | | | 26,961,555 | | | | | |
| 6.125%, 08/15/2043 | | | 22,561,000 | | | | 23,111,151 | | | | | |
| Truist Financial Corp.: | | | | | | | | | | | | |
| 7.161%, 10/30/2029 (SOFR + 2.446%) | | | | | | | | | | | | |
(Callable 10/30/2028)(3) | | | 8,000,000 | | | | 8,649,279 | | | | | |
| 5.122%, 01/26/2034 (SOFR + 1.852%) | | | | | | | | | | | | |
(Callable 01/26/2033)(3) | | | 12,000,000 | | | | 11,665,099 | | | | | |
The accompanying notes are an integral part of these financial statements.
Baird Aggregate Bond Fund
Schedule of Investments, December 31, 2023
Long-Term Investments (cont.)
| | | Principal | | | | | | % of | |
| | | Amount | | | Value | | | Net Assets | |
| Trustage Financial Group, Inc., | | | | | | | | | |
| 4.625%, 04/15/2032 | | | | | | | | | |
(Callable 01/15/2032)(2) | | $ | 2,205,000 | | | $ | 1,923,704 | | | |
| |
| UBS Group AG: | | | | | | | | | | | | |
| 2.593%, 09/11/2025 | | | | | | | | | | | | |
| (SOFR + 1.560%) | | | | | | | | | | | | |
(Callable 09/11/2024)(1)(2)(3) | | | 12,250,000 | | | | 11,984,711 | | | | | |
4.550%, 04/17/2026(1) | | | 7,000,000 | | | | 6,910,091 | | | | | |
| 2.193%, 06/05/2026 (SOFR + 2.044%) | | | | | | | | | | | | |
(Callable 06/05/2025)(1)(2)(3) | | | 15,000,000 | | | | 14,267,464 | | | | | |
| 5.711%, 01/12/2027 | | | | | | | | | | | | |
| (1 Year CMT Rate + 1.550%) | | | | | | | | | | | | |
(Callable 01/12/2026)(1)(2)(3) | | | 4,078,000 | | | | 4,102,172 | | | | | |
| 1.364%, 01/30/2027 | | | | | | | | | | | | |
| (1 Year CMT Rate + 1.080%) | | | | | | | | | | | | |
(Callable 01/30/2026)(1)(2)(3) | | | 21,397,000 | | | | 19,626,006 | | | | | |
| 1.305%, 02/02/2027 | | | | | | | | | | | | |
| (SOFRINDX + 0.980%) | | | | | | | | | | | | |
(Callable 02/02/2026)(1)(2)(3) | | | 40,000,000 | | | | 36,609,052 | | | | | |
| 1.494%, 08/10/2027 | | | | | | | | | | | | |
| (1 Year CMT Rate + 0.850%) | | | | | | | | | | | | |
(Callable 08/10/2026)(1)(2)(3) | | | 9,000,000 | | | | 8,135,428 | | | | | |
| 4.282%, 01/09/2028 | | | | | | | | | | | | |
(Callable 01/09/2027)(1)(2) | | | 17,403,000 | | | | 16,856,217 | | | | | |
| 3.869%, 01/12/2029 | | | | | | | | | | | | |
| (3 Month LIBOR USD + 1.410%) | | | | | | | | | | | | |
(Callable 01/12/2028)(1)(2)(3)(9) | | | 34,500,000 | | | | 32,547,936 | | | | | |
| 4.194%, 04/01/2031 (SOFR + 3.730%) | | | | | | | | | | | | |
(Callable 04/01/2030)(1)(2)(3) | | | 20,000,000 | | | | 18,646,662 | | | | | |
| 2.095%, 02/11/2032 | | | | | | | | | | | | |
| (1 Year CMT Rate + 1.000%) | | | | | | | | | | | | |
(Callable 02/11/2031)(1)(2)(3) | | | 43,570,000 | | | | 34,811,126 | | | | | |
| 3.091%, 05/14/2032 (SOFR + 1.730%) | | | | | | | | | | | | |
(Callable 05/14/2031)(1)(2)(3) | | | 10,000,000 | | | | 8,534,112 | | | | | |
| 6.537%, 08/12/2033 (SOFR + 3.920%) | | | | | | | | | | | | |
(Callable 08/12/2032)(1)(2)(3) | | | 6,000,000 | | | | 6,402,685 | | | | | |
| UBS Group Funding Switzerland AG, | | | | | | | | | | | | |
| 4.253%, 03/23/2028 | | | | | | | | | | | | |
(Callable 03/23/2027)(1)(2) | | | 17,150,000 | | | | 16,560,676 | | | | | |
| UnitedHealth Group, Inc.: | | | | | | | | | | | | |
| 2.750%, 05/15/2040 | | | | | | | | | | | | |
| (Callable 11/15/2039) | | | 7,000,000 | | | | 5,298,273 | | | | | |
| 4.750%, 05/15/2052 | | | | | | | | | | | | |
| (Callable 11/15/2051) | | | 8,275,000 | | | | 7,988,595 | | | | | |
| Wells Fargo & Co.: | | | | | | | | | | | | |
| 2.406%, 10/30/2025 | | | | | | | | | | | | |
| (3 Month TSFR + 1.087%) | | | | | | | | | | | | |
(Callable 10/30/2024)(3) | | | 19,000,000 | | | | 18,484,251 | | | | | |
| 2.164%, 02/11/2026 | | | | | | | | | | | | |
| (3 Month TSFR + 1.012%) | | | | | | | | | | | | |
(Callable 02/11/2025)(3) | | | 15,000,000 | | | | 14,437,762 | | | | | |
| 3.000%, 04/22/2026 | | | 3,000,000 | | | | 2,874,698 | | | | | |
| 3.908%, 04/25/2026 (SOFR + 1.320%) | | | | | | | | | | | | |
(Callable 04/25/2025)(3) | | | 5,000,000 | | | | 4,901,147 | | | | | |
| 2.393%, 06/02/2028 (SOFR + 2.100%) | | | | | | | | | | | | |
(Callable 06/02/2027)(3) | | | 64,086,000 | | | | 58,736,715 | | | | | |
| 4.808%, 07/25/2028 (SOFR + 1.980%) | | | | | | | | | | | | |
(Callable 07/25/2027)(3) | | | 13,000,000 | | | | 12,909,645 | | | | | |
| 5.574%, 07/25/2029 (SOFR + 1.740%) | | | | | | | | | | | | |
(Callable 07/25/2028)(3) | | | 30,225,000 | | | | 30,892,833 | | | | | |
| 3.350%, 03/02/2033 (SOFR + 1.500%) | | | | | | | | | | | | |
(Callable 03/02/2032)(3) | | | 5,000,000 | | | | 4,379,694 | | | | | |
| 5.389%, 04/24/2034 (SOFR + 2.020%) | | | | | | | | | | | | |
(Callable 04/24/2033)(3) | | | 23,925,000 | | | | 24,071,198 | | | | | |
| 6.491%, 10/23/2034 | | | | | | | | | | | | |
| (SOFR + 2.060%) | | | | | | | | | | | | |
(Callable 10/23/2033)(3) | | | 25,000,000 | | | | 27,251,050 | | | | | |
| 3.068%, 04/30/2041 | | | | | | | | | | | | |
| (SOFR + 2.530%) | | | | | | | | | | | | |
(Callable 04/30/2040)(3) | | | 25,000,000 | | | | 18,959,306 | | | | | |
| 3.900%, 05/01/2045 | | | 5,000,000 | | | | 4,139,297 | | | | | |
| 5.013%, 04/04/2051 | | | | | | | | | | | | |
| (3 Month TSFR + 4.502%) | | | | | | | | | | | | |
(Callable 04/04/2050)(3) | | | 7,000,000 | | | | 6,661,221 | | | | | |
| Wells Fargo Bank NA, | | | | | | | | | | | | |
| 5.850%, 02/01/2037 | | | 10,000,000 | | | | 10,516,649 | | | | | |
| Western & Southern | | | | | | | | | | | | |
| Financial Group, Inc., | | | | | | | | | | | | |
5.750%, 07/15/2033(2) | | | 8,300,000 | | | | 8,552,213 | | | | | |
| Westpac Banking Corp.: | | | | | | | | | | | | |
| 2.894%, 02/04/2030 | | | | | | | | | | | | |
| (5 Year CMT Rate + 1.350%) | | | | | | | | | | | | |
(Callable 02/04/2025)(1)(3) | | | 11,425,000 | | | | 11,005,762 | | | | | |
| 4.322%, 11/23/2031 (5 Year Mid | | | | | | | | | | | | |
| Swap Rate USD + 2.236%) | | | | | | | | | | | | |
(Callable 11/23/2026)(1)(3) | | | 8,350,000 | | | | 8,032,228 | | | | | |
| 5.405%, 08/10/2033 | | | | | | | | | | | | |
| (1 Year CMT Rate + 2.680%) | | | | | | | | | | | | |
(Callable 08/10/2032)(1)(3) | | | 5,000,000 | | | | 4,980,511 | | | | | |
6.820%, 11/17/2033(1) | | | 4,350,000 | | | | 4,731,487 | | | | | |
| 4.110%, 07/24/2034 | | | | | | | | | | | | |
| (5 Year CMT Rate + 2.000%) | | | | | | | | | | | | |
(Callable 07/24/2029)(1)(3) | | | 10,000,000 | | | | 9,151,123 | | | | | |
| 2.668%, 11/15/2035 | | | | | | | | | | | | |
| (5 Year CMT Rate + 1.750%) | | | | | | | | | | | | |
(Callable 11/15/2030)(1)(3) | | | 13,600,000 | | | | 11,082,699 | | | | | |
4.421%, 07/24/2039(1) | | | 10,000,000 | | | | 8,699,011 | | | | | |
| Willis North America, Inc.: | | | | | | | | | | | | |
| 4.650%, 06/15/2027 | | | | | | | | | | | | |
| (Callable 05/15/2027) | | | 8,525,000 | | | | 8,436,727 | | | | | |
| 2.950%, 09/15/2029 | | | | | | | | | | | | |
| (Callable 06/15/2029) | | | 7,500,000 | | | | 6,714,915 | | | | | |
| 5.350%, 05/15/2033 | | | | | | | | | | | | |
| (Callable 02/15/2033) | | | 11,425,000 | | | | 11,551,108 | | | | | |
| 5.050%, 09/15/2048 | | | | | | | | | | | | |
| (Callable 03/15/2048) | | | 10,200,000 | | | | 9,537,624 | | | | | |
| Total Financials | | | | | | | | | | | | |
| (Cost $7,336,505,736) | | | | | | | 6,975,391,857 | | | | 16.3 | % |
| Total Corporate Bonds | | | | | | | | | | | | |
| (Cost $17,200,081,274) | | | | | | | 16,158,031,184 | | | | 37.7 | % |
| Municipal Bonds | | | | | | | | | | | | |
| Atlanta Independent School System, | | | | | | | | | | | | |
| 5.557%, 03/01/2026 | | | 4,465,000 | | | | 4,553,201 | | | | | |
| California Community | | | | | | | | | | | | |
| Choice Financing Authority: | | | | | | | | | | | | |
| 5.950%, 08/01/2029 | | | 3,155,000 | | | | 3,201,193 | | | | | |
| 6.125%, 04/01/2030 | | | 5,000,000 | | | | 5,112,562 | | | | | |
| California Housing Finance Agency, | | | | | | | | | | | | |
| 2.794%, 08/01/2036 | | | | | | | | | | | | |
| (Pre-refunded to 08/01/2025) | | | 1,595,000 | | | | 1,572,749 | | | | | |
| California Qualified School | | | | | | | | | | | | |
| Bond Joint Powers Authority, | | | | | | | | | | | | |
| 7.155%, 03/01/2027 | | | 4,485,000 | | | | 4,670,129 | | | | | |
| Colorado Housing and Finance Authority, | | | | | | | | | | | | |
| 6.500%, 11/01/2053 (Callable | | | | | | | | | | | | |
| 05/01/2032) (Insured by GNMA) | | | 29,860,000 | | | | 31,718,056 | | | | | |
The accompanying notes are an integral part of these financial statements.
Baird Aggregate Bond Fund
Schedule of Investments, December 31, 2023
Long-Term Investments (cont.)
| | | Principal | | | | | | % of | |
| | | Amount | | | Value | | | Net Assets | |
| Dallas/Fort Worth International Airport: | | | | | | | | | |
| 2.246%, 11/01/2031 | | | | | | | | | |
| (Callable 11/01/2030) | | $ | 2,500,000 | | | $ | 2,114,929 | | | |
| |
| 2.416%, 11/01/2032 | | | | | | | | | | | | |
| (Callable 11/01/2030) | | | 5,000,000 | | | | 4,193,374 | | | | | |
| 2.516%, 11/01/2033 | | | | | | | | | | | | |
| (Callable 11/01/2030) | | | 1,220,000 | | | | 1,010,886 | | | | | |
| Eaton Community City School District, | | | | | | | | | | | | |
| 5.390%, 08/25/2027 | | | | | | | | | | | | |
| (Callable 01/29/2024) | | | | | | | | | | | | |
| (Insured by SD CRED PROG) | | | 2,305,000 | | | | 2,306,468 | | | | | |
| Kentucky Housing Corp., | | | | | | | | | | | | |
| 3.500%, 01/01/2040 | | | | | | | | | | | | |
| (Callable 07/01/2025) | | | 1,595,000 | | | | 1,552,301 | | | | | |
| Louisiana Housing Corp., | | | | | | | | | | | | |
| 2.100%, 12/01/2038 | | | | | | | | | | | | |
| (Callable 09/01/2024) | | | | | | | | | | | | |
| (Insured by GNMA) | | | 845,861 | | | | 768,745 | | | | | |
| Maine State Housing Authority, | | | | | | | | | | | | |
| 2.600%, 11/15/2046 | | | | | | | | | | | | |
| (Callable 11/15/2030) | | | 10,000,000 | | | | 7,300,293 | | | | | |
| Maryland Community Development | | | | | | | | | | | | |
| Administration Housing Revenue, | | | | | | | | | | | | |
| 3.160%, 09/01/2041 | | | | | | | | | | | | |
| (Callable 09/01/2025) | | | 2,895,000 | | | | 2,845,647 | | | | | |
| Maryland Economic Development Corp., | | | | | | | | | | | | |
| 3.997%, 04/01/2034 | | | | | | | | | | | | |
| (Callable 01/01/2034) | | | 18,375,000 | | | | 14,751,112 | | | | | |
| Massachusetts Educational | | | | | | | | | | | | |
| Financing Authority, | | | | | | | | | | | | |
| 3.850%, 05/25/2033 | | | 9,792,745 | | | | 9,451,162 | | | | | |
| Minnesota Housing Finance Agency: | | | | | | | | | | | | |
| 2.730%, 08/01/2046 | | | | | | | | | | | | |
| (Callable 07/01/2025) | | | | | | | | | | | | |
| (Insured by GNMA) | | | 1,962,642 | | | | 1,614,070 | | | | | |
| 3.200%, 06/01/2047 | | | | | | | | | | | | |
| (Callable 07/01/2026) | | | | | | | | | | | | |
| (Insured by GNMA) | | | 4,309,232 | | | | 3,780,283 | | | | | |
| 3.000%, 10/01/2047 | | | | | | | | | | | | |
| (Callable 01/01/2027) | | | | | | | | | | | | |
| (Insured by GNMA) | | | 5,304,905 | | | | 4,610,427 | | | | | |
| New Hampshire Business | | | | | | | | | | | | |
| Finance Authority: | | | | | | | | | | | | |
| 3.250%, 04/01/2028 | | | | | | | | | | | | |
| (Callable 01/01/2028) | | | 45,000,000 | | | | 39,141,207 | | | | | |
| 3.300%, 04/01/2032 | | | | | | | | | | | | |
| (Callable 01/01/2032) | | | 35,000,000 | | | | 27,372,464 | | | | | |
| 2.872%, 07/01/2035 | | | | | | | | | | | | |
| (Callable 01/01/2035) | | | 17,445,000 | | | | 12,640,275 | | | | | |
| New Hampshire Housing | | | | | | | | | | | | |
| Finance Authority: | | | | | | | | | | | | |
| 3.750%, 07/01/2034 | | | | | | | | | | | | |
| (Callable 01/29/2024) | | | 10,000 | | | | 9,897 | | | | | |
| 4.000%, 07/01/2036 | | | | | | | | | | | | |
| (Callable 07/01/2025) | | | 1,085,000 | | | | 1,079,191 | | | | | |
| New Jersey Higher Education | | | | | | | | | | | | |
| Student Assistance Authority: | | | | | | | | | | | | |
| 3.500%, 12/01/2039 | | | | | | | | | | | | |
| (Callable 12/01/2028) | | | 12,630,000 | | | | 12,194,048 | | | | | |
| 3.500%, 12/01/2039 | | | | | | | | | | | | |
| (Callable 12/01/2028) | | | 9,340,000 | | | | 9,051,836 | | | | | |
| New York State Dormitory Authority, | | | | | | | | | | | | |
| 2.219%, 07/01/2035 | | | 15,000,000 | | | | 12,265,893 | | | | | |
| North Carolina Housing Finance Agency: | | | | | | | | | | | | |
| 2.812%, 07/01/2035 | | | | | | | | | | | | |
| (Callable 01/29/2024) | | | 435,000 | | | | 428,858 | | | | | |
| 6.500%, 01/01/2055 | | | | | | | | | | | | |
| (Callable 07/01/2032) | | | | | | | | | | | | |
| (Insured by GNMA) | | | 6,465,000 | | | | 6,807,615 | | | | | |
| State Public School Building Authority, | | | | | | | | | | | | |
| 2.966%, 04/01/2027 (Insured by BAM) | | | 5,800,000 | | | | 5,480,865 | | | | | |
| Texas Private Activity Bond | | | | | | | | | | | | |
| Surface Transportation Corp., | | | | | | | | | | | | |
| 3.922%, 12/31/2049 | | | 8,800,000 | | | | 7,124,992 | | | | | |
| Three Rivers Local School District, | | | | | | | | | | | | |
| 5.209%, 09/15/2027 | | | | | | | | | | | | |
| (Callable 01/29/2024) | | | | | | | | | | | | |
| (Insured by SD CRED PROG) | | | 2,365,000 | | | | 2,366,214 | | | | | |
| West Contra Costa | | | | | | | | | | | | |
| Unified School District, | | | | | | | | | | | | |
| 6.250%, 08/01/2030 | | | 1,785,000 | | | | 1,967,170 | | | | | |
| Western Michigan University Homer | | | | | | | | | | | | |
| Stryker MD School of Medicine, | | | | | | | | | | | | |
| 4.750%, 11/15/2028 (Insured by AGM) | | | 11,980,000 | | | | 12,079,332 | | | | | |
| Westlake City School District, | | | | | | | | | | | | |
| 5.227%, 12/01/2026 | | | | | | | | | | | | |
| (Callable 01/29/2024) | | | 3,570,000 | | | | 3,572,301 | | | | | |
| Westvaco Corp., | | | | | | | | | | | | |
7.670%, 01/15/2027(2) | | | 8,000,000 | | | | 8,316,440 | | | | | |
| Total Municipal Bonds | | | | | | | | | | | | |
| (Cost $300,808,947) | | | | | | | 269,026,185 | | | | 0.6 | % |
| Residential Mortgage-Backed Securities | | | | | | | | | | | | |
| U.S. Government Agency Issues | | | | | | | | | | | | |
| Fannie Mae REMIC Trust, | | | | | | | | | | | | |
| Series 1998-66, Class C, | | | | | | | | | | | | |
| 6.000%, 12/25/2028 | | | 889 | | | | 886 | | | | | |
| Federal Gold Loan | | | | | | | | | | | | |
| Mortgage Corp. (FGLMC): | | | | | | | | | | | | |
| 6.500%, 06/01/2029 | | | 34,739 | | | | 35,673 | | | | | |
| 2.500%, 08/01/2030 | | | 76,759,616 | | | | 72,720,911 | | | | | |
| 3.000%, 03/01/2032 | | | 914,452 | | | | 869,981 | | | | | |
| 3.000%, 08/01/2032 | | | 6,027,672 | | | | 5,727,902 | | | | | |
| 3.000%, 09/01/2032 | | | 40,322,486 | | | | 38,257,267 | | | | | |
| 3.000%, 02/01/2033 | | | 24,044,920 | | | | 22,970,851 | | | | | |
| 3.000%, 04/01/2033 | | | 824,886 | | | | 780,389 | | | | | |
| 5.000%, 08/01/2033 | | | 1,787,075 | | | | 1,820,379 | | | | | |
| 3.000%, 01/01/2034 | | | 37,020,998 | | | | 35,341,937 | | | | | |
| 3.500%, 01/01/2034 | | | 5,781,426 | | | | 5,583,908 | | | | | |
| 2.500%, 07/01/2035 | | | 5,078,283 | | | | 4,696,556 | | | | | |
| 2.000%, 08/01/2035 | | | 42,597,411 | | | | 38,489,739 | | | | | |
| 5.000%, 09/01/2035 | | | 3,742,834 | | | | 3,812,759 | | | | | |
| 5.500%, 01/01/2036 | | | 62,879 | | | | 64,899 | | | | | |
| 5.000%, 03/01/2036 | | | 1,552,360 | | | | 1,581,359 | | | | | |
| 1.500%, 06/01/2036 | | | 20,536,301 | | | | 17,974,015 | | | | | |
| 6.000%, 12/01/2036 | | | 58,271 | | | | 60,999 | | | | | |
| 2.000%, 01/01/2037 | | | 32,790,242 | | | | 29,701,115 | | | | | |
| 3.500%, 03/01/2037 | | | 2,658,430 | | | | 2,542,348 | | | | | |
| 4.000%, 03/01/2037 | | | 1,476,758 | | | | 1,444,511 | | | | | |
| 3.500%, 02/01/2038 | | | 29,145,331 | | | | 27,666,423 | | | | | |
| 5.000%, 02/01/2038 | | | 883,751 | | | | 900,244 | | | | | |
| 5.500%, 05/01/2038 | | | 178,377 | | | | 184,116 | | | | | |
| 4.000%, 06/01/2038 | | | 56,225,081 | | | | 55,075,439 | | | | | |
| 5.500%, 01/01/2039 | | | 3,989,278 | | | | 4,117,008 | | | | | |
| 4.500%, 11/01/2039 | | | 1,370,326 | | | | 1,371,757 | | | | | |
| 4.500%, 11/01/2039 | | | 1,127,853 | | | | 1,129,262 | | | | | |
| 4.500%, 12/01/2039 | | | 6,528,121 | | | | 6,536,279 | | | | | |
The accompanying notes are an integral part of these financial statements.
Baird Aggregate Bond Fund
Schedule of Investments, December 31, 2023
Long-Term Investments (cont.)
| | | Principal | | | | | | % of | |
| | | Amount | | | Value | | | Net Assets | |
| Federal Gold Loan | | | | | | | | | |
| Mortgage Corp. (FGLMC): (cont.) | | | | | | | | | |
| 3.000%, 02/01/2040 | | $ | 9,210,897 | | | $ | 8,573,269 | | | |
| |
| 5.000%, 03/01/2040 | | | 279,897 | | | | 285,146 | | | | | |
| 4.500%, 08/01/2040 | | | 224,670 | | | | 224,951 | | | | | |
| 2.000%, 09/01/2040 | | | 23,611,319 | | | | 20,330,026 | | | | | |
| 4.500%, 09/01/2040 | | | 932,211 | | | | 933,376 | | | | | |
| 2.500%, 11/01/2040 | | | 58,436,785 | | | | 52,071,558 | | | | | |
| 1.500%, 12/01/2040 | | | 43,609,659 | | | | 36,315,855 | | | | | |
| 2.000%, 12/01/2040 | | | 107,423,171 | | | | 92,493,084 | | | | | |
| 4.000%, 01/01/2041 | | | 8,804,494 | | | | 8,609,056 | | | | | |
| 4.000%, 01/01/2041 | | | 4,496,103 | | | | 4,396,303 | | | | | |
| 4.500%, 03/01/2041 | | | 660,148 | | | | 660,974 | | | | | |
| 3.500%, 10/01/2041 | | | 2,814,002 | | | | 2,678,527 | | | | | |
| 2.000%, 11/01/2041 | | | 73,320,821 | | | | 62,765,153 | | | | | |
| 2.000%, 12/01/2041 | | | 16,432,307 | | | | 14,046,225 | | | | | |
| 2.000%, 02/01/2042 | | | 45,612,560 | | | | 38,960,183 | | | | | |
| 2.500%, 02/01/2042 | | | 10,873,669 | | | | 9,679,116 | | | | | |
| 4.000%, 03/01/2042 | | | 2,707,042 | | | | 2,644,719 | | | | | |
| 3.500%, 06/01/2042 | | | 1,432,335 | | | | 1,358,033 | | | | | |
| 3.500%, 07/01/2042 | | | 3,620,342 | | | | 3,430,288 | | | | | |
| 3.000%, 08/01/2042 | | | 5,403,533 | | | | 4,992,320 | | | | | |
| 3.500%, 08/01/2042 | | | 25,028,949 | | | | 23,676,815 | | | | | |
| 3.000%, 09/01/2042 | | | 7,984,256 | | | | 7,363,443 | | | | | |
| 3.500%, 09/01/2042 | | | 37,613,260 | | | | 35,581,302 | | | | | |
| 3.000%, 10/01/2042 | | | 2,198,836 | | | | 2,026,953 | | | | | |
| 3.000%, 11/01/2042 | | | 19,567,524 | | | | 18,078,433 | | | | | |
| 3.500%, 12/01/2042 | | | 4,196,096 | | | | 3,976,635 | | | | | |
| 3.000%, 01/01/2043 | | | 13,170,788 | | | | 12,124,100 | | | | | |
| 3.000%, 01/01/2043 | | | 9,266,541 | | | | 8,545,962 | | | | | |
| 3.500%, 01/01/2043 | | | 7,505,706 | | | | 7,088,306 | | | | | |
| 3.000%, 02/01/2043 | | | 1,240,598 | | | | 1,143,611 | | | | | |
| 3.500%, 03/01/2043 | | | 35,806,126 | | | | 33,945,153 | | | | | |
| 3.000%, 04/01/2043 | | | 7,326,500 | | | | 6,753,650 | | | | | |
| 3.000%, 04/01/2043 | | | 3,173,931 | | | | 2,925,789 | | | | | |
| 3.000%, 04/01/2043 | | | 2,687,487 | | | | 2,477,386 | | | | | |
| 4.000%, 04/01/2043 | | | 9,878,967 | | | | 9,635,118 | | | | | |
| 3.500%, 05/01/2043 | | | 5,056,311 | | | | 4,804,421 | | | | | |
| 3.000%, 06/01/2043 | | | 26,955,059 | | | | 24,847,587 | | | | | |
| 3.000%, 08/01/2043 | | | 2,108,070 | | | | 1,943,247 | | | | | |
| 3.500%, 11/01/2043 | | | 2,657,045 | | | | 2,518,651 | | | | | |
| 3.500%, 01/01/2044 | | | 4,026,649 | | | | 3,811,057 | | | | | |
| 3.500%, 02/01/2044 | | | 12,797,444 | | | | 12,112,321 | | | | | |
| 4.000%, 03/01/2044 | | | 1,584,845 | | | | 1,540,003 | | | | | |
| 3.500%, 05/01/2044 | | | 17,916,638 | | | | 16,927,922 | | | | | |
| 4.000%, 05/01/2044 | | | 7,299,291 | | | | 7,119,179 | | | | | |
| 4.000%, 07/01/2044 | | | 1,212,890 | | | | 1,174,197 | | | | | |
| 3.500%, 10/01/2044 | | | 20,513,656 | | | | 19,195,089 | | | | | |
| 4.000%, 10/01/2044 | | | 3,603,468 | | | | 3,488,514 | | | | | |
| 3.000%, 01/01/2045 | | | 7,292,309 | | | | 6,685,714 | | | | | |
| 3.500%, 01/01/2045 | | | 11,829,491 | | | | 11,196,197 | | | | | |
| 4.500%, 01/01/2045 | | | 11,225,820 | | | | 11,170,567 | | | | | |
| 3.000%, 10/01/2045 | | | 14,811,631 | | | | 13,653,759 | | | | | |
| 4.000%, 10/01/2045 | | | 1,799,887 | | | | 1,739,855 | | | | | |
| 4.000%, 11/01/2045 | | | 4,040,508 | | | | 3,905,743 | | | | | |
| 3.500%, 12/01/2045 | | | 3,008,999 | | | | 2,815,512 | | | | | |
| 3.000%, 01/01/2046 | | | 52,832,885 | | | | 48,636,625 | | | | | |
| 3.000%, 01/01/2046 | | | 41,439,070 | | | | 38,202,802 | | | | | |
| 3.500%, 01/01/2046 | | | 12,330,167 | | | | 11,587,824 | | | | | |
| 4.000%, 02/01/2046 | | | 25,815,109 | | | | 25,201,822 | | | | | |
| 4.000%, 02/01/2046 | | | 5,288,721 | | | | 5,056,769 | | | | | |
| 4.000%, 04/01/2046 | | | 3,729,272 | | | | 3,604,907 | | | | | |
| 3.500%, 05/01/2046 | | | 2,264,310 | | | | 2,118,715 | | | | | |
| 3.500%, 08/01/2046 | | | 13,323,455 | | | | 12,536,484 | | | | | |
| 3.000%, 09/01/2046 | | | 45,652,590 | | | | 41,652,678 | | | | | |
| 3.000%, 10/01/2046 | | | 48,188,036 | | | | 44,090,707 | | | | | |
| 3.000%, 10/01/2046 | | | 29,424,997 | | | | 26,868,182 | | | | | |
| 3.000%, 12/01/2046 | | | 26,150,599 | | | | 23,750,112 | | | | | |
| 3.500%, 01/01/2047 | | | 24,785,564 | | | | 23,313,364 | | | | | |
| 4.000%, 01/01/2047 | | | 22,728,955 | | | | 21,978,552 | | | | | |
| 3.000%, 02/01/2047 | | | 16,840,039 | | | | 15,260,338 | | | | | |
| 4.500%, 04/01/2047 | | | 11,247,237 | | | | 11,166,335 | | | | | |
| 3.000%, 05/01/2047 | | | 26,810,698 | | | | 24,488,207 | | | | | |
| 4.500%, 06/01/2047 | | | 68,270,412 | | | | 67,601,233 | | | | | |
| 4.500%, 08/01/2047 | | | 18,134,332 | | | | 17,968,792 | | | | | |
| 4.000%, 09/01/2047 | | | 6,085,869 | | | | 5,880,302 | | | | | |
| 3.500%, 03/01/2048 | | | 60,060,397 | | | | 56,365,635 | | | | | |
| 3.000%, 06/01/2048 | | | 36,653,270 | | | | 32,579,550 | | | | | |
| 4.000%, 08/01/2048 | | | 10,093,585 | | | | 9,745,349 | | | | | |
| 4.500%, 10/01/2048 | | | 8,100,309 | | | | 7,984,127 | | | | | |
| 3.000%, 02/01/2049 | | | 38,136,217 | | | | 34,914,947 | | | | | |
| 3.000%, 11/01/2049 | | | 43,393,520 | | | | 39,174,811 | | | | | |
| 4.000%, 05/01/2050 | | | 72,655,973 | | | | 70,086,698 | | | | | |
| 2.500%, 10/01/2050 | | | 2,214,305 | | | | 1,920,218 | | | | | |
| 2.500%, 11/01/2050 | | | 21,610,140 | | | | 18,643,930 | | | | | |
| 2.500%, 02/01/2051 | | | 40,367,127 | | | | 34,866,767 | | | | | |
| 2.500%, 02/01/2051 | | | 55,583,802 | | | | 47,919,943 | | | | | |
| 2.500%, 02/01/2051 | | | 19,912,903 | | | | 17,202,908 | | | | | |
| 2.000%, 03/01/2051 | | | 131,578,921 | | | | 108,395,670 | | | | | |
| 2.000%, 04/01/2051 | | | 72,809,872 | | | | 61,359,569 | | | | | |
| 3.000%, 04/01/2051 | | | 32,123,951 | | | | 28,592,302 | | | | | |
| 2.000%, 05/01/2051 | | | 30,442,252 | | | | 25,320,968 | | | | | |
| 2.500%, 05/01/2051 | | | 38,549,369 | | | | 33,025,616 | | | | | |
| 2.500%, 06/01/2051 | | | 16,175,620 | | | | 13,844,190 | | | | | |
| 2.500%, 07/01/2051 | | | 31,971,035 | | | | 27,499,263 | | | | | |
| 2.500%, 08/01/2051 | | | 16,740,517 | | | | 14,446,809 | | | | | |
| 2.000%, 09/01/2051 | | | 108,950,797 | | | | 89,212,542 | | | | | |
| 3.000%, 09/01/2051 | | | 16,129,885 | | | | 14,504,767 | | | | | |
| 3.000%, 10/01/2051 | | | 11,135,926 | | | | 9,892,083 | | | | | |
| 2.500%, 11/01/2051 | | | 9,266,201 | | | | 7,969,037 | | | | | |
| 2.500%, 11/01/2051 | | | 129,019,465 | | | | 111,384,650 | | | | | |
| 3.000%, 03/01/2052 | | | 119,021,869 | | | | 106,851,383 | | | | | |
| 4.500%, 07/01/2052 | | | 34,598,704 | | | | 33,747,913 | | | | | |
| 5.000%, 07/01/2052 | | | 100,074,315 | | | | 99,241,992 | | | | | |
| 3.000%, 08/01/2052 | | | 100,157,832 | | | | 90,003,784 | | | | | |
| 5.500%, 01/01/2053 | | | 105,607,531 | | | | 106,912,249 | | | | | |
| 6.000%, 01/01/2053 | | | 36,961,375 | | | | 38,050,209 | | | | | |
| 6.000%, 08/01/2053 | | | 26,126,194 | | | | 27,095,324 | | | | | |
| 6.500%, 09/01/2053 | | | 49,780,790 | | | | 51,328,766 | | | | | |
| Federal National Mortgage | | | | | | | | | | | | |
| Association (FNMA): | | | | | | | | | | | | |
| 5.000%, 05/01/2028 | | | 43,057 | | | | 42,952 | | | | | |
| 4.500%, 08/01/2029 | | | 367,067 | | | | 364,001 | | | | | |
| 4.500%, 09/01/2029 | | | 408,105 | | | | 404,695 | | | | | |
| 3.500%, 01/01/2032 | | | 14,598,283 | | | | 14,079,142 | | | | | |
| 3.500%, 06/01/2032 | | | 57,990,592 | | | | 55,936,432 | | | | | |
| 3.000%, 10/01/2032 | | | 760,048 | | | | 721,004 | | | | | |
| 3.000%, 12/01/2032 | | | 1,519,606 | | | | 1,437,095 | | | | | |
| 6.000%, 03/01/2033 | | | 15,113 | | | | 15,667 | | | | | |
| 3.000%, 09/01/2033 | | | 26,407,229 | | | | 25,209,703 | | | | | |
| 3.500%, 10/01/2033 | | | 7,772,837 | | | | 7,477,068 | | | | | |
| 4.500%, 10/01/2033 | | | 5,448,815 | | | | 5,470,372 | | | | | |
| 5.000%, 10/01/2033 | | | 6,283,257 | | | | 6,391,369 | | | | | |
| 3.000%, 11/01/2033 | | | 35,575,008 | | | | 34,052,076 | | | | | |
The accompanying notes are an integral part of these financial statements.
Baird Aggregate Bond Fund
Schedule of Investments, December 31, 2023
Long-Term Investments (cont.)
| | | Principal | | | | | | % of | |
| | | Amount | | | Value | | | Net Assets | |
| Federal National Mortgage | | | | | | | | | |
| Association (FNMA): (cont.) | | | | | | | | | |
| 5.000%, 11/01/2033 | | $ | 17,300 | | | $ | 17,598 | | | |
| |
| 4.000%, 01/01/2034 | | | 2,445,823 | | | | 2,395,707 | | | | | |
| 3.000%, 02/01/2034 | | | 22,569,552 | | | | 21,558,850 | | | | | |
| 5.500%, 04/01/2034 | | | 2,174,840 | | | | 2,241,412 | | | | | |
| 4.000%, 06/01/2034 | | | 3,238,297 | | | | 3,164,550 | | | | | |
| 4.000%, 07/01/2034 | | | 32,229,473 | | | | 31,568,413 | | | | | |
| 4.000%, 09/01/2034 | | | 3,626,286 | | | | 3,552,085 | | | | | |
| 5.500%, 09/01/2034 | | | 58,773 | | | | 60,574 | | | | | |
| 2.500%, 10/01/2034 | | | 42,493,711 | | | | 39,498,708 | | | | | |
| 2.500%, 11/01/2034 | | | 11,435,400 | | | | 10,629,093 | | | | | |
| 2.500%, 11/01/2034 | | | 14,254,368 | | | | 13,249,347 | | | | | |
| 6.000%, 11/01/2034 | | | 16,493 | | | | 17,220 | | | | | |
| 3.500%, 01/01/2035 | | | 19,954,739 | | | | 19,249,319 | | | | | |
| 5.500%, 02/01/2035 | | | 195,595 | | | | 201,588 | | | | | |
| 3.000%, 06/01/2035 | | | 4,882,864 | | | | 4,579,354 | | | | | |
| 5.000%, 07/01/2035 | | | 1,659,085 | | | | 1,687,631 | | | | | |
| 5.000%, 10/01/2035 | | | 787,925 | | | | 801,496 | | | | | |
| 2.000%, 12/01/2035 | | | 45,584,092 | | | | 41,188,389 | | | | | |
| 1.500%, 02/01/2036 | | | 38,754,239 | | | | 33,919,251 | | | | | |
| 5.000%, 02/01/2036 | | | 1,134,820 | | | | 1,154,369 | | | | | |
| 1.500%, 03/01/2036 | | | 2,685,937 | | | | 2,350,996 | | | | | |
| 3.000%, 11/01/2036 | | | 14,534,345 | | | | 13,542,720 | | | | | |
| 5.500%, 11/01/2036 | | | 75,681 | | | | 78,003 | | | | | |
| 2.500%, 12/01/2036 | | | 7,889,171 | | | | 7,175,151 | | | | | |
| 2.000%, 01/01/2037 | | | 29,491,642 | | | | 26,661,463 | | | | | |
| 3.500%, 02/01/2037 | | | 5,206,003 | | | | 5,015,578 | | | | | |
| 5.500%, 04/01/2037 | | | 484,943 | | | | 499,777 | | | | | |
| 4.000%, 05/01/2037 | | | 13,465,582 | | | | 13,153,035 | | | | | |
| 4.000%, 02/01/2038 | | | 10,263,101 | | | | 10,000,731 | | | | | |
| 2.500%, 04/01/2038 | | | 21,307,743 | | | | 19,369,872 | | | | | |
| 3.000%, 05/01/2038 | | | 11,818,910 | | | | 11,055,955 | | | | | |
| 4.000%, 05/01/2038 | | | 8,299,773 | | | | 8,129,290 | | | | | |
| 4.000%, 04/01/2039 | | | 4,110,610 | | | | 4,019,827 | | | | | |
| 4.500%, 04/01/2039 | | | 10,397,853 | | | | 10,385,138 | | | | | |
| 4.000%, 06/01/2039 | | | 8,077,485 | | | | 7,912,347 | | | | | |
| 5.000%, 06/01/2039 | | | 3,965,919 | | | | 4,034,192 | | | | | |
| 5.000%, 06/01/2039 | | | 5,591,623 | | | | 5,687,803 | | | | | |
| 4.500%, 11/01/2039 | | | 64,218 | | | | 64,207 | | | | | |
| 2.000%, 06/01/2040 | | | 38,485,821 | | | | 33,420,562 | | | | | |
| 3.000%, 08/01/2040 | | | 26,728,596 | | | | 24,861,222 | | | | | |
| 4.000%, 08/01/2040 | | | 453,149 | | | | 442,477 | | | | | |
| 3.500%, 10/01/2040 | | | 9,273,911 | | | | 8,887,906 | | | | | |
| 4.000%, 10/01/2040 | | | 11,857,689 | | | | 11,578,373 | | | | | |
| 1.500%, 11/01/2040 | | | 134,435,953 | | | | 112,350,468 | | | | | |
| 1.500%, 12/01/2040 | | | 42,053,847 | | | | 35,138,491 | | | | | |
| 3.500%, 12/01/2040 | | | 2,752,036 | | | | 2,615,973 | | | | | |
| 4.000%, 12/01/2040 | | | 2,831,523 | | | | 2,764,820 | | | | | |
| 2.500%, 01/01/2041 | | | 24,179,767 | | | | 21,548,358 | | | | | |
| 3.500%, 02/01/2041 | | | 4,517,842 | | | | 4,294,519 | | | | | |
| 4.500%, 02/01/2041 | | | 21,437,879 | | | | 21,437,998 | | | | | |
| 4.500%, 05/01/2041 | | | 2,574,771 | | | | 2,569,472 | | | | | |
| 4.000%, 06/01/2041 | | | 4,711,245 | | | | 4,575,520 | | | | | |
| 4.500%, 07/01/2041 | | | 2,655,895 | | | | 2,655,446 | | | | | |
| 5.000%, 07/01/2041 | | | 4,463,059 | | | | 4,539,869 | | | | | |
| 3.500%, 09/01/2041 | | | 6,582,717 | | | | 6,254,589 | | | | | |
| 4.000%, 09/01/2041 | | | 629,612 | | | | 613,618 | | | | | |
| 4.000%, 10/01/2041 | | | 2,219,699 | | | | 2,163,298 | | | | | |
| 2.000%, 12/01/2041 | | | 123,698,399 | | | | 105,754,646 | | | | | |
| 4.000%, 12/01/2041 | | | 2,727,100 | | | | 2,656,106 | | | | | |
| 2.000%, 01/01/2042 | | | 46,502,093 | | | | 39,757,046 | | | | | |
| 4.000%, 01/01/2042 | | | 3,605,904 | | | | 3,515,746 | | | | | |
| 4.500%, 01/01/2042 | | | 4,201,736 | | | | 4,201,016 | | | | | |
| 2.000%, 02/01/2042 | | | 13,197,795 | | | | 11,275,228 | | | | | |
| 2.000%, 02/01/2042 | | | 37,643,552 | | | | 32,176,880 | | | | | |
| 2.000%, 02/01/2042 | | | 39,910,349 | | | | 34,139,427 | | | | | |
| 4.000%, 02/01/2042 | | | 15,926,664 | | | | 15,512,082 | | | | | |
| 2.000%, 03/01/2042 | | | 90,550,159 | | | | 77,331,137 | | | | | |
| 2.500%, 03/01/2042 | | | 46,612,779 | | | | 41,432,083 | | | | | |
| 3.000%, 04/01/2042 | | | 23,556,716 | | | | 22,038,139 | | | | | |
| 2.000%, 05/01/2042 | | | 170,351,587 | | | | 146,700,639 | | | | | |
| 3.000%, 05/01/2042 | | | 2,666,944 | | | | 2,463,857 | | | | | |
| 3.500%, 07/01/2042 | | | 39,985,993 | | | | 37,900,353 | | | | | |
| 3.500%, 08/01/2042 | | | 2,893,993 | | | | 2,738,872 | | | | | |
| 3.000%, 10/01/2042 | | | 10,024,636 | | | | 9,240,565 | | | | | |
| 3.000%, 03/01/2043 | | | 14,777,893 | | | | 13,603,410 | | | | | |
| 3.000%, 03/01/2043 | | | 2,875,577 | | | | 2,647,061 | | | | | |
| 3.000%, 05/01/2043 | | | 7,018,375 | | | | 6,460,599 | | | | | |
| 3.000%, 05/01/2043 | | | 15,068,189 | | | | 13,870,714 | | | | | |
| 3.500%, 05/01/2043 | | | 15,031,198 | | | | 14,228,419 | | | | | |
| 3.000%, 06/01/2043 | | | 3,042,671 | | | | 2,800,867 | | | | | |
| 3.000%, 07/01/2043 | | | 1,271,718 | | | | 1,170,655 | | | | | |
| 4.000%, 07/01/2043 | | | 10,811,560 | | | | 10,530,187 | | | | | |
| 3.000%, 08/01/2043 | | | 2,032,659 | | | | 1,871,130 | | | | | |
| 3.000%, 09/01/2043 | | | 38,367,686 | | | | 35,317,848 | | | | | |
| 3.500%, 09/01/2043 | | | 17,475,521 | | | | 16,451,911 | | | | | |
| 4.500%, 09/01/2043 | | | 3,998,320 | | | | 3,977,900 | | | | | |
| 3.000%, 10/01/2043 | | | 44,464,510 | | | | 41,155,001 | | | | | |
| 3.500%, 10/01/2043 | | | 20,459,851 | | | | 19,279,107 | | | | | |
| 3.000%, 11/01/2043 | | | 10,599,058 | | | | 9,762,184 | | | | | |
| 4.000%, 11/01/2043 | | | 3,881,780 | | | | 3,780,663 | | | | | |
| 3.500%, 02/01/2044 | | | 36,114,791 | | | | 34,156,046 | | | | | |
| 4.000%, 12/01/2044 | | | 98,593,610 | | | | 96,026,508 | | | | | |
| 4.000%, 01/01/2045 | | | 2,469,817 | | | | 2,384,118 | | | | | |
| 4.000%, 02/01/2045 | | | 6,390,729 | | | | 6,227,066 | | | | | |
| 3.500%, 04/01/2045 | | | 10,370,055 | | | | 9,720,855 | | | | | |
| 3.500%, 06/01/2045 | | | 10,546,029 | | | | 9,920,663 | | | | | |
| 4.000%, 09/01/2045 | | | 1,812,305 | | | | 1,749,426 | | | | | |
| 4.000%, 10/01/2045 | | | 2,360,850 | | | | 2,278,940 | | | | | |
| 4.500%, 10/01/2045 | | | 100,329,107 | | | | 99,940,440 | | | | | |
| 4.000%, 11/01/2045 | | | 9,148,574 | | | | 8,785,900 | | | | | |
| 3.500%, 12/01/2045 | | | 11,746,139 | | | | 10,976,075 | | | | | |
| 4.000%, 01/01/2046 | | | 15,532,189 | | | | 14,993,278 | | | | | |
| 4.500%, 02/01/2046 | | | 11,002,991 | | | | 11,001,092 | | | | | |
| 3.000%, 05/01/2046 | | | 6,391,221 | | | | 5,843,529 | | | | | |
| 3.500%, 05/01/2046 | | | 11,398,628 | | | | 10,651,260 | | | | | |
| 3.000%, 07/01/2046 | | | 4,482,317 | | | | 4,094,094 | | | | | |
| 4.500%, 08/01/2046 | | | 8,052,030 | | | | 8,000,953 | | | | | |
| 3.500%, 09/01/2046 | | | 4,260,144 | | | | 4,002,917 | | | | | |
| 2.500%, 10/01/2046 | | | 12,048,170 | | | | 10,421,287 | | | | | |
| 3.000%, 11/01/2046 | | | 9,213,890 | | | | 8,436,578 | | | | | |
| 3.000%, 11/01/2046 | | | 19,566,571 | | | | 18,013,421 | | | | | |
| 3.500%, 11/01/2046 | | | 21,209,303 | | | | 19,818,988 | | | | | |
| 3.000%, 12/01/2046 | | | 13,164,763 | | | | 11,985,240 | | | | | |
| 4.000%, 02/01/2047 | | | 2,225,405 | | | | 2,148,187 | | | | | |
| 3.500%, 05/01/2047 | | | 919,231 | | | | 858,955 | | | | | |
| 3.500%, 07/01/2047 | | | 37,820,708 | | | | 35,556,022 | | | | | |
| 4.000%, 07/01/2047 | | | 35,301,315 | | | | 34,190,562 | | | | | |
| 3.500%, 08/01/2047 | | | 4,863,000 | | | | 4,544,092 | | | | | |
| 4.000%, 08/01/2047 | | | 17,465,247 | | | | 16,875,261 | | | | | |
| 3.500%, 10/01/2047 | | | 4,498,482 | | | | 4,203,478 | | | | | |
| 4.000%, 10/01/2047 | | | 11,662,621 | | | | 11,257,884 | | | | | |
| 4.000%, 11/01/2047 | | | 8,983,448 | | | | 8,652,229 | | | | | |
The accompanying notes are an integral part of these financial statements.
Baird Aggregate Bond Fund
Schedule of Investments, December 31, 2023
Long-Term Investments (cont.)
| | | Principal | | | | | | % of | |
| | | Amount | | | Value | | | Net Assets | |
| Federal National Mortgage | | | | | | | | | |
| Association (FNMA): (cont.) | | | | | | | | | |
| 4.500%, 11/01/2047 | | $ | 3,949,944 | | | $ | 3,929,762 | | | |
| |
| 3.500%, 12/01/2047 | | | 69,898,359 | | | | 65,272,832 | | | | | |
| 4.000%, 12/01/2047 | | | 14,270,624 | | | | 13,773,894 | | | | | |
| 4.500%, 12/01/2047 | | | 2,270,269 | | | | 2,230,640 | | | | | |
| 3.500%, 01/01/2048 | | | 16,945,911 | | | | 15,834,553 | | | | | |
| 3.500%, 02/01/2048 | | | 22,677,293 | | | | 21,190,103 | | | | | |
| 3.500%, 03/01/2048 | | | 20,281,972 | | | | 18,929,760 | | | | | |
| 3.000%, 04/01/2048 | | | 85,247,208 | | | | 78,480,269 | | | | | |
| 4.000%, 04/01/2048 | | | 30,861,277 | | | | 29,755,166 | | | | | |
| 4.000%, 07/01/2048 | | | 12,091,532 | | | | 11,676,116 | | | | | |
| 4.000%, 09/01/2048 | | | 3,110,591 | | | | 2,998,776 | | | | | |
| 4.500%, 09/01/2048 | | | 8,948,310 | | | | 8,815,297 | | | | | |
| 3.500%, 11/01/2048 | | | 53,901,658 | | | | 50,367,959 | | | | | |
| 4.500%, 11/01/2048 | | | 11,624,284 | | | | 11,485,891 | | | | | |
| 5.000%, 11/01/2048 | | | 15,296,977 | | | | 15,467,300 | | | | | |
| 4.000%, 01/01/2049 | | | 3,016,092 | | | | 2,909,861 | | | | | |
| 4.500%, 01/01/2049 | | | 7,904,260 | | | | 7,827,251 | | | | | |
| 3.000%, 02/01/2049 | | | 11,098,576 | | | | 10,051,289 | | | | | |
| 4.500%, 02/01/2049 | | | 8,386,821 | | | | 8,237,112 | | | | | |
| 4.000%, 05/01/2049 | | | 6,702,138 | | | | 6,461,226 | | | | | |
| 3.000%, 05/01/2050 | | | 36,715,447 | | | | 33,150,178 | | | | | |
| 2.500%, 07/01/2050 | | | 96,709,350 | | | | 83,731,259 | | | | | |
| 2.500%, 07/01/2050 | | | 33,641,620 | | | | 28,860,950 | | | | | |
| 3.000%, 07/01/2050 | | | 50,601,214 | | | | 45,983,112 | | | | | |
| 4.000%, 08/01/2050 | | | 26,451,444 | | | | 25,734,431 | | | | | |
| 2.000%, 09/01/2050 | | | 42,345,057 | | | | 34,835,761 | | | | | |
| 2.500%, 10/01/2050 | | | 39,009,913 | | | | 33,669,028 | | | | | |
| 2.000%, 11/01/2050 | | | 206,009,209 | | | | 169,521,696 | | | | | |
| 2.500%, 11/01/2050 | | | 52,745,520 | | | | 45,278,394 | | | | | |
| 2.500%, 11/01/2050 | | | 6,510,486 | | | | 5,645,988 | | | | | |
| 3.000%, 11/01/2050 | | | 5,913,941 | | | | 5,326,374 | | | | | |
| 3.000%, 11/01/2050 | | | 63,342,552 | | | | 57,482,512 | | | | | |
| 2.500%, 12/01/2050 | | | 51,407,211 | | | | 44,051,617 | | | | | |
| 2.500%, 12/01/2050 | | | 76,532,342 | | | | 66,037,361 | | | | | |
| 2.500%, 01/01/2051 | | | 32,422,583 | | | | 28,071,567 | | | | | |
| 2.500%, 03/01/2051 | | | 19,407,482 | | | | 16,803,039 | | | | | |
| 2.000%, 04/01/2051 | | | 158,626,151 | | | | 130,252,457 | | | | | |
| 2.500%, 04/01/2051 | | | 18,118,055 | | | | 15,637,499 | | | | | |
| 2.500%, 05/01/2051 | | | 63,832,451 | | | | 55,890,039 | | | | | |
| 2.500%, 05/01/2051 | | | 74,960,797 | | | | 65,014,916 | | | | | |
| 2.500%, 05/01/2051 | | | 34,404,602 | | | | 29,690,439 | | | | | |
| 2.500%, 06/01/2051 | | | 25,517,001 | | | | 22,061,423 | | | | | |
| 2.000%, 07/01/2051 | | | 78,964,170 | | | | 64,978,045 | | | | | |
| 2.000%, 07/01/2051 | | | 43,005,566 | | | | 35,800,346 | | | | | |
| 2.500%, 07/01/2051 | | | 22,046,089 | | | | 18,921,624 | | | | | |
| 2.500%, 07/01/2051 | | | 65,913,750 | | | | 57,013,110 | | | | | |
| 2.000%, 08/01/2051 | | | 15,396,819 | | | | 12,801,750 | | | | | |
| 2.000%, 09/01/2051 | | | 11,723,671 | | | | 9,741,648 | | | | | |
| 2.500%, 09/01/2051 | | | 120,355,459 | | | | 103,133,924 | | | | | |
| 2.500%, 10/01/2051 | | | 37,038,248 | | | | 31,816,756 | | | | | |
| 3.000%, 10/01/2051 | | | 60,323,854 | | | | 53,508,997 | | | | | |
| 2.000%, 11/01/2051 | | | 56,449,002 | | | | 46,802,865 | | | | | |
| 2.500%, 11/01/2051 | | | 32,870,446 | | | | 28,584,825 | | | | | |
| 2.500%, 11/01/2051 | | | 27,969,009 | | | | 24,056,792 | | | | | |
| 2.500%, 11/01/2051 | | | 97,800,824 | | | | 83,791,053 | | | | | |
| 3.000%, 11/01/2051 | | | 116,475,304 | | | | 104,532,397 | | | | | |
| 2.000%, 12/01/2051 | | | 24,761,386 | | | | 20,590,274 | | | | | |
| 2.000%, 12/01/2051 | | | 31,623,749 | | | | 26,219,872 | | | | | |
| 2.000%, 12/01/2051 | | | 101,085,701 | | | | 83,818,154 | | | | | |
| 2.000%, 12/01/2051 | | | 34,868,951 | | | | 28,957,471 | | | | | |
| 2.500%, 12/01/2051 | | | 22,403,643 | | | | 19,268,151 | | | | | |
| 2.500%, 12/01/2051 | | | 45,291,067 | | | | 38,585,196 | | | | | |
| 2.500%, 12/01/2051 | | | 126,570,364 | | | | 109,172,737 | | | | | |
| 2.500%, 12/01/2051 | | | 101,652,937 | | | | 87,082,542 | | | | | |
| 2.500%, 01/01/2052 | | | 43,180,462 | | | | 37,194,396 | | | | | |
| 3.000%, 02/01/2052 | | | 23,762,571 | | | | 21,298,235 | | | | | |
| 3.000%, 02/01/2052 | | | 29,352,387 | | | | 26,319,133 | | | | | |
| 3.000%, 02/01/2052 | | | 79,523,068 | | | | 70,427,260 | | | | | |
| 3.500%, 02/01/2052 | | | 30,358,352 | | | | 28,040,187 | | | | | |
| 3.000%, 03/01/2052 | | | 65,896,758 | | | | 58,870,832 | | | | | |
| 3.500%, 04/01/2052 | | | 84,039,748 | | | | 77,455,368 | | | | | |
| 3.500%, 05/01/2052 | | | 43,416,886 | | | | 40,594,546 | | | | | |
| 4.500%, 07/01/2052 | | | 14,365,225 | | | | 14,010,886 | | | | | |
| 5.000%, 07/01/2052 | | | 66,296,329 | | | | 65,728,645 | | | | | |
| 5.000%, 07/01/2052 | | | 111,956,790 | | | | 111,026,101 | | | | | |
| 5.500%, 11/01/2052 | | | 48,541,023 | | | | 49,338,588 | | | | | |
| 6.000%, 07/01/2053 | | | 11,897,691 | | | | 12,370,564 | | | | | |
| 6.500%, 09/01/2053 | | | 28,952,024 | | | | 29,937,925 | | | | | |
| 3.000%, 12/01/2054 | | | 88,472,632 | | | | 78,810,526 | | | | | |
| 3.000%, 11/01/2059 | | | 46,303,154 | | | | 40,824,549 | | | | | |
| 2.500%, 07/01/2061 | | | 9,390,962 | | | | 7,783,952 | | | | | |
| 2.500%, 03/01/2062 | | | 44,589,876 | | | | 36,876,437 | | | | | |
| 4.000%, 06/01/2062 | | | 135,046,145 | | | | 127,591,235 | | | | | |
| Government National Mortgage | | | | | | | | | | | | |
| Association (GNMA): | | | | | | | | | | | | |
| 6.000%, 11/20/2033 | | | 15,685 | | | | 16,424 | | | | | |
| 5.000%, 07/20/2040 | | | 594,656 | | | | 605,967 | | | | | |
| 3.500%, 10/20/2041 | | | 2,943,887 | | | | 2,793,347 | | | | | |
| 3.500%, 01/15/2042 | | | 4,947,600 | | | | 4,679,527 | | | | | |
| 3.500%, 06/20/2042 | | | 27,628,952 | | | | 26,236,152 | | | | | |
| 4.000%, 06/20/2042 | | | 3,231,083 | | | | 3,149,042 | | | | | |
| 3.500%, 07/20/2042 | | | 41,725,975 | | | | 39,631,563 | | | | | |
| 3.500%, 08/20/2042 | | | 18,436,020 | | | | 17,510,381 | | | | | |
| 3.500%, 09/20/2042 | | | 86,022,886 | | | | 81,721,271 | | | | | |
| 3.500%, 01/20/2043 | | | 25,939,991 | | | | 24,648,276 | | | | | |
| 3.500%, 07/20/2043 | | | 19,314,864 | | | | 18,362,770 | | | | | |
| 4.000%, 08/20/2043 | | | 27,850,028 | | | | 27,314,424 | | | | | |
| 4.000%, 09/20/2043 | | | 39,322,977 | | | | 38,496,374 | | | | | |
| 4.000%, 10/20/2043 | | | 4,241,946 | | | | 4,159,044 | | | | | |
| 4.000%, 11/20/2043 | | | 39,116,573 | | | | 38,286,500 | | | | | |
| 3.500%, 02/20/2044 | | | 29,424,561 | | | | 27,936,882 | | | | | |
| 4.000%, 09/20/2044 | | | 16,417,261 | | | | 16,081,139 | | | | | |
| 4.000%, 01/20/2045 | | | 3,588,034 | | | | 3,511,276 | | | | | |
| 3.500%, 03/20/2045 | | | 5,722,777 | | | | 5,386,513 | | | | | |
| 3.000%, 04/20/2045 | | | 6,669,747 | | | | 6,152,795 | | | | | |
| 3.500%, 04/20/2045 | | | 8,131,781 | | | | 7,693,101 | | | | | |
| 4.000%, 08/20/2045 | | | 2,869,395 | | | | 2,798,960 | | | | | |
| 3.000%, 01/20/2046 | | | 21,977,720 | | | | 20,246,633 | | | | | |
| 4.500%, 01/20/2046 | | | 4,793,710 | | | | 4,794,184 | | | | | |
| 3.500%, 04/20/2046 | | | 25,499,482 | | | | 24,059,865 | | | | | |
| 4.000%, 04/20/2046 | | | 3,118,079 | | | | 3,027,262 | | | | | |
| 3.500%, 05/20/2046 | | | 16,021,764 | | | | 15,117,022 | | | | | |
| 4.000%, 05/20/2046 | | | 7,574,971 | | | | 7,350,697 | | | | | |
| 3.500%, 06/20/2046 | | | 26,625,655 | | | | 25,118,305 | | | | | |
| 3.000%, 11/20/2046 | | | 19,111,306 | | | | 17,626,072 | | | | | |
| 5.000%, 04/20/2047 | | | 722,464 | | | | 731,721 | | | | | |
| 3.000%, 06/20/2047 | | | 11,446,009 | | | | 10,514,069 | | | | | |
| 4.500%, 06/20/2047 | | | 10,959,515 | | | | 10,893,534 | | | | | |
| 4.500%, 07/20/2047 | | | 2,562,885 | | | | 2,542,659 | | | | | |
| 4.500%, 09/20/2047 | | | 3,437,858 | | | | 3,413,376 | | | | | |
3.000%, 10/20/2047(6) | | | 16,437,775 | | | | 15,080,707 | | | | | |
3.000%, 11/20/2047(6) | | | 72,272,010 | | | | 66,327,139 | | | | | |
The accompanying notes are an integral part of these financial statements.
Baird Aggregate Bond Fund
Schedule of Investments, December 31, 2023
Long-Term Investments (cont.)
| | | Principal | | | | | | % of | |
| | | Amount | | | Value | | | Net Assets | |
| Government National Mortgage | | | | | | | | | |
| Association (GNMA): (cont.) | | | | | | | | | |
| 4.000%, 01/20/2048 | | $ | 4,748,384 | | | $ | 4,587,563 | | | | |
3.500%, 02/20/2048(6) | | | 71,978,334 | | | | 67,805,470 | | | | |
| 3.500%, 05/20/2048 | | | 62,202,454 | | | | 58,606,495 | | | | |
5.000%, 02/20/2049(6) | | | 34,761,079 | | | | 34,918,130 | | | | |
| 3.500%, 02/20/2050 | | | 59,455,533 | | | | 55,633,629 | | | | |
| 2.500%, 06/20/2050 | | | 104,459,642 | | | | 91,900,120 | | | | |
| 2.500%, 03/20/2051 | | | 47,794,814 | | | | 41,181,308 | | | | |
| 2.500%, 04/20/2051 | | | 62,775,234 | | | | 54,721,948 | | | | |
| 2.500%, 06/20/2051 | | | 31,941,391 | | | | 27,849,592 | | | | |
| 2.500%, 07/20/2051 | | | 109,123,673 | | | | 94,394,186 | | | | |
| 2.500%, 08/20/2051 | | | 35,944,469 | | | | 31,069,222 | | | | |
| 2.500%, 08/20/2051 | | | 91,823,514 | | | | 79,023,651 | | | | |
| 4.000%, 04/20/2052 | | | 25,394,309 | | | | 24,250,895 | | | | |
| 4.000%, 04/20/2052 | | | 18,077,941 | | | | 17,260,505 | | | | |
| 6.000%, 01/20/2053 | | | 38,180,067 | | | | 38,831,981 | | | | |
| 5.500%, 07/20/2053 | | | 19,504,480 | | | | 19,835,608 | | | | |
| Seasoned Credit Risk Transfer Trust: | | | | | | | | | | | |
| Series 2019-4, Class MA, 3.000%, | | | | | | | | | | | |
| 02/25/2059 (Callable 03/25/2051) | | | 31,312,487 | | | | 28,661,256 | | | | |
| Series 2020-2, Class MT, 2.000%, | | | | | | | | | | | |
| 11/25/2059 (Callable 05/25/2047) | | | 54,602,458 | | | | 43,260,157 | | | | |
| Series 2020-3, Class MT, 2.000%, | | | | | | | | | | | |
| 05/25/2060 (Callable 08/25/2046) | | | 36,076,453 | | | | 28,575,317 | | | | |
| Series 2021-3, Class MTU, 2.500%, | | | | | | | | | | | |
| 03/25/2061 (Callable 11/25/2044) | | | 66,003,979 | | | | 53,137,315 | | | | |
| Series 2022-1, Class MTU, 3.250%, | | | | | | | | | | | |
| 11/25/2061 (Callable 10/25/2049) | | | 52,617,491 | | | | 45,655,634 | | | | |
| Total U.S. Government Agency Issues | | | | | | | | | | | |
| (Cost $10,799,890,492) | | | | | | | 10,178,868,346 | | | | 23.7 | % |
| Non-U.S. Government Agency Issues | | | | | | | | | | | | |
| Alternative Loan Trust: | | | | | | | | | | | | |
| Series 2006-43CB, Class 2A1, 6.000%, | | | | | | | | | | | | |
| 02/25/2024 (Callable 01/25/2024) | | | 4,453 | | | | 4,425 | | | | | |
| Series 2006-28CB, Class A17, 6.000%, | | | | | | | | | | | | |
10/25/2036 (Callable 01/25/2024)(6) | | | 397,704 | | | | 204,153 | | | | | |
| Arroyo Mortgage Trust: | | | | | | | | | | | | |
| Series 2019-3, Class A1, 2.962%, | | | | | | | | | | | | |
10/25/2048 (Callable 01/25/2024)(2)(4) | | | 8,754,559 | | | | 8,123,383 | | | | | |
| Series 2020-1, Class A1A, 1.662%, | | | | | | | | | | | | |
03/25/2055 (Callable 01/25/2024)(2) | | | 8,382,546 | | | | 7,767,828 | | | | | |
| Bayview Financial Trust, | | | | | | | | | | | | |
| Series 2007-B, Class 1A2, 7.331%, | | | | | | | | | | | | |
08/28/2047 (Callable 01/28/2024)(6)(7) | | | 787,242 | | | | 667,191 | | | | | |
| Bear Stearns Asset Backed | | | | | | | | | | | | |
| Securities I Trust, | | | | | | | | | | | | |
| Series 2004-AC2, Class 2A, 5.000%, | | | | | | | | | | | | |
| 05/25/2034 (Callable 01/25/2024) | | | 106,730 | | | | 88,605 | | | | | |
| BRAVO Residential Funding Trust, | | | | | | | | | | | | |
| Series 2023-RPL1, Class A1, 5.000%, | | | | | | | | | | | | |
05/25/2063 (Callable 02/25/2043)(2)(4) | | | 97,492,506 | | | | 96,172,155 | | | | | |
| Chase Home Lending Mortgage Trust: | | | | | | | | | | | | |
| Series 2023-RPL1, Class A1, 3.500%, | | | | | | | | | | | | |
06/25/2062 (Callable 05/25/2050)(2)(4) | | | 119,692,053 | | | | 108,041,862 | | | | | |
| Series 2023-RPL2, Class A1, 3.250%, | | | | | | | | | | | | |
03/25/2063 (Callable 12/25/2051)(2)(4) | | | 48,864,769 | | | | 42,991,204 | | | | | |
| Series 2023-RPL3, Class A1, 3.250%, | | | | | | | | | | | | |
09/25/2063 (Callable 10/25/2048)(2)(4) | | | 127,586,749 | | | | 111,803,120 | | | | | |
| Chase Mortgage Finance Trust, | | | | | | | | | | | | |
| Series 2006-A1, Class 2A3, 5.108%, | | | | | | | | | | | | |
09/25/2036 (Callable 01/25/2024)(4)(6) | | | 457,748 | | | | 407,588 | | | | | |
| CIM Trust: | | | | | | | | | | | | |
| Series 2022-R2, Class A1, | | | | | | | | | | | | |
| 3.750%, 12/25/2061 | | | | | | | | | | | | |
(Callable 05/25/2027)(2)(4) | | | 50,076,623 | | | | 46,887,989 | | | | | |
| Series 2022-R3, Class A1, | | | | | | | | | | | | |
| 4.500%, 03/25/2062 | | | | | | | | | | | | |
(Callable 09/25/2027)(2)(4) | | | 57,901,401 | | | | 55,747,422 | | | | | |
| Series 2023-R2, Class A1, | | | | | | | | | | | | |
| 5.500%, 08/25/2064 | | | | | | | | | | | | |
(Callable 03/25/2028)(2)(4) | | | 71,265,423 | | | | 72,022,212 | | | | | |
| Citigroup Mortgage Loan Trust, Inc., | | | | | | | | | | | | |
| Series 2005-9, Class 2A2, 5.500%, | | | | | | | | | | | | |
11/25/2035 (Callable 01/25/2024)(6) | | | 6,239 | | | | 4,852 | | | | | |
| Credit Suisse First Boston | | | | | | | | | | | | |
| Mortgage Securities Corp., | | | | | | | | | | | | |
| Series 2003-AR26, Class 8A1, 5.562%, | | | | | | | | | | | | |
11/25/2033 (Callable 01/25/2024)(4) | | | 2,224,977 | | | | 2,085,790 | | | | | |
| CWABS Asset-Backed Certificates Trust: | | | | | | | | | | | | |
| Series 2004-S1, Class A3, 5.115%, | | | | | | | | | | | | |
02/25/2035 (Callable 01/25/2024)(7) | | | 51,815 | | | | 51,087 | | | | | |
| Series 2005-10, Class AF6, 4.915%, | | | | | | | | | | | | |
02/25/2036 (Callable 01/25/2024)(4) | | | 3,142 | | | | 3,077 | | | | | |
| Series 2005-17, Class 1AF5, 5.564%, | | | | | | | | | | | | |
05/25/2036 (Callable 01/25/2024)(4) | | | 45,160 | | | | 41,986 | | | | | |
| Series 2006-10, Class 1AF3, 5.971%, | | | | | | | | | | | | |
09/25/2046 (Callable 01/25/2024)(4) | | | 32,569 | | | | 33,525 | | | | | |
| First Horizon Alternative | | | | | | | | | | | | |
| Mortgage Securities Trust, | | | | | | | | | | | | |
| Series 2006-FA6, Class 3A1, 5.750%, | | | | | | | | | | | | |
11/25/2036 (Callable 01/25/2024)(6) | | | 2,040 | | | | 1,145 | | | | | |
| FirstKey Homes Trust: | | | | | | | | | | | | |
| Series 2022-SFR3, Class A, | | | | | | | | | | | | |
4.250%, 07/17/2038(2) | | | 55,697,202 | | | | 53,901,023 | | | | | |
| Series 2021-SFR1, Class A, | | | | | | | | | | | | |
1.538%, 08/17/2038(2) | | | 161,176,964 | | | | 145,959,376 | | | | | |
| Series 2021-SFR2, Class A, | | | | | | | | | | | | |
1.376%, 09/17/2038(2) | | | 48,525,070 | | | | 43,389,696 | | | | | |
| Series 2022-SFR1, Class A, | | | | | | | | | | | | |
4.145%, 05/19/2039(2) | | | 120,590,571 | | | | 115,809,204 | | | | | |
| Home Partners of America Trust, | | | | | | | | | | | | |
| Series 2021-2, Class A, | | | | | | | | | | | | |
1.901%, 12/17/2026(2) | | | 105,878,497 | | | | 95,733,040 | | | | | |
| Impac CMB Trust, | | | | | | | | | | | | |
| Series 2004-4, Class 2A2, 5.365%, | | | | | | | | | | | | |
09/25/2034 (Callable 01/25/2024)(7) | | | 41,161 | | | | 44,146 | | | | | |
| Imperial Fund Mortgage Trust, | | | | | | | | | | | | |
| Series 2022-NQM3, Class A1, 4.380%, | | | | | | | | | | | | |
05/25/2067 (Callable 04/25/2025)(2)(7) | | | 6,485,368 | | | | 6,244,473 | | | | | |
| J.P. Morgan Alternative Loan Trust, | | | | | | | | | | | | |
| Series 2006-A1, Class 2A1, 4.415%, | | | | | | | | | | | | |
03/25/2036 (Callable 01/25/2024)(4) | | | 120,488 | | | | 93,018 | | | | | |
| J.P. Morgan Mortgage Trust: | | | | | | | | | | | | |
| Series 2007-A1, Class 5A2, 5.044%, | | | | | | | | | | | | |
07/25/2035 (Callable 12/25/2025)(4) | | | 642,744 | | | | 628,544 | | | | | |
| Series 2007-A1, Class 5A5, 5.044%, | | | | | | | | | | | | |
07/25/2035 (Callable 12/25/2025)(4) | | | 973,219 | | | | 952,542 | | | | | |
| Series 2005-A4, Class 1A1, 5.528%, | | | | | | | | | | | | |
07/25/2035 (Callable 01/25/2024)(4) | | | 32,767 | | | | 32,590 | | | | | |
| Series 2006-A7, Class 2A4R, 4.362%, | | | | | | | | | | | | |
01/25/2037 (Callable 01/25/2024)(4)(6) | | | 199,826 | | | | 162,043 | | | | | |
| Series 2007-A2, Class 2A3, 4.661%, | | | | | | | | | | | | |
04/25/2037 (Callable 01/25/2024)(4) | | | 543,945 | | | | 399,240 | | | | | |
The accompanying notes are an integral part of these financial statements.
Baird Aggregate Bond Fund
Schedule of Investments, December 31, 2023
Long-Term Investments (cont.)
| | | Principal | | | | | | % of | |
| | | Amount | | | Value | | | Net Assets | |
| Merrill Lynch Mortgage Investors Trust, | | | | | | | | | |
| Series 2004-F, Class A1A, | | | | | | | | | |
| 6.277%, 12/25/2029 | | | | | | | | | |
(Callable 01/25/2024)(4) | | $ | 1,758,145 | | | $ | 1,691,144 | | | | |
| MetLife, Inc., | | | | | | | | | | | |
| Series 2019-1A, Class A1A, 3.750%, | | | | | | | | | | | |
04/25/2058 (Callable 02/25/2040)(2)(4) | | | 4,408,063 | | | | 4,274,805 | | | | |
| Mill City Mortgage Loan Trust, | | | | | | | | | | | |
| Series 2021-NMR1, Class A1, 1.125%, | | | | | | | | | | | |
11/25/2060 (Callable 12/25/2043)(2)(4) | | | 13,553,881 | | | | 12,633,784 | | | | |
| Morgan Stanley Mortgage Loan Trust, | | | | | | | | | | | |
| Series 2004-7AR, Class 2A1, 5.663%, | | | | | | | | | | | |
09/25/2034 (Callable 10/25/2024)(4) | | | 705,447 | | | | 688,972 | | | | |
| New Residential Mortgage Loan Trust: | | | | | | | | | | | |
| Series 2017-2A, Class A3, 4.000%, | | | | | | | | | | | |
03/25/2057 (Callable 10/25/2030)(2)(4) | | | 4,426,737 | | | | 4,190,499 | | | | |
| Series 2017-3A, Class A1, 4.000%, | | | | | | | | | | | |
04/25/2057 (Callable 06/25/2033)(2)(4) | | | 6,175,159 | | | | 5,844,824 | | | | |
| Series 2017-4A, Class A1, 4.000%, | | | | | | | | | | | |
05/25/2057 (Callable 12/25/2030)(2)(4) | | | 9,053,270 | | | | 8,551,936 | | | | |
| Series 2018-1A, Class A1A, 4.000%, | | | | | | | | | | | |
12/25/2057 (Callable 05/25/2034)(2)(4) | | | 4,896,825 | | | | 4,656,310 | | | | |
| Series 2020-1A, Class A1B, 3.500%, | | | | | | | | | | | |
10/25/2059 (Callable 12/25/2038)(2)(4) | | | 9,699,857 | | | | 9,064,335 | | | | |
| Series 2022-NQM2, Class A1, 3.079%, | | | | | | | | | | | |
03/27/2062 (Callable 02/25/2024)(2)(4) | | | 33,669,344 | | | | 30,694,496 | | | | |
| OBX Trust, | | | | | | | | | | | |
| Series 2022-NQM2, Class A1, 2.958%, | | | | | | | | | | | |
01/25/2062 (Callable 02/25/2025)(2)(4) | | | 80,702,327 | | | | 71,812,748 | | | | |
| Progress Residential Trust, | | | | | | | | | | | |
| Series 2021-SFR8, Class A, | | | | | | | | | | | |
1.510%, 10/17/2038(2) | | | 72,875,142 | | | | 65,403,378 | | | | |
| RALI Series Trust, | | | | | | | | | | | |
| Series 2004-QS6, Class A1, 5.000%, | | | | | | | | | | | |
| 10/25/2063 (Callable 01/25/2024) | | | 6,142 | | | | 5,692 | | | | |
| Renaissance Home Equity Loan Trust, | | | | | | | | | | | |
| Series 2007-1, Class AF3, 5.612%, | | | | | | | | | | | |
04/25/2037 (Callable 08/25/2032)(7) | | | 2,482,525 | | | | 656,387 | | | | |
| Starwood Mortgage Residential Trust: | | | | | | | | | | | |
| Series 2021-4, Class A1, 1.162%, | | | | | | | | | | | |
08/25/2056 (Callable 09/25/2024)(2)(4) | | | 30,847,142 | | | | 25,814,866 | | | | |
| Series 2022-4, Class A1, 5.192%, | | | | | | | | | | | |
05/25/2067 (Callable 06/25/2025)(2)(7) | | | 50,642,188 | | | | 50,472,045 | | | | |
| Structured Adjustable Rate | | | | | | | | | | | |
| Mortgage Loan Trust, | | | | | | | | | | | |
| Series 2004-12, Class 3A1, 5.926%, | | | | | | | | | | | |
09/25/2034 (Callable 01/25/2024)(4) | | | 475,177 | | | | 459,163 | | | | |
| Thornburg Mortgage Securities Trust, | | | | | | | | | | | |
| Series 2003-5, Class 3A, 5.058%, | | | | | | | | | | | |
10/25/2043 (Callable 01/25/2024)(4) | | | 3,174,531 | | | | 3,020,061 | | | | |
| Towd Point Mortgage Trust: | | | | | | | | | | | |
| Series 2016-5, Class A1, 2.500%, | | | | | | | | | | | |
10/25/2056 (Callable 03/25/2034)(2)(4) | | | 219,898 | | | | 218,061 | | | | |
| Series 2017-1, Class A1, 2.750%, | | | | | | | | | | | |
10/25/2056 (Callable 07/25/2031)(2)(4) | | | 702,230 | | | | 697,464 | | | | |
| Series 2017-6, Class A1, 2.750%, | | | | | | | | | | | |
10/25/2057 (Callable 10/25/2030)(2)(4) | | | 12,281,350 | | | | 11,754,340 | | | | |
| Series 2018-1, Class A1, 3.000%, | | | | | | | | | | | |
01/28/2058 (Callable 07/25/2028)(2)(4) | | | 1,054,842 | | | | 1,024,235 | | | | |
| Series 2018-6, Class A1A, 3.750%, | | | | | | | | | | | |
03/25/2058 (Callable 07/25/2034)(2)(4) | | | 8,011,254 | | | | 7,829,850 | | | | |
| Series 2019-1, Class A1, 3.750%, | | | | | | | | | | | |
03/25/2058 (Callable 06/25/2033)(2)(4) | | | 21,231,377 | | | | 20,272,818 | | | | |
| Series 2018-4, Class A1, | | | | | | | | | | | |
| 3.000%, 06/25/2058 | | | | | | | | | | | |
(Callable 12/25/2032)(2)(4) | | | 11,961,530 | | | | 11,135,073 | | | | |
| Series 2019-4, Class A1, | | | | | | | | | | | |
| 2.900%, 10/25/2059 | | | | | | | | | | | |
(Callable 05/25/2033)(2)(4) | | | 61,671,142 | | | | 57,940,525 | | | | |
| Series 2020-2, Class A1A, | | | | | | | | | | | |
| 1.636%, 04/25/2060 | | | | | | | | | | | |
(Callable 05/25/2032)(2)(4) | | | 137,701,490 | | | | 122,156,300 | | | | |
| Series 2020-4, Class A1, | | | | | | | | | | | |
| 1.750%, 10/25/2060 | | | | | | | | | | | |
(Callable 11/25/2034)(2) | | | 64,669,288 | | | | 56,886,126 | | | | |
| Series 2022-2, Class A1, | | | | | | | | | | | |
| 3.750%, 07/01/2062 | | | | | | | | | | | |
(Callable 01/25/2034)(2)(4) | | | 158,213,573 | | | | 147,556,259 | | | | |
| Series 2022-3, Class A1, | | | | | | | | | | | |
| 3.750%, 08/01/2062 | | | | | | | | | | | |
(Callable 09/25/2030)(2)(4) | | | 156,699,020 | | | | 147,895,685 | | | | |
| Series 2023-1, Class A1, 3.750%, | | | | | | | | | | | |
01/25/2063 (Callable 02/25/2033)(2) | | | 63,218,887 | | | | 59,808,026 | | | | |
| WaMu Mortgage | | | | | | | | | | | |
| Pass-Through Certificates Trust: | | | | | | | | | | | |
| Series 2004-CB2, Class 3A, 6.000%, | | | | | | | | | | | |
| 08/25/2034 (Callable 01/25/2024) | | | 2,323,238 | | | | 2,306,535 | | | | |
| Series 2004-CB3, Class 2A, 6.500%, | | | | | | | | | | | |
| 10/25/2034 (Callable 01/25/2024) | | | 944,525 | | | | 944,541 | | | | |
| Series 2004-AR14, Class A1, 5.240%, | | | | | | | | | | | |
01/25/2035 (Callable 01/25/2024)(4) | | | 2,928,940 | | | | 2,641,386 | | | | |
| Total Non-U.S. Government | | | | | | | | | | | |
| Agency Issues | | | | | | | | | | | |
| (Cost $2,044,166,976) | | | | | | | 1,967,502,203 | | | | 4.6 | % |
| Total Residential | | | | | | | | | | | | |
| Mortgage-Backed Securities | | | | | | | | | | | | |
| (Cost $12,844,057,468) | | | | | | | 12,146,370,549 | | | | 28.3 | % |
| Commercial Mortgage-Backed Securities | | | | | | | | | | | | |
| U.S. Government Agency Issues | | | | | | | | | | | | |
| Freddie Mac Multifamily Structured | | | | | | | | | | | | |
| Pass Through Certificates: | | | | | | | | | | | | |
| Series K068, Class A2, | | | | | | | | | | | | |
| 3.244%, 08/25/2027 | | | 105,313,000 | | | | 101,317,320 | | | | | |
| Series K069, Class A2, | | | | | | | | | | | | |
3.187%, 09/25/2027(4) | | | 25,488,779 | | | | 24,469,332 | | | | | |
| Series K071, Class A2, | | | | | | | | | | | | |
| 3.286%, 11/25/2027 | | | 25,529,000 | | | | 24,536,614 | | | | | |
| Series K072, Class A2, | | | | | | | | | | | | |
| 3.444%, 12/25/2027 | | | 6,050,000 | | | | 5,846,728 | | | | | |
| Series K073, Class A2, | | | | | | | | | | | | |
| 3.350%, 01/25/2028 | | | 1,350,000 | | | | 1,299,255 | | | | | |
| Series K074, Class A2, | | | | | | | | | | | | |
| 3.600%, 01/25/2028 | | | 21,722,000 | | | | 21,098,805 | | | | | |
| Series K076, Class A2, | | | | | | | | | | | | |
| 3.900%, 04/25/2028 | | | 92,070,000 | | | | 90,416,312 | | | | | |
| Series K077, Class A2, | | | | | | | | | | | | |
3.850%, 05/25/2028(4) | | | 68,650,000 | | | | 67,258,073 | | | | | |
| Series K078, Class A2, | | | | | | | | | | | | |
| 3.854%, 06/25/2028 | | | 59,788,633 | | | | 58,584,944 | | | | | |
| Series K080, Class A2, | | | | | | | | | | | | |
3.926%, 07/25/2028(4) | | | 14,950,000 | | | | 14,680,166 | | | | | |
| Series K082, Class A2, | | | | | | | | | | | | |
3.920%, 09/25/2028(4) | | | 56,545,000 | | | | 55,490,181 | | | | | |
| Series K083, Class A2, | | | | | | | | | | | | |
4.050%, 09/25/2028(4) | | | 1,000,000 | | | | 986,410 | | | | | |
The accompanying notes are an integral part of these financial statements.
Baird Aggregate Bond Fund
Schedule of Investments, December 31, 2023
Long-Term Investments (cont.)
| | | Principal | | | | | | % of | |
| | | Amount | | | Value | | | Net Assets | |
| Freddie Mac Multifamily Structured | | | | | | | | | |
| Pass Through Certificates: (cont.) | | | | | | | | | |
| Series K752, Class A2, | | | | | | | | | |
| 4.284%, 07/25/2030 | | $ | 90,425,000 | | | $ | 89,820,717 | | | | |
| Series K-1510, Class A2, | | | | | | | | | | | |
| 3.718%, 01/25/2031 | | | 39,850,000 | | | | 38,158,164 | | | | |
| Series K156, Class A3, | | | | | | | | | | | |
3.700%, 06/25/2033(4) | | | 11,088,000 | | | | 10,486,989 | | | | |
| Series K-1510, Class A3, | | | | | | | | | | | |
| 3.794%, 01/25/2034 | | | 13,525,000 | | | | 12,781,504 | | | | |
| Total U.S. Government Agency Issues | | | | | | | | | | | |
| (Cost $646,924,983) | | | | | | | 617,231,514 | | | | 1.4 | % |
| Non-U.S. Government Agency Issues | | | | | | | | | | | | |
| BANK: | | | | | | | | | | | | |
| Series 2017-BNK4, Class A3, 3.362%, | | | | | | | | | | | | |
| 05/15/2050 (Callable 04/15/2027) | | | 30,681,557 | | | | 29,225,156 | | | | | |
| Series 2017-BNK4, Class A4, 3.625%, | | | | | | | | | | | | |
| 05/15/2050 (Callable 04/15/2027) | | | 44,535,000 | | | | 42,050,321 | | | | | |
| Series 2017-BNK8, Class A4, 3.488%, | | | | | | | | | | | | |
| 11/15/2050 (Callable 11/15/2027) | | | 67,663,000 | | | | 62,562,739 | | | | | |
| Series 2019-BN21, Class A5, 2.851%, | | | | | | | | | | | | |
| 10/17/2052 (Callable 10/15/2029) | | | 39,560,000 | | | | 34,788,581 | | | | | |
| Series 2020-BN29, Class A4, 1.997%, | | | | | | | | | | | | |
| 11/15/2053 (Callable 12/15/2030) | | | 66,985,000 | | | | 52,572,983 | | | | | |
| Series 2017-BNK9, Class A4, 3.538%, | | | | | | | | | | | | |
| 11/15/2054 (Callable 12/15/2029) | | | 98,103,000 | | | | 92,511,463 | | | | | |
| Series 2022-BNK44, Class A5, 5.745%, | | | | | | | | | | | | |
11/15/2055 (Callable 11/15/2032)(4) | | | 79,775,000 | | | | 84,301,944 | | | | | |
| Series 2017-BNK5, Class A5, 3.390%, | | | | | | | | | | | | |
| 06/15/2060 (Callable 07/15/2027) | | | 22,501,000 | | | | 21,233,849 | | | | | |
| Series 2017-BNK7, Class A4, 3.175%, | | | | | | | | | | | | |
| 09/15/2060 (Callable 09/15/2027) | | | 21,500,000 | | | | 20,193,675 | | | | | |
| Series 2017-BNK7, Class A5, 3.435%, | | | | | | | | | | | | |
| 09/15/2060 (Callable 09/15/2027) | | | 350,000 | | | | 329,947 | | | | | |
| Series 2018-BN10, Class A5, 3.688%, | | | | | | | | | | | | |
| 02/15/2061 (Callable 02/15/2028) | | | 11,050,000 | | | | 10,469,754 | | | | | |
| Series 2018-BN12, Class A4, 4.255%, | | | | | | | | | | | | |
05/15/2061 (Callable 05/15/2028)(4) | | | 15,302,008 | | | | 14,779,977 | | | | | |
| Series 2018-BN13, Class A5, 4.217%, | | | | | | | | | | | | |
08/15/2061 (Callable 08/15/2028)(4) | | | 8,565,000 | | | | 8,222,023 | | | | | |
| BANK5, | | | | | | | | | | | | |
| Series 2023-5YR3, Class A2, 6.255%, | | | | | | | | | | | | |
| 09/15/2056 (Callable 09/15/2028) | | | 97,938,850 | | | | 102,382,835 | | | | | |
| BBCMS Mortgage Trust, | | | | | | | | | | | | |
| Series 2022-C15, Class ASB, 3.684%, | | | | | | | | | | | | |
04/15/2055 (Callable 04/15/2032)(4) | | | 7,104,000 | | | | 6,703,732 | | | | | |
| Benchmark Mortgage Trust: | | | | | | | | | | | | |
| Series 2018-B6, Class A4, 4.261%, | | | | | | | | | | | | |
| 10/10/2051 (Callable 10/10/2028) | | | 17,420,000 | | | | 16,519,222 | | | | | |
| Series 2018-B8, Class A5, 4.232%, | | | | | | | | | | | | |
| 01/15/2052 (Callable 12/15/2028) | | | 24,235,000 | | | | 22,885,525 | | | | | |
| Series 2020-B19, Class A5, 1.850%, | | | | | | | | | | | | |
| 09/15/2053 (Callable 10/15/2030) | | | 43,291,000 | | | | 34,582,639 | | | | | |
| Series 2020-B20, Class A5, 2.034%, | | | | | | | | | | | | |
| 10/15/2053 (Callable 10/15/2030) | | | 31,916,000 | | | | 25,267,326 | | | | | |
| Series 2020-B21, Class A5, 1.978%, | | | | | | | | | | | | |
| 12/17/2053 (Callable 12/15/2030) | | | 32,760,000 | | | | 26,625,336 | | | | | |
| Series 2021-B24, Class A5, 2.584%, | | | | | | | | | | | | |
| 03/15/2054 (Callable 03/15/2031) | | | 26,400,000 | | | | 21,525,694 | | | | | |
| Series 2021-B31, Class A5, 2.669%, | | | | | | | | | | | | |
| 12/15/2054 (Callable 12/15/2031) | | | 54,325,000 | | | | 45,783,459 | | | | | |
| Series 2023-V3, Class A2, 5.896%, | | | | | | | | | | | | |
| 07/15/2056 (Callable 07/15/2028) | | | 36,950,000 | | | | 38,080,618 | | | | | |
| Series 2019-B14, Class A5, 3.049%, | | | | | | | | | | | | |
| 12/15/2062 (Callable 11/15/2029) | | | 28,769,000 | | | | 25,827,752 | | | | | |
| CD Mortgage Trust: | | | | | | | | | | | | |
| Series 2016-CD1, Class A4, 2.724%, | | | | | | | | | | | | |
| 08/10/2049 (Callable 08/10/2026) | | | 48,986,454 | | | | 44,944,523 | | | | | |
| Series 2017-CD3, Class A4, 3.631%, | | | | | | | | | | | | |
| 02/10/2050 (Callable 02/10/2027) | | | 7,200,000 | | | | 6,684,838 | | | | | |
| Series 2018-CD7, Class A4, 4.279%, | | | | | | | | | | | | |
| 08/15/2051 (Callable 08/15/2028) | | | 7,400,000 | | | | 6,961,660 | | | | | |
| CFCRE Commercial Mortgage Trust: | | | | | | | | | | | | |
| Series 2016-C3, Class A3, 3.865%, | | | | | | | | | | | | |
| 01/10/2048 (Callable 01/10/2026) | | | 16,592,455 | | | | 15,966,639 | | | | | |
| Series 2016-C4, Class A4, 3.283%, | | | | | | | | | | | | |
| 05/10/2058 (Callable 05/10/2026) | | | 35,605,980 | | | | 33,857,986 | | | | | |
| Citigroup Commercial Mortgage Trust: | | | | | | | | | | | | |
| Series 2014-GC25, Class A4, 3.635%, | | | | | | | | | | | | |
| 10/10/2047 (Callable 10/10/2024) | | | 16,838,590 | | | | 16,512,617 | | | | | |
| Series 2015-GC29, Class A4, 3.192%, | | | | | | | | | | | | |
| 04/10/2048 (Callable 04/10/2025) | | | 17,480,000 | | | | 16,889,712 | | | | | |
| Series 2015-GC35, Class A4, 3.818%, | | | | | | | | | | | | |
| 11/10/2048 (Callable 11/10/2025) | | | 68,175,000 | | | | 65,657,461 | | | | | |
| Series 2017-P7, Class A4, 3.712%, | | | | | | | | | | | | |
| 04/14/2050 (Callable 04/14/2027) | | | 12,275,000 | | | | 11,538,008 | | | | | |
| Series 2017-P8, Class A4, 3.465%, | | | | | | | | | | | | |
| 09/15/2050 (Callable 09/15/2027) | | | 22,000,000 | | | | 20,657,450 | | | | | |
| Series 2015-GC33, Class A4, 3.778%, | | | | | | | | | | | | |
| 09/10/2058 (Callable 05/10/2026) | | | 8,600,000 | | | | 8,219,729 | | | | | |
| Series 2019-C7, Class A4, 3.102%, | | | | | | | | | | | | |
| 12/15/2072 (Callable 12/15/2029) | | | 22,880,000 | | | | 20,511,943 | | | | | |
| COMM Mortgage Trust, | | | | | | | | | | | | |
| Series 2014-UBS5, Class A4, 3.838%, | | | | | | | | | | | | |
| 09/10/2047 (Callable 09/10/2024) | | | 17,596,000 | | | | 17,254,805 | | | | | |
| CSAIL Commercial Mortgage Trust: | | | | | | | | | | | | |
| Series 2019-C17, Class A5, 3.016%, | | | | | | | | | | | | |
| 09/17/2029 (Callable 09/15/2029) | | | 16,475,000 | | | | 14,387,685 | | | | | |
| Series 2016-C7, Class A5, 3.502%, | | | | | | | | | | | | |
| 11/15/2049 (Callable 11/15/2026) | | | 5,000,000 | | | | 4,747,162 | | | | | |
| Series 2018-CX11, Class A4, 3.766%, | | | | | | | | | | | | |
| 04/15/2051 (Callable 04/15/2028) | | | 11,440,000 | | | | 10,915,123 | | | | | |
| Series 2018-CX11, Class A5, 4.033%, | | | | | | | | | | | | |
04/15/2051 (Callable 04/15/2028)(4) | | | 22,023,039 | | | | 20,868,362 | | | | | |
| Series 2018-CX12, Class A4, 4.224%, | | | | | | | | | | | | |
08/15/2051 (Callable 08/15/2028)(4) | | | 18,608,000 | | | | 17,701,491 | | | | | |
| Series 2019-C16, Class A3, 3.329%, | | | | | | | | | | | | |
| 06/15/2052 (Callable 06/15/2029) | | | 29,690,000 | | | | 26,772,978 | | | | | |
| DBGS Mortgage Trust, | | | | | | | | | | | | |
| Series 2018-C1, Class A4, 4.466%, | | | | | | | | | | | | |
| 10/15/2051 (Callable 10/15/2028) | | | 19,875,000 | | | | 18,732,676 | | | | | |
| DBJPM Mortgage Trust: | | | | | | | | | | | | |
| Series 2016-C3, Class ASB, 2.756%, | | | | | | | | | | | | |
| 08/10/2049 (Callable 08/10/2026) | | | 5,330,411 | | | | 5,142,308 | | | | | |
| Series 2017-C6, Class A5, 3.328%, | | | | | | | | | | | | |
| 06/10/2050 (Callable 06/10/2027) | | | 22,800,000 | | | | 21,475,721 | | | | | |
| Series 2020-C9, Class A5, 1.926%, | | | | | | | | | | | | |
| 08/15/2053 (Callable 09/15/2030) | | | 22,555,000 | | | | 18,431,441 | | | | | |
| GS Mortgage Securities Trust: | | | | | | | | | | | | |
| Series 2015-GS1, Class A3, 3.734%, | | | | | | | | | | | | |
| 11/10/2048 (Callable 11/10/2025) | | | 30,493,248 | | | | 29,399,583 | | | | | |
| Series 2017-GS8, Class A4, 3.469%, | | | | | | | | | | | | |
| 11/10/2050 (Callable 11/10/2027) | | | 23,655,000 | | | | 21,954,244 | | | | | |
The accompanying notes are an integral part of these financial statements.
Baird Aggregate Bond Fund
Schedule of Investments, December 31, 2023
Long-Term Investments (cont.)
| | | Principal | | | | | | % of | |
| | | Amount | | | Value | | | Net Assets | |
| JPMBB Commercial | | | | | | | | | |
| Mortgage Securities Trust: | | | | | | | | | |
| Series 2014-C24, Class ASB, 3.368%, | | | | | | | | | |
| 11/15/2047 (Callable 10/15/2024) | | $ | 1,317,275 | | | $ | 1,303,248 | | | | |
| Series 2014-C25, Class ASB, 3.407%, | | | | | | | | | | | |
| 11/15/2047 (Callable 11/15/2024) | | | 1,436,378 | | | | 1,419,705 | | | | |
| Series 2015-C30, Class A5, 3.822%, | | | | | | | | | | | |
| 07/15/2048 (Callable 07/15/2025) | | | 22,658,000 | | | | 21,669,191 | | | | |
| Series 2015-C28, Class A4, 3.227%, | | | | | | | | | | | |
| 10/15/2048 (Callable 04/15/2025) | | | 16,688,500 | | | | 16,080,139 | | | | |
| JPMCC Commercial | | | | | | | | | | | |
| Mortgage Securities Trust: | | | | | | | | | | | |
| Series 2017-JP7, Class A5, 3.454%, | | | | | | | | | | | |
| 09/15/2050 (Callable 08/15/2027) | | | 9,000,000 | | | | 8,285,307 | | | | |
| Series 2017-C7, Class A5, 3.409%, | | | | | | | | | | | |
| 10/15/2050 (Callable 11/15/2027) | | | 17,170,000 | | | | 15,918,786 | | | | |
| JPMDB Commercial | | | | | | | | | | | |
| Mortgage Securities Trust: | | | | | | | | | | | |
| Series 2016-C2, Class A4, 3.144%, | | | | | | | | | | | |
| 06/15/2049 (Callable 05/15/2026) | | | 19,890,000 | | | | 18,602,576 | | | | |
| Series 2017-C5, Class A5, 3.694%, | | | | | | | | | | | |
| 03/15/2050 (Callable 04/15/2027) | | | 24,380,000 | | | | 22,845,652 | | | | |
| Morgan Stanley Bank of | | | | | | | | | | | |
| America Merrill Lynch Trust: | | | | | | | | | | | |
| Series 2016-C30, Class A5, 2.860%, | | | | | | | | | | | |
| 09/15/2049 (Callable 10/15/2026) | | | 25,169,000 | | | | 23,385,344 | | | | |
| Series 2017-C34, Class A4, 3.536%, | | | | | | | | | | | |
| 11/15/2052 (Callable 10/15/2027) | | | 41,287,079 | | | | 38,502,839 | | | | |
| Morgan Stanley Capital I Trust: | | | | | | | | | | | |
| Series 2015-UBS8, Class A4, 3.809%, | | | | | | | | | | | |
| 12/15/2048 (Callable 12/15/2025) | | | 72,094,000 | | | | 69,393,748 | | | | |
| Series 2016-UB12, Class A4, 3.596%, | | | | | | | | | | | |
| 12/15/2049 (Callable 12/15/2026) | | | 8,500,000 | | | | 8,009,155 | | | | |
| Series 2018-H3, Class A5, 4.177%, | | | | | | | | | | | |
| 07/15/2051 (Callable 07/15/2028) | | | 22,101,510 | | | | 20,945,318 | | | | |
| Series 2018-H4, Class A3, 4.043%, | | | | | | | | | | | |
| 12/15/2051 (Callable 01/15/2029) | | | 9,633,333 | | | | 9,200,240 | | | | |
| Series 2018-H4, Class A4, 4.310%, | | | | | | | | | | | |
| 12/15/2051 (Callable 01/15/2029) | | | 6,750,000 | | | | 6,503,417 | | | | |
| UBS Commercial Mortgage Trust: | | | | | | | | | | | |
| Series 2018-C11, Class A5, 4.241%, | | | | | | | | | | | |
06/15/2051 (Callable 07/15/2028)(4) | | | 15,402,859 | | | | 14,412,628 | | | | |
| Series 2019-C17, Class A4, 2.921%, | | | | | | | | | | | |
| 10/15/2052 (Callable 10/15/2029) | | | 67,744,355 | | | | 59,435,577 | | | | |
| Series 2019-C18, Class A4, 3.035%, | | | | | | | | | | | |
| 12/15/2052 (Callable 12/15/2029) | | | 6,280,000 | | | | 5,475,486 | | | | |
| Wells Fargo Commercial Mortgage Trust: | | | | | | | | | | | |
| Series 2016-C35, Class A4, 2.931%, | | | | | | | | | | | |
| 07/15/2048 (Callable 07/15/2026) | | | 25,670,000 | | | | 24,010,034 | | | | |
| Series 2015-SG1, Class ASB, 3.556%, | | | | | | | | | | | |
| 09/15/2048 (Callable 08/15/2025) | | | 5,092,571 | | | | 5,019,633 | | | | |
| Series 2015-SG1, Class A4, 3.789%, | | | | | | | | | | | |
| 09/15/2048 (Callable 08/15/2025) | | | 29,009,612 | | | | 28,109,356 | | | | |
| Series 2015-P2, Class A3, 3.541%, | | | | | | | | | | | |
| 12/15/2048 (Callable 12/15/2025) | | | 32,066,930 | | | | 31,042,392 | | | | |
| Series 2016-C34, Class A4, 3.096%, | | | | | | | | | | | |
| 06/15/2049 (Callable 05/15/2026) | | | 10,250,000 | | | | 9,634,784 | | | | |
| Series 2017-C42, Class A4, 3.589%, | | | | | | | | | | | |
| 12/15/2050 (Callable 12/15/2027) | | | 7,315,000 | | | | 6,703,134 | | | | |
| Series 2019-C50, Class ASB, 3.635%, | | | | | | | | | | | |
| 05/15/2052 (Callable 05/15/2029) | | | 20,000,000 | | | | 19,370,650 | | | | |
| Series 2019-C51, Class A4, 3.311%, | | | | | | | | | | | |
| 06/15/2052 (Callable 06/15/2029) | | | 22,581,000 | | | | 20,201,089 | | | | |
| Series 2019-C52, Class A5, 2.892%, | | | | | | | | | | | |
| 08/15/2052 (Callable 08/15/2029) | | | 10,000,000 | | | | 8,915,076 | | | | |
| Series 2019-C54, Class A4, 3.146%, | | | | | | | | | | | |
| 12/15/2052 (Callable 11/15/2029) | | | 30,610,609 | | | | 27,492,444 | | | | |
| Series 2017-RC1, Class A4, 3.631%, | | | | | | | | | | | |
| 01/15/2060 (Callable 03/15/2027) | | | 14,349,000 | | | | 13,665,165 | | | | |
| WFRBS Commercial Mortgage Trust: | | | | | | | | | | | |
| Series 2014-C21, Class A5, 3.678%, | | | | | | | | | | | |
| 08/15/2047 (Callable 08/15/2024) | | | 34,719,000 | | | | 34,136,662 | | | | |
| Series 2014-C23, Class ASB, 3.636%, | | | | | | | | | | | |
| 10/15/2057 (Callable 09/15/2025) | | | 891,926 | | | | 884,874 | | | | |
| Series 2014-C23, Class A5, 3.917%, | | | | | | | | | | | |
| 10/15/2057 (Callable 09/15/2025) | | | 125,000 | | | | 122,041 | | | | |
| Total Non-U.S. Government | | | | | | | | | | | |
| Agency Issues | | | | | | | | | | | |
| (Cost $2,090,613,278) | | | | | | | 1,926,308,385 | | | | 4.5 | % |
| Total Commercial | | | | | | | | | | | | |
| Mortgage-Backed Securities | | | | | | | | | | | | |
| (Cost $2,737,538,261) | | | | | | | 2,543,539,899 | | | | 5.9 | % |
| Asset Backed Securities | | | | | | | | | | | | |
| BA Credit Card Trust, | | | | | | | | | | | | |
| Series 2023-A1, Class A1, | | | | | | | | | | | | |
| 4.790%, 05/15/2028 | | | 35,000,000 | | | | 35,132,860 | | | | | |
| Capital One Multi-Asset Execution Trust, | | | | | | | | | | | | |
| Series 2023-A1, Class A, | | | | | | | | | | | | |
| 4.420%, 05/15/2028 | | | 54,098,000 | | | | 53,896,436 | | | | | |
| Citizens Auto Receivables Trust, | | | | | | | | | | | | |
| Series 2023-1, Class A3, 5.840%, | | | | | | | | | | | | |
01/18/2028 (Callable 04/15/2027)(2) | | | 110,500,000 | | | | 112,074,382 | | | | | |
| Discover Card Execution Note Trust, | | | | | | | | | | | | |
| Series 2023-A1, Class A, | | | | | | | | | | | | |
| 4.310%, 03/15/2028 | | | 10,933,000 | | | | 10,859,644 | | | | | |
| Fifth Third Auto Trust, | | | | | | | | | | | | |
| Series 2023-1, Class A3, 5.530%, | | | | | | | | | | | | |
| 08/15/2028 (Callable 05/15/2027) | | | 70,525,000 | | | | 71,519,903 | | | | | |
| First National Master Note Trust: | | | | | | | | | | | | |
| Series 2023-1, Class A, | | | | | | | | | | | | |
| 5.130%, 04/15/2029 | | | 63,134,000 | | | | 63,355,746 | | | | | |
| Series 2023-2, Class A, | | | | | | | | | | | | |
| 5.770%, 09/15/2029 | | | 52,200,000 | | | | 53,374,239 | | | | | |
| Ford Credit Auto Owner Trust: | | | | | | | | | | | | |
| Series 2020-2, Class A, 1.060%, | | | | | | | | | | | | |
04/15/2033 (Callable 10/15/2025)(2) | | | 18,600,000 | | | | 17,342,930 | | | | | |
| Series 2023-1, Class A, 4.850%, | | | | | | | | | | | | |
08/15/2035 (Callable 02/15/2028)(2) | | | 91,550,000 | | | | 91,883,105 | | | | | |
| Ford Credit Floorplan | | | | | | | | | | | | |
| Master Owner Trust, | | | | | | | | | | | | |
| Series 2023-1, Class A1, | | | | | | | | | | | | |
4.920%, 05/15/2028(2) | | | 49,875,000 | | | | 49,994,840 | | | | | |
| GM Financial Revolving | | | | | | | | | | | | |
| Receivables Trust, | | | | | | | | | | | | |
| Series 2022-1, Class A, 5.910%, | | | | | | | | | | | | |
10/11/2035 (Callable 11/11/2027)(2) | | | 64,950,000 | | | | 67,608,520 | | | | | |
| GMF Floorplan Owner Revolving Trust: | | | | | | | | | | | | |
| Series 2023-1, Class A1, | | | | | | | | | | | | |
5.340%, 06/15/2028(2) | | | 10,300,000 | | | | 10,428,789 | | | | | |
| Series 2023-2, Class A, | | | | | | | | | | | | |
5.460%, 06/15/2030(2) | | | 25,000,000 | | | | 25,542,885 | | | | | |
| Golden Credit Card Trust, | | | | | | | | | | | | |
| Series 2022-4A, Class A, | | | | | | | | | | | | |
4.310%, 09/15/2027(1)(2) | | | 14,500,000 | | | | 14,329,634 | | | | | |
The accompanying notes are an integral part of these financial statements.
Baird Aggregate Bond Fund
Schedule of Investments, December 31, 2023
Long-Term Investments (cont.)
| | | Principal | | | | | | % of | |
| | | Amount | | | Value | | | Net Assets | |
| Hyundai Auto Lease Securitization Trust, | | | | | | | | | |
| Series 2023-C, Class A3, | | | | | | | | | |
| 5.800%, 12/15/2026 | | | | | | | | | |
(Callable 04/15/2026)(2) | | $ | 25,425,000 | | | $ | 25,736,629 | | | | |
| Kubota Credit Owner Trust, | | | | | | | | | | | |
| Series 2023-2A, Class A3, | | | | | | | | | | | |
| 5.280%, 01/18/2028 | | | | | | | | | | | |
(Callable 05/15/2027)(2) | | | 18,750,000 | | | | 18,966,626 | | | | |
| Navient Private Education | | | | | | | | | | | |
| Refi Loan Trust: | | | | | | | | | | | |
| Series 2021-GA, Class A, 1.580%, | | | | | | | | | | | |
04/15/2070 (Callable 08/15/2029)(2) | | | 14,610,337 | | | | 12,675,093 | | | | |
| Series 2022-A, Class A, 2.230%, | | | | | | | | | | | |
07/15/2070 (Callable 10/15/2029)(2) | | | 22,473,605 | | | | 19,824,410 | | | | |
| Series 2022-BA, Class A, 4.160%, | | | | | | | | | | | |
10/15/2070 (Callable 01/15/2030)(2) | | | 54,847,404 | | | | 52,419,364 | | | | |
| Series 2023-A, Class A, 5.510%, | | | | | | | | | | | |
10/15/2071 (Callable 10/15/2032)(2) | | | 63,134,298 | | | | 63,122,069 | | | | |
| Nelnet Student Loan Trust, | | | | | | | | | | | |
| Series 2021-A, Class APT1, 1.360%, | | | | | | | | | | | |
04/20/2062 (Callable 09/20/2029)(2) | | | 30,376,042 | | | | 27,508,741 | | | | |
| PFS Financing Corp., | | | | | | | | | | | |
| Series 2023-A, Class A, 5.800%, | | | | | | | | | | | |
03/15/2028(2) | | | 97,570,000 | | | | 98,978,901 | | | | |
| SBA Tower Trust, | | | | | | | | | | | |
| 1.840%, 10/15/2051 | | | | | | | | | | | |
(Callable 04/15/2026)(2) | | | 94,050,000 | | | | 83,285,488 | | | | |
| Synchrony Card Funding LLC, | | | | | | | | | | | |
| Series 2023-A1, Class A, | | | | | | | | | | | |
| 5.540%, 07/15/2029 | | | 73,400,000 | | | | 74,783,671 | | | | |
| Towd Point Asset Trust, | | | | | | | | | | | |
| Series 2021-SL1, Class A1, | | | | | | | | | | | |
1.050%, 11/20/2061(2) | | | 9,510,347 | | | | 8,729,098 | | | | |
| Towd Point Mortgage Trust: | | | | | | | | | | | |
| Series 2020-MH1, Class A1A, 2.184%, | | | | | | | | | | | |
02/25/2060 (Callable 01/25/2024)(2)(4) | | | 20,335,629 | | | | 19,351,785 | | | | |
| Series 2020-MH1, Class A1, 2.250%, | | | | | | | | | | | |
02/25/2060 (Callable 01/25/2024)(2)(4) | | | 12,962,951 | | | | 12,345,650 | | | | |
| Toyota Auto Loan Extended Note Trust: | | | | | | | | | | | |
| Series 2020-1A, Class A, 1.350%, | | | | | | | | | | | |
05/25/2033 (Callable 05/25/2025)(2) | | | 104,383,000 | | | | 99,082,484 | | | | |
| Series 2022-1A, Class A, 3.820%, | | | | | | | | | | | |
04/25/2035 (Callable 04/25/2027)(2) | | | 25,275,000 | | | | 24,558,863 | | | | |
| Total Asset Backed Securities | | | | | | | | | | | |
| (Cost $1,327,822,172) | | | | | | | 1,318,712,785 | | | | 3.1 | % |
| Total Long-Term Investments | | | | | | | | | | | | |
| (Cost $45,268,397,894) | | | | | | | 42,315,262,114 | | | | 98.7 | % |
| Short-Term Investment | | | | | | | | | | | | |
| | | Shares | | | | | | | | | |
| Money Market Mutual Fund | | | | | | | | | | | | |
| First American Government Obligations | | | | | | | | | | | | |
Fund, Class U, 5.31%(5) | | | 445,229,000 | | | | 445,229,000 | | | | | |
| Total Short-Term Investment | | | | | | | | | | | | |
| (Cost $445,229,000) | | | | | | | 445,229,000 | | | | 1.0 | % |
| Total Investments | | | | | | | | | | | | |
| (Cost $45,713,626,894) | | | | | | | 42,760,491,114 | | | | 99.7 | % |
| Other Assets in Excess of Liabilities | | | | | | | 145,029,918 | | | | 0.3 | % |
| TOTAL NET ASSETS | | | | | | $ | 42,905,521,032 | | | | 100.0 | % |
Notes to Schedule of Investments
AGM – Assured Guaranty Municipal
BAM – Build America Mutual Assurance Co.
GNMA – Government National Mortgage Association
SD CRED PROG – State Credit Enhancement Program
CMT – Constant Maturity Treasury
LIBOR – London Inter-bank Offered Rate
SOFR – Secured Overnight Financing Rate
SOFRINDX – Secured Overnight Financing Rate Index
TSFR – Term Secured Overnight Financing Rate
(1) | Foreign security. |
(2) | Includes securities exempt from registration under Rule 144A of the Securities Act of 1933. These securities may be resold in transactions exempt from registration to qualified institutional buyers. At December 31, 2023, the value of these securities totaled $8,065,871,947, which represented 18.80% of total net assets. |
(3) | Variable rate security based on a reference index and spread. The rate reported is the rate as of the last reset date in effect as of December 31, 2023. |
(4) | Variable rate security. The coupon is based on an underlying pool of loans. The rate reported is the rate in effect as of December 31, 2023. |
(5) | Seven-day yield. |
(6) | Security that, on the last payment date, missed a partial principal or interest payment. |
(7) | Step-up bond; the interest rate shown is the rate in effect as of December 31, 2023. |
(8) | Security in default. |
(9) | Securities referencing LIBOR are expected to transition to an alternative reference rate by the security’s next scheduled coupon reset date. |
The accompanying notes are an integral part of these financial statements.
Baird Aggregate Bond Fund
Summary of Fair Value Exposure at December 31, 2023
The Fund has adopted authoritative fair valuation accounting standards which establish a definition of fair value and set out a hierarchy for measuring fair value. These standards require additional disclosures about the various inputs and valuation techniques used to develop the measurements of fair value and a discussion on changes in valuation techniques and related inputs during the period. These standards define fair value as the price that would be received to sell an asset or paid to transfer a liability in an orderly transaction between market participants at the measurement date.
The fair value hierarchy is organized into three levels based upon the assumptions (referred to as “inputs”) used in pricing the asset or liability. These standards state that “observable inputs” reflect the assumptions market participants would use in pricing the asset or liability based on market data obtained from independent sources and “unobservable inputs” reflect an entity’s own assumptions about the assumptions market participants would use in pricing the asset or liability. These inputs are summarized into three broad levels and described below:
Level 1 – Quoted prices (unadjusted) in active markets for identical assets or liabilities that the reporting entity can access at the measurement date.
Level 2 – Inputs other than quoted prices included within Level 1 that are observable for the asset or liability, either directly or indirectly.
Level 3 – Unobservable inputs for the asset or liability.
The inputs or methodology used for valuing securities are not necessarily an indication of the risk associated with investing in those securities.
The following is a summary of the inputs used to value the Fund’s investments as of December 31, 2023:
| | | Level 1 | | | Level 2 | | | Level 3 | | | Total | |
| Long-Term Investments | | | | | | | | | | | | |
| U.S. Treasury Securities | | $ | — | | | $ | 9,803,058,680 | | | $ | — | | | $ | 9,803,058,680 | |
| Other Government Related Securities | | | — | | | | 76,522,832 | | | | — | | | | 76,522,832 | |
| Corporate Bonds | | | — | | | | 16,158,031,184 | | | | — | | | | 16,158,031,184 | |
| Municipal Bonds | | | — | | | | 269,026,185 | | | | — | | | | 269,026,185 | |
| Residential Mortgage-Backed Securities – U.S. Government Agency Issues | | | — | | | | 10,178,868,346 | | | | — | | | | 10,178,868,346 | |
| Residential Mortgage-Backed Securities – Non-U.S. Government Agency Issues | | | — | | | | 1,967,502,203 | | | | — | | | | 1,967,502,203 | |
| Commercial Mortgage-Backed Securities – U.S. Government Agency Issues | | | — | | | | 617,231,514 | | | | — | | | | 617,231,514 | |
| Commercial Mortgage-Backed Securities – Non-U.S. Government Agency Issues | | | — | | | | 1,926,308,385 | | | | — | | | | 1,926,308,385 | |
| Asset Backed Securities | | | — | | | | 1,318,712,785 | | | | — | | | | 1,318,712,785 | |
| Total Long-Term Investments | | | — | | | | 42,315,262,114 | | | | — | | | | 42,315,262,114 | |
| Short-Term Investment | | | | | | | | | | | | | | | | |
| Money Market Mutual Fund | | | 445,229,000 | | | | — | | | | — | | | | 445,229,000 | |
| Total Short-Term Investment | | | 445,229,000 | | | | — | | | | — | | | | 445,229,000 | |
| Total Investments | | $ | 445,229,000 | | | $ | 42,315,262,114 | | | $ | — | | | $ | 42,760,491,114 | |
Changes in valuation techniques may result in transfers into or out of assigned levels within the fair value hierarchy. There were no transfers into or out of Level 3 during the year, as compared to the security classifications from the prior year’s annual report. See the Fund’s Valuation Policy in Note 2a to the financial statements.
The accompanying notes are an integral part of these financial statements.
Baird Core Plus Bond Fund
December 31, 2023 (Unaudited)
The Baird Core Plus Bond Fund seeks an annual rate of total return, before Fund expenses, greater than the annual rate of total return of the Bloomberg U.S. Universal Index. The Bloomberg U.S. Universal Index is an unmanaged, market value weighted index of fixed income securities issued in U.S. dollars, including U.S. government, investment grade and non-investment grade credit, emerging market debt, asset-backed (ABS) and mortgage-backed securities, Eurobonds, 144A securities and commercial mortgage- backed securities (CMBS) with maturities of at least one year.
In 2023, the Fed slowed and likely ended its aggressive tightening campaign. Investors returned to the bond market as fixed income fund/ETF flows were a positive $159 billion, reversing the record outflows of -$345 billion in 2022. The overarching theme for 2023 was rate and credit spread volatility. After beginning the year at 3.88%, the 10-year Treasury yield fell more than 50 bps to 3.31% in April. From there, resilient economic data and heavy Treasury issuance led to a significant move up in rates. The 10-year Treasury yield rose 168 bps, peaking in mid-October at 4.99%, but the elevated rates were short-lived as one of the strongest year-end market rallies in decades ensued. The 10-year Treasury yield fell 111 bps to end the year at 3.88%, exactly the yield at which it began the year.
During 2023, the Institutional Class Shares of the Fund (BCOIX) posted a net return of 6.89% vs. a 6.17% return for the Bloomberg U.S. Universal Index.
Contributors to the Fund’s relative performance during the year include:
| | Credit – Positive overall |
| | | • | Positive – Overweight investment grade credit |
| | | • | Positive – Active positioning within investment grade credit |
| | | | o | Positive – Overweight BBB industrials as well as subsector and security selection decisions within industrials (spread across many subsectors) |
| | | | o | Positive – Subsector and security selection within financials (e.g., favoring non-U.S. versus U.S. banks) |
| | | | o | Positive – Overweight financials/industrials and underweight non-corporate credit |
| | | • | Negative – Underweight high yield corporate credit and high yield emerging market |
| | Securitized – Positive overall |
| | | • | Positive – Overweight non-agency residential mortgage-backed securities (RMBS), non-agency CMBS and ABS |
| | | • | Positive – Agency RMBS positioning |
| | | | o | Positive – Subsector and security selection decisions (e.g., favoring 20-year versus 30-year mortgages in lower coupon rates) |
| | | | o | Modest negative – Underweight agency RMBS, mitigated by increasing Fund exposure after spreads widened |
| | Yield Curve and Convexity – Positive |
| | | • | Positive – Positive convexity tilt of overall portfolio versus the benchmark |
| | | • | Neutral – Yield curve positioning |
The outlook for the fixed income markets in 2024 is favorable, thanks to an inflationary trend that is moving closer to the Fed’s 2% target and an acknowledgement, by both the Fed and the market, that the odds have shifted toward rate cuts rather than increases. Signs of economic slowing are emerging as monthly payroll growth has slowed and the U.S. unemployment rate has risen modestly. Outside of the U.S., geopolitical risks are elevated with an ongoing war in Ukraine, Israel’s full-scale campaign inside Gaza to defeat Hamas, non-state actor attacks on shipping in the Red Sea and U.S. interests in the Middle East, and relations between China and the US strained, all of which, combined with the uncertain Fed outlook, will likely lead to continued elevated market volatility. We expect the spread volatility that was visible in 2023 to continue into 2024, benefitting the patient, active investor. Finally, 2024 is an election year, which is certain to add to market uncertainty as the year progresses; this uncertainty is likely to lead to short-term price volatility although the higher income from bonds can insulate investors from this volatility.
The Fund remains duration neutral and continues to maintain a modest overweight to investment grade corporate credit, favoring the financial sector relative to its benchmark. We continue to prefer the risk/reward profile of investment grade credit and select crossover/BB-rated issuers relative to lower-rated segments of U.S. high yield and emerging market debt. The Fund has a modest underweight to agency RMBS and is maintaining an overweight within non-agency securitized sub-sectors at the top of the capital structure given attractive valuations versus both agency RMBS and higher-rated segments of investment grade credit.
Baird Core Plus Bond Fund
December 31, 2023 (Unaudited)
Portfolio Characteristics
Quality Distribution(1)(2)

| | Net Assets | $27,881,073,618 | |
| | | | |
| | SEC 30-Day Yield(3) | | |
| | Institutional Class | 4.49% | |
| | Investor Class | 4.24% | |
| | | | |
| | Average Effective Duration | 6.00 years | |
| | | | |
| | Average Effective Maturity | 8.01 years | |
| | | | |
| | Annualized Expense Ratio(4) | | |
| | Institutional Class | 0.30% | |
| | Investor Class | 0.55% | (5) |
| | | | |
| | Portfolio Turnover Rate | 35% | |
| | | | |
| | Number of Holdings | 1,557 | |
| | | | |
| | | | | |
Sector Weightings(6) | | | | |
| | | | | |
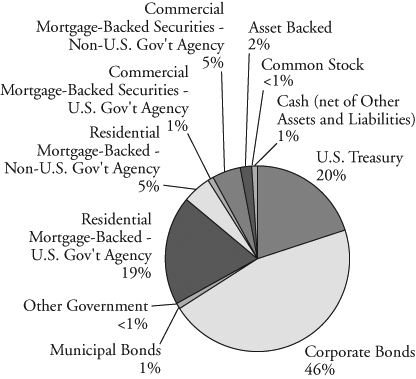
| | | | |
| | | | |
| | | | |
| | | | |
| | | | |
| | | | |
| | | | |
| | | | |
| | | | |
| | | | |
| | | | |
| | | | |
| | | | |
| | | | |
| | | | |
| | | | |
| | | | |
| | | | |
| | | | |
| | | | |
| | | | |
| | | | |
| | | | | |
(1) | Percentages shown are based on the Fund’s total investments. |
(2) | The quality profile is calculated on a market value-weighted basis using the highest credit quality rating for each security held by the Fund given by S&P, Moody’s or Fitch, each of which is a Nationally Recognized Statistical Rating Organization (NRSRO). NRSROs rate the credit quality of securities using a scale that generally ranges from AAA (highest) to D (lowest). |
(3) | SEC yields are based on SEC guidelines and are calculated for the 30 days ended December 31, 2023. |
(4) | Reflects expense ratios as stated in the Fund’s current prospectus dated May 1, 2023. |
(5) | Includes 0.25% 12b-1 fee. |
(6) | Percentages shown are based on the Fund’s total net assets. |
Baird Core Plus Bond Fund
December 31, 2023 (Unaudited)
| Institutional Class | Investor Class |
| Value of a $10,000 Investment | Value of a $10,000 Investment |
| | |
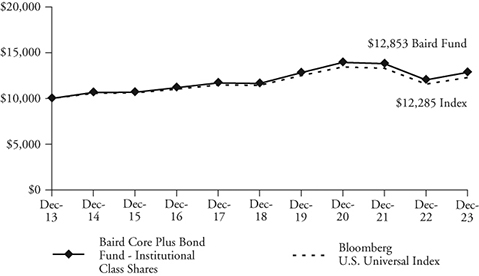 |  |
| | |
| Growth of a hypothetical investment of $10,000 made on 12/31/13, assuming | Growth of a hypothetical investment of $10,000 made on 12/31/13, assuming |
| reinvestment of all distributions. | reinvestment of all distributions. |
| Total Returns | | | | |
| | | Average Annual |
| | One | Five | Ten | Since |
| For the Periods Ended December 31, 2023 | Year | Years | Years | Inception(1) |
| Institutional Class Shares | 6.89% | 2.01% | 2.54% | 4.80% |
| Investor Class Shares | 6.60% | 1.74% | 2.28% | 4.54% |
Bloomberg U.S. Universal Index(2) | 6.17% | 1.44% | 2.08% | 4.14% |
(1) | For the period from September 29, 2000 (inception date) through December 31, 2023. |
(2) | The Bloomberg U.S. Universal Index is an unmanaged, market value weighted index of fixed income securities issued in U.S. dollars, including U.S. government and investment grade debt, non-investment grade debt, asset-backed and mortgage-backed securities, Eurobonds, 144A securities and emerging market debt, with maturities of at least one year. This Index does not reflect any deduction for fees, expenses or taxes. A direct investment in an index is not possible. |
The line graphs and the returns table shown above reflect reinvestment of dividends and/or capital gains distributions in additional shares. The returns in the graphs and table do not reflect the deduction of taxes that a shareholder would pay on Fund distributions or the redemption of Fund shares. The returns reflect the actual performance for each period and do not include the impact of trades executed on the last business day of the period that were recorded on the first business day of the next period.
The Fund’s expense ratio for each Class, as reflected in the Fund’s current prospectus, is set forth under “Portfolio Characteristics”.
The Fund may invest up to 20% of its net assets in non-investment grade debt securities (commonly referred to as “high yield” bonds). While these types of debt securities may offer higher yields than investment grade securities, they also include greater risks including increased credit risk and the increased risk of default or bankruptcy. The Fund maintains securities with longer maturities in order to provide a greater potential for return. Generally, the longer a bond’s maturity, the greater the interest rate risk. The Fund may also invest in U.S. dollar denominated foreign securities which involve additional risks such as political and economic instability, and different and sometimes less strict financial reporting standards and regulation. The Fund may also invest in mortgage- and asset-backed securities, which include interest rate and prepayment risks more pronounced than those of other fixed income securities. U.S. and international markets have experienced significant periods of volatility due to a number of economic, political and other global macro factors. The war between Ukraine and Russia is approaching its 2nd anniversary and the October 7th attack by Hamas and Israel’s response only added to global tensions. US/China relations remain strained, impacted by sluggish Chinese economic growth and numerous issues affecting trade relations. Domestically, inflation remains an area of focus since getting to the Fed’s 2% target may prove to be more challenging than the market expects. In addition, 2024 is an election year and the current level of political discord is high. Finally, while the coronavirus (COVID-19) appears to have entered an endemic stage, significant outbreaks present a continued risk to the global economy. These and other events may cause market disruptions and could have an adverse effect on the value of the Fund’s investments.
Past performance does not guarantee future results. Investment return and principal value will fluctuate so that an investor’s shares, when redeemed, may be worth more or less than their original cost.
For information about the performance of the Fund as of the most recent month-end, please call 1-866-442-2473 or visit www.bairdfunds.com. Mutual fund performance changes over time and current performance may be lower or higher than that stated.
Baird Core Plus Bond Fund
Schedule of Investments, December 31, 2023
Long-Term Investments
| | | Principal | | | | | | % of | |
| | | Amount | | | Value | | | Net Assets | |
| U.S. Treasury Securities | | | | | | | | | |
| U.S. Treasury Bonds: | | | | | | | | | |
| 4.125%, 06/15/2026 | | $ | 35,000,000 | | | $ | 35,009,570 | | | | |
| 4.500%, 07/15/2026 | | | 60,000,000 | | | | 60,578,906 | | | | |
| 4.375%, 08/15/2026 | | | 425,000,000 | | | | 428,021,487 | | | | |
| 1.125%, 10/31/2026 | | | 963,375,000 | | | | 889,428,445 | | | | |
| 1.125%, 08/31/2028 | | | 14,325,000 | | | | 12,660,838 | | | | |
| 2.375%, 03/31/2029 | | | 436,950,000 | | | | 406,124,541 | | | | |
| 3.875%, 12/31/2029 | | | 287,950,000 | | | | 287,815,023 | | | | |
| 4.125%, 08/31/2030 | | | 347,550,000 | | | | 352,410,271 | | | | |
| 3.500%, 02/15/2033 | | | 281,575,000 | | | | 273,589,708 | | | | |
| 1.375%, 11/15/2040 | | | 450,450,000 | | | | 300,112,312 | | | | |
| 2.250%, 05/15/2041 | | | 78,175,000 | | | | 59,779,445 | | | | |
| 2.375%, 02/15/2042 | | | 462,325,000 | | | | 356,134,727 | | | | |
| 3.375%, 08/15/2042 | | | 324,650,000 | | | | 290,574,431 | | | | |
| 2.875%, 05/15/2043 | | | 691,325,000 | | | | 569,722,011 | | | | |
| 2.500%, 02/15/2045 | | | 966,625,000 | | | | 735,012,583 | | | | |
| 1.250%, 05/15/2050 | | | 85,525,000 | | | | 46,350,541 | | | | |
| 1.375%, 08/15/2050 | | | 187,725,000 | | | | 105,199,329 | | | | |
| 2.875%, 05/15/2052 | | | 422,425,000 | | | | 338,006,004 | | | | |
| Total U.S. Treasury Securities | | | | | | | | | | | |
| (Cost $6,094,772,437) | | | | | | | 5,546,530,172 | | | | 19.9 | % |
| Other Government Related Securities | | | | | | | | | | | | |
| Electricite de France SA: | | | | | | | | | | | | |
| 6.250%, 05/23/2033 | | | | | | | | | | | | |
(Callable 02/23/2033)(1)(2) | | | 7,000,000 | | | | 7,589,517 | | | | | |
| 4.750%, 10/13/2035 | | | | | | | | | | | | |
(Callable 04/13/2035)(1)(2) | | | 10,000,000 | | | | 9,502,942 | | | | | |
| NBN Co. Ltd., | | | | | | | | | | | | |
| 2.625%, 05/05/2031 | | | | | | | | | | | | |
(Callable 02/05/2031)(1)(2) | | | 5,000,000 | | | | 4,294,660 | | | | | |
| Petroleos Mexicanos: | | | | | | | | | | | | |
| 5.950%, 01/28/2031 | | | | | | | | | | | | |
(Callable 10/28/2030)(1) | | | 1,005,000 | | | | 802,492 | | | | | |
| 6.700%, 02/16/2032 | | | | | | | | | | | | |
(Callable 11/16/2031)(1) | | | 31,343,000 | | | | 26,012,700 | | | | | |
| Total Other Government | | | | | | | | | | | | |
| Related Securities | | | | | | | | | | | | |
| (Cost $51,991,593) | | | | | | | 48,202,311 | | | | 0.2 | % |
| Corporate Bonds | | | | | | | | | | | | |
| Industrials | | | | | | | | | | | | |
| 180 Medical, Inc., | | | | | | | | | | | | |
| 3.875%, 10/15/2029 | | | | | | | | | | | | |
(Callable 10/07/2024)(1)(2) | | | 500,000 | | | | 450,375 | | | | | |
| AbbVie, Inc.: | | | | | | | | | | | | |
| 4.300%, 05/14/2036 | | | | | | | | | | | | |
| (Callable 11/14/2035) | | | 3,825,000 | | | | 3,672,667 | | | | | |
| 4.050%, 11/21/2039 | | | | | | | | | | | | |
| (Callable 05/21/2039) | | | 11,250,000 | | | | 10,196,225 | | | | | |
| 4.250%, 11/21/2049 | | | | | | | | | | | | |
| (Callable 05/21/2049) | | | 20,000,000 | | | | 17,883,257 | | | | | |
| Acushnet Co., | | | | | | | | | | | | |
| 7.375%, 10/15/2028 | | | | | | | | | | | | |
(Callable 10/15/2025)(1)(2) | | | 1,000,000 | | | | 1,043,290 | | | | | |
| ADT Security Corp., | | | | | | | | | | | | |
| 4.125%, 08/01/2029 | | | | | | | | | | | | |
(Callable 08/01/2028)(2) | | | 2,250,000 | | | | 2,069,515 | | | | | |
| Advanced Drainage Systems, Inc., | | | | | | | | | | | | |
| 6.375%, 06/15/2030 | | | | | | | | | | | | |
(Callable 07/15/2025)(2) | | | 1,500,000 | | | | 1,511,240 | | | | | |
| Adventist Health System: | | | | | | | | | | | | |
| 2.952%, 03/01/2029 | | | | | | | | | | | | |
| (Callable 12/01/2028) | | | 7,250,000 | | | | 6,552,707 | | | | | |
| 3.630%, 03/01/2049 | | | | | | | | | | | | |
| (Callable 09/01/2048) | | | 8,900,000 | | | | 6,761,272 | | | | | |
| Air Products and Chemicals, Inc., | | | | | | | | | | | | |
| 2.800%, 05/15/2050 | | | | | | | | | | | | |
| (Callable 11/15/2049) | | | 5,000,000 | | | | 3,573,540 | | | | | |
| Aker BP ASA, | | | | | | | | | | | | |
| 5.600%, 06/13/2028 | | | | | | | | | | | | |
(Callable 05/13/2028)(1)(2) | | | 7,000,000 | | | | 7,141,950 | | | | | |
| Albertsons Companies, Inc.: | | | | | | | | | | | | |
| 3.250%, 03/15/2026 | | | | | | | | | | | | |
(Callable 01/29/2024)(2) | | | 5,000,000 | | | | 4,716,306 | | | | | |
| 3.500%, 03/15/2029 | | | | | | | | | | | | |
(Callable 01/29/2024)(2) | | | 1,500,000 | | | | 1,362,673 | | | | | |
| Alcon Finance Corp.: | | | | | | | | | | | | |
| 3.000%, 09/23/2029 | | | | | | | | | | | | |
(Callable 06/23/2029)(1)(2) | | | 6,110,000 | | | | 5,567,233 | | | | | |
| 2.600%, 05/27/2030 | | | | | | | | | | | | |
(Callable 02/27/2030)(1)(2) | | | 6,475,000 | | | | 5,621,838 | | | | | |
| Alimentation Couche-Tard, Inc., | | | | | | | | | | | | |
| 2.950%, 01/25/2030 | | | | | | | | | | | | |
(Callable 10/25/2029)(1)(2) | | | 6,500,000 | | | | 5,826,675 | | | | | |
| Allegion PLC, | | | | | | | | | | | | |
| 3.500%, 10/01/2029 | | | | | | | | | | | | |
| (Callable 07/01/2029) | | | 12,275,000 | | | | 11,346,133 | | | | | |
| Alpek SAB de CV: | | | | | | | | | | | | |
| 4.250%, 09/18/2029 | | | | | | | | | | | | |
(Callable 06/18/2029)(1)(2) | | | 6,000,000 | | | | 5,533,972 | | | | | |
| 3.250%, 02/25/2031 | | | | | | | | | | | | |
(Callable 11/25/2030)(1)(2) | | | 10,000,000 | | | | 8,568,084 | | | | | |
| America Movil SAB de CV, | | | | | | | | | | | | |
| 2.875%, 05/07/2030 | | | | | | | | | | | | |
(Callable 02/07/2030)(1) | | | 28,000,000 | | | | 24,976,301 | | | | | |
| Amgen, Inc.: | | | | | | | | | | | | |
| 3.150%, 02/21/2040 | | | | | | | | | | | | |
| (Callable 08/21/2039) | | | 5,000,000 | | | | 3,901,307 | | | | | |
| 4.400%, 05/01/2045 | | | | | | | | | | | | |
| (Callable 11/01/2044) | | | 8,000,000 | | | | 7,123,302 | | | | | |
| 5.650%, 03/02/2053 | | | | | | | | | | | | |
| (Callable 09/02/2052) | | | 21,700,000 | | | | 22,932,472 | | | | | |
| Anglo American Capital PLC: | | | | | | | | | | | | |
| 5.625%, 04/01/2030 | | | | | | | | | | | | |
(Callable 01/01/2030)(1)(2) | | | 3,000,000 | | | | 3,049,423 | | | | | |
| 2.625%, 09/10/2030 | | | | | | | | | | | | |
(Callable 06/10/2030)(1)(2) | | | 16,025,000 | | | | 13,653,845 | | | | | |
| 5.500%, 05/02/2033 | | | | | | | | | | | | |
(Callable 02/02/2033)(1)(2) | | | 12,450,000 | | | | 12,607,527 | | | | | |
| 3.950%, 09/10/2050 | | | | | | | | | | | | |
(Callable 03/10/2050)(1)(2) | | | 10,000,000 | | | | 7,631,261 | | | | | |
| Anheuser-Busch InBev Worldwide, Inc.: | | | | | | | | | | | | |
| 4.750%, 01/23/2029 | | | | | | | | | | | | |
(Callable 10/23/2028)(1) | | | 5,000,000 | | | | 5,082,165 | | | | | |
| 5.450%, 01/23/2039 | | | | | | | | | | | | |
(Callable 07/23/2038)(1) | | | 9,975,000 | | | | 10,539,543 | | | | | |
| 4.900%, 02/01/2046 | | | | | | | | | | | | |
(Callable 08/01/2045)(1) | | | 60,675,000 | | | | 59,509,448 | | | | | |
| Antofagasta PLC, | | | | | | | | | | | | |
| 2.375%, 10/14/2030 | | | | | | | | | | | | |
(Callable 07/14/2030)(1)(2) | | | 6,000,000 | | | | 4,904,230 | | | | | |
| AP Moller - Maersk A/S, | | | | | | | | | | | | |
| 4.500%, 06/20/2029 | | | | | | | | | | | | |
(Callable 03/20/2029)(1)(2) | | | 20,575,000 | | | | 20,276,678 | | | | | |
| AptarGroup, Inc., | | | | | | | | | | | | |
| 3.600%, 03/15/2032 | | | | | | | | | | | | |
| (Callable 12/15/2031) | | | 7,500,000 | | | | 6,762,107 | | | | | |
The accompanying notes are an integral part of these financial statements.
Baird Core Plus Bond Fund
Schedule of Investments, December 31, 2023
Long-Term Investments (cont.)
| | | Principal | | | | | | % of | |
| | | Amount | | | Value | | | Net Assets | |
| Aramark Services, Inc., | | | | | | | | | |
| 5.000%, 02/01/2028 | | | | | | | | | |
(Callable 01/29/2024)(2) | | $ | 1,000,000 | | | $ | 969,982 | | | |
| |
| ArcelorMittal: | | | | | | | | | | | | |
6.125%, 06/01/2025(1) | | | 6,078,000 | | | | 6,145,694 | | | | | |
4.550%, 03/11/2026(1) | | | 30,930,000 | | | | 30,462,826 | | | | | |
4.250%, 07/16/2029(1) | | | 15,000,000 | | | | 14,607,347 | | | | | |
| 6.800%, 11/29/2032 | | | | | | | | | | | | |
(Callable 08/29/2032)(1) | | | 24,100,000 | | | | 26,107,664 | | | | | |
7.000%, 10/15/2039(1) | | | 11,096,000 | | | | 12,038,799 | | | | | |
| Arcosa, Inc., | | | | | | | | | | | | |
| 4.375%, 04/15/2029 | | | | | | | | | | | | |
(Callable 04/15/2024)(2) | | | 3,000,000 | | | | 2,794,140 | | | | | |
| Ardagh Metal Packaging SA, | | | | | | | | | | | | |
| 3.250%, 09/01/2028 | | | | | | | | | | | | |
(Callable 05/15/2024)(1)(2) | | | 500,000 | | | | 437,448 | | | | | |
| Ashtead Capital, Inc.: | | | | | | | | | | | | |
| 4.000%, 05/01/2028 | | | | | | | | | | | | |
(Callable 01/09/2024)(1)(2) | | | 9,000,000 | | | | 8,475,854 | | | | | |
| 4.250%, 11/01/2029 | | | | | | | | | | | | |
(Callable 11/01/2024)(1)(2) | | | 4,100,000 | | | | 3,832,769 | | | | | |
| 2.450%, 08/12/2031 | | | | | | | | | | | | |
(Callable 05/12/2031)(1)(2) | | | 23,840,000 | | | | 19,442,401 | | | | | |
| 5.500%, 08/11/2032 | | | | | | | | | | | | |
(Callable 05/11/2032)(1)(2) | | | 6,450,000 | | | | 6,383,053 | | | | | |
| 5.550%, 05/30/2033 | | | | | | | | | | | | |
(Callable 02/28/2033)(1)(2) | | | 5,000,000 | | | | 4,958,256 | | | | | |
| 5.950%, 10/15/2033 | | | | | | | | | | | | |
(Callable 07/15/2033)(1)(2) | | | 9,000,000 | | | | 9,186,562 | | | | | |
| AT&T, Inc.: | | | | | | | | | | | | |
| 4.300%, 02/15/2030 | | | | | | | | | | | | |
| (Callable 11/15/2029) | | | 10,980,000 | | | | 10,768,447 | | | | | |
| 2.550%, 12/01/2033 | | | | | | | | | | | | |
| (Callable 09/01/2033) | | | 14,329,000 | | | | 11,689,910 | | | | | |
| 4.650%, 06/01/2044 | | | | | | | | | | | | |
| (Callable 12/01/2043) | | | 9,700,000 | | | | 8,669,880 | | | | | |
| 3.550%, 09/15/2055 | | | | | | | | | | | | |
| (Callable 03/15/2055) | | | 40,029,000 | | | | 28,939,982 | | | | | |
| 3.800%, 12/01/2057 | | | | | | | | | | | | |
| (Callable 06/01/2057) | | | 25,315,000 | | | | 18,902,340 | | | | | |
| 3.650%, 09/15/2059 | | | | | | | | | | | | |
| (Callable 03/15/2059) | | | 31,734,000 | | | | 22,841,685 | | | | | |
| Avery Dennison Corp., | | | | | | | | | | | | |
| 2.650%, 04/30/2030 | | | | | | | | | | | | |
| (Callable 02/01/2030) | | | 10,175,000 | | | | 8,998,631 | | | | | |
| Ball Corp.: | | | | | | | | | | | | |
| 5.250%, 07/01/2025 | | | 18,675,000 | | | | 18,656,568 | | | | | |
| 4.875%, 03/15/2026 | | | | | | | | | | | | |
| (Callable 12/15/2025) | | | 23,125,000 | | | | 23,040,541 | | | | | |
| 6.875%, 03/15/2028 | | | | | | | | | | | | |
| (Callable 11/15/2024) | | | 2,000,000 | | | | 2,079,194 | | | | | |
| 6.000%, 06/15/2029 | | | | | | | | | | | | |
| (Callable 05/15/2026) | | | 5,000,000 | | | | 5,106,025 | | | | | |
| 2.875%, 08/15/2030 | | | | | | | | | | | | |
| (Callable 05/15/2030) | | | 5,000,000 | | | | 4,290,924 | | | | | |
| 3.125%, 09/15/2031 | | | | | | | | | | | | |
| (Callable 06/15/2031) | | | 25,000,000 | | | | 21,574,107 | | | | | |
| Bayer US Finance II LLC: | | | | | | | | | | | | |
| 4.250%, 12/15/2025 | | | | | | | | | | | | |
(Callable 10/15/2025)(1)(2) | | | 25,000,000 | | | | 24,365,841 | | | | | |
| 4.625%, 06/25/2038 | | | | | | | | | | | | |
(Callable 12/25/2037)(1)(2) | | | 12,000,000 | | | | 10,387,190 | | | | | |
| 4.400%, 07/15/2044 | | | | | | | | | | | | |
(Callable 01/15/2044)(1)(2) | | | 5,125,000 | | | | 4,059,894 | | | | | |
| Beacon Roofing Supply, Inc., | | | | | | | | | | | | |
| 6.500%, 08/01/2030 | | | | | | | | | | | | |
(Callable 08/01/2026)(2) | | | 3,000,000 | | | | 3,068,007 | | | | | |
| Becton Dickinson and Co., | | | | | | | | | | | | |
| 4.875%, 05/15/2044 | | | | | | | | | | | | |
| (Callable 11/15/2043) | | | 5,455,000 | | | | 4,926,327 | | | | | |
| Bell Canada, Inc., | | | | | | | | | | | | |
| 5.100%, 05/11/2033 | | | | | | | | | | | | |
(Callable 02/11/2033)(1) | | | 7,000,000 | | | | 7,195,151 | | | | | |
| Berry Global, Inc., | | | | | | | | | | | | |
| 4.875%, 07/15/2026 | | | | | | | | | | | | |
(Callable 01/29/2024)(2) | | | 28,000,000 | | | | 27,515,233 | | | | | |
| Bimbo Bakeries USA, Inc., | | | | | | | | | | | | |
| 4.000%, 05/17/2051 | | | | | | | | | | | | |
(Callable 11/17/2050)(1)(2) | | | 5,000,000 | | | | 4,019,749 | | | | | |
| Boardwalk Pipelines LP: | | | | | | | | | | | | |
| 4.950%, 12/15/2024 | | | | | | | | | | | | |
| (Callable 09/15/2024) | | | 17,475,000 | | | | 17,342,806 | | | | | |
| 5.950%, 06/01/2026 | | | | | | | | | | | | |
| (Callable 03/01/2026) | | | 26,406,000 | | | | 26,784,516 | | | | | |
| 4.800%, 05/03/2029 | | | | | | | | | | | | |
| (Callable 02/03/2029) | | | 28,916,000 | | | | 28,352,543 | | | | | |
| 3.600%, 09/01/2032 | | | | | | | | | | | | |
| (Callable 06/01/2032) | | | 15,000,000 | | | | 13,340,132 | | | | | |
| Boeing Co.: | | | | | | | | | | | | |
| 2.196%, 02/04/2026 | | | | | | | | | | | | |
| (Callable 01/09/2024) | | | 25,550,000 | | | | 24,150,013 | | | | | |
| 5.150%, 05/01/2030 | | | | | | | | | | | | |
| (Callable 02/01/2030) | | | 26,000,000 | | | | 26,502,777 | | | | | |
| Bon Secours Mercy Health, Inc., | | | | | | | | | | | | |
| 3.464%, 06/01/2030 | | | | | | | | | | | | |
| (Callable 12/01/2029) | | | 16,330,000 | | | | 14,926,680 | | | | | |
| Booz Allen Hamilton, Inc.: | | | | | | | | | | | | |
| 3.875%, 09/01/2028 | | | | | | | | | | | | |
(Callable 01/29/2024)(2) | | | 1,000,000 | | | | 943,111 | | | | | |
| 4.000%, 07/01/2029 | | | | | | | | | | | | |
(Callable 07/01/2024)(2) | | | 500,000 | | | | 468,556 | | | | | |
| Boral Finance Pty Ltd., | | | | | | | | | | | | |
| 3.750%, 05/01/2028 | | | | | | | | | | | | |
(Callable 02/01/2028)(1)(2) | | | 1,440,000 | | | | 1,329,427 | | | | | |
| BP Capital Markets America, Inc., | | | | | | | | | | | | |
| 4.812%, 02/13/2033 | | | | | | | | | | | | |
(Callable 11/13/2032)(1) | | | 4,575,000 | | | | 4,621,700 | | | | | |
| Braskem Netherlands Finance BV, | | | | | | | | | | | | |
| 8.500%, 01/12/2031 | | | | | | | | | | | | |
(Callable 11/12/2030)(1)(2) | | | 10,000,000 | | | | 9,300,000 | | | | | |
| Bristol-Myers Squibb Co., | | | | | | | | | | | | |
| 3.700%, 03/15/2052 | | | | | | | | | | | | |
| (Callable 09/15/2051) | | | 6,425,000 | | | | 5,070,241 | | | | | |
| British Telecommunications PLC, | | | | | | | | | | | | |
9.625%, 12/15/2030(1) | | | 49,000,000 | | | | 60,705,689 | | | | | |
| Broadcom, Inc.: | | | | | | | | | | | | |
| 3.150%, 11/15/2025 | | | | | | | | | | | | |
| (Callable 10/15/2025) | | | 7,150,000 | | | | 6,928,199 | | | | | |
| 4.000%, 04/15/2029 | | | | | | | | | | | | |
(Callable 02/15/2029)(2) | | | 4,000,000 | | | | 3,864,803 | | | | | |
| 5.000%, 04/15/2030 | | | | | | | | | | | | |
| (Callable 01/15/2030) | | | 9,000,000 | | | | 9,142,211 | | | | | |
| 4.150%, 11/15/2030 | | | | | | | | | | | | |
| (Callable 08/15/2030) | | | 16,000,000 | | | | 15,305,015 | | | | | |
| 2.450%, 02/15/2031 | | | | | | | | | | | | |
(Callable 11/15/2030)(2) | | | 7,250,000 | | | | 6,205,145 | | | | | |
| 4.150%, 04/15/2032 | | | | | | | | | | | | |
(Callable 01/15/2032)(2) | | | 12,000,000 | | | | 11,338,097 | | | | | |
The accompanying notes are an integral part of these financial statements.
Baird Core Plus Bond Fund
Schedule of Investments, December 31, 2023
Long-Term Investments (cont.)
| | | Principal | | | | | | % of | |
| | | Amount | | | Value | | | Net Assets | |
| Broadcom, Inc.: (cont.) | | | | | | | | | |
| 3.469%, 04/15/2034 | | | | | | | | | |
(Callable 01/15/2034)(2) | | $ | 10,000,000 | | | $ | 8,715,381 | | | |
| |
| 3.137%, 11/15/2035 | | | | | | | | | | | | |
(Callable 08/15/2035)(2) | | | 13,250,000 | | | | 10,904,125 | | | | | |
| 3.500%, 02/15/2041 | | | | | | | | | | | | |
(Callable 08/15/2040)(2) | | | 16,000,000 | | | | 12,727,461 | | | | | |
| Bunge Limited Finance Corp.: | | | | | | | | | | | | |
| 3.250%, 08/15/2026 | | | | | | | | | | | | |
| (Callable 05/15/2026) | | | 13,188,000 | | | | 12,665,852 | | | | | |
| 3.750%, 09/25/2027 | | | | | | | | | | | | |
| (Callable 06/25/2027) | | | 23,800,000 | | | | 22,954,110 | | | | | |
| Burlington Northern Santa Fe LLC, | | | | | | | | | | | | |
| 4.150%, 04/01/2045 | | | | | | | | | | | | |
| (Callable 10/01/2044) | | | 3,100,000 | | | | 2,762,605 | | | | | |
| Cameron LNG LLC, | | | | | | | | | | | | |
| 3.701%, 01/15/2039 | | | | | | | | | | | | |
(Callable 07/15/2038)(2) | | | 15,000,000 | | | | 12,758,390 | | | | | |
| Canadian Pacific Railway Co.: | | | | | | | | | | | | |
| 4.700%, 05/01/2048 | | | | | | | | | | | | |
(Callable 11/01/2047)(1) | | | 12,000,000 | | | | 10,942,982 | | | | | |
| 3.500%, 05/01/2050 | | | | | | | | | | | | |
(Callable 11/01/2049)(1) | | | 13,000,000 | | | | 10,022,377 | | | | | |
| Canpack SA / Canpack US LLC, | | | | | | | | | | | | |
| 3.875%, 11/15/2029 | | | | | | | | | | | | |
(Callable 11/15/2024)(1)(2) | | | 15,000,000 | | | | 12,856,805 | | | | | |
| Carlisle Companies, Inc.: | | | | | | | | | | | | |
| 3.750%, 12/01/2027 | | | | | | | | | | | | |
| (Callable 09/01/2027) | | | 4,600,000 | | | | 4,407,203 | | | | | |
| 2.750%, 03/01/2030 | | | | | | | | | | | | |
| (Callable 12/01/2029) | | | 21,832,000 | | | | 19,373,311 | | | | | |
| Carrier Global Corp.: | | | | | | | | | | | | |
| 2.493%, 02/15/2027 | | | | | | | | | | | | |
| (Callable 12/15/2026) | | | 12,845,000 | | | | 12,084,383 | | | | | |
| 2.700%, 02/15/2031 | | | | | | | | | | | | |
| (Callable 11/15/2030) | | | 14,700,000 | | | | 12,865,024 | | | | | |
| 3.577%, 04/05/2050 | | | | | | | | | | | | |
| (Callable 10/05/2049) | | | 3,050,000 | | | | 2,387,901 | | | | | |
| CBRE Services, Inc., | | | | | | | | | | | | |
| 5.950%, 08/15/2034 | | | | | | | | | | | | |
| (Callable 05/15/2034) | | | 5,000,000 | | | | 5,244,535 | | | | | |
| CCL Industries, Inc., | | | | | | | | | | | | |
| 3.050%, 06/01/2030 | | | | | | | | | | | | |
(Callable 03/01/2030)(1)(2) | | | 19,725,000 | | | | 17,325,724 | | | | | |
| CDW LLC / CDW Finance Corp., | | | | | | | | | | | | |
| 3.569%, 12/01/2031 | | | | | | | | | | | | |
| (Callable 09/01/2031) | | | 15,000,000 | | | | 13,282,650 | | | | | |
| Celanese US Holdings LLC, | | | | | | | | | | | | |
| 6.330%, 07/15/2029 | | | | | | | | | | | | |
| (Callable 05/15/2029) | | | 14,876,000 | | | | 15,604,021 | | | | | |
| Cellnex Finance Co., | | | | | | | | | | | | |
| 3.875%, 07/07/2041 | | | | | | | | | | | | |
(Callable 04/07/2041)(1)(2) | | | 28,000,000 | | | | 21,687,960 | | | | | |
| CF Industries, Inc., | | | | | | | | | | | | |
| 5.375%, 03/15/2044 | | | 10,922,000 | | | | 10,452,366 | | | | | |
| Charles River Laboratories | | | | | | | | | | | | |
| International, Inc., | | | | | | | | | | | | |
| 4.000%, 03/15/2031 | | | | | | | | | | | | |
(Callable 03/15/2026)(2) | | | 3,000,000 | | | | 2,707,627 | | | | | |
| Charter Communications | | | | | | | | | | | | |
| Operating LLC: | | | | | | | | | | | | |
| 4.908%, 07/23/2025 | | | | | | | | | | | | |
| (Callable 04/23/2025) | | | 63,550,000 | | | | 62,956,954 | | | | | |
| 3.750%, 02/15/2028 | | | | | | | | | | | | |
| (Callable 11/15/2027) | | | 5,000,000 | | | | 4,722,235 | | | | | |
| 6.384%, 10/23/2035 | | | | | | | | | | | | |
| (Callable 04/23/2035) | | | 52,905,000 | | | | 53,813,453 | | | | | |
| 5.375%, 04/01/2038 | | | | | | | | | | | | |
| (Callable 10/01/2037) | | | 6,000,000 | | | | 5,436,717 | | | | | |
| 3.700%, 04/01/2051 | | | | | | | | | | | | |
| (Callable 10/01/2050) | | | 6,700,000 | | | | 4,374,731 | | | | | |
| 3.850%, 04/01/2061 | | | | | | | | | | | | |
| (Callable 10/01/2060) | | | 12,075,000 | | | | 7,564,977 | | | | | |
| 4.400%, 12/01/2061 | | | | | | | | | | | | |
| (Callable 06/01/2061) | | | 10,000,000 | | | | 6,938,950 | | | | | |
| Cheniere Corpus Christi Holdings LLC, | | | | | | | | | | | | |
| 5.875%, 03/31/2025 | | | | | | | | | | | | |
| (Callable 10/02/2024) | | | 5,005,000 | | | | 5,016,172 | | | | | |
| Cheniere Energy Partners LP: | | | | | | | | | | | | |
| 3.250%, 01/31/2032 | | | | | | | | | | | | |
| (Callable 01/31/2027) | | | 3,500,000 | | | | 2,982,222 | | | | | |
| 5.950%, 06/30/2033 | | | | | | | | | | | | |
(Callable 12/30/2032)(2) | | | 13,000,000 | | | | 13,336,830 | | | | | |
| Cia Cervecerias Unidas SA, | | | | | | | | | | | | |
| 3.350%, 01/19/2032 | | | | | | | | | | | | |
(Callable 10/19/2031)(1)(2) | | | 20,000,000 | | | | 17,220,000 | | | | | |
| Cigna Corp.: | | | | | | | | | | | | |
| 4.500%, 02/25/2026 | | | | | | | | | | | | |
| (Callable 11/27/2025) | | | 5,725,000 | | | | 5,685,418 | | | | | |
| 2.400%, 03/15/2030 | | | | | | | | | | | | |
| (Callable 12/15/2029) | | | 9,850,000 | | | | 8,637,234 | | | | | |
| 4.800%, 08/15/2038 | | | | | | | | | | | | |
| (Callable 02/15/2038) | | | 7,600,000 | | | | 7,366,594 | | | | | |
| Clean Harbors, Inc.: | | | | | | | | | | | | |
| 5.125%, 07/15/2029 | | | | | | | | | | | | |
(Callable 07/15/2024)(2) | | | 100,000 | | | | 95,679 | | | | | |
| 6.375%, 02/01/2031 | | | | | | | | | | | | |
(Callable 02/01/2026)(2) | | | 1,000,000 | | | | 1,017,241 | | | | | |
| CNH Industrial Capital LLC, | | | | | | | | | | | | |
| 1.875%, 01/15/2026 | | | | | | | | | | | | |
(Callable 12/15/2025)(1) | | | 14,250,000 | | | | 13,357,740 | | | | | |
| CNH Industrial NV, | | | | | | | | | | | | |
| 3.850%, 11/15/2027 | | | | | | | | | | | | |
(Callable 08/15/2027)(1) | | | 26,114,000 | | | | 25,157,994 | | | | | |
| Columbia Pipeline Group, Inc.: | | | | | | | | | | | | |
| 4.500%, 06/01/2025 | | | | | | | | | | | | |
(Callable 03/01/2025)(1) | | | 2,830,000 | | | | 2,794,215 | | | | | |
| 5.800%, 06/01/2045 | | | | | | | | | | | | |
(Callable 12/01/2044)(1) | | | 4,733,000 | | | | 4,725,712 | | | | | |
| Columbia Pipelines Operating Co. LLC: | | | | | | | | | | | | |
| 6.497%, 08/15/2043 | | | | | | | | | | | | |
(Callable 02/15/2043)(1)(2) | | | 5,000,000 | | | | 5,371,527 | | | | | |
| 6.544%, 11/15/2053 | | | | | | | | | | | | |
(Callable 05/15/2053)(1)(2) | | | 3,400,000 | | | | 3,758,848 | | | | | |
| Comcast Corp.: | | | | | | | | | | | | |
| 4.250%, 01/15/2033 | | | 6,500,000 | | | | 6,326,242 | | | | | |
| 4.400%, 08/15/2035 | | | | | | | | | | | | |
| (Callable 02/15/2035) | | | 13,575,000 | | | | 13,118,236 | | | | | |
| 3.200%, 07/15/2036 | | | | | | | | | | | | |
| (Callable 01/15/2036) | | | 15,000,000 | | | | 12,646,045 | | | | | |
| 5.350%, 05/15/2053 | | | | | | | | | | | | |
| (Callable 11/15/2052) | | | 8,000,000 | | | | 8,312,231 | | | | | |
| 2.937%, 11/01/2056 | | | | | | | | | | | | |
| (Callable 05/01/2056) | | | 2,622,000 | | | | 1,733,536 | | | | | |
The accompanying notes are an integral part of these financial statements.
Baird Core Plus Bond Fund
Schedule of Investments, December 31, 2023
Long-Term Investments (cont.)
| | | Principal | | | | | | % of | |
| | | Amount | | | Value | | | Net Assets | |
| Comcast Corp.: (cont.) | | | | | | | | | |
| 2.987%, 11/01/2063 | | | | | | | | | |
| (Callable 05/01/2063) | | $ | 10,984,000 | | | $ | 7,120,059 | | | |
| |
| CommonSpirit Health, | | | | | | | | | | | | |
| 2.782%, 10/01/2030 | | | | | | | | | | | | |
| (Callable 04/01/2030) | | | 20,400,000 | | | | 17,697,355 | | | | | |
| Conagra Brands, Inc., | | | | | | | | | | | | |
| 5.300%, 11/01/2038 | | | | | | | | | | | | |
| (Callable 05/01/2038) | | | 6,625,000 | | | | 6,499,292 | | | | | |
| Concentrix Corp., | | | | | | | | | | | | |
| 6.600%, 08/02/2028 | | | | | | | | | | | | |
| (Callable 07/02/2028) | | | 19,277,000 | | | | 19,839,983 | | | | | |
| ConocoPhillips Canada Funding Co. I, | | | | | | | | | | | | |
| 5.950%, 10/15/2036 | | | 845,000 | | | | 913,863 | | | | | |
| Constellation Brands, Inc., | | | | | | | | | | | | |
| 4.750%, 12/01/2025 | | | 1,000,000 | | | | 995,380 | | | | | |
| Corning, Inc., | | | | | | | | | | | | |
| 4.375%, 11/15/2057 | | | | | | | | | | | | |
| (Callable 05/15/2057) | | | 10,000,000 | | | | 8,782,510 | | | | | |
| Cox Communications, Inc.: | | | | | | | | | | | | |
| 3.850%, 02/01/2025 | | | | | | | | | | | | |
(Callable 11/01/2024)(2) | | | 2,875,000 | | | | 2,825,655 | | | | | |
| 4.800%, 02/01/2035 | | | | | | | | | | | | |
(Callable 08/01/2034)(2) | | | 13,047,000 | | | | 12,249,146 | | | | | |
4.700%, 12/15/2042(2) | | | 1,670,000 | | | | 1,450,889 | | | | | |
| 3.600%, 06/15/2051 | | | | | | | | | | | | |
(Callable 12/15/2050)(2) | | | 22,900,000 | | | | 16,736,678 | | | | | |
| Crestwood Equity Partners LP, | | | | | | | | | | | | |
| 5.625%, 05/01/2027 | | | | | | | | | | | | |
(Callable 01/16/2024)(2) | | | 9,107,000 | | | | 9,075,902 | | | | | |
| Crown Castle, Inc.: | | | | | | | | | | | | |
| 5.600%, 06/01/2029 | | | | | | | | | | | | |
| (Callable 05/01/2029) | | | 21,800,000 | | | | 22,313,731 | | | | | |
| 5.100%, 05/01/2033 | | | | | | | | | | | | |
| (Callable 02/01/2033) | | | 5,000,000 | | | | 4,967,092 | | | | | |
| CSN Resources SA, | | | | | | | | | | | | |
| 8.875%, 12/05/2030 | | | | | | | | | | | | |
(Callable 12/05/2026)(1)(2) | | | 5,000,000 | | | | 5,210,500 | | | | | |
| CSX Corp.: | | | | | | | | | | | | |
| 6.220%, 04/30/2040 | | | 475,000 | | | | 535,829 | | | | | |
| 4.650%, 03/01/2068 | | | | | | | | | | | | |
| (Callable 09/01/2067) | | | 9,000,000 | | | | 8,291,147 | | | | | |
| CVS Health Corp.: | | | | | | | | | | | | |
| 3.250%, 08/15/2029 | | | | | | | | | | | | |
| (Callable 05/15/2029) | | | 11,800,000 | | | | 11,000,676 | | | | | |
| 5.300%, 06/01/2033 | | | | | | | | | | | | |
| (Callable 03/01/2033) | | | 4,225,000 | | | | 4,343,482 | | | | | |
| 4.780%, 03/25/2038 | | | | | | | | | | | | |
| (Callable 09/25/2037) | | | 35,075,000 | | | | 33,316,679 | | | | | |
| 5.050%, 03/25/2048 | | | | | | | | | | | | |
| (Callable 09/25/2047) | | | 32,600,000 | | | | 30,631,860 | | | | | |
| 5.875%, 06/01/2053 | | | | | | | | | | | | |
| (Callable 12/01/2052) | | | 6,000,000 | | | | 6,333,947 | | | | | |
| CVS Pass-Through Trust, | | | | | | | | | | | | |
7.507%, 01/10/2032(2) | | | 3,672,661 | | | | 3,866,100 | | | | | |
| Darling Ingredients, Inc., | | | | | | | | | | | | |
| 6.000%, 06/15/2030 | | | | | | | | | | | | |
(Callable 06/15/2025)(2) | | | 1,500,000 | | | | 1,500,986 | | | | | |
| DCP Midstream LLC: | | | | | | | | | | | | |
| 5.375%, 07/15/2025 | | | | | | | | | | | | |
| (Callable 04/15/2025) | | | 3,000,000 | | | | 3,001,689 | | | | | |
| 5.625%, 07/15/2027 | | | | | | | | | | | | |
| (Callable 04/15/2027) | | | 17,000,000 | | | | 17,413,389 | | | | | |
| 5.125%, 05/15/2029 | | | | | | | | | | | | |
| (Callable 02/15/2029) | | | 8,000,000 | | | | 7,990,851 | | | | | |
| 3.250%, 02/15/2032 | | | | | | | | | | | | |
| (Callable 08/15/2031) | | | 10,000,000 | | | | 8,646,670 | | | | | |
| Dell International LLC / EMC Corp.: | | | | | | | | | | | | |
| 5.850%, 07/15/2025 | | | | | | | | | | | | |
| (Callable 06/15/2025) | | | 5,000,000 | | | | 5,047,067 | | | | | |
| 6.020%, 06/15/2026 | | | | | | | | | | | | |
| (Callable 03/15/2026) | | | 19,282,000 | | | | 19,737,757 | | | | | |
| 4.900%, 10/01/2026 | | | | | | | | | | | | |
| (Callable 08/01/2026) | | | 8,395,000 | | | | 8,410,993 | | | | | |
| 5.300%, 10/01/2029 | | | | | | | | | | | | |
| (Callable 07/01/2029) | | | 5,300,000 | | | | 5,462,664 | | | | | |
| 3.450%, 12/15/2051 | | | | | | | | | | | | |
| (Callable 06/15/2051) | | | 7,227,000 | | | | 5,256,078 | | | | | |
| Dentsply Sirona, | | | | | | | | | | | | |
| 3.250%, 06/01/2030 | | | | | | | | | | | | |
| (Callable 03/01/2030) | | | 46,120,000 | | | | 40,845,412 | | | | | |
| Deutsche Telekom | | | | | | | | | | | | |
| International Finance BV, | | | | | | | | | | | | |
8.750%, 06/15/2030(1) | | | 28,015,000 | | | | 33,813,835 | | | | | |
| Dignity Health, | | | | | | | | | | | | |
| 5.267%, 11/01/2064 | | | 7,625,000 | | | | 7,076,468 | | | | | |
| Dominion Gas Holdings LLC, | | | | | | | | | | | | |
| 3.600%, 12/15/2024 | | | | | | | | | | | | |
| (Callable 09/15/2024) | | | 4,067,000 | | | | 3,997,684 | | | | | |
| DuPont de Nemours, Inc., | | | | | | | | | | | | |
| 5.319%, 11/15/2038 | | | | | | | | | | | | |
| (Callable 05/15/2038) | | | 17,350,000 | | | | 17,859,193 | | | | | |
| DXC Technology Co.: | | | | | | | | | | | | |
| 1.800%, 09/15/2026 | | | | | | | | | | | | |
| (Callable 08/15/2026) | | | 21,000,000 | | | | 19,190,414 | | | | | |
| 2.375%, 09/15/2028 | | | | | | | | | | | | |
| (Callable 07/15/2028) | | | 60,000,000 | | | | 52,551,569 | | | | | |
| Eagle Materials, Inc., | | | | | | | | | | | | |
| 2.500%, 07/01/2031 | | | | | | | | | | | | |
| (Callable 04/01/2031) | | | 15,000,000 | | | | 12,768,332 | | | | | |
| Eastern Gas Transmission & Storage, Inc., | | | | | | | | | | | | |
| 3.600%, 12/15/2024 | | | | | | | | | | | | |
| (Callable 09/15/2024) | | | 2,033,000 | | | | 1,997,676 | | | | | |
| Eaton Corp., | | | | | | | | | | | | |
| 4.000%, 11/02/2032 | | | 3,660,000 | | | | 3,546,121 | | | | | |
| Element Fleet Management Corp.: | | | | | | | | | | | | |
| 3.850%, 06/15/2025 | | | | | | | | | | | | |
(Callable 05/15/2025)(1)(2) | | | 23,000,000 | | | | 22,349,734 | | | | | |
| 6.271%, 06/26/2026 | | | | | | | | | | | | |
(Callable 05/26/2026)(1)(2) | | | 15,600,000 | | | | 15,895,459 | | | | | |
| 6.319%, 12/04/2028 | | | | | | | | | | | | |
(Callable 11/04/2028)(1)(2) | | | 50,400,000 | | | | 52,098,227 | | | | | |
| Enbridge Energy Partners LP: | | | | | | | | | | | | |
7.500%, 04/15/2038(1) | | | 4,500,000 | | | | 5,242,663 | | | | | |
| 7.375%, 10/15/2045 | | | | | | | | | | | | |
(Callable 04/15/2045)(1) | | | 23,298,000 | | | | 27,479,660 | | | | | |
| Energy Transfer LP: | | | | | | | | | | | | |
| 4.400%, 03/15/2027 | | | | | | | | | | | | |
| (Callable 12/15/2026) | | | 15,000,000 | | | | 14,673,515 | | | | | |
| 5.500%, 06/01/2027 | | | | | | | | | | | | |
| (Callable 03/01/2027) | | | 4,653,000 | | | | 4,713,165 | | | | | |
| 4.950%, 05/15/2028 | | | | | | | | | | | | |
| (Callable 02/15/2028) | | | 1,620,000 | | | | 1,613,466 | | | | | |
| 4.950%, 06/15/2028 | | | | | | | | | | | | |
| (Callable 03/15/2028) | | | 4,693,000 | | | | 4,679,116 | | | | | |
The accompanying notes are an integral part of these financial statements.
Baird Core Plus Bond Fund
Schedule of Investments, December 31, 2023
Long-Term Investments (cont.)
| | | Principal | | | | | | % of | |
| | | Amount | | | Value | | | Net Assets | |
| Energy Transfer LP: (cont.) | | | | | | | | | |
| 6.000%, 02/01/2029 | | | | | | | | | |
(Callable 02/01/2024)(2) | | $ | 8,900,000 | | | $ | 8,979,955 | | | |
| |
| 5.250%, 04/15/2029 | | | | | | | | | | | | |
| (Callable 01/15/2029) | | | 18,925,000 | | | | 19,087,404 | | | | | |
| 4.150%, 09/15/2029 | | | | | | | | | | | | |
| (Callable 06/15/2029) | | | 16,585,000 | | | | 15,822,666 | | | | | |
| 7.375%, 02/01/2031 | | | | | | | | | | | | |
(Callable 02/01/2026)(2) | | | 12,297,000 | | | | 12,923,356 | | | | | |
| 6.625%, 10/15/2036 | | | 3,575,000 | | | | 3,851,960 | | | | | |
| 6.500%, 02/01/2042 | | | | | | | | | | | | |
| (Callable 08/01/2041) | | | 18,727,000 | | | | 19,834,162 | | | | | |
| 6.100%, 02/15/2042 | | | 1,000,000 | | | | 1,004,190 | | | | | |
| 5.950%, 10/01/2043 | | | | | | | | | | | | |
| (Callable 04/01/2043) | | | 2,702,000 | | | | 2,667,499 | | | | | |
| 6.000%, 06/15/2048 | | | | | | | | | | | | |
| (Callable 12/15/2047) | | | 5,000,000 | | | | 5,053,455 | | | | | |
| Energy Transfer Partners LP: | | | | | | | | | | | | |
| 4.200%, 04/15/2027 | | | | | | | | | | | | |
| (Callable 01/15/2027) | | | 8,650,000 | | | | 8,408,756 | | | | | |
| 5.150%, 03/15/2045 | | | | | | | | | | | | |
| (Callable 09/15/2044) | | | 5,000,000 | | | | 4,599,740 | | | | | |
| Eni SpA, | | | | | | | | | | | | |
| 4.250%, 05/09/2029 | | | | | | | | | | | | |
(Callable 02/09/2029)(1)(2) | | | 18,250,000 | | | | 17,789,666 | | | | | |
| Enterprise Products Operating LLC, | | | | | | | | | | | | |
| 3.950%, 01/31/2060 | | | | | | | | | | | | |
| (Callable 07/31/2059) | | | 14,475,000 | | | | 11,786,917 | | | | | |
| EQT Corp.: | | | | | | | | | | | | |
| 6.125%, 02/01/2025 | | | | | | | | | | | | |
| (Callable 01/01/2025) | | | 10,000,000 | | | | 10,044,500 | | | | | |
| 5.000%, 01/15/2029 | | | | | | | | | | | | |
| (Callable 07/15/2028) | | | 1,000,000 | | | | 990,381 | | | | | |
| 7.000%, 02/01/2030 | | | | | | | | | | | | |
| (Callable 11/01/2029) | | | 17,950,000 | | | | 19,264,658 | | | | | |
| 3.625%, 05/15/2031 | | | | | | | | | | | | |
(Callable 05/15/2030)(2) | | | 100,000 | | | | 89,307 | | | | | |
| EQT Midstream Partners LP, | | | | | | | | | | | | |
| 4.125%, 12/01/2026 | | | | | | | | | | | | |
| (Callable 09/01/2026) | | | 14,750,000 | | | | 14,249,906 | | | | | |
| Equifax, Inc., | | | | | | | | | | | | |
| 5.100%, 06/01/2028 | | | | | | | | | | | | |
| (Callable 05/01/2028) | | | 15,000,000 | | | | 15,143,903 | | | | | |
| Equinix, Inc., | | | | | | | | | | | | |
| 3.200%, 11/18/2029 | | | | | | | | | | | | |
| (Callable 08/18/2029) | | | 15,000,000 | | | | 13,795,289 | | | | | |
| FedEx Corp.: | | | | | | | | | | | | |
| 3.900%, 02/01/2035 | | | 7,000,000 | | | | 6,405,145 | | | | | |
| 4.950%, 10/17/2048 | | | | | | | | | | | | |
| (Callable 04/17/2048) | | | 13,500,000 | | | | 12,855,209 | | | | | |
| Ferguson Finance PLC, | | | | | | | | | | | | |
| 4.500%, 10/24/2028 | | | | | | | | | | | | |
(Callable 07/24/2028)(2) | | | 37,052,000 | | | | 36,498,892 | | | | | |
| Fiserv, Inc.: | | | | | | | | | | | | |
| 3.200%, 07/01/2026 | | | | | | | | | | | | |
| (Callable 05/01/2026) | | | 6,400,000 | | | | 6,162,836 | | | | | |
| 3.500%, 07/01/2029 | | | | | | | | | | | | |
| (Callable 04/01/2029) | | | 8,810,000 | | | | 8,296,088 | | | | | |
| 5.625%, 08/21/2033 | | | | | | | | | | | | |
| (Callable 05/21/2033) | | | 10,000,000 | | | | 10,495,317 | | | | | |
| 4.400%, 07/01/2049 | | | | | | | | | | | | |
| (Callable 01/01/2049) | | | 12,500,000 | | | | 11,053,584 | | | | | |
| Flex Intermediate Holdco LLC, | | | | | | | | | | | | |
| 3.363%, 06/30/2031 | | | | | | | | | | | | |
(Callable 12/30/2030)(2) | | | 30,000,000 | | | | 24,562,437 | | | | | |
| Flex Ltd.: | | | | | | | | | | | | |
| 3.750%, 02/01/2026 | | | | | | | | | | | | |
| (Callable 01/01/2026) | | | 28,300,000 | | | | 27,395,839 | | | | | |
| 6.000%, 01/15/2028 | | | | | | | | | | | | |
| (Callable 12/15/2027) | | | 10,000,000 | | | | 10,336,818 | | | | | |
| 4.875%, 05/12/2030 | | | | | | | | | | | | |
| (Callable 02/12/2030) | | | 17,550,000 | | | | 17,228,739 | | | | | |
| Flowserve Corp.: | | | | | | | | | | | | |
| 3.500%, 10/01/2030 | | | | | | | | | | | | |
| (Callable 07/01/2030) | | | 7,075,000 | | | | 6,281,405 | | | | | |
| 2.800%, 01/15/2032 | | | | | | | | | | | | |
| (Callable 10/15/2031) | | | 5,000,000 | | | | 4,141,474 | | | | | |
| FMG Resources Pty Ltd.: | | | | | | | | | | | | |
| 4.375%, 04/01/2031 | | | | | | | | | | | | |
(Callable 01/01/2031)(1)(2) | | | 1,000,000 | | | | 915,500 | | | | | |
| 6.125%, 04/15/2032 | | | | | | | | | | | | |
(Callable 01/15/2032)(1)(2) | | | 10,000,000 | | | | 10,076,570 | | | | | |
| Ford Motor Credit Co. LLC: | | | | | | | | | | | | |
| 3.664%, 09/08/2024 | | | 34,000,000 | | | | 33,455,552 | | | | | |
| 4.063%, 11/01/2024 | | | | | | | | | | | | |
| (Callable 10/01/2024) | | | 7,000,000 | | | | 6,875,789 | | | | | |
| 2.300%, 02/10/2025 | | | | | | | | | | | | |
| (Callable 01/10/2025) | | | 30,000,000 | | | | 28,853,130 | | | | | |
| 3.375%, 11/13/2025 | | | | | | | | | | | | |
| (Callable 10/13/2025) | | | 30,000,000 | | | | 28,717,260 | | | | | |
| 2.700%, 08/10/2026 | | | | | | | | | | | | |
| (Callable 07/10/2026) | | | 15,000,000 | | | | 13,898,323 | | | | | |
| Fortune Brands Home & Security, Inc., | | | | | | | | | | | | |
| 3.250%, 09/15/2029 | | | | | | | | | | | | |
| (Callable 06/15/2029) | | | 14,000,000 | | | | 12,954,709 | | | | | |
| Fortune Brands Innovations, Inc., | | | | | | | | | | | | |
| 5.875%, 06/01/2033 | | | | | | | | | | | | |
| (Callable 03/01/2033) | | | 16,000,000 | | | | 16,749,098 | | | | | |
| Freeport-McMoRan, Inc.: | | | | | | | | | | | | |
| 5.000%, 09/01/2027 | | | | | | | | | | | | |
| (Callable 01/29/2024) | | | 12,000,000 | | | | 11,849,988 | | | | | |
| 4.125%, 03/01/2028 | | | | | | | | | | | | |
| (Callable 01/29/2024) | | | 11,550,000 | | | | 11,050,225 | | | | | |
| 4.375%, 08/01/2028 | | | | | | | | | | | | |
| (Callable 01/29/2024) | | | 6,545,000 | | | | 6,280,271 | | | | | |
| 5.250%, 09/01/2029 | | | | | | | | | | | | |
| (Callable 09/01/2024) | | | 14,415,000 | | | | 14,566,761 | | | | | |
| 4.250%, 03/01/2030 | | | | | | | | | | | | |
| (Callable 03/01/2025) | | | 29,799,000 | | | | 27,972,220 | | | | | |
| 4.625%, 08/01/2030 | | | | | | | | | | | | |
| (Callable 08/01/2025) | | | 3,000,000 | | | | 2,928,490 | | | | | |
| Fresenius Medical Care US Finance II, Inc., | | | | | | | | | | | | |
| 4.750%, 10/15/2024 | | | | | | | | | | | | |
(Callable 07/17/2024)(1)(2) | | | 8,075,000 | | | | 7,968,686 | | | | | |
| Fresenius Medical Care US Finance III, Inc.: | | | | | | | | | | | | |
| 3.750%, 06/15/2029 | | | | | | | | | | | | |
(Callable 03/15/2029)(1)(2) | | | 34,130,000 | | | | 29,975,552 | | | | | |
| 2.375%, 02/16/2031 | | | | | | | | | | | | |
(Callable 11/16/2030)(1)(2) | | | 32,300,000 | | | | 25,015,626 | | | | | |
| 3.000%, 12/01/2031 | | | | | | | | | | | | |
(Callable 09/01/2031)(1)(2) | | | 13,625,000 | | | | 10,743,424 | | | | | |
| General Motors Co., | | | | | | | | | | | | |
| 6.125%, 10/01/2025 | | | | | | | | | | | | |
| (Callable 09/01/2025) | | | 22,112,000 | | | | 22,413,747 | | | | | |
The accompanying notes are an integral part of these financial statements.
Baird Core Plus Bond Fund
Schedule of Investments, December 31, 2023
Long-Term Investments (cont.)
| | | Principal | | | | | | % of | |
| | | Amount | | | Value | | | Net Assets | |
| General Motors Financial Co., Inc.: | | | | | | | | | |
| 2.900%, 02/26/2025 | | | | | | | | | |
| (Callable 01/26/2025) | | $ | 17,725,000 | | | $ | 17,199,232 | | | |
| |
| 1.250%, 01/08/2026 | | | | | | | | | | | | |
| (Callable 12/08/2025) | | | 18,125,000 | | | | 16,775,325 | | | | | |
| 5.400%, 04/06/2026 | | | 10,000,000 | | | | 10,068,538 | | | | | |
| 2.350%, 02/26/2027 | | | | | | | | | | | | |
| (Callable 01/26/2027) | | | 10,900,000 | | | | 10,040,013 | | | | | |
| 5.800%, 06/23/2028 | | | | | | | | | | | | |
| (Callable 05/23/2028) | | | 10,000,000 | | | | 10,284,400 | | | | | |
| 5.800%, 01/07/2029 | | | | | | | | | | | | |
| (Callable 12/07/2028) | | | 15,000,000 | | | | 15,357,025 | | | | | |
| Genpact Luxembourg Sarl, | | | | | | | | | | | | |
| 3.375%, 12/01/2024 | | | | | | | | | | | | |
| (Callable 11/01/2024) | | | 36,370,000 | | | | 35,429,836 | | | | | |
| Genpact Luxembourg SARL, | | | | | | | | | | | | |
| 1.750%, 04/10/2026 | | | | | | | | | | | | |
| (Callable 03/10/2026) | | | 29,775,000 | | | | 27,652,893 | | | | | |
| GFL Environmental, Inc., | | | | | | | | | | | | |
| 6.750%, 01/15/2031 | | | | | | | | | | | | |
(Callable 01/15/2027)(1)(2) | | | 3,000,000 | | | | 3,091,422 | | | | | |
| Glencore Finance (Canada) Ltd.: | | | | | | | | | | | | |
6.000%, 11/15/2041(1)(2) | | | 9,400,000 | | | | 9,594,213 | | | | | |
5.550%, 10/25/2042(1)(2) | | | 3,543,000 | | | | 3,449,876 | | | | | |
| Glencore Funding LLC: | | | | | | | | | | | | |
| 4.000%, 03/27/2027 | | | | | | | | | | | | |
(Callable 12/27/2026)(1)(2) | | | 17,000,000 | | | | 16,519,392 | | | | | |
| 4.875%, 03/12/2029 | | | | | | | | | | | | |
(Callable 12/12/2028)(1)(2) | | | 18,000,000 | | | | 18,001,008 | | | | | |
| 2.500%, 09/01/2030 | | | | | | | | | | | | |
(Callable 06/01/2030)(1)(2) | | | 5,615,000 | | | | 4,829,480 | | | | | |
| 5.700%, 05/08/2033 | | | | | | | | | | | | |
(Callable 02/08/2033)(1)(2) | | | 12,500,000 | | | | 12,995,178 | | | | | |
| 3.875%, 04/27/2051 | | | | | | | | | | | | |
(Callable 10/27/2050)(1)(2) | | | 7,500,000 | | | | 5,812,323 | | | | | |
| 3.375%, 09/23/2051 | | | | | | | | | | | | |
(Callable 03/23/2051)(1)(2) | | | 4,000,000 | | | | 2,825,918 | | | | | |
| Global Payments, Inc.: | | | | | | | | | | | | |
| 4.800%, 04/01/2026 | | | | | | | | | | | | |
| (Callable 01/01/2026) | | | 10,035,000 | | | | 9,949,848 | | | | | |
| 2.900%, 05/15/2030 | | | | | | | | | | | | |
| (Callable 02/15/2030) | | | 5,000,000 | | | | 4,403,994 | | | | | |
| Grand Canyon University, | | | | | | | | | | | | |
| 4.125%, 10/01/2024 | | | 30,000,000 | | | | 28,311,600 | | | | | |
| Graphic Packaging International LLC: | | | | | | | | | | | | |
3.500%, 03/15/2028(2) | | | 5,000,000 | | | | 4,658,814 | | | | | |
| 3.500%, 03/01/2029 | | | | | | | | | | | | |
(Callable 09/01/2028)(2) | | | 5,000,000 | | | | 4,499,058 | | | | | |
| Gray Oak Pipeline LLC, | | | | | | | | | | | | |
| 2.600%, 10/15/2025 | | | | | | | | | | | | |
(Callable 09/15/2025)(1)(2) | | | 15,000,000 | | | | 14,220,203 | | | | | |
| Grupo Bimbo SAB de CV: | | | | | | | | | | | | |
4.875%, 06/27/2044(1)(2) | | | 9,575,000 | | | | 8,918,217 | | | | | |
| 4.700%, 11/10/2047 | | | | | | | | | | | | |
(Callable 05/10/2047)(1)(2) | | | 25,671,000 | | | | 22,903,320 | | | | | |
4.000%, 09/06/2049(1)(2) | | | 19,500,000 | | | | 15,653,008 | | | | | |
| GTCR W-2 Merger Sub LLC, | | | | | | | | | | | | |
| 7.500%, 01/15/2031 | | | | | | | | | | | | |
(Callable 01/15/2027)(2) | | | 1,000,000 | | | | 1,056,722 | | | | | |
| Gulfstream Natural Gas System LLC, | | | | | | | | | | | | |
| 4.600%, 09/15/2025 | | | | | | | | | | | | |
(Callable 06/15/2025)(2) | | | 10,000,000 | | | | 9,815,424 | | | | | |
| GYP Holdings III Corp., | | | | | | | | | | | | |
| 4.625%, 05/01/2029 | | | | | | | | | | | | |
(Callable 05/01/2024)(2) | | | 2,500,000 | | | | 2,282,258 | | | | | |
| HB Fuller Co., | | | | | | | | | | | | |
| 4.000%, 02/15/2027 | | | | | | | | | | | | |
| (Callable 11/15/2026) | | | 6,725,000 | | | | 6,449,510 | | | | | |
| HCA, Inc.: | | | | | | | | | | | | |
| 5.250%, 04/15/2025 | | | 19,200,000 | | | | 19,180,073 | | | | | |
| 5.375%, 09/01/2026 | | | | | | | | | | | | |
| (Callable 03/01/2026) | | | 1,000,000 | | | | 1,005,122 | | | | | |
| 4.500%, 02/15/2027 | | | | | | | | | | | | |
| (Callable 08/15/2026) | | | 16,500,000 | | | | 16,283,445 | | | | | |
| 5.200%, 06/01/2028 | | | | | | | | | | | | |
| (Callable 05/01/2028) | | | 10,000,000 | | | | 10,111,399 | | | | | |
| 5.875%, 02/01/2029 | | | | | | | | | | | | |
| (Callable 08/01/2028) | | | 8,500,000 | | | | 8,780,147 | | | | | |
| 3.500%, 09/01/2030 | | | | | | | | | | | | |
| (Callable 03/01/2030) | | | 5,000,000 | | | | 4,536,705 | | | | | |
| 4.375%, 03/15/2042 | | | | | | | | | | | | |
| (Callable 09/15/2041) | | | 3,900,000 | | | | 3,305,039 | | | | | |
| 4.625%, 03/15/2052 | | | | | | | | | | | | |
| (Callable 09/15/2051) | | | 12,475,000 | | | | 10,650,033 | | | | | |
| Hexcel Corp.: | | | | | | | | | | | | |
| 4.950%, 08/15/2025 | | | | | | | | | | | | |
| (Callable 05/15/2025) | | | 8,303,000 | | | | 8,252,384 | | | | | |
| 4.200%, 02/15/2027 | | | | | | | | | | | | |
| (Callable 11/15/2026) | | | 19,000,000 | | | | 18,307,181 | | | | | |
| HF Sinclair Corp.: | | | | | | | | | | | | |
| 6.375%, 04/15/2027 | | | | | | | | | | | | |
(Callable 04/15/2024)(2) | | | 10,957,000 | | | | 11,048,173 | | | | | |
| 5.000%, 02/01/2028 | | | | | | | | | | | | |
(Callable 01/09/2024)(2) | | | 5,000,000 | | | | 4,818,007 | | | | | |
| 4.500%, 10/01/2030 | | | | | | | | | | | | |
| (Callable 07/01/2030) | | | 14,157,000 | | | | 13,223,522 | | | | | |
| Hologic, Inc., | | | | | | | | | | | | |
| 3.250%, 02/15/2029 | | | | | | | | | | | | |
(Callable 01/29/2024)(2) | | | 21,238,000 | | | | 19,251,145 | | | | | |
| HP, Inc., | | | | | | | | | | | | |
| 3.000%, 06/17/2027 | | | | | | | | | | | | |
| (Callable 04/17/2027) | | | 25,000,000 | | | | 23,629,397 | | | | | |
| Huntington Ingalls Industries, Inc.: | | | | | | | | | | | | |
| 3.844%, 05/01/2025 | | | | | | | | | | | | |
| (Callable 04/01/2025) | | | 10,000,000 | | | | 9,792,775 | | | | | |
| 2.043%, 08/16/2028 | | | | | | | | | | | | |
| (Callable 06/16/2028) | | | 12,000,000 | | | | 10,557,339 | | | | | |
| Huntsman International LLC, | | | | | | | | | | | | |
| 2.950%, 06/15/2031 | | | | | | | | | | | | |
| (Callable 03/15/2031) | | | 4,900,000 | | | | 4,147,238 | | | | | |
| Hyundai Capital America: | | | | | | | | | | | | |
| 1.300%, 01/08/2026 | | | | | | | | | | | | |
(Callable 12/08/2025)(1)(2) | | | 10,000,000 | | | | 9,235,072 | | | | | |
5.500%, 03/30/2026(1)(2) | | | 7,775,000 | | | | 7,818,671 | | | | | |
| 1.650%, 09/17/2026 | | | | | | | | | | | | |
(Callable 08/17/2026)(1)(2) | | | 30,000,000 | | | | 27,276,174 | | | | | |
| 5.680%, 06/26/2028 | | | | | | | | | | | | |
(Callable 05/26/2028)(1)(2) | | | 15,000,000 | | | | 15,302,223 | | | | | |
| 6.100%, 09/21/2028 | | | | | | | | | | | | |
(Callable 08/21/2028)(1)(2) | | | 10,000,000 | | | | 10,400,749 | | | | | |
| Infor, Inc., | | | | | | | | | | | | |
| 1.750%, 07/15/2025 | | | | | | | | | | | | |
(Callable 06/15/2025)(2) | | | 8,375,000 | | | | 7,896,933 | | | | | |
| Ingersoll Rand, Inc., | | | | | | | | | | | | |
| 5.700%, 08/14/2033 | | | | | | | | | | | | |
| (Callable 05/14/2033) | | | 9,700,000 | | | | 10,268,881 | | | | | |
The accompanying notes are an integral part of these financial statements.
Baird Core Plus Bond Fund
Schedule of Investments, December 31, 2023
Long-Term Investments (cont.)
| | | Principal | | | | | | % of | |
| | | Amount | | | Value | | | Net Assets | |
| Ingersoll-Rand Global Holding Co. Ltd., | | | | | | | | | |
| 5.750%, 06/15/2043 | | $ | 4,126,000 | | | $ | 4,429,436 | | | |
| |
| Ingersoll-Rand Luxembourg Finance SA, | | | | | | | | | | | | |
| 4.650%, 11/01/2044 | | | | | | | | | | | | |
| (Callable 05/01/2044) | | | 1,300,000 | | | | 1,207,958 | | | | | |
| Ingredion, Inc., | | | | | | | | | | | | |
| 2.900%, 06/01/2030 | | | | | | | | | | | | |
| (Callable 03/01/2030) | | | 28,000,000 | | | | 25,032,916 | | | | | |
| Intel Corp.: | | | | | | | | | | | | |
| 5.200%, 02/10/2033 | | | | | | | | | | | | |
| (Callable 11/10/2032) | | | 3,275,000 | | | | 3,424,970 | | | | | |
| 4.900%, 08/05/2052 | | | | | | | | | | | | |
| (Callable 02/05/2052) | | | 2,600,000 | | | | 2,555,747 | | | | | |
| 5.700%, 02/10/2053 | | | | | | | | | | | | |
| (Callable 08/10/2052) | | | 5,575,000 | | | | 6,049,409 | | | | | |
| International Business Machines Corp., | | | | | | | | | | | | |
| 4.150%, 05/15/2039 | | | 13,000,000 | | | | 11,840,348 | | | | | |
| International Flavors & Fragrances, Inc.: | | | | | | | | | | | | |
| 5.000%, 09/26/2048 | | | | | | | | | | | | |
| (Callable 03/26/2048) | | | 10,000,000 | | | | 8,504,216 | | | | | |
| 3.468%, 12/01/2050 | | | | | | | | | | | | |
(Callable 06/01/2050)(2) | | | 8,000,000 | | | | 5,482,379 | | | | | |
| IQVIA, Inc.: | | | | | | | | | | | | |
| 5.000%, 05/15/2027 | | | | | | | | | | | | |
(Callable 01/29/2024)(2) | | | 2,500,000 | | | | 2,453,690 | | | | | |
| 6.250%, 02/01/2029 | | | | | | | | | | | | |
(Callable 01/01/2029)(2) | | | 15,000,000 | | | | 15,672,735 | | | | | |
| 6.500%, 05/15/2030 | | | | | | | | | | | | |
(Callable 05/15/2026)(2) | | | 2,000,000 | | | | 2,055,680 | | | | | |
| Iron Mountain, Inc.: | | | | | | | | | | | | |
| 5.250%, 03/15/2028 | | | | | | | | | | | | |
(Callable 01/09/2024)(2) | | | 20,303,000 | | | | 19,738,197 | | | | | |
| 5.000%, 07/15/2028 | | | | | | | | | | | | |
(Callable 01/09/2024)(2) | | | 4,000,000 | | | | 3,845,140 | | | | | |
| 7.000%, 02/15/2029 | | | | | | | | | | | | |
(Callable 08/15/2025)(2) | | | 10,000,000 | | | | 10,278,700 | | | | | |
| 4.500%, 02/15/2031 | | | | | | | | | | | | |
(Callable 02/15/2026)(2) | | | 10,000,000 | | | | 9,115,589 | | | | | |
| JAB Holdings BV: | | | | | | | | | | | | |
| 3.750%, 05/28/2051 | | | | | | | | | | | | |
(Callable 11/28/2050)(1)(2) | | | 8,600,000 | | | | 5,876,469 | | | | | |
| 4.500%, 04/08/2052 | | | | | | | | | | | | |
(Callable 10/08/2051)(1)(2) | | | 13,000,000 | | | | 10,186,077 | | | | | |
| Jabil, Inc., | | | | | | | | | | | | |
| 5.450%, 02/01/2029 | | | | | | | | | | | | |
| (Callable 01/01/2029) | | | 10,000,000 | | | | 10,216,974 | | | | | |
| Jacobs Engineering Group, Inc., | | | | | | | | | | | | |
| 6.350%, 08/18/2028 | | | | | | | | | | | | |
| (Callable 07/18/2028) | | | 14,000,000 | | | | 14,621,139 | | | | | |
| JBS USA Lux SA, JBS USA Food | | | | | | | | | | | | |
| Company, and JBS Luxembourg SARL, | | | | | | | | | | | | |
| 6.750%, 03/15/2034 | | | | | | | | | | | | |
(Callable 12/15/2033)(2) | | | 4,000,000 | | | | 4,198,557 | | | | | |
| JBS USA Lux SA, JBS USA Food | | | | | | | | | | | | |
| Company, and JBS USA Finance: | | | | | | | | | | | | |
| 2.500%, 01/15/2027 | | | | | | | | | | | | |
| (Callable 12/15/2026) | | | 15,000,000 | | | | 13,813,125 | | | | | |
| 3.750%, 12/01/2031 | | | | | | | | | | | | |
| (Callable 12/01/2026) | | | 24,344,000 | | | | 21,000,724 | | | | | |
| 3.625%, 01/15/2032 | | | | | | | | | | | | |
| (Callable 01/15/2027) | | | 7,000,000 | | | | 6,000,001 | | | | | |
| 5.750%, 04/01/2033 | | | | | | | | | | | | |
| (Callable 01/01/2033) | | | 3,000,000 | | | | 2,986,830 | | | | | |
| 4.375%, 02/02/2052 | | | | | | | | | | | | |
| (Callable 08/02/2051) | | | 7,825,000 | | | | 5,827,028 | | | | | |
| JM Smucker Co., | | | | | | | | | | | | |
| 3.550%, 03/15/2050 | | | | | | | | | | | | |
| (Callable 09/15/2049) | | | 3,350,000 | | | | 2,477,442 | | | | | |
| Jones Lang LaSalle, Inc., | | | | | | | | | | | | |
| 6.875%, 12/01/2028 | | | | | | | | | | | | |
| (Callable 11/01/2028) | | | 17,000,000 | | | | 17,966,090 | | | | | |
| KB Home, | | | | | | | | | | | | |
| 7.250%, 07/15/2030 | | | | | | | | | | | | |
| (Callable 07/15/2025) | | | 5,000,000 | | | | 5,174,245 | | | | | |
| Kennametal, Inc., | | | | | | | | | | | | |
| 4.625%, 06/15/2028 | | | | | | | | | | | | |
| (Callable 03/15/2028) | | | 7,900,000 | | | | 7,709,811 | | | | | |
| Keysight Technologies, Inc., | | | | | | | | | | | | |
| 4.600%, 04/06/2027 | | | | | | | | | | | | |
| (Callable 01/06/2027) | | | 50,189,000 | | | | 50,038,510 | | | | | |
| Kimberly-Clark de Mexico SAB de CV, | | | | | | | | | | | | |
| 2.431%, 07/01/2031 | | | | | | | | | | | | |
(Callable 04/01/2031)(1)(2) | | | 6,000,000 | | | | 5,150,392 | | | | | |
| Kinder Morgan Energy Partners LP: | | | | | | | | | | | | |
| 7.300%, 08/15/2033 | | | 1,675,000 | | | | 1,900,032 | | | | | |
| 6.500%, 02/01/2037 | | | 6,785,000 | | | | 7,153,151 | | | | | |
| 6.950%, 01/15/2038 | | | 14,755,000 | | | | 16,231,923 | | | | | |
| 7.500%, 11/15/2040 | | | 27,248,000 | | | | 30,834,945 | | | | | |
| Kinder Morgan, Inc.: | | | | | | | | | | | | |
| 8.050%, 10/15/2030 | | | 15,384,000 | | | | 17,750,995 | | | | | |
| 7.800%, 08/01/2031 | | | 16,174,000 | | | | 18,514,525 | | | | | |
| Kinetik Holdings LP, | | | | | | | | | | | | |
| 6.625%, 12/15/2028 | | | | | | | | | | | | |
(Callable 12/15/2025)(2) | | | 6,000,000 | | | | 6,113,686 | | | | | |
| Kinross Gold Corp., | | | | | | | | | | | | |
| 6.875%, 09/01/2041 | | | | | | | | | | | | |
(Callable 03/01/2041)(1) | | | 5,500,000 | | | | 5,816,412 | | | | | |
| Kraft Heinz Foods Co.: | | | | | | | | | | | | |
| 6.750%, 03/15/2032 | | | 10,000,000 | | | | 11,271,930 | | | | | |
| 5.000%, 07/15/2035 | | | | | | | | | | | | |
| (Callable 01/15/2035) | | | 5,311,000 | | | | 5,350,451 | | | | | |
| 5.000%, 06/04/2042 | | | 5,000,000 | | | | 4,838,260 | | | | | |
| Kyndryl Holdings, Inc.: | | | | | | | | | | | | |
| 2.050%, 10/15/2026 | | | | | | | | | | | | |
| (Callable 09/15/2026) | | | 18,100,000 | | | | 16,482,320 | | | | | |
| 2.700%, 10/15/2028 | | | | | | | | | | | | |
| (Callable 08/15/2028) | | | 7,939,000 | | | | 7,003,164 | | | | | |
| L3Harris Technologies, Inc., | | | | | | | | | | | | |
| 5.600%, 07/31/2053 | | | | | | | | | | | | |
| (Callable 01/31/2053) | | | 5,750,000 | | | | 6,145,106 | | | | | |
| Lafarge SA, | | | | | | | | | | | | |
| 7.125%, 07/15/2036 | | | 1,500,000 | | | | 1,724,970 | | | | | |
| LafargeHolcim Finance US LLC, | | | | | | | | | | | | |
| 3.500%, 09/22/2026 | | | | | | | | | | | | |
(Callable 06/22/2026)(2) | | | 12,565,000 | | | | 12,158,522 | | | | | |
| Lear Corp.: | | | | | | | | | | | | |
| 3.800%, 09/15/2027 | | | | | | | | | | | | |
| (Callable 06/15/2027) | | | 3,167,000 | | | | 3,053,644 | | | | | |
| 3.500%, 05/30/2030 | | | | | | | | | | | | |
| (Callable 02/28/2030) | | | 15,000,000 | | | | 13,384,391 | | | | | |
| Leidos Holdings, Inc., | | | | | | | | | | | | |
| 5.950%, 12/01/2040 | | | | | | | | | | | | |
| (Callable 06/04/2040) | | | 2,000,000 | | | | 1,911,043 | | | | | |
The accompanying notes are an integral part of these financial statements.
Baird Core Plus Bond Fund
Schedule of Investments, December 31, 2023
Long-Term Investments (cont.)
| | | Principal | | | | | | % of | |
| | | Amount | | | Value | | | Net Assets | |
| Leidos, Inc.: | | | | | | | | | |
| 4.375%, 05/15/2030 | | | | | | | | | |
| (Callable 02/15/2030) | | $ | 46,222,000 | | | $ | 44,318,988 | | | |
| |
| 2.300%, 02/15/2031 | | | | | | | | | | | | |
| (Callable 11/15/2030) | | | 7,500,000 | | | | 6,285,049 | | | | | |
| 5.750%, 03/15/2033 | | | | | | | | | | | | |
| (Callable 12/15/2032) | | | 26,839,000 | | | | 28,046,824 | | | | | |
| LKQ Corp., | | | | | | | | | | | | |
| 5.750%, 06/15/2028 | | | | | | | | | | | | |
| (Callable 05/15/2028) | | | 8,000,000 | | | | 8,189,623 | | | | | |
| Lockheed Martin Corp., | | | | | | | | | | | | |
| 5.200%, 02/15/2055 | | | | | | | | | | | | |
| (Callable 08/15/2054) | | | 2,725,000 | | | | 2,872,534 | | | | | |
| Louisiana-Pacific Corp., | | | | | | | | | | | | |
| 3.625%, 03/15/2029 | | | | | | | | | | | | |
(Callable 03/15/2024)(2) | | | 25,000,000 | | | | 22,386,317 | | | | | |
| Lowe`s Companies, Inc., | | | | | | | | | | | | |
| 5.850%, 04/01/2063 | | | | | | | | | | | | |
| (Callable 10/01/2062) | | | 10,000,000 | | | | 10,518,562 | | | | | |
| Lundin Energy Finance BV: | | | | | | | | | | | | |
| 2.000%, 07/15/2026 | | | | | | | | | | | | |
(Callable 06/15/2026)(1)(2) | | | 6,725,000 | | | | 6,200,411 | | | | | |
| 3.100%, 07/15/2031 | | | | | | | | | | | | |
(Callable 04/15/2031)(1)(2) | | | 20,958,000 | | | | 17,955,726 | | | | | |
| Magellan Midstream Partners LP: | | | | | | | | | | | | |
| 5.000%, 03/01/2026 | | | | | | | | | | | | |
| (Callable 12/01/2025) | | | 10,000,000 | | | | 9,978,555 | | | | | |
| 4.200%, 03/15/2045 | | | | | | | | | | | | |
| (Callable 09/15/2044) | | | 8,770,000 | | | | 6,672,084 | | | | | |
| Magna International, Inc., | | | | | | | | | | | | |
| 2.450%, 06/15/2030 | | | | | | | | | | | | |
(Callable 03/15/2030)(1) | | | 10,000,000 | | | | 8,770,591 | | | | | |
| Marathon Petroleum Corp.: | | | | | | | | | | | | |
| 5.125%, 12/15/2026 | | | | | | | | | | | | |
| (Callable 09/15/2026) | | | 3,000,000 | | | | 3,033,994 | | | | | |
| 4.750%, 09/15/2044 | | | | | | | | | | | | |
| (Callable 03/15/2044) | | | 3,985,000 | | | | 3,565,154 | | | | | |
| Marriott International, Inc., | | | | | | | | | | | | |
| 4.900%, 04/15/2029 | | | | | | | | | | | | |
| (Callable 03/15/2029) | | | 5,000,000 | | | | 5,037,263 | | | | | |
| Martin Marietta Materials, Inc.: | | | | | | | | | | | | |
| 2.500%, 03/15/2030 | | | | | | | | | | | | |
| (Callable 12/15/2029) | | | 5,000,000 | | | | 4,407,993 | | | | | |
| 6.250%, 05/01/2037 | | | 450,000 | | | | 480,974 | | | | | |
| Masco Corp., | | | | | | | | | | | | |
| 6.500%, 08/15/2032 | | | 15,834,000 | | | | 17,296,865 | | | | | |
| MasTec, Inc., | | | | | | | | | | | | |
| 4.500%, 08/15/2028 | | | | | | | | | | | | |
(Callable 01/29/2024)(2) | | | 12,948,000 | | | | 12,169,148 | | | | | |
| Microchip Technology, Inc., | | | | | | | | | | | | |
| 4.250%, 09/01/2025 | | | | | | | | | | | | |
| (Callable 01/29/2024) | | | 4,000,000 | | | | 3,940,433 | | | | | |
| Micron Technology, Inc., | | | | | | | | | | | | |
| 5.375%, 04/15/2028 | | | | | | | | | | | | |
| (Callable 03/15/2028) | | | 25,000,000 | | | | 25,489,466 | | | | | |
| Microsoft Corp., | | | | | | | | | | | | |
| 4.200%, 11/03/2035 | | | | | | | | | | | | |
| (Callable 05/03/2035) | | | 5,650,000 | | | | 5,678,016 | | | | | |
| Midwest Connector Capital Co. LLC: | | | | | | | | | | | | |
| 3.900%, 04/01/2024 | | | | | | | | | | | | |
(Callable 03/01/2024)(2) | | | 13,695,000 | | | | 13,616,406 | | | | | |
| 4.625%, 04/01/2029 | | | | | | | | | | | | |
(Callable 01/01/2029)(2) | | | 14,660,000 | | | | 14,128,548 | | | | | |
| Minera Mexico SA de CV, | | | | | | | | | | | | |
| 4.500%, 01/26/2050 | | | | | | | | | | | | |
(Callable 07/26/2049)(1)(2) | | | 8,000,000 | | | | 6,455,090 | | | | | |
| Mineral Resources Ltd., | | | | | | | | | | | | |
| 9.250%, 10/01/2028 | | | | | | | | | | | | |
(Callable 10/01/2025)(1)(2) | | | 1,000,000 | | | | 1,063,770 | | | | | |
| Minerva Luxembourg SA, | | | | | | | | | | | | |
| 8.875%, 09/13/2033 | | | | | | | | | | | | |
(Callable 09/13/2028)(1)(2) | | | 6,000,000 | | | | 6,343,764 | | | | | |
| Mohawk Industries, Inc., | | | | | | | | | | | | |
| 3.625%, 05/15/2030 | | | | | | | | | | | | |
| (Callable 02/15/2030) | | | 5,000,000 | | | | 4,632,144 | | | | | |
| Molex Electronic Technologies LLC, | | | | | | | | | | | | |
| 3.900%, 04/15/2025 | | | | | | | | | | | | |
(Callable 01/15/2025)(2) | | | 8,250,000 | | | | 8,018,655 | | | | | |
| Molson Coors Beverage Co., | | | | | | | | | | | | |
| 3.000%, 07/15/2026 | | | | | | | | | | | | |
| (Callable 04/15/2026) | | | 23,888,000 | | | | 22,890,526 | | | | | |
| Mosaic Co., | | | | | | | | | | | | |
| 5.450%, 11/15/2033 | | | | | | | | | | | | |
| (Callable 05/15/2033) | | | 11,101,000 | | | | 11,353,785 | | | | | |
| MPLX LP: | | | | | | | | | | | | |
| 4.875%, 06/01/2025 | | | | | | | | | | | | |
| (Callable 03/01/2025) | | | 19,150,000 | | | | 19,028,484 | | | | | |
| 1.750%, 03/01/2026 | | | | | | | | | | | | |
| (Callable 02/01/2026) | | | 20,000,000 | | | | 18,717,074 | | | | | |
| 4.250%, 12/01/2027 | | | | | | | | | | | | |
| (Callable 09/01/2027) | | | 6,519,000 | | | | 6,378,283 | | | | | |
| 5.000%, 03/01/2033 | | | | | | | | | | | | |
| (Callable 12/01/2032) | | | 4,425,000 | | | | 4,340,644 | | | | | |
| 5.500%, 02/15/2049 | | | | | | | | | | | | |
| (Callable 08/15/2048) | | | 8,825,000 | | | | 8,569,779 | | | | | |
| 4.900%, 04/15/2058 | | | | | | | | | | | | |
| (Callable 10/15/2057) | | | 5,000,000 | | | | 4,257,022 | | | | | |
| MSCI, Inc.: | | | | | | | | | | | | |
| 4.000%, 11/15/2029 | | | | | | | | | | | | |
(Callable 11/15/2024)(2) | | | 7,562,000 | | | | 7,106,606 | | | | | |
| 3.625%, 11/01/2031 | | | | | | | | | | | | |
(Callable 11/01/2026)(2) | | | 10,000,000 | | | | 8,800,829 | | | | | |
| Mueller Water Products, Inc., | | | | | | | | | | | | |
| 4.000%, 06/15/2029 | | | | | | | | | | | | |
(Callable 06/15/2024)(2) | | | 500,000 | | | | 455,499 | | | | | |
| Mylan, Inc., | | | | | | | | | | | | |
| 4.550%, 04/15/2028 | | | | | | | | | | | | |
| (Callable 01/15/2028) | | | 5,000,000 | | | | 4,851,917 | | | | | |
| NCL Corp. Ltd., | | | | | | | | | | | | |
| 3.625%, 12/15/2024 | | | | | | | | | | | | |
(Callable 01/09/2024)(2) | | | 20,000,000 | | | | 19,449,156 | | | | | |
| Newell Brands, Inc.: | | | | | | | | | | | | |
| 4.875%, 06/01/2025 | | | | | | | | | | | | |
| (Callable 05/01/2025) | | | 1,500,000 | | | | 1,475,207 | | | | | |
| 5.200%, 04/01/2026 | | | | | | | | | | | | |
| (Callable 01/01/2026) | | | 15,000,000 | | | | 14,797,941 | | | | | |
| 6.375%, 09/15/2027 | | | | | | | | | | | | |
| (Callable 06/15/2027) | | | 5,000,000 | | | | 4,972,203 | | | | | |
| NGPL PipeCo LLC, | | | | | | | | | | | | |
| 4.875%, 08/15/2027 | | | | | | | | | | | | |
(Callable 02/15/2027)(2) | | | 20,000,000 | | | | 19,624,062 | | | | | |
| Nissan Motor Acceptance Co. LLC, | | | | | | | | | | | | |
| 7.050%, 09/15/2028 | | | | | | | | | | | | |
(Callable 08/15/2028)(1)(2) | | | 15,000,000 | | | | 15,822,679 | | | | | |
| Nissan Motor Co. Ltd., | | | | | | | | | | | | |
| 4.345%, 09/17/2027 | | | | | | | | | | | | |
(Callable 07/17/2027)(1)(2) | | | 10,000,000 | | | | 9,573,044 | | | | | |
The accompanying notes are an integral part of these financial statements.
Baird Core Plus Bond Fund
Schedule of Investments, December 31, 2023
Long-Term Investments (cont.)
| | | Principal | | | | | | % of | |
| | | Amount | | | Value | | | Net Assets | |
| Norfolk Southern Corp., | | | | | | | | | |
| 3.050%, 05/15/2050 | | | | | | | | | |
| (Callable 11/15/2049) | | $ | 18,000,000 | | | $ | 12,843,178 | | | |
| |
| North Mississippi Health Services, Inc., | | | | | | | | | | | | |
| 3.183%, 10/01/2051 | | | | | | | | | | | | |
| (Callable 04/01/2051) | | | 11,800,000 | | | | 8,231,472 | | | | | |
| Nova Southeastern University, Inc., | | | | | | | | | | | | |
| 4.809%, 04/01/2053 | | | 4,800,000 | | | | 4,246,755 | | | | | |
| Nutrien Ltd.: | | | | | | | | | | | | |
| 4.000%, 12/15/2026 | | | | | | | | | | | | |
(Callable 09/15/2026)(1) | | | 10,000,000 | | | | 9,773,948 | | | | | |
| 4.125%, 03/15/2035 | | | | | | | | | | | | |
(Callable 09/15/2034)(1) | | | 6,550,000 | | | | 6,069,405 | | | | | |
| nVent Finance Sarl: | | | | | | | | | | | | |
| 4.550%, 04/15/2028 | | | | | | | | | | | | |
| (Callable 01/15/2028) | | | 32,435,000 | | | | 31,545,980 | | | | | |
| 5.650%, 05/15/2033 | | | | | | | | | | | | |
| (Callable 02/15/2033) | | | 28,950,000 | | | | 29,424,799 | | | | | |
| NXP BV / NXP Funding LLC / | | | | | | | | | | | | |
| NXP USA, Inc.: | | | | | | | | | | | | |
| 4.300%, 06/18/2029 | | | | | | | | | | | | |
(Callable 03/18/2029)(1) | | | 9,625,000 | | | | 9,360,784 | | | | | |
| 2.650%, 02/15/2032 | | | | | | | | | | | | |
(Callable 11/15/2031)(1) | | | 15,000,000 | | | | 12,659,808 | | | | | |
| Occidental Petroleum Corp.: | | | | | | | | | | | | |
| 8.500%, 07/15/2027 | | | | | | | | | | | | |
| (Callable 01/15/2027) | | | 15,000,000 | | | | 16,361,600 | | | | | |
| 7.150%, 05/15/2028 | | | 7,000,000 | | | | 7,395,290 | | | | | |
| 8.875%, 07/15/2030 | | | | | | | | | | | | |
| (Callable 01/15/2030) | | | 8,000,000 | | | | 9,361,632 | | | | | |
| 7.500%, 05/01/2031 | | | 12,000,000 | | | | 13,456,140 | | | | | |
| 7.875%, 09/15/2031 | | | 12,790,000 | | | | 14,549,382 | | | | | |
| 6.450%, 09/15/2036 | | | 7,125,000 | | | | 7,557,559 | | | | | |
| Ochsner LSU Health | | | | | | | | | | | | |
| System of North Louisiana, | | | | | | | | | | | | |
| 2.510%, 05/15/2031 | | | | | | | | | | | | |
| (Callable 11/15/2030) | | | 36,300,000 | | | | 24,852,792 | | | | | |
| OCI NV, | | | | | | | | | | | | |
| 6.700%, 03/16/2033 | | | | | | | | | | | | |
(Callable 12/16/2032)(1)(2) | | | 10,000,000 | | | | 10,231,754 | | | | | |
| Oracle Corp.: | | | | | | | | | | | | |
| 2.800%, 04/01/2027 | | | | | | | | | | | | |
| (Callable 02/01/2027) | | | 46,000,000 | | | | 43,408,516 | | | | | |
| 6.250%, 11/09/2032 | | | | | | | | | | | | |
| (Callable 08/09/2032) | | | 7,000,000 | | | | 7,626,779 | | | | | |
| 3.900%, 05/15/2035 | | | | | | | | | | | | |
| (Callable 11/15/2034) | | | 7,425,000 | | | | 6,635,687 | | | | | |
| 3.850%, 07/15/2036 | | | | | | | | | | | | |
| (Callable 01/15/2036) | | | 7,500,000 | | | | 6,547,453 | | | | | |
| 4.000%, 11/15/2047 | | | | | | | | | | | | |
| (Callable 05/15/2047) | | | 2,565,000 | | | | 2,032,123 | | | | | |
| 3.950%, 03/25/2051 | | | | | | | | | | | | |
| (Callable 09/25/2050) | | | 5,000,000 | | | | 3,932,069 | | | | | |
| 6.900%, 11/09/2052 | | | | | | | | | | | | |
| (Callable 05/09/2052) | | | 29,065,000 | | | | 34,125,922 | | | | | |
| 5.550%, 02/06/2053 | | | | | | | | | | | | |
| (Callable 08/06/2052) | | | 2,550,000 | | | | 2,561,047 | | | | | |
| Orange SA, | | | | | | | | | | | | |
9.000%, 03/01/2031(1) | | | 33,426,000 | | | | 41,282,903 | | | | | |
| Oshkosh Corp., | | | | | | | | | | | | |
| 3.100%, 03/01/2030 | | | | | | | | | | | | |
| (Callable 12/01/2029) | | | 3,500,000 | | | | 3,155,417 | | | | | |
| Owens Corning: | | | | | | | | | | | | |
| 3.400%, 08/15/2026 | | | | | | | | | | | | |
| (Callable 05/15/2026) | | | 5,000,000 | | | | 4,820,618 | | | | | |
| 7.000%, 12/01/2036 | | | 13,205,000 | | | | 15,192,310 | | | | | |
| PBF Holding Co. LLC / | | | | | | | | | | | | |
| PBF Finance Corp., | | | | | | | | | | | | |
| 7.875%, 09/15/2030 | | | | | | | | | | | | |
(Callable 09/15/2026)(2) | | | 12,075,000 | | | | 12,297,180 | | | | | |
| Penske Truck Leasing Co.: | | | | | | | | | | | | |
| 4.000%, 07/15/2025 | | | | | | | | | | | | |
(Callable 06/15/2025)(2) | | | 20,000,000 | | | | 19,563,762 | | | | | |
| 1.200%, 11/15/2025 | | | | | | | | | | | | |
(Callable 10/15/2025)(2) | | | 22,800,000 | | | | 21,141,376 | | | | | |
| 5.550%, 05/01/2028 | | | | | | | | | | | | |
(Callable 04/01/2028)(2) | | | 15,000,000 | | | | 15,243,039 | | | | | |
| 6.050%, 08/01/2028 | | | | | | | | | | | | |
(Callable 07/01/2028)(2) | | | 10,000,000 | | | | 10,379,945 | | | | | |
| 6.200%, 06/15/2030 | | | | | | | | | | | | |
(Callable 04/15/2030)(2) | | | 6,000,000 | | | | 6,311,498 | | | | | |
| Perrigo Finance Unlimited Co.: | | | | | | | | | | | | |
| 3.900%, 12/15/2024 | | | | | | | | | | | | |
| (Callable 09/15/2024) | | | 9,944,000 | | | | 9,647,450 | | | | | |
| 4.650%, 06/15/2030 | | | | | | | | | | | | |
| (Callable 03/15/2030) | | | 25,250,000 | | | | 22,965,672 | | | | | |
| Pfizer Investment Enterprises Pte Ltd., | | | | | | | | | | | | |
| 5.300%, 05/19/2053 | | | | | | | | | | | | |
| (Callable 11/19/2052) | | | 11,825,000 | | | | 12,119,705 | | | | | |
| Phillips 66 Co.: | | | | | | | | | | | | |
| 3.150%, 12/15/2029 | | | | | | | | | | | | |
| (Callable 09/15/2029) | | | 12,550,000 | | | | 11,494,178 | | | | | |
| 2.150%, 12/15/2030 | | | | | | | | | | | | |
| (Callable 09/15/2030) | | | 6,000,000 | | | | 5,061,080 | | | | | |
| 4.650%, 11/15/2034 | | | | | | | | | | | | |
| (Callable 05/15/2034) | | | 13,000,000 | | | | 12,662,633 | | | | | |
| 5.875%, 05/01/2042 | | | 5,000,000 | | | | 5,411,236 | | | | | |
| 4.680%, 02/15/2045 | | | | | | | | | | | | |
| (Callable 08/15/2044) | | | 2,000,000 | | | | 1,814,722 | | | | | |
| Pilgrim’s Pride Corp.: | | | | | | | | | | | | |
| 6.250%, 07/01/2033 | | | | | | | | | | | | |
| (Callable 04/01/2033) | | | 16,935,000 | | | | 17,426,674 | | | | | |
| 6.875%, 05/15/2034 | | | | | | | | | | | | |
| (Callable 02/15/2034) | | | 8,500,000 | | | | 9,180,697 | | | | | |
| Plains All American Pipeline LP / | | | | | | | | | | | | |
| PAA Finance Corp., | | | | | | | | | | | | |
| 3.550%, 12/15/2029 | | | | | | | | | | | | |
| (Callable 09/15/2029) | | | 10,000,000 | | | | 9,217,263 | | | | | |
| Polaris, Inc., | | | | | | | | | | | | |
| 6.950%, 03/15/2029 | | | | | | | | | | | | |
| (Callable 02/15/2029) | | | 15,000,000 | | | | 15,941,830 | | | | | |
| POSCO, | | | | | | | | | | | | |
5.750%, 01/17/2028(1)(2) | | | 5,000,000 | | | | 5,135,553 | | | | | |
| Premier Health Partners, | | | | | | | | | | | | |
| 2.911%, 11/15/2026 | | | | | | | | | | | | |
| (Callable 05/15/2026) | | | 10,000,000 | | | | 9,043,152 | | | | | |
| Quanta Services, Inc., | | | | | | | | | | | | |
| 2.900%, 10/01/2030 | | | | | | | | | | | | |
| (Callable 07/01/2030) | | | 10,000,000 | | | | 8,799,056 | | | | | |
| Rand Parent LLC, | | | | | | | | | | | | |
| 8.500%, 02/15/2030 | | | | | | | | | | | | |
(Callable 02/15/2026)(2) | | | 6,500,000 | | | | 6,224,151 | | | | | |
| Regal Rexnord Corp.: | | | | | | | | | | | | |
| 6.300%, 02/15/2030 | | | | | | | | | | | | |
(Callable 12/15/2029)(2) | | | 26,000,000 | | | | 26,708,025 | | | | | |
The accompanying notes are an integral part of these financial statements.
Baird Core Plus Bond Fund
Schedule of Investments, December 31, 2023
Long-Term Investments (cont.)
| | | Principal | | | | | | % of | |
| | | Amount | | | Value | | | Net Assets | |
| Regal Rexnord Corp.: (cont.) | | | | | | | | | |
| 6.400%, 04/15/2033 | | | | | | | | | |
(Callable 01/15/2033)(2) | | $ | 15,332,000 | | | $ | 16,004,294 | | | |
| |
| Reliance Industries Ltd., | | | | | | | | | | | | |
2.875%, 01/12/2032(1)(2) | | | 20,400,000 | | | | 17,481,168 | | | | | |
| Reliance Steel & Aluminum Co., | | | | | | | | | | | | |
| 1.300%, 08/15/2025 | | | | | | | | | | | | |
| (Callable 07/15/2025) | | | 6,100,000 | | | | 5,704,792 | | | | | |
| Republic Services, Inc., | | | | | | | | | | | | |
| 5.000%, 04/01/2034 | | | | | | | | | | | | |
| (Callable 01/01/2034) | | | 5,000,000 | | | | 5,128,863 | | | | | |
| Revvity, Inc.: | | | | | | | | | | | | |
| 3.300%, 09/15/2029 | | | | | | | | | | | | |
| (Callable 06/15/2029) | | | 25,000,000 | | | | 22,709,685 | | | | | |
| 3.625%, 03/15/2051 | | | | | | | | | | | | |
| (Callable 09/15/2050) | | | 11,775,000 | | | | 8,506,203 | | | | | |
| Rogers Communications, Inc.: | | | | | | | | | | | | |
| 3.800%, 03/15/2032 | | | | | | | | | | | | |
(Callable 12/15/2031)(1) | | | 13,000,000 | | | | 11,976,574 | | | | | |
| 4.350%, 05/01/2049 | | | | | | | | | | | | |
(Callable 11/01/2048)(1) | | | 10,000,000 | | | | 8,504,862 | | | | | |
| RTX Corp.: | | | | | | | | | | | | |
| 4.800%, 12/15/2043 | | | | | | | | | | | | |
| (Callable 06/15/2043) | | | 7,925,000 | | | | 7,398,806 | | | | | |
| 3.125%, 07/01/2050 | | | | | | | | | | | | |
| (Callable 01/01/2050) | | | 6,000,000 | | | | 4,244,834 | | | | | |
| Ryder System, Inc., | | | | | | | | | | | | |
| 5.250%, 06/01/2028 | | | | | | | | | | | | |
| (Callable 05/01/2028) | | | 16,550,000 | | | | 16,777,173 | | | | | |
| Sabine Pass Liquefaction LLC: | | | | | | | | | | | | |
| 5.875%, 06/30/2026 | | | | | | | | | | | | |
| (Callable 12/31/2025) | | | 55,015,000 | | | | 56,018,394 | | | | | |
| 5.000%, 03/15/2027 | | | | | | | | | | | | |
| (Callable 09/15/2026) | | | 20,300,000 | | | | 20,395,669 | | | | | |
| 4.500%, 05/15/2030 | | | | | | | | | | | | |
| (Callable 11/15/2029) | | | 21,897,000 | | | | 21,414,441 | | | | | |
| Samarco Mineracao SA, | | | | | | | | | | | | |
| 9.500% Cash or 9.000% PIK, | | | | | | | | | | | | |
06/30/2031 (Callable 01/16/2024)(1)(2) | | | 11,076,908 | | | | 9,287,987 | | | | | |
| Santos Finance Ltd.: | | | | | | | | | | | | |
| 3.649%, 04/29/2031 | | | | | | | | | | | | |
(Callable 01/29/2031)(1)(2) | | | 21,000,000 | | | | 18,302,838 | | | | | |
| 6.875%, 09/19/2033 | | | | | | | | | | | | |
(Callable 06/19/2033)(1)(2) | | | 9,100,000 | | | | 9,651,042 | | | | | |
| Schlumberger Holdings Corp., | | | | | | | | | | | | |
| 3.900%, 05/17/2028 | | | | | | | | | | | | |
(Callable 02/17/2028)(2) | | | 11,096,000 | | | | 10,783,319 | | | | | |
| Sealed Air Corp.: | | | | | | | | | | | | |
| 6.125%, 02/01/2028 | | | | | | | | | | | | |
(Callable 02/01/2025)(2) | | | 1,000,000 | | | | 1,008,241 | | | | | |
| 5.000%, 04/15/2029 | | | | | | | | | | | | |
(Callable 04/15/2025)(2) | | | 5,000,000 | | | | 4,810,656 | | | | | |
| Sherwin-Williams Co., | | | | | | | | | | | | |
| 4.500%, 06/01/2047 | | | | | | | | | | | | |
| (Callable 12/01/2046) | | | 5,550,000 | | | | 5,098,979 | | | | | |
| Silgan Holdings, Inc., | | | | | | | | | | | | |
| 4.125%, 02/01/2028 | | | | | | | | | | | | |
| (Callable 01/16/2024) | | | 4,000,000 | | | | 3,820,148 | | | | | |
| SK Hynix, Inc.: | | | | | | | | | | | | |
6.250%, 01/17/2026(1)(2) | | | 5,900,000 | | | | 5,957,702 | | | | | |
1.500%, 01/19/2026(1)(2) | | | 13,000,000 | | | | 11,973,118 | | | | | |
| SK Telecom Co. Ltd., | | | | | | | | | | | | |
6.625%, 07/20/2027(1)(2) | | | 960,000 | | | | 1,015,192 | | | | | |
| Smith & Nephew PLC, | | | | | | | | | | | | |
| 2.032%, 10/14/2030 | | | | | | | | | | | | |
(Callable 07/14/2030)(1) | | | 18,000,000 | | | | 14,927,796 | | | | | |
| Smithfield Foods, Inc.: | | | | | | | | | | | | |
| 5.200%, 04/01/2029 | | | | | | | | | | | | |
(Callable 01/01/2029)(1)(2) | | | 16,566,000 | | | | 15,870,614 | | | | | |
| 2.625%, 09/13/2031 | | | | | | | | | | | | |
(Callable 06/13/2031)(1)(2) | | | 18,500,000 | | | | 14,333,760 | | | | | |
| Sodexo, Inc., | | | | | | | | | | | | |
| 1.634%, 04/16/2026 | | | | | | | | | | | | |
(Callable 03/16/2026)(1)(2) | | | 6,725,000 | | | | 6,233,819 | | | | | |
| Southern Copper Corp., | | | | | | | | | | | | |
7.500%, 07/27/2035(1) | | | 19,786,000 | | | | 22,978,570 | | | | | |
| Spectra Energy Partners LP, | | | | | | | | | | | | |
| 3.500%, 03/15/2025 | | | | | | | | | | | | |
(Callable 12/15/2024)(1) | | | 15,150,000 | | | | 14,809,397 | | | | | |
| Standard Industries, Inc.: | | | | | | | | | | | | |
| 4.750%, 01/15/2028 | | | | | | | | | | | | |
(Callable 01/29/2024)(2) | | | 24,408,000 | | | | 23,507,030 | | | | | |
| 4.375%, 07/15/2030 | | | | | | | | | | | | |
(Callable 07/15/2025)(2) | | | 7,000,000 | | | | 6,441,292 | | | | | |
| 3.375%, 01/15/2031 | | | | | | | | | | | | |
(Callable 07/15/2025)(2) | | | 5,000,000 | | | | 4,300,948 | | | | | |
| Stanley Black & Decker, Inc.: | | | | | | | | | | | | |
| 6.000%, 03/06/2028 | | | | | | | | | | | | |
| (Callable 02/06/2028) | | | 3,000,000 | | | | 3,153,170 | | | | | |
| 4.850%, 11/15/2048 | | | | | | | | | | | | |
| (Callable 05/15/2048) | | | 4,175,000 | | | | 3,839,815 | | | | | |
| Stellantis Finance US, Inc., | | | | | | | | | | | | |
| 1.711%, 01/29/2027 | | | | | | | | | | | | |
(Callable 12/29/2026)(2) | | | 3,650,000 | | | | 3,316,551 | | | | | |
| Stericycle, Inc., | | | | | | | | | | | | |
| 3.875%, 01/15/2029 | | | | | | | | | | | | |
(Callable 01/16/2024)(2) | | | 1,000,000 | | | | 907,370 | | | | | |
| STERIS Irish FinCo Unlimited Co., | | | | | | | | | | | | |
| 3.750%, 03/15/2051 | | | | | | | | | | | | |
| (Callable 09/15/2050) | | | 7,500,000 | | | | 5,834,752 | | | | | |
| Summit Materials LLC / | | | | | | | | | | | | |
| Summit Materials Finance Corp., | | | | | | | | | | | | |
| 7.250%, 01/15/2031 | | | | | | | | | | | | |
(Callable 01/15/2027)(2) | | | 5,000,000 | | | | 5,261,807 | | | | | |
| Sunoco LP / Sunoco Finance Corp., | | | | | | | | | | | | |
| 7.000%, 09/15/2028 | | | | | | | | | | | | |
(Callable 09/15/2025)(2) | | | 10,000,000 | | | | 10,314,930 | | | | | |
| Synnex Corp.: | | | | | | | | | | | | |
| 1.750%, 08/09/2026 | | | | | | | | | | | | |
| (Callable 07/09/2026) | | | 10,000,000 | | | | 9,079,321 | | | | | |
| 2.375%, 08/09/2028 | | | | | | | | | | | | |
| (Callable 06/09/2028) | | | 25,000,000 | | | | 21,590,380 | | | | | |
| Sysco Corp.: | | | | | | | | | | | | |
| 5.950%, 04/01/2030 | | | | | | | | | | | | |
| (Callable 01/01/2030) | | | 22,570,000 | | | | 24,021,882 | | | | | |
| 6.000%, 01/17/2034 | | | | | | | | | | | | |
| (Callable 10/17/2033) | | | 9,000,000 | | | | 9,760,962 | | | | | |
| 3.150%, 12/14/2051 | | | | | | | | | | | | |
| (Callable 06/14/2051) | | | 9,250,000 | | | | 6,654,907 | | | | | |
| Takeda Pharmaceutical Co. Ltd., | | | | | | | | | | | | |
| 2.050%, 03/31/2030 | | | | | | | | | | | | |
(Callable 12/31/2029)(1) | | | 11,825,000 | | | | 10,149,695 | | | | | |
| Tapestry, Inc., | | | | | | | | | | | | |
| 7.000%, 11/27/2026 | | | 5,000,000 | | | | 5,187,180 | | | | | |
| Targa Resources Partners LP: | | | | | | | | | | | | |
| 6.500%, 07/15/2027 | | | | | | | | | | | | |
| (Callable 01/29/2024) | | | 1,000,000 | | | | 1,013,200 | | | | | |
The accompanying notes are an integral part of these financial statements.
Baird Core Plus Bond Fund
Schedule of Investments, December 31, 2023
Long-Term Investments (cont.)
| | | Principal | | | | | | % of | |
| | | Amount | | | Value | | | Net Assets | |
| Targa Resources Partners LP: (cont.) | | | | | | | | | |
| 5.000%, 01/15/2028 | | | | | | | | | |
| (Callable 01/29/2024) | | $ | 28,000,000 | | | $ | 27,677,421 | | | |
| |
| 4.875%, 02/01/2031 | | | | | | | | | | | | |
| (Callable 02/01/2026) | | | 10,500,000 | | | | 10,187,835 | | | | | |
| 4.000%, 01/15/2032 | | | | | | | | | | | | |
| (Callable 07/15/2026) | | | 14,000,000 | | | | 12,807,270 | | | | | |
| TC PipeLines LP: | | | | | | | | | | | | |
| 4.375%, 03/13/2025 | | | | | | | | | | | | |
(Callable 12/13/2024)(1) | | | 26,205,000 | | | | 25,837,463 | | | | | |
| 3.900%, 05/25/2027 | | | | | | | | | | | | |
(Callable 02/25/2027)(1) | | | 23,285,000 | | | | 22,355,181 | | | | | |
| Teck Resources Ltd., | | | | | | | | | | | | |
| 3.900%, 07/15/2030 | | | | | | | | | | | | |
(Callable 04/15/2030)(1) | | | 10,000,000 | | | | 9,293,444 | | | | | |
| Telecom Italia Capital SA: | | | | | | | | | | | | |
5.303%, 05/30/2024(1)(2) | | | 21,500,000 | | | | 21,398,406 | | | | | |
7.200%, 07/18/2036(1) | | | 3,175,000 | | | | 3,192,605 | | | | | |
| Telefonica Emisiones SA: | | | | | | | | | | | | |
4.103%, 03/08/2027(1) | | | 3,768,000 | | | | 3,692,669 | | | | | |
7.045%, 06/20/2036(1) | | | 4,925,000 | | | | 5,582,930 | | | | | |
5.213%, 03/08/2047(1) | | | 24,108,000 | | | | 22,392,225 | | | | | |
4.895%, 03/06/2048(1) | | | 9,475,000 | | | | 8,406,115 | | | | | |
| 5.520%, 03/01/2049 | | | | | | | | | | | | |
(Callable 09/01/2048)(1) | | | 12,000,000 | | | | 11,615,552 | | | | | |
| Tenet Healthcare Corp.: | | | | | | | | | | | | |
| 4.375%, 01/15/2030 | | | | | | | | | | | | |
| (Callable 12/01/2024) | | | 3,000,000 | | | | 2,780,668 | | | | | |
| 6.125%, 06/15/2030 | | | | | | | | | | | | |
| (Callable 06/15/2025) | | | 1,000,000 | | | | 1,010,872 | | | | | |
| Teva Pharmaceutical Finance | | | | | | | | | | | | |
| Netherlands III BV: | | | | | | | | | | | | |
3.150%, 10/01/2026(1) | | | 53,000,000 | | | | 49,075,631 | | | | | |
| 4.750%, 05/09/2027 | | | | | | | | | | | | |
(Callable 02/09/2027)(1) | | | 9,000,000 | | | | 8,617,454 | | | | | |
| 7.875%, 09/15/2029 | | | | | | | | | | | | |
(Callable 06/15/2029)(1) | | | 5,000,000 | | | | 5,384,870 | | | | | |
| Textron, Inc., | | | | | | | | | | | | |
| 3.000%, 06/01/2030 | | | | | | | | | | | | |
| (Callable 03/01/2030) | | | 15,000,000 | | | | 13,450,394 | | | | | |
| Timken Co.: | | | | | | | | | | | | |
| 3.875%, 09/01/2024 | | | | | | | | | | | | |
| (Callable 06/01/2024) | | | 10,000,000 | | | | 9,858,217 | | | | | |
| 4.500%, 12/15/2028 | | | | | | | | | | | | |
| (Callable 09/15/2028) | | | 6,025,000 | | | | 5,843,431 | | | | | |
| T-Mobile USA, Inc.: | | | | | | | | | | | | |
| 4.750%, 02/01/2028 | | | | | | | | | | | | |
| (Callable 01/09/2024) | | | 17,250,000 | | | | 17,189,183 | | | | | |
| 3.375%, 04/15/2029 | | | | | | | | | | | | |
| (Callable 04/15/2024) | | | 5,000,000 | | | | 4,645,378 | | | | | |
| 3.875%, 04/15/2030 | | | | | | | | | | | | |
| (Callable 01/15/2030) | | | 53,473,000 | | | | 50,751,324 | | | | | |
| 3.500%, 04/15/2031 | | | | | | | | | | | | |
| (Callable 04/15/2026) | | | 60,000,000 | | | | 54,812,832 | | | | | |
| 4.375%, 04/15/2040 | | | | | | | | | | | | |
| (Callable 10/15/2039) | | | 10,000,000 | | | | 9,050,033 | | | | | |
| 3.600%, 11/15/2060 | | | | | | | | | | | | |
| (Callable 05/15/2060) | | | 15,000,000 | | | | 10,916,387 | | | | | |
| Toll Road Investors Partnership II LP: | | | | | | | | | | | | |
| 0.000%, 02/15/2025 | | | | | | | | | | | | |
(Insured by NATL)(2) | | | 10,000,000 | | | | 9,254,409 | | | | | |
| 0.000%, 02/15/2027 | | | | | | | | | | | | |
(Insured by NATL)(2) | | | 32,855,000 | | | | 26,383,020 | | | | | |
| 0.000%, 02/15/2030 | | | | | | | | | | | | |
(Insured by NATL)(2) | | | 2,000,000 | | | | 1,290,528 | | | | | |
| 0.000%, 02/15/2030 | | | | | | | | | | | | |
(Insured by NATL)(2) | | | 2,938,000 | | | | 2,079,907 | | | | | |
| 0.000%, 02/15/2031 | | | | | | | | | | | | |
(Insured by AGM)(2) | | | 5,396,000 | | | | 3,599,547 | | | | | |
| 0.000%, 02/15/2036 | | | | | | | | | | | | |
(Insured by AGM)(2) | | | 12,500,000 | | | | 6,064,660 | | | | | |
| TopBuild Corp.: | | | | | | | | | | | | |
| 3.625%, 03/15/2029 | | | | | | | | | | | | |
(Callable 03/15/2024)(2) | | | 2,500,000 | | | | 2,265,280 | | | | | |
| 4.125%, 02/15/2032 | | | | | | | | | | | | |
(Callable 10/15/2026)(2) | | | 1,000,000 | | | | 889,582 | | | | | |
| TransCanada PipeLines Ltd., | | | | | | | | | | | | |
| 4.750%, 05/15/2038 | | | | | | | | | | | | |
(Callable 11/15/2037)(1) | | | 10,000,000 | | | | 9,287,400 | | | | | |
| Transcontinental Gas Pipe Line Co. LLC, | | | | | | | | | | | | |
| 4.450%, 08/01/2042 | | | | | | | | | | | | |
| (Callable 02/01/2042) | | | 2,600,000 | | | | 2,296,621 | | | | | |
| TransDigm, Inc.: | | | | | | | | | | | | |
| 6.750%, 08/15/2028 | | | | | | | | | | | | |
(Callable 02/15/2025)(2) | | | 5,500,000 | | | | 5,626,577 | | | | | |
| 6.875%, 12/15/2030 | | | | | | | | | | | | |
(Callable 08/18/2026)(2) | | | 15,000,000 | | | | 15,450,000 | | | | | |
| TreeHouse Foods, Inc., | | | | | | | | | | | | |
| 4.000%, 09/01/2028 | | | | | | | | | | | | |
| (Callable 01/16/2024) | | | 1,500,000 | | | | 1,327,792 | | | | | |
| Trimble, Inc., | | | | | | | | | | | | |
| 6.100%, 03/15/2033 | | | | | | | | | | | | |
| (Callable 12/15/2032) | | | 7,000,000 | | | | 7,486,938 | | | | | |
| Trinity Industries, Inc., | | | | | | | | | | | | |
| 7.750%, 07/15/2028 | | | | | | | | | | | | |
(Callable 07/15/2025)(2) | | | 1,000,000 | | | | 1,033,081 | | | | | |
| Triton Container International Ltd.: | | | | | | | | | | | | |
| 2.050%, 04/15/2026 | | | | | | | | | | | | |
(Callable 03/15/2026)(1)(2) | | | 7,425,000 | | | | 6,792,912 | | | | | |
| 3.150%, 06/15/2031 | | | | | | | | | | | | |
(Callable 03/15/2031)(1)(2) | | | 30,475,000 | | | | 24,283,905 | | | | | |
| 3.250%, 03/15/2032 | | | | | | | | | | | | |
(Callable 12/15/2031)(1) | | | 10,000,000 | | | | 8,005,805 | | | | | |
| TTX Co., | | | | | | | | | | | | |
4.650%, 06/15/2044(2) | | | 7,710,000 | | | | 6,886,307 | | | | | |
| Tyco Electronics Group SA, | | | | | | | | | | | | |
| 7.125%, 10/01/2037 | | | 500,000 | | | | 590,238 | | | | | |
| Tyson Foods, Inc., | | | | | | | | | | | | |
| 5.100%, 09/28/2048 | | | | | | | | | | | | |
| (Callable 03/28/2048) | | | 4,650,000 | | | | 4,231,847 | | | | | |
| United Rentals North America, Inc.: | | | | | | | | | | | | |
| 3.875%, 11/15/2027 | | | | | | | | | | | | |
| (Callable 01/09/2024) | | | 5,000,000 | | | | 4,770,762 | | | | | |
| 4.875%, 01/15/2028 | | | | | | | | | | | | |
| (Callable 01/09/2024) | | | 5,000,000 | | | | 4,876,315 | | | | | |
| 6.000%, 12/15/2029 | | | | | | | | | | | | |
(Callable 12/15/2025)(2) | | | 13,700,000 | | | | 13,910,542 | | | | | |
| 4.000%, 07/15/2030 | | | | | | | | | | | | |
| (Callable 07/15/2025) | | | 10,000,000 | | | | 9,212,391 | | | | | |
| 3.875%, 02/15/2031 | | | | | | | | | | | | |
| (Callable 08/15/2025) | | | 3,000,000 | | | | 2,725,800 | | | | | |
| 3.750%, 01/15/2032 | | | | | | | | | | | | |
| (Callable 07/15/2026) | | | 1,000,000 | | | | 888,044 | | | | | |
| Universal Health Services, Inc.: | | | | | | | | | | | | |
| 1.650%, 09/01/2026 | | | | | | | | | | | | |
| (Callable 08/01/2026) | | | 16,000,000 | | | | 14,563,741 | | | | | |
The accompanying notes are an integral part of these financial statements.
Baird Core Plus Bond Fund
Schedule of Investments, December 31, 2023
Long-Term Investments (cont.)
| | | Principal | | | | | | % of | |
| | | Amount | | | Value | | | Net Assets | |
| Universal Health Services, Inc.: (cont.) | | | | | | | | | |
| 2.650%, 10/15/2030 | | | | | | | | | |
| (Callable 07/15/2030) | | $ | 24,322,000 | | | $ | 20,653,657 | | | |
| |
| UPMC, | | | | | | | | | | | | |
| 3.600%, 04/03/2025 | | | 47,575,000 | | | | 46,484,138 | | | | | |
| Utah Acquisition Sub, Inc.: | | | | | | | | | | | | |
| 3.950%, 06/15/2026 | | | | | | | | | | | | |
| (Callable 03/15/2026) | | | 10,357,000 | | | | 10,011,971 | | | | | |
| 5.250%, 06/15/2046 | | | | | | | | | | | | |
| (Callable 12/15/2045) | | | 4,000,000 | | | | 3,342,133 | | | | | |
| Vale Canada Ltd., | | | | | | | | | | | | |
7.200%, 09/15/2032(1) | | | 1,600,000 | | | | 1,726,000 | | | | | |
| Vale Overseas Ltd.: | | | | | | | | | | | | |
| 3.750%, 07/08/2030 | | | | | | | | | | | | |
(Callable 04/08/2030)(1) | | | 25,339,000 | | | | 23,399,553 | | | | | |
| 6.125%, 06/12/2033 | | | | | | | | | | | | |
(Callable 03/12/2033)(1) | | | 32,000,000 | | | | 33,207,456 | | | | | |
8.250%, 01/17/2034(1) | | | 5,201,000 | | | | 6,107,758 | | | | | |
6.875%, 11/21/2036(1) | | | 29,519,000 | | | | 32,211,399 | | | | | |
6.875%, 11/10/2039(1) | | | 13,121,000 | | | | 14,407,960 | | | | | |
| Valero Energy Corp., | | | | | | | | | | | | |
| 6.625%, 06/15/2037 | | | 5,000,000 | | | | 5,493,737 | | | | | |
| Valero Energy Partners LP, | | | | | | | | | | | | |
| 4.500%, 03/15/2028 | | | | | | | | | | | | |
| (Callable 12/15/2027) | | | 20,000,000 | | | | 19,654,287 | | | | | |
| Var Energi ASA: | | | | | | | | | | | | |
| 7.500%, 01/15/2028 | | | | | | | | | | | | |
(Callable 12/15/2027)(1)(2) | | | 29,950,000 | | | | 31,739,634 | | | | | |
| 8.000%, 11/15/2032 | | | | | | | | | | | | |
(Callable 08/15/2032)(1)(2) | | | 22,989,000 | | | | 25,738,484 | | | | | |
| Verizon Communications, Inc.: | | | | | | | | | | | | |
| 3.000%, 03/22/2027 | | | | | | | | | | | | |
| (Callable 01/22/2027) | | | 5,000,000 | | | | 4,756,773 | | | | | |
| 4.500%, 08/10/2033 | | | 15,710,000 | | | | 15,348,677 | | | | | |
| 4.400%, 11/01/2034 | | | | | | | | | | | | |
| (Callable 05/01/2034) | | | 790,000 | | | | 761,575 | | | | | |
| 4.272%, 01/15/2036 | | | 10,793,000 | | | | 10,187,576 | | | | | |
| 5.250%, 03/16/2037 | | | 18,225,000 | | | | 18,954,258 | | | | | |
| 4.812%, 03/15/2039 | | | 38,575,000 | | | | 37,400,815 | | | | | |
| 4.862%, 08/21/2046 | | | 2,500,000 | | | | 2,394,114 | | | | | |
| 5.500%, 03/16/2047 | | | 2,500,000 | | | | 2,613,713 | | | | | |
| 3.700%, 03/22/2061 | | | | | | | | | | | | |
| (Callable 09/22/2060) | | | 11,200,000 | | | | 8,567,645 | | | | | |
| Viatris, Inc.: | | | | | | | | | | | | |
| 3.850%, 06/22/2040 | | | | | | | | | | | | |
| (Callable 12/22/2039) | | | 10,000,000 | | | | 7,461,100 | | | | | |
| 4.000%, 06/22/2050 | | | | | | | | | | | | |
| (Callable 12/22/2049) | | | 22,000,000 | | | | 15,535,477 | | | | | |
| Viterra Finance BV: | | | | | | | | | | | | |
| 2.000%, 04/21/2026 | | | | | | | | | | | | |
(Callable 03/21/2026)(1)(2) | | | 15,000,000 | | | | 13,930,430 | | | | | |
| 4.900%, 04/21/2027 | | | | | | | | | | | | |
(Callable 03/21/2027)(1)(2) | | | 7,725,000 | | | | 7,658,462 | | | | | |
| 3.200%, 04/21/2031 | | | | | | | | | | | | |
(Callable 01/21/2031)(1)(2) | | | 55,139,000 | | | | 47,595,577 | | | | | |
| 5.250%, 04/21/2032 | | | | | | | | | | | | |
(Callable 01/21/2032)(1)(2) | | | 22,000,000 | | | | 21,437,207 | | | | | |
| VMware, Inc., | | | | | | | | | | | | |
| 1.800%, 08/15/2028 | | | | | | | | | | | | |
| (Callable 06/15/2028) | | | 15,000,000 | | | | 13,165,055 | | | | | |
| Vodafone Group PLC: | | | | | | | | | | | | |
7.875%, 02/15/2030(1) | | | 16,293,000 | | | | 18,714,762 | | | | | |
6.150%, 02/27/2037(1) | | | 13,920,000 | | | | 15,093,819 | | | | | |
4.375%, 02/19/2043(1) | | | 5,054,000 | | | | 4,421,077 | | | | | |
| Volkswagen Group of | | | | | | | | | | | | |
| America Finance LLC: | | | | | | | | | | | | |
3.350%, 05/13/2025(1)(2) | | | 15,000,000 | | | | 14,606,559 | | | | | |
| 1.250%, 11/24/2025 | | | | | | | | | | | | |
(Callable 10/24/2025)(1)(2) | | | 8,300,000 | | | | 7,707,569 | | | | | |
| 6.200%, 11/16/2028 | | | | | | | | | | | | |
(Callable 10/16/2028)(1)(2) | | | 19,000,000 | | | | 19,952,911 | | | | | |
| Vontier Corp., | | | | | | | | | | | | |
| 2.400%, 04/01/2028 | | | | | | | | | | | | |
| (Callable 02/01/2028) | | | 15,725,000 | | | | 13,774,471 | | | | | |
| Vulcan Materials Co.: | | | | | | | | | | | | |
| 3.500%, 06/01/2030 | | | | | | | | | | | | |
| (Callable 03/01/2030) | | | 11,050,000 | | | | 10,288,229 | | | | | |
| 4.700%, 03/01/2048 | | | | | | | | | | | | |
| (Callable 09/01/2047) | | | 500,000 | | | | 467,311 | | | | | |
| Wabtec Corp.: | | | | | | | | | | | | |
| 3.450%, 11/15/2026 | | | | | | | | | | | | |
| (Callable 08/15/2026) | | | 36,775,000 | | | | 35,195,073 | | | | | |
| 4.700%, 09/15/2028 | | | | | | | | | | | | |
| (Callable 06/15/2028) | | | 10,205,000 | | | | 10,099,682 | | | | | |
| Walgreens Boots Alliance, Inc., | | | | | | | | | | | | |
| 3.450%, 06/01/2026 | | | | | | | | | | | | |
| (Callable 03/01/2026) | | | 5,957,000 | | | | 5,664,478 | | | | | |
| Walt Disney Co.: | | | | | | | | | | | | |
| 5.400%, 10/01/2043 | | | 5,000,000 | | | | 5,254,975 | | | | | |
| 4.750%, 09/15/2044 | | | | | | | | | | | | |
| (Callable 03/15/2044) | | | 1,950,000 | | | | 1,874,894 | | | | | |
| Warnermedia Holdings, Inc.: | | | | | | | | | | | | |
| 6.412%, 03/15/2026 | | | | | | | | | | | | |
| (Callable 03/15/2024) | | | 7,000,000 | | | | 7,003,022 | | | | | |
| 4.279%, 03/15/2032 | | | | | | | | | | | | |
| (Callable 12/15/2031) | | | 48,550,000 | | | | 44,492,222 | | | | | |
| 5.050%, 03/15/2042 | | | | | | | | | | | | |
| (Callable 09/15/2041) | | | 6,000,000 | | | | 5,309,074 | | | | | |
| Weir Group PLC, | | | | | | | | | | | | |
| 2.200%, 05/13/2026 | | | | | | | | | | | | |
(Callable 04/13/2026)(1)(2) | | | 34,748,000 | | | | 32,316,728 | | | | | |
| Western Digital Corp., | | | | | | | | | | | | |
| 4.750%, 02/15/2026 | | | | | | | | | | | | |
| (Callable 11/15/2025) | | | 57,075,000 | | | | 56,014,444 | | | | | |
| Western Midstream Operating LP: | | | | | | | | | | | | |
| 4.050%, 02/01/2030 | | | | | | | | | | | | |
| (Callable 11/01/2029) | | | 4,000,000 | | | | 3,750,600 | | | | | |
| 6.150%, 04/01/2033 | | | | | | | | | | | | |
| (Callable 01/01/2033) | | | 2,500,000 | | | | 2,598,910 | | | | | |
| 5.250%, 02/01/2050 | | | | | | | | | | | | |
| (Callable 08/01/2049) | | | 10,000,000 | | | | 8,969,457 | | | | | |
| Westinghouse Air Brake | | | | | | | | | | | | |
| Technologies Corp., | | | | | | | | | | | | |
| 3.200%, 06/15/2025 | | | | | | | | | | | | |
| (Callable 05/15/2025) | | | 14,736,000 | | | | 14,247,662 | | | | | |
| WestRock MWV LLC, | | | | | | | | | | | | |
| 8.200%, 01/15/2030 | | | 5,012,000 | | | | 5,778,969 | | | | | |
| Williams Companies, Inc.: | | | | | | | | | | | | |
| 7.500%, 01/15/2031 | | | 120,000 | | | | 135,959 | | | | | |
| 7.750%, 06/15/2031 | | | 3,500,000 | | | | 3,922,334 | | | | | |
| 8.750%, 03/15/2032 | | | 11,275,000 | | | | 13,683,589 | | | | | |
| 6.300%, 04/15/2040 | | | 1,590,000 | | | | 1,700,819 | | | | | |
| 5.750%, 06/24/2044 | | | | | | | | | | | | |
| (Callable 12/24/2043) | | | 2,500,000 | | | | 2,526,861 | | | | | |
| Wipro IT Services LLC, | | | | | | | | | | | | |
| 1.500%, 06/23/2026 | | | | | | | | | | | | |
(Callable 05/23/2026)(1)(2) | | | 17,800,000 | | | | 16,308,759 | | | | | |
The accompanying notes are an integral part of these financial statements.
Baird Core Plus Bond Fund
Schedule of Investments, December 31, 2023
Long-Term Investments (cont.)
| | | Principal | | | | | | % of | |
| | | Amount | | | Value | | | Net Assets | |
| Woodside Finance Ltd.: | | | | | | | | | |
| 3.650%, 03/05/2025 | | | | | | | | | |
(Callable 12/05/2024)(1)(2) | | $ | 15,575,000 | | | $ | 15,232,462 | | | |
| |
| 4.500%, 03/04/2029 | | | | | | | | | | | | |
(Callable 12/04/2028)(1)(2) | | | 30,000,000 | | | | 28,844,073 | | | | | |
| Xerox Holdings Corp., | | | | | | | | | | | | |
| 5.000%, 08/15/2025 | | | | | | | | | | | | |
(Callable 07/15/2025)(2) | | | 1,000,000 | | | | 979,477 | | | | | |
| XPO Escrow Sub LLC, | | | | | | | | | | | | |
| 7.500%, 11/15/2027 | | | | | | | | | | | | |
(Callable 11/15/2024)(2) | | | 7,000,000 | | | | 7,223,020 | | | | | |
| XPO, Inc.: | | | | | | | | | | | | |
| 6.250%, 06/01/2028 | | | | | | | | | | | | |
(Callable 06/01/2025)(2) | | | 1,000,000 | | | | 1,011,963 | | | | | |
| 7.125%, 06/01/2031 | | | | | | | | | | | | |
(Callable 06/01/2026)(2) | | | 500,000 | | | | 518,479 | | | | | |
| 7.125%, 02/01/2032 | | | | | | | | | | | | |
(Callable 02/01/2027)(2) | | | 250,000 | | | | 257,913 | | | | | |
| Yara International ASA, | | | | | | | | | | | | |
| 3.800%, 06/06/2026 | | | | | | | | | | | | |
(Callable 03/06/2026)(1)(2) | | | 20,250,000 | | | | 19,552,976 | | | | | |
| Zimmer Biomet Holdings, Inc.: | | | | | | | | | | | | |
| 3.550%, 03/20/2030 | | | | | | | | | | | | |
| (Callable 12/20/2029) | | | 1,000,000 | | | | 909,724 | | | | | |
| 5.750%, 11/30/2039 | | | 11,375,000 | | | | 11,633,546 | | | | | |
| Total Industrials | | | | | | | | | | | | |
| (Cost $7,913,461,877) | | | | | | | 7,410,425,048 | | | | 26.6 | % |
| Utilities | | | | | | | | | | | | |
| American Transmission Systems, Inc., | | | | | | | | | | | | |
| 2.650%, 01/15/2032 | | | | | | | | | | | | |
(Callable 10/15/2031)(2) | | | 4,850,000 | | | | 4,110,831 | | | | | |
| Appalachian Power Co., | | | | | | | | | | | | |
| 6.700%, 08/15/2037 | | | 1,400,000 | | | | 1,536,100 | | | | | |
| Avangrid, Inc., | | | | | | | | | | | | |
| 3.200%, 04/15/2025 | | | | | | | | | | | | |
(Callable 03/15/2025)(1) | | | 14,000,000 | | | | 13,599,812 | | | | | |
| Berkshire Hathaway Energy Co., | | | | | | | | | | | | |
| 2.850%, 05/15/2051 | | | | | | | | | | | | |
| (Callable 11/15/2050) | | | 10,000,000 | | | | 6,785,864 | | | | | |
| Consolidated Edison Co. | | | | | | | | | | | | |
| of New York, Inc., | | | | | | | | | | | | |
| 4.625%, 12/01/2054 | | | | | | | | | | | | |
| (Callable 06/01/2054) | | | 7,600,000 | | | | 6,851,882 | | | | | |
| Constellation Energy Generation LLC, | | | | | | | | | | | | |
| 5.800%, 03/01/2033 | | | | | | | | | | | | |
| (Callable 12/01/2032) | | | 10,000,000 | | | | 10,528,788 | | | | | |
| Consumers Energy Co., | | | | | | | | | | | | |
| 3.500%, 08/01/2051 | | | | | | | | | | | | |
| (Callable 02/01/2051) | | | 9,425,000 | | | | 7,420,828 | | | | | |
| Dominion Resources, Inc., | | | | | | | | | | | | |
| 5.950%, 06/15/2035 | | | 1,880,000 | | | | 1,980,991 | | | | | |
| DTE Electric Company, | | | | | | | | | | | | |
| 2.625%, 03/01/2031 | | | | | | | | | | | | |
| (Callable 12/01/2030) | | | 15,200,000 | | | | 13,317,551 | | | | | |
| DTE Energy Company, | | | | | | | | | | | | |
| 4.875%, 06/01/2028 | | | | | | | | | | | | |
| (Callable 05/01/2028) | | | 11,900,000 | | | | 11,998,654 | | | | | |
| Duke Energy Corp., | | | | | | | | | | | | |
| 6.100%, 09/15/2053 | | | | | | | | | | | | |
| (Callable 03/15/2053) | | | 8,400,000 | | | | 9,133,157 | | | | | |
| Duquesne Light Holdings, Inc., | | | | | | | | | | | | |
| 2.532%, 10/01/2030 | | | | | | | | | | | | |
(Callable 07/01/2030)(2) | | | 8,775,000 | | | | 7,307,959 | | | | | |
| Enel Finance International NV: | | | | | | | | | | | | |
3.500%, 04/06/2028(1)(2) | | | 7,000,000 | | | | 6,564,411 | | | | | |
| 7.500%, 10/14/2032 | | | | | | | | | | | | |
(Callable 07/14/2032)(1)(2) | | | 20,000,000 | | | | 22,873,280 | | | | | |
6.000%, 10/07/2039(1)(2) | | | 4,286,000 | | | | 4,365,802 | | | | | |
4.750%, 05/25/2047(1)(2) | | | 54,084,000 | | | | 47,182,135 | | | | | |
| Engie Energia Chile SA, | | | | | | | | | | | | |
| 3.400%, 01/28/2030 | | | | | | | | | | | | |
(Callable 10/28/2029)(1)(2) | | | 3,000,000 | | | | 2,578,469 | | | | | |
| Exelon Corp.: | | | | | | | | | | | | |
| 3.950%, 06/15/2025 | | | | | | | | | | | | |
| (Callable 03/15/2025) | | | 15,775,000 | | | | 15,506,196 | | | | | |
| 7.600%, 04/01/2032 | | | 1,650,000 | | | | 1,875,931 | | | | | |
| 5.100%, 06/15/2045 | | | | | | | | | | | | |
| (Callable 12/15/2044) | | | 5,875,000 | | | | 5,573,845 | | | | | |
| 4.100%, 03/15/2052 | | | | | | | | | | | | |
| (Callable 09/15/2051) | | | 5,000,000 | | | | 4,059,860 | | | | | |
| Exelon Generation Co. LLC, | | | | | | | | | | | | |
| 5.600%, 06/15/2042 | | | | | | | | | | | | |
| (Callable 12/15/2041) | | | 6,100,000 | | | | 6,105,580 | | | | | |
| Fells Point Funding Trust, | | | | | | | | | | | | |
| 3.046%, 01/31/2027 | | | | | | | | | | | | |
(Callable 12/31/2026)(2) | | | 10,300,000 | | | | 9,714,791 | | | | | |
| FirstEnergy Corp.: | | | | | | | | | | | | |
| 2.250%, 09/01/2030 | | | | | | | | | | | | |
| (Callable 06/01/2030) | | | 4,300,000 | | | | 3,622,500 | | | | | |
| 3.400%, 03/01/2050 | | | | | | | | | | | | |
| (Callable 09/01/2049) | | | 11,325,000 | | | | 7,986,722 | | | | | |
| FirstEnergy Transmission LLC, | | | | | | | | | | | | |
| 2.866%, 09/15/2028 | | | | | | | | | | | | |
(Callable 07/15/2028)(2) | | | 15,000,000 | | | | 13,608,155 | | | | | |
| Fortis, Inc., | | | | | | | | | | | | |
| 3.055%, 10/04/2026 | | | | | | | | | | | | |
(Callable 07/04/2026)(1) | | | 8,762,000 | | | | 8,303,913 | | | | | |
| Infraestructura Energetica | | | | | | | | | | | | |
| Nova SAB de CV, | | | | | | | | | | | | |
3.750%, 01/14/2028(2) | | | 5,000,000 | | | | 4,653,838 | | | | | |
| KeySpan Corp., | | | | | | | | | | | | |
8.000%, 11/15/2030(1) | | | 8,375,000 | | | | 9,588,446 | | | | | |
| Liberty Utilities Finance GP 1, | | | | | | | | | | | | |
| 2.050%, 09/15/2030 | | | | | | | | | | | | |
(Callable 06/15/2030)(1)(2) | | | 10,600,000 | | | | 8,611,673 | | | | | |
| National Grid PLC, | | | | | | | | | | | | |
| 5.602%, 06/12/2028 | | | | | | | | | | | | |
(Callable 05/12/2028)(1) | | | 5,000,000 | | | | 5,155,512 | | | | | |
| NiSource, Inc.: | | | | | | | | | | | | |
| 3.600%, 05/01/2030 | | | | | | | | | | | | |
| (Callable 02/01/2030) | | | 20,800,000 | | | | 19,376,733 | | | | | |
| 3.950%, 03/30/2048 | | | | | | | | | | | | |
| (Callable 09/30/2047) | | | 11,775,000 | | | | 9,555,507 | | | | | |
| Oglethorpe Power Corp., | | | | | | | | | | | | |
| 6.200%, 12/01/2053 | | | | | | | | | | | | |
(Callable 06/01/2053)(2) | | | 5,000,000 | | | | 5,371,231 | | | | | |
| Ohio Power Co., | | | | | | | | | | | | |
| 5.000%, 06/01/2033 | | | | | | | | | | | | |
| (Callable 03/01/2033) | | | 8,150,000 | | | | 8,212,854 | | | | | |
| Oklahoma Gas and Electric Co., | | | | | | | | | | | | |
| 5.600%, 04/01/2053 | | | | | | | | | | | | |
| (Callable 10/01/2052) | | | 3,700,000 | | | | 3,900,590 | | | | | |
| Oncor Electric Delivery Co. LLC, | | | | | | | | | | | | |
| 2.750%, 05/15/2030 | | | | | | | | | | | | |
| (Callable 02/15/2030) | | | 9,500,000 | | | | 8,508,776 | | | | | |
The accompanying notes are an integral part of these financial statements.
Baird Core Plus Bond Fund
Schedule of Investments, December 31, 2023
Long-Term Investments (cont.)
| | | Principal | | | | | | % of | |
| | | Amount | | | Value | | | Net Assets | |
| Piedmont Natural Gas Company, Inc., | | | | | | | | | |
| 5.400%, 06/15/2033 | | | | | | | | | |
| (Callable 03/15/2033) | | $ | 14,050,000 | | | $ | 14,472,724 | | | | |
| Total Utilities | | | | | | | | | | | |
| (Cost $384,179,258) | | | | | | | 351,901,891 | | | | 1.3 | % |
| Financials | | | | | | | | | | | | |
| ABN AMRO Bank NV: | | | | | | | | | | | | |
4.750%, 07/28/2025(1)(2) | | | 37,818,000 | | | | 37,056,346 | | | | | |
4.800%, 04/18/2026(1)(2) | | | 47,025,000 | | | | 45,964,398 | | | | | |
| 1.542%, 06/16/2027 | | | | | | | | | | | | |
| (1 Year CMT Rate + 0.800%) | | | | | | | | | | | | |
(Callable 06/16/2026)(1)(2)(3) | | | 12,250,000 | | | | 11,122,200 | | | | | |
| 3.324%, 03/13/2037 | | | | | | | | | | | | |
| (5 Year CMT Rate + 1.900%) | | | | | | | | | | | | |
(Callable 12/13/2031)(1)(2)(3) | | | 31,325,000 | | | | 25,061,389 | | | | | |
| AerCap Holdings NV: | | | | | | | | | | | | |
| 6.500%, 07/15/2025 | | | | | | | | | | | | |
(Callable 06/15/2025)(1) | | | 15,000,000 | | | | 15,193,199 | | | | | |
| 2.450%, 10/29/2026 | | | | | | | | | | | | |
(Callable 09/29/2026)(1) | | | 8,000,000 | | | | 7,408,143 | | | | | |
| 6.450%, 04/15/2027 | | | | | | | | | | | | |
(Callable 03/15/2027)(1)(2) | | | 38,501,000 | | | | 39,888,763 | | | | | |
| 5.750%, 06/06/2028 | | | | | | | | | | | | |
(Callable 05/06/2028)(1) | | | 10,000,000 | | | | 10,241,838 | | | | | |
| 3.000%, 10/29/2028 | | | | | | | | | | | | |
(Callable 08/29/2028)(1) | | | 15,500,000 | | | | 14,166,981 | | | | | |
| Agree LP, | | | | | | | | | | | | |
| 2.900%, 10/01/2030 | | | | | | | | | | | | |
| (Callable 07/01/2030) | | | 12,809,000 | | | | 10,990,921 | | | | | |
| AIB Group PLC, | | | | | | | | | | | | |
| 6.608%, 09/13/2029 (SOFR + 2.330%) | | | | | | | | | | | | |
(Callable 09/13/2028)(1)(2)(3) | | | 15,000,000 | | | | 15,812,370 | | | | | |
| AIG SunAmerica Global Financing X, | | | | | | | | | | | | |
6.900%, 03/15/2032(2) | | | 7,711,000 | | | | 8,457,283 | | | | | |
| Air Lease Corp.: | | | | | | | | | | | | |
| 2.300%, 02/01/2025 | | | | | | | | | | | | |
| (Callable 01/01/2025) | | | 14,150,000 | | | | 13,652,042 | | | | | |
| 5.850%, 12/15/2027 | | | | | | | | | | | | |
| (Callable 11/15/2027) | | | 10,000,000 | | | | 10,266,623 | | | | | |
| Ally Financial, Inc.: | | | | | | | | | | | | |
| 5.125%, 09/30/2024 | | | 13,000,000 | | | | 12,894,646 | | | | | |
| 5.800%, 05/01/2025 | | | | | | | | | | | | |
| (Callable 04/01/2025) | | | 10,000,000 | | | | 10,010,211 | | | | | |
| 6.848%, 01/03/2030 (SOFR + 2.820%) | | | | | | | | | | | | |
(Callable 01/03/2029)(3) | | | 10,000,000 | | | | 10,279,537 | | | | | |
| American International Group, Inc.: | | | | | | | | | | | | |
| 5.125%, 03/27/2033 | | | | | | | | | | | | |
| (Callable 12/27/2032) | | | 6,000,000 | | | | 6,102,709 | | | | | |
| 6.820%, 11/15/2037 | | | 4,173,000 | | | | 4,557,767 | | | | | |
| Assurant, Inc.: | | | | | | | | | | | | |
| 4.900%, 03/27/2028 | | | | | | | | | | | | |
| (Callable 12/27/2027) | | | 4,250,000 | | | | 4,198,764 | | | | | |
| 3.700%, 02/22/2030 | | | | | | | | | | | | |
| (Callable 11/22/2029) | | | 7,000,000 | | | | 6,314,333 | | | | | |
| Australia & New Zealand Banking Group Ltd.: | | | | | | | | | | | | |
| 2.950%, 07/22/2030 | | | | | | | | | | | | |
| (5 Year CMT Rate + 1.288%) | | | | | | | | | | | | |
(Callable 07/22/2025)(1)(2)(3) | | | 14,803,000 | | | | 14,059,996 | | | | | |
6.742%, 12/08/2032(1)(2) | | | 33,000,000 | | | | 35,330,235 | | | | | |
| 2.570%, 11/25/2035 | | | | | | | | | | | | |
| (5 Year CMT Rate + 1.700%) | | | | | | | | | | | | |
(Callable 11/25/2030)(1)(2)(3) | | | 13,000,000 | | | | 10,501,695 | | | | | |
| Aviation Capital Group LLC: | | | | | | | | | | | | |
| 6.250%, 04/15/2028 | | | | | | | | | | | | |
(Callable 03/15/2028)(1)(2) | | | 5,000,000 | | | | 5,102,597 | | | | | |
| 6.375%, 07/15/2030 | | | | | | | | | | | | |
(Callable 05/15/2030)(1)(2) | | | 36,120,000 | | | | 37,262,111 | | | | | |
| Avolon Holdings Funding Ltd.: | | | | | | | | | | | | |
| 5.250%, 05/15/2024 | | | | | | | | | | | | |
(Callable 04/15/2024)(1)(2) | | | 5,000,000 | | | | 4,972,543 | | | | | |
| 2.875%, 02/15/2025 | | | | | | | | | | | | |
(Callable 01/15/2025)(1)(2) | | | 10,000,000 | | | | 9,646,511 | | | | | |
| 6.375%, 05/04/2028 | | | | | | | | | | | | |
(Callable 04/04/2028)(1)(2) | | | 10,000,000 | | | | 10,206,130 | | | | | |
| Banco Santander SA: | | | | | | | | | | | | |
5.179%, 11/19/2025(1) | | | 11,150,000 | | | | 11,060,547 | | | | | |
| 1.722%, 09/14/2027 | | | | | | | | | | | | |
| (1 Year CMT Rate + 0.900%) | | | | | | | | | | | | |
(Callable 09/14/2026)(1)(3) | | | 10,000,000 | | | | 9,047,368 | | | | | |
6.607%, 11/07/2028(1) | | | 8,400,000 | | | | 8,952,917 | | | | | |
2.749%, 12/03/2030(1) | | | 5,000,000 | | | | 4,161,332 | | | | | |
| 3.225%, 11/22/2032 | | | | | | | | | | | | |
| (1 Year CMT Rate + 1.600%) | | | | | | | | | | | | |
(Callable 08/22/2031)(1)(3) | | | 35,000,000 | | | | 29,367,161 | | | | | |
6.921%, 08/08/2033(1) | | | 7,842,000 | | | | 8,378,207 | | | | | |
| Bank of America Corp.: | | | | | | | | | | | | |
| 2.456%, 10/22/2025 | | | | | | | | | | | | |
| (3 Month TSFR + 1.132%) | | | | | | | | | | | | |
(Callable 10/22/2024)(3) | | | 8,000,000 | | | | 7,790,861 | | | | | |
| 3.366%, 01/23/2026 | | | | | | | | | | | | |
| (3 Month TSFR + 1.072%) | | | | | | | | | | | | |
(Callable 01/23/2025)(3) | | | 22,700,000 | | | | 22,172,784 | | | | | |
| 5.080%, 01/20/2027 (SOFR + 1.290%) | | | | | | | | | | | | |
(Callable 01/20/2026)(3) | | | 12,750,000 | | | | 12,726,303 | | | | | |
| 1.734%, 07/22/2027 (SOFR + 0.960%) | | | | | | | | | | | | |
(Callable 07/22/2026)(3) | | | 6,000,000 | | | | 5,499,254 | | | | | |
| 6.204%, 11/10/2028 (SOFR + 1.990%) | | | | | | | | | | | | |
(Callable 11/10/2027)(3) | | | 12,000,000 | | | | 12,525,192 | | | | | |
| 3.419%, 12/20/2028 | | | | | | | | | | | | |
| (3 Month TSFR + 1.302%) | | | | | | | | | | | | |
(Callable 12/20/2027)(3) | | | 19,539,000 | | | | 18,396,902 | | | | | |
| 5.202%, 04/25/2029 (SOFR + 1.630%) | | | | | | | | | | | | |
(Callable 04/25/2028)(3) | | | 15,000,000 | | | | 15,105,048 | | | | | |
| 2.087%, 06/14/2029 (SOFR + 1.060%) | | | | | | | | | | | | |
(Callable 06/14/2028)(3) | | | 12,000,000 | | | | 10,585,885 | | | | | |
| 4.271%, 07/23/2029 | | | | | | | | | | | | |
| (3 Month TSFR + 1.572%) | | | | | | | | | | | | |
(Callable 07/23/2028)(3) | | | 10,000,000 | | | | 9,666,415 | | | | | |
| 2.496%, 02/13/2031 | | | | | | | | | | | | |
| (3 Month TSFR + 1.252%) | | | | | | | | | | | | |
(Callable 02/13/2030)(3) | | | 7,000,000 | | | | 6,019,323 | | | | | |
| 2.592%, 04/29/2031 (SOFR + 2.150%) | | | | | | | | | | | | |
(Callable 04/29/2030)(3) | | | 35,000,000 | | | | 30,207,661 | | | | | |
| 1.898%, 07/23/2031 (SOFR + 1.530%) | | | | | | | | | | | | |
(Callable 07/23/2030)(3) | | | 10,000,000 | | | | 8,194,480 | | | | | |
| 5.015%, 07/22/2033 (SOFR + 2.160%) | | | | | | | | | | | | |
(Callable 07/22/2032)(3) | | | 5,000,000 | | | | 4,952,827 | | | | | |
| 7.750%, 05/14/2038 | | | 725,000 | | | | 883,836 | | | | | |
| Bank of Ireland Group PLC, | | | | | | | | | | | | |
| 2.029%, 09/30/2027 | | | | | | | | | | | | |
| (1 Year CMT Rate + 1.100%) | | | | | | | | | | | | |
(Callable 09/30/2026)(1)(2)(3) | | | 10,202,000 | | | | 9,302,220 | | | | | |
| Bank of Montreal, | | | | | | | | | | | | |
| 3.803%, 12/15/2032 | | | | | | | | | | | | |
| (5 Year Swap Rate USD + 1.432%) | | | | | | | | | | | | |
(Callable 12/15/2027)(1)(3) | | | 5,000,000 | | | | 4,602,885 | | | | | |
The accompanying notes are an integral part of these financial statements.
Baird Core Plus Bond Fund
Schedule of Investments, December 31, 2023
Long-Term Investments (cont.)
| | | Principal | | | | | | % of | |
| | | Amount | | | Value | | | Net Assets | |
| Bank of Nova Scotia: | | | | | | | | | |
5.250%, 06/12/2028(1) | | $ | 7,000,000 | | | $ | 7,111,610 | | | |
| |
5.650%, 02/01/2034(1) | | | 7,775,000 | | | | 8,076,674 | | | | | |
| Banque Federative du Credit Mutuel SA: | | | | | | | | | | | | |
4.753%, 07/13/2027(1)(2) | | | 15,000,000 | | | | 14,907,638 | | | | | |
5.790%, 07/13/2028(1)(2) | | | 6,000,000 | | | | 6,200,806 | | | | | |
| Barclays PLC: | | | | | | | | | | | | |
3.650%, 03/16/2025(1) | | | 17,350,000 | | | | 16,962,146 | | | | | |
| 2.852%, 05/07/2026 (SOFR + 2.714%) | | | | | | | | | | | | |
(Callable 05/07/2025)(1)(3) | | | 10,000,000 | | | | 9,645,717 | | | | | |
| 4.337%, 01/10/2028 | | | | | | | | | | | | |
(Callable 01/10/2027)(1) | | | 10,000,000 | | | | 9,721,969 | | | | | |
| 2.645%, 06/24/2031 | | | | | | | | | | | | |
| (1 Year CMT Rate + 1.900%) | | | | | | | | | | | | |
(Callable 06/24/2030)(1)(3) | | | 2,150,000 | | | | 1,815,370 | | | | | |
| 6.224%, 05/09/2034 (SOFR + 2.980%) | | | | | | | | | | | | |
(Callable 05/09/2033)(1)(3) | | | 18,650,000 | | | | 19,381,395 | | | | | |
| 6.692%, 09/13/2034 (SOFR + 2.620%) | | | | | | | | | | | | |
(Callable 09/13/2033)(1)(3) | | | 20,000,000 | | | | 21,412,697 | | | | | |
| BBVA USA, | | | | | | | | | | | | |
| 3.875%, 04/10/2025 | | | | | | | | | | | | |
| (Callable 03/10/2025) | | | 45,470,000 | | | | 44,523,911 | | | | | |
| BGC Group, Inc.: | | | | | | | | | | | | |
| 4.375%, 12/15/2025 | | | | | | | | | | | | |
| (Callable 09/15/2025) | | | 13,700,000 | | | | 13,150,845 | | | | | |
| 8.000%, 05/25/2028 | | | | | | | | | | | | |
| (Callable 04/25/2028) | | | 15,000,000 | | | | 15,670,767 | | | | | |
| BNP Paribas SA: | | | | | | | | | | | | |
4.375%, 09/28/2025(1)(2) | | | 8,200,000 | | | | 8,020,203 | | | | | |
| 2.819%, 11/19/2025 | | | | | | | | | | | | |
| (3 Month TSFR + 1.373%) | | | | | | | | | | | | |
(Callable 11/19/2024)(1)(2)(3) | | | 42,500,000 | | | | 41,416,517 | | | | | |
4.375%, 05/12/2026(1)(2) | | | 16,910,000 | | | | 16,474,393 | | | | | |
| 2.219%, 06/09/2026 (SOFR + 2.074%) | | | | | | | | | | | | |
(Callable 06/09/2025)(1)(2)(3) | | | 16,500,000 | | | | 15,752,671 | | | | | |
| 1.323%, 01/13/2027 (SOFR + 1.004%) | | | | | | | | | | | | |
(Callable 01/13/2026)(1)(2)(3) | | | 8,000,000 | | | | 7,379,486 | | | | | |
| 1.904%, 09/30/2028 (SOFR + 1.609%) | | | | | | | | | | | | |
(Callable 09/30/2027)(1)(2)(3) | | | 16,000,000 | | | | 14,222,532 | | | | | |
| 3.052%, 01/13/2031 (SOFR + 1.507%) | | | | | | | | | | | | |
(Callable 01/13/2030)(1)(2)(3) | | | 10,500,000 | | | | 9,236,908 | | | | | |
| 2.871%, 04/19/2032 | | | | | | | | | | | | |
| (3 Month TSFR + 1.387%) | | | | | | | | | | | | |
(Callable 04/19/2031)(1)(2)(3) | | | 25,000,000 | | | | 21,181,529 | | | | | |
| 2.588%, 08/12/2035 | | | | | | | | | | | | |
| (5 Year CMT Rate + 2.050%) | | | | | | | | | | | | |
(Callable 08/12/2030)(1)(2)(3) | | | 5,000,000 | | | | 4,110,814 | | | | | |
| BPCE SA: | | | | | | | | | | | | |
4.625%, 07/11/2024(1)(2) | | | 3,185,000 | | | | 3,150,188 | | | | | |
5.150%, 07/21/2024(1)(2) | | | 30,902,000 | | | | 30,632,226 | | | | | |
4.500%, 03/15/2025(1)(2) | | | 40,275,000 | | | | 39,509,372 | | | | | |
| 1.652%, 10/06/2026 (SOFR + 1.520%) | | | | | | | | | | | | |
(Callable 10/06/2025)(1)(2)(3) | | | 15,000,000 | | | | 13,962,270 | | | | | |
| 3.116%, 10/19/2032 (SOFR + 1.730%) | | | | | | | | | | | | |
(Callable 10/19/2031)(1)(2)(3) | | | 30,827,000 | | | | 25,179,967 | | | | | |
| 7.003%, 10/19/2034 (SOFR + 2.590%) | | | | | | | | | | | | |
(Callable 10/19/2033)(1)(2)(3) | | | 22,896,000 | | | | 24,890,395 | | | | | |
| Brown & Brown, Inc., | | | | | | | | | | | | |
| 4.500%, 03/15/2029 | | | | | | | | | | | | |
| (Callable 12/15/2028) | | | 11,840,000 | | | | 11,464,391 | | | | | |
| Canadian Imperial Bank of Commerce, | | | | | | | | | | | | |
5.615%, 07/17/2026(1) | | | 5,000,000 | | | | 5,101,874 | | | | | |
| Cantor Fitzgerald LP: | | | | | | | | | | | | |
| 4.875%, 05/01/2024 | | | | | | | | | | | | |
(Callable 04/01/2024)(2) | | | 7,525,000 | | | | 7,467,393 | | | | | |
| 4.500%, 04/14/2027 | | | | | | | | | | | | |
(Callable 01/14/2027)(2) | | | 5,000,000 | | | | 4,802,586 | | | | | |
| 7.200%, 12/12/2028 | | | | | | | | | | | | |
(Callable 11/12/2028)(2) | | | 20,000,000 | | | | 20,527,082 | | | | | |
| Capital One Financial Corp.: | | | | | | | | | | | | |
| 3.750%, 07/28/2026 | | | | | | | | | | | | |
| (Callable 06/28/2026) | | | 5,000,000 | | | | 4,791,415 | | | | | |
| 3.800%, 01/31/2028 | | | | | | | | | | | | |
| (Callable 12/31/2027) | | | 6,960,000 | | | | 6,614,151 | | | | | |
| 5.468%, 02/01/2029 (SOFR + 2.080%) | | | | | | | | | | | | |
(Callable 02/01/2028)(3) | | | 10,000,000 | | | | 9,975,101 | | | | | |
| 6.312%, 06/08/2029 (SOFR + 2.640%) | | | | | | | | | | | | |
(Callable 06/08/2028)(3) | | | 4,600,000 | | | | 4,725,494 | | | | | |
| 3.273%, 03/01/2030 (SOFR + 1.790%) | | | | | | | | | | | | |
(Callable 03/01/2029)(3) | | | 3,250,000 | | | | 2,905,494 | | | | | |
| 6.377%, 06/08/2034 (SOFR + 2.860%) | | | | | | | | | | | | |
(Callable 06/08/2033)(3) | | | 15,000,000 | | | | 15,461,673 | | | | | |
| Centene Corp.: | | | | | | | | | | | | |
| 3.000%, 10/15/2030 | | | | | | | | | | | | |
| (Callable 07/15/2030) | | | 10,000,000 | | | | 8,665,334 | | | | | |
| 2.500%, 03/01/2031 | | | | | | | | | | | | |
| (Callable 12/01/2030) | | | 64,850,000 | | | | 54,014,139 | | | | | |
| Charles Schwab Corp., | | | | | | | | | | | | |
| 2.900%, 03/03/2032 | | | | | | | | | | | | |
| (Callable 12/03/2031) | | | 5,000,000 | | | | 4,306,753 | | | | | |
| Citigroup, Inc.: | | | | | | | | | | | | |
| 3.700%, 01/12/2026 | | | 4,700,000 | | | | 4,589,709 | | | | | |
| 3.106%, 04/08/2026 (SOFR + 2.842%) | | | | | | | | | | | | |
(Callable 04/08/2025)(3) | | | 15,000,000 | | | | 14,580,651 | | | | | |
| 3.887%, 01/10/2028 | | | | | | | | | | | | |
| (3 Month TSFR + 1.825%) | | | | | | | | | | | | |
(Callable 01/10/2027)(3) | | | 21,200,000 | | | | 20,519,032 | | | | | |
| 4.412%, 03/31/2031 (SOFR + 3.914%) | | | | | | | | | | | | |
(Callable 03/31/2030)(3) | | | 10,000,000 | | | | 9,577,393 | | | | | |
| 2.572%, 06/03/2031 (SOFR + 2.107%) | | | | | | | | | | | | |
(Callable 06/03/2030)(3) | | | 50,000,000 | | | | 42,771,771 | | | | | |
| 2.561%, 05/01/2032 (SOFR + 1.167%) | | | | | | | | | | | | |
(Callable 05/01/2031)(3) | | | 5,000,000 | | | | 4,178,447 | | | | | |
| 6.270%, 11/17/2033 (SOFR + 2.338%) | | | | | | | | | | | | |
(Callable 11/17/2032)(3) | | | 5,000,000 | | | | 5,359,426 | | | | | |
| Citizens Financial Group, Inc.: | | | | | | | | | | | | |
| 2.850%, 07/27/2026 | | | | | | | | | | | | |
| (Callable 04/27/2026) | | | 23,400,000 | | | | 21,812,053 | | | | | |
| 3.250%, 04/30/2030 | | | | | | | | | | | | |
| (Callable 01/30/2030) | | | 40,000,000 | | | | 35,174,916 | | | | | |
| CNA Financial Corp.: | | | | | | | | | | | | |
| 4.500%, 03/01/2026 | | | | | | | | | | | | |
| (Callable 12/01/2025) | | | 21,125,000 | | | | 20,890,322 | | | | | |
| 5.500%, 06/15/2033 | | | | | | | | | | | | |
| (Callable 03/15/2033) | | | 14,250,000 | | | | 14,720,200 | | | | | |
| CNO Financial Group, Inc., | | | | | | | | | | | | |
| 5.250%, 05/30/2025 | | | | | | | | | | | | |
| (Callable 02/28/2025) | | | 18,640,000 | | | | 18,513,052 | | | | | |
| CNO Global Funding, | | | | | | | | | | | | |
2.650%, 01/06/2029(2) | | | 7,625,000 | | | | 6,612,082 | | | | | |
| Comerica Bank, | | | | | | | | | | | | |
| 4.000%, 07/27/2025 | | | 21,425,000 | | | | 20,651,472 | | | | | |
| Commonwealth Bank of Australia: | | | | | | | | | | | | |
2.688%, 03/11/2031(1)(2) | | | 20,000,000 | | | | 16,470,840 | | | | | |
3.784%, 03/14/2032(1)(2) | | | 7,250,000 | | | | 6,353,783 | | | | | |
The accompanying notes are an integral part of these financial statements.
Baird Core Plus Bond Fund
Schedule of Investments, December 31, 2023
Long-Term Investments (cont.)
| | | Principal | | | | | | % of | |
| | | Amount | | | Value | | | Net Assets | |
| Commonwealth Bank of Australia: (cont.) | | | | | | | | | |
| 3.610%, 09/12/2034 | | | | | | | | | |
| (5 Year CMT Rate + 2.050%) | | | | | | | | | |
(Callable 09/12/2029)(1)(2)(3) | | $ | 35,000,000 | | | $ | 31,260,510 | | | |
| |
| Compeer Financial, | | | | | | | | | | | | |
| 3.375%, 06/01/2036 (SOFR + 1.965%) | | | | | | | | | | | | |
(Callable 06/01/2031)(2)(3) | | | 5,500,000 | | | | 3,879,071 | | | | | |
| Cooperatieve Rabobank UA: | | | | | | | | | | | | |
4.375%, 08/04/2025(1) | | | 11,975,000 | | | | 11,760,334 | | | | | |
3.750%, 07/21/2026(1) | | | 36,000,000 | | | | 34,482,909 | | | | | |
| Credit Agricole SA: | | | | | | | | | | | | |
4.375%, 03/17/2025(1)(2) | | | 37,093,000 | | | | 36,447,211 | | | | | |
| 1.907%, 06/16/2026 (SOFR + 1.676%) | | | | | | | | | | | | |
(Callable 06/16/2025)(1)(2)(3) | | | 7,000,000 | | | | 6,641,180 | | | | | |
3.250%, 01/14/2030(1)(2) | | | 13,043,000 | | | | 11,529,197 | | | | | |
5.514%, 07/05/2033(1)(2) | | | 10,750,000 | | | | 11,164,211 | | | | | |
| Danske Bank A/S, | | | | | | | | | | | | |
| 1.621%, 09/11/2026 | | | | | | | | | | | | |
| (1 Year CMT Rate + 1.350%) | | | | | | | | | | | | |
(Callable 09/11/2025)(1)(2)(3) | | | 33,945,000 | | | | 31,681,047 | | | | | |
| Deutsche Bank AG: | | | | | | | | | | | | |
| 7.146%, 07/13/2027 (SOFR + 2.520%) | | | | | | | | | | | | |
(Callable 07/13/2026)(1)(3) | | | 12,000,000 | | | | 12,458,866 | | | | | |
| 2.311%, 11/16/2027 (SOFR + 1.219%) | | | | | | | | | | | | |
(Callable 11/16/2026)(1)(3) | | | 6,000,000 | | | | 5,488,949 | | | | | |
| 6.720%, 01/18/2029 (SOFR + 3.180%) | | | | | | | | | | | | |
(Callable 01/18/2028)(1)(3) | | | 5,000,000 | | | | 5,240,693 | | | | | |
| 6.819%, 11/20/2029 (SOFR + 2.510%) | | | | | | | | | | | | |
(Callable 11/20/2028)(1)(3) | | | 30,000,000 | | | | 31,615,560 | | | | | |
| 5.882%, 07/08/2031 (SOFR + 5.438%) | | | | | | | | | | | | |
(Callable 04/08/2030)(1)(3) | | | 35,675,000 | | | | 34,640,781 | | | | | |
| 3.547%, 09/18/2031 (SOFR + 3.043%) | | | | | | | | | | | | |
(Callable 09/18/2030)(1)(3) | | | 10,000,000 | | | | 8,785,095 | | | | | |
| 3.729%, 01/14/2032 (SOFR + 2.757%) | | | | | | | | | | | | |
(Callable 10/14/2030)(1)(3) | | | 16,908,000 | | | | 14,221,606 | | | | | |
| 3.742%, 01/07/2033 (SOFR + 2.257%) | | | | | | | | | | | | |
(Callable 10/07/2031)(1)(3) | | | 25,000,000 | | | | 20,542,985 | | | | | |
| Digital Realty Trust LP: | | | | | | | | | | | | |
| 4.450%, 07/15/2028 | | | | | | | | | | | | |
| (Callable 04/15/2028) | | | 7,000,000 | | | | 6,838,389 | | | | | |
| 3.600%, 07/01/2029 | | | | | | | | | | | | |
| (Callable 04/01/2029) | | | 41,950,000 | | | | 39,382,098 | | | | | |
| Discover Bank: | | | | | | | | | | | | |
| 5.974%, 08/09/2028 (5 Year Mid | | | | | | | | | | | | |
Swap Rate USD + 1.730%)(3) | | | 19,280,000 | | | | 18,569,973 | | | | | |
| 4.650%, 09/13/2028 | | | | | | | | | | | | |
| (Callable 06/13/2028) | | | 33,225,000 | | | | 31,687,747 | | | | | |
| Discover Financial Services: | | | | | | | | | | | | |
| 3.950%, 11/06/2024 | | | | | | | | | | | | |
| (Callable 08/06/2024) | | | 25,000,000 | | | | 24,567,272 | | | | | |
| 7.964%, 11/02/2034 | | | | | | | | | | | | |
| (SOFRINDX + 3.370%) | | | | | | | | | | | | |
(Callable 11/02/2033)(3) | | | 25,000,000 | | | | 27,853,988 | | | | | |
| DNB Bank ASA: | | | | | | | | | | | | |
| 1.127%, 09/16/2026 | | | | | | | | | | | | |
| (1 Year CMT Rate + 0.850%) | | | | | | | | | | | | |
(Callable 09/16/2025)(1)(2)(3) | | | 10,000,000 | | | | 9,277,403 | | | | | |
| 1.535%, 05/25/2027 | | | | | | | | | | | | |
| (1 Year CMT Rate + 0.720%) | | | | | | | | | | | | |
(Callable 05/25/2026)(1)(2)(3) | | | 5,800,000 | | | | 5,291,555 | | | | | |
| Elevance Health, Inc., | | | | | | | | | | | | |
| 5.125%, 02/15/2053 | | | | | | | | | | | | |
| (Callable 08/15/2052) | | | 5,200,000 | | | | 5,210,108 | | | | | |
| Extra Space Storage LP: | | | | | | | | | | | | |
| 3.875%, 12/15/2027 | | | | | | | | | | | | |
| (Callable 09/15/2027) | | | 2,575,000 | | | | 2,459,957 | | | | | |
| 5.700%, 04/01/2028 | | | | | | | | | | | | |
| (Callable 03/01/2028) | | | 3,650,000 | | | | 3,744,379 | | | | | |
| 2.200%, 10/15/2030 | | | | | | | | | | | | |
| (Callable 07/15/2030) | | | 6,950,000 | | | | 5,788,901 | | | | | |
| 2.550%, 06/01/2031 | | | | | | | | | | | | |
| (Callable 03/01/2031) | | | 11,000,000 | | | | 9,186,451 | | | | | |
| Federation des Caisses | | | | | | | | | | | | |
| Desjardins du Quebec: | | | | | | | | | | | | |
4.550%, 08/23/2027(1)(2) | | | 5,000,000 | | | | 4,971,654 | | | | | |
5.700%, 03/14/2028(1)(2) | | | 22,000,000 | | | | 22,658,944 | | | | | |
| Fifth Third Bancorp, | | | | | | | | | | | | |
| 4.772%, 07/28/2030 (SOFRINDX + | | | | | | | | | | | | |
2.127%) (Callable 07/28/2029)(3) | | | 4,000,000 | | | | 3,912,250 | | | | | |
| First Citizens Bancshares, Inc., | | | | | | | | | | | | |
| 2.969%, 09/27/2025 | | | | | | | | | | | | |
| (3 Month TSFR + 1.715%) | | | | | | | | | | | | |
(Callable 09/27/2024)(3) | | | 21,219,000 | | | | 20,715,289 | | | | | |
| First Horizon National Corp., | | | | | | | | | | | | |
| 4.000%, 05/26/2025 | | | | | | | | | | | | |
| (Callable 04/26/2025) | | | 30,000,000 | | | | 29,018,885 | | | | | |
| First Republic Bank, | | | | | | | | | | | | |
| 4.625%, 02/13/2047 | | | | | | | | | | | | |
(Callable 08/13/2046)(8) | | | 1,850,000 | | | | 101,750 | | | | | |
| Five Corners Funding Trust II, | | | | | | | | | | | | |
| 2.850%, 05/15/2030 | | | | | | | | | | | | |
(Callable 02/15/2030)(2) | | | 10,000,000 | | | | 8,855,443 | | | | | |
| Five Corners Funding Trust III, | | | | | | | | | | | | |
| 5.791%, 02/15/2033 | | | | | | | | | | | | |
(Callable 11/15/2032)(2) | | | 5,800,000 | | | | 6,170,294 | | | | | |
| Five Corners Funding Trust IV, | | | | | | | | | | | | |
| 5.997%, 02/15/2053 | | | | | | | | | | | | |
(Callable 08/15/2052)(2) | | | 6,800,000 | | | | 7,380,322 | | | | | |
| FMR LLC: | | | | | | | | | | | | |
4.950%, 02/01/2033(2) | | | 4,235,000 | | | | 4,077,848 | | | | | |
6.500%, 12/14/2040(2) | | | 1,820,000 | | | | 1,947,820 | | | | | |
| Globe Life, Inc., | | | | | | | | | | | | |
| 4.550%, 09/15/2028 | | | | | | | | | | | | |
| (Callable 06/15/2028) | | | 9,350,000 | | | | 9,283,242 | | | | | |
| Goldman Sachs Group, Inc.: | | | | | | | | | | | | |
| 3.500%, 04/01/2025 | | | | | | | | | | | | |
| (Callable 03/01/2025) | | | 10,000,000 | | | | 9,774,548 | | | | | |
| 3.814%, 04/23/2029 | | | | | | | | | | | | |
| (3 Month TSFR + 1.420%) | | | | | | | | | | | | |
(Callable 04/23/2028)(3) | | | 17,875,000 | | | | 16,981,481 | | | | | |
| 4.223%, 05/01/2029 | | | | | | | | | | | | |
| (3 Month TSFR + 1.563%) | | | | | | | | | | | | |
(Callable 05/01/2028)(3) | | | 15,050,000 | | | | 14,573,688 | | | | | |
| 1.992%, 01/27/2032 (SOFR + 1.090%) | | | | | | | | | | | | |
(Callable 01/27/2031)(3) | | | 30,000,000 | | | | 24,282,339 | | | | | |
| 2.615%, 04/22/2032 (SOFR + 1.281%) | | | | | | | | | | | | |
(Callable 04/22/2031)(3) | | | 10,000,000 | | | | 8,408,574 | | | | | |
| 2.383%, 07/21/2032 (SOFR + 1.248%) | | | | | | | | | | | | |
(Callable 07/21/2031)(3) | | | 11,332,000 | | | | 9,316,074 | | | | | |
| 6.345%, 02/15/2034 | | | 125,000 | | | | 131,582 | | | | | |
| 6.750%, 10/01/2037 | | | 300,000 | | | | 331,029 | | | | | |
| Guardian Life Insurance Co. of America: | | | | | | | | | | | | |
4.875%, 06/19/2064(2) | | | 11,215,000 | | | | 10,050,571 | | | | | |
| 3.700%, 01/22/2070 | | | | | | | | | | | | |
(Callable 07/22/2069)(2) | | | 14,000,000 | | | | 9,565,967 | | | | | |
4.850%, 01/24/2077(2) | | | 16,363,000 | | | | 13,946,207 | | | | | |
The accompanying notes are an integral part of these financial statements.
Baird Core Plus Bond Fund
Schedule of Investments, December 31, 2023
Long-Term Investments (cont.)
| | | Principal | | | | | | % of | |
| | | Amount | | | Value | | | Net Assets | |
| Hartford Financial Services Group, Inc.: | | | | | | | | | |
| 6.100%, 10/01/2041 | | $ | 2,925,000 | | | $ | 3,128,431 | | | |
| |
| 3.600%, 08/19/2049 | | | | | | | | | | | | |
| (Callable 02/19/2049) | | | 15,725,000 | | | | 12,222,596 | | | | | |
| Healthpeak OP LLC, | | | | | | | | | | | | |
| 5.250%, 12/15/2032 | | | | | | | | | | | | |
| (Callable 09/15/2032) | | | 10,000,000 | | | | 10,127,480 | | | | | |
| High Street Funding Trust I, | | | | | | | | | | | | |
| 4.111%, 02/15/2028 | | | | | | | | | | | | |
(Callable 11/15/2027)(2) | | | 9,000,000 | | | | 8,521,097 | | | | | |
| High Street Funding Trust II, | | | | | | | | | | | | |
| 4.682%, 02/15/2048 | | | | | | | | | | | | |
(Callable 11/15/2047)(2) | | | 7,000,000 | | | | 5,854,411 | | | | | |
| HSBC Holdings PLC: | | | | | | | | | | | | |
| 3.803%, 03/11/2025 | | | | | | | | | | | | |
| (3 Month TSFR + 1.473%) | | | | | | | | | | | | |
(Callable 03/11/2024)(1)(3) | | | 5,200,000 | | | | 5,178,844 | | | | | |
| 1.645%, 04/18/2026 (SOFR + 1.538%) | | | | | | | | | | | | |
(Callable 04/18/2025)(1)(3) | | | 8,125,000 | | | | 7,723,993 | | | | | |
| 2.251%, 11/22/2027 (SOFR + 1.100%) | | | | | | | | | | | | |
(Callable 11/22/2026)(1)(3) | | | 10,000,000 | | | | 9,182,866 | | | | | |
| 2.013%, 09/22/2028 (SOFR + 1.732%) | | | | | | | | | | | | |
(Callable 09/22/2027)(1)(3) | | | 22,654,000 | | | | 20,183,807 | | | | | |
| 7.390%, 11/03/2028 (SOFR + 3.350%) | | | | | | | | | | | | |
(Callable 11/03/2027)(1)(3) | | | 15,000,000 | | | | 16,085,357 | | | | | |
| 6.161%, 03/09/2029 (SOFR + 1.970%) | | | | | | | | | | | | |
(Callable 03/09/2028)(1)(3) | | | 6,000,000 | | | | 6,198,415 | | | | | |
| 4.583%, 06/19/2029 | | | | | | | | | | | | |
| (3 Month TSFR + 1.796%) | | | | | | | | | | | | |
(Callable 06/19/2028)(1)(3) | | | 19,471,000 | | | | 18,898,184 | | | | | |
| 2.206%, 08/17/2029 (SOFR + 1.285%) | | | | | | | | | | | | |
(Callable 08/17/2028)(1)(3) | | | 10,000,000 | | | | 8,737,333 | | | | | |
| 3.973%, 05/22/2030 | | | | | | | | | | | | |
| (3 Month TSFR + 1.872%) | | | | | | | | | | | | |
(Callable 05/22/2029)(1)(3) | | | 4,775,000 | | | | 4,464,502 | | | | | |
| 2.804%, 05/24/2032 (SOFR + 1.187%) | | | | | | | | | | | | |
(Callable 05/24/2031)(1)(3) | | | 14,550,000 | | | | 12,166,635 | | | | | |
| Humana, Inc., | | | | | | | | | | | | |
| 8.150%, 06/15/2038 | | | 8,983,000 | | | | 10,992,738 | | | | | |
| Huntington Bancshares, Inc., | | | | | | | | | | | | |
| 2.625%, 08/06/2024 | | | | | | | | | | | | |
| (Callable 07/06/2024) | | | 1,500,000 | | | | 1,471,888 | | | | | |
| Invitation Homes Operating | | | | | | | | | | | | |
| Partnership LP, | | | | | | | | | | | | |
| 5.450%, 08/15/2030 | | | | | | | | | | | | |
| (Callable 06/15/2030) | | | 15,000,000 | | | | 15,133,367 | | | | | |
| Jackson Financial, Inc., | | | | | | | | | | | | |
| 3.125%, 11/23/2031 | | | | | | | | | | | | |
| (Callable 08/23/2031) | | | 15,000,000 | | | | 12,621,535 | | | | | |
| Jefferies Financial Group, Inc., | | | | | | | | | | | | |
| 5.875%, 07/21/2028 | | | | | | | | | | | | |
| (Callable 06/21/2028) | | | 14,000,000 | | | | 14,368,286 | | | | | |
| Jefferies Group LLC: | | | | | | | | | | | | |
| 4.850%, 01/15/2027 | | | 14,625,000 | | | | 14,564,808 | | | | | |
| 6.450%, 06/08/2027 | | | 1,300,000 | | | | 1,350,653 | | | | | |
| 4.150%, 01/23/2030 | | | 30,200,000 | | | | 28,392,278 | | | | | |
| JPMorgan Chase & Co.: | | | | | | | | | | | | |
| 2.005%, 03/13/2026 | | | | | | | | | | | | |
| (3 Month TSFR + 1.585%) | | | | | | | | | | | | |
(Callable 03/13/2025)(3) | | | 17,000,000 | | | | 16,334,991 | | | | | |
| 2.083%, 04/22/2026 (SOFR + 1.850%) | | | | | | | | | | | | |
(Callable 04/22/2025)(3) | | | 55,000,000 | | | | 52,690,297 | | | | | |
| 1.045%, 11/19/2026 (SOFR + 0.800%) | | | | | | | | | | | | |
(Callable 11/19/2025)(3) | | | 18,500,000 | | | | 17,138,420 | | | | | |
| 1.470%, 09/22/2027 (SOFR + 0.765%) | | | | | | | | | | | | |
(Callable 09/22/2026)(3) | | | 10,000,000 | | | | 9,061,689 | | | | | |
| 3.509%, 01/23/2029 | | | | | | | | | | | | |
| (3 Month TSFR + 1.207%) | | | | | | | | | | | | |
(Callable 01/23/2028)(3) | | | 51,000,000 | | | | 48,373,918 | | | | | |
| 2.522%, 04/22/2031 (SOFR + 2.040%) | | | | | | | | | | | | |
(Callable 04/22/2030)(3) | | | 30,500,000 | | | | 26,416,481 | | | | | |
| 1.953%, 02/04/2032 (SOFR + 1.065%) | | | | | | | | | | | | |
(Callable 02/04/2031)(3) | | | 5,000,000 | | | | 4,071,270 | | | | | |
| 2.580%, 04/22/2032 | | | | | | | | | | | | |
| (3 Month TSFR + 1.250%) | | | | | | | | | | | | |
(Callable 04/22/2031)(3) | | | 15,000,000 | | | | 12,711,481 | | | | | |
| 5.350%, 06/01/2034 (SOFR + 1.845%) | | | | | | | | | | | | |
(Callable 06/01/2033)(3) | | | 7,500,000 | | | | 7,614,417 | | | | | |
| Kemper Corp., | | | | | | | | | | | | |
| 3.800%, 02/23/2032 | | | | | | | | | | | | |
| (Callable 11/23/2031) | | | 11,000,000 | | | | 9,241,654 | | | | | |
| KeyBank NA, | | | | | | | | | | | | |
| 3.400%, 05/20/2026 | | | 21,575,000 | | | | 20,238,930 | | | | | |
| LeasePlan Corp. NV, | | | | | | | | | | | | |
2.875%, 10/24/2024(1)(2) | | | 77,403,000 | | | | 75,632,807 | | | | | |
| Liberty Mutual Group, Inc.: | | | | | | | | | | | | |
6.500%, 03/15/2035(2) | | | 750,000 | | | | 745,260 | | | | | |
| 3.951%, 10/15/2050 | | | | | | | | | | | | |
(Callable 04/15/2050)(2) | | | 900,000 | | | | 683,267 | | | | | |
| Liberty Mutual Insurance Co., | | | | | | | | | | | | |
7.697%, 10/15/2097(2) | | | 375,000 | | | | 412,209 | | | | | |
| Lincoln National Corp.: | | | | | | | | | | | | |
| 3.400%, 01/15/2031 | | | | | | | | | | | | |
| (Callable 10/15/2030) | | | 15,000,000 | | | | 13,464,909 | | | | | |
| 6.300%, 10/09/2037 | | | 2,190,000 | | | | 2,319,440 | | | | | |
| Lloyds Banking Group PLC: | | | | | | | | | | | | |
3.750%, 01/11/2027(1) | | | 7,800,000 | | | | 7,490,499 | | | | | |
4.375%, 03/22/2028(1) | | | 15,000,000 | | | | 14,673,425 | | | | | |
| 3.574%, 11/07/2028 | | | | | | | | | | | | |
| (3 Month LIBOR USD + 1.205%) | | | | | | | | | | | | |
(Callable 11/07/2027)(1)(3)(10) | | | 21,550,000 | | | | 20,259,377 | | | | | |
| 5.871%, 03/06/2029 | | | | | | | | | | | | |
| (1 Year CMT Rate + 1.700%) | | | | | | | | | | | | |
(Callable 03/06/2028)(1)(3) | | | 11,300,000 | | | | 11,584,498 | | | | | |
| LPL Holdings, Inc.: | | | | | | | | | | | | |
| 6.750%, 11/17/2028 | | | | | | | | | | | | |
| (Callable 10/17/2028) | | | 7,725,000 | | | | 8,235,004 | | | | | |
| 4.000%, 03/15/2029 | | | | | | | | | | | | |
(Callable 03/15/2024)(2) | | | 21,726,000 | | | | 20,083,456 | | | | | |
| M&T Bank Corp., | | | | | | | | | | | | |
| 4.000%, 07/15/2024 | | | | | | | | | | | | |
| (Callable 04/16/2024) | | | 4,400,000 | | | | 4,357,348 | | | | | |
| Macquarie Bank Ltd.: | | | | | | | | | | | | |
4.875%, 06/10/2025(1)(2) | | | 7,800,000 | | | | 7,703,288 | | | | | |
3.624%, 06/03/2030(1)(2) | | | 28,805,000 | | | | 25,061,358 | | | | | |
6.798%, 01/18/2033(1)(2) | | | 10,000,000 | | | | 10,648,681 | | | | | |
| Macquarie Group Ltd.: | | | | | | | | | | | | |
| 5.108%, 08/09/2026 (SOFR + 2.208%) | | | | | | | | | | | | |
(Callable 08/09/2025)(1)(2)(3) | | | 9,850,000 | | | | 9,809,304 | | | | | |
| 2.691%, 06/23/2032 (SOFR + 1.440%) | | | | | | | | | | | | |
(Callable 06/23/2031)(1)(2)(3) | | | 10,000,000 | | | | 8,217,408 | | | | | |
| 6.255%, 12/07/2034 (SOFR + 2.303%) | | | | | | | | | | | | |
(Callable 12/07/2033)(1)(2)(3) | | | 16,977,000 | | | | 17,762,591 | | | | | |
| Manulife Financial Corp.: | | | | | | | | | | | | |
4.150%, 03/04/2026(1) | | | 15,000,000 | | | | 14,790,342 | | | | | |
| 2.484%, 05/19/2027 | | | | | | | | | | | | |
(Callable 03/19/2027)(1) | | | 15,225,000 | | | | 14,112,884 | | | | | |
The accompanying notes are an integral part of these financial statements.
Baird Core Plus Bond Fund
Schedule of Investments, December 31, 2023
Long-Term Investments (cont.)
| | | Principal | | | | | | % of | |
| | | Amount | | | Value | | | Net Assets | |
| Maple Grove Funding Trust I, | | | | | | | | | |
| 4.161%, 08/15/2051 | | | | | | | | | |
(Callable 02/15/2051)(2) | | $ | 15,000,000 | | | $ | 10,546,628 | | | |
| |
| Marsh & McLennan Companies, Inc.: | | | | | | | | | | | | |
| 3.750%, 03/14/2026 | | | | | | | | | | | | |
| (Callable 12/14/2025) | | | 9,225,000 | | | | 9,053,913 | | | | | |
| 5.450%, 03/15/2053 | | | | | | | | | | | | |
| (Callable 09/15/2052) | | | 4,000,000 | | | | 4,201,738 | | | | | |
| Massachusetts Mutual Life Insurance Co.: | | | | | | | | | | | | |
| 5.077%, 02/15/2069 | | | | | | | | | | | | |
| (3 Month LIBOR USD + 3.191%) | | | | | | | | | | | | |
(Callable 02/15/2049)(2)(3)(10) | | | 26,000,000 | | | | 23,675,727 | | | | | |
3.729%, 10/15/2070(2) | | | 19,253,000 | | | | 13,282,889 | | | | | |
4.900%, 04/01/2077(2) | | | 13,000,000 | | | | 11,086,304 | | | | | |
| MBIA Insurance Corp., | | | | | | | | | | | | |
| 16.915%, 01/15/2033 | | | | | | | | | | | | |
| (3 Month TSFR + 11.522%) | | | | | | | | | | | | |
(Callable 01/15/2028)(2)(3)(8) | | | 700,000 | | | | 24,500 | | | | | |
| MetLife, Inc., | | | | | | | | | | | | |
| 4.875%, 11/13/2043 | | | 3,375,000 | | | | 3,300,382 | | | | | |
| Metropolitan Life Global Funding I: | | | | | | | | | | | | |
2.950%, 04/09/2030(2) | | | 9,025,000 | | | | 8,027,816 | | | | | |
5.150%, 03/28/2033(2) | | | 12,656,000 | | | | 12,902,068 | | | | | |
| Metropolitan Life Insurance Co., | | | | | | | | | | | | |
7.800%, 11/01/2025(2) | | | 3,725,000 | | | | 3,891,024 | | | | | |
| Mitsubishi UFJ Financial Group, Inc.: | | | | | | | | | | | | |
| 1.538%, 07/20/2027 | | | | | | | | | | | | |
| (1 Year CMT Rate + 0.750%) | | | | | | | | | | | | |
(Callable 07/20/2026)(1)(3) | | | 24,400,000 | | | | 22,305,471 | | | | | |
| 5.475%, 02/22/2031 | | | | | | | | | | | | |
| (1 Year CMT Rate + 1.530%) | | | | | | | | | | | | |
(Callable 02/22/2030)(1)(3) | | | 3,000,000 | | | | 3,076,754 | | | | | |
| Mizuho Financial Group, Inc.: | | | | | | | | | | | | |
| 1.234%, 05/22/2027 | | | | | | | | | | | | |
| (1 Year CMT Rate + 0.670%) | | | | | | | | | | | | |
(Callable 05/22/2026)(1)(3) | | | 10,000,000 | | | | 9,114,382 | | | | | |
3.170%, 09/11/2027(1) | | | 22,000,000 | | | | 20,680,514 | | | | | |
4.018%, 03/05/2028(1) | | | 2,650,000 | | | | 2,573,343 | | | | | |
| 1.979%, 09/08/2031 | | | | | | | | | | | | |
| (3 Month TSFR + 1.532%) | | | | | | | | | | | | |
(Callable 09/08/2030)(1)(3) | | | 7,250,000 | | | | 5,920,517 | | | | | |
| Morgan Stanley: | | | | | | | | | | | | |
| 4.000%, 07/23/2025 | | | 2,500,000 | | | | 2,464,330 | | | | | |
| 2.188%, 04/28/2026 (SOFR + 1.990%) | | | | | | | | | | | | |
(Callable 04/28/2025)(3) | | | 40,000,000 | | | | 38,431,624 | | | | | |
| 3.125%, 07/27/2026 | | | 13,175,000 | | | | 12,619,739 | | | | | |
| 3.591%, 07/22/2028 | | | | | | | | | | | | |
| (3 Month LIBOR USD + 1.340%) | | | | | | | | | | | | |
(Callable 07/22/2027)(4)(10) | | | 22,350,000 | | | | 21,356,392 | | | | | |
| 6.296%, 10/18/2028 (SOFR + 2.240%) | | | | | | | | | | | | |
(Callable 10/18/2027)(3) | | | 25,000,000 | | | | 26,205,894 | | | | | |
| 5.123%, 02/01/2029 (SOFR + 1.730%) | | | | | | | | | | | | |
(Callable 02/01/2028)(3) | | | 10,000,000 | | | | 10,053,997 | | | | | |
| 2.239%, 07/21/2032 (SOFR + 1.178%) | | | | | | | | | | | | |
(Callable 07/21/2031)(3) | | | 9,705,000 | | | | 7,923,853 | | | | | |
| 6.342%, 10/18/2033 (SOFR + 2.560%) | | | | | | | | | | | | |
(Callable 10/18/2032)(3) | | | 5,000,000 | | | | 5,401,118 | | | | | |
| 5.424%, 07/21/2034 (SOFR + 1.880%) | | | | | | | | | | | | |
(Callable 07/21/2033)(3) | | | 8,600,000 | | | | 8,745,361 | | | | | |
| National Australia Bank Ltd.: | | | | | | | | | | | | |
2.332%, 08/21/2030(1)(2) | | | 60,200,000 | | | | 49,110,461 | | | | | |
2.990%, 05/21/2031(1)(2) | | | 24,495,000 | | | | 20,531,695 | | | | | |
6.429%, 01/12/2033(1)(2) | | | 12,025,000 | | | | 12,755,580 | | | | | |
| 3.933%, 08/02/2034 | | | | | | | | | | | | |
| (5 Year CMT Rate + 1.880%) | | | | | | | | | | | | |
(Callable 08/02/2029)(1)(2)(3) | | | 5,000,000 | | | | 4,536,863 | | | | | |
| 3.347%, 01/12/2037 | | | | | | | | | | | | |
| (5 Year CMT Rate + 1.700%) | | | | | | | | | | | | |
(Callable 01/12/2032)(1)(2)(3) | | | 14,000,000 | | | | 11,640,908 | | | | | |
| National Bank of Canada, | | | | | | | | | | | | |
5.600%, 12/18/2028(1) | | | 20,000,000 | | | | 20,526,905 | | | | | |
| Nationwide Building Society: | | | | | | | | | | | | |
3.900%, 07/21/2025(1)(2) | | | 8,100,000 | | | | 7,945,031 | | | | | |
4.000%, 09/14/2026(1)(2) | | | 63,394,000 | | | | 60,857,745 | | | | | |
| 4.302%, 03/08/2029 | | | | | | | | | | | | |
| (3 Month LIBOR USD + 1.452%) | | | | | | | | | | | | |
(Callable 03/08/2028)(1)(2)(3)(10) | | | 3,525,000 | | | | 3,377,731 | | | | | |
| 3.960%, 07/18/2030 | | | | | | | | | | | | |
| (3 Month LIBOR USD + 1.855%) | | | | | | | | | | | | |
(Callable 07/18/2029)(1)(2)(3)(10) | | | 17,125,000 | | | | 15,979,752 | | | | | |
| Nationwide Financial Services, Inc., | | | | | | | | | | | | |
| 3.900%, 11/30/2049 | | | | | | | | | | | | |
(Callable 05/30/2049)(2) | | | 17,500,000 | | | | 13,919,122 | | | | | |
| Nationwide Mutual Insurance Co.: | | | | | | | | | | | | |
7.875%, 04/01/2033(2) | | | 5,600,000 | | | | 6,339,066 | | | | | |
9.375%, 08/15/2039(2) | | | 22,409,000 | | | | 29,651,425 | | | | | |
| NatWest Group PLC: | | | | | | | | | | | | |
| 1.642%, 06/14/2027 | | | | | | | | | | | | |
| (1 Year CMT Rate + 0.900%) | | | | | | | | | | | | |
(Callable 06/14/2026)(1)(3) | | | 11,725,000 | | | | 10,708,546 | | | | | |
| 4.892%, 05/18/2029 | | | | | | | | | | | | |
| (3 Month LIBOR USD + 1.754%) | | | | | | | | | | | | |
(Callable 05/18/2028)(1)(3)(10) | | | 5,150,000 | | | | 5,061,145 | | | | | |
| 5.808%, 09/13/2029 | | | | | | | | | | | | |
| (1 Year CMT Rate + 1.950%) | | | | | | | | | | | | |
(Callable 09/13/2028)(1)(3) | | | 32,500,000 | | | | 33,353,499 | | | | | |
| 4.445%, 05/08/2030 | | | | | | | | | | | | |
| (3 Month LIBOR USD + 1.871%) | | | | | | | | | | | | |
(Callable 05/08/2029)(1)(3)(10) | | | 11,000,000 | | | | 10,553,500 | | | | | |
| New England Mutual Life Insurance Co., | | | | | | | | | | | | |
7.875%, 02/15/2024(2) | | | 3,200,000 | | | | 3,203,652 | | | | | |
| New York Life Insurance Co.: | | | | | | | | | | | | |
6.750%, 11/15/2039(2) | | | 25,105,000 | | | | 28,943,543 | | | | | |
| 4.450%, 05/15/2069 | | | | | | | | | | | | |
(Callable 11/15/2068)(2) | | | 10,000,000 | | | | 8,600,002 | | | | | |
| Nomura Holdings, Inc.: | | | | | | | | | | | | |
2.648%, 01/16/2025(1) | | | 10,000,000 | | | | 9,701,822 | | | | | |
1.851%, 07/16/2025(1) | | | 15,000,000 | | | | 14,204,660 | | | | | |
2.172%, 07/14/2028(1) | | | 30,000,000 | | | | 26,352,905 | | | | | |
2.710%, 01/22/2029(1) | | | 9,600,000 | | | | 8,505,885 | | | | | |
| Old Republic International Corp., | | | | | | | | | | | | |
| 3.850%, 06/11/2051 | | | | | | | | | | | | |
| (Callable 12/11/2050) | | | 12,550,000 | | | | 9,218,711 | | | | | |
| Peachtree Corners Funding Trust, | | | | | | | | | | | | |
3.976%, 02/15/2025(2) | | | 16,000,000 | | | | 15,735,524 | | | | | |
| Pine Street Trust I, | | | | | | | | | | | | |
| 4.572%, 02/15/2029 | | | | | | | | | | | | |
(Callable 11/15/2028)(2) | | | 5,000,000 | | | | 4,759,328 | | | | | |
| Pricoa Global Funding I, | | | | | | | | | | | | |
5.100%, 05/30/2028(2) | | | 4,700,000 | | | | 4,756,806 | | | | | |
| Prologis LP, | | | | | | | | | | | | |
| 5.250%, 06/15/2053 | | | | | | | | | | | | |
| (Callable 12/15/2052) | | | 6,600,000 | | | | 6,883,724 | | | | | |
| Protective Life Corp., | | | | | | | | | | | | |
| 4.300%, 09/30/2028 | | | | | | | | | | | | |
(Callable 06/30/2028)(1)(2) | | | 4,105,000 | | | | 3,989,374 | | | | | |
The accompanying notes are an integral part of these financial statements.
Baird Core Plus Bond Fund
Schedule of Investments, December 31, 2023
Long-Term Investments (cont.)
| | | Principal | | | | | | % of | |
| | | Amount | | | Value | | | Net Assets | |
| Protective Life Global Funding, | | | | | | | | | |
5.209%, 04/14/2026(1)(2) | | $ | 22,000,000 | | | $ | 21,975,964 | | | |
| |
| Prudential Insurance Co. of America, | | | | | | | | | | | | |
8.300%, 07/01/2025(2) | | | 21,011,000 | | | | 21,695,675 | | | | | |
| Raymond James Financial, Inc., | | | | | | | | | | | | |
| 4.950%, 07/15/2046 | | | 15,000,000 | | | | 14,058,344 | | | | | |
| Regions Bank, | | | | | | | | | | | | |
| 6.450%, 06/26/2037 | | | 3,864,000 | | | | 3,936,289 | | | | | |
| Reliance Standard Life Global Funding II, | | | | | | | | | | | | |
2.500%, 10/30/2024(1)(2) | | | 20,000,000 | | | | 19,463,726 | | | | | |
| Retail Opportunity | | | | | | | | | | | | |
| Investments Partnership LP, | | | | | | | | | | | | |
| 6.750%, 10/15/2028 | | | | | | | | | | | | |
| (Callable 09/15/2028) | | | 20,000,000 | | | | 21,027,844 | | | | | |
| Rexford Industrial Realty LP, | | | | | | | | | | | | |
| 2.125%, 12/01/2030 | | | | | | | | | | | | |
| (Callable 09/01/2030) | | | 13,000,000 | | | | 10,644,364 | | | | | |
| Rocket Mortgage LLC / | | | | | | | | | | | | |
| Rocket Mortgage Co-Issuer, Inc., | | | | | | | | | | | | |
| 2.875%, 10/15/2026 | | | | | | | | | | | | |
(Callable 01/29/2024)(2) | | | 10,000,000 | | | | 9,225,000 | | | | | |
| Royal Bank of Canada, | | | | | | | | | | | | |
4.650%, 01/27/2026(1) | | | 29,930,000 | | | | 29,686,751 | | | | | |
| Sammons Financial Group, Inc., | | | | | | | | | | | | |
| 3.350%, 04/16/2031 | | | | | | | | | | | | |
(Callable 01/16/2031)(2) | | | 25,000,000 | | | | 20,094,659 | | | | | |
| Santander Holdings USA, Inc., | | | | | | | | | | | | |
| 3.450%, 06/02/2025 | | | | | | | | | | | | |
(Callable 05/02/2025)(1) | | | 10,000,000 | | | | 9,705,942 | | | | | |
| Santander UK Group Holdings PLC, | | | | | | | | | | | | |
| 1.673%, 06/14/2027 (SOFR + 0.989%) | | | | | | | | | | | | |
(Callable 06/14/2026)(1)(3) | | | 20,000,000 | | | | 18,188,009 | | | | | |
| SMBC Aviation Capital Finance DAC, | | | | | | | | | | | | |
| 5.700%, 07/25/2033 | | | | | | | | | | | | |
(Callable 04/25/2033)(1)(2) | | | 35,000,000 | | | | 35,458,835 | | | | | |
| Societe Generale SA: | | | | | | | | | | | | |
5.000%, 01/17/2024(1)(2) | | | 18,000,000 | | | | 17,989,269 | | | | | |
2.625%, 10/16/2024(1)(2) | | | 14,575,000 | | | | 14,228,100 | | | | | |
2.625%, 01/22/2025(1)(2) | | | 24,600,000 | | | | 23,838,467 | | | | | |
4.250%, 04/14/2025(1)(2) | | | 30,420,000 | | | | 29,722,372 | | | | | |
4.250%, 08/19/2026(1)(2) | | | 10,572,000 | | | | 10,155,971 | | | | | |
| 2.797%, 01/19/2028 | | | | | | | | | | | | |
| (1 Year CMT Rate + 1.300%) | | | | | | | | | | | | |
(Callable 01/19/2027)(1)(2)(3) | | | 8,000,000 | | | | 7,376,418 | | | | | |
| 6.446%, 01/10/2029 | | | | | | | | | | | | |
| (1 Year CMT Rate + 2.550%) | | | | | | | | | | | | |
(Callable 01/10/2028)(1)(2)(3) | | | 12,525,000 | | | | 12,966,787 | | | | | |
| 2.889%, 06/09/2032 | | | | | | | | | | | | |
| (1 Year CMT Rate + 1.300%) | | | | | | | | | | | | |
(Callable 06/09/2031)(1)(2)(3) | | | 7,000,000 | | | | 5,785,515 | | | | | |
3.625%, 03/01/2041(1)(2) | | | 9,200,000 | | | | 6,296,437 | | | | | |
| Standard Chartered PLC: | | | | | | | | | | | | |
| 3.785%, 05/21/2025 | | | | | | | | | | | | |
| (3 Month LIBOR USD + 1.560%) | | | | | | | | | | | | |
(Callable 05/21/2024)(1)(2)(3)(10) | | | 25,225,000 | | | | 25,002,669 | | | | | |
| 2.819%, 01/30/2026 | | | | | | | | | | | | |
| (3 Month LIBOR USD + 1.209%) | | | | | | | | | | | | |
(Callable 01/30/2025)(1)(2)(3)(10) | | | 14,075,000 | | | | 13,608,936 | | | | | |
| 1.456%, 01/14/2027 | | | | | | | | | | | | |
| (1 Year CMT Rate + 1.000%) | | | | | | | | | | | | |
(Callable 01/14/2026)(1)(2)(3) | | | 15,000,000 | | | | 13,735,530 | | | | | |
| 2.608%, 01/12/2028 | | | | | | | | | | | | |
| (1 Year CMT Rate + 1.180%) | | | | | | | | | | | | |
(Callable 01/12/2027)(1)(2)(3) | | | 18,000,000 | | | | 16,460,506 | | | | | |
| 6.301%, 01/09/2029 | | | | | | | | | | | | |
| (1 Year CMT Rate + 2.450%) | | | | | | | | | | | | |
(Callable 01/09/2028)(1)(2)(3) | | | 4,000,000 | | | | 4,099,163 | | | | | |
| 4.644%, 04/01/2031 | | | | | | | | | | | | |
| (1 Year CMT Rate + 3.850%) | | | | | | | | | | | | |
(Callable 04/01/2030)(1)(2)(3) | | | 7,000,000 | | | | 6,607,865 | | | | | |
5.700%, 03/26/2044(1)(2) | | | 14,000,000 | | | | 13,728,262 | | | | | |
| State Street Corp., | | | | | | | | | | | | |
| 2.901%, 03/30/2026 (SOFR + 2.600%) | | | | | | | | | | | | |
(Callable 03/30/2025)(3) | | | 12,975,000 | | | | 12,608,107 | | | | | |
| Stifel Financial Corp., | | | | | | | | | | | | |
| 4.000%, 05/15/2030 | | | | | | | | | | | | |
| (Callable 02/15/2030) | | | 6,325,000 | | | | 5,746,834 | | | | | |
| Sumitomo Mitsui Financial Group, Inc.: | | | | | | | | | | | | |
5.520%, 01/13/2028(1) | | | 30,000,000 | | | | 30,732,479 | | | | | |
5.800%, 07/13/2028(1) | | | 10,000,000 | | | | 10,361,615 | | | | | |
5.852%, 07/13/2030(1) | | | 23,375,000 | | | | 24,531,484 | | | | | |
| Svenska Handelsbanken AB, | | | | | | | | | | | | |
5.500%, 06/15/2028(1)(2) | | | 22,195,000 | | | | 22,573,169 | | | | | |
| Swedbank AB, | | | | | | | | | | | | |
6.136%, 09/12/2026(1)(2) | | | 18,000,000 | | | | 18,355,699 | | | | | |
| Synchrony Bank, | | | | | | | | | | | | |
| 5.625%, 08/23/2027 | | | | | | | | | | | | |
| (Callable 07/23/2027) | | | 5,000,000 | | | | 4,918,083 | | | | | |
| Synchrony Financial: | | | | | | | | | | | | |
| 4.250%, 08/15/2024 | | | | | | | | | | | | |
| (Callable 05/15/2024) | | | 33,325,000 | | | | 32,956,946 | | | | | |
| 4.500%, 07/23/2025 | | | | | | | | | | | | |
| (Callable 04/23/2025) | | | 12,795,000 | | | | 12,499,588 | | | | | |
| 3.950%, 12/01/2027 | | | | | | | | | | | | |
| (Callable 09/01/2027) | | | 43,000,000 | | | | 40,213,702 | | | | | |
| 2.875%, 10/28/2031 | | | | | | | | | | | | |
| (Callable 07/28/2031) | | | 15,000,000 | | | | 12,039,575 | | | | | |
| 7.250%, 02/02/2033 | | | | | | | | | | | | |
| (Callable 11/02/2032) | | | 7,000,000 | | | | 6,960,382 | | | | | |
| Trinity Acquisition PLC: | | | | | | | | | | | | |
| 4.400%, 03/15/2026 | | | | | | | | | | | | |
| (Callable 12/15/2025) | | | 15,776,000 | | | | 15,577,568 | | | | | |
| 6.125%, 08/15/2043 | | | 23,630,000 | | | | 24,206,218 | | | | | |
| Truist Financial Corp.: | | | | | | | | | | | | |
| 4.873%, 01/26/2029 (SOFR + 1.435%) | | | | | | | | | | | | |
(Callable 01/26/2028)(3) | | | 10,000,000 | | | | 9,861,872 | | | | | |
| 7.161%, 10/30/2029 (SOFR + 2.446%) | | | | | | | | | | | | |
(Callable 10/30/2028)(3) | | | 8,000,000 | | | | 8,649,279 | | | | | |
| UBS Group AG: | | | | | | | | | | | | |
3.750%, 03/26/2025(1) | | | 15,000,000 | | | | 14,697,322 | | | | | |
| 2.593%, 09/11/2025 (SOFR + 1.560%) | | | | | | | | | | | | |
(Callable 09/11/2024)(1)(2)(3) | | | 13,700,000 | | | | 13,403,310 | | | | | |
| 2.193%, 06/05/2026 (SOFR + 2.044%) | | | | | | | | | | | | |
(Callable 06/05/2025)(1)(2)(3) | | | 10,000,000 | | | | 9,511,643 | | | | | |
| 5.711%, 01/12/2027 | | | | | | | | | | | | |
| (1 Year CMT Rate + 1.550%) | | | | | | | | | | | | |
(Callable 01/12/2026)(1)(2)(3) | | | 30,000,000 | | | | 30,177,821 | | | | | |
| 1.305%, 02/02/2027 (SOFRINDX + | | | | | | | | | | | | |
0.980%) (Callable 02/02/2026)(1)(2)(3) | | | 19,400,000 | | | | 17,755,391 | | | | | |
| 1.494%, 08/10/2027 | | | | | | | | | | | | |
| (1 Year CMT Rate + 0.850%) | | | | | | | | | | | | |
(Callable 08/10/2026)(1)(2)(3) | | | 10,000,000 | | | | 9,039,364 | | | | | |
| 4.282%, 01/09/2028 | | | | | | | | | | | | |
(Callable 01/09/2027)(1)(2) | | | 24,750,000 | | | | 23,972,382 | | | | | |
| 3.869%, 01/12/2029 | | | | | | | | | | | | |
| (3 Month LIBOR USD + 1.410%) | | | | | | | | | | | | |
(Callable 01/12/2028)(1)(2)(3)(10) | | | 10,850,000 | | | | 10,236,090 | | | | | |
The accompanying notes are an integral part of these financial statements.
Baird Core Plus Bond Fund
Schedule of Investments, December 31, 2023
Long-Term Investments (cont.)
| | | Principal | | | | | | % of | |
| | | Amount | | | Value | | | Net Assets | |
| UBS Group AG: (cont.) | | | | | | | | | |
| 6.246%, 09/22/2029 | | | | | | | | | |
| (1 Year CMT Rate + 1.800%) | | | | | | | | | |
(Callable 09/22/2028)(1)(2)(3) | | $ | 5,000,000 | | | $ | 5,214,116 | | | | |
| 4.194%, 04/01/2031 (SOFR + 3.730%) | | | | | | | | | | | |
(Callable 04/01/2030)(1)(2)(3) | | | 20,000,000 | | | | 18,646,662 | | | | |
| 2.095%, 02/11/2032 | | | | | | | | | | | |
| (1 Year CMT Rate + 1.000%) | | | | | | | | | | | |
(Callable 02/11/2031)(1)(2)(3) | | | 12,550,000 | | | | 10,027,074 | | | | |
| 4.988%, 08/05/2033 | | | | | | | | | | | |
| (1 Year CMT Rate + 2.400%) | | | | | | | | | | | |
(Callable 08/05/2032)(1)(2)(3) | | | 3,000,000 | | | | 2,904,388 | | | | |
| UBS Group Funding Switzerland AG, | | | | | | | | | | | |
4.125%, 09/24/2025(1)(2) | | | 6,500,000 | | | | 6,358,367 | | | | |
| UnitedHealth Group, Inc., | | | | | | | | | | | |
| 4.625%, 07/15/2035 | | | 12,175,000 | | | | 12,258,148 | | | | |
| US Bancorp, | | | | | | | | | | | |
| 4.653%, 02/01/2029 (SOFR + 1.230%) | | | | | | | | | | | |
(Callable 02/01/2028)(3) | | | 3,684,000 | | | | 3,629,085 | | | | |
| Wells Fargo & Co.: | | | | | | | | | | | |
| 2.406%, 10/30/2025 | | | | | | | | | | | |
| (3 Month TSFR + 1.087%) | | | | | | | | | | | |
(Callable 10/30/2024)(3) | | | 2,500,000 | | | | 2,432,138 | | | | |
| 2.164%, 02/11/2026 | | | | | | | | | | | |
| (3 Month TSFR + 1.012%) | | | | | | | | | | | |
(Callable 02/11/2025)(3) | | | 15,000,000 | | | | 14,437,762 | | | | |
| 3.000%, 04/22/2026 | | | 4,000,000 | | | | 3,832,930 | | | | |
| 4.808%, 07/25/2028 (SOFR + 1.980%) | | | | | | | | | | | |
(Callable 07/25/2027)(3) | | | 5,500,000 | | | | 5,461,773 | | | | |
| 6.303%, 10/23/2029 (SOFR + 1.790%) | | | | | | | | | | | |
(Callable 10/23/2028)(3) | | | 12,800,000 | | | | 13,502,464 | | | | |
| 3.350%, 03/02/2033 (SOFR + 1.500%) | | | | | | | | | | | |
(Callable 03/02/2032)(3) | | | 5,000,000 | | | | 4,379,694 | | | | |
| 5.557%, 07/25/2034 (SOFR + 1.990%) | | | | | | | | | | | |
(Callable 07/25/2033)(3) | | | 28,000,000 | | | | 28,567,181 | | | | |
| 3.068%, 04/30/2041 (SOFR + 2.530%) | | | | | | | | | | | |
(Callable 04/30/2040)(3) | | | 35,000,000 | | | | 26,543,029 | | | | |
| 5.013%, 04/04/2051 | | | | | | | | | | | |
| (3 Month TSFR + 4.502%) | | | | | | | | | | | |
(Callable 04/04/2050)(3) | | | 8,000,000 | | | | 7,612,824 | | | | |
| Westpac Banking Corp.: | | | | | | | | | | | |
| 2.894%, 02/04/2030 | | | | | | | | | | | |
| (5 Year CMT Rate + 1.350%) | | | | | | | | | | | |
(Callable 02/04/2025)(1)(3) | | | 18,059,000 | | | | 17,396,329 | | | | |
| 4.322%, 11/23/2031 | | | | | | | | | | | |
| (5 Year Mid Swap Rate USD + 2.236%) | | | | | | | | | | | |
(Callable 11/23/2026)(1)(3) | | | 10,000,000 | | | | 9,619,434 | | | | |
| 5.405%, 08/10/2033 | | | | | | | | | | | |
| (1 Year CMT Rate + 2.680%) | | | | | | | | | | | |
(Callable 08/10/2032)(1)(3) | | | 3,000,000 | | | | 2,988,307 | | | | |
6.820%, 11/17/2033(1) | | | 6,000,000 | | | | 6,526,189 | | | | |
| 4.110%, 07/24/2034 | | | | | | | | | | | |
| (5 Year CMT Rate + 2.000%) | | | | | | | | | | | |
(Callable 07/24/2029)(1)(3) | | | 10,000,000 | | | | 9,151,123 | | | | |
| 2.668%, 11/15/2035 | | | | | | | | | | | |
| (5 Year CMT Rate + 1.750%) | | | | | | | | | | | |
(Callable 11/15/2030)(1)(3) | | | 10,000,000 | | | | 8,149,043 | | | | |
| Willis North America, Inc.: | | | | | | | | | | | |
| 2.950%, 09/15/2029 | | | | | | | | | | | |
| (Callable 06/15/2029) | | | 10,600,000 | | | | 9,490,413 | | | | |
| 5.350%, 05/15/2033 | | | | | | | | | | | |
| (Callable 02/15/2033) | | | 6,000,000 | | | | 6,066,227 | | | | |
| 5.050%, 09/15/2048 | | | | | | | | | | | |
| (Callable 03/15/2048) | | | 15,000,000 | | | | 14,025,919 | | | | |
| Total Financials | | | | | | | | | | | |
| (Cost $5,248,294,821) | | | | | | | 4,967,426,767 | | | | 17.8 | % |
| Total Corporate Bonds | | | | | | | | | | | | |
| (Cost $13,545,935,956) | | | | | | | 12,729,753,706 | | | | 45.7 | % |
| Municipal Bonds | | | | | | | | | | | | |
| Arizona Industrial Development Authority: | | | | | | | | | | | | |
| 4.950%, 04/01/2026 | | | | | | | | | | | | |
| (Callable 04/01/2024) (Mandatory | | | | | | | | | | | | |
Tender Date 04/01/2025)(2)(4) | | | 41,325,000 | | | | 40,172,421 | | | | | |
| 4.950%, 04/01/2026 | | | | | | | | | | | | |
| (Callable 04/01/2024) (Mandatory | | | | | | | | | | | | |
Tender Date 04/01/2025)(4) | | | 15,830,000 | | | | 15,375,785 | | | | | |
| Black Belt Energy Gas District, | | | | | | | | | | | | |
| 6.000%, 02/01/2029 | | | | | | | | | | | | |
| (Callable 11/01/2028) | | | 9,120,000 | | | | 9,239,165 | | | | | |
| Brazos Higher Education Authority, Inc.: | | | | | | | | | | | | |
| 1.931%, 04/01/2024 | | | 1,000,000 | | | | 991,687 | | | | | |
| 1.981%, 04/01/2025 | | | 1,000,000 | | | | 964,639 | | | | | |
| 2.076%, 04/01/2026 | | | 1,000,000 | | | | 944,301 | | | | | |
| 2.176%, 04/01/2027 | | | 1,300,000 | | | | 1,200,924 | | | | | |
| 2.310%, 04/01/2028 | | | 1,000,000 | | | | 907,694 | | | | | |
| 2.410%, 04/01/2029 | | | 2,360,000 | | | | 2,093,389 | | | | | |
| 2.510%, 04/01/2030 | | | 1,175,000 | | | | 1,019,742 | | | | | |
| 2.760%, 04/01/2040 | | | | | | | | | | | | |
| (Callable 04/01/2030) | | | 125,000 | | | | 124,144 | | | | | |
| California Community Choice | | | | | | | | | | | | |
| Financing Authority, | | | | | | | | | | | | |
| 6.125%, 04/01/2030 | | | 4,000,000 | | | | 4,090,049 | | | | | |
| California Housing Finance Agency, | | | | | | | | | | | | |
| 2.794%, 08/01/2036 | | | | | | | | | | | | |
| (Pre-refunded to 08/01/2025) | | | 2,205,000 | | | | 2,174,239 | | | | | |
| California Qualified School | | | | | | | | | | | | |
| Bond Joint Powers Authority, | | | | | | | | | | | | |
| 7.155%, 03/01/2027 | | | 1,135,000 | | | | 1,181,850 | | | | | |
| Colton Joint Unified School District, | | | | | | | | | | | | |
| 6.008%, 08/01/2026 | | | 1,250,000 | | | | 1,294,635 | | | | | |
| County of Hamilton OH, | | | | | | | | | | | | |
| 3.756%, 06/01/2042 (Insured by AGM) | | | 25,725,000 | | | | 21,498,691 | | | | | |
| Illinois Housing Development Authority, | | | | | | | | | | | | |
| 5.750%, 10/01/2053 (Callable | | | | | | | | | | | | |
| 10/01/2032) (Insured by GNMA) | | | 5,645,000 | | | | 5,794,557 | | | | | |
| Illinois International Port District, | | | | | | | | | | | | |
| 5.000%, 01/01/2035 | | | | | | | | | | | | |
(Callable 01/01/2026)(2) | | | 3,285,000 | | | | 2,952,232 | | | | | |
| Iowa Student Loan Liquidity Corp., | | | | | | | | | | | | |
| 2.989%, 12/01/2039 | | | | | | | | | | | | |
| (Callable 12/01/2029) | | | 580,000 | | | | 577,585 | | | | | |
| Maryland Economic Development Corp., | | | | | | | | | | | | |
| 3.997%, 04/01/2034 | | | | | | | | | | | | |
| (Callable 01/01/2034) | | | 40,100,000 | | | | 32,191,542 | | | | | |
| Massachusetts Educational | | | | | | | | | | | | |
| Financing Authority: | | | | | | | | | | | | |
| 2.455%, 07/01/2030 | | | 8,375,000 | | | | 7,198,225 | | | | | |
| 2.555%, 07/01/2031 | | | 5,000,000 | | | | 4,208,756 | | | | | |
| 3.775%, 07/01/2035 | | | | | | | | | | | | |
| (Callable 07/01/2029) | | | 4,010,000 | | | | 3,946,089 | | | | | |
| Minnesota Housing Finance Agency: | | | | | | | | | | | | |
| 2.680%, 10/01/2046 (Callable | | | | | | | | | | | | |
| 01/01/2026) (Insured by GNMA) | | | 9,786,275 | | | | 8,066,715 | | | | | |
The accompanying notes are an integral part of these financial statements.
Baird Core Plus Bond Fund
Schedule of Investments, December 31, 2023
Long-Term Investments (cont.)
| | | Principal | | | | | | % of | |
| | | Amount | | | Value | | | Net Assets | |
| Minnesota Housing Finance Agency: (cont.) | | | | | | | | | |
| 2.650%, 11/01/2046 (Callable | | | | | | | | | |
| 01/01/2026) (Insured by GNMA) | | $ | 10,170,451 | | | $ | 8,373,262 | | | | |
| 6.250%, 07/01/2053 (Callable | | | | | | | | | | | |
| 01/01/2033) (Insured by GNMA) | | | 2,400,000 | | | | 2,498,237 | | | | |
| New Hampshire Business | | | | | | | | | | | |
| Finance Authority: | | | | | | | | | | | |
| 3.250%, 04/01/2028 | | | | | | | | | | | |
| (Callable 01/01/2028) | | | 33,000,000 | | | | 28,703,552 | | | | |
| 3.300%, 04/01/2032 | | | | | | | | | | | |
| (Callable 01/01/2032) | | | 20,000,000 | | | | 15,641,408 | | | | |
| 2.872%, 07/01/2035 | | | | | | | | | | | |
| (Callable 01/01/2035) | | | 17,515,000 | | | | 12,690,996 | | | | |
| New Hampshire Housing | | | | | | | | | | | |
| Finance Authority, | | | | | | | | | | | |
| 3.750%, 07/01/2034 | | | | | | | | | | | |
| (Callable 01/29/2024) | | | 40,000 | | | | 39,587 | | | | |
| North Carolina Housing Finance Agency: | | | | | | | | | | | |
| 2.870%, 07/01/2032 | | | | | | | | | | | |
| (Callable 01/29/2024) | | | 815,000 | | | | 795,753 | | | | |
| 2.812%, 07/01/2035 | | | | | | | | | | | |
| (Callable 01/29/2024) | | | 760,000 | | | | 749,269 | | | | |
| North Dakota Housing Finance Agency, | | | | | | | | | | | |
| 6.250%, 01/01/2054 | | | | | | | | | | | |
| (Callable 07/01/2032) | | | 7,500,000 | | | | 7,777,348 | | | | |
| Ohio Housing Finance Agency, | | | | | | | | | | | |
| 6.500%, 03/01/2054 (Callable | | | | | | | | | | | |
| 09/01/2033) (Insured by GNMA) | | | 8,320,000 | | | | 8,772,969 | | | | |
| Public Finance Authority, | | | | | | | | | | | |
| 0.000%, 12/15/2027 | | | | | | | | | | | |
| (Callable 01/29/2024) | | | 12,770,000 | | | | 10,437,278 | | | | |
| Rhode Island Student Loan Authority: | | | | | | | | | | | |
| 2.400%, 12/01/2024 | | | 1,165,000 | | | | 1,137,921 | | | | |
| 2.530%, 12/01/2025 | | | 2,310,000 | | | | 2,219,690 | | | | |
| 2.730%, 12/01/2026 | | | 1,490,000 | | | | 1,414,583 | | | | |
| 2.875%, 12/01/2027 | | | 1,800,000 | | | | 1,685,928 | | | | |
| 5.000%, 12/01/2028 | | | 1,265,000 | | | | 1,367,526 | | | | |
| 5.000%, 12/01/2029 | | | 1,295,000 | | | | 1,419,361 | | | | |
| 3.625%, 12/01/2037 | | | | | | | | | | | |
| (Callable 12/01/2030) | | | 4,630,000 | | | | 4,430,678 | | | | |
| Suburban Hospital Healthcare System, Inc., | | | | | | | | | | | |
| 7.865%, 02/15/2027 | | | | | | | | | | | |
| (Insured by AMBAC) | | | 6,430,000 | | | | 6,745,026 | | | | |
| Three Rivers Local School District, | | | | | | | | | | | |
| 5.209%, 09/15/2027 | | | | | | | | | | | |
| (Callable 01/29/2024) | | | | | | | | | | | |
| (Insured by SD CRED PROG) | | | 1,350,000 | | | | 1,350,693 | | | | |
| Western Michigan University Homer | | | | | | | | | | | |
| Stryker MD School of Medicine, | | | | | | | | | | | |
| 4.750%, 11/15/2028 (Insured by AGM) | | | 11,975,000 | | | | 12,074,291 | | | | |
| Westlake City School District, | | | | | | | | | | | |
| 5.227%, 12/01/2026 | | | | | | | | | | | |
| (Callable 01/29/2024) | | | 1,160,000 | | | | 1,160,748 | | | | |
| Total Municipal Bonds | | | | | | | | | | | |
| (Cost $335,672,107) | | | | | | | 299,695,160 | | | | 1.1 | % |
| Residential Mortgage-Backed Securities | | | | | | | | | | | | |
| U.S. Government Agency Issues | | | | | | | | | | | | |
| Federal Gold Loan | | | | | | | | | | | | |
| Mortgage Corp. (FGLMC): | | | | | | | | | | | | |
| 6.500%, 12/01/2028 | | | 3,879 | | | | 3,983 | | | | | |
| 6.500%, 06/01/2029 | | | 1,718 | | | | 1,764 | | | | | |
| 3.000%, 02/01/2032 | | | 7,657,278 | | | | 7,383,519 | | | | | |
| 3.000%, 07/01/2032 | | | 3,678,450 | | | | 3,495,495 | | | | | |
| 3.000%, 10/01/2032 | | | 2,793,939 | | | | 2,653,748 | | | | | |
| 3.000%, 11/01/2032 | | | 4,349,987 | | | | 4,120,045 | | | | | |
| 3.000%, 12/01/2032 | | | 4,412,009 | | | | 4,178,612 | | | | | |
| 3.000%, 01/01/2033 | | | 2,081,049 | | | | 1,970,952 | | | | | |
| 3.000%, 04/01/2033 | | | 6,995,657 | | | | 6,692,304 | | | | | |
| 3.500%, 01/01/2034 | | | 7,356,796 | | | | 7,105,457 | | | | | |
| 3.000%, 05/01/2035 | | | 5,767,246 | | | | 5,417,113 | | | | | |
| 3.000%, 10/01/2035 | | | 4,908,791 | | | | 4,603,824 | | | | | |
| 2.500%, 01/01/2036 | | | 29,869,845 | | | | 27,763,451 | | | | | |
| 5.000%, 03/01/2036 | | | 1,714,327 | | | | 1,746,351 | | | | | |
| 5.500%, 04/01/2037 | | | 41,796 | | | | 43,139 | | | | | |
| 5.500%, 04/01/2038 | | | 23,398 | | | | 24,150 | | | | | |
| 5.500%, 05/01/2038 | | | 37,085 | | | | 38,278 | | | | | |
| 5.500%, 01/01/2039 | | | 6,414,199 | | | | 6,619,570 | | | | | |
| 4.500%, 11/01/2039 | | | 654,468 | | | | 655,286 | | | | | |
| 4.500%, 11/01/2039 | | | 198,902 | | | | 199,109 | | | | | |
| 4.500%, 08/01/2040 | | | 670,506 | | | | 671,344 | | | | | |
| 4.500%, 08/01/2040 | | | 881,534 | | | | 882,636 | | | | | |
| 4.000%, 10/01/2040 | | | 7,502,264 | | | | 7,335,732 | | | | | |
| 1.500%, 12/01/2040 | | | 83,701,510 | | | | 69,702,262 | | | | | |
| 2.000%, 12/01/2040 | | | 66,530,017 | | | | 57,283,418 | | | | | |
| 4.000%, 01/01/2041 | | | 4,469,714 | | | | 4,370,498 | | | | | |
| 2.000%, 11/01/2041 | | | 36,883,979 | | | | 31,573,959 | | | | | |
| 2.000%, 12/01/2041 | | | 102,476,375 | | | | 87,596,109 | | | | | |
| 2.500%, 02/01/2042 | | | 16,820,522 | | | | 15,039,410 | | | | | |
| 2.500%, 03/01/2042 | | | 21,811,934 | | | | 19,413,480 | | | | | |
| 3.500%, 06/01/2042 | | | 1,863,812 | | | | 1,767,127 | | | | | |
| 3.500%, 07/01/2042 | | | 6,872,283 | | | | 6,511,515 | | | | | |
| 3.500%, 07/01/2042 | | | 10,186,658 | | | | 9,651,902 | | | | | |
| 3.000%, 08/01/2042 | | | 6,444,611 | | | | 5,954,171 | | | | | |
| 3.500%, 09/01/2042 | | | 4,112,798 | | | | 3,895,195 | | | | | |
| 3.000%, 11/01/2042 | | | 22,391,351 | | | | 20,687,366 | | | | | |
| 3.500%, 12/01/2042 | | | 6,638,197 | | | | 6,291,010 | | | | | |
| 3.000%, 01/01/2043 | | | 12,083,119 | | | | 11,143,519 | | | | | |
| 3.000%, 02/01/2043 | | | 2,316,556 | | | | 2,135,453 | | | | | |
| 3.500%, 02/01/2043 | | | 8,273,350 | | | | 7,857,782 | | | | | |
| 3.000%, 03/01/2043 | | | 7,805,993 | | | | 7,195,767 | | | | | |
| 3.500%, 03/01/2043 | | | 19,389,441 | | | | 18,408,118 | | | | | |
| 3.000%, 04/01/2043 | | | 4,914,091 | | | | 4,529,901 | | | | | |
| 3.000%, 04/01/2043 | | | 5,707,003 | | | | 5,260,843 | | | | | |
| 3.000%, 06/01/2043 | | | 4,049,732 | | | | 3,733,105 | | | | | |
| 3.000%, 07/01/2043 | | | 16,390,681 | | | | 15,108,359 | | | | | |
| 3.000%, 08/01/2043 | | | 9,339,365 | | | | 8,609,149 | | | | | |
| 4.500%, 12/01/2043 | | | 3,777,569 | | | | 3,782,285 | | | | | |
| 3.500%, 05/01/2044 | | | 16,780,397 | | | | 15,854,383 | | | | | |
| 3.500%, 08/01/2044 | | | 11,451,449 | | | | 10,828,947 | | | | | |
| 4.000%, 09/01/2044 | | | 3,149,597 | | | | 3,044,573 | | | | | |
| 4.000%, 10/01/2044 | | | 5,974,143 | | | | 5,783,563 | | | | | |
| 3.500%, 01/01/2045 | | | 9,444,967 | | | | 8,939,329 | | | | | |
| 4.000%, 02/01/2045 | | | 3,666,464 | | | | 3,544,189 | | | | | |
| 3.500%, 07/01/2045 | | | 7,780,195 | | | | 7,353,479 | | | | | |
| 3.000%, 10/01/2045 | | | 12,315,857 | | | | 11,353,088 | | | | | |
| 4.000%, 10/01/2045 | | | 5,217,192 | | | | 5,010,922 | | | | | |
| 3.500%, 12/01/2045 | | | 3,008,999 | | | | 2,815,512 | | | | | |
| 4.000%, 12/01/2045 | | | 2,201,051 | | | | 2,127,635 | | | | | |
| 3.000%, 01/01/2046 | | | 43,148,694 | | | | 39,778,909 | | | | | |
| 3.500%, 01/01/2046 | | | 16,978,062 | | | | 15,955,890 | | | | | |
| 4.000%, 02/01/2046 | | | 2,722,876 | | | | 2,603,456 | | | | | |
| 4.000%, 02/01/2046 | | | 7,731,695 | | | | 7,548,014 | | | | | |
| 3.500%, 03/01/2046 | | | 2,493,674 | | | | 2,345,226 | | | | | |
| 4.000%, 05/01/2046 | | | 232,587 | | | | 224,830 | | | | | |
The accompanying notes are an integral part of these financial statements.
Baird Core Plus Bond Fund
Schedule of Investments, December 31, 2023
Long-Term Investments (cont.)
| | | Principal | | | | | | % of | |
| | | Amount | | | Value | | | Net Assets | |
| Federal Gold Loan | | | | | | | | | |
| Mortgage Corp. (FGLMC): (cont.) | | | | | | | | | |
| 4.000%, 08/01/2046 | | $ | 4,157,517 | | | $ | 4,018,871 | | | |
| |
| 3.000%, 10/01/2046 | | | 40,074,070 | | | | 36,666,654 | | | | | |
| 3.000%, 10/01/2046 | | | 27,849,369 | | | | 25,429,465 | | | | | |
| 4.500%, 11/01/2046 | | | 25,585,467 | | | | 25,617,404 | | | | | |
| 4.000%, 01/01/2047 | | | 16,415,836 | | | | 15,873,863 | | | | | |
| 3.000%, 02/01/2047 | | | 16,990,073 | | | | 15,476,173 | | | | | |
| 3.000%, 05/01/2047 | | | 31,030,230 | | | | 28,342,220 | | | | | |
| 3.500%, 07/01/2047 | | | 33,164,450 | | | | 31,142,294 | | | | | |
| 3.500%, 08/01/2047 | | | 22,010,729 | | | | 20,595,274 | | | | | |
| 3.500%, 08/01/2047 | | | 8,124,865 | | | | 7,633,112 | | | | | |
| 3.500%, 03/01/2048 | | | 38,204,106 | | | | 35,817,389 | | | | | |
| 4.500%, 05/01/2048 | | | 14,394,816 | | | | 14,356,819 | | | | | |
| 4.000%, 06/01/2048 | | | 26,679,224 | | | | 25,921,168 | | | | | |
| 4.000%, 08/01/2048 | | | 8,258,387 | | | | 7,973,467 | | | | | |
| 3.000%, 02/01/2049 | | | 29,052,689 | | | | 26,598,682 | | | | | |
| 4.000%, 05/01/2050 | | | 48,320,210 | | | | 46,611,501 | | | | | |
| 2.500%, 02/01/2051 | | | 97,818,250 | | | | 85,030,279 | | | | | |
| 2.500%, 02/01/2051 | | | 58,311,494 | | | | 50,486,557 | | | | | |
| 2.000%, 03/01/2051 | | | 80,580,084 | | | | 66,382,458 | | | | | |
| 2.000%, 05/01/2051 | | | 69,816,662 | | | | 58,071,441 | | | | | |
| 2.500%, 05/01/2051 | | | 23,876,133 | | | | 20,632,215 | | | | | |
| 2.000%, 08/01/2051 | | | 14,221,283 | | | | 11,822,722 | | | | | |
| 2.000%, 09/01/2051 | | | 82,988,826 | | | | 67,954,016 | | | | | |
| 2.500%, 11/01/2051 | | | 96,241,204 | | | | 83,086,632 | | | | | |
| 3.000%, 03/01/2052 | | | 81,051,435 | | | | 72,763,585 | | | | | |
| 3.000%, 08/01/2052 | | | 25,926,353 | | | | 23,297,928 | | | | | |
| 5.500%, 01/01/2053 | | | 14,058,764 | | | | 14,151,417 | | | | | |
| 5.500%, 03/01/2053 | | | 51,395,366 | | | | 51,891,262 | | | | | |
| Federal National Mortgage | | | | | | | | | | | | |
| Association (FNMA): | | | | | | | | | | | | |
| 5.000%, 05/01/2028 | | | 8,715 | | | | 8,693 | | | | | |
| 6.500%, 09/01/2028 | | | 2,925 | | | | 3,052 | | | | | |
| 6.500%, 02/01/2029 | | | 6,350 | | | | 6,519 | | | | | |
| 4.500%, 07/01/2030 | | | 1,109,665 | | | | 1,100,698 | | | | | |
| 3.500%, 01/01/2032 | | | 13,300,405 | | | | 12,827,419 | | | | | |
| 5.500%, 01/01/2032 | | | 3,035 | | | | 3,119 | | | | | |
| 3.000%, 11/01/2032 | | | 2,744,027 | | | | 2,597,010 | | | | | |
| 3.000%, 04/01/2033 | | | 4,829,114 | | | | 4,561,775 | | | | | |
| 3.000%, 05/01/2033 | | | 4,837,823 | | | | 4,569,876 | | | | | |
| 5.000%, 09/01/2033 | | | 3,735,317 | | | | 3,799,545 | | | | | |
| 4.500%, 10/01/2033 | | | 7,574,984 | | | | 7,604,953 | | | | | |
| 3.000%, 12/01/2033 | | | 8,276,415 | | | | 7,880,416 | | | | | |
| 4.000%, 01/01/2034 | | | 4,244,593 | | | | 4,157,621 | | | | | |
| 5.500%, 04/01/2034 | | | 257,816 | | | | 265,706 | | | | | |
| 4.000%, 08/01/2034 | | | 44,294,137 | | | | 43,388,537 | | | | | |
| 4.000%, 09/01/2034 | | | 5,861,566 | | | | 5,741,627 | | | | | |
| 5.500%, 09/01/2034 | | | 11,705 | | | | 12,064 | | | | | |
| 5.000%, 02/01/2035 | | | 5,995,126 | | | | 6,098,329 | | | | | |
| 5.000%, 02/01/2035 | | | 4,313,256 | | | | 4,387,411 | | | | | |
| 5.500%, 02/01/2035 | | | 10,094 | | | | 10,404 | | | | | |
| 5.000%, 04/01/2035 | | | 426,661 | | | | 434,005 | | | | | |
| 5.000%, 07/01/2035 | | | 1,297,404 | | | | 1,319,727 | | | | | |
| 2.500%, 01/01/2036 | | | 48,741,887 | | | | 45,185,448 | | | | | |
| 5.000%, 02/01/2036 | | | 769,916 | | | | 783,179 | | | | | |
| 5.000%, 03/01/2036 | | | 359,443 | | | | 365,635 | | | | | |
| 4.000%, 04/01/2036 | | | 2,578,298 | | | | 2,520,912 | | | | | |
| 5.500%, 04/01/2036 | | | 1,168,416 | | | | 1,204,251 | | | | | |
| 2.000%, 06/01/2036 | | | 37,529,514 | | | | 33,941,183 | | | | | |
| 2.000%, 09/01/2036 | | | 17,536,688 | | | | 15,845,485 | | | | | |
| 4.000%, 10/01/2036 | | | 4,084,128 | | | | 4,000,608 | | | | | |
| 4.000%, 05/01/2037 | | | 17,797,673 | | | | 17,384,574 | | | | | |
| 3.500%, 08/01/2037 | | | 10,348,224 | | | | 9,858,268 | | | | | |
| 2.500%, 04/01/2038 | | | 21,448,574 | | | | 19,497,895 | | | | | |
| 6.000%, 05/01/2038 | | | 1,964,649 | | | | 2,053,313 | | | | | |
| 4.500%, 04/01/2039 | | | 6,325,299 | | | | 6,317,565 | | | | | |
| 4.000%, 06/01/2039 | | | 3,736,218 | | | | 3,676,027 | | | | | |
| 5.000%, 06/01/2039 | | | 5,517,257 | | | | 5,612,159 | | | | | |
| 4.500%, 01/01/2040 | | | 2,919,136 | | | | 2,918,638 | | | | | |
| 4.500%, 01/01/2040 | | | 1,222,505 | | | | 1,227,540 | | | | | |
| 5.000%, 06/01/2040 | | | 4,089,982 | | | | 4,160,735 | | | | | |
| 4.000%, 08/01/2040 | | | 300,259 | | | | 293,187 | | | | | |
| 4.500%, 08/01/2040 | | | 3,833,668 | | | | 3,833,001 | | | | | |
| 4.500%, 08/01/2040 | | | 1,398,423 | | | | 1,398,179 | | | | | |
| 4.000%, 10/01/2040 | | | 525,005 | | | | 512,642 | | | | | |
| 4.000%, 11/01/2040 | | | 5,926,490 | | | | 5,786,876 | | | | | |
| 1.500%, 12/01/2040 | | | 95,488,727 | | | | 79,786,511 | | | | | |
| 4.000%, 12/01/2040 | | | 1,804,416 | | | | 1,761,909 | | | | | |
| 3.500%, 01/01/2041 | | | 651,387 | | | | 618,369 | | | | | |
| 4.000%, 01/01/2041 | | | 1,228,327 | | | | 1,199,136 | | | | | |
| 3.500%, 02/01/2041 | | | 699,788 | | | | 665,196 | | | | | |
| 4.000%, 02/01/2041 | | | 119,574 | | | | 116,709 | | | | | |
| 4.500%, 02/01/2041 | | | 19,572,172 | | | | 19,572,280 | | | | | |
| 4.000%, 03/01/2041 | | | 2,306,623 | | | | 2,251,804 | | | | | |
| 3.500%, 06/01/2041 | | | 72,101,894 | | | | 68,537,797 | | | | | |
| 4.500%, 07/01/2041 | | | 1,693,588 | | | | 1,693,302 | | | | | |
| 3.500%, 09/01/2041 | | | 9,812,041 | | | | 9,322,941 | | | | | |
| 4.000%, 09/01/2041 | | | 822,843 | | | | 801,941 | | | | | |
| 1.500%, 11/01/2041 | | | 24,974,534 | | | | 20,704,725 | | | | | |
| 3.500%, 12/01/2041 | | | 898,830 | | | | 852,875 | | | | | |
| 4.000%, 12/01/2041 | | | 4,088,939 | | | | 3,982,493 | | | | | |
| 2.000%, 01/01/2042 | | | 86,132,468 | | | | 73,639,103 | | | | | |
| 4.000%, 01/01/2042 | | | 8,140,050 | | | | 7,936,525 | | | | | |
| 4.500%, 01/01/2042 | | | 3,835,789 | | | | 3,835,132 | | | | | |
| 4.000%, 02/01/2042 | | | 8,477,155 | | | | 8,256,489 | | | | | |
| 1.500%, 03/01/2042 | | | 8,831,670 | | | | 7,321,573 | | | | | |
| 2.000%, 03/01/2042 | | | 55,029,766 | | | | 46,996,211 | | | | | |
| 3.000%, 04/01/2042 | | | 23,987,073 | | | | 22,440,753 | | | | | |
| 3.000%, 05/01/2042 | | | 1,138,883 | | | | 1,052,157 | | | | | |
| 3.500%, 05/01/2042 | | | 6,208,043 | | | | 5,872,679 | | | | | |
| 3.500%, 06/01/2042 | | | 2,140,841 | | | | 2,026,956 | | | | | |
| 3.500%, 07/01/2042 | | | 46,668,027 | | | | 44,233,857 | | | | | |
| 3.500%, 08/01/2042 | | | 3,646,514 | | | | 3,451,056 | | | | | |
| 3.500%, 09/01/2042 | | | 6,029,841 | | | | 5,701,591 | | | | | |
| 3.000%, 10/01/2042 | | | 9,273,391 | | | | 8,548,078 | | | | | |
| 3.000%, 03/01/2043 | | | 2,485,662 | | | | 2,288,129 | | | | | |
| 3.000%, 04/01/2043 | | | 918,929 | | | | 845,902 | | | | | |
| 3.000%, 05/01/2043 | | | 3,481,500 | | | | 3,204,828 | | | | | |
| 3.000%, 05/01/2043 | | | 9,142,728 | | | | 8,416,122 | | | | | |
| 3.500%, 05/01/2043 | | | 8,016,401 | | | | 7,550,253 | | | | | |
| 3.000%, 06/01/2043 | | | 10,132,754 | | | | 9,327,494 | | | | | |
| 3.500%, 06/01/2043 | | | 4,415,541 | | | | 4,164,174 | | | | | |
| 3.000%, 07/01/2043 | | | 8,190,893 | | | | 7,539,925 | | | | | |
| 4.000%, 07/01/2043 | | | 10,914,447 | | | | 10,630,396 | | | | | |
| 3.000%, 08/01/2043 | | | 3,048,989 | | | | 2,806,695 | | | | | |
| 3.500%, 08/01/2043 | | | 58,173,174 | | | | 55,149,795 | | | | | |
| 3.500%, 08/01/2043 | | | 3,867,159 | | | | 3,637,490 | | | | | |
| 3.500%, 09/01/2043 | | | 12,442,152 | | | | 11,713,367 | | | | | |
| 4.500%, 09/01/2043 | | | 5,234,947 | | | | 5,208,211 | | | | | |
| 4.000%, 01/01/2045 | | | 4,213,960 | | | | 4,067,742 | | | | | |
| 4.000%, 02/01/2045 | | | 2,344,222 | | | | 2,284,187 | | | | | |
| 4.000%, 02/01/2045 | | | 1,065,961 | | | | 1,028,984 | | | | | |
| 4.000%, 02/01/2045 | | | 8,536,408 | | | | 8,240,124 | | | | | |
| 4.000%, 02/01/2045 | | | 4,155,118 | | | | 4,046,983 | | | | | |
| 4.000%, 03/01/2045 | | | 3,582,120 | | | | 3,457,788 | | | | | |
The accompanying notes are an integral part of these financial statements.
Baird Core Plus Bond Fund
Schedule of Investments, December 31, 2023
Long-Term Investments (cont.)
| | | Principal | | | | | | % of | |
| | | Amount | | | Value | | | Net Assets | |
| Federal National Mortgage | | | | | | | | | |
| Association (FNMA): (cont.) | | | | | | | | | |
| 3.500%, 12/01/2045 | | $ | 4,271,630 | | | $ | 3,991,586 | | | |
| |
| 4.000%, 12/01/2045 | | | 8,801,449 | | | | 8,593,480 | | | | | |
| 4.000%, 12/01/2045 | | | 14,174,432 | | | | 13,682,584 | | | | | |
| 4.500%, 02/01/2046 | | | 10,112,488 | | | | 10,110,743 | | | | | |
| 4.000%, 04/01/2046 | | | 16,534,315 | | | | 15,996,533 | | | | | |
| 4.500%, 08/01/2046 | | | 8,848,032 | | | | 8,791,905 | | | | | |
| 3.000%, 10/01/2046 | | | 12,466,399 | | | | 11,372,123 | | | | | |
| 3.500%, 11/01/2046 | | | 4,980,523 | | | | 4,654,039 | | | | | |
| 3.000%, 03/01/2047 | | | 66,308,756 | | | | 58,869,069 | | | | | |
| 4.000%, 03/01/2047 | | | 11,199,263 | | | | 10,814,293 | | | | | |
| 3.500%, 04/01/2047 | | | 21,190,754 | | | | 19,801,025 | | | | | |
| 3.500%, 10/01/2047 | | | 37,256,148 | | | | 34,768,620 | | | | | |
| 4.000%, 11/01/2047 | | | 3,345,569 | | | | 3,222,218 | | | | | |
| 4.000%, 12/01/2047 | | | 17,058,407 | | | | 16,464,640 | | | | | |
| 3.000%, 01/01/2048 | | | 13,097,717 | | | | 11,915,601 | | | | | |
| 3.500%, 05/01/2048 | | | 31,570,183 | | | | 29,499,857 | | | | | |
| 3.500%, 08/01/2048 | | | 30,336,712 | | | | 28,677,401 | | | | | |
| 3.000%, 11/01/2048 | | | 19,167,565 | | | | 17,598,336 | | | | | |
| 5.000%, 11/01/2048 | | | 11,394,059 | | | | 11,520,925 | | | | | |
| 4.000%, 05/01/2049 | | | 12,178,401 | | | | 11,779,137 | | | | | |
| 4.000%, 09/01/2049 | | | 2,208,362 | | | | 2,122,818 | | | | | |
| 3.500%, 11/01/2049 | | | 46,052,537 | | | | 43,221,434 | | | | | |
| 4.500%, 03/01/2050 | | | 35,839,924 | | | | 35,368,904 | | | | | |
| 3.000%, 05/01/2050 | | | 84,699,993 | | | | 76,475,164 | | | | | |
| 2.500%, 06/01/2050 | | | 12,108,781 | | | | 10,456,278 | | | | | |
| 2.500%, 09/01/2050 | | | 54,568,802 | | | | 47,328,726 | | | | | |
| 3.000%, 09/01/2050 | | | 8,058,717 | | | | 7,298,613 | | | | | |
| 2.000%, 11/01/2050 | | | 121,393,736 | | | | 99,892,972 | | | | | |
| 2.500%, 12/01/2050 | | | 64,991,870 | | | | 56,079,449 | | | | | |
| 2.500%, 12/01/2050 | | | 20,006,989 | | | | 17,082,513 | | | | | |
| 3.000%, 12/01/2050 | | | 39,478,782 | | | | 35,580,814 | | | | | |
| 2.500%, 01/01/2051 | | | 40,129,748 | | | | 34,744,453 | | | | | |
| 3.000%, 02/01/2051 | | | 42,360,221 | | | | 38,195,365 | | | | | |
| 2.500%, 03/01/2051 | | | 45,325,300 | | | | 39,242,741 | | | | | |
| 2.000%, 04/01/2051 | | | 30,744,221 | | | | 25,244,957 | | | | | |
| 2.000%, 07/01/2051 | | | 112,301,455 | | | | 92,410,635 | | | | | |
| 3.500%, 07/01/2051 | | | 33,772,232 | | | | 31,454,001 | | | | | |
| 2.000%, 08/01/2051 | | | 10,096,416 | | | | 8,392,377 | | | | | |
| 2.500%, 08/01/2051 | | | 35,789,348 | | | | 30,879,646 | | | | | |
| 2.500%, 09/01/2051 | | | 87,315,234 | | | | 74,821,390 | | | | | |
| 3.000%, 10/01/2051 | | | 33,816,961 | | | | 30,387,786 | | | | | |
| 2.000%, 11/01/2051 | | | 22,132,040 | | | | 18,378,564 | | | | | |
| 2.500%, 11/01/2051 | | | 45,770,406 | | | | 39,368,185 | | | | | |
| 2.500%, 11/01/2051 | | | 32,689,424 | | | | 28,010,805 | | | | | |
| 3.000%, 11/01/2051 | | | 63,177,456 | | | | 56,776,993 | | | | | |
| 2.000%, 12/01/2051 | | | 18,501,542 | | | | 15,503,487 | | | | | |
| 2.500%, 12/01/2051 | | | 118,997,625 | | | | 102,029,385 | | | | | |
| 2.500%, 12/01/2051 | | | 60,825,686 | | | | 52,312,854 | | | | | |
| 2.500%, 12/01/2051 | | | 80,012,227 | | | | 68,543,697 | | | | | |
| 2.500%, 12/01/2051 | | | 78,176,516 | | | | 67,439,490 | | | | | |
| 2.500%, 01/01/2052 | | | 108,827,339 | | | | 92,714,348 | | | | | |
| 3.000%, 02/01/2052 | | | 82,937,547 | | | | 73,451,193 | | | | | |
| 5.000%, 07/01/2052 | | | 85,715,776 | | | | 84,981,807 | | | | | |
| 6.000%, 07/01/2053 | | | 46,923,707 | | | | 48,788,687 | | | | | |
| 6.500%, 09/01/2053 | | | 46,708,830 | | | | 48,299,403 | | | | | |
| Government National Mortgage | | | | | | | | | | | | |
| Association (GNMA): | | | | | | | | | | | | |
| 6.000%, 12/20/2028 | | | 4,966 | | | | 5,051 | | | | | |
| 6.500%, 01/20/2029 | | | 2,572 | | | | 2,635 | | | | | |
| 3.000%, 06/20/2031 | | | 8,621,082 | | | | 8,259,203 | | | | | |
| 6.000%, 11/20/2033 | | | 4,686 | | | | 4,907 | | | | | |
| 5.000%, 07/20/2040 | | | 204,476 | | | | 208,365 | | | | | |
| 4.000%, 01/20/2041 | | | 3,154,128 | | | | 3,093,480 | | | | | |
| 4.000%, 08/20/2041 | | | 1,852,520 | | | | 1,816,896 | | | | | |
| 3.500%, 10/20/2041 | | | 3,662,439 | | | | 3,475,155 | | | | | |
| 4.000%, 12/20/2041 | | | 2,555,924 | | | | 2,506,786 | | | | | |
| 4.000%, 02/20/2042 | | | 4,772,121 | | | | 4,680,361 | | | | | |
| 3.500%, 06/20/2042 | | | 66,102,442 | | | | 62,770,159 | | | | | |
| 4.000%, 06/20/2042 | | | 4,212,957 | | | | 4,105,986 | | | | | |
| 3.500%, 08/20/2042 | | | 40,845,034 | | | | 38,794,279 | | | | | |
| 3.500%, 09/20/2042 | | | 2,753,265 | | | | 2,615,587 | | | | | |
| 3.500%, 10/20/2042 | | | 48,195,445 | | | | 45,790,395 | | | | | |
| 4.000%, 10/20/2043 | | | 23,389,667 | | | | 22,932,555 | | | | | |
| 4.000%, 09/20/2044 | | | 13,076,187 | | | | 12,808,469 | | | | | |
| 3.000%, 04/20/2045 | | | 3,901,043 | | | | 3,598,684 | | | | | |
| 3.500%, 04/20/2045 | | | 5,391,524 | | | | 5,100,672 | | | | | |
| 4.000%, 05/20/2045 | | | 5,254,516 | | | | 5,132,376 | | | | | |
| 3.500%, 06/20/2045 | | | 5,408,922 | | | | 5,104,901 | | | | | |
3.500%, 10/20/2045(6) | | | 17,838,652 | | | | 16,833,983 | | | | | |
| 3.500%, 01/20/2046 | | | 13,628,067 | | | | 12,889,949 | | | | | |
| 4.500%, 01/20/2046 | | | 5,064,325 | | | | 5,064,826 | | | | | |
| 4.000%, 04/20/2046 | | | 6,320,606 | | | | 6,136,514 | | | | | |
| 3.500%, 05/20/2046 | | | 23,321,075 | | | | 22,004,144 | | | | | |
| 4.000%, 05/20/2046 | | | 2,324,672 | | | | 2,255,845 | | | | | |
| 3.000%, 08/20/2046 | | | 11,168,734 | | | | 10,272,779 | | | | | |
| 4.500%, 06/20/2047 | | | 6,187,989 | | | | 6,150,735 | | | | | |
| 4.500%, 07/20/2047 | | | 4,034,535 | | | | 4,002,694 | | | | | |
| 4.500%, 09/20/2047 | | | 20,788,814 | | | | 20,640,767 | | | | | |
3.000%, 10/20/2047(6) | | | 65,446,189 | | | | 60,043,089 | | | | | |
3.000%, 11/20/2047(6) | | | 53,596,991 | | | | 49,188,269 | | | | | |
3.500%, 02/20/2048(6) | | | 62,145,177 | | | | 58,542,380 | | | | | |
| 3.500%, 02/20/2048 | | | 20,440,342 | | | | 18,839,030 | | | | | |
5.000%, 02/20/2049(6) | | | 66,631,224 | | | | 66,932,265 | | | | | |
| 2.500%, 07/20/2051 | | | 44,364,487 | | | | 38,376,179 | | | | | |
| 2.500%, 07/20/2051 | | | 39,801,464 | | | | 34,468,570 | | | | | |
| 2.500%, 08/20/2051 | | | 85,308,660 | | | | 73,416,945 | | | | | |
| 6.000%, 01/20/2053 | | | 21,800,419 | | | | 22,172,656 | | | | | |
| 5.500%, 07/20/2053 | | | 12,171,468 | | | | 12,378,104 | | | | | |
| Seasoned Credit Risk Transfer Trust: | | | | | | | | | | | | |
| Series 2019-4, Class MA, 3.000%, | | | | | | | | | | | | |
| 02/25/2059 (Callable 03/25/2051) | | | 29,914,293 | | | | 27,381,447 | | | | | |
| Series 2020-3, Class MT, 2.000%, | | | | | | | | | | | | |
| 05/25/2060 (Callable 08/25/2046) | | | 26,289,501 | | | | 20,823,302 | | | | | |
| Total U.S. Government Agency Issues | | | | | | | | | | | | |
| (Cost $5,611,410,109) | | | | | | | 5,334,834,344 | | | | 19.1 | % |
| Non-U.S. Government Agency Issues | | | | | | | | | | | | |
| A&D Mortgage Trust, | | | | | | | | | | | | |
| Series 2023-NQM3, Class A1, 6.733%, | | | | | | | | | | | | |
07/25/2068 (Callable 07/25/2025)(2)(7) | | | 92,719,240 | | | | 93,509,588 | | | | | |
| Alternative Loan Trust: | | | | | | | | | | | | |
| Series 2006-43CB, Class 2A1, 6.000%, | | | | | | | | | | | | |
| 02/25/2024 (Callable 01/25/2024) | | | 6,498 | | | | 6,459 | | | | | |
| Series 2005-11CB, Class 2A6, 5.500%, | | | | | | | | | | | | |
06/25/2025 (Callable 01/25/2024)(6) | | | 2,934,082 | | | | 2,268,252 | | | | | |
| Series 2005-3CB, Class 2A1, 5.000%, | | | | | | | | | | | | |
06/25/2026 (Callable 01/25/2024)(6) | | | 64,058 | | | | 57,870 | | | | | |
| Series 2004-18CB, Class 1A1, 6.000%, | | | | | | | | | | | | |
| 09/25/2034 (Callable 01/25/2024) | | | 846,996 | | | | 840,529 | | | | | |
| Series 2005-6CB, Class 1A4, 5.500%, | | | | | | | | | | | | |
04/25/2035 (Callable 01/25/2024)(6) | | | 6,869,953 | | | | 5,792,483 | | | | | |
| Series 2005-29CB, Class A1, 5.500%, | | | | | | | | | | | | |
07/25/2035 (Callable 01/25/2024)(6) | | | 1,128,796 | | | | 678,551 | | | | | |
The accompanying notes are an integral part of these financial statements.
Baird Core Plus Bond Fund
Schedule of Investments, December 31, 2023
Long-Term Investments (cont.)
| | | Principal | | | | | | % of | |
| | | Amount | | | Value | | | Net Assets | |
| Alternative Loan Trust: (cont.) | | | | | | | | | |
| Series 2005-49CB, Class A5, 5.500%, | | | | | | | | | |
11/25/2035 (Callable 01/25/2024)(6) | | $ | 1,225,098 | | | $ | 813,204 | | | |
| |
| Series 2005-73CB, Class 1A7, 5.500%, | | | | | | | | | | | | |
| 01/25/2036 (Callable 01/25/2024) | | | 183,153 | | | | 170,538 | | | | | |
| Series 2005-85CB, Class 2A2, 5.500%, | | | | | | | | | | | | |
| 02/25/2036 (Callable 01/25/2024) | | | 1,630,673 | | | | 1,275,762 | | | | | |
| Series 2006-28CB, Class A17, 6.000%, | | | | | | | | | | | | |
10/25/2036 (Callable 01/25/2024)(6) | | | 339,134 | | | | 174,087 | | | | | |
| Arroyo Mortgage Trust: | | | | | | | | | | | | |
| Series 2019-3, Class A1, 2.962%, | | | | | | | | | | | | |
10/25/2048 (Callable 01/25/2024)(2)(4) | | | 9,059,874 | | | | 8,406,686 | | | | | |
| Series 2022-1, Class A1B, 3.269%, | | | | | | | | | | | | |
12/25/2056 (Callable 01/25/2025)(2)(7) | | | 11,500,000 | | | | 10,114,775 | | | | | |
| Banc of America Alternative Loan Trust, | | | | | | | | | | | | |
| Series 2004-6, Class 4A1, 5.000%, | | | | | | | | | | | | |
| 05/25/2048 (Callable 01/25/2024) | | | 221,168 | | | | 181,266 | | | | | |
| Banc of America Funding Trust, | | | | | | | | | | | | |
| Series 2007-C, Class 1A3, 4.379%, | | | | | | | | | | | | |
05/20/2036 (Callable 01/20/2024)(4)(6) | | | 855,432 | | | | 746,958 | | | | | |
| Bayview Financial Trust, | | | | | | | | | | | | |
| Series 2007-B, Class 1A2, 7.331%, | | | | | | | | | | | | |
08/28/2047 (Callable 01/28/2024)(6)(7) | | | 52,920 | | | | 44,850 | | | | | |
| Bear Stearns ARM Trust, | | | | | | | | | | | | |
| Series 2005-9, Class A1, 7.670%, | | | | | | | | | | | | |
| 10/25/2035 (1 Year CMT Rate + | | | | | | | | | | | | |
2.300%) (Callable 01/25/2024)(3) | | | 206,229 | | | | 192,843 | | | | | |
| BRAVO Residential Funding Trust, | | | | | | | | | | | | |
| Series 2020-RPL2, Class A1, 2.000%, | | | | | | | | | | | | |
05/25/2059 (Callable 01/25/2046)(2)(4) | | | 43,467,319 | | | | 39,188,213 | | | | | |
| Chase Home Lending Mortgage Trust: | | | | | | | | | | | | |
| Series 2023-RPL1, Class A1, 3.500%, | | | | | | | | | | | | |
06/25/2062 (Callable 05/25/2050)(2)(4) | | | 53,407,938 | | | | 48,209,492 | | | | | |
| Series 2023-RPL2, Class A1, 3.250%, | | | | | | | | | | | | |
03/25/2063 (Callable 12/25/2051)(2)(4) | | | 85,070,016 | | | | 74,844,566 | | | | | |
| Chase Mortgage Finance Trust: | | | | | | | | | | | | |
| Series 2005-A2, Class 1A5, 4.457%, | | | | | | | | | | | | |
01/25/2036 (Callable 01/25/2024)(4) | | | 334,473 | | | | 301,529 | | | | | |
| Series 2006-A1, Class 2A3, 5.108%, | | | | | | | | | | | | |
09/25/2036 (Callable 01/25/2024)(4)(6) | | | 264,989 | | | | 235,952 | | | | | |
| Series 2007-A1, Class 2A3, 5.256%, | | | | | | | | | | | | |
02/25/2037 (Callable 05/25/2028)(4) | | | 397,210 | | | | 368,376 | | | | | |
| CHL Mortgage Pass-Through Trust, | | | | | | | | | | | | |
| Series 2005-6, Class 2A1, 5.500%, | | | | | | | | | | | | |
04/25/2035 (Callable 01/25/2024)(6) | | | 148,771 | | | | 122,945 | | | | | |
| CIM Trust, | | | | | | | | | | | | |
| Series 2022-R1, Class A1, 3.000%, | | | | | | | | | | | | |
01/25/2061 (Callable 02/25/2027)(2)(4) | | | 19,168,334 | | | | 17,566,176 | | | | | |
| Citicorp Mortgage Securities Trust: | | | | | | | | | | | | |
| Series 2006-3, Class 1A4, 6.000%, | | | | | | | | | | | | |
06/25/2036 (Callable 01/25/2024)(6) | | | 2,119,893 | | | | 1,833,428 | | | | | |
| Series 2007-2, Class 1A3, 6.000%, | | | | | | | | | | | | |
02/25/2037 (Callable 01/25/2024)(6) | | | 705,357 | | | | 589,623 | | | | | |
| Citicorp Residential Mortgage Trust, | | | | | | | | | | | | |
| Series 2007-1, Class A6, 4.839%, | | | | | | | | | | | | |
03/25/2037 (Callable 01/25/2024)(7) | | | 80 | | | | 79 | | | | | |
| Citigroup Mortgage Loan Trust, | | | | | | | | | | | | |
| Series 2018-RP2, Class A1, 2.882%, | | | | | | | | | | | | |
02/25/2058 (Callable 06/25/2056)(2)(4) | | | 9,170,387 | | | | 8,880,366 | | | | | |
| Citigroup Mortgage Loan Trust, Inc.: | | | | | | | | | | | | |
| Series 2006-AR1, Class 1A1, 7.110%, | | | | | | | | | | | | |
| 10/25/2035 (1 Year CMT Rate + | | | | | | | | | | | | |
2.400%) (Callable 01/25/2024)(3) | | | 2,709,074 | | | | 2,589,105 | | | | | |
| Series 2005-9, Class 2A2, 5.500%, | | | | | | | | | | | | |
11/25/2035 (Callable 01/25/2024)(6) | | | 19,770 | | | | 15,376 | | | | | |
| Series 2005-9, Class 22A2, 6.000%, | | | | | | | | | | | | |
11/25/2035 (Callable 01/25/2024)(6) | | | 932,871 | | | | 924,715 | | | | | |
| Credit Suisse First Boston | | | | | | | | | | | | |
| Mortgage Securities Corp., | | | | | | | | | | | | |
| Series 2005-7, Class 3A1, 5.000%, | | | | | | | | | | | | |
10/25/2030 (Callable 01/25/2024)(6) | | | 11,507 | | | | 11,236 | | | | | |
| CWABS Asset-Backed Certificates Trust: | | | | | | | | | | | | |
| Series 2005-10, Class AF6, 4.915%, | | | | | | | | | | | | |
02/25/2036 (Callable 01/25/2024)(4) | | | 5,140 | | | | 5,034 | | | | | |
| Series 2006-10, Class 1AF3, 5.971%, | | | | | | | | | | | | |
09/25/2046 (Callable 01/25/2024)(4) | | | 31,624 | | | | 32,553 | | | | | |
| Series 2006-9, Class 1AF3, 5.859%, | | | | | | | | | | | | |
10/25/2046 (Callable 01/25/2024)(4)(6) | | | 19,515 | | | | 21,990 | | | | | |
| Deutsche Alt-A Securities, Inc. | | | | | | | | | | | | |
| Mortgage Loan Trust, | | | | | | | | | | | | |
| Series 2005-2, Class 1A7, 5.105%, | | | | | | | | | | | | |
04/25/2035 (Callable 01/25/2024)(4) | | | 4,234,687 | | | | 3,884,741 | | | | | |
| First Horizon Alternative | | | | | | | | | | | | |
| Mortgage Securities Trust: | | | | | | | | | | | | |
| Series 2004-AA1, Class A1, 6.982%, | | | | | | | | | | | | |
06/25/2034 (Callable 01/25/2024)(4) | | | 1,767,680 | | | | 1,646,219 | | | | | |
| Series 2005-AA2, Class 2A1, 5.850%, | | | | | | | | | | | | |
04/25/2035 (Callable 01/25/2024)(4) | | | 729,333 | | | | 703,159 | | | | | |
| Series 2006-FA6, Class 3A1, 5.750%, | | | | | | | | | | | | |
11/25/2036 (Callable 01/25/2024)(6) | | | 1,762 | | | | 989 | | | | | |
| FirstKey Homes Trust: | | | | | | | | | | | | |
| Series 2022-SFR3, Class A, | | | | | | | | | | | | |
4.250%, 07/17/2038(2) | | | 70,633,044 | | | | 68,355,199 | | | | | |
| Series 2021-SFR1, Class A, | | | | | | | | | | | | |
1.538%, 08/17/2038(2) | | | 97,482,091 | | | | 88,278,281 | | | | | |
| Series 2021-SFR2, Class A, | | | | | | | | | | | | |
1.376%, 09/17/2038(2) | | | 38,289,888 | | | | 34,237,696 | | | | | |
| Series 2022-SFR1, Class A, | | | | | | | | | | | | |
4.145%, 05/19/2039(2) | | | 42,599,066 | | | | 40,910,030 | | | | | |
| Series 2022-SFR2, Class A, | | | | | | | | | | | | |
4.250%, 07/17/2039(2) | | | 4,317,583 | | | | 4,146,103 | | | | | |
| GS Mortgage Securities Trust, | | | | | | | | | | | | |
| Series 2018-RPL1, Class A1A, 3.750%, | | | | | | | | | | | | |
10/25/2057 (Callable 02/25/2036)(2) | | | 20,767,756 | | | | 19,967,944 | | | | | |
| GSR Mortgage Loan Trust: | | | | | | | | | | | | |
| Series 2004-15F, Class 5A1, 5.500%, | | | | | | | | | | | | |
| 11/25/2034 (Callable 10/25/2025) | | | 19,580 | | | | 17,703 | | | | | |
| Series 2005-3F, Class 2A4, 6.000%, | | | | | | | | | | | | |
| 03/25/2035 (Callable 04/25/2033) | | | 1,097,288 | | | | 897,711 | | | | | |
| Series 2005-AR2, Class 2A1, 4.149%, | | | | | | | | | | | | |
04/25/2035 (Callable 01/25/2024)(4) | | | 1,244,571 | | | | 1,140,480 | | | | | |
| Home Partners of America Trust, | | | | | | | | | | | | |
| Series 2021-2, Class A, | | | | | | | | | | | | |
1.901%, 12/17/2026(2) | | | 75,468,950 | | | | 68,237,387 | | | | | |
| J.P. Morgan Alternative Loan Trust, | | | | | | | | | | | | |
| Series 2006-A1, Class 2A1, 4.415%, | | | | | | | | | | | | |
03/25/2036 (Callable 01/25/2024)(4) | | | 37,123 | | | | 28,659 | | | | | |
| J.P. Morgan Mortgage Trust: | | | | | | | | | | | | |
| Series 2005-A8, Class 2A3, 5.057%, | | | | | | | | | | | | |
11/25/2035 (Callable 01/25/2024)(4) | | | 2,211,556 | | | | 1,801,729 | | | | | |
| Series 2006-A2, Class 2A1, 4.218%, | | | | | | | | | | | | |
04/25/2036 (Callable 01/25/2024)(4) | | | 515,946 | | | | 446,624 | | | | | |
| Series 2006-A2, Class 3A3, 4.285%, | | | | | | | | | | | | |
04/25/2036 (Callable 01/25/2024)(4)(6) | | | 558,273 | | | | 474,277 | | | | | |
| Series 2006-A7, Class 2A4R, 4.362%, | | | | | | | | | | | | |
01/25/2037 (Callable 01/25/2024)(4)(6) | | | 816,801 | | | | 662,363 | | | | | |
The accompanying notes are an integral part of these financial statements.
Baird Core Plus Bond Fund
Schedule of Investments, December 31, 2023
Long-Term Investments (cont.)
| | | Principal | | | | | | % of | |
| | | Amount | | | Value | | | Net Assets | |
| J.P. Morgan Mortgage Trust: (cont.) | | | | | | | | | |
| Series 2007-A2, Class 2A3, 4.661%, | | | | | | | | | |
04/25/2037 (Callable 01/25/2024)(4) | | $ | 1,702,884 | | | $ | 1,249,867 | | | |
| |
| Series 2007-A4, Class 2A3, 4.303%, | | | | | | | | | | | | |
06/25/2037 (Callable 01/25/2024)(4)(6) | | | 1,836,762 | | | | 1,441,678 | | | | | |
| MASTR Alternative Loan Trust: | | | | | | | | | | | | |
| Series 2004-2, Class 2A1, 6.000%, | | | | | | | | | | | | |
| 02/25/2034 (Callable 01/25/2024) | | | 1,038,045 | | | | 1,003,191 | | | | | |
| Series 2004-8, Class 2A1, 6.000%, | | | | | | | | | | | | |
| 09/25/2034 (Callable 01/25/2024) | | | 632,585 | | | | 613,877 | | | | | |
| Series 2005-6, Class 1A5, 5.500%, | | | | | | | | | | | | |
12/25/2035 (Callable 01/25/2024)(6) | | | 1,180,602 | | | | 787,924 | | | | | |
| Merrill Lynch Mortgage Investors Trust, | | | | | | | | | | | | |
| Series 2005-A5, Class A3, 4.407%, | | | | | | | | | | | | |
06/25/2035 (Callable 01/25/2024)(4) | | | 674,390 | | | | 636,313 | | | | | |
| Mill City Mortgage Loan Trust: | | | | | | | | | | | | |
| Series 2018-2, Class A1, 3.500%, | | | | | | | | | | | | |
05/25/2058 (Callable 01/25/2031)(2)(4) | | | 3,741,000 | | | | 3,677,987 | | | | | |
| Series 2018-3, Class A1, 3.500%, | | | | | | | | | | | | |
08/25/2058 (Callable 06/25/2039)(2)(4) | | | 5,162,117 | | | | 5,004,421 | | | | | |
| Series 2019-1, Class A1, 3.250%, | | | | | | | | | | | | |
10/25/2069 (Callable 04/25/2041)(2)(4) | | | 13,689,582 | | | | 13,115,744 | | | | | |
| New Residential Funding LLC, | | | | | | | | | | | | |
| Series 2023-1, Class A, 3.500%, | | | | | | | | | | | | |
01/25/2063 (Callable 09/25/2042)(2)(4) | | | 58,783,457 | | | | 54,100,132 | | | | | |
| New Residential Mortgage Loan Trust: | | | | | | | | | | | | |
| Series 2016-1A, Class A1, 3.750%, | | | | | | | | | | | | |
03/25/2056 (Callable 11/25/2032)(2)(4) | | | 4,857,589 | | | | 4,555,202 | | | | | |
| Series 2017-1A, Class A1, 4.000%, | | | | | | | | | | | | |
02/25/2057 (Callable 07/25/2032)(2)(4) | | | 9,762,479 | | | | 9,250,575 | | | | | |
| Series 2017-3A, Class A1, 4.000%, | | | | | | | | | | | | |
04/25/2057 (Callable 06/25/2033)(2)(4) | | | 8,207,989 | | | | 7,768,909 | | | | | |
| Series 2017-6A, Class A1, 4.000%, | | | | | | | | | | | | |
08/27/2057 (Callable 10/25/2033)(2)(4) | | | 10,153,761 | | | | 9,659,063 | | | | | |
| Series 2018-1A, Class A1A, 4.000%, | | | | | | | | | | | | |
12/25/2057 (Callable 05/25/2034)(2)(4) | | | 5,464,765 | | | | 5,196,355 | | | | | |
| Series 2019-RPL2, Class A1, 3.250%, | | | | | | | | | | | | |
02/25/2059 (Callable 06/25/2045)(2)(4) | | | 12,087,566 | | | | 11,540,938 | | | | | |
| Series 2022-NQM2, Class A1, 3.079%, | | | | | | | | | | | | |
03/27/2062 (Callable 02/25/2024)(2)(4) | | | 29,797,370 | | | | 27,164,629 | | | | | |
| OBX Trust: | | | | | | | | | | | | |
| Series 2022-NQM3, Class A1, 3.387%, | | | | | | | | | | | | |
01/25/2062 (Callable 03/25/2025)(2)(4) | | | 34,920,979 | | | | 32,650,787 | | | | | |
| Series 2022-NQM5, Class A1, 4.310%, | | | | | | | | | | | | |
05/25/2062 (Callable 05/25/2025)(2)(7) | | | 62,741,362 | | | | 61,359,886 | | | | | |
| Series 2023-NQM9, Class A1, 7.159%, | | | | | | | | | | | | |
10/25/2063 (Callable 10/25/2026)(2)(7) | | | 23,345,708 | | | | 23,923,316 | | | | | |
| RALI Series Trust: | | | | | | | | | | | | |
| Series 2004-QS13, Class CB, 5.000%, | | | | | | | | | | | | |
01/25/2032 (Callable 01/25/2024)(6) | | | 3,476 | | | | 3,271 | | | | | |
| Series 2005-QA7, Class A22, 5.065%, | | | | | | | | | | | | |
07/25/2035 (Callable 01/25/2024)(4)(6) | | | 784,725 | | | | 720,653 | | | | | |
| Series 2005-QS11, Class A2, 5.500%, | | | | | | | | | | | | |
| 07/25/2035 (1 Month TSFR + 0.614%) | | | | | | | | | | | | |
(Callable 01/25/2024)(3)(6) | | | 1,958,076 | | | | 1,408,313 | | | | | |
| Renaissance Home Equity Loan Trust: | | | | | | | | | | | | |
| Series 2006-2, Class AF3, 5.797%, | | | | | | | | | | | | |
08/25/2036 (Callable 11/25/2026)(7) | | | 14,782,419 | | | | 5,826,681 | | | | | |
| Series 2006-3, Class AF2, 5.580%, | | | | | | | | | | | | |
11/25/2036 (Callable 10/25/2030)(7) | | | 9,847,275 | | | | 3,365,085 | | | | | |
| Series 2007-1, Class AF3, 5.612%, | | | | | | | | | | | | |
04/25/2037 (Callable 08/25/2032)(7) | | | 278,136 | | | | 73,540 | | | | | |
| Series 2007-2, Class AF2, 5.675%, | | | | | | | | | | | | |
06/25/2037 (Callable 07/25/2029)(7) | | | 1,435,659 | | | | 370,439 | | | | | |
| Starwood Mortgage Residential Trust, | | | | | | | | | | | | |
| Series 2020-3, Class A1, | | | | | | | | | | | | |
| 1.486%, 04/25/2065 | | | | | | | | | | | | |
(Callable 01/25/2024)(2)(4) | | | 3,083,969 | | | | 2,864,985 | | | | | |
| Structured Asset Securities Corp., | | | | | | | | | | | | |
| Series 2003-31A, Class 2A7, 6.762%, | | | | | | | | | | | | |
10/25/2033 (Callable 01/25/2024)(4) | | | 576,874 | | | | 556,486 | | | | | |
| Towd Point Mortgage Trust: | | | | | | | | | | | | |
| Series 2017-1, Class A1, 2.750%, | | | | | | | | | | | | |
10/25/2056 (Callable 07/25/2031)(2)(4) | | | 75,151 | | | | 74,641 | | | | | |
| Series 2017-6, Class A1, 2.750%, | | | | | | | | | | | | |
10/25/2057 (Callable 10/25/2030)(2)(4) | | | 7,963,300 | | | | 7,621,584 | | | | | |
| Series 2018-6, Class A1A, 3.750%, | | | | | | | | | | | | |
03/25/2058 (Callable 07/25/2034)(2)(4) | | | 4,962,420 | | | | 4,850,053 | | | | | |
| Series 2019-1, Class A1, 3.750%, | | | | | | | | | | | | |
03/25/2058 (Callable 06/25/2033)(2)(4) | | | 5,330,075 | | | | 5,089,431 | | | | | |
| Series 2018-4, Class A1, 3.000%, | | | | | | | | | | | | |
06/25/2058 (Callable 12/25/2032)(2)(4) | | | 20,059,296 | | | | 18,673,341 | | | | | |
| Series 2019-4, Class A1, 2.900%, | | | | | | | | | | | | |
10/25/2059 (Callable 05/25/2033)(2)(4) | | | 37,881,071 | | | | 35,589,566 | | | | | |
| Series 2020-2, Class A1A, 1.636%, | | | | | | | | | | | | |
04/25/2060 (Callable 05/25/2032)(2)(4) | | | 24,597,006 | | | | 21,820,238 | | | | | |
| Series 2020-4, Class A1, 1.750%, | | | | | | | | | | | | |
10/25/2060 (Callable 11/25/2034)(2) | | | 62,353,124 | | | | 54,848,720 | | | | | |
| Series 2022-2, Class A1, 3.750%, | | | | | | | | | | | | |
07/01/2062 (Callable 01/25/2034)(2)(4) | | | 104,533,591 | | | | 97,492,177 | | | | | |
| Series 2022-3, Class A1, 3.750%, | | | | | | | | | | | | |
08/01/2062 (Callable 09/25/2030)(2)(4) | | | 102,731,619 | | | | 96,960,167 | | | | | |
| WaMu Mortgage Pass-Through | | | | | | | | | | | | |
| Certificates Trust: | | | | | | | | | | | | |
| Series 2004-CB3, Class 1A, 6.000%, | | | | | | | | | | | | |
| 10/25/2034 (Callable 01/25/2024) | | | 449,860 | | | | 443,430 | | | | | |
| Series 2004-CB3, Class 2A, 6.500%, | | | | | | | | | | | | |
| 10/25/2034 (Callable 01/25/2024) | | | 1,088,874 | | | | 1,088,892 | | | | | |
| Series 2005-6, Class 2A4, 5.500%, | | | | | | | | | | | | |
08/25/2035 (Callable 01/25/2024)(6) | | | 2,547,297 | | | | 2,157,426 | | | | | |
| Series 2006-AR10, Class 1A1, 4.469%, | | | | | | | | | | | | |
09/25/2036 (Callable 01/25/2024)(4)(6) | | | 455,022 | | | | 377,683 | | | | | |
| Series 2007-HY3, Class 4A1, 4.311%, | | | | | | | | | | | | |
03/25/2037 (Callable 01/25/2024)(4)(6) | | | 5,227,474 | | | | 4,707,866 | | | | | |
| Wells Fargo Mortgage | | | | | | | | | | | | |
| Backed Securities Trust: | | | | | | | | | | | | |
| Series 2006-AR14, Class 2A3, 6.376%, | | | | | | | | | | | | |
10/25/2036 (Callable 01/25/2024)(4)(6) | | | 699,172 | | | | 614,549 | | | | | |
| Series 2007-7, Class A49, 6.000%, | | | | | | | | | | | | |
06/25/2037 (Callable 01/25/2024)(6) | | | 996,907 | | | | 849,094 | | | | | |
| Total Non-U.S. Government | | | | | | | | | | | | |
| Agency Issues | | | | | | | | | | | | |
| (Cost $1,374,459,031) | | | | | | | 1,300,001,854 | | | | 4.7 | % |
| Total Residential | | | | | | | | | | | | |
| Mortgage-Backed Securities | | | | | | | | | | | | |
| (Cost $6,985,869,140) | | | | | | | 6,634,836,198 | | | | 23.8 | % |
| Commercial Mortgage-Backed Securities | | | | | | | | | | | | |
| U.S. Government Agency Issues | | | | | | | | | | | | |
| Fannie Mae REMIC Trust, | | | | | | | | | | | | |
| Series 2017-M4, Class A2, | | | | | | | | | | | | |
2.552%, 12/25/2026(4) | | | 20,632,462 | | | | 19,567,705 | | | | | |
| Freddie Mac Multifamily Structured | | | | | | | | | | | | |
| Pass Through Certificates: | | | | | | | | | | | | |
| Series K072, Class A2, | | | | | | | | | | | | |
| 3.444%, 12/25/2027 | | | 12,000,000 | | | | 11,596,817 | | | | | |
| Series K074, Class A2, | | | | | | | | | | | | |
| 3.600%, 01/25/2028 | | | 40,495,000 | | | | 39,333,215 | | | | | |
The accompanying notes are an integral part of these financial statements.
Baird Core Plus Bond Fund
Schedule of Investments, December 31, 2023
Long-Term Investments (cont.)
| | | Principal | | | | | | % of | |
| | | Amount | | | Value | | | Net Assets | |
| Freddie Mac Multifamily Structured | | | | | | | | | |
| Pass Through Certificates: (cont.) | | | | | | | | | |
| Series K077, Class A2, | | | | | | | | | |
3.850%, 05/25/2028(4) | | $ | 46,199,000 | | | $ | 45,262,283 | | | | |
| Series K079, Class A2, | | | | | | | | | | | |
| 3.926%, 06/25/2028 | | | 63,251,000 | | | | 62,132,482 | | | | |
| Series K080, Class A2, | | | | | | | | | | | |
3.926%, 07/25/2028(4) | | | 34,095,000 | | | | 33,479,616 | | | | |
| Series K752, Class A2, | | | | | | | | | | | |
| 4.284%, 07/25/2030 | | | 31,575,000 | | | | 31,363,994 | | | | |
| Series K122, Class A2, | | | | | | | | | | | |
| 1.521%, 11/25/2030 | | | 23,000,000 | | | | 19,104,140 | | | | |
| Series K153, Class A3, | | | | | | | | | | | |
3.117%, 10/25/2031(4) | | | 15,655,000 | | | | 14,261,926 | | | | |
| Series K-154, Class A2, | | | | | | | | | | | |
4.350%, 01/25/2033(4) | | | 25,000,000 | | | | 24,851,457 | | | | |
| Series K158, Class A3, | | | | | | | | | | | |
3.900%, 10/25/2033(4) | | | 18,777,000 | | | | 17,736,350 | | | | |
| Series K-1517, Class A2, | | | | | | | | | | | |
| 1.716%, 07/25/2035 | | | 1,000,000 | | | | 751,000 | | | | |
| Total U.S. Government Agency Issues | | | | | | | | | | | |
| (Cost $332,069,437) | | | | | | | 319,440,985 | | | | 1.1 | % |
| Non-U.S. Government Agency Issues | | | | | | | | | | | | |
| BANK: | | | | | | | | | | | | |
| Series 2017-BNK4, Class A4, 3.625%, | | | | | | | | | | | | |
| 05/15/2050 (Callable 04/15/2027) | | | 30,037,000 | | | | 28,361,188 | | | | | |
| Series 2017-BNK8, Class A4, 3.488%, | | | | | | | | | | | | |
| 11/15/2050 (Callable 11/15/2027) | | | 69,721,751 | | | | 64,466,307 | | | | | |
| Series 2017-BNK9, Class A4, 3.538%, | | | | | | | | | | | | |
| 11/15/2054 (Callable 12/15/2029) | | | 32,737,000 | | | | 30,871,102 | | | | | |
| Series 2022-BNK44, Class A5, 5.745%, | | | | | | | | | | | | |
11/15/2055 (Callable 11/15/2032)(4) | | | 60,200,000 | | | | 63,616,133 | | | | | |
| Series 2017-BNK5, Class A5, 3.390%, | | | | | | | | | | | | |
| 06/15/2060 (Callable 07/15/2027) | | | 2,070,000 | | | | 1,953,427 | | | | | |
| Series 2018-BN10, Class A5, 3.688%, | | | | | | | | | | | | |
| 02/15/2061 (Callable 02/15/2028) | | | 6,400,000 | | | | 6,063,930 | | | | | |
| Series 2021-BN33, Class A5, 2.556%, | | | | | | | | | | | | |
| 05/15/2064 (Callable 05/15/2031) | | | 29,344,000 | | | | 24,853,784 | | | | | |
| BANK5: | | | | | | | | | | | | |
| Series 2023-5YR3, Class A2, 6.255%, | | | | | | | | | | | | |
| 09/15/2056 (Callable 09/15/2028) | | | 44,069,983 | | | | 46,069,662 | | | | | |
| Series 2023-5YR4, Class A3, 6.500%, | | | | | | | | | | | | |
| 12/15/2056 (Callable 12/15/2028) | | | 42,425,000 | | | | 44,905,221 | | | | | |
| BBCMS Mortgage Trust, | | | | | | | | | | | | |
| Series 2018-C2, Class A5, 4.314%, | | | | | | | | | | | | |
| 12/15/2051 (Callable 12/15/2028) | | | 14,445,000 | | | | 13,971,198 | | | | | |
| Benchmark Mortgage Trust: | | | | | | | | | | | | |
| Series 2018-B1, Class A5, 3.666%, | | | | | | | | | | | | |
01/15/2051 (Callable 01/15/2028)(4) | | | 10,240,000 | | | | 9,575,823 | | | | | |
| Series 2020-B19, Class A5, 1.850%, | | | | | | | | | | | | |
| 09/15/2053 (Callable 10/15/2030) | | | 29,825,000 | | | | 23,825,442 | | | | | |
| Series 2020-B21, Class A5, 1.978%, | | | | | | | | | | | | |
| 12/17/2053 (Callable 12/15/2030) | | | 46,400,000 | | | | 37,711,099 | | | | | |
| Series 2021-B24, Class A5, 2.584%, | | | | | | | | | | | | |
| 03/15/2054 (Callable 03/15/2031) | | | 19,075,000 | | | | 15,553,129 | | | | | |
| Series 2023-V3, Class A2, 5.896%, | | | | | | | | | | | | |
| 07/15/2056 (Callable 07/15/2028) | | | 22,950,000 | | | | 23,652,238 | | | | | |
| Series 2023-V3, Class A3, 6.363%, | | | | | | | | | | | | |
07/15/2056 (Callable 07/15/2028)(4) | | | 10,025,000 | | | | 10,510,966 | | | | | |
| BMO Mortgage Trust, | | | | | | | | | | | | |
| Series 2022-C1, Class A5, 3.374%, | | | | | | | | | | | | |
02/15/2055(4) | | | 31,900,000 | | | | 28,362,175 | | | | | |
| CD Mortgage Trust, | | | | | | | | | | | | |
| Series 2017-CD4, Class A4, 3.514%, | | | | | | | | | | | | |
05/10/2050 (Callable 05/10/2027)(4) | | | 14,359,780 | | | | 13,464,935 | | | | | |
| CFCRE Commercial Mortgage Trust, | | | | | | | | | | | | |
| Series 2016-C4, Class A4, 3.283%, | | | | | | | | | | | | |
| 05/10/2058 (Callable 05/10/2026) | | | 8,500,000 | | | | 8,082,712 | | | | | |
| Citigroup Commercial Mortgage Trust: | | | | | | | | | | | | |
| Series 2015-GC27, Class A5, 3.137%, | | | | | | | | | | | | |
| 02/10/2048 (Callable 01/10/2025) | | | 27,372,789 | | | | 26,708,777 | | | | | |
| Series 2015-GC29, Class A4, 3.192%, | | | | | | | | | | | | |
| 04/10/2048 (Callable 04/10/2025) | | | 25,065,000 | | | | 24,218,573 | | | | | |
| Series 2016-C2, Class A4, 2.832%, | | | | | | | | | | | | |
| 08/10/2049 (Callable 08/10/2026) | | | 33,387,000 | | | | 31,006,206 | | | | | |
| Series 2017-P8, Class A4, 3.465%, | | | | | | | | | | | | |
| 09/15/2050 (Callable 09/15/2027) | | | 29,775,000 | | | | 27,957,981 | | | | | |
| Series 2019-GC43, Class A4, 3.038%, | | | | | | | | | | | | |
| 11/10/2052 (Callable 11/10/2029) | | | 7,350,000 | | | | 6,453,854 | | | | | |
| COMM Mortgage Trust: | | | | | | | | | | | | |
| Series 2014-CR18, Class A4, 3.550%, | | | | | | | | | | | | |
| 07/15/2047 (Callable 07/15/2024) | | | 1,957,599 | | | | 1,935,113 | | | | | |
| Series 2014-CR20, Class ASB, 3.305%, | | | | | | | | | | | | |
| 11/10/2047 (Callable 01/10/2029) | | | 4,780,551 | | | | 4,728,547 | | | | | |
| Series 2015-LC19, Class A4, 3.183%, | | | | | | | | | | | | |
| 02/10/2048 (Callable 01/10/2027) | | | 27,105,399 | | | | 26,362,684 | | | | | |
| Series 2015-DC1, Class A5, 3.350%, | | | | | | | | | | | | |
| 02/10/2048 (Callable 02/10/2025) | | | 23,390,000 | | | | 22,670,681 | | | | | |
| CSAIL Commercial Mortgage Trust: | | | | | | | | | | | | |
| Series 2018-C14, Class A4, 4.422%, | | | | | | | | | | | | |
11/15/2051 (Callable 11/15/2028)(4) | | | 19,748,000 | | | | 18,713,849 | | | | | |
| Series 2019-C16, Class A3, 3.329%, | | | | | | | | | | | | |
| 06/15/2052 (Callable 06/15/2029) | | | 22,229,000 | | | | 20,045,016 | | | | | |
| DBJPM Mortgage Trust, | | | | | | | | | | | | |
| Series 2020-C9, Class A5, 1.926%, | | | | | | | | | | | | |
| 08/15/2053 (Callable 09/15/2030) | | | 31,100,000 | | | | 25,414,223 | | | | | |
| GS Mortgage Securities Trust: | | | | | | | | | | | | |
| Series 2017-GS5, Class A4, 3.674%, | | | | | | | | | | | | |
| 03/10/2050 (Callable 03/10/2027) | | | 14,277,969 | | | | 13,338,963 | | | | | |
| Series 2017-GS7, Class A4, 3.430%, | | | | | | | | | | | | |
| 08/10/2050 (Callable 08/10/2027) | | | 21,500,000 | | | | 19,825,184 | | | | | |
| Series 2017-GS8, Class A4, 3.469%, | | | | | | | | | | | | |
| 11/10/2050 (Callable 11/10/2027) | | | 19,575,000 | | | | 18,167,589 | | | | | |
| Series 2019-GC42, Class A4, 3.001%, | | | | | | | | | | | | |
| 09/10/2052 (Callable 09/10/2029) | | | 16,285,000 | | | | 14,527,303 | | | | | |
| JP Morgan Chase Commercial | | | | | | | | | | | | |
| Mortgage Securities Trust, | | | | | | | | | | | | |
| Series 2016-JP2, Class A4, 2.822%, | | | | | | | | | | | | |
| 08/15/2049 (Callable 07/15/2026) | | | 15,150,000 | | | | 14,104,240 | | | | | |
| JPMBB Commercial | | | | | | | | | | | | |
| Mortgage Securities Trust: | | | | | | | | | | | | |
| Series 2014-C24, Class ASB, 3.368%, | | | | | | | | | | | | |
| 11/15/2047 (Callable 10/15/2024) | | | 1,636,714 | | | | 1,619,285 | | | | | |
| Series 2014-C25, Class A5, 3.672%, | | | | | | | | | | | | |
| 11/15/2047 (Callable 11/15/2024) | | | 45,697,000 | | | | 44,572,095 | | | | | |
| Series 2015-C30, Class A5, 3.822%, | | | | | | | | | | | | |
| 07/15/2048 (Callable 07/15/2025) | | | 42,110,000 | | | | 40,272,294 | | | | | |
| Series 2015-C32, Class A5, 3.598%, | | | | | | | | | | | | |
| 11/15/2048 (Callable 10/15/2025) | | | 16,075,000 | | | | 15,295,810 | | | | | |
| Series 2016-C4, Class A3, 3.141%, | | | | | | | | | | | | |
| 12/15/2049 (Callable 04/15/2027) | | | 44,268,000 | | | | 40,652,429 | | | | | |
| JPMCC Commercial | | | | | | | | | | | | |
| Mortgage Securities Trust: | | | | | | | | | | | | |
| Series 2017-JP5, Class A5, 3.723%, | | | | | | | | | | | | |
| 03/15/2050 (Callable 04/15/2027) | | | 17,310,000 | | | | 16,317,384 | | | | | |
The accompanying notes are an integral part of these financial statements.
Baird Core Plus Bond Fund
Schedule of Investments, December 31, 2023
Long-Term Investments (cont.)
| | | Principal | | | | | | % of | |
| | | Amount | | | Value | | | Net Assets | |
| JPMCC Commercial | | | | | | | | | |
| Mortgage Securities Trust: (cont.) | | | | | | | | | |
| Series 2017-JP7, Class A5, 3.454%, | | | | | | | | | |
| 09/15/2050 (Callable 08/15/2027) | | $ | 38,516,184 | | | $ | 35,457,602 | | | | |
| Morgan Stanley Bank of | | | | | | | | | | | |
| America Merrill Lynch Trust: | | | | | | | | | | | |
| Series 2016-C30, Class A5, 2.860%, | | | | | | | | | | | |
| 09/15/2049 (Callable 10/15/2026) | | | 9,062,000 | | | | 8,419,802 | | | | |
| Series 2016-C32, Class A4, 3.720%, | | | | | | | | | | | |
| 12/15/2049 (Callable 01/15/2027) | | | 14,175,000 | | | | 13,466,356 | | | | |
| Series 2017-C34, Class A4, 3.536%, | | | | | | | | | | | |
| 11/15/2052 (Callable 10/15/2027) | | | 8,190,000 | | | | 7,637,698 | | | | |
| Morgan Stanley Capital I Trust, | | | | | | | | | | | |
| Series 2017-H1, Class A5, 3.530%, | | | | | | | | | | | |
| 06/15/2050 (Callable 06/15/2027) | | | 9,470,100 | | | | 8,861,952 | | | | |
| Morgan Stanley Capital I, Inc., | | | | | | | | | | | |
| Series 2022-L8, Class A5, 3.794%, | | | | | | | | | | | |
04/15/2055 (Callable 04/15/2032)(4) | | | 28,203,000 | | | | 25,668,879 | | | | |
| UBS Commercial Mortgage Trust: | | | | | | | | | | | |
| Series 2017-C3, Class A4, 3.426%, | | | | | | | | | | | |
| 08/15/2050 (Callable 08/15/2027) | | | 5,700,000 | | | | 5,338,331 | | | | |
| Series 2018-C11, Class A5, 4.241%, | | | | | | | | | | | |
06/15/2051 (Callable 07/15/2028)(4) | | | 4,000,000 | | | | 3,742,845 | | | | |
| Wells Fargo Commercial Mortgage Trust: | | | | | | | | | | | |
| Series 2015-C26, Class ASB, 2.991%, | | | | | | | | | | | |
| 02/15/2048 (Callable 02/15/2025) | | | 2,967,480 | | | | 2,923,706 | | | | |
| Series 2016-BNK1, Class A3, 2.652%, | | | | | | | | | | | |
| 08/15/2049 (Callable 08/15/2026) | | | 16,807,000 | | | | 15,587,237 | | | | |
| Series 2017-C40, Class A4, 3.581%, | | | | | | | | | | | |
| 10/15/2050 (Callable 10/15/2027) | | | 48,894,000 | | | | 46,180,505 | | | | |
| Series 2017-C42, Class A4, 3.589%, | | | | | | | | | | | |
| 12/15/2050 (Callable 12/15/2027) | | | 53,620,521 | | | | 49,135,411 | | | | |
| Series 2018-C46, Class A4, 4.152%, | | | | | | | | | | | |
| 08/15/2051 (Callable 08/15/2028) | | | 15,000,000 | | | | 14,251,537 | | | | |
| Series 2017-RC1, Class A4, 3.631%, | | | | | | | | | | | |
| 01/15/2060 (Callable 03/15/2027) | | | 11,875,000 | | | | 11,309,070 | | | | |
| Series 2018-C47, Class A4, 4.442%, | | | | | | | | | | | |
| 09/15/2061 (Callable 10/15/2028) | | | 10,850,000 | | | | 10,546,184 | | | | |
| WFRBS Commercial Mortgage Trust: | | | | | | | | | | | |
| Series 2014-C21, Class ASB, 3.393%, | | | | | | | | | | | |
| 08/15/2047 (Callable 08/15/2024) | | | 30 | | | | 30 | | | | |
| Series 2014-C24, Class A5, 3.607%, | | | | | | | | | | | |
| 11/15/2047 (Callable 11/15/2024) | | | 54,091,000 | | | | 52,824,849 | | | | |
| Total Non-U.S. | | | | | | | | | | | |
| Government Agency Issues | | | | | | | | | | | |
| (Cost $1,383,069,536) | | | | | | | 1,282,130,545 | | | | 4.6 | % |
| Total Commercial | | | | | | | | | | | | |
| Mortgage-Backed Securities | | | | | | | | | | | | |
| (Cost $1,715,138,973) | | | | | | | 1,601,571,530 | | | | 5.7 | % |
| Asset Backed Securities | | | | | | | | | | | | |
| BA Credit Card Trust, | | | | | | | | | | | | |
| Series 2023-A2, Class A2, | | | | | | | | | | | | |
| 4.980%, 11/15/2028 | | | 50,000,000 | | | | 50,603,730 | | | | | |
| Dell Equipment Finance Trust, | | | | | | | | | | | | |
| Series 2023-1, Class A3, 5.650%, | | | | | | | | | | | | |
09/22/2028 (Callable 10/22/2025)(2) | | | 61,075,000 | | | | 61,553,779 | | | | | |
| First National Master Note Trust: | | | | | | | | | | | | |
| Series 2023-1, Class A, | | | | | | | | | | | | |
| 5.130%, 04/15/2029 | | | 3,250,000 | | | | 3,261,415 | | | | | |
| Series 2023-2, Class A, | | | | | | | | | | | | |
| 5.770%, 09/15/2029 | | | 70,000,000 | | | | 71,574,650 | | | | | |
| Ford Credit Floorplan | | | | | | | | | | | | |
| Master Owner Trust, | | | | | | | | | | | | |
| Series 2023-1, Class A1, | | | | | | | | | | | | |
4.920%, 05/15/2028(2) | | | 72,425,000 | | | | 72,599,023 | | | | | |
| GM Financial Revolving | | | | | | | | | | | | |
| Receivables Trust, | | | | | | | | | | | | |
| Series 2023-1, Class A, 5.120%, | | | | | | | | | | | | |
04/11/2035 (Callable 05/11/2028)(2) | | | 85,750,000 | | | | 87,243,885 | | | | | |
| Golden Credit Card Trust, | | | | | | | | | | | | |
| Series 2022-4A, Class A, | | | | | | | | | | | | |
4.310%, 09/15/2027(1)(2) | | | 14,635,000 | | | | 14,463,048 | | | | | |
| Navient Private Education Refi Loan Trust: | | | | | | | | | | | | |
| Series 2021-EA, Class A, 0.970%, | | | | | | | | | | | | |
12/16/2069 (Callable 11/15/2029)(2) | | | 9,728,845 | | | | 8,388,501 | | | | | |
| Series 2021-GA, Class A, 1.580%, | | | | | | | | | | | | |
04/15/2070 (Callable 08/15/2029)(2) | | | 9,146,699 | | | | 7,935,153 | | | | | |
| Series 2022-A, Class A, 2.230%, | | | | | | | | | | | | |
07/15/2070 (Callable 10/15/2029)(2) | | | 72,915,880 | | | | 64,320,534 | | | | | |
| Series 2023-A, Class A, 5.510%, | | | | | | | | | | | | |
10/15/2071 (Callable 10/15/2032)(2) | | | 38,695,215 | | | | 38,687,720 | | | | | |
| Nelnet Student Loan Trust, | | | | | | | | | | | | |
| Series 2021-A, Class APT1, 1.360%, | | | | | | | | | | | | |
04/20/2062 (Callable 09/20/2029)(2) | | | 23,074,696 | | | | 20,896,595 | | | | | |
| PFS Financing Corp., | | | | | | | | | | | | |
| Series 2023-A, Class A, | | | | | | | | | | | | |
5.800%, 03/15/2028(2) | | | 23,225,000 | | | | 23,560,367 | | | | | |
| SBA Tower Trust, | | | | | | | | | | | | |
| 1.840%, 10/15/2051 | | | | | | | | | | | | |
(Callable 04/15/2026)(2) | | | 45,100,000 | | | | 39,938,070 | | | | | |
| Synchrony Card Funding LLC, | | | | | | | | | | | | |
| Series 2023-A1, Class A, | | | | | | | | | | | | |
| 5.540%, 07/15/2029 | | | 44,300,000 | | | | 45,135,104 | | | | | |
| Texas Electric Market | | | | | | | | | | | | |
| Stabilization Funding N LLC, | | | | | | | | | | | | |
4.966%, 02/01/2042(2) | | | 24,000,000 | | | | 23,599,176 | | | | | |
| Towd Point Mortgage Trust: | | | | | | | | | | | | |
| Series 2020-MH1, Class A1A, 2.184%, | | | | | | | | | | | | |
02/25/2060 (Callable 01/25/2024)(2)(4) | | | 20,748,823 | | | | 19,744,988 | | | | | |
| Series 2020-MH1, Class A1, 2.250%, | | | | | | | | | | | | |
02/25/2060 (Callable 01/25/2024)(2)(4) | | | 15,069,430 | | | | 14,351,818 | | | | | |
| Total Asset Backed Securities | | | | | | | | | | | | |
| (Cost $671,060,398) | | | | | | | 667,857,556 | | | | 2.4 | % |
| | | Shares | | | | | | | | | |
| Common Stock | | | | | | | | | | | | |
| Industrials | | | | | | | | | | | | |
Weatherford International PLC(9) | | | 46,003 | | | | 4,500,473 | | | | | |
| Total Common Stock | | | | | | | | | | | | |
| (Cost $3,790,590) | | | | | | | 4,500,473 | | | | 0.0 | % |
| Total Long-Term Investments | | | | | | | | | | | | |
| (Cost $29,404,231,194) | | | | | | | 27,532,947,106 | | | | 98.8 | % |
The accompanying notes are an integral part of these financial statements.
Baird Core Plus Bond Fund
Schedule of Investments, December 31, 2023
Short-Term Investment
| | | | | | | | | % of | |
| | | Shares | | | Value | | | Net Assets | |
| Money Market Mutual Fund | | | | | | | | | |
| First American Government Obligations | | | | | | | | | |
Fund, Class U, 5.31%(5) | | | 290,082,064 | | | $ | 290,082,064 | | | | |
| Total Short-Term Investment | | | | | | | | | | | |
| (Cost $290,082,064) | | | | | | | 290,082,064 | | | | 1.0 | % |
| Total Investments | | | | | | | | | | | | |
| (Cost $29,694,313,258) | | | | | | | 27,823,029,170 | | | | 99.8 | % |
| Other Assets in Excess of Liabilities | | | | | | | 58,044,448 | | | | 0.2 | % |
| TOTAL NET ASSETS | | | | | | $ | 27,881,073,618 | | | | 100.0 | % |
Notes to Schedule of Investments
AGM – Assured Guaranty Municipal
AMBAC – Ambac Assurance Corp.
GNMA – Government National Mortgage Association
NATL – National Public Finance Guarantee Corp.
SD CRED PROG – State Credit Enhancement Program
CMT – Constant Maturity Treasury
LIBOR – London Inter-bank Offered Rate
SOFR – Secured Overnight Financing Rate
SOFRINDX – Secured Overnight Financing Rate Index
TSFR – Term Secured Overnight Financing Rate
(1) | Foreign security. |
(2) | Includes securities exempt from registration under Rule 144A of the Securities Act of 1933. These securities may be resold in transactions exempt from registration to qualified institutional buyers. At December 31, 2023, the value of these securities totaled $6,091,997,868, which represented 21.85% of total net assets. |
(3) | Variable rate security based on a reference index and spread. The rate reported is the rate as of the last reset date in effect as of December 31, 2023. |
(4) | Variable rate security. The coupon is based on an underlying pool of loans. The rate reported is the rate in effect as of December 31, 2023. |
(5) | Seven-day yield. |
(6) | Security that, on the last payment date, missed a partial principal or interest payment. |
(7) | Step-up bond; the interest rate shown is the rate in effect as of December 31, 2023. |
(8) | Security in default. |
(9) | Non-income producing. |
(10) | Securities referencing LIBOR are expected to transition to an alternative reference rate by the security’s next scheduled coupon reset date. |
The accompanying notes are an integral part of these financial statements.
Baird Core Plus Bond Fund
Summary of Fair Value Exposure at December 31, 2023
The Fund has adopted authoritative fair valuation accounting standards which establish a definition of fair value and set out a hierarchy for measuring fair value. These standards require additional disclosures about the various inputs and valuation techniques used to develop the measurements of fair value and a discussion on changes in valuation techniques and related inputs during the period. These standards define fair value as the price that would be received to sell an asset or paid to transfer a liability in an orderly transaction between market participants at the measurement date.
The fair value hierarchy is organized into three levels based upon the assumptions (referred to as “inputs”) used in pricing the asset or liability. These standards state that “observable inputs” reflect the assumptions market participants would use in pricing the asset or liability based on market data obtained from independent sources and “unobservable inputs” reflect an entity’s own assumptions about the assumptions market participants would use in pricing the asset or liability. These inputs are summarized into three broad levels and described below:
Level 1 – Quoted prices (unadjusted) in active markets for identical assets or liabilities that the reporting entity can access at the measurement date.
Level 2 – Inputs other than quoted prices included within Level 1 that are observable for the asset or liability, either directly or indirectly.
Level 3 – Unobservable inputs for the asset or liability.
The inputs or methodology used for valuing securities are not necessarily an indication of the risk associated with investing in those securities.
The following is a summary of the inputs used to value the Fund’s investments as of December 31, 2023:
| | | Level 1 | | | Level 2 | | | Level 3 | | | Total | |
| Long-Term Investments | | | | | | | | | | | | |
| U.S. Treasury Securities | | $ | — | | | $ | 5,546,530,172 | | | $ | — | | | $ | 5,546,530,172 | |
| Other Government Related Securities | | | — | | | | 48,202,311 | | | | — | | | | 48,202,311 | |
| Corporate Bonds | | | — | | | | 12,729,753,706 | | | | — | | | | 12,729,753,706 | |
| Municipal Bonds | | | — | | | | 299,695,160 | | | | — | | | | 299,695,160 | |
| Residential Mortgage-Backed Securities – U.S. Government Agency Issues | | | — | | | | 5,334,834,344 | | | | — | | | | 5,334,834,344 | |
| Residential Mortgage-Backed Securities – Non-U.S. Government Agency Issues | | | — | | | | 1,300,001,854 | | | | — | | | | 1,300,001,854 | |
| Commercial Mortgage-Backed Securities – U.S. Government Agency Issues | | | — | | | | 319,440,985 | | | | — | | | | 319,440,985 | |
| Commercial Mortgage-Backed Securities – Non-U.S. Government Agency Issues | | | — | | | | 1,282,130,545 | | | | — | | | | 1,282,130,545 | |
| Asset Backed Securities | | | — | | | | 667,857,556 | | | | — | | | | 667,857,556 | |
| Common Stock | | | 4,500,473 | | | | — | | | | — | | | | 4,500,473 | |
| Total Long-Term Investments | | | 4,500,473 | | | | 27,528,446,633 | | | | — | | | | 27,532,947,106 | |
| Short-Term Investment | | | | | | | | | | | | | | | | |
| Money Market Mutual Fund | | | 290,082,064 | | | | — | | | | — | | | | 290,082,064 | |
| Total Short-Term Investment | | | 290,082,064 | | | | — | | | | — | | | | 290,082,064 | |
| Total Investments | | $ | 294,582,537 | | | $ | 27,528,446,633 | | | $ | — | | | $ | 27,823,029,170 | |
Changes in valuation techniques may result in transfers into or out of assigned levels within the fair value hierarchy. There were no transfers into or out of Level 3 during the year, as compared to the security classifications from the prior year’s annual report. See the Fund’s Valuation Policy in Note 2a to the financial statements.
The accompanying notes are an integral part of these financial statements.
2023 Municipal Bond Market Overview
(Unaudited)
The tax-exempt market closed the year on a very strong tone, yields fell dramatically in Q4 which pushed them below year ago levels across the curve. For the year, intermediate yields fell the most as 7 – 10 year maturity yields declined by 37 bps. But the year over year perspective hides the significant intra-year volatility that occurred, as shown in the adjacent graph of the 10-year AAA yield. After trading in a 50 – 60 bp range early in the year, yields began a steady, multi-month march higher. From the low of 2.08% in April, the 10-year yield rose 158 bps to peak at 3.65% in late-October. Then, one of the strongest rallies in decades occurred in November and December as the 10-year closed the year at 2.27%, down 138 bps from the peak. Other segments of the municipal curve underwent similar rate movements as the volatility in tax-exempt yields followed a similarly volatile Treasury market. Investors were on watch for signs of economic weakness/recession throughout the year, but few appeared. Instead, the Fed remained committed to fighting inflation, raising the federal funds rate by 100 bps in 2023. One of the catalysts for the Q4 rally was an acknowledgement by Fed Chair Powell that the outlook for further rate increases was now equally balanced with the possibility for rate cuts, which fueled market expectations that as many as six 25 bps rate cuts might occur in 2024; the median outlook of the Fed dot plots suggests three cuts are possible. Yet, economic growth remains quite resilient; the economy grew at a better than 2% rate in Q1 and Q2, 4.9% in Q3, and 3.3% in Q4. Slowing inflation offered investors and the Fed support as core PCE fell from a peak rate of 5.6% in February to 3.2% in November.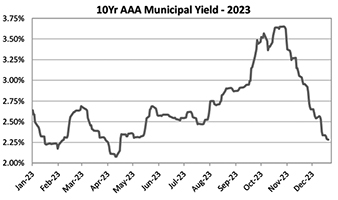
AAA Municipal Yields
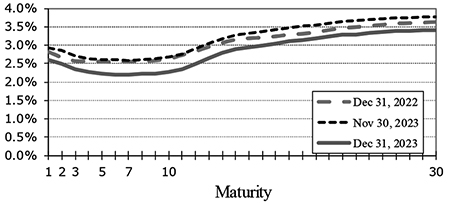
| Maturity | 12/31/22 | 9/30/23 | 11/30/23 | 12/31/23 | 1 MoΔ | Q4Δ | 2023Δ |
| 1 | 2.82% | 3.73% | 2.92% | 2.59% | -0.33% | -1.14% | -0.23% |
| 2 | 2.67% | 3.65% | 2.85% | 2.50% | -0.35% | -1.15% | -0.17% |
| 3 | 2.58% | 3.51% | 2.71% | 2.35% | -0.36% | -1.16% | -0.23% |
| 5 | 2.56% | 3.38% | 2.60% | 2.22% | -0.38% | -1.16% | -0.34% |
| 7 | 2.56% | 3.38% | 2.59% | 2.19% | -0.40% | -1.19% | -0.37% |
| 10 | 2.64% | 3.44% | 2.68% | 2.27% | -0.41% | -1.17% | -0.37% |
| 30 | 3.63% | 4.42% | 3.77% | 3.40% | -0.37% | -1.02% | -0.23% |
| | | | | | | | |
Even with the rate volatility in 2023, the municipal curve remained inverted between the 1 – 10-year segment throughout the year, from -18 bps at the start to -32 bps at year end. Contributing to the inversion in fixed rate issues was the elevated (and volatile) weekly floating-rate municipal index yield, SIFMA Index. The SIFMA Index ended the year at 3.87% (approximately 73% of the effective federal funds rate), up 21 bps from the start of the year, but 221 bps above its low in January of 1.66%. The opportunity to stay in short-term floating- or fixed-rate issues at similar or higher yields than intermediate maturities negatively impacted fund flows in 2023. Also impacting flows in Q4 was a challenging tax-loss harvesting period. A sharp sell-off in October triggered loss harvesting, but if investors went to cash to avoid the 31-day wash sale rule, they missed the massive year-end rally in November/December. If they invested in a different municipal investment, they now sit with a short-term capital gain. Nonetheless, 2023 was the second consecutive year of net redemptions from municipal funds across the industry, with $28.4 billion of outflows in year, but down significantly from the record $119.6 billion redemptions in 2022. Interestingly, most municipal fund outflows were from short-term funds as investors either went to cash or into long-term funds which had net inflows for the year. Despite the industry outflows, overall demand for the municipal sector was robust as evidenced by the outperformance of tax-exempt yields which fell more than comparable maturity Treasuries for the year. It helped that new municipal supply was modest in 2023 as total issuance fell 2% year over year; taxable issuance was off 36% year over year, from an already light base in the prior year, and tax-exempt supply rose just 5% year over year. Leading the supply was heavy issuance from Texas municipalities. To meet the significant infrastructure needs of a growing population, Texas sold more municipal debt than any other state in 2023, even more than the perennial leaders, California and New York. With more than nine million new residents moving to Texas since 2000, it now joins California as only the second state with more than thirty million residents.

Credit Update
The backdrop for municipal credit was fundamentally strong throughout the year, with rating agency upgrades exceeding downgrades for all three rating agencies. Providing support for municipalities was the lingering post-Covid federal stimulus. S&P estimates that as of June 2023, state and local governments still had an estimated 55% of their pandemic relief unspent, and approximately 40% for local school districts. This means municipalities are well positioned for slowing tax revenue growth as is occurring in many locations. For example, the State of California, always among the most cyclical of states due to its heavy reliance on income tax (the top 1% of earners pay 40% of all income tax revenues), now projects a record combined deficit of $68 billion for fiscal years 2023 and 2024. The lack of capital gains taxes following the equity market decline in 2022 is a contributing factor, but more favorable markets this year should help narrow next year’s gap. Some spending adjustments will also be needed, but the state also has a record $38 billion in reserves available to help ease the adjustment. Other states, such as New York and New Jersey are also forecasting slowing tax revenue estimates for FY 2024 and beyond.
Away from state and local governments, stresses emerged in other municipal sectors, most notably Higher Education and Hospitals. By our count, twenty smaller, private not-for-profit liberal arts colleges either closed in 2023 or announced plans to do so in 2024, while others intend to merge with another college or university to survive. Beyond the now less-favorable demographic backdrop, as fewer high school graduates are causing acute enrollment challenges, many colleges also face elevated fixed costs for tenured faculty as well as imbalances between the majors offered and majors sought by employers. Students and families are also weighing the costs of a traditional, four-year college education against other education and career options. In contrast, aging demographics are supportive of the Hospital sector, even though many of the post-pandemic challenges remain. Although the nursing and staffing shortages have eased (but not gone away), labor costs are elevated while reimbursement levels are largely unchanged, squeezing operating margins. The pressure is most obvious among smaller, rural hospitals, but encouragingly there has been stabilization and modest improvement among many of the larger regional and national healthcare systems. Finally, the municipal Single-family Housing (SFH) sector is fundamentally strong, as the demand for down-payment assistance and/or below-market mortgage rates for first-time homebuyers is high. This led to a 50% year over year increase in SFH supply in 2023, which kept spreads wide in the sector, but offers a favorable risk/reward profile for tax-exempt investors.
Strong Q4 Rally Lifts 2023 Returns Into Solidly Positive Territory
The sharp decline in rates in Q4 pushed 2023 returns into positive territory across the curve. A consistent theme for both periods was that risk-taking was rewarded in the quarter and year. Longer maturities significantly outperformed both intermediate and short-term curve segments over each period. The Revenue sector also outperformed GOs and the shorter duration Prerefunded sector for the year. Finally, the risk theme was consistent across the credit spectrum as lower-quality municipals outperformed AAAs for the quarter and year; BBBs outperformed AAAs by 313 bps for all of 2023 as both carry and narrowing spreads helped.
2023 Municipal Bond Market Overview
(Unaudited)
Total Returns of Selected Bloomberg Municipal Indices and Subsectors
Bloomberg Index/Sector | December | Q4 | 2023 | 2022 | Duration | Bloomberg Quality | December | Q4 | 2023 | 2022 | Duration |
| Municipal Index | 2.32% | 7.89% | 6.40% | -8.53% | 6.05 | AAA | 2.21% | 8.35% | 5.80% | -7.93% | 6.21 |
| General Obligation bonds | 2.15% | 7.79% | 5.62% | -7.74% | 5.72 | AA | 2.25% | 7.62% | 5.92% | -7.97% | 5.90 |
| Revenue bonds | 2.46% | 8.15% | 6.89% | -9.29% | 6.33 | A | 2.52% | 7.96% | 7.34% | -9.06% | 5.99 |
| Prerefunded bonds | 0.62% | 3.03% | 2.99% | -3.01% | 2.19 | BBB | 2.61% | 9.19% | 8.93% | -11.63% | 7.26 |
| Long maturities (22+ yrs.) | 3.45% | 11.61% | 9.35% | -15.58% | 10.01 | High Yield | 3.00% | 9.21% | 9.21% | -13.10% | 7.06 |
| Intermediate maturities (1 - 17 yrs.) | 1.89% | 6.38% | 5.26% | -4.84% | 4.54 | HY, ex-Puerto Rico | 2.97% | 8.75% | 7.92% | -12.64% | 6.97 |
| Short maturities (1 - 5 yrs.) | 0.95% | 3.53% | 3.58% | -3.17% | 2.36 | | | | | | |
2024 Outlook
The favorable backdrop for the municipal market should continue into 2024, helped by the expectation that mutual fund inflows will gradually return. Historically, municipal fund flows have been highly correlated with the slope of the tax-exempt curve, the more positive the slope the more positive the inflows. So, the outflows of the last two years against an inverted curve over much of the period is not surprising. However, if inflation continues toward the Fed’s 2% target rate and more signs of slowing growth emerge in the US economy, it is likely that short-term rates will fall faster than long-term rates, resteepening the curve. Curve positioning in 2024 will continue to be important, as investors balance the desire to position for lower short-term rates against capturing the optimal roll-down in the 10- to 15-year segment of the curve.
More favorable fund flows will likely be met with only a modest pickup in supply. Perhaps underappreciated by many is the stable level of total outstanding municipal debt, which has remained near $4 trillion since 2008 while Treasury supply has exploded. Consensus estimates among municipal dealers is for supply in 2024 to increase only slightly since the federal stimulus funds continue to limit borrowing needs for many state and local governments. And with tax-exempt yields only back near their long-term average since the global financial crisis in 2008, little change in refunding activity is expected. The exception for issuance will be those states experiencing the fastest growth in population (e.g. Texas and Florida). Issuance among other municipal sectors, particularly Higher Education and Hospitals, should improve only modestly given their ongoing challenges. Housing supply should stay robust, but it is a relatively small sector of the total market.
Finally, because municipal credit spreads are relatively tight as we enter 2024, the best investment opportunities will likely be found among higher-quality issues. While most of our strategies will benefit from the additional yield that a modest credit overweight currently offers, patience on adding to the overweight will likely be rewarded later in the year. Instead, structural opportunities, including coupon, call and prepayment variations should offer additional yield with more favorable risk characteristics.
Disclosures
This is not a complete analysis of every material fact regarding any company, industry or security. The information has been obtained from sources we consider to be reliable, but we cannot guarantee the accuracy.
Fixed income is generally considered to be a more conservative investment than stocks, but bonds and other fixed income investments still carry a variety of risks such as interest rate risk, credit risk, inflation risk, and liquidity risk. In a rising interest rate environment, the value of fixed-income securities generally decline and conversely, in a falling interest rate environment, the value of fixed-income securities generally increase. High yield securities may be subject to heightened market, interest rate or credit risk and should not be purchased solely because of the stated yield.
Indices are unmanaged and are not available for direct investment. Past performance is not a guarantee of future results.
The Bloomberg Municipal Index is a broad-based, total-return index. The bonds are all investment-grade, tax-exempt, and fixed-rate securities with long-term maturities (greater than 2 years). They are selected from issues larger than $50 million. The components listed below the Municipal Index (long maturities, intermediate maturities, short maturities, prefunded bonds, general obligation bonds and revenue bonds) are subsectors of the Bloomberg Municipal Index and do not represent separate indices.
The Bloomberg High Yield Municipal Index includes bonds with a par value of at least $3 million and must be issued as part of a transaction of at least $20 million. The maximum rating for inclusion is Ba1/BB+/BB+ using the middle rating.
For more information about the Bloomberg Municipal Index or Bloomberg High Yield Municipal Index, please visit https://index.barcap.com/Home/Guides_and_Factsheets.
Municipal securities investments are not appropriate for all investors, especially those taxed at lower rates. The alternative minimum tax (AMT) may be applicable, even for securities identified as tax exempt. Past performance is not a guarantee of future results.
Ratings are measured on a scale that ranges from AAA or Aaa (highest) to D or C (lowest). Investment grade investments are those rated from highest down to BBB- or Baa3.
Baird Short-Term Municipal Bond Fund
December 31, 2023 (Unaudited)
The Baird Short-Term Municipal Bond Fund seeks current income that is exempt from federal income tax and is consistent with the preservation of capital.
The tax-exempt market closed 2023 with a very strong tone as yields fell over 100 bps in the fourth quarter and were down 20 - 40 bps for the year, with intermediate maturities falling the most. A catalyst for the fourth quarter rally was an acknowledgement by Fed Chair Powell that the possibility of rate cuts was now equally balanced against further increases. One market anomaly which persisted throughout the year was the inversion of the municipal yield curve between the 1–10-year maturities, ending the year with 32 bps of negative slope. Relatively high short-term floating-rate yields helped sustain the inversion but also acted as a disincentive to invest in longer-term fixed-rate bonds, a drag on municipal fund flows across the industry in 2023. Yet, overall demand for municipals was robust, evidenced by the fact that tax-exempt yields fell more than comparable maturity Treasuries for the year. It also helped that the level of new municipal supply was modest in 2023. Total issuance fell 2% from the prior year with taxable municipal issuance off 36% and tax-exempt supply up just 5% on a year-over-year basis.
During 2023, the Institutional Class Shares of the Fund (BTMIX) posted a net return of 4.15% vs. a 3.58% return for the Bloomberg 1-5 Year Short Municipal Index.
Positive contributors to the Fund’s relative performance during the year include:
| | • | Portfolio Structure – A barbell curve allocation enhanced returns |
| | • | Credit Positioning – The Fund benefited from additional yield from lower-quality issues |
| | • | Security Selection – Discount bonds outperformed premium priced securities |
Negative contributors to the Fund’s relative performance during the year include:
| | • | Sector Allocation – The corporate-backed and Hospital sectors lagged other market sectors |
We expect that the favorable backdrop for the municipal market will continue into 2024, in part due to the expectation that municipal fund flows will turn positive once again. Since municipal fund flows are highly correlated with curve slope (the more positive the slope the more positive the inflows), as inflation continues toward the Fed’s 2% target rate, short-term rates should fall faster than long-term rates, re-steepening the curve. Curve positioning, which is always important, will remain so in 2024. We expect only a modest pickup in supply as the post-Covid federal stimulus funds continue to be spent, limiting borrowing needs for many state and local governments. The exception, we believe, will be those states experiencing the fastest growth in population (e.g., Texas and Florida). Issuance among other municipal sectors, particularly Higher Education and Hospitals, should improve only modestly given their ongoing challenges. Tax-Exempt Housing supply should stay robust, but it is a relatively small sector of the total market. Finally, because municipal credit spreads are relatively tight as we enter 2024, the best investment opportunities will likely be found among higher-quality issues. We will also seek favorable risk/reward through structural opportunities including coupon, call and prepayment variations to enhance both yield and return.
The Fund maintains a neutral duration posture relative to the benchmark while seeking to optimize roll opportunities along the yield curve. Sector weightings will likely favor an overweight to revenue-backed issues over general obligation debt. We believe modest credit overweight short on the curve is appropriate given current spread levels, with room to increase exposure if spreads widen further in a slowing economy. That said, a continual focus on the fundamental tax and revenue support remains especially important at this point in the credit cycle. Higher-quality, structural opportunities will also remain a focus to enhance income to investors.
Baird Short-Term Municipal Bond Fund
December 31, 2023 (Unaudited)
Portfolio Characteristics
Quality Distribution(1)(2)

| | Net Assets | $1,603,777,104 | |
| | | | |
| | SEC 30-Day Yield(4) | | |
| | Institutional Class | 3.22% | |
| | Investor Class | 2.97% | |
| | | | |
| | Average Effective Duration | 2.22 years | |
| | | | |
| | Average Effective Maturity | 2.55 years | |
| | | | |
| | Annualized Expense Ratio(5) | | |
| | Institutional Class | 0.30% | |
| | Investor Class | 0.55% | (6) |
| | | | |
| | Portfolio Turnover Rate | 40% | |
| | | | |
| | | Number of Holdings | 1,076 | |
Sector Weightings(7) | | | | |
| | | | | |
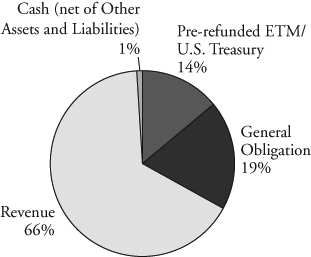 | | | | |
| | | | |
| | | | |
| | | | |
| | | | |
| | | | |
| | | | |
| | | | |
| | | | |
| | | | |
| | | | |
| | | | |
| | | | |
| | | | |
| | | | |
| | | | | |
(1) | Percentages shown are based on the Fund’s total investments. |
(2) | The quality profile is calculated on a market value-weighted basis using the highest credit quality rating for each security held by the Fund given by S&P, Moody’s or Fitch, each of which is a Nationally Recognized Statistical Rating Organization (NRSRO). NRSROs rate the credit quality of securities using a scale that generally ranges from AAA (highest) to D (lowest). |
(3) | Includes pre-refunded and escrowed-to-maturity (ETM) bonds. |
(4) | SEC yields are based on SEC guidelines and are calculated for the 30 days ended December 31, 2023. |
(5) | Reflects expense ratios as stated in the Fund’s current prospectus dated May 1, 2023. |
(6) | Includes 0.25% 12b-1 fee. |
(7) | Percentages shown are based on the Fund’s total net assets.
|
Baird Short-Term Municipal Bond Fund
December 31, 2023 (Unaudited)
| Institutional Class | Investor Class |
| Value of a $10,000 Investment | Value of a $10,000 Investment |
| | |
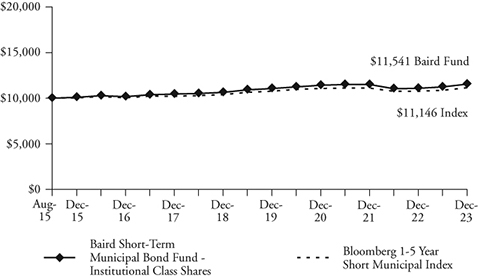 | 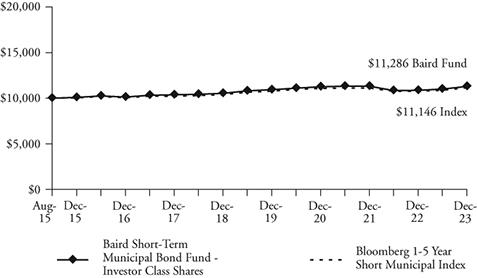 |
| | |
| Growth of a hypothetical investment of $10,000 made on 08/31/15, assuming | Growth of a hypothetical investment of $10,000 made on 08/31/15, assuming |
| reinvestment of all distributions. | reinvestment of all distributions. |
| Total Returns | | | | |
| | | Average Annual |
| | One | Three | Five | Since |
| For the Periods Ended December 31, 2023 | Year | Years | Years | Inception(1) |
| Institutional Class Shares | 4.15% | 0.36% | 1.64% | 1.73% |
| Investor Class Shares | 3.90% | 0.11% | 1.39% | 1.46% |
Bloomberg 1-5 Year Short Municipal Index(2) | 3.58% | 0.22% | 1.42% | 1.31% |
(1) | For the period from August 31, 2015 (inception date) through December 31, 2023. |
(2) | The Bloomberg 1-5 Year Short Municipal Index is an unmanaged, market value weighted index that measures the performance of investment-grade, tax-exempt, and fixed-rated municipal securities with time to maturity of more than one year and less than five years. Securities must have an outstanding par value of at least $7 million and be issued as part of a transaction of at least $75 million. The bonds must be fixed rate, have a dated-date after December 31, 1990, and must be at least one year from their maturity date. This Index does not reflect any deduction for fees, expenses or taxes. A direct investment in an index is not possible. |
The line graphs and the returns table shown above reflect reinvestment of dividends and/or capital gains distributions in additional shares. The returns in the graphs and table do not reflect the deduction of taxes that a shareholder would pay on Fund distributions or the redemption of Fund shares. The returns reflect the actual performance for each period and do not include the impact of trades executed on the last business day of the period that were recorded on the first business day of the next period.
The Fund’s expense ratio for each Class, as reflected in the Fund’s current prospectus, is set forth under “Portfolio Characteristics”.
The Fund may invest up to 10% of its net assets in non-investment grade debt securities (commonly referred to as “high yield” bonds). While these types of debt securities may offer higher yields than investment grade securities, they also include greater risks including increased credit risk and the increased risk of default or bankruptcy. The Fund may invest up to 25% of its total assets in municipal obligations issued by persons in the same state. As a result, changes in economic, business or political conditions of a particular state may have a disproportionate impact on the Fund’s share price. Municipal securities investments are not appropriate for all investors, especially those taxed at lower rates. U.S. and international markets have experienced significant periods of volatility due to a number of economic, political and other global macro factors. The war between Ukraine and Russia is approaching its 2nd anniversary and the October 7th attack by Hamas and Israel’s response only added to global tensions. US/China relations remain strained, impacted by sluggish Chinese economic growth and numerous issues affecting trade relations. Domestically, inflation remains an area of focus since getting to the Fed’s 2% target may prove to be more challenging than the market expects. In addition, 2024 is an election year and the current level of political discord is high. Finally, while the coronavirus (COVID-19) appears to have entered an endemic stage, significant outbreaks present a continued risk to the global economy. These and other events may cause market disruptions and could have an adverse effect on the value of the Fund’s investments.
Past performance does not guarantee future results. Investment return and principal value will fluctuate so that an investor’s shares, when redeemed, may be worth more or less than their original cost.
For information about the performance of the Fund as of the most recent month-end, please call 1-866-442-2473 or visit www.bairdfunds.com. Mutual fund performance changes over time and current performance may be lower or higher than that stated.
Baird Short-Term Municipal Bond Fund
Schedule of Investments, December 31, 2023
Long-Term Investments
| | | Principal | | | | | | % of | |
| | | Amount | | | Value | | | Net Assets | |
| Municipal Bonds | | | | | | | | | |
| Alabama | | | | | | | | | |
| Alabama Economic Settlement Authority, | | | | | | | | | |
| 4.000%, 09/15/2033 | | | | | | | | | |
| (Callable 09/15/2026) | | $ | 7,000,000 | | | $ | 7,017,450 | | | | |
| Alabama Housing Finance Authority: | | | | | | | | | | | |
| 3.500%, 08/01/2025 (Mandatory Tender | | | | | | | | | | | |
Date 08/01/2024) (Insured by HUD)(1) | | | 5,000,000 | | | | 4,990,891 | | | | |
| 5.000%, 05/01/2026 (Mandatory Tender | | | | | | | | | | | |
Date 05/01/2025) (Insured by FHA)(1) | | | 4,000,000 | | | | 4,072,030 | | | | |
| Black Belt Energy Gas District: | | | | | | | | | | | |
| 5.250%, 12/01/2028 | | | 3,205,000 | | | | 3,419,782 | | | | |
| 3.430%, 10/01/2052 | | | | | | | | | | | |
| (SIFMA Municipal Swap Index + 0.350%) | | | | | | | | | | | |
| (Callable 09/01/2026) | | | | | | | | | | | |
(Mandatory Tender Date 12/01/2026)(2) | | | 1,000,000 | | | | 975,536 | | | | |
| 4.000%, 10/01/2052 (Callable 09/01/2026) | | | | | | | | | | | |
(Mandatory Tender Date 12/01/2026)(1) | | | 300,000 | | | | 301,339 | | | | |
| 5.250%, 02/01/2053 (Callable 03/01/2029) | | | | | | | | | | | |
(Mandatory Tender Date 06/01/2029)(1) | | | 3,250,000 | | | | 3,470,504 | | | | |
| 5.000%, 05/01/2053 | | | | | | | | | | | |
(Mandatory Tender Date 06/01/2028)(1) | | | 13,000,000 | | | | 13,614,535 | | | | |
| City of Phenix AL, | | | | | | | | | | | |
| 2.000%, 04/01/2027 | | | 1,435,000 | | | | 1,382,686 | | | | |
| County of Jefferson AL, | | | | | | | | | | | |
| 0.000%, 10/01/2025 (Callable 01/19/2024) | | | | | | | | | | | |
| (Insured by AGM) | | | 750,000 | | | | 689,250 | | | | |
| Health Care Authority | | | | | | | | | | | |
| of the City of Huntsville, | | | | | | | | | | | |
| 5.000%, 06/01/2053 (Callable 03/01/2030) | | | | | | | | | | | |
(Mandatory Tender Date 06/01/2030)(1) | | | 5,500,000 | | | | 6,115,810 | | | | |
| Industrial Development | | | | | | | | | | | |
| Board of the City of Mobile, | | | | | | | | | | | |
| 3.920%, 06/01/2034 | | | | | | | | | | | |
(Mandatory Tender Date 06/02/2026)(1) | | | 8,400,000 | | | | 8,510,161 | | | | |
| Lauderdale County | | | | | | | | | | | |
| Agriculture Center Authority, | | | | | | | | | | | |
| 5.000%, 07/01/2024 | | | 495,000 | | | | 497,800 | | | | |
| Macon County Board of Education, | | | | | | | | | | | |
| 3.250%, 02/01/2026 (Callable 01/29/2024) | | | 375,000 | | | | 374,484 | | | | |
| Pickens County Water Authority: | | | | | | | | | | | |
| 3.000%, 01/01/2024 (Insured by BAM) | | | 100,000 | | | | 100,000 | | | | |
| 3.000%, 01/01/2025 (Insured by BAM) | | | 160,000 | | | | 160,005 | | | | |
| Prattville Industrial Development Board, | | | | | | | | | | | |
| 5.300%, 09/01/2028 | | | 1,600,000 | | | | 1,681,312 | | | | |
| Selma Industrial Development Board, | | | | | | | | | | | |
| 2.000%, 11/01/2033 | | | | | | | | | | | |
(Mandatory Tender Date 10/01/2024)(1) | | | 750,000 | | | | 737,044 | | | | |
| Southeast Alabama Gas Supply District, | | | | | | | | | | | |
| 4.563%, 04/01/2049 (1 Month TSFR + | | | | | | | | | | | |
| 0.900%) (Callable 01/19/2024) | | | | | | | | | | | |
(Mandatory Tender Date 04/01/2024)(2) | | | 920,000 | | | | 919,067 | | | | |
| Southeast Energy Authority | | | | | | | | | | | |
| A Cooperative District: | | | | | | | | | | | |
| 5.500%, 01/01/2053 (Callable 09/01/2029) | | | | | | | | | | | |
(Mandatory Tender Date 12/01/2029)(1) | | | 1,250,000 | | | | 1,357,325 | | | | |
| 5.000%, 05/01/2053 (Callable 05/01/2028) | | | | | | | | | | | |
(Mandatory Tender Date 08/01/2028)(1) | | | 1,250,000 | | | | 1,306,333 | | | | |
| 5.250%, 01/01/2054 (Callable 04/01/2029) | | | | | | | | | | | |
(Mandatory Tender Date 07/01/2029)(1) | | | 8,000,000 | | | | 8,513,557 | | | | |
| Tender Option Bond Trust, | | | | | | | | | | | |
| 2.350%, 07/01/2025 | | | | | | | | | | | |
(Optional Put Date 01/02/2024)(1)(3) | | | 3,000,000 | | | | 3,000,000 | | | | |
| Town of Berry AL, | | | | | | | | | | | |
| 3.250%, 09/01/2028 (Callable 09/01/2026) | | | | | | | | | | | |
| (Insured by AGM) | | | 610,000 | | | | 619,604 | | | | |
| Total Alabama | | | | | | | | | | | |
| (Cost $73,567,570) | | | | | | | 73,826,505 | | | | 4.6 | % |
| Alaska | | | | | | | | | | | | |
| Alaska Housing Finance Corp.: | | | | | | | | | | | | |
| 3.750%, 12/01/2042 (Callable 06/01/2028) | | | 5,115,000 | | | | 5,075,129 | | | | | |
| 4.000%, 12/01/2048 (Callable 06/01/2027) | | | 1,275,000 | | | | 1,273,213 | | | | | |
| University of Alaska: | | | | | | | | | | | | |
| 4.000%, 10/01/2025 | | | 330,000 | | | | 333,864 | | | | | |
| 4.000%, 10/01/2026 (Callable 01/29/2024) | | | 1,400,000 | | | | 1,400,781 | | | | | |
| 5.000%, 10/01/2026 | | | 865,000 | | | | 906,217 | | | | | |
| Total Alaska | | | | | | | | | | | | |
| (Cost $9,348,838) | | | | | | | 8,989,204 | | | | 0.6 | % |
| Arizona | | | | | | | | | | | | |
| Arizona Industrial Development Authority: | | | | | | | | | | | | |
| 5.000%, 05/01/2025 | | | 405,000 | | | | 243,000 | | | | | |
| 5.000%, 07/01/2027 (Callable 07/01/2026) | | | 230,000 | | | | 238,793 | | | | | |
4.625%, 08/01/2028(3) | | | 375,000 | | | | 364,666 | | | | | |
| 5.000%, 11/01/2028 (Callable 05/01/2028) | | | 7,500,000 | | | | 8,124,226 | | | | | |
| 5.000%, 07/01/2029 (Callable 07/01/2026) | | | 260,000 | | | | 270,682 | | | | | |
| 5.000%, 07/01/2030 (Callable 07/01/2026) | | | 380,000 | | | | 395,353 | | | | | |
| 1.745%, 09/01/2030 | | | | | | | | | | | | |
(Insured by AGM)(1)(3) | | | 5,916,271 | | | | 5,585,542 | | | | | |
| 5.000%, 07/01/2031 (Callable 07/01/2026) | | | 195,000 | | | | 202,436 | | | | | |
| 3.625%, 05/20/2033 | | | 3,930,503 | | | | 3,720,859 | | | | | |
| BluePath TE Trust, | | | | | | | | | | | | |
| 2.750%, 09/01/2026 | | | | | | | | | | | | |
(Callable 01/29/2024)(3) | | | 1,706,756 | | | | 1,659,991 | | | | | |
| Glendale Industrial Development Authority: | | | | | | | | | | | | |
| 4.000%, 05/15/2025 (Callable 05/15/2024) | | | 340,000 | | | | 332,963 | | | | | |
| 4.000%, 05/15/2026 (Callable 05/15/2024) | | | 320,000 | | | | 310,430 | | | | | |
| Maricopa County Industrial | | | | | | | | | | | | |
| Development Authority, | | | | | | | | | | | | |
| 4.000%, 07/01/2024 | | | | | | | | | | | | |
| (Insured by SD CRED PROG) | | | 135,000 | | | | 135,240 | | | | | |
| Salt Verde Financial Corp., | | | | | | | | | | | | |
| 5.250%, 12/01/2026 | | | 2,500,000 | | | | 2,607,167 | | | | | |
| University of Arizona, | | | | | | | | | | | | |
| 5.000%, 06/01/2032 (Callable 06/01/2026) | | | 1,020,000 | | | | 1,070,279 | | | | | |
| Total Arizona | | | | | | | | | | | | |
| (Cost $25,309,279) | | | | | | | 25,261,627 | | | | 1.6 | % |
| Arkansas | | | | | | | | | | | | |
| Arkansas Development Finance Authority: | | | | | | | | | | | | |
| 4.000%, 07/01/2024 | | | 100,000 | | | | 99,785 | | | | | |
| 4.000%, 07/01/2025 | | | 140,000 | | | | 139,398 | | | | | |
| 4.000%, 07/01/2026 | | | 190,000 | | | | 189,441 | | | | | |
| 4.000%, 07/01/2027 | | | 225,000 | | | | 224,936 | | | | | |
| 4.000%, 07/01/2028 | | | 230,000 | | | | 229,215 | | | | | |
| Batesville Public Facilities Board: | | | | | | | | | | | | |
| 5.000%, 06/01/2024 | | | 1,000,000 | | | | 1,004,023 | | | | | |
| 5.000%, 06/01/2025 | | | 1,385,000 | | | | 1,407,083 | | | | | |
| 5.000%, 06/01/2026 | | | 850,000 | | | | 876,627 | | | | | |
| City of Bentonville AR, | | | | | | | | | | | | |
| 1.050%, 11/01/2046 (Callable 11/01/2028) | | | 115,000 | | | | 113,880 | | | | | |
| City of Brookland AR, | | | | | | | | | | | | |
| 1.500%, 09/01/2046 (Callable 09/01/2026) | | | 690,000 | | | | 660,664 | | | | | |
| City of Elkins AR: | | | | | | | | | | | | |
| 1.500%, 09/01/2046 (Callable 09/01/2026) | | | | | | | | | | | | |
| (Insured by AGM) | | | 315,000 | | | | 299,126 | | | | | |
| 1.500%, 09/01/2046 (Callable 09/01/2026) | | | | | | | | | | | | |
| (Insured by AGM) | | | 465,000 | | | | 444,250 | | | | | |
The accompanying notes are an integral part of these financial statements.
Baird Short-Term Municipal Bond Fund
Schedule of Investments, December 31, 2023
Long-Term Investments (cont.)
| | | Principal | | | | | | % of | |
| | | Amount | | | Value | | | Net Assets | |
| City of Fayetteville AR, | | | | | | | | | |
| 3.050%, 01/01/2047 | | | | | | | | | |
| (Callable 01/01/2027) | | $ | 345,000 | | | $ | 337,337 | | | | |
| City of Forrest City AR, | | | | | | | | | | | |
| 1.550%, 11/01/2044 | | | | | | | | | | | |
| (Callable 11/01/2029) | | | 705,000 | | | | 638,331 | | | | |
| City of Hot Springs AR, | | | | | | | | | | | |
| 4.000%, 12/01/2027 (Callable 01/29/2024) | | | | | | | | | | | |
| (Insured by BAM) | | | 255,000 | | | | 255,265 | | | | |
| City of Mountain View AR, | | | | | | | | | | | |
| 1.375%, 11/01/2050 (Callable 11/01/2027) | | | | | | | | | | | |
| (Insured by BAM) | | | 220,000 | | | | 217,275 | | | | |
| City of Pine Bluff AR, | | | | | | | | | | | |
| 3.000%, 02/01/2047 (Callable 08/01/2027) | | | | | | | | | | | |
| (Insured by BAM) | | | 345,000 | | | | 332,860 | | | | |
| Conway Health Facilities Board, | | | | | | | | | | | |
| 5.000%, 08/01/2024 | | | 410,000 | | | | 413,504 | | | | |
| County of Cross AR, | | | | | | | | | | | |
| 2.250%, 10/01/2030 (Callable 10/01/2024) | | | 395,000 | | | | 371,921 | | | | |
| Dumas Arkansas School District No. 6, | | | | | | | | | | | |
| 1.500%, 02/01/2024 (Callable 01/29/2024) | | | | | | | | | | | |
| (Insured by ST AID) | | | 245,000 | | | | 244,503 | | | | |
| Jacksonville North Pulaski | | | | | | | | | | | |
| County School District, | | | | | | | | | | | |
| 4.000%, 06/01/2029 (Callable 06/01/2027) | | | | | | | | | | | |
| (Insured by ST AID) | | | 1,240,000 | | | | 1,288,978 | | | | |
| Northwest Arkansas Conservation Authority, | | | | | | | | | | | |
| 4.000%, 03/01/2024 (Callable 01/29/2024) | | | | | | | | | | | |
| (Insured by BAM) | | | 375,000 | | | | 375,290 | | | | |
| Van Buren School District No. 42, | | | | | | | | | | | |
| 2.000%, 04/01/2024 (Insured by ST AID) | | | 130,000 | | | | 129,430 | | | | |
| Total Arkansas | | | | | | | | | | | |
| (Cost $10,552,338) | | | | | | | 10,293,122 | | | | 0.6 | % |
| California | | | | | | | | | | | | |
| Anaheim Public Financing Authority: | | | | | | | | | | | | |
| 5.000%, 09/01/2025 | | | 2,610,000 | | | | 2,682,848 | | | | | |
| 5.000%, 09/01/2026 | | | 1,290,000 | | | | 1,356,271 | | | | | |
| Bay Area Toll Authority, | | | | | | | | | | | | |
| 4.180%, 04/01/2045 | | | | | | | | | | | | |
| (SIFMA Municipal Swap Index + 1.100%) | | | | | | | | | | | | |
| (Callable 01/29/2024) | | | | | | | | | | | | |
(Mandatory Tender Date 04/01/2024)(2) | | | 3,500,000 | | | | 3,500,336 | | | | | |
| California Community | | | | | | | | | | | | |
| Choice Financing Authority: | | | | | | | | | | | | |
| 5.000%, 10/01/2024 | | | 300,000 | | | | 301,914 | | | | | |
| 5.000%, 10/01/2025 | | | 710,000 | | | | 720,473 | | | | | |
| 5.000%, 10/01/2026 | | | 625,000 | | | | 640,212 | | | | | |
| 5.000%, 10/01/2027 | | | 700,000 | | | | 723,611 | | | | | |
| 5.000%, 10/01/2028 | | | 475,000 | | | | 494,456 | | | | | |
| 5.000%, 10/01/2029 | | | 650,000 | | | | 680,564 | | | | | |
| California Infrastructure & | | | | | | | | | | | | |
| Economic Development Bank: | | | | | | | | | | | | |
| 3.430%, 08/01/2047 | | | | | | | | | | | | |
| (SIFMA Municipal Swap Index + 0.350%) | | | | | | | | | | | | |
| (Callable 01/19/2024) | | | | | | | | | | | | |
(Mandatory Tender Date 08/01/2024)(2) | | | 1,050,000 | | | | 1,043,097 | | | | | |
| 3.780%, 12/01/2050 | | | | | | | | | | | | |
| (SIFMA Municipal Swap Index + 0.700%) | | | | | | | | | | | | |
| (Callable 06/01/2025) | | | | | | | | | | | | |
(Mandatory Tender Date 06/01/2026)(2) | | | 5,550,000 | | | | 5,407,977 | | | | | |
| 1.750%, 08/01/2055 (Callable 02/01/2026) | | | | | | | | | | | | |
(Mandatory Tender Date 08/01/2026)(1) | | | 1,265,000 | | | | 1,196,794 | | | | | |
| California Municipal Finance Authority: | | | | | | | | | | | | |
| 4.000%, 10/01/2031 | | | | | | | | | | | | |
| (Callable 10/01/2026) | | | 2,280,000 | | | | 2,308,499 | | | | | |
| 4.000%, 10/01/2032 | | | | | | | | | | | | |
| (Callable 10/01/2026) | | | 1,500,000 | | | | 1,518,323 | | | | | |
| California Public Finance Authority: | | | | | | | | | | | | |
| 2.375%, 11/15/2028 | | | | | | | | | | | | |
(Callable 01/19/2024)(3) | | | 4,250,000 | | | | 4,237,336 | | | | | |
| 3.125%, 05/15/2029 | | | | | | | | | | | | |
(Callable 01/19/2024)(3) | | | 1,000,000 | | | | 984,175 | | | | | |
| California Statewide Communities | | | | | | | | | | | | |
| Development Authority: | | | | | | | | | | | | |
| 5.000%, 08/01/2026 (Callable 02/01/2024) | | | | | | | | | | | | |
| (Mandatory Tender Date 08/01/2024) | | | | | | | | | | | | |
(Insured by HUD)(1) | | | 3,300,000 | | | | 3,298,007 | | | | | |
| 5.000%, 09/01/2026 (Callable 03/01/2024) | | | | | | | | | | | | |
| (Mandatory Tender Date 09/01/2024) | | | | | | | | | | | | |
(Insured by HUD)(1)(3) | | | 1,000,000 | | | | 1,000,617 | | | | | |
| Indio Finance Authority, | | | | | | | | | | | | |
| 3.550%, 09/02/2029 | | | | | | | | | | | | |
(Callable 03/02/2024)(3) | | | 4,681,000 | | | | 4,681,664 | | | | | |
| Los Angeles County Development Authority, | | | | | | | | | | | | |
| 3.750%, 12/01/2046 (Callable 02/01/2026) | | | | | | | | | | | | |
| (Mandatory Tender Date 12/01/2026) | | | | | | | | | | | | |
(Insured by HUD)(1) | | | 1,650,000 | | | | 1,661,965 | | | | | |
| Newman-Crows Landing | | | | | | | | | | | | |
| Unified School District, | | | | | | | | | | | | |
| 0.000%, 08/01/2025 | | | 1,000,000 | | | | 948,726 | | | | | |
| Ontario Public Financing Authority: | | | | | | | | | | | | |
| 5.000%, 11/01/2025 (Insured by AGM) | | | 250,000 | | | | 260,701 | | | | | |
| 5.000%, 11/01/2027 (Insured by AGM) | | | 175,000 | | | | 192,130 | | | | | |
| Sacramento City Unified School District, | | | | | | | | | | | | |
| 0.000%, 07/01/2026 (Insured by AGM) | | | 300,000 | | | | 279,753 | | | | | |
| San Diego Housing Authority, Inc., | | | | | | | | | | | | |
| 5.000%, 05/01/2057 (Callable 05/01/2026) | | | | | | | | | | | | |
(Mandatory Tender Date 11/01/2026)(1) | | | 1,687,000 | | | | 1,766,215 | | | | | |
| Sutter Union High School District, | | | | | | | | | | | | |
| 0.000%, 06/01/2050 | | | | | | | | | | | | |
| (Pre-refunded to 08/01/2025) | | | 300,000 | | | | 47,187 | | | | | |
| Tulare Union High School District, | | | | | | | | | | | | |
| 0.000%, 08/01/2026 (Insured by NATL) | | | 2,245,000 | | | | 2,075,627 | | | | | |
| Tuolumne Utilities District, | | | | | | | | | | | | |
| 1.250%, 08/15/2024 (Callable 01/29/2024) | | | 5,000,000 | | | | 4,899,813 | | | | | |
| Vallejo City Unified School District, | | | | | | | | | | | | |
| 5.900%, 08/01/2025 (Insured by NATL) | | | 280,000 | | | | 282,378 | | | | | |
| Western Placer Unified School District: | | | | | | | | | | | | |
| 2.000%, 06/01/2025 (Callable 01/29/2024) | | | 5,735,000 | | | | 5,581,656 | | | | | |
| 2.000%, 06/01/2025 (Callable 01/29/2024) | | | 3,300,000 | | | | 3,202,971 | | | | | |
| Total California | | | | | | | | | | | | |
| (Cost $58,637,195) | | | | | | | 57,976,296 | | | | 3.6 | % |
| Colorado | | | | | | | | | | | | |
| Bromley Park Metropolitan District No. 2, | | | | | | | | | | | | |
| 5.000%, 12/01/2025 (Insured by BAM) | | | 315,000 | | | | 326,199 | | | | | |
| City & County of Denver CO: | | | | | | | | | | | | |
| 5.250%, 11/15/2026 | | | 2,000,000 | | | | 2,115,896 | | | | | |
| 5.500%, 11/15/2026 (Callable 02/16/2024) | | | 1,500,000 | | | | 1,503,094 | | | | | |
| 5.000%, 12/01/2026 | | | 5,035,000 | | | | 5,283,101 | | | | | |
| 5.250%, 11/15/2027 | | | 1,500,000 | | | | 1,620,642 | | | | | |
| Colorado Bridge Enterprise, | | | | | | | | | | | | |
| 4.000%, 06/30/2025 | | | 570,000 | | | | 573,859 | | | | | |
| Colorado Educational & | | | | | | | | | | | | |
| Cultural Facilities Authority: | | | | | | | | | | | | |
4.000%, 12/15/2025(3) | | | 505,000 | | | | 504,137 | | | | | |
| 5.000%, 06/15/2027 (Callable 06/15/2026) | | | 635,000 | | | | 661,839 | | | | | |
The accompanying notes are an integral part of these financial statements.
Baird Short-Term Municipal Bond Fund
Schedule of Investments, December 31, 2023
Long-Term Investments (cont.)
| | | Principal | | | | | | % of | |
| | | Amount | | | Value | | | Net Assets | |
| Colorado Health Facilities Authority: | | | | | | | | | |
| 5.000%, 05/15/2025 | | $ | 525,000 | | | $ | 526,136 | | | | |
| 5.000%, 05/15/2026 | | | 475,000 | | | | 478,659 | | | | |
| 5.000%, 05/15/2027 | | | 400,000 | | | | 405,040 | | | | |
| 2.125%, 05/15/2028 (Callable 01/29/2024) | | | 2,905,000 | | | | 2,701,956 | | | | |
| 5.250%, 05/15/2028 | | | | | | | | | | | |
| (Callable 05/15/2027) | | | 250,000 | | | | 255,391 | | | | |
| 5.000%, 08/01/2028 | | | 1,235,000 | | | | 1,332,228 | | | | |
| 3.500%, 05/15/2030 (Callable 01/29/2024) | | | 3,500,000 | | | | 3,170,206 | | | | |
| 5.000%, 12/01/2030 (Callable 06/01/2025) | | | 1,030,000 | | | | 1,043,195 | | | | |
| 5.000%, 06/01/2047 | | | | | | | | | | | |
| (Pre-refunded to 06/01/2027) | | | 1,750,000 | | | | 1,883,523 | | | | |
| 5.000%, 11/15/2048 | | | | | | | | | | | |
(Mandatory Tender Date 11/20/2025)(1) | | | 195,000 | | | | 201,479 | | | | |
| 3.630%, 05/15/2061 | | | | | | | | | | | |
| (SIFMA Municipal Swap Index + 0.550%) | | | | | | | | | | | |
| (Callable 02/17/2026) | | | | | | | | | | | |
(Mandatory Tender Date 08/17/2026)(2) | | | 3,000,000 | | | | 2,976,506 | | | | |
| 5.000%, 05/15/2062 (Callable 08/15/2027) | | | | | | | | | | | |
(Mandatory Tender Date 08/15/2028)(1) | | | 7,515,000 | | | | 8,237,173 | | | | |
| Colorado Housing & Finance Authority: | | | | | | | | | | | |
| 5.000%, 07/01/2026 (Mandatory Tender | | | | | | | | | | | |
Date 01/01/2026) (Insured by FNMA)(1) | | | 1,000,000 | | | | 1,025,994 | | | | |
| 4.000%, 05/01/2048 (Callable 11/01/2026) | | | | | | | | | | | |
| (Insured by GNMA) | | | 530,000 | | | | 528,581 | | | | |
| 4.250%, 11/01/2049 (Callable 11/01/2028) | | | | | | | | | | | |
| (Insured by GNMA) | | | 535,000 | | | | 537,861 | | | | |
| 3.250%, 05/01/2052 (Callable 11/01/2030) | | | | | | | | | | | |
| (Insured by GNMA) | | | 4,465,000 | | | | 4,358,176 | | | | |
| Denver Convention Center Hotel Authority, | | | | | | | | | | | |
| 5.000%, 12/01/2024 | | | 1,170,000 | | | | 1,179,774 | | | | |
| Denver Health & Hospital Authority, | | | | | | | | | | | |
| 4.000%, 12/01/2027 (Callable 01/29/2024) | | | 255,000 | | | | 255,084 | | | | |
| E-470 Public Highway Authority, | | | | | | | | | | | |
| 3.961%, 09/01/2039 (SOFR + 0.350%) | | | | | | | | | | | |
| (Callable 06/01/2024) | | | | | | | | | | | |
(Mandatory Tender Date 09/01/2024)(2) | | | 7,525,000 | | | | 7,505,208 | | | | |
| Fort Collins Housing Authority, | | | | | | | | | | | |
| 1.250%, 07/01/2024 (Callable 01/19/2024) | | | 2,600,000 | | | | 2,568,031 | | | | |
| Pueblo Urban Renewal Authority, | | | | | | | | | | | |
0.000%, 12/01/2025(3) | | | 850,000 | | | | 686,164 | | | | |
| Ravenna Metropolitan District: | | | | | | | | | | | |
| 5.000%, 12/01/2025 (Insured by AGM) | | | 200,000 | | | | 205,796 | | | | |
| 5.000%, 12/01/2026 (Insured by AGM) | | | 240,000 | | | | 251,281 | | | | |
| 5.000%, 12/01/2028 (Insured by AGM) | | | 290,000 | | | | 313,504 | | | | |
| 5.000%, 12/01/2029 (Insured by AGM) | | | 315,000 | | | | 345,250 | | | | |
| Vauxmont Metropolitan District: | | | | | | | | | | | |
| 5.000%, 12/15/2026 (Callable 12/15/2024) | | | | | | | | | | | |
| (Insured by AGM) | | | 135,000 | | | | 141,622 | | | | |
| 5.000%, 12/15/2027 (Callable 12/15/2024) | | | | | | | | | | | |
| (Insured by AGM) | | | 160,000 | | | | 167,833 | | | | |
| Vista Ridge Metropolitan District, | | | | | | | | | | | |
| 4.500%, 12/01/2024 (Insured by BAM) | | | 200,000 | | | | 202,504 | | | | |
| Total Colorado | | | | | | | | | | | |
| (Cost $56,546,301) | | | | | | | 56,072,922 | | | | 3.5 | % |
| Connecticut | | | | | | | | | | | | |
| City of Bridgeport CT: | | | | | | | | | | | | |
| 5.000%, 08/01/2025 | | | 200,000 | | | | 206,166 | | | | | |
| 5.000%, 02/15/2027 | | | 2,480,000 | | | | 2,632,668 | | | | | |
| 5.000%, 08/01/2027 | | | 300,000 | | | | 321,446 | | | | | |
| City of West Haven CT: | | | | | | | | | | | | |
| 4.000%, 09/15/2026 | | | 505,000 | | | | 518,662 | | | | | |
| 4.000%, 09/15/2027 | | | 245,000 | | | | 254,276 | | | | | |
| Connecticut Housing Finance Authority: | | | | | | | | | | | | |
| 4.000%, 11/15/2045 | | | | | | | | | | | | |
| (Callable 11/15/2027) | | | 90,000 | | | | 90,010 | | | | | |
| 4.000%, 05/15/2049 | | | | | | | | | | | | |
| (Callable 11/15/2028) | | | 935,000 | | | | 936,566 | | | | | |
| 3.500%, 11/15/2051 | | | | | | | | | | | | |
| (Callable 05/15/2031) | | | 3,170,000 | | | | 3,119,045 | | | | | |
| Connecticut State Health & | | | | | | | | | | | | |
| Educational Facilities Authority: | | | | | | | | | | | | |
| 5.000%, 07/01/2024 | | | 965,000 | | | | 968,579 | | | | | |
| 5.000%, 07/01/2028 (Callable 07/01/2024) | | | 685,000 | | | | 688,940 | | | | | |
| 3.200%, 07/01/2037 | | | | | | | | | | | | |
(Mandatory Tender Date 07/01/2026)(1) | | | 3,245,000 | | | | 3,278,771 | | | | | |
| 2.800%, 07/01/2057 | | | | | | | | | | | | |
(Mandatory Tender Date 02/03/2026)(1) | | | 3,425,000 | | | | 3,427,249 | | | | | |
| East Hartford Housing Authority, | | | | | | | | | | | | |
| 4.250%, 02/01/2027 (Callable 08/01/2024) | | | | | | | | | | | | |
| (Mandatory Tender Date 02/01/2025) | | | | | | | | | | | | |
(Insured by HUD)(1) | | | 1,000,000 | | | | 1,002,590 | | | | | |
| State of Connecticut: | | | | | | | | | | | | |
| 4.030%, 03/01/2024 (SIFMA Municipal | | | | | | | | | | | | |
Swap Index + 0.950%)(2) | | | 270,000 | | | | 270,105 | | | | | |
| 4.000%, 06/15/2025 | | | 1,000,000 | | | | 1,017,524 | | | | | |
| 5.000%, 09/15/2026 | | | 1,000,000 | | | | 1,065,415 | | | | | |
| 5.000%, 10/01/2026 | | | 1,080,000 | | | | 1,151,988 | | | | | |
| 5.000%, 06/15/2027 | | | 500,000 | | | | 542,410 | | | | | |
| 5.000%, 10/01/2027 (Callable 01/29/2024) | | | 1,005,000 | | | | 1,006,151 | | | | | |
| Town of Stratford CT: | | | | | | | | | | | | |
| 5.000%, 05/15/2026 (Insured by BAM) | | | 265,000 | | | | 278,144 | | | | | |
| 5.000%, 05/15/2028 (Insured by BAM) | | | 400,000 | | | | 437,984 | | | | | |
| Total Connecticut | | | | | | | | | | | | |
| (Cost $23,553,671) | | | | | | | 23,214,689 | | | | 1.5 | % |
| Delaware | | | | | | | | | | | | |
| Delaware Municipal Electric Corp., | | | | | | | | | | | | |
| 5.000%, 10/01/2025 (Insured by BAM) | | | 140,000 | | | | 145,442 | | | | | |
| Delaware State Economic | | | | | | | | | | | | |
| Development Authority, | | | | | | | | | | | | |
| 5.000%, 10/01/2029 (Callable 01/29/2024) | | | 1,000,000 | | | | 999,982 | | | | | |
| Delaware State Housing Authority, | | | | | | | | | | | | |
| 2.600%, 07/01/2043 (Callable 01/19/2024) | | | | | | | | | | | | |
| (Insured by GNMA) | | | 89,680 | | | | 78,948 | | | | | |
| Total Delaware | | | | | | | | | | | | |
| (Cost $1,236,167) | | | | | | | 1,224,372 | | | | 0.1 | % |
| District of Columbia | | | | | | | | | | | | |
| District of Columbia: | | | | | | | | | | | | |
| 5.000%, 07/01/2025 | | | 500,000 | | | | 507,256 | | | | | |
| 3.000%, 06/01/2030 | | | 2,205,000 | | | | 2,006,563 | | | | | |
| District of Columbia | | | | | | | | | | | | |
| Housing Finance Agency, | | | | | | | | | | | | |
| 0.350%, 04/01/2025 (Mandatory Tender | | | | | | | | | | | | |
Date 04/01/2024) (Insured by FNMA)(1) | | | 1,625,000 | | | | 1,608,220 | | | | | |
| District of Columbia | | | | | | | | | | | | |
| Water & Sewer Authority, | | | | | | | | | | | | |
| 3.000%, 10/01/2057 (Callable 07/01/2027) | | | | | | | | | | | | |
(Mandatory Tender Date 10/01/2027)(1) | | | 12,100,000 | | | | 11,853,885 | | | | | |
| Metropolitan Washington Airports Authority, | | | | | | | | | | | | |
| 5.000%, 10/01/2028 | | | 2,400,000 | | | | 2,608,345 | | | | | |
| Tender Option Bond Trust, | | | | | | | | | | | | |
| 2.680%, 07/01/2063 (Callable 07/01/2037) | | | | | | | | | | | | |
(Optional Put Date 01/02/2024)(1)(3) | | | 1,355,000 | | | | 1,355,000 | | | | | |
| Total District of Columbia | | | | | | | | | | | | |
| (Cost $20,297,437) | | | | | | | 19,939,269 | | | | 1.2 | % |
The accompanying notes are an integral part of these financial statements.
Baird Short-Term Municipal Bond Fund
Schedule of Investments, December 31, 2023
Long-Term Investments (cont.)
| | | Principal | | | | | | % of | |
| | | Amount | | | Value | | | Net Assets | |
| Florida | | | | | | | | | |
| Broward County Housing Finance Authority: | | | | | | | | | |
| 3.500%, 04/01/2041 (Callable 10/01/2025) | | | | | | | | | |
| (Mandatory Tender Date 04/01/2026) | | | | | | | | | |
(Insured by HUD)(1) | | $ | 1,000,000 | | | $ | 1,000,221 | | | |
| |
| 4.050%, 09/01/2056 | | | | | | | | | | | | |
(Mandatory Tender Date 03/01/2026)(1) | | | 1,750,000 | | | | 1,772,581 | | | | | |
| Capital Projects Finance Authority: | | | | | | | | | | | | |
| 5.000%, 10/01/2025 | | | 1,000,000 | | | | 1,014,077 | | | | | |
| 5.000%, 10/01/2026 | | | 1,000,000 | | | | 1,025,123 | | | | | |
| 5.000%, 10/01/2028 | | | 1,000,000 | | | | 1,046,233 | | | | | |
| Capital Trust Agency, Inc., | | | | | | | | | | | | |
| 4.000%, 12/15/2024 | | | 75,000 | | | | 74,781 | | | | | |
| City of Cape Coral FL: | | | | | | | | | | | | |
| 4.350%, 03/01/2027 (Insured by BAM) | | | 1,200,000 | | | | 1,243,873 | | | | | |
| 4.450%, 03/01/2028 (Insured by BAM) | | | 1,420,000 | | | | 1,488,541 | | | | | |
| City of Jacksonville FL: | | | | | | | | | | | | |
| 5.000%, 11/01/2028 (Callable 11/01/2027) | | | 445,000 | | | | 471,775 | | | | | |
| 5.000%, 10/01/2029 (Callable 10/01/2026) | | | 1,175,000 | | | | 1,244,484 | | | | | |
| 3.050%, 08/01/2036 (Callable 01/02/2024) | | | | | | | | | | | | |
(Optional Put Date 01/05/2024)(1) | | | 150,000 | | | | 150,000 | | | | | |
| City of Lakeland FL, | | | | | | | | | | | | |
| 5.000%, 11/15/2028 (Callable 11/15/2026) | | | 640,000 | | | | 673,085 | | | | | |
| City of Port St. Lucie FL, | | | | | | | | | | | | |
| 5.000%, 07/01/2026 | | | 3,005,000 | | | | 3,180,690 | | | | | |
| City of Tallahassee FL: | | | | | | | | | | | | |
| 5.000%, 12/01/2025 | | | 500,000 | | | | 513,743 | | | | | |
| 5.000%, 12/01/2026 (Callable 12/01/2025) | | | 955,000 | | | | 981,901 | | | | | |
| 5.000%, 12/01/2027 (Callable 12/01/2025) | | | 400,000 | | | | 411,167 | | | | | |
| County of Broward FL, | | | | | | | | | | | | |
| 4.000%, 10/01/2042 (Callable 01/29/2024) | | | 300,000 | | | | 300,057 | | | | | |
| County of Miami-Dade FL: | | | | | | | | | | | | |
| 5.000%, 06/01/2027 (Callable 06/01/2025) | | | 1,500,000 | | | | 1,535,172 | | | | | |
| 4.500%, 03/01/2033 (Callable 01/29/2024) | | | 200,000 | | | | 200,228 | | | | | |
| County of Osceola FL, | | | | | | | | | | | | |
| 0.000%, 10/01/2028 | | | 500,000 | | | | 407,912 | | | | | |
| Florida Development Finance Corp.: | | | | | | | | | | | | |
| 4.000%, 06/15/2024 | | | 860,000 | | | | 859,245 | | | | | |
2.625%, 12/15/2024(3) | | | 190,000 | | | | 187,023 | | | | | |
| 5.000%, 06/15/2025 | | | 370,000 | | | | 374,280 | | | | | |
| 5.000%, 06/15/2026 | | | 1,310,000 | | | | 1,349,742 | | | | | |
| 5.000%, 06/15/2026 | | | 270,000 | | | | 278,191 | | | | | |
| 5.000%, 11/15/2026 | | | 1,000,000 | | | | 1,051,426 | | | | | |
| 5.000%, 06/15/2027 | | | 390,000 | | | | 407,790 | | | | | |
| 5.000%, 06/15/2027 | | | 285,000 | | | | 298,001 | | | | | |
| 5.000%, 06/15/2028 (Callable 06/15/2027) | | | 355,000 | | | | 371,499 | | | | | |
| 5.250%, 06/15/2029 | | | | | | | | | | | | |
(Callable 06/15/2027)(3) | | | 1,700,000 | | | | 1,720,779 | | | | | |
3.000%, 07/01/2031(3) | | | 1,210,000 | | | | 1,111,589 | | | | | |
| 6.125%, 07/01/2032 (Callable 04/02/2026) | | | | | | | | | | | | |
(Mandatory Tender Date 07/01/2026)(1)(3) | | | 2,715,000 | | | | 2,736,453 | | | | | |
| Florida Housing Finance Corp.: | | | | | | | | | | | | |
| 5.000%, 12/01/2026 (Mandatory Tender | | | | | | | | | | | | |
Date 12/01/2025) (Insured by HUD)(1) | | | 4,000,000 | | | | 4,109,943 | | | | | |
| 4.000%, 07/01/2047 (Callable 07/01/2025) | | | | | | | | | | | | |
| (Insured by GNMA) | | | 30,000 | | | | 29,955 | | | | | |
| Florida Municipal Loan Council, | | | | | | | | | | | | |
| 0.000%, 11/01/2024 (Insured by NATL) | | | 100,000 | | | | 96,730 | | | | | |
| Herons Glen Recreation District, | | | | | | | | | | | | |
| 2.500%, 05/01/2027 (Insured by BAM) | | | 250,000 | | | | 244,257 | | | | | |
| Hollywood Community | | | | | | | | | | | | |
| Redevelopment Agency, | | | | | | | | | | | | |
| 5.000%, 03/01/2024 | | | 820,000 | | | | 822,218 | | | | | |
| Miami Beach Redevelopment Agency, | | | | | | | | | | | | |
| 5.000%, 02/01/2027 | | | | | | | | | | | | |
| (Callable 02/01/2024) | | | 1,000,000 | | | | 1,003,827 | | | | | |
| Miami-Dade County | | | | | | | | | | | | |
| Housing Finance Authority: | | | | | | | | | | | | |
| 3.550%, 01/01/2027 | | | | | | | | | | | | |
(Mandatory Tender Date 01/01/2026)(1) | | | 3,750,000 | | | | 3,751,939 | | | | | |
| 5.000%, 03/01/2027 | | | | | | | | | | | | |
(Mandatory Tender Date 09/01/2025)(1) | | | 1,000,000 | | | | 1,024,648 | | | | | |
| Orange County Health Facilities Authority: | | | | | | | | | | | | |
| 4.000%, 08/01/2024 | | | 25,000 | | | | 24,936 | | | | | |
| 5.000%, 08/01/2028 (Callable 08/01/2024) | | | 2,000,000 | | | | 2,011,934 | | | | | |
| Orange County Housing Finance Authority: | | | | | | | | | | | | |
| 4.000%, 09/01/2040 (Callable 09/01/2024) | | | | | | | | | | | | |
| (Insured by GNMA) | | | 25,000 | | | | 24,987 | | | | | |
| 4.250%, 09/01/2049 (Callable 09/01/2027) | | | | | | | | | | | | |
| (Insured by GNMA) | | | 170,000 | | | | 170,722 | | | | | |
| Osceola County Expressway Authority, | | | | | | | | | | �� | | |
| 0.000%, 10/01/2024 (ETM) | | | 380,000 | | | | 370,956 | | | | | |
| Pinellas County Housing Authority, | | | | | | | | | | | | |
| 1.000%, 11/01/2027 (Insured by FNMA) | | | 2,095,000 | | | | 1,978,574 | | | | | |
| Pinellas County Industrial | | | | | | | | | | | | |
| Development Authority, | | | | | | | | | | | | |
| 5.000%, 07/01/2029 | | | 450,000 | | | | 461,259 | | | | | |
| Sarasota County Public Hospital District, | | | | | | | | | | | | |
| 5.250%, 07/01/2024 (Insured by NATL) | | | 75,000 | | | | 75,751 | | | | | |
| School Board of Miami-Dade County, | | | | | | | | | | | | |
| 5.000%, 05/01/2029 (Callable 05/01/2025) | | | 4,000,000 | | | | 4,091,510 | | | | | |
| Seminole County Industrial | | | | | | | | | | | | |
| Development Authority: | | | | | | | | | | | | |
4.000%, 06/15/2024(3) | | | 130,000 | | | | 129,354 | | | | | |
4.000%, 06/15/2025(3) | | | 100,000 | | | | 98,562 | | | | | |
4.000%, 06/15/2026(3) | | | 155,000 | | | | 151,632 | | | | | |
4.000%, 06/15/2027(3) | | | 240,000 | | | | 233,656 | | | | | |
| St. Johns River Power Park, | | | | | | | | | | | | |
| 5.000%, 10/01/2024 (Callable 01/29/2024) | | | 105,000 | | | | 105,153 | | | | | |
| Volusia County Educational Facility Authority, | | | | | | | | | | | | |
| 5.000%, 10/15/2033 (Callable 04/15/2025) | | | 550,000 | | | | 561,806 | | | | | |
| Total Florida | | | | | | | | | | | | |
| (Cost $51,242,538) | | | | | | | 51,055,971 | | | | 3.2 | % |
| Georgia | | | | | | | | | | | | |
| Atlanta Development Authority, | | | | | | | | | | | | |
| 5.000%, 07/01/2024 | | | 140,000 | | | | 141,231 | | | | | |
| Burke County Development Authority: | | | | | | | | | | | | |
| 1.500%, 01/01/2040 | | | | | | | | | | | | |
(Mandatory Tender Date 02/03/2025)(1) | | | 6,695,000 | | | | 6,433,220 | | | | | |
| 1.700%, 12/01/2049 | | | | | | | | | | | | |
(Mandatory Tender Date 08/22/2024)(1) | | | 2,180,000 | | | | 2,136,791 | | | | | |
| City of Atlanta GA: | | | | | | | | | | | | |
| 5.000%, 01/01/2024 | | | 515,000 | | | | 515,000 | | | | | |
| 4.000%, 07/01/2026 (Callable 01/29/2024) | | | 100,000 | | | | 100,025 | | | | | |
| Cobb-Marietta Coliseum & | | | | | | | | | | | | |
| Exhibit Hall Authority, | | | | | | | | | | | | |
| 5.500%, 10/01/2026 (Insured by NATL) | | | 480,000 | | | | 502,152 | | | | | |
| Development Authority for Fulton County, | | | | | | | | | | | | |
| 5.000%, 10/01/2027 | | | 1,015,000 | | | | 1,089,366 | | | | | |
| Development Authority of Monroe County, | | | | | | | | | | | | |
| 2.250%, 07/01/2025 (Callable 06/13/2024) | | | 1,390,000 | | | | 1,339,855 | | | | | |
| Forsyth County Hospital Authority, | | | | | | | | | | | | |
| 6.375%, 10/01/2028 (ETM) | | | 460,000 | | | | 507,575 | | | | | |
| George L Smith II Congress Center Authority, | | | | | | | | | | | | |
3.625%, 01/01/2031(3) | | | 5,535,000 | | | | 5,027,724 | | | | | |
The accompanying notes are an integral part of these financial statements.
Baird Short-Term Municipal Bond Fund
Schedule of Investments, December 31, 2023
Long-Term Investments (cont.)
| | | Principal | | | | | | % of | |
| | | Amount | | | Value | | | Net Assets | |
| Main Street Natural Gas, Inc.: | | | | | | | | | |
| 5.000%, 05/15/2025 | | $ | 1,785,000 | | | $ | 1,809,035 | | | | |
| 5.000%, 09/01/2026 (Callable 06/01/2026) | | | 500,000 | | | | 514,947 | | | | |
| 5.500%, 09/15/2028 | | | 1,000,000 | | | | 1,081,725 | | | | |
| 4.000%, 03/01/2050 (Callable 06/01/2026) | | | | | | | | | | | |
(Mandatory Tender Date 09/01/2026)(1) | | | 6,680,000 | | | | 6,712,175 | | | | |
| 4.000%, 07/01/2052 (Callable 06/01/2027) | | | | | | | | | | | |
(Mandatory Tender Date 09/01/2027)(1) | | | 3,700,000 | | | | 3,721,711 | | | | |
| 4.000%, 08/01/2052 (Callable 05/01/2027) | | | | | | | | | | | |
(Mandatory Tender Date 11/01/2027)(1)(3) | | | 11,000,000 | | | | 10,585,070 | | | | |
| 5.000%, 12/01/2052 (Callable 03/01/2029) | | | | | | | | | | | |
(Mandatory Tender Date 06/01/2029)(1) | | | 1,650,000 | | | | 1,741,508 | | | | |
| State of Georgia, | | | | | | | | | | | |
| 5.000%, 12/01/2026 | | | 750,000 | | | | 804,884 | | | | |
| Total Georgia | | | | | | | | | | | |
| (Cost $46,941,007) | | | | | | | 44,763,994 | | | | 2.8 | % |
| Illinois | | | | | | | | | | | | |
| Adams & Hancock Counties | | | | | | | | | | | | |
| Community Unit School District No. 4, | | | | | | | | | | | | |
| 4.000%, 12/01/2026 (Callable 12/01/2025) | | | | | | | | | | | | |
| (Insured by BAM) | | | 275,000 | | | | 281,364 | | | | | |
| Chicago Midway International Airport: | | | | | | | | | | | | |
5.000%, 01/01/2027(6) | | | 1,595,000 | | | | 1,667,548 | | | | | |
| 5.000%, 01/01/2028 (Callable 01/01/2026) | | | 1,750,000 | | | | 1,793,375 | | | | | |
| Chicago O’Hare International Airport, | | | | | | | | | | | | |
| 5.000%, 01/01/2029 (Callable 01/01/2025) | | | 2,000,000 | | | | 2,017,967 | | | | | |
| Chicago Park District, | | | | | | | | | | | | |
| 5.000%, 01/01/2024 | | | 155,000 | | | | 155,000 | | | | | |
| City of Chicago IL: | | | | | | | | | | | | |
| 5.000%, 11/01/2025 | | | 2,000,000 | | | | 2,065,669 | | | | | |
| 5.000%, 11/01/2026 (Callable 11/01/2024) | | | 1,410,000 | | | | 1,429,345 | | | | | |
| 0.000%, 01/01/2027 (Insured by NATL) | | | 5,630,000 | | | | 5,103,132 | | | | | |
| 5.000%, 11/01/2028 (Callable 11/01/2024) | | | 900,000 | | | | 912,496 | | | | | |
| 5.000%, 11/01/2028 (Callable 11/01/2026) | | | 1,000,000 | | | | 1,050,728 | | | | | |
| 5.000%, 11/01/2029 (Callable 11/01/2026) | | | 1,550,000 | | | | 1,627,945 | | | | | |
| City of Country Club Hills IL, | | | | | | | | | | | | |
| 3.000%, 01/01/2028 (Insured by BAM) | | | 185,000 | | | | 185,698 | | | | | |
| City of Evanston IL, | | | | | | | | | | | | |
| 3.000%, 12/01/2028 | | | 4,800,000 | | | | 4,862,938 | | | | | |
| City of Galesburg IL: | | | | | | | | | | | | |
| 5.000%, 10/01/2025 | | | 125,000 | | | | 127,414 | | | | | |
| 5.000%, 10/01/2026 | | | 145,000 | | | | 148,401 | | | | | |
| 5.000%, 10/01/2027 | | | 225,000 | | | | 232,643 | | | | | |
| 5.000%, 10/01/2028 | | | 250,000 | | | | 260,749 | | | | | |
| City of Springfield IL, | | | | | | | | | | | | |
| 5.000%, 12/01/2031 (Callable 12/01/2025) | | | 325,000 | | | | 336,018 | | | | | |
| Community Unit School District No. 427: | | | | | | | | | | | | |
| 0.000%, 01/01/2026 (Insured by AGM) | | | 1,000,000 | | | | 934,918 | | | | | |
| 0.000%, 01/01/2027 (Insured by AGM) | | | 2,980,000 | | | | 2,701,125 | | | | | |
| Cook County School District No. 130, | | | | | | | | | | | | |
| 5.000%, 12/01/2025 (Insured by AGM) | | | 1,320,000 | | | | 1,371,917 | | | | | |
| Cook County School District No. 144, | | | | | | | | | | | | |
| 0.000%, 12/01/2025 (Insured by AGM) | | | 730,000 | | | | 682,536 | | | | | |
| Cook County School District No. 154, | | | | | | | | | | | | |
| 3.500%, 12/01/2024 (Insured by BAM) | | | 58,000 | | | | 58,147 | | | | | |
| Cook County School District No. 99: | | | | | | | | | | | | |
| 4.000%, 12/01/2026 (Insured by BAM) | | | 1,150,000 | | | | 1,178,497 | | | | | |
| 4.000%, 12/01/2027 (Insured by BAM) | | | 1,195,000 | | | | 1,235,830 | | | | | |
| Cook County Township | | | | | | | | | | | | |
| High School District No. 201, | | | | | | | | | | | | |
| 0.000%, 12/01/2025 (Insured by AGM) | | | 165,000 | | | | 154,127 | | | | | |
| County of Cook IL: | | | | | | | | | | | | |
| 5.000%, 11/15/2028 (Callable 11/15/2026) | | | 3,000,000 | | | | 3,176,677 | | | | | |
| 5.000%, 11/15/2032 (Callable 11/15/2027) | | | 1,000,000 | | | | 1,075,262 | | | | | |
| Exceptional Children Have Opportunities, | | | | | | | | | | | | |
| 5.000%, 12/01/2026 | | | 255,000 | | | | 269,530 | | | | | |
| Hampshire Special Service Area No. 13, | | | | | | | | | | | | |
| 3.000%, 03/01/2026 (Insured by BAM) | | | 90,000 | | | | 89,057 | | | | | |
| Illinois Development Finance Authority, | | | | | | | | | | | | |
| 0.000%, 07/15/2025 (ETM) | | | 2,885,000 | | | | 2,754,163 | | | | | |
| Illinois Finance Authority: | | | | | | | | | | | | |
| 5.000%, 05/15/2024 | | | 350,000 | | | | 352,188 | | | | | |
| 5.000%, 11/01/2024 | | | 385,000 | | | | 388,030 | | | | | |
4.300%, 08/01/2028(3) | | | 1,215,000 | | | | 1,216,465 | | | | | |
| 5.000%, 09/01/2029 (Callable 09/01/2026) | | | 1,575,000 | | | | 1,640,611 | | | | | |
| 4.973%, 11/01/2034 (SOFR + 1.200%) | | | | | | | | | | | | |
| (Callable 03/01/2025) | | | | | | | | | | | | |
(Mandatory Tender Date 09/01/2025)(2) | | | 1,940,000 | | | | 1,939,441 | | | | | |
| 5.000%, 09/01/2042 | | | | | | | | | | | | |
| (Pre-refunded to 09/01/2024) | | | 570,000 | | | | 577,174 | | | | | |
| Illinois Housing Development Authority: | | | | | | | | | | | | |
| 4.000%, 06/01/2026 (Mandatory Tender | | | | | | | | | | | | |
Date 06/01/2025) (Insured by FHA)(1) | | | 1,800,000 | | | | 1,810,611 | | | | | |
| 2.450%, 06/01/2043 (Callable 01/29/2024) | | | | | | | | | | | | |
| (Insured by GNMA) | | | 172,045 | | | | 145,539 | | | | | |
| 4.500%, 10/01/2048 (Callable 04/01/2028) | | | | | | | | | | | | |
| (Insured by GNMA) | | | 385,000 | | | | 389,106 | | | | | |
| 2.830%, 05/15/2050 | | | | | | | | | | | | |
| (SIFMA Municipal Swap Index + 1.000%) | | | | | | | | | | | | |
| (Callable 11/15/2024) | | | | | | | | | | | | |
(Mandatory Tender Date 05/15/2025)(2) | | | 1,250,000 | | | | 1,246,410 | | | | | |
| 6.250%, 10/01/2052 (Callable 04/01/2032) | | | | | | | | | | | | |
| (Insured by GNMA) | | | 4,840,000 | | | | 5,261,142 | | | | | |
| 6.250%, 04/01/2054 (Callable 04/01/2033) | | | | | | | | | | | | |
| (Insured by GNMA) | | | 3,000,000 | | | | 3,324,642 | | | | | |
| Kankakee, Will, Grundy, Etc. Counties | | | | | | | | | | | | |
| Community College District No. 520, | | | | | | | | | | | | |
| 3.500%, 12/01/2026 | | | 2,415,000 | | | | 2,438,801 | | | | | |
| Knox & Warren Counties | | | | | | | | | | | | |
| Community Unit School District No. 205, | | | | | | | | | | | | |
| 5.000%, 12/01/2038 (Callable 12/01/2027) | | | 2,000,000 | | | | 2,111,453 | | | | | |
| Lake County Elementary | | | | | | | | | | | | |
| School District No. 6, | | | | | | | | | | | | |
| 0.000%, 12/01/2024 (Insured by AMBAC) | | | 70,000 | | | | 67,361 | | | | | |
| Lake County School District No. 38, | | | | | | | | | | | | |
| 0.000%, 02/01/2025 (Insured by AMBAC) | | | 210,000 | | | | 201,500 | | | | | |
| Metropolitan Pier & Exposition Authority: | | | | | | | | | | | | |
| 0.000%, 06/15/2024 (Insured by NATL) | | | 35,000 | | | | 34,418 | | | | | |
| 0.000%, 12/15/2025 (Insured by NATL) | | | 65,000 | | | | 60,769 | | | | | |
| 0.000%, 06/15/2027 (Insured by AGM) | | | 1,000,000 | | | | 896,502 | | | | | |
| Northern Illinois University: | | | | | | | | | | | | |
| 5.000%, 04/01/2027 (Insured by BAM) | | | 550,000 | | | | 579,237 | | | | | |
| 5.000%, 04/01/2028 (Insured by BAM) | | | 650,000 | | | | 695,085 | | | | | |
| 5.000%, 10/01/2029 (Insured by BAM) | | | 780,000 | | | | 848,728 | | | | | |
| Park Ridge Park District, | | | | | | | | | | | | |
| 2.500%, 12/01/2028 | | | 2,500,000 | | | | 2,476,808 | | | | | |
| Pike & Adams Counties | | | | | | | | | | | | |
| Community Unit School District No. 4, | | | | | | | | | | | | |
| 4.000%, 12/01/2024 (Insured by BAM) | | | 345,000 | | | | 347,443 | | | | | |
| Plano Special Service Areas No. 3 & 4, | | | | | | | | | | | | |
| 4.000%, 03/01/2030 (Callable 03/01/2025) | | | 210,000 | | | | 213,124 | | | | | |
| Sales Tax Securitization Corp., | | | | | | | | | | | | |
| 5.000%, 01/01/2024 | | | 200,000 | | | | 200,000 | | | | | |
| Shelby Christian Macon Counties | | | | | | | | | | | | |
| Community School District No. 21: | | | | | | | | | | | | |
| 4.000%, 12/01/2025 (Callable 01/29/2024) | | | | | | | | | | | | |
| (Insured by AGM) | | | 400,000 | | | | 400,221 | | | | | |
| 4.000%, 12/01/2026 (Callable 01/29/2024) | | | | | | | | | | | | |
| (Insured by AGM) | | | 435,000 | | | | 435,199 | | | | | |
The accompanying notes are an integral part of these financial statements.
Baird Short-Term Municipal Bond Fund
Schedule of Investments, December 31, 2023
Long-Term Investments (cont.)
| | | Principal | | | | | | % of | |
| | | Amount | | | Value | | | Net Assets | |
| Southwestern Illinois Community | | | | | | | | | |
| College District No. 522: | | | | | | | | | |
| 5.000%, 12/01/2027 | | $ | 1,300,000 | | | $ | 1,392,973 | | | | |
| 5.000%, 12/01/2028 | | | 1,500,000 | | | | 1,635,099 | | | | |
| St. Charles Public Library District, | | | | | | | | | | | |
| 4.000%, 11/01/2028 (Callable 11/01/2024) | | | 455,000 | | | | 458,871 | | | | |
| State of Illinois: | | | | | | | | | | | |
| 5.000%, 10/01/2025 | | | 4,350,000 | | | | 4,487,459 | | | | |
| 5.000%, 06/15/2026 | | | 6,580,000 | | | | 6,842,526 | | | | |
| Town of Cicero IL, | | | | | | | | | | | |
| 4.000%, 01/01/2026 (Insured by BAM) | | | 590,000 | | | | 596,170 | | | | |
| United City of Yorkville IL, | | | | | | | | | | | |
| 4.050%, 12/01/2027 (Callable 01/29/2024) | | | 120,000 | | | | 120,103 | | | | |
| Upper Illinois River Valley | | | | | | | | | | | |
| Development Authority, | | | | | | | | | | | |
| 5.000%, 12/01/2028 | | | 1,050,000 | | | | 1,115,953 | | | | |
| Village of Calumet Park IL, | | | | | | | | | | | |
| 5.250%, 12/01/2029 (Callable 12/01/2024) | | | | | | | | | | | |
| (Insured by BAM) | | | 500,000 | | | | 512,336 | | | | |
| Village of Crestwood IL, | | | | | | | | | | | |
| 4.500%, 12/15/2025 (Callable 03/04/2024) | | | | | | | | | | | |
| (Insured by BAM) | | | 60,000 | | | | 60,144 | | | | |
| Village of Hillside IL, | | | | | | | | | | | |
| 5.000%, 01/01/2030 (Callable 01/01/2027) | | | 2,690,000 | | | | 2,714,831 | | | | |
| Village of Lansing IL, | | | | | | | | | | | |
| 5.000%, 03/01/2024 (Insured by BAM) | | | 230,000 | | | | 230,438 | | | | |
| Village of Lyons IL, | | | | | | | | | | | |
| 5.000%, 12/01/2025 (Callable 01/29/2024) | | | | | | | | | | | |
| (Insured by BAM) | | | 25,000 | | | | 25,035 | | | | |
| Village of Rantoul IL, | | | | | | | | | | | |
| 4.300%, 01/01/2025 (Callable 01/29/2024) | | | 125,000 | | | | 125,120 | | | | |
| Village of Romeoville IL: | | | | | | | | | | | |
| 5.000%, 10/01/2025 (Callable 04/01/2025) | | | 1,100,000 | | | | 1,114,477 | | | | |
| 5.000%, 10/01/2030 (Callable 04/01/2025) | | | 1,000,000 | | | | 1,013,393 | | | | |
| Village of Schaumburg IL: | | | | | | | | | | | |
| 5.000%, 12/01/2025 | | | 870,000 | | | | 901,258 | | | | |
| 4.000%, 12/01/2026 | | | 915,000 | | | | 951,919 | | | | |
| Village of Stone Park IL: | | | | | | | | | | | |
| 4.000%, 02/01/2024 (Insured by BAM) | | | 135,000 | | | | 135,069 | | | | |
| 4.000%, 02/01/2025 (Insured by BAM) | | | 140,000 | | | | 141,277 | | | | |
| 4.000%, 02/01/2026 (Insured by BAM) | | | 220,000 | | | | 224,671 | | | | |
| 4.750%, 02/01/2028 (Callable 01/29/2024) | | | | | | | | | | | |
| (Insured by BAM) | | | 50,000 | | | | 50,070 | | | | |
| Village of Sugar Grove IL, | | | | | | | | | | | |
| 3.000%, 12/15/2025 (Callable 01/29/2024) | | | 225,000 | | | | 225,017 | | | | |
| Washington County Community | | | | | | | | | | | |
| Unit School Dist No. 10, | | | | | | | | | | | |
| 4.000%, 12/15/2024 (Insured by AGM) | | | 250,000 | | | | 252,192 | | | | |
| Total Illinois | | | | | | | | | | | |
| (Cost $96,359,794) | | | | | | | 95,564,625 | | | | 6.0 | % |
| Indiana | | | | | | | | | | | | |
| Cass County Indiana Building Corp., | | | | | | | | | | | | |
| 5.000%, 01/15/2028 (Insured by ST AID) | | | 400,000 | | | | 431,480 | | | | | |
| City of Hobart IN, | | | | | | | | | | | | |
| 3.000%, 07/01/2025 (Insured by ST AID) | | | 395,000 | | | | 391,270 | | | | | |
| City of Muncie IN, | | | | | | | | | | | | |
| 4.000%, 01/15/2024 (Insured by AGM) | | | 170,000 | | | | 170,028 | | | | | |
| City of Valparaiso IN, | | | | | | | | | | | | |
| 4.000%, 08/01/2026 (Callable 01/29/2024) | | | 375,000 | | | | 375,212 | | | | | |
| County of St. Joseph IN, | | | | | | | | | | | | |
| 5.000%, 04/01/2027 | | | 1,500,000 | | | | 1,586,375 | | | | | |
| Frankton-Lapel Community | | | | | | | | | | | | |
| Schools Building Corp.: | | | | | | | | | | | | |
| 5.000%, 01/15/2027 (Insured by ST AID) | | | 1,325,000 | | | | 1,412,172 | | | | | |
| 5.000%, 07/15/2027 (Insured by ST AID) | | | 1,390,000 | | | | 1,495,311 | | | | | |
| Hammond Multi-School Building Corp., | | | | | | | | | | | | |
| 5.000%, 01/15/2025 (Insured by ST AID) | | | 525,000 | | | | 535,120 | | | | | |
| Indiana Finance Authority: | | | | | | | | | | | | |
| 3.500%, 03/01/2024 | | | 5,150,000 | | | | 5,147,891 | | | | | |
| 5.000%, 09/01/2024 | | | 390,000 | | | | 391,774 | | | | | |
| 5.000%, 09/15/2024 | | | 815,000 | | | | 822,272 | | | | | |
| 5.000%, 09/15/2024 | | | 155,000 | | | | 156,265 | | | | | |
| 5.000%, 09/01/2025 | | | 445,000 | | | | 450,006 | | | | | |
| 5.000%, 09/15/2025 | | | 325,000 | | | | 329,633 | | | | | |
| 5.000%, 10/01/2025 | | | 675,000 | | | | 687,807 | | | | | |
| 5.000%, 07/01/2026 | | | 730,000 | | | | 751,969 | | | | | |
| 5.000%, 09/01/2026 | | | 1,520,000 | | | | 1,554,608 | | | | | |
| 5.000%, 09/15/2026 (Callable 09/15/2024) | | | 700,000 | | | | 699,095 | | | | | |
| 5.000%, 10/01/2028 | | | 260,000 | | | | 274,209 | | | | | |
| 4.000%, 03/01/2038 (Callable 05/01/2028) | | | | | | | | | | | | |
(Mandatory Tender Date 08/01/2028)(1) | | | 5,000,000 | | | | 5,018,989 | | | | | |
| Indiana Housing & Community | | | | | | | | | | | | |
| Development Authority: | | | | | | | | | | | | |
| 5.000%, 11/01/2025 | | | | | | | | | | | | |
(Mandatory Tender Date 11/01/2024)(1) | | | 1,300,000 | | | | 1,314,256 | | | | | |
| 3.500%, 01/01/2049 (Callable 01/01/2029) | | | | | | | | | | | | |
| (Insured by GNMA) | | | 775,000 | | | | 766,163 | | | | | |
| Indianapolis Board of School Commissioners, | | | | | | | | | | | | |
| 5.000%, 07/15/2025 (Insured by ST AID) | | | 750,000 | | | | 774,109 | | | | | |
| Indianapolis Local Public | | | | | | | | | | | | |
| Improvement Bond Bank, | | | | | | | | | | | | |
| 5.000%, 02/01/2030 (Callable 01/29/2024) | | | 1,025,000 | | | | 1,026,182 | | | | | |
| Mount Vernon Community School Corp.: | | | | | | | | | | | | |
| 5.000%, 07/15/2025 (Insured by ST AID) | | | 395,000 | | | | 406,497 | | | | | |
| 5.000%, 01/15/2026 (Insured by ST AID) | | | 1,065,000 | | | | 1,107,005 | | | | | |
| MSD of Wabash County | | | | | | | | | | | | |
| Multi-School Building Corp.: | | | | | | | | | | | | |
| 5.000%, 01/15/2026 (Insured by ST AID) | | | 330,000 | | | | 343,480 | | | | | |
| 5.000%, 07/15/2026 (Insured by ST AID) | | | 410,000 | | | | 431,308 | | | | | |
| 5.000%, 01/15/2027 (Insured by ST AID) | | | 445,000 | | | | 473,208 | | | | | |
| Posey County Redevelopment Authority, | | | | | | | | | | | | |
| 5.000%, 07/15/2025 | | | 6,000,000 | | | | 6,142,898 | | | | | |
| Salem Middle School Building Corp., | | | | | | | | | | | | |
| 4.000%, 01/15/2024 (Insured by ST AID) | | | 195,000 | | | | 195,045 | | | | | |
| Tippecanoe County School Building Corp.: | | | | | | | | | | | | |
| 5.000%, 07/15/2026 (Insured by ST AID) | | | 330,000 | | | | 347,398 | | | | | |
| 5.000%, 01/15/2027 (Insured by ST AID) | | | 300,000 | | | | 319,557 | | | | | |
| Washington Indiana Elementary | | | | | | | | | | | | |
| School Building Corp., | | | | | | | | | | | | |
| 3.000%, 01/15/2024 (Insured by ST AID) | | | 115,000 | | | | 114,975 | | | | | |
| Total Indiana | | | | | | | | | | | | |
| (Cost $36,469,335) | | | | | | | 36,443,567 | | | | 2.3 | % |
| Iowa | | | | | | | | | | | | |
| City of Coralville IA: | | | | | | | | | | | | |
| 4.000%, 06/01/2024 | | | 300,000 | | | | 298,773 | | | | | |
| 4.000%, 06/01/2025 (Callable 06/01/2024) | | | 455,000 | | | | 449,672 | | | | | |
| Iowa Finance Authority: | | | | | | | | | | | | |
| 5.000%, 02/15/2031 (Callable 02/15/2024) | | | 2,225,000 | | | | 2,227,605 | | | | | |
| 7.500%, 01/01/2032 | | | | | | | | | | | | |
(Callable 01/01/2030)(3) | | | 2,250,000 | | | | 2,148,830 | | | | | |
| 3.500%, 07/01/2046 (Callable 01/01/2026) | | | | | | | | | | | | |
| (Insured by GNMA) | | | 65,000 | | | | 64,572 | | | | | |
| 4.000%, 07/01/2047 (Callable 07/01/2027) | | | | | | | | | | | | |
| (Insured by GNMA) | | | 430,000 | | | | 428,790 | | | | | |
The accompanying notes are an integral part of these financial statements.
Baird Short-Term Municipal Bond Fund
Schedule of Investments, December 31, 2023
Long-Term Investments (cont.)
| | | Principal | | | | | | % of | |
| | | Amount | | | Value | | | Net Assets | |
| Iowa Finance Authority: (cont.) | | | | | | | | | |
| 4.000%, 07/01/2047 (Callable 07/01/2028) | | | | | | | | | |
| (Insured by GNMA) | | $ | 705,000 | | | $ | 705,786 | | | | |
| 3.000%, 07/01/2051 (Callable 01/01/2031) | | | | | | | | | | | |
| (Insured by GNMA) | | | 930,000 | | | | 898,424 | | | | |
| 6.000%, 07/01/2052 (Callable 07/01/2032) | | | | | | | | | | | |
| (Insured by GNMA) | | | 3,250,000 | | | | 3,505,659 | | | | |
| Iowa Higher Education Loan Authority: | | | | | | | | | | | |
| 3.000%, 04/01/2025 | | | 775,000 | | | | 770,242 | | | | |
| 3.000%, 04/01/2026 | | | 800,000 | | | | 795,868 | | | | |
| 3.000%, 04/01/2027 | | | 820,000 | | | | 817,250 | | | | |
| 3.000%, 04/01/2028 | | | 845,000 | | | | 838,431 | | | | |
| Lake Panorama Improvement Zone: | | | | | | | | | | | |
| 3.000%, 06/01/2024 | | | 420,000 | | | | 417,401 | | | | |
| 3.000%, 06/01/2025 | | | 430,000 | | | | 422,868 | | | | |
| PEFA, Inc., | | | | | | | | | | | |
| 5.000%, 09/01/2049 (Callable 06/01/2026) | | | | | | | | | | | |
(Mandatory Tender Date 09/01/2026)(1) | | | 6,600,000 | | | | 6,760,191 | | | | |
| Total Iowa | | | | | | | | | | | |
| (Cost $21,888,625) | | | | | | | 21,550,362 | | | | 1.3 | % |
| Kansas | | | | | | | | | | | | |
| City of Derby KS, | | | | | | | | | | | | |
| 3.900%, 03/01/2037 (Callable 03/01/2025) | | | 500,000 | | | | 501,050 | | | | | |
| City of Manhattan KS, | | | | | | | | | | | | |
| 4.000%, 06/01/2027 (Callable 06/01/2025) | | | 850,000 | | | | 850,889 | | | | | |
| City of Osawatomie KS, | | | | | | | | | | | | |
| 3.750%, 03/01/2027 (Callable 03/01/2025) | | | 2,935,000 | | | | 2,945,422 | | | | | |
| City of Park City KS, | | | | | | | | | | | | |
| 3.750%, 09/01/2026 (Callable 09/01/2024) | | | 6,075,000 | | | | 6,095,700 | | | | | |
| Total Kansas | | | | | | | | | | | | |
| (Cost $10,295,629) | | | | | | | 10,393,061 | | | | 0.6 | % |
| Kentucky | | | | | | | | | | | | |
| City of Henderson KY, | | | | | | | | | | | | |
| 3.500%, 11/01/2028 | | | 2,430,000 | | | | 2,476,501 | | | | | |
| City of Versailles KY, | | | | | | | | | | | | |
| 3.000%, 08/15/2026 (Callable 08/15/2024) | | | 2,570,000 | | | | 2,539,492 | | | | | |
| County of Carroll KY, | | | | | | | | | | | | |
| 1.550%, 09/01/2042 | | | | | | | | | | | | |
(Mandatory Tender Date 09/01/2026)(1) | | | 750,000 | | | | 696,934 | | | | | |
| County of Kenton KY, | | | | | | | | | | | | |
| 5.000%, 04/01/2026 | | | 725,000 | | | | 761,387 | | | | | |
| County of Owen KY, | | | | | | | | | | | | |
| 3.875%, 06/01/2040 | | | | | | | | | | | | |
(Mandatory Tender Date 09/01/2028)(1) | | | 1,750,000 | | | | 1,781,115 | | | | | |
| County of Trimble KY, | | | | | | | | | | | | |
| 4.700%, 06/01/2054 (Callable 03/03/2027) | | | | | | | | | | | | |
(Mandatory Tender Date 06/01/2027)(1) | | | 1,000,000 | | | | 1,015,388 | | | | | |
| Frankfort Independent School | | | | | | | | | | | | |
| District Finance Corp., | | | | | | | | | | | | |
| 2.050%, 08/01/2024 (Insured by ST AID) | | | 310,000 | | | | 306,608 | | | | | |
| Kentucky Economic Development | | | | | | | | | | | | |
| Finance Authority: | | | | | | | | | | | | |
| 0.000%, 12/01/2024 | | | | | | | | | | | | |
| (ETM) (Insured by AGC) | | | 210,000 | | | | 204,319 | | | | | |
| 0.000%, 10/01/2025 (Insured by NATL) | | | 585,000 | | | | 547,338 | | | | | |
| 5.000%, 06/01/2026 | | | 240,000 | | | | 245,014 | | | | | |
| 0.000%, 10/01/2026 (Insured by NATL) | | | 100,000 | | | | 90,376 | | | | | |
| 5.000%, 07/01/2028 (Callable 07/01/2025) | | | 1,000,000 | | | | 1,018,319 | | | | | |
| Kentucky Housing Corp., | | | | | | | | | | | | |
| 5.000%, 09/01/2043 (Callable 03/01/2026) | | | | | | | | | | | | |
| (Mandatory Tender Date 09/01/2026) | | | | | | | | | | | | |
(Insured by HUD)(1) | | | 3,000,000 | | | | 3,091,394 | | | | | |
| Kentucky Public Energy Authority: | | | | | | | | | | | | |
| 4.783%, 12/01/2049 (1 Month LIBOR | | | | | | | | | | | | |
| USD + 1.120%) (Callable 03/01/2025) | | | | | | | | | | | | |
(Mandatory Tender Date 06/01/2025)(2)(7) | | | 4,410,000 | | | | 4,401,483 | | | | | |
| 4.000%, 12/01/2050 (Callable 03/01/2026) | | | | | | | | | | | | |
(Mandatory Tender Date 06/01/2026)(1) | | | 1,925,000 | | | | 1,914,618 | | | | | |
| Northern Kentucky University, | | | | | | | | | | | | |
| 3.500%, 09/01/2028 (Insured by ST AID) | | | 2,800,000 | | | | 2,869,930 | | | | | |
| Perry County School District Finance Corp., | | | | | | | | | | | | |
| 2.000%, 12/01/2029 (Insured by ST AID) | | | 2,240,000 | | | | 2,182,668 | | | | | |
| Rural Water Financing Agency, | | | | | | | | | | | | |
| 3.100%, 11/01/2024 (Callable 01/16/2024) | | | 1,000,000 | | | | 991,728 | | | | | |
| University of Louisville: | | | | | | | | | | | | |
| 5.000%, 09/01/2026 (Insured by BAM) | | | 845,000 | | | | 889,297 | | | | | |
| 5.000%, 03/01/2034 (Callable 09/01/2026) | | | | | | | | | | | | |
| (Insured by ST AID) | | | 2,000,000 | | | | 2,083,038 | | | | | |
| Total Kentucky | | | | | | | | | | | | |
| (Cost $30,386,566) | | | | | | | 30,106,947 | | | | 1.9 | % |
| Louisiana | | | | | | | | | | | | |
| Calcasieu Parish Fire Protection District No. 1, | | | | | | | | | | | | |
| 4.000%, 03/01/2024 (Insured by BAM) | | | 155,000 | | | | 155,194 | | | | | |
| City of Shreveport LA: | | | | | | | | | | | | |
| 5.000%, 08/01/2028 (Callable 08/01/2027) | | | | | | | | | | | | |
| (Insured by BAM) | | | 1,615,000 | | | | 1,723,686 | | | | | |
3.125%, 10/01/2030(3) | | | 1,965,000 | | | | 1,857,471 | | | | | |
| Ernest N. Morial New Orleans | | | | | | | | | | | | |
| Exhibition Hall Authority, | | | | | | | | | | | | |
| 5.000%, 07/15/2024 | | | 1,925,000 | | | | 1,940,347 | | | | | |
| Louisiana Housing Corp.: | | | | | | | | | | | | |
| 3.500%, 07/01/2025 (Mandatory Tender | | | | | | | | | | | | |
Date 07/01/2024) (Insured by HUD)(1) | | | 5,000,000 | | | | 4,990,691 | | | | | |
| 5.000%, 07/01/2046 (Callable 02/01/2026) | | | | | | | | | | | | |
| (Mandatory Tender Date 07/01/2026) | | | | | | | | | | | | |
(Insured by HUD)(1) | | | 2,250,000 | | | | 2,318,134 | | | | | |
| Louisiana Local Government | | | | | | | | | | | | |
| Environmental Facilities & | | | | | | | | | | | | |
| Community Development Authority: | | | | | | | | | | | | |
| 5.000%, 08/01/2024 (Callable 01/29/2024) | | | 185,000 | | | | 185,235 | | | | | |
| 3.020%, 04/01/2031 | | | | | | | | | | | | |
(Callable 04/01/2025)(3) | | | 4,901,000 | | | | 4,882,115 | | | | | |
| Louisiana Public Facilities Authority: | | | | | | | | | | | | |
| 5.500%, 05/15/2027 | | | | | | | | | | | | |
| (Pre-refunded to 05/15/2026) | | | 2,015,000 | | | | 2,097,533 | | | | | |
5.000%, 10/01/2028(5) | | | 210,000 | | | | 227,072 | | | | | |
| 6.750%, 10/01/2053 (Callable 07/03/2028) | | | | | | | | | | | | |
(Mandatory Tender Date 10/01/2028)(1)(3) | | | 1,000,000 | | | | 1,017,006 | | | | | |
| Morehouse Parish Hospital | | | | | | | | | | | | |
| Service District No. 1, | | | | | | | | | | | | |
| 4.000%, 10/01/2027 | | | 635,000 | | | | 626,389 | | | | | |
| New Orleans Aviation Board, | | | | | | | | | | | | |
| 5.000%, 10/01/2025 (Insured by AGM) | | | 200,000 | | | | 207,081 | | | | | |
| St. Tammany Parish Wide | | | | | | | | | | | | |
| School District No. 12: | | | | | | | | | | | | |
| 5.000%, 03/01/2025 | | | 500,000 | | | | 512,378 | | | | | |
| 5.000%, 03/01/2026 | | | 415,000 | | | | 435,038 | | | | | |
| 5.000%, 03/01/2027 | | | 605,000 | | | | 650,197 | | | | | |
| Total Louisiana | | | | | | | | | | | | |
| (Cost $24,185,712) | | | | | | | 23,825,567 | | | | 1.5 | % |
| Maine | | | | | | | | | | | | |
| Maine State Housing Authority: | | | | | | | | | | | | |
| 3.500%, 11/15/2045 (Callable 05/15/2025) | | | 135,000 | | | | 134,462 | | | | | |
| 4.000%, 11/15/2045 (Callable 11/15/2025) | | | 10,000 | | | | 9,986 | | | | | |
| 4.000%, 11/15/2046 (Callable 05/15/2026) | | | 410,000 | | | | 408,828 | | | | | |
The accompanying notes are an integral part of these financial statements.
Baird Short-Term Municipal Bond Fund
Schedule of Investments, December 31, 2023
Long-Term Investments (cont.)
| | | Principal | | | | | | % of | |
| | | Amount | | | Value | | | Net Assets | |
| Maine State Housing Authority: (cont.) | | | | | | | | | |
| 3.500%, 11/15/2047 | | | | | | | | | |
| (Callable 11/15/2026) | | $ | 365,000 | | | $ | 361,462 | | | | |
| 4.000%, 11/15/2049 (Callable 05/15/2028) | | | 690,000 | | | | 688,483 | | | | |
| 4.000%, 11/15/2050 (Callable 05/15/2029) | | | 1,175,000 | | | | 1,175,254 | | | | |
| 5.000%, 11/15/2052 (Callable 11/15/2031) | | | 3,510,000 | | | | 3,644,199 | | | | |
| Total Maine | | | | | | | | | | | |
| (Cost $6,603,617) | | | | | | | 6,422,674 | | | | 0.4 | % |
| Maryland | | | | | | | | | | | | |
| City of Baltimore MD: | | | | | | | | | | | | |
| 5.000%, 07/01/2024 | | | | | | | | | | | | |
| (ETM) (Insured by FGIC) | | | 30,000 | | | | 30,295 | | | | | |
| 5.000%, 10/15/2025 | | | 1,465,000 | | | | 1,523,393 | | | | | |
| County of Frederick MD, | | | | | | | | | | | | |
| 5.000%, 04/01/2027 | | | 1,145,000 | | | | 1,239,267 | | | | | |
| County of Howard MD, | | | | | | | | | | | | |
| 5.000%, 08/15/2026 | | | 3,805,000 | | | | 4,051,000 | | | | | |
| County of Prince George’s MD: | | | | | | | | | | | | |
| 5.000%, 07/15/2026 | | | 1,000,000 | | | | 1,062,302 | | | | | |
| 7.000%, 08/01/2048 | | | | | | | | | | | | |
| (Pre-refunded to 11/01/2026) | | | 1,500,000 | | | | 1,664,019 | | | | | |
| Maryland Community | | | | | | | | | | | | |
| Development Administration: | | | | | | | | | | | | |
| 3.250%, 08/01/2024 (Insured by GNMA) | | | 6,000,000 | | | | 5,946,611 | | | | | |
| 4.050%, 10/01/2024 | | | 2,000,000 | | | | 2,000,013 | | | | | |
| 4.600%, 12/01/2024 | | | 7,545,000 | | | | 7,542,600 | | | | | |
| 3.850%, 03/01/2025 | | | 4,000,000 | | | | 3,994,684 | | | | | |
| 5.000%, 09/01/2052 (Callable 03/01/2031) | | | | | | | | | | | | |
| (Insured by GNMA) | | | 2,925,000 | | | | 3,036,046 | | | | | |
| Maryland Health & Higher | | | | | | | | | | | | |
| Educational Facilities Authority: | | | | | | | | | | | | |
| 5.000%, 01/01/2026 | | | 495,000 | | | | 507,906 | | | | | |
| 5.000%, 01/01/2027 | | | 430,000 | | | | 448,455 | | | | | |
| 5.000%, 07/01/2027 | | | | | | | | | | | | |
| (ETM) (Insured by AMBAC) | | | 1,650,000 | | | | 1,720,581 | | | | | |
| 5.000%, 07/01/2045 (Callable 01/01/2027) | | | | | | | | | | | | |
(Mandatory Tender Date 07/01/2027)(1) | | | 3,200,000 | | | | 3,385,906 | | | | | |
| Maryland Stadium Authority, | | | | | | | | | | | | |
| 5.000%, 06/01/2027 | | | 1,515,000 | | | | 1,634,704 | | | | | |
| Montgomery County Housing | | | | | | | | | | | | |
| Opportunities Commission, | | | | | | | | | | | | |
| 4.000%, 07/01/2048 (Callable 07/01/2026) | | | 215,000 | | | | 214,352 | | | | | |
| State of Maryland, | | | | | | | | | | | | |
| 5.000%, 03/15/2029 (Callable 03/15/2028) | | | 3,350,000 | | | | 3,714,317 | | | | | |
| Total Maryland | | | | | | | | | | | | |
| (Cost $43,817,924) | | | | | | | 43,716,451 | | | | 2.7 | % |
| Massachusetts | | | | | | | | | | | | |
| Massachusetts Bay Transportation Authority, | | | | | | | | | | | | |
| 0.000%, 07/01/2030 (Callable 07/01/2026) | | | 9,900,000 | | | | 7,842,673 | | | | | |
| Massachusetts Development Finance Agency: | | | | | | | | | | | | |
| 5.000%, 07/01/2025 | | | 530,000 | | | | 533,726 | | | | | |
| 3.680%, 07/01/2049 | | | | | | | | | | | | |
| (SIFMA Municipal Swap Index + 0.600%) | | | | | | | | | | | | |
| (Callable 01/02/2024) | | | | | | | | | | | | |
(Mandatory Tender Date 01/29/2026)(2)(3) | | | 3,300,000 | | | | 3,269,296 | | | | | |
| Massachusetts Educational | | | | | | | | | | | | |
| Financing Authority, | | | | | | | | | | | | |
| 5.000%, 01/01/2026 (Callable 01/01/2025) | | | 1,365,000 | | | | 1,383,008 | | | | | |
| Massachusetts Housing Finance Agency: | | | | | | | | | | | | |
| 4.000%, 12/01/2044 (Callable 06/01/2025) | | | 45,000 | | | | 44,981 | | | | | |
| 4.000%, 12/01/2048 (Callable 06/01/2027) | | | | | | | | | | | | |
| (Insured by GNMA) | | | 380,000 | | | | 379,413 | | | | | |
| 4.000%, 12/01/2048 (Callable 06/01/2027) | | | | | | | | | | | | |
| (Insured by GNMA) | | | 215,000 | | | | 214,609 | | | | | |
| 4.000%, 06/01/2049 (Callable 12/01/2028) | | | 490,000 | | | | 489,069 | | | | | |
| Total Massachusetts | | | | | | | | | | | | |
| (Cost $14,465,773) | | | | | | | 14,156,775 | | | | 0.9 | % |
| Michigan | | | | | | | | | | | | |
| Bad Axe Public Schools, | | | | | | | | | | | | |
| 4.000%, 05/01/2027 (Callable 05/01/2024) | | | | | | | | | | | | |
| (Insured by Q-SBLF) | | | 630,000 | | | | 632,598 | | | | | |
| City of Detroit MI: | | | | | | | | | | | | |
| 5.250%, 05/01/2025 | | | 1,410,000 | | | | 1,433,730 | | | | | |
| 5.250%, 05/01/2026 | | | 910,000 | | | | 940,220 | | | | | |
| 5.250%, 05/01/2027 | | | 290,000 | | | | 304,662 | | | | | |
| Detroit Wayne County Stadium Authority, | | | | | | | | | | | | |
| 5.000%, 10/01/2026 (Callable 01/29/2024) | | | | | | | | | | | | |
| (Insured by AGM) | | | 65,000 | | | | 65,066 | | | | | |
| Grand Valley State University, | | | | | | | | | | | | |
| 5.000%, 12/01/2032 (Callable 06/01/2026) | | | 1,000,000 | | | | 1,033,736 | | | | | |
| Ingham County Brownfield | | | | | | | | | | | | |
| Redevelopment Authority, | | | | | | | | | | | | |
| 4.125%, 08/01/2024 (Callable 01/29/2024) | | | | | | | | | | | | |
| (Insured by AGM) | | | 105,000 | | | | 105,113 | | | | | |
| Michigan Finance Authority: | | | | | | | | | | | | |
| 5.000%, 09/01/2025 | | | 200,000 | | | | 204,020 | | | | | |
| 4.000%, 05/01/2026 | | | 60,000 | | | | 61,481 | | | | | |
| 5.000%, 09/01/2026 | | | 200,000 | | | | 207,261 | | | | | |
| 5.000%, 11/01/2026 | | | 930,000 | | | | 946,189 | | | | | |
| 5.000%, 09/01/2027 | | | 280,000 | | | | 294,838 | | | | | |
| 5.000%, 11/01/2027 | | | 975,000 | | | | 1,000,099 | | | | | |
| 5.000%, 04/01/2028 (Callable 10/01/2026) | | | 1,000,000 | | | | 1,054,521 | | | | | |
| 4.500%, 10/01/2029 (Callable 10/01/2024) | | | 3,000,000 | | | | 3,015,938 | | | | | |
| 5.000%, 07/01/2033 (Callable 07/01/2024) | | | | | | | | | | | | |
| (Insured by AGM) | | | 2,000,000 | | | | 2,011,413 | | | | | |
| 5.000%, 11/15/2044 (Callable 05/16/2026) | | | | | | | | | | | | |
(Mandatory Tender Date 11/16/2026)(1) | | | 3,735,000 | | | | 3,908,465 | | | | | |
| Michigan State Housing | | | | | | | | | | | | |
| Development Authority: | | | | | | | | | | | | |
| 4.000%, 06/01/2046 (Callable 12/01/2024) | | | 175,000 | | | | 174,840 | | | | | |
| 3.500%, 06/01/2047 (Callable 06/01/2026) | | | 1,570,000 | | | | 1,554,418 | | | | | |
| 5.500%, 06/01/2053 (Callable 12/01/2031) | | | 2,885,000 | | | | 3,065,505 | | | | | |
| 5.750%, 06/01/2054 (Callable 12/01/2032) | | | 3,850,000 | | | | 4,169,976 | | | | | |
| Michigan Strategic Fund, | | | | | | | | | | | | |
| 0.875%, 04/01/2035 | | | | | | | | | | | | |
(Mandatory Tender Date 10/08/2026)(1) | | | 1,050,000 | | | | 939,982 | | | | | |
| Roseville Community Schools: | | | | | | | | | | | | |
| 5.000%, 05/01/2025 (Insured by Q-SBLF) | | | 2,175,000 | | | | 2,232,489 | | | | | |
| 5.000%, 05/01/2026 (Insured by Q-SBLF) | | | 2,700,000 | | | | 2,833,200 | | | | | |
| 5.000%, 05/01/2027 (Insured by Q-SBLF) | | | 2,265,000 | | | | 2,431,007 | | | | | |
| Southeastern Oakland County | | | | | | | | | | | | |
| Resource Recovery Authority, | | | | | | | | | | | | |
| 4.000%, 07/01/2024 | | | 580,000 | | | | 580,609 | | | | | |
| Wayne County Airport Authority, | | | | | | | | | | | | |
| 5.000%, 12/01/2025 (Insured by AGM) | | | 500,000 | | | | 514,771 | | | | | |
| Total Michigan | | | | | | | | | | | | |
| (Cost $35,525,521) | | | | | | | 35,716,147 | | | | 2.2 | % |
| Minnesota | | | | | | | | | | | | |
| Chaska Independent School District No. 112, | | | | | | | | | | | | |
| 2.500%, 02/01/2029 | | | 2,110,000 | | | | 2,051,018 | | | | | |
| City of Burnsville MN, | | | | | | | | | | | | |
| 2.100%, 12/20/2027 (Callable 12/20/2026) | | | 1,040,000 | | | | 970,526 | | | | | |
The accompanying notes are an integral part of these financial statements.
Baird Short-Term Municipal Bond Fund
Schedule of Investments, December 31, 2023
Long-Term Investments (cont.)
| | | Principal | | | | | | % of | |
| | | Amount | | | Value | | | Net Assets | |
| City of Mounds View MN, | | | | | | | | | |
| 5.375%, 05/01/2027 (Callable 01/01/2025) | | | | | | | | | |
| (Mandatory Tender Date 05/01/2025) | | | | | | | | | |
(Insured by HUD)(1) | | $ | 2,080,000 | | | $ | 2,086,039 | | | | |
| City of Virginia MN, | | | | | | | | | | | |
| 5.000%, 12/15/2026 (Callable 06/15/2025) | | | 7,500,000 | | | | 7,614,466 | | | | |
| Duluth Economic Development Authority, | | | | | | | | | | | |
| 5.000%, 06/15/2026 | | | 350,000 | | | | 358,391 | | | | |
| Duluth Independent | | | | | | | | | | | |
| School District No. 709, | | | | | | | | | | | |
| 0.000%, 02/01/2029 (Callable 02/01/2028) | | | | | | | | | | | |
| (Insured by SD CRED PROG) | | | 1,305,000 | | | | 1,069,433 | | | | |
| Fergus Falls Independent | | | | | | | | | | | |
| School District No. 544, | | | | | | | | | | | |
| 2.500%, 02/01/2024 | | | 105,000 | | | | 104,885 | | | | |
| Golden Valley Housing & | | | | | | | | | | | |
| Redevelopment Authority, | | | | | | | | | | | |
| 4.000%, 02/01/2030 (Callable 02/01/2024) | | | 1,070,000 | | | | 1,070,202 | | | | |
| Housing & Redevelopment Authority | | | | | | | | | | | |
| of the City of St. Paul MN: | | | | | | | | | | | |
| 5.000%, 11/15/2025 | | | 465,000 | | | | 476,403 | | | | |
| 5.000%, 12/01/2025 | | | 285,000 | | | | 287,934 | | | | |
| 2.000%, 09/01/2026 (Callable 09/01/2024) | | | 250,000 | | | | 232,641 | | | | |
| 5.000%, 12/01/2027 | | | 1,065,000 | | | | 1,082,714 | | | | |
| Minnesota Higher Education | | | | | | | | | | | |
| Facilities Authority: | | | | | | | | | | | |
| 4.000%, 12/01/2024 | | | 100,000 | | | | 99,765 | | | | |
| 5.000%, 03/01/2027 (Callable 03/01/2026) | | | 250,000 | | | | 257,333 | | | | |
| Minnesota Housing Finance Agency: | | | | | | | | | | | |
| 4.000%, 01/01/2038 (Callable 01/29/2024) | | | 230,000 | | | | 229,598 | | | | |
| 2.625%, 01/01/2040 (Callable 07/01/2029) | | | | | | | | | | | |
| (Insured by GNMA) | | | 4,530,000 | | | | 3,849,279 | | | | |
| 2.800%, 01/01/2044 (Callable 07/01/2029) | | | | | | | | | | | |
| (Insured by GNMA) | | | 1,200,000 | | | | 947,923 | | | | |
| 3.500%, 07/01/2046 (Callable 07/01/2025) | | | | | | | | | | | |
| (Insured by GNMA) | | | 1,425,000 | | | | 1,412,914 | | | | |
| 4.000%, 01/01/2047 (Callable 01/01/2026) | | | | | | | | | | | |
| (Insured by GNMA) | | | 70,000 | | | | 69,866 | | | | |
| 4.000%, 07/01/2047 (Callable 01/01/2027) | | | | | | | | | | | |
| (Insured by GNMA) | | | 175,000 | | | | 174,471 | | | | |
| 3.000%, 07/01/2052 (Callable 07/01/2031) | | | | | | | | | | | |
| (Insured by GNMA) | | | 4,690,000 | | | | 4,529,713 | | | | |
| 6.000%, 07/01/2053 (Callable 01/01/2033) | | | | | | | | | | | |
| (Insured by GNMA) | | | 2,420,000 | | | | 2,645,962 | | | | |
| Northern Municipal Power Agency, | | | | | | | | | | | |
| 5.000%, 01/01/2027 (Callable 01/29/2024) | | | 230,000 | | | | 230,316 | | | | |
| Zumbro Education District, | | | | | | | | | | | |
| 4.000%, 02/01/2025 | | | 330,000 | | | | 331,095 | | | | |
| Total Minnesota | | | | | | | | | | | |
| (Cost $33,958,954) | | | | | | | 32,182,887 | | | | 2.0 | % |
| Mississippi | | | | | | | | | | | | |
| City of Florence MS: | | | | | | | | | | | | |
| 7.125%, 08/01/2028 (Insured by BAM) | | | 240,000 | | | | 278,151 | | | | | |
| 7.125%, 08/01/2029 (Insured by BAM) | | | 250,000 | | | | 297,340 | | | | | |
| City of Louisville MS: | | | | | | | | | | | | |
| 5.625%, 09/01/2026 (Insured by BAM) | | | 180,000 | | | | 190,305 | | | | | |
| 5.625%, 09/01/2027 (Insured by BAM) | | | 190,000 | | | | 204,934 | | | | | |
| City of Oxford MS, | | | | | | | | | | | | |
| 3.000%, 09/01/2024 | | | 90,000 | | | | 88,809 | | | | | |
| City of Ridgeland MS, | | | | | | | | | | | | |
| 3.000%, 10/01/2024 | | | 1,505,000 | | | | 1,497,368 | | | | | |
| Mississippi Business Finance Corp., | | | | | | | | | | | | |
| 3.200%, 09/01/2028 (Callable 03/13/2024) | | | 2,460,000 | | | | 2,460,209 | | | | | |
| Mississippi Development Bank: | | | | | | | | | | | | |
| 5.000%, 03/01/2024 (Insured by AGM) | | | 50,000 | | | | 50,121 | | | | | |
5.000%, 10/01/2024(3) | | | 460,000 | | | | 462,666 | | | | | |
| 5.000%, 11/01/2024 | | | 720,000 | | | | 728,838 | | | | | |
| 5.000%, 11/01/2025 (Insured by BAM) | | | 240,000 | | | | 248,313 | | | | | |
| 5.000%, 09/01/2027 | | | 485,000 | | | | 503,592 | | | | | |
| 5.000%, 09/01/2028 | | | 575,000 | | | | 602,054 | | | | | |
| 5.000%, 11/01/2029 (Callable 11/01/2027) | | | 300,000 | | | | 308,892 | | | | | |
| Mississippi Home Corp.: | | | | | | | | | | | | |
| 4.000%, 12/01/2048 (Callable 06/01/2028) | | | | | | | | | | | | |
| (Insured by GNMA) | | | 245,000 | | | | 244,662 | | | | | |
| 3.500%, 12/01/2049 (Callable 12/01/2028) | | | | | | | | | | | | |
| (Insured by GNMA) | | | 545,000 | | | | 538,685 | | | | | |
| Total Mississippi | | | | | | | | | | | | |
| (Cost $8,751,042) | | | | | | | 8,704,939 | | | | 0.5 | % |
| Missouri | | | | | | | | | | | | |
| Hanley Road Corridor Transportation | | | | | | | | | | | | |
| Development District, | | | | | | | | | | | | |
| 2.000%, 10/01/2039 (Callable 10/01/2029) | | | 595,000 | | | | 587,228 | | | | | |
| Health & Educational Facilities | | | | | | | | | | | | |
| Authority of the State of Missouri: | | | | | | | | | | | | |
| 5.000%, 09/01/2024 | | | 295,000 | | | | 296,437 | | | | | |
| 4.000%, 08/01/2025 | | | 150,000 | | | | 147,479 | | | | | |
| 5.000%, 08/01/2025 (Callable 08/01/2024) | | | 350,000 | | | | 349,357 | | | | | |
| 5.000%, 09/01/2026 | | | 620,000 | | | | 632,548 | | | | | |
| 5.000%, 02/01/2029 (Callable 02/01/2024) | | | 4,775,000 | | | | 4,775,894 | | | | | |
| 5.000%, 02/01/2029 (Callable 02/01/2026) | | | 1,195,000 | | | | 1,202,913 | | | | | |
| Missouri Housing Development Commission: | | | | | | | | | | | | |
| 3.400%, 11/01/2030 (Callable 11/01/2024) | | | | | | | | | | | | |
| (Insured by GNMA) | | | 40,000 | | | | 38,122 | | | | | |
| 4.750%, 11/01/2052 (Callable 05/01/2032) | | | | | | | | | | | | |
| (Insured by GNMA) | | | 4,000,000 | | | | 4,119,688 | | | | | |
| Missouri Joint Municipal | | | | | | | | | | | | |
| Electric Utility Commission, | | | | | | | | | | | | |
| 5.000%, 12/01/2027 (Callable 06/01/2025) | | | 2,125,000 | | | | 2,177,560 | | | | | |
| Missouri Southern State University: | | | | | | | | | | | | |
| 5.000%, 10/01/2026 (Insured by AGM) | | | 105,000 | | | | 110,541 | | | | | |
| 5.000%, 10/01/2027 (Insured by AGM) | | | 100,000 | | | | 107,400 | | | | | |
| Northwest Missouri State University, | | | | | | | | | | | | |
| 5.000%, 06/01/2026 (Insured by BAM) | | | 500,000 | | | | 520,594 | | | | | |
| St. Joseph Industrial Development Authority, | | | | | | | | | | | | |
| 3.350%, 01/01/2024 | | | 125,000 | | | | 125,000 | | | | | |
| St. Louis Land Clearance for | | | | | | | | | | | | |
| Redevelopment Authority, | | | | | | | | | | | | |
| 4.250%, 06/01/2026 | | | 2,655,000 | | | | 2,666,373 | | | | | |
| Total Missouri | | | | | | | | | | | | |
| (Cost $17,933,276) | | | | | | | 17,857,134 | | | | 1.1 | % |
| Montana | | | | | | | | | | | | |
| City of Forsyth MT: | | | | | | | | | | | | |
| 3.875%, 07/01/2028 (Callable 04/02/2028) | | | 2,455,000 | | | | 2,506,099 | | | | | |
| 3.900%, 03/01/2031 | | | | | | | | | | | | |
(Callable 01/29/2024)(1) | | | 11,000,000 | | | | 10,953,593 | | | | | |
| Montana Board of Housing: | | | | | | | | | | | | |
| 3.500%, 08/01/2025 | | | | | | | | | | | | |
(Mandatory Tender Date 08/01/2024)(1) | | | 4,000,000 | | | | 3,992,712 | | | | | |
| 4.000%, 12/01/2043 (Callable 12/01/2027) | | | 450,000 | | | | 448,803 | | | | | |
| 4.000%, 06/01/2049 (Callable 12/01/2027) | | | | | | | | | | | | |
| (Insured by FHA) | | | 460,000 | | | | 458,737 | | | | | |
| 6.000%, 06/01/2053 (Callable 06/01/2032) | | | 1,990,000 | | | | 2,147,385 | | | | | |
| Montana Facility Finance Authority: | | | | | | | | | | | | |
| 4.000%, 07/01/2025 | | | 155,000 | | | | 155,379 | | | | | |
| 5.000%, 07/01/2025 (Insured by MT BRD) | | | 110,000 | | | | 113,388 | | | | | |
| 4.000%, 07/01/2026 | | | 330,000 | | | | 330,813 | | | | | |
| Total Montana | | | | | | | | | | | | |
| (Cost $21,147,865) | | | | | | | 21,106,909 | | | | 1.3 | % |
The accompanying notes are an integral part of these financial statements.
Baird Short-Term Municipal Bond Fund
Schedule of Investments, December 31, 2023
Long-Term Investments (cont.)
| | | Principal | | | | | | % of | |
| | | Amount | | | Value | | | Net Assets | |
| Nebraska | | | | | | | | | |
| Central Plains Energy Project, | | | | | | | | | |
| 5.000%, 05/01/2054 (Callable 08/01/2029) | | | | | | | | | |
(Mandatory Tender Date 11/01/2029)(1) | | $ | 5,150,000 | | | $ | 5,459,331 | | | | |
| Douglas County Hospital Authority No. 2, | | | | | | | | | | | |
| 5.000%, 05/15/2030 (Callable 05/15/2024) | | | 1,500,000 | | | | 1,505,780 | | | | |
| Nebraska Investment Finance Authority, | | | | | | | | | | | |
| 3.000%, 03/01/2052 (Callable 03/01/2031) | | | | | | | | | | | |
| (Insured by GNMA) | | | 4,530,000 | | | | 4,373,879 | | | | |
| Total Nebraska | | | | | | | | | | | |
| (Cost $11,304,370) | | | | | | | 11,338,990 | | | | 0.7 | % |
| Nevada | | | | | | | | | | | | |
| City of Reno NV, | | | | | | | | | | | | |
| 5.000%, 06/01/2031 (Callable 01/29/2024) | | | | | | | | | | | | |
| (Insured by AGM) | | | 2,590,000 | | | | 2,591,118 | | | | | |
| County of Clark NV: | | | | | | | | | | | | |
| 5.000%, 07/01/2025 | | | 490,000 | | | | 505,671 | | | | | |
| 5.000%, 12/01/2026 | | | 1,450,000 | | | | 1,553,571 | | | | | |
| Las Vegas Redevelopment Agency: | | | | | | | | | | | | |
| 5.000%, 06/15/2026 | | | 1,000,000 | | | | 1,033,657 | | | | | |
| 3.000%, 06/15/2032 (Callable 06/15/2026) | | | 790,000 | | | | 743,872 | | | | | |
| Nevada Housing Division: | | | | | | | | | | | | |
| 4.000%, 10/01/2049 (Callable 10/01/2028) | | | | | | | | | | | | |
| (Insured by GNMA) | | | 800,000 | | | | 800,815 | | | | | |
| 3.000%, 04/01/2051 (Callable 10/01/2030) | | | | | | | | | | | | |
| (Insured by GNMA) | | | 1,330,000 | | | | 1,291,711 | | | | | |
| Total Nevada | | | | | | | | | | | | |
| (Cost $8,655,458) | | | | | | | 8,520,415 | | | | 0.5 | % |
| New Hampshire | | | | | | | | | | | | |
| Hollis School District, | | | | | | | | | | | | |
| 2.769%, 06/28/2027 | | | | | | | | | | | | |
(Callable 01/19/2024)(3) | | | 1,212,469 | | | | 1,153,736 | | | | | |
| New Hampshire Business Finance Authority, | | | | | | | | | | | | |
| 4.000%, 01/01/2028 (Callable 01/01/2026) | | | 575,000 | | | | 556,632 | | | | | |
| Total New Hampshire | | | | | | | | | | | | |
| (Cost $1,821,731) | | | | | | | 1,710,368 | | | | 0.1 | % |
| New Jersey | | | | | | | | | | | | |
| Atlantic City Board of Education, | | | | | | | | | | | | |
3.400%, 08/15/2024(3) | | | 793,000 | | | | 791,448 | | | | | |
| City of Atlantic City NJ, | | | | | | | | | | | | |
| 5.000%, 03/01/2024 (Insured by BAM) | | | 300,000 | | | | 300,816 | | | | | |
| New Jersey Economic | | | | | | | | | | | | |
| Development Authority: | | | | | | | | | | | | |
| 5.250%, 07/01/2025 (Insured by NATL) | | | 6,250,000 | | | | 6,405,159 | | | | | |
| 4.330%, 09/01/2025 (SIFMA Municipal | | | | | | | | | | | | |
| Swap Index + 1.250%) (Callable | | | | | | | | | | | | |
03/01/2025) (Insured by ST AID)(2) | | | 20,000 | | | | 20,038 | | | | | |
| 3.125%, 07/01/2029 (Callable 07/01/2027) | | | 935,000 | | | | 908,977 | | | | | |
| New Jersey Housing & | | | | | | | | | | | | |
| Mortgage Finance Agency: | | | | | | | | | | | | |
| 5.000%, 05/01/2025 (Insured by HUD) | | | 2,190,000 | | | | 2,220,982 | | | | | |
| 5.000%, 11/01/2025 (Insured by HUD) | | | 1,615,000 | | | | 1,645,529 | | | | | |
| 3.600%, 05/01/2026 (Insured by HUD) | | | 3,045,000 | | | | 3,065,582 | | | | | |
| 4.500%, 10/01/2048 (Callable 10/01/2027) | | | 420,000 | | | | 425,347 | | | | | |
| 4.750%, 10/01/2050 (Callable 04/01/2028) | | | 930,000 | | | | 945,861 | | | | | |
| 5.000%, 10/01/2053 (Callable 04/01/2031) | | | 3,320,000 | | | | 3,457,374 | | | | | |
| New Jersey Transportation | | | | | | | | | | | | |
| Trust Fund Authority: | | | | | | | | | | | | |
| 0.000%, 12/15/2026 (Insured by AMBAC) | | | 210,000 | | | | 190,862 | | | | | |
| 0.000%, 12/15/2027 (Insured by BAM) | | | 2,245,000 | | | | 1,989,477 | | | | | |
| 0.000%, 12/15/2027 (Insured by NATL) | | | 165,000 | | | | 145,652 | | | | | |
| 0.000%, 12/15/2028 (Insured by BAM) | | | 4,850,000 | | | | 4,179,030 | | | | | |
| 0.000%, 12/15/2029 (Insured by AGM) | | | 3,210,000 | | | | 2,683,533 | | | | | |
| Newark Housing Authority, | | | | | | | | | | | | |
| 5.000%, 12/01/2028 (Callable 12/01/2026) | | | | | | | | | | | | |
| (Insured by AGM) | | | 1,500,000 | | | | 1,598,917 | | | | | |
| Salem County Improvement Authority, | | | | | | | | | | | | |
| 4.000%, 08/15/2026 (Insured by AGM) | | | 475,000 | | | | 482,377 | | | | | |
| Township of Mahwah NJ, | | | | | | | | | | | | |
| 1.000%, 01/15/2026 | | | 1,320,000 | | | | 1,267,143 | | | | | |
| Total New Jersey | | | | | | | | | | | | |
| (Cost $32,511,666) | | | | | | | 32,724,104 | | | | 2.0 | % |
| New Mexico | | | | | | | | | | | | |
| Los Lunas School District No. 1, | | | | | | | | | | | | |
| 2.000%, 07/15/2024 (Callable 01/29/2024) | | | | | | | | | | | | |
| (Insured by ST AID) | | | 800,000 | | | | 792,498 | | | | | |
| New Mexico Mortgage Finance Authority: | | | | | | | | | | | | |
| 5.000%, 02/01/2042 (Callable 04/01/2025) | | | | | | | | | | | | |
| (Mandatory Tender Date 09/01/2025) | | | | | | | | | | | | |
(Insured by HUD)(1) | | | 1,073,000 | | | | 1,093,197 | | | | | |
| 3.500%, 03/01/2045 (Callable 03/01/2026) | | | 45,000 | | | | 44,495 | | | | | |
| 3.750%, 03/01/2048 (Callable 03/01/2027) | | | | | | | | | | | | |
| (Insured by GNMA) | | | 285,000 | | | | 282,928 | | | | | |
| 4.250%, 07/01/2049 (Callable 01/01/2028) | | | | | | | | | | | | |
| (Insured by GNMA) | | | 240,000 | | | | 240,944 | | | | | |
| 4.250%, 01/01/2050 (Callable 07/01/2028) | | | | | | | | | | | | |
| (Insured by GNMA) | | | 1,695,000 | | | | 1,702,002 | | | | | |
| Roswell Independent School District, | | | | | | | | | | | | |
| 3.000%, 08/01/2024 (Insured by ST AID) | | | 545,000 | | | | 544,306 | | | | | |
| Total New Mexico | | | | | | | | | | | | |
| (Cost $4,756,105) | | | | | | | 4,700,370 | | | | 0.3 | % |
| New York | | | | | | | | | | | | |
| Albany Capital Resource Corp., | | | | | | | | | | | | |
| 5.000%, 05/01/2027 (Callable 05/01/2026) | | | 1,000,000 | | | | 1,033,388 | | | | | |
| Albany County Capital Resource Corp., | | | | | | | | | | | | |
| 2.600%, 07/01/2025 | | | 430,000 | | | | 422,369 | | | | | |
| Amherst Industrial Development Agency, | | | | | | | | | | | | |
| 3.900%, 04/01/2026 (Mandatory Tender | | | | | | | | | | | | |
Date 04/01/2025) (Insured by FHA)(1) | | | 8,250,000 | | | | 8,284,657 | | | | | |
| City of Amsterdam NY, | | | | | | | | | | | | |
| 5.000%, 06/20/2024 | | | 1,597,914 | | | | 1,600,960 | | | | | |
| City of New York NY, | | | | | | | | | | | | |
| 5.000%, 06/01/2044 (Callable 06/01/2025) | | | | | | | | | | | | |
(Mandatory Tender Date 12/01/2025)(1) | | | 4,000,000 | | | | 4,110,253 | | | | | |
| City of Poughkeepsie NY: | | | | | | | | | | | | |
| 4.000%, 04/15/2024 | | | 280,000 | | | | 279,631 | | | | | |
| 4.000%, 04/15/2026 | | | 450,000 | | | | 449,280 | | | | | |
| Genesee Valley Central School District: | | | | | | | | | | | | |
| 5.000%, 06/15/2027 (Insured by AGM) | | | 1,390,000 | | | | 1,506,941 | | | | | |
| 5.000%, 06/15/2028 (Insured by AGM) | | | 1,460,000 | | | | 1,620,855 | | | | | |
| Hempstead Town Local Development Corp., | | | | | | | | | | | | |
| 5.000%, 07/01/2025 (Callable 01/29/2024) | | | 815,000 | | | | 816,227 | | | | | |
| Huntington Local Development Corp., | | | | | | | | | | | | |
| 4.000%, 07/01/2027 | | | 4,125,000 | | | | 3,958,495 | | | | | |
| Monroe County Industrial | | | | | | | | | | | | |
| Development Corp., | | | | | | | | | | | | |
| 5.000%, 07/01/2028 (Mandatory Tender | | | | | | | | | | | | |
Date 07/01/2027) (Insured by HUD)(1)(6) | | | 3,905,000 | | | | 4,063,545 | | | | | |
| New York City Housing Development Corp.: | | | | | | | | | | | | |
| 2.950%, 11/01/2045 (Callable 05/01/2025) | | | | | | | | | | | | |
| (Mandatory Tender Date 02/01/2026) | | | | | | | | | | | | |
(Insured by FNMA)(1) | | | 725,000 | | | | 719,383 | | | | | |
| 3.000%, 02/15/2048 (Callable 05/15/2024) | | | 8,150,000 | | | | 8,069,893 | | | | | |
| 3.500%, 02/15/2048 (Callable 05/15/2024) | | | 5,100,000 | | | | 5,051,759 | | | | | |
| 0.700%, 11/01/2060 (Callable 01/19/2024) | | | | | | | | | | | | |
(Mandatory Tender Date 05/01/2025)(1) | | | 2,590,000 | | | | 2,471,775 | | | | | |
The accompanying notes are an integral part of these financial statements.
Baird Short-Term Municipal Bond Fund
Schedule of Investments, December 31, 2023
Long-Term Investments (cont.)
| | | Principal | | | | | | % of | |
| | | Amount | | | Value | | | Net Assets | |
| New York City Housing | | | | | | | | | |
| Development Corp.: (cont.) | | | | | | | | | |
| 0.600%, 05/01/2061 | | | | | | | | | |
| (Callable 01/19/2024) | | | | | | | | | |
| (Mandatory Tender Date 07/01/2025) | | | | | | | | | |
(Insured by FHA)(1) | | $ | 1,910,000 | | | $ | 1,808,763 | | | | |
| 3.400%, 11/01/2062 | | | | | | | | | | | |
| (Callable 05/01/2025) | | | | | | | | | | | |
| (Mandatory Tender Date 12/22/2026) | | | | | | | | | | | |
(Insured by FHA)(1) | | | 4,000,000 | | | | 4,009,651 | | | | |
| New York State Housing Finance Agency: | | | | | | | | | | | |
| 0.700%, 11/01/2024 (Callable 01/19/2024) | | | | | | | | | | | |
| (Insured by SONYMA) | | | 2,500,000 | | | | 2,416,581 | | | | |
| 1.600%, 11/01/2024 (Callable 01/19/2024) | | | 3,955,000 | | | | 3,888,055 | | | | |
| 0.750%, 05/01/2025 (Callable 01/19/2024) | | | | | | | | | | | |
| (Insured by SONYMA) | | | 4,300,000 | | | | 4,085,432 | | | | |
| 0.750%, 11/01/2025 (Callable 01/19/2024) | | | | | | | | | | | |
| (Insured by SONYMA) | | | 5,950,000 | | | | 5,562,272 | | | | |
| 1.650%, 05/15/2039 (Insured by FNMA) | | | 3,439,032 | | | | 2,568,506 | | | | |
| 0.650%, 11/01/2056 | | | | | | | | | | | |
| (Callable 01/19/2024) | | | | | | | | | | | |
| (Mandatory Tender Date 11/01/2025) | | | | | | | | | | | |
(Insured by SONYMA)(1) | | | 4,300,000 | | | | 4,019,237 | | | | |
| 4.500%, 11/01/2062 | | | | | | | | | | | |
| (Callable 11/01/2025) | | | | | | | | | | | |
| (Mandatory Tender Date 11/01/2028) | | | | | | | | | | | |
(Insured by SONYMA)(1) | | | 1,000,000 | | | | 1,021,688 | | | | |
| Oneida County Local Development Corp., | | | | | | | | | | | |
| 5.000%, 12/01/2029 (Callable 01/29/2024) | | | | | | | | | | | |
| (Insured by AGM) | | | 715,000 | | | | 715,606 | | | | |
| State of New York Mortgage Agency, | | | | | | | | | | | |
| 4.000%, 10/01/2046 (Callable 04/01/2025) | | | 85,000 | | | | 84,841 | | | | |
| Village of Island Park NY, | | | | | | | | | | | |
| 4.950%, 03/01/2024 | | | 1,515,000 | | | | 1,515,013 | | | | |
| Westchester County | | | | | | | | | | | |
| Local Development Corp.: | | | | | | | | | | | |
2.875%, 07/01/2026(3) | | | 1,000,000 | | | | 981,836 | | | | |
3.200%, 07/01/2028(3) | | | 5,855,000 | | | | 5,670,254 | | | | |
| Total New York | | | | | | | | | | | |
| (Cost $83,472,626) | | | | | | | 82,807,146 | | | | 5.2 | % |
| North Carolina | | | | | | | | | | | | |
| City of Raleigh NC, | | | | | | | | | | | | |
| 5.000%, 09/01/2027 | | | 775,000 | | | | 847,603 | | | | | |
| County of Forsyth NC, | | | | | | | | | | | | |
| 5.000%, 06/01/2027 | | | 4,915,000 | | | | 5,341,926 | | | | | |
| County of Wake NC, | | | | | | | | | | | | |
| 5.000%, 11/01/2027 | | | 1,140,000 | | | | 1,252,028 | | | | | |
| Inlivian: | | | | | | | | | | | | |
| 2.375%, 04/01/2025 | | | | | | | | | | | | |
(Mandatory Tender Date 04/01/2024)(1) | | | 8,332,000 | | | | 8,291,303 | | | | | |
| 5.000%, 06/01/2043 (Callable 12/01/2025) | | | | | | | | | | | | |
| (Mandatory Tender Date 06/01/2026) | | | | | | | | | | | | |
(Insured by HUD)(1) | | | 5,348,000 | | | | 5,495,051 | | | | | |
| North Carolina Housing Finance Agency: | | | | | | | | | | | | |
| 4.000%, 07/01/2048 (Callable 07/01/2027) | | | | | | | | | | | | |
| (Insured by GNMA) | | | 190,000 | | | | 189,516 | | | | | |
| 4.000%, 07/01/2050 (Callable 07/01/2029) | | | 2,420,000 | | | | 2,420,908 | | | | | |
| 6.000%, 07/01/2053 (Callable 07/01/2031) | | | | | | | | | | | | |
| (Insured by GNMA) | | | 4,190,000 | | | | 4,519,350 | | | | | |
| 6.250%, 01/01/2055 (Callable 07/01/2032) | | | | | | | | | | | | |
| (Insured by GNMA) | | | 2,500,000 | | | | 2,766,540 | | | | | |
| North Carolina Medical Care Commission, | | | | | | | | | | | | |
| 4.000%, 10/01/2027 | | | 1,020,000 | | | | 1,022,414 | | | | | |
| Raleigh Housing Authority: | | | | | | | | | | | | |
| 5.000%, 10/01/2026 | | | | | | | | | | | | |
(Mandatory Tender Date 10/01/2025)(1) | | | 4,000,000 | | | | 4,077,249 | | | | | |
| 5.000%, 12/01/2026 (Mandatory Tender | | | | | | | | | | | | |
Date 12/01/2025) (Insured by FHA)(1) | | | 4,000,000 | | | | 4,098,020 | | | | | |
| Total North Carolina | | | | | | | | | | | | |
| (Cost $40,280,295) | | | | | | | 40,321,908 | | | | 2.5 | % |
| North Dakota | | | | | | | | | | | | |
| Cass County Joint Water Resource District, | | | | | | | | | | | | |
| 0.480%, 05/01/2024 (Callable 01/29/2024) | | | 2,500,000 | | | | 2,456,242 | | | | | |
| City of Horace ND: | | | | | | | | | | | | |
| 4.000%, 01/01/2025 (Callable 01/19/2024) | | | 2,000,000 | | | | 2,000,236 | | | | | |
| 3.000%, 05/01/2025 | | | 250,000 | | | | 244,766 | | | | | |
| 3.000%, 05/01/2025 | | | 205,000 | | | | 200,323 | | | | | |
| 5.125%, 07/01/2025 (Callable 07/01/2024) | | | 1,000,000 | | | | 1,007,943 | | | | | |
| 3.000%, 05/01/2026 | | | 345,000 | | | | 334,875 | | | | | |
| 3.000%, 05/01/2026 | | | 100,000 | | | | 96,749 | | | | | |
| 3.000%, 05/01/2027 (Callable 05/01/2026) | | | 265,000 | | | | 256,158 | | | | | |
| 3.000%, 05/01/2028 (Callable 05/01/2027) | | | 305,000 | | | | 289,877 | | | | | |
| 5.000%, 05/01/2031 | | | 3,465,000 | | | | 3,680,721 | | | | | |
| City of Mayville ND, | | | | | | | | | | | | |
| 3.750%, 08/01/2025 (Callable 01/29/2024) | | | 4,000,000 | | | | 3,921,347 | | | | | |
| North Dakota Housing Finance Agency: | | | | | | | | | | | | |
| 4.000%, 07/01/2048 (Callable 01/01/2027) | | | 285,000 | | | | 284,169 | | | | | |
| 4.000%, 01/01/2051 (Callable 07/01/2029) | | | 1,880,000 | | | | 1,879,235 | | | | | |
| 3.000%, 07/01/2052 (Callable 01/01/2031) | | | 2,770,000 | | | | 2,677,119 | | | | | |
| Williston Parks & Recreation District: | | | | | | | | | | | | |
| 4.500%, 03/01/2025 (Callable 01/16/2024) | | | 300,000 | | | | 296,928 | | | | | |
| 4.625%, 03/01/2026 (Callable 01/16/2024) | | | 2,620,000 | | | | 2,571,557 | | | | | |
| Williston Public School District No. 1, | | | | | | | | | | | | |
| 3.000%, 08/01/2026 (Callable 08/01/2024) | | | | | | | | | | | | |
| (Insured by SD CRED PROG) | | | 1,015,000 | | | | 1,014,745 | | | | | |
| Total North Dakota | | | | | | | | | | | | |
| (Cost $23,761,850) | | | | | | | 23,212,990 | | | | 1.5 | % |
| Ohio | | | | | | | | | | | | |
| Akron Bath Copley Joint | | | | | | | | | | | | |
| Township Hospital District: | | | | | | | | | | | | |
| 5.000%, 11/15/2025 | | | 150,000 | | | | 154,253 | | | | | |
| 5.000%, 11/15/2026 | | | 120,000 | | | | 125,432 | | | | | |
| 5.000%, 11/15/2028 | | | 1,240,000 | | | | 1,329,123 | | | | | |
| City of Huron OH, | | | | | | | | | | | | |
| 3.125%, 12/01/2024 | | | 115,000 | | | | 114,201 | | | | | |
| City of Kirtland OH, | | | | | | | | | | | | |
| 4.250%, 04/18/2024 (Insured by ST AID) | | | 1,002,000 | | | | 1,002,894 | | | | | |
| City of Lorain OH: | | | | | | | | | | | | |
| 3.000%, 12/01/2024 (Insured by BAM) | | | 130,000 | | | | 129,926 | | | | | |
| 3.000%, 12/01/2025 (Insured by BAM) | | | 135,000 | | | | 135,200 | | | | | |
| 3.000%, 12/01/2026 (Insured by BAM) | | | 135,000 | | | | 135,401 | | | | | |
| City of Middleburg Heights OH, | | | | | | | | | | | | |
| 5.000%, 08/01/2026 | | | 270,000 | | | | 281,922 | | | | | |
| City of Waterville OH, | | | | | | | | | | | | |
| 1.000%, 12/01/2026 | | | 1,255,000 | | | | 1,189,143 | | | | | |
| Cleveland-Cuyahoga County Port Authority, | | | | | | | | | | | | |
| 5.000%, 08/01/2026 (Callable 08/01/2024) | | | 550,000 | | | | 555,101 | | | | | |
| Columbus-Franklin County | | | | | | | | | | | | |
| Finance Authority, | | | | | | | | | | | | |
| 4.000%, 05/15/2035 (Callable 11/15/2032) | | | 1,625,000 | | | | 1,629,312 | | | | | |
| County of Allen OH, | | | | | | | | | | | | |
| 5.000%, 10/01/2049 (Callable 02/03/2027) | | | | | | | | | | | | |
(Mandatory Tender Date 08/03/2027)(1) | | | 850,000 | | | | 897,283 | | | | | |
| County of Montgomery OH: | | | | | | | | | | | | |
| 5.000%, 11/15/2025 | | | 2,500,000 | | | | 2,561,306 | | | | | |
| 5.000%, 11/15/2027 | | | 2,015,000 | | | | 2,129,389 | | | | | |
The accompanying notes are an integral part of these financial statements.
Baird Short-Term Municipal Bond Fund
Schedule of Investments, December 31, 2023
Long-Term Investments (cont.)
| | | Principal | | | | | | % of | |
| | | Amount | | | Value | | | Net Assets | |
| County of Trumbull OH, | | | | | | | | | |
5.750%, 03/18/2024(3) | | $ | 2,082,500 | | | $ | 2,086,277 | | | | |
| County of Van Wert OH, | | | | | | | | | | | |
| 6.125%, 12/01/2049 | | | | | | | | | | | |
| (Pre-refunded to 12/01/2029) | | | 12,226,000 | | | | 14,212,191 | | | | |
| Cuyahoga Metropolitan Housing Authority, | | | | | | | | | | | |
| 4.750%, 12/01/2027 (Mandatory Tender | | | | | | | | | | | |
Date 12/01/2025) (Insured by FHA)(1) | | | 2,550,000 | | | | 2,597,993 | | | | |
| Northeast Ohio Medical University, | | | | | | | | | | | |
| 5.000%, 12/01/2025 | | | 125,000 | | | | 128,110 | | | | |
| Northwest Local School District, | | | | | | | | | | | |
| 0.000%, 12/01/2026 | | | | | | | | | | | |
| (Insured by SD CRED PROG) | | | 440,000 | | | | 400,787 | | | | |
| Ohio Air Quality Development Authority, | | | | | | | | | | | |
| 4.000%, 09/01/2030 | | | | | | | | | | | |
(Mandatory Tender Date 06/01/2027)(1) | | | 6,570,000 | | | | 6,675,590 | | | | |
| Ohio Higher Educational | | | | | | | | | | | |
| Facility Commission: | | | | | | | | | | | |
| 5.000%, 05/01/2024 | | | 705,000 | | | | 708,685 | | | | |
| 5.000%, 05/01/2024 | | | 415,000 | | | | 417,169 | | | | |
| 5.000%, 03/01/2025 | | | 585,000 | | | | 588,168 | | | | |
| 5.000%, 05/01/2025 | | | 595,000 | | | | 608,303 | | | | |
| 5.000%, 05/01/2025 | | | 455,000 | | | | 465,173 | | | | |
| 5.000%, 05/01/2026 (Callable 05/01/2025) | | | 750,000 | | | | 768,877 | | | | |
| 5.000%, 12/01/2027 | | | 715,000 | | | | 728,362 | | | | |
| Ohio Housing Finance Agency: | | | | | | | | | | | |
| 3.350%, 07/01/2025 (Mandatory Tender | | | | | | | | | | | |
Date 07/01/2024) (Insured by HUD)(1) | | | 2,500,000 | | | | 2,489,669 | | | | |
| 4.000%, 11/01/2025 | | | | | | | | | | | |
(Mandatory Tender Date 11/01/2024)(1) | | | 7,000,000 | | | | 7,011,750 | | | | |
| 6.000%, 02/01/2026 | | | | | | | | | | | |
(Callable 02/01/2025)(3) | | | 1,500,000 | | | | 1,511,095 | | | | |
| 5.000%, 08/01/2026 (Mandatory Tender | | | | | | | | | | | |
Date 08/01/2025) (Insured by HUD)(1) | | | 175,000 | | | | 178,575 | | | | |
| 5.000%, 12/01/2026 (Mandatory Tender | | | | | | | | | | | |
Date 12/01/2025) (Insured by FHA)(1) | | | 1,000,000 | | | | 1,026,367 | | | | |
| 4.000%, 03/01/2047 (Callable 09/01/2025) | | | | | | | | | | | |
| (Insured by GNMA) | | | 40,000 | | | | 39,880 | | | | |
| 4.500%, 03/01/2050 (Callable 09/01/2028) | | | 1,750,000 | | | | 1,765,640 | | | | |
| 3.750%, 09/01/2050 (Callable 03/01/2029) | | | | | | | | | | | |
| (Insured by GNMA) | | | 2,095,000 | | | | 2,085,528 | | | | |
| Ohio Turnpike & Infrastructure Commission, | | | | | | | | | | | |
| 5.500%, 02/15/2024 (Insured by BHAC) | | | 420,000 | | | | 421,298 | | | | |
| Port of Greater Cincinnati | | | | | | | | | | | |
| Development Authority: | | | | | | | | | | | |
| 5.000%, 05/01/2025 | | | | | | | | | | | |
(Callable 01/29/2024)(3) | | | 8,040,000 | | | | 8,039,215 | | | | |
| 5.000%, 04/01/2026 | | | 175,000 | | | | 181,804 | | | | |
| 5.000%, 04/01/2027 | | | 250,000 | | | | 265,110 | | | | |
| 4.000%, 11/15/2028 | | | 770,000 | | | | 790,833 | | | | |
| State of Ohio, | | | | | | | | | | | |
| 5.000%, 05/01/2034 (Callable 05/01/2025) | | | 575,000 | | | | 589,744 | | | | |
| Toledo-Lucas County Port Authority, | | | | | | | | | | | |
| 2.000%, 11/15/2031 | | | 905,000 | | | | 843,292 | | | | |
| University of Akron, | | | | | | | | | | | |
| 5.000%, 01/01/2034 (Callable 07/01/2026) | | | | | | | | | | | |
| (Insured by BAM) | | | 2,195,000 | | | | 2,272,703 | | | | |
| Village of Bluffton OH, | | | | | | | | | | | |
| 5.000%, 12/01/2025 | | | 1,500,000 | | | | 1,539,830 | | | | |
| Total Ohio | | | | | | | | | | | |
| (Cost $74,342,642) | | | | | | | 73,807,904 | | | | 4.6 | % |
| Oklahoma | | | | | | | | | | | | |
| Catoosa Industrial Authority, | | | | | | | | | | | | |
| 4.000%, 10/01/2028 | | | | | | | | | | | | |
| (Callable 10/01/2026) | | | 20,000 | | | | 19,501 | | | | | |
| Garfield County Educational | | | | | | | | | | | | |
| Facilities Authority, | | | | | | | | | | | | |
| 5.000%, 09/01/2027 (Callable 09/01/2026) | | | 3,780,000 | | | | 3,960,657 | | | | | |
| Grady County School Finance Authority: | | | | | | | | | | | | |
| 5.000%, 12/01/2024 | | | 565,000 | | | | 572,199 | | | | | |
| 5.000%, 12/01/2026 | | | 1,015,000 | | | | 1,063,861 | | | | | |
| Muskogee Industrial Trust, | | | | | | | | | | | | |
| 5.000%, 09/01/2026 | | | 1,775,000 | | | | 1,838,529 | | | | | |
| Oklahoma County Finance Authority, | | | | | | | | | | | | |
| 5.000%, 09/01/2024 | | | 350,000 | | | | 353,945 | | | | | |
| Oklahoma County Independent | | | | | | | | | | | | |
| School District No. 12, | | | | | | | | | | | | |
| 0.050%, 03/01/2024 | | | 1,465,000 | | | | 1,454,297 | | | | | |
| Oklahoma County Independent | | | | | | | | | | | | |
| School District No. 52: | | | | | | | | | | | | |
| 4.000%, 07/01/2027 | | | 4,140,000 | | | | 4,332,593 | | | | | |
| 4.000%, 07/01/2028 | | | 3,990,000 | | | | 4,233,532 | | | | | |
| Oklahoma Development Finance Authority: | | | | | | | | | | | | |
| 2.600%, 03/01/2024 | | | 345,000 | | | | 344,235 | | | | | |
| 5.000%, 08/01/2024 | | | 585,000 | | | | 586,536 | | | | | |
| Oklahoma Housing Finance Agency: | | | | | | | | | | | | |
| 4.000%, 06/01/2028 (Mandatory Tender | | | | | | | | | | | | |
Date 06/01/2025) (Insured by FHA)(1) | | | 1,250,000 | | | | 1,255,212 | | | | | |
| 5.000%, 03/01/2052 (Callable 03/01/2031) | | | | | | | | | | | | |
| (Insured by GNMA) | | | 1,855,000 | | | | 1,924,924 | | | | | |
| 6.000%, 03/01/2054 (Callable 09/01/2032) | | | | | | | | | | | | |
| (Insured by GNMA) | | | 2,625,000 | | | | 2,921,329 | | | | | |
| 6.500%, 09/01/2054 (Callable 09/01/2032) | | | | | | | | | | | | |
| (Insured by GNMA) | | | 1,630,000 | | | | 1,859,884 | | | | | |
| Purcell Public Works Authority: | | | | | | | | | | | | |
| 5.000%, 03/01/2026 | | | 435,000 | | | | 453,394 | | | | | |
| 5.000%, 03/01/2027 | | | 880,000 | | | | 938,006 | | | | | |
| Sallisaw Municipal Authority: | | | | | | | | | | | | |
| 4.000%, 06/01/2024 | | | 655,000 | | | | 654,602 | | | | | |
| 4.000%, 06/01/2025 | | | 680,000 | | | | 679,647 | | | | | |
| 4.000%, 06/01/2026 | | | 710,000 | | | | 711,439 | | | | | |
| 4.000%, 06/01/2028 (Callable 06/01/2026) | | | 765,000 | | | | 768,506 | | | | | |
| Total Oklahoma | | | | | | | | | | | | |
| (Cost $30,957,601) | | | | | | | 30,926,828 | | | | 1.9 | % |
| Oregon | | | | | | | | | | | | |
| County of Yamhill OR, | | | | | | | | | | | | |
| 4.000%, 10/01/2024 | | | 425,000 | | | | 424,077 | | | | | |
| Oregon State Business | | | | | | | | | | | | |
| Development Commission, | | | | | | | | | | | | |
| 3.800%, 12/01/2040 (Callable 02/01/2028) | | | | | | | | | | | | |
(Mandatory Tender Date 06/15/2028)(1) | | | 2,105,000 | | | | 2,149,242 | | | | | |
| State of Oregon: | | | | | | | | | | | | |
| 5.000%, 08/01/2026 | | | 1,750,000 | | | | 1,861,656 | | | | | |
| 4.000%, 12/01/2048 (Callable 12/01/2026) | | | 320,000 | | | | 319,031 | | | | | |
| State of Oregon Housing & | | | | | | | | | | | | |
| Community Services Department: | | | | | | | | | | | | |
| 3.875%, 01/01/2033 (Callable 07/01/2024) | | | 235,000 | | | | 235,268 | | | | | |
| 3.500%, 07/01/2036 (Callable 01/01/2025) | | | 20,000 | | | | 19,929 | | | | | |
| 4.500%, 01/01/2049 (Callable 07/01/2027) | | | 570,000 | | | | 571,397 | | | | | |
| 4.500%, 07/01/2049 (Callable 07/01/2027) | | | 180,000 | | | | 180,605 | | | | | |
| Yamhill County Hospital Authority: | | | | | | | | | | | | |
| 2.125%, 11/15/2027 (Callable 01/19/2024) | | | 755,000 | | | | 716,696 | | | | | |
| 2.500%, 11/15/2028 (Callable 01/19/2024) | | | 2,550,000 | | | | 2,258,227 | | | | | |
| Total Oregon | | | | | | | | | | | | |
| (Cost $8,652,225) | | | | | | | 8,736,128 | | | | 0.5 | % |
The accompanying notes are an integral part of these financial statements.
Baird Short-Term Municipal Bond Fund
Schedule of Investments, December 31, 2023
Long-Term Investments (cont.)
| | | Principal | | | | | | % of | |
| | | Amount | | | Value | | | Net Assets | |
| Pennsylvania | | | | | | | | | |
| Bucks County Industrial | | | | | | | | | |
| Development Authority, | | | | | | | | | |
| 5.000%, 07/01/2025 | | $ | 350,000 | | | $ | 347,768 | | | |
| |
| Caernarvon Township Authority: | | | | | | | | | | | | |
| 4.000%, 09/01/2027 (Callable 09/01/2024) | | | | | | | | | | | | |
| (Insured by AGM) | | | 130,000 | | | | 130,167 | | | | | |
| 4.000%, 09/01/2028 (Callable 09/01/2024) | | | | | | | | | | | | |
| (Insured by AGM) | | | 165,000 | | | | 165,233 | | | | | |
| 4.000%, 09/01/2029 (Callable 09/01/2024) | | | | | | | | | | | | |
| (Insured by AGM) | | | 170,000 | | | | 170,277 | | | | | |
| 4.000%, 09/01/2030 (Callable 09/01/2024) | | | | | | | | | | | | |
| (Insured by AGM) | | | 175,000 | | | | 175,297 | | | | | |
| City of Bradford PA, | | | | | | | | | | | | |
| 2.500%, 11/01/2025 (Insured by AGM) | | | 395,000 | | | | 387,296 | | | | | |
| City of Erie Higher | | | | | | | | | | | | |
| Education Building Authority: | | | | | | | | | | | | |
| 5.000%, 05/01/2025 | | | 160,000 | | | | 161,252 | | | | | |
| 5.000%, 05/01/2027 | | | 225,000 | | | | 232,061 | | | | | |
| City of Scranton PA: | | | | | | | | | | | | |
5.000%, 09/01/2025(3) | | | 405,000 | | | | 404,670 | | | | | |
5.000%, 09/01/2026(3) | | | 420,000 | | | | 421,256 | | | | | |
5.000%, 09/01/2027(3) | | | 440,000 | | | | 443,401 | | | | | |
| City of York PA, | | | | | | | | | | | | |
| 5.000%, 11/15/2025 | | | 1,505,000 | | | | 1,526,406 | | | | | |
| County of Allegheny PA, | | | | | | | | | | | | |
| 4.283%, 11/01/2026 (SOFR + 0.550%) | | | | | | | | | | | | |
(Callable 01/29/2024) (Insured by AGM)(2) | | | 1,520,000 | | | | 1,511,030 | | | | | |
| County of Lackawanna PA, | | | | | | | | | | | | |
| 4.000%, 09/01/2026 (Insured by BAM) | | | 1,445,000 | | | | 1,486,648 | | | | | |
| Cumberland County Municipal Authority: | | | | | | | | | | | | |
| 5.000%, 01/01/2029 | | | | | | | | | | | | |
| (Pre-refunded to 01/01/2025) | | | 190,000 | | | | 193,607 | | | | | |
| 5.000%, 01/01/2029 (Callable 01/01/2025) | | | 490,000 | | | | 492,829 | | | | | |
| Delaware Valley Regional Finance Authority, | | | | | | | | | | | | |
| 4.543%, 09/01/2048 (1 Month LIBOR | | | | | | | | | | | | |
| USD + 0.880%) (Callable 09/01/2024) | | | | | | | | | | | | |
(Mandatory Tender Date 09/01/2025)(2)(7) | | | 2,000,000 | | | | 1,982,638 | | | | | |
| East Hempfield Township | | | | | | | | | | | | |
| Industrial Development Authority, | | | | | | | | | | | | |
| 5.000%, 07/01/2029 | | | | | | | | | | | | |
| (Pre-refunded to 07/01/2024) | | | 1,730,000 | | | | 1,745,294 | | | | | |
| Indiana County Municipal Services Authority: | | | | | | | | | | | | |
| 5.000%, 10/01/2026 (Insured by BAM) | | | 300,000 | | | | 312,689 | | | | | |
| 5.000%, 10/01/2027 (Insured by BAM) | | | 310,000 | | | | 328,192 | | | | | |
| 5.000%, 10/01/2028 (Insured by BAM) | | | 325,000 | | | | 348,899 | | | | | |
| Latrobe Industrial Development Authority: | | | | | | | | | | | | |
| 5.000%, 03/01/2027 | | | 395,000 | | | | 405,122 | | | | | |
| 5.000%, 03/01/2028 | | | 215,000 | | | | 222,232 | | | | | |
| 5.000%, 03/01/2029 | | | 150,000 | | | | 156,075 | | | | | |
| 5.000%, 03/01/2030 | | | 125,000 | | | | 130,265 | | | | | |
| Lycoming County Authority, | | | | | | | | | | | | |
| 4.000%, 11/01/2043 | | | | | | | | | | | | |
(Mandatory Tender Date 05/01/2024)(1) | | | 1,260,000 | | | | 1,259,975 | | | | | |
| Montgomery County Industrial | | | | | | | | | | | | |
| Development Authority: | | | | | | | | | | | | |
| 4.000%, 12/01/2024 | | | 200,000 | | | | 200,184 | | | | | |
| 4.000%, 12/01/2025 | | | 390,000 | | | | 391,994 | | | | | |
| 4.100%, 04/01/2053 | | | | | | | | | | | | |
(Mandatory Tender Date 04/03/2028)(1) | | | 6,650,000 | | | | 6,777,021 | | | | | |
| North Penn Water Authority, | | | | | | | | | | | | |
| 3.640%, 11/01/2024 | | | | | | | | | | | | |
| (SIFMA Municipal Swap Index + 0.560%) | | | | | | | | | | | | |
(Callable 01/19/2024)(2) | | | 845,000 | | | | 845,013 | | | | | |
| Northampton County | | | | | | | | | | | | |
| General Purpose Authority, | | | | | | | | | | | | |
| 4.867%, 08/15/2048 (1 Month LIBOR | | | | | | | | | | | | |
| USD + 1.040%) (Callable 01/19/2024) | | | | | | | | | | | | |
(Mandatory Tender Date 08/15/2024)(2)(7) | | | 75,000 | | | | 75,001 | | | | | |
| Northeastern Pennsylvania | | | | | | | | | | | | |
| Hospital and Education Authority, | | | | | | | | | | | | |
| 5.000%, 03/01/2027 (Callable 03/01/2026) | | | 635,000 | | | | 642,016 | | | | | |
| Pennsylvania Economic Development | | | | | | | | | | | | |
| Financing Authority: | | | | | | | | | | | | |
| 5.000%, 12/31/2029 | | | 3,000,000 | | | | 3,245,657 | | | | | |
| 5.000%, 12/31/2029 (Callable 06/30/2026) | | | 2,655,000 | | | | 2,728,546 | | | | | |
| 5.000%, 06/30/2030 | | | 1,500,000 | | | | 1,631,590 | | | | | |
| Pennsylvania Higher Educational | | | | | | | | | | | | |
| Facilities Authority, | | | | | | | | | | | | |
| 5.000%, 05/01/2025 | | | 575,000 | | | | 587,705 | | | | | |
| Pennsylvania Housing Finance Agency: | | | | | | | | | | | | |
| 4.000%, 10/01/2046 (Callable 04/01/2026) | | | 510,000 | | | | 508,488 | | | | | |
| 4.000%, 10/01/2049 (Callable 10/01/2028) | | | 2,980,000 | | | | 2,971,008 | | | | | |
| 4.250%, 10/01/2052 (Callable 04/01/2032) | | | 1,090,000 | | | | 1,101,499 | | | | | |
| 6.250%, 10/01/2053 (Callable 04/01/2033) | | | 4,000,000 | | | | 4,426,841 | | | | | |
| Pennsylvania Turnpike Commission, | | | | | | | | | | | | |
5.000%, 12/01/2028(5) | | | 450,000 | | | | 481,042 | | | | | |
| Reading School District, | | | | | | | | | | | | |
| 0.000%, 01/15/2026 (Insured by NATL) | | | 670,000 | | | | 622,793 | | | | | |
| Sayre Area School District, | | | | | | | | | | | | |
| 3.000%, 05/15/2024 (Insured by BAM) | | | 25,000 | | | | 24,957 | | | | | |
| Sayre Health Care Facilities Authority, | | | | | | | | | | | | |
| 4.105%, 12/01/2024 (3 Month LIBOR | | | | | | | | | | | | |
USD + 0.780%) (Callable 01/29/2024)(2)(7) | | | 65,000 | | | | 65,007 | | | | | |
| School District of Philadelphia, | | | | | | | | | | | | |
| 5.000%, 09/01/2026 (Insured by ST AID) | | | 1,000,000 | | | | 1,049,279 | | | | | |
| School District of Reading, | | | | | | | | | | | | |
| 5.000%, 03/01/2024 (Insured by AGM) | | | 100,000 | | | | 100,251 | | | | | |
| Scranton-Lackawanna Health | | | | | | | | | | | | |
| and Welfare Authority, | | | | | | | | | | | | |
| 5.000%, 11/01/2025 | | | 40,000 | | | | 41,249 | | | | | |
| State Public School Building Authority, | | | | | | | | | | | | |
| 0.000%, 05/15/2028 (Insured by NATL) | | | 2,075,000 | | | | 1,793,229 | | | | | |
| Steel Valley School District: | | | | | | | | | | | | |
| 4.000%, 11/01/2025 (Insured by BAM) | | | 270,000 | | | | 274,396 | | | | | |
| 4.000%, 11/01/2025 (Insured by BAM) | | | 50,000 | | | | 50,814 | | | | | |
| 4.000%, 11/01/2026 (Insured by BAM) | | | 280,000 | | | | 287,705 | | | | | |
| Township of North Fayette PA, | | | | | | | | | | | | |
| 4.000%, 04/15/2025 (Callable 04/15/2024) | | | 210,000 | | | | 210,461 | | | | | |
| University of Pittsburgh- | | | | | | | | | | | | |
| of the Commonwealth | | | | | | | | | | | | |
| System of Higher Education, | | | | | | | | | | | | |
| 3.440%, 02/15/2024 | | | | | | | | | | | | |
| (SIFMA Municipal Swap Index + 0.360%) | | | | | | | | | | | | |
(Callable 01/29/2024) (ETM)(2) | | | 2,500,000 | | | | 2,498,222 | | | | | |
| Westmoreland County Industrial | | | | | | | | | | | | |
| Development Authority: | | | | | | | | | | | | |
| 4.000%, 07/01/2024 | | | 450,000 | | | | 450,144 | | | | | |
| 4.000%, 07/01/2025 | | | 550,000 | | | | 549,132 | | | | | |
| 4.000%, 07/01/2026 | | | 725,000 | | | | 731,594 | | | | | |
| 5.000%, 07/01/2029 | | | 1,555,000 | | | | 1,654,578 | | | | | |
| Wilkes-Barre Finance Authority, | | | | | | | | | | | | |
| 5.000%, 11/01/2024 | | | 40,000 | | | | 40,540 | | | | | |
| Total Pennsylvania | | | | | | | | | | | | |
| (Cost $52,463,391) | | | | | | | 52,198,535 | | | | 3.3 | % |
The accompanying notes are an integral part of these financial statements.
Baird Short-Term Municipal Bond Fund
Schedule of Investments, December 31, 2023
Long-Term Investments (cont.)
| | | Principal | | | | | | % of | |
| | | Amount | | | Value | | | Net Assets | |
| Puerto Rico | | | | | | | | | |
| Puerto Rico Public Finance Corp.: | | | | | | | | | |
| 5.125%, 06/01/2024 | | | | | | | | | |
| (Insured by AMBAC) | | $ | 245,000 | | | $ | 247,002 | | | | |
| 6.000%, 08/01/2026 | | | | | | | | | | | |
| (ETM) (Insured by AGC) | | | 545,000 | | | | 591,031 | | | | |
| Total Puerto Rico | | | | | | | | | | | |
| (Cost $841,225) | | | | | | | 838,033 | | | | 0.1 | % |
| Rhode Island | | | | | | | | | | | | |
| Providence Public Building Authority: | | | | | | | | | | | | |
| 5.000%, 09/15/2026 (Insured by AGM) | | | 3,230,000 | | | | 3,377,488 | | | | | |
| 5.000%, 09/15/2028 (Insured by AGM) | | | 2,425,000 | | | | 2,623,501 | | | | | |
| Rhode Island Housing & | | | | | | | | | | | | |
| Mortgage Finance Corp., | | | | | | | | | | | | |
| 3.750%, 10/01/2049 (Callable 04/01/2029) | | | | | | | | | | | | |
| (Insured by GNMA) | | | 1,185,000 | | | | 1,179,971 | | | | | |
| Tobacco Settlement Financing Corp., | | | | | | | | | | | | |
| 5.000%, 06/01/2027 (Callable 06/01/2025) | | | 1,075,000 | | | | 1,096,692 | | | | | |
| Total Rhode Island | | | | | | | | | | | | |
| (Cost $8,351,614) | | | | | | | 8,277,652 | | | | 0.5 | % |
| South Carolina | | | | | | | | | | | | |
| City of Myrtle Beach SC, | | | | | | | | | | | | |
| 5.000%, 10/01/2027 (Callable 10/01/2026) | | | 1,000,000 | | | | 1,055,002 | | | | | |
| Greenville Housing Authority, | | | | | | | | | | | | |
| 5.000%, 07/01/2027 | | | | | | | | | | | | |
(Mandatory Tender Date 07/01/2026)(1) | | | 832,000 | | | | 862,664 | | | | | |
| Greenwood Fifty School Facilities, Inc., | | | | | | | | | | | | |
| 5.000%, 12/01/2027 (Callable 06/01/2026) | | | | | | | | | | | | |
| (Insured by BAM) | | | 1,125,000 | | | | 1,183,481 | | | | | |
| Piedmont Municipal Power Agency, | | | | | | | | | | | | |
| 5.375%, 01/01/2025 | | | | | | | | | | | | |
| (ETM) (Insured by NATL) | | | 5,000 | | | | 5,111 | | | | | |
| South Carolina Jobs-Economic | | | | | | | | | | | | |
| Development Authority: | | | | | | | | | | | | |
| 5.250%, 11/15/2028 (Callable 05/15/2025) | | | 2,150,000 | | | | 2,162,238 | | | | | |
| 5.750%, 11/15/2029 (Callable 05/15/2025) | | | 1,700,000 | | | | 1,653,771 | | | | | |
| 3.660%, 05/01/2048 (Callable 01/02/2024) | | | | | | | | | | | | |
(Optional Put Date 01/05/2024)(1) | | | 9,000,000 | | | | 9,000,000 | | | | | |
| South Carolina State Housing | | | | | | | | | | | | |
| Finance & Development Authority: | | | | | | | | | | | | |
| 4.000%, 07/01/2036 (Callable 07/01/2025) | | | | | | | | | | | | |
| (Insured by GNMA) | | | 60,000 | | | | 59,820 | | | | | |
| 4.000%, 07/01/2047 (Callable 01/01/2027) | | | | | | | | | | | | |
| (Insured by FHA) | | | 260,000 | | | | 259,223 | | | | | |
| 4.500%, 07/01/2048 (Callable 07/01/2027) | | | 240,000 | | | | 241,111 | | | | | |
| 4.000%, 01/01/2050 (Callable 07/01/2028) | | | 1,555,000 | | | | 1,556,947 | | | | | |
| 4.000%, 07/01/2050 (Callable 07/01/2029) | | | 1,490,000 | | | | 1,490,760 | | | | | |
| 3.000%, 01/01/2052 (Callable 07/01/2030) | | | 9,215,000 | | | | 8,946,967 | | | | | |
| Spartanburg County School District No. 5, | | | | | | | | | | | | |
| 5.000%, 03/01/2027 (Insured by SCSDE) | | | 2,750,000 | | | | 2,965,005 | | | | | |
| Spartanburg Housing Authority, | | | | | | | | | | | | |
| 2.000%, 03/01/2026 | | | | | | | | | | | | |
(Mandatory Tender Date 03/01/2025)(1) | | | 2,671,000 | | | | 2,611,965 | | | | | |
| Total South Carolina | | | | | | | | | | | | |
| (Cost $34,516,674) | | | | | | | 34,054,065 | | | | 2.1 | % |
| South Dakota | | | | | | | | | | | | |
| City of Rapid City SD, | | | | | | | | | | | | |
| 5.000%, 12/01/2025 | | | 310,000 | | | | 316,676 | | | | | |
| South Dakota Health & | | | | | | | | | | | | |
| Educational Facilities Authority: | | | | | | | | | | | | |
| 3.000%, 09/01/2025 | | | 100,000 | | | | 98,804 | | | | | |
| 3.000%, 09/01/2027 | | | 105,000 | | | | 102,694 | | | | | |
| 3.000%, 09/01/2028 | | | 200,000 | | | | 194,005 | | | | | |
| South Dakota Housing | | | | | | | | | | | | |
| Development Authority: | | | | | | | | | | | | |
| 3.000%, 11/01/2051 (Callable 05/01/2030) | | | | | | | | | | | | |
| (Insured by GNMA) | | | 1,360,000 | | | | 1,324,474 | | | | | |
| 5.000%, 05/01/2053 (Callable 11/01/2031) | | | 2,900,000 | | | | 3,007,927 | | | | | |
| 6.250%, 05/01/2055 (Callable 05/01/2032) | | | | | | | | | | | | |
| (Insured by GNMA) | | | 2,500,000 | | | | 2,769,824 | | | | | |
| Total South Dakota | | | | | | | | | | | | |
| (Cost $7,947,383) | | | | | | | 7,814,404 | | | | 0.5 | % |
| Tennessee | | | | | | | | | | | | |
| City of Jackson TN: | | | | | | | | | | | | |
| 5.000%, 04/01/2024 (ETM) | | | 10,000 | | | | 10,042 | | | | | |
| 5.000%, 04/01/2024 | | | 335,000 | | | | 336,109 | | | | | |
| 5.000%, 04/01/2026 (Callable 04/01/2025) | | | 1,065,000 | | | | 1,081,117 | | | | | |
| 5.000%, 04/01/2027 | | | | | | | | | | | | |
| (Pre-refunded to 04/01/2025) | | | 20,000 | | | | 20,472 | | | | | |
| 5.000%, 04/01/2027 (Callable 04/01/2025) | | | 645,000 | | | | 655,947 | | | | | |
| City of Manchester TN, | | | | | | | | | | | | |
| 2.000%, 08/01/2028 | | | 1,535,000 | | | | 1,455,887 | | | | | |
| City of Memphis TN: | | | | | | | | | | | | |
| 5.000%, 12/01/2029 (Callable 12/01/2026) | | | 2,165,000 | | | | 2,305,758 | | | | | |
| 5.000%, 12/01/2029 (Callable 12/01/2026) | | | 2,185,000 | | | | 2,330,854 | | | | | |
| City of Morristown TN, | | | | | | | | | | | | |
| 2.000%, 03/01/2029 | | | 1,905,000 | | | | 1,797,039 | | | | | |
| City of Sevierville TN, | | | | | | | | | | | | |
| 5.000%, 06/01/2027 | | | 2,845,000 | | | | 3,081,418 | | | | | |
| Cleveland Housing Authority, | | | | | | | | | | | | |
| 4.000%, 08/01/2026 | | | | | | | | | | | | |
(Mandatory Tender Date 08/01/2025)(1)(3) | | | 2,880,000 | | | | 2,860,420 | | | | | |
| Johnson City Health & | | | | | | | | | | | | |
| Educational Facilities Board, | | | | | | | | | | | | |
| 5.000%, 07/01/2025 | | | 1,125,000 | | | | 1,149,364 | | | | | |
| Nashville & Davidson County | | | | | | | | | | | | |
| Metropolitan Government: | | | | | | | | | | | | |
| 4.000%, 10/01/2028 | | | 125,000 | | | | 126,443 | | | | | |
| 3.850%, 02/01/2048 (Mandatory Tender | | | | | | | | | | | | |
Date 02/01/2026) (Insured by FNMA)(1) | | | 2,250,000 | | | | 2,268,377 | | | | | |
| Tennergy Corp.: | | | | | | | | | | | | |
| 5.250%, 12/01/2026 | | | 700,000 | | | | 724,527 | | | | | |
| 5.500%, 12/01/2027 | | | 770,000 | | | | 813,240 | | | | | |
| 5.500%, 12/01/2028 | | | 1,000,000 | | | | 1,068,418 | | | | | |
| 5.500%, 12/01/2029 | | | 2,230,000 | | | | 2,394,353 | | | | | |
| 5.500%, 10/01/2053 (Callable 09/01/2030) | | | | | | | | | | | | |
(Mandatory Tender Date 12/01/2030)(1) | | | 2,500,000 | | | | 2,668,494 | | | | | |
| Tennessee Energy Acquisition Corp., | | | | | | | | | | | | |
| 5.625%, 09/01/2026 | | | 2,005,000 | | | | 2,055,476 | | | | | |
| Tennessee Housing Development Agency: | | | | | | | | | | | | |
| 3.850%, 07/01/2032 (Callable 01/01/2025) | | | 685,000 | | | | 686,853 | | | | | |
| 4.000%, 07/01/2039 (Callable 01/19/2024) | | | 165,000 | | | | 164,854 | | | | | |
| 4.000%, 01/01/2043 (Callable 07/01/2027) | | | 385,000 | | | | 383,930 | | | | | |
| 4.000%, 01/01/2046 (Callable 01/01/2025) | | | 5,000 | | | | 4,991 | | | | | |
| 3.750%, 01/01/2050 (Callable 01/01/2029) | | | 1,730,000 | | | | 1,720,641 | | | | | |
| 3.000%, 01/01/2051 (Callable 01/01/2030) | | | 810,000 | | | | 789,958 | | | | | |
| 5.000%, 01/01/2053 (Callable 07/01/2031) | | | 1,750,000 | | | | 1,835,808 | | | | | |
| 6.250%, 01/01/2054 (Callable 07/01/2032) | | | | | | | | | | | | |
| (Insured by GNMA) | | | 2,000,000 | | | | 2,211,605 | | | | | |
| Total Tennessee | | | | | | | | | | | | |
| (Cost $37,357,773) | | | | | | | 37,002,395 | | | | 2.3 | % |
| Texas | | | | | | | | | | | | |
| Abilene Convention Center | | | | | | | | | | | | |
| Hotel Development Corp.: | | | | | | | | | | | | |
| 2.500%, 10/01/2031 | | | 2,000,000 | | | | 1,762,915 | | | | | |
3.750%, 10/01/2031(3) | | | 1,120,000 | | | | 1,039,360 | | | | | |
The accompanying notes are an integral part of these financial statements.
Baird Short-Term Municipal Bond Fund
Schedule of Investments, December 31, 2023
Long-Term Investments (cont.)
| | | Principal | | | | | | % of | |
| | | Amount | | | Value | | | Net Assets | |
| Alief Independent School District, | | | | | | | | | |
| 5.000%, 02/15/2027 (PSF Guaranteed) | | $ | 1,035,000 | | | $ | 1,113,117 | | | |
| |
| Arlington Higher Education Finance Corp.: | | | | | | | | | | | | |
| 5.000%, 08/15/2024 | | | | | | | | | | | | |
| (ETM) (PSF Guaranteed) | | | 535,000 | | | | 540,920 | | | | | |
| 5.000%, 12/01/2025 (PSF Guaranteed) | | | 555,000 | | | | 576,829 | | | | | |
| 4.000%, 08/15/2026 (PSF Guaranteed) | | | 345,000 | | | | 353,317 | | | | | |
| 5.000%, 08/15/2026 (PSF Guaranteed) | | | 450,000 | | | | 474,872 | | | | | |
| 5.000%, 08/15/2027 (PSF Guaranteed) | | | 500,000 | | | | 538,304 | | | | | |
| 4.000%, 08/15/2028 (PSF Guaranteed) | | | 370,000 | | | | 384,897 | | | | | |
| 4.000%, 08/15/2028 (PSF Guaranteed) | | | 385,000 | | | | 402,190 | | | | | |
| 4.875%, 06/15/2056 (Callable 06/15/2025) | | | | | | | | | | | | |
(Mandatory Tender Date 06/15/2026)(1)(3) | | | 1,750,000 | | | | 1,757,648 | | | | | |
| Arlington Housing Finance Corp.: | | | | | | | | | | | | |
| 4.500%, 04/01/2041 (Callable 04/01/2026) | | | | | | | | | | | | |
(Mandatory Tender Date 04/01/2027)(1) | | | 4,000,000 | | | | 4,101,409 | | | | | |
| 3.500%, 11/01/2043 (Callable 05/01/2025) | | | | | | | | | | | | |
(Mandatory Tender Date 11/01/2025)(1) | | | 6,500,000 | | | | 6,520,830 | | | | | |
| Austin-Bergstrom Landhost Enterprises, Inc., | | | | | | | | | | | | |
| 5.000%, 10/01/2024 | | | 1,595,000 | | | | 1,602,964 | | | | | |
| Bexar County Housing Finance Corp., | | | | | | | | | | | | |
| 4.050%, 03/01/2028 (Callable 09/01/2025) | | | | | | | | | | | | |
(Mandatory Tender Date 03/01/2026)(1) | | | 4,000,000 | | | | 4,031,574 | | | | | |
| Brazoria County Municipal | | | | | | | | | | | | |
| Utility District No. 17, | | | | | | | | | | | | |
| 4.000%, 09/01/2024 (Callable 01/29/2024) | | | | | | | | | | | | |
| (Insured by AGM) | | | 175,000 | | | | 175,100 | | | | | |
| Bryson Independent School District, | | | | | | | | | | | | |
| 4.000%, 08/15/2030 (Callable 08/15/2027) | | | | | | | | | | | | |
| (PSF Guaranteed) | | | 785,000 | | | | 821,690 | | | | | |
| Central Texas Turnpike System: | | | | | | | | | | | | |
| 0.000%, 08/15/2026 (Insured by BHAC) | | | 9,060,000 | | | | 8,373,605 | | | | | |
| 5.000%, 08/15/2027 (Callable 08/15/2024) | | | 545,000 | | | | 548,168 | | | | | |
| Chisum Independent School District: | | | | | | | | | | | | |
| 5.000%, 08/15/2026 (PSF Guaranteed) | | | 620,000 | | | | 656,361 | | | | | |
| 5.000%, 08/15/2027 (PSF Guaranteed) | | | 325,000 | | | | 352,230 | | | | | |
| Cimarron Municipal Utility District, | | | | | | | | | | | | |
| 4.000%, 03/01/2025 (Insured by AGM) | | | 70,000 | | | | 70,739 | | | | | |
| City of Dallas Housing Finance Corp.: | | | | | | | | | | | | |
| 5.000%, 07/01/2042 (Callable 01/01/2027) | | | | | | | | | | | | |
(Mandatory Tender Date 07/01/2027)(1) | | | 2,000,000 | | | | 2,096,842 | | | | | |
| 3.500%, 02/01/2044 (Callable 06/01/2025) | | | | | | | | | | | | |
(Mandatory Tender Date 02/01/2026)(1) | | | 1,900,000 | | | | 1,886,534 | | | | | |
| City of Dallas TX, | | | | | | | | | | | | |
| 4.000%, 08/15/2030 (Callable 08/15/2026) | | | 1,000,000 | | | | 1,022,305 | | | | | |
| City of Hearne TX, | | | | | | | | | | | | |
| 3.000%, 08/01/2024 (Insured by BAM) | | | 240,000 | | | | 239,342 | | | | | |
| City of Houston TX: | | | | | | | | | | | | |
| 5.500%, 12/01/2024 | | | | | | | | | | | | |
| (ETM) (Insured by NATL) | | | 325,000 | | | | 332,349 | | | | | |
| 5.000%, 09/01/2029 (Callable 09/01/2024) | | | 1,500,000 | | | | 1,512,075 | | | | | |
| City of Pearland TX, | | | | | | | | | | | | |
| 5.000%, 03/01/2030 | | | | | | | | | | | | |
| (Pre-refunded to 03/01/2026) | | | 810,000 | | | | 843,214 | | | | | |
| City of Temple TX, | | | | | | | | | | | | |
| 5.000%, 08/01/2028 (Insured by BAM) | | | 360,000 | | | | 394,778 | | | | | |
| Clifton Higher Education Finance Corp.: | | | | | | | | | | | | |
| 5.000%, 08/15/2026 | | | 1,010,000 | | | | 1,041,817 | | | | | |
| 6.000%, 03/01/2029 | | | | | | | | | | | | |
(Callable 03/01/2024)(5) | | | 1,500,000 | | | | 1,504,215 | | | | | |
| 4.000%, 08/15/2032 (Callable 08/15/2026) | | | | | | | | | | | | |
| (PSF Guaranteed) | | | 725,000 | | | | 741,301 | | | | | |
| Collin County Municipal | | | | | | | | | | | | |
| Utility District No. 2, | | | | | | | | | | | | |
| 7.000%, 09/01/2029 (Insured by BAM) | | | 2,435,000 | | | | 2,735,982 | | | | | |
| Collin County Water Control & | | | | | | | | | | | | |
| Improvement District No. 3, | | | | | | | | | | | | |
| 2.000%, 09/15/2024 (Insured by BAM) | | | 350,000 | | | | 344,683 | | | | | |
| Colony Municipal Utility District No. 1A: | | | | | | | | | | | | |
| 7.000%, 08/15/2027 (Insured by BAM) | | | 280,000 | | | | 314,029 | | | | | |
| 7.000%, 08/15/2028 (Insured by BAM) | | | 295,000 | | | | 340,175 | | | | | |
| Comal County Water Control & | | | | | | | | | | | | |
| Improvement District No. 6: | | | | | | | | | | | | |
| 4.000%, 03/01/2025 (Insured by BAM) | | | 510,000 | | | | 513,005 | | | | | |
| 4.000%, 03/01/2026 (Insured by BAM) | | | 535,000 | | | | 543,921 | | | | | |
| 4.000%, 03/01/2027 (Insured by BAM) | | | 555,000 | | | | 569,321 | | | | | |
| 4.000%, 03/01/2028 (Insured by BAM) | | | 580,000 | | | | 599,964 | | | | | |
| Cool Water Municipal Utility District, | | | | | | | | | | | | |
| 7.000%, 08/15/2029 (Insured by BAM) | | | 1,325,000 | | | | 1,507,252 | | | | | |
| Cotulla Independent School District, | | | | | | | | | | | | |
| 5.000%, 02/15/2028 (PSF Guaranteed) | | | 1,250,000 | | | | 1,375,462 | | | | | |
| County of McLennan TX, | | | | | | | | | | | | |
| 5.000%, 06/01/2025 (Insured by AGM) | | | 240,000 | | | | 244,854 | | | | | |
| County of Wise TX: | | | | | | | | | | | | |
| 5.000%, 08/15/2025 | | | 500,000 | | | | 511,908 | | | | | |
| 5.000%, 08/15/2026 | | | 850,000 | | | | 880,291 | | | | | |
| Cypress-Fairbanks Independent | | | | | | | | | | | | |
| School District: | | | | | | | | | | | | |
| 5.000%, 02/15/2027 (PSF Guaranteed) | | | 2,740,000 | | | | 2,945,948 | | | | | |
| 5.000%, 02/15/2028 (PSF Guaranteed) | | | 1,025,000 | | | | 1,129,147 | | | | | |
| Dallas Convention Center Hotel | | | | | | | | | | | | |
| Development Corp., | | | | | | | | | | | | |
| 0.000%, 01/01/2025 | | | 4,650,000 | | | | 4,474,040 | | | | | |
| Dallas County Utility & | | | | | | | | | | | | |
| Reclamation District, | | | | | | | | | | | | |
| 5.000%, 02/15/2026 | | | 290,000 | | | | 301,918 | | | | | |
| Decatur Hospital Authority, | | | | | | | | | | | | |
| 5.750%, 09/01/2029 (ETM) | | | 1,000,000 | | | | 1,090,936 | | | | | |
| Denton Independent School District: | | | | | | | | | | | | |
| 2.000%, 08/01/2044 (Pre-refunded to | | | | | | | | | | | | |
08/01/2024) (PSF Guaranteed)(1) | | | 1,450,000 | | | | 1,441,840 | | | | | |
| 2.000%, 08/01/2044 (Mandatory Tender | | | | | | | | | | | | |
Date 08/01/2024) (PSF Guaranteed)(1) | | | 1,235,000 | | | | 1,226,166 | | | | | |
| Duncanville Independent School District, | | | | | | | | | | | | |
| 5.000%, 02/15/2027 (Callable 02/15/2025) | | | | | | | | | | | | |
| (PSF Guaranteed) | | | 220,000 | | | | 225,346 | | | | | |
| Eanes Independent School District, | | | | | | | | | | | | |
| 5.000%, 08/01/2028 (PSF Guaranteed) | | | 1,060,000 | | | | 1,174,920 | | | | | |
| Fort Bend County Municipal | | | | | | | | | | | | |
| Utility District No. 132, | | | | | | | | | | | | |
| 6.750%, 09/01/2029 (Insured by AGM) | | | 985,000 | | | | 1,089,779 | | | | | |
| Fort Bend County Municipal | | | | | | | | | | | | |
| Utility District No. 139, | | | | | | | | | | | | |
| 4.000%, 09/01/2024 (Insured by BAM) | | | 200,000 | | | | 201,076 | | | | | |
| Fort Bend County Municipal | | | | | | | | | | | | |
| Utility District No. 215, | | | | | | | | | | | | |
| 6.500%, 09/01/2030 (Insured by AGM) | | | 2,020,000 | | | | 2,312,456 | | | | | |
| Fort Bend County Municipal | | | | | | | | | | | | |
| Utility District No. 58, | | | | | | | | | | | | |
| 3.500%, 04/01/2024 (Insured by AGM) | | | 125,000 | | | | 125,037 | | | | | |
| Frisco Independent School District, | | | | | | | | | | | | |
| 0.000%, 08/15/2029 (PSF Guaranteed) | | | 100,000 | | | | 85,343 | | | | | |
| Galena Park Independent School District, | | | | | | | | | | | | |
| 0.000%, 08/15/2026 (PSF Guaranteed) | | | 1,000,000 | | | | 929,018 | | | | | |
The accompanying notes are an integral part of these financial statements.
Baird Short-Term Municipal Bond Fund
Schedule of Investments, December 31, 2023
Long-Term Investments (cont.)
| | | Principal | | | | | | % of | |
| | | Amount | | | Value | | | Net Assets | |
| Goliad Independent School District, | | | | | | | | | |
| 5.000%, 02/15/2026 (PSF Guaranteed) | | $ | 1,005,000 | | | $ | 1,053,477 | | | |
| |
| Harris County Health Facilities | | | | | | | | | | | | |
| Development Corp.: | | | | | | | | | | | | |
| 5.750%, 07/01/2027 (ETM) | | | 865,000 | | | | 910,055 | | | | | |
| 5.750%, 07/01/2027 | | | | | | | | | | | | |
| (ETM) (Insured by AMBAC) | | | 3,720,000 | | | | 3,901,845 | | | | | |
| Harris County Municipal | | | | | | | | | | | | |
| Utility District No. 120, | | | | | | | | | | | | |
| 3.250%, 08/01/2025 (Callable 01/29/2024) | | | | | | | | | | | | |
| (Insured by AGM) | | | 350,000 | | | | 350,018 | | | | | |
| Harris County Municipal | | | | | | | | | | | | |
| Utility District No. 63, | | | | | | | | | | | | |
| 3.000%, 09/01/2025 (Callable 09/01/2024) | | | | | | | | | | | | |
| (Insured by AGM) | | | 100,000 | | | | 99,809 | | | | | |
| Housing Options, Inc., | | | | | | | | | | | | |
| 3.900%, 02/01/2026 (Mandatory Tender | | | | | | | | | | | | |
Date 02/01/2025) (Insured by HUD)(1) | | | 8,035,000 | | | | 8,043,990 | | | | | |
| Houston Independent School District, | | | | | | | | | | | | |
| 3.500%, 06/01/2039 (Mandatory Tender | | | | | | | | | | | | |
Date 06/01/2025) (PSF Guaranteed)(1) | | | 4,885,000 | | | | 4,914,638 | | | | | |
| Hunt Memorial Hospital District: | | | | | | | | | | | | |
| 5.000%, 02/15/2024 | | | 200,000 | | | | 200,290 | | | | | |
| 5.000%, 02/15/2027 | | | 1,500,000 | | | | 1,579,517 | | | | | |
| 5.000%, 02/15/2028 | | | 1,000,000 | | | | 1,071,555 | | | | | |
| Katy Development Authority: | | | | | | | | | | | | |
| 3.000%, 06/01/2028 (Callable 06/01/2027) | | | | | | | | | | | | |
| (Insured by BAM) | | | 375,000 | | | | 363,217 | | | | | |
| 3.000%, 06/01/2029 (Callable 06/01/2027) | | | | | | | | | | | | |
| (Insured by BAM) | | | 450,000 | | | | 432,337 | | | | | |
| Kendall County Water Control & | | | | | | | | | | | | |
| Improvement District No. 2A, | | | | | | | | | | | | |
| 7.000%, 09/01/2030 (Insured by AGM) | | | 1,335,000 | | | | 1,523,760 | | | | | |
| Klein Independent School District, | | | | | | | | | | | | |
| 5.000%, 08/01/2028 (PSF Guaranteed) | | | 750,000 | | | | 835,437 | | | | | |
| Lake Dallas Independent School District, | | | | | | | | | | | | |
| 0.000%, 08/15/2026 (PSF Guaranteed) | | | 1,000,000 | | | | 927,342 | | | | | |
| Lakes Fresh Water Supply | | | | | | | | | | | | |
| District of Denton County: | | | | | | | | | | | | |
| 6.000%, 09/01/2026 (Insured by BAM) | | | 505,000 | | | | 540,822 | | | | | |
| 6.500%, 09/01/2026 (Insured by BAM) | | | 300,000 | | | | 325,077 | | | | | |
| 6.000%, 09/01/2027 (Insured by BAM) | | | 645,000 | | | | 706,765 | | | | | |
| 6.500%, 09/01/2027 (Insured by BAM) | | | 300,000 | | | | 333,870 | | | | | |
| Leander Independent School District: | | | | | | | | | | | | |
| 5.000%, 08/15/2026 (PSF Guaranteed) | | | 1,150,000 | | | | 1,221,341 | | | | | |
| 0.000%, 08/15/2036 (Pre-refunded to | | | | | | | | | | | | |
| 08/15/2024) (PSF Guaranteed) | | | 35,000 | | | | 19,566 | | | | | |
| 0.000%, 08/15/2040 (Pre-refunded to | | | | | | | | | | | | |
| 08/15/2024) (PSF Guaranteed) | | | 175,000 | | | | 79,583 | | | | | |
| 0.000%, 08/15/2041 (Pre-refunded to | | | | | | | | | | | | |
| 08/15/2024) (PSF Guaranteed) | | | 435,000 | | | | 174,071 | | | | | |
| 0.000%, 08/15/2042 (Pre-refunded to | | | | | | | | | | | | |
| 08/15/2024) (PSF Guaranteed) | | | 700,000 | | | | 288,167 | | | | | |
| Llano Independent School District, | | | | | | | | | | | | |
| 5.000%, 02/15/2027 (PSF Guaranteed) | | | 1,400,000 | | | | 1,503,486 | | | | | |
| Lower Colorado River Authority, | | | | | | | | | | | | |
| 4.750%, 01/01/2028 | | | | | | | | | | | | |
| (ETM) (Insured by AGM) | | | 165,000 | | | | 171,102 | | | | | |
| Manor Independent School District: | | | | | | | | | | | | |
| 5.000%, 08/01/2026 (PSF Guaranteed) | | | 100,000 | | | | 106,019 | | | | | |
| 5.000%, 08/01/2027 (PSF Guaranteed) | | | 1,015,000 | | | | 1,103,047 | | | | | |
| Meyer Ranch Municipal Utility District, | | | | | | | | | | | | |
| 6.750%, 08/15/2028 (Insured by BAM) | | | 1,080,000 | | | | 1,192,238 | | | | | |
| Montgomery County Municipal | | | | | | | | | | | | |
| Utility District No. 105, | | | | | | | | | | | | |
| 2.000%, 09/01/2027 (Callable 09/01/2025) | | | | | | | | | | | | |
| (Insured by BAM) | | | 435,000 | | | | 406,487 | | | | | |
| Montgomery County Municipal | | | | | | | | | | | | |
| Utility District No. 112, | | | | | | | | | | | | |
| 3.000%, 10/01/2024 (Insured by BAM) | | | 215,000 | | | | 214,660 | | | | | |
| Montgomery County Municipal | | | | | | | | | | | | |
| Utility District No. 186, | | | | | | | | | | | | |
| 7.000%, 12/01/2029 (Insured by BAM) | | | 1,120,000 | | | | 1,264,731 | | | | | |
| New Hope Cultural Education | | | | | | | | | | | | |
| Facilities Finance Corp., | | | | | | | | | | | | |
| 4.000%, 06/15/2024 | | | 50,000 | | | | 50,129 | | | | | |
| Newark Higher Education Finance Corp., | | | | | | | | | | | | |
| 5.000%, 08/15/2028 (Callable 08/15/2024) | | | | | | | | | | | | |
| (PSF Guaranteed) | | | 705,000 | | | | 713,667 | | | | | |
| North Central Texas Health | | | | | | | | | | | | |
| Facility Development Corp., | | | | | | | | | | | | |
| 5.750%, 06/01/2026 | | | | | | | | | | | | |
| (ETM) (Insured by NATL) | | | 265,000 | | | | 274,962 | | | | | |
| Northeast Travis County Utility District, | | | | | | | | | | | | |
| 0.000%, 09/01/2024 (Insured by BAM) | | | 470,000 | | | | 457,777 | | | | | |
| Northlake Municipal | | | | | | | | | | | | |
| Management District No. 1, | | | | | | | | | | | | |
| 6.750%, 03/01/2027 (Insured by BAM) | | | 545,000 | | | | 597,449 | | | | | |
| Northside Independent School District: | | | | | | | | | | | | |
5.000%, 08/01/2026 (PSF Guaranteed)(5) | | | 500,000 | | | | 530,099 | | | | | |
5.000%, 08/01/2027 (PSF Guaranteed)(5) | | | 500,000 | | | | 543,373 | | | | | |
5.000%, 08/01/2028 (PSF Guaranteed)(5) | | | 2,880,000 | | | | 3,202,787 | | | | | |
| 2.000%, 06/01/2052 (Mandatory Tender | | | | | | | | | | | | |
Date 06/01/2027) (PSF Guaranteed)(1) | | | 3,640,000 | | | | 3,495,836 | | | | | |
| Paseo del Este Municipal | | | | | | | | | | | | |
| Utility District No. 10, | | | | | | | | | | | | |
| 4.000%, 08/15/2024 (Insured by AGM) | | | 180,000 | | | | 180,635 | | | | | |
| Petroleum Service Corp., | | | | | | | | | | | | |
| 3.750%, 12/01/2040 | | | | | | | | | | | | |
(Mandatory Tender Date 02/01/2028)(5) | | | 6,000,000 | | | | 5,848,294 | | | | | |
| Port of Port Arthur Navigation District, | | | | | | | | | | | | |
| 2.500%, 04/01/2040 | | | | | | | | | | | | |
(Optional Put Date 01/02/2024)(1) | | | 5,500,000 | | | | 5,500,000 | | | | | |
| Prosper Independent School District, | | | | | | | | | | | | |
| 4.000%, 02/15/2050 (Mandatory Tender | | | | | | | | | | | | |
Date 08/15/2026) (PSF Guaranteed)(1) | | | 1,250,000 | | | | 1,276,021 | | | | | |
| San Antonio Independent School District: | | | | | | | | | | | | |
| 5.000%, 08/15/2027 (PSF Guaranteed) | | | 1,500,000 | | | | 1,631,634 | | | | | |
| 5.000%, 08/15/2028 (PSF Guaranteed) | | | 750,000 | | | | 834,107 | | | | | |
| Sedona Lakes Municipal Utility District No. 1, | | | | | | | | | | | | |
| 3.000%, 09/01/2024 (Insured by BAM) | | | 105,000 | | | | 104,528 | | | | | |
| Sienna Municipal Utility District No. 4: | | | | | | | | | | | | |
| 2.000%, 09/01/2027 (Callable 09/01/2025) | | | | | | | | | | | | |
| (Insured by AGM) | | | 500,000 | | | | 467,463 | | | | | |
| 2.000%, 09/01/2028 (Callable 09/01/2025) | | | | | | | | | | | | |
| (Insured by AGM) | | | 315,000 | | | | 288,957 | | | | | |
| Sienna Municipal Utility District No. 6, | | | | | | | | | | | | |
| 6.500%, 09/01/2029 (Insured by BAM) | | | 1,500,000 | | | | 1,672,754 | | | | | |
| State of Texas: | | | | | | | | | | | | |
| 4.000%, 08/01/2028 (Callable 08/01/2025) | | | 2,500,000 | | | | 2,543,630 | | | | | |
| 3.200%, 10/01/2028 (Callable 10/01/2025) | | | 3,000,000 | | | | 3,009,975 | | | | | |
| Tarrant County Cultural Education | | | | | | | | | | | | |
| Facilities Finance Corp.: | | | | | | | | | | | | |
| 5.000%, 11/15/2024 | | | 335,000 | | | | 336,419 | | | | | |
| 2.250%, 11/15/2025 | | | 225,000 | | | | 216,467 | | | | | |
| 5.000%, 11/15/2026 | | | 490,000 | | | | 499,800 | | | | | |
| 5.000%, 11/15/2028 (Callable 11/15/2027) | | | 1,050,000 | | | | 1,080,969 | | | | | |
| 5.000%, 11/15/2029 (Callable 11/15/2027) | | | 1,835,000 | | | | 1,889,900 | | | | | |
The accompanying notes are an integral part of these financial statements.
Baird Short-Term Municipal Bond Fund
Schedule of Investments, December 31, 2023
Long-Term Investments (cont.)
| | | Principal | | | | | | % of | |
| | | Amount | | | Value | | | Net Assets | |
| Tarrant County Housing Finance Corp., | | | | | | | | | |
| 5.000%, 03/01/2027 (Mandatory Tender | | | | | | | | | |
Date 03/01/2026) (Insured by FNMA)(1) | | $ | 1,000,000 | | | $ | 1,032,945 | | | | |
| Texas Department of | | | | | | | | | | | |
| Housing & Community Affairs: | | | | | | | | | | | |
| 5.000%, 03/01/2041 (Callable 03/01/2025) | | | | | | | | | | | |
(Mandatory Tender Date 03/01/2026)(1) | | | 2,000,000 | | | | 2,034,046 | | | | |
| 4.750%, 03/01/2049 (Callable 09/01/2027) | | | | | | | | | | | |
| (Insured by GNMA) | | | 415,000 | | | | 419,229 | | | | |
| 5.500%, 09/01/2052 (Callable 03/01/2032) | | | | | | | | | | | |
| (Insured by GNMA) | | | 2,935,000 | | | | 3,136,378 | | | | |
| Texas Municipal Gas Acquisition | | | | | | | | | | | |
| & Supply Corp. I, | | | | | | | | | | | |
| 4.710%, 12/15/2026 (3 Month TSFR + | | | | | | | | | | | |
1.625%) (Callable 01/02/2024)(2) | | | 8,300,000 | | | | 8,268,677 | | | | |
| Texas Municipal Gas Acquisition | | | | | | | | | | | |
| & Supply Corp. II, | | | | | | | | | | | |
| 4.130%, 09/15/2027 | | | | | | | | | | | |
(3 Month TSFR + 1.045%)(2) | | | 8,315,000 | | | | 8,222,642 | | | | |
| Texas Municipal Gas Acquisition | | | | | | | | | | | |
| & Supply Corp. III: | | | | | | | | | | | |
| 5.000%, 12/15/2027 | | | 6,250,000 | | | | 6,510,316 | | | | |
| 5.000%, 12/15/2028 | | | 1,500,000 | | | | 1,575,605 | | | | |
| Texas Municipal Gas Acquisition | | | | | | | | | | | |
| & Supply Corp. IV, | | | | | | | | | | | |
| 5.500%, 01/01/2054 (Callable 07/01/2029) | | | | | | | | | | | |
(Mandatory Tender Date 01/01/2030)(1) | | | 3,500,000 | | | | 3,773,771 | | | | |
| Texas State Affordable Housing Corp.: | | | | | | | | | | | |
| 5.000%, 04/01/2043 (Callable 09/01/2025) | | | | | | | | | | | |
| (Mandatory Tender Date 04/01/2026) | | | | | | | | | | | |
(Insured by HUD)(1) | | | 1,500,000 | | | | 1,550,898 | | | | |
| 4.250%, 03/01/2049 (Callable 03/01/2029) | | | | | | | | | | | |
| (Insured by GNMA) | | | 305,000 | | | | 305,717 | | | | |
| 5.500%, 09/01/2053 (Callable 03/01/2033) | | | | | | | | | | | |
| (Insured by GNMA) | | | 2,990,000 | | | | 3,178,579 | | | | |
| Tioga Independent School | | | | | | | | | | | |
| District Public Facility Corp.: | | | | | | | | | | | |
| 4.000%, 08/15/2024 | | | 185,000 | | | | 184,148 | | | | |
| 3.250%, 08/15/2026 (Callable 08/15/2024) | | | 195,000 | | | | 187,365 | | | | |
| Town of Providence Village TX, | | | | | | | | | | | |
| 4.000%, 03/01/2024 (Insured by BAM) | | | 275,000 | | | | 275,366 | | | | |
| Travis County Housing Finance Corp., | | | | | | | | | | | |
| 4.125%, 06/01/2045 (Callable 12/01/2025) | | | | | | | | | | | |
(Mandatory Tender Date 06/01/2027)(1) | | | 4,400,000 | | | | 4,441,783 | | | | |
| Viridian Municipal Management District: | | | | | | | | | | | |
| 4.000%, 12/01/2025 (Callable 12/01/2024) | | | | | | | | | | | |
| (Insured by BAM) | | | 440,000 | | | | 442,594 | | | | |
| 5.000%, 12/01/2025 (Insured by AGM) | | | 100,000 | | | | 102,749 | | | | |
| 5.000%, 12/01/2025 (Insured by AGM) | | | 170,000 | | | | 174,673 | | | | |
| 4.000%, 12/01/2026 (Callable 01/29/2024) | | | | | | | | | | | |
| (Insured by AGM) | | | 340,000 | | | | 340,159 | | | | |
| 5.000%, 12/01/2026 (Insured by AGM) | | | 195,000 | | | | 203,614 | | | | |
| 5.000%, 12/01/2026 (Insured by AGM) | | | 200,000 | | | | 208,835 | | | | |
| 4.000%, 12/01/2027 (Callable 12/01/2024) | | | | | | | | | | | |
| (Insured by BAM) | | | 475,000 | | | | 478,331 | | | | |
| 5.000%, 12/01/2027 (Insured by AGM) | | | 250,000 | | | | 264,942 | | | | |
| 5.000%, 12/01/2028 (Insured by AGM) | | | 200,000 | | | | 215,080 | | | | |
| 5.000%, 12/01/2028 (Insured by AGM) | | | 250,000 | | | | 268,850 | | | | |
| Waller Consolidated | | | | | | | | | | | |
| Independent School District, | | | | | | | | | | | |
| 6.000%, 02/15/2027 (PSF Guaranteed) | | | 2,680,000 | | | | 2,951,162 | | | | |
| Waller County Municipal | | | | | | | | | | | |
| Utility District No. 37, | | | | | | | | | | | |
| 7.250%, 09/01/2030 (Insured by BAM) | | | 575,000 | | | | 662,864 | | | | |
| Williamson County Municipal | | | | | | | | | | | |
| Utility District No. 31, | | | | | | | | | | | |
| 6.000%, 08/15/2028 (Insured by BAM) | | | 1,030,000 | | | | 1,112,570 | | | | |
| Total Texas | | | | | | | | | | | |
| (Cost $202,698,337) | | | | | | | 202,677,467 | | | | 12.6 | % |
| Utah | | | | | | | | | | | | |
| City of Salt Lake City UT, | | | | | | | | | | | | |
| 4.000%, 10/01/2027 (Callable 10/01/2025) | | | 1,220,000 | | | | 1,245,722 | | | | | |
| Duchesne County School District, | | | | | | | | | | | | |
| 5.000%, 06/01/2025 | | | 200,000 | | | | 204,600 | | | | | |
| Emery County UT, | | | | | | | | | | | | |
| 4.500%, 11/01/2024 (Callable 01/02/2024) | | | | | | | | | | | | |
(Optional Put Date 01/05/2024)(1) | | | 8,000,000 | | | | 8,000,000 | | | | | |
| Utah Charter School Finance Authority: | | | | | | | | | | | | |
| 5.000%, 04/15/2024 (Insured by UT CSCE) | | | 240,000 | | | | 241,078 | | | | | |
| 5.000%, 04/15/2025 (Insured by UT CSCE) | | | 135,000 | | | | 137,870 | | | | | |
| 5.000%, 04/15/2026 (Insured by UT CSCE) | | | 150,000 | | | | 155,317 | | | | | |
| 3.625%, 06/15/2029 | | | | | | | | | | | | |
(Callable 06/15/2027)(3) | | | 635,000 | | | | 587,479 | | | | | |
| Utah Housing Corp., | | | | | | | | | | | | |
| 4.000%, 01/01/2045 (Callable 01/01/2026) | | | | | | | | | | | | |
| (Insured by FHA) | | | 35,000 | | | | 34,933 | | | | | |
| Total Utah | | | | | | | | | | | | |
| (Cost $10,645,638) | | | | | | | 10,606,999 | | | | 0.7 | % |
| Vermont | | | | | | | | | | | | |
| Vermont Educational & Health | | | | | | | | | | | | |
| Buildings Financing Agency: | | | | | | | | | | | | |
| 5.000%, 10/15/2026 | | | 695,000 | | | | 699,710 | | | | | |
| 5.000%, 10/15/2028 (Callable 10/15/2026) | | | 875,000 | | | | 883,095 | | | | | |
| Vermont Housing Finance Agency: | | | | | | | | | | | | |
| 4.000%, 11/01/2044 (Callable 01/29/2024) | | | 20,000 | | | | 19,991 | | | | | |
| 4.000%, 11/01/2048 (Callable 05/01/2027) | | | 670,000 | | | | 668,111 | | | | | |
| 4.000%, 11/01/2049 (Callable 05/01/2028) | | | | | | | | | | | | |
| (Insured by GNMA) | | | 1,610,000 | | | | 1,611,830 | | | | | |
| 3.750%, 11/01/2050 (Callable 05/01/2029) | | | | | | | | | | | | |
| (Insured by GNMA) | | | 1,020,000 | | | | 1,013,938 | | | | | |
| Vermont Student Assistance Corp.: | | | | | | | | | | | | |
| 5.000%, 06/15/2024 | | | 850,000 | | | | 854,893 | | | | | |
| 5.000%, 06/15/2025 | | | 825,000 | | | | 840,482 | | | | | |
| Total Vermont | | | | | | | | | | | | |
| (Cost $6,776,159) | | | | | | | 6,592,050 | | | | 0.4 | % |
| Virginia | | | | | | | | | | | | |
| Alexandria Industrial Development Authority, | | | | | | | | | | | | |
| 5.000%, 10/01/2050 | | | | | | | | | | | | |
| (Pre-refunded to 10/01/2025) | | | 2,275,000 | | | | 2,355,546 | | | | | |
| Arlington County Industrial | | | | | | | | | | | | |
| Development Authority, | | | | | | | | | | | | |
| 5.000%, 01/01/2026 | | | 3,750,000 | | | | 3,871,132 | | | | | |
| Charles City County Economic | | | | | | | | | | | | |
| Development Authority, | | | | | | | | | | | | |
| 2.875%, 02/01/2029 | | | | | | | | | | | | |
(Callable 11/01/2026)(5) | | | 1,000,000 | | | | 938,207 | | | | | |
| Chesapeake Bay Bridge & Tunnel District, | | | | | | | | | | | | |
| 5.500%, 07/01/2025 | | | | | | | | | | | | |
| (ETM) (Insured by NATL) | | | 685,000 | | | | 696,657 | | | | | |
| Fairfax County Redevelopment | | | | | | | | | | | | |
| & Housing Authority, | | | | | | | | | | | | |
| 5.000%, 01/01/2045 (Callable 07/01/2027) | | | | | | | | | | | | |
(Mandatory Tender Date 01/01/2028)(1) | | | 5,000,000 | | | | 5,288,652 | | | | | |
| Harrisonburg Redevelopment | | | | | | | | | | | | |
| & Housing Authority, | | | | | | | | | | | | |
| 4.000%, 12/01/2028 | | | | | | | | | | | | |
(Mandatory Tender Date 12/01/2026)(1) | | | 1,650,000 | | | | 1,674,324 | | | | | |
The accompanying notes are an integral part of these financial statements.
Baird Short-Term Municipal Bond Fund
Schedule of Investments, December 31, 2023
Long-Term Investments (cont.)
| | | Principal | | | | | | % of | |
| | | Amount | | | Value | | | Net Assets | |
| Norfolk Redevelopment | | | | | | | | | |
| & Housing Authority: | | | | | | | | | |
| 4.000%, 01/01/2025 | | | | | | | | | |
| (Callable 01/29/2024) | | $ | 2,100,000 | | | $ | 2,067,928 | | | | |
| 5.000%, 05/01/2043 (Mandatory Tender | | | | | | | | | | | |
Date 05/01/2026) (Insured by HUD)(1) | | | 1,500,000 | | | | 1,548,298 | | | | |
| Portsmouth Redevelopment | | | | | | | | | | | |
| & Housing Authority, | | | | | | | | | | | |
| 3.500%, 07/01/2025 (Mandatory Tender | | | | | | | | | | | |
Date 07/01/2024) (Insured by HUD)(1) | | | 3,591,000 | | | | 3,582,576 | | | | |
| Virginia Beach Development Authority, | | | | | | | | | | | |
| 5.375%, 09/01/2029 (Callable 09/01/2026) | | | 1,500,000 | | | | 1,538,529 | | | | |
| Virginia Public Building Authority: | | | | | | | | | | | |
| 5.000%, 08/01/2029 | | | 2,400,000 | | | | 2,742,538 | | | | |
| 5.000%, 08/01/2029 (Callable 08/01/2026) | | | 3,500,000 | | | | 3,665,805 | | | | |
| Virginia Small Business Financing Authority: | | | | | | | | | | | |
| 5.000%, 01/01/2028 (Callable 07/01/2027) | | | 1,115,000 | | | | 1,168,395 | | | | |
| 5.250%, 10/01/2029 (Callable 10/01/2024) | | | 1,005,000 | | | | 1,017,475 | | | | |
| Total Virginia | | | | | | | | | | | |
| (Cost $31,799,591) | | | | | | | 32,156,062 | | | | 2.0 | % |
| Washington | | | | | | | | | | | | |
| Central Puget Sound | | | | | | | | | | | | |
| Regional Transit Authority: | | | | | | | | | | | | |
| 4.750%, 02/01/2028 (Callable 01/29/2024) | | | | | | | | | | | | |
| (Insured by NATL) | | | 135,000 | | | | 137,337 | | | | | |
| 3.280%, 11/01/2045 | | | | | | | | | | | | |
| (SIFMA Municipal Swap Index + 0.200%) | | | | | | | | | | | | |
| (Callable 11/01/2025) | | | | | | | | | | | | |
(Mandatory Tender Date 11/01/2026)(2) | | | 9,000,000 | | | | 8,848,583 | | | | | |
| Central Washington University: | | | | | | | | | | | | |
| 4.000%, 05/01/2024 (Callable 01/29/2024) | | | 260,000 | | | | 260,008 | | | | | |
| 4.000%, 05/01/2026 (Callable 01/29/2024) | | | 410,000 | | | | 410,112 | | | | | |
| City of Seattle WA, | | | | | | | | | | | | |
| 3.330%, 05/01/2045 | | | | | | | | | | | | |
| (SIFMA Municipal Swap Index + 0.250%) | | | | | | | | | | | | |
| (Callable 05/01/2026) | | | | | | | | | | | | |
(Mandatory Tender Date 11/01/2026)(2) | | | 8,840,000 | | | | 8,599,019 | | | | | |
| County of King WA, | | | | | | | | | | | | |
| 0.875%, 01/01/2042 (Callable 04/01/2025) | | | | | | | | | | | | |
(Mandatory Tender Date 01/01/2026)(1) | | | 450,000 | | | | 416,536 | | | | | |
| King County Housing Authority, | | | | | | | | | | | | |
| 5.000%, 01/01/2028 (Callable 01/01/2026) | | | | | | | | | | | | |
| (Insured by HUD) | | | 2,370,000 | | | | 2,453,210 | | | | | |
| King County Public Hospital District No. 1, | | | | | | | | | | | | |
| 5.000%, 12/01/2036 (Callable 12/01/2026) | | | 1,250,000 | | | | 1,296,192 | | | | | |
| Pend Oreille County Public | | | | | | | | | | | | |
| Utility District No. 1: | | | | | | | | | | | | |
| 5.000%, 01/01/2024 | | | 700,000 | | | | 700,000 | | | | | |
| 5.000%, 01/01/2025 | | | 445,000 | | | | 450,436 | | | | | |
| 5.000%, 01/01/2025 | | | 735,000 | | | | 743,907 | | | | | |
| San Juan County School District No. 137, | | | | | | | | | | | | |
| 4.000%, 12/01/2028 (Callable 01/29/2024) | | | | | | | | | | | | |
| (Insured by SCH BD GTY) | | | 675,000 | | | | 675,047 | | | | | |
| Seattle Housing Authority: | | | | | | | | | | | | |
| 1.250%, 06/01/2024 (Callable 01/19/2024) | | | 2,000,000 | | | | 1,981,750 | | | | | |
| 4.000%, 09/01/2025 (Callable 03/01/2025) | | | 6,200,000 | | | | 6,240,994 | | | | | |
| 1.000%, 06/01/2026 (Callable 01/19/2024) | | | 2,000,000 | | | | 1,873,004 | | | | | |
| State of Washington, | | | | | | | | | | | | |
| 5.000%, 07/01/2024 (Callable 01/29/2024) | | | | | | | | | | | | |
| (Insured by ST AID) | | | 20,000 | | | | 20,029 | | | | | |
| Tacoma Metropolitan Park District: | | | | | | | | | | | | |
| 5.000%, 12/01/2024 | | | 415,000 | | | | 418,986 | | | | | |
| 4.000%, 12/01/2026 | | | 175,000 | | | | 176,709 | | | | | |
| 4.000%, 12/01/2027 | | | | | | | | | | | | |
| (Callable 12/01/2026) | | | 4,630,000 | | | | 4,678,625 | | | | | |
| 4.000%, 12/01/2027 | | | 2,505,000 | | | | 2,542,494 | | | | | |
| Washington Health Care Facilities Authority: | | | | | | | | | | | | |
| 5.000%, 10/01/2026 | | | 1,520,000 | | | | 1,590,795 | | | | | |
5.000%, 12/01/2026(3) | | | 285,000 | | | | 299,124 | | | | | |
| Washington State Housing | | | | | | | | | | | | |
| Finance Commission: | | | | | | | | | | | | |
6.000%, 07/01/2025 (ETM)(3) | | | 555,000 | | | | 567,331 | | | | | |
| 6.500%, 07/01/2030 | | | | | | | | | | | | |
(Pre-refunded to 07/01/2025)(3) | | | 800,000 | | | | 835,483 | | | | | |
| 6.750%, 07/01/2035 | | | | | | | | | | | | |
(Pre-refunded to 07/01/2025)(3) | | | 1,130,000 | | | | 1,184,200 | | | | | |
| Total Washington | | | | | | | | | | | | |
| (Cost $48,129,727) | | | | | | | 47,399,911 | | | | 3.0 | % |
| West Virginia | | | | | | | | | | | | |
| West Virginia Housing Development Fund, | | | | | | | | | | | | |
| 3.000%, 11/01/2026 | | | 2,745,000 | | | | 2,712,099 | | | | | |
| Total West Virginia | | | | | | | | | | | | |
| (Cost $2,729,902) | | | | | | | 2,712,099 | | | | 0.2 | % |
| Wisconsin | | | | | | | | | | | | |
| City of Appleton WI, | | | | | | | | | | | | |
| 3.000%, 01/01/2026 (Callable 01/29/2024) | | | 625,000 | | | | 625,004 | | | | | |
| City of Marinette WI, | | | | | | | | | | | | |
| 4.000%, 05/01/2027 (Callable 01/29/2024) | | | 150,000 | | | | 150,014 | | | | | |
| City of Milwaukee WI, | | | | | | | | | | | | |
| 4.000%, 06/01/2027 (Callable 06/01/2026) | | | 960,000 | | | | 983,780 | | | | | |
| City of Oshkosh WI, | | | | | | | | | | | | |
| 4.000%, 05/01/2029 (Callable 01/29/2024) | | | 125,000 | | | | 125,115 | | | | | |
| County of St. Croix WI, | | | | | | | | | | | | |
| 2.600%, 03/01/2027 | | | 625,000 | | | | 608,304 | | | | | |
| County of Waushara WI, | | | | | | | | | | | | |
| 4.500%, 06/01/2027 (Callable 06/01/2025) | | | 2,500,000 | | | | 2,556,283 | | | | | |
| D.C. Everest Area School District: | | | | | | | | | | | | |
| 3.625%, 04/01/2038 | | | | | | | | | | | | |
| (Pre-refunded to 04/01/2027) | | | 1,310,000 | | | | 1,354,023 | | | | | |
| 3.625%, 04/01/2038 | | | | | | | | | | | | |
| (Pre-refunded to 04/01/2027) | | | 1,290,000 | | | | 1,335,389 | | | | | |
| Palmyra-Eagle Area School District: | | | | | | | | | | | | |
| 3.000%, 03/01/2024 (Callable 01/29/2024) | | | 700,000 | | | | 697,979 | | | | | |
| 3.000%, 03/01/2025 (Callable 01/29/2024) | | | 175,000 | | | | 171,873 | | | | | |
| Public Finance Authority: | | | | | | | | | | | | |
5.000%, 10/01/2024(3) | | | 1,605,000 | | | | 1,610,233 | | | | | |
| 5.000%, 04/01/2025 | | | 155,000 | | | | 155,125 | | | | | |
| 5.000%, 07/01/2025 | | | 265,000 | | | | 268,423 | | | | | |
| 5.000%, 07/01/2026 | | | 465,000 | | | | 476,875 | | | | | |
5.000%, 07/01/2027(3) | | | 290,000 | | | | 299,764 | | | | | |
5.000%, 07/01/2028(3) | | | 250,000 | | | | 260,464 | | | | | |
| 5.000%, 07/01/2028 | | | 1,245,000 | | | | 1,308,614 | | | | | |
| 9.000%, 11/01/2028 | | | | | | | | | | | | |
(Callable 11/01/2027)(3) | | | 1,850,000 | | | | 1,852,842 | | | | | |
5.000%, 07/01/2029(3) | | | 480,000 | | | | 503,195 | | | | | |
| 5.000%, 07/01/2029 | | | 1,365,000 | | | | 1,445,450 | | | | | |
| 0.000%, 09/01/2029 | | | | | | | | | | | | |
(Callable 09/01/2026)(3) | | | 100,000 | | | | 65,836 | | | | | |
5.000%, 10/01/2029(3) | | | 2,850,000 | | | | 2,940,156 | | | | | |
| 6.125%, 12/15/2029 | | | | | | | | | | | | |
(Callable 12/15/2027)(3) | | | 2,500,000 | | | | 2,489,353 | | | | | |
5.000%, 07/01/2030(3) | | | 995,000 | | | | 1,047,381 | | | | | |
| 3.300%, 10/01/2046 | | | | | | | | | | | | |
(Mandatory Tender Date 10/01/2026)(1) | | | 1,260,000 | | | | 1,260,892 | | | | | |
The accompanying notes are an integral part of these financial statements.
Baird Short-Term Municipal Bond Fund
Schedule of Investments, December 31, 2023
Long-Term Investments (cont.)
| | | Principal | | | | | | % of | |
| | | Amount | | | Value | | | Net Assets | |
| Village of Waunakee WI, | | | | | | | | | |
| 3.200%, 10/01/2026 | | | | | | | | | |
| (Callable 01/29/2024) | | $ | 225,000 | | | $ | 222,264 | | | | |
| Wisconsin Center District: | | | | | | | | | | | |
| 0.000%, 12/15/2024 (Insured by NATL) | | | 125,000 | | | | 121,032 | | | | |
| 5.250%, 12/15/2027 | | | | | | | | | | | |
| (ETM) (Insured by AGM) | | | 50,000 | | | | 52,794 | | | | |
| 5.250%, 12/15/2027 (Insured by AGM) | | | 1,295,000 | | | | 1,380,704 | | | | |
| Wisconsin Health & | | | | | | | | | | | |
| Educational Facilities Authority: | | | | | | | | | | | |
| 5.000%, 07/01/2025 (Callable 07/01/2024) | | | 660,000 | | | | 665,618 | | | | |
| 2.750%, 08/15/2025 (Callable 08/15/2024) | | | 1,440,000 | | | | 1,426,577 | | | | |
| 4.000%, 09/15/2025 | | | 765,000 | | | | 755,692 | | | | |
| 5.000%, 11/01/2025 | | | 245,000 | | | | 242,210 | | | | |
| 5.000%, 02/15/2026 | | | 1,105,000 | | | | 1,139,394 | | | | |
| 5.000%, 10/01/2026 | | | 2,000,000 | | | | 2,111,487 | | | | |
| 5.000%, 11/01/2026 | | | 710,000 | | | | 696,950 | | | | |
| 4.000%, 09/15/2027 | | | 830,000 | | | | 806,318 | | | | |
| 5.000%, 11/01/2029 (Callable 11/01/2026) | | | 815,000 | | | | 780,749 | | | | |
| 3.000%, 02/15/2035 | | | | | | | | | | | |
| (Pre-refunded to 08/15/2025) | | | 220,000 | | | | 219,089 | | | | |
| 4.000%, 02/15/2038 | | | | | | | | | | | |
| (Pre-refunded to 08/15/2025) | | | 575,000 | | | | 581,870 | | | | |
| 5.000%, 02/15/2051 (Callable 08/15/2026) | | | | | | | | | | | |
(Mandatory Tender Date 02/15/2027)(1) | | | 7,700,000 | | | | 7,977,590 | | | | |
| 5.000%, 02/15/2052 (Callable 08/15/2024) | | | | | | | | | | | |
(Mandatory Tender Date 02/15/2025)(1) | | | 2,050,000 | | | | 2,060,257 | | | | |
| Wisconsin Housing & | | | | | | | | | | | |
| Economic Development Authority: | | | | | | | | | | | |
| 3.500%, 09/01/2046 (Callable 09/01/2025) | | | | | | | | | | | |
| (Insured by FNMA) | | | 120,000 | | | | 118,824 | | | | |
| 4.000%, 03/01/2048 (Callable 03/01/2027) | | | | | | | | | | | |
| (Insured by FNMA) | | | 245,000 | | | | 244,260 | | | | |
| 4.250%, 03/01/2049 (Callable 09/01/2028) | | | | | | | | | | | |
| (Insured by FNMA) | | | 495,000 | | | | 497,858 | | | | |
| Total Wisconsin | | | | | | | | | | | |
| (Cost $46,630,040) | | | | | | | 46,693,904 | | | | 2.9 | % |
| Wyoming | | | | | | | | | | | | |
| Carbon County Specific Purpose | | | | | | | | | | | | |
| Tax Joint Powers Board: | | | | | | | | | | | | |
| 5.000%, 06/15/2024 | | | 735,000 | | | | 740,217 | | | | | |
| 5.000%, 06/15/2025 | | | 950,000 | | | | 969,959 | | | | | |
| 5.000%, 06/15/2026 | | | 340,000 | | | | 350,336 | | | | | |
| Sublette County Hospital District, | | | | | | | | | | | | |
| 5.000%, 06/15/2026 (Callable 06/15/2025) | | | 2,000,000 | | | | 2,010,140 | | | | | |
| Wyoming Community | | | | | | | | | | | | |
| Development Authority: | | | | | | | | | | | | |
| 4.000%, 12/01/2043 (Callable 06/01/2027) | | | 230,000 | | | | 229,573 | | | | | |
| 3.750%, 12/01/2049 (Callable 12/01/2028) | | | 870,000 | | | | 864,512 | | | | | |
| Total Wyoming | | | | | | | | | | | | |
| (Cost $5,243,526) | | | | | | | 5,164,737 | | | | 0.3 | % |
| Total Long-Term Investments | | | | | | | | | | | | |
| (Cost $1,595,669,523) | | | | | | | 1,583,361,480 | | | | 98.7 | % |
| Short-Term Investment | | | | | | | | | | | | |
| | | Shares | | | | | | | | | |
| Money Market Mutual Fund | | | | | | | | | | | | |
| Federated Hermes Institutional Tax-Free | | | | | | | | | | | | |
Cash Trust, Premier Shares, 4.03%(4) | | | 11,079,291 | | | | 11,079,291 | | | | | |
| Total Short-Term Investment | | | | | | | | | | | | |
| (Cost $11,079,291) | | | | | | | 11,079,291 | | | | 0.7 | % |
| Total Investments | | | | | | | | | | | | |
| (Cost $1,606,748,814) | | | | | | | 1,594,440,771 | | | | 99.4 | % |
| Other Assets in Excess of Liabilities | | | | | | | 9,336,333 | | | | 0.6 | % |
| TOTAL NET ASSETS | | | | | | $ | 1,603,777,104 | | | | 100.0 | % |
Notes to Schedule of Investments
AGC – Assured Guaranty Corp.
AGM – Assured Guaranty Municipal
AMBAC – Ambac Assurance Corp.
BAM – Build America Mutual Assurance Co.
BHAC – Berkshire Hathaway Assurance Corp.
FGIC – Financial Guaranty Insurance Company
FHA – Federal Housing Administration
FNMA – Federal National Mortgage Association
GNMA – Government National Mortgage Association
HUD – US Department of Housing and Development
MT BRD – Montana Board of Investments
NATL – National Public Finance Guarantee Corp.
Q-SBLF – Qualified School Building Loan Fund
SCH BD GTY – School Board Guaranty
SD CRED PROG – State Credit Enhancement Program
SONYMA – State of New York Mortgage Agency
SCSDE – South Carolina School District
ST AID – State Aid Intercept/Withholding
UT CSCE – Utah Charter School Credit Enhancement Program
ETM – Escrowed to Maturity
LIBOR – London Inter-bank Offered Rate
PSF – Permanent School Fund
SIFMA – Securities Industry and Financial Markets Association
SOFR – Secured Overnight Financing Rate
TSFR – Term Secured Overnight Financing Rate
(1) | Variable rate security. The rate reported is the rate in effect as of December 31, 2023. |
(2) | Variable rate security based on a reference index and spread. The rate reported is the rate as of the last reset date in effect as of December 31, 2023. |
(3) | Includes securities exempt from registration under Rule 144A of the Securities Act of 1933. These securities may be resold in transactions exempt from registration to qualified institutional buyers. At December 31, 2023, the value of these securities totaled $102,598,440, which represented 6.40% of total net assets. |
(4) | Seven-day yield. |
(5) | Step-up bond; the interest rate shown is the rate in effect as of December 31, 2023. |
(6) | Security or a portion of the security purchased on a when-issued or delayed delivery basis. |
(7) | Securities referencing LIBOR are expected to transition to an alternative reference rate by the security’s next scheduled coupon reset date. |
The accompanying notes are an integral part of these financial statements.
Baird Short-Term Municipal Bond Fund
Summary of Fair Value Exposure at December 31, 2023
The Fund has adopted authoritative fair valuation accounting standards which establish a definition of fair value and set out a hierarchy for measuring fair value. These standards require additional disclosures about the various inputs and valuation techniques used to develop the measurements of fair value and a discussion on changes in valuation techniques and related inputs during the period. These standards define fair value as the price that would be received to sell an asset or paid to transfer a liability in an orderly transaction between market participants at the measurement date.
The fair value hierarchy is organized into three levels based upon the assumptions (referred to as “inputs”) used in pricing the asset or liability. These standards state that “observable inputs” reflect the assumptions market participants would use in pricing the asset or liability based on market data obtained from independent sources and “unobservable inputs” reflect an entity’s own assumptions about the assumptions market participants would use in pricing the asset or liability. These inputs are summarized into three broad levels and described below:
Level 1 – Quoted prices (unadjusted) in active markets for identical assets or liabilities that the reporting entity can access at the measurement date.
Level 2 – Inputs other than quoted prices included within Level 1 that are observable for the asset or liability, either directly or indirectly.
Level 3 – Unobservable inputs for the asset or liability.
The inputs or methodology used for valuing securities are not necessarily an indication of the risk associated with investing in those securities.
The following is a summary of the inputs used to value the Fund’s investments as of December 31, 2023:
| | | Level 1 | | | Level 2 | | | Level 3 | | | Total | |
| Long-Term Investments | | | | | | | | | | | | |
| Municipal Bonds | | $ | — | | | $ | 1,583,361,480 | | | $ | — | | | $ | 1,583,361,480 | |
| Total Long-Term Investments | | | — | | | | 1,583,361,480 | | | | — | | | | 1,583,361,480 | |
| Short-Term Investment | | | | | | | | | | | | | | | | |
| Money Market Mutual Fund | | | 11,079,291 | | | | — | | | | — | | | | 11,079,291 | |
| Total Short-Term Investment | | | 11,079,291 | | | | — | | | | — | | | | 11,079,291 | |
| Total Investments | | $ | 11,079,291 | | | $ | 1,583,361,480 | | | $ | — | | | $ | 1,594,440,771 | |
Changes in valuation techniques may result in transfers into or out of assigned levels within the fair value hierarchy. There were no transfers into or out of Level 3 during the year, as compared to the security classifications from the prior year’s annual report. See the Fund’s Valuation Policy in Note 2a to the financial statements.
The accompanying notes are an integral part of these financial statements.
Baird Strategic Municipal Bond Fund
December 31, 2023 (Unaudited)
The Baird Strategic Municipal Bond Fund seeks current income that is exempt from federal income tax and is consistent with the preservation of capital.
The tax-exempt market closed 2023 with a very strong tone as yields fell over 100 bps in the fourth quarter and were down 20–40 bps for the year, with intermediate maturities falling the most. A catalyst for the fourth quarter rally was an acknowledgement by Fed Chair Powell that the possibility of rate cuts was now equally balanced against further increases. One market anomaly which persisted throughout the year was the inversion of the municipal yield curve between the 1–10-year maturities, ending the year with 32 bps of negative slope. Relatively high short-term floating-rate yields helped sustain the inversion but also acted as a disincentive to invest in longer-term fixed-rate bonds, a drag on municipal fund flows across the industry in 2023. Yet, overall demand for municipals was robust, evidenced by the fact that tax-exempt yields fell more than comparable maturity Treasuries for the year. It also helped that the level of new municipal supply was modest in 2023. Total issuance fell 2% from the prior year with taxable municipal issuance off 36% and tax-exempt supply up just 5% on a year-over-year basis.
During 2023, the Institutional Class Shares of the Fund (BSNIX) posted a net return of 6.78% vs. a 4.61% return for the Bloomberg 1-10 Year Municipal Blend Index.
Positive contributors to the Fund’s relative performance during the year include:
| | • | Portfolio Structure – Favorable duration and yield curve posture |
| | • | Credit – The Fund benefited from additional yield on lower-quality issues |
| | • | Security selection – Discount bonds outperformed premium priced securities |
Negative contributors to the Fund’s relative performance during the year include:
| | • | Sector weighting – Transportation and Higher Education lagged other sectors |
We expect that the favorable backdrop for the municipal market will continue into 2024, in part due to the expectation that municipal fund flows will turn positive once again. Since municipal fund flows are highly correlated with curve slope (the more positive the slope the more positive the inflows), as inflation continues toward the Fed’s 2% target rate short-term rates should fall faster than long-term rates, re-steepening the curve. Curve positioning, which is always important, will remain so in 2024. We expect only a modest pickup in supply as the post-Covid federal stimulus funds continue to be spent, limiting borrowing needs for many state and local governments. The exception, we believe, will be those states experiencing the fastest growth in population (e.g., Texas and Florida). Issuance among other municipal sectors, particularly Higher Education and Hospitals, should improve only modestly given their ongoing challenges. Tax-Exempt Housing supply should stay robust, but it is a relatively small sector of the total market. Finally, because municipal credit spreads are relatively tight as we enter 2024, the best investment opportunities will likely be found among higher-quality issues. We will also seek favorable risk/reward through structural opportunities including coupon, call and prepayment variations to enhance both yield and return.
The Fund target is to remain neutral to modestly long the relative duration of the benchmark while seeking to optimize roll opportunities along the yield curve. Sector weightings will likely favor an overweight to revenue-backed issues over general obligation debt. We believe a modest credit overweight is appropriate at current spread levels, allowing room to add as the economy slows. A continual focus on the fundamental tax and revenue support remains especially important at this point in the credit cycle. Higher-quality, structural opportunities will remain a focus to enhance income for investors.
Baird Strategic Municipal Bond Fund
December 31, 2023 (Unaudited)
Portfolio Characteristics
Quality Distribution(1)(2)
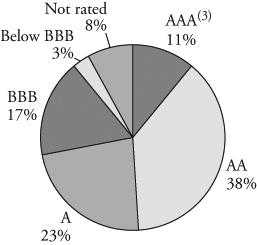
| | Net Assets | $920,111,716 | |
| | | | |
| | SEC 30-Day Yield(4) | | |
| | Institutional Class | 3.50% | |
| | Investor Class | 3.25% | |
| | | | |
| | Average Effective Duration | 4.19 years | |
| | | | |
| | Average Effective Maturity | 4.11 years | |
| | Net Derivatives Position (Current Notional | | |
| | Amount as a Percentage of Net Assets) | -2.04% | |
| | | | |
| | Annualized Expense Ratio(5) | | |
| | Institutional Class | 0.30% | |
| | Investor Class | 0.55% | (6) |
| | | | | |
Sector Weightings(7) | | Portfolio Turnover Rate | 50% | |
| | | | | |
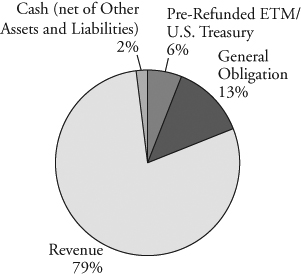 | | Number of Holdings | 977 | |
| | | | |
| | | | |
| | | | |
| | | | |
| | | | |
| | | | |
| | | | |
| | | | |
| | | | |
| | | | |
| | | | |
| | | | |
| | | | |
| | | | |
| | | | |
| | | | | |
(1) | Percentages shown are based on the Fund’s total investments. |
(2) | The quality profile is calculated on a market value-weighted basis using the highest credit quality rating for each security held by the Fund given by S&P, Moody’s or Fitch, each of which is a Nationally Recognized Statistical Rating Organization (NRSRO). NRSROs rate the credit quality of securities using a scale that generally ranges from AAA (highest) to D (lowest). |
(3) | Includes pre-refunded and escrowed-to-maturity (ETM) bonds. |
(4) | SEC yields are based on SEC guidelines and are calculated for the 30 days ended December 31, 2023. |
(5) | Reflects expense ratios as stated in the Fund’s current prospectus dated May 1, 2023. |
(6) | Includes 0.25% 12b-1 fee. |
(7) | Percentages shown are based on the Fund’s total net assets. |
Baird Strategic Municipal Bond Fund
December 31, 2023 (Unaudited)
| Institutional Class | Investor Class |
| Value of a $10,000 Investment | Value of a $10,000 Investment |
| | |
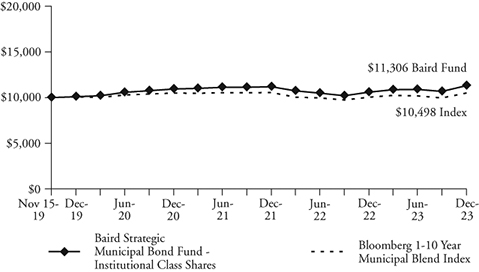 | 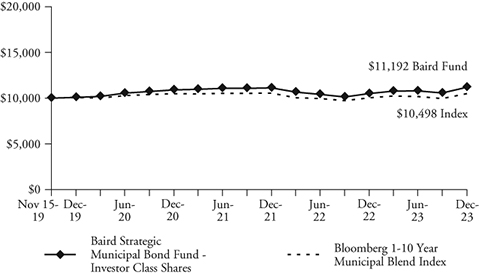 |
| | |
| Growth of a hypothetical investment of $10,000 made on 11/15/19, assuming | Growth of a hypothetical investment of $10,000 made on 11/15/19, assuming |
| reinvestment of all distributions. | reinvestment of all distributions. |
| Total Returns | | | |
| | | Average Annual |
| | One | Three | Since |
| For the Periods Ended December 31, 2023 | Year | Years | Inception(1) |
| Institutional Class Shares | 6.78% | 1.12% | 3.02% |
| Investor Class Shares | 6.53% | 0.87% | 2.77% |
Bloomberg 1-10 Year Municipal Blend Index(2) | 4.61% | 0.03% | 1.19% |
(1) | For the period from November 15, 2019 (inception date) through December 31, 2023. |
(2) | The Bloomberg 1-10 Year Municipal Blend Index is a market value-weighted index which covers the short and intermediate components of the Bloomberg Municipal Index—an unmanaged, market value-weighted index which covers the U.S. investment-grade tax-exempt bond market. The Bloomberg 1-10 Year Municipal Blend Index tracks tax-exempt municipal General Obligation, Revenue, Insured, and Pre-refunded bonds with a minimum $5 million par amount outstanding, issued as part of a transaction of at least $50 million, and with a remaining maturity from 1 up to (but not including) 12 years. The Index includes reinvestment of income. This Index does not reflect any deduction for fees, expenses or taxes. A direct investment in an index is not possible. |
The line graphs and the returns table shown above reflect reinvestment of dividends and/or capital gains distributions in additional shares. The returns in the graphs and table do not reflect the deduction of taxes that a shareholder would pay on Fund distributions or the redemption of Fund shares. The returns reflect the actual performance for each period and do not include the impact of trades executed on the last business day of the period that were recorded on the first business day of the next period.
The Fund’s expense ratio for each Class, as reflected in the Fund’s current prospectus, is set forth under “Portfolio Characteristics”.
The Fund may invest up to 30% of its net assets in non-investment grade debt securities (commonly referred to as “high yield” bonds). While these types of debt securities may offer higher yields than investment grade securities, they also include greater risks including increased credit risk and the increased risk of default or bankruptcy. The Fund may invest up to 25% of its total assets in municipal obligations issued by persons in the same state. As a result, changes in economic, business or political conditions of a particular state may have a disproportionate impact on the Fund’s share price. Municipal securities investments are not appropriate for all investors, especially those taxed at lower rates.
The Fund may invest up to 20% of its net assets in U.S. government and corporate bonds and other debt securities that are of the same quality as its investments in municipal bonds. These bonds produce income that is taxable for federal income tax purposes, unlike municipal bonds which generally provide income exempt from federal income tax.
The Fund may also invest in U.S. Treasury futures contracts. Futures contracts are subject to the risk of loss caused by unanticipated market movements, the risk that there may be an imperfect correlation between the prices of futures contracts and the value of their underlying instruments or indexes, and the risk there may not be a liquid secondary market for them. U.S. and international markets have experienced significant periods of volatility due to a number of economic, political and other global macro factors. The war between Ukraine and Russia is approaching its 2nd anniversary and the October 7th attack by Hamas and Israel’s response only added to global tensions. US/China relations remain strained, impacted by sluggish Chinese economic growth and numerous issues affecting trade relations. Domestically, inflation remains an area of focus since getting to the Fed’s 2% target may prove to be more challenging than the market expects. In addition, 2024 is an election year and the current level of political discord is high. Finally, while the coronavirus (COVID-19) appears to have entered an endemic stage, significant outbreaks present a continued risk to the global economy. These and other events may cause market disruptions and could have an adverse effect on the value of the Fund’s investments.
Past performance does not guarantee future results. Investment return and principal value will fluctuate so that an investor’s shares, when redeemed, may be worth more or less than their original cost.
For information about the performance of the Fund as of the most recent month-end, please call 1-866-442-2473 or visit www.bairdfunds.com. Mutual fund performance changes over time and current performance may be lower or higher than that stated.
Baird Strategic Municipal Bond Fund
Schedule of Investments, December 31, 2023
Long-Term Investments
| | | Principal | | | | | | % of | |
| | | Amount | | | Value | | | Net Assets | |
| Municipal Bonds | | | | | | | | | |
| Alabama | | | | | | | | | |
| Alabama Corrections Institution | | | | | | | | | |
| Finance Authority, | | | | | | | | | |
| 5.000%, 07/01/2037 (Callable 07/01/2032) | | $ | 295,000 | | | $ | 337,284 | | | | |
| Alabama Economic Settlement Authority, | | | | | | | | | | | |
| 4.000%, 09/15/2033 (Callable 09/15/2026) | | | 200,000 | | | | 200,498 | | | | |
| Alabama Housing Finance Authority, | | | | | | | | | | | |
| 5.000%, 05/01/2026 (Mandatory Tender | | | | | | | | | | | |
Date 05/01/2025) (Insured by FHA)(1) | | | 1,000,000 | | | | 1,018,008 | | | | |
| Black Belt Energy Gas District: | | | | | | | | | | | |
| 3.430%, 10/01/2052 (SIFMA Municipal | | | | | | | | | | | |
| Swap Index + 0.350%) (Callable 09/01/2026) | | | | | | | | | | | |
(Mandatory Tender Date 12/01/2026)(2) | | | 1,000,000 | | | | 975,536 | | | | |
| 4.000%, 12/01/2052 (Callable 09/01/2029) | | | | | | | | | | | |
(Mandatory Tender Date 12/01/2029)(1) | | | 1,000,000 | | | | 985,713 | | | | |
| 5.000%, 05/01/2053 | | | | | | | | | | | |
(Mandatory Tender Date 06/01/2028)(1) | | | 3,500,000 | | | | 3,665,452 | | | | |
| 5.500%, 11/01/2053 (Callable 09/01/2028) | | | | | | | | | | | |
(Mandatory Tender Date 12/01/2028)(1) | | | 1,000,000 | | | | 1,067,647 | | | | |
| City of Oxford AL, | | | | | | | | | | | |
| 3.600%, 09/01/2041 (Callable 01/02/2024) | | | | | | | | | | | |
(Optional Put Date 01/05/2024)(1) | | | 1,000,000 | | | | 1,000,000 | | | | |
| County of Elmore AL, | | | | | | | | | | | |
| 5.000%, 05/01/2047 | | | | | | | | | | | |
| (Callable 05/01/2032) (Insured by BAM) | | | 1,090,000 | | | | 1,165,728 | | | | |
| Industrial Development | | | | | | | | | | | |
| Board of the City of Mobile: | | | | | | | | | | | |
| 2.250%, 06/01/2034 | | | | | | | | | | | |
(Optional Put Date 01/02/2024)(1) | | | 500,000 | | | | 500,000 | | | | |
| 3.920%, 06/01/2034 | | | | | | | | | | | |
(Mandatory Tender Date 06/02/2026)(1) | | | 2,000,000 | | | | 2,026,229 | | | | |
| Jacksonville State University, | | | | | | | | | | | |
| 5.000%, 12/01/2036 | | | | | | | | | | | |
| (Callable 12/01/2027) (Insured by AGM) | | | 150,000 | | | | 162,659 | | | | |
| Prattville Industrial Development Board, | | | | | | | | | | | |
| 5.300%, 09/01/2028 | | | 1,000,000 | | | | 1,050,820 | | | | |
| Southeast Alabama Gas Supply District, | | | | | | | | | | | |
| 4.000%, 06/01/2049 (Callable 03/01/2024) | | | | | | | | | | | |
(Mandatory Tender Date 06/01/2024)(1) | | | 830,000 | | | | 830,401 | | | | |
| Southeast Energy Authority A | | | | | | | | | | | |
| Cooperative District: | | | | | | | | | | | |
| 5.500%, 01/01/2053 (Callable 09/01/2029) | | | | | | | | | | | |
(Mandatory Tender Date 12/01/2029)(1) | | | 250,000 | | | | 271,465 | | | | |
| 5.000%, 05/01/2053 (Callable 05/01/2028) | | | | | | | | | | | |
(Mandatory Tender Date 08/01/2028)(1) | | | 500,000 | | | | 522,533 | | | | |
| 5.000%, 01/01/2054 (Callable 03/01/2030) | | | | | | | | | | | |
(Mandatory Tender Date 06/01/2030)(1) | | | 1,000,000 | | | | 1,067,327 | | | | |
| 5.250%, 01/01/2054 (Callable 04/01/2029) | | | | | | | | | | | |
(Mandatory Tender Date 07/01/2029)(1) | | | 5,200,000 | | | | 5,533,812 | | | | |
| Tender Option Bond Trust, | | | | | | | | | | | |
| 2.350%, 07/01/2025 | | | | | | | | | | | |
(Optional Put Date 01/02/2024)(1)(3) | | | 2,000,000 | | | | 2,000,000 | | | | |
| University of South Alabama, | | | | | | | | | | | |
| 5.000%, 04/01/2034 | | | | | | | | | | | |
| (Callable 04/01/2029) (Insured by BAM) | | | 1,005,000 | | | | 1,102,747 | | | | |
| Total Alabama | | | | | | | | | | | |
| (Cost $25,038,829) | | | | | | | 25,483,859 | | | | 2.8 | % |
| Alaska | | | | | | | | | | | | |
| Alaska Housing Finance Corp., | | | | | | | | | | | | |
| 4.000%, 06/01/2036 | | | | | | | | | | | | |
| (Pre-refunded to 06/01/2025) | | | 215,000 | | | | 218,493 | | | | | |
| Alaska Industrial Development | | | | | | | | | | | | |
| & Export Authority: | | | | | | | | | | | | |
| 4.250%, 04/01/2031 (Callable 01/29/2024) | | | 185,000 | | | | 185,082 | | | | | |
| 4.000%, 04/01/2032 (Callable 04/01/2029) | | | 1,875,000 | | | | 1,907,512 | | | | | |
| Alaska Municipal Bond Bank Authority, | | | | | | | | | | | | |
| 5.000%, 12/01/2028 (Callable 12/01/2026) | | | 615,000 | | | | 642,744 | | | | | |
| Borough of Matanuska-Susitna AK: | | | | | | | | | | | | |
| 5.250%, 09/01/2026 (Callable 09/01/2025) | | | 35,000 | | | | 36,175 | | | | | |
| 5.250%, 09/01/2028 (Callable 09/01/2025) | | | 165,000 | | | | 170,455 | | | | | |
| Southeast Alaska Power Agency, | | | | | | | | | | | | |
| 5.250%, 06/01/2029 (Callable 12/01/2024) | | | 150,000 | | | | 152,738 | | | | | |
| University of Alaska, | | | | | | | | | | | | |
| 5.000%, 10/01/2028 (Callable 10/01/2025) | | | 110,000 | | | | 113,307 | | | | | |
| Total Alaska | | | | | | | | | | | | |
| (Cost $3,454,176) | | | | | | | 3,426,506 | | | | 0.4 | % |
| Arizona | | | | | | | | | | | | |
| Arizona Industrial Development Authority: | | | | | | | | | | | | |
| 2.470%, 07/01/2025 | | | | | | | | | | | | |
| (Insured by SD CRED PROG) | | | 80,000 | | | | 78,174 | | | | | |
| 3.169%, 10/01/2025 | | | 65,000 | | | | 63,118 | | | | | |
4.750%, 10/01/2025(3) | | | 155,000 | | | | 151,348 | | | | | |
4.000%, 07/15/2026(3) | | | 125,000 | | | | 122,523 | | | | | |
| 5.000%, 10/01/2028 | | | 110,000 | | | | 116,699 | | | | | |
| 5.000%, 10/01/2029 | | | 10,000 | | | | 10,713 | | | | | |
1.745%, 09/01/2030 (Insured by AGM)(1)(3) | | | 6,000,000 | | | | 5,664,590 | | | | | |
5.000%, 10/01/2030 (Callable 10/01/2026)(3) | | | 105,000 | | | | 98,903 | | | | | |
| 5.000%, 10/01/2030 (Callable 10/01/2029) | | | 140,000 | | | | 149,691 | | | | | |
| 4.000%, 10/01/2031 (Callable 10/01/2029) | | | 65,000 | | | | 65,207 | | | | | |
| 4.000%, 10/01/2032 (Callable 10/01/2029) | | | 155,000 | | | | 155,250 | | | | | |
| 3.625%, 05/20/2033 | | | 2,959,438 | | | | 2,801,588 | | | | | |
| 4.000%, 10/01/2033 (Callable 10/01/2029) | | | 100,000 | | | | 100,046 | | | | | |
| 4.000%, 10/01/2034 (Callable 10/01/2029) | | | 85,000 | | | | 85,087 | | | | | |
| 5.250%, 11/01/2048 (Callable 11/01/2032) | | | 1,500,000 | | | | 1,621,389 | | | | | |
| City of Phoenix Civic Improvement Corp.: | | | | | | | | | | | | |
| 5.000%, 07/01/2035 (Callable 07/01/2025) | | | 1,000,000 | | | | 1,023,404 | | | | | |
| 5.250%, 07/01/2047 (Callable 07/01/2033) | | | 1,000,000 | | | | 1,145,579 | | | | | |
| Glendale Industrial Development Authority: | | | | | | | | | | | | |
| 4.000%, 05/15/2025 (Callable 05/15/2024) | | | 75,000 | | | | 73,448 | | | | | |
| 4.000%, 05/15/2027 (Callable 05/15/2024) | | | 175,000 | | | | 168,112 | | | | | |
| 2.125%, 07/01/2033 (Callable 07/01/2029) | | | 100,000 | | | | 85,118 | | | | | |
| Industrial Development Authority | | | | | | | | | | | | |
| of the City of Phoenix, | | | | | | | | | | | | |
| 2.950%, 07/01/2026 (Callable 07/01/2025) | | | 1,000,000 | | | | 968,266 | | | | | |
| Maricopa County Industrial | | | | | | | | | | | | |
| Development Authority: | | | | | | | | | | | | |
4.500%, 07/01/2025(3) | | | 125,000 | | | | 122,732 | | | | | |
| 5.000%, 07/01/2025 | | | | | | | | | | | | |
| (Insured by SD CRED PROG) | | | 475,000 | | | | 483,829 | | | | | |
2.100%, 07/01/2026(3)(5) | | | 950,000 | | | | 900,882 | | | | | |
| 5.000%, 07/01/2026 | | | | | | | | | | | | |
| (Insured by SD CRED PROG) | | | 680,000 | | | | 705,392 | | | | | |
| 5.000%, 07/01/2027 | | | | | | | | | | | | |
| (Insured by SD CRED PROG) | | | 710,000 | | | | 748,839 | | | | | |
5.250%, 07/01/2033 (Callable 07/01/2030)(3) | | | 725,000 | | | | 735,746 | | | | | |
| 5.000%, 01/01/2036 | | | | | | | | | | | | |
| (Pre-refunded to 01/01/2025) | | | 1,390,000 | | | | 1,436,407 | | | | | |
6.000%, 07/01/2043 (Callable 07/01/2030)(3) | | | 1,385,000 | | | | 1,397,573 | | | | | |
| Total Arizona | | | | | | | | | | | | |
| (Cost $20,994,153) | | | | | | | 21,279,653 | | | | 2.3 | % |
| Arkansas | | | | | | | | | | | | |
| Arkansas Development Finance Authority, | | | | | | | | | | | | |
| 4.420%, 09/01/2044 (Callable 01/02/2024) | | | | | | | | | | | | |
(Optional Put Date 01/05/2024)(1) | | | 5,000,000 | | | | 5,000,000 | | | | | |
| Batesville Public Facilities Board, | | | | | | | | | | | | |
| 5.000%, 06/01/2027 | | | 500,000 | | | | 523,980 | | | | | |
| City of Heber Springs AR, | | | | | | | | | | | | |
| 1.625%, 06/01/2047 (Callable 06/01/2028) | | | 690,000 | | | | 653,057 | | | | | |
The accompanying notes are an integral part of these financial statements.
Baird Strategic Municipal Bond Fund
Schedule of Investments, December 31, 2023
Long-Term Investments (cont.)
| | | Principal | | | | | | % of | |
| | | Amount | | | Value | | | Net Assets | |
| City of Prairie Grove AR, | | | | | | | | | |
| 1.750%, 06/01/2051 | | | | | | | | | |
| (Callable 12/01/2026) (Insured by BAM) | | $ | 560,000 | | | $ | 524,228 | | | | |
| City of West Memphis AR, | | | | | | | | | | | |
| 3.000%, 12/01/2041 | | | | | | | | | | | |
| (Callable 12/01/2028) (Insured by BAM) | | | 605,000 | | | | 528,016 | | | | |
| County of Pulaski AR, | | | | | | | | | | | |
| 5.000%, 03/01/2030 (Callable 09/01/2026) | | | 40,000 | | | | 42,209 | | | | |
| Henderson State University, | | | | | | | | | | | |
| 3.625%, 11/01/2033 | | | | | | | | | | | |
| (Callable 01/29/2024) (Insured by BAM) | | | 55,000 | | | | 55,021 | | | | |
| Lonoke School District No. 1, | | | | | | | | | | | |
| 2.250%, 02/01/2030 | | | | | | | | | | | |
| (Callable 01/29/2024) (Insured by ST AID) | | | 255,000 | | | | 243,244 | | | | |
| Total Arkansas | | | | | | | | | | | |
| (Cost $7,613,267) | | | | | | | 7,569,755 | | | | 0.8 | % |
| California | | | | | | | | | | | | |
| Anaheim Public Financing Authority, | | | | | | | | | | | | |
| 0.000%, 09/01/2031 (Insured by AGM) | | | 1,500,000 | | | | 1,177,300 | | | | | |
| Burbank Unified School District, | | | | | | | | | | | | |
4.500%, 08/01/2037 (Callable 08/01/2028)(5) | | | 25,000 | | | | 26,512 | | | | | |
| California Community | | | | | | | | | | | | |
| Choice Financing Authority, | | | | | | | | | | | | |
| 5.250%, 01/01/2054 (Callable 10/01/2030) | | | | | | | | | | | | |
(Mandatory Tender Date 10/01/2031)(1) | | | 1,850,000 | | | | 1,956,969 | | | | | |
| California Health Facilities Financing Authority, | | | | | | | | | | | | |
| 5.000%, 08/15/2037 (Callable 08/15/2027) | | | 100,000 | | | | 103,580 | | | | | |
| California Housing Finance Agency: | | | | | | | | | | | | |
| 3.750%, 03/25/2035 (Insured by FHLMC) | | | 3,886,268 | | | | 3,839,974 | | | | | |
| 4.375%, 09/20/2036 | | | 1,494,263 | | | | 1,499,741 | | | | | |
| 3.600%, 08/01/2063 (Callable 02/01/2026) | | | | | | | | | | | | |
| (Mandatory Tender Date 08/01/2026) | | | | | | | | | | | | |
(Insured by FHA)(1) | | | 1,000,000 | | | | 1,000,384 | | | | | |
| California Infrastructure & | | | | | | | | | | | | |
| Economic Development Bank: | | | | | | | | | | | | |
| 4.000%, 11/01/2039 (Callable 11/01/2031) | | | 630,000 | | | | 641,959 | | | | | |
| 3.780%, 12/01/2050 (SIFMA Municipal Swap | | | | | | | | | | | | |
| Index + 0.700%) (Callable 06/01/2025) | | | | | | | | | | | | |
(Mandatory Tender Date 06/01/2026)(2) | | | 200,000 | | | | 194,882 | | | | | |
| California Municipal Finance Authority, | | | | | | | | | | | | |
| 5.000%, 05/15/2024 | | | 1,200,000 | | | | 1,205,653 | | | | | |
| California Public Finance Authority: | | | | | | | | | | | | |
2.125%, 11/15/2027 (Callable 01/19/2024)(3) | | | 595,000 | | | | 594,444 | | | | | |
2.375%, 11/15/2028 (Callable 01/19/2024)(3) | | | 665,000 | | | | 663,018 | | | | | |
3.125%, 05/15/2029 (Callable 01/19/2024)(3) | | | 2,250,000 | | | | 2,214,395 | | | | | |
| California Statewide Communities | | | | | | | | | | | | |
| Development Authority: | | | | | | | | | | | | |
| 5.000%, 08/01/2026 (Callable 02/01/2024) | | | | | | | | | | | | |
| (Mandatory Tender Date 08/01/2024) | | | | | | | | | | | | |
(Insured by HUD)(1) | | | 1,000,000 | | | | 999,396 | | | | | |
| 5.000%, 05/15/2034 (Callable 05/15/2026) | | | 100,000 | | | | 102,309 | | | | | |
| Calipatria Unified School District: | | | | | | | | | | | | |
| 0.000%, 08/01/2025 (Insured by BAM) | | | 15,000 | | | | 13,978 | | | | | |
| 0.000%, 08/01/2027 (Insured by BAM) | | | 165,000 | | | | 145,208 | | | | | |
| Cathedral City Public Financing Authority, | | | | | | | | | | | | |
| 0.000%, 08/01/2032 (Insured by NATL) | | | 1,085,000 | | | | 801,917 | | | | | |
| City of Los Angeles Department of Airports: | | | | | | | | | | | | |
| 5.000%, 05/15/2029 | | | 100,000 | | | | 109,787 | | | | | |
| 5.000%, 05/15/2034 (Callable 05/15/2028) | | | 1,710,000 | | | | 1,833,282 | | | | | |
| City of Sacramento CA, | | | | | | | | | | | | |
| 4.000%, 09/01/2036 (Callable 09/01/2027) | | | 100,000 | | | | 103,338 | | | | | |
| City of Vernon CA, | | | | | | | | | | | | |
| 5.000%, 04/01/2025 | | | 3,000,000 | | | | 3,042,873 | | | | | |
| El Monte City School District, | | | | | | | | | | | | |
| 0.000%, 08/01/2031 (Insured by AGC) | | | 100,000 | | | | 77,032 | | | | | |
| Freddie Mac Multifamily ML Certificates: | | | | | | | | | | | | |
| 3.350%, 11/25/2033 | | | 2,633,122 | | | | 2,427,780 | | | | | |
3.996%, 12/25/2036(1) | | | 1,997,715 | | | | 1,933,823 | | | | | |
4.000%, 01/25/2040(5) | | | 2,985,025 | | | | 2,695,886 | | | | | |
| Freddie Mac Multifamily | | | | | | | | | | | | |
| Variable Rate Certificate, | | | | | | | | | | | | |
| 2.875%, 07/25/2036 | | | 3,066,098 | | | | 2,702,000 | | | | | |
| Golden West Schools Financing Authority, | | | | | | | | | | | | |
| 0.000%, 08/01/2025 (Insured by NATL) | | | 150,000 | | | | 141,473 | | | | | |
| Huntington Beach Union High School District, | | | | | | | | | | | | |
| 0.000%, 09/01/2032 (Insured by AGM) | | | 400,000 | | | | 305,156 | | | | | |
| Inglewood Unified School District School | | | | | | | | | | | | |
| Facilities Financing Authority, | | | | | | | | | | | | |
| 5.250%, 10/15/2026 (Insured by AGM) | | | 1,000,000 | | | | 1,029,113 | | | | | |
| Irvine Facilities Financing Authority, | | | | | | | | | | | | |
| 5.250%, 05/01/2043 (Callable 05/01/2026) | | | 2,000,000 | | | | 2,085,707 | | | | | |
| Long Beach Bond Finance Authority, | | | | | | | | | | | | |
| 4.689%, 11/15/2026 | | | | | | | | | | | | |
(3 Month LIBOR USD + 1.430%)(2)(7) | | | 700,000 | | | | 702,514 | | | | | |
| Los Alamitos Unified School District, | | | | | | | | | | | | |
0.000%, 08/01/2034 (Callable 08/01/2029)(5) | | | 100,000 | | | | 112,590 | | | | | |
| Los Angeles Department of Water & Power, | | | | | | | | | | | | |
| 5.000%, 07/01/2044 (Callable 07/01/2024) | | | 100,000 | | | | 100,532 | | | | | |
| Mayers Memorial Hospital District: | | | | | | | | | | | | |
| 0.000%, 08/01/2025 | | | 130,000 | | | | 120,973 | | | | | |
| 0.000%, 08/01/2026 | | | 230,000 | | | | 205,432 | | | | | |
| 0.000%, 08/01/2029 | | | 165,000 | | | | 130,631 | | | | | |
| 0.000%, 08/01/2032 | | | 210,000 | | | | 144,501 | | | | | |
| 0.000%, 08/01/2034 | | | 260,000 | | | | 159,994 | | | | | |
| Metropolitan Water District | | | | | | | | | | | | |
| of Southern California, | | | | | | | | | | | | |
| 3.220%, 07/01/2037 | | | | | | | | | | | | |
| (SIFMA Municipal Swap Index + 0.140%) | | | | | | | | | | | | |
(Mandatory Tender Date 05/21/2024)(2) | | | 150,000 | | | | 149,781 | | | | | |
| Moraga Elementary School District, | | | | | | | | | | | | |
| 3.000%, 08/01/2044 (Callable 08/01/2027) | | | 100,000 | | | | 87,713 | | | | | |
| Moreno Valley Unified School District, | | | | | | | | | | | | |
| 0.000%, 08/01/2025 (Insured by NATL) | | | 150,000 | | | | 142,508 | | | | | |
| Norwalk-La Mirada Unified School District, | | | | | | | | | | | | |
| 0.000%, 08/01/2026 (Insured by NATL) | | | 750,000 | | | | 694,827 | | | | | |
| Oxnard School District, | | | | | | | | | | | | |
| 5.875%, 08/01/2045 | | | | | | | | | | | | |
(Callable 08/01/2026) (Insured by BAM)(5) | | | 95,000 | | | | 99,102 | | | | | |
| Pleasanton Unified School District, | | | | | | | | | | | | |
| 5.250%, 06/01/2041 | | | | | | | | | | | | |
| (Callable 06/01/2025) (Insured by AGM) | | | 100,000 | | | | 102,791 | | | | | |
| Sacramento County Water Financing Authority, | | | | | | | | | | | | |
| 0.678%, 06/01/2034 | | | | | | | | | | | | |
| (3 Month TSFR + 0.550%) | | | | | | | | | | | | |
(Callable 01/29/2024) (Insured by NATL)(2) | | | 2,560,000 | | | | 2,390,030 | | | | | |
| San Francisco City & County Airport Comm- | | | | | | | | | | | | |
| San Francisco International Airport, | | | | | | | | | | | | |
| 5.000%, 05/01/2028 | | | 2,725,000 | | | | 2,930,512 | | | | | |
| San Marcos Public Facilities Authority, | | | | | | | | | | | | |
| 5.000%, 09/01/2029 | | | | | | | | | | | | |
| (Callable 09/01/2024) (Insured by AGM) | | | 200,000 | | | | 202,633 | | | | | |
| San Mateo Union High School District, | | | | | | | | | | | | |
0.000%, 09/01/2033(5) | | | 45,000 | | | | 43,992 | | | | | |
| San Ysidro School District, | | | | | | | | | | | | |
| 0.000%, 08/01/2027 (Insured by NATL) | | | 50,000 | | | | 44,438 | | | | | |
| Santa Cruz City High School District, | | | | | | | | | | | | |
| 0.000%, 02/01/2024 (Insured by NATL) | | | 200,000 | | | | 199,453 | | | | | |
The accompanying notes are an integral part of these financial statements.
Baird Strategic Municipal Bond Fund
Schedule of Investments, December 31, 2023
Long-Term Investments (cont.)
| | | Principal | | | | | | % of | |
| | | Amount | | | Value | | | Net Assets | |
| Simi Valley Unified School District, | | | | | | | | | |
| 4.000%, 08/01/2038 (Callable 08/01/2027) | | $ | 155,000 | | | $ | 158,607 | | | | |
| Tuolumne Utilities District, | | | | | | | | | | | |
| 1.250%, 08/15/2024 (Callable 01/29/2024) | | | 2,200,000 | | | | 2,155,918 | | | | |
| Western Placer Unified School District, | | | | | | | | | | | |
| 2.000%, 06/01/2025 (Callable 01/29/2024) | | | 225,000 | | | | 218,384 | | | | |
| Yorba Linda Redevelopment | | | | | | | | | | | |
| Agency Successor Agency, | | | | | | | | | | | |
| 0.000%, 09/01/2026 (Insured by NATL) | | | 315,000 | | | | 285,260 | | | | |
| Total California | | | | | | | | | | | |
| (Cost $46,982,278) | | | | | | | 47,251,985 | | | | 5.1 | % |
| Colorado | | | | | | | | | | | | |
| Arkansas River Power Authority: | | | | | | | | | | | | |
| 5.875%, 10/01/2026 | | | | | | | | | | | | |
| (ETM) (Insured by XLCA) | | | 775,000 | | | | 811,117 | | | | | |
| 5.000%, 10/01/2029 (Callable 10/01/2028) | | | 725,000 | | | | 764,257 | | | | | |
| 5.000%, 10/01/2032 (Callable 10/01/2028) | | | 1,000,000 | | | | 1,052,149 | | | | | |
| City & County of Denver CO: | | | | | | | | | | | | |
| 5.000%, 11/15/2028 | | | 2,000,000 | | | | 2,167,088 | | | | | |
| 5.000%, 11/15/2029 | | | 2,000,000 | | | | 2,196,363 | | | | | |
| 5.000%, 11/15/2047 (Callable 11/15/2032) | | | 1,320,000 | | | | 1,412,607 | | | | | |
| Colorado Bridge Enterprise, | | | | | | | | | | | | |
| 4.000%, 06/30/2029 (Callable 12/31/2027) | | | 3,410,000 | | | | 3,436,733 | | | | | |
| Colorado Educational & | | | | | | | | | | | | |
| Cultural Facilities Authority: | | | | | | | | | | | | |
| 5.000%, 10/01/2028 (Callable 10/01/2025) | | | 1,500,000 | | | | 1,495,504 | | | | | |
| 2.000%, 09/01/2030 (Callable 09/01/2028) | | | 485,000 | | | | 448,632 | | | | | |
| 5.000%, 10/01/2030 (Callable 10/01/2025) | | | 100,000 | | | | 99,203 | | | | | |
| 5.000%, 12/01/2038 (Callable 12/01/2028) | | | 1,110,000 | | | | 1,166,562 | | | | | |
| 4.000%, 12/01/2039 (Callable 12/01/2024) | | | 115,000 | | | | 113,428 | | | | | |
| Colorado Health Facilities Authority: | | | | | | | | | | | | |
| 2.125%, 05/15/2028 (Callable 01/29/2024) | | | 750,000 | | | | 697,579 | | | | | |
| 5.000%, 08/01/2028 | | | 490,000 | | | | 528,576 | | | | | |
| 2.625%, 05/15/2029 (Callable 01/29/2024) | | | 1,000,000 | | | | 916,843 | | | | | |
| 5.250%, 05/15/2032 (Callable 05/15/2027) | | | 550,000 | | | | 561,345 | | | | | |
| 5.250%, 11/01/2034 (Callable 11/01/2032) | | | 1,000,000 | | | | 1,141,902 | | | | | |
| 5.000%, 08/01/2044 (Callable 08/01/2029) | | | 170,000 | | | | 177,036 | | | | | |
| 3.630%, 05/15/2061 (SIFMA Municipal Swap | | | | | | | | | | | | |
| Index + 0.550%) (Callable 02/17/2026) | | | | | | | | | | | | |
(Mandatory Tender Date 08/17/2026)(2) | | | 2,000,000 | | | | 1,984,337 | | | | | |
| 5.000%, 05/15/2062 (Callable 02/17/2026) | | | | | | | | | | | | |
(Mandatory Tender Date 08/17/2026)(1) | | | 4,000,000 | | | | 4,211,255 | | | | | |
| Denver Convention Center Hotel Authority: | | | | | | | | | | | | |
| 5.000%, 12/01/2024 | | | 1,500,000 | | | | 1,512,530 | | | | | |
| 5.000%, 12/01/2028 (Callable 12/01/2026) | | | 720,000 | | | | 745,530 | | | | | |
| Denver Health & Hospital Authority, | | | | | | | | | | | | |
| 4.000%, 12/01/2028 (Callable 01/29/2024) | | | 100,000 | | | | 100,026 | | | | | |
| Denver Housing Authority, | | | | | | | | | | | | |
| 5.000%, 07/01/2027 | | | | | | | | | | | | |
| (Callable 07/01/2026) (Insured by HUD) | | | 2,000,000 | | | | 2,102,393 | | | | | |
| E-470 Public Highway Authority, | | | | | | | | | | | | |
| 0.000%, 09/01/2031 (Insured by NATL) | | | 1,500,000 | | | | 1,181,910 | | | | | |
| Fort Collins Housing Authority, | | | | | | | | | | | | |
| 1.250%, 07/01/2024 (Callable 01/19/2024) | | | 565,000 | | | | 558,053 | | | | | |
| Prairie Center Metropolitan District No. 7, | | | | | | | | | | | | |
| 4.125%, 12/15/2036 (Callable 12/15/2025) | | | 140,000 | | | | 125,844 | | | | | |
| Vauxmont Metropolitan District, | | | | | | | | | | | | |
| 3.250%, 12/15/2050 | | | | | | | | | | | | |
| (Callable 12/15/2024) (Insured by AGM) | | | 1,858,000 | | | | 1,585,602 | | | | | |
| Total Colorado | | | | | | | | | | | | |
| (Cost $32,975,329) | | | | | | | 33,294,404 | | | | 3.6 | % |
| Connecticut | | | | | | | | | | | | |
| City of New Haven CT, | | | | | | | | | | | | |
| 5.000%, 08/01/2027 (Insured by BAM) | | | 550,000 | | | | 590,674 | | | | | |
| Connecticut Housing Finance Authority, | | | | | | | | | | | | |
| 3.500%, 11/15/2045 (Callable 05/15/2029) | | | 785,000 | | | | 772,729 | | | | | |
| Connecticut State Health & | | | | | | | | | | | | |
| Educational Facilities Authority: | | | | | | | | | | | | |
| 3.500%, 07/01/2026 | | | 825,000 | | | | 801,950 | | | | | |
| 5.000%, 07/01/2027 (Callable 07/01/2026) | | | 60,000 | | | | 60,503 | | | | | |
| 5.000%, 07/01/2029 | | | 400,000 | | | | 434,309 | | | | | |
| 5.000%, 07/01/2030 | | | 425,000 | | | | 467,202 | | | | | |
| 4.000%, 07/01/2051 (Callable 07/01/2031) | | | 300,000 | | | | 285,751 | | | | | |
| 2.800%, 07/01/2057 | | | | | | | | | | | | |
(Mandatory Tender Date 02/03/2026)(1) | | | 2,500,000 | | | | 2,501,642 | | | | | |
| East Hartford Housing Authority, | | | | | | | | | | | | |
| 4.250%, 02/01/2027 (Callable 08/01/2024) | | | | | | | | | | | | |
| (Mandatory Tender Date 02/01/2025) | | | | | | | | | | | | |
(Insured by HUD)(1) | | | 1,000,000 | | | | 1,002,590 | | | | | |
| State of Connecticut: | | | | | | | | | | | | |
| 3.000%, 01/15/2032 (Callable 01/15/2031) | | | 1,825,000 | | | | 1,827,203 | | | | | |
| 5.000%, 09/15/2032 | | | 225,000 | | | | 270,541 | | | | | |
| Town of Sprague CT: | | | | | | | | | | | | |
| 4.000%, 09/01/2024 (Insured by BAM) | | | 40,000 | | | | 40,126 | | | | | |
| 4.000%, 09/01/2025 (Insured by BAM) | | | 55,000 | | | | 55,600 | | | | | |
| Total Connecticut | | | | | | | | | | | | |
| (Cost $9,001,834) | | | | | | | 9,110,820 | | | | 1.0 | % |
| District of Columbia | | | | | | | | | | | | |
| District of Columbia: | | | | | | | | | | | | |
| 5.000%, 07/01/2027 | | | 125,000 | | | | 130,703 | | | | | |
| 5.500%, 02/28/2034 | | | 1,000,000 | | | | 1,176,246 | | | | | |
| District of Columbia Water & Sewer Authority: | | | | | | | | | | | | |
| 4.000%, 10/01/2040 (Callable 04/01/2032) | | | 100,000 | | | | 103,308 | | | | | |
| 3.000%, 10/01/2057 (Callable 07/01/2027) | | | | | | | | | | | | |
(Mandatory Tender Date 10/01/2027)(1) | | | 1,000,000 | | | | 979,660 | | | | | |
| Metropolitan Washington Airports Authority, | | | | | | | | | | | | |
| 5.000%, 10/01/2037 (Callable 10/01/2027) | | | 1,000,000 | | | | 1,048,772 | | | | | |
| Total District of Columbia | | | | | | | | | | | | |
| (Cost $3,418,673) | | | | | | | 3,438,689 | | | | 0.4 | % |
| Florida | | | | | | | | | | | | |
| Capital Projects Finance Authority, | | | | | | | | | | | | |
| 5.000%, 10/01/2027 | | | 1,000,000 | | | | 1,036,194 | | | | | |
| Capital Trust Agency, Inc.: | | | | | | | | | | | | |
5.250%, 12/01/2024(3) | | | 250,000 | | | | 246,048 | | | | | |
3.375%, 07/01/2031(3) | | | 1,000,000 | | | | 946,188 | | | | | |
| City of Cape Coral FL: | | | | | | | | | | | | |
| 5.000%, 10/01/2036 | | | | | | | | | | | | |
| (Callable 10/01/2033) (Insured by BAM) | | | 325,000 | | | | 381,147 | | | | | |
| 5.000%, 10/01/2037 | | | | | | | | | | | | |
| (Callable 10/01/2033) (Insured by BAM) | | | 520,000 | | | | 603,485 | | | | | |
| 5.000%, 10/01/2038 | | | | | | | | | | | | |
| (Callable 10/01/2033) (Insured by BAM) | | | 325,000 | | | | 374,640 | | | | | |
| 5.650%, 03/01/2054 | | | | | | | | | | | | |
| (Callable 03/01/2033) (Insured by BAM) | | | 3,750,000 | | | | 4,219,139 | | | | | |
| City of Fort Lauderdale FL, | | | | | | | | | | | | |
| 5.500%, 09/01/2048 (Callable 09/01/2033) | | | 1,750,000 | | | | 2,033,921 | | | | | |
| City of Sunrise FL, | | | | | | | | | | | | |
| 3.000%, 10/01/2050 (Callable 10/01/2030) | | | 2,000,000 | | | | 1,497,177 | | | | | |
| City of Tallahassee FL, | | | | | | | | | | | | |
| 5.000%, 12/01/2027 (Callable 12/01/2025) | | | 500,000 | | | | 513,959 | | | | | |
| County of Collier FL, | | | | | | | | | | | | |
| 5.000%, 06/01/2025 | | | 850,000 | | | | 859,935 | | | | | |
The accompanying notes are an integral part of these financial statements.
Baird Strategic Municipal Bond Fund
Schedule of Investments, December 31, 2023
Long-Term Investments (cont.)
| | | Principal | | | | | | % of | |
| | | Amount | | | Value | | | Net Assets | |
| County of Miami-Dade FL: | | | | | | | | | |
| 5.000%, 10/01/2024 | | $ | 285,000 | | | $ | 287,529 | | | | |
| 5.000%, 10/01/2031 (Callable 10/01/2024) | | | 160,000 | | | | 161,732 | | | | |
| County of Miami-Dade Seaport Department, | | | | | | | | | | | |
| 4.000%, 10/01/2040 | | | | | | | | | | | |
| (Callable 10/01/2031) (Insured by AGM) | | | 100,000 | | | | 100,836 | | | | |
| County of Osceola FL, | | | | | | | | | | | |
| 0.000%, 10/01/2029 | | | 800,000 | | | | 623,690 | | | | |
| County of Palm Beach FL, | | | | | | | | | | | |
5.000%, 04/01/2029(3) | | | 1,315,000 | | | | 1,335,140 | | | | |
| Florida Development Finance Corp.: | | | | | | | | | | | |
4.000%, 06/01/2024(3) | | | 105,000 | | | | 104,456 | | | | |
| 5.000%, 11/15/2024 | | | 600,000 | | | | 608,107 | | | | |
| 4.000%, 06/15/2025 | | | 445,000 | | | | 443,951 | | | | |
5.250%, 06/15/2029 (Callable 06/15/2027)(3) | | | 2,000,000 | | | | 2,024,446 | | | | |
| 3.000%, 06/01/2032 (Callable 06/01/2024) | | | 2,000,000 | | | | 1,603,548 | | | | |
5.000%, 08/15/2032(3) | | | 910,000 | | | | 908,689 | | | | |
| 5.000%, 02/01/2035 (Callable 02/01/2032) | | | 1,000,000 | | | | 1,021,624 | | | | |
| Florida Housing Finance Corp., | | | | | | | | | | | |
| 4.200%, 01/01/2045 | | | | | | | | | | | |
| (Callable 01/01/2028) (Insured by GNMA) | | | 55,000 | | | | 55,217 | | | | |
| Highlands County Health Facilities Authority, | | | | | | | | | | | |
| 3.080%, 11/15/2037 (Callable 01/29/2024) | | | | | | | | | | | |
(Optional Put Date 01/05/2024)(1) | | | 6,000,000 | | | | 6,000,000 | | | | |
| Lee County Housing Finance Authority, | | | | | | | | | | | |
| 3.550%, 08/01/2027 (Callable 02/01/2025) | | | | | | | | | | | |
(Mandatory Tender Date 08/01/2025)(1) | | | 1,000,000 | | | | 999,332 | | | | |
| Miami-Dade County | | | | | | | | | | | |
| Housing Finance Authority, | | | | | | | | | | | |
| 3.550%, 01/01/2027 | | | | | | | | | | | |
(Mandatory Tender Date 01/01/2026)(1) | | | 2,645,000 | | | | 2,646,368 | | | | |
| Orange County Health Facilities Authority, | | | | | | | | | | | |
| 5.000%, 08/01/2028 (Callable 08/01/2024) | | | 300,000 | | | | 301,790 | | | | |
| Palm Beach County Housing Authority, | | | | | | | | | | | |
| 5.000%, 04/01/2026 | | | | | | | | | | | |
(Mandatory Tender Date 04/01/2025)(1) | | | 1,000,000 | | | | 1,015,022 | | | | |
| Sarasota County Health Facilities Authority, | | | | | | | | | | | |
| 4.000%, 05/15/2028 (Callable 05/15/2025) | | | 50,000 | | | | 48,765 | | | | |
| School Board of Miami-Dade County, | | | | | | | | | | | |
| 5.000%, 02/01/2028 (Callable 02/01/2026) | | | 1,000,000 | | | | 1,043,430 | | | | |
| St. Johns County Housing Finance Authority: | | | | | | | | | | | |
| 3.550%, 07/01/2027 (Callable 01/01/2025) | | | | | | | | | | | |
(Mandatory Tender Date 07/01/2025)(1) | | | 1,000,000 | | | | 999,560 | | | | |
| 5.500%, 12/01/2028 (Callable 06/01/2026) | | | | | | | | | | | |
(Mandatory Tender Date 12/01/2026)(1)(3) | | | 2,500,000 | | | | 2,499,707 | | | | |
| Sumter County Industrial | | | | | | | | | | | |
| Development Authority, | | | | | | | | | | | |
| 5.000%, 07/01/2025 (Callable 01/29/2024) | | | 500,000 | | | | 500,576 | | | | |
| Tradition Community | | | | | | | | | | | |
| Development District No. 1, | | | | | | | | | | | |
| 4.000%, 05/01/2028 | | | | | | | | | | | |
| (Callable 05/01/2024) (Insured by AGM) | | | 1,495,000 | | | | 1,501,606 | | | | |
| UCF Stadium Corp., | | | | | | | | | | | |
| 5.000%, 03/01/2025 | | | 370,000 | | | | 377,029 | | | | |
| Total Florida | | | | | | | | | | | |
| (Cost $39,022,847) | | | | | | | 39,923,983 | | | | 4.3 | % |
| Georgia | | | | | | | | | | | | |
| Atlanta Development Authority, | | | | | | | | | | | | |
| 5.000%, 07/01/2024 | | | 200,000 | | | | 201,758 | | | | | |
| Atlanta Urban Residential Finance Authority, | | | | | | | | | | | | |
| 2.000%, 09/01/2025 | | | | | | | | | | | | |
(Mandatory Tender Date 09/01/2024)(1) | | | 1,000,000 | | | | 985,104 | | | | | |
| Bartow County Development Authority: | | | | | | | | | | | | |
| 3.950%, 12/01/2032 | | | | | | | | | | | | |
(Mandatory Tender Date 03/08/2028)(1) | | | 1,000,000 | | | | 1,016,553 | | | | | |
| 2.875%, 08/01/2043 | | | | | | | | | | | | |
(Mandatory Tender Date 08/19/2025)(1) | | | 2,000,000 | | | | 1,964,402 | | | | | |
| Carrollton Payroll Development Authority, | | | | | | | | | | | | |
| 5.000%, 07/01/2029 | | | 200,000 | | | | 223,763 | | | | | |
| City of Atlanta GA, | | | | | | | | | | | | |
| 5.000%, 07/01/2048 (Callable 07/01/2033) | | | 1,700,000 | | | | 1,822,762 | | | | | |
| Clayton County Development Authority, | | | | | | | | | | | | |
| 4.000%, 07/01/2034 (Callable 07/01/2027) | | | 100,000 | | | | 102,724 | | | | | |
| DeKalb County Housing Authority, | | | | | | | | | | | | |
| 4.000%, 12/01/2033 (Callable 12/01/2030) | | | 5,000,000 | | | | 4,984,026 | | | | | |
| Development Authority of Gwinnett County, | | | | | | | | | | | | |
| 5.000%, 07/01/2040 (Callable 07/01/2027) | | | 3,010,000 | | | | 3,124,373 | | | | | |
| Gainesville & Hall County | | | | | | | | | | | | |
| Development Authority, | | | | | | | | | | | | |
| 2.000%, 11/15/2033 | | | | | | | | | | | | |
| (Callable 01/01/2024) (Optional Put | | | | | | | | | | | | |
Date 01/02/2024) (Insured by AGC)(1) | | | 1,400,000 | | | | 1,400,000 | | | | | |
| George L Smith II Congress Center Authority, | | | | | | | | | | | | |
3.625%, 01/01/2031(3) | | | 2,750,000 | | | | 2,497,966 | | | | | |
| Main Street Natural Gas, Inc.: | | | | | | | | | | | | |
| 5.000%, 05/15/2024 | | | 65,000 | | | | 65,218 | | | | | |
| 5.000%, 12/01/2028 | | | 150,000 | | | | 158,178 | | | | | |
| 4.000%, 08/01/2049 (Callable 09/01/2024) | | | | | | | | | | | | |
(Mandatory Tender Date 12/02/2024)(1) | | | 1,000,000 | | | | 1,002,220 | | | | | |
| 4.000%, 07/01/2052 (Callable 06/01/2027) | | | | | | | | | | | | |
(Mandatory Tender Date 09/01/2027)(1) | | | 1,100,000 | | | | 1,106,455 | | | | | |
| 4.000%, 08/01/2052 (Callable 05/01/2027) | | | | | | | | | | | | |
(Mandatory Tender Date 11/01/2027)(1)(3) | | | 2,850,000 | | | | 2,742,495 | | | | | |
| 5.000%, 12/01/2052 (Callable 03/01/2029) | | | | | | | | | | | | |
(Mandatory Tender Date 06/01/2029)(1) | | | 1,250,000 | | | | 1,319,324 | | | | | |
| 5.000%, 06/01/2053 (Callable 03/01/2030) | | | | | | | | | | | | |
(Mandatory Tender Date 06/01/2030)(1) | | | 2,385,000 | | | | 2,529,109 | | | | | |
| Oconee County Industrial | | | | | | | | | | | | |
| Development Authority, | | | | | | | | | | | | |
| 5.750%, 03/01/2045 (Callable 03/01/2031) | | | 1,835,000 | | | | 1,575,815 | | | | | |
| Private Colleges & Universities Authority: | | | | | | | | | | | | |
| 5.000%, 06/01/2027 | | | 270,000 | | | | 286,160 | | | | | |
| 5.000%, 06/01/2033 (Callable 06/01/2031) | | | 500,000 | | | | 559,366 | | | | | |
| Total Georgia | | | | | | | | | | | | |
| (Cost $30,040,400) | | | | | | | 29,667,771 | | | | 3.2 | % |
| Hawaii | | | | | | | | | | | | |
| State of Hawaii, | | | | | | | | | | | | |
| 5.000%, 08/01/2027 (Callable 01/19/2024) | | | 2,535,000 | | | | 2,535,698 | | | | | |
| Total Hawaii | | | | | | | | | | | | |
| (Cost $2,535,000) | | | | | | | 2,535,698 | | | | 0.3 | % |
| Idaho | | | | | | | | | | | | |
| Idaho Housing & Finance Association: | | | | | | | | | | | | |
| 3.000%, 05/01/2042 (Callable 05/01/2032) | | | | | | | | | | | | |
| (Insured by SCH BD GTY) | | | 425,000 | | | | 328,296 | | | | | |
5.625%, 11/01/2043 (Callable 11/01/2033)(3) | | | 1,000,000 | | | | 1,033,904 | | | | | |
| 5.750%, 05/01/2048 (Callable 05/01/2031) | | | | | | | | | | | | |
| (Insured by SCH BD GTY) | | | 500,000 | | | | 533,943 | | | | | |
| 5.750%, 05/01/2058 (Callable 05/01/2031) | | | | | | | | | | | | |
| (Insured by SCH BD GTY) | | | 500,000 | | | | 529,828 | | | | | |
| Total Idaho | | | | | | | | | | | | |
| (Cost $2,281,910) | | | | | | | 2,425,971 | | | | 0.3 | % |
The accompanying notes are an integral part of these financial statements.
Baird Strategic Municipal Bond Fund
Schedule of Investments, December 31, 2023
Long-Term Investments (cont.)
| | | Principal | | | | | | % of | |
| | | Amount | | | Value | | | Net Assets | |
| Illinois | | | | | | | | | |
| Champaign & Piatt Counties | | | | | | | | | |
| Community Unit School District No. 3, | | | | | | | | | |
| 3.500%, 09/01/2029 (Callable 01/29/2024) | | $ | 180,000 | | | $ | 180,026 | | | |
| |
| Chicago Board of Education: | | | | | | | | | | | | |
| 0.000%, 12/01/2025 (Insured by NATL) | | | 1,000,000 | | | | 927,992 | | | | | |
| 5.250%, 04/01/2034 (Callable 04/01/2033) | | | 1,000,000 | | | | 1,119,959 | | | | | |
| Chicago Midway International Airport: | | | | | | | | | | | | |
5.000%, 01/01/2026(6) | | | 1,250,000 | | | | 1,285,455 | | | | | |
| 5.000%, 01/01/2027 (Insured by BAM) | | | 445,000 | | | | 467,331 | | | | | |
| Chicago O’Hare International Airport: | | | | | | | | | | | | |
| 5.000%, 01/01/2029 (Callable 01/01/2025) | | | 1,000,000 | | | | 1,008,983 | | | | | |
| 5.000%, 01/01/2030 (Callable 01/01/2025) | | | 625,000 | | | | 635,594 | | | | | |
| 5.000%, 01/01/2036 (Callable 01/01/2032) | | | 500,000 | | | | 558,417 | | | | | |
| 5.500%, 01/01/2055 (Callable 01/01/2032) | | | 1,255,000 | | | | 1,361,772 | | | | | |
| Chicago Park District: | | | | | | | | | | | | |
| 5.000%, 01/01/2024 | | | 225,000 | | | | 225,000 | | | | | |
| 5.000%, 01/01/2029 (Callable 01/22/2024) | | | 1,125,000 | | | | 1,126,122 | | | | | |
| 5.000%, 01/01/2030 (Callable 02/01/2024) | | | 50,000 | | | | 50,074 | | | | | |
| 5.250%, 01/01/2042 (Callable 01/01/2033) | | | 1,255,000 | | | | 1,393,766 | | | | | |
| Chicago Transit Authority, | | | | | | | | | | | | |
| 5.250%, 12/01/2049 (Callable 12/01/2024) | | | 2,430,000 | | | | 2,442,875 | | | | | |
| City of Chicago IL: | | | | | | | | | | | | |
| 5.000%, 11/01/2027 | | | | | | | | | | | | |
| (Callable 11/01/2026) (Insured by BAM) | | | 100,000 | | | | 105,382 | | | | | |
| 0.000%, 01/01/2029 (Insured by NATL) | | | 4,125,000 | | | | 3,445,133 | | | | | |
| 5.000%, 11/01/2029 (Callable 11/01/2026) | | | 390,000 | | | | 409,612 | | | | | |
| 4.000%, 11/01/2032 | | | | | | | | | | | | |
| (Callable 11/01/2024) (Insured by BAM) | | | 125,000 | | | | 126,041 | | | | | |
| 5.500%, 01/01/2040 (Callable 01/01/2032) | | | 1,000,000 | | | | 1,092,556 | | | | | |
| 5.250%, 01/01/2042 | | | | | | | | | | | | |
| (Callable 07/01/2032) (Insured by AGM) | | | 1,000,000 | | | | 1,142,005 | | | | | |
| 5.250%, 01/01/2043 | | | | | | | | | | | | |
| (Callable 07/01/2032) (Insured by AGM) | | | 1,000,000 | | | | 1,138,300 | | | | | |
| City of Springfield IL, | | | | | | | | | | | | |
| 5.000%, 03/01/2033 (Callable 03/01/2025) | | | 1,000,000 | | | | 1,017,506 | | | | | |
| Cook County Community | | | | | | | | | | | | |
| College District No. 508, | | | | | | | | | | | | |
| 5.250%, 12/01/2028 (Callable 01/29/2024) | | | 325,000 | | | | 325,166 | | | | | |
| Cook County Community | | | | | | | | | | | | |
| Consolidated School District No. 15, | | | | | | | | | | | | |
| 5.250%, 06/15/2043 (Callable 06/15/2033) | | | 1,000,000 | | | | 1,120,153 | | | | | |
| Cook County School District No. 144, | | | | | | | | | | | | |
| 0.000%, 12/01/2027 (Insured by AGM) | | | 35,000 | | | | 30,634 | | | | | |
| Crawford Hospital District, | | | | | | | | | | | | |
| 4.000%, 01/01/2027 (Insured by AGM) | | | 315,000 | | | | 322,609 | | | | | |
| Illinois Finance Authority: | | | | | | | | | | | | |
| 5.000%, 11/01/2024 | | | 50,000 | | | | 50,394 | | | | | |
| 3.000%, 05/01/2025 | | | 200,000 | | | | 197,706 | | | | | |
| 5.000%, 09/01/2025 | | | 1,185,000 | | | | 1,187,308 | | | | | |
| 5.000%, 10/01/2025 | | | 150,000 | | | | 153,662 | | | | | |
| 5.000%, 03/01/2026 | | | 900,000 | | | | 927,942 | | | | | |
| 5.000%, 02/15/2027 | | | 420,000 | | | | 427,489 | | | | | |
| 5.000%, 09/01/2027 (Callable 09/01/2026) | | | 500,000 | | | | 520,784 | | | | | |
| 5.000%, 02/15/2030 (Callable 08/15/2027) | | | 125,000 | | | | 127,686 | | | | | |
| 4.000%, 05/01/2030 (Callable 05/01/2028) | | | 275,000 | | | | 280,579 | | | | | |
| 5.000%, 05/15/2030 (Callable 05/15/2025) | | | 25,000 | | | | 23,641 | | | | | |
| 3.000%, 09/01/2031 (Callable 09/01/2026) | | | 1,475,000 | | | | 1,428,446 | | | | | |
| 5.000%, 02/15/2032 (Callable 08/15/2027) | | | 500,000 | | | | 510,074 | | | | | |
| 5.000%, 07/01/2033 (Callable 01/01/2027) | | | 200,000 | | | | 214,061 | | | | | |
| 5.000%, 02/15/2037 (Callable 08/15/2027) | | | 1,000,000 | | | | 1,007,505 | | | | | |
| 4.125%, 11/15/2037 (Callable 11/15/2025) | | | 300,000 | | | | 301,028 | | | | | |
| 5.000%, 11/15/2039 (Callable 05/15/2025) | | | 2,500,000 | | | | 2,515,765 | | | | | |
| Illinois Housing Development Authority: | | | | | | | | | | | | |
| 4.000%, 06/01/2026 (Mandatory Tender | | | | | | | | | | | | |
Date 06/01/2025) (Insured by FHA)(1) | | | 500,000 | | | | 502,948 | | | | | |
| 2.900%, 08/01/2031 (Callable 02/01/2026) | | | 1,000,000 | | | | 948,267 | | | | | |
| 2.830%, 05/15/2050 (SIFMA Municipal Swap | | | | | | | | | | | | |
| Index + 1.000%) (Callable 11/15/2024) | | | | | | | | | | | | |
(Mandatory Tender Date 05/15/2025)(2) | | | 225,000 | | | | 224,354 | | | | | |
| 4.500%, 10/01/2052 | | | | | | | | | | | | |
| (Callable 10/01/2030) (Insured by GNMA) | | | 1,405,000 | | | | 1,431,866 | | | | | |
| Illinois Sports Facilities Authority: | | | | | | | | | | | | |
| 5.000%, 06/15/2030 | | | | | | | | | | | | |
| (Callable 06/15/2029) (Insured by BAM) | | | 2,250,000 | | | | 2,418,623 | | | | | |
| 5.000%, 06/15/2030 | | | 1,000,000 | | | | 1,066,058 | | | | | |
| 5.000%, 06/15/2031 | | | 2,025,000 | | | | 2,173,190 | | | | | |
| 5.250%, 06/15/2031 | | | | | | | | | | | | |
| (Callable 06/15/2024) (Insured by AGM) | | | 600,000 | | | | 604,358 | | | | | |
| Joliet Park District, | | | | | | | | | | | | |
| 4.000%, 02/01/2033 | | | | | | | | | | | | |
| (Callable 01/29/2024) (Insured by AGM) | | | 150,000 | | | | 150,115 | | | | | |
| Lake County Consolidated | | | | | | | | | | | | |
| High School District No. 120, | | | | | | | | | | | | |
| 5.500%, 12/01/2039 (Callable 12/01/2032) | | | 160,000 | | | | 184,309 | | | | | |
| Lake County School District No. 38, | | | | | | | | | | | | |
| 0.000%, 02/01/2024 (Insured by AMBAC) | | | 50,000 | | | | 49,847 | | | | | |
| Madison County Community | | | | | | | | | | | | |
| Unit School District No. 8, | | | | | | | | | | | | |
| 4.000%, 12/01/2032 | | | | | | | | | | | | |
| (Callable 12/01/2028) (Insured by BAM) | | | 1,000,000 | | | | 1,041,340 | | | | | |
| Madison, Bond, Etc. Counties Community | | | | | | | | | | | | |
| Unit School District No. 5: | | | | | | | | | | | | |
| 5.500%, 02/01/2032 | | | | | | | | | | | | |
| (Callable 02/01/2030) (Insured by AGM) | | | 575,000 | | | | 664,922 | | | | | |
| 5.500%, 02/01/2034 | | | | | | | | | | | | |
| (Callable 02/01/2030) (Insured by AGM) | | | 600,000 | | | | 692,619 | | | | | |
| 5.500%, 02/01/2035 | | | | | | | | | | | | |
| (Callable 02/01/2030) (Insured by AGM) | | | 570,000 | | | | 656,970 | | | | | |
| Metropolitan Pier & Exposition Authority: | | | | | | | | | | | | |
| 0.000%, 06/15/2026 (Insured by AGM) | | | 200,000 | | | | 184,621 | | | | | |
| 0.000%, 06/15/2027 (Insured by AGM) | | | 4,400,000 | | | | 3,944,609 | | | | | |
| 0.000%, 12/15/2034 (Insured by NATL) | | | 2,000,000 | | | | 1,381,697 | | | | | |
| Niles Park District, | | | | | | | | | | | | |
| 3.000%, 12/01/2032 (Callable 01/29/2024) | | | 700,000 | | | | 700,002 | | | | | |
| Northern Illinois University: | | | | | | | | | | | | |
| 5.000%, 04/01/2024 (Insured by BAM) | | | 500,000 | | | | 501,914 | | | | | |
| 5.000%, 10/01/2031 | | | | | | | | | | | | |
| (Callable 04/01/2031) (Insured by BAM) | | | 450,000 | | | | 494,529 | | | | | |
| 4.000%, 10/01/2032 | | | | | | | | | | | | |
| (Callable 04/01/2031) (Insured by BAM) | | | 500,000 | | | | 520,728 | | | | | |
| Peoria Public Building Commission, | | | | | | | | | | | | |
| 0.000%, 12/01/2025 | | | 1,000,000 | | | | 928,513 | | | | | |
| Rock Island County School District No. 41, | | | | | | | | | | | | |
| 5.500%, 12/01/2038 | | | | | | | | | | | | |
| (Callable 12/01/2031) (Insured by AGM) | | | 125,000 | | | | 143,506 | | | | | |
| Sangamon Logan & Menard Counties | | | | | | | | | | | | |
| Community Unit School Dist No. 15, | | | | | | | | | | | | |
| 5.000%, 12/01/2036 | | | | | | | | | | | | |
| (Callable 12/01/2029) (Insured by BAM) | | | 100,000 | | | | 108,716 | | | | | |
| Southern Illinois University, | | | | | | | | | | | | |
| 4.000%, 04/01/2030 (Insured by BAM) | | | 1,575,000 | | | | 1,609,304 | | | | | |
| State of Illinois, | | | | | | | | | | | | |
| 5.000%, 01/01/2026 | | | 50,000 | | | | 51,821 | | | | | |
| University of Illinois, | | | | | | | | | | | | |
| 4.000%, 04/01/2034 (Callable 04/01/2025) | | | 650,000 | | | | 653,426 | | | | | |
The accompanying notes are an integral part of these financial statements.
Baird Strategic Municipal Bond Fund
Schedule of Investments, December 31, 2023
Long-Term Investments (cont.)
| | | Principal | | | | | | % of | |
| | | Amount | | | Value | | | Net Assets | |
| Upper Illinois River Valley | | | | | | | | | |
| Development Authority: | | | | | | | | | |
| 5.000%, 12/01/2025 | | $ | 125,000 | | | $ | 127,692 | | | | |
| 5.000%, 12/01/2028 | | | 75,000 | | | | 79,711 | | | | |
4.000%, 01/01/2031 (Callable 01/01/2027)(3) | | | 220,000 | | | | 209,898 | | | | |
| Village of Hoffman Estates IL, | | | | | | | | | | | |
| 4.000%, 12/01/2027 (Callable 12/01/2025) | | | 500,000 | | | | 503,738 | | | | |
| Wauconda Special Service Area No. 1, | | | | | | | | | | | |
| 5.000%, 03/01/2033 | | | | | | | | | | | |
| (Callable 03/01/2025) (Insured by BAM) | | | 3,510,000 | | | | 3,560,830 | | | | |
| Will County Community | | | | | | | | | | | |
| High School District No. 210: | | | | | | | | | | | |
| 0.000%, 01/01/2028 (Insured by BAM) | | | 310,000 | | | | 271,162 | | | | |
| 0.000%, 01/01/2032 (Insured by BAM) | | | 125,000 | | | | 94,272 | | | | |
| 4.000%, 01/01/2034 | | | | | | | | | | | |
| (Callable 01/01/2029) (Insured by AGM) | | | 150,000 | | | | 154,356 | | | | |
| Will County Township | | | | | | | | | | | |
| High School District No. 204, | | | | | | | | | | | |
| 4.000%, 01/01/2037 (Callable 01/01/2027) | | | 105,000 | | | | 106,059 | | | | |
| Total Illinois | | | | | | | | | | | |
| (Cost $60,979,502) | | | | | | | 62,073,423 | | | | 6.7 | % |
| Indiana | | | | | | | | | | | | |
| City of Rockport IN, | | | | | | | | | | | | |
| 3.125%, 07/01/2025 | | | 2,000,000 | | | | 1,975,428 | | | | | |
| Fishers Town Hall Building Corp., | | | | | | | | | | | | |
| 5.500%, 07/15/2038 (Callable 07/15/2032) | | | 140,000 | | | | 164,121 | | | | | |
| Indiana Finance Authority: | | | | | | | | | | | | |
| 3.500%, 03/01/2024 | | | 3,100,000 | | | | 3,098,731 | | | | | |
| 5.500%, 04/01/2024 | | | 665,000 | | | | 666,885 | | | | | |
| 5.000%, 04/01/2028 | | | 870,000 | | | | 897,887 | | | | | |
| 5.000%, 03/01/2036 (Callable 03/01/2025) | | | 2,000,000 | | | | 2,034,243 | | | | | |
| 5.750%, 06/01/2037 (Callable 12/01/2033) | | | 600,000 | | | | 701,414 | | | | | |
| 5.750%, 06/01/2038 (Callable 12/01/2033) | | | 635,000 | | | | 736,931 | | | | | |
| 5.750%, 06/01/2039 (Callable 12/01/2033) | | | 670,000 | | | | 775,145 | | | | | |
| 5.750%, 06/01/2040 (Callable 12/01/2033) | | | 710,000 | | | | 816,003 | | | | | |
| 5.750%, 06/01/2048 (Callable 12/01/2033) | | | 1,630,000 | | | | 1,818,384 | | | | | |
| Indiana Health & Educational | | | | | | | | | | | | |
| Facilities Financing Authority, | | | | | | | | | | | | |
| 5.000%, 11/15/2046 (Callable 11/15/2026) | | | 150,000 | | | | 153,302 | | | | | |
| Indianapolis Local Public | | | | | | | | | | | | |
| Improvement Bond Bank, | | | | | | | | | | | | |
| 6.000%, 03/01/2053 (Callable 03/01/2033) | | | 3,000,000 | | | | 3,272,373 | | | | | |
| MSD Warren Township Vision | | | | | | | | | | | | |
| 2005 School Building Corp., | | | | | | | | | | | | |
| 3.000%, 07/10/2035 | | | | | | | | | | | | |
| (Callable 07/10/2031) (Insured by ST AID) | | | 1,080,000 | | | | 1,037,942 | | | | | |
| Noblesville Redevelopment Authority, | | | | | | | | | | | | |
| 5.500%, 07/15/2043 (Callable 07/15/2031) | | | 100,000 | | | | 113,150 | | | | | |
| Plainfield Redevelopment Authority: | | | | | | | | | | | | |
| 5.000%, 02/01/2030 (Insured by ST AID) | | | 15,000 | | | | 16,286 | | | | | |
| 3.250%, 08/01/2032 | | | | | | | | | | | | |
| (Callable 01/29/2024) (Insured by ST AID) | | | 145,000 | | | | 143,010 | | | | | |
| Plainfield Redevelopment District, | | | | | | | | | | | | |
| 3.000%, 07/01/2031 (Callable 07/01/2027) | | | 435,000 | | | | 423,542 | | | | | |
| Posey County Redevelopment Authority, | | | | | | | | | | | | |
| 5.000%, 07/15/2025 | | | 3,000,000 | | | | 3,071,449 | | | | | |
| Salem Elementary School Building Corp., | | | | | | | | | | | | |
| 4.375%, 07/15/2032 | | | | | | | | | | | | |
| (Callable 07/15/2031) (Insured by ST AID) | | | 1,495,000 | | | | 1,581,394 | | | | | |
| Total Indiana | | | | | | | | | | | | |
| (Cost $22,756,009) | | | | | | | 23,497,620 | | | | 2.6 | % |
| Iowa | | | | | | | | | | | | |
| City of Coralville IA, | | | | | | | | | | | | |
| 4.000%, 06/01/2024 | | | 200,000 | | | | 199,182 | | | | | |
| City of Stuart IA, | | | | | | | | | | | | |
| 4.750%, 06/01/2026 (Callable 06/01/2025) | | | 1,000,000 | | | | 1,004,065 | | | | | |
| Iowa Finance Authority: | | | | | | | | | | | | |
7.500%, 01/01/2032 (Callable 01/01/2030)(3) | | | 1,000,000 | | | | 955,036 | | | | | |
| 4.000%, 07/01/2047 | | | | | | | | | | | | |
| (Callable 07/01/2028) (Insured by GNMA) | | | 160,000 | | | | 160,178 | | | | | |
| 3.250%, 07/01/2050 | | | | | | | | | | | | |
| (Callable 07/01/2029) (Insured by GNMA) | | | 60,000 | | | | 58,933 | | | | | |
| 5.500%, 07/01/2053 | | | | | | | | | | | | |
| (Callable 01/01/2033) (Insured by GNMA) | | | 2,575,000 | | | | 2,751,216 | | | | | |
| Iowa Higher Education Loan Authority: | | | | | | | | | | | | |
| 3.000%, 04/01/2024 | | | 255,000 | | | | 254,631 | | | | | |
| 5.000%, 10/01/2026 | | | 750,000 | | | | 777,333 | | | | | |
| 5.000%, 10/01/2037 (Callable 10/01/2030) | | | 400,000 | | | | 425,006 | | | | | |
| PEFA, Inc., | | | | | | | | | | | | |
| 5.000%, 09/01/2049 (Callable 06/01/2026) | | | | | | | | | | | | |
(Mandatory Tender Date 09/01/2026)(1) | | | 1,360,000 | | | | 1,393,009 | | | | | |
| Total Iowa | | | | | | | | | | | | |
| (Cost $7,915,764) | | | | | | | 7,978,589 | | | | 0.9 | % |
| Kansas | | | | | | | | | | | | |
| City of Burlington KS, | | | | | | | | | | | | |
| 4.300%, 03/01/2045 | | | | | | | | | | | | |
(Mandatory Tender Date 06/01/2026)(1) | | | 2,000,000 | | | | 2,024,327 | | | | | |
| City of Derby KS, | | | | | | | | | | | | |
| 3.900%, 03/01/2037 (Callable 03/01/2025) | | | 25,000 | | | | 25,053 | | | | | |
| City of Park City KS, | | | | | | | | | | | | |
| 3.750%, 09/01/2026 (Callable 09/01/2024) | | | 1,000,000 | | | | 1,003,407 | | | | | |
| Wyandotte County-Kansas City | | | | | | | | | | | | |
| Unified Government, | | | | | | | | | | | | |
| 0.000%, 12/01/2027 (Insured by NATL) | | | 175,000 | | | | 150,712 | | | | | |
| Total Kansas | | | | | | | | | | | | |
| (Cost $3,166,365) | | | | | | | 3,203,499 | | | | 0.3 | % |
| Kentucky | | | | | | | | | | | | |
| City of Columbia KY, | | | | | | | | | | | | |
| 3.250%, 12/01/2028 | | | 50,000 | | | | 47,245 | | | | | |
| County of Trimble KY: | | | | | | | | | | | | |
| 1.300%, 09/01/2044 | | | | | | | | | | | | |
(Mandatory Tender Date 09/01/2027)(1) | | | 1,000,000 | | | | 884,081 | | | | | |
| 4.700%, 06/01/2054 (Callable 03/03/2027) | | | | | | | | | | | | |
(Mandatory Tender Date 06/01/2027)(1) | | | 4,000,000 | | | | 4,061,551 | | | | | |
| Garrard County School District Finance Corp.: | | | | | | | | | | | | |
| 5.000%, 08/01/2036 | | | | | | | | | | | | |
| (Callable 08/01/2031) (Insured by BAM) | | | 1,220,000 | | | | 1,377,012 | | | | | |
| 5.000%, 08/01/2037 | | | | | | | | | | | | |
| (Callable 08/01/2031) (Insured by BAM) | | | 1,000,000 | | | | 1,116,147 | | | | | |
| Kentucky Economic | | | | | | | | | | | | |
| Development Finance Authority: | | | | | | | | | | | | |
| 0.000%, 10/01/2025 (Insured by NATL) | | | 35,000 | | | | 32,747 | | | | | |
| 5.000%, 07/01/2028 (Callable 07/01/2025) | | | 2,335,000 | | | | 2,377,775 | | | | | |
| 5.000%, 06/01/2030 (Callable 06/01/2027) | | | 50,000 | | | | 51,806 | | | | | |
| 5.000%, 07/01/2040 (Callable 07/01/2025) | | | 1,290,000 | | | | 1,299,683 | | | | | |
| Kentucky Higher Education | | | | | | | | | | | | |
| Student Loan Corp., | | | | | | | | | | | | |
| 5.000%, 06/01/2024 | | | 130,000 | | | | 130,783 | | | | | |
| Kentucky Public Energy Authority: | | | | | | | | | | | | |
| 4.000%, 01/01/2049 (Callable 10/01/2024) | | | | | | | | | | | | |
(Mandatory Tender Date 01/01/2025)(1) | | | 2,500,000 | | | | 2,500,553 | | | | | |
| 4.000%, 12/01/2049 (Callable 03/01/2025) | | | | | | | | | | | | |
(Mandatory Tender Date 06/01/2025)(1) | | | 320,000 | | | | 320,571 | | | | | |
The accompanying notes are an integral part of these financial statements.
Baird Strategic Municipal Bond Fund
Schedule of Investments, December 31, 2023
Long-Term Investments (cont.)
| | | Principal | | | | | | % of | |
| | | Amount | | | Value | | | Net Assets | |
| Kentucky Public Energy Authority: (cont.) | | | | | | | | | |
| 4.783%, 12/01/2049 (1 Month LIBOR | | | | | | | | | |
| USD + 1.120%) (Callable 03/01/2025) | | | | | | | | | |
(Mandatory Tender Date 06/01/2025)(2)(7) | | $ | 700,000 | | | $ | 698,648 | | | | |
| 4.000%, 12/01/2050 (Callable 03/01/2026) | | | | | | | | | | | |
(Mandatory Tender Date 06/01/2026)(1) | | | 275,000 | | | | 273,517 | | | | |
| Kentucky State Property & | | | | | | | | | | | |
| Building Commission, | | | | | | | | | | | |
| 5.000%, 11/01/2028 | | | | | | | | | | | |
| (Callable 11/01/2026) (Insured by ST AID) | | | 200,000 | | | | 212,264 | | | | |
| Lexington-Fayette Urban County Airport Board, | | | | | | | | | | | |
| 5.000%, 07/01/2038 (Callable 07/01/2033) | | | 320,000 | | | | 364,018 | | | | |
| Morehead State University, | | | | | | | | | | | |
| 5.000%, 04/01/2028 | | | | | | | | | | | |
| (Callable 04/01/2025) (Insured by ST AID) | | | 455,000 | | | | 466,836 | | | | |
| University of Louisville, | | | | | | | | | | | |
| 5.000%, 03/01/2034 | | | | | | | | | | | |
| (Callable 09/01/2026) (Insured by ST AID) | | | 2,120,000 | | | | 2,208,021 | | | | |
| Total Kentucky | | | | | | | | | | | |
| (Cost $18,298,732) | | | | | | | 18,423,258 | | | | 2.0 | % |
| Louisiana | | | | | | | | | | | | |
| Louisiana Housing Corp., | | | | | | | | | | | | |
| 5.000%, 07/01/2046 (Callable 02/01/2026) | | | | | | | | | | | | |
| (Mandatory Tender Date 07/01/2026) | | | | | | | | | | | | |
(Insured by HUD)(1) | | | 1,500,000 | | | | 1,545,423 | | | | | |
| Louisiana Local Government | | | | | | | | | | | | |
| Environmental Facilities & | | | | | | | | | | | | |
| Community Development Authority: | | | | | | | | | | | | |
| 4.000%, 10/01/2024 | | | 145,000 | | | | 145,043 | | | | | |
3.020%, 04/01/2031 (Callable 04/01/2025)(3) | | | 1,273,000 | | | | 1,268,095 | | | | | |
5.250%, 06/15/2033 (Callable 06/15/2031)(3) | | | 1,225,000 | | | | 1,146,809 | | | | | |
| Louisiana Public Facilities Authority: | | | | | | | | | | | | |
5.000%, 10/01/2024(5) | | | 400,000 | | | | 399,963 | | | | | |
5.250%, 10/01/2029(5) | | | 560,000 | | | | 621,561 | | | | | |
| 5.000%, 05/15/2033 (Callable 05/15/2030) | | | 350,000 | | | | 386,864 | | | | | |
5.250%, 10/01/2033(5) | | | 2,515,000 | | | | 2,920,718 | | | | | |
5.250%, 10/01/2046 (Callable 10/01/2033)(5) | | | 305,000 | | | | 328,529 | | | | | |
| 6.750%, 10/01/2053 (Callable 07/03/2028) | | | | | | | | | | | | |
(Mandatory Tender Date 10/01/2028)(1)(3) | | | 400,000 | | | | 406,803 | | | | | |
| St. Tammany Parish Hospital | | | | | | | | | | | | |
| Service District No. 1, | | | | | | | | | | | | |
| 5.000%, 07/01/2034 (Callable 07/01/2028) | | | 1,520,000 | | | | 1,637,936 | | | | | |
| Total Louisiana | | | | | | | | | | | | |
| (Cost $10,386,866) | | | | | | | 10,807,744 | | | | 1.2 | % |
| Maine | | | | | | | | | | | | |
| City of Lewiston ME: | | | | | | | | | | | | |
| 1.375%, 02/15/2033 (Callable 02/15/2028) | | | 1,000,000 | | | | 813,399 | | | | | |
| 1.500%, 02/15/2035 (Callable 02/15/2028) | | | 1,435,000 | | | | 1,126,197 | | | | | |
| Finance Authority of Maine: | | | | | | | | | | | | |
| 5.000%, 12/01/2024 (Insured by AGM) | | | 125,000 | | | | 126,761 | | | | | |
| 5.000%, 12/01/2025 (Insured by AGM) | | | 200,000 | | | | 206,171 | | | | | |
| 5.000%, 12/01/2026 (Insured by AGM) | | | 200,000 | | | | 209,401 | | | | | |
| Maine Health & Higher | | | | | | | | | | | | |
| Educational Facilities Authority: | | | | | | | | | | | | |
| 5.000%, 07/01/2026 (Insured by ST AID) | | | 100,000 | | | | 104,612 | | | | | |
| 5.000%, 07/01/2034 | | | | | | | | | | | | |
| (Callable 07/01/2030) (Insured by ST AID) | | | 960,000 | | | | 1,054,369 | | | | | |
| 5.000%, 07/01/2035 | | | | | | | | | | | | |
| (Callable 07/01/2030) (Insured by ST AID) | | | 1,510,000 | | | | 1,653,796 | | | | | |
| 5.000%, 07/01/2036 | | | | | | | | | | | | |
| (Callable 07/01/2030) (Insured by ST AID) | | | 1,615,000 | | | | 1,762,228 | | | | | |
| 5.000%, 07/01/2037 | | | | | | | | | | | | |
| (Callable 07/01/2030) (Insured by ST AID) | | | 350,000 | | | | 377,096 | | | | | |
| Maine State Housing Authority, | | | | | | | | | | | | |
| 5.000%, 11/15/2052 (Callable 11/15/2031) | | | 925,000 | | | | 960,366 | | | | | |
| Total Maine | | | | | | | | | | | | |
| (Cost $8,234,565) | | | | | | | 8,394,396 | | | | 0.9 | % |
| Maryland | | | | | | | | | | | | |
| Maryland Community | | | | | | | | | | | | |
| Development Administration: | | | | | | | | | | | | |
| 4.050%, 10/01/2024 | | | 1,000,000 | | | | 1,000,006 | | | | | |
| 3.850%, 03/01/2025 | | | 2,000,000 | | | | 1,997,342 | | | | | |
| 0.550%, 09/01/2026 | | | 555,000 | | | | 505,326 | | | | | |
| 2.000%, 03/01/2032 (Callable 09/01/2030) | | | 400,000 | | | | 339,890 | | | | | |
| 3.750%, 03/01/2050 (Callable 03/01/2029) | | | 1,595,000 | | | | 1,585,850 | | | | | |
| Maryland Economic Development Corp.: | | | | | | | | | | | | |
3.500%, 07/01/2024(3) | | | 515,000 | | | | 510,130 | | | | | |
| 5.000%, 06/01/2030 (Callable 06/01/2028) | | | 100,000 | | | | 106,465 | | | | | |
| Maryland Health & Higher | | | | | | | | | | | | |
| Educational Facilities Authority: | | | | | | | | | | | | |
| 5.000%, 01/01/2024 | | | 540,000 | | | | 540,000 | | | | | |
| 5.000%, 01/01/2025 | | | 470,000 | | | | 475,008 | | | | | |
| 5.000%, 07/01/2045 (Callable 01/01/2027) | | | | | | | | | | | | |
(Mandatory Tender Date 07/01/2027)(1) | | | 380,000 | | | | 402,076 | | | | | |
| Maryland State Transportation Authority, | | | | | | | | | | | | |
| 5.000%, 07/01/2046 (Callable 07/01/2031) | | | 1,695,000 | | | | 1,868,034 | | | | | |
| Montgomery County Housing | | | | | | | | | | | | |
| Opportunities Commission, | | | | | | | | | | | | |
| 5.750%, 01/01/2058 (Callable 01/01/2034) | | | 1,145,000 | | | | 1,284,232 | | | | | |
| Total Maryland | | | | | | | | | | | | |
| (Cost $10,448,954) | | | | | | | 10,614,359 | | | | 1.2 | % |
| Massachusetts | | | | | | | | | | | | |
| Commonwealth of Massachusetts, | | | | | | | | | | | | |
| 3.000%, 07/01/2048 (Callable 07/01/2030) | | | 150,000 | | | | 121,689 | | | | | |
| Massachusetts Department of Transportation, | | | | | | | | | | | | |
| 0.000%, 01/01/2029 (Insured by NATL) | | | 1,560,000 | | | | 1,339,223 | | | | | |
| Massachusetts Development Finance Agency: | | | | | | | | | | | | |
5.000%, 07/15/2025(3) | | | 65,000 | | | | 65,263 | | | | | |
| 5.000%, 07/01/2028 (Callable 07/01/2026) | | | 720,000 | | | | 744,818 | | | | | |
| 3.976%, 10/01/2030 | | | 155,000 | | | | 143,951 | | | | | |
| 5.000%, 07/01/2044 (Callable 07/01/2027) | | | 575,000 | | | | 585,655 | | | | | |
| Massachusetts Educational Financing Authority: | | | | | | | | | | | | |
| 5.000%, 01/01/2027 (Callable 01/01/2025) | | | 2,500,000 | | | | 2,531,515 | | | | | |
| 2.000%, 07/01/2037 (Callable 07/01/2031) | | | 2,600,000 | | | | 2,281,972 | | | | | |
| 4.250%, 07/01/2044 (Callable 07/01/2033) | | | 2,285,000 | | | | 2,295,292 | | | | | |
| Total Massachusetts | | | | | | | | | | | | |
| (Cost $10,298,803) | | | | | | | 10,109,378 | | | | 1.1 | % |
| Michigan | | | | | | | | | | | | |
| Ann Arbor School District, | | | | | | | | | | | | |
| 3.000%, 05/01/2027 | | | 1,500,000 | | | | 1,510,294 | | | | | |
| Charter Township of Lansing MI, | | | | | | | | | | | | |
| 2.750%, 05/01/2028 (Callable 01/29/2024) | | | 265,000 | | | | 256,927 | | | | | |
| City of Detroit MI: | | | | | | | | | | | | |
| 5.250%, 05/01/2025 | | | 75,000 | | | | 76,262 | | | | | |
| 6.000%, 05/01/2039 (Callable 05/01/2033) | | | 1,000,000 | | | | 1,149,524 | | | | | |
| Flint Hospital Building Authority, | | | | | | | | | | | | |
| 5.000%, 07/01/2029 | | | 90,000 | | | | 94,530 | | | | | |
| Michigan Finance Authority: | | | | | | | | | | | | |
| 5.000%, 07/01/2024 | | | 335,000 | | | | 335,917 | | | | | |
| 5.000%, 07/01/2025 (Callable 07/01/2024) | | | 140,000 | | | | 140,474 | | | | | |
| 5.000%, 07/01/2026 (Callable 07/01/2024) | | | 300,000 | | | | 301,255 | | | | | |
The accompanying notes are an integral part of these financial statements.
Baird Strategic Municipal Bond Fund
Schedule of Investments, December 31, 2023
Long-Term Investments (cont.)
| | | Principal | | | | | | % of | |
| | | Amount | | | Value | | | Net Assets | |
| Michigan Finance Authority: (cont.) | | | | | | | | | |
| 5.250%, 02/01/2027 | | $ | 1,465,000 | | | $ | 1,483,233 | | | | |
| 5.000%, 07/01/2027 (Callable 07/01/2025) | | | 160,000 | | | | 163,852 | | | | |
| 4.500%, 10/01/2029 (Callable 10/01/2024) | | | 3,550,000 | | | | 3,568,859 | | | | |
| 5.000%, 07/01/2030 (Callable 07/01/2024) | | | 165,000 | | | | 165,864 | | | | |
| 5.250%, 02/01/2032 (Callable 02/01/2027) | | | 100,000 | | | | 102,444 | | | | |
| 5.000%, 05/15/2032 (Callable 05/15/2025) | | | 2,000,000 | | | | 2,037,056 | | | | |
| 5.000%, 05/15/2033 (Callable 05/15/2025) | | | 1,265,000 | | | | 1,287,236 | | | | |
| 5.000%, 07/01/2039 (Callable 07/01/2024) | | | 50,000 | | | | 50,119 | | | | |
| 5.000%, 10/01/2039 (Callable 10/01/2024) | | | | | | | | | | | |
| (Partially Pre-refunded) | | | 1,700,000 | | | | 1,710,153 | | | | |
| 5.000%, 07/01/2044 (Callable 07/01/2024) | | | 180,000 | | | | 180,223 | | | | |
| Michigan State Building Authority, | | | | | | | | | | | |
| 3.180%, 04/15/2058 (Callable 01/02/2024) | | | | | | | | | | | |
(Optional Put Date 01/05/2024)(1) | | | 3,000,000 | | | | 3,000,000 | | | | |
| Michigan State Hospital Finance Authority, | | | | | | | | | | | |
| 5.000%, 11/15/2032 (Callable 05/15/2025) | | | 255,000 | | | | 260,445 | | | | |
| Michigan State University: | | | | | | | | | | | |
| 5.000%, 02/15/2036 (Callable 02/15/2033) | | | 440,000 | | | | 522,907 | | | | |
| 5.000%, 08/15/2037 (Callable 02/15/2033) | | | 800,000 | | | | 938,370 | | | | |
| Michigan Strategic Fund, | | | | | | | | | | | |
| 5.000%, 12/31/2043 (Callable 12/31/2028) | | | 100,000 | | | | 102,847 | | | | |
| Northview Public Schools, | | | | | | | | | | | |
| 3.000%, 11/01/2031 | | | | | | | | | | | |
| (Callable 05/01/2030) (Insured by Q-SBLF) | | | 1,000,000 | | | | 986,456 | | | | |
| Walled Lake Consolidated School District, | | | | | | | | | | | |
| 5.000%, 05/01/2047 | | | | | | | | | | | |
| (Callable 05/01/2032) (Insured by Q-SBLF) | | | 435,000 | | | | 475,341 | | | | |
| Total Michigan | | | | | | | | | | | |
| (Cost $20,626,014) | | | | | | | 20,900,588 | | | | 2.3 | % |
| Minnesota | | | | | | | | | | | | |
| City of Center City MN, | | | | | | | | | | | | |
| 4.000%, 11/01/2031 (Callable 11/01/2027) | | | 245,000 | | | | 239,828 | | | | | |
| City of Coon Rapids MN, | | | | | | | | | | | | |
| 5.600%, 12/01/2039 (Insured by FNMA) | | | 1,750,000 | | | | 1,941,360 | | | | | |
| City of Minneapolis MN, | | | | | | | | | | | | |
| 5.000%, 11/15/2034 (Callable 11/15/2025) | | | 200,000 | | | | 204,011 | | | | | |
| City of Mounds View MN, | | | | | | | | | | | | |
| 5.375%, 05/01/2027 (Callable 01/01/2025) | | | | | | | | | | | | |
| (Mandatory Tender Date 05/01/2025) | | | | | | | | | | | | |
(Insured by HUD)(1) | | | 100,000 | | | | 100,290 | | | | | |
| City of Virginia MN, | | | | | | | | | | | | |
| 5.000%, 12/15/2026 (Callable 06/15/2025) | | | 5,110,000 | | | | 5,187,989 | | | | | |
| County of Washington MN: | | | | | | | | | | | | |
| 2.375%, 02/01/2035 (Callable 02/01/2028) | | | 1,550,000 | | | | 1,402,483 | | | | | |
| 2.375%, 02/01/2036 (Callable 02/01/2028) | | | 1,590,000 | | | | 1,406,975 | | | | | |
| Housing & Redevelopment | | | | | | | | | | | | |
| Authority of the City of St. Paul MN: | | | | | | | | | | | | |
| 3.500%, 12/01/2025 (Callable 01/19/2024) | | | | | | | | | | | | |
| (Mandatory Tender Date 06/01/2024) | | | | | | | | | | | | |
(Insured by HUD)(1) | | | 1,900,000 | | | | 1,895,311 | | | | | |
| 4.000%, 09/01/2031 (Callable 09/01/2024) | | | 350,000 | | | | 333,072 | | | | | |
| Minnesota Higher Education Facilities Authority: | | | | | | | | | | | | |
| 4.000%, 12/01/2029 | | | 140,000 | | | | 141,738 | | | | | |
| 5.000%, 10/01/2039 (Callable 10/01/2030) | | | 100,000 | | | | 107,729 | | | | | |
| Minnesota Housing Finance Agency: | | | | | | | | | | | | |
| 3.450%, 02/01/2025 (Callable 08/01/2024) | | | 2,000,000 | | | | 2,000,419 | | | | | |
| 3.500%, 07/01/2050 | | | | | | | | | | | | |
| (Callable 07/01/2029) (Insured by GNMA) | | | 1,200,000 | | | | 1,185,993 | | | | | |
| 5.750%, 07/01/2053 | | | | | | | | | | | | |
| (Callable 01/01/2033) (Insured by GNMA) | | | 1,000,000 | | | | 1,079,793 | | | | | |
| 6.250%, 07/01/2054 | | | | | | | | | | | | |
| (Callable 01/01/2033) (Insured by GNMA) | | | 1,000,000 | | | | 1,107,119 | | | | | |
| Southern Minnesota Municipal Power Agency, | | | | | | | | | | | | |
| 0.000%, 01/01/2027 (Insured by NATL) | | | 435,000 | | | | 393,017 | | | | | |
| Zumbro Education District, | | | | | | | | | | | | |
| 4.000%, 02/01/2031 | | | 370,000 | | | | 376,241 | | | | | |
| Total Minnesota | | | | | | | | | | | | |
| (Cost $18,873,987) | | | | | | | 19,103,368 | | | | 2.1 | % |
| Mississippi | | | | | | | | | | | | |
| Biloxi Public School District, | | | | | | | | | | | | |
| 5.000%, 04/01/2029 | | | | | | | | | | | | |
| (Callable 04/01/2026) (Insured by BAM) | | | 250,000 | | | | 261,040 | | | | | |
| City of Oxford MS, | | | | | | | | | | | | |
| 3.500%, 09/01/2029 | | | 50,000 | | | | 45,764 | | | | | |
| City of Ridgeland MS, | | | | | | | | | | | | |
| 3.000%, 10/01/2025 | | | 325,000 | | | | 321,714 | | | | | |
| County of Hinds MS, | | | | | | | | | | | | |
| 4.000%, 08/01/2027 | | | 140,000 | | | | 143,840 | | | | | |
| Mississippi Business Finance Corp., | | | | | | | | | | | | |
| 3.200%, 09/01/2028 (Callable 03/13/2024) | | | 1,000,000 | | | | 1,000,085 | | | | | |
| Mississippi Development Bank: | | | | | | | | | | | | |
| 5.000%, 11/01/2025 | | | 840,000 | | | | 852,616 | | | | | |
| 5.000%, 11/01/2026 | | | 780,000 | | | | 800,471 | | | | | |
| 5.000%, 11/01/2029 (Callable 11/01/2027) | | | 105,000 | | | | 108,112 | | | | | |
| Mississippi Home Corp.: | | | | | | | | | | | | |
| 4.000%, 12/01/2043 | | | | | | | | | | | | |
| (Callable 12/01/2026) (Insured by GNMA) | | | 40,000 | | | | 39,880 | | | | | |
| 5.000%, 12/01/2052 | | | | | | | | | | | | |
| (Callable 06/01/2031) (Insured by GNMA) | | | 2,295,000 | | | | 2,384,343 | | | | | |
| Vicksburg Warren School District: | | | | | | | | | | | | |
| 5.000%, 03/01/2025 | | | 375,000 | | | | 380,837 | | | | | |
| 5.000%, 03/01/2028 | | | 270,000 | | | | 285,965 | | | | | |
| Total Mississippi | | | | | | | | | | | | |
| (Cost $6,711,496) | | | | | | | 6,624,667 | | | | 0.7 | % |
| Missouri | | | | | | | | | | | | |
| City of Kansas City MO, | | | | | | | | | | | | |
| 4.000%, 01/01/2036 (Callable 01/01/2028) | | | 200,000 | | | | 207,446 | | | | | |
| City of St. Louis MO, | | | | | | | | | | | | |
| 5.000%, 07/01/2039 (Callable 07/01/2029) | | | 110,000 | | | | 118,424 | | | | | |
| Clay County School District No. 40, | | | | | | | | | | | | |
| 5.000%, 04/01/2036 (Callable 04/01/2033) | | | 550,000 | | | | 612,893 | | | | | |
| County of Platte MO: | | | | | | | | | | | | |
| 5.000%, 02/01/2025 (Callable 01/29/2024) | | | 250,000 | | | | 250,058 | | | | | |
| 3.000%, 03/01/2027 (Callable 01/29/2024) | | | 200,000 | | | | 191,898 | | | | | |
| Fulton Public School District No. 58, | | | | | | | | | | | | |
| 5.000%, 03/01/2038 | | | | | | | | | | | | |
| (Callable 03/01/2025) (Insured by ST AID) | | | 750,000 | | | | 764,549 | | | | | |
| Health & Educational Facilities | | | | | | | | | | | | |
| Authority of the State of Missouri: | | | | | | | | | | | | |
| 3.500%, 02/01/2025 (Callable 02/01/2024) | | | 55,000 | | | | 54,234 | | | | | |
| 4.000%, 02/01/2025 | | | 895,000 | | | | 887,168 | | | | | |
| 5.000%, 02/01/2025 (Callable 02/01/2024) | | | 75,000 | | | | 75,122 | | | | | |
| 5.000%, 02/01/2025 (Callable 02/01/2024) | | | 180,000 | | | | 180,008 | | | | | |
| 4.000%, 08/01/2027 | | | 440,000 | | | | 422,671 | | | | | |
| 5.000%, 09/01/2027 | | | 150,000 | | | | 154,407 | | | | | |
| 5.000%, 02/01/2029 (Callable 02/01/2024) | | | 1,000,000 | | | | 1,000,187 | | | | | |
| 5.000%, 02/01/2030 (Callable 02/01/2026) | | | 160,000 | | | | 161,028 | | | | | |
| 4.000%, 08/01/2030 (Callable 08/01/2024) | | | 670,000 | | | | 619,671 | | | | | |
| 4.000%, 02/01/2032 (Callable 02/01/2029) | | | 325,000 | | | | 309,004 | | | | | |
| 5.000%, 05/15/2036 (Callable 05/15/2026) | | | 875,000 | | | | 905,958 | | | | | |
| Industrial Development | | | | | | | | | | | | |
| Authority of University City, | | | | | | | | | | | | |
| 5.500%, 06/15/2042 (Callable 06/15/2033) | | | 1,000,000 | | | | 1,010,242 | | | | | |
The accompanying notes are an integral part of these financial statements.
Baird Strategic Municipal Bond Fund
Schedule of Investments, December 31, 2023
Long-Term Investments (cont.)
| | | Principal | | | | | | % of | |
| | | Amount | | | Value | | | Net Assets | |
| Joplin Schools, | | | | | | | | | |
| 2.000%, 03/01/2032 | | | | | | | | | |
| (Callable 03/01/2029) (Insured by BAM) | | $ | 1,000,000 | | | $ | 893,652 | | | | |
| Missouri Housing Development Commission, | | | | | | | | | | | |
| 2.350%, 11/01/2046 | | | | | | | | | | | |
| (Callable 05/01/2030) (Insured by GNMA) | | | 730,000 | | | | 508,473 | | | | |
| Missouri State Environmental Improvement | | | | | | | | | | | |
| & Energy Resources Authority, | | | | | | | | | | | |
| 2.750%, 09/01/2033 (Callable 06/12/2027) | | | 3,750,000 | | | | 3,426,987 | | | | |
| St. Louis Land Clearance | | | | | | | | | | | |
| for Redevelopment Authority: | | | | | | | | | | | |
| 4.250%, 06/01/2026 | | | 155,000 | | | | 155,664 | | | | |
| 5.000%, 06/01/2028 (Callable 12/01/2026) | | | 1,000,000 | | | | 1,034,748 | | | | |
| 3.875%, 10/01/2035 (Callable 10/01/2029) | | | 2,665,000 | | | | 2,403,148 | | | | |
| 4.000%, 06/01/2037 (Callable 12/01/2026) | | | 45,000 | | | | 44,270 | | | | |
| 5.000%, 04/01/2038 (Callable 04/01/2027) | | | 595,000 | | | | 616,302 | | | | |
| St. Louis Municipal Finance Corp.: | | | | | | | | | | | |
| 5.000%, 02/15/2025 | | | 300,000 | | | | 305,595 | | | | |
| 5.000%, 10/01/2045 | | | | | | | | | | | |
| (Callable 10/01/2030) (Insured by AGM) | | | 1,000,000 | | | | 1,069,220 | | | | |
| Total Missouri | | | | | | | | | | | |
| (Cost $17,937,981) | | | | | | | 18,383,027 | | | | 2.0 | % |
| Montana | | | | | | | | | | | | |
| City of Forsyth MT: | | | | | | | | | | | | |
| 3.875%, 07/01/2028 (Callable 04/02/2028) | | | 600,000 | | | | 612,489 | | | | | |
3.900%, 03/01/2031 (Callable 01/29/2024)(1) | | | 200,000 | | | | 199,156 | | | | | |
| Montana Board of Housing, | | | | | | | | | | | | |
| 3.000%, 12/01/2045 (Callable 06/01/2029) | | | 120,000 | | | | 99,110 | | | | | |
| Montana Facility Finance Authority, | | | | | | | | | | | | |
| 5.000%, 07/01/2033 (Callable 07/01/2028) | | | 1,635,000 | | | | 1,718,356 | | | | | |
| Total Montana | | | | | | | | | | | | |
| (Cost $2,547,435) | | | | | | | 2,629,111 | | | | 0.3 | % |
| Nebraska | | | | | | | | | | | | |
| Central Plains Energy Project, | | | | | | | | | | | | |
| 5.000%, 05/01/2054 (Callable 08/01/2029) | | | | | | | | | | | | |
(Mandatory Tender Date 11/01/2029)(1) | | | 1,500,000 | | | | 1,590,096 | | | | | |
| City of Fremont NE, | | | | | | | | | | | | |
| 1.750%, 07/15/2034 (Callable 07/08/2028) | | | 1,055,000 | | | | 888,398 | | | | | |
| Douglas County Hospital Authority No. 2, | | | | | | | | | | | | |
| 5.000%, 05/15/2026 (Callable 05/15/2024) | | | 315,000 | | | | 316,122 | | | | | |
| Madison County Hospital Authority No. 1: | | | | | | | | | | | | |
| 5.000%, 07/01/2027 | | | 585,000 | | | | 603,156 | | | | | |
| 5.000%, 07/01/2032 (Callable 07/01/2025) | | | 500,000 | | | | 509,839 | | | | | |
| Total Nebraska | | | | | | | | | | | | |
| (Cost $3,828,735) | | | | | | | 3,907,611 | | | | 0.4 | % |
| Nevada | | | | | | | | | | | | |
| City of Reno NV, | | | | | | | | | | | | |
| 5.000%, 06/01/2031 | | | | | | | | | | | | |
| (Callable 01/29/2024) (Insured by AGM) | | | 1,000,000 | | | | 1,000,432 | | | | | |
| County of Clark NV, | | | | | | | | | | | | |
| 3.750%, 01/01/2036 | | | | | | | | | | | | |
(Mandatory Tender Date 03/31/2026)(1) | | | 550,000 | | | | 556,198 | | | | | |
| Henderson Public Improvement Trust, | | | | | | | | | | | | |
| 3.000%, 01/01/2026 (ETM) | | | 270,000 | | | | 269,105 | | | | | |
| Las Vegas Redevelopment Agency, | | | | | | | | | | | | |
| 3.125%, 06/15/2033 (Callable 06/15/2026) | | | 25,000 | | | | 23,621 | | | | | |
| State of Nevada, | | | | | | | | | | | | |
4.000%, 12/15/2025(3) | | | 1,030,000 | | | | 1,011,625 | | | | | |
| Total Nevada | | | | | | | | | | | | |
| (Cost $2,859,984) | | | | | | | 2,860,981 | | | | 0.3 | % |
| New Hampshire | | | | | | | | | | | | |
| New Hampshire Business Finance Authority: | | | | | | | | | | | | |
| 3.250%, 04/01/2028 (Callable 01/01/2028) | | | 2,000,000 | | | | 1,739,609 | | | | | |
| 3.455%, 10/01/2033 (SIFMA Municipal | | | | | | | | | | | | |
| Swap Index + 0.375%) (Callable 01/02/2024) | | | | | | | | | | | | |
(Mandatory Tender Date 07/01/2024)(2) | | | 1,250,000 | | | | 1,243,469 | | | | | |
| 4.500%, 10/01/2033 | | | 2,750,000 | | | | 2,961,156 | | | | | |
| 4.375%, 09/20/2036 | | | 2,648,729 | | | | 2,675,208 | | | | | |
| 4.000%, 10/20/2036 | | | 1,968,839 | | | | 1,933,081 | | | | | |
| New Hampshire Housing Finance Authority, | | | | | | | | | | | | |
| 3.700%, 01/01/2027 | | | | | | | | | | | | |
| (Callable 07/01/2026) (Insured by FHA) | | | 3,560,000 | | | | 3,576,158 | | | | | |
| Total New Hampshire | | | | | | | | | | | | |
| (Cost $13,837,963) | | | | | | | 14,128,681 | | | | 1.5 | % |
| New Jersey | | | | | | | | | | | | |
| Atlantic City Board of Education, | | | | | | | | | | | | |
3.400%, 08/15/2024(3) | | | 140,000 | | | | 139,726 | | | | | |
| New Jersey Economic Development Authority: | | | | | | | | | | | | |
| 4.330%, 09/01/2025 (SIFMA Municipal Swap | | | | | | | | | | | | |
| Index + 1.250%) (Callable 03/01/2025) | | | | | | | | | | | | |
(Insured by ST AID)(2) | | | 430,000 | | | | 430,827 | | | | | |
| 5.625%, 01/01/2052 (Callable 01/29/2024) | | | 1,000,000 | | | | 1,000,219 | | | | | |
| New Jersey Educational Facilities Authority: | | | | | | | | | | | | |
| 5.000%, 07/01/2026 (Callable 07/01/2025) | | | 70,000 | | | | 71,943 | | | | | |
| 5.000%, 07/01/2026 (Callable 07/01/2025) | | | 595,000 | | | | 609,317 | | | | | |
| 5.000%, 07/01/2027 (Insured by AGM) | | | 150,000 | | | | 156,894 | | | | | |
| 5.000%, 07/01/2028 (Insured by AGM) | | | 125,000 | | | | 132,501 | | | | | |
| New Jersey Health Care | | | | | | | | | | | | |
| Facilities Financing Authority, | | | | | | | | | | | | |
| 5.000%, 07/01/2026 | | | | | | | | | | | | |
| (Callable 07/01/2025) (Insured by AGM) | | | 1,095,000 | | | | 1,122,029 | | | | | |
| New Jersey Higher Education | | | | | | | | | | | | |
| Student Assistance Authority: | | | | | | | | | | | | |
| 5.000%, 12/01/2025 | | | 1,200,000 | | | | 1,233,655 | | | | | |
| 5.000%, 12/01/2027 (Callable 12/01/2026) | | | 1,400,000 | | | | 1,460,268 | | | | | |
| 5.000%, 12/01/2027 | | | 775,000 | | | | 818,410 | | | | | |
| 4.000%, 12/01/2044 (Callable 12/01/2033) | | | 300,000 | | | | 299,688 | | | | | |
| New Jersey Housing & | | | | | | | | | | | | |
| Mortgage Finance Agency: | | | | | | | | | | | | |
| 3.600%, 05/01/2026 (Insured by HUD) | | | 3,000,000 | | | | 3,020,278 | | | | | |
| 1.800%, 10/01/2027 | | | 3,655,000 | | | | 3,340,133 | | | | | |
| New Jersey Transportation | | | | | | | | | | | | |
| Trust Fund Authority: | | | | | | | | | | | | |
| 0.000%, 12/15/2027 (Insured by BAM) | | | 1,950,000 | | | | 1,728,053 | | | | | |
| 0.000%, 12/15/2029 (Insured by AGM) | | | 4,500,000 | | | | 3,761,962 | | | | | |
| New Jersey Turnpike Authority, | | | | | | | | | | | | |
| 4.440%, 01/01/2024 | | | | | | | | | | | | |
(1 Month TSFR + 0.700%)(2) | | | 200,000 | | | | 200,000 | | | | | |
| Newark Housing Authority: | | | | | | | | | | | | |
| 5.250%, 01/01/2025 (Insured by NATL) | | | 2,400,000 | | | | 2,434,886 | | | | | |
| 4.500%, 01/01/2028 (Insured by NATL) | | | 25,000 | | | | 26,182 | | | | | |
| South Jersey Port Corp.: | | | | | | | | | | | | |
| 3.000%, 01/01/2027 (Callable 01/24/2024) | | | 35,000 | | | | 34,961 | | | | | |
| 3.500%, 01/01/2032 (Callable 01/01/2026) | | | 100,000 | | | | 100,865 | | | | | |
| South Jersey Transportation Authority, | | | | | | | | | | | | |
| 5.250%, 11/01/2052 | | | | | | | | | | | | |
| (Callable 11/01/2032) (Insured by BAM) | | | 1,250,000 | | | | 1,362,705 | | | | | |
| Total New Jersey | | | | | | | | | | | | |
| (Cost $23,250,960) | | | | | | | 23,485,502 | | | | 2.5 | % |
| New Mexico | | | | | | | | | | | | |
| New Mexico Hospital Equipment Loan Council, | | | | | | | | | | | | |
| 5.000%, 08/01/2033 (Callable 08/01/2029) | | | 925,000 | | | | 1,013,692 | | | | | |
The accompanying notes are an integral part of these financial statements.
Baird Strategic Municipal Bond Fund
Schedule of Investments, December 31, 2023
Long-Term Investments (cont.)
| | | Principal | | | | | | % of | |
| | | Amount | | | Value | | | Net Assets | |
| New Mexico Mortgage Finance Authority, | | | | | | | | | |
| 5.000%, 02/01/2042 (Callable 10/01/2024) | | | | | | | | | |
| (Mandatory Tender Date 06/01/2025) | | | | | | | | | |
(Insured by HUD)(1) | | $ | 2,000,000 | | | $ | 2,019,893 | | | | |
| Town of Clayton NM, | | | | | | | | | | | |
| 5.000%, 11/01/2026 | | | | | | | | | | | |
| (Callable 11/01/2025) (Insured by NATL) | | | 185,000 | | | | 188,753 | | | | |
| Village of Los Ranchos de Albuquerque NM, | | | | | | | | | | | |
| 5.000%, 09/01/2027 | | | 350,000 | | | | 373,766 | | | | |
| Total New Mexico | | | | | | | | | | | |
| (Cost $3,549,311) | | | | | | | 3,596,104 | | | | 0.4 | % |
| New York | | | | | | | | | | | | |
| Albany Capital Resource Corp., | | | | | | | | | | | | |
| 5.000%, 05/01/2031 (Callable 05/01/2026) | | | 125,000 | | | | 129,122 | | | | | |
| Albany County Capital Resource Corp., | | | | | | | | | | | | |
| 3.100%, 07/01/2030 | | | 200,000 | | | | 176,624 | | | | | |
| Amherst Industrial Development Agency, | | | | | | | | | | | | |
| 3.900%, 04/01/2026 (Mandatory Tender | | | | | | | | | | | | |
Date 04/01/2025) (Insured by FHA)(1) | | | 2,000,000 | | | | 2,008,402 | | | | | |
| Build NYC Resource Corp., | | | | | | | | | | | | |
4.000%, 12/01/2031 (Callable 12/01/2029)(3) | | | 1,100,000 | | | | 1,013,214 | | | | | |
| City of Amsterdam NY, | | | | | | | | | | | | |
| 5.000%, 06/20/2024 | | | 1,500,000 | | | | 1,502,859 | | | | | |
| City of Long Beach NY, | | | | | | | | | | | | |
| 5.250%, 07/15/2037 | | | | | | | | | | | | |
| (Callable 07/15/2030) (Insured by BAM) | | | 325,000 | | | | 358,640 | | | | | |
| City of Poughkeepsie NY: | | | | | | | | | | | | |
| 4.000%, 04/15/2028 | | | 230,000 | | | | 230,848 | | | | | |
| 4.000%, 04/15/2030 | | | 250,000 | | | | 251,689 | | | | | |
| Dutchess County NY Local Development Corp., | | | | | | | | | | | | |
| 5.000%, 07/01/2030 (Callable 07/01/2026) | | | 180,000 | | | | 186,573 | | | | | |
| Huntington Local Development Corp., | | | | | | | | | | | | |
| 4.000%, 07/01/2027 | | | 905,000 | | | | 868,470 | | | | | |
| Monroe County Industrial Development Corp.: | | | | | | | | | | | | |
| 5.000%, 07/01/2028 (Mandatory Tender | | | | | | | | | | | | |
Date 07/01/2027) (Insured by HUD)(1)(6) | | | 2,000,000 | | | | 2,081,201 | | | | | |
| 4.840%, 11/01/2040 (Insured by FNMA) | | | 2,634,172 | | | | 2,719,653 | | | | | |
| New York City Housing Development Corp.: | | | | | | | | | | | | |
| 2.250%, 11/01/2041 | | | | | | | | | | | | |
| (Callable 05/01/2029) (Insured by FHA) | | | 1,410,000 | | | | 1,070,155 | | | | | |
| 2.550%, 11/01/2045 (Callable 02/01/2029) | | | 2,170,000 | | | | 1,621,901 | | | | | |
| 3.000%, 02/15/2048 (Callable 05/15/2024) | | | 2,000,000 | | | | 1,980,342 | | | | | |
| 3.500%, 02/15/2048 (Callable 05/15/2024) | | | 1,600,000 | | | | 1,584,866 | | | | | |
| 5.300%, 11/01/2053 | | | | | | | | | | | | |
| (Callable 11/01/2031) (Insured by HUD) | | | 1,000,000 | | | | 1,059,581 | | | | | |
| 0.700%, 11/01/2060 (Callable 01/19/2024) | | | | | | | | | | | | |
(Mandatory Tender Date 07/01/2025)(1) | | | 3,510,000 | | | | 3,328,985 | | | | | |
| 0.900%, 11/01/2060 (Callable 10/01/2024) | | | | | | | | | | | | |
| (Mandatory Tender Date 01/01/2026) | | | | | | | | | | | | |
(Insured by FHA)(1) | | | 1,500,000 | | | | 1,397,576 | | | | | |
| 0.600%, 05/01/2061 (Callable 01/19/2024) | | | | | | | | | | | | |
| (Mandatory Tender Date 07/01/2025) | | | | | | | | | | | | |
(Insured by FHA)(1) | | | 2,755,000 | | | | 2,608,975 | | | | | |
| 3.800%, 11/01/2063 (Callable 06/01/2027) | | | | | | | | | | | | |
(Mandatory Tender Date 01/03/2028)(1) | | | 3,000,000 | | | | 3,019,134 | | | | | |
| New York City Industrial Development Agency: | | | | | | | | | | | | |
| 2.000%, 01/01/2038 | | | | | | | | | | | | |
| (Callable 01/01/2031) (Insured by AGM) | | | 1,350,000 | | | | 1,018,642 | | | | | |
| 3.000%, 01/01/2046 | | | | | | | | | | | | |
| (Callable 01/01/2031) (Insured by AGM) | | | 3,000,000 | | | | 2,394,077 | | | | | |
| New York City Municipal | | | | | | | | | | | | |
| Water Finance Authority, | | | | | | | | | | | | |
| 5.000%, 06/15/2040 (Callable 12/15/2027) | | | 200,000 | | | | 213,425 | | | | | |
| New York City Transitional Finance Authority, | | | | | | | | | | | | |
| 4.000%, 07/15/2038 | | | | | | | | | | | | |
| (Callable 07/15/2028) (Insured by ST AID) | | | 200,000 | | | | 204,160 | | | | | |
| New York State Housing Finance Agency: | | | | | | | | | | | | |
| 0.750%, 05/01/2025 (Callable 01/19/2024) | | | | | | | | | | | | |
| (Insured by SONYMA) | | | 1,785,000 | | | | 1,695,929 | | | | | |
| 1.650%, 05/15/2039 (Insured by FNMA) | | | 2,579,274 | | | | 1,926,380 | | | | | |
| 0.650%, 11/01/2056 (Callable 01/19/2024) | | | | | | | | | | | | |
| (Mandatory Tender Date 11/01/2025) | | | | | | | | | | | | |
(Insured by SONYMA)(1) | | | 1,000,000 | | | | 934,706 | | | | | |
| 1.000%, 11/01/2061 (Callable 01/19/2024) | | | | | | | | | | | | |
| (Mandatory Tender Date 11/01/2026) | | | | | | | | | | | | |
(Insured by SONYMA)(1) | | | 3,000,000 | | | | 2,795,333 | | | | | |
| New York Transportation Development Corp.: | | | | | | | | | | | | |
| 5.000%, 12/01/2027 | | | 100,000 | | | | 107,342 | | | | | |
| 5.000%, 01/01/2029 (Callable 01/01/2028) | | | 3,310,000 | | | | 3,409,294 | | | | | |
| 5.625%, 04/01/2040 (Callable 04/01/2031) | | | 750,000 | | | | 806,868 | | | | | |
| 6.000%, 06/30/2054 (Callable 06/30/2031) | | | 2,750,000 | | | | 3,036,645 | | | | | |
| 5.125%, 06/30/2060 | | | | | | | | | | | | |
| (Callable 06/30/2031) (Insured by AGM) | | | 1,000,000 | | | | 1,048,810 | | | | | |
| Onondaga Civic Development Corp.: | | | | | | | | | | | | |
| 5.000%, 10/01/2024 | | | 90,000 | | | | 89,391 | | | | | |
| 5.000%, 10/01/2025 | | | 225,000 | | | | 221,852 | | | | | |
| 3.625%, 10/01/2028 (Callable 10/01/2025) | | | 55,000 | | | | 50,267 | | | | | |
| 5.000%, 10/01/2029 (Callable 10/01/2025) | | | 50,000 | | | | 48,159 | | | | | |
| 4.125%, 10/01/2035 (Callable 10/01/2025) | | | 770,000 | | | | 647,180 | | | | | |
| Onondaga County Trust for Cultural Resources: | | | | | | | | | | | | |
| 5.000%, 05/01/2027 | | | 180,000 | | | | 187,129 | | | | | |
| 5.000%, 05/01/2029 (Callable 05/01/2027) | | | 345,000 | | | | 358,242 | | | | | |
| Orange County Funding Corp., | | | | | | | | | | | | |
| 2.625%, 07/01/2025 (Callable 01/29/2024) | | | 125,000 | | | | 121,614 | | | | | |
| Port Authority of New York & New Jersey, | | | | | | | | | | | | |
| 5.000%, 07/15/2030 | | | 100,000 | | | | 111,159 | | | | | |
| State of New York Mortgage Agency, | | | | | | | | | | | | |
| 3.500%, 04/01/2049 (Callable 10/01/2028) | | | 110,000 | | | | 108,798 | | | | | |
| Town of Byron NY, | | | | | | | | | | | | |
| 4.500%, 04/03/2024 (Callable 01/29/2024) | | | 100,000 | | | | 100,011 | | | | | |
| Town of North Hempstead NY, | | | | | | | | | | | | |
| 2.500%, 09/15/2031 (Callable 09/15/2024) | | | | | | | | | | | | |
| (Partially Pre-refunded) | | | 1,500,000 | | | | 1,359,767 | | | | | |
| Town of Ramapo NY: | | | | | | | | | | | | |
| 3.375%, 05/15/2024 (Callable 01/29/2024) | | | 25,000 | | | | 24,764 | | | | | |
| 3.000%, 11/01/2027 (Callable 01/19/2024) | | | 100,000 | | | | 93,396 | | | | | |
| 4.125%, 05/15/2028 (Callable 01/29/2024) | | | 115,000 | | | | 109,699 | | | | | |
| Village of Mohawk NY, | | | | | | | | | | | | |
| 4.375%, 04/26/2024 (Callable 01/19/2024) | | | 100,000 | | | | 100,014 | | | | | |
| Westchester County Local Development Corp.: | | | | | | | | | | | | |
2.875%, 07/01/2026(3) | | | 2,000,000 | | | | 1,963,673 | | | | | |
| 5.750%, 11/01/2049 | | | | | | | | | | | | |
| (Callable 11/01/2033) (Insured by AGM) | | | 1,750,000 | | | | 1,986,556 | | | | | |
| 5.750%, 11/01/2053 | | | | | | | | | | | | |
| (Callable 11/01/2033) (Insured by AGM) | | | 1,025,000 | | | | 1,156,685 | | | | | |
| Total New York | | | | | | | | | | | | |
| (Cost $56,752,959) | | | | | | | 57,628,777 | | | | 6.3 | % |
| North Carolina | | | | | | | | | | | | |
| City of Asheville NC, | | | | | | | | | | | | |
| 2.000%, 08/01/2041 (Callable 08/01/2031) | | | 1,185,000 | | | | 842,251 | | | | | |
| North Carolina Housing Finance Agency: | | | | | | | | | | | | |
| 4.000%, 07/01/2050 | | | | | | | | | | | | |
| (Callable 01/01/2029) (Insured by GNMA) | | | 815,000 | | | | 814,466 | | | | | |
| 6.250%, 01/01/2055 | | | | | | | | | | | | |
| (Callable 07/01/2032) (Insured by GNMA) | | | 1,000,000 | | | | 1,106,616 | | | | | |
The accompanying notes are an integral part of these financial statements.
Baird Strategic Municipal Bond Fund
Schedule of Investments, December 31, 2023
Long-Term Investments (cont.)
| | | Principal | | | | | | % of | |
| | | Amount | | | Value | | | Net Assets | |
| North Carolina Medical Care Commission, | | | | | | | | | |
| 5.000%, 01/01/2038 (Callable 01/01/2026) | | $ | 1,250,000 | | | $ | 1,253,828 | | | | |
| North Carolina Turnpike Authority, | | | | | | | | | | | |
| 5.000%, 01/01/2028 | | | 250,000 | | | | 265,983 | | | | |
| State of North Carolina, | | | | | | | | | | | |
| 2.000%, 06/01/2032 (Callable 06/01/2029) | | | 525,000 | | | | 475,120 | | | | |
| University of North Carolina at Chapel Hill, | | | | | | | | | | | |
| 4.261%, 12/01/2041 | | | | | | | | | | | |
| (SOFR + 0.650%) (Callable 12/01/2024) | | | | | | | | | | | |
(Mandatory Tender Date 06/01/2025)(2) | | | 1,750,000 | | | | 1,751,743 | | | | |
| Winston-Salem State University, | | | | | | | | | | | |
| 4.250%, 06/01/2032 (Callable 06/01/2024) | | | 50,000 | | | | 49,808 | | | | |
| Total North Carolina | | | | | | | | | | | |
| (Cost $6,488,804) | | | | | | | 6,559,815 | | | | 0.7 | % |
| North Dakota | | | | | | | | | | | | |
| Cass County Joint Water Resource District, | | | | | | | | | | | | |
| 0.480%, 05/01/2024 (Callable 01/29/2024) | | | 2,000,000 | | | | 1,964,993 | | | | | |
| City of Grand Forks ND: | | | | | | | | | | | | |
| 5.000%, 12/01/2024 | | | 100,000 | | | | 100,648 | | | | | |
| 5.000%, 12/01/2029 | | | 750,000 | | | | 791,401 | | | | | |
| City of Horace ND: | | | | | | | | | | | | |
| 3.250%, 08/01/2024 (Callable 01/29/2024) | | | 120,000 | | | | 120,023 | | | | | |
| 4.000%, 01/01/2025 (Callable 01/19/2024) | | | 1,000,000 | | | | 1,000,118 | | | | | |
| 5.125%, 07/01/2025 (Callable 07/01/2024) | | | 780,000 | | | | 786,196 | | | | | |
| 3.000%, 05/01/2027 (Callable 05/01/2026) | | | 115,000 | | | | 111,163 | | | | | |
| 6.000%, 05/01/2049 (Callable 05/01/2032) | | | 1,500,000 | | | | 1,605,580 | | | | | |
| City of Mandan ND: | | | | | | | | | | | | |
| 4.000%, 09/01/2034 (Callable 09/01/2024) | | | 1,010,000 | | | | 1,011,683 | | | | | |
| 3.000%, 09/01/2036 (Callable 09/01/2024) | | | 255,000 | | | | 235,267 | | | | | |
| City of Mayville ND, | | | | | | | | | | | | |
| 3.750%, 08/01/2025 (Callable 01/29/2024) | | | 1,000,000 | | | | 980,337 | | | | | |
| County of Ward ND: | | | | | | | | | | | | |
| 5.000%, 06/01/2029 (Callable 06/01/2028) | | | 1,100,000 | | | | 1,079,496 | | | | | |
| 5.000%, 06/01/2031 (Callable 06/01/2028) | | | 1,365,000 | | | | 1,330,206 | | | | | |
| Williston Parks & Recreation District: | | | | | | | | | | | | |
| 4.500%, 03/01/2025 (Callable 01/16/2024) | | | 475,000 | | | | 470,135 | | | | | |
| 4.000%, 03/01/2032 (Callable 01/16/2024) | | | 45,000 | | | | 39,397 | | | | | |
| Total North Dakota | | | | | | | | | | | | |
| (Cost $11,569,291) | | | | | | | 11,626,643 | | | | 1.3 | % |
| Ohio | | | | | | | | | | | | |
| Akron Bath Copley Joint | | | | | | | | | | | | |
| Township Hospital District, | | | | | | | | | | | | |
| 5.000%, 11/15/2024 | | | 200,000 | | | | 202,411 | | | | | |
| Cleveland-Cuyahoga County Port Authority: | | | | | | | | | | | | |
| 5.000%, 08/01/2026 (Callable 08/01/2024) | | | 150,000 | | | | 151,391 | | | | | |
| 5.500%, 08/01/2052 (Callable 08/01/2032) | | | 1,400,000 | | | | 1,507,387 | | | | | |
| Columbus Metropolitan Housing Authority: | | | | | | | | | | | | |
| 2.000%, 11/01/2026 (Callable 01/16/2024) | | | 265,000 | | | | 256,763 | | | | | |
| 3.000%, 11/01/2028 (Callable 01/16/2024) | | | 275,000 | | | | 273,684 | | | | | |
| County of Cuyahoga OH: | | | | | | | | | | | | |
| 5.000%, 12/01/2026 (Callable 06/01/2024) | | | 1,000,000 | | | | 1,004,881 | | | | | |
| 4.000%, 01/01/2033 (Callable 01/01/2031) | | | 100,000 | | | | 107,377 | | | | | |
| County of Hamilton OH, | | | | | | | | | | | | |
| 5.000%, 02/01/2028 (Callable 02/01/2024) | | | 250,000 | | | | 250,218 | | | | | |
| County of Hardin OH, | | | | | | | | | | | | |
| 4.000%, 05/01/2026 | | | 75,000 | | | | 72,648 | | | | | |
| County of Montgomery OH, | | | | | | | | | | | | |
| 3.000%, 08/01/2034 (Callable 02/01/2031) | | | 200,000 | | | | 191,172 | | | | | |
| Hamilton County Convention | | | | | | | | | | | | |
| Facilities Authority, | | | | | | | | | | | | |
| 5.000%, 12/01/2026 (Callable 01/29/2024) | | | 1,000,000 | | | | 1,000,741 | | | | | |
| Lancaster Port Authority, | | | | | | | | | | | | |
| 5.000%, 08/01/2049 (Callable 11/01/2024) | | | | | | | | | | | | |
(Mandatory Tender Date 02/01/2025)(1) | | | 635,000 | | | | 643,108 | | | | | |
| Northeast Ohio Medical University: | | | | | | | | | | | | |
| 5.000%, 12/01/2024 | | | 75,000 | | | | 75,882 | | | | | |
| 5.000%, 12/01/2026 | | | 100,000 | | | | 104,051 | | | | | |
| Ohio Air Quality Development Authority: | | | | | | | | | | | | |
| 1.375%, 02/01/2026 | | | | | | | | | | | | |
(Mandatory Tender Date 11/01/2024)(1) | | | 1,000,000 | | | | 965,976 | | | | | |
| 4.000%, 09/01/2030 | | | | | | | | | | | | |
(Mandatory Tender Date 06/01/2027)(1) | | | 2,150,000 | | | | 2,184,554 | | | | | |
| 4.250%, 11/01/2040 | | | | | | | | | | | | |
(Mandatory Tender Date 06/01/2027)(1) | | | 1,000,000 | | | | 1,008,334 | | | | | |
| Ohio Higher Educational Facility Commission, | | | | | | | | | | | | |
| 5.000%, 12/01/2032 | | | 1,190,000 | | | | 1,243,103 | | | | | |
| Ohio Housing Finance Agency: | | | | | | | | | | | | |
| 6.000%, 02/01/2026 | | | | | | | | | | | | |
(Callable 02/01/2025)(3) | | | 1,000,000 | | | | 1,007,397 | | | | | |
| 2.450%, 09/01/2045 | | | | | | | | | | | | |
| (Callable 09/01/2029) (Insured by GNMA) | | | 550,000 | | | | 400,159 | | | | | |
| 4.500%, 03/01/2050 (Callable 09/01/2028) | | | 745,000 | | | | 751,658 | | | | | |
| 3.750%, 09/01/2050 | | | | | | | | | | | | |
| (Callable 03/01/2029) (Insured by GNMA) | | | 115,000 | | | | 114,480 | | | | | |
| Port of Greater Cincinnati | | | | | | | | | | | | |
| Development Authority, | | | | | | | | | | | | |
5.000%, 05/01/2025 (Callable 01/29/2024)(3) | | | 3,650,000 | | | | 3,649,644 | | | | | |
| State of Ohio: | | | | | | | | | | | | |
| 5.000%, 12/31/2026 | | | | | | | | | | | | |
| (Callable 06/30/2025) (Insured by AGM) | | | 1,000,000 | | | | 1,015,860 | | | | | |
| 5.000%, 12/31/2035 | | | | | | | | | | | | |
| (Callable 06/30/2025) (Insured by AGM) | | | 1,700,000 | | | | 1,712,733 | | | | | |
| 5.000%, 12/31/2039 (Callable 06/30/2025) | | | 1,000,000 | | | | 1,005,410 | | | | | |
| Summit County Development | | | | | | | | | | | | |
| Finance Authority, | | | | | | | | | | | | |
| 5.750%, 12/01/2053 (Callable 12/01/2033) | | | 750,000 | | | | 773,387 | | | | | |
| Tuscarawas Valley Local School District, | | | | | | | | | | | | |
| 4.000%, 12/01/2045 | | | | | | | | | | | | |
| (Callable 06/01/2029) (Insured by BAM) | | | 115,000 | | | | 111,492 | | | | | |
| Warren County Port Authority, | | | | | | | | | | | | |
| 4.000%, 12/01/2041 (Callable 12/01/2031) | | | 570,000 | | | | 512,592 | | | | | |
| Total Ohio | | | | | | | | | | | | |
| (Cost $22,306,418) | | | | | | | 22,298,493 | | | | 2.4 | % |
| Oklahoma | | | | | | | | | | | | |
| Blaine County Educational Facilities Authority, | | | | | | | | | | | | |
| 5.000%, 12/01/2033 (Callable 12/01/2032) | | | 1,080,000 | | | | 1,215,404 | | | | | |
| Canadian County Educational | | | | | | | | | | | | |
| Facilities Authority: | | | | | | | | | | | | |
| 5.000%, 09/01/2029 | | | 1,000,000 | | | | 1,097,806 | | | | | |
| 5.250%, 09/01/2034 (Callable 09/01/2033) | | | 2,500,000 | | | | 2,901,197 | | | | | |
| Delaware County Educational | | | | | | | | | | | | |
| Facilities Authority, | | | | | | | | | | | | |
| 5.000%, 09/01/2029 | | | 1,630,000 | | | | 1,791,199 | | | | | |
| Muskogee Industrial Trust: | | | | | | | | | | | | |
| 5.000%, 09/01/2027 | | | 275,000 | | | | 289,283 | | | | | |
| 4.000%, 09/01/2033 (Callable 09/01/2029) | | | 1,500,000 | | | | 1,501,533 | | | | | |
| Norman Regional Hospital Authority, | | | | | | | | | | | | |
| 5.000%, 09/01/2029 (Callable 09/01/2026) | | | 1,695,000 | | | | 1,745,845 | | | | | |
| Oklahoma Capitol Improvement Authority, | | | | | | | | | | | | |
| 3.000%, 07/01/2033 (Callable 07/01/2029) | | | 1,290,000 | | | | 1,247,336 | | | | | |
| Oklahoma County Independent | | | | | | | | | | | | |
| School District No. 12, | | | | | | | | | | | | |
| 0.050%, 03/01/2024 | | | 150,000 | | | | 148,904 | | | | | |
The accompanying notes are an integral part of these financial statements.
Baird Strategic Municipal Bond Fund
Schedule of Investments, December 31, 2023
Long-Term Investments (cont.)
| | | Principal | | | | | | % of | |
| | | Amount | | | Value | | | Net Assets | |
| Oklahoma Development Finance Authority, | | | | | | | | | |
| 3.550%, 08/15/2031 (Callable 01/02/2024) | | | | | | | | | |
(Optional Put Date 01/05/2024)(1) | | $ | 1,850,000 | | | $ | 1,850,000 | | | | |
| Pontotoc County Educational | | | | | | | | | | | |
| Facilities Authority: | | | | | | | | | | | |
| 4.000%, 09/01/2026 | | | 200,000 | | | | 204,834 | | | | |
| 4.000%, 09/01/2027 | | | 325,000 | | | | 337,260 | | | | |
| 4.000%, 09/01/2028 | | | 300,000 | | | | 313,277 | | | | |
| 4.000%, 09/01/2029 | | | 275,000 | | | | 289,474 | | | | |
| 4.000%, 09/01/2030 | | | 400,000 | | | | 423,202 | | | | |
| Total Oklahoma | | | | | | | | | | | |
| (Cost $15,019,109) | | | | | | | 15,356,554 | | | | 1.7 | % |
| Oregon | | | | | | | | | | | | |
| Clackamas County Hospital Facility Authority, | | | | | | | | | | | | |
| 5.000%, 05/15/2024 | | | 100,000 | | | | 99,760 | | | | | |
| Lane County School District No. 40: | | | | | | | | | | | | |
| 0.000%, 06/15/2032 | | | | | | | | | | | | |
| (Insured by SCH BD GTY) | | | 450,000 | | | | 345,994 | | | | | |
| 0.000%, 06/15/2033 | | | | | | | | | | | | |
| (Insured by SCH BD GTY) | | | 400,000 | | | | 297,818 | | | | | |
| 0.000%, 06/15/2038 (Callable 06/15/2033) | | | | | | | | | | | | |
| (Insured by SCH BD GTY) | | | 925,000 | | | | 502,366 | | | | | |
| Oregon Health & Science University, | | | | | | | | | | | | |
| 5.000%, 07/01/2046 (Callable 11/01/2031) | | | | | | | | | | | | |
(Mandatory Tender Date 02/01/2032)(1) | | | 150,000 | | | | 171,165 | | | | | |
| Oregon State Business | | | | | | | | | | | | |
| Development Commission, | | | | | | | | | | | | |
| 3.800%, 12/01/2040 (Callable 02/01/2028) | | | | | | | | | | | | |
(Mandatory Tender Date 06/15/2028)(1) | | | 1,000,000 | | | | 1,021,017 | | | | | |
| Oregon State Facilities Authority: | | | | | | | | | | | | |
| 5.000%, 10/01/2025 | | | 325,000 | | | | 332,380 | | | | | |
| 5.000%, 10/01/2027 (Callable 10/01/2026) | | | 100,000 | | | | 103,731 | | | | | |
| 5.000%, 10/01/2028 | | | 150,000 | | | | 159,742 | | | | | |
| State of Oregon Housing & | | | | | | | | | | | | |
| Community Services Department: | | | | | | | | | | | | |
| 3.900%, 01/01/2033 (Callable 01/29/2024) | | | 70,000 | | | | 69,389 | | | | | |
| 3.600%, 07/01/2034 (Callable 07/01/2024) | | | 700,000 | | | | 669,153 | | | | | |
| 2.900%, 07/01/2043 (Callable 07/01/2027) | | | 1,000,000 | | | | 833,636 | | | | | |
| 4.000%, 01/01/2047 (Callable 07/01/2025) | | | 65,000 | | | | 64,888 | | | | | |
| 4.000%, 07/01/2047 (Callable 07/01/2026) | | | 130,000 | | | | 129,609 | | | | | |
| 3.500%, 01/01/2051 (Callable 01/01/2029) | | | 80,000 | | | | 79,065 | | | | | |
| Yamhill County Hospital Authority: | | | | | | | | | | | | |
| 4.000%, 11/15/2026 (Callable 11/15/2024) | | | 285,000 | | | | 273,134 | | | | | |
| 2.125%, 11/15/2027 (Callable 01/19/2024) | | | 340,000 | | | | 322,750 | | | | | |
| Total Oregon | | | | | | | | | | | | |
| (Cost $5,464,157) | | | | | | | 5,475,597 | | | | 0.6 | % |
| Pennsylvania | | | | | | | | | | | | |
| Bucks County Industrial | | | | | | | | | | | | |
| Development Authority, | | | | | | | | | | | | |
| 5.000%, 07/01/2028 | | | 970,000 | | | | 952,278 | | | | | |
| Central Bradford Progress Authority, | | | | | | | | | | | | |
| 3.620%, 12/01/2041 (Callable 01/02/2024) | | | | | | | | | | | | |
(Optional Put Date 01/05/2024)(1) | | | 950,000 | | | | 950,000 | | | | | |
| Cheltenham Township School District, | | | | | | | | | | | | |
| 3.000%, 02/15/2029 | | | | | | | | | | | | |
| (Callable 01/19/2024) (Insured by ST AID) | | | 45,000 | | | | 45,006 | | | | | |
| Chester County Industrial | | | | | | | | | | | | |
| Development Authority: | | | | | | | | | | | | |
| 5.000%, 08/01/2030 (Callable 01/29/2024) | | | 125,000 | | | | 125,008 | | | | | |
| 5.000%, 08/01/2035 (Callable 01/29/2024) | | | 730,000 | | | | 724,905 | | | | | |
| 5.000%, 08/01/2045 (Callable 01/29/2024) | | | 500,000 | | | | 466,826 | | | | | |
| City of Bradford PA: | | | | | | | | | | | | |
| 4.000%, 11/01/2026 | | | | | | | | | | | | |
| (Callable 11/01/2025) (Insured by AGM) | | | 415,000 | | | | 423,005 | | | | | |
| 4.000%, 11/01/2027 | | | | | | | | | | | | |
| (Callable 11/01/2025) (Insured by AGM) | | | 370,000 | | | | 377,101 | | | | | |
| City of Erie Higher | | | | | | | | | | | | |
| Education Building Authority, | | | | | | | | | | | | |
| 5.000%, 05/01/2029 | | | 370,000 | | | | 387,568 | | | | | |
| City of York PA: | | | | | | | | | | | | |
| 5.000%, 11/15/2025 | | | 525,000 | | | | 532,467 | | | | | |
| 5.000%, 11/15/2026 | | | 205,000 | | | | 210,381 | | | | | |
| 5.000%, 11/15/2027 | | | 220,000 | | | | 228,366 | | | | | |
| Coatesville School District, | | | | | | | | | | | | |
| 5.000%, 11/15/2031 | | | | | | | | | | | | |
| (Callable 11/15/2030) (Insured by BAM) | | | 3,000,000 | | | | 3,378,202 | | | | | |
| County of Lackawanna PA, | | | | | | | | | | | | |
| 3.250%, 09/15/2035 | | | | | | | | | | | | |
| (Callable 09/15/2024) (Insured by BAM) | | | 50,000 | | | | 48,982 | | | | | |
| County of Lehigh PA, | | | | | | | | | | | | |
| 4.250%, 07/01/2045 (Callable 07/01/2025) | | | 55,000 | | | | 55,145 | | | | | |
| Cumberland County Municipal Authority: | | | | | | | | | | | | |
| 5.000%, 01/01/2029 | | | | | | | | | | | | |
| (Pre-refunded to 01/01/2025) | | | 30,000 | | | | 30,569 | | | | | |
| 5.000%, 01/01/2029 (Callable 01/01/2025) | | | 75,000 | | | | 75,433 | | | | | |
| Dallas Area Municipal Authority, | | | | | | | | | | | | |
| 5.000%, 05/01/2024 | | | 500,000 | | | | 499,835 | | | | | |
| Delaware County Industrial | | | | | | | | | | | | |
| Development Authority, | | | | | | | | | | | | |
4.375%, 06/01/2026(3) | | | 1,100,000 | | | | 1,085,501 | | | | | |
| Delaware Valley Regional Finance Authority, | | | | | | | | | | | | |
| 4.543%, 09/01/2048 (1 Month LIBOR | | | | | | | | | | | | |
| USD + 0.880%) (Callable 09/01/2024) | | | | | | | | | | | | |
(Mandatory Tender Date 09/01/2025)(2)(7) | | | 1,000,000 | | | | 991,319 | | | | | |
| East Hempfield Township | | | | | | | | | | | | |
| Industrial Development Authority: | | | | | | | | | | | | |
| 5.000%, 12/01/2024 | | | 100,000 | | | | 101,005 | | | | | |
| 5.000%, 12/01/2027 (Callable 12/01/2025) | | | 1,510,000 | | | | 1,546,812 | | | | | |
| Highlands School District: | | | | | | | | | | | | |
| 5.000%, 04/15/2034 | | | | | | | | | | | | |
| (Callable 04/15/2032) (Insured by AGM) | | | 330,000 | | | | 376,947 | | | | | |
| 5.000%, 04/15/2035 | | | | | | | | | | | | |
| (Callable 04/15/2032) (Insured by AGM) | | | 270,000 | | | | 307,787 | | | | | |
| Indiana County Municipal Services Authority, | | | | | | | | | | | | |
| 5.000%, 10/01/2030 (Insured by BAM) | | | 270,000 | | | | 296,473 | | | | | |
| Latrobe Industrial Development Authority: | | | | | | | | | | | | |
| 5.000%, 03/01/2024 | | | 80,000 | | | | 80,083 | | | | | |
| 5.000%, 03/01/2025 | | | 110,000 | | | | 110,963 | | | | | |
| 5.000%, 03/01/2026 | | | 260,000 | | | | 264,220 | | | | | |
| Montgomery County Industrial | | | | | | | | | | | | |
| Development Authority: | | | | | | | | | | | | |
| 2.000%, 11/15/2029 | | | | | | | | | | | | |
| (Callable 01/01/2024) (Optional Put Date | | | | | | | | | | | | |
01/02/2024) (Insured by AGC)(1) | | | 870,000 | | | | 870,000 | | | | | |
| 4.000%, 12/01/2031 (Callable 12/01/2025) | | | 25,000 | | | | 25,571 | | | | | |
| 4.100%, 04/01/2053 | | | | | | | | | | | | |
(Mandatory Tender Date 04/03/2028)(1) | | | 3,000,000 | | | | 3,057,303 | | | | | |
| Northeastern Pennsylvania | | | | | | | | | | | | |
| Hospital and Education Authority, | | | | | | | | | | | | |
| 5.000%, 05/01/2033 (Callable 05/01/2029) | | | 460,000 | | | | 472,639 | | | | | |
| Northern Lebanon School District, | | | | | | | | | | | | |
| 3.000%, 09/01/2034 | | | | | | | | | | | | |
| (Callable 09/01/2029) (Insured by BAM) | | | 910,000 | | | | 866,107 | | | | | |
The accompanying notes are an integral part of these financial statements.
Baird Strategic Municipal Bond Fund
Schedule of Investments, December 31, 2023
Long-Term Investments (cont.)
| | | Principal | | | | | | % of | |
| | | Amount | | | Value | | | Net Assets | |
| Pennsylvania Economic | | | | | | | | | |
| Development Financing Authority: | | | | | | | | | |
| 0.000%, 01/01/2031 (County Guaranteed) | | $ | 1,405,000 | | | $ | 1,097,331 | | | | |
| 5.000%, 06/30/2032 | | | 2,270,000 | | | | 2,519,038 | | | | |
| 5.500%, 01/01/2033 | | | | | | | | | | | |
| (Callable 01/19/2024) (Insured by AGM) | | | 3,000,000 | | | | 3,002,411 | | | | |
| 0.000%, 01/01/2037 (Insured by AGM) | | | 3,495,000 | | | | 2,134,417 | | | | |
| 0.000%, 01/01/2046 (Insured by BAM) | | | 830,000 | | | | 307,036 | | | | |
| Pennsylvania Higher Education | | | | | | | | | | | |
| Assistance Agency, | | | | | | | | | | | |
| 4.500%, 06/01/2043 (Callable 06/01/2031) | | | 1,305,000 | | | | 1,325,175 | | | | |
| Pennsylvania Higher | | | | | | | | | | | |
| Educational Facilities Authority: | | | | | | | | | | | |
| 5.000%, 05/01/2025 | | | 200,000 | | | | 204,419 | | | | |
| 5.000%, 07/01/2035 (Callable 07/01/2026) | | | 1,300,000 | | | | 1,302,389 | | | | |
| Pennsylvania Housing Finance Agency: | | | | | | | | | | | |
| 3.200%, 04/01/2040 (Callable 10/01/2025) | | | 155,000 | | | | 138,550 | | | | |
| 5.500%, 10/01/2053 | | | 1,375,000 | | | | 1,469,223 | | | | |
| 6.250%, 10/01/2053 (Callable 04/01/2033) | | | 1,905,000 | | | | 2,108,283 | | | | |
| Pennsylvania Turnpike Commission: | | | | | | | | | | | |
6.000%, 12/01/2030 (Callable 12/01/2027)(5) | | | 110,000 | | | | 123,846 | | | | |
0.000%, 12/01/2039 (Callable 06/01/2029)(5) | | | 430,000 | | | | 446,382 | | | | |
0.000%, 12/01/2040 (Callable 06/01/2029)(5) | | | 35,000 | | | | 36,299 | | | | |
4.900%, 12/01/2044 (Callable 12/01/2026)(5) | | | 50,000 | | | | 51,532 | | | | |
| Philadelphia Authority | | | | | | | | | | | |
| for Industrial Development, | | | | | | | | | | | |
| 5.250%, 11/01/2052 (Callable 11/01/2032) | | | 1,750,000 | | | | 1,869,317 | | | | |
| Public Parking Authority of Pittsburgh, | | | | | | | | | | | |
| 5.000%, 12/01/2026 (Callable 06/01/2025) | | | 90,000 | | | | 92,616 | | | | |
| Reading School District: | | | | | | | | | | | |
| 0.000%, 01/15/2026 (Insured by NATL) | | | 190,000 | | | | 176,613 | | | | |
| 0.000%, 01/15/2027 (Insured by NATL) | | | 50,000 | | | | 44,971 | | | | |
| Redevelopment Authority | | | | | | | | | | | |
| of the City of Philadelphia, | | | | | | | | | | | |
| 5.000%, 04/15/2027 (Callable 04/15/2025) | | | 100,000 | | | | 102,472 | | | | |
| Sayre Health Care Facilities Authority, | | | | | | | | | | | |
| 4.155%, 12/01/2031 (3 Month LIBOR | | | | | | | | | | | |
USD + 0.830%) (Callable 01/29/2024)(2)(7) | | | 2,355,000 | | | | 2,236,880 | | | | |
| School District of Philadelphia, | | | | | | | | | | | |
| 5.000%, 09/01/2031 | | | | | | | | | | | |
| (Callable 09/01/2029) (Insured by ST AID) | | | 1,000,000 | | | | 1,100,347 | | | | |
| State Public School Building Authority, | | | | | | | | | | | |
| 5.000%, 12/01/2028 (Pre-refunded to | | | | | | | | | | | |
| 12/01/2026) (Insured by AGM) | | | 15,000 | | | | 16,028 | | | | |
| Westmoreland County Industrial | | | | | | | | | | | |
| Development Authority, | | | | | | | | | | | |
| 5.000%, 07/01/2028 | | | 700,000 | | | | 739,621 | | | | |
| York County Industrial Development Authority, | | | | | | | | | | | |
| 3.000%, 11/01/2036 (Callable 05/01/2026) | | | 730,000 | | | | 672,922 | | | | |
| Total Pennsylvania | | | | | | | | | | | |
| (Cost $42,266,335) | | | | | | | 43,281,925 | | | | 4.7 | % |
| Rhode Island | | | | | | | | | | | | |
| Providence Redevelopment Agency, | | | | | | | | | | | | |
| 5.000%, 04/01/2027 (Callable 04/01/2025) | | | 500,000 | | | | 507,693 | | | | | |
| Rhode Island Housing | | | | | | | | | | | | |
| & Mortgage Finance Corp., | | | | | | | | | | | | |
| 1.700%, 04/01/2031 (Callable 04/01/2030) | | | 150,000 | | | | 130,043 | | | | | |
| Rhode Island Student Loan Authority, | | | | | | | | | | | | |
| 5.000%, 12/01/2028 | | | 1,175,000 | | | | 1,267,461 | | | | | |
| Total Rhode Island | | | | | | | | | | | | |
| (Cost $1,885,930) | | | | | | | 1,905,197 | | | | 0.2 | % |
| South Carolina | | | | | | | | | | | | |
| City of Myrtle Beach SC, | | | | | | | | | | | | |
| 5.000%, 10/01/2029 (Callable 10/01/2026) | | | 500,000 | | | | 527,453 | | | | | |
| Newberry Investing in Children’s Education, | | | | | | | | | | | | |
| 5.000%, 12/01/2029 (Callable 12/01/2024) | | | 500,000 | | | | 507,764 | | | | | |
| South Carolina Jobs-Economic | | | | | | | | | | | | |
| Development Authority: | | | | | | | | | | | | |
| 5.250%, 11/15/2028 (Callable 05/15/2025) | | | 2,000,000 | | | | 2,011,385 | | | | | |
| 5.750%, 11/15/2029 (Callable 05/15/2025) | | | 1,000,000 | | | | 972,806 | | | | | |
| 4.000%, 08/15/2030 (Callable 08/15/2026) | | | 130,000 | | | | 130,893 | | | | | |
| 5.250%, 08/15/2033 (Callable 08/15/2026) | | | 350,000 | | | | 364,211 | | | | | |
| 3.660%, 05/01/2048 (Callable 01/02/2024) | | | | | | | | | | | | |
(Optional Put Date 01/05/2024)(1) | | | 4,775,000 | | | | 4,775,000 | | | | | |
| 7.500%, 11/15/2053 (Callable 11/15/2030) | | | 800,000 | | | | 824,613 | | | | | |
| 7.750%, 11/15/2058 (Callable 11/15/2030) | | | 700,000 | | | | 721,291 | | | | | |
| South Carolina Public Service Authority, | | | | | | | | | | | | |
| 5.000%, 12/01/2032 (Callable 06/01/2026) | | | 465,000 | | | | 481,644 | | | | | |
| South Carolina State Housing | | | | | | | | | | | | |
| Finance & Development Authority, | | | | | | | | | | | | |
| 3.500%, 07/01/2043 (Callable 01/01/2026) | | | 175,000 | | | | 173,969 | | | | | |
| Spartanburg County School District No. 4, | | | | | | | | | | | | |
| 5.250%, 03/01/2052 | | | | | | | | | | | | |
| (Callable 03/01/2032) (Insured by SCSDE) | | | 1,000,000 | | | | 1,118,323 | | | | | |
| Spartanburg Housing Authority, | | | | | | | | | | | | |
| 2.000%, 03/01/2026 | | | | | | | | | | | | |
(Mandatory Tender Date 03/01/2025)(1) | | | 3,500,000 | | | | 3,422,642 | | | | | |
| Three Rivers Solid Waste Authority, | | | | | | | | | | | | |
| 0.000%, 10/01/2025 | | | 1,085,000 | | | | 1,021,428 | | | | | |
| Total South Carolina | | | | | | | | | | | | |
| (Cost $17,044,101) | | | | | | | 17,053,422 | | | | 1.8 | % |
| South Dakota | | | | | | | | | | | | |
| City of Rapid City SD, | | | | | | | | | | | | |
| 4.000%, 12/01/2035 (Callable 12/01/2029) | | | 250,000 | | | | 250,562 | | | | | |
| South Dakota Health & | | | | | | | | | | | | |
| Educational Facilities Authority, | | | | | | | | | | | | |
| 5.000%, 09/01/2032 (Callable 09/01/2027) | | | 100,000 | | | | 105,966 | | | | | |
| South Dakota Housing Development Authority, | | | | | | | | | | | | |
| 6.250%, 05/01/2055 | | | | | | | | | | | | |
| (Callable 05/01/2032) (Insured by GNMA) | | | 2,000,000 | | | | 2,215,859 | | | | | |
| Total South Dakota | | | | | | | | | | | | |
| (Cost $2,515,318) | | | | | | | 2,572,387 | | | | 0.3 | % |
| Tennessee | | | | | | | | | | | | |
| City of Jackson TN: | | | | | | | | | | | | |
| 5.000%, 04/01/2033 (Callable 10/01/2028) | | | 1,755,000 | | | | 1,842,168 | | | | | |
| 5.000%, 04/01/2036 (Callable 04/01/2025) | | | 2,000,000 | | | | 2,024,937 | | | | | |
| Cleveland Housing Authority, | | | | | | | | | | | | |
| 4.000%, 08/01/2026 | | | | | | | | | | | | |
(Mandatory Tender Date 08/01/2025)(1)(3) | | | 100,000 | | | | 99,320 | | | | | |
| Knox County Health Educational & | | | | | | | | | | | | |
| Housing Facility Board: | | | | | | | | | | | | |
| 5.000%, 09/01/2030 (Callable 09/01/2026) | | | 925,000 | | | | 960,846 | | | | | |
| 5.000%, 09/01/2031 (Callable 09/01/2026) | | | 100,000 | | | | 103,710 | | | | | |
| Nashville & Davidson County | | | | | | | | | | | | |
| Metropolitan Government: | | | | | | | | | | | | |
| 4.000%, 10/01/2028 | | | 50,000 | | | | 50,577 | | | | | |
| 5.000%, 05/01/2036 (Callable 05/01/2033) | | | 800,000 | | | | 908,417 | | | | | |
| 5.250%, 05/01/2048 (Callable 05/01/2033) | | | 1,500,000 | | | | 1,640,822 | | | | | |
| New Memphis Arena Public Building Authority, | | | | | | | | | | | | |
0.000%, 04/01/2031(5) | | | 200,000 | | | | 185,470 | | | | | |
| Tennergy Corp., | | | | | | | | | | | | |
| 5.500%, 10/01/2053 (Callable 09/01/2030) | | | | | | | | | | | | |
(Mandatory Tender Date 12/01/2030)(1) | | | 2,500,000 | | | | 2,668,493 | | | | | |
The accompanying notes are an integral part of these financial statements.
Baird Strategic Municipal Bond Fund
Schedule of Investments, December 31, 2023
Long-Term Investments (cont.)
| | | Principal | | | | | | % of | |
| | | Amount | | | Value | | | Net Assets | |
| Tennessee Energy Acquisition Corp., | | | | | | | | | |
| 5.000%, 02/01/2027 | | $ | 125,000 | | | $ | 127,379 | | | | |
| Tennessee Housing Development Agency: | | | | | | | | | | | |
| 4.000%, 07/01/2048 (Callable 01/01/2027) | | | 115,000 | | | | 114,662 | | | | |
| 4.500%, 07/01/2049 (Callable 01/01/2028) | | | 20,000 | | | | 20,145 | | | | |
| 6.250%, 01/01/2054 | | | | | | | | | | | |
| (Callable 07/01/2032) (Insured by GNMA) | | | 1,500,000 | | | | 1,658,704 | | | | |
| Williamson County Industrial | | | | | | | | | | | |
| Development Board, | | | | | | | | | | | |
| 5.000%, 05/01/2042 (Callable 11/01/2026) | | | | | | | | | | | |
| (Mandatory Tender Date 05/01/2027) | | | | | | | | | | | |
(Insured by HUD)(1) | | | 3,561,000 | | | | 3,722,816 | | | | |
| Total Tennessee | | | | | | | | | | | |
| (Cost $15,737,664) | | | | | | | 16,128,466 | | | | 1.7 | % |
| Texas | | | | | | | | | | | | |
| Arlington Higher Education Finance Corp., | | | | | | | | | | | | |
| 4.875%, 06/15/2056 (Callable 06/15/2025) | | | | | | | | | | | | |
(Mandatory Tender Date 06/15/2026)(1)(3) | | | 1,250,000 | | | | 1,255,463 | | | | | |
| Austin-Bergstrom Landhost Enterprises, Inc.: | | | | | | | | | | | | |
| 5.000%, 10/01/2031 (Callable 10/01/2027) | | | 1,900,000 | | | | 1,968,257 | | | | | |
| 5.000%, 10/01/2035 (Callable 10/01/2027) | | | 1,310,000 | | | | 1,349,903 | | | | | |
| Baytown Municipal Development District, | | | | | | | | | | | | |
| 5.000%, 10/01/2032 (Callable 10/01/2031) | | | 825,000 | | | | 879,147 | | | | | |
| Boerne Independent School District, | | | | | | | | | | | | |
| 3.850%, 12/01/2043 (Mandatory Tender | | | | | | | | | | | | |
Date 12/01/2027) (PSF Guaranteed)(1) | | | 3,000,000 | | | | 3,073,376 | | | | | |
| Brazos Higher Education Authority, Inc., | | | | | | | | | | | | |
| 2.350%, 04/01/2040 (Callable 04/01/2030) | | | 5,000 | | | | 4,975 | | | | | |
| Caney Creek Municipal Utility District, | | | | | | | | | | | | |
| 5.000%, 03/01/2024 | | | 390,000 | | | | 390,883 | | | | | |
| Central Texas Turnpike System, | | | | | | | | | | | | |
| 0.000%, 08/15/2026 (Insured by BHAC) | | | 1,750,000 | | | | 1,617,418 | | | | | |
| Chisum Independent School District, | | | | | | | | | | | | |
| 4.000%, 08/15/2048 | | | | | | | | | | | | |
| (Callable 08/15/2032) (PSF Guaranteed) | | | 50,000 | | | | 50,027 | | | | | |
| Cibolo Canyons Special Improvement District, | | | | | | | | | | | | |
| 3.500%, 08/15/2026 (Callable 01/29/2024) | | | 105,000 | | | | 104,676 | | | | | |
| City of Brownsville TX: | | | | | | | | | | | | |
| 5.000%, 02/15/2026 | | | 180,000 | | | | 187,737 | | | | | |
| 5.000%, 02/15/2027 | | | 250,000 | | | | 266,389 | | | | | |
| 5.000%, 02/15/2028 | | | 225,000 | | | | 244,362 | | | | | |
| 5.000%, 02/15/2029 | | | 400,000 | | | | 441,880 | | | | | |
| 5.000%, 02/15/2030 | | | 520,000 | | | | 581,864 | | | | | |
| 5.000%, 02/15/2031 | | | 585,000 | | | | 662,783 | | | | | |
| 5.000%, 09/01/2032 | | | | | | | | | | | | |
| (Callable 09/01/2031) (Insured by BAM) | | | 100,000 | | | | 114,972 | | | | | |
| City of Dallas Housing Finance Corp., | | | | | | | | | | | | |
| 5.000%, 07/01/2042 (Callable 01/01/2027) | | | | | | | | | | | | |
(Mandatory Tender Date 07/01/2027)(1) | | | 1,120,000 | | | | 1,174,232 | | | | | |
| City of Houston TX, | | | | | | | | | | | | |
| 5.000%, 07/01/2026 | | | 1,010,000 | | | | 1,050,906 | | | | | |
| City of League City TX: | | | | | | | | | | | | |
| 3.000%, 02/15/2038 (Callable 02/15/2030) | | | 1,390,000 | | | | 1,261,341 | | | | | |
| 3.000%, 02/15/2039 (Callable 02/15/2030) | | | 1,435,000 | | | | 1,274,944 | | | | | |
| 3.000%, 02/15/2040 (Callable 02/15/2030) | | | 1,480,000 | | | | 1,286,058 | | | | | |
| City of Liberty Hill TX, | | | | | | | | | | | | |
| 5.000%, 09/01/2039 | | | | | | | | | | | | |
| (Callable 09/01/2032) (Insured by AGM) | | | 475,000 | | | | 527,974 | | | | | |
| City of Magnolia TX, | | | | | | | | | | | | |
5.700%, 09/01/2046(3) | | | 470,000 | | | | 466,885 | | | | | |
| Clifton Higher Education Finance Corp.: | | | | | | | | | | | | |
| 5.000%, 08/15/2026 | | | 700,000 | | | | 722,051 | | | | | |
| 5.000%, 04/01/2028 (PSF Guaranteed) | | | 100,000 | | | | 108,590 | | | | | |
| 6.000%, 03/01/2029 | | | | | | | | | | | | |
(Callable 03/01/2024)(5) | | | 3,345,000 | | | | 3,354,399 | | | | | |
| 4.000%, 08/15/2030 | | | | | | | | | | | | |
| (Callable 08/15/2027) (PSF Guaranteed) | | | 500,000 | | | | 518,117 | | | | | |
| 3.950%, 12/01/2032 (Callable 01/29/2024) | | | 245,000 | | | | 245,010 | | | | | |
| 4.250%, 12/01/2034 (Callable 12/01/2024) | | | 300,000 | | | | 300,936 | | | | | |
| 5.750%, 08/15/2045 (Callable 08/15/2025) | | | 20,000 | | | | 19,828 | | | | | |
| Collin County Municipal Utility District No. 2: | | | | | | | | | | | | |
| 4.500%, 09/01/2030 | | | | | | | | | | | | |
| (Callable 10/01/2029) (Insured by BAM) | | | 560,000 | | | | 593,637 | | | | | |
| 4.500%, 09/01/2032 | | | | | | | | | | | | |
| (Callable 10/01/2029) (Insured by BAM) | | | 1,110,000 | | | | 1,172,783 | | | | | |
| 4.500%, 09/01/2034 | | | | | | | | | | | | |
| (Callable 10/01/2029) (Insured by BAM) | | | 1,335,000 | | | | 1,404,847 | | | | | |
| 5.000%, 09/01/2038 | | | | | | | | | | | | |
| (Callable 10/01/2029) (Insured by BAM) | | | 620,000 | | | | 660,325 | | | | | |
| County of Wise TX: | | | | | | | | | | | | |
| 5.000%, 08/15/2024 | | | 225,000 | | | | 227,142 | | | | | |
| 5.000%, 08/15/2025 | | | 250,000 | | | | 255,954 | | | | | |
| 5.000%, 08/15/2026 | | | 330,000 | | | | 341,760 | | | | | |
| 5.000%, 08/15/2027 | | | 505,000 | | | | 527,709 | | | | | |
| Dallas/Fort Worth International Airport, | | | | | | | | | | | | |
| 4.000%, 11/01/2038 (Callable 11/01/2030) | | | 100,000 | | | | 102,945 | | | | | |
| El Paso Housing Finance Corp., | | | | | | | | | | | | |
| 4.500%, 03/01/2026 (Mandatory Tender | | | | | | | | | | | | |
Date 03/01/2025) (Insured by HUD)(1) | | | 1,250,000 | | | | 1,261,142 | | | | | |
| Eula Independent School District, | | | | | | | | | | | | |
| 4.125%, 02/15/2048 | | | | | | | | | | | | |
| (Callable 02/15/2032) (PSF Guaranteed) | | | 100,000 | | | | 101,380 | | | | | |
| Frisco Independent School District, | | | | | | | | | | | | |
| 0.000%, 08/15/2029 (PSF Guaranteed) | | | 100,000 | | | | 85,343 | | | | | |
| Galena Park Independent School District, | | | | | | | | | | | | |
| 0.000%, 08/15/2026 (PSF Guaranteed) | | | 1,525,000 | | | | 1,416,753 | | | | | |
| Generation Park Management District, | | | | | | | | | | | | |
| 4.000%, 09/01/2028 | | | | | | | | | | | | |
| (Callable 09/01/2025) (Insured by BAM) | | | 125,000 | | | | 126,981 | | | | | |
| Grand Mission Municipal Utility District No. 2, | | | | | | | | | | | | |
| 2.250%, 09/01/2028 | | | | | | | | | | | | |
| (Callable 01/29/2024) (Insured by NATL) | | | 95,000 | | | | 89,440 | | | | | |
| Grand Parkway Transportation Corp., | | | | | | | | | | | | |
| 5.000%, 10/01/2052 (Callable 01/01/2028) | | | | | | | | | | | | |
(Mandatory Tender Date 04/01/2028)(1) | | | 4,000,000 | | | | 4,311,638 | | | | | |
| Green Valley Special Utility District: | | | | | | | | | | | | |
| 7.000%, 09/15/2030 (Insured by BAM) | | | 615,000 | | | | 764,044 | | | | | |
| 7.000%, 09/15/2031 (Insured by BAM) | | | 545,000 | | | | 693,174 | | | | | |
| Greenwood Utility District, | | | | | | | | | | | | |
| 9.000%, 08/01/2034 | | | | | | | | | | | | |
| (Callable 02/01/2030) (Insured by BAM) | | | 205,000 | | | | 272,149 | | | | | |
| Harris County Cultural | | | | | | | | | | | | |
| Education Facilities Finance Corp.: | | | | | | | | | | | | |
| 4.000%, 11/15/2029 (Callable 05/15/2026) | | | 285,000 | | | | 288,371 | | | | | |
| 4.503%, 11/15/2046 | | | | | | | | | | | | |
| (SOFR + 0.730%) (Callable 01/16/2024) | | | | | | | | | | | | |
(Mandatory Tender Date 07/01/2024)(2) | | | 1,210,000 | | | | 1,209,558 | | | | | |
| 3.650%, 12/01/2049 (SIFMA Municipal | | | | | | | | | | | | |
| Swap Index + 0.570%) (Callable 06/01/2024) | | | | | | | | | | | | |
(Mandatory Tender Date 12/04/2024)(2) | | | 80,000 | | | | 79,973 | | | | | |
| Housing Options, Inc., | | | | | | | | | | | | |
| 3.900%, 02/01/2026 (Mandatory Tender | | | | | | | | | | | | |
Date 02/01/2025) (Insured by HUD)(1) | | | 1,000,000 | | | | 1,001,119 | | | | | |
| Houston Independent School District, | | | | | | | | | | | | |
| 3.500%, 06/01/2039 (Mandatory Tender | | | | | | | | | | | | |
Date 06/01/2025) (PSF Guaranteed)(1) | | | 1,000,000 | | | | 1,006,067 | | | | | |
The accompanying notes are an integral part of these financial statements.
Baird Strategic Municipal Bond Fund
Schedule of Investments, December 31, 2023
Long-Term Investments (cont.)
| | | Principal | | | | | | % of | |
| | | Amount | | | Value | | | Net Assets | |
| Hunt Memorial Hospital District, | | | | | | | | | |
| 5.000%, 02/15/2030 | | $ | 1,000,000 | | | $ | 1,103,031 | | | |
| |
| Kelly Lane Water Control & | | | | | | | | | | | | |
| Improvement District No. 2, | | | | | | | | | | | | |
| 3.000%, 09/01/2036 | | | | | | | | | | | | |
| (Callable 09/01/2024) (Insured by AGM) | | | 75,000 | | | | 66,107 | | | | | |
| Kendall County Water Control & | | | | | | | | | | | | |
| Improvement District No. 2A, | | | | | | | | | | | | |
| 5.000%, 09/01/2038 | | | | | | | | | | | | |
| (Callable 11/01/2030) (Insured by AGM) | | | 1,000,000 | | | | 1,068,387 | | | | | |
| Kerrville Health Facilities Development Corp., | | | | | | | | | | | | |
| 5.000%, 08/15/2025 | | | 925,000 | | | | 945,479 | | | | | |
| Lake Dallas Independent School District, | | | | | | | | | | | | |
| 0.000%, 08/15/2026 (PSF Guaranteed) | | | 2,000,000 | | | | 1,854,684 | | | | | |
| Lower Colorado River Authority, | | | | | | | | | | | | |
| 4.750%, 01/01/2028 (ETM) (Insured by AGM) | | | 65,000 | | | | 67,404 | | | | | |
| Matagorda County Navigation District No. 1, | | | | | | | | | | | | |
| 2.600%, 11/01/2029 | | | 3,800,000 | | | | 3,486,082 | | | | | |
| Mckinney Municipal Utility District No. 1, | | | | | | | | | | | | |
| 3.375%, 09/01/2034 | | | | | | | | | | | | |
| (Callable 05/01/2030) (Insured by BAM) | | | 170,000 | | | | 166,736 | | | | | |
| Mckinney Municipal Utility District No. 2: | | | | | | | | | | | | |
| 6.500%, 09/01/2029 (Insured by BAM) | | | 345,000 | | | | 401,912 | | | | | |
| 6.000%, 09/01/2030 | | | | | | | | | | | | |
| (Callable 09/01/2029) (Insured by BAM) | | | 290,000 | | | | 329,136 | | | | | |
| 6.500%, 09/01/2030 | | | | | | | | | | | | |
| (Callable 09/01/2029) (Insured by BAM) | | | 360,000 | | | | 417,789 | | | | | |
| 6.500%, 09/01/2031 | | | | | | | | | | | | |
| (Callable 09/01/2029) (Insured by BAM) | | | 380,000 | | | | 439,219 | | | | | |
| 6.500%, 09/01/2032 | | | | | | | | | | | | |
| (Callable 09/01/2029) (Insured by BAM) | | | 170,000 | | | | 196,574 | | | | | |
| Melissa Independent School District: | | | | | | | | | | | | |
| 5.000%, 02/01/2029 (PSF Guaranteed) | | | 175,000 | | | | 195,568 | | | | | |
| 5.000%, 02/01/2030 (PSF Guaranteed) | | | 200,000 | | | | 227,729 | | | | | |
| 5.000%, 02/01/2031 (PSF Guaranteed) | | | 250,000 | | | | 289,670 | | | | | |
| 5.000%, 02/01/2032 (PSF Guaranteed) | | | 325,000 | | | | 382,760 | | | | | |
| 5.000%, 02/01/2033 (PSF Guaranteed) | | | 350,000 | | | | 418,749 | | | | | |
| 5.000%, 02/01/2034 | | | | | | | | | | | | |
| (Callable 08/01/2033) (PSF Guaranteed) | | | 280,000 | | | | 337,798 | | | | | |
| New Hope Cultural Education | | | | | | | | | | | | |
| Facilities Finance Corp.: | | | | | | | | | | | | |
4.000%, 08/15/2024(3) | | | 370,000 | | | | 368,184 | | | | | |
| 5.000%, 11/01/2031 (Callable 11/01/2024) | | | 125,000 | | | | 128,439 | | | | | |
| North Texas Tollway Authority, | | | | | | | | | | | | |
| 0.000%, 01/01/2030 (Insured by AGC) | | | 200,000 | | | | 166,579 | | | | | |
| Northlake Municipal | | | | | | | | | | | | |
| Management District No. 1, | | | | | | | | | | | | |
| 6.750%, 03/01/2029 (Insured by BAM) | | | 395,000 | | | | 454,919 | | | | | |
| Pecos Barstow Toyah | | | | | | | | | | | | |
| Independent School District, | | | | | | | | | | | | |
| 5.000%, 02/15/2039 | | | | | | | | | | | | |
| (Callable 02/15/2026) (PSF Guaranteed) | | | 2,500,000 | | | | 2,568,919 | | | | | |
| Petroleum Service Corp., | | | | | | | | | | | | |
| 3.750%, 12/01/2040 | | | | | | | | | | | | |
(Mandatory Tender Date 02/01/2028)(5) | | | 2,500,000 | | | | 2,436,789 | | | | | |
| Port Beaumont Navigation District, | | | | | | | | | | | | |
4.000%, 01/01/2050 (Callable 01/29/2024)(3) | | | 500,000 | | | | 357,853 | | | | | |
| Port of Beaumont Industrial | | | | | | | | | | | | |
| Development Authority, | | | | | | | | | | | | |
| 4.100%, 01/01/2028 | | | | | | | | | | | | |
(Callable 01/29/2024)(3) | | | 2,750,000 | | | | 2,286,161 | | | | | |
| Port of Port Arthur Navigation District: | | | | | | | | | | | | |
| 2.500%, 04/01/2040 | | | | | | | | | | | | |
(Optional Put Date 01/02/2024)(1) | | | 2,200,000 | | | | 2,200,000 | | | | | |
| 2.500%, 04/01/2040 | | | | | | | | | | | | |
(Optional Put Date 01/02/2024)(1) | | | 2,300,000 | | | | 2,300,000 | | | | | |
| St. George Place Redevelopment Authority, | | | | | | | | | | | | |
| 4.000%, 09/01/2025 | | | 100,000 | | | | 100,463 | | | | | |
| Tarrant County Cultural | | | | | | | | | | | | |
| Education Facilities Finance Corp.: | | | | | | | | | | | | |
| 2.250%, 11/15/2025 | | | 200,000 | | | | 192,415 | | | | | |
| 5.000%, 11/15/2026 | | | 75,000 | | | | 76,500 | | | | | |
| 5.000%, 11/15/2027 (Callable 11/15/2026) | | | 1,000,000 | | | | 1,021,643 | | | | | |
| 5.000%, 11/15/2027 | | | 1,300,000 | | | | 1,337,211 | | | | | |
2.750%, 02/15/2036 (Callable 01/19/2024)(1) | | | 25,000 | | | | 24,182 | | | | | |
| Tarrant County Hospital District, | | | | | | | | | | | | |
| 4.000%, 08/15/2043 (Callable 08/15/2032) | | | 500,000 | | | | 507,311 | | | | | |
| Texas Department of | | | | | | | | | | | | |
| Housing & Community Affairs, | | | | | | | | | | | | |
| 3.375%, 09/01/2039 | | | | | | | | | | | | |
| (Callable 09/01/2028) (Insured by GNMA) | | | 2,050,000 | | | | 2,004,922 | | | | | |
| Texas Municipal Gas | | | | | | | | | | | | |
| Acquisition & Supply Corp. I, | | | | | | | | | | | | |
| 4.710%, 12/15/2026 (3 Month TSFR + | | | | | | | | | | | | |
1.625%) (Callable 01/02/2024)(2) | | | 500,000 | | | | 498,113 | | | | | |
| Texas Municipal Gas | | | | | | | | | | | | |
| Acquisition & Supply Corp. II, | | | | | | | | | | | | |
| 4.130%, 09/15/2027 | | | | | | | | | | | | |
(3 Month TSFR + 1.045%)(2) | | | 2,265,000 | | | | 2,239,842 | | | | | |
| Texas Municipal Gas | | | | | | | | | | | | |
| Acquisition & Supply Corp. III, | | | | | | | | | | | | |
| 5.000%, 12/15/2032 | | | 2,000,000 | | | | 2,146,166 | | | | | |
| Texas Municipal Gas | | | | | | | | | | | | |
| Acquisition & Supply Corp. IV, | | | | | | | | | | | | |
| 5.500%, 01/01/2054 (Callable 07/01/2033) | | | | | | | | | | | | |
(Mandatory Tender Date 01/01/2034)(1) | | | 1,250,000 | | | | 1,389,150 | | | | | |
| Texas Public Finance Authority: | | | | | | | | | | | | |
| 5.250%, 05/01/2037 | | | | | | | | | | | | |
| (Callable 05/01/2033) (Insured by BAM) | | | 400,000 | | | | 452,314 | | | | | |
| 5.250%, 05/01/2039 | | | | | | | | | | | | |
| (Callable 05/01/2033) (Insured by BAM) | | | 500,000 | | | | 555,319 | | | | | |
| Texas State Affordable Housing Corp., | | | | | | | | | | | | |
| 3.900%, 03/01/2038 | | | | | | | | | | | | |
| (Callable 03/01/2033) (Insured by GNMA) | | | 200,000 | | | | 203,334 | | | | | |
| Viridian Municipal Management District: | | | | | | | | | | | | |
| 5.000%, 12/01/2037 | | | | | | | | | | | | |
| (Callable 12/01/2029) (Insured by AGM) | | | 550,000 | | | | 582,016 | | | | | |
| 5.000%, 12/01/2039 | | | | | | | | | | | | |
| (Callable 12/01/2029) (Insured by AGM) | | | 330,000 | | | | 346,363 | | | | | |
| 5.000%, 12/01/2042 | | | | | | | | | | | | |
| (Callable 12/01/2029) (Insured by AGM) | | | 890,000 | | | | 928,112 | | | | | |
| 6.000%, 12/01/2043 (Callable 12/01/2029) | | | 100,000 | | | | 103,149 | | | | | |
| Woodridge Municipal Utility District, | | | | | | | | | | | | |
| 3.750%, 09/01/2029 | | | | | | | | | | | | |
| (Callable 09/01/2024) (Insured by AGM) | | | 45,000 | | | | 45,018 | | | | | |
| Yoakum Independent School District: | | | | | | | | | | | | |
| 5.000%, 02/15/2027 (PSF Guaranteed) | | | 120,000 | | | | 128,312 | | | | | |
| 5.000%, 02/15/2028 (PSF Guaranteed) | | | 190,000 | | | | 207,744 | | | | | |
| 5.000%, 02/15/2029 (PSF Guaranteed) | | | 230,000 | | | | 256,871 | | | | | |
| 5.000%, 02/15/2030 (PSF Guaranteed) | | | 225,000 | | | | 255,961 | | | | | |
| 5.000%, 02/15/2031 (PSF Guaranteed) | | | 575,000 | | | | 665,452 | | | | | |
| 5.000%, 02/15/2032 (PSF Guaranteed) | | | 305,000 | | | | 358,694 | | | | | |
| 5.000%, 02/15/2033 (PSF Guaranteed) | | | 215,000 | | | | 256,800 | | | | | |
| 5.000%, 02/15/2034 | | | | | | | | | | | | |
| (Callable 02/15/2033) (PSF Guaranteed) | | | 335,000 | | | | 398,146 | | | | | |
| Total Texas | | | | | | | | | | | | |
| (Cost $85,284,696) | | | | | | | 86,443,797 | | | | 9.4 | % |
The accompanying notes are an integral part of these financial statements.
Baird Strategic Municipal Bond Fund
Schedule of Investments, December 31, 2023
Long-Term Investments (cont.)
| | | Principal | | | | | | % of | |
| | | Amount | | | Value | | | Net Assets | |
| Utah | | | | | | | | | |
| City of Salt Lake City UT: | | | | | | | | | |
| 5.000%, 07/01/2025 | | $ | 1,320,000 | | | $ | 1,349,360 | | | | |
| 5.000%, 07/01/2027 | | | 700,000 | | | | 742,326 | | | | |
| 5.000%, 07/01/2034 (Callable 07/01/2027) | | | 1,000,000 | | | | 1,053,294 | | | | |
| 5.000%, 07/01/2043 (Callable 07/01/2028) | | | 2,000,000 | | | | 2,073,248 | | | | |
| Emery County UT, | | | | | | | | | | | |
| 4.500%, 11/01/2024 (Callable 01/02/2024) | | | | | | | | | | | |
(Optional Put Date 01/05/2024)(1) | | | 4,000,000 | | | | 4,000,000 | | | | |
| Utah Charter School Finance Authority: | | | | | | | | | | | |
| 3.000%, 04/15/2027 (Insured by UT CSCE) | | | 160,000 | | | | 157,265 | | | | |
| 4.500%, 04/15/2037 (Callable 04/15/2024) | | | | | | | | | | | |
| (Insured by UT CSCE) | | | 150,000 | | | | 150,478 | | | | |
| 5.000%, 04/15/2037 (Callable 04/15/2026) | | | | | | | | | | | |
| (Insured by UT CSCE) | | | 270,000 | | | | 278,132 | | | | |
| Utah Housing Corp.: | | | | | | | | | | | |
| 4.000%, 01/01/2045 (Callable 01/01/2026) | | | | | | | | | | | |
| (Insured by FHA) | | | 160,000 | | | | 159,695 | | | | |
| 6.000%, 12/21/2052 (Insured by GNMA) | | | 961,419 | | | | 1,034,026 | | | | |
| 6.000%, 02/21/2053 (Insured by GNMA) | | | 962,601 | | | | 1,026,906 | | | | |
| 6.500%, 05/21/2053 (Insured by GNMA) | | | 1,192,472 | | | | 1,326,064 | | | | |
| 6.000%, 06/21/2053 (Insured by GNMA) | | | 1,491,698 | | | | 1,605,092 | | | | |
| 6.500%, 08/21/2053 (Insured by GNMA) | | | 99,651 | | | | 111,917 | | | | |
| 6.500%, 01/01/2054 (Callable 07/01/2032) | | | | | | | | | | | |
(Insured by GNMA)(6) | | | 1,000,000 | | | | 1,116,115 | | | | |
| Total Utah | | | | | | | | | | | |
| (Cost $15,916,681) | | | | | | | 16,183,918 | | | | 1.8 | % |
| Vermont | | | | | | | | | | | | |
| Vermont Housing Finance Agency: | | | | | | | | | | | | |
| 4.000%, 11/01/2043 | | | | | | | | | | | | |
| (Callable 01/29/2024) (Insured by GNMA) | | | 30,000 | | | | 29,946 | | | | | |
| 5.250%, 11/01/2052 | | | | | | | | | | | | |
| (Callable 05/01/2032) (Insured by HUD) | | | 1,000,000 | | | | 1,053,064 | | | | | |
| Vermont Student Assistance Corp., | | | | | | | | | | | | |
| 5.000%, 06/15/2026 | | | 50,000 | | | | 51,861 | | | | | |
| Total Vermont | | | | | | | | | | | | |
| (Cost $1,157,463) | | | | | | | 1,134,871 | | | | 0.1 | % |
| Virginia | | | | | | | | | | | | |
| Fairfax County Redevelopment & | | | | | | | | | | | | |
| Housing Authority, | | | | | | | | | | | | |
| 5.000%, 01/01/2045 (Callable 07/01/2027) | | | | | | | | | | | | |
(Mandatory Tender Date 01/01/2028)(1) | | | 3,250,000 | | | | 3,437,624 | | | | | |
| Farmville Industrial Development Authority, | | | | | | | | | | | | |
| 5.375%, 07/01/2053 (Callable 07/01/2028) | | | | | | | | | | | | |
| (Mandatory Tender Date 07/01/2043) | | | | | | | | | | | | |
| (Insured by AGM) | | | 1,500,000 | | | | 1,597,001 | | | | | |
| Federal Home Loan Mortgage Corp. (FHLMC), | | | | | | | | | | | | |
| 2.550%, 06/15/2035 | | | 2,820,000 | | | | 2,294,302 | | | | | |
| Norfolk Redevelopment & Housing Authority: | | | | | | | | | | | | |
| 4.000%, 01/01/2025 (Callable 01/29/2024) | | | 1,360,000 | | | | 1,339,230 | | | | | |
| 5.000%, 05/01/2043 (Mandatory Tender | | | | | | | | | | | | |
Date 05/01/2026) (Insured by HUD)(1) | | | 3,000,000 | | | | 3,096,595 | | | | | |
| Portsmouth Redevelopment & | | | | | | | | | | | | |
| Housing Authority, | | | | | | | | | | | | |
| 3.500%, 07/01/2025 (Mandatory Tender | | | | | | | | | | | | |
Date 07/01/2024) (Insured by HUD)(1) | | | 1,000,000 | | | | 997,654 | | | | | |
| Toll Road Investors Partnership II LP: | | | | | | | | | | | | |
0.000%, 02/15/2025 (Insured by NATL)(3) | | | 2,150,000 | | | | 1,989,698 | | | | | |
0.000%, 02/15/2027 (Insured by NATL)(3) | | | 1,449,000 | | | | 1,163,567 | | | | | |
0.000%, 02/15/2028 (Insured by NATL)(3) | | | 740,000 | | | | 553,240 | | | | | |
| Virginia Beach Development Authority, | | | | | | | | | | | | |
| 5.375%, 09/01/2029 (Callable 09/01/2026) | | | 1,000,000 | | | | 1,025,686 | | | | | |
| Virginia Small Business Financing Authority, | | | | | | | | | | | | |
| 5.000%, 01/01/2035 (Callable 07/01/2027) | | | 100,000 | | | | 106,291 | | | | | |
| York County Economic Development Authority, | | | | | | | | | | | | |
| 3.650%, 05/01/2033 (Mandatory Tender | | | | | | | | | | | | |
Date 10/01/2027)(1) | | | 1,925,000 | | | | 1,936,394 | | | | | |
| Total Virginia | | | | | | | | | | | | |
| (Cost $19,766,254) | | | | | | | 19,537,282 | | | | 2.1 | % |
| Washington | | | | | | | | | | | | |
| City of Tacoma WA, | | | | | | | | | | | | |
| 5.000%, 12/01/2032 (Callable 06/01/2025) | | | 2,000,000 | | | | 2,055,406 | | | | | |
| Clark County School District No. 114, | | | | | | | | | | | | |
| 5.250%, 12/01/2040 (Callable 06/01/2032) | | | | | | | | | | | | |
| (Insured by SCH BD GTY) | | | 100,000 | | | | 114,985 | | | | | |
| County of Lewis WA, | | | | | | | | | | | | |
| 3.000%, 12/01/2026 (Callable 01/19/2024) | | | 100,000 | | | | 98,034 | | | | | |
| King County Housing Authority: | | | | | | | | | | | | |
| 5.160%, 11/01/2025 | | | 1,987,273 | | | | 1,994,226 | | | | | |
| 5.000%, 01/01/2028 | | | | | | | | | | | | |
| (Callable 01/01/2027) (Insured by HUD) | | | 1,000,000 | | | | 1,055,418 | | | | | |
| 4.000%, 11/01/2033 | | | | | | | | | | | | |
| (Callable 11/01/2029) (County Guaranteed) | | | 600,000 | | | | 626,139 | | | | | |
| King County Public Hospital District No. 1: | | | | | | | | | | | | |
| 5.000%, 12/01/2028 (Callable 12/01/2026) | | | 125,000 | | | | 131,883 | | | | | |
| 5.000%, 12/01/2030 (Callable 12/01/2026) | | | 400,000 | | | | 420,200 | | | | | |
| Pend Oreille County Public Utility District No. 1: | | | | | | | | | | | | |
| 5.000%, 01/01/2028 | | | 220,000 | | | | 233,726 | | | | | |
| 5.000%, 01/01/2029 (Callable 01/01/2028) | | | 165,000 | | | | 175,425 | | | | | |
| 5.000%, 01/01/2038 (Callable 01/01/2029) | | | 300,000 | | | | 312,487 | | | | | |
| 5.000%, 01/01/2039 (Callable 01/01/2028) | | | 500,000 | | | | 516,282 | | | | | |
| Port of Seattle WA: | | | | | | | | | | | | |
| 4.000%, 08/01/2036 (Callable 08/01/2031) | | | 1,955,000 | | | | 2,021,400 | | | | | |
| 5.500%, 08/01/2047 (Callable 08/01/2032) | | | 1,750,000 | | | | 1,923,683 | | | | | |
| Seattle Housing Authority, | | | | | | | | | | | | |
| 4.000%, 09/01/2025 (Callable 03/01/2025) | | | 3,000,000 | | | | 3,019,836 | | | | | |
| Snohomish County Housing Authority, | | | | | | | | | | | | |
| 4.000%, 04/01/2033 (Callable 04/01/2031) | | | 2,500,000 | | | | 2,609,648 | | | | | |
| Tacoma Metropolitan Park District: | | | | | | | | | | | | |
| 5.000%, 12/01/2025 (Callable 12/01/2024) | | | 25,000 | | | | 25,250 | | | | | |
| 5.000%, 12/01/2025 (Callable 12/01/2024) | | | 215,000 | | | | 217,149 | | | | | |
| 5.000%, 12/01/2025 | | | 2,060,000 | | | | 2,110,098 | | | | | |
| 5.000%, 12/01/2026 | | | 80,000 | | | | 83,196 | | | | | |
| 4.000%, 12/01/2027 (Callable 12/01/2026) | | | 605,000 | | | | 611,354 | | | | | |
| 4.000%, 12/01/2028 (Callable 12/01/2026) | | | 25,000 | | | | 25,306 | | | | | |
| Vancouver Housing Authority, | | | | | | | | | | | | |
| 1.700%, 12/01/2024 | | | 140,000 | | | | 136,780 | | | | | |
| Washington Health Care Facilities Authority: | | | | | | | | | | | | |
| 5.000%, 08/15/2028 (Callable 08/15/2027) | | | 95,000 | | | | 99,378 | | | | | |
5.000%, 12/01/2031 (Callable 12/01/2030)(3) | | | 200,000 | | | | 222,199 | | | | | |
| 4.480%, 01/01/2035 (SIFMA Municipal | | | | | | | | | | | | |
| Swap Index + 1.400%) (Callable 07/01/2024) | | | | | | | | | | | | |
(Mandatory Tender Date 01/01/2025)(2) | | | 150,000 | | | | 150,026 | | | | | |
| 4.000%, 07/01/2036 (Callable 07/01/2025) | | | 135,000 | | | | 135,296 | | | | | |
| 5.000%, 08/15/2037 (Callable 02/15/2028) | | | 1,500,000 | | | | 1,559,250 | | | | | |
| 5.000%, 08/01/2049 (Callable 08/01/2029) | | | 2,640,000 | | | | 2,715,682 | | | | | |
| Washington State Convention | | | | | | | | | | | | |
| Center Public Facilities District, | | | | | | | | | | | | |
| 5.000%, 07/01/2027 | | | 100,000 | | | | 105,268 | | | | | |
| Washington State Housing Finance Commission: | | | | | | | | | | | | |
| 3.375%, 04/20/2037 | | | 4,844,948 | | | | 4,378,370 | | | | | |
| 4.000%, 06/01/2050 | | | | | | | | | | | | |
| (Callable 06/01/2029) (Insured by GNMA) | | | 310,000 | | | | 309,980 | | | | | |
6.250%, 07/01/2059 (Callable 07/01/2030)(3) | | | 1,730,000 | | | | 1,906,240 | | | | | |
| Total Washington | | | | | | | | | | | | |
| (Cost $31,477,433) | | | | | | | 32,099,600 | | | | 3.5 | % |
The accompanying notes are an integral part of these financial statements.
Baird Strategic Municipal Bond Fund
Schedule of Investments, December 31, 2023
Long-Term Investments (cont.)
| | | Principal | | | | | | % of | |
| | | Amount | | | Value | | | Net Assets | |
| West Virginia | | | | | | | | | |
| Glenville State University, | | | | | | | | | |
| 4.000%, 06/01/2027 | | $ | 815,000 | | | $ | 785,004 | | | | |
| Total West Virginia | | | | | | | | | | | |
| (Cost $784,417) | | | | | | | 785,004 | | | | 0.1 | % |
| Wisconsin | | | | | | | | | | | | |
| Appleton Redevelopment Authority, | | | | | | | | | | | | |
| 3.500%, 06/01/2036 (Callable 01/02/2024) | | | | | | | | | | | | |
(Optional Put Date 01/05/2024)(1) | | | 3,200,000 | | | | 3,200,000 | | | | | |
| Boscobel Area School District, | | | | | | | | | | | | |
| 5.000%, 03/01/2036 | | | | | | | | | | | | |
| (Callable 03/01/2031) (Insured by BAM) | | | 720,000 | | | | 812,479 | | | | | |
| City of Milwaukee WI, | | | | | | | | | | | | |
| 3.000%, 04/01/2034 | | | | | | | | | | | | |
| (Callable 04/01/2031) (Insured by BAM) | | | 410,000 | | | | 394,003 | | | | | |
| Howard-Suamico School District, | | | | | | | | | | | | |
| 1.625%, 03/01/2031 (Callable 03/01/2028) | | | 3,250,000 | | | | 2,825,796 | | | | | |
| Hudson School District, | | | | | | | | | | | | |
| 2.500%, 03/01/2025 | | | 1,305,000 | | | | 1,292,448 | | | | | |
| Palmyra-Eagle Area School District: | | | | | | | | | | | | |
| 3.000%, 03/01/2024 (Callable 01/29/2024) | | | 50,000 | | | | 49,856 | | | | | |
| 3.000%, 03/01/2025 (Callable 01/29/2024) | | | 100,000 | | | | 98,213 | | | | | |
| Public Finance Authority: | | | | | | | | | | | | |
5.000%, 05/15/2026 (Callable 05/15/2025)(3) | | | 1,660,000 | | | | 1,640,260 | | | | | |
| 0.000%, 12/15/2027 (Callable 01/29/2024) | | | 445,000 | | | | 357,195 | | | | | |
9.000%, 11/01/2028 (Callable 11/01/2027)(3) | | | 1,125,000 | | | | 1,126,728 | | | | | |
0.000%, 09/01/2029 (Callable 09/01/2026)(3) | | | 2,250,000 | | | | 1,481,301 | | | | | |
6.125%, 12/15/2029 (Callable 12/15/2027)(3) | | | 1,500,000 | | | | 1,493,612 | | | | | |
5.000%, 09/01/2030(3) | | | 1,250,000 | | | | 1,121,815 | | | | | |
4.850%, 07/01/2031(3) | | | 475,000 | | | | 417,993 | | | | | |
| 5.000%, 07/01/2031 | | | 1,875,000 | | | | 2,011,353 | | | | | |
| 4.000%, 01/01/2033 (Callable 07/01/2029) | | | 605,000 | | | | 613,722 | | | | | |
| 5.000%, 03/01/2033 (Callable 03/01/2026) | | | 5,900,000 | | | | 6,096,436 | | | | | |
| 4.000%, 06/01/2033 (Callable 06/01/2025) | | | 70,000 | | | | 70,339 | | | | | |
| 4.000%, 01/01/2034 (Callable 07/01/2029) | | | 1,150,000 | | | | 1,162,942 | | | | | |
5.000%, 10/01/2034 (Callable 10/01/2029)(3) | | | 1,500,000 | | | | 1,533,681 | | | | | |
| 4.000%, 01/01/2046 (Callable 01/01/2027) | | | 500,000 | | | | 392,612 | | | | | |
6.750%, 07/01/2063 (Callable 07/01/2033)(3) | | | 1,750,000 | | | | 1,796,826 | | | | | |
| Waunakee Community School District, | | | | | | | | | | | | |
| 2.500%, 04/01/2025 (Callable 01/29/2024) | | | 250,000 | | | | 247,049 | | | | | |
| Wisconsin Center District, | | | | | | | | | | | | |
5.250%, 12/15/2061 (Callable 12/15/2030)(3) | | | 1,100,000 | | | | 1,108,603 | | | | | |
| Wisconsin Health & | | | | | | | | | | | | |
| Educational Facilities Authority: | | | | | | | | | | | | |
| 4.000%, 08/15/2024 | | | 160,000 | | | | 158,928 | | | | | |
| 4.000%, 08/15/2025 | | | 230,000 | | | | 226,146 | | | | | |
| 5.000%, 11/01/2027 (Callable 11/01/2026) | | | 745,000 | | | | 725,736 | | | | | |
| 5.000%, 11/01/2029 (Callable 11/01/2026) | | | 430,000 | | | | 411,929 | | | | | |
| 5.000%, 04/01/2033 (Callable 10/01/2028) | | | 1,000,000 | | | | 1,081,544 | | | | | |
| 4.000%, 07/01/2036 (Callable 07/01/2029) | | | 1,000,000 | | | | 1,003,059 | | | | | |
| 4.000%, 09/15/2036 (Callable 09/15/2027) | | | 530,000 | | | | 464,628 | | | | | |
| 4.000%, 09/15/2036 (Callable 09/15/2027) | | | 775,000 | | | | 679,408 | | | | | |
| 5.000%, 11/15/2039 (Callable 05/15/2026) | | | 2,100,000 | | | | 2,152,310 | | | | | |
| 5.000%, 02/15/2051 (Callable 08/15/2026) | | | | | | | | | | | | |
(Mandatory Tender Date 02/15/2027)(1) | | | 345,000 | | | | 357,438 | | | | | |
| 5.500%, 12/01/2052 (Callable 12/01/2032) | | | 1,750,000 | | | | 1,925,250 | | | | | |
| 4.480%, 02/15/2053 (Callable 01/02/2024) | | | | | | | | | | | | |
(Optional Put Date 01/03/2024)(1) | | | 3,000,000 | | | | 3,000,000 | | | | | |
| Wisconsin Housing & Economic | | | | | | | | | | | | |
| Development Authority: | | | | | | | | | | | | |
| 4.000%, 07/01/2030 | | | | | | | | | | | | |
(Callable 07/01/2028) (Insured by HUD)(3) | | | 135,000 | | | | 121,529 | | | | | |
| 4.375%, 07/01/2037 | | | | | | | | | | | | |
(Callable 07/01/2028) (Insured by HUD)(3) | | | 430,000 | | | | 356,187 | | | | | |
| 4.000%, 03/01/2048 | | | | | | | | | | | | |
| (Callable 03/01/2027) (Insured by FNMA) | | | 20,000 | | | | 19,940 | | | | | |
| 3.750%, 05/01/2054 (Callable 05/01/2025) | | | | | | | | | | | | |
| (Mandatory Tender Date 11/01/2026) | | | | | | | | | | | | |
(Insured by HUD)(1) | | | 1,000,000 | | | | 1,004,331 | | | | | |
| 3.875%, 11/01/2054 (Callable 11/01/2025) | | | | | | | | | | | | |
| (Mandatory Tender Date 05/01/2027) | | | | | | | | | | | | |
(Insured by HUD)(1) | | | 4,250,000 | | | | 4,270,391 | | | | | |
| Total Wisconsin | | | | | | | | | | | | |
| (Cost $48,858,730) | | | | | | | 49,304,016 | | | | 5.4 | % |
| Total Long-Term Investments | | | | | | | | | | | | |
| (Cost $890,163,882) | | | | | | | 901,506,764 | | | | 98.0 | % |
| Short-Term Investment | | | | | | | | | | | | |
| | | Shares | | | | | | | | | |
| Money Market Mutual Fund | | | | | | | | | | | | |
| Federated Hermes Institutional Tax-Free | | | | | | | | | | | | |
Cash Trust, Premier Shares, 4.03%(4) | | | 7,218,681 | | | | 7,218,681 | | | | | |
| Total Short-Term Investment | | | | | | | | | | | | |
| (Cost $7,218,681) | | | | | | | 7,218,681 | | | | 0.8 | % |
| Total Investments | | | | | | | | | | | | |
| (Cost $897,382,563) | | | | | | | 908,725,445 | | | | 98.8 | % |
| Other Assets in Excess of Liabilities | | | | | | | 11,386,271 | | | | 1.2 | % |
| TOTAL NET ASSETS | | | | | | $ | 920,111,716 | | | | 100.0 | % |
Notes to Schedule of Investments
AGC – Assured Guaranty Corp.
AGM – Assured Guaranty Municipal
AMBAC – Ambac Assurance Corp.
BAM – Build America Mutual Assurance Co.
BHAC – Berkshire Hathaway Assurance Corp.
FHA – Federal Housing Administration
FHLMC – Federal Home Loan Mortgage Corporation
FNMA – Federal National Mortgage Association
GNMA – Government National Mortgage Association
HUD – US Department of Housing and Development
NATL – National Public Finance Guarantee Corp.
Q-SBLF – Qualified School Building Loan Fund
SCH BD GTY – School Board Guaranty
SD CRED PROG – State Credit Enhancement Program
SONYMA – State of New York Mortgage Agency
SCSDE – South Carolina School District
ST AID – State Aid Intercept/Withholding
UT CSCE – Utah Charter School Credit Enhancement Program
XLCA – XL Capital Assurance, Inc.
ETM – Escrowed to Maturity
LIBOR – London Inter-bank Offered Rate
PSF – Permanent School Fund
SIFMA – Securities Industry and Financial Markets Association
SOFR – Secured Overnight Financing Rate
TSFR – Term Secured Overnight Financing Rate
(1) | Variable rate security. The rate reported is the rate in effect as of December 31, 2023. |
(2) | Variable rate security based on a reference index and spread. The rate reported is the rate as of the last reset date in effect as of December 31, 2023. |
(3) | Includes securities exempt from registration under Rule 144A of the Securities Act of 1933. These securities may be resold in transactions exempt from registration to qualified institutional buyers. At December 31, 2023, the value of these securities totaled $66,305,352, which represented 7.21% of total net assets. |
(4) | Seven-day yield. |
(5) | Step-up bond; the interest rate shown is the rate in effect as of December 31, 2023. |
(6) | Security or a portion of the security purchased on a when-issued or delayed delivery basis. |
(7) | Securities referencing LIBOR are expected to transition to an alternative reference rate by the security’s next scheduled coupon reset date. |
The accompanying notes are an integral part of these financial statements.
Baird Strategic Municipal Bond Fund
Schedule of Open Futures Contracts, December 31, 2023
| | | | | | | | | | | | | Value | |
| | | Number of Contracts | | Settlement | | Current | | | Value at | | | Unrealized | | | Unrealized | |
| Description | | Purchased (Sold) | | Month-Year | | Notional Amount | | | Trade Date | | | Appreciation | | | (Depreciation) | |
| Sale Contracts: | | | | | | | | | | | | | | | | |
| U.S. Treasury 30 Year Bond | | (150) |
| Mar-24 | | $ | (18,740,625 | ) | | $ | (18,424,475 | ) | | $ | — | | | $ | (316,150 | ) |
| Total Futures Contracts | | | | | | | | | | | | | | $ | — | | | $ | (316,150 | ) |
| Net Unrealized Depreciation | | | | | | | | | | | | | | | | | | $ | (316,150 | ) |
Summary of Fair Value Exposure at December 31, 2023
The Fund has adopted authoritative fair valuation accounting standards which establish a definition of fair value and set out a hierarchy for measuring fair value. These standards require additional disclosures about the various inputs and valuation techniques used to develop the measurements of fair value and a discussion on changes in valuation techniques and related inputs during the period. These standards define fair value as the price that would be received to sell an asset or paid to transfer a liability in an orderly transaction between market participants at the measurement date.
The fair value hierarchy is organized into three levels based upon the assumptions (referred to as “inputs”) used in pricing the asset or liability. These standards state that “observable inputs” reflect the assumptions market participants would use in pricing the asset or liability based on market data obtained from independent sources and “unobservable inputs” reflect an entity’s own assumptions about the assumptions market participants would use in pricing the asset or liability. These inputs are summarized into three broad levels and described below:
Level 1 – Quoted prices (unadjusted) in active markets for identical assets or liabilities that the reporting entity can access at the measurement date.
Level 2 – Inputs other than quoted prices included within Level 1 that are observable for the asset or liability, either directly or indirectly.
Level 3 – Unobservable inputs for the asset or liability.
The inputs or methodology used for valuing securities are not necessarily an indication of the risk associated with investing in those securities.
The following is a summary of the inputs used to value the Fund’s investments as of December 31, 2023:
| | | Level 1 | | | Level 2 | | | Level 3 | | | Total | |
| Long-Term Investments | | | | | | | | | | | | |
| Municipal Bonds | | $ | — | | | $ | 901,506,764 | | | $ | — | | | $ | 901,506,764 | |
| Total Long-Term Investments | | | — | | | | 901,506,764 | | | | — | | | | 901,506,764 | |
| Short-Term Investment | | | | | | | | | | | | | | | | |
| Money Market Mutual Fund | | | 7,218,681 | | | | — | | | | — | | | | 7,218,681 | |
| Total Short-Term Investment | | | 7,218,681 | | | | — | | | | — | | | | 7,218,681 | |
| Total Investments | | $ | 7,218,681 | | | $ | 901,506,764 | | | $ | — | | | $ | 908,725,445 | |
| Futures Contracts* | | | | | | | | | | | | | | | | |
| Sale Contracts | | $ | (316,150 | ) | | $ | — | | | $ | — | | | $ | (316,150 | ) |
| Total Futures Contracts | | $ | (316,150 | ) | | $ | — | | | $ | — | | | $ | (316,150 | ) |
* The fair value of the Fund’s futures contracts represent the net unrealized depreciation at December 31, 2023.
Changes in valuation techniques may result in transfers into or out of assigned levels within the fair value hierarchy. There were no transfers into or out of Level 3 during the year, as compared to the security classifications from the prior year’s annual report. See the Fund’s Valuation Policy in Note 2a to the financial statements.
The accompanying notes are an integral part of these financial statements.
Baird Quality Intermediate Municipal Bond Fund
December 31, 2023 (Unaudited)
The Baird Quality Intermediate Municipal Bond Fund seeks current income that is exempt from federal income tax. As a reminder, the Fund maintains a quality focus and there are several key strategies employed on an ongoing basis that differentiate it from others in the intermediate municipal fund space. These include a consistent overweight among higher quality issues, with particular emphasis on AAA rated securities, a persistent overweight to U.S. government-backed issues, and minimization of maturity extension risk.
The tax-exempt market closed 2023 with a very strong tone as yields fell over 100 bps in the fourth quarter and were down 20–40 bps for the year, with intermediate maturities falling the most. A catalyst for the fourth quarter rally was an acknowledgement by Fed Chair Powell that the possibility of rate cuts was now equally balanced against further increases. One market anomaly which persisted throughout the year was the inversion of the municipal yield curve between the 1–10-year maturities, ending the year with 32 bps of negative slope. Relatively high short-term floating-rate yields helped sustain the inversion but also acted as a disincentive to invest in longer-term fixed-rate bonds, a drag on municipal fund flows across the industry in 2023. Yet, overall demand for municipals was robust, evidenced by the fact that tax-exempt yields fell more than comparable maturity Treasuries for the year. It also helped that the level of new municipal supply was modest in 2023. Total issuance fell 2% from the prior year with taxable municipal issuance off 36% and tax-exempt supply up just 5% on a year-over-year basis.
During 2023, the Institutional Class Shares of the Fund (BMBIX) posted a net return of 4.29% vs. a 4.65% return for the Bloomberg Quality Intermediate Municipal Index.
Positive contributors to the Fund’s relative performance during the year include:
| | • | Portfolio Structure – A barbell curve allocation enhanced returns |
| | • | Security selection – Discount bonds outperformed premium priced securities |
| | • | Sector weighting – An overweight to State General Obligation bonds |
Negative contributors to the Fund’s relative performance during the year include:
| | • | Credit – Overweight to AAA and other highly-rated issues |
| | • | Sector weighting – Housing securities lagged other sectors |
We expect that the favorable backdrop for the municipal market will continue into 2024, in part due to the expectation that municipal fund flows will turn positive once again. Since municipal fund flows are highly correlated with curve slope (the more positive the slope the more positive the inflows), as inflation continues toward the Fed’s 2% target rate short-term rates should fall faster than long-term rates, re-steepening the curve. Curve positioning, which is always important, will remain so in 2024. We expect only a modest pickup in supply as the post-Covid federal stimulus funds continue to be spent, limiting borrowing needs for many state and local governments. The exception, we believe, will be those states experiencing the fastest growth in population (e.g., Texas and Florida). Issuance among other municipal sectors, particularly Higher Education and Hospitals, should improve only modestly given their ongoing challenges. Tax-Exempt Housing supply should stay robust, but it is a relatively small sector of the total market. Finally, because municipal credit spreads are relatively tight as we enter 2024, the best investment opportunities will likely be found among higher-quality issues. We will also seek favorable risk/reward through structural opportunities including coupon, call and prepayment variations to enhance both yield and return.
The Fund maintains a neutral duration posture relative to the benchmark while seeking to optimize roll-down opportunities along the yield curve. Sector weightings will likely strongly favor a focus on the highest-rated issues including Pre-refunded and high-quality tax-exempt Housing bonds, which have U.S. Federal Agency support. Finally, the Fund will seek to enhance total return through security structure and cash flow optionality.
Baird Quality Intermediate Municipal Bond Fund
December 31, 2023 (Unaudited)
Portfolio Characteristics
Quality Distribution(1)(2)

| | Net Assets | $1,102,907,604 | |
| | | | |
| | SEC 30-Day Yield(4) | | |
| | Institutional Class | 3.05% | |
| | Investor Class | 2.80% | |
| | | | |
| | Average Effective Duration | 4.21 years | |
| | | | |
| | Average Effective Maturity | 4.41 years | |
| | | | |
| | Annualized Expense Ratio(5) | | |
| | Institutional Class | 0.30% | |
| | Investor Class | 0.55% | (6) |
| | | | |
| | Portfolio Turnover Rate | 33% | |
| | | | | |
Sector Weightings(7) | | Number of Holdings | 608 | |
| | | | | |

| | | | |
| | | | |
| | | | |
| | | | |
| | | | |
| | | | |
| | | | |
| | | | |
| | | | |
| | | | |
| | | | |
| | | | |
| | | | |
| | | | |
| | | | |
| | | | |
| | | | |
| | | | |
| | | | | |
(1) | Percentages shown are based on the Fund’s total investments. |
(2) | The quality profile is calculated on a market value-weighted basis using the highest credit quality rating for each security held by the Fund given by S&P, Moody’s or Fitch, each of which is a Nationally Recognized Statistical Rating Organization (NRSRO). NRSROs rate the credit quality of securities using a scale that generally ranges from AAA (highest) to D (lowest). |
(3) | Includes pre-refunded and escrowed-to-maturity (ETM) bonds. |
(4) | SEC yields are based on SEC guidelines and are calculated for the 30 days ended December 31, 2023. |
(5) | Reflects expense ratios as stated in the Fund’s current prospectus dated May 1, 2023. |
(6) | Includes 0.25% 12b-1 fee. |
(7) | Percentages shown are based on the Fund’s total net assets. |
Baird Quality Intermediate Municipal Bond Fund
December 31, 2023 (Unaudited)
| Institutional Class | Investor Class |
| Value of a $10,000 Investment | Value of a $10,000 Investment |
| | |
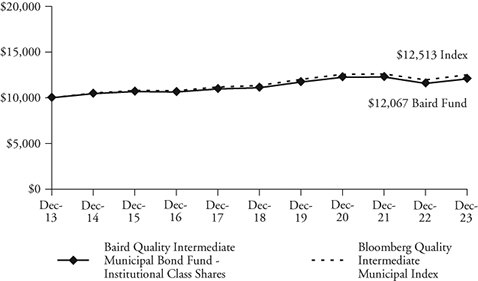 |  |
| | |
| Growth of a hypothetical investment of $10,000 made on 12/31/13, assuming | Growth of a hypothetical investment of $10,000 made on 12/31/13, assuming |
| reinvestment of all distributions. | reinvestment of all distributions. |
| Total Returns | | | | |
| | | Average Annual |
| | One | Five | Ten | Since |
| For the Periods Ended December 31, 2023 | Year | Years | Years | Inception(1) |
| Institutional Class Shares | 4.29% | 1.69% | 1.90% | 3.38% |
| Investor Class Shares | 4.01% | 1.43% | 1.64% | 3.12% |
Bloomberg Quality Intermediate Municipal Index(2) | 4.65% | 1.97% | 2.27% | 3.49% |
(1) | For the period from March 30, 2001 (inception date) through December 31, 2023. |
(2) | The Bloomberg Quality Intermediate Municipal Index is an unmanaged, market value weighted index consisting of tax-exempt, fixed-rate securities that are rated A3 or better, with maturities between 2 and 12 years. Securities must have an outstanding par value of at least $7 million and be issued as part of a transaction of at least $75 million. The bonds must be fixed rate and have a dated-date after December 31, 1990. This Index does not reflect any deduction for fees, expenses or taxes. A direct investment in an index is not possible. |
The line graphs and the returns table shown above reflect reinvestment of dividends and/or capital gains distributions in additional shares. The returns in the graphs and table do not reflect the deduction of taxes that a shareholder would pay on Fund distributions or the redemption of Fund shares. The returns reflect the actual performance for each period and do not include the impact of trades executed on the last business day of the period that were recorded on the first business day of the next period.
The Fund’s expense ratio for each Class, as reflected in the Fund’s current prospectus, is set forth under “Portfolio Characteristics”.
The Fund may invest up to 25% of its total assets in municipal obligations issued by persons in the same state. As a result, changes in economic, business or political conditions of a particular state may have a disproportionate impact on the Fund’s share price. Municipal securities investments are not appropriate for all investors, especially those taxed at lower rates. U.S. and international markets have experienced significant periods of volatility due to a number of economic, political and other global macro factors. The war between Ukraine and Russia is approaching its 2nd anniversary and the October 7th attack by Hamas and Israel’s response only added to global tensions. US/China relations remain strained, impacted by sluggish Chinese economic growth and numerous issues affecting trade relations. Domestically, inflation remains an area of focus since getting to the Fed’s 2% target may prove to be more challenging than the market expects. In addition, 2024 is an election year and the current level of political discord is high. Finally, while the coronavirus (COVID-19) appears to have entered an endemic stage, significant outbreaks present a continued risk to the global economy. These and other events may cause market disruptions and could have an adverse effect on the value of the Fund’s investments.
Past performance does not guarantee future results. Investment return and principal value will fluctuate so that an investor’s shares, when redeemed, may be worth more or less than their original cost.
For information about the performance of the Fund as of the most recent month-end, please call 1-866-442-2473 or visit www.bairdfunds.com. Mutual fund performance changes over time and current performance may be lower or higher than that stated.
Baird Quality Intermediate Municipal Bond Fund
Schedule of Investments, December 31, 2023
Long-Term Investments
| | | Principal | | | | | | % of | |
| | | Amount | | | Value | | | Net Assets | |
| U.S. Treasury Securities | | | | | | | | | |
| U.S. Treasury Bonds, | | | | | | | | | |
| 3.875%, 04/30/2025 | | $ | 11,000,000 | | | $ | 10,902,461 | | | | |
| U.S. Treasury Bonds, | | | | | | | | | | | |
| 3.875%, 11/30/2027 | | | 5,000,000 | | | | 4,993,164 | | | | |
| Total U.S. Treasury Securities | | | | | | | | | | | |
| (Cost $15,680,119) | | | | | | | 15,895,625 | | | | 1.4 | % |
| Municipal Bonds | | | | | | | | | | | | |
| Alabama | | | | | | | | | | | | |
| Alabama Housing Finance Authority, | | | | | | | | | | | | |
| 3.500%, 08/01/2025 (Mandatory Tender | | | | | | | | | | | | |
Date 08/01/2024) (Insured by HUD)(1) | | | 4,855,000 | | | | 4,846,155 | | | | | |
| Black Belt Energy Gas District, | | | | | | | | | | | | |
| 5.000%, 05/01/2053 | | | | | | | | | | | | |
(Mandatory Tender Date 06/01/2028)(1) | | | 4,000,000 | | | | 4,189,087 | | | | | |
| City of Oxford AL, | | | | | | | | | | | | |
| 3.600%, 09/01/2041 (Callable 01/02/2024) | | | | | | | | | | | | |
(Optional Put Date 01/05/2024)(1) | | | 5,300,000 | | | | 5,300,000 | | | | | |
| Total Alabama | | | | | | | | | | | | |
| (Cost $14,415,500) | | | | | | | 14,335,242 | | | | 1.3 | % |
| Alaska | | | | | | | | | | | | |
| Alaska Housing Finance Corp.: | | | | | | | | | | | | |
| 4.000%, 06/01/2036 | | | | | | | | | | | | |
| (Pre-refunded to 06/01/2025) | | | 290,000 | | | | 294,712 | | | | | |
| 4.000%, 06/01/2036 (Callable 06/01/2025) | | | 710,000 | | | | 713,179 | | | | | |
| 3.250%, 12/01/2044 (Callable 06/01/2029) | | | 165,000 | | | | 161,047 | | | | | |
| 4.000%, 12/01/2048 (Callable 06/01/2027) | | | 540,000 | | | | 539,243 | | | | | |
| City of Valdez AK, | | | | | | | | | | | | |
| 5.000%, 06/30/2029 (Callable 01/19/2024) | | | 1,225,000 | | | | 1,226,140 | | | | | |
| Total Alaska | | | | | | | | | | | | |
| (Cost $2,969,175) | | | | | | | 2,934,321 | | | | 0.3 | % |
| Arizona | | | | | | | | | | | | |
| Arizona Industrial Development Authority, | | | | | | | | | | | | |
| 1.745%, 09/01/2030 | | | | | | | | | | | | |
(Insured by AGM)(1)(3) | | | 3,000,000 | | | | 2,832,295 | | | | | |
| City of Tempe AZ: | | | | | | | | | | | | |
| 5.000%, 07/01/2033 | | | | | | | | | | | | |
| (Pre-refunded to 07/01/2028) | | | 40,000 | | | | 44,273 | | | | | |
| 5.000%, 07/01/2034 | | | | | | | | | | | | |
| (Pre-refunded to 07/01/2027) | | | 165,000 | | | | 178,498 | | | | | |
| 5.000%, 07/01/2034 | | | | | | | | | | | | |
| (Pre-refunded to 07/01/2028) | | | 325,000 | | | | 359,719 | | | | | |
| 5.000%, 07/01/2035 | | | | | | | | | | | | |
| (Pre-refunded to 07/01/2027) | | | 185,000 | | | | 200,134 | | | | | |
| 5.000%, 07/01/2037 | | | | | | | | | | | | |
| (Pre-refunded to 07/01/2028) | | | 215,000 | | | | 237,968 | | | | | |
| 5.000%, 07/01/2038 | | | | | | | | | | | | |
| (Pre-refunded to 07/01/2028) | | | 350,000 | | | | 387,389 | | | | | |
| Maricopa County Industrial | | | | | | | | | | | | |
| Development Authority, | | | | | | | | | | | | |
| 4.000%, 01/01/2045 (Callable 07/01/2030) | | | 2,000,000 | | | | 1,974,220 | | | | | |
| Total Arizona | | | | | | | | | | | | |
| (Cost $6,014,037) | | | | | | | 6,214,496 | | | | 0.6 | % |
| Arkansas | | | | | | | | | | | | |
| City of Little Rock AR, | | | | | | | | | | | | |
| 5.000%, 10/01/2034 | | | | | | | | | | | | |
| (Pre-refunded to 04/01/2025) | | | 2,500,000 | | | | 2,562,108 | | | | | |
| City of Pine Bluff AR, | | | | | | | | | | | | |
| 3.000%, 02/01/2047 (Callable 08/01/2027) | | | | | | | | | | | | |
| (Insured by BAM) | | | 1,365,000 | | | | 1,316,966 | | | | | |
| University of Arkansas: | | | | | | | | | | | | |
| 5.000%, 10/01/2031 | | | | | | | | | | | | |
| (Callable 10/01/2026) | | | 250,000 | | | | 263,834 | | | | | |
| 5.000%, 11/01/2035 | | | | | | | | | | | | |
| (Pre-refunded to 11/01/2024) | | | 665,000 | | | | 675,619 | | | | | |
| 4.000%, 04/01/2037 | | | | | | | | | | | | |
| (Callable 04/01/2029) | | | 160,000 | | | | 164,253 | | | | | |
| 4.000%, 04/01/2039 | | | | | | | | | | | | |
| (Callable 04/01/2029) | | | 245,000 | | | | 249,190 | | | | | |
| Total Arkansas | | | | | | | | | | | | |
| (Cost $5,295,984) | | | | | | | 5,231,970 | | | | 0.5 | % |
| California | | | | | | | | | | | | |
| Anaheim Public Financing Authority, | | | | | | | | | | | | |
| 0.000%, 09/01/2036 | | | | | | | | | | | | |
| (ETM) (Insured by AGM) | | | 11,240,000 | | | | 7,640,679 | | | | | |
| Brea Redevelopment Agency: | | | | | | | | | | | | |
| 5.000%, 08/01/2033 | | | | | | | | | | | | |
(Callable 08/01/2027)(5) | | | 1,500,000 | | | | 1,630,577 | | | | | |
| 5.000%, 08/01/2034 | | | | | | | | | | | | |
(Callable 08/01/2027)(5) | | | 1,750,000 | | | | 1,901,104 | | | | | |
| Buellton Union School District, | | | | | | | | | | | | |
| 0.000%, 02/01/2034 (Insured by AGC) | | | 2,000,000 | | | | 1,396,206 | | | | | |
| California Housing Finance Agency, | | | | | | | | | | | | |
| 3.750%, 03/25/2035 (Insured by FHLMC) | | | 4,857,835 | | | | 4,799,967 | | | | | |
| California Municipal Finance Authority, | | | | | | | | | | | | |
| 5.000%, 11/15/2031 (ETM) | | | 1,500,000 | | | | 1,771,206 | | | | | |
| California School Finance Authority, | | | | | | | | | | | | |
| 6.400%, 08/01/2034 | | | | | | | | | | | | |
(Pre-refunded to 02/01/2024)(3) | | | 1,000,000 | | | | 1,002,321 | | | | | |
| California State University, | | | | | | | | | | | | |
| 3.125%, 11/01/2051 (Callable 05/01/2026) | | | | | | | | | | | | |
(Mandatory Tender Date 11/01/2026)(1) | | | 2,250,000 | | | | 2,270,957 | | | | | |
| Carlsbad Unified School District, | | | | | | | | | | | | |
0.000%, 08/01/2035(5) | | | 305,000 | | | | 357,491 | | | | | |
| Central Basin Municipal Water District, | | | | | | | | | | | | |
| 5.000%, 08/01/2044 | | | | | | | | | | | | |
| (Pre-refunded to 08/01/2028) | | | 70,000 | | | | 78,588 | | | | | |
| Citrus Community College District, | | | | | | | | | | | | |
| 5.000%, 08/01/2034 | | | | | | | | | | | | |
(Pre-refunded to 02/01/2024)(5) | | | 885,000 | | | | 886,521 | | | | | |
| City of Richmond CA, | | | | | | | | | | | | |
| 0.000%, 08/01/2028 | | | | | | | | | | | | |
| (ETM) (Insured by FGIC) | | | 180,000 | | | | 160,361 | | | | | |
| El Monte City School District, | | | | | | | | | | | | |
| 0.000%, 08/01/2029 (Insured by AGC) | | | 1,640,000 | | | | 1,359,002 | | | | | |
| Fontana Unified School District, | | | | | | | | | | | | |
| 0.000%, 02/01/2033 | | | | | | | | | | | | |
| (ETM) (Insured by AGM) | | | 460,000 | | | | 357,675 | | | | | |
| Foothill-Eastern Transportation | | | | | | | | | | | | |
| Corridor Agency: | | | | | | | | | | | | |
| 0.000%, 01/01/2026 (ETM) | | | 4,695,000 | | | | 4,443,217 | | | | | |
| 0.000%, 01/01/2028 (ETM) | | | 3,260,000 | | | | 2,943,952 | | | | | |
| 0.000%, 01/01/2030 (ETM) | | | 95,000 | | | | 81,643 | | | | | |
| Freddie Mac Multifamily ML Certificates: | | | | | | | | | | | | |
3.996%, 12/25/2036(1) | | | 2,497,143 | | | | 2,417,279 | | | | | |
4.000%, 01/25/2040(5) | | | 2,985,025 | | | | 2,695,886 | | | | | |
| Freddie Mac Multifamily | | | | | | | | | | | | |
| Variable Rate Certificate, | | | | | | | | | | | | |
| 2.875%, 07/25/2036 | | | 7,319,700 | | | | 6,450,488 | | | | | |
| Gateway Unified School District, | | | | | | | | | | | | |
| 0.000%, 03/01/2037 | | | | | | | | | | | | |
| (ETM) (Insured by AGM) | | | 100,000 | | | | 65,874 | | | | | |
The accompanying notes are an integral part of these financial statements.
Baird Quality Intermediate Municipal Bond Fund
Schedule of Investments, December 31, 2023
Long-Term Investments (cont.)
| | | Principal | | | | | | % of | |
| | | Amount | | | Value | | | Net Assets | |
| Golden State Tobacco Securitization Corp.: | | | | | | | | | |
| 0.000%, 06/01/2026 | | | | | | | | | |
| (ETM) (Insured by AGM) | | $ | 240,000 | | | $ | 224,919 | | | | |
| 0.000%, 06/01/2028 | | | | | | | | | | | |
| (ETM) (Insured by AGC) | | | 605,000 | | | | 541,065 | | | | |
| 5.000%, 06/01/2028 | | | | | | | | | | | |
| (Pre-refunded to 06/01/2027) | | | 425,000 | | | | 460,317 | | | | |
| 3.250%, 06/01/2034 | | | | | | | | | | | |
| (Pre-refunded to 06/01/2025) | | | | | | | | | | | |
| (Insured by ST AID) | | | 160,000 | | | | 161,327 | | | | |
| Imperial Community College District, | | | | | | | | | | | |
| 7.000%, 08/01/2040 (Pre-refunded to | | | | | | | | | | | |
08/01/2030) (Insured by AGM)(5) | | | 180,000 | | | | 232,252 | | | | |
| Kingsburg Joint Union High School District, | | | | | | | | | | | |
| 5.000%, 08/01/2044 (Pre-refunded to | | | | | | | | | | | |
| 08/01/2026) (Insured by AGM) | | | 150,000 | | | | 159,107 | | | | |
| Long Beach Community College District: | | | | | | | | | | | |
| 0.000%, 06/01/2032 | | | | | | | | | | | |
| (ETM) (Insured by AGM) | | | 1,540,000 | | | | 1,225,510 | | | | |
| 0.000%, 06/01/2033 | | | | | | | | | | | |
| (ETM) (Insured by AGM) | | | 1,560,000 | | | | 1,201,326 | | | | |
| Merced Union High School District, | | | | | | | | | | | |
| 0.000%, 08/01/2048 (Pre-refunded to | | | | | | | | | | | |
| 02/01/2025) (Insured by AGM) | | | 850,000 | | | | 233,673 | | | | |
| Moreno Valley Unified School District, | | | | | | | | | | | |
| 0.000%, 07/01/2029 | | | | | | | | | | | |
| (ETM) (Insured by AGM) | | | 75,000 | | | | 65,284 | | | | |
| Morongo Unified School District, | | | | | | | | | | | |
| 0.000%, 08/01/2041 | | | | | | | | | | | |
(Callable 08/01/2030)(5) | | | 260,000 | | | | 266,054 | | | | |
| Pacheco Union Elementary School District: | | | | | | | | | | | |
| 0.000%, 02/01/2028 | | | | | | | | | | | |
| (ETM) (Insured by AGM) | | | 25,000 | | | | 22,442 | | | | |
| 0.000%, 02/01/2028 | | | | | | | | | | | |
| (ETM) (Insured by AGM) | | | 40,000 | | | | 35,907 | | | | |
| 0.000%, 02/01/2037 | | | | | | | | | | | |
| (ETM) (Insured by AGM) | | | 300,000 | | | | 201,649 | | | | |
| Pajaro Valley Unified School District, | | | | | | | | | | | |
| 0.000%, 08/01/2027 | | | | | | | | | | | |
| (ETM) (Insured by AGM) | | | 25,000 | | | | 22,832 | | | | |
| Palmdale Elementary School District, | | | | | | | | | | | |
| 0.000%, 08/01/2031 | | | | | | | | | | | |
| (ETM) (Insured by AGM) | | | 30,000 | | | | 24,439 | | | | |
| Paramount Unified School District, | | | | | | | | | | | |
| 6.375%, 08/01/2045 (Callable 02/01/2033) | | | | | | | | | | | |
(Insured by AGM)(5) | | | 325,000 | | | | 401,429 | | | | |
| Rio Hondo Community College District, | | | | | | | | | | | |
| 0.000%, 08/01/2042 | | | | | | | | | | | |
(Callable 08/01/2034)(5) | | | 7,160,000 | | | | 9,095,039 | | | | |
| Riverside County Redevelopment | | | | | | | | | | | |
| Successor Agency, | | | | | | | | | | | |
| 8.250%, 10/01/2031 | | | | | | | | | | | |
(Pre-refunded to 10/01/2026)(5) | | | 650,000 | | | | 746,974 | | | | |
| Roseville Joint Union High School District, | | | | | | | | | | | |
| 0.000%, 08/01/2034 (Callable 08/01/2026) | | | 85,000 | | | | 60,171 | | | | |
| San Diego Unified School District: | | | | | | | | | | | |
| 0.000%, 07/01/2030 (ETM) | | | 100,000 | | | | 84,288 | | | | |
| 0.000%, 07/01/2034 (Callable 07/01/2025) | | | 2,000,000 | | | | 1,333,144 | | | | |
| 4.000%, 07/01/2034 (Callable 07/01/2027) | | | 1,000,000 | | | | 1,037,969 | | | | |
| 0.000%, 07/01/2039 (Callable 07/01/2025) | | | 75,000 | | | | 39,584 | | | | |
| San Joaquin Hills Transportation | | | | | | | | | | | |
| Corridor Agency: | | | | | | | | | | | |
| 0.000%, 01/01/2027 (ETM) | | | 1,380,000 | | | | 1,275,453 | | | | |
| 0.000%, 01/01/2028 (ETM) | | | 1,110,000 | | | | 1,008,338 | | | | |
| San Marcos Unified School District, | | | | | | | | | | | |
| 0.000%, 08/01/2036 | | | | | | | | | | | |
| (Pre-refunded to 02/15/2024) | | | 55,000 | | | | 28,769 | | | | |
| San Mateo Union High School District, | | | | | | | | | | | |
| 0.000%, 09/01/2041 | | | | | | | | | | | |
(Callable 09/01/2036)(5) | | | 1,080,000 | | | | 1,126,349 | | | | |
| Solano County Community College District, | | | | | | | | | | | |
5.000%, 08/01/2024(5) | | | 180,000 | | | | 182,345 | | | | |
| St. Helena Unified School District, | | | | | | | | | | | |
| 0.000%, 08/01/2037 (Callable 01/29/2024) | | | 25,000 | | | | 13,056 | | | | |
| State of California, | | | | | | | | | | | |
| 5.000%, 04/01/2042 (Callable 10/01/2027) | | | 2,250,000 | | | | 2,403,687 | | | | |
| Sutter Union High School District: | | | | | | | | | | | |
| 0.000%, 08/01/2036 | | | | | | | | | | | |
| (Pre-refunded to 08/01/2025) | | | 75,000 | | | | 33,100 | | | | |
| 0.000%, 08/01/2037 | | | | | | | | | | | |
| (Pre-refunded to 08/01/2025) | | | 50,000 | | | | 20,546 | | | | |
| 0.000%, 08/01/2041 | | | | | | | | | | | |
| (Pre-refunded to 08/01/2025) | | | 50,000 | | | | 15,388 | | | | |
| 0.000%, 08/01/2043 | | | | | | | | | | | |
| (Pre-refunded to 08/01/2025) | | | 200,000 | | | | 53,050 | | | | |
| 0.000%, 06/01/2050 | | | | | | | | | | | |
| (Pre-refunded to 08/01/2025) | | | 700,000 | | | | 110,104 | | | | |
| Woodlake Union High School District, | | | | | | | | | | | |
| 0.000%, 08/01/2033 (Insured by AGM) | | | 1,000,000 | | | | 659,701 | | | | |
| Total California | | | | | | | | | | | |
| (Cost $69,185,053) | | | | | | | 69,517,581 | | | | 6.3 | % |
| Colorado | | | | | | | | | | | | |
| Boulder Valley School District No. Re-2, | | | | | | | | | | | | |
| 5.000%, 12/01/2038 (Callable 06/01/2025) | | | | | | | | | | | | |
| (Insured by ST AID) | | | 1,225,000 | | | | 1,252,278 | | | | | |
| Brush School District No. RE-2J: | | | | | | | | | | | | |
| 5.000%, 12/01/2031 (Callable 12/01/2027) | | | | | | | | | | | | |
| (Insured by BAM) | | | 380,000 | | | | 412,446 | | | | | |
| 5.000%, 12/01/2032 (Callable 12/01/2027) | | | | | | | | | | | | |
| (Insured by BAM) | | | 395,000 | | | | 427,811 | | | | | |
| City & County of Denver CO, | | | | | | | | | | | | |
| 5.000%, 06/01/2038 (Callable 06/01/2026) | | | 310,000 | | | | 322,121 | | | | | |
| City of Boulder CO, | | | | | | | | | | | | |
| 3.000%, 12/01/2030 (Callable 12/01/2025) | | | 925,000 | | | | 906,486 | | | | | |
| City of Fort Lupton CO, | | | | | | | | | | | | |
| 4.000%, 12/01/2042 (Callable 12/01/2027) | | | | | | | | | | | | |
| (Insured by AGM) | | | 850,000 | | | | 856,792 | | | | | |
| Colorado Health Facilities Authority: | | | | | | | | | | | | |
| 5.000%, 06/01/2047 | | | | | | | | | | | | |
| (Pre-refunded to 06/01/2027) | | | 5,800,000 | | | | 6,242,532 | | | | | |
| 3.630%, 05/15/2061 | | | | | | | | | | | | |
| (SIFMA Municipal Swap Index + 0.550%) | | | | | | | | | | | | |
| (Callable 02/17/2026) | | | | | | | | | | | | |
(Mandatory Tender Date 08/17/2026)(2) | | | 10,000,000 | | | | 9,921,685 | | | | | |
| Mesa County Valley School District No. 51, | | | | | | | | | | | | |
| 5.500%, 12/01/2037 (Callable 12/01/2027) | | | | | | | | | | | | |
| (Insured by ST AID) | | | 1,000,000 | | | | 1,089,465 | | | | | |
| University of Colorado, | | | | | | | | | | | | |
| 5.000%, 06/01/2044 (Callable 06/01/2029) | | | 285,000 | | | | 307,211 | | | | | |
| Wiggins School District No. RE-50J, | | | | | | | | | | | | |
| 4.000%, 12/01/2039 (Callable 12/01/2031) | | | | | | | | | | | | |
| (Insured by BAM) | | | 500,000 | | | | 518,613 | | | | | |
| Total Colorado | | | | | | | | | | | | |
| (Cost $22,565,980) | | | | | | | 22,257,440 | | | | 2.0 | % |
The accompanying notes are an integral part of these financial statements.
Baird Quality Intermediate Municipal Bond Fund
Schedule of Investments, December 31, 2023
Long-Term Investments (cont.)
| | | Principal | | | | | | % of | |
| | | Amount | | | Value | | | Net Assets | |
| Connecticut | | | | | | | | | |
| City of Norwalk CT, | | | | | | | | | |
| 5.000%, 08/15/2036 | | | | | | | | | |
| (Callable 08/15/2030) | | $ | 2,555,000 | | | $ | 2,946,122 | | | | |
| Connecticut Housing Finance Authority: | | | | | | | | | | | |
| 2.875%, 11/15/2030 (Callable 05/15/2025) | | | 1,325,000 | | | | 1,254,568 | | | | |
| 4.000%, 11/15/2045 (Callable 05/15/2028) | | | 3,420,000 | | | | 3,415,899 | | | | |
| 4.000%, 11/15/2047 (Callable 11/15/2026) | | | 500,000 | | | | 498,552 | | | | |
| 4.000%, 05/15/2049 (Callable 11/15/2028) | | | 1,475,000 | | | | 1,477,471 | | | | |
| Connecticut State Health & | | | | | | | | | | | |
| Educational Facilities Authority: | | | | | | | | | | | |
| 5.250%, 03/01/2032 | | | | | | | | | | | |
| (ETM) (Insured by AGM) | | | 100,000 | | | | 114,477 | | | | |
| 3.200%, 07/01/2037 | | | | | | | | | | | |
(Mandatory Tender Date 07/01/2026)(1) | | | 2,000,000 | | | | 2,020,815 | | | | |
| 2.800%, 07/01/2057 | | | | | | | | | | | |
(Mandatory Tender Date 02/03/2026)(1) | | | 6,000,000 | | | | 6,003,940 | | | | |
| State of Connecticut, | | | | | | | | | | | |
| 5.000%, 11/15/2036 (Callable 11/15/2032) | | | 180,000 | | | | 212,656 | | | | |
| University of Connecticut, | | | | | | | | | | | |
| 5.000%, 01/15/2031 (Callable 01/15/2027) | | | | | | | | | | | |
| (Insured by AGM) | | | 1,250,000 | | | | 1,335,571 | | | | |
| Total Connecticut | | | | | | | | | | | |
| (Cost $19,425,567) | | | | | | | 19,280,071 | | | | 1.7 | % |
| Florida | | | | | | | | | | | | |
| Broward County Housing Finance Authority, | | | | | | | | | | | | |
| 3.500%, 04/01/2041 (Callable 10/01/2025) | | | | | | | | | | | | |
| (Mandatory Tender Date 04/01/2026) | | | | | | | | | | | | |
(Insured by HUD)(1) | | | 1,000,000 | | | | 1,000,220 | | | | | |
| City of Fort Lauderdale FL, | | | | | | | | | | | | |
| 5.500%, 09/01/2048 (Callable 09/01/2033) | | | 3,500,000 | | | | 4,067,842 | | | | | |
| City of Fort Myers FL, | | | | | | | | | | | | |
| 4.000%, 12/01/2037 (Callable 12/01/2025) | | | 480,000 | | | | 482,920 | | | | | |
| City of Melbourne FL, | | | | | | | | | | | | |
| 0.000%, 10/01/2026 | | | | | | | | | | | | |
| (ETM) (Insured by FGIC) | | | 40,000 | | | | 37,110 | | | | | |
| City of Miramar FL: | | | | | | | | | | | | |
| 5.000%, 10/01/2034 (Callable 10/01/2027) | | | 1,000,000 | | | | 1,083,986 | | | | | |
| 5.000%, 10/01/2035 (Callable 10/01/2027) | | | 1,030,000 | | | | 1,118,687 | | | | | |
| City of Orlando FL, | | | | | | | | | | | | |
| 5.000%, 11/01/2034 (Callable 11/01/2027) | | | | | | | | | | | | |
| (Insured by AGM) | | | 1,000,000 | | | | 1,065,739 | | | | | |
| City of Tallahassee FL, | | | | | | | | | | | | |
| 5.000%, 10/01/2035 (Callable 10/01/2024) | | | 825,000 | | | | 833,558 | | | | | |
| County of Miami-Dade FL: | | | | | | | | | | | | |
| 0.000%, 10/01/2026 | | | | | | | | | | | | |
| (ETM) (Insured by NATL) | | | 50,000 | | | | 46,387 | | | | | |
| 0.000%, 10/01/2027 | | | | | | | | | | | | |
| (ETM) (Insured by NATL) | | | 330,000 | | | | 298,592 | | | | | |
| 5.250%, 10/01/2030 | | | | | | | | | | | | |
| (ETM) (Insured by NATL) | | | 4,625,000 | | | | 5,290,522 | | | | | |
| Florida Housing Finance Corp.: | | | | | | | | | | | | |
| 5.000%, 12/01/2026 | | | | | | | | | | | | |
| (Mandatory Tender Date 12/01/2025) | | | | | | | | | | | | |
(Insured by HUD)(1) | | | 2,500,000 | | | | 2,568,714 | | | | | |
| 1.940%, 08/01/2036 (Insured by FNMA) | | | 5,000,000 | | | | 4,110,846 | | | | | |
| 4.200%, 01/01/2045 (Callable 01/01/2028) | | | | | | | | | | | | |
| (Insured by GNMA) | | | 2,195,000 | | | | 2,203,648 | | | | | |
| 3.500%, 07/01/2051 (Callable 07/01/2029) | | | | | | | | | | | | |
| (Insured by GNMA) | | | 800,000 | | | | 790,876 | | | | | |
| Leon County – City of Tallahassee | | | | | | | | | | | | |
| Blueprint Intergovernmental Agency, | | | | | | | | | | | | |
| 4.000%, 10/01/2038 | | | | | | | | | | | | |
| (Callable 10/01/2031) | | | 4,805,000 | | | | 5,026,108 | | | | | |
| Osceola County Expressway Authority: | | | | | | | | | | | | |
0.000%, 10/01/2028 (ETM)(5) | | | 150,000 | | | | 166,198 | | | | | |
0.000%, 10/01/2031 (ETM)(5) | | | 60,000 | | | | 72,336 | | | | | |
| Seminole County School Board, | | | | | | | | | | | | |
| 5.000%, 07/01/2035 (Callable 07/01/2026) | | | 145,000 | | | | 150,978 | | | | | |
| Total Florida | | | | | | | | | | | | |
| (Cost $30,854,722) | | | | | | | 30,415,267 | | | | 2.8 | % |
| Georgia | | | | | | | | | | | | |
| City of Decatur GA, | | | | | | | | | | | | |
| 3.000%, 08/01/2038 (Callable 08/01/2025) | | | | | | | | | | | | |
| (Insured by ST AID) | | | 500,000 | | | | 454,301 | | | | | |
| Forsyth County Hospital Authority, | | | | | | | | | | | | |
| 6.375%, 10/01/2028 (ETM) | | | 5,295,000 | | | | 5,842,630 | | | | | |
| Georgia Housing & Finance Authority, | | | | | | | | | | | | |
| 3.500%, 12/01/2046 (Callable 12/01/2025) | | | 200,000 | | | | 198,912 | | | | | |
| Houston Healthcare System, Inc., | | | | | | | | | | | | |
| 5.000%, 10/01/2031 | | | | | | | | | | | | |
(Pre-refunded to 04/01/2024)(5) | | | 15,900,000 | | | | 15,949,505 | | | | | |
| Main Street Natural Gas, Inc.: | | | | | | | | | | | | |
| 4.000%, 08/01/2049 (Callable 09/01/2024) | | | | | | | | | | | | |
(Mandatory Tender Date 12/02/2024)(1) | | | 1,000,000 | | | | 1,002,220 | | | | | |
| 4.000%, 07/01/2052 (Callable 06/01/2027) | | | | | | | | | | | | |
(Mandatory Tender Date 09/01/2027)(1) | | | 1,615,000 | | | | 1,624,476 | | | | | |
| 5.000%, 07/01/2053 (Callable 12/01/2029) | | | | | | | | | | | | |
(Mandatory Tender Date 03/01/2030)(1) | | | 8,000,000 | | | | 8,529,600 | | | | | |
| Total Georgia | | | | | | | | | | | | |
| (Cost $33,572,929) | | | | | | | 33,601,644 | | | | 3.0 | % |
| Illinois | | | | | | | | | | | | |
| Boone & Winnebago Counties Community | | | | | | | | | | | | |
| Unit School District No. 200, | | | | | | | | | | | | |
| 0.000%, 01/01/2024 | | | | | | | | | | | | |
| (ETM) (Insured by AGM) | | | 815,000 | | | | 815,000 | | | | | |
| Buffalo Grove Park District, | | | | | | | | | | | | |
| 3.000%, 12/30/2024 | | | 840,000 | | | | 836,631 | | | | | |
| Cary Park District, | | | | | | | | | | | | |
| 4.000%, 12/15/2032 (Callable 12/15/2026) | | | 125,000 | | | | 127,342 | | | | | |
| City of Chicago IL: | | | | | | | | | | | | |
| 0.000%, 01/01/2027 | | | | | | | | | | | | |
| (ETM) (Insured by NATL) | | | 75,000 | | | | 68,910 | | | | | |
| 5.000%, 01/01/2034 | | | | | | | | | | | | |
| (Pre-refunded to 01/01/2025) | | | 2,170,000 | | | | 2,210,131 | | | | | |
| 5.000%, 11/01/2036 (Callable 05/01/2032) | | | | | | | | | | | | |
| (Insured by AGM) | | | 70,000 | | | | 81,414 | | | | | |
| City of Springfield IL, | | | | | | | | | | | | |
| 5.000%, 12/01/2031 (Callable 12/01/2025) | | | 500,000 | | | | 516,950 | | | | | |
| City of Woodstock IL, | | | | | | | | | | | | |
| 4.000%, 01/01/2037 (Callable 01/01/2031) | | | 675,000 | | | | 705,954 | | | | | |
| Community Unit School District No. 427, | | | | | | | | | | | | |
| 0.000%, 01/01/2026 | | | | | | | | | | | | |
| (ETM) (Insured by AGM) | | | 2,785,000 | | | | 2,622,725 | | | | | |
| Cook County School District No. 130, | | | | | | | | | | | | |
| 5.000%, 12/01/2026 (Callable 12/01/2025) | | | | | | | | | | | | |
| (Insured by AGM) | | | 1,150,000 | | | | 1,194,193 | | | | | |
| Cook County School District No. 159: | | | | | | | | | | | | |
| 0.000%, 12/01/2025 | | | | | | | | | | | | |
| (ETM) (Insured by AGM) | | | 230,000 | | | | 217,609 | | | | | |
The accompanying notes are an integral part of these financial statements.
Baird Quality Intermediate Municipal Bond Fund
Schedule of Investments, December 31, 2023
Long-Term Investments (cont.)
| | | Principal | | | | | | % of | |
| | | Amount | | | Value | | | Net Assets | |
| Cook County School District No. 159: (cont.) | | | | | | | | | |
| 0.000%, 12/01/2025 | | | | | | | | | |
| (ETM) (Insured by FGIC) | | $ | 475,000 | | | $ | 449,409 | | | | |
| 0.000%, 12/01/2026 | | | | | | | | | | | |
| (ETM) (Insured by FGIC) | | | 285,000 | | | | 263,048 | | | | |
| 0.000%, 12/01/2028 | | | | | | | | | | | |
| (ETM) (Insured by FGIC) | | | 525,000 | | | | 460,820 | | | | |
| Cook County School District No. 163, | | | | | | | | | | | |
| 5.000%, 12/15/2028 (Insured by BAM) | | | 1,305,000 | | | | 1,449,523 | | | | |
| County of Cook IL, | | | | | | | | | | | |
| 5.000%, 11/15/2033 (Callable 11/15/2027) | | | 3,000,000 | | | | 3,216,223 | | | | |
| Deerfield Park District, | | | | | | | | | | | |
| 4.000%, 12/01/2029 | | | 240,000 | | | | 252,863 | | | | |
| DuPage County Community | | | | | | | | | | | |
| High School District No. 100, | | | | | | | | | | | |
| 5.000%, 07/15/2037 (Callable 07/15/2032) | | | 575,000 | | | | 655,842 | | | | |
| Hoffman Estates Park District, | | | | | | | | | | | |
| 5.000%, 12/01/2040 (Callable 12/01/2030) | | | | | | | | | | | |
| (Insured by BAM) | | | 1,415,000 | | | | 1,545,923 | | | | |
| Illinois Development Finance Authority: | | | | | | | | | | | |
| 0.000%, 07/15/2025 (ETM) | | | 39,615,000 | | | | 37,818,436 | | | | |
| 2.450%, 11/15/2039 | | | | | | | | | | | |
(Mandatory Tender Date 03/03/2026)(1) | | | 2,230,000 | | | | 2,196,025 | | | | |
| Illinois Finance Authority: | | | | | | | | | | | |
| 5.000%, 07/01/2031 (Callable 01/01/2026) | | | 1,200,000 | | | | 1,247,002 | | | | |
| 5.250%, 08/15/2031 | | | | | | | | | | | |
| (Pre-refunded to 08/15/2026) | | | 1,830,000 | | | | 1,939,896 | | | | |
| 5.000%, 08/01/2033 | | | | | | | | | | | |
| (Pre-refunded to 08/01/2024) | | | 700,000 | | | | 707,468 | | | | |
| 5.000%, 02/15/2036 (Callable 02/15/2027) | | | 215,000 | | | | 224,420 | | | | |
| 4.000%, 12/01/2036 (Callable 12/01/2028) | | | 1,000,000 | | | | 1,040,233 | | | | |
| 4.000%, 02/15/2041 | | | | | | | | | | | |
| (Pre-refunded to 02/15/2027) | | | 495,000 | | | | 513,022 | | | | |
| 4.000%, 05/01/2044 (Callable 05/01/2025) | | | 135,000 | | | | 136,859 | | | | |
| Illinois Housing Development Authority: | | | | | | | | | | | |
| 2.550%, 04/01/2025 (Insured by GNMA) | | | 590,000 | | | | 578,808 | | | | |
| 4.000%, 06/01/2026 | | | | | | | | | | | |
| (Mandatory Tender Date 06/01/2025) | | | | | | | | | | | |
(Insured by FHA)(1) | | | 1,300,000 | | | | 1,307,664 | | | | |
| 3.100%, 02/01/2035 (Callable 02/01/2026) | | | 875,000 | | | | 833,843 | | | | |
| 3.500%, 08/01/2046 (Callable 02/01/2026) | | | 530,000 | | | | 524,810 | | | | |
| 4.000%, 08/01/2048 (Callable 08/01/2027) | | | | | | | | | | | |
| (Insured by GNMA) | | | 395,000 | | | | 394,458 | | | | |
| Illinois Municipal Electric Agency, | | | | | | | | | | | |
| 4.000%, 02/01/2034 (Callable 08/01/2025) | | | 160,000 | | | | 160,533 | | | | |
| Jefferson County School District No. 80, | | | | | | | | | | | |
| 4.000%, 06/01/2028 (Callable 06/01/2026) | | | | | | | | | | | |
| (Insured by AGM) | | | 120,000 | | | | 121,740 | | | | |
| Kane McHenry Cook & De Kalb Counties | | | | | | | | | | | |
| Unit School District No. 300, | | | | | | | | | | | |
| 5.000%, 01/01/2032 (Callable 01/01/2027) | | | 2,085,000 | | | | 2,227,606 | | | | |
| Kankakee & Will Counties Community | | | | | | | | | | | |
| Unit School District No. 5, | | | | | | | | | | | |
| 4.000%, 05/01/2025 (Callable 05/01/2024) | | | 700,000 | | | | 700,640 | | | | |
| Knox & Warren Counties Community | | | | | | | | | | | |
| Unit School District No. 205: | | | | | | | | | | | |
| 4.000%, 12/01/2034 (Callable 12/01/2027) | | | | | | | | | | | |
| (Insured by BAM) | | | 425,000 | | | | 438,795 | | | | |
| 4.000%, 12/01/2039 (Callable 12/01/2027) | | | | | | | | | | | |
| (Insured by BAM) | | | 1,305,000 | | | | 1,320,555 | | | | |
| Metropolitan Water Reclamation | | | | | | | | | | | |
| District of Greater Chicago, | | | | | | | | | | | |
| 5.000%, 12/01/2034 (Callable 12/01/2026) | | | 295,000 | | | | 311,653 | | | | |
| State of Illinois, | | | | | | | | | | | |
| 4.000%, 06/15/2038 (Callable 06/15/2028) | | | | | | | | | | | |
| (Insured by BAM) | | | 1,850,000 | | | | 1,819,819 | | | | |
| Village of Manhattan IL, | | | | | | | | | | | |
| 4.000%, 01/01/2030 (Callable 01/01/2027) | | | 250,000 | | | | 254,421 | | | | |
| Village of Schaumburg IL, | | | | | | | | | | | |
| 4.000%, 12/01/2028 | | | 470,000 | | | | 502,099 | | | | |
| Waukegan Park District, | | | | | | | | | | | |
| 3.125%, 12/15/2028 (Callable 01/29/2024) | | | 390,000 | | | | 381,929 | | | | |
| Will County Community | | | | | | | | | | | |
| High School District No. 210, | | | | | | | | | | | |
| 0.000%, 01/01/2025 | | | | | | | | | | | |
| (ETM) (Insured by AGM) | | | 350,000 | | | | 339,299 | | | | |
| Will County Community | | | | | | | | | | | |
| Unit School District No. 201-U, | | | | | | | | | | | |
| 0.000%, 11/01/2024 | | | | | | | | | | | |
| (ETM) (Insured by NATL) | | | 1,410,000 | | | | 1,372,904 | | | | |
| Will County Elementary | | | | | | | | | | | |
| School District No. 122, | | | | | | | | | | | |
| 0.000%, 10/01/2027 | | | | | | | | | | | |
| (ETM) (Insured by AGM) | | | 470,000 | | | | 425,268 | | | | |
| Total Illinois | | | | | | | | | | | |
| (Cost $77,369,315) | | | | | | | 77,530,715 | | | | 7.0 | % |
| Indiana | | | | | | | | | | | | |
| City of Evansville IN, | | | | | | | | | | | | |
| 5.000%, 02/01/2029 (Callable 02/01/2026) | | | | | | | | | | | | |
| (Insured by BAM) | | | 735,000 | | | | 760,023 | | | | | |
| City of Indianapolis IN, | | | | | | | | | | | | |
| 3.000%, 05/01/2027 (Mandatory Tender | | | | | | | | | | | | |
Date 11/01/2024) (Insured by HUD)(1) | | | 325,000 | | | | 324,552 | | | | | |
| Fishers Town Hall Building Corp., | | | | | | | | | | | | |
| 5.500%, 07/15/2040 (Callable 07/15/2032) | | | 1,000,000 | | | | 1,163,946 | | | | | |
| Hammond Multi-School Building Corp., | | | | | | | | | | | | |
| 5.000%, 07/15/2033 (Callable 01/15/2028) | | | | | | | | | | | | |
| (Insured by ST AID) | | | 820,000 | | | | 878,552 | | | | | |
| Indiana Housing & Community | | | | | | | | | | | | |
| Development Authority, | | | | | | | | | | | | |
| 5.750%, 07/01/2053 (Callable 07/01/2032) | | | | | | | | | | | | |
| (Insured by GNMA) | | | 850,000 | | | | 910,336 | | | | | |
| Indianapolis Local Public | | | | | | | | | | | | |
| Improvement Bond Bank, | | | | | | | | | | | | |
| 5.000%, 01/01/2033 | | | | | | | | | | | | |
| (Pre-refunded to 01/01/2025) | | | 1,780,000 | | | | 1,818,193 | | | | | |
| Kankakee Valley Middle | | | | | | | | | | | | |
| School Building Corp., | | | | | | | | | | | | |
| 5.000%, 07/15/2029 (Insured by ST AID) | | | 1,180,000 | | | | 1,324,328 | | | | | |
| Lake Ridge Multi-School Building Corp., | | | | | | | | | | | | |
| 5.500%, 01/15/2042 (Callable 07/15/2032) | | | | | | | | | | | | |
| (Insured by ST AID) | | | 2,000,000 | | | | 2,299,002 | | | | | |
| Northern Wells Multi-School Building Corp., | | | | | | | | | | | | |
| 4.000%, 07/15/2035 (Callable 07/15/2027) | | | | | | | | | | | | |
| (Insured by ST AID) | | | 160,000 | | | | 165,189 | | | | | |
| Northwestern School Building Corp., | | | | | | | | | | | | |
| 6.000%, 07/15/2040 (Callable 07/15/2031) | | | | | | | | | | | | |
| (Insured by ST AID) | | | 700,000 | | | | 814,602 | | | | | |
| Perry Central Multi-School Building Corp., | | | | | | | | | | | | |
| 5.000%, 07/15/2038 (Callable 07/15/2033) | | | | | | | | | | | | |
| (Insured by ST AID) | | | 375,000 | | | | 427,747 | | | | | |
| Total Indiana | | | | | | | | | | | | |
| (Cost $10,718,528) | | | | | | | 10,886,470 | | | | 1.0 | % |
The accompanying notes are an integral part of these financial statements.
Baird Quality Intermediate Municipal Bond Fund
Schedule of Investments, December 31, 2023
Long-Term Investments (cont.)
| | | Principal | | | | | | % of | |
| | | Amount | | | Value | | | Net Assets | |
| Iowa | | | | | | | | | |
| Clinton Community School District, | | | | | | | | | |
| 4.375%, 07/01/2036 (Callable 07/01/2028) | | | | | | | | | |
| (Insured by AGM) | | $ | 2,100,000 | | | $ | 2,201,394 | | | | |
| Iowa Finance Authority: | | | | | | | | | | | |
| 5.000%, 08/01/2033 (Callable 08/01/2026) | | | 175,000 | | | | 184,451 | | | | |
| 5.000%, 08/01/2035 | | | | | | | | | | | |
| (Pre-refunded to 08/01/2025) | | | 950,000 | | | | 983,752 | | | | |
| 4.000%, 07/01/2047 (Callable 07/01/2027) | | | | | | | | | | | |
| (Insured by GNMA) | | | 340,000 | | | | 339,043 | | | | |
| 4.000%, 07/01/2047 (Callable 07/01/2028) | | | | | | | | | | | |
| (Insured by GNMA) | | | 960,000 | | | | 961,071 | | | | |
| 5.500%, 07/01/2053 (Callable 01/01/2033) | | | | | | | | | | | |
| (Insured by GNMA) | | | 3,000,000 | | | | 3,205,300 | | | | |
| Total Iowa | | | | | | | | | | | |
| (Cost $7,840,752) | | | | | | | 7,875,011 | | | | 0.7 | % |
| Kansas | | | | | | | | | | | | |
| City of Goddard KS, | | | | | | | | | | | | |
| 5.000%, 12/01/2025 (Callable 06/01/2025) | | | 530,000 | | | | 543,162 | | | | | |
| Crawford County Unified | | | | | | | | | | | | |
| School District No. 250, | | | | | | | | | | | | |
| 5.000%, 09/01/2035 (Pre-refunded to | | | | | | | | | | | | |
| 09/01/2027) (Insured by BAM) | | | 60,000 | | | | 65,378 | | | | | |
| Total Kansas | | | | | | | | | | | | |
| (Cost $603,927) | | | | | | | 608,540 | | | | 0.1 | % |
| Kentucky | | | | | | | | | | | | |
| City of Versailles KY, | | | | | | | | | | | | |
| 3.000%, 08/15/2026 (Callable 08/15/2024) | | | 2,000,000 | | | | 1,976,259 | | | | | |
| Kentucky Bond Development Corp., | | | | | | | | | | | | |
| 3.000%, 05/01/2034 (Callable 05/01/2026) | | | 695,000 | | | | 685,952 | | | | | |
| Kentucky Housing Corp., | | | | | | | | | | | | |
| 5.000%, 09/01/2043 (Callable 03/01/2026) | | | | | | | | | | | | |
| (Mandatory Tender Date 09/01/2026) | | | | | | | | | | | | |
(Insured by HUD)(1) | | | 1,615,000 | | | | 1,664,200 | | | | | |
| Total Kentucky | | | | | | | | | | | | |
| (Cost $4,381,101) | | | | | | | 4,326,411 | | | | 0.4 | % |
| Louisiana | | | | | | | | | | | | |
| Louisiana Public Facilities Authority: | | | | | | | | | | | | |
| 5.500%, 05/15/2027 | | | | | | | | | | | | |
| (Pre-refunded to 05/15/2026) | | | 26,700,000 | | | | 27,793,616 | | | | | |
| 5.500%, 05/15/2032 | | | | | | | | | | | | |
| (Pre-refunded to 05/15/2026) | | | 22,190,000 | | | | 23,607,333 | | | | | |
| 4.000%, 04/01/2050 | | | | | | | | | | | | |
| (Pre-refunded to 04/01/2030) | | | 260,000 | | | | 282,308 | | | | | |
| Webster Parish School District No. 6, | | | | | | | | | | | | |
| 4.000%, 03/01/2031 (Callable 03/01/2029) | | | | | | | | | | | | |
| (Insured by AGM) | | | 840,000 | | | | 880,908 | | | | | |
| Total Louisiana | | | | | | | | | | | | |
| (Cost $52,712,969) | | | | | | | 52,564,165 | | | | 4.8 | % |
| Maryland | | | | | | | | | | | | |
| City of Baltimore MD: | | | | | | | | | | | | |
| 5.000%, 07/01/2024 | | | | | | | | | | | | |
| (ETM) (Insured by FGIC) | | | 410,000 | | | | 414,028 | | | | | |
| 5.000%, 07/01/2028 | | | | | | | | | | | | |
| (ETM) (Insured by FGIC) | | | 195,000 | | | | 204,523 | | | | | |
| Maryland Community | | | | | | | | | | | | |
| Development Administration: | | | | | | | | | | | | |
| 3.250%, 08/01/2024 (Insured by GNMA) | | | 7,000,000 | | | | 6,937,713 | | | | | |
| 3.850%, 03/01/2025 | | | 2,445,000 | | | | 2,441,751 | | | | | |
| Maryland Health & Higher | | | | | | | | | | | | |
| Educational Facilities Authority, | | | | | | | | | | | | |
| 5.000%, 07/01/2027 | | | | | | | | | | | | |
| (ETM) (Insured by AMBAC) | | | 1,150,000 | | | | 1,199,192 | | | | | |
| Total Maryland | | | | | | | | | | | | |
| (Cost $11,285,214) | | | | | | | 11,197,207 | | | | 1.0 | % |
| Massachusetts | | | | | | | | | | | | |
| Massachusetts Bay Transportation Authority, | | | | | | | | | | | | |
| 0.000%, 07/01/2030 (Callable 07/01/2026) | | | 1,400,000 | | | | 1,109,065 | | | | | |
| Massachusetts Housing Finance Agency: | | | | | | | | | | | | |
| 4.000%, 12/01/2044 (Callable 06/01/2025) | | | 170,000 | | | | 169,926 | | | | | |
| 4.000%, 12/01/2048 (Callable 06/01/2027) | | | | | | | | | | | | |
| (Insured by GNMA) | | | 600,000 | | | | 599,073 | | | | | |
| 4.000%, 06/01/2049 (Callable 12/01/2028) | | | 335,000 | | | | 334,364 | | | | | |
| 3.000%, 12/01/2050 (Callable 12/01/2029) | | | 110,000 | | | | 107,324 | | | | | |
| Massachusetts State College | | | | | | | | | | | | |
| Building Authority: | | | | | | | | | | | | |
| 0.000%, 05/01/2027 | | | | | | | | | | | | |
| (ETM) (Insured by NATL) | | | 520,000 | | | | 472,926 | | | | | |
| 0.000%, 05/01/2028 | | | | | | | | | | | | |
| (ETM ) (Insured by NATL) | | | 5,790,000 | | | | 5,133,024 | | | | | |
| Total Massachusetts | | | | | | | | | | | | |
| (Cost $8,388,737) | | | | | | | 7,925,702 | | | | 0.7 | % |
| Michigan | | | | | | | | | | | | |
| Algonac Community Schools, | | | | | | | | | | | | |
| 4.000%, 05/01/2029 (Callable 05/01/2027) | | | | | | | | | | | | |
| (Insured by Q-SBLF) | | | 370,000 | | | | 385,152 | | | | | |
| City of Ferndale MI, | | | | | | | | | | | | |
| 3.000%, 04/01/2032 (Callable 04/01/2029) | | | 450,000 | | | | 443,169 | | | | | |
| Ecorse Public School District, | | | | | | | | | | | | |
| 5.000%, 05/01/2027 (Insured by Q-SBLF) | | | 515,000 | | | | 554,108 | | | | | |
| Fraser Public School District, | | | | | | | | | | | | |
| 5.000%, 05/01/2024 (Insured by Q-SBLF) | | | 1,000,000 | | | | 1,006,577 | | | | | |
| Lakeview Public School District, | | | | | | | | | | | | |
| 3.000%, 11/01/2034 (Callable 05/01/2032) | | | | | | | | | | | | |
| (Insured by Q-SBLF) | | | 645,000 | | | | 619,317 | | | | | |
| Michigan Finance Authority: | | | | | | | | | | | | |
| 5.000%, 10/01/2039 (Callable 10/01/2024) | | | | | | | | | | | | |
| (Partially Pre-refunded) | | | 1,500,000 | | | | 1,508,958 | | | | | |
| 6.750%, 07/01/2044 | | | | | | | | | | | | |
(Pre-refunded to 07/01/2024)(3) | | | 6,700,000 | | | | 6,821,944 | | | | | |
| Michigan State Housing | | | | | | | | | | | | |
| Development Authority: | | | | | | | | | | | | |
| 2.700%, 12/01/2034 (Callable 12/01/2028) | | | 4,700,000 | | | | 4,342,817 | | | | | |
| 3.250%, 10/01/2037 (Callable 10/01/2025) | | | 755,000 | | | | 683,436 | | | | | |
| 4.250%, 12/01/2049 (Callable 06/01/2028) | | | 2,220,000 | | | | 2,230,914 | | | | | |
| 5.000%, 06/01/2053 (Callable 12/01/2031) | | | 900,000 | | | | 937,861 | | | | | |
| 5.500%, 06/01/2053 (Callable 12/01/2031) | | | 1,925,000 | | | | 2,045,441 | | | | | |
| 5.750%, 06/01/2054 (Callable 12/01/2032) | | | 2,000,000 | | | | 2,166,221 | | | | | |
| Warren Consolidated Schools: | | | | | | | | | | | | |
| 5.000%, 05/01/2033 (Callable 05/01/2026) | | | | | | | | | | | | |
| (Insured by Q-SBLF) | | | 2,595,000 | | | | 2,711,861 | | | | | |
| 5.000%, 05/01/2033 (Callable 05/01/2026) | | | | | | | | | | | | |
| (Insured by Q-SBLF) | | | 4,660,000 | | | | 4,869,854 | | | | | |
| 5.000%, 05/01/2035 (Callable 05/01/2026) | | | | | | | | | | | | |
| (Insured by Q-SBLF) | | | 950,000 | | | | 989,951 | | | | | |
| Total Michigan | | | | | | | | | | | | |
| (Cost $32,629,151) | | | | | | | 32,317,581 | | | | 2.9 | % |
| Minnesota | | | | | | | | | | | | |
| City of Coon Rapids MN, | | | | | | | | | | | | |
| 5.600%, 12/01/2039 (Insured by FNMA) | | | 2,500,000 | | | | 2,773,371 | | | | | |
The accompanying notes are an integral part of these financial statements.
Baird Quality Intermediate Municipal Bond Fund
Schedule of Investments, December 31, 2023
Long-Term Investments (cont.)
| | | Principal | | | | | | % of | |
| | | Amount | | | Value | | | Net Assets | |
| County of Hennepin MN: | | | | | | | | | |
| 5.000%, 12/01/2030 | | | | | | | | | |
| (Callable 12/01/2026) | | $ | 1,000,000 | | | $ | 1,067,113 | | | | |
| 5.000%, 12/01/2035 (Callable 12/01/2026) | | | 1,835,000 | | | | 1,940,165 | | | | |
| County of Washington MN, | | | | | | | | | | | |
| 2.125%, 02/01/2033 (Callable 02/01/2028) | | | 1,495,000 | | | | 1,339,820 | | | | |
| Housing & Redevelopment Authority | | | | | | | | | | | |
| of the City of St. Paul MN: | | | | | | | | | | | |
| 4.500%, 07/01/2028 | | | | | | | | | | | |
| (Pre-refunded to 07/01/2026) | | | 365,000 | | | | 372,856 | | | | |
| 5.000%, 07/01/2036 | | | | | | | | | | | |
| (Pre-refunded to 07/01/2026) | | | 1,315,000 | | | | 1,385,360 | | | | |
| Minnesota Housing Finance Agency: | | | | | | | | | | | |
| 4.000%, 07/01/2047 (Callable 01/01/2027) | | | | | | | | | | | |
| (Insured by GNMA) | | | 150,000 | | | | 149,546 | | | | |
| 4.250%, 07/01/2049 (Callable 07/01/2028) | | | | | | | | | | | |
| (Insured by GNMA) | | | 805,000 | | | | 808,873 | | | | |
| 6.250%, 07/01/2054 (Callable 01/01/2033) | | | | | | | | | | | |
| (Insured by GNMA) | | | 2,000,000 | | | | 2,214,237 | | | | |
| University of Minnesota, | | | | | | | | | | | |
| 4.000%, 02/01/2031 (Callable 01/29/2024) | | | 200,000 | | | | 200,086 | | | | |
| Total Minnesota | | | | | | | | | | | |
| (Cost $11,911,974) | | | | | | | 12,251,427 | | | | 1.1 | % |
| Mississippi | | | | | | | | | | | | |
| County of Warren MS, | | | | | | | | | | | | |
| 6.000%, 09/01/2036 (Callable 09/01/2033) | | | | | | | | | | | | |
| (Insured by BAM) | | | 625,000 | | | | 771,056 | | | | | |
| Mississippi Development Bank, | | | | | | | | | | | | |
| 5.250%, 03/01/2035 (Callable 03/01/2028) | | | 495,000 | | | | 522,318 | | | | | |
| Mississippi Home Corp., | | | | | | | | | | | | |
| 4.400%, 12/01/2043 (Callable 12/01/2031) | | | | | | | | | | | | |
| (Insured by GNMA) | | | 1,250,000 | | | | 1,270,419 | | | | | |
| Oxford School District, | | | | | | | | | | | | |
| 4.000%, 05/01/2027 | | | 500,000 | | | | 522,132 | | | | | |
| State of Mississippi, | | | | | | | | | | | | |
| 4.000%, 06/01/2037 (Callable 06/01/2030) | | | 500,000 | | | | 524,527 | | | | | |
| West Rankin Utility Authority: | | | | | | | | | | | | |
| 5.000%, 01/01/2038 (Pre-refunded to | | | | | | | | | | | | |
| 01/01/2025) (Insured by AGM) | | | 550,000 | | | | 561,801 | | | | | |
| 5.000%, 01/01/2043 (Pre-refunded to | | | | | | | | | | | | |
| 01/01/2028) (Insured by AGM) | | | 5,500,000 | | | | 6,052,762 | | | | | |
| Total Mississippi | | | | | | | | | | | | |
| (Cost $10,533,924) | | | | | | | 10,225,015 | | | | 0.9 | % |
| Missouri | | | | | | | | | | | | |
| Jackson County School District No. R-IV, | | | | | | | | | | | | |
| 5.500%, 03/01/2037 (Callable 03/01/2029) | | | | | | | | | | | | |
| (Insured by ST AID) | | | 1,040,000 | | | | 1,176,378 | | | | | |
| Metropolitan St. Louis Sewer District: | | | | | | | | | | | | |
| 5.000%, 05/01/2036 (Callable 05/01/2025) | | | 1,275,000 | | | | 1,309,036 | | | | | |
| 5.000%, 05/01/2045 (Callable 05/01/2025) | | | 2,335,000 | | | | 2,397,334 | | | | | |
| Missouri Housing Development Commission: | | | | | | | | | | | | |
| 1.950%, 05/01/2025 (Insured by GNMA) | | | 45,000 | | | | 43,586 | | | | | |
| 3.950%, 11/01/2040 (Callable 05/01/2025) | | | | | | | | | | | | |
| (Insured by GNMA) | | | 165,000 | | | | 159,418 | | | | | |
| Normandy Schools Collaborative: | | | | | | | | | | | | |
| 3.000%, 03/01/2038 (Callable 03/01/2028) | | | | | | | | | | | | |
| (Insured by ST AID) | | | 1,950,000 | | | | 1,814,391 | | | | | |
| 3.000%, 03/01/2039 (Callable 03/01/2028) | | | | | | | | | | | | |
| (Insured by ST AID) | | | 2,000,000 | | | | 1,840,056 | | | | | |
| Pattonville R-3 School District, | | | | | | | | | | | | |
| 5.250%, 03/01/2041 (Callable 03/01/2031) | | | | | | | | | | | | |
| (Insured by ST AID) | | | 1,000,000 | | | | 1,127,510 | | | | | |
| St. Louis County Special School District, | | | | | | | | | | | | |
| 4.000%, 04/01/2034 | | | | | | | | | | | | |
| (Callable 04/01/2029) | | | 400,000 | | | | 419,815 | | | | | |
| Total Missouri | | | | | | | | | | | | |
| (Cost $10,762,622) | | | | | | | 10,287,524 | | | | 0.9 | % |
| Montana | | | | | | | | | | | | |
| City of Belgrade MT, | | | | | | | | | | | | |
| 5.250%, 07/01/2043 (Callable 07/01/2032) | | | 2,000,000 | | | | 2,258,857 | | | | | |
| Flathead County School District No. 44, | | | | | | | | | | | | |
| 4.000%, 07/01/2036 (Callable 07/01/2028) | | | 235,000 | | | | 244,837 | | | | | |
| Montana Board of Housing: | | | | | | | | | | | | |
| 3.000%, 12/01/2045 (Callable 06/01/2029) | | | 535,000 | | | | 441,868 | | | | | |
| 3.050%, 06/01/2050 (Callable 06/01/2029) | | | 265,000 | | | | 221,338 | | | | | |
| Montana Facility Finance Authority, | | | | | | | | | | | | |
| 5.000%, 07/01/2029 (Callable 07/01/2027) | | | | | | | | | | | | |
| (Insured by MT BRD) | | | 535,000 | | | | 578,812 | | | | | |
| Total Montana | | | | | | | | | | | | |
| (Cost $3,863,561) | | | | | | | 3,745,712 | | | | 0.3 | % |
| Nebraska | | | | | | | | | | | | |
| Central Plains Energy Project, | | | | | | | | | | | | |
| 5.000%, 05/01/2054 (Callable 08/01/2029) | | | | | | | | | | | | |
(Mandatory Tender Date 11/01/2029)(1) | | | 5,000,000 | | | | 5,300,321 | | | | | |
| Nebraska Educational Health Cultural & | | | | | | | | | | | | |
| Social Services Finance Authority: | | | | | | | | | | | | |
| 4.000%, 01/01/2033 (Callable 01/01/2026) | | | 400,000 | | | | 413,959 | | | | | |
| 4.000%, 01/01/2034 (Callable 01/01/2026) | | | 2,000,000 | | | | 2,069,262 | | | | | |
| 4.000%, 01/01/2035 (Callable 01/01/2026) | | | 1,000,000 | | | | 1,033,560 | | | | | |
| Nebraska Investment Finance Authority, | | | | | | | | | | | | |
| 3.500%, 09/01/2050 (Callable 03/01/2029) | | | | | | | | | | | | |
| (Insured by GNMA) | | | 1,440,000 | | | | 1,423,283 | | | | | |
| University of Nebraska: | | | | | | | | | | | | |
| 3.000%, 05/15/2035 | | | | | | | | | | | | |
| (Pre-refunded to 05/15/2026) | | | 20,000 | | | | 20,148 | | | | | |
| 3.000%, 07/01/2039 | | | | | | | | | | | | |
| (Pre-refunded to 07/01/2026) | | | 15,000 | | | | 15,146 | | | | | |
| Total Nebraska | | | | | | | | | | | | |
| (Cost $10,250,243) | | | | | | | 10,275,679 | | | | 0.9 | % |
| Nevada | | | | | | | | | | | | |
| County of Clark NV, | | | | | | | | | | | | |
| 5.000%, 07/01/2033 (Callable 07/01/2024) | | | 1,925,000 | | | | 1,937,490 | | | | | |
| Total Nevada | | | | | | | | | | | | |
| (Cost $1,945,498) | | | | | | | 1,937,490 | | | | 0.2 | % |
| New Jersey | | | | | | | | | | | | |
| New Jersey Economic Development Authority, | | | | | | | | | | | | |
| 0.000%, 07/01/2025 | | | | | | | | | | | | |
| (ETM) (Insured by NATL) | | | 135,000 | | | | 129,125 | | | | | |
| New Jersey Health Care | | | | | | | | | | | | |
| Facilities Financing Authority, | | | | | | | | | | | | |
| 3.750%, 07/01/2027 (ETM) | | | 180,000 | | | | 182,744 | | | | | |
| New Jersey Housing & | | | | | | | | | | | | |
| Mortgage Finance Agency: | | | | | | | | | | | | |
| 4.500%, 10/01/2048 (Callable 10/01/2027) | | | 685,000 | | | | 693,721 | | | | | |
| 2.450%, 10/01/2050 (Callable 04/01/2029) | | | 525,000 | | | | 375,604 | | | | | |
| New Jersey Transportation | | | | | | | | | | | | |
| Trust Fund Authority, | | | | | | | | | | | | |
| 0.000%, 12/15/2030 (Insured by BHAC) | | | 960,000 | | | | 776,565 | | | | | |
| North Hudson Sewerage Authority, | | | | | | | | | | | | |
| 0.000%, 08/01/2024 | | | | | | | | | | | | |
| (ETM) (Insured by NATL) | | | 500,000 | | | | 491,225 | | | | | |
| Total New Jersey | | | | | | | | | | | | |
| (Cost $2,862,781) | | | | | | | 2,648,984 | | | | 0.2 | % |
The accompanying notes are an integral part of these financial statements.
Baird Quality Intermediate Municipal Bond Fund
Schedule of Investments, December 31, 2023
Long-Term Investments (cont.)
| | | Principal | | | | | | % of | |
| | | Amount | | | Value | | | Net Assets | |
| New Mexico | | | | | | | | | |
| New Mexico Hospital | | | | | | | | | |
| Equipment Loan Council, | | | | | | | | | |
| 4.125%, 08/01/2044 | | | | | | | | | |
| (Pre-refunded to 08/01/2025) | | $ | 210,000 | | | $ | 213,501 | | | | |
| New Mexico Mortgage Finance Authority: | | | | | | | | | | | |
| 3.500%, 07/01/2033 (Callable 01/01/2028) | | | | | | | | | | | |
| (Insured by GNMA) | | | 685,000 | | | | 686,092 | | | | |
| 3.950%, 09/01/2040 (Callable 09/01/2024) | | | | | | | | | | | |
| (Insured by GNMA) | | | 775,000 | | | | 751,795 | | | | |
| 5.250%, 03/01/2053 (Callable 03/01/2032) | | | | | | | | | | | |
| (Insured by GNMA) | | | 2,075,000 | | | | 2,193,472 | | | | |
| New Mexico Mortgage Financial Authority, | | | | | | | | | | | |
| 3.550%, 09/01/2037 (Callable 03/01/2027) | | | | | | | | | | | |
| (Insured by GNMA) | | | 685,000 | | | | 649,038 | | | | |
| Total New Mexico | | | | | | | | | | | |
| (Cost $4,622,663) | | | | | | | 4,493,898 | | | | 0.4 | % |
| New York | | | | | | | | | | | | |
| City of New York NY, | | | | | | | | | | | | |
| 5.000%, 08/01/2028 | | | 1,000,000 | | | | 1,114,836 | | | | | |
| Monroe County Industrial | | | | | | | | | | | | |
| Development Corp., | | | | | | | | | | | | |
| 4.840%, 11/01/2040 (Insured by FNMA) | | | 3,081,484 | | | | 3,181,481 | | | | | |
| New York City Housing Development Corp., | | | | | | | | | | | | |
| 0.700%, 11/01/2060 (Callable 01/19/2024) | | | | | | | | | | | | |
(Mandatory Tender Date 07/01/2025)(1) | | | 2,150,000 | | | | 2,039,122 | | | | | |
| New York City Municipal | | | | | | | | | | | | |
| Water Finance Authority, | | | | | | | | | | | | |
| 4.000%, 06/15/2040 (Callable 12/15/2029) | | | 500,000 | | | | 510,507 | | | | | |
| New York City Transitional Finance Authority, | | | | | | | | | | | | |
| 5.000%, 08/01/2033 (Callable 08/01/2026) | | | 2,835,000 | | | | 2,977,277 | | | | | |
| New York State Dormitory Authority: | | | | | | | | | | | | |
| 0.000%, 07/01/2028 | | | | | | | | | | | | |
| (ETM) (Insured by NATL) | | | 65,000 | | | | 57,151 | | | | | |
| 0.000%, 07/01/2029 | | | | | | | | | | | | |
| (ETM) (Insured by NATL) | | | 580,000 | | | | 496,177 | | | | | |
| 5.000%, 03/15/2037 (Callable 09/15/2025) | | | 155,000 | | | | 158,615 | | | | | |
| 5.250%, 03/15/2039 (Callable 09/15/2028) | | | 3,750,000 | | | | 4,083,204 | | | | | |
| 5.000%, 03/15/2048 (Callable 09/15/2028) | | | 2,000,000 | | | | 2,120,403 | | | | | |
| New York State Environmental | | | | | | | | | | | | |
| Facilities Corp.: | | | | | | | | | | | | |
| 5.500%, 10/15/2029 (ETM) | | | 185,000 | | | | 214,709 | | | | | |
| 5.500%, 10/15/2030 (ETM) | | | 390,000 | | | | 461,889 | | | | | |
| New York State Housing Finance Agency: | | | | | | | | | | | | |
| 1.600%, 11/01/2024 (Callable 01/19/2024) | | | 2,155,000 | | | | 2,118,523 | | | | | |
| 3.600%, 11/01/2062 (Callable 06/01/2025) | | | | | | | | | | | | |
| (Mandatory Tender Date 05/01/2027) | | | | | | | | | | | | |
(Insured by SONYMA)(1) | | | 2,920,000 | | | | 2,933,154 | | | | | |
| North Colonie Central School District, | | | | | | | | | | | | |
| 2.000%, 07/15/2032 (Callable 07/15/2029) | | | | | | | | | | | | |
| (Insured by ST AID) | | | 1,115,000 | | | | 971,218 | | | | | |
| State of New York Mortgage Agency, | | | | | | | | | | | | |
| 4.000%, 10/01/2049 (Callable 04/01/2028) | | | 2,745,000 | | | | 2,739,165 | | | | | |
| Total New York | | | | | | | | | | | | |
| (Cost $26,517,258) | | | | | | | 26,177,431 | | | | 2.4 | % |
| North Carolina | | | | | | | | | | | | |
| Asheville Housing Authority, | | | | | | | | | | | | |
| 5.000%, 11/01/2026 (Mandatory Tender | | | | | | | | | | | | |
Date 11/01/2025) (Insured by HUD)(1) | | | 675,000 | | | | 692,320 | | | | | |
| County of Forsyth NC, | | | | | | | | | | | | |
| 3.000%, 03/01/2033 (Callable 03/01/2031) | | | 600,000 | | | | 602,216 | | | | | |
| County of Wake NC, | | | | | | | | | | | | |
| 5.125%, 10/01/2026 | | | | | | | | | | | | |
| (ETM) (Insured by NATL) | | | 800,000 | | | | 826,306 | | | | | |
| Inlivian: | | | | | | | | | | | | |
| 2.550%, 05/01/2037 (Insured by FNMA) | | | 4,743,060 | | | | 4,080,642 | | | | | |
| 5.000%, 06/01/2043 (Callable 12/01/2025) | | | | | | | | | | | | |
| (Mandatory Tender Date 06/01/2026) | | | | | | | | | | | | |
(Insured by HUD)(1) | | | 2,000,000 | | | | 2,054,993 | | | | | |
| North Carolina Housing Finance Agency: | | | | | | | | | | | | |
| 4.000%, 07/01/2050 (Callable 07/01/2029) | | | 1,325,000 | | | | 1,325,497 | | | | | |
| 5.750%, 01/01/2054 (Callable 07/01/2032) | | | 3,900,000 | | | | 4,214,888 | | | | | |
| Raleigh Housing Authority: | | | | | | | | | | | | |
| 5.000%, 10/01/2026 | | | | | | | | | | | | |
(Mandatory Tender Date 10/01/2025)(1) | | | 5,500,000 | | | | 5,606,217 | | | | | |
| 5.000%, 12/01/2026 (Mandatory Tender | | | | | | | | | | | | |
Date 12/01/2025) (Insured by FHA)(1) | | | 7,850,000 | | | | 8,042,365 | | | | | |
| University of North Carolina at Chapel Hill, | | | | | | | | | | | | |
| 4.261%, 12/01/2041 (SOFR + 0.650%) | | | | | | | | | | | | |
| (Callable 12/01/2024) | | | | | | | | | | | | |
(Mandatory Tender Date 06/01/2025)(2) | | | 1,000,000 | | | | 1,000,996 | | | | | |
| Total North Carolina | | | | | | | | | | | | |
| (Cost $29,065,094) | | | | | | | 28,446,440 | | | | 2.6 | % |
| North Dakota | | | | | | | | | | | | |
| North Dakota Housing Finance Agency: | | | | | | | | | | | | |
| 3.550%, 07/01/2033 (Callable 01/01/2028) | | | 1,140,000 | | | | 1,086,033 | | | | | |
| 3.450%, 07/01/2037 (Callable 07/01/2026) | | | | | | | | | | | | |
| (Insured by FHA) | | | 900,000 | | | | 822,635 | | | | | |
| 3.500%, 07/01/2046 (Callable 01/01/2026) | | | 500,000 | | | | 495,198 | | | | | |
| 4.000%, 01/01/2050 (Callable 07/01/2028) | | | 845,000 | | | | 845,664 | | | | | |
| Total North Dakota | | | | | | | | | | | | |
| (Cost $3,504,556) | | | | | | | 3,249,530 | | | | 0.3 | % |
| Ohio | | | | | | | | | | | | |
| County of Van Wert OH, | | | | | | | | | | | | |
| 6.125%, 12/01/2049 | | | | | | | | | | | | |
| (Pre-refunded to 12/01/2029) | | | 24,869,000 | | | | 28,909,126 | | | | | |
| Lucas-Plaza Housing Development Corp., | | | | | | | | | | | | |
| 0.000%, 06/01/2024 | | | | | | | | | | | | |
| (ETM) (Insured by FHA) | | | 1,660,000 | | | | 1,637,664 | | | | | |
| Ohio Housing Finance Agency: | | | | | | | | | | | | |
| 3.950%, 09/01/2043 (Callable 09/01/2027) | | | | | | | | | | | | |
| (Insured by GNMA) | | | 165,000 | | | | 163,447 | | | | | |
| 3.500%, 09/01/2046 (Callable 09/01/2025) | | | | | | | | | | | | |
| (Insured by GNMA) | | | 435,000 | | | | 430,431 | | | | | |
| State of Ohio: | | | | | | | | | | | | |
| 5.000%, 02/01/2025 | | | 1,200,000 | | | | 1,227,413 | | | | | |
| 5.000%, 02/01/2031 (Callable 02/01/2026) | | | 1,405,000 | | | | 1,468,388 | | | | | |
| 5.000%, 01/01/2036 (Callable 01/01/2032) | | | 540,000 | | | | 627,769 | | | | | |
| 5.000%, 01/01/2038 (Callable 01/01/2032) | | | 430,000 | | | | 489,128 | | | | | |
| 2.750%, 01/01/2052 | | | | | | | | | | | | |
(Mandatory Tender Date 05/01/2028)(1) | | | 1,780,000 | | | | 1,771,875 | | | | | |
| University of Akron, | | | | | | | | | | | | |
| 5.000%, 01/01/2033 (Callable 07/01/2026) | | | 335,000 | | | | 348,077 | | | | | |
| Total Ohio | | | | | | | | | | | | |
| (Cost $36,852,991) | | | | | | | 37,073,318 | | | | 3.4 | % |
| Oklahoma | | | | | | | | | | | | |
| Oklahoma Water Resources Board, | | | | | | | | | | | | |
| 4.000%, 04/01/2037 (Callable 04/01/2030) | | | 560,000 | | | | 583,755 | | | | | |
| Total Oklahoma | | | | | | | | | | | | |
| (Cost $575,588) | | | | | | | 583,755 | | | | 0.1 | % |
The accompanying notes are an integral part of these financial statements.
Baird Quality Intermediate Municipal Bond Fund
Schedule of Investments, December 31, 2023
Long-Term Investments (cont.)
| | | Principal | | | | | | % of | |
| | | Amount | | | Value | | | Net Assets | |
| Oregon | | | | | | | | | |
| Clackamas Community College: | | | | | | | | | |
| 0.000%, 06/15/2028 (Callable 06/15/2025) | | | | | | | | | |
| (Insured by SCH BD GTY) | | $ | 1,375,000 | | | $ | 1,162,059 | | | | |
| 0.000%, 06/15/2029 (Callable 06/15/2025) | | | | | | | | | | | |
| (Insured by SCH BD GTY) | | | 1,000,000 | | | | 808,058 | | | | |
| Hillsboro School District No. 1J, | | | | | | | | | | | |
| 5.000%, 06/15/2035 (Callable 06/15/2027) | | | | | | | | | | | |
| (Insured by SCH BD GTY) | | | 600,000 | | | | 643,182 | | | | |
| State of Oregon: | | | | | | | | | | | |
| 4.000%, 12/01/2045 (Callable 06/01/2025) | | | 690,000 | | | | 688,761 | | | | |
| 4.000%, 12/01/2048 (Callable 12/01/2026) | | | 1,035,000 | | | | 1,031,866 | | | | |
| State of Oregon Housing & | | | | | | | | | | | |
| Community Services Department: | | | | | | | | | | | |
| 3.550%, 07/01/2033 (Callable 07/01/2027) | | | 1,005,000 | | | | 950,054 | | | | |
| 2.900%, 07/01/2043 (Callable 07/01/2027) | | | 1,000,000 | | | | 833,637 | | | | |
| 4.000%, 01/01/2047 (Callable 07/01/2025) | | | 290,000 | | | | 289,500 | | | | |
| 3.750%, 07/01/2048 (Callable 01/01/2027) | | | 1,020,000 | | | | 941,107 | | | | |
| Total Oregon | | | | | | | | | | | |
| (Cost $7,579,355) | | | | | | | 7,348,224 | | | | 0.7 | % |
| Pennsylvania | | | | | | | | | | | | |
| City of Sharon PA, | | | | | | | | | | | | |
| 0.000%, 05/01/2024 | | | | | | | | | | | | |
| (ETM) (Insured by NATL) | | | 250,000 | | | | 247,422 | | | | | |
| Commonwealth Financing Authority, | | | | | | | | | | | | |
| 4.000%, 06/01/2039 (Callable 06/01/2028) | | | | | | | | | | | | |
| (Insured by AGM) | | | 1,525,000 | | | | 1,536,149 | | | | | |
| Mckeesport Area School District, | | | | | | | | | | | | |
| 0.000%, 10/01/2025 | | | | | | | | | | | | |
| (ETM) (Insured by AMBAC) | | | 110,000 | | | | 104,609 | | | | | |
| Pennsylvania Housing Finance Agency: | | | | | | | | | | | | |
| 3.500%, 10/01/2046 (Callable 10/01/2025) | | | 255,000 | | | | 253,441 | | | | | |
| 3.500%, 04/01/2051 (Callable 10/01/2029) | | | 2,495,000 | | | | 2,469,343 | | | | | |
| 5.500%, 10/01/2053 | | | 2,000,000 | | | | 2,137,052 | | | | | |
| 5.750%, 10/01/2053 (Callable 10/01/2032) | | | 1,265,000 | | | | 1,356,118 | | | | | |
| Pittsburgh Water & Sewer Authority: | | | | | | | | | | | | |
| 0.000%, 09/01/2026 | | | | | | | | | | | | |
| (ETM) (Insured by NATL) | | | 890,000 | | | | 827,692 | | | | | |
| 0.000%, 09/01/2027 | | | | | | | | | | | | |
| (ETM) (Insured by FGIC) | | | 1,110,000 | | | | 1,006,353 | | | | | |
| 0.000%, 09/01/2028 | | | | | | | | | | | | |
| (ETM) (Insured by FGIC) | | | 370,000 | | | | 327,493 | | | | | |
| Pottsville Hospital Authority, | | | | | | | | | | | | |
| 6.500%, 07/01/2028 | | | | | | | | | | | | |
(Pre-refunded to 07/01/2024)(3) | | | 1,260,000 | | | | 1,277,973 | | | | | |
| Total Pennsylvania | | | | | | | | | | | | |
| (Cost $11,723,520) | | | | | | | 11,543,645 | | | | 1.0 | % |
| Puerto Rico | | | | | | | | | | | | |
| Puerto Rico Public Finance Corp.: | | | | | | | | | | | | |
| 5.125%, 06/01/2024 (Insured by AMBAC) | | | 795,000 | | | | 801,497 | | | | | |
| 6.000%, 08/01/2026 (ETM) | | | 3,585,000 | | | | 3,887,790 | | | | | |
| 6.000%, 08/01/2026 | | | | | | | | | | | | |
| (ETM) (Insured by AGC) | | | 1,565,000 | | | | 1,697,180 | | | | | |
| 6.000%, 08/01/2026 | | | | | | | | | | | | |
| (ETM) (Insured by AGC) | | | 1,440,000 | | | | 1,561,623 | | | | | |
| 6.000%, 08/01/2026 | | | | | | | | | | | | |
| (ETM) (Insured by AGC) | | | 1,825,000 | | | | 1,979,140 | | | | | |
| 5.500%, 08/01/2027 | | | | | | | | | | | | |
| (ETM) (Insured by AMBAC) | | | 7,665,000 | | | | 8,465,943 | | | | | |
| Total Puerto Rico | | | | | | | | | | | | |
| (Cost $18,519,942) | | | | | | | 18,393,173 | | | | 1.7 | % |
| Rhode Island | | | | | | | | | | | | |
| Rhode Island Housing & | | | | | | | | | | | | |
| Mortgage Finance Corp., | | | | | | | | | | | | |
| 3.500%, 10/01/2050 | | | | | | | | | | | | |
| (Callable 10/01/2029) | | | 915,000 | | | | 906,081 | | | | | |
| Total Rhode Island | | | | | | | | | | | | |
| (Cost $960,959) | | | | | | | 906,081 | | | | 0.1 | % |
| South Carolina | | | | | | | | | | | | |
| City of Columbia SC, | | | | | | | | | | | | |
| 5.000%, 02/01/2049 | | | | | | | | | | | | |
| (Pre-refunded to 02/01/2029) | | | 10,680,000 | | | | 12,027,478 | | | | | |
| Piedmont Municipal Power Agency, | | | | | | | | | | | | |
| 5.375%, 01/01/2025 | | | | | | | | | | | | |
| (ETM) (Insured by NATL) | | | 5,330,000 | | | | 5,447,770 | | | | | |
| South Carolina Jobs-Economic | | | | | | | | | | | | |
| Development Authority: | | | | | | | | | | | | |
| 5.000%, 08/15/2036 | | | | | | | | | | | | |
(Pre-refunded to 08/15/2026)(3)(5) | | | 7,500,000 | | | | 7,961,927 | | | | | |
| 5.000%, 08/15/2041 | | | | | | | | | | | | |
(Pre-refunded to 08/15/2026)(3)(5) | | | 4,165,000 | | | | 4,421,523 | | | | | |
| Tobacco Settlement Revenue | | | | | | | | | | | | |
| Management Authority, | | | | | | | | | | | | |
| 6.375%, 05/15/2030 (ETM) | | | 1,990,000 | | | | 2,378,942 | | | | | |
| Total South Carolina | | | | | | | | | | | | |
| (Cost $33,071,059) | | | | | | | 32,237,640 | | | | 2.9 | % |
| South Dakota | | | | | | | | | | | | |
| County of Clay SD, | | | | | | | | | | | | |
| 5.000%, 12/01/2038 (Callable 12/01/2031) | | | 1,000,000 | | | | 1,126,884 | | | | | |
| Harrisburg School District No. 41-2, | | | | | | | | | | | | |
| 2.375%, 08/01/2026 (Insured by ST AID) | | | 255,000 | | | | 253,257 | | | | | |
| Total South Dakota | | | | | | | | | | | | |
| (Cost $1,335,482) | | | | | | | 1,380,141 | | | | 0.1 | % |
| Tennessee | | | | | | | | | | | | |
| Nashville & Davidson County | | | | | | | | | | | | |
| Metropolitan Government: | | | | | | | | | | | | |
| 5.000%, 12/01/2026 | | | | | | | | | | | | |
(Mandatory Tender Date 12/01/2025)(1) | | | 1,000,000 | | | | 1,026,367 | | | | | |
| 4.875%, 11/01/2028 | | | | | | | | | | | | |
| (ETM) (Insured by NATL) | | | 1,450,000 | | | | 1,536,434 | | | | | |
| 3.000%, 01/01/2034 (Callable 01/01/2031) | | | 3,000,000 | | | | 2,935,569 | | | | | |
| 3.850%, 02/01/2048 | | | | | | | | | | | | |
| (Mandatory Tender Date 02/01/2026) | | | | | | | | | | | | |
(Insured by FNMA)(1) | | | 1,000,000 | | | | 1,008,168 | | | | | |
| Tennessee Housing Development Agency: | | | | | | | | | | | | |
| 1.750%, 07/01/2028 | | | 350,000 | | | | 320,316 | | | | | |
| 1.950%, 07/01/2030 (Callable 07/01/2029) | | | 550,000 | | | | 512,950 | | | | | |
| 3.850%, 01/01/2035 (Callable 01/01/2025) | | | 240,000 | | | | 227,618 | | | | | |
| 3.900%, 07/01/2042 (Callable 07/01/2027) | | | 350,000 | | | | 346,616 | | | | | |
| 4.000%, 01/01/2043 (Callable 07/01/2027) | | | 525,000 | | | | 523,540 | | | | | |
| 3.850%, 07/01/2043 (Callable 07/01/2027) | | | 1,810,000 | | | | 1,768,832 | | | | | |
| 5.200%, 07/01/2043 (Callable 07/01/2032) | | | | | | | | | | | | |
| (Insured by GNMA) | | | 7,000,000 | | | | 7,575,234 | | | | | |
| 3.650%, 07/01/2047 (Callable 01/01/2027) | | | 705,000 | | | | 651,156 | | | | | |
| 4.050%, 01/01/2049 (Callable 01/01/2028) | | | 1,645,000 | | | | 1,568,958 | | | | | |
| 4.250%, 01/01/2050 (Callable 07/01/2028) | | | 915,000 | | | | 916,824 | | | | | |
| Total Tennessee | | | | | | | | | | | | |
| (Cost $20,738,538) | | | | | | | 20,918,582 | | | | 1.9 | % |
| Texas | | | | | | | | | | | | |
| Alvarado Independent School District, | | | | | | | | | | | | |
| 2.750%, 02/15/2052 (Mandatory Tender | | | | | | | | | | | | |
Date 08/15/2025) (PSF Guaranteed)(1) | | | 1,650,000 | | | | 1,638,724 | | | | | |
The accompanying notes are an integral part of these financial statements.
Baird Quality Intermediate Municipal Bond Fund
Schedule of Investments, December 31, 2023
Long-Term Investments (cont.)
| | | Principal | | | | | | % of | |
| | | Amount | | | Value | | | Net Assets | |
| Anna Independent School District, | | | | | | | | | |
| 5.000%, 08/15/2035 | | | | | | | | | |
| (Callable 08/15/2026) (PSF Guaranteed) | | $ | 910,000 | | | $ | 962,361 | | | |
| |
| Arlington Higher Education Finance Corp.: | | | | | | | | | | | | |
| 4.000%, 08/15/2024 (PSF Guaranteed) | | | 1,025,000 | | | | 1,030,488 | | | | | |
| 5.000%, 08/15/2024 | | | | | | | | | | | | |
| (ETM) (PSF Guaranteed) | | | 1,010,000 | | | | 1,021,177 | | | | | |
| 5.000%, 08/15/2025 (PSF Guaranteed) | | | 195,000 | | | | 201,023 | | | | | |
| 5.000%, 08/15/2026 (PSF Guaranteed) | | | 500,000 | | | | 527,635 | | | | | |
| 4.000%, 08/15/2027 | | | | | | | | | | | | |
| (Callable 08/15/2026) (PSF Guaranteed) | | | 875,000 | | | | 895,886 | | | | | |
| 5.000%, 08/15/2027 (PSF Guaranteed) | | | 240,000 | | | | 258,386 | | | | | |
| 4.000%, 08/15/2028 | | | | | | | | | | | | |
| (Callable 08/15/2026) (PSF Guaranteed) | | | 850,000 | | | | 869,887 | | | | | |
| 5.000%, 08/15/2028 (Pre-refunded to | | | | | | | | | | | | |
| 08/15/2024) (PSF Guaranteed) | | | 555,000 | | | | 561,142 | | | | | |
| 5.000%, 02/15/2030 | | | | | | | | | | | | |
| (Callable 02/15/2026) (PSF Guaranteed) | | | 125,000 | | | | 128,961 | | | | | |
| 3.000%, 08/15/2032 | | | | | | | | | | | | |
| (Callable 08/15/2031) (PSF Guaranteed) | | | 835,000 | | | | 814,699 | | | | | |
| 3.000%, 08/15/2033 | | | | | | | | | | | | |
| (Callable 08/15/2031) (PSF Guaranteed) | | | 1,070,000 | | | | 1,028,589 | | | | | |
| 3.000%, 08/15/2033 | | | | | | | | | | | | |
| (Callable 08/15/2031) (PSF Guaranteed) | | | 500,000 | | | | 480,118 | | | | | |
| 4.000%, 08/15/2033 | | | | | | | | | | | | |
| (Callable 08/15/2026) (PSF Guaranteed) | | | 475,000 | | | | 483,455 | | | | | |
| 5.000%, 08/15/2033 (Pre-refunded to | | | | | | | | | | | | |
| 08/15/2024) (PSF Guaranteed) | | | 1,460,000 | | | | 1,476,156 | | | | | |
| 3.000%, 08/15/2034 | | | | | | | | | | | | |
| (Callable 08/15/2031) (PSF Guaranteed) | | | 500,000 | | | | 472,412 | | | | | |
| 4.000%, 08/15/2034 | | | | | | | | | | | | |
| (Callable 08/15/2026) (PSF Guaranteed) | | | 195,000 | | | | 198,225 | | | | | |
| 4.000%, 08/15/2035 | | | | | | | | | | | | |
| (Callable 08/15/2026) (PSF Guaranteed) | | | 480,000 | | | | 486,655 | | | | | |
| 4.000%, 12/01/2035 | | | | | | | | | | | | |
| (Callable 06/01/2027) (PSF Guaranteed) | | | 450,000 | | | | 457,250 | | | | | |
| 4.000%, 08/15/2036 | | | | | | | | | | | | |
| (Callable 08/15/2030) (PSF Guaranteed) | | | 510,000 | | | | 520,708 | | | | | |
| 4.000%, 08/15/2036 | | | | | | | | | | | | |
| (Callable 08/15/2031) (PSF Guaranteed) | | | 1,000,000 | | | | 1,029,378 | | | | | |
| 5.000%, 08/15/2037 | | | | | | | | | | | | |
| (Callable 08/15/2032) (PSF Guaranteed) | | | 510,000 | | | | 580,401 | | | | | |
| 4.000%, 08/15/2038 | | | | | | | | | | | | |
| (Callable 08/15/2030) (PSF Guaranteed) | | | 550,000 | | | | 552,877 | | | | | |
| 4.000%, 08/15/2039 | | | | | | | | | | | | |
| (Callable 08/15/2025) (PSF Guaranteed) | | | 495,000 | | | | 495,508 | | | | | |
| 3.000%, 08/15/2040 | | | | | | | | | | | | |
| (Callable 08/15/2031) (PSF Guaranteed) | | | 290,000 | | | | 249,347 | | | | | |
| 3.000%, 08/15/2041 | | | | | | | | | | | | |
| (Callable 08/15/2031) (PSF Guaranteed) | | | 300,000 | | | | 253,424 | | | | | |
| 3.000%, 08/15/2042 | | | | | | | | | | | | |
| (Callable 08/15/2031) (PSF Guaranteed) | | | 265,000 | | | | 220,440 | | | | | |
| 3.000%, 08/15/2043 | | | | | | | | | | | | |
| (Callable 08/15/2031) (PSF Guaranteed) | | | 210,000 | | | | 172,083 | | | | | |
| 3.000%, 08/15/2044 | | | | | | | | | | | | |
| (Callable 08/15/2031) (PSF Guaranteed) | | | 245,000 | | | | 197,979 | | | | | |
| Austin Community College | | | | | | | | | | | | |
| District Public Facility Corp., | | | | | | | | | | | | |
| 5.000%, 08/01/2033 (Callable 08/01/2025) | | | 750,000 | | | | 772,467 | | | | | |
| Baird Independent School District, | | | | | | | | | | | | |
| 5.000%, 08/15/2043 | | | | | | | | | | | | |
| (Callable 08/15/2032) (PSF Guaranteed) | | | 1,760,000 | | | | 1,954,940 | | | | | |
| Balmorhea Independent School District, | | | | | | | | | | | | |
| 5.000%, 02/15/2034 | | | | | | | | | | | | |
| (Callable 02/15/2031) (PSF Guaranteed) | | | 335,000 | | | | 386,267 | | | | | |
| Bexar Metropolitan Water District, | | | | | | | | | | | | |
| 0.000%, 05/01/2027 | | | | | | | | | | | | |
| (ETM) (Insured by NATL) | | | 50,000 | | | | 45,698 | | | | | |
| Boerne Independent School District, | | | | | | | | | | | | |
| 3.850%, 12/01/2043 (Mandatory Tender | | | | | | | | | | | | |
Date 12/01/2027) (PSF Guaranteed)(1) | | | 1,000,000 | | | | 1,024,459 | | | | | |
| Brazoria County Toll Road Authority: | | | | | | | | | | | | |
| 0.000%, 03/01/2039 (Callable 03/01/2030) | | | | | | | | | | | | |
(County Guaranteed)(5) | | | 200,000 | | | | 190,786 | | | | | |
| 0.000%, 03/01/2041 (Callable 03/01/2030) | | | | | | | | | | | | |
(County Guaranteed)(5) | | | 65,000 | | | | 60,422 | | | | | |
| 0.000%, 03/01/2042 (Callable 03/01/2030) | | | | | | | | | | | | |
(County Guaranteed)(5) | | | 225,000 | | | | 207,664 | | | | | |
| 0.000%, 03/01/2044 (Callable 03/01/2030) | | | | | | | | | | | | |
(County Guaranteed)(5) | | | 255,000 | | | | 232,912 | | | | | |
| Burleson Independent School District, | | | | | | | | | | | | |
| 5.000%, 08/01/2025 (PSF Guaranteed) | | | 1,260,000 | | | | 1,304,173 | | | | | |
| Centerville Independent School District: | | | | | | | | | | | | |
| 5.000%, 08/15/2036 | | | | | | | | | | | | |
| (Callable 08/15/2033) (PSF Guaranteed) | | | 375,000 | | | | 442,494 | | | | | |
| 5.000%, 08/15/2037 | | | | | | | | | | | | |
| (Callable 08/15/2033) (PSF Guaranteed) | | | 770,000 | | | | 899,396 | | | | | |
| 5.000%, 08/15/2038 | | | | | | | | | | | | |
| (Callable 08/15/2033) (PSF Guaranteed) | | | 400,000 | | | | 462,030 | | | | | |
| Chisum Independent School District, | | | | | | | | | | | | |
| 5.000%, 08/15/2025 (PSF Guaranteed) | | | 590,000 | | | | 610,304 | | | | | |
| City of Dallas TX, | | | | | | | | | | | | |
| 5.000%, 02/15/2031 (Callable 02/15/2027) | | | 1,100,000 | | | | 1,181,259 | | | | | |
| City of Denton TX, | | | | | | | | | | | | |
| 5.000%, 02/15/2035 (Callable 02/15/2031) | | | 3,055,000 | | | | 3,518,032 | | | | | |
| City of Houston TX: | | | | | | | | | | | | |
| 5.500%, 12/01/2024 | | | | | | | | | | | | |
| (ETM) (Insured by NATL) | | | 645,000 | | | | 659,586 | | | | | |
| 0.000%, 12/01/2026 | | | | | | | | | | | | |
| (ETM) (Insured by AGM) | | | 735,000 | | | | 676,443 | | | | | |
| 0.000%, 12/01/2027 | | | | | | | | | | | | |
| (ETM) (Insured by AGM) | | | 220,000 | | | | 197,134 | | | | | |
| 0.000%, 12/01/2028 | | | | | | | | | | | | |
| (ETM) (Insured by AGM) | | | 4,620,000 | | | | 4,035,617 | | | | | |
| 5.500%, 12/01/2029 | | | | | | | | | | | | |
| (ETM) (Insured by NATL) | | | 16,050,000 | | | | 17,918,656 | | | | | |
| 5.750%, 12/01/2032 | | | | | | | | | | | | |
| (ETM) (Insured by AGM) | | | 24,965,000 | | | | 31,778,335 | | | | | |
| City of San Antonio TX, | | | | | | | | | | | | |
| 4.000%, 02/01/2029 (Callable 01/29/2024) | | | 2,205,000 | | | | 2,206,298 | | | | | |
| Clifton Higher Education Finance Corp.: | | | | | | | | | | | | |
| 5.000%, 08/15/2025 (PSF Guaranteed) | | | 460,000 | | | | 472,007 | | | | | |
| 5.000%, 08/15/2027 (PSF Guaranteed) | | | 235,000 | | | | 254,266 | | | | | |
| 5.000%, 08/15/2029 | | | | | | | | | | | | |
| (Callable 08/15/2024) (PSF Guaranteed) | | | 215,000 | | | | 217,366 | | | | | |
| 5.000%, 08/15/2029 (PSF Guaranteed) | | | 295,000 | | | | 328,475 | | | | | |
| 4.000%, 08/15/2031 | | | | | | | | | | | | |
| (Callable 08/15/2026) (PSF Guaranteed) | | | 170,000 | | | | 174,131 | | | | | |
| 4.000%, 08/15/2031 | | | | | | | | | | | | |
| (Callable 08/15/2027) (PSF Guaranteed) | | | 2,000,000 | | | | 2,067,591 | | | | | |
| 4.000%, 08/15/2034 | | | | | | | | | | | | |
| (Callable 08/15/2032) (PSF Guaranteed) | | | 160,000 | | | | 171,393 | | | | | |
| 4.000%, 08/15/2040 | | | | | | | | | | | | |
| (Callable 08/15/2031) (PSF Guaranteed) | | | 390,000 | | | | 393,609 | | | | | |
| 4.000%, 08/15/2041 | | | | | | | | | | | | |
| (Callable 08/15/2031) (PSF Guaranteed) | | | 805,000 | | | | 808,234 | | | | | |
The accompanying notes are an integral part of these financial statements.
Baird Quality Intermediate Municipal Bond Fund
Schedule of Investments, December 31, 2023
Long-Term Investments (cont.)
| | | Principal | | | | | | % of | |
| | | Amount | | | Value | | | Net Assets | |
| Clifton Higher Education | | | | | | | | | |
| Finance Corp.: (cont.) | | | | | | | | | |
| 4.000%, 08/15/2043 | | | | | | | | | |
| (Callable 08/15/2028) (PSF Guaranteed) | | $ | 250,000 | | | $ | 250,591 | | | |
| |
| Coppell Independent School District, | | | | | | | | | | | | |
| 0.000%, 08/15/2029 (PSF Guaranteed) | | | 200,000 | | | | 169,556 | | | | | |
| County of Bexar TX: | | | | | | | | | | | | |
| 4.000%, 06/15/2030 (Callable 06/15/2026) | | | 150,000 | | | | 153,635 | | | | | |
| 4.000%, 06/15/2033 | | | | | | | | | | | | |
| (Pre-refunded to 06/15/2025) | | | 3,795,000 | | | | 3,861,065 | | | | | |
| 5.000%, 06/15/2036 | | | | | | | | | | | | |
| (Pre-refunded to 06/15/2026) | | | 2,145,000 | | | | 2,257,004 | | | | | |
| County of Williamson TX, | | | | | | | | | | | | |
| 4.000%, 02/15/2039 (Callable 02/15/2029) | | | 1,350,000 | | | | 1,385,567 | | | | | |
| Crowley Independent School District, | | | | | | | | | | | | |
| 5.000%, 08/01/2036 (Pre-refunded to | | | | | | | | | | | | |
| 08/01/2025) (PSF Guaranteed) | | | 2,000,000 | | | | 2,064,783 | | | | | |
| Dalhart Independent School District, | | | | | | | | | | | | |
| 5.000%, 02/15/2040 | | | | | | | | | | | | |
| (Callable 02/15/2032) (PSF Guaranteed) | | | 1,170,000 | | | | 1,316,285 | | | | | |
| Dallas Independent School District, | | | | | | | | | | | | |
| 4.000%, 02/15/2034 (Pre-refunded to | | | | | | | | | | | | |
| 02/15/2025) (PSF Guaranteed) | | | 20,715,000 | | | | 20,933,266 | | | | | |
| Decatur Hospital Authority, | | | | | | | | | | | | |
| 5.750%, 09/01/2029 (ETM) | | | 335,000 | | | | 365,464 | | | | | |
| DeSoto Independent School District, | | | | | | | | | | | | |
| 5.000%, 08/15/2032 | | | | | | | | | | | | |
| (Callable 08/15/2024) (PSF Guaranteed) | | | 1,825,000 | | | | 1,840,728 | | | | | |
| Eagle Mountain & Saginaw | | | | | | | | | | | | |
| Independent School District, | | | | | | | | | | | | |
| 4.000%, 08/15/2045 | | | | | | | | | | | | |
| (Callable 08/15/2025) (PSF Guaranteed) | | | 675,000 | | | | 676,325 | | | | | |
| Ennis Independent School District, | | | | | | | | | | | | |
| 5.000%, 08/15/2025 (PSF Guaranteed) | | | 1,145,000 | | | | 1,185,508 | | | | | |
| Eula Independent School District, | | | | | | | | | | | | |
| 4.125%, 02/15/2048 | | | | | | | | | | | | |
| (Callable 02/15/2032) (PSF Guaranteed) | | | 1,610,000 | | | | 1,632,213 | | | | | |
| Forney Independent School District, | | | | | | | | | | | | |
| 5.000%, 08/15/2034 | | | | | | | | | | | | |
| (Callable 08/15/2025) (PSF Guaranteed) | | | 525,000 | | | | 540,544 | | | | | |
| Grand Parkway Transportation Corp.: | | | | | | | | | | | | |
| 5.200%, 10/01/2031 | | | | | | | | | | | | |
(Callable 10/01/2028)(5) | | | 405,000 | | | | 452,004 | | | | | |
| 5.000%, 10/01/2043 (Callable 04/01/2028) | | | 3,930,000 | | | | 4,178,237 | | | | | |
| 5.800%, 10/01/2045 | | | | | | | | | | | | |
(Callable 10/01/2028)(5) | | | 300,000 | | | | 329,699 | | | | | |
| 5.850%, 10/01/2048 | | | | | | | | | | | | |
(Callable 10/01/2028)(5) | | | 700,000 | | | | 766,600 | | | | | |
| Harlingen Consolidated | | | | | | | | | | | | |
| Independent School District, | | | | | | | | | | | | |
| 5.000%, 08/15/2025 (PSF Guaranteed) | | | 1,445,000 | | | | 1,495,889 | | | | | |
| Harris County Health | | | | | | | | | | | | |
| Facilities Development Corp.: | | | | | | | | | | | | |
| 5.750%, 07/01/2027 (ETM) | | | 7,515,000 | | | | 7,906,437 | | | | | |
| 6.250%, 07/01/2027 (ETM) | | | 6,465,000 | | | | 6,844,675 | | | | | |
| Harris County-Houston Sports Authority, | | | | | | | | | | | | |
| 0.000%, 11/15/2030 | | | | | | | | | | | | |
| (ETM) (Insured by NATL) | | | 2,150,000 | | | | 1,736,715 | | | | | |
| Honda Auto Receivables Owner Trust, | | | | | | | | | | | | |
| 5.000%, 02/15/2026 | | | | | | | | | | | | |
| (Callable 02/15/2024) (PSF Guaranteed) | | | 1,030,000 | | | | 1,031,589 | | | | | |
| Houston Higher Education Finance Corp., | | | | | | | | | | | | |
| 5.000%, 02/15/2034 | | | | | | | | | | | | |
| (Callable 02/15/2024) (PSF Guaranteed) | | | 1,795,000 | | | | 1,797,664 | | | | | |
| Katy Independent School District, | | | | | | | | | | | | |
| 4.000%, 02/15/2053 | | | | | | | | | | | | |
| (Callable 02/15/2032) (PSF Guaranteed) | | | 5,250,000 | | | | 5,233,672 | | | | | |
| Kemp Independent School District, | | | | | | | | | | | | |
| 0.000%, 02/15/2027 (Pre-refunded to | | | | | | | | | | | | |
| 02/15/2024) (PSF Guaranteed) | | | 715,000 | | | | 649,401 | | | | | |
| Kilgore Independent School District, | | | | | | | | | | | | |
| 2.000%, 02/15/2052 (Mandatory Tender | | | | | | | | | | | | |
Date 08/15/2025) (PSF Guaranteed)(1) | | | 890,000 | | | | 875,827 | | | | | |
| Klein Independent School District, | | | | | | | | | | | | |
| 4.000%, 08/01/2031 | | | | | | | | | | | | |
| (Callable 08/01/2025) (PSF Guaranteed) | | | 1,000,000 | | | | 1,014,762 | | | | | |
| La Porte Independent School District: | | | | | | | | | | | | |
| 5.000%, 02/15/2025 (PSF Guaranteed) | | | 1,080,000 | | | | 1,105,284 | | | | | |
| 5.000%, 02/15/2037 | | | | | | | | | | | | |
| (Callable 08/15/2033) (PSF Guaranteed) | | | 2,000,000 | | | | 2,394,959 | | | | | |
| 5.000%, 02/15/2038 | | | | | | | | | | | | |
| (Callable 08/15/2033) (PSF Guaranteed) | | | 1,630,000 | | | | 1,922,838 | | | | | |
| Leander Independent School District: | | | | | | | | | | | | |
| 0.000%, 08/15/2034 (Pre-refunded to | | | | | | | | | | | | |
| 08/15/2024) (PSF Guaranteed) | | | 175,000 | | | | 105,298 | | | | | |
| 0.000%, 08/15/2035 (Pre-refunded to | | | | | | | | | | | | |
| 08/15/2024) (PSF Guaranteed) | | | 395,000 | | | | 223,457 | | | | | |
| 0.000%, 08/15/2036 (Pre-refunded to | | | | | | | | | | | | |
| 08/15/2024) (PSF Guaranteed) | | | 750,000 | | | | 399,377 | | | | | |
| 0.000%, 08/15/2037 (Pre-refunded to | | | | | | | | | | | | |
| 08/15/2024) (PSF Guaranteed) | | | 700,000 | | | | 371,050 | | | | | |
| 0.000%, 08/15/2039 (Pre-refunded to | | | | | | | | | | | | |
| 08/15/2024) (PSF Guaranteed) | | | 570,000 | | | | 255,305 | | | | | |
| 0.000%, 08/15/2040 (Pre-refunded to | | | | | | | | | | | | |
| 08/15/2024) (PSF Guaranteed) | | | 1,030,000 | | | | 468,543 | | | | | |
| 0.000%, 08/15/2040 (Pre-refunded to | | | | | | | | | | | | |
| 08/15/2024) (PSF Guaranteed) | | | 35,000 | | | | 15,917 | | | | | |
| 0.000%, 08/15/2041 (Pre-refunded to | | | | | | | | | | | | |
| 08/15/2024) (PSF Guaranteed) | | | 8,965,000 | | | | 3,587,466 | | | | | |
| 0.000%, 08/15/2042 (Pre-refunded to | | | | | | | | | | | | |
| 08/15/2024) (PSF Guaranteed) | | | 1,500,000 | | | | 567,439 | | | | | |
| 0.000%, 08/15/2043 (Pre-refunded to | | | | | | | | | | | | |
| 08/15/2024) (PSF Guaranteed) | | | 700,000 | | | | 250,698 | | | | | |
| 0.000%, 08/16/2044 (Pre-refunded to | | | | | | | | | | | | |
| 08/16/2026) (PSF Guaranteed) | | | 14,095,000 | | | | 6,315,650 | | | | | |
| 0.000%, 08/15/2045 (Pre-refunded to | | | | | | | | | | | | |
| 08/15/2024) (PSF Guaranteed) | | | 2,000,000 | | | | 635,094 | | | | | |
| 0.000%, 08/15/2046 (Pre-refunded to | | | | | | | | | | | | |
| 08/15/2024) (PSF Guaranteed) | | | 250,000 | | | | 74,596 | | | | | |
| 0.000%, 08/15/2047 (Pre-refunded to | | | | | | | | | | | | |
| 08/15/2024) (PSF Guaranteed) | | | 540,000 | | | | 151,288 | | | | | |
| 0.000%, 08/15/2048 (Pre-refunded to | | | | | | | | | | | | |
| 08/15/2024) (PSF Guaranteed) | | | 920,000 | | | | 242,386 | | | | | |
| Lower Colorado River Authority, | | | | | | | | | | | | |
| 4.750%, 01/01/2028 | | | | | | | | | | | | |
| (ETM) (Insured by AGM) | | | 730,000 | | | | 756,995 | | | | | |
| Maypearl Independent School District, | | | | | | | | | | | | |
| 5.000%, 02/15/2041 | | | | | | | | | | | | |
| (Callable 02/15/2033) (PSF Guaranteed) | | | 1,000,000 | | | | 1,140,832 | | | | | |
| McKinney Independent School District, | | | | | | | | | | | | |
| 4.000%, 02/15/2034 | | | | | | | | | | | | |
| (Callable 02/15/2026) (PSF Guaranteed) | | | 1,325,000 | | | | 1,349,982 | | | | | |
| Melissa Independent School District, | | | | | | | | | | | | |
| 5.000%, 08/01/2036 | | | | | | | | | | | | |
| (Callable 08/01/2026) (PSF Guaranteed) | | | 1,020,000 | | | | 1,063,707 | | | | | |
| Mesquite Independent School District: | | | | | | | | | | | | |
| 5.000%, 08/15/2025 (PSF Guaranteed) | | | 5,000 | | | | 5,185 | | | | | |
| 5.000%, 08/15/2025 (PSF Guaranteed) | | | 1,500,000 | | | | 1,555,482 | | | | | |
The accompanying notes are an integral part of these financial statements.
Baird Quality Intermediate Municipal Bond Fund
Schedule of Investments, December 31, 2023
Long-Term Investments (cont.)
| | | Principal | | | | | | % of | |
| | | Amount | | | Value | | | Net Assets | |
| Midland County Fresh Water | | | | | | | | | |
| Supply District No. 1: | | | | | | | | | |
| 0.000%, 09/15/2033 | | | | | | | | | |
| (Pre-refunded to 09/15/2027) | | $ | 1,390,000 | | | $ | 934,914 | | | |
| |
| 0.000%, 09/15/2034 | | | | | | | | | | | | |
| (Pre-refunded to 09/15/2027) | | | 655,000 | | | | 417,566 | | | | | |
| 0.000%, 09/15/2035 | | | | | | | | | | | | |
| (Pre-refunded to 09/15/2027) | | | 1,395,000 | | | | 841,769 | | | | | |
| 0.000%, 09/15/2036 | | | | | | | | | | | | |
| (Pre-refunded to 09/15/2027) | | | 1,020,000 | | | | 582,977 | | | | | |
| 0.000%, 09/15/2037 | | | | | | | | | | | | |
| (Pre-refunded to 09/15/2027) | | | 110,000 | | | | 59,526 | | | | | |
| Millsap Independent School District, | | | | | | | | | | | | |
| 4.000%, 02/15/2026 (Pre-refunded to | | | | | | | | | | | | |
| 02/15/2024) (PSF Guaranteed) | | | 15,000 | | | | 15,012 | | | | | |
| Moulton Independent School District: | | | | | | | | | | | | |
| 4.000%, 08/15/2035 | | | | | | | | | | | | |
| (Callable 08/15/2027) (PSF Guaranteed) | | | 545,000 | | | | 560,324 | | | | | |
| 4.000%, 08/15/2036 | | | | | | | | | | | | |
| (Callable 08/15/2027) (PSF Guaranteed) | | | 285,000 | | | | 291,843 | | | | | |
| New Caney Independent School District: | | | | | | | | | | | | |
| 5.000%, 02/15/2039 | | | | | | | | | | | | |
| (Callable 08/15/2027) (PSF Guaranteed) | | | 500,000 | | | | 529,575 | | | | | |
| 1.250%, 02/15/2050 (Mandatory Tender | | | | | | | | | | | | |
Date 08/15/2024) (PSF Guaranteed)(1) | | | 675,000 | | | | 666,768 | | | | | |
| New Hope Cultural Education | | | | | | | | | | | | |
| Facilities Finance Corp.: | | | | | | | | | | | | |
| 5.000%, 04/01/2025 (ETM) | | | 715,000 | | | | 730,998 | | | | | |
| 5.000%, 04/01/2030 | | | | | | | | | | | | |
| (Pre-refunded to 04/01/2027) | | | 1,150,000 | | | | 1,236,839 | | | | | |
| 5.000%, 04/01/2031 | | | | | | | | | | | | |
| (Pre-refunded to 04/01/2027) | | | 1,180,000 | | | | 1,269,104 | | | | | |
| 5.000%, 04/01/2042 | | | | | | | | | | | | |
| (Pre-refunded to 04/01/2027) | | | 7,755,000 | | | | 8,340,596 | | | | | |
| New Hope Higher Education Finance Corp., | | | | | | | | | | | | |
| 4.000%, 06/15/2028 (PSF Guaranteed) | | | 100,000 | | | | 103,814 | | | | | |
| North Texas Tollway Authority: | | | | | | | | | | | | |
| 0.000%, 09/01/2037 | | | | | | | | | | | | |
| (Pre-refunded to 09/01/2031) | | | 10,065,000 | | | | 5,145,616 | | | | | |
| 0.000%, 09/01/2043 | | | | | | | | | | | | |
| (Pre-refunded to 09/01/2031) | | | 32,680,000 | | | | 10,648,347 | | | | | |
| 7.000%, 09/01/2043 | | | | | | | | | | | | |
(Pre-refunded to 09/01/2031)(5) | | | 8,430,000 | | | | 10,731,977 | | | | | |
| 6.750%, 09/01/2045 | | | | | | | | | | | | |
(Pre-refunded to 09/01/2031)(5) | | | 17,125,000 | | | | 21,915,260 | | | | | |
| Northside Independent School District, | | | | | | | | | | | | |
| 2.000%, 06/01/2052 (Mandatory Tender | | | | | | | | | | | | |
Date 06/01/2027) (PSF Guaranteed)(1) | | | 2,340,000 | | | | 2,247,323 | | | | | |
| Onalaska Independent School District, | | | | | | | | | | | | |
| 4.000%, 08/15/2030 | | | | | | | | | | | | |
| (Callable 08/15/2024) (PSF Guaranteed) | | | 340,000 | | | | 340,521 | | | | | |
| Pasadena Independent School District, | | | | | | | | | | | | |
| 1.500%, 02/15/2044 (Mandatory Tender | | | | | | | | | | | | |
Date 08/15/2024) (PSF Guaranteed)(1) | | | 1,710,000 | | | | 1,691,732 | | | | | |
| Pecos Barstow Toyah | | | | | | | | | | | | |
| Independent School District: | | | | | | | | | | | | |
| 5.000%, 02/15/2041 | | | | | | | | | | | | |
| (Callable 02/15/2026) (PSF Guaranteed) | | | 2,000,000 | | | | 2,051,438 | | | | | |
| 5.000%, 02/15/2042 | | | | | | | | | | | | |
| (Callable 02/15/2026) (PSF Guaranteed) | | | 3,000,000 | | | | 3,074,083 | | | | | |
| Petroleum Service Corp., | | | | | | | | | | | | |
| 3.750%, 12/01/2040 (Mandatory Tender | | | | | | | | | | | | |
Date 02/01/2028)(5) | | | 5,000,000 | | | | 4,873,578 | | | | | |
| Plemons-Stinnett-Phillips | | | | | | | | | | | | |
| Consolidated School District: | | | | | | | | | | | | |
| 5.000%, 02/15/2027 (PSF Guaranteed) | | | 730,000 | | | | 781,693 | | | | | |
| 5.000%, 02/15/2028 | | | | | | | | | | | | |
| (Callable 02/15/2027) (PSF Guaranteed) | | | 670,000 | | | | 712,658 | | | | | |
| 5.000%, 02/15/2029 | | | | | | | | | | | | |
| (Callable 02/15/2027) (PSF Guaranteed) | | | 810,000 | | | | 860,825 | | | | | |
| Port Aransas Independent School District: | | | | | | | | | | | | |
| 5.000%, 02/15/2041 | | | | | | | | | | | | |
| (Callable 08/15/2027) (PSF Guaranteed) | | | 575,000 | | | | 606,188 | | | | | |
| 5.000%, 02/15/2043 | | | | | | | | | | | | |
| (Callable 08/15/2025) (PSF Guaranteed) | | | 625,000 | | | | 637,751 | | | | | |
| Rockwall Independent School District, | | | | | | | | | | | | |
| 5.000%, 02/15/2038 | | | | | | | | | | | | |
| (Callable 01/29/2024) (PSF Guaranteed) | | | 745,000 | | | | 745,870 | | | | | |
| Shiner Independent School District, | | | | | | | | | | | | |
| 5.000%, 08/15/2040 | | | | | | | | | | | | |
| (Callable 08/15/2032) (PSF Guaranteed) | | | 175,000 | | | | 196,759 | | | | | |
| Socorro Independent School District, | | | | | | | | | | | | |
| 4.000%, 08/15/2033 | | | | | | | | | | | | |
| (Callable 02/15/2027) (PSF Guaranteed) | | | 900,000 | | | | 924,581 | | | | | |
| Tarrant County Health | | | | | | | | | | | | |
| Facilities Development Corp., | | | | | | | | | | | | |
| 6.000%, 09/01/2024 (ETM) | | | 1,050,000 | | | | 1,070,167 | | | | | |
| Tarrant County Hospital District, | | | | | | | | | | | | |
| 5.250%, 08/15/2038 (Callable 08/15/2032) | | | 1,200,000 | | | | 1,387,231 | | | | | |
| Terrell Independent School District, | | | | | | | | | | | | |
| 4.000%, 08/01/2037 | | | | | | | | | | | | |
| (Callable 08/01/2026) (PSF Guaranteed) | | | 510,000 | | | | 518,268 | | | | | |
| Texas Department of Housing & | | | | | | | | | | | | |
| Community Affairs: | | | | | | | | | | | | |
| 2.150%, 09/01/2035 (Callable 03/01/2029) | | | | | | | | | | | | |
| (Insured by GNMA) | | | 545,000 | | | | 439,631 | | | | | |
| 3.900%, 07/01/2044 (Callable 07/01/2028) | | | | | | | | | | | | |
| (Insured by GNMA) | | | 3,000,000 | | | | 2,931,248 | | | | | |
| 3.625%, 09/01/2044 (Callable 09/01/2028) | | | | | | | | | | | | |
| (Insured by GNMA) | | | 1,570,000 | | | | 1,457,199 | | | | | |
| 4.000%, 03/01/2050 (Callable 09/01/2028) | | | | | | | | | | | | |
| (Insured by GNMA) | | | 740,000 | | | | 740,789 | | | | | |
| 5.500%, 09/01/2052 (Callable 03/01/2032) | | | | | | | | | | | | |
| (Insured by GNMA) | | | 2,940,000 | | | | 3,141,721 | | | | | |
| Texas Municipal Gas | | | | | | | | | | | | |
| Acquisition & Supply Corp. II, | | | | | | | | | | | | |
| 4.130%, 09/15/2027 | | | | | | | | | | | | |
(3 Month TSFR + 1.045%)(2) | | | 3,540,000 | | | | 3,500,680 | | | | | |
| Texas State Affordable Housing Corp.: | | | | | | | | | | | | |
| 4.250%, 03/01/2049 (Callable 03/01/2029) | | | | | | | | | | | | |
| (Insured by GNMA) | | | 155,000 | | | | 155,364 | | | | | |
| 5.500%, 09/01/2053 (Callable 03/01/2033) | | | | | | | | | | | | |
| (Insured by GNMA) | | | 1,985,000 | | | | 2,110,194 | | | | | |
| Texas Water Development Board, | | | | | | | | | | | | |
| 4.000%, 10/15/2036 (Callable 10/15/2028) | | | 3,940,000 | | | | 4,078,190 | | | | | |
| United Independent School District, | | | | | | | | | | | | |
| 5.000%, 08/15/2038 | | | | | | | | | | | | |
| (Callable 08/15/2027) (PSF Guaranteed) | | | 225,000 | | | | 239,195 | | | | | |
| Veribest Independent School District, | | | | | | | | | | | | |
| 5.000%, 08/15/2039 | | | | | | | | | | | | |
| (Callable 08/15/2032) (PSF Guaranteed) | | | 645,000 | | | | 728,818 | | | | | |
| Viridian Municipal Management District: | | | | | | | | | | | | |
| 5.000%, 12/01/2034 (Callable 12/01/2029) | | | | | | | | | | | | |
| (Insured by AGM) | | | 930,000 | | | | 998,503 | | | | | |
| 5.000%, 12/01/2036 (Callable 12/01/2029) | | | | | | | | | | | | |
| (Insured by AGM) | | | 1,050,000 | | | | 1,117,752 | | | | | |
The accompanying notes are an integral part of these financial statements.
Baird Quality Intermediate Municipal Bond Fund
Schedule of Investments, December 31, 2023
Long-Term Investments (cont.)
| | | Principal | | | | | | % of | |
| | | Amount | | | Value | | | Net Assets | |
| Viridian Municipal | | | | | | | | | |
| Management District: (cont.) | | | | | | | | | |
| 5.000%, 12/01/2037 (Callable 12/01/2029) | | | | | | | | | |
| (Insured by AGM) | | $ | 550,000 | | | $ | 582,016 | | | | |
| 5.000%, 12/01/2039 (Callable 12/01/2029) | | | | | | | | | | | |
| (Insured by AGM) | | | 1,000,000 | | | | 1,049,586 | | | | |
| Whitehouse Independent School District, | | | | | | | | | | | |
| 5.000%, 02/15/2037 | | | | | | | | | | | |
| (Callable 02/15/2027) (PSF Guaranteed) | | | 1,200,000 | | | | 1,273,527 | | | | |
| Total Texas | | | | | | | | | | | |
| (Cost $306,828,731) | | | | | | | 304,110,255 | | | | 27.6 | % |
| Utah | | | | | | | | | | | | |
| County of Utah UT, | | | | | | | | | | | | |
| 5.000%, 05/15/2060 (Callable 02/01/2026) | | | | | | | | | | | | |
(Mandatory Tender Date 08/01/2026)(1) | | | 2,875,000 | | | | 3,009,210 | | | | | |
| Davis School District, | | | | | | | | | | | | |
| 3.500%, 06/01/2034 (Callable 12/01/2024) | | | | | | | | | | | | |
| (Insured by SCH BD GTY) | | | 2,000,000 | | | | 2,003,899 | | | | | |
| Utah Charter School Finance Authority: | | | | | | | | | | | | |
| 5.000%, 04/15/2024 (Insured by UT CSCE) | | | 235,000 | | | | 236,056 | | | | | |
| 5.000%, 04/15/2037 (Callable 04/15/2026) | | | | | | | | | | | | |
| (Insured by UT CSCE) | | | 500,000 | | | | 513,511 | | | | | |
| Utah Housing Corp.: | | | | | | | | | | | | |
| 4.000%, 01/01/2045 (Callable 01/01/2026) | | | | | | | | | | | | |
| (Insured by FHA) | | | 2,090,000 | | | | 2,086,011 | | | | | |
| 6.000%, 07/01/2053 (Callable 01/01/2032) | | | | | | | | | | | | |
| (Insured by GNMA) | | | 1,000,000 | | | | 1,092,144 | | | | | |
| Utah Telecommunication Open | | | | | | | | | | | | |
| Infrastructure Agency, | | | | | | | | | | | | |
| 5.500%, 06/01/2040 (Callable 06/01/2032) | | | 500,000 | | | | 579,346 | | | | | |
| Total Utah | | | | | | | | | | | | |
| (Cost $9,425,816) | | | | | | | 9,520,177 | | | | 0.9 | % |
| Vermont | | | | | | | | | | | | |
| Vermont Housing Finance Agency: | | | | | | | | | | | | |
| 3.600%, 11/01/2036 (Callable 11/01/2025) | | | 1,255,000 | | | | 1,239,055 | | | | | |
| 4.000%, 05/01/2048 (Callable 11/01/2026) | | | | | | | | | | | | |
| (Insured by GNMA) | | | 290,000 | | | | 289,310 | | | | | |
| 4.000%, 11/01/2048 (Callable 05/01/2027) | | | 250,000 | | | | 249,295 | | | | | |
| Vermont Municipal Bond Bank, | | | | | | | | | | | | |
| 5.000%, 12/01/2034 (Callable 12/01/2026) | | | 1,625,000 | | | | 1,720,928 | | | | | |
| Total Vermont | | | | | | | | | | | | |
| (Cost $3,517,386) | | | | | | | 3,498,588 | | | | 0.3 | % |
| Virginia | | | | | | | | | | | | |
| Chesapeake Redevelopment & | | | | | | | | | | | | |
| Housing Authority, | | | | | | | | | | | | |
| 5.000%, 05/01/2043 (Mandatory Tender | | | | | | | | | | | | |
Date 05/01/2026) (Insured by HUD)(1) | | | 2,295,000 | | | | 2,368,376 | | | | | |
| Danville Industrial Development Authority, | | | | | | | | | | | | |
| 5.250%, 10/01/2028 | | | | | | | | | | | | |
| (ETM) (Insured by AMBAC) | | | 395,000 | | | | 409,487 | | | | | |
| Federal Home Loan | | | | | | | | | | | | |
| Mortgage Corp. (FHLMC), | | | | | | | | | | | | |
| 2.550%, 06/15/2035 | | | 3,660,000 | | | | 2,977,711 | | | | | |
| Hampton Roads Transportation | | | | | | | | | | | | |
| Accountability Commission, | | | | | | | | | | | | |
| 5.500%, 07/01/2057 (Pre-refunded to | | | | | | | | | | | | |
| 01/01/2028) | | | 15,000,000 | | | | 16,804,064 | | | | | |
| Virginia Resources Authority, | | | | | | | | | | | | |
| 0.000%, 11/01/2027 (ETM) | | | 520,000 | | | | 469,580 | | | | | |
| Virginia Small Business Financing Authority, | | | | | | | | | | | | |
| 5.250%, 10/01/2029 (Callable 10/01/2024) | | | 1,000,000 | | | | 1,012,412 | | | | | |
| Total Virginia | | | | | | | | | | | | |
| (Cost $23,905,830) | | | | | | | 24,041,630 | | | | 2.2 | % |
| Washington | | | | | | | | | | | | |
| Central Puget Sound Regional | | | | | | | | | | | | |
| Transit Authority, | | | | | | | | | | | | |
| 5.000%, 11/01/2032 | | | | | | | | | | | | |
| (Pre-refunded to 11/01/2025) | | | 2,725,000 | | | | 2,836,682 | | | | | |
| Clark County School District No. 114: | | | | | | | | | | | | |
| 4.000%, 12/01/2038 (Callable 06/01/2030) | | | | | | | | | | | | |
| (Insured by SCH BD GTY) | | | 1,000,000 | | | | 1,031,845 | | | | | |
| 5.250%, 12/01/2040 (Callable 06/01/2032) | | | | | | | | | | | | |
| (Insured by SCH BD GTY) | | | 9,400,000 | | | | 10,808,550 | | | | | |
| County of King WA, | | | | | | | | | | | | |
| 5.000%, 07/01/2034 | | | | | | | | | | | | |
| (Pre-refunded to 01/01/2025) | | | 705,000 | | | | 719,430 | | | | | |
| King County Housing Authority: | | | | | | | | | | | | |
| 3.250%, 05/01/2033 (Callable 05/01/2028) | | | | | | | | | | | | |
| (County Guaranteed) | | | 1,500,000 | | | | 1,459,289 | | | | | |
| 4.000%, 11/01/2034 (Callable 11/01/2029) | | | | | | | | | | | | |
| (County Guaranteed) | | | 1,520,000 | | | | 1,577,950 | | | | | |
| 4.000%, 11/01/2036 (Callable 11/01/2029) | | | | | | | | | | | | |
| (County Guaranteed) | | | 3,250,000 | | | | 3,314,519 | | | | | |
| State of Washington: | | | | | | | | | | | | |
| 5.000%, 06/01/2035 (Callable 06/01/2028) | | | 1,000,000 | | | | 1,100,111 | | | | | |
| 5.000%, 08/01/2038 (Callable 08/01/2026) | | | 1,225,000 | | | | 1,278,726 | | | | | |
| 4.000%, 07/01/2039 (Callable 07/01/2031) | | | 940,000 | | | | 977,684 | | | | | |
| Washington Health Care Facilities Authority: | | | | | | | | | | | | |
| 5.000%, 09/01/2030 | | | 300,000 | | | | 331,371 | | | | | |
| 5.000%, 09/01/2031 (Callable 09/01/2030) | | | 175,000 | | | | 194,027 | | | | | |
| 5.000%, 09/01/2032 (Callable 09/01/2030) | | | 465,000 | | | | 515,223 | | | | | |
| 5.000%, 09/01/2033 (Callable 09/01/2030) | | | 190,000 | | | | 210,294 | | | | | |
| 5.000%, 10/01/2038 (Callable 04/01/2025) | | | 2,050,000 | | | | 2,080,056 | | | | | |
| Washington State Housing | | | | | | | | | | | | |
| Finance Commission: | | | | | | | | | | | | |
| 6.750%, 07/01/2035 | | | | | | | | | | | | |
(Pre-refunded to 07/01/2025)(3) | | | 1,850,000 | | | | 1,938,735 | | | | | |
| 2.650%, 12/01/2040 (Callable 06/01/2029) | | | | | | | | | | | | |
| (Insured by GNMA) | | | 1,800,000 | | | | 1,527,380 | | | | | |
| 4.000%, 06/01/2049 (Callable 06/01/2028) | | | 315,000 | | | | 314,651 | | | | | |
| 4.000%, 06/01/2050 (Callable 06/01/2029) | | | | | | | | | | | | |
| (Insured by GNMA) | | | 1,275,000 | | | | 1,274,917 | | | | | |
| 7.000%, 07/01/2050 | | | | | | | | | | | | |
(Pre-refunded to 07/01/2025)(3) | | | 1,845,000 | | | | 1,939,332 | | | | | |
| Total Washington | | | | | | | | | | | | |
| (Cost $34,767,869) | | | | | | | 35,430,772 | | | | 3.2 | % |
| Wisconsin | | | | | | | | | | | | |
| Baraboo School District, | | | | | | | | | | | | |
| 3.000%, 04/01/2033 (Callable 04/01/2026) | | | | | | | | | | | | |
| (Insured by BAM) | | | 650,000 | | | | 632,152 | | | | | |
| Big Foot Union High School District, | | | | | | | | | | | | |
| 3.000%, 03/01/2032 (Pre-refunded to | | | | | | | | | | | | |
| 03/01/2027) (Insured by BAM) | | | 430,000 | | | | 433,938 | | | | | |
| City of Milwaukee WI, | | | | | | | | | | | | |
| 3.000%, 06/01/2033 (Callable 06/01/2026) | | | 2,500,000 | | | | 2,458,517 | | | | | |
| County of Kenosha WI, | | | | | | | | | | | | |
| 3.500%, 09/01/2028 (Callable 09/01/2024) | | | 820,000 | | | | 822,948 | | | | | |
| D.C. Everest Area School District, | | | | | | | | | | | | |
| 3.625%, 04/01/2038 | | | | | | | | | | | | |
| (Pre-refunded to 04/01/2027) | | | 3,900,000 | | | | 4,037,224 | | | | | |
| Lodi School District, | | | | | | | | | | | | |
| 3.750%, 03/01/2037 | | | | | | | | | | | | |
| (Pre-refunded to 03/01/2025) | | | 135,000 | | | | 136,228 | | | | | |
| Public Finance Authority: | | | | | | | | | | | | |
| 5.000%, 03/01/2025 | | | 535,000 | | | | 547,626 | | | | | |
| 5.750%, 11/15/2044 | | | | | | | | | | | | |
(Pre-refunded to 11/15/2024)(3) | | | 1,100,000 | | | | 1,121,113 | | | | | |
The accompanying notes are an integral part of these financial statements.
Baird Quality Intermediate Municipal Bond Fund
Schedule of Investments, December 31, 2023
Long-Term Investments (cont.)
| | | Principal | | | | | | % of | |
| | | Amount | | | Value | | | Net Assets | |
| Southeast Wisconsin Professional | | | | | | | | | |
| Baseball Park District: | | | | | | | | | |
| 5.500%, 12/15/2026 (Insured by NATL) | | $ | 1,630,000 | | | $ | 1,707,458 | | | | |
| 0.000%, 12/15/2027 | | | | | | | | | | | |
| (ETM) (Insured by NATL) | | | 1,020,000 | | | | 918,340 | | | | |
| 0.000%, 12/15/2028 | | | | | | | | | | | |
| (ETM) (Insured by NATL) | | | 825,000 | | | | 725,168 | | | | |
| 0.000%, 12/15/2029 | | | | | | | | | | | |
| (ETM) (Insured by NATL) | | | 900,000 | | | | 766,208 | | | | |
| State of Wisconsin, | | | | | | | | | | | |
| 5.000%, 05/01/2032 | | | | | | | | | | | |
| (Pre-refunded to 05/01/2026) | | | 1,000,000 | | | | 1,056,054 | | | | |
| Town of Ledgeview WI, | | | | | | | | | | | |
| 5.000%, 12/01/2030 (Callable 12/01/2029) | | | 630,000 | | | | 699,064 | | | | |
| Village of Mount Pleasant WI: | | | | | | | | | | | |
| 5.000%, 04/01/2036 (Callable 04/01/2028) | | | 275,000 | | | | 297,716 | | | | |
| 4.000%, 04/01/2037 (Callable 04/01/2028) | | | 2,400,000 | | | | 2,453,431 | | | | |
| 5.000%, 04/01/2048 (Callable 04/01/2028) | | | | | | | | | | | |
| (Insured by BAM) | | | 1,500,000 | | | | 1,562,169 | | | | |
| Village of Pewaukee WI, | | | | | | | | | | | |
| 2.250%, 03/01/2025 (Callable 01/29/2024) | | | 130,000 | | | | 128,194 | | | | |
| Waterford Union High School District, | | | | | | | | | | | |
| 3.000%, 03/01/2039 | | | | | | | | | | | |
| (Pre-refunded to 03/01/2029) | | | 665,000 | | | | 668,799 | | | | |
| West De Pere School District, | | | | | | | | | | | |
| 2.500%, 04/01/2040 | | | | | | | | | | | |
| (Pre-refunded to 04/01/2030) | | | 2,500,000 | | | | 2,510,536 | | | | |
| Wisconsin Center District: | | | | | | | | | | | |
| 4.000%, 12/15/2029 (Callable 06/15/2026) | | | 1,480,000 | | | | 1,529,168 | | | | |
| 0.000%, 12/15/2034 (Callable 12/15/2030) | | | | | | | | | | | |
| (Insured by AGM) | | | 1,810,000 | | | | 1,237,049 | | | | |
| Wisconsin Health & | | | | | | | | | | | |
| Educational Facilities Authority: | | | | | | | | | | | |
| 5.000%, 02/15/2028 | | | | | | | | | | | |
| (Pre-refunded to 08/15/2025) | | | 20,000 | | | | 20,551 | | | | |
| 5.000%, 08/15/2029 (Callable 08/15/2027) | | | 70,000 | | | | 75,515 | | | | |
| 4.000%, 02/15/2033 | | | | | | | | | | | |
| (Pre-refunded to 08/15/2025) | | | 100,000 | | | | 101,195 | | | | |
| 5.000%, 07/01/2042 (Callable 07/01/2027) | | | 2,000,000 | | | | 2,063,222 | | | | |
| 4.000%, 11/15/2046 | | | | | | | | | | | |
| (Pre-refunded to 05/15/2026) | | | 1,470,000 | | | | 1,506,875 | | | | |
| Wisconsin Housing & | | | | | | | | | | | |
| Economic Development Authority: | | | | | | | | | | | |
| 4.625%, 11/01/2043 (Callable 05/01/2032) | | | | | | | | | | | |
| (Insured by HUD) | | | 435,000 | | | | 444,769 | | | | |
| 3.500%, 09/01/2046 (Callable 09/01/2025) | | | | | | | | | | | |
| (Insured by FNMA) | | | 450,000 | | | | 445,589 | | | | |
| 4.000%, 03/01/2048 (Callable 03/01/2027) | | | | | | | | | | | |
| (Insured by FNMA) | | | 1,400,000 | | | | 1,395,770 | | | | |
| 4.000%, 03/01/2048 (Callable 03/01/2027) | | | 280,000 | | | | 279,165 | | | | |
| 4.250%, 03/01/2049 (Callable 09/01/2028) | | | | | | | | | | | |
| (Insured by FNMA) | | | 1,125,000 | | | | 1,131,496 | | | | |
| 6.000%, 03/01/2054 (Callable 09/01/2032) | | | | | | | | | | | |
| (Insured by GNMA) | | | 1,625,000 | | | | 1,807,736 | | | | |
| Total Wisconsin | | | | | | | | | | | |
| (Cost $35,868,723) | | | | | | | 35,720,983 | | | | 3.2 | % |
| Wyoming | | | | | | | | | | | | |
| Wyoming Community | | | | | | | | | | | | |
| Development Authority: | | | | | | | | | | | | |
| 4.000%, 12/01/2043 | | | | | | | | | | | | |
| (Callable 06/01/2027) | | | 110,000 | | | | 109,796 | | | | | |
| 4.000%, 12/01/2048 (Callable 06/01/2028) | | | 1,420,000 | | | | 1,418,371 | | | | | |
| Total Wyoming | | | | | | | | | | | | |
| (Cost $1,580,652) | | | | | | | 1,528,167 | | | | 0.1 | % |
| Total Municipal Bonds | | | | | | | | | | | | |
| (Cost $1,073,321,256) | | | | | | | 1,066,994,095 | | | | 96.8 | % |
| Total Long-Term Investments | | | | | | | | | | | | |
| (Cost $1,089,001,375) | | | | | | | 1,082,889,720 | | | | 98.2 | % |
| Short-Term Investment | | | | | | | | | | | | |
| | | Shares | | | | | | | | | |
| Money Market Mutual Fund | | | | | | | | | | | | |
| Federated Hermes Institutional Tax-Free | | | | | | | | | | | | |
Cash Trust, Premier Shares, 4.03%(4) | | | 9,136,090 | | | | 9,136,090 | | | | | |
| Total Short-Term Investment | | | | | | | | | | | | |
| (Cost $9,136,090) | | | | | | | 9,136,090 | | | | 0.8 | % |
| Total Investments | | | | | | | | | | | | |
| (Cost $1,098,137,465) | | | | | | | 1,092,025,810 | | | | 99.0 | % |
| Other Assets in Excess of Liabilities | | | | | | | 10,881,794 | | | | 1.0 | % |
| TOTAL NET ASSETS | | | | | | $ | 1,102,907,604 | | | | 100.0 | % |
Notes to Schedule of Investments
AGC – Assured Guaranty Corp.
AGM – Assured Guaranty Municipal
AMBAC – Ambac Assurance Corp.
BAM – Build America Mutual Assurance Co.
BHAC – Berkshire Hathaway Assurance Corp.
FGIC – Financial Guaranty Insurance Company
FHA – Federal Housing Administration
FHLMC – Federal Home Loan Mortgage Corporation
FNMA – Federal National Mortgage Association
GNMA – Government National Mortgage Association
HUD – US Department of Housing and Development
MT BRD – Montana Board of Investments
NATL – National Public Finance Guarantee Corp.
Q-SBLF – Qualified School Building Loan Fund
SCH BD GTY – School Board Guaranty
SONYMA – State of New York Mortgage Agency
ST AID – State Aid Intercept/Withholding
UT CSCE – Utah Charter School Credit Enhancement Program
ETM – Escrowed to Maturity
PSF – Permanent School Fund
SIFMA – Securities Industry and Financial Markets Association
SOFR – Secured Overnight Financing Rate
TSFR – Term Secured Overnight Financing Rate
(1) | Variable rate security. The rate reported is the rate in effect as of December 31, 2023. |
(2) | Variable rate security based on a reference index and spread. The rate reported is the rate as of the last reset date in effect as of December 31, 2023. |
(3) | Includes securities exempt from registration under Rule 144A of the Securities Act of 1933. These securities may be resold in transactions exempt from registration to qualified institutional buyers. At December 31, 2023, the value of these securities totaled $29,317,163, which represented 2.66% of total net assets. |
(4) | Seven-day yield. |
(5) | Step-up bond; the interest rate shown is the rate in effect as of December 31, 2023. |
The accompanying notes are an integral part of these financial statements.
Baird Quality Intermediate Municipal Bond Fund
Summary of Fair Value Exposure at December 31, 2023
The Fund has adopted authoritative fair valuation accounting standards which establish a definition of fair value and set out a hierarchy for measuring fair value. These standards require additional disclosures about the various inputs and valuation techniques used to develop the measurements of fair value and a discussion on changes in valuation techniques and related inputs during the period. These standards define fair value as the price that would be received to sell an asset or paid to transfer a liability in an orderly transaction between market participants at the measurement date.
The fair value hierarchy is organized into three levels based upon the assumptions (referred to as “inputs”) used in pricing the asset or liability. These standards state that “observable inputs” reflect the assumptions market participants would use in pricing the asset or liability based on market data obtained from independent sources and “unobservable inputs” reflect an entity’s own assumptions about the assumptions market participants would use in pricing the asset or liability. These inputs are summarized into three broad levels and described below:
Level 1 – Quoted prices (unadjusted) in active markets for identical assets or liabilities that the reporting entity can access at the measurement date.
Level 2 – Inputs other than quoted prices included within Level 1 that are observable for the asset or liability, either directly or indirectly.
Level 3 – Unobservable inputs for the asset or liability.
The inputs or methodology used for valuing securities are not necessarily an indication of the risk associated with investing in those securities.
The following is a summary of the inputs used to value the Fund’s investments as of December 31, 2023:
| | | Level 1 | | | Level 2 | | | Level 3 | | | Total | |
| Long-Term Investments | | | | | | | | | | | | |
| U.S. Treasury Securities | | $ | — | | | $ | 15,895,625 | | | $ | — | | | $ | 15,895,625 | |
| Municipal Bonds | | | — | | | | 1,066,994,095 | | | | — | | | | 1,066,994,095 | |
| Total Long-Term Investments | | | — | | | | 1,082,889,720 | | | | — | | | | 1,082,889,720 | |
| Short-Term Investment | | | | | | | | | | | | | | | | |
| Money Market Mutual Fund | | | 9,136,090 | | | | — | | | | — | | | | 9,136,090 | |
| Total Short-Term Investment | | | 9,136,090 | | | | — | | | | — | | | | 9,136,090 | |
| Total Investments | | $ | 9,136,090 | | | $ | 1,082,889,720 | | | $ | — | | | $ | 1,092,025,810 | |
Changes in valuation techniques may result in transfers into or out of assigned levels within the fair value hierarchy. There were no transfers into or out of Level 3 during the year, as compared to the security classifications from the prior year’s annual report. See the Fund’s Valuation Policy in Note 2a to the financial statements.
The accompanying notes are an integral part of these financial statements.
Baird Core Intermediate Municipal Bond Fund
December 31, 2023 (Unaudited)
The Baird Core Intermediate Municipal Bond Fund seeks a high level of current income that is exempt from federal income tax and is consistent with preservation of capital.
The tax-exempt market closed 2023 with a very strong tone as yields fell over 100 bps in the fourth quarter and were down 20 - 40 bps for the year, with intermediate maturities falling the most. A catalyst for the fourth quarter rally was an acknowledgement by Fed Chair Powell that the possibility of rate cuts was now equally balanced against further increases. One market anomaly which persisted throughout the year was the inversion of the municipal yield curve between the 1–10-year maturities, ending the year with 32 bps of negative slope. Relatively high short-term floating-rate yields helped sustain the inversion but also acted as a disincentive to invest in longer-term fixed-rate bonds, a drag on municipal fund flows across the industry in 2023. Yet, overall demand for municipals was robust, evidenced by the fact that tax-exempt yields fell more than comparable maturity Treasuries for the year. It also helped that the level of new municipal supply was modest in 2023. Total issuance fell 2% from the prior year with taxable municipal issuance off 36% and tax-exempt supply up just 5% on a year-over-year basis.
During 2023, the Institutional Class Shares of the Fund (BMNIX) posted a net return of 5.54% vs. a 5.26% return for the Bloomberg 1–15 Year Municipal Index.
Positive contributors to the Fund’s relative performance during the year include:
| | • | Portfolio Structure – A barbell curve allocation enhanced returns |
| | • | Credit – The Fund benefited from additional yield on lower-quality issues |
| | • | Security selection – Discount bonds outperformed premium priced securities |
Negative contributors to the Fund’s relative performance during the year include:
| | • | Sector – Housing and Higher Education issues lagged other sectors |
We expect that the favorable backdrop for the municipal market will continue into 2024, in part due to the expectation that municipal fund flows will turn positive once again. Since municipal fund flows are highly correlated with curve slope (the more positive the slope the more positive the inflows), as inflation continues toward the Fed’s 2% target rate short-term rates should fall faster than long-term rates, re-steepening the curve. Curve positioning, which is always important, will remain so in 2024. We expect only a modest pickup in supply as the post-Covid federal stimulus funds continue to be spent, limiting borrowing needs for many state and local governments. The exception, we believe, will be those states experiencing the fastest growth in population (e.g., Texas and Florida). Issuance among other municipal sectors, particularly Higher Education and Hospitals, should improve only modestly given their ongoing challenges. Tax-Exempt Housing supply should stay robust, but it is a relatively small sector of the total market. Finally, because municipal credit spreads are relatively tight as we enter 2024, the best investment opportunities will likely be found among higher-quality issues. We will also seek favorable risk/reward through structural opportunities including coupon, call and prepayment variations to enhance both yield and return.
The Fund maintains a neutral duration posture relative to the benchmark while seeking to optimize roll opportunities along the yield curve. Sector weightings will likely favor an overweight to revenue-backed issues over general obligation debt. We believe modest credit overweight short on the curve is appropriate given current spread levels, with room to increase exposure if spreads widen further in a slowing economy. That said, a continual focus on the fundamental tax and revenue support remains especially important at this point in the credit cycle. Higher-quality, structural opportunities will also remain a focus to enhance income to investors.
Baird Core Intermediate Municipal Bond Fund
December 31, 2023 (Unaudited)
Portfolio Characteristics
Quality Distribution(1)(2)
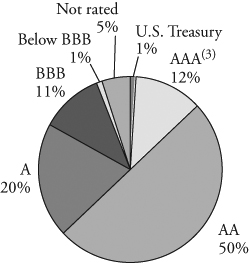
| | Net Assets | $2,979,188,166 | |
| | | | |
| | SEC 30-Day Yield(4) | | |
| | Institutional Class | 3.41% | |
| | Investor Class | 3.16% | |
| | | | |
| | Average Effective Duration | 4.62 years | |
| | | | |
| | Average Effective Maturity | 4.57 years | |
| | | | |
| | Annualized Expense Ratio(5) | | |
| | Institutional Class | 0.30% | |
| | Investor Class | 0.55% | (6) |
| | | | |
| | Portfolio Turnover Rate | 32% | |
| | | | |
| | | Number of Holdings | 2,102 | |
Sector Weightings(7) | | | | |
| | | | | |
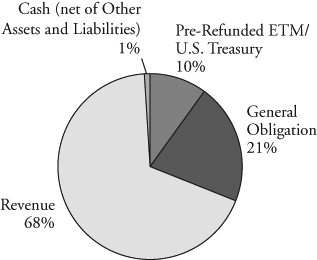
| | | | |
| | | | |
| | | | |
| | | | |
| | | | |
| | | | |
| | | | |
| | | | |
| | | | |
| | | | |
| | | | |
| | | | |
| | | | |
| | | | |
| | | | |
| | | | |
| | | | | |
(1) | Percentages shown are based on the Fund’s total investments. |
(2) | The quality profile is calculated on a market value-weighted basis using the highest credit quality rating for each security held by the Fund given by S&P, Moody’s or Fitch, each of which is a Nationally Recognized Statistical Rating Organization (NRSRO). NRSROs rate the credit quality of securities using a scale that generally ranges from AAA (highest) to D (lowest). |
(3) | Includes pre-refunded and escrowed-to-maturity (ETM) bonds. |
(4) | SEC yields are based on SEC guidelines and are calculated for the 30 days ended December 31, 2023. |
(5) | Reflects expense ratios as stated in the Fund’s current prospectus dated May 1, 2023. |
(6) | Includes 0.25% 12b-1 fee. |
(7) | Percentages shown are based on the Fund’s total net assets. |
Baird Core Intermediate Municipal Bond Fund
December 31, 2023 (Unaudited)
| Institutional Class | Investor Class |
| Value of a $10,000 Investment | Value of a $10,000 Investment |
| | |
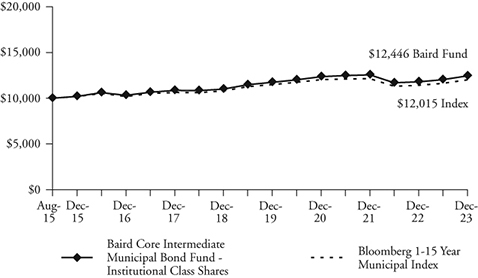 | 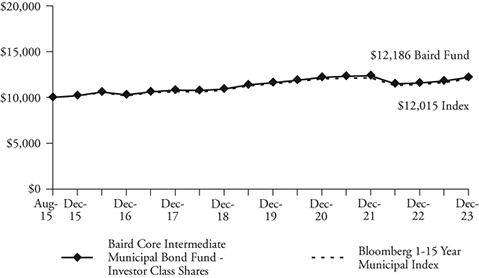 |
| | |
| Growth of a hypothetical investment of $10,000 made on 08/31/15, assuming | Growth of a hypothetical investment of $10,000 made on 08/31/15, assuming |
| reinvestment of all distributions. | reinvestment of all distributions. |
| Total Returns | | | | |
| | | Average Annual |
| | One | Three | Five | Since |
| For the Periods Ended December 31, 2023 | Year | Years | Years | Inception(1) |
| Institutional Class Shares | 5.54% | 0.24% | 2.51% | 2.66% |
| Investor Class Shares | 5.28% | -0.01% | 2.24% | 2.40% |
Bloomberg 1-15 Year Municipal Index(2) | 5.26% | -0.05% | 2.17% | 2.23% |
(1) | For the period from August 31, 2015 (inception date) through December 31, 2023. |
(2) | The Bloomberg 1-15 Year Municipal Index is an unmanaged, market value weighted index of investment-grade, tax-exempt, and fixed-rate securities with maturities between 1 and 17 years. Securities must have an outstanding par value of at least $7 million and be issued as part of a transaction of at least $75 million. The bonds must be fixed rate, have a dated-date after December 31, 1990, and must be at least one year from their maturity date. This Index does not reflect any deduction for fees, expenses or taxes. A direct investment in an index is not possible. |
The line graphs and the returns table shown above reflect reinvestment of dividends and/or capital gains distributions in additional shares. The returns in the graphs and table do not reflect the deduction of taxes that a shareholder would pay on Fund distributions or the redemption of Fund shares. The returns reflect the actual performance for each period and do not include the impact of trades executed on the last business day of the period that were recorded on the first business day of the next period.
The Fund’s expense ratio for each Class, as reflected in the Fund’s current prospectus, is set forth under “Portfolio Characteristics”.
The Fund may invest up to 10% of its net assets in non-investment grade debt securities (commonly referred to as “high yield” bonds). While these types of debt securities may offer higher yields than investment grade securities, they also include greater risks including increased credit risk and the increased risk of default or bankruptcy. The Fund may invest up to 25% of its total assets in municipal obligations issued by persons in the same state. As a result, changes in economic, business or political conditions of a particular state may have a disproportionate impact on the Fund’s share price. Municipal securities investments are not appropriate for all investors, especially those taxed at lower rates. U.S. and international markets have experienced significant periods of volatility due to a number of economic, political and other global macro factors. The war between Ukraine and Russia is approaching its 2nd anniversary and the October 7th attack by Hamas and Israel’s response only added to global tensions. US/China relations remain strained, impacted by sluggish Chinese economic growth and numerous issues affecting trade relations. Domestically, inflation remains an area of focus since getting to the Fed’s 2% target may prove to be more challenging than the market expects. In addition, 2024 is an election year and the current level of political discord is high. Finally, while the coronavirus (COVID-19) appears to have entered an endemic stage, significant outbreaks present a continued risk to the global economy. These and other events may cause market disruptions and could have an adverse effect on the value of the Fund’s investments.
Past performance does not guarantee future results. Investment return and principal value will fluctuate so that an investor’s shares, when redeemed, may be worth more or less than their original cost.
For information about the performance of the Fund as of the most recent month-end, please call 1-866-442-2473 or visit www.bairdfunds.com. Mutual fund performance changes over time and current performance may be lower or higher than that stated.
Baird Core Intermediate Municipal Bond Fund
Schedule of Investments, December 31, 2023
Long-Term Investments
| | | Principal | | | | | | % of | |
| | | Amount | | | Value | | | Net Assets | |
| U.S. Treasury Securities | | | | | | | | | |
| U.S. Treasury Bonds: | | | | | | | | | |
| 3.875%, 04/30/2025 | | $ | 15,000,000 | | | $ | 14,866,992 | | | | |
| 4.875%, 10/31/2028 | | | 20,000,000 | | | | 20,896,875 | | | | |
| Total U.S. Treasury Securities | | | | | | | | | | | |
| (Cost $34,992,961) | | | | | | | 35,763,867 | | | | 1.2 | % |
| Municipal Bonds | | | | | | | | | | | | |
| Alabama | | | | | | | | | | | | |
| Alabama Community College System: | | | | | | | | | | | | |
| 3.500%, 11/01/2025 (Insured by BAM) | | | 1,100,000 | | | | 1,107,043 | | | | | |
| 5.000%, 10/01/2028 (Callable 10/01/2026) | | | | | | | | | | | | |
| (Insured by AGM) | | | 310,000 | | | | 326,147 | | | | | |
| 5.250%, 06/01/2043 (Callable 06/01/2033) | | | | | | | | | | | | |
| (Insured by AGM) | | | 500,000 | | | | 553,837 | | | | | |
| Alabama Economic Settlement Authority, | | | | | | | | | | | | |
| 4.000%, 09/15/2033 (Callable 09/15/2026) | | | 5,810,000 | | | | 5,824,484 | | | | | |
| Alabama Housing Finance Authority: | | | | | | | | | | | | |
| 3.500%, 08/01/2025 (Mandatory Tender | | | | | | | | | | | | |
Date 08/01/2024) (Insured by HUD)(1) | | | 5,000,000 | | | | 4,990,890 | | | | | |
| 5.000%, 05/01/2026 (Mandatory Tender | | | | | | | | | | | | |
Date 05/01/2025) (Insured by FHA)(1) | | | 6,800,000 | | | | 6,922,452 | | | | | |
| Auburn University, | | | | | | | | | | | | |
| 5.000%, 06/01/2032 (Callable 06/01/2025) | | | 1,000,000 | | | | 1,026,306 | | | | | |
| Birmingham Airport Authority: | | | | | | | | | | | | |
| 4.000%, 07/01/2036 (Callable 07/01/2030) | | | | | | | | | | | | |
| (Insured by BAM) | | | 360,000 | | | | 377,145 | | | | | |
| 4.000%, 07/01/2037 (Callable 07/01/2030) | | | | | | | | | | | | |
| (Insured by BAM) | | | 500,000 | | | | 518,527 | | | | | |
| Black Belt Energy Gas District: | | | | | | | | | | | | |
| 5.000%, 06/01/2024 | | | 200,000 | | | | 201,115 | | | | | |
| 5.000%, 12/01/2024 | | | 375,000 | | | | 379,913 | | | | | |
| 5.000%, 12/01/2025 | | | 200,000 | | | | 205,759 | | | | | |
| 5.000%, 06/01/2026 | | | 250,000 | | | | 258,943 | | | | | |
| 5.000%, 12/01/2026 | | | 400,000 | | | | 418,123 | | | | | |
| 4.000%, 12/01/2049 (Callable 09/01/2025) | | | | | | | | | | | | |
(Mandatory Tender Date 12/01/2025)(1) | | | 625,000 | | | | 626,501 | | | | | |
| 3.430%, 10/01/2052 | | | | | | | | | | | | |
| (SIFMA Municipal Swap Index + 0.350%) | | | | | | | | | | | | |
| (Callable 09/01/2026) | | | | | | | | | | | | |
(Mandatory Tender Date 12/01/2026)(2) | | | 3,000,000 | | | | 2,926,610 | | | | | |
| 5.000%, 05/01/2053 | | | | | | | | | | | | |
(Mandatory Tender Date 06/01/2028)(1) | | | 12,500,000 | | | | 13,090,899 | | | | | |
| 5.500%, 11/01/2053 (Callable 09/01/2028) | | | | | | | | | | | | |
(Mandatory Tender Date 12/01/2028)(1) | | | 2,000,000 | | | | 2,135,294 | | | | | |
| Chatom Industrial Development Board, | | | | | | | | | | | | |
| 4.000%, 08/01/2037 | | | 4,000,000 | | | | 4,000,837 | | | | | |
| Chilton County Health Care Authority, | | | | | | | | | | | | |
| 4.000%, 11/01/2045 (Callable 11/01/2025) | | | 205,000 | | | | 203,184 | | | | | |
| City of Oxford AL, | | | | | | | | | | | | |
| 3.600%, 09/01/2041 (Callable 01/02/2024) | | | | | | | | | | | | |
(Optional Put Date 01/05/2024)(1) | | | 2,000,000 | | | | 2,000,000 | | | | | |
| City of Troy AL, | | | | | | | | | | | | |
| 5.000%, 07/01/2031 (Callable 07/01/2025) | | | | | | | | | | | | |
| (Insured by BAM) | | | 555,000 | | | | 570,917 | | | | | |
| County of Elmore AL: | | | | | | | | | | | | |
| 4.000%, 05/01/2024 (Insured by BAM) | | | 420,000 | | | | 420,800 | | | | | |
| 4.000%, 05/01/2025 (Insured by BAM) | | | 540,000 | | | | 544,486 | | | | | |
| 4.000%, 05/01/2026 (Insured by BAM) | | | 400,000 | | | | 406,619 | | | | | |
| 4.200%, 05/01/2042 (Callable 05/01/2032) | | | | | | | | | | | | |
| (Insured by BAM) | | | 1,625,000 | | | | 1,619,918 | | | | | |
| 5.000%, 05/01/2047 (Callable 05/01/2032) | | | | | | | | | | | | |
| (Insured by BAM) | | | 1,000,000 | | | | 1,069,475 | | | | | |
| County of Jefferson AL: | | | | | | | | | | | | |
| 0.000%, 10/01/2025 (Callable 01/19/2024) | | | | | | | | | | | | |
| (Insured by AGM) | | | 1,000,000 | | | | 919,000 | | | | | |
| 5.000%, 09/15/2029 (Callable 03/15/2027) | | | 570,000 | | | | 611,682 | | | | | |
| 0.000%, 10/01/2034 (Callable 01/19/2024) | | | | | | | | | | | | |
| (Insured by AGM) | | | 480,000 | | | | 250,320 | | | | | |
| 5.250%, 10/01/2048 (Callable 01/19/2024) | | | | | | | | | | | | |
| (Insured by AGM) | | | 125,000 | | | | 126,934 | | | | | |
| Health Care Authority | | | | | | | | | | | | |
| of the City of Huntsville, | | | | | | | | | | | | |
| 5.000%, 06/01/2053 (Callable 03/01/2030) | | | | | | | | | | | | |
(Mandatory Tender Date 06/01/2030)(1) | | | 5,225,000 | | | | 5,810,019 | | | | | |
| Homewood Educational Building Authority: | | | | | | | | | | | | |
| 4.000%, 12/01/2033 (Callable 12/01/2029) | | | 785,000 | | | | 805,425 | | | | | |
| 4.000%, 12/01/2034 (Callable 12/01/2029) | | | 255,000 | | | | 261,169 | | | | | |
| Industrial Development Board | | | | | | | | | | | | |
| of the City of Mobile, | | | | | | | | | | | | |
| 3.920%, 06/01/2034 | | | | | | | | | | | | |
(Mandatory Tender Date 06/02/2026)(1) | | | 13,000,000 | | | | 13,170,487 | | | | | |
| Jefferson County Board of Education, | | | | | | | | | | | | |
| 5.000%, 02/01/2042 (Callable 02/01/2028) | | | 825,000 | | | | 869,882 | | | | | |
| Madison Water & Wastewater Board, | | | | | | | | | | | | |
| 4.000%, 12/01/2037 (Callable 12/01/2029) | | | 530,000 | | | | 544,952 | | | | | |
| Southeast Energy Authority A | | | | | | | | | | | | |
| Cooperative District: | | | | | | | | | | | | |
| 5.000%, 07/01/2025 | | | 650,000 | | | | 661,134 | | | | | |
| 5.500%, 01/01/2053 (Callable 09/01/2029) | | | | | | | | | | | | |
(Mandatory Tender Date 12/01/2029)(1) | | | 7,000,000 | | | | 7,601,020 | | | | | |
| 5.000%, 05/01/2053 (Callable 05/01/2028) | | | | | | | | | | | | |
(Mandatory Tender Date 08/01/2028)(1) | | | 2,000,000 | | | | 2,090,132 | | | | | |
| 5.000%, 01/01/2054 (Callable 03/01/2030) | | | | | | | | | | | | |
(Mandatory Tender Date 06/01/2030)(1) | | | 2,750,000 | | | | 2,935,150 | | | | | |
| 5.250%, 01/01/2054 (Callable 04/01/2029) | | | | | | | | | | | | |
(Mandatory Tender Date 07/01/2029)(1) | | | 10,490,000 | | | | 11,163,401 | | | | | |
| Tallassee Board of Education: | | | | | | | | | | | | |
| 4.000%, 08/01/2030 (Insured by AGM) | | | 435,000 | | | | 463,183 | | | | | |
| 4.000%, 08/01/2031 (Callable 08/01/2030) | | | | | | | | | | | | |
| (Insured by AGM) | | | 455,000 | | | | 481,301 | | | | | |
| 4.000%, 08/01/2032 (Callable 08/01/2030) | | | | | | | | | | | | |
| (Insured by AGM) | | | 470,000 | | | | 492,537 | | | | | |
| Total Alabama | | | | | | | | | | | | |
| (Cost $101,444,321) | | | | | | | 101,983,952 | | | | 3.4 | % |
| Alaska | | | | | | | | | | | | |
| Alaska Housing Finance Corp.: | | | | | | | | | | | | |
| 4.000%, 06/01/2036 (Callable 06/01/2025) | | | 1,245,000 | | | | 1,250,575 | | | | | |
| 5.250%, 12/01/2041 (Callable 06/01/2033) | | | 5,375,000 | | | | 6,133,988 | | | | | |
| Alaska Industrial Development & | | | | | | | | | | | | |
| Export Authority: | | | | | | | | | | | | |
| 4.000%, 04/01/2030 (Callable 04/01/2029) | | | 2,745,000 | | | | 2,792,739 | | | | | |
| 4.000%, 10/01/2034 (Callable 10/01/2029) | | | 1,585,000 | | | | 1,625,713 | | | | | |
| University of Alaska, | | | | | | | | | | | | |
| 4.000%, 10/01/2026 (Callable 01/29/2024) | | | 650,000 | | | | 650,363 | | | | | |
| Total Alaska | | | | | | | | | | | | |
| (Cost $12,216,408) | | | | | | | 12,453,378 | | | | 0.4 | % |
| Arizona | | | | | | | | | | | | |
| Apache County Unified School District No. 8, | | | | | | | | | | | | |
| 4.125%, 07/01/2042 (Callable 07/01/2032) | | | 1,625,000 | | | | 1,644,036 | | | | | |
| Arizona Industrial Development Authority: | | | | | | | | | | | | |
| 5.000%, 05/01/2028 | | | 270,000 | | | | 162,000 | | | | | |
4.625%, 08/01/2028(3) | | | 1,160,000 | | | | 1,128,035 | | | | | |
| 3.550%, 07/15/2029 (Callable 07/15/2027) | | | 1,005,000 | | | | 976,832 | | | | | |
| 1.745%, 09/01/2030 | | | | | | | | | | | | |
(Insured by AGM)(1)(3) | | | 8,000,000 | | | | 7,552,787 | | | | | |
The accompanying notes are an integral part of these financial statements.
Baird Core Intermediate Municipal Bond Fund
Schedule of Investments, December 31, 2023
Long-Term Investments (cont.)
| | | Principal | | | | | | % of | |
| | | Amount | | | Value | | | Net Assets | |
| Arizona Industrial | | | | | | | | | |
| Development Authority: (cont.) | | | | | | | | | |
| 5.000%, 07/01/2031 (Callable 07/01/2027) | | | | | | | | | |
| (Insured by SD CRED PROG) | | $ | 515,000 | | | $ | 541,539 | | | | |
| 5.000%, 07/01/2032 (Callable 07/01/2027) | | | | | | | | | | | |
| (Insured by SD CRED PROG) | | | 545,000 | | | | 572,309 | | | | |
| 5.000%, 07/01/2032 (Callable 07/01/2026) | | | 205,000 | | | | 212,557 | | | | |
| 3.625%, 05/20/2033 | | | 6,011,358 | | | | 5,690,725 | | | | |
| 5.000%, 07/01/2033 (Callable 07/01/2027) | | | | | | | | | | | |
| (Insured by SD CRED PROG) | | | 575,000 | | | | 603,011 | | | | |
| 5.000%, 07/01/2033 (Callable 07/01/2026) | | | 340,000 | | | | 352,191 | | | | |
| 4.000%, 07/01/2034 (Callable 07/01/2026) | | | 230,000 | | | | 231,845 | | | | |
| 4.000%, 07/01/2035 (Callable 07/01/2026) | | | 475,000 | | | | 478,245 | | | | |
| 5.250%, 11/01/2048 (Callable 11/01/2032) | | | 1,500,000 | | | | 1,621,389 | | | | |
| BluePath TE Trust, | | | | | | | | | | | |
| 2.750%, 09/01/2026 | | | | | | | | | | | |
(Callable 01/29/2024)(3) | | | 1,742,500 | | | | 1,694,756 | | | | |
| Chandler Industrial Development Authority, | | | | | | | | | | | |
| 5.000%, 06/01/2049 | | | | | | | | | | | |
(Mandatory Tender Date 06/03/2024)(1) | | | 1,500,000 | | | | 1,502,915 | | | | |
| City of Phoenix Civic Improvement Corp.: | | | | | | | | | | | |
| 5.000%, 07/01/2028 | | | 1,800,000 | | | | 1,947,646 | | | | |
| 5.000%, 07/01/2035 (Callable 07/01/2025) | | | 2,450,000 | | | | 2,507,340 | | | | |
| 5.250%, 07/01/2047 (Callable 07/01/2033) | | | 1,000,000 | | | | 1,145,578 | | | | |
| City of Tucson AZ, | | | | | | | | | | | |
| 5.000%, 07/01/2032 (Callable 07/01/2025) | | | 500,000 | | | | 515,952 | | | | |
| Industrial Development Authority | | | | | | | | | | | |
| of the City of Phoenix, | | | | | | | | | | | |
| 4.000%, 10/01/2047 (Callable 10/01/2026) | | | 115,000 | | | | 109,060 | | | | |
| La Paz County Industrial | | | | | | | | | | | |
| Development Authority, | | | | | | | | | | | |
5.000%, 02/15/2026(3) | | | 330,000 | | | | 333,543 | | | | |
| Maricopa County & Phoenix | | | | | | | | | | | |
| Industrial Development Authorities: | | | | | | | | | | | |
| 5.450%, 09/01/2048 (Callable 09/01/2032) | | | | | | | | | | | |
| (Insured by GNMA) | | | 750,000 | | | | 806,431 | | | | |
| 5.550%, 09/01/2054 (Callable 09/01/2032) | | | | | | | | | | | |
| (Insured by GNMA) | | | 1,000,000 | | | | 1,064,644 | | | | |
| Maricopa County Industrial | | | | | | | | | | | |
| Development Authority: | | | | | | | | | | | |
| 5.000%, 07/01/2028 | | | | | | | | | | | |
| (Insured by SD CRED PROG) | | | 755,000 | | | | 808,404 | | | | |
| 5.000%, 01/01/2040 | | | | | | | | | | | |
| (Pre-refunded to 01/01/2025) | | | 3,740,000 | | | | 3,864,863 | | | | |
| 4.000%, 01/01/2045 (Callable 07/01/2030) | | | 7,000,000 | | | | 6,909,771 | | | | |
| Salt River Project Agricultural | | | | | | | | | | | |
| Improvement & Power District: | | | | | | | | | | | |
| 5.000%, 01/01/2048 (Callable 01/01/2034) | | | 4,500,000 | | | | 5,075,195 | | | | |
| 5.250%, 01/01/2053 (Callable 01/01/2034) | | | 11,000,000 | | | | 12,567,437 | | | | |
| Tucson Industrial Development Authority, | | | | | | | | | | | |
| 4.850%, 07/01/2048 (Callable 07/01/2032) | | | | | | | | | | | |
| (Insured by GNMA) | | | 675,000 | | | | 692,598 | | | | |
| Total Arizona | | | | | | | | | | | |
| (Cost $61,688,864) | | | | | | | 63,313,634 | | | | 2.1 | % |
| Arkansas | | | | | | | | | | | | |
| Arkadelphia Water & Sewer System, | | | | | | | | | | | | |
| 4.750%, 12/01/2043 (Callable 06/01/2029) | | | | | | | | | | | | |
| (Insured by BAM) | | | 1,210,000 | | | | 1,268,369 | | | | | |
| Arkansas Development Finance Authority: | | | | | | | | | | | | |
| 4.000%, 12/01/2031 (Callable 12/01/2027) | | | 380,000 | | | | 392,554 | | | | | |
| 4.000%, 12/01/2032 (Callable 12/01/2027) | | | 400,000 | | | | 413,814 | | | | | |
| 4.000%, 12/01/2035 (Callable 12/01/2027) | | | 445,000 | | | | 457,100 | | | | | |
| 4.000%, 12/01/2038 (Callable 12/01/2027) | | | 250,000 | | | | 251,862 | | | | | |
| 4.250%, 07/01/2041 | | | | | | | | | | | | |
| (Callable 07/01/2028) | | | 500,000 | | | | 460,595 | | | | | |
| 6.875%, 07/01/2048 | | | | | | | | | | | | |
(Callable 07/01/2028)(3) | | | 1,000,000 | | | | 1,047,161 | | | | | |
| Arkansas Technical University, | | | | | | | | | | | | |
| 4.000%, 06/01/2028 (Callable 01/29/2024) | | | 1,025,000 | | | | 1,025,792 | | | | | |
| Benton Washington Regional | | | | | | | | | | | | |
| Public Water Authority: | | | | | | | | | | | | |
| 4.000%, 10/01/2033 (Callable 10/01/2029) | | | | | | | | | | | | |
| (Insured by BAM) | | | 250,000 | | | | 262,788 | | | | | |
| 3.000%, 10/01/2041 (Callable 10/01/2028) | | | | | | | | | | | | |
| (Insured by BAM) | | | 510,000 | | | | 451,977 | | | | | |
| Carroll-Boone Water District: | | | | | | | | | | | | |
| 3.000%, 12/01/2028 (Callable 12/01/2025) | | | 780,000 | | | | 778,670 | | | | | |
| 3.000%, 12/01/2029 (Callable 12/01/2025) | | | 505,000 | | | | 504,008 | | | | | |
| 3.000%, 12/01/2030 (Callable 12/01/2025) | | | 630,000 | | | | 630,238 | | | | | |
| City of Beebe AR, | | | | | | | | | | | | |
| 3.000%, 08/01/2041 (Callable 08/01/2028) | | | | | | | | | | | | |
| (Insured by AGM) | | | 1,500,000 | | | | 1,313,200 | | | | | |
| City of Cabot AR, | | | | | | | | | | | | |
| 3.000%, 12/01/2056 (Callable 12/01/2028) | | | 2,000,000 | | | | 1,724,321 | | | | | |
| City of Fayetteville AR, | | | | | | | | | | | | |
| 3.050%, 01/01/2047 (Callable 01/01/2027) | | | 560,000 | | | | 547,562 | | | | | |
| City of Fort Smith AR, | | | | | | | | | | | | |
| 5.000%, 10/01/2034 (Callable 10/01/2028) | | | 255,000 | | | | 276,896 | | | | | |
| City of Heber Springs AR, | | | | | | | | | | | | |
| 3.000%, 11/01/2034 (Callable 11/01/2024) | | | | | | | | | | | | |
| (Insured by BAM) | | | 685,000 | | | | 655,345 | | | | | |
| City of Maumelle AR: | | | | | | | | | | | | |
| 4.000%, 08/01/2026 (Callable 08/01/2025) | | | 25,000 | | | | 25,240 | | | | | |
| 4.000%, 08/01/2028 (Callable 08/01/2025) | | | 290,000 | | | | 293,015 | | | | | |
| 4.000%, 08/01/2029 (Callable 08/01/2025) | | | 700,000 | | | | 707,042 | | | | | |
| City of Pine Bluff AR, | | | | | | | | | | | | |
| 3.000%, 02/01/2047 (Callable 08/01/2027) | | | | | | | | | | | | |
| (Insured by BAM) | | | 565,000 | | | | 545,118 | | | | | |
| City of Springdale AR, | | | | | | | | | | | | |
| 5.000%, 08/01/2038 (Callable 02/01/2030) | | | | | | | | | | | | |
| (Insured by BAM) | | | 240,000 | | | | 263,508 | | | | | |
| City of West Memphis AR, | | | | | | | | | | | | |
| 3.000%, 12/01/2041 (Callable 12/01/2028) | | | | | | | | | | | | |
| (Insured by BAM) | | | 1,750,000 | | | | 1,527,318 | | | | | |
| Conway Health Facilities Board, | | | | | | | | | | | | |
| 5.000%, 08/01/2029 (Callable 08/01/2026) | | | 360,000 | | | | 373,987 | | | | | |
| County of Madison AR, | | | | | | | | | | | | |
| 4.250%, 12/01/2058 (Callable 12/01/2030) | | | 3,395,000 | | | | 3,483,306 | | | | | |
| Jackson County Special School District, | | | | | | | | | | | | |
| 1.500%, 02/01/2024 (Callable 01/29/2024) | | | | | | | | | | | | |
| (Insured by ST AID) | | | 60,000 | | | | 59,878 | | | | | |
| National Park College District, | | | | | | | | | | | | |
| 3.000%, 05/01/2025 (Callable 11/01/2024) | | | 235,000 | | | | 233,404 | | | | | |
| Salem Public Water Authority: | | | | | | | | | | | | |
| 5.000%, 01/01/2028 (Insured by BAM) | | | 120,000 | | | | 129,726 | | | | | |
| 3.000%, 01/01/2030 (Callable 01/01/2028) | | | | | | | | | | | | |
| (Insured by BAM) | | | 340,000 | | | | 339,182 | | | | | |
| 3.000%, 01/01/2032 (Callable 01/01/2028) | | | | | | | | | | | | |
| (Insured by BAM) | | | 255,000 | | | | 251,060 | | | | | |
| Southern Arkansas University: | | | | | | | | | | | | |
| 4.000%, 03/01/2025 (Insured by AGM) | | | 415,000 | | | | 419,571 | | | | | |
| 4.000%, 03/01/2026 (Callable 03/01/2025) | | | | | | | | | | | | |
| (Insured by AGM) | | | 520,000 | | | | 525,493 | | | | | |
| 4.000%, 03/01/2026 (Callable 03/01/2025) | | | | | | | | | | | | |
| (Insured by AGM) | | | 270,000 | | | | 273,038 | | | | | |
The accompanying notes are an integral part of these financial statements.
Baird Core Intermediate Municipal Bond Fund
Schedule of Investments, December 31, 2023
Long-Term Investments (cont.)
| | | Principal | | | | | | % of | |
| | | Amount | | | Value | | | Net Assets | |
| Southern Arkansas University: (cont.) | | | | | | | | | |
| 4.000%, 03/01/2027 (Callable 03/01/2025) | | | | | | | | | |
| (Insured by AGM) | | $ | 545,000 | | | $ | 551,049 | | | | |
| University of Central Arkansas: | | | | | | | | | | | |
| 4.000%, 11/01/2027 (Callable 11/01/2025) | | | | | | | | | | | |
| (Insured by BAM) | | | 340,000 | | | | 343,439 | | | | |
| 4.000%, 11/01/2028 (Callable 11/01/2025) | | | | | | | | | | | |
| (Insured by BAM) | | | 250,000 | | | | 252,729 | | | | |
| Total Arkansas | | | | | | | | | | | |
| (Cost $24,130,760) | | | | | | | 23,059,355 | | | | 0.8 | % |
| California | | | | | | | | | | | | |
| Acalanes Union High School District: | | | | | | | | | | | | |
0.000%, 08/01/2028(5) | | | 130,000 | | | | 138,561 | | | | | |
| 0.000%, 08/01/2035 | | | | | | | | | | | | |
(Callable 08/01/2029)(5) | | | 490,000 | | | | 563,802 | | | | | |
| 0.000%, 08/01/2039 | | | | | | | | | | | | |
(Callable 08/01/2029)(5) | | | 350,000 | | | | 395,076 | | | | | |
| Alameda Corridor Transportation Authority, | | | | | | | | | | | | |
| 5.000%, 10/01/2037 (Callable 10/01/2026) | | | 500,000 | | | | 514,487 | | | | | |
| Alisal Union School District, | | | | | | | | | | | | |
| 4.000%, 05/01/2036 (Callable 05/01/2029) | | | | | | | | | | | | |
| (Insured by BAM) | | | 650,000 | | | | 675,055 | | | | | |
| Anaheim Public Financing Authority, | | | | | | | | | | | | |
| 0.000%, 09/01/2031 (Insured by AGM) | | | 2,500,000 | | | | 1,962,167 | | | | | |
| Antelope Valley Community College District: | | | | | | | | | | | | |
| 0.000%, 08/01/2029 | | | 650,000 | | | | 555,452 | | | | | |
| 0.000%, 08/01/2031 | | | 1,000,000 | | | | 803,172 | | | | | |
| Bay Area Toll Authority: | | | | | | | | | | | | |
| 4.180%, 04/01/2045 | | | | | | | | | | | | |
| (SIFMA Municipal Swap Index + 1.100%) | | | | | | | | | | | | |
| (Callable 01/29/2024) | | | | | | | | | | | | |
(Mandatory Tender Date 04/01/2024)(2) | | | 1,490,000 | | | | 1,490,143 | | | | | |
| 4.180%, 04/01/2045 | | | | | | | | | | | | |
| (SIFMA Municipal Swap Index + 1.100%) | | | | | | | | | | | | |
| (Callable 01/29/2024) | | | | | | | | | | | | |
(Mandatory Tender Date 04/01/2024)(2) | | | 3,500,000 | | | | 3,500,335 | | | | | |
| Burbank Unified School District, | | | | | | | | | | | | |
| 4.530%, 02/01/2038 | | | | | | | | | | | | |
(Callable 08/01/2028)(5) | | | 210,000 | | | | 221,817 | | | | | |
| California Community | | | | | | | | | | | | |
| Choice Financing Authority, | | | | | | | | | | | | |
| 5.250%, 01/01/2054 (Callable 10/01/2030) | | | | | | | | | | | | |
(Mandatory Tender Date 10/01/2031)(1) | | | 7,325,000 | | | | 7,748,540 | | | | | |
| California Housing Finance Agency: | | | | | | | | | | | | |
| 3.750%, 03/25/2035 (Insured by FHLMC) | | | 4,372,052 | | | | 4,319,971 | | | | | |
| 5.000%, 05/01/2054 (Callable 09/01/2026) | | | | | | | | | | | | |
(Mandatory Tender Date 11/01/2026)(1) | | | 4,600,000 | | | | 4,815,774 | | | | | |
| 3.600%, 08/01/2063 (Callable 02/01/2026) | | | | | | | | | | | | |
| (Mandatory Tender Date 08/01/2026) | | | | | | | | | | | | |
(Insured by FHA)(1) | | | 1,500,000 | | | | 1,500,576 | | | | | |
| California Infrastructure & | | | | | | | | | | | | |
| Economic Development Bank: | | | | | | | | | | | | |
| 3.430%, 08/01/2047 | | | | | | | | | | | | |
| (SIFMA Municipal Swap Index + 0.350%) | | | | | | | | | | | | |
| (Callable 01/19/2024) | | | | | | | | | | | | |
(Mandatory Tender Date 08/01/2024)(2) | | | 360,000 | | | | 357,633 | | | | | |
| 3.780%, 12/01/2050 | | | | | | | | | | | | |
| (SIFMA Municipal Swap Index + 0.700%) | | | | | | | | | | | | |
| (Callable 06/01/2025) | | | | | | | | | | | | |
(Mandatory Tender Date 06/01/2026)(2) | | | 250,000 | | | | 243,603 | | | | | |
| California Municipal Finance Authority: | | | | | | | | | | | | |
5.000%, 08/01/2024(3) | | | 400,000 | | | | 400,661 | | | | | |
| 5.000%, 10/01/2026 | | | 300,000 | | | | 313,330 | | | | | |
| 2.125%, 11/15/2026 | | | | | | | | | | | | |
| (Callable 01/19/2024) | | | 1,640,000 | | | | 1,630,259 | | | | | |
| 5.000%, 05/15/2031 (Insured by BAM) | | | 470,000 | | | | 528,369 | | | | | |
| 5.000%, 05/15/2036 (Callable 11/15/2028) | | | | | | | | | | | | |
| (Insured by BAM) | | | 1,000,000 | | | | 1,073,137 | | | | | |
| 1.300%, 02/01/2039 | | | | | | | | | | | | |
(Mandatory Tender Date 02/03/2025)(1)(3) | | | 1,500,000 | | | | 1,457,463 | | | | | |
| 4.000%, 05/15/2039 (Callable 05/15/2031) | | | | | | | | | | | | |
| (Insured by BAM) | | | 175,000 | | | | 176,689 | | | | | |
| 5.000%, 08/15/2040 (Callable 08/15/2031) | | | 320,000 | | | | 342,383 | | | | | |
| 5.000%, 08/15/2041 (Callable 08/15/2031) | | | 335,000 | | | | 357,080 | | | | | |
| 5.000%, 08/15/2042 (Callable 08/15/2031) | | | 230,000 | | | | 244,121 | | | | | |
| 5.000%, 08/15/2043 (Callable 08/15/2031) | | | 370,000 | | | | 391,596 | | | | | |
| 5.250%, 08/15/2053 (Callable 08/15/2031) | | | 900,000 | | | | 946,966 | | | | | |
| California Public Finance Authority: | | | | | | | | | | | | |
| 2.125%, 11/15/2027 | | | | | | | | | | | | |
(Callable 01/19/2024)(3) | | | 2,390,000 | | | | 2,387,768 | | | | | |
| 2.375%, 11/15/2028 | | | | | | | | | | | | |
(Callable 01/19/2024)(3) | | | 3,385,000 | | | | 3,374,914 | | | | | |
| 3.125%, 05/15/2029 | | | | | | | | | | | | |
(Callable 01/19/2024)(3) | | | 2,510,000 | | | | 2,470,280 | | | | | |
| California State University, | | | | | | | | | | | | |
| 3.125%, 11/01/2051 (Callable 05/01/2026) | | | | | | | | | | | | |
(Mandatory Tender Date 11/01/2026)(1) | | | 5,000,000 | | | | 5,046,570 | | | | | |
| California Statewide Communities | | | | | | | | | | | | |
| Development Authority: | | | | | | | | | | | | |
| 5.000%, 09/01/2026 (Callable 03/01/2024) | | | | | | | | | | | | |
| (Mandatory Tender Date 09/01/2024) | | | | | | | | | | | | |
(Insured by HUD)(1)(3) | | | 5,150,000 | | | | 5,153,176 | | | | | |
| 5.000%, 04/01/2037 (Callable 04/01/2030) | | | | | | | | | | | | |
| (Insured by CA MTG) | | | 350,000 | | | | 388,560 | | | | | |
| 5.000%, 04/01/2038 (Callable 04/01/2030) | | | | | | | | | | | | |
| (Insured by CA MTG) | | | 400,000 | | | | 440,635 | | | | | |
| Chawanakee Unified School District, | | | | | | | | | | | | |
4.000%, 08/01/2026 (Insured by BAM)(5) | | | 110,000 | | | | 113,478 | | | | | |
| City & County of San Francisco CA, | | | | | | | | | | | | |
| 4.000%, 06/15/2039 (Callable 06/15/2028) | | | 1,080,000 | | | | 1,106,734 | | | | | |
| City of Palo Alto CA, | | | | | | | | | | | | |
| 5.000%, 11/01/2036 (Callable 11/01/2028) | | | 1,295,000 | | | | 1,436,977 | | | | | |
| City of San Mateo CA, | | | | | | | | | | | | |
| 5.250%, 09/01/2040 (Callable 09/01/2032) | | | | | | | | | | | | |
| (Insured by BAM) | | | 1,250,000 | | | | 1,377,027 | | | | | |
| City of Vernon CA: | | | | | | | | | | | | |
| 5.000%, 04/01/2024 | | | 2,000,000 | | | | 2,006,473 | | | | | |
| 5.000%, 08/01/2024 | | | 700,000 | | | | 705,662 | | | | | |
| 5.000%, 10/01/2025 | | | 2,250,000 | | | | 2,298,034 | | | | | |
| Compton Community College District, | | | | | | | | | | | | |
| 0.000%, 08/01/2034 | | | 450,000 | | | | 320,882 | | | | | |
| Cypress School District, | | | | | | | | | | | | |
| 0.000%, 08/01/2050 | | | | | | | | | | | | |
(Callable 08/01/2036)(5) | | | 230,000 | | | | 209,684 | | | | | |
| Denair Unified School District, | | | | | | | | | | | | |
6.500%, 08/01/2031 (Insured by AGM)(5) | | | 130,000 | | | | 157,966 | | | | | |
| Enterprise Elementary School District, | | | | | | | | | | | | |
| 6.200%, 08/01/2035 | | | | | | | | | | | | |
(Callable 08/01/2031)(5) | | | 155,000 | | | | 192,936 | | | | | |
| Freddie Mac Multifamily ML Certificates, | | | | | | | | | | | | |
4.000%, 01/25/2040(5) | | | 5,472,546 | | | | 4,942,458 | | | | | |
| Freddie Mac Multifamily | | | | | | | | | | | | |
| Variable Rate Certificate, | | | | | | | | | | | | |
| 2.875%, 07/25/2036 | | | 7,300,233 | | | | 6,433,333 | | | | | |
The accompanying notes are an integral part of these financial statements.
Baird Core Intermediate Municipal Bond Fund
Schedule of Investments, December 31, 2023
Long-Term Investments (cont.)
| | | Principal | | | | | | % of | |
| | | Amount | | | Value | | | Net Assets | |
| Hueneme Elementary School District, | | | | | | | | | |
| 4.000%, 08/01/2037 (Callable 08/01/2028) | | | | | | | | | |
| (Insured by AGM) | | $ | 500,000 | | | $ | 513,176 | | | |
| |
| Indio Finance Authority, | | | | | | | | | | | | |
| 5.250%, 11/01/2042 (Callable 11/01/2032) | | | | | | | | | | | | |
| (Insured by BAM) | | | 1,000,000 | | | | 1,160,674 | | | | | |
| Inglewood Unified School District | | | | | | | | | | | | |
| School Facilities Financing Authority, | | | | | | | | | | | | |
| 5.250%, 10/15/2026 (Insured by AGM) | | | 2,265,000 | | | | 2,330,941 | | | | | |
| King Union School District, | | | | | | | | | | | | |
| 0.000%, 08/01/2028 (Insured by AMBAC) | | | 400,000 | | | | 345,497 | | | | | |
| Long Beach Bond Finance Authority, | | | | | | | | | | | | |
| 5.000%, 11/15/2029 | | | 50,000 | | | | 53,717 | | | | | |
| Los Angeles County Development Authority, | | | | | | | | | | | | |
| 3.750%, 12/01/2046 (Callable 02/01/2026) | | | | | | | | | | | | |
| (Mandatory Tender Date 12/01/2026) | | | | | | | | | | | | |
(Insured by HUD)(1) | | | 1,100,000 | | | | 1,107,977 | | | | | |
| Manteca Unified School District, | | | | | | | | | | | | |
| 0.000%, 09/01/2025 (Insured by NATL) | | | 225,000 | | | | 213,174 | | | | | |
| Mayers Memorial Hospital District: | | | | | | | | | | | | |
| 0.000%, 08/01/2027 | | | 260,000 | | | | 223,195 | | | | | |
| 0.000%, 08/01/2028 | | | 290,000 | | | | 239,219 | | | | | |
| Modesto High School District, | | | | | | | | | | | | |
| 0.000%, 08/01/2024 (Insured by NATL) | | | 3,625,000 | | | | 3,558,440 | | | | | |
| Morongo Unified School District, | | | | | | | | | | | | |
| 0.000%, 08/01/2041 | | | | | | | | | | | | |
(Callable 08/01/2030)(5) | | | 140,000 | | | | 143,260 | | | | | |
| Mount San Antonio | | | | | | | | | | | | |
| Community College District, | | | | | | | | | | | | |
| 0.000%, 08/01/2043 | | | | | | | | | | | | |
(Callable 08/01/2035)(5) | | | 745,000 | | | | 742,555 | | | | | |
| Mountain Empire Unified School District, | | | | | | | | | | | | |
| 6.250%, 08/01/2048 (Callable 08/01/2032) | | | | | | | | | | | | |
| (Insured by BAM) | | | 500,000 | | | | 589,133 | | | | | |
| Newman-Crows Landing | | | | | | | | | | | | |
| Unified School District, | | | | | | | | | | | | |
| 0.000%, 08/01/2025 | | | 1,850,000 | | | | 1,755,144 | | | | | |
| Palomar Community College District, | | | | | | | | | | | | |
| 0.000%, 08/01/2039 | | | | | | | | | | | | |
(Callable 08/01/2035)(5) | | | 740,000 | | | | 874,519 | | | | | |
| Peralta Community College District, | | | | | | | | | | | | |
| 3.500%, 08/01/2033 (Callable 08/01/2025) | | | 1,325,000 | | | | 1,335,579 | | | | | |
| Perris Union High School District: | | | | | | | | | | | | |
| 3.000%, 09/01/2037 (Callable 09/01/2029) | | | 800,000 | | | | 751,730 | | | | | |
| 3.000%, 09/01/2039 (Callable 09/01/2029) | | | 775,000 | | | | 708,666 | | | | | |
| Rio Hondo Community College District: | | | | | | | | | | | | |
| 0.000%, 08/01/2042 | | | | | | | | | | | | |
(Callable 08/01/2034)(5) | | | 230,000 | | | | 287,876 | | | | | |
| 0.000%, 08/01/2042 | | | | | | | | | | | | |
(Callable 08/01/2034)(5) | | | 1,420,000 | | | | 1,803,765 | | | | | |
| River Islands Public Financing Authority: | | | | | | | | | | | | |
| 4.000%, 09/01/2038 (Callable 09/01/2030) | | | | | | | | | | | | |
| (Insured by AGM) | | | 200,000 | | | | 209,627 | | | | | |
| 4.250%, 09/01/2042 (Callable 09/01/2029) | | | | | | | | | | | | |
| (Insured by AGM) | | | 1,000,000 | | | | 1,025,042 | | | | | |
| 5.000%, 09/01/2042 (Callable 09/01/2029) | | | | | | | | | | | | |
| (Insured by AGM) | | | 3,250,000 | | | | 3,591,546 | | | | | |
| 4.250%, 09/01/2043 (Callable 09/01/2030) | | | | | | | | | | | | |
| (Insured by AGM) | | | 1,500,000 | | | | 1,554,167 | | | | | |
| 4.250%, 09/01/2043 (Callable 09/01/2030) | | | | | | | | | | | | |
| (Insured by AGM) | | | 660,000 | | | | 683,833 | | | | | |
| 4.500%, 09/01/2047 (Callable 09/01/2029) | | | | | | | | | | | | |
| (Insured by AGM) | | | 1,250,000 | | | | 1,295,532 | | | | | |
| 4.500%, 09/01/2048 (Callable 09/01/2030) | | | | | | | | | | | | |
| (Insured by AGM) | | | 850,000 | | | | 885,460 | | | | | |
| Sacramento City Unified School District: | | | | | | | | | | | | |
| 5.000%, 07/01/2025 (Callable 07/01/2024) | | | 505,000 | | | | 509,472 | | | | | |
| 5.500%, 08/01/2047 (Callable 08/01/2030) | | | | | | | | | | | | |
| (Insured by BAM) | | | 2,000,000 | | | | 2,250,080 | | | | | |
| San Jacinto Unified School District, | | | | | | | | | | | | |
| 3.000%, 09/01/2028 (Insured by BAM) | | | 265,000 | | | | 266,680 | | | | | |
| San Mateo Union High School District, | | | | | | | | | | | | |
| 0.000%, 09/01/2041 | | | | | | | | | | | | |
(Callable 09/01/2036)(5) | | | 6,050,000 | | | | 6,309,641 | | | | | |
| Saugus Union School District | | | | | | | | | | | | |
| Financing Authority: | | | | | | | | | | | | |
| 4.000%, 09/01/2032 (Callable 09/01/2027) | | | | | | | | | | | | |
| (Insured by BAM) | | | 600,000 | | | | 639,090 | | | | | |
| 4.000%, 09/01/2037 (Callable 09/01/2027) | | | | | | | | | | | | |
| (Insured by BAM) | | | 625,000 | | | | 647,669 | | | | | |
| Sierra Joint Community College | | | | | | | | | | | | |
| District School Facilities District No. 1, | | | | | | | | | | | | |
| 0.000%, 08/01/2031 (Insured by NATL) | | | 370,000 | | | | 294,963 | | | | | |
| Solano County Community College District, | | | | | | | | | | | | |
| 5.125%, 08/01/2041 | | | | | | | | | | | | |
(Callable 08/01/2028)(5) | | | 655,000 | | | | 721,777 | | | | | |
| Southern Kern Unified School District, | | | | | | | | | | | | |
| 0.000%, 11/01/2034 (Insured by AGM) | | | 425,000 | | | | 300,390 | | | | | |
| Tulare Union High School District, | | | | | | | | | | | | |
| 0.000%, 08/01/2025 (Insured by NATL) | | | 1,745,000 | | | | 1,661,450 | | | | | |
| Tuolumne Utilities District, | | | | | | | | | | | | |
| 1.250%, 08/15/2024 (Callable 01/29/2024) | | | 7,520,000 | | | | 7,369,318 | | | | | |
| Washington Township Health Care District: | | | | | | | | | | | | |
| 4.125%, 08/01/2041 (Callable 08/01/2033) | | | | | | | | | | | | |
| (Insured by AGM) | | | 250,000 | | | | 260,657 | | | | | |
| 4.125%, 08/01/2042 (Callable 08/01/2033) | | | | | | | | | | | | |
| (Insured by AGM) | | | 300,000 | | | | 310,722 | | | | | |
| 4.250%, 08/01/2043 (Callable 08/01/2033) | | | | | | | | | | | | |
| (Insured by AGM) | | | 275,000 | | | | 286,495 | | | | | |
| 4.250%, 08/01/2045 (Callable 08/01/2033) | | | | | | | | | | | | |
| (Insured by AGM) | | | 400,000 | | | | 413,370 | | | | | |
| Waterford Unified School District, | | | | | | | | | | | | |
| 4.000%, 08/01/2042 (Callable 08/01/2032) | | | | | | | | | | | | |
| (Insured by BAM) | | | 1,455,000 | | | | 1,488,027 | | | | | |
| West Hills Community College District, | | | | | | | | | | | | |
| 5.100%, 08/01/2035 (Callable 08/01/2027) | | | | | | | | | | | | |
(Insured by AGM)(5) | | | 50,000 | | | | 53,899 | | | | | |
| Wiseburn School District, | | | | | | | | | | | | |
| 0.000%, 08/01/2036 (Callable 08/01/2031) | | | | | | | | | | | | |
(Insured by AGM)(5) | | | 80,000 | | | | 90,048 | | | | | |
| Woodlake Union High School District, | | | | | | | | | | | | |
| 0.000%, 08/01/2033 (Insured by AGM) | | | 1,880,000 | | | | 1,240,238 | | | | | |
| Yorba Linda Redevelopment | | | | | | | | | | | | |
| Agency Successor Agency, | | | | | | | | | | | | |
| 0.000%, 09/01/2028 (Insured by NATL) | | | 560,000 | | | | 471,487 | | | | | |
| Total California | | | | | | | | | | | | |
| (Cost $130,302,918) | | | | | | | 131,800,682 | | | | 4.4 | % |
| Colorado | | | | | | | | | | | | |
| Arkansas River Power Authority: | | | | | | | | | | | | |
| 5.000%, 10/01/2026 | | | 610,000 | | | | 626,603 | | | | | |
| 5.875%, 10/01/2026 | | | | | | | | | | | | |
| (ETM) (Insured by XLCA) | | | 3,510,000 | | | | 3,673,577 | | | | | |
| Bromley Park Metropolitan District No. 2: | | | | | | | | | | | | |
| 5.500%, 12/01/2038 (Callable 12/01/2033) | | | | | | | | | | | | |
| (Insured by BAM) | | | 200,000 | | | | 232,875 | | | | | |
The accompanying notes are an integral part of these financial statements.
Baird Core Intermediate Municipal Bond Fund
Schedule of Investments, December 31, 2023
Long-Term Investments (cont.)
| | | Principal | | | | | | % of | |
| | | Amount | | | Value | | | Net Assets | |
| Bromley Park Metropolitan | | | | | | | | | |
| District No. 2: (cont.) | | | | | | | | | |
| 5.500%, 12/01/2043 (Callable 12/01/2033) | | | | | | | | | |
| (Insured by BAM) | | $ | 250,000 | | | $ | 287,058 | | | |
| |
| 5.375%, 12/01/2053 (Callable 12/01/2033) | | | | | | | | | | | | |
| (Insured by BAM) | | | 1,000,000 | | | | 1,117,258 | | | | | |
| City & County of Denver CO: | | | | | | | | | | | | |
| 5.000%, 11/15/2026 | | | 4,700,000 | | | | 4,927,209 | | | | | |
| 5.250%, 11/15/2027 | | | 1,000,000 | | | | 1,080,428 | | | | | |
| 5.500%, 11/15/2027 (Callable 02/16/2024) | | | 1,500,000 | | | | 1,503,277 | | | | | |
| 5.000%, 12/01/2028 | | | 2,000,000 | | | | 2,168,721 | | | | | |
| 5.500%, 11/15/2029 | | | 1,905,000 | | | | 2,159,042 | | | | | |
| 0.000%, 08/01/2030 (Callable 08/01/2026) | | | 500,000 | | | | 390,783 | | | | | |
| 0.000%, 08/01/2032 (Callable 08/01/2026) | | | 365,000 | | | | 261,323 | | | | | |
| 5.500%, 11/15/2038 (Callable 11/15/2032) | | | 1,040,000 | | | | 1,204,161 | | | | | |
| City of Commerce City CO: | | | | | | | | | | | | |
| 5.000%, 12/15/2029 (Callable 12/15/2027) | | | | | | | | | | | | |
| (Insured by AGM) | | | 310,000 | | | | 337,483 | | | | | |
| 5.000%, 12/15/2030 (Callable 12/15/2027) | | | | | | | | | | | | |
| (Insured by AGM) | | | 500,000 | | | | 543,153 | | | | | |
| City of Fort Lupton CO: | | | | | | | | | | | | |
| 5.000%, 12/01/2029 (Callable 12/01/2027) | | | | | | | | | | | | |
| (Insured by AGM) | | | 250,000 | | | | 271,250 | | | | | |
| 5.000%, 12/01/2030 (Callable 12/01/2027) | | | | | | | | | | | | |
| (Insured by AGM) | | | 350,000 | | | | 379,343 | | | | | |
| Colorado Educational & | | | | | | | | | | | | |
| Cultural Facilities Authority: | | | | | | | | | | | | |
4.000%, 12/15/2025(3) | | | 845,000 | | | | 843,555 | | | | | |
3.750%, 07/01/2026(3) | | | 500,000 | | | | 494,661 | | | | | |
| 4.000%, 04/01/2028 | | | 735,000 | | | | 742,492 | | | | | |
| 4.000%, 05/01/2029 (Callable 05/01/2028) | | | 120,000 | | | | 120,393 | | | | | |
| 5.000%, 05/15/2029 (Callable 05/15/2026) | | | 2,455,000 | | | | 2,550,272 | | | | | |
| 5.000%, 06/01/2029 (Callable 06/01/2024) | | | 120,000 | | | | 120,874 | | | | | |
| 5.000%, 08/15/2030 (Callable 08/15/2024) | | | 1,110,000 | | | | 1,121,448 | | | | | |
| 2.000%, 09/01/2030 (Callable 09/01/2028) | | | | | | | | | | | | |
| (Insured by BAM) | | | 235,000 | | | | 218,720 | | | | | |
| 5.000%, 06/01/2031 (Callable 06/01/2024) | | | 40,000 | | | | 40,273 | | | | | |
| 4.000%, 07/01/2032 | | | 45,000 | | | | 47,607 | | | | | |
| 5.000%, 08/15/2034 (Callable 08/15/2024) | | | 1,000,000 | | | | 1,009,984 | | | | | |
| 4.000%, 07/01/2042 (Callable 07/01/2032) | | | 500,000 | | | | 500,560 | | | | | |
| Colorado Health Facilities Authority: | | | | | | | | | | | | |
| 5.000%, 08/01/2028 | | | 5,575,000 | | | | 6,013,904 | | | | | |
| 2.625%, 05/15/2029 (Callable 01/29/2024) | | | 3,545,000 | | | | 3,250,207 | | | | | |
| 5.000%, 12/01/2030 (Callable 06/01/2025) | | | 405,000 | | | | 410,188 | | | | | |
| 5.250%, 11/01/2035 (Callable 11/01/2032) | | | 1,100,000 | | | | 1,249,127 | | | | | |
| 5.000%, 08/01/2036 (Callable 08/01/2029) | | | 150,000 | | | | 161,749 | | | | | |
| 5.250%, 11/01/2036 (Callable 11/01/2032) | | | 1,160,000 | | | | 1,307,486 | | | | | |
| 4.000%, 10/01/2037 (Callable 10/01/2030) | | | 820,000 | | | | 831,604 | | | | | |
| 4.000%, 12/01/2042 (Callable 01/29/2024) | | | 375,000 | | | | 375,002 | | | | | |
| 4.000%, 01/15/2045 (Callable 01/15/2026) | | | 120,000 | | | | 114,665 | | | | | |
| 5.000%, 08/01/2049 (Callable 02/01/2025) | | | | | | | | | | | | |
(Mandatory Tender Date 08/01/2025)(1) | | | 2,000,000 | | | | 2,033,301 | | | | | |
| 3.630%, 05/15/2061 | | | | | | | | | | | | |
| (SIFMA Municipal Swap Index + 0.550%) | | | | | | | | | | | | |
| (Callable 02/17/2026) | | | | | | | | | | | | |
(Mandatory Tender Date 08/17/2026)(2) | | | 10,000,000 | | | | 9,921,685 | | | | | |
| 5.000%, 05/15/2062 (Callable 02/17/2026) | | | | | | | | | | | | |
(Mandatory Tender Date 08/17/2026)(1) | | | 4,175,000 | | | | 4,395,498 | | | | | |
| Colorado Housing & Finance Authority: | | | | | | | | | | | | |
| 4.000%, 05/01/2048 (Callable 11/01/2026) | | | | | | | | | | | | |
| (Insured by GNMA) | | | 140,000 | | | | 139,625 | | | | | |
| 4.250%, 11/01/2049 (Callable 11/01/2028) | | | | | | | | | | | | |
| (Insured by GNMA) | | | 1,305,000 | | | | 1,311,980 | | | | | |
| 5.250%, 11/01/2052 (Callable 11/01/2031) | | | | | | | | | | | | |
| (Insured by GNMA) | | | 3,835,000 | | | | 3,991,346 | | | | | |
| 6.000%, 11/01/2052 (Callable 11/01/2031) | | | | | | | | | | | | |
| (Insured by GNMA) | | | 185,000 | | | | 199,699 | | | | | |
| Colorado School of Mines, | | | | | | | | | | | | |
| 3.950%, 12/01/2025 | | | | | | | | | | | | |
| (SIFMA Municipal Swap Index + 0.870%) | | | | | | | | | | | | |
(Callable 06/01/2025)(2) | | | 4,855,000 | | | | 4,855,580 | | | | | |
| Colorado Water Resources & | | | | | | | | | | | | |
| Power Development Authority: | | | | | | | | | | | | |
| 5.500%, 09/01/2043 (Callable 09/01/2033) | | | | | | | | | | | | |
| (Insured by AGM) | | | 400,000 | | | | 462,076 | | | | | |
| 5.000%, 09/01/2048 (Callable 09/01/2033) | | | | | | | | | | | | |
| (Insured by AGM) | | | 300,000 | | | | 328,779 | | | | | |
| Crystal Valley Metropolitan District No. 2: | | | | | | | | | | | | |
| 4.000%, 12/01/2037 (Callable 12/01/2030) | | | | | | | | | | | | |
| (Insured by AGM) | | | 800,000 | | | | 834,575 | | | | | |
| 4.000%, 12/01/2038 (Callable 12/01/2030) | | | | | | | | | | | | |
| (Insured by AGM) | | | 1,000,000 | | | | 1,034,721 | | | | | |
| 4.000%, 12/01/2039 (Callable 12/01/2030) | | | | | | | | | | | | |
| (Insured by AGM) | | | 1,785,000 | | | | 1,834,046 | | | | | |
| Denver City & County Housing Authority, | | | | | | | | | | | | |
| 0.600%, 08/01/2024 (Insured by HUD) | | | 400,000 | | | | 393,492 | | | | | |
| Denver Health & Hospital Authority: | | | | | | | | | | | | |
| 5.000%, 12/01/2025 | | | 400,000 | | | | 410,621 | | | | | |
| 5.000%, 12/01/2027 | | | 340,000 | | | | 359,938 | | | | | |
| 4.000%, 12/01/2040 (Callable 12/01/2029) | | | 750,000 | | | | 701,019 | | | | | |
| 5.250%, 12/01/2045 (Callable 01/29/2024) | | | 485,000 | | | | 485,284 | | | | | |
| Denver Housing Authority, | | | | | | | | | | | | |
| 5.000%, 07/01/2027 (Callable 07/01/2026) | | | | | | | | | | | | |
| (Insured by HUD) | | | 3,750,000 | | | | 3,941,986 | | | | | |
| Denver Urban Renewal Authority, | | | | | | | | | | | | |
| 5.000%, 12/01/2025 (Callable 01/29/2024) | | | 200,000 | | | | 200,201 | | | | | |
| E-470 Public Highway Authority: | | | | | | | | | | | | |
| 0.000%, 09/01/2029 (Insured by NATL) | | | 2,550,000 | | | | 2,152,972 | | | | | |
| 0.000%, 09/01/2031 (Insured by NATL) | | | 3,500,000 | | | | 2,757,791 | | | | | |
| 3.961%, 09/01/2039 (SOFR + 0.350%) | | | | | | | | | | | | |
| (Callable 06/01/2024) | | | | | | | | | | | | |
(Mandatory Tender Date 09/01/2024)(2) | | | 1,000,000 | | | | 997,370 | | | | | |
| Fort Collins Housing Authority, | | | | | | | | | | | | |
| 1.250%, 07/01/2024 (Callable 01/19/2024) | | | 2,000,000 | | | | 1,975,409 | | | | | |
| Grand River Hospital District: | | | | | | | | | | | | |
| 5.250%, 12/01/2030 (Callable 12/01/2028) | | | | | | | | | | | | |
| (Insured by AGM) | | | 350,000 | | | | 383,817 | | | | | |
| 5.250%, 12/01/2031 (Callable 12/01/2028) | | | | | | | | | | | | |
| (Insured by AGM) | | | 1,190,000 | | | | 1,302,379 | | | | | |
| Gunnison County Crested | | | | | | | | | | | | |
| Butte Fire Protection District: | | | | | | | | | | | | |
| 4.000%, 12/01/2029 | | | 790,000 | | | | 843,376 | | | | | |
| 4.000%, 12/01/2030 | | | 820,000 | | | | 880,675 | | | | | |
| 4.000%, 12/01/2031 | | | 855,000 | | | | 922,354 | | | | | |
| 4.000%, 12/01/2032 | | | 890,000 | | | | 967,178 | | | | | |
| Midtown Clear Creek Metropolitan District, | | | | | | | | | | | | |
| 5.500%, 12/01/2043 (Callable 12/01/2033) | | | | | | | | | | | | |
| (Insured by BAM) | | | 425,000 | | | | 479,717 | | | | | |
| Prairie Center Metropolitan District No. 7, | | | | | | | | | | | | |
| 4.125%, 12/15/2036 (Callable 12/15/2025) | | | 275,000 | | | | 247,193 | | | | | |
| Ravenna Metropolitan District: | | | | | | | | | | | | |
| 5.000%, 12/01/2038 (Callable 12/01/2033) | | | | | | | | | | | | |
| (Insured by AGM) | | | 725,000 | | | | 804,456 | | | | | |
| 5.000%, 12/01/2043 (Callable 12/01/2033) | | | | | | | | | | | | |
| (Insured by AGM) | | | 1,650,000 | | | | 1,776,945 | | | | | |
The accompanying notes are an integral part of these financial statements.
Baird Core Intermediate Municipal Bond Fund
Schedule of Investments, December 31, 2023
Long-Term Investments (cont.)
| | | Principal | | | | | | % of | |
| | | Amount | | | Value | | | Net Assets | |
| Regional Transportation District: | | | | | | | | | |
| 5.000%, 01/15/2028 | | $ | 1,500,000 | | | $ | 1,586,409 | | | | |
| 5.000%, 01/15/2031 | | | 1,715,000 | | | | 1,881,346 | | | | |
| 5.000%, 11/01/2033 (Callable 11/01/2027) | | | 500,000 | | | | 541,462 | | | | |
| State of Colorado: | | | | | | | | | | | |
| 4.000%, 12/15/2037 (Callable 12/15/2028) | | | 705,000 | | | | 728,587 | | | | |
| 5.250%, 03/15/2042 (Callable 03/15/2027) | | | 1,535,000 | | | | 1,609,686 | | | | |
| Stetson Ridge Metropolitan District No. 3, | | | | | | | | | | | |
| 2.000%, 12/01/2030 (Insured by AGM) | | | 705,000 | | | | 654,823 | | | | |
| Vauxmont Metropolitan District: | | | | | | | | | | | |
| 5.000%, 12/15/2028 (Callable 12/15/2024) | | | | | | | | | | | |
| (Insured by AGM) | | | 125,000 | | | | 131,132 | | | | |
| 5.000%, 12/15/2029 (Callable 12/15/2024) | | | | | | | | | | | |
| (Insured by AGM) | | | 125,000 | | | | 131,095 | | | | |
| 5.000%, 12/15/2030 (Callable 12/15/2024) | | | | | | | | | | | |
| (Insured by AGM) | | | 125,000 | | | | 131,107 | | | | |
| 5.000%, 12/15/2031 (Callable 12/15/2024) | | | | | | | | | | | |
| (Insured by AGM) | | | 135,000 | | | | 141,570 | | | | |
| 3.250%, 12/15/2050 (Callable 12/15/2024) | | | | | | | | | | | |
| (Insured by AGM) | | | 4,670,000 | | | | 3,985,341 | | | | |
| Vista Ridge Metropolitan District: | | | | | | | | | | | |
| 5.000%, 12/01/2025 (Insured by BAM) | | | 600,000 | | | | 623,599 | | | | |
| 5.000%, 12/01/2026 (Insured by BAM) | | | 460,000 | | | | 489,520 | | | | |
| Total Colorado | | | | | | | | | | | |
| (Cost $109,739,438) | | | | | | | 109,651,076 | | | | 3.7 | % |
| Connecticut | | | | | | | | | | | | |
| Connecticut Housing Finance Authority: | | | | | | | | | | | | |
| 5.000%, 11/15/2026 | | | 395,000 | | | | 418,209 | | | | | |
| 5.000%, 05/15/2027 | | | 440,000 | | | | 470,168 | | | | | |
| 5.000%, 11/15/2027 | | | 445,000 | | | | 480,474 | | | | | |
| 5.000%, 05/15/2028 | | | 210,000 | | | | 228,585 | | | | | |
| 5.000%, 11/15/2028 | | | 225,000 | | | | 246,778 | | | | | |
| 5.000%, 05/15/2029 | | | 230,000 | | | | 253,229 | | | | | |
| 5.000%, 11/15/2029 | | | 125,000 | | | | 138,686 | | | | | |
| 5.000%, 11/15/2030 | | | 160,000 | | | | 179,049 | | | | | |
| 4.000%, 11/15/2047 (Callable 11/15/2026) | | | 60,000 | | | | 59,826 | | | | | |
| 4.000%, 05/15/2049 (Callable 11/15/2028) | | | 890,000 | | | | 891,491 | | | | | |
| 3.500%, 11/15/2051 (Callable 05/15/2031) | | | 3,650,000 | | | | 3,591,329 | | | | | |
| Connecticut State Health & | | | | | | | | | | | | |
| Educational Facilities Authority: | | | | | | | | | | | | |
| 4.000%, 07/01/2038 (Callable 07/01/2032) | | | 1,975,000 | | | | 1,986,244 | | | | | |
| 2.800%, 07/01/2057 | | | | | | | | | | | | |
(Mandatory Tender Date 02/03/2026)(1) | | | 5,065,000 | | | | 5,068,326 | | | | | |
| East Hartford Housing Authority, | | | | | | | | | | | | |
| 4.250%, 02/01/2027 (Callable 08/01/2024) | | | | | | | | | | | | |
| (Mandatory Tender Date 02/01/2025) | | | | | | | | | | | | |
(Insured by HUD)(1) | | | 2,000,000 | | | | 2,005,181 | | | | | |
| State of Connecticut: | | | | | | | | | | | | |
| 4.070%, 03/01/2025 (SIFMA Municipal | | | | | | | | | | | | |
Swap Index + 0.990%)(2) | | | 375,000 | | | | 376,908 | | | | | |
| 5.000%, 10/01/2027 (Callable 01/29/2024) | | | 685,000 | | | | 685,785 | | | | | |
| Town of Hamden CT: | | | | | | | | | | | | |
| 5.000%, 08/15/2026 (Insured by AGM) | | | 125,000 | | | | 131,488 | | | | | |
| 5.000%, 08/15/2028 (Insured by AGM) | | | 365,000 | | | | 400,408 | | | | | |
| 5.000%, 08/15/2029 (Insured by AGM) | | | 575,000 | | | | 642,466 | | | | | |
| 5.000%, 08/15/2032 (Insured by BAM) | | | 1,000,000 | | | | 1,170,186 | | | | | |
| Total Connecticut | | | | | | | | | | | | |
| (Cost $19,854,131) | | | | | | | 19,424,816 | | | | 0.7 | % |
| Delaware | | | | | | | | | | | | |
| Delaware Municipal Electric Corp.: | | | | | | | | | | | | |
| 4.000%, 07/01/2035 (Callable 07/01/2031) | | | 300,000 | | | | 317,606 | | | | | |
| 4.000%, 07/01/2036 (Callable 07/01/2031) | | | 330,000 | | | | 344,611 | | | | | |
| Total Delaware | | | | | | | | | | | | |
| (Cost $727,245) | | | | | | | 662,217 | | | | 0.0 | % |
| District of Columbia | | | | | | | | | | | | |
| District of Columbia, | | | | | | | | | | | | |
| 4.000%, 03/01/2037 | | | | | | | | | | | | |
| (Callable 09/01/2029) | | | 795,000 | | | | 831,889 | | | | | |
| District of Columbia | | | | | | | | | | | | |
| Housing Finance Agency: | | | | | | | | | | | | |
| 0.350%, 04/01/2025 | | | | | | | | | | | | |
| (Mandatory Tender Date 04/01/2024) | | | | | | | | | | | | |
(Insured by FNMA)(1) | | | 5,350,000 | | | | 5,294,754 | | | | | |
| 5.000%, 12/01/2026 | | | | | | | | | | | | |
| (Mandatory Tender Date 12/01/2025) | | | | | | | | | | | | |
(Insured by FHA)(1) | | | 5,090,000 | | | | 5,222,309 | | | | | |
| 0.500%, 03/01/2027 (Callable 04/01/2024) | | | | | | | | | | | | |
| (Mandatory Tender Date 10/01/2024) | | | | | | | | | | | | |
(Insured by FHA)(1) | | | 2,675,000 | | | | 2,589,016 | | | | | |
| 4.000%, 09/01/2040 (Callable 03/01/2025) | | | | | | | | | | | | |
(Mandatory Tender Date 09/01/2025)(1) | | | 3,670,000 | | | | 3,693,426 | | | | | |
| District of Columbia | | | | | | | | | | | | |
| Water & Sewer Authority, | | | | | | | | | | | | |
| 3.000%, 10/01/2057 (Callable 07/01/2027) | | | | | | | | | | | | |
(Mandatory Tender Date 10/01/2027)(1) | | | 7,500,000 | | | | 7,347,449 | | | | | |
| Metropolitan Washington Airports Authority: | | | | | | | | | | | | |
| 5.000%, 10/01/2028 | | | 2,600,000 | | | | 2,825,707 | | | | | |
| 0.000%, 10/01/2029 (Insured by AGC) | | | 110,000 | | | | 92,274 | | | | | |
| 5.000%, 10/01/2033 (Callable 10/01/2025) | | | 250,000 | | | | 257,822 | | | | | |
| 5.000%, 10/01/2038 (Callable 10/01/2028) | | | 330,000 | | | | 351,812 | | | | | |
| 6.500%, 10/01/2044 | | | | | | | | | | | | |
(Callable 10/01/2028)(5) | | | 3,015,000 | | | | 3,348,323 | | | | | |
| 6.500%, 10/01/2044 (Callable 10/01/2028) | | | | | | | | | | | | |
(Insured by AGM)(5) | | | 1,670,000 | | | | 1,894,823 | | | | | |
| Tender Option Bond Trust, | | | | | | | | | | | | |
| 2.680%, 07/01/2063 (Callable 07/01/2037) | | | | | | | | | | | | |
(Optional Put Date 01/02/2024)(1)(3) | | | 2,700,000 | | | | 2,700,000 | | | | | |
| Total District of Columbia | | | | | | | | | | | | |
| (Cost $36,663,238) | | | | | | | 36,449,604 | | | | 1.2 | % |
| Florida | | | | | | | | | | | | |
| Alachua County Health Facilities Authority, | | | | | | | | | | | | |
| 5.000%, 12/01/2027 (Callable 12/01/2024) | | | 815,000 | | | | 828,690 | | | | | |
| Broward County Housing Finance Authority: | | | | | | | | | | | | |
| 3.500%, 04/01/2041 (Callable 10/01/2025) | | | | | | | | | | | | |
| (Mandatory Tender Date 04/01/2026) | | | | | | | | | | | | |
(Insured by HUD)(1) | | | 3,000,000 | | | | 3,000,661 | | | | | |
| 4.050%, 09/01/2056 | | | | | | | | | | | | |
(Mandatory Tender Date 03/01/2026)(1) | | | 1,000,000 | | | | 1,012,904 | | | | | |
| Capital Trust Agency, Inc.: | | | | | | | | | | | | |
| 5.000%, 12/15/2029 (Callable 06/15/2026) | | | 800,000 | | | | 818,224 | | | | | |
| 4.000%, 06/01/2041 (Callable 06/01/2028) | | | 330,000 | | | | 316,481 | | | | | |
| 4.000%, 06/01/2056 (Callable 06/01/2028) | | | 485,000 | | | | 421,213 | | | | | |
| Central Florida Tourism Oversight District: | | | | | | | | | | | | |
| 4.000%, 06/01/2035 (Callable 06/01/2027) | | | 1,000,000 | | | | 1,020,053 | | | | | |
| 5.000%, 06/01/2035 (Callable 06/01/2026) | | | 5,000,000 | | | | 5,199,041 | | | | | |
| City of Cape Coral FL: | | | | | | | | | | | | |
| 5.600%, 03/01/2048 (Callable 03/01/2033) | | | | | | | | | | | | |
| (Insured by BAM) | | | 5,000,000 | | | | 5,545,470 | | | | | |
| 5.250%, 10/01/2053 (Callable 10/01/2033) | | | | | | | | | | | | |
| (Insured by BAM) | | | 1,250,000 | | | | 1,419,306 | | | | | |
| City of Fort Lauderdale FL, | | | | | | | | | | | | |
| 5.500%, 09/01/2048 (Callable 09/01/2033) | | | 7,000,000 | | | | 8,135,684 | | | | | |
| City of Fort Myers FL: | | | | | | | | | | | | |
| 5.000%, 12/01/2029 (Callable 12/01/2025) | | | 475,000 | | | | 492,266 | | | | | |
| 4.000%, 12/01/2037 (Callable 12/01/2025) | | | 1,000,000 | | | | 1,006,084 | | | | | |
| 4.000%, 12/01/2038 (Callable 12/01/2025) | | | 500,000 | | | | 505,015 | | | | | |
The accompanying notes are an integral part of these financial statements.
Baird Core Intermediate Municipal Bond Fund
Schedule of Investments, December 31, 2023
Long-Term Investments (cont.)
| | | Principal | | | | | | % of | |
| | | Amount | | | Value | | | Net Assets | |
| City of Jacksonville FL: | | | | | | | | | |
| 4.000%, 11/01/2032 | | | | | | | | | |
| (Callable 11/01/2029) | | $ | 375,000 | | | $ | 383,962 | | | |
| |
| 4.000%, 11/01/2040 (Callable 11/01/2024) | | | 65,000 | | | | 63,008 | | | | | |
| City of Orlando FL, | | | | | | | | | | | | |
| 5.000%, 11/01/2034 (Callable 11/01/2027) | | | | | | | | | | | | |
| (Insured by AGM) | | | 775,000 | | | | 825,947 | | | | | |
| City of Tallahassee FL: | | | | | | | | | | | | |
| 5.000%, 12/01/2029 (Callable 12/01/2025) | | | 610,000 | | | | 627,628 | | | | | |
| 5.000%, 12/01/2040 (Callable 06/01/2025) | | | 1,260,000 | | | | 1,269,707 | | | | | |
| County of Collier FL: | | | | | | | | | | | | |
| 5.000%, 06/01/2024 | | | 255,000 | | | | 255,611 | | | | | |
| 5.000%, 06/01/2026 | | | 1,840,000 | | | | 1,878,436 | | | | | |
| County of Miami-Dade FL: | | | | | | | | | | | | |
| 5.000%, 06/01/2027 (Callable 06/01/2025) | | | 2,500,000 | | | | 2,558,620 | | | | | |
| 5.000%, 10/01/2032 (Callable 10/01/2026) | | | 335,000 | | | | 349,922 | | | | | |
| 6.875%, 10/01/2034 (Callable 10/01/2029) | | | | | | | | | | | | |
(Insured by AGC)(5) | | | 255,000 | | | | 313,282 | | | | | |
| 7.000%, 10/01/2039 (Callable 10/01/2029) | | | | | | | | | | | | |
(Insured by AGC)(5) | | | 390,000 | | | | 474,081 | | | | | |
| County of Osceola FL, | | | | | | | | | | | | |
| 5.000%, 10/01/2031 (Callable 10/01/2029) | | | 550,000 | | | | 588,291 | | | | | |
| County of Palm Beach FL: | | | | | | | | | | | | |
| 4.000%, 12/01/2036 (Callable 12/01/2030) | | | 1,165,000 | | | | 1,229,082 | | | | | |
| 4.000%, 12/01/2037 (Callable 12/01/2030) | | | 1,295,000 | | | | 1,352,598 | | | | | |
| County of Seminole FL, | | | | | | | | | | | | |
| 5.000%, 10/01/2052 (Callable 10/01/2032) | | | 2,500,000 | | | | 2,738,700 | | | | | |
| Escambia County Health Facilities Authority, | | | | | | | | | | | | |
| 5.000%, 08/15/2035 (Callable 02/15/2030) | | | 820,000 | | | | 867,657 | | | | | |
| Florida Development Finance Corp.: | | | | | | | | | | | | |
4.000%, 06/01/2025(3) | | | 110,000 | | | | 108,047 | | | | | |
4.000%, 06/01/2026(3) | | | 225,000 | | | | 218,106 | | | | | |
| 5.000%, 04/01/2028 | | | 400,000 | | | | 431,865 | | | | | |
| 5.000%, 04/01/2029 | | | 250,000 | | | | 274,085 | | | | | |
| 6.125%, 07/01/2032 (Callable 04/02/2026) | | | | | | | | | | | | |
(Mandatory Tender Date 07/01/2026)(1)(3) | | | 4,500,000 | | | | 4,535,557 | | | | | |
| 5.250%, 06/15/2034 (Callable 06/15/2032) | | | 1,250,000 | | | | 1,372,440 | | | | | |
| 5.000%, 06/15/2040 (Callable 06/15/2027) | | | 1,650,000 | | | | 1,681,973 | | | | | |
| Florida Gulf Coast University Financing Corp., | | | | | | | | | | | | |
| 5.000%, 08/01/2029 (Callable 02/01/2028) | | | 600,000 | | | | 644,882 | | | | | |
| Florida Housing Finance Corp.: | | | | | | | | | | | | |
| 1.000%, 02/01/2025 (Mandatory Tender | | | | | | | | | | | | |
Date 08/01/2024) (Insured by FNMA)(1) | | | 4,550,000 | | | | 4,449,846 | | | | | |
| 5.000%, 12/01/2026 (Mandatory Tender | | | | | | | | | | | | |
Date 12/01/2025) (Insured by HUD)(1) | | | 3,000,000 | | | | 3,082,457 | | | | | |
| 4.200%, 01/01/2045 (Callable 01/01/2028) | | | | | | | | | | | | |
| (Insured by GNMA) | | | 595,000 | | | | 597,344 | | | | | |
| 4.000%, 07/01/2047 (Callable 07/01/2025) | | | | | | | | | | | | |
| (Insured by GNMA) | | | 60,000 | | | | 59,911 | | | | | |
| 3.000%, 01/01/2052 (Callable 01/01/2030) | | | | | | | | | | | | |
| (Insured by GNMA) | | | 1,025,000 | | | | 998,970 | | | | | |
| 5.500%, 01/01/2054 (Callable 01/01/2032) | | | | | | | | | | | | |
| (Insured by GNMA) | | | 2,495,000 | | | | 2,639,474 | | | | | |
| Florida Municipal Power Agency: | | | | | | | | | | | | |
| 4.000%, 10/01/2030 (Callable 10/01/2027) | | | 500,000 | | | | 520,312 | | | | | |
| 5.000%, 10/01/2030 (Callable 10/01/2026) | | | 445,000 | | | | 466,560 | | | | | |
| Highlands County Health Facilities Authority, | | | | | | | | | | | | |
| 3.080%, 11/15/2035 (Callable 01/02/2024) | | | | | | | | | | | | |
(Optional Put Date 01/05/2024)(1) | | | 2,000,000 | | | | 2,000,000 | | | | | |
| Lee County Housing Finance Authority: | | | | | | | | | | | | |
| 3.500%, 02/01/2027 | | | | | | | | | | | | |
(Mandatory Tender Date 02/01/2026)(1) | | | 1,000,000 | | | | 999,618 | | | | | |
| 3.550%, 08/01/2027 (Callable 02/01/2025) | | | | | | | | | | | | |
(Mandatory Tender Date 08/01/2025)(1) | | | 1,500,000 | | | | 1,498,998 | | | | | |
| Lee County Industrial | | | | | | | | | | | | |
| Development Authority, | | | | | | | | | | | | |
| 3.750%, 10/01/2027 | | | | | | | | | | | | |
| (Callable 01/29/2024) | | | 1,710,000 | | | | 1,638,853 | | | | | |
| Miami Beach Redevelopment Agency, | | | | | | | | | | | | |
| 5.000%, 02/01/2027 (Callable 02/01/2024) | | | 1,000,000 | | | | 1,003,827 | | | | | |
| Miami-Dade County | | | | | | | | | | | | |
| Educational Facilities Authority: | | | | | | | | | | | | |
| 4.000%, 04/01/2032 (Callable 01/29/2024) | | | 200,000 | | | | 200,110 | | | | | |
| 4.000%, 04/01/2037 (Callable 01/29/2024) | | | 200,000 | | | | 200,077 | | | | | |
| Miami-Dade County | | | | | | | | | | | | |
| Housing Finance Authority: | | | | | | | | | | | | |
| 4.050%, 09/01/2026 | | | | | | | | | | | | |
(Mandatory Tender Date 09/01/2025)(1) | | | 1,650,000 | | | | 1,664,791 | | | | | |
| 5.000%, 03/01/2027 | | | | | | | | | | | | |
(Mandatory Tender Date 09/01/2025)(1) | | | 1,400,000 | | | | 1,434,507 | | | | | |
| Orange County Health Facilities Authority, | | | | | | | | | | | | |
| 5.000%, 08/01/2028 (Callable 08/01/2024) | | | 2,500,000 | | | | 2,514,918 | | | | | |
| Orange County Housing Finance Authority, | | | | | | | | | | | | |
| 3.000%, 09/01/2050 (Callable 09/01/2029) | | | | | | | | | | | | |
| (Insured by GNMA) | | | 925,000 | | | | 902,070 | | | | | |
| Palm Beach County Health | | | | | | | | | | | | |
| Facilities Authority: | | | | | | | | | | | | |
| 4.000%, 05/15/2024 | | | 320,000 | | | | 317,141 | | | | | |
| 5.000%, 11/01/2032 | | | 200,000 | | | | 219,447 | | | | | |
| 4.000%, 05/15/2035 (Callable 05/15/2025) | | | 175,000 | | | | 143,789 | | | | | |
| Palm Beach County Housing Authority, | | | | | | | | | | | | |
| 5.000%, 04/01/2026 | | | | | | | | | | | | |
(Mandatory Tender Date 04/01/2025)(1) | | | 3,385,000 | | | | 3,435,850 | | | | | |
| Pinellas County Housing Finance Authority, | | | | | | | | | | | | |
| 6.000%, 03/01/2054 (Callable 03/01/2032) | | | | | | | | | | | | |
| (Insured by GNMA) | | | 2,310,000 | | | | 2,491,855 | | | | | |
| Pinellas County School Board, | | | | | | | | | | | | |
| 5.000%, 07/01/2033 (Callable 07/01/2027) | | | 515,000 | | | | 553,591 | | | | | |
| Santa Rosa County School Board, | | | | | | | | | | | | |
| 5.000%, 02/01/2038 (Callable 08/01/2029) | | | 1,030,000 | | | | 1,122,492 | | | | | |
| Sarasota County Public Hospital District, | | | | | | | | | | | | |
| 5.500%, 07/01/2028 (Insured by NATL) | | | 5,000,000 | | | | 5,332,684 | | | | | |
| School Board of Miami-Dade County: | | | | | | | | | | | | |
| 5.000%, 02/01/2028 (Callable 02/01/2026) | | | 3,500,000 | | | | 3,652,003 | | | | | |
| 5.000%, 11/01/2030 (Callable 11/01/2024) | | | 660,000 | | | | 669,448 | | | | | |
| School District of Broward County, | | | | | | | | | | | | |
| 5.000%, 07/01/2036 (Callable 07/01/2032) | | | 3,000,000 | | | | 3,456,091 | | | | | |
| Seminole County Industrial | | | | | | | | | | | | |
| Development Authority: | | | | | | | | | | | | |
4.000%, 06/15/2028(3) | | | 245,000 | | | | 236,840 | | | | | |
4.000%, 06/15/2029(3) | | | 260,000 | | | | 249,129 | | | | | |
4.000%, 06/15/2030(3) | | | 535,000 | | | | 507,680 | | | | | |
| 4.000%, 06/15/2036 | | | | | | | | | | | | |
(Callable 06/15/2031)(3) | | | 470,000 | | | | 418,251 | | | | | |
| 4.000%, 06/15/2041 | | | | | | | | | | | | |
(Callable 06/15/2031)(3) | | | 845,000 | | | | 691,545 | | | | | |
| St. Johns County Housing Finance Authority, | | | | | | | | | | | | |
| 3.550%, 07/01/2027 (Callable 01/01/2025) | | | | | | | | | | | | |
(Mandatory Tender Date 07/01/2025)(1) | | | 1,000,000 | | | | 999,560 | | | | | |
| Village Community Development | | | | | | | | | | | | |
| District No. 10, | | | | | | | | | | | | |
| 5.000%, 05/01/2035 (Callable 05/01/2033) | | | | | | | | | | | | |
| (Insured by AGM) | | | 1,125,000 | | | | 1,304,223 | | | | | |
| Village Community Development | | | | | | | | | | | | |
| District No. 13, | | | | | | | | | | | | |
| 2.625%, 05/01/2024 | | | 125,000 | | | | 124,412 | | | | | |
The accompanying notes are an integral part of these financial statements.
Baird Core Intermediate Municipal Bond Fund
Schedule of Investments, December 31, 2023
Long-Term Investments (cont.)
| | | Principal | | | | | | % of | |
| | | Amount | | | Value | | | Net Assets | |
| Volusia County Educational | | | | | | | | | |
| Facility Authority, | | | | | | | | | |
| 4.000%, 10/15/2036 | | | | | | | | | |
| (Callable 10/15/2029) | | $ | 500,000 | | | $ | 515,226 | | | | |
| Total Florida | | | | | | | | | | | |
| (Cost $106,935,081) | | | | | | | 108,078,479 | | | | 3.6 | % |
| Georgia | | | | | | | | | | | | |
| Atlanta Urban Residential Finance Authority, | | | | | | | | | | | | |
| 2.000%, 09/01/2025 | | | | | | | | | | | | |
(Mandatory Tender Date 09/01/2024)(1) | | | 5,025,000 | | | | 4,950,149 | | | | | |
| Bartow County Development Authority: | | | | | | | | | | | | |
| 1.800%, 09/01/2029 | | | | | | | | | | | | |
(Callable 11/19/2026)(1) | | | 4,810,000 | | | | 4,153,598 | | | | | |
| 3.950%, 12/01/2032 | | | | | | | | | | | | |
(Mandatory Tender Date 03/08/2028)(1) | | | 2,750,000 | | | | 2,795,520 | | | | | |
| Carrollton Payroll Development Authority, | | | | | | | | | | | | |
| 5.000%, 07/01/2029 | | | 1,175,000 | | | | 1,314,608 | | | | | |
| City of Atlanta GA: | | | | | | | | | | | | |
| 5.000%, 01/01/2025 (Callable 01/29/2024) | | | 225,000 | | | | 225,290 | | | | | |
| 5.000%, 07/01/2025 | | | 1,250,000 | | | | 1,279,821 | | | | | |
| 5.000%, 01/01/2028 (Callable 01/29/2024) | | | 1,000,000 | | | | 1,001,285 | | | | | |
| City of Monroe GA: | | | | | | | | | | | | |
| 4.000%, 12/01/2036 (Callable 12/01/2030) | | | | | | | | | | | | |
| (Insured by AGM) | | | 500,000 | | | | 520,476 | | | | | |
| 4.000%, 12/01/2037 (Callable 12/01/2030) | | | | | | | | | | | | |
| (Insured by AGM) | | | 750,000 | | | | 775,267 | | | | | |
| Clayton County Development Authority, | | | | | | | | | | | | |
| 4.000%, 07/01/2031 (Callable 07/01/2027) | | | 495,000 | | | | 510,098 | | | | | |
| Cobb County Kennestone Hospital Authority, | | | | | | | | | | | | |
| 5.000%, 04/01/2042 (Callable 04/01/2027) | | | 890,000 | | | | 916,379 | | | | | |
| DeKalb County Housing Authority, | | | | | | | | | | | | |
| 4.000%, 12/01/2033 (Callable 12/01/2030) | | | 7,500,000 | | | | 7,476,039 | | | | | |
| Development Authority for Fulton County: | | | | | | | | | | | | |
| 5.000%, 09/01/2027 | | | 565,000 | | | | 608,651 | | | | | |
| 5.000%, 09/01/2028 | | | 625,000 | | | | 686,810 | | | | | |
| 5.000%, 09/01/2029 | | | 500,000 | | | | 557,975 | | | | | |
| 5.000%, 10/01/2029 | | | 1,710,000 | | | | 1,903,236 | | | | | |
| Development Authority of Bulloch County: | | | | | | | | | | | | |
| 5.000%, 07/01/2030 | | | 405,000 | | | | 459,649 | | | | | |
| 5.000%, 07/01/2031 (Callable 07/01/2030) | | | 420,000 | | | | 473,917 | | | | | |
| 5.000%, 07/01/2032 (Callable 07/01/2030) | | | 445,000 | | | | 501,778 | | | | | |
| 5.000%, 07/01/2033 (Callable 07/01/2030) | | | 465,000 | | | | 523,993 | | | | | |
| 4.000%, 07/01/2039 (Callable 07/01/2030) | | | 305,000 | | | | 310,457 | | | | | |
| Development Authority of Monroe County, | | | | | | | | | | | | |
| 1.500%, 01/01/2039 | | | | | | | | | | | | |
(Mandatory Tender Date 02/03/2025)(1) | | | 5,240,000 | | | | 5,035,112 | | | | | |
| Fayette County Hospital Authority, | | | | | | | | | | | | |
| 5.000%, 07/01/2054 (Callable 01/29/2024) | | | | | | | | | | | | |
(Mandatory Tender Date 07/01/2024)(1) | | | 975,000 | | | | 976,067 | | | | | |
| Gainesville & Hall County | | | | | | | | | | | | |
| Development Authority, | | | | | | | | | | | | |
| 2.000%, 11/15/2033 (Callable 01/01/2024) | | | | | | | | | | | | |
| (Optional Put Date 01/02/2024) | | | | | | | | | | | | |
(Insured by AGC)(1) | | | 6,600,000 | | | | 6,600,000 | | | | | |
| Gainesville & Hall County Hospital Authority, | | | | | | | | | | | | |
| 5.000%, 02/15/2029 (Callable 02/15/2027) | | | 500,000 | | | | 529,913 | | | | | |
| Georgia Housing & Finance Authority, | | | | | | | | | | | | |
| 3.600%, 12/01/2033 (Callable 06/01/2027) | | | 225,000 | | | | 226,306 | | | | | |
| Georgia Local Government, | | | | | | | | | | | | |
| 4.750%, 06/01/2028 | | | | | | | | | | | | |
| (Insured by NATL) | | | 2,910,000 | | | | 3,029,837 | | | | | |
| Main Street Natural Gas, Inc.: | | | | | | | | | | | | |
| 5.000%, 12/01/2027 | | | 1,500,000 | | | | 1,566,699 | | | | | |
| 5.000%, 05/15/2034 (Callable 05/15/2029) | | | 1,530,000 | | | | 1,628,538 | | | | | |
| 4.000%, 03/01/2050 (Callable 06/01/2026) | | | | | | | | | | | | |
(Mandatory Tender Date 09/01/2026)(1) | | | 6,000,000 | | | | 6,028,899 | | | | | |
| 4.000%, 07/01/2052 (Callable 06/01/2027) | | | | | | | | | | | | |
(Mandatory Tender Date 09/01/2027)(1) | | | 10,515,000 | | | | 10,576,701 | | | | | |
| 4.000%, 08/01/2052 (Callable 05/01/2027) | | | | | | | | | | | | |
(Mandatory Tender Date 11/01/2027)(1)(3) | | | 13,000,000 | | | | 12,509,628 | | | | | |
| 5.000%, 12/01/2052 (Callable 03/01/2029) | | | | | | | | | | | | |
(Mandatory Tender Date 06/01/2029)(1) | | | 5,645,000 | | | | 5,958,069 | | | | | |
| Private Colleges & Universities Authority: | | | | | | | | | | | | |
| 5.000%, 06/01/2027 | | | 420,000 | | | | 445,138 | | | | | |
| 5.000%, 06/01/2028 | | | 495,000 | | | | 533,735 | | | | | |
| 5.000%, 06/01/2029 | | | 400,000 | | | | 438,400 | | | | | |
| 4.000%, 06/01/2034 (Callable 06/01/2031) | | | 395,000 | | | | 411,862 | | | | | |
| 4.000%, 06/01/2035 (Callable 06/01/2031) | | | 500,000 | | | | 516,970 | | | | | |
| Valdosta Housing Authority, | | | | | | | | | | | | |
| 1.250%, 02/01/2025 | | | | | | | | | | | | |
(Mandatory Tender Date 02/01/2024)(1) | | | 5,285,000 | | | | 5,273,488 | | | | | |
| Total Georgia | | | | | | | | | | | | |
| (Cost $96,333,745) | | | | | | | 94,230,358 | | | | 3.2 | % |
| Hawaii | | | | | | | | | | | | |
| State of Hawaii: | | | | | | | | | | | | |
| 5.250%, 08/01/2025 (Callable 01/19/2024) | | | 2,500,000 | | | | 2,501,697 | | | | | |
| 5.000%, 08/01/2027 (Callable 01/19/2024) | | | 1,000,000 | | | | 1,000,275 | | | | | |
| Total Hawaii | | | | | | | | | | | | |
| (Cost $3,500,000) | | | | | | | 3,501,972 | | | | 0.1 | % |
| Idaho | | | | | | | | | | | | |
| County of Nez Perce ID, | | | | | | | | | | | | |
| 5.500%, 03/01/2042 (Callable 03/01/2032) | | | 680,000 | | | | 758,792 | | | | | |
| Idaho Housing & Finance Association: | | | | | | | | | | | | |
| 5.250%, 05/01/2038 (Callable 05/01/2031) | | | | | | | | | | | | |
| (Insured by SCH BD GTY) | | | 300,000 | | | | 320,054 | | | | | |
| 5.500%, 05/01/2043 (Callable 05/01/2031) | | | | | | | | | | | | |
| (Insured by SCH BD GTY) | | | 350,000 | | | | 372,981 | | | | | |
| 5.625%, 11/01/2043 | | | | | | | | | | | | |
(Callable 11/01/2033)(3) | | | 1,250,000 | | | | 1,292,380 | | | | | |
| Total Idaho | | | | | | | | | | | | |
| (Cost $2,609,229) | | | | | | | 2,744,207 | | | | 0.1 | % |
| Illinois | | | | | | | | | | | | |
| Adams & Hancock Counties Community | | | | | | | | | | | | |
| Unit School District No. 4: | | | | | | | | | | | | |
| 4.000%, 12/01/2027 (Callable 12/01/2025) | | | | | | | | | | | | |
| (Insured by BAM) | | | 290,000 | | | | 296,370 | | | | | |
| 4.000%, 12/01/2029 (Callable 12/01/2025) | | | | | | | | | | | | |
| (Insured by BAM) | | | 310,000 | | | | 315,429 | | | | | |
| 4.000%, 12/01/2032 (Callable 12/01/2025) | | | | | | | | | | | | |
| (Insured by BAM) | | | 350,000 | | | | 354,331 | | | | | |
| Bridgeview Finance Corp., | | | | | | | | | | | | |
| 5.000%, 12/01/2037 (Callable 12/01/2027) | | | 735,000 | | | | 738,352 | | | | | |
| Channahon Park District: | | | | | | | | | | | | |
| 4.000%, 12/15/2031 (Callable 12/15/2029) | | | | | | | | | | | | |
| (Insured by BAM) | | | 460,000 | | | | 484,679 | | | | | |
| 4.000%, 12/15/2034 (Callable 12/15/2029) | | | | | | | | | | | | |
| (Insured by BAM) | | | 510,000 | | | | 536,327 | | | | | |
| 4.000%, 12/15/2036 (Callable 12/15/2029) | | | | | | | | | | | | |
| (Insured by BAM) | | | 950,000 | | | | 979,187 | | | | | |
| 4.000%, 12/15/2038 (Callable 12/15/2029) | | | | | | | | | | | | |
| (Insured by BAM) | | | 595,000 | | | | 606,795 | | | | | |
The accompanying notes are an integral part of these financial statements.
Baird Core Intermediate Municipal Bond Fund
Schedule of Investments, December 31, 2023
Long-Term Investments (cont.)
| | | Principal | | | | | | % of | |
| | | Amount | | | Value | | | Net Assets | |
| Chicago Board of Education: | | | | | | | | | |
| 0.000%, 12/01/2025 (Insured by NATL) | | $ | 2,280,000 | | | $ | 2,115,821 | | | |
| |
| 0.000%, 12/01/2025 (Insured by NATL) | | | 500,000 | | | | 463,996 | | | | | |
| 5.000%, 12/01/2025 (Insured by AGM) | | | 600,000 | | | | 615,149 | | | | | |
| 5.000%, 12/01/2029 (Callable 12/01/2028) | | | | | | | | | | | | |
| (Insured by AGM) | | | 1,000,000 | | | | 1,067,428 | | | | | |
| 5.250%, 04/01/2033 | | | 1,000,000 | | | | 1,124,530 | | | | | |
| 5.250%, 04/01/2035 (Callable 04/01/2033) | | | 1,500,000 | | | | 1,674,320 | | | | | |
| 7.000%, 12/01/2044 (Callable 12/01/2025) | | | 1,375,000 | | | | 1,431,567 | | | | | |
| 6.500%, 12/01/2046 (Callable 12/01/2026) | | | 1,000,000 | | | | 1,046,450 | | | | | |
| Chicago Midway International Airport: | | | | | | | | | | | | |
| 5.000%, 01/01/2024 | | | 3,240,000 | | | | 3,240,000 | | | | | |
5.000%, 01/01/2026(6) | | | 1,735,000 | | | | 1,784,211 | | | | | |
| 5.000%, 01/01/2029 (Callable 01/01/2026) | | | 2,000,000 | | | | 2,046,496 | | | | | |
| Chicago O’Hare International Airport: | | | | | | | | | | | | |
| 5.000%, 01/01/2026 | | | 3,500,000 | | | | 3,608,273 | | | | | |
| 5.000%, 01/01/2029 (Callable 01/01/2025) | | | 4,675,000 | | | | 4,716,998 | | | | | |
| 5.000%, 01/01/2029 (Callable 01/01/2025) | | | 2,150,000 | | | | 2,169,315 | | | | | |
| 5.000%, 01/01/2029 (Insured by AGM) | | | 660,000 | | | | 717,648 | | | | | |
| 5.000%, 01/01/2035 (Callable 01/01/2026) | | | 1,540,000 | | | | 1,594,722 | | | | | |
| 5.000%, 01/01/2036 (Callable 01/01/2032) | | | 335,000 | | | | 374,139 | | | | | |
| 5.000%, 01/01/2036 (Callable 01/01/2026) | | | 1,255,000 | | | | 1,274,645 | | | | | |
| 5.250%, 01/01/2042 (Callable 01/01/2033) | | | | | | | | | | | | |
| (Insured by BAM) | | | 1,370,000 | | | | 1,522,979 | | | | | |
| 5.250%, 01/01/2043 (Callable 01/01/2033) | | | | | | | | | | | | |
| (Insured by BAM) | | | 1,000,000 | | | | 1,107,234 | | | | | |
| Chicago Park District: | | | | | | | | | | | | |
| 5.000%, 01/01/2024 | | | 580,000 | | | | 580,000 | | | | | |
| 5.000%, 01/01/2027 (Callable 02/01/2024) | | | 1,000,000 | | | | 1,001,473 | | | | | |
| 5.250%, 01/01/2043 (Callable 01/01/2033) | | | 1,000,000 | | | | 1,107,622 | | | | | |
| 5.250%, 01/01/2044 (Callable 01/01/2033) | | | 1,730,000 | | | | 1,911,302 | | | | | |
| 5.250%, 01/01/2046 (Callable 01/01/2033) | | | 2,500,000 | | | | 2,738,238 | | | | | |
| Chicago Transit Authority, | | | | | | | | | | | | |
| 5.250%, 12/01/2049 (Callable 12/01/2024) | | | 6,700,000 | | | | 6,735,498 | | | | | |
| City of Chicago Heights IL: | | | | | | | | | | | | |
| 4.000%, 12/01/2028 (Insured by BAM) | | | 200,000 | | | | 211,854 | | | | | |
| 4.000%, 12/01/2029 (Insured by BAM) | | | 250,000 | | | | 267,455 | | | | | |
| 4.000%, 12/01/2030 (Callable 12/01/2029) | | | | | | | | | | | | |
| (Insured by BAM) | | | 350,000 | | | | 372,937 | | | | | |
| 4.000%, 12/01/2031 (Callable 12/01/2029) | | | | | | | | | | | | |
| (Insured by BAM) | | | 365,000 | | | | 387,352 | | | | | |
| City of Chicago IL: | | | | | | | | | | | | |
| 5.000%, 01/01/2024 | | | 250,000 | | | | 250,000 | | | | | |
| 4.000%, 09/01/2025 (Mandatory Tender | | | | | | | | | | | | |
Date 09/01/2024) (Insured by HUD)(1) | | | 1,750,000 | | | | 1,753,943 | | | | | |
| 0.000%, 01/01/2027 | | | | | | | | | | | | |
| (ETM) (Insured by NATL) | | | 195,000 | | | | 179,166 | | | | | |
| 5.000%, 11/01/2027 (Callable 11/01/2024) | | | 265,000 | | | | 267,800 | | | | | |
| 0.000%, 01/01/2028 | | | | | | | | | | | | |
| (ETM) (Insured by NATL) | | | 2,220,000 | | | | 1,989,034 | | | | | |
| 5.000%, 11/01/2028 (Callable 11/01/2027) | | | | | | | | | | | | |
| (Insured by AGM) | | | 625,000 | | | | 663,955 | | | | | |
| 5.000%, 11/01/2029 (Callable 11/01/2026) | | | 1,810,000 | | | | 1,901,020 | | | | | |
| 5.000%, 01/01/2030 (Callable 01/29/2024) | | | | | | | | | | | | |
| (Insured by AGM) | | | 445,000 | | | | 446,942 | | | | | |
| 5.500%, 01/01/2030 (Insured by NATL) | | | 765,000 | | | | 831,861 | | | | | |
| 4.000%, 11/01/2032 (Callable 11/01/2024) | | | | | | | | | | | | |
| (Insured by BAM) | | | 200,000 | | | | 201,665 | | | | | |
| 5.000%, 11/01/2033 (Callable 11/01/2027) | | | | | | | | | | | | |
| (Insured by AGM) | | | 525,000 | | | | 562,103 | | | | | |
| 5.000%, 01/01/2034 (Callable 01/29/2024) | | | 1,000,000 | | | | 1,000,649 | | | | | |
| 5.000%, 11/01/2036 (Callable 11/01/2027) | | | | | | | | | | | | |
| (Insured by AGM) | | | 260,000 | | | | 274,323 | | | | | |
| 5.000%, 11/01/2036 (Callable 05/01/2032) | | | | | | | | | | | | |
| (Insured by AGM) | | | 1,000,000 | | | | 1,163,053 | | | | | |
| 5.000%, 01/01/2039 (Callable 01/29/2024) | | | | | | | | | | | | |
| (Insured by AGM) | | | 3,220,000 | | | | 3,221,818 | | | | | |
| 5.250%, 01/01/2042 (Callable 07/01/2032) | | | | | | | | | | | | |
| (Insured by AGM) | | | 2,420,000 | | | | 2,763,652 | | | | | |
| 5.250%, 01/01/2043 (Callable 07/01/2032) | | | | | | | | | | | | |
| (Insured by AGM) | | | 6,490,000 | | | | 7,387,571 | | | | | |
| 5.000%, 01/01/2044 (Callable 01/29/2024) | | | | | | | | | | | | |
| (Insured by BAM) | | | 1,000,000 | | | | 1,000,576 | | | | | |
| City of Decatur IL: | | | | | | | | | | | | |
| 4.250%, 03/01/2030 (Callable 03/01/2024) | | | | | | | | | | | | |
| (Insured by BAM) | | | 250,000 | | | | 250,616 | | | | | |
| 5.000%, 03/01/2034 (Callable 03/01/2026) | | | | | | | | | | | | |
| (Insured by BAM) | | | 905,000 | | | | 944,748 | | | | | |
| City of Springfield IL, | | | | | | | | | | | | |
| 5.000%, 03/01/2033 (Callable 03/01/2025) | | | 4,000,000 | | | | 4,070,022 | | | | | |
| Community Unit School District No. 427, | | | | | | | | | | | | |
| 0.000%, 01/01/2026 (Insured by AGM) | | | 1,340,000 | | | | 1,252,790 | | | | | |
| Cook County Community | | | | | | | | | | | | |
| Consolidated School District No. 15, | | | | | | | | | | | | |
| 5.250%, 06/15/2041 (Callable 06/15/2033) | | | 1,190,000 | | | | 1,342,281 | | | | | |
| Cook County Community | | | | | | | | | | | | |
| High School District No. 217, | | | | | | | | | | | | |
| 4.500%, 12/01/2039 (Callable 12/01/2031) | | | 1,495,000 | | | | 1,581,828 | | | | | |
| Cook County School District No. 111, | | | | | | | | | | | | |
| 4.000%, 12/01/2025 (Insured by AGM) | | | 1,000,000 | | | | 1,022,368 | | | | | |
| Cook County School District No. 130, | | | | | | | | | | | | |
| 5.000%, 12/01/2027 (Callable 12/01/2025) | | | | | | | | | | | | |
| (Insured by AGM) | | | 1,210,000 | | | | 1,257,186 | | | | | |
| Cook County School District No. 135, | | | | | | | | | | | | |
| 5.000%, 12/01/2024 | | | 930,000 | | | | 945,537 | | | | | |
| Cook County School District No. 143-5, | | | | | | | | | | | | |
| 5.000%, 12/01/2033 (Insured by AGM) | | | 90,000 | | | | 99,350 | | | | | |
| Cook County School District No. 163: | | | | | | | | | | | | |
| 6.000%, 12/15/2025 (Insured by BAM) | | | 430,000 | | | | 455,414 | | | | | |
| 6.000%, 12/15/2027 (Insured by BAM) | | | 1,150,000 | | | | 1,293,440 | | | | | |
| Cook County School District No. 83, | | | | | | | | | | | | |
| 5.625%, 06/01/2033 | | | 815,000 | | | | 959,012 | | | | | |
| Cook County School District No. 99: | | | | | | | | | | | | |
| 4.000%, 12/01/2029 (Insured by BAM) | | | 2,425,000 | | | | 2,542,902 | | | | | |
| 4.000%, 12/01/2030 (Insured by BAM) | | | 250,000 | | | | 263,353 | | | | | |
| County of Cook IL: | | | | | | | | | | | | |
| 5.000%, 11/15/2033 (Callable 11/15/2030) | | | 1,500,000 | | | | 1,685,061 | | | | | |
| 4.000%, 11/15/2038 (Callable 11/15/2027) | | | 1,675,000 | | | | 1,696,682 | | | | | |
| 4.000%, 11/15/2040 (Callable 11/15/2030) | | | | | | | | | | | | |
| (Insured by BAM) | | | 595,000 | | | | 608,403 | | | | | |
| 5.000%, 11/15/2041 (Callable 11/15/2032) | | | 1,890,000 | | | | 2,086,372 | | | | | |
| County of Sangamon IL: | | | | | | | | | | | | |
| 3.000%, 12/15/2038 (Callable 12/15/2029) | | | | | | | | | | | | |
| (Insured by BAM) | | | 825,000 | | | | 735,375 | | | | | |
| 3.000%, 12/15/2039 (Callable 12/15/2029) | | | | | | | | | | | | |
| (Insured by BAM) | | | 700,000 | | | | 611,875 | | | | | |
| Crawford Hospital District, | | | | | | | | | | | | |
| 4.000%, 01/01/2031 (Callable 01/01/2029) | | | | | | | | | | | | |
| (Insured by AGM) | | | 345,000 | | | | 357,884 | | | | | |
| DuPage County High School District No. 87, | | | | | | | | | | | | |
| 5.000%, 01/01/2029 (Callable 01/01/2025) | | | 315,000 | | | | 321,011 | | | | | |
| DuPage County School District No. 60, | | | | | | | | | | | | |
| 4.000%, 12/30/2036 (Callable 12/30/2027) | | | 1,000,000 | | | | 1,022,183 | | | | | |
| Eastern Illinois Economic | | | | | | | | | | | | |
| Development Authority, | | | | | | | | | | | | |
| 5.000%, 11/01/2033 (Callable 11/01/2028) | | | 1,000,000 | | | | 985,445 | | | | | |
The accompanying notes are an integral part of these financial statements.
Baird Core Intermediate Municipal Bond Fund
Schedule of Investments, December 31, 2023
Long-Term Investments (cont.)
| | | Principal | | | | | | % of | |
| | | Amount | | | Value | | | Net Assets | |
| Exceptional Children Have Opportunities: | | | | | | | | | |
| 4.000%, 12/01/2034 | | | | | | | | | |
| (Callable 12/01/2029) | | $ | 765,000 | | | $ | 795,966 | | | |
| |
| 4.000%, 12/01/2035 (Callable 12/01/2029) | | | 645,000 | | | | 670,640 | | | | | |
| Ford, Champaign Counties Community | | | | | | | | | | | | |
| Unit School District No. 10, | | | | | | | | | | | | |
| 5.000%, 12/01/2027 (Callable 12/01/2026) | | | | | | | | | | | | |
| (Insured by AGM) | | | 600,000 | | | | 639,225 | | | | | |
| Hampshire Special Service Area No. 13: | | | | | | | | | | | | |
| 3.250%, 03/01/2032 (Callable 03/01/2027) | | | | | | | | | | | | |
| (Insured by BAM) | | | 165,000 | | | | 158,847 | | | | | |
| 3.300%, 03/01/2033 (Callable 03/01/2027) | | | | | | | | | | | | |
| (Insured by BAM) | | | 175,000 | | | | 168,316 | | | | | |
| 3.350%, 03/01/2034 (Callable 03/01/2027) | | | | | | | | | | | | |
| (Insured by BAM) | | | 185,000 | | | | 180,225 | | | | | |
| 3.400%, 03/01/2035 (Callable 03/01/2027) | | | | | | | | | | | | |
| (Insured by BAM) | | | 195,000 | | | | 189,558 | | | | | |
| 3.450%, 03/01/2036 (Callable 03/01/2027) | | | | | | | | | | | | |
| (Insured by BAM) | | | 205,000 | | | | 198,281 | | | | | |
| Henry & Whiteside Counties Community | | | | | | | | | | | | |
| Unit School District No. 228, | | | | | | | | | | | | |
| 5.000%, 08/15/2031 (Callable 08/15/2025) | | | | | | | | | | | | |
| (Insured by AGM) | | | 270,000 | | | | 278,647 | | | | | |
| Hoffman Estates Park District, | | | | | | | | | | | | |
| 5.000%, 12/01/2040 (Callable 12/01/2030) | | | | | | | | | | | | |
| (Insured by BAM) | | | 5,000,000 | | | | 5,462,626 | | | | | |
| Huntley Area Public Library District, | | | | | | | | | | | | |
| 5.000%, 02/01/2037 (Callable 02/01/2029) | | | 500,000 | | | | 551,878 | | | | | |
| Illinois Development Finance Authority: | | | | | | | | | | | | |
| 0.000%, 07/15/2025 (ETM) | | | 2,000,000 | | | | 1,909,299 | | | | | |
| 2.450%, 11/15/2039 | | | | | | | | | | | | |
(Mandatory Tender Date 03/03/2026)(1) | | | 1,125,000 | | | | 1,107,860 | | | | | |
| Illinois Educational Facilities Authority, | | | | | | | | | | | | |
| 4.000%, 11/01/2036 (Callable 01/29/2024) | | | 1,065,000 | | | | 1,069,772 | | | | | |
| Illinois Finance Authority: | | | | | | | | | | | | |
| 5.000%, 07/01/2024 | | | 2,870,000 | | | | 2,892,415 | | | | | |
| 5.000%, 11/01/2024 | | | 1,100,000 | | | | 1,108,657 | | | | | |
| 5.000%, 07/01/2025 | | | 3,140,000 | | | | 3,219,067 | | | | | |
| 5.000%, 05/15/2029 (Callable 05/15/2026) | | | 375,000 | | | | 390,203 | | | | | |
| 5.000%, 10/01/2030 (Callable 10/01/2026) | | | 140,000 | | | | 147,488 | | | | | |
| 5.000%, 02/15/2031 (Callable 08/15/2027) | | | 500,000 | | | | 510,577 | | | | | |
| 5.000%, 11/15/2031 (Callable 11/15/2025) | | | 1,000,000 | | | | 1,026,017 | | | | | |
| 4.000%, 12/15/2032 (Callable 12/15/2029) | | | 625,000 | | | | 656,457 | | | | | |
4.500%, 08/01/2033(3) | | | 1,275,000 | | | | 1,275,748 | | | | | |
| 4.000%, 05/15/2034 (Callable 05/15/2026) | | | 300,000 | | | | 300,947 | | | | | |
| 4.973%, 11/01/2034 (SOFR + 1.200%) | | | | | | | | | | | | |
| (Callable 03/01/2025) | | | | | | | | | | | | |
(Mandatory Tender Date 09/01/2025)(2) | | | 7,765,000 | | | | 7,762,764 | | | | | |
| 5.000%, 02/15/2036 (Callable 02/15/2027) | | | 1,405,000 | | | | 1,466,556 | | | | | |
| 5.000%, 11/15/2039 (Callable 05/15/2025) | | | 5,600,000 | | | | 5,635,314 | | | | | |
| 3.875%, 05/01/2040 | | | | | | | | | | | | |
(Mandatory Tender Date 09/01/2028)(1) | | | 2,195,000 | | | | 2,224,577 | | | | | |
| 4.000%, 12/01/2040 (Callable 12/01/2027) | | | 270,000 | | | | 273,309 | | | | | |
| 4.000%, 09/01/2041 (Callable 09/01/2026) | | | 240,000 | | | | 234,988 | | | | | |
| 5.000%, 10/01/2041 (Callable 10/01/2026) | | | 1,400,000 | | | | 1,443,576 | | | | | |
| 4.000%, 12/01/2042 (Callable 12/01/2027) | | | 275,000 | | | | 277,596 | | | | | |
| Illinois Housing Development Authority: | | | | | | | | | | | | |
| 2.375%, 04/01/2025 (Mandatory Tender | | | | | | | | | | | | |
Date 04/01/2024) (Insured by HUD)(1) | | | 3,535,000 | | | | 3,517,733 | | | | | |
| 4.000%, 09/01/2025 (Mandatory Tender | | | | | | | | | | | | |
Date 09/01/2024) (Insured by HUD)(1) | | | 1,000,000 | | | | 1,001,863 | | | | | |
| 4.000%, 06/01/2026 (Mandatory Tender | | | | | | | | | | | | |
Date 06/01/2025) (Insured by FHA)(1) | | | 2,855,000 | | | | 2,871,831 | | | | | |
| 3.100%, 02/01/2035 | | | | | | | | | | | | |
| (Callable 02/01/2026) | | | 580,000 | | | | 552,719 | | | | | |
| 4.000%, 03/01/2043 (Callable 08/01/2024) | | | | | | | | | | | | |
(Mandatory Tender Date 12/01/2024)(1) | | | 2,800,000 | | | | 2,802,815 | | | | | |
| 2.450%, 06/01/2043 (Callable 01/29/2024) | | | | | | | | | | | | |
| (Insured by GNMA) | | | 286,741 | | | | 242,565 | | | | | |
| 4.000%, 07/01/2043 (Callable 01/01/2025) | | | | | | | | | | | | |
| (Mandatory Tender Date 07/01/2025) | | | | | | | | | | | | |
(Insured by HUD)(1) | | | 2,500,000 | | | | 2,508,943 | | | | | |
| 5.250%, 10/01/2043 (Callable 10/01/2032) | | | | | | | | | | | | |
| (Insured by GNMA) | | | 2,145,000 | | | | 2,318,319 | | | | | |
| 4.000%, 10/01/2048 (Callable 04/01/2027) | | | | | | | | | | | | |
| (Insured by GNMA) | | | 3,535,000 | | | | 3,525,922 | | | | | |
| 2.830%, 05/15/2050 | | | | | | | | | | | | |
| (SIFMA Municipal Swap Index + 1.000%) | | | | | | | | | | | | |
| (Callable 11/15/2024) | | | | | | | | | | | | |
(Mandatory Tender Date 05/15/2025)(2) | | | 475,000 | | | | 473,636 | | | | | |
| 6.250%, 10/01/2052 (Callable 04/01/2032) | | | | | | | | | | | | |
| (Insured by GNMA) | | | 7,025,000 | | | | 7,636,266 | | | | | |
| 5.750%, 10/01/2053 (Callable 04/01/2032) | | | | | | | | | | | | |
| (Insured by GNMA) | | | 4,900,000 | | | | 5,294,167 | | | | | |
| Illinois Sports Facilities Authority: | | | | | | | | | | | | |
| 5.000%, 06/15/2028 | | | 1,900,000 | | | | 1,989,275 | | | | | |
| 5.000%, 06/15/2029 | | | 1,750,000 | | | | 1,851,296 | | | | | |
| 5.000%, 06/15/2029 (Insured by BAM) | | | 3,780,000 | | | | 4,068,563 | | | | | |
| 5.000%, 06/15/2032 (Callable 06/15/2031) | | | 480,000 | | | | 512,244 | | | | | |
| Illinois State Toll Highway Authority: | | | | | | | | | | | | |
| 5.000%, 12/01/2032 (Callable 01/01/2026) | | | 645,000 | | | | 671,743 | | | | | |
| 5.000%, 01/01/2036 (Callable 01/01/2025) | | | 2,100,000 | | | | 2,147,203 | | | | | |
| 5.000%, 01/01/2038 (Callable 01/01/2025) | | | 2,750,000 | | | | 2,792,964 | | | | | |
| 5.000%, 01/01/2045 (Callable 01/01/2031) | | | 1,895,000 | | | | 2,074,666 | | | | | |
| Illinois State University, | | | | | | | | | | | | |
| 5.000%, 04/01/2031 (Callable 04/01/2028) | | | | | | | | | | | | |
| (Insured by AGM) | | | 500,000 | | | | 544,100 | | | | | |
| Jo Daviess County Community | | | | | | | | | | | | |
| Unit School District No. 119: | | | | | | | | | | | | |
| 4.000%, 12/01/2034 (Callable 12/01/2028) | | | | | | | | | | | | |
| (Insured by AGM) | | | 345,000 | | | | 363,355 | | | | | |
| 4.000%, 12/01/2034 (Callable 12/01/2028) | | | | | | | | | | | | |
| (Insured by AGM) | | | 280,000 | | | | 293,194 | | | | | |
| 4.000%, 12/01/2037 (Callable 12/01/2028) | | | | | | | | | | | | |
| (Insured by AGM) | | | 380,000 | | | | 392,378 | | | | | |
| 4.000%, 12/01/2037 (Callable 12/01/2028) | | | | | | | | | | | | |
| (Insured by AGM) | | | 310,000 | | | | 317,268 | | | | | |
| 4.000%, 12/01/2039 (Callable 12/01/2028) | | | | | | | | | | | | |
| (Insured by AGM) | | | 285,000 | | | | 290,091 | | | | | |
| 4.000%, 12/01/2039 (Callable 12/01/2028) | | | | | | | | | | | | |
| (Insured by AGM) | | | 230,000 | | | | 233,590 | | | | | |
| Joliet Park District: | | | | | | | | | | | | |
| 4.000%, 02/01/2030 (Callable 02/01/2024) | | | | | | | | | | | | |
| (Insured by BAM) | | | 250,000 | | | | 250,254 | | | | | |
| 4.000%, 02/01/2033 (Callable 01/29/2024) | | | | | | | | | | | | |
| (Insured by AGM) | | | 315,000 | | | | 315,241 | | | | | |
| Kane & DeKalb Counties Community | | | | | | | | | | | | |
| Unit School District No. 301, | | | | | | | | | | | | |
| 0.000%, 12/01/2025 | | | 1,625,000 | | | | 1,514,788 | | | | | |
| Kankakee & Will Counties Community | | | | | | | | | | | | |
| Unit School District No. 5, | | | | | | | | | | | | |
| 4.000%, 05/01/2025 (Callable 05/01/2024) | | | 400,000 | | | | 400,366 | | | | | |
| Kankakee County School District No. 111, | | | | | | | | | | | | |
| 4.000%, 01/01/2025 (Insured by BAM) | | | 480,000 | | | | 484,447 | | | | | |
The accompanying notes are an integral part of these financial statements.
Baird Core Intermediate Municipal Bond Fund
Schedule of Investments, December 31, 2023
Long-Term Investments (cont.)
| | | Principal | | | | | | % of | |
| | | Amount | | | Value | | | Net Assets | |
| Knox & Warren Counties Community | | | | | | | | | |
| Unit School District No. 205: | | | | | | | | | |
| 4.000%, 01/01/2034 (Callable 01/01/2028) | | | | | | | | | |
| (Insured by BAM) | | $ | 855,000 | | | $ | 886,187 | | | |
| |
| 4.000%, 01/01/2036 (Callable 01/01/2028) | | | | | | | | | | | | |
| (Insured by BAM) | | | 920,000 | | | | 945,166 | | | | | |
| Lake County Community | | | | | | | | | | | | |
| Unit School District No. 187, | | | | | | | | | | | | |
| 4.000%, 01/01/2035 (Callable 01/01/2027) | | | | | | | | | | | | |
| (Insured by BAM) | | | 1,190,000 | | | | 1,219,785 | | | | | |
| Lake County Consolidated | | | | | | | | | | | | |
| High School District No. 120: | | | | | | | | | | | | |
| 5.500%, 12/01/2037 (Callable 12/01/2032) | | | 750,000 | | | | 876,038 | | | | | |
| 5.500%, 12/01/2038 (Callable 12/01/2032) | | | 840,000 | | | | 972,973 | | | | | |
| 5.500%, 12/01/2040 (Callable 12/01/2032) | | | 1,510,000 | | | | 1,720,626 | | | | | |
| 5.500%, 12/01/2041 (Callable 12/01/2032) | | | 890,000 | | | | 1,011,217 | | | | | |
| Lake County School District No. 33: | | | | | | | | | | | | |
| 0.000%, 12/01/2026 (Insured by XLCA) | | | 525,000 | | | | 473,309 | | | | | |
| 0.000%, 12/01/2028 (Insured by XLCA) | | | 335,000 | | | | 281,933 | | | | | |
| Lake County Township | | | | | | | | | | | | |
| High School District No. 113, | | | | | | | | | | | | |
| 4.000%, 01/01/2032 (Callable 01/01/2029) | | | 4,130,000 | | | | 4,322,074 | | | | | |
| Macon & De Witt Counties Community | | | | | | | | | | | | |
| Unit School District No. 2: | | | | | | | | | | | | |
| 4.000%, 12/01/2036 (Callable 12/01/2030) | | | | | | | | | | | | |
| (Insured by AGM) | | | 835,000 | | | | 879,377 | | | | | |
| 4.000%, 12/01/2037 (Callable 12/01/2030) | | | | | | | | | | | | |
| (Insured by AGM) | | | 400,000 | | | | 415,281 | | | | | |
| Macon County School District No. 61: | | | | | | | | | | | | |
| 4.000%, 12/01/2034 (Callable 12/01/2028) | | | | | | | | | | | | |
| (Insured by AGM) | | | 150,000 | | | | 156,649 | | | | | |
| 4.000%, 12/01/2037 (Callable 12/01/2028) | | | | | | | | | | | | |
| (Insured by AGM) | | | 200,000 | | | | 202,792 | | | | | |
| 5.000%, 12/01/2037 (Callable 12/01/2028) | | | | | | | | | | | | |
| (Insured by AGM) | | | 1,500,000 | | | | 1,607,190 | | | | | |
| Madison County Community | | | | | | | | | | | | |
| Unit School District No. 8: | | | | | | | | | | | | |
| 4.000%, 12/01/2038 (Callable 12/01/2028) | | | | | | | | | | | | |
| (Insured by BAM) | | | 1,140,000 | | | | 1,148,988 | | | | | |
| 4.000%, 12/01/2039 (Callable 12/01/2028) | | | | | | | | | | | | |
| (Insured by BAM) | | | 1,000,000 | | | | 1,003,100 | | | | | |
| Madison, Bond, Etc. Counties Community | | | | | | | | | | | | |
| Unit School District No. 5: | | | | | | | | | | | | |
| 5.500%, 02/01/2036 (Callable 02/01/2030) | | | | | | | | | | | | |
| (Insured by AGM) | | | 975,000 | | | | 1,117,385 | | | | | |
| 5.500%, 02/01/2037 (Callable 02/01/2030) | | | | | | | | | | | | |
| (Insured by AGM) | | | 380,000 | | | | 432,784 | | | | | |
| 5.500%, 02/01/2041 (Callable 02/01/2030) | | | | | | | | | | | | |
| (Insured by AGM) | | | 1,720,000 | | | | 1,916,464 | | | | | |
| 5.500%, 02/01/2042 (Callable 02/01/2030) | | | | | | | | | | | | |
| (Insured by AGM) | | | 550,000 | | | | 610,529 | | | | | |
| Metropolitan Pier & Exposition Authority: | | | | | | | | | | | | |
| 0.000%, 06/15/2029 (Insured by NATL) | | | 1,400,000 | | | | 1,173,722 | | | | | |
| 0.000%, 12/15/2034 (Insured by NATL) | | | 9,555,000 | | | | 6,601,058 | | | | | |
| Northern Illinois Municipal Power Agency, | | | | | | | | | | | | |
| 4.000%, 12/01/2031 (Callable 12/01/2026) | | | 1,000,000 | | | | 1,017,161 | | | | | |
| Northern Illinois University: | | | | | | | | | | | | |
| 5.000%, 04/01/2025 (Insured by BAM) | | | 1,675,000 | | | | 1,707,332 | | | | | |
| 5.000%, 10/01/2029 (Insured by BAM) | | | 300,000 | | | | 326,434 | | | | | |
| 5.000%, 04/01/2033 (Callable 04/01/2030) | | | | | | | | | | | | |
| (Insured by BAM) | | | 675,000 | | | | 725,994 | | | | | |
| 4.000%, 10/01/2033 (Callable 04/01/2031) | | | | | | | | | | | | |
| (Insured by BAM) | | | 1,000,000 | | | | 1,039,827 | | | | | |
| 4.000%, 10/01/2034 (Callable 04/01/2031) | | | | | | | | | | | | |
| (Insured by BAM) | | | 1,435,000 | | | | 1,486,861 | | | | | |
| 4.000%, 04/01/2035 (Callable 04/01/2030) | | | | | | | | | | | | |
| (Insured by BAM) | | | 260,000 | | | | 268,635 | | | | | |
| 4.000%, 10/01/2035 (Callable 04/01/2031) | | | | | | | | | | | | |
| (Insured by BAM) | | | 1,000,000 | | | | 1,033,830 | | | | | |
| 4.000%, 10/01/2038 (Callable 04/01/2031) | | | | | | | | | | | | |
| (Insured by BAM) | | | 1,000,000 | | | | 1,015,009 | | | | | |
| 4.000%, 10/01/2039 (Callable 04/01/2031) | | | | | | | | | | | | |
| (Insured by BAM) | | | 1,700,000 | | | | 1,713,060 | | | | | |
| 4.000%, 10/01/2040 (Callable 04/01/2031) | | | | | | | | | | | | |
| (Insured by BAM) | | | 400,000 | | | | 400,646 | | | | | |
| 4.000%, 10/01/2041 (Callable 04/01/2031) | | | | | | | | | | | | |
| (Insured by BAM) | | | 425,000 | | | | 422,417 | | | | | |
| 4.000%, 10/01/2043 (Callable 04/01/2031) | | | | | | | | | | | | |
| (Insured by BAM) | | | 625,000 | | | | 609,459 | | | | | |
| Peoria City School District No. 150, | | | | | | | | | | | | |
| 5.000%, 01/01/2026 (Insured by BAM) | | | 330,000 | | | | 343,838 | | | | | |
| Regional Transportation Authority, | | | | | | | | | | | | |
| 5.750%, 06/01/2029 (Insured by AGM) | | | 5,000,000 | | | | 5,715,898 | | | | | |
| Rock Island County School District No. 41: | | | | | | | | | | | | |
| 5.500%, 12/01/2038 (Callable 12/01/2031) | | | | | | | | | | | | |
| (Insured by AGM) | | | 1,905,000 | | | | 2,187,035 | | | | | |
| 5.500%, 12/01/2039 (Callable 12/01/2031) | | | | | | | | | | | | |
| (Insured by AGM) | | | 1,645,000 | | | | 1,877,894 | | | | | |
| 5.500%, 12/01/2040 (Callable 12/01/2031) | | | | | | | | | | | | |
| (Insured by AGM) | | | 1,665,000 | | | | 1,888,206 | | | | | |
| Sales Tax Securitization Corp., | | | | | | | | | | | | |
| 5.000%, 01/01/2038 (Callable 01/01/2028) | | | 610,000 | | | | 642,193 | | | | | |
| Salt Creek Rural Park District, | | | | | | | | | | | | |
| 5.000%, 12/01/2024 (Insured by AGM) | | | 250,000 | | | | 253,545 | | | | | |
| Sangamon & Christian Counties Community | | | | | | | | | | | | |
| Unit School District No. 3A, | | | | | | | | | | | | |
| 5.500%, 02/01/2040 (Callable 02/01/2032) | | | | | | | | | | | | |
| (Insured by BAM) | | | 500,000 | | | | 565,134 | | | | | |
| Sangamon & Morgan Counties Community | | | | | | | | | | | | |
| Unit School District No. 16, | | | | | | | | | | | | |
| 5.500%, 12/01/2042 (Callable 12/01/2030) | | | | | | | | | | | | |
| (Insured by AGM) | | | 895,000 | | | | 991,412 | | | | | |
| Sangamon County School District No. 186, | | | | | | | | | | | | |
| 4.000%, 02/01/2035 (Callable 02/01/2032) | | | | | | | | | | | | |
| (Insured by AGM) | | | 1,500,000 | | | | 1,593,944 | | | | | |
| Southwestern Illinois Community | | | | | | | | | | | | |
| College District No. 522: | | | | | | | | | | | | |
| 5.000%, 12/01/2025 | | | 1,250,000 | | | | 1,295,619 | | | | | |
| 5.000%, 12/01/2026 | | | 1,000,000 | | | | 1,052,976 | | | | | |
| 5.000%, 12/01/2029 | | | 825,000 | | | | 914,534 | | | | | |
| Southwestern Illinois Development Authority: | | | | | | | | | | | | |
| 5.500%, 12/01/2040 (Callable 12/01/2031) | | | | | | | | | | | | |
| (Insured by BAM) | | | 2,305,000 | | | | 2,619,111 | | | | | |
| 4.125%, 12/01/2041 (Callable 12/01/2031) | | | | | | | | | | | | |
| (Insured by BAM) | | | 1,610,000 | | | | 1,644,182 | | | | | |
| St. Clair County Community | | | | | | | | | | | | |
| Unit School District No. 187, | | | | | | | | | | | | |
| 4.000%, 01/01/2028 | | | | | | | | | | | | |
| (ETM) (Insured by AGM) | | | 70,000 | | | | 74,244 | | | | | |
| St. Clair County High School District No. 201: | | | | | | | | | | | | |
| 4.000%, 02/01/2029 (Callable 02/01/2028) | | | | | | | | | | | | |
| (Insured by BAM) | | | 1,375,000 | | | | 1,445,584 | | | | | |
| 4.000%, 02/01/2030 (Callable 02/01/2028) | | | | | | | | | | | | |
| (Insured by BAM) | | | 1,335,000 | | | | 1,401,566 | | | | | |
| 4.000%, 02/01/2031 (Callable 02/01/2028) | | | | | | | | | | | | |
| (Insured by BAM) | | | 1,475,000 | | | | 1,543,324 | | | | | |
The accompanying notes are an integral part of these financial statements.
Baird Core Intermediate Municipal Bond Fund
Schedule of Investments, December 31, 2023
Long-Term Investments (cont.)
| | | Principal | | | | | | % of | |
| | | Amount | | | Value | | | Net Assets | |
| State of Illinois: | | | | | | | | | |
| 5.000%, 05/01/2024 | | $ | 285,000 | | | $ | 286,517 | | | |
| |
| 5.000%, 03/01/2025 | | | 7,000,000 | | | | 7,144,872 | | | | | |
| 5.000%, 10/01/2025 | | | 5,000,000 | | | | 5,157,999 | | | | | |
| 5.000%, 01/01/2029 (Callable 01/01/2026) | | | 5,000 | | | | 5,162 | | | | | |
| 4.000%, 06/15/2038 (Callable 06/15/2028) | | | | | | | | | | | | |
| (Insured by BAM) | | | 2,500,000 | | | | 2,459,215 | | | | | |
| 5.000%, 11/01/2038 (Callable 11/01/2026) | | | 750,000 | | | | 768,522 | | | | | |
| Stephenson County School District No. 145: | | | | | | | | | | | | |
| 5.000%, 10/01/2041 (Callable 10/01/2033) | | | | | | | | | | | | |
| (Insured by AGM) | | | 1,650,000 | | | | 1,788,513 | | | | | |
| 5.000%, 10/01/2042 (Callable 10/01/2033) | | | | | | | | | | | | |
| (Insured by AGM) | | | 2,720,000 | | | | 2,949,456 | | | | | |
| 5.000%, 10/01/2043 (Callable 10/01/2033) | | | | | | | | | | | | |
| (Insured by AGM) | | | 1,200,000 | | | | 1,297,152 | | | | | |
| Tazewell County School District No. 51, | | | | | | | | | | | | |
| 9.000%, 12/01/2026 (Insured by NATL) | | | 1,060,000 | | | | 1,247,591 | | | | | |
| Town of Cicero IL: | | | | | | | | | | | | |
| 4.000%, 01/01/2028 (Insured by BAM) | | | 1,265,000 | | | | 1,300,784 | | | | | |
| 4.000%, 01/01/2029 (Insured by BAM) | | | 815,000 | | | | 839,222 | | | | | |
| University of Illinois, | | | | | | | | | | | | |
| 5.000%, 04/01/2044 (Callable 04/01/2024) | | | 685,000 | | | | 685,669 | | | | | |
| Upper Illinois River Valley | | | | | | | | | | | | |
| Development Authority: | | | | | | | | | | | | |
| 5.000%, 12/01/2024 | | | 585,000 | | | | 591,142 | | | | | |
| 4.000%, 01/01/2031 | | | | | | | | | | | | |
(Callable 01/01/2027)(3) | | | 245,000 | | | | 233,750 | | | | | |
| 5.000%, 01/01/2045 | | | | | | | | | | | | |
(Callable 01/01/2027)(3) | | | 615,000 | | | | 573,363 | | | | | |
| Village of Bartlett IL, | | | | | | | | | | | | |
| 3.000%, 12/01/2033 (Callable 12/01/2028) | | | 450,000 | | | | 450,027 | | | | | |
| Village of Bradley IL: | | | | | | | | | | | | |
| 5.000%, 12/15/2036 (Callable 12/15/2033) | | | | | | | | | | | | |
| (Insured by AGM) | | | 400,000 | | | | 461,815 | | | | | |
| 5.000%, 12/15/2037 (Callable 12/15/2033) | | | | | | | | | | | | |
| (Insured by AGM) | | | 470,000 | | | | 537,590 | | | | | |
| 5.000%, 12/15/2038 (Callable 12/15/2033) | | | | | | | | | | | | |
| (Insured by AGM) | | | 325,000 | | | | 369,153 | | | | | |
| Village of Cary IL, | | | | | | | | | | | | |
| 4.000%, 12/15/2038 (Callable 12/15/2029) | | | 750,000 | | | | 766,884 | | | | | |
| Village of Crestwood IL, | | | | | | | | | | | | |
| 5.000%, 12/15/2031 (Callable 03/04/2024) | | | | | | | | | | | | |
| (Insured by BAM) | | | 605,000 | | | | 606,961 | | | | | |
| Village of Franklin Park IL, | | | | | | | | | | | | |
| 4.000%, 07/01/2029 (Callable 07/01/2025) | | | | | | | | | | | | |
| (Insured by AGM) | | | 450,000 | | | | 456,584 | | | | | |
| Village of Hillside IL, | | | | | | | | | | | | |
| 5.000%, 01/01/2030 (Callable 01/01/2027) | | | 2,690,000 | | | | 2,714,831 | | | | | |
| Village of Matteson IL: | | | | | | | | | | | | |
| 4.000%, 12/01/2028 (Insured by BAM) | | | 300,000 | | | | 315,101 | | | | | |
| 4.000%, 12/01/2030 (Insured by BAM) | | | 300,000 | | | | 319,866 | | | | | |
| Village of McCook IL, | | | | | | | | | | | | |
| 5.000%, 12/01/2027 (Callable 12/01/2026) | | | | | | | | | | | | |
| (Insured by AGM) | | | 1,865,000 | | | | 1,958,393 | | | | | |
| Village of Minooka IL, | | | | | | | | | | | | |
| 2.540%, 12/01/2034 (Callable 12/01/2029) | | | | | | | | | | | | |
| (Insured by AGM) | | | 220,000 | | | | 196,132 | | | | | |
| Village of North Aurora IL, | | | | | | | | | | | | |
| 3.000%, 01/01/2024 | | | 370,000 | | | | 370,000 | | | | | |
| Village of River Grove IL: | | | | | | | | | | | | |
| 4.000%, 12/15/2027 (Callable 12/15/2026) | | | | | | | | | | | | |
| (Insured by BAM) | | | 135,000 | | | | 138,514 | | | | | |
| 4.000%, 12/15/2028 (Callable 12/15/2026) | | | | | | | | | | | | |
| (Insured by BAM) | | | 205,000 | | | | 210,404 | | | | | |
| 4.000%, 12/15/2035 (Callable 12/15/2030) | | | | | | | | | | | | |
| (Insured by BAM) | | | 250,000 | | | | 260,471 | | | | | |
| 4.000%, 12/15/2038 (Callable 12/15/2030) | | | | | | | | | | | | |
| (Insured by BAM) | | | 795,000 | | | | 810,927 | | | | | |
| Village of Romeoville IL: | | | | | | | | | | | | |
| 5.000%, 10/01/2035 (Callable 04/01/2025) | | | 1,445,000 | | | | 1,461,019 | | | | | |
| 5.000%, 10/01/2042 (Callable 04/01/2025) | | | 100,000 | | | | 100,274 | | | | | |
| Village of Stone Park IL: | | | | | | | | | | | | |
| 4.750%, 02/01/2029 (Callable 01/29/2024) | | | | | | | | | | | | |
| (Insured by BAM) | | | 230,000 | | | | 230,333 | | | | | |
| 4.750%, 02/01/2031 (Callable 01/29/2024) | | | | | | | | | | | | |
| (Insured by BAM) | | | 310,000 | | | | 310,449 | | | | | |
| 4.750%, 02/01/2032 (Callable 01/29/2024) | | | | | | | | | | | | |
| (Insured by BAM) | | | 275,000 | | | | 275,379 | | | | | |
| 4.750%, 02/01/2033 (Callable 01/29/2024) | | | | | | | | | | | | |
| (Insured by BAM) | | | 190,000 | | | | 190,260 | | | | | |
| 5.000%, 02/01/2035 (Callable 02/01/2029) | | | | | | | | | | | | |
| (Insured by BAM) | | | 300,000 | | | | 332,292 | | | | | |
| 5.000%, 02/01/2036 (Callable 02/01/2029) | | | | | | | | | | | | |
| (Insured by BAM) | | | 225,000 | | | | 247,888 | | | | | |
| 4.000%, 02/01/2038 (Callable 02/01/2029) | | | | | | | | | | | | |
| (Insured by BAM) | | | 150,000 | | | | 151,106 | | | | | |
| Whiteside & Lee Counties Community | | | | | | | | | | | | |
| Unit School District No. 5: | | | | | | | | | | | | |
| 4.000%, 12/01/2028 (Insured by AGM) | | | 535,000 | | | | 566,710 | | | | | |
| 4.000%, 12/01/2031 (Callable 12/01/2029) | | | | | | | | | | | | |
| (Insured by AGM) | | | 630,000 | | | | 668,933 | | | | | |
| 4.000%, 12/01/2032 (Callable 12/01/2029) | | | | | | | | | | | | |
| (Insured by AGM) | | | 500,000 | | | | 529,785 | | | | | |
| 4.000%, 12/01/2033 (Callable 12/01/2029) | | | | | | | | | | | | |
| (Insured by AGM) | | | 685,000 | | | | 724,889 | | | | | |
| Will County Community | | | | | | | | | | | | |
| High School District No. 210: | | | | | | | | | | | | |
| 0.000%, 01/01/2026 (Insured by AGM) | | | 265,000 | | | | 247,607 | | | | | |
| 0.000%, 01/01/2027 (Insured by BAM) | | | 1,120,000 | | | | 1,013,694 | | | | | |
| 0.000%, 01/01/2027 (Insured by AGM) | | | 115,000 | | | | 104,085 | | | | | |
| 0.000%, 01/01/2028 (Insured by BAM) | | | 1,140,000 | | | | 997,177 | | | | | |
| 0.000%, 01/01/2028 (Insured by AGM) | | | 180,000 | | | | 157,449 | | | | | |
| 0.000%, 01/01/2028 | | | 60,000 | | | | 52,093 | | | | | |
| 0.000%, 01/01/2029 | | | 145,000 | | | | 121,518 | | | | | |
| 0.000%, 01/01/2032 | | | 110,000 | | | | 81,731 | | | | | |
| 0.000%, 01/01/2033 (Insured by BAM) | | | 825,000 | | | | 597,476 | | | | | |
| 4.000%, 01/01/2034 (Callable 01/01/2029) | | | | | | | | | | | | |
| (Insured by AGM) | | | 410,000 | | | | 421,907 | | | | | |
| Will County Community | | | | | | | | | | | | |
| Unit School District No. 201-U: | | | | | | | | | | | | |
| 4.000%, 01/01/2033 (Callable 01/01/2028) | | | | | | | | | | | | |
| (Insured by AGM) | | | 745,000 | | | | 776,558 | | | | | |
| 4.000%, 01/01/2034 (Callable 01/01/2028) | | | | | | | | | | | | |
| (Insured by AGM) | | | 785,000 | | | | 815,734 | | | | | |
| 4.000%, 01/01/2035 (Callable 01/01/2028) | | | | | | | | | | | | |
| (Insured by AGM) | | | 480,000 | | | | 495,786 | | | | | |
| Will County Community | | | | | | | | | | | | |
| Unit School District No. 365-U, | | | | | | | | | | | | |
| 0.000%, 11/01/2025 | | | 200,000 | | | | 188,538 | | | | | |
| Winnebago & Boone Counties Community | | | | | | | | | | | | |
| High School District No. 207, | | | | | | | | | | | | |
| 4.000%, 02/01/2036 (Callable 02/01/2027) | | | | | | | | | | | | |
| (Insured by BAM) | | | 1,000,000 | | | | 1,016,871 | | | | | |
| Total Illinois | | | | | | | | | | | | |
| (Cost $324,501,642) | | | | | | | 326,994,246 | | | | 11.0 | % |
The accompanying notes are an integral part of these financial statements.
Baird Core Intermediate Municipal Bond Fund
Schedule of Investments, December 31, 2023
Long-Term Investments (cont.)
| | | Principal | | | | | | % of | |
| | | Amount | | | Value | | | Net Assets | |
| Indiana | | | | | | | | | |
| Avon Community School Building Corp., | | | | | | | | | |
| 5.500%, 01/15/2043 (Callable 07/15/2033) | | | | | | | | | |
| (Insured by ST AID) | | $ | 600,000 | | | $ | 699,231 | | | |
| |
| Ball State University, | | | | | | | | | | | | |
| 5.000%, 07/01/2035 (Callable 07/01/2028) | | | 500,000 | | | | 545,583 | | | | | |
| Bloomington Redevelopment District: | | | | | | | | | | | | |
| 5.000%, 02/01/2025 | | | 325,000 | | | | 331,034 | | | | | |
| 5.250%, 08/01/2036 (Callable 08/01/2029) | | | 3,450,000 | | | | 3,811,548 | | | | | |
| Blue River Valley School Building Corp., | | | | | | | | | | | | |
| 5.250%, 01/15/2043 (Callable 07/15/2031) | | | | | | | | | | | | |
| (Insured by ST AID) | | | 650,000 | | | | 708,727 | | | | | |
| Bluffton-Harrison Middle | | | | | | | | | | | | |
| School Building Corp.: | | | | | | | | | | | | |
| 5.500%, 07/15/2040 (Callable 07/15/2031) | | | | | | | | | | | | |
| (Insured by ST AID) | | | 290,000 | | | | 324,086 | | | | | |
| 5.500%, 01/15/2043 (Callable 07/15/2031) | | | | | | | | | | | | |
| (Insured by ST AID) | | | 450,000 | | | | 497,547 | | | | | |
| City of Rockport IN: | | | | | | | | | | | | |
| 3.050%, 06/01/2025 | | | 1,475,000 | | | | 1,463,785 | | | | | |
| 3.125%, 07/01/2025 | | | 2,750,000 | | | | 2,716,214 | | | | | |
| Evansville Waterworks District: | | | | | | | | | | | | |
| 5.000%, 07/01/2042 (Callable 01/01/2032) | | | | | | | | | | | | |
| (Insured by BAM) | | | 900,000 | | | | 990,709 | | | | | |
| 5.000%, 07/01/2047 (Callable 01/01/2032) | | | | | | | | | | | | |
| (Insured by BAM) | | | 2,150,000 | | | | 2,304,761 | | | | | |
| Fishers Town Hall Building Corp.: | | | | | | | | | | | | |
| 5.500%, 07/15/2038 (Callable 07/15/2032) | | | 1,000,000 | | | | 1,172,295 | | | | | |
| 5.500%, 01/15/2042 (Callable 07/15/2032) | | | 970,000 | | | | 1,105,022 | | | | | |
| 5.625%, 07/15/2053 (Callable 01/15/2034) | | | | | | | | | | | | |
| (Insured by BAM) | | | 2,500,000 | | | | 2,838,671 | | | | | |
| Greater Clark Building Corp.: | | | | | | | | | | | | |
| 6.000%, 07/15/2034 (Callable 07/15/2032) | | | | | | | | | | | | |
| (Insured by ST AID) | | | 1,120,000 | | | | 1,393,065 | | | | | |
| 6.000%, 07/15/2036 (Callable 07/15/2033) | | | | | | | | | | | | |
| (Insured by ST AID) | | | 500,000 | | | | 630,801 | | | | | |
| 6.000%, 07/15/2038 (Callable 07/15/2033) | | | | | | | | | | | | |
| (Insured by ST AID) | | | 250,000 | | | | 311,065 | | | | | |
| 6.000%, 07/15/2039 (Callable 07/15/2033) | | | | | | | | | | | | |
| (Insured by ST AID) | | | 525,000 | | | | 648,474 | | | | | |
| 6.000%, 07/15/2040 (Callable 07/15/2033) | | | | | | | | | | | | |
| (Insured by ST AID) | | | 500,000 | | | | 614,805 | | | | | |
| 6.000%, 07/15/2040 (Callable 07/15/2033) | | | | | | | | | | | | |
| (Insured by ST AID) | | | 650,000 | | | | 799,246 | | | | | |
| 6.000%, 07/15/2041 (Callable 07/15/2033) | | | | | | | | | | | | |
| (Insured by ST AID) | | | 1,000,000 | | | | 1,224,119 | | | | | |
| 6.000%, 07/15/2041 (Callable 07/15/2033) | | | | | | | | | | | | |
| (Insured by ST AID) | | | 650,000 | | | | 795,678 | | | | | |
| 6.000%, 01/15/2042 (Callable 07/15/2032) | | | | | | | | | | | | |
| (Insured by ST AID) | | | 1,000,000 | | | | 1,197,368 | | | | | |
| 6.000%, 01/15/2043 (Callable 07/15/2033) | | | | | | | | | | | | |
| (Insured by ST AID) | | | 1,120,000 | | | | 1,358,517 | | | | | |
| Hammond Local Public | | | | | | | | | | | | |
| Improvement Bond Bank: | | | | | | | | | | | | |
| 4.500%, 07/15/2037 (Callable 07/15/2030) | | | 455,000 | | | | 459,207 | | | | | |
| 5.000%, 01/15/2043 (Callable 07/15/2030) | | | 2,315,000 | | | | 2,351,117 | | | | | |
| Hammond Multi-School Building Corp.: | | | | | | | | | | | | |
| 4.500%, 07/15/2026 (Callable 01/29/2024) | | | | | | | | | | | | |
| (Insured by ST AID) | | | 625,000 | | | | 625,807 | | | | | |
| 5.000%, 07/15/2034 (Callable 01/15/2028) | | | | | | | | | | | | |
| (Insured by ST AID) | | | 2,000,000 | | | | 2,142,082 | | | | | |
| 5.000%, 07/15/2038 (Callable 01/15/2028) | | | | | | | | | | | | |
| (Insured by ST AID) | | | 3,105,000 | | | | 3,268,156 | | | | | |
| Hammond Sanitary District, | | | | | | | | | | | | |
| 5.000%, 07/15/2026 (Insured by BAM) | | | 610,000 | | | | 643,999 | | | | | |
| Indiana Finance Authority: | | | | | | | | | | | | |
| 3.500%, 03/01/2024 | | | 8,000,000 | | | | 7,996,724 | | | | | |
| 5.000%, 07/01/2027 | | | 1,445,000 | | | | 1,513,349 | | | | | |
| 5.000%, 09/01/2027 | | | 1,595,000 | | | | 1,648,433 | | | | | |
| 5.000%, 10/01/2027 | | | 245,000 | | | | 255,428 | | | | | |
| 5.000%, 07/01/2028 | | | 1,515,000 | | | | 1,606,558 | | | | | |
| 5.000%, 09/01/2028 | | | 1,675,000 | | | | 1,747,277 | | | | | |
| 5.000%, 10/01/2028 (Callable 10/01/2027) | | | 1,000,000 | | | | 1,043,902 | | | | | |
| 5.000%, 10/01/2029 | | | 220,000 | | | | 234,052 | | | | | |
| 5.250%, 02/01/2030 (Callable 08/01/2025) | | | 525,000 | | | | 542,062 | | | | | |
| 2.500%, 11/01/2030 | | | 2,825,000 | | | | 2,568,666 | | | | | |
| 5.000%, 10/01/2031 | | | 250,000 | | | | 269,314 | | | | | |
| 5.000%, 10/01/2033 (Callable 10/01/2031) | | | 230,000 | | | | 246,441 | | | | | |
| 5.000%, 03/01/2036 (Callable 03/01/2025) | | | 1,250,000 | | | | 1,271,402 | | | | | |
| 4.750%, 06/01/2036 (Callable 12/01/2033) | | | 3,005,000 | | | | 3,179,974 | | | | | |
| 4.000%, 10/01/2052 (Callable 04/01/2032) | | | 2,500,000 | | | | 2,388,473 | | | | | |
| Indiana Housing & Community | | | | | | | | | | | | |
| Development Authority: | | | | | | | | | | | | |
| 2.000%, 04/01/2025 | | | | | | | | | | | | |
(Mandatory Tender Date 04/01/2024)(1) | | | 3,250,000 | | | | 3,231,211 | | | | | |
| 5.000%, 07/01/2053 (Callable 01/01/2032) | | | | | | | | | | | | |
| (Insured by GNMA) | | | 4,275,000 | | | | 4,444,258 | | | | | |
| Indiana Municipal Power Agency, | | | | | | | | | | | | |
| 5.000%, 01/01/2032 (Callable 01/01/2025) | | | 1,000,000 | | | | 1,016,817 | | | | | |
| Indianapolis Board of School Commissioners: | | | | | | | | | | | | |
| 5.000%, 01/15/2024 (Insured by ST AID) | | | 325,000 | | | | 325,188 | | | | | |
| 5.000%, 01/15/2025 (Insured by ST AID) | | | 515,000 | | | | 525,191 | | | | | |
| Indianapolis Local Public | | | | | | | | | | | | |
| Improvement Bond Bank: | | | | | | | | | | | | |
| 5.000%, 03/01/2033 | | | 1,000,000 | | | | 1,093,330 | | | | | |
| 5.500%, 03/01/2038 (Callable 03/01/2033) | | | 1,000,000 | | | | 1,104,318 | | | | | |
| 6.000%, 02/01/2042 (Callable 02/01/2033) | | | 2,000,000 | | | | 2,447,943 | | | | | |
| 6.000%, 02/01/2043 (Callable 02/01/2033) | | | 1,500,000 | �� | | | 1,829,981 | | | | | |
| 5.250%, 03/01/2043 (Callable 03/01/2033) | | | | | | | | | | | | |
| (Insured by BAM) | | | 1,750,000 | | | | 1,949,063 | | | | | |
| 6.000%, 03/01/2053 (Callable 03/01/2033) | | | 5,000,000 | | | | 5,453,955 | | | | | |
| IPS Multi-School Building Corp.: | | | | | | | | | | | | |
| 5.000%, 07/15/2026 (Callable 01/15/2025) | | | | | | | | | | | | |
| (Insured by ST AID) | | | 925,000 | | | | 943,101 | | | | | |
| 5.250%, 07/15/2041 (Callable 07/15/2031) | | | | | | | | | | | | |
| (Insured by ST AID) | | | 2,000,000 | | | | 2,265,955 | | | | | |
| 5.250%, 07/15/2041 (Callable 01/15/2032) | | | | | | | | | | | | |
| (Insured by ST AID) | | | 1,850,000 | | | | 2,105,894 | | | | | |
| 5.250%, 07/15/2042 (Callable 07/15/2031) | | | | | | | | | | | | |
| (Insured by ST AID) | | | 1,640,000 | | | | 1,847,691 | | | | | |
| 4.250%, 07/15/2043 (Callable 07/15/2031) | | | | | | | | | | | | |
| (Insured by ST AID) | | | 500,000 | | | | 509,869 | | | | | |
| 5.250%, 07/15/2043 (Callable 01/15/2032) | | | | | | | | | | | | |
| (Insured by ST AID) | | | 1,500,000 | | | | 1,692,570 | | | | | |
| Merrillville Multi School Building Corp.: | | | | | | | | | | | | |
| 5.000%, 01/15/2024 (Insured by ST AID) | | | 500,000 | | | | 500,289 | | | | | |
| 5.000%, 07/15/2025 (Insured by ST AID) | | | 500,000 | | | | 515,312 | | | | | |
| Mount Vernon of Hancock County | | | | | | | | | | | | |
| Multi-School Building Corp.: | | | | | | | | | | | | |
| 5.500%, 07/15/2032 (Callable 07/15/2031) | | | | | | | | | | | | |
| (Insured by ST AID) | | | 700,000 | | | | 831,694 | | | | | |
| 5.500%, 07/15/2034 (Callable 07/15/2031) | | | | | | | | | | | | |
| (Insured by ST AID) | | | 200,000 | | | | 237,763 | | | | | |
| 5.500%, 07/15/2035 (Callable 07/15/2031) | | | | | | | | | | | | |
| (Insured by ST AID) | | | 400,000 | | | | 474,259 | | | | | |
| 5.500%, 07/15/2036 (Callable 07/15/2031) | | | | | | | | | | | | |
| (Insured by ST AID) | | | 750,000 | | | | 883,482 | | | | | |
The accompanying notes are an integral part of these financial statements.
Baird Core Intermediate Municipal Bond Fund
Schedule of Investments, December 31, 2023
Long-Term Investments (cont.)
| | | Principal | | | | | | % of | |
| | | Amount | | | Value | | | Net Assets | |
| Mount Vernon of Hancock County | | | | | | | | | |
| Multi-School Building Corp.: (cont.) | | | | | | | | | |
| 5.500%, 07/15/2038 (Callable 07/15/2031) | | | | | | | | | |
| (Insured by ST AID) | | $ | 840,000 | | | $ | 972,757 | | | | |
| 5.500%, 07/15/2039 (Callable 07/15/2031) | | | | | | | | | | | |
| (Insured by ST AID) | | | 1,655,000 | | | | 1,906,382 | | | | |
| 5.500%, 07/15/2040 (Callable 07/15/2031) | | | | | | | | | | | |
| (Insured by ST AID) | | | 750,000 | | | | 858,099 | | | | |
| 5.500%, 01/15/2042 (Callable 07/15/2031) | | | | | | | | | | | |
| (Insured by ST AID) | | | 1,000,000 | | | | 1,141,275 | | | | |
| Noblesville High School Building Corp.: | | | | | | | | | | | |
| 6.000%, 07/15/2040 (Callable 07/15/2033) | | | | | | | | | | | |
| (Insured by ST AID) | | | 625,000 | | | | 765,623 | | | | |
| 6.000%, 01/15/2043 (Callable 07/15/2033) | | | | | | | | | | | |
| (Insured by ST AID) | | | 800,000 | | | | 968,189 | | | | |
| Northwestern School Building Corp.: | | | | | | | | | | | |
| 6.000%, 07/15/2038 (Callable 07/15/2031) | | | | | | | | | | | |
| (Insured by ST AID) | | | 1,000,000 | | | | 1,180,932 | | | | |
| 6.000%, 07/15/2041 (Callable 07/15/2031) | | | | | | | | | | | |
| (Insured by ST AID) | | | 900,000 | | | | 1,044,146 | | | | |
| Plainfield Redevelopment Authority: | | | | | | | | | | | |
| 3.000%, 08/01/2024 (Insured by ST AID) | | | 360,000 | | | | 358,239 | | | | |
| 5.000%, 02/01/2027 (Insured by ST AID) | | | 500,000 | | | | 525,243 | | | | |
| Richland-Bean Blossom | | | | | | | | | | | |
| 2000 School Building Corp., | | | | | | | | | | | |
| 5.000%, 07/15/2040 (Callable 07/15/2031) | | | | | | | | | | | |
| (Insured by ST AID) | | | 250,000 | | | | 275,138 | | | | |
| Shelby Eastern Multi-School Building Corp., | | | | | | | | | | | |
| 5.250%, 01/15/2043 (Callable 07/15/2031) | | | | | | | | | | | |
| (Insured by ST AID) | | | 1,000,000 | | | | 1,099,055 | | | | |
| South Montgomery | | | | | | | | | | | |
| Community School Corp.: | | | | | | | | | | | |
| 5.000%, 01/15/2024 (Insured by ST AID) | | | 475,000 | | | | 475,178 | | | | |
| 5.000%, 07/15/2024 (Insured by ST AID) | | | 585,000 | | | | 588,892 | | | | |
| 5.000%, 01/15/2025 (Insured by ST AID) | | | 300,000 | | | | 303,947 | | | | |
| 5.000%, 07/15/2025 (Insured by ST AID) | | | 335,000 | | | | 341,972 | | | | |
| 5.000%, 01/15/2026 (Insured by ST AID) | | | 250,000 | | | | 257,068 | | | | |
| Taylor Community School Building Corp., | | | | | | | | | | | |
| 0.000%, 07/15/2029 (Callable 07/15/2025) | | | | | | | | | | | |
| (Insured by ST AID) | | | 360,000 | | | | 297,120 | | | | |
| Tippecanoe County School Building Corp.: | | | | | | | | | | | |
| 6.000%, 07/15/2039 (Callable 07/15/2033) | | | | | | | | | | | |
| (Insured by ST AID) | | | 1,000,000 | | | | 1,237,050 | | | | |
| 6.000%, 01/15/2043 (Callable 07/15/2033) | | | | | | | | | | | |
| (Insured by ST AID) | | | 1,000,000 | | | | 1,214,782 | | | | |
| Tri-Creek 2002 High School Building Corp., | | | | | | | | | | | |
| 4.000%, 07/15/2039 (Callable 07/15/2028) | | | | | | | | | | | |
| (Insured by ST AID) | | | 345,000 | | | | 353,057 | | | | |
| Westfield High School Building Corp.: | | | | | | | | | | | |
| 5.000%, 01/15/2029 (Callable 01/15/2026) | | | | | | | | | | | |
| (Insured by ST AID) | | | 250,000 | | | | 260,509 | | | | |
| 5.000%, 01/15/2030 (Callable 01/15/2026) | | | | | | | | | | | |
| (Insured by ST AID) | | | 300,000 | | | | 312,551 | | | | |
| Westfield-Washington | | | | | | | | | | | |
| Multi-School Building Corp.: | | | | | | | | | | | |
| 5.500%, 07/15/2040 (Callable 07/15/2031) | | | | | | | | | | | |
| (Insured by ST AID) | | | 745,000 | | | | 836,543 | | | | |
| 5.500%, 01/15/2043 (Callable 07/15/2031) | | | | | | | | | | | |
| (Insured by ST AID) | | | 565,000 | | | | 631,467 | | | | |
| Wheeler-Union Township School Building Corp., | | | | | | | | | | | |
| 5.000%, 01/15/2042 (Callable 07/15/2030) | | | | | | | | | | | |
| (Insured by ST AID) | | | 1,225,000 | | | | 1,320,980 | | | | |
| Total Indiana | | | | | | | | | | | |
| (Cost $117,895,414) | | | | | | | 120,240,102 | | | | 4.0 | % |
| Iowa | | | | | | | | | | | | |
| City of Ames IA, | | | | | | | | | | | | |
| 4.000%, 06/15/2035 | | | | | | | | | | | | |
| (Callable 06/15/2026) | | | 1,510,000 | | | | 1,534,789 | | | | | |
| City of Coralville IA: | | | | | | | | | | | | |
| 4.000%, 05/01/2024 | | | 560,000 | | | | 558,352 | | | | | |
| 3.000%, 06/01/2024 | | | 290,000 | | | | 287,802 | | | | | |
| 4.000%, 05/01/2030 (Callable 05/01/2029) | | | 1,000,000 | | | | 1,013,018 | | | | | |
| 4.500%, 06/01/2032 (Callable 06/01/2024) | | | 700,000 | | | | 700,760 | | | | | |
| 3.000%, 05/01/2033 (Callable 05/01/2029) | | | 1,000,000 | | | | 921,695 | | | | | |
| 5.000%, 05/01/2035 (Callable 05/01/2031) | | | | | | | | | | | | |
| (Insured by AGM) | | | 650,000 | | | | 722,880 | | | | | |
| 5.000%, 05/01/2036 (Callable 05/01/2031) | | | | | | | | | | | | |
| (Insured by AGM) | | | 685,000 | | | | 756,331 | | | | | |
| 5.000%, 05/01/2037 (Callable 05/01/2031) | | | | | | | | | | | | |
| (Insured by AGM) | | | 725,000 | | | | 793,222 | | | | | |
| College Community School District, | | | | | | | | | | | | |
| 4.000%, 06/01/2033 (Callable 06/01/2030) | | | | | | | | | | | | |
| (Insured by BAM) | | | 1,820,000 | | | | 1,926,690 | | | | | |
| Iowa Finance Authority: | | | | | | | | | | | | |
| 4.000%, 05/15/2024 | | | 250,000 | | | | 247,766 | | | | | |
| 5.000%, 01/01/2028 (Insured by GNMA) | | | 930,000 | | | | 1,005,012 | | | | | |
| 7.500%, 01/01/2032 | | | | | | | | | | | | |
(Callable 01/01/2030)(3) | | | 2,500,000 | | | | 2,387,589 | | | | | |
| 3.500%, 01/01/2047 (Callable 07/01/2026) | | | | | | | | | | | | |
| (Insured by GNMA) | | | 840,000 | | | | 832,392 | | | | | |
| 4.000%, 07/01/2047 (Callable 07/01/2028) | | | | | | | | | | | | |
| (Insured by GNMA) | | | 1,270,000 | | | | 1,271,417 | | | | | |
| Iowa Higher Education Loan Authority: | | | | | | | | | | | | |
| 3.000%, 04/01/2029 | | | 870,000 | | | | 866,628 | | | | | |
| 5.000%, 10/01/2029 | | | 1,160,000 | | | | 1,252,756 | | | | | |
| 3.000%, 04/01/2030 | | | 650,000 | | | | 645,713 | | | | | |
| 3.000%, 04/01/2031 | | | 525,000 | | | | 518,616 | | | | | |
| 5.000%, 10/01/2034 (Callable 10/01/2030) | | | 300,000 | | | | 324,581 | | | | | |
| 5.000%, 10/01/2035 (Callable 10/01/2030) | | | 360,000 | | | | 387,641 | | | | | |
| 5.000%, 10/01/2036 (Callable 10/01/2030) | | | 365,000 | | | | 390,783 | | | | | |
| 4.750%, 10/01/2042 (Callable 10/01/2030) | | | 750,000 | | | | 763,186 | | | | | |
| PEFA, Inc., | | | | | | | | | | | | |
| 5.000%, 09/01/2049 (Callable 06/01/2026) | | | | | | | | | | | | |
(Mandatory Tender Date 09/01/2026)(1) | | | 8,750,000 | | | | 8,962,374 | | | | | |
| Southern Iowa Rural Water Association, | | | | | | | | | | | | |
| 3.000%, 12/01/2032 (Callable 12/01/2028) | | | | | | | | | | | | |
| (Insured by AGM) | | | 1,030,000 | | | | 1,010,703 | | | | | |
| Total Iowa | | | | | | | | | | | | |
| (Cost $30,483,804) | | | | | | | 30,082,696 | | | | 1.0 | % |
| Kansas | | | | | | | | | | | | |
| City of Derby KS, | | | | | | | | | | | | |
| 3.900%, 03/01/2037 (Callable 03/01/2025) | | | 200,000 | | | | 200,420 | | | | | |
| City of Goddard KS, | | | | | | | | | | | | |
| 3.500%, 06/01/2034 (Callable 01/19/2024) | | | 1,420,000 | | | | 1,275,489 | | | | | |
| City of Haysville KS, | | | | | | | | | | | | |
| 4.250%, 10/01/2025 (Callable 10/01/2024) | | | 615,000 | | | | 617,704 | | | | | |
| City of Manhattan KS, | | | | | | | | | | | | |
| 4.000%, 06/01/2027 (Callable 06/01/2025) | | | 800,000 | | | | 800,836 | | | | | |
| City of Osawatomie KS, | | | | | | | | | | | | |
| 3.750%, 03/01/2027 (Callable 03/01/2025) | | | 3,750,000 | | | | 3,763,316 | | | | | |
| City of Wamego KS, | | | | | | | | | | | | |
| 4.000%, 03/01/2027 (Callable 03/01/2024) | | | 1,540,000 | | | | 1,541,604 | | | | | |
| City of Wichita KS, | | | | | | | | | | | | |
| 4.000%, 09/01/2038 (Callable 09/01/2027) | | | 1,540,000 | | | | 1,551,577 | | | | | |
| Johnson County Unified | | | | | | | | | | | | |
| School District No. 512, | | | | | | | | | | | | |
| 4.000%, 10/01/2043 (Callable 10/01/2033) | | | 3,685,000 | | | | 3,742,601 | | | | | |
The accompanying notes are an integral part of these financial statements.
Baird Core Intermediate Municipal Bond Fund
Schedule of Investments, December 31, 2023
Long-Term Investments (cont.)
| | | Principal | | | | | | % of | |
| | | Amount | | | Value | | | Net Assets | |
| Kansas Power Pool: | | | | | | | | | |
| 4.000%, 12/01/2038 | | | | | | | | | |
| (Callable 12/01/2029) | | $ | 700,000 | | | $ | 707,606 | | | | |
| 4.000%, 12/01/2040 (Callable 12/01/2029) | | | 1,095,000 | | | | 1,097,120 | | | | |
| Leavenworth County-Kansas | | | | | | | | | | | |
| Unified Government, | | | | | | | | | | | |
4.000%, 09/01/2026(6) | | | 800,000 | | | | 816,664 | | | | |
| Wabaunsee County Unified | | | | | | | | | | | |
| School District No. 330: | | | | | | | | | | | |
| 5.500%, 09/01/2042 (Callable 09/01/2031) | | | | | | | | | | | |
| (Insured by BAM) | | | 750,000 | | | | 854,550 | | | | |
| 5.500%, 09/01/2047 (Callable 09/01/2031) | | | | | | | | | | | |
| (Insured by BAM) | | | 750,000 | | | | 837,840 | | | | |
| Wyandotte County-Kansas City | | | | | | | | | | | |
| Unified Government, | | | | | | | | | | | |
| 5.000%, 09/01/2044 (Callable 09/01/2024) | | | 1,740,000 | | | | 1,748,116 | | | | |
| Total Kansas | | | | | | | | | | | |
| (Cost $19,773,789) | | | | | | | 19,555,443 | | | | 0.7 | % |
| Kentucky | | | | | | | | | | | | |
| City of Versailles KY, | | | | | | | | | | | | |
| 3.000%, 08/15/2026 (Callable 08/15/2024) | | | 3,000,000 | | | | 2,964,388 | | | | | |
| County of Leslie KY, | | | | | | | | | | | | |
| 4.000%, 02/01/2052 (Callable 02/01/2030) | | | 1,485,000 | | | | 1,441,670 | | | | | |
| Kentucky Economic Development | | | | | | | | | | | | |
| Finance Authority: | | | | | | | | | | | | |
| 0.000%, 10/01/2025 (Insured by NATL) | | | 685,000 | | | | 640,900 | | | | | |
| 0.000%, 10/01/2026 (Insured by NATL) | | | 765,000 | | | | 691,373 | | | | | |
| 0.000%, 10/01/2027 (Insured by NATL) | | | 785,000 | | | | 685,089 | | | | | |
| 0.000%, 10/01/2028 (Insured by NATL) | | | 1,015,000 | | | | 854,496 | | | | | |
| 5.000%, 07/01/2033 (Callable 07/01/2025) | | | 1,295,000 | | | | 1,316,969 | | | | | |
| Kentucky Housing Corp., | | | | | | | | | | | | |
| 5.000%, 09/01/2043 (Callable 03/01/2026) | | | | | | | | | | | | |
| (Mandatory Tender Date 09/01/2026) | | | | | | | | | | | | |
(Insured by HUD)(1) | | | 3,000,000 | | | | 3,091,394 | | | | | |
| Kentucky Public Energy Authority: | | | | | | | | | | | | |
| 4.000%, 08/01/2027 | | | 550,000 | | | | 552,315 | | | | | |
| 4.000%, 01/01/2049 (Callable 10/01/2024) | | | | | | | | | | | | |
(Mandatory Tender Date 01/01/2025)(1) | | | 1,945,000 | | | | 1,945,430 | | | | | |
| 4.000%, 12/01/2050 (Callable 03/01/2026) | | | | | | | | | | | | |
(Mandatory Tender Date 06/01/2026)(1) | | | 5,575,000 | | | | 5,544,932 | | | | | |
| Kentucky State University: | | | | | | | | | | | | |
| 4.000%, 11/01/2033 (Callable 11/01/2031) | | | | | | | | | | | | |
| (Insured by BAM) | | | 260,000 | | | | 280,121 | | | | | |
| 4.000%, 11/01/2035 (Callable 11/01/2031) | | | | | | | | | | | | |
| (Insured by BAM) | | | 270,000 | | | | 289,365 | | | | | |
| 4.000%, 11/01/2038 (Callable 11/01/2031) | | | | | | | | | | | | |
| (Insured by BAM) | | | 325,000 | | | | 336,914 | | | | | |
| 4.000%, 11/01/2041 (Callable 11/01/2031) | | | | | | | | | | | | |
| (Insured by BAM) | | | 250,000 | | | | 253,778 | | | | | |
| Lexington-Fayette Urban | | | | | | | | | | | | |
| County Airport Board: | | | | | | | | | | | | |
| 5.000%, 07/01/2043 (Callable 07/01/2033) | | | 570,000 | | | | 629,380 | | | | | |
| 5.250%, 07/01/2048 (Callable 07/01/2033) | | | 525,000 | | | | 579,249 | | | | | |
| 5.250%, 07/01/2053 (Callable 07/01/2033) | | | 1,000,000 | | | | 1,093,446 | | | | | |
| Logan County School District Finance Corp., | | | | | | | | | | | | |
| 5.000%, 09/01/2036 (Callable 09/01/2033) | | | | | | | | | | | | |
| (Insured by ST AID) | | | 1,000,000 | | | | 1,128,537 | | | | | |
| Louisville/Jefferson County | | | | | | | | | | | | |
| Metropolitan Government, | | | | | | | | | | | | |
| 5.000%, 10/01/2047 (Callable 07/01/2026) | | | | | | | | | | | | |
(Mandatory Tender Date 10/01/2026)(1) | | | 1,500,000 | | | | 1,567,050 | | | | | |
| Paducah Electric Plant Board, | | | | | | | | | | | | |
| 5.000%, 10/01/2032 (Callable 10/01/2026) | | | | | | | | | | | | |
| (Insured by AGM) | | | 1,000,000 | | | | 1,049,393 | | | | | |
| Paducah Independent School | | | | | | | | | | | | |
| District Finance Corp., | | | | | | | | | | | | |
| 3.500%, 09/01/2033 (Callable 09/01/2026) | | | | | | | | | | | | |
| (Insured by ST AID) | | | 300,000 | | | | 302,556 | | | | | |
| Rural Water Financing Agency, | | | | | | | | | | | | |
| 3.100%, 11/01/2024 (Callable 01/16/2024) | | | 1,700,000 | | | | 1,685,938 | | | | | |
| Total Kentucky | | | | | | | | | | | | |
| (Cost $29,171,098) | | | | | | | 28,924,683 | | | | 1.0 | % |
| Louisiana | | | | | | | | | | | | |
| City of Pineville LA: | | | | | | | | | | | | |
| 4.000%, 05/01/2034 (Callable 05/01/2032) | | | | | | | | | | | | |
| (Insured by BAM) | | | 400,000 | | | | 430,647 | | | | | |
| 4.000%, 05/01/2037 (Callable 05/01/2032) | | | | | | | | | | | | |
| (Insured by BAM) | | | 325,000 | | | | 341,742 | | | | | |
| 4.000%, 05/01/2047 (Callable 05/01/2032) | | | | | | | | | | | | |
| (Insured by BAM) | | | 1,000,000 | | | | 997,642 | | | | | |
| City of Shreveport LA, | | | | | | | | | | | | |
| 4.000%, 12/01/2034 (Callable 12/01/2028) | | | | | | | | | | | | |
| (Insured by BAM) | | | 1,225,000 | | | | 1,261,226 | | | | | |
| Ernest N. Morial New Orleans | | | | | | | | | | | | |
| Exhibition Hall Authority, | | | | | | | | | | | | |
| 5.000%, 07/15/2037 (Callable 07/15/2033) | | | 2,875,000 | | | | 3,326,522 | | | | | |
| Louisiana Housing Corp.: | | | | | | | | | | | | |
| 3.500%, 07/01/2025 (Mandatory Tender | | | | | | | | | | | | |
Date 07/01/2024) (Insured by HUD)(1) | | | 3,274,000 | | | | 3,267,904 | | | | | |
| 5.000%, 07/01/2046 (Callable 02/01/2026) | | | | | | | | | | | | |
| (Mandatory Tender Date 07/01/2026) | | | | | | | | | | | | |
(Insured by HUD)(1) | | | 3,024,000 | | | | 3,115,572 | | | | | |
| 4.500%, 12/01/2047 (Callable 12/01/2027) | | | 100,000 | | | | 100,599 | | | | | |
| Louisiana Local Government | | | | | | | | | | | | |
| Environmental Facilities & | | | | | | | | | | | | |
| Community Development Authority: | | | | | | | | | | | | |
| 5.000%, 10/01/2024 (Insured by BAM) | | | 100,000 | | | | 101,426 | | | | | |
| 4.250%, 04/01/2043 (Callable 04/01/2033) | | | | | | | | | | | | |
| (Insured by AGM) | | | 100,000 | | | | 102,702 | | | | | |
| 5.000%, 10/01/2043 (Callable 10/01/2033) | | | | | | | | | | | | |
| (Insured by AGM) | | | 550,000 | | | | 595,867 | | | | | |
| 5.000%, 04/01/2048 (Callable 04/01/2033) | | | | | | | | | | | | |
| (Insured by AGM) | | | 800,000 | | | | 858,380 | | | | | |
| 5.125%, 10/01/2048 (Callable 10/01/2033) | | | | | | | | | | | | |
| (Insured by AGM) | | | 700,000 | | | | 752,739 | | | | | |
| 4.500%, 04/01/2053 (Callable 04/01/2033) | | | | | | | | | | | | |
| (Insured by AGM) | | | 350,000 | | | | 354,997 | | | | | |
| 5.000%, 04/01/2053 (Callable 04/01/2033) | | | | | | | | | | | | |
| (Insured by AGM) | | | 800,000 | | | | 851,442 | | | | | |
| Louisiana Public Facilities Authority: | | | | | | | | | | | | |
5.000%, 10/01/2024(5) | | | 180,000 | | | | 179,983 | | | | | |
5.250%, 10/01/2031(5) | | | 2,105,000 | | | | 2,396,263 | | | | | |
5.250%, 10/01/2033(5) | | | 2,000,000 | | | | 2,322,639 | | | | | |
| 6.750%, 10/01/2053 (Callable 07/03/2028) | | | | | | | | | | | | |
(Mandatory Tender Date 10/01/2028)(1)(3) | | | 2,500,000 | | | | 2,542,516 | | | | | |
| Louisiana State University & | | | | | | | | | | | | |
| Agricultural & Mechanical College, | | | | | | | | | | | | |
| 5.000%, 07/01/2028 (Callable 07/01/2026) | | | 4,200,000 | | | | 4,395,887 | | | | | |
| Morehouse Parish Hospital | | | | | | | | | | | | |
| Service District No. 1, | | | | | | | | | | | | |
| 4.000%, 10/01/2028 (Callable 10/01/2027) | | | 660,000 | | | | 654,588 | | | | | |
| Parish of St. John the Baptist LA: | | | | | | | | | | | | |
| 5.000%, 03/01/2031 (Callable 03/01/2029) | | | 385,000 | | | | 426,220 | | | | | |
| 5.000%, 03/01/2032 (Callable 03/01/2029) | | | 500,000 | | | | 552,618 | | | | | |
| Plaquemines Port Harbor & Terminal District, | | | | | | | | | | | | |
| 4.000%, 03/15/2025 | | | | | | | | | | | | |
(Mandatory Tender Date 03/15/2024)(1) | | | 5,000,000 | | | | 5,001,101 | | | | | |
The accompanying notes are an integral part of these financial statements.
Baird Core Intermediate Municipal Bond Fund
Schedule of Investments, December 31, 2023
Long-Term Investments (cont.)
| | | Principal | | | | | | % of | |
| | | Amount | | | Value | | | Net Assets | |
| St. Tammany Parish Hospital | | | | | | | | | |
| Service District No. 1: | | | | | | | | | |
| 5.000%, 07/01/2036 | | | | | | | | | |
| (Callable 07/01/2028) | | $ | 1,745,000 | | | $ | 1,858,769 | | | | |
| 5.000%, 07/01/2038 (Callable 07/01/2028) | | | 855,000 | | | | 897,024 | | | | |
| Tangipahoa Parish School Board, | | | | | | | | | | | |
| 4.000%, 03/01/2041 (Callable 03/01/2031) | | | | | | | | | | | |
| (Insured by AGM) | | | 500,000 | | | | 508,032 | | | | |
| Terrebonne Parish Consolidated Government, | | | | | | | | | | | |
| 0.000%, 04/01/2034 (Insured by AGM) | | | 715,000 | | | | 509,153 | | | | |
| Total Louisiana | | | | | | | | | | | |
| (Cost $37,946,422) | | | | | | | 38,704,200 | | | | 1.3 | % |
| Maine | | | | | | | | | | | | |
| City of Lewiston ME: | | | | | | | | | | | | |
| 1.375%, 02/15/2033 (Callable 02/15/2028) | | | 1,000,000 | | | | 813,399 | | | | | |
| 1.625%, 02/15/2036 (Callable 02/15/2028) | | | 1,435,000 | | | | 1,112,844 | | | | | |
| City of Portland ME, | | | | | | | | | | | | |
| 5.000%, 01/01/2031 (Callable 01/01/2026) | | | 1,090,000 | | | | 1,126,228 | | | | | |
| Maine Health & Higher | | | | | | | | | | | | |
| Educational Facilities Authority: | | | | | | | | | | | | |
| 4.000%, 07/01/2037 (Callable 07/01/2029) | | | | | | | | | | | | |
| (Insured by ST AID) | | | 230,000 | | | | 234,431 | | | | | |
| 5.000%, 07/01/2038 (Callable 07/01/2030) | | | | | | | | | | | | |
| (Insured by ST AID) | | | 1,530,000 | | | | 1,632,972 | | | | | |
| 5.000%, 07/01/2046 (Callable 07/01/2026) | | | 250,000 | | | | 234,502 | | | | | |
| Maine State Housing Authority: | | | | | | | | | | | | |
| 3.625%, 11/15/2039 (Callable 11/15/2024) | | | 2,255,000 | | | | 2,185,692 | | | | | |
| 3.500%, 11/15/2045 (Callable 05/15/2025) | | | 5,000 | | | | 4,980 | | | | | |
| 4.000%, 11/15/2045 (Callable 11/15/2025) | | | 15,000 | | | | 14,980 | | | | | |
| 3.500%, 11/15/2047 (Callable 11/15/2026) | | | 225,000 | | | | 222,819 | | | | | |
| 4.000%, 11/15/2049 (Callable 05/15/2028) | | | 205,000 | | | | 204,549 | | | | | |
| 4.000%, 11/15/2050 (Callable 05/15/2029) | | | 595,000 | | | | 595,128 | | | | | |
| 5.000%, 11/15/2052 (Callable 11/15/2031) | | | 3,695,000 | | | | 3,836,272 | | | | | |
| 5.000%, 11/15/2052 (Callable 11/15/2031) | | | 1,440,000 | | | | 1,495,354 | | | | | |
| Total Maine | | | | | | | | | | | | |
| (Cost $13,944,918) | | | | | | | 13,714,150 | | | | 0.5 | % |
| Maryland | | | | | | | | | | | | |
| County of Baltimore MD: | | | | | | | | | | | | |
| 4.000%, 09/01/2032 (Callable 09/01/2031) | | | 350,000 | | | | 379,105 | | | | | |
| 4.000%, 09/01/2033 (Callable 09/01/2031) | | | 230,000 | | | | 248,101 | | | | | |
| 4.000%, 09/01/2036 (Callable 09/01/2031) | | | 135,000 | | | | 142,733 | | | | | |
| Maryland Community | | | | | | | | | | | | |
| Development Administration: | | | | | | | | | | | | |
| 3.250%, 08/01/2024 (Insured by GNMA) | | | 5,970,000 | | | | 5,916,878 | | | | | |
| 4.050%, 10/01/2024 | | | 4,000,000 | | | | 4,000,026 | | | | | |
| 4.600%, 12/01/2024 | | | 10,000,000 | | | | 9,996,819 | | | | | |
| 3.850%, 03/01/2025 | | | 5,000,000 | | | | 4,993,355 | | | | | |
| 4.700%, 03/01/2046 (Callable 03/01/2031) | | | | | | | | | | | | |
| (Insured by GNMA) | | | 2,250,000 | | | | 2,309,292 | | | | | |
| 3.500%, 03/01/2050 (Callable 03/01/2029) | | | 755,000 | | | | 745,443 | | | | | |
| 5.000%, 09/01/2052 (Callable 03/01/2031) | | | | | | | | | | | | |
| (Insured by GNMA) | | | 7,710,000 | | | | 8,002,706 | | | | | |
| Maryland Health & Higher | | | | | | | | | | | | |
| Educational Facilities Authority: | | | | | | | | | | | | |
| 5.000%, 01/01/2028 | | | 300,000 | | | | 317,565 | | | | | |
| 5.000%, 07/01/2028 | | | 370,000 | | | | 400,026 | | | | | |
| 4.000%, 01/01/2029 | | | 980,000 | | | | 1,005,947 | | | | | |
| 5.000%, 01/01/2029 | | | 290,000 | | | | 310,890 | | | | | |
| 5.000%, 01/01/2030 | | | 185,000 | | | | 200,161 | | | | | |
| 5.000%, 07/01/2045 (Callable 01/01/2027) | | | | | | | | | | | | |
(Mandatory Tender Date 07/01/2027)(1) | | | 780,000 | | | | 825,315 | | | | | |
| Montgomery County Housing | | | | | | | | | | | | |
| Opportunities Commission, | | | | | | | | | | | | |
| 5.000%, 01/01/2043 (Callable 01/01/2034) | | | 1,000,000 | | | | 1,100,365 | | | | | |
| Total Maryland | | | | | | | | | | | | |
| (Cost $41,078,653) | | | | | | | 40,894,727 | | | | 1.4 | % |
| Massachusetts | | | | | | | | | | | | |
| Commonwealth of Massachusetts, | | | | | | | | | | | | |
| 4.000%, 04/01/2042 | | | | | | | | | | | | |
| (Callable 04/01/2025) | | | 30,000 | | | | 30,001 | | | | | |
| Massachusetts Bay Transportation Authority, | | | | | | | | | | | | |
| 0.000%, 07/01/2030 (Callable 07/01/2026) | | | 5,800,000 | | | | 4,594,697 | | | | | |
| Massachusetts Development Finance Agency: | | | | | | | | | | | | |
| 5.000%, 10/01/2025 (Insured by AGM) | | | 575,000 | | | | 591,792 | | | | | |
| 5.000%, 01/01/2031 (Callable 01/01/2027) | | | 475,000 | | | | 492,828 | | | | | |
| Massachusetts Educational | | | | | | | | | | | | |
| Financing Authority, | | | | | | | | | | | | |
| 5.000%, 01/01/2026 (Callable 01/01/2025) | | | 2,000,000 | | | | 2,026,385 | | | | | |
| Massachusetts Housing Finance Agency: | | | | | | | | | | | | |
| 3.300%, 12/01/2026 (Callable 06/01/2025) | | | | | | | | | | | | |
| (Insured by FHA) | | | 1,000,000 | | | | 1,002,659 | | | | | |
| 3.350%, 06/01/2027 (Callable 12/01/2025) | | | | | | | | | | | | |
| (Insured by FHA) | | | 2,600,000 | | | | 2,607,999 | | | | | |
| 4.000%, 12/01/2028 (Callable 01/19/2024) | | | 1,000,000 | | | | 1,000,432 | | | | | |
| 3.500%, 06/01/2042 (Callable 06/01/2025) | | | 580,000 | | | | 577,876 | | | | | |
| 4.500%, 12/01/2048 (Callable 12/01/2027) | | | 895,000 | | | | 900,986 | | | | | |
| 4.000%, 06/01/2049 (Callable 12/01/2028) | | | 490,000 | | | | 489,069 | | | | | |
| 5.000%, 06/01/2050 (Callable 06/01/2032) | | | | | | | | | | | | |
| (Insured by GNMA) | | | 1,740,000 | | | | 1,805,110 | | | | | |
| Total Massachusetts | | | | | | | | | | | | |
| (Cost $16,345,865) | | | | | | | 16,119,834 | | | | 0.5 | % |
| Michigan | | | | | | | | | | | | |
| Allegan Public School District: | | | | | | | | | | | | |
| 5.000%, 05/01/2035 (Callable 05/01/2033) | | | | | | | | | | | | |
| (Insured by Q-SBLF) | | | 900,000 | | | | 1,061,812 | | | | | |
| 5.000%, 05/01/2036 (Callable 05/01/2033) | | | | | | | | | | | | |
| (Insured by Q-SBLF) | | | 935,000 | | | | 1,093,355 | | | | | |
| 5.000%, 05/01/2037 (Callable 05/01/2033) | | | | | | | | | | | | |
| (Insured by Q-SBLF) | | | 725,000 | | | | 836,625 | | | | | |
| 5.000%, 05/01/2038 (Callable 05/01/2033) | | | | | | | | | | | | |
| (Insured by Q-SBLF) | | | 1,025,000 | | | | 1,160,314 | | | | | |
| 5.000%, 05/01/2039 (Callable 05/01/2033) | | | | | | | | | | | | |
| (Insured by Q-SBLF) | | | 1,075,000 | | | | 1,201,637 | | | | | |
| Berkley School District: | | | | | | | | | | | | |
| 5.250%, 05/01/2044 (Callable 05/01/2033) | | | | | | | | | | | | |
| (Insured by Q-SBLF) | | | 875,000 | | | | 978,792 | | | | | |
| 5.250%, 05/01/2048 (Callable 05/01/2033) | | | | | | | | | | | | |
| (Insured by Q-SBLF) | | | 700,000 | | | | 771,815 | | | | | |
| City of Detroit MI: | | | | | | | | | | | | |
| 5.250%, 05/01/2028 | | | 275,000 | | | | 293,903 | | | | | |
| 5.250%, 05/01/2029 | | | 685,000 | | | | 742,065 | | | | | |
| 5.250%, 05/01/2030 | | | 680,000 | | | | 745,069 | | | | | |
| 5.250%, 05/01/2031 | | | 575,000 | | | | 635,987 | | | | | |
| 5.250%, 05/01/2032 | | | 600,000 | | | | 670,498 | | | | | |
| 5.250%, 05/01/2033 | | | 550,000 | | | | 620,670 | | | | | |
| 6.000%, 05/01/2039 (Callable 05/01/2033) | | | 500,000 | | | | 574,762 | | | | | |
| Clio Area School District: | | | | | | | | | | | | |
| 4.000%, 05/01/2038 (Callable 05/01/2032) | | | | | | | | | | | | |
| (Insured by Q-SBLF) | | | 635,000 | | | | 668,546 | | | | | |
| 4.000%, 05/01/2040 (Callable 05/01/2032) | | | | | | | | | | | | |
| (Insured by Q-SBLF) | | | 885,000 | | | | 918,534 | | | | | |
| 4.000%, 05/01/2041 (Callable 05/01/2032) | | | | | | | | | | | | |
| (Insured by Q-SBLF) | | | 895,000 | | | | 923,469 | | | | | |
| 4.000%, 05/01/2042 (Callable 05/01/2032) | | | | | | | | | | | | |
| (Insured by Q-SBLF) | | | 885,000 | | | | 906,598 | | | | | |
| Coopersville Area Public Schools: | | | | | | | | | | | | |
| 4.000%, 05/01/2039 (Callable 05/01/2032) | | | | | | | | | | | | |
| (Insured by Q-SBLF) | | | 300,000 | | | | 309,788 | | | | | |
The accompanying notes are an integral part of these financial statements.
Baird Core Intermediate Municipal Bond Fund
Schedule of Investments, December 31, 2023
Long-Term Investments (cont.)
| | | Principal | | | | | | % of | |
| | | Amount | | | Value | | | Net Assets | |
| Coopersville Area Public Schools: (cont.) | | | | | | | | | |
| 4.500%, 05/01/2041 (Callable 05/01/2032) | | | | | | | | | |
| (Insured by Q-SBLF) | | $ | 310,000 | | | $ | 327,967 | | | |
| |
| 4.500%, 05/01/2043 (Callable 05/01/2032) | | | | | | | | | | | | |
| (Insured by Q-SBLF) | | | 300,000 | | | | 314,574 | | | | | |
| Detroit City School District, | | | | | | | | | | | | |
| 5.250%, 05/01/2025 (Insured by BHAC) | | | 525,000 | | | | 535,198 | | | | | |
| Eastern Michigan University, | | | | | | | | | | | | |
| 4.000%, 03/01/2034 (Callable 03/01/2027) | | | | | | | | | | | | |
| (Insured by BAM) | | | 985,000 | | | | 1,014,584 | | | | | |
| Flat Rock Community School District: | | | | | | | | | | | | |
| 5.000%, 05/01/2036 (Callable 05/01/2032) | | | | | | | | | | | | |
| (Insured by Q-SBLF) | | | 670,000 | | | | 774,863 | | | | | |
| 5.000%, 05/01/2037 (Callable 05/01/2032) | | | | | | | | | | | | |
| (Insured by Q-SBLF) | | | 725,000 | | | | 830,513 | | | | | |
| 5.000%, 05/01/2038 (Callable 05/01/2032) | | | | | | | | | | | | |
| (Insured by Q-SBLF) | | | 575,000 | | | | 652,384 | | | | | |
| 5.000%, 05/01/2039 (Callable 05/01/2032) | | | | | | | | | | | | |
| (Insured by Q-SBLF) | | | 805,000 | | | | 903,688 | | | | | |
| 5.000%, 05/01/2041 (Callable 05/01/2032) | | | | | | | | | | | | |
| (Insured by Q-SBLF) | | | 1,385,000 | | | | 1,530,580 | | | | | |
| 5.000%, 05/01/2044 (Callable 05/01/2032) | | | | | | | | | | | | |
| (Insured by Q-SBLF) | | | 1,485,000 | | | | 1,620,654 | | | | | |
| Fraser Public School District, | | | | | | | | | | | | |
| 5.000%, 05/01/2048 (Callable 05/01/2033) | | | | | | | | | | | | |
| (Insured by Q-SBLF) | | | 1,000,000 | | | | 1,073,524 | | | | | |
| Great Lakes Water Authority: | | | | | | | | | | | | |
| 5.000%, 07/01/2036 (Callable 07/01/2026) | | | 5,000,000 | | | | 5,193,108 | | | | | |
| 5.000%, 07/01/2046 (Callable 07/01/2026) | | | 2,000,000 | | | | 2,048,403 | | | | | |
| Lake Superior State University, | | | | | | | | | | | | |
| 4.000%, 11/15/2028 (Insured by AGM) | | | 620,000 | | | | 652,031 | | | | | |
| Michigan Finance Authority: | | | | | | | | | | | | |
| 5.000%, 11/01/2025 | | | 885,000 | | | | 909,925 | | | | | |
| 5.250%, 02/01/2027 | | | 2,000,000 | | | | 2,024,891 | | | | | |
| 5.000%, 11/15/2027 (Callable 11/15/2026) | | | 1,055,000 | | | | 1,108,526 | | | | | |
| 5.000%, 11/01/2028 | | | 1,025,000 | | | | 1,058,314 | | | | | |
| 5.000%, 09/01/2029 | | | 400,000 | | | | 432,002 | | | | | |
| 4.500%, 10/01/2029 (Callable 10/01/2024) | | | 6,900,000 | | | | 6,936,656 | | | | | |
| 5.000%, 09/01/2030 (Callable 03/01/2030) | | | 440,000 | | | | 476,238 | | | | | |
| 5.250%, 02/01/2032 (Callable 02/01/2027) | | | 590,000 | | | | 604,418 | | | | | |
| 5.000%, 07/01/2032 (Callable 07/01/2024) | | | | | | | | | | | | |
| (Insured by AGM) | | | 5,000,000 | | | | 5,025,361 | | | | | |
| 5.000%, 05/15/2034 (Callable 05/15/2025) | | | 2,500,000 | | | | 2,542,897 | | | | | |
| 5.000%, 07/01/2034 (Callable 07/01/2025) | | | 2,000,000 | | | | 2,037,163 | | | | | |
| 5.000%, 12/01/2035 (Callable 12/01/2027) | | | 1,000,000 | | | | 1,064,681 | | | | | |
| 5.000%, 10/01/2039 (Callable 10/01/2024) | | | | | | | | | | | | |
| (Partially Pre-refunded) | | | 3,135,000 | | | | 3,153,723 | | | | | |
| 5.000%, 07/01/2044 (Callable 07/01/2024) | | | 3,910,000 | | | | 3,914,854 | | | | | |
| 6.750%, 07/01/2044 | | | | | | | | | | | | |
(Pre-refunded to 07/01/2024)(3) | | | 2,735,000 | | | | 2,784,779 | | | | | |
| 5.000%, 11/15/2044 (Callable 05/16/2026) | | | | | | | | | | | | |
(Mandatory Tender Date 11/16/2026)(1) | | | 4,950,000 | | | | 5,179,893 | | | | | |
| Michigan State Building Authority, | | | | | | | | | | | | |
| 3.180%, 04/15/2058 (Callable 01/02/2024) | | | | | | | | | | | | |
(Optional Put Date 01/05/2024)(1) | | | 2,000,000 | | | | 2,000,000 | | | | | |
| Michigan State Hospital Finance Authority, | | | | | | | | | | | | |
| 4.000%, 11/15/2047 (Callable 11/15/2026) | | | 595,000 | | | | 568,907 | | | | | |
| Michigan State Housing | | | | | | | | | | | | |
| Development Authority: | | | | | | | | | | | | |
| 3.250%, 10/01/2037 (Callable 10/01/2025) | | | 1,745,000 | | | | 1,579,597 | | | | | |
| 4.250%, 06/01/2049 (Callable 12/01/2027) | | | 1,035,000 | | | | 1,038,536 | | | | | |
| 4.250%, 12/01/2049 (Callable 06/01/2028) | | | 1,050,000 | | | | 1,055,162 | | | | | |
| 3.500%, 12/01/2050 (Callable 06/01/2029) | | | 3,765,000 | | | | 3,716,338 | | | | | |
| 5.000%, 06/01/2053 | | | | | | | | | | | | |
| (Callable 12/01/2031) | | | 2,700,000 | | | | 2,813,584 | | | | | |
| 5.500%, 06/01/2053 (Callable 12/01/2031) | | | 2,405,000 | | | | 2,555,473 | | | | | |
| 5.750%, 06/01/2054 (Callable 12/01/2032) | | | 5,000,000 | | | | 5,415,553 | | | | | |
| Michigan State University, | | | | | | | | | | | | |
| 5.000%, 02/15/2037 (Callable 08/15/2029) | | | 525,000 | | | | 582,892 | | | | | |
| Pinckney Community Schools, | | | | | | | | | | | | |
| 5.000%, 05/01/2035 (Callable 05/01/2026) | | | | | | | | | | | | |
| (Insured by Q-SBLF) | | | 1,500,000 | | | | 1,556,234 | | | | | |
| Rockford Public Schools: | | | | | | | | | | | | |
| 5.000%, 05/01/2036 (Callable 05/01/2033) | | | | | | | | | | | | |
| (Insured by Q-SBLF) | | | 1,000,000 | | | | 1,175,616 | | | | | |
| 5.000%, 05/01/2037 (Callable 05/01/2033) | | | | | | | | | | | | |
| (Insured by Q-SBLF) | | | 800,000 | | | | 930,924 | | | | | |
| 5.000%, 05/01/2040 (Callable 05/01/2033) | | | | | | | | | | | | |
| (Insured by Q-SBLF) | | | 1,230,000 | | | | 1,384,257 | | | | | |
| Romeo Community School District, | | | | | | | | | | | | |
| 5.000%, 05/01/2029 (Callable 05/01/2026) | | | | | | | | | | | | |
| (Insured by Q-SBLF) | | | 1,000,000 | | | | 1,051,025 | | | | | |
| Swartz Creek Community Schools, | | | | | | | | | | | | |
| 5.000%, 05/01/2039 (Callable 05/01/2029) | | | | | | | | | | | | |
| (Insured by Q-SBLF) | | | 815,000 | | | | 882,975 | | | | | |
| Thornapple Kellogg School District, | | | | | | | | | | | | |
| 5.000%, 05/01/2036 (Callable 05/01/2033) | | | | | | | | | | | | |
| (Insured by Q-SBLF) | | | 1,320,000 | | | | 1,526,050 | | | | | |
| Wayne County Airport Authority, | | | | | | | | | | | | |
| 5.000%, 12/01/2031 (Callable 12/01/2027) | | | 375,000 | | | | 404,211 | | | | | |
| Wayne State University, | | | | | | | | | | | | |
| 5.000%, 11/15/2030 (Callable 11/15/2025) | | | 1,025,000 | | | | 1,058,636 | | | | | |
| Western Michigan University: | | | | | | | | | | | | |
| 5.000%, 11/15/2029 (Callable 05/15/2025) | | | 250,000 | | | | 256,043 | | | | | |
| 5.000%, 11/15/2030 (Insured by AGM) | | | 300,000 | | | | 341,893 | | | | | |
| 5.000%, 11/15/2038 (Callable 05/15/2031) | | | | | | | | | | | | |
| (Insured by AGM) | | | 375,000 | | | | 416,905 | | | | | |
| 5.000%, 11/15/2039 (Callable 05/15/2031) | | | | | | | | | | | | |
| (Insured by AGM) | | | 400,000 | | | | 442,312 | | | | | |
| 5.000%, 11/15/2040 (Callable 05/15/2031) | | | | | | | | | | | | |
| (Insured by AGM) | | | 420,000 | | | | 462,063 | | | | | |
| Total Michigan | | | | | | | | | | | | |
| (Cost $104,952,933) | | | | | | | 105,055,817 | | | | 3.5 | % |
| Minnesota | | | | | | | | | | | | |
| City of Maple Grove MN: | | | | | | | | | | | | |
| 5.000%, 05/01/2027 | | | 200,000 | | | | 209,774 | | | | | |
| 5.000%, 05/01/2031 (Callable 05/01/2027) | | | 525,000 | | | | 549,003 | | | | | |
| City of Minneapolis MN: | | | | | | | | | | | | |
| 5.000%, 11/15/2034 (Callable 11/15/2025) | | | 680,000 | | | | 693,639 | | | | | |
| 5.000%, 11/15/2034 (Callable 11/15/2028) | | | 2,240,000 | | | | 2,331,706 | | | | | |
| 4.000%, 11/15/2036 (Callable 11/15/2031) | | | 1,090,000 | | | | 1,137,710 | | | | | |
| City of Virginia MN, | | | | | | | | | | | | |
| 5.000%, 12/15/2026 (Callable 06/15/2025) | | | 8,000,000 | | | | 8,122,097 | | | | | |
| County of Washington MN, | | | | | | | | | | | | |
| 2.250%, 02/01/2034 (Callable 02/01/2028) | | | 1,525,000 | | | | 1,371,901 | | | | | |
| Duluth Economic Development Authority: | | | | | | | | | | | | |
| 5.000%, 06/15/2027 | | | 300,000 | | | | 310,726 | | | | | |
| 5.000%, 06/15/2028 | | | 450,000 | | | | 471,608 | | | | | |
| Forest Lake Independent | | | | | | | | | | | | |
| School District No. 831, | | | | | | | | | | | | |
| 3.125%, 02/01/2039 (Callable 02/01/2026) | | | | | | | | | | | | |
| (Insured by SD CRED PROG) | | | 400,000 | | | | 372,962 | | | | | |
The accompanying notes are an integral part of these financial statements.
Baird Core Intermediate Municipal Bond Fund
Schedule of Investments, December 31, 2023
Long-Term Investments (cont.)
| | | Principal | | | | | | % of | |
| | | Amount | | | Value | | | Net Assets | |
| Housing & Redevelopment Authority | | | | | | | | | |
| of the City of St. Paul MN: | | | | | | | | | |
| 5.000%, 12/01/2028 | | $ | 1,115,000 | | | $ | 1,135,342 | | | |
| |
| 5.000%, 11/15/2029 (Callable 11/15/2027) | | | 705,000 | | | | 748,066 | | | | | |
| 5.000%, 12/01/2030 | | | 300,000 | | | | 305,069 | | | | | |
| 5.000%, 11/15/2034 (Callable 11/15/2027) | | | 1,900,000 | | | | 2,011,802 | | | | | |
| 5.000%, 12/01/2036 (Callable 12/01/2030) | | | 1,600,000 | | | | 1,592,406 | | | | | |
| Minnesota Higher Education | | | | | | | | | | | | |
| Facilities Authority: | | | | | | | | | | | | |
| 5.000%, 10/01/2039 (Callable 10/01/2030) | | | 2,040,000 | | | | 2,197,668 | | | | | |
| 4.000%, 10/01/2040 (Callable 10/01/2030) | | | 1,030,000 | | | | 1,036,573 | | | | | |
| 4.125%, 10/01/2041 (Callable 10/01/2030) | | | 1,000,000 | | | | 1,011,093 | | | | | |
| 4.125%, 10/01/2042 (Callable 10/01/2030) | | | 1,000,000 | | | | 1,007,396 | | | | | |
| Minnesota Housing Finance Agency: | | | | | | | | | | | | |
| 3.300%, 02/01/2025 (Callable 08/01/2024) | | | | | | | | | | | | |
| (Insured by HUD) | | | 2,000,000 | | | | 1,995,984 | | | | | |
| 3.800%, 02/01/2025 (Callable 08/01/2024) | | | 2,040,000 | | | | 2,043,314 | | | | | |
| 3.600%, 07/01/2033 (Callable 01/29/2024) | | | | | | | | | | | | |
| (Insured by GNMA) | | | 485,000 | | | | 463,628 | | | | | |
| 3.100%, 07/01/2035 (Callable 07/01/2025) | | | | | | | | | | | | |
| (Insured by GNMA) | | | 1,485,000 | | | | 1,405,315 | | | | | |
| 4.000%, 01/01/2038 (Callable 01/29/2024) | | | 200,000 | | | | 199,651 | | | | | |
| 4.000%, 08/01/2040 (Callable 08/01/2033) | | | 1,000,000 | | | | 1,005,314 | | | | | |
| 4.000%, 01/01/2047 (Callable 01/01/2026) | | | | | | | | | | | | |
| (Insured by GNMA) | | | 175,000 | | | | 174,666 | | | | | |
| 3.750%, 01/01/2050 (Callable 01/01/2029) | | | | | | | | | | | | |
| (Insured by GNMA) | | | 1,765,000 | | | | 1,755,332 | | | | | |
| 3.500%, 07/01/2050 (Callable 07/01/2029) | | | | | | | | | | | | |
| (Insured by GNMA) | | | 2,435,000 | | | | 2,406,578 | | | | | |
| 5.750%, 07/01/2053 (Callable 01/01/2033) | | | | | | | | | | | | |
| (Insured by GNMA) | | | 3,000,000 | | | | 3,239,379 | | | | | |
| Plymouth Intermediate District No. 287, | | | | | | | | | | | | |
| 4.000%, 02/01/2028 (Callable 02/01/2027) | | | 350,000 | | | | 362,484 | | | | | |
| St. Paul Port Authority: | | | | | | | | | | | | |
| 4.000%, 10/01/2041 (Callable 10/01/2027) | | | 400,000 | | | | 391,865 | | | | | |
| 4.750%, 10/01/2043 (Callable 10/01/2033) | | | 1,000,000 | | | | 1,041,247 | | | | | |
| Zumbro Education District: | | | | | | | | | | | | |
| 4.000%, 02/01/2029 | | | 350,000 | | | | 355,798 | | | | | |
| 4.000%, 02/01/2038 (Callable 02/01/2031) | | | 385,000 | | | | 376,447 | | | | | |
| Total Minnesota | | | | | | | | | | | | |
| (Cost $43,963,907) | | | | | | | 43,833,543 | | | | 1.5 | % |
| Mississippi | | | | | | | | | | | | |
| Biloxi Public School District, | | | | | | | | | | | | |
| 5.000%, 04/01/2026 (Insured by BAM) | | | 500,000 | | | | 520,873 | | | | | |
| City of Gluckstadt MS: | | | | | | | | | | | | |
| 6.000%, 06/01/2025 | | | 100,000 | | | | 102,982 | | | | | |
| 6.000%, 06/01/2027 | | | 285,000 | | | | 303,788 | | | | | |
| 6.000%, 06/01/2029 (Callable 06/01/2028) | | | 370,000 | | | | 397,151 | | | | | |
| 6.000%, 06/01/2031 (Callable 06/01/2028) | | | 405,000 | | | | 430,349 | | | | | |
| 6.000%, 06/01/2032 (Callable 06/01/2028) | | | 100,000 | | | | 105,878 | | | | | |
| 5.000%, 06/01/2034 (Callable 06/01/2028) | | | 100,000 | | | | 101,217 | | | | | |
| 5.000%, 06/01/2035 (Callable 06/01/2028) | | | 490,000 | | | | 495,849 | | | | | |
| City of Gulfport MS: | | | | | | | | | | | | |
| 5.000%, 07/01/2024 | | | 485,000 | | | | 488,099 | | | | | |
| 5.000%, 07/01/2027 (Callable 07/01/2026) | | | 500,000 | | | | 507,737 | | | | | |
| City of Louisville MS: | | | | | | | | | | | | |
| 4.500%, 09/01/2033 (Callable 09/01/2029) | | | | | | | | | | | | |
| (Insured by BAM) | | | 280,000 | | | | 295,008 | | | | | |
| 4.500%, 09/01/2034 (Callable 09/01/2029) | | | | | | | | | | | | |
| (Insured by BAM) | | | 300,000 | | | | 315,649 | | | | | |
| City of Pearl MS: | | | | | | | | | | | | |
| 5.500%, 09/01/2028 (Insured by BAM) | | | 310,000 | | | | 342,252 | | | | | |
| 5.500%, 09/01/2029 (Insured by BAM) | | | 325,000 | | | | 365,163 | | | | | |
| City of Ridgeland MS: | | | | | | | | | | | | |
| 3.000%, 10/01/2025 | | | 1,000,000 | | | | 989,888 | | | | | |
| 3.000%, 10/01/2026 | | | 1,100,000 | | | | 1,078,873 | | | | | |
| 3.000%, 10/01/2028 (Callable 10/01/2027) | | | 690,000 | | | | 666,765 | | | | | |
| County of Lowndes MS, | | | | | | | | | | | | |
| 2.650%, 04/01/2037 | | | | | | | | | | | | |
(Mandatory Tender Date 04/01/2027)(1) | | | 2,545,000 | | | | 2,433,869 | | | | | |
| County of Warren MS: | | | | | | | | | | | | |
| 6.000%, 09/01/2042 (Callable 09/01/2033) | | | | | | | | | | | | |
| (Insured by BAM) | | | 610,000 | | | | 725,010 | | | | | |
| 6.000%, 09/01/2043 (Callable 09/01/2033) | | | | | | | | | | | | |
| (Insured by BAM) | | | 550,000 | | | | 650,988 | | | | | |
| 6.000%, 09/01/2048 (Callable 09/01/2033) | | | | | | | | | | | | |
| (Insured by BAM) | | | 3,000,000 | | | | 3,470,156 | | | | | |
| 6.000%, 09/01/2053 (Callable 09/01/2033) | | | | | | | | | | | | |
| (Insured by BAM) | | | 2,070,000 | | | | 2,371,343 | | | | | |
| Medical Center Educational Building Corp.: | | | | | | | | | | | | |
| 5.000%, 06/01/2042 (Callable 06/01/2027) | | | 500,000 | | | | 521,546 | | | | | |
| 4.000%, 06/01/2048 (Callable 06/01/2033) | | | 1,500,000 | | | | 1,466,837 | | | | | |
| Mississippi Business Finance Corp., | | | | | | | | | | | | |
| 3.200%, 09/01/2028 (Callable 03/13/2024) | | | 2,100,000 | | | | 2,100,179 | | | | | |
| Mississippi Development Bank: | | | | | | | | | | | | |
| 5.000%, 11/01/2027 | | | 485,000 | | | | 501,814 | | | | | |
| 5.000%, 09/01/2029 | | | 1,900,000 | | | | 2,007,916 | | | | | |
| 5.000%, 09/01/2030 | | | 865,000 | | | | 919,714 | | | | | |
| 4.000%, 03/01/2032 (Callable 03/01/2028) | | | 200,000 | | | | 207,113 | | | | | |
| 4.000%, 07/01/2032 (Callable 07/01/2031) | | | 150,000 | | | | 156,566 | | | | | |
| 4.000%, 03/01/2033 (Callable 03/01/2028) | | | 300,000 | | | | 309,956 | | | | | |
| 5.250%, 03/01/2034 (Callable 03/01/2028) | | | 490,000 | | | | 517,486 | | | | | |
| 4.000%, 07/01/2034 (Callable 07/01/2031) | | | 285,000 | | | | 295,647 | | | | | |
| 4.000%, 07/01/2035 (Callable 07/01/2031) | | | 405,000 | | | | 420,395 | | | | | |
| 4.000%, 03/01/2036 (Callable 03/01/2028) | | | 300,000 | | | | 307,583 | | | | | |
| 4.000%, 07/01/2036 (Callable 07/01/2031) | | | 250,000 | | | | 256,808 | | | | | |
| 5.500%, 03/01/2038 (Callable 03/01/2029) | | | | | | | | | | | | |
| (Insured by BAM) | | | 265,000 | | | | 285,526 | | | | | |
| 4.000%, 07/01/2038 (Callable 07/01/2031) | | | 245,000 | | | | 248,800 | | | | | |
| 4.000%, 04/01/2039 (Callable 04/01/2033) | | | | | | | | | | | | |
| (Insured by BAM) | | | 1,345,000 | | | | 1,389,318 | | | | | |
| 4.000%, 07/01/2039 (Callable 07/01/2031) | | | 390,000 | | | | 394,089 | | | | | |
| 5.250%, 03/01/2045 (Callable 03/01/2028) | | | 1,345,000 | | | | 1,375,185 | | | | | |
| 5.000%, 03/01/2048 (Callable 03/01/2029) | | | | | | | | | | | | |
| (Insured by BAM) | | | 1,070,000 | | | | 1,104,519 | | | | | |
| Mississippi Home Corp.: | | | | | | | | | | | | |
| 3.375%, 12/01/2034 (Callable 06/01/2028) | | | | | | | | | | | | |
| (Insured by GNMA) | | | 3,000,000 | | | | 2,979,626 | | | | | |
| 4.050%, 12/01/2047 (Callable 06/01/2031) | | | | | | | | | | | | |
| (Insured by GNMA) | | | 500,000 | | | | 495,686 | | | | | |
| Mississippi Hospital Equipment | | | | | | | | | | | | |
| & Facilities Authority, | | | | | | | | | | | | |
| 5.000%, 10/01/2034 (Callable 10/01/2029) | | | 725,000 | | | | 790,102 | | | | | |
| Natchez-Adams School District, | | | | | | | | | | | | |
| 5.000%, 02/01/2030 | | | 645,000 | | | | 715,994 | | | | | |
| State of Mississippi: | | | | | | | | | | | | |
| 5.000%, 10/15/2028 (Callable 10/15/2025) | | | 1,260,000 | | | | 1,297,642 | | | | | |
| 5.000%, 10/15/2034 (Callable 10/15/2025) | | | 1,000,000 | | | | 1,023,391 | | | | | |
| 5.000%, 10/15/2035 (Callable 10/15/2028) | | | 3,000,000 | | | | 3,225,802 | | | | | |
| Sunflower County Consolidated | | | | | | | | | | | | |
| School District, | | | | | | | | | | | | |
| 4.000%, 06/01/2042 (Callable 06/01/2032) | | | | | | | | | | | | |
| (Insured by BAM) | | | 1,620,000 | | | | 1,622,906 | | | | | |
| University of Mississippi Educational | | | | | | | | | | | | |
| Building Corp.: | | | | | | | | | | | | |
| 5.000%, 10/01/2047 (Callable 10/01/2032) | | | 800,000 | | | | 873,881 | | | | | |
| 4.500%, 10/01/2052 (Callable 10/01/2032) | | | 1,000,000 | | | | 1,019,461 | | | | | |
The accompanying notes are an integral part of these financial statements.
Baird Core Intermediate Municipal Bond Fund
Schedule of Investments, December 31, 2023
Long-Term Investments (cont.)
| | | Principal | | | | | | % of | |
| | | Amount | | | Value | | | Net Assets | |
| University of Southern Mississippi, | | | | | | | | | |
| 5.000%, 09/01/2035 | | | | | | | | | |
| (Callable 09/01/2026) | | $ | 535,000 | | | $ | 557,972 | | | | |
| Vicksburg Warren School District, | | | | | | | | | | | |
| 5.000%, 03/01/2029 | | | 150,000 | | | | 161,122 | | | | |
| Total Mississippi | | | | | | | | | | | |
| (Cost $47,064,683) | | | | | | | 46,709,469 | | | | 1.6 | % |
| Missouri | | | | | | | | | | | | |
| Caldwell County School District No. R-II, | | | | | | | | | | | | |
| 5.000%, 04/15/2038 (Callable 04/15/2026) | | | 820,000 | | | | 836,621 | | | | | |
| Center School District No. 58, | | | | | | | | | | | | |
| 4.000%, 04/15/2031 (Callable 04/15/2027) | | | 170,000 | | | | 174,621 | | | | | |
| City of St. Charles MO, | | | | | | | | | | | | |
| 4.000%, 02/01/2026 | | | 500,000 | | | | 510,818 | | | | | |
| City of St. Louis MO, | | | | | | | | | | | | |
| 5.000%, 07/01/2039 (Callable 07/01/2029) | | | 425,000 | | | | 457,546 | | | | | |
| County of Cape Girardeau MO, | | | | | | | | | | | | |
| 5.000%, 06/01/2024 | | | 825,000 | | | | 830,479 | | | | | |
| Fort Zumwalt School District, | | | | | | | | | | | | |
| 5.250%, 03/01/2042 (Callable 03/01/2030) | | | | | | | | | | | | |
| (Insured by BAM) | | | 1,730,000 | | | | 1,911,297 | | | | | |
| Hazelwood School District, | | | | | | | | | | | | |
| 4.000%, 03/01/2031 (Callable 03/01/2028) | | | | | | | | | | | | |
| (Insured by ST AID) | | | 520,000 | | | | 539,884 | | | | | |
| Health & Educational Facilities | | | | | | | | | | | | |
| Authority of the State of Missouri: | | | | | | | | | | | | |
| 5.000%, 08/01/2024 | | | 330,000 | | | | 329,857 | | | | | |
| 5.000%, 02/01/2025 (Callable 02/01/2024) | | | 45,000 | | | | 45,002 | | | | | |
| 5.000%, 09/01/2025 | | | 680,000 | | | | 689,940 | | | | | |
| 5.000%, 09/01/2026 | | | 410,000 | | | | 418,298 | | | | | |
| 5.000%, 09/01/2027 | | | 280,000 | | | | 288,226 | | | | | |
| 5.000%, 11/15/2027 (Callable 11/15/2025) | | | 585,000 | | | | 599,056 | | | | | |
| 5.000%, 02/01/2034 (Callable 02/01/2024) | | | 950,000 | | | | 957,274 | | | | | |
| 5.000%, 02/01/2035 (Callable 02/01/2024) | | | 535,000 | | | | 535,016 | | | | | |
| 5.000%, 02/15/2035 (Callable 02/15/2029) | | | 615,000 | | | | 664,349 | | | | | |
| 5.000%, 11/15/2035 (Callable 11/15/2025) | | | 1,950,000 | | | | 1,983,969 | | | | | |
| 5.000%, 02/15/2036 (Callable 02/15/2029) | | | 425,000 | | | | 456,441 | | | | | |
| Industrial Development | | | | | | | | | | | | |
| Authority of University City, | | | | | | | | | | | | |
| 4.875%, 06/15/2036 (Callable 06/15/2033) | | | 2,400,000 | | | | 2,426,212 | | | | | |
| Jackson County School District No. R-IV, | | | | | | | | | | | | |
| 6.000%, 03/01/2038 (Callable 03/01/2029) | | | | | | | | | | | | |
| (Insured by ST AID) | | | 1,005,000 | | | | 1,169,019 | | | | | |
| Jefferson County Consolidated | | | | | | | | | | | | |
| School District No. 6: | | | | | | | | | | | | |
| 3.000%, 03/01/2034 (Callable 03/01/2028) | | | | | | | | | | | | |
| (Insured by ST AID) | | | 700,000 | | | | 697,794 | | | | | |
| 3.000%, 03/01/2039 (Callable 03/01/2028) | | | | | | | | | | | | |
| (Insured by ST AID) | | | 1,300,000 | | | | 1,181,812 | | | | | |
| Kansas City Industrial | | | | | | | | | | | | |
| Development Authority, | | | | | | | | | | | | |
| 4.000%, 03/01/2035 (Callable 03/01/2030) | | | 455,000 | | | | 473,845 | | | | | |
| Marshall School District: | | | | | | | | | | | | |
| 5.000%, 03/01/2036 (Callable 03/01/2033) | | | | | | | | | | | | |
| (Insured by BAM) | | | 745,000 | | | | 845,861 | | | | | |
| 5.000%, 03/01/2037 (Callable 03/01/2033) | | | | | | | | | | | | |
| (Insured by BAM) | | | 840,000 | | | | 945,867 | | | | | |
| Meramec Valley School District No. R-III: | | | | | | | | | | | | |
| 3.000%, 03/01/2037 (Callable 03/01/2028) | | | | | | | | | | | | |
| (Insured by ST AID) | | | 360,000 | | | | 343,947 | | | | | |
| 3.000%, 03/01/2038 (Callable 03/01/2028) | | | | | | | | | | | | |
| (Insured by ST AID) | | | 500,000 | | | | 465,229 | | | | | |
| Missouri Housing Development Commission: | | | | | | | | | | | | |
| 3.950%, 11/01/2040 (Callable 05/01/2025) | | | | | | | | | | | | |
| (Insured by GNMA) | | | 60,000 | | | | 57,970 | | | | | |
| 3.250%, 11/01/2052 (Callable 11/01/2030) | | | | | | | | | | | | |
| (Insured by GNMA) | | | 4,195,000 | | | | 4,095,797 | | | | | |
| Missouri Joint Municipal | | | | | | | | | | | | |
| Electric Utility Commission, | | | | | | | | | | | | |
| 5.000%, 12/01/2040 (Callable 06/01/2026) | | | 1,000,000 | | | | 1,027,440 | | | | | |
| Missouri Southern State University: | | | | | | | | | | | | |
| 4.000%, 10/01/2035 (Callable 10/01/2029) | | | | | | | | | | | | |
| (Insured by AGM) | | | 100,000 | | | | 104,019 | | | | | |
| 4.000%, 10/01/2036 (Callable 10/01/2029) | | | | | | | | | | | | |
| (Insured by AGM) | | | 110,000 | | | | 114,158 | | | | | |
| 4.000%, 10/01/2039 (Callable 10/01/2029) | | | | | | | | | | | | |
| (Insured by AGM) | | | 110,000 | | | | 111,396 | | | | | |
| Missouri State Environmental Improvement | | | | | | | | | | | | |
| & Energy Resources Authority, | | | | | | | | | | | | |
| 2.750%, 09/01/2033 (Callable 06/12/2027) | | | 5,000,000 | | | | 4,569,317 | | | | | |
| Normandy Schools Collaborative: | | | | | | | | | | | | |
| 3.000%, 03/01/2036 (Callable 03/01/2028) | | | | | | | | | | | | |
| (Insured by ST AID) | | | 1,525,000 | | | | 1,505,270 | | | | | |
| 3.000%, 03/01/2037 (Callable 03/01/2028) | | | | | | | | | | | | |
| (Insured by ST AID) | | | 1,325,000 | | | | 1,265,917 | | | | | |
| Northwest Missouri State University: | | | | | | | | | | | | |
| 5.000%, 06/01/2027 (Insured by BAM) | | | 560,000 | | | | 593,889 | | | | | |
| 5.000%, 06/01/2028 (Insured by BAM) | | | 1,595,000 | | | | 1,720,497 | | | | | |
| 5.000%, 06/01/2029 (Insured by BAM) | | | 500,000 | | | | 546,956 | | | | | |
| Pattonville R-3 School District, | | | | | | | | | | | | |
| 5.250%, 03/01/2042 (Callable 03/01/2031) | | | | | | | | | | | | |
| (Insured by ST AID) | | | 2,000,000 | | | | 2,250,595 | | | | | |
| St. Louis Land Clearance | | | | | | | | | | | | |
| for Redevelopment Authority: | | | | | | | | | | | | |
| 5.000%, 06/01/2028 (Callable 12/01/2026) | | | 4,000,000 | | | | 4,138,992 | | | | | |
| 3.875%, 10/01/2035 (Callable 10/01/2029) | | | 290,000 | | | | 261,506 | | | | | |
| 5.000%, 04/01/2038 (Callable 04/01/2027) | | | 1,540,000 | | | | 1,595,134 | | | | | |
| St. Louis Municipal Finance Corp., | | | | | | | | | | | | |
| 5.000%, 10/01/2045 (Callable 10/01/2030) | | | | | | | | | | | | |
| (Insured by AGM) | | | 1,330,000 | | | | 1,422,062 | | | | | |
| Total Missouri | | | | | | | | | | | | |
| (Cost $46,179,191) | | | | | | | 46,159,195 | | | | 1.5 | % |
| Montana | | | | | | | | | | | | |
| City of Forsyth MT: | | | | | | | | | | | | |
| 3.875%, 07/01/2028 (Callable 04/02/2028) | | | 1,600,000 | | | | 1,633,303 | | | | | |
| 3.900%, 03/01/2031 | | | | | | | | | | | | |
(Callable 01/29/2024)(1) | | | 7,395,000 | | | | 7,363,802 | | | | | |
| Judith Basin County K-12 | | | | | | | | | | | | |
| School District No. 12: | | | | | | | | | | | | |
| 5.000%, 07/01/2041 (Callable 07/01/2033) | | | | | | | | | | | | |
| (Insured by AGM) | | | 465,000 | | | | 519,443 | | | | | |
| 5.000%, 07/01/2043 (Callable 07/01/2033) | | | | | | | | | | | | |
| (Insured by AGM) | | | 300,000 | | | | 332,267 | | | | | |
| 5.250%, 07/01/2048 (Callable 07/01/2033) | | | | | | | | | | | | |
| (Insured by AGM) | | | 450,000 | | | | 502,544 | | | | | |
| Montana Board of Housing: | | | | | | | | | | | | |
| 3.500%, 08/01/2025 | | | | | | | | | | | | |
(Mandatory Tender Date 08/01/2024)(1) | | | 3,385,000 | | | | 3,378,833 | | | | | |
| 3.600%, 12/01/2030 (Callable 01/19/2024) | | | 290,000 | | | | 290,073 | | | | | |
| 3.750%, 12/01/2038 (Callable 12/01/2027) | | | | | | | | | | | | |
| (Insured by FHA) | | | 290,000 | | | | 284,358 | | | | | |
| 4.000%, 06/01/2049 (Callable 12/01/2027) | | | | | | | | | | | | |
| (Insured by FHA) | | | 795,000 | | | | 792,817 | | | | | |
| 3.000%, 06/01/2052 (Callable 06/01/2031) | | | 1,870,000 | | | | 1,811,104 | | | | | |
| 6.000%, 12/01/2053 (Callable 12/01/2032) | | | 2,110,000 | | | | 2,308,436 | | | | | |
| 6.250%, 06/01/2054 (Callable 12/01/2032) | | | 1,710,000 | | | | 1,892,338 | | | | | |
The accompanying notes are an integral part of these financial statements.
Baird Core Intermediate Municipal Bond Fund
Schedule of Investments, December 31, 2023
Long-Term Investments (cont.)
| | | Principal | | | | | | % of | |
| | | Amount | | | Value | | | Net Assets | |
| Montana Facility Finance Authority: | | | | | | | | | |
| 5.000%, 06/01/2026 | | | | | | | | | |
| (Callable 12/01/2024) | | $ | 765,000 | | | $ | 775,820 | | | | |
| 5.000%, 06/01/2029 (Callable 12/01/2024) | | | 715,000 | | | | 725,107 | | | | |
| 5.000%, 06/01/2033 (Callable 06/01/2028) | | | 310,000 | | | | 329,858 | | | | |
| 4.000%, 01/01/2037 (Callable 01/01/2030) | | | 700,000 | | | | 724,087 | | | | |
| Yellowstone and Carbon Counties | | | | | | | | | | | |
| School District No. 7-70, | | | | | | | | | | | |
| 5.000%, 07/01/2027 (Insured by BAM) | | | 740,000 | | | | 797,964 | | | | |
| Total Montana | | | | | | | | | | | |
| (Cost $24,536,175) | | | | | | | 24,462,154 | | | | 0.8 | % |
| Nebraska | | | | | | | | | | | | |
| Central Plains Energy Project, | | | | | | | | | | | | |
| 5.000%, 05/01/2054 (Callable 08/01/2029) | | | | | | | | | | | | |
(Mandatory Tender Date 11/01/2029)(1) | | | 7,200,000 | | | | 7,632,463 | | | | | |
| City of Fremont NE, | | | | | | | | | | | | |
| 1.750%, 07/15/2034 (Callable 07/08/2028) | | | 3,000,000 | | | | 2,526,250 | | | | | |
| County of Douglas NE, | | | | | | | | | | | | |
| 5.000%, 07/01/2036 (Callable 07/01/2027) | | | 200,000 | | | | 211,050 | | | | | |
| Douglas County Hospital Authority No. 2, | | | | | | | | | | | | |
| 5.000%, 05/15/2029 (Callable 05/15/2024) | | | 2,125,000 | | | | 2,133,323 | | | | | |
| Nebraska Investment Finance Authority: | | | | | | | | | | | | |
| 3.500%, 09/01/2036 (Callable 03/01/2025) | | | 275,000 | | | | 269,595 | | | | | |
| 3.500%, 09/01/2046 (Callable 03/01/2025) | | | 80,000 | | | | 79,281 | | | | | |
| 5.500%, 03/01/2052 (Callable 03/01/2032) | | | | | | | | | | | | |
| (Insured by GNMA) | | | 4,785,000 | | | | 5,069,456 | | | | | |
| Omaha Airport Authority, | | | | | | | | | | | | |
| 5.000%, 12/15/2028 (Callable 12/15/2026) | | | 550,000 | | | | 573,694 | | | | | |
| Papio-Missouri River | | | | | | | | | | | | |
| Natural Resources District: | | | | | | | | | | | | |
| 3.000%, 12/01/2031 (Callable 10/12/2026) | | | 540,000 | | | | 535,745 | | | | | |
| 3.000%, 12/01/2032 (Callable 10/12/2026) | | | 385,000 | | | | 375,419 | | | | | |
| Village of Boys Town NE, | | | | | | | | | | | | |
| 3.000%, 09/01/2028 | | | 2,125,000 | | | | 2,154,059 | | | | | |
| Total Nebraska | | | | | | | | | | | | |
| (Cost $21,195,960) | | | | | | | 21,560,335 | | | | 0.7 | % |
| Nevada | | | | | | | | | | | | |
| Carson City NV, | | | | | | | | | | | | |
| 5.000%, 09/01/2031 (Callable 09/01/2027) | | | 505,000 | | | | 525,177 | | | | | |
| City of Carson City NV, | | | | | | | | | | | | |
| 5.000%, 09/01/2033 (Callable 09/01/2027) | | | 520,000 | | | | 539,514 | | | | | |
| Clark County School District, | | | | | | | | | | | | |
| 5.000%, 06/15/2032 (Callable 06/15/2027) | | | | | | | | | | | | |
| (Insured by BAM) | | | 450,000 | | | | 483,153 | | | | | |
| County of Clark NV, | | | | | | | | | | | | |
| 3.750%, 01/01/2036 | | | | | | | | | | | | |
(Mandatory Tender Date 03/31/2026)(1) | | | 1,500,000 | | | | 1,516,904 | | | | | |
| Henderson Public Improvement Trust, | | | | | | | | | | | | |
| 5.500%, 01/01/2044 | | | | | | | | | | | | |
| (Pre-refunded to 07/01/2024) | | | 1,000,000 | | | | 1,011,767 | | | | | |
| Las Vegas Redevelopment Agency: | | | | | | | | | | | | |
| 5.000%, 06/15/2027 (Callable 06/15/2026) | | | 1,210,000 | | | | 1,252,756 | | | | | |
| 5.000%, 06/15/2029 (Callable 06/15/2026) | | | 200,000 | | | | 207,405 | | | | | |
| 3.000%, 06/15/2032 (Callable 06/15/2026) | | | 1,000,000 | | | | 941,611 | | | | | |
| Nevada Housing Division: | | | | | | | | | | | | |
| 5.000%, 12/01/2025 (Mandatory Tender | | | | | | | | | | | | |
Date 12/01/2024) (Insured by FHA)(1) | | | 2,725,000 | | | | 2,756,540 | | | | | |
| 4.000%, 04/01/2049 (Callable 10/01/2028) | | | | | | | | | | | | |
| (Insured by GNMA) | | | 1,210,000 | | | | 1,211,133 | | | | | |
| 4.000%, 10/01/2049 (Callable 10/01/2028) | | | | | | | | | | | | |
| (Insured by GNMA) | | | 245,000 | | | | 245,249 | | | | | |
| State of Nevada, | | | | | | | | | | | | |
| 5.000%, 06/01/2033 | | | | | | | | | | | | |
| (Callable 01/29/2024) | | | 300,000 | | | | 300,178 | | | | | |
| Total Nevada | | | | | | | | | | | | |
| (Cost $11,119,389) | | | | | | | 10,991,387 | | | | 0.4 | % |
| New Hampshire | | | | | | | | | | | | |
| New Hampshire Business Finance Authority: | | | | | | | | | | | | |
| 4.000%, 10/20/2036 | | | 2,953,259 | | | | 2,899,621 | | | | | |
| 4.000%, 12/01/2040 (Callable 06/01/2033) | | | | | | | | | | | | |
| (Insured by BAM) | | | 630,000 | | | | 638,913 | | | | | |
| New Hampshire Health and | | | | | | | | | | | | |
| Education Facilities Authority, | | | | | | | | | | | | |
| 5.000%, 10/01/2032 (Callable 10/01/2027) | | | 275,000 | | | | 292,123 | | | | | |
| New Hampshire Housing Finance Authority, | | | | | | | | | | | | |
| 6.000%, 01/01/2055 (Callable 07/01/2032) | | | | | | | | | | | | |
| (Insured by GNMA) | | | 5,000,000 | | | | 5,453,207 | | | | | |
| Total New Hampshire | | | | | | | | | | | | |
| (Cost $9,025,733) | | | | | | | 9,283,864 | | | | 0.3 | % |
| New Jersey | | | | | | | | | | | | |
| Atlantic City Board of Education, | | | | | | | | | | | | |
3.400%, 08/15/2027 (Insured by BAM)(3) | | | 3,293,000 | | | | 3,324,518 | | | | | |
| County of Gloucester NJ, | | | | | | | | | | | | |
| 5.000%, 12/01/2024 (ETM) | | | 455,000 | | | | 457,454 | | | | | |
| Gloucester County Improvement Authority, | | | | | | | | | | | | |
| 0.600%, 03/01/2024 (Callable 01/29/2024) | | | 2,325,000 | | | | 2,309,704 | | | | | |
| New Jersey Economic | | | | | | | | | | | | |
| Development Authority: | | | | | | | | | | | | |
| 4.000%, 11/01/2027 | | | 1,100,000 | | | | 1,143,395 | | | | | |
| 3.125%, 07/01/2029 (Callable 07/01/2027) | | | 90,000 | | | | 87,495 | | | | | |
| New Jersey Educational Facilities Authority, | | | | | | | | | | | | |
| 5.000%, 07/01/2026 (Callable 07/01/2024) | | | 115,000 | | | | 116,055 | | | | | |
| New Jersey Health Care | | | | | | | | | | | | |
| Facilities Financing Authority, | | | | | | | | | | | | |
| 5.000%, 07/01/2043 (Callable 04/01/2024) | | | | | | | | | | | | |
(Mandatory Tender Date 07/01/2024)(1) | | | 2,250,000 | | | | 2,270,223 | | | | | |
| New Jersey Higher Education | | | | | | | | | | | | |
| Student Assistance Authority: | | | | | | | | | | | | |
| 5.000%, 12/01/2025 | | | 1,850,000 | | | | 1,901,885 | | | | | |
| 5.000%, 12/01/2027 | | | 375,000 | | | | 396,005 | | | | | |
| New Jersey Housing & | | | | | | | | | | | | |
| Mortgage Finance Agency: | | | | | | | | | | | | |
| 3.125%, 02/01/2025 (Callable 02/01/2024) | | | | | | | | | | | | |
| (Mandatory Tender Date 08/01/2024) | | | | | | | | | | | | |
(Insured by HUD)(1) | | | 2,300,000 | | | | 2,285,902 | | | | | |
| 4.500%, 10/01/2048 (Callable 10/01/2027) | | | 1,340,000 | | | | 1,357,060 | | | | | |
| 4.750%, 10/01/2050 (Callable 04/01/2028) | | | 255,000 | | | | 259,349 | | | | | |
| 5.000%, 10/01/2053 (Callable 04/01/2031) | | | 2,420,000 | | | | 2,520,134 | | | | | |
| New Jersey Transportation | | | | | | | | | | | | |
| Trust Fund Authority: | | | | | | | | | | | | |
| 0.000%, 12/15/2024 (Insured by AMBAC) | | | 4,220,000 | | | | 4,079,543 | | | | | |
| 0.000%, 12/15/2026 | | | 6,410,000 | | | | 5,825,840 | | | | | |
| 0.000%, 12/15/2027 (Insured by BAM) | | | 3,000,000 | | | | 2,658,544 | | | | | |
| 5.000%, 06/15/2029 (Callable 06/15/2026) | | | 1,465,000 | | | | 1,540,186 | | | | | |
| 0.000%, 12/15/2029 (Insured by AGM) | | | 2,500,000 | | | | 2,089,979 | | | | | |
| 5.000%, 06/15/2034 (Callable 12/15/2028) | | | 900,000 | | | | 987,289 | | | | | |
| 4.000%, 06/15/2035 (Callable 12/15/2030) | | | 1,455,000 | | | | 1,524,642 | | | | | |
| 4.000%, 12/15/2037 (Callable 12/15/2028) | | | | | | | | | | | | |
| (Insured by BAM) | | | 500,000 | | | | 510,857 | | | | | |
| 0.000%, 12/15/2038 (Insured by BAM) | | | 5,145,000 | | | | 3,008,972 | | | | | |
| 5.000%, 06/15/2044 (Callable 06/15/2024) | | | 370,000 | | | | 371,019 | | | | | |
| New Jersey Turnpike Authority, | | | | | | | | | | | | |
| 4.440%, 01/01/2024 | | | | | | | | | | | | |
(1 Month TSFR + 0.700%)(2) | | | 825,000 | | | | 825,000 | | | | | |
The accompanying notes are an integral part of these financial statements.
Baird Core Intermediate Municipal Bond Fund
Schedule of Investments, December 31, 2023
Long-Term Investments (cont.)
| | | Principal | | | | | | % of | |
| | | Amount | | | Value | | | Net Assets | |
| Newark Housing Authority, | | | | | | | | | |
| 5.000%, 01/01/2032 (Insured by NATL) | | $ | 525,000 | | | $ | 582,101 | | | | |
| South Jersey Port Corp.: | | | | | | | | | | | |
| 3.000%, 01/01/2024 | | | 100,000 | | | | 100,000 | | | | |
| 5.000%, 01/01/2025 | | | 1,500,000 | | | | 1,519,642 | | | | |
| South Jersey Transportation Authority, | | | | | | | | | | | |
| 5.000%, 11/01/2041 (Callable 11/01/2030) | | | | | | | | | | | |
| (Insured by BAM) | | | 2,350,000 | | | | 2,527,234 | | | | |
| Total New Jersey | | | | | | | | | | | |
| (Cost $46,275,192) | | | | | | | 46,580,027 | | | | 1.6 | % |
| New Mexico | | | | | | | | | | | | |
| Loving Municipal School District No. 10: | | | | | | | | | | | | |
| 5.000%, 09/15/2025 (ETM) | | | | | | | | | | | | |
| (Insured by ST AID) | | | 500,000 | | | | 518,392 | | | | | |
| 5.000%, 09/15/2026 (Insured by ST AID) | | | 500,000 | | | | 530,016 | | | | | |
| New Mexico Institute of | | | | | | | | | | | | |
| Mining & Technology: | | | | | | | | | | | | |
| 4.000%, 12/01/2028 (Insured by AGM) | | | 300,000 | | | | 315,382 | | | | | |
| 4.000%, 12/01/2029 (Insured by AGM) | | | 335,000 | | | | 351,119 | | | | | |
| New Mexico Mortgage Finance Authority: | | | | | | | | | | | | |
| 3.500%, 09/01/2041 (Callable 03/01/2026) | | | 460,000 | | | | 447,679 | | | | | |
| 5.000%, 02/01/2042 (Callable 10/01/2024) | | | | | | | | | | | | |
| (Mandatory Tender Date 06/01/2025) | | | | | | | | | | | | |
(Insured by HUD)(1) | | | 2,458,000 | | | | 2,482,448 | | | | | |
| 5.000%, 02/01/2042 (Callable 04/01/2025) | | | | | | | | | | | | |
| (Mandatory Tender Date 09/01/2025) | | | | | | | | | | | | |
(Insured by HUD)(1) | | | 2,000,000 | | | | 2,037,647 | | | | | |
| 3.700%, 09/01/2042 (Callable 03/01/2027) | | | | | | | | | | | | |
| (Insured by GNMA) | | | 1,485,000 | | | | 1,393,005 | | | | | |
| 3.600%, 07/01/2044 (Callable 07/01/2028) | | | | | | | | | | | | |
| (Insured by GNMA) | | | 935,000 | | | | 838,753 | | | | | |
| 3.500%, 07/01/2050 (Callable 01/01/2029) | | | | | | | | | | | | |
| (Insured by GNMA) | | | 690,000 | | | | 681,938 | | | | | |
| 5.250%, 03/01/2053 (Callable 03/01/2032) | | | | | | | | | | | | |
| (Insured by GNMA) | | | 3,420,000 | | | | 3,615,265 | | | | | |
| New Mexico State University, | | | | | | | | | | | | |
| 4.000%, 04/01/2035 (Callable 04/01/2027) | | | 520,000 | | | | 530,940 | | | | | |
| Village of Los Ranchos de Albuquerque NM: | | | | | | | | | | | | |
| 4.000%, 09/01/2024 | | | 100,000 | | | | 100,382 | | | | | |
| 4.000%, 09/01/2025 | | | 150,000 | | | | 151,927 | | | | | |
| 5.000%, 09/01/2026 | | | 150,000 | | | | 157,274 | | | | | |
| 5.000%, 09/01/2030 | | | 125,000 | | | | 140,299 | | | | | |
| Total New Mexico | | | | | | | | | | | | |
| (Cost $14,589,744) | | | | | | | 14,292,466 | | | | 0.5 | % |
| New York | | | | | | | | | | | | |
| Albany County Airport Authority, | | | | | | | | | | | | |
| 5.000%, 12/15/2025 | | | 1,000,000 | | | | 1,028,758 | | | | | |
| Albany County Capital Resource Corp., | | | | | | | | | | | | |
| 3.100%, 07/01/2030 | | | 755,000 | | | | 666,757 | | | | | |
| Amherst Industrial Development Agency, | | | | | | | | | | | | |
| 3.900%, 04/01/2026 (Mandatory Tender | | | | | | | | | | | | |
Date 04/01/2025) (Insured by FHA)(1) | | | 9,350,000 | | | | 9,389,277 | | | | | |
| City of Long Beach NY, | | | | | | | | | | | | |
| 5.250%, 07/15/2042 (Callable 07/15/2030) | | | | | | | | | | | | |
| (Insured by BAM) | | | 1,800,000 | | | | 1,927,755 | | | | | |
| City of New York NY: | | | | | | | | | | | | |
| 5.250%, 10/01/2043 (Callable 10/01/2032) | | | 1,200,000 | | | | 1,378,451 | | | | | |
| 5.000%, 06/01/2044 (Callable 06/01/2025) | | | | | | | | | | | | |
(Mandatory Tender Date 12/01/2025)(1) | | | 2,000,000 | | | | 2,055,127 | | | | | |
| Dutchess County Local Development Corp., | | | | | | | | | | | | |
| 5.000%, 07/01/2027 (Callable 07/01/2026) | | | 1,125,000 | | | | 1,139,753 | | | | | |
| Huntington Local Development Corp., | | | | | | | | | | | | |
| 4.000%, 07/01/2027 | | | 2,005,000 | | | | 1,924,069 | | | | | |
| Long Island Power Authority, | | | | | | | | | | | | |
| 4.000%, 09/01/2034 | | | | | | | | | | | | |
| (Callable 09/01/2028) | | | 325,000 | | | | 340,814 | | | | | |
| Monroe County Industrial | | | | | | | | | | | | |
| Development Corp., | | | | | | | | | | | | |
| 4.840%, 11/01/2040 (Insured by FNMA) | | | 4,970,135 | | | | 5,131,421 | | | | | |
| New York City Housing Development Corp.: | | | | | | | | | | | | |
| 2.250%, 11/01/2041 (Callable 05/01/2029) | | | | | | | | | | | | |
| (Insured by FHA) | | | 2,000,000 | | | | 1,517,951 | | | | | |
| 3.000%, 02/15/2048 (Callable 05/15/2024) | | | 9,250,000 | | | | 9,159,081 | | | | | |
| 3.500%, 02/15/2048 (Callable 05/15/2024) | | | 3,820,000 | | | | 3,783,867 | | | | | |
| 3.400%, 11/01/2062 (Callable 05/01/2025) | | | | | | | | | | | | |
| (Mandatory Tender Date 12/22/2026) | | | | | | | | | | | | |
(Insured by FHA)(1) | | | 6,280,000 | | | | 6,295,152 | | | | | |
| New York City Industrial | | | | | | | | | | | | |
| Development Agency: | | | | | | | | | | | | |
| 5.000%, 03/01/2029 (Insured by AGM) | | | 250,000 | | | | 275,623 | | | | | |
| 5.000%, 03/01/2030 (Insured by AGM) | | | 250,000 | | | | 279,483 | | | | | |
| New York City Transitional Finance Authority: | | | | | | | | | | | | |
| 5.000%, 08/01/2034 (Callable 08/01/2026) | | | 650,000 | | | | 681,961 | | | | | |
| 5.000%, 11/01/2035 (Callable 05/01/2029) | | | 715,000 | | | | 798,355 | | | | | |
| 5.000%, 08/01/2038 (Callable 08/01/2028) | | | 1,295,000 | | | | 1,402,071 | | | | | |
| 4.000%, 11/01/2038 (Callable 05/01/2031) | | | 1,055,000 | | | | 1,113,063 | | | | | |
| 4.000%, 05/01/2039 (Callable 11/01/2030) | | | 1,000,000 | | | | 1,047,418 | | | | | |
| New York State Dormitory Authority: | | | | | | | | | | | | |
| 5.000%, 02/15/2031 (Callable 08/15/2027) | | | 730,000 | | | | 791,740 | | | | | |
| 5.000%, 03/15/2040 (Callable 03/15/2029) | | | 3,275,000 | | | | 3,560,442 | | | | | |
| 5.000%, 03/15/2041 (Callable 03/15/2029) | | | 2,965,000 | | | | 3,217,569 | | | | | |
| 5.000%, 02/15/2048 (Callable 02/15/2030) | | | 1,925,000 | | | | 2,068,951 | | | | | |
| New York State Housing Finance Agency: | | | | | | | | | | | | |
| 0.700%, 11/01/2024 (Callable 01/19/2024) | | | | | | | | | | | | |
| (Insured by SONYMA) | | | 5,000,000 | | | | 4,833,161 | | | | | |
| 1.600%, 11/01/2024 (Callable 01/19/2024) | | | 4,480,000 | | | | 4,404,169 | | | | | |
| 0.650%, 11/01/2056 (Callable 01/19/2024) | | | | | | | | | | | | |
| (Mandatory Tender Date 11/01/2025) | | | | | | | | | | | | |
(Insured by SONYMA)(1) | | | 2,500,000 | | | | 2,336,766 | | | | | |
| 1.000%, 11/01/2061 (Callable 01/19/2024) | | | | | | | | | | | | |
| (Mandatory Tender Date 11/01/2026) | | | | | | | | | | | | |
(Insured by SONYMA)(1) | | | 1,825,000 | | | | 1,700,494 | | | | | |
| 3.600%, 11/01/2062 (Callable 06/01/2025) | | | | | | | | | | | | |
| (Mandatory Tender Date 05/01/2027) | | | | | | | | | | | | |
(Insured by SONYMA)(1) | | | 2,075,000 | | | | 2,084,347 | | | | | |
| New York Transportation Development Corp.: | | | | | | | | | | | | |
| 5.000%, 12/01/2031 (Callable 12/01/2030) | | | 1,250,000 | | | | 1,386,101 | | | | | |
| 5.500%, 06/30/2038 (Callable 06/30/2031) | | | 2,650,000 | | | | 2,946,695 | | | | | |
| 5.500%, 06/30/2041 (Callable 06/30/2031) | | | 1,700,000 | | | | 1,865,119 | | | | | |
| Onondaga Civic Development Corp.: | | | | | | | | | | | | |
| 3.375%, 10/01/2026 (Callable 10/01/2025) | | | 50,000 | | | | 46,997 | | | | | |
| 5.000%, 10/01/2040 (Callable 10/01/2025) | | | 195,000 | | | | 165,400 | | | | | |
| Port Authority of New York & New Jersey, | | | | | | | | | | | | |
| 3.000%, 10/01/2028 | | | 5,000,000 | | | | 4,960,251 | | | | | |
| St. Lawrence County Industrial | | | | | | | | | | | | |
| Development Agency, | | | | | | | | | | | | |
| 5.000%, 07/01/2034 (Callable 07/01/2026) | | | 345,000 | | | | 361,501 | | | | | |
| Town of Byron NY, | | | | | | | | | | | | |
| 4.500%, 04/03/2024 (Callable 01/29/2024) | | | 2,224,000 | | | | 2,224,250 | | | | | |
| Westchester County Local | | | | | | | | | | | | |
| Development Corp.: | | | | | | | | | | | | |
2.875%, 07/01/2026(3) | | | 6,110,000 | | | | 5,999,020 | | | | | |
| 5.750%, 11/01/2048 (Callable 11/01/2033) | | | | | | | | | | | | |
| (Insured by AGM) | | | 1,250,000 | | | | 1,422,414 | | | | | |
| Total New York | | | | | | | | | | | | |
| (Cost $97,067,497) | | | | | | | 97,711,594 | | | | 3.3 | % |
The accompanying notes are an integral part of these financial statements.
Baird Core Intermediate Municipal Bond Fund
Schedule of Investments, December 31, 2023
Long-Term Investments (cont.)
| | | Principal | | | | | | % of | |
| | | Amount | | | Value | | | Net Assets | |
| North Carolina | | | | | | | | | |
| Charlotte-Mecklenburg Hospital Authority, | | | | | | | | | |
| 5.000%, 01/15/2050 | | | | | | | | | |
(Mandatory Tender Date 12/01/2028)(1) | | $ | 1,930,000 | | | $ | 2,128,853 | | | | |
| City of Monroe NC, | | | | | | | | | | | |
| 5.000%, 03/01/2043 (Callable 03/01/2027) | | | 305,000 | | | | 314,877 | | | | |
| Inlivian: | | | | | | | | | | | |
| 2.375%, 04/01/2025 | | | | | | | | | | | |
(Mandatory Tender Date 04/01/2024)(1) | | | 5,000,000 | | | | 4,975,577 | | | | |
| 5.000%, 06/01/2043 (Callable 12/01/2025) | | | | | | | | | | | |
| (Mandatory Tender Date 06/01/2026) | | | | | | | | | | | |
(Insured by HUD)(1) | | | 9,000,000 | | | | 9,247,469 | | | | |
| North Carolina Housing Finance Agency: | | | | | | | | | | | |
| 4.200%, 07/01/2040 (Callable 07/01/2032) | | | 2,000,000 | | | | 2,040,370 | | | | |
| 4.000%, 07/01/2047 (Callable 01/01/2027) | | | 300,000 | | | | 299,098 | | | | |
| 3.750%, 07/01/2052 (Callable 01/01/2031) | | | | | | | | | | | |
| (Insured by GNMA) | | | 3,470,000 | | | | 3,443,098 | | | | |
| 5.750%, 01/01/2054 (Callable 07/01/2032) | | | 2,000,000 | | | | 2,161,481 | | | | |
| North Carolina Medical Care Commission, | | | | | | | | | | | |
| 5.000%, 01/01/2038 (Callable 01/01/2026) | | | 1,090,000 | | | | 1,093,338 | | | | |
| North Carolina Turnpike Authority: | | | | | | | | | | | |
| 5.000%, 01/01/2028 | | | 250,000 | | | | 265,983 | | | | |
| 4.000%, 01/01/2041 (Callable 01/01/2029) | | | | | | | | | | | |
| (Insured by AGM) | | | 1,105,000 | | | | 1,121,128 | | | | |
| Raleigh Housing Authority, | | | | | | | | | | | |
| 5.000%, 10/01/2026 | | | | | | | | | | | |
(Mandatory Tender Date 10/01/2025)(1) | | | 3,500,000 | | | | 3,567,593 | | | | |
| University of North Carolina at Chapel Hill, | | | | | | | | | | | |
| 4.261%, 12/01/2041 (SOFR + 0.650%) | | | | | | | | | | | |
| (Callable 12/01/2024) | | | | | | | | | | | |
(Mandatory Tender Date 06/01/2025)(2) | | | 5,000,000 | | | | 5,004,979 | | | | |
| Total North Carolina | | | | | | | | | | | |
| (Cost $35,755,381) | | | | | | | 35,663,844 | | | | 1.2 | % |
| North Dakota | | | | | | | | | | | | |
| City of Horace ND: | | | | | | | | | | | | |
| 3.250%, 08/01/2024 (Callable 01/29/2024) | | | 285,000 | | | | 285,056 | | | | | |
| 4.000%, 01/01/2025 (Callable 01/19/2024) | | | 2,500,000 | | | | 2,500,295 | | | | | |
| 3.000%, 05/01/2029 (Callable 05/01/2027) | | | 430,000 | | | | 406,613 | | | | | |
| 3.000%, 05/01/2030 (Callable 05/01/2027) | | | 425,000 | | | | 398,205 | | | | | |
| 3.000%, 05/01/2031 (Callable 05/01/2027) | | | 380,000 | | | | 351,179 | | | | | |
| 5.000%, 05/01/2033 (Callable 05/01/2031) | | | 630,000 | | | | 678,164 | | | | | |
| 5.250%, 05/01/2035 (Callable 05/01/2032) | | | 3,300,000 | | | | 3,595,300 | | | | | |
| 3.000%, 05/01/2037 (Callable 05/01/2026) | | | 2,495,000 | | | | 2,101,078 | | | | | |
| 5.000%, 05/01/2038 (Callable 05/01/2031) | | | 2,645,000 | | | | 2,748,281 | | | | | |
| 5.000%, 05/01/2048 (Callable 05/01/2031) | | | 250,000 | | | | 250,512 | | | | | |
| 6.000%, 05/01/2049 (Callable 05/01/2032) | | | 3,000,000 | | | | 3,211,161 | | | | | |
| City of Mayville ND, | | | | | | | | | | | | |
| 3.750%, 08/01/2025 (Callable 01/29/2024) | | | 3,500,000 | | | | 3,431,179 | | | | | |
| City of Williston ND, | | | | | | | | | | | | |
| 5.000%, 05/01/2028 (Callable 01/29/2024) | | | 480,000 | | | | 480,214 | | | | | |
| Nesson Public School District No. 2, | | | | | | | | | | | | |
| 4.000%, 08/01/2031 (Callable 08/01/2027) | | | | | | | | | | | | |
| (Insured by SD CRED PROG) | | | 525,000 | | | | 545,615 | | | | | |
| North Dakota Housing Finance Agency: | | | | | | | | | | | | |
| 3.000%, 07/01/2034 (Callable 07/01/2028) | | | 90,000 | | | | 79,228 | | | | | |
| 3.650%, 07/01/2042 (Callable 01/01/2032) | | | 500,000 | | | | 462,051 | | | | | |
| 3.500%, 07/01/2046 (Callable 01/01/2026) | | | 165,000 | | | | 163,415 | | | | | |
| 4.000%, 01/01/2050 (Callable 07/01/2028) | | | 670,000 | | | | 670,527 | | | | | |
| 5.750%, 01/01/2054 (Callable 07/01/2032) | | | 3,840,000 | | | | 4,151,191 | | | | | |
| State Board of Higher Education | | | | | | | | | | | | |
| of the State of North Dakota: | | | | | | | | | | | | |
| 5.000%, 04/01/2028 (Insured by AGM) | | | 100,000 | | | | 108,924 | | | | | |
| 4.000%, 04/01/2037 (Callable 04/01/2029) | | | | | | | | | | | | |
| (Insured by AGM) | | | 400,000 | | | | 409,281 | | | | | |
| Williston Parks & Recreation District, | | | | | | | | | | | | |
| 4.500%, 03/01/2025 | | | | | | | | | | | | |
| (Callable 01/16/2024) | | | 1,700,000 | | | | 1,682,590 | | | | | |
| Total North Dakota | | | | | | | | | | | | |
| (Cost $28,862,191) | | | | | | | 28,710,059 | | | | 1.0 | % |
| Ohio | | | | | | | | | | | | |
| Akron Bath Copley Joint | | | | | | | | | | | | |
| Township Hospital District: | | | | | | | | | | | | |
| 5.000%, 11/15/2026 | | | 600,000 | | | | 635,254 | | | | | |
| 5.000%, 11/15/2032 (Callable 11/15/2030) | | | 1,545,000 | | | | 1,693,348 | | | | | |
| 4.000%, 11/15/2033 (Callable 11/15/2030) | | | 400,000 | | | | 402,815 | | | | | |
| American Municipal Power, Inc., | | | | | | | | | | | | |
| 4.625%, 04/12/2024 (Insured by ST AID) | | | 800,000 | | | | 801,425 | | | | | |
| City of Akron OH: | | | | | | | | | | | | |
| 4.000%, 12/01/2031 (Callable 12/01/2029) | | | 1,665,000 | | | | 1,767,894 | | | | | |
| 4.000%, 12/01/2032 (Callable 12/01/2029) | | | 5,000 | | | | 5,289 | | | | | |
| City of Middleburg Heights OH, | | | | | | | | | | | | |
| 5.000%, 08/01/2033 (Callable 08/01/2031) | | | 645,000 | | | | 713,625 | | | | | |
| City of Troy OH, | | | | | | | | | | | | |
| 3.000%, 12/01/2041 (Callable 06/01/2025) | | | 355,000 | | | | 316,437 | | | | | |
| Cleveland-Cuyahoga County Port Authority: | | | | | | | | | | | | |
| 5.000%, 07/01/2034 (Callable 07/01/2031) | | | 400,000 | | | | 456,923 | | | | | |
| 5.000%, 07/01/2036 (Callable 07/01/2031) | | | 600,000 | | | | 678,606 | | | | | |
| 4.000%, 07/01/2038 (Callable 07/01/2031) | | | 500,000 | | | | 514,524 | | | | | |
| 5.000%, 08/01/2039 (Callable 08/01/2024) | | | 2,260,000 | | | | 2,270,039 | | | | | |
| Columbus Metropolitan Housing Authority, | | | | | | | | | | | | |
| 1.000%, 11/01/2024 (Callable 01/16/2024) | | | 600,000 | | | | 588,927 | | | | | |
| Columbus-Franklin County | | | | | | | | | | | | |
| Finance Authority: | | | | | | | | | | | | |
| 2.000%, 11/15/2031 | | | 710,000 | | | | 644,187 | | | | | |
| 3.820%, 11/15/2036 (Callable 01/29/2024) | | | 395,000 | | | | 395,128 | | | | | |
| 4.000%, 11/15/2038 (Callable 01/29/2024) | | | 315,000 | | | | 315,072 | | | | | |
| Copley-Fairlawn City School District: | | | | | | | | | | | | |
| 5.000%, 12/01/2036 (Callable 06/01/2028) | | | 375,000 | | | | 408,992 | | | | | |
| 5.000%, 12/01/2037 (Callable 06/01/2028) | | | 300,000 | | | | 325,168 | | | | | |
| 5.000%, 12/01/2038 (Callable 06/01/2028) | | | 250,000 | | | | 270,257 | | | | | |
| 5.000%, 12/01/2039 (Callable 06/01/2028) | | | 430,000 | | | | 463,046 | | | | | |
| 5.000%, 12/01/2040 (Callable 06/01/2028) | | | 275,000 | | | | 294,719 | | | | | |
| County of Lorain OH: | | | | | | | | | | | | |
| 5.000%, 12/01/2031 (Callable 01/29/2024) | | | 480,000 | | | | 480,592 | | | | | |
| 3.000%, 12/01/2036 (Callable 12/01/2025) | | | 400,000 | | | | 378,729 | | | | | |
| County of Medina OH: | | | | | | | | | | | | |
| 3.000%, 12/01/2033 (Callable 06/01/2026) | | | 590,000 | | | | 581,600 | | | | | |
| 3.000%, 12/01/2037 (Callable 06/01/2026) | | | 545,000 | | | | 506,628 | | | | | |
| County of Montgomery OH: | | | | | | | | | | | | |
| 4.000%, 08/01/2037 (Callable 02/01/2031) | | | 400,000 | | | | 409,070 | | | | | |
| 5.000%, 08/01/2039 (Callable 02/01/2031) | | | 825,000 | | | | 889,747 | | | | | |
| County of Van Wert OH, | | | | | | | | | | | | |
| 6.125%, 12/01/2049 | | | | | | | | | | | | |
| (Pre-refunded to 12/01/2029) | | | 2,985,000 | | | | 3,469,932 | | | | | |
| Cuyahoga Metropolitan Housing Authority: | | | | | | | | | | | | |
| 4.000%, 06/01/2026 (Mandatory Tender | | | | | | | | | | | | |
Date 06/01/2025) (Insured by FHA)(1) | | | 3,012,000 | | | | 3,025,632 | | | | | |
| 4.750%, 12/01/2027 (Mandatory Tender | | | | | | | | | | | | |
Date 12/01/2025) (Insured by FHA)(1) | | | 2,280,000 | | | | 2,322,912 | | | | | |
| Euclid City School District, | | | | | | | | | | | | |
| 4.000%, 12/01/2037 (Callable 06/01/2027) | | | | | | | | | | | | |
| (Insured by BAM) | | | 160,000 | | | | 162,774 | | | | | |
| Franklin County Convention | | | | | | | | | | | | |
| Facilities Authority, | | | | | | | | | | | | |
| 5.000%, 12/01/2032 (Callable 12/01/2029) | | | 500,000 | | | | 559,028 | | | | | |
| Hamilton County Convention | | | | | | | | | | | | |
| Facilities Authority, | | | | | | | | | | | | |
| 5.000%, 12/01/2026 (Callable 01/29/2024) | | | 2,570,000 | | | | 2,571,904 | | | | | |
The accompanying notes are an integral part of these financial statements.
Baird Core Intermediate Municipal Bond Fund
Schedule of Investments, December 31, 2023
Long-Term Investments (cont.)
| | | Principal | | | | | | % of | |
| | | Amount | | | Value | | | Net Assets | |
| Hopewell-Loudon Local School District, | | | | | | | | | |
| 4.000%, 11/01/2036 (Callable 11/01/2026) | | | | | | | | | |
| (Insured by AGM) | | $ | 1,055,000 | | | $ | 1,071,275 | | | |
| |
| Licking Heights Local School District, | | | | | | | | | | | | |
| 6.400%, 12/01/2028 (Insured by NATL) | | | 705,000 | | | | 773,290 | | | | | |
| Ohio Air Quality Development Authority: | | | | | | | | | | | | |
| 3.250%, 09/01/2029 | | | 1,000,000 | | | | 965,650 | | | | | |
| 4.000%, 09/01/2030 | | | | | | | | | | | | |
(Mandatory Tender Date 06/01/2027)(1) | | | 5,000,000 | | | | 5,080,357 | | | | | |
| 4.000%, 01/01/2034 | | | | | | | | | | | | |
(Mandatory Tender Date 06/01/2027)(1) | | | 2,000,000 | | | | 2,016,754 | | | | | |
| 2.400%, 12/01/2038 (Callable 10/01/2024) | | | | | | | | | | | | |
(Mandatory Tender Date 10/01/2029)(1) | | | 2,615,000 | | | | 2,329,518 | | | | | |
| Ohio Higher Educational | | | | | | | | | | | | |
| Facility Commission: | | | | | | | | | | | | |
| 5.000%, 03/01/2025 | | | 585,000 | | | | 588,168 | | | | | |
| 5.000%, 05/01/2026 | | | 200,000 | | | | 209,959 | | | | | |
| 5.000%, 05/01/2027 (Callable 05/01/2026) | | | 610,000 | | | | 636,432 | | | | | |
| 5.000%, 05/01/2028 (Callable 05/01/2026) | | | 475,000 | | | | 495,251 | | | | | |
| Ohio Housing Finance Agency: | | | | | | | | | | | | |
| 5.000%, 05/01/2025 (Mandatory Tender | | | | | | | | | | | | |
Date 05/01/2024) (Insured by HUD)(1) | | | 2,340,000 | | | | 2,348,316 | | | | | |
| 3.350%, 07/01/2025 | | | | | | | | | | | | |
| (Mandatory Tender Date 07/01/2024) | | | | | | | | | | | | |
(Insured by HUD)(1) | | | 2,240,000 | | | | 2,230,744 | | | | | |
| 4.000%, 11/01/2025 | | | | | | | | | | | | |
(Mandatory Tender Date 11/01/2024)(1) | | | 4,300,000 | | | | 4,307,218 | | | | | |
| 5.000%, 08/01/2026 (Mandatory Tender | | | | | | | | | | | | |
Date 08/01/2025) (Insured by FHA)(1) | | | 3,159,000 | | | | 3,224,515 | | | | | |
| 5.000%, 12/01/2026 (Mandatory Tender | | | | | | | | | | | | |
Date 12/01/2025) (Insured by FHA)(1) | | | 1,665,000 | | | | 1,708,901 | | | | | |
| 3.200%, 09/01/2036 (Callable 09/01/2025) | | | | | | | | | | | | |
| (Insured by GNMA) | | | 585,000 | | | | 545,673 | | | | | |
| 2.900%, 09/01/2045 (Callable 03/01/2029) | | | | | | | | | | | | |
| (Insured by GNMA) | | | 6,510,000 | | | | 5,208,247 | | | | | |
| 4.000%, 03/01/2047 (Callable 09/01/2025) | | | | | | | | | | | | |
| (Insured by GNMA) | | | 100,000 | | | | 99,699 | | | | | |
| Ohio Turnpike & Infrastructure Commission: | | | | | | | | | | | | |
| 5.700%, 02/15/2034 | | | | | | | | | | | | |
(Callable 02/15/2031)(5) | | | 2,350,000 | | | | 2,837,792 | | | | | |
| 5.800%, 02/15/2036 | | | | | | | | | | | | |
(Callable 02/15/2031)(5) | | | 410,000 | | | | 492,409 | | | | | |
| Port of Greater Cincinnati | | | | | | | | | | | | |
| Development Authority, | | | | | | | | | | | | |
| 5.000%, 05/01/2025 | | | | | | | | | | | | |
(Callable 01/29/2024)(3) | | | 13,000,000 | | | | 12,998,731 | | | | | |
| State of Ohio: | | | | | | | | | | | | |
| 5.000%, 11/15/2035 (Callable 11/15/2030) | | | 605,000 | | | | 644,243 | | | | | |
| 5.000%, 12/31/2035 (Callable 06/30/2025) | | | | | | | | | | | | |
| (Insured by AGM) | | | 7,865,000 | | | | 7,923,911 | | | | | |
| 4.000%, 11/15/2036 (Callable 11/15/2030) | | | 635,000 | | | | 628,271 | | | | | |
| Summit County Development | | | | | | | | | | | | |
| Finance Authority, | | | | | | | | | | | | |
| 5.500%, 12/01/2043 (Callable 12/01/2033) | | | 1,000,000 | | | | 1,041,035 | | | | | |
| Township of Miami OH, | | | | | | | | | | | | |
| 3.000%, 12/01/2033 (Callable 12/01/2029) | | | 80,000 | | | | 78,928 | | | | | |
| Triway Local School District, | | | | | | | | | | | | |
| 4.000%, 12/01/2038 (Callable 12/01/2028) | | | | | | | | | | | | |
| (Insured by BAM) | | | 1,580,000 | | | | 1,608,762 | | | | | |
| Village of Bluffton OH: | | | | | | | | | | | | |
| 5.000%, 12/01/2026 | | | 1,890,000 | | | | 1,972,961 | | | | | |
| 5.000%, 12/01/2027 | | | 1,340,000 | | | | 1,419,083 | | | | | |
| Warren County Port Authority, | | | | | | | | | | | | |
| 4.000%, 12/01/2053 | | | | | | | | | | | | |
| (Callable 12/01/2031) | | | 1,070,000 | | | | 867,286 | | | | | |
| Total Ohio | | | | | | | | | | | | |
| (Cost $97,413,620) | | | | | | | 95,673,602 | | | | 3.2 | % |
| Oklahoma | | | | | | | | | | | | |
| Canadian County Educational | | | | | | | | | | | | |
| Facilities Authority, | | | | | | | | | | | | |
| 5.250%, 09/01/2034 (Callable 09/01/2033) | | | 6,095,000 | | | | 7,073,118 | | | | | |
| Catoosa Industrial Authority, | | | | | | | | | | | | |
| 4.000%, 10/01/2028 (Callable 10/01/2026) | | | 20,000 | | | | 19,501 | | | | | |
| Cleveland County Educational | | | | | | | | | | | | |
| Facilities Authority, | | | | | | | | | | | | |
| 5.000%, 06/01/2033 | | | 390,000 | | | | 452,303 | | | | | |
| Garfield County Educational | | | | | | | | | | | | |
| Facilities Authority, | | | | | | | | | | | | |
| 5.000%, 09/01/2029 (Callable 09/01/2026) | | | 2,620,000 | | | | 2,732,262 | | | | | |
| Muskogee Industrial Trust, | | | | | | | | | | | | |
| 4.000%, 09/01/2033 (Callable 09/01/2029) | | | 5,415,000 | | | | 5,420,533 | | | | | |
| Norman Regional Hospital Authority, | | | | | | | | | | | | |
| 5.000%, 09/01/2031 (Callable 09/01/2026) | | | 1,700,000 | | | | 1,749,987 | | | | | |
| Oklahoma Development Finance Authority, | | | | | | | | | | | | |
| 2.600%, 03/01/2024 | | | 145,000 | | | | 144,679 | | | | | |
| Oklahoma Housing Finance Agency: | | | | | | | | | | | | |
| 3.500%, 03/01/2031 (Insured by GNMA) | | | 200,000 | | | | 201,033 | | | | | |
| 3.700%, 09/01/2033 (Callable 03/01/2031) | | | | | | | | | | | | |
| (Insured by GNMA) | | | 350,000 | | | | 351,539 | | | | | |
| 3.750%, 09/01/2034 (Callable 03/01/2031) | | | | | | | | | | | | |
| (Insured by GNMA) | | | 395,000 | | | | 395,484 | | | | | |
| 3.000%, 09/01/2039 (Callable 03/01/2028) | | | | | | | | | | | | |
| (Insured by GNMA) | | | 130,000 | | | | 113,718 | | | | | |
| 5.000%, 03/01/2052 (Callable 03/01/2031) | | | | | | | | | | | | |
| (Insured by GNMA) | | | 2,925,000 | | | | 3,035,257 | | | | | |
| 6.500%, 09/01/2054 (Callable 09/01/2032) | | | | | | | | | | | | |
| (Insured by GNMA) | | | 1,250,000 | | | | 1,426,291 | | | | | |
| Oklahoma Turnpike Authority: | | | | | | | | | | | | |
| 5.000%, 01/01/2037 (Callable 01/01/2026) | | | 400,000 | | | | 410,972 | | | | | |
| 4.500%, 01/01/2053 (Callable 01/01/2032) | | | 3,000,000 | | | | 3,047,207 | | | | | |
| Tulsa County Independent | | | | | | | | | | | | |
| School District No. 3, | | | | | | | | | | | | |
| 4.500%, 03/01/2025 | | | 2,800,000 | | | | 2,845,400 | | | | | |
| University of Oklahoma, | | | | | | | | | | | | |
| 5.000%, 07/01/2033 (Callable 07/01/2025) | | | 1,500,000 | | | | 1,542,409 | | | | | |
| Total Oklahoma | | | | | | | | | | | | |
| (Cost $30,252,954) | | | | | | | 30,961,693 | | | | 1.0 | % |
| Oregon | | | | | | | | | | | | |
| Clackamas Community College, | | | | | | | | | | | | |
| 5.000%, 06/15/2039 | | | | | | | | | | | | |
(Callable 06/15/2027)(5) | | | 500,000 | | | | 529,392 | | | | | |
| County of Crook OR: | | | | | | | | | | | | |
0.000%, 06/01/2032(5) | | | 1,045,000 | | | | 997,595 | | | | | |
| 0.000%, 06/01/2034 | | | | | | | | | | | | |
(Callable 06/01/2032)(5) | | | 1,345,000 | | | | 1,271,476 | | | | | |
| 0.000%, 06/01/2035 | | | | | | | | | | | | |
(Callable 06/01/2032)(5) | | | 1,510,000 | | | | 1,426,347 | | | | | |
| Multnomah & Clackamas Counties | | | | | | | | | | | | |
| School District No. 10JT, | | | | | | | | | | | | |
| 0.000%, 06/15/2031 (Callable 06/15/2029) | | | | | | | | | | | | |
| (Insured by SCH BD GTY) | | | 110,000 | | | | 83,452 | | | | | |
| Multnomah County School District No. 40, | | | | | | | | | | | | |
| 0.000%, 06/15/2035 (Callable 06/15/2033) | | | | | | | | | | | | |
| (Insured by SCH BD GTY) | | | 1,000,000 | | | | 684,446 | | | | | |
The accompanying notes are an integral part of these financial statements.
Baird Core Intermediate Municipal Bond Fund
Schedule of Investments, December 31, 2023
Long-Term Investments (cont.)
| | | Principal | | | | | | % of | |
| | | Amount | | | Value | | | Net Assets | |
| Oregon State Business | | | | | | | | | |
| Development Commission, | | | | | | | | | |
| 3.800%, 12/01/2040 (Callable 02/01/2028) | | | | | | | | | |
(Mandatory Tender Date 06/15/2028)(1) | | $ | 1,000,000 | | | $ | 1,021,018 | | | | |
| Oregon State Facilities Authority: | | | | | | | | | | | |
| 5.000%, 10/01/2027 | | | 125,000 | | | | 131,256 | | | | |
| 4.125%, 06/01/2052 (Callable 06/01/2032) | | | 600,000 | | | | 581,920 | | | | |
| Salem Hospital Facility Authority: | | | | | | | | | | | |
| 5.000%, 05/15/2024 | | | 120,000 | | | | 119,968 | | | | |
| 5.000%, 05/15/2025 | | | 130,000 | | | | 130,111 | | | | |
| 5.000%, 05/15/2026 | | | 135,000 | | | | 135,560 | | | | |
| 5.000%, 05/15/2035 (Callable 05/15/2026) | | | 500,000 | | | | 519,512 | | | | |
| State of Oregon Housing & | | | | | | | | | | | |
| Community Services Department: | | | | | | | | | | | |
| 2.900%, 07/01/2043 (Callable 07/01/2027) | | | 3,000,000 | | | | 2,500,909 | | | | |
| 4.000%, 07/01/2051 (Callable 01/01/2031) | | | 5,405,000 | | | | 5,416,827 | | | | |
| Umatilla County School District No. 6R, | | | | | | | | | | | |
| 5.000%, 06/15/2035 (Callable 06/15/2027) | | | | | | | | | | | |
(Insured by SCH BD GTY)(5) | | | 540,000 | | | | 582,091 | | | | |
| Yamhill County Hospital Authority, | | | | | | | | | | | |
| 2.125%, 11/15/2027 (Callable 01/19/2024) | | | 510,000 | | | | 484,126 | | | | |
| Total Oregon | | | | | | | | | | | |
| (Cost $16,919,764) | | | | | | | 16,616,006 | | | | 0.6 | % |
| Pennsylvania | | | | | | | | | | | | |
| Allegheny County Higher | | | | | | | | | | | | |
| Education Building Authority: | | | | | | | | | | | | |
| 5.000%, 09/01/2024 | | | 260,000 | | | | 261,115 | | | | | |
| 5.000%, 09/01/2025 | | | 450,000 | | | | 455,206 | | | | | |
| 5.000%, 09/01/2026 | | | 400,000 | | | | 402,287 | | | | | |
| 5.000%, 09/01/2027 | | | 500,000 | | | | 505,035 | | | | | |
| Bloomsburg PA Area School District, | | | | | | | | | | | | |
| 4.000%, 09/01/2030 (Callable 03/01/2024) | | | | | | | | | | | | |
| (Insured by BAM) | | | 250,000 | | | | 250,087 | | | | | |
| Chester County Industrial | | | | | | | | | | | | |
| Development Authority, | | | | | | | | | | | | |
| 5.000%, 08/01/2045 (Callable 01/29/2024) | | | 750,000 | | | | 700,238 | | | | | |
| City of Erie Higher Education | | | | | | | | | | | | |
| Building Authority: | | | | | | | | | | | | |
| 5.000%, 05/01/2031 | | | 175,000 | | | | 184,984 | | | | | |
| 4.000%, 05/01/2036 (Callable 05/01/2031) | | | 575,000 | | | | 550,999 | | | | | |
| City of Oil City PA: | | | | | | | | | | | | |
| 4.000%, 12/01/2031 (Callable 12/01/2029) | | | | | | | | | | | | |
| (Insured by AGM) | | | 100,000 | | | | 106,236 | | | | | |
| 4.000%, 12/01/2035 (Callable 12/01/2029) | | | | | | | | | | | | |
| (Insured by AGM) | | | 275,000 | | | | 289,562 | | | | | |
| 4.000%, 12/01/2036 (Callable 12/01/2029) | | | | | | | | | | | | |
| (Insured by AGM) | | | 850,000 | | | | 888,754 | | | | | |
| City of Philadelphia PA, | | | | | | | | | | | | |
| 5.000%, 07/01/2025 | | | 3,000,000 | | | | 3,067,168 | | | | | |
| Coatesville School District, | | | | | | | | | | | | |
| 5.000%, 11/15/2031 (Callable 11/15/2030) | | | | | | | | | | | | |
| (Insured by BAM) | | | 4,395,000 | | | | 4,949,067 | | | | | |
| Commonwealth Financing Authority, | | | | | | | | | | | | |
| 4.000%, 06/01/2039 (Callable 06/01/2028) | | | | | | | | | | | | |
| (Insured by AGM) | | | 1,670,000 | | | | 1,682,209 | | | | | |
| Dallas Area Municipal Authority, | | | | | | | | | | | | |
| 5.000%, 05/01/2029 (Callable 05/01/2024) | | | 2,855,000 | | | | 2,858,132 | | | | | |
| Dauphin County General Authority, | | | | | | | | | | | | |
| 5.000%, 06/01/2029 (Callable 06/01/2026) | | | 690,000 | | | | 718,455 | | | | | |
| Delaware County Authority, | | | | | | | | | | | | |
| 5.000%, 10/01/2035 (Callable 04/01/2027) | | | 485,000 | | | | 516,150 | | | | | |
| Delaware Valley Regional Finance Authority, | | | | | | | | | | | | |
| 4.543%, 09/01/2048 (1 Month LIBOR | | | | | | | | | | | | |
| USD + 0.880%) (Callable 09/01/2024) | | | | | | | | | | | | |
(Mandatory Tender Date 09/01/2025)(2)(7) | | | 1,000,000 | | | | 991,319 | | | | | |
| East Hempfield Township Industrial | | | | | | | | | | | | |
| Development Authority, | | | | | | | | | | | | |
| 5.000%, 12/01/2025 | | | 225,000 | | | | 230,054 | | | | | |
| Erie Parking Authority, | | | | | | | | | | | | |
| 4.000%, 09/01/2038 (Callable 09/01/2030) | | | | | | | | | | | | |
| (Insured by BAM) | | | 250,000 | | | | 254,919 | | | | | |
| Hamburg Area School District: | | | | | | | | | | | | |
| 3.000%, 04/01/2034 (Callable 10/01/2026) | | | | | | | | | | | | |
| (Insured by ST AID) | | | 1,000,000 | | | | 953,246 | | | | | |
| 3.000%, 04/01/2036 (Callable 10/01/2026) | | | | | | | | | | | | |
| (Insured by ST AID) | | | 1,400,000 | | | | 1,357,507 | | | | | |
| Indiana County Industrial | | | | | | | | | | | | |
| Development Authority: | | | | | | | | | | | | |
| 5.000%, 05/01/2030 (Insured by BAM) | | | 1,040,000 | | | | 1,140,335 | | | | | |
| 5.000%, 05/01/2032 (Callable 11/01/2031) | | | | | | | | | | | | |
| (Insured by BAM) | | | 920,000 | | | | 1,021,254 | | | | | |
| Lancaster County Convention | | | | | | | | | | | | |
| Center Authority: | | | | | | | | | | | | |
| 4.000%, 05/01/2038 (Callable 05/01/2032) | | | | | | | | | | | | |
| (County Guaranteed) | | | 1,645,000 | | | | 1,725,779 | | | | | |
| 4.375%, 05/01/2042 (Callable 05/01/2032) | | | | | | | | | | | | |
| (County Guaranteed) | | | 1,000,000 | | | | 1,025,803 | | | | | |
| Lancaster County Hospital Authority: | | | | | | | | | | | | |
| 5.000%, 11/01/2037 (Callable 11/01/2029) | | | 600,000 | | | | 646,297 | | | | | |
| 5.000%, 11/01/2040 (Callable 11/01/2029) | | | 3,100,000 | | | | 3,298,248 | | | | | |
| Lancaster Higher Education Authority: | | | | | | | | | | | | |
| 4.000%, 10/01/2030 (Callable 10/01/2028) | | | | | | | | | | | | |
| (Insured by BAM) | | | 1,225,000 | | | | 1,276,685 | | | | | |
| 4.000%, 10/01/2031 (Callable 10/01/2028) | | | | | | | | | | | | |
| (Insured by BAM) | | | 1,000,000 | | | | 1,039,084 | | | | | |
| Latrobe Industrial Development Authority: | | | | | | | | | | | | |
| 5.000%, 03/01/2031 | | | 175,000 | | | | 183,047 | | | | | |
| 5.000%, 03/01/2032 (Callable 03/01/2031) | | | 265,000 | | | | 276,781 | | | | | |
| 5.000%, 03/01/2033 (Callable 03/01/2031) | | | 290,000 | | | | 303,254 | | | | | |
| 5.000%, 03/01/2034 (Callable 03/01/2031) | | | 300,000 | | | | 313,578 | | | | | |
| Lycoming County Authority, | | | | | | | | | | | | |
| 4.000%, 11/01/2043 | | | | | | | | | | | | |
(Mandatory Tender Date 05/01/2024)(1) | | | 525,000 | | | | 524,990 | | | | | |
| Montgomery County Higher | | | | | | | | | | | | |
| Education & Health Authority, | | | | | | | | | | | | |
| 5.000%, 09/01/2037 (Callable 09/01/2028) | | | 1,000,000 | | | | 1,053,102 | | | | | |
| Montgomery County Industrial | | | | | | | | | | | | |
| Development Authority: | | | | | | | | | | | | |
| 2.000%, 11/15/2029 (Callable 01/01/2024) | | | | | | | | | | | | |
| (Optional Put Date 01/02/2024) | | | | | | | | | | | | |
(Insured by AGC)(1) | | | 865,000 | | | | 865,000 | | | | | |
| 4.100%, 04/01/2053 | | | | | | | | | | | | |
(Mandatory Tender Date 04/03/2028)(1) | | | 5,000,000 | | | | 5,095,504 | | | | | |
| Old Forge School District, | | | | | | | | | | | | |
| 4.000%, 05/01/2045 (Callable 05/01/2027) | | | | | | | | | | | | |
| (Insured by BAM) | | | 530,000 | | | | 530,815 | | | | | |
| Panther Valley School District: | | | | | | | | | | | | |
| 4.000%, 10/15/2031 (Callable 10/15/2028) | | | | | | | | | | | | |
| (Insured by BAM) | | | 730,000 | | | | 763,305 | | | | | |
| 4.000%, 10/15/2032 (Callable 10/15/2028) | | | | | | | | | | | | |
| (Insured by BAM) | | | 350,000 | | | | 365,163 | | | | | |
| 4.000%, 10/15/2033 (Callable 10/15/2028) | | | | | | | | | | | | |
| (Insured by BAM) | | | 185,000 | | | | 192,557 | | | | | |
The accompanying notes are an integral part of these financial statements.
Baird Core Intermediate Municipal Bond Fund
Schedule of Investments, December 31, 2023
Long-Term Investments (cont.)
| | | Principal | | | | | | % of | |
| | | Amount | | | Value | | | Net Assets | |
| Pennsylvania Economic Development | | | | | | | | | |
| Financing Authority: | | | | | | | | | |
| 5.000%, 06/30/2030 | | $ | 1,245,000 | | | $ | 1,354,219 | | | | |
| 3.750%, 12/01/2030 | | | 1,760,000 | | | | 1,759,965 | | | | |
| 5.000%, 12/31/2030 | | | 1,000,000 | | | | 1,093,501 | | | | |
| 0.000%, 01/01/2034 (County Guaranteed) | | | 3,410,000 | | | | 2,356,121 | | | | |
| 0.000%, 01/01/2034 (Insured by AGM) | | | 1,680,000 | | | | 1,183,801 | | | | |
| 4.000%, 11/15/2034 (Callable 11/15/2027) | | | 1,000,000 | | | | 1,025,563 | | | | |
| 5.500%, 06/30/2038 (Callable 12/31/2032) | | | 2,045,000 | | | | 2,265,998 | | | | |
| 0.000%, 01/01/2039 (Insured by AGM) | | | 3,640,000 | | | | 1,958,188 | | | | |
| 5.000%, 12/31/2057 (Callable 12/31/2032) | | | | | | | | | | | |
| (Insured by AGM) | | | 3,000,000 | | | | 3,096,497 | | | | |
| Pennsylvania Higher Educational | | | | | | | | | | | |
| Facilities Authority, | | | | | | | | | | | |
| 5.000%, 07/01/2035 (Callable 07/01/2026) | | | 300,000 | | | | 300,551 | | | | |
| Pennsylvania Housing Finance Agency: | | | | | | | | | | | |
| 3.500%, 10/01/2046 (Callable 10/01/2025) | | | 100,000 | | | | 99,389 | | | | |
| 4.000%, 10/01/2049 (Callable 10/01/2028) | | | 845,000 | | | | 842,450 | | | | |
| 4.250%, 10/01/2052 (Callable 04/01/2032) | | | 5,020,000 | | | | 5,072,958 | | | | |
| Pennsylvania Turnpike Commission: | | | | | | | | | | | |
| 0.000%, 12/01/2037 | | | | | | | | | | | |
(Callable 12/01/2035)(5) | | | 270,000 | | | | 260,056 | | | | |
| 4.750%, 12/01/2037 | | | | | | | | | | | |
(Callable 12/01/2026)(5) | | | 600,000 | | | | 623,152 | | | | |
| 5.000%, 12/01/2038 | | | | | | | | | | | |
(Callable 12/01/2028)(5) | | | 2,480,000 | | | | 2,627,769 | | | | |
| 6.375%, 12/01/2038 | | | | | | | | | | | |
(Callable 12/01/2027)(5) | | | 4,385,000 | | | | 4,885,938 | | | | |
| 4.000%, 12/01/2039 (Callable 12/01/2031) | | | 1,975,000 | | | | 2,038,844 | | | | |
| 0.000%, 12/01/2040 | | | | | | | | | | | |
(Callable 06/01/2029)(5) | | | 795,000 | | | | 824,506 | | | | |
| Ridley School District: | | | | | | | | | | | |
| 4.000%, 09/15/2031 (Callable 03/15/2025) | | | | | | | | | | | |
| (Insured by ST AID) | | | 830,000 | | | | 837,471 | | | | |
| 4.000%, 11/15/2036 (Callable 11/15/2029) | | | | | | | | | | | |
| (Insured by AGM) | | | 1,000,000 | | | | 1,038,561 | | | | |
| 4.000%, 11/15/2037 (Callable 11/15/2029) | | | | | | | | | | | |
| (Insured by AGM) | | | 325,000 | | | | 334,071 | | | | |
| School District of Philadelphia: | | | | | | | | | | | |
| 5.000%, 09/01/2024 (Insured by ST AID) | | | 600,000 | | | | 606,370 | | | | |
| 5.000%, 09/01/2032 (Callable 09/01/2025) | | | | | | | | | | | |
| (Insured by ST AID) | | | 575,000 | | | | 589,450 | | | | |
| 4.000%, 09/01/2037 (Callable 09/01/2029) | | | | | | | | | | | |
| (Insured by ST AID) | | | 1,000,000 | | | | 1,024,066 | | | | |
| Sports & Exhibition Authority of | | | | | | | | | | | |
| Pittsburgh and Allegheny County: | | | | | | | | | | | |
| 5.000%, 12/15/2028 (Callable 12/15/2027) | | | | | | | | | | | |
| (Insured by BAM) | | | 500,000 | | | | 539,301 | | | | |
| 5.000%, 02/01/2031 (Insured by AGM) | | | 3,175,000 | | | | 3,638,954 | | | | |
| 5.000%, 02/01/2034 (Callable 02/01/2032) | | | | | | | | | | | |
| (Insured by AGM) | | | 4,000,000 | | | | 4,633,332 | | | | |
| State Public School Building Authority: | | | | | | | | | | | |
| 0.000%, 05/15/2027 (Insured by NATL) | | | 160,000 | | | | 142,886 | | | | |
| 0.000%, 05/15/2030 (Insured by NATL) | | | 1,780,000 | | | | 1,439,037 | | | | |
| Tulpehocken Area School District, | | | | | | | | | | | |
| 5.250%, 10/01/2049 (Callable 10/01/2031) | | | | | | | | | | | |
| (Insured by BAM) | | | 1,000,000 | | | | 1,087,401 | | | | |
| Upper Moreland Township School District, | | | | | | | | | | | |
| 5.000%, 10/01/2030 (Callable 04/01/2025) | | | | | | | | | | | |
| (Insured by ST AID) | | | 250,000 | | | | 256,125 | | | | |
| Westmoreland County Industrial | | | | | | | | | | | |
| Development Authority: | | | | | | | | | | | |
| 5.000%, 07/01/2029 | | | 725,000 | | | | 771,427 | | | | |
| 5.000%, 07/01/2030 | | | 550,000 | | | | 587,363 | | | | |
| York Suburban School District, | | | | | | | | | | | |
| 4.000%, 05/01/2030 (Callable 05/01/2024) | | | | | | | | | | | |
| (Insured by BAM) | | | 1,780,000 | | | | 1,781,365 | | | | |
| Total Pennsylvania | | | | | | | | | | | |
| (Cost $96,386,471) | | | | | | | 96,789,956 | | | | 3.2 | % |
| Puerto Rico | | | | | | | | | | | | |
| Puerto Rico Industrial Tourist Educational | | | | | | | | | | | | |
| Medical & Environmental Control Facilities: | | | | | | | | | | | | |
| 5.000%, 07/01/2028 | | | 135,000 | | | | 144,491 | | | | | |
| 5.000%, 07/01/2034 (Callable 07/01/2031) | | | 200,000 | | | | 220,729 | | | | | |
| 5.000%, 07/01/2035 (Callable 07/01/2031) | | | 200,000 | | | | 219,893 | | | | | |
| Total Puerto Rico | | | | | | | | | | | | |
| (Cost $635,528) | | | | | | | 585,113 | | | | 0.0 | % |
| Rhode Island | | | | | | | | | | | | |
| Rhode Island Commerce Corp., | | | | | | | | | | | | |
| 5.000%, 07/01/2033 (Callable 07/01/2028) | | | | | | | | | | | | |
| (Insured by BAM) | | | 950,000 | | | | 1,050,944 | | | | | |
| Rhode Island Health and | | | | | | | | | | | | |
| Educational Building Corp., | | | | | | | | | | | | |
| 4.000%, 09/15/2031 (Callable 09/15/2026) | | | 125,000 | | | | 127,720 | | | | | |
| Rhode Island Housing & | | | | | | | | | | | | |
| Mortgage Finance Corp., | | | | | | | | | | | | |
| 3.000%, 10/01/2051 (Callable 04/01/2030) | | | 2,410,000 | | | | 2,337,714 | | | | | |
| Rhode Island Student Loan Authority: | | | | | | | | | | | | |
| 5.000%, 12/01/2027 | | | 1,000,000 | | | | 1,065,435 | | | | | |
| 5.000%, 12/01/2028 | | | 1,000,000 | | | | 1,078,690 | | | | | |
| Total Rhode Island | | | | | | | | | | | | |
| (Cost $5,694,417) | | | | | | | 5,660,503 | | | | 0.2 | % |
| South Carolina | | | | | | | | | | | | |
| County of Florence SC, | | | | | | | | | | | | |
| 5.000%, 11/01/2033 (Callable 11/01/2024) | | | 250,000 | | | | 253,067 | | | | | |
| Lexington County Health | | | | | | | | | | | | |
| Services District, Inc., | | | | | | | | | | | | |
| 5.000%, 11/01/2036 (Callable 05/01/2026) | | | 1,000,000 | | | | 1,033,695 | | | | | |
| Patriots Energy Group Financing Agency, | | | | | | | | | | | | |
| 5.250%, 10/01/2054 (Callable 05/01/2031) | | | | | | | | | | | | |
(Mandatory Tender Date 08/01/2031)(1) | | | 2,000,000 | | | | 2,155,114 | | | | | |
| Scago Educational Facilities Corp. | | | | | | | | | | | | |
| for Cherokee School District No. 1, | | | | | | | | | | | | |
| 5.000%, 12/01/2028 (Callable 06/01/2025) | | | 1,230,000 | | | | 1,258,346 | | | | | |
| Scago Educational Facilities Corp. | | | | | | | | | | | | |
| for Pickens School District, | | | | | | | | | | | | |
| 5.000%, 12/01/2029 (Callable 06/01/2025) | | | 675,000 | | | | 691,114 | | | | | |
| South Carolina Jobs-Economic | | | | | | | | | | | | |
| Development Authority: | | | | | | | | | | | | |
| 5.250%, 11/15/2028 (Callable 05/15/2025) | | | 3,350,000 | | | | 3,369,070 | | | | | |
| 5.000%, 05/01/2029 (Callable 05/01/2028) | | | 1,080,000 | | | | 1,151,458 | | | | | |
| 5.750%, 11/15/2029 (Callable 05/15/2025) | | | 2,200,000 | | | | 2,140,174 | | | | | |
| 4.000%, 08/15/2030 (Callable 08/15/2026) | | | 270,000 | | | | 271,855 | | | | | |
| 5.250%, 08/15/2033 (Callable 08/15/2026) | | | 2,500,000 | | | | 2,601,509 | | | | | |
| 5.250%, 07/01/2037 (Callable 07/01/2026) | | | 100,000 | | | | 102,951 | | | | | |
| 7.500%, 11/15/2053 (Callable 11/15/2030) | | | 2,600,000 | | | | 2,679,992 | | | | | |
| 7.750%, 11/15/2058 (Callable 11/15/2030) | | | 2,000,000 | | | | 2,060,830 | | | | | |
| South Carolina State Housing | | | | | | | | | | | | |
| Finance & Development Authority: | | | | | | | | | | | | |
| 2.000%, 09/01/2024 | | | | | | | | | | | | |
(Mandatory Tender Date 03/01/2024)(1) | | | 2,219,000 | | | | 2,210,455 | | | | | |
| 3.800%, 01/01/2049 (Callable 07/01/2027) | | | 140,000 | | | | 127,675 | | | | | |
| 4.000%, 07/01/2050 (Callable 07/01/2029) | | | 2,230,000 | | | | 2,231,137 | | | | | |
| 3.000%, 01/01/2052 (Callable 07/01/2030) | | | 8,185,000 | | | | 7,946,926 | | | | | |
| Spartanburg Regional Health Services District: | | | | | | | | | | | | |
| 4.000%, 04/15/2036 (Callable 04/15/2030) | | | | | | | | | | | | |
| (Insured by AGM) | | | 445,000 | | | | 461,764 | | | | | |
The accompanying notes are an integral part of these financial statements.
Baird Core Intermediate Municipal Bond Fund
Schedule of Investments, December 31, 2023
Long-Term Investments (cont.)
| | | Principal | | | | | | % of | |
| | | Amount | | | Value | | | Net Assets | |
| Spartanburg Regional Health | | | | | | | | | |
| Services District: (cont.) | | | | | | | | | |
| 4.000%, 04/15/2037 (Callable 04/15/2030) | | | | | | | | | |
| (Insured by AGM) | | $ | 500,000 | | | $ | 509,517 | | | | |
| 4.000%, 04/15/2038 (Callable 04/15/2030) | | | | | | | | | | | |
| (Insured by AGM) | | | 500,000 | | | | 507,151 | | | | |
| Williamsburg County Public Facilities Corp., | | | | | | | | | | | |
| 4.000%, 06/01/2032 (Callable 06/01/2030) | | | | | | | | | | | |
| (Insured by BAM) | | | 490,000 | | | | 511,845 | | | | |
| Total South Carolina | | | | | | | | | | | |
| (Cost $34,434,239) | | | | | | | 34,275,645 | | | | 1.1 | % |
| South Dakota | | | | | | | | | | | | |
| City of Brandon SD, | | | | | | | | | | | | |
| 5.000%, 08/01/2037 (Callable 08/01/2030) | | | | | | | | | | | | |
| (Insured by AGM) | | | 1,880,000 | | | | 2,049,257 | | | | | |
| City of Rapid City SD, | | | | | | | | | | | | |
| 4.000%, 12/01/2035 (Callable 12/01/2029) | | | 3,260,000 | | | | 3,267,330 | | | | | |
| County of Minnehaha SD, | | | | | | | | | | | | |
| 5.000%, 12/01/2041 (Callable 12/01/2032) | | | 1,000,000 | | | | 1,134,262 | | | | | |
| South Dakota Health & | | | | | | | | | | | | |
| Educational Facilities Authority: | | | | | | | | | | | | |
| 3.000%, 09/01/2029 (Callable 09/01/2028) | | | 380,000 | | | | 364,783 | | | | | |
| 3.000%, 09/01/2030 (Callable 09/01/2028) | | | 175,000 | | | | 166,415 | | | | | |
| 4.000%, 11/01/2034 (Callable 11/01/2024) | | | 4,390,000 | | | | 4,413,407 | | | | | |
| 4.000%, 11/01/2040 (Callable 11/01/2025) | | | 325,000 | | | | 326,771 | | | | | |
| 3.000%, 09/01/2041 (Callable 09/01/2028) | | | 250,000 | | | | 195,856 | | | | | |
| South Dakota Housing | | | | | | | | | | | | |
| Development Authority: | | | | | | | | | | | | |
| 4.000%, 05/01/2049 (Callable 05/01/2028) | | | 1,330,000 | | | | 1,328,112 | | | | | |
| 5.000%, 05/01/2053 (Callable 11/01/2031) | | | 2,900,000 | | | | 3,007,927 | | | | | |
| 6.250%, 05/01/2055 (Callable 05/01/2032) | | | | | | | | | | | | |
| (Insured by GNMA) | | | 1,000,000 | | | | 1,107,930 | | | | | |
| Total South Dakota | | | | | | | | | | | | |
| (Cost $17,593,999) | | | | | | | 17,362,050 | | | | 0.6 | % |
| Tennessee | | | | | | | | | | | | |
| City of Clarksville TN, | | | | | | | | | | | | |
| 4.125%, 09/01/2039 (Callable 09/01/2032) | | | 1,000,000 | | | | 1,064,183 | | | | | |
| City of Jackson TN: | | | | | | | | | | | | |
| 5.000%, 04/01/2029 | | | | | | | | | | | | |
| (Pre-refunded to 04/01/2025) | | | 30,000 | | | | 30,708 | | | | | |
| 5.000%, 04/01/2029 (Callable 04/01/2025) | | | 1,125,000 | | | | 1,145,036 | | | | | |
| 5.000%, 04/01/2036 | | | | | | | | | | | | |
| (Pre-refunded to 04/01/2025) | | | 60,000 | | | | 61,417 | | | | | |
| 5.000%, 04/01/2036 (Callable 04/01/2025) | | | 3,205,000 | | | | 3,244,962 | | | | | |
| City of Memphis TN: | | | | | | | | | | | | |
| 4.000%, 12/01/2033 (Callable 12/01/2026) | | | 1,300,000 | | | | 1,328,580 | | | | | |
| 4.000%, 12/01/2033 (Callable 12/01/2027) | | | 480,000 | | | | 493,962 | | | | | |
| 4.000%, 12/01/2034 (Callable 12/01/2026) | | | 1,310,000 | | | | 1,335,054 | | | | | |
| Cleveland Housing Authority, | | | | | | | | | | | | |
| 4.000%, 08/01/2026 | | | | | | | | | | | | |
(Mandatory Tender Date 08/01/2025)(1)(3) | | | 3,380,000 | | | | 3,357,027 | | | | | |
| County of Putnam TN, | | | | | | | | | | | | |
| 2.000%, 04/01/2035 (Callable 04/01/2030) | | | 3,875,000 | | | | 3,235,088 | | | | | |
| Knox County Health Educational & | | | | | | | | | | | | |
| Housing Facility Board: | | | | | | | | | | | | |
| 5.000%, 01/01/2025 (Callable 01/29/2024) | | | 1,190,000 | | | | 1,191,356 | | | | | |
| 5.000%, 01/01/2026 (Callable 01/29/2024) | | | 145,000 | | | | 146,349 | | | | | |
| 0.650%, 12/01/2026 | | | | | | | | | | | | |
(Mandatory Tender Date 12/01/2024)(1) | | | 1,200,000 | | | | 1,155,473 | | | | | |
| 3.950%, 12/01/2027 (Mandatory Tender | | | | | | | | | | | | |
Date 12/01/2025) (Insured by HUD)(1) | | | 2,425,000 | | | | 2,433,848 | | | | | |
| Memphis-Shelby County | | | | | | | | | | | | |
| Industrial Development Board, | | | | | | | | | | | | |
| 4.000%, 04/01/2038 (Callable 04/01/2031) | | | | | | | | | | | | |
| (Insured by AGM) | | | 535,000 | | | | 557,514 | | | | | |
| Nashville & Davidson County | | | | | | | | | | | | |
| Metropolitan Government: | | | | | | | | | | | | |
| 3.000%, 10/01/2024 | | | 70,000 | | | | 69,226 | | | | | |
| 5.000%, 12/01/2026 | | | | | | | | | | | | |
(Mandatory Tender Date 12/01/2025)(1) | | | 2,492,000 | | | | 2,557,706 | | | | | |
| 3.000%, 01/01/2034 (Callable 01/01/2031) | | | 2,010,000 | | | | 1,966,831 | | | | | |
| 5.000%, 07/01/2036 (Callable 01/01/2034) | | | | | | | | | | | | |
| (Insured by AGM) | | | 1,695,000 | | | | 2,003,140 | | | | | |
| 5.000%, 07/01/2036 (Callable 01/01/2034) | | | 500,000 | | | | 586,630 | | | | | |
| 5.000%, 05/01/2037 (Callable 05/01/2033) | | | 720,000 | | | | 810,535 | | | | | |
| 5.000%, 07/01/2037 (Callable 01/01/2034) | | | | | | | | | | | | |
| (Insured by AGM) | | | 1,000,000 | | | | 1,167,825 | | | | | |
| 5.000%, 05/01/2039 (Callable 05/01/2033) | | | 500,000 | | | | 553,624 | | | | | |
| 5.000%, 05/01/2040 (Callable 05/01/2033) | | | 725,000 | | | | 798,654 | | | | | |
| 5.250%, 05/01/2053 (Callable 05/01/2033) | | | 2,000,000 | | | | 2,173,141 | | | | | |
| Tennergy Corp.: | | | | | | | | | | | | |
| 5.500%, 12/01/2030 | | | 3,470,000 | | | | 3,743,628 | | | | | |
| 5.500%, 10/01/2053 (Callable 09/01/2030) | | | | | | | | | | | | |
(Mandatory Tender Date 12/01/2030)(1) | | | 11,550,000 | | | | 12,328,440 | | | | | |
| Tennessee Energy Acquisition Corp., | | | | | | | | | | | | |
| 5.000%, 02/01/2027 | | | 195,000 | | | | 198,711 | | | | | |
| Tennessee Housing Development Agency: | | | | | | | | | | | | |
| 3.600%, 01/01/2031 (Callable 01/19/2024) | | | 1,105,000 | | | | 1,105,063 | | | | | |
| 3.100%, 07/01/2036 (Callable 01/01/2026) | | | 245,000 | | | | 227,843 | | | | | |
| 3.550%, 07/01/2039 (Callable 07/01/2024) | | | 180,000 | | | | 169,695 | | | | | |
| 4.000%, 01/01/2042 (Callable 07/01/2026) | | | 90,000 | | | | 89,748 | | | | | |
| 3.600%, 07/01/2042 (Callable 01/01/2027) | | | 205,000 | | | | 197,098 | | | | | |
| 4.000%, 07/01/2043 (Callable 01/19/2024) | | | 100,000 | | | | 99,338 | | | | | |
| 4.450%, 07/01/2043 (Callable 07/01/2032) | | | 2,300,000 | | | | 2,338,721 | | | | | |
| 3.500%, 07/01/2045 (Callable 01/01/2025) | | | 2,290,000 | | | | 2,271,079 | | | | | |
| 4.000%, 07/01/2045 (Callable 01/01/2025) | | | 35,000 | | | | 34,941 | | | | | |
| 3.500%, 01/01/2047 (Callable 01/01/2026) | | | 25,000 | | | | 24,781 | | | | | |
| 4.500%, 07/01/2049 (Callable 01/01/2028) | | | 495,000 | | | | 498,582 | | | | | |
| 3.750%, 01/01/2050 (Callable 01/01/2029) | | | 695,000 | | | | 691,240 | | | | | |
| 4.250%, 01/01/2050 (Callable 07/01/2028) | | | 535,000 | | | | 536,067 | | | | | |
| 5.000%, 01/01/2053 (Callable 07/01/2031) | | | 3,000,000 | | | | 3,147,100 | | | | | |
| 6.250%, 01/01/2054 (Callable 07/01/2032) | | | | | | | | | | | | |
| (Insured by GNMA) | | | 13,450,000 | | | | 14,873,042 | | | | | |
| Total Tennessee | | | | | | | | | | | | |
| (Cost $74,514,295) | | | | | | | 76,042,986 | | | | 2.5 | % |
| Texas | | | | | | | | | | | | |
| Alamo Community College District: | | | | | | | | | | | | |
| 5.000%, 08/15/2038 (Callable 08/15/2027) | | | 1,040,000 | | | | 1,110,016 | | | | | |
| 4.500%, 08/15/2042 (Callable 08/15/2031) | | | 750,000 | | | | 779,404 | | | | | |
| Arlington Higher Education Finance Corp.: | | | | | | | | | | | | |
| 4.000%, 08/15/2028 (Callable 08/15/2026) | | | | | | | | | | | | |
| (PSF Guaranteed) | | | 250,000 | | | | 255,849 | | | | | |
| 5.000%, 08/15/2028 (PSF Guaranteed) | | | 980,000 | | | | 1,074,176 | | | | | |
| 4.000%, 08/15/2029 (PSF Guaranteed) | | | 325,000 | | | | 341,988 | | | | | |
| 5.000%, 08/15/2029 (PSF Guaranteed) | | | 560,000 | | | | 625,088 | | | | | |
| 4.000%, 08/15/2030 (PSF Guaranteed) | | | 415,000 | | | | 438,431 | | | | | |
| 5.000%, 08/15/2030 (PSF Guaranteed) | | | 605,000 | | | | 686,791 | | | | | |
| 4.000%, 08/15/2031 (Callable 08/15/2029) | | | | | | | | | | | | |
| (PSF Guaranteed) | | | 510,000 | | | | 531,447 | | | | | |
| 5.000%, 08/15/2031 (PSF Guaranteed) | | | 585,000 | | | | 674,679 | | | | | |
| 5.000%, 08/15/2032 (PSF Guaranteed) | | | 660,000 | | | | 772,322 | | | | | |
| 4.000%, 08/15/2033 (Callable 08/15/2031) | | | | | | | | | | | | |
| (PSF Guaranteed) | | | 355,000 | | | | 374,369 | | | | | |
The accompanying notes are an integral part of these financial statements.
Baird Core Intermediate Municipal Bond Fund
Schedule of Investments, December 31, 2023
Long-Term Investments (cont.)
| | | Principal | | | | | | % of | |
| | | Amount | | | Value | | | Net Assets | |
| Arlington Higher Education | | | | | | | | | |
| Finance Corp.: (cont.) | | | | | | | | | |
| 4.000%, 08/15/2036 (Callable 08/15/2029) | | | | | | | | | |
| (PSF Guaranteed) | | $ | 1,150,000 | | | $ | 1,180,263 | | | |
| |
| 4.000%, 08/15/2037 (Callable 08/15/2031) | | | | | | | | | | | | |
| (PSF Guaranteed) | | | 765,000 | | | | 782,841 | | | | | |
| 4.000%, 02/15/2040 (Callable 02/15/2025) | | | | | | | | | | | | |
| (PSF Guaranteed) | | | 805,000 | | | | 805,248 | | | | | |
| 4.125%, 08/15/2042 (Callable 08/15/2031) | | | | | | | | | | | | |
| (PSF Guaranteed) | | | 2,920,000 | | | | 2,949,492 | | | | | |
| Arlington Housing Finance Corp.: | | | | | | | | | | | | |
| 4.500%, 04/01/2041 (Callable 04/01/2026) | | | | | | | | | | | | |
(Mandatory Tender Date 04/01/2027)(1) | | | 5,215,000 | | | | 5,347,212 | | | | | |
| 3.500%, 11/01/2043 (Callable 05/01/2025) | | | | | | | | | | | | |
(Mandatory Tender Date 11/01/2025)(1) | | | 5,000,000 | | | | 5,016,023 | | | | | |
| Austin-Bergstrom Landhost Enterprises, Inc.: | | | | | | | | | | | | |
| 5.000%, 10/01/2035 (Callable 10/01/2027) | | | 1,250,000 | | | | 1,288,075 | | | | | |
| 5.000%, 10/01/2036 (Callable 10/01/2027) | | | 885,000 | | | | 904,260 | | | | | |
| Barker Cypress Municipal Utility District, | | | | | | | | | | | | |
| 4.000%, 04/01/2028 (Callable 01/29/2024) | | | | | | | | | | | | |
| (Insured by BAM) | | | 1,125,000 | | | | 1,125,120 | | | | | |
| Baytown Municipal Development District: | | | | | | | | | | | | |
| 2.500%, 10/01/2031 | | | 500,000 | | | | 443,470 | | | | | |
3.500%, 10/01/2031(3) | | | 1,020,000 | | | | 933,993 | | | | | |
| Bexar County Housing Finance Corp., | | | | | | | | | | | | |
| 4.050%, 03/01/2028 (Callable 09/01/2025) | | | | | | | | | | | | |
(Mandatory Tender Date 03/01/2026)(1) | | | 1,000,000 | | | | 1,007,894 | | | | | |
| Boerne Independent School District, | | | | | | | | | | | | |
| 3.850%, 12/01/2043 (Mandatory Tender | | | | | | | | | | | | |
Date 12/01/2027) (PSF Guaranteed)(1) | | | 2,525,000 | | | | 2,586,758 | | | | | |
| Brazoria County Municipal | | | | | | | | | | | | |
| Utility District No. 61, | | | | | | | | | | | | |
| 4.000%, 09/01/2036 (Callable 09/01/2028) | | | | | | | | | | | | |
| (Insured by BAM) | | | 685,000 | | | | 694,023 | | | | | |
| Brazoria County Toll Road Authority, | | | | | | | | | | | | |
| 0.000%, 03/01/2040 (Callable 03/01/2030) | | | | | | | | | | | | |
(County Guaranteed)(5) | | | 1,075,000 | | | | 1,007,894 | | | | | |
| Cedar Port Navigation & | | | | | | | | | | | | |
| Improvement District: | | | | | | | | | | | | |
| 5.000%, 09/01/2025 | | | 1,700,000 | | | | 1,744,118 | | | | | |
| 5.000%, 09/01/2026 | | | 1,700,000 | | | | 1,773,587 | | | | | |
| Central Texas Regional Mobility Authority, | | | | | | | | | | | | |
| 4.000%, 01/01/2040 (Callable 01/01/2031) | | | 1,250,000 | | | | 1,272,316 | | | | | |
| Central Texas Turnpike System: | | | | | | | | | | | | |
| 0.000%, 08/15/2026 (Insured by BHAC) | | | 5,000,000 | | | | 4,621,195 | | | | | |
| 0.000%, 08/15/2036 (Callable 08/15/2024) | | | 1,000,000 | | | | 581,119 | | | | | |
| Chisum Independent School District, | | | | | | | | | | | | |
| 4.000%, 08/15/2048 (Callable 08/15/2032) | | | | | | | | | | | | |
| (PSF Guaranteed) | | | 1,450,000 | | | | 1,450,788 | | | | | |
| City of Arlington TX, | | | | | | | | | | | | |
| 5.000%, 02/15/2034 (Callable 02/15/2025) | | | | | | | | | | | | |
| (Insured by AGM) | | | 825,000 | | | | 838,776 | | | | | |
| City of Austin TX, | | | | | | | | | | | | |
| 5.000%, 11/15/2025 | | | 1,000,000 | | | | 1,025,797 | | | | | |
| City of Bryan TX, | | | | | | | | | | | | |
| 4.000%, 07/01/2040 (Callable 07/01/2027) | | | 250,000 | | | | 250,459 | | | | | |
| City of Conroe TX, | | | | | | | | | | | | |
| 5.000%, 11/15/2036 (Callable 11/15/2028) | | | 500,000 | | | | 550,057 | | | | | |
| City of Dallas Housing Finance Corp.: | | | | | | | | | | | | |
| 5.000%, 07/01/2026 (Mandatory Tender | | | | | | | | | | | | |
Date 12/01/2025) (Insured by FHA)(1) | | | 2,750,000 | | | | 2,829,696 | | | | | |
| 3.500%, 02/01/2044 (Callable 06/01/2025) | | | | | | | | | | | | |
(Mandatory Tender Date 02/01/2026)(1) | | | 1,000,000 | | | | 992,912 | | | | | |
| City of Decatur TX, | | | | | | | | | | | | |
| 5.000%, 03/01/2024 (Insured by BAM) | | | 300,000 | | | | 300,855 | | | | | |
| City of Houston TX, | | | | | | | | | | | | |
| 5.500%, 12/01/2029 | | | | | | | | | | | | |
| (ETM) (Insured by NATL) | | | 500,000 | | | | 558,214 | | | | | |
| City of Hutto TX, | | | | | | | | | | | | |
| 4.250%, 08/01/2047 (Callable 08/01/2032) | | | 1,205,000 | | | | 1,204,153 | | | | | |
| City of Magnolia TX, | | | | | | | | | | | | |
5.700%, 09/01/2046(3) | | | 955,000 | | | | 948,670 | | | | | |
| City of Mesquite TX: | | | | | | | | | | | | |
| 5.000%, 03/01/2039 (Callable 03/01/2032) | | | 500,000 | | | | 566,197 | | | | | |
| 5.000%, 03/01/2040 (Callable 03/01/2032) | | | 500,000 | | | | 562,205 | | | | | |
| 5.000%, 03/01/2041 (Callable 03/01/2032) | | | 500,000 | | | | 558,848 | | | | | |
| 5.000%, 03/01/2042 (Callable 03/01/2032) | | | 500,000 | | | | 556,109 | | | | | |
| City of San Antonio TX, | | | | | | | | | | | | |
| 2.000%, 02/01/2049 | | | | | | | | | | | | |
(Mandatory Tender Date 12/01/2027)(1) | | | 7,500,000 | | | | 7,048,537 | | | | | |
| City of Temple TX: | | | | | | | | | | | | |
| 4.000%, 08/01/2035 (Callable 08/01/2030) | | | | | | | | | | | | |
| (Insured by BAM) | | | 650,000 | | | | 684,968 | | | | | |
| 4.000%, 08/01/2037 (Callable 08/01/2030) | | | | | | | | | | | | |
| (Insured by BAM) | | | 200,000 | | | | 207,692 | | | | | |
| 4.000%, 08/01/2038 (Callable 08/01/2030) | | | | | | | | | | | | |
| (Insured by BAM) | | | 165,000 | | | | 169,861 | | | | | |
| 4.000%, 08/01/2039 (Callable 08/01/2030) | | | | | | | | | | | | |
| (Insured by BAM) | | | 435,000 | | | | 444,496 | | | | | |
| 4.000%, 08/01/2041 (Callable 08/01/2030) | | | | | | | | | | | | |
| (Insured by BAM) | | | 200,000 | | | | 201,738 | | | | | |
| Clifton Higher Education Finance Corp.: | | | | | | | | | | | | |
| 5.000%, 08/15/2025 (PSF Guaranteed) | | | 360,000 | | | | 369,397 | | | | | |
| 6.000%, 03/01/2029 | | | | | | | | | | | | |
(Callable 03/01/2024)(5) | | | 1,475,000 | | | | 1,479,145 | | | | | |
| 4.000%, 08/15/2030 (Callable 08/15/2026) | | | | | | | | | | | | |
| (PSF Guaranteed) | | | 800,000 | | | | 819,795 | | | | | |
| 4.000%, 08/15/2032 (Callable 08/15/2026) | | | | | | | | | | | | |
| (PSF Guaranteed) | | | 600,000 | | | | 613,491 | | | | | |
| 4.000%, 08/15/2033 (Callable 08/15/2028) | | | | | | | | | | | | |
| (PSF Guaranteed) | | | 2,000,000 | | | | 2,079,144 | | | | | |
| 4.000%, 04/01/2034 (Callable 04/01/2030) | | | | | | | | | | | | |
| (PSF Guaranteed) | | | 325,000 | | | | 339,745 | | | | | |
| 5.000%, 08/15/2034 (Callable 08/15/2026) | | | | | | | | | | | | |
| (PSF Guaranteed) | | | 1,000,000 | | | | 1,047,207 | | | | | |
| 4.000%, 04/01/2035 (Callable 04/01/2030) | | | | | | | | | | | | |
| (PSF Guaranteed) | | | 250,000 | | | | 260,411 | | | | | |
| 4.000%, 08/15/2035 (Callable 08/15/2029) | | | | | | | | | | | | |
| (PSF Guaranteed) | | | 1,380,000 | | | | 1,437,737 | | | | | |
| Collin County Municipal | | | | | | | | | | | | |
| Utility District No. 2: | | | | | | | | | | | | |
| 4.750%, 09/01/2036 (Callable 10/01/2029) | | | | | | | | | | | | |
| (Insured by BAM) | | | 1,470,000 | | | | 1,549,764 | | | | | |
| 5.125%, 09/01/2048 (Callable 10/01/2029) | | | | | | | | | | | | |
| (Insured by BAM) | | | 1,500,000 | | | | 1,572,788 | | | | | |
| Colony Municipal Utility District No. 1A: | | | | | | | | | | | | |
| 7.000%, 08/15/2026 (Insured by BAM) | | | 265,000 | | | | 288,584 | | | | | |
| 7.000%, 08/15/2029 (Insured by BAM) | | | 310,000 | | | | 366,229 | | | | | |
| 5.000%, 08/15/2030 (Callable 08/15/2029) | | | | | | | | | | | | |
| (Insured by BAM) | | | 330,000 | | | | 355,191 | | | | | |
| Comal County Water Control & | | | | | | | | | | | | |
| Improvement District No. 6: | | | | | | | | | | | | |
| 4.000%, 03/01/2031 (Callable 03/01/2028) | | | | | | | | | | | | |
| (Insured by BAM) | | | 560,000 | | | | 576,326 | | | | | |
| 4.000%, 03/01/2032 (Callable 03/01/2028) | | | | | | | | | | | | |
| (Insured by BAM) | | | 690,000 | | | | 709,727 | | | | | |
The accompanying notes are an integral part of these financial statements.
Baird Core Intermediate Municipal Bond Fund
Schedule of Investments, December 31, 2023
Long-Term Investments (cont.)
| | | Principal | | | | | | % of | |
| | | Amount | | | Value | | | Net Assets | |
| Comal County Water Control & | | | | | | | | | |
| Improvement District No. 6: (cont.) | | | | | | | | | |
| 4.000%, 03/01/2033 (Callable 03/01/2028) | | | | | | | | | |
| (Insured by BAM) | | $ | 720,000 | | | $ | 739,217 | | | |
| |
| 4.375%, 03/01/2033 (Callable 03/01/2028) | | | | | | | | | | | | |
| (Insured by AGM) | | | 425,000 | | | | 442,490 | | | | | |
| 4.000%, 03/01/2034 (Callable 03/01/2028) | | | | | | | | | | | | |
| (Insured by BAM) | | | 750,000 | | | | 768,293 | | | | | |
| 4.375%, 03/01/2034 (Callable 03/01/2028) | | | | | | | | | | | | |
| (Insured by AGM) | | | 445,000 | | | | 462,281 | | | | | |
| 4.375%, 03/01/2035 (Callable 03/01/2028) | | | | | | | | | | | | |
| (Insured by AGM) | | | 475,000 | | | | 491,960 | | | | | |
| 4.375%, 03/01/2036 (Callable 03/01/2028) | | | | | | | | | | | | |
| (Insured by AGM) | | | 500,000 | | | | 516,389 | | | | | |
| 4.375%, 03/01/2037 (Callable 03/01/2028) | | | | | | | | | | | | |
| (Insured by AGM) | | | 530,000 | | | | 545,355 | | | | | |
| 4.375%, 03/01/2038 (Callable 03/01/2028) | | | | | | | | | | | | |
| (Insured by AGM) | | | 560,000 | | | | 572,745 | | | | | |
| 4.375%, 03/01/2042 (Callable 03/01/2028) | | | | | | | | | | | | |
| (Insured by AGM) | | | 1,250,000 | | | | 1,265,720 | | | | | |
| 4.375%, 03/01/2045 (Callable 03/01/2028) | | | | | | | | | | | | |
| (Insured by AGM) | | | 2,330,000 | | | | 2,341,627 | | | | | |
| Conroe Municipal Management | | | | | | | | | | | | |
| District No. 1, | | | | | | | | | | | | |
| 4.000%, 09/01/2032 (Callable 09/01/2028) | | | | | | | | | | | | |
| (Insured by BAM) | | | 410,000 | | | | 421,101 | | | | | |
| County of Wise TX: | | | | | | | | | | | | |
| 5.000%, 08/15/2029 | | | 880,000 | | | | 933,380 | | | | | |
| 5.000%, 08/15/2033 (Callable 08/15/2031) | | | 930,000 | | | | 990,504 | | | | | |
| Crane Independent School District: | | | | | | | | | | | | |
| 5.000%, 02/15/2037 (Callable 02/15/2032) | | | | | | | | | | | | |
| (PSF Guaranteed) | | | 750,000 | | | | 865,567 | | | | | |
| 5.000%, 02/15/2039 (Callable 02/15/2032) | | | | | | | | | | | | |
| (PSF Guaranteed) | | | 800,000 | | | | 907,565 | | | | | |
| Dallas/Fort Worth International Airport: | | | | | | | | | | | | |
| 5.000%, 11/01/2025 | | | 1,400,000 | | | | 1,439,680 | | | | | |
| 5.000%, 11/01/2026 | | | 1,250,000 | | | | 1,309,385 | | | | | |
| Danbury Higher Education Authority, Inc.: | | | | | | | | | | | | |
| 4.000%, 02/15/2028 (Callable 02/15/2027) | | | | | | | | | | | | |
| (PSF Guaranteed) | | | 250,000 | | | | 258,796 | | | | | |
| 4.000%, 02/15/2031 (Callable 02/15/2027) | | | | | | | | | | | | |
| (PSF Guaranteed) | | | 200,000 | | | | 207,331 | | | | | |
| Deaf Smith County Hospital District: | | | | | | | | | | | | |
| 5.000%, 03/01/2030 (Callable 03/01/2027) | | | 1,000,000 | | | | 1,036,113 | | | | | |
| 5.000%, 03/01/2034 (Callable 03/01/2027) | | | 475,000 | | | | 488,534 | | | | | |
| 4.000%, 03/01/2040 (Callable 03/01/2027) | | | 2,045,000 | | | | 1,890,416 | | | | | |
| Deer Park Independent School District, | | | | | | | | | | | | |
| 5.000%, 08/15/2048 (Callable 08/15/2032) | | | | | | | | | | | | |
| (PSF Guaranteed) | | | 1,500,000 | | | | 1,658,412 | | | | | |
| Dickinson Independent School District, | | | | | | | | | | | | |
| 3.500%, 08/01/2037 (Mandatory Tender | | | | | | | | | | | | |
Date 08/01/2025) (PSF Guaranteed)(1) | | | 5,255,000 | | | | 5,293,195 | | | | | |
| East Fork Fresh Water | | | | | | | | | | | | |
| Supply District No. 1-A: | | | | | | | | | | | | |
| 4.750%, 09/01/2039 (Callable 12/01/2029) | | | | | | | | | | | | |
| (Insured by BAM) | | | 240,000 | | | | 248,775 | | | | | |
| 4.750%, 09/01/2040 (Callable 12/01/2029) | | | | | | | | | | | | |
| (Insured by BAM) | | | 290,000 | | | | 299,675 | | | | | |
| El Paso Housing Finance Corp., | | | | | | | | | | | | |
| 4.500%, 03/01/2026 (Mandatory Tender | | | | | | | | | | | | |
Date 03/01/2025) (Insured by HUD)(1) | | | 1,500,000 | | | | 1,513,371 | | | | | |
| El Paso Independent School District, | | | | | | | | | | | | |
| 5.000%, 02/01/2040 (Callable 02/01/2026) | | | | | | | | | | | | |
(Mandatory Tender Date 08/01/2026)(1) | | | 2,575,000 | | | | 2,669,495 | | | | | |
| Eula Independent School District, | | | | | | | | | | | | |
| 4.125%, 02/15/2048 (Callable 02/15/2032) | | | | | | | | | | | | |
| (PSF Guaranteed) | | | 3,000,000 | | | | 3,041,390 | | | | | |
| Fort Bend County Municipal | | | | | | | | | | | | |
| Utility District No. 134C, | | | | | | | | | | | | |
| 3.250%, 03/01/2035 (Callable 03/01/2029) | | | | | | | | | | | | |
| (Insured by BAM) | | | 590,000 | | | | 586,852 | | | | | |
| Fort Bend County Municipal | | | | | | | | | | | | |
| Utility District No. 134E, | | | | | | | | | | | | |
| 4.000%, 09/01/2038 (Callable 08/01/2029) | | | | | | | | | | | | |
| (Insured by BAM) | | | 1,225,000 | | | | 1,247,440 | | | | | |
| Fort Bend County Municipal | | | | | | | | | | | | |
| Utility District No. 141, | | | | | | | | | | | | |
| 5.000%, 09/01/2033 (Callable 09/01/2028) | | | | | | | | | | | | |
| (Insured by AGM) | | | 1,075,000 | | | | 1,154,810 | | | | | |
| Fort Bend County Municipal | | | | | | | | | | | | |
| Utility District No. 182: | | | | | | | | | | | | |
| 4.000%, 09/01/2031 (Callable 09/01/2029) | | | | | | | | | | | | |
| (Insured by BAM) | | | 1,190,000 | | | | 1,231,895 | | | | | |
| 4.000%, 09/01/2032 (Callable 09/01/2029) | | | | | | | | | | | | |
| (Insured by BAM) | | | 1,260,000 | | | | 1,304,270 | | | | | |
| 4.000%, 09/01/2033 (Callable 09/01/2029) | | | | | | | | | | | | |
| (Insured by BAM) | | | 1,300,000 | | | | 1,343,947 | | | | | |
| 4.000%, 09/01/2034 (Callable 09/01/2029) | | | | | | | | | | | | |
| (Insured by BAM) | | | 1,380,000 | | | | 1,424,201 | | | | | |
| 4.000%, 09/01/2035 (Callable 09/01/2029) | | | | | | | | | | | | |
| (Insured by BAM) | | | 1,430,000 | | | | 1,470,198 | | | | | |
| 4.000%, 09/01/2036 (Callable 09/01/2029) | | | | | | | | | | | | |
| (Insured by BAM) | | | 1,515,000 | | | | 1,548,934 | | | | | |
| Fort Bend County Municipal | | | | | | | | | | | | |
| Utility District No. 184: | | | | | | | | | | | | |
| 4.250%, 04/01/2038 (Callable 04/01/2027) | | | | | | | | | | | | |
| (Insured by BAM) | | | 630,000 | | | | 631,850 | | | | | |
| 4.500%, 04/01/2040 (Callable 04/01/2027) | | | | | | | | | | | | |
| (Insured by BAM) | | | 1,055,000 | | | | 1,063,558 | | | | | |
| 4.500%, 04/01/2042 (Callable 04/01/2027) | | | | | | | | | | | | |
| (Insured by BAM) | | | 1,130,000 | | | | 1,136,222 | | | | | |
| Fort Bend County Municipal | | | | | | | | | | | | |
| Utility District No. 215, | | | | | | | | | | | | |
| 5.000%, 09/01/2033 (Callable 10/01/2030) | | | | | | | | | | | | |
| (Insured by AGM) | | | 1,240,000 | | | | 1,366,564 | | | | | |
| Fort Bend County Municipal | | | | | | | | | | | | |
| Utility District No. 5, | | | | | | | | | | | | |
| 5.750%, 09/01/2025 (Insured by AGM) | | | 325,000 | | | | 337,391 | | | | | |
| Fort Bend County Municipal | | | | | | | | | | | | |
| Utility District No. 58: | | | | | | | | | | | | |
| 3.000%, 04/01/2033 (Callable 04/01/2029) | | | | | | | | | | | | |
| (Insured by BAM) | | | 800,000 | | | | 778,344 | | | | | |
| 3.000%, 04/01/2034 (Callable 04/01/2029) | | | | | | | | | | | | |
| (Insured by BAM) | | | 450,000 | | | | 439,782 | | | | | |
| 3.000%, 04/01/2035 (Callable 04/01/2029) | | | | | | | | | | | | |
| (Insured by BAM) | | | 430,000 | | | | 413,357 | | | | | |
| 3.000%, 04/01/2037 (Callable 04/01/2029) | | | | | | | | | | | | |
| (Insured by BAM) | | | 825,000 | | | | 766,196 | | | | | |
| Fulshear Municipal Utility District No. 3A: | | | | | | | | | | | | |
| 6.500%, 09/01/2028 (Insured by AGM) | | | 120,000 | | | | 136,929 | | | | | |
| 6.500%, 09/01/2029 (Insured by AGM) | | | 455,000 | | | | 529,547 | | | | | |
| 6.500%, 09/01/2029 (Insured by AGM) | | | 440,000 | | | | 511,596 | | | | | |
| 4.000%, 09/01/2032 (Callable 09/01/2029) | | | | | | | | | | | | |
| (Insured by AGM) | | | 445,000 | | | | 456,858 | | | | | |
| 4.000%, 09/01/2032 (Callable 09/01/2029) | | | | | | | | | | | | |
| (Insured by AGM) | | | 325,000 | | | | 333,661 | | | | | |
| 4.000%, 09/01/2035 (Callable 09/01/2029) | | | | | | | | | | | | |
| (Insured by AGM) | | | 665,000 | | | | 680,029 | | | | | |
The accompanying notes are an integral part of these financial statements.
Baird Core Intermediate Municipal Bond Fund
Schedule of Investments, December 31, 2023
Long-Term Investments (cont.)
| | | Principal | | | | | | % of | |
| | | Amount | | | Value | | | Net Assets | |
| Fulshear Municipal Utility | | | | | | | | | |
| District No. 3A: (cont.) | | | | | | | | | |
| 4.000%, 09/01/2036 (Callable 09/01/2029) | | | | | | | | | |
| (Insured by AGM) | | $ | 805,000 | | | $ | 820,418 | | | |
| |
| 4.250%, 09/01/2039 (Callable 09/01/2029) | | | | | | | | | | | | |
| (Insured by AGM) | | | 720,000 | | | | 730,915 | | | | | |
| 4.250%, 09/01/2040 (Callable 09/01/2029) | | | | | | | | | | | | |
| (Insured by AGM) | | | 585,000 | | | | 592,381 | | | | | |
| 4.250%, 09/01/2040 (Callable 09/01/2029) | | | | | | | | | | | | |
| (Insured by AGM) | | | 700,000 | | | | 708,831 | | | | | |
| 4.375%, 09/01/2042 (Callable 09/01/2029) | | | | | | | | | | | | |
| (Insured by AGM) | | | 465,000 | | | | 471,984 | | | | | |
| Galveston County Municipal | | | | | | | | | | | | |
| Utility District No. 56: | | | | | | | | | | | | |
| 4.500%, 06/01/2035 (Callable 06/01/2030) | | | | | | | | | | | | |
| (Insured by AGM) | | | 360,000 | | | | 379,372 | | | | | |
| 4.500%, 06/01/2036 (Callable 06/01/2030) | | | | | | | | | | | | |
| (Insured by AGM) | | | 305,000 | | | | 318,934 | | | | | |
| 4.750%, 06/01/2038 (Callable 06/01/2030) | | | | | | | | | | | | |
| (Insured by AGM) | | | 1,425,000 | | | | 1,495,508 | | | | | |
| 4.750%, 06/01/2039 (Callable 06/01/2030) | | | | | | | | | | | | |
| (Insured by AGM) | | | 760,000 | | | | 795,093 | | | | | |
| 4.875%, 06/01/2040 (Callable 06/01/2030) | | | | | | | | | | | | |
| (Insured by AGM) | | | 535,000 | | | | 563,146 | | | | | |
| Grand Parkway Transportation Corp.: | | | | | | | | | | | | |
| 5.300%, 10/01/2032 | | | | | | | | | | | | |
(Callable 10/01/2028)(5) | | | 95,000 | | | | 106,229 | | | | | |
| 5.450%, 10/01/2034 | | | | | | | | | | | | |
(Callable 10/01/2028)(5) | | | 180,000 | | | | 201,820 | | | | | |
| 5.500%, 10/01/2035 | | | | | | | | | | | | |
(Callable 10/01/2028)(5) | | | 100,000 | | | | 111,867 | | | | | |
| 5.500%, 10/01/2036 | | | | | | | | | | | | |
(Callable 10/01/2028)(5) | | | 450,000 | | | | 500,450 | | | | | |
| 5.800%, 10/01/2045 | | | | | | | | | | | | |
(Callable 10/01/2028)(5) | | | 1,830,000 | | | | 2,011,166 | | | | | |
| 5.800%, 10/01/2046 | | | | | | | | | | | | |
(Callable 10/01/2028)(5) | | | 1,290,000 | | | | 1,414,613 | | | | | |
| 5.850%, 10/01/2047 | | | | | | | | | | | | |
(Callable 10/01/2028)(5) | | | 5,255,000 | | | | 5,763,563 | | | | | |
| 5.850%, 10/01/2048 | | | | | | | | | | | | |
(Callable 10/01/2028)(5) | | | 1,155,000 | | | | 1,264,890 | | | | | |
| 5.000%, 10/01/2052 | | | | | | | | | | | | |
| (Callable 01/01/2028) | | | | | | | | | | | | |
(Mandatory Tender Date 04/01/2028)(1) | | | 5,000,000 | | | | 5,389,547 | | | | | |
| Harris County Cultural Education | | | | | | | | | | | | |
| Facilities Finance Corp., | | | | | | | | | | | | |
| 4.503%, 11/15/2046 (SOFR + 0.730%) | | | | | | | | | | | | |
| (Callable 01/16/2024) | | | | | | | | | | | | |
(Mandatory Tender Date 07/01/2024)(2) | | | 2,000,000 | | | | 1,999,269 | | | | | |
| Harris County Municipal | | | | | | | | | | | | |
| Utility District No. 1: | | | | | | | | | | | | |
| 4.000%, 09/01/2035 (Callable 08/01/2028) | | | | | | | | | | | | |
| (Insured by AGM) | | | 985,000 | | | | 1,010,746 | | | | | |
| 4.000%, 09/01/2036 (Callable 08/01/2028) | | | | | | | | | | | | |
| (Insured by AGM) | | | 1,030,000 | | | | 1,050,760 | | | | | |
| Harris County Municipal | | | | | | | | | | | | |
| Utility District No. 157, | | | | | | | | | | | | |
| 4.000%, 03/01/2029 (Callable 03/01/2025) | | | | | | | | | | | | |
| (Insured by BAM) | | | 285,000 | | | | 288,058 | | | | | |
| Harris County Municipal | | | | | | | | | | | | |
| Utility District No. 165: | | | | | | | | | | | | |
| 4.000%, 03/01/2036 (Callable 08/01/2029) | | | | | | | | | | | | |
| (Insured by BAM) | | | 1,375,000 | | | | 1,434,315 | | | | | |
| 4.000%, 03/01/2037 (Callable 08/01/2029) | | | | | | | | | | | | |
| (Insured by BAM) | | | 535,000 | | | | 555,373 | | | | | |
| 4.750%, 03/01/2038 (Callable 12/01/2029) | | | | | | | | | | | | |
| (Insured by AGM) | | | 455,000 | | | | 472,536 | | | | | |
| Harris County Municipal | | | | | | | | | | | | |
| Utility District No. 368, | | | | | | | | | | | | |
| 4.000%, 09/01/2025 (Callable 09/01/2024) | | | | | | | | | | | | |
| (Insured by NATL) | | | 1,000,000 | | | | 1,004,391 | | | | | |
| Harris County Municipal | | | | | | | | | | | | |
| Utility District No. 423: | | | | | | | | | | | | |
| 5.500%, 04/01/2025 (Insured by AGM) | | | 425,000 | | | | 437,028 | | | | | |
| 5.500%, 04/01/2026 (Insured by AGM) | | | 450,000 | | | | 473,729 | | | | | |
| 5.500%, 04/01/2027 (Insured by AGM) | | | 450,000 | | | | 484,532 | | | | | |
| 5.500%, 04/01/2028 (Insured by AGM) | | | 450,000 | | | | 496,453 | | | | | |
| 5.500%, 04/01/2029 (Insured by AGM) | | | 475,000 | | | | 536,140 | | | | | |
| 5.500%, 04/01/2030 (Callable 04/01/2029) | | | | | | | | | | | | |
| (Insured by AGM) | | | 500,000 | | | | 566,138 | | | | | |
| Harris County Municipal | | | | | | | | | | | | |
| Utility District No. 558: | | | | | | | | | | | | |
| 3.000%, 09/01/2032 (Callable 09/01/2029) | | | | | | | | | | | | |
| (Insured by BAM) | | | 360,000 | | | | 346,467 | | | | | |
| 3.125%, 09/01/2033 (Callable 09/01/2029) | | | | | | | | | | | | |
| (Insured by BAM) | | | 360,000 | | | | 347,030 | | | | | |
| 3.250%, 09/01/2034 (Callable 09/01/2029) | | | | | | | | | | | | |
| (Insured by BAM) | | | 360,000 | | | | 349,035 | | | | | |
| 3.375%, 09/01/2035 (Callable 09/01/2029) | | | | | | | | | | | | |
| (Insured by BAM) | | | 360,000 | | | | 351,827 | | | | | |
| 3.500%, 09/01/2036 (Callable 09/01/2029) | | | | | | | | | | | | |
| (Insured by BAM) | | | 360,000 | | | | 351,977 | | | | | |
| 3.500%, 09/01/2037 (Callable 09/01/2029) | | | | | | | | | | | | |
| (Insured by BAM) | | | 360,000 | | | | 346,582 | | | | | |
| Harris County Municipal | | | | | | | | | | | | |
| Utility District No. 71, | | | | | | | | | | | | |
| 4.000%, 09/01/2028 (Callable 01/29/2024) | | | | | | | | | | | | |
| (Insured by BAM) | | | 250,000 | | | | 250,229 | | | | | |
| Harris County Toll Road Authority, | | | | | | | | | | | | |
| 5.000%, 08/15/2043 (Callable 02/15/2028) | | | 500,000 | | | | 530,815 | | | | | |
| Harris County-Houston Sports Authority: | | | | | | | | | | | | |
| 0.000%, 11/15/2025 (Insured by NATL) | | | 11,185,000 | | | | 10,468,733 | | | | | |
| 5.000%, 11/15/2053 (Callable 11/15/2024) | | | 2,220,000 | | | | 2,225,197 | | | | | |
| Harris-Waller Counties Municipal | | | | | | | | | | | | |
| Utility District No. 3: | | | | | | | | | | | | |
| 6.000%, 09/01/2024 (Insured by AGM) | | | 290,000 | | | | 294,822 | | | | | |
| 6.000%, 09/01/2025 (Insured by AGM) | | | 315,000 | | | | 329,155 | | | | | |
| 6.000%, 09/01/2026 (Insured by AGM) | | | 335,000 | | | | 361,968 | | | | | |
| 6.000%, 09/01/2027 (Insured by AGM) | | | 365,000 | | | | 405,016 | | | | | |
| 6.000%, 09/01/2028 (Insured by AGM) | | | 390,000 | | | | 443,881 | | | | | |
| Harris-Waller Counties Municipal | | | | | | | | | | | | |
| Utility District No. 4, | | | | | | | | | | | | |
| 7.250%, 11/01/2031 (Callable 11/01/2030) | | | | | | | | | | | | |
| (Insured by BAM) | | | 330,000 | | | | 403,035 | | | | | |
| Headwaters Municipal Utility | | | | | | | | | | | | |
| District of Hays County, | | | | | | | | | | | | |
| 4.375%, 08/15/2038 (Callable 08/15/2029) | | | | | | | | | | | | |
| (Insured by AGM) | | | 1,015,000 | | | | 1,032,379 | | | | | |
| Highway 380 Municipal Management | | | | | | | | | | | | |
| District No. 1: | | | | | | | | | | | | |
| 4.000%, 05/01/2035 (Callable 08/01/2029) | | | | | | | | | | | | |
| (Insured by AGM) | | | 1,310,000 | | | | 1,341,353 | | | | | |
| 4.000%, 05/01/2036 (Callable 08/01/2029) | | | | | | | | | | | | |
| (Insured by AGM) | | | 1,370,000 | | | | 1,398,382 | | | | | |
| 4.000%, 05/01/2037 (Callable 08/01/2029) | | | | | | | | | | | | |
| (Insured by AGM) | | | 1,430,000 | | | | 1,451,123 | | | | | |
The accompanying notes are an integral part of these financial statements.
Baird Core Intermediate Municipal Bond Fund
Schedule of Investments, December 31, 2023
Long-Term Investments (cont.)
| | | Principal | | | | | | % of | |
| | | Amount | | | Value | | | Net Assets | |
| Housing Options, Inc., | | | | | | | | | |
| 3.900%, 02/01/2026 (Mandatory Tender | | | | | | | | | |
Date 02/01/2025) (Insured by HUD)(1) | | $ | 4,000,000 | | | $ | 4,004,476 | | | |
| |
| Houston Higher Education Finance Corp., | | | | | | | | | | | | |
| 3.375%, 10/01/2037 (Callable 01/29/2024) | | | 1,070,000 | | | | 902,905 | | | | | |
| Houston Housing Finance Corp., | | | | | | | | | | | | |
| 5.000%, 08/01/2041 | | | | | | | | | | | | |
(Mandatory Tender Date 08/01/2026)(1) | | | 3,650,000 | | | | 3,760,736 | | | | | |
| Hunt Memorial Hospital District: | | | | | | | | | | | | |
| 5.000%, 02/15/2028 | | | 525,000 | | | | 562,567 | | | | | |
| 5.000%, 02/15/2030 | | | 1,015,000 | | | | 1,119,576 | | | | | |
| Katy Development Authority: | | | | | | | | | | | | |
| 3.000%, 06/01/2032 (Callable 06/01/2027) | | | | | | | | | | | | |
| (Insured by BAM) | | | 485,000 | | | | 449,942 | | | | | |
| 3.000%, 06/01/2033 (Callable 06/01/2027) | | | | | | | | | | | | |
| (Insured by BAM) | | | 420,000 | | | | 384,858 | | | | | |
| 3.000%, 06/01/2034 (Callable 06/01/2027) | | | | | | | | | | | | |
| (Insured by BAM) | | | 575,000 | | | | 519,871 | | | | | |
| 3.000%, 06/01/2035 (Callable 06/01/2027) | | | | | | | | | | | | |
| (Insured by BAM) | | | 500,000 | | | | 445,067 | | | | | |
| 3.000%, 06/01/2039 (Callable 06/01/2027) | | | | | | | | | | | | |
| (Insured by BAM) | | | 1,125,000 | | | | 904,170 | | | | | |
| Kaufman County Fresh | | | | | | | | | | | | |
| Water Supply District No. 4A: | | | | | | | | | | | | |
| 5.000%, 09/01/2035 (Callable 12/01/2029) | | | | | | | | | | | | |
| (Insured by BAM) | | | 420,000 | | | | 448,164 | | | | | |
| 5.000%, 09/01/2036 (Callable 12/01/2029) | | | | | | | | | | | | |
| (Insured by BAM) | | | 715,000 | | | | 759,942 | | | | | |
| Kendall County Water Control & | | | | | | | | | | | | |
| Improvement District No. 2A: | | | | | | | | | | | | |
| 5.000%, 09/01/2035 (Callable 11/01/2030) | | | | | | | | | | | | |
| (Insured by AGM) | | | 1,030,000 | | | | 1,111,056 | | | | | |
| 5.000%, 09/01/2040 (Callable 11/01/2030) | | | | | | | | | | | | |
| (Insured by AGM) | | | 790,000 | | | | 839,281 | | | | | |
| 5.500%, 09/01/2042 (Callable 11/01/2030) | | | | | | | | | | | | |
| (Insured by AGM) | | | 865,000 | | | | 955,157 | | | | | |
| 5.000%, 09/01/2046 (Callable 11/01/2030) | | | | | | | | | | | | |
| (Insured by AGM) | | | 1,000,000 | | | | 1,051,070 | | | | | |
| Kilgore Independent School District, | | | | | | | | | | | | |
| 2.000%, 02/15/2052 (Mandatory Tender | | | | | | | | | | | | |
Date 08/15/2025) (PSF Guaranteed)(1) | | | 4,400,000 | | | | 4,329,930 | | | | | |
| Lakes Fresh Water Supply | | | | | | | | | | | | |
| District of Denton County: | | | | | | | | | | | | |
| 4.000%, 09/01/2031 (Callable 09/01/2029) | | | | | | | | | | | | |
| (Insured by AGM) | | | 680,000 | | | | 702,874 | | | | | |
| 4.000%, 09/01/2034 (Callable 09/01/2029) | | | | | | | | | | | | |
| (Insured by BAM) | | | 1,745,000 | | | | 1,791,546 | | | | | |
| 4.250%, 09/01/2040 (Callable 09/01/2029) | | | | | | | | | | | | |
| (Insured by BAM) | | | 425,000 | | | | 431,500 | | | | | |
| Las Varas Public Facility Corp., | | | | | | | | | | | | |
| 0.400%, 05/01/2025 (Callable 01/29/2024) | | | | | | | | | | | | |
(Mandatory Tender Date 05/01/2024)(1) | | | 1,000,000 | | | | 984,872 | | | | | |
| Lazy Nine Municipal Utility District No. 1B: | | | | | | | | | | | | |
| 2.000%, 03/01/2035 (Callable 03/01/2027) | | | | | | | | | | | | |
| (Insured by AGM) | | | 525,000 | | | | 429,139 | | | | | |
| 2.000%, 03/01/2037 (Callable 03/01/2027) | | | | | | | | | | | | |
| (Insured by AGM) | | | 530,000 | | | | 411,612 | | | | | |
| Leander Independent School District, | | | | | | | | | | | | |
| 0.000%, 08/15/2040 (Pre-refunded to | | | | | | | | | | | | |
| 08/15/2024) (PSF Guaranteed) | | | 20,000 | | | | 9,095 | | | | | |
| Lone Star College System, | | | | | | | | | | | | |
| 5.000%, 02/15/2034 (Callable 02/15/2025) | | | 2,475,000 | | | | 2,512,982 | | | | | |
| Martin County Hospital District: | | | | | | | | | | | | |
| 4.000%, 04/01/2027 | | | 225,000 | | | | 232,332 | | | | | |
| 4.000%, 04/01/2028 | | | 430,000 | | | | 448,282 | | | | | |
| 4.000%, 04/01/2031 (Callable 04/01/2030) | | | 235,000 | | | | 247,473 | | | | | |
| 4.000%, 04/01/2033 (Callable 04/01/2030) | | | 375,000 | | | | 391,283 | | | | | |
| 4.000%, 04/01/2034 (Callable 04/01/2030) | | | 500,000 | | | | 519,883 | | | | | |
| Matagorda County Navigation District No. 1: | | | | | | | | | | | | |
| 4.250%, 05/01/2030 | | | 2,000,000 | | | | 2,002,379 | | | | | |
| 4.400%, 05/01/2030 (Insured by AMBAC) | | | 3,430,000 | | | | 3,519,867 | | | | | |
| Maypearl Independent School District, | | | | | | | | | | | | |
| 5.000%, 02/15/2043 (Callable 02/15/2033) | | | | | | | | | | | | |
| (PSF Guaranteed) | | | 1,000,000 | | | | 1,131,159 | | | | | |
| Mckinney Municipal Utility District No. 1: | | | | | | | | | | | | |
| 3.250%, 09/01/2033 (Callable 05/01/2030) | | | | | | | | | | | | |
| (Insured by BAM) | | | 60,000 | | | | 58,573 | | | | | |
| 3.250%, 09/01/2033 (Callable 05/01/2030) | | | | | | | | | | | | |
| (Insured by BAM) | | | 200,000 | | | | 195,726 | | | | | |
| Metropolitan Transit Authority | | | | | | | | | | | | |
| of Harris County, | | | | | | | | | | | | |
| 5.000%, 11/01/2034 (Callable 11/01/2029) | | | 560,000 | | | | 628,304 | | | | | |
| Meyer Ranch Municipal Utility District: | | | | | | | | | | | | |
| 6.500%, 08/15/2029 (Callable 08/15/2028) | | | | | | | | | | | | |
| (Insured by BAM) | | | 310,000 | | | | 352,829 | | | | | |
| 6.500%, 08/15/2030 (Callable 08/15/2028) | | | | | | | | | | | | |
| (Insured by BAM) | | | 330,000 | | | | 374,700 | | | | | |
| 6.000%, 08/15/2031 (Callable 08/15/2028) | | | | | | | | | | | | |
| (Insured by BAM) | | | 345,000 | | | | 383,407 | | | | | |
| 6.000%, 08/15/2032 (Callable 08/15/2028) | | | | | | | | | | | | |
| (Insured by BAM) | | | 365,000 | | | | 404,784 | | | | | |
| 5.000%, 08/15/2034 (Callable 08/15/2028) | | | | | | | | | | | | |
| (Insured by BAM) | | | 795,000 | | | | 847,331 | | | | | |
| Montgomery County Municipal | | | | | | | | | | | | |
| Utility District No. 121: | | | | | | | | | | | | |
| 5.000%, 09/01/2025 (Insured by BAM) | | | 355,000 | | | | 364,329 | | | | | |
| 5.000%, 09/01/2026 (Insured by BAM) | | | 370,000 | | | | 386,112 | | | | | |
| 4.000%, 09/01/2031 (Callable 09/01/2028) | | | | | | | | | | | | |
| (Insured by BAM) | | | 460,000 | | | | 472,144 | | | | | |
| 4.000%, 09/01/2034 (Callable 09/01/2028) | | | | | | | | | | | | |
| (Insured by BAM) | | | 530,000 | | | | 542,593 | | | | | |
| 4.000%, 09/01/2035 (Callable 09/01/2028) | | | | | | | | | | | | |
| (Insured by BAM) | | | 550,000 | | | | 562,939 | | | | | |
| 4.000%, 09/01/2036 (Callable 09/01/2028) | | | | | | | | | | | | |
| (Insured by BAM) | | | 575,000 | | | | 586,527 | | | | | |
| 4.000%, 09/01/2039 (Callable 09/01/2028) | | | | | | | | | | | | |
| (Insured by BAM) | | | 655,000 | | | | 661,846 | | | | | |
| Montgomery County Municipal | | | | | | | | | | | | |
| Utility District No. 165: | | | | | | | | | | | | |
| 6.500%, 09/01/2027 (Insured by BAM) | | | 250,000 | | | | 278,682 | | | | | |
| 6.500%, 09/01/2028 (Insured by BAM) | | | 260,000 | | | | 296,921 | | | | | |
| 6.500%, 09/01/2029 (Insured by BAM) | | | 250,000 | | | | 291,662 | | | | | |
| 6.000%, 09/01/2030 (Callable 06/01/2029) | | | | | | | | | | | | |
| (Insured by BAM) | | | 200,000 | | | | 227,283 | | | | | |
| 6.000%, 09/01/2031 (Callable 06/01/2029) | | | | | | | | | | | | |
| (Insured by BAM) | | | 300,000 | | | | 341,498 | | | | | |
| Montgomery County Municipal | | | | | | | | | | | | |
| Utility District No. 88, | | | | | | | | | | | | |
| 4.250%, 09/01/2047 (Callable 09/01/2029) | | | | | | | | | | | | |
| (Insured by AGM) | | | 1,400,000 | | | | 1,359,692 | | | | | |
| Montgomery County Municipal | | | | | | | | | | | | |
| Utility District No. 95: | | | | | | | | | | | | |
| 4.000%, 09/01/2032 (Callable 09/01/2028) | | | | | | | | | | | | |
| (Insured by AGM) | | | 665,000 | | | | 678,199 | | | | | |
| 4.000%, 09/01/2034 (Callable 09/01/2028) | | | | | | | | | | | | |
| (Insured by AGM) | | | 785,000 | | | | 796,209 | | | | | |
The accompanying notes are an integral part of these financial statements.
Baird Core Intermediate Municipal Bond Fund
Schedule of Investments, December 31, 2023
Long-Term Investments (cont.)
| | | Principal | | | | | | % of | |
| | | Amount | | | Value | | | Net Assets | |
| New Fairview Municipal | | | | | | | | | |
| Utility District No. 1, | | | | | | | | | |
| 6.000%, 09/01/2033 (Callable 09/01/2029) | | | | | | | | | |
| (Insured by AGM) | | $ | 245,000 | | | $ | 276,614 | | | |
| |
| New Hope Cultural Education | | | | | | | | | | | | |
| Facilities Finance Corp.: | | | | | | | | | | | | |
| 2.000%, 01/01/2026 | | | 1,020,000 | | | | 965,735 | | | | | |
| 5.000%, 07/01/2038 (Callable 07/01/2027) | | | | | | | | | | | | |
| (Insured by AGM) | | | 1,000,000 | | | | 1,038,426 | | | | | |
| 5.000%, 04/01/2048 | | | | | | | | | | | | |
| (Pre-refunded to 04/01/2026) | | | 2,315,000 | | | | 2,429,639 | | | | | |
| Newark Higher Education Finance Corp., | | | | | | | | | | | | |
| 4.000%, 08/15/2035 (Callable 08/15/2025) | | | | | | | | | | | | |
| (PSF Guaranteed) | | | 425,000 | | | | 428,965 | | | | | |
| North Lamar Independent School District: | | | | | | | | | | | | |
| 4.000%, 02/15/2036 (Callable 02/15/2031) | | | | | | | | | | | | |
| (PSF Guaranteed) | | | 715,000 | | | | 758,491 | | | | | |
| 4.000%, 02/15/2037 (Callable 02/15/2031) | | | | | | | | | | | | |
| (PSF Guaranteed) | | | 625,000 | | | | 655,245 | | | | | |
| 4.000%, 02/15/2038 (Callable 02/15/2031) | | | | | | | | | | | | |
| (PSF Guaranteed) | | | 650,000 | | | | 673,896 | | | | | |
| North Texas Tollway Authority: | | | | | | | | | | | | |
| 0.000%, 01/01/2031 (Insured by AGC) | | | 1,000,000 | | | | 804,466 | | | | | |
| 5.000%, 01/01/2033 (Callable 01/01/2026) | | | 675,000 | | | | 703,478 | | | | | |
| 6.750%, 09/01/2045 | | | | | | | | | | | | |
(Pre-refunded to 09/01/2031)(5) | | | 40,000 | | | | 51,189 | | | | | |
| Northlake Municipal Management | | | | | | | | | | | | |
| District No. 1: | | | | | | | | | | | | |
| 5.500%, 03/01/2032 (Callable 09/01/2029) | | | | | | | | | | | | |
| (Insured by BAM) | | | 1,870,000 | | | | 2,057,249 | | | | | |
| 5.000%, 03/01/2036 (Callable 09/01/2029) | | | | | | | | | | | | |
| (Insured by BAM) | | | 800,000 | | | | 854,609 | | | | | |
| 5.000%, 03/01/2037 (Callable 09/01/2029) | | | | | | | | | | | | |
| (Insured by BAM) | | | 835,000 | | | | 887,568 | | | | | |
| 5.000%, 03/01/2038 (Callable 09/01/2029) | | | | | | | | | | | | |
| (Insured by BAM) | | | 300,000 | | | | 317,063 | | | | | |
| Northside Independent School District, | | | | | | | | | | | | |
| 1.600%, 08/01/2049 (Mandatory Tender | | | | | | | | | | | | |
Date 08/01/2024) (PSF Guaranteed)(1) | | | 735,000 | | | | 728,074 | | | | | |
| Northwest Harris County Municipal | | | | | | | | | | | | |
| Utility District No. 10: | | | | | | | | | | | | |
| 5.000%, 04/01/2024 (Insured by BAM) | | | 640,000 | | | | 642,623 | | | | | |
| 5.000%, 04/01/2025 (Insured by BAM) | | | 650,000 | | | | 662,945 | | | | | |
| 5.000%, 04/01/2026 (Insured by BAM) | | | 725,000 | | | | 752,069 | | | | | |
| Pecos Barstow Toyah | | | | | | | | | | | | |
| Independent School District, | | | | | | | | | | | | |
| 3.250%, 02/15/2031 | | | | | | | | | | | | |
| (Pre-refunded to 02/15/2027) | | | | | | | | | | | | |
| (PSF Guaranteed) | | | 3,400,000 | | | | 3,450,203 | | | | | |
| Petroleum Service Corp., | | | | | | | | | | | | |
| 3.750%, 12/01/2040 | | | | | | | | | | | | |
(Mandatory Tender Date 02/01/2028)(5) | | | 8,550,000 | | | | 8,333,818 | | | | | |
| Plemons-Stinnett-Phillips | | | | | | | | | | | | |
| Consolidated School District: | | | | | | | | | | | | |
| 5.000%, 02/15/2030 (Callable 02/15/2027) | | | | | | | | | | | | |
| (PSF Guaranteed) | | | 850,000 | | | | 902,552 | | | | | |
| 5.000%, 02/15/2031 (Callable 02/15/2027) | | | | | | | | | | | | |
| (PSF Guaranteed) | | | 450,000 | | | | 477,684 | | | | | |
| 5.000%, 02/15/2032 (Callable 02/15/2027) | | | | | | | | | | | | |
| (PSF Guaranteed) | | | 500,000 | | | | 530,606 | | | | | |
| 5.000%, 02/15/2033 (Callable 02/15/2027) | | | | | | | | | | | | |
| (PSF Guaranteed) | | | 500,000 | | | | 529,993 | | | | | |
| Port Aransas Independent School District, | | | | | | | | | | | | |
| 5.000%, 02/15/2038 (Callable 08/15/2029) | | | | | | | | | | | | |
| (PSF Guaranteed) | | | 1,295,000 | | | | 1,421,651 | | | | | |
| Port Beaumont Navigation District, | | | | | | | | | | | | |
| 2.875%, 01/01/2041 | | | | | | | | | | | | |
(Callable 01/29/2024)(3) | | | 1,200,000 | | | | 791,172 | | | | | |
| Port of Beaumont Industrial | | | | | | | | | | | | |
| Development Authority, | | | | | | | | | | | | |
| 4.100%, 01/01/2028 | | | | | | | | | | | | |
(Callable 01/29/2024)(3) | | | 4,000,000 | | | | 3,325,326 | | | | | |
| Prosper Independent School District, | | | | | | | | | | | | |
| 4.000%, 02/15/2050 (Mandatory Tender | | | | | | | | | | | | |
Date 08/15/2026) (PSF Guaranteed)(1) | | | 4,500,000 | | | | 4,593,677 | | | | | |
| Rankin Independent School District, | | | | | | | | | | | | |
| 5.000%, 02/15/2029 (Callable 02/15/2026) | | | | | | | | | | | | |
| (PSF Guaranteed) | | | 2,690,000 | | | | 2,810,547 | | | | | |
| Red River Health Facilities | | | | | | | | | | | | |
| Development Corp., | | | | | | | | | | | | |
| 8.000%, 11/15/2049 | | | | | | | | | | | | |
| (Pre-refunded to 11/15/2024) | | | 2,425,000 | | | | 2,524,059 | | | | | |
| Redbird Ranch Fresh Water | | | | | | | | | | | | |
| Supply District No. 2: | | | | | | | | | | | | |
| 6.625%, 09/01/2032 (Callable 09/01/2029) | | | | | | | | | | | | |
| (Insured by BAM) | | | 820,000 | | | | 958,467 | | | | | |
| 4.250%, 09/01/2034 (Callable 09/01/2029) | | | | | | | | | | | | |
| (Insured by BAM) | | | 470,000 | | | | 485,428 | | | | | |
| Remington Municipal Utility District No. 1, | | | | | | | | | | | | |
| 3.000%, 09/01/2025 (Callable 09/01/2024) | | | | | | | | | | | | |
| (Insured by AGM) | | | 540,000 | | | | 539,994 | | | | | |
| Sabine-Neches Navigation District, | | | | | | | | | | | | |
| 4.625%, 02/15/2047 (Callable 02/15/2031) | | | 2,000,000 | | | | 2,069,428 | | | | | |
| San Antonio Housing Trust Finance Corp., | | | | | | | | | | | | |
| 1.450%, 03/01/2026 (Mandatory Tender | | | | | | | | | | | | |
Date 03/01/2025) (Insured by HUD)(1) | | | 1,500,000 | | | | 1,448,500 | | | | | |
| Seminole Hospital District, | | | | | | | | | | | | |
| 3.000%, 02/15/2034 (Callable 02/15/2026) | | | 1,125,000 | | | | 816,999 | | | | | |
| Sienna Municipal Utility District No. 6, | | | | | | | | | | | | |
| 5.000%, 09/01/2034 (Callable 09/01/2029) | | | | | | | | | | | | |
| (Insured by BAM) | | | 1,650,000 | | | | 1,783,413 | | | | | |
| Southwest Houston Redevelopment Authority, | | | | | | | | | | | | |
| 5.000%, 09/01/2027 (Insured by AGM) | | | 250,000 | | | | 266,172 | | | | | |
| Spring Meadows Municipal Utility District, | | | | | | | | | | | | |
| 4.000%, 09/01/2026 (Callable 01/29/2024) | | | | | | | | | | | | |
| (Insured by AGM) | | | 275,000 | | | | 275,023 | | | | | |
| Sunfield Municipal Utility District No. 3: | | | | | | | | | | | | |
| 4.000%, 09/01/2044 (Callable 09/01/2029) | | | | | | | | | | | | |
(Insured by AGM)(6) | | | 910,000 | | | | 909,741 | | | | | |
| 4.000%, 09/01/2045 (Callable 09/01/2029) | | | | | | | | | | | | |
(Insured by AGM)(6) | | | 960,000 | | | | 954,616 | | | | | |
| Tarrant County Cultural Education | | | | | | | | | | | | |
| Facilities Finance Corp.: | | | | | | | | | | | | |
| 5.000%, 11/15/2029 (Callable 11/15/2026) | | | 1,665,000 | | | | 1,702,660 | | | | | |
| 5.000%, 11/15/2030 (Callable 11/15/2026) | | | 1,750,000 | | | | 1,789,557 | | | | | |
| 2.750%, 02/15/2036 | | | | | | | | | | | | |
(Callable 01/19/2024)(1) | | | 2,800,000 | | | | 2,708,430 | | | | | |
| 5.000%, 11/15/2040 (Callable 11/15/2026) | | | 400,000 | | | | 403,077 | | | | | |
| 4.000%, 11/15/2042 (Callable 05/15/2026) | | | 500,000 | | | | 495,720 | | | | | |
| Tarrant County Hospital District, | | | | | | | | | | | | |
| 4.000%, 08/15/2043 (Callable 08/15/2032) | | | 1,750,000 | | | | 1,775,589 | | | | | |
| Tarrant County Housing Finance Corp., | | | | | | | | | | | | |
| 5.000%, 03/01/2027 (Mandatory Tender | | | | | | | | | | | | |
Date 03/01/2026) (Insured by FNMA)(1) | | | 2,044,000 | | | | 2,111,339 | | | | | |
The accompanying notes are an integral part of these financial statements.
Baird Core Intermediate Municipal Bond Fund
Schedule of Investments, December 31, 2023
Long-Term Investments (cont.)
| | | Principal | | | | | | % of | |
| | | Amount | | | Value | | | Net Assets | |
| Tender Option Bond Trust, | | | | | | | | | |
2.680%, 06/01/2063(1)(3) | | $ | 4,976,000 | | | $ | 4,976,000 | | | |
| |
| Texas Department of Housing & | | | | | | | | | | | | |
| Community Affairs: | | | | | | | | | | | | |
| 5.000%, 08/01/2026 (Mandatory Tender | | | | | | | | | | | | |
Date 08/01/2025) (Insured by FHA)(1) | | | 1,800,000 | | | | 1,838,164 | | | | | |
| 5.000%, 01/01/2029 (Insured by GNMA) | | | 215,000 | | | | 235,342 | | | | | |
| 5.000%, 07/01/2029 (Insured by GNMA) | | | 175,000 | | | | 193,062 | | | | | |
| 5.000%, 01/01/2030 (Insured by GNMA) | | | 450,000 | | | | 498,945 | | | | | |
| 5.000%, 03/01/2041 (Callable 03/01/2025) | | | | | | | | | | | | |
(Mandatory Tender Date 03/01/2026)(1) | | | 1,700,000 | | | | 1,728,939 | | | | | |
| 4.750%, 01/01/2049 (Callable 07/01/2028) | | | | | | | | | | | | |
| (Insured by GNMA) | | | 2,325,000 | | | | 2,348,297 | | | | | |
| 3.750%, 09/01/2049 (Callable 09/01/2028) | | | | | | | | | | | | |
| (Insured by GNMA) | | | 1,290,000 | | | | 1,217,423 | | | | | |
| 5.500%, 09/01/2052 (Callable 03/01/2032) | | | | | | | | | | | | |
| (Insured by GNMA) | | | 5,885,000 | | | | 6,288,785 | | | | | |
| 6.000%, 03/01/2053 (Callable 03/01/2032) | | | | | | | | | | | | |
| (Insured by GNMA) | | | 975,000 | | | | 1,073,209 | | | | | |
| Texas Municipal Gas Acquisition | | | | | | | | | | | | |
| & Supply Corp. I: | | | | | | | | | | | | |
| 4.710%, 12/15/2026 (3 Month TSFR + | | | | | | | | | | | | |
1.625%) (Callable 01/02/2024)(2) | | | 4,100,000 | | | | 4,084,528 | | | | | |
| 6.250%, 12/15/2026 | | | 880,000 | | | | 920,931 | | | | | |
| Texas Municipal Gas Acquisition | | | | | | | | | | | | |
| & Supply Corp. II, | | | | | | | | | | | | |
| 4.130%, 09/15/2027 | | | | | | | | | | | | |
(3 Month TSFR + 1.045%)(2) | | | 9,360,000 | | | | 9,256,035 | | | | | |
| Texas Municipal Gas Acquisition | | | | | | | | | | | | |
| & Supply Corp. III: | | | | | | | | | | | | |
| 5.000%, 12/15/2027 | | | 1,500,000 | | | | 1,562,476 | | | | | |
| 5.000%, 12/15/2028 | | | 3,000,000 | | | | 3,151,210 | | | | | |
| 5.000%, 12/15/2032 | | | 2,180,000 | | | | 2,339,321 | | | | | |
| Texas Municipal Gas Acquisition | | | | | | | | | | | | |
| & Supply Corp. IV, | | | | | | | | | | | | |
| 5.500%, 01/01/2054 (Callable 07/01/2033) | | | | | | | | | | | | |
(Mandatory Tender Date 01/01/2034)(1) | | | 4,250,000 | | | | 4,723,110 | | | | | |
| Texas Municipal Power Agency, | | | | | | | | | | | | |
| 3.000%, 09/01/2029 (Callable 09/01/2026) | | | | | | | | | | | | |
| (Insured by AGM) | | | 2,080,000 | | | | 2,060,418 | | | | | |
| Texas Public Finance Authority: | | | | | | | | | | | | |
| 5.250%, 05/01/2036 (Callable 05/01/2033) | | | | | | | | | | | | |
| (Insured by BAM) | | | 485,000 | | | | 550,254 | | | | | |
| 5.250%, 05/01/2038 (Callable 05/01/2033) | | | | | | | | | | | | |
| (Insured by BAM) | | | 400,000 | | | | 446,487 | | | | | |
| 5.250%, 05/01/2040 (Callable 05/01/2033) | | | | | | | | | | | | |
| (Insured by BAM) | | | 500,000 | | | | 553,244 | | | | | |
| 5.250%, 05/01/2042 (Callable 05/01/2033) | | | | | | | | | | | | |
| (Insured by BAM) | | | 635,000 | | | | 697,069 | | | | | |
| Texas State Affordable Housing Corp.: | | | | | | | | | | | | |
| 4.625%, 03/01/2043 (Callable 03/01/2033) | | | | | | | | | | | | |
| (Insured by GNMA) | | | 3,690,000 | | | | 3,792,837 | | | | | |
| 3.750%, 07/01/2044 | | | | | | | | | | | | |
(Mandatory Tender Date 07/01/2026)(1) | | | 2,000,000 | | | | 2,008,739 | | | | | |
| 4.750%, 03/01/2048 (Callable 03/01/2033) | | | | | | | | | | | | |
| (Insured by GNMA) | | | 2,750,000 | | | | 2,822,656 | | | | | |
| Texas State Technical College, | | | | | | | | | | | | |
| 5.750%, 08/01/2047 (Callable 08/01/2032) | | | | | | | | | | | | |
| (Insured by AGM) | | | 4,000,000 | | | | 4,561,712 | | | | | |
| THF Public Facility Corp., | | | | | | | | | | | | |
| 3.250%, 03/01/2040 (Callable 09/01/2024) | | | | | | | | | | | | |
(Mandatory Tender Date 09/01/2025)(1) | | | 1,500,000 | | | | 1,484,776 | | | | | |
| Tioga Independent School District | | | | | | | | | | | | |
| Public Facility Corp., | | | | | | | | | | | | |
| 3.250%, 08/15/2027 | | | | | | | | | | | | |
| (Callable 08/15/2024) | | | 200,000 | | | | 188,796 | | | | | |
| Travis County Housing Finance Corp., | | | | | | | | | | | | |
| 3.750%, 08/01/2026 | | | | | | | | | | | | |
(Mandatory Tender Date 08/01/2025)(1) | | | 3,000,000 | | | | 3,011,184 | | | | | |
| Travis County Municipal | | | | | | | | | | | | |
| Utility District No. 20, | | | | | | | | | | | | |
| 5.000%, 09/01/2031 (Insured by BAM) | | | 175,000 | | | | 197,191 | | | | | |
| Travis County Municipal | | | | | | | | | | | | |
| Utility District No. 4, | | | | | | | | | | | | |
| 4.000%, 09/01/2035 (Callable 01/29/2024) | | | | | | | | | | | | |
| (Insured by AGM) | | | 615,000 | | | | 615,152 | | | | | |
| Upper Trinity Regional Water District, | | | | | | | | | | | | |
| 5.000%, 08/01/2032 (Callable 08/01/2028) | | | | | | | | | | | | |
| (Insured by BAM) | | | 265,000 | | | | 292,546 | | | | | |
| Viridian Municipal Management District: | | | | | | | | | | | | |
| 4.000%, 12/01/2027 (Callable 01/29/2024) | | | | | | | | | | | | |
| (Insured by AGM) | | | 315,000 | | | | 315,145 | | | | | |
| 4.000%, 12/01/2028 (Callable 01/29/2024) | | | | | | | | | | | | |
| (Insured by AGM) | | | 470,000 | | | | 470,217 | | | | | |
| 5.000%, 12/01/2029 (Insured by AGM) | | | 375,000 | | | | 408,063 | | | | | |
| 5.000%, 12/01/2030 (Callable 12/01/2029) | | | | | | | | | | | | |
| (Insured by AGM) | | | 220,000 | | | | 238,895 | | | | | |
| 5.000%, 12/01/2030 (Callable 12/01/2029) | | | | | | | | | | | | |
| (Insured by AGM) | | | 400,000 | | | | 434,355 | | | | | |
| 5.000%, 12/01/2031 (Callable 12/01/2029) | | | | | | | | | | | | |
| (Insured by AGM) | | | 245,000 | | | | 265,155 | | | | | |
| 5.000%, 12/01/2031 (Callable 12/01/2029) | | | | | | | | | | | | |
| (Insured by AGM) | | | 400,000 | | | | 432,906 | | | | | |
| 5.000%, 12/01/2032 (Callable 12/01/2029) | | | | | | | | | | | | |
| (Insured by AGM) | | | 650,000 | | | | 700,952 | | | | | |
| 5.000%, 12/01/2032 (Callable 12/01/2029) | | | | | | | | | | | | |
| (Insured by AGM) | | | 360,000 | | | | 388,220 | | | | | |
| 5.500%, 12/01/2032 (Callable 12/01/2029) | | | 415,000 | | | | 430,859 | | | | | |
| 5.000%, 12/01/2034 (Callable 12/01/2029) | | | | | | | | | | | | |
| (Insured by AGM) | | | 565,000 | | | | 606,617 | | | | | |
| 4.000%, 12/01/2037 (Callable 12/01/2027) | | | | | | | | | | | | |
| (Insured by BAM) | | | 865,000 | | | | 873,842 | | | | | |
| 5.750%, 12/01/2037 (Callable 12/01/2029) | | | 690,000 | | | | 713,672 | | | | | |
| 5.000%, 12/01/2038 (Callable 12/01/2029) | | | | | | | | | | | | |
| (Insured by AGM) | | | 605,000 | | | | 637,182 | | | | | |
| 5.000%, 12/01/2040 (Callable 12/01/2029) | | | | | | | | | | | | |
| (Insured by AGM) | | | 455,000 | | | | 476,096 | | | | | |
| 5.000%, 12/01/2041 (Callable 12/01/2029) | | | | | | | | | | | | |
| (Insured by AGM) | | | 750,000 | | | | 782,792 | | | | | |
| 5.000%, 12/01/2042 (Callable 12/01/2029) | | | | | | | | | | | | |
| (Insured by AGM) | | | 400,000 | | | | 417,129 | | | | | |
| 6.000%, 12/01/2043 (Callable 12/01/2029) | | | 1,260,000 | | | | 1,299,680 | | | | | |
| 5.000%, 12/01/2045 (Callable 12/01/2029) | | | | | | | | | | | | |
| (Insured by AGM) | | | 100,000 | | | | 103,728 | | | | | |
| 5.000%, 12/01/2049 (Callable 12/01/2029) | | | | | | | | | | | | |
| (Insured by AGM) | | | 1,030,000 | | | | 1,061,989 | | | | | |
| 6.250%, 12/01/2049 (Callable 12/01/2029) | | | 1,300,000 | | | | 1,347,233 | | | | | |
| Washington County Junior College District, | | | | | | | | | | | | |
| 5.000%, 10/01/2028 (Callable 04/01/2026) | | | | | | | | | | | | |
| (Insured by BAM) | | | 500,000 | | | | 521,591 | | | | | |
| Williamson County Municipal | | | | | | | | | | | | |
| Utility District No. 31: | | | | | | | | | | | | |
| 6.500%, 08/15/2029 (Callable 08/15/2028) | | | | | | | | | | | | |
| (Insured by BAM) | | | 295,000 | | | | 336,708 | | | | | |
| 5.000%, 08/15/2030 (Callable 08/15/2028) | | | | | | | | | | | | |
| (Insured by BAM) | | | 310,000 | | | | 333,200 | | | | | |
The accompanying notes are an integral part of these financial statements.
Baird Core Intermediate Municipal Bond Fund
Schedule of Investments, December 31, 2023
Long-Term Investments (cont.)
| | | Principal | | | | | | % of | |
| | | Amount | | | Value | | | Net Assets | |
| Williamson County Municipal | | | | | | | | | |
| Utility District No. 31: (cont.) | | | | | | | | | |
| 4.000%, 08/15/2033 (Callable 08/15/2028) | | | | | | | | | |
| (Insured by BAM) | | $ | 720,000 | | | $ | 740,209 | | | | |
| 4.000%, 08/15/2035 (Callable 08/15/2028) | | | | | | | | | | | |
| (Insured by BAM) | | | 805,000 | | | | 826,447 | | | | |
| Wimberley Independent School District, | | | | | | | | | | | |
| 4.000%, 08/15/2031 (Callable 08/15/2027) | | | | | | | | | | | |
| (PSF Guaranteed) | | | 355,000 | | | | 368,851 | | | | |
| Total Texas | | | | | | | | | | | |
| (Cost $391,128,310) | | | | | | | 393,069,256 | | | | 13.2 | % |
| Utah | | | | | | | | | | | | |
| City of Herriman City UT, | | | | | | | | | | | | |
| 4.000%, 01/01/2041 (Callable 01/01/2031) | | | | | | | | | | | | |
| (Insured by AGM) | | | 500,000 | | | | 506,450 | | | | | |
| City of Salt Lake City UT: | | | | | | | | | | | | |
| 5.000%, 07/01/2028 | | | 1,000,000 | | | | 1,076,796 | | | | | |
| 5.000%, 07/01/2030 (Callable 07/01/2027) | | | 155,000 | | | | 166,494 | | | | | |
| 5.000%, 07/01/2042 (Callable 07/01/2027) | | | 4,140,000 | | | | 4,328,122 | | | | | |
| County of Utah UT, | | | | | | | | | | | | |
| 5.000%, 05/15/2060 (Callable 02/01/2026) | | | | | | | | | | | | |
(Mandatory Tender Date 08/01/2026)(1) | | | 3,000,000 | | | | 3,140,045 | | | | | |
| Emery County UT, | | | | | | | | | | | | |
| 4.500%, 11/01/2024 (Callable 01/02/2024) | | | | | | | | | | | | |
(Optional Put Date 01/05/2024)(1) | | | 5,000,000 | | | | 5,000,000 | | | | | |
| Grand County School District, | | | | | | | | | | | | |
| 5.000%, 12/15/2037 (Callable 12/15/2025) | | | | | | | | | | | | |
| (Insured by AGM) | | | 870,000 | | | | 895,039 | | | | | |
| Utah Charter School Finance Authority: | | | | | | | | | | | | |
| 0.000%, 04/15/2025 (Insured by UT CSCE) | | | 410,000 | | | | 388,995 | | | | | |
| 3.000%, 04/15/2027 (Insured by UT CSCE) | | | 310,000 | | | | 306,214 | | | | | |
| 5.000%, 04/15/2027 (Callable 04/15/2026) | | | | | | | | | | | | |
| (Insured by UT CSCE) | | | 365,000 | | | | 379,705 | | | | | |
| 5.000%, 04/15/2028 (Callable 04/15/2026) | | | | | | | | | | | | |
| (Insured by UT CSCE) | | | 720,000 | | | | 749,665 | | | | | |
| 4.000%, 04/15/2029 (Insured by UT CSCE) | | | 225,000 | | | | 232,568 | | | | | |
| 5.000%, 10/15/2029 (Callable 10/15/2027) | | | | | | | | | | | | |
| (Insured by UT CSCE) | | | 500,000 | | | | 530,658 | | | | | |
| 4.000%, 04/15/2030 (Insured by UT CSCE) | | | 1,120,000 | | | | 1,143,946 | | | | | |
| 5.000%, 10/15/2031 (Callable 10/15/2027) | | | | | | | | | | | | |
| (Insured by UT CSCE) | | | 500,000 | | | | 528,749 | | | | | |
| 5.000%, 10/15/2032 (Callable 10/15/2027) | | | | | | | | | | | | |
| (Insured by UT CSCE) | | | 310,000 | | | | 327,253 | | | | | |
| 5.000%, 10/15/2036 (Callable 01/19/2024) | | | | | | | | | | | | |
| (Insured by UT CSCE) | | | 700,000 | | | | 700,588 | | | | | |
| 4.000%, 04/15/2037 (Callable 04/15/2032) | | | | | | | | | | | | |
| (Insured by UT CSCE) | | | 500,000 | | | | 509,828 | | | | | |
| 5.000%, 04/15/2037 (Callable 04/15/2026) | | | | | | | | | | | | |
| (Insured by UT CSCE) | | | 925,000 | | | | 950,813 | | | | | |
| 5.000%, 04/15/2037 (Callable 04/15/2026) | | | | | | | | | | | | |
| (Insured by UT CSCE) | | | 520,000 | | | | 534,052 | | | | | |
| 4.000%, 04/15/2042 (Callable 04/15/2032) | | | | | | | | | | | | |
| (Insured by UT CSCE) | | | 480,000 | | | | 468,150 | | | | | |
| 5.000%, 10/15/2043 (Callable 10/15/2027) | | | | | | | | | | | | |
| (Insured by UT CSCE) | | | 1,000,000 | | | | 1,025,212 | | | | | |
| Utah Housing Corp.: | | | | | | | | | | | | |
| 4.000%, 01/01/2045 (Callable 01/01/2026) | | | | | | | | | | | | |
| (Insured by FHA) | | | 125,000 | | | | 124,761 | | | | | |
| 6.000%, 12/21/2052 (Insured by GNMA) | | | 2,163,193 | | | | 2,326,558 | | | | | |
| 6.000%, 02/21/2053 (Insured by GNMA) | | | 2,887,804 | | | | 3,080,718 | | | | | |
| 6.500%, 05/21/2053 (Insured by GNMA) | | | 1,540,276 | | | | 1,712,833 | | | | | |
| 6.000%, 06/21/2053 (Insured by GNMA) | | | 1,988,931 | | | | 2,140,122 | | | | | |
| 6.000%, 07/01/2053 (Callable 01/01/2032) | | | | | | | | | | | | |
| (Insured by GNMA) | | | 2,080,000 | | | | 2,271,660 | | | | | |
| 6.500%, 08/21/2053 (Insured by GNMA) | | | 1,893,360 | | | | 2,126,431 | | | | | |
| Utah Telecommunication | | | | | | | | | | | | |
| Open Infrastructure Agency: | | | | | | | | | | | | |
| 4.375%, 06/01/2040 (Callable 06/01/2032) | | | 1,750,000 | | | | 1,825,663 | | | | | |
| 5.500%, 06/01/2040 (Callable 06/01/2032) | | | 1,150,000 | | | | 1,332,496 | | | | | |
| Total Utah | | | | | | | | | | | | |
| (Cost $40,212,689) | | | | | | | 40,830,584 | | | | 1.4 | % |
| Vermont | | | | | | | | | | | | |
| City of Burlington VT, | | | | | | | | | | | | |
| 5.000%, 07/01/2028 (Callable 07/01/2027) | | | 275,000 | | | | 297,207 | | | | | |
| Vermont Educational & Health | | | | | | | | | | | | |
| Buildings Financing Agency: | | | | | | | | | | | | |
| 5.000%, 10/15/2024 | | | 1,400,000 | | | | 1,400,269 | | | | | |
| 5.000%, 10/15/2025 | | | 615,000 | | | | 617,311 | | | | | |
| 5.000%, 12/01/2039 (Callable 06/01/2026) | | | 500,000 | | | | 511,143 | | | | | |
| Vermont Housing Finance Agency, | | | | | | | | | | | | |
| 3.650%, 11/01/2032 (Callable 11/01/2024) | | | 95,000 | | | | 95,130 | | | | | |
| Vermont Public Power Supply Authority, | | | | | | | | | | | | |
| 5.000%, 07/01/2028 (Callable 07/01/2027) | | | 500,000 | | | | 527,433 | | | | | |
| Total Vermont | | | | | | | | | | | | |
| (Cost $3,511,695) | | | | | | | 3,448,493 | | | | 0.1 | % |
| Virginia | | | | | | | | | | | | |
| Arlington County Industrial | | | | | | | | | | | | |
| Development Authority, | | | | | | | | | | | | |
| 5.000%, 01/01/2026 | | | 5,000,000 | | | | 5,161,509 | | | | | |
| Charles City County Economic | | | | | | | | | | | | |
| Development Authority, | | | | | | | | | | | | |
| 2.875%, 02/01/2029 | | | | | | | | | | | | |
(Callable 11/01/2026)(5) | | | 2,330,000 | | | | 2,186,022 | | | | | |
| City of Virginia Beach VA, | | | | | | | | | | | | |
| 3.000%, 03/01/2031 (Callable 03/01/2028) | | | | | | | | | | | | |
| (Insured by ST AID) | | | 1,350,000 | | | | 1,356,207 | | | | | |
| Farmville Industrial Development Authority, | | | | | | | | | | | | |
| 5.375%, 07/01/2053 (Callable 07/01/2028) | | | | | | | | | | | | |
| (Mandatory Tender Date 07/01/2043) | | | | | | | | | | | | |
| (Insured by AGM) | | | 11,100,000 | | | | 11,817,808 | | | | | |
| Federal Home Loan | | | | | | | | | | | | |
| Mortgage Corp. (FHLMC), | | | | | | | | | | | | |
| 2.550%, 06/15/2035 | | | 4,220,000 | | | | 3,433,317 | | | | | |
| Fredericksburg Economic | | | | | | | | | | | | |
| Development Authority, | | | | | | | | | | | | |
| 5.000%, 06/15/2030 (Callable 06/15/2024) | | | 1,000,000 | | | | 1,006,925 | | | | | |
| Isle of Wight County Economic | | | | | | | | | | | | |
| Development Authority: | | | | | | | | | | | | |
| 5.000%, 07/01/2035 (Callable 07/01/2033) | | | | | | | | | | | | |
| (Insured by AGM) | | | 945,000 | | | | 1,071,255 | | | | | |
| 5.000%, 07/01/2036 (Callable 07/01/2033) | | | | | | | | | | | | |
| (Insured by AGM) | | | 500,000 | | | | 564,341 | | | | | |
| 5.250%, 07/01/2043 (Callable 07/01/2033) | | | | | | | | | | | | |
| (Insured by AGM) | | | 1,000,000 | | | | 1,117,447 | | | | | |
| Louisa Industrial Development Authority, | | | | | | | | | | | | |
| 3.650%, 11/01/2035 | | | | | | | | | | | | |
(Mandatory Tender Date 10/01/2027)(1) | | | 2,800,000 | | | | 2,816,573 | | | | | |
| Norfolk Redevelopment & | | | | | | | | | | | | |
| Housing Authority, | | | | | | | | | | | | |
| 5.000%, 05/01/2043 (Mandatory Tender | | | | | | | | | | | | |
Date 05/01/2026) (Insured by HUD)(1) | | | 1,500,000 | | | | 1,548,298 | | | | | |
The accompanying notes are an integral part of these financial statements.
Baird Core Intermediate Municipal Bond Fund
Schedule of Investments, December 31, 2023
Long-Term Investments (cont.)
| | | Principal | | | | | | % of | |
| | | Amount | | | Value | | | Net Assets | |
| Portsmouth Redevelopment & | | | | | | | | | |
| Housing Authority, | | | | | | | | | |
| 3.500%, 07/01/2025 (Mandatory Tender | | | | | | | | | |
Date 07/01/2024) (Insured by HUD)(1) | | $ | 3,500,000 | | | $ | 3,491,790 | | | | |
| Richmond Redevelopment & | | | | | | | | | | | |
| Housing Authority, | | | | | | | | | | | |
| 4.250%, 03/01/2026 (Mandatory Tender | | | | | | | | | | | |
Date 03/01/2025) (Insured by HUD)(1) | | | 2,775,000 | | | | 2,795,704 | | | | |
| Toll Road Investors Partnership II LP, | | | | | | | | | | | |
0.000%, 02/15/2025 (Insured by NATL)(3) | | | 3,950,000 | | | | 3,655,491 | | | | |
| Virginia Beach Development Authority, | | | | | | | | | | | |
| 5.375%, 09/01/2029 (Callable 09/01/2026) | | | 2,500,000 | | | | 2,564,214 | | | | |
| Virginia College Building Authority: | | | | | | | | | | | |
| 5.250%, 01/01/2026 (Insured by NATL) | | | 1,455,000 | | | | 1,496,305 | | | | |
| 5.000%, 06/01/2027 | | | 300,000 | | | | 313,602 | | | | |
| 4.000%, 02/01/2034 (Callable 02/01/2031) | | | 2,000,000 | | | | 2,159,903 | | | | |
| Virginia Housing Development Authority, | | | | | | | | | | | |
| 3.450%, 04/01/2038 (Callable 01/19/2024) | | | 2,570,000 | | | | 2,527,088 | | | | |
| Virginia Resources Authority, | | | | | | | | | | | |
| 3.000%, 11/01/2031 (Callable 11/01/2028) | | | 1,200,000 | | | | 1,214,809 | | | | |
| Virginia Small Business Financing Authority: | | | | | | | | | | | |
| 5.250%, 10/01/2029 (Callable 10/01/2024) | | | 2,500,000 | | | | 2,531,030 | | | | |
| 5.000%, 10/01/2042 (Callable 10/01/2032) | | | 1,105,000 | | | | 1,206,423 | | | | |
| Total Virginia | | | | | | | | | | | |
| (Cost $56,333,547) | | | | | | | 56,036,061 | | | | 1.9 | % |
| Washington | | | | | | | | | | | | |
| Eastern Washington University, | | | | | | | | | | | | |
| 3.000%, 10/01/2033 (Callable 10/01/2026) | | | 600,000 | | | | 574,203 | | | | | |
| FYI Properties, | | | | | | | | | | | | |
| 5.000%, 06/01/2038 (Callable 06/01/2028) | | | 1,500,000 | | | | 1,602,746 | | | | | |
| Grant County Public Hospital District No. 1: | | | | | | | | | | | | |
| 5.250%, 12/01/2026 | | | 650,000 | | | | 686,510 | | | | | |
| 5.250%, 12/01/2027 | | | 1,250,000 | | | | 1,344,623 | | | | | |
| 5.250%, 12/01/2028 | | | 1,315,000 | | | | 1,435,782 | | | | | |
| Grant County Public Utility District No. 2, | | | | | | | | | | | | |
| 2.000%, 01/01/2044 (Callable 09/01/2025) | | | | | | | | | | | | |
(Mandatory Tender Date 12/01/2025)(1) | | | 350,000 | | | | 343,549 | | | | | |
| King County Housing Authority: | | | | | | | | | | | | |
| 5.000%, 01/01/2028 (Callable 01/01/2027) | | | | | | | | | | | | |
| (Insured by HUD) | | | 2,110,000 | | | | 2,226,932 | | | | | |
| 4.000%, 06/01/2029 | | | 800,000 | | | | 833,537 | | | | | |
| King County Public Hospital District No. 1: | | | | | | | | | | | | |
| 5.000%, 12/01/2029 (Callable 12/01/2028) | | | 1,050,000 | | | | 1,152,744 | | | | | |
| 5.000%, 12/01/2030 (Callable 12/01/2026) | | | 1,650,000 | | | | 1,733,326 | | | | | |
| 5.000%, 12/01/2036 (Callable 12/01/2026) | | | 550,000 | | | | 570,324 | | | | | |
| Pend Oreille County Public | | | | | | | | | | | | |
| Utility District No. 1: | | | | | | | | | | | | |
| 5.000%, 01/01/2028 | | | 220,000 | | | | 233,726 | | | | | |
| 5.000%, 01/01/2031 (Callable 01/01/2028) | | | 115,000 | | | | 121,929 | | | | | |
| 5.000%, 01/01/2038 (Callable 01/01/2029) | | | 2,500,000 | | | | 2,604,060 | | | | | |
| 5.000%, 01/01/2039 (Callable 01/01/2028) | | | 1,500,000 | | | | 1,548,846 | | | | | |
| Pike Place Market Preservation & | | | | | | | | | | | | |
| Development Authority, | | | | | | | | | | | | |
| 5.000%, 12/01/2040 (Callable 12/01/2025) | | | 500,000 | | | | 506,481 | | | | | |
| Public Hospital District 1A | | | | | | | | | | | | |
| of Whitman County: | | | | | | | | | | | | |
| 5.500%, 12/01/2038 (Callable 12/01/2033) | | | 375,000 | | | | 428,807 | | | | | |
| 5.500%, 12/01/2043 (Callable 12/01/2033) | | | 700,000 | | | | 787,275 | | | | | |
| Seattle Housing Authority, | | | | | | | | | | | | |
| 4.000%, 09/01/2025 (Callable 03/01/2025) | | | 5,000,000 | | | | 5,033,060 | | | | | |
| State of Washington: | | | | | | | | | | | | |
| 5.000%, 07/01/2035 (Callable 07/01/2028) | | | 805,000 | | | | 883,022 | | | | | |
| 5.000%, 07/01/2042 (Callable 07/01/2028) | | | 1,330,000 | | | | 1,417,924 | | | | | |
| Tacoma Metropolitan Park District: | | | | | | | | | | | | |
| 4.000%, 12/01/2024 | | | 1,175,000 | | | | 1,175,876 | | | | | |
| 5.000%, 12/01/2024 | | | 1,485,000 | | | | 1,499,262 | | | | | |
| 5.000%, 12/01/2024 | | | 570,000 | | | | 575,475 | | | | | |
| 5.000%, 12/01/2024 | | | 265,000 | | | | 267,545 | | | | | |
| 5.000%, 12/01/2025 | | | 375,000 | | | | 384,120 | | | | | |
| 4.000%, 12/01/2028 | | | 2,495,000 | | | | 2,544,824 | | | | | |
| 4.000%, 12/01/2029 (Callable 12/01/2028) | | | 1,735,000 | | | | 1,765,685 | | | | | |
| 4.000%, 12/01/2030 (Callable 12/01/2026) | | | 550,000 | | | | 555,044 | | | | | |
| 4.000%, 12/01/2030 (Callable 12/01/2028) | | | 795,000 | | | | 806,884 | | | | | |
| 5.000%, 12/01/2033 (Callable 12/01/2026) | | | 500,000 | | | | 519,835 | | | | | |
| 5.000%, 12/01/2033 (Callable 12/01/2027) | | | 385,000 | | | | 406,132 | | | | | |
| 5.000%, 12/01/2035 (Callable 12/01/2027) | | | 335,000 | | | | 350,393 | | | | | |
| 5.000%, 12/01/2036 (Callable 12/01/2027) | | | 500,000 | | | | 519,650 | | | | | |
| Washington Health Care Facilities Authority: | | | | | | | | | | | | |
| 5.000%, 10/01/2027 | | | 2,510,000 | | | | 2,671,869 | | | | | |
| 5.000%, 08/15/2033 (Callable 02/15/2028) | | | 500,000 | | | | 526,084 | | | | | |
| 5.000%, 08/15/2037 (Callable 02/15/2028) | | | 3,015,000 | | | | 3,134,093 | | | | | |
| Washington State Housing | | | | | | | | | | | | |
| Finance Commission: | | | | | | | | | | | | |
| 2.400%, 06/01/2025 (Insured by GNMA) | | | 810,000 | | | | 790,744 | | | | | |
| 3.700%, 12/01/2033 (Callable 06/01/2024) | | | 20,000 | | | | 19,468 | | | | | |
| 3.375%, 04/20/2037 | | | 7,241,873 | | | | 6,544,467 | | | | | |
| 4.000%, 06/01/2049 (Callable 06/01/2028) | | | 355,000 | | | | 354,606 | | | | | |
| Western Washington University: | | | | | | | | | | | | |
| 4.000%, 05/01/2028 (Insured by BAM) | | | 320,000 | | | | 333,781 | | | | | |
| 4.000%, 05/01/2029 (Insured by BAM) | | | 345,000 | | | | 361,159 | | | | | |
| 4.000%, 05/01/2030 (Insured by BAM) | | | 530,000 | | | | 557,277 | | | | | |
| Total Washington | | | | | | | | | | | | |
| (Cost $52,633,178) | | | | | | | 52,733,679 | | | | 1.8 | % |
| West Virginia | | | | | | | | | | | | |
| Glenville State University, | | | | | | | | | | | | |
| 4.000%, 06/01/2027 | | | 1,220,000 | | | | 1,175,098 | | | | | |
| West Virginia Economic | | | | | | | | | | | | |
| Development Authority, | | | | | | | | | | | | |
| 3.750%, 12/01/2042 | | | | | | | | | | | | |
(Mandatory Tender Date 06/01/2025)(1) | | | 2,500,000 | | | | 2,500,072 | | | | | |
| West Virginia Hospital Finance Authority, | | | | | | | | | | | | |
| 4.000%, 06/01/2029 (Callable 06/01/2026) | | | 445,000 | | | | 454,594 | | | | | |
| Total West Virginia | | | | | | | | | | | | |
| (Cost $4,129,196) | | | | | | | 4,129,764 | | | | 0.1 | % |
| Wisconsin | | | | | | | | | | | | |
| County of Waushara WI, | | | | | | | | | | | | |
| 4.500%, 06/01/2027 (Callable 06/01/2025) | | | 2,260,000 | | | | 2,310,880 | | | | | |
| Oak Creek-Franklin Joint School District, | | | | | | | | | | | | |
| 3.150%, 04/01/2028 (Callable 04/01/2025) | | | 5,140,000 | | | | 5,154,691 | | | | | |
| Prescott School District, | | | | | | | | | | | | |
| 4.000%, 03/01/2037 (Callable 03/01/2030) | | | 1,500,000 | | | | 1,549,791 | | | | | |
| Public Finance Authority: | | | | | | | | | | | | |
5.000%, 10/01/2024(3) | | | 2,725,000 | | | | 2,733,884 | | | | | |
3.000%, 04/01/2025(3) | | | 135,000 | | | | 131,807 | | | | | |
| 5.000%, 06/15/2025 | | | 220,000 | | | | 222,545 | | | | | |
| 3.500%, 03/01/2027 | | | | | | | | | | | | |
(Callable 01/29/2024)(3) | | | 3,200,000 | | | | 3,121,262 | | | | | |
| 0.000%, 09/01/2028 | | | | | | | | | | | | |
| (Pre-refunded to 09/01/2026) | | | 130,000 | | | | 111,449 | | | | | |
| 9.000%, 11/01/2028 | | | | | | | | | | | | |
(Callable 11/01/2027)(3) | | | 3,750,000 | | | | 3,755,761 | | | | | |
5.000%, 10/01/2029(3) | | | 1,000,000 | | | | 1,031,634 | | | | | |
| 6.125%, 12/15/2029 | | | | | | | | | | | | |
(Callable 12/15/2027)(3) | | | 4,500,000 | | | | 4,480,835 | | | | | |
| 5.000%, 07/01/2030 | | | 1,110,000 | | | | 1,184,089 | | | | | |
The accompanying notes are an integral part of these financial statements.
Baird Core Intermediate Municipal Bond Fund
Schedule of Investments, December 31, 2023
Long-Term Investments (cont.)
| | | Principal | | | | | | % of | |
| | | Amount | | | Value | | | Net Assets | |
| Public Finance Authority: (cont.) | | | | | | | | | |
4.000%, 04/01/2032(3) | | $ | 1,615,000 | | | $ | 1,527,786 | | | |
| |
| 5.000%, 10/01/2034 | | | | | | | | | | | | |
(Callable 10/01/2029)(3) | | | 2,750,000 | | | | 2,811,749 | | | | | |
| 5.000%, 07/01/2035 (Callable 07/01/2028) | | | | | | | | | | | | |
| (Insured by AGM) | | | 400,000 | | | | 431,122 | | | | | |
| 5.250%, 07/01/2038 | | | | | | | | | | | | |
(Callable 07/01/2033)(3) | | | 700,000 | | | | 723,226 | | | | | |
| 4.000%, 04/01/2042 | | | | | | | | | | | | |
(Callable 04/01/2032)(3) | | | 800,000 | | | | 660,423 | | | | | |
| 4.000%, 04/01/2042 | | | | | | | | | | | | |
(Pre-refunded to 04/01/2032)(3) | | | 50,000 | | | | 55,821 | | | | | |
| 5.000%, 10/01/2044 (Callable 04/01/2029) | | | 1,750,000 | | | | 1,827,825 | | | | | |
| 4.000%, 04/01/2052 | | | | | | | | | | | | |
(Pre-refunded to 04/01/2032)(3) | | | 45,000 | | | | 50,238 | | | | | |
| University of Wisconsin Hospitals & Clinics: | | | | | | | | | | | | |
| 5.000%, 04/01/2036 (Callable 10/01/2028) | | | 465,000 | | | | 506,989 | | | | | |
| 5.000%, 04/01/2043 (Callable 10/01/2028) | | | 2,795,000 | | | | 2,933,524 | | | | | |
| Village of Mount Pleasant WI: | | | | | | | | | | | | |
| 4.000%, 04/01/2035 (Callable 04/01/2028) | | | 1,795,000 | | | | 1,866,383 | | | | | |
| 5.000%, 04/01/2036 (Callable 04/01/2028) | | | 1,000,000 | | | | 1,082,604 | | | | | |
| 4.000%, 04/01/2037 (Callable 04/01/2028) | | | 1,000,000 | | | | 1,022,263 | | | | | |
| 5.000%, 04/01/2038 (Callable 04/01/2028) | | | 1,000,000 | | | | 1,074,073 | | | | | |
| 5.000%, 04/01/2048 (Callable 04/01/2028) | | | 565,000 | | | | 586,179 | | | | | |
| Whitehall School District, | | | | | | | | | | | | |
| 4.000%, 03/01/2031 (Callable 03/01/2030) | | | | | | | | | | | | |
| (Insured by AGM) | | | 600,000 | | | | 632,896 | | | | | |
| Wisconsin Center District: | | | | | | | | | | | | |
| 0.000%, 12/15/2027 (Insured by AGM) | | | 525,000 | | | | 464,703 | | | | | |
| 0.000%, 12/15/2027 (Insured by NATL) | | | 220,000 | | | | 193,977 | | | | | |
| 5.000%, 12/15/2027 (Callable 06/15/2026) | | | 500,000 | | | | 526,084 | | | | | |
| 0.000%, 12/15/2028 (Insured by AGM) | | | 1,045,000 | | | | 895,615 | | | | | |
| 0.000%, 12/15/2028 (Insured by AGM) | | | 255,000 | | | | 218,547 | | | | | |
| 5.000%, 12/15/2028 (Callable 06/15/2026) | | | 345,000 | | | | 362,579 | | | | | |
| 0.000%, 12/15/2029 (Insured by AGM) | | | 315,000 | | | | 260,880 | | | | | |
| 0.000%, 12/15/2030 (Insured by AGM) | | | 1,325,000 | | | | 1,058,703 | | | | | |
| 0.000%, 12/15/2030 (Insured by AGM) | | | 460,000 | | | | 367,550 | | | | | |
| 0.000%, 12/15/2031 (Insured by AGM) | | | 50,000 | | | | 38,485 | | | | | |
| 5.000%, 12/15/2031 (Callable 06/15/2026) | | | 440,000 | | | | 462,100 | | | | | |
| 0.000%, 12/15/2034 (Callable 12/15/2030) | | | | | | | | | | | | |
| (Insured by AGM) | | | 615,000 | | | | 420,323 | | | | | |
| 0.000%, 12/15/2035 (Callable 12/15/2030) | | | | | | | | | | | | |
| (Insured by AGM) | | | 2,780,000 | | | | 1,817,124 | | | | | |
| 5.250%, 12/15/2061 | | | | | | | | | | | | |
(Callable 12/15/2030)(3) | | | 1,000,000 | | | | 1,007,820 | | | | | |
| Wisconsin Health & Educational | | | | | | | | | | | | |
| Facilities Authority: | | | | | | | | | | | | |
| 5.000%, 03/01/2024 | | | 945,000 | | | | 943,716 | | | | | |
| 5.000%, 07/01/2024 | | | 250,000 | | | | 251,879 | | | | | |
| 5.000%, 11/01/2024 | | | 155,000 | | | | 154,233 | | | | | |
| 5.000%, 03/01/2025 (Callable 03/01/2024) | | | 840,000 | | | | 835,719 | | | | | |
| 5.000%, 11/01/2025 | | | 245,000 | | | | 242,210 | | | | | |
| 5.000%, 12/01/2025 | | | 135,000 | | | | 139,545 | | | | | |
| 5.000%, 03/01/2026 (Callable 03/01/2024) | | | 820,000 | | | | 812,927 | | | | | |
| 5.000%, 07/01/2026 (Callable 07/01/2024) | | | 50,000 | | | | 50,243 | | | | | |
| 5.000%, 12/01/2026 (Callable 11/01/2024) | | | 1,290,000 | | | | 1,302,543 | | | | | |
| 5.000%, 03/01/2027 (Callable 03/01/2024) | | | 1,095,000 | | | | 1,090,658 | | | | | |
| 5.000%, 10/01/2027 | | | 250,000 | | | | 269,422 | | | | | |
| 5.000%, 02/15/2028 (Insured by AGM) | | | 3,205,000 | | | | 3,460,056 | | | | | |
| 5.000%, 02/15/2028 (Callable 02/15/2027) | | | 575,000 | | | | 599,841 | | | | | |
| 5.000%, 03/01/2028 (Callable 03/01/2024) | | | 830,000 | | | | 828,071 | | | | | |
| 5.000%, 08/15/2028 (Callable 01/29/2024) | | | 1,025,000 | | | | 1,026,054 | | | | | |
| 5.000%, 11/01/2028 (Callable 11/01/2026) | | | 470,000 | | | | 454,134 | | | | | |
| 5.000%, 12/01/2028 | | | | | | | | | | | | |
| (Callable 11/01/2026) | | | 395,000 | | | | 416,208 | | | | | |
| 5.000%, 10/01/2029 | | | 555,000 | | | | 620,837 | | | | | |
| 5.000%, 11/01/2030 (Callable 11/01/2026) | | | 515,000 | | | | 488,939 | | | | | |
| 5.000%, 12/15/2030 (Callable 12/15/2024) | | | 480,000 | | | | 486,781 | | | | | |
| 5.000%, 04/01/2031 (Callable 04/01/2027) | | | 250,000 | | | | 264,611 | | | | | |
| 5.000%, 10/01/2031 (Callable 10/01/2029) | | | 250,000 | | | | 276,203 | | | | | |
| 5.000%, 04/01/2033 (Callable 10/01/2028) | | | 2,130,000 | | | | 2,303,689 | | | | | |
| 4.000%, 11/15/2034 (Callable 05/15/2026) | | | 1,000,000 | | | | 1,017,157 | | | | | |
| 4.000%, 08/15/2037 (Callable 08/15/2027) | | | 1,905,000 | | | | 1,937,699 | | | | | |
| 4.375%, 06/01/2039 (Callable 01/29/2024) | | | 230,000 | | | | 230,021 | | | | | |
| 5.000%, 12/15/2044 (Callable 12/15/2024) | | | 675,000 | | | | 679,463 | | | | | |
| 5.000%, 12/01/2045 (Callable 12/01/2032) | | | 2,000,000 | | | | 2,140,072 | | | | | |
| 4.000%, 11/15/2046 (Callable 05/15/2026) | | | 1,030,000 | | | | 990,130 | | | | | |
| 5.250%, 12/01/2048 (Callable 12/01/2032) | | | 3,000,000 | | | | 3,206,172 | | | | | |
| 5.000%, 02/15/2051 (Callable 08/15/2026) | | | | | | | | | | | | |
(Mandatory Tender Date 02/15/2027)(1) | | | 2,300,000 | | | | 2,382,917 | | | | | |
| 5.000%, 02/15/2052 (Callable 08/15/2024) | | | | | | | | | | | | |
(Mandatory Tender Date 02/15/2025)(1) | | | 1,000,000 | | | | 1,005,003 | | | | | |
| 4.480%, 02/15/2053 (Callable 01/02/2024) | | | | | | | | | | | | |
(Optional Put Date 01/03/2024)(1) | | | 8,000,000 | | | | 8,000,000 | | | | | |
| Wisconsin Housing & Economic | | | | | | | | | | | | |
| Development Authority: | | | | | | | | | | | | |
| 4.000%, 03/01/2048 (Callable 03/01/2027) | | | | | | | | | | | | |
| (Insured by FNMA) | | | 2,310,000 | | | | 2,303,020 | | | | | |
| 4.250%, 03/01/2049 (Callable 09/01/2028) | | | | | | | | | | | | |
| (Insured by FNMA) | | | 1,000,000 | | | | 1,005,774 | | | | | |
| 0.500%, 11/01/2050 (Callable 01/19/2024) | | | | | | | | | | | | |
| (Mandatory Tender Date 11/01/2024) | | | | | | | | | | | | |
(Insured by HUD)(1) | | | 1,185,000 | | | | 1,142,701 | | | | | |
| 3.750%, 05/01/2054 (Callable 05/01/2025) | | | | | | | | | | | | |
| (Mandatory Tender Date 11/01/2026) | | | | | | | | | | | | |
(Insured by HUD)(1) | | | 2,000,000 | | | | 2,008,661 | | | | | |
| Total Wisconsin | | | | | | | | | | | | |
| (Cost $97,698,890) | | | | | | | 97,043,528 | | | | 3.3 | % |
| Wyoming | | | | | | | | | | | | |
| County of Laramie WY: | | | | | | | | | | | | |
| 4.000%, 05/01/2030 | | | 720,000 | | | | 763,006 | | | | | |
| 4.000%, 05/01/2032 (Callable 05/01/2031) | | | 525,000 | | | | 549,062 | | | | | |
| 4.000%, 05/01/2034 (Callable 05/01/2031) | | | 500,000 | | | | 518,692 | | | | | |
| 4.000%, 05/01/2036 (Callable 05/01/2031) | | | 600,000 | | | | 617,145 | | | | | |
| 4.000%, 05/01/2037 (Callable 05/01/2031) | | | 225,000 | | | | 229,231 | | | | | |
| Sublette County Hospital District, | | | | | | | | | | | | |
| 5.000%, 06/15/2026 (Callable 06/15/2025) | | | 4,500,000 | | | | 4,522,814 | | | | | |
| Wyoming Community | | | | | | | | | | | | |
| Development Authority: | | | | | | | | | | | | |
| 3.000%, 12/01/2044 (Callable 06/01/2024) | | | 10,000 | | | | 9,947 | | | | | |
| 4.000%, 12/01/2048 (Callable 06/01/2028) | | | 885,000 | | | | 883,985 | | | | | |
| Total Wyoming | | | | | | | | | | | | |
| (Cost $8,380,622) | | | | | | | 8,093,882 | | | | 0.3 | % |
| Total Municipal Bonds | | | | | | | | | | | | |
| (Cost $2,895,748,373) | | | | | | | 2,902,950,366 | | | | 97.5 | % |
| Total Long-Term Investments | | | | | | | | | | | | |
| (Cost $2,930,741,334) | | | | | | | 2,938,714,233 | | | | 98.7 | % |
The accompanying notes are an integral part of these financial statements.
Baird Core Intermediate Municipal Bond Fund
Schedule of Investments, December 31, 2023
Short-Term Investment
| | | | | | | | | % of | |
| | | Shares | | | Value | | | Net Assets | |
| Money Market Mutual Fund | | | | | | | | | |
| Federated Hermes Institutional Tax-Free | | | | | | | | | |
Cash Trust, Premier Shares, 4.03%(4) | | | 6,418,819 | | | $ | 6,418,819 | | | | |
| Total Short-Term Investment | | | | | | | | | | | |
| (Cost $6,418,819) | | | | | | | 6,418,819 | | | | 0.2 | % |
| Total Investments | | | | | | | | | | | | |
| (Cost $2,937,160,153) | | | | | | | 2,945,133,052 | | | | 98.9 | % |
| Other Assets in Excess of Liabilities | | | | | | | 34,055,114 | | | | 1.1 | % |
| TOTAL NET ASSETS | | | | | | $ | 2,979,188,166 | | | | 100.0 | % |
Notes to Schedule of Investments
AGC – Assured Guaranty Corp.
AGM – Assured Guaranty Municipal
AMBAC – Ambac Assurance Corp.
BAM – Build America Mutual Assurance Co.
BHAC – Berkshire Hathaway Assurance Corp.
CA MTG – CA Mortgage Insurance
FHA – Federal Housing Administration
FHLMC – Federal Home Loan Mortgage Corporation
FNMA – Federal National Mortgage Association
GNMA – Government National Mortgage Association
HUD – US Department of Housing and Development
NATL – National Public Finance Guarantee Corp.
Q-SBLF – Qualified School Building Loan Fund
SCH BD GTY – School Board Guaranty
SD CRED PROG – State Credit Enhancement Program
SONYMA – State of New York Mortgage Agency
ST AID – State Aid Intercept/Withholding
UT CSCE – Utah Charter School Credit Enhancement Program
XLCA – XL Capital Assurance, Inc.
ETM – Escrowed to Maturity
LIBOR – London Inter-bank Offered Rate
PSF – Permanent School Fund
SIFMA – Securities Industry and Financial Markets Association
SOFR – Secured Overnight Financing Rate
TSFR – Term Secured Overnight Financing Rate
(1) | Variable rate security. The rate reported is the rate in effect as of December 31, 2023. |
(2) | Variable rate security based on a reference index and spread. The rate reported is the rate as of the last reset date in effect as of December 31, 2023. |
(3) | Includes securities exempt from registration under Rule 144A of the Securities Act of 1933. These securities may be resold in transactions exempt from registration to qualified institutional buyers. At December 31, 2023, the value of these securities totaled $124,005,862, which represented 4.16% of total net assets. |
(4) | Seven-day yield. |
(5) | Step-up bond; the interest rate shown is the rate in effect as of December 31, 2023. |
(6) | Security or a portion of the security purchased on a when-issued or delayed delivery basis. |
(7) | Securities referencing LIBOR are expected to transition to an alternative reference rate by the security’s next scheduled coupon reset date. |
The accompanying notes are an integral part of these financial statements.
Baird Core Intermediate Municipal Bond Fund
Summary of Fair Value Exposure at December 31, 2023
The Fund has adopted authoritative fair valuation accounting standards which establish a definition of fair value and set out a hierarchy for measuring fair value. These standards require additional disclosures about the various inputs and valuation techniques used to develop the measurements of fair value and a discussion on changes in valuation techniques and related inputs during the period. These standards define fair value as the price that would be received to sell an asset or paid to transfer a liability in an orderly transaction between market participants at the measurement date.
The fair value hierarchy is organized into three levels based upon the assumptions (referred to as “inputs”) used in pricing the asset or liability. These standards state that “observable inputs” reflect the assumptions market participants would use in pricing the asset or liability based on market data obtained from independent sources and “unobservable inputs” reflect an entity’s own assumptions about the assumptions market participants would use in pricing the asset or liability. These inputs are summarized into three broad levels and described below:
Level 1 – Quoted prices (unadjusted) in active markets for identical assets or liabilities that the reporting entity can access at the measurement date.
Level 2 – Inputs other than quoted prices included within Level 1 that are observable for the asset or liability, either directly or indirectly.
Level 3 – Unobservable inputs for the asset or liability.
The inputs or methodology used for valuing securities are not necessarily an indication of the risk associated with investing in those securities.
The following is a summary of the inputs used to value the Fund’s investments as of December 31, 2023:
| | | Level 1 | | | Level 2 | | | Level 3 | | | Total | |
| Long-Term Investments | | | | | | | | | | | | |
| U.S. Treasury Securities | | $ | — | | | $ | 35,763,867 | | | $ | — | | | $ | 35,763,867 | |
| Municipal Bonds | | | — | | | | 2,902,950,366 | | | | — | | | | 2,902,950,366 | |
| Total Long-Term Investments | | | — | | | | 2,938,714,233 | | | | — | | | | 2,938,714,233 | |
| Short-Term Investment | | | | | | | | | | | | | | | | |
| Money Market Mutual Fund | | | 6,418,819 | | | | — | | | | — | | | | 6,418,819 | |
| Total Short-Term Investment | | | 6,418,819 | | | | — | | | | — | | | | 6,418,819 | |
| Total Investments | | $ | 6,418,819 | | | $ | 2,938,714,233 | | | $ | — | | | $ | 2,945,133,052 | |
Changes in valuation techniques may result in transfers into or out of assigned levels within the fair value hierarchy. There were no transfers into or out of Level 3 during the year, as compared to the security classifications from the prior year’s annual report. See the Fund’s Valuation Policy in Note 2a to the financial statements.
The accompanying notes are an integral part of these financial statements.
Baird Municipal Bond Fund
December 31, 2023 (Unaudited)
The Baird Municipal Bond Fund seeks a high level of current income that is exempt from federal income tax and is consistent with the preservation of capital.
The tax-exempt market closed 2023 with a very strong tone as yields fell over 100 bps in the fourth quarter and were down 20–40 bps for the year, with intermediate maturities falling the most. A catalyst for the fourth quarter rally was an acknowledgement by Fed Chair Powell that the possibility of rate cuts was now equally balanced against further increases. One market anomaly which persisted throughout the year was the inversion of the municipal yield curve between the 1–10-year maturities, ending the year with 32 bps of negative slope. Relatively high short-term floating-rate yields helped sustain the inversion but also acted as a disincentive to invest in longer-term fixed-rate bonds, a drag on municipal fund flows across the industry in 2023. Yet, overall demand for municipals was robust, evidenced by the fact that tax-exempt yields fell more than comparable maturity Treasuries for the year. It also helped that the level of new municipal supply was modest in 2023. Total issuance fell 2% from the prior year with taxable municipal issuance off 36% and tax-exempt supply up just 5% on a year-over-year basis.
During 2023, the Institutional Class Shares of the Fund (BMQIX) posted a net return of 7.14% vs. a 6.40% return for the Bloomberg Municipal Index.
Positive contributors to the Fund’s relative performance during the year include:
| | • | Credit – The Fund benefited from additional yield on lower-quality issues |
| | • | Sector – Local General Obligation and Transportation outperformed other sectors |
Negative contributors to the Fund’s relative performance during the year include:
| | • | Sector – Hospitals and Higher Education lagged |
| | • | Portfolio Structure – An underweight to the longest maturities as market rallied |
We expect that the favorable backdrop for the municipal market will continue into 2024, in part due to the expectation that municipal fund flows will turn positive once again. Since municipal fund flows are highly correlated with curve slope (the more positive the slope the more positive the inflows), as inflation continues toward the Fed’s 2% target rate short-term rates should fall faster than long-term rates, re-steepening the curve. Curve positioning, which is always important, will remain so in 2024. We expect only a modest pickup in supply as the post-Covid federal stimulus funds continue to be spent, limiting borrowing needs for many state and local governments. The exception, we believe, will be those states experiencing the fastest growth in population (e.g., Texas and Florida). Issuance among other municipal sectors, particularly Higher Education and Hospitals, should improve only modestly given their ongoing challenges. Tax-Exempt Housing supply should stay robust, but it is a relatively small sector of the total market. Finally, because municipal credit spreads are relatively tight as we enter 2024, the best investment opportunities will likely be found among higher-quality issues. We will also seek favorable risk/reward through structural opportunities including coupon, call and prepayment variations to enhance both yield and return.
The Fund targets a neutral duration posture relative to the benchmark while seeking to optimize roll opportunities along the yield curve. Sector weightings will likely favor an overweight to revenue-backed issues over general obligation debt. We believe a modest overweight credit posture is appropriate given current spread levels, with room to increase exposure if spreads widen further in a slowing economy. A continual focus on the fundamental tax and revenue support remains especially important at this point in the credit cycle. Higher-quality, structural opportunities will remain a focus to enhance income for investors.
Baird Municipal Bond Fund
December 31, 2023 (Unaudited)
Portfolio Characteristics
Quality Distribution(1)(2)

| | Net Assets | $187,901,730 | |
| | | | |
| | SEC 30-Day Yield(4) | | |
| | Institutional Class | 3.70% | |
| | Investor Class | 3.46% | |
| | | | |
| | Average Effective Duration | 6.08 years | |
| | | | |
| | Average Effective Maturity | 6.47 years | |
| | | | |
| | Annualized Expense Ratio(5) | | |
| | Institutional Class | 0.30% | |
| | Investor Class | 0.55% | (6) |
| | | | |
| | | Portfolio Turnover Rate | 58% | |
Sector Weightings(7) | | | | |
| | | Number of Holdings | 417 | |
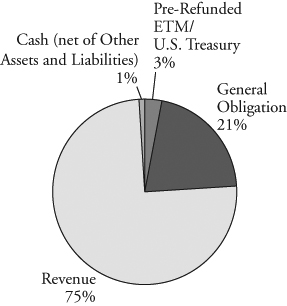 | | | | |
| | | | |
| | | | |
| | | | |
| | | | |
| | | | |
| | | | |
| | | | |
| | | | |
| | | | |
| | | | |
| | | | |
| | | | |
| | | | |
| | | | |
| | | | |
| | | | |
| | | | | |
(1) | Percentages shown are based on the Fund’s total investments. |
(2) | The quality profile is calculated on a market value-weighted basis using the highest credit quality rating for each security held by the Fund given by S&P, Moody’s or Fitch, each of which is a Nationally Recognized Statistical Rating Organization (NRSRO). NRSROs rate the credit quality of securities using a scale that generally ranges from AAA (highest) to D (lowest). |
(3) | Includes pre-refunded and escrowed-to-maturity (ETM) bonds. |
(4) | SEC yields are based on SEC guidelines and are calculated for the 30 days ended December 31, 2023. |
(5) | Reflects expense ratios as stated in the Fund’s current prospectus dated May 1, 2023. |
(6) | Includes 0.25% 12b-1 fee. |
(7) | Percentages shown are based on the Fund’s total net assets. |
Baird Municipal Bond Fund
December 31, 2023 (Unaudited)
| Institutional Class | Investor Class |
| Value of a $10,000 Investment | Value of a $10,000 Investment |
| | |
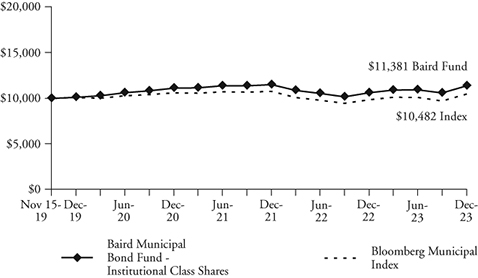 |  |
| | |
| Growth of a hypothetical investment of $10,000 made on 11/15/19, assuming | Growth of a hypothetical investment of $10,000 made on 11/15/19, assuming |
| reinvestment of all distributions. | reinvestment of all distributions. |
| Total Returns | | | |
| | | Average Annual |
| | One | Three | Since |
| For the Periods Ended December 31, 2023 | Year | Years | Inception(1) |
| Institutional Class Shares | 7.14% | 0.76% | 3.18% |
| Investor Class Shares | 6.67% | 0.48% | 2.88% |
Bloomberg Municipal Index(2) | 6.40% | -0.40% | 1.15% |
(1) | For the period from November 15, 2019 (inception date) through December 31, 2023. |
(2) | The Bloomberg Municipal Index is considered representative of the broad market for investment grade, tax-exempt bonds with a maturity of at least one year. The Index has four main sectors: state and local general obligation bonds, revenue bonds, insured bonds and pre-refunded bonds. This Index does not reflect any deduction for fees, expenses or taxes. A direct investment in an index is not possible. |
The line graphs and the returns table shown above reflect reinvestment of dividends and/or capital gains distributions in additional shares. The returns in the graphs and table do not reflect the deduction of taxes that a shareholder would pay on Fund distributions or the redemption of Fund shares. The returns reflect the actual performance for each period and do not include the impact of trades executed on the last business day of the period that were recorded on the first business day of the next period.
The Fund’s expense ratio for each Class, as reflected in the Fund’s current prospectus, is set forth under “Portfolio Characteristics”.
The Fund may invest up to 15% of its net assets in non-investment grade debt securities (commonly referred to as “high yield” bonds). While these types of debt securities may offer higher yields than investment grade securities, they also include greater risks including increased credit risk and the increased risk of default or bankruptcy. The Fund may invest up to 25% of its total assets in municipal obligations issued by persons in the same state. As a result, changes in economic, business or political conditions of a particular state may have a disproportionate impact on the Fund’s share price. Municipal securities investments are not appropriate for all investors, especially those taxed at lower rates.
U.S. and international markets have experienced significant periods of volatility due to a number of economic, political and other global macro factors. The war between Ukraine and Russia is approaching its 2nd anniversary and the October 7th attack by Hamas and Israel’s response only added to global tensions. US/China relations remain strained, impacted by sluggish Chinese economic growth and numerous issues affecting trade relations. Domestically, inflation remains an area of focus since getting to the Fed’s 2% target may prove to be more challenging than the market expects. In addition, 2024 is an election year and the current level of political discord is high. Finally, while the coronavirus (COVID-19) appears to have entered an endemic stage, significant outbreaks present a continued risk to the global economy. These and other events may cause market disruptions and could have an adverse effect on the value of the Fund’s investments..
Past performance does not guarantee future results. Investment return and principal value will fluctuate so that an investor’s shares, when redeemed, may be worth more or less than their original cost.
For information about the performance of the Fund as of the most recent month-end, please call 1-866-442-2473 or visit www.bairdfunds.com. Mutual fund performance changes over time and current performance may be lower or higher than that stated.
Baird Municipal Bond Fund
Schedule of Investments, December 31, 2023
Long-Term Investments
| | | Principal | | | | | | % of | |
| | | Amount | | | Value | | | Net Assets | |
| Municipal Bonds | | | | | | | | | |
| Alabama | | | | | | | | | |
| Alabama Corrections Institution | | | | | | | | | |
| Finance Authority, | | | | | | | | | |
| 5.000%, 07/01/2037 (Callable 07/01/2032) | | $ | 500,000 | | | $ | 571,667 | | | | |
| Alabama Special Care Facilities | | | | | | | | | | | |
| Financing Authority, | | | | | | | | | | | |
| 5.000%, 06/01/2026 (Callable 06/01/2025) | | | 110,000 | | | | 112,710 | | | | |
| Black Belt Energy Gas District: | | | | | | | | | | | |
| 4.000%, 12/01/2049 (Callable 09/01/2025) | | | | | | | | | | | |
(Mandatory Tender Date 12/01/2025)(1) | | | 100,000 | | | | 100,240 | | | | |
| 5.000%, 05/01/2053 | | | | | | | | | | | |
(Mandatory Tender Date 06/01/2028)(1) | | | 750,000 | | | | 785,454 | | | | |
| Chilton County Health Care Authority, | | | | | | | | | | | |
| 3.000%, 11/01/2027 (Callable 11/01/2025) | | | 100,000 | | | | 99,153 | | | | |
| Industrial Development Board | | | | | | | | | | | |
| of the City of Mobile, | | | | | | | | | | | |
| 3.920%, 06/01/2034 | | | | | | | | | | | |
(Mandatory Tender Date 06/02/2026)(1) | | | 600,000 | | | | 607,869 | | | | |
| Jacksonville State University, | | | | | | | | | | | |
| 5.000%, 12/01/2036 (Callable 12/01/2027) | | | | | | | | | | | |
| (Insured by AGM) | | | 500,000 | | | | 542,197 | | | | |
| Southeast Alabama Gas Supply District, | | | | | | | | | | | |
| 4.000%, 06/01/2049 (Callable 03/01/2024) | | | | | | | | | | | |
(Mandatory Tender Date 06/01/2024)(1) | | | 370,000 | | | | 370,179 | | | | |
| Southeast Energy Authority A | | | | | | | | | | | |
| Cooperative District: | | | | | | | | | | | |
| 5.500%, 01/01/2053 (Callable 09/01/2029) | | | | | | | | | | | |
(Mandatory Tender Date 12/01/2029)(1) | | | 250,000 | | | | 271,465 | | | | |
| 5.000%, 05/01/2053 (Callable 05/01/2028) | | | | | | | | | | | |
(Mandatory Tender Date 08/01/2028)(1) | | | 250,000 | | | | 261,267 | | | | |
| 5.000%, 01/01/2054 (Callable 03/01/2030) | | | | | | | | | | | |
(Mandatory Tender Date 06/01/2030)(1) | | | 750,000 | | | | 800,495 | | | | |
| 5.250%, 01/01/2054 (Callable 04/01/2029) | | | | | | | | | | | |
(Mandatory Tender Date 07/01/2029)(1) | | | 500,000 | | | | 532,097 | | | | |
| Total Alabama | | | | | | | | | | | |
| (Cost $4,930,588) | | | | | | | 5,054,793 | | | | 2.7 | % |
| Alaska | | | | | | | | | | | | |
| CIVIC Ventures, | | | | | | | | | | | | |
| 5.000%, 09/01/2027 (Callable 09/01/2025) | | | 200,000 | | | | 202,633 | | | | | |
| Total Alaska | | | | | | | | | | | | |
| (Cost $205,751) | | | | | | | 202,633 | | | | 0.1 | % |
| Arizona | | | | | | | | | | | | |
| Arizona Industrial Development Authority: | | | | | | | | | | | | |
5.000%, 07/01/2026(3) | | | 315,000 | | | | 316,373 | | | | | |
4.000%, 07/15/2027(3) | | | 125,000 | | | | 122,140 | | | | | |
5.000%, 10/01/2030 (Callable 10/01/2026)(3) | | | 100,000 | | | | 94,193 | | | | | |
| 4.000%, 07/01/2032 (Callable 01/01/2028) | | | | | | | | | | | | |
| (Insured by SD CRED PROG) | | | 100,000 | | | | 101,606 | | | | | |
| 3.625%, 05/20/2033 | | | 693,618 | | | | 656,622 | | | | | |
| 5.250%, 11/01/2053 (Callable 11/01/2032) | | | 1,250,000 | | | | 1,339,771 | | | | | |
| Glendale Industrial Development Authority: | | | | | | | | | | | | |
| 4.000%, 05/15/2027 (Callable 05/15/2024) | | | 175,000 | | | | 168,112 | | | | | |
| 2.125%, 07/01/2033 (Callable 07/01/2029) | | | 685,000 | | | | 583,060 | | | | | |
| Industrial Development Authority | | | | | | | | | | | | |
| of the County of Pima, | | | | | | | | | | | | |
| 4.000%, 07/01/2029 | | | 25,000 | | | | 25,035 | | | | | |
| Maricopa County Industrial | | | | | | | | | | | | |
| Development Authority, | | | | | | | | | | | | |
| 6.000%, 07/01/2043 | | | | | | | | | | | | |
(Callable 07/01/2030)(3) | | | 500,000 | | | | 504,539 | | | | | |
| Salt Verde Financial Corp., | | | | | | | | | | | | |
| 5.250%, 12/01/2026 | | | 425,000 | | | | 443,218 | | | | | |
| Total Arizona | | | | | | | | | | | | |
| (Cost $4,342,631) | | | | | | | 4,354,669 | | | | 2.3 | % |
| Arkansas | | | | | | | | | | | | |
| Arkadelphia Water & Sewer System, | | | | | | | | | | | | |
| 5.000%, 12/01/2053 (Callable 06/01/2029) | | | | | | | | | | | | |
| (Insured by BAM) | | | 450,000 | | | | 470,729 | | | | | |
| Batesville Public Facilities Board, | | | | | | | | | | | | |
| 5.000%, 06/01/2026 | | | 150,000 | | | | 154,699 | | | | | |
| City of Heber Springs AR, | | | | | | | | | | | | |
| 1.625%, 06/01/2047 (Callable 06/01/2028) | | | 160,000 | | | | 151,434 | | | | | |
| City of West Memphis AR, | | | | | | | | | | | | |
| 3.000%, 12/01/2041 (Callable 12/01/2028) | | | | | | | | | | | | |
| (Insured by BAM) | | | 380,000 | | | | 331,646 | | | | | |
| Total Arkansas | | | | | | | | | | | | |
| (Cost $1,067,768) | | | | | | | 1,108,508 | | | | 0.6 | % |
| California | | | | | | | | | | | | |
| California Community Choice | | | | | | | | | | | | |
| Financing Authority, | | | | | | | | | | | | |
| 5.250%, 01/01/2054 (Callable 10/01/2030) | | | | | | | | | | | | |
(Mandatory Tender Date 10/01/2031)(1) | | | 200,000 | | | | 211,564 | | | | | |
| California Housing Finance Agency: | | | | | | | | | | | | |
| 3.750%, 03/25/2035 (Insured by FHLMC) | | | 485,784 | | | | 479,997 | | | | | |
| 4.375%, 09/20/2036 | | | 498,088 | | | | 499,913 | | | | | |
| California Infrastructure & | | | | | | | | | | | | |
| Economic Development Bank: | | | | | | | | | | | | |
| 3.430%, 08/01/2047 | | | | | | | | | | | | |
| (SIFMA Municipal Swap Index + 0.350%) | | | | | | | | | | | | |
| (Callable 01/19/2024) | | | | | | | | | | | | |
(Mandatory Tender Date 08/01/2024)(2) | | | 250,000 | | | | 248,357 | | | | | |
| 3.430%, 08/01/2047 | | | | | | | | | | | | |
| (SIFMA Municipal Swap Index + 0.350%) | | | | | | | | | | | | |
| (Callable 01/19/2024) | | | | | | | | | | | | |
(Mandatory Tender Date 08/01/2024)(2) | | | 400,000 | | | | 397,370 | | | | | |
| California Pollution Control | | | | | | | | | | | | |
| Financing Authority, | | | | | | | | | | | | |
5.000%, 07/01/2029(3) | | | 250,000 | | | | 261,175 | | | | | |
| California Public Finance Authority: | | | | | | | | | | | | |
2.375%, 11/15/2028 (Callable 01/19/2024)(3) | | | 275,000 | | | | 274,180 | | | | | |
3.125%, 05/15/2029 (Callable 01/19/2024)(3) | | | 250,000 | | | | 246,044 | | | | | |
| California State University, | | | | | | | | | | | | |
| 3.125%, 11/01/2051 (Callable 05/01/2026) | | | | | | | | | | | | |
(Mandatory Tender Date 11/01/2026)(1) | | | 750,000 | | | | 756,986 | | | | | |
| City of Los Angeles Department of Airports, | | | | | | | | | | | | |
| 5.000%, 05/15/2033 (Callable 05/15/2029) | | | 500,000 | | | | 545,717 | | | | | |
| City of Vernon CA, | | | | | | | | | | | | |
| 5.000%, 08/01/2025 | | | 500,000 | | | | 509,523 | | | | | |
| Freddie Mac Multifamily ML Certificates, | | | | | | | | | | | | |
4.000%, 01/25/2040(5) | | | 497,504 | | | | 449,314 | | | | | |
| Freddie Mac Multifamily | | | | | | | | | | | | |
| Variable Rate Certificate, | | | | | | | | | | | | |
| 2.875%, 07/25/2036 | | | 730,023 | | | | 643,333 | | | | | |
| Los Alamitos Unified School District, | | | | | | | | | | | | |
0.000%, 08/01/2042 (Callable 08/01/2029)(5) | | | 345,000 | | | | 379,173 | | | | | |
| Mayers Memorial Hospital District: | | | | | | | | | | | | |
| 0.000%, 08/01/2029 | | | 160,000 | | | | 126,672 | | | | | |
| 0.000%, 08/01/2030 | | | 360,000 | | | | 270,721 | | | | | |
| Morongo Unified School District, | | | | | | | | | | | | |
0.000%, 08/01/2041 (Callable 08/01/2030)(5) | | | 175,000 | | | | 179,075 | | | | | |
The accompanying notes are an integral part of these financial statements.
Baird Municipal Bond Fund
Schedule of Investments, December 31, 2023
Long-Term Investments (cont.)
| | | Principal | | | | | | % of | |
| | | Amount | | | Value | | | Net Assets | |
| Regents of the University of | | | | | | | | | |
| California Medical Center, | | | | | | | | | |
| 5.000%, 05/15/2041 (Callable 05/15/2032) | | $ | 330,000 | | | $ | 380,239 | | | | |
| Rio Hondo Community College District, | | | | | | | | | | | |
| 0.000%, 08/01/2031 | | | 545,000 | | | | 430,599 | | | | |
| San Francisco City & County Airport | | | | | | | | | | | |
| Comm-San Francisco International Airport, | | | | | | | | | | | |
| 5.750%, 05/01/2048 (Callable 05/01/2033) | | | 1,000,000 | | | | 1,132,141 | | | | |
| Siskiyou Community College District, | | | | | | | | | | | |
| 0.000%, 08/01/2031 (Insured by AGM) | | | 240,000 | | | | 188,072 | | | | |
| Total California | | | | | | | | | | | |
| (Cost $8,424,450) | | | | | | | 8,610,165 | | | | 4.6 | % |
| Colorado | | | | | | | | | | | | |
| Colorado Bridge Enterprise: | | | | | | | | | | | | |
| 4.000%, 12/31/2030 (Callable 12/31/2027) | | | 750,000 | | | | 755,088 | | | | | |
| 4.000%, 06/30/2031 (Callable 12/31/2027) | | | 250,000 | | | | 251,717 | | | | | |
| Colorado Educational & | | | | | | | | | | | | |
| Cultural Facilities Authority: | | | | | | | | | | | | |
| 5.000%, 10/01/2028 (Callable 10/01/2025) | | | 350,000 | | | | 348,951 | | | | | |
| 2.000%, 09/01/2030 (Callable 09/01/2028) | | | 90,000 | | | | 83,251 | | | | | |
| 5.000%, 10/01/2030 (Callable 10/01/2025) | | | 420,000 | | | | 416,651 | | | | | |
| 5.000%, 12/01/2038 (Callable 12/01/2028) | | | 75,000 | | | | 78,822 | | | | | |
| Denver Convention Center Hotel Authority, | | | | | | | | | | | | |
| 5.000%, 12/01/2024 | | | 300,000 | | | | 302,506 | | | | | |
| Denver Health & Hospital Authority, | | | | | | | | | | | | |
| 5.000%, 12/01/2033 (Callable 12/01/2029) | | | 100,000 | | | | 106,284 | | | | | |
| Denver Housing Authority, | | | | | | | | | | | | |
| 5.000%, 07/01/2027 (Callable 07/01/2026) | | | | | | | | | | | | |
| (Insured by HUD) | | | 500,000 | | | | 525,598 | | | | | |
| Grand River Hospital District, | | | | | | | | | | | | |
| 5.250%, 12/01/2031 (Callable 12/01/2028) | | | | | | | | | | | | |
| (Insured by AGM) | | | 75,000 | | | | 82,083 | | | | | |
| Pueblo Urban Renewal Authority, | | | | | | | | | | | | |
0.000%, 12/01/2025(3) | | | 200,000 | | | | 161,450 | | | | | |
| Regional Transportation District, | | | | | | | | | | | | |
| 4.000%, 07/15/2039 | | | 110,000 | | | | 110,535 | | | | | |
| Vauxmont Metropolitan District, | | | | | | | | | | | | |
| 3.250%, 12/15/2050 (Callable 12/15/2024) | | | | | | | | | | | | |
| (Insured by AGM) | | | 145,000 | | | | 123,742 | | | | | |
| Windy Gap Firming Project | | | | | | | | | | | | |
| Water Activity Enterprise, | | | | | | | | | | | | |
| 5.000%, 07/15/2046 (Callable 07/15/2031) | | | 1,000,000 | | | | 1,095,527 | | | | | |
| Total Colorado | | | | | | | | | | | | |
| (Cost $4,389,710) | | | | | | | 4,442,205 | | | | 2.4 | % |
| Connecticut | | | | | | | | | | | | |
| Connecticut Housing Finance Authority, | | | | | | | | | | | | |
| 2.750%, 11/15/2052 (Callable 01/29/2024) | | | | | | | | | | | | |
(Mandatory Tender Date 05/15/2025)(1) | | | 1,000,000 | | | | 987,239 | | | | | |
| Connecticut State Health & | | | | | | | | | | | | |
| Educational Facilities Authority: | | | | | | | | | | | | |
| 4.000%, 07/01/2029 (Callable 07/01/2028) | | | 40,000 | | | | 38,266 | | | | | |
| 4.000%, 07/01/2031 (Callable 07/01/2028) | | | 30,000 | | | | 28,126 | | | | | |
| 4.000%, 07/01/2043 (Callable 07/01/2033) | | | 1,000,000 | | | | 1,002,580 | | | | | |
| Total Connecticut | | | | | | | | | | | | |
| (Cost $2,045,069) | | | | | | | 2,056,211 | | | | 1.1 | % |
| Florida | | | | | | | | | | | | |
| Brevard County Health Facilities Authority, | | | | | | | | | | | | |
| 5.000%, 04/01/2052 (Callable 04/01/2032) | | | 750,000 | | | | 796,197 | | | | | |
| Capital Trust Agency, Inc., | | | | | | | | | | | | |
3.375%, 07/01/2031(3) | | | 395,000 | | | | 373,744 | | | | | |
| City of Cape Coral FL: | | | | | | | | | | | | |
| 5.250%, 10/01/2048 (Callable 10/01/2033) | | | | | | | | | | | | |
| (Insured by BAM) | | | 750,000 | | | | 853,123 | | | | | |
| 5.650%, 03/01/2054 (Callable 03/01/2033) | | | | | | | | | | | | |
| (Insured by BAM) | | | 1,000,000 | | | | 1,125,104 | | | | | |
| City of Fort Lauderdale FL, | | | | | | | | | | | | |
| 5.500%, 09/01/2048 (Callable 09/01/2033) | | | 500,000 | | | | 581,120 | | | | | |
| City of Gainesville FL, | | | | | | | | | | | | |
| 5.000%, 10/01/2051 (Callable 10/01/2031) | | | 1,000,000 | | | | 1,070,730 | | | | | |
| City of Sunrise FL, | | | | | | | | | | | | |
| 3.000%, 10/01/2050 (Callable 10/01/2030) | | | 1,000,000 | | | | 748,589 | | | | | |
| City of Tampa FL: | | | | | | | | | | | | |
| 5.000%, 10/01/2047 (Callable 10/01/2032) | | | 1,000,000 | | | | 1,105,701 | | | | | |
| 5.250%, 10/01/2057 (Callable 10/01/2032) | | | 750,000 | | | | 835,278 | | | | | |
| County of Pasco FL, | | | | | | | | | | | | |
| 5.000%, 09/01/2048 (Callable 03/01/2033) | | | | | | | | | | | | |
| (Insured by AGM) | | | 500,000 | | | | 541,860 | | | | | |
| County of Sarasota FL, | | | | | | | | | | | | |
| 5.250%, 10/01/2047 (Callable 10/01/2032) | | | 1,000,000 | | | | 1,128,329 | | | | | |
| Florida Development Finance Corp.: | | | | | | | | | | | | |
5.250%, 06/15/2029 (Callable 06/15/2027)(3) | | | 500,000 | | | | 506,112 | | | | | |
| 3.000%, 06/01/2032 (Callable 06/01/2024) | | | 500,000 | | | | 400,887 | | | | | |
5.000%, 08/15/2032(3) | | | 455,000 | | | | 454,344 | | | | | |
| Florida Housing Finance Corp., | | | | | | | | | | | | |
| 4.200%, 01/01/2045 (Callable 01/01/2028) | | | | | | | | | | | | |
| (Insured by GNMA) | | | 40,000 | | | | 40,158 | | | | | |
| Highlands County Health Facilities Authority: | | | | | | | | | | | | |
| 3.080%, 11/15/2035 (Callable 01/02/2024) | | | | | | | | | | | | |
(Optional Put Date 01/05/2024)(1) | | | 2,000,000 | | | | 2,000,000 | | | | | |
| 3.080%, 11/15/2037 (Callable 01/29/2024) | | | | | | | | | | | | |
(Optional Put Date 01/05/2024)(1) | | | 2,000,000 | | | | 2,000,000 | | | | | |
| Mid-Bay Bridge Authority, | | | | | | | | | | | | |
| 5.000%, 10/01/2024 | | | 545,000 | | | | 550,717 | | | | | |
| Orange County Health Facilities Authority, | | | | | | | | | | | | |
| 5.000%, 08/01/2028 (Callable 08/01/2024) | | | 200,000 | | | | 201,193 | | | | | |
| Palm Beach County Educational | | | | | | | | | | | | |
| Facilities Authority: | | | | | | | | | | | | |
| 4.000%, 10/01/2027 | | | 260,000 | | | | 262,521 | | | | | |
| 4.000%, 10/01/2028 | | | 270,000 | | | | 273,704 | | | | | |
| St. Johns County Housing Finance Authority, | | | | | | | | | | | | |
| 5.500%, 12/01/2028 (Callable 06/01/2026) | | | | | | | | | | | | |
(Mandatory Tender Date 12/01/2026)(1)(3) | | | 500,000 | | | | 499,942 | | | | | |
| Total Florida | | | | | | | | | | | | |
| (Cost $15,967,766) | | | | | | | 16,349,353 | | | | 8.7 | % |
| Georgia | | | | | | | | | | | | |
| Atlanta Urban Residential Finance Authority, | | | | | | | | | | | | |
| 2.000%, 09/01/2025 | | | | | | | | | | | | |
(Mandatory Tender Date 09/01/2024)(1) | | | 200,000 | | | | 197,021 | | | | | |
| Bartow County Development Authority, | | | | | | | | | | | | |
| 3.950%, 12/01/2032 | | | | | | | | | | | | |
(Mandatory Tender Date 03/08/2028)(1) | | | 500,000 | | | | 508,276 | | | | | |
| Burke County Development Authority, | | | | | | | | | | | | |
2.750%, 01/01/2052 (Callable 05/03/2031)(5) | | | 500,000 | | | | 355,126 | | | | | |
| City of Atlanta GA, | | | | | | | | | | | | |
| 5.000%, 07/01/2048 (Callable 07/01/2033) | | | 1,300,000 | | | | 1,393,877 | | | | | |
| DeKalb County Housing Authority, | | | | | | | | | | | | |
| 4.000%, 12/01/2033 (Callable 12/01/2030) | | | 1,000,000 | | | | 996,805 | | | | | |
| Development Authority of Monroe County, | | | | | | | | | | | | |
| 1.500%, 01/01/2039 | | | | | | | | | | | | |
(Mandatory Tender Date 02/03/2025)(1) | | | 500,000 | | | | 480,450 | | | | | |
| George L Smith II Congress Center Authority, | | | | | | | | | | | | |
3.625%, 01/01/2031(3) | | | 650,000 | | | | 590,428 | | | | | |
The accompanying notes are an integral part of these financial statements.
Baird Municipal Bond Fund
Schedule of Investments, December 31, 2023
Long-Term Investments (cont.)
| | | Principal | | | | | | % of | |
| | | Amount | | | Value | | | Net Assets | |
| Main Street Natural Gas, Inc.: | | | | | | | | | |
| 4.000%, 08/01/2049 (Callable 09/01/2024) | | | | | | | | | |
(Mandatory Tender Date 12/02/2024)(1) | | $ | 800,000 | | | $ | 801,776 | | | | |
| 4.000%, 08/01/2052 (Callable 05/01/2027) | | | | | | | | | | | |
(Mandatory Tender Date 11/01/2027)(1)(3) | | | 400,000 | | | | 384,911 | | | | |
| 5.000%, 12/01/2052 (Callable 03/01/2029) | | | | | | | | | | | |
(Mandatory Tender Date 06/01/2029)(1) | | | 350,000 | | | | 369,411 | | | | |
| Total Georgia | | | | | | | | | | | |
| (Cost $5,918,511) | | | | | | | 6,078,081 | | | | 3.2 | % |
| Idaho | | | | | | | | | | | | |
| Idaho Housing & Finance Association: | | | | | | | | | | | | |
| 3.000%, 05/01/2042 (Callable 05/01/2032) | | | | | | | | | | | | |
| (Insured by SCH BD GTY) | | | 340,000 | | | | 262,637 | | | | | |
5.625%, 11/01/2043 (Callable 11/01/2033)(3) | | | 250,000 | | | | 258,476 | | | | | |
| 5.750%, 05/01/2058 (Callable 05/01/2031) | | | | | | | | | | | | |
| (Insured by SCH BD GTY) | | | 500,000 | | | | 529,828 | | | | | |
| Total Idaho | | | | | | | | | | | | |
| (Cost $988,460) | | | | | | | 1,050,941 | | | | 0.6 | % |
| Illinois | | | | | | | | | | | | |
| Chicago Board of Education: | | | | | | | | | | | | |
| 0.000%, 12/01/2025 (Insured by NATL) | | | 500,000 | | | | 463,996 | | | | | |
| 5.500%, 12/01/2026 (Insured by NATL) | | | 60,000 | | | | 62,444 | | | | | |
| 5.250%, 04/01/2034 (Callable 04/01/2033) | | | 375,000 | | | | 419,984 | | | | | |
| Chicago Midway International Airport: | | | | | | | | | | | | |
5.000%, 01/01/2027(6) | | | 500,000 | | | | 522,742 | | | | | |
| 5.000%, 01/01/2029 (Callable 01/01/2026) | | | 365,000 | | | | 373,486 | | | | | |
| Chicago O’Hare International Airport, | | | | | | | | | | | | |
| 5.500%, 01/01/2055 (Callable 01/01/2032) | | | 300,000 | | | | 325,523 | | | | | |
| Chicago Transit Authority, | | | | | | | | | | | | |
| 5.250%, 12/01/2049 (Callable 12/01/2024) | | | 500,000 | | | | 502,649 | | | | | |
| City of Chicago IL: | | | | | | | | | | | | |
| 0.000%, 01/01/2027 | | | | | | | | | | | | |
| (ETM) (Insured by NATL) | | | 100,000 | | | | 91,880 | | | | | |
| 5.000%, 11/01/2029 (Callable 11/01/2026) | | | 1,050,000 | | | | 1,102,802 | | | | | |
| Cook County Community | | | | | | | | | | | | |
| College District No. 508: | | | | | | | | | | | | |
| 5.250%, 12/01/2026 (Callable 01/29/2024) | | | 400,000 | | | | 400,292 | | | | | |
| 5.250%, 12/01/2028 (Callable 01/29/2024) | | | 75,000 | | | | 75,038 | | | | | |
| Cook County Community | | | | | | | | | | | | |
| Consolidated School District No. 15, | | | | | | | | | | | | |
| 5.250%, 06/15/2043 (Callable 06/15/2033) | | | 540,000 | | | | 604,882 | | | | | |
| County of Du Page IL, | | | | | | | | | | | | |
| 3.000%, 05/15/2047 (Callable 05/15/2030) | | | 1,100,000 | | | | 811,167 | | | | | |
| Exceptional Children Have Opportunities, | | | | | | | | | | | | |
| 4.000%, 12/01/2035 (Callable 12/01/2029) | | | 150,000 | | | | 155,963 | | | | | |
| Illinois Finance Authority: | | | | | | | | | | | | |
| 5.000%, 11/01/2031 (Callable 11/01/2026) | | | 135,000 | | | | 139,819 | | | | | |
| 5.000%, 02/15/2036 (Callable 02/15/2027) | | | 400,000 | | | | 417,525 | | | | | |
| 5.000%, 02/15/2037 (Callable 08/15/2027) | | | 955,000 | | | | 962,167 | | | | | |
| 4.125%, 11/15/2037 (Callable 11/15/2025) | | | 60,000 | | | | 60,206 | | | | | |
| 5.000%, 11/15/2039 (Callable 05/15/2025) | | | 300,000 | | | | 301,892 | | | | | |
| Illinois Sports Facilities Authority, | | | | | | | | | | | | |
| 5.000%, 06/15/2030 | | | 500,000 | | | | 533,029 | | | | | |
| Illinois State Toll Highway Authority: | | | | | | | | | | | | |
| 5.000%, 01/01/2041 (Callable 07/01/2033) | | | 250,000 | | | | 285,114 | | | | | |
| 5.000%, 01/01/2045 (Callable 01/01/2031) | | | 580,000 | | | | 634,990 | | | | | |
| Joliet Park District, | | | | | | | | | | | | |
| 4.000%, 02/01/2033 (Callable 01/29/2024) | | | | | | | | | | | | |
| (Insured by AGM) | | | 100,000 | | | | 100,076 | | | | | |
| Metropolitan Pier & Exposition Authority: | | | | | | | | | | | | |
| 0.000%, 06/15/2029 (Insured by NATL) | | | 100,000 | | | | 83,837 | | | | | |
| 0.000%, 12/15/2034 (Insured by NATL) | | | 500,000 | | | | 345,425 | | | | | |
| Sangamon & Christian Counties | | | | | | | | | | | | |
| Community Unit School District No. 3A, | | | | | | | | | | | | |
| 5.500%, 02/01/2038 (Callable 02/01/2032) | | | | | | | | | | | | |
| (Insured by BAM) | | | 450,000 | | | | 511,939 | | | | | |
| State of Illinois, | | | | | | | | | | | | |
| 5.000%, 03/01/2027 | | | 200,000 | | | | 212,026 | | | | | |
| Upper Illinois River Valley | | | | | | | | | | | | |
| Development Authority, | | | | | | | | | | | | |
5.000%, 01/01/2045 (Callable 01/01/2027)(3) | | | 200,000 | | | | 186,459 | | | | | |
| Village of Romeoville IL, | | | | | | | | | | | | |
| 5.000%, 10/01/2035 (Callable 04/01/2025) | | | 300,000 | | | | 303,326 | | | | | |
| Will County Community | | | | | | | | | | | | |
| High School District No. 210: | | | | | | | | | | | | |
| 0.000%, 01/01/2027 | | | 95,000 | | | | 85,378 | | | | | |
| 0.000%, 01/01/2033 | | | 570,000 | | | | 405,933 | | | | | |
| 4.000%, 01/01/2034 (Callable 01/01/2029) | | | | | | | | | | | | |
| (Insured by AGM) | | | 100,000 | | | | 102,904 | | | | | |
| Winnebago County Community | | | | | | | | | | | | |
| Unit School District No. 320, | | | | | | | | | | | | |
| 5.000%, 02/01/2032 (Insured by AGM) | | | 400,000 | | | | 452,979 | | | | | |
| Total Illinois | | | | | | | | | | | | |
| (Cost $11,730,753) | | | | | | | 12,037,872 | | | | 6.4 | % |
| Indiana | | | | | | | | | | | | |
| Indiana Finance Authority: | | | | | | | | | | | | |
| 2.500%, 11/01/2030 | | | 100,000 | | | | 90,926 | | | | | |
| 5.750%, 06/01/2048 (Callable 12/01/2033) | | | 500,000 | | | | 557,787 | | | | | |
| Indiana Health & Educational | | | | | | | | | | | | |
| Facilities Financing Authority, | | | | | | | | | | | | |
| 5.000%, 11/15/2046 (Callable 11/15/2026) | | | 100,000 | | | | 102,202 | | | | | |
| St. Joseph County Airport Authority, | | | | | | | | | | | | |
| 0.010%, 07/01/2028 (Insured by BAM) | | | 155,000 | | | | 133,982 | | | | | |
| Total Indiana | | | | | | | | | | | | |
| (Cost $864,528) | | | | | | | 884,897 | | | | 0.5 | % |
| Iowa | | | | | | | | | | | | |
| City of Coralville IA, | | | | | | | | | | | | |
| 4.000%, 06/01/2025 (Callable 06/01/2024) | | | 100,000 | | | | 98,829 | | | | | |
| City of Stuart IA, | | | | | | | | | | | | |
| 4.750%, 06/01/2026 (Callable 06/01/2025) | | | 680,000 | | | | 682,764 | | | | | |
| Iowa Finance Authority, | | | | | | | | | | | | |
7.500%, 01/01/2032 (Callable 01/01/2030)(3) | | | 250,000 | | | | 238,759 | | | | | |
| Iowa Higher Education Loan Authority, | | | | | | | | | | | | |
| 5.375%, 10/01/2052 (Callable 10/01/2030) | | | 500,000 | | | | 519,116 | | | | | |
| PEFA, Inc., | | | | | | | | | | | | |
| 5.000%, 09/01/2049 (Callable 06/01/2026) | | | | | | | | | | | | |
(Mandatory Tender Date 09/01/2026)(1) | | | 230,000 | | | | 235,583 | | | | | |
| Total Iowa | | | | | | | | | | | | |
| (Cost $1,765,575) | | | | | | | 1,775,051 | | | | 0.9 | % |
| Kansas | | | | | | | | | | | | |
| City of Coffeyville KS, | | | | | | | | | | | | |
5.000%, 06/01/2025 (Insured by NATL)(3) | | | 100,000 | | | | 100,149 | | | | | |
| City of Osawatomie KS, | | | | | | | | | | | | |
| 3.750%, 03/01/2027 (Callable 03/01/2025) | | | 500,000 | | | | 501,776 | | | | | |
| Wyandotte County-Kansas City | | | | | | | | | | | | |
| Unified Government, | | | | | | | | | | | | |
| 0.000%, 12/01/2027 (Insured by NATL) | | | 245,000 | | | | 210,996 | | | | | |
| Total Kansas | | | | | | | | | | | | |
| (Cost $813,771) | | | | | | | 812,921 | | | | 0.4 | % |
| Kentucky | | | | | | | | | | | | |
| Garrard County School District Finance Corp., | | | | | | | | | | | | |
| 5.000%, 08/01/2037 (Callable 08/01/2031) | | | | | | | | | | | | |
| (Insured by BAM) | | | 810,000 | | | | 904,079 | | | | | |
The accompanying notes are an integral part of these financial statements.
Baird Municipal Bond Fund
Schedule of Investments, December 31, 2023
Long-Term Investments (cont.)
| | | Principal | | | | | | % of | |
| | | Amount | | | Value | | | Net Assets | |
| Kentucky Economic Development | | | | | | | | | |
| Finance Authority: | | | | | | | | | |
| 0.000%, 10/01/2027 (Insured by NATL) | | $ | 125,000 | | | $ | 109,090 | | | | |
| 4.000%, 07/01/2031 (Callable 07/01/2025) | | | 100,000 | | | | 100,329 | | | | |
| 5.000%, 07/01/2033 (Callable 07/01/2025) | | | 200,000 | | | | 203,393 | | | | |
| Kentucky Public Energy Authority: | | | | | | | | | | | |
| 4.000%, 01/01/2049 (Callable 10/01/2024) | | | | | | | | | | | |
(Mandatory Tender Date 01/01/2025)(1) | | | 500,000 | | | | 500,111 | | | | |
| 4.783%, 12/01/2049 | | | | | | | | | | | |
| (1 Month LIBOR USD + 1.120%) | | | | | | | | | | | |
| (Callable 03/01/2025) | | | | | | | | | | | |
(Mandatory Tender Date 06/01/2025)(2)(7) | | | 50,000 | | | | 49,903 | | | | |
| 4.000%, 12/01/2050 (Callable 03/01/2026) | | | | | | | | | | | |
(Mandatory Tender Date 06/01/2026)(1) | | | 250,000 | | | | 248,652 | | | | |
| Louisville/Jefferson County | | | | | | | | | | | |
| Metropolitan Government, | | | | | | | | | | | |
| 5.000%, 10/01/2047 (Callable 07/01/2026) | | | | | | | | | | | |
(Mandatory Tender Date 10/01/2026)(1) | | | 500,000 | | | | 522,350 | | | | |
| Total Kentucky | | | | | | | | | | | |
| (Cost $2,620,137) | | | | | | | 2,637,907 | | | | 1.4 | % |
| Louisiana | | | | | | | | | | | | |
| Louisiana Housing Corp., | | | | | | | | | | | | |
| 5.000%, 07/01/2046 (Callable 02/01/2026) | | | | | | | | | | | | |
| (Mandatory Tender Date 07/01/2026) | | | | | | | | | | | | |
(Insured by HUD)(1) | | | 500,000 | | | | 515,141 | | | | | |
| Louisiana Public Facilities Authority: | | | | | | | | | | | | |
| 5.000%, 10/01/2025 | | | 250,000 | | | | 256,658 | | | | | |
| 6.750%, 10/01/2053 (Callable 07/03/2028) | | | | | | | | | | | | |
(Mandatory Tender Date 10/01/2028)(1)(3) | | | 100,000 | | | | 101,701 | | | | | |
| Plaquemines Port Harbor & Terminal District, | | | | | | | | | | | | |
| 4.000%, 03/15/2025 | | | | | | | | | | | | |
(Mandatory Tender Date 03/15/2024)(1) | | | 250,000 | | | | 250,055 | | | | | |
| Total Louisiana | | | | | | | | | | | | |
| (Cost $1,118,109) | | | | | | | 1,123,555 | | | | 0.6 | % |
| Maine | | | | | | | | | | | | |
| City of Lewiston ME, | | | | | | | | | | | | |
| 1.375%, 02/15/2033 (Callable 02/15/2028) | | | 345,000 | | | | 280,623 | | | | | |
| Maine Health & Higher | | | | | | | | | | | | |
| Educational Facilities Authority, | | | | | | | | | | | | |
| 5.000%, 07/01/2037 (Callable 07/01/2030) | | | | | | | | | | | | |
| (Insured by ST AID) | | | 600,000 | | | | 646,449 | | | | | |
| Total Maine | | | | | | | | | | | | |
| (Cost $905,403) | | | | | | | 927,072 | | | | 0.5 | % |
| Maryland | | | | | | | | | | | | |
| Maryland Community | | | | | | | | | | | | |
| Development Administration, | | | | | | | | | | | | |
| 4.700%, 03/01/2046 (Callable 03/01/2031) | | | | | | | | | | | | |
| (Insured by GNMA) | | | 400,000 | | | | 410,541 | | | | | |
| Maryland Economic Development Corp., | | | | | | | | | | | | |
| 5.000%, 06/01/2030 (Callable 06/01/2028) | | | 500,000 | | | | 532,322 | | | | | |
| Maryland Health & Higher | | | | | | | | | | | | |
| Educational Facilities Authority: | | | | | | | | | | | | |
| 5.000%, 01/01/2030 | | | 100,000 | | | | 108,195 | | | | | |
5.250%, 07/01/2033 (Callable 07/01/2030)(3) | | | 590,000 | | | | 594,835 | | | | | |
| Montgomery County Housing | | | | | | | | | | | | |
| Opportunities Commission, | | | | | | | | | | | | |
| 5.125%, 01/01/2053 (Callable 01/01/2034) | | | 700,000 | | | | 754,444 | | | | | |
| Total Maryland | | | | | | | | | | | | |
| (Cost $2,302,249) | | | | | | | 2,400,337 | | | | 1.3 | % |
| Massachusetts | | | | | | | | | | | | |
| Commonwealth of Massachusetts, | | | | | | | | | | | | |
| 2.750%, 03/01/2050 (Callable 03/01/2030) | | | 600,000 | | | | 442,153 | | | | | |
| Massachusetts Development Finance Agency: | | | | | | | | | | | | |
| 5.000%, 10/01/2024 | | | 150,000 | | | | 150,839 | | | | | |
5.000%, 07/15/2025(3) | | | 50,000 | | | | 50,202 | | | | | |
| 5.000%, 07/01/2028 (Callable 07/01/2026) | | | 500,000 | | | | 517,235 | | | | | |
| 5.250%, 10/01/2033 (Insured by AGC) | | | 775,000 | | | | 847,425 | | | | | |
| 5.000%, 07/01/2044 (Callable 07/01/2027) | | | 500,000 | | | | 509,266 | | | | | |
| Massachusetts Educational Financing Authority: | | | | | | | | | | | | |
| 5.000%, 01/01/2027 (Callable 01/01/2025) | | | 500,000 | | | | 506,303 | | | | | |
| 2.000%, 07/01/2037 (Callable 07/01/2031) | | | 400,000 | | | | 351,072 | | | | | |
| 4.250%, 07/01/2044 (Callable 07/01/2033) | | | 400,000 | | | | 401,802 | | | | | |
| Massachusetts State College Building Authority, | | | | | | | | | | | | |
| 2.000%, 05/01/2041 (Callable 05/01/2030) | | | 295,000 | | | | 211,007 | | | | | |
| Town of Middleton MA, | | | | | | | | | | | | |
| 2.000%, 12/15/2038 (Callable 12/15/2030) | | | 1,520,000 | | | | 1,176,156 | | | | | |
| Total Massachusetts | | | | | | | | | | | | |
| (Cost $5,137,462) | | | | | | | 5,163,460 | | | | 2.7 | % |
| Michigan | | | | | | | | | | | | |
| Allegan Public School District, | | | | | | | | | | | | |
| 5.000%, 05/01/2037 (Callable 05/01/2033) | | | | | | | | | | | | |
| (Insured by Q-SBLF) | | | 250,000 | | | | 288,491 | | | | | |
| Ann Arbor School District, | | | | | | | | | | | | |
| 3.000%, 05/01/2027 | | | 780,000 | | | | 785,353 | | | | | |
| City of Detroit MI, | | | | | | | | | | | | |
| 6.000%, 05/01/2043 (Callable 05/01/2033) | | | 250,000 | | | | 281,142 | | | | | |
| Flat Rock Community School District, | | | | | | | | | | | | |
| 5.000%, 05/01/2041 (Callable 05/01/2032) | | | | | | | | | | | | |
| (Insured by Q-SBLF) | | | 350,000 | | | | 386,789 | | | | | |
| Fraser Public School District: | | | | | | | | | | | | |
| 5.000%, 05/01/2038 (Callable 05/01/2033) | | | | | | | | | | | | |
| (Insured by Q-SBLF) | | | 400,000 | | | | 453,491 | | | | | |
| 5.000%, 05/01/2039 (Callable 05/01/2033) | | | | | | | | | | | | |
| (Insured by Q-SBLF) | | | 180,000 | | | | 200,750 | | | | | |
| 5.000%, 05/01/2048 (Callable 05/01/2033) | | | | | | | | | | | | |
| (Insured by Q-SBLF) | | | 475,000 | | | | 509,924 | | | | | |
| Michigan Finance Authority: | | | | | | | | | | | | |
| 4.500%, 10/01/2029 (Callable 10/01/2024) | | | 370,000 | | | | 371,966 | | | | | |
| 5.000%, 05/15/2035 (Callable 05/15/2025) | | | 1,010,000 | | | | 1,026,606 | | | | | |
| 5.000%, 10/01/2039 (Callable 10/01/2024) | | | | | | | | | | | | |
| (Partially Pre-refunded) | | | 1,000,000 | | | | 1,005,972 | | | | | |
| 5.000%, 07/01/2044 (Callable 07/01/2024) | | | 300,000 | | | | 300,372 | | | | | |
| Michigan Strategic Fund, | | | | | | | | | | | | |
| 5.000%, 12/31/2043 (Callable 12/31/2028) | | | 305,000 | | | | 313,684 | | | | | |
| Rockford Public Schools, | | | | | | | | | | | | |
| 5.000%, 05/01/2040 (Callable 05/01/2033) | | | | | | | | | | | | |
| (Insured by Q-SBLF) | | | 500,000 | | | | 562,706 | | | | | |
| Walled Lake Consolidated School District, | | | | | | | | | | | | |
| 5.000%, 05/01/2047 (Callable 05/01/2032) | | | | | | | | | | | | |
| (Insured by Q-SBLF) | | | 1,000,000 | | | | 1,092,739 | | | | | |
| Total Michigan | | | | | | | | | | | | |
| (Cost $7,432,042) | | | | | | | 7,579,985 | | | | 4.0 | % |
| Minnesota | | | | | | | | | | | | |
| City of Virginia MN, | | | | | | | | | | | | |
| 5.000%, 12/15/2026 (Callable 06/15/2025) | | | 1,000,000 | | | | 1,015,262 | | | | | |
| Housing & Redevelopment Authority | | | | | | | | | | | | |
| of the City of St. Paul MN, | | | | | | | | | | | | |
| 5.000%, 12/01/2036 (Callable 12/01/2030) | | | 150,000 | | | | 149,288 | | | | | |
| Minnesota Housing Finance Agency: | | | | | | | | | | | | |
| 4.500%, 01/01/2043 (Callable 01/01/2033) | | | | | | | | | | | | |
| (Insured by GNMA) | | | 500,000 | | | | 511,719 | | | | | |
The accompanying notes are an integral part of these financial statements.
Baird Municipal Bond Fund
Schedule of Investments, December 31, 2023
Long-Term Investments (cont.)
| | | Principal | | | | | | % of | |
| | | Amount | | | Value | | | Net Assets | |
| Minnesota Housing Finance Agency: (cont.) | | | | | | | | | |
| 4.250%, 01/01/2049 (Callable 01/01/2028) | | | | | | | | | |
| (Insured by GNMA) | | $ | 150,000 | | | $ | 150,565 | | | | |
| Northern Municipal Power Agency: | | | | | | | | | | | |
| 5.000%, 01/01/2039 (Callable 01/01/2031) | | | | | | | | | | | |
| (Insured by AGM) | | | 125,000 | | | | 137,348 | | | | |
| 5.000%, 01/01/2040 (Callable 01/01/2031) | | | | | | | | | | | |
| (Insured by AGM) | | | 100,000 | | | | 109,183 | | | | |
| Total Minnesota | | | | | | | | | | | |
| (Cost $2,066,103) | | | | | | | 2,073,365 | | | | 1.1 | % |
| Mississippi | | | | | | | | | | | | |
| City of Gulfport MS, | | | | | | | | | | | | |
| 5.000%, 07/01/2026 | | | 100,000 | | | | 103,178 | | | | | |
| County of Hinds MS, | | | | | | | | | | | | |
| 4.000%, 11/01/2034 (Callable 11/01/2025) | | | 100,000 | | | | 100,115 | | | | | |
| Mississippi Development Bank: | | | | | | | | | | | | |
| 5.000%, 11/01/2030 (Callable 11/01/2027) | | | 100,000 | | | | 102,927 | | | | | |
| 5.250%, 03/01/2045 (Callable 03/01/2028) | | | 150,000 | | | | 153,366 | | | | | |
| Total Mississippi | | | | | | | | | | | | |
| (Cost $479,242) | | | | | | | 459,586 | | | | 0.2 | % |
| Missouri | | | | | | | | | | | | |
| City of Kansas City MO, | | | | | | | | | | | | |
| 0.000%, 02/01/2029 | | | 635,000 | | | | 531,649 | | | | | |
| City of St. Louis MO, | | | | | | | | | | | | |
| 5.000%, 07/01/2039 (Callable 07/01/2029) | | | 300,000 | | | | 322,973 | | | | | |
| Clay County School District No. 40, | | | | | | | | | | | | |
| 5.000%, 04/01/2039 (Callable 04/01/2033) | | | 600,000 | | | | 649,068 | | | | | |
| Health & Educational Facilities | | | | | | | | | | | | |
| Authority of the State of Missouri: | | | | | | | | | | | | |
| 5.000%, 02/01/2025 (Callable 02/01/2024) | | | 30,000 | | | | 30,001 | | | | | |
| 4.000%, 08/01/2025 | | | 150,000 | | | | 147,480 | | | | | |
| 5.000%, 11/15/2032 (Callable 11/15/2025) | | | 1,200,000 | | | | 1,222,295 | | | | | |
| 5.000%, 11/15/2033 (Callable 11/15/2030) | | | 360,000 | | | | 397,826 | | | | | |
| Industrial Development | | | | | | | | | | | | |
| Authority of University City, | | | | | | | | | | | | |
| 5.500%, 06/15/2042 (Callable 06/15/2033) | | | 500,000 | | | | 505,121 | | | | | |
| Joplin Schools, | | | | | | | | | | | | |
| 2.000%, 03/01/2032 (Callable 03/01/2029) | | | | | | | | | | | | |
| (Insured by BAM) | | | 600,000 | | | | 536,191 | | | | | |
| Missouri Housing Development Commission, | | | | | | | | | | | | |
| 2.350%, 11/01/2046 (Callable 05/01/2030) | | | | | | | | | | | | |
| (Insured by GNMA) | | | 1,000,000 | | | | 696,538 | | | | | |
| St. Louis Land Clearance for | | | | | | | | | | | | |
| Redevelopment Authority: | | | | | | | | | | | | |
| 4.250%, 06/01/2026 | | | 80,000 | | | | 80,343 | | | | | |
| 3.875%, 10/01/2035 (Callable 10/01/2029) | | | 660,000 | | | | 595,151 | | | | | |
| 5.000%, 04/01/2038 (Callable 04/01/2027) | | | 1,000,000 | | | | 1,035,801 | | | | | |
| St. Louis Municipal Finance Corp., | | | | | | | | | | | | |
| 5.000%, 10/01/2045 (Callable 10/01/2030) | | | | | | | | | | | | |
| (Insured by AGM) | | | 1,000,000 | | | | 1,069,220 | | | | | |
| Total Missouri | | | | | | | | | | | | |
| (Cost $7,764,058) | | | | | | | 7,819,657 | | | | 4.2 | % |
| Montana | | | | | | | | | | | | |
| Montana Facility Finance Authority, | | | | | | | | | | | | |
| 5.000%, 07/01/2033 (Callable 07/01/2028) | | | 500,000 | | | | 525,491 | | | | | |
| Total Montana | | | | | | | | | | | | |
| (Cost $504,910) | | | | | | | 525,491 | | | | 0.3 | % |
| Nebraska | | | | | | | | | | | | |
| Central Plains Energy Project, | | | | | | | | | | | | |
| 5.000%, 05/01/2054 (Callable 08/01/2029) | | | | | | | | | | | | |
(Mandatory Tender Date 11/01/2029)(1) | | | 750,000 | | | | 795,048 | | | | | |
| Total Nebraska | | | | | | | | | | | | |
| (Cost $767,094) | | | | | | | 795,048 | | | | 0.4 | % |
| Nevada | | | | | | | | | | | | |
| Carson City NV, | | | | | | | | | | | | |
| 5.000%, 09/01/2031 (Callable 09/01/2027) | | | 495,000 | | | | 514,778 | | | | | |
| Total Nevada | | | | | | | | | | | | |
| (Cost $513,935) | | | | | | | 514,778 | | | | 0.3 | % |
| New Hampshire | | | | | | | | | | | | |
| New Hampshire Business Finance Authority: | | | | | | | | | | | | |
| 4.500%, 10/01/2033 | | | 1,000,000 | | | | 1,076,784 | | | | | |
| 4.375%, 09/20/2036 | | | 490,505 | | | | 495,409 | | | | | |
| Total New Hampshire | | | | | | | | | | | | |
| (Cost $1,467,672) | | | | | | | 1,572,193 | | | | 0.8 | % |
| New Jersey | | | | | | | | | | | | |
| Atlantic City Board of Education, | | | | | | | | | | | | |
3.400%, 08/15/2024(3) | | | 85,000 | | | | 84,834 | | | | | |
| New Jersey Housing & Mortgage | | | | | | | | | | | | |
| Finance Agency, | | | | | | | | | | | | |
| 5.000%, 10/01/2063 (Insured by HUD) | | | 500,000 | | | | 525,277 | | | | | |
| Newark Parking Authority: | | | | | | | | | | | | |
| 5.250%, 02/01/2043 (Callable 02/01/2033) | | | | | | | | | | | | |
| (Insured by AGM) | | | 200,000 | | | | 217,308 | | | | | |
| 5.500%, 02/01/2051 (Callable 02/01/2033) | | | | | | | | | | | | |
| (Insured by AGM) | | | 340,000 | | | | 368,310 | | | | | |
| South Jersey Transportation Authority, | | | | | | | | | | | | |
| 5.250%, 11/01/2052 (Callable 11/01/2032) | | | | | | | | | | | | |
| (Insured by BAM) | | | 500,000 | | | | 545,082 | | | | | |
| Township of Willingboro NJ, | | | | | | | | | | | | |
| 2.125%, 09/01/2033 (Callable 09/01/2028) | | | 225,000 | | | | 199,346 | | | | | |
| Total New Jersey | | | | | | | | | | | | |
| (Cost $1,871,924) | | | | | | | 1,940,157 | | | | 1.0 | % |
| New York | | | | | | | | | | | | |
| Albany County Capital Resource Corp., | | | | | | | | | | | | |
| 3.100%, 07/01/2030 | | | 100,000 | | | | 88,312 | | | | | |
| Amherst Industrial Development Agency, | | | | | | | | | | | | |
| 3.900%, 04/01/2026 (Mandatory Tender | | | | | | | | | | | | |
Date 04/01/2025) (Insured by FHA)(1) | | | 400,000 | | | | 401,680 | | | | | |
| Brookhaven Local Development Corp., | | | | | | | | | | | | |
| 5.000%, 11/01/2024 | | | 45,000 | | | | 45,131 | | | | | |
| Build NYC Resource Corp., | | | | | | | | | | | | |
4.000%, 12/01/2031 (Callable 12/01/2029)(3) | | | 300,000 | | | | 276,331 | | | | | |
| Huntington Local Development Corp., | | | | | | | | | | | | |
| 4.000%, 07/01/2027 | | | 205,000 | | | | 196,725 | | | | | |
| Monroe County Industrial Development Corp., | | | | | | | | | | | | |
| 4.840%, 11/01/2040 (Insured by FNMA) | | | 994,027 | | | | 1,026,284 | | | | | |
| New York City Housing Development Corp.: | | | | | | | | | | | | |
| 2.550%, 11/01/2045 (Callable 02/01/2029) | | | 1,000,000 | | | | 747,420 | | | | | |
| 3.000%, 02/15/2048 (Callable 05/15/2024) | | | 500,000 | | | | 495,085 | | | | | |
| 0.900%, 11/01/2060 (Callable 10/01/2024) | | | | | | | | | | | | |
| (Mandatory Tender Date 01/01/2026) | | | | | | | | | | | | |
(Insured by FHA)(1) | | | 500,000 | | | | 465,859 | | | | | |
| New York City Industrial Development Agency, | | | | | | | | | | | | |
| 3.000%, 01/01/2046 (Callable 01/01/2031) | | | | | | | | | | | | |
| (Insured by AGM) | | | 810,000 | | | | 646,401 | | | | | |
| New York State Dormitory Authority, | | | | | | | | | | | | |
| 5.000%, 03/15/2048 (Callable 09/15/2028) | | | 250,000 | | | | 265,051 | | | | | |
| New York State Environmental Facilities Corp., | | | | | | | | | | | | |
| 5.125%, 09/01/2050 (Callable 06/05/2030) | | | | | | | | | | | | |
(Mandatory Tender Date 09/03/2030)(1)(3) | | | 500,000 | | | | 506,384 | | | | | |
| New York State Housing Finance Agency, | | | | | | | | | | | | |
| 3.600%, 11/01/2062 (Callable 06/01/2025) | | | | | | | | | | | | |
| (Mandatory Tender Date 05/01/2027) | | | | | | | | | | | | |
(Insured by SONYMA)(1) | | | 500,000 | | | | 502,253 | | | | | |
The accompanying notes are an integral part of these financial statements.
Baird Municipal Bond Fund
Schedule of Investments, December 31, 2023
Long-Term Investments (cont.)
| | | Principal | | | | | | % of | |
| | | Amount | | | Value | | | Net Assets | |
| New York Transportation Development Corp.: | | | | | | | | | |
| 5.000%, 01/01/2029 (Callable 01/01/2028) | | $ | 1,000,000 | | | $ | 1,029,998 | | | | |
| 5.625%, 04/01/2040 (Callable 04/01/2031) | | | 250,000 | | | | 268,956 | | | | |
| 6.000%, 06/30/2054 (Callable 06/30/2031) | | | 750,000 | | | | 828,176 | | | | |
| Onondaga Civic Development Corp., | | | | | | | | | | | |
| 5.000%, 10/01/2040 (Callable 10/01/2025) | | | 170,000 | | | | 144,194 | | | | |
| Schenectady County Capital Resource Corp., | | | | | | | | | | | |
| 5.250%, 07/01/2052 (Callable 07/01/2032) | | | 350,000 | | | | 387,470 | | | | |
| Town of Hempstead NY, | | | | | | | | | | | |
| 2.125%, 06/15/2041 (Callable 06/15/2029) | | | 1,000,000 | | | | 715,391 | | | | |
| Town of Ramapo NY, | | | | | | | | | | | |
| 3.750%, 03/01/2030 (Callable 01/19/2024) | | | 50,000 | | | | 46,503 | | | | |
| Triborough Bridge & Tunnel Authority, | | | | | | | | | | | |
| 4.500%, 05/15/2047 (Callable 11/15/2032) | | | 500,000 | | | | 517,472 | | | | |
| Westchester County Local Development Corp.: | | | | | | | | | | | |
2.875%, 07/01/2026(3) | | | 500,000 | | | | 490,918 | | | | |
| 5.750%, 11/01/2053 (Callable 11/01/2033) | | | | | | | | | | | |
| (Insured by AGM) | | | 750,000 | | | | 846,355 | | | | |
| Total New York | | | | | | | | | | | |
| (Cost $10,607,053) | | | | | | | 10,938,349 | | | | 5.8 | % |
| North Carolina | | | | | | | | | | | | |
| Greater Asheville Regional Airport Authority: | | | | | | | | | | | | |
| 5.250%, 07/01/2038 (Callable 07/01/2032) | | | | | | | | | | | | |
| (Insured by AGM) | | | 350,000 | | | | 393,836 | | | | | |
| 5.500%, 07/01/2047 (Callable 07/01/2032) | | | | | | | | | | | | |
| (Insured by AGM) | | | 500,000 | | | | 552,061 | | | | | |
| North Carolina Housing Finance Agency, | | | | | | | | | | | | |
| 2.850%, 07/01/2040 (Callable 07/01/2029) | | | 460,000 | | | | 395,968 | | | | | |
| North Carolina Medical Care Commission, | | | | | | | | | | | | |
| 5.000%, 01/01/2038 (Callable 01/01/2026) | | | 250,000 | | | | 250,766 | | | | | |
| Winston-Salem State University, | | | | | | | | | | | | |
| 4.250%, 06/01/2032 (Callable 06/01/2024) | | | 50,000 | | | | 49,809 | | | | | |
| Total North Carolina | | | | | | | | | | | | |
| (Cost $1,575,934) | | | | | | | 1,642,440 | | | | 0.9 | % |
| North Dakota | | | | | | | | | | | | |
| City of Horace ND: | | | | | | | | | | | | |
| 5.000%, 05/01/2048 (Callable 05/01/2031) | | | 500,000 | | | | 501,025 | | | | | |
| 6.000%, 05/01/2049 (Callable 05/01/2032) | | | 500,000 | | | | 535,194 | | | | | |
| City of Mandan ND, | | | | | | | | | | | | |
| 3.000%, 09/01/2036 (Callable 09/01/2024) | | | 200,000 | | | | 184,523 | | | | | |
| County of Ward ND: | | | | | | | | | | | | |
| 5.000%, 06/01/2029 (Callable 06/01/2028) | | | 200,000 | | | | 196,272 | | | | | |
| 5.000%, 06/01/2031 (Callable 06/01/2028) | | | 300,000 | | | | 292,353 | | | | | |
| North Dakota Housing Finance Agency, | | | | | | | | | | | | |
| 5.750%, 01/01/2054 (Callable 07/01/2032) | | | 1,000,000 | | | | 1,081,039 | | | | | |
| Williston Parks & Recreation District, | | | | | | | | | | | | |
| 4.500%, 03/01/2025 (Callable 01/16/2024) | | | 50,000 | | | | 49,488 | | | | | |
| Total North Dakota | | | | | | | | | | | | |
| (Cost $2,807,488) | | | | | | | 2,839,894 | | | | 1.5 | % |
| Ohio | | | | | | | | | | | | |
| Akron Bath Copley Joint | | | | | | | | | | | | |
| Township Hospital District, | | | | | | | | | | | | |
| 5.000%, 11/15/2031 (Callable 11/15/2030) | | | 100,000 | | | | 109,667 | | | | | |
| Cleveland-Cuyahoga County Port Authority, | | | | | | | | | | | | |
| 5.500%, 08/01/2052 (Callable 08/01/2032) | | | 350,000 | | | | 376,846 | | | | | |
| County of Hamilton OH, | | | | | | | | | | | | |
| 5.000%, 02/01/2028 (Callable 02/01/2024) | | | 550,000 | | | | 550,480 | | | | | |
| County of Montgomery OH, | | | | | | | | | | | | |
| 3.000%, 08/01/2034 (Callable 02/01/2031) | | | 100,000 | | | | 95,586 | | | | | |
| Ohio Air Quality Development Authority, | | | | | | | | | | | | |
| 4.000%, 09/01/2030 | | | | | | | | | | | | |
(Mandatory Tender Date 06/01/2027)(1) | | | 520,000 | | | | 528,357 | | | | | |
| Ohio Housing Finance Agency: | | | | | | | | | | | | |
| 6.000%, 02/01/2026 | | | | | | | | | | | | |
(Callable 02/01/2025)(3) | | | 500,000 | | | | 503,698 | | | | | |
| 2.900%, 09/01/2045 (Callable 03/01/2029) | | | | | | | | | | | | |
| (Insured by GNMA) | | | 800,000 | | | | 640,031 | | | | | |
| 3.750%, 09/01/2050 (Callable 03/01/2029) | | | | | | | | | | | | |
| (Insured by GNMA) | | | 50,000 | | | | 49,774 | | | | | |
| Ohio Turnpike & Infrastructure Commission, | | | | | | | | | | | | |
5.700%, 02/15/2034 (Callable 02/15/2031)(5) | | | 95,000 | | | | 114,719 | | | | | |
| Port of Greater Cincinnati | | | | | | | | | | | | |
| Development Authority, | | | | | | | | | | | | |
5.000%, 05/01/2025 (Callable 01/29/2024)(3) | | | 750,000 | | | | 749,927 | | | | | |
| Summit County Development | | | | | | | | | | | | |
| Finance Authority, | | | | | | | | | | | | |
| 5.750%, 12/01/2053 (Callable 12/01/2033) | | | 250,000 | | | | 257,796 | | | | | |
| Warren County Port Authority, | | | | | | | | | | | | |
| 4.000%, 12/01/2053 (Callable 12/01/2031) | | | 100,000 | | | | 81,055 | | | | | |
| Total Ohio | | | | | | | | | | | | |
| (Cost $4,163,009) | | | | | | | 4,057,936 | | | | 2.2 | % |
| Oklahoma | | | | | | | | | | | | |
| Canadian County Educational | | | | | | | | | | | | |
| Facilities Authority, | | | | | | | | | | | | |
| 5.000%, 09/01/2029 | | | 1,000,000 | | | | 1,097,805 | | | | | |
| Muskogee Industrial Trust: | | | | | | | | | | | | |
| 4.000%, 09/01/2032 (Callable 09/01/2029) | | | 250,000 | | | | 250,743 | | | | | |
| 4.000%, 09/01/2033 (Callable 09/01/2029) | | | 500,000 | | | | 500,511 | | | | | |
| Oklahoma Turnpike Authority, | | | | | | | | | | | | |
| 4.500%, 01/01/2053 (Callable 01/01/2032) | | | 500,000 | | | | 507,868 | | | | | |
| Total Oklahoma | | | | | | | | | | | | |
| (Cost $2,248,516) | | | | | | | 2,356,927 | | | | 1.3 | % |
| Oregon | | | | | | | | | | | | |
| Clackamas County Hospital Facility Authority, | | | | | | | | | | | | |
| 5.000%, 05/15/2024 | | | 165,000 | | | | 164,604 | | | | | |
| Port of Portland OR, | | | | | | | | | | | | |
| 5.000%, 07/01/2028 | | | 425,000 | | | | 457,454 | | | | | |
| Salem Hospital Facility Authority, | | | | | | | | | | | | |
| 5.000%, 05/15/2034 (Callable 05/15/2029) | | | 50,000 | | | | 54,642 | | | | | |
| Yamhill County Hospital Authority, | | | | | | | | | | | | |
| 2.500%, 11/15/2028 (Callable 01/19/2024) | | | 250,000 | | | | 221,395 | | | | | |
| Total Oregon | | | | | | | | | | | | |
| (Cost $877,198) | | | | | | | 898,095 | | | | 0.5 | % |
| Pennsylvania | | | | | | | | | | | | |
| Borough of Bellevue PA, | | | | | | | | | | | | |
| 2.000%, 04/01/2031 (Callable 04/01/2027) | | | | | | | | | | | | |
| (Insured by BAM) | | | 400,000 | | | | 350,641 | | | | | |
| Chester County Industrial | | | | | | | | | | | | |
| Development Authority, | | | | | | | | | | | | |
| 5.000%, 08/01/2035 (Callable 01/29/2024) | | | 135,000 | | | | 134,058 | | | | | |
| Delaware County Industrial | | | | | | | | | | | | |
| Development Authority, | | | | | | | | | | | | |
4.375%, 06/01/2026(3) | | | 510,000 | | | | 503,278 | | | | | |
| East Hempfield Township Industrial | | | | | | | | | | | | |
| Development Authority, | | | | | | | | | | | | |
| 5.000%, 12/01/2027 (Callable 12/01/2025) | | | 400,000 | | | | 409,751 | | | | | |
| Hempfield School District: | | | | | | | | | | | | |
| 2.000%, 04/15/2030 (Callable 04/15/2027) | | | | | | | | | | | | |
| (Insured by ST AID) | | | 150,000 | | | | 135,146 | | | | | |
| 2.000%, 04/15/2031 (Callable 04/15/2027) | | | | | | | | | | | | |
| (Insured by ST AID) | | | 200,000 | | | | 177,473 | | | | | |
| Highlands School District, | | | | | | | | | | | | |
| 5.000%, 04/15/2032 (Insured by AGM) | | | 610,000 | | | | 695,834 | | | | | |
The accompanying notes are an integral part of these financial statements.
Baird Municipal Bond Fund
Schedule of Investments, December 31, 2023
Long-Term Investments (cont.)
| | | Principal | | | | | | % of | |
| | | Amount | | | Value | | | Net Assets | |
| Lancaster County Hospital Authority, | | | | | | | | | |
| 5.000%, 11/01/2040 (Callable 11/01/2029) | | $ | 275,000 | | | $ | 292,587 | | | | |
| Mckeesport Area School District, | | | | | | | | | | | |
| 0.000%, 10/01/2033 (Insured by AGM) | | | 400,000 | | | | 282,802 | | | | |
| Mercer County Industrial | | | | | | | | | | | |
| Development Authority, | | | | | | | | | | | |
6.125%, 10/01/2050 (Callable 10/01/2025)(3) | | | 650,000 | | | | 437,370 | | | | |
| Montgomery County Industrial | | | | | | | | | | | |
| Development Authority, | | | | | | | | | | | |
| 4.100%, 04/01/2053 | | | | | | | | | | | |
(Mandatory Tender Date 04/03/2028)(1) | | | 1,000,000 | | | | 1,019,101 | | | | |
| Pennsylvania Economic | | | | | | | | | | | |
| Development Financing Authority: | | | | | | | | | | | |
| 0.000%, 01/01/2039 (County Guaranteed) | | | 140,000 | | | | 73,136 | | | | |
| 5.000%, 06/30/2042 (Callable 06/30/2026) | | | 300,000 | | | | 302,202 | | | | |
| Pennsylvania Higher Educational | | | | | | | | | | | |
| Facilities Authority, | | | | | | | | | | | |
| 5.000%, 07/01/2035 (Callable 07/01/2026) | | | 150,000 | | | | 150,276 | | | | |
| Pennsylvania Turnpike Commission: | | | | | | | | | | | |
6.375%, 12/01/2038 (Callable 12/01/2027)(5) | | | 45,000 | | | | 50,141 | | | | |
0.000%, 12/01/2040 (Callable 06/01/2029)(5) | | | 75,000 | | | | 77,783 | | | | |
0.000%, 12/01/2041 (Callable 12/01/2035)(5) | | | 125,000 | | | | 117,129 | | | | |
| Philadelphia Authority for | | | | | | | | | | | |
| Industrial Development: | | | | | | | | | | | |
| 5.000%, 09/01/2024 | | | 695,000 | | | | 701,923 | | | | |
| 5.000%, 06/15/2032 (Callable 06/15/2030) | | | 340,000 | | | | 341,665 | | | | |
| 5.250%, 11/01/2052 (Callable 11/01/2032) | | | 250,000 | | | | 267,045 | | | | |
| Sayre Health Care Facilities Authority, | | | | | | | | | | | |
| 4.155%, 12/01/2031 (3 Month LIBOR | | | | | | | | | | | |
USD + 0.830%) (Callable 01/29/2024)(2)(7) | | | 500,000 | | | | 474,921 | | | | |
| State Public School Building Authority: | | | | | | | | | | | |
| 5.000%, 12/01/2029 (Callable 12/01/2026) | | | | | | | | | | | |
| (Insured by AGM) | | | 925,000 | | | | 981,467 | | | | |
| 0.000%, 05/15/2030 (Insured by NATL) | | | 200,000 | | | | 161,690 | | | | |
| Tulpehocken Area School District, | | | | | | | | | | | |
| 5.250%, 10/01/2049 (Callable 10/01/2031) | | | | | | | | | | | |
| (Insured by BAM) | | | 500,000 | | | | 543,700 | | | | |
| Total Pennsylvania | | | | | | | | | | | |
| (Cost $8,619,998) | | | | | | | 8,681,119 | | | | 4.6 | % |
| Rhode Island | | | | | | | | | | | | |
| Providence Redevelopment Agency, | | | | | | | | | | | | |
| 5.000%, 04/01/2027 (Callable 04/01/2025) | | | 410,000 | | | | 416,309 | | | | | |
| Total Rhode Island | | | | | | | | | | | | |
| (Cost $417,947) | | | | | | | 416,309 | | | | 0.2 | % |
| South Carolina | | | | | | | | | | | | |
| Scago Educational Facilities Corp. for | | | | | | | | | | | | |
| Spartanburg School District No. 1, | | | | | | | | | | | | |
| 3.375%, 06/01/2030 (Callable 06/01/2025) | | | 100,000 | | | | 99,864 | | | | | |
| South Carolina Jobs-Economic | | | | | | | | | | | | |
| Development Authority: | | | | | | | | | | | | |
| 5.250%, 11/15/2028 (Callable 05/15/2025) | | | 600,000 | | | | 603,415 | | | | | |
| 4.000%, 08/15/2030 (Callable 08/15/2026) | | | 100,000 | | | | 100,687 | | | | | |
| 5.250%, 08/15/2033 (Callable 08/15/2026) | | | 150,000 | | | | 156,090 | | | | | |
| 7.750%, 11/15/2058 (Callable 11/15/2030) | | | 300,000 | | | | 309,125 | | | | | |
| Spartanburg County School District No. 4, | | | | | | | | | | | | |
| 5.250%, 03/01/2052 (Callable 03/01/2032) | | | | | | | | | | | | |
| (Insured by SCSDE) | | | 1,000,000 | | | | 1,118,323 | | | | | |
| Three Rivers Solid Waste Authority, | | | | | | | | | | | | |
| 0.000%, 10/01/2025 | | | 750,000 | | | | 706,057 | | | | | |
| Total South Carolina | | | | | | | | | | | | |
| (Cost $3,064,932) | | | | | | | 3,093,561 | | | | 1.6 | % |
| South Dakota | | | | | | | | | | | | |
| City of Rapid City SD: | | | | | | | | | | | | |
| 5.000%, 12/01/2026 | | | 220,000 | | | | 227,557 | | | | | |
| 4.000%, 12/01/2035 (Callable 12/01/2029) | | | 125,000 | | | | 125,281 | | | | | |
| South Dakota Health & Educational | | | | | | | | | | | | |
| Facilities Authority, | | | | | | | | | | | | |
| 4.000%, 11/01/2034 (Callable 11/01/2024) | | | 600,000 | | | | 603,199 | | | | | |
| Total South Dakota | | | | | | | | | | | | |
| (Cost $955,245) | | | | | | | 956,037 | | | | 0.5 | % |
| Tennessee | | | | | | | | | | | | |
| Chattanooga Health Educational & | | | | | | | | | | | | |
| Housing Facility Board, | | | | | | | | | | | | |
| 5.000%, 08/01/2033 (Callable 08/01/2029) | | | 250,000 | | | | 273,466 | | | | | |
| Nashville & Davidson County | | | | | | | | | | | | |
| Metropolitan Government: | | | | | | | | | | | | |
| 5.000%, 07/01/2037 (Callable 01/01/2034) | | | 500,000 | | | | 580,172 | | | | | |
| 5.250%, 05/01/2053 (Callable 05/01/2033) | | | 500,000 | | | | 543,285 | | | | | |
| Tennergy Corp., | | | | | | | | | | | | |
| 5.500%, 10/01/2053 (Callable 09/01/2030) | | | | | | | | | | | | |
(Mandatory Tender Date 12/01/2030)(1) | | | 500,000 | | | | 533,699 | | | | | |
| Tennessee Housing Development Agency, | | | | | | | | | | | | |
| 3.850%, 07/01/2043 (Callable 07/01/2027) | | | 220,000 | | | | 214,996 | | | | | |
| Total Tennessee | | | | | | | | | | | | |
| (Cost $2,092,712) | | | | | | | 2,145,618 | | | | 1.1 | % |
| Texas | | | | | | | | | | | | |
| Arlington Higher Education Finance Corp., | | | | | | | | | | | | |
| 4.000%, 08/15/2036 (Callable 08/15/2031) | | | | | | | | | | | | |
| (PSF Guaranteed) | | | 440,000 | | | | 452,926 | | | | | |
| Arlington Housing Finance Corp., | | | | | | | | | | | | |
| 4.500%, 04/01/2041 (Callable 04/01/2026) | | | | | | | | | | | | |
(Mandatory Tender Date 04/01/2027)(1) | | | 1,815,000 | | | | 1,861,014 | | | | | |
| Austin-Bergstrom Landhost Enterprises, Inc., | | | | | | | | | | | | |
| 5.000%, 10/01/2035 (Callable 10/01/2027) | | | 100,000 | | | | 103,046 | | | | | |
| Bells Independent School District, | | | | | | | | | | | | |
| 5.000%, 02/15/2041 (Callable 08/15/2033) | | | | | | | | | | | | |
| (PSF Guaranteed) | | | 690,000 | | | | 783,684 | | | | | |
| Brazoria County Toll Road Authority, | | | | | | | | | | | | |
| 0.000%, 03/01/2038 (Callable 03/01/2030) | | | | | | | | | | | | |
(County Guaranteed)(5) | | | 105,000 | | | | 101,172 | | | | | |
| Brazos Higher Education Authority, Inc., | | | | | | | | | | | | |
| 2.350%, 04/01/2040 (Callable 04/01/2030) | | | 5,000 | | | | 4,975 | | | | | |
| Brushy Creek Regional Utility Authority, Inc., | | | | | | | | | | | | |
| 4.000%, 08/01/2031 (Callable 08/01/2026) | | | 400,000 | | | | 405,775 | | | | | |
| Chisum Independent School District, | | | | | | | | | | | | |
| 4.000%, 08/15/2048 (Callable 08/15/2032) | | | | | | | | | | | | |
| (PSF Guaranteed) | | | 500,000 | | | | 500,272 | | | | | |
| City of Magnolia TX, | | | | | | | | | | | | |
5.700%, 09/01/2046(3) | | | 50,000 | | | | 49,669 | | | | | |
| Clifton Higher Education Finance Corp.: | | | | | | | | | | | | |
6.000%, 03/01/2029 (Callable 03/01/2024)(5) | | | 385,000 | | | | 386,082 | | | | | |
| 5.750%, 08/15/2038 (Callable 08/15/2025) | | | 10,000 | | | | 10,040 | | | | | |
| Collin County Municipal Utility District No. 2, | | | | | | | | | | | | |
| 5.000%, 09/01/2038 (Callable 10/01/2029) | | | | | | | | | | | | |
| (Insured by BAM) | | | 1,000,000 | | | | 1,065,040 | | | | | |
| Conroe Municipal Utility District No. 1, | | | | | | | | | | | | |
| 2.250%, 09/01/2035 (Callable 09/01/2027) | | | | | | | | | | | | |
| (Insured by BAM) | | | 620,000 | | | | 519,493 | | | | | |
| Dalhart Independent School District, | | | | | | | | | | | | |
| 5.000%, 02/15/2041 (Callable 02/15/2032) | | | | | | | | | | | | |
| (PSF Guaranteed) | | | 1,000,000 | | | | 1,120,468 | | | | | |
| Dallas Independent School District, | | | | | | | | | | | | |
| 3.000%, 02/15/2033 (Callable 02/15/2030) | | | | | | | | | | | | |
| (PSF Guaranteed) | | | 500,000 | | | | 494,495 | | | | | |
The accompanying notes are an integral part of these financial statements.
Baird Municipal Bond Fund
Schedule of Investments, December 31, 2023
Long-Term Investments (cont.)
| | | Principal | | | | | | % of | |
| | | Amount | | | Value | | | Net Assets | |
| El Paso Housing Finance Corp., | | | | | | | | | |
| 4.500%, 03/01/2026 (Mandatory Tender | | | | | | | | | |
Date 03/01/2025) (Insured by HUD)(1) | | $ | 500,000 | | | $ | 504,457 | | | | |
| Eula Independent School District, | | | | | | | | | | | |
| 4.125%, 02/15/2048 (Callable 02/15/2032) | | | | | | | | | | | |
| (PSF Guaranteed) | | | 500,000 | | | | 506,898 | | | | |
| Far North Fort Worth Municipal | | | | | | | | | | | |
| Utility District No. 1, | | | | | | | | | | | |
| 4.000%, 09/01/2037 (Callable 10/01/2029) | | | | | | | | | | | |
| (Insured by BAM) | | | 350,000 | | | | 351,472 | | | | |
| Harris County Cultural Education | | | | | | | | | | | |
| Facilities Finance Corp., | | | | | | | | | | | |
| 3.650%, 12/01/2049 | | | | | | | | | | | |
| (SIFMA Municipal Swap Index + 0.570%) | | | | | | | | | | | |
| (Callable 06/01/2024) | | | | | | | | | | | |
(Mandatory Tender Date 12/04/2024)(2) | | | 40,000 | | | | 39,986 | | | | |
| Harris County-Houston Sports Authority, | | | | | | | | | | | |
| 0.000%, 11/15/2025 (Insured by NATL) | | | 500,000 | | | | 467,981 | | | | |
| Houston Higher Education Finance Corp., | | | | | | | | | | | |
| 3.375%, 10/01/2037 (Callable 01/29/2024) | | | 200,000 | | | | 168,767 | | | | |
| Kendall County Water Control & | | | | | | | | | | | |
| Improvement District No. 2A, | | | | | | | | | | | |
| 5.000%, 09/01/2046 (Callable 11/01/2030) | | | | | | | | | | | |
| (Insured by AGM) | | | 510,000 | | | | 536,045 | | | | |
| Matagorda County Navigation District No. 1: | | | | | | | | | | | |
| 2.600%, 11/01/2029 | | | 575,000 | | | | 527,499 | | | | |
| 4.400%, 05/01/2030 (Insured by AMBAC) | | | 70,000 | | | | 71,834 | | | | |
| Mckinney Municipal Utility District No. 1, | | | | | | | | | | | |
| 3.375%, 09/01/2034 (Callable 05/01/2030) | | | | | | | | | | | |
| (Insured by BAM) | | | 260,000 | | | | 256,596 | | | | |
| Montgomery County Municipal | | | | | | | | | | | |
| Utility District No. 88, | | | | | | | | | | | |
| 4.250%, 09/01/2047 (Callable 09/01/2029) | | | | | | | | | | | |
| (Insured by AGM) | | | 500,000 | | | | 485,604 | | | | |
| Needville Independent School District, | | | | | | | | | | | |
| 4.250%, 08/15/2053 (Callable 08/15/2031) | | | | | | | | | | | |
| (PSF Guaranteed) | | | 1,000,000 | | | | 1,018,386 | | | | |
| Northwest Harris County Municipal | | | | | | | | | | | |
| Utility District No. 5, | | | | | | | | | | | |
| 2.500%, 05/01/2028 (Callable 05/01/2024) | | | | | | | | | | | |
| (Insured by BAM) | | | 350,000 | | | | 340,103 | | | | |
| Pecos Barstow Toyah | | | | | | | | | | | |
| Independent School District, | | | | | | | | | | | |
| 5.000%, 02/15/2042 (Callable 02/15/2026) | | | | | | | | | | | |
| (PSF Guaranteed) | | | 1,000,000 | | | | 1,024,694 | | | | |
| Port Beaumont Navigation District, | | | | | | | | | | | |
4.000%, 01/01/2050 (Callable 01/29/2024)(3) | | | 500,000 | | | | 357,853 | | | | |
| Port of Port Arthur Navigation District, | | | | | | | | | | | |
| 2.500%, 04/01/2040 | | | | | | | | | | | |
(Optional Put Date 01/02/2024)(1) | | | 1,000,000 | | | | 1,000,000 | | | | |
| Rio Grande City Consolidated | | | | | | | | | | | |
| Independent School District, | | | | | | | | | | | |
| 3.000%, 08/15/2034 (Callable 08/15/2030) | | | | | | | | | | | |
| (PSF Guaranteed) | | | 250,000 | | | | 245,913 | | | | |
| Slidell Independent School District, | | | | | | | | | | | |
| 4.375%, 08/15/2053 (Callable 08/15/2032) | | | | | | | | | | | |
| (PSF Guaranteed) | | | 1,000,000 | | | | 1,042,245 | | | | |
| Tarrant County Cultural Education | | | | | | | | | | | |
| Facilities Finance Corp.: | | | | | | | | | | | |
| 2.250%, 11/15/2025 | | | 150,000 | | | | 144,311 | | | | |
| 5.000%, 11/15/2027 (Callable 11/15/2026) | | | 510,000 | | | | 521,038 | | | | |
| Tarrant County Hospital District, | | | | | | | | | | | |
| 4.000%, 08/15/2043 (Callable 08/15/2032) | | | 250,000 | | | | 253,656 | | | | |
| Texas Department of Housing & | | | | | | | | | | | |
| Community Affairs, | | | | | | | | | | | |
| 3.750%, 09/01/2049 (Callable 09/01/2028) | | | | | | | | | | | |
| (Insured by GNMA) | | | 655,000 | | | | 618,149 | | | | |
| Texas Municipal Gas Acquisition & | | | | | | | | | | | |
| Supply Corp. I, | | | | | | | | | | | |
| 6.250%, 12/15/2026 | | | 50,000 | | | | 52,326 | | | | |
| Texas Municipal Gas Acquisition & | | | | | | | | | | | |
| Supply Corp. II, | | | | | | | | | | | |
| 4.130%, 09/15/2027 | | | | | | | | | | | |
(3 Month TSFR + 1.045%)(2) | | | 185,000 | | | | 182,945 | | | | |
| Texas Municipal Gas Acquisition & | | | | | | | | | | | |
| Supply Corp. III, | | | | | | | | | | | |
| 5.000%, 12/15/2024 | | | 625,000 | | | | 631,075 | | | | |
| Texas Municipal Gas Acquisition & | | | | | | | | | | | |
| Supply Corp. IV, | | | | | | | | | | | |
| 5.500%, 01/01/2054 (Callable 07/01/2033) | | | | | | | | | | | |
(Mandatory Tender Date 01/01/2034)(1) | | | 500,000 | | | | 555,660 | | | | |
| Texas Public Finance Authority: | | | | | | | | | | | |
| 5.250%, 05/01/2041 (Callable 05/01/2033) | | | | | | | | | | | |
| (Insured by BAM) | | | 500,000 | | | | 550,794 | | | | |
| 5.250%, 05/01/2042 (Callable 05/01/2033) | | | | | | | | | | | |
| (Insured by BAM) | | | 750,000 | | | | 823,310 | | | | |
| Viridian Municipal Management District: | | | | | | | | | | | |
| 5.000%, 12/01/2037 (Callable 12/01/2029) | | | | | | | | | | | |
| (Insured by AGM) | | | 150,000 | | | | 158,732 | | | | |
| 5.000%, 12/01/2045 (Callable 12/01/2029) | | | | | | | | | | | |
| (Insured by AGM) | | | 200,000 | | | | 207,455 | | | | |
| 6.250%, 12/01/2049 (Callable 12/01/2029) | | | 375,000 | | | | 388,625 | | | | |
| Total Texas | | | | | | | | | | | |
| (Cost $21,219,974) | | | | | | | 21,892,560 | | | | 11.7 | % |
| Utah | | | | | | | | | | | | |
| City of Salt Lake City UT: | | | | | | | | | | | | |
| 5.000%, 07/01/2034 (Callable 07/01/2027) | | | 500,000 | | | | 526,647 | | | | | |
| 5.000%, 07/01/2043 (Callable 07/01/2028) | | | 455,000 | | | | 471,664 | | | | | |
| Emery County UT, | | | | | | | | | | | | |
| 4.500%, 11/01/2024 (Callable 01/02/2024) | | | | | | | | | | | | |
(Optional Put Date 01/05/2024)(1) | | | 1,000,000 | | | | 1,000,000 | | | | | |
| Utah Charter School Finance Authority, | | | | | | | | | | | | |
| 4.000%, 10/15/2051 (Callable 10/15/2031) | | | | | | | | | | | | |
| (Insured by UT CSCE) | | | 790,000 | | | | 727,021 | | | | | |
| Utah Housing Corp.: | | | | | | | | | | | | |
| 6.000%, 12/21/2052 (Insured by GNMA) | | | 721,064 | | | | 775,519 | | | | | |
| 6.500%, 05/21/2053 (Insured by GNMA) | | | 496,863 | | | | 552,527 | | | | | |
| Total Utah | | | | | | | | | | | | |
| (Cost $3,966,967) | | | | | | | 4,053,378 | | | | 2.2 | % |
| Vermont | | | | | | | | | | | | |
| Vermont Student Assistance Corp., | | | | | | | | | | | | |
| 5.000%, 06/15/2026 | | | 500,000 | | | | 518,375 | | | | | |
| Total Vermont | | | | | | | | | | | | |
| (Cost $511,690) | | | | | | | 518,375 | | | | 0.3 | % |
| Virginia | | | | | | | | | | | | |
| Arlington County Industrial | | | | | | | | | | | | |
| Development Authority, | | | | | | | | | | | | |
| 5.000%, 07/01/2053 (Callable 07/01/2030) | | | | | | | | | | | | |
(Mandatory Tender Date 07/01/2031)(1) | | | 1,000,000 | | | | 1,111,652 | | | | | |
| Chesapeake Bay Bridge & Tunnel District, | | | | | | | | | | | | |
| 5.500%, 07/01/2025 | | | | | | | | | | | | |
| (ETM) (Insured by NATL) | | | 685,000 | | | | 696,657 | | | | | |
| Farmville Industrial Development Authority, | | | | | | | | | | | | |
| 5.375%, 07/01/2053 (Callable 07/01/2028) | | | | | | | | | | | | |
| (Mandatory Tender Date 07/01/2043) | | | | | | | | | | | | |
| (Insured by AGM) | | | 150,000 | | | | 159,700 | | | | | |
The accompanying notes are an integral part of these financial statements.
Baird Municipal Bond Fund
Schedule of Investments, December 31, 2023
Long-Term Investments (cont.)
| | | Principal | | | | | | % of | |
| | | Amount | | | Value | | | Net Assets | |
| Federal Home Loan Mortgage | | | | | | | | | |
| Corp. (FHLMC), | | | | | | | | | |
| 2.550%, 06/15/2035 | | $ | 470,000 | | | $ | 382,384 | | | | |
| Toll Road Investors Partnership II LP, | | | | | | | | | | | |
0.000%, 02/15/2025 (Insured by NATL)(3) | | | 500,000 | | | | 462,720 | | | | |
| Virginia Small Business Financing Authority, | | | | | | | | | | | |
| 5.250%, 10/01/2029 (Callable 10/01/2024) | | | 520,000 | | | | 526,454 | | | | |
| Total Virginia | | | | | | | | | | | |
| (Cost $3,324,309) | | | | | | | 3,339,567 | | | | 1.8 | % |
| Washington | | | | | | | | | | | | |
| City of Lynnwood WA, | | | | | | | | | | | | |
| 4.750%, 12/01/2042 (Callable 12/01/2032) | | | 435,000 | | | | 476,043 | | | | | |
| King County Housing Authority, | | | | | | | | | | | | |
| 4.000%, 11/01/2036 (Callable 11/01/2029) | | | | | | | | | | | | |
| (County Guaranteed) | | | 600,000 | | | | 611,911 | | | | | |
| Pend Oreille County Public | | | | | | | | | | | | |
| Utility District No. 1, | | | | | | | | | | | | |
| 5.000%, 01/01/2038 (Callable 01/01/2029) | | | 150,000 | | | | 156,244 | | | | | |
| Port of Seattle WA: | | | | | | | | | | | | |
| 4.000%, 08/01/2036 (Callable 08/01/2031) | | | 300,000 | | | | 310,189 | | | | | |
| 5.500%, 08/01/2047 (Callable 08/01/2032) | | | 250,000 | | | | 274,812 | | | | | |
| Snohomish County Housing Authority, | | | | | | | | | | | | |
| 4.000%, 04/01/2033 (Callable 04/01/2031) | | | 500,000 | | | | 521,930 | | | | | |
| State of Washington, | | | | | | | | | | | | |
| 5.000%, 02/01/2045 (Callable 02/01/2033) | | | 1,000,000 | | | | 1,126,045 | | | | | |
| Tacoma Metropolitan Park District, | | | | | | | | | | | | |
| 5.000%, 12/01/2024 | | | 1,000,000 | | | | 1,009,604 | | | | | |
| Washington Health Care Facilities Authority: | | | | | | | | | | | | |
| 4.480%, 01/01/2035 | | | | | | | | | | | | |
| (SIFMA Municipal Swap Index + 1.400%) | | | | | | | | | | | | |
| (Callable 07/01/2024) | | | | | | | | | | | | |
(Mandatory Tender Date 01/01/2025)(2) | | | 90,000 | | | | 90,015 | | | | | |
| 5.000%, 08/15/2037 (Callable 02/15/2028) | | | 300,000 | | | | 311,850 | | | | | |
| 5.000%, 08/01/2049 (Callable 08/01/2029) | | | 250,000 | | | | 257,167 | | | | | |
| Washington State Housing | | | | | | | | | | | | |
| Finance Commission: | | | | | | | | | | | | |
| 3.375%, 04/20/2037 | | | 1,248,599 | | | | 1,128,356 | | | | | |
| 6.250%, 07/01/2059 | | | | | | | | | | | | |
(Callable 07/01/2030)(3) | | | 530,000 | | | | 583,993 | | | | | |
| Total Washington | | | | | | | | | | | | |
| (Cost $6,656,762) | | | | | | | 6,858,159 | | | | 3.7 | % |
| Wisconsin | | | | | | | | | | | | |
| Appleton Redevelopment Authority, | | | | | | | | | | | | |
| 3.500%, 06/01/2036 (Callable 01/02/2024) | | | | | | | | | | | | |
(Optional Put Date 01/05/2024)(1) | | | 500,000 | | | | 500,000 | | | | | |
| Boscobel Area School District, | | | | | | | | | | | | |
| 5.000%, 03/01/2038 (Callable 03/01/2031) | | | | | | | | | | | | |
| (Insured by BAM) | | | 735,000 | | | | 813,381 | | | | | |
| City of Wausau WI, | | | | | | | | | | | | |
| 2.750%, 05/01/2039 | | | 860,000 | | | | 705,112 | | | | | |
| County of Waushara WI, | | | | | | | | | | | | |
| 4.500%, 06/01/2027 (Callable 06/01/2025) | | | 500,000 | | | | 511,257 | | | | | |
| Howard-Suamico School District, | | | | | | | | | | | | |
| 1.625%, 03/01/2031 (Callable 03/01/2028) | | | 750,000 | | | | 652,107 | | | | | |
| Palmyra-Eagle Area School District, | | | | | | | | | | | | |
| 3.000%, 03/01/2025 (Callable 01/29/2024) | | | 75,000 | | | | 73,660 | | | | | |
| Public Finance Authority: | | | | | | | | | | | | |
5.000%, 05/15/2026 (Callable 05/15/2025)(3) | | | 250,000 | | | | 247,027 | | | | | |
3.500%, 03/01/2027 (Callable 01/29/2024)(3) | | | 800,000 | | | | 780,315 | | | | | |
9.000%, 11/01/2028 (Callable 11/01/2027)(3) | | | 275,000 | | | | 275,423 | | | | | |
| 3.250%, 01/01/2029 | | | 130,000 | | | | 121,255 | | | | | |
0.000%, 09/01/2029 (Callable 09/01/2026)(3) | | | 750,000 | | | | 493,767 | | | | | |
| 6.125%, 12/15/2029 | | | | | | | | | | | | |
(Callable 12/15/2027)(3) | | | 500,000 | | | | 497,871 | | | | | |
| 5.000%, 01/01/2031 (Callable 01/01/2030) | | | 550,000 | | | | 594,720 | | | | | |
| 5.000%, 10/01/2044 (Callable 04/01/2029) | | | 250,000 | | | | 261,118 | | | | | |
| 4.000%, 01/01/2046 (Callable 01/01/2027) | | | 1,000,000 | | | | 785,224 | | | | | |
| 3.300%, 10/01/2046 | | | | | | | | | | | | |
(Mandatory Tender Date 10/01/2026)(1) | | | 245,000 | | | | 245,173 | | | | | |
6.750%, 07/01/2063 (Callable 07/01/2033)(3) | | | 750,000 | | | | 770,068 | | | | | |
| Westosha Central High School District, | | | | | | | | | | | | |
| 1.600%, 03/01/2031 (Callable 03/01/2028) | | | 400,000 | | | | 338,462 | | | | | |
| Wisconsin Health & Educational | | | | | | | | | | | | |
| Facilities Authority: | | | | | | | | | | | | |
| 5.000%, 03/01/2028 (Callable 03/01/2024) | | | 300,000 | | | | 299,303 | | | | | |
| 5.500%, 12/01/2052 (Callable 12/01/2032) | | | 250,000 | | | | 275,036 | | | | | |
| Wisconsin Housing & Economic | | | | | | | | | | | | |
| Development Authority: | | | | | | | | | | | | |
3.500%, 07/01/2025 (Insured by HUD)(3) | | | 50,000 | | | | 48,459 | | | | | |
| 2.450%, 11/01/2046 (Callable 05/01/2030) | | | | | | | | | | | | |
| (Insured by HUD) | | | 1,500,000 | | | | 1,056,590 | | | | | |
| Total Wisconsin | | | | | | | | | | | | |
| (Cost $10,110,941) | | | | | | | 10,345,328 | | | | 5.5 | % |
| Wyoming | | | | | | | | | | | | |
| Carbon County Specific Purpose | | | | | | | | | | | | |
| Tax Joint Powers Board, | | | | | | | | | | | | |
| 5.000%, 06/15/2025 | | | 100,000 | | | | 102,101 | | | | | |
| Sublette County Hospital District, | | | | | | | | | | | | |
| 5.000%, 06/15/2026 (Callable 06/15/2025) | | | 500,000 | | | | 502,535 | | | | | |
| Total Wyoming | | | | | | | | | | | | |
| (Cost $604,290) | | | | | | | 604,636 | | | | 0.3 | % |
| Total Long-Term Investments | | | | | | | | | | | | |
| (Cost $182,230,636) | | | | | | | 185,989,179 | | | | 99.0 | % |
The accompanying notes are an integral part of these financial statements.
Baird Municipal Bond Fund
Schedule of Investments, December 31, 2023
Short-Term Investment
| | | | | | | | | % of | |
| | | Shares | | | Value | | | Net Assets | |
| Money Market Mutual Fund | | | | | | | | | |
| Federated Hermes Institutional Tax-Free | | | | | | | | | |
Cash Trust, Premier Shares, 4.03%(4) | | | 1,329,918 | | | $ | 1,329,918 | | | | |
| Total Short-Term Investment | | | | | | | | | | | |
| (Cost $1,329,918) | | | | | | | 1,329,918 | | | | 0.7 | % |
| Total Investments | | | | | | | | | | | | |
| (Cost $183,560,554) | | | | | | | 187,319,097 | | | | 99.7 | % |
| Other Assets in Excess of Liabilities | | | | | | | 582,633 | | | | 0.3 | % |
| TOTAL NET ASSETS | | | | | | $ | 187,901,730 | | | | 100.0 | % |
Notes to Schedule of Investments
AGC – Assured Guaranty Corp.
AGM – Assured Guaranty Municipal
AMBAC – Ambac Assurance Corp.
BAM – Build America Mutual Assurance Co.
FHA – Federal Housing Administration
FHLMC – Federal Home Loan Mortgage Corporation
FNMA – Federal National Mortgage Association
GNMA – Government National Mortgage Association
HUD – US Department of Housing and Development
NATL – National Public Finance Guarantee Corp.
Q-SBLF – Qualified School Building Loan Fund
SCH BD GTY – School Board Guaranty
SD CRED PROG – State Credit Enhancement Program
SONYMA – State of New York Mortgage Agency
SCSDE – South Carolina School District
ST AID – State Aid Intercept/Withholding
UT CSCE – Utah Charter School Credit Enhancement Program
ETM – Escrowed to Maturity
LIBOR – London Inter-bank Offered Rate
PSF – Permanent School Fund
SIFMA – Securities Industry and Financial Markets Association
TSFR – Term Secured Overnight Financing Rate
(1) | Variable rate security. The rate reported is the rate in effect as of December 31, 2023. |
(2) | Variable rate security based on a reference index and spread. The rate reported is the rate as of the last reset date in effect as of December 31, 2023. |
(3) | Includes securities exempt from registration under Rule 144A of the Securities Act of 1933. These securities may be resold in transactions exempt from registration to qualified institutional buyers. At December 31, 2023, the value of these securities totaled $14,440,061, which represented 7.68% of total net assets. |
(4) | Seven-day yield. |
(5) | Step-up bond; the interest rate shown is the rate in effect as of December 31, 2023. |
(6) | Security or a portion of the security purchased on a when-issued or delayed delivery basis. |
(7) | Securities referencing LIBOR are expected to transition to an alternative reference rate by the security’s next scheduled coupon reset date. |
The accompanying notes are an integral part of these financial statements.
Baird Municipal Bond Fund
Summary of Fair Value Exposure at December 31, 2023
The Fund has adopted authoritative fair valuation accounting standards which establish a definition of fair value and set out a hierarchy for measuring fair value. These standards require additional disclosures about the various inputs and valuation techniques used to develop the measurements of fair value and a discussion on changes in valuation techniques and related inputs during the period. These standards define fair value as the price that would be received to sell an asset or paid to transfer a liability in an orderly transaction between market participants at the measurement date.
The fair value hierarchy is organized into three levels based upon the assumptions (referred to as “inputs”) used in pricing the asset or liability. These standards state that “observable inputs” reflect the assumptions market participants would use in pricing the asset or liability based on market data obtained from independent sources and “unobservable inputs” reflect an entity’s own assumptions about the assumptions market participants would use in pricing the asset or liability. These inputs are summarized into three broad levels and described below:
Level 1 – Quoted prices (unadjusted) in active markets for identical assets or liabilities that the reporting entity can access at the measurement date.
Level 2 – Inputs other than quoted prices included within Level 1 that are observable for the asset or liability, either directly or indirectly.
Level 3 – Unobservable inputs for the asset or liability.
The inputs or methodology used for valuing securities are not necessarily an indication of the risk associated with investing in those securities.
The following is a summary of the inputs used to value the Fund’s investments as of December 31, 2023:
| | | Level 1 | | | Level 2 | | | Level 3 | | | Total | |
| Long-Term Investments | | | | | | | | | | | | |
| Municipal Bonds | | $ | — | | | $ | 185,989,179 | | | $ | — | | | $ | 185,989,179 | |
| Total Long-Term Investments | | | — | | | | 185,989,179 | | | | — | | | | 185,989,179 | |
| Short-Term Investment | | | | | | | | | | | | | | | | |
| Money Market Mutual Fund | | | 1,329,918 | | | | — | | | | — | | | | 1,329,918 | |
| Total Short-Term Investment | | | 1,329,918 | | | | — | | | | — | | | | 1,329,918 | |
| Total Investments | | $ | 1,329,918 | | | $ | 185,989,179 | | | $ | — | | | $ | 187,319,097 | |
Changes in valuation techniques may result in transfers into or out of assigned levels within the fair value hierarchy. There were no transfers into or out of Level 3 during the year, as compared to the security classifications from the prior year’s annual report. See the Fund’s Valuation Policy in Note 2a to the financial statements.
The accompanying notes are an integral part of these financial statements.
Additional Information on Fund Expenses
December 31, 2023 (Unaudited)
Expense ExampleAs a shareholder of the Funds, you incur ongoing costs, such as management fees; distribution and/or service (12b-1) fees; and other fund expenses. Although the Funds do not charge any sales loads, redemption fees, or other transaction fees, you will be assessed fees for outgoing wire transfers, returned checks and stop payment orders at prevailing rates charged by U.S. Bancorp Fund Services, LLC, doing business as U.S. Bank Global Fund Services, the Funds’ transfer agent. If you request that a redemption be made by wire transfer, currently the Funds’ transfer agent charges a $15.00 fee.
This Example is intended to help you understand your ongoing costs (in dollars) of investing in each Fund and to compare these costs with the ongoing costs of investing in other mutual funds. The Example is based on an investment of $1,000 invested at the beginning of the period and held for the entire period (7/1/23 – 12/31/23).
Actual Expenses
The third and fourth columns of the following tables provide information about account values and actual expenses. You may use the information in these columns, together with the amount you invested, to estimate the expenses that you paid over the period. Simply divide your account value by $1,000 (for example, an $8,600 account value divided by $1,000 = 8.6), then multiply the result by the number in the fourth column entitled “Expenses Paid During Period’’ to estimate the expenses you paid on your account during this period.
Hypothetical Example for Comparison Purposes
The fifth and sixth columns of the following tables provide information about hypothetical account values and hypothetical expenses based on each Fund’s actual expense ratio and an assumed rate of return of 5% per year before expenses, which is not each Fund’s actual return. The hypothetical account values and expenses may not be used to estimate the actual ending account balance or expenses you paid for the period. You may use this information to compare the ongoing costs of investing in the Funds and other mutual funds. To do so, compare this 5% hypothetical example with the 5% hypothetical examples that appear in the shareholder reports of the other mutual funds. Please note that the expenses shown in the table are meant to highlight your ongoing costs only. Therefore, the sixth column of the tables (entitled “Expenses Paid During Period”) is useful in comparing ongoing costs only, and will not help you determine the relative total costs of owning different mutual funds.
Actual vs. Hypothetical Returns
| | | | | | | Hypothetical (5% return |
| | | | Actual | | before expenses) |
| | | Beginning | Ending | Expenses Paid | | Ending | Expenses Paid |
| | Fund’s Annualized | Account Value | Account Value | During Period(1) | | Account Value | During Period(1) |
| | Expense Ratio(1) | 7/1/23 | 12/31/23 | (7/1/23 – 12/31/23) |
| 12/31/23 | (7/1/23 – 12/31/23) |
| Baird Ultra Short Bond Fund | | | | | | | |
| Institutional Class | 0.15% | $1,000.00 | $1,032.00 | $0.77 | | $1,024.45 | $0.77 |
| Investor Class | 0.40% | $1,000.00 | $1,030.50 | $2.05 | | $1,023.19 | $2.04 |
| | | | | | | | |
| Baird Short-Term Bond Fund | | | | | | | |
| Institutional Class | 0.30% | $1,000.00 | $1,040.40 | $1.54 | | $1,023.69 | $1.53 |
| Investor Class | 0.55% | $1,000.00 | $1,039.00 | $2.83 | | $1,022.43 | $2.80 |
| | | | | | | | |
| Baird Intermediate Bond Fund | | | | | | | |
| Institutional Class | 0.30% | $1,000.00 | $1,039.40 | $1.54 | | $1,023.69 | $1.53 |
| Investor Class | 0.55% | $1,000.00 | $1,039.00 | $2.83 | | $1,022.43 | $2.80 |
| | | | | | | | |
| Baird Aggregate Bond Fund | | | | | | | |
| Institutional Class | 0.30% | $1,000.00 | $1,039.10 | $1.54 | | $1,023.69 | $1.53 |
| Investor Class | 0.55% | $1,000.00 | $1,038.30 | $2.83 | | $1,022.43 | $2.80 |
| | | | | | | | |
| Baird Core Plus Bond Fund | | | | | | | |
| Institutional Class | 0.30% | $1,000.00 | $1,042.00 | $1.54 | | $1,023.69 | $1.53 |
| Investor Class | 0.55% | $1,000.00 | $1,040.60 | $2.83 | | $1,022.43 | $2.80 |
| | | | | | | | |
| Baird Short-Term Municipal Bond Fund | | | | | | |
| Institutional Class | 0.30% | $1,000.00 | $1,027.50 | $1.53 | | $1,023.69 | $1.53 |
| Investor Class | 0.55% | $1,000.00 | $1,026.20 | $2.81 | | $1,022.43 | $2.80 |
| | | | | | | | |
| Baird Strategic Municipal Bond Fund | | | | | | |
| Institutional Class | 0.30% | $1,000.00 | $1,038.00 | $1.54 | | $1,023.69 | $1.53 |
| Investor Class | 0.55% | $1,000.00 | $1,036.70 | $2.82 | | $1,022.43 | $2.80 |
| | | | | | | | |
| Baird Quality Intermediate Municipal Bond Fund | | | | | | |
| Institutional Class | 0.30% | $1,000.00 | $1,029.60 | $1.53 | | $1,023.69 | $1.53 |
| Investor Class | 0.55% | $1,000.00 | $1,028.40 | $2.81 | | $1,022.43 | $2.80 |
| | | | | | | | |
| Baird Core Intermediate Municipal Bond Fund | | | | | | |
| Institutional Class | 0.30% | $1,000.00 | $1,034.50 | $1.54 | | $1,023.69 | $1.53 |
| Investor Class | 0.55% | $1,000.00 | $1,033.20 | $2.82 | | $1,022.43 | $2.80 |
| | | | | | | | |
| Baird Municipal Bond Fund | | | | | | | |
| Institutional Class | 0.30% | $1,000.00 | $1,040.20 | $1.54 | | $1,023.69 | $1.53 |
| Investor Class | 0.55% | $1,000.00 | $1,036.80 | $2.82 | | $1,022.43 | $2.80 |
(1) | Expenses are equal to the Fund’s annualized net expense ratio multiplied by the average account value over the period, 184 days and divided by 365 to reflect the one-half year period. |
Statements of Assets and Liabilities
December 31, 2023
| | | Baird | | | Baird | | | Baird | | | Baird | | | Baird | |
| | | Ultra Short | | | Short-Term | | | Intermediate | | | Aggregate | | | Core Plus | |
| | | Bond Fund | | | Bond Fund | | | Bond Fund | | | Bond Fund | | | Bond Fund | |
| ASSETS: | | | | | | | | | | | | | | | |
| Investments, at value (cost $6,360,227,137, $9,671,146,297, | | | | | | | | | | | | | | | |
| $8,536,952,811, $45,713,626,894, and $29,694,313,258, respectively) | | $ | 6,377,109,682 | | | $ | 9,619,192,753 | | | $ | 8,343,913,504 | | | $ | 42,760,491,114 | | | $ | 27,823,029,170 | |
| Interest receivable | | | 32,269,929 | | | | 99,016,480 | | | | 78,289,931 | | | | 309,303,934 | | | | 230,166,628 | |
| Receivable for investments sold | | | 12,825,000 | | | | 28,658,824 | | | | — | | | | — | | | | 20,487,376 | |
| Receivable for Fund shares sold | | | 36,480,413 | | | | 50,064,596 | | | | 36,605,582 | | | | 103,871,532 | | | | 74,665,909 | |
| Uninvested cash | | | 36,262 | | | | 11,505 | | | | 4,054 | | | | 65,178 | | | | 121,190 | |
| Prepaid expenses and other assets | | | — | | | | — | | | | 131,629 | | | | 129,481 | | | | 7,222 | |
| Total assets | | | 6,458,721,286 | | | | 9,796,944,158 | | | | 8,458,944,700 | | | | 43,173,861,239 | | | | 28,148,477,495 | |
| LIABILITIES: | | | | | | | | | | | | | | | | | | | | |
| Payable for investments purchased | | | 219,866,073 | | | | 304,009,736 | | | | 127,252,893 | | | | 232,735,859 | | | | 241,517,053 | |
| Payable for Fund shares redeemed | | | 1,491,443 | | | | 6,729,234 | | | | 3,164,607 | | | | 24,450,598 | | | | 18,469,209 | |
| Payable to Advisor, net (Note 5) | | | 516,736 | | | | 1,991,346 | | | | 1,724,638 | | | | 8,939,614 | | | | 5,753,423 | |
| Accrued administration fees (Note 5) | | | 258,417 | | | | 398,807 | | | | 345,213 | | | | 1,788,159 | | | | 1,150,695 | |
| Accrued Rule 12b-1 fees (Note 7) | | | 19,204 | | | | 78,942 | | | | 40,209 | | | | 425,977 | | | | 513,497 | |
| Total liabilities | | | 222,151,873 | | | | 313,208,065 | | | | 132,527,560 | | | | 268,340,207 | | | | 267,403,877 | |
| NET ASSETS | | $ | 6,236,569,413 | | | $ | 9,483,736,093 | | | $ | 8,326,417,140 | | | $ | 42,905,521,032 | | | $ | 27,881,073,618 | |
| NET ASSETS CONSIST OF: | | | | | | | | | | | | | | | | | | | | |
| Paid-in capital | | $ | 6,244,545,058 | | | $ | 9,903,250,154 | | | $ | 8,874,052,388 | | | $ | 47,402,646,679 | | | $ | 30,539,479,213 | |
| Total accumulated deficit | | | (7,975,645 | ) | | | (419,514,061 | ) | | | (547,635,248 | ) | | | (4,497,125,647 | ) | | | (2,658,405,595 | ) |
| NET ASSETS | | $ | 6,236,569,413 | | | $ | 9,483,736,093 | | | $ | 8,326,417,140 | | | $ | 42,905,521,032 | | | $ | 27,881,073,618 | |
| INSTITUTIONAL CLASS SHARES | | | | | | | | | | | | | | | | | | | | |
| Net Assets | | $ | 6,158,989,647 | | | $ | 9,334,455,033 | | | $ | 8,238,601,068 | | | $ | 41,933,738,006 | | | $ | 26,783,046,277 | |
| Shares outstanding ($0.01 par value, unlimited shares authorized) | | | 611,283,076 | | | | 992,156,239 | | | | 798,255,466 | | | | 4,253,624,133 | | | | 2,632,979,085 | |
| Net asset value, offering and redemption price per share | | $ | 10.08 | | | $ | 9.41 | | | $ | 10.32 | | | $ | 9.86 | | | $ | 10.17 | |
| INVESTOR CLASS SHARES | | | | | | | | | | | | | | | | | | | | |
| Net Assets | | $ | 77,579,766 | | | $ | 149,281,060 | | | $ | 87,816,072 | | | $ | 971,783,026 | | | $ | 1,098,027,341 | |
| Shares outstanding ($0.01 par value, unlimited shares authorized) | | | 7,678,498 | | | | 15,871,572 | | | | 8,087,725 | | | | 94,831,516 | | | | 102,881,214 | |
| Net asset value, offering and redemption price per share | | $ | 10.10 | | | $ | 9.41 | | | $ | 10.86 | | | $ | 10.25 | | | $ | 10.67 | |
The accompanying notes are an integral part of these financial statements.
Statements of Assets and Liabilities
December 31, 2023
| | | | | | | | | Baird | | | Baird | | | | |
| | | Baird | | | Baird | | | Quality | | | Core | | | | |
| | | Short-Term | | | Strategic | | | Intermediate | | | Intermediate | | | Baird | |
| | | Municipal | | | Municipal | | | Municipal | | | Municipal | | | Municipal | |
| | | Bond Fund | | | Bond Fund | | | Bond Fund | | | Bond Fund | | | Bond Fund | |
| ASSETS: | | | | | | | | | | | | | | | |
| Investments, at value (cost $1,606,748,814, $897,382,563, | | | | | | | | | | | | | | | |
| $1,098,137,465, $2,937,160,153, and $183,560,554, respectively) | | $ | 1,594,440,771 | | | $ | 908,725,445 | | | $ | 1,092,025,810 | | | $ | 2,945,133,052 | | | $ | 187,319,097 | |
| Interest receivable | | | 15,292,467 | | | | 8,807,719 | | | | 11,302,812 | | | | 30,412,819 | | | | 1,965,523 | |
| Receivable for investments sold | | | — | | | | 104,595 | | | | — | | | | — | | | | — | |
| Receivable for Fund shares sold | | | 6,689,756 | | | | 9,292,358 | | | | 1,398,439 | | | | 12,921,944 | | | | 827,946 | |
| Deposits with broker for futures contracts | | | — | | | | 732,983 | | | | — | | | | — | | | | — | |
| Receivable for variation margin on futures contracts | | | — | | | | 28,125 | | | | — | | | | — | | | | — | |
| Prepaid expenses and other assets | | | — | | | | 71,781 | | | | — | | | | — | | | | 41 | |
| Total assets | | | 1,616,422,994 | | | | 927,763,006 | | | | 1,104,727,061 | | | | 2,988,467,815 | | | | 190,112,607 | |
| LIABILITIES: | | | | | | | | | | | | | | | | | | | | |
| Payable for investments purchased | | | 9,175,249 | | | | 6,809,761 | | | | — | | | | 6,856,730 | | | | 2,154,515 | |
| Payable for Fund shares redeemed | | | 3,026,113 | | | | 522,917 | | | | 1,432,977 | | | | 1,650,528 | | | | 288 | |
| Payable to Advisor, net (Note 5) | | | 340,473 | | | | 186,824 | | | | 235,230 | | | | 620,716 | | | | 38,230 | |
| Accrued administration fees (Note 5) | | | 69,842 | | | | 120,820 | | | | 75,277 | | | | 141,306 | | | | 14,064 | |
| Accrued Rule 12b-1 fees (Note 7) | | | 34,213 | | | | 10,968 | | | | 75,973 | | | | 10,369 | | | | 3,780 | |
| Total liabilities | | | 12,645,890 | | | | 7,651,290 | | | | 1,819,457 | | | | 9,279,649 | | | | 2,210,877 | |
| NET ASSETS | | $ | 1,603,777,104 | | | $ | 920,111,716 | | | $ | 1,102,907,604 | | | $ | 2,979,188,166 | | | $ | 187,901,730 | |
| NET ASSETS CONSIST OF: | | | | | | | | | | | | | | | | | | | | |
| Paid-in capital | | $ | 1,683,835,831 | | | $ | 921,082,754 | | | $ | 1,160,245,904 | | | $ | 3,030,149,673 | | | $ | 186,516,133 | |
| Total distributable earnings (accumulated deficit) | | | (80,058,727 | ) | | | (971,038 | ) | | | (57,338,300 | ) | | | (50,961,507 | ) | | | 1,385,597 | |
| NET ASSETS | | $ | 1,603,777,104 | | | $ | 920,111,716 | | | $ | 1,102,907,604 | | | $ | 2,979,188,166 | | | $ | 187,901,730 | |
| INSTITUTIONAL CLASS SHARES | | | | | | | | | | | | | | | | | | | | |
| Net Assets | | $ | 1,525,328,103 | | | $ | 881,534,436 | | | $ | 1,051,887,921 | | | $ | 2,942,725,246 | | | $ | 180,352,319 | |
| Shares outstanding ($0.01 par value, unlimited shares authorized) | | | 152,882,259 | | | | 85,669,887 | | | | 94,494,175 | | | | 284,686,513 | | | | 18,025,923 | |
| Net asset value, offering and redemption price per share | | $ | 9.98 | | | $ | 10.29 | | | $ | 11.13 | | | $ | 10.34 | | | $ | 10.01 | |
| INVESTOR CLASS SHARES | | | | | | | | | | | | | | | | | | | | |
| Net Assets | | $ | 78,449,001 | | | $ | 38,577,280 | | | $ | 51,019,683 | | | $ | 36,462,920 | | | $ | 7,549,411 | |
| Shares outstanding ($0.01 par value, unlimited shares authorized) | | | 7,876,551 | | | | 3,750,107 | | | | 4,463,007 | | | | 3,529,348 | | | | 755,327 | |
| Net asset value, offering and redemption price per share | | $ | 9.96 | | | $ | 10.29 | | | $ | 11.43 | | | $ | 10.33 | | | $ | 9.99 | |
The accompanying notes are an integral part of these financial statements.
Statements of Operations
Year Ended December 31, 2023
| | | Baird | | | Baird | | | Baird | | | Baird | | | Baird | |
| | | Ultra Short | | | Short-Term | | | Intermediate | | | Aggregate | | | Core Plus | |
| | | Bond Fund | | | Bond Fund | | | Bond Fund | | | Bond Fund | | | Bond Fund | |
| INVESTMENT INCOME: | | | | | | | | | | | | | | | |
| Interest income, net of paydowns | | $ | 284,948,516 | | | $ | 347,151,284 | | | $ | 268,616,631 | | | $ | 1,490,842,346 | | | $ | 966,464,323 | |
| Other income | | | 40,195 | | | | 328,042 | | | | 298,912 | | | | 833,072 | | | | 314,139 | |
| Total investment income | | | 284,988,711 | | | | 347,479,326 | | | | 268,915,543 | | | | 1,491,675,418 | | | | 966,778,462 | |
| | | | | | | | | | | | | | | | | | | | | |
| EXPENSES: | | | | | | | | | | | | | | | | | | | | |
| Investment advisory fees (Note 5) | | | 14,781,092 | | | | 22,997,153 | | | | 18,761,999 | | | | 96,884,633 | | | | 60,844,986 | |
| Administration fees (Note 5) | | | 2,956,218 | | | | 4,599,431 | | | | 3,752,400 | | | | 19,376,927 | | | | 12,168,997 | |
| Rule 12b-1 fees – Investor Class Shares (Note 7) | | | 197,949 | | | | 443,500 | | | | 181,194 | | | | 2,214,498 | | | | 2,624,969 | |
| Total expenses | | | 17,935,259 | | | | 28,040,084 | | | | 22,695,593 | | | | 118,476,058 | | | | 75,638,952 | |
| Fee waiver by Advisor (Note 5) | | | (8,868,655 | ) | | | — | | | | — | | | | — | | | | — | |
| Net expenses | | | 9,066,604 | | | | 28,040,084 | | | | 22,695,593 | | | | 118,476,058 | | | | 75,638,952 | |
| NET INVESTMENT INCOME | | | 275,922,107 | | | | 319,439,242 | | | | 246,219,950 | | | | 1,373,199,360 | | | | 891,139,510 | |
| | | | | | | | | | | | | | | | | | | | | |
| REALIZED AND UNREALIZED GAIN (LOSS) ON INVESTMENTS: | | | | | | | | | | | | | | | | | |
| Net realized loss on investments | | | (1,777,136 | ) | | | (108,937,596 | ) | | | (147,117,723 | ) | | | (504,191,530 | ) | | | (226,111,687 | ) |
| Net change in unrealized appreciation/depreciation on investments | | | 54,110,657 | | | | 293,350,772 | | | | 331,806,659 | | | | 1,596,137,054 | | | | 1,056,056,193 | |
| Net realized and unrealized gain on investments | | | 52,333,521 | | | | 184,413,176 | | | | 184,688,936 | | | | 1,091,945,524 | | | | 829,944,506 | |
NET INCREASE IN NET ASSETS RESULTING FROM OPERATIONS | $ | 328,255,628 | | | $ | 503,852,418 | | | $ | 430,908,886 | | | $ | 2,465,144,884 | | | $ | 1,721,084,016 | |
The accompanying notes are an integral part of these financial statements.
Statements of Operations
Year Ended December 31, 2023
| | | | | | | | | Baird | | | Baird | | | | |
| | | Baird | | | Baird | | | Quality | | | Core | | | | |
| | | Short-Term | | | Strategic | | | Intermediate | | | Intermediate | | | Baird | |
| | | Municipal | | | Municipal | | | Municipal | | | Municipal | | | Municipal | |
| | | Bond Fund | | | Bond Fund | | | Bond Fund | | | Bond Fund | | | Bond Fund | |
| INVESTMENT INCOME: | | | | | | | | | | | | | | | |
| Interest income | | $ | 49,999,389 | | | $ | 23,720,230 | | | $ | 31,705,872 | | | $ | 89,227,678 | | | $ | 5,132,703 | |
| Total investment income | | | 49,999,389 | | | | 23,720,230 | | | | 31,705,872 | | | | 89,227,678 | | | | 5,132,703 | |
| | | | | | | | | | | | | | | | | | | | | |
| EXPENSES: | | | | | | | | | | | | | | | | | | | | |
| Investment advisory fees (Note 5) | | | 4,118,924 | | | | 1,592,564 | | | | 2,780,715 | | | | 6,597,808 | | | | 315,073 | |
| Administration fees (Note 5) | | | 823,784 | | | | 318,513 | | | | 556,143 | | | | 1,319,562 | | | | 63,014 | |
| Interest expense (Note 6) | | | — | | | | 25 | | | | — | | | | — | | | | — | |
| Rule 12b-1 fees – Investor Class Shares (Note 7) | | | 167,398 | | | | 46,895 | | | | 118,226 | | | | 99,097 | | | | 14,295 | |
| Total expenses | | | 5,110,106 | | | | 1,957,997 | | | | 3,455,084 | | | | 8,016,467 | | | | 392,382 | |
| NET INVESTMENT INCOME | | | 44,889,283 | | | | 21,762,233 | | | | 28,250,788 | | | | 81,211,211 | | | | 4,740,321 | |
| | | | | | | | | | | | | | | | | | | | | |
| REALIZED AND UNREALIZED GAIN (LOSS) ON INVESTMENTS: | | | | | | | | | | | | | | | | | |
| Net realized gain (loss) on: | | | | | | | | | | | | | | | | | | | | |
| Investments | | | (20,586,404 | ) | | | 1,075,484 | | | | (10,567,897 | ) | | | (20,153,038 | ) | | | (453,625 | ) |
| Futures contracts | | | — | | | | (45,379 | ) | | | — | | | | — | | | | — | |
| Net change in unrealized appreciation/depreciation on: | | | | | | | | | | | | | | | | | | | | |
| Investments | | | 40,877,858 | | | | 25,084,157 | | | | 27,389,486 | | | | 84,261,226 | | | | 5,396,373 | |
| Futures contracts | | | — | | | | (316,150 | ) | | | — | | | | — | | | | — | |
| Net realized and unrealized gain on investments | | | 20,291,454 | | | | 25,798,112 | | | | 16,821,589 | | | | 64,108,188 | | | | 4,942,748 | |
NET INCREASE IN NET ASSETS RESULTING FROM OPERATIONS | | $ | 65,180,737 | | | $ | 47,560,345 | | | $ | 45,072,377 | | | $ | 145,319,399 | | | $ | 9,683,069 | |
The accompanying notes are an integral part of these financial statements.
Statements of Changes in Net Assets
| | | Baird Ultra Short Bond Fund | | | Baird Short-Term Bond Fund | |
| | | Year Ended | | | Year Ended | | | Year Ended | | | Year Ended | |
| | | December 31, 2023 | | | December 31, 2022 | | | December 31, 2023 | | | December 31, 2022 | |
| OPERATIONS: | | | | | | | | | | | | |
| Net investment income | | $ | 275,922,107 | | | $ | 81,273,584 | | | $ | 319,439,242 | | | $ | 165,908,820 | |
| Net realized loss on investments | | | (1,777,136 | ) | | | (9,717,166 | ) | | | (108,937,596 | ) | | | (254,007,629 | ) |
| Net change in unrealized appreciation/depreciation on investments | | | 54,110,657 | | | | (26,291,187 | ) | | | 293,350,772 | | | | (309,605,768 | ) |
| Net increase (decrease) in net assets resulting from operations | | | 328,255,628 | | | | 45,265,231 | | | | 503,852,418 | | | | (397,704,577 | ) |
| | | | | | | | | | | | | | | | | |
| CAPITAL SHARE TRANSACTIONS: | | | | | | | | | | | | | | | | |
| Proceeds from shares sold | | | 4,189,667,339 | | | | 5,151,744,331 | | | | 3,129,799,702 | | | | 3,778,175,889 | |
| Shares issued to holders in reinvestment of distributions | | | 261,267,513 | | | | 81,671,057 | | | | 291,457,402 | | | | 152,694,426 | |
| Cost of shares redeemed | | | (3,873,653,895 | ) | | | (6,635,885,368 | ) | | | (3,086,829,689 | ) | | | (5,136,435,328 | ) |
| Net increase (decrease) in net assets resulting from capital share transactions | | | 577,280,957 | | | | (1,402,469,980 | ) | | | 334,427,415 | | | | (1,205,565,013 | ) |
| | | | | | | | | | | | | | | | | |
| DISTRIBUTIONS TO SHAREHOLDERS: | | | | | | | | | | | | | | | | |
| Distributions to shareholders: | | | | | | | | | | | | | | | | |
| Institutional Class | | | (273,183,209 | ) | | | (87,591,687 | ) | | | (313,337,089 | ) | | | (167,714,327 | ) |
| Investor Class | | | (3,394,276 | ) | | | (1,276,605 | ) | | | (5,562,356 | ) | | | (3,523,701 | ) |
| Total distributions to shareholders | | | (276,577,485 | ) | | | (88,868,292 | ) | | | (318,899,445 | ) | | | (171,238,028 | ) |
| | | | | | | | | | | | | | | | | |
| TOTAL INCREASE (DECREASE) IN NET ASSETS | | | 628,959,100 | | | | (1,446,073,041 | ) | | | 519,380,388 | | | | (1,774,507,618 | ) |
| | | | | | | | | | | | | | | | | |
| NET ASSETS: | | | | | | | | | | | | | | | | |
| Beginning of year | | | 5,607,610,313 | | | | 7,053,683,354 | | | | 8,964,355,705 | | | | 10,738,863,323 | |
| End of year | | $ | 6,236,569,413 | | | $ | 5,607,610,313 | | | $ | 9,483,736,093 | | | $ | 8,964,355,705 | |
The accompanying notes are an integral part of these financial statements.
Statements of Changes in Net Assets
| | | Baird Intermediate Bond Fund | | | Baird Aggregate Bond Fund | |
| | | Year Ended | | | Year Ended | | | Year Ended | | | Year Ended | |
| | | December 31, 2023 | | | December 31, 2022 | | | December 31, 2023 | | | December 31, 2022 | |
| OPERATIONS: | | | | | | | | | | | | |
| Net investment income | | $ | 246,219,950 | | | $ | 145,373,769 | | | $ | 1,373,199,360 | | | $ | 884,588,943 | |
| Net realized loss on investments | | | (147,117,723 | ) | | | (201,837,334 | ) | | | (504,191,530 | ) | | | (895,602,951 | ) |
| Net change in unrealized appreciation/depreciation on investments | | | 331,806,659 | | | | (563,129,596 | ) | | | 1,596,137,054 | | | | (5,301,736,772 | ) |
| Net increase (decrease) in net assets resulting from operations | | | 430,908,886 | | | | (619,593,161 | ) | | | 2,465,144,884 | | | | (5,312,750,780 | ) |
| | | | | | | | | | | | | | | | | |
| CAPITAL SHARE TRANSACTIONS: | | | | | | | | | | | | | | | | |
| Proceeds from shares sold | | | 2,591,965,303 | | | | 3,016,470,885 | | | | 14,170,842,512 | | | | 11,664,210,933 | |
| Shares issued to holders in reinvestment of distributions | | | 222,527,242 | | | | 126,726,838 | | | | 1,262,374,480 | | | | 831,583,616 | |
| Cost of shares redeemed | | | (1,711,218,390 | ) | | | (2,018,763,028 | ) | | | (8,384,021,071 | ) | | | (11,436,828,390 | ) |
| Net increase in net assets resulting from capital share transactions | | | 1,103,274,155 | | | | 1,124,434,695 | | | | 7,049,195,921 | | | | 1,058,966,159 | |
| | | | | | | | | | | | | | | | | |
| DISTRIBUTIONS TO SHAREHOLDERS: | | | | | | | | | | | | | | | | |
| Distributions to shareholders: | | | | | | | | | | | | | | | | |
| Institutional Class | | | (245,596,276 | ) | | | (145,267,678 | ) | | | (1,363,810,091 | ) | | | (900,625,260 | ) |
| Investor Class | | | (2,124,437 | ) | | | (825,985 | ) | | | (28,657,218 | ) | | | (16,400,637 | ) |
| Total distributions to shareholders | | | (247,720,713 | ) | | | (146,093,663 | ) | | | (1,392,467,309 | ) | | | (917,025,897 | ) |
| | | | | | | | | | | | | | | | | |
| TOTAL INCREASE (DECREASE) IN NET ASSETS | | | 1,286,462,328 | | | | 358,747,871 | | | | 8,121,873,496 | | | | (5,170,810,518 | ) |
| | | | | | | | | | | | | | | | | |
| NET ASSETS: | | | | | | | | | | | | | | | | |
| Beginning of year | | | 7,039,954,812 | | | | 6,681,206,941 | | | | 34,783,647,536 | | | | 39,954,458,054 | |
| End of year | | $ | 8,326,417,140 | | | $ | 7,039,954,812 | | | $ | 42,905,521,032 | | | $ | 34,783,647,536 | |
The accompanying notes are an integral part of these financial statements.
Statements of Changes in Net Assets
| | | Baird Core Plus Bond Fund | | | Baird Short-Term Municipal Bond Fund | |
| | | Year Ended | | | Year Ended | | | Year Ended | | | Year Ended | |
| | | December 31, 2023 | | | December 31, 2022 | | | December 31, 2023 | | | December 31, 2022 | |
| OPERATIONS: | | | | | | | | | | | | |
| Net investment income | | $ | 891,139,510 | | | $ | 685,346,165 | | | $ | 44,889,283 | | | $ | 32,143,881 | |
| Net realized loss on investments | | | (226,111,687 | ) | | | (487,341,184 | ) | | | (20,586,404 | ) | | | (47,128,258 | ) |
| Net change in unrealized appreciation/depreciation on investments | | | 1,056,056,193 | | | | (3,821,826,740 | ) | | | 40,877,858 | | | | (72,671,094 | ) |
| Net increase (decrease) in net assets resulting from operations | | | 1,721,084,016 | | | | (3,623,821,759 | ) | | | 65,180,737 | | | | (87,655,471 | ) |
| | | | | | | | | | | | | | | | | |
| CAPITAL SHARE TRANSACTIONS: | | | | | | | | | | | | | | | | |
| Proceeds from shares sold | | | 8,452,572,154 | | | | 5,516,171,299 | | | | 710,848,527 | | | | 1,692,061,716 | |
| Shares issued to holders in reinvestment of distributions | | | 834,805,778 | | | | 651,747,060 | | | | 33,434,530 | | | | 23,012,924 | |
| Cost of shares redeemed | | | (4,561,688,419 | ) | | | (8,771,298,217 | ) | | | (928,056,596 | ) | | | (2,128,711,604 | ) |
| Net increase (decrease) in net assets resulting from capital share transactions | | | 4,725,689,513 | | | | (2,603,379,858 | ) | | | (183,773,539 | ) | | | (413,636,964 | ) |
| | | | | | | | | | | | | | | | | |
| DISTRIBUTIONS TO SHAREHOLDERS: | | | | | | | | | | | | | | | | |
| Distributions to shareholders: | | | | | | | | | | | | | | | | |
| Institutional Class | | | (865,014,062 | ) | | | (675,060,211 | ) | | | (43,166,904 | ) | | | (30,930,374 | ) |
| Investor Class | | | (34,257,660 | ) | | | (31,303,480 | ) | | | (1,682,653 | ) | | | (1,121,192 | ) |
| Total distributions to shareholders | | | (899,271,722 | ) | | | (706,363,691 | ) | | | (44,849,557 | ) | | | (32,051,566 | ) |
| | | | | | | | | | | | | | | | | |
| TOTAL INCREASE (DECREASE) IN NET ASSETS | | | 5,547,501,807 | | | | (6,933,565,308 | ) | | | (163,442,359 | ) | | | (533,344,001 | ) |
| | | | | | | | | | | | | | | | | |
| NET ASSETS: | | | | | | | | | | | | | | | | |
| Beginning of year | | | 22,333,571,811 | | | | 29,267,137,119 | | | | 1,767,219,463 | | | | 2,300,563,464 | |
| End of year | | $ | 27,881,073,618 | | | $ | 22,333,571,811 | | | $ | 1,603,777,104 | | | $ | 1,767,219,463 | |
The accompanying notes are an integral part of these financial statements.
Statements of Changes in Net Assets
| | | | | | | | | Baird Quality Intermediate | |
| | | Baird Strategic Municipal Bond Fund | | | Municipal Bond Fund | |
| | | Year Ended | | | Year Ended | | | Year Ended | | | Year Ended | |
| | | December 31, 2023 | | | December 31, 2022 | | | December 31, 2023 | | | December 31, 2022 | |
| OPERATIONS: | | | | | | | | | | | | |
| Net investment income | | $ | 21,762,233 | | | $ | 8,624,615 | | | $ | 28,250,788 | | | $ | 25,687,671 | |
| Net realized gain (loss) on investments and futures contracts | | | 1,030,105 | | | | (13,302,908 | ) | | | (10,567,897 | ) | | | (28,730,038 | ) |
| Net change in unrealized appreciation/depreciation | | | | | | | | | | | | | | | | |
| on investments and futures contracts | | | 24,768,007 | | | | (17,057,248 | ) | | | 27,389,486 | | | | (90,334,500 | ) |
| Net increase (decrease) in net assets resulting from operations | | | 47,560,345 | | | | (21,735,541 | ) | | | 45,072,377 | | | | (93,376,867 | ) |
| | | | | | | | | | | | | | | | | |
| CAPITAL SHARE TRANSACTIONS: | | | | | | | | | | | | | | | | |
| Proceeds from shares sold | | | 544,809,127 | | | | 475,706,389 | | | | 403,561,843 | | | | 813,043,520 | |
| Shares issued to holders in reinvestment of distributions | | | 20,060,756 | | | | 8,250,455 | | | | 25,154,632 | | | | 22,811,318 | |
| Cost of shares redeemed | | | (152,149,063 | ) | | | (325,367,747 | ) | | | (456,255,871 | ) | | | (1,188,546,488 | ) |
| Net increase (decrease) in net assets resulting from capital share transactions | | | 412,720,820 | | | | 158,589,097 | | | | (27,539,396 | ) | | | (352,691,650 | ) |
| | | | | | | | | | | | | | | | | |
| DISTRIBUTIONS TO SHAREHOLDERS: | | | | | | | | | | | | | | | | |
| Distributions to shareholders: | | | | | | | | | | | | | | | | |
| Institutional Class | | | (21,014,782 | ) | | | (8,469,135 | ) | | | (27,160,792 | ) | | | (24,886,321 | ) |
| Investor Class | | | (614,739 | ) | | | (157,066 | ) | | | (1,093,825 | ) | | | (864,715 | ) |
| Total distributions to shareholders | | | (21,629,521 | ) | | | (8,626,201 | ) | | | (28,254,617 | ) | | | (25,751,036 | ) |
| | | | | | | | | | | | | | | | | |
| TOTAL INCREASE (DECREASE) IN NET ASSETS | | | 438,651,644 | | | | 128,227,355 | | | | (10,721,636 | ) | | | (471,819,553 | ) |
| | | | | | | | | | | | | | | | | |
| NET ASSETS: | | | | | | | | | | | | | | | | |
| Beginning of year | | | 481,460,072 | | | | 353,232,717 | | | | 1,113,629,240 | | | | 1,585,448,793 | |
| End of year | | $ | 920,111,716 | | | $ | 481,460,072 | | | $ | 1,102,907,604 | | | $ | 1,113,629,240 | |
The accompanying notes are an integral part of these financial statements.
Statements of Changes in Net Assets
| | | Baird Core Intermediate | | | | | | | |
| | | Municipal Bond Fund | | | Baird Municipal Bond Fund | |
| | | Year Ended | | | Year Ended | | | Year Ended | | | Year Ended | |
| | | December 31, 2023 | | | December 31, 2022 | | | December 31, 2023 | | | December 31, 2022 | |
| OPERATIONS: | | | | | | | | | | | | |
| Net investment income | | $ | 81,211,211 | | | $ | 40,069,912 | | | $ | 4,740,321 | | | $ | 1,314,034 | |
| Net realized loss on investments | | | (20,153,038 | ) | | | (39,517,721 | ) | | | (453,625 | ) | | | (1,980,641 | ) |
| Net change in unrealized appreciation/depreciation on investments | | | 84,261,226 | | | | (111,608,035 | ) | | | 5,396,373 | | | | (2,574,152 | ) |
| Net increase (decrease) in net assets resulting from operations | | | 145,319,399 | | | | (111,055,844 | ) | | | 9,683,069 | | | | (3,240,759 | ) |
| | | | | | | | | | | | | | | | | |
| CAPITAL SHARE TRANSACTIONS: | | | | | | | | | | | | | | | | |
| Proceeds from shares sold | | | 1,562,009,133 | | | | 2,707,781,167 | | | | 163,600,248 | | | | 57,743,925 | |
| Shares issued to holders in reinvestment of distributions | | | 69,233,270 | | | | 30,661,901 | | | | 4,062,255 | | | | 1,126,834 | |
| Cost of shares redeemed | | | (1,204,801,185 | ) | | | (1,672,955,500 | ) | | | (44,502,744 | ) | | | (32,272,377 | ) |
| Net increase in net assets resulting from capital share transactions | | | 426,441,218 | | | | 1,065,487,568 | | | | 123,159,759 | | | | 26,598,382 | |
| | | | | | | | | | | | | | | | | |
| DISTRIBUTIONS TO SHAREHOLDERS: | | | | | | | | | | | | | | | | |
| Distributions to shareholders: | | | | | | | | | | | | | | | | |
| Institutional Class | | | (79,953,197 | ) | | | (39,031,327 | ) | | | (4,503,233 | ) | | | (1,223,767 | ) |
| Investor Class | | | (1,099,336 | ) | | | (663,365 | ) | | | (193,077 | ) | | | (81,592 | ) |
| Total distributions to shareholders | | | (81,052,533 | ) | | | (39,694,692 | ) | | | (4,696,310 | ) | | | (1,305,359 | ) |
| | | | | | | | | | | | | | | | | |
| TOTAL INCREASE IN NET ASSETS | | | 490,708,084 | | | | 914,737,032 | | | | 128,146,518 | | | | 22,052,264 | |
| | | | | | | | | | | | | | | | | |
| NET ASSETS: | | | | | | | | | | | | | | | | |
| Beginning of year | | | 2,488,480,082 | | | | 1,573,743,050 | | | | 59,755,212 | | | | 37,702,948 | |
| End of year | | $ | 2,979,188,166 | | | $ | 2,488,480,082 | | | $ | 187,901,730 | | | $ | 59,755,212 | |
The accompanying notes are an integral part of these financial statements.
Financial Highlights
Baird Ultra Short Bond Fund – Institutional Class
| | | Year Ended December 31, | |
| | | 2023 | | | 2022 | | | 2021 | | | 2020 | | | 2019 | |
| Per Share Data: | | | | | | | | | | | | | | | |
| Net asset value, beginning of year | | $ | 9.99 | | | $ | 10.05 | | | $ | 10.08 | | | $ | 10.06 | | | $ | 10.01 | |
| Income from investment operations: | | | | | | | | | | | | | | | | | | | | |
Net investment income(1) | | | 0.47 | | | | 0.13 | | | | 0.04 | | | | 0.12 | | | | 0.26 | |
| Net realized and unrealized gains (losses) on investments | | | 0.09 | | | | (0.03 | ) | | | (0.02 | ) | | | 0.05 | (2) | | | 0.05 | |
| Total from investment operations | | | 0.56 | | | | 0.10 | | | | 0.02 | | | | 0.17 | | | | 0.31 | |
| Less distributions: | | | | | | | | | | | | | | | | | | | | |
| Distributions from net investment income | | | (0.47 | ) | | | (0.16 | ) | | | (0.05 | ) | | | (0.14 | ) | | | (0.26 | ) |
| Distributions from net realized gains | | | — | | | | — | | | | (0.00 | )(3) | | | (0.01 | ) | | | (0.00 | )(3) |
| Total distributions | | | (0.47 | ) | | | (0.16 | ) | | | (0.05 | ) | | | (0.15 | ) | | | (0.26 | ) |
| Net asset value, end of year | | $ | 10.08 | | | $ | 9.99 | | | $ | 10.05 | | | $ | 10.08 | | | $ | 10.06 | |
| Total return | | | 5.71 | % | | | 0.96 | % | | | 0.20 | % | | | 1.66 | % | | | 3.11 | % |
| Supplemental data and ratios: | | | | | | | | | | | | | | | | | | | | |
| Net assets, end of year (millions) | | $ | 6,159.0 | | | $ | 5,515.0 | | | $ | 6,889.5 | | | $ | 4,456.4 | | | $ | 1,701.0 | |
| Ratio of expenses to average net assets | | | 0.15 | % | | | 0.15 | % | | | 0.15 | % | | | 0.15 | % | | | 0.15 | % |
| Ratio of expenses to average net assets (before waivers) | | | 0.30 | % | | | 0.30 | % | | | 0.30 | % | | | 0.30 | % | | | 0.30 | % |
| Ratio of net investment income to average net assets | | | 4.67 | % | | | 1.34 | % | | | 0.38 | % | | | 1.24 | % | | | 2.61 | % |
| Ratio of net investment income to average net assets (before waivers) | 4.52 | % | | | 1.19 | % | | | 0.23 | % | | | 1.09 | % | | | 2.46 | % |
Portfolio turnover rate(4) | | | 105 | % | | | 104 | % | | | 96 | % | | | 92 | % | | | 70 | % |
(1) | Calculated using average shares outstanding during the year. |
(2) | Due to timing of capital share transactions, the per share amount of net realized and unrealized gain (loss) on investments varies from the amounts shown in the Statement of Operations. |
(3) | Amount is less than $0.005. |
(4) | Portfolio turnover is calculated on the basis of the Fund as a whole without distinguishing between the classes of shares issued and excludes in-kind transactions, where applicable. |
Baird Ultra Short Bond Fund – Investor Class
| | | Year Ended December 31, | |
| | | 2023 | | | 2022 | | | 2021 | | | 2020 | | | 2019 | |
| Per Share Data: | | | | | | | | | | | | | | | |
| Net asset value, beginning of year | | $ | 10.01 | | | $ | 10.07 | | | $ | 10.10 | | | $ | 10.05 | | | $ | 10.00 | |
| Income from investment operations: | | | | | | | | | | | | | | | | | | | | |
Net investment income(1) | | | 0.45 | | | | 0.11 | | | | 0.01 | | | | 0.10 | | | | 0.24 | |
| Net realized and unrealized gains (losses) on investments | | | 0.08 | | | | (0.04 | ) | | | (0.01 | ) | | | 0.07 | (2) | | | 0.04 | |
| Total from investment operations | | | 0.53 | | | | 0.07 | | | | — | | | | 0.17 | | | | 0.28 | |
| Less distributions: | | | | | | | | | | | | | | | | | | | | |
| Distributions from net investment income | | | (0.44 | ) | | | (0.13 | ) | | | (0.03 | ) | | | (0.11 | ) | | | (0.23 | ) |
| Distributions from net realized gains | | | — | | | | — | | | | (0.00 | )(3) | | | (0.01 | ) | | | (0.00 | )(3) |
| Total distributions | | | (0.44 | ) | | | (0.13 | ) | | | (0.03 | ) | | | (0.12 | ) | | | (0.23 | ) |
| Net asset value, end of year | | $ | 10.10 | | | $ | 10.01 | | | $ | 10.07 | | | $ | 10.10 | | | $ | 10.05 | |
| Total return | | | 5.43 | % | | | 0.70 | % | | | (0.05 | )% | | | 1.66 | % | | | 2.87 | % |
| Supplemental data and ratios: | | | | | | | | | | | | | | | | | | | | |
| Net assets, end of year (millions) | | $ | 77.6 | | | $ | 92.7 | | | $ | 164.2 | | | $ | 122.7 | | | $ | 32.5 | |
| Ratio of expenses to average net assets | | | 0.40 | % | | | 0.40 | % | | | 0.40 | % | | | 0.40 | % | | | 0.40 | % |
| Ratio of expenses to average net assets (before waivers) | | | 0.55 | % | | | 0.55 | % | | | 0.55 | % | | | 0.55 | % | | | 0.55 | % |
| Ratio of net investment income to average net assets | | | 4.42 | % | | | 1.09 | % | | | 0.13 | % | | | 0.99 | % | | | 2.36 | % |
| Ratio of net investment income (loss) to average net assets (before waivers) | 4.27 | % | | | 0.94 | % | | | (0.02 | )% | | | 0.84 | % | | | 2.21 | % |
Portfolio turnover rate(4) | | | 105 | % | | | 104 | % | | | 96 | % | | | 92 | % | | | 70 | % |
(1) | Calculated using average shares outstanding during the year. |
(2) | Due to timing of capital share transactions, the per share amount of net realized and unrealized gain (loss) on investments varies from the amounts shown in the Statement of Operations. |
(3) | Amount is less than $0.005. |
(4) | Portfolio turnover is calculated on the basis of the Fund as a whole without distinguishing between the classes of shares issued and excludes in-kind transactions, where applicable. |
The accompanying notes are an integral part of these financial statements.
Financial Highlights
Baird Short-Term Bond Fund – Institutional Class
| | | Year Ended December 31, | |
| | | 2023 | | | 2022 | | | 2021 | | | 2020 | | | 2019 | |
| Per Share Data: | | | | | | | | | | | | | | | |
| Net asset value, beginning of year | | $ | 9.22 | | | $ | 9.74 | | | $ | 9.92 | | | $ | 9.77 | | | $ | 9.57 | |
| Income from investment operations: | | | | | | | | | | | | | | | | | | | | |
Net investment income(1) | | | 0.32 | | | | 0.16 | | | | 0.10 | | | | 0.18 | | | | 0.24 | |
| Net realized and unrealized gains (losses) on investments | | | 0.19 | | | | (0.51 | ) | | | (0.14 | ) | | | 0.23 | | | | 0.20 | |
| Total from investment operations | | | 0.51 | | | | (0.35 | ) | | | (0.04 | ) | | | 0.41 | | | | 0.44 | |
| Less distributions: | | | | | | | | | | | | | | | | | | | | |
| Distributions from net investment income | | | (0.32 | ) | | | (0.17 | ) | | | (0.11 | ) | | | (0.19 | ) | | | (0.24 | ) |
| Distributions from net realized gains | | | — | | | | (0.00 | )(2) | | | (0.03 | ) | | | (0.07 | ) | | | — | |
| Total distributions | | | (0.32 | ) | | | (0.17 | ) | | | (0.14 | ) | | | (0.26 | ) | | | (0.24 | ) |
| Net asset value, end of year | | $ | 9.41 | | | $ | 9.22 | | | $ | 9.74 | | | $ | 9.92 | | | $ | 9.77 | |
| Total return | | | 5.65 | % | | | (3.64 | )% | | | (0.42 | )% | | | 4.23 | % | | | 4.68 | % |
| Supplemental data and ratios: | | | | | | | | | | | | | | | | | | | | |
| Net assets, end of year (millions) | | $ | 9,334.5 | | | $ | 8,747.4 | | | $ | 10,486.4 | | | $ | 8,790.5 | | | $ | 6,469.1 | |
| Ratio of expenses to average net assets | | | 0.30 | % | | | 0.30 | % | | | 0.30 | % | | | 0.30 | % | | | 0.30 | % |
| Ratio of net investment income to average net assets | | | 3.48 | % | | | 1.67 | % | | | 1.05 | % | | | 1.87 | % | | | 2.50 | % |
Portfolio turnover rate(3) | | | 87 | % | | | 77 | % | | | 67 | % | | | 64 | % | | | 64 | % |
(1) | Calculated using average shares outstanding during the year. |
(2) | Amount is less than $0.005. |
(3) | Portfolio turnover is calculated on the basis of the Fund as a whole without distinguishing between the classes of shares issued and excludes in-kind transactions, where applicable. |
Baird Short-Term Bond Fund – Investor Class
| | | Year Ended December 31, | |
| | | 2023 | | | 2022 | | | 2021 | | | 2020 | | | 2019 | |
| Per Share Data: | | | | | | | | | | | | | | | |
| Net asset value, beginning of year | | $ | 9.22 | | | $ | 9.74 | | | $ | 9.91 | | | $ | 9.77 | | | $ | 9.57 | |
| Income from investment operations: | | | | | | | | | | | | | | | | | | | | |
Net investment income(1) | | | 0.30 | | | | 0.13 | | | | 0.08 | | | | 0.16 | | | | 0.22 | |
| Net realized and unrealized gains (losses) on investments | | | 0.19 | | | | (0.51 | ) | | | (0.13 | ) | | | 0.21 | | | | 0.20 | |
| Total from investment operations | | | 0.49 | | | | (0.38 | ) | | | (0.05 | ) | | | 0.37 | | | | 0.42 | |
| Less distributions: | | | | | | | | | | | | | | | | | | | | |
| Distributions from net investment income | | | (0.30 | ) | | | (0.14 | ) | | | (0.09 | ) | | | (0.16 | ) | | | (0.22 | ) |
| Distributions from net realized gains | | | — | | | | (0.00 | )(2) | | | (0.03 | ) | | | (0.07 | ) | | | — | |
| Total distributions | | | (0.30 | ) | | | (0.14 | ) | | | (0.12 | ) | | | (0.23 | ) | | | (0.22 | ) |
| Net asset value, end of year | | $ | 9.41 | | | $ | 9.22 | | | $ | 9.74 | | | $ | 9.91 | | | $ | 9.77 | |
| Total return | | | 5.39 | % | | | (3.88 | )% | | | (0.57 | )% | | | 3.86 | % | | | 4.42 | % |
| Supplemental data and ratios: | | | | | | | | | | | | | | | | | | | | |
| Net assets, end of year (millions) | | $ | 149.3 | | | $ | 216.9 | | | $ | 252.5 | | | $ | 192.7 | | | $ | 182.4 | |
| Ratio of expenses to average net assets | | | 0.55 | % | | | 0.55 | % | | | 0.55 | % | | | 0.55 | % | | | 0.55 | % |
| Ratio of net investment income to average net assets | | | 3.23 | % | | | 1.42 | % | | | 0.80 | % | | | 1.62 | % | | | 2.25 | % |
Portfolio turnover rate(3) | | | 87 | % | | | 77 | % | | | 67 | % | | | 64 | % | | | 64 | % |
(1) | Calculated using average shares outstanding during the year. |
(2) | Amount is less than $0.005. |
(3) | Portfolio turnover is calculated on the basis of the Fund as a whole without distinguishing between the classes of shares issued and excludes in-kind transactions, where applicable. |
The accompanying notes are an integral part of these financial statements.
Financial Highlights
Baird Intermediate Bond Fund – Institutional Class
| | | Year Ended December 31, | |
| | | 2023 | | | 2022 | | | 2021 | | | 2020 | | | 2019 | |
| Per Share Data: | | | | | | | | | | | | | | | |
| Net asset value, beginning of year | | $ | 10.08 | | | $ | 11.27 | | | $ | 11.69 | | | $ | 11.27 | | | $ | 10.80 | |
| Income from investment operations: | | | | | | | | | | | | | | | | | | | | |
Net investment income(1) | | | 0.33 | | | | 0.22 | | | | 0.18 | | | | 0.25 | | | | 0.29 | |
| Net realized and unrealized gains (losses) on investments | | | 0.24 | | | | (1.19 | ) | | | (0.34 | ) | | | 0.58 | | | | 0.46 | |
| Total from investment operations | | | 0.57 | | | | (0.97 | ) | | | (0.16 | ) | | | 0.83 | | | | 0.75 | |
| Less distributions: | | | | | | | | | | | | | | | | | | | | |
| Distributions from net investment income | | | (0.33 | ) | | | (0.22 | ) | | | (0.18 | ) | | | (0.25 | ) | | | (0.28 | ) |
| Distributions from net realized gains | | | — | | | | — | | | | (0.08 | ) | | | (0.16 | ) | | | — | |
| Total distributions | | | (0.33 | ) | | | (0.22 | ) | | | (0.26 | ) | | | (0.41 | ) | | | (0.28 | ) |
| Net asset value, end of year | | $ | 10.32 | | | $ | 10.08 | | | $ | 11.27 | | | $ | 11.69 | | | $ | 11.27 | |
| Total return | | | 5.78 | % | | | (8.64 | )% | | | (1.41 | )% | | | 7.42 | % | | | 7.05 | % |
| Supplemental data and ratios: | | | | | | | | | | | | | | | | | | | | |
| Net assets, end of year (millions) | | $ | 8,238.6 | | | $ | 6,980.6 | | | $ | 6,639.0 | | | $ | 5,264.4 | | | $ | 4,342.1 | |
| Ratio of expenses to average net assets | | | 0.30 | % | | | 0.30 | % | | | 0.30 | % | | | 0.30 | % | | | 0.30 | % |
| Ratio of net investment income to average net assets | | | 3.28 | % | | | 2.11 | % | | | 1.54 | % | | | 2.17 | % | | | 2.57 | % |
Portfolio turnover rate(2) | | | 45 | % | | | 47 | % | | | 51 | % | | | 37 | % | | | 26 | % |
(1) | Calculated using average shares outstanding during the year. |
(2) | Portfolio turnover is calculated on the basis of the Fund as a whole without distinguishing between the classes of shares issued and excludes in-kind transactions, where applicable. |
Baird Intermediate Bond Fund – Investor Class
| | | Year Ended December 31, | |
| | | 2023 | | | 2022 | | | 2021 | | | 2020 | | | 2019 | |
| Per Share Data: | | | | | | | | | | | | | | | |
| Net asset value, beginning of year | | $ | 10.59 | | | $ | 11.83 | | | $ | 12.26 | | | $ | 11.80 | | | $ | 11.29 | |
| Income from investment operations: | | | | | | | | | | | | | | | | | | | | |
Net investment income(1) | | | 0.32 | | | | 0.20 | | | | 0.16 | | | | 0.23 | | | | 0.27 | |
| Net realized and unrealized gains (losses) on investments | | | 0.26 | | | | (1.25 | ) | | | (0.36 | ) | | | 0.61 | | | | 0.50 | |
| Total from investment operations | | | 0.58 | | | | (1.05 | ) | | | (0.20 | ) | | | 0.84 | | | | 0.77 | |
| Less distributions: | | | | | | | | | | | | | | | | | | | | |
| Distributions from net investment income | | | (0.31 | ) | | | (0.19 | ) | | | (0.15 | ) | | | (0.22 | ) | | | (0.26 | ) |
| Distributions from net realized gains | | | — | | | | — | | | | (0.08 | ) | | | (0.16 | ) | | | — | |
| Total distributions | | | (0.31 | ) | | | (0.19 | ) | | | (0.23 | ) | | | (0.38 | ) | | | (0.26 | ) |
| Net asset value, end of year | | $ | 10.86 | | | $ | 10.59 | | | $ | 11.83 | | | $ | 12.26 | | | $ | 11.80 | |
| Total return | | | 5.53 | % | | | (8.88 | )% | | | (1.68 | )% | | | 7.16 | % | | | 6.83 | % |
| Supplemental data and ratios: | | | | | | | | | | | | | | | | | | | | |
| Net assets, end of year (millions) | | $ | 87.8 | | | $ | 59.3 | | | $ | 42.2 | | | $ | 55.2 | | | $ | 52.2 | |
| Ratio of expenses to average net assets | | | 0.55 | % | | | 0.55 | % | | | 0.55 | % | | | 0.55 | % | | | 0.55 | % |
| Ratio of net investment income to average net assets | | | 3.03 | % | | | 1.86 | % | | | 1.29 | % | | | 1.92 | % | | | 2.32 | % |
Portfolio turnover rate(2) | | | 45 | % | | | 47 | % | | | 51 | % | | | 37 | % | | | 26 | % |
(1) | Calculated using average shares outstanding during the year. |
(2) | Portfolio turnover is calculated on the basis of the Fund as a whole without distinguishing between the classes of shares issued and excludes in-kind transactions, where applicable. |
The accompanying notes are an integral part of these financial statements.
Financial Highlights
Baird Aggregate Bond Fund – Institutional Class
| | | Year Ended December 31, | |
| | | 2023 | | | 2022 | | | 2021 | | | 2020 | | | 2019 | |
| Per Share Data: | | | | | | | | | | | | | | | |
| Net asset value, beginning of year | | $ | 9.60 | | | $ | 11.37 | | | $ | 11.77 | | | $ | 11.21 | | | $ | 10.53 | |
| Income from investment operations: | | | | | | | | | | | | | | | | | | | | |
Net investment income(1) | | | 0.34 | | | | 0.25 | | | | 0.19 | | | | 0.25 | | | | 0.30 | |
| Net realized and unrealized gains (losses) on investments | | | 0.26 | | | | (1.76 | ) | | | (0.36 | ) | | | 0.71 | | | | 0.69 | |
| Total from investment operations | | | 0.60 | | | | (1.51 | ) | | | (0.17 | ) | | | 0.96 | | | | 0.99 | |
| Less distributions: | | | | | | | | | | | | | | | | | | | | |
| Distributions from net investment income | | | (0.34 | ) | | | (0.26 | ) | | | (0.22 | ) | | | (0.27 | ) | | | (0.31 | ) |
| Distributions from net realized gains | | | — | | | | — | | | | (0.01 | ) | | | (0.13 | ) | | | — | |
| Total distributions | | | (0.34 | ) | | | (0.26 | ) | | | (0.23 | ) | | | (0.40 | ) | | | (0.31 | ) |
| Net asset value, end of year | | $ | 9.86 | | | $ | 9.60 | | | $ | 11.37 | | | $ | 11.77 | | | $ | 11.21 | |
| Total return | | | 6.43 | % | | | (13.35 | )% | | | (1.46 | )% | | | 8.63 | % | | | 9.48 | % |
| Supplemental data and ratios: | | | | | | | | | | | | | | | | | | | | |
| Net assets, end of year (millions) | | $ | 41,933.7 | | | $ | 34,102.5 | | | $ | 39,050.1 | | | $ | 31,874.6 | | | $ | 21,857.4 | |
| Ratio of expenses to average net assets | | | 0.30 | % | | | 0.30 | % | | | 0.30 | % | | | 0.30 | % | | | 0.30 | % |
| Ratio of net investment income to average net assets | | | 3.55 | % | | | 2.46 | % | | | 1.66 | % | | | 2.13 | % | | | 2.74 | % |
Portfolio turnover rate(2) | | | 38 | % | | | 43 | % | | | 39 | % | | | 35 | % | | | 31 | % |
(1) | Calculated using average shares outstanding during the year. |
(2) | Portfolio turnover is calculated on the basis of the Fund as a whole without distinguishing between the classes of shares issued and excludes in-kind transactions, where applicable. |
Baird Aggregate Bond Fund – Investor Class
| | | Year Ended December 31, | |
| | | 2023 | | | 2022 | | | 2021 | | | 2020 | | | 2019 | |
| Per Share Data: | | | | | | | | | | | | | | | |
| Net asset value, beginning of year | | $ | 9.97 | | | $ | 11.79 | | | $ | 12.20 | | | $ | 11.60 | | | $ | 10.89 | |
| Income from investment operations: | | | | | | | | | | | | | | | | | | | | |
Net investment income(1) | | | 0.33 | | | | 0.23 | | | | 0.17 | | | | 0.23 | | | | 0.28 | |
| Net realized and unrealized gains (losses) on investments | | | 0.27 | | | | (1.82 | ) | | | (0.38 | ) | | | 0.74 | | | | 0.71 | |
| Total from investment operations | | | 0.60 | | | | (1.59 | ) | | | (0.21 | ) | | | 0.97 | | | | 0.99 | |
| Less distributions: | | | | | | | | | | | | | | | | | | | | |
| Distributions from net investment income | | | (0.32 | ) | | | (0.23 | ) | | | (0.19 | ) | | | (0.24 | ) | | | (0.28 | ) |
| Distributions from net realized gains | | | — | | | | — | | | | (0.01 | ) | | | (0.13 | ) | | | — | |
| Total distributions | | | (0.32 | ) | | | (0.23 | ) | | | (0.20 | ) | | | (0.37 | ) | | | (0.28 | ) |
| Net asset value, end of year | | $ | 10.25 | | | $ | 9.97 | | | $ | 11.79 | | | $ | 12.20 | | | $ | 11.60 | |
| Total return | | | 6.13 | % | | | (13.52 | )% | | | (1.74 | )% | | | 8.42 | % | | | 9.17 | % |
| Supplemental data and ratios: | | | | | | | | | | | | | | | | | | | | |
| Net assets, end of year (millions) | | $ | 971.8 | | | $ | 681.1 | | | $ | 904.3 | | | $ | 1,029.0 | | | $ | 786.4 | |
| Ratio of expenses to average net assets | | | 0.55 | % | | | 0.55 | % | | | 0.55 | % | | | 0.55 | % | | | 0.55 | % |
| Ratio of net investment income to average net assets | | | 3.30 | % | | | 2.21 | % | | | 1.41 | % | | | 1.88 | % | | | 2.49 | % |
Portfolio turnover rate(2) | | | 38 | % | | | 43 | % | | | 39 | % | | | 35 | % | | | 31 | % |
(1) | Calculated using average shares outstanding during the year. |
(2) | Portfolio turnover is calculated on the basis of the Fund as a whole without distinguishing between the classes of shares issued and excludes in-kind transactions, where applicable. |
The accompanying notes are an integral part of these financial statements.
Financial Highlights
Baird Core Plus Bond Fund – Institutional Class
| | | Year Ended December 31, | |
| | | 2023 | | | 2022 | | | 2021 | | | 2020 | | | 2019 | |
| Per Share Data: | | | | | | | | | | | | | | | |
| Net asset value, beginning of year | | $ | 9.87 | | | $ | 11.67 | | | $ | 12.14 | | | $ | 11.56 | | | $ | 10.82 | |
| Income from investment operations: | | | | | | | | | | | | | | | | | | | | |
Net investment income(1) | | | 0.36 | | | | 0.29 | | | | 0.26 | | | | 0.29 | | | | 0.33 | |
| Net realized and unrealized gains (losses) on investments | | | 0.30 | | | | (1.79 | ) | | | (0.38 | ) | | | 0.72 | | | | 0.75 | |
| Total from investment operations | | | 0.66 | | | | (1.50 | ) | | | (0.12 | ) | | | 1.01 | | | | 1.08 | |
| Less distributions: | | | | | | | | | | | | | | | | | | | | |
| Distributions from net investment income | | | (0.36 | ) | | | (0.30 | ) | | | (0.28 | ) | | | (0.31 | ) | | | (0.34 | ) |
| Distributions from net realized gains | | | — | | | | (0.00 | )(2) | | | (0.07 | ) | | | (0.12 | ) | | | — | |
| Total distributions | | | (0.36 | ) | | | (0.30 | ) | | | (0.35 | ) | | | (0.43 | ) | | | (0.34 | ) |
| Net asset value, end of year | | $ | 10.17 | | | $ | 9.87 | | | $ | 11.67 | | | $ | 12.14 | | | $ | 11.56 | |
| Total return | | | 6.89 | % | | | (12.87 | )% | | | (1.02 | )% | | | 8.80 | % | | | 10.11 | % |
| Supplemental data and ratios: | | | | | | | | | | | | | | | | | | | | |
| Net assets, end of year (millions) | | $ | 26,783.0 | | | $ | 21,288.5 | | | $ | 27,654.9 | | | $ | 26,805.5 | | | $ | 21,424.9 | |
| Ratio of expenses to average net assets | | | 0.30 | % | | | 0.30 | % | | | 0.30 | % | | | 0.30 | % | | | 0.30 | % |
| Ratio of net investment income to average net assets | | | 3.67 | % | | | 2.82 | % | | | 2.16 | % | | | 2.46 | % | | | 2.95 | % |
Portfolio turnover rate(3) | | | 35 | % | | | 29 | % | | | 45 | % | | | 33 | % | | | 26 | % |
(1) | Calculated using average shares outstanding during the year. |
(2) | Amount is less than $0.005. |
(3) | Portfolio turnover is calculated on the basis of the Fund as a whole without distinguishing between the classes of shares issued and excludes in-kind transactions, where applicable. |
Baird Core Plus Bond Fund – Investor Class
| | | Year Ended December 31, | |
| | | 2023 | | | 2022 | | | 2021 | | | 2020 | | | 2019 | |
| Per Share Data: | | | | | | | | | | | | | | | |
| Net asset value, beginning of year | | $ | 10.34 | | | $ | 12.21 | | | $ | 12.68 | | | $ | 12.05 | | | $ | 11.28 | |
| Income from investment operations: | | | | | | | | | | | | | | | | | | | | |
Net investment income(1) | | | 0.36 | | | | 0.28 | | | | 0.24 | | | | 0.28 | | | | 0.32 | |
| Net realized and unrealized gains (losses) on investments | | | 0.31 | | | | (1.87 | ) | | | (0.39 | ) | | | 0.74 | | | | 0.76 | |
| Total from investment operations | | | 0.67 | | | | (1.59 | ) | | | (0.15 | ) | | | 1.02 | | | | 1.08 | |
| Less distributions: | | | | | | | | | | | | | | | | | | | | |
| Distributions from net investment income | | | (0.34 | ) | | | (0.28 | ) | | | (0.25 | ) | | | (0.28 | ) | | | (0.31 | ) |
| Distributions from net realized gains | | | — | | | | (0.00 | )(2) | | | (0.07 | ) | | | (0.11 | ) | | | — | |
| Total distributions | | | (0.34 | ) | | | (0.28 | ) | | | (0.32 | ) | | | (0.39 | ) | | | (0.31 | ) |
| Net asset value, end of year | | $ | 10.67 | | | $ | 10.34 | | | $ | 12.21 | | | $ | 12.68 | | | $ | 12.05 | |
| Total return | | | 6.60 | % | | | (13.09 | )% | | | (1.23 | )% | | | 8.58 | % | | | 9.69 | % |
| Supplemental data and ratios: | | | | | | | | | | | | | | | | | | | | |
| Net assets, end of year (millions) | | $ | 1,098.0 | | | $ | 1,045.0 | | | $ | 1,612.2 | | | $ | 2,684.3 | | | $ | 2,500.0 | |
| Ratio of expenses to average net assets | | | 0.55 | % | | | 0.55 | % | | | 0.55 | % | | | 0.55 | % | | | 0.55 | % |
| Ratio of net investment income to average net assets | | | 3.42 | % | | | 2.57 | % | | | 1.91 | % | | | 2.21 | % | | | 2.70 | % |
Portfolio turnover rate(3) | | | 35 | % | | | 29 | % | | | 45 | % | | | 33 | % | | | 26 | % |
(1) | Calculated using average shares outstanding during the year. |
(2) | Amount is less than $0.005. |
(3) | Portfolio turnover is calculated on the basis of the Fund as a whole without distinguishing between the classes of shares issued and excludes in-kind transactions, where applicable. |
The accompanying notes are an integral part of these financial statements.
Financial Highlights
Baird Short-Term Municipal Bond Fund – Institutional Class
| | | Year Ended December 31, | |
| | | 2023 | | | 2022 | | | 2021 | | | 2020 | | | 2019 | |
| Per Share Data: | | | | | | | | | | | | | | | |
| Net asset value, beginning of year | | $ | 9.85 | | | $ | 10.39 | | | $ | 10.43 | | | $ | 10.26 | | | $ | 10.06 | |
| Income from investment operations: | | | | | | | | | | | | | | | | | | | | |
Net investment income(1) | | | 0.27 | | | | 0.16 | | | | 0.12 | | | | 0.17 | | | | 0.20 | |
| Net realized and unrealized gains (losses) on investments | | | 0.13 | | | | (0.54 | ) | | | (0.04 | ) | | | 0.16 | | | | 0.20 | |
| Total from investment operations | | | 0.40 | | | | (0.38 | ) | | | 0.08 | | | | 0.33 | | | | 0.40 | |
| Less distributions: | | | | | | | | | | | | | | | | | | | | |
| Distributions from net investment income | | | (0.27 | ) | | | (0.16 | ) | | | (0.12 | ) | | | (0.16 | ) | | | (0.20 | ) |
| Distributions from net realized gains | | | — | | | | — | | | | (0.00 | )(2) | | | — | | | | — | |
| Total distributions | | | (0.27 | ) | | | (0.16 | ) | | | (0.12 | ) | | | (0.16 | ) | | | (0.20 | ) |
| Net asset value, end of year | | $ | 9.98 | | | $ | 9.85 | | | $ | 10.39 | | | $ | 10.43 | | | $ | 10.26 | |
| Total return | | | 4.15 | % | | | (3.66 | )% | | | 0.74 | % | | | 3.25 | % | | | 3.96 | % |
| Supplemental data and ratios: | | | | | | | | | | | | | | | | | | | | |
| Net assets, end of year (millions) | | $ | 1,525.3 | | | $ | 1,695.5 | | | $ | 2,190.2 | | | $ | 1,520.0 | | | $ | 926.1 | |
| Ratio of expenses to average net assets | | | 0.30 | % | | | 0.30 | % | | | 0.30 | % | | | 0.30 | % | | | 0.30 | % |
| Ratio of net investment income to average net assets | | | 2.73 | % | | | 1.56 | % | | | 1.10 | % | | | 1.61 | % | | | 1.96 | % |
Portfolio turnover rate(3) | | | 40 | % | | | 64 | % | | | 44 | % | | | 32 | % | | | 34 | % |
(1) | Calculated using average shares outstanding during the year. |
(2) | Amount is less than $0.005. |
(3) | Portfolio turnover is calculated on the basis of the Fund as a whole without distinguishing between the classes of shares issued and excludes in-kind transactions, where applicable. |
Baird Short-Term Municipal Bond Fund – Investor Class
| | | Year Ended December 31, | |
| | | 2023 | | | 2022 | | | 2021 | | | 2020 | | | 2019 | |
| Per Share Data: | | | | | | | | | | | | | | | |
| Net asset value, beginning of year | | $ | 9.83 | | | $ | 10.38 | | | $ | 10.41 | | | $ | 10.25 | | | $ | 10.04 | |
| Income from investment operations: | | | | | | | | | | | | | | | | | | | | |
Net investment income(1) | | | 0.24 | | | | 0.13 | | | | 0.09 | | | | 0.14 | | | | 0.17 | |
| Net realized and unrealized gains (losses) on investments | | | 0.14 | | | | (0.55 | ) | | | (0.03 | ) | | | 0.15 | | | | 0.21 | |
| Total from investment operations | | | 0.38 | | | | (0.42 | ) | | | 0.06 | | | | 0.29 | | | | 0.38 | |
| Less distributions: | | | | | | | | | | | | | | | | | | | | |
| Distributions from net investment income | | | (0.25 | ) | | | (0.13 | ) | | | (0.09 | ) | | | (0.13 | ) | | | (0.17 | ) |
| Distributions from net realized gains | | | — | | | | — | | | | (0.00 | )(2) | | | — | | | | — | |
| Total distributions | | | (0.25 | ) | | | (0.13 | ) | | | (0.09 | ) | | | (0.13 | ) | | | (0.17 | ) |
| Net asset value, end of year | | $ | 9.96 | | | $ | 9.83 | | | $ | 10.38 | | | $ | 10.41 | | | $ | 10.25 | |
| Total return | | | 3.90 | % | | | (4.01 | )% | | | 0.59 | % | | | 2.90 | % | | | 3.81 | % |
| Supplemental data and ratios: | | | | | | | | | | | | | | | | | | | | |
| Net assets, end of year (millions) | | $ | 78.4 | | | $ | 71.7 | | | $ | 110.4 | | | $ | 92.2 | | | $ | 89.6 | |
| Ratio of expenses to average net assets | | | 0.55 | % | | | 0.55 | % | | | 0.55 | % | | | 0.55 | % | | | 0.55 | % |
| Ratio of net investment income to average net assets | | | 2.48 | % | | | 1.31 | % | | | 0.85 | % | | | 1.36 | % | | | 1.71 | % |
Portfolio turnover rate(3) | | | 40 | % | | | 64 | % | | | 44 | % | | | 32 | % | | | 34 | % |
(1) | Calculated using average shares outstanding during the year. |
(2) | Amount is less than $0.005. |
(3) | Portfolio turnover is calculated on the basis of the Fund as a whole without distinguishing between the classes of shares issued and excludes in-kind transactions, where applicable. |
The accompanying notes are an integral part of these financial statements.
Financial Highlights
Baird Strategic Municipal Bond Fund – Institutional Class
| | | | | | | | | | | | | | | Period Ended | |
| | | Year Ended December 31, | | | December 31, | |
| | | 2023 | | | 2022 | | | 2021 | | | 2020 | | | 2019(1) | |
| Per Share Data: | | | | | | | | | | | | | | | |
| Net asset value, beginning of period | | $ | 9.96 | | | $ | 10.74 | | | $ | 10.67 | | | $ | 10.07 | | | $ | 10.00 | |
| Income from investment operations: | | | | | | | | | | | | | | | | | | | | |
Net investment income(2) | | | 0.34 | | | | 0.22 | | | | 0.11 | | | | 0.18 | | | | 0.02 | |
| Net realized and unrealized gains (losses) on investments | | | 0.32 | | | | (0.79 | ) | | | 0.14 | | | | 0.66 | | | | 0.07 | |
| Total from investment operations | | | 0.66 | | | | (0.57 | ) | | | 0.25 | | | | 0.84 | | | | 0.09 | |
| Less distributions: | | | | | | | | | | | | | | | | | | | | |
| Distributions from net investment income | | | (0.33 | ) | | | (0.21 | ) | | | (0.12 | ) | | | (0.17 | ) | | | (0.02 | ) |
| Distributions from net realized gains | | | — | | | | (0.00 | )(3) | | | (0.06 | ) | | | (0.07 | ) | | | — | |
| Total distributions | | | (0.33 | ) | | | (0.21 | ) | | | (0.18 | ) | | | (0.24 | ) | | | (0.02 | ) |
| Net asset value, end of period | | $ | 10.29 | | | $ | 9.96 | | | $ | 10.74 | | | $ | 10.67 | | | $ | 10.07 | |
| Total return | | | 6.78 | % | | | (5.31 | )% | | | 2.26 | % | | | 8.39 | % | | | 0.88 | %(4) |
| Supplemental data and ratios: | | | | | | | | | | | | | | | | | | | | |
| Net assets, end of period (millions) | | $ | 881.5 | | | $ | 470.8 | | | $ | 345.0 | | | $ | 164.3 | | | $ | 12.0 | |
| Ratio of expenses to average net assets | | | 0.30 | % | | | 0.30 | % | | | 0.30 | % | | | 0.30 | % | | | 0.30 | %(5) |
| Ratio of net investment income to average net assets | | | 3.42 | % | | | 2.18 | % | | | 1.07 | % | | | 1.72 | % | | | 1.60 | %(5) |
Portfolio turnover rate(6) | | | 50 | % | | | 89 | % | | | 55 | % | | | 119 | % | | | 47 | %(4) |
(1) | Inception was close of business on November 15, 2019. |
(2) | Calculated using average shares outstanding during the period. |
(3) | Amount is less than $0.005. |
(4) | Not annualized. |
(5) | Annualized. |
(6) | Portfolio turnover is calculated on the basis of the Fund as a whole without distinguishing between the classes of shares issued and excludes in-kind transactions, where applicable. |
Baird Strategic Municipal Bond Fund – Investor Class
| | | | | | | | | | | | | | | Period Ended | |
| | | Year Ended December 31, | | | December 31, | |
| | | 2023 | | | 2022 | | | 2021 | | | 2020 | | | 2019(1) | |
| Per Share Data: | | | | | | | | | | | | | | | |
| Net asset value, beginning of period | | $ | 9.96 | | | $ | 10.74 | | | $ | 10.67 | | | $ | 10.07 | | | $ | 10.00 | |
| Income from investment operations: | | | | | | | | | | | | | | | | | | | | |
Net investment income(2) | | | 0.32 | | | | 0.19 | | | | 0.09 | | | | 0.15 | | | | 0.02 | |
| Net realized and unrealized gains (losses) on investments | | | 0.32 | | | | (0.79 | ) | | | 0.13 | | | | 0.67 | | | | 0.06 | |
| Total from investment operations | | | 0.64 | | | | (0.60 | ) | | | 0.22 | | | | 0.82 | | | | 0.08 | |
| Less distributions: | | | | | | | | | | | | | | | | | | | | |
| Distributions from net investment income | | | (0.31 | ) | | | (0.18 | ) | | | (0.09 | ) | | | (0.15 | ) | | | (0.01 | ) |
| Distributions from net realized gains | | | — | | | | (0.00 | )(3) | | | (0.06 | ) | | | (0.07 | ) | | | — | |
| Total distributions | | | (0.31 | ) | | | (0.18 | ) | | | (0.15 | ) | | | (0.22 | ) | | | (0.01 | ) |
| Net asset value, end of period | | $ | 10.29 | | | $ | 9.96 | | | $ | 10.74 | | | $ | 10.67 | | | $ | 10.07 | |
| Total return | | | 6.53 | % | | | (5.55 | )% | | | 2.00 | % | | | 8.13 | % | | | 0.85 | %(4) |
| Supplemental data and ratios: | | | | | | | | | | | | | | | | | | | | |
| Net assets, end of period (thousands) | | $ | 38,577.3 | | | $ | 10,660.1 | | | $ | 8,262.3 | | | $ | 6,976.1 | | | $ | 27.4 | |
| Ratio of expenses to average net assets | | | 0.55 | % | | | 0.55 | % | | | 0.55 | % | | | 0.55 | % | | | 0.55 | %(5) |
| Ratio of net investment income to average net assets | | | 3.17 | % | | | 1.93 | % | | | 0.82 | % | | | 1.47 | % | | | 1.35 | %(5) |
Portfolio turnover rate(6) | | | 50 | % | | | 89 | % | | | 55 | % | | | 119 | % | | | 47 | %(4) |
(1) | Inception was close of business on November 15, 2019. |
(2) | Calculated using average shares outstanding during the period. |
(3) | Amount is less than $0.005. |
(4) | Not annualized. |
(5) | Annualized. |
(6) | Portfolio turnover is calculated on the basis of the Fund as a whole without distinguishing between the classes of shares issued and excludes in-kind transactions, where applicable. |
The accompanying notes are an integral part of these financial statements.
Financial Highlights
Baird Quality Intermediate Municipal Bond Fund – Institutional Class
| | | Year Ended December 31, | |
| | | 2023 | | | 2022 | | | 2021 | | | 2020 | | | 2019 | |
| Per Share Data: | | | | | | | | | | | | | | | |
| Net asset value, beginning of year | | $ | 10.95 | | | $ | 11.85 | | | $ | 12.03 | | | $ | 11.75 | | | $ | 11.38 | |
| Income from investment operations: | | | | | | | | | | | | | | | | | | | | |
Net investment income(1) | | | 0.28 | | | | 0.22 | | | | 0.21 | | | | 0.24 | | | | 0.27 | |
| Net realized and unrealized gains (losses) on investments | | | 0.18 | | | | (0.90 | ) | | | (0.17 | ) | | | 0.28 | | | | 0.37 | |
| Total from investment operations | | | 0.46 | | | | (0.68 | ) | | | 0.04 | | | | 0.52 | | | | 0.64 | |
| Less distributions: | | | | | | | | | | | | | | | | | | | | |
| Distributions from net investment income | | | (0.28 | ) | | | (0.22 | ) | | | (0.22 | ) | | | (0.24 | ) | | | (0.27 | ) |
| Total distributions | | | (0.28 | ) | | | (0.22 | ) | | | (0.22 | ) | | | (0.24 | ) | | | (0.27 | ) |
| Net asset value, end of year | | $ | 11.13 | | | $ | 10.95 | | | $ | 11.85 | | | $ | 12.03 | | | $ | 11.75 | |
| Total return | | | 4.29 | % | | | (5.74 | )% | | | 0.27 | % | | | 4.43 | % | | | 5.65 | % |
| Supplemental data and ratios: | | | | | | | | | | | | | | | | | | | | |
| Net assets, end of year (millions) | | $ | 1,051.9 | | | $ | 1,083.0 | | | $ | 1,526.2 | | | $ | 1,449.2 | | | $ | 1,257.4 | |
| Ratio of expenses to average net assets | | | 0.30 | % | | | 0.30 | % | | | 0.30 | % | | | 0.30 | % | | | 0.30 | % |
| Ratio of net investment income to average net assets | | | 2.55 | % | | | 1.94 | % | | | 1.75 | % | | | 2.03 | % | | | 2.30 | % |
Portfolio turnover rate(2) | | | 33 | % | | | 33 | % | | | 18 | % | | | 15 | % | | | 20 | % |
(1) | Calculated using average shares outstanding during the year. |
(2) | Portfolio turnover is calculated on the basis of the Fund as a whole without distinguishing between the classes of shares issued and excludes in-kind transactions, where applicable. |
Baird Quality Intermediate Municipal Bond Fund – Investor Class
| | | Year Ended December 31, | |
| | | 2023 | | | 2022 | | | 2021 | | | 2020 | | | 2019 | |
| Per Share Data: | | | | | | | | | | | | | | | |
| Net asset value, beginning of year | | $ | 11.24 | | | $ | 12.16 | | | $ | 12.34 | | | $ | 12.04 | | | $ | 11.66 | |
| Income from investment operations: | | | | | | | | | | | | | | | | | | | | |
Net investment income(1) | | | 0.26 | | | | 0.19 | | | | 0.18 | | | | 0.22 | | | | 0.24 | |
| Net realized and unrealized gains (losses) on investments | | | 0.18 | | | | (0.92 | ) | | | (0.18 | ) | | | 0.29 | | | | 0.38 | |
| Total from investment operations | | | 0.44 | | | | (0.73 | ) | | | — | | | | 0.51 | | | | 0.62 | |
| Less distributions: | | | | | | | | | | | | | | | | | | | | |
| Distributions from net investment income | | | (0.25 | ) | | | (0.19 | ) | | | (0.18 | ) | | | (0.21 | ) | | | (0.24 | ) |
| Total distributions | | | (0.25 | ) | | | (0.19 | ) | | | (0.18 | ) | | | (0.21 | ) | | | (0.24 | ) |
| Net asset value, end of year | | $ | 11.43 | | | $ | 11.24 | | | $ | 12.16 | | | $ | 12.34 | | | $ | 12.04 | |
| Total return | | | 4.01 | % | | | (5.99 | )% | | | 0.02 | % | | | 4.23 | % | | | 5.33 | % |
| Supplemental data and ratios: | | | | | | | | | | | | | | | | | | | | |
| Net assets, end of year (millions) | | $ | 51.0 | | | $ | 30.6 | | | $ | 59.2 | | | $ | 52.4 | | | $ | 85.1 | |
| Ratio of expenses to average net assets | | | 0.55 | % | | | 0.55 | % | | | 0.55 | % | | | 0.55 | % | | | 0.55 | % |
| Ratio of net investment income to average net assets | | | 2.30 | % | | | 1.69 | % | | | 1.50 | % | | | 1.78 | % | | | 2.05 | % |
Portfolio turnover rate(2) | | | 33 | % | | | 33 | % | | | 18 | % | | | 15 | % | | | 20 | % |
(1) | Calculated using average shares outstanding during the year. |
(2) | Portfolio turnover is calculated on the basis of the Fund as a whole without distinguishing between the classes of shares issued and excludes in-kind transactions, where applicable. |
The accompanying notes are an integral part of these financial statements.
Financial Highlights
Baird Core Intermediate Municipal Bond Fund – Institutional Class
| | | Year Ended December 31, | |
| | | 2023 | | | 2022 | | | 2021 | | | 2020 | | | 2019 | |
| Per Share Data: | | | | | | | | | | | | | | | |
| Net asset value, beginning of year | | $ | 10.10 | | | $ | 10.96 | | | $ | 10.96 | | | $ | 10.65 | | | $ | 10.22 | |
| Income from investment operations: | | | | | | | | | | | | | | | | | | | | |
Net investment income(1) | | | 0.31 | | | | 0.21 | | | | 0.16 | | | | 0.23 | | | | 0.25 | |
| Net realized and unrealized gains (losses) on investments | | | 0.24 | | | | (0.88 | ) | | | 0.02 | (2) | | | 0.33 | | | | 0.43 | |
| Total from investment operations | | | 0.55 | | | | (0.67 | ) | | | 0.18 | | | | 0.56 | | | | 0.68 | |
| Less distributions: | | | | | | | | | | | | | | | | | | | | |
| Distributions from net investment income | | | (0.31 | ) | | | (0.19 | ) | | | (0.17 | ) | | | (0.22 | ) | | | (0.24 | ) |
| Distributions from net realized gains | | | — | | | | (0.00 | )(3) | | | (0.01 | ) | | | (0.03 | ) | | | (0.01 | ) |
| Total distributions | | | (0.31 | ) | | | (0.19 | ) | | | (0.18 | ) | | | (0.25 | ) | | | (0.25 | ) |
| Net asset value, end of year | | $ | 10.34 | | | $ | 10.10 | | | $ | 10.96 | | | $ | 10.96 | | | $ | 10.65 | |
| Total return | | | 5.54 | % | | | (6.07 | )% | | | 1.60 | % | | | 5.26 | % | | | 6.75 | % |
| Supplemental data and ratios: | | | | | | | | | | | | | | | | | | | | |
| Net assets, end of year (millions) | | $ | 2,942.7 | | | $ | 2,449.7 | | | $ | 1,531.2 | | | $ | 842.2 | | | $ | 535.5 | |
| Ratio of expenses to average net assets | | | 0.30 | % | | | 0.30 | % | | | 0.30 | % | | | 0.30 | % | | | 0.30 | % |
| Ratio of net investment income to average net assets | | | 3.08 | % | | | 2.01 | % | | | 1.47 | % | | | 2.09 | % | | | 2.36 | % |
Portfolio turnover rate(4) | | | 32 | % | | | 59 | % | | | 31 | % | | | 35 | % | | | 38 | % |
(1) | Calculated using average shares outstanding during the year. |
(2) | Due to timing of capital share transactions, the per share amount of net realized and unrealized gain (loss) on investments varies from the amounts shown in the Statement of Operations. |
(3) | Amount is less than $0.005. |
(4) | Portfolio turnover is calculated on the basis of the Fund as a whole without distinguishing between the classes of shares issued and excludes in-kind transactions, where applicable. |
Baird Core Intermediate Municipal Bond Fund – Investor Class
| | | Year Ended December 31, | |
| | | 2023 | | | 2022 | | | 2021 | | | 2020 | | | 2019 | |
| Per Share Data: | | | | | | | | | | | | | | | |
| Net asset value, beginning of year | | $ | 10.09 | | | $ | 10.96 | | | $ | 10.95 | | | $ | 10.64 | | | $ | 10.22 | |
| Income from investment operations: | | | | | | | | | | | | | | | | | | | | |
Net investment income(1) | | | 0.29 | | | | 0.18 | | | | 0.13 | | | | 0.20 | | | | 0.22 | |
| Net realized and unrealized gains (losses) on investments | | | 0.23 | | | | (0.88 | ) | | | 0.03 | (2) | | | 0.33 | | | | 0.43 | |
| Total from investment operations | | | 0.52 | | | | (0.70 | ) | | | 0.16 | | | | 0.53 | | | | 0.65 | |
| Less distributions: | | | | | | | | | | | | | | | | | | | | |
| Distributions from net investment income | | | (0.28 | ) | | | (0.17 | ) | | | (0.14 | ) | | | (0.19 | ) | | | (0.22 | ) |
| Distributions from net realized gains | | | — | | | | (0.00 | )(3) | | | (0.01 | ) | | | (0.03 | ) | | | (0.01 | ) |
| Total distributions | | | (0.28 | ) | | | (0.17 | ) | | | (0.15 | ) | | | (0.22 | ) | | | (0.23 | ) |
| Net asset value, end of year | | $ | 10.33 | | | $ | 10.09 | | | $ | 10.96 | | | $ | 10.95 | | | $ | 10.64 | |
| Total return | | | 5.28 | % | | | (6.40 | )% | | | 1.44 | % | | | 5.01 | % | | | 6.40 | % |
| Supplemental data and ratios: | | | | | | | | | | | | | | | | | | | | |
| Net assets, end of year (millions) | | $ | 36.5 | | | $ | 38.8 | | | $ | 42.5 | | | $ | 22.3 | | | $ | 5.9 | |
| Ratio of expenses to average net assets | | | 0.55 | % | | | 0.55 | % | | | 0.55 | % | | | 0.55 | % | | | 0.55 | % |
| Ratio of net investment income to average net assets | | | 2.83 | % | | | 1.76 | % | | | 1.22 | % | | | 1.84 | % | | | 2.11 | % |
Portfolio turnover rate(4) | | | 32 | % | | | 59 | % | | | 31 | % | | | 35 | % | | | 38 | % |
(1) | Calculated using average shares outstanding during the year. |
(2) | Due to timing of capital share transactions, the per share amount of net realized and unrealized gain (loss) on investments varies from the amounts shown in the Statement of Operations. |
(3) | Amount is less than $0.005. |
(4) | Portfolio turnover is calculated on the basis of the Fund as a whole without distinguishing between the classes of shares issued and excludes in-kind transactions, where applicable. |
The accompanying notes are an integral part of these financial statements.
Financial Highlights
Baird Municipal Bond Fund – Institutional Class
| | | | | | | | | | | | | | | Period Ended | |
| | | Year Ended December 31, | | | December 31, | |
| | | 2023 | | | 2022 | | | 2021 | | | 2020 | | | 2019(1) | |
| Per Share Data: | | | | | | | | | | | | | | | |
| Net asset value, beginning of period | | $ | 9.68 | | | $ | 10.76 | | | $ | 10.67 | | | $ | 10.10 | | | $ | 10.00 | |
| Income from investment operations: | | | | | | | | | | | | | | | | | | | | |
Net investment income(2) | | | 0.37 | | | | 0.26 | | | | 0.20 | | | | 0.23 | | | | 0.02 | |
| Net realized and unrealized gains (losses) on investments | | | 0.31 | | | | (1.09 | ) | | | 0.17 | | | | 0.76 | | | | 0.10 | |
| Total from investment operations | | | 0.68 | | | | (0.83 | ) | | | 0.37 | | | | 0.99 | | | | 0.12 | |
| Less distributions: | | | | | | | | | | | | | | | | | | | | |
| Distributions from net investment income | | | (0.35 | ) | | | (0.25 | ) | | | (0.20 | ) | | | (0.21 | ) | | | (0.02 | ) |
| Distributions from net realized gains | | | — | | | | — | | | | (0.08 | ) | | | (0.21 | ) | | | — | |
| Total distributions | | | (0.35 | ) | | | (0.25 | ) | | | (0.28 | ) | | | (0.42 | ) | | | (0.02 | ) |
| Net asset value, end of period | | $ | 10.01 | | | $ | 9.68 | | | $ | 10.76 | | | $ | 10.67 | | | $ | 10.10 | |
| Total return | | | 7.14 | % | | | (7.73 | )% | | | 3.46 | % | | | 9.95 | % | | | 1.19 | %(3) |
| Supplemental data and ratios: | | | | | | | | | | | | | | | | | | | | |
| Net assets, end of period (millions) | | $ | 180.4 | | | $ | 55.7 | | | $ | 34.5 | | | $ | 20.3 | | | $ | 7.4 | |
| Ratio of expenses to average net assets | | | 0.30 | % | | | 0.30 | % | | | 0.30 | % | | | 0.30 | % | | | 0.30 | %(4) |
| Ratio of net investment income to average net assets | | | 3.77 | % | | | 2.63 | % | | | 1.83 | % | | | 2.20 | % | | | 1.69 | %(4) |
Portfolio turnover rate(5) | | | 58 | % | | | 76 | % | | | 38 | % | | | 124 | % | | | 46 | %(3) |
(1) | Inception was close of business on November 15, 2019. |
(2) | Calculated using average shares outstanding during the period. |
(3) | Not annualized. |
(4) | Annualized. |
(5) | Portfolio turnover is calculated on the basis of the Fund as a whole without distinguishing between the classes of shares issued and excludes in-kind transactions, where applicable. |
Baird Municipal Bond Fund – Investor Class
| | | | | | | | | | | | | | | Period Ended | |
| | | Year Ended December 31, | | | December 31, | |
| | | 2023 | | | 2022 | | | 2021 | | | 2020 | | | 2019(1) | |
| Per Share Data: | | | | | | | | | | | | | | | |
| Net asset value, beginning of period | | $ | 9.68 | | | $ | 10.74 | | | $ | 10.66 | | | $ | 10.10 | | | $ | 10.00 | |
| Income from investment operations: | | | | | | | | | | | | | | | | | | | | |
Net investment income(2) | | | 0.34 | | | | 0.24 | | | | 0.17 | | | | 0.21 | | | | 0.02 | |
| Net realized and unrealized gains (losses) on investments | | | 0.29 | | | | (1.08 | ) | | | 0.16 | | | | 0.75 | | | | 0.10 | |
| Total from investment operations | | | 0.63 | | | | (0.84 | ) | | | 0.33 | | | | 0.96 | | | | 0.12 | |
| Less distributions: | | | | | | | | | | | | | | | | | | | | |
| Distributions from net investment income | | | (0.32 | ) | | | (0.22 | ) | | | (0.17 | ) | | | (0.19 | ) | | | (0.02 | ) |
| Distributions from net realized gains | | | — | | | | — | | | | (0.08 | ) | | | (0.21 | ) | | | — | |
| Total distributions | | | (0.32 | ) | | | (0.22 | ) | | | (0.25 | ) | | | (0.40 | ) | | | (0.02 | ) |
| Net asset value, end of period | | $ | 9.99 | | | $ | 9.68 | | | $ | 10.74 | | | $ | 10.66 | | | $ | 10.10 | |
| Total return | | | 6.67 | % | | | (7.78 | )% | | | 3.12 | % | | | 9.58 | % | | | 1.16 | %(3) |
| Supplemental data and ratios: | | | | | | | | | | | | | | | | | | | | |
| Net assets, end of period (thousands) | | $ | 7,549.4 | | | $ | 4,055.6 | | | $ | 3,193.3 | | | $ | 1,624.8 | | | $ | 29.1 | |
| Ratio of expenses to average net assets | | | 0.55 | % | | | 0.55 | % | | | 0.55 | % | | | 0.55 | % | | | 0.55 | %(4) |
| Ratio of net investment income to average net assets | | | 3.52 | % | | | 2.38 | % | | | 1.58 | % | | | 1.95 | % | | | 1.44 | %(4) |
Portfolio turnover rate(5) | | | 58 | % | | | 76 | % | | | 38 | % | | | 124 | % | | | 46 | %(3) |
(1) | Inception was close of business on November 15, 2019. |
(2) | Calculated using average shares outstanding during the period. |
(3) | Not annualized. |
(4) | Annualized. |
(5) | Portfolio turnover is calculated on the basis of the Fund as a whole without distinguishing between the classes of shares issued and excludes in-kind transactions, where applicable. |
The accompanying notes are an integral part of these financial statements.
Notes to the Financial Statements
December 31, 2023
Baird Funds, Inc. (the “Company”) was incorporated on June 9, 2000, as a Wisconsin corporation and is registered as an open-end investment management company under the Investment Company Act of 1940, as amended (the “1940 Act”). The accompanying financial statements include the Baird Ultra Short Bond Fund, Baird Short-Term Bond Fund, Baird Intermediate Bond Fund, Baird Aggregate Bond Fund, Baird Core Plus Bond Fund, Baird Short-Term Municipal Bond Fund, Baird Strategic Municipal Bond Fund, Baird Quality Intermediate Municipal Bond Fund, Baird Core Intermediate Municipal Bond Fund, and Baird Municipal Bond Fund (each, a “Fund” and collectively, the “Funds”), ten of the fifteen active funds in the series comprising the Company. Pursuant to the 1940 Act, the Funds in this report are “diversified” series of the Company. Robert W. Baird & Co. Incorporated (“Baird” or the “Advisor”) serves as investment advisor to the Funds.
The following table presents the class-specific inception dates for each of the Funds:
| | Inception Date |
Fund | Institutional Class | | Investor Class
|
| Baird Ultra Short Bond Fund | December 31, 2013 | | December 31, 2013 |
| Baird Short-Term Bond Fund | August 31, 2004 | | September 19, 2012 |
| Baird Intermediate Bond Fund | September 29, 2000 | | September 29, 2000 |
| Baird Aggregate Bond Fund | September 29, 2000 | | September 29, 2000 |
| Baird Core Plus Bond Fund | September 29, 2000 | | September 29, 2000 |
| Baird Short-Term Municipal Bond Fund | August 31, 2015 | | August 31, 2015 |
| Baird Strategic Municipal Bond Fund | November 15, 2019 | | November 15, 2019 |
| Baird Quality Intermediate Municipal Bond Fund | March 30, 2001 | | March 30, 2001 |
| Baird Core Intermediate Municipal Bond Fund | August 31, 2015 | | August 31, 2015 |
| Baird Municipal Bond Fund | November 15, 2019 | | November 15, 2019 |
Institutional Class shares are not subject to a distribution and service (12b-1) fee, while Investor Class shares are subject to a distribution and service (12b-1) fee of 0.25%. See Note 7.
The investment objective of the Baird Ultra Short Bond Fund is to seek current income consistent with preservation of capital.
The investment objective of the Baird Short-Term Bond Fund is to seek an annual rate of total return, before Fund expenses, greater than the annual rate of total return of the Bloomberg 1-3 Year U.S. Government/Credit Index. The Fund’s benchmark index, the Bloomberg 1-3 Year U.S. Government/Credit Index, is an unmanaged, market value weighted index of investment grade, fixed-rate debt issues, including government and corporate securities, with maturities between one and three years.
The investment objective of the Baird Intermediate Bond Fund is to seek an annual rate of total return, before Fund expenses, greater than the annual rate of total return of the Bloomberg Intermediate U.S. Government/Credit Index. The Fund’s benchmark index, the Bloomberg Intermediate U.S. Government/Credit Index, is an unmanaged, market value weighted index of investment grade, fixed-rate debt issues, including government and corporate securities, with maturities between one and ten years.
The investment objective of the Baird Aggregate Bond Fund is to seek an annual rate of total return, before Fund expenses, greater than the annual rate of total return of the Bloomberg U.S. Aggregate Index. The Fund’s benchmark index, the Bloomberg U.S. Aggregate Index, is an unmanaged, market value weighted index of investment grade, fixed-rate debt issues, including government, corporate, asset-backed and mortgage-backed debt obligations, with maturities of at least one year.
The investment objective of the Baird Core Plus Bond Fund is to seek an annual rate of total return, before Fund expenses, greater than the annual rate of total return of the Bloomberg U.S. Universal Index. The Fund’s benchmark index, the Bloomberg U.S. Universal Index, is an unmanaged, market value weighted index of fixed income debt obligations issued in U.S. dollars, including U.S. government and investment grade debt, non-investment grade debt, asset-backed and mortgage-backed debt obligations, Eurobonds, 144A securities and emerging market debt, with maturities of at least one year.
The investment objective of the Baird Short-Term Municipal Bond Fund is to seek current income that is exempt from federal income tax and is consistent with the preservation of capital.
The investment objective of the Baird Strategic Municipal Bond Fund is to seek a high level of current income that is exempt from federal income tax and is consistent with preservation of capital.
The primary investment objective of the Baird Quality Intermediate Municipal Bond Fund is to seek current income that is substantially exempt from federal income tax. A secondary objective is to seek total return with relatively low volatility of principal.
The investment objective of the Baird Core Intermediate Municipal Bond Fund is to seek a high level of current income that is exempt from federal income tax and is consistent with preservation of capital.
The investment objective of the Baird Municipal Bond Fund is to seek a high level of current income that is exempt from federal income tax and is consistent with preservation of capital.
| 2. | Significant Accounting Policies |
The following is a summary of significant accounting policies consistently followed by the Funds in the preparation of their financial statements. These policies are in conformity with accounting principles generally accepted in the United States of America (“GAAP”). The Funds are investment companies and therefore follow the investment company accounting and reporting guidance of the Financial Accounting Standards Board (“FASB”) Accounting Standards Codification Topic 946, Financial Services – Investment Companies.
| a) | Investment Valuation – Section 2(a)(41) of the 1940 Act, together with the rules and interpretations of the U.S. Securities and Exchange Commission (the “SEC”), require the Funds, in computing net asset value (“NAV”), to value their portfolio securities using market quotations when they are “readily available.” When market quotations are not readily available (e.g., because there is no regular market quotation for such securities, the securities are valued at fair value using methods determined by the Advisor as the valuation designee of the Board of Directors of the Company (the “Board”) in accordance with policies and procedures adopted pursuant to Rule 2a-5 of the 1940 Act. Per GAAP, the “fair value” of a security means the price that would be received to sell a security in an orderly transaction between market participants at the measurement date. |
| | |
| | The Funds determine the fair value of their investments and compute their NAV per share as of the close of regular trading of the New York Stock Exchange (generally, 4:00 p.m. ET). |
Notes to the Financial Statements
December 31, 2023
| 2. | Significant Accounting Policies (cont.) |
| | Consistent with Section 2(a)(41) of the 1940 Act, the Funds price their securities as follows: debt securities are valued at their evaluated bid prices as provided by an independent pricing service based on various market inputs such as benchmark yields, market transactions and dealer quotations. Investments in mutual funds, including money market funds, are valued at their stated NAV. Common stocks that are listed on a securities exchange (other than NASDAQ) are valued at the last quoted sales price. Securities traded on NASDAQ are valued at the NASDAQ Official Closing Price. Price information on listed stocks is taken from the exchange where the security is primarily traded. Securities, other than debt securities, that were not traded on the valuation date, as well as stocks that are not listed on an exchange, including NASDAQ, are valued at the average of the current bid and ask price. Other assets and securities for which market quotations are not readily available are valued at fair value as determined in good faith by the Advisor in accordance with the Funds’ fair value procedures. In accordance with such procedures, the Advisor may, under certain circumstances, use alternative valuation methodologies, such as broker quotes. If prices are unavailable or deemed to be unreliable, fair value will be determined by the Advisor. The Advisor, as Valuation Designee, has further designated its valuation committee to be responsible for fair value determinations. In determining fair value, the valuation committee takes into account factors deemed relevant by the valuation committee and available information. Consequently, the price of the security used by a Fund to calculate its NAV may differ from quoted or published prices for the same security. Fair value pricing involves subjective judgments and there is no single standard for determining a security’s fair value. As a result, different mutual funds could reasonably arrive at a different fair value for the same security. It is possible that the fair value determined for a security is materially different from the value that could be realized upon the sale of that security or from the values that other mutual funds may determine. The prices determined for any individual security on any given day may vary significantly from the amount that can be obtained in an actual sale of that security, and a Fund’s NAV may fluctuate significantly from day to day or from period to period. Occasionally, significant events may occur after the close of the exchange on which a security is traded. If such events materially affect the value of a Fund’s securities, these securities may be valued at their fair value pursuant to the Funds’ fair value procedures. |
| | |
| b) | Securities Purchased on a When-Issued, Delayed Delivery or Forward Commitment Basis – Each Fund may purchase securities on a when-issued, delayed delivery or forward commitment basis. When-issued, delayed delivery and forward commitment transactions involve the risk that the price or yield obtained in a transaction may be more or less favorable than the price or yield available in the market when delivery takes place. At the time a Fund makes a commitment to purchase a security, the Fund records the transaction and reflects the value of the security in determining net asset value. Certain when-issued, delayed delivery or forward commitment securities are considered derivatives. |
| | |
| c) | Unregistered Securities – The Funds own certain investment securities which are unregistered. All of the unregistered securities held by the Funds as of December 31, 2023 consisted of securities issued pursuant to Rule 144A under the Securities Act of 1933 which may be resold in transactions exempt from registration to qualified institutional buyers. |
| | |
| | The value of such securities held by the Funds was as follows: |
| | Fund | | Value | | | % of Net Assets |
| | Baird Ultra Short Bond Fund | | $ | 1,432,921,386 | | | | 22.98 | % | |
| | Baird Short-Term Bond Fund | | | 3,070,200,514 | | | | 32.37 | % | |
| | Baird Intermediate Bond Fund | | | 1,645,411,950 | | | | 19.76 | % | |
| | Baird Aggregate Bond Fund | | | 8,065,871,947 | | | | 18.80 | % | |
| | Baird Core Plus Bond Fund | | | 6,091,997,868 | | | | 21.85 | % | |
| | Baird Short-Term Municipal Bond Fund | | | 102,598,440 | | | | 6.40 | % | |
| | Baird Strategic Municipal Bond Fund | | | 66,305,352 | | | | 7.21 | % | |
| | Baird Quality Intermediate Municipal Bond Fund | | | 29,317,163 | | | | 2.66 | % | |
| | Baird Core Intermediate Municipal Bond Fund | | | 124,005,862 | | | | 4.16 | % | |
| | Baird Municipal Bond Fund | | | 14,440,061 | | | | 7.68 | % | |
| d) | Foreign Securities – The Baird Ultra Short Bond Fund, Baird Short-Term Bond Fund, Baird Intermediate Bond Fund, Baird Aggregate Bond Fund, and Baird Core Plus Bond Fund may invest in U.S. dollar-denominated debt obligations of foreign companies and foreign governments. Investing in securities of foreign companies and foreign governments involves special risks and considerations not typically associated with investing in U.S. companies and the U.S. government. These risks include foreign currency fluctuations, political and economic instability, differences in financial reporting standards and less strict regulation of securities markets. Moreover, securities of many foreign companies and foreign governments and their markets may be less liquid and their prices more volatile than those of securities of comparable U.S. companies and the U.S. government. |
| | |
| e) | Financial Derivatives Instruments – Financial derivatives instruments, such as futures contracts, derive their value from the performance of underlying asset prices, indices, reference rates and other inputs or a combination of these factors. These contracts are normally valued on the basis of broker-dealer quotations or by a pricing service at the settlement price determined by the relevant exchange. Depending on the product and the terms of the transaction, the value of the derivatives contracts can be estimated by a pricing service provider using a series of techniques, including simulation pricing models. The pricing models use inputs that are observed from actively quoted markets such as issuer details, indices, spreads, interest rates, curves, dividends and exchange rates. Futures contracts are carried at fair value using the primary exchange’s closing (settlement) price and are generally categorized in Level 1. The Baird Strategic Municipal Bond Fund qualifies as a “limited derivatives user” under Rule 18f-4 of the 1940 Act. |
| | |
| f) | Deposits with Broker – When trading derivatives instruments, such as futures contracts, a Fund is only required to post initial or variation margin with the exchange or clearing broker. The use of margin in trading these instruments has the effect of creating leverage, which can expose the Fund to substantial gains or losses occurring from relatively small price changes in the value of the underlying instrument and can increase the volatility of the Fund’s returns. |
| | |
| | Upon entering into a futures contract, and to maintain the Fund’s open positions in futures contracts, the Fund is required to deposit with its custodian or futures broker in a segregated account in the name of the futures broker an amount of cash, U.S. government securities, suitable money market instruments, or other liquid securities, known as “initial margin.” The margin required for a particular futures contract is set by the exchange on which the contract is traded and may be significantly modified from time to time by the exchange during the term of the contract. Futures contracts are customarily purchased and sold on margins that may range upward from less than 5% of the value of the contract being traded. |
| | |
| | At December 31, 2023, the Baird Strategic Municipal Bond Fund had $732,983 in cash and cash equivalents on deposit with the broker for futures contracts, which is presented on the Fund’s Statement of Assets and Liabilities. |
| | |
| | If the price of an open futures contract changes (by increase in underlying instrument or index in the case of a sale or by decrease in the case of a purchase) so that the loss on the futures contract reaches a point at which the margin on deposit does not satisfy margin requirements, the broker will require an increase in the margin. However, if the value of a position increases because of favorable price changes in the futures contract so that the margin deposit exceeds the required margin, the broker will pay the excess to the Fund. |
Notes to the Financial Statements
December 31, 2023
| 2. | Significant Accounting Policies (cont.) |
| | These subsequent payments, called “variation margin,” to and from the futures broker are made as the price of the underlying assets fluctuates making the long and short positions in the futures contract more or less valuable, a process known as “marking to the market.” At period end, the variation margin may be shown as either a receivable or payable on the Fund’s Statement of Assets and Liabilities. The Fund expects to earn interest income on any margin deposits. |
| | |
| g) | Income Tax Status – The Funds intend to continue to qualify as regulated investment companies as provided in Subchapter M of the Internal Revenue Code and to distribute substantially all of their taxable income to their shareholders in a manner which results in no tax expense to the Funds. Therefore, no federal income or excise tax provision is recorded. |
| | |
| | There is no tax liability resulting from unrecognized tax benefits relating to uncertain income tax positions taken or expected to be taken on the tax return for the fiscal year ended December 31, 2023, or for any other tax years which are open for exam. As of December 31, 2023, open tax years include the tax years ended December 31, 2020 through 2023. The Funds are not aware of any tax positions for which it is reasonably possible that the total amounts of unrecognized tax benefits will significantly change in the next 12 months. The Funds recognize interest and penalties, if any, related to unrecognized tax benefits as interest and other expense, respectively, in the Statements of Operations. During the period, the Funds did not incur any interest or penalties. |
| | |
| h) | Allocation of Income and Expenses – Each Fund is charged for those expenses directly attributable to it. Expenses directly attributable to a class of shares, such as Rule 12b-1 distribution fees, are charged to that class of shares. Income, expenses and realized and unrealized gains and losses are allocated to the classes based on their respective net assets. Expenses that are not directly attributable to a Fund are allocated among the Funds in the series in proportion to their assets or are divided equally amongst the Funds. |
| | |
| i) | Shareholder Transactions and Distributions – Shareholder transactions are recorded on the trade date. Dividends from net investment income are declared and paid monthly. Distributions of net realized capital gains, if any, are declared and paid at least annually. All distributions to shareholders are recorded on the ex-dividend date. The book basis character of distributions may differ from their ultimate characterization for Federal income tax purposes. GAAP requires that permanent financial reporting and tax differences be reclassified in the capital accounts. |
| | |
| j) | Use of Estimates – The preparation of financial statements in conformity with GAAP requires management to make estimates and assumptions that affect the reported amounts of assets and liabilities and disclosure of contingent assets and liabilities at the date of the financial statements and the reported amounts of increases and decreases in net assets during the reporting period. Actual results could differ from those estimates. |
| | |
| k) | Securities Transactions and Investment Income – Investment transactions are recorded on the trade date. The Funds determine the gain or loss realized from investment transactions using the identified cost basis. Dividend income is recognized on the ex-dividend date and interest income is recognized on an accrual basis. Premiums and discounts on the purchase of securities are amortized/accreted using the effective interest method. Paydown gains and losses are recorded as interest income on the Statements of Operations for financial reporting purposes. |
| | |
| l) | Guarantees and Indemnifications – In the normal course of business, the Funds enter into contracts with service providers that contain general indemnification clauses. The Funds’ maximum exposure under these arrangements is unknown and would involve future claims against the Funds that have not yet occurred. Based on experience, the Funds would expect the risk of loss to be low. |
| | |
| m) | New Regulatory and Accounting Pronouncements – In March 2020, FASB issued Accounting Standards Update 2020-04, Reference Rate Reform: Facilitation of the Effects of Reference Rate Reform on Financial Reporting (“ASU 2020-04”), in January 2021, the FASB issued Accounting Standards Update 2021-01, Reference Rate Reform (Topic 848): Scope (“ASU 2021-01”), and in December 2022, the FASB issued Accounting Standards Update ASU 2022-06, Reference Rate Reform (Topic 848): Deferral of the Sunset Date of Topic 848 (“ASU 2022-06”), which provides optional, temporary relief with respect to the financial reporting of contracts subject to certain types of modifications due to the planned discontinuation of the London Interbank Offered Rate (“LIBOR”) and other interbank offered rates as of the end of 2021. The temporary relief provided by ASU 2020-04, ASU 2021-01, and ASU 2022-06 is effective for certain reference rate-related contract modifications that occur during the period from March 12, 2020 through December 31, 2024. Management is evaluating the impact of ASU 2020-04, ASU 2021-01, and ASU 2022-06 on the Funds’ investments, derivatives, debt, and other contracts that will undergo reference rate-related modifications as a result of the reference rate reform. Management is also actively working with other financial institutions and counterparties to modify contracts as required by applicable regulation and within the regulatory deadlines. |
| | |
| | In October 2022, the Securities and Exchange Commission (the “SEC”) adopted a final rule relating to Tailored Shareholder Reports for Mutual Funds and Exchange-Traded Funds; Fee Information in Investment Company Advertisements. The rule and form amendments will, among other things, require the Funds to transmit concise and visually engaging shareholder reports that highlight key information. The amendments will require that the Funds tag information in a structured data format and that certain more in-depth information be made available online and available for delivery free of charge to investors on request. The amendments became effective January 24, 2023. There is an 18-month transition period after the effective date of the amendments. |
| | |
| 3. | Capital Share Transactions |
The following table summarizes the capital share transactions of each Fund for the past two fiscal years:
Baird Ultra Short Bond Fund
| | | Year Ended | | | Year Ended | |
| | | December 31, 2023 | | | December 31, 2022 | |
| Institutional Class Shares | | Shares | | | Amount | | | Shares | | | Amount | |
| Shares sold | | | 411,604,492 | | | $ | 4,137,514,663 | | | | 510,778,406 | | | $ | 5,106,885,871 | |
| Shares issued to shareholders in reinvestment of distributions | | | 25,679,955 | | | | 257,878,405 | | | | 8,061,269 | | | | 80,399,650 | |
| Shares redeemed | | | (378,180,104 | ) | | | (3,802,264,321 | ) | | | (652,378,673 | ) | | | (6,519,104,866 | ) |
| Net increase (decrease) | | | 59,104,343 | | | $ | 593,128,747 | | | | (133,538,998 | ) | | $ | (1,331,819,345 | ) |
| Shares Outstanding: | | | | | | | | | | | | | | | | |
| Beginning of year | | | 552,178,733 | | | | | | | | 685,717,731 | | | | | |
| End of year | | | 611,283,076 | | | | | | | | 552,178,733 | | | | | |
Notes to the Financial Statements
December 31, 2023
| 3. | Capital Share Transactions (cont.) |
Baird Ultra Short Bond Fund (cont.)
| | | Year Ended | | | Year Ended | |
| | | December 31, 2023 | | | December 31, 2022 | |
| Investor Class Shares | | Shares | | | Amount | | | Shares | | | Amount | |
| Shares sold | | | 5,174,768 | | | $ | 52,152,676 | | | | 4,481,615 | | | $ | 44,858,460 | |
| Shares issued to shareholders in reinvestment of distributions | | | 336,594 | | | | 3,389,108 | | | | 127,158 | | | | 1,271,407 | |
| Shares redeemed | | | (7,085,576 | ) | | | (71,389,574 | ) | | | (11,658,271 | ) | | | (116,780,502 | ) |
| Net decrease | | | (1,574,214 | ) | | $ | (15,847,790 | ) | | | (7,049,498 | ) | | $ | (70,650,635 | ) |
| Shares Outstanding: | | | | | | | | | | | | | | | | |
| Beginning of year | | | 9,252,712 | | | | | | | | 16,302,210 | | | | | |
| End of year | | | 7,678,498 | | | | | | | | 9,252,712 | | | | | |
| Total net increase (decrease) | | | | | | $ | 577,280,957 | | | | | | | $ | (1,402,469,980 | ) |
| | | | | | | | | | | | | | | | | |
| Baird Short-Term Bond Fund | | | | | | | | | | | | | | | | |
| | | Year Ended | | | Year Ended | |
| | | December 31, 2023 | | | December 31, 2022 | |
| Institutional Class Shares | | Shares | | | Amount | | | Shares | | | Amount | |
| Shares sold | | | 330,854,385 | | | $ | 3,071,363,063 | | | | 391,080,943 | | | $ | 3,673,283,683 | |
| Shares issued to shareholders in reinvestment of distributions | | | 30,856,142 | | | | 286,023,809 | | | | 16,033,899 | | | | 149,270,614 | |
| Shares redeemed | | | (318,221,945 | ) | | | (2,951,966,458 | ) | | | (535,281,625 | ) | | | (5,005,563,954 | ) |
| Net increase (decrease) | | | 43,488,582 | | | $ | 405,420,414 | | | | (128,166,783 | ) | | $ | (1,183,009,657 | ) |
| Shares Outstanding: | | | | | | | | | | | | | | | | |
| Beginning of year | | | 948,667,657 | | | | | | | | 1,076,834,440 | | | | | |
| End of year | | | 992,156,239 | | | | | | | | 948,667,657 | | | | | |
| | | | | | | |
| | | Year Ended | | | Year Ended | |
| | | December 31, 2023 | | | December 31, 2022 | |
| Investor Class Shares | | Shares | | | Amount | | | Shares | | | Amount | |
| Shares sold | | | 6,287,883 | | | $ | 58,436,639 | | | | 11,154,652 | | | $ | 104,892,206 | |
| Shares issued to shareholders in reinvestment of distributions | | | 586,410 | | | | 5,433,593 | | | | 368,325 | | | | 3,423,812 | |
| Shares redeemed | | | (14,533,892 | ) | | | (134,863,231 | ) | | | (13,924,914 | ) | | | (130,871,374 | ) |
| Net decrease | | | (7,659,599 | ) | | $ | (70,992,999 | ) | | | (2,401,937 | ) | | $ | (22,555,356 | ) |
| Shares Outstanding: | | | | | | | | | | | | | | | | |
| Beginning of year | | | 23,531,171 | | | | | | | | 25,933,108 | | | | | |
| End of year | | | 15,871,572 | | | | | | | | 23,531,171 | | | | | |
| Total net increase (decrease) | | | | | | $ | 334,427,415 | | | | | | | $ | (1,205,565,013 | ) |
| | | | | | | | | | | | | | | | | |
| Baird Intermediate Bond Fund | | | | | | | | | | | | | | | | |
| | | Year Ended | | | Year Ended | |
| | | December 31, 2023 | | | December 31, 2022 | |
| Institutional Class Shares | | Shares | | | Amount | | | Shares | | | Amount | |
| Shares sold | | | 248,886,882 | | | $ | 2,522,306,938 | | | | 283,794,838 | (1) | | $ | 2,977,433,440 | (1) |
| Shares issued to shareholders in reinvestment of distributions | | | 21,784,824 | | | | 220,411,749 | | | | 12,209,851 | | | | 125,904,456 | |
| Shares redeemed | | | (164,777,475 | ) | | | (1,666,076,797 | ) | | | (192,704,900 | ) | | | (2,000,544,006 | ) |
| Net increase | | | 105,894,231 | | | $ | 1,076,641,890 | | | | 103,299,789 | | | $ | 1,102,793,890 | |
| Shares Outstanding: | | | | | | | | | | | | | | | | |
| Beginning of year | | | 692,361,235 | | | | | | | | 589,061,446 | | | | | |
| End of year | | | 798,255,466 | | | | | | | | 692,361,235 | | | | | |
| | | | | | | |
| | | Year Ended | | | Year Ended | |
| | | December 31, 2023 | | | December 31, 2022 | |
| Investor Class Shares | | Shares | | | Amount | | | Shares | | | Amount | |
| Shares sold | | | 6,542,336 | | | $ | 69,658,365 | | | | 3,627,892 | | | $ | 39,037,445 | |
| Shares issued to shareholders in reinvestment of distributions | | | 198,951 | | | | 2,115,493 | | | | 76,180 | | | | 822,382 | |
| Shares redeemed | | | (4,257,033 | ) | | | (45,141,593 | ) | | | (1,669,780 | ) | | | (18,219,022 | ) |
| Net increase | | | 2,484,254 | | | $ | 26,632,265 | | | | 2,034,292 | | | $ | 21,640,805 | |
| Shares Outstanding: | | | | | | | | | | | | | | | | |
| Beginning of year | | | 5,603,471 | | | | | | | | 3,569,179 | | | | | |
| End of year | | | 8,087,725 | | | | | | | | 5,603,471 | | | | | |
| Total net increase | | | | | | $ | 1,103,274,155 | | | | | | | $ | 1,124,434,695 | |
(1) Includes purchase in-kind transactions. See additional information contained in this Note.
Notes to the Financial Statements
December 31, 2023
| 3. | Capital Share Transactions (cont.) |
Baird Aggregate Bond Fund
| | | Year Ended | | | Year Ended | |
| | | December 31, 2023 | | | December 31, 2022 | |
| Institutional Class Shares | | Shares | | | Amount | | | Shares | | | Amount | |
| Shares sold | | | 1,413,254,416 | | | $ | 13,602,163,428 | | | | 1,132,790,635 | | | $ | 11,448,888,258 | |
| Shares issued to shareholders in reinvestment of distributions | | | 128,410,230 | | | | 1,233,825,075 | | | | 81,727,428 | | | | 815,301,963 | |
| Shares redeemed | | | (839,803,359 | ) | | | (8,057,527,758 | ) | | | (1,098,175,721 | ) | | | (11,116,504,107 | ) |
| Net increase | | | 701,861,287 | | | $ | 6,778,460,745 | | | | 116,342,342 | | | $ | 1,147,686,114 | |
| Shares Outstanding: | | | | | | | | | | | | | | | | |
| Beginning of year | | | 3,551,762,846 | | | | | | | | 3,435,420,504 | | | | | |
| End of year | | | 4,253,624,133 | | | | | | | | 3,551,762,846 | | | | | |
| | | | | | | |
| | | Year Ended | | | Year Ended | |
| | | December 31, 2023 | | | December 31, 2022 | |
| Investor Class Shares | | Shares | | | Amount | | | Shares | | | Amount | |
| Shares sold | | | 56,472,756 | | | $ | 568,679,084 | | | | 20,420,963 | | | $ | 215,322,675 | |
| Shares issued to shareholders in reinvestment of distributions | | | 2,861,591 | | | | 28,549,405 | | | | 1,570,967 | | | | 16,281,653 | |
| Shares redeemed | | | (32,836,243 | ) | | | (326,493,313 | ) | | | (30,367,979 | ) | | | (320,324,283 | ) |
| Net increase (decrease) | | | 26,498,104 | | | $ | 270,735,176 | | | | (8,376,049 | ) | | $ | (88,719,955 | ) |
| Shares Outstanding: | | | | | | | | | | | | | | | | |
| Beginning of year | | | 68,333,412 | | | | | | | | 76,709,461 | | | | | |
| End of year | | | 94,831,516 | | | | | | | | 68,333,412 | | | | | |
| Total net increase | | | | | | $ | 7,049,195,921 | | | | | | | $ | 1,058,966,159 | |
| | | | | | | | | | | | | | | | | |
| Baird Core Plus Bond Fund | | | | | | | | | | | | | | | | |
| | | Year Ended | | | Year Ended | |
| | | December 31, 2023 | | | December 31, 2022 | |
| Institutional Class Shares | | Shares | | | Amount | | | Shares | | | Amount | |
| Shares sold | | | 822,006,477 | | | $ | 8,133,324,614 | | | | 504,649,661 | | | $ | 5,264,617,388 | |
| Shares issued to shareholders in reinvestment of distributions | | | 80,884,846 | | | | 800,860,864 | | | | 60,377,638 | | | | 620,675,811 | |
| Shares redeemed | | | (427,183,368 | ) | | | (4,225,561,007 | ) | | | (777,453,867 | ) | | | (8,149,147,748 | ) |
| Net increase (decrease) | | | 475,707,955 | | | $ | 4,708,624,471 | | | | (212,426,568 | ) | | $ | (2,263,854,549 | ) |
| Shares Outstanding: | | | | | | | | | | | | | | | | |
| Beginning of year | | | 2,157,271,130 | | | | | | | | 2,369,697,698 | | | | | |
| End of year | | | 2,632,979,085 | | | | | | | | 2,157,271,130 | | | | | |
| | | | | | | |
| | | Year Ended | | | Year Ended | |
| | | December 31, 2023 | | | December 31, 2022 | |
| Investor Class Shares | | Shares | | | Amount | | | Shares | | | Amount | |
| Shares sold | | | 30,724,067 | | | $ | 319,247,540 | | | | 22,790,115 | | | $ | 251,553,911 | |
| Shares issued to shareholders in reinvestment of distributions | | | 3,269,372 | | | | 33,944,914 | | | | 2,880,904 | | | | 31,071,249 | |
| Shares redeemed | | | (32,214,934 | ) | | | (336,127,412 | ) | | | (56,639,771 | ) | | | (622,150,469 | ) |
| Net increase (decrease) | | | 1,778,505 | | | $ | 17,065,042 | | | | (30,968,752 | ) | | $ | (339,525,309 | ) |
| Shares Outstanding: | | | | | | | | | | | | | | | | |
| Beginning of year | | | 101,102,709 | | | | | | | | 132,071,461 | | | | | |
| End of year | | | 102,881,214 | | | | | | | | 101,102,709 | | | | | |
| Total net increase (decrease) | | | | | | $ | 4,725,689,513 | | | | | | | $ | (2,603,379,858 | ) |
| | | | | | | | | | | | | | | | | |
| Baird Short-Term Municipal Bond Fund | | | | | | | | | | | | | | | | |
| | | Year Ended | | | Year Ended | |
| | | December 31, 2023 | | | December 31, 2022 | |
| Institutional Class Shares | | Shares | | | Amount | | | Shares | | | Amount | |
| Shares sold | | | 68,282,496 | | | $ | 672,959,700 | | | | 167,243,863 | | | $ | 1,663,156,971 | |
| Shares issued to shareholders in reinvestment of distributions | | | 3,243,634 | | | | 31,921,381 | | | | 2,226,981 | | | | 22,051,002 | |
| Shares redeemed | | | (90,771,071 | ) | | | (894,199,966 | ) | | | (208,046,440 | ) | | | (2,065,552,673 | ) |
| Net decrease | | | (19,244,941 | ) | | $ | (189,318,885 | ) | | | (38,575,596 | ) | | $ | (380,344,700 | ) |
| Shares Outstanding: | | | | | | | | | | | | | | | | |
| Beginning of year | | | 172,127,200 | | | | | | | | 210,702,796 | | | | | |
| End of year | | | 152,882,259 | | | | | | | | 172,127,200 | | | | | |
Notes to the Financial Statements
December 31, 2023
| 3. | Capital Share Transactions (cont.) |
Baird Short-Term Municipal Bond Fund (cont.)
| | | Year Ended | | | Year Ended | |
| | | December 31, 2023 | | | December 31, 2022 | |
| Investor Class Shares | | Shares | | | Amount | | | Shares | | | Amount | |
| Shares sold | | | 3,869,099 | | | $ | 37,888,827 | | | | 2,906,247 | | | $ | 28,904,745 | |
| Shares issued to shareholders in reinvestment of distributions | | | 153,990 | | | | 1,513,149 | | | | 97,420 | | | | 961,922 | |
| Shares redeemed | | | (3,441,024 | ) | | | (33,856,630 | ) | | | (6,344,406 | ) | | | (63,158,931 | ) |
| Net increase (decrease) | | | 582,065 | | | $ | 5,545,346 | | | | (3,340,739 | ) | | $ | (33,292,264 | ) |
| Shares Outstanding: | | | | | | | | | | | | | | | | |
| Beginning of year | | | 7,294,486 | | | | | | | | 10,635,225 | | | | | |
| End of year | | | 7,876,551 | | | | | | | | 7,294,486 | | | | | |
| Total net decrease | | | | | | $ | (183,773,539 | ) | | | | | | $ | (413,636,964 | ) |
| | | | | | | | | | | | | | | | | |
| Baird Strategic Municipal Bond Fund | | | | | | | | | | | | | | | | |
| | | Year Ended | | | Year Ended | |
| | | December 31, 2023 | | | December 31, 2022 | |
| Institutional Class Shares | | Shares | | | Amount | | | Shares | | | Amount | |
| Shares sold | | | 50,874,131 | (1) | | $ | 510,726,122 | (1) | | | 46,538,898 | | | $ | 469,432,787 | |
| Shares issued to shareholders in reinvestment of distributions | | | 1,950,789 | | | | 19,587,376 | | | | 820,672 | | | | 8,177,741 | |
| Shares redeemed | | | (14,418,667 | ) | | | (144,596,339 | ) | | | (32,225,708 | ) | | | (322,083,246 | ) |
| Net increase | | | 38,406,253 | | | $ | 385,717,159 | | | | 15,133,862 | | | $ | 155,527,282 | |
| Shares Outstanding: | | | | | | | | | | | | | | | | |
| Beginning of year | | | 47,263,634 | | | | | | | | 32,129,772 | | | | | |
| End of year | | | 85,669,887 | | | | | | | | 47,263,634 | | | | | |
| | | | | | | |
| | | Year Ended | | | Year Ended | |
| | | December 31, 2023 | | | December 31, 2022 | |
| Investor Class Shares | | Shares | | | Amount | | | Shares | | | Amount | |
| Shares sold | | | 3,386,481 | | | $ | 34,083,005 | | | | 620,372 | | | $ | 6,273,602 | |
| Shares issued to shareholders in reinvestment of distributions | | | 47,070 | | | | 473,380 | | | | 7,297 | | | | 72,714 | |
| Shares redeemed | | | (753,691 | ) | | | (7,552,724 | ) | | | (327,044 | ) | | | (3,284,501 | ) |
| Net increase | | | 2,679,860 | | | $ | 27,003,661 | | | | 300,625 | | | $ | 3,061,815 | |
| Shares Outstanding: | | | | | | | | | | | | | | | | |
| Beginning of year | | | 1,070,247 | | | | | | | | 769,622 | | | | | |
| End of year | | | 3,750,107 | | | | | | | | 1,070,247 | | | | | |
| Total net increase | | | | | | $ | 412,720,820 | | | | | | | $ | 158,589,097 | |
| | | | | | | | | | | | | | | | | |
(1) Includes purchase in-kind transactions. See additional information contained in this Note. | | | | | | | | | |
| | | | | | | | | | | | | | | | | |
| Baird Quality Intermediate Municipal Bond Fund | | | | | | | | | | | | | | | | |
| | | Year Ended | | | Year Ended | |
| | | December 31, 2023 | | | December 31, 2022 | |
| Institutional Class Shares | | Shares | | | Amount | | | Shares | | | Amount | |
| Shares sold | | | 32,875,869 | | | $ | 359,047,920 | | | | 69,927,672 | | | $ | 772,989,941 | |
| Shares issued to shareholders in reinvestment of distributions | | | 2,204,880 | | | | 24,076,699 | | | | 1,987,985 | | | | 21,982,125 | |
| Shares redeemed | | | (39,462,525 | ) | | | (430,517,693 | ) | | | (101,791,866 | ) | | | (1,123,505,420 | ) |
| Net decrease | | | (4,381,776 | ) | | $ | (47,393,074 | ) | | | (29,876,209 | ) | | $ | (328,533,354 | ) |
| Shares Outstanding: | | | | | | | | | | | | | | | | |
| Beginning of year | | | 98,875,951 | | | | | | | | 128,752,160 | | | | | |
| End of year | | | 94,494,175 | | | | | | | | 98,875,951 | | | | | |
| | | | | | | |
| | | Year Ended | | | Year Ended | |
| | | December 31, 2023 | | | December 31, 2022 | |
| Investor Class Shares | | Shares | | | Amount | | | Shares | | | Amount | |
| Shares sold | | | 3,960,479 | | | $ | 44,513,923 | | | | 3,517,749 | | | $ | 40,053,579 | |
| Shares issued to shareholders in reinvestment of distributions | | | 96,281 | | | | 1,077,933 | | | | 73,270 | | | | 829,193 | |
| Shares redeemed | | | (2,317,293 | ) | | | (25,738,178 | ) | | | (5,738,401 | ) | | | (65,041,068 | ) |
| Net increase (decrease) | | | 1,739,467 | | | $ | 19,853,678 | | | | (2,147,382 | ) | | $ | (24,158,296 | ) |
| Shares Outstanding: | | | | | | | | | | | | | | | | |
| Beginning of year | | | 2,723,540 | | | | | | | | 4,870,922 | | | | | |
| End of year | | | 4,463,007 | | | | | | | | 2,723,540 | | | | | |
| Total net decrease | | | | | | $ | (27,539,396 | ) | | | | | | $ | (352,691,650 | ) |
Notes to the Financial Statements
December 31, 2023
| 3. | Capital Share Transactions (cont.) |
Baird Core Intermediate Municipal Bond Fund
| | | Year Ended | | | Year Ended | |
| | | December 31, 2023 | | | December 31, 2022 | |
| Institutional Class Shares | | Shares | | | Amount | | | Shares | | | Amount | |
| Shares sold | | | 152,654,271 | | | $ | 1,542,643,151 | | | | 260,786,481 | | | $ | 2,665,957,218 | |
| Shares issued to shareholders in reinvestment of distributions | | | 6,745,190 | | | | 68,138,267 | | | | 2,967,412 | | | | 30,034,377 | |
| Shares redeemed | | | (117,282,423 | ) | | | (1,181,349,071 | ) | | | (160,863,049 | ) | | | (1,630,020,249 | ) |
| Net increase | | | 42,117,038 | | | $ | 429,432,347 | | | | 102,890,844 | | | $ | 1,065,971,346 | |
| Shares Outstanding: | | | | | | | | | | | | | | | | |
| Beginning of year | | | 242,569,475 | | | | | | | | 139,678,631 | | | | | |
| End of year | | | 284,686,513 | | | | | | | | 242,569,475 | | | | | |
| | | | | | | |
| | | Year Ended | | | Year Ended | |
| | | December 31, 2023 | | | December 31, 2022 | |
| Investor Class Shares | | Shares | | | Amount | | | Shares | | | Amount | |
| Shares sold | | | 1,907,974 | | | $ | 19,365,982 | | | | 4,085,710 | | | $ | 41,823,949 | |
| Shares issued to shareholders in reinvestment of distributions | | | 108,419 | | | | 1,095,003 | | | | 62,064 | | | | 627,524 | |
| Shares redeemed | | | (2,332,933 | ) | | | (23,452,114 | ) | | | (4,181,317 | ) | | | (42,935,251 | ) |
| Net decrease | | | (316,540 | ) | | $ | (2,991,129 | ) | | | (33,543 | ) | | $ | (483,778 | ) |
| Shares Outstanding: | | | | | | | | | | | | | | | | |
| Beginning of year | | | 3,845,888 | | | | | | | | 3,879,431 | | | | | |
| End of year | | | 3,529,348 | | | | | | | | 3,845,888 | | | | | |
| Total net increase | | | | | | $ | 426,441,218 | | | | | | | $ | 1,065,487,568 | |
| | | | | | | | | | | | | | | | | |
| Baird Municipal Bond Fund | | | | | | | | | | | | | | | | |
| | | Year Ended | | | Year Ended | |
| | | December 31, 2023 | | | December 31, 2022 | |
| Institutional Class Shares | | Shares | | | Amount | | | Shares | | | Amount | |
| Shares sold | | | 16,338,863 | | | $ | 159,295,064 | | | | 5,433,325 | | | $ | 53,876,656 | |
| Shares issued to shareholders in reinvestment of distributions | | | 410,603 | | | | 3,985,595 | | | | 112,936 | | | | 1,101,451 | |
| Shares redeemed | | | (4,475,144 | ) | | | (43,392,250 | ) | | | (3,002,030 | ) | | | (29,485,764 | ) |
| Net increase | | | 12,274,322 | | | $ | 119,888,409 | | | | 2,544,231 | | | $ | 25,492,343 | |
| Shares Outstanding: | | | | | | | | | | | | | | | | |
| Beginning of year | | | 5,751,601 | | | | | | | | 3,207,370 | | | | | |
| End of year | | | 18,025,923 | | | | | | | | 5,751,601 | | | | | |
| | | | | | | |
| | | Year Ended | | | Year Ended | |
| | | December 31, 2023 | | | December 31, 2022 | |
| Investor Class Shares | | Shares | | | Amount | | | Shares | | | Amount | |
| Shares sold | | | 441,906 | | | $ | 4,305,184 | | | | 396,064 | | | $ | 3,867,269 | |
| Shares issued to shareholders in reinvestment of distributions | | | 7,883 | | | | 76,660 | | | | 2,621 | | | | 25,383 | |
| Shares redeemed | | | (113,506 | ) | | | (1,110,494 | ) | | | (276,876 | ) | | | (2,786,613 | ) |
| Net increase | | | 336,283 | | | $ | 3,271,350 | | | | 121,809 | | | $ | 1,106,039 | |
| Shares Outstanding: | | | | | | | | | | | | | | | | |
| Beginning of year | | | 419,044 | | | | | | | | 297,235 | | | | | |
| End of year | | | 755,327 | | | | | | | | 419,044 | | | | | |
| Total net increase | | | | | | $ | 123,159,759 | | | | | | | $ | 26,598,382 | |
Notes to the Financial Statements
December 31, 2023
| 3. | Capital Share Transactions (cont.) |
Purchase In-Kind Transactions
During the year ended December 31, 2023, the Funds satisfied purchase in-kind requests made by large institutional shareholders by transferring cash and securities into the Funds. The transfers were effected in accordance with policies and procedures approved by the Board. Consideration received and shares sold were as follows:
| | Year Ended December 31, 2023 |
| | | Value of Cash and | |
Fund | Effective Date | Securities Received | Shares Sold |
| Baird Strategic Municipal Bond Fund – Institutional Class | November 28, 2023 | $27,596,318 | 2,745,902 |
During the year ended December 31, 2022, the Funds satisfied purchase in-kind requests made by large institutional shareholders by transferring cash and securities into the Funds. The transfers were effected in accordance with policies and procedures approved by the Board. Consideration received and shares sold were as follows:
| | Year Ended December 31, 2022 | |
| | | Value of Cash and | | |
Fund | Effective Date | Securities Received | Shares Sold |
| Baird Intermediate Bond Fund – Institutional Class | March 29, 2022 | | $ | 105,831,914 | | 9,909,355 | |
| Baird Intermediate Bond Fund – Institutional Class | March 30, 2022 | | | 512,255 | | 47,874 | |
| Baird Intermediate Bond Fund – Institutional Class | April 27, 2022 | | | 60,581,686 | | 5,764,195 | |
| Baird Intermediate Bond Fund – Institutional Class | May 17, 2022 | | | 253,996 | | 24,329 | |
| Total | | | $ | 167,179,851 | | | |
| 4. | Investment Transactions and Income Tax Information |
During the year ended December 31, 2023, purchases and sales of investment securities (excluding short-term investments and any in-kind transactions) were as follows:
| | | U.S. Government Obligations | | | All Other | |
| | | Purchases | | | Sales | | | Purchases | | | Sales | |
| Baird Ultra Short Bond Fund | | $ | 58,778,906 | | | $ | 470,859,141 | | | $ | 3,657,766,443 | | | $ | 3,380,084,469 | |
| Baird Short-Term Bond Fund | | | 4,831,470,872 | | | | 4,977,438,316 | | | | 3,502,768,408 | | | | 2,962,867,771 | |
| Baird Intermediate Bond Fund | | | 3,135,649,390 | | | | 2,685,561,508 | | | | 1,345,278,895 | | | | 680,965,040 | |
| Baird Aggregate Bond Fund | | | 12,302,115,909 | | | | 10,518,248,355 | | | | 9,288,034,678 | | | | 4,191,550,637 | |
| Baird Core Plus Bond Fund | | | 7,451,570,839 | | | | 5,214,323,768 | | | | 5,485,596,308 | | | | 3,114,948,106 | |
| Baird Short-Term Municipal Bond Fund | | | 14,965,430 | | | | 15,031,641 | | | | 615,809,069 | | | | 804,094,959 | |
| Baird Strategic Municipal Bond Fund | | | — | | | | — | | | | 660,136,632 | | | | 300,063,551 | |
| Baird Quality Intermediate Municipal Bond Fund | | | 60,402,422 | | | | 44,612,168 | | | | 290,421,704 | | | | 314,315,401 | |
| Baird Core Intermediate Municipal Bond Fund | | | 113,616,016 | | | | 79,615,625 | | | | 1,290,677,549 | | | | 733,878,688 | |
| Baird Municipal Bond Fund | | | — | | | | — | | | | 187,401,259 | | | | 69,948,869 | |
As of December 31, 2023, the components of distributable earnings (accumulated losses) for income tax purposes were as follows:
| | | Baird | | | Baird | | | Baird | | | Baird | | | Baird | |
| | | Ultra Short | | | Short-Term | | | Intermediate | | | Aggregate | | | Core Plus | |
| | | Bond Fund | | | Bond Fund | | | Bond Fund | | | Bond Fund | | | Bond Fund | |
| Cost of investments | | $ | 6,360,227,137 | | | $ | 9,680,558,106 | | | $ | 8,572,393,037 | | | $ | 45,952,406,685 | | | $ | 29,739,056,785 | |
| Gross unrealized appreciation | | | 23,022,716 | | | | 72,254,615 | | | | 81,352,758 | | | | 492,707,347 | | | | 309,308,377 | |
| Gross unrealized depreciation | | | (6,140,171 | ) | | | (133,619,968 | ) | | | (309,832,291 | ) | | | (3,684,622,918 | ) | | | (2,225,335,992 | ) |
| Net unrealized appreciation (depreciation) | | | 16,882,545 | | | | (61,365,353 | ) | | | (228,479,533 | ) | | | (3,191,915,571 | ) | | | (1,916,027,615 | ) |
| Undistributed ordinary income | | | 239,592 | | | | 3,514,837 | | | | 20,366 | | | | 872,169 | | | | 2,013,359 | |
| Distributable earnings | | | 239,592 | | | | 3,514,837 | | | | 20,366 | | | | 872,169 | | | | 2,013,359 | |
| Other accumulated losses | | | (25,097,782 | ) | | | (361,663,545 | ) | | | (319,176,081 | ) | | | (1,306,082,245 | ) | | | (744,391,339 | ) |
| Total accumulated deficit | | $ | (7,975,645 | ) | | $ | (419,514,061 | ) | | $ | (547,635,248 | ) | | $ | (4,497,125,647 | ) | | $ | (2,658,405,595 | ) |
| | | | | | | | | | | | | | | | | | | | | |
| | | Baird | | | Baird | | | Baird Quality | | | Baird Core | | | | | |
| | | Short-Term | | | Strategic | | | Intermediate | | | Intermediate | | | Baird | |
| | | Municipal | | | Municipal | | | Municipal | | | Municipal | | | Municipal | |
| | | Bond Fund | | | Bond Fund | | | Bond Fund | | | Bond Fund | | | Bond Fund | |
| Cost of investments | | $ | 1,607,071,114 | | | $ | 897,384,344 | | | $ | 1,098,168,258 | | | $ | 2,937,256,519 | | | $ | 183,560,592 | |
| Gross unrealized appreciation | | | 10,646,383 | | | | 18,756,528 | | | | 13,978,113 | | | | 48,883,535 | | | | 4,646,053 | |
| Gross unrealized depreciation | | | (23,276,726 | ) | | | (7,415,427 | ) | | | (20,120,561 | ) | | | (41,007,002 | ) | | | (887,548 | ) |
| Net unrealized appreciation (depreciation) | | | (12,630,343 | ) | | | 11,341,101 | | | | (6,142,448 | ) | | | 7,876,533 | | | | 3,758,505 | |
| Undistributed tax-exempt income | | | 382,786 | | | | 275,442 | | | | 225,353 | | | | 775,059 | | | | 61,408 | |
| Distributable earnings | | | 382,786 | | | | 275,442 | | | | 225,353 | | | | 775,059 | | | | 61,408 | |
| Other accumulated losses | | | (67,811,170 | ) | | | (12,587,581 | ) | | | (51,421,205 | ) | | | (59,613,099 | ) | | | (2,434,316 | ) |
| Total distributable earnings (accumulated deficit) | | $ | (80,058,727 | ) | | $ | (971,038 | ) | | $ | (57,338,300 | ) | | $ | (50,961,507 | ) | | $ | 1,385,597 | |
The difference between book-basis and tax-basis unrealized appreciation is attributable primarily to the tax deferral of losses on wash sales.
Additionally, GAAP requires that certain components of net assets relating to permanent differences be reclassified between financial and tax reporting. These reclassifications have no effect on net assets or NAV per share. There were no reclassifications made for the year ended December 31, 2023.
Notes to the Financial Statements
December 31, 2023
| 4. | Investment Transactions and Income Tax Information (cont.) |
Distributions to Shareholders
Each Fund generally pays dividends from net investment income monthly and distributes net realized capital gains annually. Income and capital gain distributions are determined in accordance with income tax regulations, which may differ from GAAP. Certain Funds also utilize earnings and profits distributed to shareholders on redemptions of shares as part of the dividends paid deduction. Distributions to shareholders are recorded on the ex-dividend date.
The tax components of distributions paid during the year shown below were as follows:
| | | Year Ended December 31, 2023 | |
| | | Ordinary | | | Long-Term | | | Tax-Exempt | | | | |
Fund | | Income | | | Capital Gains | | | Income | | | Total | |
| Baird Ultra Short Bond Fund | | $ | 276,577,485 | | | $ | — | | | $ | — | | | $ | 276,577,485 | |
| Baird Short-Term Bond Fund | | | 318,899,445 | | | | — | | | | — | | | | 318,899,445 | |
| Baird Intermediate Bond Fund | | | 247,720,713 | | | | — | | | | — | | | | 247,720,713 | |
| Baird Aggregate Bond Fund | | | 1,392,467,309 | | | | — | | | | — | | | | 1,392,467,309 | |
| Baird Core Plus Bond Fund | | | 899,271,722 | | | | — | | | | — | | | | 899,271,722 | |
| Baird Short-Term Municipal Bond Fund | | | 841,861 | | | | — | | | | 44,007,696 | | | | 44,849,557 | |
| Baird Strategic Municipal Bond Fund | | | 1,311,518 | | | | — | | | | 20,318,003 | | | | 21,629,521 | |
| Baird Quality Intermediate Municipal Bond Fund | | | 991,053 | | | | — | | | | 27,263,564 | | | | 28,254,617 | |
| Baird Core Intermediate Municipal Bond Fund | | | 2,659,346 | | | | — | | | | 78,393,187 | | | | 81,052,533 | |
| Baird Municipal Bond Fund | | | 200,414 | | | | — | | | | 4,495,896 | | | | 4,696,310 | |
For the year ended December 31, 2023, the table above reflects the estimated characterization of the distributions paid based on each Fund’s operating results for the year. The actual characterization of the distributions made during the year is not determined until after the end of the fiscal year.
| | | Year Ended December 31, 2022 | |
| | | Ordinary | | | Long-Term | | | Tax-Exempt | | | | |
Fund | | Income | | | Capital Gains | | | Income | | | Total | |
| Baird Ultra Short Bond Fund | | $ | 88,868,292 | | | $ | — | | | $ | — | | | $ | 88,868,292 | |
| Baird Short-Term Bond Fund | | | 167,037,340 | | | | 4,200,688 | | | | — | | | | 171,238,028 | |
| Baird Intermediate Bond Fund | | | 146,093,663 | | | | — | | | | — | | | | 146,093,663 | |
| Baird Aggregate Bond Fund | | | 917,025,897 | | | | — | | | | — | | | | 917,025,897 | |
| Baird Core Plus Bond Fund | | | 702,114,693 | | | | 4,248,998 | | | | — | | | | 706,363,691 | |
| Baird Short-Term Municipal Bond Fund | | | 341,883 | | | | — | | | | 31,709,683 | | | | 32,051,566 | |
| Baird Strategic Municipal Bond Fund | | | 827,054 | | | | — | | | | 7,799,147 | | | | 8,626,201 | |
| Baird Quality Intermediate Municipal Bond Fund | | | 10,535 | | | | — | | | | 25,740,501 | | | | 25,751,036 | |
| Baird Core Intermediate Municipal Bond Fund | | | 499,131 | | | | — | | | | 39,195,561 | | | | 39,694,692 | |
| Baird Municipal Bond Fund | | | 23,809 | | | | — | | | | 1,281,550 | | | | 1,305,359 | |
The Funds in the table above designated as long-term capital gain dividends, pursuant to Internal Revenue Code Section 852(b)(3), the amount necessary to reduce the earnings and profits of the Funds related to net capital gain to zero for the tax years ended December 31, 2022 and 2023. To the extent necessary to fully distribute such capital gains, the Funds also designate earnings and profits distributed to shareholders on the redemption of shares.
At December 31, 2023, no Funds deferred, on a tax basis, qualified late year losses.
At December 31, 2023, accumulated capital loss carryovers, if any, were as follows:
| | | Capital Loss Carryover | | Year of Expiration |
Fund | | Short-term | | | Long-term | | Short-term | | Long-term |
| Baird Ultra Short Bond Fund | | $ | 21,891,113 | | | $ | 3,206,669 | | Indefinitely | | Indefinitely |
| Baird Short-Term Bond Fund | | | 206,456,436 | | | | 155,207,109 | | Indefinitely | | Indefinitely |
| Baird Intermediate Bond Fund | | | 81,267,152 | | | | 237,908,929 | | Indefinitely | | Indefinitely |
| Baird Aggregate Bond Fund | | | 478,023,983 | | | | 828,058,262 | | Indefinitely | | Indefinitely |
| Baird Core Plus Bond Fund | | | 233,972,544 | | | | 510,418,795 | | Indefinitely | | Indefinitely |
| Baird Short-Term Municipal Bond Fund | | | 26,600,206 | | | | 41,210,964 | | Indefinitely | | Indefinitely |
| Baird Strategic Municipal Bond Fund | | | 6,056,849 | | | | 6,530,732 | | Indefinitely | | Indefinitely |
| Baird Quality Intermediate Municipal Bond Fund | | | 11,715,979 | | | | 39,705,227 | | Indefinitely | | Indefinitely |
| Baird Core Intermediate Municipal Bond Fund | | | 22,841,438 | | | | 36,771,661 | | Indefinitely | | Indefinitely |
| Baird Municipal Bond Fund | | | 883,596 | | | | 1,550,720 | | Indefinitely | | Indefinitely |
During the year ended December 31, 2023, the Baird Strategic Municipal Bond Fund utilized $715,629 of capital loss carryover.
| 5. | Investment Advisory, Other Agreements and Related Party Transactions |
The Funds have entered into an Investment Advisory Agreement with Baird for the provision of investment advisory services. Pursuant to the Investment Advisory Agreement, the Advisor is entitled to receive a fee, calculated daily and payable monthly, at the annual rate of 0.25% for each Fund as applied to the respective Fund’s average daily net assets. Certain officers and employees of the Advisor are also officers of the Funds.
For the Baird Ultra Short Bond Fund, the Advisor has contractually agreed to waive management fees in an amount equal to an annual rate of 0.15% of average daily net assets for the Fund, at least through April 30, 2025. The agreement may only be terminated prior to the end of this term by or with the consent of the Board.
Notes to the Financial Statements
December 31, 2023
| 5. | Investment Advisory, Other Agreements and Related Party Transactions (cont.) |
For the year ended December 31, 2023, the Advisor waived the following amount pursuant to the fee waiver agreement between the Advisor and the Company on behalf of the Baird Ultra Short Bond Fund:
Fund | Waived Amount |
| Baird Ultra Short Bond Fund | $8,868,655 |
These fees are not subject to recoupment by the Advisor.
The Funds have entered into an Administration Agreement with Baird. Under the Administration Agreement, the Advisor assumes and pays all expenses of the applicable Fund other than the investment advisory fees, fees under the 12b-1 plan, costs related to portfolio securities transactions and other excluded expenses, such as borrowing costs and extraordinary or non-recurring expenses. Pursuant to the Administration Agreement, the Advisor is entitled to receive a fee, calculated daily and payable monthly, at the annual rate of 0.05% for each Fund as applied to the respective Fund’s average daily net assets.
U.S. Bancorp Fund Services, LLC, doing business as U.S. Bank Global Fund Services, serves as transfer agent, administrator, and accounting services agent for the Funds. U.S. Bank, N.A. (“U.S. Bank”) serves as custodian for the Funds.
Robert W. Baird & Co. Incorporated (the “Distributor”) is the sole distributor of the Funds pursuant to a distribution agreement.
No commissions were earned by the Distributor for services rendered as a registered broker-dealer in securities transactions for the year ended December 31, 2023 for the Funds.
The Funds may use related party broker-dealers. For the year ended December 31, 2023, there were no brokerage commissions paid to broker-dealers affiliated with the Advisor. The Advisor or its affiliates may have lending, banking, brokerage, underwriting, or other business relationships with the issuers of the securities in which the Funds invest.
The Funds may purchase securities from an underwriting syndicate in which the principal underwriter or members of the syndicate are affiliated with the Advisor. For the year ended December 31, 2023, the Funds purchased the following amounts of such securities:
Fund | | Purchases | |
| Baird Ultra Short Bond Fund | | $ | 18,000,000 | |
| Baird Strategic Municipal Bond Fund | | | 1,000,000 | |
| Baird Quality Intermediate Municipal Bond Fund | | | 9,250,000 | |
| Baird Core Intermediate Municipal Bond Fund | | | 1,000,000 | |
| Baird Municipal Bond Fund | | | 750,000 | |
| 6. | Line of Credit and Other Interest Charges |
The Company maintains an uncommitted line of credit (“LOC”) with U.S. Bank to provide the fifteen Funds comprising the Company a temporary liquidity source to meet unanticipated redemptions or other permissible borrowing needs. The LOC is unsecured at all times and is subject to certain restrictions and covenants. Under the terms of the LOC, borrowings for each Fund are limited to one third of the total eligible net assets (including the amount borrowed) of the respective Fund, or $850,000,000 of total borrowings for the Funds comprising the Company, whichever is less. U.S. Bank charges annualized interest at the greater of 1.00% and the Prime Rate minus 2.00%. As of December 31, 2023, the Prime Rate was 8.50%. The LOC matures on May 20, 2024, unless renewed. The Company has authorized U.S. Bank to charge any of the accounts of the borrowing Fund subject to the agreement for any missed payments.
During the year ended December 31, 2023, the Baird Strategic Municipal Bond Fund incurred broker interest charges of $25 related to its trading of futures contracts.
No other borrowings occurred during the year ended December 31, 2023, nor were any other borrowings outstanding under the LOC as of December 31, 2023.
| 7. | Distribution and Shareholder Service Plan |
The Funds have adopted a distribution and shareholder service plan (the “Plan”) pursuant to Rule 12b-1 under the 1940 Act. The Plan allows the Funds to compensate the Distributor for the costs incurred in distributing the Funds’ Investor Class shares, including amounts paid to brokers or dealers, at an annual rate of 0.25% of the average daily net assets of the Funds’ Investor Class shares.
For the year ended December 31, 2023, the Funds’ Investor Class shares incurred fees pursuant to the Plan as follows:
Fund | | | |
| Baird Ultra Short Bond Fund | | $ | 197,949 | |
| Baird Short-Term Bond Fund | | | 443,500 | |
| Baird Intermediate Bond Fund | | | 181,194 | |
| Baird Aggregate Bond Fund | | | 2,214,498 | |
| Baird Core Plus Bond Fund | | | 2,624,969 | |
| Baird Short-Term Municipal Bond Fund | | | 167,398 | |
| Baird Strategic Municipal Bond Fund | | | 46,895 | |
| Baird Quality Intermediate Municipal Bond Fund | | | 118,226 | |
| Baird Core Intermediate Municipal Bond Fund | | | 99,097 | |
| Baird Municipal Bond Fund | | | 14,295 | |
| 8. | Other Derivatives Information |
As a principal investment strategy, the Baird Strategic Municipal Bond Fund may invest in U.S. Treasury futures contracts for duration and yield curve management or to manage market and interest rate risk. The Fund’s market risk related to its derivatives trading is influenced by a wide variety of factors, including the level and volatility of interest rates, the market value of futures contracts, the diversification effects among the Fund’s open positions and the liquidity of the markets in which it trades.
Management has adopted authoritative standards regarding disclosure about derivatives and hedging activities and how they affect a Fund’s Statement of Assets and Liabilities and Statement of Operations. Since the derivatives may be held for speculative trading purposes, the derivative instruments are not designated as hedging instruments. Accordingly, all realized gains and losses, as well as any change in net unrealized gains or losses on open contracts from the preceding period, are recognized as part of realized and unrealized gain (loss) in the Statement of Operations. These contracts are not subject to a master netting agreement.
Notes to the Financial Statements
December 31, 2023
| 8. | Other Derivatives Information (cont.) |
The following table presents the fair value of derivative instruments for the Baird Strategic Municipal Bond Fund as of December 31, 2023 as presented on the Fund’s Statement of Assets and Liabilities:
| | | | | | | | | Net Unrealized | |
| | | Fair Value | | | Loss on Open | |
Derivatives Not Accounted for as Hedging Instruments | | Assets | | | Liabilities | | | Positions | |
| Baird Strategic Municipal Bond Fund | | | | | | | | | |
U.S. Treasury futures contracts(a) | | | | | | | | | |
| Sale contracts | | | | | | | | | |
| Interest rate | | $ | — | | | $ | 316,150 | | | $ | (316,150 | ) |
| Total U.S. Treasury futures contracts | | $ | — | | | $ | 316,150 | | | $ | (316,150 | ) |
(a) | Reflects the cumulative unrealized depreciation of futures contracts as reported in the Fund’s schedule of open futures contracts. Only the current day variation margin for futures contracts may be separately reported within the Fund’s Statement of Assets and Liabilities. |
The following table presents the results of the derivatives trading and information related to volume for the year ended December 31, 2023 for the Baird Strategic Municipal Bond Fund. The below captions of “Net Realized” and “Net Change in Unrealized” correspond to the captions in the Fund’s Statement of Operations.
| | | Loss from Trading |
| | | | | | Net Change in Unrealized |
Fund and Type of Derivatives Instrument | | Net Realized | | | Appreciation/Depreciation |
| Baird Strategic Municipal Bond Fund | | | | | | | |
| U.S. Treasury futures contracts | | | | | | | |
| Interest rate | | $ | (45,379 | ) | | | $ | (316,150 | ) |
| Total U.S. Treasury futures contracts | | $ | (45,379 | ) | | | $ | (316,150 | ) |
The average monthly notional amount is shown as an indicator of volume. The Funds calculate notional value for futures contracts as the number of open contracts multiplied by contract size multiplied by the price of the underlying security or asset. The average monthly notional amounts during the year ended December 31, 2023 were:
| | | Average Notional Amount | |
| | | Purchase | | | | Sale | |
| | | Contracts | | | | Contracts | |
| Baird Strategic Municipal Bond Fund | | | | | | | |
| U.S. Treasury futures contracts | | $ | 14,299,219 | | | | $ | 6,656,286 | |
Please refer to the Fund’s prospectus for a full listing of risks associated with these investments.
In preparing these financial statements, management has evaluated events after December 31, 2023. There were no subsequent events since December 31, 2023, through the date the financial statements were issued that would warrant adjustment to or additional disclosure in these financial statements.
Report of Independent Registered Public Accounting Firm
To the Shareholders and Board of Directors of Baird Funds, Inc.
Opinion on the Financial Statements
We have audited the accompanying statements of assets and liabilities, including the schedule of open futures contracts of Baird Strategic Municipal Bond Fund and the schedules of investments of the funds listed below (the “Funds”), each a series of Baird Funds, Inc., as of December 31, 2023, the related statements of operations, the statements of changes in net assets, the related notes, and the financial highlights for each of the periods indicated below (collectively referred to as the “financial statements”). In our opinion, the financial statements present fairly, in all material respects, the financial position of each of the Funds as of December 31, 2023, the results of their operations, the changes in net assets, and the financial highlights for each of the periods indicated below in conformity with accounting principles generally accepted in the United States of America.
| | Statements of | Statements of Changes | |
| Fund Name | Operations | in Net Assets | Financial Highlights |
| Baird Ultra Short Bond Fund | For the year ended | For the years ended | For the years ended December 31, |
| Baird Short-Term Bond Fund | December 31, 2023 | December 31, 2023 and 2022 | 2023, 2022, 2021, 2020, and 2019 |
| Baird Intermediate Bond Fund | | | |
| Baird Aggregate Bond Fund | | | |
| Baird Core Plus Bond Fund | | | |
| Baird Short-Term Municipal Bond Fund | | | |
| Baird Quality Intermediate Municipal Bond Fund | | | |
| Baird Core Intermediate Municipal Bond Fund | | | |
| Baird Strategic Municipal Bond Fund | For the year ended | For the years ended | For the years ended December 31, |
| Baird Municipal Bond Fund | December 31, 2023 | December 31, 2023 and 2022 | 2023, 2022, 2021, 2020, and for |
| | | | the period from November 15, 2019 |
| | | | (commencement of operations) |
| | | | through December 31, 2019 |
Basis for Opinion
These financial statements are the responsibility of the Funds’ management. Our responsibility is to express an opinion on the Funds’ financial statements based on our audits. We are a public accounting firm registered with the Public Company Accounting Oversight Board (United States) (“PCAOB”) and are required to be independent with respect to the Funds in accordance with the U.S. federal securities laws and the applicable rules and regulations of the Securities and Exchange Commission and the PCAOB.
We conducted our audits in accordance with the standards of the PCAOB. Those standards require that we plan and perform the audit to obtain reasonable assurance about whether the financial statements are free of material misstatement whether due to error or fraud.
Our audits included performing procedures to assess the risks of material misstatement of the financial statements, whether due to error or fraud, and performing procedures that respond to those risks. Such procedures included examining, on a test basis, evidence regarding the amounts and disclosures in the financial statements. Our procedures included confirmation of securities owned as of December 31, 2023, by correspondence with the custodian and brokers. Our audits also included evaluating the accounting principles used and significant estimates made by management, as well as evaluating the overall presentation of the financial statements. We believe that our audits provide a reasonable basis for our opinion.
We have served as the Funds’ auditor since 2017.
COHEN & COMPANY, LTD.
Milwaukee, Wisconsin
February 26, 2024
Directors & Officers
As of December 31, 2023 (Unaudited)
Independent Directors
John W. Feldt
Independent Director, Audit Committee Chair
Term of Office: Indefinite
Length of Time Served: Since September 2000
Age: 81
c/o Robert W. Baird & Co. Incorporated
777 East Wisconsin Avenue
Milwaukee, WI 53202
Principal Occupation(s) During the Past 5 Years: Retired.
Number of Active Portfolios in Complex Overseen by Director: 15
Other Directorships Held by Director: Director of Thompson Plumb Funds, Inc., a mutual fund complex (3 portfolios) (1987-2018).
Darren R. Jackson
Independent Director
Term of Office: Indefinite
Length of Time Served: Since November 2018
Age: 59
c/o Robert W. Baird & Co. Incorporated
777 East Wisconsin Avenue
Milwaukee, WI 53202
Principal Occupation(s) During the Past 5 Years: Retired.
Number of Active Portfolios in Complex Overseen by Director: 15
Other Directorships Held by Director: Director of Wolfspeed, Inc., a semiconductor company, since 2016; Director of Fastenal Company, a tool and supply distributor (2012-2020).
David J. Lubar
Independent Director
Term of Office: Indefinite
Length of Time Served: Since November 2021
Age: 69
c/o Lubar & Co.
833 E. Michigan Street,
Suite 1500
Milwaukee, WI 53202
Principal Occupation(s) During the Past 5 Years: President and CEO, Lubar & Co., Incorporated, a private investment firm, since 1983.
Number of Portfolios in Complex Overseen by Director: 15
Other Directorships Held by Director: Director of Hallador Energy Company, since 2018.
Cory L. Nettles
Independent Director
Term of Office: Indefinite
Length of Time Served: Since January 2008
Age: 53
c/o Generation Growth Capital, Inc.
111 East Kilbourn Avenue, Suite 2800
Milwaukee, WI 53202
Principal Occupation(s) During the Past 5 Years: Managing Director, Generation Growth Capital, Inc., a private equity fund, since March 2007.
Number of Active Portfolios in Complex Overseen by Director: 15
Other Directorships Held by Director: Director of Weyco Group, Inc., a men’s footwear distributor, since 2007; Director of Associated Banc-Corp,
since 2013.
Marlyn J. Spear, CFA
Independent Director, Chair of Board
Term of Office: Indefinite
Length of Time Served: Since January 2008
Age: 70
c/o Robert W. Baird & Co. Incorporated
777 East Wisconsin Avenue
Milwaukee, WI 53202
Principal Occupation(s) During the Past 5 Years: Retired.
Number of Active Portfolios in Complex Overseen by Director: 15
Other Directorships Held by Director: Management Trustee of AFL-CIO Housing Investment Trust, a mutual fund complex (1 portfolio) (1995-2018).
Frederick P. Stratton, Jr.
Independent Director, Nominating Committee Chair
Term of Office: Indefinite
Length of Time Served: Since May 2004
Age: 84
c/o Robert W. Baird & Co. Incorporated
777 East Wisconsin Avenue
Milwaukee, WI 53202
Principal Occupation(s) During the Past 5 Years: Retired; Chairman Emeritus, Briggs & Stratton Corporation, a manufacturing company (2003-2020).
Number of Active Portfolios in Complex Overseen by Director: 15
Other Directorships Held by Director: Director of Weyco Group, Inc., a men’s footwear distributor, since 1976.
Directors & Officers
As of December 31, 2023 (Unaudited)
Officers
Mary Ellen Stanek
President
Term of Office: Re-elected by Board annually
Length of Time Served: Since September 2000
Age: 67
c/o Robert W. Baird & Co. Incorporated
777 East Wisconsin Avenue
Milwaukee, WI 53202
Principal Occupation(s) During the Past 5 Years: Co-Chief Investment Officer, Baird Advisors, a department of the Advisor, since October 2021; Chief Investment Officer, Baird Advisors (March 2000-October 2021); Managing Director, the Advisor, since March 2000.
Charles B. Groeschell
Vice President
Term of Office: Re-elected by Board annually
Length of Time Served: Since January 2010
Age: 70
c/o Robert W. Baird & Co. Incorporated
777 East Wisconsin Avenue
Milwaukee, WI 53202
Principal Occupation(s) During the Past 5 Years: Managing Director, the Advisor, and Senior Portfolio Manager, Baird Advisors, a department of the Advisor, since February 2000.
Angela M. Palmer
Chief Compliance Officer and
AML Compliance Officer
Term of Office: Re-elected by Board annually
Length of Time Served: Since March 2014
Age: 51
c/o Robert W. Baird & Co. Incorporated
777 East Wisconsin Ave
Milwaukee, WI 53202
Principal Occupation(s) During the Past 5 Years: Chief Compliance Officer, the Advisor, since March 2014; Anti-Money Laundering Compliance Officer since May 2015; Managing Director, the Advisor, since January 2022; Director, the Advisor, (July 2014-December 2021).
Dustin J. Hutter
Treasurer
Term of Office: Re-elected by Board annually
Length of Time Served: Since April 2021
Age: 47
c/o Robert W. Baird & Co. Incorporated
777 East Wisconsin Avenue
Milwaukee, WI 53202
Principal Occupation(s) During the Past 5 Years: Senior Business Analyst, the Advisor, since September 2017; Managing Director, the Advisor, since January 2020; Director, the Advisor (July 2014-December 2019).
Charles M. Weber
Secretary
Term of Office: Re-elected by Board annually
Length of Time Served: Since September 2005
Age: 60
c/o Robert W. Baird & Co. Incorporated
777 East Wisconsin Avenue
Milwaukee, WI 53202
Principal Occupation(s) During the Past 5 Years: Deputy General Counsel, the Advisor, since January 2022; Senior Associate General Counsel, the Advisor, January 2013 to December 2021; Managing Director, the Advisor, since January 2009.
Peter J. Hammond
Vice President
Term of Office: Re-elected by Board annually
Length of Time Served: Since August 2012
Age: 60
c/o Robert W. Baird & Co. Incorporated
777 East Wisconsin Avenue
Milwaukee, WI 53202
Principal Occupation(s) During the Past 5 Years: Managing Director, the Advisor, since January 2016.
Mandy L. Hess
Assistant Treasurer
Term of Office: Re-elected by Board annually
Length of Time Served: Since April 2021
Age: 53
c/o Robert W. Baird & Co. Incorporated
777 East Wisconsin Avenue
Milwaukee, WI 53202
Principal Occupation(s) During the Past 5 Years: Senior Vice President, the Advisor, since November 2019; Director of Finance and Assistant Treasurer, The Lynde and Harry Bradley Foundation, Inc. (a private grantmaking foundation) (December 2005-July 2019).
Andrew D. Ketter
Assistant Secretary
Term of Office: Re-elected by Board annually
Length of Time Served: Since February 2011
Age: 49
c/o Robert W. Baird & Co. Incorporated
777 East Wisconsin Avenue
Milwaukee, WI 53202
Principal Occupation(s) During the Past 5 Years: Associate General Counsel, the Advisor, since September 2010; Managing Director, the Advisor, since January 2022; Director, the Advisor, (July 2014-December 2021).
Additional information about the Funds’ Directors is available in the Statement of Additional Information which may be obtained without charge, upon request, by calling 1-866-442-2473, or at www.bairdfunds.com.
Baird Funds, Inc.
Disclosure Regarding Approval of the Investment Advisory Agreement for Baird Bond Funds (Unaudited)
The Board of Directors (the “Board”) of Baird Funds, Inc. (the “Company”), comprised of directors who are not “interested persons” of the Company within the meaning of the Investment Company Act of 1940 (the “Independent Directors”), met on August 9, 2023 and August 22, 2023 to consider the annual renewal of the investment advisory agreement between Robert W. Baird & Co. Incorporated (“Baird” or the “Advisor”) and the Company on behalf of the Baird Ultra Short Bond Fund, the Baird Short-Term Bond Fund, the Baird Intermediate Bond Fund, the Baird Aggregate Bond Fund, the Baird Core Plus Bond Fund, the Baird Short-Term Municipal Bond Fund, the Baird Strategic Municipal Bond Fund, the Baird Quality Intermediate Municipal Bond Fund, the Baird Core Intermediate Municipal Bond Fund, and the Baird Municipal Bond Fund (the “Bond Funds” or the “Funds”).
The Board, which is comprised solely of Independent Directors, approved the continuation of the investment advisory agreement for the Bond Funds through a process that concluded at the August 22, 2023 meeting. In connection with the consideration of the investment advisory agreement, the Board reviewed and discussed various information that had been provided prior to the meeting, including a copy of the investment advisory agreement and the Funds’ fee schedules, the fee waiver agreement for the Baird Ultra Short Bond Fund, a memorandum provided by the Funds’ legal counsel summarizing the guidelines relevant to the Board’s consideration of the investment advisory agreement, a memorandum and other information provided in response to a request from the Board by the Advisor, a copy of the Advisor’s Form ADV Part 1A and Form ADV brochures and brochure supplements, organizational chart for the Advisor, financial information for the Advisor and its parent company, a profitability analysis, comparative information about the Funds’ performance for the applicable periods ended June 30, 2023, comparative information about management fees and expense ratios, composite performance information for similar accounts managed by the Advisor, trading and brokerage commission information and information related to payments to financial intermediaries.
The Board reviewed the Advisor’s 15(c) response with representatives of the Advisor and separately with legal counsel to the Independent Directors at the August 9, 2023 special meeting. The Board also took into account knowledge gained over time through its experience with the Advisor as well as information reviewed periodically throughout the year, including information about performance, asset flows and expenses; discussions with management about personnel, succession planning and services provided to the Funds and their shareholders; discussions with the Company’s Chief Compliance Officer about compliance matters and discussions with the Funds’ portfolio managers.
In considering the investment advisory agreement and reaching its conclusions, the Board reviewed and analyzed various factors that it determined were relevant, including the factors below. In deciding to approve the renewal of the investment advisory agreement for each Fund, the Board did not identify any single factor as determinative but considered all factors together.
Nature, Extent and Quality of Services Provided to the Funds
The Board considered the nature, extent and quality of the services provided by the Advisor to the Funds. The Board noted the Advisor’s positive reputation, the Advisor’s long-term history of managing the Funds and the continuity and experience of the portfolio management teams employed to manage the investments of the Funds. The Board considered the depth and quality of the Advisor’s personnel who provide services to the Funds, including investment management, shareholder services, legal, compliance and accounting personnel. The Board also considered the Advisor’s continued investment in resources that benefit the Funds, including investments in personnel, technology, and research.
The Board considered the Advisor’s disciplined investment decision-making processes used for the Funds. The Board noted that, for all Funds, Baird makes investment decisions, selects broker-dealers for the execution of portfolio transactions, votes proxies and provides other customary investment management services. The Board also considered other services that the Advisor provides the Funds in its capacity as their investment advisor, such as providing key personnel to serve as officers of the Funds, ensuring adherence to the Funds’ investment policies and restrictions, compliance services, shareholder servicing, administering the Funds’ liquidity risk management program, administering the Funds’ cybersecurity program and business continuity plan, serving as valuation designee of the Board for purposes of the Funds’ fair value procedures, providing support services to the Board and the committees of the Board and overseeing the Funds’ other service providers. The Board considered the strength of the Advisor’s legal and compliance department and the qualifications of the Funds’ Chief Compliance Officer. The Board noted the effective operation of the Advisor’s risk management, valuation and liquidity risk management processes.
The Board concluded that the nature, extent and quality of the services provided by the Advisor to each Fund were appropriate and that each Fund was likely to continue to benefit from the services provided by the Advisor under the investment advisory agreement.
Investment Performance of the Advisor and the Funds
In considering the investment performance of each Fund, the Board reviewed information as of June 30, 2023 regarding the performance of each class of the Fund for applicable one-year, three-year, five-year, ten-year and since-inception periods in comparison to its benchmark index and its peer group as determined by Lipper. The Board reviewed the composite investment performance of the Advisor with respect to accounts managed by the Advisor that are managed in the same strategy as the Funds but did not consider it to be a material factor in the 15(c) process.
The Board noted that the Bond Funds have generated competitive and consistent long-term performance results and the Institutional Class of each Fund has generally outperformed the respective benchmark index for the one-year, three-year, five-year, ten-year and since-inception periods, where applicable. With respect to the Baird Quality Intermediate Municipal Bond Fund, the Board considered the Advisor’s commentary regarding the high-quality focus of the Fund as the primary cause of the Fund’s underperformance relative to the benchmark over all time periods. The Board noted that the Institutional Class returns of each Fund have also generally exceeded the Lipper peer group average over all applicable periods, other than the Baird Quality Intermediate Municipal Bond Fund, which underperformed the peer group average for all periods except the since-inception period, and the Short-Term Bond Fund and the Intermediate Bond Fund, which underperformed the peer group average for certain periods. The Board considered the Advisor’s analysis regarding the performance of those Funds relative to peer funds.
The Board also considered the Advisor’s quarterly portfolio commentaries and discussions regarding the Funds’ performance and the investment strategies the Advisor employs for each Fund. The Board concluded that each Fund and its shareholders were likely to benefit from the continued management by the Advisor.
Advisory Fees and Expenses
The Board reviewed the fee and expense information for each of the Funds, including a comparison of each Fund’s advisory fee and total net expense ratio to industry data for all funds in the same Morningstar category (excluding ETFs and index funds). The Board noted that each Fund’s advisory fee (after waivers, in the case of the Baird Ultra Short Bond Fund) is lower than the average and median advisory fee for the Morningstar category and that the net expense ratio for each Fund’s Institutional Class is also lower than the Morningstar category average and median. With respect to the Baird Ultra Short Bond Fund, the Board considered the Advisor’s contractual agreement to waive management fees in an amount equal to an annual rate of 0.15% until April 30, 2024. In addition, the Board considered that under the Administration Agreement, each of the Bond Funds pays administrative fees to the Advisor at an annual rate of 0.05% of each Fund’s average daily net assets, and the Advisor is responsible for paying almost all other expenses of each Fund, excluding management fees, Rule 12b-1 fees and specified excluded expenses, which has the effect of capping the Funds’ expense ratios at 0.55% and 0.30% for Investor and Institutional Class Shares, respectively.
The Board also considered investment management fees charged by the Advisor to other investment accounts managed in similar strategies, including separately managed accounts, subadvised funds and a collective investment trust, but did not consider these comparisons to be a material factor given the Advisor’s greater level of responsibilities and additional services provided with respect to the Funds, as well as the more extensive regulatory requirements and risks associated with managing the Funds.
Baird Funds, Inc.
Disclosure Regarding Approval of the Investment Advisory Agreement for Baird Bond Funds (Unaudited) (Continued)
The Board concluded that the advisory fee and total expense ratio of each Fund were reasonable in light of the nature and quality of services provided and fees paid by comparable funds.
Costs and Profitability
The Board considered the fees realized, and the costs incurred, by the Advisor in providing investment management services to the Funds and administration services to the Bond Funds and a profitability analysis with respect to each Fund. The Board considered that the Advisor’s profitability information does not reflect costs incurred for various internal support services and systems to the Funds such as IT, compliance, risk, human resources, legal and finance.
The Board reviewed the financial condition of the Advisor and its parent company and determined it to be sound. The Board noted that certain Funds were not profitable to the Advisor. The Board concluded that the Advisor’s current level of profitability for each Fund, where applicable, was reasonable.
Economies of Scale and Fee Levels Reflecting Those Economies
The Board considered the extent to which economies of scale might be realized as each Fund grows and to the extent which each Fund’s advisory fee reflects those economies of scale for the benefit of Fund investors.
The Board considered that the Funds’ advisory fee structure does not contain any breakpoint reductions as the Funds grow in size. The Board agreed with management’s view that each Fund shares in economies of scale through the low advisory fee, which was designed to be comparable to the second or third breakpoint advisory fee levels paid by other comparable mutual funds and noted that this pricing structure has been in place since the inception of each Fund. In addition, the Board noted that the Advisor bears almost all of the Bond Funds’ expenses other than investment advisory, Rule 12b-1 and administration fees. The Board also considered investments made by the Advisor in resources that benefit the Funds. The Directors concluded that the current fee structure of each Fund was reasonable and provides for a sharing of any economies of scale with the Fund’s investors.
Benefits Derived from the Relationship with the Funds
The Board considered other benefits to the Advisor from serving as advisor to the Funds (in addition to the advisory fee). Those benefits include fees received by the Advisor under the administration agreement with the Bond Funds and Rule 12b-1 fees received by the Distributor and its representatives. The Board noted that the Advisor’s asset management and other institutional businesses may experience indirect benefits from the Advisor’s association with the Funds. The Board concluded that the other benefits realized by the Advisor from its relationship with the Funds were appropriate.
Based on its evaluation of the above factors, the Directors, all of whom are Independent Directors, concluded that the continuation of the investment advisory agreement was in the best interest of each Fund and its shareholders.
Additional Information (Unaudited)
Proxy VotingA description of the policies and procedures that the Funds use to determine how to vote proxies relating to portfolio securities is available without charge, upon request, by calling toll free, 1-866-442-2473, by accessing the Funds’ website at www.bairdfunds.com or by accessing the SEC’s website at www.sec.gov.
Each Fund’s proxy voting record for the most recent 12-month period ended June 30, if applicable, is available without charge, upon request, by calling toll free, 1-866-442-2473, by accessing the Funds’ website at www.bairdfunds.com or by accessing the SEC’s website at www.sec.gov. The Funds generally do not vote proxies because the securities held in their portfolios, consisting of bonds and other fixed-income securities, are not entitled to vote.
Portfolio Holdings Disclosure
The Funds file a complete schedule of portfolio holdings with the SEC for the first and third quarters of each fiscal year on Part F of Form N-PORT. The Funds’ filings on Part F of Form N-PORT are available on the SEC’s website at www.sec.gov. The Funds’ Form N-PORT reports may also be obtained by calling toll-free 1-866-442-2473 or by accessing the Funds’ website at www.bairdfunds.com.
Tax Information
For the fiscal year ended December 31, 2023, the percentage of taxable ordinary income distributions that are designated as short-term capital gain distributions under Internal Revenue Section 871(k)(2)(C) for each Fund was 0.00%.
Baird Funds, Inc. Privacy Policy
| | FACTS | | WHAT DOES BAIRD FUNDS DO WITH YOUR PERSONAL INFORMATION? | |
| | | | | |
| | Why? | | Financial companies choose how they share your personal information. Federal law gives consumers the right to limit some but not all sharing. Federal law also requires us to tell you how we collect, share, and protect your personal information. Please read this notice carefully to understand what we do. | |
| | | | | |
| | What? | | The types of personal information we collect and share depend on the product or service you have with us. This information can include: | |
| | | | • Social Security number | |
| | | | • Account balances, transaction history and assets | |
| | | | • Checking account information and wire transfer instructions | |
| | | | | |
| | How? | | All financial companies need to share customers’ personal information to run their everyday business. In the section below, we list the reasons financial companies can share their customers’ personal information; the reasons Baird Funds, Inc. chooses to share; and whether you can limit this sharing. | |
| | | Does Baird | Can you limit |
| | Reasons we can share your personal information | Funds, Inc. share? | this sharing? |
| | For our everyday business purposes— | Yes | No |
| | such as to process your transactions, maintain your account(s), respond | | |
| | to court orders and legal investigations, or report to credit bureaus | | |
| | For our marketing purposes— | Yes | No |
| | to offer our products and services to you | | |
| | For joint marketing with other financial companies | No | We do not share |
| | For our affiliates’ everyday business purposes— | Yes | No |
| | information about your transactions and experiences | | |
| | For our affiliates’ everyday business purposes— | No | We do not share |
| | information about your creditworthiness | | |
| | For our affiliates to market to you | No | We do not share |
| | For nonaffiliates to market to you | No | We do not share |
| | Questions? | | Call (toll free) 1-866-442-2473, Email prospectus@bairdfunds.com or go to www.bairdfunds.com | |
Baird Funds, Inc. Privacy Policy
| | Who we are | | | |
| | Who is providing this notice? | | Baird Funds, Inc. | |
| | | | | |
| | What we do | | | |
| | How does Baird Funds, Inc. | | To protect your personal information from unauthorized access and use, we use security measures that comply with | |
| | protect my personal information? | | federal law. These measures include computer safeguards and secured files and buildings. | |
| | | | | |
| | How does Baird Funds, Inc. | | We collect your personal information, for example, when you | |
| | collect my personal information? | | • open an account or give us your contact information | |
| | | | • make a wire transfer or provide account information | |
| | | | • make deposits or withdrawals from your account | |
| | | | We also collect your personal information from other companies. | |
| | Why can’t I limit all sharing? | | Federal law gives you the right to limit only | |
| | | | • sharing for affiliates’ everyday business purposes—information about your creditworthiness | |
| | | | • affiliates from using your information to market to you | |
| | | | • sharing for nonaffiliates to market to you | |
| | | | State laws and individual companies may give you additional rights to limit sharing. | |
| | Definitions | | | |
| | Affiliates | | Companies related by common ownership or control. They can be financial and nonfinancial companies. | |
| | | | • Robert W. Baird & Co Incorporated (the investment adviser and distributor to the Baird Funds) and its affiliates may share information among each other. | |
| | Nonaffiliates | | Companies not related by common ownership or control. They can be financial and nonfinancial companies. | |
| | | | • Baird Funds, Inc. does not share with nonaffiliates so they can market to you. | |
| | Joint marketing | | A formal agreement between nonaffiliated financial companies that together market financial products or services to you. We do not have any joint marketing partners. | |
| | | | • Baird Funds, Inc. does not have any joint marketing partners. | |
(This Page Intentionally Left Blank.)
Baird Funds, Inc.
c/o U.S. Bancorp Fund Services, LLC
P.O. Box 701
Milwaukee, WI 53201-0701
1-866-442-2473
Board of Directors
John W. Feldt
Darren R. Jackson
David J. Lubar
Cory L. Nettles
Marlyn J. Spear (Chair)
Frederick P. Stratton, Jr.
Investment Advisor and Distributor
Robert W. Baird & Co. Incorporated
777 East Wisconsin Avenue
Milwaukee, WI 53202
Administrator and Transfer Agent
U.S. Bancorp Fund Services, LLC
P.O. Box 701
615 East Michigan Street
Milwaukee, WI 53202
Custodian
U.S. Bank, N.A.
1555 N. RiverCenter Drive, Suite 302
Milwaukee, WI 53212
Legal Counsel
Godfrey & Kahn, S.C.
833 East Michigan Street, Suite 1800
Milwaukee, WI 53202
Independent Registered Public
Accounting Firm
Cohen & Company, Ltd.
342 North Water Street, Suite 830
Milwaukee, WI 53202
Annual Report –
Baird Funds
December 31, 2023
Baird Mid Cap Growth Fund
Baird Small/Mid Cap Growth Fund
Baird Equity Opportunity Fund
Baird Chautauqua International Growth Fund
Baird Chautauqua Global Growth Fund
| Go Green. | | Go Paperless. |
Sign up to receive your Baird Funds’ prospectuses and reports online.
Table of Contents
| Letter to Shareholders | | 1 |
| Baird Mid Cap Growth Fund | | 2 |
| Baird Small/Mid Cap Growth Fund | | 7 |
| Baird Equity Opportunity Fund | | 13 |
| Baird Chautauqua International Growth Fund | | 18 |
| Baird Chautauqua Global Growth Fund | | 24 |
| Additional Information on Fund Expenses | | 30 |
| Statements of Assets and Liabilities | | 31 |
| Statements of Operations | | 33 |
| Statements of Changes in Net Assets | | 35 |
| Financial Highlights | | 38 |
| Notes to the Financial Statements | | 43 |
| Report of Independent Registered Public Accounting Firm | | 51 |
| Directors and Officers | | 52 |
| Disclosure Regarding Approval of Investment Advisory Agreements and Subadvisory Agreement for Baird Equity Funds | | 54 |
| Additional Information | | 56 |
| Privacy Notice | | A-1 |
This report has been prepared for shareholders and may be distributed to others only if preceded or accompanied by a current prospectus.
Cautionary Note on Analyses, Opinions and Outlooks: In this report we offer analyses and opinions on the performance of individual securities, companies, industries, sectors, markets, interest rates and governmental policies, including predictions, forecasts and outlooks regarding possible future events. These can generally be identified as such because the context of the statements may include such words as “believe,” “should,” “will,” “expects,” “anticipates,” “hopes” and words of similar effect. These statements reflect the portfolio managers’ good faith beliefs and judgments and involve risks and uncertainties, including the risk that the portfolio managers’ analyses, opinions and outlooks are or will prove to be inaccurate. It is inherently difficult to correctly assess and explain the performance of particular securities, sectors, markets, interest rate movements, governmental actions or general economic trends and conditions, and many unforeseen factors contribute to the performance of Baird Funds. Investors are, therefore, cautioned not to place undue reliance on subjective judgments contained in this report.
Baird Funds
1-866-442-2473
www.bairdfunds.com
February 26, 2024
Dear Shareholder,
Equity markets had a solid year in 2023 with U.S. and international indices posting double-digit returns for the year. The Baird Equity Funds also delivered solid risk adjusted absolute returns, while relative returns trailed their respective benchmarks.
For the equity markets, 2023 marked an about-face from weaker performance in 2022. The change was fueled by lower market expectations for equity returns entering the year, continued economic growth, and importantly, moderating inflation, which raised investor hopes that the Federal Reserve’s rate hiking cycle had reached a conclusion.
However, there was considerable volatility along the way, starting in March with the rapid failure of three regional banks, headlined by Silicon Valley Bank. The failures initially placed pressure on equities, which quickly reversed as the Federal Reserve injected liquidity into the market and the government took steps to fully protect depositors of the failed institutions.
Equites resumed their climb until July, when the market weakened over concerns that China’s economy may be softening and that the Federal Reserve saw “upside risks” to inflation, leading rates to climb; smaller cap stocks were disproportionally impacted. A favorable inflation report late in October turned the market sharply higher into year-end as rates retreated, and the market narrative shifted to an economic soft landing coveted by investors. The Treasury aided the rally with the injection of additional liquidity.
Further, two themes emerged that aided the equity rally, but likewise created fundamental uncertainty and volatility within the technology and healthcare sectors. These included the broader, potentially powerful applications of artificial intelligence and the increased medical use of GLP-1 drugs for weight loss, such as Ozempic. Our teams continue to evaluate the long-term implications and opportunities of these potentially revolutionary trends.
Through these stages of market volatility, the teams that manage the Baird Equity Funds on your behalf adhered to their underlying investment philosophies and remained focused on identifying attractive, high-quality businesses. In our view, the consistent application of these underlying processes is central to delivering superior long-term investment results. We continue to invest in our business so that we may best serve you.
We are proud of our firm, proud of our team and so very grateful, honored and humbled to serve as your equity manager.
Sincerely,
Mary Ellen Stanek, CFA
President
Baird Funds, Inc.
Baird Mid Cap Growth Fund
December 31, 2023 (Unaudited)
Portfolio Managers’ Commentary
For the year ended December 31, 2023, the Baird Mid Cap Growth Fund Institutional Class posted a total return of 20.17% as compared to 25.87% for the Russell Midcap® Growth Index, the Fund’s benchmark index.
The market environment in 2023 changed dramatically over the last two months of the year as stocks rallied meaningfully following a lower-than-expected inflation report in late October. The market move signaled an abrupt end to the Federal Reserve’s tightening cycle, shifting instead to a view incorporating multiple interest rate cuts beginning in the first half of 2024. Time will tell if the market read of a Federal Reserve “pivot” proves correct, but the changed outlook took a nondescript return year for many stocks and broadened to a strong positive year for nearly all parts of the stock market.
The Fund’s relative performance experienced distinct phases during 2023, including modest outperformance in the first half of the year, a stretch of meaningful underperformance encompassing the third quarter into October, and full participation during the sharp move higher late in the year. We are pleased that the Fund recaptured a good portion of last year’s decline, but we would have liked a stronger result that tracked closer to the benchmark index return.
Fund characteristics remained similar to prior years and are instructive regarding our high-quality investment philosophy with overall Fund portfolio holdings possessing a higher level of profitability, solid revenue growth, and lower balance sheet leverage compared to its benchmark index. The Fund’s investment mix has tended to earn a higher relative valuation level as measured by price-to-earnings, which we view as justified by the stronger fundamental profile of Fund holdings.
We believe the Fund’s favorable fundamental profile compared to its benchmark is the right starting point in our effort to drive attractive long-term investment performance. However, there are times when the market rewards different characteristics. This most recent year was one of those periods, particularly in the technology sector, where there was a wide performance differential between unprofitable companies, which the Fund does not hold, and profitable companies. The difference was an important determinant of the poor relative performance of Fund technology holdings compared to its benchmark and explained the bulk of overall Fund underperformance for the year. By our analysis, unprofitable technology companies comprised approximately 40% of the sector and advanced 79% for the year, compared to 37% for the profitable group. We will hold to our rule of requiring profitability as a key measure defining a quality company, despite the periodic performance headwinds it creates when unprofitable companies are in vogue. We know that over time, the requirement has kept the Fund invested in the higher return portion of its benchmark and added value to the Fund’s relative performance. We welcome new companies entering our investment opportunity set but look for more than just revenue growth and a good story.
The Fund’s industrial sector holdings also detracted from relative performance as stock picking was not good enough to keep pace with the benchmark. Several Fund holdings declined amid a strong return environment and accounted for the Fund’s holdings’ underperformance in that sector. Of note, two holdings in the transaction processing industry lagged as company fundamentals did not recover as quickly as other companies in the industry. Two other Fund holdings, one a producer of home standby generators and related systems, and the other a diversified manufacturer, struggled to deal with an uneven demand environment. We typically view the materials sector as an extension of the industrial sector, as we favor companies tied to manufacturing rather than more commodity-related activities. The two Fund holdings in the materials sector helped offset a portion of the underperformance from industrials.
The Fund’s largest relative positive performance contribution came from the energy sector. A solid, positive return from an oil production company offset weakness from a provider of renewable energy systems. In addition, the Fund’s small exposure to the sector proved beneficial as energy prices retreated and the sector’s negative overall return significantly trailed the benchmark index advance.
The healthcare sector recovered from a difficult period mid-year to post a positive contribution to Fund performance. Two long-time Fund holdings led the way: one company develops and manufactures products and services for animal health, and the other offers contract research services for drug development. Both exhibited fundamental strength. In addition, the lack of Fund exposure to the biotechnology industry proved helpful as that industry group performed poorly. In our view, the sector has displayed unusual performance the past 24 months, struggling to hold up in the difficult market in 2023 and lagging in this year’s rising market. We continue to believe that we can assemble a strong mix of high-quality growth companies in this sector given the favorable trends in long-term spending and innovation.
The Fund’s consumer discretionary holdings produced a drag on relative performance. Fund holdings in an auto parts supplier and holdings in the specialty retail group lagged, more than offsetting strength in holdings providing products and services for the housing market, which benefitted from stability in underlying demand and the fourth quarter decline in interest rates. The consumer staples sector provided a slight offset to consumer discretionary underperformance as the Fund’s lower-than-benchmark weight proved helpful as the sector’s return trailed the broad market strength.
Two sectors, telecommunications and real estate, each had a single Fund holding during the year, owing to their small benchmark weights. The Fund’s telecommunications sector holding outperformed, benefitting from continued favorable product demand for the network switching business. In the real estate sector, the Fund’s holding of a data provider to the apartment and commercial real estate markets failed to keep pace with holdings of the corresponding benchmark index sector as the company embarked on a path of accelerated spending to pursue a new market opportunity, pushing out a potential inflection in earnings growth.
Fund holdings in the financial sector did not keep pace with those included in the benchmark for the sector. While avoiding direct exposure to failed banks last spring, the Fund’s one bank holding detracted from performance as the industry came under pressure. Also, a lack of exposure to the asset management industry, which participated with the strong up market, hurt relative results for the sector and offset strong performance from a Fund holding serving the specialty insurance market.
The Fund does not use its cash position tactically; however, with the market moving higher, cash held to accommodate additions to individual holdings or new investment ideas served as a headwind to relative performance.
The Fund’s long-standing investment process remains focused on identifying high-quality companies that deliver attractive returns and above-average growth relative to peers. Seeking to control risk at the sector and position level is also a priority of our process, with the goal of providing attractive long-term returns for the Fund compared to its benchmark index. Over shorter time periods a factor, like profitability, may work against performance when comparing to a benchmark; however, over longer time periods, we believe holding a mix of highly profitable and fundamentally sound businesses is the best way to generate strong investment performance.
We appreciate your support.
Portfolio Managers:
Charles F. Severson, CFA
Kenneth M. Hemauer, CFA
Baird Mid Cap Growth Fund
December 31, 2023 (Unaudited)
Portfolio Characteristics
A December 31, 2023 summary of the Fund’s top 10 holdings and equity sector analysis compared to the Russell Midcap® Growth Index is shown below.
Top 10 Holdings(1) | | | Equity Sector Analysis(2) |
| | | | |
| IDEXX Laboratories, Inc. | 3.0% | | 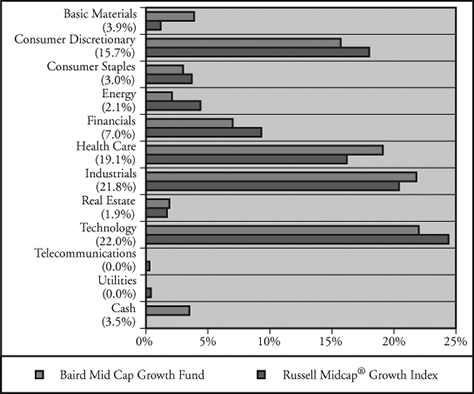
|
| DexCom, Inc. | 3.0% | |
| Globant SA | 2.7% | |
| Copart, Inc. | 2.7% | |
| PTC, Inc. | 2.6% | |
| ICON PLC | 2.6% | |
| CDW Corp. | 2.4% | |
| Watsco, Inc. | 2.4% | |
| Pool Corp. | 2.4% | |
| HEICO Corp. | 2.3% | |
| | | |
| Net Assets: | $2,529,413,633 | |
| Portfolio Turnover Rate: | 42% | |
| Number of Equity Holdings: | 52 | |
| | | |
Annualized Portfolio Expense Ratio(3): | | |
| Institutional Class: | 0.82% | |
| Investor Class: | 1.07% | (4) |
| | | |
| | | |
| | | |
| | | |
| | | |
| | | | |
(1) | The Fund’s portfolio composition is subject to change and there is no assurance that the Fund will continue to hold any particular security. Percentages shown relate to the Fund’s total net assets as of December 31, 2023. |
(2) | Percentages shown in parentheses relate to the Fund’s total value of investments as of December 31, 2023, and may not add up to 100% due to rounding. |
(3) | Reflects expense ratios as stated in the Fund’s current prospectus dated May 1, 2023. The Advisor has contractually agreed to limit the Fund’s total annual fund operating expenses to 0.85% of average daily net assets for the Institutional Class shares and 1.10% of average daily net assets for the Investor Class shares, at least through April 30, 2025. |
(4) | Includes 0.25% 12b-1 fee. |
Baird Mid Cap Growth Fund
December 31, 2023 (Unaudited)
| Institutional Class | Investor Class |
| Value of a $10,000 Investment | Value of a $10,000 Investment |
| | |
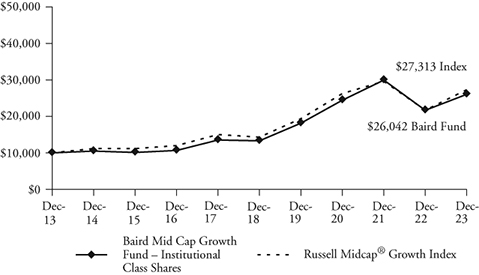 |  |
| | |
| Growth of a hypothetical investment of $10,000 made on 12/31/13, assuming | Growth of a hypothetical investment of $10,000 made on 12/31/13, assuming |
| reinvestment of all distributions. | reinvestment of all distributions. |
| Total Returns | | | | |
| | | Average Annual |
| | One | Five | Ten | Since |
| For the Periods Ended December 31, 2023 | Year | Years | Years | Inception(1) |
| Institutional Class Shares | 20.17% | 14.38% | 10.04% | 8.43% |
| Investor Class Shares | 19.86% | 14.07% | 9.76% | 8.17% |
Russell Midcap® Growth Index(2) | 25.87% | 13.81% | 10.57% | 7.89% |
(1) | For the period from December 29, 2000 (inception date) through December 31, 2023. |
(2) | The Russell Midcap® Growth Index measures the performance of the mid-cap growth segment of the U.S. equity universe. It includes those Russell Midcap® Index companies with higher price-to-book ratios and higher forecasted growth values. This index does not reflect any deduction for fees, expenses or taxes. A direct investment in the index is not possible. |
The line graphs and the returns table shown above reflect reinvestment of dividends and/or capital gains distributions in additional shares. The returns in the graphs and table do not reflect the deduction of taxes that a shareholder would pay on Fund distributions or the redemption of Fund shares. The returns reflect the actual performance for each period and do not include the impact of trades executed on the last business day of the period that were recorded on the first business day of the next period.
The expense ratio for each Class, as reflected in the Fund’s current prospectus, is set forth under “Portfolio Characteristics”.
The Fund focuses on growth-style stocks and therefore the performance of the Fund will typically be more volatile than the performance of funds that focus on types of stocks that have a broader investment style. The Fund may invest up to 15% of its total assets in equity securities (consisting of common stock, ordinary shares and ADRs) of foreign companies. Foreign investments involve additional risks such as currency rate fluctuations, political and economic instability, and different and sometimes less strict financial reporting standards and regulation. The Fund invests a substantial portion of its assets in the stocks of mid-capitalization companies. Mid-capitalization companies often are more volatile and face greater risks than larger, more established companies. U.S. and international markets have experienced significant periods of volatility due to a number of economic, political and other global macro factors. The war between Ukraine and Russia is approaching its 2nd anniversary and the October 7th attack by Hamas and Israel’s response only added to global tensions. US/China relations remain strained, impacted by sluggish Chinese economic growth and numerous issues affecting trade relations. Domestically, inflation remains an area of focus since getting to the Fed’s 2% target may prove to be more challenging than the market expects. In addition, 2024 is an election year and the current level of political discord is high. Finally, while the coronavirus (COVID-19) appears to have entered an endemic stage, significant outbreaks present a continued risk to the global economy. These and other events may cause market disruptions and could have an adverse effect on the value of the Fund’s investments.
Past performance does not guarantee future results. Investment return and principal value will fluctuate so that an investor’s shares, when redeemed, may be worth more or less than their original cost.
For information about the performance of the Fund as of the most recent month-end, please call 1-866-442-2473 or visit www.bairdfunds.com. Mutual fund performance changes over time and current performance may be lower or higher than that stated.
Baird Mid Cap Growth Fund
Schedule of Investments, December 31, 2023
Common Stocks
| | | | | | | | | % of | |
| | | Shares | | | Value | | | Net Assets | |
| Aerospace & Defense | | | | | | | | | |
| HEICO Corp. | | | 331,305 | | | $ | 59,260,525 | | | | 2.3 | % |
| Air Freight & Logistics | | | | | | | | | | | | |
GXO Logistics, Inc.(1) | | | 623,726 | | | | 38,147,082 | | | | 1.5 | % |
| Automobile Components | | | | | | | | | | | | |
Aptiv PLC(1) | | | 301,069 | | | | 27,011,911 | | | | 1.1 | % |
| Beverages | | | | | | | | | | | | |
Boston Beer Co., Inc.(1) | | | 98,677 | | | | 34,101,784 | | | | 1.4 | % |
| Building Products | | | | | | | | | | | | |
Trex Co., Inc.(1) | | | 652,532 | | | | 54,023,124 | | | | 2.1 | % |
| Capital Markets | | | | | | | | | | | | |
| MarketAxess Holdings, Inc. | | | 122,307 | | | | 35,817,605 | | | | 1.4 | % |
| MSCI, Inc. | | | 85,533 | | | | 48,381,741 | | | | 1.9 | % |
| | | | | | | | 84,199,346 | | | | 3.3 | % |
| Commercial Services & Supplies | | | | | | | | | | | | |
| Cintas Corp. | | | 66,125 | | | | 39,850,893 | | | | 1.6 | % |
Copart, Inc.(1) | | | 1,383,242 | | | | 67,778,858 | | | | 2.7 | % |
| | | | | | | | 107,629,751 | | | | 4.3 | % |
| Consumer Staples Distribution & Retail | | | | | | | | | | | | |
BJ’s Wholesale Club Holdings, Inc.(1) | | | 354,664 | | | | 23,641,902 | | | | 0.9 | % |
Dollar Tree, Inc.(1) | | | 323,542 | | | | 45,959,141 | | | | 1.8 | % |
| | | | | | | | 69,601,043 | | | | 2.7 | % |
| Distributors | | | | | | | | | | | | |
| Pool Corp. | | | 149,683 | | | | 59,680,109 | | | | 2.4 | % |
| Electronic Equipment, | | | | | | | | | | | | |
| Instruments, & Components | | | | | | | | | | | | |
| CDW Corp. | | | 269,403 | | | | 61,240,690 | | | | 2.4 | % |
| Financial Services | | | | | | | | | | | | |
| Jack Henry & Associates, Inc. | | | 233,310 | | | | 38,125,187 | | | | 1.5 | % |
| Food Products | | | | | | | | | | | | |
| Lamb Weston Holdings, Inc. | | | 388,237 | | | | 41,964,537 | | | | 1.7 | % |
| Ground Transportation | | | | | | | | | | | | |
| J.B. Hunt Transport Services, Inc. | | | 208,521 | | | | 41,649,985 | | | | 1.6 | % |
| Health Care Equipment & Supplies | | | | | | | | | | | | |
Align Technology, Inc.(1) | | | 160,784 | | | | 44,054,816 | | | | 1.7 | % |
DexCom, Inc.(1) | | | 611,332 | | | | 75,860,188 | | | | 3.0 | % |
IDEXX Laboratories, Inc.(1) | | | 137,630 | | | | 76,391,531 | | | | 3.0 | % |
Insulet Corp.(1) | | | 220,507 | | | | 47,845,609 | | | | 1.9 | % |
| ResMed, Inc. | | | 267,360 | | | | 45,991,267 | | | | 1.8 | % |
| | | | | | | | 290,143,411 | | | | 11.4 | % |
| Health Care Technology | | | | | | | | | | | | |
Veeva Systems, Inc.(1) | | | 266,951 | | | | 51,393,407 | | | | 2.0 | % |
| Hotels, Restaurants, & Leisure | | | | | | | | | | | | |
| Churchill Downs, Inc. | | | 246,657 | | | | 33,281,429 | | | | 1.3 | % |
| Household Durables | | | | | | | | | | | | |
| DR Horton, Inc. | | | 365,151 | | | | 55,495,649 | | | | 2.2 | % |
| Insurance | | | | | | | | | | | | |
| Kinsale Capital Group, Inc. | | | 112,024 | | | | 37,517,958 | | | | 1.5 | % |
| IT Services | | | | | | | | | | | | |
EPAM Systems, Inc.(1) | | | 136,404 | | | | 40,558,365 | | | | 1.6 | % |
Globant SA(1) | | | 290,922 | | | | 69,233,618 | | | | 2.7 | % |
| | | | | | | | 109,791,983 | | | | 4.3 | % |
| Life Sciences Tools & Services | | | | | | | | | | | | |
| Bio-Techne Corp. | | | 328,947 | | | | 25,381,551 | | | | 1.0 | % |
ICON PLC(1) | | | 232,969 | | | | 65,946,535 | | | | 2.6 | % |
Repligen Corp.(1) | | | 276,018 | | | | 49,628,036 | | | | 2.0 | % |
| | | | | | | | 140,956,122 | | | | 5.6 | % |
| Machinery | | | | | | | | | | | | |
| Graco, Inc. | | | 532,200 | | | | 46,173,672 | | | | 1.8 | % |
| IDEX Corp. | | | 215,944 | | | | 46,883,602 | | | | 1.9 | % |
| Ingersoll Rand, Inc. | | | 511,429 | | | | 39,553,919 | | | | 1.6 | % |
RBC Bearings, Inc.(1) | | | 178,285 | | | | 50,791,613 | | | | 2.0 | % |
| | | | | | | | 183,402,806 | | | | 7.3 | % |
| Oil, Gas, & Consumable Fuels | | | | | | | | | | | | |
| Diamondback Energy, Inc. | | | 335,936 | | | | 52,096,955 | | | | 2.1 | % |
| Professional Services | | | | | | | | | | | | |
| Broadridge Financial Solutions, Inc. | | | 270,084 | | | | 55,569,783 | | | | 2.2 | % |
| Equifax, Inc. | | | 200,009 | | | | 49,460,225 | | | | 2.0 | % |
| Paycom Software, Inc. | | | 144,576 | | | | 29,886,751 | | | | 1.2 | % |
| | | | | | | | 134,916,759 | | | | 5.4 | % |
| Real Estate Management & Development | | | | | | | | | | | | |
CoStar Group, Inc.(1) | | | 556,103 | | | | 48,597,841 | | | | 1.9 | % |
| Semiconductors & | | | | | | | | | | | | |
| Semiconductor Equipment | | | | | | | | | | | | |
Lattice Semiconductor Corp.(1) | | | 524,572 | | | | 36,190,222 | | | | 1.4 | % |
| Monolithic Power Systems, Inc. | | | 75,455 | | | | 47,595,505 | | | | 1.9 | % |
| | | | | | | | 83,785,727 | | | | 3.3 | % |
| Software | | | | | | | | | | | | |
ANSYS, Inc.(1) | | | 137,970 | | | | 50,066,554 | | | | 2.0 | % |
| Bentley Systems, Inc. | | | 635,030 | | | | 33,135,865 | | | | 1.3 | % |
Descartes Systems Group, Inc.(1)(2) | | | 314,689 | | | | 26,452,757 | | | | 1.0 | % |
Dynatrace, Inc.(1) | | | 856,559 | | | | 46,845,212 | | | | 1.9 | % |
PTC, Inc.(1) | | | 381,699 | | | | 66,782,057 | | | | 2.6 | % |
Tyler Technologies, Inc.(1) | | | 117,063 | | | | 48,946,382 | | | | 1.9 | % |
| | | | | | | | 272,228,827 | | | | 10.7 | % |
| Specialty Retail | | | | | | | | | | | | |
Five Below, Inc.(1) | | | 167,934 | | | | 35,796,811 | | | | 1.4 | % |
Floor & Decor Holdings, Inc.(1) | | | 444,010 | | | | 49,533,756 | | | | 2.0 | % |
| | | | | | | | 85,330,567 | | | | 3.4 | % |
| Trading Companies & Distributors | | | | | | | | | | | | |
| Fastenal Co. | | | 738,814 | | | | 47,852,983 | | | | 1.9 | % |
| Ferguson PLC | | | 203,686 | | | | 39,325,656 | | | | 1.6 | % |
| Watsco, Inc. | | | 140,285 | | | | 60,107,914 | | | | 2.4 | % |
| | | | | | | | 147,286,553 | | | | 5.9 | % |
| Total Common Stocks | | | | | | | | | | | | |
| (Cost $1,724,644,687) | | | | | | | 2,442,861,068 | | | | 96.6 | % |
The accompanying notes are an integral part of these financial statements.
Baird Mid Cap Growth Fund
Schedule of Investments, December 31, 2023
Short-Term Investment
| | | | | | | | | % of | |
| | | Shares | | | Value | | | Net Assets | |
| Money Market Mutual Fund | | | | | | | | | |
| First American Government Obligations | | | | | | | | | |
Fund, Class U, 5.31%(3) | | | 86,739,978 | | | $ | 86,739,978 | | | | 3.4 | % |
| Total Short-Term Investment | | | | | | | | | | | | |
| (Cost $86,739,978) | | | | | | | 86,739,978 | | | | 3.4 | % |
| Total Investments | | | | | | | | | | | | |
| (Cost $1,811,384,665) | | | | | | | 2,529,601,046 | | | | 100.0 | % |
| Liabilities in Excess of Other Assets | | | | | | | (187,413 | ) | | | (0.0 | )% |
| TOTAL NET ASSETS | | | | | | $ | 2,529,413,633 | | | | 100.0 | % |
Notes to Schedule of Investments
(1) | Non-Income Producing. |
(2) | Foreign Security. |
(3) | Seven-Day Yield. |
Industry classifications shown in the Schedule of Investments are based off of the Global Industry Classification Standard (GICS®). GICS® was developed by and/or is the exclusive property of MSCI, Inc. (“MSCI”) and Standard & Poor’s Financial Services LLC (“S&P”). GICS® is a service mark of MSCI and S&P and has been licensed for use by U.S. Bancorp Fund Services, LLC.
Summary of Fair Value Exposure at December 31, 2023
The Fund has adopted authoritative fair valuation accounting standards which establish a definition of fair value and set out a hierarchy for measuring fair value. These standards require additional disclosures about the various inputs and valuation techniques used to develop the measurements of fair value and a discussion on changes in valuation techniques and related inputs during the period. These standards define fair value as the price that would be received to sell an asset or paid to transfer a liability in an orderly transaction between market participants at the measurement date.
The fair value hierarchy is organized into three levels based upon the assumptions (referred to as “inputs”) used in pricing the asset or liability. These standards state that “observable inputs” reflect the assumptions market participants would use in pricing the asset or liability based on market data obtained from independent sources and “unobservable inputs” reflect an entity’s own assumptions about the assumptions market participants would use in pricing the asset or liability. These inputs are summarized into three broad levels and described below:
Level 1 – Quoted prices (unadjusted) in active markets for identical assets or liabilities that the reporting entity can access at the measurement date.
Level 2 – Inputs other than quoted prices included within Level 1 that are observable for the asset or liability, either directly or indirectly.
Level 3 – Unobservable inputs for the asset or liability.
The inputs or methodology used for valuing securities are not necessarily an indication of the risk associated with investing in those securities.
The following is a summary of the inputs used to value the Fund’s investments as of December 31, 2023:
| | | Level 1 | | | Level 2 | | | Level 3 | | | Total | |
| Equity | | | | | | | | | | | | |
| Common Stocks | | $ | 2,442,861,068 | | | $ | — | | | $ | — | | | $ | 2,442,861,068 | |
| Total Equity | | | 2,442,861,068 | | | | — | | | | — | | | | 2,442,861,068 | |
| Short-Term Investment | | | | | | | | | | | | | | | | |
| Money Market Mutual Fund | | | 86,739,978 | | | | — | | | | — | | | | 86,739,978 | |
| Total Short-Term Investment | | | 86,739,978 | | | | — | | | | — | | | | 86,739,978 | |
| Total Investments* | | $ | 2,529,601,046 | | | $ | — | | | $ | — | | | $ | 2,529,601,046 | |
| * | Additional information regarding the industry classifications of these investments is disclosed in the Schedule of Investments. |
Changes in valuation techniques may result in transfers into or out of assigned levels within the fair value hierarchy. There were no transfers into or out of Level 3 during the year, as compared to the security classifications from the prior year’s annual report. See the Fund’s Valuation Policy in Note 2a to the financial statements.
The accompanying notes are an integral part of these financial statements.
Baird Small/Mid Cap Growth Fund
December 31, 2023 (Unaudited)
Portfolio Manager's Commentary
For the year ended December 31, 2023, the Baird Small/Mid Growth Fund Institutional Class posted a total return of 10.88% as compared to 18.93% for the Russell 2500® Growth Index, the Fund’s benchmark index.
In 2023, both relative and absolute returns were dominated by macroeconomic headlines that caused interest rate volatility that led to either “risk-on” or “risk-off” environments for small/mid-cap growth stocks, in our view. After a strong 10% benchmark return in January, the index declined the next four months, before another strong rally in June and July. Markets then sold off through the end of October, and benchmark returns were negative for the year before favorable inflation data and Federal Reserve commentary sparked a sharp rally into year-end. While we were pleased with a solid recovery after a difficult 2022, we were disappointed to trail benchmark, particularly during the late-year rally.
For calendar 2023, the Fund generated positive relative performance in six sectors. Unfortunately, they represented only 30% of the portfolio by weight. The Fund’s holdings in its three largest sectors, healthcare, technology, and industrials, all lagged benchmark returns, resulting in total portfolio performance below benchmark returns. Recall the characteristics of the Fund’s portfolio have remained consistent since inception five years ago. Relative to its benchmark, the overall Fund portfolio holdings tend to be slightly larger by market cap, and generally only including companies with better profitability, revenue growth, earnings growth, and less levered balance sheets. That has typically resulted in a portfolio that trades at a higher price-to-earnings ratio and price-to-sales ratio than the benchmark. For the year, factor impact on the Fund’s portfolio was minimal, although there were significant impacts in specific quarters. Valuation was a headwind to Fund performance, as the least expensive quintile of companies based on price-to-sales outperformed significantly, and the most expensive quintile based on price-to-earnings lagged benchmark returns. The majority of the Fund’s relative underperformance occurred in December, when the most unprofitable, lowest margin quintiles of companies outperformed significantly.
The Fund’s strongest relative performance contributor in 2023 came from the consumer staples sector, led by a small-cap, high-growth beverage producer specializing in coconut water. The strong stock performance was the result of both continued market share leadership, as well as an improvement in margins driven by lower shipping costs. Two other Fund portfolio positions in that sector lagged in 2023, although we remain optimistic on their prospects going forward. We also initiated one new Fund position earlier in the year, a company focused on high protein snacks that we think can gain market share in a growing category.
The Fund’s energy sector performance overall lagged benchmark returns, and the Fund’s underweight in the group helped drive slightly positive portfolio attribution. We were fortunate to exit the Fund’s lone holding in solar energy, preventing a worse outcome as the company’s business slowed further in 2023 given ballooning channel inventories. The Fund’s two remaining energy positions generated slightly positive returns for the calendar year, compared to benchmark returns that were negative. As we do not make major sector bets, we continue to maintain two Fund positions in the sector, an oilfield services provider and an oil/gas producer, although the future performance of these two business likely depends on the direction of oil prices.
The Fund’s positive annual performance from the financials sector was led by a company that consolidates and manages registered investment advisors that was acquired for a healthy premium. The Fund also benefitted from a long-time holding that provides excess and surplus insurance, as the company continues to grow rapidly with favorable pricing trends in its business. The lone detractor in the sector was a company that provides bond trading technology. Despite a volatile rate environment, we were disappointed with the company’s execution and sold the stock out of the Fund. Finally, we added one new Fund holding in the sector which provides accounting and back-office software to financial services institutions. We like the profile of projected double-digit organic revenue growth and the potential for continued margin expansion.
Several consumer discretionary holdings within the Fund were beneficiaries of lower interest rate expectations, which led to modest relative outperformance for the sector for the calendar year. Those holdings included a retailer of flooring supplies, a distributor of pool supplies, as well as a homebuilder focused on the first-time buyer in large, fast-growing cities in the United States. The Fund also benefited from strong performance and continued sales execution of a footwear brand business held by the Fund for the past two years. Given the strong outperformance of this business and the always-present fashion risk, we reduced the Fund’s position size twice during the calendar year. Detractors for the year included two retailers, one focused on lower price items and one focused on western gear sold in geographies with economies reliant on the energy industry. Although we have a longer-term secular thesis, the western gear retailer stock did not work as interest rates and oil prices declined in the fourth quarter. During the year, we exited two Fund positions: a home furnishings retailer and an auto auction salvage business that was acquired by another company. We added three new companies to the Fund’s holdings in the sector during the year, including a software provider to the K-12 educational market, a mid-cap warehouse club, and a leading online gaming and entertainment company. We think all three businesses provide opportunities for improving growth in a variety of industries within consumer discretionary.
The Fund only owns one stock each in the materials and real estate sectors, and both were positive contributors to calendar year performance. In real estate, a small cap storage REIT responded positively in the fourth quarter as interest rates declined. Similarly, the lone materials holding, a provider of key components to the aerospace industry, responded well to the rising market environment towards the end of the year.
The Fund’s holdings in three sectors underperformed more than 300 basis points each on a relative basis in calendar 2023. Simply put, our stock picking in 2023 wasn’t good enough across the board to keep pace with strong benchmark returns in technology and industrials, while we also faced a few stock-specific headwinds that led to negative returns in the healthcare sector.
There were a handful of setbacks throughout the year that negatively affected several industrials holdings in the Fund. We view this sector more broadly than just manufacturing business, as we think this sector includes diverse business in services, technology, energy, and financials as well. Within the services business, a Fund holding focused on business process outsourcing was viewed as being challenged by the emergence of artificial intelligence; however, it was a delay in new contracts starts that caused the company to reduce its earnings outlook later in the year. Another Fund holding that has a diversified industrial portfolio faced headwinds in its life science instruments business due to lower spending in China. We also saw elevated channel inventories from prior above-market growth reduce demand for a leading equipment provider to the lawn and landscape industry. Lastly, a choppy macroeconomic environment led to inconsistent execution from other Fund holdings, including a leading engineering and construction firm, a higher growth provider of payroll software, and a manufacturer of mobile storage units used at construction sites. Offsetting these challenges were positive contributions from Fund holdings that were beneficiaries of an expectation for lower interest rates, including a leading HVAC distributor and supplier of composite decking. The Fund also saw strong gains from a provider of paper manufacturing equipment, a leading payments platform for the hotel and restaurant industries, and a supplier of components and services for the nuclear power industry. We sold out of five Fund positions given the companies’ uneven business execution in a challenging macro environment and our lack of conviction in our original investment thesis in those companies.
The technology sector also detracted from relative returns in calendar 2023, as only a few Fund holdings exceed the benchmark’s strong 34% return for the year. We sold the Fund’s longtime semiconductor holding that specializes in power management as the company exceeded $25 billion in market capitalization after returning over 40%. We also sold a software business focused on customer experience that was a positive contributor due to its acquisition by private equity. Finally, the Fund saw continued strong performance from a software business used for designing complex products as well as very strong execution from an IT-consulting firm owned by the Fund for several years. More than offsetting the gains were disappointing fundamental developments that resulted in growth below consensus expectations, whether due to the economy, company-specific challenges, or simply poor investment timing. We experienced setbacks in several software holdings in the Fund, including businesses focused on sales and marketing, social media monitoring, and cloud infrastructure. A long-time Fund holding focused on shipping and transportation logistics software also underperformed, mostly due to the sluggish macro environment. In summary, 2023 was quite challenging as growth stocks in technology were subject to the swings in interest rates, selling off through the third quarter before the strong market rally in November and December.
Baird Small/Mid Cap Growth Fund
December 31, 2023 (Unaudited)
Finally, the healthcare sector also generated below benchmark returns, which was a departure from previous years where the industry has traditionally been a source of positive outperformance. In addition to the Fund’s lack of exposure to small cap biotech (which rallied significantly late in the year), its long-time exposure to the medical technology industry was upended by investor worries about the emergence of new data from GLP-1 drugs. While we underestimated the downside in a few Fund holdings, we kept ownership of both the Fund’s insulin pump and sleep apnea device companies as we believed the sell-off was overdone. We were rewarded for this patience in the fourth quarter; however, lack of biotech exposure overwhelmed the recovery in the Fund’s med tech positions. We exited Fund positions where performance fell short of our expectations, resulting in slower growth. These included a diversified specialty pharma company, a small cap provider of a novel aesthetics toxin, and a profitable biotech company that licenses its drug delivery technology to expand indications for existing branded infused drugs. Also detracting from performance were two Fund holdings that provide consumable technology for life sciences research that are facing headwinds from slowdowns in research activity in China. Two positive contributors to Fund performance for the year were a long-time clinical research organization holding, as well as a provider of surgical instruments.
The Fund does not use its cash position tactically; however, with the market moving sharply higher in the last two months of the year even cash held to accommodate additions to individual holdings or new investment ideas detracted from relative performance.
The long-standing investment process underlying the Fund remains focused on identifying high-quality companies that deliver attractive returns and above-average growth relative to peers. Seeking to control risk at the sector and position level is also a priority of our process, with the goal of providing attractive long-term returns for the Fund compared to its benchmark index.
We appreciate your support.
Portfolio Manager:
Jonathan Good
Baird Small/Mid Cap Growth Fund
December 31, 2023 (Unaudited)
Portfolio Characteristics
A December 31, 2023 summary of the Fund’s top 10 holdings and equity sector analysis compared to the Russell 2500® Growth Index is shown below.
Top 10 Holdings(1) | | | Equity Sector Analysis(2) |
| | | | |
| PTC, Inc. | 3.2% | | 
|
| RBC Bearings, Inc. | 2.9% | |
| ICON PLC | 2.8% | |
| Kadant, Inc. | 2.8% | |
| Watsco, Inc. | 2.6% | |
| Pool Corp. | 2.5% | |
| BWX Technologies, Inc. | 2.5% | |
| Dynatrace, Inc. | 2.4% | |
| Descartes Systems Group, Inc. | 2.3% | |
| IDEX Corp. | 2.3% | |
| | | |
| Net Assets: | $176,684,379 | |
| Portfolio Turnover Rate: | 48% | |
| Number of Equity Holdings: | 56 | |
| | | |
Annualized Portfolio Expense Ratio(3): | | |
Gross | | |
| Institutional Class: | 0.98% | |
| Investor Class: | 1.23% | (4) |
| | | |
Net | | |
| Institutional Class: | 0.85% | |
| Investor Class: | 1.10% | (4) |
| | | | |
(1) | The Fund’s portfolio composition is subject to change and there is no assurance that the Fund will continue to hold any particular security. Percentages shown relate to the Fund’s total net assets as of December 31, 2023. |
(2) | Percentages shown in parentheses relate to the Fund’s total value of investments as of December 31, 2023, and may not add up to 100% due to rounding. |
(3) | Reflects expense ratios as stated in the Fund’s current prospectus dated May 1, 2023. The Advisor has contractually agreed to limit the Fund’s total annual fund operating expenses to 0.85% of average daily net assets for the Institutional Class shares and 1.10% of average daily net assets for the Investor Class shares, at least through April 30, 2025. |
(4) | Includes 0.25% 12b-1 fee. |
Baird Small/Mid Cap Growth Fund
December 31, 2023 (Unaudited)
| Institutional Class | Investor Class |
| Value of a $10,000 Investment | Value of a $10,000 Investment |
| | |
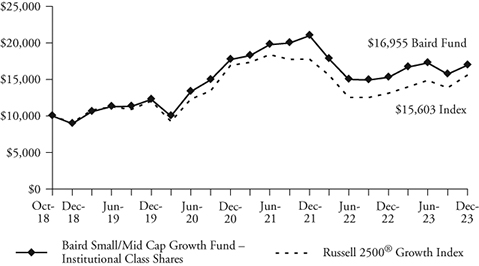 |  |
| | |
| Growth of a hypothetical investment of $10,000 made on 10/31/18, assuming | Growth of a hypothetical investment of $10,000 made on 10/31/18, assuming |
| reinvestment of all distributions. | reinvestment of all distributions. |
| Total Returns | | | | |
| | | Average Annual |
| | One | Three | Five | Since |
| For the Periods Ended December 31, 2023 | Year | Years | Years | Inception(1) |
| Institutional Class Shares | 10.88% | -1.47% | 13.63% | 10.76% |
| Investor Class Shares | 10.60% | -1.70% | 13.31% | 10.43% |
Russell 2500® Growth Index(2) | 18.93% | -2.68% | 11.43% | 8.99% |
(1) | For the period from October 31, 2018 (inception date) through December 31, 2023. |
(2) | The Russell 2500® Growth Index measures the performance of the small-to-mid cap growth segment of the U.S. equity universe. It includes those Russell 2500® Index companies with higher price-to-book ratios and higher forecasted growth values. This index does not reflect any deduction for fees, expenses or taxes. A direct investment in the index is not possible. |
The line graphs and the returns table shown above reflect reinvestment of dividends and/or capital gains distributions in additional shares. The returns in the graphs and table do not reflect the deduction of taxes that a shareholder would pay on Fund distributions or the redemption of Fund shares. The returns reflect the actual performance for each period and do not include the impact of trades executed on the last business day of the period that were recorded on the first business day of the next period.
The gross and net expense ratio for each Class, as reflected in the Fund’s current prospectus, are set forth under “Portfolio Characteristics”.
The Fund focuses on growth-style stocks and therefore the performance of the Fund will typically be more volatile than the performance of funds that focus on types of stocks that have a broader investment style. The Fund may invest up to 15% of its total assets in equity securities (consisting of common stock, ordinary shares and ADRs) of foreign companies. Foreign investments involve additional risks such as currency rate fluctuations, political and economic instability, and different and sometimes less strict financial reporting standards and regulation. The Fund invests a substantial portion of its assets in the stocks of small- and mid-capitalization companies. Small- and mid-capitalization companies often are more volatile and face greater risks than larger, more established companies. U.S. and international markets have experienced significant periods of volatility due to a number of economic, political and other global macro factors. The war between Ukraine and Russia is approaching its 2nd anniversary and the October 7th attack by Hamas and Israel’s response only added to global tensions. US/China relations remain strained, impacted by sluggish Chinese economic growth and numerous issues affecting trade relations. Domestically, inflation remains an area of focus since getting to the Fed’s 2% target may prove to be more challenging than the market expects. In addition, 2024 is an election year and the current level of political discord is high. Finally, while the coronavirus (COVID-19) appears to have entered an endemic stage, significant outbreaks present a continued risk to the global economy. These and other events may cause market disruptions and could have an adverse effect on the value of the Fund’s investments.
Past performance does not guarantee future results. Investment return and principal value will fluctuate so that an investor’s shares, when redeemed, may be worth more or less than their original cost.
For information about the performance of the Fund as of the most recent month-end, please call 1-866-442-2473 or visit www.bairdfunds.com. Mutual fund performance changes over time and current performance may be lower or higher than that stated.
Baird Small/Mid Cap Growth Fund
Schedule of Investments, December 31, 2023
Common Stocks
| | | | | | | | | % of | |
| | | Shares | | | Value | | | Net Assets | |
| Aerospace & Defense | | | | | | | | | |
| BWX Technologies, Inc. | | | 56,614 | | | $ | 4,343,993 | | | | 2.5 | % |
| HEICO Corp. | | | 20,666 | | | | 3,696,527 | | | | 2.1 | % |
| | | | | | | | 8,040,520 | | | | 4.6 | % |
| Air Freight & Logistics | | | | | | | | | | | | |
GXO Logistics, Inc.(1) | | | 49,046 | | | | 2,999,653 | | | | 1.7 | % |
| Beverages | | | | | | | | | | | | |
Boston Beer Co., Inc.(1) | | | 9,261 | | | | 3,200,509 | | | | 1.8 | % |
Vita Coco Co., Inc.(1) | | | 96,721 | | | | 2,480,894 | | | | 1.4 | % |
| | | | | | | | 5,681,403 | | | | 3.2 | % |
| Biotechnology | | | | | | | | | | | | |
Exact Sciences Corp.(1) | | | 52,039 | | | | 3,849,846 | | | | 2.2 | % |
Halozyme Therapeutics, Inc.(1) | | | 74,516 | | | | 2,754,111 | | | | 1.6 | % |
| | | | | | | | 6,603,957 | | | | 3.8 | % |
| Broadline Retail | | | | | | | | | | | | |
Global-e Online Ltd.(1)(2) | | | 67,127 | | | | 2,660,243 | | | | 1.5 | % |
| Building Products | | | | | | | | | | | | |
Trex Co., Inc.(1) | | | 46,366 | | | | 3,838,641 | | | | 2.2 | % |
| Capital Markets | | | | | | | | | | | | |
| Factset Research Systems, Inc. | | | 5,608 | | | | 2,675,296 | | | | 1.5 | % |
| Construction & Engineering | | | | | | | | | | | | |
WillScot Mobile Mini Holdings Corp.(1) | | | 81,364 | | | | 3,620,698 | | | | 2.0 | % |
| Consumer Staples Distribution & Retail | | | | | | | | | | | | |
BJ’s Wholesale Club Holdings, Inc.(1) | | | 31,632 | | | | 2,108,589 | | | | 1.2 | % |
| Distributors | | | | | | | | | | | | |
| Pool Corp. | | | 10,993 | | | | 4,383,019 | | | | 2.5 | % |
| Electronic Equipment, | | | | | | | | | | | | |
| Instruments, & Components | | | | | | | | | | | | |
| Littelfuse, Inc. | | | 9,607 | | | | 2,570,449 | | | | 1.5 | % |
| Energy Equipment & Services | | | | | | | | | | | | |
| ChampionX Corp. | | | 72,721 | | | | 2,124,180 | | | | 1.2 | % |
| Financial Services | | | | | | | | | | | | |
| Jack Henry & Associates, Inc. | | | 15,219 | | | | 2,486,937 | | | | 1.4 | % |
Shift4 Payments, Inc.(1) | | | 49,406 | | | | 3,672,842 | | | | 2.1 | % |
| | | | | | | | 6,159,779 | | | | 3.5 | % |
| Food Products | | | | | | | | | | | | |
| Lamb Weston Holdings, Inc. | | | 23,727 | | | | 2,564,651 | | | | 1.5 | % |
Simply Good Foods Co.(1) | | | 48,865 | | | | 1,935,054 | | | | 1.1 | % |
| | | | | | | | 4,499,705 | | | | 2.6 | % |
| Ground Transportation | | | | | | | | | | | | |
| Knight-Swift Transportation Holdings, Inc. | | | 40,514 | | | | 2,335,632 | | | | 1.3 | % |
| Health Care Equipment & Supplies | | | | | | | | | | | | |
| CONMED Corp. | | | 28,687 | | | | 3,141,513 | | | | 1.8 | % |
Inspire Medical Systems, Inc.(1) | | | 15,778 | | | | 3,209,719 | | | | 1.8 | % |
Insulet Corp.(1) | | | 11,803 | | | | 2,561,015 | | | | 1.4 | % |
iRhythm Technologies, Inc.(1) | | | 22,180 | | | | 2,374,147 | | | | 1.3 | % |
QuidelOrtho Corp.(1) | | | 23,777 | | | | 1,752,365 | | | | 1.0 | % |
Shockwave Medical, Inc.(1) | | | 13,292 | | | | 2,532,924 | | | | 1.4 | % |
| | | | | | | | 15,571,683 | | | | 8.7 | % |
| Hotels, Restaurants, & Leisure | | | | | | | | | | | | |
| Churchill Downs, Inc. | | | 21,114 | | | | 2,848,912 | | | | 1.6 | % |
| Household Durables | | | | | | | | | | | | |
LGI Homes, Inc.(1) | | | 19,887 | | | | 2,648,153 | | | | 1.5 | % |
| Insurance | | | | | | | | | | | | |
| Kinsale Capital Group, Inc. | | | 8,098 | | | | 2,712,101 | | | | 1.5 | % |
| IT Services | | | | | | | | | | | | |
Endava PLC – ADR(1)(2) | | | 23,463 | | | | 1,826,595 | | | | 1.0 | % |
Globant SA(1) | | | 15,327 | | | | 3,647,519 | | | | 2.1 | % |
| | | | | | | | 5,474,114 | | | | 3.1 | % |
| Life Sciences Tools & Services | | | | | | | | | | | | |
| Bio-Techne Corp. | | | 35,390 | | | | 2,730,692 | | | | 1.5 | % |
ICON PLC(1) | | | 17,338 | | | | 4,907,868 | | | | 2.8 | % |
Repligen Corp.(1) | | | 14,998 | | | | 2,696,640 | | | | 1.5 | % |
| | | | | | | | 10,335,200 | | | | 5.8 | % |
| Machinery | | | | | | | | | | | | |
| IDEX Corp. | | | 18,452 | | | | 4,006,114 | | | | 2.3 | % |
| Kadant, Inc. | | | 17,440 | | | | 4,888,606 | | | | 2.8 | % |
RBC Bearings, Inc.(1) | | | 18,204 | | | | 5,186,137 | | | | 2.9 | % |
| | | | | | | | 14,080,857 | | | | 8.0 | % |
| Oil, Gas, & Consumable Fuels | | | | | | | | | | | | |
| Matador Resources Co. | | | 63,937 | | | | 3,635,458 | | | | 2.1 | % |
| Professional Services | | | | | | | | | | | | |
ExlService Holdings, Inc.(1) | | | 72,588 | | | | 2,239,340 | | | | 1.3 | % |
Paylocity Holding Corp.(1) | | | 14,489 | | | | 2,388,512 | | | | 1.4 | % |
WNS Holdings Ltd. – ADR(1)(2) | | | 26,916 | | | | 1,701,091 | | | | 1.0 | % |
| | | | | | | | 6,328,943 | | | | 3.7 | % |
| Semiconductors & | | | | | | | | | | | | |
| Semiconductor Equipment | | | | | | | | | | | | |
Lattice Semiconductor Corp.(1) | | | 42,098 | | | | 2,904,342 | | | | 1.6 | % |
SiTime Corp.(1) | | | 17,458 | | | | 2,131,273 | | | | 1.2 | % |
| | | | | | | | 5,035,615 | | | | 2.8 | % |
| Software | | | | | | | | | | | | |
| Bentley Systems, Inc. | | | 55,023 | | | | 2,871,100 | | | | 1.6 | % |
Clearwater Analytics Holdings, Inc.(1) | | | 180,269 | | | | 3,610,788 | | | | 2.0 | % |
Descartes Systems Group, Inc.(1)(2) | | | 47,664 | | | | 4,006,636 | | | | 2.3 | % |
Dynatrace, Inc.(1) | | | 78,332 | | | | 4,283,977 | | | | 2.4 | % |
PowerSchool Holdings, Inc.(1) | | | 90,902 | | | | 2,141,651 | | | | 1.2 | % |
PTC, Inc.(1) | | | 32,274 | | | | 5,646,660 | | | | 3.2 | % |
Tyler Technologies, Inc.(1) | | | 8,679 | | | | 3,628,863 | | | | 2.1 | % |
| | | | | | | | 26,189,675 | | | | 14.8 | % |
| Specialized REITs | | | | | | | | | | | | |
| National Storage Affiliates Trust | | | 66,259 | | | | 2,747,761 | | | | 1.6 | % |
| Specialty Retail | | | | | | | | | | | | |
Boot Barn Holdings, Inc.(1) | | | 28,565 | | | | 2,192,649 | | | | 1.2 | % |
Five Below, Inc.(1) | | | 13,521 | | | | 2,882,137 | | | | 1.6 | % |
Floor & Decor Holdings, Inc.(1) | | | 29,161 | | | | 3,253,201 | | | | 1.8 | % |
| | | | | | | | 8,327,987 | | | | 4.6 | % |
| Textiles, Apparel, & Luxury Goods | | | | | | | | | | | | |
Deckers Outdoor Corp.(1) | | | 4,629 | | | | 3,094,162 | | | | 1.8 | % |
| Trading Companies & Distributors | | | | | | | | | | | | |
| Watsco, Inc. | | | 10,811 | | | | 4,632,189 | | | | 2.6 | % |
| Total Common Stocks | | | | | | | | | | | | |
| (Cost $148,523,231) | | | | | | | 173,964,574 | | | | 98.5 | % |
The accompanying notes are an integral part of these financial statements.
Baird Small/Mid Cap Growth Fund
Schedule of Investments, December 31, 2023
Short-Term Investment
| | | | | | | | | % of | |
| | | Shares | | | Value | | | Net Assets | |
| Money Market Mutual Fund | | | | | | | | | |
| First American Government Obligations | | | | | | | | | |
Fund, Class U, 5.31%(3) | | | 5,564,678 | | | $ | 5,564,678 | | | | 3.1 | % |
| Total Short-Term Investment | | | | | | | | | | | | |
| (Cost $5,564,678) | | | | | | | 5,564,678 | | | | 3.1 | % |
| Total Investments | | | | | | | | | | | | |
| (Cost $154,087,909) | | | | | | | 179,529,252 | | | | 101.6 | % |
| Liabilities in Excess of Other Assets | | | | | | | (2,844,873 | ) | | | (1.6 | )% |
| TOTAL NET ASSETS | | | | | | $ | 176,684,379 | | | | 100.0 | % |
Notes to Schedule of Investments
(1) | Non-Income Producing. |
(2) | Foreign Security. |
(3) | Seven-Day Yield. |
ADR – American Depositary Receipt
Industry classifications shown in the Schedule of Investments are based off of the Global Industry Classification Standard (GICS®). GICS® was developed by and/or is the exclusive property of MSCI, Inc. (“MSCI”) and Standard & Poor’s Financial Services LLC (“S&P”). GICS® is a service mark of MSCI and S&P and has been licensed for use by U.S. Bancorp Fund Services, LLC.
Summary of Fair Value Exposure at December 31, 2023
The Fund has adopted authoritative fair valuation accounting standards which establish a definition of fair value and set out a hierarchy for measuring fair value. These standards require additional disclosures about the various inputs and valuation techniques used to develop the measurements of fair value and a discussion on changes in valuation techniques and related inputs during the period. These standards define fair value as the price that would be received to sell an asset or paid to transfer a liability in an orderly transaction between market participants at the measurement date.
The fair value hierarchy is organized into three levels based upon the assumptions (referred to as “inputs”) used in pricing the asset or liability. These standards state that “observable inputs” reflect the assumptions market participants would use in pricing the asset or liability based on market data obtained from independent sources and “unobservable inputs” reflect an entity’s own assumptions about the assumptions market participants would use in pricing the asset or liability. These inputs are summarized into three broad levels and described below:
Level 1 – Quoted prices (unadjusted) in active markets for identical assets or liabilities that the reporting entity can access at the measurement date.
Level 2 – Inputs other than quoted prices included within Level 1 that are observable for the asset or liability, either directly or indirectly.
Level 3 – Unobservable inputs for the asset or liability.
The inputs or methodology used for valuing securities are not necessarily an indication of the risk associated with investing in those securities.
The following is a summary of the inputs used to value the Fund’s investments as of December 31, 2023:
| | | Level 1 | | | Level 2 | | | Level 3 | | | Total | |
| Equity | | | | | | | | | | | | |
| Common Stocks | | $ | 173,964,574 | | | $ | — | | | $ | — | | | $ | 173,964,574 | |
| Total Equity | | | 173,964,574 | | | | — | | | | — | | | | 173,964,574 | |
| Short-Term Investment | | | | | | | | | | | | | | | | |
| Money Market Mutual Fund | | | 5,564,678 | | | | — | | | | — | | | | 5,564,678 | |
| Total Short-Term Investment | | | 5,564,678 | | | | — | | | | — | | | | 5,564,678 | |
| Total Investments* | | $ | 179,529,252 | | | $ | — | | | $ | — | | | $ | 179,529,252 | |
| * | Additional information regarding the industry classifications of these investments is disclosed in the Schedule of Investments. |
Changes in valuation techniques may result in transfers into or out of assigned levels within the fair value hierarchy. There were no transfers into or out of Level 3 during the year, as compared to the security classifications from the prior year’s annual report. See the Fund’s Valuation Policy in Note 2a to the financial statements.
The accompanying notes are an integral part of these financial statements.
Baird Equity Opportunity Fund
December 31, 2023 (Unaudited)
Portfolio Manager's Commentary
Equities bounced back in 2023, as easing inflation raised hopes for looser monetary policy and drove valuations higher. Smaller-cap stocks struggled for much of the year but posted a strong final two months, enabling the Russell 2000 Index to finish with a 14.03% gain for the quarter (16.93% for the year), while the Baird Equity Opportunity Fund modestly underperformed the Russell 2000 Index, its benchmark index, with a 13.65% net return in the fourth quarter (13.75% for the year).
The Federal Reserve (Fed) hiked interest rates another four times in 2023 while maintaining a steady pace of balance sheet reduction (quantitative tightening) to try and quell higher-than-normal inflation. As key price indexes peaked, investor focus shifted toward the timing of a potential Fed pivot toward loosening monetary policy. Investors bid up equities with a particular focus on larger cap technology stocks – the S&P 500 Information Technology Index rose a whopping 58% for the year. Within our target universe of smaller-cap stocks, that bullish sentiment lagged but returns were solid, nonetheless. The Russell 2000 Industrial and Tech sectors led the way, up 29% and 28%, respectively.
The Fund’s results were a bit frustrating since many of its positions suffered more from a lack of investor interest than any meaningful disappointment with company fundamentals. Said differently, while the market at large benefited from rising valuations, it was more of a grind for the Fund’s portfolio. Given the concentrated nature of the Fund’s portfolio, the idiosyncratic nature of its holdings, and the portfolio management team’s willingness to take a view that runs counter to the market’s prevailing wisdom, the Fund’s portfolio can feel out of step from time to time – and in 2023 it did. A few incremental factors seemed to challenge performance in the second and third quarters, in particular. First, in March, regional bank liquidity fears spiked and drove the Fed to employ a burst of “closet financial easing” to manage contagion risk. Then, in the spring, surprisingly strong results from artificial intelligence (AI) chip maker Nvidia led investors to aggressively drive up technology shares in search of the next AI winners. While neither had a measurable negative impact on the Fund’s portfolio, we also did not have much upside leverage to these factors.
Ups and downs aside, the Fund had many winners during the year, including Blackbaud, Cadre Holdings, and Universal Display. Software-maker Blackbaud rose in lockstep with its strong results throughout the year, driven by accelerating revenue growth, strong margin expansion, and a newer pricing initiative that we believe will pay dividends for several more years. Cadre, a maker of public safety products, benefited from strong execution even during a period of declining law enforcement headcount. As the “defund the police” movement subsides and rising crime in many cities comes to the fore, we think municipalities will renew their efforts to combat violence and theft. If so, Cadre’s array of non-lethal products should experience demand tailwinds, driving profit growth in the years to come.
Universal Display (OLED) benefitted from investors’ rising appreciation of the potential for the company’s blue phosphorescent emitters (which, in our estimation, increases OLED’s materials revenue addressable market by 67%) and the market adoption of OLED displays in tablets and notebooks, beginning in 2024. Like many technology stocks, while 2023 revenue and EPS were relatively in line with beginning of the year expectations, valuation levels expanded meaningfully. We continue to anticipate above-trend revenue and EPS growth over the next several years.
Some of the Fund’s biggest detractors from performance for the year were Infinera, Valmont Industries, and ZoomInfo. Infinera has been a tough stock to own for several years. Always mindful of potential value traps, we maintain the view that the company’s optical products are best-in-class, management is strong, and optionality exists. Nevertheless, we acknowledge that our thesis has been derailed several times since initiating a position in the company, including significant supply chain issues in 2021-2022 and uneven customer spending in 2023. We continue to exercise patience, as we believe reacceleration in Infinera’s core markets is likely and the benefits of the company’s technological advancements and operational improvements should put the stock on better footing this year.
Industrial manufacturer Valmont Industries weakened after a period of strong multi-year gains. With leverage to the farm economy through its leadership position in manufacturing irrigation equipment, trends softened in 2023 as corn prices fell from peak levels. The company has become much more than a farm equipment company and holds a leadership position in utility transmission and distribution infrastructure, a key part of America’s ongoing electric grid upgrade. The Fund continues to hold the stock and we are biased to add to the Fund’s position on further weakness.
ZoomInfo declined as the company’s outlook for an extended period of decelerating revenue growth compressed the multiple investors were willing to pay for the stock. The company has many positive attributes, such as a leadership position in its core market for contact databases, double digit secular growth, and very high operating margins. Still, investor enthusiasm tends to wane when a company moves the period for positive inflection out further into the future, even if for macroeconomic reasons. We anticipate key metrics and overall growth to improve in the latter part of 2024, and we remain optimistic about shareholder returns this year.
There is no getting around the fact that the Fed’s actions – and words – move markets more than ever. Many of us on our team grew up as analysts during a time when the mantra “don’t fight the Fed” became prominent, but investors rarely lost sight of corporate fundamentals and business models. To say the game has changed over the past few decades would be an understatement. A near singular focus on Fed policy, along with the rising prominence of systematic and quantitative investment strategies and an explosion of various speculation tools, including zero-day options, all make our style of longer-term investing tougher than it used to be.
Even so, we believe that opportunity is often borne out of the uncertainty, momentum, speculation, and volatility in the marketplace. Many of our holdings illustrate this point, including Mister Car Wash (consumer discretionary), Chefs’ Warehouse (consumer staples), and Merit Medical Systems (healthcare). We added to the Fund’s Mister Car Wash position at prices below our estimate of the firm’s replacement cost. Chefs’ Warehouse fell roughly 50% mid-year for no apparent reason – and then almost doubled after posting a single reassuring third quarter. Similarly, Merit Medical Systems fell 25% during the same mid-year slump, only to recoup a chunk of the loss by year end – in neither the fall nor the subsequent rise was there any major stock-moving news. Stock price movements such as these have become more commonplace, making it more important than ever to have exceedingly high conviction in our underlying investments.
We anticipate a higher degree of difficulty in managing money to persist. We admit that we do not fully comprehend the Fed’s intent to loosen monetary policy so soon, especially given that core inflation is still running above the central bank’s own target, and unemployment under 4% can best be described as “full.” That said, lessons learned from the past force us to respect this pivot and how it could positively impact investors’ risk appetite, equity valuations and, of course, stock prices. We also note that gains could have legs if swollen money market assets are redeployed into equities as interest rates retrench.
Lest one think the setup is sufficiently easy, other considerations must be weighed. For example, while the Fed may have called the top on this cycle’s Fed Funds rate, the timing of rate cuts may or may not sync with investor expectations.
Already, futures markets appear to have taken the Fed’s 75-basis point dot-plot for 2024 and re-imagined it into twice that much (with a near imminent start). Additionally, it seems apparent that the effects of prior tightening have weighed on corporate fundamentals, leading to slowing growth and a growing number of earnings disappointments. Significant and ongoing geopolitical tensions along with the November elections could also drive uncertainty and volatility throughout 2024.
Having said this, we are more constructive than not. Timing aside, more accommodative monetary conditions seem likely. Additionally, at some point, small cap stocks should re-emerge and at least partially close the wide performance gap with larger cap stocks. And, most importantly, we believe the Fund’s portfolio remains well-positioned to deliver positive outperformance even while not losing sight of ever-present risks in the environment.
We have seen many plot twists in our time managing portfolios, and we suspect 2024 will not disappoint on that front. We may not hold the crystal ball that others claim to possess, but we feel fortunate to have a time-tested investment process, decades of collective experience, emotional fortitude to find opportunity from volatility, and the humility to manage the risks that we cannot so readily see.
Respectfully,
Joe Milano, CFA
Portfolio Manager and CIO, Greenhouse Funds
Baird Equity Opportunity Fund
December 31, 2023 (Unaudited)
Portfolio Characteristics
A December 31, 2023 summary of the Fund’s top 10 holdings and equity sector analysis compared to the Russell 2000® Index is shown below.
Top 10 Holdings(1) | | | Equity Sector Analysis(2) |
| | | | |
| Blackbaud, Inc. | 8.2% | | 
|
| Cadre Holdings, Inc. | 5.8% | |
| Sportradar Holding AG | 5.2% | |
| Global Payments, Inc. | 5.0% | |
| Chefs' Warehouse, Inc. | 5.0% | |
| NeoGenomics, Inc. | 4.8% | |
| Fluor Corp. | 4.8% | |
| Universal Display Corp. | 4.7% | |
| Madison Square Garden Sports Corp. | 4.4% | |
| Equifax, Inc. | 4.2% | |
| | | |
| Net Assets: | $60,243,802 | |
| Portfolio Turnover Rate: | 67% | |
| Number of Equity Holdings: | 31 | |
| | | |
Annualized Portfolio Expense Ratio(3): | | |
Gross | | |
| Institutional Class: | 1.73% | |
| Investor Class: | 1.98% | (4) |
| | | |
Net | | |
| Institutional Class: | 1.25% | |
| Investor Class: | 1.50% | (4) | |
| | | | |
(1) | The Fund’s portfolio composition is subject to change and there is no assurance that the Fund will continue to hold any particular security. Percentages shown relate to the Fund’s total net assets as of December 31, 2023. |
(2) | Percentages shown in parentheses relate to the Fund’s total value of investments as of December 31, 2023, and may not add up to 100% due to rounding. |
(3) | Reflects expense ratios as stated in the Fund’s current prospectus dated May 1, 2023. The Advisor has contractually agreed to limit the Fund’s total annual fund operating expenses to 1.25% of average daily net assets for the Institutional Class shares and 1.50% of average daily net assets for the Investor Class shares, at least through April 30, 2025. |
(4) | Includes 0.25% 12b-1 fee. |
(5) | Consists of a Russell 2000® Index ETF position with a 1.3% weight as of December 31, 2023. |
Baird Equity Opportunity Fund
December 31, 2023 (Unaudited)
| Institutional Class | Investor Class |
| Value of a $10,000 Investment | Value of a $10,000 Investment |
| | |
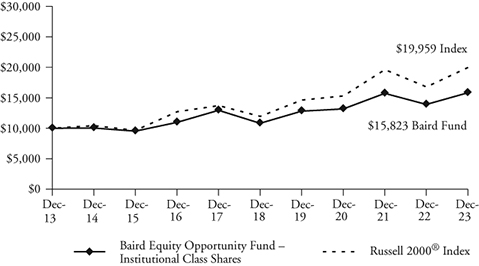 | 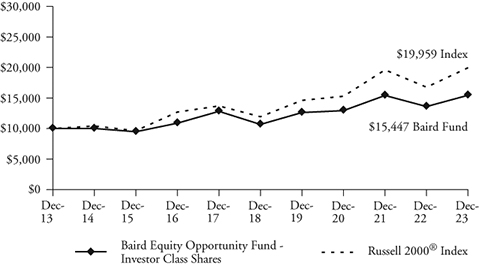 |
| | |
| Growth of a hypothetical investment of $10,000 made on 12/31/13, assuming | Growth of a hypothetical investment of $10,000 made on 12/31/13, assuming |
| reinvestment of all distributions. | reinvestment of all distributions. |
| Total Returns | | | | |
| | | Average Annual |
| | One | Five | Ten | Since |
| For the Periods Ended December 31, 2023 | Year | Years | Years | Inception(1) |
| Institutional Class Shares | 13.75% | 7.90% | 4.70% | 7.36% |
| Investor Class Shares | 13.56% | 7.67% | 4.44% | 7.10% |
Russell 2000® Index(2) | 16.93% | 9.97% | 7.16% | 9.59% |
(1) | For the period from May 1, 2012 (inception date) through December 31, 2023. |
(2) | The Russell 2000® Index measures the performance of the small-cap segment of the U.S. equity universe. The Russell 2000® Index is a subset of the Russell 3000® Index representing approximately 10% of the total market capitalization of that index. It includes approximately 2,000 of the smallest securities based on a combination of their market cap and current index membership. The Russell 2000® Index is constructed to provide a comprehensive and unbiased small-cap barometer and is completely reconstituted annually to ensure larger stocks do not distort the performance and characteristics of the true small-cap opportunity set. This index does not reflect any deduction for fees, expenses or taxes. A direct investment in the index is not possible. |
The line graphs and the returns table shown above reflect reinvestment of dividends and/or capital gains distributions in additional shares. The returns in the graphs and table do not reflect the deduction of taxes that a shareholder would pay on Fund distributions or the redemption of Fund shares. The returns reflect the actual performance for each period and do not include the impact of trades executed on the last business day of the period that were recorded on the first business day of the next period.
The Fund invests primarily in a select portfolio of equity securities of companies with small- to medium-market capitalizations (those with market capitalizations, at the time of purchase, of less than $20 billion). The Fund may invest up to 15% of its total assets in equity securities of foreign companies. Foreign investments involve additional risks such as currency rate fluctuations and the potential for political and economic instability, and different and sometimes less strict financial reporting standards and regulation. The Fund invests a substantial portion of its assets in the stocks of smaller-capitalization companies. Smaller-capitalization companies often are more volatile and face greater risks than larger, more established companies. U.S. and international markets have experienced significant periods of volatility due to a number of economic, political and other global macro factors. The war between Ukraine and Russia is approaching its 2nd anniversary and the October 7th attack by Hamas and Israel’s response only added to global tensions. US/China relations remain strained, impacted by sluggish Chinese economic growth and numerous issues affecting trade relations. Domestically, inflation remains an area of focus since getting to the Fed’s 2% target may prove to be more challenging than the market expects. In addition, 2024 is an election year and the current level of political discord is high. Finally, while the coronavirus (COVID-19) appears to have entered an endemic stage, significant outbreaks present a continued risk to the global economy. These and other events may cause market disruptions and could have an adverse effect on the value of the Fund’s investments.
The gross and net expense ratio for each Class, as reflected in the Fund’s current prospectus, are set forth under “Portfolio Characteristics”.
The Fund is “non-diversified,” meaning that it may invest a greater percentage of its assets in a smaller number of companies than a diversified mutual fund. Given Greenhouse’s opportunistic investment strategy, the Fund will generally be overweight in certain sectors and underweight in other sectors, as compared to the sector weightings in the Russell 2000® Index (the Fund’s benchmark index), based on Greenhouse’s judgment of the sectors’ relative attractiveness and its individual securities selection.
The Fund may purchase and sell (or write) call and put options. Options are subject to various types of risks, including market risk, liquidity risk, volatility risk, counterparty risk, legal risk and operations risk. With options purchased by the Fund, the risk is limited to the premium paid for the option if the underlying stock price moves in the opposite direction from desired and the option expires worthless. For options sold or written by the Fund, the primary risk is that the underlying stock price may move directionally away from the exercise price resulting in the option holder exercising the option and requiring the Fund to either deliver the securities (in the case of a call option) or pay for the securities (in the case of a put option) and recognize a significant loss.
Past performance does not guarantee future results. Investment return and principal value will fluctuate so that an investor’s shares, when redeemed, may be worth more or less than their original cost.
For information about the performance of the Fund as of the most recent month-end, please call 1-866-442-2473 or visit www.bairdfunds.com. Mutual fund performance changes over time and current performance may be lower or higher than that stated.
Baird Equity Opportunity Fund
Schedule of Investments, December 31, 2023
Long-Term Investments
| | | | | | | | | % of | |
| | | Shares | | | Value | | | Net Assets | |
| Common Stocks | | | | | | | | | |
| Aerospace & Defense | | | | | | | | | |
| Cadre Holdings, Inc. | | | 106,906 | | | $ | 3,516,138 | | | | 5.8 | % |
| Building Products | | | | | | | | | | | | |
Hayward Holdings, Inc.(1) | | | 93,984 | | | | 1,278,182 | | | | 2.1 | % |
| Communications Equipment | | | | | | | | | | | | |
Infinera Corp.(1) | | | 370,549 | | | | 1,760,108 | | | | 2.9 | % |
| Construction & Engineering | | | | | | | | | | | | |
Fluor Corp.(1) | | | 73,996 | | | | 2,898,423 | | | | 4.8 | % |
| Valmont Industries, Inc. | | | 6,150 | | | | 1,436,087 | | | | 2.4 | % |
| | | | | | | | 4,334,510 | | | | 7.2 | % |
| Consumer Staples Distribution & Retail | | | | | | | | | | | | |
Chefs’ Warehouse, Inc.(1) | | | 101,316 | | | | 2,981,730 | | | | 5.0 | % |
| Diversified Consumer Services | | | | | | | | | | | | |
Mister Car Wash, Inc.(1) | | | 258,990 | | | | 2,237,674 | | | | 3.7 | % |
| Diversified Telecommunication Services | | | | | | | | | | | | |
Globalstar, Inc.(1) | | | 511,607 | | | | 992,517 | | | | 1.6 | % |
| Electrical Equipment | | | | | | | | | | | | |
| nVent Electric PLC | | | 15,409 | | | | 910,518 | | | | 1.5 | % |
| Energy Equipment & Services | | | | | | | | | | | | |
Oceaneering International, Inc.(1) | | | 70,236 | | | | 1,494,622 | | | | 2.5 | % |
| Patterson-UTI Energy, Inc. | | | 167,520 | | | | 1,809,216 | | | | 3.0 | % |
| | | | | | | | 3,303,838 | | | | 5.5 | % |
| Entertainment | | | | | | | | | | | | |
Madison Square Garden Sports Corp.(1) | | | 14,482 | | | | 2,633,262 | | | | 4.4 | % |
| Financial Services | | | | | | | | | | | | |
AvidXchange Holdings, Inc.(1) | | | 108,649 | | | | 1,346,161 | | | | 2.2 | % |
| Global Payments, Inc. | | | 23,534 | | | | 2,988,818 | | | | 5.0 | % |
Toast, Inc.(1) | | | 50,998 | | | | 931,224 | | | | 1.5 | % |
| | | | | | | | 5,266,203 | | | | 8.7 | % |
| Health Care Equipment & Supplies | | | | | | | | | | | | |
Merit Medical Systems, Inc.(1) | | | 29,646 | | | | 2,251,910 | | | | 3.7 | % |
| Health Care Providers & Services | | | | | | | | | | | | |
NeoGenomics, Inc.(1)(4) | | | 179,599 | | | | 2,905,912 | | | | 4.8 | % |
| Health Care Technology | | | | | | | | | | | | |
Phreesia, Inc.(1) | | | 19,512 | | | | 451,703 | | | | 0.7 | % |
| Hotels, Restaurants, & Leisure | | | | | | | | | | | | |
Sportradar Holding AG(1)(2) | | | 282,052 | | | | 3,116,675 | | | | 5.2 | % |
| Interactive Media & Services | | | | | | | | | | | | |
ZoomInfo Technologies, Inc.(1) | | | 72,892 | | | | 1,347,773 | | | | 2.2 | % |
| Leisure Products | | | | | | | | | | | | |
| Clarus Corp. | | | 181,434 | | | | 1,250,987 | | | | 2.1 | % |
Vista Outdoor, Inc.(1) | | | 33,812 | | | | 999,821 | | | | 1.7 | % |
| | | | | | | | 2,250,808 | | | | 3.8 | % |
| Machinery | | | | | | | | | | | | |
| Ingersoll Rand, Inc. | | | 4,465 | | | | 345,323 | | | | 0.6 | % |
| Professional Services | | | | | | | | | | | | |
| Equifax, Inc. | | | 10,244 | | | | 2,533,239 | | | | 4.2 | % |
Fiverr International Ltd.(1) | | | 49,533 | | | | 1,348,288 | | | | 2.2 | % |
| | | | | | | | 3,881,527 | | | | 6.4 | % |
| Semiconductors & | | | | | | | | | | | | |
| Semiconductor Equipment | | | | | | | | | | | | |
| Universal Display Corp. | | | 14,649 | | | | 2,801,768 | | | | 4.7 | % |
| Software | | | | | | | | | | | | |
Blackbaud, Inc.(1) | | | 56,732 | | | | 4,918,665 | | | | 8.2 | % |
| Clear Secure, Inc. | | | 105,225 | | | | 2,172,896 | | | | 3.6 | % |
| ON24, Inc. | | | 18,264 | | | | 143,920 | | | | 0.2 | % |
RingCentral, Inc.(1) | | | 59,861 | | | | 2,032,281 | | | | 3.4 | % |
| | | | | | | | 9,267,762 | | | | 15.4 | % |
| Total Common Stocks | | | | | | | | | | | | |
| (Cost $51,122,442) | | | | | | | 57,835,841 | | | | 95.9 | % |
| | | Notional | | | Number of | | | | | | | |
| | | Amount | | | Contracts(5) | | | | | | | |
| Purchased Option Contracts | | | | | | | | | | | | |
| Call Option Contracts | | | | | | | | | | | | |
| ADT, Inc., | | | | | | | | | | | | |
| (Exercise Price: $7.00, | | | | | | | | | | | | |
| Expiration: 01/19/2024) | | $ | 702,460 | | | | 1,030 | | | | 20,600 | | | | 0.0 | % |
| ADT, Inc., | | | | | | | | | | | | | | | | |
| (Exercise Price: $8.00, | | | | | | | | | | | | | | | | |
| Expiration: 01/19/2024) | | | 332,816 | | | | 488 | | | | 1,464 | | | | 0.0 | % |
| Avantor, Inc., | | | | | | | | | | | | | | | | |
| (Exercise Price: $22.50, | | | | | | | | | | | | | | | | |
Expiration: 01/19/2024)(6) | | | 799,050 | | | | 350 | | | | 31,500 | | | | 0.1 | % |
| Globalstar, Inc., | | | | | | | | | | | | | | | | |
| (Exercise Price: $1.50, | | | | | | | | | | | | | | | | |
| Expiration: 01/19/2024) | | | 182,166 | | | | 939 | | | | 42,255 | | | | 0.1 | % |
| Globalstar, Inc., | | | | | | | | | | | | | | | | |
| (Exercise Price: $2.00, | | | | | | | | | | | | | | | | |
| Expiration: 01/19/2024) | | | 191,478 | | | | 987 | | | | 7,896 | | | | 0.0 | % |
| Total Purchased | | | | | | | | | | | | | | | | |
| Option Contracts | | | | | | | | | | | | | | | | |
| (Cost $135,115) | | | | | | | | | | | 103,715 | | | | 0.2 | % |
| | | Shares | | | | | | | |
| Exchange Traded Fund | | | | | | | | | |
| iShares Russell 2000 ETF | | | 3,900 | | | | 782,769 | | | | 1.3 | % |
| Total Exchange Traded Fund | | | | | | | | | | | | |
| (Cost $735,302) | | | | | | | 782,769 | | | | 1.3 | % |
| Total Long-Term Investments | | | | | | | | | | | | |
| (Cost $51,992,859) | | | | | | | 58,722,325 | | | | 97.4 | % |
| Short-Term Investment | | | | | | | | | | | | |
| Money Market Mutual Fund | | | | | | | | | | | | |
| First American Government Obligations | | | | | | | | | | | | |
Fund, Class U, 5.31%(3) | | | 1,907,263 | | | | 1,907,263 | | | | 3.2 | % |
| Total Short-Term Investment | | | | | | | | | | | | |
| (Cost $1,907,263) | | | | | | | 1,907,263 | | | | 3.2 | % |
| Total Investments | | | | | | | | | | | | |
| (Cost $53,900,122) | | | | | | | 60,629,588 | | | | 100.6 | % |
| Liabilities in Excess of Other Assets | | | | | | | (385,786 | ) | | | (0.6 | )% |
| TOTAL NET ASSETS | | | | | | $ | 60,243,802 | | | | 100.0 | % |
Notes to Schedule of Investments
(1) | Non-Income Producing. |
(2) | Foreign Security. |
(3) | Seven-Day Yield. |
(4) | All or a portion of this security was held as collateral for options written. At December 31, 2023, the value of this collateral was $2,588,800. |
(5) | Each contract is equivalent to 100 shares of common stock. |
(6) | Held in connection with written option contracts. See Schedule of Written Option Contracts for further information. |
Industry classifications shown in the Schedule of Investments are based off of the Global Industry Classification Standard (GICS®). GICS® was developed by and/or is the exclusive property of MSCI, Inc. (“MSCI”) and Standard & Poor’s Financial Services LLC (“S&P”). GICS® is a service mark of MSCI and S&P and has been licensed for use by U.S. Bancorp Fund Services, LLC.
The accompanying notes are an integral part of these financial statements.
Baird Equity Opportunity Fund
Schedule of Written Option Contracts, December 31, 2023
| | | Notional | | | Number of | | | | |
Written Option Contracts | | Amount | | | Contracts(a) | | | Value | |
| Put Option Contracts | | | | | | | | | |
| Avantor, Inc., (Exercise Price: $20.00, Expiration: 01/19/2024) | | $ | 799,050 | | | | (350 | ) | | $ | (14,875 | ) |
| Total Written Option Contracts (Premiums Received $31,677) | | | | | | | | | | $ | (14,875 | ) |
(a) | Each contract is equivalent to 100 shares of common stock. |
Summary of Fair Value Exposure at December 31, 2023
The Fund has adopted authoritative fair valuation accounting standards which establish a definition of fair value and set out a hierarchy for measuring fair value. These standards require additional disclosures about the various inputs and valuation techniques used to develop the measurements of fair value and a discussion on changes in valuation techniques and related inputs during the period. These standards define fair value as the price that would be received to sell an asset or paid to transfer a liability in an orderly transaction between market participants at the measurement date.
The fair value hierarchy is organized into three levels based upon the assumptions (referred to as “inputs”) used in pricing the asset or liability. These standards state that “observable inputs” reflect the assumptions market participants would use in pricing the asset or liability based on market data obtained from independent sources and “unobservable inputs” reflect an entity’s own assumptions about the assumptions market participants would use in pricing the asset or liability. These inputs are summarized into three broad levels and described below:
Level 1 – Quoted prices (unadjusted) in active markets for identical assets or liabilities that the reporting entity can access at the measurement date.
Level 2 – Inputs other than quoted prices included within Level 1 that are observable for the asset or liability, either directly or indirectly.
Level 3 – Unobservable inputs for the asset or liability.
The inputs or methodology used for valuing securities are not necessarily an indication of the risk associated with investing in those securities.
The following is a summary of the inputs used to value the Fund’s investments as of December 31, 2023:
| | | Level 1 | | | Level 2 | | | Level 3 | | | Total | |
| Equity | | | | | | | | | | | | |
| Common Stocks | | $ | 57,835,841 | | | $ | — | | | $ | — | | | $ | 57,835,841 | |
| Total Equity | | | 57,835,841 | | | | — | | | | — | | | | 57,835,841 | |
| Purchased Option Contracts | | | | | | | | | | | | | | | | |
| Call Option Contracts | | | 72,215 | | | | 31,500 | | | | — | | | | 103,715 | |
| Total Purchased Option Contracts | | | 72,215 | | | | 31,500 | | | | — | | | | 103,715 | |
| Exchange Traded Fund | | | | | | | | | | | | | | | | |
| Exchange Traded Fund | | | 782,769 | | | | — | | | | — | | | | 782,769 | |
| Total Exchange Traded Fund | | | 782,769 | | | | — | | | | — | | | | 782,769 | |
| Short-Term Investment | | | | | | | | | | | | | | | | |
| Money Market Mutual Fund | | | 1,907,263 | | | | — | | | | — | | | | 1,907,263 | |
| Total Short-Term Investment | | | 1,907,263 | | | | — | | | | — | | | | 1,907,263 | |
| Total Investments* | | $ | 60,598,088 | | | $ | 31,500 | | | $ | — | | | $ | 60,629,588 | |
| Written Option Contracts | | | | | | | | | | | | | | | | |
| Put Option Contracts | | $ | — | | | $ | (14,875 | ) | | $ | — | | | $ | (14,875 | ) |
| Total Written Option Contracts | | $ | — | | | $ | (14,875 | ) | | $ | — | | | $ | (14,875 | ) |
| * | Additional information regarding the industry classifications of these investments is disclosed in the Schedule of Investments. |
Changes in valuation techniques may result in transfers into or out of assigned levels within the fair value hierarchy. There were no transfers into or out of Level 3 during the year, as compared to the security classifications from the prior year’s annual report. See the Fund’s Valuation Policy in Note 2a to the financial statements.
The accompanying notes are an integral part of these financial statements.
Baird Chautauqua International Growth Fund
December 31, 2023 (Unaudited)
Portfolio Highlights and Commentary
In 2023, the Baird Chautauqua International Growth Fund Institutional Class returned 12.41%, underperforming its benchmark index, the MSCI ACWI ex USA Index, which returned 15.62%.
The Fund typically holds a limited number of companies (25 to 35) and invests primarily in equity securities of non-U.S. companies with medium to large market capitalizations. Stock selection was a detractor to relative performance for the Fund, as compared to its benchmark. However, portfolio allocation was a positive contributor to relative performance, helped by an overweight positioning in the top-performing information technology sector and lack of exposure to the consumer staples and communications services sectors. Investments in the information technology sector were among the most additive to the Fund’s performance, and standouts included Constellation Software, Atlassian, Temenos, and ASML. Certain investments in the consumer discretionary and health care sectors were major relative detractors from performance, especially Sea Limited, Genmab, and WuXi Biologics. Separately, SolarEdge was also a detractor.
The first quarter of 2023 provided a solid start to the year. There was a strong rotation back into growth stocks, which was supported by the deceleration in inflation rates. This caused many to believe that central banks could slow the pressure of rate hikes. Additionally, Europe avoided a potential energy crisis due to a mild winter, and the re-opening in China following the lifting of COVID restrictions commenced. The biggest shock of the quarter came in March as Silicon Valley Bank collapsed, followed by Signature Bank just days later. The biggest U.S. banks scrambled to stop the panic from taking down more lenders. Elsewhere, Credit Suisse came to the brink of failure, which culminated in a hurried takeover by UBS. The Fed, U.S. Treasury, and Federal Deposit Insurance Corporation (FDIC) unveiled a sweeping intervention so that depositors at the failed U.S. banks would be made whole. The tumult in the banking sector marked another turning point in the quarter.
The global economy remained in a fragile state in the second quarter. Headline inflation was above targets set by central banks in almost all major economies, and core inflation was sticky and elevated. As inflation pressures persisted, economic growth was weighed down by the lagged and ongoing effects of monetary tightening. Growth style stocks underperformed value style stocks in both international developed and emerging markets. However, this was not the case in the U.S. market, where growth style stocks significantly outperformed value style stocks. The positive market performance in the U.S. was concentrated in a small number of mostly mega-cap tech stocks, and it is for this reason that the U.S. market also significantly outperformed international markets in the quarter.
Equity markets started off strong in the third quarter, reaching year-to-date highs in July. However, an amalgamation of factors, with perhaps the most important being the growing market acceptance that interest rates will remain high in the longer term, led equity markets lower in August and September. International developed, U.S., and emerging equity markets all finished negative in the quarter, and in that order from worst to best performing. Additionally, growth style stocks significantly underperformed value style stocks in international developed and emerging markets, but the same effect was less pronounced in the U.S. market.
During the fourth quarter, the risk appetite of equity markets rebounded substantially, as financial conditions improved. This rally in equity markets to close out the year was extremely broad, buoying U.S. and international stocks of both growth and value types. The main driver was the market’s reassessment of U.S. monetary policy, which forecast a higher probability of interest rate cuts in 2024, and as early as the first half of the year, following recent U.S. inflation data that came in much softer than predicted.
On the economic front, despite signs of resilience in 2023, the lagged and ongoing effects of elevated real interest rates may keep global activity weak, thereby moderating inflationary forces further. Additionally, the divergence across economies is anticipated to persist, and weakness in manufacturing and trade is beginning to spread into services. In other words, the global economy is beginning to normalize following the substantial dislocations in the pandemic and post-pandemic periods.
In this inflationary environment, we have made ongoing adjustments to emphasize holdings that we believe are well-suited to transmit pricing power or in our view have more attractive valuations. These attributes should help protect against two of the most pernicious effects of inflation for equity investors, namely the compression of profit margins and valuation multiples.
For better or worse, the performance of managed portfolios may lag benchmarks on a short-term basis. But this is why we invest with a long-term time horizon, and do not overreact to what we view are shorter term economic perturbations. Furthermore, our investment philosophy emphasizes businesses that benefit from secular trends and possess strong competitive advantages and market positions. We purposefully select portfolio companies that earn attractive profit margins, carry strong balance sheets, and generate cash on a consistent basis. We believe these attributes hold tack even if the macroeconomic backdrop is soft or deteriorating. We deploy this strategy in concentrated and conviction-weighted portfolios that we believe have the ability to outgrow market growth rates over full investment cycle.
Outlook
We believe global growth is set to remain modest, driven by the impacts of tight monetary policies and soft business and consumer confidence. Additionally, we believe weakness in the manufacturing and trade sectors is beginning to spread into services. We expect a growing divergence across economies will persist in the near term, with growth in the emerging economies generally holding up better than in the developed economies, and growth in Europe being relatively subdued compared to that in North America and the major emerging Asian economies.
According to the Organization for Economic Cooperation and Development (OECD), global GDP growth of 2.9% in 2023 will be followed by a mild slowdown to 2.7% in 2024. Asia is projected to continue to account for the bulk of global growth in 2024, which would continue to be below the pre-pandemic global growth rate. GDP growth in the U.S. is projected at 2.4% in 2023 before slowing to 1.5% in 2024. In the euro zone, GDP growth is projected at 0.6% in 2023 before rising to 0.9% in 2024. China is projected to grow at 5.2% in 2023 before slowing to 4.7% in 2024, on the back of ongoing stresses in the real estate sector, weak manufacturing activity, and continued high household savings rates.
Inflation has declined steadily from the peak in mid-2022. Headline inflation has fallen in almost all economies. Core inflation has also fallen but remains high. Global demand is easing, supply disruptions are fading, and commodity prices are moderating, while monetary policies remain restrictive. We expect inflation to continue easing gradually, given moderating cost pressures and the effects of prior rate hikes continuing to work their way through economies. In the absence of further large shocks to energy and food prices, we project inflation to be at or near target for most major central banks by 2025, or even by 2024 in some cases.
Policy interest rates appear to be at or close to peak for most economies. Eventually, gradually easing inflation should pave the way for interest rate cuts as the jobs of central banks will have been completed. But monetary policies will likely remain restrictive until there are signs that underlying inflation pressures have durably abated. The implication is that even if central banks start cutting interest rates, they will keep them high enough to maintain downward pressure on prices.
We believe there are at least two key reasons to be cautious about the rate of disinflation, including pressures that have kept core interest rates high and an inflationary shock stemming from geopolitical tensions. The decline in global core inflation has been smaller than that of headline inflation over the past year. Core inflation must continue to decline to convince central banks that inflationary pressures have been brought firmly under control. This will likely require further moderation in demand, particularly for services. Geopolitical tensions have also historically been an inflationary force. The latest conflict in the Middle East, on the heels of the invasion of Ukraine, could be another driver of inflation by destabilizing energy markets. However, the impact has been minimal so far.
Baird Chautauqua International Growth Fund
December 31, 2023 (Unaudited)
There is optimism in the U.S., as it is looking more likely that its economy will achieve the coveted soft landing, which was once thought of as highly improbable. Inflation is continuing to ease, the Fed is likely done raising rates, and economic growth and the labor market have outperformed estimates. The Fed sent equity markets rallying after it revealed forecasts for at least three rate cuts in 2024 and four rate cuts in 2025. The futures market is even more convinced of lower rates. It appears to be anticipating six rate cuts in 2024, with the first to occur in March. In Europe, the picture is somewhat different. Both the European Central Bank (ECB) and Bank of England (BOE) did not act in accordance with market predictions for interest rate cuts, drawing attention to persistence in price and wage pressures such as services inflation and wage growth. Monetary policy will likely remain sufficiently restrictive until it can be assured that inflation returns to the target level.
Among the large emerging economies, China stands apart as having its own cyclical and structural stresses. High debt and the ailing property sector provide significant challenges, and consumer spending has been slow to recover after the reopening. The government has opted for a broad but piecemeal approach to stimulus, characterized by modest cuts to interest rates, extended tax breaks for companies, and lowered mortgage costs for consumers. Recently, the government has signaled that more help is coming by way of new fiscal stimulus and supportive central bank policies, but it has also indicated that stimulus will continue to be measured rather than aggressive. Economic growth in China is anticipated to slow in 2024 to 4.7%. In contrast, GDP growth in the other major Asian emerging economies is projected to remain relatively steady in 2023 and 2024; it is projected to be around 6% for India and 5% for Indonesia.
Over the last two-plus years, we have reduced the Fund’s Greater China weightings on a net basis, inclusive of holdings in Mainland China, Hong Kong, and Taiwan. In the Fund’s portfolio, roughly 17% of assets are invested in Greater China holdings, which is modestly overweight relative to the benchmark. We believe our Chinese holdings are at valuation levels, in the context of their long-term growth outlooks and competitive positioning, that more than compensate us for the risks. Our Chinese holdings are exposed to secular growth areas of the domestic economy (private consumption and healthcare) that align with government priorities, have strong balance sheets and resilient cash flows, and are not reliant on restricted Western technology inputs for future growth.
Our investment philosophy emphasizes businesses that should benefit from secular trends and possess strong competitive advantages and market positions. Over longer investment horizons, some of the most exciting growth areas can be relatively agnostic to the global picture or the specific situations impacting certain regions. These include our many investments in and adjacent to cloud computing, software-as-a-service, digitalization, artificial intelligence, semiconductor advancement, e-commerce and payments, industrial automation, electric vehicles, and novel biologic and biosimilar therapies. Other exciting growth areas pertain to rapidly expanding consumer classes, broadly in emerging economies and especially in Asia, which are propelling the uptake of various consumer goods and financial products.
Lastly, valuation matters. It is a core deliberation in our investment process, alongside growth rates and returns on capital. Over the past year, we made a series of adjustments to reduce weightings in holdings with extended valuations and to increase weightings in holdings with comparatively attractive valuations or that we believe were well-suited to transmit pricing power in the inflationary environment.
Portfolio Managers:
Jesse A. Flores, CFA
Haicheng Li, CFA
Nathaniel R. Velarde
Baird Chautauqua International Growth Fund
December 31, 2023 (Unaudited)
Portfolio Characteristics
A December 31, 2023 summary of the Fund’s top 10 holdings and equity sector analysis compared to the MSCI ACWI ex USA Index is shown below.
Top 10 Holdings(1) | | | | | |
| | | | | | |
| Tata Consultancy Services Ltd. | 4.7% | | Net Assets: | $824,006,735 | |
| Novo Nordisk A/S | 4.7% | | Portfolio Turnover Rate: | 12% | |
| Constellation Software, Inc. | 4.6% | | Number of Equity Holdings: | 32 | |
| ASML Holding NV | 4.6% | | | | |
| Waste Connections, Inc. | 4.6% | | Annualized Portfolio Expense Ratio(3): | | |
| Bank Rakyat Indonesia Persero Tbk PT | 4.5% | | Gross | | |
| Taiwan Semiconductor Manufacturing Co. Ltd. | 4.3% | | Institutional Class: | 0.87% | |
| HDFC Bank Ltd. | 4.3% | | Investor Class: | 1.12% | (4) |
| Adyen NV | 3.9% | | | | |
| Fairfax Financial Holdings Ltd. | 3.7% | | Net | | |
| | | | Institutional Class: | 0.80% | |
| | | | Investor Class: | 1.05% | (4) |
| | | | | | |
Equity Sector Analysis(2) | | | Country Allocation(2) | | |
| | | | | | |
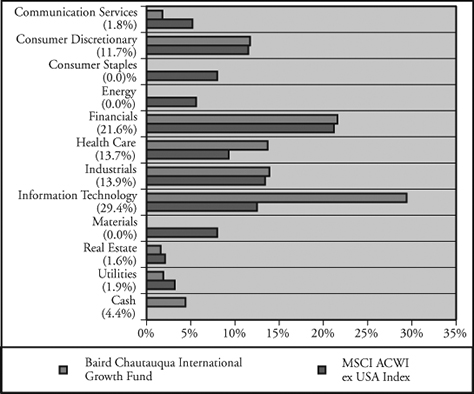 | 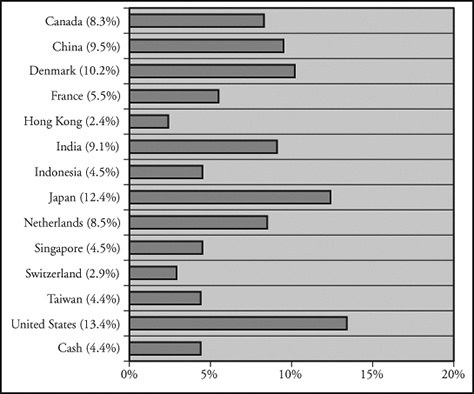 |
(1) | The Fund’s portfolio composition is subject to change and there is no assurance that the Fund will continue to hold any particular security. Percentages shown relate to the Fund’s total net assets as of December 31, 2023. |
(2) | Percentages shown in parentheses relate to the Fund’s total value of investments as of December 31, 2023, and may not add up to 100% due to rounding. |
(3) | Reflects expense ratios as stated in the Fund’s current prospectus dated May 1, 2023. The Advisor has contractually agreed to limit the Fund’s total annual fund operating expenses to 0.80% of average daily net assets for the Institutional Class shares and 1.05% of average daily net assets for the Investor Class shares, at least through April 30, 2025. |
(4) | Includes 0.25% 12b-1 fee. |
Baird Chautauqua International Growth Fund(1)
December 31, 2023 (Unaudited)
| Institutional Class | Investor Class |
| Value of a $10,000 Investment | Value of a $10,000 Investment |
| | |
 | 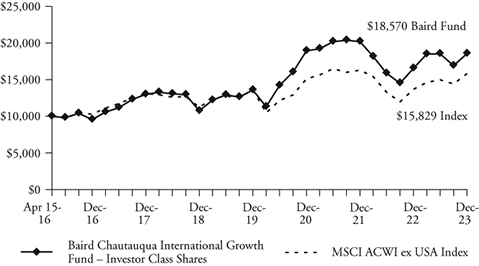 |
| | |
| Growth of a hypothetical investment of $10,000 made on 04/15/16, assuming | Growth of a hypothetical investment of $10,000 made on 04/15/16, assuming |
| reinvestment of all distributions. | reinvestment of all distributions. |
| Total Returns | | | | |
| | | Average Annual |
| | One | Three | Five | Since |
| For the Periods Ended December 31, 2023 | Year | Years | Years | Inception(2) |
| Institutional Class Shares | 12.41% | -0.43% | 11.84% | 8.62% |
| Investor Class Shares | 12.15% | -0.67% | 11.55% | 8.36% |
MSCI ACWI ex USA Index(3) | 15.62% | 1.55% | 7.08% | 6.14% |
(1) | Effective April 30, 2023, the Fund changed its name from the Chautauqua International Growth Fund to the Baird Chautauqua International Growth Fund. |
(2) | For the period from April 15, 2016 (inception date) through December 31, 2023. |
(3) | The MSCI ACWI ex USA Index is a market-capitalization-weighted index maintained by MSCI, Inc. and designed to provide a broad measure of stock performance throughout the world, with the exception of U.S. based companies. The MSCI ACWI ex USA Index includes both developed and emerging markets. This index does not reflect any deduction for fees, expenses or taxes. A direct investment in the index is not possible. |
The line graphs and the returns table shown above reflect reinvestment of dividends and/or capital gains distributions in additional shares. The returns in the graphs and table do not reflect the deduction of taxes that a shareholder would pay on Fund distributions or the redemption of Fund shares. The returns reflect the actual performance for each period and do not include the impact of trades executed on the last business day of the period that were recorded on the first business day of the next period.
The gross and net expense ratio for each Class, as reflected in the Fund’s current prospectus, are set forth under “Portfolio Characteristics”.
The Fund focuses primarily on non-U.S. stocks with medium to large market capitalizations and therefore the performance of the Fund may be more volatile than the performance of funds that focus on types of stocks that have a broader investment style. Under normal market conditions, the Fund will invest at least 65% of its total assets at the time of purchase in non-U.S. companies. Foreign investments involve additional risks such as currency rate fluctuations and the potential for political and economic instability, and different and sometimes less strict financial reporting standards and regulation. U.S. and international markets have experienced significant periods of volatility due to a number of economic, political and other global macro factors. The war between Ukraine and Russia is approaching its 2nd anniversary and the October 7th attack by Hamas and Israel’s response only added to global tensions. US/China relations remain strained, impacted by sluggish Chinese economic growth and numerous issues affecting trade relations. Domestically, inflation remains an area of focus since getting to the Fed’s 2% target may prove to be more challenging than the market expects. In addition, 2024 is an election year and the current level of political discord is high. Finally, while the coronavirus (COVID-19) appears to have entered an endemic stage, significant outbreaks present a continued risk to the global economy. These and other events may cause market disruptions and could have an adverse effect on the value of the Fund’s investments.
Past performance does not guarantee future results. Investment return and principal value will fluctuate so that an investor’s shares, when redeemed, may be worth more or less than their original cost.
For information about the performance of the Fund as of the most recent month-end, please call 1-866-442-2473 or visit www.bairdfunds.com. Mutual fund performance changes over time and current performance may be lower or higher than that stated.
Baird Chautauqua International Growth Fund
Schedule of Investments, December 31, 2023
Long-Term Investments
| | | | | | | | | % of | |
| | | Shares | | | Value | | | Net Assets | |
| Common Stocks | | | | | | | | | |
| Aerospace & Defense | | | | | | | | | |
Safran SA (France)(2) | | | 172,428 | | | $ | 30,400,789 | | | | 3.7 | % |
| Automobile Components | | | | | | | | | | | | |
Aptiv PLC (United States)(1) | | | 186,485 | | | | 16,731,434 | | | | 2.0 | % |
| Automobiles | | | | | | | | | | | | |
Suzuki Motor Corp. (Japan)(2) | | | 665,910 | | | | 28,378,791 | | | | 3.5 | % |
| Banks | | | | | | | | | | | | |
| Bank Rakyat Indonesia Persero | | | | | | | | | | | | |
Tbk PT (Indonesia)(2) | | | 99,669,480 | | | | 37,043,944 | | | | 4.5 | % |
DBS Group Holdings Ltd. (Singapore)(2) | | | 858,904 | | | | 21,720,679 | | | | 2.6 | % |
| HDFC Bank Ltd. – ADR (India) | | | 522,439 | | | | 35,060,881 | | | | 4.3 | % |
| | | | | | | | 93,825,504 | | | | 11.4 | % |
| Biotechnology | | | | | | | | | | | | |
BeiGene Ltd. – ADR (China)(1) | | | 105,638 | | | | 19,052,870 | | | | 2.3 | % |
Genmab A/S (Denmark)(1)(2) | | | 85,177 | | | | 27,158,945 | | | | 3.3 | % |
| | | | | | | | 46,211,815 | | | | 5.6 | % |
| Broadline Retail | | | | | | | | | | | | |
| Alibaba Group Holding | | | | | | | | | | | | |
| Ltd. – ADR (China) | | | 183,411 | | | | 14,216,187 | | | | 1.7 | % |
Prosus NV (China)(2) | | | 754,821 | | | | 22,466,677 | | | | 2.7 | % |
| | | | | | | | 36,682,864 | | | | 4.4 | % |
| Capital Markets | | | | | | | | | | | | |
| Hong Kong Exchanges & | | | | | | | | | | | | |
Clearing Ltd. (Hong Kong)(2) | | | 584,495 | | | | 20,048,330 | | | | 2.4 | % |
| Commercial Services & Supplies | | | | | | | | | | | | |
| Waste Connections, Inc. (United States) | | | 251,767 | | | | 37,581,260 | | | | 4.6 | % |
| Electronic Equipment, | | | | | | | | | | | | |
| Instruments, & Components | | | | | | | | | | | | |
Keyence Corp. (Japan)(2) | | | 62,916 | | | | 27,642,552 | | | | 3.4 | % |
| Entertainment | | | | | | | | | | | | |
Sea Ltd. – ADR (Singapore)(1) | | | 369,200 | | | | 14,952,600 | | | | 1.8 | % |
| Financial Services | | | | | | | | | | | | |
Adyen NV (Netherlands)(1)(2) | | | 24,842 | | | | 32,069,491 | | | | 3.9 | % |
| Health Care Equipment & Supplies | | | | | | | | | | | | |
Coloplast A/S (Denmark)(2) | | | 159,606 | | | | 18,237,562 | | | | 2.2 | % |
| Independent Power & | | | | | | | | | | | | |
| Renewable Electricity Producers | | | | | | | | | | | | |
| Brookfield Renewable Corp. (United States) | | | 549,364 | | | | 15,816,190 | | | | 1.9 | % |
| Insurance | | | | | | | | | | | | |
| Fairfax Financial Holdings Ltd. (Canada) | | | 32,979 | | | | 30,426,895 | | | | 3.7 | % |
| IT Services | | | | | | | | | | | | |
Tata Consultancy Services Ltd. (India)(2) | | | 855,916 | | | | 38,981,752 | | | | 4.7 | % |
| Life Sciences Tools & Services | | | | | | | | | | | | |
Wuxi Biologics Cayman, Inc. (China)(1)(2) | | | 2,349,889 | | | | 8,887,877 | | | | 1.1 | % |
| Machinery | | | | | | | | | | | | |
FANUC Corp. (Japan)(2) | | | 624,881 | | | | 18,339,712 | | | | 2.2 | % |
| Pharmaceuticals | | | | | | | | | | | | |
| Novo Nordisk A/S – ADR (Denmark) | | | 369,870 | | | | 38,263,051 | | | | 4.7 | % |
| Professional Services | | | | | | | | | | | | |
Recruit Holdings Co. Ltd. (Japan)(2) | | | 652,717 | | | | 27,290,839 | | | | 3.3 | % |
| Real Estate Management & Development | | | | | | | | | | | | |
| KE Holdings, Inc. – ADR (China) | | | 784,244 | | | | 12,712,595 | | | | 1.6 | % |
| Semiconductors & | | | | | | | | | | | | |
| Semiconductor Equipment | | | | | | | | | | | | |
| ASML Holding NV (Netherlands) | | | 49,716 | | | | 37,631,035 | | | | 4.6 | % |
| SolarEdge Technologies, Inc. | | | | | | | | | | | | |
(United States)(1) | | | 112,363 | | | | 10,517,177 | | | | 1.3 | % |
| Taiwan Semiconductor Manufacturing | | | | | | | | | | | | |
| Co. Ltd. – ADR (Taiwan) | | | 343,822 | | | | 35,757,488 | | | | 4.3 | % |
| | | | | | | | 83,905,700 | | | | 10.2 | % |
| Software | | | | | | | | | | | | |
Atlassian Corp. (United States)(1) | | | 121,245 | | | | 28,839,336 | | | | 3.5 | % |
| Constellation Software, Inc. (Canada) | | | 15,247 | | | | 37,802,732 | | | | 4.6 | % |
Temenos Group AG (Switzerland)(2) | | | 251,452 | | | | 23,432,365 | | | | 2.8 | % |
| | | | | | | | 90,074,433 | | | | 10.9 | % |
| Textiles, Apparel, & Luxury Goods | | | | | | | | | | | | |
Kering SA (France)(2) | | | 32,032 | | | | 14,186,898 | | | | 1.7 | % |
| Total Common Stocks | | | | | | | | | | | | |
| (Cost $667,049,430) | | | | | | | 781,648,934 | | | | 94.9 | % |
| | | Contracts | | | | | | | | | |
| Warrants | | | | | | | | | | | | |
| Software | | | | | | | | | | | | |
Constellation Software, Inc. (Canada)(5) | | | 14,550 | | | | — | (4) | | | 0.0 | % |
| Total Warrants | | | | | | | | | | | | |
| (Cost $0) | | | | | | | — | | | | 0.0 | % |
| Total Long-Term Investments | | | | | | | | | | | | |
| (Cost $667,049,430) | | | | | | | 781,648,934 | | | | 94.9 | % |
| Short-Term Investment | | | | | | | | | | | | |
| | | Shares | | | | | | | | | |
| Money Market Mutual Fund | | | | | | | | | | | | |
| First American Government | | | | | | | | | | | | |
Obligations Fund, Class U, 5.31%(3) | | | 35,610,014 | | | | 35,610,014 | | | | 4.3 | % |
| Total Short-Term Investment | | | | | | | | | | | | |
| (Cost $35,610,014) | | | | | | | 35,610,014 | | | | 4.3 | % |
| Total Investments | | | | | | | | | | | | |
| (Cost $702,659,444) | | | | | | | 817,258,948 | | | | 99.2 | % |
| Other Assets in Excess of Liabilities | | | | | | | 6,747,787 | | | | 0.8 | % |
| TOTAL NET ASSETS | | | | | | $ | 824,006,735 | | | | 100.0 | % |
Notes to Schedule of Investments
(1) | Non-Income Producing. |
(2) | Level 2 Security – See Note 2a to the financial statements. |
(3) | Seven-Day Yield. |
(4) | Amount less than $1. |
(5) | Level 3 Security – See Note 2a to the financial statements. |
ADR – American Depositary Receipt
Industry classifications shown in the Schedule of Investments are based off of the Global Industry Classification Standard (GICS®). GICS® was developed by and/or is the exclusive property of MSCI, Inc. (“MSCI”) and Standard & Poor’s Financial Services LLC (“S&P”). GICS® is a service mark of MSCI and S&P and has been licensed for use by U.S. Bancorp Fund Services, LLC.
The accompanying notes are an integral part of these financial statements.
Baird Chautauqua International Growth Fund
Summary of Fair Value Exposure at December 31, 2023
The Fund has adopted authoritative fair valuation accounting standards which establish a definition of fair value and set out a hierarchy for measuring fair value. These standards require additional disclosures about the various inputs and valuation techniques used to develop the measurements of fair value and a discussion on changes in valuation techniques and related inputs during the period. These standards define fair value as the price that would be received to sell an asset or paid to transfer a liability in an orderly transaction between market participants at the measurement date.
The fair value hierarchy is organized into three levels based upon the assumptions (referred to as “inputs”) used in pricing the asset or liability. These standards state that “observable inputs” reflect the assumptions market participants would use in pricing the asset or liability based on market data obtained from independent sources and “unobservable inputs” reflect an entity’s own assumptions about the assumptions market participants would use in pricing the asset or liability. These inputs are summarized into three broad levels and described below:
Level 1 – Quoted prices (unadjusted) in active markets for identical assets or liabilities that the reporting entity can access at the measurement date.
Level 2 – Inputs other than quoted prices included within Level 1 that are observable for the asset or liability, either directly or indirectly.
Level 3 – Unobservable inputs for the asset or liability.
The inputs or methodology used for valuing securities are not necessarily an indication of the risk associated with investing in those securities.
The following is a summary of the inputs used to value the Fund’s investments as of December 31, 2023:
| | | Level 1 | | | Level 2 | | | Level 3 | | | Total | |
| Equity | | | | | | | | | | | | |
| Common Stocks | | $ | 385,361,731 | | | $ | 396,287,203 | | | $ | — | | | $ | 781,648,934 | |
| Total Equity | | | 385,361,731 | | | | 396,287,203 | | | | — | | | | 781,648,934 | |
| Warrants | | | | | | | | | | | | | | | | |
| Warrants | | | — | | | | — | | | | — | (1) | | | — | |
| Total Warrants | | | — | | | | — | | | | — | | | | — | |
| Short-Term Investment | | | | | | | | | | | | | | | | |
| Money Market Mutual Fund | | | 35,610,014 | | | | — | | | | — | | | | 35,610,014 | |
| Total Short-Term Investment | | | 35,610,014 | | | | — | | | | — | | | | 35,610,014 | |
Total Investments(2) | | $ | 420,971,745 | | | $ | 396,287,203 | | | $ | — | | | $ | 817,258,948 | |
(1) | Amount less than $1. |
(2) | Additional information regarding the industry classifications of these investments is disclosed in the Schedule of Investments. |
Changes in valuation techniques may result in transfers into or out of assigned levels within the fair value hierarchy. Warrants with a fair value of $0 are priced at fair value by the Valuation Committee instead of the Fund’s pricing vendor and are valued using level 3 inputs. Management has evaluated these warrants and has determined that they are immaterial. There were no transfers into or out of Level 3 during the year, as compared to the security classifications from the prior year’s annual report. See the Fund’s Valuation Policy in Note 2a to the financial statements.
The accompanying notes are an integral part of these financial statements.
Baird Chautauqua Global Growth Fund
December 31, 2023 (Unaudited)
Portfolio Highlights and Commentary
In 2023, the Baird Chautauqua Global Growth Fund Institutional Class returned 16.34%, underperforming its benchmark index, the MSCI ACWI Index, which returned 22.20%.
The Fund typically holds a limited number of companies (35 to 45) and invests primarily in equity securities of both U.S. and non-U.S. companies with medium to large market capitalizations. Stock selection was a detractor to relative performance for the Fund, as compared to its benchmark. However, portfolio allocation was a positive contributor to relative performance, helped by lack of exposure to the consumer staples, energy, and materials sectors and overweight positioning in the top-performing information technology sector. Investments in the information technology sector were among the most additive to the Fund’s performance, and standouts included Nvidia, Constellation Software, and Atlassian. Certain investments in the consumer discretionary, financials, and health care sectors were major relative detractors from performance, especially Sea Limited, Genmab, Incyte, Hong Kong Exchanges and Clearing, and WuXi Biologics. Separately, SolarEdge was also a detractor.
The first quarter of 2023 provided a solid start to the year. There was a strong rotation back into growth stocks, which was supported by deceleration in inflation rates. This caused many to believe that central banks could slow the pressure of rate hikes. Additionally, Europe avoided a potential energy crisis due to a mild winter, and the reopening in China following the lifting of COVID restrictions commenced. The biggest shock of the quarter came in March as Silicon Valley Bank collapsed, followed by Signature Bank just days later. The biggest U.S. banks scrambled to stop the panic from taking down more lenders. Elsewhere, Credit Suisse came to the brink of failure, which culminated in a hurried takeover by UBS. The Fed, U.S. Treasury, and Federal Deposit Insurance Corporation (FDIC) unveiled a sweeping intervention so that depositors at the failed U.S. banks would be made whole. The tumult in the banking sector marked another turning point in the quarter.
The global economy remained in a fragile state in the second quarter. Headline inflation was above targets set by central banks in almost all major economies, and core inflation was sticky and elevated. As inflation pressures persisted, economic growth was weighed down by the lagged and ongoing effects of monetary tightening. Growth style stocks underperformed value style stocks in both international developed and emerging markets. However, this was not the case in the U.S. market, where growth style stocks significantly outperformed value style stocks. The positive market performance in the U.S. was concentrated in a small number of mostly mega-cap tech stocks, and it is for this reason that the U.S. market also significantly outperformed international markets in the quarter.
Equity markets started off strong in the third quarter, reaching year-to-date highs in July. However, an amalgamation of factors, with perhaps the most important being the growing market acceptance that interest rates will remain high in the longer term, led equity markets lower in August and September. International developed, U.S., and emerging equity markets all finished negative in the quarter, and in that order from worst to best performing. Additionally, growth style stocks significantly underperformed value style stocks in international developed and emerging markets, but the same effect was less pronounced in the U.S. market.
During the fourth quarter, the risk appetite of equity markets rebounded substantially, as financial conditions improved. This rally in equity markets to close out the year was extremely broad, buoying U.S. and international stocks of both growth and value types. The main driver was the market’s reassessment of U.S. monetary policy, which forecast a higher probability of interest rate cuts in 2024, and as early as the first half of the year, following recent U.S. inflation data that came in much softer than predicted.
On the economic front, despite signs of resilience in 2023, the lagged and ongoing effects of elevated real interest rates may keep global activity weak, thereby moderating inflationary forces further. Additionally, the divergence across economies is anticipated to persist, and weakness in manufacturing and trade is beginning to spread into services. In other words, the global economy is beginning to normalize following the substantial dislocations in the pandemic and post-pandemic periods.
In this inflationary environment, we have made ongoing adjustments to emphasize holdings that we believe are well-suited to transmit pricing power or in our view have more attractive valuations. These attributes should help protect against two of the most pernicious effects of inflation for equity investors, namely the compression of profit margins and valuation multiples.
For better or worse, the performance of managed portfolios may lag benchmarks on a short-term basis. But this is why we invest with a long-term time horizon and do not overreact to what we view are shorter term economic perturbations. Furthermore, our investment philosophy emphasizes businesses that benefit from secular trends and possess strong competitive advantages and market positions. We purposefully select portfolio companies that earn attractive profit margins, carry strong balance sheets, and generate cash on a consistent basis. We believe these attributes hold tack even if the macroeconomic backdrop is soft or deteriorating. We deploy this strategy in concentrated and conviction-weighted portfolios that we believe have the ability to outgrow market growth rates over a full investment cycle.
Outlook
We believe global growth is set to remain modest, driven by the impacts of tight monetary policies and soft business and consumer confidence. Additionally, we believe weakness in the manufacturing and trade sectors is beginning to spread into services. We expect a growing divergence across economies will persist in the near term, with growth in the emerging economies generally holding up better than in the developed economies, and growth in Europe being relatively subdued compared to that in North America and the major emerging Asian economies.
According to the Organization for Economic Cooperation and Development (OECD), global GDP growth of 2.9% in 2023 will be followed by a mild slowdown to 2.7% in 2024. Asia is projected to continue to account for the bulk of global growth in 2024, which would continue to be below the pre-pandemic global growth rate . GDP growth in the U.S. is projected at 2.4% in 2023 before slowing to 1.5% in 2024. In the euro zone, GDP growth is projected at 0.6% in 2023 before rising to 0.9% in 2024. China is projected to grow at 5.2% in 2023 before slowing to 4.7% in 2024, on the back of ongoing stresses in the real estate sector, weak manufacturing activity, and continued high household savings rates.
Inflation has declined steadily from the peak in mid-2022. Headline inflation has fallen in almost all economies. Core inflation has also fallen but remains high. Global demand is easing, supply disruptions are fading, and commodity prices are moderating, while monetary policies remain restrictive. We expect inflation to continue easing gradually, given moderating cost pressures and the effects of prior rate hikes continuing to work their way through economies. In the absence of further large shocks to energy and food prices, we project inflation to be at or near target for most major central banks by 2025, or even by 2024 in some cases.
Policy interest rates appear to be at or close to peak for most economies. Eventually, gradually easing inflation should pave the way for interest rate cuts as the jobs of central banks will have been completed. But monetary policies will likely remain restrictive until there are signs that underlying inflation pressures have durably abated. The implication is that even if central banks start cutting interest rates, they will keep them high enough to maintain downward pressure on prices.
We believe there are at least two key reasons to be cautious about the rate of disinflation, including pressures that have kept core interest rates high and an inflationary shock stemming from geopolitical tensions. The decline in global core inflation has been smaller than that of headline inflation over the past year. Core inflation must continue to decline to convince central banks that inflationary pressures have been brought firmly under control. This will likely require further moderation in demand, particularly for services. Geopolitical tensions have also historically been an inflationary force. The latest conflict in the Middle East, on the heels of the invasion of Ukraine, could be another driver of inflation by destabilizing energy markets. However, the impact has been minimal so far.
Baird Chautauqua Global Growth Fund
December 31, 2023 (Unaudited)
There is optimism in the U.S., as it is looking more likely that its economy will achieve the coveted soft landing, which was once thought of as highly improbable. Inflation is continuing to ease, the Fed is likely done raising rates, and economic growth and the labor markets have outperformed estimates. The Fed sent equity markets rallying after it revealed forecasts for at least three rate cuts in 2024 and four rate cuts in 2025. The futures market is even more convinced of lower rates. It appears to be anticipating six rate cuts in 2024, with the first to occur in March. In Europe, the picture is somewhat different. Both the European Central Bank (ECB) and Bank of England (BOE) did not act in accordance with market predictions for interest rate cuts, drawing attention to persistence in price and wage pressures such as services inflation and wage growth. Monetary policy will likely remain sufficiently restrictive until it can be assured that inflation returns to the target level.
Among the large emerging economies, China stands apart as having its own cyclical and structural stresses. High debt and the ailing property sector provide significant challenges, and consumer spending has been slow to recover after the reopening. The government has opted for a broad but piecemeal approach to stimulus, characterized by modest cuts to interest rates, extended tax breaks for companies, and lowered mortgage costs for consumers. Recently, the government has signaled that more help is coming by way of new fiscal stimulus and supportive central bank policies, but it has also indicated that stimulus will continue to be measured rather than aggressive. Economic growth in China is anticipated to slow in 2024 to 4.7%. In contrast, GDP growth in the other major Asian emerging economies is projected to remain relatively steady in 2023 and 2024; it is projected to be around 6% for India and 5% for Indonesia.
Over the last two-plus years, we have reduced the Fund’s Greater China weightings on a net basis, inclusive of holdings in Mainland China, Hong Kong, and Taiwan. In the Fund’s portfolio, roughly 11% of assets are invested in Greater China holdings, which is overweight relative to the benchmark. We believe our Chinese holdings are at valuation levels, in the context of their long-term growth outlooks and competitive positioning, that more than compensate us for the risks. Our Chinese holdings are exposed to secular growth areas of the domestic economy (private consumption and healthcare) that align with government priorities, have strong balance sheets and resilient cash flows, and are not reliant on restricted Western technology inputs for future growth.
Our investment philosophy emphasizes businesses that should benefit from secular trends and possess strong competitive advantages and market positions. Over longer investment horizons, some of the most exciting growth areas can be relatively agnostic to the global picture or the specific situations impacting certain regions. These include our many investments in and adjacent to cloud computing, software-as-a-service, digitalization, artificial intelligence, semiconductor advancement, e-commerce and payments, industrial automation, electric vehicles, and novel biologic and biosimilar therapies. Other exciting growth areas pertain to rapidly expanding consumer classes, broadly in emerging economies and especially in Asia, which are propelling the uptake of various consumer goods and financial products.
Lastly, valuation matters. It is a core deliberation in our investment process, alongside growth rates and returns on capital. Over the past year, we made a series of adjustments to reduce weightings in holdings with extended valuations and to increase weightings in holdings with comparatively attractive valuations or that we believe were well-suited to transmit pricing power in the inflationary environment.
Portfolio Managers:
Jesse A. Flores, CFA
Haicheng Li, CFA
Nathaniel R. Velarde
Baird Chautauqua Global Growth Fund
December 31, 2023 (Unaudited)
Portfolio Characteristics
A December 31, 2023 summary of the Fund’s top 10 holdings and equity sector analysis compared to the MSCI ACWI Index is shown below.
Top 10 Holdings(1) | | | | | |
| | | | | | |
| Novo Nordisk A/S | 4.7% | | Net Assets: | $319,502,906 | |
| MasterCard, Inc. – Class A | 4.3% | | Portfolio Turnover Rate: | 14% | |
| Alphabet, Inc. – Class A | 4.0% | | Number of Equity Holdings: | 43 | |
| Constellation Software, Inc. | 3.9% | | | | |
| Fairfax Financial Holdings Ltd. | 3.5% | | Annualized Portfolio Expense Ratio(3): | | |
| Regeneron Pharmaceuticals, Inc. | 3.3% | | Gross | | |
| Nvidia Corp. | 3.3% | | Institutional Class: | 0.92% | |
| ASML Holding NV | 3.2% | | Investor Class: | 1.17% | (4) |
| Waste Connections, Inc. | 3.2% | | | | |
| Bank Rakyat Indonesia Persero Tbk PT | 3.1% | | Net | | |
| | | | Institutional Class: | 0.80% | |
| | | | Investor Class: | 1.05% | (4) |
| | | | | | |
Equity Sector Analysis(2) | | | Country Allocation(2) | | |
| | | | | | |
 | 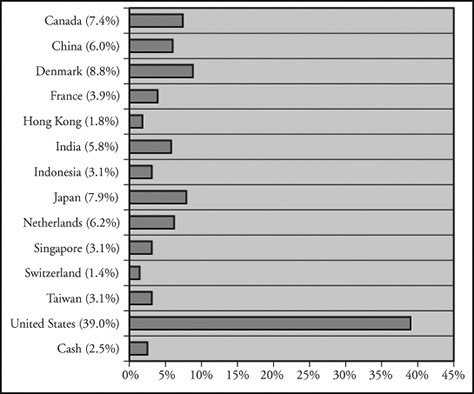 |
(1) | The Fund’s portfolio composition is subject to change and there is no assurance that the Fund will continue to hold any particular security. Percentages shown relate to the Fund’s total net assets as of December 31, 2023. |
(2) | Percentages shown in parentheses relate to the Fund’s total value of investments as of December 31, 2023, and may not add up to 100% due to rounding. |
(3) | Reflects expense ratios as stated in the Fund’s current prospectus dated May 1, 2023. The Advisor has contractually agreed to limit the Fund’s total annual fund operating expenses to 0.80% of average daily net assets for the Institutional Class shares and 1.05% of average daily net assets for the Investor Class shares, at least through April 30, 2025. |
(4) | Includes 0.25% 12b-1 fee. |
Baird Chautauqua Global Growth Fund(1)
December 31, 2023 (Unaudited)
| Institutional Class | Investor Class |
| Value of a $10,000 Investment | Value of a $10,000 Investment |
| | |
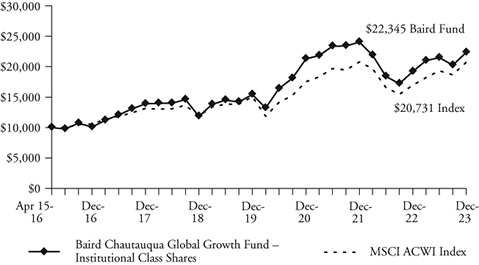 | 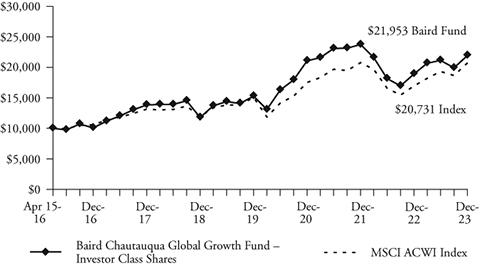 |
| | |
| | |
| Growth of a hypothetical investment of $10,000 made on 04/15/16, assuming | Growth of a hypothetical investment of $10,000 made on 04/15/16, assuming |
| reinvestment of all distributions. | reinvestment of all distributions. |
| Total Returns | | | | |
| | | Average Annual |
| | One | Three | Five | Since |
| For the Periods Ended December 31, 2023 | Year | Years | Years | Inception(2) |
| Institutional Class Shares | 16.34% | 1.62% | 13.51% | 10.99% |
| Investor Class Shares | 16.01% | 1.35% | 13.25% | 10.73% |
MSCI ACWI Index(3) | 22.20% | 5.75% | 11.72% | 9.91% |
(1) | Effective April 30, 2023, the Fund changed its name from the Chautauqua Global Growth Fund to the Baird Chautauqua Global Growth Fund. |
(2) | For the period from April 15, 2016 (inception date) through December 31, 2023. |
(3) | The MSCI ACWI Index is a market-capitalization-weighted index maintained by MSCI, Inc. and designed to provide a broad measure of stock performance throughout the world. The MSCI ACWI Index includes both developed and emerging markets. This index does not reflect any deduction for fees, expenses or taxes. A direct investment in the index is not possible. |
The line graphs and the returns table shown above reflect reinvestment of dividends and/or capital gains distributions in additional shares. The returns in the graphs and table do not reflect the deduction of taxes that a shareholder would pay on Fund distributions or the redemption of Fund shares. The returns reflect the actual performance for each period and do not include the impact of trades executed on the last business day of the period that were recorded on the first business day of the next period.
The gross and net expense ratio for each Class, as reflected in the Fund’s current prospectus, are set forth under “Portfolio Characteristics”.
The Fund focuses on both U.S. and non-U.S. stocks with medium to large market capitalizations and therefore the performance of the Fund may be more volatile than the performance of funds that focus on types of stocks that have a broader investment style. Under normal market conditions, the Fund will invest at least 40% of its total assets at the time of purchase in non-U.S. companies. Foreign investments involve additional risks such as currency rate fluctuations and the potential for political and economic instability, and different and sometimes less strict financial reporting standards and regulation. U.S. and international markets have experienced significant periods of volatility due to a number of economic, political and other global macro factors. The war between Ukraine and Russia is approaching its 2nd anniversary and the October 7th attack by Hamas and Israel’s response only added to global tensions. US/China relations remain strained, impacted by sluggish Chinese economic growth and numerous issues affecting trade relations. Domestically, inflation remains an area of focus since getting to the Fed’s 2% target may prove to be more challenging than the market expects. In addition, 2024 is an election year and the current level of political discord is high. Finally, while the coronavirus (COVID-19) appears to have entered an endemic stage, significant outbreaks present a continued risk to the global economy. These and other events may cause market disruptions and could have an adverse effect on the value of the Fund’s investments.
Past performance does not guarantee future results. Investment return and principal value will fluctuate so that an investor’s shares, when redeemed, may be worth more or less than their original cost.
For information about the performance of the Fund as of the most recent month-end, please call 1-866-442-2473 or visit www.bairdfunds.com. Mutual fund performance changes over time and current performance may be lower or higher than that stated.
Baird Chautauqua Global Growth Fund
Schedule of Investments, December 31, 2023
Long-Term Investments
| | | | | | | | | % of | |
| | | Shares | | | Value | | | Net Assets | |
| Common Stocks | | | | | | | | | |
| Aerospace & Defense | | | | | | | | | |
Safran SA (France)(2) | | | 45,586 | | | $ | 8,037,270 | | | | 2.5 | % |
| Automobile Components | | | | | | | | | | | | |
Aptiv PLC (United States)(1) | | | 49,488 | | | | 4,440,063 | | | | 1.4 | % |
| Automobiles | | | | | | | | | | | | |
Suzuki Motor Corp. (Japan)(2) | | | 169,216 | | | | 7,211,403 | | | | 2.2 | % |
| Banks | | | | | | | | | | | | |
| Bank Rakyat Indonesia | | | | | | | | | | | | |
Persero Tbk PT (Indonesia)(2) | | | 26,306,533 | | | | 9,777,293 | | | | 3.1 | % |
DBS Group Holdings Ltd. (Singapore)(2) | | | 230,728 | | | | 5,834,842 | | | | 1.8 | % |
| HDFC Bank Ltd. – ADR (India) | | | 140,149 | | | | 9,405,399 | | | | 2.9 | % |
| | | | | | | | 25,017,534 | | | | 7.8 | % |
| Biotechnology | | | | | | | | | | | | |
BeiGene Ltd. – ADR (China)(1) | | | 24,468 | | | | 4,413,048 | | | | 1.4 | % |
Genmab A/S (Denmark)(1)(2) | | | 26,253 | | | | 8,370,849 | | | | 2.6 | % |
Incyte Corp. (United States)(1) | | | 110,883 | | | | 6,962,344 | | | | 2.2 | % |
| Regeneron Pharmaceuticals, Inc. | | | | | | | | | | | | |
(United States)(1) | | | 11,996 | | | | 10,535,967 | | | | 3.3 | % |
| | | | | | | | 30,282,208 | | | | 9.5 | % |
| Broadline Retail | | | | | | | | | | | | |
| Alibaba Group Holding Ltd. – ADR (China) | | | 38,395 | | | | 2,975,996 | | | | 0.9 | % |
Amazon.com, Inc. (United States)(1) | | | 61,263 | | | | 9,308,301 | | | | 2.9 | % |
Prosus NV (China)(2) | | | 199,397 | | | | 5,934,901 | | | | 1.9 | % |
| | | | | | | | 18,219,198 | | | | 5.7 | % |
| Capital Markets | | | | | | | | | | | | |
| Charles Schwab Corp. (United States) | | | 119,014 | | | | 8,188,164 | | | | 2.6 | % |
| Hong Kong Exchanges & Clearing Ltd. | | | | | | | | | | | | |
(Hong Kong)(2) | | | 168,316 | | | | 5,773,282 | | | | 1.8 | % |
| | | | | | | | 13,961,446 | | | | 4.4 | % |
| Commercial Services & Supplies | | | | | | | | | | | | |
| Waste Connections, Inc. (United States) | | | 68,588 | | | | 10,238,131 | | | | 3.2 | % |
| Electronic Equipment, Instruments, | | | | | | | | | | | | |
| & Components | | | | | | | | | | | | |
Keyence Corp. (Japan)(2) | | | 13,488 | | | | 5,926,040 | | | | 1.8 | % |
| Entertainment | | | | | | | | | | | | |
Sea Ltd. – ADR (Singapore)(1) | | | 101,993 | | | | 4,130,717 | | | | 1.3 | % |
| Financial Services | | | | | | | | | | | | |
Adyen NV (Netherlands)(1)(2) | | | 7,253 | | | | 9,363,176 | | | | 2.9 | % |
| MasterCard, Inc. – Class A (United States) | | | 31,954 | | | | 13,628,701 | | | | 4.3 | % |
| | | | | | | | 22,991,877 | | | | 7.2 | % |
| Health Care Equipment & Supplies | | | | | | | | | | | | |
Coloplast A/S (Denmark)(2) | | | 41,272 | | | | 4,715,992 | | | | 1.5 | % |
| Independent Power & | | | | | | | | | | | | |
| Renewable Electricity Producers | | | | | | | | | | | | |
| Brookfield Renewable Corp. (United States) | | | 194,062 | | | | 5,587,045 | | | | 1.7 | % |
| Insurance | | | | | | | | | | | | |
| Fairfax Financial Holdings Ltd. (Canada) | | | 12,108 | | | | 11,171,013 | | | | 3.5 | % |
| Interactive Media & Services | | | | | | | | | | | | |
Alphabet, Inc. – Class A (United States)(1) | | | 90,501 | | | | 12,642,085 | | | | 4.0 | % |
| IT Services | | | | | | | | | | | | |
Tata Consultancy Services Ltd. (India)(2) | | | 203,401 | | | | 9,263,675 | | | | 2.9 | % |
| Life Sciences Tools & Services | | | | | | | | | | | | |
Illumina, Inc. (United States)(1) | | | 21,657 | | | | 3,015,520 | | | | 0.9 | % |
Wuxi Biologics Cayman, Inc. (China)(1)(2) | | | 682,094 | | | | 2,579,853 | | | | 0.8 | % |
| | | | | | | | 5,595,373 | | | | 1.7 | % |
| Machinery | | | | | | | | | | | | |
FANUC Corp. (Japan)(2) | | | 159,427 | | | | 4,679,043 | | | | 1.5 | % |
| Pharmaceuticals | | | | | | | | | | | | |
| Novo Nordisk A/S – ADR (Denmark) | | | 144,039 | | | | 14,900,835 | | | | 4.7 | % |
| Professional Services | | | | | | | | | | | | |
Recruit Holdings Co. Ltd. (Japan)(2) | | | 174,160 | | | | 7,281,827 | | | | 2.3 | % |
| Real Estate Management & Development | | | | | | | | | | | | |
| KE Holdings, Inc. – ADR (China) | | | 204,071 | | | | 3,307,991 | | | | 1.0 | % |
| Semiconductors & | | | | | | | | | | | | |
| Semiconductor Equipment | | | | | | | | | | | | |
| ASML Holding NV (Netherlands) | | | 13,712 | | | | 10,378,887 | | | | 3.2 | % |
| Micron Technology, Inc. (United States) | | | 77,491 | | | | 6,613,082 | | | | 2.1 | % |
| Nvidia Corp. (United States) | | | 21,059 | | | | 10,428,838 | | | | 3.3 | % |
| SolarEdge Technologies, Inc. | | | | | | | | | | | | |
(United States)(1) | | | 30,029 | | | | 2,810,714 | | | | 0.9 | % |
| Taiwan Semiconductor | | | | | | | | | | | | |
| Manufacturing Co. Ltd. – ADR (Taiwan) | | | 93,902 | | | | 9,765,808 | | | | 3.1 | % |
| Universal Display Corp. (United States) | | | 21,193 | | | | 4,053,373 | | | | 1.3 | % |
| | | | | | | | 44,050,702 | | | | 13.9 | % |
| Software | | | | | | | | | | | | |
Atlassian Corp. (United States)(1) | | | 29,804 | | | | 7,089,179 | | | | 2.2 | % |
| Constellation Software, Inc. (Canada) | | | 5,052 | | | | 12,525,704 | | | | 3.9 | % |
Temenos Group AG (Switzerland)(2) | | | 48,749 | | | | 4,542,833 | | | | 1.4 | % |
| | | | | | | | 24,157,716 | | | | 7.5 | % |
| Specialty Retail | | | | | | | | | | | | |
| TJX Companies, Inc. (United States) | | | 98,587 | | | | 9,248,446 | | | | 2.9 | % |
| Textiles, Apparel, & Luxury Goods | | | | | | | | | | | | |
Kering SA (France)(2) | | | 10,262 | | | | 4,545,016 | | | | 1.4 | % |
| Total Common Stocks | | | | | | | | | | | | |
| (Cost $266,503,620) | | | | | | | 311,602,646 | | | | 97.5 | % |
| | | Contracts | | | | | | | | | |
| Warrants | | | | | | | | | | | | |
| Software | | | | | | | | | | | | |
Constellation Software, Inc. (Canada)(5) | | | 5,137 | | | | — | (4) | | | 0.0 | % |
| Total Warrants | | | | | | | | | | | | |
| (Cost $0) | | | | | | | — | | | | 0.0 | % |
| Total Long-Term Investments | | | | | | | | | | | | |
| (Cost $266,503,620) | | | | | | | 311,602,646 | | | | 97.5 | % |
The accompanying notes are an integral part of these financial statements.
Baird Chautauqua Global Growth Fund
Schedule of Investments, December 31, 2023
Short-Term Investment
| | | | | | | | | % of | |
| | | Shares | | | Value | | | Net Assets | |
| Money Market Mutual Fund | | | | | | | | | |
| First American Government Obligations | | | | | | | | | |
Fund, Class U, 5.31%(3) | | | 7,557,156 | | | $ | 7,557,156 | | | | 2.4 | % |
| Total Short-Term Investment | | | | | | | | | | | | |
| (Cost $7,557,156) | | | | | | | 7,557,156 | | | | 2.4 | % |
| Total Investments | | | | | | | | | | | | |
| (Cost $274,060,776) | | | | | | | 319,159,802 | | | | 99.9 | % |
| Other Assets in Excess of Liabilities | | | | | | | 343,104 | | | | 0.1 | % |
| TOTAL NET ASSETS | | | | | | $ | 319,502,906 | | | | 100.0 | % |
Notes to Schedule of Investments
(1) | Non-Income Producing. |
(2) | Level 2 Security – See Note 2a to the financial statements. |
(3) | Seven-Day Yield. |
(4) | Amount less than $1. |
(5) | Level 3 Security – See Note 2a to the financial statements. |
ADR – American Depositary Receipt
Industry classifications shown in the Schedule of Investments are based off of the Global Industry Classification Standard (GICS®). GICS® was developed by and/or is the exclusive property of MSCI, Inc. (“MSCI”) and Standard & Poor’s Financial Services LLC (“S&P”). GICS® is a service mark of MSCI and S&P and has been licensed for use by U.S. Bancorp Fund Services, LLC.
Summary of Fair Value Exposure at December 31, 2023
The Fund has adopted authoritative fair valuation accounting standards which establish a definition of fair value and set out a hierarchy for measuring fair value. These standards require additional disclosures about the various inputs and valuation techniques used to develop the measurements of fair value and a discussion on changes in valuation techniques and related inputs during the period. These standards define fair value as the price that would be received to sell an asset or paid to transfer a liability in an orderly transaction between market participants at the measurement date.
The fair value hierarchy is organized into three levels based upon the assumptions (referred to as “inputs”) used in pricing the asset or liability. These standards state that “observable inputs” reflect the assumptions market participants would use in pricing the asset or liability based on market data obtained from independent sources and “unobservable inputs” reflect an entity’s own assumptions about the assumptions market participants would use in pricing the asset or liability. These inputs are summarized into three broad levels and described below:
Level 1 – Quoted prices (unadjusted) in active markets for identical assets or liabilities that the reporting entity can access at the measurement date.
Level 2 – Inputs other than quoted prices included within Level 1 that are observable for the asset or liability, either directly or indirectly.
Level 3 – Unobservable inputs for the asset or liability.
The inputs or methodology used for valuing securities are not necessarily an indication of the risk associated with investing in those securities.
The following is a summary of the inputs used to value the Fund’s investments as of December 31, 2023:
| | | Level 1 | | | Level 2 | | | Level 3 | | | Total | |
| Equity | | | | | | | | | | | | |
| Common Stocks | | $ | 207,765,351 | | | $ | 103,837,295 | | | $ | — | | | $ | 311,602,646 | |
| Total Equity | | | 207,765,351 | | | | 103,837,295 | | | | — | | | | 311,602,646 | |
| Warrants | | | | | | | | | | | | | | | | |
| Warrants | | | — | | | | — | | | | — | (1) | | | — | |
| Total Warrants | | | — | | | | — | | | | — | | | | — | |
| Short-Term Investment | | | | | | | | | | | | | | | | |
| Money Market Mutual Fund | | | 7,557,156 | | | | — | | | | — | | | | 7,557,156 | |
| Total Short-Term Investment | | | 7,557,156 | | | | — | | | | — | | | | 7,557,156 | |
Total Investments(2) | | $ | 215,322,507 | | | $ | 103,837,295 | | | $ | — | | | $ | 319,159,802 | |
(1) | Amount less than $1. |
(2) | Additional information regarding the industry classifications of these investments is disclosed in the Schedule of Investments. |
Changes in valuation techniques may result in transfers into or out of assigned levels within the fair value hierarchy. Warrants with a fair value of $0 are priced at fair value by the Valuation Committee instead of the Fund’s pricing vendor and are valued using level 3 inputs. Management has evaluated these warrants and has determined that they are immaterial. There were no transfers into or out of Level 3 during the year, as compared to the security classifications from the prior year’s annual report. See the Fund’s Valuation Policy in Note 2a to the financial statements.
The accompanying notes are an integral part of these financial statements.
Additional Information on Fund Expenses
December 31, 2023 (Unaudited)
Expense Example
As a shareholder of the Funds, you incur ongoing costs, such as management fees; distribution and/or service (12b-1) fees; and other fund expenses. The Funds do not charge any sales loads, redemption fees or other transaction fees; however, you will be assessed fees for outgoing wire transfers, returned checks and stop payment orders at prevailing rates charged by U.S. Bancorp Fund Services, LLC, doing business as U.S. Bank Global Fund Services, the Funds’ transfer agent. If you request that a redemption be made by wire transfer, currently the Funds’ transfer agent charges a $15.00 fee.
This Example is intended to help you understand your ongoing costs (in dollars) of investing in each Fund and to compare these costs with the ongoing costs of investing in other mutual funds. The Example is based on an investment of $1,000 invested at the beginning of the period and held for the entire period (7/1/23 – 12/31/23).
Actual Expenses
The third and fourth columns of the following table provide information about account values and actual expenses. You may use the information in these columns, together with the amount you invested, to estimate the expenses that you paid over the period. Simply divide your account value by $1,000 (for example, an $8,600 account value divided by $1,000 = 8.6), then multiply the result by the number in the fourth column entitled “Expenses Paid During Period” to estimate the expenses you paid on your account during this period.
Hypothetical Example for Comparison Purposes
The fifth and sixth columns of the following table provide information about hypothetical account values and hypothetical expenses based on the Funds’ actual expense ratios and an assumed rate of return of 5% per year before expenses, which is not the Funds’ actual returns. The hypothetical account values and expenses may not be used to estimate the actual ending account balance or expenses you paid for the period. You may use this information to compare the ongoing costs of investing in the Funds and other mutual funds. To do so, compare this 5% hypothetical example with the 5% hypothetical examples that appear in the shareholder reports of the other mutual funds. Please note that the expenses shown in the table are meant to highlight your ongoing costs only. Therefore, the sixth column of the table (entitled “Expenses Paid During Period”) is useful in comparing ongoing costs only, and will not help you determine the relative total costs of owning different mutual funds.
Actual vs. Hypothetical Returns
| | | | | | | Hypothetical (5% return |
| | | | Actual | | before expenses) |
| | | Beginning | Ending | Expenses Paid | | Ending | Expenses Paid |
| | Fund’s Annualized | Account Value | Account Value | During Period(1) | | Account Value | During Period(1) |
| | Expense Ratio(1) | 7/1/23 | 12/31/23 | (7/1/23 – 12/31/23) |
| 12/31/23 | (7/1/23 – 12/31/23) |
| Baird Mid Cap Growth Fund | | | | | | | |
| Institutional Class | 0.81% | $1,000.00 | $1,031.00 | $4.15 | | $1,021.12 | $4.13 |
| Investor Class | 1.06% | $1,000.00 | $1,030.00 | $5.42 | | $1,019.86 | $5.40 |
| | | | | | | | |
| Baird Small/Mid Cap Growth Fund | | | | | | | |
| Institutional Class | 0.85% | $1,000.00 | $ 982.20 | $4.25 | | $1,020.92 | $4.33 |
| Investor Class | 1.10% | $1,000.00 | $ 980.70 | $5.49 | | $1,019.66 | $5.60 |
| | | | | | | | |
| Baird Equity Opportunity Fund | | | | | | | |
| Institutional Class | 1.25% | $1,000.00 | $1,035.00 | $6.41 | | $1,018.90 | $6.36 |
| Investor Class | 1.50% | $1,000.00 | $1,033.60 | $7.69 | | $1,017.64 | $7.63 |
| | | | | | | | |
| Baird Chautauqua International Growth Fund | | | | | | |
| Institutional Class | 0.80% | $1,000.00 | $1,003.20 | $4.04 | | $1,021.17 | $4.08 |
| Investor Class | 1.05% | $1,000.00 | $1,002.20 | $5.30 | | $1,019.91 | $5.35 |
| | | | | | | | |
| Baird Chautauqua Global Growth Fund | | | | | | | |
| Institutional Class | 0.80% | $1,000.00 | $1,039.80 | $4.11 | | $1,021.17 | $4.08 |
| Investor Class | 1.05% | $1,000.00 | $1,038.30 | $5.39 | | $1,019.91 | $5.35 |
(1) | Expenses are equal to the Fund’s annualized net expense ratio multiplied by the average account value over the period, 184 days and divided by 365 to reflect the one-half year period. |
Statements of Assets and Liabilities
December 31, 2023
| | | Baird Mid Cap | | | Baird Small/Mid | | | Baird Equity | |
| | | Growth Fund | | | Cap Growth Fund | | | Opportunity Fund | |
| ASSETS: | | | | | | | | | |
| Investments, at value (cost $1,811,384,665, $154,087,909, and $53,900,122, respectively) | | $ | 2,529,601,046 | | | $ | 179,529,252 | | | $ | 60,629,588 | |
| Dividends receivable | | | 551,119 | | | | 12,495 | | | | 3,690 | |
| Interest receivable | | | 283,142 | | | | 38,856 | | | | 8,291 | |
| Receivable for investments sold | | | — | | | | 1,718,058 | | | | — | |
| Receivable for Fund shares sold | | | 4,008,742 | | | | 28,474 | | | | 145,919 | |
| Uninvested cash | | | 48,599 | | | | 71 | | | | 6,285 | |
| Prepaid expenses and other assets | | | 42,469 | | | | 39,363 | | | | 13,623 | |
| Total assets | | | 2,534,535,117 | | | | 181,366,569 | | | | 60,807,396 | |
| LIABILITIES: | | | | | | | | | | | | |
| Written option contracts, at value (premiums received $0, $0, and $31,677, respectively) | | | — | | | | — | | | | 14,875 | |
| Payable for investments purchased | | | — | | | | 4,523,364 | | | | 459,521 | |
| Payable for Fund shares redeemed | | | 3,166,587 | | | | 6,709 | | | | — | |
| Payable to Advisor, net (Note 5) | | | 1,561,991 | | | | 98,491 | | | | 38,528 | |
| Payable to Directors | | | 18,097 | | | | 18,097 | | | | 18,097 | |
| Accrued fund accounting and administration fees | | | 28,595 | | | | 7,131 | | | | 6,276 | |
| Accrued shareholder servicing fees | | | 163,432 | | | | 5,603 | | | | 6,320 | |
| Accrued professional fees | | | 15,150 | | | | 15,150 | | | | 16,150 | |
| Accrued custody fees | | | 4,649 | | | | 960 | | | | 1,480 | |
| Accrued Rule 12b-1 fees (Note 7) | | | 89,574 | | | | 810 | | | | 464 | |
| Accrued expenses and other liabilities | | | 73,409 | | | | 5,875 | | | | 1,883 | |
| Total liabilities | | | 5,121,484 | | | | 4,682,190 | | | | 563,594 | |
| NET ASSETS | | $ | 2,529,413,633 | | | $ | 176,684,379 | | | $ | 60,243,802 | |
| NET ASSETS CONSIST OF: | | | | | | | | | | | | |
| Paid-in capital | | $ | 1,819,556,076 | | | $ | 182,009,710 | | | $ | 56,603,614 | |
| Total distributable earnings (accumulated deficit) | | | 709,857,557 | | | | (5,325,331 | ) | | | 3,640,188 | |
| NET ASSETS | | $ | 2,529,413,633 | | | $ | 176,684,379 | | | $ | 60,243,802 | |
| INSTITUTIONAL CLASS SHARES | | | | | | | | | | | | |
| Net Assets | | $ | 2,351,391,336 | | | $ | 175,858,377 | | | $ | 60,241,230 | |
| Shares outstanding ($0.01 par value, unlimited shares authorized) | | | 95,228,088 | | | | 10,993,556 | | | | 4,519,384 | |
| Net asset value, offering and redemption price per share | | $ | 24.69 | | | $ | 16.00 | | | $ | 13.33 | |
| INVESTOR CLASS SHARES | | | | | | | | | | | | |
| Net Assets | | $ | 178,022,297 | | | $ | 826,002 | | | $ | 2,572 | |
| Shares outstanding ($0.01 par value, unlimited shares authorized) | | | 7,935,226 | | | | 52,460 | | | | 194 | |
| Net asset value, offering and redemption price per share | | $ | 22.43 | | | $ | 15.75 | | | $ | 13.23 | |
The accompanying notes are an integral part of these financial statements.
Statements of Assets and Liabilities
December 31, 2023
| | | Baird Chautauqua | | | Baird Chautauqua | |
| | | International | | | Global | |
| | | Growth Fund | | | Growth Fund | |
| ASSETS: | | | | | | |
| Investments, at value (cost $702,659,444 and $274,060,776, respectively) | | $ | 817,258,948 | | | $ | 319,159,802 | |
| Foreign currency, at value (cost $612,837 and $398,569, respectively) | | | 613,688 | | | | 400,318 | |
| Dividends receivable | | | 816,235 | | | | 243,146 | |
| Interest receivable | | | 131,527 | | | | 31,628 | |
| Receivable for Fund shares sold | | | 6,780,974 | | | | 181,571 | |
| Uninvested cash | | | 152,360 | | | | 62,923 | |
| Prepaid expenses and other assets | | | 29,329 | | | | 11,382 | |
| Total assets | | | 825,783,061 | | | | 320,090,770 | |
| LIABILITIES: | | | | | | | | |
| Payable for Fund shares redeemed | | | 218,969 | | | | 63,223 | |
| Payable to Advisor, net (Note 5) | | | 423,745 | | | | 173,505 | |
| Payable to Directors | | | 18,097 | | | | 18,097 | |
| Accrued fund accounting and administration fees | | | 12,916 | | | | 9,245 | |
| Accrued shareholder servicing fees | | | 36,357 | | | | 11,369 | |
| Accrued professional fees | | | 17,250 | | | | 17,250 | |
| Accrued custody fees | | | 18,643 | | | | 8,170 | |
| Accrued Rule 12b-1 fees (Note 7) | | | 8,708 | | | | 898 | |
| Deferred tax | | | 970,256 | | | | 272,572 | |
| Accrued expenses and other liabilities | | | 51,385 | | | | 13,535 | |
| Total liabilities | | | 1,776,326 | | | | 587,864 | |
| NET ASSETS | | $ | 824,006,735 | | | $ | 319,502,906 | |
| NET ASSETS CONSIST OF: | | | | | | | | |
| Paid-in capital | | $ | 730,431,665 | | | $ | 279,046,720 | |
| Total distributable earnings | | | 93,575,070 | | | | 40,456,186 | |
| NET ASSETS | | $ | 824,006,735 | | | $ | 319,502,906 | |
| INSTITUTIONAL CLASS SHARES | | | | | | | | |
| Net Assets | | $ | 808,350,304 | | | $ | 318,464,989 | |
| Shares outstanding ($0.01 par value, unlimited shares authorized) | | | 47,439,555 | | | | 15,409,869 | |
| Net asset value, offering and redemption price per share | | $ | 17.04 | | | $ | 20.67 | |
| INVESTOR CLASS SHARES | | | | | | | | |
| Net Assets | | $ | 15,656,431 | | | $ | 1,037,917 | |
| Shares outstanding ($0.01 par value, unlimited shares authorized) | | | 925,585 | | | | 50,768 | |
| Net asset value, offering and redemption price per share | | $ | 16.92 | | | $ | 20.44 | |
The accompanying notes are an integral part of these financial statements.
Statements of Operations
Year Ended December 31, 2023
| | | Baird Mid Cap | | | Baird Small/Mid | | | Baird Equity | |
| | | Growth Fund | | | Cap Growth Fund | | | Opportunity Fund | |
| INVESTMENT INCOME: | | | | | | | | | |
| Dividends (net of issuance fees and/or foreign taxes withheld of $0, $440, and $6,868, respectively) | | $ | 13,857,910 | | | $ | 694,887 | | | $ | 674,438 | |
| Interest | | | 3,526,356 | | | | 348,758 | | | | 84,568 | |
| Total investment income | | | 17,384,266 | | | | 1,043,645 | | | | 759,006 | |
| | | | | | | | | | | | | |
| EXPENSES: | | | | | | | | | | | | |
| Investment advisory fees (Note 5) | | | 16,813,519 | | | | 1,238,404 | | | | 747,755 | |
| Shareholder servicing fees | | | 917,258 | | | | 30,580 | | | | 24,375 | |
| Directors fees | | | 97,008 | | | | 97,008 | | | | 97,008 | |
| Fund accounting and administration fees | | | 154,167 | | | | 45,387 | | | | 40,006 | |
| Federal and state registration | | | 134,434 | | | | 55,940 | | | | 47,883 | |
| Professional fees | | | 39,718 | | | | 40,336 | | | | 44,052 | |
| Reports to shareholders | | | 87,194 | | | | 7,086 | | | | 5,830 | |
| Custody fees | | | 23,170 | | | | 3,272 | | | | 8,205 | |
| Interest expense (Note 6) | | | — | | | | 47 | | | | 81 | |
| Miscellaneous expenses | | | 2,394 | | | | 666 | | | | 339 | |
| Rule 12b-1 fees – Investor Class Shares (Note 7) | | | 424,154 | | | | 2,217 | | | | 7 | |
| Total expenses | | | 18,693,016 | | | | 1,520,943 | | | | 1,015,541 | |
| Fee waiver by Advisor (Note 5) | | | — | | | | (115,155 | ) | | | (267,698 | ) |
| Net expenses | | | 18,693,016 | | | | 1,405,788 | | | | 747,843 | |
| NET INVESTMENT INCOME (LOSS) | | | (1,308,750 | ) | | | (362,143 | ) | | | 11,163 | |
| | | | | | | | | | | | | |
| REALIZED AND UNREALIZED GAIN (LOSS) ON INVESTMENTS: | | | | | | | | | | | | |
| Net realized gain (loss) on: | | | | | | | | | | | | |
| Investments | | | 102,098,984 | | | | (10,960,374 | ) | | | (2,487,818 | ) |
| Written option contracts | | | — | | | | — | | | | 330,784 | |
| Net change in unrealized appreciation/depreciation on: | | | | | | | | | | | | |
| Investments | | | 290,593,196 | | | | 27,715,416 | | | | 9,498,983 | |
| Written option contracts | | | — | | | | — | | | | (66,961 | ) |
| Net realized and unrealized gain on investments | | | 392,692,180 | | | | 16,755,042 | | | | 7,274,988 | |
| NET INCREASE IN NET ASSETS RESULTING FROM OPERATIONS | | $ | 391,383,430 | | | $ | 16,392,899 | | | $ | 7,286,151 | |
The accompanying notes are an integral part of these financial statements.
Statements of Operations
Year Ended December 31, 2023
| | | Baird Chautauqua | | | Baird Chautauqua | |
| | | International | | | Global | |
| | | Growth Fund | | | Growth Fund | |
| INVESTMENT INCOME: | | | | | | |
| Dividends (net of issuance fees and/or foreign taxes withheld of $1,219,130 and $417,128, respectively) | | $ | 8,589,432 | | | $ | 3,400,147 | |
Non-cash dividends(1) | | | 609,429 | | | | 205,299 | |
| Interest | | | 996,138 | | | | 361,313 | |
| Total investment income | | | 10,194,999 | | | | 3,966,759 | |
| | | | | | | | | |
| EXPENSES: | | | | | | | | |
| Investment advisory fees (Note 5) | | | 4,834,135 | | | | 2,219,692 | |
| Shareholder servicing fees | | | 222,864 | | | | 58,563 | |
| Directors fees | | | 97,008 | | | | 97,008 | |
| Federal and state registration | | | 91,814 | | | | 72,059 | |
| Custody fees | | | 99,814 | | | | 40,126 | |
| Fund accounting and administration fees | | | 76,085 | | | | 57,130 | |
| Professional fees | | | 41,269 | | | | 41,269 | |
| Reports to shareholders | | | 36,165 | | | | 9,449 | |
| Interest expense (Note 6) | | | 2,786 | | | | — | |
| Miscellaneous expenses | | | 14,911 | | | | 15,768 | |
| Rule 12b-1 fees – Investor Class Shares (Note 7) | | | 40,102 | | | | 2,544 | |
| Total expenses | | | 5,556,953 | | | | 2,613,608 | |
| Fee waiver by Advisor (Note 5) | | | (357,653 | ) | | | (243,392 | ) |
| Net expenses | | | 5,199,300 | | | | 2,370,216 | |
| NET INVESTMENT INCOME | | | 4,995,699 | | | | 1,596,543 | |
| | | | | | | | | |
| REALIZED AND UNREALIZED GAIN (LOSS) ON INVESTMENTS AND FOREIGN CURRENCY TRANSLATION: | | | | | | | | |
| Net realized gain (loss) on: | | | | | | | | |
| Investments (net of foreign taxes paid of $21,191 and $3,106, respectively) | | | 2,913,723 | | | | (405,586 | ) |
| Foreign currency transactions | | | (210,521 | ) | | | (51,757 | ) |
| Net change in unrealized appreciation/depreciation on: | | | | | | | | |
| Investments | | | 62,254,085 | | | | 42,768,190 | |
| Foreign currency translation | | | 16,391 | | | | 5,754 | |
| Net realized and unrealized gain on investments and foreign currency translation | | | 64,973,678 | | | | 42,316,601 | |
| NET INCREASE IN NET ASSETS RESULTING FROM OPERATIONS | | $ | 69,969,377 | | | $ | 43,913,144 | |
(1) | Non-cash dividends are recorded at the fair value of the securities received. |
The accompanying notes are an integral part of these financial statements.
Statements of Changes in Net Assets
| | | Baird Mid Cap Growth Fund | | | Baird Small/Mid Cap Growth Fund | |
| | | Year Ended | | | Year Ended | | | Year Ended | | | Year Ended | |
| | | December 31, 2023 | | | December 31, 2022 | | | December 31, 2023 | | | December 31, 2022 | |
| OPERATIONS: | | | | | | | | | | | | |
| Net investment loss | | $ | (1,308,750 | ) | | $ | (6,399,901 | ) | | $ | (362,143 | ) | | $ | (522,310 | ) |
| Net realized gain (loss) on investments | | | 102,098,984 | | | | (45,618,233 | ) | | | (10,960,374 | ) | | | (19,684,321 | ) |
| Net change in unrealized appreciation/depreciation on investments | | | 290,593,196 | | | | (676,294,509 | ) | | | 27,715,416 | | | | (28,001,622 | ) |
| Net increase (decrease) in net assets resulting from operations | | | 391,383,430 | | | | (728,312,643 | ) | | | 16,392,899 | | | | (48,208,253 | ) |
| | | | | | | | | | | | | | | | | |
| CAPITAL SHARE TRANSACTIONS: | | | | | | | | | | | | | | | | |
| Proceeds from shares sold | | | 722,927,473 | | | | 630,389,326 | | | | 29,411,729 | | | | 46,431,461 | |
| Shares issued to holders in reinvestment of distributions | | | 49,173,891 | | | | 26,758,497 | | | | — | | | | 993,301 | |
| Cost of shares redeemed | | | (494,791,697 | ) | | | (549,380,616 | ) | | | (16,983,990 | ) | | | (15,543,812 | ) |
| Net increase in net assets resulting from capital share transactions | | | 277,309,667 | | | | 107,767,207 | | | | 12,427,739 | | | | 31,880,950 | |
| | | | | | | | | | | | | | | | | |
| DISTRIBUTIONS TO SHAREHOLDERS: | | | | | | | | | | | | | | | | |
| Distributions to shareholders: | | | | | | | | | | | | | | | | |
| Institutional Class | | | (51,408,482 | ) | | | (28,370,957 | ) | | | — | | | | (994,847 | ) |
| Investor Class | | | (4,277,963 | ) | | | (2,701,934 | ) | | | — | | | | (5,385 | ) |
| Total distributions to shareholders | | | (55,686,445 | ) | | | (31,072,891 | ) | | | — | | | | (1,000,232 | ) |
| | | | | | | | | | | | | | | | | |
| TOTAL INCREASE (DECREASE) IN NET ASSETS | | | 613,006,652 | | | | (651,618,327 | ) | | | 28,820,638 | | | | (17,327,535 | ) |
| | | | | | | | | | | | | | | | | |
| NET ASSETS: | | | | | | | | | | | | | | | | |
| Beginning of year | | | 1,916,406,981 | | | | 2,568,025,308 | | | | 147,863,741 | | | | 165,191,276 | |
| End of year | | $ | 2,529,413,633 | | | $ | 1,916,406,981 | | | $ | 176,684,379 | | | $ | 147,863,741 | |
The accompanying notes are an integral part of these financial statements.
Statements of Changes in Net Assets
| | | Baird Equity Opportunity Fund | |
| | | Year Ended | | | Year Ended | |
| | | December 31, 2023 | | | December 31, 2022 | |
| OPERATIONS: | | | | | | |
| Net investment income (loss) | | $ | 11,163 | | | $ | (314,797 | ) |
| Net realized gain (loss) on investments and written option contracts | | | (2,157,034 | ) | | | 628,660 | |
| Net change in unrealized appreciation/depreciation on investments and written option contracts | | | 9,432,022 | | | | (7,300,490 | ) |
| Net increase (decrease) in net assets resulting from operations | | | 7,286,151 | | | | (6,986,627 | ) |
| | | | | | | | | |
| CAPITAL SHARE TRANSACTIONS: | | | | | | | | |
| Proceeds from shares sold | | | 6,853,485 | | | | 12,850,612 | |
| Shares issued to holders in reinvestment of distributions | | | 6,261 | | | | 14,261,145 | |
| Cost of shares redeemed | | | (11,710,271 | ) | | | (8,777,787 | ) |
| Net increase (decrease) in net assets resulting from capital share transactions | | | (4,850,525 | ) | | | 18,333,970 | |
| | | | | | | | | |
| DISTRIBUTIONS TO SHAREHOLDERS: | | | | | | | | |
| Distributions to shareholders: | | | | | | | | |
| Institutional Class | | | (6,327 | ) | | | (14,495,880 | ) |
| Investor Class | | | — | | | | (570 | ) |
| Total distributions to shareholders | | | (6,327 | ) | | | (14,496,450 | ) |
| | | | | | | | | |
| TOTAL INCREASE (DECREASE) IN NET ASSETS | | | 2,429,299 | | | | (3,149,107 | ) |
| | | | | | | | | |
| NET ASSETS: | | | | | | | | |
| Beginning of year | | | 57,814,503 | | | | 60,963,610 | |
| End of year | | $ | 60,243,802 | | | $ | 57,814,503 | |
The accompanying notes are an integral part of these financial statements.
Statements of Changes in Net Assets
| | Baird Chautauqua International Growth Fund | | Baird Chautauqua Global Growth Fund | |
| | | Year Ended | | | Year Ended | | | Year Ended | | | Year Ended | |
| | | December 31, 2023 | | | December 31, 2022 | | | December 31, 2023 | | | December 31, 2022 | |
| OPERATIONS: | | | | | | | | | | | | |
| Net investment income | | $ | 4,995,699 | | | $ | 1,716,204 | | | $ | 1,596,543 | | | $ | 548,276 | |
| Net realized gain (loss) on investments and foreign currency transactions | | | 2,703,202 | | | | (22,963,179 | ) | | | (457,343 | ) | | | (3,016,153 | ) |
| Net change in unrealized appreciation/depreciation on | | | | | | | | | | | | | | | | |
| investments and foreign currency translation | | | 62,270,476 | | | | (71,271,860 | ) | | | 42,773,944 | | | | (62,326,005 | ) |
| Net increase (decrease) in net assets resulting from operations | | | 69,969,377 | | | | (92,518,835 | ) | | | 43,913,144 | | | | (64,793,882 | ) |
| | | | | | | | | | | | | | | | | |
| CAPITAL SHARE TRANSACTIONS: | | | | | | | | | | | | | | | | |
| Proceeds from shares sold | | | 401,673,235 | | | | 284,419,533 | | | | 32,304,361 | | | | 56,027,768 | |
| Shares issued to holders in reinvestment of distributions | | | 1,494,819 | | | | 3,796,060 | | | | 1,236,689 | | | | 326,779 | |
| Cost of shares redeemed | | | (140,522,720 | ) | | | (167,135,571 | ) | | | (22,510,079 | ) | | | (41,676,691 | ) |
| Net increase in net assets resulting from capital share transactions | | | 262,645,334 | | | | 121,080,022 | | | | 11,030,971 | | | | 14,677,856 | |
| | | | | | | | | | | | | | | | | |
| DISTRIBUTIONS TO SHAREHOLDERS: | | | | | | | | | | | | | | | | |
| Distributions to shareholders: | | | | | | | | | | | | | | | | |
| Institutional Class | | | (1,649,060 | ) | | | (4,214,970 | ) | | | (1,307,617 | ) | | | (343,463 | ) |
| Investor Class | | | (24,611 | ) | | | (110,964 | ) | | | (1,777 | ) | | | (1,217 | ) |
| Total distributions to shareholders | | | (1,673,671 | ) | | | (4,325,934 | ) | | | (1,309,394 | ) | | | (344,680 | ) |
| | | | | | | | | | | | | | | | | |
| TOTAL INCREASE (DECREASE) IN NET ASSETS | | | 330,941,040 | | | | 24,235,253 | | | | 53,634,721 | | | | (50,460,706 | ) |
| | | | | | | | | | | | | | | | | |
| NET ASSETS: | | | | | | | | | | | | | | | | |
| Beginning of year | | | 493,065,695 | | | | 468,830,442 | | | | 265,868,185 | | | | 316,328,891 | |
| End of year | | $ | 824,006,735 | | | $ | 493,065,695 | | | $ | 319,502,906 | | | $ | 265,868,185 | |
The accompanying notes are an integral part of these financial statements.
Financial Highlights
Baird Mid Cap Growth Fund – Institutional Class
| | | Year Ended December 31, | |
| | | 2023 | | | 2022 | | | 2021 | | | 2020 | | | 2019 | |
| Per Share Data: | | | | | | | | | | | | | | | |
| Net asset value, beginning of year | | $ | 21.01 | | | $ | 29.50 | | | $ | 28.17 | | | $ | 22.90 | | | $ | 17.72 | |
| Income from investment operations: | | | | | | | | | | | | | | | | | | | | |
Net investment loss(1) | | | (0.01 | ) | | | (0.07 | ) | | | (0.15 | ) | | | (0.08 | ) | | | (0.02 | ) |
| Net realized and unrealized gains (losses) on investments | | | 4.24 | | | | (8.08 | ) | | | 6.30 | | | | 7.99 | | | | 6.44 | |
| Total from investment operations | | | 4.23 | | | | (8.15 | ) | | | 6.15 | | | | 7.91 | | | | 6.42 | |
| Less distributions: | | | | | | | | | | | | | | | | | | | | |
| Distributions from net realized gains | | | (0.55 | ) | | | (0.34 | ) | | | (4.82 | ) | | | (2.64 | ) | | | (1.24 | ) |
| Total distributions | | | (0.55 | ) | | | (0.34 | ) | | | (4.82 | ) | | | (2.64 | ) | | | (1.24 | ) |
| Net asset value, end of year | | $ | 24.69 | | | $ | 21.01 | | | $ | 29.50 | | | $ | 28.17 | | | $ | 22.90 | |
| Total return | | | 20.17 | % | | | (27.64 | )% | | | 22.51 | % | | | 34.81 | % | | | 36.31 | % |
| Supplemental data and ratios: | | | | | | | | | | | | | | | | | | | | |
| Net assets, end of year (millions) | | $ | 2,351.4 | | | $ | 1,762.8 | | | $ | 2,334.3 | | | $ | 2,065.5 | | | $ | 1,825.8 | |
| Ratio of expenses to average net assets | | | 0.81 | % | | | 0.81 | % | | | 0.80 | % | | | 0.82 | % | | | 0.82 | % |
| Ratio of net investment loss to average net assets | | | (0.04 | )% | | | (0.29 | )% | | | (0.49 | )% | | | (0.35 | )% | | | (0.07 | )% |
Portfolio turnover rate(2) | | | 42 | % | | | 26 | % | | | 31 | % | | | 47 | % | | | 43 | % |
(1) | Calculated using average shares outstanding during the year. |
(2) | Portfolio turnover is calculated on the basis of the Fund as a whole without distinguishing between the classes of shares issued and excludes in-kind transactions, where applicable. |
Baird Mid Cap Growth Fund – Investor Class
| | | Year Ended December 31, | |
| | | 2023 | | | 2022 | | | 2021 | | | 2020 | | | 2019 | |
| Per Share Data: | | | | | | | | | | | | | | | |
| Net asset value, beginning of year | | $ | 19.18 | | | $ | 27.04 | | | $ | 26.22 | | | $ | 21.53 | | | $ | 16.76 | |
| Income from investment operations: | | | | | | | | | | | | | | | | | | | | |
Net investment loss(1) | | | (0.06 | ) | | | (0.11 | ) | | | (0.21 | ) | | | (0.14 | ) | | | (0.07 | ) |
| Net realized and unrealized gains (losses) on investments | | | 3.86 | | | | (7.41 | ) | | | 5.85 | | | | 7.47 | | | | 6.08 | |
| Total from investment operations | | | 3.80 | | | | (7.52 | ) | | | 5.64 | | | | 7.33 | | | | 6.01 | |
| Less distributions: | | | | | | | | | | | | | | | | | | | | |
| Distributions from net realized gains | | | (0.55 | ) | | | (0.34 | ) | | | (4.82 | ) | | | (2.64 | ) | | | (1.24 | ) |
| Total distributions | | | (0.55 | ) | | | (0.34 | ) | | | (4.82 | ) | | | (2.64 | ) | | | (1.24 | ) |
| Net asset value, end of year | | $ | 22.43 | | | $ | 19.18 | | | $ | 27.04 | | | $ | 26.22 | | | $ | 21.53 | |
| Total return | | | 19.86 | % | | | (27.82 | )% | | | 22.25 | % | | | 34.32 | % | | | 35.94 | % |
| Supplemental data and ratios: | | | | | | | | | | | | | | | | | | | | |
| Net assets, end of year (millions) | | $ | 178.0 | | | $ | 153.6 | | | $ | 233.7 | | | $ | 200.3 | | | $ | 148.3 | |
| Ratio of expenses to average net assets | | | 1.06 | % | | | 1.06 | % | | | 1.05 | % | | | 1.07 | % | | | 1.07 | % |
| Ratio of net investment loss to average net assets | | | (0.29 | )% | | | (0.54 | )% | | | (0.74 | )% | | | (0.60 | )% | | | (0.32 | )% |
Portfolio turnover rate(2) | | | 42 | % | | | 26 | % | | | 31 | % | | | 47 | % | | | 43 | % |
(1) | Calculated using average shares outstanding during the year. |
(2) | Portfolio turnover is calculated on the basis of the Fund as a whole without distinguishing between the classes of shares issued and excludes in-kind transactions, where applicable. |
The accompanying notes are an integral part of these financial statements.
Financial Highlights
Baird Small/Mid Cap Growth Fund – Institutional Class
| | | Year Ended December 31, | |
| | | 2023 | | | 2022 | | | 2021 | | | 2020 | | | 2019 | |
| Per Share Data: | | | | | | | | | | | | | | | |
| Net asset value, beginning of year | | $ | 14.43 | | | $ | 19.94 | | | $ | 17.39 | | | $ | 12.26 | | | $ | 8.95 | |
| Income from investment operations: | | | | | | | | | | | | | | | | | | | | |
Net investment loss(1) | | | (0.03 | ) | | | (0.05 | ) | | | (0.12 | ) | | | (0.06 | ) | | | (0.03 | ) |
| Net realized and unrealized gains (losses) on investments | | | 1.60 | | | | (5.36 | ) | | | 3.29 | | | | 5.52 | | | | 3.34 | |
| Total from investment operations | | | 1.57 | | | | (5.41 | ) | | | 3.17 | | | | 5.46 | | | | 3.31 | |
| Less distributions: | | | | | | | | | | | | | | | | | | | | |
| Distributions from net realized gains | | | — | | | | (0.10 | ) | | | (0.62 | ) | | | (0.33 | ) | | | — | |
| Total distributions | | | — | | | | (0.10 | ) | | | (0.62 | ) | | | (0.33 | ) | | | — | |
| Net asset value, end of year | | $ | 16.00 | | | $ | 14.43 | | | $ | 19.94 | | | $ | 17.39 | | | $ | 12.26 | |
| Total return | | | 10.88 | % | | | (27.14 | )% | | | 18.42 | % | | | 44.57 | % | | | 36.98 | % |
| Supplemental data and ratios: | | | | | | | | | | | | | | | | | | | | |
| Net assets, end of year (millions) | | $ | 175.9 | | | $ | 147.1 | | | $ | 164.3 | | | $ | 51.2 | | | $ | 18.3 | |
| Ratio of expenses to average net assets | | | 0.85 | % | | | 0.85 | % | | | 0.85 | % | | | 0.85 | % | | | 0.85 | % |
| Ratio of expenses to average net assets (before waivers) | | | 0.92 | % | | | 0.98 | % | | | 1.00 | % | | | 1.43 | % | | | 2.10 | % |
| Ratio of net investment loss to average net assets | | | (0.22 | )% | | | (0.33 | )% | | | (0.63 | )% | | | (0.41 | )% | | | (0.25 | )% |
| Ratio of net investment loss to average net assets (before waivers) | (0.29 | )% | | | (0.45 | )% | | | (0.78 | )% | | | (0.99 | )% | | | (1.50 | )% |
Portfolio turnover rate(2) | | | 48 | % | | | 39 | % | | | 50 | % | | | 65 | % | | | 60 | % |
(1) | Calculated using average shares outstanding during the year. |
(2) | Portfolio turnover is calculated on the basis of the Fund as a whole without distinguishing between the classes of shares issued and excludes in-kind transactions, where applicable. |
Baird Small/Mid Cap Growth Fund – Investor Class
| | | Year Ended December 31, | |
| | | 2023 | | | 2022 | | | 2021 | | | 2020 | | | 2019 | |
| Per Share Data: | | | | | | | | | | | | | | | |
| Net asset value, beginning of year | | $ | 14.24 | | | $ | 19.72 | | | $ | 17.25 | | | $ | 12.21 | | | $ | 8.94 | |
| Income from investment operations: | | | | | | | | | | | | | | | | | | | | |
Net investment loss(1) | | | (0.07 | ) | | | (0.09 | ) | | | (0.17 | ) | | | (0.09 | ) | | | (0.06 | ) |
| Net realized and unrealized gains (losses) on investments | | | 1.58 | | | | (5.29 | ) | | | 3.26 | | | | 5.46 | | | | 3.33 | |
| Total from investment operations | | | 1.51 | | | | (5.38 | ) | | | 3.09 | | | | 5.37 | | | | 3.27 | |
| Less distributions: | | | | | | | | | | | | | | | | | | | | |
| Distributions from net realized gains | | | — | | | | (0.10 | ) | | | (0.62 | ) | | | (0.33 | ) | | | — | |
| Total distributions | | | — | | | | (0.10 | ) | | | (0.62 | ) | | | (0.33 | ) | | | — | |
| Net asset value, end of year | | $ | 15.75 | | | $ | 14.24 | | | $ | 19.72 | | | $ | 17.25 | | | $ | 12.21 | |
| Total return | | | 10.60 | % | | | (27.29 | )% | | | 18.10 | % | | | 43.89 | % | | | 36.69 | % |
| Supplemental data and ratios: | | | | | | | | | | | | | | | | | | | | |
| Net assets, end of year (thousands) | | $ | 826.0 | | | $ | 779.4 | | | $ | 863.7 | | | $ | 661.0 | | | $ | 287.3 | |
| Ratio of expenses to average net assets | | | 1.10 | % | | | 1.10 | % | | | 1.10 | % | | | 1.10 | % | | | 1.10 | % |
| Ratio of expenses to average net assets (before waivers) | | | 1.17 | % | | | 1.23 | % | | | 1.25 | % | | | 1.68 | % | | | 2.35 | % |
| Ratio of net investment loss to average net assets | | | (0.47 | )% | | | (0.58 | )% | | | (0.88 | )% | | | (0.66 | )% | | | (0.50 | )% |
| Ratio of net investment loss to average net assets (before waivers) | (0.54 | )% | | | (0.70 | )% | | | (1.03 | )% | | | (1.24 | )% | | | (1.75 | )% |
Portfolio turnover rate(2) | | | 48 | % | | | 39 | % | | | 50 | % | | | 65 | % | | | 60 | % |
(1) | Calculated using average shares outstanding during the year. |
(2) | Portfolio turnover is calculated on the basis of the Fund as a whole without distinguishing between the classes of shares issued and excludes in-kind transactions, where applicable. |
The accompanying notes are an integral part of these financial statements.
Financial Highlights
Baird Equity Opportunity Fund – Institutional Class
| | | Year Ended December 31, | |
| | | 2023 | | | 2022 | | | 2021 | | | 2020 | | | 2019 | |
| Per Share Data: | | | | | | | | | | | | | | | |
| Net asset value, beginning of year | | $ | 11.72 | | | $ | 17.68 | | | $ | 15.56 | | | $ | 15.96 | | | $ | 13.58 | |
| Income from investment operations: | | | | | | | | | | | | | | | | | | | | |
Net investment income (loss)(1) | | | 0.00 | (2) | | | (0.09 | ) | | | 0.14 | | | | 0.03 | | | | 0.13 | |
Net realized and unrealized gains (losses) on investments and written option contracts | | | 1.61 | | | | (1.95 | ) | | | 2.82 | | | | 0.43 | (3) | | | 2.36 | |
| Total from investment operations | | | 1.61 | | | | (2.04 | ) | | | 2.96 | | | | 0.46 | | | | 2.49 | |
| Less distributions: | | | | | | | | | | | | | | | | | | | | |
| Distributions from net investment income | | | (0.00 | )(2) | | | — | | | | (0.17 | ) | | | (0.03 | ) | | | (0.11 | ) |
| Distributions from net realized gains | | | — | | | | (3.92 | ) | | | (0.67 | ) | | | (0.83 | ) | | | — | |
| Total distributions | | | (0.00 | ) | | | (3.92 | ) | | | (0.84 | ) | | | (0.86 | ) | | | (0.11 | ) |
| Net asset value, end of year | | $ | 13.33 | | | $ | 11.72 | | | $ | 17.68 | | | $ | 15.56 | | | $ | 15.96 | |
| Total return | | | 13.75 | % | | | (11.56 | )% | | | 19.40 | % | | | 2.85 | % | | | 18.40 | % |
| Supplemental data and ratios: | | | | | | | | | | | | | | | | | | | | |
| Net assets, end of year (millions) | | $ | 60.2 | | | $ | 57.8 | | | $ | 61.0 | | | $ | 30.4 | | | $ | 33.0 | |
| Ratio of expenses to average net assets | | | 1.25 | % | | | 1.25 | % | | | 0.98 | %(4) | | | 0.95 | % | | | 0.95 | % |
| Ratio of expenses to average net assets (before waivers) | | | 1.70 | % | | | 1.73 | % | | | 1.53 | % | | | 1.64 | % | | | 1.44 | % |
| Ratio of net investment income (loss) to average net assets | | | 0.02 | % | | | (0.55 | )% | | | 0.82 | % | | | 0.21 | % | | | 0.87 | % |
Ratio of net investment income (loss) to average net assets (before waivers) | | | (0.43 | )% | | | (1.02 | )% | | | 0.27 | % | | | (0.48 | )% | | | 0.38 | % |
Portfolio turnover rate(6) | | | 67 | % | | | 72 | % | | | 67 | %(5) | | | 61 | % | | | 55 | % |
(1) | Calculated using average shares outstanding during the year. |
(2) | Amount is less than $0.005. |
(3) | Due to timing of capital share transactions, the per share amount of net realized and unrealized gain (loss) on investments varies from the amounts shown in the Statement of Operations. |
(4) | Blended rate. Pursuant to the Expense Cap/Reimbursement Agreement effective December 12, 2021, the expense cap increased to 1.25%. Prior to December 12, 2021, the expense cap was 0.95%. |
(5) | The cost of purchases and the proceeds from sales of securities that were incurred by the Fund subsequent to Greenhouse’s appointment as subadvisor to the Baird Equity Opportunity Fund that related to the alignment of the Fund’s portfolio with Greenhouse’s investment style are excluded from the portfolio turnover rate calculation. If such amounts has not been excluded, the portfolio turnover rate would have been 189% for the year ended December 31, 2021. |
(6) | Portfolio turnover is calculated on the basis of the Fund as a whole without distinguishing between the classes of shares issued and excludes in-kind transactions, where applicable. |
Baird Equity Opportunity Fund – Investor Class
| | | Year Ended December 31, | |
| | | 2023 | | | 2022 | | | 2021 | | | 2020 | | | 2019 | |
| Per Share Data: | | | | | | | | | | | | | | | |
| Net asset value, beginning of year | | $ | 11.65 | | | $ | 17.65 | | | $ | 15.52 | | | $ | 15.97 | | | $ | 13.58 | |
| Income from investment operations: | | | | | | | | | | | | | | | | | | | | |
Net investment income (loss)(1) | | | (0.03 | ) | | | (0.13 | ) | | | 0.10 | | | | (0.01 | ) | | | 0.09 | |
Net realized and unrealized gains (losses) on investments and written option contracts | | | 1.61 | | | | (1.95 | ) | | | 2.83 | | | | 0.42 | (2) | | | 2.37 | |
| Total from investment operations | | | 1.58 | | | | (2.08 | ) | | | 2.93 | | | | 0.41 | | | | 2.46 | |
| Less distributions: | | | | | | | | | | | | | | | | | | | | |
| Distributions from net investment income | | | — | | | | — | | | | (0.13 | ) | | | (0.03 | ) | | | (0.07 | ) |
| Distributions from net realized gains | | | — | | | | (3.92 | ) | | | (0.67 | ) | | | (0.83 | ) | | | — | |
| Total distributions | | | — | | | | (3.92 | ) | | | (0.80 | ) | | | (0.86 | ) | | | (0.07 | ) |
| Net asset value, end of year | | $ | 13.23 | | | $ | 11.65 | | | $ | 17.65 | | | $ | 15.52 | | | $ | 15.97 | |
| Total return | | | 13.56 | % | | | (11.77 | )% | | | 19.16 | % | | | 2.54 | % | | | 18.19 | % |
| Supplemental data and ratios: | | | | | | | | | | | | | | | | | | | | |
| Net assets, end of year (thousands) | | $ | 2.6 | | | $ | 2.3 | | | $ | 2.6 | | | $ | 295.7 | | | $ | 883.8 | |
| Ratio of expenses to average net assets | | | 1.50 | % | | | 1.50 | % | | | 1.23 | %(3) | | | 1.20 | % | | | 1.20 | % |
| Ratio of expenses to average net assets (before waivers) | | | 1.95 | % | | | 1.98 | % | | | 1.78 | % | | | 1.89 | % | | | 1.69 | % |
| Ratio of net investment income (loss) to average net assets | | | (0.23 | )% | | | (0.80 | )% | | | 0.57 | % | | | (0.04 | )% | | | 0.62 | % |
Ratio of net investment income (loss) to average net assets (before waivers) | | | (0.68 | )% | | | (1.27 | )% | | | 0.02 | % | | | (0.73 | )% | | | 0.13 | % |
Portfolio turnover rate(5) | | | 67 | % | | | 72 | % | | | 67 | %(4) | | | 61 | % | | | 55 | % |
(1) | Calculated using average shares outstanding during the year. |
(2) | Due to timing of capital share transactions, the per share amount of net realized and unrealized gain (loss) on investments varies from the amounts shown in the Statement of Operations. |
(3) | Blended rate. Pursuant to the Expense Cap/Reimbursement Agreement effective December 12, 2021, the expense cap increased to 1.50%. Prior to December 12, 2021, the expense cap was 1.20%. |
(4) | The cost of purchases and proceeds from sales of securities that were incurred by the Fund subsequent to Greenhouse’s appointment as subadvisor to the Baird Equity Opportunity Fund that related to the alignment of the Fund’s portfolio with Greenhouse’s investment style are excluded from the portfolio turnover rate calculation. If such amounts had not been excluded, the portfolio turnover rate would have been 189% for the year ended December 31, 2021. |
(5) | Portfolio turnover is calculated on the basis of the Fund as a whole without distinguishing between the classes of shares issued and excludes in-kind transactions, where applicable. |
The accompanying notes are an integral part of these financial statements.
Financial Highlights
Baird Chautauqua International Growth Fund – Institutional Class
| | | Year Ended December 31, | |
| | | 2023 | | | 2022 | | | 2021 | | | 2020 | | | 2019 | |
| Per Share Data: | | | | | | | | | | | | | | | |
| Net asset value, beginning of year | | $ | 15.19 | | | $ | 18.65 | | | $ | 17.51 | | | $ | 12.62 | | | $ | 10.17 | |
| Income from investment operations: | | | | | | | | | | | | | | | | | | | | |
Net investment income(1) | | | 0.13 | | | | 0.06 | | | | 0.04 | | | | 0.01 | | | | 0.30 | |
Net realized and unrealized gains (losses)
on investments and foreign currency translation | | | 1.76 | | | | (3.38 | ) | | | 1.19 | | | | 5.00 | | | | 2.42 | |
| Total from investment operations | | | 1.89 | | | | (3.32 | ) | | | 1.23 | | | | 5.01 | | | | 2.72 | |
| Less distributions: | | | | | | | | | | | | | | | | | | | | |
| Distributions from net investment income | | | (0.04 | ) | | | (0.03 | ) | | | (0.09 | ) | | | (0.12 | ) | | | (0.27 | ) |
| Distributions from net realized gains | | | — | | | | (0.11 | ) | | | — | | | | — | | | | — | |
| Total distributions | | | (0.04 | ) | | | (0.14 | ) | | | (0.09 | ) | | | (0.12 | ) | | | (0.27 | ) |
Paid in capital from redemption fees(2) | | | — | | | | — | | | | 0.00 | (3) | | | 0.00 | (3) | | | 0.00 | (3) |
| Net asset value, end of year | | $ | 17.04 | | | $ | 15.19 | | | $ | 18.65 | | | $ | 17.51 | | | $ | 12.62 | |
| Total return | | | 12.41 | % | | | (17.84 | )% | | | 6.90 | % | | | 39.84 | % | | | 26.72 | % |
| Supplemental data and ratios: | | | | | | | | | | | | | | | | | | | | |
| Net assets, end of year (millions) | | $ | 808.4 | | | $ | 479.1 | | | $ | 468.2 | | | $ | 321.8 | | | $ | 172.7 | |
| Ratio of expenses to average net assets | | | 0.80 | % | | | 0.80 | % | | | 0.80 | % | | | 0.80 | % | | | 0.80 | % |
| Ratio of expenses to average net assets (before waivers) | | | 0.86 | % | | | 0.87 | % | | | 0.86 | % | | | 0.90 | % | | | 0.96 | % |
| Ratio of net investment income to average net assets | | | 0.78 | % | | | 0.37 | % | | | 0.20 | % | | | 0.07 | % | | | 2.56 | % |
Ratio of net investment income (loss) to average net assets (before waivers) | | | 0.73 | % | | | 0.31 | % | | | 0.14 | % | | | (0.03 | )% | | | 2.40 | % |
Portfolio turnover rate(4) | | | 12 | % | | | 23 | % | | | 14 | % | | | 31 | % | | | 31 | % |
(1) | Calculated using average shares outstanding during the year. |
(2) | Effective December 1, 2021, the Fund eliminated the 2.00% redemption fee charged on amounts redeemed for shares held 90 days or less. |
(3) | Amount is less than $0.005. |
(4) | Portfolio turnover is calculated on the basis of the Fund as a whole without distinguishing between the classes of shares issued and excludes in-kind transactions, where applicable. |
Baird Chautauqua International Growth Fund – Investor Class
| | | Year Ended December 31, | |
| | | 2023 | | | 2022 | | | 2021 | | | 2020 | | | 2019 | |
| Per Share Data: | | | | | | | | | | | | | | | |
| Net asset value, beginning of year | | $ | 15.11 | | | $ | 18.58 | | | $ | 17.48 | | | $ | 12.60 | | | $ | 10.15 | |
| Income from investment operations: | | | | | | | | | | | | | | | | | | | | |
Net investment income (loss)(1) | | | 0.09 | | | | 0.02 | | | | (0.01 | ) | | | (0.02 | ) | | | 0.27 | |
Net realized and unrealized gains (losses) on investments and foreign currency translation | | | 1.75 | | | | (3.37 | ) | | | 1.20 | | | | 4.95 | (2) | | | 2.41 | |
| Total from investment operations | | | 1.84 | | | | (3.35 | ) | | | 1.19 | | | | 4.93 | | | | 2.68 | |
| Less distributions: | | | | | | | | | | | | | | | | | | | | |
| Distributions from net investment income | | | (0.03 | ) | | | (0.01 | ) | | | (0.09 | ) | | | (0.05 | ) | | | (0.23 | ) |
| Distributions from net realized gains | | | — | | | | (0.11 | ) | | | — | | | | — | | | | — | |
| Total distributions | | | (0.03 | ) | | | (0.12 | ) | | | (0.09 | ) | | | (0.05 | ) | | | (0.23 | ) |
Paid in capital from redemption fees(3) | | | — | | | | — | | | | 0.00 | (4) | | | 0.00 | (4) | | | 0.00 | (4) |
| Net asset value, end of year | | $ | 16.92 | | | $ | 15.11 | | | $ | 18.58 | | | $ | 17.48 | | | $ | 12.60 | |
| Total return | | | 12.15 | % | | | (18.03 | )% | | | 6.62 | % | | | 39.37 | % | | | 26.42 | % |
| Supplemental data and ratios: | | | | | | | | | | | | | | | | | | | | |
| Net assets, end of year (thousands) | | $ | 15,656.4 | | | $ | 13,993.5 | | | $ | 608.0 | | | $ | 697.4 | | | $ | 1,494.8 | |
| Ratio of expenses to average net assets | | | 1.05 | % | | | 1.05 | % | | | 1.05 | % | | | 1.05 | % | | | 1.05 | % |
| Ratio of expenses to average net assets (before waivers) | | | 1.11 | % | | | 1.12 | % | | | 1.11 | % | | | 1.15 | % | | | 1.21 | % |
| Ratio of net investment income (loss) to average net assets | | | 0.53 | % | | | 0.12 | % | | | (0.05 | )% | | | (0.18 | )% | | | 2.31 | % |
Ratio of net investment income (loss) to average net assets (before waivers) | | | 0.48 | % | | | 0.06 | % | | | (0.11 | )% | | | (0.28 | )% | | | 2.15 | % |
Portfolio turnover rate(5) | | | 12 | % | | | 23 | % | | | 14 | % | | | 31 | % | | | 31 | % |
(1) | Calculated using average shares outstanding during the year. |
(2) | Due to timing of capital share transactions, the per share amount of net realized and unrealized gain (loss) on investments varies from the amounts shown in the Statement of Operations. |
(3) | Effective December 1, 2021, the Fund eliminated the 2.00% redemption fee charged on amounts redeemed for shares held 90 days or less. |
(4) | Amount is less than $0.005. |
(5) | Portfolio turnover is calculated on the basis of the Fund as a whole without distinguishing between the classes of shares issued and excludes in-kind transactions, where applicable. |
The accompanying notes are an integral part of these financial statements.
Financial Highlights
Baird Chautauqua Global Growth Fund – Institutional Class
| | | Year Ended December 31, | |
| | | 2023 | | | 2022 | | | 2021 | | | 2020 | | | 2019 | |
| Per Share Data: | | | | | | | | | | | | | | | |
| Net asset value, beginning of year | | $ | 17.84 | | | $ | 22.36 | | | $ | 19.85 | | | $ | 14.47 | | | $ | 11.29 | |
| Income from investment operations: | | | | | | | | | | | | | | | | | | | | |
Net investment income (loss)(1) | | | 0.11 | | | | 0.04 | | | | 0.00 | (2) | | | (0.03 | ) | | | 0.22 | |
Net realized and unrealized gains (losses) on investments and foreign currency translation | | | 2.81 | | | | (4.54 | ) | | | 2.59 | | | | 5.49 | | | | 3.18 | |
| Total from investment operations | | | 2.92 | | | | (4.50 | ) | | | 2.59 | | | | 5.46 | | | | 3.40 | |
| Less distributions: | | | | | | | | | | | | | | | | | | | | |
| Distributions from net investment income | | | (0.09 | ) | | | — | | | | (0.08 | ) | | | (0.09 | ) | | | (0.16 | ) |
| Distributions from net realized gains | | | — | | | | (0.02 | ) | | | — | | | | — | | | | (0.06 | ) |
| Total distributions | | | (0.09 | ) | | | (0.02 | ) | | | (0.08 | ) | | | (0.09 | ) | | | (0.22 | ) |
Paid in capital from redemption fees(3) | | | — | | | | — | | | | 0.00 | (2) | | | 0.01 | | | | 0.00 | (2) |
| Net asset value, end of year | | $ | 20.67 | | | $ | 17.84 | | | $ | 22.36 | | | $ | 19.85 | | | $ | 14.47 | |
| Total return | | | 16.34 | % | | | (20.11 | )% | | | 12.93 | % | | | 37.97 | % | | | 30.14 | % |
| Supplemental data and ratios: | | | | | | | | | | | | | | | | | | | | |
| Net assets, end of year (millions) | | $ | 318.5 | | | $ | 264.9 | | | $ | 314.7 | | | $ | 137.3 | | | $ | 55.8 | |
| Ratio of expenses to average net assets | | | 0.80 | % | | | 0.80 | % | | | 0.80 | % | | | 0.80 | % | | | 0.80 | % |
| Ratio of expenses to average net assets (before waivers) | | | 0.88 | % | | | 0.92 | % | | | 0.92 | % | | | 1.04 | % | | | 1.23 | % |
| Ratio of net investment income (loss) to average net assets | | | 0.54 | % | | | 0.20 | % | | | 0.01 | % | | | (0.17 | )% | | | 1.64 | % |
Ratio of net investment income (loss) to average net assets (before waivers) | | | 0.46 | % | | | 0.09 | % | | | (0.11 | )% | | | (0.41 | )% | | | 1.21 | % |
Portfolio turnover rate(4) | | | 14 | % | | | 12 | % | | | 13 | % | | | 24 | % | | | 26 | % |
(1) | Calculated using average shares outstanding during the year. |
(2) | Amount is less than $0.005. |
(3) | Effective December 1, 2021, the Fund eliminated the 2.00% redemption fee charged on amounts redeemed for shares held 90 days or less. |
(4) | Portfolio turnover is calculated on the basis of the Fund as a whole without distinguishing between the classes of shares issued and excludes in-kind transactions, where applicable. |
Baird Chautauqua Global Growth Fund – Investor Class
| | | Year Ended December 31, | |
| | | 2023 | | | 2022 | | | 2021 | | | 2020 | | | 2019 | |
| Per Share Data: | | | | | | | | | | | | | | | |
| Net asset value, beginning of year | | $ | 17.65 | | | $ | 22.18 | | | $ | 19.74 | | | $ | 14.36 | | | $ | 11.22 | |
| Income from investment operations: | | | | | | | | | | | | | | | | | | | | |
Net investment income (loss)(1) | | | 0.06 | | | | (0.01 | ) | | | (0.05 | ) | | | (0.06 | ) | | | 0.19 | |
Net realized and unrealized gains (losses) on investments and foreign currency translation | | | 2.77 | | | | (4.50 | ) | | | 2.57 | | | | 5.44 | | | | 3.15 | |
| Total from investment operations | | | 2.83 | | | | (4.51 | ) | | | 2.52 | | | | 5.38 | | | | 3.34 | |
| Less distributions: | | | | | | | | | | | | | | | | | | | | |
| Distributions from net investment income | | | (0.04 | ) | | | — | | | | (0.08 | ) | | | (0.05 | ) | | | (0.14 | ) |
| Distributions from net realized gains | | | — | | | | (0.02 | ) | | | — | | | | — | | | | (0.06 | ) |
| Total distributions | | | (0.04 | ) | | | (0.02 | ) | | | (0.08 | ) | | | (0.05 | ) | | | (0.20 | ) |
Paid in capital from redemption fees(3) | | | — | | | | — | | | | 0.00 | (2) | | | 0.05 | | | | 0.00 | (2) |
| Net asset value, end of year | | $ | 20.44 | | | $ | 17.65 | | | $ | 22.18 | | | $ | 19.74 | | | $ | 14.36 | |
| Total return | | | 16.01 | % | | | (20.32 | )% | | | 12.64 | % | | | 37.94 | % | | | 29.73 | % |
| Supplemental data and ratios: | | | | | | | | | | | | | | | | | | | | |
| Net assets, end of year (thousands) | | $ | 1,037.9 | | | $ | 931.8 | | | $ | 1,590.1 | | | $ | 1,676.7 | | | $ | 1,606.9 | |
| Ratio of expenses to average net assets | | | 1.05 | % | | | 1.05 | % | | | 1.05 | % | | | 1.05 | % | | | 1.05 | % |
| Ratio of expenses to average net assets (before waivers) | | | 1.13 | % | | | 1.17 | % | | | 1.17 | % | | | 1.29 | % | | | 1.48 | % |
| Ratio of net investment income (loss) to average net assets | | | 0.29 | % | | | (0.05 | )% | | | (0.24 | )% | | | (0.42 | )% | | | 1.39 | % |
Ratio of net investment income (loss) to average net assets (before waivers) | | | 0.21 | % | | | (0.16 | )% | | | (0.36 | )% | | | (0.66 | )% | | | 0.96 | % |
Portfolio turnover rate(4) | | | 14 | % | | | 12 | % | | | 13 | % | | | 24 | % | | | 26 | % |
(1) | Calculated using average shares outstanding during the year. |
(2) | Amount is less than $0.005. |
(3) | Effective December 1, 2021, the Fund eliminated the 2.00% redemption fee charged on amounts redeemed for shares held 90 days or less. |
(4) | Portfolio turnover is calculated on the basis of the Fund as a whole without distinguishing between the classes of shares issued and excludes in-kind transactions, where applicable. |
The accompanying notes are an integral part of these financial statements.
Notes to the Financial Statements
December 31, 2023
Baird Funds, Inc. (the “Company”) was incorporated on June 9, 2000, as a Wisconsin corporation and is registered as an open-end management investment company under the Investment Company Act of 1940, as amended (the “1940 Act”). The accompanying financial statements include the Baird Mid Cap Growth Fund, the Baird Small/Mid Cap Growth Fund, the Baird Equity Opportunity Fund, the Baird Chautauqua International Growth Fund and the Baird Chautauqua Global Growth Fund (each a “Fund” and collectively the “Funds”), five of the fifteen active funds in the series comprising the Company. Pursuant to the 1940 Act, the Funds are “diversified” series of the Company except for the Baird Equity Opportunity Fund, which is a non-diversified fund. The investment advisor to the Funds is Robert W. Baird & Co. Incorporated (“Baird” or the “Advisor”). The investment subadvisor to the Baird Equity Opportunity Fund is Greenhouse Funds LLLP (“Greenhouse” or the “Subadvisor”).
The following table presents the class-specific inception dates for each of the Funds:
| | Inception Date |
Fund | Institutional Class | | Investor Class
|
| Baird Mid Cap Growth Fund | December 29, 2000 | | December 29, 2000 |
| Baird Small/Mid Cap Growth Fund | October 31, 2018 | | October 31, 2018 |
| Baird Equity Opportunity Fund | May 1, 2012 | | May 1, 2012 |
Baird Chautauqua International Growth Fund(1) | April 15, 2016 | | April 15, 2016 |
Baird Chautauqua Global Growth Fund(2) | April 15, 2016 | | April 15, 2016 |
(1) | Effective April 30, 2023, the Fund changed its name from the Chautauqua International Growth Fund to the Baird Chautauqua International Growth Fund. |
(2) | Effective April 30, 2023, the Fund changed its name from the Chautauqua Global Growth Fund to the Baird Chautauqua Global Growth Fund. |
Institutional Class shares are not subject to a distribution and service (12b-1) fee, while Investor Class shares are subject to a distribution and service (12b-1) fee up to 0.25%. See Note 7.
The Baird Mid Cap Growth Fund seeks to provide long-term growth of capital through investments in equity securities of mid-capitalization companies.
The Baird Small/Mid Cap Growth Fund seeks to provide long-term growth of capital through investments in equity securities of small- and mid-capitalization companies.
The Baird Equity Opportunity Fund seeks to provide long-term capital appreciation through investments in equity securities of small- and medium-capitalization companies.
The Baird Chautauqua International Growth Fund seeks to provide long-term capital appreciation. The Fund invests primarily in equity securities of non-U.S. companies with medium to large market capitalizations.
The Baird Chautauqua Global Growth Fund seeks to provide long-term capital appreciation. The Fund invests primarily in equity securities of both U.S. and non-U.S. companies with medium to large market capitalizations.
The beneficial ownership, either directly or indirectly, of more than 25% of the voting securities of a fund creates a presumption of control of the fund, under Section 2(a)(9) of the 1940 Act. As of December 31, 2023, the Advisor, in its capacity as sponsor of the Baird Profit Sharing & Savings Plan and the Baird Non-Qualified Compensation Plan, and the Baird Foundation, an entity related to the Advisor, on a combined basis, owned a controlling ownership in the Baird Equity Opportunity Fund.
| 2. | Significant Accounting Policies |
The following is a summary of significant accounting policies consistently followed by the Funds in the preparation of their financial statements. These policies are in conformity with accounting principles generally accepted in the United States of America (“GAAP”). The Funds are investment companies and therefore follow the investment company accounting and reporting guidance of the Financial Accounting Standards Board (“FASB”) Accounting Standards Codification Topic 946, Financial Services – Investment Companies.
| a) | Investment Valuation – Section 2(a)(41) of the 1940 Act, together with the rules and interpretations of the U.S. Securities and Exchange Commission (the “SEC”), require the Funds, in computing net asset value (“NAV”), to value their portfolio securities using market quotations when they are “readily available.” When market quotations are not readily available (e.g., because there is no regular market quotation for such securities), the securities are valued at fair value using methods determined by the Advisor as the valuation designee of the Board of Directors of the Company (the “Board”) in accordance with policies and procedures adopted pursuant to Rule 2a-5 of the 1940 Act. Per GAAP, the “fair value” of a security means the price that would be received to sell a security in an orderly transaction between market participants at the measurement date. |
| | |
| | The Funds determine the fair value of their investments and compute their NAV per share as of the close of regular trading of the New York Stock Exchange (generally, 4:00 p.m. ET). |
| | |
| | Consistent with Section 2(a)(41) of the 1940 Act, the Funds price their securities as follows: common stocks that are listed on a securities exchange (other than NASDAQ) are valued at the last quoted sales price. Securities traded on NASDAQ are valued at the NASDAQ Official Closing Price. Price information on listed stocks is taken from the exchange where the security is primarily traded. Securities that were not traded on the valuation date, as well as stocks that are not listed on an exchange, including NASDAQ, are valued at the average of the current bid and ask price. Debt securities are valued at their evaluated bid prices as provided by an independent pricing service based on various market inputs such as benchmark yields, market transactions and dealer quotations. Investments in mutual funds, including money market funds, are valued at their stated NAV. Other assets and securities for which market quotations are not readily available are valued at fair value as determined in good faith by the Advisor in accordance with the Fund’s fair value procedures. In accordance with such procedures, the Advisor may, under certain circumstances, use alternative valuation methodologies, such as broker quotes. If prices are unavailable or deemed to be unreliable, fair value will be determined by the Advisor. The Advisor, as valuation designee, has further designated its valuation committee to be responsible for fair value determinations. In determining fair value, the valuation committee takes into account factors deemed relevant by the valuation committee and available information. Consequently, the price of the security used by a Fund to calculate its NAV may differ from quoted or published prices for the same security. Fair value pricing involves subjective judgments and there is no single standard for determining a security’s fair value. As a result, different mutual funds could reasonably arrive at a different fair value for the same security. It is possible that the fair value determined for a security is materially different from the value that could be realized upon the sale of that security or from the values that other mutual funds may determine. The prices determined for any individual security on any given day may vary significantly from the amount that can be obtained in an actual sale of that security, and a Fund’s NAV may fluctuate significantly from day to day or from period to period. |
| | |
| | Put and call options will be valued at the last sale price or, in the absence of such a price, at the mean between bid and asked prices. See Note 2(d) for additional information regarding financial derivative instruments. |
Notes to the Financial Statements
December 31, 2023
| 2. | Significant Accounting Policies (cont.) |
| | The Baird Chautauqua International Growth, Baird Chautauqua Global Growth, and Baird Equity Opportunity Funds have retained an independent fair value pricing service to assist in valuing foreign securities traded on a foreign exchange in order to adjust for possible changes in value that may occur between the close of the foreign exchange and the time at which the Funds calculate their NAVs. The fair value pricing service uses statistical data based on historical performance of securities and markets, and other data in developing factors used to estimate fair value for that day. Occasionally, significant events that affect these values and exchange rates may occur after the close of the exchange on which such securities are traded. If such events materially affect the value of a Fund’s securities, these securities may be valued at their fair value pursuant to the Funds’ fair value procedures. |
| | |
| b) | Foreign Securities – The Baird Mid Cap Growth Fund, Baird Small/Mid Cap Growth Fund, and Baird Equity Opportunity Fund may invest in common stocks, ADRs or other depositary shares or receipts, or ordinary shares of publicly-traded foreign issuers, and ADRs that are traded on a major U.S. exchange. The Baird Chautauqua International Growth Fund and Baird Chautauqua Global Growth Fund may invest in common stocks, preferred stocks, depositary shares and receipts, rights, warrants and ETFs of non-U.S. companies. Investing in securities of foreign companies and foreign governments involves special risks and considerations not typically associated with investing in U.S. companies and the U.S. government. These risks include foreign currency fluctuations and adverse political and economic developments. Moreover, securities of many foreign companies and foreign governments and their markets may be less liquid and their prices more volatile than those of securities of comparable U.S. companies and the U.S. government. |
| | |
| c) | Foreign Currency Translation – Portfolio securities and other assets and liabilities denominated in foreign currencies are translated into U.S. dollar amounts at date of valuation. Purchases and sales of portfolio securities and income items denominated in foreign currencies are translated into U.S. dollar amounts on the respective dates of such transactions. When a Fund purchases or sells a foreign security, it will customarily enter into a foreign exchange contract to minimize foreign exchange risk from the trade date to the settlement date of such transaction. The Funds do not isolate the portion of the results of operations resulting from changes in foreign exchange rates on investments from the fluctuations arising from changes in market prices of securities held nor currency gains or losses realized between the trade and settlement dates on securities transactions. Such fluctuations are included with the net realized and unrealized gain or loss from investments. Net realized gain (loss) on foreign currency transactions include those gains and losses arising from the sale of foreign currencies, currency gains or losses realized between the trade and settlement dates on foreign currency transactions, the differences between the amounts of dividends, and foreign withholding taxes recorded on a Fund’s books, and the U.S. dollar equivalent of the amounts actually received or paid. Net unrealized appreciation (depreciation) on investments includes changes in the value of investments resulting from exchange rates. |
| | |
| d) | Financial Derivatives Instruments – Financial derivatives instruments, such as option contracts, derive their value from the performance of an underlying asset or index. The Baird Equity Opportunity Fund (the “Fund”) may purchase and sell (write) put options and call options on securities or indices in standardized contracts listed on securities exchanges. The Fund may also purchase and sell (write) over-the-counter (“OTC”) put options and call options. The Fund qualifies as a “limited derivatives user” under Rule 18f-4 of the 1940 Act. |
| | |
| | A call option gives the purchaser of the option the right to buy, and a writer the obligation to sell, the underlying security or index at the stated exercise price at any time prior to the expiration of the option, regardless of the market price of the security. The premium paid to the writer is in consideration for undertaking the obligations under the option contract. A put option gives the purchaser the right to sell the underlying security or index at the stated exercise price at any time prior to the expiration date of the option, regardless of the market price of the security or index. In contrast to an option on a particular security, an option on an index provides the holder with the right to make or receive a cash settlement upon exercise of the option. The amount of this settlement will be equal to the difference between the closing price of the index at the time of exercise and the exercise price of the option expressed in dollars, times a specified multiple. |
| | |
| | Writing Put and Call Options |
| | As the writer of a put option, the Fund has a risk of loss should the underlying reference instrument decline in value. If the value of the underlying reference instrument declines below the exercise price of the put option and the put option is exercised, the Fund, as the writer of the put option, will be required to buy the instrument at the exercise price, which will exceed the market value of the underlying reference instrument at that time. The Fund will incur a loss to the extent that the current market value of the underlying reference instrument is less than the exercise price of the put option. However, the loss will be offset in part by the premium received from the buyer of the put. If a put option written by the Fund expires unexercised, the Fund will realize a gain in the amount of the premium received. |
| | |
| | By writing a call option on a security, the Fund foregoes the opportunity to profit from an increase in the market price of the underlying security above the exercise price except insofar as the premium represents such a profit, and it is not able to sell the underlying security until the option expires or is exercised or the Fund effects a closing purchase transaction by purchasing an option of the same series. Except to the extent that a written call option on an index is covered by an option on the same index purchased by the Fund, movements in the index may result in a loss to the Fund; however, such losses may be mitigated by changes in the value of securities held by the Fund during the period the option was outstanding. |
| | |
| | If a call option on a security is exercised, the Fund may deliver the underlying security held by the Fund or purchase the underlying security in the open market. In either event, the proceeds of the sale will be increased by the net premium originally received, and the Fund will realize a gain or loss. |
| | |
| | At December 31, 2023, the Baird Equity Opportunity Fund pledged securities with a fair value of $2,588,800 as collateral for option contracts. See the Fund’s Schedule of Investments for the securities pledged as collateral. |
| | |
| e) | Income Tax Status – The Funds intend to continue to qualify as regulated investment companies as provided in Subchapter M of the Internal Revenue Code and to distribute substantially all of their taxable income to their shareholders in a manner which results in no tax expense to the Funds. Therefore, no federal income or excise tax provision is recorded. |
| | |
| | There is no tax liability resulting from unrecognized tax benefits relating to uncertain income tax positions taken or expected to be taken on the tax return for the year ended December 31, 2023, or for any other tax years which are open for exam. As of December 31, 2023, open tax years include the tax years ended December 31, 2020 through 2023. The Funds are not aware of any tax positions for which it is reasonably possible that the total amounts of unrecognized tax benefits will significantly change in the next 12 months. The Funds recognize interest and penalties, if any, related to unrecognized tax benefits as interest expense and other expense, respectively, in the Statement of Operations. During the period, the Funds did not incur any interest or penalties. |
| | |
| f) | Allocation of Income and Expenses – Each Fund is charged for those expenses directly attributable to it. Expenses directly attributable to a class of shares, such as Rule 12b-1 distribution fees, are charged to that class of shares. Income, expenses and realized and unrealized gains and losses are allocated to the classes based on their respective net assets. Expenses that are not directly attributable to a Fund are allocated among the Funds in the series in proportion to their respective assets or are divided equally amongst the Funds. |
| | |
| g) | Shareholder Transactions and Distributions – Shareholder transactions are recorded on trade date. Dividends from net investment income, if any, are declared and paid annually. Distributions of net realized capital gains, if any, are declared and paid at least annually. All distributions to shareholders are recorded on the ex-dividend date. The book basis character of distributions may differ from their ultimate characterization for Federal income tax purposes. GAAP requires that permanent financial reporting and tax differences be reclassified in the capital accounts. |
Notes to the Financial Statements
December 31, 2023
| 2. | Significant Accounting Policies (cont.) |
| h) | Use of Estimates – The preparation of financial statements in conformity with GAAP requires management to make estimates and assumptions that affect the reported amounts of assets and liabilities and disclosure of contingent assets and liabilities at the date of the financial statements and the reported amounts of increases and decreases in net assets from operations during the reporting period. Actual results could differ from those estimates. |
| | |
| i) | Securities Transactions and Investment Income – The Funds determine the gain or loss realized from investment transactions using the identified cost basis. For financial reporting purposes, investment transactions are recorded on the trade date. When a capital gain tax is determined to apply, the Funds may record an estimated deferred tax liability in an amount that would be payable if the securities were disposed of on the valuation date. Dividend income is recognized on the ex-dividend date net of withholding taxes, if any, and interest income is recognized on an accrual basis. Withholding taxes on foreign dividends have been accounted for in accordance with the Funds’ interpretation of applicable tax laws of the countries in which they invest. Distributions received from underlying investments in real estate investment trusts (“REITs”) may be classified as dividends, capital gains or return of capital. |
| | |
| j) | Guarantees and Indemnifications – In the normal course of business, the Funds enter into contracts with service providers that contain general indemnification clauses. The Funds’ maximum exposure under these arrangements is unknown and would involve future claims against the Funds that have not yet occurred. Based on experience, the Funds would expect the risk of loss to be low. |
| | |
| k) | New Regulatory and Accounting Pronouncements – In October 2022, the Securities and Exchange Commission (the “SEC”) adopted a final rule relating to Tailored Shareholder Reports for Mutual Funds and Exchange-Traded Funds; Fee Information in Investment Company Advertisements. The rule and form amendments will, among other things, require the Funds to transmit concise and visually engaging shareholder reports that highlight key information. The amendments will require that the Funds tag information in a structured data format and that certain more in-depth information be made available online and available for delivery free of charge to investors on request. The amendments became effective January 24, 2023. There is an 18-month transition period after the effective date of the amendment. |
| | |
| 3. | Capital Share Transactions |
The following table summarizes the capital share transactions of each Fund for the past two fiscal years:
Baird Mid Cap Growth Fund
| | | Year Ended | | | Year Ended | |
| | | December 31, 2023 | | | December 31, 2022 | |
| Institutional Class Shares | | Shares | | | Amount | | | Shares | | | Amount | |
| Shares sold | | | 29,037,067 | | | $ | 684,051,811 | | | | 25,796,351 | | | $ | 593,227,526 | |
| Shares issued to shareholders in reinvestment of distributions | | | 1,856,978 | | | | 44,994,578 | | | | 1,129,988 | | | | 24,102,645 | |
| Shares redeemed | | | (19,556,605 | ) | | | (450,452,068 | ) | | | (22,159,031 | ) | | | (495,135,412 | ) |
| Net increase | | | 11,337,440 | | | $ | 278,594,321 | | | | 4,767,308 | | | $ | 122,194,759 | |
| Shares Outstanding: | | | | | | | | | | | | | | | | |
| Beginning of year | | | 83,890,648 | | | | | | | | 79,123,340 | | | | | |
| End of year | | | 95,228,088 | | | | | | | | 83,890,648 | | | | | |
| | | | | | | | | | | | | | | | | |
| | | Year Ended | | | Year Ended | |
| | | December 31, 2023 | | | December 31, 2022 | |
| Investor Class Shares | | Shares | | | Amount | | | Shares | | | Amount | |
| Shares sold | | | 1,839,593 | | | $ | 38,875,662 | | | | 1,757,374 | | | $ | 37,161,800 | |
| Shares issued to shareholders in reinvestment of distributions | | | 189,883 | | | | 4,179,313 | | | | 136,407 | | | | 2,655,852 | |
| Shares redeemed | | | (2,104,022 | ) | | | (44,339,629 | ) | | | (2,528,284 | ) | | | (54,245,204 | ) |
| Net decrease | | | (74,546 | ) | | $ | (1,284,654 | ) | | | (634,503 | ) | | $ | (14,427,552 | ) |
| Shares Outstanding: | | | | | | | | | | | | | | | | |
| Beginning of year | | | 8,009,772 | | | | | | | | 8,644,275 | | | | | |
| End of year | | | 7,935,226 | | | | | | | | 8,009,772 | | | | | |
| Total net increase | | | | | | $ | 277,309,667 | | | | | | | $ | 107,767,207 | |
Notes to the Financial Statements
December 31, 2023
| 3. | Capital Share Transactions (cont.) |
Baird Small/Mid Cap Growth Fund
| | | Year Ended | | | Year Ended | |
| | | December 31, 2023 | | | December 31, 2022 | |
| Institutional Class Shares | | Shares | | | Amount | | | Shares | | | Amount | |
| Shares sold | | | 1,890,067 | | | $ | 29,260,638 | | | | 2,879,793 | | | $ | 46,228,086 | |
| Shares issued to shareholders in reinvestment of distributions | | | — | | | | — | | | | 67,805 | | | | 987,916 | |
| Shares redeemed | | | (1,089,756 | ) | | | (16,795,892 | ) | | | (996,638 | ) | | | (15,500,122 | ) |
| Net increase | | | 800,311 | | | $ | 12,464,746 | | | | 1,950,960 | | | $ | 31,715,880 | |
| Shares Outstanding: | | | | | | | | | | | | | | | | |
| Beginning of year | | | 10,193,245 | | | | | | | | 8,242,285 | | | | | |
| End of year | | | 10,993,556 | | | | | | | | 10,193,245 | | | | | |
| | | | | | | | | | | | | | | | | |
| | | Year Ended | | | Year Ended | |
| | | December 31, 2023 | | | December 31, 2022 | |
| Investor Class Shares | | Shares | | | Amount | | | Shares | | | Amount | |
| Shares sold | | | 9,764 | | | $ | 151,091 | | | | 13,483 | | | $ | 203,375 | |
| Shares issued to shareholders in reinvestment of distributions | | | — | | | | — | | | | 374 | | | | 5,385 | |
| Shares redeemed | | | (12,042 | ) | | | (188,098 | ) | | | (2,908 | ) | | | (43,690 | ) |
| Net increase (decrease) | | | (2,278 | ) | | $ | (37,007 | ) | | | 10,949 | | | $ | 165,070 | |
| Shares Outstanding: | | | | | | | | | | | | | | | | |
| Beginning of year | | | 54,738 | | | | | | | | 43,789 | | | | | |
| End of year | | | 52,460 | | | | | | | | 54,738 | | | | | |
| Total net increase | | | | | | $ | 12,427,739 | | | | | | | $ | 31,880,950 | |
| | | | | | | | | | | | | | | | | |
| Baird Equity Opportunity Fund | | | | | | | | | | | | | | | | |
| | | Year Ended | | | Year Ended | |
| | | December 31, 2023 | | | December 31, 2022 | |
| Institutional Class Shares | | Shares | | | Amount | | | Shares | | | Amount | |
| Shares sold | | | 544,710 | | | $ | 6,853,485 | | | | 828,640 | | | $ | 12,850,612 | |
| Shares issued to shareholders in reinvestment of distributions | | | 465 | | | | 6,261 | | | | 1,217,811 | | | | 14,260,575 | |
| Shares redeemed | | | (959,077 | ) | | | (11,710,271 | ) | | | (560,334 | ) | | | (8,777,787 | ) |
| Net increase (decrease) | | | (413,902 | ) | | $ | (4,850,525 | ) | | | 1,486,117 | | | $ | 18,333,400 | |
| Shares Outstanding: | | | | | | | | | | | | | | | | |
| Beginning of year | | | 4,933,286 | | | | | | | | 3,447,169 | | | | | |
| End of year | | | 4,519,384 | | | | | | | | 4,933,286 | | | | | |
| | | | | | | | | | | | | | | | | |
| | | Year Ended | | | Year Ended | |
| | | December 31, 2023 | | | December 31, 2022 | |
| Investor Class Shares | | Shares | | | Amount | | | Shares | | | Amount | |
| Shares sold | | | — | | | $ | — | | | | — | | | $ | — | |
| Shares issued to shareholders in reinvestment of distributions | | | — | | | | — | | | | 49 | | | | 570 | |
| Shares redeemed | | | — | | | | — | | | | — | | | | — | |
| Net increase | | | — | | | $ | — | | | | 49 | | | $ | 570 | |
| Shares Outstanding: | | | | | | | | | | | | | | | | |
| Beginning of year | | | 194 | | | | | | | | 145 | | | | | |
| End of year | | | 194 | | | | | | | | 194 | | | | | |
| Total net increase (decrease) | | | | | | $ | (4,850,525 | ) | | | | | | $ | 18,333,970 | |
Notes to the Financial Statements
December 31, 2023
| 3. | Capital Share Transactions (cont.) |
Baird Chautauqua International Growth Fund
| | | Year Ended | | | Year Ended | |
| | | December 31, 2023 | | | December 31, 2022 | |
| Institutional Class Shares | | Shares | | | Amount | | | Shares | | | Amount | |
| Shares sold | | | 24,161,666 | | | $ | 398,499,097 | | | | 17,375,159 | | | $ | 270,605,607 | |
| Shares issued to shareholders in reinvestment of distributions | | | 86,180 | | | | 1,470,224 | | | | 239,100 | | | | 3,685,237 | |
| Shares redeemed | | | (8,352,531 | ) | | | (137,364,324 | ) | | | (11,175,681 | ) | | | (166,780,762 | ) |
| Net increase | | | 15,895,315 | | | $ | 262,604,997 | | | | 6,438,578 | | | $ | 107,510,082 | |
| Shares Outstanding: | | | | | | | | | | | | | | | | |
| Beginning of year | | | 31,544,240 | | | | | | | | 25,105,662 | | | | | |
| End of year | | | 47,439,555 | | | | | | | | 31,544,240 | | | | | |
| | | | | | | | | | | | | | | | | |
| | | Year Ended | | | Year Ended | |
| | | December 31, 2023 | | | December 31, 2022 | |
| Investor Class Shares | | Shares | | | Amount | | | Shares | | | Amount | |
| Shares sold | | | 192,145 | | | $ | 3,174,138 | | | | 910,520 | | | $ | 13,813,926 | |
| Shares issued to shareholders in reinvestment of distributions | | | 1,453 | | | | 24,595 | | | | 7,208 | | | | 110,823 | |
| Shares redeemed | | | (194,323 | ) | | | (3,158,396 | ) | | | (24,147 | ) | | | (354,809 | ) |
| Net increase (decrease) | | | (725 | ) | | $ | 40,337 | | | | 893,581 | | | $ | 13,569,940 | |
| Shares Outstanding: | | | | | | | | | | | | | | | | |
| Beginning of year | | | 926,310 | | | | | | | | 32,729 | | | | | |
| End of year | | | 925,585 | | | | | | | | 926,310 | | | | | |
| Total net increase | | | | | | $ | 262,645,334 | | | | | | | $ | 121,080,022 | |
| | | | | | | | | | | | | | | | | |
| Baird Chautauqua Global Growth Fund | | | | | | | | | | | | | | | | |
| | | Year Ended | | | Year Ended | |
| | | December 31, 2023 | | | December 31, 2022 | |
| Institutional Class Shares | | Shares | | | Amount | | | Shares | | | Amount | |
| Shares sold | | | 1,649,691 | | | $ | 32,128,385 | | | | 2,949,098 | | | $ | 55,678,922 | |
| Shares issued to shareholders in reinvestment of distributions | | | 59,665 | | | | 1,235,054 | | | | 17,927 | | | | 325,563 | |
| Shares redeemed | | | (1,146,580 | ) | | | (22,297,065 | ) | | | (2,197,613 | ) | | | (40,872,035 | ) |
| Net increase | | | 562,776 | | | $ | 11,066,374 | | | | 769,412 | | | $ | 15,132,450 | |
| Shares Outstanding: | | | | | | | | | | | | | | | | |
| Beginning of year | | | 14,847,093 | | | | | | | | 14,077,681 | | | | | |
| End of year | | | 15,409,869 | | | | | | | | 14,847,093 | | | | | |
| | | | | | | | | | | | | | | | | |
| | | Year Ended | | | Year Ended | |
| | | December 31, 2023 | | | December 31, 2022 | |
| Investor Class Shares | | Shares | | | Amount | | | Shares | | | Amount | |
| Shares sold | | | 9,165 | | | $ | 175,976 | | | | 19,559 | | | $ | 348,846 | |
| Shares issued to shareholders in reinvestment of distributions | | | 80 | | | | 1,635 | | | | 68 | | | | 1,216 | |
| Shares redeemed | | | (11,257 | ) | | | (213,014 | ) | | | (38,552 | ) | | | (804,656 | ) |
| Net decrease | | | (2,012 | ) | | $ | (35,403 | ) | | | (18,925 | ) | | $ | (454,594 | ) |
| Shares Outstanding: | | | | | | | | | | | | | | | | |
| Beginning of year | | | 52,780 | | | | | | | | 71,705 | | | | | |
| End of year | | | 50,768 | | | | | | | | 52,780 | | | | | |
| Total net increase | | | | | | $ | 11,030,971 | | | | | | | $ | 14,677,856 | |
| 4. | Investment Transactions and Income Tax Information |
During the year ended December 31, 2023, purchases and sales of investment securities (excluding short-term investments) were as follows:
| | | | | | | | | | | | Baird Chautauqua | | | Baird Chautauqua | |
| | | Baird Mid Cap | | | Baird Small/Mid | | | Baird Equity | | | International | | | Global | |
| | | Growth Fund | | | Cap Growth Fund | | | Opportunity Fund | | | Growth Fund | | | Growth Fund | |
| Purchases: | | $ | 1,107,891,277 | | | $ | 91,098,815 | | | $ | 38,803,727 | | | $ | 310,152,085 | | | $ | 47,674,327 | |
| Sales: | | | 913,518,825 | | | | 76,607,502 | | | | 44,982,276 | | | | 73,865,044 | | | | 39,447,680 | |
The Funds did not purchase or sell U.S. Government securities during the year ended December 31, 2023.
Notes to the Financial Statements
December 31, 2023
| 4. | Investment Transactions and Income Tax Information (cont.) |
As of December 31, 2023, the components of accumulated earnings (accumulated losses) for income tax purposes were as follows:
| | | | | | | | | | | | Baird | | | Baird | |
| | | Baird | | | Baird | | | Baird Equity | | | Chautauqua | | | Chautauqua | |
| | | Mid Cap | | | Small/Mid Cap | | | Opportunity | | | International | | | Global | |
| | | Growth Fund | | | Growth Fund | | | Fund | | | Growth Fund | | | Growth Fund | |
| Cost of investments | | $ | 1,818,033,415 | | | $ | 154,937,582 | | | $ | 55,149,998 | | | $ | 723,247,955 | | | $ | 277,029,508 | |
| Gross unrealized appreciation | | | 764,350,468 | | | | 30,796,740 | | | | 10,290,008 | | | | 182,387,335 | | | | 82,551,836 | |
| Gross unrealized depreciation | | | (52,782,837 | ) | | | (6,205,070 | ) | | | (4,810,418 | ) | | | (89,346,598 | ) | | | (40,694,114 | ) |
| Net unrealized appreciation | | | 711,567,631 | | | | 24,591,670 | | | | 5,479,590 | | | | 93,040,737 | | | | 41,857,722 | |
| Undistributed ordinary income | | | — | | | | — | | | | 4,836 | | | | 4,474,758 | | | | 646,627 | |
| Distributable earnings | | | — | | | | — | | | | 4,836 | | | | 4,474,758 | | | | 646,627 | |
| Other accumulated losses | | | (1,710,074 | ) | | | (29,917,001 | ) | | | (1,844,238 | ) | | | (3,940,425 | ) | | | (2,048,163 | ) |
| Total distributable earnings (accumulated deficit) | | $ | 709,857,557 | | | $ | (5,325,331 | ) | | $ | 3,640,188 | | | $ | 93,575,070 | | | $ | 40,456,186 | |
The difference between book-basis and tax-basis unrealized appreciation is attributable primarily to the tax deferral of losses on wash sales and mark-to-market on passive foreign investment companies.
Additionally, GAAP requires that certain components of net assets relating to permanent differences be reclassified between financial and tax reporting. These reclassifications are primarily due to differing treatments for equalization accounting for tax purposes and net operating losses. These reclassifications have no effect on net assets or NAV per share.
For the year ended December 31, 2023, the following table shows the reclassifications made:
Fund | Total Distributable Earnings | | | Paid In Capital | |
| Baird Mid Cap Growth Fund | | $ | (3,869,570 | ) | | | $ | 3,869,570 | |
| Baird Small/Mid Cap Growth Fund | | | 362,143 | | | | | (362,143 | ) |
| Baird Chautauqua International Growth Fund | | | 1 | | | | | (1 | ) |
Distributions to Shareholders
Each Fund generally pays dividends from net investment income and distributes net realized capital gains, if any, at least annually. Income and capital gain distributions are determined in accordance with income tax regulations, which may differ from GAAP. Certain Funds also utilize earnings and profits distributed to shareholders on redemptions of shares as part of the dividends paid deduction.
The tax components of distributions paid during the years shown below are as follows:
| | | Year Ended December 31, 2023 | |
| | | Ordinary | | | Long-Term | | | | |
Fund | | Income | | | Capital Gains | | | Total | |
| Baird Mid Cap Growth Fund | | $ | — | | | $ | 55,686,445 | | | $ | 55,686,445 | |
| Baird Equity Opportunity Fund | | | 6,327 | | | | — | | | | 6,327 | |
| Baird Chautauqua International Growth Fund | | | 1,673,671 | | | | — | | | | 1,673,671 | |
| Baird Chautauqua Global Growth Fund | | | 1,309,394 | | | | — | | | | 1,309,394 | |
| | | | | | | | | | | | | |
| | | Year Ended December 31, 2022 | |
| | | Ordinary | | | Long-Term | | | | | |
Fund | | Income | | | Capital Gains | | | Total | |
| Baird Mid Cap Growth Fund | | $ | 5,430,320 | | | $ | 25,642,571 | | | $ | 31,072,891 | |
| Baird Small/Mid Cap Growth Fund | | | — | | | | 1,000,232 | | | | 1,000,232 | |
| Baird Equity Opportunity Fund | | | 449,445 | | | | 14,047,005 | | | | 14,496,450 | |
| Baird Chautauqua International Growth Fund | | | 2,548,180 | | | | 1,777,754 | | | | 4,325,934 | |
| Baird Chautauqua Global Growth Fund | | | 344,680 | | | | — | | | | 344,680 | |
The Funds in the table above designated as long-term capital gain dividend, pursuant to Internal Revenue Code Section 852(b)(3), the amount necessary to reduce the earnings and profits of the Funds related to net capital gain to zero for the tax year ended December 31, 2023.
At December 31, 2023, the following Fund deferred, on a tax basis, post-October losses and specified losses of:
Fund | Loss Deferral |
| Baird Mid Cap Growth Fund | $1,710,074 |
At December 31, 2023, accumulated capital loss carryovers without expiration were:
| | | Capital Loss Carryover | | Year of Expiration |
Fund | | Short-term | | | Long-term | | Short-term | | Long-term |
| Baird Small/Mid Cap Growth Fund | | $ | 14,397,685 | | | $ | 15,519,316 | | Indefinitely | | Indefinitely |
| Baird Equity Opportunity Fund | | | 1,549,548 | | | | 311,492 | | Indefinitely | | Indefinitely |
| Baird Chautauqua International Growth Fund | | | 3,024,809 | | | | 932,913 | | Indefinitely | | Indefinitely |
| Baird Chautauqua Global Growth Fund | | | 641,323 | | | | 1,413,051 | | Indefinitely | | Indefinitely |
During the year ended December 31, 2023, the Baird Chautauqua International Growth Fund utilized $2,955,716 of long-term capital loss carryover. During the year ended December 31, 2023, the Baird Mid Cap Growth Fund and the Baird Chautauqua International Growth Fund utilized $45,587,598 and $2,661,512 of short-term capital loss carryover, respectively.
Notes to the Financial Statements
December 31, 2023
| 5. | Investment Advisory and Other Agreements |
The Funds have entered into Investment Advisory Agreements with Baird for the provision of investment advisory services. In addition, Baird has entered into a Subadvisory Agreement with Greenhouse related to the Baird Equity Opportunity Fund. Pursuant to the Investment Advisory Agreements, the Advisor is entitled to receive a fee, calculated daily and payable monthly, at the annual rates as follows:
Fund | Investment Advisory Fees |
| Baird Mid Cap Growth Fund | 0.75% |
| Baird Small/Mid Cap Growth Fund | 0.75% |
| Baird Equity Opportunity Fund | 1.25% |
| Baird Chautauqua International Growth Fund | 0.75% |
| Baird Chautauqua Global Growth Fund | 0.75% |
Under the Subadvisory Agreement, Baird is obligated to pay Greenhouse its subadvisory fee out of the advisory fee paid to Baird by the Baird Equity Opportunity Fund.
The Advisor has contractually agreed to waive its investment advisory fee and/or reimburse the Funds’ operating expenses, to the extent necessary to ensure that total operating expenses, including the fees and expenses incurred by the Funds in connection with the Funds’ investments in other investment companies (to the extent, in the aggregate, such fees and expenses on an annual basis exceed 0.0049% of the Fund’s average daily net assets) and interest expense, but excluding taxes, brokerage commissions and extraordinary expenses, do not exceed the following annual percentages of the average daily net assets attributable to the Funds’ Institutional Class and Investor Class shares:
Fund | Institutional Class | Investor Class |
| Baird Mid Cap Growth Fund | 0.85% | 1.10% |
| Baird Small/Mid Cap Growth Fund | 0.85% | 1.10% |
| Baird Equity Opportunity Fund | 1.25% | 1.50% |
| Baird Chautauqua International Growth Fund | 0.80% | 1.05% |
| Baird Chautauqua Global Growth Fund | 0.80% | 1.05% |
The Expense Cap/Reimbursement Agreements are in effect through at least April 30, 2025 for all Funds.
To the extent that the Advisor reimburses or absorbs fees and expenses, it may seek payment of such amounts for three years after the date in which expenses were reimbursed or absorbed for the Baird Mid Cap Growth Fund, the Baird Small/Mid Cap Growth Fund, the Baird Chautauqua International Growth Fund and the Baird Chautauqua Global Growth Fund. A Fund will make no such payment, however, if its total annual operating expenses exceed the expense limits in effect at the time the expenses were reimbursed or at the time these payments are proposed.
| | | Fiscal Year Ended December 31, | |
| Recoverable amounts reimbursed during: | | 2023 | | | 2022 | | | 2021 | |
| Subject to recovery on or before: | | 2026 | | | 2025 | | | 2024 | |
Fund: | | | | | | | | | |
| Baird Small/Mid Cap Growth Fund | | $ | 115,155 | | | $ | 189,890 | | | $ | 161,354 | |
| Baird Chautauqua International Growth Fund | | | 357,653 | | | | 315,901 | | | | 265,579 | |
| Baird Chautauqua Global Growth Fund | | | 243,392 | | | | 317,746 | | | | 295,197 | |
The Advisor is not entitled to recoup any fees waived and/or expenses reimbursed by the Baird Equity Opportunity Fund under the Expense Cap/Reimbursement Agreement or under prior agreements. For the year ended December 31, 2023, the Advisor waived the following amount pursuant to the Expense Cap/Reimbursement Agreement between the Advisor and the Company on behalf of the Baird Equity Opportunity Fund:
Fund | Waived Amount | |
| Baird Equity Opportunity Fund | $267,698 | |
U.S. Bancorp Fund Services, LLC, doing business as U.S. Bank Global Fund Services, serves as transfer agent, administrator, and accounting services agent for the Funds. U.S. Bank, N.A. (“U.S. Bank”) serves as custodian for the Funds.
Robert W. Baird & Co. Incorporated (the “Distributor”) is the sole distributor of the Funds pursuant to a distribution agreement.
No commissions were earned by the Distributor for services rendered as a registered broker-dealer in securities transactions for the year ended December 31, 2023 for the Funds.
Certain officers and employees of the Advisor are also officers of the Funds.
The Company maintains an uncommitted line of credit (“LOC”) with U.S. Bank to provide the fifteen Funds comprising the Company a temporary liquidity source to meet unanticipated redemptions or other permissible borrowing needs. The LOC is unsecured at all times and is subject to certain restrictions and covenants. Under the terms of the LOC, borrowings for each Fund are limited to one third of the total eligible net assets (including the amount borrowed) of the respective Fund, or $850,000,000 of total borrowings for the Funds comprising the Company, whichever is less. U.S. Bank charges annualized interest at the greater of 1.00% and the Prime Rate minus 2.00%. As of December 31, 2023, the Prime Rate was 8.50%. The LOC matures on May 20, 2024, unless renewed. The Company has authorized U.S. Bank to charge any of the accounts of the borrowing Fund subject to the agreement for any missed payments.
During the year ended December 31, 2023, the Funds borrowed on three occasions from the LOC as follows:
| | | Amount | | | Interest Charges | | | Borrowing | |
Fund | | Borrowed | | | Accrued | | | Rate | |
| Baird Equity Opportunity Fund | | $ | 149,000 | | | $ | 81 | | | 5.50% |
|
| Baird Small/Mid Cap Growth Fund | | | 282,000 | | | | 47 | | | 6.00% |
|
| Baird Chautauqua International Growth Fund | | | 4,221,000 | | | | 2,786 | | | 6.50% |
|
No other borrowings occurred during the year ended December 31, 2023, nor were any other borrowings outstanding under the LOC as of December 31, 2023.
Notes to the Financial Statements
December 31, 2023
| 7. | Distribution and Shareholder Service Plan |
The Funds have adopted a distribution and shareholder service plan (the “Plan”) pursuant to Rule 12b-1 under the 1940 Act. The Plan allows the Funds to compensate the Distributor for the costs incurred in distributing the Funds’ Investor Class shares, including amounts paid to brokers or dealers, at an annual rate of 0.25% of the average daily net assets of the Funds’ Investor Class shares.
For the year ended December 31, 2023, the Funds’ Investor Class shares incurred fees pursuant to the Plan as follows:
Fund | | | |
| Baird Mid Cap Growth Fund | |
| $424,154 | |
| Baird Small/Mid Cap Growth Fund | | | 2,217 | |
| Baird Equity Opportunity Fund | | | 7 | |
| Baird Chautauqua International Growth Fund | | | 40,102 | |
| Baird Chautauqua Global Growth Fund | | | 2,544 | |
| 8. | Other Derivatives Information |
As a principal investment strategy, the Baird Equity Opportunity Fund may purchase and write options to hedge its portfolio and enhance returns. Options are subject to various risks including market risk, liquidity risk, volatility risk, counterparty risk, legal risk, and operations risk.
Management has adopted authoritative standards regarding disclosure about derivatives and hedging activities and how they affect a Fund’s Statement of Assets and Liabilities and Statement of Operations. Since the derivatives may be held for speculative trading purposes, the derivative instruments are not designated as hedging instruments. Accordingly, all realized gains and losses, as well as any change in net unrealized gains or losses on open contracts from the preceding period, are recognized as part of realized and unrealized gain (loss) in the Statement of Operations. These contracts are not subject to a master netting agreement.
The following table presents the fair value of derivative instruments for the Baird Equity Opportunity Fund as of December 31, 2023 as presented on the Fund’s Statement of Assets and Liabilities:
| |
| | | Fair Value | |
| | | Statement of | | | | | | |
| | | Assets and | | | | | | |
Derivatives Not Accounted for as Hedging Instruments | | Liabilities Location | | Assets | | | Liabilities | |
| Baird Equity Opportunity Fund | | | | | | | | |
| Option Contracts | | | | | | | | |
| Purchased option contracts | | Investments, at value | | $ | 103,715 | | | $ | — | |
| Written option contracts | | Written option contracts, at value | | | — | | | | 14,875 | |
| Total Option Contracts | | | | $ | 103,715 | | | $ | 14,875 | |
The following table presents the results of the derivatives trading and information related to volume for the year ended December 31, 2023. The below captions of “Net Realized” and “Net Change in Unrealized” correspond to the captions in the Fund’s Statement of Operations.
| | | Gain (Loss) from Trading | | |
| | | | | | Net Change | | |
| | | | | | in Unrealized | | |
| | | Net | | | Appreciation/ | | |
| | | Realized | | | Depreciation | | |
| Baird Equity Opportunity Fund | | | | | | | |
| Option Contracts | | | | | | | |
Purchased option contracts(a) | | | | | | | |
| Equity | | $ | (126,723 | ) | | $ | (34,303 | ) | |
| Written option contracts | | | | | | | | | |
| Equity | | | 330,784 | | | | (66,961 | ) | |
| Total Option Contracts | | $ | 204,061 | | | $ | (101,264 | ) | |
(a) | Purchased options are included in the net realized gain (loss) on investments and net change in unrealized appreciation/depreciation on investments. |
The average monthly notional amount is shown as an indicator of volume. The average monthly notional amounts during the year ended December 31, 2023 were:
| | | Average Notional | |
| | | Purchased | | | Written | |
| Baird Equity Opportunity Fund | | | | | | |
| Option contracts | | | | | | |
| Equity | | $ | 3,489,581 | | | $ | 1,803,626 | |
Please refer to the Fund’s prospectus for a full listing of risks associated with these investments.
In preparing these financial statements, management has evaluated events after December 31, 2023. There were no subsequent events since December 31, 2023, through the date the financial statements were issued that would warrant adjustment to or additional disclosure in these financial statements.
Report of Independent Registered Public Accounting Firm
To the Shareholders and Board of Directors of Baird Funds, Inc.
Opinion on the Financial Statements
We have audited the accompanying statements of assets and liabilities, including the schedule of written option contracts of Baird Equity Opportunity Fund and the schedules of investments of Baird Mid Cap Growth Fund, Baird Small/Mid Cap Growth Fund, Baird Equity Opportunity Fund, Baird Chautauqua International Growth Fund, and Baird Chautauqua Global Growth Fund (the “Funds”), each a series of Baird Funds, Inc., as of December 31, 2023, the related statements of operations for the year then ended, the statements of changes in net assets for each of the two years in the period then ended, the related notes, and the financial highlights for each of the five years in the period then ended (collectively referred to as the “financial statements”). In our opinion, the financial statements present fairly, in all material respects, the financial position of each of the Funds as of December 31, 2023, the results of their operations for the year then ended, the changes in net assets for each of the two years in the period then ended, and the financial highlights for each of the five years in the period then ended, in conformity with accounting principles generally accepted in the United States of America.
Basis for Opinion
These financial statements are the responsibility of the Funds’ management. Our responsibility is to express an opinion on the Funds’ financial statements based on our audits. We are a public accounting firm registered with the Public Company Accounting Oversight Board (United States) (“PCAOB”) and are required to be independent with respect to the Funds in accordance with the U.S. federal securities laws and the applicable rules and regulations of the Securities and Exchange Commission and the PCAOB.
We conducted our audits in accordance with the standards of the PCAOB. Those standards require that we plan and perform the audit to obtain reasonable assurance about whether the financial statements are free of material misstatement whether due to error or fraud.
Our audits included performing procedures to assess the risks of material misstatement of the financial statements, whether due to error or fraud, and performing procedures that respond to those risks. Such procedures included examining, on a test basis, evidence regarding the amounts and disclosures in the financial statements. Our procedures included confirmation of securities owned as of December 31, 2023, by correspondence with the custodian and brokers. Our audits also included evaluating the accounting principles used and significant estimates made by management, as well as evaluating the overall presentation of the financial statements. We believe that our audits provide a reasonable basis for our opinion.
We have served as the Funds’ auditor since 2017.
COHEN & COMPANY, LTD.
Milwaukee, Wisconsin
February 26, 2024
Directors & Officers
As of December 31, 2023 (Unaudited)
Independent Directors
John W. Feldt
Independent Director, Audit Committee Chair
Term of Office: Indefinite
Length of Time Served: Since September 2000
Age: 81
c/o Robert W. Baird & Co. Incorporated
777 East Wisconsin Avenue
Milwaukee, WI 53202
Principal Occupation(s) During the Past 5 Years: Retired.
Number of Active Portfolios in Complex Overseen by Director: 15
Other Directorships Held by Director: Director of Thompson Plumb Funds, Inc., a mutual fund complex (3 portfolios) (1987-2018).
Darren R. Jackson
Independent Director
Term of Office: Indefinite
Length of Time Served: Since November 2018
Age: 59
c/o Robert W. Baird & Co. Incorporated
777 East Wisconsin Avenue
Milwaukee, WI 53202
Principal Occupation(s) During the Past 5 Years: Retired.
Number of Active Portfolios in Complex Overseen by Director: 15
Other Directorships Held by Director: Director of Wolfspeed, Inc., a semiconductor company, since 2016; Director of Fastenal Company, a tool and supply distributor (2012-2020).
David J. Lubar
Independent Director
Term of Office: Indefinite
Length of Time Served: Since November 2021
Age: 69
c/o Lubar & Co.
833 E. Michigan Street,
Suite 1500
Milwaukee, WI 53202
Principal Occupation(s) During the Past 5 Years: President and CEO, Lubar & Co., Incorporated, a private investment firm, since 1983.
Number of Portfolios in Complex Overseen by Director: 15
Other Directorships Held by Director: Director of Hallador Energy Company, since 2018.
Cory L. Nettles
Independent Director
Term of Office: Indefinite
Length of Time Served: Since January 2008
Age: 53
c/o Generation Growth Capital, Inc.
111 East Kilbourn Avenue, Suite 2800
Milwaukee, WI 53202
Principal Occupation(s) During the Past 5 Years: Managing Director, Generation Growth Capital, Inc., a private equity fund, since March 2007.
Number of Active Portfolios in Complex Overseen by Director: 15
Other Directorships Held by Director: Director of Weyco Group, Inc., a men’s footwear distributor, since 2007; Director of Associated Banc-Corp,
since 2013.
Marlyn J. Spear, CFA
Independent Director, Chair of Board
Term of Office: Indefinite
Length of Time Served: Since January 2008
Age: 70
c/o Robert W. Baird & Co. Incorporated
777 East Wisconsin Avenue
Milwaukee, WI 53202
Principal Occupation(s) During the Past 5 Years: Retired.
Number of Active Portfolios in Complex Overseen by Director: 15
Other Directorships Held by Director: Management Trustee of AFL-CIO Housing Investment Trust, a mutual fund complex (1 portfolio) (1995-2018).
Frederick P. Stratton, Jr.
Independent Director, Nominating Committee Chair
Term of Office: Indefinite
Length of Time Served: Since May 2004
Age: 84
c/o Robert W. Baird & Co. Incorporated
777 East Wisconsin Avenue
Milwaukee, WI 53202
Principal Occupation(s) During the Past 5 Years: Retired; Chairman Emeritus, Briggs & Stratton Corporation, a manufacturing company (2003-2020).
Number of Active Portfolios in Complex Overseen by Director: 15
Other Directorships Held by Director: Director of Weyco Group, Inc., a men’s footwear distributor, since 1976.
Directors & Officers
As of December 31, 2023 (Unaudited)
Officers
Mary Ellen Stanek
President
Term of Office: Re-elected by Board annually
Length of Time Served: Since September 2000
Age: 67
c/o Robert W. Baird & Co. Incorporated
777 East Wisconsin Avenue
Milwaukee, WI 53202
Principal Occupation(s) During the Past 5 Years: Co-Chief Investment Officer, Baird Advisors, a department of the Advisor, since October 2021; Chief Investment Officer, Baird Advisors (March 2000-October 2021); Managing Director, the Advisor, since March 2000.
Charles B. Groeschell
Vice President
Term of Office: Re-elected by Board annually
Length of Time Served: Since January 2010
Age: 70
c/o Robert W. Baird & Co. Incorporated
777 East Wisconsin Avenue
Milwaukee, WI 53202
Principal Occupation(s) During the Past 5 Years: Managing Director, the Advisor, and Senior Portfolio Manager, Baird Advisors, a department of the Advisor, since February 2000.
Angela M. Palmer
Chief Compliance Officer and
AML Compliance Officer
Term of Office: Re-elected by Board annually
Length of Time Served: Since March 2014
Age: 51
c/o Robert W. Baird & Co. Incorporated
777 East Wisconsin Ave
Milwaukee, WI 53202
Principal Occupation(s) During the Past 5 Years: Chief Compliance Officer, the Advisor, since March 2014; Anti-Money Laundering Compliance Officer since May 2015; Managing Director, the Advisor, since January 2022; Director, the Advisor (July 2014-December 2021).
Dustin J. Hutter
Treasurer
Term of Office: Re-elected by Board annually
Length of Time Served: Since April 2021
Age: 47
c/o Robert W. Baird & Co. Incorporated
777 East Wisconsin Avenue
Milwaukee, WI 53202
Principal Occupation(s) During the Past 5 Years: Senior Business Analyst, the Advisor, since September 2017; Managing Director, the Advisor, since January 2020; Director, the Advisor (July 2014-December 2019).
Charles M. Weber
Secretary
Term of Office: Re-elected by Board annually
Length of Time Served: Since September 2005
Age: 60
c/o Robert W. Baird & Co. Incorporated
777 East Wisconsin Avenue
Milwaukee, WI 53202
Principal Occupation(s) During the Past 5 Years: Deputy General Counsel, the Advisor, since January 2022; Senior Associate General Counsel, the Advisor, January 2013 to December 2021; Managing Director, the Advisor, since January 2009.
Peter J. Hammond
Vice President
Term of Office: Re-elected by Board annually
Length of Time Served: Since August 2012
Age: 60
c/o Robert W. Baird & Co. Incorporated
777 East Wisconsin Avenue
Milwaukee, WI 53202
Principal Occupation(s) During the Past 5 Years: Managing Director, the Advisor, since January 2016.
Mandy L. Hess
Assistant Treasurer
Term of Office: Re-elected by Board annually
Length of Time Served: Since April 2021
Age: 53
c/o Robert W. Baird & Co. Incorporated
777 East Wisconsin Avenue
Milwaukee, WI 53202
Principal Occupation(s) During the Past 5 Years: Senior Vice President, the Advisor, since November 2019; Director of Finance and Assistant Treasurer, The Lynde and Harry Bradley Foundation, Inc. (a private grantmaking foundation) (December 2005-July 2019).
Andrew D. Ketter
Assistant Secretary
Term of Office: Re-elected by Board annually
Length of Time Served: Since February 2011
Age: 49
c/o Robert W. Baird & Co. Incorporated
777 East Wisconsin Avenue
Milwaukee, WI 53202
Principal Occupation(s) During the Past 5 Years: Managing Director, the Advisor, since January 2022; Associate General Counsel, the Advisor, since September 2010; Director, the Advisor (July 2014-December 2021).
Additional information about the Funds’ Directors is available in the Statement of Additional Information which may be obtained without charge, upon request, by calling 1-866-442-2473, or at www.bairdfunds.com.
Baird Funds, Inc.
Disclosure Regarding Approval of the Investment Advisory Agreements and Subadvisory Agreement for Baird Equity Funds (Unaudited)
The Board of Directors (the “Board”) of Baird Funds, Inc. (the “Company”), comprised of directors who are not “interested persons” of the Company within the meaning of the Investment Company Act of 1940 (the “Independent Directors”), met on August 9, 2023 and August 22, 2023 to consider the annual renewal of the investment advisory agreements between Robert W. Baird & Co. Incorporated (“Baird” or the “Advisor”) and the Company on behalf of the Baird Mid Cap Growth Fund, the Baird Small/Mid Cap Growth Fund, the Baird Chautauqua International Growth Fund and the Baird Chautauqua Global Growth Fund (the “Equity Funds” or the “Funds”).
The Board, which is comprised solely of Independent Directors, approved the continuation of the investment advisory agreements for the Equity Funds through a process that concluded at the August 22, 2023 meeting. At the August 22, 2023 meeting, the Board also considered the continuation of the subadvisory agreement between the Company and Greenhouse Funds LLLP (“Greenhouse”), the subadvisor to the Baird Equity Opportunity Fund (the “Equity Opportunity Fund”). In connection with the consideration of the investment advisory and subadvisory agreements, the Board reviewed and discussed various information that had been provided prior to the meeting, including a copy of the investment advisory and subadvisory agreements and the Funds’ fee schedules, the expense cap agreements for the Funds, a memorandum provided by the Funds’ legal counsel summarizing the guidelines relevant to the Board’s consideration of the investment advisory and subadvisory agreements, a memorandum and other information provided in response to a request from the Board by the Advisor, a copy of the Advisor’s Form ADV Part 1A and the Form ADV brochures and brochure supplements for the Advisor and Greenhouse, organizational charts for the Advisor and Greenhouse, financial information for the Advisor, its parent company and Greenhouse, a profitability analysis, comparative information about the Funds’ performance for the applicable periods ended June 30, 2023, comparative information about management fees and expense ratios, composite performance information for similar accounts managed by the Advisor and Greenhouse, trading and brokerage commission information and information related to payments to financial intermediaries.
The Board reviewed the Advisor’s 15(c) response with representatives of the Advisor and separately with legal counsel to the Independent Directors at the August 9, 2023 special meeting. The Board also took into account knowledge gained over time through its experience with the Advisor and Greenhouse as well as information reviewed periodically throughout the year, including information about performance, asset flows and expenses; discussions with management about personnel, succession planning and services provided to the Funds and their shareholders; discussions with the Company’s Chief Compliance Officer about compliance matters and discussions with the Funds’ portfolio managers.
In considering the investment advisory and subadvisory agreements and reaching its conclusions, the Board reviewed and analyzed various factors that it determined were relevant, including the factors below. In deciding to approve the renewal of the investment advisory agreements for each Fund and the subadvisory agreement for the Equity Opportunity Fund, the Board did not identify any single factor as determinative but considered all factors together.
Nature, Extent and Quality of Services Provided to the Funds
The Board considered the nature, extent and quality of the services provided by the Advisor to the Funds. The Board noted the Advisor’s positive reputation, the Advisor’s long-term history of managing the Funds and the continuity and experience of the portfolio management teams employed to manage the investments of the Funds, noting that the Advisor provides supervision of Greenhouse’s portfolio management in the case of the Equity Opportunity Fund. The Board considered the depth and quality of the Advisor’s personnel who provide services to the Funds, including investment management, shareholder services, legal, compliance and accounting personnel. The Board also considered the Advisor’s continued investment in resources that benefit the Funds, including investments in personnel, technology, and research. With respect to the Equity Opportunity Fund, the Board noted that the Advisor is responsible for overseeing Greenhouse as subadvisor to the Fund and also provides administrative, compliance and support services to the Fund.
The Board considered the Advisor’s disciplined investment decision-making processes used for the applicable Funds. The Board noted that, for all Funds other than the Equity Opportunity Fund, Baird makes investment decisions, selects broker-dealers for the execution of portfolio transactions, votes proxies and provides other customary investment management services. The Board also considered other services that the Advisor provides the Funds in its capacity as their investment advisor, such as providing key personnel to serve as officers of the Funds, ensuring adherence to the Funds’ investment policies and restrictions, compliance services, shareholder servicing, administering the Funds’ liquidity risk management program, administering the Funds’ cybersecurity program and business continuity plan, serving as valuation designee of the Board for purposes of the Funds’ fair value procedures, providing support services to the Board and the committees of the Board and overseeing the Funds’ other service providers. The Board considered the strength of the Advisor’s legal and compliance department and the qualifications of the Funds’ Chief Compliance Officer. The Board noted the effective operation of the Advisor’s risk management, valuation and liquidity risk management processes. With respect to the Equity Opportunity Fund, the Board considered Greenhouse’s investment decision-making process used for the Fund, the experience and credentials of the Fund’s portfolio manager, and the investment management, trading, compliance, proxy voting and other services provided by Greenhouse.
The Board concluded that the nature, extent and quality of the services provided by the Advisor to each Fund were appropriate and that each Fund was likely to continue to benefit from the services provided by the Advisor under the applicable investment advisory agreement. The Board also concluded that the nature, extent and quality of the services provided by Greenhouse to the Equity Opportunity Fund were appropriate and that the Fund was likely to continue to benefit from the services provided by Greenhouse under the subadvisory agreement.
Investment Performance of the Advisor, Greenhouse and the Funds
In considering the investment performance of each Fund, the Board reviewed information as of June 30, 2023 regarding the performance of each class of the Fund for applicable one-year, three-year, five-year, ten-year and since-inception periods in comparison to its benchmark index and its peer group as determined by Lipper. The Board reviewed the composite investment performance of the Advisor and Greenhouse with respect to accounts managed by the Advisor and Greenhouse, respectively, that are managed in the same strategy as the applicable Funds but did not consider it to be a material factor in the 15(c) process.
The Board considered each Fund’s absolute performance, noting competitive results over most time periods. The Board noted that the performance of the Institutional Class of the Baird Mid Cap Growth Fund exceeded the benchmark index for the three-year, five-year, ten-year and since-inception periods and had outperformed the Lipper peer group average over all time periods. The Board considered that the Institutional Class of the Baird Small/Mid Cap Growth Fund had outperformed the benchmark and the Lipper peer group average over the three-year and since-inception time periods. The Board considered the Advisor’s commentary regarding each Fund’s relative underperformance compared to the benchmark for the one-year period.
The Board noted that the Institutional Class of the Baird Chautauqua International Growth Fund had outperformed the benchmark index and the Lipper peer group average for all time periods. The Board noted that the Institutional Class of the Baird Chautauqua Global Growth Fund had outperformed the benchmark index for the one-year, five-year and since-inception periods, had underperformed the index for the three-year period, had underperformed the Lipper peer group average for the one-year period and had outperformed the peer group average for the other time periods. The Board considered the Advisor’s commentary regarding the Baird Chautauqua Global Growth Fund’s relative underperformance compared to the benchmark for the three-year period.
The Board noted that the Equity Opportunity Fund has seen improved performance under Greenhouse’s management, ranking in the top Lipper quartile for the one-year period. The Board noted that the Institutional Class had outperformed the benchmark for the one-year and three-year periods and trailed the benchmark over longer time periods. The Board considered that the longer time periods include performance for when the Fund was managed by a different portfolio management team.
Baird Funds, Inc.
Disclosure Regarding Approval of the Investment Advisory Agreements and Subadvisory Agreement for Baird Equity Funds (Unaudited) (Continued)
The Board also considered the Advisor’s quarterly portfolio commentaries and discussions regarding the Funds’ performance and the investment strategies the Advisor (or Greenhouse, with respect to the Equity Opportunity Fund) employs for each Fund. The Board concluded that each Fund and its shareholders were likely to benefit from the continued management by the Advisor, and that the Equity Opportunity Fund and its shareholders were likely to benefit from the continued management by Greenhouse.
Advisory Fees and Expenses
The Board reviewed the fee and expense information for each of the Funds, including a comparison of each Fund’s advisory fee and total net expense ratio to (1) peer funds selected by Broadridge Financial Solutions, Inc. (“Broadridge”), an independent data provider, in the same Morningstar category (the “Expense Universe”) and (2) a smaller peer group of similar funds selected by Broadridge (the “Expense Group”). The Board noted that the contractual management fee at a common asset level is below the Expense Group median for the Baird Small/Mid Cap Growth Fund, Baird Chautauqua International Growth Fund and Baird Chautauqua Global Growth Fund and above the Expense Group median with respect to the Baird Mid Cap Growth Fund and the Equity Opportunity Fund. The Board noted that the net advisory fee for each Fund, except the Baird Mid Cap Growth Fund, is below the Expense Group median. The Board also considered the net expense ratio of the Institutional Class of each Fund, after fee waivers and expense reimbursements by the Advisor, relative to the Expense Group and the Expense Universe. With respect to the Equity Opportunity Fund, the Board considered the portion of the advisory fee retained by the Advisor and the level of the subadvisory fee in light of the services provided by each of the Advisor and Greenhouse.
The Board also considered management fees charged by the Advisor to other investment accounts managed in similar strategies, including separately managed accounts, subadvised funds, private partnerships and a collective investment trust, but did not consider these comparisons to be a material factor given the Advisor’s greater level of responsibilities and additional services provided with respect to the Funds, as well as the more extensive regulatory requirements and risks associated with managing the Funds. The Board also considered the level of the subadvisory fee as compared to the fee payable by investors in Greenhouse’s long-only private fund as well as Greenhouse’s commentary regarding additional services it provides to the Fund.
The Board concluded that the advisory fee and total expense ratio of each Fund were reasonable in light of the nature and quality of services provided and fees paid by comparable funds. With respect to the Equity Opportunity Fund, the Board concluded that the subadvisory fee was appropriate.
Costs and Profitability
The Board considered the fees realized, and the costs incurred, by the Advisor in providing investment management services to the Funds and a profitability analysis with respect to each Fund. The Board considered that the Advisor’s profitability information does not reflect costs incurred for various internal support services and systems to the Funds such as IT, compliance, risk, human resources, legal and finance. With respect to the Equity Opportunity Fund, the Board considered information regarding the fee revenue retained by the Advisor, taking into account the Advisor’s parent company’s ownership interest in Greenhouse, and the fee revenue retained by Greenhouse.
The Board reviewed the financial condition of the Advisor and its parent company and determined it to be sound. The Board noted that certain Funds were not profitable to the Advisor. The Board concluded that the Advisor’s current level of profitability for each Fund, where applicable, was reasonable.
Economies of Scale and Fee Levels Reflecting Those Economies
The Board considered the extent to which economies of scale might be realized as each Fund grows and to the extent which each Fund’s advisory fee reflects those economies of scale for the benefit of Fund investors.
The Board noted that the Funds’ advisory fee structure does not contain any breakpoint reductions as the Funds grow in size but considered the expenses incurred and investment advisory fees waived by the Advisor in the past and the competitiveness of the Funds’ fees and expenses. The Board also considered investments made by the Advisor in resources that benefit the Funds as well as hard dollar payments for research. The Directors concluded that the current fee structure of each Fund was reasonable and provides for a sharing of any economies of scale with the Fund’s investors.
Benefits Derived from the Relationship with the Funds
The Board considered other benefits to the Advisor from serving as advisor to the Funds (in addition to the advisory fee). Those benefits include Rule 12b-1 fees received by the Distributor and its representatives. The Board noted that the Advisor and Greenhouse derive ancillary benefits from their association with the Funds in the form of research products and services received from unaffiliated broker-dealers who execute portfolio trades for the Funds. With respect to the Equity Opportunity Fund, the Board noted that the Advisor indirectly shares in the subadvisory fee paid to Greenhouse due to its ownership interest in Greenhouse. The Board noted that the Advisor’s asset management and other institutional businesses may experience indirect benefits from the Advisor’s association with the Funds. The Board considered that Greenhouse may benefit from some reputational benefits by virtue of its management of the Equity Opportunity Fund. The Board concluded that the other benefits realized by the Advisor and Greenhouse from their relationship with the Funds were appropriate.
Based on its evaluation of the above factors, the Directors concluded that (1) the continuation of the investment advisory agreements was in the best interest of each Fund and its shareholders and (2) the continuation of the subadvisory agreement was in the best interest of the Equity Opportunity Fund and its shareholders.
Additional Information (Unaudited)
Proxy Voting
A description of the policies and procedures that the Funds use to determine how to vote proxies relating to portfolio securities is available without charge, upon request, by calling toll free, 1-866-442-2473, by accessing the Funds’ website at www.bairdfunds.com or by accessing the SEC’s website at www.sec.gov.
Each Fund’s proxy voting record for the most recent 12-month period ended June 30 is available without charge, upon request, by calling toll free, 1-866-442-2473, by accessing the Funds’ website at www.bairdfunds.com or by accessing the SEC’s website at www.sec.gov.
Portfolio Holdings Disclosure
The Funds file a complete schedule of portfolio holdings with the SEC for the first and third quarters of each fiscal year on Part F of Form N-PORT. The Funds’ filings on Part F of Form N-PORT are available on the SEC’s website at www.sec.gov. The Funds’ Form N-PORT reports may also be obtained by calling toll-free 1-866-442-2473 or by accessing the Funds’ website at www.bairdfunds.com.
Qualified Dividend Income/Dividends Received Deduction
For the fiscal year ended December 31, 2023, certain dividends paid by the Funds may be subject to a maximum tax rate of 15%, as provided for by the Jobs and Growth Tax Relief Reconciliation Act of 2003.
The percentage of dividends declared from ordinary income designated as qualified dividend income was as follows:
| Baird Equity Opportunity Fund | 100.00% |
| Baird Chautauqua International Growth Fund | 100.00% |
| Baird Chautauqua Global Growth Fund | 100.00% |
For corporate shareholders, the percent of ordinary income distributions qualifying for the corporate dividends received deduction for the fiscal year ended December 31, 2023 was as follows:
| Baird Equity Opportunity Fund | 100.00% |
| Baird Chautauqua Global Growth Fund | 15.50% |
For the fiscal year ended December 31, 2023, the percentage of taxable ordinary income distributions that are designated as short-term capital gain distributions under Internal Revenue Section 871(k)(2)(C) for each Fund was 0.00%.
Baird Funds, Inc. Privacy Policy
| | FACTS | | WHAT DOES BAIRD FUNDS DO WITH YOUR PERSONAL INFORMATION? | |
| | | | | |
| | Why? | | Financial companies choose how they share your personal information. Federal law gives consumers the right to limit some but not all sharing. Federal law also requires us to tell you how we collect, share, and protect your personal information. Please read this notice carefully to understand what we do. | |
| | | | | |
| | What? | | The types of personal information we collect and share depend on the product or service you have with us. This information can include: | |
| | | | • Social Security number | |
| | | | • Account balances, transaction history and assets | |
| | | | • Checking account information and wire transfer instructions | |
| | | | | |
| | How? | | All financial companies need to share customers’ personal information to run their everyday business. In the section below, we list the reasons financial companies can share their customers’ personal information; the reasons Baird Funds, Inc. chooses to share; and whether you can limit this sharing. | |
| | | Does Baird | Can you limit |
| | Reasons we can share your personal information | Funds, Inc. share? | this sharing? |
| | For our everyday business purposes— | Yes | No |
| | such as to process your transactions, maintain your account(s), respond | | |
| | to court orders and legal investigations, or report to credit bureaus | | |
| | For our marketing purposes— | Yes | No |
| | to offer our products and services to you | | |
| | For joint marketing with other financial companies | No | We do not share |
| | For our affiliates’ everyday business purposes— | Yes | No |
| | information about your transactions and experiences | | |
| | For our affiliates’ everyday business purposes— | No | We do not share |
| | information about your creditworthiness | | |
| | For our affiliates to market to you | No | We do not share |
| | For nonaffiliates to market to you | No | We do not share |
| | Questions? | | Call (toll free) 1-866-442-2473, Email prospectus@bairdfunds.com or go to www.bairdfunds.com | |
Baird Funds, Inc. Privacy Policy
| | Who we are | | | |
| | Who is providing this notice? | | Baird Funds, Inc. | |
| | | | | |
| | What we do | | | |
| | How does Baird Funds, Inc. | | To protect your personal information from unauthorized access and use, we use security measures that comply with | |
| | protect my personal information? | | federal law. These measures include computer safeguards and secured files and buildings. | |
| | | | | |
| | How does Baird Funds, Inc. | | We collect your personal information, for example, when you | |
| | collect my personal information? | | • open an account or give us your contact information | |
| | | | • make a wire transfer or provide account information | |
| | | | • make deposits or withdrawals from your account | |
| | | | We also collect your personal information from other companies. | |
| | Why can’t I limit all sharing? | | Federal law gives you the right to limit only | |
| | | | • sharing for affiliates’ everyday business purposes—information about your creditworthiness | |
| | | | • affiliates from using your information to market to you | |
| | | | • sharing for nonaffiliates to market to you | |
| | | | State laws and individual companies may give you additional rights to limit sharing. | |
| | Definitions | | | |
| | Affiliates | | Companies related by common ownership or control. They can be financial and nonfinancial companies. | |
| | | | • Robert W. Baird & Co Incorporated (the investment adviser and distributor to the Baird Funds) and its affiliates may share information among each other. | |
| | Nonaffiliates | | Companies not related by common ownership or control. They can be financial and nonfinancial companies. | |
| | | | • Baird Funds, Inc. does not share with nonaffiliates so they can market to you. | |
| | Joint marketing | | A formal agreement between nonaffiliated financial companies that together market financial products or services to you. We do not have any joint marketing partners. | |
| | | | • Baird Funds, Inc. does not have any joint marketing partners. | |
(This Page Intentionally Left Blank.)
Baird Funds, Inc.
c/o U.S. Bancorp Fund Services, LLC
P.O. Box 701
Milwaukee, WI 53201-0701
1-866-442-2473
Board of Directors
John W. Feldt
Darren R. Jackson
David J. Lubar
Cory L. Nettles
Marlyn J. Spear (Chair)
Frederick P. Stratton, Jr.
Investment Advisor and Distributor
Robert W. Baird & Co. Incorporated
777 East Wisconsin Avenue
Milwaukee, WI 53202
Administrator and Transfer Agent
U.S. Bancorp Fund Services, LLC
P.O. Box 701
615 East Michigan Street
Milwaukee, WI 53202
Custodian
U.S. Bank, N.A.
1555 N. RiverCenter Drive, Suite 302
Milwaukee, WI 53212
Legal Counsel
Godfrey & Kahn, S.C.
833 East Michigan Street, Suite 1800
Milwaukee, WI 53202
Independent Registered Public
Accounting Firm
Cohen & Company, Ltd.
342 North Water Street, Suite 830
Milwaukee, WI 53202
Item 2. Code of Ethics.
As of the end of the period covered by this report, the Registrant has adopted a code of ethics that applies to the President, Treasurer and Assistant Treasurer of the Registrant. The Registrant has not made any substantive amendments to its code of ethics during the period covered by this report. The Registrant has not granted any waivers from any provisions of the code of ethics during the period covered by this report.
A copy of the Registrant's Code of Ethics is incorporated by reference. See Item 13(a)(1).
Item 3. Audit Committee Financial Expert.
The Registrant’s board of directors has determined that John W. Feldt, Frederick P. Stratton, Jr., Marlyn J. Spear, Darren R. Jackson, and David J. Lubar, each a member of the audit committee, each qualify as an “audit committee financial expert” as such term is defined in paragraph (b) of Item 3 of Form N-CSR. Mr. Feldt, Mr. Stratton, Ms. Spear, Mr. Jackson, and Mr. Lubar are each “independent” as such term is defined in paragraph (a)(2) of Item 3 of Form N‑CSR.
Item 4. Principal Accountant Fees and Services.
Aggregate fees billed by Cohen & Company, Ltd. (“Cohen”), the Registrant’s principal accountant, during the last two fiscal years were as follows:
| | FYE 12/31/2023 | FYE 12/31/2022 |
| (a) Audit Fees | $239,450 | $239,450 |
| (b) Audit-Related Fees | $0 | $0 |
| (c) Tax Fees | $67,500 | $67,500 |
| (d) All Other Fees | $0 | $0 |
In the above table, “audit fees” are fees billed for professional services for the audit of the Registrant’s annual financial statements or for services that are normally provided by the accountant in connection with statutory and regulatory filings or engagements. “Tax fees” are fees billed for professional services rendered for tax compliance, tax advice and tax planning, and specifically relate to Cohen’s review of the Registrant’s federal and state tax returns.
(e)(1) The audit committee has adopted pre-approval policies and procedures that require the audit committee to pre‑approve all audit and non‑audit services rendered to the Registrant, as well as all non-audit services provided to the Registrant’s investment adviser and any entity affiliated with the Registrant’s investment adviser with respect to any engagement that relates directly to the operations and financial reporting of the Registrant. In accordance with its policies and procedures, the audit committee pre-approved all audit and tax services provided by Cohen to the Registrant during fiscal 2023. During the past two fiscal years, the Registrant did not receive any non-audit services from Cohen pursuant to any waivers of the pre-approval requirement under paragraph (c)(7)(i)(C) of Rule 2-01 of Regulation S-X. Additionally, during the past two fiscal years, neither the Registrant’s investment adviser nor any entity controlling, controlled by, or under common control with the investment adviser that provides ongoing services to the Registrant received non-audit services from Cohen.
(e)(2) The percentages of fees billed by Cohen applicable to non-audit services pursuant to waiver of the pre-approval requirement were as follows:
| | FYE 12/31/2023 | FYE 12/31/2022 |
Audit-Related Fees | Not applicable | Not applicable |
Tax Fees | 0% | 0% |
All Other Fees | Not applicable | Not applicable |
(f) Not applicable.
(g) Not applicable.
(h) Not applicable.
(i) Not applicable.
(j) Not applicable.
Item 5. Audit Committee of Listed Registrants.
Not applicable because the Registrant is not a “listed issuer” within the meaning of Rule 10A-3 under the Securities Exchange Act of 1934.
Item 6. Investments.
| (a) | The complete Schedules of Investments in securities of unaffiliated issuers as of the close of the reporting period for the Baird Mid Cap Growth Fund, Baird Small/Mid Cap Growth Fund, Baird Equity Opportunity Fund, Baird Chautauqua International Growth Fund, Baird Chautauqua Global Growth Fund, Baird Ultra Short Bond Fund, Baird Short-Term Bond Fund, Baird Intermediate Bond Fund, Baird Aggregate Bond Fund, Baird Core Plus Bond Fund, Baird Short-Term Municipal Bond Fund, Baird Strategic Municipal Bond Fund, Baird Quality Intermediate Municipal Bond Fund, Baird Core Intermediate Municipal Bond Fund, and Baird Municipal Bond Fund are included as part of the report to shareholders filed under Item 1. |
Item 7. Disclosure of Proxy Voting Policies and Procedures for Closed-End Management Investment Companies.
Not applicable because the Registrant is not a closed-end management investment company.
Item 8. Portfolio Managers of Closed-End Management Investment Companies.
Not applicable because the Registrant is not a closed-end management investment company.
Item 9. Purchases of Equity Securities by Closed‑End Management Investment Company and Affiliated Purchasers.
Not applicable because the Registrant is not a closed-end management investment company.
Item 10. Submission of Matters to a Vote of Security Holders.
The Board of Directors of the Registrant adopted revisions to the Nominating Committee Charter on August 22, 2023 that clarify the contact persons for shareholder recommendations of director candidates. Shareholder recommendations for consideration by the Nominating Committee should be sent in writing to the Chairperson of the Committee or the Registrant's Secretary together with appropriate biographical information concerning each such proposed nominee.
Item 11. Controls and Procedures.
| (a) | The Registrant’s management, with the participation of its principal executive and principal financial officers, has evaluated the effectiveness of the Registrant's disclosure controls and procedures (as defined in Rule 30a-3(c) under the Investment Company Act of 1940 (the “Act”)), as of a date within 90 days prior to the filing date of this Form N-CSR, as required by Rule 30a-3(b) under the Act and Rules 13a-15(b) or 15d-15(b) under the Securities Exchange Act of 1934. Based on such evaluation, the Registrant's principal executive and principal financial officers have concluded that the design and operation of the Registrant's disclosure controls and procedures are effective in providing reasonable assurance that the information required to be disclosed on Form N-CSR is recorded, processed, summarized and reported within the applicable time periods. |
| (b) | There were no changes in the Registrant's internal control over financial reporting (as defined in Rule 30a-3(d) under the Act) that occurred during the period covered by this report that have materially affected, or are reasonably likely to materially affect, the Registrant's internal control over financial reporting. |
Item 12. Disclosure of Securities Lending Activities for Closed-End Management Investment Companies
Not applicable because the Registrant is not a closed-end management investment company.
Item 13. Exhibits.
(3) Any written solicitation to purchase securities under Rule 23c-1 under the Act sent or given during the period covered by the report by or on behalf of the Registrant to 10 or more persons. Not applicable because the Registrant is not a closed-end management investment company.
(4) Changes in the Registrant’s independent public accountant.
There was no change in the Registrant’s independent public accountant for the period covered by the report.
SIGNATURES
Pursuant to the requirements of the Securities Exchange Act of 1934 and the Investment Company Act of 1940, the Registrant has duly caused this report to be signed on its behalf by the undersigned, thereunto duly authorized.
(Registrant) BAIRD FUNDS, INC.
By (Signature and Title) /s/Mary Ellen Stanek
Mary Ellen Stanek, President (Principal Executive Officer)
Date March 6, 2024
Pursuant to the requirements of the Securities Exchange Act of 1934 and the Investment Company Act of 1940, this report has been signed below by the following persons on behalf of the Registrant and in the capacities and on the dates indicated.
By (Signature and Title) /s/Mary Ellen Stanek
Mary Ellen Stanek, President (Principal Executive Officer)
Date March 6, 2024
By (Signature and Title) /s/Dustin J. Hutter
Dustin J. Hutter, Treasurer (Principal Financial Officer)
Date March 6, 2024