(a) Include a copy of the report transmitted to stockholders pursuant to Rule 30e-1 under the Act (17 CFR 270.30e-1).
Annual Report –
Baird Funds
December 31, 2020
Taxable Bond Funds
| Baird Ultra Short Bond Fund | Baird Aggregate Bond Fund |
| Baird Short-Term Bond Fund | Baird Core Plus Bond Fund |
Baird Intermediate Bond Fund
Municipal Bond Funds
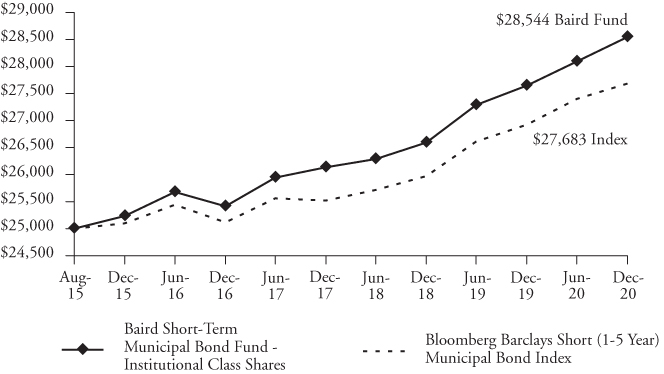
Baird Short-Term Municipal Bond Fund
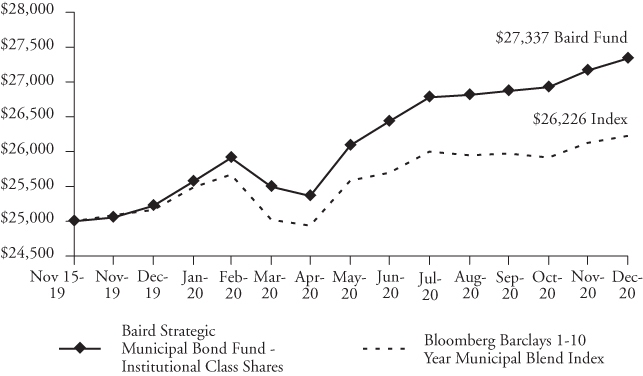
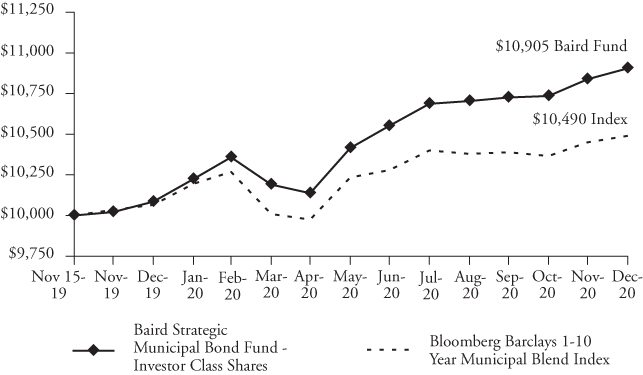
Baird Strategic Municipal Bond Fund
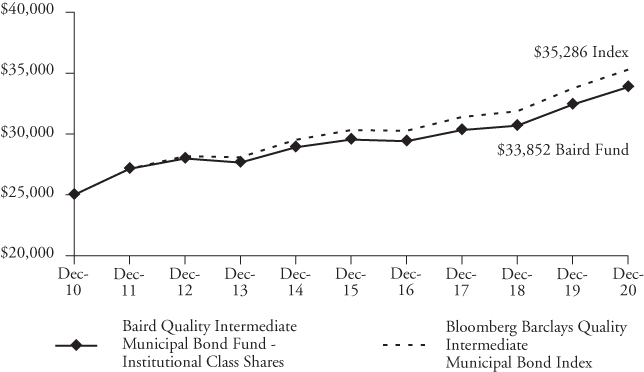
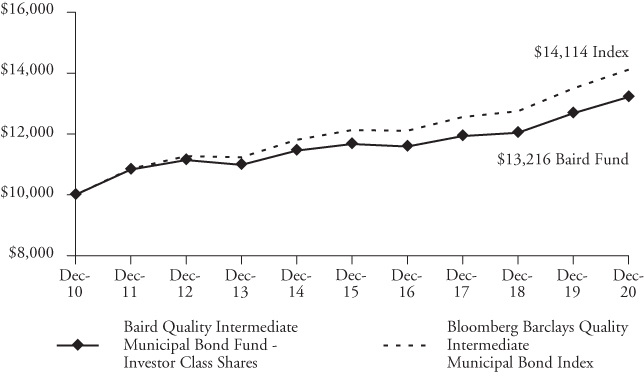
Baird Quality Intermediate Municipal Bond Fund
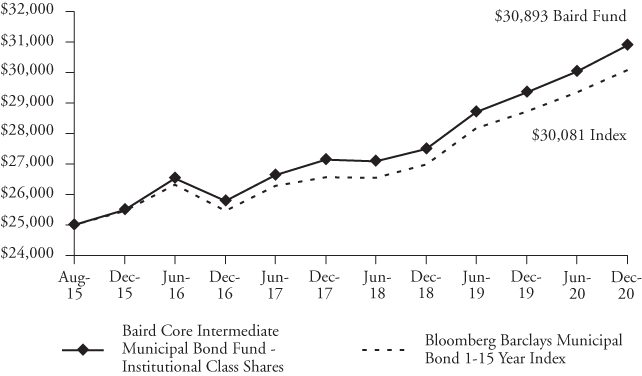
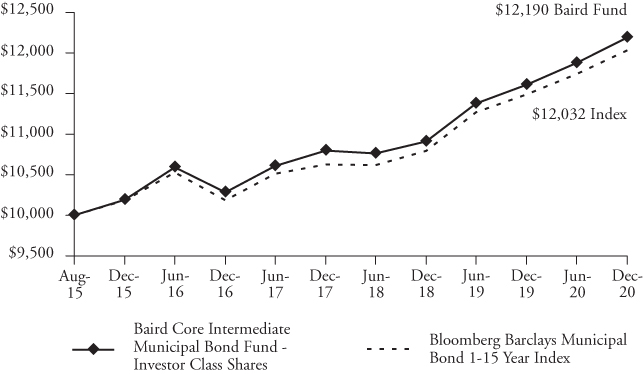
Baird Core Intermediate Municipal Bond Fund
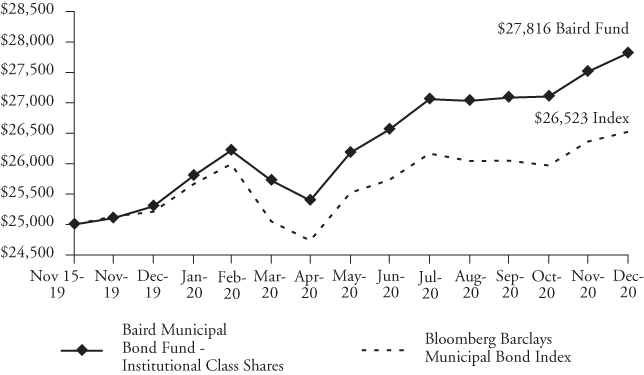
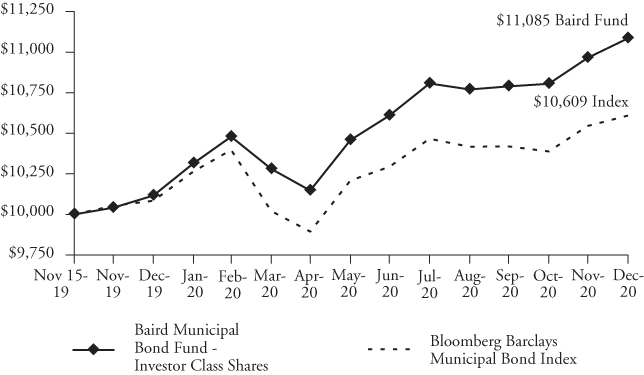
Baird Municipal Bond Fund
Beginning on January 1, 2021, as permitted by regulations adopted by the U.S. Securities and Exchange Commission, paper copies of the Funds’ annual and semi-annual shareholder reports will no longer be sent by mail, unless you specifically request paper copies of the reports from the Funds or from your financial intermediary, such as a broker-dealer or bank. Instead, the reports will be made available on the Funds’ website (www.bairdassetmanagement.com/baird-funds/funds-and-performance#Literature) and you will be notified by mail each time a report is posted and provided with a website link to access the report.
If you already elected to receive shareholder reports electronically, you will not be affected by this change and you need not take any action. You may elect to receive shareholder reports and other communications from the Funds electronically anytime by contacting your financial intermediary or, if you are a direct investor, by calling 1-866-442-2473, or sending an e-mail request to prospectus@bairdfunds.com.
You may elect to receive all future reports in paper free of charge. If you invest through a financial intermediary, you can contact your financial intermediary to request that you continue to receive paper copies of your shareholder reports. If you invest directly with a Fund, you can call 1-866-442-2473 or send an e-mail request to prospectus@bairdfunds.com to let the Fund know you wish to continue receiving paper copies of your shareholder reports. Your election to receive reports in paper will apply to all Funds held in your account if you invest through your financial intermediary or all Funds held with the fund complex if you invest directly with the Funds.
| Go Green. |  | Go Paperless. |
Sign up to receive your Baird Funds’ prospectuses and reports online.
Table of Contents
| Letter to Shareholders | | 1 |
| 2020 Bond Market Overview | | 2 |
| Baird Ultra Short Bond Fund | | 7 |
| Baird Short-Term Bond Fund | | 33 |
| Baird Intermediate Bond Fund | | 62 |
| Baird Aggregate Bond Fund | | 89 |
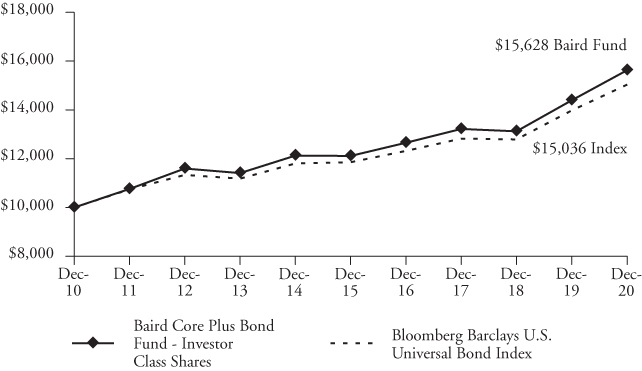
| Baird Core Plus Bond Fund | | 144 |
| 2020 Municipal Bond Market Overview | | 206 |
| Baird Short-Term Municipal Bond Fund | | 210 |
| Baird Strategic Municipal Bond Fund | | 298 |
| Baird Quality Intermediate Municipal Bond Fund | | 329 |
| Baird Core Intermediate Municipal Bond Fund | | 371 |
| Baird Municipal Bond Fund | | 431 |
| Additional Information on Fund Expenses | | 450 |
| Statements of Assets and Liabilities | | 452 |
| Statements of Operations | | 456 |
| Statements of Changes in Net Assets | | 460 |
| Financial Highlights | | 470 |
| Notes to the Financial Statements | | 490 |
| Report of Independent Registered Public Accounting Firm | | 509 |
| Directors and Officers | | 510 |
| Disclosure Regarding the Board of Directors’ Approval | | |
| of the Investment Advisory Agreement for Baird Bond Funds | | 513 |
| Additional Information | | 517 |
| Privacy Notice | | A-1 |
This report has been prepared for shareholders and may be distributed to others only if preceded or accompanied by a current prospectus.
Cautionary Note on Analyses, Opinions and Outlooks: In this report we offer analyses and opinions on the performance of individual securities, companies, industries, sectors, markets, interest rates, asset classes, types of fixed income securities and governmental policies, including predictions, forecasts and outlooks regarding possible future events. These can generally be identified as such because the context of the statements may include such words as “believe,” “should,” “will,” “expects,” “anticipates,” “hopes” and words of similar effect. These statements reflect the portfolio managers’ good faith beliefs and judgments and involve risks and uncertainties, including the risk that the portfolio managers’ analyses, opinions and outlooks are or will prove to be inaccurate. It is inherently difficult to correctly assess and explain the performance of particular securities, sectors, markets, interest rate movements, governmental actions or general economic trends and conditions, and many unforeseen factors contribute to the performance of Baird Funds. Investors are, therefore, cautioned not to place undue reliance on subjective judgments contained in this report.

Baird Funds
1-866-442-2473
www.bairdfunds.com
February 26, 2021
Dear Shareholder,
After the challenges we have all endured over the past year, our Baird Advisors team hopes this letter finds you, your families and your loved ones healthy and safe. To say that 2020 was a challenging year for the financial markets and investors truly understates what we have all experienced. The impact of the coronavirus on our investors’ lives, families, businesses and communities felt at times overwhelming, but you all persevered and we are honored to have been your fixed income manager during this period. For our Baird Advisors team, this year has reminded us of the importance of looking out for each other and remaining laser focused on delivering on your financial needs. We have spent decades building and refining our all-weather strategies and I am extremely proud of our team for navigating the unprecedented weather in 2020. We delivered competitive returns but also peace of mind that your bond portfolio was doing what it was supposed to do. In addition, having a talented, well-respected municipal bond team embedded with our taxable team remains a significant competitive advantage. That expertise and talent was a contributor to the Baird Bond Funds’ strong performance in 2020 across our entire lineup.
Amidst this extremely volatile and challenged environment, the Baird Bond Funds delivered very strong absolute performance and nearly all materially exceeded their benchmarks. While the Baird Quality Intermediate Municipal Bond Fund modestly lagged its benchmark, it continued to achieve its wealth preservation goal, remaining one of if not the highest quality bond fund available in the market. All of the Baird Bond Funds’ long-term track records remain very competitive and we believe the portfolios are positioned well as we enter 2021.
While much in the world has changed, our core commitment to our investors has not. We remain dedicated to generating competitive, risk-controlled returns over full market cycles, providing competitively-priced products, delivering outstanding service and continuing to invest in our long-tenured and seasoned investment team.
Through all of the challenges in 2020, we never lost sight of the fact that our long-term success rests on the trust you have placed in us to be effective stewards of your assets. We want to express our sincere appreciation for your confidence in our work and continued investment in the Baird Bond Funds. May 2021 bring you health, happiness and success.
Sincerely,
Mary Ellen Stanek, CFA
President
Baird Funds
2020 Bond Market Overview
(Unaudited)
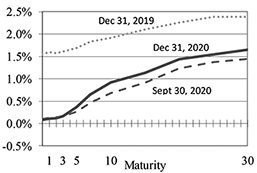
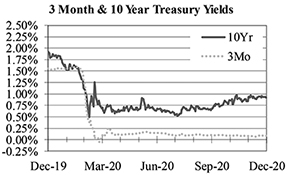
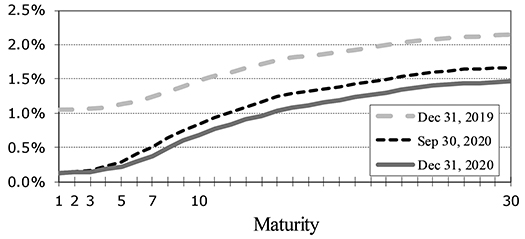
2020 – Global Pandemic Shock Followed by Massive Coordinated Fiscal and Monetary ResponseTreasury yields fell across the curve in 2020, with the benchmark 10yr Treasury down 100 bps to finish the year at 0.92%, after hitting an all-time [intra-day] record low of 0.31% on March 9. The curve steepened, with the spread between 2yr and 30yr Treasuries increasing from 82 bps to 153 bps during the year, as yields in shorter maturities saw the largest decline. Starting in late February, the coronavirus (COVID-19) affected every aspect of the economy, leading to the swiftest equity bear market in history, with an over 33% peak-to-trough drop in the S&P 500 in just over a month ending March 23, and fixed income markets hitting levels of distress not seen since the Global Financial Crisis (GFC) in 2008. However, unlike 2008, the massive, coordinated monetary and fiscal responses resulted in a much swifter recovery. Unemployment dropped to 6.7% by year end after peaking at 14.7% in April as businesses reopened, and the Pfizer and Moderna vaccines offered hope for a return to normal. The S&P 500 ended the year +16% at record highs and credit spreads tightened through year end, completely erasing the pandemic-related widening in many sectors. The COVID-19 pandemic and the policy response to it essentially created a full market cycle for spreads in the span of a calendar year.
Treasury Yields
Maturity | 12/31/19 | 9/30/20 | 12/31/20 | Q4 Change | 2020 Change |
| 3mo | 1.55% | 0.10% | 0.09% | -0.01% | -1.46% |
| 1 | 1.60% | 0.12% | 0.11% | -0.01% | -1.49% |
| 2 | 1.57% | 0.13% | 0.12% | -0.01% | -1.45% |
| 3 | 1.61% | 0.15% | 0.17% | 0.02% | -1.44% |
| 5 | 1.69% | 0.27% | 0.36% | 0.09% | -1.33% |
| 7 | 1.83% | 0.47% | 0.65% | 0.18% | -1.18% |
| 10 | 1.92% | 0.68% | 0.92% | 0.24% | -1.00% |
| 30 | 2.39% | 1.45% | 1.65% | 0.20% | -0.74% |
Fed’s Response and Congress’ CARES Act Eased the Pain; Politics and Geopolitical Uncertainty were High in 2020
The Fed cut rates in two emergency meetings in early March, slashing the fed funds rate 150 bps to the zero bound. Then as credit markets froze up, the Fed implemented “unlimited” purchases of U.S. Treasuries and Agency Mortgage-Backed Securities at a truly astounding pace, authorizing their fourth quantitative easing (“QE”) program with purchases of up to $75B Treasuries and $50B MBS per day, buying more in a day than during a full month during QE3. The Fed rebooted several 2008-era emergency lending programs, and created a few brand new lending facilities to keep primary and secondary bond trading in corporates and municipals from grinding to a halt. Late in March, Congress passed the $2.2T Coronavirus Aid, Relief, and Economic Security
2020 Bond Market Overview
(Unaudited)
(CARES) Act, the largest fiscal aid package ever at 10% of GDP. The act included support for small businesses, direct payments and enhanced unemployment benefit payments to consumers, and additional funding to hospitals and health care providers. In August, Fed Chair Powell released a “Statement on Longer-Run Goals and Monetary Policy Strategy” – as expected, the Fed moved to an inflation target that averages 2% over time, while forecasting the fed funds rate to remain at the zero bound through 2023. Housing was a bright spot in the economy, with the Freddie Mac 30-yr Mortgage Market Survey Rate hitting all-times lows 14 times during the year, ending at 2.7%. Political uncertainty was high throughout the year. Democratic challenger Joe Biden defeated incumbent President Trump in November, and despite claims of widespread voter fraud by President Trump, Biden was inaugurated on January 20. U.S./China trade tensions continued and Beijing further limited Hong Kong’s autonomy by enacting a national security law on June 30. The UK officially left the EU on January 31, 2020, reaching a final agreement on trade in late December and avoiding a worst-case scenario no-deal Brexit.
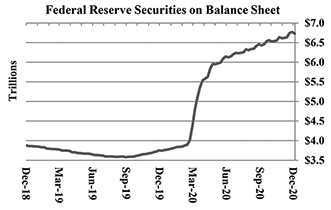
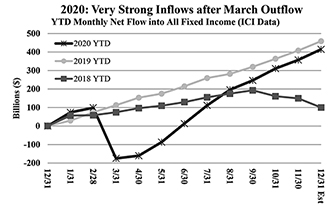
As the Fed Balance Sheet Expanded at a Furious Pace, Fixed Income Flows Rebounded
The Fed’s bond-buying program (QE4) added an astounding $3T to its investment portfolio, from $3.7 T to $6.7T. QE4 in combination with slashing short rates to zero helped stabilize the bond market. As investor confidence swiftly returned, the $175B in YTD net mutual fund and ETF outflows through March completely reversed, and fund inflows returned at record-setting pace. Net fixed income mutual fund and ETF inflows ended 2020 at $415B and, importantly, the ICI data doesn’t fully capture demand from all market participants – such as insurance companies, pensions, and foreign investors. Global investors have been drawn to the positive yields on U.S. debt, as nearly $18T in global bonds were trading at negative yields at year end, reaching all-time highs in 2020 according to Bloomberg data.
Option-Adjusted Spreads (in bps)
| | | | March | | | Q4 | YTD |
| | | 12/31/19 | Wides | 9/30/20 | 12/31/20 | Chg | Chg |
| U.S. Aggregate Index | | 39 | 127 (3/20) | 60 | 42 | -18 | 3 |
| U.S. Agency (non-mortgage) | | 10 | 53 (3/25) | 16 | 10 | -6 | 0 |
| Mortgage and ABS Sectors | | | | | | | |
| U.S. Agency Pass-throughs | | 39 | 132 (3/19) | 61 | 39 | -22 | 0 |
| U.S. Agency CMBS | | 53 | 144 (3/23) | 62 | 44 | -18 | -9 |
| U.S. Non-Agency CMBS | | 85 | 348 (3/25) | 139 | 109 | -30 | 24 |
| Asset-Backed Securities | | 44 | 325 (3/26) | 41 | 33 | -8 | -11 |
| Corporate Sectors | | | | | | | |
| U.S. Investment Grade | | 93 | 373 (3/23) | 136 | 96 | -40 | 3 |
| Industrial | | 99 | 383 (3/23) | 140 | 101 | -39 | 2 |
| Utility | | 97 | 298 (3/24) | 141 | 106 | -35 | 9 |
| Financial Institutions | | 80 | 378 (3/23) | 126 | 83 | -43 | 3 |
| Other Govt. Related | | 72 | 180 (3/23) | 84 | 66 | -18 | -6 |
| U.S. High Yield Corporates | | 336 | 1100 (3/23) | 517 | 360 | -157 | 24 |
| Emerging Market Debt | | 573 | 1370 (3/23) | 638 | 503 | -135 | -70 |
Source: Bloomberg Barclays Indices
2020 Bond Market Overview
(Unaudited)
2020 Spreads: Full Market Cycle for Spreads in One YearSpreads in most sectors ended the year relatively close to where they began, masking huge intra-year volatility in 2020. For the year, spreads in Agency Pass-throughs were flat, U.S. Investment Grade Corporates widened 3 bps and ABS tightened 11 bps. However, at their March wides, these three sectors were wider by 93 bps, 280 bps and 281 bps, respectively. These swings were due in large part to the uncertainty around COVID-19 and what impact the government’s containment efforts would have on the economy, the unprecedented fiscal and monetary support detailed above, and positive vaccine news later in the year providing investors with a light at the end of the tunnel. In particular, the tightening in Agency Pass-through spreads was primarily due to the Fed’s $600B in net purchases, which decreased available supply to investors. Furthermore, record-low mortgage rates provided strength to the housing sector and homeowners refinanced at faster-than-expected speeds. Outlier sectors include Non-Agency CMBS, which widened 24 bps (with the most severe widening focused in “A” and lower rated securities) on uncertainty around pandemic-hit sectors such as retail and hotel space, and U.S. High Yield Corporates which widened 24 bps. The outsized move tighter in Emerging Market Debt for the year (70 bps tighter) was largely driven by the removal of Venezuela from the index in May which reduced the OAS of the index by over 300bps. (The EM index underperformed similar-maturity Treasuries in 2020). Investment Grade Corporates had record gross ($2.1T) and net ($1.1T) supply, which was met by very strong demand.
Strong Market Returns, Credit Outperformed in 2020
The returns in the U.S. fixed income market were truly remarkable considering the strong total returns in 2019 and the fact the 10-year Treasury yield began the year at just 1.92%. Both credit risk and duration risk were rewarded in 2020. U.S. Investment Grade Corporates posted the strongest spread sector returns in 2020 (+9.89%), and returns on longer maturities (U.S. Gov’t/Credit + 8.93%) were substantially greater than those on shorter maturities (U.S. 1-3 Yr. Gov’t/Credit Index +3.33%). Agency Pass-throughs were the weakest-performing sector (+3.87%), largely due to record-low mortgage rates and historically fast residential mortgage refinancing activity, generating large prepayments in the premium-priced sector. TIPS were the top-performing sector (+10.99%) due to their longer duration and the Fed’s efforts to engineer negative real yields.
Total Returns of Selected Bloomberg Barclays Indices and Subsectors
| | | | | | Effective |
| | December | Q4 | 2020 | 2019 | Duration (yrs) |
| U.S. Aggregate Index | 0.14% | 0.67% | 7.51% | 8.72% | 6.22 |
| U.S. Gov’t/Credit Index | 0.09% | 0.82% | 8.93% | 9.71% | 7.74 |
| U.S. Intermediate Gov’t/Credit Index | 0.21% | 0.48% | 6.43% | 6.80% | 4.12 |
| U.S. 1-3 Yr. Gov’t/Credit Index | 0.09% | 0.21% | 3.33% | 4.03% | 1.91 |
| U.S. Treasury | -0.23% | -0.83% | 8.00% | 6.86% | 7.21 |
| U.S. Agency (Non-Mortgage) | 0.11% | 0.04% | 5.48% | 5.89% | 3.66 |
| U.S. Agency Pass-Throughs | 0.22% | 0.24% | 3.87% | 6.35% | 2.34 |
| CMBS (Commercial Mortgage | | | | | |
| Backed Securities) | 0.73% | 1.05% | 8.11% | 8.29% | 5.31 |
| ABS (Asset-Backed Securities) | 0.20% | 0.36% | 4.52% | 4.53% | 2.10 |
| U.S. Corporate Investment Grade | 0.44% | 3.05% | 9.89% | 14.54% | 8.84 |
| U.S. High Yield Corporates | 1.88% | 6.45% | 7.11% | 14.32% | 3.58 |
| Emerging Market Debt | 2.86% | 7.62% | 4.26% | 10.90% | 5.35 |
| Municipal Bond Index | 0.61% | 1.82% | 5.21% | 7.54% | 5.18 |
| TIPS (Treasury Inflation | | | | | |
| Protected Securities) | 1.15% | 1.62% | 10.99% | 8.43% | 7.81 |
2020 Bond Market Overview
(Unaudited)
2021 OutlookWe expect above-average economic growth in 2021 as the lagged stimulus benefits, reduced spread of COVID-19 as vaccinations increase, and pent-up consumer demand take effect. While the Fed will remain highly accommodative, anchoring short-term rates at zero and continuing QE, market consensus anticipates a steeper curve with higher inflation expectations and ever-rising Treasury supply pushing longer rates higher. However, we anticipate more modest upward pressure on yields as still-strong secular disinflationary forces temper near-term cyclical inflation pressure and strong demand from yield-starved investors limit the increase in yields. We expect spreads to remain relatively tight in 2021 on solid and improving fundamentals and favorable supply/demand technicals. Absolute returns will be more modest given the low starting yields, and every basis point will be especially important. Sector weightings, security selection and roll down will take on even greater importance in this new year.
Disclosures
Fixed income is generally considered to be a more conservative investment than stocks, but bonds and other fixed income investments still carry a variety of risks such as interest rate risk, credit risk, inflation risk, and liquidity risk. In a rising interest rate environment, the value of fixed-income securities generally decline and conversely, in a falling interest rate environment, the value of fixed-income securities generally increase. High yield securities may be subject to heightened market, interest rate or credit risk and should not be purchased solely because of the stated yield.
The Bloomberg Barclays Aggregate Bond Index is an index comprised of approximately 6000 publicly traded bonds including U.S. Government, mortgage-backed, corporate, and Yankee bonds with an average maturity of approximately 10 years.
The Bloomberg Barclays Government/Credit Index is a combination of the Government Index which measures government-bond general and Treasury funds, and the Credit Bond Index, which is a market value-weighted index which tracks the returns of all publicly issued, fixed-rate, nonconvertible, dollar-denominated, SEC registered, investment grade Corporate Debt.
The Bloomberg Barclays Intermediate Government/Credit Index is a combination of the Government Index which measures government-bond general and Treasury funds, and the Credit Bond Index, which is a market value-weighted index which tracks the returns of all publicly issued, fixed-rate, nonconvertible, dollar-denominated, SEC registered, investment grade Corporate Debt with maturities between one and ten years.
The Bloomberg Barclays Government/Credit Intermediate Index (1 – 3 yr.) is a combination of the Government Index which measures government-bond general and Treasury funds, and the Credit Bond Index, which is a market value-weighted index which tracks the returns of all publicly issued, fixed-rate, nonconvertible, dollar-denominated, SEC registered, investment grade Corporate Debt with maturities between zero and three years.
The Bloomberg Barclays U.S. Treasury Index includes public obligations of the U.S. Treasury. Treasury bills are excluded by the maturity constraint of at least one year but are part of a separate Short Treasury Index. In addition, certain special issues, such as state and local government series bonds (SLGs), as well as U.S. Treasury TIPS, are excluded. STRIPS are excluded from the index because their inclusion would result in double-counting. Securities in the Index roll up to the U.S. Aggregate, U.S. Universal, and Global Aggregate Indices. The U.S. Treasury Index was launched on January 1, 1973.
U.S. Agency: This index is the U.S. Agency component of the U.S. Government/Credit index. Publicly issued debt of U.S. Government agencies, quasi-federal corporations, and corporate or foreign debt guaranteed by the U.S. Government (such as USAID securities). The largest issues are Fannie Mae, Freddie Mac, and the Federal Home Loan Bank System (FHLB). The index includes both callable and non-callable agency securities.
2020 Bond Market Overview
(Unaudited)
U.S Corporate – Investment Grade: This index is the Corporate component of the U.S. Credit index. It includes publicly issued U.S. corporate and specified foreign debentures and secured notes that meet the specified maturity, liquidity, and quality requirements. To qualify, bonds must be SEC-registered.
CMBS (Commercial Mortgage-Backed Securities): This index is the CMBS component of the U.S. Aggregate index. The Bloomberg Barclays CMBS ERISA-Eligible Index is the ERISA-eligible component of the Bloomberg Barclays CMBS Index. This index, which includes investment grade securities that are ERISA eligible under the underwriter’s exemption, is the only CMBS sector that is included in the U.S. Aggregate Index.
MBS (Mortgage-Backed Securities): This index is the U.S. MBS component of the U.S. Aggregate index. The MBS Index covers the mortgage-backed pass-through securities of Ginnie Mae (GNMA), Fannie Mae (FNMA), and Freddie Mac (FHLMC). The MBS Index is formed by grouping the universe of over 600,000 individual fixed rate MBS pools into approximately 3,500 generic aggregates.
ABS (Asset-Backed Securities): This index is the ABS component of the U.S. Aggregate index. The ABS index has three subsectors: credit and charge cards, autos, and utility. The index includes pass-through, bullet, and controlled amortization structures. The ABS Index includes only the senior class of each ABS issue and the ERISA-eligible B and C tranche. The Manufactured Housing sector was removed as of January 1, 2008, and the Home Equity Loan sector was removed as of October 1, 2009.
Corporate High Yield: The Bloomberg Barclays U.S. High Yield Index covers the universe of fixed rate, non-investment grade debt. Eurobonds and debt issues from countries designated as emerging markets (sovereign rating of Baa1/BBB+/BBB+ and below using the middle of Moody’s, S&P, and Fitch) are excluded, but Canadian and global bonds (SEC registered) of issuers in non-EMG countries are included. Original issue zeroes, step-up coupon structures, 144-As and pay-in-kind bonds (PIKs, as of October 1, 2009) are also included.
Emerging Market: Bloomberg uses a fixed list of countries defined as emerging markets countries for index inclusion purposes that is based on World Bank Income group definitions (Low/Middle), IMF country classifications (Non-Advanced Economies), and other advanced economies that may be less accessible or investable for global debt investors.
The Bloomberg Barclays Municipal Bond Index is a broad-based, total-return index. The bonds are all investment-grade, tax-exempt, and fixed-rate securities with long-term maturities (greater than 2 years). They are selected from issues larger than $50 million.
The Bloomberg Barclays TIPS Index consists of Treasury Inflation Protected Securities (TIPS). TIPS are securities whose principal is tied to the Consumer Price Index. TIPS pay interest semi-annually, based on the fixed rate applied to the adjusted principal.
Ratings are measured on a scale that ranges from AAA or Aaa (highest) to D or C (lowest). Investment grade investments are those rated from highest down to BBB- or Baa3.
Robert W. Baird & Co. Incorporated. This is not a complete analysis of every material fact regarding any company, industry or security. The information has been obtained from sources we consider to be reliable, but we cannot guarantee the accuracy. Indices are unmanaged, and are not available for direct investment. Past performance is not a guarantee of future results.
Baird Ultra Short Bond Fund
December 31, 2020 (Unaudited)
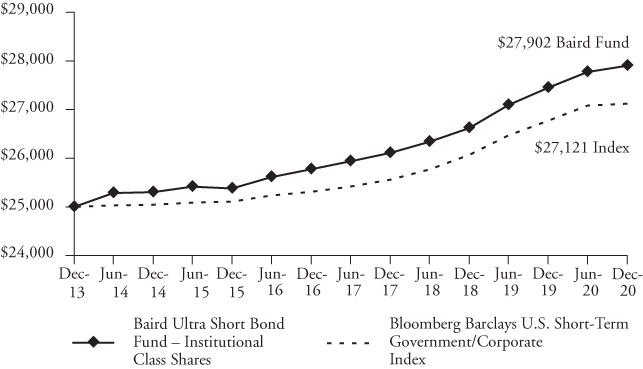
The Baird Ultra Short Bond Fund seeks current income consistent with preservation of capital. The Fund’s primary benchmark index against which it measures performance is the Bloomberg Barclays U.S. Short-Term Government/Corporate Index. The Bloomberg Barclays U.S. Short-Term Government/Corporate Index is an unmanaged, market value weighted index of investment grade fixed debt, including government and corporate securities, with maturities of less than one year.
Treasury yields fell across the curve in 2020, with the benchmark 10-year Treasury down 100 bps to finish the year at 0.92%, after hitting an all-time [intra-day] record low of 0.31% on March 9. The curve steepened, with the spread between 2-year and 30-year Treasuries increasing from 82 bps to 153 bps during the year, as yields in shorter maturities saw the largest decline. Starting in late February, the coronavirus (COVID-19) affected every aspect of the economy, leading to the swiftest equity bear market in history, with an over 33% peak-to-trough drop in the S&P 500 in just over a month ending March 23, and fixed income markets hitting levels of distress not seen since the Global Financial Crisis (GFC) in 2008. However, unlike 2008, the massive, coordinated monetary and fiscal policy response resulted in a much swifter recovery. U.S. unemployment dropped to 6.7% by year end after peaking at 14.7% in April as businesses reopened, and the Pfizer and Moderna vaccines offered hope for a return to normal sometime in 2021. The S&P 500 ended the year up 16% at record highs, and credit spreads tightened through year end, completely erasing the pandemic-related widening in many sectors. The COVID-19 pandemic and the massive government policy response to it essentially created a full market cycle for spreads in the span of a calendar year.
During 2020, the Fund’s Institutional Class Shares generated strong absolute and relative returns and outperformed its benchmark by 35 basis points net of fees. The primary factors contributing to the Fund’s absolute and relative performance in 2020 include:
| | • | Credit Positioning |
| | | • | Positive – Overweight to Investment Grade Credit (increased exposure post widening of the spread) |
| | | • | Positive – Opportunistically increasing exposure to municipal securities |
| | • | Mortgage-Backed Securities (MBS) & Asset-Backed Securities (ABS) Positioning – Positive overall |
| | | • | Positive – Exposure to ABS & Non-Agency RMBS (increased exposure post widening of the spread) |
We expect the economic impact of COVID-19 to linger well into 2021, particularly as it relates to the travel and hospitality service sectors. Yet, with the massive fiscal stimulus that is already in the pipeline, and likely more coming now that the Democratic Party has full, albeit narrow, control of Washington, above-average economic growth is very likely in 2021. Stronger growth may pressure inflation modestly higher, a goal of the Fed, translating into moderately higher intermediate and long-term rates. With short-term rates still anchored close to zero by the Fed, a steeper yield curve will enable investors to capture some added performance as bonds roll down the curve. We expect the roll-down return to be an important component of total return this year, as well as security selection, sector allocation, and the yield advantage the Fund enjoys above that of its benchmark. Strategic positioning across market sectors and along the yield curve (including the ability to thoughtfully reposition should spreads widen into volatility) will complement the always-important security selection process to help navigate through the current environment.
The Fund remains duration neutral with a modest overweight to Investment Grade corporate credit, particularly Financials. The Fund is also maintaining its allocation in the MBS/ABS sectors at the senior part of the capital structure given attractive relative valuations and the continued broad sector diversification benefit they provide to the overall portfolio. The Fund only purchases U.S. dollar denominated securities in the cash bond market (no derivatives) and we believe the Fund is well positioned to add value relative to its benchmark.
Baird Ultra Short Bond Fund
December 31, 2020 (Unaudited)
Portfolio Characteristics
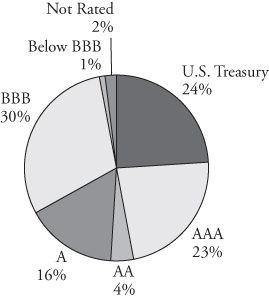
Quality Distribution(1)(2)
 | | Net Assets | $4,579,120,228 | |
| | | | |
| | SEC 30-Day | | |
| | Yield(3) | | |
| | Institutional Class | | |
| | (Subsidized) | 0.68% | |
| | Institutional Class | | |
| | (Unsubsidized) | 0.53% | |
| | Investor Class | | |
| | (Subsidized) | 0.43% | |
| | Investor Class | | |
| | (Unsubsidized) | 0.29% | |
| | | | |
| | Average | | |
| | Effective | | |
| | Duration | 0.47 years | |
| | | | |
| | Average | | |
| | | Effective | | |
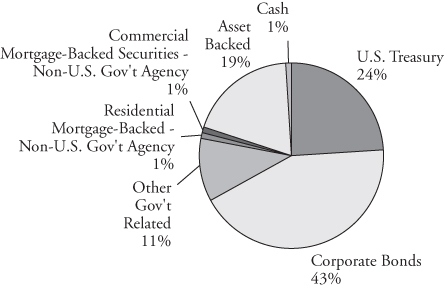
Sector Weightings(1) | | Maturity | 0.53 years | |
| | | | | |
 | | Annualized | | |
| | Expense Ratio(4) | | |
| | Gross | | |
| | Institutional Class | 0.30% | |
| | Investor Class | 0.55% | (5) |
| | | | |
| | Net | | |
| | Institutional Class | 0.15% | |
| | Investor Class | 0.40% | (5) |
| | | | |
| | Portfolio | | |
| | Turnover Rate | 92% | |
| | | | |
| | Number of | | |
| | Holdings | 453 | |
| | | | |
| | | | |
| | | | | |
| (1) | Percentages shown are based on the Fund’s total investments. |
| (2) | The quality profile is calculated on a market value-weighted basis using the highest credit quality rating for each security held by the Fund given by S&P, Moody’s or Fitch, each of which is a Nationally Recognized Statistical Rating Organization (NRSRO). NRSROs rate the credit quality of securities using a scale that generally ranges from AAA (highest) to D (lowest). |
| (3) | SEC yields are based on SEC guidelines and are calculated for the 30 days ended December 31, 2020. |
| (4) | Reflects expense ratios as stated in the Fund’s current prospectus. The Advisor has contractually agreed to waive management fees in an amount equal to an annual rate of 0.15% of average daily net assets for the Fund, at least through April 30, 2022. The agreement may only be terminated prior to the end of this term by or with the consent of the Board of Directors of Baird Funds, Inc. |
| (5) | Includes 0.25% 12b-1 fee. |
Baird Ultra Short Bond Fund
December 31, 2020 (Unaudited)
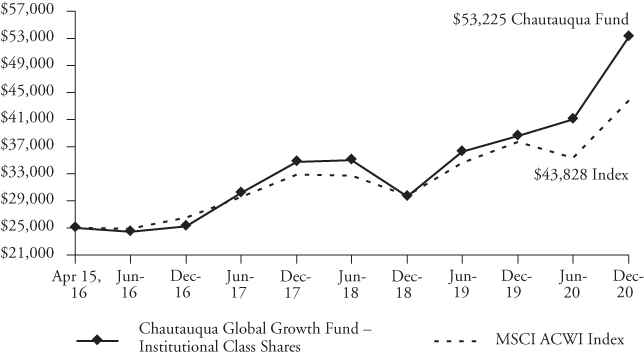
Institutional ClassValue of a $25,000 Investment
Growth of a hypothetical investment of $25,000 made on the Fund’s inception date (12/31/13), assuming reinvestment of all distributions.
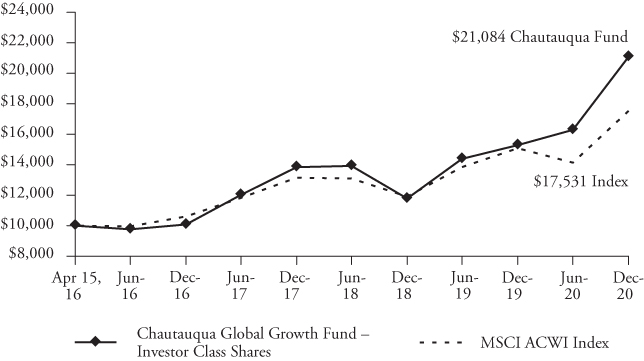
Investor Class
Value of a $10,000 Investment
Growth of a hypothetical investment of $10,000 made on the Fund’s inception date (12/31/13), assuming reinvestment of all distributions.
Baird Ultra Short Bond Fund
December 31, 2020 (Unaudited)
Total Returns
| | | Average Annual |
| | One | Three | Five | Since |
| For the Periods Ended December 31, 2020 | Year | Years | Years | Inception(1) |
| Institutional Class Shares | 1.66% | 2.24% | 1.91% | 1.58% |
| Investor Class Shares | 1.66% | 2.04% | 1.70% | 1.36% |
| Bloomberg Barclays U.S. Short-Term | | | | |
Government/Corporate Index(2) | 1.31% | 2.00% | 1.55% | 1.17% |
| (1) | For the period from December 31, 2013 (inception date) through December 31, 2020. |
| (2) | The Bloomberg Barclays U.S. Short-Term Government/Corporate Index is an unmanaged, market value weighted index of investment grade, fixed-rate debt issues, including government and corporate securities, with maturities less than one year. This Index does not reflect any deduction for fees, expenses or taxes. A direct investment in an index is not possible. |
The line graphs on the previous page and the returns shown in the table above reflect reinvestment of dividends and/or capital gains distributions in additional shares. The returns in the graphs and table do not reflect the deduction of taxes that a shareholder would pay on Fund distributions or the redemption of Fund shares. The returns reflect the actual performance for each period and do not include the impact of trades executed on the last business day of the period that were recorded on the first business day of the next period.
The Fund’s gross expense ratio for each Class, as reflected in the Fund’s current prospectus, is set forth under “Portfolio Characteristics”.
The Fund may invest up to 10% of its net assets in non-investment grade debt securities (commonly referred to as “high yield” bonds). While these types of securities typically offer higher yields than investment grade securities, they also include greater risks including increased credit risk and the increased risk of default or bankruptcy. The Fund may also invest in U.S. dollar denominated foreign securities which involve additional risks such as political and economic instability, and different and sometimes less strict financial reporting standards and regulation. The Fund may also invest in mortgage- and asset-backed securities, which include interest rate and prepayment risks more pronounced than those of other fixed income securities. U.S. and international markets have experienced significant periods of volatility in recent years and months due to a number of economic, political and global macro factors including the impact of the coronavirus (COVID-19) as a global pandemic and related public health issues, growth concerns in the U.S. and overseas, uncertainties regarding interest rates, trade tensions and the threat of tariffs imposed by the U.S. and other countries. These and other geopolitical events may cause market disruptions and could have an adverse effect on the value of the Fund’s investments.
Past performance does not guarantee future results. Investment return and principal value will fluctuate so that an investor’s shares, when redeemed, may be worth more or less than their original cost.
For information about the performance of the Fund as of the most recent month-end, please call 1-866-44BAIRD or visit www.bairdfunds.com. Mutual fund performance changes over time and current performance may be lower or higher than that stated.
Baird Ultra Short Bond Fund
Schedule of Investments, December 31, 2020
Long-Term Investments
| | | Principal | | | | | | % of | |
| | | Amount | | | Value | | | Net Assets | |
| U.S. Treasury Securities | | | | | | | | | |
| U.S. Treasury Bonds: | | | | | | | | | |
| 2.000%, 01/15/2021 | | $ | 45,000,000 | | | $ | 45,025,000 | | | | |
| 2.250%, 02/15/2021 | | | 15,000,000 | | | | 15,035,923 | | | | |
| 2.375%, 03/15/2021 | | | 80,000,000 | | | | 80,347,059 | | | | |
| 2.625%, 05/15/2021 | | | 190,000,000 | | | | 191,736,718 | | | | |
| 2.125%, 08/15/2021 | | | 230,000,000 | | | | 232,857,032 | | | | |
| 2.000%, 11/15/2021 | | | 245,000,000 | | | | 249,000,389 | | | | |
| 2.500%, 01/15/2022 | | | 60,000,000 | | | | 61,475,820 | | | | |
| Total U.S. Treasury Securities | | | | | | | | | | | |
| (Cost $875,369,336) | | | | | | | 875,477,941 | | | | 19.1 | % |
| Other Government Related Securities | | | | | | | | | | | | |
| Industrial Bank of Korea, | | | | | | | | | | | | |
| 0.814%, 08/02/2021 | | | | | | | | | | | | |
(3 Month LIBOR USD + 0.600%)(1)(2)(3) | | | 4,000,000 | | | | 4,007,280 | | | | | |
| Total Other Government Related Securities | | | | | | | | | | | | |
| (Cost $4,000,000) | | | | | | | 4,007,280 | | | | 0.1 | % |
| Corporate Bonds | | | | | | | | | | | | |
| Industrials | | | | | | | | | | | | |
| AbbVie, Inc.: | | | | | | | | | | | | |
| 0.563%, 05/21/2021 | | | | | | | | | | | | |
(3 Month LIBOR USD + 0.350%)(3) | | | 6,525,000 | | | | 6,531,296 | | | | | |
| 2.150%, 11/19/2021 | | | 7,195,000 | | | | 7,310,885 | | | | | |
| 5.000%, 12/15/2021 | | | 18,628,000 | | | | 19,230,778 | | | | | |
| Analog Devices, Inc., | | | | | | | | | | | | |
| 2.500%, 12/05/2021 | | | 2,000,000 | | | | 2,036,045 | | | | | |
| Anglo American Capital PLC, | | | | | | | | | | | | |
4.125%, 04/15/2021(1)(2) | | | 5,304,000 | | | | 5,346,303 | | | | | |
| AT&T, Inc., | | | | | | | | | | | | |
| 1.187%, 07/15/2021 | | | | | | | | | | | | |
(3 Month LIBOR USD + 0.950%)(3) | | | 3,000,000 | | | | 3,013,429 | | | | | |
| AutoNation, Inc., | | | | | | | | | | | | |
| 3.350%, 01/15/2021 | | | 1,403,000 | | | | 1,403,794 | | | | | |
| BAE Systems PLC, | | | | | | | | | | | | |
4.750%, 10/11/2021(1)(2) | | | 4,395,000 | | | | 4,536,139 | | | | | |
| Bayer US Finance II LLC: | | | | | | | | | | | | |
| 0.881%, 06/25/2021 | | | | | | | | | | | | |
(3 Month LIBOR USD + 0.630%)(2)(3) | | | 10,000,000 | | | | 10,020,308 | | | | | |
3.500%, 06/25/2021(2) | | | 7,110,000 | | | | 7,196,439 | | | | | |
2.750%, 07/15/2021(2) | | | 1,184,000 | | | | 1,198,625 | | | | | |
| Bayer US Finance LLC, | | | | | | | | | | | | |
3.000%, 10/08/2021(2) | | | 2,800,000 | | | | 2,847,685 | | | | | |
| Becton Dickinson and Co., | | | | | | | | | | | | |
| 3.125%, 11/08/2021 | | | 31,610,000 | | | | 32,310,779 | | | | | |
The accompanying notes are an integral part of these financial statements.
Baird Ultra Short Bond Fund
Schedule of Investments, December 31, 2020
Long-Term Investments (cont.)
| | | Principal | | | | | | % of | |
| | | Amount | | | Value | | | Net Assets | |
| BG Energy Capital PLC, | | | | | | | | | |
4.000%, 10/15/2021(1)(2) | | $ | 2,940,000 | | | $ | 3,018,393 | | | |
|
|
| BMW US Capital LLC, | | | | | | | | | | | | |
3.100%, 04/12/2021(2) | | | 2,671,000 | | | | 2,690,124 | | | | | |
| Broadcom, Inc.: | | | | | | | | | | | | |
| 3.125%, 04/15/2021 | | | 16,222,000 | | | | 16,314,888 | | | | | |
| 3.000%, 01/15/2022 | | | 8,997,000 | | | | 9,203,978 | | | | | |
| Campbell Soup Co., | | | | | | | | | | | | |
| 0.847%, 03/15/2021 | | | | | | | | | | | | |
(3 Month LIBOR USD + 0.630%)(3) | | | 4,275,000 | | | | 4,278,824 | | | | | |
| Canadian Natural Resources Ltd., | | | | | | | | | | | | |
3.450%, 11/15/2021(1) | | | 12,696,000 | | | | 12,923,512 | | | | | |
| Celanese US Holdings LLC, | | | | | | | | | | | | |
| 5.875%, 06/15/2021 | | | 3,491,000 | | | | 3,567,853 | | | | | |
| CF Industries, Inc., | | | | | | | | | | | | |
3.400%, 12/01/2021(2) | | | 10,045,000 | | | | 10,280,584 | | | | | |
| Cigna Corp.: | | | | | | | | | | | | |
| 0.879%, 09/17/2021 | | | | | | | | | | | | |
(3 Month LIBOR USD + 0.650%)(3) | | | 2,000,000 | | | | 2,000,316 | | | | | |
| 3.900%, 02/15/2022 | | | 9,376,000 | | | | 9,740,612 | | | | | |
| CNH Industrial Capital LLC: | | | | | | | | | | | | |
| 4.875%, 04/01/2021 | | | 2,009,000 | | | | 2,028,658 | | | | | |
| 3.875%, 10/15/2021 | | | 9,528,000 | | | | 9,751,722 | | | | | |
| CRH America, Inc., | | | | | | | | | | | | |
| 5.750%, 01/15/2021 | | | 4,855,000 | | | | 4,861,878 | | | | | |
| CVS Health Corp., | | | | | | | | | | | | |
| 0.950%, 03/09/2021 | | | | | | | | | | | | |
(3 Month LIBOR USD + 0.720%)(3) | | | 7,485,000 | | | | 7,493,669 | | | | | |
| Daimler Finance North America LLC: | | | | | | | | | | | | |
| 0.663%, 02/22/2021 | | | | | | | | | | | | |
(3 Month LIBOR USD + 0.450%)(2)(3) | | | 3,500,000 | | | | 3,501,612 | | | | | |
3.000%, 02/22/2021(2) | | | 2,800,000 | | | | 2,809,236 | | | | | |
3.350%, 05/04/2021(2) | | | 4,605,000 | | | | 4,649,164 | | | | | |
2.000%, 07/06/2021(2) | | | 5,000,000 | | | | 5,039,614 | | | | | |
3.750%, 11/05/2021(2) | | | 6,629,000 | | | | 6,812,710 | | | | | |
2.850%, 01/06/2022(2) | | | 1,091,000 | | | | 1,117,046 | | | | | |
| 1.121%, 02/15/2022 | | | | | | | | | | | | |
(3 Month LIBOR USD + 0.900%)(2)(3) | | | 3,500,000 | | | | 3,526,332 | | | | | |
| 1.093%, 02/22/2022 | | | | | | | | | | | | |
(3 Month LIBOR USD + 0.880%)(2)(3) | | | 3,150,000 | | | | 3,172,925 | | | | | |
| Danone SA, | | | | | | | | | | | | |
2.077%, 11/02/2021(1)(2) | | | 4,184,000 | | | | 4,235,610 | | | | | |
| Dentsply Sirona, | | | | | | | | | | | | |
| 4.125%, 08/15/2021 | | | 2,000,000 | | | | 2,024,848 | | | | | |
The accompanying notes are an integral part of these financial statements.
Baird Ultra Short Bond Fund
Schedule of Investments, December 31, 2020
Long-Term Investments (cont.)
| | | Principal | | | | | | % of | |
| | | Amount | | | Value | | | Net Assets | |
| Eastman Chemical Co., | | | | | | | | | |
| 3.500%, 12/01/2021 | | $ | 10,820,000 | | | $ | 11,113,875 | | | | |
| Enbridge Energy Partners LP, | | | | | | | | | | |
|
|
| 4.200%, 09/15/2021 | | | 7,459,000 | | | | 7,584,338 | | | | | |
| Energy Transfer Operating LP, | | | | | | | | | | | | |
| 4.650%, 06/01/2021 | | | 9,491,000 | | | | 9,562,203 | | | | | |
| Energy Transfer Partners LP, | | | | | | | | | | | | |
| 5.200%, 02/01/2022 | | | 3,500,000 | | | | 3,630,277 | | | | | |
| Enterprise Products Operating LLC, | | | | | | | | | | | | |
| 2.850%, 04/15/2021 | | | 20,701,000 | | | | 20,802,070 | | | | | |
| Equifax, Inc.: | | | | | | | | | | | | |
| 1.091%, 08/15/2021 | | | | | | | | | | | | |
(3 Month LIBOR USD + 0.870%)(3) | | | 6,420,000 | | | | 6,439,738 | | | | | |
| 3.600%, 08/15/2021 | | | 2,859,000 | | | | 2,912,280 | | | | | |
| ERAC USA Finance LLC, | | | | | | | | | | | | |
2.600%, 12/01/2021(2) | | | 3,100,000 | | | | 3,153,606 | | | | | |
| Family Dollar Stores, Inc., | | | | | | | | | | | | |
| 5.000%, 02/01/2021 | | | 905,000 | | | | 907,719 | | | | | |
| FedEx Corp., | | | | | | | | | | | | |
| 3.400%, 01/14/2022 | | | 12,500,000 | | | | 12,894,854 | | | | | |
| Ford Motor Credit Co. LLC: | | | | | | | | | | | | |
| 5.085%, 01/07/2021 | | | 350,000 | | | | 350,000 | | | | | |
| 5.750%, 02/01/2021 | | | 5,200,000 | | | | 5,213,000 | | | | | |
| 3.336%, 03/18/2021 | | | 1,700,000 | | | | 1,704,250 | | | | | |
| Fresenius Medical Care US Finance, Inc., | | | | | | | | | | | | |
5.750%, 02/15/2021(2) | | | 8,027,000 | | | | 8,071,571 | | | | | |
| Fresenius US Finance II, Inc., | | | | | | | | | | | | |
4.250%, 02/01/2021(2) | | | 2,350,000 | | | | 2,355,997 | | | | | |
| General Mills, Inc., | | | | | | | | | | | | |
| 0.770%, 04/16/2021 | | | | | | | | | | | | |
(3 Month LIBOR USD + 0.540%)(3) | | | 3,500,000 | | | | 3,505,008 | | | | | |
| General Motors Co., | | | | | | | | | | | | |
| 1.130%, 09/10/2021 | | | | | | | | | | | | |
(3 Month LIBOR USD + 0.900%)(3) | | | 1,500,000 | | | | 1,501,725 | | | | | |
| General Motors Financial Co., Inc.: | | | | | | | | | | | | |
| 4.200%, 03/01/2021 | | | 1,815,000 | | | | 1,819,463 | | | | | |
| 3.550%, 04/09/2021 | | | 4,155,000 | | | | 4,187,169 | | | | | |
| 3.200%, 07/06/2021 | | | 11,356,000 | | | | 11,478,144 | | | | | |
| 4.375%, 09/25/2021 | | | 2,808,000 | | | | 2,883,823 | | | | | |
| 4.200%, 11/06/2021 | | | 7,996,000 | | | | 8,241,614 | | | | | |
| 3.450%, 01/14/2022 | | | 4,100,000 | | | | 4,209,693 | | | | | |
| Georgia-Pacific LLC, | | | | | | | | | | | | |
3.163%, 11/15/2021(2) | | | 3,670,000 | | | | 3,738,778 | | | | | |
| Glencore Finance (Canada) Ltd., | | | | | | | | | | | | |
4.950%, 11/15/2021(1)(2) | | | 14,364,000 | | | | 14,937,489 | | | | | |
The accompanying notes are an integral part of these financial statements.
Baird Ultra Short Bond Fund
Schedule of Investments, December 31, 2020
Long-Term Investments (cont.)
| | | Principal | | | | | | % of | |
| | | Amount | | | Value | | | Net Assets | |
| Global Payments, Inc., | | | | | | | | | |
| 3.800%, 04/01/2021 | | $ | 12,116,000 | | | $ | 12,182,684 | | | | |
| Grupo Bimbo SAB de CV, | | | | | | | | | | |
|
|
4.500%, 01/25/2022(1)(2) | | | 3,000,000 | | | | 3,117,570 | | | | | |
| Halliburton Co., | | | | | | | | | | | | |
| 3.250%, 11/15/2021 | | | 2,121,000 | | | | 2,157,364 | | | | | |
| Hewlett Packard Enterprise Co.: | | | | | | | | | | | | |
| 0.900%, 03/12/2021 | | | | | | | | | | | | |
(3 Month LIBOR USD + 0.680%)(3) | | | 5,000,000 | | | | 5,004,432 | | | | | |
| 3.500%, 10/05/2021 | | | 13,340,000 | | | | 13,621,736 | | | | | |
| Hyundai Capital America: | | | | | | | | | | | | |
3.450%, 03/12/2021(2) | | | 1,905,000 | | | | 1,914,430 | | | | | |
2.450%, 06/15/2021(2) | | | 3,150,000 | | | | 3,174,852 | | | | | |
3.750%, 07/08/2021(2) | | | 17,785,000 | | | | 18,044,821 | | | | | |
3.950%, 02/01/2022(2) | | | 1,595,000 | | | | 1,647,888 | | | | | |
| Hyundai Capital America, Inc., | | | | | | | | | | | | |
| 1.174%, 07/08/2021 | | | | | | | | | | | | |
(3 Month LIBOR USD + 0.940%)(2)(3) | | | 1,825,000 | | | | 1,827,422 | | | | | |
| IDEX Corp., | | | | | | | | | | | | |
| 4.200%, 12/15/2021 | | | 1,200,000 | | | | 1,230,837 | | | | | |
| Ingersoll-Rand Global Holding Co. Ltd., | | | | | | | | | | | | |
| 2.900%, 02/21/2021 | | | 3,000,000 | | | | 3,009,493 | | | | | |
| International Business Machines Corp., | | | | | | | | | | | | |
| 0.621%, 05/13/2021 | | | | | | | | | | | | |
(3 Month LIBOR USD + 0.400%)(3) | | | 6,400,000 | | | | 6,409,289 | | | | | |
| JD.com, Inc., | | | | | | | | | | | | |
3.125%, 04/29/2021(1) | | | 10,645,000 | | | | 10,718,195 | | | | | |
| Keurig Dr Pepper, Inc.: | | | | | | | | | | | | |
| 3.551%, 05/25/2021 | | | 3,624,000 | | | | 3,669,199 | | | | | |
| 2.530%, 11/15/2021 | | | 1,000,000 | | | | 1,018,444 | | | | | |
| Kinder Morgan Energy Partners LP: | | | | | | | | | | | | |
| 5.800%, 03/01/2021 | | | 9,581,000 | | | | 9,659,000 | | | | | |
| 5.000%, 10/01/2021 | | | 11,779,000 | | | | 12,033,506 | | | | | |
| Kinder Morgan, Inc., | | | | | | | | | | | | |
5.000%, 02/15/2021(2) | | | 9,105,000 | | | | 9,131,871 | | | | | |
| Kinross Gold Corp., | | | | | | | | | | | | |
5.125%, 09/01/2021(1) | | | 22,869,000 | | | | 23,281,768 | | | | | |
| Kroger Co., | | | | | | | | | | | | |
| 3.400%, 04/15/2022 | | | 4,800,000 | | | | 4,950,123 | | | | | |
| Lennar Corp., | | | | | | | | | | | | |
| 6.250%, 12/15/2021 | | | 18,621,000 | | | | 19,067,904 | | | | | |
| Marathon Petroleum Corp., | | | | | | | | | | | | |
| 5.125%, 03/01/2021 | | | 5,000,000 | | | | 5,035,364 | | | | | |
The accompanying notes are an integral part of these financial statements.
Baird Ultra Short Bond Fund
Schedule of Investments, December 31, 2020
Long-Term Investments (cont.)
| | | Principal | | | | | | % of | |
| | | Amount | | | Value | | | Net Assets | |
| Marriott International, Inc.: | | | | | | | | | |
| 0.876%, 03/08/2021 | | | | | | | | | |
(3 Month LIBOR USD + 0.650%)(3) | | $ | 3,300,000 | | | $ | 3,301,252 | | | |
|
|
| 2.300%, 01/15/2022 | | | 3,002,000 | | | | 3,041,508 | | | | | |
| Microchip Technology, Inc., | | | | | | | | | | | | |
| 3.922%, 06/01/2021 | | | 33,038,000 | | | | 33,507,114 | | | | | |
| Molson Coors Beverage Co., | | | | | | | | | | | | |
| 2.100%, 07/15/2021 | | | 18,135,000 | | | | 18,287,214 | | | | | |
| Mosaic Co., | | | | | | | | | | | | |
| 3.750%, 11/15/2021 | | | 2,105,000 | | | | 2,146,843 | | | | | |
| Mylan NV, | | | | | | | | | | | | |
3.150%, 06/15/2021(1) | | | 23,233,000 | | | | 23,457,585 | | | | | |
| Nissan Motor Acceptance Corp.: | | | | | | | | | | | | |
2.550%, 03/08/2021(2) | | | 4,630,000 | | | | 4,642,617 | | | | | |
1.900%, 09/14/2021(2) | | | 1,250,000 | | | | 1,258,648 | | | | | |
| 0.869%, 09/21/2021 | | | | | | | | | | | | |
(3 Month LIBOR USD + 0.630%)(2)(3) | | | 4,800,000 | | | | 4,788,178 | | | | | |
3.650%, 09/21/2021(2) | | | 3,773,000 | | | | 3,838,751 | | | | | |
2.800%, 01/13/2022(2) | | | 7,409,000 | | | | 7,534,477 | | | | | |
| Occidental Petroleum Corp.: | | | | | | | | | | | | |
| 4.850%, 03/15/2021 | | | 5,160,000 | | | | 5,160,000 | | | | | |
| 1.671%, 08/15/2022 | | | | | | | | | | | | |
(3 Month LIBOR USD + 1.450%)(3) | | | 8,000,000 | | | | 7,840,000 | | | | | |
| Orlando Health Obligated Group, | | | | | | | | | | | | |
| 3.205%, 10/01/2021 | | | 1,000,000 | | | | 1,017,797 | | | | | |
| Ovintiv Inc., | | | | | | | | | | | | |
| 3.900%, 11/15/2021 (Callable 8/15/2021) | | | 11,619,000 | | | | 11,765,061 | | | | | |
| Penske Truck Leasing Co.: | | | | | | | | | | | | |
3.300%, 04/01/2021(2) | | | 3,000,000 | | | | 3,013,789 | | | | | |
3.650%, 07/29/2021(2) | | | 6,560,000 | | | | 6,661,245 | | | | | |
3.375%, 02/01/2022(2) | | | 11,050,000 | | | | 11,342,921 | | | | | |
| Phillips 66: | | | | | | | | | | | | |
| 0.833%, 02/26/2021 | | | | | | | | | | | | |
(3 Month LIBOR USD + 0.600%)(3) | | | 2,710,000 | | | | 2,710,313 | | | | | |
| 4.300%, 04/01/2022 | | | 3,751,000 | | | | 3,928,290 | | | | | |
| POSCO, | | | | | | | | | | | | |
5.250%, 04/14/2021(1)(2) | | | 9,116,000 | | | | 9,223,933 | | | | | |
| Raytheon Technologies Corp., | | | | | | | | | | | | |
| 3.100%, 11/15/2021 | | | 6,329,000 | | | | 6,443,205 | | | | | |
| Regency Energy Partners LP / | | | | | | | | | | | | |
| Regency Energy Finance Corp., | | | | | | | | | | | | |
| 5.875%, 03/01/2022 | | | 4,001,000 | | | | 4,183,151 | | | | | |
| Reliance Industries Ltd., | | | | | | | | | | | | |
5.400%, 02/14/2022(1)(2) | | | 1,100,000 | | | | 1,151,707 | | | | | |
| Roper Technologies, Inc., | | | | | | | | | | | | |
| 2.800%, 12/15/2021 | | | 2,851,000 | | | | 2,911,539 | | | | | |
The accompanying notes are an integral part of these financial statements.
Baird Ultra Short Bond Fund
Schedule of Investments, December 31, 2020
Long-Term Investments (cont.)
| | | Principal | | | | | | % of | |
| | | Amount | | | Value | | | Net Assets | |
| Sabine Pass Liquefaction LLC, | | | | | | | | | |
| 6.250%, 03/15/2022 | | $ | 11,834,000 | | | $ | 12,454,625 | | | |
|
|
| Seven & i Holdings Co., Ltd., | | | | | | | | | | | | |
3.350%, 09/17/2021(1)(2) | | | 1,608,000 | | | | 1,639,374 | | | | | |
| Shell International Finance BV, | | | | | | | | | | | | |
1.875%, 05/10/2021(1) | | | 10,200,000 | | | | 10,258,170 | | | | | |
| Sonoco Products Co., | | | | | | | | | | | | |
| 4.375%, 11/01/2021 | | | 2,000,000 | | | | 2,040,873 | | | | | |
| Southern Natural Gas Co. LLC, | | | | | | | | | | | | |
| 4.400%, 06/15/2021 (Callable 03/15/2021) | | | 22,428,000 | | | | 22,595,106 | | | | | |
| Spirit AeroSystems, Inc., | | | | | | | | | | | | |
| 1.017%, 06/15/2021 | | | | | | | | | | | | |
(3 Month LIBOR USD + 0.800%)(3) | | | 4,000,000 | | | | 3,949,447 | | | | | |
| Sunoco Logistics Partners Operations LP, | | | | | | | | | | | | |
| 4.400%, 04/01/2021 | | | 15,000,000 | | | | 15,093,762 | | | | | |
| Takeda Pharmaceutical Co. Ltd., | | | | | | | | | | | | |
2.450%, 01/18/2022(1)(2) | | | 3,076,000 | | | | 3,136,042 | | | | | |
| Telefonica Emisiones SA, | | | | | | | | | | | | |
5.462%, 02/16/2021(1) | | | 8,643,000 | | | | 8,691,409 | | | | | |
| Time Warner Cable LLC, | | | | | | | | | | | | |
| 4.000%, 09/01/2021 | | | 24,622,000 | | | | 24,971,500 | | | | | |
| TTX Co., | | | | | | | | | | | | |
4.400%, 05/01/2021(2) | | | 524,000 | | | | 530,529 | | | | | |
| Verizon Communications, Inc., | | | | | | | | | | | | |
| 1.321%, 05/15/2025 | | | | | | | | | | | | |
(3 Month LIBOR USD + 1.100%(3) | | | 4,000,000 | | | | 4,107,403 | | | | | |
| Volkswagen Group of America Finance LLC: | | | | | | | | | | | | |
2.500%, 09/24/2021(2) | | | 7,300,000 | | | | 7,408,773 | | | | | |
| 1.154%, 11/12/2021 | | | | | | | | | | | | |
(3 Month LIBOR USD + 0.940%)(2)(3) | | | 6,000,000 | | | | 6,043,263 | | | | | |
4.000%, 11/12/2021(2) | | | 10,041,000 | | | | 10,347,526 | | | | | |
| Vulcan Materials Co., | | | | | | | | | | | | |
| 0.875%, 03/01/2021 | | | | | | | | | | | | |
(3 Month LIBOR USD + 0.650%)(3) | | | 9,236,000 | | | | 9,239,910 | | | | | |
| Williams Companies, Inc.: | | | | | | | | | | | | |
| 7.875%, 09/01/2021 | | | 11,619,000 | | | | 12,181,343 | | | | | |
| 4.000%, 11/15/2021 | | | 14,625,000 | | | | 14,939,700 | | | | | |
| 3.600%, 03/15/2022 | | | 4,610,000 | | | | 4,758,695 | | | | | |
| Xylem, Inc., | | | | | | | | | | | | |
| 4.875%, 10/01/2021 | | | 28,425,000 | | | | 29,343,279 | | | | | |
| Zimmer Holdings, Inc., | | | | | | | | | | | | |
| 3.150%, 04/01/2022 | | | 10,898,000 | | | | 11,207,762 | | | | | |
| Total Industrials | | | | | | | | | | | | |
| (Cost $959,650,997) | | | | | | | 961,229,118 | | | | 21.0 | % |
The accompanying notes are an integral part of these financial statements.
Baird Ultra Short Bond Fund
Schedule of Investments, December 31, 2020
Long-Term Investments (cont.)
| | | Principal | | | | | | % of | |
| | | Amount | | | Value | | | Net Assets | |
| Utilities | | | | | | | | | |
| American Electric Power Co., Inc., | | | | | | | | | |
| 3.650%, 12/01/2021 | | $ | 6,450,000 | | | $ | 6,649,187 | | | | |
| American Transmission Systems, Inc., | | | | | | | | | | | |
5.250%, 01/15/2022(2) | | | 9,300,000 | | | | 9,692,481 | | | | |
| EDP Finance BV, | | | | | | | | | | | |
5.250%, 01/14/2021(1)(2) | | | 29,227,000 | | | | 29,260,974 | | | | |
| Emera US Finance LP, | | | | | | | | | | | |
| 2.700%, 06/15/2021 | | | 17,903,000 | | | | 18,042,314 | | | | |
| Exelon Corp., | | | | | | | | | | | |
| 2.450%, 04/15/2021 | | | 6,615,000 | | | | 6,640,955 | | | | |
| LG&E and KU Energy LLC, | | | | | | | | | | | |
| 4.375%, 10/01/2021 | | | 1,900,000 | | | | 1,935,085 | | | | |
| NextEra Energy Capital Holdings, Inc., | | | | | | | | | | | |
| 0.774%, 08/28/2021 | | | | | | | | | | | |
(3 Month LIBOR USD + 0.550%)(3) | | | 2,619,000 | | | | 2,619,842 | | | | |
| PNM Resources, Inc., | | | | | | | | | | | |
| 3.250%, 03/09/2021 | | | 23,964,000 | | | | 24,058,013 | | | | |
| Southwestern Electric Power Co., | | | | | | | | | | | |
| 3.550%, 02/15/2022 | | | 10,750,000 | | | | 11,038,099 | | | | |
| Tampa Electric Co., | | | | | | | | | | | |
| 5.400%, 05/15/2021 | | | 2,930,000 | | | | 2,981,803 | | | | |
| Western Power Distribution, | | | | | | | | | | | |
5.375%, 05/01/2021(1)(2) | | | 16,221,000 | | | | 16,279,448 | | | | |
| Total Utilities | | | | | | | | | | | |
| (Cost $129,077,713) | | | | | | | 129,198,201 | | | | 2.8 | % |
| Financials | | | | | | | | | | | | |
| ABN AMRO Bank NV, | | | | | | | | | | | | |
| 0.803%, 08/27/2021 | | | | | | | | | | | | |
(3 Month LIBOR USD + 0.570%)(1)(2)(3) | | | 1,000,000 | | | | 1,003,228 | | | | | |
| Ally Financial, Inc.: | | | | | | | | | | | | |
| 4.250%, 04/15/2021 | | | 11,625,000 | | | | 11,744,648 | | | | | |
| 4.125%, 02/13/2022 | | | 13,631,000 | | | | 14,155,614 | | | | | |
| American International Group, Inc., | | | | | | | | | | | | |
| 3.300%, 03/01/2021 | | | 1,804,000 | | | | 1,807,798 | | | | | |
| Banco Santander SA, | | | | | | | | | | | | |
3.500%, 04/11/2022(1) | | | 6,505,000 | | | | 6,755,142 | | | | | |
| Bank of America Corp.: | | | | | | | | | | | | |
| 5.700%, 01/24/2022 | | | 11,399,000 | | | | 12,047,096 | | | | | |
| 0.901%, 06/25/2022 | | | | | | | | | | | | |
(3 Month LIBOR USD + 0.650%)(3) | | | 4,000,000 | | | | 4,010,140 | | | | | |
| Barclays Bank PLC, | | | | | | | | | | | | |
10.180%, 06/12/2021(1)(2) | | | 1,951,000 | | | | 2,029,135 | | | | | |
The accompanying notes are an integral part of these financial statements.
Baird Ultra Short Bond Fund
Schedule of Investments, December 31, 2020
Long-Term Investments (cont.)
| | | Principal | | | | | | % of | |
| | | Amount | | | Value | | | Net Assets | |
| Barclays PLC: | | | | | | | | | |
3.250%, 01/12/2021(1) | | $ | 3,720,000 | | | $ | 3,722,007 | | | |
|
|
3.200%, 08/10/2021(1) | | | 16,325,000 | | | | 16,594,192 | | | | | |
| BBVA USA: | | | | | | | | | | | | |
| 0.951%, 06/11/2021 | | | | | | | | | | | | |
(3 Month LIBOR USD + 0.730%)(3) | | | 4,750,000 | | | | 4,760,819 | | | | | |
| 3.500%, 06/11/2021 | | | 26,214,000 | | | | 26,510,168 | | | | | |
| BPCE SA, | | | | | | | | | | | | |
2.750%, 12/02/2021(1) | | | 5,870,000 | | | | 5,997,664 | | | | | |
| Capital One Financial Corp., | | | | | | | | | | | | |
| 3.450%, 04/30/2021 | | | 8,401,000 | | | | 8,463,401 | | | | | |
| Capital One NA, | | | | | | | | | | | | |
| 2.950%, 07/23/2021 | | | 14,214,000 | | | | 14,386,385 | | | | | |
| CIT Group, Inc., | | | | | | | | | | | | |
| 4.125%, 03/09/2021 | | | 16,265,000 | | | | 16,313,795 | | | | | |
| Citibank NA, | | | | | | | | | | | | |
| 0.824%, 05/20/2022 | | | | | | | | | | | | |
(3 Month LIBOR USD + 0.600%)(3) | | | 7,000,000 | | | | 7,012,254 | | | | | |
| Citigroup, Inc.: | | | | | | | | | | | | |
| 2.350%, 08/02/2021 | | | 1,269,000 | | | | 1,283,780 | | | | | |
| 2.900%, 12/08/2021 | | | 18,821,000 | | | | 19,227,751 | | | | | |
| 1.175%, 04/25/2022 | | | | | | | | | | | | |
(3 Month LIBOR USD + 0.960%)(3) | | | 4,875,000 | | | | 4,918,518 | | | | | |
| Citizens Bank NA, | | | | | | | | | | | | |
| 0.941%, 02/14/2022 | | | | | | | | | | | | |
(3 Month LIBOR USD + 0.720%)(3) | | | 1,500,000 | | | | 1,506,976 | | | | | |
| Citizens Financial Group, Inc., | | | | | | | | | | | | |
| 2.375%, 07/28/2021 | | | 4,000,000 | | | | 4,039,336 | | | | | |
| Credit Suisse, | | | | | | | | | | | | |
3.450%, 04/16/2021(1) | | | 11,509,000 | | | | 11,614,474 | | | | | |
| Danske Bank A/S, | | | | | | | | | | | | |
5.000%, 01/12/2022(1)(2) | | | 19,458,000 | | | | 20,313,341 | | | | | |
| Deutsche Bank AG: | | | | | | | | | | | | |
3.150%, 01/22/2021(1) | | | 11,708,000 | | | | 11,720,986 | | | | | |
4.250%, 10/14/2021(1) | | | 11,666,000 | | | | 11,962,630 | | | | | |
| Fifth Third Bank NA, | | | | | | | | | | | | |
| 0.854%, 02/01/2022 | | | | | | | | | | | | |
(3 Month LIBOR USD + 0.640%)(3) | | | 2,000,000 | | | | 2,011,945 | | | | | |
| Goldman Sachs Group, Inc.: | | | | | | | | | | | | |
| 1.977%, 02/25/2021 | | | | | | | | | | | | |
(3 Month LIBOR USD + 1.770%)(3) | | | 2,285,000 | | | | 2,290,520 | | | | | |
| 5.750%, 01/24/2022 | | | 27,450,000 | | | | 29,014,534 | | | | | |
| HSBC Finance Corp., | | | | | | | | | | | | |
| 6.676%, 01/15/2021 | | | 9,975,000 | | | | 9,988,377 | | | | | |
The accompanying notes are an integral part of these financial statements.
Baird Ultra Short Bond Fund
Schedule of Investments, December 31, 2020
Long-Term Investments (cont.)
| | | Principal | | | | | | % of | |
| | | Amount | | | Value | | | Net Assets | |
| Lloyds Bank PLC: | | | | | | | | | |
| 0.703%, 05/07/2021 | | | | | | | | | |
(3 Month LIBOR USD + 0.490%)(1)(3) | | $ | 3,665,000 | | | $ | 3,670,488 | | | |
|
|
3.000%, 01/11/2022(1) | | | 7,622,000 | | | | 7,817,734 | | | | | |
| Macquarie Bank Ltd., | | | | | | | | | | | | |
6.625%, 04/07/2021(1)(2) | | | 3,971,000 | | | | 4,032,979 | | | | | |
| Macquarie Group Ltd., | | | | | | | | | | | | |
6.250%, 01/14/2021(1)(2) | | | 10,344,000 | | | | 10,358,929 | | | | | |
| Mitsubishi UFJ Financial Group, Inc.: | | | | | | | | | | | | |
| 0.865%, 07/26/2021 | | | | | | | | | | | | |
(3 Month LIBOR USD + 0.650%)(1)(3) | | | 5,981,000 | | | | 5,999,073 | | | | | |
| 0.925%, 03/07/2022 | | | | | | | | | | | | |
(3 Month LIBOR USD + 0.700%)(1)(3) | | | 3,173,000 | | | | 3,190,859 | | | | | |
| Mizuho Financial Group, Inc.: | | | | | | | | | | | | |
| 1.704%, 04/12/2021 | | | | | | | | | | | | |
(3 Month LIBOR USD + 1.480%)(1)(2)(3) | | | 1,500,000 | | | | 1,505,692 | | | | | |
2.632%, 04/12/2021(1)(2) | | | 3,600,000 | | | | 3,622,727 | | | | | |
| 1.164%, 02/28/2022 | | | | | | | | | | | | |
(3 Month LIBOR USD + 0.940%)(1)(3) | | | 5,205,000 | | | | 5,250,465 | | | | | |
| Morgan Stanley, | | | | | | | | | | | | |
| 1.398%, 01/20/2022 | | | | | | | | | | | | |
(3 Month LIBOR USD + 1.180%)(3) | | | 17,400,000 | | | | 17,408,875 | | | | | |
| Nationwide Financial Services, Inc., | | | | | | | | | | | | |
5.375%, 03/25/2021(2) | | | 5,372,000 | | | | 5,430,363 | | | | | |
| Nordea Bank AB, | | | | | | | | | | | | |
4.875%, 05/13/2021(1)(2) | | | 23,525,000 | | | | 23,886,903 | | | | | |
| PNC Bank NA, | | | | | | | | | | | | |
| 0.660%, 12/09/2022 | | | | | | | | | | | | |
(3 Month LIBOR USD + 0.430%)(3) | | | 8,000,000 | | | | 8,021,985 | | | | | |
| Reliance Standard Life Global Funding II, | | | | | | | | | | | | |
3.050%, 01/20/2021(2) | | | 1,000,000 | | | | 1,001,146 | | | | | |
| Santander Holdings USA, Inc., | | | | | | | | | | | | |
| 4.450%, 12/03/2021 | | | 2,000,000 | | | | 2,065,229 | | | | | |
| Santander UK Group Holdings PLC: | | | | | | | | | | | | |
3.125%, 01/08/2021(1) | | | 4,588,000 | | | | 4,588,992 | | | | | |
2.875%, 08/05/2021(1) | | | 3,270,000 | | | | 3,315,798 | | | | | |
| Santander UK PLC: | | | | | | | | | | | | |
2.500%, 01/05/2021(1) | | | 2,000,000 | | | | 2,000,000 | | | | | |
3.400%, 06/01/2021(1) | | | 2,088,000 | | | | 2,114,387 | | | | | |
| 0.881%, 11/15/2021 | | | | | | | | | | | | |
(3 Month LIBOR USD + 0.660%)(1)(3) | | | 2,750,000 | | | | 2,763,183 | | | | | |
| Standard Chartered PLC: | | | | | | | | | | | | |
3.050%, 01/15/2021(1)(2) | | | 3,500,000 | | | | 3,502,627 | | | | | |
| 1.430%, 09/10/2022 | | | | | | | | | | | | |
(3 Month LIBOR USD + 1.200%)(1)(2)(3) | | | 5,000,000 | | | | 5,020,907 | | | | | |
The accompanying notes are an integral part of these financial statements.
Baird Ultra Short Bond Fund
Schedule of Investments, December 31, 2020
Long-Term Investments (cont.)
| | | Principal | | | | | | % of | |
| | | Amount | | | Value | | | Net Assets | |
| Standard Chartered PLC: (cont.) | | | | | | | | | |
| 1.368%, 01/20/2023 | | | | | | | | | |
(3 Month LIBOR USD + 1.150%)(1)(2)(3) | | $ | 3,000,000 | | | $ | 3,019,698 | | | |
|
|
| Sumitomo Mitsui Financial Group, Inc.: | | | | | | | | | | | | |
2.442%, 10/19/2021(1) | | | 15,000,000 | | | | 15,246,146 | | | | | |
2.846%, 01/11/2022(1) | | | 2,356,000 | | | | 2,415,068 | | | | | |
| SunTrust Banks, Inc., | | | | | | | | | | | | |
| 0.812%, 05/17/2022 | | | | | | | | | | | | |
(3 Month LIBOR USD + 0.590%)(3) | | | 8,400,000 | | | | 8,451,060 | | | | | |
| Svenska Handelsbanken AB, | | | | | | | | | | | | |
| 0.675%, 05/24/2021 | | | | | | | | | | | | |
(3 Month LIBOR USD + 0.470%)(1)(3) | | | 3,725,000 | | | | 3,731,626 | | | | | |
| Swedbank AB, | | | | | | | | | | | | |
2.650%, 03/10/2021(1)(2) | | | 1,750,000 | | | | 1,757,340 | | | | | |
| Synchrony Bank, | | | | | | | | | | | | |
| 3.650%, 05/24/2021 | | | 11,730,000 | | | | 11,846,307 | | | | | |
| Synchrony Financial, | | | | | | | | | | | | |
| 3.750%, 08/15/2021 | | | 13,877,000 | | | | 14,075,629 | | | | | |
| Toronto-Dominion Bank, | | | | | | | | | | | | |
3.250%, 06/11/2021(1) | | | 10,000,000 | | | | 10,131,686 | | | | | |
| Trinity Acquisition PLC, | | | | | | | | | | | | |
3.500%, 09/15/2021(1) | | | 4,815,000 | | | | 4,901,260 | | | | | |
| UBS Group Funding Switzerland AG: | | | | | | | | | | | | |
| 2.004%, 04/14/2021 | | | | | | | | | | | | |
(3 Month LIBOR USD + 1.780%)(1)(2)(3) | | | 8,500,000 | | | | 8,539,410 | | | | | |
| 1.744%, 02/01/2022 | | | | | | | | | | | | |
(3 Month LIBOR USD + 1.530%)(1)(2)(3) | | | 4,650,000 | | | | 4,719,547 | | | | | |
| Wells Fargo & Co.: | | | | | | | | | | | | |
| 1.240%, 07/26/2021 | | | | | | | | | | | | |
(3 Month LIBOR USD + 1.025%)(3) | | | 4,975,000 | | | | 5,001,787 | | | | | |
| 1.144%, 02/11/2022 | | | | | | | | | | | | |
(3 Month LIBOR USD + 0.930%)(3) | | | 19,300,000 | | | | 19,316,384 | | | | | |
| Wells Fargo Bank NA, | | | | | | | | | | | | |
| 0.890%, 09/09/2022 | | | | | | | | | | | | |
(3 Month LIBOR USD + 0.660%)(3) | | | 8,150,000 | | | | 8,182,321 | | | | | |
| Willis Towers Watson PLC, | | | | | | | | | | | | |
5.750%, 03/15/2021(1) | | | 17,847,000 | | | | 18,026,717 | | | | | |
| Total Financials | | | | | | | | | | | | |
| (Cost $551,945,322) | | | | | | | 553,137,981 | | | | 12.1 | % |
| Total Corporate Bonds | | | | | | | | | | | | |
| (Cost $1,640,674,032) | | | | | | | 1,643,565,300 | | | | 35.9 | % |
The accompanying notes are an integral part of these financial statements.
Baird Ultra Short Bond Fund
Schedule of Investments, December 31, 2020
Long-Term Investments (cont.)
| | | Principal | | | | | | % of | |
| | | Amount | | | Value | | | Net Assets | |
| Municipal Bonds | | | | | | | | | |
| Berks County Municipal Authority, | | | | | | | | | |
1.050%, 05/15/2022 (Callable 01/04/2021)(4) | | $ | 800,000 | | | $ | 800,000 | | | |
|
|
| Borough of Carlstadt NJ, | | | | | | | | | | | | |
| 2.000%, 07/23/2021 | | | 8,525,000 | | | | 8,595,928 | | | | | |
| Burke County Development Authority: | | | | | | | | | | | | |
1.650%, 11/01/2048(4) | | | 3,000,000 | | | | 3,016,950 | | | | | |
1.550%, 12/01/2049(4) | | | 13,000,000 | | | | 13,207,480 | | | | | |
| Central Texas Turnpike System, | | | | | | | | | | | | |
| 0.000%, 08/15/2021 | | | 1,115,000 | | | | 1,111,599 | | | | | |
| Chicago Midway International Airport, | | | | | | | | | | | | |
| 5.000%, 01/01/2021 | | | 2,000,000 | | | | 2,000,000 | | | | | |
| City of Baton Rouge and Parish of East Baton Rouge, | | | | | | | | | | | | |
| 5.000%, 08/01/2021 | | | 1,500,000 | | | | 1,539,300 | | | | | |
| City of Bridgeport CT, | | | | | | | | | | | | |
| 3.313%, 07/01/2021 | | | 2,150,000 | | | | 2,171,349 | | | | | |
| City of New York NY, | | | | | | | | | | | | |
0.310%, 10/01/2046 (Callable 01/04/2021)(4) | | | 1,700,000 | | | | 1,700,000 | | | | | |
| City of Newark NJ, | | | | | | | | | | | | |
| 2.000%, 10/05/2021 | | | 3,000,000 | | | | 3,021,420 | | | | | |
| City of Ontario CA, | | | | | | | | | | | | |
| 1.971%, 06/01/2021 | | | 470,000 | | | | 471,772 | | | | | |
| City of Philadelphia PA, | | | | | | | | | | | | |
| 5.000%, 08/01/2021 | | | 1,040,000 | | | | 1,066,770 | | | | | |
| City of Troy NY, | | | | | | | | | | | | |
| 1.250%, 07/30/2021 | | | 12,902,475 | | | | 12,982,083 | | | | | |
| City of Whiting IN, | | | | | | | | | | | | |
| 5.250%, 01/01/2021 | | | 10,000,000 | | | | 10,000,000 | | | | | |
| Clark County School District, | | | | | | | | | | | | |
| 5.000%, 06/15/2021 | | | 1,075,000 | | | | 1,097,027 | | | | | |
| Connecticut State Development Authority, | | | | | | | | | | | | |
| 5.500%, 04/01/2021 | | | 1,000,000 | | | | 1,011,690 | | | | | |
| County of Burleigh ND: | | | | | | | | | | | | |
| 0.650%, 11/01/2021 | | | 3,200,000 | | | | 3,200,640 | | | | | |
| 2.750%, 02/01/2022 (Callable 01/21/2021) | | | 20,000,000 | | | | 20,003,400 | | | | | |
| County of Carroll KY, | | | | | | | | | | | | |
1.200%, 02/01/2032(4) | | | 14,250,000 | | | | 14,278,785 | | | | | |
| County of Clark Department of Aviation, | | | | | | | | | | | | |
| 5.000%, 07/01/2021 | | | 9,500,000 | | | | 9,708,050 | | | | | |
| County of Hudson NJ, | | | | | | | | | | | | |
| 7.000%, 06/01/2021 | | | 5,070,000 | | | | 5,186,813 | | | | | |
| County of Lucas OH, | | | | | | | | | | | | |
| 0.450%, 10/15/2021 | | | 10,500,000 | | | | 10,502,205 | | | | | |
| County of Meade KY, | | | | | | | | | | | | |
0.120%, 07/01/2060 (Callable 01/04/2021)(4) | | | 8,000,000 | | | | 8,000,000 | | | | | |
The accompanying notes are an integral part of these financial statements.
Baird Ultra Short Bond Fund
Schedule of Investments, December 31, 2020
Long-Term Investments (cont.)
| | | Principal | | | | | | % of | |
| | | Amount | | | Value | | | Net Assets | |
| County of Riverside CA, | | | | | | | | | |
| 2.165%, 02/15/2021 | | $ | 3,500,000 | | | $ | 3,506,930 | | | |
|
|
| County of St. Lucie FL, | | | | | | | | | | | | |
0.030%, 09/01/2028 (Callable 01/04/2021)(4) | | | 15,000,000 | | | | 15,000,000 | | | | | |
| County of Suffolk NY: | | | | | | | | | | | | |
| 2.000%, 07/22/2021 | | | 4,800,000 | | | | 4,830,576 | | | | | |
| 2.000%, 08/19/2021 | | | 9,000,000 | | | | 9,065,430 | | | | | |
| Dallas/Fort Worth International Airport, | | | | | | | | | | | | |
| 5.000%, 11/01/2038 (Callable 11/01/2021) | | | 1,120,000 | | | | 1,163,568 | | | | | |
| Delaware River Port Authority, | | | | | | | | | | | | |
| 5.000%, 01/01/2021 | | | 5,500,000 | | | | 5,500,000 | | | | | |
| Florida Development Finance Corp., | | | | | | | | | | | | |
| 1.645%, 04/01/2021 | | | 505,000 | | | | 505,505 | | | | | |
| Garden State Preservation Trust, | | | | | | | | | | | | |
| 0.000%, 11/01/2021 | | | 1,000,000 | | | | 993,700 | | | | | |
| Glendale-River Hills School District: | | | | | | | | | | | | |
| 1.000%, 04/19/2021 | | | 2,050,000 | | | | 2,055,309 | | | | | |
| 1.000%, 08/23/2021 | | | 2,000,000 | | | | 2,010,420 | | | | | |
| Gulf Coast Authority: | | | | | | | | | | | | |
2.450%, 05/01/2028(4) | | | 2,500,000 | | | | 2,514,700 | | | | | |
0.040%, 06/01/2030 (Callable 01/04/2021)(4) | | | 10,950,000 | | | | 10,950,000 | | | | | |
| Howard University, | | | | | | | | | | | | |
| 2.638%, 10/01/2021 | | | 925,000 | | | | 933,047 | | | | | |
| Illinois Development Finance Authority, | | | | | | | | | | | | |
0.550%, 11/01/2044 (Callable 08/03/2021)(4) | | | 6,000,000 | | | | 6,004,440 | | | | | |
| Indiana Finance Authority, | | | | | | | | | | | | |
| 3.875%, 08/01/2021 | | | 8,500,000 | | | | 8,665,665 | | | | | |
| Indianapolis Local Public Improvement Bond Bank, | | | | | | | | | | | | |
| 1.450%, 06/01/2021 (Callable 02/01/2021) | | | 11,000,000 | | | | 11,000,440 | | | | | |
| Industrial Development Authority | | | | | | | | | | | | |
| of the County of Yavapai, | | | | | | | | | | | | |
2.800%, 06/01/2027(4) | | | 1,500,000 | | | | 1,513,965 | | | | | |
| Jersey City Redevelopment Agency, | | | | | | | | | | | | |
| 3.000%, 05/27/2021 | | | 2,000,000 | | | | 2,021,220 | | | | | |
| Joplin Industrial Development Authority, | | | | | | | | | | | | |
| 2.154%, 02/15/2022 | | | 1,400,000 | | | | 1,418,340 | | | | | |
| Kendall County Forest Preserve District, | | | | | | | | | | | | |
| 5.000%, 01/01/2021 | | | 2,000,000 | | | | 2,000,000 | | | | | |
| Louisiana Public Facilities Authority, | | | | | | | | | | | | |
| 6.750%, 05/01/2041 (Callable 05/01/2021) | | | 3,000,000 | | | | 3,060,870 | | | | | |
| Massachusetts Development Finance Agency, | | | | | | | | | | | | |
2.450%, 05/01/2027(2)(4) | | | 3,000,000 | | | | 3,017,640 | | | | | |
| Massachusetts Educational Financing Authority, | | | | | | | | | | | | |
| 5.000%, 01/01/2021 | | | 3,000,000 | | | | 3,000,000 | | | | | |
The accompanying notes are an integral part of these financial statements.
Baird Ultra Short Bond Fund
Schedule of Investments, December 31, 2020
Long-Term Investments (cont.)
| | | Principal | | | | | | % of | |
| | | Amount | | | Value | | | Net Assets | |
| Memphis-Shelby County Airport Authority, | | | | | | | | | |
| 5.000%, 07/01/2021 | | $ | 1,000,000 | | | $ | 1,021,800 | | | |
|
|
| Merrimack Valley Regional Transit Authority, | | | | | | | | | | | | |
| 1.500%, 06/25/2021 | | | 1,650,000 | | | | 1,656,881 | | | | | |
| Metropolitan Transportation Authority: | | | | | | | | | | | | |
| 5.000%, 05/15/2021 | | | 4,685,000 | | | | 4,734,146 | | | | | |
| 5.000%, 05/15/2021 | | | 1,365,000 | | | | 1,379,319 | | | | | |
| 5.000%, 09/01/2021 | | | 16,960,000 | | | | 17,281,392 | | | | | |
| Miami-Dade County Industrial | | | | | | | | | | | | |
| Development Authority, | | | | | | | | | | | | |
0.550%, 11/01/2041(4) | | | 2,750,000 | | | | 2,752,035 | | | | | |
| Minneapolis-Saint Paul | | | | | | | | | | | | |
| Metropolitan Airports Commission, | | | | | | | | | | | | |
| 5.000%, 01/01/2022 | | | 1,000,000 | | | | 1,044,230 | | | | | |
| Mississippi Business Finance Corp., | | | | | | | | | | | | |
| 2.500%, 04/01/2022 (Callable 04/01/2021) | | | 4,000,000 | | | | 4,016,280 | | | | | |
| Mizuho Floater/Residual Trust, | | | | | | | | | | | | |
0.470%, 11/15/2036(2)(4) | | | 15,200,000 | | | | 15,200,000 | | | | | |
| Monroe County Development Authority, | | | | | | | | | | | | |
0.060%, 09/01/2037 (Callable 01/04/2021)(4) | | | 10,000,000 | | | | 10,000,000 | | | | | |
| Montachusett Regional Transit Authority, | | | | | | | | | | | | |
| 1.500%, 07/30/2021 | | | 19,000,000 | | | | 19,113,810 | | | | | |
| New Jersey Economic Development Authority: | | | | | | | | | | | | |
| 0.000%, 02/15/2021 | | | 12,980,000 | | | | 12,974,159 | | | | | |
| 5.000%, 06/15/2021 | | | 5,000,000 | | | | 5,101,800 | | | | | |
| 0.000%, 02/15/2022 | | | 5,000,000 | | | | 4,969,800 | | | | | |
| New Jersey Educational Facilities Authority, | | | | | | | | | | | | |
| 5.000%, 09/01/2021 | | | 1,610,000 | | | | 1,658,220 | | | | | |
| New Jersey Housing & Mortgage Finance Agency, | | | | | | | | | | | | |
| 0.743%, 04/01/2021 | | | 1,080,000 | | | | 1,080,054 | | | | | |
| New Jersey Sports & Exposition Authority, | | | | | | | | | | | | |
| 5.000%, 09/01/2021 | | | 1,300,000 | | | | 1,335,087 | | | | | |
| New York State Dormitory Authority: | | | | | | | | | | | | |
| 4.200%, 01/01/2021 | | | 2,170,000 | | | | 2,170,000 | | | | | |
| 5.000%, 07/01/2021 | | | 1,545,000 | | | | 1,579,824 | | | | | |
| Penns Grove-Carneys Point Regional School District, | | | | | | | | | | | | |
| 2.000%, 07/09/2021 | | | 6,858,000 | | | | 6,909,298 | | | | | |
| Pennsylvania Economic | | | | | | | | | | | | |
| Development Financing Authority, | | | | | | | | | | | | |
0.700%, 08/01/2037(4) | | | 7,500,000 | | | | 7,502,175 | | | | | |
| Philadelphia Authority for Industrial Development, | | | | | | | | | | | | |
| 3.664%, 04/15/2022 | | | 6,750,000 | | | | 6,877,035 | | | | | |
| Philadelphia Parking Authority, | | | | | | | | | | | | |
| 5.000%, 09/01/2021 (Callable 02/01/2021) | | | 8,450,000 | | | | 8,477,463 | | | | | |
The accompanying notes are an integral part of these financial statements.
Baird Ultra Short Bond Fund
Schedule of Investments, December 31, 2020
Long-Term Investments (cont.)
| | | Principal | | | | | | % of | |
| | | Amount | | | Value | | | Net Assets | |
| Port of Port Arthur Navigation District: | | | | | | | | | |
0.090%, 04/01/2040 (Callable 01/04/2021)(4) | | $ | 8,505,000 | | | $ | 8,505,000 | | | |
|
|
0.220%, 11/01/2040 (Callable 01/04/2021)(4) | | | 10,000,000 | | | | 10,000,000 | | | | | |
| Public Finance Authority, | | | | | | | | | | | | |
| 5.000%, 07/01/2022 | | | 2,790,000 | | | | 2,895,853 | | | | | |
| Regional Transit Authority, | | | | | | | | | | | | |
| 0.000%, 12/01/2021 | | | 1,425,000 | | | | 1,421,010 | | | | | |
| Sacramento County Public Financing Authority, | | | | | | | | | | | | |
| 3.543%, 04/01/2021 | | | 1,300,000 | | | | 1,308,983 | | | | | |
| San Antonio Housing Trust Finance Corp., | | | | | | | | | | | | |
1.400%, 07/01/2022(4) | | | 10,000,000 | | | | 10,082,700 | | | | | |
| San Diego Convention Center | | | | | | | | | | | | |
| Expansion Financing Authority, | | | | | | | | | | | | |
| 0.990%, 04/15/2021 | | | 1,000,000 | | | | 1,001,220 | | | | | |
| School District of Philadelphia, | | | | | | | | | | | | |
| 5.000%, 09/01/2021 | | | 5,000,000 | | | | 5,146,350 | | | | | |
| South Carolina Transportation Infrastructure Bank, | | | | | | | | | | | | |
| 0.546%, 10/01/2031 | | | | | | | | | | | | |
| (1 Month LIBOR USD + 0.450%) | | | | | | | | | | | | |
(Callable 10/01/2021)(3) | | | 20,500,000 | | | | 20,472,530 | | | | | |
| Southwestern Illinois Community | | | | | | | | | | | | |
| College District No. 522, | | | | | | | | | | | | |
| 0.747%, 12/01/2021 | | | 4,255,000 | | | | 4,255,723 | | | | | |
| State of Connecticut, | | | | | | | | | | | | |
| 3.000%, 07/01/2021 | | | 3,250,000 | | | | 3,293,485 | | | | | |
| State of Illinois: | | | | | | | | | | | | |
| 5.000%, 08/01/2021 | | | 1,035,000 | | | | 1,058,494 | | | | | |
| 1.900%, 10/01/2021 | | | 19,000,000 | | | | 18,886,380 | | | | | |
| Tender Option Bond Trust: | | | | | | | | | | | | |
0.470%, 11/15/2045(2)(4) | | | 10,400,000 | | | | 10,400,000 | | | | | |
0.340%, 07/01/2047(2)(4) | | | 2,000,000 | | | | 2,000,000 | | | | | |
0.230%, 08/01/2055 (Callable 02/01/2031)(2)(4) | | | 5,365,000 | | | | 5,365,000 | | | | | |
| Tennessee Housing Development Agency, | | | | | | | | | | | | |
| 4.350%, 07/01/2022 (Callable 01/04/2021) | | | 1,495,000 | | | | 1,495,000 | | | | | |
| Terrebonne Levee & Conservation District, | | | | | | | | | | | | |
| 0.804%, 06/01/2021 | | | 1,000,000 | | | | 1,001,450 | | | | | |
| Tobacco Settlement Finance Authority, | | | | | | | | | | | | |
| 0.797%, 06/01/2021 | | | 3,000,000 | | | | 3,000,990 | | | | | |
| Town of Oyster Bay NY, | | | | | | | | | | | | |
| 3.000%, 02/01/2021 | | | 3,420,000 | | | | 3,426,395 | | | | | |
| University of Louisville, | | | | | | | | | | | | |
| 5.000%, 09/01/2027 (Callable 09/01/2021) | | | 1,200,000 | | | | 1,234,320 | | | | | |
| Westfield-Washington Schools, | | | | | | | | | | | | |
| 2.000%, 07/15/2021 | | | 1,120,000 | | | | 1,129,430 | | | | | |
The accompanying notes are an integral part of these financial statements.
Baird Ultra Short Bond Fund
Schedule of Investments, December 31, 2020
Long-Term Investments (cont.)
| | | Principal | | | | | | % of | |
| | | Amount | | | Value | | | Net Assets | |
| Wheaton College, | | | | | | | | | |
0.620%, 10/01/2035 (Callable 01/04/2021)(4) | | $ | 5,000,000 | | | $ | 5,000,000 | | | | |
| Winooski School District, | | | | | | | | | | | |
| 1.250%, 10/15/2021 | | | 4,700,000 | | | | 4,715,698 | | | | |
| Total Municipal Bonds | | | | | | | | | | | |
| (Cost $500,831,211) | | | | | | | 501,335,845 | | | | 10.9 | % |
| Residential Mortgage-Backed Securities | | | | | | | | | | | | |
| Non-U.S. Government Agency Issues | | | | | | | | | | | | |
| Aegis Asset Backed Securities Trust, | | | | | | | | | | | | |
| Series 2005-4, Class M1, 0.823%, 10/25/2035 | | | | | | | | | | | | |
(1 Month LIBOR USD + 0.675%)(3) | | | 1,453,061 | | | | 1,449,760 | | | | | |
| Arroyo Mortgage Trust, | | | | | | | | | | | | |
Series 2019-3, Class A1, 2.962%, 10/25/2048(2)(4) | | | 904,909 | | | | 932,902 | | | | | |
| Carrington Mortgage Loan Trust, | | | | | | | | | | | | |
| Series 2005-NC1, Class M2, 0.928%, 02/26/2035 | | | | | | | | | | | | |
(1 Month LIBOR USD + 0.780%)(3) | | | 289,244 | | | | 292,767 | | | | | |
| Citigroup Mortgage Loan Trust, Inc., | | | | | | | | | | | | |
| Series 2007-AMC4, Class A2C, 0.318%, 05/25/2037 | | | | | | | | | | | | |
(1 Month LIBOR USD + 0.170%)(3) | | | 81,596 | | | | 81,507 | | | | | |
| GSAMP Trust: | | | | | | | | | | | | |
| Series 2005-WMC2, Class A2C, 0.848%, 11/25/2035 | | | | | | | | | | | | |
(1 Month LIBOR USD + 0.700%)(3) | | | 238,050 | | | | 239,366 | | | | | |
| Series 2006-HE4, Class A2C, 0.298%, 06/25/2036 | | | | | | | | | | | | |
(1 Month LIBOR USD + 0.150%)(3) | | | 194,370 | | | | 194,178 | | | | | |
| Home Equity Asset Trust, | | | | | | | | | | | | |
| Series 2006-2, Class 2A4, 0.768%, 05/25/2036 | | | | | | | | | | | | |
(1 Month LIBOR USD + 0.620%)(2)(3) | | | 1,194,260 | | | | 1,190,586 | | | | | |
| Popular ABS Mortgage Pass-Through Trust, | | | | | | | | | | | | |
| Series 2006-C, Class A4, 0.398%, 07/25/2036 | | | | | | | | | | | | |
(1 Month LIBOR USD + 0.250%)(3) | | | 251,473 | | | | 251,110 | | | | | |
| RAMP Series Trust, | | | | | | | | | | | | |
| Series 2007-RZ1, Class A2, 0.308%, 02/25/2037 | | | | | | | | | | | | |
(1 Month LIBOR USD + 0.160%)(3) | | | 244,848 | | | | 244,559 | | | | | |
| Towd Point Mortgage Trust: | | | | | | | | | | | | |
Series 2015-4, Class A1, 3.500%, 04/25/2055(2)(4) | | | 1,013,480 | | | | 1,019,236 | | | | | |
Series 2016-4, Class A1, 2.250%, 07/25/2056(2)(4) | | | 5,046,725 | | | | 5,124,730 | | | | | |
Series 2017-1, Class A1, 2.750%, 10/25/2056(2)(4) | | | 8,280,750 | | | | 8,486,953 | | | | | |
| Series 2017-5, Class A1, 0.748%, 02/26/2057 | | | | | | | | | | | | |
(1 Month LIBOR USD + 0.600%)(2)(3) | | | 3,824,934 | | | | 3,812,680 | | | | | |
Series 2017-6, Class A1, 2.750%, 10/25/2057(2)(4) | | | 16,978,636 | | | | 17,480,932 | | | | | |
| Total Residential Mortgage-Backed Securities | | | | | | | | | | | | |
| (Cost $40,798,006) | | | | | | | 40,801,266 | | | | 0.9 | % |
The accompanying notes are an integral part of these financial statements.
Baird Ultra Short Bond Fund
Schedule of Investments, December 31, 2020
Long-Term Investments (cont.)
| | | Principal | | | | | | % of | |
| | | Amount | | | Value | | | Net Assets | |
| Commercial Mortgage-Backed Securities | | | | | | | | | |
| Non-U.S. Government Agency Issues | | | | | | | | | |
| COMM Mortgage Trust: | | | | | | | | | |
| Series 2012-CR2, Class ASB, 2.752%, 08/17/2045 | | $ | 1,038,926 | | | $ | 1,042,696 | | | | |
| Series 2013-LC6, Class ASB, 2.478%, 01/12/2046 | | | 449,079 | | | | 457,423 | | | | |
| GS Mortgage Securities Trust: | | | | | | | | | | | |
| Series 2011-GC5, Class A4, 3.707%, 08/10/2044 | | | 4,542,222 | | | | 4,562,325 | | | | |
| Series 2012-GC6, Class AAB, 3.314%, 01/12/2045 | | | 4,544,160 | | | | 4,564,089 | | | | |
| Morgan Stanley Bank of America Merrill Lynch Trust, | | | | | | | | | | | |
| Series 2012-C5, Class A4, 3.176%, 08/17/2045 | | | 14,000,000 | | | | 14,431,739 | | | | |
| WFRBS Commercial Mortgage Trust: | | | | | | | | | | | |
| Series 2012-C8, Class ASB, 2.559%, 08/17/2045 | | | 2,660,763 | | | | 2,681,852 | | | | |
| Series 2013-C14, Class ASB, 2.977%, 06/15/2046 | | | 308,868 | | | | 315,476 | | | | |
| Total Commercial Mortgage-Backed Securities | | | | | | | | | | | |
| (Cost $28,115,512) | | | | | | | 28,055,600 | | | | 0.6 | % |
| Asset Backed Securities | | | | | | | | | | | | |
| Ally Auto Receivables: | | | | | | | | | | | | |
| Series 2017-5, Class A3, 1.990%, 03/15/2022 | | | 45,916 | | | | 45,945 | | | | | |
| Series 2019-2, Class A2, 2.340%, 07/15/2022 | | | 1,116,697 | | | | 1,118,047 | | | | | |
| Series 2019-4, Class A2, 1.930%, 10/15/2022 | | | 7,868,619 | | | | 7,889,022 | | | | | |
| Series 2017-5, Class A4, 2.220%, 10/17/2022 | | | 4,050,000 | | | | 4,072,822 | | | | | |
| Ally Master Owner Trust: | | | | | | | | | | | | |
| Series 2018-1, Class A2, 2.700%, 01/15/2023 | | | 3,065,000 | | | | 3,067,741 | | | | | |
| Series 2018-2, Class A, 3.290%, 05/15/2023 | | | 11,241,000 | | | | 11,365,463 | | | | | |
| Series 2018-4, Class A, 3.300%, 07/15/2023 | | | 38,760,000 | | | | 39,250,054 | | | | | |
| American Express Credit Account Master Trust: | | | | | | | | | | | | |
| Series 2018-4, Class A, 2.990%, 12/15/2023 | | | 3,351,000 | | | | 3,385,302 | | | | | |
| Series 2018-8, Class A, 3.180%, 04/15/2024 | | | 4,000,000 | | | | 4,082,513 | | | | | |
| BA Credit Card Trust, | | | | | | | | | | | | |
| Series 2018-A1, Class A1, 2.700%, 07/17/2023 | | | 12,090,000 | | | | 12,126,382 | | | | | |
| Bank of The West Auto Trust: | | | | | | | | | | | | |
Series 2019-1, Class A2, 2.400%, 10/17/2022(2) | | | 426,206 | | | | 427,537 | | | | | |
Series 2018-1, Class A3, 3.430%, 12/15/2022(2) | | | 2,414,506 | | | | 2,434,013 | | | | | |
Series 2017-1, Class A3, 2.110%, 01/15/2023(2) | | | 1,171,555 | | | | 1,176,418 | | | | | |
| BMW Vehicle Owner Trust, | | | | | | | | | | | | |
| Series 2018-A, Class A3, 2.350%, 04/25/2022 | | | 935,853 | | | | 938,288 | | | | | |
| Capital One Multi-Asset Execution Trust: | | | | | | | | | | | | |
| Series 2018-A1, Class A1, 3.010%, 02/15/2024 | | | 7,440,000 | | | | 7,499,964 | | | | | |
| Series 2017-A2, Class A2, 0.569%, 01/15/2025 | | | | | | | | | | | | |
(1 Month LIBOR USD + 0.410%)(3) | | | 13,500,000 | | | | 13,543,543 | | | | | |
| Capital One Prime Auto Receivables Trust, | | | | | | | | | | | | |
| Series 2019-2, Class A2, 2.060%, 09/15/2022 | | | 2,314,787 | | | | 2,322,484 | | | | | |
The accompanying notes are an integral part of these financial statements.
Baird Ultra Short Bond Fund
Schedule of Investments, December 31, 2020
Long-Term Investments (cont.)
| | | Principal | | | | | | % of | |
| | | Amount | | | Value | | | Net Assets | |
| CarMax Auto Owner Trust: | | | | | | | | | |
| Series 2019-3, Class A2A, 2.210%, 12/15/2022 | | $ | 2,247,867 | | | $ | 2,258,198 | | | |
|
|
| Series 2020-3, Class A2A, 0.490%, 06/15/2023 | | | 10,895,000 | | | | 10,911,690 | | | | | |
| Series 2018-4, Class A3, 3.360%, 09/15/2023 | | | 20,091,146 | | | | 20,514,517 | | | | | |
| Citibank Credit Card Issuance Trust, | | | | | | | | | | | | |
| Series 2018-A1, Class A1, 2.490%, 01/20/2023 | | | 20,628,000 | | | | 20,653,346 | | | | | |
| CNH Equipment Trust, | | | | | | | | | | | | |
| Series 2020-A, Class A2, 1.080%, 07/15/2023 | | | 1,677,297 | | | | 1,683,018 | | | | | |
| Conseco Financial Corp., | | | | | | | | | | | | |
Series 1998-4, Class A6, 6.530%, 04/01/2030(4) | | | 105,733 | | | | 107,600 | | | | | |
| Daimler Trucks Retail Trust, | | | | | | | | | | | | |
Series 2019-1, Class A3, 2.770%, 08/15/2022(2) | | | 11,448,189 | | | | 11,578,194 | | | | | |
| Dell Equipment Finance Trust: | | | | | | | | | | | | |
Series 2020-1, Class A2, 2.260%, 06/22/2022(2) | | | 11,025,000 | | | | 11,153,747 | | | | | |
Series 2020-2, Class A2, 0.470%, 10/24/2022(2) | | | 6,000,000 | | | | 6,010,760 | | | | | |
| Discover Card Execution Note Trust: | | | | | | | | | | | | |
| Series 2016-A3, Class A3, 1.850%, 10/16/2023 | | | 2,500,000 | | | | 2,511,788 | | | | | |
| Series 2019-A9, Class A1, 3.040%, 07/15/2024 | | | 33,333,542 | | | | 34,319,715 | | | | | |
| Evergreen Credit Card Trust, | | | | | | | | | | | | |
Series 2018-1, Class A, 2.950%, 03/15/2023(2) | | | 38,560,000 | | | | 38,764,044 | | | | | |
| Ford Credit Auto Lease Trust: | | | | | | | | | | | | |
| Series 2019-B, Class A2A, 2.280%, 02/15/2022 | | | 2,268,575 | | | | 2,272,370 | | | | | |
| Series 2020-B, Class A2A, 0.500%, 12/15/2022 | | | 7,875,000 | | | | 7,884,793 | | | | | |
| Ford Credit Auto Owner Trust: | | | | | | | | | | | | |
| Series 2017-B, Class A4, 1.870%, 09/15/2022 | | | 1,040,692 | | | | 1,043,627 | | | | | |
| Series 2020-A, Class A2, 1.030%, 10/15/2022 | | | 2,486,491 | | | | 2,493,382 | | | | | |
| Series 2019-A, Class A3, 2.780%, 09/15/2023 | | | 6,450,000 | | | | 6,561,467 | | | | | |
Series 2016-1, Class A, 2.310%, 08/15/2027(2) | | | 7,795,000 | | | | 7,813,183 | | | | | |
| Ford Credit Floorplan Master Owner Trust, | | | | | | | | | | | | |
| Series 2018-3, Class A1, 3.520%, 10/15/2023 | | | 30,925,000 | | | | 31,711,710 | | | | | |
| GM Financial Automobile Leasing Trust, | | | | | | | | | | | | |
| Series 2019-1, Class A4, 3.080%, 12/20/2022 | | | 8,775,000 | | | | 8,860,798 | | | | | |
| GM Financial Consumer Automobile Receivables Trust: | | | | | | | | | | | | |
| Series 2018-1, Class A3, 2.320%, 07/18/2022 | | | 5,601,223 | | | | 5,626,453 | | | | | |
| Series 2018-2, Class A3, 2.810%, 12/16/2022 | | | 614,223 | | | | 620,128 | | | | | |
| Series 2020-2, Class A2A, 1.500%, 03/16/2023 | | | 5,113,695 | | | | 5,136,206 | | | | | |
| Series 2020-3, Class A2, 0.350%, 07/16/2023 | | | 9,859,478 | | | | 9,865,193 | | | | | |
| GMF Floorplan Owner Revolving Trust, | | | | | | | | | | | | |
Series 2018-4, Class A1, 3.500%, 09/15/2023(2) | | | 5,000,000 | | | | 5,113,016 | | | | | |
| Golden Credit Card Trust, | | | | | | | | | | | | |
Series 2018-1A, Class A, 2.620%, 01/15/2023(2) | | | 33,681,000 | | | | 33,709,811 | | | | | |
| Honda Auto Receivables Owner Trust, | | | | | | | | | | | | |
| Series 2019-2, Class A2, 2.570%, 12/21/2021 | | | 1,363,088 | | | | 1,366,283 | | | | | |
The accompanying notes are an integral part of these financial statements.
Baird Ultra Short Bond Fund
Schedule of Investments, December 31, 2020
Long-Term Investments (cont.)
| | | Principal | | | | | | % of | |
| | | Amount | | | Value | | | Net Assets | |
| HPEFS Equipment Trust: | | | | | | | | | |
Series 2019-1A, Class A2, 2.190%, 09/20/2029(2) | | $ | 1,789,214 | | | $ | 1,796,442 | | | |
|
|
Series 2020-2A, Class A2, 0.650%, 07/22/2030(2) | | | 20,118,000 | | | | 20,157,524 | | | | | |
| Hyundai Auto Lease Securitization Trust: | | | | | | | | | | | | |
Series 2019-A, Class A3, 2.980%, 07/15/2022(2) | | | 4,622,855 | | | | 4,651,370 | | | | | |
Series 2020-B, Class A2, 0.360%, 01/17/2023(2) | | | 9,850,000 | | | | 9,860,112 | | | | | |
| Hyundai Auto Receivables Trust: | | | | | | | | | | | | |
| Series 2020-B, Class A2, 0.380%, 03/15/2023 | | | 7,500,000 | | | | 7,506,898 | | | | | |
| Series 2020-A, Class A2, 1.510%, 04/15/2023 | | | 7,516,089 | | | | 7,566,716 | | | | | |
| Series 2017-A, Class A4, 2.090%, 04/17/2023 | | | 1,564,881 | | | | 1,567,291 | | | | | |
| Marlette Funding Trust, | | | | | | | | | | | | |
Series 2020-2A, Class A, 1.020%, 09/16/2030(2) | | | 4,184,982 | | | | 4,192,027 | | | | | |
| Mercedes-Benz Auto Lease Trust: | | | | | | | | | | | | |
| Series 2018-B, Class A3, 3.210%, 09/15/2021 | | | 1,887,442 | | | | 1,890,958 | | | | | |
| Series 2020-A, Class A2, 1.820%, 03/15/2022 | | | 16,895,130 | | | | 16,950,235 | | | | | |
| Series 2018-B, Class A4, 3.310%, 07/15/2024 | | | 2,505,000 | | | | 2,521,451 | | | | | |
| Mercedes-Benz Auto Receivables Trust, | | | | | | | | | | | | |
| Series 2020-1, Class A2, 0.460%, 03/15/2023 | | | 10,625,000 | | | | 10,639,809 | | | | | |
| Mercedes-Benz Master Owner Trust: | | | | | | | | | | | | |
| Series 2019-AA, Class A, 0.509%, 05/15/2023 | | | | | | | | | | | | |
(1 Month LIBOR USD + 0.350%)(2)(3) | | | 16,515,000 | | | | 16,531,928 | | | | | |
Series 2019-BA, Class A, 2.610%, 05/15/2024(2) | | | 10,765,000 | | | | 11,121,357 | | | | | |
| MMAF Equipment Finance LLC, | | | | | | | | | | | | |
Series 2020-A, Class A2, 0.740%, 04/09/2024(2) | | | 4,500,000 | | | | 4,515,090 | | | | | |
| Nissan Auto Lease Trust, | | | | | | | | | | | | |
| Series 2020-B, Class A2, 0.340%, 12/15/2022 | | | 12,825,000 | | | | 12,839,191 | | | | | |
| Nissan Auto Receivables Owner Trust: | | | | | | | | | | | | |
| Series 2017-C, Class A3, 2.120%, 04/18/2022 | | | 1,209,724 | | | | 1,212,843 | | | | | |
| Series 2018-C, Class A3, 3.220%, 06/15/2023 | | | 13,372,830 | | | | 13,629,956 | | | | | |
| Series 2019-A, Class A3, 2.900%, 10/16/2023 | | | 24,943,189 | | | | 25,411,527 | | | | | |
| PFS Financing Corp.: | | | | | | | | | | | | |
Series 2018-B, Class A, 2.890%, 02/15/2023(2) | | | 13,273,000 | | | | 13,300,649 | | | | | |
Series 2018-D, Class A, 3.190%, 04/17/2023(2) | | | 2,091,000 | | | | 2,105,649 | | | | | |
| Santander Consumer Auto Receivables Trust: | | | | | | | | | | | | |
Series 2020-BA, Class A2, 0.380%, 02/15/2023(2) | | | 5,500,000 | | | | 5,501,689 | | | | | |
Series 2020-A, 1.370%, 10/15/2024(2) | | | 16,718,108 | | | | 16,880,449 | | | | | |
| Santander Retail Auto Lease Trust, | | | | | | | | | | | | |
Series 2019-A, Class A2, 2.720%, 01/20/2022(2) | | | 1,043,909 | | | | 1,045,942 | | | | | |
| SoFi Consumer Loan Program LLC: | | | | | | | | | | | | |
Series 2017-3, Class A, 2.770%, 05/26/2026(2) | | | 166,295 | | | | 166,783 | | | | | |
Series 2017-4, Class A, 2.500%, 06/25/2026(2) | | | 2,804,706 | | | | 2,815,154 | | | | | |
Series 2018-3, Class A2, 3.670%, 08/25/2027(2) | | | 548,108 | | | | 551,740 | | | | | |
Series 2018-4, Class A, 3.540%, 11/26/2027(2) | | | 265,317 | | | | 266,308 | | | | | |
Series 2019-2, Class A, 3.010%, 04/25/2028(2) | | | 1,509,727 | | | | 1,524,926 | | | | | |
The accompanying notes are an integral part of these financial statements.
Baird Ultra Short Bond Fund
Schedule of Investments, December 31, 2020
Long-Term Investments (cont.)
| | | Principal | | | | | | % of | |
| | | Amount | | | Value | | | Net Assets | |
| Synchrony Card Funding LLC, | | | | | | | | | |
| Series 2019-A2, Class A, 2.340%, 06/15/2025 | | $ | 11,598,000 | | | $ | 11,946,573 | | | |
|
|
| Synchrony Card Issuance Trust, | | | | | | | | | | | | |
| Series 2018-A1, Class A, 3.380%, 09/15/2024 | | | 1,800,000 | | | | 1,839,411 | | | | | |
| Synchrony Credit Card Master Note Trust, | | | | | | | | | | | | |
| Series 2016-2, Class A, 2.210%, 05/15/2024 | | | 31,205,000 | | | | 31,424,487 | | | | | |
| Tesla Auto Lease Trust, | | | | | | | | | | | | |
Series 2018-B, Class A, 3.710%, 08/20/2021(2) | | | 8,116,273 | | | | 8,167,682 | | | | | |
| Towd Point Mortgage Trust, | | | | | | | | | | | | |
Series 2019-MH1, Class A1, 3.000%, 11/25/2058(2)(4) | | | 3,135,440 | | | | 3,214,083 | | | | | |
| Toyota Auto Receivables Owner Trust: | | | | | | | | | | | | |
| Series 2017-C, Class A3, 1.780%, 11/15/2021 | | | 74,678 | | | | 74,727 | | | | | |
| Series 2017-A, Class A4, 2.100%, 09/15/2022 | | | 2,549,122 | | | | 2,550,989 | | | | | |
| Series 2020-A, Class A2, 1.670%, 11/15/2022 | | | 3,793,792 | | | | 3,816,523 | | | | | |
| Trillium Credit Card Trust II, | | | | | | | | | | | | |
Series 2019-2A, Class A, 3.038%, 01/26/2024(1)(2) | | | 19,365,000 | | | | 19,399,526 | | | | | |
| Verizon Owner Trust: | | | | | | | | | | | | |
Series 2018-1A, Class A1A, 2.820%, 09/20/2022(2) | | | 10,694,113 | | | | 10,738,006 | | | | | |
| Series 2018-A, Class A1A, 3.230%, 04/20/2023 | | | 163,971 | | | | 166,147 | | | | | |
| Series 2019-A, Class A1A, 2.930%, 09/20/2023 | | | 22,756,000 | | | | 23,197,382 | | | | | |
| Volkswagen Auto Lease Trust, | | | | | | | | | | | | |
| Series 2019-A, Class A2A, 2.000%, 03/21/2022 | | | 3,550,633 | | | | 3,567,946 | | | | | |
| Volkswagen Auto Loan Enhanced Trust, | | | | | | | | | | | | |
| Series 2020-1, Class A2A, 0.930%, 12/20/2022 | | | 2,870,452 | | | | 2,877,706 | | | | | |
| Volvo Financial Equipment LLC: | | | | | | | | | | | | |
Series 2017-1A, Class A4, 2.210%, 11/15/2021(2) | | | 1,277,029 | | | | 1,277,896 | | | | | |
Series 2018-1A, Class A3, 2.540%, 02/15/2022(2) | | | 1,567,936 | | | | 1,572,896 | | | | | |
| Wheels SPV 2 LLC, | | | | | | | | | | | | |
Series 2019-1A, Class A2, 2.300%, 05/22/2028(2) | | | 12,361,163 | | | | 12,479,053 | | | | | |
| World Financial Network Credit Card Master Trust: | | | | | | | | | | | | |
| Series 2018-A, Class A, 3.070%, 12/15/2024 | | | 13,382,000 | | | | 13,425,306 | | | | | |
| Series 2016-A, Class A, 2.030%, 04/15/2025 | | | 10,195,000 | | | | 10,271,615 | | | | | |
| Series 2018-B, Class A, 3.460%, 07/15/2025 | | | 25,000,000 | | | | 25,547,160 | | | | | |
| Series 2018-C, Class A, 3.550%, 08/15/2025 | | | 32,400,000 | | | | 33,215,288 | | | | | |
| World Omni Auto Receivables Trust, | | | | | | | | | | | | |
| Series 2020-C, Class A2, 0.350%, 12/15/2023 | | | 14,000,000 | | | | 14,013,135 | | | | | |
| World Omni Automobile Lease Securitization Trust: | | | | | | | | | | | | |
| Series 2019-A, Class A2, 2.890%, 11/15/2021 | | | 36,797 | | | | 36,834 | | | | | |
| Series 2018-B, Class A3, 3.190%, 12/15/2021 | | | 3,093,791 | | | | 3,104,156 | | | | | |
| World Omni Select Auto Trust, | | | | | | | | | | | | |
| Series 2020-A, Class A2, 0.470%, 06/17/2024 | | | 7,500,000 | | | | 7,511,805 | | | | | |
| Total Asset Backed Securities | | | | | | | | | | | | |
| (Cost $869,625,407) | | | | | | | 869,448,921 | | | | 19.0 | % |
| Total Long-Term Investments | | | | | | | | | | | | |
| (Cost $3,959,413,504) | | | | | | | 3,962,692,153 | | | | 86.5 | % |
The accompanying notes are an integral part of these financial statements.
Baird Ultra Short Bond Fund
Schedule of Investments, December 31, 2020
Short-Term Investments
| | | Principal | | | | | | % of | |
| | | Amount | | | Value | | | Net Assets | |
| Commercial Paper | | | | | | | | | |
American Honda Finance Corp., 0.34%(6), 03/22/2021 | | $ | 32,400,000 | | | $ | 32,375,141 | | | | |
Banco Santander SA, 0.26%(6), 08/23/2021 | | | 8,400,000 | | | | 8,385,798 | | | | |
Banner Health, 0.59%(6), 01/06/2021 | | | 25,000,000 | | | | 24,997,561 | | | | |
Catholic Health Initiatives, 0.10%(6), 01/21/2021 | | | 18,000,000 | | | | 17,998,971 | | | | |
Catholic Health Initiatives, 0.16%(6), 03/03/2021 | | | 3,000,000 | | | | 2,999,168 | | | | |
Catholic Health Initiatives, 0.18%(6), 03/24/2021 | | | 13,700,000 | | | | 13,694,472 | | | | |
Enable Midstream Partners LP, 0.44%(6), 01/14/2021 | | | 17,700,000 | | | | 17,696,985 | | | | |
Enable Midstream Partners LP, 0.45%(6), 02/08/2021 | | | 3,000,000 | | | | 2,998,531 | | | | |
Eni Finance USA, Inc., 0.41%(6), 05/17/2021 | | | 18,275,000 | | | | 18,246,416 | | | | |
Glencore Funding LLC, 0.59%(6), 03/05/2021 | | | 19,350,000 | | | | 19,329,601 | | | | |
Marathon Petroleum Corp.(2), 0.24%(6), 02/01/2021 | | | 16,500,000 | | | | 16,496,436 | | | | |
Nationwide Mutual Insurance Co., 0.34%(6), 07/26/2021 | | | 3,400,000 | | | | 3,393,392 | | | | |
Shell International Finance BV, 0.22%(6), 07/12/2021 | | | 16,200,000 | | | | 16,180,546 | | | | |
Viatris, Inc.(2), 0.65%(6), 03/21/2021 | | | 11,200,000 | | | | 11,183,822 | | | | |
Vodafone Group PLC, 0.15%(6), 01/04/2021 | | | 35,000,000 | | | | 34,999,417 | | | | |
| Volkswagen Group of America | | | | | | | | | | | |
Finance LLC, 0.62%(6), 11/10/2021 | | | 7,000,000 | | | | 6,962,207 | | | | |
Walgreens Boots Alliance, Inc., 0.36%(6), 03/04/2021 | | | 5,000,000 | | | | 4,996,824 | | | | |
Walgreens Boots Alliance, Inc., 0.36%(6), 03/03/2021 | | | 20,253,000 | | | | 20,240,374 | | | | |
Walgreens Boots Alliance, Inc., 0.45%(6), 05/18/2021 | | | 8,700,000 | | | | 8,685,059 | | | | |
Walt Disney Co., 0.32%(6), 04/30/2021 | | | 17,000,000 | | | | 16,981,867 | | | | |
Walt Disney Co., 0.33%(6), 07/16/2021 | | | 7,350,000 | | | | 7,336,566 | | | | |
| Total Commercial Paper | | | | | | | | | | | |
| (Cost $306,040,742) | | | | | | | 306,179,154 | | | | 6.7 | % |
| U.S. Treasury Security | | | | | | | | | | | | |
United States Treasury Bill, 0.07%(6), 04/08/2021 | | | 210,000,000 | | | | 209,958,876 | | | | | |
| Total U.S. Treasury Security | | | | | | | | | | | | |
| (Cost $209,940,911) | | | | | | | 209,958,876 | | | | 4.6 | % |
| | | Shares | | | | | | | | | |
| Money Market Mutual Fund | | | | | | | | | | | | |
| First American Government Obligations | | | | | | | | | | | | |
Fund, Class U, 0.04%(5) | | | 133,827,441 | | | | 133,827,441 | | | | | |
| Total Money Market Mutual Fund | | | | | | | | | | | | |
| (Cost $133,827,441) | | | | | | | 133,827,441 | | | | 2.9 | % |
| Total Short-Term Investments | | | | | | | | | | | | |
| (Cost $649,809,094) | | | | | | | 649,965,471 | | | | 14.2 | % |
| Total Investments | | | | | | | | | | | | |
| (Cost $4,609,222,598) | | | | | | | 4,612,657,624 | | | | 100.7 | % |
| Liabilities in Excess of Other Assets | | | | | | | (33,537,396 | ) | | | (0.7 | )% |
| TOTAL NET ASSETS | | | | | | $ | 4,579,120,228 | | | | 100.0 | % |
The accompanying notes are an integral part of these financial statements.
Baird Ultra Short Bond Fund
Schedule of Investments, December 31, 2020
Notes to Schedule of InvestmentsLIBOR – London Inter-bank Offered Rate
| (1) | Foreign security. |
| (2) | Security as defined in Rule 144A under the Securities Act of 1933 and classified as liquid under the Fund’s liquidity risk management program. Purchased in a private placement transaction; resale to the public may require registration or may extend only to qualified institutional buyers. At December 31, 2020, the value of these securities total $788,386,993, which represents 17.22% of total net assets. |
| (3) | Variable rate security based on a reference index and spread. The rate reported is the rate in effect as of December 31, 2020. |
| (4) | Variable rate security. The coupon is based on an underlying pool of loans. The rate reported is the rate in effect as of December 31, 2020. |
| (5) | Seven-day yield. |
| (6) | Effective yield as of December 31, 2020. |
Summary of Fair Value Exposure at December 31, 2020
The Fund has adopted authoritative fair valuation accounting standards which establish a definition of fair value and set out a hierarchy for measuring fair value. These standards require additional disclosures about the various inputs and valuation techniques used to develop the measurements of fair value and a discussion on changes in valuation techniques and related inputs during the period. These standards define fair value as the price that would be received to sell an asset or paid to transfer a liability in an orderly transaction between market participants at the measurement date.
The fair value hierarchy is organized into three levels based upon the assumptions (referred to as “inputs”) used in pricing the asset or liability. These standards state that “observable inputs” reflect the assumptions market participants would use in pricing the asset or liability based on market data obtained from independent sources and “unobservable inputs” reflect an entity’s own assumptions about the assumptions market participants would use in pricing the asset or liability. These inputs are summarized into three broad levels and described below:
| Level 1 – | Quoted prices (unadjusted) in active markets for identical assets or liabilities that the reporting entity can access at the measurement date. |
| Level 2 – | Inputs other than quoted prices included within Level 1 that are observable for the asset or liability, either directly or indirectly. |
| Level 3 – | Unobservable inputs for the asset or liability. |
The inputs or methodology used for valuing securities are not necessarily an indication of the risk associated with investing in those securities.
The accompanying notes are an integral part of these financial statements.
Baird Ultra Short Bond Fund
Summary of Fair Value Exposure at December 31, 2020 (cont.)
The following is a summary of the inputs used to value the Fund’s investments as of December 31, 2020:
| | | Level 1 | | | Level 2 | | | Level 3 | | | Total | |
| Long-Term Investments | | | | | | | | | | | | |
| U.S. Treasury Securities | | $ | — | | | $ | 875,477,941 | | | $ | — | | | $ | 875,477,941 | |
| Other Government Related Securities | | | — | | | | 4,007,280 | | | | — | | | | 4,007,280 | |
| Corporate Bonds | | | — | | | | 1,643,565,300 | | | | — | | | | 1,643,565,300 | |
| Municipal Bonds | | | — | | | | 501,335,845 | | | | — | | | | 501,335,845 | |
| Residential Mortgage-Backed Securities – | | | | | | | | | | | | | | | | |
| Non-U.S. Government Agency Issues | | | — | | | | 40,801,266 | | | | — | | | | 40,801,266 | |
| Commercial Mortgage-Backed Securities – | | | | | | | | | | | | | | | | |
| Non-U.S. Government Agency Issues | | | — | | | | 28,055,600 | | | | — | | | | 28,055,600 | |
| Asset Backed Securities | | | — | | | | 869,448,921 | | | | — | | | | 869,448,921 | |
| Total Long-Term Investments | | | — | | | | 3,962,692,153 | | | | — | | | | 3,962,692,153 | |
| Short-Term Investment | | | | | | | | | | | | | | | | |
| Commercial Paper | | | — | | | | 306,179,154 | | | | — | | | | 306,179,154 | |
| U.S. Treasury Securities | | | — | | | | 209,958,876 | | | | — | | | | 209,958,876 | |
| Money Market Mutual Fund | | | 133,827,441 | | | | — | | | | — | | | | 133,827,441 | |
| Total Short-Term Investment | | | 133,827,441 | | | | 516,138,030 | | | | — | | | | 649,965,471 | |
| Total Investments | | $ | 133,827,441 | | | $ | 4,478,830,183 | | | $ | — | | | $ | 4,612,657,624 | |
Changes in valuation techniques may result in transfers into or out of assigned levels within the fair value hierarchy. There were no transfers into or out of Level 3 during the reporting period, as compared to the security classifications from the prior year’s annual report. See the Fund’s Valuation Policy in Note 2a to the financial statements.
The accompanying notes are an integral part of these financial statements.
Baird Short-Term Bond Fund
December 31, 2020 (Unaudited)
The Baird Short-Term Bond Fund seeks an annual rate of total return, before Fund expenses, greater than the annual rate of total return of the Bloomberg Barclays 1-3 Year U.S. Government/Credit Bond Index. The Bloomberg Barclays 1-3 Year U.S. Government/Credit Bond Index is an unmanaged, market value weighted index of investment grade, fixed rate debt issues, including government and credit securities, with maturities between one and three years.
Treasury yields fell across the curve in 2020, with the benchmark 10-year Treasury down 100 bps to finish the year at 0.92%, after hitting an all-time [intra-day] record low of 0.31% on March 9. The curve steepened, with the spread between 2-year and 30-year Treasuries increasing from 82 bps to 153 bps during the year, as yields in shorter maturities saw the largest decline. Starting in late February, the coronavirus (COVID-19) affected every aspect of the economy, leading to the swiftest equity bear market in history, with an over 33% peak-to-trough drop in the S&P 500 in just over a month ending March 23, and fixed income markets hitting levels of distress not seen since the Global Financial Crisis (GFC) in 2008. However, unlike 2008, the massive, coordinated monetary and fiscal policy response resulted in a much swifter recovery. U.S. unemployment dropped to 6.7% by year end after peaking at 14.7% in April as businesses reopened, and the Pfizer and Moderna vaccines offered hope for a return to normal sometime in 2021. The S&P 500 ended the year up 16% at record highs and credit spreads tightened through year end, completely erasing the pandemic-related widening in many sectors. The COVID-19 pandemic and the massive government policy response to it essentially created a full market cycle for spreads in the span of a calendar year.
During 2020, the Fund’s Institutional Class Shares generated strong absolute and relative returns and outperformed its benchmark by 90 basis points net of fees.
The primary factors contributing to the Fund’s absolute and relative performance in 2020 include:
| | | • | Positive – Overweight to Investment Grade Credit (increased exposure post widening of the spread) |
| | | • | Positive – Active positioning within Investment Grade Credit |
| | | | • | Positive – Underweight to the Other Government Sector in favor of Corporate Credit including Financials |
| | | | • | Positive – Security selection, including attractive new issue concessions |
| | • | Mortgage-Backed Securities (MBS) & Asset-Backed Securities (ABS) Positioning |
| | | • | Positive – Exposure to Asset Backed Securities (ABS) (increased exposure post widening of the spread) |
| | | • | Positive – Exposure to Non-Agency Commercial Mortgage-Backed Securities (CMBS) & Non-Agency Residential Mortgage-Backed Securities (RMBS) |
We expect the economic impact of COVID-19 to linger well into 2021, particularly as it relates to the travel and hospitality service sectors. Yet, with the massive fiscal stimulus that is already in the pipeline, and likely more coming now that the Democratic Party has full, albeit narrow, control of Washington, above-average economic growth is very likely in 2021. Stronger growth may pressure inflation modestly higher, a goal of the Fed, translating into moderately higher intermediate and long-term rates. With short-term rates still anchored close to zero by the Fed, a steeper yield curve will enable investors to capture some added performance as bonds roll down the curve. We expect the roll-down return to be an important component of total return this year, as well as security selection, sector allocation, and the yield advantage the Fund enjoys above that of its benchmark. Strategic positioning across market sectors and along the yield curve (including the ability to thoughtfully reposition should spreads widen into volatility) will complement the always-important security selection process to help navigate through the current environment.
The Fund remains duration neutral with a modest overweight to Investment Grade corporate credit, particularly Financials. The Fund is also maintaining its allocation in the MBS/ABS sectors at the senior part of the capital structure given attractive relative valuations and the continued broad sector diversification benefit they provide to the overall portfolio. The Fund only purchases investment grade, U.S. dollar denominated securities in the cash bond market (no derivatives) and we believe the Fund is well positioned to add value relative to its benchmark.
Baird Short-Term Bond Fund
December 31, 2020 (Unaudited)
Portfolio Characteristics
Quality Distribution(1)(2)
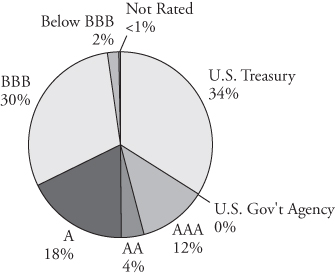
| | Net Assets | $8,983,218,546 | |
| | | | |
| | SEC 30-Day | | |
| | Yield(3) | | |
| | Institutional Class | 0.52% | |
| | Investor Class | 0.28% | |
| | | | |
| | Average | | |
| | Effective | | |
| | Duration | 1.91 years | |
| | | | |
| | Average | | |
| | Effective | | |
| | Maturity | 1.99 years | |
| | | | |
| | Annualized | | |
| | | Expense | | |
Sector Weightings(1) | | Ratio(4) | | |
| | | Institutional Class | 0.30% | |
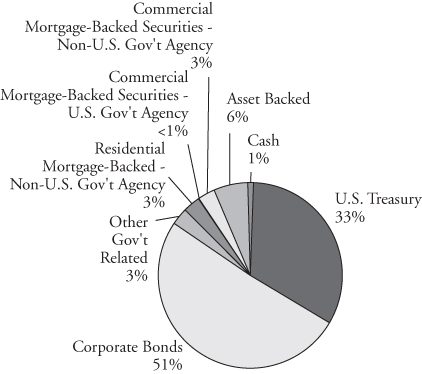
| | Investor Class | 0.55% | (5) |
| | | | |
| | Portfolio | | |
| | Turnover Rate | 64% | |
| | | | |
| | Number of | | |
| | Holdings | 560 | |
| | | | |
| | | | |
| | | | |
| | | | |
| | | | |
| | | | |
| | | | |
| | | | |
| | | | |
| | | | |
| | | | |
| | | | |
| | | | |
| | | | |
| | | | |
| | | | | |
| (1) | Percentages shown are based on the Fund’s total investments. |
| (2) | The quality profile is calculated on a market value-weighted basis using the highest credit quality rating for each security held by the Fund given by S&P, Moody’s or Fitch, each of which is a Nationally Recognized Statistical Rating Organization (NRSRO). NRSROs rate the credit quality of securities using a scale that generally ranges from AAA (highest) to D (lowest). |
| (3) | SEC yields are based on SEC guidelines and are calculated for the 30 days ended December 31, 2020. |
| (4) | Reflects expense ratios as stated in the Fund’s current prospectus. |
| (5) | Includes 0.25% 12b-1 fee. |
Baird Short-Term Bond Fund
December 31, 2020 (Unaudited)
Institutional ClassValue of a $25,000 Investment
Growth of a hypothetical investment of $25,000 made on 12/31/10, assuming reinvestment of all distributions.
Investor Class
Value of a $10,000 Investment
Growth of a hypothetical investment of $10,000 made on the Fund’s inception date (09/19/12), assuming reinvestment of all distributions.
Baird Short-Term Bond Fund
December 31, 2020 (Unaudited)
Total Returns
| | | Average Annual |
| | | | | Since | Since |
| | One | Five | Ten | Inception | Inception |
| For the Periods Ended December 31, 2020 | Year | Years | Years | (8/31/04) | (9/19/12) |
| Institutional Class Shares | 4.23% | 2.83% | 2.40% | 2.88% | N/A |
| Investor Class Shares | 3.86% | 2.55% | N/A | N/A | 1.98% |
| Bloomberg Barclays 1-3 Year U.S. | | | | | |
Government/Credit Bond Index(1) | 3.33% | 2.21% | 1.60% | 2.46% | 1.61% |
| (1) | The Bloomberg Barclays 1-3 Year U.S. Government/Credit Bond Index is an unmanaged, market value weighted index of investment grade, fixed-rate debt issues, including government and corporate securities, with maturities between one and three years. This Index does not reflect any deduction for fees, expenses or taxes. A direct investment in an index is not possible. |
The line graphs on the previous page and the returns shown in the table above reflect reinvestment of dividends and/or capital gains distributions in additional shares. The returns in the graphs and table do not reflect the deduction of taxes that a shareholder would pay on Fund distributions or the redemption of Fund shares. The returns reflect the actual performance for each period and do not include the impact of trades executed on the last business day of the period that were recorded on the first business day of the next period.
The Fund’s gross expense ratio for each Class, as reflected in the Fund’s current prospectus, is set forth under “Portfolio Characteristics”.
The Fund may invest in U.S. dollar denominated foreign securities which involve additional risks such as political and economic instability, and different and sometimes less strict financial reporting standards and regulation. The Fund may also invest in mortgage- and asset-backed securities, which include interest rate and prepayment risks more pronounced than those of other fixed income securities. U.S. and international markets have experienced significant periods of volatility in recent years and months due to a number of economic, political and global macro factors including the impact of the coronavirus (COVID-19) as a global pandemic and related public health issues, growth concerns in the U.S. and overseas, uncertainties regarding interest rates, trade tensions and the threat of tariffs imposed by the U.S. and other countries. These and other geopolitical events may cause market disruptions and could have an adverse effect on the value of the Fund’s investments.
Past performance does not guarantee future results. Investment returns and principal value will fluctuate so that an investor’s shares, when redeemed, may be worth more or less than their original cost.
For information about the performance of the Fund as of the most recent month-end, please call 1-866-44BAIRD or visit www.bairdfunds.com. Mutual fund performance changes over time and current performance may be lower or higher than that stated.
Baird Short-Term Bond Fund
Schedule of Investments, December 31, 2020
Long-Term Investments
| | | Principal | | | | | | % of | |
| | | Amount | | | Value | | | Net Assets | |
| U.S. Treasury Securities | | | | | | | | | |
| U.S. Treasury Bonds: | | | | | | | | | |
| 2.125%, 12/31/2022 | | $ | 663,125,000 | | | $ | 689,520,485 | | | | |
| 1.750%, 05/15/2023 | | | 1,266,950,000 | | | | 1,315,153,495 | | | | |
| 2.750%, 11/15/2023 | | | 922,000,000 | | | | 990,429,687 | | | | |
| Total U.S. Treasury Securities | | | | | | | | | | | |
| (Cost $2,992,754,892) | | | | | | | 2,995,103,667 | | | | 33.3 | % |
| Other Government Related Securities | | | | | | | | | | | | |
| Industrial Bank of Korea, | | | | | | | | | | | | |
| 0.814%, 08/02/2021 | | | | | | | | | | | | |
(3 Month LIBOR USD + 0.600%)(1)(2)(3) | | | 2,150,000 | | | | 2,153,913 | | | | | |
| Syngenta Finance NV, | | | | | | | | | | | | |
3.933%, 04/23/2021(1)(2) | | | 10,000,000 | | | | 10,067,117 | | | | | |
| Total Other Government Related Securities | | | | | | | | | | | | |
| (Cost $12,150,000) | | | | | | | 12,221,030 | | | | 0.1 | % |
| Corporate Bonds | | | | | | | | | | | | |
| Industrials | | | | | | | | | | | | |
| A.P. Meoller – Maersk A/S, | | | | | | | | | | | | |
3.750%, 09/22/2024(1)(2) | | | 7,000,000 | | | | 7,579,895 | | | | | |
| AbbVie, Inc.: | | | | | | | | | | | | |
| 5.000%, 12/15/2021 | | | 20,045,000 | | | | 20,693,630 | | | | | |
| 3.450%, 03/15/2022 | | | 6,975,000 | | | | 7,193,336 | | | | | |
| 3.850%, 06/15/2024 | | | 13,187,000 | | | | 14,523,451 | | | | | |
| Agilent Technologies, Inc., | | | | | | | | | | | | |
| 3.875%, 07/15/2023 | | | 7,500,000 | | | | 8,070,478 | | | | | |
| Albemarle Corp., | | | | | | | | | | | | |
| 1.271%, 11/15/2022 | | | | | | | | | | | | |
(3 Month LIBOR USD + 1.050%)(3) | | | 7,000,000 | | | | 6,983,418 | | | | | |
| Alimentation Couche-Tard, Inc., | | | | | | | | | | | | |
2.700%, 07/26/2022(1)(2) | | | 33,135,000 | | | | 34,247,809 | | | | | |
| Allegion US Holding Co., Inc., | | | | | | | | | | | | |
| 3.200%, 10/01/2024 | | | 9,075,000 | | | | 9,692,643 | | | | | |
| Anglo American Capital PLC: | | | | | | | | | | | | |
4.125%, 04/15/2021(1)(2) | | | 10,630,000 | | | | 10,714,781 | | | | | |
4.125%, 09/27/2022(1)(2) | | | 2,775,000 | | | | 2,922,003 | | | | | |
| AutoNation, Inc., | | | | | | | | | | | | |
| 3.350%, 01/15/2021 | | | 4,603,000 | | | | 4,605,604 | | | | | |
| Bayer US Finance II LLC: | | | | | | | | | | | | |
3.500%, 06/25/2021(2) | | | 26,245,000 | | | | 26,564,072 | | | | | |
2.200%, 07/15/2022(2) | | | 2,250,000 | | | | 2,292,658 | | | | | |
| Beam Suntory, Inc., | | | | | | | | | | | | |
| 3.250%, 05/15/2022 | | | 10,875,000 | | | | 11,202,423 | | | | | |
The accompanying notes are an integral part of these financial statements.
Baird Short-Term Bond Fund
Schedule of Investments, December 31, 2020
Long-Term Investments (cont.)
| | | Principal | | | | | | % of | |
| | | Amount | | | Value | | | Net Assets | |
| Becton Dickinson and Co.: | | | | | | | | | |
| 3.125%, 11/08/2021 | | $ | 1,000,000 | | | $ | 1,022,170 | | | |
|
|
| 2.894%, 06/06/2022 | | | 19,186,000 | | | | 19,831,355 | | | | | |
| 3.363%, 06/06/2024 | | | 6,882,000 | | | | 7,481,248 | | | | | |
| Bemis Co., Inc., | | | | | | | | | | | | |
| 4.500%, 10/15/2021 | | | 5,375,000 | | | | 5,491,498 | | | | | |
| Boeing Co., | | | | | | | | | | | | |
| 1.950%, 02/01/2024 | | | 10,000,000 | | | | 10,298,785 | | | | | |
| Boral Finance Pty Ltd., | | | | | | | | | | | | |
3.000%, 11/01/2022(1)(2) | | | 2,475,000 | | | | 2,529,309 | | | | | |
| BP Capital Markets America, Inc., | | | | | | | | | | | | |
| 2.937%, 04/06/2023 | | | 24,550,000 | | | | 25,908,401 | | | | | |
| Broadcom, Inc.: | | | | | | | | | | | | |
| 3.125%, 10/15/2022 | | | 5,060,000 | | | | 5,295,665 | | | | | |
| 2.650%, 01/15/2023 | | | 1,658,000 | | | | 1,725,084 | | | | | |
| 2.250%, 11/15/2023 | | | 15,000,000 | | | | 15,665,766 | | | | | |
| 3.625%, 01/15/2024 | | | 11,225,000 | | | | 12,132,678 | | | | | |
| Canadian Natural Resources Ltd., | | | | | | | | | | | | |
2.950%, 01/15/2023(1) | | | 6,500,000 | | | | 6,798,220 | | | | | |
| Cardinal Health, Inc., | | | | | | | | | | | | |
| 3.200%, 06/15/2022 | | | 9,922,000 | | | | 10,285,033 | | | | | |
| Cargill, Inc., | | | | | | | | | | | | |
1.375%, 07/23/2023(2) | | | 14,400,000 | | | | 14,759,504 | | | | | |
| Carlisle Companies, Inc., | | | | | | | | | | | | |
| 3.750%, 11/15/2022 | | | 2,230,000 | | | | 2,338,000 | | | | | |
| Carrier Global Corp., | | | | | | | | | | | | |
| 1.923%, 02/15/2023 | | | 7,000,000 | | | | 7,211,190 | | | | | |
| Celanese US Holdings LLC, | | | | | | | | | | | | |
| 4.625%, 11/15/2022 | | | 3,395,000 | | | | 3,643,591 | | | | | |
| Charter Communications Operating LLC, | | | | | | | | | | | | |
| 4.464%, 07/23/2022 | | | 22,835,000 | | | | 24,073,649 | | | | | |
| Cheniere Corpus Christi Holdings LLC, | | | | | | | | | | | | |
| 7.000%, 06/30/2024 | | | 18,650,000 | | | | 21,778,994 | | | | | |
| Chevron Phillips Chemical Co. LLC / | | | | | | | | | | | | |
| Chevron Phillips Chemical Co. LP, | | | | | | | | | | | | |
3.300%, 05/01/2023(2) | | | 1,930,000 | | | | 2,042,830 | | | | | |
| Choice Hotels International, Inc., | | | | | | | | | | | | |
| 5.750%, 07/01/2022 | | | 4,495,000 | | | | 4,776,953 | | | | | |
| Cigna Corp.: | | | | | | | | | | | | |
| 3.400%, 09/17/2021 | | | 3,000,000 | | | | 3,064,493 | | | | | |
| 3.750%, 07/15/2023 | | | 2,664,000 | | | | 2,879,971 | | | | | |
| CNH Industrial Capital LLC: | | | | | | | | | | | | |
| 4.875%, 04/01/2021 | | | 2,554,000 | | | | 2,578,992 | | | | | |
| 3.875%, 10/15/2021 | | | 13,460,000 | | | | 13,776,047 | | | | | |
| 4.375%, 04/05/2022 | | | 4,102,000 | | | | 4,288,467 | | | | | |
The accompanying notes are an integral part of these financial statements.
Baird Short-Term Bond Fund
Schedule of Investments, December 31, 2020
Long-Term Investments (cont.)
| | | Principal | | | | | | % of | |
| | | Amount | | | Value | | | Net Assets | |
| CNH Industrial NV, | | | | | | | | | |
4.500%, 08/15/2023(1) | | $ | 7,000,000 | | | $ | 7,632,711 | | | |
|
|
| CommonSpirit Health: | | | | | | | | | | | | |
| 2.950%, 11/01/2022 | | | 6,349,000 | | | | 6,631,206 | | | | | |
| 4.200%, 08/01/2023 | | | 4,210,000 | | | | 4,549,576 | | | | | |
| Constellation Brands, Inc., | | | | | | | | | | | | |
| 3.200%, 02/15/2023 | | | 9,650,000 | | | | 10,197,360 | | | | | |
| CVS Health Corp.: | | | | | | | | | | | | |
| 3.350%, 03/09/2021 | | | 10,462,000 | | | | 10,519,367 | | | | | |
| 2.125%, 06/01/2021 | | | 5,000,000 | | | | 5,029,617 | | | | | |
| 3.700%, 03/09/2023 | | | 1,360,000 | | | | 1,454,953 | | | | | |
| Daimler Finance North America LLC: | | | | | | | | | | | | |
3.350%, 05/04/2021(2) | | | 15,000,000 | | | | 15,143,857 | | | | | |
3.400%, 02/22/2022(2) | | | 13,000,000 | | | | 13,426,214 | | | | | |
3.350%, 02/22/2023(2) | | | 1,619,000 | | | | 1,713,384 | | | | | |
1.750%, 03/10/2023(2) | | | 7,000,000 | | | | 7,186,714 | | | | | |
| Dell Technologies, Inc., | | | | | | | | | | | | |
4.000%, 07/15/2024(2) | | | 6,090,000 | | | | 6,714,997 | | | | | |
| Diamond 1 Finance Corp. / Diamond 2 Finance Corp., | | | | | | | | | | | | |
5.450%, 06/15/2023(2) | | | 20,000,000 | | | | 22,120,413 | | | | | |
| Domtar Corp., | | | | | | | | | | | | |
| 4.400%, 04/01/2022 | | | 4,775,000 | | | | 4,911,908 | | | | | |
| DXC Technology Co., | | | | | | | | | | | | |
| 4.450%, 09/18/2022 | | | 34,423,000 | | | | 36,230,823 | | | | | |
| Eastman Chemical Co., | | | | | | | | | | | | |
| 3.500%, 12/01/2021 | | | 17,550,000 | | | | 18,026,665 | | | | | |
| Edward-Elmhurst Healthcare, | | | | | | | | | | | | |
| 3.500%, 05/04/2023 | | | 35,000,000 | | | | 36,777,317 | | | | | |
| Elanco Animal Health, Inc., | | | | | | | | | | | | |
| 4.912%, 08/27/2021 | | | 32,689,000 | | | | 33,424,503 | | | | | |
| Embotelladora Andina SA, | | | | | | | | | | | | |
5.000%, 10/01/2023(1)(2) | | | 12,389,000 | | | | 13,694,088 | | | | | |
| EMD Finance LLC, | | | | | | | | | | | | |
2.950%, 03/19/2022(2) | | | 12,400,000 | | | | 12,731,325 | | | | | |
| Encana Corp., | | | | | | | | | | | | |
| 3.900%, 11/15/2021 | | | 32,690,000 | | | | 33,100,941 | | | | | |
| Energy Transfer Operating LP, | | | | | | | | | | | | |
| 4.250%, 03/15/2023 | | | 15,933,000 | | | | 16,931,304 | | | | | |
| Eni SpA, | | | | | | | | | | | | |
4.000%, 09/12/2023(1)(2) | | | 3,187,000 | | | | 3,468,550 | | | | | |
| EQT Corp., | | | | | | | | | | | | |
| 4.875%, 11/15/2021 | | | 2,755,000 | | | | 2,823,875 | | | | | |
| Equifax, Inc., | | | | | | | | | | | | |
| 3.950%, 06/15/2023 | | | 12,294,000 | | | | 13,282,180 | | | | | |
The accompanying notes are an integral part of these financial statements.
Baird Short-Term Bond Fund
Schedule of Investments, December 31, 2020
Long-Term Investments (cont.)
| | | Principal | | | | | | % of | |
| | | Amount | | | Value | | | Net Assets | |
| ERAC USA Finance LLC, | | | | | | | | | |
2.600%, 12/01/2021(2) | | $ | 1,450,000 | | | $ | 1,475,074 | | | |
|
|
| Exxon Mobil Corp., | | | | | | | | | | | | |
| 1.571%, 04/15/2023 | | | 35,000,000 | | | | 35,993,956 | | | | | |
| FedEx Corp., | | | | | | | | | | | | |
| 3.400%, 01/14/2022 | | | 7,000,000 | | | | 7,221,118 | | | | | |
| Fiserv, Inc.: | | | | | | | | | | | | |
| 4.750%, 06/15/2021 | | | 3,220,000 | | | | 3,286,124 | | | | | |
| 3.500%, 10/01/2022 | | | 6,350,000 | | | | 6,643,692 | | | | | |
| Flowserve Corp., | | | | | | | | | | | | |
| 4.000%, 11/15/2023 | | | 1,669,000 | | | | 1,766,865 | | | | | |
| FMC Corp.: | | | | | | | | | | | | |
| 3.950%, 02/01/2022 | | | 13,172,000 | | | | 13,551,481 | | | | | |
| 4.100%, 02/01/2024 | | | 2,425,000 | | | | 2,639,629 | | | | | |
| Ford Motor Credit Co. LLC: | | | | | | | | | | | | |
| 3.200%, 01/15/2021 | | | 4,705,000 | | | | 4,707,353 | | | | | |
| 3.470%, 04/05/2021 | | | 2,500,000 | | | | 2,500,000 | | | | | |
| 2.979%, 08/03/2022 | | | 15,000,000 | | | | 15,250,500 | | | | | |
| 3.087%, 01/09/2023 | | | 12,000,000 | | | | 12,209,340 | | | | | |
| Fortune Brands Home & Security, Inc., | | | | | | | | | | | | |
| 4.000%, 09/21/2023 | | | 3,805,000 | | | | 4,145,787 | | | | | |
| Fox Corp., | | | | | | | | | | | | |
| 3.666%, 01/25/2022 | | | 5,000,000 | | | | 5,174,682 | | | | | |
| Fresenius Medical Care US Finance II, Inc., | | | | | | | | | | | | |
5.875%, 01/31/2022(2) | | | 2,947,000 | | | | 3,103,685 | | | | | |
| Fresenius Medical Care US Finance, Inc., | | | | | | | | | | | | |
5.750%, 02/15/2021(2) | | | 4,907,000 | | | | 4,934,247 | | | | | |
| Fresenius US Finance II, Inc., | | | | | | | | | | | | |
4.500%, 01/15/2023(2) | | | 2,828,000 | | | | 3,003,560 | | | | | |
| General Electric Co., | | | | | | | | | | | | |
| 3.375%, 03/11/2024 | | | 9,475,000 | | | | 10,293,959 | | | | | |
| General Mills, Inc., | | | | | | | | | | | | |
| 3.200%, 04/16/2021 | | | 5,000,000 | | | | 5,038,368 | | | | | |
| General Motors Financial Co., Inc.: | | | | | | | | | | | | |
| 4.200%, 03/01/2021 | | | 1,215,000 | | | | 1,217,988 | | | | | |
| 3.550%, 04/09/2021 | | | 4,750,000 | | | | 4,786,775 | | | | | |
| 3.200%, 07/06/2021 | | | 8,500,000 | | | | 8,591,425 | | | | | |
| 4.200%, 11/06/2021 | | | 5,000,000 | | | | 5,153,586 | | | | | |
| 3.550%, 07/08/2022 | | | 5,000,000 | | | | 5,214,824 | | | | | |
| 1.700%, 08/18/2023 | | | 12,000,000 | | | | 12,309,041 | | | | | |
| 5.100%, 01/17/2024 | | | 2,925,000 | | | | 3,273,215 | | | | | |
| Genpact Luxembourg Sarl, | | | | | | | | | | | | |
3.700%, 04/01/2022(1) | | | 5,511,000 | | | | 5,619,036 | | | | | |
| Gilead Sciences, Inc., | | | | | | | | | | | | |
| 0.750%, 09/29/2023 | | | 20,275,000 | | | | 20,336,617 | | | | | |
The accompanying notes are an integral part of these financial statements.
Baird Short-Term Bond Fund
Schedule of Investments, December 31, 2020
Long-Term Investments (cont.)
| | | Principal | | | | | | % of | |
| | | Amount | | | Value | | | Net Assets | |
| Glencore Finance (Canada) Ltd.: | | | | | | | | | |
4.950%, 11/15/2021(1)(2) | | $ | 18,000,000 | | | $ | 18,718,658 | | | |
|
|
4.250%, 10/25/2022(1)(2) | | | 7,555,000 | | | | 8,047,370 | | | | | |
| Glencore Funding LLC: | | | | | | | | | | | | |
4.125%, 05/30/2023(2) | | | 7,121,000 | | | | 7,701,006 | | | | | |
4.625%, 04/29/2024(2) | | | 7,500,000 | | | | 8,375,862 | | | | | |
| Global Payments, Inc.: | | | | | | | | | | | | |
| 3.800%, 04/01/2021 | | | 30,693,000 | | | | 30,861,928 | | | | | |
| 3.750%, 06/01/2023 | | | 4,550,000 | | | | 4,863,617 | | | | | |
| Gray Oak Pipeline LLC, | | | | | | | | | | | | |
2.000%, 09/15/2023(2) | | | 7,000,000 | | | | 7,108,938 | | | | | |
| Grupo Bimbo SAB de CV: | | | | | | | | | | | | |
4.500%, 01/25/2022(1)(2) | | | 18,907,000 | | | | 19,647,965 | | | | | |
3.875%, 06/27/2024(1)(2) | | | 6,750,000 | | | | 7,385,985 | | | | | |
| Gulf South Pipeline Co. LP, | | | | | | | | | | | | |
| 4.000%, 06/15/2022 | | | 3,000,000 | | | | 3,088,677 | | | | | |
| HCA, Inc.: | | | | | | | | | | | | |
| 4.750%, 05/01/2023 | | | 20,093,000 | | | | 21,912,856 | | | | | |
| 5.000%, 03/15/2024 | | | 14,570,000 | | | | 16,390,862 | | | | | |
| Hewlett Packard Enterprise Co.: | | | | | | | | | | | | |
| 3.500%, 10/05/2021 | | | 5,000,000 | | | | 5,105,598 | | | | | |
| 2.250%, 04/01/2023 | | | 23,000,000 | | | | 23,838,040 | | | | | |
| 4.450%, 10/02/2023 | | | 11,109,000 | | | | 12,220,836 | | | | | |
| Huntsman International LLC, | | | | | | | | | | | | |
| 5.125%, 11/15/2022 | | | 4,500,000 | | | | 4,810,589 | | | | | |
| Hutchison Whampoa International Ltd., | | | | | | | | | | | | |
4.625%, 01/13/2022(1)(2) | | | 8,200,000 | | | | 8,518,822 | | | | | |
| Hyundai Capital America: | | | | | | | | | | | | |
3.450%, 03/12/2021(2) | | | 5,000,000 | | | | 5,024,750 | | | | | |
2.450%, 06/15/2021(2) | | | 1,000,000 | | | | 1,007,890 | | | | | |
3.750%, 07/08/2021(2) | | | 2,650,000 | | | | 2,688,714 | | | | | |
3.950%, 02/01/2022(2) | | | 5,024,000 | | | | 5,190,589 | | | | | |
3.000%, 06/20/2022(2) | | | 5,000,000 | | | | 5,157,549 | | | | | |
2.850%, 11/01/2022(2) | | | 6,000,000 | | | | 6,217,791 | | | | | |
1.250%, 09/18/2023(2) | | | 15,000,000 | | | | 15,177,784 | | | | | |
| IDEX Corp., | | | | | | | | | | | | |
| 4.200%, 12/15/2021 | | | 14,244,000 | | | | 14,610,035 | | | | | |
| IHS Markit Ltd., | | | | | | | | | | | | |
5.000%, 11/01/2022(1)(2) | | | 9,613,000 | | | | 10,278,795 | | | | | |
| Infor, Inc., | | | | | | | | | | | | |
1.450%, 07/15/2023(2) | | | 28,072,000 | | | | 28,525,575 | | | | | |
| Inversiones CMPC SA, | | | | | | | | | | | | |
4.375%, 05/15/2023(1)(2) | | | 2,325,000 | | | | 2,472,219 | | | | | |
| Johnson Controls International PLC, | | | | | | | | | | | | |
3.625%, 07/02/2024(1)(7) | | | 1,651,000 | | | | 1,790,786 | | | | | |
The accompanying notes are an integral part of these financial statements.
Baird Short-Term Bond Fund
Schedule of Investments, December 31, 2020
Long-Term Investments (cont.)
| | | Principal | | | | | | % of | |
| | | Amount | | | Value | | | Net Assets | |
| Kerry Group Financial Services Unlimited Co., | | | | | | | | | |
3.200%, 04/09/2023(1)(2) | | $ | 36,325,000 | | | $ | 38,118,125 | | | |
|
|
| Keurig Dr Pepper, Inc., | | | | | | | | | | | | |
| 2.530%, 11/15/2021 | | | 23,880,000 | | | | 24,320,434 | | | | | |
| Kinder Morgan Energy Partners LP, | | | | | | | | | | | | |
| 5.000%, 10/01/2021 | | | 13,000,000 | | | | 13,280,888 | | | | | |
| Kinder Morgan, Inc., | | | | | | | | | | | | |
5.625%, 11/15/2023(2) | | | 9,060,000 | | | | 10,221,143 | | | | | |
| Kraft Heinz Foods Co., | | | | | | | | | | | | |
| 4.000%, 06/15/2023 | | | 29,000,000 | | | | 30,838,007 | | | | | |
| Leggett & Platt, Inc., | | | | | | | | | | | | |
| 3.400%, 08/15/2022 | | | 10,000,000 | | | | 10,320,365 | | | | | |
| Leidos, Inc., | | | | | | | | | | | | |
2.950%, 05/15/2023(2) | | | 27,875,000 | | | | 29,327,480 | | | | | |
| Lennar Corp., | | | | | | | | | | | | |
| 4.875%, 12/15/2023 | | | 5,000,000 | | | | 5,525,000 | | | | | |
| Lennox International, Inc., | | | | | | | | | | | | |
| 3.000%, 11/15/2023 | | | 16,160,000 | | | | 17,032,640 | | | | | |
| LYB International Finance III LLC, | | | | | | | | | | | | |
| 1.238%, 10/01/2023 | | | | | | | | | | | | |
(3 Month LIBOR USD + 1.000%)(3) | | | 20,000,000 | | | | 20,034,651 | | | | | |
| Marathon Petroleum Corp., | | | | | | | | | | | | |
| 4.500%, 05/01/2023 | | | 10,000,000 | | | | 10,858,255 | | | | | |
| Marriott International, Inc., | | | | | | | | | | | | |
| 2.125%, 10/03/2022 | | | 10,000,000 | | | | 10,152,859 | | | | | |
| Masco Corp., | | | | | | | | | | | | |
| 5.950%, 03/15/2022 | | | 10,800,000 | | | | 11,499,425 | | | | | |
| Maxim Integrated Products, Inc., | | | | | | | | | | | | |
| 3.375%, 03/15/2023 | | | 2,190,000 | | | | 2,305,512 | | | | | |
| Microchip Technology, Inc.: | | | | | | | | | | | | |
| 3.922%, 06/01/2021 | | | 18,102,000 | | | | 18,359,034 | | | | | |
2.670%, 09/01/2023(2) | | | 3,100,000 | | | | 3,242,179 | | | | | |
0.972%, 02/15/2024(2) | | | 23,775,000 | | | | 23,833,196 | | | | | |
| Micron Technology, Inc.: | | | | | | | | | | | | |
| 2.497%, 04/24/2023 | | | 36,364,000 | | | | 37,891,936 | | | | | |
| 4.640%, 02/06/2024 | | | 3,700,000 | | | | 4,119,791 | | | | | |
| Midwest Connector Capital Co. LLC, | | | | | | | | | | | | |
3.625%, 04/01/2022(2) | | | 22,750,000 | | | | 23,148,535 | | | | | |
| Mondelez International, Inc., | | | | | | | | | | | | |
| 2.125%, 04/13/2023 | | | 10,000,000 | | | | 10,386,475 | | | | | |
| Mosaic Co.: | | | | | | | | | | | | |
| 3.750%, 11/15/2021 | | | 2,850,000 | | | | 2,906,652 | | | | | |
| 3.250%, 11/15/2022 | | | 6,443,000 | | | | 6,732,894 | | | | | |
| MPLX LP, | | | | | | | | | | | | |
| 3.500%, 12/01/2022 | | | 6,403,000 | | | | 6,724,804 | | | | | |
The accompanying notes are an integral part of these financial statements.
Baird Short-Term Bond Fund
Schedule of Investments, December 31, 2020
Long-Term Investments (cont.)
| | | Principal | | | | | | % of | |
| | | Amount | | | Value | | | Net Assets | |
| Mylan, Inc., | | | | | | | | | |
3.125%, 01/15/2023(2) | | $ | 32,660,000 | | | $ | 34,281,650 | | | |
|
|
| Newell Brands, Inc., | | | | | | | | | | | | |
| 3.850%, 04/01/2023 | | | 33,713,000 | | | | 35,361,229 | | | | | |
| Newfield Exploration Co., | | | | | | | | | | | | |
| 5.750%, 01/30/2022 | | | 8,410,000 | | | | 8,735,060 | | | | | |
| Newmont Goldcorp Corp., | | | | | | | | | | | | |
| 3.625%, 06/09/2021 | | | 4,900,000 | | | | 4,943,971 | | | | | |
| Nissan Motor Acceptance Corp., | | | | | | | | | | | | |
3.450%, 03/15/2023(2) | | | 1,585,000 | | | | 1,654,433 | | | | | |
| Nissan Motor Co. Ltd., | | | | | | | | | | | | |
3.043%, 09/15/2023(1)(2) | | | 10,000,000 | | | | 10,455,947 | | | | | |
| Northern Border Pipeline Co., | | | | | | | | | | | | |
| 7.500%, 09/15/2021 | | | 4,500,000 | | | | 4,711,543 | | | | | |
| Nutrien Ltd.: | | | | | | | | | | | | |
3.150%, 10/01/2022(1) | | | 1,000,000 | | | | 1,040,037 | | | | | |
1.900%, 05/13/2023(1) | | | 19,400,000 | | | | 20,039,151 | | | | | |
| nVent Finance Sarl, | | | | | | | | | | | | |
3.950%, 04/15/2023(1) | | | 12,565,000 | | | | 13,231,217 | | | | | |
| NXP Semiconductors NV: | | | | | | | | | | | | |
3.875%, 09/01/2022(1)(2) | | | 10,862,000 | | | | 11,447,962 | | | | | |
4.625%, 06/01/2023(1)(2) | | | 19,023,000 | | | | 20,792,667 | | | | | |
| Occidental Petroleum Corp.: | | | | | | | | | | | | |
| 1.671%, 08/15/2022 | | | | | | | | | | | | |
(3 Month LIBOR USD + 1.450%)(3) | | | 4,250,000 | | | | 4,165,000 | | | | | |
| 2.700%, 08/15/2022 | | | 17,650,000 | | | | 17,672,063 | | | | | |
| 2.700%, 02/15/2023 | | | 10,000,000 | | | | 9,990,500 | | | | | |
| Owens Corning, | | | | | | | | | | | | |
| 4.200%, 12/15/2022 | | | 924,000 | | | | 971,662 | | | | | |
| Panasonic Corp., | | | | | | | | | | | | |
2.536%, 07/19/2022(1)(2) | | | 15,000,000 | | | | 15,419,421 | | | | | |
| PayPal Holdings, Inc., | | | | | | | | | | | | |
| 1.350%, 06/01/2023 | | | 6,400,000 | | | | 6,553,054 | | | | | |
| Penske Truck Leasing Co.: | | | | | | | | | | | | |
3.650%, 07/29/2021(2) | | | 5,000,000 | | | | 5,077,169 | | | | | |
4.250%, 01/17/2023(2) | | | 10,000,000 | | | | 10,743,875 | | | | | |
2.700%, 03/14/2023(2) | | | 1,500,000 | | | | 1,568,316 | | | | | |
4.125%, 08/01/2023(2) | | | 1,350,000 | | | | 1,467,352 | | | | | |
| Phillips 66, | | | | | | | | | | | | |
| 3.700%, 04/06/2023 | | | 9,800,000 | | | | 10,495,604 | | | | | |
| POSCO: | | | | | | | | | | | | |
2.375%, 01/17/2023(1)(2) | | | 35,000,000 | | | | 36,069,250 | | | | | |
4.000%, 08/01/2023(1)(2) | | | 5,000,000 | | | | 5,391,480 | | | | | |
| Ralph Lauren Corp., | | | | | | | | | | | | |
| 1.700%, 06/15/2022 | | | 3,000,000 | | | | 3,054,574 | | | | | |
The accompanying notes are an integral part of these financial statements.
Baird Short-Term Bond Fund
Schedule of Investments, December 31, 2020
Long-Term Investments (cont.)
| | | Principal | | | | | | % of | |
| | | Amount | | | Value | | | Net Assets | |
| Reckitt Benckiser Treasury Services PLC: | | | | | | | | | |
| 0.798%, 06/24/2022 | | | | | | | | | |
(3 Month LIBOR USD + 0.560%)(1)(2)(3) | | $ | 2,000,000 | | | $ | 2,009,227 | | | |
|
|
2.375%, 06/24/2022(1)(2) | | | 30,000,000 | | | | 30,850,635 | | | | | |
| Regency Energy Partners LP / | | | | | | | | | | | | |
| Regency Energy Finance Corp.: | | | | | | | | | | | | |
| 5.000%, 10/01/2022 | | | 1,430,000 | | | | 1,517,471 | | | | | |
| 4.500%, 11/01/2023 | | | 13,121,000 | | | | 14,206,394 | | | | | |
| Reliance Industries Ltd., | | | | | | | | | | | | |
5.400%, 02/14/2022(1)(2) | | | 5,000,000 | | | | 5,235,033 | | | | | |
| Roper Technologies, Inc., | | | | | | | | | | | | |
| 3.125%, 11/15/2022 | | | 10,000,000 | | | | 10,455,154 | | | | | |
| Royalty Pharma PLC, | | | | | | | | | | | | |
0.750%, 09/02/2023(1)(2) | | | 15,000,000 | | | | 15,071,697 | | | | | |
| RPM International, Inc., | | | | | | | | | | | | |
| 3.450%, 11/15/2022 | | | 2,508,000 | | | | 2,605,193 | | | | | |
| Ryder System, Inc., | | | | | | | | | | | | |
| 2.875%, 06/01/2022 | | | 5,000,000 | | | | 5,165,027 | | | | | |
| Sabine Pass Liquefaction LLC: | | | | | | | | | | | | |
| 5.625%, 04/15/2023 | | | 15,800,000 | | | | 17,358,343 | | | | | |
| 5.750%, 05/15/2024 | | | 6,463,000 | | | | 7,389,099 | | | | | |
| Schneider Electric SE, | | | | | | | | | | | | |
2.950%, 09/27/2022(1)(2) | | | 8,824,000 | | | | 9,206,192 | | | | | |
| Seagate HDD Cayman: | | | | | | | | | | | | |
4.750%, 06/01/2023(1) | | | 12,400,000 | | | | 13,393,860 | | | | | |
4.875%, 03/01/2024(1) | | | 2,500,000 | | | | 2,715,500 | | | | | |
| Shell International Finance BV, | | | | | | | | | | | | |
3.500%, 11/13/2023(1) | | | 5,000,000 | | | | 5,442,784 | | | | | |
| Shire Acquisitions Investments Ireland DAC: | | | | | | | | | | | | |
2.400%, 09/23/2021(1) | | | 5,366,000 | | | | 5,435,979 | | | | | |
2.875%, 09/23/2023(1) | | | 2,145,000 | | | | 2,274,620 | | | | | |
| Smithfield Foods, Inc.: | | | | | | | | | | | | |
2.650%, 10/03/2021(2) | | | 17,740,000 | | | | 17,896,803 | | | | | |
3.350%, 02/01/2022(2) | | | 4,023,000 | | | | 4,078,299 | | | | | |
| Smiths Group PLC, | | | | | | | | | | | | |
3.625%, 10/12/2022(1)(2) | | | 17,604,000 | | | | 18,446,176 | | | | | |
| Sociedad Quimica y Minera de Chile SA, | | | | | | | | | | | | |
3.625%, 04/03/2023(1)(2) | | | 3,000,000 | | | | 3,147,030 | | | | | |
| Sonoco Products Co., | | | | | | | | | | | | |
| 4.375%, 11/01/2021 | | | 855,000 | | | | 872,473 | | | | | |
| Spirit AeroSystems, Inc.: | | | | | | | | | | | | |
| 1.017%, 06/15/2021 | | | | | | | | | | | | |
(3 Month LIBOR USD + 0.800%)(3) | | | 9,625,000 | | | | 9,503,356 | | | | | |
| 3.950%, 06/15/2023 | | | 3,515,000 | | | | 3,444,700 | | | | | |
The accompanying notes are an integral part of these financial statements.
Baird Short-Term Bond Fund
Schedule of Investments, December 31, 2020
Long-Term Investments (cont.)
| | | Principal | | | | | | % of | |
| | | Amount | | | Value | | | Net Assets | |
| SSM Health Care Corp., | | | | | | | | | |
| 3.688%, 06/01/2023 | | $ | 16,500,000 | | | $ | 17,620,927 | | | |
|
|
| Starbucks Corp., | | | | | | | | | | | | |
| 1.300%, 05/07/2022 | | | 5,000,000 | | | | 5,069,953 | | | | | |
| Suncor Energy, Inc., | | | | | | | | | | | | |
2.800%, 05/15/2023(1) | | | 10,000,000 | | | | 10,521,782 | | | | | |
| Suntory Holdings Ltd., | | | | | | | | | | | | |
2.550%, 06/28/2022(1)(2) | | | 25,600,000 | | | | 26,304,881 | | | | | |
| Takeda Pharmaceutical Co. Ltd., | | | | | | | | | | | | |
2.450%, 01/18/2022(1)(2) | | | 13,000,000 | | | | 13,253,752 | | | | | |
| TC PipeLines LP, | | | | | | | | | | | | |
| 4.375%, 03/13/2025 | | | 4,125,000 | | | | 4,652,392 | | | | | |
| Telefonica Emisiones SA, | | | | | | | | | | | | |
5.462%, 02/16/2021(1) | | | 12,577,000 | | | | 12,647,442 | | | | | |
| Teva Pharmaceutical Finance Netherlands III BV, | | | | | | | | | | | | |
2.200%, 07/21/2021(1) | | | 15,654,000 | | | | 15,614,865 | | | | | |
| Time Warner Cable LLC, | | | | | | | | | | | | |
| 4.000%, 09/01/2021 | | | 9,706,000 | | | | 9,843,773 | | | | | |
| Timken Co., | | | | | | | | | | | | |
| 3.875%, 09/01/2024 | | | 30,952,000 | | | | 33,262,094 | | | | | |
| Toll Road Investors Partnership II LP, | | | | | | | | | | | | |
0.000%, 02/15/2022(2) | | | 26,200,000 | | | | 25,241,164 | | | | | |
| Toyota Motor Credit Corp., | | | | | | | | | | | | |
| 2.900%, 03/30/2023 | | | 23,175,000 | | | | 24,516,744 | | | | | |
| TransCanada PipeLines Ltd., | | | | | | | | | | | | |
9.875%, 01/01/2021(1) | | | 1,025,000 | | | | 1,025,000 | | | | | |
| TTX Co., | | | | | | | | | | | | |
4.400%, 05/01/2021(2) | | | 2,100,000 | | | | 2,126,164 | | | | | |
| Valero Energy Corp.: | | | | | | | | | | | | |
| 2.700%, 04/15/2023 | | | 19,400,000 | | | | 20,246,087 | | | | | |
| 1.200%, 03/15/2024 | | | 20,000,000 | | | | 20,184,081 | | | | | |
| Verisk Analytics, Inc., | | | | | | | | | | | | |
| 5.800%, 05/01/2021 | | | 9,011,000 | | | | 9,165,052 | | | | | |
| Verizon Communications, Inc., | | | | | | | | | | | | |
| 2.946%, 03/15/2022 | | | 31,030,000 | | | | 32,001,012 | | | | | |
| VF Corp., | | | | | | | | | | | | |
| 2.050%, 04/23/2022 | | | 32,900,000 | | | | 33,606,693 | | | | | |
| Vodafone Group PLC, | | | | | | | | | | | | |
| 1.220%, 01/16/2024 | | | | | | | | | | | | |
(3 Month LIBOR USD + 0.990%)(1)(3) | | | 15,000,000 | | | | 15,201,781 | | | | | |
| Volkswagen Group of America Finance LLC: | | | | | | | | | | | | |
4.000%, 11/12/2021(2) | | | 24,700,000 | | | | 25,454,027 | | | | | |
3.125%, 05/12/2023(2) | | | 7,000,000 | | | | 7,393,327 | | | | | |
0.875%, 11/22/2023(2) | | | 10,000,000 | | | | 10,056,334 | | | | | |
The accompanying notes are an integral part of these financial statements.
Baird Short-Term Bond Fund
Schedule of Investments, December 31, 2020
Long-Term Investments (cont.)
| | | Principal | | | | | | % of | |
| | | Amount | | | Value | | | Net Assets | |
| Vulcan Materials Co., | | | | | | | | | |
| 0.875%, 03/01/2021 | | | | | | | | | |
(3 Month LIBOR USD + 0.650%)(3) | | $ | 16,433,000 | | | $ | 16,439,958 | | | | |
| Wabtec Corp., | | | | | | | | | | | |
| 4.400%, 03/15/2024 | | | 3,125,000 | | | | 3,419,922 | | | | |
| WestRock RKT LLC, | | | | | | | | | | | |
| 4.900%, 03/01/2022 | | | 4,100,000 | | | | 4,308,177 | | | | |
| Williams Companies, Inc.: | | | | | | | | | | | |
| 7.875%, 09/01/2021 | | | 3,065,000 | | | | 3,213,341 | | | | |
| 3.600%, 03/15/2022 | | | 4,750,000 | | | | 4,903,211 | | | | |
| 3.350%, 08/15/2022 | | | 235,000 | | | | 244,408 | | | | |
| 3.700%, 01/15/2023 | | | 12,537,000 | | | | 13,280,757 | | | | |
| 4.300%, 03/04/2024 | | | 15,000,000 | | | | 16,528,504 | | | | |
| Zimmer Biomet Holdings, Inc.: | | | | | | | | | | | |
| 0.989%, 03/19/2021 | | | | | | | | | | | |
(3 Month LIBOR USD + 0.750%)(3) | | | 307,000 | | | | 307,000 | | | | |
| 3.700%, 03/19/2023 | | | 6,307,000 | | | | 6,728,004 | | | | |
| Zimmer Holdings, Inc., | | | | | | | | | | | |
| 3.150%, 04/01/2022 | | | 2,690,000 | | | | 2,766,460 | | | | |
| Zoetis, Inc., | | | | | | | | | | | |
| 3.250%, 02/01/2023 | | | 13,085,000 | | | | 13,763,947 | | | | |
| Total Industrials | | | | | | | | | | | |
| (Cost $2,523,599,362) | | | | | | | 2,588,018,483 | | | | 28.8 | % |
| Utilities | | | | | | | | | | | | |
| Ausgrid Finance Pty Ltd., | | | | | | | | | | | | |
3.850%, 05/01/2023(1)(2) | | | 9,979,000 | | | | 10,537,544 | | | | | |
| Dominion Energy, Inc., | | | | | | | | | | | | |
2.450%, 01/15/2023(2) | | | 30,000,000 | | | | 31,212,917 | | | | | |
| EDP Finance BV: | | | | | | | | | | | | |
5.250%, 01/14/2021(1)(2) | | | 2,840,000 | | | | 2,843,301 | | | | | |
3.625%, 07/15/2024(1)(2) | | | 35,091,000 | | | | 38,297,312 | | | | | |
| Enel Finance International NV: | | | | | | | | | | | | |
2.875%, 05/25/2022(1)(2) | | | 28,583,000 | | | | 29,491,125 | | | | | |
4.250%, 09/14/2023(1)(2) | | | 1,100,000 | | | | 1,202,559 | | | | | |
| Exelon Corp., | | | | | | | | | | | | |
| 2.450%, 04/15/2021 | | | 955,000 | | | | 958,747 | | | | | |
| ITC Holdings Corp., | | | | | | | | | | | | |
| 4.050%, 07/01/2023 | | | 8,000,000 | | | | 8,619,471 | | | | | |
| Jersey Central Power & Light Co., | | | | | | | | | | | | |
4.700%, 04/01/2024(2) | | | 3,000,000 | | | | 3,280,785 | | | | | |
| Orange Cogen Funding Corp., | | | | | | | | | | | | |
8.175%, 03/15/2022(2) | | | 2,918,505 | | | | 3,021,251 | | | | | |
| Total Utilities | | | | | | | | | | | | |
| (Cost $126,674,935) | | | | | | | 129,465,012 | | | | 1.4 | % |
The accompanying notes are an integral part of these financial statements.
Baird Short-Term Bond Fund
Schedule of Investments, December 31, 2020
Long-Term Investments (cont.)
| | | Principal | | | | | | % of | |
| | | Amount | | | Value | | | Net Assets | |
| Financials | | | | | | | | | |
| AerCap Holdings NV: | | | | | | | | | |
4.450%, 12/16/2021(1) | | $ | 25,000,000 | | | $ | 25,747,006 | | | |
|
|
3.300%, 01/23/2023(1) | | | 8,000,000 | | | | 8,347,623 | | | | | |
| Aetna, Inc., | | | | | | | | | | | | |
| 2.800%, 06/15/2023 | | | 2,000,000 | | | | 2,104,308 | | | | | |
| AIG Global Funding, | | | | | | | | | | | | |
2.300%, 07/01/2022(2) | | | 8,775,000 | | | | 9,012,287 | | | | | |
| Air Lease Corp.: | | | | | | | | | | | | |
| 3.875%, 04/01/2021 | | | 6,885,000 | | | | 6,919,574 | | | | | |
| 3.375%, 06/01/2021 | | | 3,000,000 | | | | 3,031,992 | | | | | |
| 2.625%, 07/01/2022 | | | 1,609,000 | | | | 1,650,404 | | | | | |
| 2.750%, 01/15/2023 | | | 21,150,000 | | | | 21,862,205 | | | | | |
| Ally Financial, Inc.: | | | | | | | | | | | | |
| 4.625%, 05/19/2022 | | | 16,661,000 | | | | 17,561,578 | | | | | |
| 1.450%, 10/02/2023 | | | 27,100,000 | | | | 27,664,197 | | | | | |
| Ameriprise Financial, Inc., | | | | | | | | | | | | |
| 3.000%, 03/22/2022 | | | 6,300,000 | | | | 6,505,795 | | | | | |
| Assurant, Inc.: | | | | | | | | | | | | |
| 1.501%, 03/26/2021 | | | | | | | | | | | | |
(3 Month LIBOR USD + 1.250%)(3) | | | 1,276,000 | | | | 1,276,017 | | | | | |
| 4.200%, 09/27/2023 | | | 4,099,000 | | | | 4,483,583 | | | | | |
| Banco Bilbao Vizcaya Argentaria SA, | | | | | | | | | | | | |
0.875%, 09/18/2023(1) | | | 27,000,000 | | | | 27,189,404 | | | | | |
| Bank of America Corp.: | | | | | | | | | | | | |
| 3.499%, 05/17/2022 | | | | | | | | | | | | |
(3 Month LIBOR USD + 0.630%)(3) | | | 5,000,000 | | | | 5,059,247 | | | | | |
| 2.816%, 07/21/2023 | | | | | | | | | | | | |
(3 Month LIBOR USD + 0.930%)(3) | | | 10,000,000 | | | | 10,384,310 | | | | | |
| 3.550%, 03/05/2024 | | | | | | | | | | | | |
(3 Month LIBOR USD + 0.780%)(3) | | | 5,000,000 | | | | 5,341,448 | | | | | |
| 3.864%, 07/23/2024 | | | | | | | | | | | | |
(3 Month LIBOR USD + 0.940%)(3) | | | 5,275,000 | | | | 5,719,163 | | | | | |
| Bank of Nova Scotia, | | | | | | | | | | | | |
1.625%, 05/01/2023(1) | | | 30,000,000 | | | | 30,863,234 | | | | | |
| Banque Federative du Credit Mutuel SA: | | | | | | | | | | | | |
2.700%, 07/20/2022(1)(2) | | | 3,000,000 | | | | 3,105,523 | | | | | |
2.125%, 11/21/2022(1)(2) | | | 18,000,000 | | | | 18,587,522 | | | | | |
| Barclays Bank PLC: | | | | | | | | | | | | |
10.180%, 06/12/2021(1)(2) | | | 7,179,000 | | | | 7,466,509 | | | | | |
1.700%, 05/12/2022(1) | | | 5,000,000 | | | | 5,088,426 | | | | | |
| Barclays PLC: | | | | | | | | | | | | |
3.250%, 01/12/2021(1) | | | 10,950,000 | | | | 10,955,909 | | | | | |
| 4.610%, 02/15/2023 | | | | | | | | | | | | |
(3 Month LIBOR USD + 1.400%)(1)(3) | | | 7,000,000 | | | | 7,307,539 | | | | | |
The accompanying notes are an integral part of these financial statements.
Baird Short-Term Bond Fund
Schedule of Investments, December 31, 2020
Long-Term Investments (cont.)
| | | Principal | | | | | | % of | |
| | | Amount | | | Value | | | Net Assets | |
| Barclays PLC: (cont.) | | | | | | | | | |
| 1.007%, 12/10/2024 | | | | | | | | | |
(1 Year CMT Rate + 0.800%)(1)(3) | | $ | 6,250,000 | | | $ | 6,294,312 | | | |
|
|
| 3.932%, 05/07/2025 | | | | | | | | | | | | |
(3 Month LIBOR USD + 1.610%)(1)(3) | | | 1,000,000 | | | | 1,093,995 | | | | | |
| BBVA USA, | | | | | | | | | | | | |
| 2.875%, 06/29/2022 | | | 18,861,000 | | | | 19,545,312 | | | | | |
| BNP Paribas SA: | | | | | | | | | | | | |
2.950%, 05/23/2022(1)(2) | | | 23,125,000 | | | | 23,947,883 | | | | | |
3.500%, 03/01/2023(1)(2) | | | 10,794,000 | | | | 11,486,173 | | | | | |
| BNZ International Funding Ltd.: | | | | | | | | | | | | |
2.900%, 02/21/2022(1)(2) | | | 1,950,000 | | | | 2,007,385 | | | | | |
3.375%, 03/01/2023(1)(2) | | | 15,305,000 | | | | 16,253,815 | | | | | |
| BPCE SA: | | | | | | | | | | | | |
3.000%, 05/22/2022(1)(2) | | | 12,127,000 | | | | 12,549,722 | | | | | |
5.700%, 10/22/2023(1)(2) | | | 17,793,000 | | | | 20,138,800 | | | | | |
5.150%, 07/21/2024(1)(2) | | | 16,000,000 | | | | 18,219,792 | | | | | |
| Brown & Brown, Inc., | | | | | | | | | | | | |
| 4.200%, 09/15/2024 | | | 1,000,000 | | | | 1,113,621 | | | | | |
| Canadian Imperial Bank of Commerce, | | | | | | | | | | | | |
| 2.606%, 07/22/2023 | | | | | | | | | | | | |
(3 Month LIBOR USD + 0.785%)(1)(3) | | | 36,050,000 | | | | 37,292,225 | | | | | |
| Cantor Fitzgerald LP, | | | | | | | | | | | | |
6.500%, 06/17/2022(2) | | | 1,177,000 | | | | 1,271,728 | | | | | |
| Capital One NA, | | | | | | | | | | | | |
| 3.375%, 02/15/2023 | | | 34,182,000 | | | | 36,121,906 | | | | | |
| Citigroup, Inc., | | | | | | | | | | | | |
1.678%, 05/15/2024 (SOFR + 1.667%)(3) | | | 25,000,000 | | | | 25,752,774 | | | | | |
| Citizens Bank NA, | | | | | | | | | | | | |
| 3.250%, 02/14/2022 | | | 3,000,000 | | | | 3,088,621 | | | | | |
| Cooperatieve Rabobank UA: | | | | | | | | | | | | |
3.950%, 11/09/2022(1) | | | 37,273,000 | | | | 39,570,540 | | | | | |
4.625%, 12/01/2023(1) | | | 5,000,000 | | | | 5,572,758 | | | | | |
| Credit Agricole SA: | | | | | | | | | | | | |
3.375%, 01/10/2022(1)(2) | | | 19,895,000 | | | | 20,500,267 | | | | | |
3.750%, 04/24/2023(1)(2) | | | 3,380,000 | | | | 3,628,358 | | | | | |
| Credit Suisse Group AG: | | | | | | | | | | | | |
3.574%, 01/09/2023(1)(2) | | | 11,400,000 | | | | 11,745,511 | | | | | |
| 2.997%, 12/14/2023 | | | | | | | | | | | | |
(3 Month LIBOR USD + 1.200%)(1)(2)(3) | | | 18,000,000 | | | | 18,820,574 | | | | | |
| Credit Suisse Group Funding Guernsey Ltd., | | | | | | | | | | | | |
3.800%, 09/15/2022(1) | | | 4,650,000 | | | | 4,911,284 | | | | | |
| CyrusOne LP / CyrusOne Finance Corp., | | | | | | | | | | | | |
| 2.900%, 11/15/2024 | | | 11,549,000 | | | | 12,329,828 | | | | | |
The accompanying notes are an integral part of these financial statements.
Baird Short-Term Bond Fund
Schedule of Investments, December 31, 2020
Long-Term Investments (cont.)
| | | Principal | | | | | | % of | |
| | | Amount | | | Value | | | Net Assets | |
| Daiwa Securities Group, Inc., | | | | | | | | | |
3.129%, 04/19/2022(1)(2) | | $ | 9,750,000 | | | $ | 10,064,145 | | | |
|
|
| Danske Bank A/S: | | | | | | | | | | | | |
3.875%, 09/12/2023(1)(2) | | | 8,500,000 | | | | 9,158,953 | | | | | |
| 1.171%, 12/08/2023 | | | | | | | | | | | | |
(1 Year CMT Rate + 1.030%(1)(2)(3) | | | 26,375,000 | | | | 26,493,780 | | | | | |
| DBS Group Holdings Ltd., | | | | | | | | | | | | |
2.850%, 04/16/2022(1)(2) | | | 10,000,000 | | | | 10,297,177 | | | | | |
| Deutsche Bank AG: | | | | | | | | | | | | |
3.125%, 01/13/2021(1) | | | 5,515,000 | | | | 5,517,486 | | | | | |
3.150%, 01/22/2021(1) | | | 7,400,000 | | | | 7,408,208 | | | | | |
4.250%, 10/14/2021(1) | | | 5,400,000 | | | | 5,537,305 | | | | | |
5.000%, 02/14/2022(1) | | | 10,000,000 | | | | 10,455,287 | | | | | |
2.222%, 09/18/2024 (SOFR + 2.159%)(1)(3) | | | 17,000,000 | | | | 17,488,558 | | | | | |
| Discover Bank: | | | | | | | | | | | | |
| 3.350%, 02/06/2023 | | | 7,964,000 | | | | 8,403,515 | | | | | |
| 4.200%, 08/08/2023 | | | 17,405,000 | | | | 19,029,142 | | | | | |
| Discover Financial Services, | | | | | | | | | | | | |
| 5.200%, 04/27/2022 | | | 10,443,000 | | | | 11,064,906 | | | | | |
| F.N.B. Corporation, | | | | | | | | | | | | |
| 2.200%, 02/24/2023 | | | 16,075,000 | | | | 16,373,352 | | | | | |
| Fifth Third Bancorp, | | | | | | | | | | | | |
| 1.625%, 05/05/2023 | | | 15,000,000 | | | | 15,471,327 | | | | | |
| First Horizon National Corp., | | | | | | | | | | | | |
| 3.550%, 05/26/2023 | | | 30,000,000 | | | | 31,874,332 | | | | | |
| GATX Corp., | | | | | | | | | | | | |
| 4.350%, 02/15/2024 | | | 2,650,000 | | | | 2,925,313 | | | | | |
| Goldman Sachs Group, Inc.: | | | | | | | | | | | | |
| 3.000%, 04/26/2022 | | | 5,000,000 | | | | 5,040,572 | | | | | |
| 2.876%, 10/31/2022 | | | | | | | | | | | | |
(3 Month LIBOR USD + 0.821%)(3) | | | 12,000,000 | | | | 12,243,536 | | | | | |
| 2.908%, 06/05/2023 | | | | | | | | | | | | |
(3 Month LIBOR USD + 1.053%)(3) | | | 8,280,000 | | | | 8,574,358 | | | | | |
| 2.905%, 07/24/2023 | | | | | | | | | | | | |
(3 Month LIBOR USD + 0.990%)(3) | | | 14,200,000 | | | | 14,748,678 | | | | | |
| HSBC Holdings PLC, | | | | | | | | | | | | |
| 3.803%, 03/11/2025 | | | | | | | | | | | | |
(3 Month LIBOR USD + 1.211%)(1)(3) | | | 28,200,000 | | | | 30,789,477 | | | | | |
| Huntington National Bank, | | | | | | | | | | | | |
| 3.250%, 05/14/2021 | | | 5,000,000 | | | | 5,041,222 | | | | | |
| ING Groep NV, | | | | | | | | | | | | |
3.150%, 03/29/2022(1) | | | 3,700,000 | | | | 3,826,496 | | | | | |
| Invesco Finance PLC, | | | | | | | | | | | | |
3.125%, 11/30/2022(1) | | | 9,377,000 | | | | 9,848,238 | | | | | |
The accompanying notes are an integral part of these financial statements.
Baird Short-Term Bond Fund
Schedule of Investments, December 31, 2020
Long-Term Investments (cont.)
| | | Principal | | | | | | % of | |
| | | Amount | | | Value | | | Net Assets | |
| Jefferies Group LLC, | | | | | | | | | |
| 5.125%, 01/20/2023 | | $ | 30,883,000 | | | $ | 33,737,659 | | | |
|
|
| KeyBank NA, | | | | | | | | | | | | |
| 3.180%, 05/22/2022 | | | 25,343,000 | | | | 26,276,597 | | | | | |
| LeasePlan Corp. NV, | | | | | | | | | | | | |
2.875%, 10/24/2024(1)(2) | | | 210,000 | | | | 221,898 | | | | | |
| Lexington Realty Trust, | | | | | | | | | | | | |
| 4.250%, 06/15/2023 | | | 10,962,000 | | | | 11,674,534 | | | | | |
| Liberty Mutual Group, Inc., | | | | | | | | | | | | |
4.950%, 05/01/2022(2) | | | 3,000,000 | | | | 3,174,500 | | | | | |
| Lloyds Bank PLC: | | | | | | | | | | | | |
3.000%, 01/11/2022(1) | | | 10,000,000 | | | | 10,256,801 | | | | | |
| 1.326%, 06/15/2023 | | | | | | | | | | | | |
(1 Year CMT Rate + 1.100%)(1)(3) | | | 9,400,000 | | | | 9,503,592 | | | | | |
| 2.907%, 11/07/2023 | | | | | | | | | | | | |
(3 Month LIBOR USD + 0.810%)(1)(3) | | | 21,704,000 | | | | 22,675,036 | | | | | |
| Macquarie Bank Ltd.: | | | | | | | | | | | | |
6.625%, 04/07/2021(1)(2) | | | 1,965,000 | | | | 1,995,670 | | | | | |
2.100%, 10/17/2022(1)(2) | | | 17,600,000 | | | | 18,153,772 | | | | | |
| Macquarie Group Ltd., | | | | | | | | | | | | |
| 3.189%, 11/28/2023 | | | | | | | | | | | | |
(3 Month LIBOR USD + 1.023%)(1)(2)(3) | | | 4,000,000 | | | | 4,181,605 | | | | | |
| Massachusetts Mutual Life Insurance Co., | | | | | | | | | | | | |
7.625%, 11/15/2023(2) | | | 9,035,000 | | | | 10,235,947 | | | | | |
| Mitsubishi UFJ Financial Group, Inc.: | | | | | | | | | | | | |
2.623%, 07/18/2022(1) | | | 10,000,000 | | | | 10,337,377 | | | | | |
| 0.848%, 09/15/2024 | | | | | | | | | | | | |
(1 Year CMT Rate + 0.680%)(1)(3) | | | 20,000,000 | | | | 20,119,256 | | | | | |
| Mitsubishi UFJ Lease & Finance Co. Ltd.: | | | | | | | | | | | | |
3.406%, 02/28/2022(1)(2) | | | 5,200,000 | | | | 5,348,201 | | | | | |
2.652%, 09/19/2022(1)(2) | | | 3,000,000 | | | | 3,089,984 | | | | | |
| Mizuho Financial Group, Inc.: | | | | | | | | | | | | |
2.953%, 02/28/2022(1) | | | 8,700,000 | | | | 8,960,373 | | | | | |
| 1.241%, 07/10/2024 | | | | | | | | | | | | |
(3 Month LIBOR USD + 0.990%)(1)(3) | | | 14,700,000 | | | | 14,943,915 | | | | | |
| 0.849%, 09/08/2024 | | | | | | | | | | | | |
(3 Month LIBOR USD + 0.610%)(1)(3) | | | 25,075,000 | | | | 25,227,757 | | | | | |
| Morgan Stanley, | | | | | | | | | | | | |
| 3.737%, 04/24/2024 | | | | | | | | | | | | |
(3 Month LIBOR USD + 0.847%)(3) | | | 34,242,000 | | | | 36,842,937 | | | | | |
| National Bank of Canada, | | | | | | | | | | | | |
2.100%, 02/01/2023(1) | | | 36,075,000 | | | | 37,297,584 | | | | | |
| National Securities Clearing Corp., | | | | | | | | | | | | |
1.200%, 04/23/2023(2) | | | 27,000,000 | | | | 27,538,797 | | | | | |
The accompanying notes are an integral part of these financial statements.
Baird Short-Term Bond Fund
Schedule of Investments, December 31, 2020
Long-Term Investments (cont.)
| | | Principal | | | | | | % of | |
| | | Amount | | | Value | | | Net Assets | |
| Nationwide Building Society: | | | | | | | | | |
2.000%, 01/27/2023(1)(2) | | $ | 4,980,000 | | | $ | 5,138,707 | | | |
|
|
| 3.622%, 04/26/2023 | | | | | | | | | | | | |
(3 Month LIBOR USD + 1.181%)(1)(2)(3) | | | 18,635,000 | | | | 19,356,500 | | | | | |
| 3.766%, 03/08/2024 | | | | | | | | | | | | |
(3 Month LIBOR USD + 1.064%)(1)(2)(3) | | | 9,670,000 | | | | 10,287,664 | | | | | |
| Nationwide Financial Services, Inc., | | | | | | | | | | | | |
5.375%, 03/25/2021(2) | | | 1,797,000 | | | | 1,816,523 | | | | | |
| New York Life Global Funding, | | | | | | | | | | | | |
1.100%, 05/05/2023(2) | | | 14,425,000 | | | | 14,676,501 | | | | | |
| Nordea Bank AB: | | | | | | | | | | | | |
4.875%, 05/13/2021(1)(2) | | | 16,080,000 | | | | 16,327,371 | | | | | |
4.250%, 09/21/2022(1)(2) | | | 14,785,000 | | | | 15,694,657 | | | | | |
3.750%, 08/30/2023(1)(2) | | | 3,725,000 | | | | 4,026,223 | | | | | |
| Park Aerospace Holdings Ltd., | | | | | | | | | | | | |
4.500%, 03/15/2023(1)(2) | | | 7,746,000 | | | | 8,117,227 | | | | | |
| People’s United Financial, Inc., | | | | | | | | | | | | |
| 3.650%, 12/06/2022 | | | 6,329,000 | | | | 6,629,712 | | | | | |
| Protective Life Global Funding, | | | | | | | | | | | | |
1.082%, 06/09/2023(2) | | | 15,900,000 | | | | 16,175,278 | | | | | |
| Prudential Funding LLC, | | | | | | | | | | | | |
6.750%, 09/15/2023(2) | | | 8,492,000 | | | | 9,716,653 | | | | | |
| Reliance Standard Life Global Funding II: | | | | | | | | | | | | |
2.625%, 07/22/2022(2) | | | 13,625,000 | | | | 14,004,683 | | | | | |
2.150%, 01/21/2023(2) | | | 15,000,000 | | | | 15,377,340 | | | | | |
| Royal Bank of Canada, | | | | | | | | | | | | |
1.600%, 04/17/2023(1) | | | 14,400,000 | | | | 14,808,237 | | | | | |
| Royal Bank of Scotland Group PLC: | | | | | | | | | | | | |
| 3.498%, 05/15/2023 | | | | | | | | | | | | |
(3 Month LIBOR USD + 1.480%)(1)(3) | | | 13,000,000 | | | | 13,497,231 | | | | | |
3.875%, 09/12/2023(1) | | | 8,187,000 | | | | 8,883,199 | | | | | |
| 4.519%, 06/25/2024 | | | | | | | | | | | | |
(3 Month LIBOR USD + 1.550%)(1)(3) | | | 2,384,000 | | | | 2,602,876 | | | | | |
| Royal Bank of Scotland PLC, | | | | | | | | | | | | |
6.125%, 01/11/2021(1) | | | 9,667,000 | | | | 9,676,114 | | | | | |
| Santander Holdings USA, Inc.: | | | | | | | | | | | | |
| 4.450%, 12/03/2021 | | | 7,500,000 | | | | 7,744,608 | | | | | |
| 3.400%, 01/18/2023 | | | 7,114,000 | | | | 7,472,418 | | | | | |
| Santander UK Group Holdings PLC: | | | | | | | | | | | | |
3.125%, 01/08/2021(1) | | | 3,500,000 | | | | 3,500,757 | | | | | |
2.875%, 08/05/2021(1) | | | 2,970,000 | | | | 3,011,596 | | | | | |
3.571%, 01/10/2023(1) | | | 2,500,000 | | | | 2,576,026 | | | | | |
| 3.373%, 01/05/2024 | | | | | | | | | | | | |
(3 Month LIBOR USD + 1.080%)(1)(3) | | | 10,000,000 | | | | 10,524,622 | | | | | |
The accompanying notes are an integral part of these financial statements.
Baird Short-Term Bond Fund
Schedule of Investments, December 31, 2020
Long-Term Investments (cont.)
| | | Principal | | | | | | % of | |
| | | Amount | | | Value | | | Net Assets | |
| Santander UK PLC, | | | | | | | | | |
5.000%, 11/07/2023(1)(2) | | $ | 1,100,000 | | | $ | 1,214,241 | | | |
|
|
| Skandinaviska Enskilda Banken AB, | | | | | | | | | | | | |
2.200%, 12/12/2022(1)(2) | | | 17,825,000 | | | | 18,467,368 | | | | | |
| SMBC Aviation Capital Finance DAC: | | | | | | | | | | | | |
2.650%, 07/15/2021(1)(2) | | | 1,950,000 | | | | 1,970,363 | | | | | |
4.125%, 07/15/2023(1)(2) | | | 1,960,000 | | | | 2,092,568 | | | | | |
| Societe Generale SA: | | | | | | | | | | | | |
4.250%, 09/14/2023(1)(2) | | | 8,500,000 | | | | 9,270,087 | | | | | |
5.000%, 01/17/2024(1)(2) | | | 2,800,000 | | | | 3,090,707 | | | | | |
3.875%, 03/28/2024(1)(2) | | | 8,500,000 | | | | 9,267,451 | | | | | |
2.625%, 10/16/2024(1)(2) | | | 14,000,000 | | | | 14,834,160 | | | | | |
| Standard Chartered PLC: | | | | | | | | | | | | |
3.050%, 01/15/2021(1)(2) | | | 17,471,000 | | | | 17,484,113 | | | | | |
| 2.744%, 09/10/2022 | | | | | | | | | | | | |
(3 Month LIBOR USD + 1.200%)(1)(2)(3) | | | 10,000,000 | | | | 10,142,032 | | | | | |
| 4.247%, 01/20/2023 | | | | | | | | | | | | |
(3 Month LIBOR USD + 1.150%)(1)(2)(3) | | | 5,486,000 | | | | 5,688,970 | | | | | |
| 1.319%, 10/14/2023 | | | | | | | | | | | | |
(1 Year CMT Rate + 1.170%)(1)(2)(3) | | | 2,525,000 | | | | 2,550,250 | | | | | |
| 3.885%, 03/15/2024 | | | | | | | | | | | | |
(3 Month LIBOR USD + 1.080%)(1)(2)(3) | | | 13,450,000 | | | | 14,306,695 | | | | | |
| State Street Corp., | | | | | | | | | | | | |
2.825%, 03/30/2023 (SOFR + 2.690%)(3) | | | 13,175,000 | | | | 13,597,452 | | | | | |
| Stifel Financial Corp., | | | | | | | | | | | | |
| 4.250%, 07/18/2024 | | | 3,021,000 | | | | 3,394,123 | | | | | |
| SunTrust Banks, Inc., | | | | | | | | | | | | |
| 2.800%, 05/17/2022 | | | 18,000,000 | | | | 18,591,705 | | | | | |
| Synchrony Financial: | | | | | | | | | | | | |
| 3.750%, 08/15/2021 | | | 8,839,000 | | | | 8,965,517 | | | | | |
| 2.850%, 07/25/2022 | | | 25,219,000 | | | | 26,042,379 | | | | | |
| 4.375%, 03/19/2024 | | | 8,000,000 | | | | 8,807,734 | | | | | |
| Synovus Bank, | | | | | | | | | | | | |
2.289%, 02/10/2023 (SOFR + 0.945%)(3) | | | 7,000,000 | | | | 7,088,966 | | | | | |
| Trinity Acquisition PLC, | | | | | | | | | | | | |
3.500%, 09/15/2021(1) | | | 18,183,000 | | | | 18,508,747 | | | | | |
| UBS AG, | | | | | | | | | | | | |
1.750%, 04/21/2022(1)(2) | | | 15,000,000 | | | | 15,266,892 | | | | | |
| UBS Group AG, | | | | | | | | | | | | |
| 1.008%, 07/30/2024 | | | | | | | | | | | | |
(1 Year CMT Rate + 0.830%)(1)(2)(3) | | | 6,000,000 | | | | 6,058,014 | | | | | |
| UBS Group Funding Switzerland AG, | | | | | | | | | | | | |
| 2.859%, 08/15/2023 | | | | | | | | | | | | |
(3 Month LIBOR USD + 0.954%)(1)(2)(3) | | | 7,200,000 | | | | 7,464,042 | | | | | |
The accompanying notes are an integral part of these financial statements.
Baird Short-Term Bond Fund
Schedule of Investments, December 31, 2020
Long-Term Investments (cont.)
| | | Principal | | | | | | % of | |
| | | Amount | | | Value | | | Net Assets | |
| USAA Capital Corp., | | | | | | | | | |
1.500%, 05/01/2023(2) | | $ | 6,000,000 | | | $ | 6,154,520 | | | | |
| WEA Finance LLC, | | | | | | | | | | | |
3.150%, 04/05/2022(2) | | | 12,750,000 | | | | 12,967,201 | | | | |
| Wells Fargo & Co.: | | | | | | | | | | | |
| 3.069%, 01/24/2023 | | | 4,650,000 | | | | 4,782,718 | | | | |
| 3.750%, 01/24/2024 | | | 9,840,000 | | | | 10,742,225 | | | | |
1.654%, 06/02/2024 (SOFR + 1.600%)(3) | | | 30,000,000 | | | | 30,836,504 | | | | |
| Willis North America, Inc., | | | | | | | | | | | |
| 3.600%, 05/15/2024 | | | 2,600,000 | | | | 2,838,960 | | | | |
| Willis Towers Watson PLC, | | | | | | | | | | | |
5.750%, 03/15/2021(1) | | | 13,585,000 | | | | 13,721,799 | | | | |
| Zions Bancorp NA: | | | | | | | | | | | |
| 3.500%, 08/27/2021 | | | 11,700,000 | | | | 11,922,123 | | | | |
| 3.350%, 03/04/2022 | | | 20,000,000 | | | | 20,583,390 | | | | |
| Total Financials | | | | | | | | | | | |
| (Cost $1,815,476,446) | | | | | | | 1,866,317,881 | | | | 20.8 | % |
| Total Corporate Bonds | | | | | | | | | | | | |
| (Cost $4,465,750,743) | | | | | | | 4,583,801,376 | | | | 51.0 | % |
| Municipal Bonds | | | | | | | | | | | | |
| Bartow County Development Authority, | | | | | | | | | | | | |
| 1.550%, 08/01/2043 | | | 10,000,000 | | | | 10,159,600 | | | | | |
| Bloomington Redevelopment District, | | | | | | | | | | | | |
| 2.400%, 08/01/2024 | | | 785,000 | | | | 794,137 | | | | | |
| Brazos Higher Education Authority, Inc.: | | | | | | | | | | | | |
| 2.378%, 04/01/2021 | | | 675,000 | | | | 677,909 | | | | | |
| 2.427%, 04/01/2022 | | | 1,320,000 | | | | 1,349,740 | | | | | |
| Bucks County Industrial Development Authority, | | | | | | | | | | | | |
| 2.750%, 12/01/2022 | | | 5,000,000 | | | | 5,216,000 | | | | | |
| Burke County Development Authority, | | | | | | | | | | | | |
1.550%, 12/01/2049(4) | | | 6,730,000 | | | | 6,837,411 | | | | | |
| Central Texas Turnpike System, | | | | | | | | | | | | |
1.980%, 08/15/2042(4) | | | 8,280,000 | | | | 8,357,998 | | | | | |
| Chandler Industrial Development Authority, | | | | | | | | | | | | |
5.000%, 06/01/2049(4) | | | 2,000,000 | | | | 2,300,340 | | | | | |
| Chicago Transit Authority: | | | | | | | | | | | | |
| 1.708%, 12/01/2022 | | | 1,000,000 | | | | 1,015,860 | | | | | |
| 1.838%, 12/01/2023 | | | 1,000,000 | | | | 1,025,600 | | | | | |
| City of Houston TX, | | | | | | | | | | | | |
| 1.054%, 07/01/2023 | | | 6,000,000 | | | | 6,020,760 | | | | | |
| City of Johnson TN, | | | | | | | | | | | | |
| 7.850%, 03/01/2024 | | | 4,890,000 | | | | 5,352,545 | | | | | |
The accompanying notes are an integral part of these financial statements.
Baird Short-Term Bond Fund
Schedule of Investments, December 31, 2020
Long-Term Investments (cont.)
| | | Principal | | | | | | % of | |
| | | Amount | | | Value | | | Net Assets | |
| City of Ontario CA: | | | | | | | | | |
| 2.071%, 06/01/2022 | | $ | 1,095,000 | | | $ | 1,109,301 | | | |
|
|
| 2.216%, 06/01/2023 | | | 1,300,000 | | | | 1,329,666 | | | | | |
| City of Pittsburg CA, | | | | | | | | | | | | |
| 5.864%, 07/01/2021 | | | 555,000 | | | | 569,463 | | | | | |
| Coconino County Pollution Control Corp., | | | | | | | | | | | | |
1.875%, 09/01/2032(4) | | | 3,000,000 | | | | 3,040,380 | | | | | |
| County of Burleigh ND, | | | | | | | | | | | | |
| 2.750%, 02/01/2022 (Callable 01/21/2021) | | | 7,355,000 | | | | 7,356,250 | | | | | |
| County of Riverside CA: | | | | | | | | | | | | |
| 2.265%, 02/15/2022 | | | 5,000,000 | | | | 5,093,950 | | | | | |
| 2.363%, 02/15/2023 | | | 5,000,000 | | | | 5,185,550 | | | | | |
| County of Sacramento CA: | | | | | | | | | | | | |
7.680%, 08/15/2021(7) | | | 16,535,000 | | | | 17,226,494 | | | | | |
7.680%, 08/15/2021(7) | | | 2,000,000 | | | | 2,086,160 | | | | | |
| County of Saline AR, | | | | | | | | | | | | |
| 3.550%, 06/01/2042 (Callable 06/01/2024) | | | 1,890,000 | | | | 1,977,016 | | | | | |
| Dauphin County Industrial Development Authority, | | | | | | | | | | | | |
| 6.900%, 06/01/2024 | | | 3,000,000 | | | | 3,605,220 | | | | | |
| Florida Development Finance Corp.: | | | | | | | | | | | | |
| 1.795%, 04/01/2022 | | | 1,000,000 | | | | 1,004,850 | | | | | |
| 1.976%, 04/01/2023 | | | 1,255,000 | | | | 1,266,031 | | | | | |
| Fresno Joint Powers Financing Authority, | | | | | | | | | | | | |
| 2.880%, 04/01/2021 | | | 1,685,000 | | | | 1,691,504 | | | | | |
| Great Lakes Water Authority: | | | | | | | | | | | | |
| 1.684%, 07/01/2022 | | | 250,000 | | | | 254,490 | | | | | |
| 1.879%, 07/01/2023 | | | 500,000 | | | | 516,365 | | | | | |
| 1.984%, 07/01/2024 | | | 500,000 | | | | 521,530 | | | | | |
| Housing & Redevelopment | | | | | | | | | | | | |
| Authority of The City of St. Paul, | | | | | | | | | | | | |
| 3.539%, 07/01/2023 | | | 5,000,000 | | | | 5,261,550 | | | | | |
| Illinois Housing Development Authority, | | | | | | | | | | | | |
| 4.000%, 02/01/2034 (Callable 08/01/2025) | | | 4,010,000 | | | | 4,134,510 | | | | | |
| Iowa Tobacco Settlement Authority, | | | | | | | | | | | | |
| 6.500%, 06/01/2023 (Callable 02/01/2021) | | | 155,000 | | | | 157,296 | | | | | |
| Massachusetts Educational Financing Authority, | | | | | | | | | | | | |
| 5.000%, 01/01/2024 | | | 26,990,000 | | | | 30,433,924 | | | | | |
| Metropolitan Transportation Authority: | | | | | | | | | | | | |
| 5.000%, 05/15/2021 | | | 5,500,000 | | | | 5,557,695 | | | | | |
| 5.000%, 05/15/2021 | | | 1,475,000 | | | | 1,490,473 | | | | | |
| 5.000%, 05/15/2021 | | | 3,755,000 | | | | 3,794,390 | | | | | |
| 5.000%, 09/01/2021 | | | 14,715,000 | | | | 14,993,849 | | | | | |
| 5.000%, 11/15/2021 | | | 1,500,000 | | | | 1,537,800 | | | | | |
| 5.000%, 11/15/2021 | | | 260,000 | | | | 266,552 | | | | | |
| 5.000%, 11/15/2021 | | | 750,000 | | | | 768,900 | | | | | |
The accompanying notes are an integral part of these financial statements.
Baird Short-Term Bond Fund
Schedule of Investments, December 31, 2020
Long-Term Investments (cont.)
| | | Principal | | | | | | % of | |
| | | Amount | | | Value | | | Net Assets | |
| New Hampshire Housing Finance Authority, | | | | | | | | | |
| 4.000%, 07/01/2036 (Callable 07/10/2024) | | $ | 3,250,000 | | | $ | 3,331,835 | | | |
|
|
| New Jersey Economic Development Authority: | | | | | | | | | | | | |
| 0.000%, 02/15/2021 | | | 1,440,000 | | | | 1,439,352 | | | | | |
| 2.609%, 06/15/2022 | | | 500,000 | | | | 507,450 | | | | | |
| 2.781%, 06/15/2023 | | | 2,085,000 | | | | 2,141,691 | | | | | |
| New Jersey Higher Education | | | | | | | | | | | | |
| Student Assistance Authority: | | | | | | | | | | | | |
| 5.000%, 12/01/2023 | | | 1,500,000 | | | | 1,694,070 | | | | | |
| 5.000%, 12/01/2023 | | | 2,375,000 | | | | 2,682,278 | | | | | |
| New Jersey Sports & Exposition Authority: | | | | | | | | | | | | |
| 6.076%, 03/01/2023 | | | 1,395,000 | | | | 1,476,579 | | | | | |
| 5.976%, 03/01/2024 | | | 3,875,000 | | | | 3,984,004 | | | | | |
| New Jersey Transportation Trust Fund Authority, | | | | | | | | | | | | |
| 2.384%, 06/15/2022 | | | 4,245,000 | | | | 4,350,531 | | | | | |
| Niagara Area Development Corp., | | | | | | | | | | | | |
| 2.643%, 05/01/2022 | | | 1,000,000 | | | | 1,003,130 | | | | | |
| Philadelphia Authority for Industrial Development: | | | | | | | | | | | | |
| 0.000%, 04/15/2022 | | | 6,022,000 | | | | 5,907,401 | | | | | |
| 0.000%, 04/15/2023 | | | 7,250,000 | | | | 6,998,498 | | | | | |
| 3.964%, 04/15/2026 | | | 4,500,000 | | | | 4,889,700 | | | | | |
| Port of Seattle WA, | | | | | | | | | | | | |
| 2.430%, 05/01/2022 | | | 1,000,000 | | | | 1,025,270 | | | | | |
| Public Finance Authority, | | | | | | | | | | | | |
| 3.750%, 02/01/2022 (Callable 01/21/2021) | | | 7,000,000 | | | | 7,001,820 | | | | | |
| Rhode Island Housing & Mortgage Finance Corp., | | | | | | | | | | | | |
| 3.000%, 10/01/2034 (Callable 10/01/2022) | | | 1,615,000 | | | | 1,630,084 | | | | | |
| South Carolina Transportation Infrastructure Bank, | | | | | | | | | | | | |
| 0.546%, 10/01/2031 | | | | | | | | | | | | |
| (1 Month LIBOR USD + 0.450%) | | | | | | | | | | | | |
(Callable 10/01/2021)(3) | | | 11,940,000 | | | | 11,924,000 | | | | | |
| State of Connecticut: | | | | | | | | | | | | |
| 2.500%, 07/01/2022 | | | 3,000,000 | | | | 3,095,160 | | | | | |
| 2.000%, 07/01/2023 | | | 3,000,000 | | | | 3,116,250 | | | | | |
| State of Illinois, | | | | | | | | | | | | |
| 1.900%, 10/01/2021 | | | 5,500,000 | | | | 5,467,110 | | | | | |
| State Public School Building Authority, | | | | | | | | | | | | |
| 2.615%, 04/01/2023 | | | 2,500,000 | | | | 2,537,650 | | | | | |
| Tennessee Housing Development Agency, | | | | | | | | | | | | |
| 4.000%, 07/01/2040 (Callable 07/01/2029) | | | 5,320,000 | | | | 5,643,509 | | | | | |
| Tobacco Settlement Finance Authority, | | | | | | | | | | | | |
| 0.947%, 06/01/2022 | | | 3,500,000 | | | | 3,502,730 | | | | | |
| Total Municipal Bonds | | | | | | | | | | | | |
| (Cost $252,271,677) | | | | | | | 256,689,161 | | | | 2.9 | % |
The accompanying notes are an integral part of these financial statements.
Baird Short-Term Bond Fund
Schedule of Investments, December 31, 2020
Long-Term Investments (cont.)
| | | Principal | | | | | | % of | |
| | | Amount | | | Value | | | Net Assets | |
| Residential Mortgage-Backed Securities | | | | | | | | | |
| Non-U.S. Government Agency Issues | | | | | | | | | |
| ACE Securities Corp. Home Equity Loan Trust, | | | | | | | | | |
| Series 2006-OP1, Class A2C, 0.298%, 04/25/2036 | | | | | | | | | |
(1 Month LIBOR USD + 0.150%)(3) | | $ | 242,572 | | | $ | 242,326 | | | |
|
|
| Aegis Asset Backed Securities Trust, | | | | | | | | | | | | |
| Series 2005-4, Class M1, 0.823%, 10/25/2035 | | | | | | | | | | | | |
(1 Month LIBOR USD + 0.675%)(3) | | | 9,822,693 | | | | 9,800,380 | | | | | |
| Alternative Loan Trust: | | | | | | | | | | | | |
| Series 2004-12CB, Class 1A1, 5.000%, 01/25/2021 | | | 4,221 | | | | 4,207 | | | | | |
| Series 2004-J2, Class 3A3, 5.500%, 04/25/2034 | | | 62,810 | | | | 64,746 | | | | | |
Series 2005-73CB, Class 1A7, 5.500%, 01/25/2036(6) | | | 48,955 | | | | 49,223 | | | | | |
Series 2006-28CB, Class A17, 6.000%, 10/25/2036(6) | | | 501,083 | | | | 365,998 | | | | | |
| Argent Securities Inc. Asset-Backed | | | | | | | | | | | | |
| Pass-Through Certificates, | | | | | | | | | | | | |
| Series 2005-W3, Class A2D, 0.828%, 11/25/2035 | | | | | | | | | | | | |
(1 Month LIBOR USD + 0.680%)(3) | | | 1,558,138 | | | | 1,555,004 | | | | | |
| Arroyo Mortgage Trust: | | | | | | | | | | | | |
Series 2019-3, Class A1, 2.962%, 10/25/2048(2)(4) | | | 10,417,728 | | | | 10,739,992 | | | | | |
Series 2020-1, Class A1A, 1.662%, 03/25/2055(2) | | | 12,488,300 | | | | 12,607,159 | | | | | |
| Asset Backed Securities Corp. Home Equity Loan Trust, | | | | | | | | | | | | |
| Series 2006-HE1, Class A1, 0.363%, 01/25/2036 | | | | | | | | | | | | |
(1 Month LIBOR USD + 0.215%)(3) | | | 1,783,771 | | | | 1,778,284 | | | | | |
| COLT Trust, | | | | | | | | | | | | |
Series 2020-RPL1, Class A1, 1.390%, 01/25/2065(2)(4) | | | 26,435,681 | | | | 26,563,949 | | | | | |
| Countrywide Asset-Backed Certificates, | | | | | | | | | | | | |
| Series 2006-2, Class 2A3, 0.748%, 06/25/2036 | | | | | | | | | | | | |
(1 Month LIBOR USD + 0.600%)(3) | | | 651,546 | | | | 651,277 | | | | | |
| CSMC Trust, | | | | | | | | | | | | |
| Series 2019-RPL1, Class A1A, | | | | | | | | | | | | |
3.650%, 07/25/2058(2)(4) | | | 36,685,317 | | | | 39,848,930 | | | | | |
| CWABS Asset-Backed Certificates Trust, | | | | | | | | | | | | |
Series 2006-9, Class 1AF3, 5.859%, 08/25/2036(4)(6) | | | 341,379 | | | | 332,967 | | | | | |
| GSAMP Trust, | | | | | | | | | | | | |
| Series 2006-HE7, Class A2D, 0.378%, 10/25/2036 | | | | | | | | | | | | |
(1 Month LIBOR USD + 0.230%)(3) | | | 5,112,814 | | | | 5,044,504 | | | | | |
| J.P. Morgan Mortgage Trust, | | | | | | | | | | | | |
Series 2005-A4, Class 1A1, 2.588%, 07/25/2035(4) | | | 263,791 | | | | 269,629 | | | | | |
| MASTR Alternative Loan Trust: | | | | | | | | | | | | |
Series 2003-5, Class 7A1, 5.000%, 10/01/2031(6) | | | 39,528 | | | | 25,396 | | | | | |
| Series 2003-5, Class 4A1, 5.500%, 07/25/2033 | | | 2,156,915 | | | | 2,247,489 | | | | | |
| Mill City Mortgage Loan Trust, | | | | | | | | | | | | |
Series 2018-2, Class A1, 3.500%, 05/25/2058(2)(4) | | | 1,535,211 | | | | 1,596,544 | | | | | |
The accompanying notes are an integral part of these financial statements.
Baird Short-Term Bond Fund
Schedule of Investments, December 31, 2020
Long-Term Investments (cont.)
| | | Principal | | | | | | % of | |
| | | Amount | | | Value | | | Net Assets | |
| Morgan Stanley, | | | | | | | | | |
| Series 2005-HE5, Class M2, 0.793%, 09/25/2035 | | | | | | | | | |
(1 Month LIBOR USD + 0.645%)(3) | | $ | 5,629,390 | | | $ | 5,610,469 | | | | |
| Renaissance Home Equity Loan Trust, | | | | | | | | | | | |
Series 2007-2, Class AF2, 5.675%, 06/25/2037(7) | | | 1,914,212 | | | | 732,087 | | | | |
| Saxon Asset Securities Trust, | | | | | | | | | | | |
| Series 2006-2, Class A3C, 0.298%, 09/25/2036 | | | | | | | | | | | |
(1 Month LIBOR USD + 0.150%)(3) | | | 200,247 | | | | 199,841 | | | | |
| Structured Asset Securities Corp., | | | | | | | | | | | |
Series 2004-4XS, Class 1A6, 5.050%, 02/25/2034(7) | | | 23,551 | | | | 23,639 | | | | |
| Thornburg Mortgage Securities Trust, | | | | | | | | | | | |
Series 2003-5, Class 3A, 2.307%, 10/25/2043(4) | | | 3,133,571 | | | | 3,085,627 | | | | |
| Towd Point Mortgage Trust: | | | | | | | | | | | |
Series 2015-4, Class A1B, 2.750%, 04/25/2055(2)(4) | | | 297,238 | | | | 298,204 | | | | |
Series 2015-4, Class A1, 3.500%, 04/25/2055(2)(4) | | | 640,093 | | | | 643,728 | | | | |
Series 2016-5, Class A1, 2.500%, 10/25/2056(2)(4) | | | 19,198,648 | | | | 19,571,883 | | | | |
Series 2017-1, Class A1, 2.750%, 10/25/2056(2)(4) | | | 16,305,919 | | | | 16,711,961 | | | | |
| Series 2017-5, Class A1, 0.748%, 02/26/2057 | | | | | | | | | | | |
(1 Month LIBOR USD + 0.600%)(2)(3) | | | 6,032,512 | | | | 6,013,185 | | | | |
Series 2017-2, Class A1, 2.750%, 04/25/2057(2)(4) | | | 5,572,148 | | | | 5,696,253 | | | | |
Series 2017-3, Class A1, 2.750%, 06/25/2057(2)(4) | | | 13,098,822 | | | | 13,487,466 | | | | |
Series 2017-4, Class A1, 2.750%, 06/25/2057(2)(4) | | | 6,301,812 | | | | 6,530,093 | | | | |
Series 2017-6, Class A1, 2.750%, 10/25/2057(2)(4) | | | 15,477,446 | | | | 15,935,330 | | | | |
Series 2018-6, Class A1A, 3.750%, 03/25/2058(2)(4) | | | 8,853,661 | | | | 9,331,989 | | | | |
| WaMu Mortgage Pass-Through Certificates Trust, | | | | | | | | | | | |
Series 2004-AR3, Class A1, 3.655%, 06/25/2034(4) | | | 2,362,814 | | | | 2,401,677 | | | | |
| Total Residential Mortgage-Backed Securities | | | | | | | | | | | |
| (Cost $216,213,746) | | | | | | | 220,061,436 | | | | 2.5 | % |
| Commercial Mortgage-Backed Securities | | | | | | | | | | | | |
| U.S. Government Agency Issues | | | | | | | | | | | | |
| Freddie Mac Multifamily Structured | | | | | | | | | | | | |
| Pass Through Certificates, | | | | | | | | | | | | |
| Series K014, Class A2, 3.871%, 04/25/2021 | | | 7,499,242 | | | | 7,522,536 | | | | | |
| Total U.S. Government Agency Issues | | | | | | | | | | | | |
| (Cost $7,499,872) | | | | | | | 7,522,536 | | | | 0.1 | % |
| Non-U.S. Government Agency Issues | | | | | | | | | | | | |
| Citigroup Commercial Mortgage Trust: | | | | | | | | | | | | |
| Series 2013-GC11, Class A4, 3.093%, 04/10/2046 | | | 11,499,024 | | | | 12,059,555 | | | | | |
| Series 2014-GC19, Class AAB, 3.552%, 03/12/2047 | | | 2,913,431 | | | | 3,059,206 | | | | | |
| Series 2014-GC23, Class AAB, 3.337%, 07/12/2047 | | | 10,626,198 | | | | 11,112,522 | | | | | |
| COMM Mortgage Trust: | | | | | | | | | | | | |
| Series 2012-CR1, Class ASB, 3.053%, 05/17/2045 | | | 7,124,252 | | | | 7,213,361 | | | | | |
| Series 2012-CR2, Class A4, 3.147%, 08/17/2045 | | | 7,890,000 | | | | 8,143,353 | | | | | |
| Series 2013-LC6, Class ASB, 2.478%, 01/12/2046 | | | 5,426,640 | | | | 5,527,464 | | | | | |
The accompanying notes are an integral part of these financial statements.
Baird Short-Term Bond Fund
Schedule of Investments, December 31, 2020
Long-Term Investments (cont.)
| | | Principal | | | | | | % of | |
| | | Amount | | | Value | | | Net Assets | |
| COMM Mortgage Trust: (cont.) | | | | | | | | | |
| Series 2014-LC15, Class ASB, 3.528%, 04/12/2047 | | $ | 9,173,228 | | | $ | 9,537,493 | | | | |
| Series 2014-CR16, Class ASB, 3.653%, 04/12/2047 | | | 8,917,378 | | | | 9,265,042 | | | | |
| Series 2013-CR11, Class A4, 4.258%, 08/12/2050 | | | 5,130,000 | | | | 5,600,203 | | | | |
| GS Mortgage Securities Trust: | | | | | | | | | | | |
| Series 2011-GC5, Class A4, 3.707%, 08/10/2044 | | | 12,348,569 | | | | 12,403,220 | | | | |
| Series 2012-GCJ9, Class A3, 2.773%, 11/13/2045 | | | 23,247,021 | | | | 23,936,253 | | | | |
| J.P. Morgan Chase Commercial Mortgage Securities Trust: | | | | | | | | | | | |
| Series 2012-C8, Class ASB, 2.379%, 10/17/2045 | | | 6,815,149 | | | | 6,920,876 | | | | |
| Series 2012-C8, Class A3, 2.829%, 10/17/2045 | | | 10,018,546 | | | | 10,307,771 | | | | |
| Series 2013-LC11, Class A5, 2.960%, 04/15/2046 | | | 12,580,000 | | | | 13,179,980 | | | | |
| Series 2011-C5, Class ASB, 3.678%, 08/15/2046 | | | 584,486 | | | | 588,519 | | | | |
| JPMBB Commercial Mortgage Securities Trust: | | | | | | | | | | | |
Series 2013-C14, Class ASB, 3.761%, 08/17/2046(4) | | | 10,086,980 | | | | 10,480,714 | | | | |
Series 2013-C14, Class A4, 4.133%, 08/17/2046(4) | | | 10,625,000 | | | | 11,452,522 | | | | |
| Series 2015-C31, Class ASB, 3.540%, 08/17/2048 | | | 8,764,922 | | | | 9,344,079 | | | | |
| Series 2015-C33, Class ASB, 3.562%, 12/17/2048 | | | 4,053,647 | | | | 4,332,575 | | | | |
| Morgan Stanley Bank of America Merrill Lynch Trust: | | | | | | | | | | | |
| Series 2013-C9, Class AAB, 2.657%, 05/17/2046 | | | 12,118,042 | | | | 12,368,438 | | | | |
| Series 2015-C25, Class ASB, 3.383%, 10/19/2048 | | | 14,207,216 | | | | 15,084,546 | | | | |
| Series 2013-C8, Class ASB, 2.699%, 12/17/2048 | | | 7,334,797 | | | | 7,444,039 | | | | |
| Wells Fargo Commercial Mortgage Trust, | | | | | | | | | | | |
| Series 2014-LC16, Class ASB, 3.477%, 08/17/2050 | | | 10,617,819 | | | | 11,109,377 | | | | |
| WFRBS Commercial Mortgage Trust: | | | | | | | | | | | |
| Series 2013-C11, Class A5, 3.071%, 03/17/2045 | | | 5,000,000 | | | | 5,222,420 | | | | |
| Series 2012-C6, Class A4, 3.440%, 04/15/2045 | | | 8,219,087 | | | | 8,314,334 | | | | |
| Series 2013-C14, Class ASB, 2.977%, 06/15/2046 | | | 14,640,670 | | | | 14,953,892 | | | | |
| Series 2013-C14, Class A4, 3.073%, 06/15/2046 | | | 13,000,000 | | | | 13,662,806 | | | | |
| Series 2014-C23, Class ASB, 3.636%, 10/17/2057 | | | 899,140 | | | | 946,904 | | | | |
| Total Non-U.S. Government Agency Issues | | | | | | | | | | | |
| (Cost $260,525,251) | | | | | | | 263,571,464 | | | | 2.9 | % |
| Total Commercial Mortgage-Backed Securities | | | | | | | | | | | | |
| (Cost $268,025,123) | | | | | | | 271,094,000 | | | | 3.0 | % |
| Asset Backed Securities | | | | | | | | | | | | |
| American Express Credit Account Master Trust, | | | | | | | | | | | | |
| Series 2019-2, Class A, 2.670%, 11/15/2024 | | | 7,130,000 | | | | 7,353,073 | | | | | |
| Bank of The West Auto Trust: | | | | | | | | | | | | |
Series 2017-1, Class A3, 2.110%, 01/15/2023(2) | | | 1,719,167 | | | | 1,726,303 | | | | | |
Series 2019-1, Class A3, 2.430%, 04/15/2024(2) | | | 13,005,000 | | | | 13,252,161 | | | | | |
| Capital One Multi-Asset Execution Trust, | | | | | | | | | | | | |
| Series 2019-A2, Class A2, 1.720%, 08/15/2024 | | | 15,250,000 | | | | 15,620,142 | | | | | |
| CarMax Auto Owner Trust, | | | | | | | | | | | | |
| Series 2018-4, Class A3, 3.360%, 09/15/2023 | | | 9,671,137 | | | | 9,874,932 | | | | | |
The accompanying notes are an integral part of these financial statements.
Baird Short-Term Bond Fund
Schedule of Investments, December 31, 2020
Long-Term Investments (cont.)
| | | Principal | | | | | | % of | |
| | | Amount | | | Value | | | Net Assets | |
| Chase Auto Credit Linked Notes, | | | | | | | | | |
Series 2020-2, Class B, 0.840%, 02/25/2028(2) | | $ | 12,000,000 | | | $ | 12,011,910 | | | |
|
|
| Chesapeake Funding II LLC: | | | | | | | | | | | | |
Series 2018-1A, Class A1, 3.040%, 04/15/2030(2) | | | 4,088,514 | | | | 4,130,215 | | | | | |
Series 2020-1A, Class A1, 0.870%, 08/15/2032(2) | | | 18,580,177 | | | | 18,672,333 | | | | | |
| Conseco Financial Corp., | | | | | | | | | | | | |
| Series 1998-3, Class A5, 6.220%, 03/01/2030 | | | 21,869 | | | | 22,139 | | | | | |
| Discover Card Execution Note Trust, | | | | | | | | | | | | |
| Series 2019-A3, Class A, 1.890%, 10/15/2024 | | | 2,700,000 | | | | 2,778,975 | | | | | |
| Ford Credit Auto Owner Trust: | | | | | | | | | | | | |
| Series 2020-A, Class A3, 1.040%, 08/15/2024 | | | 35,300,000 | | | | 35,730,159 | | | | | |
Series 2017-1, Class A, 2.620%, 08/15/2028(2) | | | 24,017,000 | | | | 24,624,868 | | | | | |
| Ford Credit Floorplan Master Owner Trust, | | | | | | | | | | | | |
| Series 2019-3, Class A1, 2.230%, 09/15/2024 | | | 36,300,000 | | | | 37,435,286 | | | | | |
| GM Financial Automobile Leasing Trust, | | | | | | | | | | | | |
| Series 2020-2, Class A3, 0.800%, 07/20/2023 | | | 9,500,000 | | | | 9,571,803 | | | | | |
| GMF Floorplan Owner Revolving Trust, | | | | | | | | | | | | |
Series 2020-1, Class A, 0.680%, 08/15/2025(2) | | | 8,900,000 | | | | 8,952,640 | | | | | |
| Hyundai Auto Lease Securitization Trust, | | | | | | | | | | | | |
Series 2020-A, Class A3, 1.950%, 07/15/2023(2) | | | 23,600,000 | | | | 23,982,785 | | | | | |
| Mercedes-Benz Master Owner Trust, | | | | | | | | | | | | |
Series 2019-BA, Class A, 2.610%, 05/15/2024(2) | | | 16,025,000 | | | | 16,555,480 | | | | | |
| PFS Financing Corp.: | | | | | | | | | | | | |
Series 2018-B, Class A, 2.890%, 02/15/2023(2) | | | 11,725,000 | | | | 11,749,424 | | | | | |
Series 2018-D, Class A, 3.190%, 04/17/2023(2) | | | 13,015,000 | | | | 13,106,181 | | | | | |
Series 2018-F, Class A, 3.520%, 10/16/2023(2) | | | 6,419,000 | | | | 6,579,528 | | | | | |
Series 2019-A, Class A2, 2.860%, 04/15/2024(2) | | | 7,675,000 | | | | 7,892,619 | | | | | |
| SoFi Consumer Loan Program LLC: | | | | | | | | | | | | |
Series 2017-3, Class A, 2.770%, 05/26/2026(2) | | | 365,502 | | | | 366,573 | | | | | |
Series 2017-4, Class A, 2.500%, 06/25/2026(2) | | | 313,131 | | | | 314,298 | | | | | |
| Synchrony Card Issuance Trust, | | | | | | | | | | | | |
| Series 2018-A1, Class A, 3.380%, 09/15/2024 | | | 33,970,000 | | | | 34,713,770 | | | | | |
| Towd Point Mortgage Trust: | | | | | | | | | | | | |
Series 2019-MH1, Class A1, 3.000%, 11/25/2058(2)(4) | | | 10,656,597 | | | | 10,923,886 | | | | | |
Series 2020-MH1, Class A1A, 2.184%, 02/25/2060(2)(4) | | | 19,019,254 | | | | 19,358,093 | | | | | |
Series 2020-MH1, Class A1, 2.250%, 02/25/2060(2)(4) | | | 24,674,667 | | | | 25,096,248 | | | | | |
| Verizon Owner Trust: | | | | | | | | | | | | |
| Series 2019-B, Class A1A, 2.330%, 12/20/2023 | | | 24,450,000 | | | | 24,933,953 | | | | | |
| Series 2020-B, Class A, 0.470%, 02/20/2025 | | | 45,175,000 | | | | 45,334,906 | | | | | |
| Volkswagen Auto Lease Trust, | | | | | | | | | | | | |
| Series 2019-A, Class A3, 1.990%, 11/21/2022 | | | 8,868,000 | | | | 8,999,879 | | | | | |
| Volkswagen Auto Loan Enhanced Trust, | | | | | | | | | | | | |
| Series 2020-1, Class A3, 0.980%, 11/20/2024 | | | 19,375,000 | | | | 19,578,058 | | | | | |
The accompanying notes are an integral part of these financial statements.
Baird Short-Term Bond Fund
Schedule of Investments, December 31, 2020
Long-Term Investments (cont.)
| | | Principal | | | | | | % of | |
| | | Amount | | | Value | | | Net Assets | |
| World Financial Network Credit Card Master Trust: | | | | | | | | | |
| Series 2016-A, Class A, 2.030%, 04/15/2025 | | $ | 16,710,000 | | | $ | 16,835,576 | | | | |
| Series 2019-A, Class A, 3.140%, 12/15/2025 | | | 58,210,000 | | | | 60,028,876 | | | | |
| Total Asset Backed Securities | | | | | | | | | | | |
| (Cost $542,025,509) | | | | | | | 548,107,072 | | | | 6.1 | % |
| Total Long-Term Investments | | | | | | | | | | | | |
| (Cost $8,749,191,690) | | | | | | | 8,887,077,742 | | | | 98.9 | % |
| Short-Term Investment | | | | | | | | | | | | |
| | | Shares | | | | | | | | | |
| Money Market Mutual Fund | | | | | | | | | | | | |
| First American Government Obligations | | | | | | | | | | | | |
Fund, Class U, 0.04%(5) | | | 324,227,630 | | | | 324,227,630 | | | | | |
| Total Short-Term Investment | | | | | | | | | | | | |
| (Cost $324,227,630) | | | | | | | 324,227,630 | | | | 3.6 | % |
| Total Investments | | | | | | | | | | | | |
| (Cost $9,073,419,320) | | | | | | | 9,211,305,372 | | | | 102.5 | % |
| Liabilities in Excess of Other Assets | | | | | | | (228,086,826 | ) | | | (2.5 | )% |
| TOTAL NET ASSETS | | | | | | $ | 8,983,218,546 | | | | 100.0 | % |
Notes to Schedule of Investments
CMT – Constant Maturity Treasury
LIBOR – London Inter-bank Offered Rate
SOFR – Secured Overnight Financing Rate
| (1) | Foreign security. |
| (2) | Security as defined in Rule 144A under the Securities Act of 1933 and classified as liquid under the Fund’s liquidity risk management program. Purchased in a private placement transaction; resale to the public may require registration or may extend only to qualified institutional buyers. At December 31, 2020, the value of these securities total $2,052,327,466, which represents 22.85% of total net assets. |
| (3) | Variable rate security based on a reference index and spread. The rate reported is the rate in effect as of December 31, 2020. |
| (4) | Variable rate security. The coupon is based on an underlying pool of loans. The rate reported is the rate in effect as of December 31, 2020. |
| (5) | Seven-day yield. |
| (6) | Security that, on the last payment date, missed a partial principal or interest payment. |
| (7) | Step-up bond; the interest rate shown is the rate in effect as of December 31, 2020. |
Summary of Fair Value Exposure at December 31, 2020
The Fund has adopted authoritative fair valuation accounting standards which establish a definition of fair value and set out a hierarchy for measuring fair value. These standards require additional disclosures about the various inputs and valuation techniques used to develop the measurements of fair value and a discussion on changes in valuation techniques and related inputs during the period. These standards define fair value as the price that would be received to sell an asset or paid to transfer a liability in an orderly transaction between market participants at the measurement date.
The accompanying notes are an integral part of these financial statements.
Baird Short-Term Bond Fund
Summary of Fair Value Exposure at December 31, 2020 (cont.)
The fair value hierarchy is organized into three levels based upon the assumptions (referred to as “inputs”) used in pricing the asset or liability. These standards state that “observable inputs” reflect the assumptions market participants would use in pricing the asset or liability based on market data obtained from independent sources and “unobservable inputs” reflect an entity’s own assumptions about the assumptions market participants would use in pricing the asset or liability. These inputs are summarized into three broad levels and described below:
| Level 1 – | Quoted prices (unadjusted) in active markets for identical assets or liabilities that the reporting entity can access at the measurement date. |
| Level 2 – | Inputs other than quoted prices included within Level 1 that are observable for the asset or liability, either directly or indirectly. |
| Level 3 – | Unobservable inputs for the asset or liability. |
The inputs or methodology used for valuing securities are not necessarily an indication of the risk associated with investing in those securities.
The following is a summary of the inputs used to value the Fund’s investments as of December 31, 2020:
| | | Level 1 | | | Level 2 | | | Level 3 | | | Total | |
| Long-Term Investments | | | | | | | | | | | | |
| U.S. Treasury Securities | | $ | — | | | $ | 2,995,103,667 | | | $ | — | | | $ | 2,995,103,667 | |
| Other Government Related Securities | | | — | | | | 12,221,030 | | | | — | | | | 12,221,030 | |
| Corporate Bonds | | | — | | | | 4,583,801,376 | | | | — | | | | 4,583,801,376 | |
| Municipal Bonds | | | — | | | | 256,689,161 | | | | — | | | | 256,689,161 | |
| Residential Mortgage-Backed Securities – | | | | | | | | | | | | | | | | |
| Non-U.S. Government Agency Issues | | | — | | | | 220,061,436 | | | | — | | | | 220,061,436 | |
| Commercial Mortgage-Backed Securities – | | | | | | | | | | | | | | | | |
| U.S. Government Agency Issues | | | — | | | | 7,522,536 | | | | — | | | | 7,522,536 | |
| Commercial Mortgage-Backed Securities – | | | | | | | | | | | | | | | | |
| Non-U.S. Government Agency Issues | | | — | | | | 263,571,464 | | | | — | | | | 263,571,464 | |
| Asset Backed Securities | | | — | | | | 548,107,072 | | | | — | | | | 548,107,072 | |
| Total Long-Term Investments | | | — | | | | 8,887,077,742 | | | | — | | | | 8,887,077,742 | |
| Short-Term Investment | | | | | | | | | | | | | | | | |
| Money Market Mutual Fund | | | 324,227,630 | | | | — | | | | — | | | | 324,227,630 | |
| Total Short-Term Investment | | | 324,227,630 | | | | — | | | | — | | | | 324,227,630 | |
| Total Investments | | $ | 324,227,630 | | | $ | 8,887,077,742 | | | $ | — | | | $ | 9,211,305,372 | |
Changes in valuation techniques may result in transfers into or out of assigned levels within the fair value hierarchy. There were no transfers into or out of Level 3 during the reporting period, as compared to the security classifications from the prior year’s annual report. See the Fund’s Valuation Policy in Note 2a to the financial statements.
The accompanying notes are an integral part of these financial statements.
Baird Intermediate Bond Fund
December 31, 2020 (Unaudited)
The Baird Intermediate Bond Fund seeks an annual rate of total return, before Fund expenses, greater than the annual rate of total return of the Bloomberg Barclays Intermediate U.S. Government/Credit Bond Index. The Bloomberg Barclays Intermediate U.S. Government/Credit Bond Index is an unmanaged, market value weighted index of investment grade, fixed-rate debt issues, including government and credit securities, with maturities between one and ten years.
Treasury yields fell across the curve in 2020, with the benchmark 10-year Treasury down 100 bps to finish the year at 0.92%, after hitting an all-time [intra-day] record low of 0.31% on March 9. The curve steepened, with the spread between 2-year and 30-year Treasuries increasing from 82 bps to 153 bps during the year, as yields in shorter maturities saw the largest decline. Starting in late February, the coronavirus (COVID-19) affected every aspect of the economy, leading to the swiftest equity bear market in history, with an over 33% peak-to-trough drop in the S&P 500 in just over a month ending March 23, and fixed income markets hitting levels of distress not seen since the Global Financial Crisis (GFC) in 2008. However, unlike 2008, the massive, coordinated monetary and fiscal policy response resulted in a much swifter recovery. U.S. unemployment dropped to 6.7% by year end after peaking at 14.7% in April as businesses reopened, and the Pfizer and Moderna vaccines offered hope for a return to normal sometime in 2021. The S&P 500 ended the year up 16% at record highs and credit spreads tightened through year end, completely erasing the pandemic-related widening in many sectors. The COVID-19 pandemic and the massive government policy response to it essentially created a full market cycle for spreads in the span of a calendar year.
During 2020, the Fund’s Institutional Class Shares generated strong absolute and relative returns and outperformed its benchmark by 99 basis points net of fees.
The primary factors contributing to the Fund’s absolute and relative performance in 2020 include:
| | | • | | Positive – Overweight to Investment Grade Credit (increased exposure post widening of the spread) |
| | | • | | Positive – Active positioning within Investment Grade Credit |
| | | | • | Positive – Underweight to the Other Government Sector in favor of Corporate Credit including Financials |
| | | | • | Positive – Security selection, including attractive new issue concessions |
| | • | Mortgage-Backed Securities (MBS) & Asset-Backed Securities (ABS) Positioning |
| | | • | | Positive – Exposure to ABS (increased exposure post widening of the spread) |
| | | • | | Positive – Exposure to Non-Agency Commercial Mortgage-Backed Securities (CMBS) & Non-Agency Residential Mortgage-Backed Securities (RMBS) |
We expect the economic impact of COVID-19 to linger well into 2021, particularly as it relates to the travel and hospitality service sectors. Yet, with the massive fiscal stimulus that is already in the pipeline, and likely more coming now that the Democratic Party has full, albeit narrow, control of Washington, above-average economic growth is very likely in 2021. Stronger growth may pressure inflation modestly higher, a goal of the Fed, translating into moderately higher intermediate and long-term rates. With short-term rates still anchored close to zero by the Fed, a steeper yield curve will enable investors to capture some added performance as bonds roll down the curve. We expect the roll-down return to be an important component of total return this year, as well as security selection, sector allocation, and the yield advantage the Fund enjoys above that of its benchmark. Strategic positioning across market sectors and along the yield curve (including the ability to thoughtfully reposition should spreads widen into volatility) will complement the always-important security selection process to help navigate through the current environment.
The Fund remains duration neutral with a modest overweight to Investment Grade corporate credit, particularly Financials. The Fund is also maintaining its allocation in the MBS/ABS sectors at the senior part of the capital structure given attractive relative valuations and the continued broad sector diversification benefit they provide to the overall portfolio. The Fund only purchases investment grade, U.S. dollar denominated securities in the cash bond market (no derivatives) and we believe the Fund is well positioned to add value relative to its benchmark.
Baird Intermediate Bond Fund
December 31, 2020 (Unaudited)
Portfolio Characteristics
Quality Distribution(1)(2)
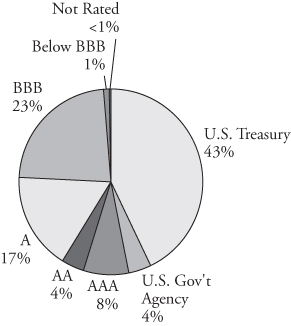
| | Net Assets | $5,319,604,851 | |
| | | | |
| | SEC 30-Day | | |
| | Yield(3) | | |
| | Institutional Class | 0.71% | |
| | Investor Class | 0.46% | |
| | | | |
| | Average | | |
| | Effective | | |
| | Duration | 4.12 years | |
| | | | |
| | Average | | |
| | Effective | | |
| | Maturity | 4.47 years | |
| | | | |
| | Annualized | | |
| | Expense | | |
| | Ratio(4) | | |
| | Institutional Class | 0.30% | |
| | | Investor Class | 0.55% | (5) |
Sector Weightings(1) | | | | |
| | | Portfolio | | |
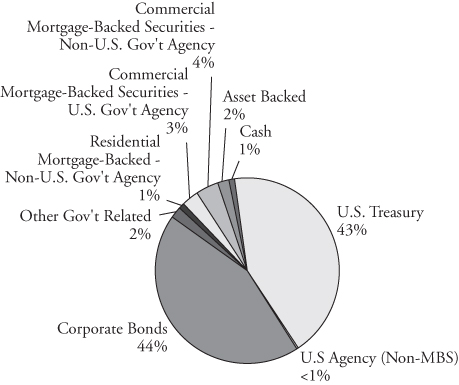 | | Turnover Rate | 37% | |
| | | | |
| | Number of | | |
| | Holdings | 509 | |
| | | | |
| | | | |
| | | | |
| | | | |
| | | | |
| | | | |
| | | | |
| | | | |
| | | | |
| | | | |
| | | | |
| | | | |
| | | | |
| | | | |
| | | | |
| | | | |
| | | | |
| | | | |
| | | | |
| | | | | |
| (1) | Percentages shown are based on the Fund’s total investments. |
| (2) | The quality profile is calculated on a market value-weighted basis using the highest credit quality rating for each security held by the Fund given by S&P, Moody’s or Fitch, each of which is a Nationally Recognized Statistical Rating Organization (NRSRO). NRSROs rate the credit quality of securities using a scale that generally ranges from AAA (highest) to D (lowest). |
| (3) | SEC yields are based on SEC guidelines and are calculated for the 30 days ended December 31, 2020. |
| (4) | Reflects expense ratios as stated in the Fund’s current prospectus. |
| (5) | Includes 0.25% 12b-1 fee. |
Baird Intermediate Bond Fund
December 31, 2020 (Unaudited)
Institutional ClassValue of a $25,000 Investment
Growth of a hypothetical investment of $25,000 made on 12/31/10, assuming reinvestment of all distributions.
Investor Class
Value of a $10,000 Investment
Growth of a hypothetical investment of $10,000 made on 12/31/10, assuming reinvestment of all distributions.
Baird Intermediate Bond Fund
December 31, 2020 (Unaudited)
Total Returns
| | | Average Annual |
| | One | Five | Ten | Since |
| For the Periods Ended December 31, 2020 | Year | Years | Years | Inception(1) |
| Institutional Class Shares | 7.42% | 4.09% | 3.72% | 4.89% |
| Investor Class Shares | 7.16% | 3.84% | 3.47% | 4.63% |
| Bloomberg Barclays Intermediate U.S. | | | | |
Government/Credit Bond Index(2) | 6.43% | 3.64% | 3.11% | 4.43% |
| (1) | For the period from September 29, 2000 (inception date) through December 31, 2020. |
| (2) | The Bloomberg Barclays Intermediate U.S. Government/Credit Bond Index is an unmanaged, market value weighted index of investment grade, fixed-rate debt issues, including government and corporate securities, with maturities between one and ten years. This Index does not reflect any deduction for fees, expenses or taxes. A direct investment in an index is not possible. |
The line graphs on the previous page and the returns shown in the table above reflect reinvestment of dividends and/or capital gains distributions in additional shares. The returns in the graphs and table do not reflect the deduction of taxes that a shareholder would pay on Fund distributions or the redemption of Fund shares. The returns reflect the actual performance for each period and do not include the impact of trades executed on the last business day of the period that were recorded on the first business day of the next period.
The Fund’s gross expense ratio for each Class, as reflected in the Fund’s current prospectus, is set forth under “Portfolio Characteristics”.
The Fund may invest in U.S. dollar denominated foreign securities which involve additional risks such as political and economic instability, and different and sometimes less strict financial reporting standards and regulation. The Fund may also invest in mortgage- and asset-backed securities, which include interest rate and prepayment risks more pronounced than those of other fixed income securities. U.S. and international markets have experienced significant periods of volatility in recent years and months due to a number of economic, political and global macro factors including the impact of the coronavirus (COVID-19) as a global pandemic and related public health issues, growth concerns in the U.S. and overseas, uncertainties regarding interest rates, trade tensions and the threat of tariffs imposed by the U.S. and other countries. These and other geopolitical events may cause market disruptions and could have an adverse effect on the value of the Fund’s investments.
Past performance does not guarantee future results. Investment return and principal value will fluctuate so that an investor’s shares, when redeemed, may be worth more or less than their original cost.
For information about the performance of the Fund as of the most recent month-end, please call 1-866-44BAIRD or visit www.bairdfunds.com. Mutual fund performance changes over time and current performance may be lower or higher than that stated.
Baird Intermediate Bond Fund
Schedule of Investments, December 31, 2020
Long-Term Investments
| | | Principal | | | | | | % of | |
| | | Amount | | | Value | | | Net Assets | |
| U.S. Treasury Securities | | | | | | | | | |
| U.S. Treasury Bonds: | | | | | | | | | |
| 1.750%, 03/31/2022 | | $ | 154,950,000 | | | $ | 158,097,422 | | | | |
| 1.875%, 03/31/2022 | | | 280,600,000 | | | | 286,738,125 | | | | |
| 2.500%, 05/15/2024 | | | 550,950,000 | | | | 593,691,665 | | | | |
| 2.250%, 11/15/2025 | | | 461,225,000 | | | | 503,672,113 | | | | |
| 2.000%, 11/15/2026 | | | 34,550,000 | | | | 37,604,166 | | | | |
| 2.250%, 11/15/2027 | | | 297,600,000 | | | | 330,452,248 | | | | |
| 3.125%, 11/15/2028 | | | 123,200,000 | | | | 145,866,876 | | | | |
| 1.625%, 08/15/2029 | | | 210,300,000 | | | | 224,971,710 | | | | |
| Total U.S. Treasury Securities | | | | | | | | | | | |
| (Cost $2,224,965,450) | | | | | | | 2,281,094,325 | | | | 42.9 | % |
| Other Government Related Securities | | | | | | | | | | | | |
| Sinopec Group Overseas Development [2016] Ltd., | | | | | | | | | | | | |
2.750%, 05/03/2021(1)(2) | | | 5,300,000 | | | | 5,330,489 | | | | | |
| Total Other Government Related Securities | | | | | | | | | | | | |
| (Cost $5,290,908) | | | | | | | 5,330,489 | | | | 0.1 | % |
| Corporate Bonds | | | | | | | | | | | | |
| Industrials | | | | | | | | | | | | |
| Abbott Laboratories, | | | | | | | | | | | | |
| 3.400%, 11/30/2023 | | | 4,853,000 | | | | 5,262,035 | | | | | |
| Agilent Technologies, Inc., | | | | | | | | | | | | |
| 3.050%, 09/22/2026 | | | 1,495,000 | | | | 1,631,359 | | | | | |
| Alimentation Couche-Tard, Inc., | | | | | | | | | | | | |
2.700%, 07/26/2022(1)(2) | | | 7,730,000 | | | | 7,989,605 | | | | | |
| Allegion PLC, | | | | | | | | | | | | |
3.500%, 10/01/2029(1) | | | 3,160,000 | | | | 3,506,806 | | | | | |
| Allegion US Holding Co., Inc., | | | | | | | | | | | | |
| 3.200%, 10/01/2024 | | | 4,523,000 | | | | 4,830,835 | | | | | |
| Anheuser-Busch InBev Worldwide, Inc.: | | | | | | | | | | | | |
| 3.650%, 02/01/2026 | | | 3,945,000 | | | | 4,459,308 | | | | | |
| 4.750%, 01/23/2029 | | | 835,000 | | | | 1,031,138 | | | | | |
| ArcelorMittal, | | | | | | | | | | | | |
4.550%, 03/11/2026(1) | | | 4,015,000 | | | | 4,511,036 | | | | | |
| AT&T, Inc.: | | | | | | | | | | | | |
| 4.350%, 03/01/2029 | | | 2,150,000 | | | | 2,564,221 | | | | | |
| 4.300%, 02/15/2030 | | | 9,604,000 | | | | 11,472,337 | | | | | |
| 2.750%, 06/01/2031 | | | 7,900,000 | | | | 8,442,122 | | | | | |
| 2.250%, 02/01/2032 | | | 1,000,000 | | | | 1,014,419 | | | | | |
2.550%, 12/01/2033(2) | | | 2,672,000 | | | | 2,739,169 | | | | | |
| Becton Dickinson and Co., | | | | | | | | | | | | |
| 7.000%, 08/01/2027 | | | 1,900,000 | | | | 2,424,459 | | | | | |
| Bemis Co., Inc., | | | | | | | | | | | | |
| 2.630%, 06/19/2030 | | | 4,525,000 | | | | 4,900,316 | | | | | |
The accompanying notes are an integral part of these financial statements.
Baird Intermediate Bond Fund
Schedule of Investments, December 31, 2020
Long-Term Investments (cont.)
| | | Principal | | | | | | % of | |
| | | Amount | | | Value | | | Net Assets | |
| Boardwalk Pipelines LP: | | | | | | | | | |
| 5.950%, 06/01/2026 | | $ | 1,360,000 | | | $ | 1,608,503 | | | |
|
|
| 4.800%, 05/03/2029 | | | 750,000 | | | | 859,417 | | | | | |
| Broadcom, Inc.: | | | | | | | | | | | | |
| 3.625%, 10/15/2024 | | | 8,000,000 | | | | 8,789,372 | | | | | |
| 3.150%, 11/15/2025 | | | 10,000,000 | | | | 10,919,517 | | | | | |
| Bunge Limited Finance Corp., | | | | | | | | | | | | |
| 3.750%, 09/25/2027 | | | 5,000,000 | | | | 5,701,413 | | | | | |
| Campbell Soup Co., | | | | | | | | | | | | |
| 3.950%, 03/15/2025 | | | 8,000,000 | | | | 9,016,395 | | | | | |
| Carrier Global Corp., | | | | | | | | | | | | |
| 2.242%, 02/15/2025 | | | 13,275,000 | | | | 14,047,111 | | | | | |
| CH Robinson Worldwide, Inc., | | | | | | | | | | | | |
| 4.200%, 04/15/2028 | | | 12,300,000 | | | | 14,551,168 | | | | | |
| Charter Communications Operating LLC: | | | | | | | | | | | | |
| 4.464%, 07/23/2022 | | | 10,548,000 | | | | 11,120,160 | | | | | |
| 4.908%, 07/23/2025 | | | 1,277,000 | | | | 1,483,169 | | | | | |
| 3.750%, 02/15/2028 | | | 5,830,000 | | | | 6,536,782 | | | | | |
| 4.200%, 03/15/2028 | | | 2,070,000 | | | | 2,388,215 | | | | | |
| 5.050%, 03/30/2029 | | | 3,000,000 | | | | 3,647,591 | | | | | |
| Cheniere Corpus Christi Holdings LLC, | | | | | | | | | | | | |
| 5.125%, 06/30/2027 | | | 2,000,000 | | | | 2,365,956 | | | | | |
| Cigna Corp., | | | | | | | | | | | | |
| 3.000%, 07/15/2023 | | | 5,655,000 | | | | 5,988,543 | | | | | |
| CK Hutchison International Ltd., | | | | | | | | | | | | |
3.250%, 04/11/2024(1)(2) | | | 10,000,000 | | | | 10,688,800 | | | | | |
| CNH Industrial Capital LLC: | | | | | | | | | | | | |
| 3.875%, 10/15/2021 | | | 3,000,000 | | | | 3,070,441 | | | | | |
| 4.200%, 01/15/2024 | | | 2,800,000 | | | | 3,071,398 | | | | | |
| CNH Industrial NV: | | | | | | | | | | | | |
4.500%, 08/15/2023(1) | | | 5,000,000 | | | | 5,451,936 | | | | | |
3.850%, 11/15/2027(1) | | | 2,243,000 | | | | 2,526,930 | | | | | |
| Coca-Cola Femsa SAB de CV, | | | | | | | | | | | | |
2.750%, 01/22/2030(1) | | | 8,875,000 | | | | 9,545,420 | | | | | |
| Columbia Pipeline Group, Inc., | | | | | | | | | | | | |
| 4.500%, 06/01/2025 | | | 630,000 | | | | 724,522 | | | | | |
| Comcast Corp., | | | | | | | | | | | | |
| 3.100%, 04/01/2025 | | | 8,925,000 | | | | 9,820,275 | | | | | |
| Conagra Brands, Inc., | | | | | | | | | | | | |
| 8.250%, 09/15/2030 | | | 1,140,000 | | | | 1,710,836 | | | | | |
| Constellation Brands, Inc.: | | | | | | | | | | | | |
| 2.700%, 05/09/2022 | | | 2,975,000 | | | | 3,059,811 | | | | | |
| 3.500%, 05/09/2027 | | | 3,625,000 | | | | 4,089,562 | | | | | |
The accompanying notes are an integral part of these financial statements.
Baird Intermediate Bond Fund
Schedule of Investments, December 31, 2020
Long-Term Investments (cont.)
| | | Principal | | | | | | % of | |
| | | Amount | | | Value | | | Net Assets | |
| Cox Communications, Inc.: | | | | | | | | | |
3.250%, 12/15/2022(2) | | $ | 3,610,000 | | | $ | 3,802,446 | | | |
|
|
3.850%, 02/01/2025(2) | | | 2,800,000 | | | | 3,122,595 | | | | | |
3.350%, 09/15/2026(2) | | | 1,927,000 | | | | 2,165,242 | | | | | |
| CVS Health Corp.: | | | | | | | | | | | | |
| 3.625%, 04/01/2027 | | | 2,500,000 | | | | 2,844,938 | | | | | |
| 1.300%, 08/21/2027 | | | 5,750,000 | | | | 5,776,702 | | | | | |
| 4.300%, 03/25/2028 | | | 8,531,000 | | | | 10,151,556 | | | | | |
| CVS Pass-Through Trust, | | | | | | | | | | | | |
5.926%, 01/10/2034(2) | | | 2,017,093 | | | | 2,446,499 | | | | | |
| Daimler Finance North America LLC: | | | | | | | | | | | | |
3.750%, 11/05/2021(2) | | | 6,800,000 | | | | 6,988,449 | | | | | |
1.750%, 03/10/2023(2) | | | 11,000,000 | | | | 11,293,408 | | | | | |
| Dentsply Sirona, | | | | | | | | | | | | |
| 3.250%, 06/01/2030 | | | 10,600,000 | | | | 11,805,551 | | | | | |
| Diageo Capital PLC, | | | | | | | | | | | | |
2.000%, 04/29/2030(1) | | | 3,275,000 | | | | 3,415,202 | | | | | |
| Diamond 1 Finance Corp. / Diamond 2 Finance Corp.: | | | | | | | | | | | | |
5.450%, 06/15/2023(2) | | | 12,100,000 | | | | 13,382,850 | | | | | |
6.020%, 06/15/2026(2) | | | 3,000,000 | | | | 3,659,835 | | | | | |
| Dollar Tree, Inc., | | | | | | | | | | | | |
| 3.700%, 05/15/2023 | | | 5,050,000 | | | | 5,405,798 | | | | | |
| Dow Chemical Co., | | | | | | | | | | | | |
| 4.550%, 11/30/2025 | | | 2,515,000 | | | | 2,942,894 | | | | | |
| DuPont de Nemours, Inc., | | | | | | | | | | | | |
| 4.493%, 11/15/2025 | | | 4,175,000 | | | | 4,873,686 | | | | | |
| DXC Technology Co.: | | | | | | | | | | | | |
| 4.450%, 09/18/2022 | | | 14,000,000 | | | | 14,735,250 | | | | | |
| 4.250%, 04/15/2024 | | | 5,700,000 | | | | 6,219,252 | | | | | |
| 4.125%, 04/15/2025 | | | 4,555,000 | | | | 5,035,301 | | | | | |
| Ecolab, Inc., | | | | | | | | | | | | |
| 4.800%, 03/24/2030 | | | 10,000,000 | | | | 12,759,909 | | | | | |
| Edward-Elmhurst Healthcare, | | | | | | | | | | | | |
| 3.500%, 05/04/2023 | | | 6,575,000 | | | | 6,908,882 | | | | | |
| EI du Pont de Nemours and Co., | | | | | | | | | | | | |
| 1.700%, 07/15/2025 | | | 10,000,000 | | | | 10,421,072 | | | | | |
| Emerson Electric Co., | | | | | | | | | | | | |
| 1.950%, 10/15/2030 | | | 12,600,000 | | | | 13,293,485 | | | | | |
| Energy Transfer Operating LP: | | | | | | | | | | | | |
| 4.500%, 04/15/2024 | | | 1,000,000 | | | | 1,093,682 | | | | | |
| 5.500%, 06/01/2027 | | | 17,931,000 | | | | 21,104,758 | | | | | |
| EnLink Midstream Partners LP, | | | | | | | | | | | | |
| 4.400%, 04/01/2024 | | | 10,000,000 | | | | 9,867,700 | | | | | |
| EQT Midstream Partners LP, | | | | | | | | | | | | |
| 4.125%, 12/01/2026 | | | 5,000,000 | | | | 5,037,500 | | | | | |
The accompanying notes are an integral part of these financial statements.
Baird Intermediate Bond Fund
Schedule of Investments, December 31, 2020
Long-Term Investments (cont.)
| | | Principal | | | | | | % of | |
| | | Amount | | | Value | | | Net Assets | |
| Equifax, Inc., | | | | | | | | | |
| 2.600%, 12/01/2024 | | $ | 5,000,000 | | | $ | 5,355,278 | | | |
|
|
| Equinix, Inc., | | | | | | | | | | | | |
| 1.800%, 07/15/2027 | | | 7,000,000 | | | | 7,205,745 | | | | | |
| ERAC USA Finance LLC, | | | | | | | | | | | | |
2.600%, 12/01/2021(2) | | | 4,825,000 | | | | 4,908,436 | | | | | |
| Exxon Mobil Corp.: | | | | | | | | | | | | |
| 1.571%, 04/15/2023 | | | 7,500,000 | | | | 7,712,990 | | | | | |
| 2.992%, 03/19/2025 | | | 11,250,000 | | | | 12,313,175 | | | | | |
| Ferguson Finance PLC, | | | | | | | | | | | | |
4.500%, 10/24/2028(1)(2) | | | 5,930,000 | | | | 7,106,940 | | | | | |
| Fidelity National Information Services, Inc.: | | | | | | | | | | | | |
| 3.500%, 04/15/2023 | | | 2,373,000 | | | | 2,518,346 | | | | | |
| 3.875%, 06/05/2024 | | | 1,247,000 | | | | 1,372,384 | | | | | |
| 3.000%, 08/15/2026 | | | 2,027,000 | | | | 2,255,467 | | | | | |
| 4.250%, 05/15/2028 | | | 8,690,000 | | | | 10,343,525 | | | | | |
| 3.750%, 05/21/2029 | | | 7,000,000 | | | | 8,217,978 | | | | | |
| Fiserv, Inc.: | | | | | | | | | | | | |
| 3.500%, 10/01/2022 | | | 3,050,000 | | | | 3,191,064 | | | | | |
| 2.250%, 06/01/2027 | | | 16,000,000 | | | | 17,051,946 | | | | | |
| 4.200%, 10/01/2028 | | | 1,035,000 | | | | 1,234,028 | | | | | |
| FMC Corp., | | | | | | | | | | | | |
| 4.100%, 02/01/2024 | | | 4,685,000 | | | | 5,099,655 | | | | | |
| Ford Motor Credit Co. LLC: | | | | | | | | | | | | |
| 5.750%, 02/01/2021 | | | 2,000,000 | | | | 2,005,000 | | | | | |
| 3.336%, 03/18/2021 | | | 1,800,000 | | | | 1,804,500 | | | | | |
| 3.339%, 03/28/2022 | | | 2,000,000 | | | | 2,020,000 | | | | | |
| 2.979%, 08/03/2022 | | | 12,000,000 | | | | 12,200,400 | | | | | |
| 4.250%, 09/20/2022 | | | 1,545,000 | | | | 1,594,687 | | | | | |
| Fortune Brands Home & Security, Inc.: | | | | | | | | | | | | |
| 4.000%, 09/21/2023 | | | 5,775,000 | | | | 6,292,226 | | | | | |
| 3.250%, 09/15/2029 | | | 2,725,000 | | | | 3,019,626 | | | | | |
| Fox Corp., | | | | | | | | | | | | |
| 4.030%, 01/25/2024 | | | 5,155,000 | | | | 5,677,427 | | | | | |
| Freeport-McMoRan, Inc., | | | | | | | | | | | | |
| 3.875%, 03/15/2023 | | | 1,100,000 | | | | 1,147,630 | | | | | |
| General Motors Financial Co., Inc.: | | | | | | | | | | | | |
| 4.375%, 09/25/2021 | | | 5,325,000 | | | | 5,468,788 | | | | | |
| 4.200%, 11/06/2021 | | | 2,000,000 | | | | 2,061,434 | | | | | |
| 3.450%, 01/14/2022 | | | 1,475,000 | | | | 1,514,463 | | | | | |
| 3.150%, 06/30/2022 | | | 1,000,000 | | | | 1,035,328 | | | | | |
| 4.150%, 06/19/2023 | | | 1,325,000 | | | | 1,425,463 | | | | | |
| 1.700%, 08/18/2023 | | | 10,000,000 | | | | 10,257,534 | | | | | |
| 2.900%, 02/26/2025 | | | 4,000,000 | | | | 4,271,686 | | | | | |
The accompanying notes are an integral part of these financial statements.
Baird Intermediate Bond Fund
Schedule of Investments, December 31, 2020
Long-Term Investments (cont.)
| | | Principal | | | | | | % of | |
| | | Amount | | | Value | | | Net Assets | |
| Genpact Luxembourg Sarl, | | | | | | | | | |
3.375%, 12/01/2024(1) | | $ | 7,000,000 | | | $ | 7,621,593 | | | |
|
|
| Glencore Funding LLC: | | | | | | | | | | | | |
4.125%, 05/30/2023(2) | | | 1,750,000 | | | | 1,892,537 | | | | | |
4.125%, 03/12/2024(2) | | | 5,000,000 | | | | 5,501,966 | | | | | |
4.625%, 04/29/2024(2) | | | 1,000,000 | | | | 1,116,782 | | | | | |
4.000%, 03/27/2027(2) | | | 4,850,000 | | | | 5,486,235 | | | | | |
3.875%, 10/27/2027(2) | | | 1,150,000 | | | | 1,295,935 | | | | | |
2.500%, 09/01/2030(2) | | | 6,343,000 | | | | 6,468,888 | | | | | |
| Global Payments, Inc., | | | | | | | | | | | | |
| 3.750%, 06/01/2023 | | | 2,325,000 | | | | 2,485,255 | | | | | |
| Grupo Bimbo SAB de CV: | | | | | | | | | | | | |
4.500%, 01/25/2022(1)(2) | | | 8,129,000 | | | | 8,447,575 | | | | | |
3.875%, 06/27/2024(1)(2) | | | 5,340,000 | | | | 5,843,135 | | | | | |
| HP, Inc., | | | | | | | | | | | | |
| 2.200%, 06/17/2025 | | | 18,325,000 | | | | 19,401,391 | | | | | |
| Husky Energy, Inc., | | | | | | | | | | | | |
4.400%, 04/15/2029(1) | | | 5,000,000 | | | | 5,563,190 | | | | | |
| Hutchison Whampoa International Ltd., | | | | | | | | | | | | |
4.625%, 01/13/2022(1)(2) | | | 7,000,000 | | | | 7,272,165 | | | | | |
| Hyundai Capital America, | | | | | | | | | | | | |
3.450%, 03/12/2021(2) | | | 9,000,000 | | | | 9,044,550 | | | | | |
| Ingersoll-Rand Co., | | | | | | | | | | | | |
6.391%, 11/15/2027(1) | | | 1,195,000 | | | | 1,514,095 | | | | | |
| International Business Machines Corp., | | | | | | | | | | | | |
| 3.300%, 05/15/2026 | | | 6,150,000 | | | | 6,949,242 | | | | | |
| JB Hunt Transport Services, Inc., | | | | | | | | | | | | |
| 3.875%, 03/01/2026 | | | 3,000,000 | | | | 3,444,882 | | | | | |
| Kerry Group Financial Services Unlimited Co., | | | | | | | | | | | | |
3.200%, 04/09/2023(1)(2) | | | 5,000,000 | | | | 5,246,817 | | | | | |
| Kinder Morgan, Inc.: | | | | | | | | | | | | |
5.625%, 11/15/2023(2) | | | 1,000,000 | | | | 1,128,162 | | | | | |
| 7.800%, 08/01/2031 | | | 12,425,000 | | | | 17,743,871 | | | | | |
| Kraft Heinz Foods Co., | | | | | | | | | | | | |
| 6.375%, 07/15/2028 | | | 7,929,000 | | | | 9,743,913 | | | | | |
| Lear Corp., | | | | | | | | | | | | |
| 3.800%, 09/15/2027 | | | 1,000,000 | | | | 1,121,825 | | | | | |
| Lennox International, Inc., | | | | | | | | | | | | |
| 1.350%, 08/01/2025 | | | 7,000,000 | | | | 7,161,066 | | | | | |
| LYB International Finance III LLC, | | | | | | | | | | | | |
| 2.250%, 10/01/2030 | | | 5,000,000 | | | | 5,143,972 | | | | | |
| Microchip Technology, Inc.: | | | | | | | | | | | | |
| 3.922%, 06/01/2021 | | | 7,000,000 | | | | 7,099,395 | | | | | |
0.972%, 02/15/2024(2) | | | 5,000,000 | | | | 5,012,239 | | | | | |
The accompanying notes are an integral part of these financial statements.
Baird Intermediate Bond Fund
Schedule of Investments, December 31, 2020
Long-Term Investments (cont.)
| | | Principal | | | | | | % of | |
| | | Amount | | | Value | | | Net Assets | |
| Midwest Connector Capital Co. LLC, | | | | | | | | | |
3.900%, 04/01/2024(2) | | $ | 7,450,000 | | | $ | 7,636,250 | | | |
|
|
| Mosaic Co., | | | | | | | | | | | | |
| 4.250%, 11/15/2023 | | | 8,606,000 | | | | 9,393,103 | | | | | |
| MPLX LP: | | | | | | | | | | | | |
| 4.875%, 06/01/2025 | | | 10,219,000 | | | | 11,803,654 | | | | | |
| 4.800%, 02/15/2029 | | | 3,475,000 | | | | 4,199,757 | | | | | |
| Newell Brands, Inc., | | | | | | | | | | | | |
| 3.850%, 04/01/2023 | | | 3,166,000 | | | | 3,320,786 | | | | | |
| Nissan Motor Acceptance Corp., | | | | | | | | | | | | |
3.650%, 09/21/2021(2) | | | 7,210,000 | | | | 7,335,647 | | | | | |
| Nutrien Ltd., | | | | | | | | | | | | |
3.150%, 10/01/2022(1) | | | 1,306,000 | | | | 1,358,289 | | | | | |
| nVent Finance Sarl, | | | | | | | | | | | | |
3.950%, 04/15/2023(1) | | | 18,275,000 | | | | 19,243,971 | | | | | |
| NXP Semiconductors NV: | | | | | | | | | | | | |
3.875%, 09/01/2022(1)(2) | | | 7,000,000 | | | | 7,377,623 | | | | | |
4.875%, 03/01/2024(1)(2) | | | 5,790,000 | | | | 6,530,655 | | | | | |
| Occidental Petroleum Corp.: | | | | | | | | | | | | |
| 2.900%, 08/15/2024 | | | 5,000,000 | | | | 4,812,500 | | | | | |
| 7.500%, 10/15/2026 | | | 1,288,000 | | | | 1,310,476 | | | | | |
| ONEOK, Inc.: | | | | | | | | | | | | |
| 7.500%, 09/01/2023 | | | 7,470,000 | | | | 8,646,500 | | | | | |
| 2.750%, 09/01/2024 | | | 3,300,000 | | | | 3,481,956 | | | | | |
| Oracle Corp., | | | | | | | | | | | | |
| 2.800%, 04/01/2027 | | | 10,500,000 | | | | 11,580,219 | | | | | |
| Orange SA, | | | | | | | | | | | | |
9.000%, 03/01/2031(1) | | | 4,125,000 | | | | 6,785,260 | | | | | |
| Penske Truck Leasing Co.: | | | | | | | | | | | | |
2.700%, 11/01/2024(2) | | | 8,000,000 | | | | 8,570,595 | | | | | |
3.950%, 03/10/2025(2) | | | 12,000,000 | | | | 13,440,805 | | | | | |
| PepsiCo, Inc., | | | | | | | | | | | | |
| 2.625%, 03/19/2027 | | | 5,650,000 | | | | 6,216,358 | | | | | |
| Phillips 66, | | | | | | | | | | | | |
| 2.150%, 12/15/2030 | | | 10,000,000 | | | | 10,151,710 | | | | | |
| Phillips 66 Partners LP, | | | | | | | | | | | | |
| 3.605%, 02/15/2025 | | | 2,000,000 | | | | 2,161,499 | | | | | |
| POSCO: | | | | | | | | | | | | |
5.250%, 04/14/2021(1)(2) | | | 3,000,000 | | | | 3,035,520 | | | | | |
4.000%, 08/01/2023(1)(2) | | | 5,000,000 | | | | 5,391,480 | | | | | |
| Procter & Gamble Co., | | | | | | | | | | | | |
| 2.800%, 03/25/2027 | | | 10,000,000 | | | | 11,141,388 | | | | | |
| Regency Energy Partners LP / | | | | | | | | | | | | |
| Regency Energy Finance Corp., | | | | | | | | | | | | |
| 4.500%, 11/01/2023 | | | 1,100,000 | | | | 1,190,994 | | | | | |
The accompanying notes are an integral part of these financial statements.
Baird Intermediate Bond Fund
Schedule of Investments, December 31, 2020
Long-Term Investments (cont.)
| | | Principal | | | | | | % of | |
| | | Amount | | | Value | | | Net Assets | |
| Roper Technologies, Inc.: | | | | | | | | | |
| 3.800%, 12/15/2026 | | $ | 1,450,000 | | | $ | 1,675,216 | | | |
|
|
| 2.000%, 06/30/2030 | | | 14,675,000 | | | | 14,999,565 | | | | | |
| Sabine Pass Liquefaction LLC: | | | | | | | | | | | | |
| 5.875%, 06/30/2026 | | | 9,730,000 | | | | 11,764,566 | | | | | |
4.500%, 05/15/2030(2) | | | 4,500,000 | | | | 5,333,749 | | | | | |
| Samarco Mineracao SA, | | | | | | | | | | | | |
5.375%, 09/26/2024(1)(2)(9) | | | 1,675,000 | | | | 1,197,625 | | | | | |
| Schneider Electric SE, | | | | | | | | | | | | |
2.950%, 09/27/2022(1)(2) | | | 2,000,000 | | | | 2,086,626 | | | | | |
| Shell International Finance BV: | | | | | | | | | | | | |
2.375%, 04/06/2025(1) | | | 5,000,000 | | | | 5,362,502 | | | | | |
2.750%, 04/06/2030(1) | | | 5,000,000 | | | | 5,531,669 | | | | | |
| Sherwin-Williams Co., | | | | | | | | | | | | |
| 3.300%, 02/01/2025 | | | 3,851,000 | | | | 4,175,574 | | | | | |
| Smith & Nephew PLC, | | | | | | | | | | | | |
2.032%, 10/14/2030(1) | | | 5,000,000 | | | | 5,093,591 | | | | | |
| Smithfield Foods, Inc., | | | | | | | | | | | | |
2.650%, 10/03/2021(2) | | | 8,000,000 | | | | 8,070,712 | | | | | |
| Solvay Finance America LLC, | | | | | | | | | | | | |
4.450%, 12/03/2025(2) | | | 6,145,000 | | | | 7,025,808 | | | | | |
| Southern Natural Gas Co. LLC, | | | | | | | | | | | | |
| 8.000%, 03/01/2032 | | | 2,523,000 | | | | 3,603,812 | | | | | |
| Sysco Corp., | | | | | | | | | | | | |
| 2.600%, 06/12/2022 | | | 150,000 | | | | 154,591 | | | | | |
| TC PipeLines LP: | | | | | | | | | | | | |
| 4.375%, 03/13/2025 | | | 5,500,000 | | | | 6,203,189 | | | | | |
| 3.900%, 05/25/2027 | | | 13,425,000 | | | | 15,099,566 | | | | | |
| Telefonica Emisiones SA, | | | | | | | | | | | | |
5.462%, 02/16/2021(1) | | | 650,000 | | | | 653,641 | | | | | |
| Toyota Motor Credit Corp., | | | | | | | | | | | | |
| 2.900%, 03/30/2023 | | | 10,000,000 | | | | 10,578,962 | | | | | |
| TransCanada PipeLines Ltd., | | | | | | | | | | | | |
9.875%, 01/01/2021(1) | | | 556,000 | | | | 556,000 | | | | | |
| Tyson Foods, Inc., | | | | | | | | | | | | |
| 4.000%, 03/01/2026 | | | 3,000,000 | | | | 3,450,795 | | | | | |
| Vale Overseas Ltd., | | | | | | | | | | | | |
6.250%, 08/10/2026(1) | | | 5,830,000 | | | | 7,229,200 | | | | | |
| Valero Energy Corp., | | | | | | | | | | | | |
| 3.400%, 09/15/2026 | | | 4,985,000 | | | | 5,465,796 | | | | | |
| Verisk Analytics, Inc., | | | | | | | | | | | | |
| 4.125%, 03/15/2029 | | | 3,000,000 | | | | 3,605,163 | | | | | |
| Verizon Communications, Inc.: | | | | | | | | | | | | |
| 3.376%, 02/15/2025 | | | 853,000 | | | | 947,372 | | | | | |
| 4.125%, 03/16/2027 | | | 3,196,000 | | | | 3,767,093 | | | | | |
The accompanying notes are an integral part of these financial statements.
Baird Intermediate Bond Fund
Schedule of Investments, December 31, 2020
Long-Term Investments (cont.)
| | | Principal | | | | | | % of | |
| | | Amount | | | Value | | | Net Assets | |
| Verizon Communications, Inc.: (cont.) | | | | | | | | | |
| 3.000%, 03/22/2027 | | $ | 13,000,000 | | | $ | 14,422,778 | | | |
|
|
| 4.329%, 09/21/2028 | | | 2,051,000 | | | | 2,469,875 | | | | | |
| 4.016%, 12/03/2029 | | | 5,628,000 | | | | 6,692,190 | | | | | |
| VISA, Inc., | | | | | | | | | | | | |
| 1.900%, 04/15/2027 | | | 4,775,000 | | | | 5,082,106 | | | | | |
| Vodafone Group PLC, | | | | | | | | | | | | |
3.750%, 01/16/2024(1) | | | 3,940,000 | | | | 4,305,463 | | | | | |
| Volkswagen Group of America Finance LLC: | | | | | | | | | | | | |
| 1.154%, 11/12/2021 | | | | | | | | | | | | |
(3 Month LIBOR USD + 0.940%)(2)(3) | | | 1,800,000 | | | | 1,812,979 | | | | | |
4.000%, 11/12/2021(2) | | | 8,000,000 | | | | 8,244,219 | | | | | |
0.875%, 11/22/2023(2) | | | 6,875,000 | | | | 6,913,730 | | | | | |
2.850%, 09/26/2024(2) | | | 8,600,000 | | | | 9,184,740 | | | | | |
| Wabtec Corp.: | | | | | | | | | | | | |
| 4.375%, 08/15/2023 | | | 12,302,000 | | | | 12,982,880 | | | | | |
| 3.450%, 11/15/2026 | | | 5,000,000 | | | | 5,488,853 | | | | | |
| Walgreens Boots Alliance, Inc., | | | | | | | | | | | | |
| 3.200%, 04/15/2030 | | | 6,335,000 | | | | 6,881,748 | | | | | |
| Waste Management, Inc., | | | | | | | | | | | | |
| 3.125%, 03/01/2025 | | | 4,000,000 | | | | 4,379,267 | | | | | |
| Western Midstream Operating LP, | | | | | | | | | | | | |
| 4.500%, 03/01/2028 | | | 7,195,000 | | | | 7,457,617 | | | | | |
| Williams Companies, Inc.: | | | | | | | | | | | | |
| 3.700%, 01/15/2023 | | | 1,775,000 | | | | 1,880,302 | | | | | |
| 4.300%, 03/04/2024 | | | 14,329,000 | | | | 15,789,129 | | | | | |
| WRKCo, Inc., | | | | | | | | | | | | |
| 3.900%, 06/01/2028 | | | 8,275,000 | | | | 9,594,488 | | | | | |
| Yara International ASA, | | | | | | | | | | | | |
3.800%, 06/06/2026(1)(2) | | | 650,000 | | | | 725,644 | | | | | |
| Zimmer Biomet Holdings, Inc., | | | | | | | | | | | | |
| 3.700%, 03/19/2023 | | | 10,000,000 | | | | 10,667,518 | | | | | |
| Zoetis, Inc.: | | | | | | | | | | | | |
| 3.250%, 02/01/2023 | | | 7,500,000 | | | | 7,889,156 | | | | | |
| 4.500%, 11/13/2025 | | | 2,000,000 | | | | 2,334,556 | | | | | |
| Total Industrials | | | | | | | | | | | | |
| (Cost $1,105,052,297) | | | | | | | 1,191,499,291 | | | | 22.4 | % |
| Utilities | | | | | | | | | | | | |
| Ausgrid Finance Pty Ltd., | | | | | | | | | | | | |
3.850%, 05/01/2023(1)(2) | | | 6,200,000 | | | | 6,547,026 | | | | | |
| Avangrid, Inc., | | | | | | | | | | | | |
| 3.800%, 06/01/2029 | | | 10,975,000 | | | | 12,587,188 | | | | | |
| Berkshire Hathaway Energy Co., | | | | | | | | | | | | |
4.050%, 04/15/2025(2) | | | 14,925,000 | | | | 16,899,127 | | | | | |
The accompanying notes are an integral part of these financial statements.
Baird Intermediate Bond Fund
Schedule of Investments, December 31, 2020
Long-Term Investments (cont.)
| | | Principal | | | | | | % of | |
| | | Amount | | | Value | | | Net Assets | |
| Edison International: | | | | | | | | | |
| 2.950%, 03/15/2023 | | $ | 2,650,000 | | | $ | 2,753,515 | | | |
|
|
| 4.125%, 03/15/2028 | | | 13,600,000 | | | | 15,164,529 | | | | | |
| Enel Finance International NV: | | | | | | | | | | | | |
3.625%, 05/25/2027(1)(2) | | | 1,550,000 | | | | 1,758,814 | | | | | |
3.500%, 04/06/2028(1)(2) | | | 13,550,000 | | | | 15,432,062 | | | | | |
| Entergy Corp., | | | | | | | | | | | | |
| 2.800%, 06/15/2030 | | | 12,425,000 | | | | 13,418,745 | | | | | |
| FirstEnergy Corp., | | | | | | | | | | | | |
| 2.050%, 03/01/2025 | | | 6,450,000 | | | | 6,424,186 | | | | | |
| ITC Holdings Corp., | | | | | | | | | | | | |
2.950%, 05/14/2030(2) | | | 15,717,000 | | | | 17,179,142 | | | | | |
| Oncor Electric Delivery Co. LLC, | | | | | | | | | | | | |
| 2.750%, 05/15/2030 | | | 6,000,000 | | | | 6,717,939 | | | | | |
| PPL Capital Funding, Inc., | | | | | | | | | | | | |
| 3.400%, 06/01/2023 | | | 2,475,000 | | | | 2,628,428 | | | | | |
| RGS I&M Funding Corp., | | | | | | | | | | | | |
| 9.820%, 12/07/2022 | | | 184,811 | | | | 190,207 | | | | | |
| Talent Yield Investments Ltd., | | | | | | | | | | | | |
4.500%, 04/25/2022(1)(2) | | | 3,800,000 | | | | 3,950,796 | | | | | |
| Total Utilities | | | | | | | | | | | | |
| (Cost $109,968,757) | | | | | | | 121,651,704 | | | | 2.3 | % |
| Financials | | | | | | | | | | | | |
| ABN AMRO Bank NV, | | | | | | | | | | | | |
4.750%, 07/28/2025(1)(2) | | | 14,323,000 | | | | 16,483,639 | | | | | |
| AerCap Holdings NV, | | | | | | | | | | | | |
2.875%, 08/14/2024(1) | | | 5,000,000 | | | | 5,199,930 | | | | | |
| Aetna, Inc., | | | | | | | | | | | | |
| 2.800%, 06/15/2023 | | | 4,010,000 | | | | 4,219,138 | | | | | |
| AIA Group Ltd., | | | | | | | | | | | | |
3.200%, 03/11/2025(1)(2) | | | 3,000,000 | | | | 3,236,550 | | | | | |
| Air Lease Corp., | | | | | | | | | | | | |
| 2.250%, 01/15/2023 | | | 3,800,000 | | | | 3,901,532 | | | | | |
| American International Group, Inc.: | | | | | | | | | | | | |
| 4.875%, 06/01/2022 | | | 6,000,000 | | | | 6,365,773 | | | | | |
| 4.125%, 02/15/2024 | | | 1,000,000 | | | | 1,107,232 | | | | | |
| AmSouth Bancorporation, | | | | | | | | | | | | |
| 6.750%, 11/01/2025 | | | 630,000 | | | | 773,530 | | | | | |
| Anthem, Inc.: | | | | | | | | | | | | |
| 3.350%, 12/01/2024 | | | 10,000,000 | | | | 11,018,275 | | | | | |
| 2.375%, 01/15/2025 | | | 12,000,000 | | | | 12,834,604 | | | | | |
| Banco Santander SA, | | | | | | | | | | | | |
3.500%, 04/11/2022(1) | | | 4,400,000 | | | | 4,569,197 | | | | | |
The accompanying notes are an integral part of these financial statements.
Baird Intermediate Bond Fund
Schedule of Investments, December 31, 2020
Long-Term Investments (cont.)
| | | Principal | | | | | | % of | |
| | | Amount | | | Value | | | Net Assets | |
| Bank of America Corp.: | | | | | | | | | |
| 3.300%, 01/11/2023 | | $ | 4,710,000 | | | $ | 4,993,589 | | | |
|
|
| 2.816%, 07/21/2023 | | | | | | | | | | | | |
(3 Month LIBOR USD + 0.930%)(3) | | | 3,500,000 | | | | 3,634,509 | | | | | |
| 4.000%, 04/01/2024 | | | 1,596,000 | | | | 1,771,658 | | | | | |
| 3.864%, 07/23/2024 | | | | | | | | | | | | |
(3 Month LIBOR USD + 0.940%)(3) | | | 10,000,000 | | | | 10,842,015 | | | | | |
| 3.458%, 03/15/2025 | | | | | | | | | | | | |
(3 Month LIBOR USD + 0.970%)(3) | | | 5,060,000 | | | | 5,509,286 | | | | | |
| 3.093%, 10/01/2025 | | | | | | | | | | | | |
(3 Month LIBOR USD + 1.090%)(3) | | | 3,295,000 | | | | 3,566,891 | | | | | |
| 3.705%, 04/24/2028 | | | | | | | | | | | | |
(3 Month LIBOR USD + 1.512%)(3) | | | 5,050,000 | | | | 5,749,216 | | | | | |
| 3.419%, 12/20/2028 | | | | | | | | | | | | |
(3 Month LIBOR USD + 1.040%)(3) | | | 1,519,000 | | | | 1,715,777 | | | | | |
| Bank of Montreal, | | | | | | | | | | | | |
3.300%, 02/05/2024(1) | | | 10,000,000 | | | | 10,846,074 | | | | | |
| Bank of New Zealand, | | | | | | | | | | | | |
3.500%, 02/20/2024(1)(2) | | | 5,000,000 | | | | 5,432,334 | | | | | |
| Bank of Nova Scotia: | | | | | | | | | | | | |
1.625%, 05/01/2023(1) | | | 10,000,000 | | | | 10,287,745 | | | | | |
4.500%, 12/16/2025(1) | | | 7,000,000 | | | | 8,161,595 | | | | | |
| Banque Federative du Credit Mutuel SA, | | | | | | | | | | | | |
3.750%, 07/20/2023(1)(2) | | | 8,000,000 | | | | 8,645,752 | | | | | |
| Barclays Bank PLC, | | | | | | | | | | | | |
10.180%, 06/12/2021(1)(2) | | | 5,000,000 | | | | 5,200,243 | | | | | |
| Barclays PLC: | | | | | | | | | | | | |
3.684%, 01/10/2023(1) | | | 7,350,000 | | | | 7,575,269 | | | | | |
| 3.932%, 05/07/2025 | | | | | | | | | | | | |
(3 Month LIBOR USD + 1.610%)(1)(3) | | | 4,500,000 | | | | 4,922,976 | | | | | |
4.337%, 01/10/2028(1) | | | 2,275,000 | | | | 2,613,492 | | | | | |
| BBVA USA: | | | | | | | | | | | | |
| 2.875%, 06/29/2022 | | | 3,475,000 | | | | 3,601,079 | | | | | |
| 3.875%, 04/10/2025 | | | 4,200,000 | | | | 4,709,838 | | | | | |
| BNP Paribas SA: | | | | | | | | | | | | |
3.500%, 03/01/2023(1)(2) | | | 10,000,000 | | | | 10,641,257 | | | | | |
| 2.819%, 11/19/2025 | | | | | | | | | | | | |
(3 Month LIBOR USD + 1.111%)(1)(2)(3) | | | 5,000,000 | | | | 5,329,615 | | | | | |
| BNZ International Funding Ltd., | | | | | | | | | | | | |
3.375%, 03/01/2023(1)(2) | | | 2,000,000 | | | | 2,123,988 | | | | | |
| Boston Properties LP, | | | | | | | | | | | | |
| 3.200%, 01/15/2025 | | | 12,175,000 | | | | 13,266,920 | | | | | |
| BPCE SA: | | | | | | | | | | | | |
5.700%, 10/22/2023(1)(2) | | | 5,375,000 | | | | 6,083,631 | | | | | |
4.000%, 04/15/2024(1) | | | 3,500,000 | | | | 3,875,276 | | | | | |
4.625%, 07/11/2024(1)(2) | | | 10,000,000 | | | | 11,178,713 | | | | | |
The accompanying notes are an integral part of these financial statements.
Baird Intermediate Bond Fund
Schedule of Investments, December 31, 2020
Long-Term Investments (cont.)
| | | Principal | | | | | | % of | |
| | | Amount | | | Value | | | Net Assets | |
| Brown & Brown, Inc.: | | | | | | | | | |
| 4.200%, 09/15/2024 | | $ | 10,461,000 | | | $ | 11,649,594 | | | |
|
|
| 4.500%, 03/15/2029 | | | 8,597,000 | | | | 10,176,578 | | | | | |
| 2.375%, 03/15/2031 | | | 3,500,000 | | | | 3,663,147 | | | | | |
| Capital One Financial Corp., | | | | | | | | | | | | |
| 3.650%, 05/11/2027 | | | 3,000,000 | | | | 3,439,391 | | | | | |
| Citigroup, Inc.: | | | | | | | | | | | | |
| 2.876%, 07/24/2023 | | | | | | | | | | | | |
(3 Month LIBOR USD + 0.950%)(3) | | | 2,000,000 | | | | 2,077,565 | | | | | |
| 3.750%, 06/16/2024 | | | 500,000 | | | | 553,073 | | | | | |
| 3.352%, 04/24/2025 | | | | | | | | | | | | |
(3 Month LIBOR USD + 0.897%)(3) | | | 10,040,000 | | | | 10,915,246 | | | | | |
| 3.200%, 10/21/2026 | | | 5,000,000 | | | | 5,588,339 | | | | | |
| 3.887%, 01/10/2028 | | | | | | | | | | | | |
(3 Month LIBOR USD + 1.563%)(3) | | | 9,000,000 | | | | 10,314,706 | | | | | |
| Citizens Bank NA, | | | | | | | | | | | | |
| 2.250%, 04/28/2025 | | | 19,000,000 | | | | 20,160,331 | | | | | |
| CNA Financial Corp.: | | | | | | | | | | | | |
| 7.250%, 11/15/2023 | | | 1,980,000 | | | | 2,347,815 | | | | | |
| 4.500%, 03/01/2026 | | | 5,070,000 | | | | 5,964,371 | | | | | |
| 3.900%, 05/01/2029 | | | 4,000,000 | | | | 4,700,602 | | | | | |
| Cooperatieve Rabobank UA: | | | | | | | | | | | | |
3.950%, 11/09/2022(1) | | | 2,250,000 | | | | 2,388,692 | | | | | |
4.625%, 12/01/2023(1) | | | 7,400,000 | | | | 8,247,681 | | | | | |
3.750%, 07/21/2026(1) | | | 1,276,000 | | | | 1,442,085 | | | | | |
| Credit Agricole SA, | | | | | | | | | | | | |
3.375%, 01/10/2022(1)(2) | | | 7,400,000 | | | | 7,625,131 | | | | | |
| Credit Suisse Group AG: | | | | | | | | | | | | |
3.574%, 01/09/2023(1)(2) | | | 1,000,000 | | | | 1,030,308 | | | | | |
| 4.207%, 06/12/2024 | | | | | | | | | | | | |
(3 Month LIBOR USD + 1.240%)(1)(2)(3) | | | 4,000,000 | | | | 4,333,690 | | | | | |
2.593%, 09/11/2025 (SOFR + 1.560%)(1)(2)(3) | | | 7,000,000 | | | | 7,365,914 | | | | | |
| Credit Suisse Group Funding Guernsey Ltd., | | | | | | | | | | | | |
3.800%, 06/09/2023(1) | | | 9,000,000 | | | | 9,692,916 | | | | | |
| Deutsche Bank AG: | | | | | | | | | | | | |
3.150%, 01/22/2021(1) | | | 1,500,000 | | | | 1,501,664 | | | | | |
4.250%, 10/14/2021(1) | | | 7,000,000 | | | | 7,177,988 | | | | | |
3.300%, 11/16/2022(1) | | | 5,175,000 | | | | 5,396,694 | | | | | |
2.222%, 09/18/2024 (SOFR + 2.159%)(1)(3) | | | 5,000,000 | | | | 5,143,694 | | | | | |
| Discover Financial Services: | | | | | �� | | | | | | | |
| 3.950%, 11/06/2024 | | | 4,200,000 | | | | 4,663,831 | | | | | |
| 4.100%, 02/09/2027 | | | 9,000,000 | | | | 10,368,725 | | | | | |
| FirstMerit Bank NA, | | | | | | | | | | | | |
| 4.270%, 11/25/2026 | | | 5,450,000 | | | | 6,251,183 | | | | | |
The accompanying notes are an integral part of these financial statements.
Baird Intermediate Bond Fund
Schedule of Investments, December 31, 2020
Long-Term Investments (cont.)
| | | Principal | | | | | | % of | |
| | | Amount | | | Value | | | Net Assets | |
| GE Capital Funding LLC, | | | | | | | | | |
4.050%, 05/15/2027(2) | | $ | 5,000,000 | | | $ | 5,719,970 | | | |
|
|
| Goldman Sachs Group, Inc.: | | | | | | | | | | | | |
| 3.500%, 01/23/2025 | | | 2,000,000 | | | | 2,207,319 | | | | | |
| 3.272%, 09/29/2025 | | | | | | | | | | | | |
(3 Month LIBOR USD + 1.201%)(3) | | | 3,500,000 | | | | 3,833,989 | | | | | |
1.093%, 12/09/2026 (SOFR + 0.789%)(3) | | | 5,000,000 | | | | 5,054,961 | | | | | |
| 3.691%, 06/05/2028 | | | | | | | | | | | | |
(3 Month LIBOR USD + 1.510%)(3) | | | 4,000,000 | | | | 4,608,092 | | | | | |
| 4.223%, 05/01/2029 | | | | | | | | | | | | |
(3 Month LIBOR USD + 1.301%)(3) | | | 3,100,000 | | | | 3,677,726 | | | | | |
| Guardian Life Global Funding, | | | | | | | | | | | | |
3.400%, 04/25/2023(2) | | | 9,000,000 | | | | 9,614,064 | | | | | |
| Hartford Financial Services Group, Inc., | | | | | | | | | | | | |
| 2.800%, 08/19/2029 | | | 3,625,000 | | | | 3,938,080 | | | | | |
| Health Care Service Corp. A Mutual Legal Reserve Co., | | | | | | | | | | | | |
2.200%, 06/01/2030(2) | | | 10,000,000 | | | | 10,461,288 | | | | | |
| High Street Funding Trust I, | | | | | | | | | | | | |
4.111%, 02/15/2028(2) | | | 5,000,000 | | | | 5,765,350 | | | | | |
| Highmark, Inc., | | | | | | | | | | | | |
4.750%, 05/15/2021(2) | | | 2,000,000 | | | | 2,032,487 | | | | | |
| HSBC Holdings PLC: | | | | | | | | | | | | |
| 3.262%, 03/13/2023 | | | | | | | | | | | | |
(3 Month LIBOR USD + 1.055%)(1)(3) | | | 10,140,000 | | | | 10,474,074 | | | | | |
| 3.600%, 05/25/2023 (1) | | | 2,700,000 | | | | 2,904,153 | | | | | |
| 3.803%, 03/11/2025 | | | | | | | | | | | | |
(3 Month LIBOR USD + 1.211%)(1)(3) | | | 3,000,000 | | | | 3,275,476 | | | | | |
| 4.292%, 09/12/2026 | | | | | | | | | | | | |
(3 Month LIBOR USD + 1.348%)(1)(3) | | | 7,235,000 | | | | 8,245,587 | | | | | |
| 3.973%, 05/22/2030 | | | | | | | | | | | | |
(3 Month LIBOR USD + 1.610%)(1)(3) | | | 1,000,000 | | | | 1,154,750 | | | | | |
| Humana, Inc., | | | | | | | | | | | | |
| 2.900%, 12/15/2022 | | | 6,275,000 | | | | 6,560,572 | | | | | |
| ING Groep NV, | | | | | | | | | | | | |
3.550%, 04/09/2024(1) | | | 4,000,000 | | | | 4,370,278 | | | | | |
| Invesco Finance PLC, | | | | | | | | | | | | |
3.125%, 11/30/2022(1) | | | 4,750,000 | | | | 4,988,710 | | | | | |
| Jackson National Life Global Funding, | | | | | | | | | | | | |
3.250%, 01/30/2024(2) | | | 10,350,000 | | | | 11,127,813 | | | | | |
| Jefferies Group LLC, | | | | | | | | | | | | |
| 4.850%, 01/15/2027 | | | 1,425,000 | | | | 1,666,899 | | | | | |
| John Hancock Life Insurance Co., | | | | | | | | | | | | |
7.375%, 02/15/2024(2) | | | 11,325,000 | | | | 13,350,487 | | | | | |
The accompanying notes are an integral part of these financial statements.
Baird Intermediate Bond Fund
Schedule of Investments, December 31, 2020
Long-Term Investments (cont.)
| | | Principal | | | | | | % of | |
| | | Amount | | | Value | | | Net Assets | |
| JPMorgan Chase & Co.: | | | | | | | | | |
| 1.445%, 10/24/2023 | | | | | | | | | |
(3 Month LIBOR USD + 1.230%)(3) | | $ | 5,035,000 | | | $ | 5,125,182 | | | |
|
|
| 4.023%, 12/05/2024 | | | | | | | | | | | | |
(3 Month LIBOR USD + 1.000%)(3) | | | 20,000,000 | | | | 22,032,567 | | | | | |
2.301%, 10/15/2025 (SOFR + 1.160%)(3) | | | 13,000,000 | | | | 13,799,839 | | | | | |
2.005%, 03/13/2026 (SOFR + 1.585%)(3) | | | 7,625,000 | | | | 8,009,238 | | | | | |
2.083%, 04/22/2026 (SOFR + 1.850%)(3) | | | 3,000,000 | | | | 3,168,380 | | | | | |
1.045%, 11/19/2026 (SOFR + 0.800%)(3) | | | 5,000,000 | | | | 5,056,500 | | | | | |
2.522%, 04/22/2031 (SOFR + 2.040%)(3) | | | 1,500,000 | | | | 1,612,293 | | | | | |
| KeyBank NA: | | | | | | | | | | | | |
| 3.180%, 05/22/2022 | | | 2,750,000 | | | | 2,851,306 | | | | | |
| 3.400%, 05/20/2026 | | | 2,200,000 | | | | 2,470,095 | | | | | |
| LeasePlan Corp. NV, | | | | | | | | | | | | |
2.875%, 10/24/2024(1)(2) | | | 10,000,000 | | | | 10,566,581 | | | | | |
| Liberty Mutual Group, Inc.: | | | | | | | | | | | | |
4.250%, 06/15/2023(2) | | | 966,000 | | | | 1,051,059 | | | | | |
4.569%, 02/01/2029(2) | | | 1,559,000 | | | | 1,915,601 | | | | | |
| Life Storage LP, | | | | | | | | | | | | |
| 3.875%, 12/15/2027 | | | 8,000,000 | | | | 9,140,295 | | | | | |
| Lloyds Bank PLC, | | | | | | | | | | | | |
4.050%, 08/16/2023(1) | | | 4,580,000 | | | | 5,004,922 | | | | | |
| Macquarie Bank Ltd., | | | | | | | | | | | | |
6.625%, 04/07/2021(1)(2) | | | 5,482,000 | | | | 5,567,563 | | | | | |
| Macquarie Group Ltd.: | | | | | | | | | | | | |
| 3.189%, 11/28/2023 | | | | | | | | | | | | |
(3 Month LIBOR USD + 1.023%)(1)(2)(3) | | | 5,250,000 | | | | 5,488,357 | | | | | |
| 4.150%, 03/27/2024 | | | | | | | | | | | | |
(3 Month LIBOR USD + 1.330%)(1)(2)(3) | | | 4,000,000 | | | | 4,298,020 | | | | | |
| Marsh & McLennan Companies, Inc., | | | | | | | | | | | | |
| 3.875%, 03/15/2024 | | | 1,550,000 | | | | 1,709,584 | | | | | |
| Massachusetts Mutual Life Insurance Co., | | | | | | | | | | | | |
7.625%, 11/15/2023(2) | | | 12,053,000 | | | | 13,655,105 | | | | | |
| MBIA Insurance Corp., | | | | | | | | | | | | |
| 11.497%, 01/15/2033 | | | | | | | | | | | | |
(3 Month LIBOR USD + 11.260%)(2)(3)(9) | | | 500,000 | | | | 175,000 | | | | | |
| Metropolitan Life Global Funding I, | | | | | | | | | | | | |
3.000%, 01/10/2023(2) | | | 1,300,000 | | | | 1,370,500 | | | | | |
| Mitsubishi UFJ Financial Group, Inc.: | | | | | | | | | | | | |
2.998%, 02/22/2022(1) | | | 2,595,000 | | | | 2,672,757 | | | | | |
3.455%, 03/02/2023(1) | | | 2,000,000 | | | | 2,130,981 | | | | | |
2.193%, 02/25/2025(1) | | | 5,000,000 | | | | 5,281,978 | | | | | |
| Mizuho Financial Group, Inc.: | | | | | | | | | | | | |
2.601%, 09/11/2022(1) | | | 5,000,000 | | | | 5,188,922 | | | | | |
4.600%, 03/27/2024(1)(2) | | | 7,000,000 | | | | 7,710,497 | | | | | |
The accompanying notes are an integral part of these financial statements.
Baird Intermediate Bond Fund
Schedule of Investments, December 31, 2020
Long-Term Investments (cont.)
| | | Principal | | | | | | % of | |
| | | Amount | | | Value | | | Net Assets | |
| Mizuho Financial Group, Inc.: (cont.) | | | | | | | | | |
| 3.922%, 09/11/2024 | | | | | | | | | |
(3 Month LIBOR USD + 1.000%)(1)(3) | | $ | 3,000,000 | | | $ | 3,261,933 | | | |
|
|
| Morgan Stanley: | | | | | | | | | | | | |
| 1.615%, 10/24/2023 | | | | | | | | | | | | |
(3 Month LIBOR USD + 1.400%)(3) | | | 7,000,000 | | | | 7,132,892 | | | | | |
2.188%, 04/28/2026 (SOFR + 1.990%)(3) | | | 10,000,000 | | | | 10,562,420 | | | | | |
| 3.125%, 07/27/2026 | | | 4,600,000 | | | | 5,141,726 | | | | | |
| MUFG Americas Holdings Corp., | | | | | | | | | | | | |
| 3.500%, 06/18/2022 | | | 225,000 | | | | 235,379 | | | | | |
| National Australia Bank Ltd., | | | | | | | | | | | | |
2.332%, 08/21/2030(1)(2) | | | 7,575,000 | | | | 7,700,953 | | | | | |
| Nationwide Building Society: | | | | | | | | | | | | |
| 3.766%, 03/08/2024 | | | | | | | | | | | | |
(3 Month LIBOR USD + 1.064%)(1)(2)(3) | | | 5,000,000 | | | | 5,319,371 | | | | | |
4.000%, 09/14/2026(1)(2) | | | 10,000,000 | | | | 11,132,588 | | | | | |
| Nationwide Financial Services, Inc., | | | | | | | | | | | | |
5.375%, 03/25/2021(2) | | | 1,478,000 | | | | 1,494,057 | | | | | |
| Nationwide Mutual Insurance Co., | | | | | | | | | | | | |
8.250%, 12/01/2031(2) | | | 2,195,000 | | | | 3,145,057 | | | | | |
| Nordea Bank AB, | | | | | | | | | | | | |
4.250%, 09/21/2022(1)(2) | | | 12,850,000 | | | | 13,640,605 | | | | | |
| Peachtree Corners Funding Trust, | | | | | | | | | | | | |
3.976%, 02/15/2025(2) | | | 6,556,000 | | | | 7,269,406 | | | | | |
| People’s United Bank NA, | | | | | | | | | | | | |
| 4.000%, 07/15/2024 | | | 5,000,000 | | | | 5,389,826 | | | | | |
| Pine Street Trust I, | | | | | | | | | | | | |
4.572%, 02/15/2029(2) | | | 5,000,000 | | | | 5,927,633 | | | | | |
| Principal Life Global Funding II, | | | | | | | | | | | | |
3.000%, 04/18/2026(2) | | | 7,000,000 | | | | 7,784,195 | | | | | |
| Protective Life Corp., | | | | | | | | | | | | |
4.300%, 09/30/2028(2) | | | 1,400,000 | | | | 1,636,498 | | | | | |
| Prudential Insurance Co. of America, | | | | | | | | | | | | |
8.300%, 07/01/2025(2) | | | 8,300,000 | | | | 10,758,560 | | | | | |
| Reliance Standard Life Global Funding II: | | | | | | | | | | | | |
3.050%, 01/20/2021(2) | | | 5,000,000 | | | | 5,005,729 | | | | | |
2.750%, 01/21/2027(2) | | | 11,775,000 | | | | 12,372,654 | | | | | |
| Royal Bank of Scotland Group PLC: | | | | | | | | | | | | |
| 4.269%, 03/22/2025 | | | | | | | | | | | | |
(3 Month LIBOR USD + 1.762%)(1)(3) | | | 7,454,000 | | | | 8,246,295 | | | | | |
| 5.076%, 01/27/2030 | | | | | | | | | | | | |
(3 Month LIBOR USD + 1.905%)(1)(3) | | | 4,700,000 | | | | 5,778,498 | | | | | |
| 4.445%, 05/08/2030 | | | | | | | | | | | | |
(3 Month LIBOR USD + 1.871%)(1)(3) | | | 6,850,000 | | | | 8,160,685 | | | | | |
The accompanying notes are an integral part of these financial statements.
Baird Intermediate Bond Fund
Schedule of Investments, December 31, 2020
Long-Term Investments (cont.)
| | | Principal | | | | | | % of | |
| | | Amount | | | Value | | | Net Assets | |
| Santander UK Group Holdings PLC: | | | | | | | | | |
| 3.373%, 01/05/2024 | | | | | | | | | |
(3 Month LIBOR USD + 1.080%)(1)(3) | | $ | 2,500,000 | | | $ | 2,631,156 | | | |
|
|
| 4.796%, 11/15/2024 | | | | | | | | | | | | |
(3 Month LIBOR USD + 1.570%)(1)(3) | | | 5,000,000 | | | | 5,561,769 | | | | | |
| Santander UK PLC, | | | | | | | | | | | | |
5.000%, 11/07/2023(1)(2) | | | 3,675,000 | | | | 4,056,669 | | | | | |
| SMBC Aviation Capital Finance DAC: | | | | | | | | | | | | |
3.000%, 07/15/2022(1)(2) | | | 4,000,000 | | | | 4,105,310 | | | | | |
3.550%, 04/15/2024(1)(2) | | | 6,075,000 | | | | 6,452,977 | | | | | |
| Societe Generale SA: | | | | | | | | | | | | |
4.250%, 09/14/2023(1)(2) | | | 5,000,000 | | | | 5,452,992 | | | | | |
5.000%, 01/17/2024(1)(2) | | | 3,350,000 | | | | 3,697,811 | | | | | |
2.625%, 01/22/2025(1)(2) | | | 2,855,000 | | | | 3,023,701 | | | | | |
4.250%, 04/14/2025(1)(2) | | | 4,814,000 | | | | 5,303,212 | | | | | |
| Standard Chartered PLC: | | | | | | | | | | | | |
3.050%, 01/15/2021(1)(2) | | | 10,350,000 | | | | 10,357,769 | | | | | |
| 3.785%, 05/21/2025 | | | | | | | | | | | | |
(3 Month LIBOR USD + 1.560%)(1)(2)(3) | | | 4,125,000 | | | | 4,473,181 | | | | | |
| 2.819%, 01/30/2026 | | | | | | | | | | | | |
(3 Month LIBOR USD + 1.209%)(1)(2)(3) | | | 5,000,000 | | | | 5,296,290 | | | | | |
| Stifel Financial Corp.: | | | | | | | | | | | | |
| 4.250%, 07/18/2024 | | | 10,139,000 | | | | 11,391,267 | | | | | |
| 4.000%, 05/15/2030 | | | 3,000,000 | | | | 3,428,213 | | | | | |
| Synchrony Financial: | | | | | | | | | | | | |
| 3.750%, 08/15/2021 | | | 5,000,000 | | | | 5,071,568 | | | | | |
| 4.250%, 08/15/2024 | | | 5,275,000 | | | | 5,828,436 | | | | | |
| 3.700%, 08/04/2026 | | | 3,000,000 | | | | 3,329,788 | | | | | |
| Trinity Acquisition PLC, | | | | | | | | | | | | |
4.400%, 03/15/2026(1) | | | 1,125,000 | | | | 1,310,723 | | | | | |
| UBS Group Funding Switzerland AG, | | | | | | | | | | | | |
3.491%, 05/23/2023(1)(2) | | | 3,050,000 | | | | 3,173,901 | | | | | |
| Voya Financial, Inc.: | | | | | | | | | | | | |
| 3.125%, 07/15/2024 | | | 3,350,000 | | | | 3,620,412 | | | | | |
| 3.650%, 06/15/2026 | | | 2,410,000 | | | | 2,756,379 | | | | | |
| Wells Fargo & Co.: | | | | | | | | | | | | |
| 2.625%, 07/22/2022 | | | 10,000,000 | | | | 10,351,186 | | | | | |
| 1.444%, 10/31/2023 | | | | | | | | | | | | |
(3 Month LIBOR USD + 1.230%)(3) | | | 5,000,000 | | | | 5,078,999 | | | | | |
1.654%, 06/02/2024 (SOFR + 1.600%)(3) | | | 5,000,000 | | | | 5,139,417 | | | | | |
| 2.164%, 02/11/2026 | | | | | | | | | | | | |
(3 Month LIBOR USD + 0.750%)(3) | | | 5,000,000 | | | | 5,257,706 | | | | | |
2.188%, 04/30/2026 (SOFR + 2.000%)(3) | | | 16,000,000 | | | | 16,846,198 | | | | | |
| Westpac Banking Corp., | | | | | | | | | | | | |
| 2.894%, 02/04/2030 | | | | | | | | | | | | |
(5 Year CMT Rate + 1.350%)(1)(3) | | | 2,000,000 | | | | 2,096,668 | | | | | |
The accompanying notes are an integral part of these financial statements.
Baird Intermediate Bond Fund
Schedule of Investments, December 31, 2020
Long-Term Investments (cont.)
| | | Principal | | | | | | % of | |
| | | Amount | | | Value | | | Net Assets | |
| Willis North America, Inc.: | | | | | | | | | |
| 3.600%, 05/15/2024 | | $ | 8,150,000 | | | $ | 8,899,048 | | | | |
| 4.500%, 09/15/2028 | | | 8,500,000 | | | | 10,245,016 | | | | |
| Willis Towers Watson PLC, | | | | | | | | | | | |
5.750%, 03/15/2021(1) | | | 3,450,000 | | | | 3,484,741 | | | | |
| Total Financials | | | | | | | | | | | |
| (Cost $922,244,934) | | | | | | | 993,073,802 | | | | 18.7 | % |
| Total Corporate Bonds | | | | | | | | | | | | |
| (Cost $2,137,265,988) | | | | | | | 2,306,224,797 | | | | 43.4 | % |
| Municipal Bonds | | | | | | | | | | | | |
| Alabama Economic Settlement Authority, | | | | | | | | | | | | |
| 3.163%, 09/15/2025 | | | 3,305,000 | | | | 3,498,673 | | | | | |
| Central Valley Support Joint Powers Agency, | | | | | | | | | | | | |
| 5.326%, 09/01/2022 | | | 2,000,000 | | | | 2,132,660 | | | | | |
| City of Berwyn IL: | | | | | | | | | | | | |
| 5.790%, 12/01/2022 | | | 430,000 | | | | 448,043 | | | | | |
| 5.790%, 12/01/2022 | | | 1,280,000 | | | | 1,313,152 | | | | | |
| County of Cook IL, | | | | | | | | | | | | |
| 5.240%, 11/15/2025 (Callable 11/15/2021) | | | 2,345,000 | | | | 2,420,861 | | | | | |
| County of Hamilton OH, | | | | | | | | | | | | |
| 3.374%, 06/01/2034 | | | 10,000,000 | | | | 11,003,500 | | | | | |
| County of Miami-Dade FL, | | | | | | | | | | | | |
2.536%, 10/01/2033 (Callable 10/01/2030)(8) | | | 2,800,000 | | | | 2,886,212 | | | | | |
| GBG LLC, | | | | | | | | | | | | |
2.250%, 09/01/2030(2) | | | 1,300,000 | | | | 1,332,638 | | | | | |
| Great Lakes Water Authority, | | | | | | | | | | | | |
| 2.315%, 07/01/2031 | | | 2,000,000 | | | | 2,089,520 | | | | | |
| Iowa Tobacco Settlement Authority, | | | | | | | | | | | | |
| 6.500%, 06/01/2023 (Callable 02/01/2021) | | | 570,000 | | | | 578,442 | | | | | |
| Massachusetts Educational Financing Authority, | | | | | | | | | | | | |
| 5.000%, 01/01/2025 | | | 5,450,000 | | | | 6,349,195 | | | | | |
| New Jersey Economic Development Authority: | | | | | | | | | | | | |
| 0.000%, 02/15/2021 | | | 3,000,000 | | | | 2,998,650 | | | | | |
| 0.000%, 02/15/2022 | | | 2,000,000 | | | | 1,987,920 | | | | | |
| New Jersey Higher Education | | | | | | | | | | | | |
| Student Assistance Authority: | | | | | | | | | | | | |
| 5.000%, 12/01/2024 | | | 2,100,000 | | | | 2,445,597 | | | | | |
| 5.000%, 12/01/2024 | | | 2,450,000 | | | | 2,853,196 | | | | | |
| 5.000%, 12/01/2025 | | | 1,680,000 | | | | 2,012,808 | | | | | |
| 5.000%, 12/01/2025 | | | 2,675,000 | | | | 3,204,917 | | | | | |
| 5.000%, 12/01/2026 | | | 1,550,000 | | | | 1,895,696 | | | | | |
| 5.000%, 12/01/2026 | | | 2,350,000 | | | | 2,874,121 | | | | | |
| 5.000%, 12/01/2027 | | | 1,000,000 | | | | 1,239,790 | | | | | |
| 5.000%, 12/01/2027 | | | 1,600,000 | | | | 1,983,664 | | | | | |
The accompanying notes are an integral part of these financial statements.
Baird Intermediate Bond Fund
Schedule of Investments, December 31, 2020
Long-Term Investments (cont.)
| | | Principal | | | | | | % of | |
| | | Amount | | | Value | | | Net Assets | |
| New Jersey Higher Education | | | | | | | | | |
| Student Assistance Authority: (cont.) | | | | | | | | | |
| 5.000%, 12/01/2028 | | $ | 1,225,000 | | | $ | 1,543,194 | | | | |
| 5.000%, 12/01/2028 | | | 1,205,000 | | | | 1,517,999 | | | | |
| New Jersey Turnpike Authority, | | | | | | | | | | | |
3.223%, 01/01/2036 (Callable 07/01/2025)(2) | | | 5,000,000 | | | | 5,301,150 | | | | |
| Niagara Area Development Corp.: | | | | | | | | | | | |
| 3.004%, 05/01/2025 | | | 1,000,000 | | | | 1,012,730 | | | | |
| 3.204%, 05/01/2026 | | | 1,995,000 | | | | 2,028,995 | | | | |
| 3.272%, 05/01/2027 | | | 2,060,000 | | | | 2,095,226 | | | | |
| 3.372%, 05/01/2028 | | | 2,130,000 | | | | 2,159,713 | | | | |
| 3.422%, 05/01/2029 | | | 2,200,000 | | | | 2,227,060 | | | | |
| North Carolina Housing Finance Agency: | | | | | | | | | | | |
| 4.000%, 01/01/2030 (Callable 07/01/2021) | | | 130,000 | | | | 131,673 | | | | |
| 3.000%, 01/01/2033 (Callable 01/01/2025) | | | 1,465,000 | | | | 1,480,163 | | | | |
| North East Independent School District, | | | | | | | | | | | |
| 5.240%, 08/01/2027 | | | 2,100,000 | | | | 2,691,318 | | | | |
| San Diego Convention Center | | | | | | | | | | | |
| Expansion Financing Authority: | | | | | | | | | | | |
| 1.987%, 04/15/2026 | | | 3,440,000 | | | | 3,472,164 | | | | |
| 2.363%, 04/15/2028 | | | 1,325,000 | | | | 1,342,848 | | | | |
| South Dakota Housing Development Authority, | | | | | | | | | | | |
| 2.700%, 11/01/2036 (Callable 11/01/2025) | | | 975,000 | | | | 990,366 | | | | |
| Winnebago & Boone Counties School District No. 205: | | | | | | | | | | | |
| 3.800%, 12/01/2026 (Callable 12/01/2025) | | | 2,200,000 | | | | 2,377,518 | | | | |
| 3.950%, 12/01/2027 (Callable 12/01/2025) | | | 1,700,000 | | | | 1,839,689 | | | | |
| Total Municipal Bonds | | | | | | | | | | | |
| (Cost $85,301,991) | | | | | | | 89,761,061 | | | | 1.7 | % |
| Residential Mortgage-Backed Securities | | | | | | | | | | | | |
| U.S. Government Agency Issues | | | | | | | | | | | | |
| Fannie Mae REMIC Trust: | | | | | | | | | | | | |
| Series G-29, Class O, 8.500%, 09/25/2021 | | | 7 | | | | 7 | | | | | |
| Series 1991-137, Class H, 7.000%, 10/25/2021 | | | 1,506 | | | | 1,524 | | | | | |
| Series 1993-32, Class H, 6.000%, 03/25/2023 | | | 2,743 | | | | 2,860 | | | | | |
| Federal Gold Loan Mortgage Corp. (FGLMC): | | | | | | | | | | | | |
| 6.000%, 06/01/2021 | | | 2,720 | | | | 2,740 | | | | | |
| 6.000%, 07/01/2028 | | | 2,418 | | | | 2,763 | | | | | |
| Federal Home Loan Mortgage Corp. (FHLMC), | | | | | | | | | | | | |
| Series 1395, Class G, 6.000%, 10/15/2022 | | | 1,034 | | | | 1,067 | | | | | |
| Federal National Mortgage Association (FNMA), | | | | | | | | | | | | |
| 0.875%, 08/05/2030 | | | 24,400,000 | | | | 23,945,867 | | | | | |
| Total U.S. Government Agency Issues | | | | | | | | | | | | |
| (Cost $24,353,754) | | | | | | | 23,956,828 | | | | 0.4 | % |
The accompanying notes are an integral part of these financial statements.
Baird Intermediate Bond Fund
Schedule of Investments, December 31, 2020
Long-Term Investments (cont.)
| | | Principal | | | | | | % of | |
| | | Amount | | | Value | | | Net Assets | |
| Non-U.S. Government Agency Issues | | | | | | | | | |
| Alternative Loan Trust, | | | | | | | | | |
Series 2005-11CB, Class 2A1, 5.500%, 06/25/2035(6) | | $ | 26,072 | | | $ | 25,888 | | | |
|
|
| AMRESCO Residential Securities | | | | | | | | | | | | |
| Corp. Mortgage Loan Trust, | | | | | | | | | | | | |
Series 1998-1, Class A6, 6.510%, 08/25/2027(4) | | | 51 | | | | 52 | | | | | |
| Argent Securities Inc. Asset-Backed | | | | | | | | | | | | |
| Pass-Through Certificates: | | | | | | | | | | | | |
| Series 2005-W3, Class A2D, 0.828%, 11/25/2035 | | | | | | | | | | | | |
(1 Month LIBOR USD + 0.680%)(3) | | | 298,923 | | | | 298,322 | | | | | |
| Series 2005-W5, Class A1, 0.618%, 01/25/2036 | | | | | | | | | | | | |
(1 Month LIBOR USD + 0.470%)(3) | | | 4,420,749 | | | | 4,376,506 | | | | | |
| Banc of America Alternative Loan Trust, | | | | | | | | | | | | |
Series 2006-2, Class 7A1, 6.000%, 03/25/2021(6) | | | 21,306 | | | | 19,365 | | | | | |
| Banc of America Funding Trust, | | | | | | | | | | | | |
| Series 2004-2, Class 1CB1, 5.750%, 09/20/2034 | | | 1,522,539 | | | | 1,648,855 | | | | | |
| Bear Stearns ARM Trust, | | | | | | | | | | | | |
Series 2004-5, Class 2A, 3.395%, 07/25/2034(4) | | | 615,480 | | | | 624,256 | | | | | |
| Citigroup Global Markets Mortgage Securities VII, Inc., | | | | | | | | | | | | |
Series 2003-UP2, Class A2, 7.000%, 06/25/2033(7) | | | 28,801 | | | | 29,898 | | | | | |
| Countrywide Asset-Backed Certificates, | | | | | | | | | | | | |
Series 2004-12, Class AF6, 4.634%, 03/25/2035(4) | | | 33 | | | | 33 | | | | | |
| CWABS Asset-Backed Certificates Trust: | | | | | | | | | | | | |
Series 2005-1, Class AF6, 5.030%, 06/25/2035(4) | | | 4,703 | | | | 4,768 | | | | | |
Series 2006-9, Class 1AF3, 5.859%, 08/25/2036(4)(6) | | | 314,068 | | | | 306,330 | | | | | |
| Delta Funding Home Equity Loan Trust: | | | | | | | | | | | | |
| Series 1997-2, Class A6, 7.040%, 06/25/2027 | | | 461 | | | | 411 | | | | | |
Series 1999-2, Class A7F, 7.030%, 08/15/2030(6) | | | 110,242 | | | | 111,471 | | | | | |
| GSAMP Trust, | | | | | | | | | | | | |
| Series 2005-WMC2, Class A1B, 0.768%, 11/25/2035 | | | | | | | | | | | | |
(1 Month LIBOR USD + 0.620%)(3) | | | 255,173 | | | | 255,193 | | | | | |
| IMC Home Equity Loan Trust, | | | | | | | | | | | | |
Series 1998-1, Class A6, 7.020%, 06/20/2029(7) | | | 279 | | | | 281 | | | | | |
| J.P. Morgan Alternative Loan Trust, | | | | | | | | | | | | |
Series 2006-A1, Class 2A1, 3.524%, 03/25/2036(4) | | | 223,066 | | | | 208,741 | | | | | |
| New Residential Mortgage Loan Trust, | | | | | | | | | | | | |
Series 2017-2A, Class A3, 4.000%, 03/25/2057(2)(4) | | | 2,500,581 | | | | 2,703,994 | | | | | |
| RALI Series Trust, | | | | | | | | | | | | |
Series 2004-QS6, Class A1, 5.000%, 06/15/2021(6) | | | 1,187 | | | | 1,147 | | | | | |
| RAMP Series Trust, | | | | | | | | | | | | |
| Series 2005-RS1, Class AI6, 4.713%, 11/25/2034 | | | 399 | | | | 403 | | | | | |
| Soundview Home Loan Trust, | | | | | | | | | | | | |
| Series 2003-2, Class A2, 1.448%, 11/25/2033 | | | | | | | | | | | | |
(1 Month LIBOR USD + 1.300%)(3) | | | 1,034,389 | | | | 1,031,824 | | | | | |
The accompanying notes are an integral part of these financial statements.
Baird Intermediate Bond Fund
Schedule of Investments, December 31, 2020
Long-Term Investments (cont.)
| | | Principal | | | | | | % of | |
| | | Amount | | | Value | | | Net Assets | |
| Specialty Underwriting & Residential Finance Trust, | | | | | | | | | |
| Series 2004-BC4, Class A1A, 0.818%, 10/25/2035 | | | | | | | | | |
(1 Month LIBOR USD + 0.670%)(3) | | $ | 987,411 | | | $ | 984,838 | | | |
|
|
| Thornburg Mortgage Securities Trust, | | | | | | | | | | | | |
Series 2003-5, Class 3A, 2.307%, 10/25/2043(4) | | | 1,880,143 | | | | 1,851,376 | | | | | |
| Towd Point Mortgage Trust: | | | | | | | | | | | | |
Series 2015-5, Class A1B, 2.750%, 05/25/2055(2)(4) | | | 606,035 | | | | 610,452 | | | | | |
Series 2016-2, Class A1, 3.000%, 08/25/2055(2)(4) | | | 991,352 | | | | 1,005,753 | | | | | |
Series 2017-1, Class A1, 2.750%, 10/25/2056(2)(4) | | | 10,291,191 | | | | 10,547,457 | | | | | |
| Series 2017-5, Class A1, 0.748%, 02/26/2057 | | | | | | | | | | | | |
(1 Month LIBOR USD + 0.600%)(2)(3) | | | 2,823,216 | | | | 2,814,171 | | | | | |
Series 2019-1, Class A1, 3.750%, 03/25/2058(2)(4) | | | 7,151,969 | | | | 7,684,494 | | | | | |
Series 2019-4, Class A1, 2.900%, 10/25/2059(2)(4) | | | 11,665,832 | | | | 12,313,974 | | | | | |
Series 2020-4, Class A1, 1.750%, 10/25/2060(2) | | | 18,270,654 | | | | 18,684,261 | | | | | |
| WaMu Mortgage Pass-Through Certificates Trust: | | | | | | | | | | | | |
Series 2004-AR3, Class A1, 3.655%, 06/25/2034(4) | | | 1,430,290 | | | | 1,453,815 | | | | | |
| Series 2004-CB2, Class 3A, 6.000%, 08/25/2034 | | | 1,918,226 | | | | 2,090,458 | | | | | |
| Wells Fargo Home Equity Asset-Backed Securities Trust, | | | | | | | | | | | | |
| Series 2004-2, Class A33, 1.148%, 10/25/2034 | | | | | | | | | | | | |
(1 Month LIBOR USD + 1.000%)(3) | | | 1,720,612 | | | | 1,694,104 | | | | | |
| Total Non-U.S. Government Agency Issues | | | | | | | | | | | | |
| (Cost $71,358,826) | | | | | | | 73,382,891 | | | | 1.4 | % |
| Total Residential Mortgage-Backed Securities | | | | | | | | | | | | |
| (Cost $95,712,580) | | | | | | | 97,339,719 | | | | 1.8 | % |
| Commercial Mortgage-Backed Securities | | | | | | | | | | | | |
| U.S. Government Agency Issues | | | | | | | | | | | | |
| Freddie Mac Multifamily Structured | | | | | | | | | | | | |
| Pass Through Certificates: | | | | | | | | | | | | |
| Series K720, Class A2, 2.716%, 06/25/2022 | | | 17,125,000 | | | | 17,540,048 | | | | | |
| Series K028, Class A2, 3.111%, 02/25/2023 | | | 13,850,000 | | | | 14,570,118 | | | | | |
| Series K723, Class A2, 2.454%, 08/25/2023 | | | 14,500,000 | | | | 15,200,195 | | | | | |
| Series K038, Class A2, 3.389%, 03/25/2024 | | | 1,650,000 | | | | 1,794,734 | | | | | |
| Series K727, Class A2, 2.946%, 07/25/2024 | | | 5,400,000 | | | | 5,812,001 | | | | | |
| Series K041, Class A2, 3.171%, 10/25/2024 | | | 4,895,000 | | | | 5,367,163 | | | | | |
| Series K043, Class A2, 3.062%, 12/25/2024 | | | 4,250,000 | | | | 4,673,060 | | | | | |
Series K048, Class A2, 3.284%, 06/25/2025(4) | | | 8,725,000 | | | | 9,713,404 | | | | | |
Series K050, Class A2, 3.334%, 08/25/2025(4) | | | 12,375,000 | | | | 13,836,907 | | | | | |
| Series K734, Class A2, 3.208%, 02/25/2026 | | | 9,375,000 | | | | 10,435,179 | | | | | |
| Series K062, Class A2, 3.413%, 12/25/2026 | | | 21,599,000 | | | | 24,763,837 | | | | | |
| Series K065, Class A2, 3.243%, 04/25/2027 | | | 2,075,000 | | | | 2,369,565 | | | | | |
| Series K068, Class A2, 3.244%, 08/25/2027 | | | 9,354,000 | | | | 10,731,764 | | | | | |
| Series K071, Class A2, 3.286%, 11/25/2027 | | | 7,075,000 | | | | 8,159,032 | | | | | |
| Series K073, Class A2, 3.350%, 01/25/2028 | | | 9,100,000 | | | | 10,528,051 | | | | | |
Series K083, Class A2, 4.050%, 09/25/2028(4) | | | 9,525,000 | | | | 11,552,594 | | | | | |
| Total U.S. Government Agency Issues | | | | | | | | | | | | |
| (Cost $156,471,761) | | | | | | | 167,047,652 | | | | 3.1 | % |
The accompanying notes are an integral part of these financial statements.
Baird Intermediate Bond Fund
Schedule of Investments, December 31, 2020
Long-Term Investments (cont.)
| | | Principal | | | | | | % of | |
| | | Amount | | | Value | | | Net Assets | |
| Non-U.S. Government Agency Issues | | | | | | | | | |
| BANK, | | | | | | | | | |
| Series 2017-BNK7, Class ASB, 3.265%, 09/17/2060 | | $ | 1,300,000 | | | $ | 1,419,859 | | | | |
| CD Mortgage Trust, | | | | | | | | | | | |
| Series 2017-CD6, Class ASB, 3.332%, 11/15/2050 | | | 10,480,000 | | | | 11,573,908 | | | | |
| Citigroup Commercial Mortgage Trust: | | | | | | | | | | | |
| Series 2013-GC11, Class A4, 3.093%, 04/10/2046 | | | 11,550,000 | | | | 12,113,015 | | | | |
| Series 2015-GC27, Class A5, 3.137%, 02/10/2048 | | | 13,635,576 | | | | 14,783,762 | | | | |
| Series 2015-GC35, Class A4, 3.818%, 11/13/2048 | | | 8,795,000 | | | | 9,950,957 | | | | |
| COMM Mortgage Trust, | | | | | | | | | | | |
| Series 2013-CR11, Class A4, 4.258%, 08/12/2050 | | | 13,025,000 | | | | 14,218,839 | | | | |
| J.P. Morgan Chase Commercial Mortgage Securities Trust, | | | | | | | | | | | |
| Series 2013-LC11, Class A4, 2.694%, 04/17/2046 | | | 3,058,423 | | | | 3,181,089 | | | | |
| JPMBB Commercial Mortgage Securities Trust: | | | | | | | | | | | |
| Series 2013-C12, Class A5, 3.664%, 07/17/2045 | | | 3,373,000 | | | | 3,590,825 | | | | |
| Series 2014-C26, Class A4, 3.494%, 01/17/2048 | | | 14,480,202 | | | | 15,920,122 | | | | |
| Morgan Stanley Bank of America Merrill Lynch Trust: | | | | | | | | | | | |
| Series 2013-C7, Class A4, 2.918%, 02/16/2046 | | | 12,980,000 | | | | 13,485,080 | | | | |
| Series 2014-C16, Class A4, 3.600%, 06/17/2047 | | | 13,175,000 | | | | 14,020,329 | | | | |
| Series 2015-C27, Class A4, 3.753%, 12/17/2047 | | | 28,920,000 | | | | 32,406,775 | | | | |
| Series 2016-C29, Class ASB, 3.140%, 05/17/2049 | | | 5,000,000 | | | | 5,338,597 | | | | |
| Wells Fargo Commercial Mortgage Trust: | | | | | | | | | | | |
| Series 2014-LC18, Class ASB, 3.244%, 12/17/2047 | | | 13,129,347 | | | | 13,753,044 | | | | |
| Series 2015-P2, Class ASB, 3.656%, 12/17/2048 | | | 11,674,880 | | | | 12,503,726 | | | | |
| Series 2015-P2, Class A4, 3.809%, 12/17/2048 | | | 20,769,144 | | | | 23,594,958 | | | | |
| WFRBS Commercial Mortgage Trust: | | | | | | | | | | | |
| Series 2012-C6, Class A4, 3.440%, 04/15/2045 | | | 8,369,022 | | | | 8,466,007 | | | | |
| Series 2014-C24, Class ASB, 3.324%, 11/18/2047 | | | 7,820,797 | | | | 8,187,375 | | | | |
| Series 2013-C12, Class ASB, 2.838%, 03/17/2048 | | | 3,650,385 | | | | 3,735,195 | | | | |
| Total Non-U.S. Government Agency Issues | | | | | | | | | | | |
| (Cost $213,182,037) | | | | | | | 222,243,462 | | | | 4.2 | % |
| Total Commercial Mortgage-Backed Securities | | | | | | | | | | | | |
| (Cost $369,653,798) | | | | | | | 389,291,114 | | | | 7.3 | % |
| Asset Backed Securities | | | | | | | | | | | | |
| Bank of The West Auto Trust, | | | | | | | | | | | | |
Series 2019-1, Class A3, 2.430%, 04/15/2024(2) | | | 8,100,000 | | | | 8,253,941 | | | | | |
| Conseco Financial Corp.: | | | | | | | | | | | | |
| Series 1998-7, Class A1, 6.320%, 05/01/2029 | | | 364,618 | | | | 368,362 | | | | | |
| Series 1998-3, Class A5, 6.220%, 03/01/2030 | | | 39,948 | | | | 40,441 | | | | | |
| Series 1998-4, Class A5, 6.180%, 04/01/2030 | | | 25,572 | | | | 26,057 | | | | | |
| Discover Card Execution Note Trust, | | | | | | | | | | | | |
| Series 2017-A4, Class A4, 2.530%, 10/15/2026 | | | 4,000,000 | | | | 4,274,177 | | | | | |
| Ford Credit Auto Owner Trust, | | | | | | | | | | | | |
Series 2019-1, Class A, 3.520%, 07/15/2030(2) | | | 10,825,000 | | | | 11,805,964 | | | | | |
The accompanying notes are an integral part of these financial statements.
Baird Intermediate Bond Fund
Schedule of Investments, December 31, 2020
Long-Term Investments (cont.)
| | | Principal | | | | | | % of | |
| | | Amount | | | Value | | | Net Assets | |
| Hyundai Auto Lease Securitization Trust, | | | | | | | | | |
Series 2020-A, Class A3, 1.950%, 07/15/2023(2) | | $ | 15,050,000 | | | $ | 15,294,106 | | | | |
| MMAF Equipment Finance LLC, | | | | | | | | | | | |
Series 2020-A, Class A3, 0.970%, 04/09/2027(2) | | | 6,550,000 | | | | 6,613,564 | | | | |
| Oakwood Mortgage Investors, Inc., | | | | | | | | | | | |
| Series 1999-B, Class A3, 6.450%, 12/15/2023 | | | 18,581 | | | | 19,132 | | | | |
| PFS Financing Corp., | | | | | | | | | | | |
Series 2019-A, Class A2, 2.860%, 04/15/2024(2) | | | 12,125,000 | | | | 12,468,796 | | | | |
| SoFi Consumer Loan Program LLC, | | | | | | | | | | | |
| Series 2017-3, Class A, 2.770%, 05/26/2026 (2) | | | 193,405 | | | | 193,972 | | | | |
| Towd Point Mortgage Trust, | | | | | | | | | | | |
Series 2020-MH1, Class A1, 2.250%, 02/25/2060(2)(4) | | | 12,283,695 | | | | 12,493,569 | | | | |
| Toyota Auto Loan Extended Note Trust, | | | | | | | | | | | |
Series 2019-1A, Class A, 2.560%, 11/25/2031(2) | | | 19,075,000 | | | | 20,370,327 | | | | |
| Total Asset Backed Securities | | | | | | | | | | | |
| (Cost $89,059,688) | | | | | | | 92,222,408 | | | | 1.7 | % |
| Total Long-Term Investments | | | | | | | | | | | | |
| (Cost $5,007,250,403) | | | | | | | 5,261,263,913 | | | | 98.9 | % |
| Short-Term Investment | | | | | | | | | | | | |
| | | Shares | | | | | | | | | |
| Money Market Mutual Fund | | | | | | | | | | | | |
| First American Government Obligations | | | | | | | | | | | | |
Fund, Class U, 0.04%(5) | | | 145,132,424 | | | | 145,132,424 | | | | | |
| Total Short-Term Investment | | | | | | | | | | | | |
| (Cost $145,132,424) | | | | | | | 145,132,424 | | | | 2.7 | % |
| Total Investments | | | | | | | | | | | | |
| (Cost $5,152,382,827) | | | | | | | 5,406,396,337 | | | | 101.6 | % |
| Liabilities in Excess of Other Assets | | | | | | | (86,791,486 | ) | | | (1.6 | )% |
| TOTAL NET ASSETS | | | | | | $ | 5,319,604,851 | | | | 100.0 | % |
Notes to Schedule of Investments
CMT – Constant Maturity Treasury
LIBOR – London Inter-bank Offered Rate
SOFR – Secured Overnight Financing Rate
| (1) | Foreign security. |
| (2) | Security as defined in Rule 144A under the Securities Act of 1933 and classified as liquid under the Fund’s liquidity risk management program. Purchased in a private placement transaction; resale to the public may require registration or may extend only to qualified institutional buyers. At December 31, 2020, the value of these securities total $824,717,333, which represents 15.50% of total net assets. |
| (3) | Variable rate security based on a reference index and spread. The rate reported is the rate in effect as of December 31, 2020. |
| (4) | Variable rate security. The coupon is based on an underlying pool of loans. The rate reported is the rate in effect as of December 31, 2020. |
The accompanying notes are an integral part of these financial statements.
Baird Intermediate Bond Fund
Schedule of Investments, December 31, 2020
Notes to Schedule of Investments (cont.)
| (5) | Seven-day yield. |
| (6) | Security that, on the last payment date, missed a partial principal or interest payment. |
| (7) | Step-up bond; the interest rate shown is the rate in effect as of December 31, 2020. |
| (8) | Security or a portion of the security, purchased on a when-issued or delayed delivery basis. |
| (9) | Security in default. |
Summary of Fair Value Exposure at December 31, 2020
The Fund has adopted authoritative fair valuation accounting standards which establish a definition of fair value and set out a hierarchy for measuring fair value. These standards require additional disclosures about the various inputs and valuation techniques used to develop the measurements of fair value and a discussion on changes in valuation techniques and related inputs during the period. These standards define fair value as the price that would be received to sell an asset or paid to transfer a liability in an orderly transaction between market participants at the measurement date.
The fair value hierarchy is organized into three levels based upon the assumptions (referred to as “inputs”) used in pricing the asset or liability. These standards state that “observable inputs” reflect the assumptions market participants would use in pricing the asset or liability based on market data obtained from independent sources and “unobservable inputs” reflect an entity’s own assumptions about the assumptions market participants would use in pricing the asset or liability. These inputs are summarized into three broad levels and described below:
| Level 1 – | Quoted prices (unadjusted) in active markets for identical assets or liabilities that the reporting entity can access at the measurement date. |
| Level 2 – | Inputs other than quoted prices included within Level 1 that are observable for the asset or liability, either directly or indirectly. |
| Level 3 – | Unobservable inputs for the asset or liability. |
The inputs or methodology used for valuing securities are not necessarily an indication of the risk associated with investing in those securities.
The accompanying notes are an integral part of these financial statements.
Baird Intermediate Bond Fund
Summary of Fair Value Exposure at December 31, 2020 (cont.)
The following is a summary of the inputs used to value the Fund’s investments as of December 31, 2020:
| | | Level 1 | | | Level 2 | | | Level 3 | | | Total | |
| Long-Term Investments | | | | | | | | | | | | |
| U.S. Treasury Securities | | $ | — | | | $ | 2,281,094,325 | | | $ | — | | | $ | 2,281,094,325 | |
| Other Government Related Securities | | | — | | | | 5,330,489 | | | | — | | | | 5,330,489 | |
| Corporate Bonds | | | — | | | | 2,306,224,797 | | | | — | | | | 2,306,224,797 | |
| Municipal Bonds | | | — | | | | 89,761,061 | | | | — | | | | 89,761,061 | |
| Residential Mortgage-Backed Securities – | | | | | | | | | | | | | | | | |
| U.S. Government Agency Issues | | | — | | | | 23,956,828 | | | | — | | | | 23,956,828 | |
| Residential Mortgage-Backed Securities – | | | | | | | | | | | | | | | | |
| Non-U.S. Government Agency Issues | | | — | | | | 73,382,891 | | | | — | | | | 73,382,891 | |
| Commercial Mortgage-Backed Securities – | | | | | | | | | | | | | | | | |
| U.S. Government Agency Issues | | | — | | | | 167,047,652 | | | | — | | | | 167,047,652 | |
| Commercial Mortgage-Backed Securities – | | | | | | | | | | | | | | | | |
| Non-U.S. Government Agency Issues | | | — | | | | 222,243,462 | | | | — | | | | 222,243,462 | |
| Asset Backed Securities | | | — | | | | 92,222,408 | | | | — | | | | 92,222,408 | |
| Total Long-Term Investments | | | — | | | | 5,261,263,913 | | | | — | | | | 5,261,263,913 | |
| Short-Term Investment | | | | | | | | | | | | | | | | |
| Money Market Mutual Fund | | | 145,132,424 | | | | — | | | | — | | | | 145,132,424 | |
| Total Short-Term Investment | | | 145,132,424 | | | | — | | | | — | | | | 145,132,424 | |
| Total Investments | | $ | 145,132,424 | | | $ | 5,261,263,913 | | | $ | — | | | $ | 5,406,396,337 | |
Changes in valuation techniques may result in transfers into or out of assigned levels within the fair value hierarchy. There were no transfers into or out of Level 3 during the reporting period, as compared to the security classifications from the prior year’s annual report. See the Fund’s Valuation Policy in Note 2a to the financial statements.
The accompanying notes are an integral part of these financial statements.
Baird Aggregate Bond Fund
December 31, 2020 (Unaudited)
The Baird Aggregate Bond Fund seeks an annual rate of total return, before Fund expenses, greater than the annual rate of total return of the Bloomberg Barclays U.S. Aggregate Bond Index. The Bloomberg Barclays Aggregate Bond Index is an unmanaged, market value weighted index of investment grade, fixed-rate debt issues, including government, credit, asset-backed (ABS), mortgage-backed (MBS) and commercial mortgage-backed (CMBS) securities with maturities of at least one year.
Treasury yields fell across the curve in 2020, with the benchmark 10-year Treasury down 100 bps to finish the year at 0.92%, after hitting an all-time [intra-day] record low of 0.31% on March 9. The curve steepened, with the spread between 2-year and 30-year Treasuries increasing from 82 bps to 153 bps during the year, as yields in shorter maturities saw the largest decline. Starting in late February, the coronavirus (COVID-19) affected every aspect of the economy, leading to the swiftest equity bear market in history, with an over 33% peak-to-trough drop in the S&P 500 in just over a month ending March 23, and fixed income markets hitting levels of distress not seen since the Global Financial Crisis (GFC) in 2008. However, unlike 2008, the massive, coordinated monetary and fiscal policy response resulted in a much swifter recovery. U.S. unemployment dropped to 6.7% by year end after peaking at 14.7% in April as businesses reopened, and the Pfizer and Moderna vaccines offered hope for a return to normal sometime in 2021. The S&P 500 ended the year up 16% at record highs and credit spreads tightened through year end, completely erasing the pandemic-related widening in many sectors. The COVID-19 pandemic and the massive government policy response to it essentially created a full market cycle for spreads in the span of a calendar year.
During 2020, the Fund’s Institutional Class Shares generated strong absolute and relative returns and outperformed its benchmark by 112 basis points net of fees.
The primary factors contributing to the Fund’s absolute and relative performance in 2020 include:
| | | • | Positive – Overweight to Investment Grade Credit (increased exposure post widening of the spread) |
| | | • | Positive – Active positioning within Investment Grade Credit |
| | | | • | Positive – Underweight to the Other Government Sector in favor of Corporate Credit including Financials |
| | | | • | Positive – Favoring credit shorter on the curve versus the benchmark |
| | | | • | Positive – Security selection, including attractive new issue concessions |
| | • | Mortgage-Backed Securities (MBS) & Asset-Backed Securities (ABS) Positioning |
| | | • | Positive – Active positioning within MBS & ABS |
| | | | • | Positive – Underweight to Agency Residential Mortgage-Backed Securities (RMBS) |
| | | | • | Positive – Active positioning within Agency RMBS, including opportunistically increasing specified pool exposure in March, which outperformed more generic, faster-paying pools at record low mortgage rates |
| | | | • | Positive – Overweight to Agency & Non-Agency Commercial Mortgage-Backed Securities (CMBS), Non-Agency RMBS & ABS |
| | | | • | Positive – Within Non-Agency CMBS, investing in only the most senior classes which outperformed subordinated classes |
| | • | Yield Curve Positioning – Positive overall |
| | | • | Positive – Overall portfolio positive convexity tilt versus the benchmark |
| | | • | Modest positive – Modest underweight to the long end of the yield curve as the yield curve steepened |
We expect the economic impact of COVID-19 to linger well into 2021, particularly as it relates to the travel and hospitality service sectors. Yet, with the massive fiscal stimulus that is already in the pipeline, and likely more coming now that the Democratic Party has full, albeit narrow, control of Washington, above-average economic growth is very likely in 2021. Stronger growth may pressure inflation modestly higher, a goal of the Fed, translating into moderately higher intermediate and long-term rates. With short-term rates still anchored
Baird Aggregate Bond Fund
December 31, 2020 (Unaudited)
close to zero by the Fed, a steeper yield curve will enable investors to capture some added performance as bonds roll down the curve. We expect the roll-down return to be an important component of total return this year, as well as security selection, sector allocation, and the yield advantage the Fund enjoys above that of its benchmark. Strategic positioning across market sectors and along the yield curve (including the ability to thoughtfully reposition should spreads widen into volatility) will complement the always-important security selection process to help navigate through the current environment.
The Fund continues to maintain its underweight to Agency RMBS (providing a positive convexity tilt versus the benchmark for the overall portfolio) after increasing exposure at more attractive valuations in March. The Fund also continues to maintain its overweight to Agency CMBS, Non-Agency CMBS, Non-Agency RMBS and ABS at the top of the capital structure. The Fund only purchases investment grade, U.S. dollar denominated securities in the cash bond market (no derivatives). The Fund remains duration neutral to its benchmark and we believe it is well positioned to add value relative to its benchmark.
Baird Aggregate Bond Fund
December 31, 2020 (Unaudited)
Portfolio Characteristics
Quality Distribution(1)(2)
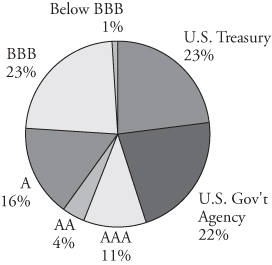
| | Net Assets | $32,903,550,392 | |
| | | | |
| | SEC 30-Day | | |
| | Yield(3) | | |
| | Institutional Class | 1.33% | |
| | Investor Class | 1.08% | |
| | | | |
| | Average | | |
| | Effective | | |
| | Duration | 6.22 years | |
| | | | |
| | Average | | |
| | Effective | | |
| | Maturity | 7.94 years | |
| | | | |
| | Annualized | | |
| | | Expense | | |
Sector Weightings(1) | | Ratio(4) | | |
| | | Institutional Class | 0.30% | |
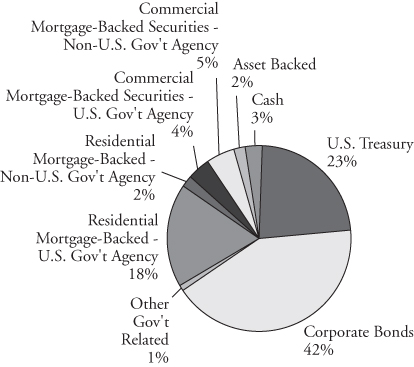 | | Investor Class | 0.55% | (5) |
| |
| | |
| | Portfolio | | |
| | Turnover Rate | 35% | |
| | | | |
| | Number of | | |
| | Holdings | 1,456 | |
| | | | |
| | | | |
| | | | |
| | | | |
| | | | |
| | | | |
| | | | |
| | | | |
| | | | |
| | | | |
| | | | |
| | | | |
| | | | |
| | | | |
| | | | | |
| (1) | Percentages shown are based on the Fund’s total investments. |
| (2) | The quality profile is calculated on a market value-weighted basis using the highest credit quality rating for each security held by the Fund given by S&P, Moody’s or Fitch, each of which is a Nationally Recognized Statistical Rating Organization (NRSRO). NRSROs rate the credit quality of securities using a scale that generally ranges from AAA (highest) to D (lowest). |
| (3) | SEC yields are based on SEC guidelines and are calculated for the 30 days ended December 31, 2020. |
| (4) | Reflects expense ratios as stated in the Fund’s current prospectus. |
| (5) | Includes 0.25% 12b-1 fee. |
Baird Aggregate Bond Fund
December 31, 2020 (Unaudited)
Institutional ClassValue of a $25,000 Investment
Growth of a hypothetical investment of $25,000 made on 12/31/10, assuming reinvestment of all distributions.
Investor Class
Value of a $10,000 Investment
Growth of a hypothetical investment of $10,000 made on 12/31/10, assuming reinvestment of all distributions.
Baird Aggregate Bond Fund
December 31, 2020 (Unaudited)
Total Returns
| | | Average Annual |
| | One | Five | Ten | Since |
| For the Periods Ended December 31, 2020 | Year | Years | Years | Inception(1) |
| Institutional Class Shares | 8.63% | 5.04% | 4.68% | 5.50% |
| Investor Class Shares | 8.42% | 4.80% | 4.42% | 5.25% |
Bloomberg Barclays U.S. Aggregate Bond Index(2) | 7.51% | 4.44% | 3.84% | 4.98% |
| (1) | For the period from September 29, 2000 (inception date) through December 31, 2020. |
| (2) | The Bloomberg Barclays U.S. Aggregate Bond Index is an unmanaged, market value weighted index of investment grade, fixed-rate debt issues, including government, corporate, asset-backed, mortgage-backed and commercial mortgage-backed securities, with maturities of at least one year. This Index does not reflect any deduction for fees, expenses or taxes. A direct investment in an index is not possible. |
The line graphs on the previous page and the returns shown in the table above reflect reinvestment of dividends and/or capital gains distributions in additional shares. The returns in the graphs and table do not reflect the deduction of taxes that a shareholder would pay on Fund distributions or the redemption of Fund shares. The returns reflect the actual performance for each period and do not include the impact of trades executed on the last business day of the period that were recorded on the first business day of the next period.
The Fund’s gross expense ratio for each Class, as reflected in the Fund’s current prospectus, is set forth under “Portfolio Characteristics”.
The Fund maintains securities with longer maturities in order to provide a greater potential for return. Generally, the longer a bond’s maturity, the greater the interest rate risk. The Fund may also invest in U.S. dollar denominated foreign securities which involve additional risks such as political and economic instability, and different and sometimes less strict financial reporting standards and regulation. The Fund may also invest in mortgage- and asset-backed securities, which include interest rate and prepayment risks more pronounced than those of other fixed income securities. U.S. and international markets have experienced significant periods of volatility in recent years and months due to a number of economic, political and global macro factors including the impact of the coronavirus (COVID-19) as a global pandemic and related public health issues, growth concerns in the U.S. and overseas, uncertainties regarding interest rates, trade tensions and the threat of tariffs imposed by the U.S. and other countries. These and other geopolitical events may cause market disruptions and could have an adverse effect on the value of the Fund’s investments.
Past performance does not guarantee future results. Investment return and principal value will fluctuate so that an investor’s shares, when redeemed, may be worth more or less than their original cost.
For information about the performance of the Fund as of the most recent month-end, please call 1-866-44BAIRD or visit www.bairdfunds.com. Mutual fund performance changes over time and current performance may be lower or higher than that stated.
Baird Aggregate Bond Fund
Schedule of Investments, December 31, 2020
Long-Term Investments
| | | Principal | | | | | | % of | |
| | | Amount | | | Value | | | Net Assets | |
| U.S. Treasury Securities | | | | | | | | | |
| U.S. Treasury Bonds: | | | | | | | | | |
| 1.875%, 03/31/2022 | | $ | 1,091,700,000 | | | $ | 1,115,580,937 | | | | |
| 2.125%, 12/31/2022 | | | 473,525,000 | | | | 492,373,516 | | | | |
| 2.500%, 05/15/2024 | | | 567,485,000 | | | | 611,509,419 | | | | |
| 2.250%, 11/15/2025 | | | 509,800,000 | | | | 556,717,531 | | | | |
| 2.000%, 11/15/2026 | | | 533,750,000 | | | | 580,932,667 | | | | |
| 2.250%, 11/15/2027 | | | 616,775,000 | | | | 684,861,175 | | | | |
| 1.625%, 08/15/2029 | | | 167,350,000 | | | | 179,025,277 | | | | |
| 2.875%, 05/15/2043 | | | 1,379,195,000 | | | | 1,743,604,179 | | | | |
| 2.500%, 02/15/2045 | | | 929,375,000 | | | | 1,108,315,989 | | | | |
| 2.875%, 05/15/2049 | | | 348,625,000 | | | | 450,107,559 | | | | |
| Total U.S. Treasury Securities | | | | | | | | | | | |
| (Cost $7,253,736,457) | | | | | | | 7,523,028,249 | | | | 22.9 | % |
| Other Government Related Securities | | | | | | | | | | | | |
| Comision Federal de Electricidad, | | | | | | | | | | | | |
4.875%, 01/15/2024(1)(2) | | | 3,423,000 | | | | 3,791,007 | | | | | |
| Corp Andina de Fomento, | | | | | | | | | | | | |
�� 4.375%, 06/15/2022(1) | | | 6,107,000 | | | | 6,424,625 | | | | | |
| Petroleos Mexicanos: | | | | | | | | | | | | |
4.500%, 01/23/2026(1) | | | 1,953,000 | | | | 1,946,145 | | | | | |
5.950%, 01/28/2031(1) | | | 558,000 | | | | 556,605 | | | | | |
6.350%, 02/12/2048(1) | | | 8,500,000 | | | | 7,705,250 | | | | | |
| Sinopec Group Overseas Development [2014] Ltd., | | | | | | | | | | | | |
4.375%, 04/10/2024(1)(2) | | | 1,500,000 | | | | 1,645,426 | | | | | |
| Sinopec Group Overseas Development [2015] Ltd., | | | | | | | | | | | | |
3.250%, 04/28/2025(1)(2) | | | 7,500,000 | | | | 8,042,700 | | | | | |
| Sinopec Group Overseas Development [2017] Ltd., | | | | | | | | | | | | |
3.000%, 04/12/2022(1)(2) | | | 15,000,000 | | | | 15,376,909 | | | | | |
| Total Other Government Related Securities | | | | | | | | | | | | |
| (Cost $44,369,297) | | | | | | | 45,488,667 | | | | 0.1 | % |
| Corporate Bonds | | | | | | | | | | | | |
| Industrials | | | | | | | | | | | | |
| A.P. Meoller – Maersk A/S, | | | | | | | | | | | | |
3.750%, 09/22/2024(1)(2) | | | 22,000,000 | | | | 23,822,529 | | | | | |
| Abbott Laboratories, | | | | | | | | | | | | |
| 4.900%, 11/30/2046 | | | 4,700,000 | | | | 6,967,769 | | | | | |
| AbbVie, Inc.: | | | | | | | | | | | | |
| 5.000%, 12/15/2021 | | | 24,000,000 | | | | 24,776,609 | | | | | |
| 3.250%, 10/01/2022 | | | 17,863,000 | | | | 18,605,168 | | | | | |
| 3.850%, 06/15/2024 | | | 12,067,000 | | | | 13,289,943 | | | | | |
| 3.800%, 03/15/2025 | | | 16,425,000 | | | | 18,316,806 | | | | | |
| 2.950%, 11/21/2026 | | | 9,625,000 | | | | 10,643,798 | | | | | |
| 4.550%, 03/15/2035 | | | 12,000,000 | | | | 15,171,683 | | | | | |
The accompanying notes are an integral part of these financial statements.
Baird Aggregate Bond Fund
Schedule of Investments, December 31, 2020
Long-Term Investments (cont.)
| | | Principal | | | | | | % of | |
| | | Amount | | | Value | | | Net Assets | |
| AbbVie, Inc.: (cont.) | | | | | | | | | |
| 4.500%, 05/14/2035 | | $ | 9,000,000 | | | $ | 11,304,670 | | | |
|
|
| 4.300%, 05/14/2036 | | | 6,000,000 | | | | 7,383,457 | | | | | |
| 4.050%, 11/21/2039 | | | 12,700,000 | | | | 15,369,853 | | | | | |
| Adventist Health System: | | | | | | | | | | | | |
| 2.952%, 03/01/2029 | | | 19,250,000 | | | | 20,877,546 | | | | | |
| 3.630%, 03/01/2049 | | | 9,000,000 | | | | 9,994,407 | | | | | |
| Agilent Technologies, Inc., | | | | | | | | | | | | |
| 2.100%, 06/04/2030 | | | 14,000,000 | | | | 14,490,973 | | | | | |
| Air Products and Chemicals, Inc., | | | | | | | | | | | | |
| 2.700%, 05/15/2040 | | | 10,425,000 | | | | 11,235,393 | | | | | |
| Alcon Finance Corp.: | | | | | | | | | | | | |
2.750%, 09/23/2026(2) | | | 14,770,000 | | | | 16,165,362 | | | | | |
3.800%, 09/23/2049(2) | | | 7,000,000 | | | | 8,258,229 | | | | | |
| Allegion PLC, | | | | | | | | | | | | |
3.500%, 10/01/2029(1) | | | 21,494,000 | | | | 23,852,940 | | | | | |
| Allegion US Holding Co., Inc.: | | | | | | | | | | | | |
| 3.200%, 10/01/2024 | | | 7,000,000 | | | | 7,476,419 | | | | | |
| 3.550%, 10/01/2027 | | | 11,975,000 | | | | 13,096,615 | | | | | |
| Amgen, Inc.: | | | | | | | | | | | | |
| 3.150%, 02/21/2040 | | | 13,350,000 | | | | 14,695,811 | | | | | |
| 4.400%, 05/01/2045 | | | 12,300,000 | | | | 15,786,636 | | | | | |
| Analog Devices, Inc., | | | | | | | | | | | | |
| 3.125%, 12/05/2023 | | | 10,000,000 | | | | 10,759,446 | | | | | |
| Anglo American Capital PLC: | | | | | | | | | | | | |
5.375%, 04/01/2025(1)(2) | | | 19,876,000 | | | | 23,228,356 | | | | | |
4.875%, 05/14/2025(1)(2) | | | 13,831,000 | | | | 15,999,104 | | | | | |
4.750%, 04/10/2027(1)(2) | | | 10,000,000 | | | | 11,796,456 | | | | | |
4.000%, 09/11/2027(1)(2) | | | 2,570,000 | | | | 2,951,131 | | | | | |
2.625%, 09/10/2030(1)(2) | | | 25,000,000 | | | | 26,142,211 | | | | | |
| Anheuser-Busch InBev Worldwide, Inc.: | | | | | | | | | | | | |
| 4.750%, 01/23/2029 | | | 4,075,000 | | | | 5,032,200 | | | | | |
| 4.375%, 04/15/2038 | | | 7,000,000 | | | | 8,667,384 | | | | | |
| 5.450%, 01/23/2039 | | | 20,000,000 | | | | 27,170,878 | | | | | |
| 4.900%, 02/01/2046 | | | 45,553,000 | | | | 59,229,404 | | | | | |
| AP Moller – Maersk A/S: | | | | | | | | | | | | |
3.875%, 09/28/2025(1)(2) | | | 8,900,000 | | | | 9,929,960 | | | | | |
4.500%, 06/20/2029(1)(2) | | | 8,000,000 | | | | 9,356,764 | | | | | |
| Apple, Inc.: | | | | | | | | | | | | |
| 2.400%, 05/03/2023 | | | 2,678,000 | | | | 2,809,125 | | | | | |
| 2.650%, 05/11/2050 | | | 10,000,000 | | | | 10,613,461 | | | | | |
| ArcelorMittal: | | | | | | | | | | | | |
3.600%, 07/16/2024(1) | | | 10,000,000 | | | | 10,791,481 | | | | | |
4.550%, 03/11/2026(1) | | | 13,000,000 | | | | 14,606,096 | | | | | |
4.250%, 07/16/2029(1) | | | 15,000,000 | | | | 16,614,138 | | | | | |
The accompanying notes are an integral part of these financial statements.
Baird Aggregate Bond Fund
Schedule of Investments, December 31, 2020
Long-Term Investments (cont.)
| | | Principal | | | | | | % of | |
| | | Amount | | | Value | | | Net Assets | |
| Archer-Daniels-Midland Co., | | | | | | | | | |
| 3.250%, 03/27/2030 | | $ | 7,000,000 | | | $ | 8,095,435 | | | |
|
|
| AT&T, Inc.: | | | | | | | | | | | | |
2.550%, 12/01/2033(2) | | | 22,965,000 | | | | 23,542,297 | | | | | |
| 5.250%, 03/01/2037 | | | 10,000,000 | | | | 13,014,574 | | | | | |
| 4.900%, 08/15/2037 | | | 10,000,000 | | | | 12,540,003 | | | | | |
| 6.375%, 03/01/2041 | | | 11,764,000 | | | | 17,269,968 | | | | | |
| 3.100%, 02/01/2043 | | | 5,825,000 | | | | 5,912,190 | | | | | |
3.550%, 09/15/2055(2) | | | 55,110,000 | | | | 54,922,916 | | | | | |
3.800%, 12/01/2057(2) | | | 9,423,000 | | | | 9,846,440 | | | | | |
3.650%, 09/15/2059(2) | | | 49,359,000 | | | | 49,839,677 | | | | | |
| BAE Systems PLC, | | | | | | | | | | | | |
1.900%, 02/15/2031(1)(2) | | | 18,500,000 | | | | 18,702,640 | | | | | |
| Bayer US Finance II LLC: | | | | | | | | | | | | |
5.500%, 08/15/2025(2) | | | 14,400,000 | | | | 16,918,058 | | | | | |
4.250%, 12/15/2025(2) | | | 14,440,000 | | | | 16,506,082 | | | | | |
| Becton Dickinson and Co.: | | | | | | | | | | | | |
| 3.363%, 06/06/2024 | | | 6,300,000 | | | | 6,848,570 | | | | | |
| 3.734%, 12/15/2024 | | | 4,000,000 | | | | 4,434,744 | | | | | |
| 2.823%, 05/20/2030 | | | 15,000,000 | | | | 16,486,424 | | | | | |
| 4.875%, 05/15/2044 | | | 10,815,000 | | | | 13,357,877 | | | | | |
| Bell Canada, Inc.: | | | | | | | | | | | | |
4.464%, 04/01/2048(1) | | | 1,225,000 | | | | 1,635,581 | | | | | |
4.300%, 07/29/2049(1) | | | 4,123,000 | | | | 5,399,281 | | | | | |
| Biogen, Inc., | | | | | | | | | | | | |
| 3.150%, 05/01/2050 | | | 20,000,000 | | | | 20,738,577 | | | | | |
| Boardwalk Pipelines LP: | | | | | | | | | | | | |
| 4.950%, 12/15/2024 | | | 27,631,000 | | | | 30,838,414 | | | | | |
| 5.950%, 06/01/2026 | | | 28,506,000 | | | | 33,714,706 | | | | | |
| 4.450%, 07/15/2027 | | | 13,777,000 | | | | 15,421,098 | | | | | |
| 4.800%, 05/03/2029 | | | 16,918,000 | | | | 19,386,155 | | | | | |
| 3.400%, 02/15/2031 | | | 5,825,000 | | | | 6,077,991 | | | | | |
| Boeing Co.: | | | | | | | | | | | | |
| 5.040%, 05/01/2027 | | | 5,140,000 | | | | 6,009,029 | | | | | |
| 5.150%, 05/01/2030 | | | 14,000,000 | | | | 16,943,521 | | | | | |
| 3.625%, 02/01/2031 | | | 10,000,000 | | | | 10,943,810 | | | | | |
| Bon Secours Mercy Health, Inc.: | | | | | | | | | | | | |
| 3.464%, 06/01/2030 | | | 8,000,000 | | | | 9,086,772 | | | | | |
| 3.205%, 06/01/2050 | | | 10,800,000 | | | | 11,533,490 | | | | | |
| Boral Finance Pty Ltd., | | | | | | | | | | | | |
3.000%, 11/01/2022(1)(2) | | | 6,000,000 | | | | 6,131,659 | | | | | |
| BorgWarner, Inc., | | | | | | | | | | | | |
5.000%, 10/01/2025(2) | | | 27,301,000 | | | | 32,101,292 | | | | | |
| Bristol-Myers Squibb Co.: | | | | | | | | | | | | |
| 3.550%, 08/15/2022 | | | 6,450,000 | | | | 6,795,397 | | | | | |
The accompanying notes are an integral part of these financial statements.
Baird Aggregate Bond Fund
Schedule of Investments, December 31, 2020
Long-Term Investments (cont.)
| | | Principal | | | | | | % of | |
| | | Amount | | | Value | | | Net Assets | |
| Bristol-Myers Squibb Co.: (cont.) | | | | | | | | | |
| 3.250%, 02/20/2023 | | $ | 6,175,000 | | | $ | 6,496,043 | | | |
|
|
| 4.000%, 08/15/2023 | | | 2,477,000 | | | | 2,710,691 | | | | | |
| 4.125%, 06/15/2039 | | | 9,150,000 | | | | 11,658,535 | | | | | |
| Broadcom, Inc.: | | | | | | | | | | | | |
| 3.625%, 10/15/2024 | | | 19,075,000 | | | | 20,957,159 | | | | | |
| 3.125%, 01/15/2025 | | | 12,000,000 | | | | 12,957,397 | | | | | |
| 3.150%, 11/15/2025 | | | 23,600,000 | | | | 25,770,060 | | | | | |
| 4.250%, 04/15/2026 | | | 58,100,000 | | | | 66,538,245 | | | | | |
| 4.750%, 04/15/2029 | | | 20,000,000 | | | | 23,854,438 | | | | | |
| Broadridge Financial Solutions, Inc., | | | | | | | | | | | | |
| 2.900%, 12/01/2029 | | | 11,300,000 | | | | 12,377,791 | | | | | |
| Bunge Limited Finance Corp.: | | | | | | | | | | | | |
| 3.000%, 09/25/2022 | | | 15,000,000 | | | | 15,572,715 | | | | | |
| 1.630%, 08/17/2025 | | | 10,000,000 | | | | 10,335,140 | | | | | |
| 3.250%, 08/15/2026 | | | 11,550,000 | | | | 12,837,403 | | | | | |
| Burlington Northern Santa Fe LLC, | | | | | | | | | | | | |
| 4.150%, 04/01/2045 | | | 3,000,000 | | | | 3,918,262 | | | | | |
| Cameron LNG LLC, | | | | | | | | | | | | |
3.302%, 01/15/2035(2) | | | 20,000,000 | | | | 22,569,153 | | | | | |
| Campbell Soup Co., | | | | | | | | | | | | |
| 3.950%, 03/15/2025 | | | 10,325,000 | | | | 11,636,784 | | | | | |
| Canadian Natural Resources Ltd., | | | | | | | | | | | | |
6.500%, 02/15/2037(1) | | | 982,000 | | | | 1,292,363 | | | | | |
| Carlisle Companies, Inc.: | | | | | | | | | | | | |
| 3.500%, 12/01/2024 | | | 5,000,000 | | | | 5,480,766 | | | | | |
| 2.750%, 03/01/2030 | | | 16,000,000 | | | | 17,139,567 | | | | | |
| Carrier Global Corp.: | | | | | | | | | | | | |
| 2.242%, 02/15/2025 | | | 8,125,000 | | | | 8,597,573 | | | | | |
| 2.493%, 02/15/2027 | | | 25,975,000 | | | | 28,028,029 | | | | | |
| 2.722%, 02/15/2030 | | | 6,861,000 | | | | 7,337,244 | | | | | |
| 2.700%, 02/15/2031 | | | 18,500,000 | | | | 19,876,804 | | | | | |
| CCL Industries, Inc., | | | | | | | | | | | | |
3.050%, 06/01/2030(1)(2) | | | 20,000,000 | | | | 21,810,845 | | | | | |
| Celanese US Holdings LLC, | | | | | | | | | | | | |
| 3.500%, 05/08/2024 | | | 10,640,000 | | | | 11,522,246 | | | | | |
| Celulosa Arauco y Constitucion SA, | | | | | | | | | | | | |
3.875%, 11/02/2027(1) | | | 12,000,000 | | | | 13,230,000 | | | | | |
| CF Industries, Inc.: | | | | | | | | | | | | |
| 3.450%, 06/01/2023 | | | 21,000,000 | | | | 21,892,500 | | | | | |
| 5.150%, 03/15/2034 | | | 3,000,000 | | | | 3,686,415 | | | | | |
| Charter Communications Operating LLC: | | | | | | | | | | | | |
| 4.464%, 07/23/2022 | | | 13,773,000 | | | | 14,520,095 | | | | | |
| 4.908%, 07/23/2025 | | | 54,750,000 | | | | 63,589,276 | | | | | |
| 3.750%, 02/15/2028 | | | 5,000,000 | | | | 5,606,159 | | | | | |
The accompanying notes are an integral part of these financial statements.
Baird Aggregate Bond Fund
Schedule of Investments, December 31, 2020
Long-Term Investments (cont.)
| | | Principal | | | | | | % of | |
| | | Amount | | | Value | | | Net Assets | |
| Charter Communications Operating LLC: (cont.) | | | | | | | | | |
| 5.050%, 03/30/2029 | | $ | 33,420,000 | | | $ | 40,634,161 | | | |
|
|
| 2.300%, 02/01/2032 | | | 10,525,000 | | | | 10,537,222 | | | | | |
| 6.384%, 10/23/2035 | | | 22,906,000 | | | | 31,382,298 | | | | | |
| Cheniere Corpus Christi Holdings LLC: | | | | | | | | | | | | |
| 7.000%, 06/30/2024 | | | 4,000,000 | | | | 4,671,098 | | | | | |
| 5.875%, 03/31/2025 | | | 5,646,000 | | | | 6,570,686 | | | | | |
| 5.125%, 06/30/2027 | | | 18,219,000 | | | | 21,552,677 | | | | | |
| Cigna Corp.: | | | | | | | | | | | | |
| 3.900%, 02/15/2022 | | | 10,000,000 | | | | 10,388,878 | | | | | |
| 3.050%, 11/30/2022 | | | 10,000,000 | | | | 10,473,649 | | | | | |
| 3.000%, 07/15/2023 | | | 5,512,000 | | | | 5,837,108 | | | | | |
| 3.500%, 06/15/2024 | | | 9,000,000 | | | | 9,833,491 | | | | | |
| 4.125%, 11/15/2025 | | | 3,190,000 | | | | 3,674,950 | | | | | |
| 4.500%, 02/25/2026 | | | 9,810,000 | | | | 11,500,852 | | | | | |
| 2.400%, 03/15/2030 | | | 15,000,000 | | | | 15,993,318 | | | | | |
| 4.800%, 08/15/2038 | | | 5,000,000 | | | | 6,514,195 | | | | | |
| CK Hutchison International Ltd., | | | | | | | | | | | | |
2.875%, 04/05/2022(1)(2) | | | 8,000,000 | | | | 8,203,204 | | | | | |
| CNH Industrial Capital LLC: | | | | | | | | | | | | |
| 1.950%, 07/02/2023 | | | 22,275,000 | | | | 22,930,904 | | | | | |
| 4.200%, 01/15/2024 | | | 2,450,000 | | | | 2,687,473 | | | | | |
| 1.875%, 01/15/2026 | | | 20,000,000 | | | | 20,944,927 | | | | | |
| CNH Industrial NV, | | | | | | | | | | | | |
3.850%, 11/15/2027(1) | | | 23,656,000 | | | | 26,650,492 | | | | | |
| Columbia Pipeline Group, Inc.: | | | | | | | | | | | | |
| 4.500%, 06/01/2025 | | | 6,199,000 | | | | 7,129,071 | | | | | |
| 5.800%, 06/01/2045 | | | 10,776,000 | | | | 14,721,223 | | | | | |
| Comcast Corp.: | | | | | | | | | | | | |
| 3.300%, 04/01/2027 | | | 9,125,000 | | | | 10,375,988 | | | | | |
| 3.200%, 07/15/2036 | | | 6,000,000 | | | | 6,816,414 | | | | | |
| 3.969%, 11/01/2047 | | | 8,622,000 | | | | 10,811,302 | | | | | |
| 4.950%, 10/15/2058 | | | 10,000,000 | | | | 15,182,613 | | | | | |
| CommonSpirit Health, | | | | | | | | | | | | |
| 3.347%, 10/01/2029 | | | 17,635,000 | | | | 19,364,475 | | | | | |
| Conagra Brands, Inc.: | | | | | | | | | | | | |
| 9.750%, 03/01/2021 | | | 4,548,000 | | | | 4,606,043 | | | | | |
| 7.125%, 10/01/2026 | | | 6,441,000 | | | | 8,257,362 | | | | | |
| 7.000%, 10/01/2028 | | | 4,300,000 | | | | 5,797,509 | | | | | |
| 5.300%, 11/01/2038 | | | 5,000,000 | | | | 6,684,508 | | | | | |
| Corning, Inc., | | | | | | | | | | | | |
| 4.375%, 11/15/2057 | | | 9,000,000 | | | | 11,254,909 | | | | | |
| Costco Wholesale Corp.: | | | | | | | | | | | | |
| 1.375%, 06/20/2027 | | | 8,600,000 | | | | 8,860,492 | | | | | |
| 1.600%, 04/20/2030 | | | 15,000,000 | | | | 15,370,459 | | | | | |
The accompanying notes are an integral part of these financial statements.
Baird Aggregate Bond Fund
Schedule of Investments, December 31, 2020
Long-Term Investments (cont.)
| | | Principal | | | | | | % of | |
| | | Amount | | | Value | | | Net Assets | |
| Cox Communications, Inc.: | | | | | | | | | |
3.850%, 02/01/2025(2) | | $ | 4,725,000 | | | $ | 5,269,380 | | | |
|
|
3.350%, 09/15/2026(2) | | | 4,450,000 | | | | 5,000,170 | | | | | |
4.800%, 02/01/2035(2) | | | 14,000,000 | | | | 17,705,215 | | | | | |
8.375%, 03/01/2039(2) | | | 19,011,000 | | | | 32,746,122 | | | | | |
| CSX Corp., | | | | | | | | | | | | |
| 4.650%, 03/01/2068 | | | 9,000,000 | | | | 12,619,432 | | | | | |
| CVS Health Corp.: | | | | | | | | | | | | |
| 3.625%, 04/01/2027 | | | 3,000,000 | | | | 3,413,926 | | | | | |
| 3.250%, 08/15/2029 | | | 8,000,000 | | | | 9,009,876 | | | | | |
| 4.780%, 03/25/2038 | | | 40,059,000 | | | | 50,753,978 | | | | | |
| 2.700%, 08/21/2040 | | | 5,000,000 | | | | 5,058,270 | | | | | |
| 5.125%, 07/20/2045 | | | 22,500,000 | | | | 30,293,131 | | | | | |
| 5.050%, 03/25/2048 | | | 28,300,000 | | | | 38,354,380 | | | | | |
| Daimler Finance North America LLC: | | | | | | | | | | | | |
3.400%, 02/22/2022(2) | | | 6,550,000 | | | | 6,764,746 | | | | | |
2.550%, 08/15/2022(2) | | | 30,000,000 | | | | 31,019,236 | | | | | |
1.750%, 03/10/2023(2) | | | 20,000,000 | | | | 20,533,470 | | | | | |
| Danone SA, | | | | | | | | | | | | |
2.589%, 11/02/2023(1)(2) | | | 19,600,000 | | | | 20,624,181 | | | | | |
| Dell Technologies, Inc., | | | | | | | | | | | | |
6.100%, 07/15/2027(2) | | | 5,580,000 | | | | 6,935,956 | | | | | |
| Dentsply Sirona, | | | | | | | | | | | | |
| 3.250%, 06/01/2030 | | | 25,000,000 | | | | 27,843,280 | | | | | |
| Deutsche Telekom International Finance BV, | | | | | | | | | | | | |
8.750%, 06/15/2030(1) | | | 8,661,000 | | | | 13,703,214 | | | | | |
| Diamond 1 Finance Corp. / Diamond 2 Finance Corp.: | | | | | | | | | | | | |
5.450%, 06/15/2023(2) | | | 15,043,000 | | | | 16,637,868 | | | | | |
6.020%, 06/15/2026(2) | | | 67,171,000 | | | | 81,944,942 | | | | | |
| Dollar General Corp., | | | | | | | | | | | | |
| 3.500%, 04/03/2030 | | | 7,000,000 | | | | 8,035,807 | | | | | |
| DuPont de Nemours, Inc.: | | | | | | | | | | | | |
| 4.493%, 11/15/2025 | | | 10,000,000 | | | | 11,673,500 | | | | | |
| 5.319%, 11/15/2038 | | | 29,000,000 | | | | 39,277,799 | | | | | |
| DXC Technology Co.: | | | | | | | | | | | | |
| 4.250%, 04/15/2024 | | | 54,525,000 | | | | 59,492,048 | | | | | |
| 4.125%, 04/15/2025 | | | 12,041,000 | | | | 13,310,661 | | | | | |
| 4.750%, 04/15/2027 | | | 36,917,000 | | | | 42,263,342 | | | | | |
| Edward-Elmhurst Healthcare, | | | | | | | | | | | | |
| 3.500%, 05/04/2023 | | | 4,000,000 | | | | 4,203,122 | | | | | |
| EI du Pont de Nemours and Co., | | | | | | | | | | | | |
| 2.300%, 07/15/2030 | | | 7,450,000 | | | | 7,924,622 | | | | | |
| Elanco Animal Health, Inc., | | | | | | | | | | | | |
| 5.272%, 08/28/2023 | | | 10,000,000 | | | | 10,925,000 | | | | | |
The accompanying notes are an integral part of these financial statements.
Baird Aggregate Bond Fund
Schedule of Investments, December 31, 2020
Long-Term Investments (cont.)
| | | Principal | | | | | | % of | |
| | | Amount | | | Value | | | Net Assets | |
| Element Fleet Management Corp., | | | | | | | | | |
3.850%, 06/15/2025(1)(2) | | $ | 18,492,000 | | | $ | 19,709,935 | | | |
|
|
| Emerson Electric Co., | | | | | | | | | | | | |
| 2.750%, 10/15/2050 | | | 16,158,000 | | | | 17,017,259 | | | | | |
| Enable Midstream Partners LP, | | | | | | | | | | | | |
| 3.900%, 05/15/2024 | | | 5,000,000 | | | | 5,112,778 | | | | | |
| Enbridge Energy Partners LP: | | | | | | | | | | | | |
| 7.500%, 04/15/2038 | | | 4,500,000 | | | | 6,386,666 | | | | | |
| 7.375%, 10/15/2045 | | | 20,000,000 | | | | 30,519,670 | | | | | |
| Encana Corp., | | | | | | | | | | | | |
| 3.900%, 11/15/2021 | | | 20,000,000 | | | | 20,251,417 | | | | | |
| Energy Transfer Operating LP: | | | | | | | | | | | | |
| 5.500%, 06/01/2027 | | | 5,468,000 | | | | 6,435,827 | | | | | |
| 4.900%, 03/15/2035 | | | 4,550,000 | | | | 5,009,378 | | | | | |
| 5.800%, 06/15/2038 | | | 7,797,000 | | | | 8,957,211 | | | | | |
| 6.050%, 06/01/2041 | | | 1,968,000 | | | | 2,304,832 | | | | | |
| 5.950%, 10/01/2043 | | | 3,550,000 | | | | 4,021,284 | | | | | |
| 6.125%, 12/15/2045 | | | 5,797,000 | | | | 6,847,979 | | | | | |
| 6.000%, 06/15/2048 | | | 10,000,000 | | | | 11,783,323 | | | | | |
| 6.250%, 04/15/2049 | | | 3,850,000 | | | | 4,656,799 | | | | | |
| Energy Transfer Partners LP: | | | | | | | | | | | | |
| 4.050%, 03/15/2025 | | | 21,190,000 | | | | 23,245,502 | | | | | |
| 6.500%, 02/01/2042 | | | 5,621,000 | | | | 6,857,540 | | | | | |
| Eni SpA, | | | | | | | | | | | | |
4.250%, 05/09/2029(1)(2) | | | 18,250,000 | | | | 21,619,255 | | | | | |
| Enterprise Products Operating LLC: | | | | | | | | | | | | |
| 3.700%, 02/15/2026 | | | 8,350,000 | | | | 9,458,121 | | | | | |
| 5.750%, 03/01/2035 | | | 4,930,000 | | | | 6,216,585 | | | | | |
| 3.200%, 02/15/2052 | | | 30,725,000 | | | | 31,239,602 | | | | | |
| EQT Midstream Partners LP: | | | | | | | | | | | | |
| 4.750%, 07/15/2023 | | | 10,405,000 | | | | 10,940,649 | | | | | |
| 4.000%, 08/01/2024 | | | 3,000,000 | | | | 3,090,660 | | | | | |
| 4.125%, 12/01/2026 | | | 10,000,000 | | | | 10,075,000 | | | | | |
| Equinix, Inc., | | | | | | | | | | | | |
| 2.150%, 07/15/2030 | | | 9,675,000 | | | | 9,840,928 | | | | | |
| ERAC USA Finance LLC, | | | | | | | | | | | | |
3.300%, 12/01/2026(2) | | | 20,225,000 | | | | 22,521,919 | | | | | |
| Exxon Mobil Corp.: | | | | | | | | | | | | |
| 1.571%, 04/15/2023 | | | 3,500,000 | | | | 3,599,395 | | | | | |
| 2.992%, 03/19/2025 | | | 33,700,000 | | | | 36,884,800 | | | | | |
| 3.294%, 03/19/2027 | | | 10,000,000 | | | | 11,396,350 | | | | | |
| 3.482%, 03/19/2030 | | | 11,125,000 | | | | 12,938,206 | | | | | |
| 2.610%, 10/15/2030 | | | 14,500,000 | | | | 15,838,095 | | | | | |
| FedEx Corp., | | | | | | | | | | | | |
| 4.950%, 10/17/2048 | | | 15,000,000 | | | | 20,479,064 | | | | | |
The accompanying notes are an integral part of these financial statements.
Baird Aggregate Bond Fund
Schedule of Investments, December 31, 2020
Long-Term Investments (cont.)
| | | Principal | | | | | | % of | |
| | | Amount | | | Value | | | Net Assets | |
| Ferguson Finance PLC: | | | | | | | | | |
4.500%, 10/24/2028 (Callable 07/24/2028)(1)(2) | | $ | 34,125,000 | | | $ | 40,897,862 | | | |
|
|
3.250%, 06/02/2030(1)(2) | | | 28,100,000 | | | | 31,334,554 | | | | | |
| Fidelity National Information Services, Inc.: | | | | | | | | | | | | |
| 3.500%, 04/15/2023 | | | 12,188,000 | | | | 12,934,513 | | | | | |
| 3.875%, 06/05/2024 | | | 582,000 | | | | 640,519 | | | | | |
| 4.500%, 08/15/2046 | | | 17,040,000 | | | | 21,784,233 | | | | | |
| Fiserv, Inc.: | | | | | | | | | | | | |
| 3.500%, 10/01/2022 | | | 5,410,000 | | | | 5,660,216 | | | | | |
| 3.200%, 07/01/2026 | | | 11,650,000 | | | | 13,050,098 | | | | | |
| 4.200%, 10/01/2028 | | | 5,000,000 | | | | 5,961,485 | | | | | |
| 2.650%, 06/01/2030 | | | 28,900,000 | | | | 31,267,448 | | | | | |
| 4.400%, 07/01/2049 | | | 3,500,000 | | | | 4,688,180 | | | | | |
| Flex Ltd.: | | | | | | | | | | | | |
3.750%, 02/01/2026(1) | | | 15,000,000 | | | | 16,778,384 | | | | | |
4.875%, 06/15/2029(1) | | | 14,600,000 | | | | 17,245,450 | | | | | |
| FLIR Systems, Inc., | | | | | | | | | | | | |
| 2.500%, 08/01/2030 | | | 7,000,000 | | | | 7,347,299 | | | | | |
| Florida Gas Transmission Co. LLC, | | | | | | | | | | | | |
2.550%, 07/01/2030(2) | | | 18,500,000 | | | | 19,498,918 | | | | | |
| FMC Corp.: | | | | | | | | | | | | |
| 4.100%, 02/01/2024 | | | 46,920,000 | | | | 51,072,743 | | | | | |
| 3.200%, 10/01/2026 | | | 5,000,000 | | | | 5,568,585 | | | | | |
| Fomento Economico Mexicano SAB de CV: | | | | | | | | | | | | |
2.875%, 05/10/2023(1) | | | 5,000,000 | | | | 5,225,000 | | | | | |
4.375%, 05/10/2043(1) | | | 1,874,000 | | | | 2,363,039 | | | | | |
3.500%, 01/16/2050(1) | | | 26,734,000 | | | | 29,749,454 | | | | | |
| Ford Motor Credit Co. LLC: | | | | | | | | | | | | |
| 3.200%, 01/15/2021 | | | 25,000,000 | | | | 25,012,500 | | | | | |
| 3.336%, 03/18/2021 | | | 7,500,000 | | | | 7,518,750 | | | | | |
| 3.339%, 03/28/2022 | | | 5,000,000 | | | | 5,050,000 | | | | | |
| 2.979%, 08/03/2022 | | | 34,690,000 | | | | 35,269,323 | | | | | |
| 3.087%, 01/09/2023 | | | 5,900,000 | | | | 6,002,925 | | | | | |
| 4.140%, 02/15/2023 | | | 10,000,000 | | | | 10,300,000 | | | | | |
| 5.584%, 03/18/2024 | | | 9,350,000 | | | | 10,085,378 | | | | | |
| 3.664%, 09/08/2024 | | | 5,565,000 | | | | 5,711,081 | | | | | |
| Fortune Brands Home & Security, Inc., | | | | | | | | | | | | |
| 3.250%, 09/15/2029 | | | 15,000,000 | | | | 16,621,793 | | | | | |
| Fresenius Medical Care US Finance II, Inc., | | | | | | | | | | | | |
4.750%, 10/15/2024(2) | | | 14,530,000 | | | | 16,268,287 | | | | | |
| Fresenius Medical Care US Finance III, Inc.: | | | | | | | | | | | | |
3.750%, 06/15/2029(2) | | | 24,200,000 | | | | 27,134,114 | | | | | |
2.375%, 02/16/2031(2) | | | 25,000,000 | | | | 25,408,813 | | | | | |
| General Dynamics Corp.: | | | | | | | | | | | | |
| 3.250%, 04/01/2025 | | | 4,000,000 | | | | 4,416,743 | | | | | |
| 3.500%, 04/01/2027 | | | 10,500,000 | | | | 12,079,157 | | | | | |
The accompanying notes are an integral part of these financial statements.
Baird Aggregate Bond Fund
Schedule of Investments, December 31, 2020
Long-Term Investments (cont.)
| | | Principal | | | | | | % of | |
| | | Amount | | | Value | | | Net Assets | |
| General Electric Co.: | | | | | | | | | |
| 3.450%, 05/01/2027 | | $ | 4,000,000 | | | $ | 4,524,182 | | | |
|
|
| 3.625%, 05/01/2030 | | | 10,000,000 | | | | 11,428,870 | | | | | |
| 6.150%, 08/07/2037 | | | 13,124,000 | | | | 18,092,172 | | | | | |
| 6.875%, 01/10/2039 | | | 5,000,000 | | | | 7,360,411 | | | | | |
| General Motors Co., | | | | | | | | | | | | |
| 6.125%, 10/01/2025 | | | 16,854,000 | | | | 20,443,375 | | | | | |
| General Motors Financial Co., Inc.: | | | | | | | | | | | | |
| 4.200%, 03/01/2021 | | | 30,000,000 | | | | 30,073,769 | | | | | |
| 4.375%, 09/25/2021 | | | 2,675,000 | | | | 2,747,232 | | | | | |
| 3.450%, 01/14/2022 | | | 5,000,000 | | | | 5,133,772 | | | | | |
| 3.150%, 06/30/2022 | | | 6,000,000 | | | | 6,211,966 | | | | | |
| 1.700%, 08/18/2023 | | | 25,000,000 | | | | 25,643,835 | | | | | |
| 5.100%, 01/17/2024 | | | 33,000,000 | | | | 36,928,586 | | | | | |
| 2.900%, 02/26/2025 | | | 13,000,000 | | | | 13,882,979 | | | | | |
| Genpact Luxembourg Sarl, | | | | | | | | | | | | |
3.375%, 12/01/2024(1) | | | 49,575,000 | | | | 53,977,207 | | | | | |
| Gilead Sciences, Inc., | | | | | | | | | | | | |
| 4.600%, 09/01/2035 | | | 4,600,000 | | | | 5,942,019 | | | | | |
| Glencore Finance (Canada) Ltd., | | | | | | | | | | | | |
5.550%, 10/25/2042(1)(2) | | | 5,000,000 | | | | 6,131,900 | | | | | |
| Glencore Funding LLC: | | | | | | | | | | | | |
4.125%, 05/30/2023(2) | | | 13,691,000 | | | | 14,806,132 | | | | | |
4.625%, 04/29/2024(2) | | | 35,620,000 | | | | 39,779,762 | | | | | |
4.000%, 04/16/2025(2) | | | 4,450,000 | | | | 4,979,455 | | | | | |
4.000%, 03/27/2027(2) | | | 25,550,000 | | | | 28,901,710 | | | | | |
3.875%, 10/27/2027(2) | | | 2,000,000 | | | | 2,253,800 | | | | | |
4.875%, 03/12/2029(2) | | | 11,000,000 | | | | 13,119,249 | | | | | |
2.500%, 09/01/2030(2) | | | 30,000,000 | | | | 30,595,402 | | | | | |
| Global Payments, Inc.: | | | | | | | | | | | | |
| 4.000%, 06/01/2023 | | | 19,700,000 | | | | 21,305,107 | | | | | |
| 4.800%, 04/01/2026 | | | 13,830,000 | | | | 16,412,353 | | | | | |
| 2.900%, 05/15/2030 | | | 14,467,000 | | | | 15,752,726 | | | | | |
| Grupo Bimbo SAB de CV: | | | | | | | | | | | | |
4.500%, 01/25/2022(1)(2) | | | 17,505,000 | | | | 18,191,021 | | | | | |
3.875%, 06/27/2024(1)(2) | | | 18,220,000 | | | | 19,936,689 | | | | | |
4.875%, 06/27/2044(1)(2) | | | 7,400,000 | | | | 9,274,743 | | | | | |
4.700%, 11/10/2047(1)(2) | | | 25,000,000 | | | | 31,047,000 | | | | | |
| Gulf South Pipeline Co. LP, | | | | | | | | | | | | |
| 4.000%, 06/15/2022 | | | 3,633,000 | | | | 3,740,388 | | | | | |
| Gulfstream Natural Gas System LLC, | | | | | | | | | | | | |
4.600%, 09/15/2025(2) | | | 5,000,000 | | | | 5,691,470 | | | | | |
| Halliburton Co., | | | | | | | | | | | | |
| 3.800%, 11/15/2025 | | | 551,000 | | | | 617,959 | | | | | |
The accompanying notes are an integral part of these financial statements.
Baird Aggregate Bond Fund
Schedule of Investments, December 31, 2020
Long-Term Investments (cont.)
| | | Principal | | | | | | % of | |
| | | Amount | | | Value | | | Net Assets | |
| HCA, Inc.: | | | | | | | | | |
| 5.250%, 04/15/2025 | | $ | 30,686,000 | | | $ | 35,831,481 | | | |
|
|
| 4.500%, 02/15/2027 | | | 15,000,000 | | | | 17,448,028 | | | | | |
| Hewlett Packard Enterprise Co., | | | | | | | | | | | | |
| 4.400%, 10/15/2022 | | | 15,150,000 | | | | 16,092,049 | | | | | |
| HP, Inc.: | | | | | | | | | | | | |
| 2.200%, 06/17/2025 | | | 15,000,000 | | | | 15,881,084 | | | | | |
| 3.000%, 06/17/2027 | | | 35,000,000 | | | | 38,619,258 | | | | | |
| Hubbell, Inc., | | | | | | | | | | | | |
| 3.150%, 08/15/2027 | | | 11,700,000 | | | | 12,434,879 | | | | | |
| Husky Energy, Inc., | | | | | | | | | | | | |
4.400%, 04/15/2029(1) | | | 20,000,000 | | | | 22,252,760 | | | | | |
| Hutchison Whampoa International Ltd., | | | | | | | | | | | | |
3.625%, 10/31/2024(1)(2) | | | 7,850,000 | | | | 8,594,887 | | | | | |
| Hyundai Capital America: | | | | | | | | | | | | |
3.000%, 03/18/2021(2) | | | 15,000,000 | | | | 15,067,177 | | | | | |
3.750%, 07/08/2021(2) | | | 12,950,000 | | | | 13,139,186 | | | | | |
3.950%, 02/01/2022(2) | | | 17,222,000 | | | | 17,793,060 | | | | | |
3.100%, 04/05/2022(2) | | | 21,255,000 | | | | 21,853,786 | | | | | |
3.000%, 06/20/2022(2) | | | 6,222,000 | | | | 6,418,054 | | | | | |
1.250%, 09/18/2023(2) | | | 14,000,000 | | | | 14,165,932 | | | | | |
3.400%, 06/20/2024(2) | | | 19,025,000 | | | | 20,284,454 | | | | | |
5.875%, 04/07/2025(2) | | | 3,000,000 | | | | 3,549,220 | | | | | |
| Infor, Inc., | | | | | | | | | | | | |
1.750%, 07/15/2025(2) | | | 17,375,000 | | | | 18,048,101 | | | | | |
| Ingersoll-Rand Luxembourg Finance SA, | | | | | | | | | | | | |
4.500%, 03/21/2049(1) | | | 10,000,000 | | | | 13,036,391 | | | | | |
| Ingredion, Inc., | | | | | | | | | | | | |
| 2.900%, 06/01/2030 | | | 26,775,000 | | | | 29,489,016 | | | | | |
| International Business Machines Corp., | | | | | | | | | | | | |
| 4.150%, 05/15/2039 | | | 11,325,000 | | | | 14,338,549 | | | | | |
| JAB Holdings BV, | | | | | | | | | | | | |
2.200%, 11/23/2030(1)(2) | | | 18,925,000 | | | | 19,026,659 | | | | | |
| JM Smucker Co.: | | | | | | | | | | | | |
| 3.500%, 03/15/2025 | | | 5,000,000 | | | | 5,572,911 | | | | | |
| 2.375%, 03/15/2030 | | | 9,125,000 | | | | 9,658,895 | | | | | |
| Johnson Controls International PLC: | | | | | | | | | | | | |
6.000%, 01/15/2036(1) | | | 892,000 | | | | 1,264,804 | | | | | |
4.500%, 02/15/2047(1) | | | 4,400,000 | | | | 5,783,226 | | | | | |
4.950%, 07/02/2064(1)(7) | | | 1,713,000 | | | | 2,351,567 | | | | | |
| Kansas City Southern: | | | | | | | | | | | | |
| 4.700%, 05/01/2048 | | | 10,075,000 | | | | 12,683,716 | | | | | |
| 3.500%, 05/01/2050 | | | 12,000,000 | | | | 13,341,650 | | | | | |
| Kellogg Co., | | | | | | | | | | | | |
| 2.100%, 06/01/2030 | | | 20,000,000 | | | | 21,008,357 | | | | | |
The accompanying notes are an integral part of these financial statements.
Baird Aggregate Bond Fund
Schedule of Investments, December 31, 2020
Long-Term Investments (cont.)
| | | Principal | | | | | | % of | |
| | | Amount | | | Value | | | Net Assets | |
| Keysight Technologies, Inc., | | | | | | | | | |
| 4.600%, 04/06/2027 | | $ | 36,562,000 | | | $ | 43,578,051 | | | |
|
|
| Kinder Morgan Energy Partners LP: | | | | | | | | | | | | |
| 4.300%, 05/01/2024 | | | 10,000,000 | | | | 11,072,343 | | | | | |
| 7.300%, 08/15/2033 | | | 8,103,000 | | | | 11,357,680 | | | | | |
| 5.800%, 03/15/2035 | | | 2,150,000 | | | | 2,700,008 | | | | | |
| 6.950%, 01/15/2038 | | | 14,008,000 | | | | 19,167,281 | | | | | |
| 6.500%, 09/01/2039 | | | 5,359,000 | | | | 6,991,006 | | | | | |
| 7.500%, 11/15/2040 | | | 7,917,000 | | | | 11,364,438 | | | | | |
| Kinder Morgan, Inc.: | | | | | | | | | | | | |
5.000%, 02/15/2021(2) | | | 4,155,000 | | | | 4,167,262 | | | | | |
5.625%, 11/15/2023(2) | | | 5,017,000 | | | | 5,659,986 | | | | | |
| 8.050%, 10/15/2030 | | | 3,670,000 | | | | 5,103,086 | | | | | |
| 7.800%, 08/01/2031 | | | 16,745,000 | | | | 23,913,169 | | | | | |
| 7.750%, 01/15/2032 | | | 36,569,000 | | | | 52,867,456 | | | | | |
| Kraft Heinz Foods Co.: | | | | | | | | | | | | |
| 4.000%, 06/15/2023 | | | 7,000,000 | | | | 7,443,657 | | | | | |
| 3.000%, 06/01/2026 | | | 10,000,000 | | | | 10,442,717 | | | | | |
| 5.000%, 07/15/2035 | | | 14,740,000 | | | | 17,868,453 | | | | | |
| L3Harris Technologies, Inc., | | | | | | | | | | | | |
| 3.832%, 04/27/2025 | | | 5,000,000 | | | | 5,612,018 | | | | | |
| Laboratory Corp. of America Holdings, | | | | | | | | | | | | |
| 3.200%, 02/01/2022 | | | 2,400,000 | | | | 2,471,434 | | | | | |
| Lafarge SA, | | | | | | | | | | | | |
7.125%, 07/15/2036(1) | | | 893,000 | | | | 1,301,759 | | | | | |
| Leidos, Inc.: | | | | | | | | | | | | |
3.625%, 05/15/2025(2) | | | 12,925,000 | | | | 14,451,313 | | | | | |
4.375%, 05/15/2030(2) | | | 11,500,000 | | | | 13,770,675 | | | | | |
2.300%, 02/15/2031(2) | | | 8,175,000 | | | | 8,323,777 | | | | | |
| Lennar Corp., | | | | | | | | | | | | |
| 4.125%, 01/15/2022 | | | 496,000 | | | | 507,780 | | | | | |
| Lennox International, Inc., | | | | | | | | | | | | |
| 3.000%, 11/15/2023 | | | 5,930,000 | | | | 6,250,220 | | | | | |
| Lockheed Martin Corp., | | | | | | | | | | | | |
| 3.100%, 01/15/2023 | | | 5,000,000 | | | | 5,254,539 | | | | | |
| LYB International Finance III LLC, | | | | | | | | | | | | |
| 2.250%, 10/01/2030 | | | 5,925,000 | | | | 6,095,607 | | | | | |
| Magellan Midstream Partners LP: | | | | | | | | | | | | |
| 3.200%, 03/15/2025 | | | 5,000,000 | | | | 5,391,528 | | | | | |
| 3.950%, 03/01/2050 | | | 5,100,000 | | | | 5,747,655 | | | | | |
| Marathon Petroleum Corp.: | | | | | | | | | | | | |
| 3.625%, 09/15/2024 | | | 1,600,000 | | | | 1,746,063 | | | | | |
| 4.750%, 09/15/2044 | | | 1,500,000 | | | | 1,723,073 | | | | | |
| Marshfield Clinic Health System, Inc., | | | | | | | | | | | | |
| 2.703%, 02/15/2030 | | | 23,125,000 | | | | 24,236,476 | | | | | |
The accompanying notes are an integral part of these financial statements.
Baird Aggregate Bond Fund
Schedule of Investments, December 31, 2020
Long-Term Investments (cont.)
| | | Principal | | | | | | % of | |
| | | Amount | | | Value | | | Net Assets | |
| Martin Marietta Materials, Inc.: | | | | | | | | | |
| 2.500%, 03/15/2030 | | $ | 6,200,000 | | | $ | 6,605,883 | | | |
|
|
| 6.250%, 05/01/2037 | | | 893,000 | | | | 1,143,754 | | | | | |
| Masco Corp., | | | | | | | | | | | | |
| 4.450%, 04/01/2025 | | | 5,000,000 | | | | 5,740,278 | | | | | |
| McDonald’s Corp.: | | | | | | | | | | | | |
| 3.300%, 07/01/2025 | | | 3,000,000 | | | | 3,340,701 | | | | | |
| 3.500%, 07/01/2027 | | | 6,000,000 | | | | 6,882,801 | | | | | |
| Microchip Technology, Inc.: | | | | | | | | | | | | |
| 3.922%, 06/01/2021 | | | 19,981,000 | | | | 20,264,715 | | | | | |
| 4.333%, 06/01/2023 | | | 16,455,000 | | | | 17,812,755 | | | | | |
0.972%, 02/15/2024(2) | | | 10,000,000 | | | | 10,024,478 | | | | | |
| Microsoft Corp.: | | | | | | | | | | | | |
| 3.950%, 08/08/2056 | | | 9,903,000 | | | | 13,599,515 | | | | | |
| 2.675%, 06/01/2060 | | | 2,097,000 | | | | 2,272,523 | | | | | |
| Midwest Connector Capital Co. LLC, | | | | | | | | | | | | |
4.625%, 04/01/2029(2) | | | 11,300,000 | | | | 11,845,287 | | | | | |
| Molex Electronic Technologies LLC, | | | | | | | | | | | | |
3.900%, 04/15/2025(2) | | | 9,365,000 | | | | 9,689,621 | | | | | |
| Molson Coors Beverage Co., | | | | | | | | | | | | |
| 3.000%, 07/15/2026 | | | 9,889,000 | | | | 10,780,710 | | | | | |
| Mosaic Co.: | | | | | | | | | | | | |
| 4.250%, 11/15/2023 | | | 36,878,000 | | | | 40,250,856 | | | | | |
| 5.450%, 11/15/2033 | | | 2,000,000 | | | | 2,486,515 | | | | | |
| 4.875%, 11/15/2041 | | | 5,000,000 | | | | 5,779,131 | | | | | |
| MPLX LP: | | | | | | | | | | | | |
| 4.500%, 07/15/2023 | | | 18,255,000 | | | | 19,882,974 | | | | | |
| 5.250%, 01/15/2025 | | | 9,276,000 | | | | 9,519,492 | | | | | |
| 4.000%, 02/15/2025 | | | 6,000,000 | | | | 6,705,297 | | | | | |
| 4.875%, 06/01/2025 | | | 18,665,000 | | | | 21,559,370 | | | | | |
| 1.750%, 03/01/2026 | | | 17,125,000 | | | | 17,722,754 | | | | | |
| 4.125%, 03/01/2027 | | | 11,700,000 | | | | 13,494,020 | | | | | |
| 2.650%, 08/15/2030 | | | 22,125,000 | | | | 23,187,277 | | | | | |
| 4.500%, 04/15/2038 | | | 5,725,000 | | | | 6,548,339 | | | | | |
| Mylan NV: | | | | | | | | | | | | |
3.150%, 06/15/2021(1) | | | 5,000,000 | | | | 5,048,333 | | | | | |
3.950%, 06/15/2026(1) | | | 32,400,000 | | | | 37,069,833 | | | | | |
| Mylan, Inc.: | | | | | | | | | | | | |
3.125%, 01/15/2023(2) | | | 5,000,000 | | | | 5,248,262 | | | | | |
| 4.550%, 04/15/2028 | | | 16,705,000 | | | | 19,858,940 | | | | | |
| Newell Brands, Inc., | | | | | | | | | | | | |
| 3.850%, 04/01/2023 | | | 15,000,000 | | | | 15,733,350 | | | | | |
| NIKE, Inc., | | | | | | | | | | | | |
| 2.850%, 03/27/2030 | | | 7,000,000 | | | | 7,930,080 | | | | | |
The accompanying notes are an integral part of these financial statements.
Baird Aggregate Bond Fund
Schedule of Investments, December 31, 2020
Long-Term Investments (cont.)
| | | Principal | | | | | | % of | |
| | | Amount | | | Value | | | Net Assets | |
| Norfolk Southern Corp., | | | | | | | | | |
| 3.050%, 05/15/2050 | | $ | 15,000,000 | | | $ | 16,342,335 | | | |
|
|
| Nutrien Ltd.: | | | | | | | | | | | | |
3.375%, 03/15/2025(1) | | | 5,125,000 | | | | 5,634,064 | | | | | |
4.200%, 04/01/2029(1) | | | 7,000,000 | | | | 8,370,046 | | | | | |
| nVent Finance Sarl, | | | | | | | | | | | | |
4.550%, 04/15/2028(1) | | | 26,190,000 | | | | 28,446,355 | | | | | |
| Occidental Petroleum Corp.: | | | | | | | | | | | | |
| 3.200%, 08/15/2026 | | | 11,000,000 | | | | 10,285,000 | | | | | |
| 7.500%, 05/01/2031 | | | 7,170,000 | | | | 8,079,228 | | | | | |
| 7.875%, 09/15/2031 | | | 6,320,000 | | | | 7,046,800 | | | | | |
| ONEOK, Inc.: | | | | | | | | | | | | |
| 7.500%, 09/01/2023 | | | 5,000,000 | | | | 5,787,483 | | | | | |
| 2.750%, 09/01/2024 | | | 1,200,000 | | | | 1,266,166 | | | | | |
| Oracle Corp., | | | | | | | | | | | | |
| 2.800%, 04/01/2027 | | | 41,225,000 | | | | 45,466,147 | | | | | |
| Orange SA, | | | | | | | | | | | | |
9.000%, 03/01/2031(1) | | | 29,044,000 | | | | 47,774,810 | | | | | |
| Otis Worldwide Corp., | | | | | | | | | | | | |
| 3.362%, 02/15/2050 | | | 3,025,000 | | | | 3,499,319 | | | | | |
| Pactiv LLC, | | | | | | | | | | | | |
| 7.950%, 12/15/2025 | | | 286,000 | | | | 327,470 | | | | | |
| PeaceHealth Obligated Group, | | | | | | | | | | | | |
| 3.218%, 11/15/2050 | | | 7,200,000 | | | | 7,818,362 | | | | | |
| Penske Truck Leasing Co., | | | | | | | | | | | | |
2.700%, 11/01/2024(2) | | | 5,275,000 | | | | 5,651,236 | | | | | |
| PepsiCo, Inc., | | | | | | | | | | | | |
| 2.750%, 03/19/2030 | | | 10,675,000 | | | | 11,952,638 | | | | | |
| PerkinElmer, Inc., | | | | | | | | | | | | |
| 3.300%, 09/15/2029 | | | 24,200,000 | | | | 27,285,775 | | | | | |
| Pernod Ricard SA, | | | | | | | | | | | | |
4.250%, 07/15/2022(1)(2) | | | 20,527,000 | | | | 21,672,278 | | | | | |
| Perrigo Finance Unlimited Co., | | | | | | | | | | | | |
4.375%, 03/15/2026(1) | | | 4,875,000 | | | | 5,517,074 | | | | | |
| Phillips 66: | | | | | | | | | | | | |
| 2.150%, 12/15/2030 | | | 12,000,000 | | | | 12,182,053 | | | | | |
| 5.875%, 05/01/2042 | | | 6,000,000 | | | | 8,342,146 | | | | | |
| 4.875%, 11/15/2044 | | | 21,130,000 | | | | 26,650,355 | | | | | |
| Phillips 66 Partners LP: | | | | | | | | | | | | |
| 3.605%, 02/15/2025 | | | 3,000,000 | | | | 3,242,249 | | | | | |
| 3.550%, 10/01/2026 | | | 7,000,000 | | | | 7,669,398 | | | | | |
| 3.150%, 12/15/2029 | | | 12,000,000 | | | | 12,484,088 | | | | | |
| Plains All American Pipeline LP / PAA Finance Corp., | | | | | | | | | | | | |
| 3.550%, 12/15/2029 | | | 10,000,000 | | | | 10,465,039 | | | | | |
The accompanying notes are an integral part of these financial statements.
Baird Aggregate Bond Fund
Schedule of Investments, December 31, 2020
Long-Term Investments (cont.)
| | | Principal | | | | | | % of | |
| | | Amount | | | Value | | | Net Assets | |
| Quanta Services, Inc., | | | | | | | | | |
| 2.900%, 10/01/2030 | | $ | 8,275,000 | | | $ | 8,872,095 | | | |
|
|
| Raytheon Technologies Corp.: | | | | | | | | | | | | |
| 3.500%, 03/15/2027 | | | 9,578,000 | | | | 10,931,926 | | | | | |
| 7.500%, 09/15/2029 | | | 8,000,000 | | | | 11,612,120 | | | | | |
| 2.250%, 07/01/2030 | | | 12,375,000 | | | | 13,144,657 | | | | | |
| 4.350%, 04/15/2047 | | | 9,175,000 | | | | 12,049,716 | | | | | |
| 3.125%, 07/01/2050 | | | 6,000,000 | | | | 6,616,151 | | | | | |
| Regency Energy Partners LP / | | | | | | | | | | | | |
| Regency Energy Finance Corp., | | | | | | | | | | | | |
| 5.875%, 03/01/2022 | | | 8,955,000 | | | | 9,362,688 | | | | | |
| Reliance Steel & Aluminum Co., | | | | | | | | | | | | |
| 2.150%, 08/15/2030 | | | 10,000,000 | | | | 10,274,250 | | | | | |
| Rio Tinto Alcan, Inc., | | | | | | | | | | | | |
5.750%, 06/01/2035(1) | | | 446,000 | | | | 651,497 | | | | | |
| Rogers Communications, Inc., | | | | | | | | | | | | |
5.450%, 10/01/2043(1) | | | 16,560,000 | | | | 23,362,322 | | | | | |
| Sabine Pass Liquefaction LLC: | | | | | | | | | | | | |
| 5.625%, 03/01/2025 | | | 17,500,000 | | | | 20,410,636 | | | | | |
| 5.875%, 06/30/2026 | | | 60,000,000 | | | | 72,546,140 | | | | | |
| Samarco Mineracao SA, | | | | | | | | | | | | |
5.750%, 10/24/2023(1)(2)(9) | | | 4,463,000 | | | | 3,202,203 | | | | | |
| Seagate HDD Cayman, | | | | | | | | | | | | |
4.750%, 06/01/2023(1) | | | 7,500,000 | | | | 8,101,125 | | | | | |
| Shell International Finance BV: | | | | | | | | | | | | |
2.375%, 04/06/2025(1) | | | 8,875,000 | | | | 9,518,440 | | | | | |
3.250%, 05/11/2025(1) | | | 5,725,000 | | | | 6,345,756 | | | | | |
2.750%, 04/06/2030(1) | | | 8,750,000 | | | | 9,680,421 | | | | | |
4.125%, 05/11/2035(1) | | | 10,000,000 | | | | 12,510,551 | | | | | |
| Sherwin-Williams Co., | | | | | | | | | | | | |
| 4.500%, 06/01/2047 | | | 4,000,000 | | | | 5,350,501 | | | | | |
| Shire Acquisitions Investments Ireland DAC, | | | | | | | | | | | | |
2.875%, 09/23/2023(1) | | | 26,223,000 | | | | 27,807,628 | | | | | |
| SK Telecom Co. Ltd., | | | | | | | | | | | | |
6.625%, 07/20/2027(1)(2) | | | 1,339,000 | | | | 1,755,031 | | | | | |
| Smith & Nephew PLC, | | | | | | | | | | | | |
2.032%, 10/14/2030(1) | | | 14,575,000 | | | | 14,847,818 | | | | | |
| Smithfield Foods, Inc.: | | | | | | | | | | | | |
2.650%, 10/03/2021(2) | | | 6,000,000 | | | | 6,053,034 | | | | | |
3.350%, 02/01/2022(2) | | | 30,802,000 | | | | 31,225,397 | | | | | |
| Sociedad Quimica y Minera de Chile SA, | | | | | | | | | | | | |
3.625%, 04/03/2023(1)(2) | | | 10,000,000 | | | | 10,490,100 | | | | | |
| Solvay Finance America LLC, | | | | | | | | | | | | |
4.450%, 12/03/2025(2) | | | 61,307,000 | | | | 70,094,586 | | | | | |
The accompanying notes are an integral part of these financial statements.
Baird Aggregate Bond Fund
Schedule of Investments, December 31, 2020
Long-Term Investments (cont.)
| | | Principal | | | | | | % of | |
| | | Amount | | | Value | | | Net Assets | |
| Spectra Energy Partners LP, | | | | | | | | | |
| 4.500%, 03/15/2045 | | $ | 7,000,000 | | | $ | 8,179,968 | | | |
|
|
| Steel Dynamics, Inc.: | | | | | | | | | | | | |
| 2.400%, 06/15/2025 | | | 5,000,000 | | | | 5,314,346 | | | | | |
| 3.250%, 01/15/2031 | | | 7,000,000 | | | | 7,827,717 | | | | | |
| Sunoco Logistics Partners Operations LP: | | | | | | | | | | | | |
| 3.900%, 07/15/2026 | | | 12,000,000 | | | | 13,149,207 | | | | | |
| 5.400%, 10/01/2047 | | | 7,425,000 | | | | 8,296,209 | | | | | |
| Suntory Holdings Ltd.: | | | | | | | | | | | | |
2.550%, 06/28/2022(1)(2) | | | 16,500,000 | | | | 16,954,318 | | | | | |
2.250%, 10/16/2024(1)(2) | | | 8,500,000 | | | | 8,892,569 | | | | | |
| Sysco Corp.: | | | | | | | | | | | | |
| 5.650%, 04/01/2025 | | | 10,165,000 | | | | 12,086,200 | | | | | |
| 3.300%, 07/15/2026 | | | 11,550,000 | | | | 12,846,436 | | | | | |
| Takeda Pharmaceutical Co. Ltd., | | | | | | | | | | | | |
3.175%, 07/09/2050(1) | | | 25,000,000 | | | | 26,656,841 | | | | | |
| TC PipeLines LP: | | | | | | | | | | | | |
| 4.375%, 03/13/2025 | | | 31,115,000 | | | | 35,093,135 | | | | | |
| 3.900%, 05/25/2027 | | | 30,327,000 | | | | 34,109,835 | | | | | |
| Telecom Italia Capital SA, | | | | | | | | | | | | |
7.200%, 07/18/2036(1) | | | 5,475,000 | | | | 7,386,706 | | | | | |
| Telefonica Emisiones SA: | | | | | | | | | | | | |
5.462%, 02/16/2021(1) | | | 8,830,000 | | | | 8,879,456 | | | | | |
4.665%, 03/06/2038(1) | | | 4,000,000 | | | | 4,801,920 | | | | | |
5.213%, 03/08/2047(1) | | | 7,225,000 | | | | 9,261,082 | | | | | |
4.895%, 03/06/2048(1) | | | 12,550,000 | | | | 15,745,116 | | | | | |
5.520%, 03/01/2049(1) | | | 10,375,000 | | | | 13,999,919 | | | | | |
| Teva Pharmaceutical Finance Netherlands III BV: | | | | | | | | | | | | |
2.800%, 07/21/2023(1) | | | 25,000,000 | | | | 24,752,500 | | | | | |
3.150%, 10/01/2026(1) | | | 15,000,000 | | | | 14,418,900 | | | | | |
| Textron, Inc., | | | | | | | | | | | | |
| 3.000%, 06/01/2030 | | | 19,675,000 | | | | 21,208,652 | | | | | |
| Thermo Fisher Scientific, Inc., | | | | | | | | | | | | |
| 3.000%, 04/15/2023 | | | 7,975,000 | | | | 8,416,713 | | | | | |
| Time Warner Cable LLC: | | | | | | | | | | | | |
| 6.550%, 05/01/2037 | | | 893,000 | | | | 1,225,840 | | | | | |
| 6.750%, 06/15/2039 | | | 2,767,000 | | | | 3,938,013 | | | | | |
| Timken Co.: | | | | | | | | | | | | |
| 3.875%, 09/01/2024 | | | 11,255,000 | | | | 12,095,014 | | | | | |
| 4.500%, 12/15/2028 | | | 6,550,000 | | | | 7,335,405 | | | | | |
| TransCanada PipeLines Ltd., | | | | | | | | | | | | |
7.625%, 01/15/2039(1) | | | 11,800,000 | | | | 18,400,620 | | | | | |
| Transcontinental Gas Pipe Line Co. LLC: | | | | | | | | | | | | |
| 7.250%, 12/01/2026 | | | 3,500,000 | | | | 4,515,701 | | | | | |
| 4.600%, 03/15/2048 | | | 5,150,000 | | | | 6,252,478 | | | | | |
The accompanying notes are an integral part of these financial statements.
Baird Aggregate Bond Fund
Schedule of Investments, December 31, 2020
Long-Term Investments (cont.)
| | | Principal | | | | | | % of | |
| | | Amount | | | Value | | | Net Assets | |
| TTX Co.: | | | | | | | | | |
3.600%, 01/15/2025(2) | | $ | 5,000,000 | | | $ | 5,566,357 | | | |
|
|
3.900%, 02/01/2045(2) | | | 10,250,000 | | | | 12,105,474 | | | | | |
4.600%, 02/01/2049(2) | | | 8,325,000 | | | | 11,062,399 | | | | | |
| Tyson Foods, Inc., | | | | | | | | | | | | |
| 5.100%, 09/23/2048 | | | 10,000,000 | | | | 14,396,279 | | | | | |
| Upjohn, Inc.: | | | | | | | | | | | | |
3.850%, 06/22/2040(2) | | | 13,083,000 | | | | 14,766,411 | | | | | |
4.000%, 06/22/2050(2) | | | 20,600,000 | | | | 23,601,172 | | | | | |
| UPMC, | | | | | | | | | | | | |
| 3.600%, 04/03/2025 | | | 45,000,000 | | | | 49,976,633 | | | | | |
| Valaris PLC, | | | | | | | | | | | | |
5.200%, 03/15/2025(1)(9) | | | 4,000,000 | | | | 170,000 | | | | | |
| Vale Overseas Ltd.: | | | | | | | | | | | | |
6.250%, 08/10/2026(1) | | | 32,481,000 | | | | 40,276,440 | | | | | |
3.750%, 07/08/2030(1) | | | 13,926,000 | | | | 15,492,814 | | | | | |
8.250%, 01/17/2034(1) | | | 8,526,000 | | | | 13,100,199 | | | | | |
6.875%, 11/21/2036(1) | | | 3,483,000 | | | | 5,104,789 | | | | | |
6.875%, 11/10/2039(1) | | | 16,643,000 | | | | 24,777,433 | | | | | |
| Valero Energy Corp.: | | | | | | | | | | | | |
| 2.850%, 04/15/2025 | | | 15,000,000 | | | | 15,975,623 | | | | | |
| 2.150%, 09/15/2027 | | | 14,150,000 | | | | 14,457,961 | | | | | |
| 4.000%, 04/01/2029 | | | 15,475,000 | | | | 17,409,539 | | | | | |
| 6.625%, 06/15/2037 | | | 2,100,000 | | | | 2,793,393 | | | | | |
| Valero Energy Partners LP, | | | | | | | | | | | | |
| 4.375%, 12/15/2026 | | | 10,000,000 | | | | 11,575,566 | | | | | |
| Verisk Analytics, Inc., | | | | | | | | | | | | |
| 5.800%, 05/01/2021 | | | 8,325,000 | | | | 8,467,324 | | | | | |
| Verizon Communications, Inc.: | | | | | | | | | | | | |
| 3.000%, 03/22/2027 | | | 5,000,000 | | | | 5,547,222 | | | | | |
| 4.329%, 09/21/2028 | | | 3,077,000 | | | | 3,705,415 | | | | | |
| 4.500%, 08/10/2033 | | | 16,325,000 | | | | 20,599,049 | | | | | |
| 4.272%, 01/15/2036 | | | 8,148,000 | | | | 10,105,805 | | | | | |
| 5.250%, 03/16/2037 | | | 28,793,000 | | | | 39,019,986 | | | | | |
| 4.812%, 03/15/2039 | | | 36,839,000 | | | | 48,060,843 | | | | | |
| 2.650%, 11/20/2040 | | | 10,000,000 | | | | 10,097,658 | | | | | |
| 4.862%, 08/21/2046 | | | 2,500,000 | | | | 3,378,592 | | | | | |
| Vodafone Group PLC: | | | | | | | | | | | | |
7.875%, 02/15/2030(1) | | | 3,100,000 | | | | 4,599,000 | | | | | |
5.000%, 05/30/2038(1) | | | 6,800,000 | | | | 8,897,404 | | | | | |
4.375%, 02/19/2043(1) | | | 15,554,000 | | | | 19,317,362 | | | | | |
5.250%, 05/30/2048(1) | | | 16,830,000 | | | | 23,443,332 | | | | | |
| Volkswagen Group of America Finance LLC: | | | | | | | | | | | | |
4.000%, 11/12/2021(2) | | | 8,845,000 | | | | 9,115,015 | | | | | |
4.250%, 11/13/2023(2) | | | 17,350,000 | | | | 19,081,892 | | | | | |
The accompanying notes are an integral part of these financial statements.
Baird Aggregate Bond Fund
Schedule of Investments, December 31, 2020
Long-Term Investments (cont.)
| | | Principal | | | | | | % of | |
| | | Amount | | | Value | | | Net Assets | |
| Volkswagen Group of America Finance LLC: (cont.) | | | | | | | | | |
2.850%, 09/26/2024(2) | | $ | 14,000,000 | | | $ | 14,951,902 | | | |
|
|
3.350%, 05/13/2025(2) | | | 10,000,000 | | | | 10,993,550 | | | | | |
1.250%, 11/24/2025(2) | | | 30,000,000 | | | | 30,297,396 | | | | | |
| Vulcan Materials Co., | | | | | | | | | | | | |
| 4.700%, 03/01/2048 | | | 3,446,000 | | | | 4,452,089 | | | | | |
| Wabtec Corp.: | | | | | | | | | | | | |
| 4.375%, 08/15/2023 | | | 2,678,000 | | | | 2,826,220 | | | | | |
| 4.400%, 03/15/2024 | | | 24,825,000 | | | | 27,167,858 | | | | | |
| 3.450%, 11/15/2026 | | | 28,315,000 | | | | 31,083,378 | | | | | |
| 4.950%, 09/15/2028 | | | 4,739,000 | | | | 5,622,459 | | | | | |
| Walgreens Boots Alliance, Inc.: | | | | | | | | | | | | |
| 3.300%, 11/18/2021 | | | 6,383,000 | | | | 6,515,770 | | | | | |
| 3.450%, 06/01/2026 | | | 5,934,000 | | | | 6,563,014 | | | | | |
| 3.200%, 04/15/2030 | | | 13,575,000 | | | | 14,746,603 | | | | | |
| 4.500%, 11/18/2034 | | | 4,750,000 | | | | 5,455,386 | | | | | |
| 4.800%, 11/18/2044 | | | 4,520,000 | | | | 5,134,076 | | | | | |
| 4.650%, 06/01/2046 | | | 4,000,000 | | | | 4,459,241 | | | | | |
| Waste Connections, Inc., | | | | | | | | | | | | |
2.600%, 02/01/2030(1) | | | 7,525,000 | | | | 8,099,620 | | | | | |
| Western Digital Corp., | | | | | | | | | | | | |
| 4.750%, 02/15/2026 | | | 4,000,000 | | | | 4,420,000 | | | | | |
| Western Gas Partners LP: | | | | | | | | | | | | |
| 4.000%, 07/01/2022 | | | 10,463,000 | | | | 10,755,755 | | | | | |
| 3.950%, 06/01/2025 | | | 8,000,000 | | | | 8,160,000 | | | | | |
| Western Midstream Operating LP, | | | | | | | | | | | | |
| 4.100%, 02/01/2025 | | | 20,000,000 | | | | 20,611,400 | | | | | |
| Westinghouse Air Brake Technologies Corp., | | | | | | | | | | | | |
| 3.200%, 06/15/2025 | | | 5,295,000 | | | | 5,712,560 | | | | | |
| WestRock MWV LLC, | | | | | | | | | | | | |
| 8.200%, 01/15/2030 | | | 7,963,000 | | | | 11,347,938 | | | | | |
| Williams Companies, Inc.: | | | | | | | | | | | | |
| 3.600%, 03/15/2022 | | | 10,176,000 | | | | 10,504,226 | | | | | |
| 3.700%, 01/15/2023 | | | 1,690,000 | | | | 1,790,259 | | | | | |
| 4.300%, 03/04/2024 | | | 7,310,000 | | | | 8,054,891 | | | | | |
| 4.550%, 06/24/2024 | | | 7,000,000 | | | | 7,835,487 | | | | | |
| 3.900%, 01/15/2025 | | | 3,160,000 | | | | 3,503,601 | | | | | |
| 8.750%, 03/15/2032 | | | 4,000,000 | | | | 5,851,365 | | | | | |
| 6.300%, 04/15/2040 | | | 8,142,000 | | | | 10,828,364 | | | | | |
| 4.850%, 03/01/2048 | | | 7,000,000 | | | | 8,604,113 | | | | | |
| Woodside Finance Ltd.: | | | | | | | | | | | | |
3.650%, 03/05/2025(1)(2) | | | 12,300,000 | | | | 13,260,630 | | | | | |
4.500%, 03/04/2029(1)(2) | | | 10,000,000 | | | | 11,161,111 | | | | | |
| WRKCo, Inc., | | | | | | | | | | | | |
| 3.000%, 09/15/2024 | | | 14,895,000 | | | | 16,038,224 | | | | | |
The accompanying notes are an integral part of these financial statements.
Baird Aggregate Bond Fund
Schedule of Investments, December 31, 2020
Long-Term Investments (cont.)
| | | Principal | | | | | | % of | |
| | | Amount | | | Value | | | Net Assets | |
| Xylem, Inc.: | | | | | | | | | |
| 1.950%, 01/30/2028 | | $ | 10,000,000 | | | $ | 10,544,256 | | | | |
| 2.250%, 01/30/2031 | | | 9,325,000 | | | | 9,820,925 | | | | |
| Yara International ASA, | | | | | | | | | | | |
3.800%, 06/06/2026(1)(2) | | | 13,965,000 | | | | 15,590,180 | | | | |
| Zimmer Biomet Holdings, Inc.: | | | | | | | | | | | |
| 3.550%, 04/01/2025 | | | 20,996,000 | | | | 23,192,047 | | | | |
| 3.550%, 03/20/2030 | | | 14,977,000 | | | | 16,959,690 | | | | |
| 5.750%, 11/30/2039 | | | 9,850,000 | | | | 12,929,420 | | | | |
| Zimmer Holdings, Inc., | | | | | | | | | | | |
| 3.150%, 04/01/2022 | | | 9,500,000 | | | | 9,770,026 | | | | |
| Zoetis, Inc.: | | | | | | | | | | | |
| 3.250%, 02/01/2023 | | | 34,200,000 | | | | 35,974,550 | | | | |
| 4.700%, 02/01/2043 | | | 3,568,000 | | | | 4,885,918 | | | | |
| Total Industrials | | | | | | | | | | | |
| (Cost $6,748,273,886) | | | | | | | 7,422,028,205 | | | | 22.5 | % |
| Utilities | | | | | | | | | | | | |
| Ameren Corp., | | | | | | | | | | | | |
| 3.500%, 01/15/2031 | | | 20,000,000 | | | | 23,075,079 | | | | | |
| American Electric Power Co., Inc., | | | | | | | | | | | | |
| 3.250%, 03/01/2050 | | | 10,175,000 | | | | 10,731,716 | | | | | |
| Ausgrid Finance Pty Ltd., | | | | | | | | | | | | |
3.850%, 05/01/2023(1)(2) | | | 5,000,000 | | | | 5,279,860 | | | | | |
| Avangrid, Inc., | | | | | | | | | | | | |
| 3.200%, 04/15/2025 | | | 14,000,000 | | | | 15,326,353 | | | | | |
| Berkshire Hathaway Energy Co.: | | | | | | | | | | | | |
4.050%, 04/15/2025(2) | | | 5,000,000 | | | | 5,661,349 | | | | | |
3.700%, 07/15/2030(2) | | | 18,425,000 | | | | 21,794,104 | | | | | |
2.850%, 05/15/2051(2) | | | 13,675,000 | | | | 14,067,097 | | | | | |
| Consumers Energy Co., | | | | | | | | | | | | |
| 3.500%, 08/01/2051 | | | 9,400,000 | | | | 11,499,421 | | | | | |
| Dominion Energy, Inc.: | | | | | | | | | | | | |
2.450%, 01/15/2023(2) | | | 15,000,000 | | | | 15,606,458 | | | | | |
| 3.375%, 04/01/2030 | | | 10,000,000 | | | | 11,390,949 | | | | | |
| Duke Energy Corp., | | | | | | | | | | | | |
| 2.650%, 09/01/2026 | | | 10,000,000 | | | | 10,895,976 | | | | | |
| Edison International, | | | | | | | | | | | | |
| 2.950%, 03/15/2023 | | | 5,000,000 | | | | 5,195,311 | | | | | |
| EDP Finance BV, | | | | | | | | | | | | |
3.625%, 07/15/2024(1)(2) | | | 19,175,000 | | | | 20,927,045 | | | | | |
| Enel Finance International NV: | | | | | | | | | | | | |
2.875%, 05/25/2022(1)(2) | | | 7,000,000 | | | | 7,222,401 | | | | | |
3.625%, 05/25/2027(1)(2) | | | 22,790,000 | | | | 25,860,244 | | | | | |
3.500%, 04/06/2028(1)(2) | | | 8,000,000 | | | | 9,111,180 | | | | | |
The accompanying notes are an integral part of these financial statements.
Baird Aggregate Bond Fund
Schedule of Investments, December 31, 2020
Long-Term Investments (cont.)
| | | Principal | | | | | | % of | |
| | | Amount | | | Value | | | Net Assets | |
| Enel Finance International NV: (cont.) | | | | | | | | | |
4.875%, 06/14/2029(1)(2) | | $ | 6,615,000 | | | $ | 8,259,119 | | | |
|
|
6.800%, 09/15/2037(1)(2) | | | 4,565,000 | | | | 6,718,254 | | | | | |
4.750%, 05/25/2047(1)(2) | | | 55,875,000 | | | | 74,400,746 | | | | | |
| Entergy Corp., | | | | | | | | | | | | |
| 2.950%, 09/01/2026 | | | 13,075,000 | | | | 14,411,398 | | | | | |
| Essential Utilities, Inc., | | | | | | | | | | | | |
| 2.704%, 04/15/2030 | | | 14,100,000 | | | | 15,285,657 | | | | | |
| Evergy, Inc., | | | | | | | | | | | | |
| 2.450%, 09/15/2024 | | | 6,675,000 | | | | 7,077,733 | | | | | |
| Eversource Energy, | | | | | | | | | | | | |
| 1.650%, 08/15/2030 | | | 9,925,000 | | | | 9,884,792 | | | | | |
| Exelon Corp.: | | | | | | | | | | | | |
| 4.050%, 04/15/2030 | | | 8,900,000 | | | | 10,531,231 | | | | | |
| 4.950%, 06/15/2035 | | | 3,500,000 | | | | 4,409,080 | | | | | |
| FirstEnergy Corp.: | | | | | | | | | | | | |
| 2.650%, 03/01/2030 | | | 4,300,000 | | | | 4,313,637 | | | | | |
| 3.400%, 03/01/2050 | | | 15,000,000 | | | | 14,367,493 | | | | | |
| Interstate Power and Light Co., | | | | | | | | | | | | |
| 2.300%, 06/01/2030 | | | 9,350,000 | | | | 9,887,258 | | | | | |
| ITC Holdings Corp.: | | | | | | | | | | | | |
| 3.350%, 11/15/2027 | | | 25,581,000 | | | | 28,797,025 | | | | | |
2.950%, 05/14/2030(2) | | | 10,000,000 | | | | 10,930,294 | | | | | |
| Liberty Utilities Finance GP 1, | | | | | | | | | | | | |
2.050%, 09/15/2030(2) | | | 10,000,000 | | | | 10,051,703 | | | | | |
| Mega Advance Investments Ltd., | | | | | | | | | | | | |
5.000%, 05/12/2021(1)(2) | | | 4,909,000 | | | | 4,965,797 | | | | | |
| National Rural Utilities Cooperative Finance Corp., | | | | | | | | | | | | |
| 8.000%, 03/01/2032 | | | 4,659,000 | | | | 7,338,021 | | | | | |
| NiSource, Inc.: | | | | | | | | | | | | |
| 3.600%, 05/01/2030 | | | 4,585,000 | | | | 5,305,641 | | | | | |
| 5.250%, 02/15/2043 | | | 5,779,000 | | | | 7,914,775 | | | | | |
| 3.950%, 03/30/2048 | | | 11,750,000 | | | | 14,433,681 | | | | | |
| Oncor Electric Delivery Co. LLC, | | | | | | | | | | | | |
| 2.750%, 05/15/2030 | | | 9,500,000 | | | | 10,636,737 | | | | | |
| RGS I&M Funding Corp., | | | | | | | | | | | | |
| 9.820%, 12/07/2022 | | | 320,268 | | | | 329,619 | | | | | |
| Southern Co., | | | | | | | | | | | | |
| 4.250%, 07/01/2036 | | | 5,525,000 | | | | 6,776,807 | | | | | |
| Talent Yield Investments Ltd., | | | | | | | | | | | | |
4.500%, 04/25/2022(1)(2) | | | 1,785,000 | | | | 1,855,834 | | | | | |
| Xcel Energy, Inc., | | | | | | | | | | | | |
| 3.400%, 06/01/2030 | | | 15,000,000 | | | | 17,192,588 | | | | | |
| Total Utilities | | | | | | | | | | | | |
| (Cost $466,855,421) | | | | | | | 519,719,463 | | | | 1.6 | % |
The accompanying notes are an integral part of these financial statements.
Baird Aggregate Bond Fund
Schedule of Investments, December 31, 2020
Long-Term Investments (cont.)
| | | Principal | | | | | | % of | |
| | | Amount | | | Value | | | Net Assets | |
| Financials | | | | | | | | | |
| ABN AMRO Bank NV: | | | | | | | | | |
7.750%, 05/15/2023(1)(2) | | $ | 7,200,000 | | | $ | 8,244,267 | | | |
|
|
4.750%, 07/28/2025(1)(2) | | | 59,016,000 | | | | 67,918,623 | | | | | |
4.800%, 04/18/2026(1)(2) | | | 24,705,000 | | | | 28,948,856 | | | | | |
| AerCap Holdings NV: | | | | | | | | | | | | |
4.875%, 01/16/2024(1) | | | 20,000,000 | | | | 21,834,126 | | | | | |
2.875%, 08/14/2024(1) | | | 20,000,000 | | | | 20,799,720 | | | | | |
| AIA Group Ltd., | | | | | | | | | | | | |
3.200%, 03/11/2025(1)(2) | | | 6,000,000 | | | | 6,473,100 | | | | | |
| Air Lease Corp.: | | | | | | | | | | | | |
| 4.250%, 02/01/2024 | | | 8,550,000 | | | | 9,278,983 | | | | | |
| 2.300%, 02/01/2025 | | | 15,000,000 | | | | 15,528,664 | | | | | |
| American International Group, Inc.: | | | | | | | | | | | | |
| 4.875%, 06/01/2022 | | | 17,698,000 | | | | 18,776,907 | | | | | |
| 4.125%, 02/15/2024 | | | 893,000 | | | | 988,758 | | | | | |
| 3.750%, 07/10/2025 | | | 12,135,000 | | | | 13,633,613 | | | | | |
| 3.875%, 01/15/2035 | | | 4,875,000 | | | | 5,849,418 | | | | | |
| 6.820%, 11/15/2037 | | | 1,410,000 | | | | 2,003,090 | | | | | |
| Ameriprise Financial, Inc., | | | | | | | | | | | | |
| 3.000%, 04/02/2025 | | | 13,700,000 | | | | 14,914,742 | | | | | |
| AmSouth Bancorporation, | | | | | | | | | | | | |
| 6.750%, 11/01/2025 | | | 223,000 | | | | 273,805 | | | | | |
| Anthem, Inc.: | | | | | | | | | | | | |
| 2.375%, 01/15/2025 | | | 6,000,000 | | | | 6,417,302 | | | | | |
| 5.100%, 01/15/2044 | | | 1,584,000 | | | | 2,196,662 | | | | | |
| 4.375%, 12/01/2047 | | | 8,650,000 | | | | 11,149,176 | | | | | |
| ANZ New Zealand (Int’l) Ltd.: | | | | | | | | | | | | |
2.750%, 02/03/2021(1)(2) | | | 3,000,000 | | | | 3,005,760 | | | | | |
3.400%, 03/19/2024(1)(2) | | | 2,000,000 | | | | 2,171,155 | | | | | |
| Aon PLC: | | | | | | | | | | | | |
4.000%, 11/27/2023(1) | | | 6,150,000 | | | | 6,713,540 | | | | | |
3.875%, 12/15/2025(1) | | | 9,126,000 | | | | 10,404,179 | | | | | |
4.450%, 05/24/2043(1) | | | 1,274,000 | | | | 1,551,668 | | | | | |
| ASB Bank Ltd., | | | | | | | | | | | | |
3.750%, 06/14/2023(1)(2) | | | 10,000,000 | | | | 10,782,265 | | | | | |
| Australia & New Zealand Banking Group Ltd.: | | | | | | | | | | | | |
4.500%, 03/19/2024(1)(2) | | | 44,423,000 | | | | 48,971,344 | | | | | |
| 2.950%, 07/22/2030 | | | | | | | | | | | | |
(5 Year CMT Rate + 1.288%)(1)(2)(3) | | | 5,000,000 | | | | 5,275,489 | | | | | |
| 2.570%, 11/25/2035 | | | | | | | | | | | | |
(5 Year CMT Rate + 1.700%)(1)(2)(3) | | | 15,000,000 | | | | 15,302,560 | | | | | |
| Banco Bilbao Vizcaya Argentaria SA, | | | | | | | | | | | | |
1.125%, 09/18/2025(1) | | | 10,000,000 | | | | 10,072,247 | | | | | |
The accompanying notes are an integral part of these financial statements.
Baird Aggregate Bond Fund
Schedule of Investments, December 31, 2020
Long-Term Investments (cont.)
| | | Principal | | | | | | % of | |
| | | Amount | | | Value | | | Net Assets | |
| Banco Santander SA: | | | | | | | | | |
3.500%, 04/11/2022(1) | | $ | 13,000,000 | | | $ | 13,499,899 | | | |
|
|
2.746%, 05/28/2025(1) | | | 7,000,000 | | | | 7,472,673 | | | | | |
5.179%, 11/19/2025(1) | | | 16,183,000 | | | | 18,976,080 | | | | | |
4.379%, 04/12/2028(1) | | | 13,400,000 | | | | 15,629,936 | | | | | |
3.490%, 05/28/2030(1) | | | 5,000,000 | | | | 5,603,927 | | | | | |
2.749%, 12/03/2030(1) | | | 12,200,000 | | | | 12,574,869 | | | | | |
| Bank of America Corp.: | | | | | | | | | | | | |
| 3.300%, 01/11/2023 | | | 7,000,000 | | | | 7,421,470 | | | | | |
| 4.125%, 01/22/2024 | | | 15,000,000 | | | | 16,625,004 | | | | | |
| 3.458%, 03/15/2025 | | | | | | | | | | | | |
(3 Month LIBOR USD + 0.970%)(3) | | | 28,881,000 | | | | 31,445,391 | | | | | |
| 3.093%, 10/01/2025 | | | | | | | | | | | | |
(3 Month LIBOR USD + 1.090%)(3) | | | 15,000,000 | | | | 16,237,745 | | | | | |
| 2.456%, 10/22/2025 | | | | | | | | | | | | |
(3 Month LIBOR USD + 0.870%)(3) | | | 17,775,000 | | | | 18,948,665 | | | | | |
| 3.559%, 04/23/2027 | | | | | | | | | | | | |
(3 Month LIBOR USD + 1.060%)(3) | | | 9,000,000 | | | | 10,161,980 | | | | | |
| 3.248%, 10/21/2027 | | | 6,000,000 | | | | 6,714,556 | | | | | |
| 3.419%, 12/20/2028 | | | | | | | | | | | | |
(3 Month LIBOR USD + 1.040%)(3) | | | 14,000,000 | | | | 15,813,617 | | | | | |
| 3.194%, 07/23/2030 | | | | | | | | | | | | |
(3 Month LIBOR USD + 1.180%)(3) | | | 5,000,000 | | | | 5,603,449 | | | | | |
| 2.496%, 02/13/2031 | | | | | | | | | | | | |
(3 Month LIBOR USD + 0.990%)(3) | | | 13,000,000 | | | | 13,806,868 | | | | | |
2.592%, 04/29/2031 (SOFR + 2.150%)(3) | | | 60,000,000 | | | | 64,305,503 | | | | | |
| 7.750%, 05/14/2038 | | | 1,138,000 | | | | 1,940,298 | | | | | |
| Bank of New Zealand, | | | | | | | | | | | | |
2.000%, 02/21/2025(1)(2) | | | 16,000,000 | | | | 16,854,791 | | | | | |
| Bank of Nova Scotia: | | | | | | | | | | | | |
2.450%, 09/19/2022(1) | | | 10,000,000 | | | | 10,387,388 | | | | | |
4.500%, 12/16/2025(1) | | | 8,500,000 | | | | 9,910,508 | | | | | |
| Bank of Tokyo-Mitsubishi UFJ Ltd.: | | | | | | | | | | | | |
4.100%, 09/09/2023(1)(2) | | | 2,911,000 | | | | 3,192,860 | | | | | |
3.750%, 03/10/2024(1)(2) | | | 2,800,000 | | | | 3,072,414 | | | | | |
| Banque Federative du Credit Mutuel SA: | | | | | | | | | | | | |
2.700%, 07/20/2022(1)(2) | | | 5,000,000 | | | | 5,175,871 | | | | | |
3.750%, 07/20/2023(1)(2) | | | 34,100,000 | | | | 36,852,516 | | | | | |
| Barclays Bank PLC, | | | | | | | | | | | | |
10.180%, 06/12/2021(1)(2) | | | 12,770,000 | | | | 13,281,420 | | | | | |
| Barclays PLC: | | | | | | | | | | | | |
3.250%, 01/12/2021(1) | | | 12,175,000 | | | | 12,181,570 | | | | | |
3.684%, 01/10/2023(1) | | | 25,475,000 | | | | 26,255,780 | | | | | |
| 4.610%, 02/15/2023 | | | | | | | | | | | | |
(3 Month LIBOR USD + 1.400%)(1)(3) | | | 10,000,000 | | | | 10,439,342 | | | | | |
The accompanying notes are an integral part of these financial statements.
Baird Aggregate Bond Fund
Schedule of Investments, December 31, 2020
Long-Term Investments (cont.)
| | | Principal | | | | | | % of | |
| | | Amount | | | Value | | | Net Assets | |
| Barclays PLC: (cont.) | | | | | | | | | |
| 4.338%, 05/16/2024 | | | | | | | | | |
(3 Month LIBOR USD + 1.356%)(1)(3) | | $ | 13,000,000 | | | $ | 14,070,034 | | | |
|
|
3.650%, 03/16/2025(1) | | | 8,100,000 | | | | 8,911,102 | | | | | |
| 3.932%, 05/07/2025 | | | | | | | | | | | | |
(3 Month LIBOR USD + 1.610%)(1)(3) | | | 34,300,000 | | | | 37,524,015 | | | | | |
| 2.852%, 05/07/2026 | | | | | | | | | | | | |
(3 Month LIBOR USD + 2.452%)(1)(3) | | | 10,000,000 | | | | 10,739,405 | | | | | |
| BBVA USA: | | | | | | | | | | | | |
| 2.875%, 06/29/2022 | | | 8,000,000 | | | | 8,290,255 | | | | | |
| 3.875%, 04/10/2025 | | | 36,235,000 | | | | 40,633,562 | | | | | |
| Belrose Funding Trust, | | | | | | | | | | | | |
2.330%, 08/15/2030(2) | | | 13,950,000 | | | | 14,356,799 | | | | | |
| Berkshire Hathaway, Inc., | | | | | | | | | | | | |
| 2.750%, 03/15/2023 | | | 14,675,000 | | | | 15,411,122 | | | | | |
| BNP Paribas SA: | | | | | | | | | | | | |
3.500%, 03/01/2023(1)(2) | | | 8,570,000 | | | | 9,119,557 | | | | | |
3.375%, 01/09/2025(1)(2) | | | 8,350,000 | | | | 9,137,805 | | | | | |
| 2.819%, 11/19/2025 | | | | | | | | | | | | |
(3 Month LIBOR USD + 1.111%)(1)(2)(3) | | | 17,100,000 | | | | 18,227,284 | | | | | |
2.219%, 06/09/2026 (SOFR + 2.074%)(1)(2)(3) | | | 15,000,000 | | | | 15,699,475 | | | | | |
4.625%, 03/13/2027(1)(2) | | | 4,500,000 | | | | 5,239,990 | | | | | |
1.904%, 09/30/2028 (SOFR + 1.609%)(1)(2)(3) | | | 27,000,000 | | | | 27,450,028 | | | | | |
| 2.588%, 08/12/2035 | | | | | | | | | | | | |
(5 Year CMT Rate + 2.050%)(1)(2)(3) | | | 14,000,000 | | | | 14,312,569 | | | | | |
| BNZ International Funding Ltd.: | | | | | | | | | | | | |
2.750%, 03/02/2021(1)(2) | | | 14,000,000 | | | | 14,055,298 | | | | | |
2.650%, 11/03/2022(1)(2) | | | 20,350,000 | | | | 21,207,775 | | | | | |
3.375%, 03/01/2023(1)(2) | | | 20,000,000 | | | | 21,239,876 | | | | | |
| BPCE SA: | | | | | | | | | | | | |
5.700%, 10/22/2023(1)(2) | | | 22,955,000 | | | | 25,981,350 | | | | | |
4.000%, 04/15/2024(1) | | | 2,500,000 | | | | 2,768,054 | | | | | |
5.150%, 07/21/2024(1)(2) | | | 31,285,000 | | | | 35,625,388 | | | | | |
2.375%, 01/14/2025(1)(2) | | | 12,000,000 | | | | 12,682,248 | | | | | |
4.500%, 03/15/2025(1)(2) | | | 44,242,000 | | | | 50,011,658 | | | | | |
1.652%, 10/06/2026 (SOFR + 1.520%(1)(2)(3) | | | 15,000,000 | | | | 15,349,989 | | | | | |
| Brown & Brown, Inc.: | | | | | | | | | | | | |
| 4.500%, 03/15/2029 | | | 23,825,000 | | | | 28,202,511 | | | | | |
| 2.375%, 03/15/2031 | | | 27,360,000 | | | | 28,635,342 | | | | | |
| Canadian Imperial Bank of Commerce, | | | | | | | | | | | | |
3.100%, 04/02/2024(1) | | | 37,700,000 | | | | 40,795,101 | | | | | |
| Capital One Financial Corp.: | | | | | | | | | | | | |
| 3.200%, 01/30/2023 | | | 6,550,000 | | | | 6,901,091 | | | | | |
| 3.900%, 01/29/2024 | | | 4,550,000 | | | | 4,983,965 | | | | | |
| 3.300%, 10/30/2024 | | | 2,998,000 | | | | 3,293,409 | | | | | |
| 3.650%, 05/11/2027 | | | 26,000,000 | | | | 29,808,056 | | | | | |
The accompanying notes are an integral part of these financial statements.
Baird Aggregate Bond Fund
Schedule of Investments, December 31, 2020
Long-Term Investments (cont.)
| | | Principal | | | | | | % of | |
| | | Amount | | | Value | | | Net Assets | |
| Capital One NA, | | | | | | | | | |
| 3.375%, 02/15/2023 | | $ | 45,962,000 | | | $ | 48,570,448 | | | |
|
|
| Citigroup, Inc.: | | | | | | | | | | | | |
| 2.350%, 08/02/2021 | | | 6,100,000 | | | | 6,171,047 | | | | | |
| 2.750%, 04/25/2022 | | | 11,575,000 | | | | 11,920,950 | | | | | |
| 3.142%, 01/24/2023 | | | | | | | | | | | | |
(3 Month LIBOR USD + 0.722%)(3) | | | 12,200,000 | | | | 12,545,113 | | | | | |
| 2.876%, 07/24/2023 | | | | | | | | | | | | |
(3 Month LIBOR USD + 0.950%)(3) | | | 20,350,000 | | | | 21,139,226 | | | | | |
| 1.655%, 09/01/2023 | | | | | | | | | | | | |
(3 Month LIBOR USD + 1.430%)(3) | | | 7,000,000 | | | | 7,119,758 | | | | | |
| 4.044%, 06/01/2024 | | | | | | | | | | | | |
(3 Month LIBOR USD + 1.023%)(3) | | | 22,600,000 | | | | 24,578,511 | | | | | |
| 3.750%, 06/16/2024 | | | 1,000,000 | | | | 1,106,146 | | | | | |
| 3.352%, 04/24/2025 | | | | | | | | | | | | |
(3 Month LIBOR USD + 0.897%)(3) | | | 5,650,000 | | | | 6,142,544 | | | | | |
| 3.700%, 01/12/2026 | | | 4,500,000 | | | | 5,113,611 | | | | | |
3.106%, 04/08/2026 (SOFR + 2.750%)(3) | | | 20,000,000 | | | | 21,851,241 | | | | | |
| 3.887%, 01/10/2028 | | | | | | | | | | | | |
(3 Month LIBOR USD + 1.563%)(3) | | | 20,600,000 | | | | 23,609,217 | | | | | |
| 3.668%, 07/24/2028 | | | | | | | | | | | | |
(3 Month LIBOR USD + 1.390%)(3) | | | 3,142,000 | | | | 3,562,100 | | | | | |
| 3.520%, 10/27/2028 | | | | | | | | | | | | |
(3 Month LIBOR USD + 1.151%)(3) | | | 1,500,000 | | | | 1,695,832 | | | | | |
2.572%, 06/03/2031 (SOFR + 2.107%)(3) | | | 25,000,000 | | | | 26,646,504 | | | | | |
| Citizens Bank NA: | | | | | | | | | | | | |
| 2.250%, 04/28/2025 | | | 20,000,000 | | | | 21,221,401 | | | | | |
| 3.750%, 02/18/2026 | | | 12,120,000 | | | | 13,771,658 | | | | | |
| Citizens Financial Group, Inc.: | | | | | | | | | | | | |
| 2.850%, 07/27/2026 | | | 10,000,000 | | | | 11,129,273 | | | | | |
| 3.250%, 04/30/2030 | | | 28,025,000 | | | | 31,581,359 | | | | | |
| CNA Financial Corp.: | | | | | | | | | | | | |
| 7.250%, 11/15/2023 | | | 4,000,000 | | | | 4,743,060 | | | | | |
| 4.500%, 03/01/2026 | | | 14,000,000 | | | | 16,469,663 | | | | | |
| 3.450%, 08/15/2027 | | | 12,000,000 | | | | 13,594,223 | | | | | |
| 3.900%, 05/01/2029 | | | 8,000,000 | | | | 9,401,204 | | | | | |
| Comerica Bank, | | | | | | | | | | | | |
| 4.000%, 07/27/2025 | | | 10,000,000 | | | | 11,283,816 | | | | | |
| Commonwealth Bank of Australia: | | | | | | | | | | | | |
4.500%, 12/09/2025(1)(2) | | | 15,000,000 | | | | 17,305,025 | | | | | |
| 3.610%, 09/12/2034 | | | | | | | | | | | | |
(5 Year CMT Rate + 2.050%)(1)(2)(3) | | | 10,000,000 | | | | 10,986,113 | | | | | |
3.743%, 09/12/2039(1)(2) | | | 23,500,000 | | | | 27,659,496 | | | | | |
| Cooperatieve Rabobank UA: | | | | | | | | | | | | |
4.625%, 12/01/2023(1) | | | 14,630,000 | | | | 16,305,889 | | | | | |
The accompanying notes are an integral part of these financial statements.
Baird Aggregate Bond Fund
Schedule of Investments, December 31, 2020
Long-Term Investments (cont.)
| | | Principal | | | | | | % of | |
| | | Amount | | | Value | | | Net Assets | |
| Cooperatieve Rabobank UA: (cont.) | | | | | | | | | |
4.375%, 08/04/2025(1) | | $ | 20,397,000 | | | $ | 23,278,605 | | | |
|
|
3.750%, 07/21/2026(1) | | | 20,829,000 | | | | 23,540,113 | | | | | |
| Credit Agricole SA: | | | | | | | | | | | | |
3.375%, 01/10/2022(1)(2) | | | 10,180,000 | | | | 10,489,707 | | | | | |
3.750%, 04/24/2023(1)(2) | | | 5,000,000 | | | | 5,367,394 | | | | | |
4.375%, 03/17/2025(1)(2) | | | 4,204,000 | | | | 4,718,427 | | | | | |
3.250%, 01/14/2030(1)(2) | | | 6,800,000 | | | | 7,461,057 | | | | | |
| 4.000%, 01/10/2033 | | | | | | | | | | | | |
(5 Year Swap Rate USD + 1.644%)(1)(2)(3) | | | 8,000,000 | | | | 8,947,820 | | | | | |
| Credit Suisse AG, | | | | | | | | | | | | |
3.625%, 09/09/2024(1) | | | 4,325,000 | | | | 4,799,056 | | | | | |
| Credit Suisse Group AG: | | | | | | | | | | | | |
3.574%, 01/09/2023(1)(2) | | | 17,000,000 | | | | 17,515,235 | | | | | |
| 4.207%, 06/12/2024 | | | | | | | | | | | | |
(3 Month LIBOR USD + 1.240%)(1)(2)(3) | | | 8,325,000 | | | | 9,019,491 | | | | | |
2.593%, 09/11/2025 (SOFR + 1.560%)(1)(2)(3) | | | 12,250,000 | | | | 12,890,350 | | | | | |
2.193%, 06/05/2026 (SOFR + 2.044%)(1)(2)(3) | | | 15,000,000 | | | | 15,675,786 | | | | | |
4.282%, 01/09/2028(1)(2) | | | 17,403,000 | | | | 20,111,167 | | | | | |
| 3.869%, 01/12/2029 | | | | | | | | | | | | |
(3 Month LIBOR USD + 1.410%)(1)(2)(3) | | | 11,000,000 | | | | 12,458,614 | | | | | |
4.194%, 04/01/2031 (SOFR + 3.730%)(1)(2)(3) | | | 20,000,000 | | | | 23,539,472 | | | | | |
| Credit Suisse Group Funding Guernsey Ltd.: | | | | | | | | | | | | |
3.800%, 06/09/2023(1) | | | 14,550,000 | | | | 15,670,214 | | | | | |
4.550%, 04/17/2026(1) | | | 2,000,000 | | | | 2,352,999 | | | | | |
| Credit Suisse USA, Inc., | | | | | | | | | | | | |
| 7.125%, 07/15/2032 | | | 5,063,000 | | | | 7,858,450 | | | | | |
| CyrusOne LP / CyrusOne Finance Corp., | | | | | | | | | | | | |
| 2.150%, 11/01/2030 | | | 11,000,000 | | | | 10,721,590 | | | | | |
| Daiwa Securities Group, Inc., | | | | | | | | | | | | |
3.129%, 04/19/2022(1)(2) | | | 12,000,000 | | | | 12,386,640 | | | | | |
| Danske Bank A/S, | | | | | | | | | | | | |
| 1.621%, 09/11/2026 | | | | | | | | | | | | |
(1 Year CMT Rate + 1.350%)(1)(2)(3) | | | 10,000,000 | | | | 10,045,148 | | | | | |
| Deutsche Bank AG: | | | | | | | | | | | | |
3.125%, 01/13/2021(1) | | | 1,625,000 | | | | 1,625,732 | | | | | |
3.150%, 01/22/2021(1) | | | 3,000,000 | | | | 3,003,327 | | | | | |
4.250%, 10/14/2021(1) | | | 36,125,000 | | | | 37,043,548 | | | | | |
5.000%, 02/14/2022(1) | | | 10,000,000 | | | | 10,455,287 | | | | | |
3.300%, 11/16/2022(1) | | | 22,175,000 | | | | 23,124,964 | | | | | |
3.700%, 05/30/2024(1) | | | 10,000,000 | | | | 10,757,187 | | | | | |
2.222%, 09/18/2024 (SOFR + 2.159%)(1)(3) | | | 52,000,000 | | | | 53,494,414 | | | | | |
2.129%, 11/24/2026 (SOFR + 1.870%)(1)(3) | | | 17,000,000 | | | | 17,398,450 | | | | | |
| Discover Bank: | | | | | | | | | | | | |
| 3.350%, 02/06/2023 | | | 8,600,000 | | | | 9,074,614 | | | | | |
The accompanying notes are an integral part of these financial statements.
Baird Aggregate Bond Fund
Schedule of Investments, December 31, 2020
Long-Term Investments (cont.)
| | | Principal | | | | | | % of | |
| | | Amount | | | Value | | | Net Assets | |
| Discover Bank: (cont.) | | | | | | | | | |
| 4.200%, 08/08/2023 | | $ | 20,000,000 | | | $ | 21,866,294 | | | |
|
|
| 3.450%, 07/27/2026 | | | 22,000,000 | | | | 24,604,654 | | | | | |
| 4.650%, 09/13/2028 | | | 13,747,000 | | | | 16,445,244 | | | | | |
| Discover Financial Services: | | | | | | | | | | | | |
| 3.950%, 11/06/2024 | | | 10,000,000 | | | | 11,104,360 | | | | | |
| 4.100%, 02/09/2027 | | | 9,150,000 | | | | 10,541,537 | | | | | |
| DNB Bank ASA, | | | | | | | | | | | | |
| 1.127%, 09/16/2026 | | | | | | | | | | | | |
(5 Year CMT Rate + 0.850%)(1)(2)(3) | | | 10,000,000 | | | | 10,105,969 | | | | | |
| Federation des Caisses Desjardins du Quebec, | | | | | | | | | | | | |
2.050%, 02/10/2025(1)(2) | | | 12,100,000 | | | | 12,720,422 | | | | | |
| FirstMerit Bank NA, | | | | | | | | | | | | |
| 4.270%, 11/25/2026 | | | 4,600,000 | | | | 5,276,228 | | | | | |
| Five Corners Funding Trust, | | | | | | | | | | | | |
4.419%, 11/15/2023(2) | | | 11,330,000 | | | | 12,567,513 | | | | | |
| Five Corners Funding Trust II, | | | | | | | | | | | | |
2.850%, 05/15/2030(2) | | | 30,000,000 | | | | 33,186,329 | | | | | |
| FMR LLC, | | | | | | | | | | | | |
4.950%, 02/01/2033(2) | | | 1,750,000 | | | | 2,354,776 | | | | | |
| GE Capital Funding LLC: | | | | | | | | | | | | |
4.050%, 05/15/2027(2) | | | 8,975,000 | | | | 10,267,346 | | | | | |
4.550%, 05/15/2032(2) | | | 10,000,000 | | | | 12,001,181 | | | | | |
| GE Capital International Funding Co. Unlimited Co., | | | | | | | | | | | | |
4.418%, 11/15/2035(1) | | | 24,309,000 | | | | 29,013,910 | | | | | |
| Globe Life, Inc.: | | | | | | | | | | | | |
| 3.800%, 09/15/2022 | | | 12,475,000 | | | | 13,149,335 | | | | | |
| 4.550%, 09/15/2028 | | | 5,000,000 | | | | 6,000,390 | | | | | |
| Goldman Sachs Group, Inc.: | | | | | | | | | | | | |
| 3.000%, 04/26/2022 | | | 20,000,000 | | | | 20,162,286 | | | | | |
| 2.908%, 06/05/2023 | | | | | | | | | | | | |
(3 Month LIBOR USD + 1.053%)(3) | | | 12,000,000 | | | | 12,426,606 | | | | | |
| 2.905%, 07/24/2023 | | | | | | | | | | | | |
(3 Month LIBOR USD + 0.990%)(3) | | | 8,000,000 | | | | 8,309,114 | | | | | |
| 1.824%, 11/29/2023 | | | | | | | | | | | | |
(3 Month LIBOR USD + 1.600%)(3) | | | 5,000,000 | | | | 5,171,305 | | | | | |
| 3.850%, 07/08/2024 | | | 3,000,000 | | | | 3,317,011 | | | | | |
| 3.500%, 01/23/2025 | | | 3,000,000 | | | | 3,310,978 | | | | | |
| 3.500%, 04/01/2025 | | | 5,000,000 | | | | 5,554,949 | | | | | |
| 3.750%, 05/22/2025 | | | 5,000,000 | | | | 5,613,752 | | | | | |
| 3.272%, 09/29/2025 | | | | | | | | | | | | |
(3 Month LIBOR USD + 1.201%)(3) | | | 15,000,000 | | | | 16,431,382 | | | | | |
1.093%, 12/09/2026 (SOFR + 0.789%)(3) | | | 10,000,000 | | | | 10,109,922 | | | | | |
| 1.972%, 10/28/2027 | | | | | | | | | | | | |
(3 Month LIBOR USD + 1.750%)(3) | | | 10,000,000 | | | | 10,510,922 | | | | | |
The accompanying notes are an integral part of these financial statements.
Baird Aggregate Bond Fund
Schedule of Investments, December 31, 2020
Long-Term Investments (cont.)
| | | Principal | | | | | | % of | |
| | | Amount | | | Value | | | Net Assets | |
| Goldman Sachs Group, Inc.: (cont.) | | | | | | | | | |
| 3.691%, 06/05/2028 | | | | | | | | | |
(3 Month LIBOR USD + 1.510%)(3) | | $ | 6,775,000 | | | $ | 7,804,956 | | | |
|
|
| 4.223%, 05/01/2029 | | | | | | | | | | | | |
(3 Month LIBOR USD + 1.301%)(3) | | | 10,000,000 | | | | 11,863,631 | | | | | |
| 3.800%, 03/15/2030 | | | 30,000,000 | | | | 35,299,735 | | | | | |
| 6.345%, 02/15/2034 | | | 1,053,000 | | | | 1,470,822 | | | | | |
| Guardian Life Global Funding, | | | | | | | | | | | | |
3.400%, 04/25/2023(2) | | | 6,950,000 | | | | 7,424,194 | | | | | |
| Guardian Life Insurance Co. of America: | | | | | | | | | | | | |
4.875%, 06/19/2064(2) | | | 5,000,000 | | | | 6,672,751 | | | | | |
3.700%, 01/22/2070(2) | | | 13,115,000 | | | | 14,702,426 | | | | | |
4.850%, 01/24/2077(2) | | | 22,227,000 | | | | 31,171,232 | | | | | |
| Hanover Insurance Group, Inc., | | | | | | | | | | | | |
| 2.500%, 09/01/2030 | | | 10,550,000 | | | | 11,011,327 | | | | | |
| Harborwalk Funding Trust, | | | | | | | | | | | | |
| 5.077%, 02/15/2069 | | | | | | | | | | | | |
(3 Month LIBOR USD + 3.191%(2)(3) | | | 23,170,000 | | | | 30,084,286 | | | | | |
| Hartford Financial Services Group, Inc., | | | | | | | | | | | | |
| 3.600%, 08/19/2049 | | | 7,000,000 | | | | 8,214,338 | | | | | |
| Health Care Service Corp. A Mutual Legal Reserve Co., | | | | | | | | | | | | |
2.200%, 06/01/2030(2) | | | 6,125,000 | | | | 6,407,539 | | | | | |
| Highmark, Inc., | | | | | | | | | | | | |
4.750%, 05/15/2021(2) | | | 4,378,000 | | | | 4,449,114 | | | | | |
| HSBC Bank PLC, | | | | | | | | | | | | |
7.650%, 05/01/2025(1) | | | 2,525,000 | | | | 3,140,081 | | | | | |
| HSBC Bank USA NA, | | | | | | | | | | | | |
| 7.000%, 01/15/2039 | | | 4,200,000 | | | | 6,671,810 | | | | | |
| HSBC Holdings PLC: | | | | | | | | | | | | |
| 3.262%, 03/13/2023 | | | | | | | | | | | | |
(3 Month LIBOR USD + 1.055%)(1)(3) | | | 17,600,000 | | | | 18,179,853 | | | | | |
3.600%, 05/25/2023(1) | | | 2,275,000 | | | | 2,447,018 | | | | | |
| 3.950%, 05/18/2024 | | | | | | | | | | | | |
(3 Month LIBOR USD + 0.987%)(1)(3) | | | 6,000,000 | | | | 6,472,005 | | | | | |
| 3.803%, 03/11/2025 | | | | | | | | | | | | |
(3 Month LIBOR USD + 1.211%)(1)(3) | | | 26,550,000 | | | | 28,987,965 | | | | | |
1.645%, 04/18/2026 (SOFR + 1.538%)(1)(3) | | | 15,000,000 | | | | 15,341,424 | | | | | |
| 4.292%, 09/12/2026 | | | | | | | | | | | | |
(3 Month LIBOR USD + 1.348%)(1)(3) | | | 7,450,000 | | | | 8,490,618 | | | | | |
| 4.375%, 11/23/2026 (1) | | | 10,000,000 | | | | 11,538,265 | | | | | |
1.589%, 05/24/2027 (SOFR + 1.290%)(1)(3) | | | 12,500,000 | | | | 12,711,465 | | | | | |
2.013%, 09/22/2028 (SOFR + 1.732%)(1)(3) | | | 25,000,000 | | | | 25,593,172 | | | | | |
4.950%, 03/31/2030(1) | | | 7,000,000 | | | | 8,775,183 | | | | | |
| 3.973%, 05/22/2030 | | | | | | | | | | | | |
(3 Month LIBOR USD + 1.610%)(1)(3) | | | 2,000,000 | | | | 2,309,500 | | | | | |
The accompanying notes are an integral part of these financial statements.
Baird Aggregate Bond Fund
Schedule of Investments, December 31, 2020
Long-Term Investments (cont.)
| | | Principal | | | | | | % of | |
| | | Amount | | | Value | | | Net Assets | |
| HSBC USA, Inc., | | | | | | | | | |
| 9.125%, 05/15/2021 | | $ | 625,000 | | | $ | 643,267 | | | |
|
|
| Huntington Bancshares, Inc.: | | | | | | | | | | | | |
| 3.150%, 03/14/2021 | | | 4,732,000 | | | | 4,746,599 | | | | | |
| 2.300%, 01/14/2022 | | | 12,075,000 | | | | 12,292,520 | | | | | |
| Invesco Finance PLC: | | | | | | | | | | | | |
3.125%, 11/30/2022(1) | | | 5,902,000 | | | | 6,198,603 | | | | | |
3.750%, 01/15/2026(1) | | | 4,900,000 | | | | 5,527,706 | | | | | |
| Jackson National Life Global Funding, | | | | | | | | | | | | |
3.250%, 01/30/2024(2) | | | 23,475,000 | | | | 25,239,170 | | | | | |
| Jefferies Group LLC: | | | | | | | | | | | | |
| 4.850%, 01/15/2027 | | | 4,600,000 | | | | 5,380,866 | | | | | |
| 4.150%, 01/23/2030 | | | 10,000,000 | | | | 11,655,751 | | | | | |
| 6.250%, 01/15/2036 | | | 1,390,000 | | | | 1,853,796 | | | | | |
| John Hancock Life Insurance Co., | | | | | | | | | | | | |
7.375%, 02/15/2024(2) | | | 13,339,000 | | | | 15,724,693 | | | | | |
| JPMorgan Chase & Co.: | | | | | | | | | | | | |
| 1.445%, 10/24/2023 | | | | | | | | | | | | |
(3 Month LIBOR USD + 1.230%)(3) | | | 15,000,000 | | | | 15,268,667 | | | | | |
| 3.559%, 04/23/2024 | | | | | | | | | | | | |
(3 Month LIBOR USD + 0.730%)(3) | | | 15,000,000 | | | | 16,077,236 | | | | | |
| 3.125%, 01/23/2025 | | | 14,000,000 | | | | 15,333,626 | | | | | |
2.301%, 10/15/2025 (SOFR + 1.160%)(3) | | | 10,000,000 | | | | 10,615,260 | | | | | |
2.005%, 03/13/2026 (SOFR + 1.585%)(3) | | | 50,000,000 | | | | 52,519,592 | | | | | |
2.083%, 04/22/2026 (SOFR + 1.850%)(3) | | | 76,000,000 | | | | 80,265,618 | | | | | |
1.045%, 11/19/2026 (SOFR + 0.800%)(3) | | | 25,000,000 | | | | 25,282,500 | | | | | |
2.522%, 04/22/2031 (SOFR + 2.040%)(3) | | | 28,000,000 | | | | 30,096,138 | | | | | |
| 5.600%, 07/15/2041 | | | 4,106,000 | | | | 6,211,567 | | | | | |
| KeyBank NA: | | | | | | | | | | | | |
| 3.180%, 05/22/2022 | | | 6,500,000 | | | | 6,739,450 | | | | | |
| 3.400%, 05/20/2026 | | | 18,965,000 | | | | 21,293,343 | | | | | |
| LeasePlan Corp. NV, | | | | | | | | | | | | |
2.875%, 10/24/2024(1)(2) | | | 59,600,000 | | | | 62,976,821 | | | | | |
| Lexington Realty Trust, | | | | | | | | | | | | |
| 2.700%, 09/15/2030 | | | 7,000,000 | | | | 7,286,857 | | | | | |
| Liberty Mutual Group, Inc.: | | | | | | | | | | | | |
4.250%, 06/15/2023(2) | | | 591,000 | | | | 643,039 | | | | | |
4.569%, 02/01/2029(2) | | | 2,087,000 | | | | 2,564,374 | | | | | |
3.951%, 10/15/2050(2) | | | 2,231,000 | | | | 2,671,630 | | | | | |
| Liberty Mutual Insurance Co., | | | | | | | | | | | | |
7.697%, 10/15/2097(2) | | | 465,000 | | | | 747,603 | | | | | |
| Life Storage LP, | | | | | | | | | | | | |
| 3.500%, 07/01/2026 | | | 6,819,000 | | | | 7,695,687 | | | | | |
| Lincoln National Corp., | | | | | | | | | | | | |
| 3.050%, 01/15/2030 | | | 24,650,000 | | | | 27,493,367 | | | | | |
The accompanying notes are an integral part of these financial statements.
Baird Aggregate Bond Fund
Schedule of Investments, December 31, 2020
Long-Term Investments (cont.)
| | | Principal | | | | | | % of | |
| | | Amount | | | Value | | | Net Assets | |
| Lloyds Bank PLC: | | | | | | | | | |
| 2.907%, 11/07/2023 | | | | | | | | | |
(3 Month LIBOR USD + 0.810%)(1)(3) | | $ | 18,669,000 | | | $ | 19,504,250 | | | |
|
|
| 3.870%, 07/09/2025 | | | | | | | | | | | | |
(1 Year CMT Rate + 3.500%)(1)(3) | | | 15,000,000 | | | | 16,537,283 | | | | | |
| 2.438%, 02/05/2026 | | | | | | | | | | | | |
(1 Year CMT Rate + 1.000%)(1)(3) | | | 15,725,000 | | | | 16,612,835 | | | | | |
| 3.574%, 11/07/2028 | | | | | | | | | | | | |
(3 Month LIBOR USD + 1.205%)(1)(3) | | | 10,000,000 | | | | 11,292,417 | | | | | |
| Macquarie Bank Ltd.: | | | | | | | | | | | | |
4.875%, 06/10/2025(1)(2) | | | 23,717,000 | | | | 26,912,203 | | | | | |
3.624%, 06/03/2030(1)(2) | | | 12,550,000 | | | | 13,739,292 | | | | | |
| Macquarie Group Ltd.: | | | | | | | | | | | | |
| 3.189%, 11/28/2023 | | | | | | | | | | | | |
(3 Month LIBOR USD + 1.023%)(1)(2)(3) | | | 29,067,000 | | | | 30,386,679 | | | | | |
| 4.150%, 03/27/2024 | | | | | | | | | | | | |
(3 Month LIBOR USD + 1.330%)(1)(2)(3) | | | 24,000,000 | | | | 25,788,122 | | | | | |
| Manulife Financial Corp.: | | | | | | | | | | | | |
4.150%, 03/04/2026(1) | | | 10,000,000 | | | | 11,631,611 | | | | | |
5.375%, 03/04/2046(1) | | | 5,150,000 | | | | 7,545,010 | | | | | |
| Marsh & McLennan Companies, Inc.: | | | | | | | | | | | | |
| 2.250%, 11/15/2030 | | | 5,000,000 | | | | 5,293,548 | | | | | |
| 5.875%, 08/01/2033 | | | 4,700,000 | | | | 6,759,964 | | | | | |
| 4.350%, 01/30/2047 | | | 3,450,000 | | | | 4,570,967 | | | | | |
| Massachusetts Mutual Life Insurance Co.: | | | | | | | | | | | | |
3.729%, 10/15/2070(2) | | | 16,676,000 | | | | 18,411,365 | | | | | |
4.900%, 04/01/2077(2) | | | 11,175,000 | | | | 15,351,403 | | | | | |
| MBIA Insurance Corp., | | | | | | | | | | | | |
| 11.497%, 01/15/2033 | | | | | | | | | | | | |
(3 Month LIBOR USD + 11.260%)(2)(3)(9) | | | 714,000 | | | | 249,900 | | | | | |
| MetLife, Inc.: | | | | | | | | | | | | |
| 6.500%, 12/15/2032 | | | 466,000 | | | | 705,016 | | | | | |
| 4.875%, 11/13/2043 | | | 3,375,000 | | | | 4,801,460 | | | | | |
| 4.050%, 03/01/2045 | | | 12,375,000 | | | | 15,866,594 | | | | | |
| Metropolitan Life Global Funding I, | | | | | | | | | | | | |
2.950%, 04/09/2030(2) | | | 10,000,000 | | | | 11,259,883 | | | | | |
| Metropolitan Life Insurance Co., | | | | | | | | | | | | |
7.800%, 11/01/2025(2) | | | 6,300,000 | | | | 8,154,540 | | | | | |
| Mitsubishi UFJ Financial Group, Inc.: | | | | | | | | | | | | |
2.950%, 03/01/2021(1) | | | 5,076,000 | | | | 5,097,269 | | | | | |
2.190%, 09/13/2021(1) | | | 6,844,000 | | | | 6,931,877 | | | | | |
2.665%, 07/25/2022(1) | | | 9,000,000 | | | | 9,311,517 | | | | | |
3.455%, 03/02/2023(1) | | | 10,650,000 | | | | 11,347,474 | | | | | |
2.801%, 07/18/2024(1) | | | 10,000,000 | | | | 10,719,386 | | | | | |
2.193%, 02/25/2025(1) | | | 25,000,000 | | | | 26,409,888 | | | | | |
The accompanying notes are an integral part of these financial statements.
Baird Aggregate Bond Fund
Schedule of Investments, December 31, 2020
Long-Term Investments (cont.)
| | | Principal | | | | | | % of | |
| | | Amount | | | Value | | | Net Assets | |
| Mizuho Financial Group, Inc.: | | | | | | | | | |
2.632%, 04/12/2021(1)(2) | | $ | 13,000,000 | | | $ | 13,082,069 | | | |
|
|
2.953%, 02/28/2022(1) | | | 12,575,000 | | | | 12,951,344 | | | | | |
2.601%, 09/11/2022(1) | | | 13,000,000 | | | | 13,491,197 | | | | | |
| 3.922%, 09/11/2024 | | | | | | | | | | | | |
(3 Month LIBOR USD + 1.000%)(1)(3) | | | 5,000,000 | | | | 5,436,555 | | | | | |
| 2.555%, 09/13/2025 | | | | | | | | | | | | |
(3 Month LIBOR USD + 1.100%)(1)(3) | | | 20,000,000 | | | | 21,126,386 | | | | | |
| 1.979%, 09/08/2031 | | | | | | | | | | | | |
(3 Month LIBOR USD + 1.270%)(1)(3) | | | 20,000,000 | | | | 20,355,410 | | | | | |
| Morgan Stanley: | | | | | | | | | | | | |
| 2.500%, 04/21/2021 | | | 8,000,000 | | | | 8,049,612 | | | | | |
| 2.750%, 05/19/2022 | | | 20,000,000 | | | | 20,654,475 | | | | | |
| 1.615%, 10/24/2023 | | | | | | | | | | | | |
(3 Month LIBOR USD + 1.400%)(3) | | | 8,000,000 | | | | 8,151,877 | | | | | |
| 3.737%, 04/24/2024 | | | | | | | | | | | | |
(3 Month LIBOR USD + 0.847%)(3) | | | 6,455,000 | | | | 6,945,306 | | | | | |
| 3.875%, 04/29/2024 | | | 1,650,000 | | | | 1,827,899 | | | | | |
| 3.700%, 10/23/2024 | | | 4,000,000 | | | | 4,451,192 | | | | | |
| 3.591%, 07/22/2028 | | | | | | | | | | | | |
(3 Month LIBOR USD + 1.340%)(3) | | | 12,000,000 | | | | 13,700,339 | | | | | |
| 3.772%, 01/24/2029 | | | | | | | | | | | | |
(3 Month LIBOR USD + 1.140%)(3) | | | 1,000,000 | | | | 1,159,287 | | | | | |
3.622%, 04/01/2031 (SOFR + 3.120%)(3) | | | 10,000,000 | | | | 11,631,027 | | | | | |
| National Australia Bank Ltd.: | | | | | | | | | | | | |
2.332%, 08/21/2030(1)(2) | | | 49,282,000 | | | | 50,101,433 | | | | | |
| 3.933%, 08/02/2034 | | | | | | | | | | | | |
(5 Year CMT Rate + 1.880%)(1)(2)(3) | | | 10,000,000 | | | | 11,230,206 | | | | | |
| National Securities Clearing Corp., | | | | | | | | | | | | |
1.500%, 04/23/2025(2) | | | 12,124,000 | | | | 12,550,241 | | | | | |
| Nationwide Building Society: | | | | | | | | | | | | |
| 3.766%, 03/08/2024 | | | | | | | | | | | | |
(3 Month LIBOR USD + 1.064%)(1)(2)(3) | | | 20,000,000 | | | | 21,277,485 | | | | | |
4.000%, 09/14/2026(1)(2) | | | 43,507,000 | | | | 48,434,551 | | | | | |
| 4.302%, 03/08/2029 | | | | | | | | | | | | |
(3 Month LIBOR USD + 1.452%)(1)(2)(3) | | | 20,000,000 | | | | 23,239,707 | | | | | |
| 3.960%, 07/18/2030 | | | | | | | | | | | | |
(3 Month LIBOR USD + 1.855%)(1)(2)(3) | | | 10,125,000 | | | | 11,796,155 | | | | | |
| 4.125%, 10/18/2032 | | | | | | | | | | | | |
(5 Year Mid Swap Rate USD + 1.849%)(1)(2)(3) | | | 7,000,000 | | | | 7,655,400 | | | | | |
| Nationwide Financial Services, Inc.: | | | | | | | | | | | | |
5.375%, 03/25/2021(2) | | | 16,905,000 | | | | 17,088,661 | | | | | |
3.900%, 11/30/2049(2) | | | 10,000,000 | | | | 11,136,894 | | | | | |
| Nationwide Mutual Insurance Co.: | | | | | | | | | | | | |
9.375%, 08/15/2039(2) | | | 9,000,000 | | | | 15,669,618 | | | | | |
4.350%, 04/30/2050(2) | | | 25,000,000 | | | | 29,368,053 | | | | | |
The accompanying notes are an integral part of these financial statements.
Baird Aggregate Bond Fund
Schedule of Investments, December 31, 2020
Long-Term Investments (cont.)
| | | Principal | | | | | | % of | |
| | | Amount | | | Value | | | Net Assets | |
| New York Life Insurance Co.: | | | | | | | | | |
6.750%, 11/15/2039(2) | | $ | 12,026,000 | | | $ | 18,645,212 | | | |
|
|
3.750%, 05/15/2050(2) | | | 17,000,000 | | | | 20,335,971 | | | | | |
4.450%, 05/15/2069(2) | | | 10,000,000 | | | | 13,437,082 | | | | | |
| Nomura Holdings, Inc.: | | | | | | | | | | | | |
2.648%, 01/16/2025(1) | | | 20,000,000 | | | | 21,359,376 | | | | | |
1.851%, 07/16/2025(1) | | | 23,825,000 | | | | 24,760,757 | | | | | |
| Nordea Bank AB, | | | | | | | | | | | | |
4.250%, 09/21/2022(1)(2) | | | 15,793,000 | | | | 16,764,675 | | | | | |
| Pacific Life Global Funding II, | | | | | | | | | | | | |
1.200%, 06/24/2025(2) | | | 22,300,000 | | | | 22,604,953 | | | | | |
| Peachtree Corners Funding Trust, | | | | | | | | | | | | |
3.976%, 02/15/2025(2) | | | 12,295,000 | | | | 13,632,908 | | | | | |
| People’s United Bank NA, | | | | | | | | | | | | |
| 4.000%, 07/15/2024 | | | 11,400,000 | | | | 12,288,803 | | | | | |
| Pine Street Trust I, | | | | | | | | | | | | |
4.572%, 02/15/2029(2) | | | 7,825,000 | | | | 9,276,745 | | | | | |
| PNC Bank NA, | | | | | | | | | | | | |
| 4.200%, 11/01/2025 | | | 2,678,000 | | | | 3,087,493 | | | | | |
| Principal Financial Group, Inc.: | | | | | | | | | | | | |
| 3.300%, 09/15/2022 | | | 1,860,000 | | | | 1,951,500 | | | | | |
| 3.125%, 05/15/2023 | | | 4,667,000 | | | | 4,960,748 | | | | | |
| 4.300%, 11/15/2046 | | | 2,325,000 | | | | 2,964,139 | | | | | |
| Principal Life Global Funding II: | | | | | | | | | | | | |
1.250%, 06/23/2025(2) | | | 16,000,000 | | | | 16,334,407 | | | | | |
3.000%, 04/18/2026(2) | | | 13,400,000 | | | | 14,901,174 | | | | | |
| Protective Life Corp.: | | | | | | | | | | | | |
4.300%, 09/30/2028(2) | | | 10,000,000 | | | | 11,689,274 | | | | | |
| 8.450%, 10/15/2039 | | | 2,650,000 | | | | 4,174,379 | | | | | |
| Prudential Financial, Inc.: | | | | | | | | | | | | |
| 6.625%, 12/01/2037 | | | 5,000,000 | | | | 7,511,215 | | | | | |
| 3.935%, 12/07/2049 | | | 11,426,000 | | | | 13,883,113 | | | | | |
| Raymond James Financial, Inc., | | | | | | | | | | | | |
| 4.650%, 04/01/2030 | | | 9,700,000 | | | | 11,898,504 | | | | | |
| Regions Financial Corp., | | | | | | | | | | | | |
| 2.250%, 05/18/2025 | | | 25,000,000 | | | | 26,511,934 | | | | | |
| Reliance Standard Life Global Funding II, | | | | | | | | | | | | |
2.500%, 10/30/2024(2) | | | 22,800,000 | | | | 23,648,014 | | | | | |
| Royal Bank of Canada, | | | | | | | | | | | | |
4.650%, 01/27/2026(1) | | | 7,773,000 | | | | 9,176,253 | | | | | |
| Royal Bank of Scotland Group PLC: | | | | | | | | | | | | |
| 3.498%, 05/15/2023 | | | | | | | | | | | | |
(3 Month LIBOR USD + 1.480%)(1)(3) | | | 10,650,000 | | | | 11,057,347 | | | | | |
3.875%, 09/12/2023(1) | | | 10,000,000 | | | | 10,850,371 | | | | | |
The accompanying notes are an integral part of these financial statements.
Baird Aggregate Bond Fund
Schedule of Investments, December 31, 2020
Long-Term Investments (cont.)
| | | Principal | | | | | | % of | |
| | | Amount | | | Value | | | Net Assets | |
| Royal Bank of Scotland Group PLC: (cont.) | | | | | | | | | |
| 4.269%, 03/22/2025 | | | | | | | | | |
(3 Month LIBOR USD + 1.762%)(1)(3) | | $ | 27,351,000 | | | $ | 30,258,172 | | | |
|
|
| 3.073%, 05/22/2028 | | | | | | | | | | | | |
(1 Year CMT Rate + 2.550%)(1)(3) | | | 15,000,000 | | | | 16,280,569 | | | | | |
| 4.892%, 05/18/2029 | | | | | | | | | | | | |
(3 Month LIBOR USD + 1.754%)(1)(3) | | | 10,000,000 | | | | 12,017,476 | | | | | |
| 5.076%, 01/27/2030 | | | | | | | | | | | | |
(3 Month LIBOR USD + 1.905%)(1)(3) | | | 7,000,000 | | | | 8,606,274 | | | | | |
| 4.445%, 05/08/2030 | | | | | | | | | | | | |
(3 Month LIBOR USD + 1.871%)(1)(3) | | | 35,000,000 | | | | 41,696,931 | | | | | |
| Santander Holdings USA, Inc., | | | | | | | | | | | | |
| 3.500%, 06/07/2024 | | | 5,695,000 | | | | 6,152,390 | | | | | |
| Santander UK Group Holdings PLC: | | | | | | | | | | | | |
3.125%, 01/08/2021(1) | | | 2,600,000 | | | | 2,600,562 | | | | | |
3.571%, 01/10/2023(1) | | | 5,000,000 | | | | 5,152,052 | | | | | |
| 3.373%, 01/05/2024 | | | | | | | | | | | | |
(3 Month LIBOR USD + 1.080%)(1)(3) | | | 5,967,000 | | | | 6,280,042 | | | | | |
| 4.796%, 11/15/2024 | | | | | | | | | | | | |
(3 Month LIBOR USD + 1.570%)(1)(3) | | | 5,250,000 | | | | 5,839,858 | | | | | |
| 3.823%, 11/03/2028 | | | | | | | | | | | | |
(3 Month LIBOR USD + 1.400%)(1)(3) | | | 6,000,000 | | | | 6,767,482 | | | | | |
| Santander UK PLC, | | | | | | | | | | | | |
�� 5.000%, 11/07/2023(1)(2) | | | 21,921,000 | | | | 24,197,619 | | | | | |
| SMBC Aviation Capital Finance DAC, | | | | | | | | | | | | |
3.000%, 07/15/2022(1)(2) | | | 8,000,000 | | | | 8,210,621 | | | | | |
| Societe Generale SA: | | | | | | | | | | | | |
3.250%, 01/12/2022(1)(2) | | | 8,000,000 | | | | 8,218,900 | | | | | |
4.250%, 09/14/2023(1)(2) | | | 8,000,000 | | | | 8,724,788 | | | | | |
5.000%, 01/17/2024(1)(2) | | | 20,000,000 | | | | 22,076,482 | | | | | |
3.875%, 03/28/2024(1)(2) | | | 15,300,000 | | | | 16,681,411 | | | | | |
2.625%, 10/16/2024(1)(2) | | | 23,000,000 | | | | 24,370,406 | | | | | |
2.625%, 01/22/2025(1)(2) | | | 31,125,000 | | | | 32,964,161 | | | | | |
4.250%, 04/14/2025(1)(2) | | | 21,032,000 | | | | 23,169,332 | | | | | |
4.250%, 08/19/2026(1)(2) | | | 12,000,000 | | | | 13,428,310 | | | | | |
| 1.488%, 12/14/2026 | | | | | | | | | | | | |
(1 Year CMT Rate + 1.100%)(1)(2)(3) | | | 12,000,000 | | | | 12,106,009 | | | | | |
| Standard Chartered PLC: | | | | | | | | | | | | |
3.050%, 01/15/2021(1)(2) | | | 4,500,000 | | | | 4,503,378 | | | | | |
| 4.247%, 01/20/2023 | | | | | | | | | | | | |
(3 Month LIBOR USD + 1.150%)(1)(2)(3) | | | 10,000,000 | | | | 10,369,978 | | | | | |
| 3.885%, 03/15/2024 | | | | | | | | | | | | |
(3 Month LIBOR USD + 1.080%)(1)(2)(3) | | | 31,557,000 | | | | 33,567,016 | | | | | |
| 3.785%, 05/21/2025 | | | | | | | | | | | | |
(3 Month LIBOR USD + 1.560%)(1)(2)(3) | | | 26,294,000 | | | | 28,513,410 | | | | | |
The accompanying notes are an integral part of these financial statements.
Baird Aggregate Bond Fund
Schedule of Investments, December 31, 2020
Long-Term Investments (cont.)
| | | Principal | | | | | | % of | |
| | | Amount | | | Value | | | Net Assets | |
| Standard Chartered PLC: (cont.) | | | | | | | | | |
| 2.819%, 01/30/2026 | | | | | | | | | |
(3 Month LIBOR USD + 1.209%)(1)(2)(3) | | $ | 14,700,000 | | | $ | 15,571,093 | | | |
|
|
| 4.644%, 04/01/2031 | | | | | | | | | | | | |
(5 Year CMT Rate + 3.850%)(1)(2)(3) | | | 14,700,000 | | | | 17,782,585 | | | | | |
5.700%, 03/26/2044(1)(2) | | | 6,000,000 | | | | 8,048,066 | | | | | |
| Stifel Financial Corp.: | | | | | | | | | | | | |
| 4.250%, 07/18/2024 | | | 17,850,000 | | | | 20,054,651 | | | | | |
| 4.000%, 05/15/2030 | | | 39,140,000 | | | | 44,726,758 | | | | | |
| Sumitomo Mitsui Banking Corp., | | | | | | | | | | | | |
3.950%, 07/19/2023(1) | | | 1,850,000 | | | | 2,013,031 | | | | | |
| Sumitomo Mitsui Financial Group, Inc.: | | | | | | | | | | | | |
2.442%, 10/19/2021(1) | | | 15,775,000 | | | | 16,033,863 | | | | | |
2.784%, 07/12/2022(1) | | | 10,000,000 | | | | 10,367,278 | | | | | |
3.102%, 01/17/2023(1) | | | 12,000,000 | | | | 12,660,292 | | | | | |
2.696%, 07/16/2024(1) | | | 12,000,000 | | | | 12,811,773 | | | | | |
2.448%, 09/27/2024(1) | | | 19,000,000 | | | | 20,235,163 | | | | | |
2.130%, 07/08/2030(1) | | | 7,575,000 | | | | 7,895,412 | | | | | |
| SunTrust Banks, Inc.: | | | | | | | | | | | | |
| 2.900%, 03/03/2021 | | | 14,150,000 | | | | 14,179,280 | | | | | |
| 2.700%, 01/27/2022 | | | 12,800,000 | | | | 13,102,071 | | | | | |
| 3.300%, 05/15/2026 | | | 3,925,000 | | | | 4,388,807 | | | | | |
| Synchrony Financial: | | | | | | | | | | | | |
| 3.750%, 08/15/2021 | | | 10,225,000 | | | | 10,371,356 | | | | | |
| 4.375%, 03/19/2024 | | | 1,538,000 | | | | 1,693,287 | | | | | |
| 4.250%, 08/15/2024 | | | 26,864,000 | | | | 29,682,484 | | | | | |
| 4.500%, 07/23/2025 | | | 23,127,000 | | | | 26,017,111 | | | | | |
| 3.700%, 08/04/2026 | | | 17,635,000 | | | | 19,573,607 | | | | | |
| 3.950%, 12/01/2027 | | | 44,825,000 | | | | 50,277,124 | | | | | |
| TD Ameritrade Holding Corp.: | | | | | | | | | | | | |
| 2.950%, 04/01/2022 | | | 4,625,000 | | | | 4,759,086 | | | | | |
| 3.625%, 04/01/2025 | | | 7,000,000 | | | | 7,785,676 | | | | | |
| Trinity Acquisition PLC: | | | | | | | | | | | | |
4.400%, 03/15/2026(1) | | | 27,305,000 | | | | 31,812,710 | | | | | |
6.125%, 08/15/2043(1) | | | 19,286,000 | | | | 28,570,614 | | | | | |
| UBS AG, | | | | | | | | | | | | |
1.750%, 04/21/2022(1)(2) | | | 10,000,000 | | | | 10,177,928 | | | | | |
| UBS Group AG, | | | | | | | | | | | | |
| 1.364%, 01/30/2027 | | | | | | | | | | | | |
(1 Year CMT Rate + 1.080%(1)(2)(3) | | | 10,950,000 | | | | 11,072,598 | | | | | |
| UBS Group Funding Switzerland AG: | | | | | | | | | | | | |
2.650%, 02/01/2022(1)(2) | | | 14,150,000 | | | | 14,509,727 | | | | | |
3.491%, 05/23/2023(1)(2) | | | 14,825,000 | | | | 15,427,240 | | | | | |
| 2.859%, 08/15/2023 | | | | | | | | | | | | |
(3 Month LIBOR USD + 0.954%)(1)(2)(3) | | | 42,658,000 | | | | 44,222,373 | | | | | |
4.253%, 03/23/2028(1)(2) | | | 17,150,000 | | | | 20,078,652 | | | | | |
The accompanying notes are an integral part of these financial statements.
Baird Aggregate Bond Fund
Schedule of Investments, December 31, 2020
Long-Term Investments (cont.)
| | | Principal | | | | | | % of | |
| | | Amount | | | Value | | | Net Assets | |
| UnitedHealth Group, Inc., | | | | | | | | | |
| 2.750%, 05/15/2040 | | $ | 7,000,000 | | | $ | 7,593,777 | | | |
|
|
| USAA Capital Corp., | | | | | | | | | | | | |
2.125%, 05/01/2030(2) | | | 5,000,000 | | | | 5,257,454 | | | | | |
| Voya Financial, Inc.: | | | | | | | | | | | | |
| 3.125%, 07/15/2024 | | | 21,875,000 | | | | 23,640,750 | | | | | |
| 3.650%, 06/15/2026 | | | 5,800,000 | | | | 6,633,609 | | | | | |
| Wells Fargo & Co.: | | | | | | | | | | | | |
| 3.069%, 01/24/2023 | | | 10,000,000 | | | | 10,285,414 | | | | | |
| 1.444%, 10/31/2023 | | | | | | | | | | | | |
(3 Month LIBOR USD + 1.230%)(3) | | | 5,000,000 | | | | 5,078,999 | | | | | |
| 3.000%, 02/19/2025 | | | 5,000,000 | | | | 5,435,720 | | | | | |
| 2.406%, 10/30/2025 | | | | | | | | | | | | |
(3 Month LIBOR USD + 0.825%)(3) | | | 11,500,000 | | | | 12,159,756 | | | | | |
| 2.164%, 02/11/2026 | | | | | | | | | | | | |
(3 Month LIBOR USD + 0.750%)(3) | | | 15,000,000 | | | | 15,773,117 | | | | | |
| 3.000%, 04/22/2026 | | | 8,000,000 | | | | 8,804,781 | | | | | |
2.393%, 06/02/2028 (SOFR + 2.100%)(3) | | | 45,850,000 | | | | 48,812,918 | | | | | |
3.068%, 04/30/2041 (SOFR + 2.530%)(3) | | | 25,000,000 | | | | 27,194,976 | | | | | |
| 3.900%, 05/01/2045 | | | 5,000,000 | | | | 6,249,870 | | | | | |
| 5.013%, 04/04/2051 | | | | | | | | | | | | |
(3 Month LIBOR USD + 4.240%)(3) | | | 7,000,000 | | | | 9,948,520 | | | | | |
| Wells Fargo Bank NA, | | | | | | | | | | | | |
| 5.850%, 02/01/2037 | | | 10,000,000 | | | | 14,226,279 | | | | | |
| Westpac Banking Corp.: | | | | | | | | | | | | |
| 2.894%, 02/04/2030 | | | | | | | | | | | | |
(5 Year CMT Rate + 1.350%)(1)(3) | | | 11,425,000 | | | | 11,977,218 | | | | | |
| 4.322%, 11/23/2031 | | | | | | | | | | | | |
(5 Year Mid Swap Rate USD + 2.236%)(1)(3) | | | 8,350,000 | | | | 9,521,297 | | | | | |
| 4.110%, 07/24/2034 | | | | | | | | | | | | |
(5 Year CMT Rate + 2.000%)(1)(3) | | | 10,000,000 | | | | 11,411,259 | | | | | |
| 2.668%, 11/15/2035 | | | | | | | | | | | | |
(5 Year CMT Rate + 1.750%)(1)(3) | | | 13,600,000 | | | | 14,010,176 | | | | | |
4.421%, 07/24/2039(1) | | | 10,000,000 | | | | 12,766,431 | | | | | |
| Willis North America, Inc.: | | | | | | | | | | | | |
| 3.600%, 05/15/2024 | | | 9,000,000 | | | | 9,827,170 | | | | | |
| 2.950%, 09/15/2029 | | | 7,500,000 | | | | 8,205,883 | | | | | |
| 5.050%, 09/15/2048 | | | 10,200,000 | | | | 14,347,136 | | | | | |
| Willis Towers Watson PLC, | | | | | | | | | | | | |
5.750%, 03/15/2021(1) | | | 13,879,000 | | | | 14,018,760 | | | | | |
| Total Financials | | | | | | | | | | | | |
| (Cost $5,318,118,962) | | | | | | | 5,766,280,653 | | | | 17.5 | % |
| Total Corporate Bonds | | | | | | | | | | | | |
| (Cost $12,533,248,269) | | | | | | | 13,708,028,321 | | | | 41.6 | % |
The accompanying notes are an integral part of these financial statements.
Baird Aggregate Bond Fund
Schedule of Investments, December 31, 2020
Long-Term Investments (cont.)
| | | Principal | | | | | | % of | |
| | | Amount | | | Value | | | Net Assets | |
| Municipal Bonds | | | | | | | | | |
| Atlanta Independent School System, | | | | | | | | | |
| 5.557%, 03/01/2026 | | $ | 4,465,000 | | | $ | 5,474,090 | | | |
|
|
| California Housing Finance Agency: | | | | | | | | | | | | |
| 3.656%, 02/01/2029 (Callable 08/01/2025) | | | 19,650,000 | | | | 20,999,366 | | | | | |
| 2.794%, 08/01/2036 (Callable 08/01/2025) | | | 6,325,000 | | | | 6,434,169 | | | | | |
| California Qualified School | | | | | | | | | | | | |
| Bond Joint Powers Authority, | | | | | | | | | | | | |
| 7.155%, 03/01/2027 | | | 6,695,000 | | | | 8,060,044 | | | | | |
| City of Berwyn IL: | | | | | | | | | | | | |
| 5.790%, 12/01/2022 | | | 820,000 | | | | 854,407 | | | | | |
| 5.790%, 12/01/2022 | | | 2,525,000 | | | | 2,590,398 | | | | | |
| City of Vernon CA, | | | | | | | | | | | | |
| 4.500%, 08/01/2022 | | | 7,265,000 | | | | 7,546,591 | | | | | |
| County of Cuyahoga OH, | | | | | | | | | | | | |
| 9.125%, 10/01/2023 | | | 700,000 | | | | 781,186 | | | | | |
| County of Riverside CA, | | | | | | | | | | | | |
| 2.617%, 02/15/2024 | | | 20,000,000 | | | | 21,117,400 | | | | | |
| Dallas/Fort Worth International Airport: | | | | | | | | | | | | |
| 2.246%, 11/01/2031 (Callable 11/01/2030) | | | 2,500,000 | | | | 2,589,075 | | | | | |
| 2.416%, 11/01/2032 (Callable 11/01/2030) | | | 5,000,000 | | | | 5,209,500 | | | | | |
| 2.516%, 11/01/2033 (Callable 11/01/2030) | | | 1,220,000 | | | | 1,271,643 | | | | | |
| Eaton Community City School District, | | | | | | | | | | | | |
| 5.390%, 08/25/2027 (Callable 02/01/2021) | | | 2,305,000 | | | | 2,309,679 | | | | | |
| Iowa Tobacco Settlement Authority, | | | | | | | | | | | | |
| 6.500%, 06/01/2023 (Callable 02/01/2021) | | | 3,010,000 | | | | 3,054,578 | | | | | |
| Kentucky Housing Corp., | | | | | | | | | | | | |
| 3.500%, 01/01/2040 (Callable 07/01/2025) | | | 2,830,000 | | | | 2,931,965 | | | | | |
| Kentucky Public Energy Authority, | | | | | | | | | | | | |
| 1.396%, 12/01/2049 | | | | | | | | | | | | |
| (1 Month LIBOR USD + 1.300%) | | | | | | | | | | | | |
(Callable 03/01/2025)(3) | | | 28,000,000 | | | | 28,409,920 | | | | | |
| Louisiana Housing Corp., | | | | | | | | | | | | |
| 2.100%, 12/01/2038 (Callable 09/01/2024) | | | 2,325,941 | | | | 2,374,669 | | | | | |
| Maryland Community Development | | | | | | | | | | | | |
| Administration Housing Revenue, | | | | | | | | | | | | |
| 3.160%, 09/01/2041 (Callable 09/01/2025) | | | 8,900,000 | | | | 9,199,663 | | | | | |
| Massachusetts Educational Financing Authority, | | | | | | | | | | | | |
| 3.850%, 05/25/2033 | | | 25,056,474 | | | | 25,692,909 | | | | | |
| Minnesota Housing Finance Agency: | | | | | | | | | | | | |
| 2.730%, 08/01/2046 (Callable 07/01/2025) | | | 3,824,303 | | | | 3,950,122 | | | | | |
| 3.200%, 06/01/2047 (Callable 07/01/2026) | | | 8,874,749 | | | | 9,215,806 | | | | | |
| 3.000%, 10/01/2047 (Callable 01/01/2027) | | | 11,668,574 | | | | 12,017,114 | | | | | |
| New Hampshire Business Finance Authority, | | | | | | | | | | | | |
| 2.872%, 07/01/2035 (Callable 01/01/2035) | | | 18,210,000 | | | | 18,924,378 | | | | | |
The accompanying notes are an integral part of these financial statements.
Baird Aggregate Bond Fund
Schedule of Investments, December 31, 2020
Long-Term Investments (cont.)
| | | Principal | | | | | | % of | |
| | | Amount | | | Value | | | Net Assets | |
| New Hampshire Housing Finance Authority: | | | | | | | | | |
| 3.050%, 01/01/2021 | | $ | 720,000 | | | $ | 720,000 | | | |
|
|
| 3.750%, 07/01/2034 (Callable 07/01/2023) | | | 525,000 | | | | 534,298 | | | | | |
| 4.000%, 07/01/2036 (Callable 07/01/2025) | | | 3,490,000 | | | | 3,595,014 | | | | | |
| New Jersey Higher Education | | | | | | | | | | | | |
| Student Assistance Authority: | | | | | | | | | | | | |
| 3.500%, 12/01/2039 (Callable 12/01/2028) | | | 17,910,000 | | | | 18,695,174 | | | | | |
| 3.500%, 12/01/2039 (Callable 12/01/2028) | | | 18,250,000 | | | | 19,057,380 | | | | | |
| New Jersey Turnpike Authority, | | | | | | | | | | | | |
3.223%, 01/01/2036 (Callable 07/01/2025)(2) | | | 90,230,000 | | | | 95,664,553 | | | | | |
| New York State Dormitory Authority, | | | | | | | | | | | | |
| 2.219%, 07/01/2035 | | | 15,000,000 | | | | 15,108,000 | | | | | |
| North Carolina Housing Finance Agency, | | | | | | | | | | | | |
| 2.812%, 07/01/2035 (Callable 01/01/2024) | | | 1,425,000 | | | | 1,450,308 | | | | | |
| Premier Health Partners, | | | | | | | | | | | | |
| 2.911%, 11/15/2026 | | | 20,004,000 | | | | 21,018,464 | | | | | |
| State Public School Building Authority, | | | | | | | | | | | | |
| 2.966%, 04/01/2027 | | | 5,800,000 | | | | 6,204,144 | | | | | |
| Texas Private Activity Bond Surface Transportation Corp., | | | | | | | | | | | | |
| 3.922%, 12/31/2049 | | | 8,800,000 | | | | 10,033,496 | | | | | |
| Three Rivers Local School District, | | | | | | | | | | | | |
| 5.209%, 09/15/2027 (Callable 02/01/2021) | | | 2,365,000 | | | | 2,371,456 | | | | | |
| West Contra Costa Unified School District, | | | | | | | | | | | | |
| 6.250%, 08/01/2030 | | | 1,785,000 | | | | 2,451,055 | | | | | |
| Western Michigan University Homer | | | | | | | | | | | | |
| Stryker MD School of Medicine, | | | | | | | | | | | | |
| 4.750%, 11/15/2028 | | | 12,905,000 | | | | 15,042,068 | | | | | |
| Westlake City School District, | | | | | | | | | | | | |
| 5.227%, 12/01/2026 (Callable 02/01/2021) | | | 3,570,000 | | | | 3,579,425 | | | | | |
| Total Municipal Bonds | | | | | | | | | | | | |
| (Cost $401,559,391) | | | | | | | 416,533,507 | | | | 1.3 | % |
| Residential Mortgage-Backed Securities | | | | | | | | | | | | |
| U.S. Government Agency Issues | | | | | | | | | | | | |
| Fannie Mae REMIC Trust: | | | | | | | | | | | | |
| Series 1991-86, Class Z, 6.500%, 07/25/2021 | | | 255 | | | | 257 | | | | | |
| Series 1993-58, Class H, 5.500%, 04/25/2023 | | | 21,715 | | | | 22,483 | | | | | |
| Series 1998-66, Class C, 6.000%, 12/25/2028 | | | 18,918 | | | | 19,989 | | | | | |
| Federal Gold Loan Mortgage Corp. (FGLMC): | | | | | | | | | | | | |
| 2.500%, 04/01/2028 | | | 1,683,470 | | | | 1,760,345 | | | | | |
| 6.500%, 06/01/2029 | | | 76,271 | | | | 85,476 | | | | | |
| 3.000%, 12/01/2030 | | | 6,073,678 | | | | 6,554,650 | | | | | |
| 3.000%, 04/01/2031 | | | 5,409,346 | | | | 5,787,122 | | | | | |
| 3.000%, 02/01/2032 | | | 49,489,755 | | | | 53,197,722 | | | | | |
| 3.000%, 03/01/2032 | | | 1,873,196 | | | | 1,983,074 | | | | | |
The accompanying notes are an integral part of these financial statements.
Baird Aggregate Bond Fund
Schedule of Investments, December 31, 2020
Long-Term Investments (cont.)
| | | Principal | | | | | | % of | |
| | | Amount | | | Value | | | Net Assets | |
| Federal Gold Loan Mortgage Corp. (FGLMC): (cont.) | | | | | | | | | |
| 3.500%, 05/01/2032 | | $ | 13,222,363 | | | $ | 14,297,981 | | | |
|
|
| 3.000%, 07/01/2032 | | | 12,455,150 | | | | 13,384,790 | | | | | |
| 3.500%, 07/01/2032 | | | 17,123,207 | | | | 18,445,137 | | | | | |
| 3.000%, 04/01/2033 | | | 1,678,120 | | | | 1,779,722 | | | | | |
| 5.000%, 08/01/2033 | | | 3,441,843 | | | | 3,953,998 | | | | | |
| 3.500%, 01/01/2034 | | | 12,989,039 | | | | 14,035,734 | | | | | |
| 5.000%, 09/01/2035 | | | 6,937,905 | | | | 8,071,312 | | | | | |
| 5.500%, 01/01/2036 | | | 118,580 | | | | 139,434 | | | | | |
| 5.000%, 03/01/2036 | | | 3,049,815 | | | | 3,544,324 | | | | | |
| 6.000%, 12/01/2036 | | | 106,157 | | | | 126,525 | | | | | |
| 4.000%, 03/01/2037 | | | 3,112,181 | | | | 3,372,177 | | | | | |
| 3.500%, 02/01/2038 | | | 77,639,256 | | | | 82,367,302 | | | | | |
| 5.000%, 02/01/2038 | | | 1,670,014 | | | | 1,938,945 | | | | | |
| 5.500%, 05/01/2038 | | | 356,042 | | | | 418,699 | | | | | |
| 5.500%, 01/01/2039 | | | 7,521,823 | | | | 8,781,708 | | | | | |
| 4.500%, 11/01/2039 | | | 2,775,786 | | | | 3,104,384 | | | | | |
| 4.500%, 11/01/2039 | | | 2,381,785 | | | | 2,663,597 | | | | | |
| 4.500%, 12/01/2039 | | | 14,789,541 | | | �� | 16,602,987 | | | | | |
| 5.000%, 03/01/2040 | | | 619,493 | | | | 720,565 | | | | | |
| 4.500%, 08/01/2040 | | | 484,305 | | | | 542,759 | | | | | |
| 2.000%, 09/01/2040 | | | 34,834,906 | | | | 36,264,290 | | | | | |
| 4.500%, 09/01/2040 | | | 2,012,586 | | | | 2,260,456 | | | | | |
| 4.000%, 01/01/2041 | | | 9,943,557 | | | | 10,910,622 | | | | | |
| 4.000%, 01/01/2041 | | | 19,471,972 | | | | 21,366,670 | | | | | |
| 4.500%, 03/01/2041 | | | 1,442,846 | | | | 1,614,922 | | | | | |
| 3.500%, 10/01/2041 | | | 6,048,800 | | | | 6,533,526 | | | | | |
| 4.000%, 03/01/2042 | | | 4,837,255 | | | | 5,333,415 | | | | | |
| 3.500%, 06/01/2042 | | | 3,070,850 | | | | 3,304,488 | | | | | |
| 3.500%, 07/01/2042 | | | 7,859,878 | | | | 8,452,848 | | | | | |
| 3.000%, 08/01/2042 | | | 11,257,011 | | | | 11,941,809 | | | | | |
| 3.000%, 10/01/2042 | | | 4,428,348 | | | | 4,710,305 | | | | | |
| 3.000%, 11/01/2042 | | | 32,493,602 | | | | 35,277,079 | | | | | |
| 3.500%, 12/01/2042 | | | 9,021,941 | | | | 9,780,896 | | | | | |
| 3.000%, 01/01/2043 | | | 18,461,903 | | | | 19,634,972 | | | | | |
| 3.500%, 01/01/2043 | | | 14,962,601 | | | | 16,270,920 | | | | | |
| 3.000%, 02/01/2043 | | | 2,479,041 | | | | 2,636,235 | | | | | |
| 3.000%, 04/01/2043 | | | 12,185,745 | | | | 13,170,524 | | | | | |
| 3.000%, 04/01/2043 | | | 4,427,552 | | | | 4,806,949 | | | | | |
| 3.000%, 04/01/2043 | | | 6,262,884 | | | | 6,661,104 | | | | | |
| 3.500%, 04/01/2043 | | | 41,769,635 | | | | 45,280,670 | | | | | |
| 4.000%, 04/01/2043 | | | 16,030,539 | | | | 18,128,704 | | | | | |
| 3.500%, 05/01/2043 | | | 8,864,870 | | | | 9,644,050 | | | | | |
| 3.000%, 06/01/2043 | | | 12,897,793 | | | | 13,719,643 | | | | | |
| 3.000%, 08/01/2043 | | | 4,084,104 | | | | 4,352,061 | | | | | |
The accompanying notes are an integral part of these financial statements.
Baird Aggregate Bond Fund
Schedule of Investments, December 31, 2020
Long-Term Investments (cont.)
| | | Principal | | | | | | % of | |
| | | Amount | | | Value | | | Net Assets | |
| Federal Gold Loan Mortgage Corp. (FGLMC): (cont.) | | | | | | | | | |
| 3.500%, 11/01/2043 | | $ | 6,548,514 | | | $ | 7,097,398 | | | |
|
|
| 3.500%, 01/01/2044 | | | 7,859,027 | | | | 8,542,278 | | | | | |
| 3.500%, 02/01/2044 | | | 26,792,379 | | | | 29,019,911 | | | | | |
| 4.000%, 03/01/2044 | | | 3,600,084 | | | | 3,918,443 | | | | | |
| 3.500%, 05/01/2044 | | | 31,269,591 | | | | 34,193,590 | | | | | |
| 4.000%, 05/01/2044 | | | 14,373,258 | | | | 15,767,161 | | | | | |
| 4.000%, 07/01/2044 | | | 2,909,997 | | | | 3,171,410 | | | | | |
| 3.500%, 10/01/2044 | | | 50,706,612 | | | | 54,362,968 | | | | | |
| 4.000%, 10/01/2044 | | | 7,613,085 | | | | 8,354,655 | | | | | |
| 3.000%, 01/01/2045 | | | 16,545,673 | | | | 17,460,240 | | | | | |
| 3.500%, 01/01/2045 | | | 21,415,365 | | | | 23,277,104 | | | | | |
| 4.500%, 01/01/2045 | | | 23,351,846 | | | | 26,200,977 | | | | | |
| 3.500%, 06/01/2045 | | | 14,676,637 | | | | 16,049,771 | | | | | |
| 3.500%, 07/01/2045 | | | 55,223,336 | | | | 59,833,336 | | | | | |
| 3.000%, 10/01/2045 | | | 28,461,476 | | | | 30,277,808 | | | | | |
| 4.000%, 10/01/2045 | | | 4,481,455 | | | | 4,861,390 | | | | | |
| 4.000%, 11/01/2045 | | | 9,691,119 | | | | 10,513,385 | | | | | |
| 3.000%, 01/01/2046 | | | 85,359,914 | | | | 93,148,791 | | | | | |
| 3.000%, 01/01/2046 | | | 66,951,398 | | | | 73,081,019 | | | | | |
| 3.500%, 01/01/2046 | | | 25,578,530 | | | | 27,780,240 | | | | | |
| 4.000%, 02/01/2046 | | | 55,328,383 | | | | 60,833,319 | | | | | |
| 4.000%, 02/01/2046 | | | 13,162,995 | | | | 14,260,868 | | | | | |
| 4.000%, 04/01/2046 | | | 7,760,475 | | | | 8,533,391 | | | | | |
| 3.500%, 05/01/2046 | | | 5,943,881 | | | | 6,396,817 | | | | | |
| 3.500%, 08/01/2046 | | | 25,040,995 | | | | 27,354,557 | | | | | |
| 3.000%, 10/01/2046 | | | 48,732,666 | | | | 52,758,030 | | | | | |
| 3.000%, 10/01/2046 | | | 55,116,415 | | | | 59,334,597 | | | | | |
| 3.000%, 12/01/2046 | | | 57,681,626 | | | | 60,774,951 | | | | | |
| 4.000%, 01/01/2047 | | | 45,288,437 | | | | 49,959,531 | | | | | |
| 3.000%, 02/01/2047 | | | 34,452,884 | | | | 36,117,008 | | | | | |
| 4.500%, 04/01/2047 | | | 32,195,688 | | | | 35,226,528 | | | | | |
| 3.000%, 05/01/2047 | | | 49,877,836 | | | | 53,820,453 | | | | | |
| 4.000%, 09/01/2047 | | | 17,149,612 | | | | 18,377,855 | | | | | |
| 4.000%, 08/01/2048 | | | 26,301,410 | | | | 28,488,679 | | | | | |
| 3.000%, 11/01/2049 | | | 76,724,314 | | | | 82,965,860 | | | | | |
| 4.000%, 05/01/2050 | | | 157,409,233 | | | | 173,557,421 | | | | | |
| Federal Home Loan Mortgage Corp. (FHLMC), | | | | | | | | | | | | |
| Series 1081, Class K, 7.000%, 05/15/2021 | | | 540 | | | | 544 | | | | | |
| Federal National Mortgage Association (FNMA): | | | | | | | | | | | | |
| 5.000%, 11/01/2021 | | | 191 | | | | 200 | | | | | |
| 2.500%, 12/01/2027 | | | 5,527,686 | | | | 5,777,778 | | | | | |
| 2.500%, 05/01/2028 | | | 8,062,965 | | | | 8,522,413 | | | | | |
| 5.000%, 05/01/2028 | | | 115,488 | | | | 128,809 | | | | | |
| 4.500%, 08/01/2029 | | | 884,304 | | | | 966,463 | | | | | |
The accompanying notes are an integral part of these financial statements.
Baird Aggregate Bond Fund
Schedule of Investments, December 31, 2020
Long-Term Investments (cont.)
| | | Principal | | | | | | % of | |
| | | Amount | | | Value | | | Net Assets | |
| Federal National Mortgage Association (FNMA): (cont.) | | | | | | | | | |
| 4.500%, 09/01/2029 | | $ | 1,041,209 | | | $ | 1,140,786 | | | |
|
|
| 2.500%, 04/01/2030 | | | 2,911,152 | | | | 3,088,921 | | | | | |
| 2.500%, 05/01/2030 | | | 9,354,018 | | | | 9,948,175 | | | | | |
| 3.500%, 11/01/2030 | | | 24,370,200 | | | | 26,440,945 | | | | | |
| 3.000%, 12/01/2030 | | | 10,136,728 | | | | 10,860,519 | | | | | |
| 3.000%, 12/01/2030 | | | 16,186,025 | | | | 17,340,675 | | | | | |
| 2.500%, 09/01/2031 | | | 34,412,901 | | | | 36,661,635 | | | | | |
| 3.500%, 01/01/2032 | | | 31,775,856 | | | | 33,867,964 | | | | | |
| 2.500%, 02/01/2032 | | | 5,604,875 | | | | 5,938,214 | | | | | |
| 3.000%, 09/01/2032 | | | 2,233,881 | | | | 2,387,335 | | | | | |
| 3.000%, 10/01/2032 | | | 1,626,774 | | | | 1,709,984 | | | | | |
| 3.000%, 11/01/2032 | | | 4,324,194 | | | | 4,620,457 | | | | | |
| 3.500%, 11/01/2032 | | | 3,571,080 | | | | 3,845,261 | | | | | |
| 2.500%, 12/01/2032 | | | 37,995,412 | | | | 39,698,226 | | | | | |
| 3.000%, 12/01/2032 | | | 3,220,990 | | | | 3,405,703 | | | | | |
| 6.000%, 03/01/2033 | | | 30,351 | | | | 35,850 | | | | | |
| 3.500%, 10/01/2033 | | | 15,956,125 | | | | 17,253,801 | | | | | |
| 4.500%, 10/01/2033 | | | 11,375,638 | | | | 12,577,970 | | | | | |
| 5.000%, 10/01/2033 | | | 12,444,940 | | | | 14,393,399 | | | | | |
| 3.000%, 11/01/2033 | | | 70,982,242 | | | | 76,959,236 | | | | | |
| 5.000%, 11/01/2033 | | | 34,805 | | | | 40,256 | | | | | |
| 4.000%, 01/01/2034 | | | 5,040,760 | | | | 5,505,185 | | | | | |
| 5.500%, 04/01/2034 | | | 4,202,822 | | | | 4,903,852 | | | | | |
| 3.000%, 06/01/2034 | | | 23,446,150 | | | | 25,159,666 | | | | | |
| 4.000%, 06/01/2034 | | | 6,612,192 | | | | 7,219,743 | | | | | |
| 4.000%, 09/01/2034 | | | 7,617,101 | | | | 8,317,062 | | | | | |
| 5.500%, 09/01/2034 | | | 110,547 | | | | 129,257 | | | | | |
| 6.000%, 11/01/2034 | | | 30,607 | | | | 36,756 | | | | | |
| 3.500%, 01/01/2035 | | | 42,882,634 | | | | 46,460,347 | | | | | |
| 5.500%, 02/01/2035 | | | 374,333 | | | | 438,933 | | | | | |
| 4.000%, 03/01/2035 | | | 37,766,526 | | | | 40,552,968 | | | | | |
| 3.000%, 06/01/2035 | | | 10,324,584 | | | | 10,914,930 | | | | | |
| 5.000%, 07/01/2035 | | | 3,198,830 | | | | 3,715,861 | | | | | |
| 5.000%, 10/01/2035 | | | 1,541,603 | | | | 1,790,085 | | | | | |
| 5.000%, 02/01/2036 | | | 2,253,195 | | | | 2,618,560 | | | | | |
| 3.000%, 11/01/2036 | | | 32,697,628 | | | | 34,569,543 | | | | | |
| 5.500%, 11/01/2036 | | | 147,090 | | | | 172,831 | | | | | |
| 2.500%, 12/01/2036 | | | 18,842,266 | | | | 19,951,966 | | | | | |
| 5.500%, 04/01/2037 | | | 935,710 | | | | 1,089,195 | | | | | |
| 4.000%, 05/01/2037 | | | 31,017,006 | | | | 33,516,478 | | | | | |
| 4.000%, 02/01/2038 | | | 28,104,441 | | | | 30,343,354 | | | | | |
| 2.500%, 04/01/2038 | | | 46,164,393 | | | | 49,050,013 | | | | | |
| 3.000%, 05/01/2038 | | | 25,032,381 | | | | 26,279,482 | | | | | |
| 4.000%, 05/01/2038 | | | 17,118,311 | | | | 19,016,418 | | | | | |
The accompanying notes are an integral part of these financial statements.
Baird Aggregate Bond Fund
Schedule of Investments, December 31, 2020
Long-Term Investments (cont.)
| | | Principal | | | | | | % of | |
| | | Amount | | | Value | | | Net Assets | |
| Federal National Mortgage Association (FNMA): (cont.) | | | | | | | | | |
| 4.000%, 04/01/2039 | | $ | 8,539,070 | | | $ | 9,411,776 | | | |
|
|
| 4.500%, 04/01/2039 | | | 11,657,012 | | | | 13,070,442 | | | | | |
| 5.000%, 06/01/2039 | | | 7,528,713 | | | | 8,738,855 | | | | | |
| 5.000%, 06/01/2039 | | | 11,069,632 | | | | 12,740,462 | | | | | |
| 4.500%, 11/01/2039 | | | 136,891 | | | | 153,708 | | | | | |
| 4.000%, 08/01/2040 | | | 983,881 | | | | 1,078,675 | | | | | |
| 4.000%, 10/01/2040 | | | 21,821,736 | | | | 24,110,639 | | | | | |
| 3.500%, 12/01/2040 | | | 6,203,218 | | | | 6,698,432 | | | | | |
| 4.000%, 12/01/2040 | | | 5,846,055 | | | | 6,388,941 | | | | | |
| 3.500%, 02/01/2041 | | | 9,628,441 | | | | 10,396,804 | | | | | |
| 4.500%, 02/01/2041 | | | 41,772,688 | | | | 46,698,901 | | | | | |
| 3.500%, 03/01/2041 | | | 13,668,998 | | | | 14,759,058 | | | | | |
| 4.500%, 05/01/2041 | | | 5,290,193 | | | | 5,913,022 | | | | | |
| 4.000%, 06/01/2041 | | | 10,953,659 | | | | 11,976,618 | | | | | |
| 4.500%, 07/01/2041 | | | 5,649,679 | | | | 6,343,932 | | | | | |
| 5.000%, 07/01/2041 | | | 8,454,885 | | | | 9,813,702 | | | | | |
| 3.500%, 09/01/2041 | | | 13,857,206 | | | | 14,946,169 | | | | | |
| 4.000%, 09/01/2041 | | | 1,490,789 | | | | 1,630,036 | | | | | |
| 4.000%, 10/01/2041 | | | 4,176,948 | | | | 4,566,654 | | | | | |
| 3.500%, 11/01/2041 | | | 5,255,477 | | | | 5,659,256 | | | | | |
| 3.500%, 12/01/2041 | | | 24,267,834 | | | | 26,174,937 | | | | | |
| 4.000%, 12/01/2041 | | | 6,188,165 | | | | 6,785,887 | | | | | |
| 4.000%, 01/01/2042 | | | 7,727,421 | | | | 8,474,731 | | | | | |
| 4.500%, 01/01/2042 | | | 8,004,033 | | | | 8,980,263 | | | | | |
| 4.000%, 02/01/2042 | | | 29,539,506 | | | | 32,410,138 | | | | | |
| 3.000%, 04/01/2042 | | | 46,164,314 | | | | 49,324,008 | | | | | |
| 3.000%, 05/01/2042 | | | 5,611,565 | | | | 5,951,103 | | | | | |
| 3.500%, 07/01/2042 | | | 72,722,959 | | | | 79,526,301 | | | | | |
| 3.500%, 08/01/2042 | | | 6,341,371 | | | | 6,896,645 | | | | | |
| 3.000%, 10/01/2042 | | | 15,761,641 | | | | 17,237,139 | | | | | |
| 3.000%, 03/01/2043 | | | 26,114,954 | | | | 27,841,351 | | | | | |
| 3.000%, 03/01/2043 | | | 4,872,085 | | | | 5,288,070 | | | | | |
| 3.000%, 05/01/2043 | | | 14,043,428 | | | | 14,938,868 | | | | | |
| 3.000%, 05/01/2043 | | | 26,339,402 | | | | 28,473,536 | | | | | |
| 3.500%, 05/01/2043 | | | 27,220,948 | | | | 29,573,600 | | | | | |
| 3.000%, 06/01/2043 | | | 6,095,183 | | | | 6,484,494 | | | | | |
| 3.000%, 07/01/2043 | | | 2,418,693 | | | | 2,577,931 | | | | | |
| 4.000%, 07/01/2043 | | | 21,457,122 | | | | 23,574,487 | | | | | |
| 3.000%, 08/01/2043 | | | 4,032,737 | | | | 4,297,574 | | | | | |
| 3.000%, 09/01/2043 | | | 62,737,262 | | | | 68,407,181 | | | | | |
| 3.500%, 09/01/2043 | | | 36,804,096 | | | | 39,872,356 | | | | | |
| 4.500%, 09/01/2043 | | | 8,638,921 | | | | 9,687,210 | | | | | |
| 3.000%, 10/01/2043 | | | 80,484,555 | | | | 85,999,032 | | | | | |
| 3.500%, 10/01/2043 | | | 42,276,540 | | | | 45,932,231 | | | | | |
The accompanying notes are an integral part of these financial statements.
Baird Aggregate Bond Fund
Schedule of Investments, December 31, 2020
Long-Term Investments (cont.)
| | | Principal | | | | | | % of | |
| | | Amount | | | Value | | | Net Assets | |
| Federal National Mortgage Association (FNMA): (cont.) | | | | | | | | | |
| 3.000%, 11/01/2043 | | $ | 19,422,654 | | | $ | 20,648,195 | | | |
|
|
| 4.000%, 11/01/2043 | | | 6,664,656 | | | | 7,345,838 | | | | | |
| 4.000%, 01/01/2045 | | | 5,233,737 | | | | 5,758,116 | | | | | |
| 3.500%, 02/01/2045 | | | 28,191,011 | | | | 30,527,765 | | | | | |
| 4.000%, 02/01/2045 | | | 13,588,263 | | | | 14,881,654 | | | | | |
| 3.500%, 04/01/2045 | | | 20,709,732 | | | | 22,517,133 | | | | | |
| 4.000%, 09/01/2045 | | | 4,158,385 | | | | 4,534,561 | | | | | |
| 4.000%, 10/01/2045 | | | 5,647,821 | | | | 6,158,727 | | | | | |
| 4.000%, 11/01/2045 | | | 21,242,477 | | | | 23,079,726 | | | | | |
| 3.500%, 12/01/2045 | | | 20,173,056 | | | | 21,578,696 | | | | | |
| 4.500%, 02/01/2046 | | | 22,882,477 | | | | 25,659,870 | | | | | |
| 3.000%, 05/01/2046 | | | 11,372,612 | | | | 12,339,167 | | | | | |
| 3.500%, 05/01/2046 | | | 31,900,384 | | | | 34,196,653 | | | | | |
| 3.000%, 07/01/2046 | | | 7,870,397 | | | | 8,539,324 | | | | | |
| 4.500%, 08/01/2046 | | | 19,031,536 | | | | 21,216,523 | | | | | |
| 3.500%, 09/01/2046 | | | 8,088,806 | | | | 8,843,406 | | | | | |
| 2.500%, 10/01/2046 | | | 21,214,160 | | | | 22,399,500 | | | | | |
| 3.000%, 11/01/2046 | | | 37,052,044 | | | | 39,467,534 | | | | | |
| 3.000%, 11/01/2046 | | | 18,559,347 | | | | 19,558,826 | | | | | |
| 3.500%, 11/01/2046 | | | 35,117,528 | | | | 37,608,827 | | | | | |
| 3.000%, 12/01/2046 | | | 21,234,906 | | | | 23,004,436 | | | | | |
| 3.500%, 05/01/2047 | | | 2,313,602 | | | | 2,463,293 | | | | | |
| 4.000%, 08/01/2047 | | | 45,685,981 | | | | 49,281,225 | | | | | |
| 3.500%, 10/01/2047 | | | 11,489,081 | | | | 12,176,310 | | | | | |
| 4.000%, 10/01/2047 | | | 30,258,586 | | | | 32,510,958 | | | | | |
| 4.000%, 11/01/2047 | | | 25,679,007 | | | | 27,579,169 | | | | | |
| 4.500%, 11/01/2047 | | | 11,110,540 | | | | 12,119,026 | | | | | |
| 3.500%, 12/01/2047 | | | 101,103,403 | | | | 107,236,569 | | | | | |
| 4.000%, 12/01/2047 | | | 40,330,776 | | | | 43,264,740 | | | | | |
4.500%, 12/01/2047(8) | | | 5,783,931 | | | | 6,280,674 | | | | | |
| 3.500%, 01/01/2048 | | | 8,513,395 | | | | 9,027,246 | | | | | |
| 3.500%, 02/01/2048 | | | 58,305,396 | | | | 61,766,421 | | | | | |
| 4.000%, 04/01/2048 | | | 95,446,941 | | | | 102,164,972 | | | | | |
| 4.000%, 07/01/2048 | | | 23,630,795 | | | | 26,043,789 | | | | | |
| 4.000%, 09/01/2048 | | | 9,869,836 | | | | 10,516,134 | | | | | |
| 4.500%, 11/01/2048 | | | 34,514,147 | | | | 37,382,453 | | | | | |
| 5.000%, 11/01/2048 | | | 37,049,528 | | | | 42,122,925 | | | | | |
| 4.000%, 01/01/2049 | | | 7,155,062 | | | | 7,787,357 | | | | | |
| 4.500%, 01/01/2049 | | | 20,061,928 | | | | 22,229,055 | | | | | |
| 3.000%, 02/01/2049 | | | 21,324,992 | | | | 22,801,162 | | | | | |
| 3.500%, 06/01/2049 | | | 57,627,700 | | | | 60,843,001 | | | | | |
| 3.500%, 01/01/2050 | | | 47,002,865 | | | | 51,351,472 | | | | | |
| 3.000%, 05/01/2050 | | | 58,273,643 | | | | 63,455,619 | | | | | |
| 2.500%, 11/01/2050 | | | 71,777,176 | | | | 76,118,649 | | | | | |
The accompanying notes are an integral part of these financial statements.
Baird Aggregate Bond Fund
Schedule of Investments, December 31, 2020
Long-Term Investments (cont.)
| | | Principal | | | | | | % of | |
| | | Amount | | | Value | | | Net Assets | |
| Federal National Mortgage Association (FNMA): (cont.) | | | | | | | | | |
| 2.500%, 12/01/2050 | | $ | 72,058,542 | | | $ | 76,198,740 | | | |
|
|
2.500%, 12/01/2050(8) | | | 106,675,000 | | | | 113,709,822 | | | | | |
| 3.500%, 05/01/2052 | | | 74,005,313 | | | | 81,011,444 | | | | | |
| 3.000%, 11/01/2059 | | | 78,421,361 | | | | 85,127,586 | | | | | |
| Government National Mortgage Association (GNMA): | | | | | | | | | | | | |
| 6.000%, 11/20/2033 | | | 28,615 | | | | 33,192 | | | | | |
| 5.000%, 07/20/2040 | | | 1,166,933 | | | | 1,334,418 | | | | | |
| 3.500%, 10/20/2041 | | | 5,575,790 | | | | 6,072,657 | | | | | |
| 3.500%, 01/15/2042 | | | 9,566,731 | | | | 10,432,152 | | | | | |
| 4.000%, 06/20/2042 | | | 6,100,198 | | | | 6,746,670 | | | | | |
| 3.500%, 09/20/2042 | | | 2,402,994 | | | | 2,616,682 | | | | | |
| 3.500%, 01/20/2043 | | | 48,969,709 | | | | 53,312,619 | | | | | |
| 4.000%, 10/20/2043 | | | 9,099,711 | | | | 10,056,250 | | | | | |
| 4.000%, 09/20/2044 | | | 34,287,397 | | | | 37,838,385 | | | | | |
| 4.000%, 01/20/2045 | | | 7,379,395 | | | | 8,140,748 | | | | | |
| 3.500%, 03/20/2045 | | | 10,871,304 | | | | 12,030,212 | | | | | |
| 3.000%, 04/20/2045 | | | 16,051,271 | | | | 17,123,277 | | | | | |
| 3.500%, 04/20/2045 | | | 19,800,231 | | | | 21,260,082 | | | | | |
| 4.000%, 08/20/2045 | | | 6,923,186 | | | | 7,586,020 | | | | | |
| 4.500%, 01/20/2046 | | | 10,276,302 | | | | 11,447,027 | | | | | |
| 3.500%, 04/20/2046 | | | 64,270,726 | | | | 69,449,369 | | | | | |
| 4.000%, 04/20/2046 | | | 7,501,826 | | | | 8,218,189 | | | | | |
| 3.500%, 05/20/2046 | | | 41,064,216 | | | | 44,458,005 | | | | | |
| 4.000%, 05/20/2046 | | | 18,159,464 | | | | 19,875,601 | | | | | |
| 3.500%, 06/20/2046 | | | 69,338,682 | | | | 75,442,569 | | | | | |
| 3.000%, 11/20/2046 | | | 31,963,759 | | | | 33,915,750 | | | | | |
| 5.000%, 04/20/2047 | | | 1,750,066 | | | | 1,944,411 | | | | | |
| 3.000%, 06/20/2047 | | | 28,774,732 | | | | 30,575,934 | | | | | |
| 4.500%, 06/20/2047 | | | 30,111,856 | | | | 32,759,724 | | | | | |
| 4.500%, 07/20/2047 | | | 7,483,854 | | | | 8,137,056 | | | | | |
4.500%, 09/20/2047(6) | | | 9,821,092 | | | | 10,718,256 | | | | | |
| 4.000%, 01/20/2048 | | | 14,896,280 | | | | 16,086,186 | | | | | |
| 3.500%, 02/20/2050 | | | 139,984,787 | | | | 151,107,954 | | | | | |
| Seasoned Credit Risk Transfer Trust: | | | | | | | | | | | | |
| Series 2019-4, Class MA, 3.000%, 02/25/2059 | | | 56,076,657 | | | | 59,805,525 | | | | | |
Series 2020-2, Class MT, 2.000%, 11/25/2059(6) | | | 79,447,042 | | | | 81,885,033 | | | | | |
| Series 2020-3, Class MT, 2.000%, 05/25/2060 | | | 55,202,394 | | | | 56,863,787 | | | | | |
| Total U.S. Government Agency Issues | | | | | | | | | | | | |
| (Cost $5,769,742,042) | | | | | | | 6,014,309,283 | | | | 18.3 | % |
| Non-U.S. Government Agency Issues | | | | | | | | | | | | |
| Alternative Loan Trust: | | | | | | | | | | | | |
Series 2006-43CB, Class 2A1, 6.000%, 02/25/2022(6) | | | 22,298 | | | | 22,414 | | | | | |
Series 2006-28CB, Class A17, 6.000%, 10/25/2036(6) | | | 503,152 | | | | 367,509 | | | | | |
The accompanying notes are an integral part of these financial statements.
Baird Aggregate Bond Fund
Schedule of Investments, December 31, 2020
Long-Term Investments (cont.)
| | | Principal | | | | | | % of | |
| | | Amount | | | Value | | | Net Assets | |
| Argent Securities Inc. Asset-Backed | | | | | | | | | |
| Pass-Through Certificates: | | | | | | | | | |
| Series 2005-W3, Class A2D, 0.828%, 11/25/2035 | | | | | | | | | |
(1 Month LIBOR USD + 0.680%)(3) | | $ | 941,609 | | | $ | 939,715 | | | |
|
|
| Series 2005-W5, Class A1, 0.618%, 01/25/2036 | | | | | | | | | | | | |
(1 Month LIBOR USD + 0.470%)(3) | | | 20,195,549 | | | | 19,993,434 | | | | | |
| Arroyo Mortgage Trust: | | | | | | | | | | | | |
Series 2018-1, Class A1, 3.763%, 04/25/2048(2)(4) | | | 16,872,250 | | | | 17,121,857 | | | | | |
Series 2019-3, Class A1, 2.962%, 10/25/2048(2)(4) | | | 30,915,050 | | | | 31,871,382 | | | | | |
Series 2020-1, Class A1A, 1.662%, 03/25/2055(2) | | | 29,139,367 | | | | 29,416,704 | | | | | |
| Asset Backed Securities Corp. Home Equity Loan Trust: | | | | | | | | | | | | |
| Series 2006-HE1, Class A1, 0.363%, 01/25/2036 | | | | | | | | | | | | |
(1 Month LIBOR USD + 0.215%)(3) | | | 598,965 | | | | 597,123 | | | | | |
| Series 2006-HE3, Class A2, 0.313%, 03/25/2036 | | | | | | | | | | | | |
(1 Month LIBOR USD + 0.165%)(3) | | | 8,053,677 | | | | 7,965,054 | | | | | |
| Series 2006-HE6, Class A1, 0.293%, 11/25/2036 | | | | | | | | | | | | |
(1 Month LIBOR USD + 0.145%)(3) | | | 19,082,607 | | | | 18,432,365 | | | | | |
| Banc of America Alternative Loan Trust: | | | | | | | | | | | | |
Series 2007-1, Class 1A1, 4.520%, 04/25/2022(4)(6) | | | 115,711 | | | | 110,711 | | | | | |
Series 2005-9, Class 1CB3, 5.500%, 10/25/2035(6) | | | 102,016 | | | | 101,395 | | | | | |
Series 2005-11, Class 1CB4, 5.500%, 12/25/2035(6) | | | 56,684 | | | | 56,678 | | | | | |
Series 2006-5, Class CB7, 6.000%, 06/25/2046(6) | | | 242,628 | | | | 236,138 | | | | | |
| Bayview Financial Trust, | | | | | | | | | | | | |
Series 2007-B, Class 1A2, 6.831%, 08/28/2037(7) | | | 1,201,128 | | | | 1,196,846 | | | | | |
| Bear Stearns ALT-A Trust: | | | | | | | | | | | | |
| Series 2004-4, Class A1, 0.748%, 06/25/2034 | | | | | | | | | | | | |
(1 Month LIBOR USD + 0.600%)(3) | | | 743,687 | | | | 749,716 | | | | | |
| Series 2005-4, Class 1A1, 0.588%, 04/25/2035 | | | | | | | | | | | | |
(1 Month LIBOR USD + 0.440%)(3) | | | 1,033,270 | | | | 1,033,605 | | | | | |
| Series 2005-7, Class 12A1, 0.688%, 08/25/2035 | | | | | | | | | | | | |
(1 Month LIBOR USD + 0.540%)(3) | | | 207,547 | | | | 207,443 | | | | | |
| Bear Stearns Asset Backed Securities I Trust, | | | | | | | | | | | | |
| Series 2004-AC2, Class 2A, 5.000%, 05/25/2034 | | | 158,466 | | | | 156,612 | | | | | |
| Chase Mortgage Finance Trust, | | | | | | | | | | | | |
Series 2006-A1, Class 2A3, 3.259%, 09/25/2036(4) | | | 792,648 | | | | 723,235 | | | | | |
| Citigroup Global Markets Mortgage Securities VII, Inc., | | | | | | | | | | | | |
Series 2003-UP2, Class A2, 7.000%, 06/25/2033(7) | | | 103,685 | | | | 107,631 | | | | | |
| Citigroup Mortgage Loan Trust, Inc., | | | | | | | | | | | | |
Series 2005-9, Class 2A2, 5.500%, 11/25/2035(6) | | | 2,280 | | | | 2,280 | | | | | |
| Countrywide Asset-Backed Certificates: | | | | | | | | | | | | |
Series 2005-13, Class AF3, 5.430%, 02/25/2033(4)(6) | | | 236,350 | | | | 225,170 | | | | | |
Series 2004-S1, Class A3, 5.115%, 02/25/2035(7) | | | 112,533 | | | | 112,364 | | | | | |
Series 2005-10, Class AF6, 4.915%, 12/25/2035(4) | | | 39,771 | | | | 41,000 | | | | | |
Series 2006-10, Class 1AF3, 5.971%, 12/25/2035(4) | | | 361,583 | | | | 347,212 | | | | | |
The accompanying notes are an integral part of these financial statements.
Baird Aggregate Bond Fund
Schedule of Investments, December 31, 2020
Long-Term Investments (cont.)
| | | Principal | | | | | | % of | |
| | | Amount | | | Value | | | Net Assets | |
| Credit Suisse First Boston Mortgage Securities Corp., | | | | | | | | | |
Series 2003-AR26, Class 8A1, 2.891%, 11/25/2033(4) | | $ | 4,096,203 | | | $ | 4,047,841 | | | |
|
|
| CWABS Asset-Backed Certificates Trust: | | | | | | | | | | | | |
Series 2004-15, Class AF6, 4.613%, 04/25/2035(4) | | | 2,934 | | | | 2,952 | | | | | |
Series 2005-1, Class AF6, 5.030%, 06/25/2035(4) | | | 10,117 | | | | 10,256 | | | | | |
Series 2005-17, Class 1AF5, 5.564%, 03/25/2036(4) | | | 120,165 | | | | 123,680 | | | | | |
| Deutsche Mortgage Securities, Inc. Mortgage Loan Trust, | | | | | | | | | | | | |
Series 2004-4, Class 1A6, 6.000%, 04/25/2034(7) | | | 676 | | | | 687 | | | | | |
| First Franklin Mortgage Loan Trust, | | | | | | | | | | | | |
| Series 2006-FF1, Class 2A4, 0.828%, 01/25/2036 | | | | | | | | | | | | |
(1 Month LIBOR USD + 0.680%)(3) | | | 907,211 | | | | 907,063 | | | | | |
| First Horizon Alternative Mortgage Securities Trust: | | | | | | | | | | | | |
| Series 2006-FA6, Class 3A1, 5.750%, 11/25/2021 | | | 7,018 | | | | 6,392 | | | | | |
Series 2006-FA8, Class 2A1, 5.750%, 01/25/2022(6) | | | 86,503 | | | | 53,397 | | | | | |
| Fremont Home Loan Trust, | | | | | | | | | | | | |
| Series 2006-A, Class 1A1, 0.293%, 05/25/2036 | | | | | | | | | | | | |
(1 Month LIBOR USD + 0.145%)(3) | | | 16,585,356 | | | | 16,117,767 | | | | | |
| GE Capital Mortgage Services, Inc. Trust, | | | | | | | | | | | | |
| Series 1999-HE1, Class A7, 6.265%, 04/25/2029 | | | 67 | | | | 68 | | | | | |
| GSAA Home Equity Trust, | | | | | | | | | | | | |
| Series 2004-6, Class A1, 0.948%, 06/25/2034 | | | | | | | | | | | | |
(1 Month LIBOR USD + 0.800%)(3) | | | 658,355 | | | | 662,025 | | | | | |
| GSAMP Trust: | | | | | | | | | | | | |
| Series 2005-WMC2, Class A1B, 0.768%, 11/25/2035 | | | | | | | | | | | | |
(1 Month LIBOR USD + 0.620%)(3) | | | 1,235,246 | | | | 1,235,343 | | | | | |
| Series 2005-WMC2, Class A2C, 0.848%, 11/25/2035 | | | | | | | | | | | | |
(1 Month LIBOR USD + 0.700%)(3) | | | 1,474,385 | | | | 1,482,536 | | | | | |
| HomeBanc Mortgage Trust, | | | | | | | | | | | | |
| Series 2005-3, Class A1, 0.628%, 07/25/2035 | | | | | | | | | | | | |
(1 Month LIBOR USD + 0.480%)(3) | | | 630,876 | | | | 631,255 | | | | | |
| IMC Home Equity Loan Trust, | | | | | | | | | | | | |
| Series 1997-5, Class A10, 6.880%, 11/20/2028 | | | 171 | | | | 170 | | | | | |
| Impac CMB Trust: | | | | | | | | | | | | |
Series 2004-4, Class 2A2, 4.966%, 09/25/2034(7) | | | 65,118 | | | | 69,231 | | | | | |
| Series 2004-5, Class 1A2, 0.848%, 10/25/2034 | | | | | | | | | | | | |
(1 Month LIBOR USD + 0.700%)(3) | | | 2,166,477 | | | | 2,247,214 | | | | | |
| Series 2004-6, Class 1A1, 0.948%, 10/25/2034 | | | | | | | | | | | | |
(1 Month LIBOR USD + 0.800%)(3) | | | 1,566,635 | | | | 1,566,206 | | | | | |
| J.P. Morgan Alternative Loan Trust, | | | | | | | | | | | | |
Series 2006-A1, Class 2A1, 3.524%, 03/25/2036(4) | | | 199,099 | | | | 186,314 | | | | | |
| J.P. Morgan Mortgage Trust: | | | | | | | | | | | | |
Series 2005-A4, Class 1A1, 2.588%, 07/25/2035(4) | | | 476,121 | | | | 486,659 | | | | | |
Series 2007-A1, Class 5A2, 3.059%, 07/25/2035(4) | | | 1,550,611 | | | | 1,537,061 | | | | | |
Series 2007-A1, Class 5A5, 3.059%, 07/25/2035(4) | | | 2,347,876 | | | | 2,331,650 | | | | | |
Series 2006-A7, Class 2A2, 3.116%, 01/25/2037(4)(6) | | | 93,600 | | | | 86,809 | | | | | |
The accompanying notes are an integral part of these financial statements.
Baird Aggregate Bond Fund
Schedule of Investments, December 31, 2020
Long-Term Investments (cont.)
| | | Principal | | | | | | % of | |
| | | Amount | | | Value | | | Net Assets | |
| J.P. Morgan Mortgage Trust: (cont.) | | | | | | | | | |
Series 2006-A7, Class 2A4R, 3.116%, 01/25/2037(4)(6) | | $ | 399,900 | | | $ | 370,885 | | | |
|
|
Series 2007-A2, Class 2A3, 3.549%, 04/25/2037(4)(6) | | | 1,022,302 | | | | 926,190 | | | | | |
| MASTR Asset Backed Securities Trust, | | | | | | | | | | | | |
| Series 2006-NC1, Class A4, 0.748%, 01/25/2036 | | | | | | | | | | | | |
(1 Month LIBOR USD + 0.600%)(3) | | | 242,211 | | | | 242,173 | | | | | |
| Merrill Lynch Mortgage Investors Trust: | | | | | | | | | | | | |
Series 2004-F, Class A1A, 1.858%, 12/25/2029(4) | | | 3,613,616 | | | | 3,672,758 | | | | | |
| Series 2005-A10, Class A, 0.568%, 02/25/2036 | | | | | | | | | | | | |
(1 Month LIBOR USD + 0.420%)(3) | | | 10,048,737 | | | | 9,902,096 | | | | | |
| MetLife, Inc., | | | | | | | | | | | | |
Series 2019-1A, Class A1A, 3.750%, 04/25/2058(2)(4) | | | 14,866,390 | | | | 15,936,318 | | | | | |
| Morgan Stanley Mortgage Loan Trust, | | | | | | | | | | | | |
Series 2004-7AR, Class 2A1, 2.849%, 09/25/2034(4) | | | 1,494,717 | | | | 1,504,060 | | | | | |
| MortgageIT Trust, | | | | | | | | | | | | |
| Series 2005-2, Class 1A1, 0.668%, 05/25/2035 | | | | | | | | | | | | |
(1 Month LIBOR USD + 0.520%)(3) | | | 736,080 | | | | 729,244 | | | | | |
| New Residential Mortgage Loan Trust: | | | | | | | | | | | | |
Series 2017-2A, Class A3, 4.000%, 03/25/2057(2)(4) | | | 9,270,085 | | | | 10,024,172 | | | | | |
Series 2017-3A, Class A1, 4.000%, 04/25/2057(2)(4) | | | 12,932,475 | | | | 13,752,880 | | | | | |
Series 2017-4A, Class A1, 4.000%, 05/25/2057(2)(4) | | | 16,415,644 | | | | 17,815,080 | | | | | |
Series 2018-1A, Class A1A, 4.000%, 12/25/2057(2)(4) | | | 9,862,919 | | | | 10,665,324 | | | | | |
Series 2020-1A, Class A1B, 3.500%, 10/25/2059(2)(4) | | | 19,363,916 | | | | 20,670,297 | | | | | |
| RALI Series Trust, | | | | | | | | | | | | |
Series 2004-QS6, Class A1, 5.000%, 06/15/2021(6) | | | 6,170 | | | | 5,962 | | | | | |
| RAMP Series Trust, | | | | | | | | | | | | |
| Series 2005-RS1, Class AI6, 4.713%, 11/25/2034 | | | 623 | | | | 629 | | | | | |
| Renaissance Home Equity Loan Trust, | | | | | | | | | | | | |
Series 2007-1, Class AF3, 5.612%, 04/25/2037(7) | | | 2,482,525 | | | | 1,012,298 | | | | | |
| Specialty Underwriting & Residential Finance Trust, | | | | | | | | | | | | |
| Series 2004-BC4, Class A1A, 0.818%, 10/25/2035 | | | | | | | | | | | | |
(1 Month LIBOR USD + 0.670%)(3) | | | 1,042,252 | | | | 1,039,536 | | | | | |
| Structured Adjustable Rate Mortgage Loan Trust, | | | | | | | | | | | | |
Series 2004-12, Class 3A1, 2.651%, 09/25/2034(4) | | | 1,604,982 | | | | 1,624,646 | | | | | |
| Structured Asset Securities Corp., | | | | | | | | | | | | |
Series 2005-7XS, Class 1A4B, 5.940%, 04/25/2035(7) | | | 4,454 | | | | 4,636 | | | | | |
| Structured Asset Securities Corp. Mortgage Loan Trust, | | | | | | | | | | | | |
| Series 2006-OPT1, Class A6, 0.298%, 04/25/2036 | | | | | | | | | | | | |
(1 Month LIBOR USD + 0.150%)(3) | | | 9,090,597 | | | | 8,662,938 | | | | | |
| Thornburg Mortgage Securities Trust, | | | | | | | | | | | | |
Series 2003-5, Class 3A, 2.307%, 10/25/2043(4) | | | 7,286,534 | | | | 7,175,049 | | | | | |
| Towd Point Mortgage Trust: | | | | | | | | | | | | |
Series 2015-3, Class A1A, 3.500%, 03/25/2054(2)(4) | | | 780,963 | | | | 784,550 | | | | | |
Series 2015-5, Class A1, 3.500%, 05/25/2055(2)(4) | | | 1,592,077 | | | | 1,609,319 | | | | | |
Series 2016-3, Class A1, 2.250%, 08/25/2055(2)(4) | | | 669,194 | | | | 675,543 | | | | | |
The accompanying notes are an integral part of these financial statements.
Baird Aggregate Bond Fund
Schedule of Investments, December 31, 2020
Long-Term Investments (cont.)
| | | Principal | | | | | | % of | |
| | | Amount | | | Value | | | Net Assets | |
| Towd Point Mortgage Trust: (cont.) | | | | | | | | | |
Series 2016-2, Class A1, 3.000%, 08/25/2055(2)(4) | | $ | 4,093,127 | | | $ | 4,152,588 | | | | |
Series 2016-5, Class A1, 2.500%, 10/25/2056(2)(4) | | | 4,438,892 | | | | 4,525,187 | | | | |
Series 2017-1, Class A1, 2.750%, 10/25/2056(2)(4) | | | 21,250,292 | | | | 21,779,456 | | | | |
Series 2017-6, Class A1, 2.750%, 10/25/2057(2)(4) | | | 36,969,289 | | | | 38,062,989 | | | | |
Series 2018-1, Class A1, 3.000%, 01/28/2058(2)(4) | | | 1,367,701 | | | | 1,421,394 | | | | |
Series 2018-6, Class A1A, 3.750%, 03/25/2058(2)(4) | | | 31,169,237 | | | | 32,853,184 | | | | |
Series 2019-1, Class A1, 3.750%, 03/25/2058(2)(4) | | | 21,179,865 | | | | 22,756,886 | | | | |
Series 2018-4, Class A1, 3.000%, 06/25/2058(2)(4) | | | 22,843,562 | | | | 24,242,780 | | | | |
Series 2019-4, Class A1, 2.900%, 10/25/2059(2)(4) | | | 62,514,302 | | | | 65,987,534 | | | | |
Series 2020-2, Class A1A, 1.636%, 04/25/2060(2)(4) | | | 16,891,703 | | | | 17,193,623 | | | | |
Series 2020-4, Class A1, 1.750%, 10/25/2060(2) | | | 109,669,119 | | | | 112,151,786 | | | | |
| WaMu Mortgage Pass-Through Certificates Trust: | | | | | | | | | | | |
| Series 2004-CB2, Class 3A, 6.000%, 08/25/2034 | | | 4,742,761 | | | | 5,168,599 | | | | |
| Series 2004-CB3, Class 2A, 6.500%, 10/25/2034 | | | 2,141,369 | | | | 2,242,659 | | | | |
Series 2004-AR14, Class A1, 2.897%, 01/25/2035(4) | | | 5,041,511 | | | | 5,146,274 | | | | |
| Total Non-U.S. Government Agency Issues | | | | | | | | | | | |
| (Cost $638,155,980) | | | | | | | 652,419,691 | | | | 2.0 | % |
| Total Residential Mortgage-Backed Securities | | | | | | | | | | | | |
| (Cost $6,407,898,022) | | | | | | | 6,666,728,974 | | | | 20.3 | % |
| Commercial Mortgage-Backed Securities | | | | | | | | | | | | |
| U.S. Government Agency Issues | | | | | | | | | | | | |
| Fannie Mae REMIC Trust, | | | | | | | | | | | | |
Series 2014-M2, Class A2, 3.513%, 12/25/2023(4) | | | 7,815,987 | | | | 8,362,620 | | | | | |
| Freddie Mac Multifamily Structured | | | | | | | | | | | | |
| Pass Through Certificates: | | | | | | | | | | | | |
| Series K720, Class A2, 2.716%, 06/25/2022 | | | 17,950,000 | | | | 18,385,043 | | | | | |
Series K721, Class A2, 3.090%, 08/25/2022(4) | | | 25,545,000 | | | | 26,391,188 | | | | | |
| Series K028, Class A2, 3.111%, 02/25/2023 | | | 47,010,000 | | | | 49,454,243 | | | | | |
| Series K029, Class A2, 3.320%, 02/25/2023 | | | 27,398,000 | | | | 28,973,739 | | | | | |
| Series K723, Class A2, 2.454%, 08/25/2023 | | | 28,425,000 | | | | 29,797,623 | | | | | |
| Series K037, Class A2, 3.490%, 01/25/2024 | | | 69,525,000 | | | | 75,494,604 | | | | | |
Series K048, Class A2, 3.284%, 06/25/2025(4) | | | 60,430,000 | | | | 67,275,758 | | | | | |
Series K050, Class A2, 3.334%, 08/25/2025(4) | | | 82,739,000 | | | | 92,513,281 | | | | | |
| Series K734, Class A2, 3.208%, 02/25/2026 | | | 21,500,000 | | | | 23,931,345 | | | | | |
| Series K057, Class A2, 2.570%, 07/25/2026 | | | 21,420,000 | | | | 23,436,136 | | | | | |
| Series K058, Class A2, 2.653%, 08/25/2026 | | | 19,865,000 | | | | 21,932,372 | | | | | |
Series K063, Class A2, 3.430%, 01/25/2027(4) | | | 67,604,857 | | | | 77,556,434 | | | | | |
| Series K064, Class A2, 3.224%, 03/25/2027 | | | 56,345,903 | | | | 64,211,459 | | | | | |
| Series K065, Class A2, 3.243%, 04/25/2027 | | | 31,065,000 | | | | 35,474,950 | | | | | |
| Series K066, Class A2, 3.117%, 06/25/2027 | | | 11,100,000 | | | | 12,609,731 | | | | | |
| Series K067, Class A2, 3.194%, 07/25/2027 | | | 62,034,045 | | | | 70,956,669 | | | | | |
| Series K068, Class A2, 3.244%, 08/25/2027 | | | 27,963,000 | | | | 32,081,709 | | | | | |
Series K069, Class A2, 3.187%, 09/25/2027(4) | | | 25,488,779 | | | | 29,193,876 | | | | | |
The accompanying notes are an integral part of these financial statements.
Baird Aggregate Bond Fund
Schedule of Investments, December 31, 2020
Long-Term Investments (cont.)
| | | Principal | | | | | | % of | |
| | | Amount | | | Value | | | Net Assets | |
| Freddie Mac Multifamily Structured | | | | | | | | | |
| Pass Through Certificates: (cont.) | | | | | | | | | |
| Series K071, Class A2, 3.286%, 11/25/2027 | | $ | 25,529,000 | | | $ | 29,440,556 | | | | |
| Series K072, Class A2, 3.444%, 12/25/2027 | | | 6,050,000 | | | | 7,031,527 | | | | |
| Series K073, Class A2, 3.350%, 01/25/2028 | | | 1,350,000 | | | | 1,561,854 | | | | |
| Series K074, Class A2, 3.600%, 01/25/2028 | | | 21,722,000 | | | | 25,469,716 | | | | |
| Series K076, Class A2, 3.900%, 04/25/2028 | | | 18,299,000 | | | | 21,873,316 | | | | |
Series K077, Class A2, 3.850%, 05/25/2028(4) | | | 68,650,000 | | | | 81,829,860 | | | | |
| Series K078, Class A2, 3.854%, 06/25/2028 | | | 59,788,633 | | | | 71,273,784 | | | | |
Series K080, Class A2, 3.926%, 07/25/2028(4) | | | 42,725,000 | | | | 51,335,938 | | | | |
Series K082, Class A2, 3.920%, 09/25/2028(4) | | | 56,545,000 | | | | 68,025,993 | | | | |
Series K083, Class A2, 4.050%, 09/25/2028(4) | | | 1,000,000 | | | | 1,212,871 | | | | |
Series K156, Class A3, 3.700%, 06/25/2033(4) | | | 11,088,000 | | | | 13,474,904 | | | | |
| Series K-1510, Class A3, 3.794%, 01/25/2034 | | | 13,525,000 | | | | 16,743,367 | | | | |
| Total U.S. Government Agency Issues | | | | | | | | | | | |
| (Cost $1,088,732,513) | | | | | | | 1,177,306,466 | | | | 3.6 | % |
| Non-U.S. Government Agency Issues | | | | | | | | | | | | |
| BANK: | | | | | | | | | | | | |
| Series 2017-BNK4, Class A4, 3.625%, 05/17/2050 | | | 44,535,000 | | | | 50,890,563 | | | | | |
| Series 2017-BNK8, Class A4, 3.488%, 11/17/2050 | | | 66,833,000 | | | | 76,262,862 | | | | | |
| Series 2020-BN29, Class A4, 1.997%, 11/18/2053 | | | 63,275,000 | | | | 65,548,357 | | | | | |
| Series 2017-BNK9, Class A4, 3.538%, 11/17/2054 | | | 93,773,000 | | | | 107,475,814 | | | | | |
| Series 2017-BNK5, Class A5, 3.390%, 06/17/2060 | | | 22,501,000 | | | | 25,481,008 | | | | | |
| Benchmark Mortgage Trust: | | | | | | | | | | | | |
| Series 2020-B19, Class A5, 1.850%, 09/17/2053 | | | 53,725,000 | | | | 55,130,817 | | | | | |
| Series 2020-B21, Class A5, 1.978%, 12/17/2053 | | | 9,000,000 | | | | 9,301,274 | | | | | |
| CD Mortgage Trust, | | | | | | | | | | | | |
| Series 2016-CD1, Class A4, 2.724%, 08/12/2049 | | | 46,415,000 | | | | 50,506,125 | | | | | |
| CFCRE Commercial Mortgage Trust, | | | | | | | | | | | | |
| Series 2016-C4, Class A4, 3.283%, 05/10/2058 | | | 29,732,980 | | | | 32,289,023 | | | | | |
| Citigroup Commercial Mortgage Trust: | | | | | | | | | | | | |
| Series 2013-GC11, Class A4, 3.093%, 04/10/2046 | | | 34,503,388 | | | | 36,185,287 | | | | | |
| Series 2014-GC19, Class A3, 3.753%, 03/12/2047 | | | 6,361,490 | | | | 6,871,933 | | | | | |
| Series 2014-GC25, Class A4, 3.635%, 10/10/2047 | | | 16,838,590 | | | | 18,451,971 | | | | | |
| Series 2015-GC27, Class A5, 3.137%, 02/10/2048 | | | 59,202,541 | | | | 64,187,703 | | | | | |
| Series 2015-GC35, Class A4, 3.818%, 11/13/2048 | | | 34,430,000 | | | | 38,955,252 | | | | | |
| Series 2017-P8, Class A4, 3.465%, 09/16/2050 | | | 22,000,000 | | | | 25,051,611 | | | | | |
| COMM Mortgage Trust: | | | | | | | | | | | | |
| Series 2012-CR1, Class A3, 3.391%, 05/17/2045 | | | 7,488,584 | | | | 7,638,812 | | | | | |
| Series 2013-CR9, Class A3, 4.022%, 07/12/2045 | | | 19,677,928 | | | | 21,112,721 | | | | | |
| Series 2012-CR2, Class A4, 3.147%, 08/17/2045 | | | 20,250,536 | | | | 20,900,793 | | | | | |
| Series 2013-CR10, Class A3, 3.923%, 08/10/2046 | | | 23,113,096 | | | | 24,817,991 | | | | | |
| Series 2014-CR15, Class ASB, 3.595%, 02/12/2047 | | | 8,599,616 | | | | 8,977,314 | | | | | |
| Series 2014-CR19, Class A5, 3.796%, 08/12/2047 | | | 15,789,828 | | | | 17,425,414 | | | | | |
| Series 2013-CR11, Class A3, 3.983%, 08/12/2050 | | | 10,259,146 | | | | 11,113,398 | | | | | |
The accompanying notes are an integral part of these financial statements.
Baird Aggregate Bond Fund
Schedule of Investments, December 31, 2020
Long-Term Investments (cont.)
| | | Principal | | | | | | % of | |
| | | Amount | | | Value | | | Net Assets | |
| DBJPM Mortgage Trust: | | | | | | | | | |
| Series 2016-C3, Class ASB, 2.756%, 08/12/2049 | | $ | 10,755,000 | | | $ | 11,409,593 | | | |
|
|
| Series 2017-C6, Class A5, 3.328%, 06/10/2050 | | | 20,800,000 | | | | 23,483,618 | | | | | |
| Series 2020-C9, Class A5, 1.926%, 08/15/2053 | | | 10,177,000 | | | | 10,505,748 | | | | | |
| GS Mortgage Securities Trust: | | | | | | | | | | | | |
| Series 2012-GCJ9, Class A3, 2.773%, 11/13/2045 | | | 37,675,945 | | | | 38,792,969 | | | | | |
| Series 2013-GC14, Class A5, 4.243%, 08/10/2046 | | | 25,500,000 | | | | 27,615,210 | | | | | |
| J.P. Morgan Chase Commercial | | | | | | | | | | | | |
| Mortgage Securities Trust: | | | | | | | | | | | | |
| Series 2013-LC11, Class A5, 2.960%, 04/15/2046 | | | 18,102,913 | | | | 18,966,299 | | | | | |
| Series 2013-C10, Class ASB, 2.702%, 12/17/2047 | | | 4,801,705 | | | | 4,898,486 | | | | | |
| Series 2012-LC9, Class A5, 2.840%, 12/17/2047 | | | 11,490,066 | | | | 11,834,000 | | | | | |
| JPMBB Commercial Mortgage Securities Trust: | | | | | | | | | | | | |
| Series 2013-C12, Class ASB, 3.157%, 07/17/2045 | | | 1,790,630 | | | | 1,821,453 | | | | | |
| Series 2013-C12, Class A5, 3.664%, 07/17/2045 | | | 6,835,000 | | | | 7,276,397 | | | | | |
| Series 2013-C15, Class A4, 4.096%, 11/17/2045 | | | 1,480,087 | | | | 1,603,565 | | | | | |
Series 2013-C14, Class A4, 4.133%, 08/17/2046(4) | | | 29,020,000 | | | | 31,280,205 | | | | | |
| Series 2013-C17, Class A3, 3.928%, 01/17/2047 | | | 3,382,847 | | | | 3,590,981 | | | | | |
| Series 2013-C17, Class A4, 4.199%, 01/17/2047 | | | 17,276,000 | | | | 18,938,682 | | | | | |
| Series 2014-C24, Class ASB, 3.368%, 11/18/2047 | | | 7,555,757 | | | | 7,939,372 | | | | | |
| Series 2014-C25, Class ASB, 3.407%, 11/18/2047 | | | 7,020,589 | | | | 7,400,880 | | | | | |
| Series 2015-C30, Class A5, 3.822%, 07/15/2048 | | | 22,658,000 | | | | 25,584,283 | | | | | |
| Series 2015-C28, Class A4, 3.227%, 10/19/2048 | | | 16,688,500 | | | | 18,182,099 | | | | | |
| JPMCC Commercial Mortgage Securities Trust, | | | | | | | | | | | | |
| Series 2017-JP7, Class A5, 3.454%, 09/16/2050 | | | 9,000,000 | | | | 10,185,800 | | | | | |
| Morgan Stanley Bank of America Merrill Lynch Trust: | | | | | | | | | | | | |
| Series 2012-C5, Class A4, 3.176%, 08/17/2045 | | | 37,925,000 | | | | 39,094,550 | | | | | |
| Series 2012-C6, Class A4, 2.858%, 11/15/2045 | | | 21,556,827 | | | | 22,198,779 | | | | | |
Series 2013-C10, Class A3, 3.967%, 07/17/2046(4) | | | 6,148,843 | | | | 6,533,245 | | | | | |
| Series 2013-C12, Class A3, 3.973%, 10/17/2046 | | | 16,211,562 | | | | 17,209,632 | | | | | |
| Series 2014-C16, Class A5, 3.892%, 06/17/2047 | | | 25,000,000 | | | | 27,197,977 | | | | | |
| Series 2016-C29, Class ASB, 3.140%, 05/17/2049 | | | 12,500,000 | | | | 13,346,491 | | | | | |
| Series 2016-C30, Class A5, 2.860%, 09/17/2049 | | | 18,082,000 | | | | 19,758,133 | | | | | |
| Series 2017-C34, Class A4, 3.536%, 11/18/2052 | | | 41,287,079 | | | | 46,874,534 | | | | | |
| Wells Fargo Commercial Mortgage Trust: | | | | | | | | | | | | |
| Series 2015-C27, Class ASB, 3.278%, 02/18/2048 | | | 15,467,871 | | | | 16,256,714 | | | | | |
| Series 2015-SG1, Class ASB, 3.556%, 09/17/2048 | | | 19,807,249 | | | | 20,978,922 | | | | | |
| Series 2015-SG1, Class A4, 3.789%, 09/17/2048 | | | 19,895,789 | | | | 22,107,705 | | | | | |
| Series 2015-P2, Class A3, 3.541%, 12/15/2048 | | | 46,750,000 | | | | 51,795,947 | | | | | |
| Series 2017-C42, Class A4, 3.589%, 12/16/2050 | | | 7,315,000 | | | | 8,401,179 | | | | | |
| Series 2019-C50, Class ASB, 3.635%, 05/17/2052 | | | 20,000,000 | | | | 22,824,464 | | | | | |
| Series 2017-RC1, Class A4, 3.631%, 01/15/2060 | | | 1,950,000 | | | | 2,223,368 | | | | | |
| WFRBS Commercial Mortgage Trust: | | | | | | | | | | | | |
| Series 2012-C6, Class A4, 3.440%, 04/15/2045 | | | 25,211,002 | | | | 25,503,160 | | | | | |
| Series 2013-C13, Class ASB, 2.654%, 05/17/2045 | | | 3,497,582 | | | | 3,571,582 | | | | | |
The accompanying notes are an integral part of these financial statements.
Baird Aggregate Bond Fund
Schedule of Investments, December 31, 2020
Long-Term Investments (cont.)
| | | Principal | | | | | | % of | |
| | | Amount | | | Value | | | Net Assets | |
| WFRBS Commercial Mortgage Trust: (cont.) | | | | | | | | | |
| Series 2013-C18, Class A4, 3.896%, 12/17/2046 | | $ | 12,196,476 | | | $ | 13,044,870 | | | | |
| Series 2014-C21, Class A5, 3.678%, 08/16/2047 | | | 34,719,000 | | | | 37,976,611 | | | | |
| Series 2014-C24, Class A4, 3.343%, 11/18/2047 | | | 36,730,000 | | | | 39,449,504 | | | | |
| Series 2014-C23, Class ASB, 3.636%, 10/17/2057 | | | 5,317,991 | | | | 5,600,494 | | | | |
| Total Non-U.S. Government Agency Issues | | | | | | | | | | | |
| (Cost $1,455,677,685) | | | | | | | 1,517,833,544 | | | | 4.6 | % |
| Total Commercial Mortgage-Backed Securities | | | | | | | | | | | | |
| (Cost $2,544,410,198) | | | | | | | 2,695,140,010 | | | | 8.2 | % |
| Asset Backed Securities | | | | | | | | | | | | |
| Capital One Multi-Asset Execution Trust, | | | | | | | | | | | | |
| Series 2019-A3, Class A3, 2.060%, 08/15/2028 | | | 3,227,000 | | | | 3,450,836 | | | | | |
| Citibank Credit Card Issuance Trust, | | | | | | | | | | | | |
| Series 2007-A3, Class A3, 6.150%, 06/15/2039 | | | 8,691,000 | | | | 13,019,227 | | | | | |
| Conseco Financial Corp.: | | | | | | | | | | | | |
| Series 1998-7, Class A1, 6.320%, 05/01/2029 | | | 2,790,467 | | | | 2,819,123 | | | | | |
| Series 1998-3, Class A5, 6.220%, 03/01/2030 | | | 53,806 | | | | 54,469 | | | | | |
| Series 1998-4, Class A5, 6.180%, 04/01/2030 | | | 478,057 | | | | 487,133 | | | | | |
| Ford Credit Auto Owner Trust: | | | | | | | | | | | | |
Series 2016-1, Class A, 2.310%, 08/15/2027(2) | | | 28,860,000 | | | | 28,927,319 | | | | | |
Series 2016-2, Class A, 2.030%, 12/15/2027(2) | | | 43,505,000 | | | | 43,855,929 | | | | | |
Series 2017-1, Class A, 2.620%, 08/15/2028(2) | | | 2,400,000 | | | | 2,460,744 | | | | | |
Series 2019-1, Class A, 3.520%, 07/15/2030(2) | | | 38,742,000 | | | | 42,252,808 | | | | | |
Series 2018-1, Class A, 3.190%, 07/15/2031(2) | | | 40,550,000 | | | | 44,557,629 | | | | | |
| GM Financial Consumer Automobile Receivables Trust, | | | | | | | | | | | | |
| Series 2020-2, Class A3, 1.490%, 12/16/2024 | | | 4,475,000 | | | | 4,556,934 | | | | | |
| MMAF Equipment Finance LLC, | | | | | | | | | | | | |
Series 2016-AA, Class A5, 2.210%, 12/15/2032(2) | | | 14,100,000 | | | | 14,434,077 | | | | | |
| Oakwood Mortgage Investors, Inc., | | | | | | | | | | | | |
| Series 1999-B, Class A3, 6.450%, 12/15/2023 | | | 8,293 | | | | 8,538 | | | | | |
| PFS Financing Corp., | | | | | | | | | | | | |
Series 2020-F, Class A, 0.930%, 08/15/2024(2) | | | 16,750,000 | | | | 16,850,549 | | | | | |
| SoFi Consumer Loan Program LLC: | | | | | | | | | | | | |
Series 2017-6, Class A2, 2.820%, 11/25/2026(2) | | | 2,087,653 | | | | 2,097,321 | | | | | |
Series 2018-3, Class A2, 3.670%, 08/25/2027(2) | | | 6,079,696 | | | | 6,119,981 | | | | | |
| Synchrony Card Funding LLC, | | | | | | | | | | | | |
| Series 2019-A1, Class A, 2.950%, 03/15/2025 | | | 47,621,000 | | | | 49,151,096 | | | | | |
| Towd Point Mortgage Trust: | | | | | | | | | | | | |
Series 2020-MH1, Class A1A, 2.184%, 02/25/2060(2)(4) | | | 51,386,789 | | | | 52,302,275 | | | | | |
Series 2020-MH1, Class A1, 2.250%, 02/25/2060(2)(4) | | | 32,756,519 | | | | 33,316,184 | | | | | |
| Toyota Auto Loan Extended Note Trust: | | | | | | | | | | | | |
Series 2019-1A, Class A, 2.560%, 11/25/2031(2) | | | 68,654,950 | | | | 73,317,108 | | | | | |
Series 2020-1A, Class A, 1.350%, 05/25/2033(2) | | | 104,383,000 | | | | 107,481,829 | | | | | |
The accompanying notes are an integral part of these financial statements.
Baird Aggregate Bond Fund
Schedule of Investments, December 31, 2020
Long-Term Investments (cont.)
| | | Principal | | | | | | % of | |
| | | Amount | | | Value | | | Net Assets | |
| Verizon Owner Trust, | | | | | | | | | |
| Series 2019-B, Class A1A, 2.330%, 12/20/2023 | | $ | 37,825,000 | | | $ | 38,573,693 | | | | |
| Total Asset Backed Securities | | | | | | | | | | | |
| (Cost $559,825,177) | | | | | | | 580,094,802 | | | | 1.8 | % |
| Total Long-Term Investments | | | | | | | | | | | | |
| (Cost $29,745,046,811) | | | | | | | 31,635,042,530 | | | | 96.2 | % |
| Short-Term Investment | | | | | | | | | | | | |
| | | Shares | | | | | | | | | |
| Money Market Mutual Funds | | | | | | | | | | | | |
| Fidelity Institutional Money Market Fund – | | | | | | | | | | | | |
Government Portfolio, Institutional Class, 0.01%(5) | | | 34,663,289 | | | | 34,663,289 | | | | | |
| First American Government Obligations | | | | | | | | | | | | |
Fund, Class U, 0.04%(5) | | | 1,548,643,000 | | | | 1,548,643,000 | | | | | |
| Total Short-Term Investments | | | | | | | | | | | | |
| (Cost $1,583,306,289) | | | | | | | 1,583,306,289 | | | | 4.8 | % |
| Total Investments | | | | | | | | | | | | |
| (Cost $31,328,353,100) | | | | | | | 33,218,348,819 | | | | 101.0 | % |
| Liabilities in Excess of Other Assets | | | | | | | (314,798,427 | ) | | | (1.0 | )% |
| TOTAL NET ASSETS | | | | | | $ | 32,903,550,392 | | | | 100.0 | % |
Notes to Schedule of Investments
CMT – Constant Maturity Treasury
LIBOR – London Inter-bank Offered Rate
SOFR – Secured Overnight Financing Rate
| (1) | Foreign security. |
| (2) | Security as defined in Rule 144A under the Securities Act of 1933 and classified as liquid under the Fund’s liquidity risk management program. Purchased in a private placement transaction; resale to the public may require registration or may extend only to qualified institutional buyers. At December 31, 2020, the value of these securities total $5,236,253,267, which represents 15.91% of total net assets. |
| (3) | Variable rate security based on a reference index and spread. The rate reported is the rate in effect as of December 31, 2020. |
| (4) | Variable rate security. The coupon is based on an underlying pool of loans. The rate reported is the rate in effect as of December 31, 2020. |
| (5) | Seven-day yield. |
| (6) | Security that, on the last payment date, missed a partial principal or interest payment. |
| (7) | Step-up bond; the interest rate shown is the rate in effect as of December 31, 2020. |
| (8) | Security or a portion of the security purchased on a when-issued or delayed delivery basis. |
| (9) | Security in default. |
The accompanying notes are an integral part of these financial statements.
Baird Aggregate Bond Fund
Summary of Fair Value Exposure at December 31, 2020
The Fund has adopted authoritative fair valuation accounting standards which establish a definition of fair value and set out a hierarchy for measuring fair value. These standards require additional disclosures about the various inputs and valuation techniques used to develop the measurements of fair value and a discussion on changes in valuation techniques and related inputs during the period. These standards define fair value as the price that would be received to sell an asset or paid to transfer a liability in an orderly transaction between market participants at the measurement date.
The fair value hierarchy is organized into three levels based upon the assumptions (referred to as “inputs”) used in pricing the asset or liability. These standards state that “observable inputs” reflect the assumptions market participants would use in pricing the asset or liability based on market data obtained from independent sources and “unobservable inputs” reflect an entity’s own assumptions about the assumptions market participants would use in pricing the asset or liability. These inputs are summarized into three broad levels and described below:
| Level 1 – | Quoted prices (unadjusted) in active markets for identical assets or liabilities that the reporting entity can access at the measurement date. |
| Level 2 – | Inputs other than quoted prices included within Level 1 that are observable for the asset or liability, either directly or indirectly. |
| Level 3 – | Unobservable inputs for the asset or liability. |
The inputs or methodology used for valuing securities are not necessarily an indication of the risk associated with investing in those securities.
The following is a summary of the inputs used to value the Fund’s investments as of December 31, 2020:
| | | Level 1 | | | Level 2 | | | Level 3 | | | Total | |
| Long-Term Investments | | | | | | | | | | | | |
| U.S. Treasury Securities | | $ | — | | | $ | 7,523,028,249 | | | $ | — | | | $ | 7,523,028,249 | |
| Other Government Related Securities | | | — | | | | 45,488,667 | | | | — | | | | 45,488,667 | |
| Corporate Bonds | | | — | | | | 13,708,028,321 | | | | — | | | | 13,708,028,321 | |
| Municipal Bonds | | | — | | | | 416,533,507 | | | | — | | | | 416,533,507 | |
| Residential Mortgage-Backed Securities – | | | | | | | | | | | | | | | | |
| U.S. Government Agency Issues | | | — | | | | 6,014,309,283 | | | | — | | | | 6,014,309,283 | |
| Residential Mortgage-Backed Securities – | | | | | | | | | | | | | | | | |
| Non-U.S. Government Agency Issues | | | — | | | | 652,419,691 | | | | — | | | | 652,419,691 | |
| Commercial Mortgage-Backed Securities – | | | | | | | | | | | | | | | | |
| U.S. Government Agency Issues | | | — | | | | 1,177,306,466 | | | | — | | | | 1,177,306,466 | |
| Commercial Mortgage-Backed Securities – | | | | | | | | | | | | | | | | |
| Non-U.S. Government Agency Issues | | | — | | | | 1,517,833,544 | | | | — | | | | 1,517,833,544 | |
| Asset Backed Securities | | | — | | | | 580,094,802 | | | | — | | | | 580,094,802 | |
| Total Long-Term Investments | | | — | | | | 31,635,042,530 | | | | — | | | | 31,635,042,530 | |
| Short-Term Investments | | | | | | | | | | | | | | | | |
| Money Market Mutual Funds | | | 1,583,306,289 | | | | — | | | | — | | | | 1,583,306,289 | |
| Total Short-Term Investments | | | 1,583,306,289 | | | | — | | | | — | | | | 1,583,306,289 | |
| Total Investments | | $ | 1,583,306,289 | | | $ | 31,635,042,530 | | | $ | — | | | $ | 33,218,348,819 | |
Changes in valuation techniques may result in transfers into or out of assigned levels within the fair value hierarchy. There were no transfers into or out of Level 3 during the reporting period, as compared to the security classifications from the prior year’s annual report. See the Fund’s Valuation Policy in Note 2a to the financial statements.
The accompanying notes are an integral part of these financial statements.
Baird Core Plus Bond Fund
December 31, 2020 (Unaudited)
The Baird Core Plus Bond Fund seeks an annual rate of total return, before Fund expenses, greater than the annual rate of total return of the Bloomberg Barclays U.S. Universal Bond Index. The Bloomberg Barclays U.S. Universal Bond Index is an unmanaged, market value weighted index of fixed income securities issued in dollars, including U.S. government, investment grade and non-investment grade credit, emerging market debt, asset-backed and mortgage-backed securities, Eurobonds, 144A securities and commercial mortgage- backed securities (CMBS) with maturities of at least one year.
Treasury yields fell across the curve in 2020, with the benchmark 10-year Treasury down 100 bps to finish the year at 0.92%, after hitting an all-time [intra-day] record low of 0.31% on March 9. The curve steepened, with the spread between 2-year and 30-year Treasuries increasing from 82 bps to 153 bps during the year, as yields in shorter maturities saw the largest decline. Starting in late February, the coronavirus (COVID-19) affected every aspect of the economy, leading to the swiftest equity bear market in history, with an over 33% peak-to-trough drop in the S&P 500 in just over a month ending March 23, and fixed income markets hitting levels of distress not seen since the Global Financial Crisis (GFC) in 2008. However, unlike 2008, the massive, coordinated monetary and fiscal policy response resulted in a much swifter recovery. U.S. unemployment dropped to 6.7% by year end after peaking at 14.7% in April as businesses reopened, and the Pfizer and Moderna vaccines offered hope for a return to normal sometime in 2021. The S&P 500 ended the year up16% at record highs and credit spreads tightened through year end, completely erasing the pandemic-related widening in many sectors. The COVID-19 pandemic and the massive government policy response to it essentially created a full market cycle for spreads in the span of a calendar year.
During 2020, the Fund generated strong absolute and relative returns and outperformed its benchmark by 122 basis points net of fees.
The primary factors contributing to the Fund’s Institutional Class Shares absolute and relative performance in 2020 include:
| | • | Credit Positioning – Positive overall |
| | | • | Positive – Overweight to Investment Grade Credit (increased exposure post widening of the spread) |
| | | • | Positive – Active positioning within Investment Grade Credit |
| | | | • | Positive – Underweight to the Other Government Sector in favor of Corporate Credit including Financials |
| | | | • | Positive – Favoring credit shorter on the curve versus the benchmark |
| | | | • | Positive – Security selection, including attractive new issue concessions |
| | | • | Negative – Underweight to High Yield Corporate Credit |
| | • | Mortgage-Backed Securities (MBS) & Asset-Backed Securities (ABS) Positioning – Positive overall |
| | | • | Positive – Active positioning within MBS & ABS |
| | | | • | Positive – Underweight to Agency Residential Mortgage-Backed Securities (RMBS) |
| | | | • | Positive – Active positioning within Agency RMBS, including opportunistically increasing specified pool exposure in March, which outperformed more generic, faster-paying pools at record low mortgage rates |
| | | | • | Positive – Overweight to Agency & Non-Agency Commercial Mortgage-Backed Securities (CMBS), Non-Agency RMBS & ABS |
| | | | • | Positive – Within Non-Agency CMBS investing in only the most senior classes, which outperformed subordinated classes |
| | • | Yield Curve Positioning – Positive overall |
| | | • | Positive – Positive convexity tilt of overall portfolio versus the benchmark |
| | | • | Modest positive – Modest underweight to the long end of the yield curve as the yield curve steepened |
Baird Core Plus Bond Fund
December 31, 2020 (Unaudited)
We expect the economic impact of COVID-19 to linger well into 2021, particularly as it relates to the travel and hospitality service sectors. Yet, with the massive fiscal stimulus that is already in the pipeline, and likely more coming now that the Democratic Party has full, albeit narrow, control of Washington, above-average economic growth is very likely in 2021. Stronger growth may pressure inflation modestly higher, a goal of the Fed, translating into moderately higher intermediate and long-term rates. With short-term rates still anchored close to zero by the Fed, a steeper yield curve will enable investors to capture some added performance as bonds roll down the curve. We expect the roll-down return to be an important component of total return this year, as well as security selection and sector allocation. Strategic positioning across market sectors and along the yield curve (including the ability to thoughtfully reposition should spreads widen into volatility) will complement the always-important security selection process to help navigate through the current environment.
The Fund remains duration neutral with a modest overweight to Investment Grade corporate credit, particularly Financials, and prefers the risk-reward profile of Investment Grade credit relative to High Yield credit. The Fund continues to maintain its underweight to Agency RMBS (providing a positive convexity tilt versus the benchmark at the overall portfolio) after increasing exposure at more attractive valuations in March. The Fund also continues to maintain its overweight to Agency CMBS, Non-Agency CMBS, Non-Agency RMBS and ABS at the top of the capital structure. The Fund only purchases U.S. dollar denominated securities in the cash bond market (no derivatives) and we believe the Fund is well positioned to add value relative to its benchmark.
Baird Core Plus Bond Fund
December 31, 2020 (Unaudited)
Portfolio Characteristics
Quality Distribution(1)(2)
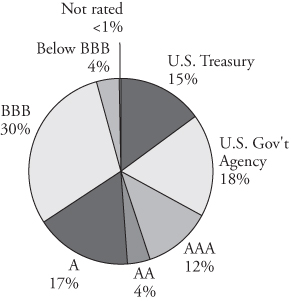
| | Net Assets | $29,489,863,587 | |
| | | | |
| | SEC 30-Day | | |
| | Yield(3) | | |
| | Institutional Class | 1.50% | |
| | Investor Class | 1.26% | |
| | | | |
| | Average | | |
| | Effective | | |
| | Duration | 6.05 years | |
| | | | |
| | Average | | |
| | Effective | | |
| | Maturity | 7.72 years | |
| | | | |
| | Annualized | | |
| | Expense | | |
| | Ratio(4) | | |
| | | Institutional Class | 0.30% | |
Sector Weightings(1) | | Investor Class | 0.55% | (5) |
| | | | | |
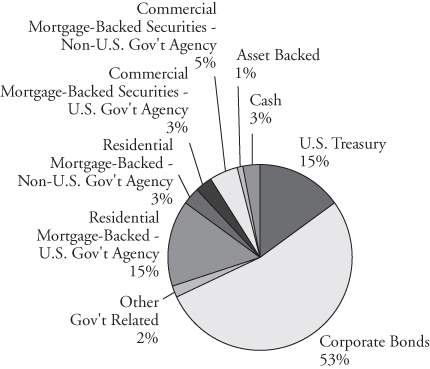 | | Portfolio | | |
| | Turnover Rate | 33% | |
| | | | |
| | Number of | | |
| | Holdings | 1,606 | |
| | | | |
| | | | |
| | | | |
| | | | |
| | | | |
| | | | |
| | | | |
| | | | |
| | | | |
| | | | |
| | | | |
| | | | |
| | | | |
| | | | |
| | | | |
| | | | |
| | | | |
| | | | | |
| (1) | Percentages shown are based on the Fund’s total investments. |
| (2) | The quality profile is calculated on a market value-weighted basis using the highest credit quality rating for each security held by the Fund given by S&P, Moody’s or Fitch, each of which is a Nationally Recognized Statistical Rating Organization (NRSRO). NRSROs rate the credit quality of securities using a scale that generally ranges from AAA (highest) to D (lowest). |
| (3) | SEC yields are based on SEC guidelines and are calculated for the 30 days ended December 31, 2020. |
| (4) | Reflects expense ratios as stated in the Fund’s current prospectus. |
| (5) | Includes 0.25% 12b-1 fee. |
Baird Core Plus Bond Fund
December 31, 2020 (Unaudited)
Institutional ClassValue of a $25,000 Investment
Growth of a hypothetical investment of $25,000 made on 12/31/10, assuming reinvestment of all distributions.
Investor Class
Value of a $10,000 Investment
Growth of a hypothetical investment of $10,000 made on 12/31/10, assuming reinvestment of all distributions.
Baird Core Plus Bond Fund
December 31, 2020 (Unaudited)
Total Returns
| | | Average Annual |
| | One | Five | Ten | Since |
| For the Periods Ended December 31, 2020 | Year | Years | Years | Inception(1) |
| Institutional Class Shares | 8.80% | 5.49% | 4.83% | 5.95% |
| Investor Class Shares | 8.58% | 5.23% | 4.57% | 5.69% |
Bloomberg Barclays U.S. Universal Bond Index(2) | 7.58% | 4.87% | 4.16% | 5.24% |
| (1) | For the period from September 29, 2000 (inception date) through December 31, 2020. |
| (2) | The Bloomberg Barclays U.S. Universal Bond Index is an unmanaged, market value weighted index of fixed income securities issued in U.S. dollars, including U.S. government and investment grade debt, non-investment grade debt, asset-backed and mortgage-backed securities, Eurobonds, 144A securities and emerging market debt, with maturities of at least one year. This Index does not reflect any deduction for fees, expenses or taxes. A direct investment in an index is not possible. |
The line graphs on the previous page and the returns shown in the table above reflect reinvestment of dividends and/or capital gains distributions in additional shares. The returns in the graphs and table do not reflect the deduction of taxes that a shareholder would pay on Fund distributions or the redemption of Fund shares. The returns reflect the actual performance for each period and do not include the impact of trades executed on the last business day of the period that were recorded on the first business day of the next period.
The Fund’s gross expense ratio for each Class, as reflected in the Fund’s current prospectus, is set forth under “Portfolio Characteristics”.
The Fund may invest up to 20% of its net assets in non-investment grade debt securities (commonly referred to as “high yield” bonds). While these types of debt securities typically offer higher yields than investment grade securities, they also include greater risks including increased credit risk and the increased risk of default or bankruptcy. The Fund maintains securities with longer maturities in order to provide a greater potential for return. Generally, the longer a bond’s maturity, the greater the interest rate risk. The Fund may also invest in U.S. dollar denominated foreign securities which involve additional risks such as political and economic instability, and different and sometimes less strict financial reporting standards and regulation. The Fund may also invest in mortgage- and asset-backed securities, which include interest rate and prepayment risks more pronounced than those of other fixed income securities. U.S. and international markets have experienced significant periods of volatility in recent years and months due to a number of economic, political and global macro factors including the impact of the coronavirus (COVID-19) as a global pandemic and related public health issues, growth concerns in the U.S. and overseas, uncertainties regarding interest rates, trade tensions and the threat of tariffs imposed by the U.S. and other countries. These and other geopolitical events may cause market disruptions and could have an adverse effect on the value of the Fund’s investments.
Past performance does not guarantee future results. Investment return and principal value will fluctuate so that an investor’s shares, when redeemed, may be worth more or less than their original cost.
For information about the performance of the Fund as of the most recent month-end, please call 1-866-44BAIRD or visit www.bairdfunds.com. Mutual fund performance changes over time and current performance may be lower or higher than that stated.
Baird Core Plus Bond Fund
Schedule of Investments, December 31, 2020
Long-Term Investments
| | | Principal | | | | | | % of | |
| | | Amount | | | Value | | | Net Assets | |
| U.S. Treasury Securities | | | | | | | | | |
| U.S. Treasury Bonds: | | | | | | | | | |
| 1.875%, 03/31/2022 | | $ | 139,025,000 | | | $ | 142,066,172 | | | | |
| 1.625%, 08/31/2022 | | | 3,950,000 | | | | 4,048,133 | | | | |
| 2.125%, 12/31/2022 | | | 509,965,000 | | | | 530,263,999 | | | | |
| 2.000%, 11/15/2026 | | | 351,850,000 | | | | 382,952,991 | | | | |
| 2.250%, 11/15/2027 | | | 698,375,000 | | | | 775,469,049 | | | | |
| 3.125%, 11/15/2028 | | | 1,650,000 | | | | 1,953,574 | | | | |
| 2.875%, 05/15/2043 | | | 1,141,975,000 | | | | 1,443,706,207 | | | | |
| 2.500%, 02/15/2045 | | | 681,100,000 | | | | 812,238,354 | | | | |
| 2.875%, 05/15/2049 | | | 179,450,000 | | | | 231,686,773 | | | | |
| Total U.S. Treasury Securities | | | | | | | | | | | |
| (Cost $4,089,869,375) | | | | | | | 4,324,385,252 | | | | 14.7 | % |
| Other Government Related Securities | | | | | | | | | | | | |
| Comision Federal de Electricidad, | | | | | | | | | | | | |
5.750%, 02/14/2042(1)(2) | | | 5,200,000 | | | | 6,175,000 | | | | | |
| Corp Andina de Fomento, | | | | | | | | | | | | |
4.375%, 06/15/2022(1) | | | 4,265,000 | | | | 4,486,823 | | | | | |
| Electricite de France SA, | | | | | | | | | | | | |
4.750%, 10/13/2035(1)(2) | | | 10,000,000 | | | | 12,450,755 | | | | | |
| Export-Import Bank of Korea, | | | | | | | | | | | | |
4.000%, 01/29/2021(1) | | | 2,400,000 | | | | 2,405,902 | | | | | |
| Korea Development Bank, | | | | | | | | | | | | |
3.000%, 09/14/2022(1) | | | 4,400,000 | | | | 4,594,128 | | | | | |
| Petrobras Global Finance BV, | | | | | | | | | | | | |
7.375%, 01/17/2027(1) | | | 9,300,000 | | | | 11,509,587 | | | | | |
| Petroleos Mexicanos: | | | | | | | | | | | | |
4.500%, 01/23/2026(1) | | | 3,516,000 | | | | 3,503,659 | | | | | |
6.490%, 01/23/2027(1) | | | 11,743,000 | | | | 12,400,608 | | | | | |
6.840%, 01/23/2030(1) | | | 14,606,000 | | | | 15,289,269 | | | | | |
5.950%, 01/28/2031(1) | | | 1,005,000 | | | | 1,002,487 | | | | | |
| Sinopec Group Overseas Development [2014] Ltd., | | | | | | | | | | | | |
4.375%, 04/10/2024(1)(2) | | | 1,500,000 | | | | 1,645,426 | | | | | |
| Sinopec Group Overseas Development [2015] Ltd., | | | | | | | | | | | | |
3.250%, 04/28/2025(1)(2) | | | 7,500,000 | | | | 8,042,700 | | | | | |
| Sinopec Group Overseas Development [2017] Ltd., | | | | | | | | | | | | |
3.000%, 04/12/2022(1)(2) | | | 6,950,000 | | | | 7,124,635 | | | | | |
| Syngenta Finance NV, | | | | | | | | | | | | |
4.892%, 04/24/2025(1)(2) | | | 27,231,000 | | | | 29,225,814 | | | | | |
| Total Other Government Related Securities | | | | | | | | | | | | |
| (Cost $110,525,012) | | | | | | | 119,856,793 | | | | 0.4 | % |
The accompanying notes are an integral part of these financial statements.
Baird Core Plus Bond Fund
Schedule of Investments, December 31, 2020
Long-Term Investments (cont.)
| | | Principal | | | | | | % of | |
| | | Amount | | | Value | | | Net Assets | |
| Corporate Bonds | | | | | | | | | |
| Industrials | | | | | | | | | |
| A.P. Meoller – Maersk A/S, | | | | | | | | | |
3.750%, 09/22/2024(1)(2) | | $ | 4,475,000 | | | $ | 4,845,719 | | | |
|
|
| Abbott Laboratories: | | | | | | | | | | | | |
| 3.400%, 11/30/2023 | | | 4,583,000 | | | | 4,969,278 | | | | | |
| 4.750%, 11/30/2036 | | | 7,506,000 | | | | 10,324,646 | | | | | |
| AbbVie, Inc.: | | | | | | | | | | | | |
| 5.000%, 12/15/2021 | | | 41,397,000 | | | | 42,736,553 | | | | | |
| 3.250%, 10/01/2022 | | | 7,500,000 | | | | 7,811,609 | | | | | |
| 3.200%, 11/06/2022 | | | 3,000,000 | | | | 3,140,926 | | | | | |
| 3.850%, 06/15/2024 | | | 10,125,000 | | | | 11,151,129 | | | | | |
| 3.800%, 03/15/2025 | | | 29,200,000 | | | | 32,563,210 | | | | | |
| 3.600%, 05/14/2025 | | | 2,500,000 | | | | 2,785,219 | | | | | |
| 4.550%, 03/15/2035 | | | 14,098,000 | | | | 17,824,198 | | | | | |
| 4.300%, 05/14/2036 | | | 3,825,000 | | | | 4,706,954 | | | | | |
| 4.050%, 11/21/2039 | | | 11,250,000 | | | | 13,615,027 | | | | | |
| 4.250%, 11/21/2049 | | | 20,000,000 | | | | 25,076,423 | | | | | |
| ADT Corp., | | | | | | | | | | | | |
| 3.500%, 07/15/2022 | | | 6,900,000 | | | | 7,081,125 | | | | | |
| Adventist Health System: | | | | | | | | | | | | |
| 2.952%, 03/01/2029 | | | 7,250,000 | | | | 7,862,972 | | | | | |
| 3.630%, 03/01/2049 | | | 8,900,000 | | | | 9,883,358 | | | | | |
| Agilent Technologies, Inc., | | | | | | | | | | | | |
| 3.875%, 07/15/2023 | | | 5,325,000 | | | | 5,730,039 | | | | | |
| Air Liquide Finance, | | | | | | | | | | | | |
2.500%, 09/27/2026(1)(2) | | | 4,833,000 | | | | 5,265,413 | | | | | |
| Air Products and Chemicals, Inc., | | | | | | | | | | | | |
| 2.800%, 05/15/2050 | | | 5,000,000 | | | | 5,495,617 | | | | | |
| Aker BP ASA, | | | | | | | | | | | | |
2.875%, 01/15/2026(1)(2) | | | 15,000,000 | | | | 15,307,874 | | | | | |
| Albertsons Companies, Inc.: | | | | | | | | | | | | |
3.250%, 03/15/2026(2) | | | 5,000,000 | | | | 5,075,000 | | | | | |
3.500%, 03/15/2029(2) | | | 1,500,000 | | | | 1,517,805 | | | | | |
| Alcon Finance Corp.: | | | | | | | | | | | | |
3.000%, 09/23/2029(2) | | | 6,110,000 | | | | 6,668,407 | | | | | |
2.600%, 05/27/2030(2) | | | 6,475,000 | | | | 6,898,486 | | | | | |
| Alibaba Group Holding Ltd., | | | | | | | | | | | | |
3.125%, 11/28/2021(1) | | | 10,000,000 | | | | 10,197,559 | | | | | |
| Alimentation Couche-Tard, Inc., | | | | | | | | | | | | |
2.950%, 01/25/2030(1)(2) | | | 6,500,000 | | | | 7,103,329 | | | | | |
| Allegion PLC, | | | | | | | | | | | | |
3.500%, 10/01/2029(1) | | | 8,000,000 | | | | 8,877,990 | | | | | |
| Allegion US Holding Co., Inc., | | | | | | | | | | | | |
| 3.200%, 10/01/2024 | | | 22,750,000 | | | | 24,298,362 | | | | | |
The accompanying notes are an integral part of these financial statements.
Baird Core Plus Bond Fund
Schedule of Investments, December 31, 2020
Long-Term Investments (cont.)
| | | Principal | | | | | | % of | |
| | | Amount | | | Value | | | Net Assets | |
| Alpek SAB de CV, | | | | | | | | | |
4.250%, 09/18/2029(1)(2) | | $ | 6,000,000 | | | $ | 6,579,000 | | | |
|
|
| America Movil SAB de CV, | | | | | | | | | | | | |
2.875%, 05/07/2030(1) | | | 28,000,000 | | | | 30,358,440 | | | | | |
| Amgen, Inc.: | | | | | | | | | | | | |
| 2.200%, 02/21/2027 | | | 11,750,000 | | | | 12,596,146 | | | | | |
| 3.150%, 02/21/2040 | | | 5,000,000 | | | | 5,504,049 | | | | | |
| 4.400%, 05/01/2045 | | | 8,000,000 | | | | 10,267,731 | | | | | |
| Anglo American Capital PLC: | | | | | | | | | | | | |
4.125%, 09/27/2022(1)(2) | | | 5,385,000 | | | | 5,670,265 | | | | | |
3.625%, 09/11/2024(1)(2) | | | 4,325,000 | | | | 4,705,014 | | | | | |
5.375%, 04/01/2025(1)(2) | | | 29,505,000 | | | | 34,481,417 | | | | | |
2.625%, 09/10/2030(1)(2) | | | 16,025,000 | | | | 16,757,157 | | | | | |
3.950%, 09/10/2050(1)(2) | | | 10,000,000 | | | | 11,219,805 | | | | | |
| Anheuser-Busch InBev Worldwide, Inc.: | | | | | | | | | | | | |
| 4.750%, 01/23/2029 | | | 5,000,000 | | | | 6,174,478 | | | | | |
| 5.450%, 01/23/2039 | | | 9,975,000 | | | | 13,551,475 | | | | | |
| 4.900%, 02/01/2046 | | | 41,075,000 | | | | 53,406,972 | | | | | |
| ANR Pipeline Co., | | | | | | | | | | | | |
| 9.625%, 11/01/2021 | | | 9,150,000 | | | | 9,795,770 | | | | | |
| Antofagasta PLC, | | | | | | | | | | | | |
2.375%, 10/14/2030(1)(2) | | | 6,000,000 | | | | 6,015,000 | | | | | |
| AP Moller – Maersk A/S: | | | | | | | | | | | | |
3.875%, 09/28/2025(1)(2) | | | 18,140,000 | | | | 20,239,266 | | | | | |
4.500%, 06/20/2029(1)(2) | | | 9,475,000 | | | | 11,081,917 | | | | | |
| Apple, Inc., | | | | | | | | | | | | |
| 2.650%, 05/11/2050 | | | 15,000,000 | | | | 15,920,191 | | | | | |
| Aramark Services, Inc., | | | | | | | | | | | | |
5.000%, 02/01/2028(2) | | | 1,000,000 | | | | 1,053,750 | | | | | |
| ArcelorMittal: | | | | | | | | | | | | |
3.600%, 07/16/2024(1) | | | 14,575,000 | | | | 15,728,584 | | | | | |
6.125%, 06/01/2025(1) | | | 6,078,000 | | | | 7,262,368 | | | | | |
4.550%, 03/11/2026(1) | | | 22,730,000 | | | | 25,538,196 | | | | | |
4.250%, 07/16/2029(1) | | | 15,000,000 | | | | 16,614,138 | | | | | |
| Arrow Electronics, Inc., | | | | | | | | | | | | |
| 3.250%, 09/08/2024 | | | 15,000,000 | | | | 16,233,053 | | | | | |
| Ashtead Capital, Inc., | | | | | | | | | | | | |
4.000%, 05/01/2028(2) | | | 4,000,000 | | | | 4,248,560 | | | | | |
| AT&T, Inc.: | | | | | | | | | | | | |
| 4.300%, 02/15/2030 | | | 10,980,000 | | | | 13,116,021 | | | | | |
2.550%, 12/01/2033(2) | | | 14,329,000 | | | | 14,689,204 | | | | | |
| 5.250%, 03/01/2037 | | | 7,125,000 | | | | 9,272,884 | | | | | |
| 4.900%, 08/15/2037 | | | 10,000,000 | | | | 12,540,003 | | | | | |
3.550%, 09/15/2055(2) | | | 45,029,000 | | | | 44,876,138 | | | | | |
3.800%, 12/01/2057(2) | | | 15,315,000 | | | | 16,003,208 | | | | | |
3.650%, 09/15/2059(2) | | | 31,734,000 | | | | 32,043,038 | | | | | |
The accompanying notes are an integral part of these financial statements.
Baird Core Plus Bond Fund
Schedule of Investments, December 31, 2020
Long-Term Investments (cont.)
| | | Principal | | | | | | % of | |
| | | Amount | | | Value | | | Net Assets | |
| Avery Dennison Corp., | | | | | | | | | |
| 2.650%, 04/30/2030 | | $ | 10,175,000 | | | $ | 10,913,502 | | | |
|
|
| Avnet, Inc., | | | | | | | | | | | | |
| 3.750%, 12/01/2021 | | | 5,000,000 | | | | 5,120,921 | | | | | |
| Ball Corp.: | | | | | | | | | | | | |
| 5.250%, 07/01/2025 | | | 21,675,000 | | | | 24,736,160 | | | | | |
| 4.875%, 03/15/2026 | | | 23,125,000 | | | | 26,119,688 | | | | | |
| 2.875%, 08/15/2030 | | | 5,000,000 | | | | 4,987,500 | | | | | |
| Bayer US Finance II LLC: | | | | | | | | | | | | |
4.250%, 12/15/2025(2) | | | 25,000,000 | | | | 28,577,011 | | | | | |
4.625%, 06/25/2038(2) | | | 12,000,000 | | | | 14,584,873 | | | | | |
4.400%, 07/15/2044(2) | | | 5,125,000 | | | | 5,808,784 | | | | | |
| Beam Suntory, Inc.: | | | | | | | | | | | | |
| 3.250%, 05/15/2022 | | | 10,650,000 | | | | 10,970,649 | | | | | |
| 3.250%, 06/15/2023 | | | 10,960,000 | | | | 11,586,656 | | | | | |
| Becton Dickinson and Co.: | | | | | | | | | | | | |
| 3.363%, 06/06/2024 | | | 10,000,000 | | | | 10,870,747 | | | | | |
| 3.734%, 12/15/2024 | | | 9,250,000 | | | | 10,255,345 | | | | | |
| 4.875%, 05/15/2044 | | | 5,455,000 | | | | 6,737,607 | | | | | |
| Bemis Co., Inc., | | | | | | | | | | | | |
| 4.500%, 10/15/2021 | | | 1,000,000 | | | | 1,021,674 | | | | | |
| Berry Global, Inc., | | | | | | | | | | | | |
4.875%, 07/15/2026(2) | | | 28,000,000 | | | | 30,077,320 | | | | | |
| Biogen, Inc., | | | | | | | | | | | | |
| 3.150%, 05/01/2050 | | | 20,000,000 | | | | 20,738,577 | | | | | |
| Boardwalk Pipelines LP: | | | | | | | | | | | | |
| 4.950%, 12/15/2024 | | | 17,475,000 | | | | 19,503,503 | | | | | |
| 5.950%, 06/01/2026 | | | 26,406,000 | | | | 31,230,988 | | | | | |
| 4.800%, 05/03/2029 | | | 26,341,000 | | | | 30,183,869 | | | | | |
| Boeing Co.: | | | | | | | | | | | | |
| 5.150%, 05/01/2030 | | | 14,000,000 | | | | 16,943,521 | | | | | |
| 3.625%, 02/01/2031 | | | 10,000,000 | | | | 10,943,810 | | | | | |
| Bon Secours Mercy Health, Inc., | | | | | | | | | | | | |
| 3.464%, 06/01/2030 | | | 16,330,000 | | | | 18,548,374 | | | | | |
| Booz Allen Hamilton, Inc., | | | | | | | | | | | | |
3.875%, 09/01/2028(2) | | | 1,000,000 | | | | 1,030,000 | | | | | |
| Boral Finance Pty Ltd.: | | | | | | | | | | | | |
3.000%, 11/01/2022(1)(2) | | | 8,650,000 | | | | 8,839,809 | | | | | |
3.750%, 05/01/2028(1)(2) | | | 5,550,000 | | | | 5,853,961 | | | | | |
| BorgWarner, Inc.: | | | | | | | | | | | | |
5.000%, 10/01/2025(2) | | | 10,000,000 | | | | 11,758,284 | | | | | |
| 2.650%, 07/01/2027 | | | 9,000,000 | | | | 9,677,583 | | | | | |
| Boston Scientific Corp., | | | | | | | | | | | | |
| 1.900%, 06/01/2025 | | | 15,000,000 | | | | 15,756,179 | | | | | |
The accompanying notes are an integral part of these financial statements.
Baird Core Plus Bond Fund
Schedule of Investments, December 31, 2020
Long-Term Investments (cont.)
| | | Principal | | | | | | % of | |
| | | Amount | | | Value | | | Net Assets | |
| Bristol-Myers Squibb Co.: | | | | | | | | | |
| 3.550%, 08/15/2022 | | $ | 5,730,000 | | | $ | 6,036,841 | | | |
|
|
| 3.250%, 02/20/2023 | | | 10,000,000 | | | | 10,519,907 | | | | | |
| Broadcom, Inc.: | | | | | | | | | | | | |
| 3.625%, 10/15/2024 | | | 32,800,000 | | | | 36,036,426 | | | | | |
| 3.125%, 01/15/2025 | | | 13,250,000 | | | | 14,307,125 | | | | | |
| 4.700%, 04/15/2025 | | | 18,300,000 | | | | 20,971,209 | | | | | |
| 3.150%, 11/15/2025 | | | 7,150,000 | | | | 7,807,455 | | | | | |
| 4.250%, 04/15/2026 | | | 30,400,000 | | | | 34,815,192 | | | | | |
| 4.750%, 04/15/2029 | | | 9,400,000 | | | | 11,211,586 | | | | | |
| 4.150%, 11/15/2030 | | | 10,000,000 | | | | 11,577,622 | | | | | |
| Broadridge Financial Solutions, Inc., | | | | | | | | | | | | |
| 3.400%, 06/27/2026 | | | 18,286,000 | | | | 20,578,135 | | | | | |
| Browning-Ferris Industries, Inc., | | | | | | | | | | | | |
| 9.250%, 05/01/2021 | | | 1,600,000 | | | | 1,631,929 | | | | | |
| Bunge Limited Finance Corp.: | | | | | | | | | | | | |
| 3.250%, 08/15/2026 | | | 13,188,000 | | | | 14,657,980 | | | | | |
| 3.750%, 09/25/2027 | | | 23,800,000 | | | | 27,138,726 | | | | | |
| Burlington Northern Santa Fe LLC, | | | | | | | | | | | | |
| 4.150%, 04/01/2045 | | | 3,100,000 | | | | 4,048,871 | | | | | |
| Cameron LNG LLC, | | | | | | | | | | | | |
3.701%, 01/15/2039(2) | | | 15,000,000 | | | | 16,914,122 | | | | | |
| Campbell Soup Co., | | | | | | | | | | | | |
| 3.950%, 03/15/2025 | | | 11,000,000 | | | | 12,397,543 | | | | | |
| Cargill, Inc., | | | | | | | | | | | | |
2.125%, 04/23/2030(2) | | | 7,000,000 | | | | 7,364,515 | | | | | |
| Carlisle Companies, Inc.: | | | | | | | | | | | | |
| 3.750%, 12/01/2027 | | | 4,600,000 | | | | 5,204,751 | | | | | |
| 2.750%, 03/01/2030 | | | 21,832,000 | | | | 23,386,939 | | | | | |
| Carrier Global Corp.: | | | | | | | | | | | | |
| 2.493%, 02/15/2027 | | | 12,845,000 | | | | 13,860,252 | | | | | |
| 2.700%, 02/15/2031 | | | 14,700,000 | | | | 15,794,001 | | | | | |
| 3.377%, 04/05/2040 | | | 10,000,000 | | | | 10,970,280 | | | | | |
| 3.577%, 04/05/2050 | | | 3,050,000 | | | | 3,413,015 | | | | | |
| CCL Industries, Inc., | | | | | | | | | | | | |
3.050%, 06/01/2030(1)(2) | | | 19,725,000 | | | | 21,510,945 | | | | | |
| CF Industries, Inc.: | | | | | | | | | | | | |
| 3.450%, 06/01/2023 | | | 24,874,000 | | | | 25,931,145 | | | | | |
| 5.375%, 03/15/2044 | | | 10,922,000 | | | | 13,824,576 | | | | | |
| Charter Communications Operating LLC: | | | | | | | | | | | | |
| 4.464%, 07/23/2022 | | | 33,748,000 | | | | 35,578,608 | | | | | |
| 4.908%, 07/23/2025 | | | 63,550,000 | | | | 73,810,018 | | | | | |
| 3.750%, 02/15/2028 | | | 5,000,000 | | | | 5,606,159 | | | | | |
| 5.050%, 03/30/2029 | | | 3,437,000 | | | | 4,178,923 | | | | | |
| 2.300%, 02/01/2032 | | | 5,000,000 | | | | 5,005,806 | | | | | |
The accompanying notes are an integral part of these financial statements.
Baird Core Plus Bond Fund
Schedule of Investments, December 31, 2020
Long-Term Investments (cont.)
| | | Principal | | | | | | % of | |
| | | Amount | | | Value | | | Net Assets | |
| Charter Communications Operating LLC: (cont.) | | | | | | | | | |
| 6.384%, 10/23/2035 | | $ | 27,030,000 | | | $ | 37,032,372 | | | |
|
|
| 3.700%, 04/01/2051 | | | 6,700,000 | | | | 6,957,647 | | | | | |
| Cheniere Corpus Christi Holdings LLC: | | | | | | | | | | | | |
| 7.000%, 06/30/2024 | | | 4,269,000 | | | | 4,985,229 | | | | | |
| 5.875%, 03/31/2025 | | | 5,005,000 | | | | 5,824,705 | | | | | |
| 5.125%, 06/30/2027 | | | 11,397,000 | | | | 13,482,401 | | | | | |
| Chevron Phillips Chemical Co. LLC / | | | | | | | | | | | | |
| Chevron Phillips Chemical Co. LP, | | | | | | | | | | | | |
5.125%, 04/01/2025(2) | | | 15,000,000 | | | | 17,614,348 | | | | | |
| Cigna Corp.: | | | | | | | | | | | | |
| 3.050%, 11/30/2022 | | | 15,000,000 | | | | 15,710,473 | | | | | |
| 3.000%, 07/15/2023 | | | 7,525,000 | | | | 7,968,839 | | | | | |
| 3.500%, 06/15/2024 | | | 7,800,000 | | | | 8,522,359 | | | | | |
| 4.500%, 02/25/2026 | | | 5,725,000 | | | | 6,711,761 | | | | | |
| 2.400%, 03/15/2030 | | | 9,850,000 | | | | 10,502,279 | | | | | |
| 4.800%, 08/15/2038 | | | 7,600,000 | | | | 9,901,577 | | | | | |
| CK Hutchison International Ltd.: | | | | | | | | | | | | |
2.875%, 04/05/2022(1)(2) | | | 7,475,000 | | | | 7,664,868 | | | | | |
3.250%, 04/11/2024(1)(2) | | | 7,000,000 | | | | 7,482,160 | | | | | |
| Clean Harbors, Inc., | | | | | | | | | | | | |
5.125%, 07/15/2029(2) | | | 100,000 | | | | 109,250 | | | | | |
| CNH Industrial Capital LLC: | | | | | | | | | | | | |
| 4.200%, 01/15/2024 | | | 15,000,000 | | | | 16,453,918 | | | | | |
| 1.875%, 01/15/2026 | | | 14,250,000 | | | | 14,923,261 | | | | | |
| CNH Industrial NV: | | | | | | | | | | | | |
4.500%, 08/15/2023(1) | | | 16,168,000 | | | | 17,629,381 | | | | | |
3.850%, 11/15/2027(1) | | | 26,114,000 | | | | 29,419,638 | | | | | |
| Columbia Pipeline Group, Inc.: | | | | | | | | | | | | |
| 4.500%, 06/01/2025 | | | 14,135,000 | | | | 16,255,754 | | | | | |
| 5.800%, 06/01/2045 | | | 4,733,000 | | | | 6,465,808 | | | | | |
| Comcast Cable Communications Holdings, Inc., | | | | | | | | | | | | |
| 9.455%, 11/15/2022 | | | 2,030,000 | | | | 2,375,724 | | | | | |
| Comcast Corp.: | | | | | | | | | | | | |
| 4.250%, 01/15/2033 | | | 6,500,000 | | | | 8,157,904 | | | | | |
| 4.400%, 08/15/2035 | | | 13,575,000 | | | | 17,372,585 | | | | | |
| 3.200%, 07/15/2036 | | | 15,000,000 | | | | 17,041,036 | | | | | |
| 4.600%, 10/15/2038 | | | 12,350,000 | | | | 16,275,155 | | | | | |
| 4.650%, 07/15/2042 | | | 2,000,000 | | | | 2,709,875 | | | | | |
| 4.950%, 10/15/2058 | | | 7,500,000 | | | | 11,386,960 | | | | | |
| CommonSpirit Health: | | | | | | | | | | | | |
| 2.760%, 10/01/2024 | | | 7,500,000 | | | | 8,040,331 | | | | | |
| 2.782%, 10/01/2030 | | | 20,400,000 | | | | 21,598,204 | | | | | |
| Conagra Brands, Inc., | | | | | | | | | | | | |
| 5.300%, 11/01/2038 | | | 6,625,000 | | | | 8,856,974 | | | | | |
The accompanying notes are an integral part of these financial statements.
Baird Core Plus Bond Fund
Schedule of Investments, December 31, 2020
Long-Term Investments (cont.)
| | | Principal | | | | | | % of | |
| | | Amount | | | Value | | | Net Assets | |
| Concho Resources, Inc., | | | | | | | | | |
| 2.400%, 02/15/2031 | | $ | 12,000,000 | | | $ | 12,559,476 | | | |
|
|
| ConocoPhillips Canada Funding Co. I, | | | | | | | | | | | | |
5.950%, 10/15/2036(1) | | | 845,000 | | | | 1,194,235 | | | | | |
| Constellation Brands, Inc., | | | | | | | | | | | | |
| 4.750%, 12/01/2025 | | | 1,000,000 | | | | 1,184,537 | | | | | |
| Corning, Inc., | | | | | | | | | | | | |
| 4.375%, 11/15/2057 | | | 10,000,000 | | | | 12,505,454 | | | | | |
| Costco Wholesale Corp., | | | | | | | | | | | | |
| 1.750%, 04/20/2032 | | | 10,000,000 | | | | 10,393,249 | | | | | |
| Cox Communications, Inc.: | | | | | | | | | | | | |
2.950%, 06/30/2023(2) | | | 5,475,000 | | | | 5,759,830 | | | | | |
3.850%, 02/01/2025(2) | | | 2,875,000 | | | | 3,206,236 | | | | | |
3.350%, 09/15/2026(2) | | | 20,850,000 | | | | 23,427,763 | | | | | |
4.800%, 02/01/2035(2) | | | 4,450,000 | | | | 5,627,729 | | | | | |
6.450%, 12/01/2036(2) | | | 5,550,000 | | | | 7,737,179 | | | | | |
8.375%, 03/01/2039(2) | | | 11,639,000 | | | | 20,047,978 | | | | | |
4.700%, 12/15/2042(2) | | | 5,000,000 | | | | 6,456,823 | | | | | |
| CSX Corp.: | | | | | | | | | | | | |
| 6.220%, 04/30/2040 | | | 475,000 | | | | 730,606 | | | | | |
| 4.650%, 03/01/2068 | | | 9,000,000 | | | | 12,619,432 | | | | | |
| CVS Health Corp.: | | | | | | | | | | | | |
| 3.875%, 07/20/2025 | | | 2,302,000 | | | | 2,607,037 | | | | | |
| 3.250%, 08/15/2029 | | | 11,800,000 | | | | 13,289,567 | | | | | |
| 4.780%, 03/25/2038 | | | 35,075,000 | | | | 44,439,346 | | | | | |
| 5.125%, 07/20/2045 | | | 15,000,000 | | | | 20,195,421 | | | | | |
| 5.050%, 03/25/2048 | | | 19,600,000 | | | | 26,563,458 | | | | | |
| CVS Pass-Through Trust, | | | | | | | | | | | | |
7.507%, 01/10/2032(2) | | | 3,656,597 | | | | 4,495,124 | | | | | |
| Daimler Finance North America LLC: | | | | | | | | | | | | |
2.550%, 08/15/2022(2) | | | 19,750,000 | | | | 20,420,997 | | | | | |
1.750%, 03/10/2023(2) | | | 29,550,000 | | | | 30,338,201 | | | | | |
| Danone SA: | | | | | | | | | | | | |
3.000%, 06/15/2022(1)(2) | | | 3,500,000 | | | | 3,633,696 | | | | | |
2.589%, 11/02/2023(1)(2) | | | 10,000,000 | | | | 10,522,542 | | | | | |
| DCP Midstream LLC: | | | | | | | | | | | | |
4.750%, 09/30/2021(2) | | | 2,245,000 | | | | 2,278,675 | | | | | |
| 5.375%, 07/15/2025 | | | 3,000,000 | | | | 3,296,460 | | | | | |
| 5.625%, 07/15/2027 | | | 17,000,000 | | | | 18,870,000 | | | | | |
| 5.125%, 05/15/2029 | | | 8,000,000 | | | | 8,872,960 | | | | | |
| Dell Technologies, Inc.: | | | | | | | | | | | | |
5.850%, 07/15/2025(2) | | | 5,000,000 | | | | 6,004,083 | | | | | |
4.900%, 10/01/2026(2) | | | 8,395,000 | | | | 9,913,133 | | | | | |
| Dentsply Sirona, | | | | | | | | | | | | |
| ��3.250%, 06/01/2030 | | | 46,120,000 | | | | 51,365,283 | | | | | |
The accompanying notes are an integral part of these financial statements.
Baird Core Plus Bond Fund
Schedule of Investments, December 31, 2020
Long-Term Investments (cont.)
| | | Principal | | | | | | % of | |
| | | Amount | | | Value | | | Net Assets | |
| Deutsche Telekom AG, | | | | | | | | | |
3.625%, 01/21/2050(1)(2) | | $ | 5,925,000 | | | $ | 6,810,238 | | | |
|
|
| Deutsche Telekom International Finance BV, | | | | | | | | | | | | |
8.750%, 06/15/2030(1) | | | 28,015,000 | | | | 44,324,620 | | | | | |
| Diamond 1 Finance Corp. / Diamond 2 Finance Corp.: | | | | | | | | | | | | |
5.450%, 06/15/2023(2) | | | 42,180,000 | | | | 46,651,950 | | | | | |
6.020%, 06/15/2026(2) | | | 37,004,000 | | | | 45,142,854 | | | | | |
| DISH DBS Corp., | | | | | | | | | | | | |
| 5.000%, 03/15/2023 | | | 2,500,000 | | | | 2,581,250 | | | | | |
| Dominion Gas Holdings LLC, | | | | | | | | | | | | |
| 3.600%, 12/15/2024 | | | 6,100,000 | | | | 6,744,867 | | | | | |
| DuPont de Nemours, Inc.: | | | | | | | | | | | | |
| 4.493%, 11/15/2025 | | | 9,275,000 | | | | 10,827,172 | | | | | |
| 5.319%, 11/15/2038 | | | 17,350,000 | | | | 23,498,959 | | | | | |
| DXC Technology Co.: | | | | | | | | | | | | |
| 4.450%, 09/18/2022 | | | 2,000,000 | | | | 2,105,036 | | | | | |
| 4.250%, 04/15/2024 | | | 52,810,000 | | | | 57,620,817 | | | | | |
| 4.125%, 04/15/2025 | | | 30,000,000 | | | | 33,163,344 | | | | | |
| 4.750%, 04/15/2027 | | | 28,650,000 | | | | 32,799,110 | | | | | |
| Eaton Corp.: | | | | | | | | | | | | |
| 2.750%, 11/02/2022 | | | 2,625,000 | | | | 2,739,058 | | | | | |
| 4.000%, 11/02/2032 | | | 3,660,000 | | | | 4,470,566 | | | | | |
| Ecolab, Inc., | | | | | | | | | | | | |
| 3.250%, 01/14/2023 | | | 6,325,000 | | | | 6,656,473 | | | | | |
| Edward-Elmhurst Healthcare, | | | | | | | | | | | | |
| 3.500%, 05/04/2023 | | | 4,000,000 | | | | 4,203,122 | | | | | |
| Element Fleet Management Corp., | | | | | | | | | | | | |
3.850%, 06/15/2025(1)(2) | | | 23,000,000 | | | | 24,514,844 | | | | | |
| Emerson Electric Co., | | | | | | | | | | | | |
| 2.750%, 10/15/2050 | | | 16,200,000 | | | | 17,061,493 | | | | | |
| Enable Midstream Partners LP, | | | | | | | | | | | | |
| 4.400%, 03/15/2027 | | | 15,000,000 | | | | 15,136,708 | | | | | |
| Enbridge Energy Partners LP: | | | | | | | | | | | | |
| 7.500%, 04/15/2038 | | | 4,500,000 | | | | 6,386,666 | | | | | |
| 7.375%, 10/15/2045 | | | 23,298,000 | | | | 35,552,363 | | | | | |
| Energy Transfer Operating LP: | | | | | | | | | | | | |
| 4.250%, 03/15/2023 | | | 10,000,000 | | | | 10,626,564 | | | | | |
| 5.875%, 01/15/2024 | | | 15,000,000 | | | | 16,861,281 | | | | | |
| 5.500%, 06/01/2027 | | | 6,204,000 | | | | 7,302,098 | | | | | |
| 3.750%, 05/15/2030 | | | 6,350,000 | | | | 6,849,443 | | | | | |
| 5.950%, 10/01/2043 | | | 2,702,000 | | | | 3,060,706 | | | | | |
| 6.000%, 06/15/2048 | | | 5,000,000 | | | | 5,891,662 | | | | | |
| Energy Transfer Partners LP: | | | | | | | | | | | | |
| 4.200%, 04/15/2027 | | | 8,650,000 | | | | 9,533,700 | | | | | |
| 6.500%, 02/01/2042 | | | 18,727,000 | | | | 22,846,673 | | | | | |
| 5.150%, 03/15/2045 | | | 5,000,000 | | | | 5,418,464 | | | | | |
The accompanying notes are an integral part of these financial statements.
Baird Core Plus Bond Fund
Schedule of Investments, December 31, 2020
Long-Term Investments (cont.)
| | | Principal | | | | | | % of | |
| | | Amount | | | Value | | | Net Assets | |
| Eni SpA, | | | | | | | | | |
4.250%, 05/09/2029(1)(2) | | $ | 18,250,000 | | | $ | 21,619,255 | | | |
|
|
| EnLink Midstream Partners LP, | | | | | | | | | | | | |
| 4.400%, 04/01/2024 | | | 23,605,000 | | | | 23,292,706 | | | | | |
| Enterprise Products Operating LLC: | | | | | | | | | | | | |
| 3.350%, 03/15/2023 | | | 10,000,000 | | | | 10,569,836 | | | | | |
| 3.950%, 01/31/2060 | | | 14,475,000 | | | | 16,023,257 | | | | | |
| EQT Corp.: | | | | | | | | | | | | |
| 7.875%, 02/01/2025 | | | 10,000,000 | | | | 11,387,500 | | | | | |
| 5.000%, 01/15/2029 | | | 1,000,000 | | | | 1,054,320 | | | | | |
| EQT Midstream Partners LP: | | | | | | | | | | | | |
| 4.750%, 07/15/2023 | | | 22,000,000 | | | | 23,132,560 | | | | | |
| 4.125%, 12/01/2026 | | | 14,750,000 | | | | 14,860,625 | | | | | |
| Equinix, Inc.: | | | | | | | | | | | | |
| 2.625%, 11/18/2024 | | | 8,000,000 | | | | 8,552,153 | | | | | |
| 2.150%, 07/15/2030 | | | 15,000,000 | | | | 15,257,254 | | | | | |
| ERAC USA Finance LLC, | | | | | | | | | | | | |
2.600%, 12/01/2021(2) | | | 10,400,000 | | | | 10,579,840 | | | | | |
| Exxon Mobil Corp.: | | | | | | | | | | | | |
| 1.571%, 04/15/2023 | | | 3,400,000 | | | | 3,496,556 | | | | | |
| 2.992%, 03/19/2025 | | | 35,000,000 | | | | 38,307,655 | | | | | |
| 3.294%, 03/19/2027 | | | 5,000,000 | | | | 5,698,175 | | | | | |
| 3.482%, 03/19/2030 | | | 11,125,000 | | | | 12,938,206 | | | | | |
| 2.610%, 10/15/2030 | | | 14,400,000 | | | | 15,728,867 | | | | | |
| 4.327%, 03/19/2050 | | | 3,950,000 | | | | 5,171,561 | | | | | |
| FedEx Corp.: | | | | | | | | | | | | |
| 3.800%, 05/15/2025 | | | 10,000,000 | | | | 11,288,532 | | | | | |
| 3.900%, 02/01/2035 | | | 7,000,000 | | | | 8,358,584 | | | | | |
| 4.950%, 10/17/2048 | | | 13,500,000 | | | | 18,431,158 | | | | | |
| Ferguson Finance PLC, | | | | | | | | | | | | |
4.500%, 10/24/2028(1)(2) | | | 37,052,000 | | | | 44,405,790 | | | | | |
| Fidelity National Information Services, Inc.: | | | | | | | | | | | | |
| 3.500%, 04/15/2023 | | | 3,268,000 | | | | 3,468,164 | | | | | |
| 3.875%, 06/05/2024 | | | 6,367,000 | | | | 7,007,191 | | | | | |
| 3.000%, 08/15/2026 | | | 9,300,000 | | | | 10,348,222 | | | | | |
| 4.500%, 08/15/2046 | | | 6,700,000 | | | | 8,565,397 | | | | | |
| Fiserv, Inc.: | | | | | | | | | | | | |
| 3.500%, 10/01/2022 | | | 11,625,000 | | | | 12,162,664 | | | | | |
| 3.850%, 06/01/2025 | | | 11,720,000 | | | | 13,210,864 | | | | | |
| 3.200%, 07/01/2026 | | | 6,400,000 | | | | 7,169,152 | | | | | |
| 2.250%, 06/01/2027 | | | 10,650,000 | | | | 11,350,201 | | | | | |
| 3.500%, 07/01/2029 | | | 6,010,000 | | | | 6,862,557 | | | | | |
| 4.400%, 07/01/2049 | | | 20,000,000 | | | | 26,789,599 | | | | | |
| Flex Ltd., | | | | | | | | | | | | |
3.750%, 02/01/2026(1) | | | 19,300,000 | | | | 21,588,187 | | | | | |
The accompanying notes are an integral part of these financial statements.
Baird Core Plus Bond Fund
Schedule of Investments, December 31, 2020
Long-Term Investments (cont.)
| | | Principal | | | | | | % of | |
| | | Amount | | | Value | | | Net Assets | |
| Florida Gas Transmission Co. LLC, | | | | | | | | | |
3.875%, 07/15/2022(2) | | $ | 3,000,000 | | | $ | 3,119,148 | | | |
|
|
| Flowserve Corp., | | | | | | | | | | | | |
| 3.500%, 10/01/2030 | | | 7,075,000 | | | | 7,552,128 | | | | | |
| FMC Corp., | | | | | | | | | | | | |
| 3.200%, 10/01/2026 | | | 8,100,000 | | | | 9,021,108 | | | | | |
| FMG Resources Pty Ltd., | | | | | | | | | | | | |
5.125%, 03/15/2023(1)(2) | | | 24,000,000 | | | | 25,350,000 | | | | | |
| Fomento Economico Mexicano SAB de CV: | | | | | | | | | | | | |
2.875%, 05/10/2023(1) | | | 11,700,000 | | | | 12,226,500 | | | | | |
4.375%, 05/10/2043(1) | | | 2,000,000 | | | | 2,521,920 | | | | | |
3.500%, 01/16/2050(1) | | | 11,625,000 | | | | 12,936,238 | | | | | |
| Ford Motor Credit Co. LLC: | | | | | | | | | | | | |
| 3.200%, 01/15/2021 | | | 11,250,000 | | | | 11,255,625 | | | | | |
| 5.750%, 02/01/2021 | | | 13,000,000 | | | | 13,032,500 | | | | | |
| 3.336%, 03/18/2021 | | | 5,500,000 | | | | 5,513,750 | | | | | |
| 5.875%, 08/02/2021 | | | 8,975,000 | | | | 9,185,912 | | | | | |
| 2.979%, 08/03/2022 | | | 20,000,000 | | | | 20,334,000 | | | | | |
| 4.250%, 09/20/2022 | | | 4,459,000 | | | | 4,602,401 | | | | | |
| 4.140%, 02/15/2023 | | | 10,000,000 | | | | 10,300,000 | | | | | |
| 5.584%, 03/18/2024 | | | 29,367,000 | | | | 31,676,715 | | | | | |
| 3.664%, 09/08/2024 | | | 12,000,000 | | | | 12,315,000 | | | | | |
| 4.063%, 11/01/2024 | | | 7,000,000 | | | | 7,353,990 | | | | | |
| 3.375%, 11/13/2025 | | | 25,000,000 | | | | 25,684,000 | | | | | |
| Fortune Brands Home & Security, Inc., | | | | | | | | | | | | |
| 3.250%, 09/15/2029 | | | 14,000,000 | | | | 15,513,674 | | | | | |
| Fox Corp., | | | | | | | | | | | | |
| 3.050%, 04/07/2025 | | | 5,000,000 | | | | 5,456,037 | | | | | |
| Freeport-McMoRan, Inc.: | | | | | | | | | | | | |
| 3.875%, 03/15/2023 | | | 38,916,000 | | | | 40,601,063 | | | | | |
| 5.000%, 09/01/2027 | | | 12,000,000 | | | | 12,720,000 | | | | | |
| 4.125%, 03/01/2028 | | | 10,000,000 | | | | 10,487,500 | | | | | |
| 5.250%, 09/01/2029 | | | 14,415,000 | | | | 16,036,687 | | | | | |
| 4.625%, 08/01/2030 | | | 3,000,000 | | | | 3,292,500 | | | | | |
| Fresenius Medical Care US Finance II, Inc., | | | | | | | | | | | | |
4.750%, 10/15/2024(2) | | | 8,075,000 | | | | 9,041,047 | | | | | |
| Fresenius Medical Care US Finance III, Inc.: | | | | | | | | | | | | |
3.750%, 06/15/2029(2) | | | 34,130,000 | | | | 38,268,070 | | | | | |
2.375%, 02/16/2031(2) | | | 32,300,000 | | | | 32,828,186 | | | | | |
| Fresenius US Finance II, Inc., | | | | | | | | | | | | |
4.500%, 01/15/2023(2) | | | 33,385,000 | | | | 35,457,514 | | | | | |
| General Dynamics Corp., | | | | | | | | | | | | |
| 3.500%, 04/01/2027 | | | 11,000,000 | | | | 12,654,355 | | | | | |
The accompanying notes are an integral part of these financial statements.
Baird Core Plus Bond Fund
Schedule of Investments, December 31, 2020
Long-Term Investments (cont.)
| | | Principal | | | | | | % of | |
| | | Amount | | | Value | | | Net Assets | |
| General Electric Co.: | | | | | | | | | |
| 3.450%, 05/01/2027 | | $ | 3,925,000 | | | $ | 4,439,354 | | | |
|
|
| 3.625%, 05/01/2030 | | | 5,000,000 | | | | 5,714,435 | | | | | |
| 6.150%, 08/07/2037 | | | 2,000,000 | | | | 2,757,112 | | | | | |
| General Mills, Inc.: | | | | | | | | | | | | |
| 3.700%, 10/17/2023 | | | 20,000,000 | | | | 21,781,677 | | | | | |
| 4.000%, 04/17/2025 | | | 3,175,000 | | | | 3,589,317 | | | | | |
| General Motors Financial Co., Inc.: | | | | | | | | | | | | |
| 4.200%, 03/01/2021 | | | 21,283,000 | | | | 21,335,335 | | | | | |
| 3.200%, 07/06/2021 | | | 25,600,000 | | | | 25,875,352 | | | | | |
| 4.375%, 09/25/2021 | | | 4,875,000 | | | | 5,006,637 | | | | | |
| 3.450%, 01/14/2022 | | | 5,200,000 | | | | 5,339,122 | | | | | |
| 3.150%, 06/30/2022 | | | 13,050,000 | | | | 13,511,026 | | | | | |
| 4.150%, 06/19/2023 | | | 3,375,000 | | | | 3,630,897 | | | | | |
| 1.700%, 08/18/2023 | | | 15,500,000 | | | | 15,899,178 | | | | | |
| 5.100%, 01/17/2024 | | | 18,750,000 | | | | 20,982,151 | | | | | |
| 2.900%, 02/26/2025 | | | 17,725,000 | | | | 18,928,908 | | | | | |
| Genpact Luxembourg Sarl: | | | | | | | | | | | | |
3.700%, 04/01/2022(1) | | | 43,005,000 | | | | 43,848,058 | | | | | |
3.375%, 12/01/2024(1) | | | 46,370,000 | | | | 50,487,607 | | | | | |
| Georgia-Pacific LLC, | | | | | | | | | | | | |
3.163%, 11/15/2021(2) | | | 20,000,000 | | | | 20,374,814 | | | | | |
| Glencore Finance (Canada) Ltd.: | | | | | | | | | | | | |
4.950%, 11/15/2021(1)(2) | | | 2,000,000 | | | | 2,079,851 | | | | | |
4.250%, 10/25/2022(1)(2) | | | 7,000,000 | | | | 7,456,200 | | | | | |
6.000%, 11/15/2041(1)(2) | | | 9,400,000 | | | | 11,911,680 | | | | | |
5.550%, 10/25/2042(1)(2) | | | 3,543,000 | | | | 4,345,064 | | | | | |
| Glencore Funding LLC: | | | | | | | | | | | | |
4.125%, 05/30/2023(2) | | | 16,940,000 | | | | 18,319,763 | | | | | |
4.625%, 04/29/2024(2) | | | 29,230,000 | | | | 32,643,527 | | | | | |
4.000%, 03/27/2027(2) | | | 17,000,000 | | | | 19,230,101 | | | | | |
4.875%, 03/12/2029(2) | | | 18,000,000 | | | | 21,467,863 | | | | | |
2.500%, 09/01/2030(2) | | | 19,800,000 | | | | 20,192,965 | | | | | |
| Global Payments, Inc.: | | | | | | | | | | | | |
| 3.800%, 04/01/2021 | | | 9,199,000 | | | | 9,249,630 | | | | | |
| 4.000%, 06/01/2023 | | | 10,775,000 | | | | 11,652,920 | | | | | |
| 4.800%, 04/01/2026 | | | 10,035,000 | | | | 11,908,746 | | | | | |
| 2.900%, 05/15/2030 | | | 5,000,000 | | | | 5,444,365 | | | | | |
| Graphic Packaging International LLC: | | | | | | | | | | | | |
3.500%, 03/15/2028(2) | | | 5,000,000 | | | | 5,181,250 | | | | | |
3.500%, 03/01/2029(2) | | | 5,000,000 | | | | 5,112,500 | | | | | |
| Gray Oak Pipeline LLC, | | | | | | | | | | | | |
2.600%, 10/15/2025(2) | | | 15,000,000 | | | | 15,460,007 | | | | | |
The accompanying notes are an integral part of these financial statements.
Baird Core Plus Bond Fund
Schedule of Investments, December 31, 2020
Long-Term Investments (cont.)
| | | Principal | | | | | | % of | |
| | | Amount | | | Value | | | Net Assets | |
| Grupo Bimbo SAB de CV: | | | | | | | | | |
4.500%, 01/25/2022(1)(2) | | $ | 3,915,000 | | | $ | 4,068,429 | | | |
|
|
3.875%, 06/27/2024(1)(2) | | | 31,501,000 | | | | 34,469,024 | | | | | |
4.875%, 06/27/2044(1)(2) | | | 9,575,000 | | | | 12,000,766 | | | | | |
4.700%, 11/10/2047(1)(2) | | | 22,671,000 | | | | 28,154,661 | | | | | |
4.000%, 09/06/2049(1)(2) | | | 13,000,000 | | | | 14,707,550 | | | | | |
| Gulf South Pipeline Co. LP, | | | | | | | | | | | | |
| 4.000%, 06/15/2022 | | | 3,000,000 | | | | 3,088,677 | | | | | |
| Gulfstream Natural Gas System LLC, | | | | | | | | | | | | |
4.600%, 09/15/2025(2) | | | 10,000,000 | | | | 11,382,941 | | | | | |
| HB Fuller Co., | | | | | | | | | | | | |
| 4.000%, 02/15/2027 | | | 6,725,000 | | | | 7,010,812 | | | | | |
| HCA, Inc.: | | | | | | | | | | | | |
| 5.000%, 03/15/2024 | | | 10,366,000 | | | | 11,661,474 | | | | | |
| 5.375%, 02/01/2025 | | | 25,300,000 | | | | 28,450,609 | | | | | |
| 5.250%, 04/15/2025 | | | 19,200,000 | | | | 22,419,489 | | | | | |
| 5.375%, 09/01/2026 | | | 1,000,000 | | | | 1,149,400 | | | | | |
| 4.500%, 02/15/2027 | | | 16,500,000 | | | | 19,192,831 | | | | | |
| 5.875%, 02/01/2029 | | | 500,000 | | | | 601,740 | | | | | |
| 4.125%, 06/15/2029 | | | 15,000,000 | | | | 17,401,224 | | | | | |
| 3.500%, 09/01/2030 | | | 5,000,000 | | | | 5,312,881 | | | | | |
| Hewlett Packard Enterprise Co., | | | | | | | | | | | | |
| 4.450%, 10/02/2023 | | | 12,575,000 | | | | 13,833,560 | | | | | |
| Hexcel Corp.: | | | | | | | | | | | | |
| 4.700%, 08/15/2025 | | | 8,303,000 | | | | 9,321,243 | | | | | |
| 3.950%, 02/15/2027 | | | 19,000,000 | | | | 20,536,712 | | | | | |
| Hologic, Inc., | | | | | | | | | | | | |
3.250%, 02/15/2029(2) | | | 10,000,000 | | | | 10,175,000 | | | | | |
| HP, Inc.: | | | | | | | | | | | | |
| 2.200%, 06/17/2025 | | | 10,000,000 | | | | 10,587,390 | | | | | |
| 3.000%, 06/17/2027 | | | 25,000,000 | | | | 27,585,184 | | | | | |
| Huntington Ingalls Industries, Inc., | | | | | | | | | | | | |
3.844%, 05/01/2025(2) | | | 10,000,000 | | | | 11,111,780 | | | | | |
| Husky Energy, Inc.: | | | | | | | | | | | | |
4.000%, 04/15/2024(1) | | | 7,380,000 | | | | 7,909,148 | | | | | |
4.400%, 04/15/2029(1) | | | 15,000,000 | | | | 16,689,570 | | | | | |
| Hutchison Whampoa International Ltd.: | | | | | | | | | | | | |
3.250%, 11/08/2022(1)(2) | | | 4,625,000 | | | | 4,826,607 | | | | | |
3.625%, 10/31/2024(1)(2) | | | 15,000,000 | | | | 16,423,350 | | | | | |
| Hyundai Capital America: | | | | | | | | | | | | |
3.450%, 03/12/2021(2) | | | 20,950,000 | | | | 21,053,702 | | | | | |
3.000%, 03/18/2021(2) | | | 10,000,000 | | | | 10,044,785 | | | | | |
3.750%, 07/08/2021(2) | | | 10,150,000 | | | | 10,298,281 | | | | | |
3.100%, 04/05/2022(2) | | | 2,000,000 | | | | 2,056,343 | | | | | |
2.850%, 11/01/2022(2) | | | 5,225,000 | | | | 5,414,659 | | | | | |
The accompanying notes are an integral part of these financial statements.
Baird Core Plus Bond Fund
Schedule of Investments, December 31, 2020
Long-Term Investments (cont.)
| | | Principal | | | | | | % of | |
| | | Amount | | | Value | | | Net Assets | |
| Hyundai Capital America: (cont.) | | | | | | | | | |
2.375%, 02/10/2023(2) | | $ | 20,000,000 | | | $ | 20,612,448 | | | |
|
|
1.250%, 09/18/2023(2) | | | 14,125,000 | | | | 14,292,414 | | | | | |
3.400%, 06/20/2024(2) | | | 16,850,000 | | | | 17,965,469 | | | | | |
| IHS Markit Ltd., | | | | | | | | | | | | |
3.625%, 05/01/2024(1) | | | 10,000,000 | | | | 10,907,800 | | | | | |
| Infor, Inc., | | | | | | | | | | | | |
1.750%, 07/15/2025(2) | | | 8,375,000 | | | | 8,699,444 | | | | | |
| Ingersoll-Rand Global Holding Co. Ltd., | | | | | | | | | | | | |
| 5.750%, 06/15/2043 | | | 4,126,000 | | | | 5,927,502 | | | | | |
| Ingersoll-Rand Luxembourg Finance SA, | | | | | | | | | | | | |
4.650%, 11/01/2044(1) | | | 1,300,000 | | | | 1,662,166 | | | | | |
| Ingredion, Inc., | | | | | | | | | | | | |
| 2.900%, 06/01/2030 | | | 28,000,000 | | | | 30,838,187 | | | | | |
| International Business Machines Corp., | | | | | | | | | | | | |
| 4.150%, 05/15/2039 | | | 13,000,000 | | | | 16,459,262 | | | | | |
| International Flavors & Fragrances, Inc., | | | | | | | | | | | | |
| 5.000%, 09/26/2048 | | | 10,000,000 | | | | 13,461,399 | | | | | |
| Iron Mountain, Inc., | | | | | | | | | | | | |
4.500%, 02/15/2031(2) | | | 10,000,000 | | | | 10,475,000 | | | | | |
| JM Smucker Co.: | | | | | | | | | | | | |
| 2.375%, 03/15/2030 | | | 5,000,000 | | | | 5,292,545 | | | | | |
| 3.550%, 03/15/2050 | | | 3,350,000 | | | | 3,780,523 | | | | | |
| Johnson Controls International PLC, | | | | | | | | | | | | |
3.900%, 02/14/2026(1) | | | 3,645,000 | | | | 4,129,128 | | | | | |
| Kansas City Southern: | | | | | | | | | | | | |
| 4.700%, 05/01/2048 | | | 12,000,000 | | | | 15,107,156 | | | | | |
| 3.500%, 05/01/2050 | | | 13,000,000 | | | | 14,453,454 | | | | | |
| Kerry Group Financial Services Unlimited Co., | | | | | | | | | | | | |
3.200%, 04/09/2023(1)(2) | | | 18,500,000 | | | | 19,413,223 | | | | | |
| Keurig Dr Pepper, Inc., | | | | | | | | | | | | |
| 4.417%, 05/25/2025 | | | 7,000,000 | | | | 8,070,564 | | | | | |
| Keysight Technologies, Inc.: | | | | | | | | | | | | |
| 4.550%, 10/30/2024 | | | 7,283,000 | | | | 8,235,007 | | | | | |
| 4.600%, 04/06/2027 | | | 50,189,000 | | | | 59,819,999 | | | | | |
| Kimberly-Clark de Mexico SAB de CV, | | | | | | | | | | | | |
2.431%, 07/01/2031(1)(2) | | | 10,000,000 | | | | 10,330,200 | | | | | |
| Kinder Morgan Energy Partners LP: | | | | | | | | | | | | |
| 7.300%, 08/15/2033 | | | 1,675,000 | | | | 2,347,786 | | | | | |
| 6.500%, 02/01/2037 | | | 400,000 | | | | 519,128 | | | | | |
| 6.950%, 01/15/2038 | | | 14,755,000 | | | | 20,189,409 | | | | | |
| 7.500%, 11/15/2040 | | | 27,248,000 | | | | 39,113,074 | | | | | |
| Kinder Morgan, Inc.: | | | | | | | | | | | | |
5.000%, 02/15/2021(2) | | | 10,008,000 | | | | 10,037,536 | | | | | |
| 8.050%, 10/15/2030 | | | 15,384,000 | | | | 21,391,244 | | | | | |
The accompanying notes are an integral part of these financial statements.
Baird Core Plus Bond Fund
Schedule of Investments, December 31, 2020
Long-Term Investments (cont.)
| | | Principal | | | | | | % of | |
| | | Amount | | | Value | | | Net Assets | |
| Kinder Morgan, Inc.: (cont.) | | | | | | | | | |
| 7.800%, 08/01/2031 | | $ | 16,174,000 | | | $ | 23,097,737 | | | |
|
|
| 7.750%, 01/15/2032 | | | 7,466,000 | | | | 10,793,525 | | | | | |
| Kinross Gold Corp., | | | | | | | | | | | | |
6.875%, 09/01/2041(1) | | | 5,500,000 | | | | 7,563,988 | | | | | |
| Kraft Heinz Foods Co.: | | | | | | | | | | | | |
| 4.000%, 06/15/2023 | | | 34,774,000 | | | | 36,977,961 | | | | | |
| 6.750%, 03/15/2032 | | | 10,000,000 | | | | 13,278,345 | | | | | |
| 5.000%, 07/15/2035 | | | 7,375,000 | | | | 8,940,287 | | | | | |
| 5.000%, 06/04/2042 | | | 5,000,000 | | | | 5,866,368 | | | | | |
| Lafarge SA, | | | | | | | | | | | | |
7.125%, 07/15/2036(1) | | | 1,500,000 | | | | 2,186,606 | | | | | |
| LafargeHolcim Finance US LLC, | | | | | | | | | | | | |
3.500%, 09/22/2026(2) | | | 12,565,000 | | | | 13,811,990 | | | | | |
| Lear Corp.: | | | | | | | | | | | | |
| 3.800%, 09/15/2027 | | | 7,725,000 | | | | 8,666,101 | | | | | |
| 3.500%, 05/30/2030 | | | 15,000,000 | | | | 16,413,417 | | | | | |
| Leidos, Inc.: | | | | | | | | | | | | |
4.375%, 05/15/2030(2) | | | 24,000,000 | | | | 28,738,800 | | | | | |
2.300%, 02/15/2031(2) | | | 7,500,000 | | | | 7,636,492 | | | | | |
| Lennar Corp., | | | | | | | | | | | | |
| 4.125%, 01/15/2022 | | | 1,385,000 | | | | 1,417,894 | | | | | |
| Lennox International, Inc., | | | | | | | | | | | | |
| 3.000%, 11/15/2023 | | | 10,000,000 | | | | 10,540,000 | | | | | |
| Magellan Midstream Partners LP: | | | | | | | | | | | | |
| 5.000%, 03/01/2026 | | | 10,000,000 | | | | 11,917,601 | | | | | |
| 4.200%, 03/15/2045 | | | 8,770,000 | | | | 9,491,622 | | | | | |
| 4.250%, 09/15/2046 | | | 1,230,000 | | | | 1,416,751 | | | | | |
| 3.950%, 03/01/2050 | | | 19,000,000 | | | | 21,412,831 | | | | | |
| Magna International, Inc., | | | | | | | | | | | | |
2.450%, 06/15/2030(1) | | | 10,000,000 | | | | 10,756,862 | | | | | |
| Marathon Oil Corp., | | | | | | | | | | | | |
| 2.800%, 11/01/2022 | | | 3,452,000 | | | | 3,548,207 | | | | | |
| Marathon Petroleum Corp.: | | | | | | | | | | | | |
| 3.625%, 09/15/2024 | | | 2,500,000 | | | | 2,728,223 | | | | | |
| 4.700%, 05/01/2025 | | | 15,000,000 | | | | 17,183,328 | | | | | |
| 5.125%, 12/15/2026 | | | 3,000,000 | | | | 3,575,933 | | | | | |
| 4.750%, 09/15/2044 | | | 3,985,000 | | | | 4,577,632 | | | | | |
| Martin Marietta Materials, Inc.: | | | | | | | | | | | | |
| 2.500%, 03/15/2030 | | | 5,000,000 | | | | 5,327,325 | | | | | |
| 6.250%, 05/01/2037 | | | 450,000 | | | | 576,360 | | | | | |
| Masco Corp.: | | | | | | | | | | | | |
| 4.450%, 04/01/2025 | | | 5,000,000 | | | | 5,740,278 | | | | | |
| 6.500%, 08/15/2032 | | | 14,934,000 | | | | 19,939,471 | | | | | |
The accompanying notes are an integral part of these financial statements.
Baird Core Plus Bond Fund
Schedule of Investments, December 31, 2020
Long-Term Investments (cont.)
| | | Principal | | | | | | % of | |
| | | Amount | | | Value | | | Net Assets | |
| MasTec, Inc., | | | | | | | | | |
4.500%, 08/15/2028(2) | | $ | 5,000,000 | | | $ | 5,250,000 | | | |
|
|
| McDonald’s Corp.: | | | | | | | | | | | | |
| 3.700%, 01/30/2026 | | | 7,250,000 | | | | 8,258,386 | | | | | |
| 3.500%, 07/01/2027 | | | 6,000,000 | | | | 6,882,802 | | | | | |
| Microchip Technology, Inc.: | | | | | | | | | | | | |
| 3.922%, 06/01/2021 | | | 12,845,000 | | | | 13,027,389 | | | | | |
| 4.333%, 06/01/2023 | | | 32,298,000 | | | | 34,963,013 | | | | | |
2.670%, 09/01/2023(2) | | | 25,000,000 | | | | 26,146,603 | | | | | |
4.250%, 09/01/2025(2) | | | 4,000,000 | | | | 4,231,773 | | | | | |
| Micron Technology, Inc., | | | | | | | | | | | | |
| 4.640%, 02/06/2024 | | | 3,000,000 | | | | 3,340,371 | | | | | |
| Microsoft Corp., | | | | | | | | | | | | |
| 4.200%, 11/03/2035 | | | 5,650,000 | | | | 7,418,237 | | | | | |
| Midwest Connector Capital Co. LLC: | | | | | | | | | | | | |
3.900%, 04/01/2024(2) | | | 13,695,000 | | | | 14,037,375 | | | | | |
4.625%, 04/01/2029(2) | | | 12,000,000 | | | | 12,579,066 | | | | | |
| Minera Mexico SA de CV, | | | | | | | | | | | | |
4.500%, 01/26/2050(1)(2) | | | 5,000,000 | | | | 5,782,550 | | | | | |
| Molex Electronic Technologies LLC, | | | | | | | | | | | | |
3.900%, 04/15/2025(2) | | | 8,250,000 | | | | 8,535,972 | | | | | |
| Molson Coors Beverage Co., | | | | | | | | | | | | |
| 3.000%, 07/15/2026 | | | 33,888,000 | | | | 36,943,747 | | | | | |
| Mosaic Co., | | | | | | | | | | | | |
| 5.450%, 11/15/2033 | | | 16,101,000 | | | | 20,017,690 | | | | | |
| MPLX LP: | | | | | | | | | | | | |
| 3.500%, 12/01/2022 | | | 8,600,000 | | | | 9,032,222 | | | | | |
| 4.000%, 02/15/2025 | | | 13,125,000 | | | | 14,667,836 | | | | | |
| 4.875%, 06/01/2025 | | | 19,150,000 | | | | 22,119,579 | | | | | |
| 1.750%, 03/01/2026 | | | 20,000,000 | | | | 20,698,107 | | | | | |
| 4.250%, 12/01/2027 | | | 6,519,000 | | | | 7,654,419 | | | | | |
| 5.500%, 02/15/2049 | | | 8,825,000 | | | | 11,620,874 | | | | | |
| 4.900%, 04/15/2058 | | | 5,000,000 | | | | 5,942,716 | | | | | |
| MSCI, Inc., | | | | | | | | | | | | |
4.000%, 11/15/2029(2) | | | 7,562,000 | | | | 8,053,530 | | | | | |
| Mylan NV: | | | | | | | | | | | | |
3.150%, 06/15/2021(1) | | | 8,100,000 | | | | 8,178,300 | | | | | |
3.950%, 06/15/2026(1) | | | 5,000,000 | | | | 5,720,653 | | | | | |
| Mylan, Inc.: | | | | | | | | | | | | |
3.125%, 01/15/2023(2) | | | 16,800,000 | | | | 17,634,162 | | | | | |
| 4.200%, 11/29/2023 | | | 4,525,000 | | | | 4,947,992 | | | | | |
| 4.550%, 04/15/2028 | | | 5,000,000 | | | | 5,944,010 | | | | | |
| NCL Corp. Ltd., | | | | | | | | | | | | |
3.625%, 12/15/2024(1)(2) | | | 20,000,000 | | | | 19,000,000 | | | | | |
The accompanying notes are an integral part of these financial statements.
Baird Core Plus Bond Fund
Schedule of Investments, December 31, 2020
Long-Term Investments (cont.)
| | | Principal | | | | | | % of | |
| | | Amount | | | Value | | | Net Assets | |
| Newell Brands, Inc.: | | | | | | | | | |
| 3.850%, 04/01/2023 | | $ | 40,709,000 | | | $ | 42,699,263 | | | |
|
|
| 4.875%, 06/01/2025 | | | 1,500,000 | | | | 1,650,450 | | | | | |
| Newfield Exploration Co., | | | | | | | | | | | | |
| 5.750%, 01/30/2022 | | | 7,700,000 | | | | 7,997,618 | | | | | |
| NGPL PipeCo LLC, | | | | | | | | | | | | |
4.875%, 08/15/2027 (Callable 02/15/2027)(2) | | | 20,000,000 | | | | 22,659,136 | | | | | |
| NIKE, Inc., | | | | | | | | | | | | |
| 2.750%, 03/27/2027 | | | 7,000,000 | | | | 7,745,679 | | | | | |
| Noble Energy, Inc.: | | | | | | | | | | | | |
| 3.900%, 11/15/2024 | | | 3,000,000 | | | | 3,347,777 | | | | | |
| 5.050%, 11/15/2044 | | | 3,000,000 | | | | 4,221,750 | | | | | |
| Norfolk Southern Corp., | | | | | | | | | | | | |
| 3.050%, 05/15/2050 | | | 20,000,000 | | | | 21,789,780 | | | | | |
| NuStar Logistics LP, | | | | | | | | | | | | |
| 6.750%, 02/01/2021 | | | 3,000,000 | | | | 3,007,500 | | | | | |
| Nutrien Ltd.: | | | | | | | | | | | | |
4.000%, 12/15/2026(1) | | | 10,000,000 | | | | 11,623,274 | | | | | |
4.125%, 03/15/2035(1) | | | 6,550,000 | | | | 7,800,158 | | | | | |
| Nutrition & Biosciences, Inc., | | | | | | | | | | | | |
3.468%, 12/01/2050(2) | | | 8,000,000 | | | | 8,690,202 | | | | | |
| nVent Finance Sarl: | | | | | | | | | | | | |
3.950%, 04/15/2023(1) | | | 11,055,000 | | | | 11,641,155 | | | | | |
4.550%, 04/15/2028(1) | | | 32,435,000 | | | | 35,229,382 | | | | | |
| NXP Semiconductors NV, | | | | | | | | | | | | |
3.875%, 09/01/2022(1)(2) | | | 9,300,000 | | | | 9,801,699 | | | | | |
| Occidental Petroleum Corp.: | | | | | | | | | | | | |
| 2.900%, 08/15/2024 | | | 10,000,000 | | | | 9,625,000 | | | | | |
| 8.500%, 07/15/2027 | | | 15,000,000 | | | | 17,310,750 | | | | | |
| 7.150%, 05/15/2028 | | | 7,000,000 | | | | 7,096,250 | | | | | |
| 7.875%, 09/15/2031 | | | 12,790,000 | | | | 14,260,850 | | | | | |
| 6.450%, 09/15/2036 | | | 7,125,000 | | | | 7,459,875 | | | | | |
| ONEOK Partners LP, | | | | | | | | | | | | |
| 3.375%, 10/01/2022 | | | 4,007,000 | | | | 4,170,425 | | | | | |
| ONEOK, Inc.: | | | | | | | | | | | | |
| 4.250%, 02/01/2022 | | | 6,450,000 | | | | 6,639,113 | | | | | |
| 7.500%, 09/01/2023 | | | 22,959,000 | | | | 26,574,967 | | | | | |
| 2.750%, 09/01/2024 | | | 8,300,000 | | | | 8,757,647 | | | | | |
| Oracle Corp.: | | | | | | | | | | | | |
| 2.800%, 04/01/2027 | | | 46,000,000 | | | | 50,732,389 | | | | | |
| 3.900%, 05/15/2035 | | | 7,425,000 | | | | 9,116,575 | | | | | |
| Orange SA, | | | | | | | | | | | | |
9.000%, 03/01/2031(1) | | | 33,426,000 | | | | 54,982,813 | | | | | |
| Oshkosh Corp., | | | | | | | | | | | | |
| 3.100%, 03/01/2030 | | | 5,000,000 | | | | 5,453,223 | | | | | |
The accompanying notes are an integral part of these financial statements.
Baird Core Plus Bond Fund
Schedule of Investments, December 31, 2020
Long-Term Investments (cont.)
| | | Principal | | | | | | % of | |
| | | Amount | | | Value | | | Net Assets | |
| Owens Corning: | | | | | | | | | |
| 4.200%, 12/01/2024 | | $ | 10,000,000 | | | $ | 11,116,911 | | | |
|
|
| 3.400%, 08/15/2026 | | | 5,000,000 | | | | 5,521,294 | | | | | |
| Packaging Corp. of America, | | | | | | | | | | | | |
| 4.500%, 11/01/2023 | | | 4,700,000 | | | | 5,183,084 | | | | | |
| Pactiv LLC, | | | | | | | | | | | | |
| 7.950%, 12/15/2025 | | | 1,338,000 | | | | 1,532,010 | | | | | |
| Penske Truck Leasing Co.: | | | | | | | | | | | | |
4.000%, 07/15/2025(2) | | | 20,000,000 | | | | 22,680,300 | | | | | |
1.200%, 11/15/2025(2) | | | 22,800,000 | | | | 22,995,038 | | | | | |
| PepsiCo, Inc., | | | | | | | | | | | | |
| 2.750%, 03/19/2030 | | | 9,200,000 | | | | 10,301,103 | | | | | |
| PerkinElmer, Inc., | | | | | | | | | | | | |
| 3.300%, 09/15/2029 | | | 25,000,000 | | | | 28,187,784 | | | | | |
| Pernod Ricard SA, | | | | | | | | | | | | |
4.250%, 07/15/2022(1)(2) | | | 26,700,000 | | | | 28,189,692 | | | | | |
| Perrigo Finance Unlimited Co.: | | | | | | | | | | | | |
3.900%, 12/15/2024(1) | | | 42,000,000 | | | | 46,120,708 | | | | | |
3.150%, 06/15/2030(1) | | | 18,250,000 | | | | 19,504,805 | | | | | |
| Phillips 66: | | | | | | | | | | | | |
| 3.850%, 04/09/2025 | | | 8,000,000 | | | | 8,974,464 | | | | | |
| 2.150%, 12/15/2030 | | | 6,000,000 | | | | 6,091,026 | | | | | |
| 4.650%, 11/15/2034 | | | 13,000,000 | | | | 15,749,964 | | | | | |
| 5.875%, 05/01/2042 | | | 5,000,000 | | | | 6,951,788 | | | | | |
| 4.875%, 11/15/2044 | | | 15,000,000 | | | | 18,918,852 | | | | | |
| Phillips 66 Partners LP: | | | | | | | | | | | | |
| 3.605%, 02/15/2025 | | | 2,000,000 | | | | 2,161,499 | | | | | |
| 3.150%, 12/15/2029 | | | 12,550,000 | | | | 13,056,276 | | | | | |
| 4.680%, 02/15/2045 | | | 2,000,000 | | | | 2,169,082 | | | | | |
| Plains All American Pipeline LP / PAA Finance Corp., | | | | | | | | | | | | |
| 3.550%, 12/15/2029 | | | 20,000,000 | | | | 20,930,078 | | | | | |
| POSCO: | | | | | | | | | | | | |
2.375%, 01/17/2023(1)(2) | | | 5,550,000 | | | | 5,719,552 | | | | | |
4.000%, 08/01/2023(1)(2) | | | 13,000,000 | | | | 14,017,849 | | | | | |
| Quanta Services, Inc., | | | | | | | | | | | | |
| 2.900%, 10/01/2030 | | | 10,000,000 | | | | 10,721,565 | | | | | |
| Qwest Capital Funding, Inc., | | | | | | | | | | | | |
| 7.625%, 08/03/2021 | | | 200,000 | | | | 205,164 | | | | | |
| Raytheon Technologies Corp.: | | | | | | | | | | | | |
| 7.500%, 09/15/2029 | | | 8,188,000 | | | | 11,885,005 | | | | | |
| 2.250%, 07/01/2030 | | | 12,000,000 | | | | 12,746,334 | | | | | |
| 4.800%, 12/15/2043 | | | 7,925,000 | | | | 10,103,505 | | | | | |
| 3.125%, 07/01/2050 | | | 6,000,000 | | | | 6,616,151 | | | | | |
The accompanying notes are an integral part of these financial statements.
Baird Core Plus Bond Fund
Schedule of Investments, December 31, 2020
Long-Term Investments (cont.)
| | | Principal | | | | | | % of | |
| | | Amount | | | Value | | | Net Assets | |
| Regency Energy Partners LP / | | | | | | | | | |
| Regency Energy Finance Corp., | | | | | | | | | |
| 4.500%, 11/01/2023 | | $ | 11,850,000 | | | $ | 12,830,255 | | | |
|
|
| Reliance Industries Ltd., | | | | | | | | | | | | |
5.400%, 02/14/2022(1)(2) | | | 3,500,000 | | | | 3,664,523 | | | | | |
| Reliance Steel & Aluminum Co., | | | | | | | | | | | | |
| 1.300%, 08/15/2025 | | | 6,100,000 | | | | 6,195,584 | | | | | |
| Republic Services, Inc.: | | | | | | | | | | | | |
| 4.750%, 05/15/2023 | | | 7,341,000 | | | | 8,014,110 | | | | | |
| 2.900%, 07/01/2026 | | | 5,000,000 | | | | 5,524,592 | | | | | |
| Rogers Communications, Inc., | | | | | | | | | | | | |
4.350%, 05/01/2049(1) | | | 10,000,000 | | | | 12,947,977 | | | | | |
| Sabine Pass Liquefaction LLC: | | | | | | | | | | | | |
| 5.625%, 03/01/2025 | | | 14,500,000 | | | | 16,911,670 | | | | | |
| 5.875%, 06/30/2026 | | | 55,015,000 | | | | 66,518,765 | | | | | |
| 5.000%, 03/15/2027 | | | 20,300,000 | | | | 23,935,026 | | | | | |
| Samarco Mineracao SA: | | | | | | | | | | | | |
5.750%, 10/24/2023(1)(2)(9) | | | 5,475,000 | | | | 3,928,313 | | | | | |
5.375%, 09/26/2024(1)(2)(9) | | | 5,125,000 | | | | 3,664,375 | | | | | |
| Schlumberger Holdings Corp., | | | | | | | | | | | | |
3.900%, 05/17/2028(2) | | | 11,096,000 | | | | 12,539,830 | | | | | |
| Schneider Electric SE, | | | | | | | | | | | | |
2.950%, 09/27/2022(1)(2) | | | 5,000,000 | | | | 5,216,564 | | | | | |
| Seagate HDD Cayman, | | | | | | | | | | | | |
4.875%, 03/01/2024(1) | | | 24,400,000 | | | | 26,503,280 | | | | | |
| Shell International Finance BV: | | | | | | | | | | | | |
2.375%, 04/06/2025(1) | | | 9,000,000 | | | | 9,652,502 | | | | | |
2.750%, 04/06/2030(1) | | | 8,725,000 | | | | 9,652,763 | | | | | |
| Sherwin-Williams Co., | | | | | | | | | | | | |
| 4.500%, 06/01/2047 | | | 10,550,000 | | | | 14,111,945 | | | | | |
| Shire Acquisitions Investments Ireland DAC, | | | | | | | | | | | | |
2.875%, 09/23/2023(1) | | | 54,946,000 | | | | 58,266,329 | | | | | |
| Silgan Holdings, Inc.: | | | | | | | | | | | | |
| 4.750%, 03/15/2025 | | | 1,000,000 | | | | 1,016,250 | | | | | |
| 4.125%, 02/01/2028 | | | 4,000,000 | | | | 4,155,000 | | | | | |
| SK Telecom Co. Ltd., | | | | | | | | | | | | |
6.625%, 07/20/2027(1)(2) | | | 960,000 | | | | 1,258,275 | | | | | |
| Smith & Nephew PLC, | | | | | | | | | | | | |
2.032%, 10/14/2030(1) | | | 10,000,000 | | | | 10,187,182 | | | | | |
| Smithfield Foods, Inc.: | | | | | | | | | | | | |
2.650%, 10/03/2021(2) | | | 10,200,000 | | | | 10,290,157 | | | | | |
3.350%, 02/01/2022(2) | | | 31,389,000 | | | | 31,820,466 | | | | | |
5.200%, 04/01/2029(2) | | | 16,566,000 | | | | 19,723,106 | | | | | |
3.000%, 10/15/2030(2) | | | 10,000,000 | | | | 10,580,768 | | | | | |
The accompanying notes are an integral part of these financial statements.
Baird Core Plus Bond Fund
Schedule of Investments, December 31, 2020
Long-Term Investments (cont.)
| | | Principal | | | | | | % of | |
| | | Amount | | | Value | | | Net Assets | |
| Sociedad Quimica y Minera de Chile SA, | | | | | | | | | |
3.625%, 04/03/2023(1)(2) | | $ | 8,093,000 | | | $ | 8,489,638 | | | |
|
|
| Solvay Finance America LLC, | | | | | | | | | | | | |
4.450%, 12/03/2025(2) | | | 40,018,000 | | | | 45,754,076 | | | | | |
| Sonoco Products Co., | | | | | | | | | | | | |
| 4.375%, 11/01/2021 | | | 1,000,000 | | | | 1,020,437 | | | | | |
| Southern Copper Corp., | | | | | | | | | | | | |
| 7.500%, 07/27/2035 | | | 10,000,000 | | | | 15,251,904 | | | | | |
| Spectra Energy Partners LP: | | | | | | | | | | | | |
| 3.500%, 03/15/2025 | | | 15,150,000 | | | | 16,705,569 | | | | | |
| 4.500%, 03/15/2045 | | | 5,000,000 | | | | 5,842,834 | | | | | |
| Standard Industries, Inc.: | | | | | | | | | | | | |
4.750%, 01/15/2028(2) | | | 24,408,000 | | | | 25,689,420 | | | | | |
4.375%, 07/15/2030(2) | | | 5,000,000 | | | | 5,348,650 | | | | | |
3.375%, 01/15/2031(2) | | | 5,000,000 | | | | 5,025,000 | | | | | |
| Stanley Black & Decker, Inc., | | | | | | | | | | | | |
| 4.850%, 11/15/2048 | | | 4,175,000 | | | | 5,884,465 | | | | | |
| Steel Dynamics, Inc., | | | | | | | | | | | | |
| 2.800%, 12/15/2024 | | | 7,000,000 | | | | 7,525,630 | | | | | |
| Stericycle, Inc., | | | | | | | | | | | | |
3.875%, 01/15/2029(2) | | | 1,000,000 | | | | 1,027,500 | | | | | |
| Sunoco Logistics Partners Operations LP: | | | | | | | | | | | | |
| 3.450%, 01/15/2023 | | | 2,000,000 | | | | 2,086,423 | | | | | |
| 6.100%, 02/15/2042 | | | 1,000,000 | | | | 1,157,099 | | | | | |
| Suntory Holdings Ltd., | | | | | | | | | | | | |
2.550%, 06/28/2022(1)(2) | | | 2,000,000 | | | | 2,055,069 | | | | | |
| Sysco Corp.: | | | | | | | | | | | | |
| 5.650%, 04/01/2025 | | | 7,000,000 | | | | 8,323,011 | | | | | |
| 5.950%, 04/01/2030 | | | 18,220,000 | | | | 23,941,902 | | | | | |
| Takeda Pharmaceutical Co. Ltd., | | | | | | | | | | | | |
3.175%, 07/09/2050(1) | | | 21,825,000 | | | | 23,271,422 | | | | | |
| Targa Resources Partners LP: | | | | | | | | | | | | |
| 6.500%, 07/15/2027 | | | 1,000,000 | | | | 1,085,000 | | | | | |
| 5.000%, 01/15/2028 | | | 28,000,000 | | | | 29,555,680 | | | | | |
4.875%, 02/01/2031(2) | | | 500,000 | | | | 544,795 | | | | | |
| TC PipeLines LP: | | | | | | | | | | | | |
| 4.375%, 03/13/2025 | | | 26,205,000 | | | | 29,555,379 | | | | | |
| 3.900%, 05/25/2027 | | | 25,885,000 | | | | 29,113,762 | | | | | |
| Teck Resources Ltd., | | | | | | | | | | | | |
3.900%, 07/15/2030(1) | | | 10,000,000 | | | | 11,136,925 | | | | | |
| Telecom Italia Capital SA: | | | | | | | | | | | | |
5.303%, 05/30/2024(1)(2) | | | 21,500,000 | | | | 23,381,250 | | | | | |
7.200%, 07/18/2036(1) | | | 3,175,000 | | | | 4,283,615 | | | | | |
The accompanying notes are an integral part of these financial statements.
Baird Core Plus Bond Fund
Schedule of Investments, December 31, 2020
Long-Term Investments (cont.)
| | | Principal | | | | | | % of | |
| | | Amount | | | Value | | | Net Assets | |
| Telefonica Emisiones SA: | | | | | | | | | |
5.462%, 02/16/2021(1) | | $ | 2,402,000 | | | $ | 2,415,453 | | | |
|
|
4.570%, 04/27/2023(1) | | | 1,000,000 | | | | 1,093,279 | | | | | |
4.103%, 03/08/2027(1) | | | 8,125,000 | | | | 9,405,809 | | | | | |
7.045%, 06/20/2036(1) | | | 4,925,000 | | | | 7,346,110 | | | | | |
5.213%, 03/08/2047(1) | | | 5,000,000 | | | | 6,409,053 | | | | | |
4.895%, 03/06/2048(1) | | | 9,475,000 | | | | 11,887,249 | | | | | |
5.520%, 03/01/2049(1) | | | 12,000,000 | | | | 16,192,678 | | | | | |
| TELUS Corp., | | | | | | | | | | | | |
2.800%, 02/16/2027(1) | | | 13,100,000 | | | | 14,392,758 | | | | | |
| Tenet Healthcare Corp., | | | | | | | | | | | | |
| 6.750%, 06/15/2023 | | | 1,000,000 | | | | 1,072,500 | | | | | |
| Teva Pharmaceutical Finance Netherlands III BV: | | | | | | | | | | | | |
2.800%, 07/21/2023(1) | | | 24,275,000 | | | | 24,034,678 | | | | | |
3.150%, 10/01/2026(1) | | | 36,000,000 | | | | 34,605,360 | | | | | |
| Textron, Inc., | | | | | | | | | | | | |
| 3.000%, 06/01/2030 | | | 15,000,000 | | | | 16,169,239 | | | | | |
| Thermo Fisher Scientific, Inc., | | | | | | | | | | | | |
| 4.133%, 03/25/2025 | | | 15,000,000 | | | | 17,055,562 | | | | | |
| Timken Co.: | | | | | | | | | | | | |
| 3.875%, 09/01/2024 | | | 18,500,000 | | | | 19,880,742 | | | | | |
| 4.500%, 12/15/2028 | | | 6,025,000 | | | | 6,747,453 | | | | | |
| T-Mobile USA, Inc., | | | | | | | | | | | | |
| 4.750%, 02/01/2028 | | | 17,250,000 | | | | 18,541,853 | | | | | |
| Toll Road Investors Partnership II LP: | | | | | | | | | | | | |
0.000%, 02/15/2022(2) | | | 21,200,000 | | | | 20,424,148 | | | | | |
0.000%, 02/15/2025(2) | | | 10,000,000 | | | | 8,541,720 | | | | | |
| TransCanada PipeLines Ltd., | | | | | | | | | | | | |
4.750%, 05/15/2038(1) | | | 10,000,000 | | | | 12,510,150 | | | | | |
| Transcontinental Gas Pipe Line Co. LLC, | | | | | | | | | | | | |
| 4.450%, 08/01/2042 | | | 2,600,000 | | | | 3,025,767 | | | | | |
| Transocean, Inc., | | | | | | | | | | | | |
11.500%, 01/30/2027(1)(2) | | | 3,650,000 | | | | 2,609,750 | | | | | |
| TreeHouse Foods, Inc., | | | | | | | | | | | | |
| 4.000%, 09/01/2028 | | | 1,500,000 | | | | 1,551,563 | | | | | |
| TTX Co.: | | | | | | | | | | | | |
4.650%, 06/15/2044(2) | | | 7,710,000 | | | | 9,856,374 | | | | | |
3.900%, 02/01/2045(2) | | | 25,325,000 | | | | 29,909,378 | | | | | |
| Tyco Electronics Group SA, | | | | | | | | | | | | |
7.125%, 10/01/2037(1) | | | 500,000 | | | | 755,923 | | | | | |
| Tyson Foods, Inc., | | | | | | | | | | | | |
| 5.100%, 09/23/2048 | | | 4,650,000 | | | | 6,694,270 | | | | | |
| United Rentals North America, Inc.: | | | | | | | | | | | | |
| 5.875%, 09/15/2026 | | | 13,000,000 | | | | 13,763,100 | | | | | |
| 3.875%, 11/15/2027 | | | 5,000,000 | | | | 5,237,500 | | | | | |
The accompanying notes are an integral part of these financial statements.
Baird Core Plus Bond Fund
Schedule of Investments, December 31, 2020
Long-Term Investments (cont.)
| | | Principal | | | | | | % of | |
| | | Amount | | | Value | | | Net Assets | |
| United Rentals North America, Inc.: (cont.) | | | | | | | | | |
| 4.875%, 01/15/2028 | | $ | 5,000,000 | | | $ | 5,325,000 | | | |
|
|
| 5.250%, 01/15/2030 | | | 5,000,000 | | | | 5,550,000 | | | | | |
| 4.000%, 07/15/2030 | | | 10,000,000 | | | | 10,525,000 | | | | | |
| 3.875%, 02/15/2031 | | | 3,000,000 | | | | 3,147,150 | | | | | |
| Universal Health Services, Inc., | | | | | | | | | | | | |
2.650%, 10/15/2030(2) | | | 7,325,000 | | | | 7,604,181 | | | | | |
| Upjohn, Inc.: | | | | | | | | | | | | |
3.850%, 06/22/2040(2) | | | 10,000,000 | | | | 11,286,717 | | | | | |
4.000%, 06/22/2050(2) | | | 17,000,000 | | | | 19,476,695 | | | | | |
| UPMC, | | | | | | | | | | | | |
| 3.600%, 04/03/2025 | | | 47,575,000 | | | | 52,836,407 | | | | | |
| Utah Acquisition Sub, Inc., | | | | | | | | | | | | |
5.250%, 06/15/2046(1) | | | 4,000,000 | | | | 5,240,321 | | | | | |
| Valaris PLC, | | | | | | | | | | | | |
5.200%, 03/15/2025(1)(9) | | | 6,000,000 | | | | 255,000 | | | | | |
| Vale Canada Ltd., | | | | | | | | | | | | |
7.200%, 09/15/2032(1) | | | 1,600,000 | | | | 2,192,000 | | | | | |
| Vale Overseas Ltd.: | | | | | | | | | | | | |
6.250%, 08/10/2026(1) | | | 22,000,000 | | | | 27,280,000 | | | | | |
3.750%, 07/08/2030(1) | | | 12,545,000 | | | | 13,956,438 | | | | | |
8.250%, 01/17/2034(1) | | | 425,000 | | | | 653,013 | | | | | |
6.875%, 11/21/2036(1) | | | 12,475,000 | | | | 18,283,734 | | | | | |
6.875%, 11/10/2039(1) | | | 15,850,000 | | | | 23,596,846 | | | | | |
| Valero Energy Corp.: | | | | | | | | | | | | |
| 1.200%, 03/15/2024 | | | 13,450,000 | | | | 13,573,795 | | | | | |
| 3.400%, 09/15/2026 | | | 17,500,000 | | | | 19,187,849 | | | | | |
| 6.625%, 06/15/2037 | | | 5,000,000 | | | | 6,650,935 | | | | | |
| Valero Energy Partners LP, | | | | | | | | | | | | |
| 4.500%, 03/15/2028 | | | 20,000,000 | | | | 22,975,347 | | | | | |
| Verisk Analytics, Inc.: | | | | | | | | | | | | |
| 5.800%, 05/01/2021 | | | 2,585,000 | | | | 2,629,193 | | | | | |
| 4.000%, 06/15/2025 | | | 10,000,000 | | | | 11,328,019 | | | | | |
| Verizon Communications, Inc.: | | | | | | | | | | | | |
| 3.000%, 03/22/2027 | | | 5,000,000 | | | | 5,547,222 | | | | | |
| 4.500%, 08/10/2033 | | | 15,710,000 | | | | 19,823,036 | | | | | |
| 4.400%, 11/01/2034 | | | 790,000 | | | | 985,865 | | | | | |
| 4.272%, 01/15/2036 | | | 19,793,000 | | | | 24,548,871 | | | | | |
| 5.250%, 03/16/2037 | | | 18,225,000 | | | | 24,698,338 | | | | | |
| 4.812%, 03/15/2039 | | | 38,575,000 | | | | 50,325,661 | | | | | |
| 4.862%, 08/21/2046 | | | 2,500,000 | | | | 3,378,592 | | | | | |
| VF Corp., | | | | | | | | | | | | |
| 2.800%, 04/23/2027 | | | 7,000,000 | | | | 7,656,700 | | | | | |
The accompanying notes are an integral part of these financial statements.
Baird Core Plus Bond Fund
Schedule of Investments, December 31, 2020
Long-Term Investments (cont.)
| | | Principal | | | | | | % of | |
| | | Amount | | | Value | | | Net Assets | |
| Vodafone Group PLC: | | | | | | | | | |
3.750%, 01/16/2024(1) | | $ | 2,184,000 | | | $ | 2,386,582 | | | |
|
|
7.875%, 02/15/2030(1) | | | 16,293,000 | | | | 24,171,452 | | | | | |
6.150%, 02/27/2037(1) | | | 11,825,000 | | | | 17,048,388 | | | | | |
4.375%, 02/19/2043(1) | | | 5,054,000 | | | | 6,276,839 | | | | | |
| Volkswagen Group of America Finance LLC: | | | | | | | | | | | | |
4.000%, 11/12/2021(2) | | | 9,000,000 | | | | 9,274,747 | | | | | |
4.250%, 11/13/2023(2) | | | 18,000,000 | | | | 19,796,775 | | | | | |
2.850%, 09/26/2024(2) | | | 5,000,000 | | | | 5,339,965 | | | | | |
3.350%, 05/13/2025(2) | | | 15,000,000 | | | | 16,490,326 | | | | | |
1.250%, 11/24/2025(2) | | | 11,075,000 | | | | 11,184,789 | | | | | |
| Vulcan Materials Co.: | | | | | | | | | | | | |
| 4.500%, 04/01/2025 | | | 3,000,000 | | | | 3,431,608 | | | | | |
| 3.500%, 06/01/2030 | | | 11,050,000 | | | | 12,692,158 | | | | | |
| 4.700%, 03/01/2048 | | | 500,000 | | | | 645,979 | | | | | |
| Wabtec Corp.: | | | | | | | | | | | | |
| 4.375%, 08/15/2023 | | | 9,750,000 | | | | 10,289,634 | | | | | |
| 4.400%, 03/15/2024 | | | 13,109,000 | | | | 14,346,161 | | | | | |
| 3.450%, 11/15/2026 | | | 33,125,000 | | | | 36,363,655 | | | | | |
| 4.950%, 09/15/2028 | | | 10,205,000 | | | | 12,107,448 | | | | | |
| Walgreens Boots Alliance, Inc.: | | | | | | | | | | | | |
| 3.300%, 11/18/2021 | | | 8,060,000 | | | | 8,227,653 | | | | | |
| 3.450%, 06/01/2026 | | | 17,000,000 | | | | 18,802,028 | | | | | |
| Walmart, Inc., | | | | | | | | | | | | |
| 4.050%, 06/29/2048 | | | 11,975,000 | | | | 16,250,618 | | | | | |
| Walt Disney Co.: | | | | | | | | | | | | |
| 3.700%, 09/15/2024 | | | 4,025,000 | | | | 4,467,767 | | | | | |
| 7.430%, 10/01/2026 | | | 3,300,000 | | | | 4,456,511 | | | | | |
| 5.400%, 10/01/2043 | | | 5,000,000 | | | | 7,313,761 | | | | | |
| 4.750%, 09/15/2044 | | | 1,950,000 | | | | 2,676,161 | | | | | |
| Waste Management, Inc., | | | | | | | | | | | | |
| 3.900%, 03/01/2035 | | | 5,000,000 | | | | 6,122,295 | | | | | |
| Western Digital Corp., | | | | | | | | | | | | |
| 4.750%, 02/15/2026 | | | 57,075,000 | | | | 63,067,875 | | | | | |
| Western Gas Partners LP, | | | | | | | | | | | | |
| 4.000%, 07/01/2022 | | | 17,845,000 | | | | 18,344,303 | | | | | |
| Western Midstream Operating LP, | | | | | | | | | | | | |
| 6.000%, 02/01/2050 | | | 10,000,000 | | | | 11,000,000 | | | | | |
| Westinghouse Air Brake Technologies Corp., | | | | | | | | | | | | |
| 3.200%, 06/15/2025 | | | 10,000,000 | | | | 10,788,593 | | | | | |
| WestRock MWV LLC, | | | | | | | | | | | | |
| 8.200%, 01/15/2030 | | | 5,012,000 | | | | 7,142,517 | | | | | |
| Williams Companies, Inc.: | | | | | | | | | | | | |
| 7.875%, 09/01/2021 | | | 5,065,000 | | | | 5,310,139 | | | | | |
| 3.700%, 01/15/2023 | | | 44,375,000 | | | | 47,007,545 | | | | | |
The accompanying notes are an integral part of these financial statements.
Baird Core Plus Bond Fund
Schedule of Investments, December 31, 2020
Long-Term Investments (cont.)
| | | Principal | | | | | | % of | |
| | | Amount | | | Value | | | Net Assets | |
| Williams Companies, Inc.: (cont.) | | | | | | | | | |
| 4.550%, 06/24/2024 | | $ | 7,629,000 | | | $ | 8,539,562 | | | |
|
|
| 7.500%, 01/15/2031 | | | 120,000 | | | | 163,128 | | | | | |
| 7.750%, 06/15/2031 | | | 3,500,000 | | | | 4,715,203 | | | | | |
| 8.750%, 03/15/2032 | | | 9,275,000 | | | | 13,567,852 | | | | | |
| 6.300%, 04/15/2040 | | | 1,590,000 | | | | 2,114,603 | | | | | |
| 5.750%, 06/24/2044 | | | 2,500,000 | | | | 3,240,118 | | | | | |
| Woodside Finance Ltd., | | | | | | | | | | | | |
3.650%, 03/05/2025(1)(2) | | | 15,575,000 | | | | 16,791,408 | | | | | |
| WRKCo, Inc., | | | | | | | | | | | | |
| 3.000%, 09/15/2024 | | | 6,000,000 | | | | 6,460,513 | | | | | |
| Wynn Las Vegas LLC / Wynn Las Vegas Capital Corp., | | | | | | | | | | | | |
4.250%, 05/30/2023(2) | | | 4,000,000 | | | | 4,058,200 | | | | | |
| Xerox Corp., | | | | | | | | | | | | |
| 4.375%, 03/15/2023 | | | 35,175,000 | | | | 36,933,750 | | | | | |
| Xerox Holdings Corp., | | | | | | | | | | | | |
5.000%, 08/15/2025(2) | | | 1,000,000 | | | | 1,064,270 | | | | | |
| Yara International ASA, | | | | | | | | | | | | |
3.800%, 06/06/2026(1)(2) | | | 20,250,000 | | | | 22,606,598 | | | | | |
| Zimmer Biomet Holdings, Inc.: | | | | | | | | | | | | |
| 3.550%, 04/01/2025 | | | 20,000,000 | | | | 22,091,871 | | | | | |
| 5.750%, 11/30/2039 | | | 9,000,000 | | | | 11,813,684 | | | | | |
| Zoetis, Inc.: | | | | | | | | | | | | |
| 3.250%, 02/01/2023 | | | 24,701,000 | | | | 25,982,671 | | | | | |
| 4.500%, 11/13/2025 | | | 16,275,000 | | | | 18,997,452 | | | | | |
| Total Industrials | | | | | | | | | | | | |
| (Cost $7,970,786,165) | | | | | | | 8,797,804,259 | | | | 29.8 | % |
| Utilities | | | | | | | | | | | | |
| American Water Capital Corp., | | | | | | | | | | | | |
| 2.800%, 05/01/2030 | | | 8,500,000 | | | | 9,382,994 | | | | | |
| Appalachian Power Co., | | | | | | | | | | | | |
| 6.700%, 08/15/2037 | | | 1,400,000 | | | | 1,986,679 | | | | | |
| Avangrid, Inc., | | | | | | | | | | | | |
| 3.200%, 04/15/2025 | | | 14,000,000 | | | | 15,326,353 | | | | | |
| Berkshire Hathaway Energy Co.: | | | | | | | | | | | | |
| 3.500%, 02/01/2025 | | | 7,000,000 | | | | 7,709,472 | | | | | |
2.850%, 05/15/2051(2) | | | 10,000,000 | | | | 10,286,725 | | | | | |
| Consolidated Edison Co. of New York, Inc., | | | | | | | | | | | | |
| 4.625%, 12/01/2054 | | | 7,600,000 | | | | 10,122,803 | | | | | |
| Consumers Energy Co., | | | | | | | | | | | | |
| 3.500%, 08/01/2051 | | | 9,425,000 | | | | 11,530,004 | | | | | |
| Dominion Energy, Inc., | | | | | | | | | | | | |
2.450%, 01/15/2023(2) | | | 15,000,000 | | | | 15,606,459 | | | | | |
The accompanying notes are an integral part of these financial statements.
Baird Core Plus Bond Fund
Schedule of Investments, December 31, 2020
Long-Term Investments (cont.)
| | | Principal | | | | | | % of | |
| | | Amount | | | Value | | | Net Assets | |
| Dominion Resources, Inc., | | | | | | | | | |
| 5.950%, 06/15/2035 | | $ | 1,880,000 | | | $ | 2,634,383 | | | |
|
|
| DTE Electric Company, | | | | | | | | | | | | |
| 2.625%, 03/01/2031 | | | 30,200,000 | | | | 33,434,297 | | | | | |
| Duquesne Light Holdings, Inc., | | | | | | | | | | | | |
2.532%, 10/01/2030(2) | | | 8,775,000 | | | | 9,076,684 | | | | | |
| Edison International, | | | | | | | | | | | | |
| 2.950%, 03/15/2023 | | | 5,000,000 | | | | 5,195,311 | | | | | |
| EDP Finance BV, | | | | | | | | | | | | |
3.625%, 07/15/2024(1)(2) | | | 51,299,000 | | | | 55,986,258 | | | | | |
| Enel Finance International NV: | | | | | | | | | | | | |
2.875%, 05/25/2022(1)(2) | | | 7,500,000 | | | | 7,738,286 | | | | | |
3.625%, 05/25/2027(1)(2) | | | 27,500,000 | | | | 31,204,771 | | | | | |
3.500%, 04/06/2028(1)(2) | | | 7,000,000 | | | | 7,972,283 | | | | | |
4.875%, 06/14/2029(1)(2) | | | 11,775,000 | | | | 14,701,605 | | | | | |
6.800%, 09/15/2037(1)(2) | | | 3,875,000 | | | | 5,702,790 | | | | | |
6.000%, 10/07/2039(1)(2) | | | 1,836,000 | | | | 2,619,564 | | | | | |
4.750%, 05/25/2047(1)(2) | | | 42,584,000 | | | | 56,703,022 | | | | | |
| Engie Energia Chile SA, | | | | | | | | | | | | |
3.400%, 01/28/2030(1)(2) | | | 3,000,000 | | | | 3,251,250 | | | | | |
| Exelon Corp.: | | | | | | | | | | | | |
| 3.950%, 06/15/2025 | | | 15,775,000 | | | | 17,844,437 | | | | | |
| 7.600%, 04/01/2032 | | | 1,650,000 | | | | 2,398,298 | | | | | |
| 5.100%, 06/15/2045 | | | 5,875,000 | | | | 7,959,352 | | | | | |
| Exelon Generation Co. LLC, | | | | | | | | | | | | |
| 5.600%, 06/15/2042 | | | 6,100,000 | | | | 6,948,510 | | | | | |
| FirstEnergy Corp.: | | | | | | | | | | | | |
| 2.650%, 03/01/2030 | | | 4,300,000 | | | | 4,313,637 | | | | | |
| 3.400%, 03/01/2050 | | | 11,325,000 | | | | 10,847,457 | | | | | |
| Fortis Inc., | | | | | | | | | | | | |
3.055%, 10/04/2026(1) | | | 8,762,000 | | | | 9,644,161 | | | | | |
| Infraestructura Energetica Nova SAB de CV, | | | | | | | | | | | | |
3.750%, 01/14/2028(1)(2) | | | 5,000,000 | | | | 5,331,250 | | | | | |
| KeySpan Corp., | | | | | | | | | | | | |
| 8.000%, 11/15/2030 | | | 1,875,000 | | | | 2,724,418 | | | | | |
| Liberty Utilities Finance GP 1, | | | | | | | | | | | | |
2.050%, 09/15/2030(2) | | | 10,600,000 | | | | 10,654,805 | | | | | |
| Mega Advance Investments Ltd., | | | | | | | | | | | | |
5.000%, 05/12/2021(1)(2) | | | 2,800,000 | | | | 2,832,396 | | | | | |
| NiSource, Inc.: | | | | | | | | | | | | |
| 3.600%, 05/01/2030 | | | 20,800,000 | | | | 24,069,212 | | | | | |
| 3.950%, 03/30/2048 | | | 11,775,000 | | | | 14,464,391 | | | | | |
| Oncor Electric Delivery Co. LLC, | | | | | | | | | | | | |
| 2.750%, 05/15/2030 | | | 9,500,000 | | | | 10,636,737 | | | | | |
The accompanying notes are an integral part of these financial statements.
Baird Core Plus Bond Fund
Schedule of Investments, December 31, 2020
Long-Term Investments (cont.)
| | | Principal | | | | | | % of | |
| | | Amount | | | Value | | | Net Assets | |
| PSEG Power LLC, | | | | | | | | | |
| 3.000%, 06/15/2021 | | $ | 25,027,000 | | | $ | 25,264,169 | | | | |
| RGS I&M Funding Corp., | | | | | | | | | | | |
| 9.820%, 12/07/2022 | | | 163,069 | | | | 167,830 | | | | |
| Southern Co., | | | | | | | | | | | |
| 2.950%, 07/01/2023 | | | 17,400,000 | | | | 18,425,969 | | | | |
| Talent Yield Investments Ltd., | | | | | | | | | | | |
4.500%, 04/25/2022(1)(2) | | | 6,000,000 | | | | 6,238,099 | | | | |
| Total Utilities | | | | | | | | | | | |
| (Cost $445,522,826) | | | | | | | 498,937,121 | | | | 1.7 | % |
| Financials | | | | | | | | | | | | |
| ABN AMRO Bank NV: | | | | | | | | | | | | |
7.750%, 05/15/2023(1)(2) | | | 8,000,000 | | | | 9,160,296 | | | | | |
4.750%, 07/28/2025(1)(2) | | | 37,818,000 | | | | 43,522,883 | | | | | |
4.800%, 04/18/2026(1)(2) | | | 47,025,000 | | | | 55,103,015 | | | | | |
| AerCap Holdings NV: | | | | | | | | | | | | |
4.875%, 01/16/2024(1) | | | 6,708,000 | | | | 7,323,166 | | | | | |
2.875%, 08/14/2024(1) | | | 39,395,000 | | | | 40,970,249 | | | | | |
6.500%, 07/15/2025(1) | | | 15,000,000 | | | | 17,931,739 | | | | | |
| AIA Group Ltd., | | | | | | | | | | | | |
3.200%, 03/11/2025(1)(2) | | | 9,000,000 | | | | 9,709,650 | | | | | |
| AIG Life Holdings, Inc., | | | | | | | | | | | | |
| 6.625%, 02/15/2029 | | | 16,500,000 | | | | 21,474,573 | | | | | |
| AIG SunAmerica Global Financing X, | | | | | | | | | | | | |
6.900%, 03/15/2032(2) | | | 2,000,000 | | | | 3,012,793 | | | | | |
| Air Lease Corp.: | | | | | | | | | | | | |
| 4.250%, 02/01/2024 | | | 8,175,000 | | | | 8,872,010 | | | | | |
| 2.300%, 02/01/2025 | | | 14,150,000 | | | | 14,648,707 | | | | | |
| Allstate Corp., | | | | | | | | | | | | |
| 3.850%, 08/10/2049 | | | 10,968,000 | | | | 13,750,708 | | | | | |
| Ally Financial, Inc.: | | | | | | | | | | | | |
| 1.450%, 10/02/2023 | | | 15,000,000 | | | | 15,312,286 | | | | | |
| 5.125%, 09/30/2024 | | | 13,000,000 | | | | 14,986,863 | | | | | |
| 5.800%, 05/01/2025 | | | 10,000,000 | | | | 11,874,507 | | | | | |
| American International Group, Inc.: | | | | | | | | | | | | |
| 4.875%, 06/01/2022 | | | 25,951,000 | | | | 27,533,027 | | | | | |
| 3.750%, 07/10/2025 | | | 11,400,000 | | | | 12,807,844 | | | | | |
| 3.875%, 01/15/2035 | | | 15,000,000 | | | | 17,998,207 | | | | | |
| 6.820%, 11/15/2037 | | | 4,173,000 | | | | 5,928,294 | | | | | |
| AmSouth Bancorporation, | | | | | | | | | | | | |
| 6.750%, 11/01/2025 | | | 1,110,000 | | | | 1,362,886 | | | | | |
| Anthem, Inc.: | | | | | | | | | | | | |
| 3.350%, 12/01/2024 | | | 7,050,000 | | | | 7,767,884 | | | | | |
| 2.375%, 01/15/2025 | | | 4,075,000 | | | | 4,358,417 | | | | | |
The accompanying notes are an integral part of these financial statements.
Baird Core Plus Bond Fund
Schedule of Investments, December 31, 2020
Long-Term Investments (cont.)
| | | Principal | | | | | | % of | |
| | | Amount | | | Value | | | Net Assets | |
| ANZ New Zealand (Int’l) Ltd.: | | | | | | | | | |
2.750%, 02/03/2021(1)(2) | | $ | 10,000,000 | | | $ | 10,019,200 | | | |
|
|
2.125%, 07/28/2021(1)(2) | | | 17,175,000 | | | | 17,348,046 | | | | | |
| Aon PLC, | | | | | | | | | | | | |
3.875%, 12/15/2025(1) | | | 14,490,000 | | | | 16,519,456 | | | | | |
| Assurant, Inc.: | | | | | | | | | | | | |
| 1.501%, 03/26/2021 | | | | | | | | | | | | |
(3 Month LIBOR USD + 1.250%)(3) | | | 1,916,000 | | | | 1,916,026 | | | | | |
| 4.900%, 03/27/2028 | | | 3,000,000 | | | | 3,445,996 | | | | | |
| 3.700%, 02/22/2030 | | | 7,000,000 | | | | 7,789,043 | | | | | |
| Australia & New Zealand Banking Group Ltd.: | | | | | | | | | | | | |
4.500%, 03/19/2024(1)(2) | | | 32,000,000 | | | | 35,276,388 | | | | | |
| 2.950%, 07/22/2030 | | | | | | | | | | | | |
(5 Year CMT Rate + 1.288%)(1)(2)(3) | | | 14,803,000 | | | | 15,618,612 | | | | | |
| 2.570%, 11/25/2035 | | | | | | | | | | | | |
(5 Year CMT Rate + 1.700%)(1)(2)(3) | | | 13,000,000 | | | | 13,262,219 | | | | | |
| Avolon Holdings Funding Ltd.: | | | | | | | | | | | | |
5.250%, 05/15/2024(1)(2) | | | 5,000,000 | | | | 5,438,076 | | | | | |
2.875%, 02/15/2025(1)(2) | | | 10,000,000 | | | | 10,196,666 | | | | | |
| Banco Bilbao Vizcaya Argentaria SA, | | | | | | | | | | | | |
1.125%, 09/18/2025(1) | | | 15,000,000 | | | | 15,108,371 | | | | | |
| Banco Santander Chile, | | | | | | | | | | | | |
2.700%, 01/10/2025(1)(2) | | | 8,000,000 | | | | 8,470,080 | | | | | |
| Banco Santander SA: | | | | | | | | | | | | |
3.500%, 04/11/2022(1) | | | 12,000,000 | | | | 12,461,446 | | | | | |
3.848%, 04/12/2023(1) | | | 16,700,000 | | | | 17,937,784 | | | | | |
5.179%, 11/19/2025(1) | | | 11,150,000 | | | | 13,074,417 | | | | | |
| Bank of America Corp.: | | | | | | | | | | | | |
| 2.625%, 04/19/2021 | | | 17,500,000 | | | | 17,622,356 | | | | | |
| 3.300%, 01/11/2023 | | | 22,650,000 | | | | 24,013,756 | | | | | |
| 3.004%, 12/20/2023 | | | | | | | | | | | | |
(3 Month LIBOR USD + 0.790%)(3) | | | 8,352,000 | | | | 8,790,564 | | | | | |
| 3.864%, 07/23/2024 | | | | | | | | | | | | |
(3 Month LIBOR USD + 0.940%)(3) | | | 12,575,000 | | | | 13,633,834 | | | | | |
| 3.458%, 03/15/2025 | | | | | | | | | | | | |
(3 Month LIBOR USD + 0.970%)(3) | | | 9,650,000 | | | | 10,506,839 | | | | | |
| 3.093%, 10/01/2025 | | | | | | | | | | | | |
(3 Month LIBOR USD + 1.090%)(3) | | | 22,000,000 | | | | 23,815,359 | | | | | |
| 2.456%, 10/22/2025 | | | | | | | | | | | | |
(3 Month LIBOR USD + 0.870%)(3) | | | 8,000,000 | | | | 8,528,232 | | | | | |
| 3.366%, 01/23/2026 | | | | | | | | | | | | |
(3 Month LIBOR USD + 0.810%)(3) | | | 22,700,000 | | | | 24,990,441 | | | | | |
| 3.248%, 10/21/2027 | | | 6,000,000 | | | | 6,714,556 | | | | | |
| 3.419%, 12/20/2028 | | | | | | | | | | | | |
(3 Month LIBOR USD + 1.040%)(3) | | | 10,539,000 | | | | 11,904,265 | | | | | |
The accompanying notes are an integral part of these financial statements.
Baird Core Plus Bond Fund
Schedule of Investments, December 31, 2020
Long-Term Investments (cont.)
| | | Principal | | | | | | % of | |
| | | Amount | | | Value | | | Net Assets | |
| Bank of America Corp.: (cont.) | | | | | | | | | |
| 2.496%, 02/13/2031 | | | | | | | | | |
(3 Month LIBOR USD + 0.990%)(3) | | $ | 7,000,000 | | | $ | 7,434,467 | | | |
|
|
2.592%, 04/29/2031 (SOFR + 2.150%)(3) | | | 35,000,000 | | | | 37,511,544 | | | | | |
| 7.750%, 05/14/2038 | | | 725,000 | | | | 1,236,130 | | | | | |
| Bank of Montreal: | | | | | | | | | | | | |
1.900%, 08/27/2021(1) | | | 26,450,000 | | | | 26,742,687 | | | | | |
| 3.803%, 12/15/2032 | | | | | | | | | | | | |
(5 Year Swap Rate USD + 1.432%)(1)(3) | | | 5,000,000 | | | | 5,667,458 | | | | | |
| Bank of New Zealand, | | | | | | | | | | | | |
2.000%, 02/21/2025(1)(2) | | | 15,475,000 | | | | 16,301,743 | | | | | |
| Bank of Nova Scotia: | | | | | | | | | | | | |
2.450%, 09/19/2022(1) | | | 8,225,000 | | | | 8,543,627 | | | | | |
1.625%, 05/01/2023(1) | | | 11,425,000 | | | | 11,753,748 | | | | | |
4.500%, 12/16/2025(1) | | | 8,048,000 | | | | 9,383,502 | | | | | |
| Banque Federative du Credit Mutuel SA, | | | | | | | | | | | | |
3.750%, 07/20/2023(1)(2) | | | 12,475,000 | | | | 13,481,969 | | | | | |
| Barclays PLC: | | | | | | | | | | | | |
3.250%, 01/12/2021(1) | | | 25,000,000 | | | | 25,013,490 | | | | | |
3.684%, 01/10/2023(1) | | | 22,500,000 | | | | 23,189,599 | | | | | |
| 4.610%, 02/15/2023 | | | | | | | | | | | | |
(3 Month LIBOR USD + 1.400%)(1)(3) | | | 10,000,000 | | | | 10,439,342 | | | | | |
| 4.338%, 05/16/2024 | | | | | | | | | | | | |
(3 Month LIBOR USD + 1.356%)(1)(3) | | | 5,000,000 | | | | 5,411,552 | | | | | |
3.650%, 03/16/2025(1) | | | 17,350,000 | | | | 19,087,360 | | | | | |
| 3.932%, 05/07/2025 | | | | | | | | | | | | |
(3 Month LIBOR USD + 1.610%)(1)(3) | | | 23,400,000 | | | | 25,599,474 | | | | | |
| 2.852%, 05/07/2026 | | | | | | | | | | | | |
(3 Month LIBOR USD + 2.452%)(1)(3) | | | 10,000,000 | | | | 10,739,405 | | | | | |
4.337%, 01/10/2028(1) | | | 10,000,000 | | | | 11,487,879 | | | | | |
| BBVA USA: | | | | | | | | | | | | |
| 2.875%, 06/29/2022 | | | 15,700,000 | | | | 16,269,625 | | | | | |
| 3.875%, 04/10/2025 | | | 45,470,000 | | | | 50,989,598 | | | | | |
| Berkshire Hathaway Finance Corp., | | | | | | | | | | | | |
| 4.400%, 05/15/2042 | | | 3,500,000 | | | | 4,649,824 | | | | | |
| BGC Partners, Inc., | | | | | | | | | | | | |
| 4.375%, 12/15/2025 | | | 13,000,000 | | | | 13,750,983 | | | | | |
| BNP Paribas SA: | | | | | | | | | | | | |
3.500%, 03/01/2023(1)(2) | | | 4,000,000 | | | | 4,256,503 | | | | | |
3.375%, 01/09/2025(1)(2) | | | 8,000,000 | | | | 8,754,783 | | | | | |
4.375%, 09/28/2025(1)(2) | | | 14,700,000 | | | | 16,816,590 | | | | | |
| 2.819%, 11/19/2025 | | | | | | | | | | | | |
(3 Month LIBOR USD + 1.111%)(1)(2)(3) | | | 42,500,000 | | | | 45,301,729 | | | | | |
2.219%, 06/09/2026 (SOFR + 2.074%)(1)(2)(3) | | | 10,000,000 | | | | 10,466,317 | | | | | |
1.904%, 09/30/2028 (SOFR + 1.609%)(1)(2)(3) | | | 16,000,000 | | | | 16,266,684 | | | | | |
The accompanying notes are an integral part of these financial statements.
Baird Core Plus Bond Fund
Schedule of Investments, December 31, 2020
Long-Term Investments (cont.)
| | | Principal | | | | | | % of | |
| | | Amount | | | Value | | | Net Assets | |
| BNP Paribas SA: (cont.) | | | | | | | | | |
3.052%, 01/13/2031 (SOFR + 1.507%)(1)(2)(3) | | $ | 10,500,000 | | | $ | 11,457,893 | | | |
|
|
| 2.588%, 08/12/2035 | | | | | | | | | | | | |
(5 Year CMT Rate + 2.050%)(1)(2)(3) | | | 5,000,000 | | | | 5,111,632 | | | | | |
| BNZ International Funding Ltd.: | | | | | | | | | | | | |
| 2.750%, 03/02/2021 (1)(2) | | | 18,750,000 | | | | 18,824,060 | | | | | |
| 3.375%, 03/01/2023 (1)(2) | | | 24,750,000 | | | | 26,284,347 | | | | | |
| BPCE SA: | | | | | | | | | | | | |
| 5.700%, 10/22/2023 (1)(2) | | | 33,770,000 | | | | 38,222,182 | | | | | |
| 4.625%, 07/11/2024 (1)(2) | | | 3,185,000 | | | | 3,560,420 | | | | | |
| 5.150%, 07/21/2024 (1)(2) | | | 30,902,000 | | | | 35,189,251 | | | | | |
| 2.375%, 01/14/2025 (1)(2) | | | 5,000,000 | | | | 5,284,270 | | | | | |
| 4.500%, 03/15/2025 (1)(2) | | | 40,275,000 | | | | 45,527,317 | | | | | |
1.652%, 10/06/2026 (SOFR + 1.520%)(1)(2)(3) | | | 25,000,000 | | | | 25,583,316 | | | | | |
| Brown & Brown, Inc., | | | | | | | | | | | | |
| 4.500%, 03/15/2029 | | | 11,840,000 | | | | 14,015,434 | | | | | |
| Canadian Imperial Bank of Commerce, | | | | | | | | | | | | |
2.250%, 01/28/2025(1) | | | 8,000,000 | | | | 8,497,741 | | | | | |
| Cantor Fitzgerald LP, | | | | | | | | | | | | |
4.875%, 05/01/2024(2) | | | 7,525,000 | | | | 8,377,385 | | | | | |
| Capital One Financial Corp.: | | | | | | | | | | | | |
| 3.200%, 01/30/2023 | | | 5,000,000 | | | | 5,268,009 | | | | | |
| 3.750%, 07/28/2026 | | | 5,000,000 | | | | 5,672,328 | | | | | |
| 3.650%, 05/11/2027 | | | 16,750,000 | | | | 19,203,266 | | | | | |
| 3.800%, 01/31/2028 | | | 6,960,000 | | | | 8,020,716 | | | | | |
| Capital One NA, | | | | | | | | | | | | |
| 3.375%, 02/15/2023 | | | 54,066,000 | | | | 57,134,368 | | | | | |
| Centene Corp., | | | | | | | | | | | | |
| 3.000%, 10/15/2030 | | | 10,000,000 | | | | 10,599,000 | | | | | |
| CIT Bank NA, | | | | | | | | | | | | |
2.969%, 09/27/2025 (SOFR + 1.715%)(3) | | | 21,219,000 | | | | 22,226,902 | | | | | |
| CIT Group, Inc.: | | | | | | | | | | | | |
| 4.125%, 03/09/2021 | | | 100,000 | | | | 100,300 | | | | | |
| 5.000%, 08/01/2023 | | | 5,000,000 | | | | 5,462,500 | | | | | |
| 4.750%, 02/16/2024 | | | 13,000,000 | | | | 14,218,750 | | | | | |
| 5.250%, 03/07/2025 | | | 100,000 | | | | 113,500 | | | | | |
| Citigroup, Inc.: | | | | | | | | | | | | |
| 2.350%, 08/02/2021 | | | 8,125,000 | | | | 8,219,633 | | | | | |
| 3.142%, 01/24/2023 | | | | | | | | | | | | |
(3 Month LIBOR USD + 0.722%)(3) | | | 10,000,000 | | | | 10,282,880 | | | | | |
| 2.876%, 07/24/2023 | | | | | | | | | | | | |
(3 Month LIBOR USD + 0.950%)(3) | | | 12,450,000 | | | | 12,932,843 | | | | | |
| 1.655%, 09/01/2023 | | | | | | | | | | | | |
(3 Month LIBOR USD + 1.430%)(3) | | | 8,000,000 | | | | 8,136,866 | | | | | |
The accompanying notes are an integral part of these financial statements.
Baird Core Plus Bond Fund
Schedule of Investments, December 31, 2020
Long-Term Investments (cont.)
| | | Principal | | | | | | % of | |
| | | Amount | | | Value | | | Net Assets | |
| Citigroup, Inc.: (cont.) | | | | | | | | | |
| 3.352%, 04/24/2025 | | | | | | | | | |
(3 Month LIBOR USD + 0.897%)(3) | | $ | 11,000,000 | | | $ | 11,958,934 | | | |
|
|
| 3.700%, 01/12/2026 | | | 4,700,000 | | | | 5,340,883 | | | | | |
3.106%, 04/08/2026 (SOFR + 2.750%)(3) | | | 15,000,000 | | | | 16,388,431 | | | | | |
| 3.200%, 10/21/2026 | | | 10,931,000 | | | | 12,217,226 | | | | | |
| 3.887%, 01/10/2028 | | | | | | | | | | | | |
(3 Month LIBOR USD + 1.563%)(3) | | | 30,000,000 | | | | 34,382,355 | | | | | |
2.572%, 06/03/2031 (SOFR + 2.107%)(3) | | | 50,000,000 | | | | 53,293,008 | | | | | |
| Citizens Bank NA: | | | | | | | | | | | | |
| 2.550%, 05/13/2021 | | | 6,175,000 | | | | 6,213,132 | | | | | |
| 2.250%, 04/28/2025 | | | 9,000,000 | | | | 9,549,630 | | | | | |
| Citizens Financial Group, Inc.: | | | | | | | | | | | | |
| 2.850%, 07/27/2026 | | | 23,400,000 | | | | 26,042,498 | | | | | |
| 3.250%, 04/30/2030 | | | 40,000,000 | | | | 45,075,981 | | | | | |
| CNA Financial Corp.: | | | | | | | | | | | | |
| 7.250%, 11/15/2023 | | | 12,400,000 | | | | 14,703,488 | | | | | |
| 4.500%, 03/01/2026 | | | 21,125,000 | | | | 24,851,545 | | | | | |
| 3.450%, 08/15/2027 | | | 9,000,000 | | | | 10,195,667 | | | | | |
| CNO Financial Group, Inc., | | | | | | | | | | | | |
| 5.250%, 05/30/2025 | | | 18,640,000 | | | | 21,636,883 | | | | | |
| Comerica Bank, | | | | | | | | | | | | |
| 4.000%, 07/27/2025 | | | 21,425,000 | | | | 24,175,577 | | | | | |
| Commonwealth Bank of Australia: | | | | | | | | | | | | |
4.500%, 12/09/2025(1)(2) | | | 19,000,000 | | | | 21,919,698 | | | | | |
| 3.610%, 09/12/2034 | | | | | | | | | | | | |
(5 Year CMT Rate + 2.050%)(1)(2)(3) | | | 35,000,000 | | | | 38,451,397 | | | | | |
| Cooperatieve Rabobank UA: | | | | | | | | | | | | |
3.875%, 02/08/2022(1) | | | 4,150,000 | | | | 4,315,243 | | | | | |
4.625%, 12/01/2023(1) | | | 7,229,000 | | | | 8,057,093 | | | | | |
4.375%, 08/04/2025(1) | | | 11,805,000 | | | | 13,472,762 | | | | | |
3.750%, 07/21/2026(1) | | | 36,000,000 | | | | 40,685,778 | | | | | |
| Credit Agricole SA: | | | | | | | | | | | | |
3.375%, 01/10/2022(1)(2) | | | 23,225,000 | | | | 23,931,575 | | | | | |
3.750%, 04/24/2023(1)(2) | | | 8,375,000 | | | | 8,990,385 | | | | | |
3.250%, 10/04/2024(1)(2) | | | 8,575,000 | | | | 9,301,966 | | | | | |
4.375%, 03/17/2025(1)(2) | | | 37,093,000 | | | | 41,631,922 | | | | | |
1.907%, 06/16/2026 (SOFRINDX + 1.676%)(1)(2)(3) | | | 7,000,000 | | | | 7,260,448 | | | | | |
3.250%, 01/14/2030(1)(2) | | | 5,000,000 | | | | 5,486,072 | | | | | |
| Credit Suisse Group AG: | | | | | | | | | | | | |
3.574%, 01/09/2023(1)(2) | | | 9,000,000 | | | | 9,272,772 | | | | | |
| 4.207%, 06/12/2024 | | | | | | | | | | | | |
(3 Month LIBOR USD + 1.240%)(1)(2)(3) | | | 6,000,000 | | | | 6,500,534 | | | | | |
2.593%, 09/11/2025 (SOFR + 1.560%)(1)(2)(3) | | | 13,700,000 | | | | 14,416,146 | | | | | |
2.193%, 06/05/2026 (SOFR + 2.044%)(1)(2)(3) | | | 10,000,000 | | | | 10,450,524 | | | | | |
The accompanying notes are an integral part of these financial statements.
Baird Core Plus Bond Fund
Schedule of Investments, December 31, 2020
Long-Term Investments (cont.)
| | | Principal | | | | | | % of | |
| | | Amount | | | Value | | | Net Assets | |
| Credit Suisse Group AG: (cont.) | | | | | | | | | |
4.282%, 01/09/2028(1)(2) | | $ | 16,750,000 | | | $ | 19,356,550 | | | |
|
|
| 3.869%, 01/12/2029 | | | | | | | | | | | | |
(3 Month LIBOR USD + 1.410%)(1)(2)(3) | | | 10,850,000 | | | | 12,288,724 | | | | | |
4.194%, 04/01/2031 (SOFR + 3.730%)(1)(2)(3) | | | 20,000,000 | | | | 23,539,472 | | | | | |
| Credit Suisse Group Funding Guernsey Ltd.: | | | | | | | | | | | | |
3.800%, 06/09/2023(1) | | | 21,400,000 | | | | 23,047,600 | | | | | |
3.750%, 03/26/2025(1) | | | 15,000,000 | | | | 16,653,142 | | | | | |
4.550%, 04/17/2026(1) | | | 5,000,000 | | | | 5,882,498 | | | | | |
| CyrusOne LP / CyrusOne Finance Corp.: | | | | | | | | | | | | |
| 2.900%, 11/15/2024 | | | 10,000,000 | | | | 10,676,100 | | | | | |
| 3.450%, 11/15/2029 | | | 1,485,000 | | | | 1,597,459 | | | | | |
| 2.150%, 11/01/2030 | | | 11,000,000 | | | | 10,721,590 | | | | | |
| Daiwa Securities Group, Inc., | | | | | | | | | | | | |
3.129%, 04/19/2022(1)(2) | | | 14,175,000 | | | | 14,631,719 | | | | | |
| Danske Bank A/S, | | | | | | | | | | | | |
| 1.621%, 09/11/2026 | | | | | | | | | | | | |
(1 Year CMT Rate + 1.350%)(1)(2)(3) | | | 20,450,000 | | | | 20,542,328 | | | | | |
| Deutsche Bank AG: | | | | | | | | | | | | |
3.150%, 01/22/2021(1) | | | 16,954,000 | | | | 16,972,804 | | | | | |
3.375%, 05/12/2021(1) | | | 5,450,000 | | | | 5,502,470 | | | | | |
4.250%, 10/14/2021(1) | | | 29,900,000 | | | | 30,660,265 | | | | | |
5.000%, 02/14/2022(1) | | | 10,000,000 | | | | 10,455,287 | | | | | |
3.300%, 11/16/2022(1) | | | 17,625,000 | | | | 18,380,045 | | | | | |
3.950%, 02/27/2023(1) | | | 14,875,000 | | | | 15,804,383 | | | | | |
5.882%, 07/08/2031 (SOFR + 5.438%)(1)(3) | | | 30,000,000 | | | | 35,967,704 | | | | | |
3.547%, 09/18/2031 (SOFR + 3.043%)(1)(3) | | | 10,000,000 | | | | 10,837,412 | | | | | |
| Digital Realty Trust LP: | | | | | | | | | | | | |
| 4.450%, 07/15/2028 | | | 7,000,000 | | | | 8,416,354 | | | | | |
| 3.600%, 07/01/2029 | | | 41,950,000 | | | | 48,095,280 | | | | | |
| Discover Bank: | | | | | | | | | | | | |
| 3.350%, 02/06/2023 | | | 7,000,000 | | | | 7,386,314 | | | | | |
| 4.682%, 08/09/2028 | | | | | | | | | | | | |
(5 Year Swap Rate USD + 1.730%)(3) | | | 6,500,000 | | | | 6,909,500 | | | | | |
| 4.650%, 09/13/2028 | | | 23,225,000 | | | | 27,783,573 | | | | | |
| Discover Financial Services: | | | | | | | | | | | | |
| 3.950%, 11/06/2024 | | | 25,000,000 | | | | 27,760,902 | | | | | |
| 4.100%, 02/09/2027 | | | 13,379,000 | | | | 15,413,685 | | | | | |
| DNB Bank ASA, | | | | | | | | | | | | |
| 1.127%, 09/16/2026 | | | | | | | | | | | | |
(5 Year CMT Rate + 0.850%)(1)(2)(3) | | | 10,000,000 | | | | 10,105,969 | | | | | |
| First Horizon National Corp., | | | | | | | | | | | | |
| 4.000%, 05/26/2025 | | | 30,000,000 | | | | 33,515,570 | | | | | |
| First Republic Bank, | | | | | | | | | | | | |
| 4.625%, 02/13/2047 | | | 1,850,000 | | | | 2,441,903 | | | | | |
The accompanying notes are an integral part of these financial statements.
Baird Core Plus Bond Fund
Schedule of Investments, December 31, 2020
Long-Term Investments (cont.)
| | | Principal | | | | | | % of | |
| | | Amount | | | Value | | | Net Assets | |
| Five Corners Funding Trust II, | | | | | | | | | |
2.850%, 05/15/2030(2) | | $ | 10,000,000 | | | $ | 11,062,110 | | | |
|
|
| FMR LLC: | | | | | | | | | | | | |
4.950%, 02/01/2033(2) | | | 4,235,000 | | | | 5,698,558 | | | | | |
6.500%, 12/14/2040(2) | | | 1,820,000 | | | | 2,825,562 | | | | | |
| GE Capital Funding LLC: | | | | | | | | | | | | |
4.050%, 05/15/2027(2) | | | 10,000,000 | | | | 11,439,940 | | | | | |
4.550%, 05/15/2032(2) | | | 10,000,000 | | | | 12,001,181 | | | | | |
| GE Capital International Funding Co. Unlimited Co.: | | | | | | | | | | | | |
3.373%, 11/15/2025(1) | | | 5,000,000 | | | | 5,549,347 | | | | | |
4.418%, 11/15/2035(1) | | | 51,000,000 | | | | 60,870,847 | | | | | |
| Globe Life, Inc.: | | | | | | | | | | | | |
| 3.800%, 09/15/2022 | | | 1,275,000 | | | | 1,343,920 | | | | | |
| 4.550%, 09/15/2028 | | | 9,350,000 | | | | 11,220,728 | | | | | |
| Goldman Sachs Group, Inc.: | | | | | | | | | | | | |
| 5.250%, 07/27/2021 | | | 1,100,000 | | | | 1,130,888 | | | | | |
| 5.750%, 01/24/2022 | | | 15,100,000 | | | | 15,960,636 | | | | | |
| 1.824%, 11/29/2023 | | | | | | | | | | | | |
(3 Month LIBOR USD + 1.600%(3) | | | 10,000,000 | | | | 10,342,610 | | | | | |
| 3.500%, 01/23/2025 | | | 9,400,000 | | | | 10,374,398 | | | | | |
| 3.500%, 04/01/2025 | | | 10,000,000 | | | | 11,109,897 | | | | | |
| 3.272%, 09/29/2025 | | | | | | | | | | | | |
(3 Month LIBOR USD + 1.201%)(3) | | | 24,000,000 | | | | 26,290,211 | | | | | |
| 3.814%, 04/23/2029 | | | | | | | | | | | | |
(3 Month LIBOR USD + 1.158%)(3) | | | 17,875,000 | | | | 20,688,889 | | | | | |
| 4.223%, 05/01/2029 | | | | | | | | | | | | |
(3 Month LIBOR USD + 1.301%)(3) | | | 15,050,000 | | | | 17,854,765 | | | | | |
| 6.345%, 02/15/2034 | | | 125,000 | | | | 174,599 | | | | | |
| 6.750%, 10/01/2037 | | | 300,000 | | | | 459,048 | | | | | |
| Guardian Life Insurance Co. of America: | | | | | | | | | | | | |
4.875%, 06/19/2064(2) | | | 11,215,000 | | | | 14,966,980 | | | | | |
3.700%, 01/22/2070(2) | | | 14,000,000 | | | | 15,694,545 | | | | | |
4.850%, 01/24/2077(2) | | | 15,693,000 | | | | 22,007,925 | | | | | |
| Harborwalk Funding Trust, | | | | | | | | | | | | |
| 5.077%, 02/15/2069 | | | | | | | | | | | | |
(3 Month LIBOR USD + 3.191%)(2)(3) | | | 10,000,000 | | | | 12,984,154 | | | | | |
| Hartford Financial Services Group, Inc.: | | | | | | | | | | | | |
| 6.100%, 10/01/2041 | | | 2,925,000 | | | | 4,374,563 | | | | | |
| 3.600%, 08/19/2049 | | | 15,725,000 | | | | 18,452,924 | | | | | |
| High Street Funding Trust I, | | | | | | | | | | | | |
4.111%, 02/15/2028(2) | | | 9,000,000 | | | | 10,377,630 | | | | | |
| High Street Funding Trust II, | | | | | | | | | | | | |
4.682%, 02/15/2048(2) | | | 7,000,000 | | | | 8,974,630 | | | | | |
| Highmark, Inc., | | | | | | | | | | | | |
4.750%, 05/15/2021(2) | | | 7,800,000 | | | | 7,926,699 | | | | | |
The accompanying notes are an integral part of these financial statements.
Baird Core Plus Bond Fund
Schedule of Investments, December 31, 2020
Long-Term Investments (cont.)
| | | Principal | | | | | | % of | |
| | | Amount | | | Value | | | Net Assets | |
| HSBC Holdings PLC: | | | | | | | | | |
| 3.262%, 03/13/2023 | | | | | | | | | |
(3 Month LIBOR USD + 1.055%)(1)(3) | | $ | 30,996,000 | | | $ | 32,017,200 | | | |
|
|
3.600%, 05/25/2023(1) | | | 6,000,000 | | | | 6,453,674 | | | | | |
| 3.950%, 05/18/2024 | | | | | | | | | | | | |
(3 Month LIBOR USD + 0.987%)(1)(3) | | | 9,000,000 | | | | 9,708,007 | | | | | |
| 3.803%, 03/11/2025 | | | | | | | | | | | | |
(3 Month LIBOR USD + 1.211%)(1)(3) | | | 5,200,000 | | | | 5,677,492 | | | | | |
1.645%, 04/18/2026 (SOFR + 1.538%)(1)(3) | | | 8,125,000 | | | | 8,309,938 | | | | | |
1.589%, 05/24/2027 (SOFR + 1.290%)(1)(3) | | | 10,000,000 | | | | 10,169,172 | | | | | |
2.013%, 09/22/2028 (SOFR + 1.732%)(1)(3) | | | 25,000,000 | | | | 25,593,172 | | | | | |
| 4.583%, 06/19/2029 | | | | | | | | | | | | |
(3 Month LIBOR USD + 1.535%)(1)(3) | | | 17,125,000 | | | | 20,259,767 | | | | | |
| 3.973%, 05/22/2030 | | | | | | | | | | | | |
(3 Month LIBOR USD + 1.610%)(1)(3) | | | 4,775,000 | | | | 5,513,932 | | | | | |
| Humana, Inc., | | | | | | | | | | | | |
| 8.150%, 06/15/2038 | | | 8,983,000 | | | | 14,363,465 | | | | | |
| Huntington Bancshares, Inc.: | | | | | | | | | | | | |
| 3.150%, 03/14/2021 | | | 10,725,000 | | | | 10,758,090 | | | | | |
| 2.300%, 01/14/2022 | | | 6,951,000 | | | | 7,076,215 | | | | | |
| 2.625%, 08/06/2024 | | | 1,500,000 | | | | 1,602,948 | | | | | |
| ING Groep NV, | | | | | | | | | | | | |
3.150%, 03/29/2022(1) | | | 4,000,000 | | | | 4,136,752 | | | | | |
| Invesco Finance PLC, | | | | | | | | | | | | |
3.125%, 11/30/2022(1) | | | 5,500,000 | | | | 5,776,401 | | | | | |
| Jackson National Life Global Funding, | | | | | | | | | | | | |
3.250%, 01/30/2024(2) | | | 10,000,000 | | | | 10,751,510 | | | | | |
| Jefferies Group LLC: | | | | | | | | | | | | |
| 4.850%, 01/15/2027 | | | 15,750,000 | | | | 18,423,618 | | | | | |
| 6.450%, 06/08/2027 | | | 1,300,000 | | | | 1,648,061 | | | | | |
| 4.150%, 01/23/2030 | | | 30,200,000 | | | | 35,200,368 | | | | | |
| John Hancock Life Insurance Co., | | | | | | | | | | | | |
7.375%, 02/15/2024(2) | | | 17,615,000 | | | | 20,765,460 | | | | | |
| JPMorgan Chase & Co.: | | | | | | | | | | | | |
| 3.200%, 01/25/2023 | | | 5,350,000 | | | | 5,663,578 | | | | | |
| 1.445%, 10/24/2023 | | | | | | | | | | | | |
(3 Month LIBOR USD + 1.230%)(3) | | | 10,000,000 | | | | 10,179,111 | | | | | |
| 3.559%, 04/23/2024 | | | | | | | | | | | | |
(3 Month LIBOR USD + 0.730%)(3) | | | 15,575,000 | | | | 16,693,530 | | | | | |
| 3.125%, 01/23/2025 | | | 21,850,000 | | | | 23,931,409 | | | | | |
2.301%, 10/15/2025 (SOFR + 1.160%)(3) | | | 19,859,000 | | | | 21,080,846 | | | | | |
2.005%, 03/13/2026 (SOFR + 1.585%)(3) | | | 17,000,000 | | | | 17,856,661 | | | | | |
2.083%, 04/22/2026 (SOFR + 1.850%)(3) | | | 71,000,000 | | | | 74,984,985 | | | | | |
1.045%, 11/19/2026 (SOFR + 0.800%)(3) | | | 18,500,000 | | | | 18,709,050 | | | | | |
2.522%, 04/22/2031 (SOFR + 2.040%)(3) | | | 30,500,000 | | | | 32,783,293 | | | | | |
The accompanying notes are an integral part of these financial statements.
Baird Core Plus Bond Fund
Schedule of Investments, December 31, 2020
Long-Term Investments (cont.)
| | | Principal | | | | | | % of | |
| | | Amount | | | Value | | | Net Assets | |
| KeyBank NA, | | | | | | | | | |
| 3.400%, 05/20/2026 | | $ | 21,575,000 | | | $ | 24,223,774 | | | |
|
|
| LeasePlan Corp. NV, | | | | | | | | | | | | |
2.875%, 10/24/2024(1)(2) | | | 77,403,000 | | | | 81,788,505 | | | | | |
| Liberty Mutual Group, Inc.: | | | | | | | | | | | | |
6.500%, 03/15/2035(2) | | | 750,000 | | | | 1,122,135 | | | | | |
3.951%, 10/15/2050(2) | | | 900,000 | | | | 1,077,753 | | | | | |
| Liberty Mutual Insurance Co., | | | | | | | | | | | | |
7.697%, 10/15/2097(2) | | | 375,000 | | | | 602,905 | | | | | |
| Life Storage LP: | | | | | | | | | | | | |
| 3.875%, 12/15/2027 | | | 2,575,000 | | | | 2,942,032 | | | | | |
| 2.200%, 10/15/2030 | | | 6,950,000 | | | | 7,094,356 | | | | | |
| Lincoln National Corp.: | | | | | | | | | | | | |
| 3.400%, 01/15/2031 | | | 23,000,000 | | | | 26,356,321 | | | | | |
| 6.300%, 10/09/2037 | | | 2,190,000 | | | | 3,018,667 | | | | | |
| Lloyds Bank PLC: | | | | | | | | | | | | |
4.050%, 08/16/2023(1) | | | 6,575,000 | | | | 7,185,014 | | | | | |
| 2.907%, 11/07/2023 | | | | | | | | | | | | |
(3 Month LIBOR USD + 0.810%)(1)(3) | | | 21,520,000 | | | | 22,482,803 | | | | | |
3.870%, 07/09/2025 (1 Year CMT Rate + 3.500%)(1)(3) | | | 15,000,000 | | | | 16,537,284 | | | | | |
3.750%, 01/11/2027(1) | | | 7,800,000 | | | | 8,845,355 | | | | | |
4.375%, 03/22/2028(1) | | | 15,000,000 | | | | 17,852,182 | | | | | |
| 3.574%, 11/07/2028 | | | | | | | | | | | | |
(3 Month LIBOR USD + 1.205%)(1)(3) | | | 21,550,000 | | | | 24,335,158 | | | | | |
| Macquarie Bank Ltd.: | | | | | | | | | | | | |
6.625%, 04/07/2021(1)(2) | | | 275,000 | | | | 279,292 | | | | | |
4.875%, 06/10/2025(1)(2) | | | 7,800,000 | | | | 8,850,832 | | | | | |
3.624%, 06/03/2030(1)(2) | | | 28,805,000 | | | | 31,534,685 | | | | | |
| Macquarie Group Ltd.: | | | | | | | | | | | | |
| 3.189%, 11/28/2023 | | | | | | | | | | | | |
(3 Month LIBOR USD + 1.023%)(1)(2)(3) | | | 35,850,000 | | | | 37,477,636 | | | | | |
| 4.150%, 03/27/2024 | | | | | | | | | | | | |
(3 Month LIBOR USD + 1.330%)(1)(2)(3) | | | 21,000,000 | | | | 22,564,607 | | | | | |
| Manulife Financial Corp.: | | | | | | | | | | | | |
4.150%, 03/04/2026(1) | | | 15,000,000 | | | | 17,447,416 | | | | | |
2.484%, 05/19/2027(1) | | | 15,225,000 | | | | 16,522,436 | | | | | |
| Marsh & McLennan Companies, Inc.: | | | | | | | | | | | | |
| 4.800%, 07/15/2021 | | | 1,000,000 | | | | 1,013,784 | | | | | |
| 3.300%, 03/14/2023 | | | 6,875,000 | | | | 7,278,619 | | | | | |
| 3.750%, 03/14/2026 | | | 9,225,000 | | | | 10,466,908 | | | | | |
| 5.875%, 08/01/2033 | | | 3,729,000 | | | | 5,363,384 | | | | | |
| Massachusetts Mutual Life Insurance Co.: | | | | | | | | | | | | |
7.625%, 11/15/2023(2) | | | 3,184,000 | | | | 3,607,222 | | | | | |
3.729%, 10/15/2070(2) | | | 19,253,000 | | | | 21,256,537 | | | | | |
4.900%, 04/01/2077(2) | | | 8,000,000 | | | | 10,989,819 | | | | | |
The accompanying notes are an integral part of these financial statements.
Baird Core Plus Bond Fund
Schedule of Investments, December 31, 2020
Long-Term Investments (cont.)
| | | Principal | | | | | | % of | |
| | | Amount | | | Value | | | Net Assets | |
| MBIA Insurance Corp., | | | | | | | | | |
| 11.497%, 01/15/2033 | | | | | | | | | |
(3 Month LIBOR USD + 11.260%)(2)(3)(9) | | $ | 700,000 | | | $ | 245,000 | | | |
|
|
| MetLife, Inc.: | | | | | | | | | | | | |
| 4.875%, 11/13/2043 | | | 3,375,000 | | | | 4,801,460 | | | | | |
| 4.050%, 03/01/2045 | | | 9,025,000 | | | | 11,571,395 | | | | | |
| Metropolitan Life Insurance Co., | | | | | | | | | | | | |
7.800%, 11/01/2025(2) | | | 3,725,000 | | | | 4,821,533 | | | | | |
| Mitsubishi UFJ Financial Group, Inc.: | | | | | | | | | | | | |
2.190%, 09/13/2021(1) | | | 11,039,000 | | | | 11,180,741 | | | | | |
3.455%, 03/02/2023(1) | | | 15,000,000 | | | | 15,982,358 | | | | | |
2.801%, 07/18/2024(1) | | | 10,000,000 | | | | 10,719,386 | | | | | |
2.193%, 02/25/2025(1) | | | 11,500,000 | | | | 12,148,549 | | | | | |
| Mizuho Financial Group, Inc.: | | | | | | | | | | | | |
2.953%, 02/28/2022(1) | | | 9,750,000 | | | | 10,041,798 | | | | | |
2.601%, 09/11/2022(1) | | | 5,000,000 | | | | 5,188,922 | | | | | |
| 3.922%, 09/11/2024 | | | | | | | | | | | | |
(3 Month LIBOR USD + 1.000%)(1)(3) | | | 9,000,000 | | | | 9,785,798 | | | | | |
| 2.555%, 09/13/2025 | | | | | | | | | | | | |
(3 Month LIBOR USD + 1.100%)(1)(3) | | | 20,000,000 | | | | 21,126,387 | | | | | |
3.170%, 09/11/2027(1) | | | 24,650,000 | | | | 27,501,062 | | | | | |
| 1.979%, 09/08/2031 | | | | | | | | | | | | |
(3 Month LIBOR USD + 1.270%)(1)(3) | | | 13,250,000 | | | | 13,485,459 | | | | | |
| Morgan Stanley: | | | | | | | | | | | | |
| 3.125%, 01/23/2023 | | | 15,000,000 | | | | 15,830,549 | | | | | |
| 3.750%, 02/25/2023 | | | 1,000,000 | | | | 1,072,171 | | | | | |
| 1.615%, 10/24/2023 | | | | | | | | | | | | |
(3 Month LIBOR USD + 1.400%)(3) | | | 10,000,000 | | | | 10,189,847 | | | | | |
| 3.737%, 04/24/2024 | | | | | | | | | | | | |
(3 Month LIBOR USD + 0.847%)(3) | | | 25,000,000 | | | | 26,898,938 | | | | | |
| 3.700%, 10/23/2024 | | | 5,000,000 | | | | 5,563,991 | | | | | |
2.720%, 07/22/2025 (SOFR + 1.152%)(3) | | | 15,000,000 | | | | 16,043,654 | | | | | |
| 4.000%, 07/23/2025 | | | 2,500,000 | | | | 2,860,930 | | | | | |
| 3.875%, 01/27/2026 | | | 7,000,000 | | | | 8,029,518 | | | | | |
2.188%, 04/28/2026 (SOFR + 1.990%)(3) | | | 40,000,000 | | | | 42,249,679 | | | | | |
| 3.125%, 07/27/2026 | | | 13,175,000 | | | | 14,726,573 | | | | | |
| 3.591%, 07/22/2028 | | | | | | | | | | | | |
(3 Month LIBOR USD + 1.340%)(3) | | | 15,350,000 | | | | 17,525,017 | | | | | |
| MUFG Americas Holdings Corp., | | | | | | | | | | | | |
| 3.500%, 06/18/2022 | | | 1,150,000 | | | | 1,203,051 | | | | | |
| National Australia Bank Ltd.: | | | | | | | | | | | | |
2.332%, 08/21/2030(1)(2) | | | 53,625,000 | | | | 54,516,646 | | | | | |
| 3.933%, 08/02/2034 | | | | | | | | | | | | |
(5 Year CMT Rate + 1.880%)(1)(2)(3) | | | 5,000,000 | | | | 5,615,103 | | | | | |
The accompanying notes are an integral part of these financial statements.
Baird Core Plus Bond Fund
Schedule of Investments, December 31, 2020
Long-Term Investments (cont.)
| | | Principal | | | | | | % of | |
| | | Amount | | | Value | | | Net Assets | |
| National Securities Clearing Corp., | | | | | | | | | |
1.500%, 04/23/2025(2) | | $ | 13,000,000 | | | $ | 13,457,038 | | | |
|
|
| Nationwide Building Society: | | | | | | | | | | | | |
| 3.766%, 03/08/2024 | | | | | | | | | | | | |
(3 Month LIBOR USD + 1.064%)(1)(2)(3) | | | 14,500,000 | | | | 15,426,177 | | | | | |
3.900%, 07/21/2025(1)(2) | | | 8,100,000 | | | | 9,125,340 | | | | | |
4.000%, 09/14/2026(1)(2) | | | 63,424,000 | | | | 70,607,326 | | | | | |
| 4.302%, 03/08/2029 | | | | | | | | | | | | |
(3 Month LIBOR USD + 1.452%)(1)(2)(3) | | | 1,425,000 | | | | 1,655,829 | | | | | |
| 3.960%, 07/18/2030 | | | | | | | | | | | | |
(3 Month LIBOR USD + 1.855%)(1)(2)(3) | | | 10,125,000 | | | | 11,796,155 | | | | | |
| 4.125%, 10/18/2032 | | | | | | | | | | | | |
(5 Year Mid Swap Rate USD + 1.849%)(1)(2)(3) | | | 8,000,000 | | | | 8,749,028 | | | | | |
| Nationwide Financial Services, Inc.: | | | | | | | | | | | | |
5.375%, 03/25/2021(2) | | | 15,088,000 | | | | 15,251,920 | | | | | |
3.900%, 11/30/2049(2) | | | 17,500,000 | | | | 19,489,565 | | | | | |
| Nationwide Mutual Insurance Co.: | | | | | | | | | | | | |
7.875%, 04/01/2033(2) | | | 5,600,000 | | | | 8,098,590 | | | | | |
9.375%, 08/15/2039(2) | | | 27,409,000 | | | | 47,720,951 | | | | | |
| New England Mutual Life Insurance Co., | | | | | | | | | | | | |
7.875%, 02/15/2024(2) | | | 3,200,000 | | | | 3,829,643 | | | | | |
| New York Life Insurance Co.: | | | | | | | | | | | | |
6.750%, 11/15/2039(2) | | | 25,105,000 | | | | 38,923,004 | | | | | |
4.450%, 05/15/2069(2) | | | 10,000,000 | | | | 13,437,082 | | | | | |
| Nomura Holdings, Inc.: | | | | | | | | | | | | |
2.648%, 01/16/2025(1) | | | 10,000,000 | | | | 10,679,688 | | | | | |
1.851%, 07/16/2025(1) | | | 15,000,000 | | | | 15,589,144 | | | | | |
| Peachtree Corners Funding Trust, | | | | | | | | | | | | |
3.976%, 02/15/2025(2) | | | 16,000,000 | | | | 17,741,075 | | | | | |
| People’s United Bank NA, | | | | | | | | | | | | |
| 4.000%, 07/15/2024 | | | 4,400,000 | | | | 4,743,047 | | | | | |
| Pine Street Trust I, | | | | | | | | | | | | |
4.572%, 02/15/2029(2) | | | 5,000,000 | | | | 5,927,633 | | | | | |
| Principal Financial Group, Inc.: | | | | | | | | | | | | |
| 3.300%, 09/15/2022 | | | 1,215,000 | | | | 1,274,770 | | | | | |
| 3.125%, 05/15/2023 | | | 3,675,000 | | | | 3,906,310 | | | | | |
| Protective Life Corp., | | | | | | | | | | | | |
4.300%, 09/30/2028(2) | | | 4,105,000 | | | | 4,798,447 | | | | | |
| Prudential Financial, Inc., | | | | | | | | | | | | |
| 3.878%, 03/27/2028 | | | 11,025,000 | | | | 12,963,463 | | | | | |
| Prudential Insurance Co. of America, | | | | | | | | | | | | |
8.300%, 07/01/2025(2) | | | 21,011,000 | | | | 27,234,712 | | | | | |
| Raymond James Financial, Inc.: | | | | | | | | | | | | |
| 3.625%, 09/15/2026 | | | 425,000 | | | | 487,544 | | | | | |
| 4.950%, 07/15/2046 | | | 15,000,000 | | | | 20,556,721 | | | | | |
The accompanying notes are an integral part of these financial statements.
Baird Core Plus Bond Fund
Schedule of Investments, December 31, 2020
Long-Term Investments (cont.)
| | | Principal | | | | | | % of | |
| | | Amount | | | Value | | | Net Assets | |
| Realty Income Corp., | | | | | | | | | |
| 3.875%, 04/15/2025 | | $ | 10,000,000 | | | $ | 11,264,487 | | | |
|
|
| Regions Bank, | | | | | | | | | | | | |
| 6.450%, 06/26/2037 | | | 3,864,000 | | | | 5,464,403 | | | | | |
| Regions Financial Corp.: | | | | | | | | | | | | |
| 3.800%, 08/14/2023 | | | 19,737,000 | | | | 21,410,785 | | | | | |
| 2.250%, 05/18/2025 | | | 16,650,000 | | | | 17,656,948 | | | | | |
| Reliance Standard Life Global Funding II: | | | | | | | | | | | | |
3.050%, 01/20/2021(2) | | | 10,954,000 | | | | 10,966,552 | | | | | |
2.625%, 07/22/2022(2) | | | 9,700,000 | | | | 9,970,306 | | | | | |
2.500%, 10/30/2024(2) | | | 20,000,000 | | | | 20,743,872 | | | | | |
| Rexford Industrial Realty LP, | | | | | | | | | | | | |
| 2.125%, 12/01/2030 | | | 10,000,000 | | | | 10,013,124 | | | | | |
| Royal Bank of Canada, | | | | | | | | | | | | |
4.650%, 01/27/2026(1) | | | 29,930,000 | | | | 35,333,237 | | | | | |
| Royal Bank of Scotland Group PLC: | | | | | | | | | | | | |
| 3.498%, 05/15/2023 | | | | | | | | | | | | |
(3 Month LIBOR USD + 1.480%(1)(3) | | | 62,335,000 | | | | 64,719,223 | | | | | |
| 4.519%, 06/25/2024 | | | | | | | | | | | | |
(3 Month LIBOR USD + 1.550%(1)(3) | | | 17,475,000 | | | | 19,079,390 | | | | | |
| 4.269%, 03/22/2025 | | | | | | | | | | | | |
(3 Month LIBOR USD + 1.762%)(1)(3) | | | 8,300,000 | | | | 9,182,217 | | | | | |
| 4.892%, 05/18/2029 | | | | | | | | | | | | |
(3 Month LIBOR USD + 1.754%)(1)(3) | | | 5,150,000 | | | | 6,189,000 | | | | | |
| 4.445%, 05/08/2030 | | | | | | | | | | | | |
(3 Month LIBOR USD + 1.871%)(1)(3) | | | 11,000,000 | | | | 13,104,750 | | | | | |
| Santander Holdings USA, Inc.: | | | | | | | | | | | | |
| 3.400%, 01/18/2023 | | | 5,750,000 | | | | 6,039,697 | | | | | |
| 3.450%, 06/02/2025 | | | 10,000,000 | | | | 10,921,045 | | | | | |
| Santander UK Group Holdings PLC: | | | | | | | | | | | | |
2.875%, 08/05/2021(1) | | | 9,375,000 | | | | 9,506,302 | | | | | |
| 3.823%, 11/03/2028 | | | | | | | | | | | | |
(3 Month LIBOR USD + 1.400%)(1)(3) | | | 6,000,000 | | | | 6,767,482 | | | | | |
| Santander UK PLC: | | | | | | | | | | | | |
5.000%, 11/07/2023(1)(2) | | | 36,375,000 | | | | 40,152,748 | | | | | |
4.000%, 03/13/2024(1) | | | 7,700,000 | | | | 8,516,509 | | | | | |
| SMBC Aviation Capital Finance DAC, | | | | | | | | | | | | |
3.550%, 04/15/2024(1)(2) | | | 15,000,000 | | | | 15,933,276 | | | | | |
| Societe Generale SA: | | | | | | | | | | | | |
4.250%, 09/14/2023(1)(2) | | | 9,725,000 | | | | 10,606,070 | | | | | |
5.000%, 01/17/2024(1)(2) | | | 18,000,000 | | | | 19,868,834 | | | | | |
3.875%, 03/28/2024(1)(2) | | | 10,000,000 | | | | 10,902,883 | | | | | |
2.625%, 10/16/2024(1)(2) | | | 14,575,000 | | | | 15,443,420 | | | | | |
2.625%, 01/22/2025(1)(2) | | | 34,600,000 | | | | 36,644,497 | | | | | |
4.250%, 04/14/2025(1)(2) | | | 21,975,000 | | | | 24,208,162 | | | | | |
The accompanying notes are an integral part of these financial statements.
Baird Core Plus Bond Fund
Schedule of Investments, December 31, 2020
Long-Term Investments (cont.)
| | | Principal | | | | | | % of | |
| | | Amount | | | Value | | | Net Assets | |
| Societe Generale SA: (cont.) | | | | | | | | | |
4.250%, 08/19/2026(1)(2) | | $ | 18,572,000 | | | $ | 20,782,548 | | | |
|
|
| 1.488%, 12/14/2026 | | | | | | | | | | | | |
(1 Year CMT Rate + 1.100%)(1)(2)(3) | | | 6,800,000 | | | | 6,860,072 | | | | | |
| Standard Chartered PLC: | | | | | | | | | | | | |
3.050%, 01/15/2021(1)(2) | | | 14,000,000 | | | | 14,010,508 | | | | | |
| 3.885%, 03/15/2024 | | | | | | | | | | | | |
(3 Month LIBOR USD + 1.080%)(1)(2)(3) | | | 17,600,000 | | | | 18,721,028 | | | | | |
| 3.785%, 05/21/2025 | | | | | | | | | | | | |
(3 Month LIBOR USD + 1.560%)(1)(2)(3) | | | 40,500,000 | | | | 43,918,502 | | | | | |
| 2.819%, 01/30/2026 | | | | | | | | | | | | |
(3 Month LIBOR USD + 1.209%)(1)(2)(3) | | | 8,800,000 | | | | 9,321,471 | | | | | |
| 4.644%, 04/01/2031 | | | | | | | | | | | | |
(5 Year CMT Rate + 3.850%)(1)(2)(3) | | | 7,000,000 | | | | 8,467,898 | | | | | |
5.700%, 03/26/2044(1)(2) | | | 14,000,000 | | | | 18,778,821 | | | | | |
| State Street Corp., | | | | | | | | | | | | |
2.901%, 03/30/2026 (SOFR + 2.600%)(3) | | | 12,975,000 | | | | 14,133,926 | | | | | |
| Stifel Financial Corp.: | | | | | | | | | | | | |
| 4.250%, 07/18/2024 | | | 19,615,000 | | | | 22,037,646 | | | | | |
| 4.000%, 05/15/2030 | | | 6,325,000 | | | | 7,227,817 | | | | | |
| Sumitomo Mitsui Banking Corp., | | | | | | | | | | | | |
3.000%, 01/18/2023(1) | | | 2,500,000 | | | | 2,630,897 | | | | | |
| Sumitomo Mitsui Financial Group, Inc.: | | | | | | | | | | | | |
2.784%, 07/12/2022(1) | | | 13,325,000 | | | | 13,814,398 | | | | | |
3.102%, 01/17/2023(1) | | | 16,125,000 | | | | 17,012,266 | | | | | |
2.696%, 07/16/2024(1) | | | 10,400,000 | | | | 11,103,536 | | | | | |
2.448%, 09/27/2024(1) | | | 20,000,000 | | | | 21,300,172 | | | | | |
| SunTrust Banks, Inc.: | | | | | | | | | | | | |
| 3.689%, 08/02/2024 | | | | | | | | | | | | |
(3 Month LIBOR USD + 0.735%)(3) | | | 6,345,000 | | | | 6,871,400 | | | | | |
| 3.300%, 05/15/2026 | | | 28,734,000 | | | | 32,129,421 | | | | | |
| Swedbank AB, | | | | | | | | | | | | |
2.650%, 03/10/2021(1)(2) | | | 7,025,000 | | | | 7,054,463 | | | | | |
| Synchrony Financial: | | | | | | | | | | | | |
| 3.750%, 08/15/2021 | | | 16,825,000 | | | | 17,065,826 | | | | | |
| 4.250%, 08/15/2024 | | | 33,325,000 | | | | 36,821,352 | | | | | |
| 4.500%, 07/23/2025 | | | 12,795,000 | | | | 14,393,952 | | | | | |
| 3.700%, 08/04/2026 | | | 5,388,000 | | | | 5,980,300 | | | | | |
| 3.950%, 12/01/2027 | | | 43,000,000 | | | | 48,230,147 | | | | | |
| Synovus Financial Corp., | | | | | | | | | | | | |
| 3.125%, 11/01/2022 | | | 19,588,000 | | | | 20,338,631 | | | | | |
| Travelers Companies, Inc., | | | | | | | | | | | | |
| 2.550%, 04/27/2050 | | | 8,775,000 | | | | 9,237,397 | | | | | |
| Trinity Acquisition PLC: | | | | | | | | | | | | |
4.400%, 03/15/2026(1) | | | 15,776,000 | | | | 18,380,418 | | | | | |
6.125%, 08/15/2043(1) | | | 22,605,000 | | | | 33,487,438 | | | | | |
The accompanying notes are an integral part of these financial statements.
Baird Core Plus Bond Fund
Schedule of Investments, December 31, 2020
Long-Term Investments (cont.)
| | | Principal | | | | | | % of | |
| | | Amount | | | Value | | | Net Assets | |
| UBS Group Funding Switzerland AG: | | | | | | | | | |
2.650%, 02/01/2022(1)(2) | | $ | 10,000,000 | | | $ | 10,254,224 | | | |
|
|
3.491%, 05/23/2023(1)(2) | | | 34,075,000 | | | | 35,459,237 | | | | | |
| 2.859%, 08/15/2023 | | | | | | | | | | | | |
(3 Month LIBOR USD + 0.954%)(1)(2)(3) | | | 31,700,000 | | | | 32,862,517 | | | | | |
4.125%, 09/24/2025(1)(2) | | | 6,500,000 | | | | 7,442,877 | | | | | |
| UnitedHealth Group, Inc., | | | | | | | | | | | | |
| 4.625%, 07/15/2035 | | | 12,175,000 | | | | 16,314,525 | | | | | |
| Voya Financial, Inc., | | | | | | | | | | | | |
| 3.650%, 06/15/2026 | | | 7,102,000 | | | | 8,122,740 | | | | | |
| Wells Fargo & Co.: | | | | | | | | | | | | |
| 3.069%, 01/24/2023 | | | 12,000,000 | | | | 12,342,497 | | | | | |
| 1.444%, 10/31/2023 | | | | | | | | | | | | |
(3 Month LIBOR USD + 1.230%)(3) | | | 10,000,000 | | | | 10,157,998 | | | | | |
1.654%, 06/02/2024 (SOFR + 1.600%)(3) | | | 12,375,000 | | | | 12,720,058 | | | | | |
| 3.000%, 02/19/2025 | | | 5,225,000 | | | | 5,680,328 | | | | | |
| 2.406%, 10/30/2025 | | | | | | | | | | | | |
(3 Month LIBOR USD + 0.825%)(3) | | | 10,000,000 | | | | 10,573,701 | | | | | |
| 2.164%, 02/11/2026 | | | | | | | | | | | | |
(3 Month LIBOR USD + 0.750%)(3) | | | 15,000,000 | | | | 15,773,117 | | | | | |
| 3.000%, 04/22/2026 | | | 4,000,000 | | | | 4,402,390 | | | | | |
2.393%, 06/02/2028 (SOFR + 2.100%)(3) | | | 9,236,000 | | | | 9,832,849 | | | | | |
3.068%, 04/30/2041 (SOFR + 2.530%)(3) | | | 35,000,000 | | | | 38,072,966 | | | | | |
| 5.013%, 04/04/2051 | | | | | | | | | | | | |
(3 Month LIBOR USD + 4.240%)(3) | | | 8,000,000 | | | | 11,369,737 | | | | | |
| Westpac Banking Corp.: | | | | | | | | | | | | |
2.100%, 05/13/2021(1) | | | 13,300,000 | | | | 13,392,077 | | | | | |
| 2.894%, 02/04/2030 | | | | | | | | | | | | |
(5 Year CMT Rate + 1.350%)(1)(3) | | | 18,059,000 | | | | 18,931,867 | | | | | |
| 4.322%, 11/23/2031 | | | | | | | | | | | | |
(5 Year Mid Swap Rate USD + 2.236%)(1)(3) | | | 10,000,000 | | | | 11,402,751 | | | | | |
| 4.110%, 07/24/2034 | | | | | | | | | | | | |
(5 Year CMT Rate + 2.000%)(1)(3) | | | 10,000,000 | | | | 11,411,259 | | | | | |
| 2.668%, 11/15/2035 | | | | | | | | | | | | |
(5 Year CMT Rate + 1.750%)(1)(3) | | | 10,000,000 | | | | 10,301,600 | | | | | |
| Willis North America, Inc.: | | | | | | | | | | | | |
| 2.950%, 09/15/2029 | | | 10,600,000 | | | | 11,597,648 | | | | | |
| 5.050%, 09/15/2048 | | | 15,000,000 | | | | 21,098,729 | | | | | |
| Willis Towers Watson PLC, | | | | | | | | | | | | |
5.750%, 03/15/2021(1) | | | 20,329,000 | | | | 20,533,711 | | | | | |
| Total Financials | | | | | | | | | | | | |
| (Cost $5,567,936,454) | | | | | | | 6,064,934,808 | | | | 20.6 | % |
| Total Corporate Bonds | | | | | | | | | | | | |
| (Cost $13,984,245,445) | | | | | | | 15,361,676,188 | | | | 52.1 | % |
The accompanying notes are an integral part of these financial statements.
Baird Core Plus Bond Fund
Schedule of Investments, December 31, 2020
Long-Term Investments (cont.)
| | | Principal | | | | | | % of | |
| | | Amount | | | Value | | | Net Assets | |
| Municipal Bonds | | | | | | | | | |
| Bellevue Union School District, | | | | | | | | | |
| 5.000%, 08/01/2028 | | $ | 625,000 | | | $ | 743,775 | | | |
|
|
| Brazos Higher Education Authority, Inc.: | | | | | | | | | | | | |
| 1.931%, 04/01/2024 | | | 1,000,000 | | | | 1,036,300 | | | | | |
| 1.981%, 04/01/2025 | | | 1,000,000 | | | | 1,044,400 | | | | | |
| 2.076%, 04/01/2026 | | | 1,000,000 | | | | 1,052,450 | | | | | |
| 2.176%, 04/01/2027 | | | 1,300,000 | | | | 1,336,413 | | | | | |
| 2.310%, 04/01/2028 | | | 1,000,000 | | | | 1,029,180 | | | | | |
| 2.410%, 04/01/2029 | | | 2,360,000 | | | | 2,416,144 | | | | | |
| 2.510%, 04/01/2030 | | | 1,175,000 | | | | 1,199,311 | | | | | |
| 2.760%, 04/01/2040 (Callable 04/01/2030) | | | 2,285,000 | | | | 2,259,682 | | | | | |
| California Housing Finance Agency, | | | | | | | | | | | | |
| 2.794%, 08/01/2036 (Callable 08/01/2025) | | | 8,685,000 | | | | 8,834,903 | | | | | |
| California Qualified School | | | | | | | | | | | | |
| Bond Joint Powers Authority: | | | | | | | | | | | | |
| 6.739%, 09/01/2026 | | | 2,415,000 | | | | 2,880,008 | | | | | |
| 7.155%, 03/01/2027 | | | 1,700,000 | | | | 2,046,613 | | | | | |
| Central Valley Support Joint Powers Agency, | | | | | | | | | | | | |
| 5.676%, 09/01/2024 | | | 1,500,000 | | | | 1,726,290 | | | | | |
| City of Vernon CA, | | | | | | | | | | | | |
| 4.500%, 08/01/2022 | | | 7,500,000 | | | | 7,790,700 | | | | | |
| Colton Joint Unified School District, | | | | | | | | | | | | |
| 6.008%, 08/01/2026 | | | 1,250,000 | | | | 1,582,050 | | | | | |
| County of Hamilton OH, | | | | | | | | | | | | |
| 3.756%, 06/01/2042 | | | 25,725,000 | | | | 28,960,948 | | | | | |
| County of Riverside CA, | | | | | | | | | | | | |
| 2.667%, 02/15/2025 | | | 15,000,000 | | | | 15,906,000 | | | | | |
| Great Lakes Water Authority, | | | | | | | | | | | | |
| 2.615%, 07/01/2036 | | | 20,000,000 | | | | 21,012,000 | | | | | |
| Hillsborough City School District: | | | | | | | | | | | | |
| 0.000%, 09/01/2036 (Callable 09/01/2021) | | | 10,000,000 | | | | 5,179,200 | | | | | |
| 0.000%, 09/01/2042 (Callable 09/01/2021) | | | 10,000,000 | | | | 3,867,900 | | | | | |
| Illinois International Port District, | | | | | | | | | | | | |
5.000%, 01/01/2035 (Callable 01/01/2026)(2) | | | 3,750,000 | | | | 3,466,912 | | | | | |
| Iowa Student Loan Liquidity Corp., | | | | | | | | | | | | |
| 2.989%, 12/01/2039 (Callable 12/01/2029) | | | 5,600,000 | | | | 5,780,712 | | | | | |
| Iowa Tobacco Settlement Authority, | | | | | | | | | | | | |
| 6.500%, 06/01/2023 (Callable 02/01/2021) | | | 1,660,000 | | | | 1,684,585 | | | | | |
| Massachusetts Educational Financing Authority, | | | | | | | | | | | | |
| 3.775%, 07/01/2035 (Callable 07/01/2029) | | | 10,000,000 | | | | 10,753,100 | | | | | |
| Michigan Finance Authority, | | | | | | | | | | | | |
| 4.600%, 10/01/2022 | | | 8,990,000 | | | | 9,127,097 | | | | | |
The accompanying notes are an integral part of these financial statements.
Baird Core Plus Bond Fund
Schedule of Investments, December 31, 2020
Long-Term Investments (cont.)
| | | Principal | | | | | | % of | |
| | | Amount | | | Value | | | Net Assets | |
| Minnesota Housing Finance Agency: | | | | | | | | | |
| 2.680%, 10/01/2046 (Callable 01/01/2026) | | $ | 19,220,073 | | | $ | 19,833,193 | | | |
|
|
| 2.650%, 11/01/2046 (Callable 01/01/2026) | | | 18,566,709 | | | | 19,159,359 | | | | | |
| New Hampshire Business Finance Authority, | | | | | | | | | | | | |
| 2.872%, 07/01/2035 (Callable 01/01/2035) | | | 18,285,000 | | | | 19,002,321 | | | | | |
| New Hampshire Housing Finance Authority: | | | | | | | | | | | | |
| 3.100%, 07/01/2021 | | | 1,300,000 | | | | 1,311,115 | | | | | |
| 3.750%, 07/01/2034 (Callable 07/01/2023) | | | 1,570,000 | | | | 1,597,805 | | | | | |
| New Jersey Turnpike Authority, | | | | | | | | | | | | |
3.223%, 01/01/2036 (Callable 07/01/2025)(2) | | | 40,000,000 | | | | 42,409,200 | | | | | |
| North Carolina Housing Finance Agency: | | | | | | | | | | | | |
| 2.870%, 07/01/2032 (Callable 01/01/2024) | | | 2,030,000 | | | | 2,073,868 | | | | | |
| 2.812%, 07/01/2035 (Callable 01/01/2024) | | | 2,535,000 | | | | 2,580,022 | | | | | |
| North East Independent School District, | | | | | | | | | | | | |
| 5.240%, 08/01/2027 | | | 3,000,000 | | | | 3,844,740 | | | | | |
| Public Finance Authority, | | | | | | | | | | | | |
| 0.000%, 12/15/2027 | | | 19,290,000 | | | | 14,553,533 | | | | | |
| Rhode Island Housing & Mortgage Finance Corp., | | | | | | | | | | | | |
| 2.913%, 10/01/2039 (Callable 10/01/2023) | | | 1,190,000 | | | | 1,203,233 | | | | | |
| Rhode Island Student Loan Authority: | | | | | | | | | | | | |
| 2.100%, 12/01/2022 | | | 1,125,000 | | | | 1,127,565 | | | | | |
| 2.200%, 12/01/2023 | | | 1,400,000 | | | | 1,406,174 | | | | | |
| 2.400%, 12/01/2024 | | | 1,165,000 | | | | 1,173,772 | | | | | |
| 2.530%, 12/01/2025 | | | 2,310,000 | | | | 2,334,532 | | | | | |
| 2.730%, 12/01/2026 | | | 1,490,000 | | | | 1,506,912 | | | | | |
| 5.000%, 12/01/2026 | | | 1,200,000 | | | | 1,463,028 | | | | | |
| 2.875%, 12/01/2027 | | | 1,800,000 | | | | 1,818,036 | | | | | |
| 5.000%, 12/01/2027 | | | 1,130,000 | | | | 1,395,923 | | | | | |
| 5.000%, 12/01/2028 | | | 1,265,000 | | | | 1,576,506 | | | | | |
| 5.000%, 12/01/2029 | | | 1,295,000 | | | | 1,620,654 | | | | | |
| 3.625%, 12/01/2037 (Callable 12/01/2030) | | | 6,000,000 | | | | 6,382,500 | | | | | |
| State of Illinois, | | | | | | | | | | | | |
| 6.200%, 07/01/2021 | | | 3,977,500 | | | | 4,045,436 | | | | | |
| Suburban Hospital Healthcare System, Inc., | | | | | | | | | | | | |
| 7.865%, 02/15/2027 | | | 8,755,000 | | | | 10,425,542 | | | | | |
| Tennessee Energy Acquisition Corp., | | | | | | | | | | | | |
4.000%, 05/01/2048(4) | | | 16,965,000 | | | | 18,251,626 | | | | | |
| Three Rivers Local School District, | | | | | | | | | | | | |
| 5.209%, 09/15/2027 (Callable 02/01/2021) | | | 1,350,000 | | | | 1,353,685 | | | | | |
| Toll Road Investors Partnership II LP, | | | | | | | | | | | | |
0.000%, 02/15/2027(2) | | | 17,855,000 | | | | 13,389,388 | | | | | |
| West Contra Costa Unified School District, | | | | | | | | | | | | |
| 6.250%, 08/01/2030 | | | 4,320,000 | | | | 5,931,965 | | | | | |
The accompanying notes are an integral part of these financial statements.
Baird Core Plus Bond Fund
Schedule of Investments, December 31, 2020
Long-Term Investments (cont.)
| | | Principal | | | | | | % of | |
| | | Amount | | | Value | | | Net Assets | |
| Western Michigan University Homer | | | | | | | | | |
| Stryker MD School of Medicine, | | | | | | | | | |
| 4.750%, 11/15/2028 | | $ | 12,900,000 | | | $ | 15,036,240 | | | | |
| Westlake City School District, | | | | | | | | | | | |
| 5.227%, 12/01/2026 (Callable 02/01/2021) | | | 1,160,000 | | | | 1,163,062 | | | | |
| Total Municipal Bonds | | | | | | | | | | | |
| (Cost $347,510,405) | | | | | | | 361,687,608 | | | | 1.2 | % |
| Residential Mortgage-Backed Securities | | | | | | | | | | | | |
| U.S. Government Agency Issues | | | | | | | | | | | | |
| Fannie Mae REMIC Trust: | | | | | | | | | | | | |
| Series 1991-43, Class J, 7.000%, 05/25/2021 | | | 803 | | | | 807 | | | | | |
| Series 1991-65, Class Z, 6.500%, 06/25/2021 | | | 284 | | | | 285 | | | | | |
| Series 1992-129, Class L, 6.000%, 07/25/2022 | | | 6,710 | | | | 6,850 | | | | | |
| Series 1993-32, Class H, 6.000%, 03/25/2023 | | | 3,171 | | | | 3,306 | | | | | |
| Series 1993-58, Class H, 5.500%, 04/25/2023 | | | 13,744 | | | | 14,230 | | | | | |
| Federal Gold Loan Mortgage Corp. (FGLMC): | | | | | | | | | | | | |
| 6.000%, 06/01/2021 | | | 418 | | | | 422 | | | | | |
| 6.500%, 12/01/2028 | | | 9,074 | | | | 10,195 | | | | | |
| 6.500%, 06/01/2029 | | | 3,772 | | | | 4,227 | | | | | |
| 3.000%, 10/01/2030 | | | 23,277,438 | | | | 24,950,493 | | | | | |
| 3.000%, 02/01/2032 | | | 36,388,884 | | | | 39,115,283 | | | | | |
| 3.500%, 05/01/2032 | | | 17,023,531 | | | | 18,408,368 | | | | | |
| 3.000%, 07/01/2032 | | | 7,706,352 | | | | 8,170,852 | | | | | |
| 3.000%, 10/01/2032 | | | 5,767,459 | | | | 6,116,592 | | | | | |
| 3.000%, 11/01/2032 | | | 9,207,706 | | | | 9,764,904 | | | | | |
| 3.000%, 12/01/2032 | | | 9,813,354 | | | | 10,408,755 | | | | | |
| 3.000%, 01/01/2033 | | | 4,324,320 | | | | 4,586,155 | | | | | |
| 3.000%, 04/01/2033 | | | 4,668,932 | | | | 4,951,149 | | | | | |
| 3.500%, 01/01/2034 | | | 16,528,398 | | | | 17,860,305 | | | | | |
| 3.000%, 05/01/2035 | | | 13,414,379 | | | | 14,148,921 | | | | | |
| 3.000%, 10/01/2035 | | | 11,600,870 | | | | 12,265,529 | | | | | |
| 5.000%, 03/01/2036 | | | 3,368,019 | | | | 3,914,124 | | | | | |
| 5.500%, 04/01/2037 | | | 73,072 | | | | 85,929 | | | | | |
| 5.500%, 04/01/2038 | | | 45,483 | | | | 53,434 | | | | | |
| 5.500%, 05/01/2038 | | | 74,023 | | | | 87,049 | | | | | |
| 5.500%, 01/01/2039 | | | 12,094,035 | | | | 14,119,754 | | | | | |
| 4.500%, 11/01/2039 | | | 402,903 | | | | 450,599 | | | | | |
| 4.500%, 11/01/2039 | | | 1,382,097 | | | | 1,545,626 | | | | | |
| 4.500%, 08/01/2040 | | | 1,900,258 | | | | 2,129,611 | | | | | |
| 4.500%, 08/01/2040 | | | 1,376,206 | | | | 1,540,290 | | | | | |
| 4.000%, 10/01/2040 | | | 15,047,294 | | | | 16,586,553 | | | | | |
| 4.000%, 01/01/2041 | | | 9,885,196 | | | | 10,847,064 | | | | | |
| 3.500%, 06/01/2042 | | | 2,627,786 | | | | 2,835,741 | | | | | |
| 3.500%, 06/01/2042 | | | 3,995,914 | | | | 4,299,933 | | | | | |
The accompanying notes are an integral part of these financial statements.
Baird Core Plus Bond Fund
Schedule of Investments, December 31, 2020
Long-Term Investments (cont.)
| | | Principal | | | | | | % of | |
| | | Amount | | | Value | | | Net Assets | |
| Federal Gold Loan Mortgage Corp. (FGLMC): (cont.) | | | | | | | | | |
| 3.500%, 07/01/2042 | | $ | 14,919,945 | | | $ | 16,045,545 | | | |
|
|
| 3.500%, 07/01/2042 | | | 22,199,522 | | | | 23,881,585 | | | | | |
| 3.000%, 08/01/2042 | | | 13,425,856 | | | | 14,242,591 | | | | | |
| 3.500%, 09/01/2042 | | | 8,684,680 | | | | 9,370,570 | | | | | |
| 3.000%, 11/01/2042 | | | 37,182,815 | | | | 40,367,981 | | | | | |
| 3.500%, 12/01/2042 | | | 14,272,653 | | | | 15,473,314 | | | | | |
| 3.000%, 01/01/2043 | | | 24,073,424 | | | | 25,603,049 | | | | | |
| 3.000%, 02/01/2043 | | | 4,629,088 | | | | 4,922,615 | | | | | |
| 3.500%, 02/01/2043 | | | 11,424,311 | | | | 12,548,658 | | | | | |
| 3.000%, 03/01/2043 | | | 12,480,539 | | | | 13,495,052 | | | | | |
| 3.000%, 04/01/2043 | | | 9,402,111 | | | | 10,207,778 | | | | | |
| 3.000%, 04/01/2043 | | | 9,696,614 | | | | 10,313,164 | | | | | |
| 3.000%, 06/01/2043 | | | 7,788,471 | | | | 8,284,754 | | | | | |
| 3.000%, 08/01/2043 | | | 18,093,772 | | | | 19,280,901 | | | | | |
| 4.500%, 12/01/2043 | | | 7,802,756 | | | | 8,726,665 | | | | | |
| 3.500%, 05/01/2044 | | | 29,286,529 | | | | 32,025,093 | | | | | |
| 3.500%, 08/01/2044 | | | 13,826,257 | | | | 14,949,954 | | | | | |
| 3.500%, 08/01/2044 | | | 21,037,860 | | | | 22,802,008 | | | | | |
| 4.000%, 09/01/2044 | | | 7,689,906 | | | | 8,380,245 | | | | | |
| 4.000%, 10/01/2044 | | | 12,621,635 | | | | 13,851,075 | | | | | |
| 3.500%, 01/01/2045 | | | 17,098,574 | | | | 18,585,033 | | | | | |
| 4.000%, 02/01/2045 | | | 8,677,117 | | | | 9,486,780 | | | | | |
| 3.500%, 06/01/2045 | | | 18,352,779 | | | | 20,069,850 | | | | | |
| 3.500%, 07/01/2045 | | | 15,793,967 | | | | 17,112,434 | | | | | |
| 3.000%, 10/01/2045 | | | 23,665,690 | | | | 25,175,969 | | | | | |
| 4.000%, 10/01/2045 | | | 12,352,088 | | | | 13,431,972 | | | | | |
| 3.500%, 12/01/2045 | | | 14,784,988 | | | | 15,821,261 | | | | | |
| 4.000%, 12/01/2045 | | | 5,015,852 | | | | 5,439,254 | | | | | |
| 3.000%, 01/01/2046 | | | 69,713,566 | | | | 76,096,073 | | | | | |
| 3.500%, 01/01/2046 | | | 35,220,437 | | | | 38,252,088 | | | | | |
| 4.000%, 02/01/2046 | | | 6,776,912 | | | | 7,342,148 | | | | | |
| 4.000%, 02/01/2046 | | | 16,571,000 | | | | 18,219,743 | | | | | |
| 3.500%, 03/01/2046 | | | 4,811,749 | | | | 5,223,456 | | | | | |
| 4.000%, 05/01/2046 | | | 603,612 | | | | 654,274 | | | | | |
| 3.500%, 08/01/2046 | | | 57,814,855 | | | | 63,156,425 | | | | | |
| 4.000%, 08/01/2046 | | | 9,070,715 | | | | 9,972,804 | | | | | |
| 3.000%, 10/01/2046 | | | 52,165,082 | | | | 56,157,392 | | | | | |
| 3.000%, 10/01/2046 | | | 70,595,409 | | | | 76,426,657 | | | | | |
| 4.500%, 11/01/2046 | | | 52,533,361 | | | | 58,921,652 | | | | | |
| 4.000%, 01/01/2047 | | | 32,709,272 | | | | 36,082,938 | | | | | |
| 3.000%, 02/01/2047 | | | 29,179,011 | | | | 31,435,930 | | | | | |
| 3.000%, 05/01/2047 | | | 57,727,729 | | | | 62,290,844 | | | | | |
| 3.500%, 08/01/2047 | | | 17,209,561 | | | | 18,702,675 | | | | | |
| 3.500%, 03/01/2048 | | | 5,934,294 | | | | 6,385,056 | | | | | |
The accompanying notes are an integral part of these financial statements.
Baird Core Plus Bond Fund
Schedule of Investments, December 31, 2020
Long-Term Investments (cont.)
| | | Principal | | | | | | % of | |
| | | Amount | | | Value | | | Net Assets | |
| Federal Gold Loan Mortgage Corp. (FGLMC): (cont.) | | | | | | | | | |
| 4.000%, 06/01/2048 | | $ | 51,145,770 | | | $ | 57,250,556 | | | |
|
|
| 4.000%, 08/01/2048 | | | 21,519,336 | | | | 23,308,919 | | | | | |
| 3.000%, 12/01/2049 | | | 151,002,276 | | | | 161,531,468 | | | | | |
| 4.000%, 05/01/2050 | | | 104,685,780 | | | | 115,425,211 | | | | | |
| 3.000%, 06/01/2050 | | | 42,178,019 | | | | 45,230,445 | | | | | |
| Federal Home Loan Mortgage Corp. (FHLMC): | | | | | | | | | | | | |
| Series 1053, Class G, 7.000%, 03/15/2021 | | | 70 | | | | 70 | | | | | |
| Series 1122, Class G, 7.000%, 08/15/2021 | | | 265 | | | | 269 | | | | | |
| Series 1186, Class I, 7.000%, 12/15/2021 | | | 1,001 | | | | 1,020 | | | | | |
| Federal National Mortgage Association (FNMA): | | | | | | | | | | | | |
| 5.000%, 11/01/2021 | | | 31 | | | | 32 | | | | | |
| 2.500%, 12/01/2027 | | | 8,363,549 | | | | 8,741,946 | | | | | |
| 5.000%, 05/01/2028 | | | 23,374 | | | | 26,071 | | | | | |
| 6.500%, 09/01/2028 | | | 6,835 | | | | 7,657 | | | | | |
| 6.500%, 02/01/2029 | | | 15,491 | | | | 17,423 | | | | | |
| 3.000%, 07/01/2029 | | | 12,072,583 | | | | 12,689,561 | | | | | |
| 4.500%, 07/01/2030 | | | 2,615,118 | | | | 2,890,139 | | | | | |
| 3.000%, 08/01/2030 | | | 17,995,844 | | | | 19,210,210 | | | | | |
| 3.000%, 01/01/2031 | | | 49,974,759 | | | | 53,395,807 | | | | | |
| 4.000%, 11/01/2031 | | | 12,264,289 | | | | 13,393,403 | | | | | |
| 3.500%, 01/01/2032 | | | 28,950,786 | | | | 30,856,893 | | | | | |
| 5.500%, 01/01/2032 | | | 6,151 | | | | 7,070 | | | | | |
| 2.500%, 07/01/2032 | | | 19,737,284 | | | | 21,026,395 | | | | | |
| 3.000%, 11/01/2032 | | | 5,790,256 | | | | 6,097,450 | | | | | |
| 2.500%, 12/01/2032 | | | 69,415,757 | | | | 72,526,716 | | | | | |
| 3.000%, 04/01/2033 | | | 9,978,841 | | | | 10,547,466 | | | | | |
| 3.000%, 05/01/2033 | | | 9,833,938 | | | | 10,397,714 | | | | | |
| 3.500%, 09/01/2033 | | | 48,429,822 | | | | 53,203,094 | | | | | |
| 5.000%, 09/01/2033 | | | 7,497,915 | | | | 8,640,462 | | | | | |
| 4.500%, 10/01/2033 | | | 15,814,498 | | | | 17,485,989 | | | | | |
| 3.000%, 11/01/2033 | | | 77,848,262 | | | | 84,403,402 | | | | | |
| 4.000%, 01/01/2034 | | | 8,747,968 | | | | 9,553,953 | | | | | |
| 5.500%, 04/01/2034 | | | 488,516 | | | | 564,825 | | | | | |
| 4.000%, 09/01/2034 | | | 12,312,362 | | | | 13,443,787 | | | | | |
| 5.500%, 09/01/2034 | | | 22,017 | | | | 25,743 | | | | | |
| 5.000%, 02/01/2035 | | | 8,503,526 | | | | 9,828,043 | | | | | |
| 5.000%, 02/01/2035 | | | 12,111,486 | | | | 14,043,050 | | | | | |
| 5.500%, 02/01/2035 | | | 19,319 | | | | 22,652 | | | | | |
| 5.000%, 04/01/2035 | | | 868,382 | | | | 1,008,870 | | | | | |
| 5.000%, 07/01/2035 | | | 2,501,485 | | | | 2,905,804 | | | | | |
| 5.000%, 02/01/2036 | | | 1,528,674 | | | | 1,776,555 | | | | | |
| 5.000%, 03/01/2036 | | | 704,490 | | | | 818,743 | | | | | |
| 5.500%, 04/01/2036 | | | 2,276,166 | | | | 2,675,136 | | | | | |
| 4.000%, 05/01/2037 | | | 40,995,668 | | | | 44,299,259 | | | | | |
The accompanying notes are an integral part of these financial statements.
Baird Core Plus Bond Fund
Schedule of Investments, December 31, 2020
Long-Term Investments (cont.)
| | | Principal | | | | | | % of | |
| | | Amount | | | Value | | | Net Assets | |
| Federal National Mortgage Association (FNMA): (cont.) | | | | | | | | | |
| 3.500%, 08/01/2037 | | $ | 24,521,573 | | | $ | 26,248,248 | | | |
|
|
| 2.500%, 04/01/2038 | | | 46,469,512 | | | | 49,374,204 | | | | | |
| 6.000%, 05/01/2038 | | | 3,719,907 | | | | 4,394,722 | | | | | |
| 4.500%, 04/01/2039 | | | 12,179,455 | | | | 13,656,233 | | | | | |
| 4.000%, 06/01/2039 | | | 8,022,151 | | | | 8,820,956 | | | | | |
| 5.000%, 06/01/2039 | | | 10,922,412 | | | | 12,571,021 | | | | | |
| 4.500%, 01/01/2040 | | | 2,485,443 | | | | 2,746,617 | | | | | |
| 4.500%, 01/01/2040 | | | 5,513,538 | | | | 6,190,844 | | | | | |
| 5.000%, 06/01/2040 | | | 8,588,753 | | | | 9,906,058 | | | | | |
| 4.000%, 08/01/2040 | | | 651,924 | | | | 714,735 | | | | | |
| 4.500%, 08/01/2040 | | | 2,970,691 | | | | 3,332,655 | | | | | |
| 4.500%, 08/01/2040 | | | 8,043,666 | | | | 8,992,011 | | | | | |
| 4.000%, 10/01/2040 | | | 1,162,400 | | | | 1,274,745 | | | | | |
| 4.000%, 11/01/2040 | | | 12,455,470 | | | | 13,663,008 | | | | | |
| 4.000%, 12/01/2040 | | | 3,025,244 | | | | 3,396,486 | | | | | |
| 3.500%, 01/01/2041 | | | 1,399,961 | | | | 1,522,667 | | | | | |
| 4.000%, 01/01/2041 | | | 2,637,902 | | | | 2,892,538 | | | | | |
| 3.500%, 02/01/2041 | | | 1,491,390 | | | | 1,610,405 | | | | | |
| 4.000%, 02/01/2041 | | | 256,347 | | | | 280,991 | | | | | |
| 4.500%, 02/01/2041 | | | 38,137,272 | | | | 42,634,764 | | | | | |
| 3.500%, 03/01/2041 | | | 9,973,329 | | | | 10,768,671 | | | | | |
| 4.000%, 03/01/2041 | | | 4,756,165 | | | | 5,215,314 | | | | | |
| 4.500%, 07/01/2041 | | | 3,602,638 | | | | 4,045,343 | | | | | |
| 3.500%, 09/01/2041 | | | 20,655,222 | | | | 22,278,404 | | | | | |
| 4.000%, 09/01/2041 | | | 1,948,320 | | | | 2,130,302 | | | | | |
| 3.500%, 11/01/2041 | | | 10,507,084 | | | | 11,314,345 | | | | | |
| 3.500%, 12/01/2041 | | | 1,967,563 | | | | 2,122,713 | | | | | |
| 4.000%, 12/01/2041 | | | 9,278,364 | | | | 10,174,573 | | | | | |
| 4.000%, 01/01/2042 | | | 17,444,056 | | | | 19,131,050 | | | | | |
| 4.500%, 01/01/2042 | | | 7,306,928 | | | | 8,198,134 | | | | | |
| 4.000%, 02/01/2042 | | | 15,722,751 | | | | 17,250,679 | | | | | |
| 3.000%, 04/01/2042 | | | 47,007,690 | | | | 50,225,109 | | | | | |
| 3.000%, 05/01/2042 | | | 2,396,344 | | | | 2,541,339 | | | | | |
| 3.500%, 05/01/2042 | | | 12,386,951 | | | | 13,467,865 | | | | | |
| 3.500%, 06/01/2042 | | | 4,429,935 | | | | 4,800,121 | | | | | |
| 3.500%, 07/01/2042 | | | 84,875,646 | | | | 92,815,891 | | | | | |
| 3.500%, 08/01/2042 | | | 7,990,308 | | | | 8,689,970 | | | | | |
| 3.500%, 09/01/2042 | | | 12,025,233 | | | | 13,031,947 | | | | | |
| 3.000%, 10/01/2042 | | | 14,580,464 | | | | 15,945,389 | | | | | |
| 3.000%, 03/01/2043 | | | 4,934,118 | | | | 5,258,313 | | | | | |
| 3.000%, 04/01/2043 | | | 1,649,560 | | | | 1,758,262 | | | | | |
| 3.000%, 05/01/2043 | | | 18,294,155 | | | | 19,460,631 | | | | | |
| 3.000%, 05/01/2043 | | | 6,076,782 | | | | 6,595,642 | | | | | |
| 3.500%, 05/01/2043 | | | 14,156,956 | | | | 15,554,391 | | | | | |
The accompanying notes are an integral part of these financial statements.
Baird Core Plus Bond Fund
Schedule of Investments, December 31, 2020
Long-Term Investments (cont.)
| | | Principal | | | | | | % of | |
| | | Amount | | | Value | | | Net Assets | |
| Federal National Mortgage Association (FNMA): (cont.) | | | | | | | | | |
| 3.000%, 06/01/2043 | | $ | 20,298,278 | | | $ | 21,594,769 | | | |
|
|
| 3.500%, 06/01/2043 | | | 7,172,439 | | | | 7,960,654 | | | | | |
| 3.000%, 07/01/2043 | | | 15,939,255 | | | | 17,004,185 | | | | | |
| 4.000%, 07/01/2043 | | | 21,661,315 | | | | 23,798,829 | | | | | |
| 3.000%, 08/01/2043 | | | 6,049,107 | | | | 6,446,361 | | | | | |
| 3.500%, 08/01/2043 | | | 7,224,445 | | | | 7,886,832 | | | | | |
| 3.500%, 09/01/2043 | | | 26,203,634 | | | | 28,388,162 | | | | | |
| 4.500%, 09/01/2043 | | | 11,310,823 | | | | 12,683,334 | | | | | |
| 4.000%, 01/01/2045 | | | 8,929,713 | | | | 9,824,399 | | | | | |
| 3.500%, 02/01/2045 | | | 34,986,801 | | | | 37,886,859 | | | | | |
| 4.000%, 02/01/2045 | | | 2,584,375 | | | | 2,813,400 | | | | | |
| 4.000%, 02/01/2045 | | | 10,206,204 | | | | 11,179,004 | | | | | |
| 4.000%, 02/01/2045 | | | 4,984,392 | | | | 5,458,828 | | | | | |
| 4.000%, 02/01/2045 | | | 15,151,109 | | | | 16,697,581 | | | | | |
| 4.000%, 03/01/2045 | | | 7,408,167 | | | | 8,153,449 | | | | | |
| 4.000%, 11/01/2045 | | | 29,284,742 | | | | 31,817,562 | | | | | |
| 3.500%, 12/01/2045 | | | 23,057,517 | | | | 24,664,144 | | | | | |
| 4.000%, 12/01/2045 | | | 37,153,306 | | | | 40,301,926 | | | | | |
| 4.000%, 12/01/2045 | | | 16,465,624 | | | | 18,410,376 | | | | | |
| 4.500%, 02/01/2046 | | | 21,030,534 | | | | 23,583,146 | | | | | |
| 4.500%, 08/01/2046 | | | 20,912,941 | | | | 23,313,930 | | | | | |
| 3.000%, 10/01/2046 | | | 21,733,361 | | | | 23,467,386 | | | | | |
| 3.500%, 11/01/2046 | | | 21,554,749 | | | | 23,083,881 | | | | | |
| 4.000%, 02/01/2047 | | | 12,777,866 | | | | 13,819,851 | | | | | |
| 4.000%, 03/01/2047 | | | 26,678,146 | | | | 28,965,997 | | | | | |
| 4.000%, 03/01/2047 | | | 21,982,614 | | | | 24,244,428 | | | | | |
| 4.000%, 10/01/2047 | | | 15,598,167 | | | | 16,759,254 | | | | | |
| 4.000%, 11/01/2047 | | | 9,563,243 | | | | 10,270,892 | | | | | |
| 3.500%, 12/01/2047 | | | 84,373,092 | | | | 89,491,359 | | | | | |
| 4.000%, 12/01/2047 | | | 48,209,439 | | | | 51,716,557 | | | | | |
| 3.000%, 01/01/2048 | | | 23,755,080 | | | | 25,647,483 | | | | | |
| 3.500%, 03/01/2048 | | | 14,272,527 | | | | 15,123,468 | | | | | |
| 3.500%, 05/01/2048 | | | 69,005,526 | | | | 74,741,054 | | | | | |
| 5.000%, 11/01/2048 | | | 27,596,598 | | | | 31,375,552 | | | | | |
| 3.500%, 06/01/2049 | | | 64,158,298 | | | | 67,737,970 | | | | | |
| 4.000%, 09/01/2049 | | | 7,594,741 | | | | 8,146,761 | | | | | |
| 3.500%, 01/01/2050 | | | 45,831,480 | | | | 50,071,712 | | | | | |
| 3.000%, 05/01/2050 | | | 134,433,258 | | | | 146,387,717 | | | | | |
2.500%, 12/01/2050(8) | | | 90,589,253 | | | | 96,563,279 | | | | | |
| Government National Mortgage Association (GNMA): | | | | | | | | | | | | |
| 6.000%, 12/20/2028 | | | 11,330 | | | | 12,880 | | | | | |
| 6.500%, 01/20/2029 | | | 6,352 | | | | 7,331 | | | | | |
| 6.000%, 11/20/2033 | | | 8,549 | | | | 9,917 | | | | | |
| 5.000%, 07/20/2040 | | | 401,257 | | | | 458,848 | | | | | |
The accompanying notes are an integral part of these financial statements.
Baird Core Plus Bond Fund
Schedule of Investments, December 31, 2020
Long-Term Investments (cont.)
| | | Principal | | | | | | % of | |
| | | Amount | | | Value | | | Net Assets | |
| Government National Mortgage | | | | | | | | | |
| Association (GNMA): (cont.) | | | | | | | | | |
| 4.000%, 01/20/2041 | | $ | 6,318,900 | | | $ | 6,973,818 | | | |
|
|
| 4.000%, 08/20/2041 | | | 3,704,105 | | | | 4,094,782 | | | | | |
| 3.500%, 10/20/2041 | | | 6,936,745 | | | | 7,554,888 | | | | | |
| 4.000%, 12/20/2041 | | | 4,880,092 | | | | 5,392,619 | | | | | |
| 4.000%, 02/20/2042 | | | 9,447,182 | | | | 10,440,649 | | | | | |
| 4.000%, 06/20/2042 | | | 7,953,951 | | | | 8,796,876 | | | | | |
| 3.500%, 09/20/2042 | | | 5,380,972 | | | | 5,859,478 | | | | | |
| 4.000%, 09/20/2044 | | | 27,309,575 | | | | 30,137,902 | | | | | |
| 3.000%, 04/20/2045 | | | 9,388,166 | | | | 10,015,168 | | | | | |
| 3.500%, 04/20/2045 | | | 13,127,928 | | | | 14,095,837 | | | | | |
| 4.000%, 05/20/2045 | | | 11,406,293 | | | | 12,539,356 | | | | | |
| 3.500%, 06/20/2045 | | | 12,971,347 | | | | 13,964,838 | | | | | |
| 3.500%, 10/20/2045 | | | 43,802,102 | | | | 47,662,596 | | | | | |
| 4.500%, 01/20/2046 | | | 10,856,421 | | | | 12,093,235 | | | | | |
| 4.000%, 04/20/2046 | | | 15,206,829 | | | | 16,658,956 | | | | | |
| 3.500%, 05/20/2046 | | | 59,772,548 | | | | 64,712,503 | | | | | |
| 4.000%, 05/20/2046 | | | 5,572,931 | | | | 6,099,594 | | | | | |
| 4.500%, 06/20/2047 | | | 17,001,832 | | | | 18,496,878 | | | | | |
| 4.500%, 07/20/2047 | | | 11,781,202 | | | | 12,809,484 | | | | | |
4.500%, 09/20/2047(6) | | | 59,388,386 | | | | 64,813,558 | | | | | |
| 3.500%, 02/20/2048 | | | 32,711,318 | | | | 35,048,836 | | | | | |
| Seasoned Credit Risk Transfer Trust: | | | | | | | | | | | | |
| Series 2019-4, Class MA, 3.000%, 02/25/2059 | | | 53,572,671 | | | | 57,135,034 | | | | | |
| Series 2020-3, Class MT, 2.000%, 05/25/2060 | | | 40,226,888 | | | | 41,437,573 | | | | | |
| Total U.S. Government Agency Issues | | | | | | | | | | | | |
| (Cost $4,206,966,721) | | | | | | | 4,435,581,989 | | | | 15.0 | % |
| Non-U.S. Government Agency Issues | | | | | | | | | | | | |
| ABFC Trust, | | | | | | | | | | | | |
| Series 2006-OPT1, Class A3C2, 0.448%, 09/25/2036 | | | | | | | | | | | | |
(1 Month LIBOR USD + 0.300%)(3) | | | 5,212,506 | | | | 5,143,295 | | | | | |
| ACE Securities Corp. Home Equity Loan Trust, | | | | | | | | | | | | |
| Series 2006-OP1, Class A2C, 0.298%, 04/25/2036 | | | | | | | | | | | | |
(1 Month LIBOR USD + 0.150%)(3) | | | 601,162 | | | | 600,551 | | | | | |
| Alternative Loan Trust: | | | | | | | | | | | | |
Series 2005-3CB, Class 2A1, 5.000%, 06/15/2021(6) | | | 88,462 | | | | 86,320 | | | | | |
Series 2006-43CB, Class 2A1, 6.000%, 02/25/2022(6) | | | 32,544 | | | | 32,712 | | | | | |
Series 2005-11CB, Class 2A6, 5.500%, 06/25/2025(6) | | | 4,574,025 | | | | 4,541,713 | | | | | |
| Series 2004-18CB, Class 1A1, 6.000%, 09/25/2034 | | | 2,985,529 | | | | 3,083,318 | | | | | |
Series 2005-6CB, Class 1A4, 5.500%, 04/25/2035(6) | | | 11,236,785 | | | | 10,996,483 | | | | | |
Series 2005-29CB, Class A1, 5.500%, 07/25/2035(6) | | | 1,908,527 | | | | 1,585,208 | | | | | |
Series 2005-49CB, Class A5, 5.500%, 11/25/2035(6) | | | 1,904,813 | | | | 1,716,424 | | | | | |
Series 2005-73CB, Class 1A7, 5.500%, 01/25/2036(6) | | | 294,907 | | | | 296,522 | | | | | |
The accompanying notes are an integral part of these financial statements.
Baird Core Plus Bond Fund
Schedule of Investments, December 31, 2020
Long-Term Investments (cont.)
| | | Principal | | | | | | % of | |
| | | Amount | | | Value | | | Net Assets | |
| Alternative Loan Trust: (cont.) | | | | | | | | | |
Series 2005-85CB, Class 2A2, 5.500%, 02/25/2036(6) | | $ | 2,555,827 | | | $ | 2,467,969 | | | |
|
|
Series 2006-28CB, Class A17, 6.000%, 10/25/2036(6) | | | 429,052 | | | | 313,386 | | | | | |
| AMRESCO Residential Securities | | | | | | | | | | | | |
| Corp. Mortgage Loan Trust, | | | | | | | | | | | | |
| Series 1998-2, Class A6, 6.405%, 12/25/2027 | | | 56 | | | | 56 | | | | | |
| Argent Securities Inc. Asset-Backed | | | | | | | | | | | | |
| Pass-Through Certificates, | | | | | | | | | | | | |
| Series 2005-W5, Class A1, 0.618%, 01/25/2036 | | | | | | | | | | | | |
(1 Month LIBOR USD + 0.470%)(3) | | | 24,922,195 | | | | 24,672,776 | | | | | |
| Arroyo Mortgage Trust: | | | | | | | | | | | | |
Series 2018-1, Class A1, 3.763%, 04/25/2048(2)(4) | | | 3,247,429 | | | | 3,295,472 | | | | | |
Series 2019-3, Class A1, 2.962%, 10/25/2048(2)(4) | | | 31,993,212 | | | | 32,982,896 | | | | | |
| Asset Backed Securities Corp. Home Equity Loan Trust: | | | | | | | | | | | | |
| Series 2006-HE2, Class A1, 0.528%, 03/25/2036 | | | | | | | | | | | | |
(1 Month LIBOR USD + 0.380%)(3)(6) | | | 10,241,958 | | | | 10,154,070 | | | | | |
| Series 2006-HE6, Class A4, 0.308%, 11/25/2036 | | | | | | | | | | | | |
(1 Month LIBOR USD + 0.160%)(3) | | | 295,022 | | | | 291,528 | | | | | |
| Banc of America Alternative Loan Trust: | | | | | | | | | | | | |
Series 2005-8, Class 5A1, 5.500%, 05/01/2021(6) | | | 16,044 | | | | 14,526 | | | | | |
| Series 2004-6, Class 4A1, 5.000%, 06/15/2021 | | | 236,866 | | | | 243,009 | | | | | |
Series 2007-1, Class 1A1, 4.520%, 04/25/2022(4)(6) | | | 120,565 | | | | 115,355 | | | | | |
| Series 2003-8, Class 1CB1, 5.500%, 10/25/2033 | | | 1,576,170 | | | | 1,583,461 | | | | | |
Series 2005-9, Class 1CB3, 5.500%, 10/25/2035(6) | | | 26,987 | | | | 26,822 | | | | | |
Series 2005-9, Class 2CB1, 6.000%, 10/25/2035(6) | | | 4,486,170 | | | | 4,344,372 | | | | | |
Series 2006-5, Class CB7, 6.000%, 06/25/2046(6) | | | 167,631 | | | | 163,148 | | | | | |
| Banc of America Funding Trust: | | | | | | | | | | | | |
| Series 2005-C, Class A1, 0.392%, 05/20/2035 | | | | | | | | | | | | |
(1 Month LIBOR USD + 0.240%)(3) | | | 3,282,992 | | | | 3,298,182 | | | | | |
Series 2007-C, Class 1A3, 3.481%, 05/20/2036(4)(6) | | | 1,600,709 | | | | 1,576,930 | | | | | |
| Series 2006-G, Class 1A1, 0.532%, 07/20/2036 | | | | | | | | | | | | |
(1 Month LIBOR USD + 0.380%)(3) | | | 23,051,948 | | | | 22,634,535 | | | | | |
| Bayview Financial Trust, | | | | | | | | | | | | |
Series 2007-B, Class 1A2, 6.831%, 08/28/2037(7) | | | 80,743 | | | | 80,455 | | | | | |
| Bear Stearns ARM Trust, | | | | | | | | | | | | |
| Series 2005-9, Class A1, 2.410%, 10/25/2035 | | | | | | | | | | | | |
(1 Year CMT Rate + 2.300%)(3) | | | 402,936 | | | | 403,174 | | | | | |
| Bear Stearns Asset Backed Securities I Trust: | | | | | | | | | | | | |
| Series 2005-HE4, Class M2, 1.108%, 04/25/2035 | | | | | | | | | | | | |
(1 Month LIBOR USD + 0.960%)(3) | | | 2,887,982 | | | | 2,886,975 | | | | | |
| Series 2006-HE8, Class 21A2, 0.318%, 07/25/2036 | | | | | | | | | | | | |
(1 Month LIBOR USD + 0.170%)(3) | | | 2,439,520 | | | | 2,431,129 | | | | | |
| BRAVO Residential Funding Trust, | | | | | | | | | | | | |
Series 2020-RPL2, Class A1, 2.000%, 05/25/2059(2)(4) | | | 42,101,047 | | | | 43,360,222 | | | | | |
The accompanying notes are an integral part of these financial statements.
Baird Core Plus Bond Fund
Schedule of Investments, December 31, 2020
Long-Term Investments (cont.)
| | | Principal | | | | | | % of | |
| | | Amount | | | Value | | | Net Assets | |
| Carrington Mortgage Loan Trust, | | | | | | | | | |
| Series 2005-NC1, Class M2, 0.928%, 02/26/2035 | | | | | | | | | |
(1 Month LIBOR USD + 0.780%)(3) | | $ | 585,909 | | | $ | 593,046 | | | |
|
|
| Chase Mortgage Finance Trust: | | | | | | | | | | | | |
Series 2005-A2, Class 1A5, 3.356%, 01/25/2036(4) | | | 632,204 | | | | 609,869 | | | | | |
Series 2006-A1, Class 2A3, 3.259%, 09/25/2036(4) | | | 458,863 | | | | 418,679 | | | | | |
Series 2007-A1, Class 2A3, 3.174%, 02/25/2037(4) | | | 812,948 | | | | 805,983 | | | | | |
Series 2007-A1, Class 3A1, 3.562%, 02/25/2037(4) | | | 2,146,467 | | | | 2,193,860 | | | | | |
| CHL Mortgage Pass-Through Trust, | | | | | | | | | | | | |
Series 2005-6, Class 2A1, 5.500%, 04/25/2035(6) | | | 312,218 | | | | 299,287 | | | | | |
| Citicorp Mortgage Securities Trust: | | | | | | | | | | | | |
| Series 2006-3, Class 1A4, 6.000%, 06/25/2036 | | | 3,574,907 | | | | 3,636,886 | | | | | |
Series 2007-2, Class 1A3, 6.000%, 02/25/2037(6) | | | 1,026,703 | | | | 1,037,868 | | | | | |
| Citicorp Residential Mortgage Trust, | | | | | | | | | | | | |
Series 2007-1, Class A6, 5.702%, 03/25/2037(7) | | | 8,178 | | | | 8,410 | | | | | |
| Citigroup Mortgage Loan Trust, | | | | | | | | | | | | |
Series 2018-RP2, Class A1, 3.500%, 02/25/2058(2)(4) | | | 25,507,446 | | | | 26,923,803 | | | | | |
| Citigroup Mortgage Loan Trust, Inc.: | | | | | | | | | | | | |
| Series 2006-AR1, Class 1A1, 3.880%, 10/25/2035 | | | | | | | | | | | | |
(1 Year CMT Rate + 2.400%)(3) | | | 6,382,822 | | | | 6,504,184 | | | | | |
Series 2005-9, Class 22A2, 6.000%, 10/25/2035(6) | | | 2,430,057 | | | | 2,488,660 | | | | | |
Series 2005-9, Class 2A2, 5.500%, 11/25/2035(6) | | | 7,225 | | | | 7,225 | | | | | |
| Series 2007-AMC4, Class A2C, 0.318%, 05/25/2037 | | | | | | | | | | | | |
(1 Month LIBOR USD + 0.170%)(3) | | | 349,699 | | | | 349,317 | | | | | |
| Countrywide Asset-Backed Certificates: | | | | | | | | | | | | |
Series 2005-13, Class AF3, 5.430%, 02/25/2033(4)(6) | | | 154,270 | | | | 146,972 | | | | | |
| Series 2006-22, Class 2A3, 0.308%, 01/25/2034 | | | | | | | | | | | | |
(1 Month LIBOR USD + 0.160%)(3) | | | 1,886,240 | | | | 1,881,422 | | | | | |
| Series 2007-11, Class 2A3, 0.338%, 04/25/2034 | | | | | | | | | | | | |
(1 Month LIBOR USD + 0.190%)(3) | | | 3,310,063 | | | | 3,285,369 | | | | | |
Series 2004-12, Class AF6, 4.634%, 03/25/2035(4) | | | 591 | | | | 594 | | | | | |
Series 2005-10, Class AF6, 4.915%, 12/25/2035(4) | | | 65,061 | | | | 67,072 | | | | | |
Series 2006-10, Class 1AF3, 5.971%, 12/25/2035(4) | | | 351,093 | | | | 337,139 | | | | | |
| Series 2007-9, Class 2A3, 0.328%, 06/25/2047 | | | | | | | | | | | | |
(1 Month LIBOR USD + 0.180%)(3) | | | 11,563,346 | | | | 11,503,954 | | | | | |
| Credit Suisse First Boston Mortgage Securities Corp., | | | | | | | | | | | | |
Series 2005-7, Class 3A1, 5.000%, 06/15/2021(6) | | | 11,902 | | | | 10,659 | | | | | |
| Credit-Based Asset Servicing & Securitization LLC, | | | | | | | | | | | | |
| Series 2007-CB4, Class A1A, 0.238%, 04/25/2037 | | | | | | | | | | | | |
(1 Month LIBOR USD + 0.090%)(3) | | | 2,691,985 | | | | 2,630,694 | | | | | |
| CWABS Asset-Backed Certificates Trust: | | | | | | | | | | | | |
Series 2004-15, Class AF6, 4.613%, 04/25/2035(4) | | | 853 | | | | 858 | | | | | |
Series 2005-7, Class AF6, 4.693%, 08/25/2035(4) | | | 6,396 | | | | 6,485 | | | | | |
Series 2006-9, Class 1AF3, 5.859%, 08/25/2036(4)(6) | | | 140,193 | | | | 136,738 | | | | | |
| Series 2006-18, Class 2A2, 0.308%, 03/25/2037 | | | | | | | | | | | | |
(1 Month LIBOR USD + 0.160%)(3) | | | 1,994,629 | | | | 1,982,606 | | | | | |
The accompanying notes are an integral part of these financial statements.
Baird Core Plus Bond Fund
Schedule of Investments, December 31, 2020
Long-Term Investments (cont.)
| | | Principal | | | | | | % of | |
| | | Amount | | | Value | | | Net Assets | |
| Deutsche Alt-A Securities, Inc. Mortgage Loan Trust: | | | | | | | | | |
| Series 2005-1, Class 1A1, 0.648%, 02/25/2035 | | | | | | | | | |
(1 Month LIBOR USD + 0.500%)(3) | | $ | 4,647,272 | | | $ | 4,455,149 | | | |
|
|
Series 2005-2, Class 1A7, 5.346%, 04/25/2035(4) | | | 6,959,450 | | | | 6,994,968 | | | | | |
| First Franklin Mortgage Loan Trust: | | | | | | | | | | | | |
| Series 2006-FF3, Class A2B, 0.548%, 02/25/2036 | | | | | | | | | | | | |
(1 Month LIBOR USD + 0.400%)(3) | | | 2,430,705 | | | | 2,427,416 | | | | | |
| Series 2006-FF6, Class A4, 0.648%, 04/25/2036 | | | | | | | | | | | | |
(1 Month LIBOR USD + 0.500%)(3) | | | 18,761,439 | | | | 18,499,466 | | | | | |
| First Horizon Alternative Mortgage Securities Trust: | | | | | | | | | | | | |
| Series 2006-FA6, Class 3A1, 5.750%, 11/25/2021 | | | 6,061 | | | | 5,520 | | | | | |
Series 2006-FA8, Class 2A1, 5.750%, 01/25/2022(6) | | | 61,127 | | | | 37,734 | | | | | |
Series 2004-AA1, Class A1, 2.226%, 06/25/2034(4) | | | 3,176,577 | | | | 3,166,605 | | | | | |
Series 2005-AA2, Class 2A1, 2.651%, 04/25/2035(4) | | | 1,500,564 | | | | 1,559,396 | | | | | |
| Fremont Home Loan Trust, | | | | | | | | | | | | |
| Series 2005-B, Class M4, 0.853%, 04/25/2035 | | | | | | | | | | | | |
(1 Month LIBOR USD + 0.705%)(3) | | | 393,846 | | | | 393,531 | | | | | |
| GE Capital Mortgage Services, Inc. Trust, | | | | | | | | | | | | |
| Series 1999-HE1, Class A7, 6.265%, 04/25/2029 | | | 40 | | | | 41 | | | | | |
| GS Mortgage Securities Trust, | | | | | | | | | | | | |
Series 2018-RPL1, Class A1A, 3.750%, 10/25/2057(2) | | | 49,664,321 | | | | 52,961,322 | | | | | |
| GSAA Home Equity Trust: | | | | | | | | | | | | |
| Series 2004-6, Class A1, 0.948%, 06/25/2034 | | | | | | | | | | | | |
(1 Month LIBOR USD + 0.800%)(3) | | | 966,344 | | | | 971,732 | | | | | |
| Series 2005-14, Class 1A1, 0.648%, 12/25/2035 | | | | | | | | | | | | |
(1 Month LIBOR USD + 0.500%)(3) | | | 10,311,667 | | | | 10,300,691 | | | | | |
| GSAMP Trust: | | | | | | | | | | | | |
| Series 2005-AHL2, Class A2C, 0.388%, 12/25/2035 | | | | | | | | | | | | |
(1 Month LIBOR USD + 0.240%)(3) | | | 708,133 | | | | 707,529 | | | | | |
| Series 2006-HE7, Class A2D, 0.378%, 10/25/2036 | | | | | | | | | | | | |
(1 Month LIBOR USD + 0.230%)(3) | | | 736,927 | | | | 727,081 | | | | | |
| GSR Mortgage Loan Trust: | | | | | | | | | | | | |
| Series 2004-15F, Class 5A1, 5.500%, 12/01/2021 | | | 21,644 | | | | 21,504 | | | | | |
| Series 2005-3F, Class 2A4, 6.000%, 03/25/2035 | | | 1,944,132 | | | | 1,997,816 | | | | | |
Series 2005-AR2, Class 2A1, 3.678%, 04/25/2035(4) | | | 2,182,921 | | | | 2,124,621 | | | | | |
| Home Equity Asset Trust, | | | | | | | | | | | | |
| Series 2004-7, Class A1, 0.868%, 01/25/2035 | | | | | | | | | | | | |
(1 Month LIBOR USD + 0.720%)(3) | | | 10,084,238 | | | | 9,754,777 | | | | | |
| HomeBanc Mortgage Trust, | | | | | | | | | | | | |
| Series 2005-4, Class A1, 0.688%, 10/25/2035 | | | | | | | | | | | | |
(1 Month LIBOR USD + 0.540%)(3) | | | 2,156,496 | | | | 2,165,833 | | | | | |
| HSI Asset Securitization Corp. Trust, | | | | | | | | | | | | |
| Series 2006-OPT4, Class 2A3, 0.308%, 03/25/2036 | | | | | | | | | | | | |
(1 Month LIBOR USD + 0.160%)(3) | | | 547,387 | | | | 545,885 | | | | | |
The accompanying notes are an integral part of these financial statements.
Baird Core Plus Bond Fund
Schedule of Investments, December 31, 2020
Long-Term Investments (cont.)
| | | Principal | | | | | | % of | |
| | | Amount | | | Value | | | Net Assets | |
| J.P. Morgan Alternative Loan Trust: | | | | | | | | | |
Series 2006-A1, Class 2A1, 3.524%, 03/25/2036(4) | | $ | 61,343 | | | $ | 57,404 | | | |
|
|
| Series 2007-S1, Class A1, 0.428%, 06/25/2037 | | | | | | | | | | | | |
(1 Month LIBOR USD + 0.280%)(3) | | | 4,573,289 | | | | 4,435,757 | | | | | |
| J.P. Morgan Mortgage Trust: | | | | | | | | | | | | |
Series 2005-A8, Class 2A3, 2.896%, 11/25/2035(4) | | | 3,845,159 | | | | 3,632,088 | | | | | |
Series 2006-A2, Class 3A3, 3.422%, 04/25/2036(4)(6) | | | 1,123,127 | | | | 1,006,101 | | | | | |
Series 2006-A2, Class 2A1, 3.521%, 04/25/2036(4) | | | 981,478 | | | | 969,226 | | | | | |
Series 2006-A7, Class 2A2, 3.116%, 01/25/2037(4)(6) | | | 1,598,167 | | | | 1,482,210 | | | | | |
Series 2006-A7, Class 2A4R, 3.116%, 01/25/2037(4)(6) | | | 1,634,614 | | | | 1,516,013 | | | | | |
Series 2007-A2, Class 2A3, 3.549%, 04/25/2037(4)(6) | | | 3,200,438 | | | | 2,899,549 | | | | | |
Series 2007-A4, Class 2A3, 3.771%, 06/25/2037(4)(6) | | | 3,519,330 | | | | 3,091,377 | | | | | |
| Luminent Mortgage Trust, | | | | | | | | | | | | |
| Series 2005-1, Class A1, 0.668%, 11/25/2035 | | | | | | | | | | | | |
(1 Month LIBOR USD + 0.520%)(3) | | | 5,862,240 | | | | 5,656,005 | | | | | |
| MASTR Alternative Loan Trust: | | | | | | | | | | | | |
| Series 2004-2, Class 2A1, 6.000%, 02/25/2034 | | | 1,802,255 | | | | 1,876,865 | | | | | |
| Series 2004-8, Class 2A1, 6.000%, 09/25/2034 | | | 1,271,489 | | | | 1,314,641 | | | | | |
Series 2005-6, Class 1A5, 5.500%, 12/25/2035(6) | | | 1,863,410 | | | | 1,706,938 | | | | | |
| MASTR Asset Backed Securities Trust, | | | | | | | | | | | | |
| Series 2006-NC1, Class A4, 0.748%, 01/25/2036 | | | | | | | | | | | | |
(1 Month LIBOR USD + 0.600%)(3) | | | 133,682 | | | | 133,661 | | | | | |
| Merrill Lynch Mortgage Investors Trust: | | | | | | | | | | | | |
| Series 2004-F, Class A1B, 0.768%, 12/25/2029 | | | | | | | | | | | | |
(1 Month LIBOR USD + 0.620%)(3) | | | 4,661,511 | | | | 4,580,943 | | | | | |
Series 2005-A5, Class A3, 3.512%, 06/25/2035(4) | | | 1,256,645 | | | | 1,260,480 | | | | | |
| Mill City Mortgage Loan Trust: | | | | | | | | | | | | |
Series 2018-2, Class A1, 3.500%, 05/25/2058(2)(4) | | | 22,659,190 | | | | 23,564,440 | | | | | |
Series 2018-3, Class A1, 3.500%, 08/25/2058(2)(4) | | | 14,156,027 | | | | 14,933,025 | | | | | |
Series 2019-1, Class A1, 3.250%, 10/25/2069(2)(4) | | | 29,739,336 | | | | 31,383,267 | | | | | |
| Morgan Stanley Capital I, Inc. Trust, | | | | | | | | | | | | |
| Series 2006-HE2, Class A1, 0.488%, 03/25/2036 | | | | | | | | | | | | |
(1 Month LIBOR USD + 0.340%)(3) | | | 3,189,505 | | | | 3,170,237 | | | | | |
| MortgageIT Trust: | | | | | | | | | | | | |
| Series 2005-4, Class A1, 0.708%, 10/25/2035 | | | | | | | | | | | | |
(1 Month LIBOR USD + 0.560%)(3) | | | 2,493,304 | | | | 2,531,024 | | | | | |
| Series 2005-5, Class A1, 0.668%, 12/25/2035 | | | | | | | | | | | | |
(1 Month LIBOR USD + 0.520%)(3) | | | 2,751,090 | | | | 2,749,843 | | | | | |
| New Residential Mortgage Loan Trust: | | | | | | | | | | | | |
Series 2016-1A, Class A1, 3.750%, 03/25/2056(2)(4) | | | 10,391,099 | | | | 11,012,856 | | | | | |
Series 2017-1A, Class A1, 4.000%, 02/25/2057(2)(4) | | | 20,571,393 | | | | 22,232,481 | | | | | |
Series 2017-3A, Class A1, 4.000%, 04/25/2057(2)(4) | | | 17,189,777 | | | | 18,280,255 | | | | | |
Series 2017-6A, Class A1, 4.000%, 08/25/2057(2)(4) | | | 21,122,753 | | | | 22,815,560 | | | | | |
Series 2018-1A, Class A1A, 4.000%, 12/25/2057(2)(4) | | | 11,006,834 | | | | 11,902,302 | | | | | |
Series 2019-RPL2, Class A1, 3.250%, 02/25/2059(2)(4) | | | 26,194,415 | | | | 27,757,771 | | | | | |
The accompanying notes are an integral part of these financial statements.
Baird Core Plus Bond Fund
Schedule of Investments, December 31, 2020
Long-Term Investments (cont.)
| | | Principal | | | | | | % of | |
| | | Amount | | | Value | | | Net Assets | |
| RALI Series Trust: | | | | | | | | | |
| Series 2004-QS13, Class CB, 5.000%, 06/15/2021 | | $ | 3,495 | | | $ | 3,475 | | | |
|
|
| Series 2005-QS5, Class A1, 0.548%, 04/25/2035 | | | | | | | | | | | | |
(1 Month LIBOR USD + 0.400%)(3)(6) | | | 1,819,716 | | | | 1,421,671 | | | | | |
| Series 2005-QS11, Class A2, 0.648%, 07/25/2035 | | | | | | | | | | | | |
(1 Month LIBOR USD + 0.500%)(3)(6) | | | 3,192,261 | | | | 2,354,571 | | | | | |
Series 2005-QA7, Class A22, 3.490%, 07/25/2035(4)(6) | | | 1,515,817 | | | | 1,452,802 | | | | | |
| RAMP Series Trust, | | | | | | | | | | | | |
Series 2002-RS3, Class AI5, 5.572%, 06/25/2032(4) | | | 1,246,158 | | | | 1,267,459 | | | | | |
| RASC Series Trust, | | | | | | | | | | | | |
| Series 2007-KS1, Class A3, 0.298%, 11/25/2036 | | | | | | | | | | | | |
(1 Month LIBOR USD + 0.150%)(3) | | | 1,011,138 | | | | 997,457 | | | | | |
| Renaissance Home Equity Loan Trust: | | | | | | | | | | | | |
Series 2005-1, Class AF6, 4.970%, 05/25/2035(7) | | | 8,451 | | | | 8,877 | | | | | |
Series 2005-2, Class AF6, 4.781%, 08/25/2035(7) | | | 573,591 | | | | 603,290 | | | | | |
Series 2006-2, Class AF3, 5.797%, 08/25/2036(7) | | | 15,212,058 | | | | 8,663,472 | | | | | |
Series 2006-3, Class AF2, 5.580%, 11/25/2036(7) | | | 10,100,807 | | | | 5,342,607 | | | | | |
Series 2007-1, Class AF3, 5.612%, 04/25/2037(7) | | | 278,136 | | | | 113,415 | | | | | |
Series 2007-2, Class AF2, 5.675%, 06/25/2037(7) | | | 1,435,659 | | | | 549,065 | | | | | |
| Soundview Home Loan Trust: | | | | | | | | | | | | |
| Series 2006-OPT4, Class 2A3, 0.448%, 06/25/2036 | | | | | | | | | | | | |
(1 Month LIBOR USD + 0.300%)(3) | | | 489,661 | | | | 489,158 | | | | | |
| Series 2006-EQ1, Class A3, 0.308%, 10/25/2036 | | | | | | | | | | | | |
(1 Month LIBOR USD + 0.160%)(3) | | | 5,703,437 | | | | 5,651,295 | | | | | |
| Specialty Underwriting & Residential Finance Trust, | | | | | | | | | | | | |
| Series 2004-BC4, Class A1A, 0.818%, 10/25/2035 | | | | | | | | | | | | |
(1 Month LIBOR USD + 0.670%)(3) | | | 1,167,712 | | | | 1,164,669 | | | | | |
| Starwood Mortgage Residential Trust, | | | | | | | | | | | | |
Series 2020-3, Class A1, 1.486%, 04/25/2065(2)(4) | | | 14,185,605 | | | | 14,279,070 | | | | | |
| Structured Asset Securities Corp.: | | | | | | | | | | | | |
Series 2003-31A, Class 2A7, 2.409%, 10/25/2033(4) | | | 922,958 | | | | 927,989 | | | | | |
Series 2005-7XS, Class 1A4B, 5.940%, 04/25/2035(7) | | | 7,823 | | | | 8,143 | | | | | |
| Towd Point Mortgage Trust: | | | | | | | | | | | | |
Series 2015-3, Class A1A, 3.500%, 03/25/2054(2)(4) | | | 1,003,590 | | | | 1,008,201 | | | | | |
Series 2016-3, Class A1, 2.250%, 08/25/2055(2)(4) | | | 40,313 | | | | 40,695 | | | | | |
Series 2016-2, Class A1, 3.000%, 08/25/2055(2)(4) | | | 5,327,755 | | | | 5,405,152 | | | | | |
Series 2016-4, Class A1, 2.250%, 07/25/2056(2)(4) | | | 7,000,070 | | | | 7,108,266 | | | | | |
Series 2017-1, Class A1, 2.750%, 10/25/2056(2)(4) | | | 2,274,150 | | | | 2,330,779 | | | | | |
Series 2017-6, Class A1, 2.750%, 10/25/2057(2)(4) | | | 23,971,107 | | | | 24,680,269 | | | | | |
Series 2018-6, Class A1A, 3.750%, 03/25/2058(2)(4) | | | 19,307,195 | | | | 20,350,284 | | | | | |
Series 2019-1, Class A1, 3.750%, 03/25/2058(2)(4) | | | 10,959,182 | | | | 11,775,186 | | | | | |
Series 2018-4, Class A1, 3.000%, 06/25/2058(2)(4) | | | 38,308,291 | | | | 40,654,758 | | | | | |
Series 2019-4, Class A1, 2.900%, 10/25/2059(2)(4) | | | 78,361,232 | | | | 82,714,904 | | | | | |
Series 2020-2, Class A1A, 1.636%, 04/25/2060(2)(4) | | | 45,907,521 | | | | 46,728,067 | | | | | |
Series 2020-4, Class A1, 1.750%, 10/25/2060(2) | | | 101,594,451 | | | | 103,894,326 | | | | | |
The accompanying notes are an integral part of these financial statements.
Baird Core Plus Bond Fund
Schedule of Investments, December 31, 2020
Long-Term Investments (cont.)
| | | Principal | | | | | | % of | |
| | | Amount | | | Value | | | Net Assets | |
| WaMu Mortgage Pass-Through Certificates Trust: | | | | | | | | | |
| Series 2004-CB3, Class 1A, 6.000%, 10/25/2034 | | $ | 1,361,821 | | | $ | 1,408,601 | | | |
|
|
| Series 2004-CB3, Class 2A, 6.500%, 10/25/2034 | | | 2,468,628 | | | | 2,585,397 | | | | | |
| Series 2005-3, Class 1CB3, 0.598%, 05/25/2035 | | | | | | | | | | | | |
(1 Month LIBOR USD + 0.450%)(3)(6) | | | 4,426,212 | | | | 3,604,103 | | | | | |
Series 2005-6, Class 2A4, 5.500%, 08/25/2035(6) | | | 4,292,985 | | | | 4,250,195 | | | | | |
Series 2007-HY3, Class 4A1, 3.410%, 08/25/2036(4) | | | 9,589,752 | | | | 9,585,468 | | | | | |
Series 2006-AR10, Class 1A1, 3.014%, 09/25/2036(4)(6) | | | 763,431 | | | | 728,487 | | | | | |
| Wells Fargo Mortgage Backed Securities Trust: | | | | | | | | | | | | |
Series 2006-AR14, Class 2A3, 2.771%, 10/25/2036(4)(6) | | | 1,494,420 | | | | 1,405,221 | | | | | |
Series 2007-7, Class A49, 6.000%, 06/25/2037(6) | | | 2,213,795 | | | | 2,204,282 | | | | | |
| Total Non-U.S. Government Agency Issues | | | | | | | | | | | | |
| (Cost $1,001,644,569) | | | | | | | 1,018,822,695 | | | | 3.5 | % |
| Total Residential Mortgage-Backed Securities | | | | | | | | | | | | |
| (Cost $5,208,611,290) | | | | | | | 5,454,404,684 | | | | 18.5 | % |
| Commercial Mortgage-Backed Securities | | | | | | | | | | | | |
| U.S. Government Agency Issues | | | | | | | | | | | | |
| Fannie Mae REMIC Trust, | | | | | | | | | | | | |
Series 2017-M4, Class A2, 2.584%, 12/25/2026(4) | | | 30,550,000 | | | | 33,515,492 | | | | | |
| Freddie Mac Multifamily Structured | | | | | | | | | | | | |
| Pass Through Certificates: | | | | | | | | | | | | |
| Series K029, Class A2, 3.320%, 02/25/2023 | | | 64,407,000 | | | | 68,111,233 | | | | | |
| Series K725, Class A2, 3.002%, 01/25/2024 | | | 15,000,000 | | | | 16,122,540 | | | | | |
| Series K037, Class A2, 3.490%, 01/25/2024 | | | 66,950,000 | | | | 72,698,508 | | | | | |
| Series K038, Class A2, 3.389%, 03/25/2024 | | | 48,968,000 | | | | 53,263,346 | | | | | |
Series K048, Class A2, 3.284%, 06/25/2025(4) | | | 59,391,000 | | | | 66,119,056 | | | | | |
Series K050, Class A2, 3.334%, 08/25/2025(4) | | | 82,951,000 | | | | 92,750,325 | | | | | |
| Series K734, Class A2, 3.208%, 02/25/2026 | | | 45,125,000 | | | | 50,227,997 | | | | | |
Series K061, Class A2, 3.347%, 11/25/2026(4) | | | 57,140,000 | | | | 65,225,287 | | | | | |
| Series K062, Class A2, 3.413%, 12/25/2026 | | | 13,903,000 | | | | 15,940,165 | | | | | |
Series K063, Class A2, 3.430%, 01/25/2027(4) | | | 5,315,000 | | | | 6,097,379 | | | | | |
| Series K064, Class A2, 3.224%, 03/25/2027 | | | 1,000,000 | | | | 1,139,594 | | | | | |
| Series K065, Class A2, 3.243%, 04/25/2027 | | | 24,367,000 | | | | 27,826,110 | | | | | |
| Series K072, Class A2, 3.444%, 12/25/2027 | | | 12,000,000 | | | | 13,946,831 | | | | | |
| Series K074, Class A2, 3.600%, 01/25/2028 | | | 36,495,000 | | | | 42,791,515 | | | | | |
Series K077, Class A2, 3.850%, 05/25/2028(4) | | | 46,199,000 | | | | 55,068,575 | | | | | |
| Series K079, Class A2, 3.926%, 06/25/2028 | | | 63,251,000 | | | | 75,851,934 | | | | | |
Series K080, Class A2, 3.926%, 07/25/2028(4) | | | 56,820,000 | | | | 68,271,690 | | | | | |
Series K158, Class A3, 3.900%, 10/25/2033(4) | | | 18,777,000 | | | | 23,356,393 | | | | | |
| Total U.S. Government Agency Issues | | | | | | | | | | | | |
| (Cost $775,762,754) | | | | | | | 848,323,970 | | | | 2.9 | % |
The accompanying notes are an integral part of these financial statements.
Baird Core Plus Bond Fund
Schedule of Investments, December 31, 2020
Long-Term Investments (cont.)
| | | Principal | | | | | | % of | |
| | | Amount | | | Value | | | Net Assets | |
| Non-U.S. Government Agency Issues | | | | | | | | | |
| BANK: | | | | | | | | | |
| Series 2017-BNK4, Class A4, 3.625%, 05/17/2050 | | $ | 30,037,000 | | | $ | 34,323,562 | | | |
|
|
| Series 2017-BNK8, Class A4, 3.488%, 11/17/2050 | | | 69,721,751 | | | | 79,559,204 | | | | | |
| Series 2017-BNK9, Class A4, 3.538%, 11/17/2054 | | | 32,737,000 | | | | 37,520,776 | | | | | |
| Benchmark Mortgage Trust: | | | | | | | | | | | | |
| Series 2020-B19, Class A5, 1.850%, 09/17/2053 | | | 40,850,000 | | | | 41,918,918 | | | | | |
| Series 2020-B21, Class A5, 1.978%, 12/17/2053 | | | 46,400,000 | | | | 47,953,235 | | | | | |
| Citigroup Commercial Mortgage Trust: | | | | | | | | | | | | |
| Series 2014-GC19, Class A3, 3.753%, 03/12/2047 | | | 2,689,848 | | | | 2,905,680 | | | | | |
| Series 2015-GC27, Class A5, 3.137%, 02/10/2048 | | | 50,189,111 | | | | 54,415,295 | | | | | |
| Series 2015-GC29, Class A4, 3.192%, 04/10/2048 | | | 25,030,000 | | | | 27,314,869 | | | | | |
| Series 2016-C2, Class A4, 2.832%, 08/12/2049 | | | 33,387,000 | | | | 36,428,249 | | | | | |
| Series 2017-P8, Class A4, 3.465%, 09/16/2050 | | | 29,775,000 | | | | 33,905,078 | | | | | |
| COMM Mortgage Trust: | | | | | | | | | | | | |
| Series 2012-CR1, Class A3, 3.391%, 05/17/2045 | | | 24,224,935 | | | | 24,710,912 | | | | | |
| Series 2013-CR9, Class A3, 4.022%, 07/12/2045 | | | 26,979,223 | | | | 28,946,381 | | | | | |
| Series 2012-CR2, Class A4, 3.147%, 08/17/2045 | | | 35,388,000 | | | | 36,524,330 | | | | | |
| Series 2013-CR6, Class A4, 3.101%, 03/10/2046 | | | 14,680,000 | | | | 15,220,055 | | | | | |
Series 2013-CR10, Class A4, 4.210%, 08/10/2046(4) | | | 11,500,000 | | | | 12,479,645 | | | | | |
| Series 2014-CR18, Class A4, 3.550%, 07/17/2047 | | | 5,422,382 | | | | 5,876,584 | | | | | |
| Series 2014-CR19, Class A5, 3.796%, 08/12/2047 | | | 33,800,000 | | | | 37,301,166 | | | | | |
| Series 2014-CR20, Class ASB, 3.305%, 11/13/2047 | | | 22,744,914 | | | | 23,826,521 | | | | | |
| Series 2015-LC19, Class A4, 3.183%, 02/10/2048 | | | 27,105,399 | | | | 29,597,808 | | | | | |
| Series 2015-DC1, Class A5, 3.350%, 02/12/2048 | | | 23,390,000 | | | | 25,626,028 | | | | | |
| DBJPM Mortgage Trust, | | | | | | | | | | | | |
| Series 2020-C9, Class A5, 1.926%, 08/15/2053 | | | 30,000,000 | | | | 30,969,090 | | | | | |
| DBUBS Mortgage Trust, | | | | | | | | | | | | |
| Series 2011-LC3A, Class A4, 4.551%, 08/10/2044 | | | 1,163,294 | | | | 1,168,382 | | | | | |
| GS Mortgage Securities Trust: | | | | | | | | | | | | |
| Series 2011-GC5, Class A4, 3.707%, 08/10/2044 | | | 17,357,789 | | | | 17,434,610 | | | | | |
| Series 2012-GCJ9, Class A3, 2.773%, 11/13/2045 | | | 40,568,791 | | | | 41,771,582 | | | | | |
Series 2013-GC13, Class A4, 3.871%, 07/12/2046(4) | | | 14,700,000 | | | | 15,470,351 | | | | | |
| Series 2014-GC20, Class AAB, 3.655%, 04/12/2047 | | | 14,711,531 | | | | 15,441,983 | | | | | |
| Series 2014-GC20, Class A5, 3.998%, 04/12/2047 | | | 9,959,000 | | | | 10,840,136 | | | | | |
| J.P. Morgan Chase Commercial | | | | | | | | | | | | |
| Mortgage Securities Trust: | | | | | | | | | | | | |
| Series 2013-LC11, Class A5, 2.960%, 04/15/2046 | | | 31,025,000 | | | | 32,504,682 | | | | | |
| Series 2013-LC11, Class A4, 2.694%, 04/17/2046 | | | 4,598,963 | | | | 4,783,415 | | | | | |
| Series 2012-LC9, Class ASB, 2.437%, 12/17/2047 | | | 1,574,514 | | | | 1,598,096 | | | | | |
| Series 2013-C10, Class ASB, 2.702%, 12/17/2047 | | | 9,464,899 | | | | 9,655,670 | | | | | |
| JPMBB Commercial Mortgage Securities Trust: | | | | | | | | | | | | |
| Series 2013-C15, Class A4, 4.096%, 11/17/2045 | | | 6,948,764 | | | | 7,528,477 | | | | | |
| Series 2013-C17, Class A3, 3.928%, 01/17/2047 | | | 8,714,507 | | | | 9,250,680 | | | | | |
| Series 2014-C24, Class ASB, 3.368%, 11/18/2047 | | | 9,388,028 | | | | 9,864,669 | | | | | |
The accompanying notes are an integral part of these financial statements.
Baird Core Plus Bond Fund
Schedule of Investments, December 31, 2020
Long-Term Investments (cont.)
| | | Principal | | | | | | % of | |
| | | Amount | | | Value | | | Net Assets | |
| JPMBB Commercial Mortgage Securities Trust: (cont.) | | | | | | | | | |
| Series 2014-C25, Class A5, 3.672%, 11/18/2047 | | $ | 45,697,000 | | | $ | 50,357,326 | | | |
|
|
| Series 2015-C30, Class A5, 3.822%, 07/15/2048 | | | 42,110,000 | | | | 47,548,511 | | | | | |
| Series 2016-C4, Class A3, 3.141%, 12/17/2049 | | | 29,133,000 | | | | 32,408,642 | | | | | |
| JPMCC Commercial Mortgage Securities Trust, | | | | | | | | | | | | |
| Series 2017-JP7, Class A5, 3.454%, 09/16/2050 | | | 27,356,184 | | | | 30,960,515 | | | | | |
| Morgan Stanley Bank of America Merrill Lynch Trust: | | | | | | | | | | | | |
| Series 2012-C5, Class A4, 3.176%, 08/17/2045 | | | 41,590,000 | | | | 42,872,573 | | | | | |
| Series 2012-C6, Class A4, 2.858%, 11/15/2045 | | | 27,721,819 | | | | 28,547,361 | | | | | |
Series 2013-C10, Class A3, 3.967%, 07/17/2046(4) | | | 39,931,311 | | | | 42,427,664 | | | | | |
| Series 2013-C12, Class A3, 3.973%, 10/17/2046 | | | 13,728,391 | | | | 14,573,583 | | | | | |
| Series 2014-C16, Class A5, 3.892%, 06/17/2047 | | | 35,020,000 | | | | 38,098,927 | | | | | |
| Series 2015-C25, Class ASB, 3.383%, 10/19/2048 | | | 27,825,299 | | | | 29,543,578 | | | | | |
| Series 2016-C30, Class A5, 2.860%, 09/17/2049 | | | 9,062,000 | | | | 9,902,013 | | | | | |
| Wells Fargo Commercial Mortgage Trust: | | | | | | | | | | | | |
| Series 2015-C26, Class ASB, 2.991%, 02/15/2048 | | | 12,633,497 | | | | 13,199,895 | | | | | |
| Series 2016-C35, Class ASB, 2.788%, 07/17/2048 | | | 11,425,000 | | | | 12,055,478 | | | | | |
| Series 2016-BNK1, Class A3, 2.652%, 08/17/2049 | | | 7,952,000 | | | | 8,597,749 | | | | | |
| Series 2017-C40, Class A4, 3.581%, 10/17/2050 | | | 38,250,000 | | | | 43,601,779 | | | | | |
| Series 2017-C42, Class A4, 3.589%, 12/16/2050 | | | 52,370,521 | | | | 60,146,837 | | | | | |
| Series 2017-RC1, Class A4, 3.631%, 01/15/2060 | | | 11,875,000 | | | | 13,539,742 | | | | | |
| WFRBS Commercial Mortgage Trust: | | | | | | | | | | | | |
| Series 2013-C11, Class A5, 3.071%, 03/17/2045 | | | 14,324,000 | | | | 14,961,189 | | | | | |
| Series 2012-C6, Class A4, 3.440%, 04/15/2045 | | | 18,191,189 | | | | 18,401,998 | | | | | |
| Series 2013-C14, Class A4, 3.073%, 06/15/2046 | | | 37,078,000 | | | | 38,968,425 | | | | | |
| Series 2013-C18, Class A4, 3.896%, 12/17/2046 | | | 20,847,465 | | | | 22,297,627 | | | | | |
| Series 2014-C21, Class ASB, 3.393%, 08/16/2047 | | | 8,999,576 | | | | 9,353,888 | | | | | |
| Series 2014-C24, Class A5, 3.607%, 11/18/2047 | | | 54,091,000 | | | | 59,149,341 | | | | | |
| Series 2014-C23, Class ASB, 3.636%, 10/17/2057 | | | 8,069,206 | | | | 8,497,859 | | | | | |
| Total Non-U.S. Government Agency Issues | | | | | | | | | | | | |
| (Cost $1,467,517,397) | | | | | | | 1,534,648,619 | | | | 5.2 | % |
| Total Commercial Mortgage-Backed Securities | | | | | | | | | | | | |
| (Cost $2,243,280,151) | | | | | | | 2,382,972,589 | | | | 8.1 | % |
| Asset Backed Securities | | | | | | | | | | | | |
| Citibank Credit Card Issuance Trust, | | | | | | | | | | | | |
| Series 2007-A3, Class A3, 6.150%, 06/15/2039 | | | 6,100,000 | | | | 9,137,876 | | | | | |
| Conseco Financial Corp.: | | | | | | | | | | | | |
| Series 1998-3, Class A5, 6.220%, 03/01/2030 | | | 30,996 | | | | 31,379 | | | | | |
| Series 1998-4, Class A5, 6.180%, 04/01/2030 | | | 22,056 | | | | 22,474 | | | | | |
| Ford Credit Auto Owner Trust: | | | | | | | | | | | | |
Series 2019-1, Class A, 3.520%, 07/15/2030(2) | | | 29,300,000 | | | | 31,955,172 | | | | | |
Series 2018-1, Class A, 3.190%, 07/15/2031(2) | | | 28,641,000 | | | | 31,471,641 | | | | | |
| Oakwood Mortgage Investors, Inc., | | | | | | | | | | | | |
| Series 1999-B, Class A3, 6.450%, 12/15/2023 | | | 5,309 | | | | 5,466 | | | | | |
The accompanying notes are an integral part of these financial statements.
Baird Core Plus Bond Fund
Schedule of Investments, December 31, 2020
Long-Term Investments (cont.)
| | | Principal | | | | | | % of | |
| | | Amount | | | Value | | | Net Assets | |
| PFS Financing Corp., | | | | | | | | | |
Series 2018-D, Class A, 3.190%, 04/17/2023(2) | | $ | 32,525,000 | | | $ | 32,752,864 | | | | |
| SoFi Consumer Loan Program LLC: | | | | | | | | | | | |
Series 2017-4, Class A, 2.500%, 06/25/2026(2) | | | 939,394 | | | | 942,894 | | | | |
Series 2017-5, Class A2, 2.780%, 09/25/2026(2) | | | 8,317,282 | | | | 8,380,820 | | | | |
| Synchrony Card Funding LLC, | | | | | | | | | | | |
| Series 2019-A1, Class A, 2.950%, 03/15/2025 | | | 16,745,000 | | | | 17,283,029 | | | | |
| Towd Point Mortgage Trust: | | | | | | | | | | | |
Series 2020-MH1, Class A1A, 2.184%, 02/25/2060(2)(4) | | | 52,430,903 | | | | 53,364,991 | | | | |
Series 2020-MH1, Class A1, 2.250%, 02/25/2060(2)(4) | | | 38,079,453 | | | | 38,730,063 | | | | |
| Toyota Auto Loan Extended Note Trust: | | | | | | | | | | | |
Series 2019-1A, Class A, 2.560%, 11/25/2031(2) | | | 62,085,050 | | | | 66,301,066 | | | | |
Series 2020-1A, Class A, 1.350%, 05/25/2033(2) | | | 42,408,000 | | | | 43,666,970 | | | | |
| World Financial Network Credit Card Master Trust, | | | | | | | | | | | |
| Series 2016-A, Class A, 2.030%, 04/15/2025 | | | 20,102,000 | | | | 20,253,067 | | | | |
| Total Asset Backed Securities | | | | | | | | | | | |
| (Cost $338,871,660) | | | | | | | 354,299,772 | | | | 1.2 | % |
| Common Stock | | | | | | | | | | | | |
| | | Shares | | | | | | | | | |
| Industrials | | | | | | | | | | | | |
Weatherford International PLC(1) | | | 46,003 | | | | 276,018 | | | | | |
| Total Common Stock | | | | | | | | | | | | |
| (Cost $3,790,590) | | | | | | | 276,018 | | | | 0.0 | % |
| Total Long-Term Investments | | | | | | | | | | | | |
| (Cost $26,326,703,928) | | | | | | | 28,359,558,904 | | | | 96.2 | % |
| Short-Term Investment | | | | | | | | | | | | |
| Money Market Mutual Fund | | | | | | | | | | | | |
| First American Government Obligations | | | | | | | | | | | | |
Fund, Class U, 0.04%(5) | | | 1,319,454,362 | | | | 1,319,454,362 | | | | | |
| Total Short-Term Investment | | | | | | | | | | | | |
| (Cost $1,319,454,362) | | | | | | | 1,319,454,362 | | | | 4.5 | % |
| Total Investments | | | | | | | | | | | | |
| (Cost $27,646,158,290) | | | | | | | 29,679,013,266 | | | | 100.7 | % |
| Liabilities in Excess of Other Assets | | | | | | | (189,149,679 | ) | | | (0.7 | )% |
| TOTAL NET ASSETS | | | | | | $ | 29,489,863,587 | | | | 100.0 | % |
Notes to Schedule of Investments
CMT – Constant Maturity Treasury
LIBOR – London Inter-bank Offered Rate
SOFR – Secured Overnight Financing Rate
SOFRINDX – Secured Overnight Financing Rate Index
The accompanying notes are an integral part of these financial statements.
Baird Core Plus Bond Fund
Schedule of Investments, December 31, 2020
Notes to Schedule of Investments (cont.)| (2) | Security as defined in Rule 144A under the Securities Act of 1933 and classified as liquid under the Fund’s liquidity risk management program. Purchased in a private placement transaction; resale to the public may require registration or may extend only to qualified institutional buyers. At December 31, 2020, the value of these securities total $5,713,026,639, which represents 19.37% of total net assets. |
| (3) | Variable rate security based on a reference index and spread. The rate reported is the rate in effect as of December 31, 2020. |
| (4) | Variable rate security. The coupon is based on an underlying pool of loans. The rate reported is the rate in effect as of December 31, 2020. |
| (5) | Seven-day yield. |
| (6) | Security that, on the last payment date, missed a partial principal or interest payment. |
| (7) | Step-up bond; the interest rate shown is the rate in effect as of December 31, 2020. |
| (8) | Security or a portion of the security purchased on a when-issued or delayed delivery basis. |
| (9) | Security in default. |
Summary of Fair Value Exposure at December 31, 2020
The Fund has adopted authoritative fair valuation accounting standards which establish a definition of fair value and set out a hierarchy for measuring fair value. These standards require additional disclosures about the various inputs and valuation techniques used to develop the measurements of fair value and a discussion on changes in valuation techniques and related inputs during the period. These standards define fair value as the price that would be received to sell an asset or paid to transfer a liability in an orderly transaction between market participants at the measurement date.
The fair value hierarchy is organized into three levels based upon the assumptions (referred to as “inputs”) used in pricing the asset or liability. These standards state that “observable inputs” reflect the assumptions market participants would use in pricing the asset or liability based on market data obtained from independent sources and “unobservable inputs” reflect an entity’s own assumptions about the assumptions market participants would use in pricing the asset or liability. These inputs are summarized into three broad levels and described below:
| Level 1 – | Quoted prices (unadjusted) in active markets for identical assets or liabilities that the reporting entity can access at the measurement date. |
| Level 2 – | Inputs other than quoted prices included within Level 1 that are observable for the asset or liability, either directly or indirectly. |
| Level 3 – | Unobservable inputs for the asset or liability. |
The inputs or methodology used for valuing securities are not necessarily an indication of the risk associated with investing in those securities.
The accompanying notes are an integral part of these financial statements.
Baird Core Plus Bond Fund
Summary of Fair Value Exposure at December 31, 2020 (cont.)
The following is a summary of the inputs used to value the Fund’s investments as of December 31, 2020:
| | | Level 1 | | | Level 2 | | | Level 3 | | | Total | |
| Long-Term Investments | | | | | | | | | | | | |
| U.S. Treasury Securities | | $ | — | | | $ | 4,324,385,252 | | | $ | — | | | $ | 4,324,385,252 | |
| Other Government Related Securities | | | — | | | | 119,856,793 | | | | — | | | | 119,856,793 | |
| Corporate Bonds | | | — | | | | 15,361,676,188 | | | | — | | | | 15,361,676,188 | |
| Municipal Bonds | | | — | | | | 361,687,608 | | | | — | | | | 361,687,608 | |
| Residential Mortgage-Backed Securities – | | | | | | | | | | | | | | | | |
| U.S. Government Agency Issues | | | — | | | | 4,435,581,989 | | | | — | | | | 4,435,581,989 | |
| Residential Mortgage-Backed Securities – | | | | | | | | | | | | | | | | |
| Non-U.S. Government Agency Issues | | | — | | | | 1,018,822,695 | | | | — | | | | 1,018,822,695 | |
| Commercial Mortgage-Backed Securities – | | | | | | | | | | | | | | | | |
| U.S. Government Agency Issues | | | — | | | | 848,323,970 | | | | — | | | | 848,323,970 | |
| Commercial Mortgage-Backed Securities – | | | | | | | | | | | | | | | | |
| Non-U.S. Government Agency Issues | | | — | | | | 1,534,648,619 | | | | — | | | | 1,534,648,619 | |
| Asset Backed Securities | | | — | | | | 354,299,772 | | | | — | | | | 354,299,772 | |
| Common Stock | | | 276,018 | | | | — | | | | — | | | | 276,018 | |
| Total Long-Term Investments | | | 276,018 | | | | 28,359,282,886 | | | | — | | | | 28,359,558,904 | |
| Short-Term Investment | | | | | | | | | | | | | | | | |
| Money Market Mutual Fund | | | 1,319,454,362 | | | | — | | | | — | | | | 1,319,454,362 | |
| Total Short-Term Investment | | | 1,319,454,362 | | | | — | | | | — | | | | 1,319,454,362 | |
| Total Investments | | $ | 1,319,730,380 | | | $ | 28,359,282,886 | | | $ | — | | | $ | 29,679,013,266 | |
Changes in valuation techniques may result in transfers into or out of assigned levels within the fair value hierarchy. There were no transfers into or out of Level 3 during the reporting period, as compared to the security classifications from the prior year’s annual report. See the Fund’s Valuation Policy in Note 2a to the financial statements.
The accompanying notes are an integral part of these financial statements.
2020 Municipal Bond Market Overview
(Unaudited)
Key Municipal Events of 2020The COVID-19 challenges of 2020 were unexpected and unprecedented, but so was the speed and magnitude of the monetary and fiscal responses. The result was a year of significant volatility, yet a rewarding one for investors who stayed the course. Over the full year, tax-exempt rates fell sharply across the curve with short rates falling 93bps and long yields declining 68bps, steepening the curve. As the year began, no one could have known the challenges that would soon be faced. Municipal funds were benefiting from a record streak of weekly inflows, state and local tax revenues were rising with the economy in its eleventh year of expansion and municipalities were adding to an already healthy level of reserves. News broke in January of the COVID-19 virus in the State of Washington; by the end of February, seven states had confirmed cases and it was spreading rapidly. Trading activity in the municipal market initially froze as the lockdowns began, then a torrent of selling was unleashed and a liquidity crisis quickly emerged.
Not only did the record streak of fund inflows end (at 60 weeks), but record weekly outflows occurred as municipal funds lost $12.2B and $13.7B in just the last two weeks of March, each 3 times larger than any prior weekly redemption. The selling and lack of dealer support for the market drove tax-exempt yields to record highs relative to comparable maturity Treasuries. At the peak, 5yr AAA exempt yields were 900% of the 5yr Treasury yield. Ten-year AAA municipal yields rose 190 bps (to 2.88%) in the first three weeks of March. Credit spreads widened dramatically as well; the BBB to AAA spread gapped out 210bps (to +280bps) before peaking in mid-May. Never had a U.S. economic shock been so swift, deep and broad, affecting so many municipalities. Investors were questioning the ability of municipalities to withstand this crisis and meet their obligations. Not surprisingly, the heaviest redemptions occurred in the High Yield segment of the municipal market.
AAA Municipal Yields
Maturity | 12/31/19 | 9/30/20 | 12/31/20 | Q4 | YTD |
| 1 | 1.06% | 0.13% | 0.13% | 0.00% | -0.93% |
| 2 | 1.06% | 0.15% | 0.14% | -0.01% | -0.92% |
| 3 | 1.07% | 0.16% | 0.14% | -0.02% | -0.93% |
| 5 | 1.14% | 0.29% | 0.22% | -0.07% | -0.92% |
| 7 | 1.25% | 0.51% | 0.37% | -0.14% | -0.88% |
| 10 | 1.48% | 0.84% | 0.69% | -0.15% | -0.79% |
| 30 | 2.15% | 1.67% | 1.47% | -0.20% | -0.68% |
Sellers couldn’t know how rapid and coordinated the response would be from policymakers (the Fed, Congress and the Trump administration) who agreed to provide massive support to stabilize the market. On March 27th, the President signed the $2.2 trillion CARES Act which, along with other measures, offered substantial aid to nearly every sector of the municipal market. The goal was to cover COVID-19-related costs and help offset lost revenue. In addition, the establishment of the Municipal Liquidity Facility (MLF), which, for the first time ever, allowed the Fed to lend directly to states and other select municipalities. This facility, although used by just two municipalities (State of IL and NY MTA), most importantly offered investors the psychological support they were looking for. As the policymakers acted, AAA-rated municipal yields peaked on
2020 Municipal Bond Market Overview
(Unaudited)
March 20th and opportunistic investors began to emerge, looking to capitalize on the incredible undervaluation that had been created in the downdraft. While the entire municipal market was “on sale,” the hardest-hit sectors, such as Healthcare, Higher Education and Transportation, offered some of the best values for risk-seeking investors. From a credit perspective, the further in time we moved away from the initial economic shutdowns, the better the news became on tax revenues. Rather than the steep tax losses states initially anticipated, average tax revenues through September were down just 1% YoY, with most states within a +/- 5% range of the prior year. Not surprisingly, the states most dependent upon tourism, such as Nevada (-15.9%), Hawaii (-12.5%) and Florida (-11.1%) saw the greatest revenue declines. Other states, however, fared much better, experiencing YoY increases in tax revenue, including Vermont (+15.1%), New Mexico (+12.1%) and Idaho (+10.3%). Cities and school districts, which are more reliant on property taxes, saw average revenues rise over 4% YoY thanks to a strong residential housing market in most regions.
Investor demand was impressive once fund inflows resumed. In fact, annual 2020 net inflows of $39.7B were the fourth highest on record, something that seemed nearly impossible amid the $47.5B of redemptions over a five-week period in March/April. Several records were established on the supply side as well. Total municipal supply of $500B in 2020 was a new record, as was October’s issuance of $80B just prior to the November elections. The heavy issuance was driven by a record $181B of taxable municipal issuance (36% of total). This was up from $83B in taxable supply in 2019, even exceeding the Build America Bond (BAB) issuance of 2010. While taxable municipal debt grew, tax-exempt issuance fell 6% YoY (to $317B), providing a favorable supply/demand backdrop for tax-paying investors.
Finally, the 2020 elections also provided drama. Given that Democrats have gained control of the Senate, the probability of at least modest tax changes, additional fiscal stimulus and perhaps even a federal infrastructure plan has increased. One surprise among the many state referendums was the defeat of an Illinois constitutional amendment to move from a flat tax to a graduated income tax which they estimated would boost tax revenues by $3B annually. This makes Illinois’ already difficult fiscal situation even more challenging. So far, the rating agencies have maintained the state’s ratings at the lowest investment grade level awaiting the next steps by the Governor and legislature.
Solid Q4 Returns Complement Surprisingly Strong Full-Year Results
The decline in rates in Q4, primarily among intermediate and long-term rates, added to the already strong full-year returns. While short-term funds benefited from heavy inflows in 2020, performance among the longest maturities (6.25%) easily outperformed short maturities (2.83%) for the year. The Revenue sector outperformed other sectors in Q4, but GO’s edged them out for all of 2020. A similar pattern emerged within the credit spectrum where lower quality issues set the pace in Q4, but AAA’s, having held their value best during the economic lockdowns, outperformed lower-quality credits for the year.
Total Returns of Selected Barclays Municipal Indices and Subsectors
| Bloomberg | | | | | Bloomberg | | | |
| Barclays | | | | | Barclays | | | |
Index/Sector | Dec | Q4 | 2020 | | Quality | Dec | Q4 | 2020 |
| Municipal Bond Index | 0.61% | 1.82% | 5.21% | | AAA | 0.28% | 1.22% | 5.51% |
| General Obligation bonds | 0.48% | 1.51% | 5.49% | | AA | 0.43% | 1.47% | 5.24% |
| Revenue bonds | 0.71% | 2.11% | 5.31% | | A | 0.82% | 2.37% | 5.27% |
| Prerefunded bonds | 0.07% | 0.12% | 2.76% | | BBB | 1.72% | 3.53% | 4.55% |
| Long maturities (22+ yrs.) | 0.92% | 3.02% | 6.25% | | High Yield | 1.87% | 4.51% | 4.89% |
| Intermediate | | | | | HY, ex- | | | |
| maturities (1 - 17 yrs.) | 0.48% | 1.33% | 4.73% | | Puerto Rico | 1.87% | 4.27% | 4.02% |
| Short maturities (1 - 5 yrs.) | 0.20% | 0.33% | 2.83% | | | | | |
2020 Municipal Bond Market Overview
(Unaudited)
2021 Outlook and OpportunitiesWhile the entire world is anxious to turn the calendar to a new year, for the municipal market the early part of 2021 will likely be a continuation of the trends from late 2020. COVID-19 will continue to preoccupy the news, but with a shifting focus to vaccine distribution rather than a spreading virus. Although it may be several months before economic activity returns to pre-pandemic levels, the powerful combination of monetary and fiscal measures, as well as pent-up consumer demand, especially for travel and entertainment, should provide strong economic growth in 2021. The economic recovery will boost tax revenues, allowing municipalities to rebound from the pandemic decline. The favorable supply/demand backdrop that has supported tax-exempt municipal prices – even richening them relative to taxables in Q4 – should keep valuations elevated. Supply estimates for the new year are unusually wide given uncertainty on rates and how much refunding activity may occur, but total supply could match or even exceed the $500B of 2020. Taxable municipal issuance will remain robust, once again comprising one-third or more of total supply. While the taxable market grows, a trend that may continue for many years, the amount of tax-exempt debt outstanding is expected to remain steady or even decline in 2021. Demand remains strong even in the face of low nominal rates. Clearly, demographics play an important role as more baby boomers retire. This secular trend should continue to provide ongoing support, even increasing demand if rates were to rise. While investors realize the income return going forward will be less than in recent years, the desire to preserve capital may take on even greater importance in their allocation decisions. Coincidentally, the majority of municipal fund flows in 2020 went into short-term funds.
Seeking opportunities to add value to a managed municipal portfolio/fund in 2021 will be more important than ever given the low starting yield levels. In addition to the always important bottom-up security selection process, four key strategic areas of focus will be: Carry, Credit, Compression and Curve. We define “carry” here as the additional yield that a managed portfolio offers relative to an unmanaged benchmark. Any yield advantage should prove helpful since over extended periods “income” is the dominant contributor to total return. Secondly, credit analysis will be critical as not all municipalities will recover at the same pace, or to the same extent. Credits will need to be evaluated based on not only their sustainability through this period, but also on how longer-term behaviors and trends may have changed as a result of the pandemic. A third strategic opportunity exists through the further compression, or narrowing, of credit spreads. Narrowing spreads can occur when fundamental credit strength improves, as we expect in 2021, and as demand for additional yield is sought by investors, which was evident in Q4. Municipal spreads have already recovered more than one-half of the widening of 2020, but there is room for further compression, particularly if the municipal market follows the lead of corporate credit spreads which are virtually back to pre-pandemic levels. The desire for carry and the expectation of further spread compression support a modest credit overweight in prudently managed and appropriately diversified portfolios. A fourth strategic opportunity to add value in 2021 will be by optimizing curve exposure, particularly the benefit of rolling down an upwardly sloping curve. At year end, there was 45 bps of slope between the 5 – 10yr segments of the municipal curve. The intermediate segment, especially the 8 – 9yr maturities, offers investors roughly 70 bps of roll return over a twelve-month period assuming the curve slope remains unchanged. For perspective, the roll benefit on AAA bonds in that portion of the curve roughly matches the starting yields of 0.69% - 0.77% for those same maturities. We expect every basis point to matter in 2021, so strategic positioning of portfolios will be especially important as we look to the new year.
2020 Municipal Bond Market Overview
(Unaudited)
Disclosures
Fixed income is generally considered to be a more conservative investment than stocks, but bonds and other fixed income investments still carry a variety of risks such as interest rate risk, credit risk, inflation risk, and liquidity risk. In a rising interest rate environment, the value of fixed-income securities generally decline and conversely, in a falling interest rate environment, the value of fixed-income securities generally increase. High yield securities may be subject to heightened market, interest rate or credit risk and should not be purchased solely because of the stated yield.
The Bloomberg Barclays Municipal Bond Index is a broad-based, total-return index. The bonds are all investment-grade, tax-exempt, and fixed-rate securities with long-term maturities (greater than 2 years). They are selected from issues larger than $50 million. The components listed below the Municipal Bond Index (long maturities, intermediate maturities, short maturities, prefunded bonds, general obligation bonds and revenue bonds) are subsectors of the Bloomberg Barclays Municipal Bond Index and do not represent separate indices.
The Bloomberg Barclays High Yield Municipal Index includes bonds with a par value of at least $3 million and must be issued as part of a transaction of at least $20 million. The maximum rating for inclusion is Ba1/BB+/BB+ using the middle rating.
For more information about the Bloomberg Barclays Municipal Bond Index or Bloomberg Barclays High Yield Municipal Index, please visit https://index.barcap.com/Home/Guides_and_Factsheets.
Municipal securities investments are not appropriate for all investors, especially those taxed at lower rates. The alternative minimum tax (AMT) may be applicable, even for securities identified as tax exempt. Past performance is not a guarantee of future results.
Ratings are measured on a scale that ranges from AAA or Aaa (highest) to D or C (lowest). Investment grade investments are those rated from highest down to BBB- or Baa3.
Robert W. Baird & Co. Incorporated. This is not a complete analysis of every material fact regarding any company, industry or security. The information has been obtained from sources we consider to be reliable, but we cannot guarantee the accuracy. Indices are unmanaged, and are not available for direct investment. Past performance is not a guarantee of future results.
Baird Short-Term Municipal Bond Fund
December 31, 2020 (Unaudited)
The Baird Short-Term Municipal Bond Fund seeks current income that is exempt from federal income tax and is consistent with the preservation of capital.
The coronavirus (COVID-19) challenges of 2020 were unexpected and unprecedented, but so was the speed and magnitude of the monetary and fiscal responses. The result was a year of significant volatility, yet a rewarding one for Fund investors who stayed the course. Over the full year, tax-exempt rates fell sharply across the curve with short rates falling 93 bps and long yields declining 68 bps, steepening the curve. As the year began, no one could have known the challenges that would soon be faced. Municipal funds were benefiting from a record streak of weekly inflows, state and local tax revenues were generally rising with the economy in its eleventh year of expansion and many municipalities were adding to an already healthy level of reserves. News broke in January of the COVID-19 in the State of Washington; by the end of February, seven states had confirmed cases and it was spreading rapidly. Trading activity in the municipal market initially froze as the lockdowns began, then a torrent of selling was unleashed and a liquidity crisis quickly emerged. The selling and lack of dealer support for the market drove tax-exempt yields to record highs relative to comparable maturity Treasuries. Never had a U.S. economic shock been so swift, deep and broad, affecting so many municipalities. Investors were questioning the ability of municipalities to withstand this crisis and meet their obligations. On March 27th, President Trump signed the $2.2 trillion CARES Act which, along with other measures, offered substantial aid to nearly every sector of the municipal market. In addition, the establishment of the Municipal Liquidity Facility (MLF), which, for the first time ever, allowed the Fed to lend directly to states and other select municipalities, offered investors the psychological support they were looking for. As the policymakers acted, AAA-rated municipal yields peaked on March 20th and opportunistic investors began to emerge, looking to capitalize on the incredible undervaluation that had been created in the downdraft. From a credit perspective, the further in time we moved away from the initial economic shutdowns, the better the news became on tax revenues.
During 2020, the Fund’s Institutional Class Shares generated strong absolute and relative returns and outperformed its benchmark by 42 basis points net of fees.
The primary factors contributing to the Fund’s absolute and relative performance in 2020 include:
Contributors to Performance
| | • | Credit sector – added to lower-quality issues as valuations became more attractive |
| | • | Security selection – provided consistent return throughout the year |
| | • | Curve allocation – especially the 5+ year allocation |
| | • | Sector weighting – particularly Transportation and Housing |
Detractors from Performance
| | • | Allocation to below investment grade and non-rated issues |
| | • | Allocation to the Education sector |
Although the COVID-19 vaccinations have begun, we expect the economic impact of the COVID-19 to linger well into 2021, particularly as it relates to travel and entertainment. Yet, with the massive fiscal stimulus that is already in the pipeline, and perhaps more coming now that the Democratic Party has full, albeit narrow, control of Washington, above-average economic growth is very likely this year. This should boost state and local tax revenues helping municipalities recover from the pandemic-induced decline. With short-term rates anchored by the Fed, a steeper yield curve is likely, which provides the opportunity for investors to capture the roll-down benefit as bonds age along a relatively steep curve. We expect the roll-down return to be an important component of total return this year, along with the yield advantage the Fund enjoys above that of its benchmark. Municipal credit spreads have room to narrow further, suggesting a modest credit overweight is appropriate. Strategic positioning across market sectors and the yield curve, a continued focus on credit to identify improving trends, plus the always-important security selection process will all be important to navigate through the current environment.
Baird Short-Term Municipal Bond Fund
December 31, 2020 (Unaudited)
We expect the Fund will maintain a neutral duration posture relative to the benchmark with an allocation that seeks to optimize the roll-down benefit of a steep, upwardly-sloping municipal curve and its sector weightings will favor an overweight to revenue-backed issues over general obligation debt. We believe a modestly overweight credit posture is appropriate for the Fund to benefit from further economic recovery. We also believe our continued focus on selecting investments with strong fundamental tax and revenue support remains critical.
Baird Short-Term Municipal Bond Fund
December 31, 2020 (Unaudited)
Portfolio Characteristics
Quality Distribution(1)(2)
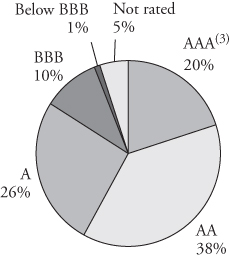
| | Net Assets | $1,612,211,734 | |
| | | | |
| | SEC 30-Day | | |
| | Yield(4) | | |
| | Institutional Class | 0.78% | |
| | Investor Class | 0.53% | |
| | | | |
| | Average | | |
| | Effective | | |
| | Duration | 2.24 years | |
| | | | |
| | Average | | |
| | Effective | | |
| | Maturity | 2.53 years | |
| | | | |
| | | Annualized | | |
Sector Weightings(1) | | Expense | | |
| | | Ratio(5) | | |
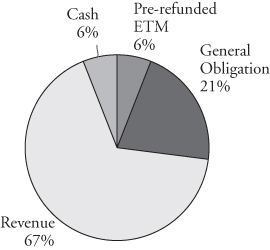 | | Institutional Class | 0.30% | |
| | Investor Class | 0.55% | (6) |
| | | | |
| | Portfolio | | |
| | Turnover Rate | 32% | |
| | | | |
| | Number of | | |
| | Holdings | 1,901 | |
| | | | |
| | | | |
| | | | |
| | | | |
| | | | |
| | | | |
| | | | |
| | | | | |
| (1) | Percentages shown are based on the Fund’s total investments. |
| (2) | The quality profile is calculated on a market value-weighted basis using the highest credit quality rating for each security held by the Fund given by S&P, Moody’s or Fitch, each of which is a Nationally Recognized Statistical Rating Organization (NRSRO). NRSROs rate the credit quality of securities using a scale that generally ranges from AAA (highest) to D (lowest). |
| (3) | Includes pre-refunded and escrowed-to-maturity (ETM) bonds. |
| (4) | SEC yields are based on SEC guidelines and are calculated for the 30 days ended December 31, 2020. |
| (5) | Reflects expense ratios as stated in the Fund’s current prospectus. |
| (6) | Includes 0.25% 12b-1 fee. |
Baird Short-Term Municipal Bond Fund
December 31, 2020 (Unaudited)
Institutional ClassValue of a $25,000 Investment
Growth of a hypothetical investment of $25,000 made on the Fund’s inception date (08/31/15), assuming reinvestment of all distributions.
Investor Class
Value of a $10,000 Investment
Growth of a hypothetical investment of $10,000 made on the Fund’s inception date (08/31/15), assuming reinvestment of all distributions.
Baird Short-Term Municipal Bond Fund
December 31, 2020 (Unaudited)
Total Returns
| | | Average Annual |
| | One | Three | Five | Since |
| For the Periods Ended December 31, 2020 | Year | Years | Years | Inception(1) |
| Institutional Class Shares | 3.25% | 2.98% | 2.50% | 2.52% |
| Investor Class Shares | 2.90% | 2.74% | 2.21% | 2.23% |
| Bloomberg Barclays Short | | | | |
(1-5 Year) Municipal Index(2) | 2.83% | 2.75% | 1.98% | 1.93% |
| (1) | For the period from August 31, 2015 (inception date) through December 31, 2020. |
| (2) | The Bloomberg Barclays Short (1-5 Year) Municipal Bond Index is an unmanaged, market value weighted index that measures the performance of investment-grade, tax-exempt, and fixed-rated municipal securities with time to maturity of more than one year and less than five years. Securities must have an outstanding par value of at least $7 million and be issued as part of a transaction of at least $75 million. The bonds must be fixed rate, have a dated-date after December 31, 1990, and must be at least one year from their maturity date. This Index does not reflect any deduction for fees, expenses or taxes. A direct investment in an index is not possible. |
The line graphs on the previous page and the returns shown in the table above reflect reinvestment of dividends and/or capital gains distributions in additional shares. The returns in the graphs and table do not reflect the deduction of taxes that a shareholder would pay on Fund distributions or the redemption of Fund shares. The returns reflect the actual performance for each period and do not include the impact of trades executed on the last business day of the period that were recorded on the first business day of the next period.
The Fund’s gross expense ratio for each Class, as reflected in the Fund’s current prospectus, is set forth under “Portfolio Characteristics”.
The Fund may invest up to 10% of its net assets in non-investment grade debt securities (commonly referred to as “high yield” bonds). While these types of debt securities typically offer higher yields than investment grade securities, they also include greater risks including increased credit risk and the increased risk of default or bankruptcy. The Fund may invest up to 25% of its total assets in municipal obligations issued by persons in the same state. As a result, changes in economic, business or political conditions of a particular state may have a disproportionate impact on the Fund’s share price. Municipal securities investments are not appropriate for all investors, especially those taxed at lower rates. U.S. and international markets have experienced significant periods of volatility in recent years and months due to a number of economic, political and global macro factors including the impact of the coronavirus (COVID-19) as a global pandemic and related public health issues, growth concerns in the U.S. and overseas, uncertainties regarding interest rates, trade tensions and the threat of tariffs imposed by the U.S. and other countries. These and other geopolitical events may cause market disruptions and could have an adverse effect on the value of the Fund’s investments.
Past performance does not guarantee future results. Investment return and principal value will fluctuate so that an investor’s shares, when redeemed, may be worth more or less than their original cost.
For information about the performance of the Fund as of the most recent month-end, please call 1-866-44BAIRD or visit www.bairdfunds.com. Mutual fund performance changes over time and current performance may be lower or higher than that stated.
Baird Short-Term Municipal Bond Fund
Schedule of Investments, December 31, 2020
Long-Term Investments
| | | Principal | | | | | | % of | |
| | | Amount | | | Value | | | Net Assets | |
| Municipal Bonds | | | | | | | | | |
| Alabama | | | | | | | | | |
| Alabama Community College System, | | | | | | | | | |
| 3.500%, 11/01/2023 (Insured by BAM) | | $ | 1,050,000 | | | $ | 1,132,729 | | | |
|
|
| Alabama Housing Finance Authority, | | | | | | | | | | | | |
| 1.500%, 11/01/2022 | | | | | | | | | | | | |
(Mandatory Tender Date 05/01/2022)(1) | | | 775,000 | | | | 785,827 | | | | | |
| Alabama Incentives Financing Authority, | | | | | | | | | | | | |
| 5.000%, 09/01/2023 | | | 650,000 | | | | 725,731 | | | | | |
| Alabama Public School and College Authority, | | | | | | | | | | | | |
| 5.000%, 11/01/2027 | | | 5,000,000 | | | | 6,510,400 | | | | | |
| Alabama Special Care Facilities Financing Authority, | | | | | | | | | | | | |
| 1.850%, 11/15/2046 | | | | | | | | | | | | |
(Mandatory Tender Date 11/01/2022)(1) | | | 340,000 | | | | 349,445 | | | | | |
| Birmingham Airport Authority: | | | | | | | | | | | | |
| 5.000%, 07/01/2024 (Insured by BAM) | | | 190,000 | | | | 217,932 | | | | | |
| 5.000%, 07/01/2025 (Insured by BAM) | | | 500,000 | | | | 593,410 | | | | | |
| 5.000%, 07/01/2026 (Insured by BAM) | | | 450,000 | | | | 549,571 | | | | | |
| Birmingham-Jefferson Civic Center Authority: | | | | | | | | | | | | |
| 5.000%, 05/01/2024 | | | 430,000 | | | | 482,254 | | | | | |
| 5.000%, 05/01/2026 | | | 500,000 | | | | 594,395 | | | | | |
| Black Belt Energy Gas District: | | | | | | | | | | | | |
| 4.000%, 04/01/2026 | | | 370,000 | | | | 431,953 | | | | | |
| 4.000%, 07/01/2046 (Callable 03/01/2021) | | | | | | | | | | | | |
(Mandatory Tender Date 06/01/2021)(1) | | | 1,470,000 | | | | 1,487,272 | | | | | |
| 4.000%, 08/01/2047 (Callable 04/01/2022) | | | | | | | | | | | | |
(Mandatory Tender Date 07/01/2022)(1) | | | 795,000 | | | | 834,917 | | | | | |
| 0.996%, 12/01/2048 | | | | | | | | | | | | |
| (1 Month LIBOR USD + 0.900%) (Callable 09/01/2023) | | | | | | | | | | | | |
(Mandatory Tender Date 12/01/2023)(2) | | | 1,705,000 | | | | 1,708,393 | | | | | |
| Calera Waterworks Board, | | | | | | | | | | | | |
| 2.400%, 02/01/2026 (Callable 02/01/2021) | | | 485,000 | | | | 485,456 | | | | | |
| Chilton County Health Care Authority: | | | | | | | | | | | | |
| 3.000%, 11/01/2021 | | | 560,000 | | | | 570,164 | | | | | |
| 5.000%, 11/01/2024 | | | 825,000 | | | | 957,932 | | | | | |
| City of Hartselle AL: | | | | | | | | | | | | |
| 2.000%, 06/01/2024 (Insured by BAM) | | | 120,000 | | | | 125,058 | | | | | |
| 2.000%, 06/01/2025 (Insured by BAM) | | | 225,000 | | | | 236,891 | | | | | |
| 2.000%, 06/01/2026 (Insured by BAM) | | | 225,000 | | | | 238,709 | | | | | |
| 2.000%, 06/01/2027 (Insured by BAM) | | | 1,455,000 | | | | 1,548,266 | | | | | |
| City of Opelika AL, | | | | | | | | | | | | |
| 3.000%, 10/01/2022 | | | 445,000 | | | | 463,049 | | | | | |
| City of Phenix AL: | | | | | | | | | | | | |
| 3.000%, 08/15/2021 (Insured by BAM) | | | 385,000 | | | | 389,963 | | | | | |
| 3.000%, 08/15/2022 (Insured by BAM) | | | 500,000 | | | | 516,345 | | | | | |
| 3.000%, 08/15/2023 (Insured by BAM) | | | 100,000 | | | | 105,217 | | | | | |
The accompanying notes are an integral part of these financial statements.
Baird Short-Term Municipal Bond Fund
Schedule of Investments, December 31, 2020
Long-Term Investments (cont.)
| | | Principal | | | | | | % of | |
| | | Amount | | | Value | | | Net Assets | |
| County of Jefferson AL, | | | | | | | | | |
| 0.000%, 10/01/2025 | | | | | | | | | |
| (Callable 10/01/2023) (Insured by AGM) | | $ | 750,000 | | | $ | 683,670 | | | |
|
|
| County of Morgan AL: | | | | | | | | | | | | |
| 3.000%, 04/01/2022 | | | 135,000 | | | | 138,484 | | | | | |
| 4.000%, 04/01/2023 | | | 210,000 | | | | 225,643 | | | | | |
| 4.000%, 04/01/2024 | | | 220,000 | | | | 243,413 | | | | | |
| Douglas Water Authority, | | | | | | | | | | | | |
| 3.000%, 07/01/2024 (Insured by AGM) | | | 270,000 | | | | 291,414 | | | | | |
| Eutaw Industrial Development Board, | | | | | | | | | | | | |
0.060%, 06/01/2028 (Optional Put Date 01/04/2021)(1) | | | 800,000 | | | | 800,000 | | | | | |
| Greenville Public Improvement Cooperative District: | | | | | | | | | | | | |
| 4.000%, 03/01/2022 (Insured by BAM) | | | 25,000 | | | | 25,995 | | | | | |
| 4.000%, 03/01/2023 (Insured by BAM) | | | 100,000 | | | | 107,223 | | | | | |
| 5.000%, 03/01/2024 (Insured by BAM) | | | 140,000 | | | | 159,075 | | | | | |
| Jasper Water Works & Sewer Board, Inc., | | | | | | | | | | | | |
| 5.000%, 06/01/2024 (Callable 06/01/2021) | | | 100,000 | | | | 101,965 | | | | | |
| Lauderdale County Agriculture Center Authority: | | | | | | | | | | | | |
| 2.000%, 07/01/2022 | | | 450,000 | | | | 456,367 | | | | | |
| 5.000%, 07/01/2024 | | | 495,000 | | | | 563,909 | | | | | |
| 5.000%, 07/01/2025 (Callable 07/01/2024) | | | 490,000 | | | | 555,974 | | | | | |
| 5.000%, 07/01/2026 (Callable 07/01/2024) | | | 545,000 | | | | 616,079 | | | | | |
| 5.000%, 07/01/2027 (Callable 07/01/2024) | | | 570,000 | | | | 640,777 | | | | | |
| 5.000%, 07/01/2028 (Callable 07/01/2024) | | | 600,000 | | | | 670,668 | | | | | |
| Macon County Board of Education, | | | | | | | | | | | | |
| 3.250%, 02/01/2026 (Callable 02/01/2023) | | | 375,000 | | | | 390,784 | | | | | |
| Mobile County Board of School Commissioners, | | | | | | | | | | | | |
| 5.000%, 03/01/2023 | | | 875,000 | | | | 956,707 | | | | | |
| Montgomery Waterworks & Sanitation, | | | | | | | | | | | | |
| 5.000%, 03/01/2025 (Pre-refunded to 03/01/2022) | | | 150,000 | | | | 158,395 | | | | | |
| Morgan County Board of Education: | | | | | | | | | | | | |
| 2.500%, 03/01/2025 (Pre-refunded to 03/01/2022) | | | 1,165,000 | | | | 1,195,092 | | | | | |
| 2.700%, 03/01/2027 (Pre-refunded to 03/01/2022) | | | 865,000 | | | | 889,332 | | | | | |
| Pickens County Water Authority: | | | | | | | | | | | | |
| 3.000%, 01/01/2021 (Insured by BAM) | | | 145,000 | | | | 145,000 | | | | | |
| 3.000%, 01/01/2022 (Insured by BAM) | | | 145,000 | | | | 148,238 | | | | | |
| 3.000%, 01/01/2023 (Insured by BAM) | | | 155,000 | | | | 161,747 | | | | | |
| 3.000%, 01/01/2024 (Insured by BAM) | | | 100,000 | | | | 106,240 | | | | | |
| 3.000%, 01/01/2025 (Insured by BAM) | | | 160,000 | | | | 172,874 | | | | | |
| Selma Industrial Development Board, | | | | | | | | | | | | |
| 2.000%, 11/01/2033 | | | | | | | | | | | | |
(Mandatory Tender Date 10/01/2024)(1) | | | 750,000 | | | | 792,480 | | | | | |
The accompanying notes are an integral part of these financial statements.
Baird Short-Term Municipal Bond Fund
Schedule of Investments, December 31, 2020
Long-Term Investments (cont.)
| | | Principal | | | | | | % of | |
| | | Amount | | | Value | | | Net Assets | |
| Southeast Alabama Gas Supply District: | | | | | | | | | |
| 0.720%, 04/01/2049 | | | | | | | | | |
| (SIFMA Municipal Swap Index + 0.650%) | | | | | | | | | |
| (Callable 01/01/2024) | | | | | | | | | |
(Mandatory Tender Date 04/01/2024)(2) | | $ | 2,000,000 | | | $ | 2,002,780 | | | | |
| 0.996%, 04/01/2049 | | | | | | | | | | | |
| (1 Month LIBOR USD + 0.900%) (Callable 01/01/2024) | | | | | | | | | | | |
(Mandatory Tender Date 04/01/2024)(2) | | | 750,000 | | | | 750,218 | | | | |
| Tallassee Board of Education: | | | | | | | | | | | |
| 4.000%, 08/01/2027 (Insured by AGM) | | | 360,000 | | | | 430,704 | | | | |
| 4.000%, 08/01/2028 (Insured by AGM) | | | 405,000 | | | | 491,771 | | | | |
| Town of Berry AL, | | | | | | | | | | | |
| 3.250%, 09/01/2028 | | | | | | | | | | | |
| (Callable 09/01/2026) (Insured by AGM) | | | 930,000 | | | | 1,006,065 | | | | |
| West Escambia Utilities, Inc., | | | | | | | | | | | |
| 2.400%, 08/15/2025 | | | | | | | | | | | |
| (Callable 08/15/2022) (Insured by BAM) | | | 760,000 | | | | 779,160 | | | | |
| Total Alabama | | | | | | | | | | | |
| (Cost $38,279,821) | | | | | | | 38,899,522 | | | | 2.4 | % |
| Alaska | | | | | | | | | | | | |
| Alaska Housing Finance Corp.: | | | | | | | | | | | | |
| 3.750%, 12/01/2042 (Callable 06/01/2028) | | | 8,550,000 | | | | 9,621,913 | | | | | |
| 4.000%, 12/01/2048 (Callable 06/01/2027) | | | 1,170,000 | | | | 1,301,485 | | | | | |
| Alaska Industrial Development & Export Authority: | | | | | | | | | | | | |
| 5.000%, 10/01/2022 | | | 550,000 | | | | 591,294 | | | | | |
| 5.000%, 10/01/2023 | | | 600,000 | | | | 672,396 | | | | | |
| Borough of Matanuska-Susitna AK, | | | | | | | | | | | | |
| 5.250%, 09/01/2027 (Callable 09/01/2025) | | | 5,590,000 | | | | 6,600,393 | | | | | |
| University of Alaska: | | | | | | | | | | | | |
| 5.000%, 10/01/2024 | | | 765,000 | | | | 858,200 | | | | | |
| 4.000%, 10/01/2025 | | | 330,000 | | | | 364,198 | | | | | |
| 4.000%, 10/01/2026 (Callable 10/01/2023) | | | 1,400,000 | | | | 1,486,506 | | | | | |
| 5.000%, 10/01/2026 | | | 865,000 | | | | 1,015,181 | | | | | |
| Total Alaska | | | | | | | | | | | | |
| (Cost $21,783,604) | | | | | | | 22,511,566 | | | | 1.4 | % |
| Arizona | | | | | | | | | | | | |
| Arizona Health Facilities Authority, | | | | | | | | | | | | |
| 1.920%, 02/01/2048 | | | | | | | | | | | | |
| (SIFMA Municipal Swap Index + 1.850%) | | | | | | | | | | | | |
| (Callable 08/05/2022) | | | | | | | | | | | | |
(Mandatory Tender Date 02/01/2023)(2) | | | 200,000 | | | | 203,528 | | | | | |
| Arizona Industrial Development Authority: | | | | | | | | | | | | |
3.375%, 07/01/2021(3) | | | 110,000 | | | | 110,731 | | | | | |
| 4.000%, 07/01/2021 (Insured by SD CRED PROG) | | | 165,000 | | | | 167,384 | | | | | |
The accompanying notes are an integral part of these financial statements.
Baird Short-Term Municipal Bond Fund
Schedule of Investments, December 31, 2020
Long-Term Investments (cont.)
| | | Principal | | | | | | % of | |
| | | Amount | | | Value | | | Net Assets | |
| Arizona Industrial Development Authority: (cont.) | | | | | | | | | |
2.500%, 05/01/2022 (Insured by AGM)(3) | | $ | 6,135,557 | | | $ | 6,177,033 | | | |
|
|
| 4.000%, 05/01/2022 | | | 300,000 | | | | 302,103 | | | | | |
3.000%, 07/01/2022(3) | | | 50,000 | | | | 50,480 | | | | | |
| 5.000%, 02/01/2023 | | | 1,000,000 | | | | 1,093,590 | | | | | |
4.000%, 08/01/2023(3) | | | 705,000 | | | | 723,196 | | | | | |
| 5.000%, 05/01/2025 | | | 405,000 | | | | 428,389 | | | | | |
4.625%, 08/01/2028(3) | | | 375,000 | | | | 408,308 | | | | | |
| Arizona State University, | | | | | | | | | | | | |
| 5.000%, 07/01/2032 (Pre-refunded to 07/01/2022) | | | 885,000 | | | | 947,437 | | | | | |
| Chandler Industrial Development Authority, | | | | | | | | | | | | |
| 2.400%, 12/01/2035 | | | | | | | | | | | | |
(Mandatory Tender Date 08/14/2023)(1) | | | 265,000 | | | | 278,666 | | | | | |
| City of Tucson AZ, | | | | | | | | | | | | |
| 5.000%, 07/01/2026 (Insured by AGM) | | | 500,000 | | | | 615,160 | | | | | |
| Glendale Industrial Development Authority: | | | | | | | | | | | | |
| 5.250%, 05/15/2021 | | | 500,000 | | | | 508,405 | | | | | |
| 5.250%, 05/15/2022 | | | 550,000 | | | | 584,612 | | | | | |
| 4.000%, 05/15/2026 (Callable 05/15/2024) | | | 185,000 | | | | 200,490 | | | | | |
| Industrial Development Authority of the County of Pima: | | | | | | | | | | | | |
| 4.000%, 07/01/2021 | | | 245,000 | | | | 248,178 | | | | | |
| 4.000%, 07/01/2022 | | | 105,000 | | | | 108,645 | | | | | |
| 4.000%, 07/01/2023 | | | 265,000 | | | | 282,408 | | | | | |
| La Paz County Industrial Development Authority, | | | | | | | | | | | | |
5.000%, 02/15/2021(3) | | | 100,000 | | | | 100,426 | | | | | |
| Maricopa County Industrial Development Authority: | | | | | | | | | | | | |
| 2.625%, 07/01/2021 | | | 20,000 | | | | 20,014 | | | | | |
| 4.000%, 07/01/2024 (Insured by SD CRED PROG) | | | 135,000 | | | | 150,155 | | | | | |
| 5.000%, 01/01/2048 | | | | | | | | | | | | |
(Mandatory Tender Date 10/18/2024)(1) | | | 1,050,000 | | | | 1,228,794 | | | | | |
| Salt Verde Financial Corp., | | | | | | | | | | | | |
| 5.250%, 12/01/2026 | | | 2,500,000 | | | | 3,090,000 | | | | | |
| Santa Cruz County Jail District, | | | | | | | | | | | | |
| 5.000%, 07/01/2029 | | | | | | | | | | | | |
| (Callable 07/01/2027) (Insured by AGM) | | | 150,000 | | | | 187,794 | | | | | |
| Total Arizona | | | | | | | | | | | | |
| (Cost $17,869,603) | | | | | | | 18,215,926 | | | | 1.1 | % |
| Arkansas | | | | | | | | | | | | |
| Arkansas Technical University, | | | | | | | | | | | | |
| 4.000%, 06/01/2026 (Callable 06/01/2023) | | | 200,000 | | | | 213,118 | | | | | |
| Batesville Public Facilities Board: | | | | | | | | | | | | |
| 5.000%, 06/01/2024 | | | 1,000,000 | | | | 1,086,760 | | | | | |
| 5.000%, 06/01/2025 | | | 1,385,000 | | | | 1,530,550 | | | | | |
| 5.000%, 06/01/2026 | | | 850,000 | | | | 952,943 | | | | | |
The accompanying notes are an integral part of these financial statements.
Baird Short-Term Municipal Bond Fund
Schedule of Investments, December 31, 2020
Long-Term Investments (cont.)
| | | Principal | | | | | | % of | |
| | | Amount | | | Value | | | Net Assets | |
| Carroll-Boone Water District, | | | | | | | | | |
| 4.000%, 12/01/2026 (Callable 12/01/2025) | | $ | 735,000 | | | $ | 838,775 | | | |
|
|
| City of Conway AR, | | | | | | | | | | | | |
| 4.000%, 12/01/2023 (Callable 06/01/2022) | | | 35,000 | | | | 36,730 | | | | | |
| City of Fayetteville AR: | | | | | | | | | | | | |
| 1.750%, 11/01/2032 (Callable 11/01/2026) | | | 2,500,000 | | | | 2,546,175 | | | | | |
| 3.050%, 01/01/2047 (Callable 01/01/2027) | | | 615,000 | | | | 638,862 | | | | | |
| City of Heber Springs AR: | | | | | | | | | | | | |
| 3.000%, 11/01/2021 (Insured by BAM) | | | 55,000 | | | | 56,251 | | | | | |
| 3.000%, 11/01/2022 (Insured by BAM) | | | 50,000 | | | | 52,498 | | | | | |
| 3.000%, 11/01/2023 (Insured by BAM) | | | 40,000 | | | | 42,605 | | | | | |
| City of Hot Springs AR: | | | | | | | | | | | | |
| 3.000%, 10/01/2023 (Insured by BAM) | | | 510,000 | | | | 543,997 | | | | | |
| 3.000%, 10/01/2024 (Insured by BAM) | | | 1,110,000 | | | | 1,208,024 | | | | | |
| 4.000%, 12/01/2027 | | | | | | | | | | | | |
| (Callable 12/01/2023) (Insured by BAM) | | | 255,000 | | | | 279,694 | | | | | |
| City of Jacksonville AR, | | | | | | | | | | | | |
| 4.000%, 12/01/2025 (Pre-refunded to 06/01/2021) | | | 110,000 | | | | 111,694 | | | | | |
| City of Little Rock AR: | | | | | | | | | | | | |
| 3.000%, 10/01/2021 | | | 100,000 | | | | 102,081 | | | | | |
| 2.375%, 04/01/2028 (Callable 10/01/2022) | | | 130,000 | | | | 131,645 | | | | | |
| City of Lonoke AR, | | | | | | | | | | | | |
| 5.000%, 06/01/2023 | | | 160,000 | | | | 177,533 | | | | | |
| City of Magnolia AR, | | | | | | | | | | | | |
| 2.600%, 08/01/2036 | | | | | | | | | | | | |
| (Callable 08/01/2024) (Insured by BAM) | | | 420,000 | | | | 422,482 | | | | | |
| City of Marion AR, | | | | | | | | | | | | |
| 2.900%, 09/01/2047 (Callable 09/01/2027) | | | 205,000 | | | | 209,170 | | | | | |
| City of Maumelle AR, | | | | | | | | | | | | |
| 2.875%, 08/01/2038 (Callable 08/01/2025) | | | 485,000 | | | | 493,691 | | | | | |
| City of Mountain View AR, | | | | | | | | | | | | |
| 1.375%, 11/01/2050 | | | | | | | | | | | | |
| (Callable 11/01/2027) (Insured by BAM) | | | 885,000 | | | | 893,284 | | | | | |
| City of North Little Rock AR: | | | | | | | | | | | | |
| 5.000%, 11/01/2021 | | | 310,000 | | | | 321,482 | | | | | |
| 5.000%, 11/01/2024 | | | 305,000 | | | | 355,151 | | | | | |
| 5.000%, 11/01/2025 | | | 510,000 | | | | 613,943 | | | | | |
| 5.000%, 11/01/2026 | | | 535,000 | | | | 661,512 | | | | | |
| City of Pine Bluff AR, | | | | | | | | | | | | |
| 3.000%, 02/01/2047 | | | | | | | | | | | | |
| (Callable 08/01/2027) (Insured by BAM) | | | 510,000 | | | | 546,067 | | | | | |
| City of Rogers AR, | | | | | | | | | | | | |
| 3.250%, 11/01/2043 (Callable 11/01/2026) | | | 1,485,000 | | | | 1,569,511 | | | | | |
| City of Sherwood AR, | | | | | | | | | | | | |
| 3.050%, 12/01/2043 (Callable 12/01/2026) | | | 275,000 | | | | 287,925 | | | | | |
The accompanying notes are an integral part of these financial statements.
Baird Short-Term Municipal Bond Fund
Schedule of Investments, December 31, 2020
Long-Term Investments (cont.)
| | | Principal | | | | | | % of | |
| | | Amount | | | Value | | | Net Assets | |
| City of Springdale AR: | | | | | | | | | |
| 5.000%, 11/01/2025 (Pre-refunded to 11/01/2022) | | $ | 150,000 | | | $ | 162,916 | | | |
|
|
| 3.000%, 04/01/2043 | | | | | | | | | | | | |
| (Callable 04/01/2024) (Insured by BAM) | | | 595,000 | | | | 610,512 | | | | | |
| Conway Health Facilities Board: | | | | | | | | | | | | |
| 5.000%, 08/01/2021 | | | 450,000 | | | | 460,634 | | | | | |
| 5.000%, 08/01/2023 | | | 500,000 | | | | 553,345 | | | | | |
| 5.000%, 08/01/2024 | | | 410,000 | | | | 470,274 | | | | | |
| County of Cross AR, | | | | | | | | | | | | |
| 2.250%, 10/01/2030 (Callable 10/01/2024) | | | 1,525,000 | | | | 1,592,542 | | | | | |
| Dumas Arkansas School District No. 6: | | | | | | | | | | | | |
| 1.400%, 02/01/2022 (Insured by ST AID) | | | 235,000 | | | | 237,790 | | | | | |
| 1.450%, 02/01/2023 | | | | | | | | | | | | |
| (Callable 08/01/2022) (Insured by ST AID) | | | 245,000 | | | | 248,758 | | | | | |
| 1.500%, 02/01/2024 | | | | | | | | | | | | |
| (Callable 08/01/2022) (Insured by ST AID) | | | 245,000 | | | | 248,790 | | | | | |
| Jackson County Special School District, | | | | | | | | | | | | |
| 1.500%, 02/01/2022 (Insured by ST AID) | | | 175,000 | | | | 177,264 | | | | | |
| Lonoke White Public Water Authority, | | | | | | | | | | | | |
| 3.000%, 12/01/2022 (Insured by BAM) | | | 100,000 | | | | 104,152 | | | | | |
| National Park College District: | | | | | | | | | | | | |
| 3.000%, 05/01/2021 | | | 210,000 | | | | 211,667 | | | | | |
| 3.000%, 05/01/2022 | | | 115,000 | | | | 118,536 | | | | | |
| 3.000%, 05/01/2023 | | | 65,000 | | | | 68,368 | | | | | |
| Northwest Arkansas Conservation Authority, | | | | | | | | | | | | |
| 4.000%, 03/01/2024 | | | | | | | | | | | | |
| (Callable 09/01/2022) (Insured by BAM) | | | 375,000 | | | | 397,046 | | | | | |
| Pulaski County Special School District, | | | | | | | | | | | | |
| 3.250%, 02/01/2029 | | | | | | | | | | | | |
| (Pre-refunded to 02/01/2021) (Insured by ST AID) | | | 50,000 | | | | 50,104 | | | | | |
| Southern Arkansas University: | | | | | | | | | | | | |
| 4.000%, 03/01/2023 (Insured by AGM) | | | 465,000 | | | | 499,317 | | | | | |
| 4.000%, 03/01/2023 (Insured by AGM) | | | 235,000 | | | | 251,817 | | | | | |
| 4.000%, 03/01/2024 (Insured by AGM) | | | 245,000 | | | | 271,227 | | | | | |
| 4.000%, 03/01/2024 (Insured by AGM) | | | 175,000 | | | | 193,154 | | | | | |
| Van Buren School District No. 42: | | | | | | | | | | | | |
| 2.000%, 04/01/2022 (Insured by ST AID) | | | 250,000 | | | | 255,282 | | | | | |
| 2.000%, 04/01/2024 (Insured by ST AID) | | | 130,000 | | | | 135,519 | | | | | |
| Total Arkansas | | | | | | | | | | | | |
| (Cost $23,601,509) | | | | | | | 24,243,167 | | | | 1.5 | % |
| California | | | | | | | | | | | | |
| Allan Hancock Joint Community College District, | | | | | | | | | | | | |
| 0.000%, 08/01/2036 (Pre-refunded to 08/01/2022) | | | 225,000 | | | | 103,604 | | | | | |
The accompanying notes are an integral part of these financial statements.
Baird Short-Term Municipal Bond Fund
Schedule of Investments, December 31, 2020
Long-Term Investments (cont.)
| | | Principal | | | | | | % of | |
| | | Amount | | | Value | | | Net Assets | |
| American Valley Community Services District, | | | | | | | | | |
1.500%, 11/01/2023 (Callable 11/01/2022)(3) | | $ | 13,068,000 | | | $ | 13,257,747 | | | |
|
|
| Bay Area Toll Authority: | | | | | | | | | | | | |
| 0.716%, 04/01/2045 | | | | | | | | | | | | |
| (3 Month LIBOR USD + 0.550%) | | | | | | | | | | | | |
| (Callable 02/01/2021) | | | | | | | | | | | | |
(Mandatory Tender Date 04/01/2021)(2) | | | 500,000 | | | | 500,040 | | | | | |
| 0.970%, 04/01/2045 | | | | | | | | | | | | |
| (SIFMA Municipal Swap Index + 0.900%) | | | | | | | | | | | | |
| (Callable 11/01/2022) | | | | | | | | | | | | |
(Mandatory Tender Date 05/01/2023)(2) | | | 100,000 | | | | 100,721 | | | | | |
| Beaumont Unified School District, | | | | | | | | | | | | |
| 0.000%, 08/01/2041 | | | | | | | | | | | | |
(Pre-refunded to 08/01/2026) (Insured by AGM)(7) | | | 160,000 | | | | 211,947 | | | | | |
| California Health Facilities Financing Authority, | | | | | | | | | | | | |
| 3.000%, 03/01/2041 (Callable 09/01/2023) | | | | | | | | | | | | |
(Mandatory Tender Date 03/01/2024)(1) | | | 4,100,000 | | | | 4,349,608 | | | | | |
| California Infrastructure & Economic Development Bank: | | | | | | | | | | | | |
| 0.478%, 08/01/2047 | | | | | | | | | | | | |
| (1 Month LIBOR USD + 0.380%) (Callable 02/01/2021) | | | | | | | | | | | | |
(Mandatory Tender Date 08/01/2021)(2) | | | 150,000 | | | | 149,985 | | | | | |
| 1.750%, 08/01/2055 (Callable 02/01/2026) | | | | | | | | | | | | |
(Mandatory Tender Date 08/01/2026)(1) | | | 1,000,000 | | | | 1,020,170 | | | | | |
| California Municipal Finance Authority: | | | | | | | | | | | | |
| 5.000%, 08/01/2021 | | | 400,000 | | | | 404,176 | | | | | |
| 5.000%, 08/01/2021 | | | 610,000 | | | | 619,266 | | | | | |
| 5.000%, 08/01/2022 | | | 400,000 | | | | 410,944 | | | | | |
| 5.000%, 08/01/2022 | | | 640,000 | | | | 665,715 | | | | | |
| 5.000%, 08/01/2023 | | | 670,000 | | | | 712,324 | | | | | |
| California State University, | | | | | | | | | | | | |
| 4.000%, 11/01/2049 (Callable 05/01/2021) | | | | | | | | | | | | |
(Mandatory Tender Date 11/01/2021)(1) | | | 75,000 | | | | 75,834 | | | | | |
| California Statewide Communities Development Authority: | | | | | | | | | | | | |
| 6.000%, 01/01/2021 (ETM) | | | 85,000 | | | | 85,000 | | | | | |
| 3.500%, 11/01/2021 | | | | | | | | | | | | |
| (Callable 02/01/2021) (Insured by CA MTG) | | | 55,000 | | | | 55,678 | | | | | |
| 3.000%, 07/01/2026 | | | | | | | | | | | | |
| (Callable 02/01/2021) (Insured by CA MTG) | | | 625,000 | | | | 626,112 | | | | | |
| Campbell Union School District, | | | | | | | | | | | | |
0.000%, 08/01/2035 (Callable 08/01/2026)(7) | | | 775,000 | | | | 946,624 | | | | | |
| Centinela Valley Union High School District, | | | | | | | | | | | | |
| 0.000%, 08/01/2037 | | | | | | | | | | | | |
| (Callable 08/01/2022) (Insured by AGM) | | | 370,000 | | | | 153,439 | | | | | |
| Central School District, | | | | | | | | | | | | |
| 0.000%, 08/01/2051 (Callable 08/01/2022) | | | 400,000 | | | | 67,924 | | | | | |
The accompanying notes are an integral part of these financial statements.
Baird Short-Term Municipal Bond Fund
Schedule of Investments, December 31, 2020
Long-Term Investments (cont.)
| | | Principal | | | | | | % of | |
| | | Amount | | | Value | | | Net Assets | |
| City & County of San Francisco CA, | | | | | | | | | |
| 1.300%, 07/01/2023 | | | | | | | | | |
(Mandatory Tender Date 01/01/2023)(1) | | $ | 810,000 | | | $ | 819,145 | | | |
|
|
| City of Redding CA, | | | | | | | | | | | | |
0.280%, 07/01/2022 (ETM) (Insured by NATL)(1)(5) | | | 65,000 | | | | 65,000 | | | | | |
| Commerce Community Development | | | | | | | | | | | | |
| Commission Successor Agency, | | | | | | | | | | | | |
| 0.000%, 08/01/2021 (ETM) | | | 50,000 | | | | 49,912 | | | | | |
| Corona-Norco Unified School District, | | | | | | | | | | | | |
0.000%, 08/01/2024(7) | | | 30,000 | | | | 34,215 | | | | | |
| Department of Veterans Affairs Veteran’s | | | | | | | | | | | | |
| Farm & Home Purchase Program, | | | | | | | | | | | | |
| 4.000%, 12/01/2049 (Callable 06/01/2028) | | | 2,340,000 | | | | 2,599,272 | | | | | |
| Eastern Municipal Water District, | | | | | | | | | | | | |
| 0.401%, 07/01/2030 | | | | | | | | | | | | |
| (1 Month LIBOR USD + 0.300%) (Callable 04/01/2021) | | | | | | | | | | | | |
(Mandatory Tender Date 10/01/2021)(2) | | | 745,000 | | | | 744,493 | | | | | |
| Emery Unified School District, | | | | | | | | | | | | |
| 0.000%, 08/01/2041 (Pre-refunded to 08/01/2023) | | | 505,000 | | | | 191,900 | | | | | |
| Fresno Unified School District: | | | | | | | | | | | | |
| 0.000%, 08/01/2027 (Callable 08/01/2021) | | | 200,000 | | | | 136,244 | | | | | |
| 0.000%, 08/01/2028 (Callable 08/01/2021) | | | 225,000 | | | | 142,861 | | | | | |
| 0.000%, 08/01/2030 (Callable 08/01/2021) | | | 65,000 | | | | 35,677 | | | | | |
| 0.000%, 08/01/2032 | | | | | | | | | | | | |
| (Callable 08/01/2023) (Insured by BAM) | | | 75,000 | | | | 42,039 | | | | | |
| 0.000%, 08/01/2033 (Callable 08/01/2021) | | | 310,000 | | | | 136,388 | | | | | |
| 0.000%, 08/01/2033 | | | | | | | | | | | | |
| (Callable 08/01/2023) (Insured by BAM) | | | 645,000 | | | | 337,296 | | | | | |
| 0.000%, 08/01/2034 (Callable 08/01/2021) | | | 100,000 | | | | 40,940 | | | | | |
| 0.000%, 08/01/2034 | | | | | | | | | | | | |
| (Callable 08/01/2023) (Insured by BAM) | | | 400,000 | | | | 195,304 | | | | | |
| 0.000%, 08/01/2035 | | | | | | | | | | | | |
| (Callable 08/01/2023) (Insured by BAM) | | | 150,000 | | | | 68,316 | | | | | |
| 0.000%, 08/01/2036 | | | | | | | | | | | | |
| (Callable 08/01/2023) (Insured by BAM) | | | 665,000 | | | | 282,592 | | | | | |
| 0.000%, 08/01/2039 | | | | | | | | | | | | |
| (Callable 08/01/2023) (Insured by BAM) | | | 650,000 | | | | 223,685 | | | | | |
| 0.000%, 08/01/2040 | | | | | | | | | | | | |
| (Callable 08/01/2023) (Insured by BAM) | | | 805,000 | | | | 258,123 | | | | | |
| 0.000%, 08/01/2041 (Callable 08/01/2021) | | | 1,480,000 | | | | 372,768 | | | | | |
| 0.000%, 08/01/2041 (Callable 08/01/2021) | | | 1,075,000 | | | | 270,868 | | | | | |
| 0.000%, 08/01/2041 | | | | | | | | | | | | |
| (Callable 08/01/2023) (Insured by BAM) | | | 1,000,000 | | | | 298,090 | | | | | |
| 0.000%, 08/01/2044 (Callable 08/01/2023) | | | 1,000,000 | | | | 236,930 | | | | | |
The accompanying notes are an integral part of these financial statements.
Baird Short-Term Municipal Bond Fund
Schedule of Investments, December 31, 2020
Long-Term Investments (cont.)
| | | Principal | | | | | | % of | |
| | | Amount | | | Value | | | Net Assets | |
| Glendale Unified School District: | | | | | | | | | |
| 0.000%, 09/01/2030 (Callable 09/01/2021) | | $ | 350,000 | | | $ | 196,504 | | | |
|
|
| 0.000%, 09/01/2041 (Callable 09/01/2021) | | | 500,000 | | | | 125,980 | | | | | |
| Golden State Tobacco Securitization Corp., | | | | | | | | | | | | |
| 5.000%, 06/01/2023 | | | 590,000 | | | | 653,401 | | | | | |
| Healdsburg Unified School District, | | | | | | | | | | | | |
| 0.000%, 08/01/2032 (Callable 08/01/2022) | | | 90,000 | | | | 53,852 | | | | | |
| Kern Community College District, | | | | | | | | | | | | |
| 0.000%, 08/01/2023 | | | 2,000,000 | | | | 1,972,420 | | | | | |
| Lemoore Union High School District, | | | | | | | | | | | | |
| 0.000%, 01/01/2022 (Insured by AMBAC) | | | 30,000 | | | | 29,802 | | | | | |
| Mendocino-Lake Community College District, | | | | | | | | | | | | |
| 0.000%, 08/01/2035 | | | | | | | | | | | | |
| (Pre-refunded to 08/01/2021) (Insured by AGM) | | | 65,000 | | | | 23,682 | | | | | |
| Merced Union High School District, | | | | | | | | | | | | |
| 0.000%, 08/01/2046 (Pre-refunded to 08/01/2021) | | | 100,000 | | | | 16,760 | | | | | |
| Mizuho Floater/Residual Trust, | | | | | | | | | | | | |
| 0.270%, 09/01/2046 (Callable 02/01/2021) | | | | | | | | | | | | |
(Optional Put Date 01/07/2021)(1)(3) | | | 1,000,000 | | | | 1,000,000 | | | | | |
| Morongo Unified School District, | | | | | | | | | | | | |
| 0.000%, 08/01/2039 (Pre-refunded to 08/01/2022) | | | 170,000 | | | | 60,637 | | | | | |
| Oakland California University School District, | | | | | | | | | | | | |
| 5.000%, 08/01/2029 (Callable 08/01/2026) | | | 265,000 | | | | 322,616 | | | | | |
| Oro Grande Elementary School District: | | | | | | | | | | | | |
| 4.000%, 09/15/2021 | | | 1,595,000 | | | | 1,623,981 | | | | | |
| 4.000%, 09/15/2022 | | | 1,975,000 | | | | 2,058,286 | | | | | |
| Piedmont Unified School District: | | | | | | | | | | | | |
| 0.000%, 08/01/2029 (Callable 08/01/2023) | | | 200,000 | | | | 140,204 | | | | | |
| 0.000%, 08/01/2036 (Callable 08/01/2023) | | | 975,000 | | | | 436,176 | | | | | |
| 0.000%, 08/01/2037 (Callable 08/01/2023) | | | 400,000 | | | | 167,500 | | | | | |
| 0.000%, 08/01/2038 (Callable 08/01/2023) | | | 150,000 | | | | 58,834 | | | | | |
| 0.000%, 08/01/2039 (Callable 08/01/2023) | | | 420,000 | | | | 154,216 | | | | | |
| Pittsburg Unified School District Financing Authority, | | | | | | | | | | | | |
| 0.000%, 09/01/2035 | | | | | | | | | | | | |
| (Pre-refunded to 09/01/2021) (Insured by AGM) | | | 200,000 | | | | 70,030 | | | | | |
| Ripon Unified School District: | | | | | | | | | | | | |
| 0.000%, 08/01/2025 | | | | | | | | | | | | |
| (Callable 08/01/2023) (Insured by BAM) | | | 60,000 | | | | 53,921 | | | | | |
| 0.000%, 08/01/2026 | | | | | | | | | | | | |
| (Callable 08/01/2023) (Insured by BAM) | | | 35,000 | | | | 29,860 | | | | | |
| 0.000%, 08/01/2035 | | | | | | | | | | | | |
| (Callable 08/01/2023) (Insured by BAM) | | | 585,000 | | | | 299,970 | | | | | |
| Rosemead School District: | | | | | | | | | | | | |
| 0.000%, 08/01/2032 | | | | | | | | | | | | |
| (Callable 08/01/2023) (Insured by AGM) | | | 495,000 | | | | 283,254 | | | | | |
The accompanying notes are an integral part of these financial statements.
Baird Short-Term Municipal Bond Fund
Schedule of Investments, December 31, 2020
Long-Term Investments (cont.)
| | | Principal | | | | | | % of | |
| | | Amount | | | Value | | | Net Assets | |
| Rosemead School District: (cont.) | | | | | | | | | |
| 0.000%, 08/01/2033 | | | | | | | | | |
| (Callable 08/01/2023) (Insured by AGM) | | $ | 700,000 | | | $ | 372,764 | | | |
|
|
| 0.000%, 08/01/2035 | | | | | | | | | | | | |
| (Callable 08/01/2023) (Insured by AGM) | | | 735,000 | | | | 337,394 | | | | | |
| Roseville Natural Gas Financing Authority, | | | | | | | | | | | | |
| 5.000%, 02/15/2023 | | | 330,000 | | | | 361,584 | | | | | |
| Sacramento City Unified School District: | | | | | | | | | | | | |
| 5.000%, 07/01/2022 | | | 100,000 | | | | 106,096 | | | | | |
| 5.000%, 07/01/2025 (Callable 07/01/2022) | | | 170,000 | | | | 180,157 | | | | | |
| 5.000%, 07/01/2025 (Callable 07/01/2024) | | | 725,000 | | | | 825,558 | | | | | |
| 0.000%, 07/01/2026 (Insured by AGM) | | | 300,000 | | | | 281,181 | | | | | |
| San Joaquin Hills Transportation Corridor Agency, | | | | | | | | | | | | |
| 0.000%, 01/15/2025 (Insured by NATL) | | | 90,000 | | | | 83,797 | | | | | |
| San Mateo Union High School District: | | | | | | | | | | | | |
| 0.000%, 09/01/2033 (Callable 09/01/2021) | | | 100,000 | | | | 44,819 | | | | | |
| 5.000%, 12/15/2043 | | | | | | | | | | | | |
(Pre-refunded to 12/15/2024) (Insured by AMBAC)(7) | | | 480,000 | | | | 567,360 | | | | | |
| San Ysidro School District, | | | | | | | | | | | | |
| 0.000%, 08/01/2042 | | | | | | | | | | | | |
| (Pre-refunded to 08/01/2021) (Insured by AGM) | | | 300,000 | | | | 62,880 | | | | | |
| Sutter Union High School District, | | | | | | | | | | | | |
| 0.000%, 06/01/2050 (Pre-refunded to 08/01/2025) | | | 250,000 | | | | 40,138 | | | | | |
| Tender Option Bond Trust, | | | | | | | | | | | | |
0.270%, 06/15/2055(1)(3) | | | 4,815,000 | | | | 4,815,000 | | | | | |
| Twin Rivers Unified School District: | | | | | | | | | | | | |
| 0.000%, 08/01/2035 | | | | | | | | | | | | |
| (Pre-refunded to 02/01/2024) (Insured by BAM) | | | 275,000 | | | | 132,825 | | | | | |
| 0.000%, 08/01/2036 | | | | | | | | | | | | |
| (Pre-refunded to 02/01/2024) (Insured by BAM) | | | 85,000 | | | | 38,353 | | | | | |
| Vallejo City Unified School District, | | | | | | | | | | | | |
| 5.900%, 08/01/2025 (Insured by NATL) | | | 500,000 | | | | 562,580 | | | | | |
| Victor Valley Union High School District, | | | | | | | | | | | | |
| 0.000%, 08/01/2044 (Pre-refunded to 08/01/2023) | | | 1,000,000 | | | | 301,740 | | | | | |
| Western Placer Unified School District: | | | | | | | | | | | | |
| 2.000%, 06/01/2025 (Callable 06/01/2023) | | | 1,625,000 | | | | 1,682,915 | | | | | |
| 2.000%, 06/01/2025 (Callable 06/01/2023) | | | 3,300,000 | | | | 3,404,742 | | | | | |
| Westminster School District: | | | | | | | | | | | | |
| 0.000%, 08/01/2036 | | | | | | | | | | | | |
| (Callable 08/01/2023) (Insured by BAM) | | | 190,000 | | | | 82,369 | | | | | |
| 0.000%, 08/01/2038 | | | | | | | | | | | | |
| (Callable 08/01/2023) (Insured by BAM) | | | 600,000 | | | | 226,494 | | | | | |
| 0.000%, 08/01/2048 | | | | | | | | | | | | |
| (Callable 08/01/2023) (Insured by BAM) | | | 2,215,000 | | | | 391,944 | | | | | |
The accompanying notes are an integral part of these financial statements.
Baird Short-Term Municipal Bond Fund
Schedule of Investments, December 31, 2020
Long-Term Investments (cont.)
| | | Principal | | | | | | % of | |
| | | Amount | | | Value | | | Net Assets | |
| Westminster School District: (cont.) | | | | | | | | | |
| 0.000%, 08/01/2053 | | | | | | | | | |
| (Callable 08/01/2023) (Insured by BAM) | | $ | 445,000 | | | $ | 53,449 | | | | |
| Total California | | | | | | | | | | | |
| (Cost $56,170,113) | | | | | | | 56,886,941 | | | | 3.5 | % |
| Colorado | | | | | | | | | | | | |
| Bromley Park Metropolitan District No. 2: | | | | | | | | | | | | |
| 5.000%, 12/01/2024 (Insured by BAM) | | | 300,000 | | | | 350,001 | | | | | |
| 5.000%, 12/01/2025 (Insured by BAM) | | | 315,000 | | | | 379,591 | | | | | |
| City & County of Denver CO, | | | | | | | | | | | | |
| 5.000%, 11/15/2031 | | | | | | | | | | | | |
(Mandatory Tender Date 11/15/2022)(1) | | | 3,275,000 | | | | 3,558,517 | | | | | |
| Colorado Educational & Cultural Facilities Authority: | | | | | | | | | | | | |
| 4.000%, 11/01/2021 | | | 50,000 | | | | 51,338 | | | | | |
| 4.000%, 12/01/2021 | | | 100,000 | | | | 103,084 | | | | | |
| 5.000%, 12/01/2021 | | | 80,000 | | | | 83,301 | | | | | |
| 4.000%, 03/01/2022 | | | 45,000 | | | | 46,631 | | | | | |
| 5.000%, 12/01/2022 | | | 200,000 | | | | 215,060 | | | | | |
| 4.000%, 04/01/2023 | | | 95,000 | | | | 98,451 | | | | | |
| 5.000%, 10/01/2023 | | | 1,360,000 | | | | 1,461,973 | | | | | |
| 5.000%, 10/01/2024 | | | 2,165,000 | | | | 2,384,033 | | | | | |
| 5.250%, 03/01/2025 (Insured by NATL) | | | 840,000 | | | | 966,907 | | | | | |
| 4.000%, 12/15/2025 | | | 790,000 | | | | 839,091 | | | | | |
| 5.000%, 06/15/2027 (Callable 06/15/2026) | | | 635,000 | | | | 764,019 | | | | | |
| Colorado Health Facilities Authority: | | | | | | | | | | | | |
| 0.000%, 07/15/2022 (ETM) | | | 3,000,000 | | | | 2,986,290 | | | | | |
| 5.000%, 10/01/2023 | | | 300,000 | | | | 335,850 | | | | | |
| 5.000%, 12/01/2023 (Pre-refunded to 12/01/2022) | | | 1,000,000 | | | | 1,091,040 | | | | | |
| 5.000%, 05/15/2025 (Pre-refunded to 05/15/2023) | | | 320,000 | | | | 354,397 | | | | | |
| 5.000%, 10/01/2025 | | | 350,000 | | | | 420,329 | | | | | |
| 5.000%, 12/01/2025 (Pre-refunded to 12/01/2022) | | | 1,600,000 | | | | 1,745,664 | | | | | |
| 5.000%, 10/01/2026 | | | 400,000 | | | | 492,996 | | | | | |
| 4.000%, 12/01/2026 (Pre-refunded to 06/01/2022) | | | 1,535,000 | | | | 1,616,831 | | | | | |
| 5.000%, 12/01/2027 (Pre-refunded to 12/01/2022) | | | 300,000 | | | | 327,312 | | | | | |
| 5.000%, 12/01/2030 (Callable 06/01/2025) | | | 1,000,000 | | | | 1,139,070 | | | | | |
| 5.000%, 11/15/2036 | | | | | | | | | | | | |
(Mandatory Tender Date 11/15/2023)(1) | | | 145,000 | | | | 164,278 | | | | | |
| 2.800%, 05/15/2042 (Callable 11/15/2022) | | | | | | | | | | | | |
(Mandatory Tender Date 05/15/2023)(1) | | | 2,225,000 | | | | 2,320,363 | | | | | |
| 5.625%, 06/01/2043 (Pre-refunded to 06/01/2023) | | | 1,080,000 | | | | 1,219,968 | | | | | |
| 5.000%, 11/15/2048 | | | | | | | | | | | | |
(Mandatory Tender Date 11/20/2025)(1) | | | 190,000 | | | | 232,092 | | | | | |
| 5.000%, 08/01/2049 (Callable 02/01/2025) | | | | | | | | | | | | |
(Mandatory Tender Date 08/01/2025)(1) | | | 5,500,000 | | | | 6,443,635 | | | | | |
The accompanying notes are an integral part of these financial statements.
Baird Short-Term Municipal Bond Fund
Schedule of Investments, December 31, 2020
Long-Term Investments (cont.)
| | | Principal | | | | | | % of | |
| | | Amount | | | Value | | | Net Assets | |
| Colorado Housing & Finance Authority: | | | | | | | | | |
| 1.450%, 04/01/2022 | | $ | 60,000 | | | $ | 60,631 | | | |
|
|
| 4.000%, 05/01/2048 | | | | | | | | | | | | |
| (Callable 11/01/2026) (Insured by GNMA) | | | 375,000 | | | | 408,221 | | | | | |
| 4.250%, 11/01/2049 | | | | | | | | | | | | |
| (Callable 11/01/2028) (Insured by GNMA) | | | 930,000 | | | | 1,046,166 | | | | | |
| 1.650%, 10/01/2057 | | | | | | | | | | | | |
(Mandatory Tender Date 04/01/2023)(1) | | | 2,415,000 | | | | 2,470,593 | | | | | |
| County of Moffat CO, | | | | | | | | | | | | |
| 2.000%, 03/01/2036 | | | | | | | | | | | | |
(Mandatory Tender Date 10/03/2022)(1) | | | 540,000 | | | | 549,785 | | | | | |
| Crystal Valley Metropolitan District No. 2, | | | | | | | | | | | | |
| 5.000%, 12/01/2027 (Insured by AGM) | | | 275,000 | | | | 349,877 | | | | | |
| Denver Convention Center Hotel Authority: | | | | | | | | | | | | |
| 5.000%, 12/01/2024 | | | 2,170,000 | | | | 2,468,614 | | | | | |
| 5.000%, 12/01/2025 | | | 1,100,000 | | | | 1,285,592 | | | | | |
| Denver Health & Hospital Authority, | | | | | | | | | | | | |
| 4.000%, 12/01/2027 (Callable 12/01/2023) | | | 225,000 | | | | 240,923 | | | | | |
| E-470 Public Highway Authority: | | | | | | | | | | | | |
| 0.000%, 09/01/2022 (Insured by NATL) | | | 30,000 | | | | 29,798 | | | | | |
| 1.138%, 09/01/2039 | | | | | | | | | | | | |
| (1 Month LIBOR USD + 1.050%) | | | | | | | | | | | | |
| (Callable 03/01/2021) | | | | | | | | | | | | |
(Mandatory Tender Date 09/01/2021)(2) | | | 400,000 | | | | 400,292 | | | | | |
| High Plains Metropolitan District: | | | | | | | | | | | | |
| 4.000%, 12/01/2022 (Insured by NATL) | | | 420,000 | | | | 446,435 | | | | | |
| 4.000%, 12/01/2024 (Insured by NATL) | | | 200,000 | | | | 224,566 | | | | | |
| Lincoln Park Metropolitan District, | | | | | | | | | | | | |
| 4.000%, 12/01/2023 (Insured by AGM) | | | 150,000 | | | | 165,223 | | | | | |
| Southlands Metropolitan District No. 1: | | | | | | | | | | | | |
| 3.000%, 12/01/2022 | | | 78,000 | | | | 79,010 | | | | | |
| 3.000%, 12/01/2022 | | | 95,000 | | | | 96,228 | | | | | |
| Tallyns Reach Metropolitan District No. 3, | | | | | | | | | | | | |
| 5.000%, 12/01/2023 (Insured by BAM) | | | 30,000 | | | | 33,733 | | | | | |
| Vauxmont Metropolitan District: | | | | | | | | | | | | |
| 5.000%, 12/15/2025 | | | | | | | | | | | | |
| (Callable 12/15/2024) (Insured by AGM) | | | 125,000 | | | | 148,899 | | | | | |
| 5.000%, 12/15/2026 | | | | | | | | | | | | |
| (Callable 12/15/2024) (Insured by AGM) | | | 135,000 | | | | 160,177 | | | | | |
| 5.000%, 12/15/2027 | | | | | | | | | | | | |
| (Callable 12/15/2024) (Insured by AGM) | | | 160,000 | | | | 189,067 | | | | | |
| Vista Ridge Metropolitan District, | | | | | | | | | | | | |
| 4.500%, 12/01/2024 (Insured by BAM) | | | 200,000 | | | | 230,154 | | | | | |
| Total Colorado | | | | | | | | | | | | |
| (Cost $41,963,694) | | | | | | | 43,276,096 | | | | 2.7 | % |
The accompanying notes are an integral part of these financial statements.
Baird Short-Term Municipal Bond Fund
Schedule of Investments, December 31, 2020
Long-Term Investments (cont.)
| | | Principal | | | | | | % of | |
| | | Amount | | | Value | | | Net Assets | |
| Connecticut | | | | | | | | | |
| City of Bridgeport CT: | | | | | | | | | |
| 5.000%, 02/01/2022 (Insured by BAM) | | $ | 250,000 | | | $ | 262,042 | | | |
|
|
| 5.000%, 02/01/2024 (Insured by BAM) | | | 475,000 | | | | 535,715 | | | | | |
| City of Hartford CT, | | | | | | | | | | | | |
| 5.000%, 04/01/2022 (Insured by AGM) | | | 1,000,000 | | | | 1,055,370 | | | | | |
| City of New Haven CT, | | | | | | | | | | | | |
| 5.000%, 08/15/2022 (ETM) (Insured by AGM) | | | 520,000 | | | | 560,128 | | | | | |
| Connecticut Housing Finance Authority: | | | | | | | | | | | | |
| 3.000%, 05/15/2025 (Callable 05/15/2021) | | | 825,000 | | | | 831,682 | | | | | |
| 4.000%, 11/15/2044 (Callable 11/15/2023) | | | 90,000 | | | | 94,251 | | | | | |
| 4.000%, 11/15/2045 (Callable 11/15/2027) | | | 185,000 | | | | 204,259 | | | | | |
| 4.000%, 05/15/2049 (Callable 11/15/2028) | | | 1,515,000 | | | | 1,727,676 | | | | | |
| 2.600%, 11/15/2058 (Callable 02/01/2021) | | | | | | | | | | | | |
(Mandatory Tender Date 11/15/2021)(1) | | | 320,000 | | | | 320,499 | | | | | |
| 1.625%, 11/15/2059 (Callable 02/01/2021) | | | | | | | | | | | | |
(Mandatory Tender Date 11/15/2022)(1) | | | 2,500,000 | | | | 2,501,875 | | | | | |
| Connecticut Municipal Electric Energy Cooperative, | | | | | | | | | | | | |
| 5.000%, 01/01/2030 (Callable 01/01/2022) | | | 530,000 | | | | 553,553 | | | | | |
| Connecticut State Health & | | | | | | | | | | | | |
| Educational Facilities Authority: | | | | | | | | | | | | |
| 4.000%, 11/01/2021 | | | 100,000 | | | | 102,960 | | | | | |
| 5.000%, 07/01/2022 | | | 1,300,000 | | | | 1,374,074 | | | | | |
| 5.000%, 07/01/2023 | | | 805,000 | | | | 879,817 | | | | | |
| 5.000%, 07/01/2024 | | | 800,000 | | | | 901,664 | | | | | |
2.750%, 01/01/2026 (Callable 07/01/2022)(3) | | | 450,000 | | | | 454,266 | | | | | |
| 5.000%, 11/01/2026 (Callable 11/01/2022) | | | 445,000 | | | | 479,981 | | | | | |
| 5.000%, 07/01/2028 (Callable 07/01/2024) | | | 630,000 | | | | 724,128 | | | | | |
| Connecticut State Higher Education | | | | | | | | | | | | |
| Supplement Loan Authority: | | | | | | | | | | | | |
| 5.000%, 11/15/2022 | | | 500,000 | | | | 540,225 | | | | | |
| 5.000%, 11/15/2023 | | | 400,000 | | | | 448,424 | | | | | |
| 5.000%, 11/15/2023 | | | 850,000 | | | | 952,901 | | | | | |
| 5.000%, 11/15/2024 | | | 450,000 | | | | 522,108 | | | | | |
| 5.000%, 11/15/2024 | | | 225,000 | | | | 261,054 | | | | | |
| Southeastern Connecticut Water Authority, | | | | | | | | | | | | |
| 4.000%, 09/01/2022 | | | | | | | | | | | | |
| (Callable 02/01/2021) (Insured by ST AID) | | | 175,000 | | | | 175,488 | | | | | |
| State of Connecticut: | | | | | | | | | | | | |
| 1.020%, 03/01/2024 | | | | | | | | | | | | |
(SIFMA Municipal Swap Index + 0.950%)(2) | | | 200,000 | | | | 201,784 | | | | | |
| 5.000%, 10/01/2026 | | | 1,040,000 | | | | 1,299,647 | | | | | |
| 5.000%, 10/01/2027 (Callable 10/01/2023) | | | 1,005,000 | | | | 1,126,263 | | | | | |
| Town of Hamden CT: | | | | | | | | | | | | |
| 4.000%, 08/15/2021 (ETM) (Insured by BAM) | | | 415,000 | | | | 424,703 | | | | | |
| 5.000%, 08/01/2022 (Insured by BAM) | | | 285,000 | | | | 301,815 | | | | | |
The accompanying notes are an integral part of these financial statements.
Baird Short-Term Municipal Bond Fund
Schedule of Investments, December 31, 2020
Long-Term Investments (cont.)
| | | Principal | | | | | | % of | |
| | | Amount | | | Value | | | Net Assets | |
| Town of Hamden CT: (cont.) | | | | | | | | | |
| 5.000%, 08/01/2023 (Insured by BAM) | | $ | 150,000 | | | $ | 164,271 | | | | |
| Town of Plainfield CT, | | | | | | | | | | | |
| 3.375%, 07/15/2026 (Callable 07/15/2024) | | | 275,000 | | | | 300,405 | | | | |
| Town of Plymouth CT, | | | | | | | | | | | |
| 3.000%, 10/15/2027 | | | | | | | | | | | |
| (Callable 10/15/2024) (Insured by BAM) | | | 300,000 | | | | 323,727 | | | | |
| University of Connecticut, | | | | | | | | | | | |
| 5.000%, 11/15/2026 (Callable 11/15/2022) | | | 760,000 | | | | 819,812 | | | | |
| Total Connecticut | | | | | | | | | | | |
| (Cost $20,833,319) | | | | | | | 21,426,567 | | | | 1.3 | % |
| Delaware | | | | | | | | | | | | |
| Delaware Municipal Electric Corp.: | | | | | | | | | | | | |
| 5.000%, 10/01/2024 (Insured by BAM) | | | 230,000 | | | | 266,825 | | | | | |
| 5.000%, 10/01/2025 (Insured by BAM) | | | 140,000 | | | | 167,842 | | | | | |
| Delaware State Economic Development Authority, | | | | | | | | | | | | |
| 5.000%, 10/01/2028 | | | | | | | | | | | | |
| (Callable 10/01/2024) (Insured by AGM) | | | 1,000,000 | | | | 1,134,740 | | | | | |
| Delaware State Housing Authority, | | | | | | | | | | | | |
| 2.600%, 07/01/2043 | | | | | | | | | | | | |
| (Callable 06/01/2023) (Insured by GNMA) | | | 142,661 | | | | 146,853 | | | | | |
| Total Delaware | | | | | | | | | | | | |
| (Cost $1,687,711) | | | | | | | 1,716,260 | | | | 0.1 | % |
| District of Columbia | | | | | | | | | | | | |
| District of Columbia: | | | | | | | | | | | | |
| 5.000%, 07/01/2025 | | | 500,000 | | | | 585,205 | | | | | |
| 5.000%, 12/01/2026 (Callable 12/01/2022) | | | 310,000 | | | | 337,882 | | | | | |
| 4.000%, 12/01/2028 (Callable 12/01/2022) | | | 330,000 | | | | 351,727 | | | | | |
| 3.000%, 06/01/2030 | | | 1,205,000 | | | | 1,254,417 | | | | | |
| District of Columbia Housing Finance Agency: | | | | | | | | | | | | |
| 1.250%, 03/01/2023 | | | | | | | | | | | | |
| (Mandatory Tender Date 03/01/2022) | | | | | | | | | | | | |
(Insured by FNMA)(1) | | | 1,700,000 | | | | 1,715,164 | | | | | |
| 3.500%, 06/15/2023 | | | 245,000 | | | | 253,974 | | | | | |
| 2.550%, 09/01/2023 | | | | | | | | | | | | |
| (Mandatory Tender Date 03/01/2022) | | | | | | | | | | | | |
(Insured by FHA)(1) | | | 1,200,000 | | | | 1,228,668 | | | | | |
| 1.750%, 09/01/2025 | | | | | | | | | | | | |
| (Mandatory Tender Date 09/01/2023) | | | | | | | | | | | | |
(Insured by FHA)(1) | | | 2,260,000 | | | | 2,325,178 | | | | | |
| 1.450%, 02/01/2039 | | | | | | | | | | | | |
(Mandatory Tender Date 08/01/2022)(1) | | | 150,000 | | | | 152,357 | | | | | |
| Total District of Columbia | | | | | | | | | | | | |
| (Cost $8,044,526) | | | | | | | 8,204,572 | | | | 0.5 | % |
The accompanying notes are an integral part of these financial statements.
Baird Short-Term Municipal Bond Fund
Schedule of Investments, December 31, 2020
Long-Term Investments (cont.)
| | | Principal | | | | | | % of | |
| | | Amount | | | Value | | | Net Assets | |
| Florida | | | | | | | | | |
| Capital Trust Agency, Inc.: | | | | | | | | | |
| 4.000%, 12/15/2024 | | $ | 250,000 | | | $ | 266,155 | | | |
|
|
| 4.000%, 11/01/2025 (Pre-refunded to 11/01/2022) | | | 270,000 | | | | 283,022 | | | | | |
| 4.250%, 12/01/2042 (Pre-refunded to 12/01/2022) | | | 65,000 | | | | 72,957 | | | | | |
| City of Auburndale FL, | | | | | | | | | | | | |
| 5.250%, 12/01/2023 | | | 1,010,000 | | | | 1,153,622 | | | | | |
| City of Boynton Beach FL, | | | | | | | | | | | | |
| 4.500%, 11/01/2022 | | | | | | | | | | | | |
| (Callable 11/01/2021) (Insured by AGM) | | | 130,000 | | | | 134,458 | | | | | |
| City of Jacksonville FL: | | | | | | | | | | | | |
| 5.000%, 11/01/2022 | | | 100,000 | | | | 107,847 | | | | | |
0.040%, 05/01/2029 (Optional Put Date 01/04/2021)(1) | | | 11,000,000 | | | | 11,000,000 | | | | | |
| 5.000%, 10/01/2029 (Callable 10/01/2026) | | | 1,175,000 | | | | 1,437,836 | | | | | |
| City of Lakeland FL, | | | | | | | | | | | | |
| 5.000%, 11/15/2028 (Callable 11/15/2026) | | | 100,000 | | | | 122,915 | | | | | |
| City of Melbourne FL, | | | | | | | | | | | | |
| 0.000%, 10/01/2023 (Insured by NATL) | | | 100,000 | | | | 98,307 | | | | | |
| City of Orlando FL, | | | | | | | | | | | | |
| 5.000%, 11/01/2025 (Insured by AGM) | | | 1,000,000 | | | | 1,202,230 | | | | | |
| City of Port St. Lucie FL: | | | | | | | | | | | | |
| 5.000%, 09/01/2021 | | | 55,000 | | | | 56,618 | | | | | |
| 5.250%, 09/01/2022 (Insured by NATL) | | | 100,000 | | | | 108,081 | | | | | |
| City of Tallahassee FL: | | | | | | | | | | | | |
| 5.000%, 12/01/2022 | | | 475,000 | | | | 510,064 | | | | | |
| 5.000%, 12/01/2024 | | | 200,000 | | | | 229,496 | | | | | |
| 5.000%, 12/01/2025 | | | 500,000 | | | | 591,390 | | | | | |
| County of Brevard FL, | | | | | | | | | | | | |
| 5.000%, 07/01/2031 (Callable 07/01/2027) | | | 540,000 | | | | 671,285 | | | | | |
| County of Broward FL: | | | | | | | | | | | | |
| 5.000%, 09/01/2025 (Callable 09/01/2023) | | | 1,540,000 | | | | 1,719,025 | | | | | |
| 5.000%, 09/01/2026 (Callable 09/01/2023) | | | 1,045,000 | | | | 1,164,704 | | | | | |
| 5.000%, 09/01/2027 (Callable 09/01/2023) | | | 1,525,000 | | | | 1,697,066 | | | | | |
| County of Escambia FL, | | | | | | | | | | | | |
0.060%, 07/01/2022 (Optional Put Date 01/04/2021)(1) | | | 1,000,000 | | | | 1,000,000 | | | | | |
| County of Manatee FL, | | | | | | | | | | | | |
0.020%, 09/01/2024 (Optional Put Date 01/04/2021)(1) | | | 6,000,000 | | | | 6,000,000 | | | | | |
| County of Miami-Dade FL: | | | | | | | | | | | | |
| 0.000%, 10/01/2023 (ETM) (Insured by NATL) | | | 200,000 | | | | 197,768 | | | | | |
| 0.000%, 10/01/2028 (ETM) (Insured by NATL) | | | 40,000 | | | | 37,603 | | | | | |
| County of Okeechobee FL, | | | | | | | | | | | | |
| 1.550%, 07/01/2039 | | | | | | | | | | | | |
(Mandatory Tender Date 07/01/2021)(1) | | | 475,000 | | | | 477,874 | | | | | |
| County of St. Johns FL, | | | | | | | | | | | | |
| 0.000%, 06/01/2021 (Insured by NATL) | | | 255,000 | | | | 254,712 | | | | | |
The accompanying notes are an integral part of these financial statements.
Baird Short-Term Municipal Bond Fund
Schedule of Investments, December 31, 2020
Long-Term Investments (cont.)
| | | Principal | | | | | | % of | |
| | | Amount | | | Value | | | Net Assets | |
| County of St. Lucie FL, | | | | | | | | | |
0.030%, 09/01/2028 (Optional Put Date 01/04/2021)(1) | | $ | 8,000,000 | | | $ | 8,000,000 | | | |
|
|
| Florida Department of Environmental Protection, | | | | | | | | | | | | |
| 5.000%, 07/01/2025 | | | 525,000 | | | | 634,447 | | | | | |
| Florida Development Finance Corp.: | | | | | | | | | | | | |
| 5.000%, 04/01/2022 | | | 155,000 | | | | 162,750 | | | | | |
| 5.000%, 04/01/2023 | | | 275,000 | | | | 299,654 | | | | | |
| 4.000%, 06/15/2024 | | | 430,000 | | | | 468,304 | | | | | |
2.625%, 12/15/2024(3) | | | 310,000 | | | | 317,794 | | | | | |
| 5.000%, 04/01/2025 | | | 200,000 | | | | 233,078 | | | | | |
| 5.250%, 02/01/2026 (Callable 08/01/2023) | | | 100,000 | | | | 108,324 | | | | | |
| 5.000%, 06/15/2026 | | | 370,000 | | | | 437,902 | | | | | |
| 5.000%, 06/15/2027 | | | 390,000 | | | | 470,613 | | | | | |
| Florida Gulf Coast University Financing Corp.: | | | | | | | | | | | | |
| 5.000%, 02/01/2023 | | | 240,000 | | | | 261,614 | | | | | |
| 5.000%, 02/01/2024 | | | 250,000 | | | | 282,853 | | | | | |
| 5.000%, 02/01/2027 | | | 270,000 | | | | 334,036 | | | | | |
| Florida Higher Educational Facilities Financial Authority, | | | | | | | | | | | | |
| 5.000%, 04/01/2028 (Callable 04/01/2026) | | | 435,000 | | | | 517,084 | | | | | |
| Florida Housing Finance Corp.: | | | | | | | | | | | | |
| 3.700%, 07/01/2021 | | | | | | | | | | | | |
| (Callable 01/21/2021) (Insured by GNMA) | | | 535,000 | | | | 535,637 | | | | | |
| 1.450%, 03/01/2023 | | | | | | | | | | | | |
(Mandatory Tender Date 03/01/2022)(1) | | | 100,000 | | | | 101,169 | | | | | |
| 4.350%, 01/01/2046 (Callable 01/01/2024) | | | 210,000 | | | | 218,123 | | | | | |
| 4.000%, 07/01/2047 | | | | | | | | | | | | |
| (Callable 07/01/2025) (Insured by GNMA) | | | 90,000 | | | | 96,010 | | | | | |
| 4.000%, 07/01/2049 | | | | | | | | | | | | |
| (Callable 07/01/2027) (Insured by GNMA) | | | 200,000 | | | | 218,720 | | | | | |
| Florida Municipal Loan Council: | | | | | | | | | | | | |
| 0.000%, 04/01/2021 (Insured by NATL) | | | 50,000 | | | | 49,879 | | | | | |
| 0.000%, 04/01/2022 (Insured by NATL) | | | 265,000 | | | | 261,370 | | | | | |
| 4.000%, 12/01/2022 (Insured by AGM) | | | 155,000 | | | | 165,520 | | | | | |
| 0.000%, 04/01/2023 (Insured by NATL) | | | 190,000 | | | | 184,965 | | | | | |
| 5.000%, 12/01/2023 (Insured by AGM) | | | 160,000 | | | | 180,850 | | | | | |
| 0.000%, 04/01/2024 (Insured by NATL) | | | 55,000 | | | | 52,803 | | | | | |
| 5.000%, 12/01/2024 (Insured by AGM) | | | 85,000 | | | | 99,850 | | | | | |
| Florida Municipal Power Agency, | | | | | | | | | | | | |
| 5.000%, 10/01/2025 (Callable 10/01/2021) | | | 585,000 | | | | 605,750 | | | | | |
| Heritage Bay Community Development District, | | | | | | | | | | | | |
| 2.250%, 05/01/2021 | | | 125,000 | | | | 125,637 | | | | | |
| Herons Glen Recreation District, | | | | | | | | | | | | |
| 2.500%, 05/01/2027 (Insured by BAM) | | | 250,000 | | | | 266,480 | | | | | |
The accompanying notes are an integral part of these financial statements.
Baird Short-Term Municipal Bond Fund
Schedule of Investments, December 31, 2020
Long-Term Investments (cont.)
| | | Principal | | | | | | % of | |
| | | Amount | | | Value | | | Net Assets | |
| Highlands County Health Facilities Authority: | | | | | | | | | |
| 0.070%, 11/15/2035 (Callable 01/04/2021) | | | | | | | | | |
(Optional Put Date 01/07/2021)(1) | | $ | 4,200,000 | | | $ | 4,200,000 | | | |
|
|
| 0.070%, 11/15/2037 (Callable 01/04/2021) | | | | | | | | | | | | |
(Optional Put Date 01/07/2021)(1) | | | 10,000,000 | | | | 10,000,000 | | | | | |
| Hillsborough County Industrial Development Authority, | | | | | | | | | | | | |
| 3.500%, 10/01/2028 (Callable 10/01/2023) | | | 240,000 | | | | 253,320 | | | | | |
| Hollywood Beach Community Development District I, | | | | | | | | | | | | |
| 5.000%, 10/01/2027 | | | 545,000 | | | | 688,635 | | | | | |
| Hollywood Community Redevelopment Agency: | | | | | | | | | | | | |
| 5.000%, 03/01/2023 | | | 665,000 | | | | 728,454 | | | | | |
| 5.000%, 03/01/2024 | | | 800,000 | | | | 910,888 | | | | | |
| JEA Water & Sewer System Revenue: | | | | | | | | | | | | |
| 5.000%, 10/01/2023 | | | 150,000 | | | | 169,327 | | | | | |
| 5.000%, 10/01/2023 | | | 210,000 | | | | 237,059 | | | | | |
| 5.000%, 10/01/2026 (Callable 04/01/2021) | | | 245,000 | | | | 247,688 | | | | | |
| Lee County School Board, | | | | | | | | | | | | |
| 5.000%, 08/01/2023 | | | 190,000 | | | | 212,705 | | | | | |
| Miami Beach Health Facilities Authority, | | | | | | | | | | | | |
| 4.000%, 11/15/2025 (Callable 11/15/2022) | | | 735,000 | | | | 770,868 | | | | | |
| Miami Health Facilities Authority, | | | | | | | | | | | | |
| 5.000%, 07/01/2021 | | | 310,000 | | | | 309,597 | | | | | |
| Miami-Dade County Educational Facilities Authority: | | | | | | | | | | | | |
| 5.000%, 04/01/2022 | | | 150,000 | | | | 157,864 | | | | | |
| 5.000%, 04/01/2023 | | | 150,000 | | | | 163,239 | | | | | |
| Miami-Dade County Industrial Development Authority: | | | | | | | | | | | | |
0.040%, 06/01/2021 (Optional Put Date 01/04/2021)(1) | | | 7,635,000 | | | | 7,635,000 | | | | | |
| 5.000%, 01/15/2022 | | | 385,000 | | | | 397,528 | | | | | |
| Orange County Convention Center, | | | | | | | | | | | | |
| 5.000%, 10/01/2027 (Callable 10/01/2025) | | | 1,000,000 | | | | 1,190,670 | | | | | |
| Orange County Health Facilities Authority: | | | | | | | | | | | | |
| 3.500%, 08/01/2021 | | | 575,000 | | | | 583,544 | | | | | |
| 6.250%, 10/01/2021 (ETM) (Insured by NATL) | | | 40,000 | | | | 41,758 | | | | | |
| 4.000%, 08/01/2024 | | | 25,000 | | | | 27,518 | | | | | |
| 5.000%, 08/01/2028 (Callable 08/01/2024) | | | 2,000,000 | | | | 2,241,880 | | | | | |
| Orange County Housing Finance Authority: | | | | | | | | | | | | |
| 1.900%, 04/01/2022 | | | | | | | | | | | | |
(Mandatory Tender Date 04/01/2021)(1) | | | 2,530,000 | | | | 2,539,665 | | | | | |
| 4.375%, 03/01/2031 | | | | | | | | | | | | |
| (Callable 03/01/2021) (Insured by GNMA) | | | 50,000 | | | | 50,270 | | | | | |
| 4.000%, 09/01/2040 | | | | | | | | | | | | |
| (Callable 09/01/2024) (Insured by GNMA) | | | 305,000 | | | | 319,036 | | | | | |
| 4.250%, 09/01/2049 | | | | | | | | | | | | |
| (Callable 09/01/2027) (Insured by GNMA) | | | 195,000 | | | | 217,743 | | | | | |
The accompanying notes are an integral part of these financial statements.
Baird Short-Term Municipal Bond Fund
Schedule of Investments, December 31, 2020
Long-Term Investments (cont.)
| | | Principal | | | | | | % of | |
| | | Amount | | | Value | | | Net Assets | |
| Osceola County Expressway Authority, | | | | | | | | | |
| 0.000%, 10/01/2024 (ETM) | | $ | 265,000 | | | $ | 258,553 | | | |
|
|
| Palm Beach County Health Facilities Authority: | | | | | | | | | | | | |
| 5.000%, 08/15/2021 | | | 400,000 | | | | 410,892 | | | | | |
| 5.000%, 11/15/2022 | | | 220,000 | | | | 236,504 | | | | | |
| 5.000%, 12/01/2031 (Pre-refunded to 12/01/2024) | | | 1,250,000 | | | | 1,476,875 | | | | | |
| Pasco County School Board, | | | | | | | | | | | | |
| 0.820%, 08/01/2032 | | | | | | | | | | | | |
| (SIFMA Municipal Swap Index + 0.750%) | | | | | | | | | | | | |
| (Callable 08/04/2021) | | | | | | | | | | | | |
(Mandatory Tender Date 08/02/2023)(2) | | | 3,650,000 | | | | 3,660,220 | | | | | |
| Pinellas County Housing Authority, | | | | | | | | | | | | |
| 1.000%, 11/01/2027 | | | 3,565,000 | | | | 3,590,311 | | | | | |
| Pinellas County Housing Finance Authority: | | | | | | | | | | | | |
| 1.250%, 08/01/2022 | | | | | | | | | | | | |
(Mandatory Tender Date 08/01/2021)(1) | | | 1,015,000 | | | | 1,020,329 | | | | | |
| 4.375%, 09/01/2027 | | | | | | | | | | | | |
| (Callable 09/01/2021) (Insured by GNMA) | | | 50,000 | | | | 50,488 | | | | | |
| 3.500%, 03/01/2046 | | | | | | | | | | | | |
| (Callable 09/01/2025) (Insured by GNMA) | | | 1,045,000 | | | | 1,104,596 | | | | | |
| Reedy Creek Improvement District, | | | | | | | | | | | | |
| 5.000%, 10/01/2024 (Callable 10/01/2023) | | | 145,000 | | | | 161,655 | | | | | |
| Sarasota County Public Hospital District, | | | | | | | | | | | | |
| 5.250%, 07/01/2024 (Insured by NATL) | | | 115,000 | | | | 130,960 | | | | | |
| School Board of Miami-Dade County: | | | | | | | | | | | | |
| 5.000%, 05/01/2031 | | | | | | | | | | | | |
(Mandatory Tender Date 05/01/2024)(1) | | | 805,000 | | | | 923,528 | | | | | |
| 5.500%, 05/01/2031 | | | | | | | | | | | | |
| (Callable 05/01/2021) (Insured by AGM) | | | 300,000 | | | | 304,791 | | | | | |
| St. Johns River Power Park, | | | | | | | | | | | | |
| 5.000%, 10/01/2024 (Callable 02/01/2021) | | | 105,000 | | | | 105,345 | | | | | |
| St. Lucie County School Board, | | | | | | | | | | | | |
| 5.000%, 07/01/2027 (Callable 07/01/2023) | | | 1,150,000 | | | | 1,271,233 | | | | | |
| UCF Convocation Corp.: | | | | | | | | | | | | |
| 5.000%, 10/01/2028 (Callable 10/01/2025) | | | 630,000 | | | | 750,418 | | | | | |
| 5.000%, 10/01/2030 (Callable 10/01/2025) | | | 935,000 | | | | 1,100,383 | | | | | |
| University of North Florida Financing Corp., | | | | | | | | | | | | |
| 5.000%, 11/01/2023 (Insured by AGM) | | | 485,000 | | | | 533,903 | | | | | |
| Volusia County Educational Facility Authority: | | | | | | | | | | | | |
| 5.000%, 10/15/2029 (Callable 04/15/2025) | | | 1,035,000 | | | | 1,197,940 | | | | | |
| 5.000%, 10/15/2033 (Callable 04/15/2025) | | | 450,000 | | | | 515,318 | | | | | |
| Total Florida | | | | | | | | | | | | |
| (Cost $98,612,285) | | | | | | | 99,384,749 | | | | 6.2 | % |
The accompanying notes are an integral part of these financial statements.
Baird Short-Term Municipal Bond Fund
Schedule of Investments, December 31, 2020
Long-Term Investments (cont.)
| | | Principal | | | | | | % of | |
| | | Amount | | | Value | | | Net Assets | |
| Georgia | | | | | | | | | |
| Athens Housing Authority: | | | | | | | | | |
| 5.000%, 06/15/2022 | | $ | 280,000 | | | $ | 296,271 | | | |
|
|
| 5.000%, 06/15/2027 | | | 1,570,000 | | | | 1,931,225 | | | | | |
| 5.000%, 06/15/2028 (Callable 06/15/2027) | | | 1,755,000 | | | | 2,145,856 | | | | | |
| Atlanta Development Authority, | | | | | | | | | | | | |
| 5.000%, 07/01/2024 | | | 140,000 | | | | 155,459 | | | | | |
| Bartow County Development Authority, | | | | | | | | | | | | |
| 2.750%, 12/01/2032 | | | | | | | | | | | | |
(Mandatory Tender Date 03/15/2023)(1) | | | 2,000,000 | | | | 2,085,900 | | | | | |
| Burke County Development Authority: | | | | | | | | | | | | |
| 2.250%, 10/01/2032 | | | | | | | | | | | | |
(Mandatory Tender Date 05/25/2023)(1) | | | 170,000 | | | | 175,918 | | | | | |
| 1.500%, 01/01/2040 | | | | | | | | | | | | |
(Mandatory Tender Date 02/03/2025)(1) | | | 6,500,000 | | | | 6,636,955 | | | | | |
| 1.650%, 11/01/2048 | | | | | | | | | | | | |
(Mandatory Tender Date 06/18/2021)(1) | | | 245,000 | | | | 246,384 | | | | | |
| 1.550%, 12/01/2049 | | | | | | | | | | | | |
(Mandatory Tender Date 08/19/2022)(1) | | | 2,000,000 | | | | 2,031,920 | | | | | |
| 1.700%, 12/01/2049 | | | | | | | | | | | | |
(Mandatory Tender Date 08/22/2024)(1) | | | 1,680,000 | | | | 1,732,382 | | | | | |
| City of Atlanta GA: | | | | | | | | | | | | |
| 5.000%, 01/01/2023 (Callable 02/01/2021) | | | 450,000 | | | | 451,571 | | | | | |
| 5.000%, 01/01/2024 (Callable 02/01/2021) | | | 515,000 | | | | 516,797 | | | | | |
| 4.000%, 07/01/2026 (Callable 07/01/2023) | | | 100,000 | | | | 107,578 | | | | | |
| City of Thomson GA: | | | | | | | | | | | | |
| 3.000%, 07/01/2022 | | | 535,000 | | | | 553,276 | | | | | |
| 3.000%, 07/01/2023 (Callable 07/01/2022) | | | 550,000 | | | | 568,133 | | | | | |
| Colquitt County Development Authority, | | | | | | | | | | | | |
| 0.000%, 12/01/2021 (ETM) | | | 525,000 | | | | 524,003 | | | | | |
| Cornelia Urban Redevelopment Agency, | | | | | | | | | | | | |
| 4.000%, 10/01/2023 (Insured by AGM) | | | 80,000 | | | | 86,638 | | | | | |
| Development Authority for Fulton County: | | | | | | | | | | | | |
| 5.000%, 10/01/2025 | | | 975,000 | | | | 1,142,544 | | | | | |
| 5.000%, 10/01/2026 | | | 1,415,000 | | | | 1,695,665 | | | | | |
| 5.000%, 10/01/2027 | | | 1,015,000 | | | | 1,241,670 | | | | | |
| Development Authority of Appling County, | | | | | | | | | | | | |
| 1.500%, 01/01/2038 | | | | | | | | | | | | |
(Mandatory Tender Date 02/03/2025)(1) | | | 900,000 | | | | 918,963 | | | | | |
| Development Authority of Bulloch County: | | | | | | | | | | | | |
| 5.000%, 07/01/2023 | | | 260,000 | | | | 285,646 | | | | | |
| 5.000%, 07/01/2024 | | | 200,000 | | | | 227,178 | | | | | |
| 5.000%, 07/01/2025 | | | 315,000 | | | | 370,191 | | | | | |
| 5.000%, 07/01/2026 | | | 330,000 | | | | 398,297 | | | | | |
The accompanying notes are an integral part of these financial statements.
Baird Short-Term Municipal Bond Fund
Schedule of Investments, December 31, 2020
Long-Term Investments (cont.)
| | | Principal | | | | | | % of | |
| | | Amount | | | Value | | | Net Assets | |
| Development Authority of Cobb County, | | | | | | | | | |
| 5.000%, 07/15/2024 | | $ | 1,900,000 | | | $ | 2,144,758 | | | |
|
|
| Development Authority of Monroe County, | | | | | | | | | | | | |
0.060%, 11/01/2048 (Optional Put Date 01/04/2021)(1) | | | 6,450,000 | | | | 6,450,000 | | | | | |
| Fayette County Hospital Authority, | | | | | | | | | | | | |
| 5.000%, 07/01/2054 (Callable 01/01/2024) | | | | | | | | | | | | |
(Mandatory Tender Date 07/01/2024)(1) | | | 1,755,000 | | | | 1,990,117 | | | | | |
| Forsyth County Hospital Authority, | | | | | | | | | | | | |
| 6.375%, 10/01/2028 (ETM) | | | 675,000 | | | | 840,220 | | | | | |
| Main Street Natural Gas, Inc.: | | | | | | | | | | | | |
| 5.000%, 03/15/2022 | | | 195,000 | | | | 205,639 | | | | | |
| 5.000%, 09/01/2026 (Callable 06/01/2026) | | | 500,000 | | | | 616,815 | | | | | |
| 0.846%, 04/01/2048 | | | | | | | | | | | | |
| (1 Month LIBOR USD + 0.750%) | | | | | | | | | | | | |
| (Callable 06/01/2023) | | | | | | | | | | | | |
(Mandatory Tender Date 09/01/2023)(2) | | | 5,140,000 | | | | 5,148,687 | | | | | |
| 0.926%, 08/01/2048 | | | | | | | | | | | | |
| (1 Month LIBOR USD + 0.830%) | | | | | | | | | | | | |
| (Callable 09/01/2023) | | | | | | | | | | | | |
(Mandatory Tender Date 12/01/2023)(2) | | | 6,600,000 | | | | 6,623,562 | | | | | |
| 4.000%, 08/01/2049 (Callable 09/01/2024) | | | | | | | | | | | | |
(Mandatory Tender Date 12/02/2024)(1) | | | 3,735,000 | | | | 4,234,257 | | | | | |
| 4.000%, 03/01/2050 (Callable 06/01/2026) | | | | | | | | | | | | |
(Mandatory Tender Date 09/01/2026)(1) | | | 355,000 | | | | 416,905 | | | | | |
| Monroe County Public Facilities Authority: | | | | | | | | | | | | |
| 5.000%, 06/01/2024 | | | 180,000 | | | | 207,090 | | | | | |
| 5.000%, 06/01/2025 | | | 200,000 | | | | 238,228 | | | | | |
| Pelham School District: | | | | | | | | | | | | |
| 5.000%, 09/01/2021 (Insured by ST AID) | | | 100,000 | | | | 103,008 | | | | | |
| 5.000%, 09/01/2022 (Insured by ST AID) | | | 125,000 | | | | 134,370 | | | | | |
| 5.000%, 09/01/2023 (Insured by ST AID) | | | 290,000 | | | | 324,278 | | | | | |
| 5.000%, 09/01/2024 (Insured by ST AID) | | | 210,000 | | | | 243,634 | | | | | |
| Private Colleges & Universities Authority: | | | | | | | | | | | | |
| 3.750%, 10/01/2021 | | | 80,000 | | | | 81,328 | | | | | |
| 5.000%, 10/01/2021 | | | 75,000 | | | | 76,932 | | | | | |
| 5.000%, 06/01/2024 | | | 275,000 | | | | 308,547 | | | | | |
| 0.490%, 10/01/2039 | | | | | | | | | | | | |
| (SIFMA Municipal Swap Index + 0.420%) | | | | | | | | | | | | |
| (Callable 02/16/2022) | | | | | | | | | | | | |
(Mandatory Tender Date 08/16/2022)(2) | | | 2,200,000 | | | | 2,199,428 | | | | | |
| Richmond County Development Authority: | | | | | | | | | | | | |
| 0.000%, 12/01/2021 (ETM) | | | 425,000 | | | | 424,193 | | | | | |
| 0.000%, 12/01/2021 (ETM) | | | 370,000 | | | | 369,297 | | | | | |
| Valdosta & Lowndes County Hospital Authority, | | | | | | | | | | | | |
| 5.000%, 10/01/2033 (Pre-refunded to 10/01/2021) | | | 300,000 | | | | 310,809 | | | | | |
The accompanying notes are an integral part of these financial statements.
Baird Short-Term Municipal Bond Fund
Schedule of Investments, December 31, 2020
Long-Term Investments (cont.)
| | | Principal | | | | | | % of | |
| | | Amount | | | Value | | | Net Assets | |
| Washington Wilkes Payroll Development Authority, | | | | | | | | | |
| 0.000%, 12/01/2021 (ETM) | | $ | 400,000 | | | $ | 398,700 | | | | |
| Total Georgia | | | | | | | | | | | |
| (Cost $59,702,712) | | | | | | | 60,617,222 | | | | 3.8 | % |
| Guam | | | | | | | | | | | | |
| Guam Department of Education, | | | | | | | | | | | | |
| 3.625%, 02/01/2025 | | | 250,000 | | | | 251,535 | | | | | |
| Total Guam | | | | | | | | | | | | |
| (Cost $250,000) | | | | | | | 251,535 | | | | 0.0 | % |
| Idaho | | | | | | | | | | | | |
| University of Idaho, | | | | | | | | | | | | |
| 5.250%, 04/01/2041 | | | | | | | | | | | | |
(Mandatory Tender Date 04/01/2021)(1) | | | 2,805,000 | | | | 2,833,695 | | | | | |
| Total Idaho | | | | | | | | | | | | |
| (Cost $2,827,499) | | | | | | | 2,833,695 | | | | 0.2 | % |
| Illinois | | | | | | | | | | | | |
| Adams & Hancock Counties | | | | | | | | | | | | |
| Community Unit School District No. 4, | | | | | | | | | | | | |
| 4.000%, 12/01/2026 | | | | | | | | | | | | |
| (Callable 12/01/2025) (Insured by BAM) | | | 275,000 | | | | 315,532 | | | | | |
| Bureau County Township High School District No. 502, | | | | | | | | | | | | |
| 3.000%, 12/01/2021 (Insured by BAM) | | | 30,000 | | | | 30,696 | | | | | |
| Channahon Park District: | | | | | | | | | | | | |
| 4.000%, 12/15/2025 (Insured by BAM) | | | 365,000 | | | | 421,757 | | | | | |
| 4.000%, 12/15/2026 (Insured by BAM) | | | 380,000 | | | | 447,925 | | | | | |
| 4.000%, 12/15/2027 (Insured by BAM) | | | 395,000 | | | | 473,554 | | | | | |
| Chicago Board of Education: | | | | | | | | | | | | |
| 0.000%, 12/01/2022 | | | 125,000 | | | | 122,495 | | | | | |
| 5.000%, 12/01/2022 (Insured by AGM) | | | 145,000 | | | | 155,747 | | | | | |
| 5.000%, 12/01/2023 (Insured by AGM) | | | 500,000 | | | | 555,785 | | | | | |
| Chicago Park District: | | | | | | | | | | | | |
| 5.000%, 01/01/2024 | | | 1,305,000 | | | | 1,446,501 | | | | | |
| 5.250%, 01/01/2040 (Callable 01/01/2021) | | | 3,895,000 | | | | 3,895,000 | | | | | |
| City of Burbank IL, | | | | | | | | | | | | |
| 4.000%, 12/01/2021 (Insured by BAM) | | | 500,000 | | | | 515,880 | | | | | |
| City of Chicago IL: | | | | | | | | | | | | |
| 5.125%, 01/01/2022 | | | 1,220,000 | | | | 1,237,824 | | | | | |
| 5.000%, 01/01/2024 (Callable 01/01/2022) | | | 705,000 | | | | 734,532 | | | | | |
| 5.000%, 11/01/2026 | | | 2,900,000 | | | | 3,545,134 | | | | | |
| 0.000%, 01/01/2027 (Insured by NATL) | | | 3,750,000 | | | | 3,461,888 | | | | | |
| 5.000%, 01/01/2027 (Callable 01/01/2025) | | | 1,085,000 | | | | 1,257,059 | | | | | |
| 5.250%, 01/01/2038 (Pre-refunded to 01/01/2022) | | | 400,000 | | | | 420,192 | | | | | |
The accompanying notes are an integral part of these financial statements.
Baird Short-Term Municipal Bond Fund
Schedule of Investments, December 31, 2020
Long-Term Investments (cont.)
| | | Principal | | | | | | % of | |
| | | Amount | | | Value | | | Net Assets | |
| City of Decatur IL, | | | | | | | | | |
| 4.000%, 03/01/2022 | | $ | 65,000 | | | $ | 67,326 | | | |
|
|
| City of Oregon IL, | | | | | | | | | | | | |
| 4.000%, 12/01/2024 (Callable 12/01/2022) | | | 105,000 | | | | 110,972 | | | | | |
| City of Peoria IL: | | | | | | | | | | | | |
| 4.500%, 01/01/2023 (Callable 04/15/2021) | | | 500,000 | | | | 514,880 | | | | | |
| 4.000%, 01/01/2026 (Callable 04/15/2021) | | | 500,000 | | | | 514,015 | | | | | |
| City of Princeton IL: | | | | | | | | | | | | |
| 4.000%, 11/01/2021 (Insured by AGM) | | | 45,000 | | | | 46,374 | | | | | |
| 4.000%, 11/01/2022 (Insured by AGM) | | | 100,000 | | | | 106,190 | | | | | |
| 4.000%, 01/01/2023 (Insured by AGM) | | | 50,000 | | | | 53,274 | | | | | |
| 4.000%, 01/01/2025 (Insured by AGM) | | | 120,000 | | | | 135,045 | | | | | |
| City of Rock Island IL, | | | | | | | | | | | | |
| 3.000%, 12/01/2022 | | | 435,000 | | | | 450,373 | | | | | |
| City of Rockford IL, | | | | | | | | | | | | |
| 5.000%, 12/15/2023 (Insured by BAM) | | | 110,000 | | | | 124,038 | | | | | |
| City of Springfield IL: | | | | | | | | | | | | |
| 5.000%, 12/01/2023 | | | 155,000 | | | | 173,239 | | | | | |
| 5.000%, 03/01/2024 | | | 35,000 | | | | 39,781 | | | | | |
| City of Waukegan IL, | | | | | | | | | | | | |
| 3.000%, 12/30/2022 | | | 365,000 | | | | 380,494 | | | | | |
| Cook County Forest Preserve District, | | | | | | | | | | | | |
| 5.000%, 11/15/2021 | | | 750,000 | | | | 775,777 | | | | | |
| Cook County School District No. 123, | | | | | | | | | | | | |
| 0.000%, 12/01/2021 (ETM) | | | 200,000 | | | | 199,440 | | | | | |
| Cook County School District No. 130, | | | | | | | | | | | | |
| 5.000%, 12/01/2025 (Insured by AGM) | | | 1,320,000 | | | | 1,582,205 | | | | | |
| Cook County School District No. 154, | | | | | | | | | | | | |
| 3.500%, 12/01/2024 (Insured by BAM) | | | 114,000 | | | | 123,192 | | | | | |
| Cook County School District No. 159: | | | | | | | | | | | | |
| 0.000%, 12/01/2022 (ETM) (Insured by AGM) | | | 80,000 | | | | 79,454 | | | | | |
| 0.000%, 12/01/2022 (Insured by AGM) | | | 20,000 | | | | 19,696 | | | | | |
| Cook County School District No. 163, | | | | | | | | | | | | |
| 6.000%, 12/15/2024 (Insured by BAM) | | | 795,000 | | | | 950,422 | | | | | |
| Cook County School District No. 84: | | | | | | | | | | | | |
| 0.000%, 12/01/2021 (ETM) (Insured by AGM) | | | 180,000 | | | | 179,496 | | | | | |
| 0.000%, 12/01/2021 (ETM) (Insured by AGM) | | | 105,000 | | | | 104,706 | | | | | |
| Cook County Township High School District No. 201, | | | | | | | | | | | | |
| 0.000%, 12/01/2025 (Insured by AGM) | | | 165,000 | | | | 156,308 | | | | | |
| County of Cook IL: | | | | | | | | | | | | |
| 5.000%, 11/15/2028 (Callable 11/15/2026) | | | 3,000,000 | | | | 3,590,970 | | | | | |
| 5.000%, 11/15/2032 (Callable 11/15/2027) | | | 1,000,000 | | | | 1,244,820 | | | | | |
| County of Washington IL, | | | | | | | | | | | | |
| 4.000%, 12/15/2024 (Insured by AGM) | | | 250,000 | | | | 281,838 | | | | | |
The accompanying notes are an integral part of these financial statements.
Baird Short-Term Municipal Bond Fund
Schedule of Investments, December 31, 2020
Long-Term Investments (cont.)
| | | Principal | | | | | | % of | |
| | | Amount | | | Value | | | Net Assets | |
| DeKalb & Kane Counties Community | | | | | | | | | |
| Unit School District No. 427, | | | | | | | | | |
| 4.000%, 02/01/2029 | | | | | | | | | |
| (Callable 02/01/2022) (Insured by BAM) | | $ | 475,000 | | | $ | 491,297 | | | |
|
|
| DeKalb County Community | | | | | | | | | | | | |
| Unit School District No. 424, | | | | | | | | | | | | |
| 0.000%, 01/01/2022 (Insured by AMBAC) | | | 250,000 | | | | 247,887 | | | | | |
| Exceptional Children Have Opportunities: | | | | | | | | | | | | |
| 5.000%, 12/01/2024 | | | 380,000 | | | | 440,941 | | | | | |
| 5.000%, 12/01/2025 | | | 505,000 | | | | 604,505 | | | | | |
| 5.000%, 12/01/2025 | | | 245,000 | | | | 293,275 | | | | | |
| 5.000%, 12/01/2026 | | | 530,000 | | | | 650,246 | | | | | |
| 5.000%, 12/01/2026 | | | 255,000 | | | | 312,854 | | | | | |
| Fulton, Mason, Knox, Schuyler, Etc. | | | | | | | | | | | | |
| Counties Community College District No. 534, | | | | | | | | | | | | |
| 4.000%, 12/01/2027 | | | | | | | | | | | | |
| (Callable 12/01/2022) (Insured by BAM) | | | 90,000 | | | | 94,678 | | | | | |
| Hampshire Special Service Area No. 13: | | | | | | | | | | | | |
| 3.000%, 03/01/2022 (Insured by BAM) | | | 100,000 | | | | 102,245 | | | | | |
| 3.000%, 03/01/2023 (Insured by BAM) | | | 210,000 | | | | 218,377 | | | | | |
| 3.000%, 03/01/2026 (Insured by BAM) | | | 90,000 | | | | 97,573 | | | | | |
| Hoffman Estates Park District, | | | | | | | | | | | | |
| 5.000%, 12/01/2025 | | | 2,585,000 | | | | 2,914,794 | | | | | |
| Illinois Development Finance Authority, | | | | | | | | | | | | |
| 0.000%, 07/15/2025 (ETM) | | | 870,000 | | | | 850,547 | | | | | |
| Illinois Finance Authority: | | | | | | | | | | | | |
| 5.000%, 01/01/2021 | | | 85,000 | | | | 85,000 | | | | | |
| 4.000%, 09/01/2021 | | | 75,000 | | | | 76,252 | | | | | |
| 5.000%, 11/01/2021 | | | 75,000 | | | | 77,361 | | | | | |
| 5.000%, 02/15/2022 | | | 235,000 | | | | 246,595 | | | | | |
| 5.000%, 05/15/2022 | | | 190,000 | | | | 197,847 | | | | | |
| 5.000%, 09/01/2022 | | | 200,000 | | | | 212,418 | | | | | |
| 5.000%, 05/15/2023 | | | 120,000 | | | | 132,014 | | | | | |
| 5.000%, 08/01/2023 | | | 1,455,000 | | | | 1,576,449 | | | | | |
| 5.000%, 09/01/2023 | | | 400,000 | | | | 438,724 | | | | | |
| 5.000%, 05/15/2024 | | | 350,000 | | | | 399,228 | | | | | |
| 5.000%, 11/01/2024 | | | 340,000 | | | | 385,958 | | | | | |
| 5.000%, 09/01/2029 (Callable 09/01/2026) | | | 1,575,000 | | | | 1,826,496 | | | | | |
| 5.000%, 10/01/2030 (Callable 10/01/2026) | | | 500,000 | | | | 596,815 | | | | | |
| 4.000%, 11/01/2030 | | | 2,995,000 | | | | 3,445,448 | | | | | |
| 1.451%, 05/01/2036 | | | | | | | | | | | | |
| (1 Month LIBOR USD + 1.350%) | | | | | | | | | | | | |
| (Callable 02/01/2021) | | | | | | | | | | | | |
(Mandatory Tender Date 05/01/2021)(2) | | | 235,000 | | | | 235,028 | | | | | |
The accompanying notes are an integral part of these financial statements.
Baird Short-Term Municipal Bond Fund
Schedule of Investments, December 31, 2020
Long-Term Investments (cont.)
| | | Principal | | | | | | % of | |
| | | Amount | | | Value | | | Net Assets | |
| Illinois Finance Authority: (cont.) | | | | | | | | | |
| 0.820%, 01/01/2046 | | | | | | | | | |
| (SIFMA Municipal Swap Index + 0.750%) | | | | | | | | | |
| (Callable 07/01/2022) | | | | | | | | | |
(Mandatory Tender Date 07/01/2023)(2) | | $ | 835,000 | | | $ | 835,676 | | | |
|
|
| 5.000%, 05/15/2050 (Callable 05/15/2026) | | | | | | | | | | | | |
(Mandatory Tender Date 11/15/2026)(1) | | | 4,000,000 | | | | 4,882,280 | | | | | |
| Illinois Housing Development Authority: | | | | | | | | | | | | |
| 2.600%, 10/01/2025 (Insured by GNMA) | | | 1,120,000 | | | | 1,210,653 | | | | | |
| 2.750%, 04/01/2026 (Insured by GNMA) | | | 1,435,000 | | | | 1,571,626 | | | | | |
| 2.450%, 06/01/2043 | | | | | | | | | | | | |
| (Callable 01/01/2023) (Insured by GNMA) | | | 292,501 | | | | 299,387 | | | | | |
| 4.500%, 10/01/2048 (Callable 04/01/2028) | | | 505,000 | | | | 566,761 | | | | | |
| 4.250%, 10/01/2049 (Callable 04/01/2028) | | | 1,820,000 | | | | 2,035,379 | | | | | |
| Illinois Sports Facilities Authority: | | | | | | | | | | | | |
| 0.000%, 06/15/2021 (Insured by AMBAC) | | | 150,000 | | | | 148,776 | | | | | |
| 5.000%, 06/15/2028 (Insured by BAM) | | | 1,000,000 | | | | 1,247,520 | | | | | |
| Iroquois & Kankakee Counties | | | | | | | | | | | | |
| Community Unit School District No. 4, | | | | | | | | | | | | |
| 0.000%, 11/01/2021 (Insured by AMBAC) | | | 500,000 | | | | 495,835 | | | | | |
| Joliet Park District: | | | | | | | | | | | | |
| 5.000%, 03/01/2022 (Callable 03/01/2021) | | | 90,000 | | | | 90,471 | | | | | |
| 4.000%, 02/01/2023 (Insured by BAM) | | | 150,000 | | | | 159,495 | | | | | |
| 4.000%, 02/01/2028 | | | | | | | | | | | | |
| (Callable 02/01/2024) (Insured by BAM) | | | 715,000 | | | | 769,833 | | | | | |
| Joliet Regional Port District, | | | | | | | | | | | | |
| 4.000%, 06/30/2025 | | | | | | | | | | | | |
| (Callable 06/30/2024) (Insured by AGM) | | | 40,000 | | | | 44,540 | | | | | |
| Kane & DeKalb Counties Community | | | | | | | | | | | | |
| Unit School District No. 302, | | | | | | | | | | | | |
| 5.000%, 02/01/2026 | | | 500,000 | | | | 606,470 | | | | | |
| Kane County School District No. 131, | | | | | | | | | | | | |
| 3.500%, 06/01/2024 | | | | | | | | | | | | |
| (Callable 06/01/2021) (Insured by AGM) | | | 785,000 | | | | 793,384 | | | | | |
| Kankakee, Iroquois, Ford, Etc. Counties | | | | | | | | | | | | |
| Community Unit School District No. 2, | | | | | | | | | | | | |
| 4.000%, 12/01/2023 (Insured by AGM) | | | 445,000 | | | | 483,960 | | | | | |
| Kendall & Kane Counties Community | | | | | | | | | | | | |
| Unit School District No. 115, | | | | | | | | | | | | |
| 0.000%, 01/01/2022 (Insured by NATL) | | | 1,000,000 | | | | 994,580 | | | | | |
| Kendall County Forest Preserve District, | | | | | | | | | | | | |
| 4.000%, 01/01/2025 (Insured by BAM) | | | 215,000 | | | | 238,912 | | | | | |
| Knox & Warren Counties Community | | | | | | | | | | | | |
| Unit School District No. 205, | | | | | | | | | | | | |
| 6.000%, 01/01/2030 (Callable 01/01/2021) | | | 500,000 | | | | 500,000 | | | | | |
The accompanying notes are an integral part of these financial statements.
Baird Short-Term Municipal Bond Fund
Schedule of Investments, December 31, 2020
Long-Term Investments (cont.)
| | | Principal | | | | | | % of | |
| | | Amount | | | Value | | | Net Assets | |
| Lake County Community Unit School District No. 116, | | | | | | | | | |
| 5.000%, 01/15/2025 (Callable 01/15/2023) | | $ | 255,000 | | | $ | 278,348 | | | |
|
|
| Lake County Elementary School District No. 6: | | | | | | | | | | | | |
| 0.000%, 12/01/2021 (Insured by AMBAC) | | | 115,000 | | | | 113,423 | | | | | |
| 0.000%, 12/01/2022 (Insured by AMBAC) | | | 115,000 | | | | 111,424 | | | | | |
| 0.000%, 12/01/2024 (Insured by AMBAC) | | | 70,000 | | | | 65,019 | | | | | |
| Lake County School District No. 38: | | | | | | | | | | | | |
| 0.000%, 02/01/2023 (Insured by AMBAC) | | | 1,065,000 | | | | 1,032,965 | | | | | |
| 0.000%, 02/01/2025 (Insured by AMBAC) | | | 210,000 | | | | 196,633 | | | | | |
| Logan Sangamon Etc Counties | | | | | | | | | | | | |
| Community Unit School District No. 23: | | | | | | | | | | | | |
| 5.000%, 12/01/2021 (Insured by AGM) | | | 440,000 | | | | 456,231 | | | | | |
| 5.000%, 12/01/2022 (Insured by AGM) | | | 520,000 | | | | 562,973 | | | | | |
| Macon & De Witt Counties | | | | | | | | | | | | |
| Community Unit School District No. 1, | | | | | | | | | | | | |
| 2.250%, 12/01/2022 (Callable 02/01/2021) | | | 80,000 | | | | 80,080 | | | | | |
| Madison-Macoupin Etc. Counties | | | | | | | | | | | | |
| Community College District No. 536: | | | | | | | | | | | | |
| 4.000%, 05/01/2025 (Insured by AGM) | | | 400,000 | | | | 453,796 | | | | | |
| 4.000%, 05/01/2030 | | | | | | | | | | | | |
| (Callable 05/01/2027) (Insured by AGM) | | | 1,000,000 | | | | 1,155,220 | | | | | |
| McHenry County Community | | | | | | | | | | | | |
| Unit School District No. 200, | | | | | | | | | | | | |
| 5.250%, 01/15/2027 (Callable 01/15/2024) | | | 135,000 | | | | 154,683 | | | | | |
| Menard Cass & Sangamon Counties | | | | | | | | | | | | |
| Community Unit School District No. 202, | | | | | | | | | | | | |
| 4.000%, 12/01/2022 (Insured by AGM) | | | 300,000 | | | | 318,528 | | | | | |
| Metropolitan Pier & Exposition Authority: | | | | | | | | | | | | |
| 0.000%, 06/15/2021 (ETM) (Insured by NATL) | | | 45,000 | | | | 44,926 | | | | | |
| 0.000%, 06/15/2021 (ETM) | | | 55,000 | | | | 54,910 | | | | | |
| 0.000%, 06/15/2022 (ETM) (Insured by NATL) | | | 30,000 | | | | 29,806 | | | | | |
5.650%, 06/15/2022 (Insured by NATL)(7) | | | 160,000 | | | | 167,453 | | | | | |
| 5.500%, 12/15/2023 (ETM) (Insured by NATL) | | | 20,000 | | | | 20,462 | | | | | |
| 5.500%, 12/15/2023 (Insured by NATL) | | | 135,000 | | | | 145,966 | | | | | |
| 0.000%, 06/15/2024 (Insured by NATL) | | | 35,000 | | | | 33,398 | | | | | |
| 5.700%, 06/15/2025 | | | | | | | | | | | | |
(Callable 06/15/2022) (Insured by NATL)(7) | | | 35,000 | | | | 37,201 | | | | | |
| 5.000%, 12/15/2026 | | | | | | | | | | | | |
| (Callable 06/15/2022) (Insured by ST AID) | | | 290,000 | | | | 303,096 | | | | | |
| Metropolitan Water Reclamation | | | | | | | | | | | | |
| District of Greater Chicago, | | | | | | | | | | | | |
| 5.000%, 12/01/2027 (Callable 12/01/2026) | | | 500,000 | | | | 626,795 | | | | | |
| Newport Township Fire Protection District: | | | | | | | | | | | | |
| 4.000%, 01/01/2022 (Insured by BAM) | | | 125,000 | | | | 128,744 | | | | | |
| 4.000%, 01/01/2023 (Insured by BAM) | | | 135,000 | | | | 143,093 | | | | | |
The accompanying notes are an integral part of these financial statements.
Baird Short-Term Municipal Bond Fund
Schedule of Investments, December 31, 2020
Long-Term Investments (cont.)
| | | Principal | | | | | | % of | |
| | | Amount | | | Value | | | Net Assets | |
| Ogle & Winnebago Counties Community | | | | | | | | | |
| Unit School District No. 223, | | | | | | | | | |
| 5.000%, 12/01/2021 (Insured by BAM) | | $ | 150,000 | | | $ | 156,258 | | | |
|
|
| Pike & Adams Counties Community | | | | | | | | | | | | |
| Unit School District No. 4, | | | | | | | | | | | | |
| 4.000%, 12/01/2024 (Insured by BAM) | | | 345,000 | | | | 382,457 | | | | | |
| Plano Special Service Areas No. 3 & 4, | | | | | | | | | | | | |
| 4.000%, 03/01/2030 (Callable 03/01/2025) | | | 280,000 | | | | 316,627 | | | | | |
| Prospect Heights Park District, | | | | | | | | | | | | |
| 4.000%, 12/01/2021 (Insured by BAM) | | | 330,000 | | | | 341,095 | | | | | |
| Regional Transportation Authority: | | | | | | | | | | | | |
| 6.250%, 07/01/2021 (Insured by AGM) | | | 675,000 | | | | 694,946 | | | | | |
| 5.750%, 06/01/2023 (Insured by AGM) | | | 175,000 | | | | 188,809 | | | | | |
| Sales Tax Securitization Corp.: | | | | | | | | | | | | |
| 5.000%, 01/01/2022 | | | 2,035,000 | | | | 2,099,754 | | | | | |
| 5.000%, 01/01/2024 | | | 200,000 | | | | 222,996 | | | | | |
| Shelby Christian Macon Counties | | | | | | | | | | | | |
| Community School District No. 21: | | | | | | | | | | | | |
| 4.000%, 12/01/2025 | | | | | | | | | | | | |
| (Callable 12/01/2023) (Insured by AGM) | | | 400,000 | | | | 438,792 | | | | | |
| 4.000%, 12/01/2026 | | | | | | | | | | | | |
| (Callable 12/01/2023) (Insured by AGM) | | | 435,000 | | | | 475,290 | | | | | |
| Southwestern Illinois Development Authority, | | | | | | | | | | | | |
| 7.125%, 11/01/2030 (Pre-refunded to 11/01/2023) | | | 195,000 | | | | 231,824 | | | | | |
| St. Charles Public Library District, | | | | | | | | | | | | |
| 4.000%, 11/01/2028 (Callable 11/01/2024) | | | 455,000 | | | | 505,437 | | | | | |
| St. Clair County Community Consolidated School District: | | | | | | | | | | | | |
| 0.000%, 12/01/2021 | | | 485,000 | | | | 481,552 | | | | | |
| 0.000%, 12/01/2022 | | | 190,000 | | | | 186,722 | | | | | |
| St. Clair County School District No. 119: | | | | | | | | | | | | |
| 5.000%, 04/01/2022 (Insured by AGM) | | | 350,000 | | | | 369,918 | | | | | |
| 5.000%, 04/01/2023 (Insured by AGM) | | | 300,000 | | | | 330,138 | | | | | |
| St. Clair County Township High School District No. 203, | | | | | | | | | | | | |
| 4.000%, 12/01/2022 | | | 400,000 | | | | 425,336 | | | | | |
| State of Illinois: | | | | | | | | | | | | |
| 4.875%, 05/01/2021 | | | 500,000 | | | | 506,240 | | | | | |
| 5.000%, 08/01/2021 | | | 190,000 | | | | 194,313 | | | | | |
| 5.000%, 01/01/2022 (Callable 02/01/2021) | | | 145,000 | | | | 145,410 | | | | | |
| 5.000%, 03/01/2022 | | | 55,000 | | | | 57,480 | | | | | |
| 5.125%, 05/01/2022 | | | 1,500,000 | | | | 1,577,835 | | | | | |
| 6.500%, 06/15/2022 | | | 180,000 | | | | 185,496 | | | | | |
| 5.000%, 06/15/2023 | | | 270,000 | | | | 293,711 | | | | | |
| 5.000%, 06/15/2023 | | | 670,000 | | | | 728,839 | | | | | |
| 5.500%, 07/01/2024 (Callable 07/01/2023) | | | 835,000 | | | | 910,092 | | | | | |
| 3.750%, 06/15/2025 (Callable 06/15/2021) | | | 310,000 | | | | 313,339 | | | | | |
The accompanying notes are an integral part of these financial statements.
Baird Short-Term Municipal Bond Fund
Schedule of Investments, December 31, 2020
Long-Term Investments (cont.)
| | | Principal | | | | | | % of | |
| | | Amount | | | Value | | | Net Assets | |
| State of Illinois: (cont.) | | | | | | | | | |
| 4.000%, 06/15/2026 (Callable 06/15/2021) | | $ | 365,000 | | | $ | 368,986 | | | |
|
|
| 6.000%, 06/15/2026 | | | 200,000 | | | | 247,602 | | | | | |
| Tender Option Bond Trust: | | | | | | | | | | | | |
| 0.310%, 12/01/2050 | | | | | | | | | | | | |
(Optional Put Date 01/07/2021)(1)(3) | | | 1,000,000 | | | | 1,000,000 | | | | | |
| 0.310%, 12/01/2055 | | | | | | | | | | | | |
(Optional Put Date 01/07/2021)(1)(3) | | | 3,450,000 | | | | 3,450,000 | | | | | |
| United City of Yorkville IL, | | | | | | | | | | | | |
| 4.050%, 12/01/2027 (Callable 12/01/2023) | | | 120,000 | | | | 129,983 | | | | | |
| University of Illinois: | | | | | | | | | | | | |
| 5.000%, 10/01/2021 | | | 330,000 | | | | 340,362 | | | | | |
| 5.000%, 03/15/2022 | | | 50,000 | | | | 52,528 | | | | | |
| 5.000%, 04/01/2026 | | | 1,905,000 | | | | 2,319,490 | | | | | |
| 5.000%, 04/01/2027 | | | 2,000,000 | | | | 2,495,400 | | | | | |
| Upper Illinois River Valley Development Authority: | | | | | | | | | | | | |
| 5.000%, 12/01/2022 | | | 680,000 | | | | 734,101 | | | | | |
| 5.000%, 12/01/2023 | | | 400,000 | | | | 447,928 | | | | | |
| Village of Calumet Park IL, | | | | | | | | | | | | |
| 5.250%, 12/01/2029 | | | | | | | | | | | | |
| (Callable 12/01/2024) (Insured by BAM) | | | 500,000 | | | | 571,170 | | | | | |
| Village of Crestwood IL: | | | | | | | | | | | | |
| 4.000%, 12/15/2021 (Insured by BAM) | | | 250,000 | | | | 257,992 | | | | | |
| 4.000%, 12/15/2021 (Insured by BAM) | | | 500,000 | | | | 515,985 | | | | | |
| 4.000%, 12/15/2023 (Insured by BAM) | | | 540,000 | | | | 589,205 | | | | | |
| 4.500%, 12/15/2025 | | | | | | | | | | | | |
| (Callable 12/15/2022) (Insured by BAM) | | | 60,000 | | | | 64,484 | | | | | |
| Village of Lansing IL: | | | | | | | | | | | | |
| 5.000%, 03/01/2023 (Insured by AGM) | | | 275,000 | | | | 297,957 | | | | | |
| 5.000%, 03/01/2024 (Insured by BAM) | | | 230,000 | | | | 257,651 | | | | | |
| Village of Lyons IL, | | | | | | | | | | | | |
| 5.000%, 12/01/2025 | | | | | | | | | | | | |
| (Callable 12/01/2022) (Insured by BAM) | | | 25,000 | | | | 27,213 | | | | | |
| Village of Matteson IL, | | | | | | | | | | | | |
8.000%, 12/01/2029 (Pre-refunded to 06/01/2022)(7) | | | 295,000 | | | | 322,043 | | | | | |
| Village of Oak Park IL, | | | | | | | | | | | | |
| 4.000%, 11/01/2021 | | | 245,000 | | | | 252,274 | | | | | |
| Village of Orland Hills IL: | | | | | | | | | | | | |
| 4.000%, 12/01/2022 (Insured by BAM) | | | 145,000 | | | | 153,585 | | | | | |
| 4.000%, 12/01/2023 (Insured by BAM) | | | 130,000 | | | | 141,226 | | | | | |
| Village of Rantoul IL, | | | | | | | | | | | | |
| 4.300%, 01/01/2025 (Callable 01/01/2023) | | | 125,000 | | | | 134,362 | | | | | |
| Village of Richton Park IL, | | | | | | | | | | | | |
| 4.000%, 12/01/2022 (Insured by BAM) | | | 80,000 | | | | 84,378 | | | | | |
The accompanying notes are an integral part of these financial statements.
Baird Short-Term Municipal Bond Fund
Schedule of Investments, December 31, 2020
Long-Term Investments (cont.)
| | | Principal | | | | | | % of | |
| | | Amount | | | Value | | | Net Assets | |
| Village of River Grove IL, | | | | | | | | | |
| 3.000%, 12/15/2021 (Insured by BAM) | | $ | 120,000 | | | $ | 122,581 | | | |
|
|
| Village of Sauk Village IL, | | | | | | | | | | | | |
| 4.000%, 12/01/2024 (Insured by BAM) | | | 1,260,000 | | | | 1,400,364 | | | | | |
| Village of Stone Park IL: | | | | | | | | | | | | |
| 4.000%, 02/01/2022 (Insured by BAM) | | | 125,000 | | | | 129,893 | | | | | |
| 4.000%, 02/01/2023 (Insured by BAM) | | | 130,000 | | | | 136,173 | | | | | |
| 4.000%, 02/01/2024 (Insured by BAM) | | | 135,000 | | | | 144,334 | | | | | |
| 4.000%, 02/01/2025 (Insured by BAM) | | | 140,000 | | | | 152,664 | | | | | |
| 4.000%, 02/01/2026 (Insured by BAM) | | | 220,000 | | | | 244,292 | | | | | |
| 4.750%, 02/01/2028 | | | | | | | | | | | | |
| (Callable 02/01/2023) (Insured by BAM) | | | 50,000 | | | | 52,841 | | | | | |
| Village of Sugar Grove IL, | | | | | | | | | | | | |
| 3.000%, 12/15/2025 (Callable 12/15/2021) | | | 225,000 | | | | 230,256 | | | | | |
| Will County Community Consolidated | | | | | | | | | | | | |
| School District No. 70-C, | | | | | | | | | | | | |
| 4.000%, 12/01/2022 (Insured by AGM) | | | 270,000 | | | | 288,433 | | | | | |
| Will County Community High School District No. 210: | | | | | | | | | | | | |
| 0.000%, 01/01/2021 (Insured by AGM) | | | 215,000 | | | | 215,000 | | | | | |
| 0.000%, 01/01/2022 (ETM) (Insured by AGM) | | | 165,000 | | | | 164,284 | | | | | |
| 4.000%, 01/01/2022 (Insured by AGM) | | | 600,000 | | | | 614,070 | | | | | |
| 0.000%, 01/01/2023 (ETM) (Insured by AGM) | | | 365,000 | | | | 361,463 | | | | | |
| 0.000%, 01/01/2023 (Insured by AGM) | | | 325,000 | | | | 317,814 | | | | | |
| 0.000%, 01/01/2024 (ETM) (Insured by AGM) | | | 510,000 | | | | 501,845 | | | | | |
| 0.000%, 01/01/2024 (Insured by AGM) | | | 275,000 | | | | 265,339 | | | | | |
| 5.000%, 01/01/2029 (Callable 01/01/2023) | | | 35,000 | | | | 37,079 | | | | | |
| Will County Community Unit School District No. 201-U, | | | | | | | | | | | | |
| 0.000%, 11/01/2021 (Insured by NATL) | | | 215,000 | | | | 213,628 | | | | | |
| Will County Community Unit School District No. 365: | | | | | | | | | | | | |
| 0.000%, 11/01/2021 (Insured by AGM) | | | 200,000 | | | | 199,246 | | | | | |
| 0.000%, 11/01/2022 (ETM) (Insured by AGM) | | | 45,000 | | | | 44,788 | | | | | |
| Will County Elementary School District No. 122: | | | | | | | | | | | | |
| 0.000%, 11/01/2021 (ETM) (Insured by AGM) | | | 50,000 | | | | 49,877 | | | | | |
| 0.000%, 11/01/2023 (ETM) (Insured by AGM) | | | 125,000 | | | | 123,564 | | | | | |
| Will County School District No. 86, | | | | | | | | | | | | |
| 3.000%, 03/01/2025 (Callable 03/01/2024) | | | 600,000 | | | | 643,128 | | | | | |
| Will County School District No. 88A: | | | | | | | | | | | | |
| 5.250%, 01/01/2022 (ETM) (Insured by AGM) | | | 315,000 | | | | 323,735 | | | | | |
| 5.250%, 01/01/2022 (Insured by AGM) | | | 545,000 | | | | 560,843 | | | | | |
| Will County Township High School District No. 204, | | | | | | | | | | | | |
| 5.000%, 01/01/2023 | | | 195,000 | | | | 209,960 | | | | | |
| Winnebago & Boone Counties School District No. 205: | | | | | | | | | | | | |
| 0.000%, 02/01/2022 | | | 95,000 | | | | 94,037 | | | | | |
| 4.000%, 02/01/2028 (Callable 02/01/2023) | | | 965,000 | | | | 1,029,182 | | | | | |
The accompanying notes are an integral part of these financial statements.
Baird Short-Term Municipal Bond Fund
Schedule of Investments, December 31, 2020
Long-Term Investments (cont.)
| | | Principal | | | | | | % of | |
| | | Amount | | | Value | | | Net Assets | |
| | | | | | | | | | |
| Woodford, Lasalle, Livingston, Etc. Counties | | | | | | | | | |
| Community Unit School District No. 6: | | | | | | | | | |
| 4.000%, 12/01/2024 (Insured by BAM) | | $ | 185,000 | | | $ | 207,572 | | | | |
| 4.000%, 12/01/2025 (Insured by BAM) | | | 200,000 | | | | 229,516 | | | | |
| 4.000%, 12/01/2026 (Insured by BAM) | | | 175,000 | | | | 204,703 | | | | |
| Total Illinois | | | | | | | | | | | |
| (Cost $108,549,704) | | | | | | | 110,512,504 | | | | 6.9 | % |
| Indiana | | | | | | | | | | | | |
| City of Goshen IN, | | | | | | | | | | | | |
| 4.100%, 01/01/2021 (Insured by AGM) | | | 470,000 | | | | 470,000 | | | | | |
| City of Hobart IN, | | | | | | | | | | | | |
| 3.000%, 07/01/2025 (Insured by ST AID) | | | 395,000 | | | | 418,526 | | | | | |
| City of Lawrence IN, | | | | | | | | | | | | |
| 4.000%, 01/01/2022 (Insured by BAM) | | | 400,000 | | | | 413,872 | | | | | |
| City of Mishawaka IN, | | | | | | | | | | | | |
| 5.000%, 03/01/2025 (Insured by AGM) | | | 100,000 | | | | 118,743 | | | | | |
| City of Muncie IN: | | | | | | | | | | | | |
| 4.000%, 07/15/2022 (Insured by AGM) | | | 110,000 | | | | 114,905 | | | | | |
| 4.000%, 01/15/2024 (Insured by AGM) | | | 170,000 | | | | 184,161 | | | | | |
| City of Valparaiso IN, | | | | | | | | | | | | |
| 4.000%, 08/01/2026 (Callable 08/01/2023) | | | 375,000 | | | | 409,076 | | | | | |
| Clarksville Redevelopment Authority: | | | | | | | | | | | | |
| 4.000%, 08/01/2021 | | | 155,000 | | | | 158,150 | | | | | |
| 4.000%, 02/01/2022 | | | 230,000 | | | | 238,724 | | | | | |
| County of Lake IN, | | | | | | | | | | | | |
| 4.000%, 07/15/2021 (Insured by AGM) | | | 100,000 | | | | 102,041 | | | | | |
| County of St. Joseph IN, | | | | | | | | | | | | |
| 5.000%, 04/01/2024 | | | 1,000,000 | | | | 1,122,630 | | | | | |
| County of Warrick IN, | | | | | | | | | | | | |
| 1.625%, 06/01/2022 | | | | | | | | | | | | |
(Mandatory Tender Date 06/01/2021)(1) | | | 500,000 | | | | 502,620 | | | | | |
| Evansville Vanderburgh Public Library, | | | | | | | | | | | | |
| 4.000%, 07/01/2021 (Insured by ST AID) | | | 135,000 | | | | 135,996 | | | | | |
| Fishers Redevelopment Authority: | | | | | | | | | | | | |
| 4.000%, 01/15/2023 | | | 270,000 | | | | 289,896 | | | | | |
| 4.000%, 07/15/2023 | | | 275,000 | | | | 300,168 | | | | | |
| Hammond Multi-School Building Corp., | | | | | | | | | | | | |
| 5.000%, 01/15/2025 (Insured by ST AID) | | | 525,000 | | | | 614,030 | | | | | |
| Indiana Bond Bank, | | | | | | | | | | | | |
| 1.129%, 10/15/2022 | | | | | | | | | | | | |
(3 Month LIBOR USD + 0.970%)(2) | | | 1,140,000 | | | | 1,140,171 | | | | | |
| Indiana Finance Authority: | | | | | | | | | | | | |
| 5.000%, 09/15/2022 | | | 60,000 | | | | 63,364 | | | | | |
| 5.000%, 10/01/2022 | | | 175,000 | | | | 185,159 | | | | | |
The accompanying notes are an integral part of these financial statements.
Baird Short-Term Municipal Bond Fund
Schedule of Investments, December 31, 2020
Long-Term Investments (cont.)
| | | Principal | | | | | | % of | |
| | | Amount | | | Value | | | Net Assets | |
| Indiana Finance Authority: (cont.) | | | | | | | | | |
| 5.250%, 10/01/2022 (Callable 10/01/2021) | | $ | 800,000 | | | $ | 829,448 | | | |
|
|
| 5.000%, 02/01/2023 | | | 25,000 | | | | 26,684 | | | | | |
| 5.000%, 09/15/2023 | | | 75,000 | | | | 81,607 | | | | | |
| 5.000%, 09/15/2024 | | | 155,000 | | | | 172,899 | | | | | |
| 5.000%, 09/15/2025 | | | 325,000 | | | | 370,152 | | | | | |
| 3.000%, 10/01/2025 (Callable 10/01/2023) | | | 95,000 | | | | 93,347 | | | | | |
| 3.000%, 10/01/2026 (Callable 10/01/2023) | | | 95,000 | | | | 92,740 | | | | | |
| 2.250%, 12/01/2058 (Callable 01/01/2025) | | | | | | | | | | | | |
(Mandatory Tender Date 07/01/2025)(1) | | | 2,985,000 | | | | 3,196,607 | | | | | |
| Indiana Health & Educational | | | | | | | | | | | | |
| Facilities Financing Authority: | | | | | | | | | | | | |
1.750%, 11/15/2031 (Pre-refunded to 11/02/2021)(1) | | | 5,000 | | | | 5,060 | | | | | |
| 1.750%, 11/15/2031 | | | | | | | | | | | | |
(Mandatory Tender Date 11/02/2021)(1) | | | 370,000 | | | | 374,477 | | | | | |
| Indiana Housing & Community Development Authority: | | | | | | | | | | | | |
| 4.000%, 12/01/2027 | | | | | | | | | | | | |
| (Callable 06/01/2021) (Insured by GNMA) | | | 350,000 | | | | 354,148 | | | | | |
| 3.500%, 01/01/2049 | | | | | | | | | | | | |
| (Callable 01/01/2029) (Insured by GNMA) | | | 1,265,000 | | | | 1,391,702 | | | | | |
| Indianapolis Local Public Improvement Bond Bank, | | | | | | | | | | | | |
| 1.400%, 06/01/2021 (Callable 03/01/2021) | | | 2,900,000 | | | | 2,900,058 | | | | | |
| Jasper Hospital Authority, | | | | | | | | | | | | |
| 4.125%, 11/01/2025 (Callable 11/01/2023) | | | 2,025,000 | | | | 2,195,039 | | | | | |
| Kankakee Valley Middle School Building Corp., | | | | | | | | | | | | |
| 5.000%, 07/15/2022 (Insured by ST AID) | | | 215,000 | | | | 230,871 | | | | | |
| Lafayette School Corp., | | | | | | | | | | | | |
| 4.000%, 01/15/2021 (Insured by ST AID) | | | 280,000 | | | | 280,277 | | | | | |
| Lake Central Multi-District School Building Corp., | | | | | | | | | | | | |
| 5.000%, 07/15/2026 | | | | | | | | | | | | |
| (Pre-refunded to 01/15/2023) (Insured by ST AID) | | | 585,000 | | | | 641,669 | | | | | |
| Lake Station School Building Corp., | | | | | | | | | | | | |
| 3.000%, 07/15/2022 | | | | | | | | | | | | |
| (Pre-refunded to 01/15/2022) (Insured by ST AID) | | | 75,000 | | | | 76,365 | | | | | |
| Marion High School Building Corp.: | | | | | | | | | | | | |
| 3.000%, 01/15/2021 (Insured by ST AID) | | | 115,000 | | | | 115,086 | | | | | |
| 4.000%, 01/15/2022 (Insured by ST AID) | | | 170,000 | | | | 176,469 | | | | | |
| 4.000%, 07/15/2022 (Insured by ST AID) | | | 135,000 | | | | 142,609 | | | | | |
| 4.000%, 01/15/2023 (Insured by ST AID) | | | 215,000 | | | | 230,615 | | | | | |
| 4.000%, 01/15/2025 (Insured by ST AID) | | | 200,000 | | | | 226,160 | | | | | |
| Michigan City School Building Corp., | | | | | | | | | | | | |
| 5.000%, 07/15/2023 (Insured by ST AID) | | | 350,000 | | | | 385,924 | | | | | |
| Munster School Building Corp.: | | | | | | | | | | | | |
| 5.000%, 01/15/2022 (Insured by ST AID) | | | 205,000 | | | | 214,401 | | | | | |
| 5.000%, 07/15/2022 (Insured by ST AID) | | | 215,000 | | | | 229,603 | | | | | |
The accompanying notes are an integral part of these financial statements.
Baird Short-Term Municipal Bond Fund
Schedule of Investments, December 31, 2020
Long-Term Investments (cont.)
| | | Principal | | | | | | % of | |
| | | Amount | | | Value | | | Net Assets | |
| Munster School Building Corp.: (cont.) | | | | | | | | | |
| 5.000%, 01/15/2023 (Insured by ST AID) | | $ | 215,000 | | | $ | 234,176 | | | |
|
|
| 4.000%, 07/15/2023 (Insured by ST AID) | | | 160,000 | | | | 173,123 | | | | | |
| 5.000%, 01/15/2024 (Insured by ST AID) | | | 225,000 | | | | 254,655 | | | | | |
| New Durham Township Metropolitan | | | | | | | | | | | | |
| School District School Building Corp., | | | | | | | | | | | | |
| 1.600%, 01/15/2021 | | | 80,000 | | | | 80,024 | | | | | |
| Salem Middle School Building Corp., | | | | | | | | | | | | |
| 4.000%, 01/15/2024 (Insured by ST AID) | | | 195,000 | | | | 214,488 | | | | | |
| Shelbyville Central Renovation School Building Corp., | | | | | | | | | | | | |
| 5.000%, 07/15/2022 (Insured by ST AID) | | | 260,000 | | | | 278,613 | | | | | |
| Starke County Building Corp., | | | | | | | | | | | | |
| 4.000%, 08/01/2028 | | | | | | | | | | | | |
| (Pre-refunded to 02/01/2022) (Insured by ST AID) | | | 700,000 | | | | 727,706 | | | | | |
| Town of Rossville IN, | | | | | | | | | | | | |
| 3.500%, 07/01/2023 | | | 115,000 | | | | 121,655 | | | | | |
| Vinton-Tecumseh School Building Corp.: | | | | | | | | | | | | |
| 4.000%, 07/15/2021 (Insured by ST AID) | | | 220,000 | | | | 224,195 | | | | | |
| 4.000%, 07/15/2022 (Insured by ST AID) | | | 385,000 | | | | 406,090 | | | | | |
| 5.000%, 01/15/2023 (Insured by ST AID) | | | 145,000 | | | | 158,458 | | | | | |
| Wabash City Schools Building Corp.: | | | | | | | | | | | | |
| 4.000%, 07/15/2024 (Insured by ST AID) | | | 110,000 | | | | 123,219 | | | | | |
| 4.000%, 01/15/2025 (Insured by ST AID) | | | 140,000 | | | | 159,149 | | | | | |
| 4.000%, 07/15/2025 (Insured by ST AID) | | | 240,000 | | | | 276,749 | | | | | |
| Washington Indiana Elementary School Building Corp., | | | | | | | | | | | | |
| 3.000%, 01/15/2024 (Insured by ST AID) | | | 550,000 | | | | 574,514 | | | | | |
| West Washington School Corp.: | | | | | | | | | | | | |
| 2.000%, 01/15/2022 (Insured by ST AID) | | | 125,000 | | | | 126,817 | | | | | |
| 2.000%, 07/15/2022 (Insured by ST AID) | | | 195,000 | | | | 199,475 | | | | | |
| Westfield High School Building Corp., | | | | | | | | | | | | |
| 5.000%, 01/15/2024 (Insured by ST AID) | | | 200,000 | | | | 226,296 | | | | | |
| Total Indiana | | | | | | | | | | | | |
| (Cost $26,065,984) | | | | | | | 26,575,651 | | | | 1.6 | % |
| Iowa | | | | | | | | | | | | |
| Bondurant-Farrar Community School District, | | | | | | | | | | | | |
| 3.000%, 06/01/2023 (Insured by MAC) | | | 110,000 | | | | 116,386 | | | | | |
| City of Cedar Rapids IA, | | | | | | | | | | | | |
0.158%, 08/15/2029 (Insured by AMBAC)(1)(5) | | | 6,650,000 | | | | 6,400,625 | | | | | |
| City of Coralville IA: | | | | | | | | | | | | |
| 4.000%, 06/01/2024 | | | 300,000 | | | | 299,760 | | | | | |
| 4.000%, 06/01/2025 (Callable 06/01/2024) | | | 455,000 | | | | 453,758 | | | | | |
| City of New Hampton IA: | | | | | | | | | | | | |
| 3.000%, 06/01/2022 (Insured by BAM) | | | 130,000 | | | | 134,452 | | | | | |
| 3.000%, 06/01/2023 (Insured by BAM) | | | 135,000 | | | | 142,737 | | | | | |
The accompanying notes are an integral part of these financial statements.
Baird Short-Term Municipal Bond Fund
Schedule of Investments, December 31, 2020
Long-Term Investments (cont.)
| | | Principal | | | | | | % of | |
| | | Amount | | | Value | | | Net Assets | |
| City of Waverly IA, | | | | | | | | | |
| 2.500%, 12/31/2022 (Callable 07/01/2022) | | $ | 2,750,000 | | | $ | 2,799,720 | | | | |
| County of Adair IA: | | | | | | | | | | | |
| 2.000%, 06/01/2022 | | | 580,000 | | | | 593,404 | | | | |
| 2.000%, 06/01/2023 | | | 730,000 | | | | 757,988 | | | | |
| Iowa Finance Authority: | | | | | | | | | | | |
| 3.500%, 07/01/2046 | | | | | | | | | | | |
| (Callable 01/01/2026) (Insured by GNMA) | | | 155,000 | | | | 165,160 | | | | |
| 4.000%, 07/01/2047 | | | | | | | | | | | |
| (Callable 07/01/2027) (Insured by GNMA) | | | 810,000 | | | | 886,845 | | | | |
| 4.000%, 07/01/2047 | | | | | | | | | | | |
| (Callable 07/01/2028) (Insured by GNMA) | | | 1,045,000 | | | | 1,194,226 | | | | |
| 2.875%, 05/15/2049 (Callable 01/21/2021) | | | 900,000 | | | | 908,703 | | | | |
| Iowa Higher Education Loan Authority, | | | | | | | | | | | |
| 3.750%, 05/19/2021 | | | 4,000,000 | | | | 4,021,720 | | | | |
| Iowa Western Community College, | | | | | | | | | | | |
| 3.000%, 06/01/2021 | | | 500,000 | | | | 504,585 | | | | |
| Lake Panorama Improvement Zone: | | | | | | | | | | | |
| 3.000%, 06/01/2021 | | | 385,000 | | | | 388,561 | | | | |
| 3.000%, 06/01/2022 | | | 395,000 | | | | 407,178 | | | | |
| 3.000%, 06/01/2023 | | | 405,000 | | | | 425,918 | | | | |
| 3.000%, 06/01/2024 | | | 420,000 | | | | 449,598 | | | | |
| 3.000%, 06/01/2025 | | | 430,000 | | | | 467,023 | | | | |
| West Monona Community School District, | | | | | | | | | | | |
| 2.000%, 06/01/2021 (Callable 02/01/2021) | | | 280,000 | | | | 280,305 | | | | |
| Total Iowa | | | | | | | | | | | |
| (Cost $21,536,427) | | | | | | | 21,798,652 | | | | 1.4 | % |
| Kansas | | | | | | | | | | | | |
| City of Derby KS, | | | | | | | | | | | | |
| 3.900%, 03/01/2037 (Callable 03/01/2025) | | | 1,300,000 | | | | 1,318,902 | | | | | |
| City of Lenexa KS, | | | | | | | | | | | | |
| 1.625%, 09/01/2021 (Callable 02/01/2021) | | | 275,000 | | | | 275,193 | | | | | |
| City of Washington KS, | | | | | | | | | | | | |
| 2.000%, 12/01/2022 (Callable 02/01/2021) | | | 1,860,000 | | | | 1,862,213 | | | | | |
| City of Wichita KS, | | | | | | | | | | | | |
| 3.000%, 09/01/2023 (Callable 09/01/2022) | | | 115,000 | | | | 117,425 | | | | | |
| Kansas Independent College Finance Authority: | | | | | | | | | | | | |
| 5.000%, 05/01/2021 | | | 3,900,000 | | | | 3,929,640 | | | | | |
| 5.250%, 05/01/2021 | | | 825,000 | | | | 831,254 | | | | | |
| Kansas Municipal Energy Agency, | | | | | | | | | | | | |
| 5.000%, 04/01/2022 (Insured by BAM) | | | 515,000 | | | | 544,839 | | | | | |
| Public Building Commission of Johnson County, | | | | | | | | | | | | |
| 5.000%, 09/01/2023 | | | 1,360,000 | | | | 1,532,706 | | | | | |
The accompanying notes are an integral part of these financial statements.
Baird Short-Term Municipal Bond Fund
Schedule of Investments, December 31, 2020
Long-Term Investments (cont.)
| | | Principal | | | | | | % of | |
| | | Amount | | | Value | | | Net Assets | |
| Reno County Unified School District No. 313, | | | | | | | | | |
| 4.000%, 09/01/2030 (Pre-refunded to 09/01/2022) | | $ | 200,000 | | | $ | 212,554 | | | | |
| Total Kansas | | | | | | | | | | | |
| (Cost $10,435,835) | | | | | | | 10,624,726 | | | | 0.7 | % |
| Kentucky | | | | | | | | | | | | |
| City of Somerset KY, | | | | | | | | | | | | |
| 4.000%, 11/01/2026 (Callable 11/01/2021) | | | 205,000 | | | | 211,086 | | | | | |
| County of Carroll KY, | | | | | | | | | | | | |
| 1.550%, 09/01/2042 | | | | | | | | | | | | |
(Mandatory Tender Date 09/01/2026)(1) | | | 750,000 | | | | 761,212 | | | | | |
| County of Kenton KY: | | | | | | | | | | | | |
| 5.000%, 04/01/2024 | | | 375,000 | | | | 429,765 | | | | | |
| 5.000%, 04/01/2026 | | | 700,000 | | | | 859,992 | | | | | |
| Danville Independent School District Finance Corp., | | | | | | | | | | | | |
| 2.000%, 03/01/2023 (Insured by ST AID) | | | 235,000 | | | | 239,239 | | | | | |
| Frankfort Independent School District Finance Corp., | | | | | | | | | | | | |
| 2.050%, 08/01/2024 (Insured by ST AID) | | | 1,205,000 | | | | 1,240,487 | | | | | |
| Harlan County School District Finance Corp., | | | | | | | | | | | | |
| 3.000%, 08/01/2025 | | | | | | | | | | | | |
| (Callable 02/01/2025) (Insured by ST AID) | | | 1,150,000 | | | | 1,248,256 | | | | | |
| Kentucky Association of Counties Finance Corp., | | | | | | | | | | | | |
| 4.000%, 02/01/2028 | | | 240,000 | | | | 288,338 | | | | | |
| Kentucky Economic Development Finance Authority: | | | | | | | | | | | | |
| 0.000%, 12/01/2022 (ETM) (Insured by AGC) | | | 75,000 | | | | 74,488 | | | | | |
| 0.000%, 10/01/2024 (Insured by NATL) | | | 945,000 | | | | 904,082 | | | | | |
| 0.000%, 12/01/2024 (ETM) (Insured by AGC) | | | 60,000 | | | | 58,933 | | | | | |
| 0.000%, 10/01/2025 (Insured by NATL) | | | 270,000 | | | | 253,878 | | | | | |
| 5.000%, 06/01/2026 | | | 240,000 | | | | 275,592 | | | | | |
| Kentucky Public Energy Authority: | | | | | | | | | | | | |
| 4.000%, 01/01/2049 (Callable 10/01/2024) | | | | | | | | | | | | |
(Mandatory Tender Date 01/01/2025)(1) | | | 4,655,000 | | | | 5,232,592 | | | | | |
| 1.216%, 12/01/2049 (1 Month LIBOR USD + 1.120%) | | | | | | | | | | | | |
| (Callable 03/01/2025) | | | | | | | | | | | | |
(Mandatory Tender Date 06/01/2025)(2) | | | 3,850,000 | | | | 3,878,259 | | | | | |
| 1.396%, 12/01/2049 (1 Month LIBOR USD + 1.300%) | | | | | | | | | | | | |
| (Callable 03/01/2025) | | | | | | | | | | | | |
(Mandatory Tender Date 06/01/2025)(2) | | | 2,000,000 | | | | 2,029,280 | | | | | |
| 4.000%, 12/01/2049 (Callable 03/01/2025) | | | | | | | | | | | | |
(Mandatory Tender Date 06/01/2025)(1) | | | 5,720,000 | | | | 6,516,224 | | | | | |
| 4.000%, 12/01/2050 (Callable 03/01/2026) | | | | | | | | | | | | |
(Mandatory Tender Date 06/01/2026)(1) | | | 1,685,000 | | | | 1,961,172 | | | | | |
| Kentucky State Property & Building Commission: | | | | | | | | | | | | |
| 5.000%, 11/01/2021 (Insured by ST AID) | | | 250,000 | | | | 259,578 | | | | | |
| 5.000%, 05/01/2028 | | | 300,000 | | | | 382,476 | | | | | |
The accompanying notes are an integral part of these financial statements.
Baird Short-Term Municipal Bond Fund
Schedule of Investments, December 31, 2020
Long-Term Investments (cont.)
| | | Principal | | | | | | % of | |
| | | Amount | | | Value | | | Net Assets | |
| Kentucky Turnpike Authority, | | | | | | | | | |
| 4.000%, 07/01/2026 | | $ | 1,000,000 | | | $ | 1,145,230 | | | | |
| Louisville & Jefferson County Metropolitan Government: | | | | | | | | | | | |
| 5.000%, 12/01/2022 (Pre-refunded to 06/01/2022) | | | 1,020,000 | | | | 1,087,932 | | | | |
| 5.000%, 10/01/2027 (Callable 10/01/2023) | | | 500,000 | | | | 558,470 | | | | |
| Magoffin County Justice Center Corp., | | | | | | | | | | | |
| 3.000%, 05/01/2023 | | | 345,000 | | | | 362,385 | | | | |
| Murray State University: | | | | | | | | | | | |
| 5.000%, 09/01/2021 (Insured by ST AID) | | | 285,000 | | | | 293,707 | | | | |
| 5.000%, 09/01/2022 (Insured by ST AID) | | | 410,000 | | | | 441,443 | | | | |
| 5.000%, 09/01/2023 (Insured by ST AID) | | | 435,000 | | | | 482,998 | | | | |
| University of Louisville: | | | | | | | | | | | |
| 5.000%, 03/01/2021 (Insured by ST AID) | | | 105,000 | | | | 105,645 | | | | |
| 5.000%, 03/01/2022 (Insured by ST AID) | | | 525,000 | | | | 548,814 | | | | |
| Total Kentucky | | | | | | | | | | | |
| (Cost $30,419,522) | | | | | | | 32,131,553 | | | | 2.0 | % |
| Louisiana | | | | | | | | | | | | |
| Calcasieu Parish Fire Protection District No. 1: | | | | | | | | | | | | |
| 3.500%, 03/01/2022 (Insured by BAM) | | | 145,000 | | | | 150,108 | | | | | |
| 4.000%, 03/01/2024 (Insured by BAM) | | | 155,000 | | | | 171,029 | | | | | |
| Calcasieu Parish School Board, | | | | | | | | | | | | |
| 5.000%, 02/01/2025 (Pre-refunded to 02/01/2022) | | | 115,000 | | | | 120,973 | | | | | |
| Calcasieu Parish School District No. 23: | | | | | | | | | | | | |
| 5.000%, 09/01/2022 (Insured by BAM) | | | 85,000 | | | | 91,372 | | | | | |
| 5.000%, 09/01/2023 (Insured by BAM) | | | 175,000 | | | | 196,031 | | | | | |
| 5.000%, 09/01/2024 (Insured by BAM) | | | 250,000 | | | | 290,633 | | | | | |
| Calcasieu Parish School District No. 30: | | | | | | | | | | | | |
| 2.500%, 02/15/2022 | | | 225,000 | | | | 230,132 | | | | | |
| 4.000%, 02/15/2023 (Insured by AGM) | | | 125,000 | | | | 133,983 | | | | | |
| Calcasieu Parish School District No. 34, | | | | | | | | | | | | |
| 2.000%, 11/01/2022 | | | 425,000 | | | | 437,963 | | | | | |
| City of New Iberia LA, | | | | | | | | | | | | |
| 4.500%, 03/01/2022 | | | | | | | | | | | | |
| (Callable 03/01/2021) (Insured by AGM) | | | 865,000 | | | | 870,450 | | | | | |
| City of Shreveport LA: | | | | | | | | | | | | |
| 5.000%, 08/01/2023 (Insured by BAM) | | | 165,000 | | | | 182,604 | | | | | |
| 5.000%, 03/01/2024 (Insured by BAM) | | | 435,000 | | | | 496,030 | | | | | |
| 5.000%, 09/01/2024 | | | 1,000,000 | | | | 1,116,580 | | | | | |
| East Ouachita Parish School District: | | | | | | | | | | | | |
| 2.500%, 03/01/2022 | | | 435,000 | | | | 446,079 | | | | | |
| 2.500%, 03/01/2024 | | | 200,000 | | | | 211,396 | | | | | |
| Ernest N Morial New Orleans Exhibition Hall Authority, | | | | | | | | | | | | |
| 5.000%, 07/15/2021 | | | 265,000 | | | | 270,891 | | | | | |
| Greater Ouachita Water Co., | | | | | | | | | | | | |
| 5.000%, 09/01/2022 (Insured by BAM) | | | 300,000 | | | | 322,125 | | | | | |
The accompanying notes are an integral part of these financial statements.
Baird Short-Term Municipal Bond Fund
Schedule of Investments, December 31, 2020
Long-Term Investments (cont.)
| | | Principal | | | | | | % of | |
| | | Amount | | | Value | | | Net Assets | |
| Jefferson Sales Tax District: | | | | | | | | | |
| 5.000%, 12/01/2023 (Insured by AGM) | | $ | 550,000 | | | $ | 620,989 | | | | |
| 5.000%, 12/01/2024 (Insured by AGM) | | | 575,000 | | | | 673,020 | | | | |
| Louisiana Local Government Environmental | | | | | | | | | | | |
| Facilities & Community Development Authority: | | | | | | | | | | | |
| 5.000%, 08/01/2024 (Callable 08/01/2023) | | | 185,000 | | | | 203,069 | | | | |
| 5.750%, 09/01/2035 (Pre-refunded to 09/01/2023) | | | 75,000 | | | | 85,846 | | | | |
| Louisiana Public Facilities Authority: | | | | | | | | | | | |
| 5.000%, 10/01/2023 | | | 705,000 | | | | 758,446 | | | | |
| 5.500%, 05/15/2027 (Pre-refunded to 05/15/2026) | | | 2,015,000 | | | | 2,428,720 | | | | |
| Louisiana Stadium & Exposition District: | | | | | | | | | | | |
| 5.000%, 07/03/2023 (Callable 01/01/2023) | | | 2,950,000 | | | | 3,181,250 | | | | |
| 5.000%, 07/01/2024 (Callable 07/01/2023) | | | 2,065,000 | | | | 2,266,007 | | | | |
| 5.000%, 07/01/2025 (Callable 07/01/2023) | | | 940,000 | | | | 1,031,011 | | | | |
| Louisiana State University & | | | | | | | | | | | |
| Agricultural & Mechanical College, | | | | | | | | | | | |
| 5.000%, 07/01/2027 | | | | | | | | | | | |
| (Callable 07/01/2026) (Insured by BAM) | | | 340,000 | | | | 412,563 | | | | |
| New Orleans Aviation Board, | | | | | | | | | | | |
| 5.000%, 10/01/2025 (Insured by AGM) | | | 200,000 | | | | 238,640 | | | | |
| Parish of St. Charles LA, | | | | | | | | | | | |
| 4.000%, 12/01/2040 | | | | | | | | | | | |
(Mandatory Tender Date 06/01/2022)(1) | | | 2,900,000 | | | | 3,011,099 | | | | |
| Regional Transit Authority, | | | | | | | | | | | |
| 0.000%, 12/01/2021 (ETM) (Insured by NATL) | | | 35,000 | | | | 34,902 | | | | |
| St. Landry Parish Road District No. 1, | | | | | | | | | | | |
| 3.250%, 03/01/2025 | | | | | | | | | | | |
| (Callable 03/01/2024) (Insured by BAM) | | | 210,000 | | | | 227,417 | | | | |
| St. Tammany Parish Recreation District No. 14, | | | | | | | | | | | |
| 2.250%, 04/01/2023 | | | 225,000 | | | | 234,356 | | | | |
| State of Louisiana: | | | | | | | | | | | |
| 5.000%, 05/01/2024 (Pre-refunded to 05/01/2022) | | | 345,000 | | | | 366,856 | | | | |
| 5.000%, 06/15/2034 (Callable 06/15/2024) | | | 60,000 | | | | 68,511 | | | | |
| Total Louisiana | | | | | | | | | | | |
| (Cost $20,943,535) | | | | | | | 21,581,081 | | | | 1.3 | % |
| Maine | | | | | | | | | | | | |
| Maine Health & Higher Educational Facilities Authority, | | | | | | | | | | | | |
| 5.000%, 07/01/2027 | | | 2,365,000 | | | | 2,987,633 | | | | | |
| Maine State Housing Authority: | | | | | | | | | | | | |
| 2.700%, 11/15/2029 (Callable 11/15/2025) | | | 615,000 | | | | 653,315 | | | | | |
| 3.500%, 11/15/2045 (Callable 05/15/2025) | | | 20,000 | | | | 21,012 | | | | | |
| 4.000%, 11/15/2045 (Callable 11/15/2025) | | | 260,000 | | | | 275,285 | | | | | |
| 4.000%, 11/15/2046 (Callable 05/15/2026) | | | 1,575,000 | | | | 1,690,463 | | | | | |
| 3.500%, 11/15/2047 (Callable 11/15/2026) | | | 1,000,000 | | | | 1,071,170 | | | | | |
The accompanying notes are an integral part of these financial statements.
Baird Short-Term Municipal Bond Fund
Schedule of Investments, December 31, 2020
Long-Term Investments (cont.)
| | | Principal | | | | | | % of | |
| | | Amount | | | Value | | | Net Assets | |
| Maine State Housing Authority: (cont.) | | | | | | | | | |
| 4.000%, 11/15/2049 (Callable 05/15/2028) | | $ | 1,440,000 | | | $ | 1,590,149 | | | | |
| 4.000%, 11/15/2050 (Callable 05/15/2029) | | | 1,865,000 | | | | 2,113,642 | | | | |
| Total Maine | | | | | | | | | | | |
| (Cost $10,101,399) | | | | | | | 10,402,669 | | | | 0.6 | % |
| Maryland | | | | | | | | | | | | |
| City of Baltimore MD, | | | | | | | | | | | | |
| 5.000%, 07/01/2024 (ETM) | | | 100,000 | | | | 110,125 | | | | | |
| County of Baltimore MD, | | | | | | | | | | | | |
| 3.000%, 09/01/2025 (Callable 09/01/2022) | | | 950,000 | | | | 990,679 | | | | | |
| County of Washington MD, | | | | | | | | | | | | |
| 5.000%, 01/01/2022 | | | 415,000 | | | | 428,620 | | | | | |
| Maryland Community Development Administration, | | | | | | | | | | | | |
| 3.250%, 09/01/2050 (Callable 09/01/2029) | | | 5,330,000 | | | | 5,905,747 | | | | | |
| Maryland Health & Higher | | | | | | | | | | | | |
| Educational Facilities Authority: | | | | | | | | | | | | |
| 4.000%, 01/01/2023 | | | 580,000 | | | | 612,561 | | | | | |
| 5.000%, 07/01/2023 | | | 850,000 | | | | 939,607 | | | | | |
| 5.000%, 07/01/2024 | | | 1,775,000 | | | | 2,035,286 | | | | | |
5.000%, 01/01/2026(6) | | | 495,000 | | | | 561,043 | | | | | |
5.000%, 01/01/2027(6) | | | 430,000 | | | | 497,734 | | | | | |
| 5.000%, 07/01/2027 (ETM) (Insured by AMBAC) | | | 2,370,000 | | | | 2,767,046 | | | | | |
| Montgomery County Housing Opportunities Commission, | | | | | | | | | | | | |
| 4.000%, 07/01/2048 (Callable 07/01/2026) | | | 350,000 | | | | 381,654 | | | | | |
| State of Maryland, | | | | | | | | | | | | |
| 5.000%, 08/01/2033 (Callable 08/01/2030) | | | 1,520,000 | | | | 2,086,291 | | | | | |
| Total Maryland | | | | | | | | | | | | |
| (Cost $17,086,033) | | | | | | | 17,316,393 | | | | 1.1 | % |
| Massachusetts | | | | | | | | | | | | |
| Massachusetts Development Finance Agency: | | | | | | | | | | | | |
| 5.000%, 07/01/2022 (Callable 07/01/2021) | | | 1,735,000 | | | | 1,770,568 | | | | | |
3.500%, 10/01/2022(3) | | | 540,000 | | | | 551,804 | | | | | |
| 5.000%, 10/01/2022 (Insured by AGM) | | | 200,000 | | | | 215,380 | | | | | |
| 5.000%, 12/01/2023 | | | 190,000 | | | | 214,877 | | | | | |
| 5.000%, 12/01/2024 | | | 500,000 | | | | 585,445 | | | | | |
| 5.000%, 07/01/2025 | | | 365,000 | | | | 403,770 | | | | | |
| 5.250%, 07/01/2033 | | | | | | | | | | | | |
| (Pre-refunded to 07/01/2021) (Insured by AGM) | | | 1,025,000 | | | | 1,050,430 | | | | | |
| Massachusetts Housing Finance Agency: | | | | | | | | | | | | |
| 4.000%, 12/01/2044 (Callable 06/01/2025) | | | 100,000 | | | | 106,263 | | | | | |
| 4.000%, 12/01/2048 | | | | | | | | | | | | |
| (Callable 06/01/2027) (Insured by GNMA) | | | 845,000 | | | | 924,591 | | | | | |
| 4.000%, 12/01/2048 | | | | | | | | | | | | |
| (Callable 06/01/2027) (Insured by GNMA) | | | 540,000 | | | | 586,440 | | | | | |
| 4.000%, 06/01/2049 (Callable 12/01/2028) | | | 940,000 | | | | 1,043,757 | | | | | |
The accompanying notes are an integral part of these financial statements.
Baird Short-Term Municipal Bond Fund
Schedule of Investments, December 31, 2020
Long-Term Investments (cont.)
| | | Principal | | | | | | % of | |
| | | Amount | | | Value | | | Net Assets | |
| Massachusetts Transportation Trust, | | | | | | | | | |
| 5.000%, 01/01/2039 | | | | | | | | | |
(Mandatory Tender Date 01/01/2023)(1) | | $ | 3,825,000 | | | $ | 4,179,616 | | | | |
| Town of Ashburnham MA, | | | | | | | | | | | |
| 4.250%, 07/01/2021 | | | | | | | | | | | |
| (Callable 02/01/2021) (Insured by AGC) | | | 125,000 | | | | 125,345 | | | | |
| Total Massachusetts | | | | | | | | | | | |
| (Cost $11,482,890) | | | | | | | 11,758,286 | | | | 0.7 | % |
| Michigan | | | | | | | | | | | | |
| Bad Axe Public Schools, | | | | | | | | | | | | |
| 4.000%, 05/01/2027 | | | | | | | | | | | | |
| (Callable 05/01/2024) (Insured by Q-SBLF) | | | 630,000 | | | | 700,428 | | | | | |
| Battle Creek Tax Increment Finance Authority, | | | | | | | | | | | | |
| 4.300%, 12/01/2028 (Callable 02/01/2021) | | | 500,000 | | | | 501,395 | | | | | |
| City of Allen Park Brownfield Redevelopment Authority: | | | | | | | | | | | | |
| 4.000%, 05/01/2022 (Insured by BAM) | | | 600,000 | | | | 628,860 | | | | | |
| 4.000%, 05/01/2023 (Insured by BAM) | | | 620,000 | | | | 667,120 | | | | | |
| 4.000%, 05/01/2024 (Insured by BAM) | | | 320,000 | | | | 353,466 | | | | | |
| City of Allen Park MI: | | | | | | | | | | | | |
| 2.000%, 05/01/2022 (Insured by BAM) | | | 220,000 | | | | 222,649 | | | | | |
| 4.000%, 09/01/2022 (Insured by BAM) | | | 250,000 | | | | 264,022 | | | | | |
| 4.000%, 05/01/2023 (Insured by BAM) | | | 115,000 | | | | 123,823 | | | | | |
| 4.000%, 09/01/2023 (Insured by BAM) | | | 300,000 | | | | 326,226 | | | | | |
| City of Detroit MI, | | | | | | | | | | | | |
| 5.000%, 04/01/2021 | | | 650,000 | | | | 655,447 | | | | | |
| City of Kalamazoo MI, | | | | | | | | | | | | |
| 5.000%, 10/01/2023 | | | 50,000 | | | | 55,960 | | | | | |
| Comstock Public Schools, | | | | | | | | | | | | |
| 5.000%, 11/01/2023 (Insured by AGM) | | | 240,000 | | | | 270,977 | | | | | |
| Davison Community Schools, | | | | | | | | | | | | |
| 3.000%, 05/01/2022 | | | 190,000 | | | | 196,764 | | | | | |
| Detroit Wayne County Stadium Authority, | | | | | | | | | | | | |
| 5.000%, 10/01/2026 | | | | | | | | | | | | |
| (Callable 10/01/2022) (Insured by AGM) | | | 25,000 | | | | 26,832 | | | | | |
| Essexville-Hampton Public Schools, | | | | | | | | | | | | |
| 4.000%, 05/01/2022 (Insured by Q-SBLF) | | | 325,000 | | | | 341,520 | | | | | |
| Ferris State University: | | | | | | | | | | | | |
| 5.000%, 10/01/2024 | | | 950,000 | | | | 1,095,625 | | | | | |
| 5.000%, 10/01/2029 | | | 1,500,000 | | | | 1,921,680 | | | | | |
| Fruitport Community Schools: | | | | | | | | | | | | |
| 4.000%, 05/01/2021 (Insured by Q-SBLF) | | | 100,000 | | | | 101,164 | | | | | |
| 4.000%, 05/01/2023 (Insured by Q-SBLF) | | | 135,000 | | | | 146,304 | | | | | |
| Holly Area School District, | | | | | | | | | | | | |
| 4.000%, 05/01/2025 (Insured by Q-SBLF) | | | 450,000 | | | | 517,342 | | | | | |
The accompanying notes are an integral part of these financial statements.
Baird Short-Term Municipal Bond Fund
Schedule of Investments, December 31, 2020
Long-Term Investments (cont.)
| | | Principal | | | | | | % of | |
| | | Amount | | | Value | | | Net Assets | |
| Ingham County Brownfield Redevelopment Authority, | | | | | | | | | |
| 4.125%, 08/01/2024 | | | | | | | | | |
| (Callable 02/01/2021) (Insured by AGM) | | $ | 215,000 | | | $ | 215,608 | | | |
|
|
| Michigan Finance Authority: | | | | | | | | | | | | |
| 5.000%, 11/01/2022 | | | 100,000 | | | | 108,228 | | | | | |
| 5.000%, 09/01/2023 | | | 185,000 | | | | 202,999 | | | | | |
| 5.000%, 09/01/2024 | | | 200,000 | | | | 226,126 | | | | | |
| 4.000%, 10/01/2024 | | | 1,350,000 | | | | 1,420,942 | | | | | |
| 5.000%, 07/01/2025 | | | | | | | | | | | | |
| (Callable 07/01/2024) (Insured by AGM) | | | 1,595,000 | | | | 1,843,836 | | | | | |
| 5.000%, 09/01/2025 | | | 200,000 | | | | 232,614 | | | | | |
| 4.000%, 05/01/2026 | | | 60,000 | | | | 70,034 | | | | | |
| 5.000%, 09/01/2026 | | | 200,000 | | | | 237,790 | | | | | |
| 5.500%, 12/01/2026 (Callable 06/01/2025) | | | 335,000 | | | | 409,206 | | | | | |
| 5.000%, 09/01/2027 | | | 280,000 | | | | 338,624 | | | | | |
| 3.500%, 11/15/2044 | | | | | | | | | | | | |
(Mandatory Tender Date 11/15/2022)(1) | | | 2,010,000 | | | | 2,117,716 | | | | | |
| 4.000%, 11/15/2044 | | | | | | | | | | | | |
(Mandatory Tender Date 08/15/2024)(1) | | | 2,405,000 | | | | 2,722,845 | | | | | |
| 5.000%, 12/01/2044 | | | | | | | | | | | | |
(Mandatory Tender Date 02/01/2025)(1) | | | 1,525,000 | | | | 1,798,478 | | | | | |
| Michigan State Building Authority, | | | | | | | | | | | | |
| 0.170%, 10/15/2042 (Callable 01/04/2021) | | | | | | | | | | | | |
(Optional Put Date 01/07/2021)(1) | | | 1,000,000 | | | | 1,000,000 | | | | | |
| Michigan State Hospital Finance Authority: | | | | | | | | | | | | |
| 1.900%, 11/15/2047 | | | | | | | | | | | | |
(Mandatory Tender Date 04/01/2021)(1) | | | 335,000 | | | | 336,293 | | | | | |
| 4.000%, 11/15/2047 | | | | | | | | | | | | |
(Mandatory Tender Date 07/01/2024)(1) | | | 350,000 | | | | 394,716 | | | | | |
| Michigan State Housing Development Authority: | | | | | | | | | | | | |
| 4.000%, 06/01/2046 (Callable 12/01/2024) | | | 1,015,000 | | | | 1,076,144 | | | | | |
| 3.500%, 06/01/2047 (Callable 06/01/2026) | | | 3,650,000 | | | | 3,905,427 | | | | | |
| 3.500%, 12/01/2050 (Callable 06/01/2029) | | | 1,985,000 | | | | 2,213,632 | | | | | |
| Michigan Strategic Fund, | | | | | | | | | | | | |
| 7.000%, 05/01/2021 (Insured by AMBAC) | | | 2,320,000 | | | | 2,370,158 | | | | | |
| Pinckney Community Schools: | | | | | | | | | | | | |
| 5.000%, 05/01/2021 (Insured by Q-SBLF) | | | 100,000 | | | | 101,502 | | | | | |
| 4.000%, 05/01/2028 | | | | | | | | | | | | |
| (Callable 05/01/2026) (Insured by Q-SBLF) | | | 1,000,000 | | | | 1,162,210 | | | | | |
| South Lake Schools: | | | | | | | | | | | | |
| 4.000%, 11/01/2021 (Insured by Q-SBLF) | | | 425,000 | | | | 437,223 | | | | | |
| 4.000%, 05/01/2022 (Insured by Q-SBLF) | | | 290,000 | | | | 303,004 | | | | | |
| 4.000%, 11/01/2023 (Insured by Q-SBLF) | | | 500,000 | | | | 546,520 | | | | | |
| Tri-County Area School District: | | | | | | | | | | | | |
| 4.000%, 05/01/2021 (Insured by AGM) | | | 520,000 | | | | 526,089 | | | | | |
The accompanying notes are an integral part of these financial statements.
Baird Short-Term Municipal Bond Fund
Schedule of Investments, December 31, 2020
Long-Term Investments (cont.)
| | | Principal | | | | | | % of | |
| | | Amount | | | Value | | | Net Assets | |
| Tri-County Area School District: (cont.) | | | | | | | | | |
| 4.000%, 05/01/2022 (Insured by AGM) | | $ | 640,000 | | | $ | 670,784 | | | | |
| 4.000%, 05/01/2023 (Insured by AGM) | | | 705,000 | | | | 762,493 | | | | |
| Western Michigan University, | | | | | | | | | | | |
| 5.000%, 11/15/2025 (Callable 11/15/2021) | | | 25,000 | | | | 25,992 | | | | |
| Total Michigan | | | | | | | | | | | |
| (Cost $36,044,762) | | | | | | | 36,894,837 | | | | 2.3 | % |
| Minnesota | | | | | | | | | | | | |
| Brainerd Independent School District No. 181, | | | | | | | | | | | | |
| 4.000%, 02/01/2027 (Insured by SD CRED PROG) | | | 685,000 | | | | 821,020 | | | | | |
| City of Crosslake MN, | | | | | | | | | | | | |
| 3.250%, 02/01/2027 (Callable 02/01/2023) | | | 40,000 | | | | 42,232 | | | | | |
| City of Maple Grove MN, | | | | | | | | | | | | |
| 4.000%, 05/01/2022 | | | 610,000 | | | | 632,332 | | | | | |
| City of Minneapolis MN/St. Paul | | | | | | | | | | | | |
| Housing & Redevelopment Authority, | | | | | | | | | | | | |
0.105%, 08/01/2028 (Insured by NATL)(1)(5) | | | 100,000 | | | | 97,125 | | | | | |
| City of Plato MN, | | | | | | | | | | | | |
| 4.000%, 04/01/2022 | | | 265,000 | | | | 275,295 | | | | | |
| City of St. Louis Park MN, | | | | | | | | | | | | |
| 0.950%, 09/01/2023 (Callable 02/01/2021) | | | | | | | | | | | | |
(Mandatory Tender Date 09/01/2021)(1) | | | 1,675,000 | | | | 1,675,620 | | | | | |
| Duluth Independent School District No. 709, | | | | | | | | | | | | |
| 5.000%, 02/01/2023 (Insured by SD CRED PROG) | | | 815,000 | | | | 886,272 | | | | | |
| Fergus Falls Independent School District No. 544: | | | | | | | | | | | | |
| 2.500%, 02/01/2021 | | | 160,000 | | | | 160,216 | | | | | |
| 2.500%, 02/01/2022 | | | 145,000 | | | | 148,191 | | | | | |
| 2.500%, 02/01/2024 | | | 105,000 | | | | 110,370 | | | | | |
| Housing & Redevelopment | | | | | | | | | | | | |
| Authority of The City of St. Paul: | | | | | | | | | | | | |
| 5.000%, 07/01/2021 | | | 80,000 | | | | 81,704 | | | | | |
| 0.950%, 11/01/2022 (Callable 05/01/2021) | | | | | | | | | | | | |
(Mandatory Tender Date 11/01/2021)(1) | | | 1,000,000 | | | | 1,001,670 | | | | | |
| 5.000%, 11/15/2025 | | | 465,000 | | | | 562,734 | | | | | |
| 5.000%, 12/01/2025 | | | 285,000 | | | | 329,953 | | | | | |
| 5.000%, 12/01/2027 | | | 1,065,000 | | | | 1,269,341 | | | | | |
| Maple River Independent School District No. 2135: | | | | | | | | | | | | |
| 5.000%, 02/01/2022 (Insured by SD CRED PROG) | | | 80,000 | | | | 84,110 | | | | | |
| 5.000%, 02/01/2023 (Insured by SD CRED PROG) | | | 515,000 | | | | 565,197 | | | | | |
| 5.000%, 02/01/2024 (Insured by SD CRED PROG) | | | 915,000 | | | | 1,046,385 | | | | | |
| 5.000%, 02/01/2025 (Insured by SD CRED PROG) | | | 395,000 | | | | 469,880 | | | | | |
| 5.000%, 02/01/2026 (Insured by SD CRED PROG) | | | 1,000,000 | | | | 1,234,290 | | | | | |
| Minneapolis-Saint Paul Metropolitan Airports Commission: | | | | | | | | | | | | |
| 5.000%, 01/01/2022 | | | 1,050,000 | | | | 1,097,838 | | | | | |
| 5.000%, 01/01/2025 | | | 310,000 | | | | 366,510 | | | | | |
The accompanying notes are an integral part of these financial statements.
Baird Short-Term Municipal Bond Fund
Schedule of Investments, December 31, 2020
Long-Term Investments (cont.)
| | | Principal | | | | | | % of | |
| | | Amount | | | Value | | | Net Assets | |
| Minnesota Higher Education Facilities Authority: | | | | | | | | | |
| 3.000%, 12/01/2021 | | $ | 275,000 | | | $ | 278,743 | | | |
|
|
| 5.000%, 04/01/2023 | | | 100,000 | | | | 109,059 | | | | | |
| 3.000%, 12/01/2023 | | | 150,000 | | | | 155,598 | | | | | |
| 5.000%, 03/01/2024 | | | 160,000 | | | | 175,522 | | | | | |
| 4.000%, 12/01/2024 | | | 100,000 | | | | 108,460 | | | | | |
| 5.000%, 03/01/2027 (Callable 03/01/2026) | | | 250,000 | | | | 286,587 | | | | | |
| 5.000%, 10/01/2027 | | | 750,000 | | | | 934,357 | | | | | |
| 5.000%, 10/01/2028 (Callable 10/01/2027) | | | 1,445,000 | | | | 1,789,286 | | | | | |
| 5.000%, 10/01/2029 (Callable 10/01/2027) | | | 770,000 | | | | 947,770 | | | | | |
| Minnesota Housing Finance Agency: | | | | | | | | | | | | |
| 2.900%, 01/01/2025 (Insured by GNMA) | | | 30,000 | | | | 32,175 | | | | | |
| 3.900%, 07/01/2030 | | | | | | | | | | | | |
| (Callable 01/01/2022) (Insured by GNMA) | | | 185,000 | | | | 189,593 | | | | | |
| 4.000%, 01/01/2038 (Callable 01/01/2024) | | | 620,000 | | | | 663,456 | | | | | |
| 0.620%, 07/01/2041 | | | | | | | | | | | | |
| (SIFMA Municipal Swap Index + 0.550%) | | | | | | | | | | | | |
| (Callable 07/01/2023) | | | | | | | | | | | | |
| (Mandatory Tender Date 12/12/2023) | | | | | | | | | | | | |
(Insured by GNMA)(2) | | | 220,000 | | | | 220,451 | | | | | |
| 0.500%, 01/01/2045 | | | | | | | | | | | | |
| (SIFMA Municipal Swap Index + 0.430%) | | | | | | | | | | | | |
| (Callable 01/01/2023) | | | | | | | | | | | | |
| (Mandatory Tender Date 07/03/2023) | | | | | | | | | | | | |
�� (Insured by GNMA)(2) | | | 6,595,000 | | | | 6,588,801 | | | | | |
| 3.500%, 07/01/2046 | | | | | | | | | | | | |
| (Callable 07/01/2025) (Insured by GNMA) | | | 3,370,000 | | | | 3,600,171 | | | | | |
| 4.000%, 01/01/2047 | | | | | | | | | | | | |
| (Callable 01/01/2026) (Insured by GNMA) | | | 225,000 | | | | 241,353 | | | | | |
| 4.000%, 07/01/2047 | | | | | | | | | | | | |
| (Callable 01/01/2027) (Insured by GNMA) | | | 435,000 | | | | 471,227 | | | | | |
| Moorhead Independent School District No. 152: | | | | | | | | | | | | |
| 4.000%, 02/01/2021 | | | 220,000 | | | | 220,574 | | | | | |
| 4.000%, 02/01/2022 | | | 230,000 | | | | 238,876 | | | | | |
| 4.000%, 02/01/2023 | | | 235,000 | | | | 251,281 | | | | | |
| 4.000%, 02/01/2024 | | | 245,000 | | | | 269,600 | | | | | |
| 4.000%, 02/01/2025 | | | 255,000 | | | | 288,599 | | | | | |
| Northern Municipal Power Agency, | | | | | | | | | | | | |
| 5.000%, 01/01/2027 (Callable 01/01/2023) | | | 220,000 | | | | 238,894 | | | | | |
| Plymouth Intermediate District No. 287, | | | | | | | | | | | | |
| 5.000%, 05/01/2022 | | | 105,000 | | | | 111,507 | | | | | |
| Shakopee Independent School District No. 720: | | | | | | | | | | | | |
| 5.000%, 02/01/2023 (Insured by SD CRED PROG) | | | 675,000 | | | | 739,908 | | | | | |
| 0.000%, 02/01/2027 (Insured by SD CRED PROG) | | | 6,660,000 | | | | 6,257,736 | | | | | |
The accompanying notes are an integral part of these financial statements.
Baird Short-Term Municipal Bond Fund
Schedule of Investments, December 31, 2020
Long-Term Investments (cont.)
| | | Principal | | | | | | % of | |
| | | Amount | | | Value | | | Net Assets | |
| St. Cloud Metropolitan Transit Commission, | | | | | | | | | |
| 3.000%, 06/01/2024 (Callable 02/01/2021) | | $ | 300,000 | | | $ | 300,522 | | | | |
| University of Minnesota, | | | | | | | | | | | |
| 5.500%, 07/01/2021 (ETM) | | | 110,000 | | | | 112,698 | | | | |
| Total Minnesota | | | | | | | | | | | |
| (Cost $38,225,329) | | | | | | | 38,781,089 | | | | 2.4 | % |
| Mississippi | | | | | | | | | | | | |
| Brookhaven School District, | | | | | | | | | | | | |
| 3.000%, 08/01/2023 (Insured by MAC) | | | 200,000 | | | | 212,494 | | | | | |
| City of Oxford MS, | | | | | | | | | | | | |
| 3.000%, 09/01/2024 | | | 250,000 | | | | 250,570 | | | | | |
| City of Ridgeland MS: | | | | | | | | | | | | |
| 3.000%, 10/01/2021 | | | 725,000 | | | | 733,381 | | | | | |
| 3.000%, 10/01/2022 | | | 1,420,000 | | | | 1,456,153 | | | | | |
| 3.000%, 10/01/2023 | | | 1,335,000 | | | | 1,387,986 | | | | | |
| 3.000%, 10/01/2024 | | | 1,505,000 | | | | 1,576,262 | | | | | |
| City of Yazoo MS: | | | | | | | | | | | | |
| 3.000%, 03/01/2021 (Insured by MAC) | | | 105,000 | | | | 105,338 | | | | | |
| 3.000%, 03/01/2025 (Insured by MAC) | | | 125,000 | | | | 137,494 | | | | | |
| 3.000%, 03/01/2026 (Insured by MAC) | | | 130,000 | | | | 145,628 | | | | | |
| Copiah-Lincoln Community College District: | | | | | | | | | | | | |
| 2.000%, 09/01/2022 (Insured by MAC) | | | 165,000 | | | | 169,212 | | | | | |
| 2.000%, 09/01/2023 (Insured by MAC) | | | 95,000 | | | | 98,671 | | | | | |
| 2.000%, 09/01/2025 (Insured by MAC) | | | 205,000 | | | | 217,944 | | | | | |
| 2.000%, 09/01/2026 | | | | | | | | | | | | |
| (Callable 09/01/2025) (Insured by MAC) | | | 110,000 | | | | 116,423 | | | | | |
| County of Lowndes MS, | | | | | | | | | | | | |
| 6.800%, 04/01/2022 | | | 50,000 | | | | 53,729 | | | | | |
| Marshall County School District, | | | | | | | | | | | | |
| 3.000%, 06/01/2022 (Insured by BAM) | | | 275,000 | | | | 283,280 | | | | | |
| Mississippi Business Finance Corp.: | | | | | | | | | | | | |
| 2.500%, 04/01/2022 (Callable 04/01/2021) | | | 3,550,000 | | | | 3,564,449 | | | | | |
| 3.200%, 09/01/2028 (Callable 03/13/2024) | | | 2,460,000 | | | | 2,608,879 | | | | | |
| Mississippi Development Bank: | | | | | | | | | | | | |
| 3.000%, 07/01/2021 (Insured by ST AID) | | | 730,000 | | | | 731,584 | | | | | |
| 4.000%, 07/01/2022 | | | 170,000 | | | | 178,347 | | | | | |
| 5.000%, 03/01/2024 (Insured by AGM) | | | 50,000 | | | | 56,227 | | | | | |
| 5.000%, 11/01/2025 (Insured by BAM) | | | 215,000 | | | | 258,931 | | | | | |
| Mississippi Home Corp., | | | | | | | | | | | | |
| 3.500%, 12/01/2049 | | | | | | | | | | | | |
| (Callable 12/01/2028) (Insured by GNMA) | | | 975,000 | | | | 1,071,428 | | | | | |
| State of Mississippi: | | | | | | | | | | | | |
| 5.000%, 10/15/2025 | | | 205,000 | | | | 241,962 | | | | | |
| 5.000%, 10/15/2028 (Callable 10/15/2025) | | | 1,255,000 | | | | 1,462,426 | | | | | |
| Total Mississippi | | | | | | | | | | | | |
| (Cost $16,980,261) | | | | | | | 17,118,798 | | | | 1.1 | % |
The accompanying notes are an integral part of these financial statements.
Baird Short-Term Municipal Bond Fund
Schedule of Investments, December 31, 2020
Long-Term Investments (cont.)
| | | Principal | | | | | | % of | |
| | | Amount | | | Value | | | Net Assets | |
| Missouri | | | | | | | | | |
| Arnold Retail Corridor | | | | | | | | | |
| Transportation Development District, | | | | | | | | | |
| 3.000%, 11/01/2028 (Callable 11/01/2024) | | $ | 1,165,000 | | | $ | 1,157,730 | | | |
|
|
| City of Berkeley MO, | | | | | | | | | | | | |
| 3.000%, 05/01/2024 (Insured by BAM) | | | 205,000 | | | | 217,784 | | | | | |
| City of St. Louis MO, | | | | | | | | | | | | |
| 5.000%, 07/01/2023 (Insured by AGM) | | | 415,000 | | | | 461,148 | | | | | |
| Hanley Road Corridor | | | | | | | | | | | | |
| Transportation Development District: | | | | | | | | | | | | |
| 1.000%, 10/01/2027 | | | 550,000 | | | | 548,119 | | | | | |
| 1.625%, 10/01/2033 (Callable 10/01/2029) | | | 700,000 | | | | 700,028 | | | | | |
| 2.000%, 10/01/2039 (Callable 10/01/2029) | | | 750,000 | | | | 750,285 | | | | | |
| Health & Educational Facilities | | | | | | | | | | | | |
| Authority of the State of Missouri: | | | | | | | | | | | | |
| 4.000%, 04/01/2021 | | | 500,000 | | | | 502,545 | | | | | |
| 4.000%, 06/01/2021 | | | 175,000 | | | | 177,455 | | | | | |
| 5.000%, 09/01/2021 | | | 235,000 | | | | 240,419 | | | | | |
| 0.000%, 09/01/2022 (ETM) (Insured by NATL) | | | 55,000 | | | | 54,502 | | | | | |
| 5.000%, 09/01/2023 | | | 285,000 | | | | 311,628 | | | | | |
| 5.000%, 06/01/2024 | | | 235,000 | | | | 270,542 | | | | | |
| 5.000%, 09/01/2024 | | | 295,000 | | | | 332,524 | | | | | |
| Industrial Development Authority of the City of St. Louis, | | | | | | | | | | | | |
| 3.875%, 11/15/2029 (Callable 11/15/2026) | | | 970,000 | | | | 908,473 | | | | | |
| Joplin Industrial Development Authority, | | | | | | | | | | | | |
| 4.250%, 02/15/2021 (ETM) | | | 70,000 | | | | 70,304 | | | | | |
| Metropolitan Park and Recreation District, | | | | | | | | | | | | |
| 5.000%, 12/30/2025 (Callable 12/30/2023) | | | 1,000,000 | | | | 1,105,230 | | | | | |
| Missouri Association of Rural Education, | | | | | | | | | | | | |
| 3.000%, 04/15/2022 (Callable 02/01/2021) | | | 300,000 | | | | 300,441 | | | | | |
| Missouri Housing Development Commission, | | | | | | | | | | | | |
| 3.400%, 11/01/2030 | | | | | | | | | | | | |
| (Callable 11/01/2024) (Insured by GNMA) | | | 210,000 | | | | 225,298 | | | | | |
| Missouri Southern State University: | | | | | | | | | | | | |
| 5.000%, 10/01/2026 (Insured by AGM) | | | 105,000 | | | | 124,742 | | | | | |
| 5.000%, 10/01/2027 (Insured by AGM) | | | 100,000 | | | | 120,836 | | | | | |
| Move Rolla Transportation Development District, | | | | | | | | | | | | |
| 3.750%, 06/01/2029 (Callable 06/01/2026) | | | 265,000 | | | | 282,145 | | | | | |
| Neosho R-V School District: | | | | | | | | | | | | |
| 4.000%, 03/01/2022 (Insured by ST AID) | | | 155,000 | | | | 161,905 | | | | | |
| 4.000%, 03/01/2023 (Insured by ST AID) | | | 170,000 | | | | 183,423 | | | | | |
| 4.000%, 03/01/2024 (Insured by ST AID) | | | 275,000 | | | | 305,995 | | | | | |
| 4.000%, 03/01/2025 (Insured by ST AID) | | | 220,000 | | | | 252,186 | | | | | |
| 4.000%, 03/01/2026 (Insured by ST AID) | | | 510,000 | | | | 599,980 | | | | | |
The accompanying notes are an integral part of these financial statements.
Baird Short-Term Municipal Bond Fund
Schedule of Investments, December 31, 2020
Long-Term Investments (cont.)
| | | Principal | | | | | | % of | |
| | | Amount | | | Value | | | Net Assets | |
| Riverview Gardens School District, | | | | | | | | | |
| 4.000%, 04/01/2022 (Insured by ST AID) | | $ | 380,000 | | | $ | 397,906 | | | | |
| St. Joseph Industrial Development Authority, | | | | | | | | | | | |
| 3.350%, 01/01/2024 | | | 175,000 | | | | 172,891 | | | | |
| St. Louis Land Clearance for Redevelopment Authority, | | | | | | | | | | | |
| 4.250%, 06/01/2026 | | | 2,040,000 | | | | 2,237,125 | | | | |
| State of Missouri Health & Educational Facilities Authority: | | | | | | | | | | | |
| 5.000%, 02/01/2022 | | | 265,000 | | | | 276,043 | | | | |
| 5.000%, 06/01/2036 (Callable 12/01/2022) | | | | | | | | | | | |
(Mandatory Tender Date 06/01/2023)(1) | | | 195,000 | | | | 211,795 | | | | |
| Trenton School District No. R-IX, | | | | | | | | | | | |
| 4.000%, 03/01/2022 (Insured by ST AID) | | | 40,000 | | | | 41,782 | | | | |
| Total Missouri | | | | | | | | | | | |
| (Cost $13,530,051) | | | | | | | 13,703,209 | | | | 0.8 | % |
| Montana | | | | | | | | | | | | |
| City of Red Lodge MT: | | | | | | | | | | | | |
| 2.000%, 07/01/2021 (Insured by BAM) | | | 210,000 | | | | 211,814 | | | | | |
| 2.000%, 07/01/2022 (Insured by BAM) | | | 195,000 | | | | 200,068 | | | | | |
| 2.000%, 07/01/2023 (Insured by BAM) | | | 270,000 | | | | 281,038 | | | | | |
| Montana Board of Housing: | | | | | | | | | | | | |
| 4.000%, 12/01/2043 (Callable 12/01/2027) | | | 890,000 | | | | 970,625 | | | | | |
| 4.000%, 06/01/2049 | | | | | | | | | | | | |
| (Callable 12/01/2027) (Insured by FHA) | | | 1,045,000 | | | | 1,140,806 | | | | | |
| Montana Facility Finance Authority: | | | | | | | | | | | | |
| 5.000%, 01/01/2023 | | | 100,000 | | | | 109,083 | | | | | |
| 4.000%, 07/01/2025 | | | 155,000 | | | | 171,342 | | | | | |
| 5.000%, 07/01/2025 | | | 110,000 | | | | 132,059 | | | | | |
| 4.000%, 07/01/2026 | | | 330,000 | | | | 369,547 | | | | | |
| Total Montana | | | | | | | | | | | | |
| (Cost $3,462,245) | | | | | | | 3,586,382 | | | | 0.2 | % |
| Nebraska | | | | | | | | | | | | |
| Central Plains Energy Project, | | | | | | | | | | | | |
| 5.000%, 09/01/2032 (Callable 09/01/2022) | | | 350,000 | | | | 374,545 | | | | | |
| Public Power Generation Agency: | | | | | | | | | | | | |
| 5.000%, 01/01/2029 (Callable 01/01/2025) | | | 285,000 | | | | 332,863 | | | | | |
| 5.000%, 01/01/2031 (Callable 01/01/2025) | | | 625,000 | | | | 727,469 | | | | | |
| Scotts Bluff County School District No. 16, | | | | | | | | | | | | |
| 5.000%, 12/01/2026 (Pre-refunded to 05/30/2022) | | | 115,000 | | | | 122,728 | | | | | |
| Total Nebraska | | | | | | | | | | | | |
| (Cost $1,547,276) | | | | | | | 1,557,605 | | | | 0.1 | % |
| Nevada | | | | | | | | | | | | |
| City of Yerington NV, | | | | | | | | | | | | |
| 1.625%, 11/01/2023 (Callable 11/01/2022) | | | 7,000,000 | | | | 7,093,240 | | | | | |
The accompanying notes are an integral part of these financial statements.
Baird Short-Term Municipal Bond Fund
Schedule of Investments, December 31, 2020
Long-Term Investments (cont.)
| | | Principal | | | | | | % of | |
| | | Amount | | | Value | | | Net Assets | |
| Clark County School District: | | | | | | | | | |
| 5.000%, 06/15/2021 | | $ | 1,040,000 | | | $ | 1,061,309 | | | | |
| 5.000%, 06/15/2023 | | | 585,000 | | | | 647,098 | | | | |
| County of Clark NV, | | | | | | | | | | | |
| 5.000%, 07/01/2025 | | | 490,000 | | | | 588,510 | | | | |
| Las Vegas Redevelopment Agency, | | | | | | | | | | | |
| 5.000%, 06/15/2023 | | | 250,000 | | | | 272,892 | | | | |
| Lyon County School District, | | | | | | | | | | | |
| 5.000%, 04/01/2021 | | | 490,000 | | | | 495,395 | | | | |
| Nevada Housing Division, | | | | | | | | | | | |
| 4.000%, 10/01/2049 | | | | | | | | | | | |
| (Callable 10/01/2028) (Insured by GNMA) | | | 960,000 | | | | 1,071,322 | | | | |
| Total Nevada | | | | | | | | | | | |
| (Cost $11,086,295) | | | | | | | 11,229,766 | | | | 0.7 | % |
| New Hampshire | | | | | | | | | | | | |
| New Hampshire Health and Education Facilities Authority: | | | | | | | | | | | | |
3.150%, 04/01/2022 (Callable 11/01/2021)(3) | | | 8,900,000 | | | | 8,955,269 | | | | | |
| 0.070%, 10/01/2030 | | | | | | | | | | | | |
(Callable 01/04/2021) (Optional Put Date 01/07/2021)(1) | | | 2,400,000 | | | | 2,400,000 | | | | | |
| Total New Hampshire | | | | | | | | | | | | |
| (Cost $11,356,171) | | | | | | | 11,355,269 | | | | 0.7 | % |
| New Jersey | | | | | | | | | | | | |
| Atlantic City Board of Education: | | | | | | | | | | | | |
3.400%, 08/15/2021(3) | | | 2,026,000 | | | | 2,057,403 | | | | | |
3.400%, 08/15/2022(3) | | | 2,087,000 | | | | 2,164,782 | | | | | |
3.400%, 08/15/2023(3) | | | 2,171,000 | | | | 2,294,465 | | | | | |
3.400%, 08/15/2024(3) | | | 793,000 | | | | 851,658 | | | | | |
| Cape May County Industrial | | | | | | | | | | | | |
| Pollution Control Financing Authority, | | | | | | | | | | | | |
| 6.800%, 03/01/2021 (Insured by NATL) | | | 120,000 | | | | 121,168 | | | | | |
| City of Atlantic City NJ: | | | | | | | | | | | | |
| 5.000%, 03/01/2022 (Insured by BAM) | | | 100,000 | | | | 104,987 | | | | | |
| 5.000%, 03/01/2024 (Insured by BAM) | | | 300,000 | | | | 339,867 | | | | | |
| City of Bayonne NJ, | | | | | | | | | | | | |
| 5.000%, 07/15/2022 (Insured by AGM) | | | 475,000 | | | | 508,625 | | | | | |
| City of Newark NJ, | | | | | | | | | | | | |
| 5.000%, 10/01/2022 (Insured by ST AID) | | | 700,000 | | | | 748,769 | | | | | |
| City of Trenton NJ: | | | | | | | | | | | | |
| 4.000%, 07/15/2022 (Insured by AGM) | | | 500,000 | | | | 527,545 | | | | | |
| 4.000%, 07/15/2023 (Insured by AGM) | | | 200,000 | | | | 217,616 | | | | | |
| City of Union City NJ: | | | | | | | | | | | | |
| 5.000%, 11/01/2021 (Insured by ST AID) | | | 530,000 | | | | 546,287 | | | | | |
| 5.000%, 11/01/2022 (Insured by ST AID) | | | 505,000 | | | | 538,976 | | | | | |
| 5.000%, 11/01/2023 (Insured by ST AID) | | | 435,000 | | | | 479,753 | | | | | |
The accompanying notes are an integral part of these financial statements.
Baird Short-Term Municipal Bond Fund
Schedule of Investments, December 31, 2020
Long-Term Investments (cont.)
| | | Principal | | | | | | % of | |
| | | Amount | | | Value | | | Net Assets | |
| County of Hudson NJ, | | | | | | | | | |
| 7.000%, 12/01/2021 (Insured by NATL) | | $ | 5,280,000 | | | $ | 5,550,970 | | | |
|
|
| New Jersey Economic Development Authority: | | | | | | | | | | | | |
| 0.000%, 01/01/2021 (Insured by AMBAC) | | | 130,000 | | | | 130,000 | | | | | |
| 3.250%, 01/01/2021 | | | 230,000 | | | | 230,000 | | | | | |
| 5.000%, 07/15/2021 | | | 100,000 | | | | 102,186 | | | | | |
| 5.250%, 12/15/2021 (Insured by NATL) | | | 500,000 | | | | 522,690 | | | | | |
| 4.000%, 01/01/2022 | | | 660,000 | | | | 671,873 | | | | | |
| 0.000%, 07/01/2022 (ETM) (Insured by NATL) | | | 25,000 | | | | 24,833 | | | | | |
| 5.000%, 07/15/2022 | | | 240,000 | | | | 251,150 | | | | | |
| 4.000%, 01/01/2023 | | | 50,000 | | | | 51,781 | | | | | |
| 5.000%, 09/01/2023 (Callable 03/01/2021) | | | 485,000 | | | | 488,395 | | | | | |
| 5.000%, 06/15/2024 | | | 390,000 | | | | 444,167 | | | | | |
| 0.000%, 07/01/2024 (ETM) (Insured by NATL) | | | 455,000 | | | | 446,519 | | | | | |
| 5.250%, 09/01/2024 (Callable 03/01/2021) | | | 320,000 | | | | 322,365 | | | | | |
| 5.250%, 07/01/2025 (Insured by NATL) | | | 380,000 | | | | 451,087 | | | | | |
| 5.000%, 03/01/2026 (Callable 03/01/2023) | | | 1,180,000 | | | | 1,275,875 | | | | | |
| 5.000%, 06/15/2026 (Callable 06/15/2024) | | | 400,000 | | | | 450,036 | | | | | |
| 5.250%, 09/01/2026 (Callable 03/01/2021) | | | 585,000 | | | | 589,323 | | | | | |
| 5.000%, 06/15/2027 (Callable 06/15/2024) | | | 1,050,000 | | | | 1,177,701 | | | | | |
| 5.000%, 03/01/2029 (Callable 03/01/2023) | | | 500,000 | | | | 536,510 | | | | | |
| 3.125%, 07/01/2029 (Callable 07/01/2027) | | | 140,000 | | | | 141,397 | | | | | |
| 5.000%, 03/01/2030 (Callable 03/01/2023) | | | 735,000 | | | | 787,729 | | | | | |
| 4.000%, 07/01/2030 (Callable 02/01/2021) | | | 500,000 | | | | 501,215 | | | | | |
| 5.000%, 03/01/2031 (Pre-refunded to 09/01/2022) | | | 65,000 | | | | 70,210 | | | | | |
| New Jersey Educational Facilities Authority: | | | | | | | | | | | | |
| 5.000%, 07/01/2021 | | | 125,000 | | | | 127,725 | | | | | |
| 5.000%, 07/01/2022 (ETM) | | | 150,000 | | | | 160,815 | | | | | |
| New Jersey Health Care Facilities Financing Authority: | | | | | | | | | | | | |
| 5.000%, 07/01/2025 (Insured by AGM) | | | 55,000 | | | | 64,752 | | | | | |
| 0.170%, 07/01/2038 (Callable 01/04/2021) | | | | | | | | | | | | |
(Optional Put Date 01/07/2021)(1) | | | 5,515,000 | | | | 5,515,000 | | | | | |
| New Jersey Higher Education Student Assistance Authority, | | | | | | | | | | | | |
| 2.375%, 12/01/2029 (Callable 06/01/2028) | | | 2,385,000 | | | | 2,478,826 | | | | | |
| New Jersey Housing & Mortgage Finance Agency: | | | | | | | | | | | | |
| 1.500%, 09/01/2022 | | | | | | | | | | | | |
(Mandatory Tender Date 09/01/2021)(1) | | | 4,000,000 | | | | 4,028,240 | | | | | |
| 4.500%, 10/01/2048 (Callable 10/01/2027) | | | 770,000 | | | | 868,206 | | | | | |
| 4.750%, 10/01/2050 (Callable 04/01/2028) | | | 1,350,000 | | | | 1,537,069 | | | | | |
| New Jersey Transportation Trust Fund Authority: | | | | | | | | | | | | |
| 5.500%, 12/15/2021 (Insured by AGM) | | | 255,000 | | | | 267,472 | | | | | |
| 5.000%, 06/15/2023 | | | 3,995,000 | | | | 4,395,459 | | | | | |
| 5.000%, 12/15/2023 | | | 275,000 | | | | 309,317 | | | | | |
| 5.000%, 12/15/2023 | | | 620,000 | | | | 697,370 | | | | | |
| 5.250%, 12/15/2023 | | | 360,000 | | | | 407,804 | | | | | |
The accompanying notes are an integral part of these financial statements.
Baird Short-Term Municipal Bond Fund
Schedule of Investments, December 31, 2020
Long-Term Investments (cont.)
| | | Principal | | | | | | % of | |
| | | Amount | | | Value | | | Net Assets | |
| New Jersey Transportation Trust Fund Authority: (cont.) | | | | | | | | | |
| 5.000%, 06/15/2024 | | $ | 800,000 | | | $ | 909,104 | | | | |
| 0.000%, 12/15/2026 (Insured by AMBAC) | | | 110,000 | | | | 100,741 | | | | |
| 5.000%, 12/15/2026 | | | 1,390,000 | | | | 1,679,287 | | | | |
| North Hudson Sewerage Authority: | | | | | | | | | | | |
| 0.000%, 08/01/2021 (ETM) (Insured by NATL) | | | 60,000 | | | | 59,900 | | | | |
| 0.000%, 08/01/2025 (ETM) (Insured by NATL) | | | 25,000 | | | | 24,104 | | | | |
| South Jersey Transportation Authority, | | | | | | | | | | | |
| 5.000%, 11/01/2029 (Pre-refunded to 11/01/2022) | | | 125,000 | | | | 135,644 | | | | |
| State of New Jersey: | | | | | | | | | | | |
| 5.000%, 06/01/2024 | �� | | 7,350,000 | | | | 8,458,895 | | | | |
| 5.000%, 06/01/2025 | | | 6,500,000 | | | | 7,736,170 | | | | |
| Tender Option Bond Trust, | | | | | | | | | | | |
| 0.220%, 07/01/2047 | | | | | | | | | | | |
(Optional Put Date 01/07/2021)(1)(3) | | | 600,000 | | | | 600,000 | | | | |
| Washington Township Municipal Utilities Authority: | | | | | | | | | | | |
| 0.000%, 12/15/2021 (Insured by NATL) | | | 100,000 | | | | 99,267 | | | | |
| 0.000%, 12/15/2023 (Insured by NATL) | | | 25,000 | | | | 24,256 | | | | |
| Total New Jersey | | | | | | | | | | | |
| (Cost $66,193,753) | | | | | | | 67,405,336 | | | | 4.2 | % |
| New Mexico | | | | | | | | | | | | |
| City of Farmington NM, | | | | | | | | | | | | |
| 1.875%, 04/01/2033 | | | | | | | | | | | | |
(Mandatory Tender Date 10/01/2021)(1) | | | 200,000 | | | | 201,966 | | | | | |
| New Mexico Hospital Equipment Loan Council, | | | | | | | | | | | | |
| 4.750%, 07/01/2022 | | | 170,000 | | | | 175,824 | | | | | |
| New Mexico Mortgage Finance Authority: | | | | | | | | | | | | |
| 3.500%, 03/01/2045 (Callable 03/01/2026) | | | 40,000 | | | | 43,212 | | | | | |
| 3.750%, 03/01/2048 | | | | | | | | | | | | |
| (Callable 03/01/2027) (Insured by GNMA) | | | 230,000 | | | | 251,597 | | | | | |
| 4.250%, 07/01/2049 (Callable 01/01/2028) | | | 65,000 | | | | 72,716 | | | | | |
| 3.750%, 01/01/2050 | | | | | | | | | | | | |
| (Callable 01/01/2029) (Insured by GNMA) | | | 1,930,000 | | | | 2,144,423 | | | | | |
| 4.250%, 01/01/2050 | | | | | | | | | | | | |
| (Callable 07/01/2028) (Insured by GNMA) | | | 2,690,000 | | | | 3,014,871 | | | | | |
| Total New Mexico | | | | | | | | | | | | |
| (Cost $5,649,611) | | | | | | | 5,904,609 | | | | 0.4 | % |
| New York | | | | | | | | | | | | |
| Albany Capital Resource Corp., | | | | | | | | | | | | |
| 5.000%, 05/01/2027 (Callable 05/01/2026) | | | 1,000,000 | | | | 1,136,640 | | | | | |
| Albany County Capital Resource Corp., | | | | | | | | | | | | |
| 2.600%, 07/01/2025 | | | 970,000 | | | | 937,553 | | | | | |
| BluePath TE Trust, | | | | | | | | | | | | |
2.750%, 09/01/2026 (Callable 08/27/2021)(3) | | | 1,067,285 | | | | 1,094,465 | | | | | |
The accompanying notes are an integral part of these financial statements.
Baird Short-Term Municipal Bond Fund
Schedule of Investments, December 31, 2020
Long-Term Investments (cont.)
| | | Principal | | | | | | % of | |
| | | Amount | | | Value | | | Net Assets | |
| City of Long Beach NY: | | | | | | | | | |
| 4.000%, 08/15/2025 | | | | | | | | | |
| (Callable 08/15/2022) (Insured by BAM) | | $ | 100,000 | | | $ | 105,674 | | | |
|
|
| 5.000%, 09/01/2026 | | | 1,370,000 | | | | 1,630,492 | | | | | |
| City of New York NY: | | | | | | | | | | | | |
| 5.000%, 08/01/2022 | | | 185,000 | | | | 198,627 | | | | | |
| 5.000%, 10/01/2022 (Pre-refunded to 10/01/2021) | | | 190,000 | | | | 196,802 | | | | | |
| 5.000%, 08/01/2038 (Callable 08/01/2023) | | | | | | | | | | | | |
(Mandatory Tender Date 02/01/2024)(1) | | | 5,500,000 | | | | 6,131,070 | | | | | |
0.010%, 10/01/2040 (Optional Put Date 01/04/2021)(1) | | | 10,930,000 | | | | 10,930,000 | | | | | |
| County of Rockland NY, | | | | | | | | | | | | |
| 5.000%, 03/01/2023 (Insured by AGM) | | | 415,000 | | | | 457,147 | | | | | |
| County of Suffolk NY: | | | | | | | | | | | | |
| 2.000%, 07/22/2021 | | | 9,000,000 | | | | 9,057,330 | | | | | |
| 5.000%, 05/01/2023 | | | 2,845,000 | | | | 3,099,002 | | | | | |
| 5.000%, 05/01/2027 (Callable 05/01/2024) | | | 500,000 | | | | 559,320 | | | | | |
| Dutchess County Local Development Corp., | | | | | | | | | | | | |
| 5.000%, 07/01/2026 | | | 1,000,000 | | | | 1,205,770 | | | | | |
| Geneva Development Corp.: | | | | | | | | | | | | |
| 5.000%, 09/01/2023 (Pre-refunded to 09/01/2022) | | | 450,000 | | | | 485,838 | | | | | |
| 5.000%, 09/01/2023 (ETM) | | | 30,000 | | | | 33,803 | | | | | |
| 5.000%, 09/01/2024 (Pre-refunded to 09/01/2023) | | | 50,000 | | | | 56,339 | | | | | |
| Hempstead Town Local Development Corp., | | | | | | | | | | | | |
| 5.000%, 07/01/2025 (Callable 07/01/2023) | | | 815,000 | | | | 898,782 | | | | | |
| Housing Development Corp., | | | | | | | | | | | | |
| 2.000%, 11/01/2057 (Callable 01/19/2021) | | | | | | | | | | | | |
(Mandatory Tender Date 12/31/2021)(1) | | | 1,775,000 | | | | 1,775,834 | | | | | |
| Long Island Power Authority: | | | | | | | | | | | | |
| 0.850%, 05/01/2033 | | | | | | | | | | | | |
| (1 Month LIBOR USD + 0.750%) (Callable 10/01/2022) | | | | | | | | | | | | |
(Mandatory Tender Date 10/01/2023)(2) | | | 5,360,000 | | | | 5,366,003 | | | | | |
| 1.650%, 09/01/2049 (Callable 03/01/2024) | | | | | | | | | | | | |
(Mandatory Tender Date 09/01/2024)(1) | | | 1,805,000 | | | | 1,875,576 | | | | | |
| Metropolitan Transportation Authority: | | | | | | | | | | | | |
| 5.000%, 05/15/2021 | | | 615,000 | | | | 621,451 | | | | | |
| 5.000%, 09/01/2021 | | | 4,515,000 | | | | 4,600,559 | | | | | |
| 5.000%, 11/15/2021 | | | 1,075,000 | | | | 1,102,090 | | | | | |
| 4.000%, 02/01/2022 | | | 1,565,000 | | | | 1,596,644 | | | | | |
| 5.000%, 03/01/2022 | | | 445,000 | | | | 466,814 | | | | | |
| 5.000%, 05/15/2022 | | | 525,000 | | | | 545,759 | | | | | |
| 5.000%, 09/01/2022 | | | 3,250,000 | | | | 3,405,545 | | | | | |
| 5.000%, 11/15/2023 | | | 150,000 | | | | 162,363 | | | | | |
| 0.779%, 11/01/2032 (1 Month LIBOR USD + 0.680%) | | | | | | | | | | | | |
| (Mandatory Tender Date 04/06/2021) | | | | | | | | | | | | |
(Insured by AGM)(2) | | | 145,000 | | | | 144,542 | | | | | |
The accompanying notes are an integral part of these financial statements.
Baird Short-Term Municipal Bond Fund
Schedule of Investments, December 31, 2020
Long-Term Investments (cont.)
| | | Principal | | | | | | % of | |
| | | Amount | | | Value | | | Net Assets | |
| Monroe County Industrial Development Corp., | | | | | | | | | |
| 5.000%, 06/01/2021 | | $ | 1,730,000 | | | $ | 1,759,843 | | | |
|
|
| New York City Housing Development Corp.: | | | | | | | | | | | | |
| 2.950%, 11/01/2045 (Callable 05/01/2025) | | | | | | | | | | | | |
| (Mandatory Tender Date 02/01/2026) | | | | | | | | | | | | |
(Insured by FNMA)(1) | | | 225,000 | | | | 245,637 | | | | | |
| 2.750%, 05/01/2050 | | | 300,000 | | | | 312,318 | | | | | |
| 2.100%, 11/01/2058 (Callable 02/01/2022) | | | | | | | | | | | | |
(Mandatory Tender Date 07/03/2023)(1) | | | 230,000 | | | | 233,436 | | | | | |
| 0.700%, 11/01/2060 (Callable 05/01/2023) | | | | | | | | | | | | |
(Mandatory Tender Date 05/01/2025)(1) | | | 5,000,000 | | | | 5,000,450 | | | | | |
| New York City Water & Sewer System, | | | | | | | | | | | | |
| 0.010%, 06/15/2033 (Callable 01/15/2021) | | | | | | | | | | | | |
(Optional Put Date 01/04/2021)(1) | | | 735,000 | | | | 735,000 | | | | | |
| New York Liberty Development Corp.: | | | | | | | | | | | | |
| 0.570%, 10/01/2035 | | | | | | | | | | | | |
(Optional Put Date 01/07/2021)(1)(3) | | | 3,750,000 | | | | 3,750,000 | | | | | |
| 0.570%, 10/01/2035 | | | | | | | | | | | | |
(Optional Put Date 01/07/2021)(1)(3) | | | 3,464,000 | | | | 3,464,000 | | | | | |
| New York State Dormitory Authority: | | | | | | | | | | | | |
| 5.000%, 12/15/2021 | | | 55,000 | | | | 57,527 | | | | | |
| 5.000%, 07/01/2028 (Callable 07/01/2025) | | | 505,000 | | | | 593,921 | | | | | |
| 5.000%, 05/01/2048 (Callable 11/01/2025) | | | | | | | | | | | | |
(Mandatory Tender Date 05/01/2026)(1) | | | 2,375,000 | | | | 2,834,111 | | | | | |
| New York State Energy Research & Development Authority, | | | | | | | | | | | | |
| 2.625%, 04/01/2034 | | | | | | | | | | | | |
(Mandatory Tender Date 07/03/2023)(1) | | | 2,865,000 | | | | 3,022,289 | | | | | |
| New York State Housing Finance Agency: | | | | | | | | | | | | |
| 1.600%, 11/01/2024 (Callable 12/01/2021) | | | 5,815,000 | | | | 5,878,093 | | | | | |
| 0.750%, 11/01/2025 (Callable 01/01/2022) | | | 5,000,000 | | | | 5,001,750 | | | | | |
| New York Transportation Development Corp., | | | | | | | | | | | | |
| 5.000%, 12/01/2027 | | | 900,000 | | | | 1,123,884 | | | | | |
| Oneida County Local Development Corp., | | | | | | | | | | | | |
| 5.000%, 12/01/2029 | | | | | | | | | | | | |
| (Callable 12/01/2023) (Insured by AGM) | | | 715,000 | | | | 800,521 | | | | | |
| St. Lawrence County Industrial Development Agency: | | | | | | | | | | | | |
| 5.000%, 07/01/2025 (Callable 01/01/2023) | | | 235,000 | | | | 253,713 | | | | | |
| 5.000%, 07/01/2026 | | | 300,000 | | | | 363,333 | | | | | |
| 5.000%, 07/01/2027 (Callable 07/01/2026) | | | 175,000 | | | | 209,248 | | | | | |
| State of New York Mortgage Agency: | | | | | | | | | | | | |
| 3.500%, 10/01/2043 (Callable 04/01/2023) | | | 150,000 | | | | 157,977 | | | | | |
| 4.000%, 10/01/2046 (Callable 04/01/2025) | | | 280,000 | | | | 298,771 | | | | | |
| Town of Oyster Bay NY: | | | | | | | | | | | | |
| 3.000%, 02/01/2022 | | | 3,260,000 | | | | 3,344,825 | | | | | |
| 4.000%, 02/15/2026 (Insured by BAM) | | | 95,000 | | | | 110,961 | | | | | |
The accompanying notes are an integral part of these financial statements.
Baird Short-Term Municipal Bond Fund
Schedule of Investments, December 31, 2020
Long-Term Investments (cont.)
| | | Principal | | | | | | % of | |
| | | Amount | | | Value | | | Net Assets | |
| Triborough Bridge & Tunnel Authority: | | | | | | | | | |
| 0.596%, 11/15/2027 | | | | | | | | | |
| (1 Month LIBOR USD + 0.500%) | | | | | | | | | |
| (Callable 05/15/2021) | | | | | | | | | |
(Mandatory Tender Date 11/15/2021)(2) | | $ | 2,540,000 | | | $ | 2,539,314 | | | | |
| 0.796%, 01/01/2032 | | | | | | | | | | | |
| (1 Month LIBOR USD + 0.700%) | | | | | | | | | | | |
(Mandatory Tender Date 02/01/2021)(2) | | | 7,985,000 | | | | 7,986,597 | | | | |
| Utility Debt Securitization Authority, | | | | | | | | | | | |
| 5.000%, 12/15/2025 (Callable 12/15/2023) | | | 210,000 | | | | 239,917 | | | | |
| Total New York | | | | | | | | | | | |
| (Cost $109,142,658) | | | | | | | 110,195,270 | | | | 6.8 | % |
| North Carolina | | | | | | | | | | | | |
| Durham Housing Authority, | | | | | | | | | | | | |
| 5.000%, 12/01/2035 (Pre-refunded to 12/01/2022) | | | 265,000 | | | | 283,781 | | | | | |
| North Carolina Capital Facilities Finance Agency, | | | | | | | | | | | | |
| 5.000%, 06/01/2022 (Insured by AGC) | | | 100,000 | | | | 105,136 | | | | | |
| North Carolina Eastern Municipal Power Agency: | | | | | | | | | | | | |
| 5.000%, 01/01/2021 (ETM) | | | 890,000 | | | | 890,000 | | | | | |
| 6.000%, 01/01/2022 (ETM) | | | 155,000 | | | | 163,909 | | | | | |
| North Carolina Housing Finance Agency: | | | | | | | | | | | | |
| 4.000%, 07/01/2048 | | | | | | | | | | | | |
| (Callable 07/01/2027) (Insured by GNMA) | | | 340,000 | | | | 373,939 | | | | | |
| 4.000%, 01/01/2050 (Callable 07/01/2028) | | | 1,760,000 | | | | 1,970,531 | | | | | |
| 4.000%, 07/01/2050 (Callable 07/01/2029) | | | 3,200,000 | | | | 3,629,472 | | | | | |
| North Carolina Medical Care Commission: | | | | | | | | | | | | |
| 5.750%, 01/01/2035 (Pre-refunded to 01/01/2021) | | | 130,000 | | | | 130,000 | | | | | |
| 2.200%, 12/01/2048 (Callable 06/01/2022) | | | | | | | | | | | | |
(Mandatory Tender Date 12/01/2022)(1) | | | 1,845,000 | | | | 1,889,428 | | | | | |
| North Carolina Turnpike Authority: | | | | | | | | | | | | |
| 5.000%, 02/01/2024 | | | 8,650,000 | | | | 9,803,737 | | | | | |
| 5.000%, 01/01/2025 | | | 50,000 | | | | 58,443 | | | | | |
| State of North Carolina, | | | | | | | | | | | | |
| 5.000%, 05/01/2024 (Callable 05/01/2023) | | | 1,250,000 | | | | 1,388,525 | | | | | |
| University of North Carolina at Chapel Hill, | | | | | | | | | | | | |
| 0.496%, 12/01/2041 | | | | | | | | | | | | |
| (1 Month LIBOR USD + 0.400%) | | | | | | | | | | | | |
| (Callable 03/09/2022) | | | | | | | | | | | | |
(Mandatory Tender Date 11/09/2022)(2) | | | 5,000,000 | | | | 5,003,050 | | | | | |
| Total North Carolina | | | | | | | | | | | | |
| (Cost $25,254,806) | | | | | | | 25,689,951 | | | | 1.6 | % |
| North Dakota | | | | | | | | | | | | |
| City of Dickinson ND, | | | | | | | | | | | | |
| 5.000%, 10/01/2025 (Callable 10/01/2021) | | | 1,150,000 | | | | 1,172,552 | | | | | |
The accompanying notes are an integral part of these financial statements.
Baird Short-Term Municipal Bond Fund
Schedule of Investments, December 31, 2020
Long-Term Investments (cont.)
| | | Principal | | | | | | % of | |
| | | Amount | | | Value | | | Net Assets | |
| City of Horace ND: | | | | | | | | | |
| 1.900%, 08/01/2022 (Callable 08/01/2021) | | $ | 1,325,000 | | | $ | 1,326,047 | | | |
|
|
| 3.000%, 05/01/2025 | | | 250,000 | | | | 271,585 | | | | | |
| 3.000%, 05/01/2026 | | | 335,000 | | | | 368,812 | | | | | |
| 3.000%, 05/01/2027 (Callable 05/01/2026) | | | 265,000 | | | | 288,855 | | | | | |
| City of Mandan ND, | | | | | | | | | | | | |
| 2.750%, 09/01/2041 (Callable 02/01/2021) | | | 430,000 | | | | 430,202 | | | | | |
| City of Watford City ND: | | | | | | | | | | | | |
| 3.000%, 12/01/2021 (Insured by AGM) | | | 1,980,000 | | | | 2,020,491 | | | | | |
| 3.000%, 12/01/2023 (Insured by AGM) | | | 1,825,000 | | | | 1,930,430 | | | | | |
| City of West Fargo ND: | | | | | | | | | | | | |
| 5.000%, 05/01/2022 | | | 200,000 | | | | 212,174 | | | | | |
| 4.000%, 05/01/2023 | | | 305,000 | | | | 329,650 | | | | | |
| 4.000%, 05/01/2024 | | | 900,000 | | | | 1,001,016 | | | | | |
| City of Williston ND, | | | | | | | | | | | | |
| 4.250%, 07/15/2025 (Callable 07/15/2022) | | | 775,000 | | | | 813,463 | | | | | |
| County of Burleigh ND: | | | | | | | | | | | | |
| 4.000%, 11/01/2021 | | | 1,000,000 | | | | 1,025,660 | | | | | |
| 2.750%, 02/01/2022 (Callable 01/21/2021) | | | 10,000,000 | | | | 10,001,700 | | | | | |
| 4.000%, 11/01/2029 | | | | | | | | | | | | |
| (Pre-refunded to 11/01/2022) (Insured by AGM) | | | 400,000 | | | | 427,556 | | | | | |
| 4.500%, 07/01/2032 (Pre-refunded to 07/01/2022) | | | 360,000 | | | | 381,056 | | | | | |
| County of McKenzie ND: | | | | | | | | | | | | |
| 5.000%, 08/01/2022 | | | 1,000,000 | | | | 1,059,970 | | | | | |
| 5.000%, 08/01/2023 | | | 2,300,000 | | | | 2,523,123 | | | | | |
| County of Ward ND, | | | | | | | | | | | | |
| 4.000%, 04/01/2024 | | | | | | | | | | | | |
| (Callable 04/01/2023) (Insured by AGM) | | | 400,000 | | | | 429,524 | | | | | |
| Jamestown Park District, | | | | | | | | | | | | |
| 2.900%, 07/01/2035 (Callable 01/19/2021) | | | 1,025,000 | | | | 1,025,728 | | | | | |
| North Dakota Housing Finance Agency: | | | | | | | | | | | | |
| 4.000%, 07/01/2048 (Callable 01/01/2027) | | | 215,000 | | | | 235,070 | | | | | |
| 4.000%, 01/01/2051 (Callable 07/01/2029) | | | 2,500,000 | | | | 2,834,925 | | | | | |
| Williston Public School District No. 1, | | | | | | | | | | | | |
| 3.000%, 08/01/2026 | | | | | | | | | | | | |
| (Callable 08/01/2024) (Insured by SD CRED PROG) | | | 1,015,000 | | | | 1,094,485 | | | | | |
| Total North Dakota | | | | | | | | | | | | |
| (Cost $30,719,188) | | | | | | | 31,204,074 | | | | 1.9 | % |
| Ohio | | | | | | | | | | | | |
| Akron Bath Copley Joint Township Hospital District, | | | | | | | | | | | | |
| 5.000%, 11/15/2028 | | | 460,000 | | | | 582,130 | | | | | |
| Alliance City School District, | | | | | | | | | | | | |
| 2.500%, 12/01/2022 (Insured by SD CRED PROG) | | | 200,000 | | | | 208,550 | | | | | |
The accompanying notes are an integral part of these financial statements.
Baird Short-Term Municipal Bond Fund
Schedule of Investments, December 31, 2020
Long-Term Investments (cont.)
| | | Principal | | | | | | % of | |
| | | Amount | | | Value | | | Net Assets | |
| American Municipal Power, Inc.: | | | | | | | | | |
| 5.000%, 02/15/2026 (Callable 02/15/2024) | | $ | 1,200,000 | | | $ | 1,363,632 | | | |
|
|
| 2.250%, 02/15/2048 (Callable 02/15/2021) | | | | | | | | | | | | |
(Mandatory Tender Date 08/15/2021)(7) | | | 275,000 | | | | 275,506 | | | | | |
| City of Huron OH, | | | | | | | | | | | | |
| 3.125%, 12/01/2024 | | | 325,000 | | | | 340,119 | | | | | |
| City of Lorain OH: | | | | | | | | | | | | |
| 3.000%, 12/01/2021 (Insured by BAM) | | | 110,000 | | | | 112,521 | | | | | |
| 3.000%, 12/01/2022 (Insured by BAM) | | | 185,000 | | | | 193,436 | | | | | |
| 3.000%, 12/01/2023 (Insured by BAM) | | | 185,000 | | | | 196,344 | | | | | |
| 3.000%, 12/01/2024 (Insured by BAM) | | | 130,000 | | | | 140,093 | | | | | |
| 3.000%, 12/01/2025 (Insured by BAM) | | | 135,000 | | | | 147,308 | | | | | |
| 3.000%, 12/01/2026 (Insured by BAM) | | | 135,000 | | | | 147,924 | | | | | |
| City of Middleburg Heights OH: | | | | | | | | | | | | |
| 4.000%, 08/01/2025 | | | 165,000 | | | | 184,772 | | | | | |
| 5.000%, 08/01/2026 | | | 270,000 | | | | 321,770 | | | | | |
| 5.000%, 08/01/2027 | | | 280,000 | | | | 340,334 | | | | | |
| 5.250%, 08/01/2041 (Callable 08/01/2021) | | | 1,900,000 | | | | 1,955,746 | | | | | |
| City of St. Clairsville OH, | | | | | | | | | | | | |
| 4.000%, 12/01/2023 (Insured by BAM) | | | 340,000 | | | | 375,234 | | | | | |
| City of Tiffin OH, | | | | | | | | | | | | |
| 2.500%, 12/01/2024 (Callable 12/01/2023) | | | 250,000 | | | | 262,630 | | | | | |
| Cleveland-Cuyahoga County Port Authority, | | | | | | | | | | | | |
| 5.000%, 08/01/2026 (Callable 08/01/2024) | | | 525,000 | | | | 585,317 | | | | | |
| County of Franklin OH: | | | | | | | | | | | | |
| 5.000%, 05/15/2027 (Callable 05/15/2023) | | | 1,000,000 | | | | 1,103,220 | | | | | |
| 5.000%, 05/15/2030 (Callable 05/15/2023) | | | 270,000 | | | | 295,893 | | | | | |
| 0.500%, 05/15/2050 | | | | | | | | | | | | |
| (SIFMA Municipal Swap Index + 0.430%) | | | | | | | | | | | | |
| (Callable 05/15/2021) | | | | | | | | | | | | |
(Mandatory Tender Date 11/15/2021)(2) | | | 500,000 | | | | 500,230 | | | | | |
| County of Gallia OH, | | | | | | | | | | | | |
| 8.000%, 07/01/2042 (Pre-refunded to 07/01/2022) | | | 540,000 | | | | 596,657 | | | | | |
| County of Holmes OH, | | | | | | | | | | | | |
| 3.000%, 12/01/2022 | | | | | | | | | | | | |
| (Callable 02/01/2021) (Insured by AGM) | | | 130,000 | | | | 131,464 | | | | | |
| County of Montgomery OH: | | | | | | | | | | | | |
| 5.000%, 11/15/2024 | | | 1,460,000 | | | | 1,658,706 | | | | | |
| 5.000%, 11/15/2025 | | | 2,500,000 | | | | 2,923,325 | | | | | |
| 5.000%, 11/15/2027 | | | 2,000,000 | | | | 2,434,860 | | | | | |
| Cuyahoga Metropolitan Housing Authority: | | | | | | | | | | | | |
| 3.000%, 12/01/2022 | | | 245,000 | | | | 255,861 | | | | | |
| 4.000%, 12/01/2023 | | | 310,000 | | | | 339,106 | | | | | |
| 4.000%, 12/01/2024 | | | 335,000 | | | | 376,975 | | | | | |
| 4.000%, 12/01/2025 | | | 335,000 | | | | 386,356 | | | | | |
The accompanying notes are an integral part of these financial statements.
Baird Short-Term Municipal Bond Fund
Schedule of Investments, December 31, 2020
Long-Term Investments (cont.)
| | | Principal | | | | | | % of | |
| | | Amount | | | Value | | | Net Assets | |
| Euclid City School District: | | | | | | | | | |
| 4.000%, 12/01/2023 (Insured by BAM) | | $ | 130,000 | | | $ | 143,392 | | | |
|
|
| 4.000%, 12/01/2025 (Insured by BAM) | | | 65,000 | | | | 75,817 | | | | | |
| 4.000%, 12/01/2026 (Insured by BAM) | | | 100,000 | | | | 118,993 | | | | | |
| Great Oaks Career Campuses Board of Education, | | | | | | | | | | | | |
| 4.000%, 12/01/2022 | | | 400,000 | | | | 429,212 | | | | | |
| Greater Cleveland Regional Transit Authority, | | | | | | | | | | | | |
| 5.000%, 12/01/2023 | | | 145,000 | | | | 164,798 | | | | | |
| Groveport-Madison Local School District, | | | | | | | | | | | | |
| 4.000%, 12/01/2024 | | | | | | | | | | | | |
| (Callable 12/01/2022) (Insured by BAM) | | | 50,000 | | | | 53,217 | | | | | |
| Miami University, | | | | | | | | | | | | |
| 4.000%, 09/01/2027 (Callable 09/01/2022) | | | 160,000 | | | | 168,218 | | | | | |
| Norton City School District, | | | | | | | | | | | | |
| 4.000%, 11/01/2026 | | | | | | | | | | | | |
| (Callable 11/01/2023) (Insured by SD CRED PROG) | | | 430,000 | | | | 472,239 | | | | | |
| Ohio Higher Educational Facility Commission: | | | | | | | | | | | | |
| 5.000%, 11/01/2023 | | | 580,000 | | | | 638,818 | | | | | |
| 5.000%, 05/01/2024 | | | 705,000 | | | | 804,786 | | | | | |
| 5.000%, 05/01/2024 | | | 415,000 | | | | 473,739 | | | | | |
| 5.000%, 03/01/2025 | | | 685,000 | | | | 726,490 | | | | | |
| 5.000%, 05/01/2025 | | | 595,000 | | | | 702,457 | | | | | |
| 5.000%, 05/01/2025 | | | 455,000 | | | | 537,173 | | | | | |
| 5.000%, 05/01/2026 (Callable 05/01/2025) | | | 750,000 | | | | 881,970 | | | | | |
| Ohio Housing Finance Agency: | | | | | | | | | | | | |
| 4.000%, 03/01/2047 | | | | | | | | | | | | |
| (Callable 09/01/2025) (Insured by GNMA) | | | 105,000 | | | | 112,795 | | | | | |
| 3.750%, 09/01/2050 | | | | | | | | | | | | |
| (Callable 03/01/2029) (Insured by GNMA) | | | 1,990,000 | | | | 2,248,959 | | | | | |
| Ohio Turnpike & Infrastructure Commission, | | | | | | | | | | | | |
| 5.500%, 02/15/2024 | | | 1,185,000 | | | | 1,317,281 | | | | | |
| Oregon City School District, | | | | | | | | | | | | |
| 0.000%, 12/01/2021 | | | 245,000 | | | | 244,292 | | | | | |
| Port of Greater Cincinnati Development Authority: | | | | | | | | | | | | |
| 3.000%, 05/01/2023 (Callable 05/01/2022) | | | 5,805,000 | | | | 5,808,947 | | | | | |
| 3.125%, 11/15/2023 | | | 360,000 | | | | 369,893 | | | | | |
| 5.000%, 04/01/2026 | | | 175,000 | | | | 207,435 | | | | | |
| 5.000%, 04/01/2027 | | | 250,000 | | | | 302,965 | | | | | |
| State of Ohio: | | | | | | | | | | | | |
| 5.000%, 04/01/2029 (Callable 04/01/2023) | | | 25,000 | | | | 27,547 | | | | | |
| 5.000%, 01/15/2050 | | | | | | | | | | | | |
(Mandatory Tender Date 01/15/2025)(1) | | | 4,485,000 | | | | 5,237,762 | | | | | |
| Toledo OH, | | | | | | | | | | | | |
| 5.000%, 12/01/2022 | | | 150,000 | | | | 160,941 | | | | | |
The accompanying notes are an integral part of these financial statements.
Baird Short-Term Municipal Bond Fund
Schedule of Investments, December 31, 2020
Long-Term Investments (cont.)
| | | Principal | | | | | | % of | |
| | | Amount | | | Value | | | Net Assets | |
| Troy City School District, | | | | | | | | | |
| 2.050%, 12/01/2023 (Callable 12/01/2022) | | $ | 130,000 | | | $ | 134,198 | | | | |
| Village of Cuyahoga Heights OH: | | | | | | | | | | | |
| 4.000%, 12/01/2023 (Insured by AGM) | | | 95,000 | | | | 103,460 | | | | |
| 4.000%, 12/01/2024 (Insured by AGM) | | | 100,000 | | | | 111,833 | | | | |
| Wauseon Exempted Village School District, | | | | | | | | | | | |
| 0.000%, 12/01/2021 (Insured by SD CRED PROG) | | | 400,000 | | | | 398,484 | | | | |
| Total Ohio | | | | | | | | | | | |
| (Cost $41,171,746) | | | | | | | 41,914,130 | | | | 2.6 | % |
| Oklahoma | | | | | | | | | | | | |
| Catoosa Industrial Authority, | | | | | | | | | | | | |
| 4.000%, 10/01/2028 (Callable 10/01/2026) | | | 240,000 | | | | 240,876 | | | | | |
| City of Midwest City OK: | | | | | | | | | | | | |
| 3.000%, 06/01/2021 | | | 370,000 | | | | 374,229 | | | | | |
| 3.000%, 06/01/2023 | | | 485,000 | | | | 513,872 | | | | | |
| Cleveland County Educational Facilities Authority, | | | | | | | | | | | | |
| 5.000%, 06/01/2021 | | | 1,080,000 | | | | 1,099,526 | | | | | |
| Custer County Economic Development Authority: | | | | | | | | | | | | |
| 4.000%, 12/01/2021 | | | 415,000 | | | | 428,566 | | | | | |
| 4.000%, 12/01/2023 | | | 450,000 | | | | 492,930 | | | | | |
| Elk City Industrial Authority, | | | | | | | | | | | | |
| 3.000%, 05/01/2022 | | | 105,000 | | | | 108,596 | | | | | |
| Kingfisher County Educational Facilities Authority, | | | | | | | | | | | | |
| 3.000%, 03/01/2023 | | | 385,000 | | | | 404,662 | | | | | |
| Oklahoma County Finance Authority, | | | | | | | | | | | | |
| 5.000%, 09/01/2024 | | | 350,000 | | | | 407,162 | | | | | |
| Oklahoma Development Finance Authority: | | | | | | | | | | | | |
| 4.000%, 08/01/2021 | | | 425,000 | | | | 430,589 | | | | | |
| 4.000%, 08/01/2022 | | | 535,000 | | | | 554,003 | | | | | |
| 5.000%, 08/01/2023 | | | 485,000 | | | | 523,063 | | | | | |
| 2.600%, 03/01/2024 | | | 1,000,000 | | | | 998,480 | | | | | |
| 5.000%, 08/01/2024 | | | 585,000 | | | | 646,998 | | | | | |
| 0.250%, 08/15/2031 (Callable 01/04/2021) | | | | | | | | | | | | |
(Optional Put Date 01/07/2021)(1) | | | 12,500,000 | | | | 12,500,000 | | | | | |
| Oklahoma Municipal Power Authority, | | | | | | | | | | | | |
| 0.460%, 01/01/2023 | | | | | | | | | | | | |
(SIFMA Municipal Swap Index + 0.390%)(2) | | | 205,000 | | | | 204,980 | | | | | |
| Oklahoma Water Resources Board, | | | | | | | | | | | | |
| 5.000%, 04/01/2023 | | | 750,000 | | | | 830,858 | | | | | |
| Purcell Public Works Authority: | | | | | | | | | | | | |
| 5.000%, 03/01/2024 | | | 250,000 | | | | 277,423 | | | | | |
| 5.000%, 03/01/2025 | | | 200,000 | | | | 227,722 | | | | | |
| 5.000%, 03/01/2026 | | | 435,000 | | | | 506,105 | | | | | |
| 5.000%, 03/01/2027 | | | 880,000 | | | | 1,038,426 | | | | | |
The accompanying notes are an integral part of these financial statements.
Baird Short-Term Municipal Bond Fund
Schedule of Investments, December 31, 2020
Long-Term Investments (cont.)
| | | Principal | | | | | | % of | |
| | | Amount | | | Value | | | Net Assets | |
| Texas County Development Authority, | | | | | | | | | |
| 4.000%, 12/01/2023 | | $ | 675,000 | | | $ | 737,762 | | | | |
| Tulsa County Industrial Authority, | | | | | | | | | | | |
| 5.000%, 09/01/2024 | | | 400,000 | | | | 464,856 | | | | |
| Tulsa Industrial Authority, | | | | | | | | | | | |
| 5.000%, 10/01/2023 | | | 790,000 | | | | 845,182 | | | | |
| University of Oklahoma, | | | | | | | | | | | |
| 5.000%, 07/01/2029 (Callable 07/01/2026) | | | 3,515,000 | | | | 4,265,699 | | | | |
| Total Oklahoma | | | | | | | | | | | |
| (Cost $28,922,940) | | | | | | | 29,122,565 | | | | 1.8 | % |
| Oregon | | | | | | | | | | | | |
| County of Yamhill OR: | | | | | | | | | | | | |
| 4.000%, 10/01/2022 | | | 500,000 | | | | 517,515 | | | | | |
| 4.000%, 10/01/2023 | | | 425,000 | | | | 448,766 | | | | | |
| 4.000%, 10/01/2024 | | | 425,000 | | | | 456,297 | | | | | |
| Oregon State Business Development Commission, | | | | | | | | | | | | |
| 2.400%, 12/01/2040 | | | | | | | | | | | | |
(Mandatory Tender Date 08/14/2023)(1) | | | 100,000 | | | | 105,157 | | | | | |
| Port of Morrow OR, | | | | | | | | | | | | |
| 4.000%, 06/01/2026 (Callable 02/01/2021) | | | 220,000 | | | | 220,534 | | | | | |
| State of Oregon: | | | | | | | | | | | | |
| 4.000%, 05/01/2023 | | | 500,000 | | | | 544,305 | | | | | |
| 4.000%, 12/01/2048 (Callable 12/01/2026) | | | 775,000 | | | | 842,363 | | | | | |
| State of Oregon Housing & | | | | | | | | | | | | |
| Community Services Department: | | | | | | | | | | | | |
| 3.500%, 07/01/2032 (Callable 07/01/2026) | | | 2,695,000 | | | | 2,940,568 | | | | | |
| 3.875%, 01/01/2033 (Callable 07/01/2024) | | | 315,000 | | | | 338,181 | | | | | |
| 3.500%, 07/01/2036 (Callable 01/01/2025) | | | 95,000 | | | | 100,222 | | | | | |
| 4.500%, 01/01/2049 (Callable 07/01/2027) | | | 1,380,000 | | | | 1,521,243 | | | | | |
| 4.500%, 07/01/2049 (Callable 07/01/2027) | | | 425,000 | | | | 471,555 | | | | | |
| Total Oregon | | | | | | | | | | | | |
| (Cost $8,225,261) | | | | | | | 8,506,706 | | | | 0.5 | % |
| Pennsylvania | | | | | | | | | | | | |
| Abington Heights School District Lackawanna County, | | | | | | | | | | | | |
| 2.000%, 03/15/2023 | | | | | | | | | | | | |
| (Callable 02/01/2021) (Insured by ST AID) | | | 195,000 | | | | 195,205 | | | | | |
| Aliquippa Municipal Water Authority, | | | | | | | | | | | | |
| 2.000%, 11/15/2023 | | | | | | | | | | | | |
| (Callable 11/15/2022) (Insured by BAM) | | | 250,000 | | | | 256,480 | | | | | |
| Allegheny County Higher Education Building Authority, | | | | | | | | | | | | |
| 5.000%, 03/01/2023 (Callable 03/01/2021) | | | 250,000 | | | | 251,767 | | | | | |
| Allegheny County Hospital Development Authority: | | | | | | | | | | | | |
| 5.000%, 07/15/2021 | | | 2,525,000 | | | | 2,586,307 | | | | | |
| 4.125%, 10/15/2026 (Callable 10/15/2021) | | | 55,000 | | | | 56,403 | | | | | |
The accompanying notes are an integral part of these financial statements.
Baird Short-Term Municipal Bond Fund
Schedule of Investments, December 31, 2020
Long-Term Investments (cont.)
| | | Principal | | | | | | % of | |
| | | Amount | | | Value | | | Net Assets | |
| Allentown City School District, | | | | | | | | | |
| 2.375%, 03/31/2021 | | | | | | | | | |
| (Callable 02/01/2021) (Insured by ST AID) | | $ | 1,500,000 | | | $ | 1,500,105 | | | |
|
|
| Berks County Industrial Development Authority: | | | | | | | | | | | | |
| 5.000%, 11/01/2021 | | | 270,000 | | | | 277,282 | | | | | |
| 5.000%, 11/01/2023 | | | 75,000 | | | | 79,851 | | | | | |
| 5.000%, 11/01/2024 | | | 375,000 | | | | 407,269 | | | | | |
| Berks County Municipal Authority: | | | | | | | | | | | | |
| 5.000%, 02/01/2024 | | | 435,000 | | | | 465,481 | | | | | |
| 5.000%, 02/01/2025 | | | 565,000 | | | | 616,573 | | | | | |
| 5.000%, 02/01/2040 (Callable 08/01/2024) | | | | | | | | | | | | |
(Mandatory Tender Date 02/01/2025)(1) | | | 360,000 | | | | 389,426 | | | | | |
| 5.000%, 02/01/2040 (Callable 08/01/2026) | | | | | | | | | | | | |
(Mandatory Tender Date 02/01/2027)(1) | | | 1,000,000 | | | | 1,112,680 | | | | | |
| Blacklick Valley School District: | | | | | | | | | | | | |
| 5.000%, 11/15/2021 (Insured by MAC) | | | 170,000 | | | | 176,609 | | | | | |
| 5.000%, 11/15/2022 (Insured by MAC) | | | 175,000 | | | | 189,604 | | | | | |
| 5.000%, 11/15/2023 (Insured by MAC) | | | 190,000 | | | | 214,041 | | | | | |
| 5.000%, 11/15/2024 (Insured by MAC) | | | 200,000 | | | | 233,630 | | | | | |
| Borough of Lewistown PA: | | | | | | | | | | | | |
| 4.000%, 09/01/2022 (Insured by AGM) | | | 265,000 | | | | 281,406 | | | | | |
| 4.000%, 09/01/2023 (Insured by AGM) | | | 315,000 | | | | 343,149 | | | | | |
| 4.000%, 09/01/2024 (Insured by AGM) | | | 100,000 | | | | 112,133 | | | | | |
| Caernarvon Township Authority: | | | | | | | | | | | | |
| 4.000%, 09/01/2023 (Insured by MAC) | | | 100,000 | | | | 108,936 | | | | | |
| 4.000%, 09/01/2024 (Insured by MAC) | | | 140,000 | | | | 157,041 | | | | | |
| 4.000%, 09/01/2025 | | | | | | | | | | | | |
| (Callable 09/01/2024) (Insured by MAC) | | | 100,000 | | | | 111,766 | | | | | |
| 4.000%, 09/01/2026 | | | | | | | | | | | | |
| (Callable 09/01/2024) (Insured by MAC) | | | 150,000 | | | | 167,302 | | | | | |
| 4.000%, 09/01/2027 | | | | | | | | | | | | |
| (Callable 09/01/2024) (Insured by MAC) | | | 130,000 | | | | 144,690 | | | | | |
| 4.000%, 09/01/2028 | | | | | | | | | | | | |
| (Callable 09/01/2024) (Insured by MAC) | | | 165,000 | | | | 182,990 | | | | | |
| 4.000%, 09/01/2029 | | | | | | | | | | | | |
| (Callable 09/01/2024) (Insured by MAC) | | | 170,000 | | | | 187,942 | | | | | |
| 4.000%, 09/01/2030 | | | | | | | | | | | | |
| (Callable 09/01/2024) (Insured by MAC) | | | 175,000 | | | | 193,107 | | | | | |
| 4.000%, 09/01/2032 | | | | | | | | | | | | |
| (Callable 09/01/2024) (Insured by MAC) | | | 375,000 | | | | 411,653 | | | | | |
| Carmichaels Area School District: | | | | | | | | | | | | |
| 4.000%, 09/01/2022 (Insured by BAM) | | | 100,000 | | | | 105,320 | | | | | |
| 4.000%, 09/01/2023 (Insured by BAM) | | | 155,000 | | | | 168,379 | | | | | |
| 4.000%, 09/01/2024 (Insured by BAM) | | | 220,000 | | | | 245,507 | | | | | |
The accompanying notes are an integral part of these financial statements.
Baird Short-Term Municipal Bond Fund
Schedule of Investments, December 31, 2020
Long-Term Investments (cont.)
| | | Principal | | | | | | % of | |
| | | Amount | | | Value | | | Net Assets | |
| Catholic Health Initiatives, | | | | | | | | | |
| 4.000%, 05/15/2022 | | | | | | | | | |
| (Pre-refunded to 05/15/2021) (Insured by ST AID) | | $ | 50,000 | | | $ | 50,678 | | | |
|
|
| Centennial School District Bucks County, | | | | | | | | | | | | |
| 5.000%, 12/15/2022 (Insured by ST AID) | | | 50,000 | | | | 54,655 | | | | | |
| Central Bradford Progress Authority, | | | | | | | | | | | | |
| 5.000%, 12/01/2026 (Pre-refunded to 12/01/2021) | | | 415,000 | | | | 433,052 | | | | | |
| City of Altoona PA, | | | | | | | | | | | | |
| 4.000%, 08/01/2027 (Insured by AGM) | | | 110,000 | | | | 130,985 | | | | | |
| City of Bradford PA: | | | | | | | | | | | | |
| 2.500%, 11/01/2025 (Insured by AGM) | | | 395,000 | | | | 415,852 | | | | | |
| 3.500%, 11/01/2028 | | | | | | | | | | | | |
| (Callable 11/01/2025) (Insured by AGM) | | | 385,000 | | | | 413,906 | | | | | |
| 3.500%, 11/01/2029 | | | | | | | | | | | | |
| (Callable 11/01/2025) (Insured by AGM) | | | 100,000 | | | | 106,640 | | | | | |
| City of Pittston PA: | | | | | | | | | | | | |
| 1.000%, 11/15/2022 (Insured by BAM) | | | 100,000 | | | | 100,276 | | | | | |
| 4.000%, 11/15/2023 (Insured by BAM) | | | 175,000 | | | | 189,938 | | | | | |
| 4.000%, 11/15/2024 (Insured by BAM) | | | 265,000 | | | | 294,089 | | | | | |
| 4.000%, 11/15/2025 (Insured by BAM) | | | 275,000 | | | | 312,147 | | | | | |
| 4.000%, 11/15/2026 | | | | | | | | | | | | |
| (Callable 11/15/2025) (Insured by BAM) | | | 140,000 | | | | 158,134 | | | | | |
| 4.000%, 11/15/2027 | | | | | | | | | | | | |
| (Callable 11/15/2025) (Insured by BAM) | | | 125,000 | | | | 140,304 | | | | | |
| City of Wilkes-Barre PA: | | | | | | | | | | | | |
| 4.000%, 11/15/2025 (Insured by BAM) | | | 200,000 | | | | 226,916 | | | | | |
| 4.000%, 11/15/2026 (Insured by BAM) | | | 595,000 | | | | 686,993 | | | | | |
| 4.000%, 11/15/2027 (Insured by BAM) | | | 1,000,000 | | | | 1,167,620 | | | | | |
| City of York PA, | | | | | | | | | | | | |
| 5.000%, 11/15/2025 | | | 1,505,000 | | | | 1,585,382 | | | | | |
| Coatesville School District, | | | | | | | | | | | | |
| 5.000%, 08/01/2023 (Insured by AGM) | | | 150,000 | | | | 166,450 | | | | | |
| Commonwealth Financing Authority: | | | | | | | | | | | | |
| 5.000%, 06/01/2022 | | | 265,000 | | | | 281,597 | | | | | |
| 5.000%, 06/01/2023 | | | 225,000 | | | | 248,796 | | | | | |
| Commonwealth of Pennsylvania, | | | | | | | | | | | | |
| 3.750%, 10/01/2021 (Callable 02/01/2021) | | | 175,000 | | | | 175,404 | | | | | |
| County of Allegheny PA, | | | | | | | | | | | | |
| 0.693%, 11/01/2026 (3 Month LIBOR USD + 0.550%) | | | | | | | | | | | | |
(Callable 02/01/2021) (Insured by AGM)(2) | | | 650,000 | | | | 649,103 | | | | | |
| County of Lackawanna PA, | | | | | | | | | | | | |
| 3.000%, 03/15/2021 (Insured by BAM) | | | 215,000 | | | | 216,092 | | | | | |
| County of McKean PA: | | | | | | | | | | | | |
| 4.000%, 11/01/2022 (Insured by BAM) | | | 120,000 | | | | 127,360 | | | | | |
| 4.000%, 11/01/2023 (Insured by BAM) | | | 395,000 | | | | 432,102 | | | | | |
The accompanying notes are an integral part of these financial statements.
Baird Short-Term Municipal Bond Fund
Schedule of Investments, December 31, 2020
Long-Term Investments (cont.)
| | | Principal | | | | | | % of | |
| | | Amount | | | Value | | | Net Assets | |
| Crawford Central School District: | | | | | | | | | |
| 4.000%, 02/15/2022 (Insured by BAM) | | $ | 275,000 | | | $ | 286,151 | | | |
|
|
| 4.000%, 02/15/2024 (Insured by BAM) | | | 1,505,000 | | | | 1,660,436 | | | | | |
| 4.000%, 02/15/2025 (Insured by BAM) | | | 2,455,000 | | | | 2,784,633 | | | | | |
| Cumberland County Municipal Authority: | | | | | | | | | | | | |
| 5.000%, 01/01/2029 (Pre-refunded to 01/01/2025) | | | 190,000 | | | | 224,717 | | | | | |
| 5.000%, 01/01/2029 (Callable 01/01/2025) | | | 935,000 | | | | 1,032,193 | | | | | |
| Delaware Valley Regional Finance Authority: | | | | | | | | | | | | |
| 0.600%, 09/01/2048 | | | | | | | | | | | | |
| (SIFMA Municipal Swap Index + 0.530%) | | | | | | | | | | | | |
| (Callable 09/01/2022) | | | | | | | | | | | | |
(Mandatory Tender Date 09/01/2023)(2) | | | 5,000,000 | | | | 4,993,700 | | | | | |
| 0.856%, 09/01/2048 (1 Month LIBOR USD + 0.760%) | | | | | | | | | | | | |
| (Callable 09/01/2023) | | | | | | | | | | | | |
(Mandatory Tender Date 09/01/2024)(2) | | | 2,000,000 | | | | 2,000,240 | | | | | |
| 0.976%, 09/01/2048 (1 Month LIBOR USD + 0.880%) | | | | | | | | | | | | |
| (Callable 09/01/2024) | | | | | | | | | | | | |
(Mandatory Tender Date 09/01/2025)(2) | | | 2,000,000 | | | | 2,003,600 | | | | | |
| 0.190%, 11/01/2055 | | | | | | | | | | | | |
| (SIFMA Municipal Swap Index + 0.210%) | | | | | | | | | | | | |
(Callable 01/04/2021) (Optional Put Date 01/07/2021)(1) | | | 6,100,000 | | | | 6,100,000 | | | | | |
| East Allegheny School District, | | | | | | | | | | | | |
| 0.000%, 11/15/2021 (Insured by AGM) | | | 480,000 | | | | 477,859 | | | | | |
| East Hempfield Township | | | | | | | | | | | | |
| Industrial Development Authority, | | | | | | | | | | | | |
| 5.000%, 07/01/2029 (Callable 07/01/2024) | | | 1,730,000 | | | | 1,756,279 | | | | | |
| Eastern York School District, | | | | | | | | | | | | |
| 2.250%, 09/01/2025 | | | | | | | | | | | | |
| (Callable 02/01/2021) (Insured by BAM) | | | 655,000 | | | | 655,688 | | | | | |
| Easton Area School District, | | | | | | | | | | | | |
| 4.000%, 04/01/2030 | | | | | | | | | | | | |
| (Callable 10/01/2024) (Insured by ST AID) | | | 1,150,000 | | | | 1,275,902 | | | | | |
| Elizabeth Forward School District, | | | | | | | | | | | | |
| 0.000%, 09/01/2022 (ETM) (Insured by NATL) | | | 250,000 | | | | 248,353 | | | | | |
| Erie City Water Authority, | | | | | | | | | | | | |
| 4.000%, 12/01/2025 | | | | | | | | | | | | |
| (Pre-refunded to 12/01/2022) (Insured by AGM) | | | 385,000 | | | | 411,969 | | | | | |
| Greater Hazleton Joint Sewer Authority: | | | | | | | | | | | | |
| 4.000%, 05/15/2022 (Insured by BAM) | | | 255,000 | | | | 267,985 | | | | | |
| 4.000%, 05/15/2023 (Insured by BAM) | | | 460,000 | | | | 497,674 | | | | | |
| 4.000%, 05/15/2024 (Insured by BAM) | | | 325,000 | | | | 362,820 | | | | | |
| 4.000%, 05/15/2025 (Insured by BAM) | | | 255,000 | | | | 292,541 | | | | | |
| Hamburg Area School District, | | | | | | | | | | | | |
| 4.000%, 04/01/2024 (Insured by ST AID) | | | 845,000 | | | | 936,936 | | | | | |
The accompanying notes are an integral part of these financial statements.
Baird Short-Term Municipal Bond Fund
Schedule of Investments, December 31, 2020
Long-Term Investments (cont.)
| | | Principal | | | | | | % of | |
| | | Amount | | | Value | | | Net Assets | |
| Hazleton Area School District, | | | | | | | | | |
| 4.000%, 03/01/2025 (Insured by BAM) | | $ | 430,000 | | | $ | 485,883 | | | |
|
|
| Indiana Area School District, | | | | | | | | | | | | |
| 2.250%, 09/01/2022 | | | | | | | | | | | | |
| (Callable 02/01/2021) (Insured by BAM) | | | 950,000 | | | | 950,741 | | | | | |
| Lackawanna County Industrial Development Authority, | | | | | | | | | | | | |
| 5.000%, 11/01/2021 | | | 450,000 | | | | 466,097 | | | | | |
| Lancaster City Parking Authority, | | | | | | | | | | | | |
| 3.000%, 12/01/2027 (Insured by BAM) | | | 645,000 | | | | 727,592 | | | | | |
| Lancaster Higher Education Authority, | | | | | | | | | | | | |
| 5.000%, 10/01/2022 (Insured by BAM) | | | 35,000 | | | | 37,800 | | | | | |
| Lancaster Industrial Development Authority, | | | | | | | | | | | | |
| 5.000%, 05/01/2022 (ETM) | | | 45,000 | | | | 47,851 | | | | | |
| Lehigh County Industrial Development Authority, | | | | | | | | | | | | |
| 1.800%, 09/01/2029 | | | | | | | | | | | | |
(Mandatory Tender Date 09/01/2022)(1) | | | 5,090,000 | | | | 5,205,747 | | | | | |
| Lycoming County Authority: | | | | | | | | | | | | |
| 2.000%, 11/01/2035 | | | | | | | | | | | | |
(Mandatory Tender Date 11/01/2022)(1) | | | 1,000,000 | | | | 1,000,000 | | | | | |
| 4.000%, 11/01/2043 | | | | | | | | | | | | |
(Mandatory Tender Date 05/01/2024)(1) | | | 1,260,000 | | | | 1,338,788 | | | | | |
| Montgomery County Higher | | | | | | | | | | | | |
| Education & Health Authority, | | | | | | | | | | | | |
| 3.000%, 05/01/2036 | | | | | | | | | | | | |
(Mandatory Tender Date 05/01/2021)(1) | | | 1,660,000 | | | | 1,668,532 | | | | | |
| Montgomery County Industrial Development Authority: | | | | | | | | | | | | |
| 4.000%, 12/01/2021 | | | 100,000 | | | | 102,385 | | | | | |
| 4.000%, 12/01/2022 | | | 90,000 | | | | 94,341 | | | | | |
| 4.000%, 12/01/2023 | | | 125,000 | | | | 133,857 | | | | | |
| 4.000%, 12/01/2024 | | | 200,000 | | | | 218,424 | | | | | |
| 4.000%, 12/01/2025 | | | 200,000 | | | | 222,294 | | | | | |
| North East School District, | | | | | | | | | | | | |
| 2.000%, 09/01/2021 | | | | | | | | | | | | |
| (Callable 02/01/2021) (Insured by BAM) | | | 445,000 | | | | 445,507 | | | | | |
| North Penn Water Authority, | | | | | | | | | | | | |
| 0.630%, 11/01/2024 | | | | | | | | | | | | |
| (SIFMA Municipal Swap Index + 0.560%) | | | | | | | | | | | | |
(Callable 11/01/2023)(2) | | | 845,000 | | | | 839,955 | | | | | |
| North Pocono School District, | | | | | | | | | | | | |
| 4.000%, 03/15/2024 (Insured by BAM) | | | 230,000 | | | | 254,918 | | | | | |
| Northampton County General Purpose Authority: | | | | | | | | | | | | |
| 5.000%, 10/01/2021 | | | 100,000 | | | | 101,719 | | | | | |
| 1.141%, 08/15/2048 (1 Month LIBOR USD + 1.040%) | | | | | | | | | | | | |
| (Callable 02/15/2023) | | | | | | | | | | | | |
(Mandatory Tender Date 08/15/2024)(2) | | | 75,000 | | | | 75,272 | | | | | |
The accompanying notes are an integral part of these financial statements.
Baird Short-Term Municipal Bond Fund
Schedule of Investments, December 31, 2020
Long-Term Investments (cont.)
| | | Principal | | | | | | % of | |
| | | Amount | | | Value | | | Net Assets | |
| Octorara Area School District, | | | | | | | | | |
| 4.000%, 04/01/2025 (Insured by AGM) | | $ | 355,000 | | | $ | 406,333 | | | |
|
|
| Palmyra Area School District, | | | | | | | | | | | | |
| 5.000%, 06/01/2030 | | | | | | | | | | | | |
| (Callable 06/01/2025) (Insured by ST AID) | | | 400,000 | | | | 474,920 | | | | | |
| Pennsylvania Economic Development Financing Authority, | | | | | | | | | | | | |
| 2.800%, 12/01/2033 | | | | | | | | | | | | |
(Mandatory Tender Date 12/01/2021)(1) | | | 720,000 | | | | 736,200 | | | | | |
| Pennsylvania Higher Educational Facilities Authority: | | | | | | | | | | | | |
| 5.000%, 08/15/2024 (Pre-refunded to 08/15/2021) | | | 185,000 | | | | 190,513 | | | | | |
| 5.000%, 05/01/2025 | | | 575,000 | | | | 675,625 | | | | | |
| 5.000%, 05/01/2026 | | | 570,000 | | | | 689,683 | | | | | |
| 2.850%, 05/01/2034 | | | | | | | | | | | | |
(Mandatory Tender Date 05/01/2021)(1) | | | 495,000 | | | | 497,821 | | | | | |
| Pennsylvania Housing Finance Agency: | | | | | | | | | | | | |
| 2.450%, 07/01/2022 | | | | | | | | | | | | |
(Mandatory Tender Date 07/01/2021)(1) | | | 2,500,000 | | | | 2,525,875 | | | | | |
| 3.700%, 10/01/2042 (Callable 10/01/2021) | | | 155,000 | | | | 156,386 | | | | | |
| 4.000%, 10/01/2046 (Callable 04/01/2026) | | | 130,000 | | | | 139,925 | | | | | |
| 4.000%, 10/01/2049 (Callable 10/01/2028) | | | 5,560,000 | | | | 6,044,165 | | | | | |
| Pennsylvania Turnpike Commission: | | | | | | | | | | | | |
| 1.050%, 12/01/2021 | | | | | | | | | | | | |
| (SIFMA Municipal Swap Index + 0.980%) | | | | | | | | | | | | |
(Callable 06/01/2021)(2) | | | 1,010,000 | | | | 1,012,717 | | | | | |
| 5.000%, 12/01/2022 | | | 50,000 | | | | 54,013 | | | | | |
| 0.000%, 12/01/2023 | | | 85,000 | | | | 82,409 | | | | | |
| 0.770%, 12/01/2023 | | | | | | | | | | | | |
| (SIFMA Municipal Swap Index + 0.700%) | | | | | | | | | | | | |
(Callable 12/01/2022)(2) | | | 2,150,000 | | | | 2,160,750 | | | | | |
5.000%, 12/01/2028(7) | | | 360,000 | | | | 436,622 | | | | | |
| Perkasie Regional Authority, | | | | | | | | | | | | |
| 4.000%, 02/01/2023 (Insured by BAM) | | | 460,000 | | | | 492,959 | | | | | |
| Pittsburgh Water & Sewer Authority, | | | | | | | | | | | | |
| 0.720%, 09/01/2040 (1 Month LIBOR USD + 0.650%) | | | | | | | | | | | | |
| (Callable 06/01/2023) | | | | | | | | | | | | |
| (Mandatory Tender Date 12/01/2023) | | | | | | | | | | | | |
(Insured by AGM)(2) | | | 11,000,000 | | | | 11,026,620 | | | | | |
| Public Parking Authority Of Pittsburgh: | | | | | | | | | | | | |
| 5.000%, 12/01/2026 (Pre-refunded to 06/01/2025) | | | 285,000 | | | | 342,886 | | | | | |
| 5.000%, 12/01/2026 (Callable 06/01/2025) | | | 415,000 | | | | 480,342 | | | | | |
| Quakertown Community School District, | | | | | | | | | | | | |
| 2.150%, 08/01/2025 | | | | | | | | | | | | |
| (Callable 02/01/2021) (Insured by ST AID) | | | 1,090,000 | | | | 1,091,537 | | | | | |
| Reading School District: | | | | | | | | | | | | |
| 4.000%, 04/01/2023 (Insured by BAM) | | | 160,000 | | | | 172,328 | | | | | |
The accompanying notes are an integral part of these financial statements.
Baird Short-Term Municipal Bond Fund
Schedule of Investments, December 31, 2020
Long-Term Investments (cont.)
| | | Principal | | | | | | % of | |
| | | Amount | | | Value | | | Net Assets | |
| Reading School District: (cont.) | | | | | | | | | |
| 4.000%, 04/01/2023 (Insured by BAM) | | $ | 565,000 | | | $ | 608,533 | | | |
|
|
| 5.000%, 04/01/2023 (Insured by BAM) | | | 750,000 | | | | 823,042 | | | | | |
| 4.000%, 04/01/2024 (Insured by BAM) | | | 615,000 | | | | 681,912 | | | | | |
| 5.000%, 04/01/2024 (Insured by BAM) | | | 2,250,000 | | | | 2,564,528 | | | | | |
| Sayre Area School District: | | | | | | | | | | | | |
| 3.000%, 05/15/2022 (Insured by BAM) | | | 25,000 | | | | 25,822 | | | | | |
| 3.000%, 05/15/2024 (Insured by BAM) | | | 25,000 | | | | 27,008 | | | | | |
| Sayre Health Care Facilities Authority, | | | | | | | | | | | | |
| 0.931%, 12/01/2024 (3 Month LIBOR USD + 0.780%) | | | | | | | | | | | | |
(Callable 02/01/2021)(2) | | | 200,000 | | | | 199,616 | | | | | |
| School District of Philadelphia: | | | | | | | | | | | | |
| 5.000%, 06/01/2024 | | | 345,000 | | | | 392,593 | | | | | |
| 5.000%, 09/01/2025 (Insured by ST AID) | | | 135,000 | | | | 160,847 | | | | | |
| 5.000%, 09/01/2025 (Insured by ST AID) | | | 500,000 | | | | 595,730 | | | | | |
| 5.000%, 09/01/2026 (Insured by ST AID) | | | 1,000,000 | | | | 1,225,430 | | | | | |
| School District of Reading, | | | | | | | | | | | | |
| 5.000%, 03/01/2024 (Insured by AGM) | | | 100,000 | | | | 113,625 | | | | | |
| School District of the City of Erie: | | | | | | | | | | | | |
| 5.000%, 04/01/2023 (Insured by AGM) | | | 265,000 | | | | 290,808 | | | | | |
| 5.000%, 04/01/2024 (Insured by AGM) | | | 230,000 | | | | 262,152 | | | | | |
| 5.000%, 04/01/2024 (Insured by AGM) | | | 250,000 | | | | 284,948 | | | | | |
| Scranton School District, | | | | | | | | | | | | |
| 0.947%, 04/01/2031 (1 Month LIBOR USD + 0.850%) | | | | | | | | | | | | |
| (Callable 12/01/2022) | | | | | | | | | | | | |
| (Mandatory Tender Date 06/01/2023) | | | | | | | | | | | | |
(Insured by ST AID)(2) | | | 4,975,000 | | | | 4,974,304 | | | | | |
| Scranton-Lackawanna Health and Welfare Authority: | | | | | | | | | | | | |
| 5.000%, 11/01/2023 | | | 35,000 | | | | 39,181 | | | | | |
| 5.000%, 11/01/2025 | | | 40,000 | | | | 47,984 | | | | | |
| State Public School Building Authority, | | | | | | | | | | | | |
| 5.000%, 12/01/2027 | | | | | | | | | | | | |
| (Callable 12/01/2026) (Insured by AGM) | | | 1,090,000 | | | | 1,355,677 | | | | | |
| Steel Valley School District: | | | | | | | | | | | | |
| 3.000%, 11/01/2021 (Insured by BAM) | | | 50,000 | | | | 50,974 | | | | | |
| 4.000%, 11/01/2022 (Insured by BAM) | | | 190,000 | | | | 201,332 | | | | | |
| 4.000%, 11/01/2024 (Insured by BAM) | | | 260,000 | | | | 291,065 | | | | | |
| 4.000%, 11/01/2024 (Insured by BAM) | | | 50,000 | | | | 55,974 | | | | | |
| 4.000%, 11/01/2025 (Insured by BAM) | | | 270,000 | | | | 309,479 | | | | | |
| 4.000%, 11/01/2025 (Insured by BAM) | | | 50,000 | | | | 57,311 | | | | | |
| 4.000%, 11/01/2026 (Insured by BAM) | | | 280,000 | | | | 326,172 | | | | | |
| Township of Hampton PA, | | | | | | | | | | | | |
| 5.900%, 02/01/2023 | | | 125,000 | | | | 138,104 | | | | | |
| Township of North Fayette PA, | | | | | | | | | | | | |
| 4.000%, 04/15/2025 (Callable 04/15/2024) | | | 210,000 | | | | 233,318 | | | | | |
The accompanying notes are an integral part of these financial statements.
Baird Short-Term Municipal Bond Fund
Schedule of Investments, December 31, 2020
Long-Term Investments (cont.)
| | | Principal | | | | | | % of | |
| | | Amount | | | Value | | | Net Assets | |
| University of Pittsburgh-of the | | | | | | | | | |
| Commonwealth System of Higher Education: | | | | | | | | | |
| 0.310%, 09/15/2021 | | | | | | | | | |
| (SIFMA Municipal Swap Index + 0.240%) | | | | | | | | | |
(Callable 03/15/2021)(2) | | $ | 100,000 | | | $ | 100,022 | | | | |
| 0.430%, 02/15/2024 | | | | | | | | | | | |
| (SIFMA Municipal Swap Index + 0.360%) | | | | | | | | | | | |
(Callable 08/15/2023)(2) | | | 2,500,000 | | | | 2,509,425 | | | | |
| West Cornwall Township Municipal Authority, | | | | | | | | | | | |
| 0.070%, 01/01/2037 (Callable 01/04/2021) | | | | | | | | | | | |
(Optional Put Date 01/07/2021)(1) | | | 1,840,000 | | | | 1,840,000 | | | | |
| Westmoreland County Industrial Development Authority: | | | | | | | | | | | |
| 4.000%, 07/01/2023 | | | 375,000 | | | | 399,634 | | | | |
| 4.000%, 07/01/2024 | | | 450,000 | | | | 490,104 | | | | |
| 4.000%, 07/01/2025 | | | 550,000 | | | | 611,017 | | | | |
| 4.000%, 07/01/2026 | | | 625,000 | | | | 706,200 | | | | |
| Westmoreland County Municipal Authority, | | | | | | | | | | | |
| 0.000%, 08/15/2023 (ETM) | | | 220,000 | | | | 216,810 | | | | |
| Wilkes-Barre Finance Authority, | | | | | | | | | | | |
| 5.000%, 11/01/2024 | | | 40,000 | | | | 46,429 | | | | |
| York City School District, | | | | | | | | | | | |
| 4.000%, 05/01/2025 (Insured by BAM) | | | 3,070,000 | | | | 3,530,868 | | | | |
| Total Pennsylvania | | | | | | | | | | | |
| (Cost $118,523,352) | | | | | | | 120,060,491 | | | | 7.4 | % |
| Puerto Rico | | | | | | | | | | | | |
| Puerto Rico Highway & Transportation Authority, | | | | | | | | | | | | |
| 4.600%, 07/01/2022 (ETM) (Insured by NATL) | | | 25,000 | | | | 26,596 | | | | | |
| Puerto Rico Public Finance Corp.: | | | | | | | | | | | | |
| 5.125%, 06/01/2024 (Insured by AMBAC) | | | 305,000 | | | | 328,244 | | | | | |
| 6.000%, 08/01/2026 (ETM) (Insured by AGC) | | | 375,000 | | | | 484,616 | | | | | |
| Total Puerto Rico | | | | | | | | | | | | |
| (Cost $790,763) | | | | | | | 839,456 | | | | 0.1 | % |
| Rhode Island | | | | | | | | | | | | |
| Providence Public Buildings Authority, | | | | | | | | | | | | |
| 5.125%, 06/15/2021 (Insured by AGM) | | | 140,000 | | | | 142,820 | | | | | |
| Rhode Island Health and Educational Building Corp., | | | | | | | | | | | | |
| 0.070%, 06/01/2035 (Callable 01/01/2021) | | | | | | | | | | | | |
(Optional Put Date 01/04/2021)(1) | | | 3,205,000 | | | | 3,205,000 | | | | | |
| Rhode Island Housing & Mortgage Finance Corp.: | | | | | | | | | | | | |
| 3.500%, 10/01/2046 (Callable 04/01/2025) | | | 30,000 | | | | 30,978 | | | | | |
| 3.750%, 10/01/2049 (Callable 04/01/2029) | | | 2,225,000 | | | | 2,473,043 | | | | | |
| Total Rhode Island | | | | | | | | | | | | |
| (Cost $5,778,939) | | | | | | | 5,851,841 | | | | 0.4 | % |
The accompanying notes are an integral part of these financial statements.
Baird Short-Term Municipal Bond Fund
Schedule of Investments, December 31, 2020
Long-Term Investments (cont.)
| | | Principal | | | | | | % of | |
| | | Amount | | | Value | | | Net Assets | |
| South Carolina | | | | | | | | | |
| Barnwell Facilities Corp.: | | | | | | | | | |
| 5.000%, 09/01/2023 (Insured by BAM) | | $ | 285,000 | | | $ | 318,528 | | | |
|
|
| 5.000%, 09/01/2024 (Insured by BAM) | | | 280,000 | | | | 324,514 | | | | | |
| City of Myrtle Beach SC, | | | | | | | | | | | | |
| 5.000%, 10/01/2027 (Callable 10/01/2026) | | | 1,000,000 | | | | 1,224,250 | | | | | |
| City of Walhalla SC, | | | | | | | | | | | | |
| 5.000%, 06/01/2023 (Insured by BAM) | | | 320,000 | | | | 354,170 | | | | | |
| Greenville Health System, | | | | | | | | | | | | |
| 5.000%, 05/01/2026 (Callable 05/01/2022) | | | 1,045,000 | | | | 1,102,674 | | | | | |
| Greenwood Fifty School Facilities, Inc., | | | | | | | | | | | | |
| 5.000%, 12/01/2027 | | | | | | | | | | | | |
| (Callable 06/01/2026) (Insured by BAM) | | | 1,125,000 | | | | 1,367,077 | | | | | |
| Patriots Energy Group Financing Agency, | | | | | | | | | | | | |
| 0.956%, 10/01/2048 (1 Month LIBOR USD + 0.860%) | | | | | | | | | | | | |
| (Callable 11/01/2023) | | | | | | | | | | | | |
(Mandatory Tender Date 02/01/2024)(2) | | | 1,500,000 | | | | 1,505,940 | | | | | |
| Piedmont Municipal Power Agency: | | | | | | | | | | | | |
| 5.375%, 01/01/2025 (ETM) (Insured by NATL) | | | 230,000 | | | | 269,983 | | | | | |
| 5.000%, 01/01/2029 (Callable 01/01/2025) | | | 1,000,000 | | | | 1,152,160 | | | | | |
| South Carolina Jobs-Economic Development Authority: | | | | | | | | | | | | |
| 5.250%, 08/01/2030 (Pre-refunded to 08/01/2023) | | | 110,000 | | | | 124,154 | | | | | |
| 6.000%, 08/01/2031 | | | | | | | | | | | | |
| (Pre-refunded to 08/01/2021) (Insured by AGM) | | | 125,000 | | | | 129,159 | | | | | |
| 6.500%, 08/01/2039 | | | | | | | | | | | | |
| (Pre-refunded to 08/01/2021) (Insured by AGM) | | | 1,570,000 | | | | 1,626,347 | | | | | |
| South Carolina State Housing | | | | | | | | | | | | |
| Finance & Development Authority: | | | | | | | | | | | | |
| 4.000%, 07/01/2036 | | | | | | | | | | | | |
| (Callable 07/01/2025) (Insured by GNMA) | | | 155,000 | | | | 168,485 | | | | | |
| 4.000%, 07/01/2047 (Callable 01/01/2027) | | | 585,000 | | | | 634,719 | | | | | |
| 4.500%, 07/01/2048 (Callable 07/01/2027) | | | 465,000 | | | | 517,294 | | | | | |
| 4.000%, 01/01/2050 (Callable 07/01/2028) | | | 2,360,000 | | | | 2,676,925 | | | | | |
| 4.000%, 07/01/2050 (Callable 07/01/2029) | | | 1,980,000 | | | | 2,262,110 | | | | | |
| South Carolina Transportation Infrastructure Bank, | | | | | | | | | | | | |
| 0.546%, 10/01/2031 (1 Month LIBOR USD + 0.450%) | | | | | | | | | | | | |
| (Callable 10/01/2021) | | | | | | | | | | | | |
(Mandatory Tender Date 10/01/2022)(2) | | | 12,575,000 | | | | 12,558,149 | | | | | |
| Spartanburg Regional Health Services District: | | | | | | | | | | | | |
| 5.000%, 04/15/2023 (Insured by AGM) | | | 350,000 | | | | 385,256 | | | | | |
| 5.000%, 04/15/2024 (Callable 04/15/2022) | | | 845,000 | | | | 890,207 | | | | | |
| University of South Carolina, | | | | | | | | | | | | |
| 5.000%, 05/01/2027 | | | 785,000 | | | | 974,373 | | | | | |
| Total South Carolina | | | | | | | | | | | | |
| (Cost $29,910,134) | | | | | | | 30,566,474 | | | | 1.9 | % |
The accompanying notes are an integral part of these financial statements.
Baird Short-Term Municipal Bond Fund
Schedule of Investments, December 31, 2020
Long-Term Investments (cont.)
| | | Principal | | | | | | % of | |
| | | Amount | | | Value | | | Net Assets | |
| South Dakota | | | | | | | | | |
| Aberdeen School District No. 6-1, | | | | | | | | | |
| 2.200%, 01/01/2023 (Callable 02/01/2021) | | $ | 255,000 | | | $ | 255,331 | | | | |
| City of Rapid City SD, | | | | | | | | | | | |
| 5.000%, 12/01/2025 | | | 310,000 | | | | 365,202 | | | | |
| Total South Dakota | | | | | | | | | | | |
| (Cost $610,827) | | | | | | | 620,533 | | | | 0.0 | % |
| Tennessee | | | | | | | | | | | | |
| City of Cleveland TN, | | | | | | | | | | | | |
| 5.000%, 12/01/2027 | | | 3,320,000 | | | | 4,306,372 | | | | | |
| City of Jackson TN: | | | | | | | | | | | | |
| 5.000%, 04/01/2024 | | | 250,000 | | | | 284,688 | | | | | |
| 5.000%, 04/01/2027 (Callable 04/01/2025) | | | 665,000 | | | | 777,318 | | | | | |
| Clarksville Natural Gas Acquisition Corp., | | | | | | | | | | | | |
| 5.000%, 12/15/2021 | | | 185,000 | | | | 192,959 | | | | | |
| County of Hardin TN: | | | | | | | | | | | | |
| 5.000%, 06/01/2021 (Insured by AGM) | | | 1,420,000 | | | | 1,447,150 | | | | | |
| 5.000%, 06/01/2022 (Insured by AGM) | | | 1,465,000 | | | | 1,564,723 | | | | | |
| Hollow Rock-Bruceton Special School District, | | | | | | | | | | | | |
| 3.000%, 04/01/2023 | | | 346,000 | | | | 365,369 | | | | | |
| Knox County Health Educational & | | | | | | | | | | | | |
| Housing Facility Board: | | | | | | | | | | | | |
| 1.500%, 07/01/2022 | | | | | | | | | | | | |
(Mandatory Tender Date 07/01/2021)(1) | | | 650,000 | | | | 653,711 | | | | | |
| 5.000%, 11/15/2022 | | | 400,000 | | | | 432,056 | | | | | |
| 5.000%, 04/01/2024 | | | 190,000 | | | | 212,785 | | | | | |
| Memphis Health Educational & Housing Facility Board, | | | | | | | | | | | | |
| 6.750%, 12/01/2046 (Pre-refunded to 06/01/2021) | | | 865,000 | | | | 887,412 | | | | | |
| Nashville & Davidson County Metropolitan Government, | | | | | | | | | | | | |
| 0.000%, 06/01/2021 (ETM) | | | 30,000 | | | | 29,967 | | | | | |
| Tennessee Energy Acquisition Corp., | | | | | | | | | | | | |
| 5.625%, 09/01/2026 | | | 6,705,000 | | | | 8,267,869 | | | | | |
| Tennessee Housing Development Agency: | | | | | | | | | | | | |
| 4.000%, 07/01/2025 (Callable 01/02/2021) | | | 160,000 | | | | 160,000 | | | | | |
| 3.050%, 07/01/2029 (Callable 07/01/2024) | | | 135,000 | | | | 142,879 | | | | | |
| 3.600%, 01/01/2031 (Callable 01/01/2023) | | | 1,450,000 | | | | 1,508,159 | | | | | |
| 3.850%, 07/01/2032 (Callable 01/01/2025) | | | 1,590,000 | | | | 1,727,599 | | | | | |
| 4.000%, 07/01/2039 (Callable 01/01/2024) | | | 795,000 | | | | 839,305 | | | | | |
| 4.200%, 07/01/2042 (Callable 01/01/2022) | | | 350,000 | | | | 354,662 | | | | | |
| 4.000%, 01/01/2043 (Callable 07/01/2027) | | | 710,000 | | | | 778,430 | | | | | |
| 3.800%, 07/01/2043 (Callable 01/01/2022) | | | 200,000 | | | | 202,664 | | | | | |
| 4.000%, 01/01/2046 (Callable 01/01/2025) | | | 25,000 | | | | 26,858 | | | | | |
| 3.750%, 01/01/2050 (Callable 01/01/2029) | | | 2,145,000 | | | | 2,411,688 | | | | | |
| 3.000%, 01/01/2051 (Callable 01/01/2030) | | | 5,000,000 | | | | 5,498,750 | | | | | |
The accompanying notes are an integral part of these financial statements.
Baird Short-Term Municipal Bond Fund
Schedule of Investments, December 31, 2020
Long-Term Investments (cont.)
| | | Principal | | | | | | % of | |
| | | Amount | | | Value | | | Net Assets | |
| Wilson County Water & Wastewater Authority, | | | | | | | | | |
| 0.000%, 03/01/2022 | | $ | 300,000 | | | $ | 296,136 | | | | |
| Total Tennessee | | | | | | | | | | | |
| (Cost $32,490,725) | | | | | | | 33,369,509 | | | | 2.1 | % |
| Texas | | | | | | | | | | | | |
| Alvin Independent School District, | | | | | | | | | | | | |
| 1.250%, 02/15/2033 | | | | | | | | | | | | |
| (Mandatory Tender Date 08/15/2022) | | | | | | | | | | | | |
(PSF Guaranteed)(1) | | | 300,000 | | | | 304,578 | | | | | |
| Arlington Higher Education Finance Corp.: | | | | | | | | | | | | |
| 5.000%, 08/15/2021 (PSF Guaranteed) | | | 1,290,000 | | | | 1,326,507 | | | | | |
| 5.000%, 08/15/2021 (PSF Guaranteed) | | | 375,000 | | | | 385,613 | | | | | |
| 5.000%, 08/15/2022 (PSF Guaranteed) | | | 350,000 | | | | 375,123 | | | | | |
| 5.000%, 08/15/2023 (PSF Guaranteed) | | | 325,000 | | | | 362,157 | | | | | |
| 5.000%, 08/15/2024 (PSF Guaranteed) | | | 535,000 | | | | 618,417 | | | | | |
| 5.000%, 08/15/2025 (PSF Guaranteed) | | | 50,000 | | | | 60,393 | | | | | |
| 4.000%, 08/15/2026 (PSF Guaranteed) | | | 200,000 | | | | 233,880 | | | | | |
| Bandera Independent School District, | | | | | | | | | | | | |
| 5.000%, 02/15/2024 (PSF Guaranteed) | | | 460,000 | | | | 527,339 | | | | | |
| Beaumont Independent School District, | | | | | | | | | | | | |
| 5.000%, 02/15/2025 (PSF Guaranteed) | | | 170,000 | | | | 202,604 | | | | | |
| Boerne Public Facilities Corp., | | | | | | | | | | | | |
| 2.750%, 11/01/2022 | | | | | | | | | | | | |
(Mandatory Tender Date 11/01/2021)(1) | | | 265,000 | | | | 270,305 | | | | | |
| Brazoria County Municipal Utility District No. 17, | | | | | | | | | | | | |
| 4.000%, 09/01/2024 | | | | | | | | | | | | |
| (Callable 09/01/2023) (Insured by MAC) | | | 175,000 | | | | 190,375 | | | | | |
| Bryson Independent School District, | | | | | | | | | | | | |
| 4.000%, 08/15/2030 | | | | | | | | | | | | |
| (Callable 08/15/2027) (PSF Guaranteed) | | | 785,000 | | | | 941,325 | | | | | |
| Caney Creek Municipal Utility District: | | | | | | | | | | | | |
| 5.000%, 03/01/2022 | | | 345,000 | | | | 361,384 | | | | | |
| 5.000%, 03/01/2023 | | | 365,000 | | | | 395,963 | | | | | |
| 5.000%, 03/01/2025 | | | 405,000 | | | | 468,034 | | | | | |
| Capital Area Housing Finance Corp., | | | | | | | | | | | | |
| 2.100%, 09/01/2037 (Callable 08/01/2021) | | | | | | | | | | | | |
(Mandatory Tender Date 09/01/2022)(1) | | | 1,615,000 | | | | 1,628,921 | | | | | |
| Central Texas Regional Mobility Authority, | | | | | | | | | | | | |
| 5.000%, 01/01/2022 | | | 460,000 | | | | 480,392 | | | | | |
| Central Texas Turnpike System: | | | | | | | | | | | | |
| 5.000%, 08/15/2023 | | | 205,000 | | | | 229,688 | | | | | |
| 0.000%, 08/15/2024 (ETM) (Insured by AMBAC) | | | 700,000 | | | | 691,215 | | | | | |
| 5.000%, 08/15/2027 (Callable 08/15/2024) | | | 330,000 | | | | 381,681 | | | | | |
The accompanying notes are an integral part of these financial statements.
Baird Short-Term Municipal Bond Fund
Schedule of Investments, December 31, 2020
Long-Term Investments (cont.)
| | | Principal | | | | | | % of | |
| | | Amount | | | Value | | | Net Assets | |
| Cibolo Canyons Special Improvement District: | | | | | | | | | |
| 5.000%, 08/15/2021 (Insured by AGM) | | $ | 65,000 | | | $ | 66,811 | | | |
|
|
| 5.000%, 08/15/2022 (Insured by AGM) | | | 365,000 | | | | 391,627 | | | | | |
| Cimarron Municipal Utility District, | | | | | | | | | | | | |
| 4.000%, 03/01/2025 (Insured by AGM) | | | 70,000 | | | | 79,497 | | | | | |
| Cinco Municipal Utility District, | | | | | | | | | | | | |
| 4.000%, 12/01/2023 (Insured by BAM) | | | 690,000 | | | | 757,924 | | | | | |
| City of Dallas TX, | | | | | | | | | | | | |
| 5.000%, 02/15/2027 (Callable 02/15/2024) | | | 535,000 | | | | 609,558 | | | | | |
| City of Elgin TX: | | | | | | | | | | | | |
| 4.000%, 07/15/2023 (Insured by AGM) | | | 155,000 | | | | 167,713 | | | | | |
| 4.000%, 07/15/2023 (Insured by BAM) | | | 50,000 | | | | 54,114 | | | | | |
| City of Hearne TX: | | | | | | | | | | | | |
| 3.000%, 08/01/2022 (Insured by BAM) | | | 225,000 | | | | 232,789 | | | | | |
| 3.000%, 08/01/2023 (Insured by BAM) | | | 230,000 | | | | 242,852 | | | | | |
| 3.000%, 08/01/2024 (Insured by BAM) | | | 240,000 | | | | 258,418 | | | | | |
| City of Houston TX: | | | | | | | | | | | | |
| 0.000%, 12/01/2024 (ETM) (Insured by AGM) | | | 90,000 | | | | 88,572 | | | | | |
| 5.500%, 12/01/2024 (ETM) (Insured by NATL) | | | 925,000 | | | | 1,062,344 | | | | | |
| 0.000%, 12/01/2025 (ETM) (Insured by AGM) | | | 375,000 | | | | 365,925 | | | | | |
| 0.452%, 05/15/2034 (1 Month LIBOR USD + 0.360%) | | | | | | | | | | | | |
| (Callable 02/01/2021) | | | | | | | | | | | | |
(Mandatory Tender Date 08/01/2021)(2) | | | 1,525,000 | | | | 1,524,710 | | | | | |
| City of Mission TX, | | | | | | | | | | | | |
| 3.500%, 02/15/2027 | | | | | | | | | | | | |
| (Callable 02/15/2021) (Insured by AGM) | | | 110,000 | | | | 110,299 | | | | | |
| City of Round Rock TX: | | | | | | | | | | | | |
| 4.000%, 12/01/2023 | | | 130,000 | | | | 142,600 | | | | | |
| 4.000%, 12/01/2024 | | | 250,000 | | | | 282,460 | | | | | |
| City of San Antonio TX: | | | | | | | | | | | | |
| 2.000%, 02/01/2033 (Callable 06/01/2021) | | | | | | | | | | | | |
(Mandatory Tender Date 12/01/2021)(1) | | | 100,000 | | | | 100,721 | | | | | |
| 2.750%, 02/01/2048 | | | | | | | | | | | | |
(Mandatory Tender Date 12/01/2022)(1) | | | 1,055,000 | | | | 1,105,313 | | | | | |
| City of Waxahachie TX, | | | | | | | | | | | | |
| 4.000%, 08/01/2028 (Callable 08/01/2026) | | | 765,000 | | | | 901,667 | | | | | |
| City of Wilmer TX: | | | | | | | | | | | | |
| 5.000%, 09/01/2026 (Insured by BAM) | | | 410,000 | | | | 500,655 | | | | | |
| 5.000%, 09/01/2027 (Insured by BAM) | | | 380,000 | | | | 473,381 | | | | | |
| Clear Creek Independent School District: | | | | | | | | | | | | |
| 5.000%, 02/15/2024 (PSF Guaranteed) | | | 115,000 | | | | 131,990 | | | | | |
| 1.350%, 02/15/2032 | | | | | | | | | | | | |
(Mandatory Tender Date 08/15/2022) (PSF Guaranteed)(1) | | | 2,450,000 | | | | 2,491,307 | | | | | |
| 2.150%, 02/15/2038 | | | | | | | | | | | | |
(Mandatory Tender Date 08/16/2021) (PSF Guaranteed)(1) | | | 250,000 | | | | 252,895 | | | | | |
The accompanying notes are an integral part of these financial statements.
Baird Short-Term Municipal Bond Fund
Schedule of Investments, December 31, 2020
Long-Term Investments (cont.)
| | | Principal | | | | | | % of | |
| | | Amount | | | Value | | | Net Assets | |
| Clyde Education Facilities Corp., | | | | | | | | | |
| 4.000%, 08/15/2021 (PSF Guaranteed) | | $ | 140,000 | | | $ | 143,081 | | | |
|
|
| Collin County Water Control & | | | | | | | | | | | | |
| Improvement District No. 3: | | | | | | | | | | | | |
| 2.000%, 09/15/2022 (Insured by BAM) | | | 315,000 | | | | 324,585 | | | | | |
| 2.000%, 09/15/2023 (Insured by BAM) | | | 335,000 | | | | 347,027 | | | | | |
| 2.000%, 09/15/2024 (Insured by BAM) | | | 350,000 | | | | 366,471 | | | | | |
| Corpus Christi Business & Job Development Corp., | | | | | | | | | | | | |
| 5.000%, 09/01/2021 | | | 1,000,000 | | | | 1,025,190 | | | | | |
| Cotulla Independent School District, | | | | | | | | | | | | |
| 5.000%, 02/15/2023 (PSF Guaranteed) | | | 100,000 | | | | 109,972 | | | | | |
| County of Archer TX, | | | | | | | | | | | | |
| 4.000%, 02/15/2024 | | | 350,000 | | | | 385,920 | | | | | |
| County of Bexar TX, | | | | | | | | | | | | |
| 5.000%, 06/15/2029 (Callable 06/15/2026) | | | 840,000 | | | | 1,044,355 | | | | | |
| County of Fort Bend TX, | | | | | | | | | | | | |
| 2.000%, 03/01/2027 (Insured by BAM) | | | 745,000 | | | | 796,837 | | | | | |
| County of Harris TX: | | | | | | | | | | | | |
| 5.000%, 10/01/2028 (Pre-refunded to 10/01/2021) | | | 135,000 | | | | 139,761 | | | | | |
| 5.000%, 08/15/2030 (Callable 08/15/2022) | | | 1,430,000 | | | | 1,537,036 | | | | | |
| County of McLennan TX, | | | | | | | | | | | | |
| 5.000%, 06/01/2025 (Insured by AGM) | | | 240,000 | | | | 280,735 | | | | | |
| County of Montgomery TX, | | | | | | | | | | | | |
| 2.000%, 09/01/2027 | | | | | | | | | | | | |
| (Callable 09/01/2025) (Insured by BAM) | | | 435,000 | | | | 451,243 | | | | | |
| County of Winkler TX, | | | | | | | | | | | | |
| 2.000%, 02/15/2025 | | | 250,000 | | | | 235,178 | | | | | |
| Cypress-Fairbanks Independent School District: | | | | | | | | | | | | |
| 1.250%, 02/15/2040 | | | | | | | | | | | | |
(Mandatory Tender Date 08/15/2022) (PSF Guaranteed)(1) | | | 575,000 | | | | 583,774 | | | | | |
| 2.125%, 02/15/2040 | | | | | | | | | | | | |
(Mandatory Tender Date 08/16/2021) (PSF Guaranteed)(1) | | | 100,000 | | | | 101,143 | | | | | |
| Dallas Convention Center Hotel Development Corp., | | | | | | | | | | | | |
| 0.000%, 01/01/2025 | | | 4,450,000 | | | | 3,964,060 | | | | | |
| Dallas County Utility & Reclamation District, | | | | | | | | | | | | |
| 5.000%, 02/15/2026 | | | 190,000 | | | | 231,564 | | | | | |
| Dallas Independent School District: | | | | | | | | | | | | |
| 5.000%, 02/15/2036 | | | | | | | | | | | | |
(Pre-refunded to 02/15/2022) (PSF Guaranteed)(1) | | | 45,000 | | | | 47,396 | | | | | |
| 5.000%, 02/15/2036 | | | | | | | | | | | | |
| (Pre-refunded to 02/15/2022) (PSF Guaranteed) | | | 305,000 | | | | 321,241 | | | | | |
| 5.000%, 02/15/2036 | | | | | | | | | | | | |
(Pre-refunded to 02/15/2022) (PSF Guaranteed)(1) | | | 770,000 | | | | 811,003 | | | | | |
| 5.000%, 02/15/2036 | | | | | | | | | | | | |
(Mandatory Tender Date 02/15/2022) (PSF Guaranteed)(1) | | | 745,000 | | | | 783,807 | | | | | |
The accompanying notes are an integral part of these financial statements.
Baird Short-Term Municipal Bond Fund
Schedule of Investments, December 31, 2020
Long-Term Investments (cont.)
| | | Principal | | | | | | % of | |
| | | Amount | | | Value | | | Net Assets | |
| Decatur Hospital Authority, | | | | | | | | | |
| 5.750%, 09/01/2029 (ETM) | | $ | 1,385,000 | | | $ | 1,715,239 | | | |
|
|
| Decatur Independent School District, | | | | | | | | | | | | |
| 0.000%, 08/15/2027 (PSF Guaranteed) | | | 925,000 | | | | 876,363 | | | | | |
| Denton County Fresh Water Supply District No. 6, | | | | | | | | | | | | |
| 4.000%, 02/15/2023 (Insured by BAM) | | | 275,000 | | | | 294,704 | | | | | |
| Denton Independent School District, | | | | | | | | | | | | |
| 2.000%, 08/01/2044 | | | | | | | | | | | | |
(Mandatory Tender Date 08/01/2024) (PSF Guaranteed)(1) | | | 1,655,000 | | | | 1,749,683 | | | | | |
| El Paso Downtown Development Corp., | | | | | | | | | | | | |
| 5.000%, 08/15/2027 (Callable 08/15/2026) | | | 1,000,000 | | | | 1,180,660 | | | | | |
| Everman Independent School District, | | | | | | | | | | | | |
| 5.000%, 02/15/2025 (PSF Guaranteed) | | | 125,000 | | | | 148,804 | | | | | |
| Fort Bend County Municipal Utility District No. 116, | | | | | | | | | | | | |
| 4.000%, 09/01/2025 | | | | | | | | | | | | |
| (Callable 09/01/2024) (Insured by BAM) | | | 325,000 | | | | 363,990 | | | | | |
| Fort Bend County Municipal Utility District No. 118: | | | | | | | | | | | | |
| 2.000%, 09/01/2023 (Insured by AGM) | | | 330,000 | | | | 340,095 | | | | | |
| 2.000%, 09/01/2024 (Insured by AGM) | | | 350,000 | | | | 364,367 | | | | | |
| Fort Bend County Municipal Utility District No. 134B, | | | | | | | | | | | | |
| 4.625%, 09/01/2024 (Insured by AGM) | | | 320,000 | | | | 365,293 | | | | | |
| Fort Bend County Municipal Utility District No. 134E, | | | | | | | | | | | | |
| 4.500%, 09/01/2022 (Insured by BAM) | | | 330,000 | | | | 350,262 | | | | | |
| Fort Bend County Municipal Utility District No. 139: | | | | | | | | | | | | |
| 4.000%, 09/01/2022 (Insured by BAM) | | | 180,000 | | | | 190,526 | | | | | |
| 4.000%, 09/01/2023 (Insured by BAM) | | | 190,000 | | | | 206,139 | | | | | |
| 4.000%, 09/01/2024 (Insured by BAM) | | | 200,000 | | | | 222,806 | | | | | |
| Fort Bend County Municipal Utility District No. 23, | | | | | | | | | | | | |
| 3.000%, 09/01/2021 | | | | | | | | | | | | |
| (Callable 02/01/2021) (Insured by BAM) | | | 340,000 | | | | 340,619 | | | | | |
| Fort Bend County Municipal Utility District No. 30, | | | | | | | | | | | | |
| 4.000%, 09/01/2024 (Insured by BAM) | | | 500,000 | | | | 556,440 | | | | | |
| Fort Bend County Municipal Utility District No. 58, | | | | | | | | | | | | |
| 3.500%, 04/01/2024 (Insured by AGM) | | | 125,000 | | | | 135,674 | | | | | |
| Fort Bend County Municipal Utility District No. 81, | | | | | | | | | | | | |
| 3.000%, 09/01/2023 | | | | | | | | | | | | |
| (Callable 02/01/2021) (Insured by AGM) | | | 440,000 | | | | 440,686 | | | | | |
| Fort Bend Independent School District: | | | | | | | | | | | | |
| 1.500%, 08/01/2042 | | | | | | | | | | | | |
| (Mandatory Tender Date 08/01/2021) | | | | | | | | | | | | |
(PSF Guaranteed)(1) | | | 1,115,000 | | | | 1,122,905 | | | | | |
| 0.875%, 08/01/2050 | | | | | | | | | | | | |
| (Mandatory Tender Date 08/01/2025) | | | | | | | | | | | | |
(PSF Guaranteed)(1) | | | 3,600,000 | | | | 3,646,152 | | | | | |
The accompanying notes are an integral part of these financial statements.
Baird Short-Term Municipal Bond Fund
Schedule of Investments, December 31, 2020
Long-Term Investments (cont.)
| | | Principal | | | | | | % of | |
| | | Amount | | | Value | | | Net Assets | |
| Friendswood Independent School District, | | | | | | | | | |
| 5.000%, 02/15/2025 (PSF Guaranteed) | | $ | 145,000 | | | $ | 172,482 | | | |
|
|
| Harris County Cultural Education | | | | | | | | | | | | |
| Facilities Finance Corp.: | | | | | | | | | | | | |
| 5.000%, 07/01/2049 (Callable 09/01/2026) | | | | | | | | | | | | |
(Mandatory Tender Date 12/01/2026)(1) | | | 455,000 | | | | 571,257 | | | | | |
| 0.900%, 05/15/2050 (Callable 05/15/2021) | | | | | | | | | | | | |
(Mandatory Tender Date 05/15/2025)(1) | | | 4,500,000 | | | | 4,506,165 | | | | | |
| Harris County Health Facilities Development Corp.: | | | | | | | | | | | | |
| 5.750%, 07/01/2027 (ETM) | | | 975,000 | | | | 1,187,501 | | | | | |
| 5.750%, 07/01/2027 (ETM) | | | 4,205,000 | | | | 5,136,492 | | | | | |
| Harris County Municipal Utility District No. 109, | | | | | | | | | | | | |
| 4.000%, 10/01/2027 | | | | | | | | | | | | |
| (Callable 10/01/2021) (Insured by BAM) | | | 460,000 | | | | 471,155 | | | | | |
| Harris County Municipal Utility District No. 120, | | | | | | | | | | | | |
| 3.250%, 08/01/2025 | | | | | | | | | | | | |
| (Callable 02/01/2021) (Insured by AGM) | | | 350,000 | | | | 350,644 | | | | | |
| Harris County Municipal Utility District No. 153, | | | | | | | | | | | | |
| 4.000%, 09/01/2023 | | | | | | | | | | | | |
| (Callable 09/01/2022) (Insured by BAM) | | | 100,000 | | | | 105,878 | | | | | |
| Harris County Municipal Utility District No. 276, | | | | | | | | | | | | |
| 3.000%, 09/01/2024 (Insured by BAM) | | | 445,000 | | | | 482,264 | | | | | |
| Harris County Municipal Utility District No. 284: | | | | | | | | | | | | |
| 4.000%, 09/01/2023 (Insured by MAC) | | | 370,000 | | | | 401,428 | | | | | |
| 4.000%, 09/01/2024 (Insured by MAC) | | | 235,000 | | | | 261,975 | | | | | |
| Harris County Municipal Utility District No. 371, | | | | | | | | | | | | |
| 4.000%, 09/01/2025 (Insured by AGM) | | | 330,000 | | | | 377,969 | | | | | |
| Harris County Municipal Utility District No. 374, | | | | | | | | | | | | |
| 3.000%, 09/01/2024 (Insured by BAM) | | | 225,000 | | | | 243,162 | | | | | |
| Harris County Municipal Utility District No. 500, | | | | | | | | | | | | |
| 5.000%, 12/01/2021 (Insured by AGM) | | | 85,000 | | | | 88,546 | | | | | |
| Harris County Municipal Utility District No. 63, | | | | | | | | | | | | |
| 3.000%, 09/01/2025 | | | | | | | | | | | | |
| (Callable 09/01/2024) (Insured by AGM) | | | 100,000 | | | | 107,827 | | | | | |
| Hitchcock Independent School District, | | | | | | | | | | | | |
| 5.000%, 02/15/2023 (PSF Guaranteed) | | | 100,000 | | | | 109,726 | | | | | |
| Hunt Memorial Hospital District: | | | | | | | | | | | | |
| 5.000%, 02/15/2024 | | | 200,000 | | | | 223,780 | | | | | |
| 5.000%, 02/15/2027 | | | 1,425,000 | | | | 1,720,403 | | | | | |
| Ingleside Independent School District, | | | | | | | | | | | | |
| 5.000%, 08/15/2024 (PSF Guaranteed) | | | 120,000 | | | | 140,448 | | | | | |
| Irving Hospital Authority, | | | | | | | | | | | | |
| 5.000%, 10/15/2023 | | | 150,000 | | | | 168,794 | | | | | |
The accompanying notes are an integral part of these financial statements.
Baird Short-Term Municipal Bond Fund
Schedule of Investments, December 31, 2020
Long-Term Investments (cont.)
| | | Principal | | | | | | % of | |
| | | Amount | | | Value | | | Net Assets | |
| Katy Independent School District, | | | | | | | | | |
| 0.386%, 08/15/2036 (1 Month LIBOR USD + 0.280%) | | | | | | | | | |
| (Callable 01/11/2021) | | | | | | | | | |
| (Mandatory Tender Date 08/16/2021) | | | | | | | | | |
(PSF Guaranteed)(2) | | $ | 680,000 | | | $ | 679,136 | | | |
|
|
| La Vernia Independent School District, | | | | | | | | | | | | |
| 4.000%, 08/15/2025 (PSF Guaranteed) | | | 260,000 | | | | 303,355 | | | | | |
| Lake Travis Independent School District: | | | | | | | | | | | | |
| 2.625%, 02/15/2048 | | | | | | | | | | | | |
(Pre-refunded to 02/15/2022) (PSF Guaranteed)(1) | | | 95,000 | | | | 97,491 | | | | | |
| 2.625%, 02/15/2048 | | | | | | | | | | | | |
(Pre-refunded to 02/15/2022) (PSF Guaranteed)(1) | | | 169,999 | | | | 174,457 | | | | | |
| Leander Independent School District: | | | | | | | | | | | | |
| 0.000%, 08/15/2033 | | | | | | | | | | | | |
| (Pre-refunded to 08/15/2024) (PSF Guaranteed) | | | 50,000 | | | | 32,160 | | | | | |
| 0.000%, 08/15/2034 | | | | | | | | | | | | |
| (Pre-refunded to 08/15/2024) (PSF Guaranteed) | | | 325,000 | | | | 196,999 | | | | | |
| 0.000%, 08/15/2036 | | | | | | | | | | | | |
| (Pre-refunded to 08/15/2024) (PSF Guaranteed) | | | 15,000 | | | | 8,397 | | | | | |
| 0.000%, 08/15/2036 | | | | | | | | | | | | |
| (Pre-refunded to 08/15/2024) (PSF Guaranteed) | | | 100,000 | | | | 53,644 | | | | | |
| 0.000%, 08/15/2039 | | | | | | | | | | | | |
| (Pre-refunded to 08/15/2024) (PSF Guaranteed) | | | 50,000 | | | | 22,560 | | | | | |
| 0.000%, 08/15/2040 | | | | | | | | | | | | |
| (Callable 08/15/2024) (PSF Guaranteed) | | | 130,000 | | | | 57,586 | | | | | |
| 0.000%, 08/15/2041 | | | | | | | | | | | | |
| (Pre-refunded to 08/15/2024) (PSF Guaranteed) | | | 1,325,000 | | | | 577,409 | | | | | |
| 0.000%, 08/15/2041 | | | | | | | | | | | | |
| (Pre-refunded to 08/15/2024) (PSF Guaranteed) | | | 8,190,000 | | | | 3,549,792 | | | | | |
| 0.000%, 08/15/2041 | | | | | | | | | | | | |
| (Pre-refunded to 08/15/2024) (PSF Guaranteed) | | | 435,000 | | | | 175,357 | | | | | |
| 0.000%, 08/15/2042 | | | | | | | | | | | | |
| (Pre-refunded to 08/15/2024) (PSF Guaranteed) | | | 50,000 | | | | 20,618 | | | | | |
| 0.000%, 08/15/2042 | | | | | | | | | | | | |
| (Pre-refunded to 08/15/2024) (PSF Guaranteed) | | | 305,000 | | | | 125,767 | | | | | |
| 0.000%, 08/15/2043 | | | | | | | | | | | | |
| (Pre-refunded to 08/15/2024) (PSF Guaranteed) | | | 40,000 | | | | 15,688 | | | | | |
| 0.000%, 08/15/2045 | | | | | | | | | | | | |
| (Pre-refunded to 08/15/2024) (PSF Guaranteed) | | | 1,010,000 | | | | 323,089 | | | | | |
| 0.000%, 08/15/2046 | | | | | | | | | | | | |
| (Pre-refunded to 08/15/2024) (PSF Guaranteed) | | | 890,000 | | | | 267,525 | | | | | |
| 0.000%, 08/15/2047 | | | | | | | | | | | | |
| (Pre-refunded to 08/15/2024) (PSF Guaranteed) | | | 75,000 | | | | 21,167 | | | | | |
| Lewisville Independent School District, | | | | | | | | | | | | |
| 5.000%, 08/15/2024 (PSF Guaranteed) | | | 440,000 | | | | 515,324 | | | | | |
The accompanying notes are an integral part of these financial statements.
Baird Short-Term Municipal Bond Fund
Schedule of Investments, December 31, 2020
Long-Term Investments (cont.)
| | | Principal | | | | | | % of | |
| | | Amount | | | Value | | | Net Assets | |
| Longview Independent School District, | | | | | | | | | |
| 5.000%, 02/15/2024 (PSF Guaranteed) | | $ | 125,000 | | | $ | 143,509 | | | |
|
|
| Lower Colorado River Authority: | | | | | | | | | | | | |
| 5.000%, 05/15/2024 (Callable 05/15/2022) | | | 125,000 | | | | 132,814 | | | | | |
| 4.750%, 01/01/2028 (ETM) (Insured by AGM) | | | 375,000 | | | | 429,900 | | | | | |
| 5.000%, 05/15/2028 (Callable 05/15/2022) | | | 495,000 | | | | 524,893 | | | | | |
| Manor Independent School District, | | | | | | | | | | | | |
| 5.000%, 08/01/2026 (PSF Guaranteed) | | | 100,000 | | | | 125,179 | | | | | |
| Mansfield Independent School District, | | | | | | | | | | | | |
| 2.500%, 08/01/2042 | | | | | | | | | | | | |
| (Mandatory Tender Date 08/01/2021) | | | | | | | | | | | | |
(PSF Guaranteed)(1) | | | 3,790,000 | | | | 3,838,512 | | | | | |
| Melissa Independent School District, | | | | | | | | | | | | |
| 5.000%, 08/01/2027 | | | | | | | | | | | | |
| (Callable 08/01/2026) (PSF Guaranteed) | | | 560,000 | | | | 698,202 | | | | | |
| Midlothian Independent School District, | | | | | | | | | | | | |
| 2.000%, 08/01/2051 | | | | | | | | | | | | |
| (Mandatory Tender Date 08/01/2024) | | | | | | | | | | | | |
(PSF Guaranteed)(1) | | | 1,000,000 | | | | 1,053,190 | | | | | |
| Montgomery County Health Facilities Development Corp., | | | | | | | | | | | | |
| 0.000%, 07/15/2023 (ETM) | | | 595,000 | | | | 589,020 | | | | | |
| Montgomery County Municipal Utility District No. 112: | | | | | | | | | | | | |
| 3.000%, 10/01/2022 (Insured by BAM) | | | 200,000 | | | | 208,502 | | | | | |
| 3.000%, 10/01/2024 (Insured by BAM) | | | 215,000 | | | | 233,903 | | | | | |
| Montgomery County Municipal Utility District No. 119, | | | | | | | | | | | | |
| 4.000%, 04/01/2021 (Insured by BAM) | | | 250,000 | | | | 252,158 | | | | | |
| Montgomery County Municipal Utility District No. 95, | | | | | | | | | | | | |
| 3.000%, 09/01/2023 (Insured by AGM) | | | 115,000 | | | | 120,385 | | | | | |
| Montgomery Independent School District, | | | | | | | | | | | | |
| 5.000%, 02/15/2024 (PSF Guaranteed) | | | 175,000 | | | | 200,442 | | | | | |
| New Caney Independent School District: | | | | | | | | | | | | |
| 5.000%, 02/15/2025 (PSF Guaranteed) | | | 100,000 | | | | 119,043 | | | | | |
| 3.000%, 02/15/2050 | | | | | | | | | | | | |
| (Mandatory Tender Date 08/15/2021) | | | | | | | | | | | | |
(PSF Guaranteed)(1) | | | 230,000 | | | | 233,846 | | | | | |
| New Hope Cultural Education Facilities Finance Corp.: | | | | | | | | | | | | |
3.625%, 08/15/2022 (Callable 08/15/2021)(3) | | | 65,000 | | | | 65,436 | | | | | |
| 4.000%, 06/15/2024 | | | 50,000 | | | | 54,489 | | | | | |
| Newark Higher Education Finance Corp.: | | | | | | | | | | | | |
| 5.000%, 08/15/2023 (PSF Guaranteed) | | | 260,000 | | | | 290,228 | | | | | |
| 5.000%, 08/15/2028 | | | | | | | | | | | | |
| (Callable 08/15/2024) (PSF Guaranteed) | | | 705,000 | | | | 813,556 | | | | | |
| North Central Texas Health Facility Development Corp., | | | | | | | | | | | | |
| 5.750%, 06/01/2026 (ETM) (Insured by NATL) | | | 485,000 | | | | 558,924 | | | | | |
The accompanying notes are an integral part of these financial statements.
Baird Short-Term Municipal Bond Fund
Schedule of Investments, December 31, 2020
Long-Term Investments (cont.)
| | | Principal | | | | | | % of | |
| | | Amount | | | Value | | | Net Assets | |
| North East Independent School District, | | | | | | | | | |
| 2.200%, 08/01/2049 | | | | | | | | | |
| (Mandatory Tender Date 08/01/2024) | | | | | | | | | |
(PSF Guaranteed)(1) | | $ | 1,225,000 | | | $ | 1,292,559 | | | |
|
|
| North Mission Glen Municipal Utility District, | | | | | | | | | | | | |
| 3.000%, 09/01/2024 (Insured by AGM) | | | 185,000 | | | | 198,962 | | | | | |
| North Texas Education Finance Corp., | | | | | | | | | | | | |
| 5.250%, 12/01/2047 (Pre-refunded to 06/01/2022) | | | 1,600,000 | | | | 1,712,176 | | | | | |
| North Texas Tollway Authority: | | | | | | | | | | | | |
| 5.000%, 01/01/2022 | | | 25,000 | | | | 26,172 | | | | | |
| 5.250%, 09/01/2026 (Pre-refunded to 09/01/2021) | | | 3,055,000 | | | | 3,156,640 | | | | | |
| Northeast Travis County Utility District, | | | | | | | | | | | | |
| 0.000%, 09/01/2024 (Insured by BAM) | | | 470,000 | | | | 453,226 | | | | | |
| Northgate Crossing Road Utility District, | | | | | | | | | | | | |
| 0.000%, 12/01/2022 | | | | | | | | | | | | |
| (Callable 02/01/2021) (Insured by AGM) | | | 100,000 | | | | 93,497 | | | | | |
| Northside Independent School District: | | | | | | | | | | | | |
| 5.000%, 08/15/2022 (PSF Guaranteed) | | | 110,000 | | | | 118,581 | | | | | |
| 1.750%, 06/01/2032 (Callable 01/21/2021) | | | | | | | | | | | | |
| (Mandatory Tender Date 06/01/2022) | | | | | | | | | | | | |
(PSF Guaranteed)(1) | | | 1,145,000 | | | | 1,148,115 | | | | | |
| 1.600%, 08/01/2049 | | | | | | | | | | | | |
| (Mandatory Tender Date 08/01/2024) | | | | | | | | | | | | |
(PSF Guaranteed)(1) | | | 3,085,000 | | | | 3,200,996 | | | | | |
| Northwest Harris County | | | | | | | | | | | | |
| Municipal Utility District No. 16, | | | | | | | | | | | | |
| 5.500%, 10/01/2021 (Insured by BAM) | | | 25,000 | | | | 25,934 | | | | | |
| Northwest Harris County | | | | | | | | | | | | |
| Municipal Utility District No. 19: | | | | | | | | | | | | |
| 2.000%, 10/01/2021 (Insured by AGM) | | | 95,000 | | | | 96,134 | | | | | |
| 2.000%, 10/01/2022 (Insured by AGM) | | | 105,000 | | | | 107,465 | | | | | |
| 2.000%, 10/01/2023 (Insured by AGM) | | | 105,000 | | | | 108,771 | | | | | |
| 3.000%, 10/01/2024 (Insured by AGM) | | | 110,000 | | | | 118,822 | | | | | |
| Odessa Junior College District, | | | | | | | | | | | | |
| 4.000%, 07/01/2029 | | | | | | | | | | | | |
| (Callable 07/01/2022) (Insured by AGM) | | | 190,000 | | | | 198,772 | | | | �� | |
| Olmos Park Higher Education Facilities Corp., | | | | | | | | | | | | |
| 5.000%, 12/01/2021 | | | 210,000 | | | | 217,688 | | | | | |
| Palestine Independent School District, | | | | | | | | | | | | |
| 5.000%, 02/15/2024 (PSF Guaranteed) | | | 135,000 | | | | 154,310 | | | | | |
| Paloma Lake Municipal Utility District No. 1, | | | | | | | | | | | | |
| 2.000%, 09/01/2022 (Insured by NATL) | | | 150,000 | | | | 153,956 | | | | | |
| Paseo del Este Municipal Utility District No. 10: | | | | | | | | | | | | |
| 4.000%, 08/15/2022 (Insured by MAC) | | | 160,000 | | | | 169,240 | | | | | |
| 4.000%, 08/15/2023 (Insured by MAC) | | | 130,000 | | | | 141,145 | | | | | |
| 4.000%, 08/15/2024 (Insured by MAC) | | | 180,000 | | | | 200,417 | | | | | |
The accompanying notes are an integral part of these financial statements.
Baird Short-Term Municipal Bond Fund
Schedule of Investments, December 31, 2020
Long-Term Investments (cont.)
| | | Principal | | | | | | % of | |
| | | Amount | | | Value | | | Net Assets | |
| Poteet Independent School District, | | | | | | | | | |
| 3.000%, 08/15/2021 (PSF Guaranteed) | | $ | 235,000 | | | $ | 239,047 | | | |
|
|
| Prosper Independent School District, | | | | | | | | | | | | |
| 5.000%, 02/15/2024 (PSF Guaranteed) | | | 110,000 | | | | 126,140 | | | | | |
| Red River Education Finance Corp.: | | | | | | | | | | | | |
| 5.000%, 06/01/2021 | | | 300,000 | | | | 303,756 | | | | | |
| 3.000%, 06/01/2022 | | | 655,000 | | | | 664,936 | | | | | |
| 5.000%, 06/01/2022 | | | 880,000 | | | | 917,647 | | | | | |
| Remington Municipal Utility District No. 1: | | | | | | | | | | | | |
| 3.000%, 09/01/2021 (Insured by AGM) | | | 415,000 | | | | 422,250 | | | | | |
| 3.000%, 09/01/2022 (Insured by AGM) | | | 100,000 | | | | 104,370 | | | | | |
| Rockwall Independent School District: | | | | | | | | | | | | |
| 0.000%, 02/15/2023 (PSF Guaranteed) | | | 1,000,000 | | | | 991,390 | | | | | |
| 0.000%, 02/15/2024 (PSF Guaranteed) | | | 1,270,000 | | | | 1,249,197 | | | | | |
| SA Energy Acquisition Public Facility Corp., | | | | | | | | | | | | |
| 5.500%, 08/01/2021 | | | 25,000 | | | | 25,740 | | | | | |
| San Antonio Water System, | | | | | | | | | | | | |
| 2.000%, 05/01/2043 | | | | | | | | | | | | |
(Mandatory Tender Date 11/01/2021)(1) | | | 645,000 | | | | 654,423 | | | | | |
| San Benito Consolidated Independent School District, | | | | | | | | | | | | |
| 5.000%, 02/15/2024 (PSF Guaranteed) | | | 100,000 | | | | 114,371 | | | | | |
| Sedona Lakes Municipal Utility District No. 1, | | | | | | | | | | | | |
| 3.000%, 09/01/2024 (Insured by BAM) | | | 105,000 | | | | 113,476 | | | | | |
| Sherman Independent School District, | | | | | | | | | | | | |
| 5.000%, 02/15/2026 | | | | | | | | | | | | |
| (Callable 02/15/2024) (PSF Guaranteed) | | | 1,000,000 | | | | 1,142,370 | | | | | |
| Sienna Plantation: | | | | | | | | | | | | |
| 2.000%, 09/01/2027 | | | | | | | | | | | | |
| (Callable 09/01/2025) (Insured by AGM) | | | 500,000 | | | | 519,360 | | | | | |
| 2.000%, 09/01/2028 | | | | | | | | | | | | |
| (Callable 09/01/2025) (Insured by AGM) | | | 315,000 | | | | 326,264 | | | | | |
| South Shore Harbor Municipal Utility District No. 7, | | | | | | | | | | | | |
| 4.000%, 09/01/2023 (Insured by BAM) | | | 370,000 | | | | 401,224 | | | | | |
| Southwest Houston Redevelopment Authority, | | | | | | | | | | | | |
| 5.000%, 09/01/2025 (Insured by AGM) | | | 250,000 | | | | 294,478 | | | | | |
| Southwest Texas Junior College District, | | | | | | | | | | | | |
| 4.000%, 10/01/2023 (Insured by BAM) | | | 100,000 | | | | 109,009 | | | | | |
| Spring Creek Utility District of Montgomery County: | | | | | | | | | | | | |
| 2.500%, 10/01/2023 (Insured by AGM) | | | 150,000 | | | | 157,879 | | | | | |
| 3.000%, 10/01/2023 (Insured by AGM) | | | 145,000 | | | | 154,789 | | | | | |
| State of Texas: | | | | | | | | | | | | |
| 5.000%, 10/01/2027 (Callable 10/01/2025) | | | 1,210,000 | | | | 1,473,986 | | | | | |
| 1.850%, 08/01/2029 | | | | | | | | | | | | |
(Callable 02/01/2021) (Optional Put Date 08/01/2022)(1) | | | 315,000 | | | | 315,258 | | | | | |
The accompanying notes are an integral part of these financial statements.
Baird Short-Term Municipal Bond Fund
Schedule of Investments, December 31, 2020
Long-Term Investments (cont.)
| | | Principal | | | | | | % of | |
| | | Amount | | | Value | | | Net Assets | |
| Tarrant County Cultural Education | | | | | | | | | |
| Facilities Finance Corp.: | | | | | | | | | |
| 5.000%, 11/15/2024 | | $ | 225,000 | | | $ | 254,804 | | | |
|
|
| 5.000%, 10/01/2025 (Callable 10/01/2023) | | | 2,110,000 | | | | 2,372,062 | | | | | |
| 2.250%, 11/15/2025 | | | 225,000 | | | | 231,858 | | | | | |
| Taylor Independent School District, | | | | | | | | | | | | |
| 3.000%, 02/15/2023 (PSF Guaranteed) | | | 815,000 | | | | 859,849 | | | | | |
| Texas Department of Housing & Community Affairs: | | | | | | | | | | | | |
| 4.050%, 07/01/2026 | | | | | | | | | | | | |
| (Callable 02/01/2021) (Insured by GNMA) | | | 380,000 | | | | 380,817 | | | | | |
| 4.750%, 03/01/2049 | | | | | | | | | | | | |
| (Callable 09/01/2027) (Insured by GNMA) | | | 630,000 | | | | 704,850 | | | | | |
| Texas Municipal Gas Acquisition & Supply Corp. I: | | | | | | | | | | | | |
| 5.250%, 12/15/2021 | | | 120,000 | | | | 125,446 | | | | | |
| 1.595%, 12/15/2026 (3 Month LIBOR USD + 1.450%) | | | | | | | | | | | | |
(Callable 01/04/2021)(2) | | | 7,800,000 | | | | 7,676,526 | | | | | |
| 6.250%, 12/15/2026 | | | 2,750,000 | | | | 3,300,055 | | | | | |
| Texas Municipal Gas Acquisition & Supply Corp. III: | | | | | | | | | | | | |
| 5.000%, 12/15/2021 | | | 140,000 | | | | 145,996 | | | | | |
| 5.000%, 12/15/2022 | | | 150,000 | | | | 162,935 | | | | | |
| 5.000%, 12/15/2023 (Callable 12/15/2022) | | | 345,000 | | | | 374,304 | | | | | |
| 5.000%, 12/15/2029 (Callable 12/15/2022) | | | 1,425,000 | | | | 1,529,923 | | | | | |
| Texas Public Finance Authority, | | | | | | | | | | | | |
| 5.000%, 12/01/2027 (Callable 06/01/2025) | | | 900,000 | | | | 1,052,181 | | | | | |
| Texas State Affordable Housing Corp., | | | | | | | | | | | | |
| 4.250%, 03/01/2049 | | | | | | | | | | | | |
| (Callable 03/01/2029) (Insured by GNMA) | | | 915,000 | | | | 1,020,143 | | | | | |
| Texas State Public Finance Authority | | | | | | | | | | | | |
| Charter School Finance Corp., | | | | | | | | | | | | |
7.250%, 08/15/2041 (Pre-refunded to 08/15/2021)(7) | | | 450,000 | | | | 468,792 | | | | | |
| Texas Transportation Commission State Highway Fund, | | | | | | | | | | | | |
| 4.000%, 04/01/2026 | | | | | | | | | | | | |
(Mandatory Tender Date 10/01/2021)(1) | | | 910,000 | | | | 934,970 | | | | | |
| Tioga Independent School District Public Facility Corp.: | | | | | | | | | | | | |
| 4.000%, 08/15/2021 | | | 185,000 | | | | 186,286 | | | | | |
| 4.000%, 08/15/2022 | | | 450,000 | | | | 457,582 | | | | | |
| 4.000%, 08/15/2023 | | | 470,000 | | | | 481,947 | | | | | |
| 4.000%, 08/15/2024 | | | 185,000 | | | | 191,153 | | | | | |
| 3.250%, 08/15/2026 (Callable 08/15/2024) | | | 195,000 | | | | 195,525 | | | | | |
| Town of Providence Village TX, | | | | | | | | | | | | |
| 4.000%, 03/01/2024 (Insured by BAM) | | | 275,000 | | | | 303,166 | | | | | |
| Travis County Health Facilities Development Corp.: | | | | | | | | | | | | |
| 7.000%, 01/01/2032 (Pre-refunded to 01/01/2021) | | | 165,000 | | | | 165,000 | | | | | |
| 7.125%, 01/01/2046 (Pre-refunded to 01/01/2021) | | | 485,000 | | | | 485,000 | | | | | |
The accompanying notes are an integral part of these financial statements.
Baird Short-Term Municipal Bond Fund
Schedule of Investments, December 31, 2020
Long-Term Investments (cont.)
| | | Principal | | | | | | % of | |
| | | Amount | | | Value | | | Net Assets | |
| Tyler Health Facilities Development Corp., | | | | | | | | | |
| 5.500%, 07/01/2027 (Pre-refunded to 07/01/2021) | | $ | 55,000 | | | $ | 56,404 | | | |
|
|
| Upper Trinity Regional Water District, | | | | | | | | | | | | |
| 5.000%, 08/01/2024 | | | | | | | | | | | | |
| (Callable 08/01/2022) (Insured by AGM) | | | 195,000 | | | | 208,769 | | | | | |
| Viridian Municipal Management District: | | | | | | | | | | | | |
| 6.000%, 12/01/2023 (Insured by BAM) | | | 50,000 | | | | 57,517 | | | | | |
| 4.000%, 12/01/2024 (Insured by BAM) | | | 425,000 | | | | 477,377 | | | | | |
| 4.000%, 12/01/2025 | | | | | | | | | | | | |
| (Callable 12/01/2024) (Insured by BAM) | | | 440,000 | | | | 498,221 | | | | | |
| 4.000%, 12/01/2026 | | | | | | | | | | | | |
| (Callable 12/01/2023) (Insured by AGM) | | | 340,000 | | | | 372,024 | | | | | |
| 4.000%, 12/01/2026 | | | | | | | | | | | | |
| (Callable 12/01/2024) (Insured by BAM) | | | 460,000 | | | | 518,586 | | | | | |
| 4.000%, 12/01/2027 | | | | | | | | | | | | |
| (Callable 12/01/2024) (Insured by BAM) | | | 475,000 | | | | 533,539 | | | | | |
| 4.000%, 12/01/2028 | | | | | | | | | | | | |
| (Callable 12/01/2024) (Insured by BAM) | | | 495,000 | | | | 552,559 | | | | | |
| 4.000%, 12/01/2028 | | | | | | | | | | | | |
| (Callable 12/01/2024) (Insured by BAM) | | | 455,000 | | | | 507,907 | | | | | |
| 4.000%, 12/01/2029 | | | | | | | | | | | | |
| (Callable 12/01/2024) (Insured by BAM) | | | 685,000 | | | | 761,309 | | | | | |
| West Harris County Municipal Utility District No. 17: | | | | | | | | | | | | |
| 0.000%, 09/01/2021 (Insured by AGM) | | | 60,000 | | | | 59,835 | | | | | |
| 3.000%, 09/01/2023 (Insured by AGM) | | | 360,000 | | | | 381,035 | | | | | |
| Willow Creek Farms Municipal Utility District: | | | | | | | | | | | | |
| 2.400%, 09/01/2023 (Insured by AGM) | | | 45,000 | | | | 47,043 | | | | | |
| 3.500%, 09/01/2023 (Insured by AGM) | | | 125,000 | | | | 134,286 | | | | | |
| Wink-Loving Independent School District: | | | | | | | | | | | | |
| 5.000%, 02/15/2026 | | | | | | | | | | | | |
| (Callable 02/15/2023) (PSF Guaranteed) | | | 1,995,000 | | | | 2,193,941 | | | | | |
| 5.000%, 02/15/2027 | | | | | | | | | | | | |
| (Callable 02/15/2023) (PSF Guaranteed) | | | 500,000 | | | | 549,750 | | | | | |
| Total Texas | | | | | | | | | | | | |
| (Cost $138,971,826) | | | | | | | 142,092,580 | | | | 8.8 | % |
| Utah | | | | | | | | | | | | |
| County of Utah UT: | | | | | | | | | | | | |
| 5.000%, 05/15/2057 (Callable 02/01/2024) | | | | | | | | | | | | |
(Mandatory Tender Date 08/01/2024)(1) | | | 410,000 | | | | 468,191 | | | | | |
| 5.000%, 05/15/2060 (Callable 02/01/2024) | | | | | | | | | | | | |
(Mandatory Tender Date 08/01/2024)(1) | | | 100,000 | | | | 116,317 | | | | | |
| Utah Charter School Finance Authority: | | | | | | | | | | | | |
| 5.000%, 04/15/2021 (Insured by UT CSCE) | | | 110,000 | | | | 111,362 | | | | | |
| 4.000%, 04/15/2022 (Insured by UT CSCE) | | | 250,000 | | | | 260,998 | | | | | |
The accompanying notes are an integral part of these financial statements.
Baird Short-Term Municipal Bond Fund
Schedule of Investments, December 31, 2020
Long-Term Investments (cont.)
| | | Principal | | | | | | % of | |
| | | Amount | | | Value | | | Net Assets | |
| Utah Charter School Finance Authority: (cont.) | | | | | | | | | |
| 5.000%, 04/15/2022 (Insured by UT CSCE) | | $ | 110,000 | | | $ | 116,238 | | | | |
| 5.000%, 04/15/2023 (Insured by UT CSCE) | | | 160,000 | | | | 175,083 | | | | |
| 4.000%, 04/15/2024 (Insured by UT CSCE) | | | 100,000 | | | | 110,218 | | | | |
| 5.000%, 04/15/2024 (Insured by UT CSCE) | | | 240,000 | | | | 272,268 | | | | |
| 5.000%, 10/15/2024 (Insured by UT CSCE) | | | 355,000 | | | | 409,826 | | | | |
| 5.000%, 04/15/2025 (Insured by UT CSCE) | | | 135,000 | | | | 158,204 | | | | |
| 5.000%, 04/15/2026 (Insured by UT CSCE) | | | 150,000 | | | | 180,849 | | | | |
3.625%, 06/15/2029 (Callable 06/15/2027)(3) | | | 485,000 | | | | 496,436 | | | | |
| Utah Housing Corp., | | | | | | | | | | | |
| 4.000%, 01/01/2045 | | | | | | | | | | | |
| (Callable 01/01/2026) (Insured by FHA) | | | 60,000 | | | | 64,708 | | | | |
| Utah Infrastructure Agency: | | | | | | | | | | | |
| 4.000%, 10/15/2023 | | | 180,000 | | | | 196,178 | | | | |
| 4.000%, 10/15/2024 | | | 190,000 | | | | 212,745 | | | | |
| 4.000%, 10/15/2025 | | | 100,000 | | | | 114,696 | | | | |
| Total Utah | | | | | | | | | | | |
| (Cost $3,375,013) | | | | | | | 3,464,317 | | | | 0.2 | % |
| Vermont | | | | | | | | | | | | |
| City of Burlington VT, | | | | | | | | | | | | |
| 5.000%, 07/01/2023 (Pre-refunded to 07/01/2021) | | | 25,000 | | | | 25,571 | | | | | |
| Vermont Educational & Health | | | | | | | | | | | | |
| Buildings Financing Agency, | | | | | | | | | | | | |
| 5.000%, 12/01/2033 (Callable 06/01/2026) | | | 2,445,000 | | | | 2,948,132 | | | | | |
| Vermont Housing Finance Agency: | | | | | | | | | | | | |
| 4.000%, 11/01/2044 (Callable 11/01/2023) | | | 55,000 | | | | 59,638 | | | | | |
| 4.000%, 11/01/2048 (Callable 05/01/2027) | | | 1,210,000 | | | | 1,318,307 | | | | | |
| 4.000%, 11/01/2049 | | | | | | | | | | | | |
| (Callable 05/01/2028) (Insured by GNMA) | | | 2,455,000 | | | | 2,804,199 | | | | | |
| 3.750%, 11/01/2050 | | | | | | | | | | | | |
| (Callable 05/01/2029) (Insured by GNMA) | | | 1,525,000 | | | | 1,707,298 | | | | | |
| Vermont Public Power Supply Authority: | | | | | | | | | | | | |
| 5.000%, 07/01/2022 | | | 380,000 | | | | 404,430 | | | | | |
| 5.000%, 07/01/2025 | | | 520,000 | | | | 615,129 | | | | | |
| 5.000%, 07/01/2026 | | | 500,000 | | | | 607,345 | | | | | |
| Winooski School District, | | | | | | | | | | | | |
| 1.250%, 10/15/2021 | | | 6,000,000 | | | | 6,020,040 | | | | | |
| Total Vermont | | | | | | | | | | | | |
| (Cost $16,278,331) | | | | | | | 16,510,089 | | | | 1.0 | % |
| Virginia | | | | | | | | | | | | |
| City of Petersburg VA, | | | | | | | | | | | | |
| 4.000%, 11/01/2025 | | | | | | | | | | | | |
| (Callable 11/01/2022) (Insured by ST AID) | | | 1,170,000 | | | | 1,217,104 | | | | | |
The accompanying notes are an integral part of these financial statements.
Baird Short-Term Municipal Bond Fund
Schedule of Investments, December 31, 2020
Long-Term Investments (cont.)
| | | Principal | | | | | | % of | |
| | | Amount | | | Value | | | Net Assets | |
| Henry County Industrial Development Authority, | | | | | | | | | |
| 2.000%, 11/01/2023 (Callable 11/01/2021) | | $ | 3,250,000 | | | $ | 3,290,040 | | | | |
| Stafford County & Staunton | | | | | | | | | | | |
| Industrial Development Authority, | | | | | | | | | | | |
| 5.500%, 02/01/2041 | | | | | | | | | | | |
| (Pre-refunded to 02/01/2021) (Insured by ST AID) | | | 30,000 | | | | 30,112 | | | | |
| Virginia Commonwealth University | | | | | | | | | | | |
| Health System Authority, | | | | | | | | | | | |
| 4.750%, 07/01/2041 (Pre-refunded to 07/01/2021) | | | 105,000 | | | | 107,375 | | | | |
| Virginia Housing Development Authority, | | | | | | | | | | | |
| 2.490%, 01/01/2022 | | | 1,000,000 | | | | 1,019,600 | | | | |
| Wise County Industrial Development Authority, | | | | | | | | | | | |
| 1.200%, 11/01/2040 | | | | | | | | | | | |
(Mandatory Tender Date 05/31/2024)(1) | | | 1,875,000 | | | | 1,918,875 | | | | |
| Total Virginia | | | | | | | | | | | |
| (Cost $7,493,817) | | | | | | | 7,583,106 | | | | 0.5 | % |
| Washington | | | | | | | | | | | | |
| Central Puget Sound Regional Transit Authority, | | | | | | | | | | | | |
| 0.520%, 11/01/2045 | | | | | | | | | | | | |
| (SIFMA Municipal Swap Index + 0.450%) | | | | | | | | | | | | |
| (Callable 11/01/2022) | | | | | | | | | | | | |
(Mandatory Tender Date 11/01/2023)(2) | | | 100,000 | | | | 100,290 | | | | | |
| Central Washington University: | | | | | | | | | | | | |
| 4.000%, 05/01/2024 (Callable 05/01/2023) | | | 260,000 | | | | 277,526 | | | | | |
| 4.000%, 05/01/2026 (Callable 05/01/2023) | | | 410,000 | | | | 436,060 | | | | | |
| 5.000%, 05/01/2026 (Insured by BAM) | | | 410,000 | | | | 503,021 | | | | | |
| City of Port Angeles WA, | | | | | | | | | | | | |
| 4.000%, 11/01/2024 | | | | | | | | | | | | |
| (Callable 01/22/2021) (Insured by AGC) | | | 85,000 | | | | 85,155 | | | | | |
| City of Richland WA, | | | | | | | | | | | | |
| 4.000%, 11/01/2026 (Insured by BAM) | | | 210,000 | | | | 252,113 | | | | | |
| King County Housing Authority: | | | | | | | | | | | | |
| 2.200%, 05/01/2021 | | | 1,000,000 | | | | 1,005,850 | | | | | |
| 3.500%, 05/01/2021 | | | 300,000 | | | | 303,009 | | | | | |
| 4.000%, 01/01/2022 | | | 100,000 | | | | 103,418 | | | | | |
| 3.500%, 05/01/2022 | | | 350,000 | | | | 363,632 | | | | | |
| 5.000%, 11/01/2026 | | | 810,000 | | | | 1,003,104 | | | | | |
| Pend Oreille County Public Utility District No. 1: | | | | | | | | | | | | |
| 5.000%, 01/01/2021 | | | 605,000 | | | | 605,000 | | | | | |
| 5.000%, 01/01/2022 | | | 635,000 | | | | 655,460 | | | | | |
| 5.000%, 01/01/2023 | | | 665,000 | | | | 706,961 | | | | | |
| 5.000%, 01/01/2024 | | | 1,010,000 | | | | 1,102,092 | | | | | |
| 5.000%, 01/01/2024 | | | 700,000 | | | | 759,780 | | | | | |
| 5.000%, 01/01/2025 | | | 735,000 | | | | 821,826 | | | | | |
The accompanying notes are an integral part of these financial statements.
Baird Short-Term Municipal Bond Fund
Schedule of Investments, December 31, 2020
Long-Term Investments (cont.)
| | | Principal | | | | | | % of | |
| | | Amount | | | Value | | | Net Assets | |
| San Juan County School District No. 137, | | | | | | | | | |
| 4.000%, 12/01/2028 | | | | | | | | | |
| (Callable 12/01/2022) (Insured by SCH BD GTY) | | $ | 675,000 | | | $ | 716,654 | | | | |
| Spokane Public Facilities District, | | | | | | | | | | | |
| 5.000%, 12/01/2028 (Callable 06/01/2023) | | | 550,000 | | | | 585,574 | | | | |
| State of Washington: | | | | | | | | | | | |
| 5.000%, 07/01/2024 | | | | | | | | | | | |
| (Callable 07/01/2022) (Insured by ST AID) | | | 620,000 | | | | 664,088 | | | | |
| 5.000%, 07/01/2024 (Callable 07/01/2022) | | | 250,000 | | | | 267,855 | | | | |
| Vancouver Housing Authority, | | | | | | | | | | | |
| 1.530%, 12/01/2022 (Callable 12/01/2021) | | | 1,780,000 | | | | 1,793,386 | | | | |
| Washington Health Care Facilities Authority: | | | | | | | | | | | |
| 1.188%, 01/01/2042 | | | | | | | | | | | |
| (1 Month LIBOR USD + 1.100%) (Callable 01/01/2022) | | | | | | | | | | | |
(Mandatory Tender Date 07/01/2022)(2) | | | 500,000 | | | | 501,795 | | | | |
| 5.000%, 10/01/2042 | | | | | | | | | | | |
(Mandatory Tender Date 10/01/2021)(1) | | | 120,000 | | | | 124,195 | | | | |
| Total Washington | | | | | | | | | | | |
| (Cost $13,600,831) | | | | | | | 13,737,844 | | | | 0.9 | % |
| West Virginia | | | | | | | | | | | | |
| City of Fairmont WV, | | | | | | | | | | | | |
| 5.250%, 07/01/2022 (Insured by AMBAC) | | | 70,000 | | | | 73,092 | | | | | |
| Roane County Building Commission, | | | | | | | | | | | | |
| 2.550%, 11/01/2021 (Callable 02/01/2021) | | | 2,000,000 | | | | 2,002,460 | | | | | |
| West Virginia Economic Development Authority, | | | | | | | | | | | | |
| 2.625%, 12/01/2042 | | | | | | | | | | | | |
(Mandatory Tender Date 06/01/2022)(1) | | | 290,000 | | | | 298,973 | | | | | |
| Total West Virginia | | | | | | | | | | | | |
| (Cost $2,365,145) | | | | | | | 2,374,525 | | | | 0.1 | % |
| Wisconsin | | | | | | | | | | | | |
| Appleton Redevelopment Authority, | | | | | | | | | | | | |
| 0.200%, 06/01/2036 (Callable 01/04/2021) | | | | | | | | | | | | |
(Optional Put Date 01/07/2021)(1) | | | 5,000,000 | | | | 5,000,000 | | | | | |
| Baldwin-Woodville Area School District, | | | | | | | | | | | | |
| 2.000%, 04/01/2023 (Callable 02/01/2021) | | | 110,000 | | | | 110,125 | | | | | |
| City of Antigo WI, | | | | | | | | | | | | |
| 2.000%, 06/01/2022 | | | 75,000 | | | | 76,649 | | | | | |
| City of Greenfield WI, | | | | | | | | | | | | |
| 2.000%, 02/01/2025 (Callable 02/01/2021) | | | 450,000 | | | | 450,459 | | | | | |
| City of Kaukauna WI, | | | | | | | | | | | | |
| 2.625%, 09/01/2024 (Callable 09/01/2022) | | | 270,000 | | | | 279,326 | | | | | |
| City of Ladysmith WI, | | | | | | | | | | | | |
| 4.000%, 06/01/2022 (Callable 02/01/2021) | | | 150,000 | | | | 150,407 | | | | | |
The accompanying notes are an integral part of these financial statements.
Baird Short-Term Municipal Bond Fund
Schedule of Investments, December 31, 2020
Long-Term Investments (cont.)
| | | Principal | | | | | | % of | |
| | | Amount | | | Value | | | Net Assets | |
| City of Marinette WI, | | | | | | | | | |
| 4.000%, 05/01/2027 (Callable 05/01/2023) | | $ | 150,000 | | | $ | 160,818 | | | |
|
|
| City of Menomonie WI, | | | | | | | | | | | | |
| 3.000%, 12/01/2024 | | | 415,000 | | | | 450,051 | | | | | |
| City of Oshkosh WI, | | | | | | | | | | | | |
| 4.000%, 05/01/2029 (Callable 05/01/2023) | | | 125,000 | | | | 134,078 | | | | | |
| City of Plymouth WI, | | | | | | | | | | | | |
| 2.000%, 05/01/2023 (Callable 05/01/2021) | | | 825,000 | | | | 829,208 | | | | | |
| City of Waupun WI, | | | | | | | | | | | | |
| 2.700%, 12/01/2024 (Callable 12/01/2021) | | | 250,000 | | | | 254,460 | | | | | |
| City of West Allis WI, | | | | | | | | | | | | |
| 2.375%, 04/01/2023 (Callable 02/01/2021) | | | 100,000 | | | | 100,145 | | | | | |
| Coleman School District, | | | | | | | | | | | | |
| 4.000%, 03/01/2025 (Callable 03/01/2024) | | | 200,000 | | | | 221,004 | | | | | |
| County of Manitowoc WI, | | | | | | | | | | | | |
| 4.000%, 11/01/2021 | | | 90,000 | | | | 92,710 | | | | | |
| Greendale School District, | | | | | | | | | | | | |
| 2.700%, 03/01/2026 (Callable 03/01/2022) | | | 500,000 | | | | 511,625 | | | | | |
| Hilbert School District, | | | | | | | | | | | | |
| 4.000%, 04/01/2027 (Callable 04/01/2025) | | | 250,000 | | | | 285,215 | | | | | |
| Palmyra-Eagle Area School District: | | | | | | | | | | | | |
| 3.000%, 03/01/2024 (Callable 03/01/2023) | | | 700,000 | | | | 685,475 | | | | | |
| 3.000%, 03/01/2025 (Callable 03/01/2023) | | | 175,000 | | | | 170,231 | | | | | |
| Public Finance Authority: | | | | | | | | | | | | |
| 5.000%, 06/15/2021 | | | 140,000 | | | | 142,142 | | | | | |
| 4.000%, 10/01/2021 | | | 200,000 | | | | 202,206 | | | | | |
5.000%, 10/01/2022(3) | | | 2,000,000 | | | | 2,081,700 | | | | | |
| 5.000%, 06/15/2023 | | | 395,000 | | | | 429,772 | | | | | |
5.000%, 10/01/2023(3) | | | 2,000,000 | | | | 2,124,940 | | | | | |
5.000%, 10/01/2024(3) | | | 1,605,000 | | | | 1,737,172 | | | | | |
3.000%, 03/01/2026 (Callable 03/01/2021)(3) | | | 2,250,000 | | | | 2,252,115 | | | | | |
| 8.375%, 06/01/2037 (Pre-refunded to 06/01/2022) | | | 1,020,000 | | | | 1,127,885 | | | | | |
| 8.625%, 06/01/2047 (Pre-refunded to 06/01/2022) | | | 1,255,000 | | | | 1,393,966 | | | | | |
| Pulaski Community School District, | | | | | | | | | | | | |
| 2.500%, 03/01/2023 (Callable 02/01/2021) | | | 40,000 | | | | 40,055 | | | | | |
| Southeast Wisconsin Professional Baseball Park District: | | | | | | | | | | | | |
| 0.000%, 12/15/2021 (ETM) (Insured by NATL) | | | 30,000 | | | | 29,898 | | | | | |
| 0.000%, 12/15/2024 (ETM) (Insured by NATL) | | | 95,000 | | | | 93,294 | | | | | |
| State of Wisconsin: | | | | | | | | | | | | |
| 5.000%, 05/01/2026 (Callable 05/01/2023) | | | 60,000 | | | | 66,639 | | | | | |
| 5.000%, 05/01/2029 (Pre-refunded to 05/01/2022) | | | 145,000 | | | | 154,286 | | | | | |
| Tender Option Bond Trust: | | | | | | | | | | | | |
| 0.270%, 01/01/2035 | | | | | | | | | | | | |
(Optional Put Date 01/07/2021)(1)(3) | | | 795,000 | | | | 795,000 | | | | | |
The accompanying notes are an integral part of these financial statements.
Baird Short-Term Municipal Bond Fund
Schedule of Investments, December 31, 2020
Long-Term Investments (cont.)
| | | Principal | | | | | | % of | |
| | | Amount | | | Value | | | Net Assets | |
| Tender Option Bond Trust: (cont.) | | | | | | | | | |
| 0.320%, 05/01/2054 | | | | | | | | | |
(Optional Put Date 01/07/2021)(1)(3) | | $ | 1,300,000 | | | $ | 1,300,000 | | | |
|
|
| 0.320%, 05/01/2054 | | | | | | | | | | | | |
(Optional Put Date 01/07/2021)(1)(3) | | | 2,250,000 | | | | 2,250,000 | | | | | |
| 0.320%, 05/01/2054 | | | | | | | | | | | | |
(Optional Put Date 01/07/2021)(1)(3) | | | 2,184,000 | | | | 2,184,000 | | | | | |
| Town of Delavan WI, | | | | | | | | | | | | |
| 4.500%, 03/01/2024 | | | 130,000 | | | | 146,164 | | | | | |
| Town of St. Joseph WI: | | | | | | | | | | | | |
| 3.000%, 12/01/2023 (Insured by MAC) | | | 450,000 | | | | 481,351 | | | | | |
| 3.000%, 12/01/2024 (Insured by MAC) | | | 370,000 | | | | 404,240 | | | | | |
| Village of DeForest WI, | | | | | | | | | | | | |
| 3.375%, 05/01/2023 (Callable 05/01/2021) | | | 100,000 | | | | 100,968 | | | | | |
| Village of Hales Corners WI, | | | | | | | | | | | | |
| 3.000%, 11/01/2022 | | | 345,000 | | | | 361,270 | | | | | |
| Village of Holmen WI, | | | | | | | | | | | | |
| 4.000%, 10/01/2025 | | | 260,000 | | | | 301,987 | | | | | |
| Village of Waunakee WI, | | | | | | | | | | | | |
| 3.200%, 10/01/2026 (Callable 02/01/2021) | | | 225,000 | | | | 225,450 | | | | | |
| West Bend Joint School District No. 1, | | | | | | | | | | | | |
| 2.000%, 04/01/2024 (Callable 04/01/2021) | | | 535,000 | | | | 537,113 | | | | | |
| Wisconsin Center District: | | | | | | | | | | | | |
| 5.000%, 12/15/2022 | | | 715,000 | | | | 781,567 | | | | | |
| 5.250%, 12/15/2023 (ETM) (Insured by AGM) | | | 35,000 | | | | 38,028 | | | | | |
| 5.250%, 12/15/2023 (Insured by AGM) | | | 20,000 | | | | 22,313 | | | | | |
| 0.000%, 12/15/2024 (Insured by NATL) | | | 100,000 | | | | 95,917 | | | | | |
| 5.000%, 12/15/2025 | | | 120,000 | | | | 147,215 | | | | | |
| 5.250%, 12/15/2027 (ETM) (Insured by AGM) | | | 50,000 | | | | 62,434 | | | | | |
| 5.250%, 12/15/2027 (Insured by AGM) | | | 215,000 | | | | 267,591 | | | | | |
| Wisconsin Health & Educational Facilities Authority: | | | | | | | | | | | | |
| 5.000%, 11/01/2021 | | | 110,000 | | | | 111,932 | | | | | |
| 5.875%, 02/15/2022 (Insured by BHAC) | | | 90,000 | | | | 92,920 | | | | | |
| 5.000%, 03/01/2022 | | | 230,000 | | | | 238,374 | | | | | |
| 5.000%, 07/01/2022 | | | 185,000 | | | | 196,905 | | | | | |
| 4.000%, 09/15/2022 | | | 200,000 | | | | 206,966 | | | | | |
| 5.000%, 03/01/2023 | | | 300,000 | | | | 320,325 | | | | | |
| 5.000%, 06/01/2023 (Callable 06/01/2022) | | | 415,000 | | | | 439,028 | | | | | |
| 4.000%, 09/15/2023 (Callable 09/15/2022) | | | 150,000 | | | | 155,046 | | | | | |
| 5.000%, 12/01/2023 | | | 150,000 | | | | 169,639 | | | | | |
| 4.000%, 09/15/2024 (Callable 09/15/2023) | | | 360,000 | | | | 378,497 | | | | | |
| 5.000%, 07/01/2025 (Callable 07/01/2024) | | | 660,000 | | | | 759,898 | | | | | |
| 2.750%, 08/15/2025 (Callable 08/15/2024) | | | 1,440,000 | | | | 1,551,442 | | | | | |
| 4.000%, 09/15/2025 (Callable 09/15/2023) | | | 375,000 | | | | 393,461 | | | | | |
| 4.000%, 09/15/2025 (Callable 09/15/2022) | | | 200,000 | | | | 206,254 | | | | | |
The accompanying notes are an integral part of these financial statements.
Baird Short-Term Municipal Bond Fund
Schedule of Investments, December 31, 2020
Long-Term Investments (cont.)
| | | Principal | | | | | | % of | |
| | | Amount | | | Value | | | Net Assets | |
| Wisconsin Health & Educational | | | | | | | | | |
| Facilities Authority: (cont.) | | | | | | | | | |
| 5.000%, 11/01/2025 | | $ | 245,000 | | | $ | 265,805 | | | | |
| 5.000%, 02/15/2026 (Insured by AGM) | | | 500,000 | | | | 614,470 | | | | |
| 5.000%, 02/15/2026 | | | 1,000,000 | | | | 1,194,830 | | | | |
| 2.250%, 11/01/2026 (Callable 11/01/2021) | | | 1,250,000 | | | | 1,249,988 | | | | |
| 5.000%, 11/15/2027 (Callable 11/15/2024) | | | 640,000 | | | | 741,024 | | | | |
| 5.000%, 08/15/2029 (Callable 08/15/2027) | | | 720,000 | | | | 907,733 | | | | |
| 5.000%, 11/01/2029 (Callable 11/01/2026) | | | 500,000 | | | | 551,710 | | | | |
| 3.000%, 02/15/2035 (Pre-refunded to 08/15/2025) | | | 185,000 | | | | 206,684 | | | | |
| 5.250%, 04/15/2035 (Pre-refunded to 04/15/2023) | | | 560,000 | | | | 622,602 | | | | |
| 4.000%, 02/15/2038 (Pre-refunded to 08/15/2025) | | | 425,000 | | | | 494,832 | | | | |
| 5.000%, 02/15/2051 (Callable 08/15/2026) | | | | | | | | | | | |
(Mandatory Tender Date 02/15/2027)(1) | | | 3,100,000 | | | | 3,760,331 | | | | |
| 5.000%, 02/15/2052 (Callable 08/15/2024) | | | | | | | | | | | |
(Mandatory Tender Date 02/15/2025)(1) | | | 5,300,000 | | | | 6,097,650 | | | | |
| 0.620%, 08/15/2054 | | | | | | | | | | | |
| (SIFMA Municipal Swap Index + 0.550%) | | | | | | | | | | | |
| (Callable 07/26/2022) | | | | | | | | | | | |
(Mandatory Tender Date 07/26/2023)(2) | | | 255,000 | | | | 255,518 | | | | |
| Wisconsin Housing & Economic Development Authority: | | | | | | | | | | | |
| 3.500%, 09/01/2046 | | | | | | | | | | | |
| (Callable 09/01/2025) (Insured by FNMA) | | | 270,000 | | | | 288,022 | | | | |
| 4.000%, 03/01/2048 | | | | | | | | | | | |
| (Callable 03/01/2027) (Insured by FNMA) | | | 405,000 | | | | 437,185 | | | | |
| 1.600%, 11/01/2048 (Callable 11/01/2021) | | | | | | | | | | | |
(Mandatory Tender Date 11/01/2022)(1) | | | 430,000 | | | | 433,866 | | | | |
| 4.250%, 03/01/2049 (Callable 09/01/2028) | | | 905,000 | | | | 1,014,053 | | | | |
| Total Wisconsin | | | | | | | | | | | |
| (Cost $55,646,207) | | | | | | | 56,697,654 | | | | 3.5 | % |
| Wyoming | | | | | | | | | | | | |
| Carbon County Specific Purpose Tax Joint Powers Board: | | | | | | | | | | | | |
| 5.000%, 06/15/2023 | | | 675,000 | | | | 729,121 | | | | | |
| 5.000%, 06/15/2024 | | | 735,000 | | | | 815,027 | | | | | |
| 5.000%, 06/15/2025 | | | 950,000 | | | | 1,077,100 | | | | | |
| 5.000%, 06/15/2026 | | | 340,000 | | | | 391,796 | | | | | |
| Wyoming Community Development Authority: | | | | | | | | | | | | |
| 4.000%, 12/01/2043 (Callable 06/01/2027) | | | 1,130,000 | | | | 1,201,156 | | | | | |
| 3.750%, 12/01/2049 (Callable 12/01/2028) | | | 1,910,000 | | | | 2,067,843 | | | | | |
| Total Wyoming | | | | | | | | | | | | |
| (Cost $6,228,593) | | | | | | | 6,282,043 | | | | 0.4 | % |
| Total Municipal Bonds | | | | | | | | | | | | |
| (Cost $1,527,824,581) | | | | | | | 1,555,389,391 | | | | 96.4 | % |
The accompanying notes are an integral part of these financial statements.
Baird Short-Term Municipal Bond Fund
Schedule of Investments, December 31, 2020
Long-Term Investments (cont.)
| | | | | | | | | % of | |
| | | Shares | | | Value | | | Net Assets | |
| Closed-End Investment Companies | | | | | | | | | |
| Nuveen AMT-Free Municipal Credit | | | | | | | | | |
| Income Fund, Series B Preferred Shares, | | | | | | | | | |
0.470%, 03/01/2029(1) | | | 10,000 | | | $ | 10,000,000 | | | | |
| Nuveen AMT-Free Quality Municipal | | | | | | | | | | | |
| Income Fund, Series D Preferred Shares, | | | | | | | | | | | |
0.470%, 03/01/2029(1) | | | 4,000 | | | | 4,000,000 | | | | |
| Total Closed-End Investment Companies | | | | | | | | | | | |
| (Cost $14,000,000) | | | | | | | 14,000,000 | | | | 0.9 | % |
| Total Long-Term Investments | | | | | | | | | | | | |
| (Cost $1,541,824,581) | | | | | | | 1,569,389,391 | | | | 97.3 | % |
| Short-Term Investment | | | | | | | | | | | | |
| Money Market Mutual Fund | | | | | | | | | | | | |
| Federated Hermes Institutional Tax-Free | | | | | | | | | | | | |
Cash Trust, Premier Shares, 0.01%(4) | | | 4,396,284 | | | | 4,396,284 | | | | | |
| Total Short-Term Investment | | | | | | | | | | | | |
| (Cost $4,396,284) | | | | | | | 4,396,284 | | | | 0.3 | % |
| Total Investments | | | | | | | | | | | | |
| (Cost $1,546,220,865) | | | | | | | 1,573,785,675 | | | | 97.6 | % |
| Other Assets in Excess of Liabilities | | | | | | | 38,426,059 | | | | 2.4 | % |
| TOTAL NET ASSETS | | | | | | $ | 1,612,211,734 | | | | 100.0 | % |
Notes to Schedule of Investments
AGC – Assured Guaranty Corp.
AGM – Assured Guaranty Municipal
AMBAC – Ambac Assurance Corp.
BAM – Build America Mutual Assurance Co.
BHAC – Berkshire Hathaway Assurance Corp.
CA MTG – CA Mortgage Insurance
FHA – Federal Housing Administration
FNMA – Federal National Mortgage Association
GNMA – Government National Mortgage Association
MAC – Municipal Assurance Corp.
NATL – National Public Finance Guarantee Corp.
Q-SBLF – Qualified School Building Loan Fund
SCH BD GTY – School Board Guaranty
SD CRED PROG – State Credit Enhancement Program
ST AID – State Aid Intercept/Withholding
UT CSCE – Utah Charter School Finance Authority
ETM – Escrowed to Maturity
LIBOR – London Inter-bank Offered Rate
PSF – Permanent School Fund
SIFMA – Securities Industry and Financial Markets Association
The accompanying notes are an integral part of these financial statements.
Baird Short-Term Municipal Bond Fund
Schedule of Investments, December 31, 2020
Notes to Schedule of Investments (cont.)| (1) | Variable rate security. The rate reported is the rate in effect as of December 31, 2020. |
| (2) | Variable rate security based on a reference index and spread. The rate reported is the rate in effect as of December 31, 2020. |
| (3) | Security issued under Rule 144A under the Securities Act of 1933 and classified as liquid under the Fund’s liquidity risk management program. Purchased in a private placement transaction; resale to the public may require registration or may extend only to qualified institutional buyers. At December 31, 2020, the value of these securities total $72,935,626, which represents 4.52% of total net assets. |
| (4) | Seven-day yield. |
| (5) | Auction Rate Security. An Auction Rate Security is a debt instrument with a long nominal maturity for which the interest rate is regularly reset through a Dutch auction. The rate presented is either the rate set through the auction or the maximum interest rate provided for in the security issuance provision. |
| (6) | Security or a portion of the security purchased on a when-issued or delayed delivery basis. |
| (7) | Step-up bond; the interest rate shown is the rate in effect as of December 31, 2020. |
Summary of Fair Value Exposure at December 31, 2020
The Fund has adopted authoritative fair valuation accounting standards which establish a definition of fair value and set out a hierarchy for measuring fair value. These standards require additional disclosures about the various inputs and valuation techniques used to develop the measurements of fair value and a discussion on changes in valuation techniques and related inputs during the period. These standards define fair value as the price that would be received to sell an asset or paid to transfer a liability in an orderly transaction between market participants at the measurement date.
The fair value hierarchy is organized into three levels based upon the assumptions (referred to as “inputs”) used in pricing the asset or liability. These standards state that “observable inputs” reflect the assumptions market participants would use in pricing the asset or liability based on market data obtained from independent sources and “unobservable inputs” reflect an entity’s own assumptions about the assumptions market participants would use in pricing the asset or liability. These inputs are summarized into three broad levels and described below:
| Level 1 – | Quoted prices (unadjusted) in active markets for identical assets or liabilities that the reporting entity can access at the measurement date. |
| Level 2 – | Inputs other than quoted prices included within Level 1 that are observable for the asset or liability, either directly or indirectly. |
| Level 3 – | Unobservable inputs for the asset or liability. |
The inputs or methodology used for valuing securities are not necessarily an indication of the risk associated with investing in those securities.
The accompanying notes are an integral part of these financial statements.
Baird Short-Term Municipal Bond Fund
Summary of Fair Value Exposure at December 31, 2020 (cont.)
The following is a summary of the inputs used to value the Fund’s investments as of December 31, 2020:
| | | Level 1 | | | Level 2 | | | Level 3 | | | Total | |
| Long-Term Investments | | | | | | | | | | | | |
| Municipal Bonds | | $ | — | | | $ | 1,555,389,391 | | | $ | — | | | $ | 1,555,389,391 | |
| Closed-End Investment Companies | | | — | | | | 14,000,000 | | | | — | | | | 14,000,000 | |
| Total Long-Term Investments | | | — | | | | 1,569,389,391 | | | | — | | | | 1,569,389,391 | |
| Short-Term Investment | | | | | | | | | | | | | | | | |
| Money Market Mutual Fund | | | 4,396,284 | | | | — | | | | — | | | | 4,396,284 | |
| Total Short-Term Investment | | | 4,396,284 | | | | — | | | | — | | | | 4,396,284 | |
| Total Investments | | $ | 4,396,284 | | | $ | 1,569,389,391 | | | $ | — | | | $ | 1,573,785,675 | |
Changes in valuation techniques may result in transfers into or out of assigned levels within the fair value hierarchy. There were no transfers into or out of Level 3 during the reporting period, as compared to the security classifications from the prior year’s annual report. See the Fund’s Valuation Policy in Note 2a to the financial statements.
The accompanying notes are an integral part of these financial statements.
Baird Strategic Municipal Bond Fund
December 31, 2020 (Unaudited)
The Baird Strategic Municipal Bond Fund seeks current income that is exempt from federal income tax and is consistent with the preservation of capital.
The coronavirus (COVID-19) challenges of 2020 were unexpected and unprecedented, but so was the speed and magnitude of the monetary and fiscal responses. The result was a year of significant volatility, yet a rewarding one for Fund investors who stayed the course. Over the full year, tax-exempt rates fell sharply across the curve with short rates falling 93bps and long yields declining 68bps, steepening the curve. As the year began, no one could have known the challenges that would soon be faced. Municipal funds were benefiting from a record streak of weekly inflows, state and local tax revenues were generally rising with the economy in its eleventh year of expansion and many municipalities were adding to an already healthy level of reserves. News broke in January of COVID-19 in the State of Washington; by the end of February, seven states had confirmed cases and it was spreading rapidly. Trading activity in the municipal market initially froze as the lockdowns began, then a torrent of selling was unleashed and a liquidity crisis quickly emerged. The selling and lack of dealer support for the market drove tax-exempt yields to record highs relative to comparable maturity Treasuries. Never had a U.S. economic shock been so swift, deep and broad, affecting so many municipalities. Investors were questioning the ability of municipalities to withstand this crisis and meet their obligations. On March 27th, President Trump signed the $2.2 trillion CARES Act which, along with other measures, offered substantial aid to nearly every sector of the municipal market. In addition, the establishment of the Municipal Liquidity Facility (MLF), which, for the first time ever, allowed the Fed to lend directly to states and other select municipalities, offered investors the psychological support they were looking for. As the policymakers acted, AAA-rated municipal yields peaked on March 20th and opportunistic investors began to emerge, looking to capitalize on the incredible undervaluation that had been created in the downdraft. From a credit perspective, the further in time we moved away from the initial economic shutdowns, the better the news became on tax revenues.
During 2020, the Fund’s Institutional Class Shares generated strong absolute and relative returns and outperformed its benchmark by 416 basis points net of fees.
The primary factors contributing to the Fund’s absolute and relative performance in 2020 include:
Contributors to Performance
| | • | Security selection – the largest and most consistent contributor to performance for the year |
| | • | Credit sector – added to lower-quality issues as valuations became more attractive |
| | • | Yield curve exposure |
Detractors from Performance
| | • | The relative price differences between ICE (Fund) and BVAL (benchmark) |
| | • | The allocation to non-rated issues |
| | • | An overweight to the Education sector |
Although the COVID-19 vaccinations have begun, we expect the economic impact of COVID-19 to linger well into 2021, particularly as it relates to travel and entertainment. Yet, with the massive fiscal stimulus that is already in the pipeline, and perhaps more coming now that the Democratic Party has full, albeit narrow, control of Washington, above-average economic growth is very likely this year. This should boost state and local tax revenues helping municipalities recover from the pandemic-induced decline. With short-term rates anchored by the Fed, a steeper yield curve is likely which provides the opportunity for investors to capture the roll-down benefit as bonds age along a relatively steep curve. We expect the roll-down return to be an important component of total return this year, along with the yield advantage the Fund enjoys above that of its benchmark. Municipal credit spreads have room to narrow further, suggesting a modest credit overweight is appropriate. Strategic positioning across market sectors and the yield curve, a continued focus on credit to identify improving trends, plus the always-important security selection process will all be important to navigate through the current environment.
Baird Strategic Municipal Bond Fund
December 31, 2020 (Unaudited)
The Fund will seek to capitalize on market volatility to add value from multiple decisions, including duration, curve, credit, as well as sector weightings and individual security selection. The Fund’s underweight to duration is a near-term focus of ours, while the Fund’s curve weightings will seek to optimize the roll-down benefit. We believe the uneven recovery across market sectors requires us to intensely focus on credit and our continued focus on selecting investments with strong fundamental tax and revenue support remains critical.
Baird Strategic Municipal Bond Fund
December 31, 2020 (Unaudited)
Portfolio Characteristics
Quality Distribution(1)(2)
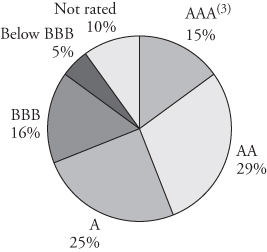
| | Net Assets | $171,322,549 | |
| | | | |
| | SEC 30-Day | | |
| | Yield(4) | | |
| | Institutional Class | 1.15% | |
| | Investor Class | 0.92% | |
| | | | |
| | Average | | |
| | Effective | | |
| | Duration | 2.75 years | |
| | | | |
| | Average | | |
| | Effective | | |
| | Maturity | 2.99 years | |
| | | | |
| | | Annualized | | |
Sector Weightings(1) | | Expense | | |
| | | Ratio(5) | | |
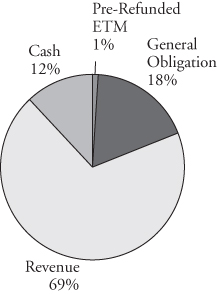
| | Institutional Class | 0.30% | |
| | Investor Class | 0.55% | (6) |
| | | | |
| | Portfolio | | |
| | Turnover Rate | 119% | |
| | | | |
| | Number of | | |
| | Holdings | 436 | |
| | | | |
| | | | |
| | | | |
| | | | |
| | | | |
| | | | |
| | | | |
| | | | |
| | | | |
| | | | | |
| (1) | Percentages shown are based on the Fund’s total investments. |
| (2) | The quality profile is calculated on a market value-weighted basis using the highest credit quality rating for each security held by the Fund given by S&P, Moody’s or Fitch, each of which is a Nationally Recognized Statistical Rating Organization (NRSRO). NRSROs rate the credit quality of securities using a scale that generally ranges from AAA (highest) to D (lowest). |
| (3) | Includes pre-refunded and escrowed-to-maturity (ETM) bonds. |
| (4) | SEC yields are based on SEC guidelines and are calculated for the 30 days ended December 31, 2020. |
| (5) | Reflects expense ratios as stated in the Fund’s current prospectus. |
| (6) | Includes 0.25% 12b-1 fee. |
Baird Strategic Municipal Bond Fund
December 31, 2020 (Unaudited)
Institutional ClassValue of a $25,000 Investment
Growth of a hypothetical investment of $25,000 made on the Fund’s inception date (11/15/19), assuming reinvestment of all distributions.
Investor Class
Value of a $10,000 Investment
Growth of a hypothetical investment of $10,000 made on the Fund’s inception date (11/15/19), assuming reinvestment of all distributions.
Baird Strategic Municipal Bond Fund
December 31, 2020 (Unaudited)
Total Returns
| | | Average |
| | | Annual |
| | One | Since |
| For the Periods Ended December 31, 2020 | Year | Inception(1) |
| Institutional Class Shares | 8.39% | 8.26% |
| Investor Class Shares | 8.13% | 8.00% |
Bloomberg Barclays 1-10 Year Municipal Blend Index(2) | 4.23% | 4.34% |
| (1) | For the period from November 15, 2019 (inception date) through December 31, 2020. |
| (2) | The Bloomberg Barclays 1-10 Year Municipal Blend Index is a market value-weighted index which covers the short and intermediate components of the Barclays Municipal Bond Index—an unmanaged, market value-weighted index which covers the U.S. investment-grade tax-exempt bond market. The 1-10 Year Municipal Blend index tracks tax-exempt municipal General Obligation, Revenue, Insured, and Prerefunded bonds with a minimum $5 million par amount outstanding, issued as part of a transaction of at least $50 million, and with a remaining maturity from 1 up to (but not including) 12 years. The index includes reinvestment of income. This Index does not reflect any deduction for fees, expenses or taxes. A direct investment in an index is not possible. |
The line graphs on the previous page and the returns shown in the table above reflect reinvestment of dividends and/or capital gains distributions in additional shares. The returns in the graphs and table do not reflect the deduction of taxes that a shareholder would pay on Fund distributions or the redemption of Fund shares. The returns reflect the actual performance for each period and do not include the impact of trades executed on the last business day of the period that were recorded on the first business day of the next period.
The Fund’s gross expense ratio for each Class, as reflected in the Fund’s current prospectus, is set forth under “Portfolio Characteristics”.
The Fund may invest up to 30% of its net assets in non-investment grade debt securities (commonly referred to as “high yield” bonds). While these types of debt securities typically offer higher yields than investment grade securities, they also include greater risks including increased credit risk and the increased risk of default or bankruptcy. The Fund may invest up to 25% of its total assets in municipal obligations issued by persons in the same state. As a result, changes in economic, business or political conditions of a particular state may have a disproportionate impact on the Fund’s share price. Municipal securities investments are not appropriate for all investors, especially those taxed at lower rates.
The Fund may invest up to 20% of its net assets in U.S. government and corporate bonds and other debt securities that are of the same quality as its investments in municipal bonds. These bonds produce income that is taxable for federal income tax purposes, unlike municipal bonds which generally provide income exempt from federal income tax.
The Fund may also invest in U.S. Treasury futures contracts. Futures contracts are subject to the risk of loss caused by unanticipated market movements, the risk that there may be an imperfect correlation between the prices of futures contracts and the value of their underlying instruments or indexes, and the risk there may not be a liquid secondary market for them. U.S. and international markets have experienced significant periods of volatility in recent years and months due to a number of economic, political and global macro factors including the impact of the coronavirus (COVID-19) as a global pandemic and related public health issues, growth concerns in the U.S. and overseas, uncertainties regarding interest rates, trade tensions and the threat of tariffs imposed by the U.S. and other countries. These and other geopolitical events may cause market disruptions and could have an adverse effect on the value of the Fund’s investments.
Past performance does not guarantee future results. Investment return and principal value will fluctuate so that an investor’s shares, when redeemed, may be worth more or less than their original cost.
For information about the performance of the Fund as of the most recent month-end, please call 1-866-44BAIRD or visit www.bairdfunds.com. Mutual fund performance changes over time and current performance may be lower or higher than that stated.
Baird Strategic Municipal Bond Fund
Schedule of Investments, December 31, 2020
Long-Term Investments
| | | Principal | | | | | | % of | |
| | | Amount | | | Value | | | Net Assets | |
| Municipal Bonds | | | | | | | | | |
| Alabama | | | | | | | | | |
| Alabama Public School and College Authority, | | | | | | | | | |
| 5.000%, 11/01/2029 | | $ | 500,000 | | | $ | 683,295 | | | | |
| City of Huntsville AL: | | | | | | | | | | | |
| 5.000%, 09/01/2030 | | | 535,000 | | | | 740,157 | | | | |
| 5.000%, 09/01/2030 | | | 1,390,000 | | | | 1,923,023 | | | | |
| Eutaw Industrial Development Board, | | | | | | | | | | | |
0.060%, 06/01/2028 (Optional Put Date 01/04/2021)(1) | | | 800,000 | | | | 800,000 | | | | |
| Industrial Development Board of the City of Mobile AL, | | | | | | | | | | | |
0.050%, 06/01/2034 (Optional Put Date 01/04/2021)(1) | | | 1,000,000 | | | | 1,000,000 | | | | |
| Mizuho Floater/Residual Trust, | | | | | | | | | | | |
| 0.470%, 12/01/2048 (Callable 02/01/2021) | | | | | | | | | | | |
(Optional Put Date 02/04/2021)(1)(3) | | | 2,000,000 | | | | 2,000,000 | | | | |
| Tallassee Board of Education, | | | | | | | | | | | |
| 4.000%, 08/01/2034 | | | | | | | | | | | |
| (Callable 08/01/2030) (Insured by AGM) | | | 310,000 | | | | 379,871 | | | | |
| Total Alabama | | | | | | | | | | | |
| (Cost $7,452,817) | | | | | | | 7,526,346 | | | | 4.4 | % |
| Alaska | | | | | | | | | | | | |
| Alaska Housing Finance Corp.: | | | | | | | | | | | | |
| 3.450%, 12/01/2033 (Callable 06/01/2027) | | | 265,000 | | | | 272,044 | | | | | |
| 4.000%, 06/01/2036 (Callable 06/01/2025) | | | 750,000 | | | | 833,692 | | | | | |
| 3.750%, 12/01/2046 (Callable 02/01/2021) | | | 190,000 | | | | 190,500 | | | | | |
| Alaska Municipal Bond Bank Authority, | | | | | | | | | | | | |
| 5.000%, 10/01/2026 | | | 175,000 | | | | 214,037 | | | | | |
| CIVIC Ventures: | | | | | | | | | | | | |
| 5.000%, 09/01/2022 | | | 260,000 | | | | 269,823 | | | | | |
| 5.000%, 09/01/2023 | | | 235,000 | | | | 248,924 | | | | | |
| 5.000%, 09/01/2025 | | | 170,000 | | | | 186,978 | | | | | |
| 5.000%, 09/01/2026 (Callable 09/01/2025) | | | 130,000 | | | | 142,446 | | | | | |
| University of Alaska, | | | | | | | | | | | | |
| 5.000%, 10/01/2028 (Callable 10/01/2025) | | | 110,000 | | | | 124,761 | | | | | |
| Total Alaska | | | | | | | | | | | | |
| (Cost $2,449,396) | | | | | | | 2,483,205 | | | | 1.4 | % |
| Arizona | | | | | | | | | | | | |
| Arizona Industrial Development Authority: | | | | | | | | | | | | |
| 2.470%, 07/01/2025 (Insured by SD CRED PROG) | | | 190,000 | | | | 192,499 | | | | | |
| 3.169%, 10/01/2025 | | | 150,000 | | | | 150,238 | | | | | |
4.750%, 10/01/2025(3) | | | 165,000 | | | | 167,097 | | | | | |
5.000%, 10/01/2030 (Callable 10/01/2026)(3) | | | 105,000 | | | | 108,357 | | | | | |
| Cochise County Community College District, | | | | | | | | | | | | |
| 5.000%, 07/01/2026 | | | | | | | | | | | | |
| (Callable 07/01/2025) (Insured by BAM) | | | 120,000 | | | | 139,334 | | | | | |
The accompanying notes are an integral part of these financial statements.
Baird Strategic Municipal Bond Fund
Schedule of Investments, December 31, 2020
Long-Term Investments (cont.)
| | | Principal | | | | | | % of | |
| | | Amount | | | Value | | | Net Assets | |
| Maricopa County Industrial Development Authority: | | | | | | | | | |
4.500%, 07/01/2025(3) | | $ | 125,000 | | | $ | 123,684 | | | | |
| 5.000%, 07/01/2026 (Insured by SD CRED PROG) | | | 430,000 | | | | 516,198 | | | | |
| 5.000%, 07/01/2027 (Insured by SD CRED PROG) | | | 710,000 | | | | 866,789 | | | | |
| 5.000%, 01/01/2033 (Callable 01/01/2027) | | | 250,000 | | | | 309,400 | | | | |
| Tender Option Bond Trust, | | | | | | | | | | | |
| 0.340%, 07/01/2047 | | | | | | | | | | | |
(Optional Put Date 01/07/2021)(1)(3) | | | 1,500,000 | | | | 1,500,000 | | | | |
| Total Arizona | | | | | | | | | | | |
| (Cost $4,026,615) | | | | | | | 4,073,596 | | | | 2.4 | % |
| Arkansas | | | | | | | | | | | | |
| Batesville Public Facilities Board, | | | | | | | | | | | | |
| 5.000%, 06/01/2027 | | | 500,000 | | | | 566,100 | | | | | |
| Carroll-Boone Water District, | | | | | | | | | | | | |
| 3.000%, 12/01/2034 (Callable 12/01/2025) | | | 750,000 | | | | 790,470 | | | | | |
| City of Maumelle AR, | | | | | | | | | | | | |
| 4.000%, 08/01/2030 (Callable 08/01/2025) | | | 75,000 | | | | 82,352 | | | | | |
| Henderson State University, | | | | | | | | | | | | |
| 2.625%, 07/01/2022 (Callable 02/01/2021) | | | 100,000 | | | | 100,135 | | | | | |
| Little Rock Metrocentere Improvement District No. 1, | | | | | | | | | | | | |
0.030%, 12/01/2025 (Optional Put Date 01/04/2021)(1) | | | 1,600,000 | | | | 1,600,000 | | | | | |
| Lonoke School District No. 1, | | | | | | | | | | | | |
| 2.250%, 02/01/2030 | | | | | | | | | | | | |
| (Callable 02/01/2021) (Insured by ST AID) | | | 255,000 | | | | 255,186 | | | | | |
| Southern Arkansas University, | | | | | | | | | | | | |
| 4.000%, 03/01/2028 | | | | | | | | | | | | |
| (Callable 03/01/2025) (Insured by AGM) | | | 205,000 | | | | 231,156 | | | | | |
| Total Arkansas | | | | | | | | | | | | |
| (Cost $3,600,399) | | | | | | | 3,625,399 | | | | 2.1 | % |
| California | | | | | | | | | | | | |
| American Valley Community Services District, | | | | | | | | | | | | |
1.500%, 11/01/2023 (Callable 11/01/2022)(3) | | | 1,000,000 | | | | 1,014,520 | | | | | |
| Bay Area Toll Authority, | | | | | | | | | | | | |
| 1.320%, 04/01/2036 | | | | | | | | | | | | |
| (SIFMA Municipal Swap Index + 1.250%) | | | | | | | | | | | | |
| (Callable 10/01/2026) | | | | | | | | | | | | |
(Mandatory Tender Date 04/01/2027)(2) | | | 1,075,000 | | | | 1,090,534 | | | | | |
| California Health Facilities Financing Authority, | | | | | | | | | | | | |
| 3.000%, 03/01/2041 (Callable 09/01/2023) | | | | | | | | | | | | |
(Mandatory Tender Date 03/01/2024)(1) | | | 1,000,000 | | | | 1,060,880 | | | | | |
| California Infrastructure & Economic Development Bank, | | | | | | | | | | | | |
| 0.478%, 08/01/2047 | | | | | | | | | | | | |
| (1 Month LIBOR USD + 0.380%) (Callable 02/01/2021) | | | | | | | | | | | | |
(Mandatory Tender Date 08/01/2021)(2) | | | 175,000 | | | | 174,982 | | | | | |
The accompanying notes are an integral part of these financial statements.
Baird Strategic Municipal Bond Fund
Schedule of Investments, December 31, 2020
Long-Term Investments (cont.)
| | | Principal | | | | | | % of | |
| | | Amount | | | Value | | | Net Assets | |
| California Municipal Finance Authority: | | | | | | | | | |
| 3.000%, 01/01/2021 | | $ | 250,000 | | | $ | 250,000 | | | | |
| 5.000%, 10/01/2023 | | | 140,000 | | | | 155,072 | | | | |
| California Pollution Control Financing Authority, | | | | | | | | | | | |
0.010%, 03/01/2042 (Optional Put Date 01/04/2021)(1) | | | 2,000,000 | | | | 2,000,000 | | | | |
| California Public Finance Authority, | | | | | | | | | | | |
0.010%, 08/01/2052 (Optional Put Date 01/04/2021)(1) | | | 300,000 | | | | 300,000 | | | | |
| City & County of San Francisco CA, | | | | | | | | | | | |
| 1.300%, 07/01/2023 | | | | | | | | | | | |
(Mandatory Tender Date 01/01/2023)(1) | | | 200,000 | | | | 202,258 | | | | |
| Mayers Memorial Hospital District: | | | | | | | | | | | |
| 0.000%, 08/01/2026 | | | 230,000 | | | | 203,118 | | | | |
| 0.000%, 08/01/2029 | | | 165,000 | | | | 132,663 | | | | |
| Metropolitan Water District of Southern California, | | | | | | | | | | | |
| 0.010%, 07/01/2037 (Callable 01/21/2021) | | | | | | | | | | | |
(Optional Put Date 01/04/2021)(1) | | | 2,500,000 | | | | 2,500,000 | | | | |
| Mizuho Floater/Residual Trust, | | | | | | | | | | | |
| 0.270%, 09/01/2046 (Callable 02/01/2021) | | | | | | | | | | | |
(Optional Put Date 01/07/2021)(1)(3) | | | 1,000,000 | | | | 1,000,000 | | | | |
| Modesto Irrigation District, | | | | | | | | | | | |
| 0.731%, 09/01/2027 (3 Month LIBOR USD + 0.580%) | | | | | | | | | | | |
(Callable 02/01/2021) (Insured by NATL)(2) | | | 90,000 | | | | 88,885 | | | | |
| Oxnard School District, | | | | | | | | | | | |
| 2.000%, 08/01/2045 | | | | | | | | | | | |
(Callable 08/01/2026) (Insured by BAM)(7) | | | 200,000 | | | | 222,248 | | | | |
| Riverside County Redevelopment Successor Agency: | | | | | | | | | | | |
0.000%, 10/01/2025 (Insured by BAM)(7) | | | 200,000 | | | | 231,292 | | | | |
| 0.000%, 10/01/2041 | | | | | | | | | | | |
(Callable 10/01/2026) (Insured by BAM)(7) | | | 80,000 | | | | 90,514 | | | | |
| Tender Option Bond Trust, | | | | | | | | | | | |
0.270%, 06/15/2055(1)(3) | | | 1,000,000 | | | | 1,000,000 | | | | |
| Western Placer Unified School District, | | | | | | | | | | | |
| 2.000%, 06/01/2025 (Callable 06/01/2023) | | | 200,000 | | | | 206,348 | | | | |
| Total California | | | | | | | | | | | |
| (Cost $11,855,911) | | | | | | | 11,923,314 | | | | 7.0 | % |
| Colorado | | | | | | | | | | | | |
| Colorado Educational & Cultural Facilities Authority: | | | | | | | | | | | | |
| 5.250%, 03/01/2025 (Insured by NATL) | | | 200,000 | | | | 230,216 | | | | | |
| 2.000%, 09/01/2030 (Callable 09/01/2028) | | | 550,000 | | | | 554,526 | | | | | |
| Colorado Health Facilities Authority, | | | | | | | | | | | | |
| 4.000%, 12/01/2026 (Pre-refunded to 12/01/2022) | | | 170,000 | | | | 182,247 | | | | | |
| Colorado Housing & Finance Authority, | | | | | | | | | | | | |
| 1.350%, 02/01/2022 (Callable 08/01/2021) | | | 345,000 | | | | 346,608 | | | | | |
The accompanying notes are an integral part of these financial statements.
Baird Strategic Municipal Bond Fund
Schedule of Investments, December 31, 2020
Long-Term Investments (cont.)
| | | Principal | | | | | | % of | |
| | | Amount | | | Value | | | Net Assets | |
| Denver Convention Center Hotel Authority: | | | | | | | | | |
| 5.000%, 12/01/2023 | | $ | 200,000 | | | $ | 220,800 | | | | |
| 5.000%, 12/01/2024 | | | 800,000 | | | | 910,088 | | | | |
| Denver Health & Hospital Authority, | | | | | | | | | | | |
| 4.000%, 12/01/2028 (Callable 12/01/2023) | | | 100,000 | | | | 106,778 | | | | |
| E-470 Public Highway Authority, | | | | | | | | | | | |
| 0.000%, 09/01/2029 (Insured by NATL) | | | 50,000 | | | | 44,429 | | | | |
| Glen Metropolitan District No. 2, | | | | | | | | | | | |
| 2.000%, 12/01/2030 (Insured by BAM) | | | 275,000 | | | | 275,300 | | | | |
| Poudre Tech Metropolitan District: | | | | | | | | | | | |
| 3.000%, 12/01/2026 (Insured by AGM) | | | 115,000 | | | | 128,086 | | | | |
| 3.000%, 12/01/2027 (Insured by AGM) | | | 270,000 | | | | 302,662 | | | | |
| Prairie Center Metropolitan District No. 7, | | | | | | | | | | | |
| 4.125%, 12/15/2036 (Callable 12/15/2025) | | | 235,000 | | | | 244,362 | | | | |
| Vauxmont Metropolitan District: | | | | | | | | | | | |
| 5.000%, 12/15/2032 | | | | | | | | | | | |
| (Callable 12/15/2024) (Insured by AGM) | | | 135,000 | | | | 157,124 | | | | |
| 3.250%, 12/15/2050 | | | | | | | | | | | |
| (Callable 12/15/2024) (Insured by AGM) | | | 750,000 | | | | 806,797 | | | | |
| Total Colorado | | | | | | | | | | | |
| (Cost $4,441,099) | | | | | | | 4,510,023 | | | | 2.6 | % |
| Connecticut | | | | | | | | | | | | |
| Connecticut State Health & Educational Facilities Authority: | | | | | | | | | | | | |
| 4.500%, 07/01/2024 (Callable 07/01/2021) | | | 300,000 | | | | 303,636 | | | | | |
2.750%, 01/01/2026 (Callable 07/01/2022)(3) | | | 200,000 | | | | 201,896 | | | | | |
| 3.500%, 07/01/2026 | | | 700,000 | | | | 716,877 | | | | | |
| Connecticut State Higher Education | | | | | | | | | | | | |
| Supplement Loan Authority, | | | | | | | | | | | | |
| 5.000%, 11/15/2026 | | | 350,000 | | | | 429,600 | | | | | |
| Town of Sprague CT: | | | | | | | | | | | | |
| 4.000%, 09/01/2021 (Insured by BAM) | | | 50,000 | | | | 51,017 | | | | | |
| 4.000%, 09/01/2024 (Insured by BAM) | | | 40,000 | | | | 44,165 | | | | | |
| 4.000%, 09/01/2025 (Insured by BAM) | | | 55,000 | | | | 62,080 | | | | | |
| Total Connecticut | | | | | | | | | | | | |
| (Cost $1,776,302) | | | | | | | 1,809,271 | | | | 1.1 | % |
| District of Columbia | | | | | | | | | | | | |
| Howard University, | | | | | | | | | | | | |
| 2.638%, 10/01/2021 | | | 150,000 | | | | 151,305 | | | | | |
| Metropolitan Washington Airports Authority, | | | | | | | | | | | | |
| 0.000%, 10/01/2036 (Insured by AGC) | | | 1,000,000 | | | | 714,690 | | | | | |
| Total District of Columbia | | | | | | | | | | | | |
| (Cost $793,720) | | | | | | | 865,995 | | | | 0.5 | % |
The accompanying notes are an integral part of these financial statements.
Baird Strategic Municipal Bond Fund
Schedule of Investments, December 31, 2020
Long-Term Investments (cont.)
| | | Principal | | | | | | % of | |
| | | Amount | | | Value | | | Net Assets | |
| Florida | | | | | | | | | |
| Capital Trust Agency, Inc., | | | | | | | | | |
5.250%, 12/01/2024(3) | | $ | 750,000 | | | $ | 747,795 | | | |
|
|
| City of Jacksonville FL, | | | | | | | | | | | | |
| 4.000%, 10/01/2033 (Callable 10/01/2026) | | | 100,000 | | | | 115,886 | | | | | |
| City of Orlando FL, | | | | | | | | | | | | |
| 5.000%, 11/01/2025 (Insured by AGM) | | | 180,000 | | | | 216,401 | | | | | |
| County of Escambia FL, | | | | | | | | | | | | |
0.060%, 07/01/2022 (Optional Put Date 01/04/2021)(1) | | | 900,000 | | | | 900,000 | | | | | |
| Florida Development Finance Corp., | | | | | | | | | | | | |
| 4.000%, 06/15/2025 | | | 445,000 | | | | 494,520 | | | | | |
| Florida Higher Educational Facilities Financial Authority, | | | | | | | | | | | | |
| 5.000%, 10/01/2021 | | | 225,000 | | | | 229,118 | | | | | |
| Florida Housing Finance Corp.: | | | | | | | | | | | | |
| 4.200%, 01/01/2045 | | | | | | | | | | | | |
| (Callable 01/01/2028) (Insured by GNMA) | | | 165,000 | | | | 182,327 | | | | | |
| 3.500%, 07/01/2046 | | | | | | | | | | | | |
| (Callable 07/01/2024) (Insured by GNMA) | | | 30,000 | | | | 31,109 | | | | | |
| Halifax Hospital Medical Center, | | | | | | | | | | | | |
| 5.000%, 06/01/2021 | | | 125,000 | | | | 127,156 | | | | | |
| Hollywood Beach Community Development District I, | | | | | | | | | | | | |
| 5.000%, 10/01/2026 | | | 520,000 | | | | 642,866 | | | | | |
| JEA Water & Sewer System Revenue, | | | | | | | | | | | | |
| 0.080%, 10/01/2038 (Callable 01/04/2021) | | | | | | | | | | | | |
(Optional Put Date 01/07/2021)(1) | | | 700,000 | | | | 700,000 | | | | | |
| Miami Health Facilities Authority, | | | | | | | | | | | | |
| 5.000%, 07/01/2021 | | | 50,000 | | | | 49,935 | | | | | |
| Orange County Convention Center, | | | | | | | | | | | | |
| 4.000%, 10/01/2034 (Callable 10/01/2026) | | | 300,000 | | | | 341,784 | | | | | |
| Orange County Health Facilities Authority: | | | | | | | | | | | | |
| 3.500%, 08/01/2022 | | | 150,000 | | | | 155,892 | | | | | |
| 5.000%, 08/01/2028 (Callable 08/01/2024) | | | 300,000 | | | | 336,282 | | | | | |
| Palm Beach County Health Facilities Authority: | | | | | | | | | | | | |
| 5.000%, 05/15/2023 | | | 300,000 | | | | 320,361 | | | | | |
| 5.000%, 05/15/2031 (Callable 05/15/2027) | | | 305,000 | | | | 341,011 | | | | | |
| Pasco County School Board, | | | | | | | | | | | | |
| 0.820%, 08/01/2032 | | | | | | | | | | | | |
| (SIFMA Municipal Swap Index + 0.750%) | | | | | | | | | | | | |
| (Callable 08/04/2021) | | | | | | | | | | | | |
(Mandatory Tender Date 08/02/2023)(2) | | | 500,000 | | | | 501,400 | | | | | |
| Sarasota County Health Facilities Authority, | | | | | | | | | | | | |
| 3.000%, 05/15/2023 | | | 180,000 | | | | 182,736 | | | | | |
| Sumter County Industrial Development Authority, | | | | | | | | | | | | |
| 5.000%, 07/01/2021 | | | 100,000 | | | | 102,080 | | | | | |
The accompanying notes are an integral part of these financial statements.
Baird Strategic Municipal Bond Fund
Schedule of Investments, December 31, 2020
Long-Term Investments (cont.)
| | | Principal | | | | | | % of | |
| | | Amount | | | Value | | | Net Assets | |
| Tender Option Bond Trust, | | | | | | | | | |
| 0.270%, 01/01/2046 (Callable 01/01/2025) | | | | | | | | | |
(Optional Put Date 01/07/2021)(1)(3) | | $ | 1,000,000 | | | $ | 1,000,000 | | | | |
| UCF Stadium Corp.: | | | | | | | | | | | |
| 5.000%, 03/01/2024 | | | 300,000 | | | | 333,399 | | | | |
| 5.000%, 03/01/2025 | | | 370,000 | | | | 423,698 | | | | |
| Total Florida | | | | | | | | | | | |
| (Cost $8,386,483) | | | | | | | 8,475,756 | | | | 4.9 | % |
| Georgia | | | | | | | | | | | | |
| Atlanta Development Authority, | | | | | | | | | | | | |
| 5.000%, 07/01/2024 | | | 200,000 | | | | 222,084 | | | | | |
| Burke County Development Authority, | | | | | | | | | | | | |
0.050%, 07/01/2049 (Optional Put Date 01/04/2021)(1) | | | 2,000,000 | | | | 2,000,000 | | | | | |
| City of Atlanta GA, | | | | | | | | | | | | |
| 5.000%, 12/01/2021 | | | 875,000 | | | | 904,925 | | | | | |
| City of Monroe GA, | | | | | | | | | | | | |
| 4.000%, 12/01/2035 | | | | | | | | | | | | |
| (Callable 12/01/2030) (Insured by AGM) | | | 500,000 | | | | 619,470 | | | | | |
| Clayton County Development Authority, | | | | | | | | | | | | |
| 4.000%, 07/01/2034 (Callable 07/01/2027) | | | 100,000 | | | | 112,595 | | | | | |
| Development Authority of Appling County, | | | | | | | | | | | | |
0.060%, 09/01/2029 (Optional Put Date 01/04/2021)(1) | | | 600,000 | | | | 600,000 | | | | | |
| Development Authority of Bulloch County, | | | | | | | | | | | | |
| 5.000%, 07/01/2029 | | | 385,000 | | | | 491,945 | | | | | |
| Main Street Natural Gas, Inc.: | | | | | | | | | | | | |
| 5.000%, 05/15/2024 | | | 65,000 | | | | 74,003 | | | | | |
| 0.846%, 04/01/2048 | | | | | | | | | | | | |
| (1 Month LIBOR USD + 0.750%) (Callable 06/01/2023) | | | | | | | | | | | | |
(Mandatory Tender Date 09/01/2023)(2) | | | 460,000 | | | | 460,778 | | | | | |
| 0.926%, 08/01/2048 (1 Month LIBOR USD + 0.830%) | | | | | | | | | | | | |
| (Callable 09/01/2023) | | | | | | | | | | | | |
(Mandatory Tender Date 12/01/2023)(2) | | | 290,000 | | | | 291,035 | | | | | |
| Private Colleges & Universities Authority: | | | | | | | | | | | | |
| 5.000%, 06/01/2023 | | | 145,000 | | | | 157,603 | | | | | |
| 5.000%, 06/01/2027 | | | 200,000 | | | | 242,520 | | | | | |
| 5.250%, 10/01/2027 (Callable 10/01/2021) | | | 525,000 | | | | 539,312 | | | | | |
| 0.490%, 10/01/2039 | | | | | | | | | | | | |
| (SIFMA Municipal Swap Index + 0.420%) | | | | | | | | | | | | |
| (Callable 02/16/2022) | | | | | | | | | | | | |
(Mandatory Tender Date 08/16/2022)(2) | | | 300,000 | | | | 299,922 | | | | | |
| Total Georgia | | | | | | | | | | | | |
| (Cost $6,929,674) | | | | | | | 7,016,192 | | | | 4.1 | % |
The accompanying notes are an integral part of these financial statements.
Baird Strategic Municipal Bond Fund
Schedule of Investments, December 31, 2020
Long-Term Investments (cont.)
| | | Principal | | | | | | % of | |
| | | Amount | | | Value | | | Net Assets | |
| Guam | | | | | | | | | |
| Guam Department of Education, | | | | | | | | | |
| 3.625%, 02/01/2025 | | $ | 500,000 | | | $ | 503,070 | | | | |
| Total Guam | | | | | | | | | | | |
| (Cost $500,000) | | | | | | | 503,070 | | | | 0.3 | % |
| Illinois | | | | | | | | | | | | |
| Chicago Park District: | | | | | | | | | | | | |
| 5.000%, 01/01/2022 | | | 140,000 | | | | 144,904 | | | | | |
| 5.000%, 01/01/2024 | | | 225,000 | | | | 249,397 | | | | | |
| 5.000%, 01/01/2030 (Callable 01/01/2024) | | | 50,000 | | | | 54,356 | | | | | |
| 4.200%, 01/01/2031 (Callable 01/01/2022) | | | 150,000 | | | | 152,927 | | | | | |
| City of Chicago IL: | | | | | | | | | | | | |
| 4.000%, 11/01/2021 | | | 80,000 | | | | 82,213 | | | | | |
| 5.000%, 11/01/2022 | | | 100,000 | | | | 107,336 | | | | | |
| 0.000%, 01/01/2023 | | | 325,000 | | | | 306,927 | | | | | |
| 5.000%, 11/01/2023 | | | 125,000 | | | | 139,150 | | | | | |
| 0.000%, 01/01/2027 (Insured by NATL) | | | 1,000,000 | | | | 923,170 | | | | | |
| 5.000%, 11/01/2027 | | | | | | | | | | | | |
| (Callable 11/01/2026) (Insured by BAM) | | | 100,000 | | | | 123,704 | | | | | |
| Cook County Community College District No. 508, | | | | | | | | | | | | |
| 5.250%, 12/01/2028 (Callable 12/01/2023) | | | 325,000 | | | | 347,753 | | | | | |
| Exceptional Children Have Opportunities, | | | | | | | | | | | | |
| 4.000%, 12/01/2032 (Callable 12/01/2029) | | | 500,000 | | | | 592,980 | | | | | |
| Hoffman Estates Park District, | | | | | | | | | | | | |
| 5.000%, 12/01/2025 | | | 500,000 | | | | 563,790 | | | | | |
| Illinois Finance Authority: | | | | | | | | | | | | |
| 4.000%, 02/15/2023 | | | 395,000 | | | | 397,374 | | | | | |
| 5.000%, 10/01/2023 | | | 100,000 | | | | 110,996 | | | | | |
| 5.000%, 11/01/2024 | | | 50,000 | | | | 56,759 | | | | | |
| 5.000%, 10/01/2025 | | | 150,000 | | | | 177,598 | | | | | |
| 4.000%, 11/01/2030 | | | 100,000 | | | | 115,040 | | | | | |
| 4.125%, 11/15/2037 (Callable 11/15/2025) | | | 300,000 | | | | 331,746 | | | | | |
| 4.250%, 05/15/2041 (Pre-refunded to 05/15/2022) | | | 80,000 | | | | 84,402 | | | | | |
| 6.000%, 10/01/2048 (Callable 10/01/2022) | | | 600,000 | | | | 625,656 | | | | | |
| Joliet Park District, | | | | | | | | | | | | |
| 4.000%, 02/01/2033 | | | | | | | | | | | | |
| (Callable 02/01/2023) (Insured by AGM) | | | 150,000 | | | | 155,909 | | | | | |
| Metropolitan Pier & Exposition Authority: | | | | | | | | | | | | |
| 0.000%, 12/15/2022 (Insured by NATL) | | | 125,000 | | | | 122,159 | | | | | |
| 5.000%, 12/15/2026 | | | | | | | | | | | | |
| (Callable 06/15/2022) (Insured by ST AID) | | | 85,000 | | | | 88,839 | | | | | |
| 5.000%, 12/15/2028 | | | | | | | | | | | | |
| (Callable 06/15/2022) (Insured by ST AID) | | | 60,000 | | | | 62,521 | | | | | |
| 0.000%, 06/15/2029 (Insured by NATL) | | | 200,000 | | | | 168,244 | | | | | |
The accompanying notes are an integral part of these financial statements.
Baird Strategic Municipal Bond Fund
Schedule of Investments, December 31, 2020
Long-Term Investments (cont.)
| | | Principal | | | | | | % of | |
| | | Amount | | | Value | | | Net Assets | |
| Southern Illinois University, | | | | | | | | | |
| 5.000%, 04/01/2021 | | $ | 160,000 | | | $ | 160,976 | | | | |
| State of Illinois: | | | | | | | | | | | |
| 5.250%, 01/01/2021 | | | 100,000 | | | | 100,000 | | | | |
| 6.000%, 06/15/2024 (Insured by NATL) | | | 100,000 | | | | 115,108 | | | | |
| 5.000%, 01/01/2026 | | | 50,000 | | | | 57,089 | | | | |
| 6.000%, 06/15/2027 (Insured by NATL) | | | 200,000 | | | | 249,984 | | | | |
| 5.000%, 06/01/2028 (Callable 06/01/2026) | | | 300,000 | | | | 340,371 | | | | |
| University of Illinois, | | | | | | | | | | | |
| 5.500%, 04/01/2031 (Callable 04/01/2021) | | | 30,000 | | | | 30,302 | | | | |
| Upper Illinois River Valley Development Authority, | | | | | | | | | | | |
4.000%, 01/01/2031 (Callable 01/01/2027)(3) | | | 200,000 | | | | 206,124 | | | | |
| Village of Crestwood IL, | | | | | | | | | | | |
| 4.000%, 12/15/2027 | | | | | | | | | | | |
| (Callable 12/15/2025) (Insured by BAM) | | | 135,000 | | | | 152,223 | | | | |
| Will County Community High School District No. 210: | | | | | | | | | | | |
| 0.000%, 01/01/2028 (Insured by BAM) | | | 310,000 | | | | 276,167 | | | | |
| 4.000%, 01/01/2034 | | | | | | | | | | | |
| (Callable 01/01/2029) (Insured by AGM) | | | 150,000 | | | | 168,445 | | | | |
| Total Illinois | | | | | | | | | | | |
| (Cost $7,921,108) | | | | | | | 8,142,639 | | | | 4.8 | % |
| Indiana | | | | | | | | | | | | |
| City of Muncie IN, | | | | | | | | | | | | |
| 4.000%, 01/15/2022 (Insured by AGM) | | | 160,000 | | | | 164,779 | | | | | |
| Hammond Local Public Improvement Bond Bank, | | | | | | | | | | | | |
| 2.000%, 12/31/2021 | | | 1,170,000 | | | | 1,183,256 | | | | | |
| Indiana Finance Authority: | | | | | | | | | | | | |
| 5.000%, 10/01/2032 (Callable 10/01/2023) | | | 250,000 | | | | 256,315 | | | | | |
| 3.750%, 10/01/2042 (Callable 10/01/2023) | | | 40,000 | | | | 34,710 | | | | | |
| 5.000%, 10/01/2042 (Callable 10/01/2023) | | | 50,000 | | | | 50,686 | | | | | |
| Indiana Health & Educational Facilities Financing Authority, | | | | | | | | | | | | |
| 5.000%, 11/15/2046 (Callable 11/15/2026) | | | 150,000 | | | | 181,990 | | | | | |
| Indianapolis Local Public Improvement Bond Bank, | | | | | | | | | | | | |
| 1.400%, 06/01/2021 (Callable 03/01/2021) | | | 1,000,000 | | | | 1,000,020 | | | | | |
| Lafayette School Corp., | | | | | | | | | | | | |
| 4.000%, 01/15/2021 (Insured by ST AID) | | | 150,000 | | | | 150,149 | | | | | |
| St. Joseph County Airport Authority, | | | | | | | | | | | | |
| 0.010%, 07/01/2027 | | | 410,000 | | | | 379,266 | | | | | |
| Total Indiana | | | | | | | | | | | | |
| (Cost $3,333,195) | | | | | | | 3,401,171 | | | | 2.0 | % |
| Iowa | | | | | | | | | | | | |
| City of Cedar Rapids IA, | | | | | | | | | | | | |
0.158%, 08/15/2029 (Insured by AMBAC)(1)(5) | | | 1,160,000 | | | | 1,116,500 | | | | | |
The accompanying notes are an integral part of these financial statements.
Baird Strategic Municipal Bond Fund
Schedule of Investments, December 31, 2020
Long-Term Investments (cont.)
| | | Principal | | | | | | % of | |
| | | Amount | | | Value | | | Net Assets | |
| City of Coralville IA, | | | | | | | | | |
| 4.000%, 06/01/2024 | | $ | 200,000 | | | $ | 199,840 | | | | |
| Iowa Finance Authority, | | | | | | | | | | | |
| 4.000%, 07/01/2047 | | | | | | | | | | | |
| (Callable 07/01/2028) (Insured by GNMA) | | | 240,000 | | | | 274,272 | | | | |
| Iowa Higher Education Loan Authority, | | | | | | | | | | | |
| 3.750%, 05/19/2021 | | | 300,000 | | | | 301,629 | | | | |
| Total Iowa | | | | | | | | | | | |
| (Cost $1,878,204) | | | | | | | 1,892,241 | | | | 1.1 | % |
| Kansas | | | | | | | | | | | | |
| City of Derby KS, | | | | | | | | | | | | |
| 3.900%, 03/01/2037 (Callable 03/01/2025) | | | 75,000 | | | | 76,090 | | | | | |
| City of Goddard KS, | | | | | | | | | | | | |
| 3.000%, 12/01/2022 (Callable 12/01/2021) | | | 150,000 | | | | 153,342 | | | | | |
| Kansas Independent College Finance Authority, | | | | | | | | | | | | |
| 5.250%, 05/01/2021 | | | 175,000 | | | | 176,327 | | | | | |
| Wyandotte County-Kansas City Unified Government, | | | | | | | | | | | | |
| 0.000%, 12/01/2027 (Insured by NATL) | | | 370,000 | | | | 279,413 | | | | | |
| Total Kansas | | | | | | | | | | | | |
| (Cost $662,384) | | | | | | | 685,172 | | | | 0.4 | % |
| Kentucky | | | | | | | | | | | | |
| County of Carroll KY, | | | | | | | | | | | | |
| 1.200%, 02/01/2032 | | | | | | | | | | | | |
(Mandatory Tender Date 06/01/2021)(1) | | | 1,000,000 | | | | 1,002,020 | | | | | |
| Kentucky Asset Liability Commission, | | | | | | | | | | | | |
| 0.693%, 11/01/2025 (3 Month LIBOR USD + 0.550%) | | | | | | | | | | | | |
(Callable 02/01/2021) (Insured by NATL)(2) | | | 620,000 | | | | 611,921 | | | | | |
| Kentucky Economic Development Finance Authority, | | | | | | | | | | | | |
| 0.000%, 10/01/2025 (Insured by NATL) | | | 35,000 | | | | 32,910 | | | | | |
| Kentucky Higher Education Student Loan Corp., | | | | | | | | | | | | |
| 5.000%, 06/01/2024 | | | 130,000 | | | | 147,675 | | | | | |
| Kentucky Public Energy Authority: | | | | | | | | | | | | |
| 4.000%, 01/01/2049 (Callable 10/01/2024) | | | | | | | | | | | | |
(Mandatory Tender Date 01/01/2025)(1) | | | 255,000 | | | | 286,640 | | | | | |
| 1.216%, 12/01/2049 (1 Month LIBOR USD + 1.120%) | | | | | | | | | | | | |
| (Callable 03/01/2025) | | | | | | | | | | | | |
(Mandatory Tender Date 06/01/2025)(2) | | | 100,000 | | | | 100,734 | | | | | |
| 4.000%, 12/01/2049 (Callable 03/01/2025) | | | | | | | | | | | | |
(Mandatory Tender Date 06/01/2025)(1) | | | 240,000 | | | | 273,430 | | | | | |
| Louisville Regional Airport Authority, | | | | | | | | | | | | |
0.010%, 01/01/2029 (Optional Put Date 01/04/2021)(1) | | | 1,100,000 | | | | 1,100,000 | | | | | |
| Total Kentucky | | | | | | | | | | | | |
| (Cost $3,508,598) | | | | | | | 3,555,330 | | | | 2.1 | % |
The accompanying notes are an integral part of these financial statements.
Baird Strategic Municipal Bond Fund
Schedule of Investments, December 31, 2020
Long-Term Investments (cont.)
| | | Principal | | | | | | % of | |
| | | Amount | | | Value | | | Net Assets | |
| Louisiana | | | | | | | | | |
| City of Shreveport LA, | | | | | | | | | |
| 5.000%, 09/01/2024 | | $ | 440,000 | | | $ | 491,295 | | | | |
| Lafayette Public Trust Financing Authority, | | | | | | | | | | | |
| 3.000%, 10/01/2021 | | | 150,000 | | | | 152,503 | | | | |
| Louisiana Public Facilities Authority, | | | | | | | | | | | |
0.000%, 10/01/2024(7) | | | 300,000 | | | | 285,063 | | | | |
| Louisiana Stadium & Exposition District, | | | | | | | | | | | |
| 5.000%, 07/03/2023 (Callable 01/01/2023) | | | 200,000 | | | | 215,678 | | | | |
| Louisiana State University & | | | | | | | | | | | |
| Agricultural & Mechanical College, | | | | | | | | | | | |
| 5.000%, 07/01/2027 (Callable 07/01/2024) | | | 235,000 | | | | 266,763 | | | | |
| Total Louisiana | | | | | | | | | | | |
| (Cost $1,398,537) | | | | | | | 1,411,302 | | | | 0.8 | % |
| Maine | | | | | | | | | | | | |
| Maine Health & Higher Educational Facilities Authority, | | | | | | | | | | | | |
| 5.000%, 07/01/2026 | | | 100,000 | | | | 123,153 | | | | | |
| Total Maine | | | | | | | | | | | | |
| (Cost $110,873) | | | | | | | 123,153 | | | | 0.1 | % |
| Maryland | | | | | | | | | | | | |
| Maryland Health & Higher Educational Facilities Authority: | | | | | | | | | | | | |
5.000%, 01/01/2024(8) | | | 540,000 | | | | 579,857 | | | | | |
5.000%, 01/01/2025(8) | | | 470,000 | | | | 519,209 | | | | | |
| Total Maryland | | | | | | | | | | | | |
| (Cost $1,096,270) | | | | | | | 1,099,066 | | | | 0.6 | % |
| Massachusetts | | | | | | | | | | | | |
| Massachusetts Development Finance Agency: | | | | | | | | | | | | |
5.000%, 07/15/2021(3) | | | 100,000 | | | | 101,833 | | | | | |
5.000%, 07/15/2022(3) | | | 115,000 | | | | 120,824 | | | | | |
5.000%, 07/15/2023(3) | | | 115,000 | | | | 125,097 | | | | | |
5.000%, 07/15/2024(3) | | | 125,000 | | | | 139,906 | | | | | |
5.000%, 07/15/2025(3) | | | 65,000 | | | | 74,831 | | | | | |
| Massachusetts Health & Educational Facilities Authority, | | | | | | | | | | | | |
| 0.010%, 12/01/2037 (Callable 01/06/2021) | | | | | | | | | | | | |
(Optional Put Date 01/04/2021)(1) | | | 600,000 | | | | 600,000 | | | | | |
| Total Massachusetts | | | | | | | | | | | | |
| (Cost $1,158,152) | | | | | | | 1,162,491 | | | | 0.7 | % |
| Michigan | | | | | | | | | | | | |
| City of Detroit MI: | | | | | | | | | | | | |
| 5.000%, 04/01/2022 | | | 250,000 | | | | 259,478 | | | | | |
| 5.000%, 04/01/2023 | | | 275,000 | | | | 290,466 | | | | | |
| Flint Hospital Building Authority, | | | | | | | | | | | | |
| 5.000%, 07/01/2023 | | | 100,000 | | | | 105,249 | | | | | |
The accompanying notes are an integral part of these financial statements.
Baird Strategic Municipal Bond Fund
Schedule of Investments, December 31, 2020
Long-Term Investments (cont.)
| | | Principal | | | | | | % of | |
| | | Amount | | | Value | | | Net Assets | |
| Michigan Finance Authority: | | | | | | | | | |
| 5.000%, 07/01/2024 | | $ | 230,000 | | | $ | 259,564 | | | | |
| 5.000%, 07/01/2027 (Callable 07/01/2025) | | | 160,000 | | | | 190,986 | | | | |
| 5.000%, 07/01/2030 (Callable 07/01/2024) | | | 145,000 | | | | 160,034 | | | | |
| 5.000%, 07/01/2044 (Callable 07/01/2024) | | | 130,000 | | | | 139,985 | | | | |
| Michigan State Housing Development Authority, | | | | | | | | | | | |
| 3.500%, 12/01/2050 (Callable 06/01/2029) | | | 300,000 | | | | 334,554 | | | | |
| Michigan Strategic Fund, | | | | | | | | | | | |
| 1.450%, 09/01/2030 | | | | | | | | | | | |
(Mandatory Tender Date 09/01/2021)(1) | | | 500,000 | | | | 501,695 | | | | |
| Tender Option Bond Trust, | | | | | | | | | | | |
| 0.170%, 05/01/2050 (Optional Put Date 01/07/2021) | | | | | | | | | | | |
(Insured by Q-SBLF)(1)(3) | | | 2,000,000 | | | | 2,000,000 | | | | |
| Western Michigan University, | | | | | | | | | | | |
| 5.000%, 11/15/2022 | | | 165,000 | | | | 177,807 | | | | |
| Total Michigan | | | | | | | | | | | |
| (Cost $4,390,134) | | | | | | | 4,419,818 | | | | 2.6 | % |
| Minnesota | | | | | | | | | | | | |
| Minneapolis-Saint Paul Metropolitan Airports Commission, | | | | | | | | | | | | |
| 5.000%, 01/01/2026 (Callable 01/01/2022) | | | 50,000 | | | | 52,105 | | | | | |
| Shakopee Independent School District No. 720, | | | | | | | | | | | | |
| 0.000%, 02/01/2021 (Insured by SD CRED PROG) | | | 335,000 | | | | 334,839 | | | | | |
| Total Minnesota | | | | | | | | | | | | |
| (Cost $385,714) | | | | | | | 386,944 | | | | 0.2 | % |
| Mississippi | | | | | | | | | | | | |
| City of Ridgeland MS, | | | | | | | | | | | | |
| 3.000%, 10/01/2025 | | | 325,000 | | | | 343,645 | | | | | |
| Mississippi Business Finance Corp.: | | | | | | | | | | | | |
| 2.500%, 04/01/2022 (Callable 04/01/2021) | | | 1,000,000 | | | | 1,004,070 | | | | | |
| 3.200%, 09/01/2028 (Callable 03/13/2024) | | | 1,000,000 | | | | 1,060,520 | | | | | |
0.020%, 12/01/2030 (Optional Put Date 01/04/2021)(1) | | | 2,000,000 | | | | 2,000,000 | | | | | |
0.020%, 11/01/2035 (Optional Put Date 01/04/2021)(1) | | | 400,000 | | | | 400,000 | | | | | |
| Mississippi Hospital Equipment & Facilities Authority, | | | | | | | | | | | | |
| 5.000%, 10/01/2040 (Callable 12/01/2026) | | | | | | | | | | | | |
(Mandatory Tender Date 03/01/2027)(1) | | | 100,000 | | | | 121,664 | | | | | |
| Total Mississippi | | | | | | | | | | | | |
| (Cost $4,906,688) | | | | | | | 4,929,899 | | | | 2.9 | % |
| Missouri | | | | | | | | | | | | |
| County of Platte MO: | | | | | | | | | | | | |
| 3.000%, 03/01/2021 | | | 50,000 | | | | 50,068 | | | | | |
| 5.000%, 02/01/2025 (Callable 02/01/2023) | | | 125,000 | | | | 133,411 | | | | | |
The accompanying notes are an integral part of these financial statements.
Baird Strategic Municipal Bond Fund
Schedule of Investments, December 31, 2020
Long-Term Investments (cont.)
| | | Principal | | | | | | % of | |
| | | Amount | | | Value | | | Net Assets | |
| Health & Educational Facilities | | | | | | | | | |
| Authority of the State of Missouri: | | | | | | | | | |
| 5.000%, 02/01/2021 | | $ | 100,000 | | | $ | 100,286 | | | | |
| 5.000%, 02/01/2022 | | | 255,000 | | | | 265,626 | | | | |
| 5.000%, 02/01/2024 (Callable 02/01/2021) | | | 250,000 | | | | 250,677 | | | | |
| 5.000%, 02/01/2025 (Callable 02/01/2024) | | | 180,000 | | | | 199,935 | | | | |
| 5.000%, 09/01/2027 | | | 150,000 | | | | 181,511 | | | | |
| 4.000%, 08/01/2030 (Callable 08/01/2024) | | | 200,000 | | | | 206,654 | | | | |
| Industrial Development Authority of the City of St. Louis, | | | | | | | | | | | |
| 3.875%, 11/15/2029 (Callable 11/15/2026) | | | 100,000 | | | | 93,657 | | | | |
| St. Joseph Industrial Development Authority, | | | | | | | | | | | |
| 3.100%, 01/01/2023 | | | 100,000 | | | | 98,840 | | | | |
| St. Louis Land Clearance for Redevelopment Authority: | | | | | | | | | | | |
| 4.250%, 06/01/2026 | | | 250,000 | | | | 274,157 | | | | |
| 3.875%, 10/01/2035 (Callable 10/01/2029) | | | 305,000 | | | | 288,387 | | | | |
| St. Louis Municipal Finance Corp., | | | | | | | | | | | |
| 5.000%, 02/15/2025 | | | 300,000 | | | | 343,095 | | | | |
| Total Missouri | | | | | | | | | | | |
| (Cost $2,430,669) | | | | | | | 2,486,304 | | | | 1.5 | % |
| Nebraska | | | | | | | | | | | | |
| Central Plains Energy Project, | | | | | | | | | | | | |
| 5.000%, 09/01/2042 (Callable 09/01/2022) | | | 45,000 | | | | 48,156 | | | | | |
| Madison County Hospital Authority No. 1: | | | | | | | | | | | | |
| 5.000%, 07/01/2021 | | | 295,000 | | | | 300,549 | | | | | |
| 5.000%, 07/01/2022 | | | 520,000 | | | | 549,468 | | | | | |
| Total Nebraska | | | | | | | | | | | | |
| (Cost $897,165) | | | | | | | 898,173 | | | | 0.5 | % |
| Nevada | | | | | | | | | | | | |
| City of Las Vegas NV Special Improvement District No. 814, | | | | | | | | | | | | |
| 3.000%, 06/01/2021 | | | 100,000 | | | | 100,469 | | | | | |
| City of Sparks NV, | | | | | | | | | | | | |
2.500%, 06/15/2024(3) | | | 175,000 | | | | 175,719 | | | | | |
| Clark County School District, | | | | | | | | | | | | |
| 5.000%, 06/15/2023 | | | 100,000 | | | | 110,615 | | | | | |
| Total Nevada | | | | | | | | | | | | |
| (Cost $365,873) | | | | | | | 386,803 | | | | 0.2 | % |
| New Hampshire | | | | | | | | | | | | |
| New Hampshire Health and Education Facilities Authority, | | | | | | | | | | | | |
3.150%, 04/01/2022 (Callable 11/01/2021)(3) | | | 1,500,000 | | | | 1,509,315 | | | | | |
| Total New Hampshire | | | | | | | | | | | | |
| (Cost $1,509,467) | | | | | | | 1,509,315 | | | | 0.9 | % |
The accompanying notes are an integral part of these financial statements.
Baird Strategic Municipal Bond Fund
Schedule of Investments, December 31, 2020
Long-Term Investments (cont.)
| | | Principal | | | | | | % of | |
| | | Amount | | | Value | | | Net Assets | |
| New Jersey | | | | | | | | | |
| Atlantic City Board of Education, | | | | | | | | | |
3.400%, 08/15/2024(3) | | $ | 140,000 | | | $ | 150,356 | | | | |
| City of Newark NJ: | | | | | | | | | | | |
| 5.000%, 10/01/2021 (Insured by ST AID) | | | 95,000 | | | | 97,933 | | | | |
| 2.000%, 10/05/2021 | | | 1,000,000 | | | | 1,010,120 | | | | |
| 5.000%, 10/01/2022 | | | 500,000 | | | | 534,835 | | | | |
| 5.000%, 10/01/2022 (Insured by ST AID) | | | 130,000 | | | | 139,057 | | | | |
| Essex County Improvement Authority, | | | | | | | | | | | |
| 5.000%, 11/01/2027 | | | 350,000 | | | | 440,209 | | | | |
| New Jersey Economic Development Authority: | | | | | | | | | | | |
| 1.320%, 09/01/2025 | | | | | | | | | | | |
| (SIFMA Municipal Swap Index + 1.250%) | | | | | | | | | | | |
(Callable 03/01/2025) (Insured by ST AID)(2) | | | 90,000 | | | | 88,902 | | | | |
| 5.000%, 03/01/2029 (Callable 03/01/2023) | | | 200,000 | | | | 214,604 | | | | |
| New Jersey Educational Facilities Authority: | | | | | | | | | | | |
| 5.000%, 07/01/2026 (Pre-refunded to 07/01/2025) | | | 55,000 | | | | 66,380 | | | | |
| 5.000%, 07/01/2026 (Callable 07/01/2025) | | | 70,000 | | | | 81,980 | | | | |
| New Jersey Housing & Mortgage Finance Agency, | | | | | | | | | | | |
| 3.500%, 04/01/2051 (Callable 04/01/2029) | | | 500,000 | | | | 559,180 | | | | |
| New Jersey Transportation Trust Fund Authority: | | | | | | | | | | | |
| 4.000%, 06/15/2045 (Callable 12/15/2030) | | | 300,000 | | | | 335,496 | | | | |
| 5.000%, 06/15/2045 (Callable 12/15/2030) | | | 300,000 | | | | 365,226 | | | | |
| South Jersey Port Corp., | | | | | | | | | | | |
| 4.000%, 01/01/2021 | | | 250,000 | | | | 250,000 | | | | |
| State of New Jersey, | | | | | | | | | | | |
| 5.000%, 06/01/2029 | | | 1,300,000 | | | | 1,683,747 | | | | |
| Total New Jersey | | | | | | | | | | | |
| (Cost $5,882,352) | | | | | | | 6,018,025 | | | | 3.5 | % |
| New Mexico | | | | | | | | | | | | |
| City of Farmington NM, | | | | | | | | | | | | |
| 1.875%, 04/01/2033 | | | | | | | | | | | | |
(Mandatory Tender Date 10/01/2021)(1) | | | 50,000 | | | | 50,491 | | | | | |
| Town of Clayton NM, | | | | | | | | | | | | |
| 5.000%, 11/01/2026 | | | | | | | | | | | | |
| (Callable 11/01/2025) (Insured by NATL) | | | 185,000 | | | | 213,938 | | | | | |
| Village of Los Ranchos de Albuquerque NM, | | | | | | | | | | | | |
| 5.000%, 09/01/2027 | | | 350,000 | | | | 429,965 | | | | | |
| Total New Mexico | | | | | | | | | | | | |
| (Cost $674,611) | | | | | | | 694,394 | | | | 0.4 | % |
| New York | | | | | | | | | | | | |
| Albany Capital Resource Corp., | | | | | | | | | | | | |
| 5.000%, 05/01/2023 | | | 140,000 | | | | 149,975 | | | | | |
The accompanying notes are an integral part of these financial statements.
Baird Strategic Municipal Bond Fund
Schedule of Investments, December 31, 2020
Long-Term Investments (cont.)
| | | Principal | | | | | | % of | |
| | | Amount | | | Value | | | Net Assets | |
| Albany County Capital Resource Corp., | | | | | | | | | |
| 3.100%, 07/01/2030 | | $ | 200,000 | | | $ | 187,714 | | | |
|
|
| Board of Cooperative Educational | | | | | | | | | | | | |
| Services First Supervisory District, | | | | | | | | | | | | |
| 1.250%, 04/30/2021 | | | 750,000 | | | | 751,635 | | | | | |
| City of Olean NY, | | | | | | | | | | | | |
| 2.000%, 06/10/2021 | | | 750,000 | | | | 755,123 | | | | | |
| County of Suffolk NY: | | | | | | | | | | | | |
| 5.000%, 05/01/2021 | | | 500,000 | | | | 506,785 | | | | | |
| 2.000%, 07/22/2021 | | | 1,000,000 | | | | 1,006,370 | | | | | |
| Dutchess County Local Development Corp.: | | | | | | | | | | | | |
| 3.000%, 07/01/2036 (Callable 07/01/2026) | | | 500,000 | | | | 524,165 | | | | | |
5.000%, 07/01/2045 (Callable 07/01/2030)(3) | | | 850,000 | | | | 936,309 | | | | | |
| JPMorgan Chase Putters/Drivers Trust, | | | | | | | | | | | | |
| 0.260%, 06/01/2021 | | | | | | | | | | | | |
(Optional Put Date 01/04/2021)(1)(3) | | | 600,000 | | | | 600,000 | | | | | |
| Long Island Power Authority, | | | | | | | | | | | | |
| 0.850%, 05/01/2033 (1 Month LIBOR USD + 0.750%) | | | | | | | | | | | | |
| (Callable 10/01/2022) | | | | | | | | | | | | |
(Mandatory Tender Date 10/01/2023)(2) | | | 850,000 | | | | 850,943 | | | | | |
| Metropolitan Transportation Authority: | | | | | | | | | | | | |
| 5.000%, 11/15/2021 | | | 90,000 | | | | 92,268 | | | | | |
| 5.000%, 11/15/2021 | | | 100,000 | | | | 102,520 | | | | | |
| 5.000%, 05/15/2022 | | | 375,000 | | | | 389,828 | | | | | |
| 5.000%, 11/15/2022 | | | 225,000 | | | | 237,224 | | | | | |
| 0.646%, 11/01/2030 (1 Month LIBOR USD + 0.550%) | | | | | | | | | | | | |
(Mandatory Tender Date 11/01/2022)(2) | | | 200,000 | | | | 193,714 | | | | | |
| Monroe County Industrial Development Corp., | | | | | | | | | | | | |
| 5.000%, 06/01/2021 | | | 200,000 | | | | 203,450 | | | | | |
| New York City Industrial Development Agency, | | | | | | | | | | | | |
| 5.000%, 03/01/2028 (Insured by AGM) | | | 250,000 | | | | 317,952 | | | | | |
| New York City Water & Sewer System: | | | | | | | | | | | | |
| 0.010%, 06/15/2033 (Callable 01/15/2021) | | | | | | | | | | | | |
(Optional Put Date 01/04/2021)(1) | | | 1,165,000 | | | | 1,165,000 | | | | | |
0.010%, 06/15/2038 (Optional Put Date 01/04/2021)(1) | | | 500,000 | | | | 500,000 | | | | | |
0.020%, 06/15/2044 (Optional Put Date 01/04/2021)(1) | | | 1,000,000 | | | | 1,000,000 | | | | | |
0.010%, 06/15/2048 (Optional Put Date 01/04/2021)(1) | | | 500,000 | | | | 500,000 | | | | | |
0.010%, 06/15/2050 (Optional Put Date 01/04/2021)(1) | | | 200,000 | | | | 200,000 | | | | | |
| New York State Energy Research & Development Authority, | | | | | | | | | | | | |
| 2.625%, 04/01/2034 | | | | | | | | | | | | |
(Mandatory Tender Date 07/03/2023)(1) | | | 200,000 | | | | 210,980 | | | | | |
| Onondaga Civic Development Corp.: | | | | | | | | | | | | |
| 5.000%, 10/01/2023 | | | 165,000 | | | | 169,922 | | | | | |
| 5.000%, 10/01/2024 | | | 35,000 | | | | 36,300 | | | | | |
| 5.000%, 10/01/2025 | | | 225,000 | | | | 234,513 | | | | | |
| 4.125%, 10/01/2035 (Callable 10/01/2025) | | | 80,000 | | | | 74,177 | | | | | |
The accompanying notes are an integral part of these financial statements.
Baird Strategic Municipal Bond Fund
Schedule of Investments, December 31, 2020
Long-Term Investments (cont.)
| | | Principal | | | | | | % of | |
| | | Amount | | | Value | | | Net Assets | |
| Onondaga County Trust for Cultural Resources: | | | | | | | | | |
| 5.000%, 05/01/2027 | | $ | 180,000 | | | $ | 209,705 | | | | |
| 5.000%, 05/01/2029 (Callable 05/01/2027) | | | 345,000 | | | | 398,848 | | | | |
| State of New York Mortgage Agency, | | | | | | | | | | | |
| 3.500%, 04/01/2049 (Callable 10/01/2028) | | | 265,000 | | | | 284,178 | | | | |
| Tender Option Bond Trust, | | | | | | | | | | | |
| 0.400%, 11/15/2023 | | | | | | | | | | | |
(Optional Put Date 01/07/2021)(3)(7) | | | 1,000,000 | | | | 1,000,000 | | | | |
| Town of Alabama NY, | | | | | | | | | | | |
| 1.000%, 09/30/2021 (Callable 04/01/2021) | | | 600,000 | | | | 600,666 | | | | |
| Town of Ramapo NY: | | | | | | | | | | | |
| 3.250%, 05/15/2023 | | | 200,000 | | | | 196,134 | | | | |
| 3.375%, 05/15/2024 (Callable 05/15/2023) | | | 25,000 | | | | 24,486 | | | | |
| 3.000%, 11/01/2027 (Callable 11/01/2022) | | | 100,000 | | | | 93,781 | | | | |
| 4.125%, 05/15/2028 (Callable 05/15/2023) | | | 115,000 | | | | 115,065 | | | | |
| Triborough Bridge & Tunnel Authority, | | | | | | | | | | | |
| 0.596%, 11/15/2027 (1 Month LIBOR USD + 0.500%) | | | | | | | | | | | |
| (Callable 05/15/2021) | | | | | | | | | | | |
(Mandatory Tender Date 11/15/2021)(2) | | | 200,000 | | | | 199,946 | | | | |
| Total New York | | | | | | | | | | | |
| (Cost $14,936,737) | | | | | | | 15,019,676 | | | | 8.8 | % |
| North Carolina | | | | | | | | | | | | |
| Durham Housing Authority, | | | | | | | | | | | | |
| 2.000%, 09/01/2024 (Callable 04/01/2022) | | | | | | | | | | | | |
(Mandatory Tender Date 09/01/2022)(1) | | | 1,000,000 | | | | 1,000,070 | | | | | |
| North Carolina Central University, | | | | | | | | | | | | |
| 5.000%, 04/01/2027 | | | 410,000 | | | | 498,773 | | | | | |
| Winston-Salem State University, | | | | | | | | | | | | |
| 4.250%, 06/01/2032 (Callable 06/01/2024) | | | 50,000 | | | | 50,935 | | | | | |
| Total North Carolina | | | | | | | | | | | | |
| (Cost $1,531,666) | | | | | | | 1,549,778 | | | | 0.9 | % |
| North Dakota | | | | | | | | | | | | |
| City of Dickinson ND, | | | | | | | | | | | | |
| 5.000%, 10/01/2025 (Callable 10/01/2021) | | | 165,000 | | | | 168,236 | | | | | |
| City of Grand Forks ND, | | | | | | | | | | | | |
| 5.000%, 12/01/2024 | | | 100,000 | | | | 113,966 | | | | | |
| City of Horace ND: | | | | | | | | | | | | |
| 3.000%, 05/01/2021 | | | 100,000 | | | | 100,768 | | | | | |
| 3.000%, 05/01/2022 | | | 215,000 | | | | 221,586 | | | | | |
| 1.900%, 08/01/2022 (Callable 08/01/2021) | | | 500,000 | | | | 500,395 | | | | | |
| County of Burleigh ND, | | | | | | | | | | | | |
| 2.750%, 02/01/2022 (Callable 01/21/2021) | | | 1,000,000 | | | | 1,000,170 | | | | | |
The accompanying notes are an integral part of these financial statements.
Baird Strategic Municipal Bond Fund
Schedule of Investments, December 31, 2020
Long-Term Investments (cont.)
| | | Principal | | | | | | % of | |
| | | Amount | | | Value | | | Net Assets | |
| County of McKenzie ND: | | | | | | | | | |
| 5.000%, 08/01/2023 | | $ | 300,000 | | | $ | 329,103 | | | | |
| 5.000%, 08/01/2024 (Callable 08/01/2023) | | | 400,000 | | | | 438,696 | | | | |
| County of Mercer ND, | | | | | | | | | | | |
| 2.000%, 05/01/2022 | | | 125,000 | | | | 127,501 | | | | |
| Jamestown Park District: | | | | | | | | | | | |
| 4.000%, 07/01/2031 (Callable 07/01/2024) | | | 200,000 | | | | 217,812 | | | | |
| 2.900%, 07/01/2035 (Callable 01/19/2021) | | | 200,000 | | | | 200,142 | | | | |
| North Dakota Housing Finance Agency, | | | | | | | | | | | |
| 3.350%, 07/01/2031 (Callable 01/01/2027) | | | 120,000 | | | | 132,476 | | | | |
| Total North Dakota | | | | | | | | | | | |
| (Cost $3,517,125) | | | | | | | 3,550,851 | | | | 2.1 | % |
| Ohio | | | | | | | | | | | | |
| City of Middleburg Heights OH: | | | | | | | | | | | | |
| 5.000%, 08/01/2034 (Callable 08/01/2031) | | | 200,000 | | | | 253,456 | | | | | |
| 5.250%, 08/01/2041 (Callable 08/01/2021) | | | 700,000 | | | | 720,538 | | | | | |
| City of West Carrollton OH, | | | | | | | | | | | | |
| 2.500%, 10/01/2021 | | | 800,000 | | | | 812,184 | | | | | |
| County of Lucas OH, | | | | | | | | | | | | |
| 5.000%, 11/15/2021 | | | 25,000 | | | | 25,750 | | | | | |
| Ohio Higher Educational Facility Commission: | | | | | | | | | | | | |
| 5.000%, 12/01/2021 | | | 200,000 | | | | 203,722 | | | | | |
| 2.659%, 12/01/2023 (Insured by AMBAC)(1) | | | 500,000 | | | | 515,795 | | | | | |
| Ohio Housing Finance Agency, | | | | | | | | | | | | |
| 3.750%, 09/01/2050 | | | | | | | | | | | | |
| (Callable 03/01/2029) (Insured by GNMA) | | | 155,000 | | | | 175,170 | | | | | |
| Port of Greater Cincinnati Development Authority, | | | | | | | | | | | | |
| 3.000%, 05/01/2023 (Callable 05/01/2022) | | | 150,000 | | | | 150,102 | | | | | |
| Premier Health Partners, | | | | | | | | | | | | |
| 2.911%, 11/15/2026 (Callable 05/15/2026) | | | 1,002,000 | | | | 1,052,814 | | | | | |
| Total Ohio | | | | | | | | | | | | |
| (Cost $3,807,394) | | | | | | | 3,909,531 | | | | 2.3 | % |
| Oklahoma | | | | | | | | | | | | |
| Oklahoma Development Finance Authority, | | | | | | | | | | | | |
| 0.250%, 08/15/2031 (Callable 01/04/2021) | | | | | | | | | | | | |
(Optional Put Date 01/07/2021)(1) | | | 1,000,000 | | | | 1,000,000 | | | | | |
| Tulsa Industrial Authority: | | | | | | | | | | | | |
| 5.000%, 10/01/2022 | | | 165,000 | | | | 172,603 | | | | | |
| 5.000%, 10/01/2023 | | | 185,000 | | | | 197,922 | | | | | |
| Total Oklahoma | | | | | | | | | | | | |
| (Cost $1,369,900) | | | | | | | 1,370,525 | | | | 0.8 | % |
The accompanying notes are an integral part of these financial statements.
Baird Strategic Municipal Bond Fund
Schedule of Investments, December 31, 2020
Long-Term Investments (cont.)
| | | Principal | | | | | | % of | |
| | | Amount | | | Value | | | Net Assets | |
| Oregon | | | | | | | | | |
| Clackamas Community College District, | | | | | | | | | |
5.000%, 06/15/2038 (Callable 06/15/2027)(7) | | $ | 125,000 | | | $ | 152,982 | | | | |
| County of Yamhill OR, | | | | | | | | | | | |
| 4.000%, 10/01/2021 | | | 325,000 | | | | 330,171 | | | | |
| Oregon State Facilities Authority: | | | | | | | | | | | |
| 5.000%, 10/01/2025 | | | 225,000 | | | | 269,048 | | | | |
| 5.000%, 10/01/2028 | | | 150,000 | | | | 192,693 | | | | |
| State of Oregon Housing & | | | | | | | | | | | |
| Community Services Department: | | | | | | | | | | | |
| 3.900%, 01/01/2033 (Callable 07/01/2023) | | | 85,000 | | | | 89,063 | | | | |
| 3.600%, 07/01/2034 (Callable 07/01/2024) | | | 940,000 | | | | 990,252 | | | | |
| 4.000%, 01/01/2047 (Callable 07/01/2025) | | | 30,000 | | | | 32,161 | | | | |
| 4.000%, 07/01/2047 (Callable 07/01/2026) | | | 45,000 | | | | 48,919 | | | | |
| Total Oregon | | | | | | | | | | | |
| (Cost $2,055,138) | | | | | | | 2,105,289 | | | | 1.2 | % |
| Pennsylvania | | | | | | | | | | | | |
| Berks County Industrial Development Authority: | | | | | | | | | | | | |
| 5.000%, 11/01/2023 | | | 300,000 | | | | 319,407 | | | | | |
| 5.000%, 11/01/2025 | | | 100,000 | | | | 110,641 | | | | | |
| 5.000%, 11/01/2026 | | | 200,000 | | | | 224,270 | | | | | |
| 5.000%, 11/01/2027 | | | 150,000 | | | | 169,941 | | | | | |
| 5.000%, 11/01/2029 (Callable 11/01/2027) | | | 150,000 | | | | 167,922 | | | | | |
| Berks County Municipal Authority, | | | | | | | | | | | | |
| 5.000%, 02/01/2040 (Callable 08/01/2024) | | | | | | | | | | | | |
(Mandatory Tender Date 02/01/2025)(1) | | | 110,000 | | | | 118,991 | | | | | |
| Bucks County Industrial Development Authority, | | | | | | | | | | | | |
| 3.750%, 09/15/2043 (Callable 09/15/2023) | | | 150,000 | | | | 157,539 | | | | | |
| City of Bradford PA: | | | | | | | | | | | | |
| 4.000%, 11/01/2026 | | | | | | | | | | | | |
| (Callable 11/01/2025) (Insured by AGM) | | | 415,000 | | | | 465,327 | | | | | |
| 4.000%, 11/01/2027 | | | | | | | | | | | | |
| (Callable 11/01/2025) (Insured by AGM) | | | 370,000 | | | | 410,830 | | | | | |
| City of Philadelphia PA, | | | | | | | | | | | | |
| 5.000%, 06/15/2027 (Callable 06/15/2021) | | | 1,000,000 | | | | 1,018,820 | | | | | |
| City of York PA, | | | | | | | | | | | | |
| 5.000%, 11/15/2025 | | | 525,000 | | | | 553,040 | | | | | |
| Crestwood School District, | | | | | | | | | | | | |
| 2.350%, 09/01/2025 | | | | | | | | | | | | |
| (Callable 02/01/2021) (Insured by ST AID) | | | 400,000 | | | | 400,080 | | | | | |
| Cumberland County Municipal Authority: | | | | | | | | | | | | |
| 5.000%, 01/01/2029 (Pre-refunded to 01/01/2025) | | | 30,000 | | | | 35,481 | | | | | |
| 5.000%, 01/01/2029 (Callable 01/01/2025) | | | 145,000 | | | | 160,073 | | | | | |
The accompanying notes are an integral part of these financial statements.
Baird Strategic Municipal Bond Fund
Schedule of Investments, December 31, 2020
Long-Term Investments (cont.)
| | | Principal | | | | | | % of | |
| | | Amount | | | Value | | | Net Assets | |
| Dauphin County General Authority, | | | | | | | | | |
6.250%, 10/15/2053 (Callable 10/15/2028)(3) | | $ | 1,000,000 | | | $ | 1,028,370 | | | |
|
|
| Dauphin County Industrial Development Authority, | | | | | | | | | | | | |
| 6.900%, 06/01/2024 | | | 400,000 | | | | 480,696 | | | | | |
| Delaware Valley Regional Finance Authority: | | | | | | | | | | | | |
| 0.600%, 09/01/2048 | | | | | | | | | | | | |
| (SIFMA Municipal Swap Index + 0.530%) | | | | | | | | | | | | |
| (Callable 09/01/2022) | | | | | | | | | | | | |
(Mandatory Tender Date 09/01/2023)(2) | | | 500,000 | | | | 499,370 | | | | | |
| 0.976%, 09/01/2048 (1 Month LIBOR USD + 0.880%) | | | | | | | | | | | | |
| (Callable 09/01/2024) | | | | | | | | | | | | |
(Mandatory Tender Date 09/01/2025)(2) | | | 1,000,000 | | | | 1,001,800 | | | | | |
| East Hempfield Township Industrial | | | | | | | | | | | | |
| Development Authority: | | | | | | | | | | | | |
| 5.000%, 07/01/2025 | | | 250,000 | | | | 253,045 | | | | | |
| 5.000%, 07/01/2030 (Callable 07/01/2023) | | | 300,000 | | | | 303,000 | | | | | |
| Lancaster Industrial Development Authority: | | | | | | | | | | | | |
| 0.600%, 01/15/2023 (Callable 01/04/2021) | | | | | | | | | | | | |
(Optional Put Date 01/07/2021)(1) | | | 155,000 | | | | 155,000 | | | | | |
| 0.600%, 02/15/2024 (Callable 01/04/2021) | | | | | | | | | | | | |
(Optional Put Date 01/07/2021)(1) | | | 225,000 | | | | 225,000 | | | | | |
| Mercer County Industrial Development Authority, | | | | | | | | | | | | |
6.125%, 10/01/2050 (Callable 10/01/2025)(3) | | | 1,000,000 | | | | 1,029,440 | | | | | |
| Montgomery County Higher Education & Health Authority, | | | | | | | | | | | | |
| 3.000%, 05/01/2036 | | | | | | | | | | | | |
(Mandatory Tender Date 05/01/2021)(1) | | | 170,000 | | | | 170,874 | | | | | |
| Montgomery County Industrial Development Authority: | | | | | | | | | | | | |
| 5.000%, 11/15/2027 (Pre-refunded to 05/15/2022) | | | 130,000 | | | | 138,570 | | | | | |
| 5.000%, 11/15/2036 (Callable 11/15/2026) | | | 750,000 | | | | 871,252 | | | | | |
| Northeastern Pennsylvania Hospital and Education Authority, | | | | | | | | | | | | |
| 5.000%, 05/01/2033 (Callable 05/01/2029) | | | 260,000 | | | | 301,597 | | | | | |
| Pennsylvania Economic Development Financing Authority: | | | | | | | | | | | | |
| 3.000%, 01/01/2021 | | | 150,000 | | | | 150,000 | | | | | |
| 3.000%, 01/01/2023 | | | 745,000 | | | | 775,620 | | | | | |
| Pennsylvania Higher Educational Facilities Authority: | | | | | | | | | | | | |
| 5.000%, 05/01/2025 | | | 200,000 | | | | 235,000 | | | | | |
| 5.000%, 07/01/2035 (Callable 07/01/2026) | | | 600,000 | | | | 602,274 | | | | | |
| Pennsylvania Housing Finance Agency, | | | | | | | | | | | | |
| 3.200%, 04/01/2040 (Callable 10/01/2025) | | | 205,000 | | | | 215,925 | | | | | |
| Pennsylvania Turnpike Commission: | | | | | | | | | | | | |
| 0.770%, 12/01/2023 | | | | | | | | | | | | |
| (SIFMA Municipal Swap Index + 0.700%) | | | | | | | | | | | | |
(Callable 12/01/2022)(2) | | | 500,000 | | | | 502,500 | | | | | |
0.000%, 12/01/2040 (Callable 06/01/2029)(7) | | | 35,000 | | | | 36,850 | | | | | |
The accompanying notes are an integral part of these financial statements.
Baird Strategic Municipal Bond Fund
Schedule of Investments, December 31, 2020
Long-Term Investments (cont.)
| | | Principal | | | | | | % of | |
| | | Amount | | | Value | | | Net Assets | |
| Pittsburgh Water & Sewer Authority, | | | | | | | | | |
| 0.720%, 09/01/2040 (1 Month LIBOR USD + 0.650%) | | | | | | | | | |
| (Callable 06/01/2023) | | | | | | | | | |
| (Mandatory Tender Date 12/01/2023) | | | | | | | | | |
(Insured by AGM)(2) | | $ | 1,100,000 | | | $ | 1,102,662 | | | | |
| Redevelopment Authority of the City of Philadelphia, | | | | | | | | | | | |
| 5.000%, 04/15/2027 (Callable 04/15/2025) | | | 100,000 | | | | 117,051 | | | | |
| Scranton School District, | | | | | | | | | | | |
| 0.947%, 04/01/2031 (1 Month LIBOR USD + 0.850%) | | | | | | | | | | | |
| (Callable 12/01/2022) | | | | | | | | | | | |
| (Mandatory Tender Date 06/01/2023) | | | | | | | | | | | |
(Insured by ST AID)(2) | | | 1,000,000 | | | | 999,860 | | | | |
| State Public School Building Authority: | | | | | | | | | | | |
| 5.000%, 12/01/2028 | | | | | | | | | | | |
| (Pre-refunded to 12/01/2026) (Insured by AGM) | | | 15,000 | | | | 19,043 | | | | |
| 5.000%, 12/01/2028 | | | | | | | | | | | |
| (Callable 12/01/2026) (Insured by AGM) | | | 85,000 | | | | 104,888 | | | | |
| Westmoreland County Industrial Development Authority, | | | | | | | | | | | |
| 5.000%, 07/01/2028 | | | 575,000 | | | | 704,237 | | | | |
| Total Pennsylvania | | | | | | | | | | | |
| (Cost $16,132,322) | | | | | | | 16,336,286 | | | | 9.5 | % |
| Rhode Island | | | | | | | | | | | | |
| Rhode Island Health and Educational Building Corp., | | | | | | | | | | | | |
| 0.070%, 06/01/2035 (Callable 01/01/2021) | | | | | | | | | | | | |
(Optional Put Date 01/04/2021)(1) | | | 840,000 | | | | 840,000 | | | | | |
| Total Rhode Island | | | | | | | | | | | | |
| (Cost $840,000) | | | | | | | 840,000 | | | | 0.5 | % |
| South Carolina | | | | | | | | | | | | |
| City of Charleston SC, | | | | | | | | | | | | |
| 0.462%, 01/01/2035 (1 Month LIBOR USD + 0.370%) | | | | | | | | | | | | |
| (Callable 02/01/2021) | | | | | | | | | | | | |
(Mandatory Tender Date 01/01/2022)(2) | | | 105,000 | | | | 104,849 | | | | | |
| Florence-Darlington Commission for Technical Education, | | | | | | | | | | | | |
| 5.000%, 03/01/2024 (Callable 09/01/2023) | | | 210,000 | | | | 222,724 | | | | | |
| Patriots Energy Group Financing Agency, | | | | | | | | | | | | |
| 0.956%, 10/01/2048 (1 Month LIBOR USD + 0.860%) | | | | | | | | | | | | |
| (Callable 11/01/2023) | | | | | | | | | | | | |
(Mandatory Tender Date 02/01/2024)(2) | | | 850,000 | | | | 853,366 | | | | | |
| South Carolina Jobs-Economic Development Authority: | | | | | | | | | | | | |
| 4.000%, 08/15/2030 (Callable 08/15/2026) | | | 130,000 | | | | 145,408 | | | | | |
| 5.250%, 08/15/2033 (Callable 08/15/2026) | | | 350,000 | | | | 415,474 | | | | | |
The accompanying notes are an integral part of these financial statements.
Baird Strategic Municipal Bond Fund
Schedule of Investments, December 31, 2020
Long-Term Investments (cont.)
| | | Principal | | | | | | % of | |
| | | Amount | | | Value | | | Net Assets | |
| South Carolina State Housing | | | | | | | | | |
| Finance & Development Authority, | | | | | | | | | |
| 3.800%, 07/01/2034 | | | | | | | | | |
| (Callable 07/01/2024) (Insured by GNMA) | | $ | 135,000 | | | $ | 139,440 | | | | |
| South Carolina Transportation Infrastructure Bank, | | | | | | | | | | | |
| 0.546%, 10/01/2031 (1 Month LIBOR USD + 0.450%) | | | | | | | | | | | |
| (Callable 10/01/2021) | | | | | | | | | | | |
(Mandatory Tender Date 10/01/2022)(2) | | | 800,000 | | | | 798,928 | | | | |
| Total South Carolina | | | | | | | | | | | |
| (Cost $2,636,614) | | | | | | | 2,680,189 | | | | 1.6 | % |
| South Dakota | | | | | | | | | | | | |
| City of Rapid City SD, | | | | | | | | | | | | |
| 4.000%, 12/01/2035 (Callable 12/01/2029) | | | 250,000 | | | | 281,103 | | | | | |
| South Dakota Health & Educational Facilities Authority, | | | | | | | | | | | | |
| 5.000%, 09/01/2032 (Callable 09/01/2027) | | | 100,000 | | | | 123,187 | | | | | |
| Total South Dakota | | | | | | | | | | | | |
| (Cost $382,201) | | | | | | | 404,290 | | | | 0.2 | % |
| Tennessee | | | | | | | | | | | | |
| City of Memphis TN, | | | | | | | | | | | | |
| 4.000%, 12/01/2035 (Callable 12/01/2026) | | | 500,000 | | | | 580,910 | | | | | |
| City of Sevierville TN Public Building authority, | | | | | | | | | | | | |
0.080%, 06/01/2032(1) | | | 1,300,000 | | | | 1,300,000 | | | | | |
| Greeneville Health & Educational Facilities Board, | | | | | | | | | | | | |
| 1.450%, 12/01/2022 | | | | | | | | | | | | |
(Mandatory Tender Date 12/01/2021)(1) | | | 150,000 | | | | 151,532 | | | | | |
| Tennessee Energy Acquisition Corp., | | | | | | | | | | | | |
| 5.625%, 09/01/2026 | | | 1,100,000 | | | | 1,356,399 | | | | | |
| Tennessee Housing Development Agency: | | | | | | | | | | | | |
| 2.350%, 07/01/2022 | | | 25,000 | | | | 25,650 | | | | | |
| 4.000%, 07/01/2048 (Callable 01/01/2027) | | | 225,000 | | | | 245,252 | | | | | |
| 4.500%, 07/01/2049 (Callable 01/01/2028) | | | 45,000 | | | | 50,648 | | | | | |
| Total Tennessee | | | | | | | | | | | | |
| (Cost $3,657,523) | | | | | | | 3,710,391 | | | | 2.2 | % |
| Texas | | | | | | | | | | | | |
| Austin-Bergstrom Landhost Enterprises, Inc., | | | | | | | | | | | | |
| 5.000%, 10/01/2035 (Callable 10/01/2027) | | | 700,000 | | | | 762,965 | | | | | |
| Brazos Higher Education Authority, Inc., | | | | | | | | | | | | |
| 2.350%, 04/01/2040 (Callable 04/01/2030) | | | 120,000 | | | | 118,385 | | | | | |
| Caney Creek Municipal Utility District, | | | | | | | | | | | | |
| 5.000%, 03/01/2024 | | | 390,000 | | | | 437,014 | | | | | |
| Central Texas Regional Mobility Authority, | | | | | | | | | | | | |
| 5.000%, 01/01/2034 (Callable 01/01/2026) | | | 25,000 | | | | 29,367 | | | | | |
The accompanying notes are an integral part of these financial statements.
Baird Strategic Municipal Bond Fund
Schedule of Investments, December 31, 2020
Long-Term Investments (cont.)
| | | Principal | | | | | | % of | |
| | | Amount | | | Value | | | Net Assets | |
| City of Austin TX, | | | | | | | | | |
| 5.250%, 05/15/2025 | | $ | 150,000 | | | $ | 166,299 | | | |
|
|
| Clifton Higher Education Finance Corp.: | | | | | | | | | | | | |
| 3.100%, 12/01/2022 | | | 30,000 | | | | 30,499 | | | | | |
| 3.950%, 12/01/2032 (Callable 12/01/2022) | | | 265,000 | | | | 271,270 | | | | | |
| County of Winkler TX, | | | | | | | | | | | | |
| 2.000%, 02/15/2025 | | | 125,000 | | | | 117,589 | | | | | |
| El Paso Downtown Development Corp., | | | | | | | | | | | | |
| 5.000%, 08/15/2027 (Callable 08/15/2026) | | | 230,000 | | | | 271,552 | | | | | |
| Grand Mission Municipal Utility District No. 2, | | | | | | | | | | | | |
| 2.250%, 09/01/2028 | | | | | | | | | | | | |
| (Callable 09/01/2023) (Insured by NATL) | | | 95,000 | | | | 96,084 | | | | | |
| Harris County Cultural Education Facilities Finance Corp.: | | | | | | | | | | | | |
| 4.000%, 11/15/2029 (Callable 05/15/2026) | | | 285,000 | | | | 320,460 | | | | | |
| 0.640%, 12/01/2049 | | | | | | | | | | | | |
| (SIFMA Municipal Swap Index + 0.570%) | | | | | | | | | | | | |
| (Callable 06/01/2024) | | | | | | | | | | | | |
(Mandatory Tender Date 12/04/2024)(2) | | | 35,000 | | | | 34,830 | | | | | |
| Harris County Municipal Utility District No. 406, | | | | | | | | | | | | |
| 3.500%, 09/01/2022 | | | 100,000 | | | | 104,026 | | | | | |
| Hunt Memorial Hospital District, | | | | | | | | | | | | |
| 5.000%, 02/15/2030 | | | 1,000,000 | | | | 1,260,960 | | | | | |
| Matagorda County Navigation District No. 1, | | | | | | | | | | | | |
| 5.125%, 11/01/2028 (Insured by AMBAC) | | | 850,000 | | | | 1,084,931 | | | | | |
| Port of Port Arthur Navigation District, | | | | | | | | | | | | |
| 0.200%, 11/01/2040 (Callable 01/04/2021) | | | | | | | | | | | | |
(Optional Put Date 01/07/2021)(1) | | | 300,000 | | | | 300,000 | | | | | |
| San Antonio Public Facilities Corp., | | | | | | | | | | | | |
| 4.000%, 09/15/2034 (Callable 09/15/2022) | | | 465,000 | | | | 484,135 | | | | | |
| Texas Municipal Gas Acquisition & Supply Corp. I, | | | | | | | | | | | | |
| 1.595%, 12/15/2026 (3 Month LIBOR USD + 1.450%) | | | | | | | | | | | | |
(Callable 01/04/2021)(2) | | | 500,000 | | | | 492,085 | | | | | |
| Texas Municipal Gas Acquisition and Supply Corp. II, | | | | | | | | | | | | |
1.015%, 09/15/2027 (3 Month LIBOR USD + 0.870%)(2) | | | 120,000 | | | | 119,998 | | | | | |
| Total Texas | | | | | | | | | | | | |
| (Cost $6,407,431) | | | | | | | 6,502,449 | | | | 3.8 | % |
| Utah | | | | | | | | | | | | |
| Utah Charter School Finance Authority: | | | | | | | | | | | | |
| 3.000%, 04/15/2027 (Insured by UT CSCE) | | | 160,000 | | | | 178,888 | | | | | |
| 5.000%, 04/15/2037 | | | | | | | | | | | | |
| (Callable 04/15/2026) (Insured by UT CSCE) | | | 270,000 | | | | 312,857 | | | | | |
| 5.000%, 10/15/2043 | | | | | | | | | | | | |
| (Callable 10/15/2023) (Insured by UT CSCE) | | | 500,000 | | | | 546,490 | | | | | |
The accompanying notes are an integral part of these financial statements.
Baird Strategic Municipal Bond Fund
Schedule of Investments, December 31, 2020
Long-Term Investments (cont.)
| | | Principal | | | | | | % of | |
| | | Amount | | | Value | | | Net Assets | |
| Utah Housing Corp., | | | | | | | | | |
| 4.000%, 01/01/2045 | | | | | | | | | |
| (Callable 01/01/2026) (Insured by FHA) | | $ | 310,000 | | | $ | 334,323 | | | | |
| Total Utah | | | | | | | | | | | |
| (Cost $1,354,662) | | | | | | | 1,372,558 | | | | 0.8 | % |
| Vermont | | | | | | | | | | | | |
| Winooski School District, | | | | | | | | | | | | |
| 1.250%, 10/15/2021 | | | 1,000,000 | | | | 1,003,340 | | | | | |
| Total Vermont | | | | | | | | | | | | |
| (Cost $1,002,330) | | | | | | | 1,003,340 | | | | 0.6 | % |
| Virginia | | | | | | | | | | | | |
| Toll Road Investors Partnership II LP, | | | | | | | | | | | | |
0.000%, 02/15/2027(3) | | | 1,000,000 | | | | 749,896 | | | | | |
| Total Virginia | | | | | | | | | | | | |
| (Cost $766,896) | | | | | | | 749,896 | | | | 0.4 | % |
| Washington | | | | | | | | | | | | |
| City of Seattle WA, | | | | | | | | | | | | |
| 0.560%, 11/01/2046 | | | | | | | | | | | | |
| (SIFMA Municipal Swap Index + 0.490%) | | | | | | | | | | | | |
| (Callable 11/01/2022) | | | | | | | | | | | | |
(Mandatory Tender Date 11/01/2023)(2) | | | 500,000 | | | | 501,590 | | | | | |
| County of Lewis WA, | | | | | | | | | | | | |
| 3.000%, 12/01/2026 (Callable 12/01/2022) | | | 100,000 | | | | 104,248 | | | | | |
| King County Housing Authority, | | | | | | | | | | | | |
| 5.000%, 12/01/2030 (Callable 12/01/2026) | | | 400,000 | | | | 479,104 | | | | | |
| Pend Oreille County Public Utility District No. 1: | | | | | | | | | | | | |
| 5.000%, 01/01/2022 | | | 225,000 | | | | 232,249 | | | | | |
| 5.000%, 01/01/2029 (Callable 01/01/2028) | | | 165,000 | | | | 193,479 | | | | | |
| 5.000%, 01/01/2038 (Callable 01/01/2029) | | | 300,000 | | | | 345,249 | | | | | |
| Skagit County Public Hospital District No. 1, | | | | | | | | | | | | |
| 5.000%, 12/01/2021 | | | 150,000 | | | | 154,923 | | | | | |
| Vancouver Housing Authority, | | | | | | | | | | | | |
| 1.700%, 12/01/2024 | | | 140,000 | | | | 144,402 | | | | | |
| Washington Health Care Facilities Authority, | | | | | | | | | | | | |
| 1.470%, 01/01/2035 | | | | | | | | | | | | |
| (SIFMA Municipal Swap Index + 1.400%) | | | | | | | | | | | | |
| (Callable 07/01/2024) | | | | | | | | | | | | |
(Mandatory Tender Date 01/01/2025)(2) | | | 150,000 | | | | 148,686 | | | | | |
| Washington State Housing Finance Commission, | | | | | | | | | | | | |
| 4.000%, 06/01/2050 | | | | | | | | | | | | |
| (Callable 06/01/2029) (Insured by GNMA) | | | 295,000 | | | | 334,787 | | | | | |
| Total Washington | | | | | | | | | | | | |
| (Cost $2,559,287) | | | | | | | 2,638,717 | | | | 1.5 | % |
The accompanying notes are an integral part of these financial statements.
Baird Strategic Municipal Bond Fund
Schedule of Investments, December 31, 2020
Long-Term Investments (cont.)
| | | Principal | | | | | | % of | |
| | | Amount | | | Value | | | Net Assets | |
| West Virginia | | | | | | | | | |
| County of Ohio WV, | | | | | | | | | |
| 3.410%, 03/01/2021 | | $ | 500,000 | | | $ | 497,890 | | | | |
| Total West Virginia | | | | | | | | | | | |
| (Cost $497,750) | | | | | | | 497,890 | | | | 0.3 | % |
| Wisconsin | | | | | | | | | | | | |
| Appleton Redevelopment Authority, | | | | | | | | | | | | |
| 0.200%, 06/01/2036 (Callable 01/04/2021) | | | | | | | | | | | | |
(Optional Put Date 01/07/2021)(1) | | | 2,500,000 | | | | 2,500,000 | | | | | |
| Mizuho Floater/Residual Trust, | | | | | | | | | | | | |
| 0.470%, 07/01/2027 | | | | | | | | | | | | |
(Optional Put Date 02/04/2021)(1)(3) | | | 830,000 | | | | 830,000 | | | | | |
| Palmyra-Eagle Area School District: | | | | | | | | | | | | |
| 2.550%, 03/01/2021 | | | 250,000 | | | | 250,047 | | | | | |
| 3.000%, 03/01/2025 (Callable 03/01/2023) | | | 100,000 | | | | 97,275 | | | | | |
| Public Finance Authority: | | | | | | | | | | | | |
| 4.000%, 06/01/2022 | | | 100,000 | | | | 102,594 | | | | | |
| 5.000%, 07/01/2022 | | | 55,000 | | | | 57,087 | | | | | |
5.000%, 10/01/2023(3) | | | 100,000 | | | | 106,247 | | | | | |
3.000%, 03/01/2026 (Callable 03/01/2021)(3) | | | 700,000 | | | | 700,658 | | | | | |
| Tender Option Bond Trust: | | | | | | | | | | | | |
| 0.270%, 01/01/2035 | | | | | | | | | | | | |
(Optional Put Date 01/07/2021)(1)(3) | | | 1,000,000 | | | | 1,000,000 | | | | | |
| 0.320%, 05/01/2054 (Callable 02/01/2021) | | | | | | | | | | | �� | |
(Optional Put Date 01/07/2021)(1)(3) | | | 1,000,000 | | | | 1,000,000 | | | | | |
| Village of Mount Pleasant WI, | | | | | | | | | | | | |
| 5.000%, 04/01/2048 (Callable 04/01/2028) | | | 325,000 | | | | 391,791 | | | | | |
| Wisconsin Center District, | | | | | | | | | | | | |
| 0.000%, 12/15/2029 (Insured by AGM) | | | 1,050,000 | | | | 910,591 | | | | | |
| Wisconsin Health & Educational Facilities Authority: | | | | | | | | | | | | |
| 2.700%, 05/01/2021 | | | 50,000 | | | | 49,803 | | | | | |
| 5.000%, 09/15/2028 (Callable 09/15/2023) | | | 45,000 | | | | 48,021 | | | | | |
| 5.000%, 11/01/2029 (Callable 11/01/2026) | | | 430,000 | | | | 474,471 | | | | | |
| 5.250%, 10/15/2039 (Callable 10/15/2021) | | | 200,000 | | | | 205,614 | | | | | |
| 5.000%, 02/15/2051 (Callable 08/15/2026) | | | | | | | | | | | | |
(Mandatory Tender Date 02/15/2027)(1) | | | 300,000 | | | | 363,903 | | | | | |
| 5.000%, 02/15/2052 (Callable 08/15/2024) | | | | | | | | | | | | |
(Mandatory Tender Date 02/15/2025)(1) | | | 300,000 | | | | 345,150 | | | | | |
| 0.230%, 02/15/2053 (Callable 01/04/2021) | | | | | | | | | | | | |
(Optional Put Date 01/07/2021)(1) | | | 300,000 | | | | 300,000 | | | | | |
| Wisconsin Housing & Economic Development Authority: | | | | | | | | | | | | |
3.000%, 07/01/2022 (Callable 07/01/2021)(3) | | | 150,000 | | | | 151,463 | | | | | |
4.000%, 07/01/2030 (Callable 07/01/2028)(3) | | | 135,000 | | | | 140,832 | | | | | |
| Total Wisconsin | | | | | | | | | | | | |
| (Cost $9,893,999) | | | | | | | 10,025,547 | | | | 5.9 | % |
The accompanying notes are an integral part of these financial statements.
Baird Strategic Municipal Bond Fund
Schedule of Investments, December 31, 2020
Long-Term Investments (cont.)
| | | Principal | | | | | | % of | |
| | | Amount | | | Value | | | Net Assets | |
| Wyoming | | | | | | | | | |
| Carbon County Specific Purpose Tax Joint Powers Board: | | | | | | | | | |
| 5.000%, 06/15/2021 | | $ | 300,000 | | | $ | 304,791 | | | | |
| 5.000%, 06/15/2022 | | | 435,000 | | | | 456,672 | | | | |
| Total Wyoming | | | | | | | | | | | |
| (Cost $760,745) | | | | | | | 761,463 | | | | 0.4 | % |
| Total Long-Term Investments | | | | | | | | | | | | |
| (Cost $168,832,130) | | | | | | | 171,043,073 | | | | 99.9 | % |
| Short-Term Investments | | | | | | | | | | | | |
| U.S. Treasury Security | | | | | | | | | | | | |
United States Treasury Bill, 0.07%(6), 03/25/2021 | | | 25,000 | | | | 24,996 | | | | | |
| Total U.S. Treasury Security | | | | | | | | | | | | |
| (Cost $24,990) | | | | | | | 24,996 | | | | 0.0 | % |
| | | Shares | | | | | | | | | |
| Money Market Mutual Fund | | | | | | | | | | | | |
| Federated Hermes Institutional Tax-Free | | | | | | | | | | | | |
Cash Trust, Premier Shares, 0.01%(4) | | | 182,010 | | | | 182,010 | | | | | |
| Total Money Market Mutual Fund | | | | | | | | | | | | |
| (Cost $182,010) | | | | | | | 182,010 | | | | 0.1 | % |
| Total Short-Term Investments | | | | | | | | | | | | |
| (Cost $207,000) | | | | | | | 207,006 | | | | 0.1 | % |
| Total Investments | | | | | | | | | | | | |
| (Cost $169,039,130) | | | | | | | 171,250,079 | | | | 100.0 | % |
| Other Assets in Excess of Liabilities | | | | | | | 72,470 | | | | 0.0 | % |
| TOTAL NET ASSETS | | | | | | $ | 171,322,549 | | | | 100.0 | % |
Notes to Schedule of Investments
AGC – Assured Guaranty Corp.
AGM – Assured Guaranty Municipal
AMBAC – Ambac Assurance Corp.
BAM – Build America Mutual Assurance Co.
FHA – Federal Housing Administration
GNMA – Government National Mortgage Association
NATL – National Public Finance Guarantee Corp.
Q-SBLF – Qualified School Building Loan Fund
SD CRED PROG – State Credit Enhancement Program
ST AID – State Aid Intercept/Withholding
UT CSCE – Utah Charter School Credit Enhancement Program
LIBOR – London Inter-bank Offered Rate
SIFMA – Securities Industry and Financial Markets Association
The accompanying notes are an integral part of these financial statements.
Baird Strategic Municipal Bond Fund
Schedule of Investments, December 31, 2020
Notes to Schedule of Investments (cont.)| (1) | Variable rate security. The rate reported is the rate in effect as of December 31, 2020. |
| (2) | Variable rate security based on a reference index and spread. The rate reported is the rate in effect as of December 31, 2020. |
| (3) | Security issued under Rule 144A under the Securities Act of 1933 and classified as liquid under the Fund’s liquidity risk management program. Purchased in a private placement transaction; resale to the public may require registration or may extend only to qualified institutional buyers. At December 31, 2020, the value of these securities total $22,740,569, which represents 13.27% of total net assets. |
| (4) | Seven-day yield. |
| (5) | Auction rate security. An auction rate security is a debt instrument with a long nominal maturity for which the interest rate is regularly reset through a Dutch auction. The rate presented is either the rate set through the auction or the maximum interest rate provided for in the security issuance provision. |
| (6) | Effective yield as of December 31, 2020. |
| (7) | Step-up bond; the interest rate shown is the rate in effect as of December 31, 2020. |
| (8) | Security or a portion of the security purchased on a when-issued or delayed delivery basis. |
Summary of Fair Value Exposure at December 31, 2020
The Fund has adopted authoritative fair valuation accounting standards which establish a definition of fair value and set out a hierarchy for measuring fair value. These standards require additional disclosures about the various inputs and valuation techniques used to develop the measurements of fair value and a discussion on changes in valuation techniques and related inputs during the period. These standards define fair value as the price that would be received to sell an asset or paid to transfer a liability in an orderly transaction between market participants at the measurement date.
The fair value hierarchy is organized into three levels based upon the assumptions (referred to as “inputs”) used in pricing the asset or liability. These standards state that “observable inputs” reflect the assumptions market participants would use in pricing the asset or liability based on market data obtained from independent sources and “unobservable inputs” reflect an entity’s own assumptions about the assumptions market participants would use in pricing the asset or liability. These inputs are summarized into three broad levels and described below:
| Level 1 – | Quoted prices (unadjusted) in active markets for identical assets or liabilities that the reporting entity can access at the measurement date. |
| Level 2 – | Inputs other than quoted prices included within Level 1 that are observable for the asset or liability, either directly or indirectly. |
| Level 3 – | Unobservable inputs for the asset or liability. |
The inputs or methodology used for valuing securities are not necessarily an indication of the risk associated with investing in those securities.
The accompanying notes are an integral part of these financial statements.
Baird Strategic Municipal Bond Fund
Summary of Fair Value Exposure at December 31, 2020 (cont.)
The following is a summary of the inputs used to value the Fund’s investments as of December 31, 2020:
| | | Level 1 | | | Level 2 | | | Level 3 | | | Total | |
| Long-Term Investments | | | | | | | | | | | | |
| Municipal Bonds | | $ | — | | | $ | 171,043,073 | | | $ | — | | | $ | 171,043,073 | |
| Total Long-Term Investments | | | — | | | | 171,043,073 | | | | — | | | | 171,043,073 | |
| Short-Term Investments | | | | | | | | | | | | | | | | |
| Money Market Mutual Fund | | | 182,010 | | | | — | | | | — | | | | 182,010 | |
| U.S. Treasury Security | | | — | | | | 24,996 | | | | — | | | | 24,996 | |
| Total Short-Term Investments | | | 182,010 | | | | 24,996 | | | | — | | | | 207,006 | |
| Total Investments | | $ | 182,010 | | | $ | 171,068,069 | | | $ | — | | | $ | 171,250,079 | |
Changes in valuation techniques may result in transfers into or out of assigned levels within the fair value hierarchy. There were no transfers into or out of Level 3 during the reporting period, as compared to the security classifications from the prior year’s annual report. See the Fund’s Valuation Policy in Note 2a to the financial statements.
The accompanying notes are an integral part of these financial statements.
Baird Quality Intermediate Municipal Bond Fund
December 31, 2020 (Unaudited)
The Baird Quality Intermediate Municipal Bond Fund seeks current income that is exempt from federal income tax. As a reminder, the Fund maintains a quality focus and there are several key strategies employed on an ongoing basis that differentiate it from others in the intermediate municipal fund space. These include a consistent overweight among higher quality issues, with particular emphasis on AAA rated securities, a persistent overweight to U.S. government backed issues, and minimization of maturity extension risk.
The coronavirus (COVID-19) challenges of 2020 were unexpected and unprecedented, but so was the speed and magnitude of the monetary and fiscal responses. The result was a year of significant volatility, yet a rewarding one for Fund investors who stayed the course. Over the full year, tax-exempt rates fell sharply across the curve with short rates falling 93bps and long yields declining 68bps, steepening the curve. As the year began, no one could have known the challenges that would soon be faced. Municipal funds were benefiting from a record streak of weekly inflows, state and local tax revenues were generally rising with the economy in its eleventh year of expansion and many municipalities were adding to an already healthy level of reserves. News broke in January of COVID-19 in the State of Washington; by the end of February, seven states had confirmed cases and it was spreading rapidly. Trading activity in the municipal market initially froze as the lockdowns began, then a torrent of selling was unleashed and a liquidity crisis quickly emerged. The selling and lack of dealer support for the market drove tax-exempt yields to record highs relative to comparable maturity Treasuries. Never had a U.S. economic shock been so swift, deep and broad, affecting so many municipalities. Investors were questioning the ability of municipalities to withstand this crisis and meet their obligations. On March 27th, President Trump signed the $2.2 trillion CARES Act which, along with other measures, offered substantial aid to nearly every sector of the municipal market. In addition, the establishment of the Municipal Liquidity Facility (MLF), which, for the first time ever, allowed the Fed to lend directly to states and other select municipalities, offered investors the psychological support they were looking for. As the policymakers acted, AAA-rated municipal yields peaked on March 20th and opportunistic investors began to emerge, looking to capitalize on the incredible undervaluation that had been created in the downdraft. From a credit perspective, the further in time we moved away from the initial economic shutdowns, the better the news became on tax revenues.
During 2020, the Fund’s Institutional Class Shares generated strong absolute returns and modestly lagged its benchmark.
The primary factors contributing to the Fund’s absolute and relative performance in 2020 include:
Contributors to Performance
| | • | Yield curve exposure and favorable relative call structure of securities |
| | • | Sector weighting – overweight to pre-refunded bonds a meaningful contributor |
Detractors from Performance
| | • | The relative price differences between pricing services used by the Fund (ICE) and its benchmark (Bloomberg BVAL) |
| | • | Security selection |
Although the COVID-19 vaccinations have begun, we expect the economic impact of COVID-19 to linger well into 2021, particularly as it relates to travel and entertainment. Yet, with the massive fiscal stimulus that is already in the pipeline, and perhaps more coming now that the Democratic Party has full, albeit narrow, control of Washington, above-average economic growth is very likely this year. This should boost state and local tax revenues helping municipalities recover from the pandemic-induced decline. With short-term rates anchored by the Fed, a steeper yield curve is likely which provides the opportunity for investors to capture the roll-down benefit as bonds age along a relatively steep curve. We expect the roll-down return to be an important component of total return this year, along with the yield advantage the Fund enjoys above that of its benchmark. Municipal credit spreads have room to narrow further, suggesting a modest credit overweight is appropriate. Strategic positioning across market sectors and the yield curve, a continued focus on credit to identify improving trends, plus the always-important security selection process will all be important to navigate through the current environment.
Baird Quality Intermediate Municipal Bond Fund
December 31, 2020 (Unaudited)
We expect the Fund will maintain a neutral duration posture relative to the benchmark with an allocation that seeks to optimize the roll-down benefit of a steep, upwardly-sloping municipal curve. We also expect the Fund’s sector weightings will strongly favor a focus on the highest-rated issues including the pre-refunded and high-quality tax-exempt housing bonds, which have U.S. Federal Agency support. Finally, the Fund will seek to enhance total return through security structure and cash flow optionality.
Baird Quality Intermediate Municipal Bond Fund
December 31, 2020 (Unaudited)
Portfolio Characteristics
Quality Distribution(1)(2)
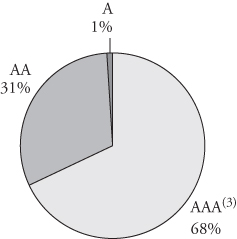 | | Net Assets | $1,501,622,680 | |
| | | | |
| | SEC 30-Day | | |
| | Yield(4) | | |
| | Institutional Class | 0.72% | |
| | Investor Class | 0.47% | |
| | | | |
| | Average | | |
| | Effective | | |
| | Duration | 4.10 years | |
| | | | |
| | Average | | |
| | Effective | | |
| | Maturity | 4.50 years | |
| | | | | |
| | | Annualized | | |
Sector Weightings(1) | | Expense | | |
| | | Ratio(5) | | |
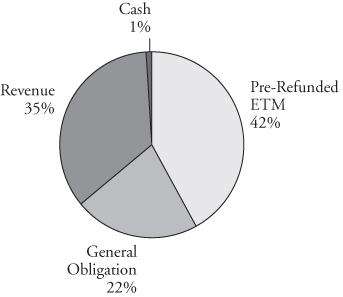
| | Institutional Class | 0.30% | |
| | Investor Class | 0.55% | (6) |
| | | | |
| | Portfolio | | |
| | Turnover Rate | 15% | |
| | | | |
| | Number of | | |
| | Holdings | 730 | |
| | | | |
| | | | |
| | | | |
| | | | |
| | | | |
| | | | |
| | | | |
| | | | |
| | | | |
| | | | | |
| (1) | Percentages shown are based on the Fund’s total investments. |
| (2) | The quality profile is calculated on a market value-weighted basis using the highest credit quality rating for each security held by the Fund given by S&P, Moody’s or Fitch, each of which is a Nationally Recognized Statistical Rating Organization (NRSRO). NRSROs rate the credit quality of securities using a scale that generally ranges from AAA (highest) to D (lowest). |
| (3) | Includes pre-refunded and escrowed-to-maturity (ETM) bonds. |
| (4) | SEC yields are based on SEC guidelines and are calculated for the 30 days ended December 31, 2020. |
| (5) | Reflects expense ratios as stated in the Fund’s current prospectus. |
| (6) | Includes 0.25% 12b-1 fee. |
Baird Quality Intermediate Municipal Bond Fund
December 31, 2020 (Unaudited)
Institutional ClassValue of a $25,000 Investment
Growth of a hypothetical investment of $25,000 made on 12/31/10, assuming reinvestment of all distributions.
Investor Class
Value of a $10,000 Investment
Growth of a hypothetical investment of $10,000 made on 12/31/10, assuming reinvestment of all distributions.
Baird Quality Intermediate Municipal Bond Fund
December 31, 2020 (Unaudited)
Total Returns
| | | Average Annual |
| | One | Five | Ten | Since |
| For the Periods Ended December 31, 2020 | Year | Years | Years | Inception(1) |
| Institutional Class Shares | 4.43% | 2.76% | 3.08% | 3.98% |
| Investor Class Shares | 4.23% | 2.52% | 2.83% | 3.72% |
| Bloomberg Barclays Quality Intermediate | | | | |
Municipal Bond Index(2) | 4.58% | 3.08% | 3.51% | 4.05% |
| (1) | For the period from March 30, 2001 (inception date) through December 31, 2020. |
| (2) | The Bloomberg Barclays Quality Intermediate Municipal Bond Index is an unmanaged, market value weighted index consisting of tax-exempt, fixed-rate securities that are rated A3 or better, with maturities between 2 and 12 years. Securities must have an outstanding par value of at least $7 million and be issued as part of a transaction of at least $75 million. The bonds must be fixed rate, have a dated-date after December 31, 1990. This Index does not reflect any deduction for fees, expenses or taxes. A direct investment in an index is not possible. |
The line graphs on the previous page and the returns shown in the table above reflect reinvestment of dividends and/or capital gains distributions in additional shares. The returns in the graphs and table do not reflect the deduction of taxes that a shareholder would pay on Fund distributions or the redemption of Fund shares. The returns reflect the actual performance for each period and do not include the impact of trades executed on the last business day of the period that were recorded on the first business day of the next period.
The Fund’s gross expense ratio for each Class, as reflected in the Fund’s current prospectus, is set forth under “Portfolio Characteristics”.
The Fund may invest up to 25% of its total assets in municipal obligations issued by persons in the same state. As a result, changes in economic, business or political conditions of a particular state may have a disproportionate impact on the Fund’s share price. Municipal securities investments are not appropriate for all investors, especially those taxed at lower rates. U.S. and international markets have experienced significant periods of volatility in recent years and months due to a number of economic, political and global macro factors including the impact of the coronavirus (COVID-19) as a global pandemic and related public health issues, growth concerns in the U.S. and overseas, uncertainties regarding interest rates, trade tensions and the threat of tariffs imposed by the U.S. and other countries. These and other geopolitical events may cause market disruptions and could have an adverse effect on the value of the Fund’s investments.
Past performance does not guarantee future results. Investment return and principal value will fluctuate so that an investor’s shares, when redeemed, may be worth more or less than their original cost.
For information about the performance of the Fund as of the most recent month-end, please call 1-866-44BAIRD or visit www.bairdfunds.com. Mutual fund performance changes over time and current performance may be lower or higher than that stated.
Baird Quality Intermediate Municipal Bond Fund
Schedule of Investments, December 31, 2020
Long-Term Investments
| | | Principal | | | | | | % of | |
| | | Amount | | | Value | | | Net Assets | |
| Municipal Bonds | | | | | | | | | |
| Alabama | | | | | | | | | |
| City of Huntsville AL: | | | | | | | | | |
| 5.000%, 09/01/2029 | | $ | 2,190,000 | | | $ | 2,960,004 | | | | |
| 5.000%, 09/01/2029 | | | 1,325,000 | | | | 1,794,818 | | | | |
| City of Tuscaloosa AL, | | | | | | | | | | | |
| 4.000%, 10/01/2028 | | | 1,000,000 | | | | 1,228,210 | | | | |
| Montgomery Water Works & Sanitary Sewer Board: | | | | | | | | | | | |
| 4.000%, 09/01/2033 (Callable 09/01/2029) | | | 410,000 | | | | 508,728 | | | | |
| 4.000%, 09/01/2034 (Callable 09/01/2029) | | | 190,000 | | | | 235,211 | | | | |
| 4.000%, 09/01/2035 (Callable 09/01/2029) | | | 500,000 | | | | 617,265 | | | | |
| Total Alabama | | | | | | | | | | | |
| (Cost $7,153,065) | | | | | | | 7,344,236 | | | | 0.5 | % |
| Alaska | | | | | | | | | | | | |
| Alaska Housing Finance Corp.: | | | | | | | | | | | | |
| 4.000%, 06/01/2031 (Callable 06/01/2027) | | | 1,700,000 | | | | 1,978,800 | | | | | |
| 4.000%, 12/01/2031 (Callable 06/01/2027) | | | 2,980,000 | | | | 3,462,254 | | | | | |
| 5.000%, 12/01/2031 (Callable 06/01/2028) | | | 1,465,000 | | | | 1,816,878 | | | | | |
| 4.000%, 12/01/2032 (Callable 06/01/2027) | | | 865,000 | | | | 1,000,200 | | | | | |
| 3.450%, 12/01/2033 (Callable 06/01/2027) | | | 635,000 | | | | 651,878 | | | | | |
| 4.000%, 06/01/2036 (Callable 06/01/2025) | | | 1,000,000 | | | | 1,111,590 | | | | | |
| 4.000%, 12/01/2048 (Callable 06/01/2027) | | | 1,010,000 | | | | 1,123,504 | | | | | |
| City of Valdez AK, | | | | | | | | | | | | |
| 5.000%, 06/30/2029 (Callable 06/30/2022) | | | 1,225,000 | | | | 1,302,922 | | | | | |
| Total Alaska | | | | | | | | | | | | |
| (Cost $12,121,454) | | | | | | | 12,448,026 | | | | 0.8 | % |
| Arizona | | | | | | | | | | | | |
| Arizona Industrial Development Authority, | | | | | | | | | | | | |
2.500%, 05/01/2022 (Insured by AGM)(3) | | | 7,348,635 | | | | 7,398,312 | | | | | |
| Arizona State University, | | | | | | | | | | | | |
| 5.000%, 07/01/2032 (Pre-refunded to 07/01/2022) | | | 715,000 | | | | 764,886 | | | | | |
| City of Tempe AZ: | | | | | | | | | | | | |
| 5.000%, 07/01/2033 (Pre-refunded to 07/01/2028) | | | 40,000 | | | | 53,042 | | | | | |
| 5.000%, 07/01/2034 (Pre-refunded to 07/01/2027) | | | 165,000 | | | | 213,814 | | | | | |
| 5.000%, 07/01/2034 (Pre-refunded to 07/01/2028) | | | 325,000 | | | | 430,966 | | | | | |
| 5.000%, 07/01/2035 (Pre-refunded to 07/01/2027) | | | 185,000 | | | | 239,730 | | | | | |
| 5.000%, 07/01/2037 (Pre-refunded to 07/01/2028) | | | 215,000 | | | | 285,101 | | | | | |
| 5.000%, 07/01/2038 (Pre-refunded to 07/01/2028) | | | 350,000 | | | | 464,118 | | | | | |
| City of Tucson AZ, | | | | | | | | | | | | |
| 5.000%, 07/01/2028 (Callable 07/01/2025) | | | 750,000 | | | | 901,890 | | | | | |
| Maricopa County Unified School District No. 48: | | | | | | | | | | | | |
| 4.000%, 07/01/2033 (Callable 07/01/2028) | | | 500,000 | | | | 601,180 | | | | | |
| 3.000%, 07/01/2034 (Callable 07/01/2028) | | | 1,350,000 | | | | 1,492,357 | | | | | |
The accompanying notes are an integral part of these financial statements.
Baird Quality Intermediate Municipal Bond Fund
Schedule of Investments, December 31, 2020
Long-Term Investments (cont.)
| | | Principal | | | | | | % of | |
| | | Amount | | | Value | | | Net Assets | |
| Salt River Project Agricultural | | | | | | | | | |
| Improvement & Power District, | | | | | | | | | |
| 5.000%, 01/01/2034 (Callable 01/01/2027) | | $ | 3,555,000 | | | $ | 4,415,665 | | | | |
| Total Arizona | | | | | | | | | | | |
| (Cost $16,656,199) | | | | | | | 17,261,061 | | | | 1.1 | % |
| Arkansas | | | | | | | | | | | | |
| City of Little Rock AR, | | | | | | | | | | | | |
| 5.000%, 10/01/2034 (Callable 04/01/2025) | | | 5,000,000 | | | | 5,845,950 | | | | | |
| City of Pine Bluff AR, | | | | | | | | | | | | |
| 3.000%, 02/01/2047 | | | | | | | | | | | | |
| (Callable 08/01/2027) (Insured by BAM) | | | 2,005,000 | | | | 2,146,794 | | | | | |
| City of Rogers AR: | | | | | | | | | | | | |
| 4.000%, 11/01/2025 (Callable 05/01/2024) | | | 570,000 | | | | 636,753 | | | | | |
| 4.000%, 11/01/2027 (Callable 05/01/2024) | | | 460,000 | | | | 511,497 | | | | | |
| County of St. Francis AR, | | | | | | | | | | | | |
| 1.250%, 08/01/2033 | | | | | | | | | | | | |
| (Callable 08/01/2026) (Insured by BAM) | | | 1,010,000 | | | | 1,010,858 | | | | | |
| Jonesboro City Water & Light Plant: | | | | | | | | | | | | |
| 4.000%, 06/01/2033 (Callable 12/01/2030) | | | 500,000 | | | | 623,220 | | | | | |
| 4.000%, 06/01/2035 (Callable 12/01/2030) | | | 1,360,000 | | | | 1,672,609 | | | | | |
| University of Arkansas: | | | | | | | | | | | | |
| 5.000%, 11/01/2035 (Callable 11/01/2024) | | | 665,000 | | | | 758,492 | | | | | |
| 4.000%, 04/01/2037 (Callable 04/01/2029) | | | 160,000 | | | | 190,939 | | | | | |
| 4.000%, 04/01/2039 (Callable 04/01/2029) | | | 245,000 | | | | 290,921 | | | | | |
| Total Arkansas | | | | | | | | | | | | |
| (Cost $12,941,058) | | | | | | | 13,688,033 | | | | 0.9 | % |
| California | | | | | | | | | | | | |
| Anaheim Housing & Public Improvements Authority: | | | | | | | | | | | | |
| 5.000%, 10/01/2037 (Callable 10/01/2025) | | | 750,000 | | | | 887,610 | | | | | |
| 5.000%, 10/01/2038 (Callable 10/01/2025) | | | 1,000,000 | | | | 1,181,440 | | | | | |
| Antelope Valley Community College District, | | | | | | | | | | | | |
| 0.000%, 08/01/2034 (Pre-refunded to 02/01/2025) | | | 150,000 | | | | 98,997 | | | | | |
| Aromas-San Juan Unified School District, | | | | | | | | | | | | |
| 0.000%, 08/01/2050 | | | | | | | | | | | | |
| (Pre-refunded to 08/01/2021) (Insured by AGM) | | | 925,000 | | | | 82,593 | | | | | |
| Brea Redevelopment Agency: | | | | | | | | | | | | |
0.000%, 08/01/2033 (Callable 08/01/2027)(5) | | | 1,500,000 | | | | 1,620,195 | | | | | |
0.000%, 08/01/2034 (Callable 08/01/2027)(5) | | | 1,750,000 | | | | 1,886,325 | | | | | |
| California Health Facilities Financing Authority, | | | | | | | | | | | | |
| 4.000%, 08/15/2035 (Callable 08/15/2026) | | | 2,000,000 | | | | 2,317,820 | | | | | |
| California Municipal Finance Authority, | | | | | | | | | | | | |
| 5.000%, 01/01/2028 (Pre-refunded to 01/01/2022) | | | 1,230,000 | | | | 1,286,285 | | | | | |
| Citrus Community College District, | | | | | | | | | | | | |
0.000%, 08/01/2034 (Pre-refunded to 02/01/2024)(5) | | | 885,000 | | | | 918,798 | | | | | |
The accompanying notes are an integral part of these financial statements.
Baird Quality Intermediate Municipal Bond Fund
Schedule of Investments, December 31, 2020
Long-Term Investments (cont.)
| | | Principal | | | | | | % of | |
| | | Amount | | | Value | | | Net Assets | |
| City of Bakersfield CA, | | | | | | | | | |
| 0.000%, 04/15/2021 (ETM) | | $ | 12,385,000 | | | $ | 12,378,808 | | | |
|
|
| City of Pasadena CA, | | | | | | | | | | | | |
| 4.250%, 06/01/2034 (Callable 06/01/2023) | | | 500,000 | | | | 538,600 | | | | | |
| Commerce Community Development | | | | | | | | | | | | |
| Commission Successor Agency, | | | | | | | | | | | | |
| 0.000%, 08/01/2021 (ETM) | | | 90,000 | | | | 89,841 | | | | | |
| Contra Costa Transportation Authority, | | | | | | | | | | | | |
| 5.000%, 03/01/2028 (Callable 03/01/2025) | | | 1,570,000 | | | | 1,857,137 | | | | | |
| Department of Veterans Affairs Veteran’s | | | | | | | | | | | | |
| Farm & Home Purchase Program, | | | | | | | | | | | | |
| 4.000%, 12/01/2049 (Callable 06/01/2028) | | | 1,640,000 | | | | 1,821,712 | | | | | |
| El Rancho Unified School District, | | | | | | | | | | | | |
| 0.000%, 08/01/2035 | | | | | | | | | | | | |
| (Pre-refunded to 08/01/2023) (Insured by BAM) | | | 300,000 | | | | 144,267 | | | | | |
| Fontana Unified School District: | | | | | | | | | | | | |
| 3.000%, 08/01/2040 | | | | | | | | | | | | |
| (Callable 08/01/2028) (Insured by BAM) | | | 3,000,000 | | | | 3,296,820 | | | | | |
| 3.000%, 08/01/2041 | | | | | | | | | | | | |
| (Callable 08/01/2028) (Insured by BAM) | | | 3,000,000 | | | | 3,287,220 | | | | | |
| Foothill-Eastern Transportation Corridor Agency: | | | | | | | | | | | | |
| 0.000%, 01/01/2028 (ETM) | | | 3,150,000 | | | | 2,999,871 | | | | | |
| 0.000%, 01/01/2030 (ETM) | | | 75,000 | | | | 67,836 | | | | | |
| Gateway Unified School District, | | | | | | | | | | | | |
| 0.000%, 03/01/2037 (ETM) (Insured by AGM) | | | 45,000 | | | | 30,130 | | | | | |
| Imperial Community College District, | | | | | | | | | | | | |
| 7.000%, 08/01/2040 | | | | | | | | | | | | |
(Pre-refunded to 08/01/2030) (Insured by AGM)(5) | | | 180,000 | | | | 278,775 | | | | | |
| Kern Community College District, | | | | | | | | | | | | |
| 0.000%, 08/01/2023 | | | 2,200,000 | | | | 2,169,662 | | | | | |
| La Canada Unified School District: | | | | | | | | | | | | |
| 4.000%, 08/01/2045 (Callable 08/01/2028) | | | 850,000 | | | | 1,001,572 | | | | | |
| 4.000%, 08/01/2049 (Callable 08/01/2028) | | | 1,000,000 | | | | 1,172,270 | | | | | |
| Mendocino-Lake Community College District, | | | | | | | | | | | | |
| 0.000%, 08/01/2051 | | | | | | | | | | | | |
| (Pre-refunded to 08/01/2021) (Insured by AGM) | | | 1,285,000 | | | | 127,151 | | | | | |
| Moorpark Unified School District, | | | | | | | | | | | | |
| 0.000%, 08/01/2036 | | | | | | | | | | | | |
(Callable 08/01/2032) (Insured by AGM)(5) | | | 385,000 | | | | 406,679 | | | | | |
| Mount Diablo Unified School District, | | | | | | | | | | | | |
| 0.000%, 08/01/2030 | | | | | | | | | | | | |
(Callable 08/01/2025) (Insured by AGM)(5) | | | 150,000 | | | | 167,339 | | | | | |
| Mount San Antonio Community College District, | | | | | | | | | | | | |
0.000%, 08/01/2028 (Callable 02/01/2028)(5) | | | 550,000 | | | | 645,931 | | | | | |
The accompanying notes are an integral part of these financial statements.
Baird Quality Intermediate Municipal Bond Fund
Schedule of Investments, December 31, 2020
Long-Term Investments (cont.)
| | | Principal | | | | | | % of | |
| | | Amount | | | Value | | | Net Assets | |
| Northern California Power Agency, | | | | | | | | | |
| 7.500%, 07/01/2023 | | | | | | | | | |
| (Pre-refunded to 07/01/2021) (Insured by AMBAC) | | $ | 265,000 | | | $ | 274,288 | | | |
|
|
| Pacheco Union Elementary School District, | | | | | | | | | | | | |
| 0.000%, 02/01/2037 (ETM) (Insured by AGM) | | | 300,000 | | | | 202,944 | | | | | |
| Pajaro Valley Unified School District: | | | | | | | | | | | | |
| 5.000%, 08/01/2030 | | | | | | | | | | | | |
| (Callable 01/21/2021) (Insured by BAM) | | | 235,000 | | | | 235,423 | | | | | |
| 5.000%, 08/01/2031 | | | | | | | | | | | | |
| (Callable 01/21/2021) (Insured by BAM) | | | 275,000 | | | | 275,481 | | | | | |
| Paramount Unified School District, | | | | | | | | | | | | |
| 0.000%, 08/01/2045 | | | | | | | | | | | | |
(Callable 02/01/2033) (Insured by AGM)(5) | | | 325,000 | | | | 441,971 | | | | | |
| Peralta Community College District, | | | | | | | | | | | | |
| 3.500%, 08/01/2032 (Callable 08/01/2025) | | | 1,715,000 | | | | 1,898,145 | | | | | |
| Pittsburg Unified School District Financing Authority, | | | | | | | | | | | | |
| 0.000%, 09/01/2040 | | | | | | | | | | | | |
| (Pre-refunded to 09/01/2021) (Insured by AGM) | | | 815,000 | | | | 193,758 | | | | | |
| Pleasanton Unified School District, | | | | | | | | | | | | |
| 3.000%, 08/01/2033 (Callable 08/01/2025) | | | 2,000,000 | | | | 2,143,600 | | | | | |
| Rio Hondo Community College District, | | | | | | | | | | | | |
0.000%, 08/01/2042 (Callable 08/01/2034)(5) | | | 6,760,000 | | | | 9,257,414 | | | | | |
| San Diego Unified School District: | | | | | | | | | | | | |
6.000%, 07/01/2033 (Pre-refunded to 07/01/2024)(5) | | | 350,000 | | | | 419,594 | | | | | |
| 0.000%, 07/01/2034 (Callable 07/01/2025) | | | 2,000,000 | | | | 1,313,020 | | | | | |
| 4.000%, 07/01/2034 (Callable 07/01/2027) | | | 1,000,000 | | | | 1,187,630 | | | | | |
| San Joaquin Hills Transportation Corridor Agency: | | | | | | | | | | | | |
| 0.000%, 01/01/2023 (ETM) | | | 14,005,000 | | | | 13,919,009 | | | | | |
| 0.000%, 01/01/2027 (ETM) | | | 1,380,000 | | | | 1,330,569 | | | | | |
| 0.000%, 01/01/2028 (ETM) | | | 810,000 | | | | 771,395 | | | | | |
| San Marcos Unified School District: | | | | | | | | | | | | |
| 0.000%, 08/01/2032 (Pre-refunded to 02/01/2024) | | | 400,000 | | | | 261,448 | | | | | |
| 0.000%, 08/01/2038 (Pre-refunded to 02/01/2024) | | | 1,500,000 | | | | 694,965 | | | | | |
| San Mateo Foster City School District, | | | | | | | | | | | | |
0.000%, 08/01/2032 (Callable 08/01/2028)(5) | | | 125,000 | | | | 151,271 | | | | | |
| San Mateo Union High School District: | | | | | | | | | | | | |
| 5.000%, 09/01/2041 (Callable 09/01/2023) | | | 2,105,000 | | | | 2,355,158 | | | | | |
| 5.000%, 12/15/2043 | | | | | | | | | | | | |
(Pre-refunded to 12/15/2024) (Insured by AMBAC)(5) | | | 1,635,000 | | | | 1,932,570 | | | | | |
| San Ysidro School District: | | | | | | | | | | | | |
| 0.000%, 08/01/2042 | | | | | | | | | | | | |
| (Pre-refunded to 08/01/2021) (Insured by AGM) | | | 375,000 | | | | 78,600 | | | | | |
| 0.000%, 08/01/2043 | | | | | | | | | | | | |
| (Pre-refunded to 08/01/2021) (Insured by AGM) | | | 290,000 | | | | 56,257 | | | | | |
| 0.000%, 08/01/2050 | | | | | | | | | | | | |
| (Pre-refunded to 08/01/2021) (Insured by AGM) | | | 525,000 | | | | 58,931 | | | | | |
The accompanying notes are an integral part of these financial statements.
Baird Quality Intermediate Municipal Bond Fund
Schedule of Investments, December 31, 2020
Long-Term Investments (cont.)
| | | Principal | | | | | | % of | |
| | | Amount | | | Value | | | Net Assets | |
| St. Helena Unified School District, | | | | | | | | | |
0.000%, 08/01/2028(5) | | $ | 130,000 | | | $ | 146,251 | | | | |
| State of California, | | | | | | | | | | | |
| 5.000%, 08/01/2031 (Callable 02/01/2025) | | | 1,100,000 | | | | 1,296,284 | | | | |
| Sutter Union High School District: | | | | | | | | | | | |
| 0.000%, 08/01/2030 (Pre-refunded to 08/01/2025) | | | 185,000 | | | | 128,886 | | | | |
| 0.000%, 08/01/2036 (Pre-refunded to 08/01/2025) | | | 75,000 | | | | 33,787 | | | | |
| 0.000%, 08/01/2037 (Pre-refunded to 08/01/2025) | | | 50,000 | | | | 20,972 | | | | |
| 0.000%, 08/01/2041 (Pre-refunded to 08/01/2025) | | | 50,000 | | | | 15,707 | | | | |
| 0.000%, 08/01/2043 (Pre-refunded to 08/01/2025) | | | 200,000 | | | | 54,150 | | | | |
| 0.000%, 08/01/2044 (Pre-refunded to 08/01/2025) | | | 420,000 | | | | 105,512 | | | | |
| 0.000%, 06/01/2050 (Pre-refunded to 08/01/2025) | | | 700,000 | | | | 112,385 | | | | |
| Tustin Unified School District, | | | | | | | | | | | |
6.000%, 08/01/2028 (Callable 08/01/2021)(5) | | | 1,310,000 | | | | 1,353,427 | | | | |
| Victor Valley Union High School District: | | | | | | | | | | | |
| 0.000%, 08/01/2036 | | | | | | | | | | | |
| (Pre-refunded to 08/01/2023) (Insured by AGM) | | | 510,000 | | | | 250,731 | | | | |
| 0.000%, 08/01/2038 | | | | | | | | | | | |
| (Pre-refunded to 08/01/2023) (Insured by AGM) | | | 460,000 | | | | 199,488 | | | | |
| 0.000%, 08/01/2041 (Pre-refunded to 08/01/2023) | | | 545,000 | | | | 197,623 | | | | |
| 0.000%, 08/01/2042 (Pre-refunded to 08/01/2023) | | | 2,000,000 | | | | 682,060 | | | | |
| 0.000%, 08/01/2046 (Pre-refunded to 08/01/2023) | | | 200,000 | | | | 53,478 | | | | |
| 0.000%, 08/01/2052 (Pre-refunded to 08/01/2023) | | | 790,000 | | | | 145,084 | | | | |
| Total California | | | | | | | | | | | |
| (Cost $81,583,960) | | | | | | | 87,010,950 | | | | 5.8 | % |
| Colorado | | | | | | | | | | | | |
| Boulder Valley School District No. Re-2, | | | | | | | | | | | | |
| 5.000%, 12/01/2038 | | | | | | | | | | | | |
| (Callable 06/01/2025) (Insured by ST AID) | | | 1,225,000 | | | | 1,443,932 | | | | | |
| Brush School District No. RE-2J: | | | | | | | | | | | | |
| 5.000%, 12/01/2031 | | | | | | | | | | | | |
| (Callable 12/01/2027) (Insured by BAM) | | | 380,000 | | | | 479,621 | | | | | |
| 5.000%, 12/01/2032 | | | | | | | | | | | | |
| (Callable 12/01/2027) (Insured by BAM) | | | 395,000 | | | | 496,061 | | | | | |
| 5.000%, 12/01/2035 | | | | | | | | | | | | |
| (Callable 12/01/2027) (Insured by BAM) | | | 460,000 | | | | 573,532 | | | | | |
| City of Aurora CO, | | | | | | | | | | | | |
| 5.000%, 12/01/2029 | | | 2,400,000 | | | | 3,209,976 | | | | | |
| City of Fort Lupton CO, | | | | | | | | | | | | |
| 4.000%, 12/01/2042 | | | | | | | | | | | | |
| (Callable 12/01/2027) (Insured by AGM) | | | 850,000 | | | | 975,392 | | | | | |
| Colorado Health Facilities Authority: | | | | | | | | | | | | |
| 0.000%, 07/15/2022 (ETM) | | | 14,125,000 | | | | 14,060,449 | | | | | |
| 0.000%, 07/15/2024 (ETM) | | | 875,000 | | | | 861,534 | | | | | |
The accompanying notes are an integral part of these financial statements.
Baird Quality Intermediate Municipal Bond Fund
Schedule of Investments, December 31, 2020
Long-Term Investments (cont.)
| | | Principal | | | | | | % of | |
| | | Amount | | | Value | | | Net Assets | |
| Colorado Health Facilities Authority: (cont.) | | | | | | | | | |
| 4.000%, 07/01/2039 (Pre-refunded to 11/09/2022) | | $ | 100,000 | | | $ | 106,781 | | | | |
| 5.250%, 01/01/2040 (Pre-refunded to 01/01/2023) | | | 3,545,000 | | | | 3,891,949 | | | | |
| 5.250%, 01/01/2045 (Pre-refunded to 01/01/2023) | | | 335,000 | | | | 368,138 | | | | |
| 5.000%, 06/01/2047 (Pre-refunded to 06/01/2027) | | | 5,800,000 | | | | 7,451,724 | | | | |
| Dawson Ridge Metropolitan District No. 1: | | | | | | | | | | | |
| 0.000%, 10/01/2022 (ETM) | | | 13,745,000 | | | | 13,685,347 | | | | |
| 0.000%, 10/01/2022 (ETM) | | | 23,840,000 | | | | 23,736,534 | | | | |
| Mesa County Valley School District No. 51, | | | | | | | | | | | |
| 5.500%, 12/01/2037 | | | | | | | | | | | |
| (Callable 12/01/2027) (Insured by ST AID) | | | 1,000,000 | | | | 1,296,400 | | | | |
| Regional Transportation District, | | | | | | | | | | | |
| 4.375%, 06/01/2039 (Callable 06/01/2023) | | | 5,725,000 | | | | 6,170,233 | | | | |
| Total Colorado | | | | | | | | | | | |
| (Cost $75,349,960) | | | | | | | 78,807,603 | | | | 5.3 | % |
| Connecticut | | | | | | | | | | | | |
| City of Norwalk CT, | | | | | | | | | | | | |
| 4.000%, 09/01/2031 (Callable 09/01/2029) | | | 1,210,000 | | | | 1,517,364 | | | | | |
| Connecticut Housing Finance Authority: | | | | | | | | | | | | |
| 2.875%, 11/15/2030 (Callable 05/15/2025) | | | 1,500,000 | | | | 1,597,425 | | | | | |
| 4.000%, 11/15/2045 (Callable 05/15/2028) | | | 6,480,000 | | | | 7,171,416 | | | | | |
| 4.000%, 11/15/2047 (Callable 11/15/2026) | | | 1,175,000 | | | | 1,272,114 | | | | | |
| 4.000%, 05/15/2049 (Callable 11/15/2028) | | | 2,380,000 | | | | 2,714,104 | | | | | |
| State of Connecticut, | | | | | | | | | | | | |
| 5.000%, 05/01/2026 | | | 1,300,000 | | | | 1,604,915 | | | | | |
| University of Connecticut, | | | | | | | | | | | | |
| 5.000%, 01/15/2031 | | | | | | | | | | | | |
| (Callable 01/15/2027) (Insured by AGM) | | | 1,250,000 | | | | 1,546,988 | | | | | |
| Total Connecticut | | | | | | | | | | | | |
| (Cost $16,556,190) | | | | | | | 17,424,326 | | | | 1.2 | % |
| District of Columbia | | | | | | | | | | | | |
| District of Columbia: | | | | | | | | | | | | |
| 5.000%, 03/01/2036 (Callable 09/01/2029) | | | 1,500,000 | | | | 1,987,725 | | | | | |
| 5.000%, 04/01/2042 (Pre-refunded to 04/01/2027) | | | 160,000 | | | | 204,963 | | | | | |
| 5.000%, 10/15/2044 (Callable 04/15/2029) | | | 1,965,000 | | | | 2,522,922 | | | | | |
| District of Columbia Housing Finance Agency, | | | | | | | | | | | | |
| 1.450%, 02/01/2039 | | | | | | | | | | | | |
(Mandatory Tender Date 08/01/2022)(1) | | | 1,915,000 | | | | 1,945,085 | | | | | |
| Total District of Columbia | | | | | | | | | | | | |
| (Cost $6,422,833) | | | | | | | 6,660,695 | | | | 0.4 | % |
| Florida | | | | | | | | | | | | |
| City of Fort Myers FL, | | | | | | | | | | | | |
| 4.000%, 12/01/2037 (Callable 12/01/2025) | | | 480,000 | | | | 529,114 | | | | | |
The accompanying notes are an integral part of these financial statements.
Baird Quality Intermediate Municipal Bond Fund
Schedule of Investments, December 31, 2020
Long-Term Investments (cont.)
| | | Principal | | | | | | % of | |
| | | Amount | | | Value | | | Net Assets | |
| City of Jacksonville FL, | | | | | | | | | |
| 0.060%, 08/01/2036 | | | | | | | | | |
| (Callable 01/04/2021) | | | | | | | | | |
(Optional Put Date 01/07/2021)(1) | | $ | 8,460,000 | | | $ | 8,460,000 | | | |
|
|
| City of Miami Beach FL, | | | | | | | | | | | | |
| 6.250%, 10/01/2022 (ETM) (Insured by AMBAC) | | | 550,000 | | | | 588,456 | | | | | |
| City of Miramar FL: | | | | | | | | | | | | |
| 5.000%, 10/01/2029 (Callable 10/01/2027) | | | 1,025,000 | | | | 1,321,799 | | | | | |
| 5.000%, 10/01/2030 (Callable 10/01/2027) | | | 1,000,000 | | | | 1,286,420 | | | | | |
| 5.000%, 10/01/2034 (Callable 10/01/2027) | | | 1,000,000 | | | | 1,262,950 | | | | | |
| 5.000%, 10/01/2035 (Callable 10/01/2027) | | | 1,030,000 | | | | 1,296,327 | | | | | |
| City of Orlando FL, | | | | | | | | | | | | |
| 5.000%, 11/01/2034 | | | | | | | | | | | | |
| (Callable 11/01/2027) (Insured by AGM) | | | 1,000,000 | | | | 1,229,600 | | | | | |
| City of Tallahassee FL: | | | | | | | | | | | | |
| 5.000%, 10/01/2033 (Callable 10/01/2024) | | | 255,000 | | | | 296,652 | | | | | |
| 5.000%, 10/01/2034 (Callable 10/01/2024) | | | 1,010,000 | | | | 1,173,337 | | | | | |
| 5.000%, 10/01/2035 (Callable 10/01/2024) | | | 825,000 | | | | 957,091 | | | | | |
| City of Tampa FL: | | | | | | | | | | | | |
| 4.125%, 10/01/2031 (Pre-refunded to 10/01/2021) | | | 1,930,000 | | | | 1,987,070 | | | | | |
| 5.250%, 05/01/2043 (Callable 05/01/2028) | | | 2,000,000 | | | | 2,551,980 | | | | | |
| County of Miami-Dade FL: | | | | | | | | | | | | |
| 5.250%, 10/01/2022 (Insured by AGM) | | | 1,175,000 | | | | 1,279,246 | | | | | |
| 0.000%, 10/01/2027 (ETM) (Insured by NATL) | | | 185,000 | | | | 177,084 | | | | | |
| 5.250%, 10/01/2030 (ETM) (Insured by NATL) | | | 2,630,000 | | | | 3,643,365 | | | | | |
| Florida Housing Finance Corp.: | | | | | | | | | | | | |
| 1.940%, 08/01/2036 (Insured by FNMA) | | | 5,000,000 | | | | 5,062,200 | | | | | |
| 4.200%, 01/01/2045 | | | | | | | | | | | | |
| (Callable 01/01/2028) (Insured by GNMA) | | | 5,990,000 | | | | 6,619,010 | | | | | |
| 3.800%, 07/01/2047 | | | | | | | | | | | | |
| (Callable 01/01/2027) (Insured by GNMA) | | | 235,000 | | | | 243,350 | | | | | |
| 4.000%, 07/01/2050 | | | | | | | | | | | | |
| (Callable 07/01/2028) (Insured by GNMA) | | | 4,145,000 | | | | 4,632,203 | | | | | |
| 3.500%, 07/01/2051 | | | | | | | | | | | | |
| (Callable 07/01/2029) (Insured by GNMA) | | | 650,000 | | | | 725,744 | | | | | |
| Highlands County Health Facilities Authority: | | | | | | | | | | | | |
| 0.070%, 11/15/2035 (Callable 01/04/2021) | | | | | | | | | | | | |
(Optional Put Date 01/07/2021)(1) | | | 1,000,000 | | | | 1,000,000 | | | | | |
| 0.070%, 11/15/2037 (Callable 01/04/2021) | | | | | | | | | | | | |
(Optional Put Date 01/07/2021)(1) | | | 4,900,000 | | | | 4,900,000 | | | | | |
| JEA Electric System Revenue, | | | | | | | | | | | | |
| 5.000%, 10/01/2023 (Pre-refunded to 04/01/2023) | | | 690,000 | | | | 763,616 | | | | | |
| JEA Water & Sewer System Revenue, | | | | | | | | | | | | |
| 5.000%, 10/01/2028 (Pre-refunded to 04/01/2024) | | | 755,000 | | | | 869,284 | | | | | |
The accompanying notes are an integral part of these financial statements.
Baird Quality Intermediate Municipal Bond Fund
Schedule of Investments, December 31, 2020
Long-Term Investments (cont.)
| | | Principal | | | | | | % of | |
| | | Amount | | | Value | | | Net Assets | |
| Lee County School Board, | | | | | | | | | |
| 5.000%, 08/01/2032 (Callable 08/01/2026) | | $ | 1,650,000 | | | $ | 2,013,528 | | | | |
| Miami-Dade County Health Facilities Authority, | | | | | | | | | | | |
| 5.750%, 05/01/2021 (ETM) (Insured by NATL) | | | 305,000 | | | | 310,057 | | | | |
| Mid-Bay Bridge Authority: | | | | | | | | | | | |
| 6.875%, 10/01/2022 (ETM) | | | 2,110,000 | | | | 2,267,216 | | | | |
| 6.875%, 10/01/2022 (ETM) (Insured by AMBAC) | | | 1,450,000 | | | | 1,566,435 | | | | |
| Osceola County Expressway Authority, | | | | | | | | | | | |
0.000%, 10/01/2028 (ETM)(5) | | | 95,000 | | | | 107,274 | | | | |
| Reedy Creek Improvement District, | | | | | | | | | | | |
| 5.000%, 10/01/2031 (Callable 10/01/2028) | | | 310,000 | | | | 392,538 | | | | |
| School Board of Miami-Dade County, | | | | | | | | | | | |
| 5.000%, 03/15/2039 (Callable 03/15/2024) | | | 2,000,000 | | | | 2,241,980 | | | | |
| School District of Broward County: | | | | | | | | | | | |
| 5.250%, 07/01/2022 (Pre-refunded to 07/01/2021) | | | 8,460,000 | | | | 8,672,092 | | | | |
| 5.250%, 07/01/2023 (Pre-refunded to 07/01/2021) | | | 4,840,000 | | | | 4,961,339 | | | | |
| 5.000%, 07/01/2024 (Pre-refunded to 07/01/2022) | | | 940,000 | | | | 1,006,317 | | | | |
| Seminole County School Board, | | | | | | | | | | | |
| 5.000%, 07/01/2035 (Callable 07/01/2026) | | | 145,000 | | | | 175,525 | | | | |
| Total Florida | | | | | | | | | | | |
| (Cost $74,095,496) | | | | | | | 76,570,199 | | | | 5.1 | % |
| Georgia | | | | | | | | | | | | |
| Atlanta Development Authority: | | | | | | | | | | | | |
| 5.000%, 09/01/2023 (ETM) | | | 2,450,000 | | | | 2,755,735 | | | | | |
| 5.000%, 09/01/2024 (Pre-refunded to 09/01/2023) | | | 910,000 | | | | 1,023,559 | | | | | |
| 5.000%, 09/01/2032 (Pre-refunded to 09/01/2023) | | | 1,315,000 | | | | 1,479,099 | | | | | |
| Development Authority of Rockdale County: | | | | | | | | | | | | |
| 5.000%, 07/01/2022 | | | 415,000 | | | | 442,344 | | | | | |
| 5.000%, 07/01/2023 | | | 220,000 | | | | 244,755 | | | | | |
| Forsyth County Hospital Authority, | | | | | | | | | | | | |
| 6.375%, 10/01/2028 (ETM) | | | 7,335,000 | | | | 9,130,388 | | | | | |
| Georgia Housing & Finance Authority, | | | | | | | | | | | | |
| 3.500%, 12/01/2046 (Callable 12/01/2025) | | | 655,000 | | | | 693,383 | | | | | |
| Main Street Natural Gas, Inc., | | | | | | | | | | | | |
| 0.926%, 08/01/2048 (1 Month LIBOR USD + 0.830%) | | | | | | | | | | | | |
| (Callable 09/01/2023) | | | | | | | | | | | | |
(Mandatory Tender Date 12/01/2023)(2) | | | 1,000,000 | | | | 1,003,570 | | | | | |
| Richmond County Development Authority: | | | | | | | | | | | | |
| 0.000%, 12/01/2021 (ETM) | | | 1,950,000 | | | | 1,946,295 | | | | | |
| 0.000%, 12/01/2021 (ETM) | | | 4,030,000 | | | | 4,022,343 | | | | | |
| Total Georgia | | | | | | | | | | | | |
| (Cost $21,694,636) | | | | | | | 22,741,471 | | | | 1.5 | % |
The accompanying notes are an integral part of these financial statements.
Baird Quality Intermediate Municipal Bond Fund
Schedule of Investments, December 31, 2020
Long-Term Investments (cont.)
| | | Principal | | | | | | % of | |
| | | Amount | | | Value | | | Net Assets | |
| Idaho | | | | | | | | | |
| Ada & Boise Counties Independent School District, | | | | | | | | | |
| 5.000%, 08/01/2032 (Callable 02/01/2027) | | $ | 500,000 | | | $ | 620,585 | | | | |
| Total Idaho | | | | | | | | | | | |
| (Cost $594,346) | | | | | | | 620,585 | | | | 0.0 | % |
| Illinois | | | | | | | | | | | | |
| Boone & Winnebago Counties | | | | | | | | | | | | |
| Community Unit School District No. 200, | | | | | | | | | | | | |
| 0.000%, 01/01/2024 (ETM) (Insured by AGM) | | | 720,000 | | | | 696,982 | | | | | |
| City of Chicago IL: | | | | | | | | | | | | |
| 5.000%, 01/01/2021 | | | 230,000 | | | | 230,000 | | | | | |
| 5.125%, 01/01/2022 (Insured by BHAC) | | | 885,000 | | | | 897,930 | | | | | |
| 5.000%, 01/01/2034 (Pre-refunded to 01/01/2025) | | | 2,170,000 | | | | 2,576,007 | | | | | |
| Cook County Community High School District No. 233, | | | | | | | | | | | | |
| 4.000%, 12/01/2026 (Callable 06/01/2022) | | | 2,695,000 | | | | 2,833,173 | | | | | |
| Cook County Forest Preserve District, | | | | | | | | | | | | |
| 5.000%, 12/15/2037 (Callable 06/15/2022) | | | 1,070,000 | | | | 1,131,974 | | | | | |
| Cook County School District No. 130, | | | | | | | | | | | | |
| 5.000%, 12/01/2026 | | | | | | | | | | | | |
| (Callable 12/01/2025) (Insured by AGM) | | | 1,140,000 | | | | 1,384,804 | | | | | |
| Cook County School District No. 144, | | | | | | | | | | | | |
| 4.500%, 12/01/2025 (ETM) (Insured by AGM) | | | 5,000 | | | | 5,430 | | | | | |
| Cook County School District No. 159: | | | | | | | | | | | | |
| 0.000%, 12/01/2022 (ETM) | | | 2,000,000 | | | | 1,986,340 | | | | | |
| 0.000%, 12/01/2025 (ETM) | | | 400,000 | | | | 390,320 | | | | | |
| 0.000%, 12/01/2028 (ETM) | | | 295,000 | | | | 275,866 | | | | | |
| Cook County School District No. 163: | | | | | | | | | | | | |
| 6.000%, 12/15/2026 (Insured by BAM) | | | 1,165,000 | | | | 1,494,567 | | | | | |
| 5.000%, 12/15/2028 (Insured by BAM) | | | 1,305,000 | | | | 1,660,769 | | | | | |
| County of Cook IL: | | | | | | | | | | | | |
| 5.000%, 11/15/2033 (Callable 11/15/2027) | | | 3,000,000 | | | | 3,722,010 | | | | | |
| 5.000%, 11/15/2034 (Callable 11/15/2027) | | | 4,325,000 | | | | 5,358,199 | | | | | |
| County of Du Page IL, | | | | | | | | | | | | |
| 5.600%, 01/01/2021 | | | 180,000 | | | | 180,000 | | | | | |
| Exceptional Children Have Opportunities: | | | | | | | | | | | | |
| 5.000%, 12/01/2027 | | | 340,000 | | | | 424,833 | | | | | |
| 5.000%, 12/01/2027 | | | 270,000 | | | | 337,368 | | | | | |
| 5.000%, 12/01/2028 | | | 585,000 | | | | 742,441 | | | | | |
| 5.000%, 12/01/2029 | | | 615,000 | | | | 799,463 | | | | | |
| 5.000%, 12/01/2030 (Callable 12/01/2029) | | | 645,000 | | | | 854,032 | | | | | |
| 5.000%, 12/01/2031 (Callable 12/01/2029) | | | 675,000 | | | | 890,109 | | | | | |
| 4.000%, 12/01/2032 (Callable 12/01/2029) | | | 210,000 | | | | 249,052 | | | | | |
| 4.000%, 12/01/2033 (Callable 12/01/2029) | | | 740,000 | | | | 872,630 | | | | | |
The accompanying notes are an integral part of these financial statements.
Baird Quality Intermediate Municipal Bond Fund
Schedule of Investments, December 31, 2020
Long-Term Investments (cont.)
| | | Principal | | | | | | % of | |
| | | Amount | | | Value | | | Net Assets | |
| Illinois Development Finance Authority: | | | | | | | | | |
| 0.000%, 07/15/2023 (ETM) | | $ | 27,625,000 | | | $ | 27,347,369 | | | |
|
|
| 0.000%, 07/15/2025 (ETM) | | | 51,620,000 | | | | 50,465,777 | | | | | |
| 2.450%, 11/15/2039 | | | | | | | | | | | | |
(Mandatory Tender Date 03/03/2026)(1) | | | 2,230,000 | | | | 2,407,731 | | | | | |
| Illinois Finance Authority: | | | | | | | | | | | | |
| 5.000%, 02/15/2022 | | | 1,095,000 | | | | 1,148,392 | | | | | |
| 5.000%, 12/01/2030 (Pre-refunded to 12/01/2021) | | | 6,875,000 | | | | 7,174,062 | | | | | |
| 5.000%, 07/01/2031 (Callable 01/01/2026) | | | 1,200,000 | | | | 1,467,852 | | | | | |
| 4.000%, 01/15/2033 (Callable 01/15/2028) | | | 2,170,000 | | | | 2,595,103 | | | | | |
| 5.000%, 07/01/2033 (Callable 01/01/2027) | | | 705,000 | | | | 882,033 | | | | | |
| 5.000%, 08/01/2033 (Pre-refunded to 08/01/2024) | | | 700,000 | | | | 817,901 | | | | | |
| 4.000%, 01/01/2034 (Callable 01/01/2026) | | | 1,030,000 | | | | 1,175,920 | | | | | |
| 4.000%, 07/01/2035 (Callable 01/01/2026) | | | 1,000,000 | | | | 1,139,440 | | | | | |
| 5.000%, 02/15/2036 (Callable 02/15/2027) | | | 215,000 | | | | 263,756 | | | | | |
| 4.000%, 12/01/2036 (Callable 12/01/2028) | | | 1,000,000 | | | | 1,205,270 | | | | | |
| 4.000%, 12/01/2037 (Callable 12/01/2028) | | | 2,995,000 | | | | 3,608,017 | | | | | |
| 4.000%, 07/01/2041 (Callable 01/01/2031) | | | 5,000,000 | | | | 6,142,150 | | | | | |
| 4.000%, 05/01/2044 (Callable 05/01/2025) | | | 135,000 | | | | 156,118 | | | | | |
| Illinois Housing Development Authority: | | | | | | | | | | | | |
| 2.550%, 04/01/2025 (Insured by GNMA) | | | 1,400,000 | | | | 1,499,204 | | | | | |
| 3.100%, 02/01/2035 (Callable 02/01/2026) | | | 2,500,000 | | | | 2,660,650 | | | | | |
| 3.500%, 08/01/2046 (Callable 02/01/2026) | | | 535,000 | | | | 572,702 | | | | | |
| 4.000%, 08/01/2048 | | | | | | | | | | | | |
| (Callable 08/01/2027) (Insured by GNMA) | | | 670,000 | | | | 738,903 | | | | | |
| 4.250%, 10/01/2049 (Callable 04/01/2028) | | | 9,960,000 | | | | 11,138,666 | | | | | |
| Kane County Community Unit School District No. 304: | | | | | | | | | | | | |
| 9.000%, 01/01/2023 (ETM) (Insured by AGM) | | | 805,000 | | | | 943,066 | | | | | |
| 9.000%, 01/01/2023 (Insured by AGM) | | | 2,720,000 | | | | 3,184,712 | | | | | |
| Kane McHenry Cook & De Kalb | | | | | | | | | | | | |
| Counties Unit School District No. 300, | | | | | | | | | | | | |
| 5.000%, 01/01/2032 (Callable 01/01/2027) | | | 2,060,000 | | | | 2,544,697 | | | | | |
| Knox & Warren Counties Community | | | | | | | | | | | | |
| Unit School District No. 205: | | | | | | | | | | | | |
| 4.000%, 12/01/2034 | | | | | | | | | | | | |
| (Callable 12/01/2027) (Insured by BAM) | | | 425,000 | | | | 489,502 | | | | | |
| 4.000%, 12/01/2039 | | | | | | | | | | | | |
| (Callable 12/01/2027) (Insured by BAM) | | | 1,305,000 | | | | 1,485,769 | | | | | |
| Lake County Community | | | | | | | | | | | | |
| Consolidated School District No. 50: | | | | | | | | | | | | |
| 5.000%, 01/01/2021 (ETM) | | | 910,000 | | | | 910,000 | | | | | |
| 5.000%, 01/01/2021 | | | 465,000 | | | | 465,000 | | | | | |
| Lake County Township High School District No. 113, | | | | | | | | | | | | |
| 5.000%, 01/01/2034 (Pre-refunded to 01/01/2023) | | | 3,675,000 | | | | 4,028,057 | | | | | |
The accompanying notes are an integral part of these financial statements.
Baird Quality Intermediate Municipal Bond Fund
Schedule of Investments, December 31, 2020
Long-Term Investments (cont.)
| | | Principal | | | | | | % of | |
| | | Amount | | | Value | | | Net Assets | |
| McHenry County Community | | | | | | | | | |
| Consolidated School District No. 47, | | | | | | | | | |
| 4.000%, 02/01/2032 (Callable 02/01/2028) | | $ | 850,000 | | | $ | 994,177 | | | |
|
|
| Metropolitan Pier & Exposition Authority, | | | | | | | | | | | | |
| 5.500%, 12/15/2023 (ETM) | | | 1,335,000 | | | | 1,435,339 | | | | | |
| Metropolitan Water Reclamation | | | | | | | | | | | | |
| District of Greater Chicago: | | | | | | | | | | | | |
| 5.000%, 12/01/2031 (Callable 12/01/2021) | | | 4,800,000 | | | | 4,999,344 | | | | | |
| 5.000%, 12/01/2034 (Callable 12/01/2026) | | | 295,000 | | | | 362,118 | | | | | |
| Regional Transportation Authority: | | | | | | | | | | | | |
| 6.700%, 11/01/2021 (Insured by NATL) | | | 210,000 | | | | 221,208 | | | | | |
| 6.000%, 07/01/2022 (Insured by NATL) | | | 3,705,000 | | | | 4,017,331 | | | | | |
| 6.000%, 07/01/2027 (Insured by AGM) | | | 1,000,000 | | | | 1,310,820 | | | | | |
| Southwestern Illinois Development Authority, | | | | | | | | | | | | |
| 7.625%, 11/01/2048 (Pre-refunded to 11/01/2023) | | | 6,185,000 | | | | 7,439,689 | | | | | |
| State of Illinois: | | | | | | | | | | | | |
| 6.500%, 06/15/2022 | | | 80,000 | | | | 82,442 | | | | | |
| 4.000%, 06/15/2038 | | | | | | | | | | | | |
| (Callable 06/15/2028) (Insured by BAM) | | | 1,850,000 | | | | 2,036,092 | | | | | |
| Village of Carpentersville IL, | | | | | | | | | | | | |
| 4.000%, 12/30/2030 | | | | | | | | | | | | |
| (Callable 12/30/2028) (Insured by BAM) | | | 1,920,000 | | | | 2,319,456 | | | | | |
| Village of Schaumburg IL, | | | | | | | | | | | | |
| 4.000%, 12/01/2024 (Callable 12/01/2022) | | | 5,750,000 | | | | 6,154,052 | | | | | |
| Will County Community Consolidated | | | | | | | | | | | | |
| School District No. 157-C, | | | | | | | | | | | | |
| 2.300%, 01/01/2021 | | | 100,000 | | | | 100,000 | | | | | |
| Will County Community High School District No. 210: | | | | | | | | | | | | |
| 0.000%, 01/01/2024 (ETM) (Insured by AGM) | | | 1,355,000 | | | | 1,333,333 | | | | | |
| 0.000%, 01/01/2025 (ETM) (Insured by AGM) | | | 110,000 | | | | 107,488 | | | | | |
| Will County Community Unit School District No. 201-U, | | | | | | | | | | | | |
| 0.000%, 11/01/2024 (ETM) (Insured by NATL) | | | 705,000 | | | | 690,089 | | | | | |
| Will County Elementary School District No. 122, | | | | | | | | | | | | |
| 0.000%, 10/01/2027 (ETM) (Insured by AGM) | | | 470,000 | | | | 446,876 | | | | | |
| Total Illinois | | | | | | | | | | | | |
| (Cost $190,024,909) | | | | | | | 202,701,972 | | | | 13.5 | % |
| Indiana | | | | | | | | | | | | |
| Carmel Redevelopment Authority, | | | | | | | | | | | | |
| 4.000%, 08/01/2033 (Pre-refunded to 08/01/2022) | | | 1,000,000 | | | | 1,059,620 | | | | | |
| Columbus Multi-High School Building Corp.: | | | | | | | | | | | | |
| 5.000%, 01/15/2026 (Insured by ST AID) | | | 1,125,000 | | | | 1,377,765 | | | | | |
| 5.000%, 01/15/2027 (Insured by ST AID) | | | 1,265,000 | | | | 1,594,545 | | | | | |
| 5.000%, 07/15/2028 (Insured by ST AID) | | | 1,000,000 | | | | 1,310,080 | | | | | |
The accompanying notes are an integral part of these financial statements.
Baird Quality Intermediate Municipal Bond Fund
Schedule of Investments, December 31, 2020
Long-Term Investments (cont.)
| | | Principal | | | | | | % of | |
| | | Amount | | | Value | | | Net Assets | |
| Fishers Redevelopment Authority: | | | | | | | | | |
| 4.000%, 07/15/2027 | | $ | 200,000 | | | $ | 242,192 | | | | |
| 4.000%, 01/15/2028 | | | 330,000 | | | | 402,920 | | | | |
| 4.000%, 07/15/2028 | | | 335,000 | | | | 411,930 | | | | |
| 4.000%, 07/15/2029 (Callable 01/15/2029) | | | 540,000 | | | | 667,645 | | | | |
| 4.000%, 07/15/2030 (Callable 01/15/2029) | | | 725,000 | | | | 890,104 | | | | |
| Fort Wayne Redevelopment Authority, | | | | | | | | | | | |
| 5.000%, 02/01/2025 | | | | | | | | | | | |
| (Callable 02/01/2024) (Insured by ST AID) | | | 335,000 | | | | 382,101 | | | | |
| Indiana Health & Educational | | | | | | | | | | | |
| Facilities Financing Authority, | | | | | | | | | | | |
| 4.000%, 11/15/2046 (Callable 11/15/2026) | | | 1,780,000 | | | | 2,019,303 | | | | |
| Indiana Health Facility Financing Authority, | | | | | | | | | | | |
2.000%, 11/15/2036 (Pre-refunded to 02/01/2023)(1) | | | 110,000 | | | | 113,466 | | | | |
| Indianapolis Local Public Improvement Bond Bank, | | | | | | | | | | | |
| 5.000%, 01/01/2033 (Pre-refunded to 01/01/2025) | | | 1,780,000 | | | | 2,116,936 | | | | |
| Kankakee Valley Middle School Building Corp.: | | | | | | | | | | | |
| 5.000%, 01/15/2029 (Insured by ST AID) | | | 475,000 | | | | 628,720 | | | | |
| 5.000%, 07/15/2029 (Insured by ST AID) | | | 1,180,000 | | | | 1,578,970 | | | | |
| Kokomo-Center School Building Corp., | | | | | | | | | | | |
| 5.000%, 01/15/2037 | | | | | | | | | | | |
| (Callable 07/15/2027) (Insured by ST AID) | | | 500,000 | | | | 603,985 | | | | |
| Northern Wells Multi-School Building Corp., | | | | | | | | | | | |
| 4.000%, 07/15/2035 | | | | | | | | | | | |
| (Callable 07/15/2027) (Insured by ST AID) | | | 160,000 | | | | 184,352 | | | | |
| Total Indiana | | | | | | | | | | | |
| (Cost $14,398,965) | | | | | | | 15,584,634 | | | | 1.0 | % |
| Iowa | | | | | | | | | | | | |
| County of Washington IA, | | | | | | | | | | | | |
| 4.000%, 06/01/2030 (Callable 06/01/2026) | | | 1,015,000 | | | | 1,167,971 | | | | | |
| Iowa Finance Authority: | | | | | | | | | | | | |
| 5.000%, 08/01/2028 (Pre-refunded to 08/01/2026) | | | 3,625,000 | | | | 4,574,931 | | | | | |
| 5.000%, 08/01/2035 (Callable 08/01/2025) | | | 950,000 | | | | 1,127,270 | | | | | |
| 4.000%, 07/01/2047 | | | | | | | | | | | | |
| (Callable 07/01/2027) (Insured by GNMA) | | | 675,000 | | | | 739,037 | | | | | |
| 4.000%, 07/01/2047 | | | | | | | | | | | | |
| (Callable 07/01/2028) (Insured by GNMA) | | | 1,235,000 | | | | 1,411,358 | | | | | |
| 3.250%, 07/01/2050 | | | | | | | | | | | | |
| (Callable 07/01/2029) (Insured by GNMA) | | | 1,725,000 | | | | 1,911,007 | | | | | |
| Iowa Higher Education Loan Authority: | | | | | | | | | | | | |
| 4.500%, 10/01/2033 (Pre-refunded to 10/01/2021) | | | 2,100,000 | | | | 2,166,318 | | | | | |
| 5.000%, 10/01/2038 (Pre-refunded to 10/01/2021) | | | 2,090,000 | | | | 2,163,714 | | | | | |
| University of Iowa, | | | | | | | | | | | | |
| 4.000%, 07/01/2033 (Callable 07/01/2027) | | | 655,000 | | | | 768,721 | | | | | |
| Total Iowa | | | | | | | | | | | | |
| (Cost $15,483,300) | | | | | | | 16,030,327 | | | | 1.1 | % |
The accompanying notes are an integral part of these financial statements.
Baird Quality Intermediate Municipal Bond Fund
Schedule of Investments, December 31, 2020
Long-Term Investments (cont.)
| | | Principal | | | | | | % of | |
| | | Amount | | | Value | | | Net Assets | |
| Kansas | | | | | | | | | |
| Crawford County Unified School District No. 250, | | | | | | | | | |
| 5.000%, 09/01/2035 | | | | | | | | | |
| (Callable 09/01/2027) (Insured by BAM) | | $ | 445,000 | | | $ | 565,043 | | | | |
| Johnson County Unified School District No. 512, | | | | | | | | | | | |
| 4.000%, 10/01/2035 (Callable 10/01/2025) | | | 300,000 | | | | 341,106 | | | | |
| Kansas Development Finance Authority, | | | | | | | | | | | |
| 5.000%, 11/15/2032 (Callable 05/15/2022) | | | 1,955,000 | | | | 2,069,387 | | | | |
| Shawnee County Unified School District No. 501, | | | | | | | | | | | |
| 2.000%, 08/01/2044 (Pre-refunded to 08/01/2026) | | | 85,000 | | | | 92,095 | | | | |
| Total Kansas | | | | | | | | | | | |
| (Cost $2,992,510) | | | | | | | 3,067,631 | | | | 0.2 | % |
| Kentucky | | | | | | | | | | | | |
| Louisville & Jefferson County Metropolitan Government, | | | | | | | | | | | | |
| 5.000%, 12/01/2035 (Callable 06/01/2022) | | | 1,320,000 | | | | 1,407,912 | | | | | |
| Total Kentucky | | | | | | | | | | | | |
| (Cost $1,390,148) | | | | | | | 1,407,912 | | | | 0.1 | % |
| Louisiana | | | | | | | | | | | | |
| Caddo Parish Commission, | | | | | | | | | | | | |
| 5.000%, 02/01/2028 (Callable 02/01/2025) | | | 530,000 | | | | 624,170 | | | | | |
| Jefferson Parish Hospital Service District No. 1, | | | | | | | | | | | | |
| 6.000%, 01/01/2039 (Pre-refunded to 01/01/2021) | | | 1,080,000 | | | | 1,080,000 | | | | | |
| Jefferson Sales Tax District, | | | | | | | | | | | | |
| 4.000%, 12/01/2032 | | | | | | | | | | | | |
| (Callable 12/01/2029) (Insured by AGM) | | | 1,300,000 | | | | 1,571,544 | | | | | |
| Louisiana Public Facilities Authority: | | | | | | | | | | | | |
| 5.500%, 05/15/2027 (Pre-refunded to 05/15/2026) | | | 26,700,000 | | | | 32,182,044 | | | | | |
| 5.500%, 05/15/2032 (Pre-refunded to 05/15/2026) | | | 22,180,000 | | | | 28,160,172 | | | | | |
| State of Louisiana, | | | | | | | | | | | | |
| 5.000%, 05/01/2027 (Pre-refunded to 05/01/2022) | | | 1,420,000 | | | | 1,509,957 | | | | | |
| Webster Parish School District No. 6: | | | | | | | | | | | | |
| 5.000%, 03/01/2025 (Insured by AGM) | | | 425,000 | | | | 501,959 | | | | | |
| 5.000%, 03/01/2026 (Insured by AGM) | | | 635,000 | | | | 774,224 | | | | | |
| 5.000%, 03/01/2027 (Insured by AGM) | | | 620,000 | | | | 775,762 | | | | | |
| 5.000%, 03/01/2028 (Insured by AGM) | | | 755,000 | | | | 966,204 | | | | | |
| 4.000%, 03/01/2030 | | | | | | | | | | | | |
| (Callable 03/01/2029) (Insured by AGM) | | | 665,000 | | | | 806,738 | | | | | |
| 4.000%, 03/01/2031 | | | | | | | | | | | | |
| (Callable 03/01/2029) (Insured by AGM) | | | 840,000 | | | | 1,010,982 | | | | | |
| Total Louisiana | | | | | | | | | | | | |
| (Cost $63,886,805) | | | | | | | 69,963,756 | | | | 4.7 | % |
The accompanying notes are an integral part of these financial statements.
Baird Quality Intermediate Municipal Bond Fund
Schedule of Investments, December 31, 2020
Long-Term Investments (cont.)
| | | Principal | | | | | | % of | |
| | | Amount | | | Value | | | Net Assets | |
| Maryland | | | | | | | | | |
| City of Baltimore MD: | | | | | | | | | |
| 5.000%, 07/01/2024 (ETM) | | $ | 1,220,000 | | | $ | 1,343,525 | | | | |
| 5.000%, 07/01/2028 (ETM) | | | 250,000 | | | | 294,417 | | | | |
| Maryland Community Development Administration, | | | | | | | | | | | |
| 0.625%, 07/01/2022 (Callable 01/01/2022) | | | 500,000 | | | | 500,500 | | | | |
| Maryland Health & Higher | | | | | | | | | | | |
| Educational Facilities Authority: | | | | | | | | | | | |
| 5.250%, 07/01/2026 (Pre-refunded to 07/01/2024) | | | 285,000 | | | | 333,385 | | | | |
| 5.000%, 07/01/2027 (ETM) (Insured by AMBAC) | | | 1,740,000 | | | | 2,031,502 | | | | |
| State of Maryland: | | | | | | | | | | | |
| 4.000%, 06/01/2030 (Callable 06/01/2024) | | | 5,790,000 | | | | 6,459,092 | | | | |
| 4.000%, 08/01/2030 (Callable 08/01/2027) | | | 2,130,000 | | | | 2,585,458 | | | | |
| 5.000%, 08/01/2031 (Callable 08/01/2028) | | | 9,835,000 | | | | 12,904,504 | | | | |
| Total Maryland | | | | | | | | | | | |
| (Cost $24,211,904) | | | | | | | 26,452,383 | | | | 1.8 | % |
| Massachusetts | | | | | | | | | | | | |
| Commonwealth of Massachusetts, | | | | | | | | | | | | |
| 4.500%, 12/01/2043 (Pre-refunded to 12/01/2021) | | | 1,235,000 | | | | 1,283,709 | | | | | |
| Massachusetts Department of Transportation, | | | | | | | | | | | | |
| 5.125%, 01/01/2023 (ETM) | | | 940,000 | | | | 982,394 | | | | | |
| Massachusetts Development Finance Agency, | | | | | | | | | | | | |
| 5.000%, 07/15/2033 (Callable 07/15/2026) | | | 1,470,000 | | | | 1,824,593 | | | | | |
| Massachusetts Housing Finance Agency: | | | | | | | | | | | | |
| 0.875%, 12/01/2023 (Callable 06/01/2022) | | | 1,000,000 | | | | 1,005,270 | | | | | |
| 4.000%, 12/01/2044 (Callable 06/01/2025) | | | 810,000 | | | | 860,730 | | | | | |
| 4.000%, 12/01/2048 | | | | | | | | | | | | |
| (Callable 06/01/2027) (Insured by GNMA) | | | 1,345,000 | | | | 1,471,686 | | | | | |
| 4.000%, 06/01/2049 (Callable 12/01/2028) | | | 625,000 | | | | 693,987 | | | | | |
| Massachusetts State College Building Authority, | | | | | | | | | | | | |
| 0.000%, 05/01/2027 (ETM) (Insured by NATL) | | | 335,000 | | | | 323,158 | | | | | |
| Total Massachusetts | | | | | | | | | | | | |
| (Cost $8,209,102) | | | | | | | 8,445,527 | | | | 0.6 | % |
| Michigan | | | | | | | | | | | | |
| Algonac Community Schools: | | | | | | | | | | | | |
| 4.000%, 05/01/2028 | | | | | | | | | | | | |
| (Callable 05/01/2027) (Insured by Q-SBLF) | | | 175,000 | | | | 208,693 | | | | | |
| 4.000%, 05/01/2029 | | | | | | | | | | | | |
| (Callable 05/01/2027) (Insured by Q-SBLF) | | | 370,000 | | | | 437,455 | | | | | |
| 4.000%, 05/01/2030 | | | | | | | | | | | | |
| (Callable 05/01/2027) (Insured by Q-SBLF) | | | 470,000 | | | | 551,333 | | | | | |
| Brighton Area School District, | | | | | | | | | | | | |
| 5.000%, 05/01/2021 (Insured by Q-SBLF) | | | 500,000 | | | | 507,180 | | | | | |
The accompanying notes are an integral part of these financial statements.
Baird Quality Intermediate Municipal Bond Fund
Schedule of Investments, December 31, 2020
Long-Term Investments (cont.)
| | | Principal | | | | | | % of | |
| | | Amount | | | Value | | | Net Assets | |
| Chippewa Hills School District, | | | | | | | | | |
| 4.000%, 05/01/2033 | | | | | | | | | |
| (Callable 05/01/2025) (Insured by Q-SBLF) | | $ | 300,000 | | | $ | 333,783 | | | |
|
|
| Ecorse Public School District, | | | | | | | | | | | | |
| 5.000%, 05/01/2027 (Insured by Q-SBLF) | | | 515,000 | | | | 652,572 | | | | | |
| Fraser Public School District, | | | | | | | | | | | | |
| 5.000%, 05/01/2024 (Insured by Q-SBLF) | | | 1,000,000 | | | | 1,150,810 | | | | | |
| Michigan Finance Authority, | | | | | | | | | | | | |
| 5.000%, 06/01/2027 (Pre-refunded to 06/01/2022) | | | 1,315,000 | | | | 1,403,552 | | | | | |
| Michigan State Housing Development Authority: | | | | | | | | | | | | |
| 2.700%, 12/01/2034 (Callable 12/01/2028) | | | 4,700,000 | | | | 5,041,173 | | | | | |
| 4.250%, 12/01/2049 (Callable 06/01/2028) | | | 4,125,000 | | | | 4,624,290 | | | | | |
| 3.500%, 12/01/2050 (Callable 06/01/2029) | | | 6,925,000 | | | | 7,722,622 | | | | | |
| Pinckney Community Schools: | | | | | | | | | | | | |
| 5.000%, 05/01/2022 (Insured by Q-SBLF) | | | 1,935,000 | | | | 2,050,926 | | | | | |
| 5.000%, 05/01/2023 (Insured by Q-SBLF) | | | 2,200,000 | | | | 2,424,774 | | | | | |
| State of Michigan, | | | | | | | | | | | | |
| 0.000%, 06/01/2022 (ETM) (Insured by AMBAC) | | | 2,085,000 | | | | 2,074,783 | | | | | |
| Swartz Creek Community Schools, | | | | | | | | | | | | |
| 5.000%, 05/01/2038 | | | | | | | | | | | | |
| (Callable 05/01/2029) (Insured by Q-SBLF) | | | 1,000,000 | | | | 1,280,450 | | | | | |
| Utica Community Schools, | | | | | | | | | | | | |
| 5.000%, 05/01/2034 | | | | | | | | | | | | |
| (Callable 05/01/2029) (Insured by Q-SBLF) | | | 305,000 | | | | 393,670 | | | | | |
| Warren Consolidated Schools: | | | | | | | | | | | | |
| 5.000%, 05/01/2033 | | | | | | | | | | | | |
| (Callable 05/01/2026) (Insured by Q-SBLF) | | | 2,595,000 | | | | 3,123,420 | | | | | |
| 5.000%, 05/01/2033 | | | | | | | | | | | | |
| (Callable 05/01/2026) (Insured by Q-SBLF) | | | 4,660,000 | | | | 5,608,916 | | | | | |
| 5.000%, 05/01/2035 | | | | | | | | | | | | |
| (Callable 05/01/2026) (Insured by Q-SBLF) | | | 925,000 | | | | 1,104,357 | | | | | |
| Total Michigan | | | | | | | | | | | | |
| (Cost $38,358,679) | | | | | | | 40,694,759 | | | | 2.7 | % |
| Minnesota | | | | | | | | | | | | |
| Brainerd Independent School District No. 181, | | | | | | | | | | | | |
| 4.000%, 02/01/2026 (Insured by SD CRED PROG) | | | 660,000 | | | | 773,837 | | | | | |
| County of Hennepin MN: | | | | | | | | | | | | |
| 4.000%, 12/01/2025 (Callable 12/01/2022) | | | 3,000,000 | | | | 3,216,930 | | | | | |
| 5.000%, 12/01/2041 (Callable 12/01/2026) | | | 1,000,000 | | | | 1,232,690 | | | | | |
| Maple River Independent School District No. 2135, | | | | | | | | | | | | |
| 4.000%, 02/01/2039 | | | | | | | | | | | | |
| (Callable 02/01/2030) (Insured by SD CRED PROG) | | | 2,095,000 | | | | 2,561,180 | | | | | |
| Minneapolis-Saint Paul Metropolitan Airports Commission, | | | | | | | | | | | | |
| 5.000%, 01/01/2032 (Callable 01/01/2027) | | | 505,000 | | | | 618,873 | | | | | |
The accompanying notes are an integral part of these financial statements.
Baird Quality Intermediate Municipal Bond Fund
Schedule of Investments, December 31, 2020
Long-Term Investments (cont.)
| | | Principal | | | | | | % of | |
| | | Amount | | | Value | | | Net Assets | |
| Minnesota Housing Finance Agency: | | | | | | | | | |
| 4.500%, 07/01/2034 | | | | | | | | | |
| (Callable 07/01/2021) (Insured by GNMA) | | $ | 55,000 | | | $ | 55,996 | | | | |
| 4.000%, 07/01/2047 | | | | | | | | | | | |
| (Callable 01/01/2027) (Insured by GNMA) | | | 325,000 | | | | 352,066 | | | | |
| 4.250%, 07/01/2049 | | | | | | | | | | | |
| (Callable 07/01/2028) (Insured by GNMA) | | | 1,255,000 | | | | 1,412,327 | | | | |
| Pipestone-Jasper Independent School District No. 2689, | | | | | | | | | | | |
| 4.000%, 02/01/2032 | | | | | | | | | | | |
| (Callable 02/01/2029) (Insured by SD CRED PROG) | | | 580,000 | | | | 711,271 | | | | |
| State of Minnesota, | | | | | | | | | | | |
| 5.000%, 08/01/2037 (Callable 08/01/2029) | | | 3,245,000 | | | | 4,306,115 | | | | |
| Total Minnesota | | | | | | | | | | | |
| (Cost $14,669,712) | | | | | | | 15,241,285 | | | | 1.0 | % |
| Mississippi | | | | | | | | | | | | |
| Mississippi Development Bank: | | | | | | | | | | | | |
| 5.000%, 03/01/2029 (Callable 03/01/2027) | | | 825,000 | | | | 1,028,313 | | | | | |
| 5.250%, 03/01/2035 (Callable 03/01/2028) | | | 495,000 | | | | 621,121 | | | | | |
| Oxford School District, | | | | | | | | | | | | |
| 4.000%, 05/01/2027 | | | 500,000 | | | | 600,615 | | | | | |
| State of Mississippi, | | | | | | | | | | | | |
| 5.000%, 10/01/2028 (Callable 10/01/2027) | | | 1,130,000 | | | | 1,453,056 | | | | | |
| West Rankin Utility Authority, | | | | | | | | | | | | |
| 5.000%, 01/01/2038 | | | | | | | | | | | | |
| (Callable 01/01/2025) (Insured by AGM) | | | 550,000 | | | | 630,157 | | | | | |
| Total Mississippi | | | | | | | | | | | | |
| (Cost $3,904,094) | | | | | | | 4,333,262 | | | | 0.3 | % |
| Missouri | | | | | | | | | | | | |
| Independence School District, | | | | | | | | | | | | |
| 5.500%, 03/01/2035 | | | | | | | | | | | | |
| (Callable 03/01/2027) (Insured by ST AID) | | | 955,000 | | | | 1,215,285 | | | | | |
| Jackson County School District No. R-IV, | | | | | | | | | | | | |
| 5.500%, 03/01/2037 | | | | | | | | | | | | |
| (Callable 03/01/2029) (Insured by ST AID) | | | 1,040,000 | | | | 1,397,604 | | | | | |
| Metropolitan St. Louis Sewer District, | | | | | | | | | | | | |
| 5.000%, 05/01/2036 (Callable 05/01/2025) | | | 1,275,000 | | | | 1,517,224 | | | | | |
| Missouri Housing Development Commission: | | | | | | | | | | | | |
| 1.950%, 05/01/2025 (Insured by GNMA) | | | 85,000 | | | | 88,975 | | | | | |
| 3.950%, 11/01/2040 | | | | | | | | | | | | |
| (Callable 05/01/2025) (Insured by GNMA) | | | 1,255,000 | | | | 1,283,978 | | | | | |
| Moberly School District No. 81, | | | | | | | | | | | | |
| 4.000%, 03/01/2030 | | | | | | | | | | | | |
| (Callable 03/01/2027) (Insured by ST AID) | | | 315,000 | | | | 372,235 | | | | | |
The accompanying notes are an integral part of these financial statements.
Baird Quality Intermediate Municipal Bond Fund
Schedule of Investments, December 31, 2020
Long-Term Investments (cont.)
| | | Principal | | | | | | % of | |
| | | Amount | | | Value | | | Net Assets | |
| St. Louis County School District, | | | | | | | | | |
| 4.000%, 03/01/2031 (Callable 03/01/2025) | | $ | 1,480,000 | | | $ | 1,672,208 | | | | |
| Total Missouri | | | | | | | | | | | |
| (Cost $7,063,753) | | | | | | | 7,547,509 | | | | 0.5 | % |
| Montana | | | | | | | | | | | | |
| Flathead County School District No. 44, | | | | | | | | | | | | |
| 4.000%, 07/01/2036 (Callable 07/01/2028) | | | 210,000 | | | | 247,317 | | | | | |
| Montana Facility Finance Authority: | | | | | | | | | | | | |
| 5.000%, 07/01/2028 (Callable 07/01/2027) | | | 430,000 | | | | 544,264 | | | | | |
| 5.000%, 07/01/2029 (Callable 07/01/2027) | | | 535,000 | | | | 673,249 | | | | | |
| Total Montana | | | | | | | | | | | | |
| (Cost $1,335,321) | | | | | | | 1,464,830 | | | | 0.1 | % |
| Nebraska | | | | | | | | | | | | |
| City of Lincoln NE, | | | | | | | | | | | | |
| 5.000%, 04/01/2023 | | | 290,000 | | | | 321,334 | | | | | |
| Nebraska Educational Health Cultural & | | | | | | | | | | | | |
| Social Services Finance Authority: | | | | | | | | | | | | |
| 4.000%, 01/01/2033 (Callable 01/01/2026) | | | 400,000 | | | | 456,488 | | | | | |
| 4.000%, 01/01/2034 (Callable 01/01/2026) | | | 2,000,000 | | | | 2,273,920 | | | | | |
| 4.000%, 01/01/2035 (Callable 01/01/2026) | | | 1,000,000 | | | | 1,134,360 | | | | | |
| Nebraska Investment Finance Authority, | | | | | | | | | | | | |
| 3.500%, 09/01/2050 | | | | | | | | | | | | |
| (Callable 03/01/2029) (Insured by GNMA) | | | 1,965,000 | | | | 2,189,305 | | | | | |
| Omaha School District, | | | | | | | | | | | | |
| 4.000%, 12/15/2033 (Callable 12/15/2028) | | | 1,125,000 | | | | 1,364,569 | | | | | |
| University of Nebraska: | | | | | | | | | | | | |
| 3.000%, 07/01/2028 (Pre-refunded to 07/01/2026) | | | 30,000 | | | | 34,441 | | | | | |
| 3.000%, 05/15/2035 (Pre-refunded to 05/15/2026) | | | 20,000 | | | | 22,893 | | | | | |
| 3.000%, 07/01/2039 (Pre-refunded to 07/01/2026) | | | 15,000 | | | | 17,221 | | | | | |
| Village of Boys Town NE, | | | | | | | | | | | | |
| 3.000%, 09/01/2028 | | | 150,000 | | | | 172,084 | | | | | |
| Total Nebraska | | | | | | | | | | | | |
| (Cost $7,695,091) | | | | | | | 7,986,615 | | | | 0.5 | % |
| Nevada | | | | | | | | | | | | |
| County of Clark NV: | | | | | | | | | | | | |
| 5.000%, 07/01/2033 (Callable 07/01/2024) | | | 1,925,000 | | | | 2,188,706 | | | | | |
| 5.000%, 07/01/2035 (Callable 07/01/2025) | | | 430,000 | | | | 502,657 | | | | | |
| Total Nevada | | | | | | | | | | | | |
| (Cost $2,555,224) | | | | | | | 2,691,363 | | | | 0.2 | % |
The accompanying notes are an integral part of these financial statements.
Baird Quality Intermediate Municipal Bond Fund
Schedule of Investments, December 31, 2020
Long-Term Investments (cont.)
| | | Principal | | | | | | % of | |
| | | Amount | | | Value | | | Net Assets | |
| New Hampshire | | | | | | | | | |
| New Hampshire Health and Education Facilities Authority, | | | | | | | | | |
| 0.070%, 10/01/2030 (Callable 01/04/2021) | | | | | | | | | |
(Optional Put Date 01/07/2021)(1) | | $ | 1,000,000 | | | $ | 1,000,000 | | | | |
| New Hampshire Housing Finance Authority, | | | | | | | | | | | |
| 5.250%, 07/01/2028 (Callable 01/01/2021) | | | 20,000 | | | | 20,000 | | | | |
| Total New Hampshire | | | | | | | | | | | |
| (Cost $1,020,000) | | | | | | | 1,020,000 | | | | 0.1 | % |
| New Jersey | | | | | | | | | | | | |
| New Jersey Building Authority, | | | | | | | | | | | | |
| 5.000%, 06/15/2024 (ETM) | | | 1,410,000 | | | | 1,636,911 | | | | | |
| New Jersey Economic Development Authority, | | | | | | | | | | | | |
| 5.250%, 07/01/2025 | | | 1,285,000 | | | | 1,537,181 | | | | | |
| New Jersey Educational Facilities Authority, | | | | | | | | | | | | |
| 5.000%, 07/01/2044 (Callable 07/01/2024) | | | 615,000 | | | | 698,708 | | | | | |
| New Jersey Health Care Facilities Financing Authority: | | | | | | | | | | | | |
| 0.000%, 07/01/2023 (ETM) (Insured by NATL) | | | 10,000 | | | | 9,913 | | | | | |
| 3.750%, 07/01/2027 (ETM) | | | 205,000 | | | | 230,674 | | | | | |
| New Jersey Housing & Mortgage Finance Agency: | | | | | | | | | | | | |
| 0.750%, 05/01/2023 | | | | | | | | | | | | |
(Mandatory Tender Date 06/01/2022)(1) | | | 5,800,000 | | | | 5,825,056 | | | | | |
| 6.000%, 11/01/2023 (Pre-refunded to 02/01/2021) | | | 30,000 | | | | 31,441 | | | | | |
| 4.500%, 10/01/2048 (Callable 10/01/2027) | | | 1,290,000 | | | | 1,454,527 | | | | | |
| 2.450%, 10/01/2050 (Callable 04/01/2029) | | | 650,000 | | | | 655,324 | | | | | |
| New Jersey Transportation Trust Fund Authority: | | | | | | | | | | | | |
| 0.000%, 12/15/2026 (Insured by BHAC) | | | 1,210,000 | | | | 1,144,757 | | | | | |
| 0.000%, 12/15/2030 | | | 960,000 | | | | 826,483 | | | | | |
| Total New Jersey | | | | | | | | | | | | |
| (Cost $13,643,988) | | | | | | | 14,050,975 | | | | 0.9 | % |
| New Mexico | | | | | | | | | | | | |
| Jal Public School District No. 19, | | | | | | | | | | | | |
| 2.750%, 10/01/2027 | | | | | | | | | | | | |
| (Pre-refunded to 10/01/2023) (Insured by ST AID) | | | 600,000 | | | | 640,236 | | | | | |
| New Mexico Finance Authority, | | | | | | | | | | | | |
| 4.000%, 06/01/2029 (Callable 06/01/2026) | | | 2,615,000 | | | | 3,075,946 | | | | | |
| New Mexico Mortgage Finance Authority: | | | | | | | | | | | | |
| 3.500%, 07/01/2033 | | | | | | | | | | | | |
| (Callable 01/01/2028) (Insured by GNMA) | | | 1,150,000 | | | | 1,284,263 | | | | | |
| 3.950%, 09/01/2040 | | | | | | | | | | | | |
| (Callable 09/01/2024) (Insured by GNMA) | | | 990,000 | | | | 1,054,825 | | | | | |
| New Mexico Mortgage Financial Authority: | | | | | | | | | | | | |
| 4.625%, 09/01/2025 | | | | | | | | | | | | |
| (Callable 02/01/2021) (Insured by GNMA) | | | 220,000 | | | | 221,027 | | | | | |
The accompanying notes are an integral part of these financial statements.
Baird Quality Intermediate Municipal Bond Fund
Schedule of Investments, December 31, 2020
Long-Term Investments (cont.)
| | | Principal | | | | | | % of | |
| | | Amount | | | Value | | | Net Assets | |
| New Mexico Mortgage Financial Authority: (cont.) | | | | | | | | | |
| 3.550%, 09/01/2037 | | | | | | | | | |
| (Callable 03/01/2027) (Insured by GNMA) | | $ | 1,135,000 | | | $ | 1,241,123 | | | | |
| Ruidoso Municipal School District No. 3, | | | | | | | | | | | |
| 4.000%, 08/01/2032 | | | | | | | | | | | |
| (Callable 08/01/2026) (Insured by ST AID) | | | 115,000 | | | | 132,649 | | | | |
| Total New Mexico | | | | | | | | | | | |
| (Cost $7,161,219) | | | | | | | 7,650,069 | | | | 0.5 | % |
| New York | | | | | | | | | | | | |
| City of New York NY: | | | | | | | | | | | | |
| 5.000%, 08/01/2022 | | | 5,000,000 | | | | 5,368,300 | | | | | |
| 5.000%, 12/01/2041 (Callable 12/01/2028) | | | 1,125,000 | | | | 1,411,245 | | | | | |
| Metropolitan Transportation Authority, | | | | | | | | | | | | |
| 5.000%, 11/15/2028 (Pre-refunded to 11/15/2023) | | | 210,000 | | | | 239,001 | | | | | |
| New York City Transitional Finance Authority: | | | | | | | | | | | | |
| 5.000%, 08/01/2029 (Callable 08/01/2026) | | | 1,550,000 | | | | 1,899,060 | | | | | |
| 5.000%, 08/01/2030 (Callable 08/01/2024) | | | 2,500,000 | | | | 2,899,175 | | | | | |
| 5.000%, 08/01/2033 (Callable 08/01/2026) | | | 2,835,000 | | | | 3,435,595 | | | | | |
| 5.000%, 05/01/2035 (Callable 05/01/2028) | | | 4,000,000 | | | | 5,052,480 | | | | | |
| 5.000%, 05/01/2042 (Callable 05/01/2027) | | | 500,000 | | �� | | 605,095 | | | | | |
| New York City Water & Sewer System: | | | | | | | | | | | | |
| 5.000%, 06/15/2032 (Callable 12/15/2025) | | | 6,500,000 | | | | 7,920,640 | | | | | |
| 5.000%, 06/15/2035 (Callable 12/15/2025) | | | 500,000 | | | | 606,825 | | | | | |
| 4.000%, 06/15/2040 (Callable 12/15/2029) | | | 500,000 | | | | 602,295 | | | | | |
| 5.000%, 06/15/2040 (Callable 12/15/2027) | | | 2,000,000 | | | | 2,538,120 | | | | | |
| 5.000%, 06/15/2040 (Callable 12/15/2027) | | | 1,800,000 | | | | 2,284,308 | | | | | |
| 5.000%, 06/15/2040 (Callable 06/15/2028) | | | 2,000,000 | | | | 2,526,300 | | | | | |
| New York Liberty Development Corp., | | | | | | | | | | | | |
| 4.000%, 09/15/2035 (Callable 03/15/2022) | | | 3,000,000 | | | | 3,108,090 | | | | | |
| New York State Dormitory Authority: | | | | | | | | | | | | |
| 5.000%, 03/15/2030 (Callable 03/15/2024) | | | 3,735,000 | | | | 4,255,173 | | | | | |
| 5.000%, 03/15/2033 (Callable 03/15/2025) | | | 5,050,000 | | | | 5,972,736 | | | | | |
| 5.000%, 03/15/2037 (Callable 09/15/2025) | | | 155,000 | | | | 183,576 | | | | | |
| 5.250%, 03/15/2039 (Callable 09/15/2028) | | | 3,700,000 | | | | 4,737,184 | | | | | |
| 5.000%, 03/15/2048 (Callable 09/15/2028) | | | 4,550,000 | | | | 5,679,947 | | | | | |
| New York State Environmental Facilities Corp., | | | | | | | | | | | | |
| 5.500%, 10/15/2030 (ETM) | | | 390,000 | | | | 556,058 | | | | | |
| New York State Housing Finance Agency, | | | | | | | | | | | | |
| 1.600%, 11/01/2024 (Callable 12/01/2021) | | | 5,895,000 | | | | 5,958,961 | | | | | |
| New York State Urban Development Corp.: | | | | | | | | | | | | |
| 5.000%, 03/15/2022 | | | 2,015,000 | | | | 2,131,830 | | | | | |
| 5.000%, 03/15/2032 (Callable 03/15/2024) | | | 6,000,000 | | | | 6,831,480 | | | | | |
| State of New York Mortgage Agency, | | | | | | | | | | | | |
| 4.000%, 10/01/2049 (Callable 04/01/2028) | | | 4,345,000 | | | | 4,799,139 | | | | | |
The accompanying notes are an integral part of these financial statements.
Baird Quality Intermediate Municipal Bond Fund
Schedule of Investments, December 31, 2020
Long-Term Investments (cont.)
| | | Principal | | | | | | % of | |
| | | Amount | | | Value | | | Net Assets | |
| Triborough Bridge & Tunnel Authority, | | | | | | | | | |
| 0.596%, 11/15/2027 (1 Month LIBOR USD + 0.500%) | | | | | | | | | |
| (Callable 05/15/2021) | | | | | | | | | |
(Mandatory Tender Date 11/15/2021)(2) | | $ | 3,180,000 | | | $ | 3,179,141 | | | | |
| Total New York | | | | | | | | | | | |
| (Cost $81,003,928) | | | | | | | 84,781,754 | | | | 5.6 | % |
| North Carolina | | | | | | | | | | | | |
| City of Charlotte NC, | | | | | | | | | | | | |
| 5.000%, 07/01/2031 (Callable 07/01/2028) | | | 2,580,000 | | | | 3,371,234 | | | | | |
| County of Wake NC, | | | | | | | | | | | | |
| 5.000%, 08/01/2026 | | | 1,715,000 | | | | 2,163,010 | | | | | |
| Inlivian, | | | | | | | | | | | | |
| 2.550%, 05/01/2037 | | | 4,994,078 | | | | 5,254,370 | | | | | |
| North Carolina Eastern Municipal Power Agency: | | | | | | | | | | | | |
| 6.400%, 01/01/2021 (ETM) | | | 932,000 | | | | 932,000 | | | | | |
| 4.500%, 01/01/2024 (Pre-refunded to 01/01/2022) | | | 7,245,000 | | | | 7,322,304 | | | | | |
| North Carolina Housing Finance Agency: | | | | | | | | | | | | |
| 4.000%, 01/01/2050 (Callable 07/01/2028) | | | 1,185,000 | | | | 1,326,750 | | | | | |
| 4.000%, 07/01/2050 (Callable 07/01/2029) | | | 1,800,000 | | | | 2,041,578 | | | | | |
| North Carolina Medical Care Commission, | | | | | | | | | | | | |
| 5.750%, 01/01/2035 (Pre-refunded to 01/01/2021) | | | 525,000 | | | | 525,000 | | | | | |
| State of North Carolina, | | | | | | | | | | | | |
| 5.000%, 05/01/2024 (Callable 05/01/2023) | | | 1,000,000 | | | | 1,110,820 | | | | | |
| University of North Carolina at Chapel Hill: | | | | | | | | | | | | |
| 0.446%, 12/01/2034 (1 Month LIBOR USD + 0.350%) | | | | | | | | | | | | |
| (Callable 06/01/2021) | | | | | | | | | | | | |
(Mandatory Tender Date 12/01/2021)(2) | | | 200,000 | | | | 199,992 | | | | | |
| 0.496%, 12/01/2041 (1 Month LIBOR USD + 0.400%) | | | | | | | | | | | | |
| (Callable 03/09/2022) | | | | | | | | | | | | |
(Mandatory Tender Date 11/09/2022)(2) | | | 7,000,000 | | | | 7,004,270 | | | | | |
| Total North Carolina | | | | | | | | | | | | |
| (Cost $30,680,974) | | | | | | | 31,251,328 | | | | 2.1 | % |
| North Dakota | | | | | | | | | | | | |
| County of Burleigh ND: | | | | | | | | | | | | |
| 5.000%, 07/01/2025 (Pre-refunded to 07/01/2021) | | | 1,500,000 | | | | 1,532,775 | | | | | |
| 5.000%, 07/01/2029 (Pre-refunded to 07/01/2021) | | | 470,000 | | | | 480,270 | | | | | |
| 4.000%, 11/01/2029 | | | | | | | | | | | | |
| (Pre-refunded to 11/01/2022) (Insured by AGM) | | | 425,000 | | | | 454,278 | | | | | |
| North Dakota Housing Finance Agency: | | | | | | | | | | | | |
| 3.550%, 07/01/2033 (Callable 01/01/2028) | | | 2,605,000 | | | | 2,867,167 | | | | | |
| 3.450%, 07/01/2037 | | | | | | | | | | | | |
| (Callable 07/01/2026) (Insured by FHA) | | | 2,555,000 | | | | 2,756,973 | | | | | |
| 3.500%, 07/01/2046 (Callable 01/01/2026) | | | 1,005,000 | | | | 1,081,460 | | | | | |
| 4.000%, 01/01/2050 (Callable 07/01/2028) | | | 1,230,000 | | | | 1,406,739 | | | | | |
The accompanying notes are an integral part of these financial statements.
Baird Quality Intermediate Municipal Bond Fund
Schedule of Investments, December 31, 2020
Long-Term Investments (cont.)
| | | Principal | | | | | | % of | |
| | | Amount | | | Value | | | Net Assets | |
| North Dakota Public Finance Authority, | | | | | | | | | |
| 5.000%, 10/01/2032 (Callable 10/01/2028) | | $ | 2,640,000 | | | $ | 3,442,111 | | | | |
| Total North Dakota | | | | | | | | | | | |
| (Cost $13,467,592) | | | | | | | 14,021,773 | | | | 0.9 | % |
| Ohio | | | | | | | | | | | | |
| Akron Bath Copley Joint Township Hospital District, | | | | | | | | | | | | |
| 3.800%, 01/01/2027 (Pre-refunded to 01/01/2022) | | | 815,000 | | | | 838,268 | | | | | |
| City of Cleveland OH: | | | | | | | | | | | | |
| 5.000%, 12/01/2029 (Pre-refunded to 12/01/2022) | | | 850,000 | | | | 928,243 | | | | | |
| 5.000%, 12/01/2029 (Callable 12/01/2022) | | | 10,000 | | | | 10,853 | | | | | |
| City of Delaware OH, | | | | | | | | | | | | |
| 4.000%, 12/01/2033 (Callable 12/01/2024) | | | 200,000 | | | | 222,342 | | | | | |
| City of Oxford OH, | | | | | | | | | | | | |
| 4.000%, 12/01/2033 (Callable 12/01/2026) | | | 40,000 | | | | 46,512 | | | | | |
| County of Lucas OH, | | | | | | | | | | | | |
| 5.750%, 11/15/2031 (Pre-refunded to 11/15/2021) | | | 1,110,000 | | | | 1,163,169 | | | | | |
| County of Montgomery OH: | | | | | | | | | | | | |
| 5.250%, 05/01/2029 (Pre-refunded to 11/12/2023) | | | 1,085,000 | | | | 1,231,117 | | | | | |
| 5.250%, 05/01/2029 (Pre-refunded to 11/13/2023) | | | 1,685,000 | | | | 1,881,960 | | | | | |
| Lucas-Plaza Housing Development Corp., | | | | | | | | | | | | |
| 0.000%, 06/01/2024 (ETM) (Insured by FHA) | | | 1,385,000 | | | | 1,362,106 | | | | | |
| Ohio Housing Finance Agency: | | | | | | | | | | | | |
| 3.950%, 09/01/2043 | | | | | | | | | | | | |
| (Callable 09/01/2027) (Insured by GNMA) | | | 370,000 | | | | 406,319 | | | | | |
| 3.500%, 09/01/2046 | | | | | | | | | | | | |
| (Callable 09/01/2025) (Insured by GNMA) | | | 875,000 | | | | 937,090 | | | | | |
| 3.750%, 09/01/2050 | | | | | | | | | | | | |
| (Callable 03/01/2029) (Insured by GNMA) | | | 2,410,000 | | | | 2,723,613 | | | | | |
| State of Ohio: | | | | | | | | | | | | |
| 5.000%, 06/15/2021 | | | 6,740,000 | | | | 6,887,000 | | | | | |
| 5.000%, 09/01/2033 (Callable 03/01/2024) | | | 575,000 | | | | 654,896 | | | | | |
| 5.000%, 04/01/2039 (Callable 04/01/2030) | | | 2,000,000 | | | | 2,624,720 | | | | | |
| University of Akron, | | | | | | | | | | | | |
| 5.000%, 01/01/2033 (Callable 07/01/2026) | | | 335,000 | | | | 394,931 | | | | | |
| Total Ohio | | | | | | | | | | | | |
| (Cost $21,779,526) | | | | | | | 22,313,139 | | | | 1.5 | % |
| Oregon | | | | | | | | | | | | |
| Clackamas County School District No. 12, | | | | | | | | | | | | |
| 5.000%, 06/15/2037 | | | | | | | | | | | | |
| (Callable 06/15/2027) (Insured by SCH BD GTY) | | | 825,000 | | | | 1,023,256 | | | | | |
| Clackamas County Service District No. 1, | | | | | | | | | | | | |
| 2.125%, 12/01/2030 (Callable 12/01/2026) | | | 1,000,000 | | | | 1,062,040 | | | | | |
The accompanying notes are an integral part of these financial statements.
Baird Quality Intermediate Municipal Bond Fund
Schedule of Investments, December 31, 2020
Long-Term Investments (cont.)
| | | Principal | | | | | | % of | |
| | | Amount | | | Value | | | Net Assets | |
| County of Multnomah OR, | | | | | | | | | |
| 4.000%, 06/01/2030 (Callable 06/01/2022) | | $ | 1,565,000 | | | $ | 1,638,039 | | | | |
| Salem-Keizer School District No. 24J, | | | | | | | | | | | |
| 0.000%, 06/15/2033 | | | | | | | | | | | |
(Callable 06/15/2030) (Insured by SCH BD GTY)(5) | | | 2,535,000 | | | | 3,331,953 | | | | |
| State of Oregon: | | | | | | | | | | | |
| 4.000%, 12/01/2045 (Callable 06/01/2025) | | | 2,210,000 | | | | 2,371,816 | | | | |
| 4.000%, 12/01/2048 (Callable 12/01/2026) | | | 2,480,000 | | | | 2,695,562 | | | | |
| State of Oregon Housing & | | | | | | | | | | | |
| Community Services Department: | | | | | | | | | | | |
| 4.000%, 01/01/2047 (Callable 07/01/2025) | | | 1,120,000 | | | | 1,200,685 | | | | |
| 3.750%, 07/01/2048 (Callable 01/01/2027) | | | 1,560,000 | | | | 1,683,411 | | | | |
| 3.500%, 01/01/2051 (Callable 01/01/2029) | | | 4,185,000 | | | | 4,663,011 | | | | |
| Washington County School District No. 1, | | | | | | | | | | | |
| 5.000%, 06/15/2035 | | | | | | | | | | | |
| (Callable 06/15/2027) (Insured by SCH BD GTY) | | | 600,000 | | | | 749,994 | | | | |
| Total Oregon | | | | | | | | | | | |
| (Cost $19,776,650) | | | | | | | 20,419,767 | | | | 1.4 | % |
| Pennsylvania | | | | | | | | | | | | |
| Centennial School District Bucks County, | | | | | | | | | | | | |
| 4.000%, 12/15/2029 | | | | | | | | | | | | |
| (Callable 12/15/2024) (Insured by ST AID) | | | 265,000 | | | | 299,196 | | | | | |
| Commonwealth Financing Authority, | | | | | | | | | | | | |
| 4.000%, 06/01/2039 | | | | | | | | | | | | |
| (Callable 06/01/2028) (Insured by AGM) | | | 1,500,000 | | | | 1,728,900 | | | | | |
| Delaware Valley Regional Finance Authority: | | | | | | | | | | | | |
| 0.600%, 09/01/2048 | | | | | | | | | | | | |
| (SIFMA Municipal Swap Index + 0.530%) | | | | | | | | | | | | |
| (Callable 09/01/2022) | | | | | | | | | | | | |
(Mandatory Tender Date 09/01/2023)(2) | | | 2,000,000 | | | | 1,997,480 | | | | | |
| 0.190%, 11/01/2055 (Callable 01/04/2021) | | | | | | | | | | | | |
(Optional Put Date 01/07/2021)(1) | | | 4,000,000 | | | | 4,000,000 | | | | | |
| Mckeesport Area School District, | | | | | | | | | | | | |
| 0.000%, 10/01/2025 (ETM) | | | 110,000 | | | | 107,427 | | | | | |
| Pennsylvania Higher Educational Facilities Authority: | | | | | | | | | | | | |
| 5.000%, 04/01/2035 (Pre-refunded to 04/01/2022) | | | 200,000 | | | | 212,002 | | | | | |
| 5.750%, 08/15/2041 (Pre-refunded to 08/15/2021) | | | 535,000 | | | | 553,393 | | | | | |
| Pennsylvania Housing Finance Agency: | | | | | | | | | | | | |
| 2.450%, 07/01/2022 | | | | | | | | | | | | |
(Mandatory Tender Date 07/01/2021)(1) | | | 5,325,000 | | | | 5,380,114 | | | | | |
| 3.500%, 10/01/2046 (Callable 10/01/2025) | | | 815,000 | | | | 858,871 | | | | | |
| 3.500%, 04/01/2051 (Callable 10/01/2029) | | | 4,200,000 | | | | 4,578,378 | | | | | |
The accompanying notes are an integral part of these financial statements.
Baird Quality Intermediate Municipal Bond Fund
Schedule of Investments, December 31, 2020
Long-Term Investments (cont.)
| | | Principal | | | | | | % of | |
| | | Amount | | | Value | | | Net Assets | |
| Pittsburgh Water & Sewer Authority: | | | | | | | | | |
| 0.000%, 09/01/2026 (ETM) | | $ | 720,000 | | | $ | 698,371 | | | | |
| 0.000%, 09/01/2027 (ETM) | | | 1,075,000 | | | | 1,030,925 | | | | |
| 0.000%, 09/01/2028 (ETM) | | | 360,000 | | | | 338,656 | | | | |
| Total Pennsylvania | | | | | | | | | | | |
| (Cost $21,223,770) | | | | | | | 21,783,713 | | | | 1.5 | % |
| Puerto Rico | | | | | | | | | | | | |
| Puerto Rico Highways & Transportation Authority, | | | | | | | | | | | | |
| 5.250%, 07/01/2022 (ETM) (Insured by AGM) | | | 1,150,000 | | | | 1,234,502 | | | | | |
| Puerto Rico Public Finance Corp.: | | | | | | | | | | | | |
| 5.125%, 06/01/2024 (Insured by AMBAC) | | | 5,225,000 | | | | 5,623,197 | | | | | |
| 6.000%, 08/01/2026 (ETM) | | | 4,340,000 | | | | 5,608,626 | | | | | |
| 6.000%, 08/01/2026 (ETM) (Insured by AGC) | | | 1,055,000 | | | | 1,363,387 | | | | | |
| 6.000%, 08/01/2026 (ETM) (Insured by AGC) | | | 1,155,000 | | | | 1,492,618 | | | | | |
| 6.000%, 08/01/2026 (ETM) (Insured by AGC) | | | 1,785,000 | | | | 2,306,773 | | | | | |
| 6.000%, 08/01/2026 (ETM) (Insured by AGC) | | | 1,310,000 | | | | 1,692,926 | | | | | |
| 5.500%, 08/01/2027 (ETM) (Insured by AMBAC) | | | 6,500,000 | | | | 8,534,760 | | | | | |
| Total Puerto Rico | | | | | | | | | | | | |
| (Cost $25,952,301) | | | | | | | 27,856,789 | | | | 1.9 | % |
| Rhode Island | | | | | | | | | | | | |
| Rhode Island Housing & Mortgage Finance Corp., | | | | | | | | | | | | |
| 3.500%, 10/01/2050 (Callable 10/01/2029) | | | 1,390,000 | | | | 1,549,433 | | | | | |
| State of Rhode Island, | | | | | | | | | | | | |
| 5.000%, 08/01/2024 | | | 5,000,000 | | | | 5,837,100 | | | | | |
| Total Rhode Island | | | | | | | | | | | | |
| (Cost $6,931,065) | | | | | | | 7,386,533 | | | | 0.5 | % |
| South Carolina | | | | | | | | | | | | |
| Charleston Educational Excellence Finance Corp., | | | | | | | | | | | | |
| 5.000%, 12/01/2026 (Callable 12/01/2023) | | | 4,625,000 | | | | 5,223,151 | | | | | |
| City of Columbia SC, | | | | | | | | | | | | |
| 5.000%, 02/01/2029 (Callable 02/01/2028) | | | 25,000 | | | | 32,546 | | | | | |
| Patriots Energy Group Financing Agency, | | | | | | | | | | | | |
| 0.956%, 10/01/2048 (1 Month LIBOR USD + 0.860%) | | | | | | | | | | | | |
| (Callable 11/01/2023) | | | | | | | | | | | | |
(Mandatory Tender Date 02/01/2024)(2) | | | 2,895,000 | | | | 2,906,464 | | | | | |
| Piedmont Municipal Power Agency, | | | | | | | | | | | | |
| 5.375%, 01/01/2025 (ETM) (Insured by NATL) | | | 5,530,000 | | | | 6,491,335 | | | | | |
| South Carolina Jobs-Economic Development Authority, | | | | | | | | | | | | |
| 0.230%, 05/01/2048 (Callable 01/04/2021) | | | | | | | | | | | | |
(Optional Put Date 01/07/2021)(1) | | | 1,600,000 | | | | 1,600,000 | | | | | |
| Total South Carolina | | | | | | | | | | | | |
| (Cost $15,628,281) | | | | | | | 16,253,496 | | | | 1.1 | % |
The accompanying notes are an integral part of these financial statements.
Baird Quality Intermediate Municipal Bond Fund
Schedule of Investments, December 31, 2020
Long-Term Investments (cont.)
| | | Principal | | | | | | % of | |
| | | Amount | | | Value | | | Net Assets | |
| South Dakota | | | | | | | | | |
| Harrisburg School District No. 41-2, | | | | | | | | | |
| 2.375%, 08/01/2026 (Insured by ST AID) | | $ | 415,000 | | | $ | 441,850 | | | | |
| Sioux Falls School District No. 49-5, | | | | | | | | | | | |
| 1.375%, 08/01/2021 (Insured by ST AID) | | | 50,000 | | | | 50,194 | | | | |
| South Dakota Housing Development Authority: | | | | | | | | | | | |
| 4.100%, 11/01/2028 (Callable 05/01/2023) | | | 255,000 | | | | 268,487 | | | | |
| 3.375%, 05/01/2033 (Callable 05/01/2022) | | | 340,000 | | | | 347,810 | | | | |
| Total South Dakota | | | | | | | | | | | |
| (Cost $1,058,409) | | | | | | | 1,108,341 | | | | 0.1 | % |
| Tennessee | | | | | | | | | | | | |
| City of Murfreesboro TN: | | | | | | | | | | | | |
| 3.000%, 06/01/2030 (Callable 06/01/2023) | | | 3,400,000 | | | | 3,568,776 | | | | | |
| 3.000%, 06/01/2031 (Callable 06/01/2023) | | | 3,005,000 | | | | 3,145,905 | | | | | |
| Memphis Health Educational & Housing Facility Board, | | | | | | | | | | | | |
| 0.625%, 06/01/2023 | | | | | | | | | | | | |
(Mandatory Tender Date 06/01/2022)(1) | | | 2,500,000 | | | | 2,508,175 | | | | | |
| Nashville & Davidson County Metropolitan Government: | | | | | | | | | | | | |
| 0.000%, 06/01/2021 (ETM) | | | 2,380,000 | | | | 2,377,406 | | | | | |
| 4.875%, 11/01/2028 (ETM) (Insured by NATL) | | | 1,840,000 | | | | 2,165,091 | | | | | |
| Tennessee Housing Development Agency: | | | | | | | | | | | | |
| 3.850%, 01/01/2035 (Callable 01/01/2025) | | | 410,000 | | | | 439,311 | | | | | |
| 3.900%, 07/01/2042 (Callable 07/01/2027) | | | 735,000 | | | | 812,109 | | | | | |
| 4.000%, 01/01/2043 (Callable 07/01/2027) | | | 1,015,000 | | | | 1,112,826 | | | | | |
| 3.650%, 07/01/2047 (Callable 01/01/2027) | | | 1,125,000 | | | | 1,203,052 | | | | | |
| 4.050%, 01/01/2049 (Callable 01/01/2028) | | | 2,935,000 | | | | 3,257,586 | | | | | |
| 4.250%, 01/01/2050 (Callable 07/01/2028) | | | 1,585,000 | | | | 1,769,002 | | | | | |
| Total Tennessee | | | | | | | | | | | | |
| (Cost $21,650,843) | | | | | | | 22,359,239 | | | | 1.5 | % |
| Texas | | | | | | | | | | | | |
| Amarillo Independent School District, | | | | | | | | | | | | |
| 5.000%, 02/01/2026 | | | | | | | | | | | | |
| (Callable 02/01/2024) (PSF Guaranteed) | | | 1,370,000 | | | | 1,565,814 | | | | | |
| Anna Independent School District, | | | | | | | | | | | | |
| 5.000%, 08/15/2035 | | | | | | | | | | | | |
| (Callable 08/15/2026) (PSF Guaranteed) | | | 910,000 | | | | 1,110,491 | | | | | |
| Arlington Higher Education Finance Corp.: | | | | | | | | | | | | |
| 4.000%, 08/15/2024 (PSF Guaranteed) | | | 1,025,000 | | | | 1,142,434 | | | | | |
| 5.000%, 08/15/2024 (PSF Guaranteed) | | | 1,010,000 | | | | 1,167,479 | | | | | |
| 5.000%, 08/15/2024 (PSF Guaranteed) | | | 100,000 | | | | 115,592 | | | | | |
| 5.000%, 08/15/2026 (PSF Guaranteed) | | | 500,000 | | | | 623,475 | | | | | |
| 4.000%, 08/15/2027 | | | | | | | | | | | | |
| (Callable 08/15/2026) (PSF Guaranteed) | | | 875,000 | | | | 1,025,841 | | | | | |
The accompanying notes are an integral part of these financial statements.
Baird Quality Intermediate Municipal Bond Fund
Schedule of Investments, December 31, 2020
Long-Term Investments (cont.)
| | | Principal | | | | | | % of | |
| | | Amount | | | Value | | | Net Assets | |
| Arlington Higher Education Finance Corp.: (cont.) | | | | | | | | | |
| 5.000%, 02/15/2028 | | | | | | | | | |
| (Callable 02/15/2025) (PSF Guaranteed) | | $ | 1,905,000 | | | $ | 2,226,050 | | | |
|
|
| 4.000%, 08/15/2028 | | | | | | | | | | | | |
| (Callable 08/15/2026) (PSF Guaranteed) | | | 850,000 | | | | 989,434 | | | | | |
| 5.000%, 08/15/2028 | | | | | | | | | | | | |
| (Callable 08/15/2024) (PSF Guaranteed) | | | 555,000 | | | | 632,767 | | | | | |
| 4.000%, 08/15/2033 | | | | | | | | | | | | |
| (Callable 08/15/2026) (PSF Guaranteed) | | | 450,000 | | | | 505,481 | | | | | |
| 5.000%, 08/15/2033 | | | | | | | | | | | | |
| (Callable 08/15/2024) (PSF Guaranteed) | | | 1,460,000 | | | | 1,640,237 | | | | | |
| 4.000%, 08/15/2034 | | | | | | | | | | | | |
| (Callable 08/15/2026) (PSF Guaranteed) | | | 195,000 | | | | 222,284 | | | | | |
| 4.000%, 08/15/2035 | | | | | | | | | | | | |
| (Callable 08/15/2026) (PSF Guaranteed) | | | 455,000 | | | | 517,726 | | | | | |
| 4.000%, 12/01/2035 | | | | | | | | | | | | |
| (Callable 06/01/2027) (PSF Guaranteed) | | | 450,000 | | | | 530,586 | | | | | |
| Austin Community College District, | | | | | | | | | | | | |
| 5.000%, 08/01/2035 (Callable 08/01/2025) | | | 1,175,000 | | | | 1,403,103 | | | | | |
| Austin Community College District Public Facility Corp., | | | | | | | | | | | | |
| 5.000%, 08/01/2033 (Callable 08/01/2025) | | | 750,000 | | | | 893,730 | | | | | |
| Balmorhea Independent School District, | | | | | | | | | | | | |
| 4.000%, 02/15/2042 | | | | | | | | | | | | |
| (Callable 02/15/2024) (PSF Guaranteed) | | | 350,000 | | | | 378,703 | | | | | |
| Barbers Hill Independent School District, | | | | | | | | | | | | |
| 4.000%, 02/15/2037 | | | | | | | | | | | | |
| (Callable 08/15/2026) (PSF Guaranteed) | | | 860,000 | | | | 1,000,558 | | | | | |
| Blum Independent School District: | | | | | | | | | | | | |
| 4.000%, 08/15/2032 | | | | | | | | | | | | |
| (Callable 08/15/2026) (PSF Guaranteed) | | | 165,000 | | | | 190,364 | | | | | |
| 4.000%, 08/15/2033 | | | | | | | | | | | | |
| (Callable 08/15/2026) (PSF Guaranteed) | | | 210,000 | | | | 241,489 | | | | | |
| Burleson Independent School District, | | | | | | | | | | | | |
| 5.000%, 08/01/2025 (PSF Guaranteed) | | | 1,260,000 | | | | 1,523,579 | | | | | |
| City of Dallas TX, | | | | | | | | | | | | |
| 5.000%, 02/15/2029 | | | 1,875,000 | | | | 2,488,050 | | | | | |
| City of El Paso TX, | | | | | | | | | | | | |
| 5.000%, 08/15/2022 | | | 170,000 | | | | 183,177 | | | | | |
| City of Fort Worth TX, | | | | | | | | | | | | |
| 4.000%, 02/15/2035 (Callable 02/15/2028) | | | 2,530,000 | | | | 3,013,028 | | | | | |
| City of Houston TX: | | | | | | | | | | | | |
| 5.500%, 12/01/2024 (ETM) (Insured by NATL) | | | 1,835,000 | | | | 2,107,461 | | | | | |
| 0.000%, 12/01/2026 (ETM) (Insured by AGM) | | | 465,000 | | | | 448,571 | | | | | |
| 5.500%, 12/01/2029 (ETM) (Insured by NATL) | | | 16,050,000 | | | | 20,855,049 | | | | | |
| 5.750%, 12/01/2032 (ETM) (Insured by AGM) | | | 29,965,000 | | | | 45,816,485 | | | | | |
The accompanying notes are an integral part of these financial statements.
Baird Quality Intermediate Municipal Bond Fund
Schedule of Investments, December 31, 2020
Long-Term Investments (cont.)
| | | Principal | | | | | | % of | |
| | | Amount | | | Value | | | Net Assets | |
| City of San Antonio TX, | | | | | | | | | |
| 5.000%, 02/01/2025 (ETM) | | $ | 175,000 | | | $ | 207,953 | | | |
|
|
| Clifton Higher Education Finance Corp.: | | | | | | | | | | | | |
| 5.000%, 08/15/2029 | | | | | | | | | | | | |
| (Callable 08/15/2024) (PSF Guaranteed) | | | 215,000 | | | | 249,527 | | | | | |
| 4.000%, 08/15/2031 | | | | | | | | | | | | |
| (Callable 08/15/2026) (PSF Guaranteed) | | | 120,000 | | | | 138,832 | | | | | |
| 4.000%, 08/15/2044 | | | | | | | | | | | | |
| (Callable 08/15/2029) (PSF Guaranteed) | | | 525,000 | | | | 617,468 | | | | | |
| Conroe Independent School District, | | | | | | | | | | | | |
| 5.000%, 02/15/2023 | | | | | | | | | | | | |
| (Pre-refunded to 02/15/2021) (PSF Guaranteed) | | | 1,745,000 | | | | 1,754,423 | | | | | |
| County of Bexar TX: | | | | | | | | | | | | |
| 4.000%, 06/15/2030 (Callable 06/15/2026) | | | 150,000 | | | | 176,668 | | | | | |
| 4.000%, 06/15/2033 (Callable 06/15/2025) | | | 3,795,000 | | | | 4,358,558 | | | | | |
| 5.000%, 06/15/2036 (Callable 06/15/2026) | | | 2,120,000 | | | | 2,588,478 | | | | | |
| County of Harris TX: | | | | | | | | | | | | |
| 5.000%, 10/01/2026 (Callable 10/01/2025) | | | 4,170,000 | | | | 5,077,559 | | | | | |
| 5.000%, 08/15/2030 (Callable 08/15/2022) | | | 700,000 | | | | 752,395 | | | | | |
| County of Montgomery TX, | | | | | | | | | | | | |
| 5.000%, 03/01/2027 (Pre-refunded to 03/01/2022) | | | 665,000 | | | | 702,220 | | | | | |
| County of Williamson TX: | | | | | | | | | | | | |
| 4.000%, 02/15/2034 (Callable 08/15/2026) | | | 2,270,000 | | | | 2,659,964 | | | | | |
| 4.000%, 02/15/2039 (Callable 02/15/2029) | | | 1,320,000 | | | | 1,602,229 | | | | | |
| Crowley Independent School District, | | | | | | | | | | | | |
| 5.000%, 08/01/2036 | | | | | | | | | | | | |
| (Pre-refunded to 08/01/2025) (PSF Guaranteed) | | | 2,000,000 | | | | 2,426,540 | | | | | |
| Dallas Independent School District: | | | | | | | | | | | | |
| 5.000%, 02/15/2036 | | | | | | | | | | | | |
| (Pre-refunded to 02/15/2022) (PSF Guaranteed) | | | 390,000 | | | | 410,768 | | | | | |
| 5.000%, 02/15/2036 | | | | | | | | | | | | |
(Pre-refunded to 02/15/2022) (PSF Guaranteed)(1) | | | 700,000 | | | | 737,275 | | | | | |
| 5.000%, 02/15/2036 | | | | | | | | | | | | |
(Mandatory Tender Date 02/15/2022) (PSF Guaranteed)(1) | | | 705,000 | | | | 741,723 | | | | | |
| Decatur Hospital Authority, | | | | | | | | | | | | |
| 5.750%, 09/01/2029 (ETM) | | | 460,000 | | | | 569,682 | | | | | |
| DeSoto Independent School District: | | | | | | | | | | | | |
| 5.000%, 08/15/2032 | | | | | | | | | | | | |
| (Callable 08/15/2025) (Insured by BAM) | | | 1,080,000 | | | | 1,281,107 | | | | | |
| 5.000%, 08/15/2032 | | | | | | | | | | | | |
| (Callable 08/15/2024) (PSF Guaranteed) | | | 1,825,000 | | | | 2,103,896 | | | | | |
| Eagle Mountain & Saginaw Independent School District, | | | | | | | | | | | | |
| 4.000%, 08/15/2045 | | | | | | | | | | | | |
| (Callable 08/15/2025) (PSF Guaranteed) | | | 675,000 | | | | 769,594 | | | | | |
The accompanying notes are an integral part of these financial statements.
Baird Quality Intermediate Municipal Bond Fund
Schedule of Investments, December 31, 2020
Long-Term Investments (cont.)
| | | Principal | | | | | | % of | |
| | | Amount | | | Value | | | Net Assets | |
| Ennis Independent School District, | | | | | | | | | |
| 5.000%, 08/15/2025 (PSF Guaranteed) | | $ | 1,145,000 | | | $ | 1,390,019 | | | |
|
|
| Forney Independent School District, | | | | | | | | | | | | |
| 5.000%, 08/15/2034 | | | | | | | | | | | | |
| (Callable 08/15/2025) (PSF Guaranteed) | | | 525,000 | | | | 626,960 | | | | | |
| Fort Bend Independent School District, | | | | | | | | | | | | |
| 5.000%, 08/15/2024 (PSF Guaranteed) | | | 1,655,000 | | | | 1,938,319 | | | | | |
| Godley Independent School District, | | | | | | | | | | | | |
| 5.000%, 02/15/2023 (PSF Guaranteed) | | | 1,445,000 | | | | 1,586,509 | | | | | |
| Harlingen Consolidated Independent School District: | | | | | | | | | | | | |
| 5.000%, 08/15/2024 (PSF Guaranteed) | | | 2,810,000 | | | | 3,282,193 | | | | | |
| 5.000%, 08/15/2025 (PSF Guaranteed) | | | 1,445,000 | | | | 1,753,464 | | | | | |
| Harris County Cultural Education Facilities Finance Corp., | | | | | | | | | | | | |
| 7.000%, 01/01/2048 (Pre-refunded to 01/01/2023) | | | 3,800,000 | | | | 4,290,656 | | | | | |
| Harris County Health Facilities Development Corp.: | | | | | | | | | | | | |
| 5.750%, 07/01/2027 (ETM) | | | 4,545,000 | | | | 5,535,583 | | | | | |
| 6.250%, 07/01/2027 (ETM) | | | 7,295,000 | | | | 9,065,788 | | | | | |
| Harris County Toll Road Authority, | | | | | | | | | | | | |
| 5.000%, 08/15/2028 (Callable 02/15/2028) | | | 770,000 | | | | 1,003,433 | | | | | |
| Hays Consolidated Independent School District, | | | | | | | | | | | | |
| 4.000%, 02/15/2033 | | | | | | | | | | | | |
| (Callable 02/15/2027) (PSF Guaranteed) | | | 880,000 | | | | 1,036,086 | | | | | |
| Honda Auto Receivables Owner Trust, | | | | | | | | | | | | |
| 5.000%, 02/15/2026 | | | | | | | | | | | | |
| (Callable 02/15/2024) (PSF Guaranteed) | | | 1,030,000 | | | | 1,158,534 | | | | | |
| Houston Higher Education Finance Corp., | | | | | | | | | | | | |
| 5.000%, 02/15/2034 | | | | | | | | | | | | |
| (Callable 02/15/2024) (PSF Guaranteed) | | | 1,795,000 | | | | 1,985,162 | | | | | |
| Humble Independent School District: | | | | | | | | | | | | |
| 5.000%, 02/15/2021 (PSF Guaranteed) | | | 1,500,000 | | | | 1,508,115 | | | | | |
| 5.000%, 02/15/2036 | | | | | | | | | | | | |
| (Callable 02/15/2027) (PSF Guaranteed) | | | 1,000,000 | | | | 1,235,420 | | | | | |
| Irving Independent School District, | | | | | | | | | | | | |
| 5.000%, 02/15/2025 | | | | | | | | | | | | |
| (Callable 08/15/2024) (PSF Guaranteed) | | | 1,250,000 | | | | 1,457,587 | | | | | |
| Kenedy Independent School District: | | | | | | | | | | | | |
| 4.000%, 08/15/2031 | | | | | | | | | | | | |
| (Pre-refunded to 08/15/2023) (PSF Guaranteed) | | | 100,000 | | | | 109,809 | | | | | |
| 4.000%, 08/15/2035 | | | | | | | | | | | | |
| (Pre-refunded to 08/15/2021) (PSF Guaranteed) | | | 100,000 | | | | 102,338 | | | | | |
| 4.000%, 08/15/2036 | | | | | | | | | | | | |
| (Pre-refunded to 08/15/2021) (PSF Guaranteed) | | | 150,000 | | | | 153,507 | | | | | |
| 4.000%, 08/15/2037 | | | | | | | | | | | | |
| (Pre-refunded to 08/15/2021) (PSF Guaranteed) | | | 100,000 | | | | 102,338 | | | | | |
| 4.000%, 08/15/2038 | | | | | | | | | | | | |
| (Pre-refunded to 08/15/2021) (PSF Guaranteed) | | | 100,000 | | | | 102,338 | | | | | |
The accompanying notes are an integral part of these financial statements.
Baird Quality Intermediate Municipal Bond Fund
Schedule of Investments, December 31, 2020
Long-Term Investments (cont.)
| | | Principal | | | | | | % of | |
| | | Amount | | | Value | | | Net Assets | |
| Killeen Independent School District, | | | | | | | | | |
| 4.000%, 02/15/2024 | | | | | | | | | |
| (Callable 02/15/2021) (PSF Guaranteed) | | $ | 1,145,000 | | | $ | 1,149,969 | | | |
|
|
| Kirbyville Consolidated Independent School District, | | | | | | | | | | | | |
| 4.000%, 02/15/2029 | | | | | | | | | | | | |
| (Pre-refunded to 02/15/2024) (PSF Guaranteed) | | | 160,000 | | | | 177,790 | | | | | |
| Klein Independent School District, | | | | | | | | | | | | |
| 4.000%, 08/01/2031 | | | | | | | | | | | | |
| (Callable 08/01/2025) (PSF Guaranteed) | | | 1,000,000 | | | | 1,157,010 | | | | | |
| La Joya Independent School District, | | | | | | | | | | | | |
| 4.000%, 02/15/2035 | | | | | | | | | | | | |
| (Callable 02/15/2027) (Insured by AGM) | | | 910,000 | | | | 1,035,425 | | | | | |
| La Porte Independent School District, | | | | | | | | | | | | |
| 5.000%, 02/15/2025 (PSF Guaranteed) | | | 1,080,000 | | | | 1,286,150 | | | | | |
| Leander Independent School District: | | | | | | | | | | | | |
| 0.000%, 08/15/2035 | | | | | | | | | | | | |
| (Pre-refunded to 08/15/2024) (PSF Guaranteed) | | | 250,000 | | | | 142,473 | | | | | |
| 0.000%, 08/15/2037 | | | | | | | | | | | | |
| (Pre-refunded to 08/15/2024) (PSF Guaranteed) | | | 700,000 | | | | 371,553 | | | | | |
| 0.000%, 08/15/2040 | | | | | | | | | | | | |
| (Pre-refunded to 08/15/2024) (PSF Guaranteed) | | | 635,000 | | | | 290,817 | | | | | |
| 0.000%, 08/15/2040 | | | | | | | | | | | | |
| (Callable 08/15/2024) (PSF Guaranteed) | | | 20,000 | | | | 8,859 | | | | | |
| 0.000%, 08/15/2041 | | | | | | | | | | | | |
| (Pre-refunded to 08/15/2024) (PSF Guaranteed) | | | 8,915,000 | | | | 3,593,815 | | | | | |
| 0.000%, 08/15/2041 | | | | | | | | | | | | |
| (Pre-refunded to 08/15/2024) (PSF Guaranteed) | | | 135,000 | | | | 58,513 | | | | | |
| 0.000%, 08/15/2042 | | | | | | | | | | | | |
| (Pre-refunded to 08/15/2024) (PSF Guaranteed) | | | 1,500,000 | | | | 571,635 | | | | | |
| 0.000%, 08/15/2045 | | | | | | | | | | | | |
| (Pre-refunded to 08/15/2024) (PSF Guaranteed) | | | 2,000,000 | | | | 639,780 | | | | | |
| 0.000%, 08/15/2048 | | | | | | | | | | | | |
| (Pre-refunded to 08/15/2024) (PSF Guaranteed) | | | 750,000 | | | | 199,058 | | | | | |
| Lower Colorado River Authority: | | | | | | | | | | | | |
| 4.750%, 01/01/2028 (ETM) (Insured by AGM) | | | 1,655,000 | | | | 1,897,292 | | | | | |
| 5.000%, 05/15/2040 (Callable 05/15/2025) | | | 1,970,000 | | | | 2,273,813 | | | | | |
| Lubbock Housing Finance Corp., | | | | | | | | | | | | |
| 8.000%, 10/01/2021 (ETM) | | | 1,980,000 | | | | 2,089,494 | | | | | |
| Luling Independent School District: | | | | | | | | | | | | |
| 4.000%, 02/15/2028 (PSF Guaranteed) | | | 190,000 | | | | 229,855 | | | | | |
| 4.000%, 02/15/2029 | | | | | | | | | | | | |
| (Callable 02/15/2028) (PSF Guaranteed) | | | 90,000 | | | | 107,843 | | | | | |
| McKinney Independent School District, | | | | | | | | | | | | |
| 4.000%, 02/15/2034 | | | | | | | | | | | | |
| (Callable 02/15/2026) (PSF Guaranteed) | | | 1,325,000 | | | | 1,518,848 | | | | | |
The accompanying notes are an integral part of these financial statements.
Baird Quality Intermediate Municipal Bond Fund
Schedule of Investments, December 31, 2020
Long-Term Investments (cont.)
| | | Principal | | | | | | % of | |
| | | Amount | | | Value | | | Net Assets | |
| Melissa Independent School District, | | | | | | | | | |
| 5.000%, 08/01/2036 | | | | | | | | | |
| (Callable 08/01/2026) (PSF Guaranteed) | | $ | 1,020,000 | | | $ | 1,244,114 | | | |
|
|
| Mesquite Independent School District: | | | | | | | | | | | | |
| 5.000%, 08/15/2024 (PSF Guaranteed) | | | 1,425,000 | | | | 1,667,250 | | | | | |
| 5.000%, 08/15/2025 (PSF Guaranteed) | | | 2,615,000 | | | | 3,185,305 | | | | | |
| 5.000%, 08/15/2025 (PSF Guaranteed) | | | 1,500,000 | | | | 1,827,135 | | | | | |
| Millsap Independent School District, | | | | | | | | | | | | |
| 4.000%, 02/15/2026 | | | | | | | | | | | | |
| (Callable 02/15/2024) (PSF Guaranteed) | | | 335,000 | | | | 372,004 | | | | | |
| Montgomery County Health Facilities Development Corp., | | | | | | | | | | | | |
| 0.000%, 07/15/2023 (ETM) | | | 200,000 | | | | 197,990 | | | | | |
| Moulton Independent School District: | | | | | | | | | | | | |
| 4.000%, 08/15/2031 | | | | | | | | | | | | |
| (Callable 08/15/2027) (PSF Guaranteed) | | | 235,000 | | | | 278,919 | | | | | |
| 4.000%, 08/15/2032 | | | | | | | | | | | | |
| (Callable 08/15/2027) (PSF Guaranteed) | | | 200,000 | | | | 236,294 | | | | | |
| 4.000%, 08/15/2034 | | | | | | | | | | | | |
| (Callable 08/15/2027) (PSF Guaranteed) | | | 225,000 | | | | 264,170 | | | | | |
| 4.000%, 08/15/2035 | | | | | | | | | | | | |
| (Callable 08/15/2027) (PSF Guaranteed) | | | 545,000 | | | | 638,528 | | | | | |
| 4.000%, 08/15/2036 | | | | | | | | | | | | |
| (Callable 08/15/2027) (PSF Guaranteed) | | | 285,000 | | | | 333,008 | | | | | |
| Navasota Independent School District, | | | | | | | | | | | | |
| 5.000%, 02/15/2048 | | | | | | | | | | | | |
| (Callable 02/15/2025) (PSF Guaranteed) | | | 6,785,000 | | | | 7,883,627 | | | | | |
| New Caney Independent School District: | | | | | | | | | | | | |
| 5.000%, 02/15/2023 (PSF Guaranteed) | | | 1,000,000 | | | | 1,099,270 | | | | | |
| 5.000%, 02/15/2024 (PSF Guaranteed) | | | 1,030,000 | | | | 1,179,402 | | | | | |
| 5.000%, 02/15/2039 | | | | | | | | | | | | |
| (Callable 08/15/2027) (PSF Guaranteed) | | | 500,000 | | | | 620,660 | | | | | |
| New Hope Cultural Education Facilities Finance Corp., | | | | | | | | | | | | |
| 5.000%, 04/01/2025 (ETM) | | | 715,000 | | | | 848,126 | | | | | |
| Newark Higher Education Finance Corp., | | | | | | | | | | | | |
| 4.000%, 08/15/2022 (PSF Guaranteed) | | | 215,000 | | | | 227,201 | | | | | |
| North East Independent School District, | | | | | | | | | | | | |
| 5.000%, 02/01/2024 (PSF Guaranteed) | | | 2,930,000 | | | | 3,351,686 | | | | | |
| North Texas Tollway Authority: | | | | | | | | | | | | |
| 0.000%, 09/01/2037 (Pre-refunded to 09/01/2031) | | | 2,940,000 | | | | 1,655,573 | | | | | |
| 0.000%, 09/01/2043 (Pre-refunded to 09/01/2031) | | | 7,590,000 | | | | 2,724,051 | | | | | |
0.000%, 09/01/2043 (Pre-refunded to 09/01/2031)(5) | | | 3,025,000 | | | | 4,215,428 | | | | | |
0.000%, 09/01/2045 (Pre-refunded to 09/01/2031)(5) | | | 1,390,000 | | | | 2,094,800 | | | | | |
| Northside Independent School District, | | | | | | | | | | | | |
| 5.000%, 08/15/2025 (PSF Guaranteed) | | | 1,000,000 | | | | 1,213,990 | | | | | |
The accompanying notes are an integral part of these financial statements.
Baird Quality Intermediate Municipal Bond Fund
Schedule of Investments, December 31, 2020
Long-Term Investments (cont.)
| | | Principal | | | | | | % of | |
| | | Amount | | | Value | | | Net Assets | |
| Pasadena Independent School District, | | | | | | | | | |
| 1.500%, 02/15/2044 | | | | | | | | | |
| (Mandatory Tender Date 08/15/2024) | | | | | | | | | |
(PSF Guaranteed)(1) | | $ | 1,360,000 | | | $ | 1,413,761 | | | |
|
|
| Pflugerville Independent School District: | | | | | | | | | | | | |
| 5.000%, 02/15/2025 | | | | | | | | | | | | |
| (Callable 02/15/2024) (PSF Guaranteed) | | | 1,020,000 | | | | 1,168,288 | | | | | |
| 5.000%, 02/15/2037 | | | | | | | | | | | | |
| (Callable 02/15/2026) (PSF Guaranteed) | | | 100,000 | | | | 120,644 | | | | | |
| Princeton Independent School District, | | | | | | | | | | | | |
| 5.000%, 02/15/2032 | | | | | | | | | | | | |
| (Callable 02/15/2025) (PSF Guaranteed) | | | 560,000 | | | | 657,602 | | | | | |
| Prosper Independent School District, | | | | | | | | | | | | |
| 5.000%, 02/15/2031 | | | | | | | | | | | | |
| (Callable 02/15/2028) (PSF Guaranteed) | | | 1,020,000 | | | | 1,319,421 | | | | | |
| Red River Education Finance Corp., | | | | | | | | | | | | |
| 5.000%, 03/15/2043 (Pre-refunded to 03/15/2023) | | | 4,500,000 | | | | 4,975,875 | | | | | |
| Rockwall Independent School District, | | | | | | | | | | | | |
| 5.000%, 02/15/2038 | | | | | | | | | | | | |
| (Callable 02/01/2021) (PSF Guaranteed) | | | 745,000 | | | | 747,384 | | | | | |
| San Angelo Independent School District, | | | | | | | | | | | | |
| 5.000%, 02/15/2029 | | | | | | | | | | | | |
| (Pre-refunded to 02/15/2024) (PSF Guaranteed) | | | 1,500,000 | | | | 1,723,185 | | | | | |
| San Antonio Housing Trust Finance Corp., | | | | | | | | | | | | |
| 1.375%, 09/01/2022 | | | | | | | | | | | | |
(Mandatory Tender Date 09/01/2021)(1) | | | 1,690,000 | | | | 1,701,881 | | | | | |
| San Antonio Public Facilities Corp., | | | | | | | | | | | | |
| 4.000%, 09/15/2034 (Callable 09/15/2022) | | | 1,750,000 | | | | 1,822,013 | | | | | |
| San Jacinto College District, | | | | | | | | | | | | |
| 5.000%, 02/15/2026 (Pre-refunded to 02/15/2021) | | | 700,000 | | | | 703,696 | | | | | |
| Sherman Independent School District, | | | | | | | | | | | | |
| 5.000%, 02/15/2026 | | | | | | | | | | | | |
| (Callable 02/15/2024) (PSF Guaranteed) | | | 1,775,000 | | | | 2,027,707 | | | | | |
| Smithville Independent School District: | | | | | | | | | | | | |
| 4.000%, 08/15/2031 | | | | | | | | | | | | |
| (Callable 08/15/2028) (PSF Guaranteed) | | | 185,000 | | | | 225,051 | | | | | |
| 4.000%, 08/15/2032 | | | | | | | | | | | | |
| (Callable 08/15/2028) (PSF Guaranteed) | | | 100,000 | | | | 121,019 | | | | | |
| 4.000%, 08/15/2033 | | | | | | | | | | | | |
| (Callable 08/15/2028) (PSF Guaranteed) | | | 110,000 | | | | 132,549 | | | | | |
| Socorro Independent School District, | | | | | | | | | | | | |
| 4.000%, 08/15/2033 | | | | | | | | | | | | |
| (Callable 02/15/2027) (PSF Guaranteed) | | | 900,000 | | | | 1,066,329 | | | | | |
| State of Texas: | | | | | | | | | | | | |
| 5.000%, 04/01/2038 (Callable 04/01/2026) | | | 2,000,000 | | | | 2,439,780 | | | | | |
| 4.000%, 04/01/2046 (Callable 04/01/2026) | | | 4,110,000 | | | | 4,655,479 | | | | | |
The accompanying notes are an integral part of these financial statements.
Baird Quality Intermediate Municipal Bond Fund
Schedule of Investments, December 31, 2020
Long-Term Investments (cont.)
| | | Principal | | | | | | % of | |
| | | Amount | | | Value | | | Net Assets | |
| Tarrant County Health Facilities Development Corp., | | | | | | | | | |
| 6.000%, 09/01/2024 (ETM) | | $ | 3,850,000 | | | $ | 4,301,682 | | | |
|
|
| Terrell Independent School District, | | | | | | | | | | | | |
| 4.000%, 08/01/2037 | | | | | | | | | | | | |
| (Callable 08/01/2026) (PSF Guaranteed) | | | 510,000 | | | | 582,808 | | | | | |
| Texas Department of Housing & Community Affairs: | | | | | | | | | | | | |
| 3.350%, 09/01/2033 | | | | | | | | | | | | |
| (Callable 09/01/2027) (Insured by GNMA) | | | 880,000 | | | | 942,471 | | | | | |
| 2.150%, 09/01/2035 (Callable 03/01/2029) | | | 1,350,000 | | | | 1,396,494 | | | | | |
| 4.000%, 03/01/2050 | | | | | | | | | | | | |
| (Callable 09/01/2028) (Insured by GNMA) | | | 1,055,000 | | | | 1,206,002 | | | | | |
| Texas State Affordable Housing Corp., | | | | | | | | | | | | |
| 4.250%, 03/01/2049 | | | | | | | | | | | | |
| (Callable 03/01/2029) (Insured by GNMA) | | | 495,000 | | | | 551,880 | | | | | |
| Texas Water Development Board: | | | | | | | | | | | | |
| 4.000%, 10/15/2033 (Callable 10/15/2027) | | | 600,000 | | | | 725,760 | | | | | |
| 5.000%, 10/15/2033 (Callable 10/15/2025) | | | 1,250,000 | | | | 1,507,075 | | | | | |
| 4.000%, 10/15/2034 (Callable 04/15/2028) | | | 2,000,000 | | | | 2,435,540 | | | | | |
| 4.000%, 10/15/2034 (Callable 10/15/2028) | | | 975,000 | | | | 1,201,405 | | | | | |
| 4.000%, 04/15/2038 (Callable 10/15/2027) | | | 1,900,000 | | | | 2,276,181 | | | | | |
| Town of Flower Mound TX, | | | | | | | | | | | | |
| 5.000%, 03/01/2033 (Callable 03/01/2024) | | | 250,000 | | | | 285,500 | | | | | |
| Travis County Health Facilities Development Corp., | | | | | | | | | | | | |
| 7.125%, 01/01/2046 (Pre-refunded to 01/01/2021) | | | 15,000 | | | | 15,000 | | | | | |
| Tyler Health Facilities Development Corp., | | | | | | | | | | | | |
| 5.500%, 07/01/2027 (Pre-refunded to 07/01/2021) | | | 600,000 | | | | 615,318 | | | | | |
| United Independent School District: | | | | | | | | | | | | |
| 5.000%, 08/15/2033 | | | | | | | | | | | | |
| (Callable 08/15/2028) (PSF Guaranteed) | | | 835,000 | | | | 1,082,285 | | | | | |
| 5.000%, 08/15/2038 | | | | | | | | | | | | |
| (Callable 08/15/2027) (PSF Guaranteed) | | | 225,000 | | | | 285,467 | | | | | |
| Webb Consolidated Independent School District, | | | | | | | | | | | | |
| 4.000%, 02/15/2033 | | | | | | | | | | | | |
| (Callable 02/15/2025) (PSF Guaranteed) | | | 250,000 | | | | 279,590 | | | | | |
| Wylie Independent School District, | | | | | | | | | | | | |
| 6.750%, 08/15/2023 (PSF Guaranteed) | | | 1,010,000 | | | | 1,180,124 | | | | | |
| Ysleta Independent School District: | | | | | | | | | | | | |
| 5.000%, 08/15/2023 | | | | | | | | | | | | |
| (Pre-refunded to 08/15/2021) (PSF Guaranteed) | | | 1,020,000 | | | | 1,050,396 | | | | | |
| 5.000%, 08/15/2025 | | | | | | | | | | | | |
| (Callable 08/15/2024) (PSF Guaranteed) | | | 1,545,000 | | | | 1,800,373 | | | | | |
| Total Texas | | | | | | | | | | | | |
| (Cost $253,434,341) | | | | | | | 270,811,593 | | | | 18.0 | % |
The accompanying notes are an integral part of these financial statements.
Baird Quality Intermediate Municipal Bond Fund
Schedule of Investments, December 31, 2020
Long-Term Investments (cont.)
| | | Principal | | | | | | % of | |
| | | Amount | | | Value | | | Net Assets | |
| Utah | | | | | | | | | |
| Granite School District Board of Education: | | | | | | | | | |
| 5.000%, 06/01/2022 (Pre-refunded to 06/01/2021) | | | | | | | | | |
| (Insured by SCH BD GTY) | | $ | 3,900,000 | | | $ | 3,976,635 | | | | |
| 5.000%, 06/01/2023 (Pre-refunded to 06/01/2021) | | | | | | | | | | | |
| (Insured by SCH BD GTY) | | | 1,750,000 | | | | 1,784,387 | | | | |
| Timpanogos Special Service District, | | | | | | | | | | | |
| 4.000%, 06/01/2028 (Callable 06/01/2024) | | | 425,000 | | | | 470,110 | | | | |
| University of Utah, | | | | | | | | | | | |
| 5.000%, 08/01/2044 (Callable 08/01/2028) | | | 2,000,000 | | | | 2,529,920 | | | | |
| Utah Charter School Finance Authority: | | | | | | | | | | | |
| 5.000%, 04/15/2024 (Insured by UT CSCE) | | | 235,000 | | | | 266,596 | | | | |
| 5.000%, 04/15/2037 | | | | | | | | | | | |
| (Callable 04/15/2026) (Insured by UT CSCE) | | | 500,000 | | | | 579,365 | | | | |
| Utah Housing Corp., | | | | | | | | | | | |
| 4.000%, 01/01/2045 | | | | | | | | | | | |
| (Callable 01/01/2026) (Insured by FHA) | | | 4,015,000 | | | | 4,330,017 | | | | |
| Total Utah | | | | | | | | | | | |
| (Cost $13,617,759) | | | | | | | 13,937,030 | | | | 0.9 | % |
| Vermont | | | | | | | | | | | | |
| City of Burlington VT: | | | | | | | | | | | | |
| 5.500%, 07/01/2029 (Pre-refunded to 07/01/2021) | | | 265,000 | | | | 271,699 | | | | | |
| 5.625%, 07/01/2030 (Pre-refunded to 07/01/2021) | | | 315,000 | | | | 323,155 | | | | | |
| 5.750%, 07/01/2031 (Pre-refunded to 07/01/2021) | | | 460,000 | | | | 472,190 | | | | | |
| Vermont Housing Finance Agency: | | | | | | | | | | | | |
| 3.600%, 11/01/2036 (Callable 11/01/2025) | | | 1,510,000 | | | | 1,627,750 | | | | | |
| 4.000%, 05/01/2048 | | | | | | | | | | | | |
| (Callable 11/01/2026) (Insured by GNMA) | | | 855,000 | | | | 918,330 | | | | | |
| 4.000%, 11/01/2048 (Callable 05/01/2027) | | | 555,000 | | | | 604,678 | | | | | |
| Total Vermont | | | | | | | | | | | | |
| (Cost $4,080,599) | | | | | | | 4,217,802 | | | | 0.3 | % |
| Virginia | | | | | | | | | | | | |
| County of Fairfax VA, | | | | | | | | | | | | |
| 5.000%, 04/01/2042 (Callable 04/01/2027) | | | 585,000 | | | | 724,218 | | | | | |
| Danville Industrial Development Authority, | | | | | | | | | | | | |
| 5.250%, 10/01/2028 (ETM) (Insured by AMBAC) | | | 1,095,000 | | | | 1,231,087 | | | | | |
| Hampton Redevelopment & Housing Authority, | | | | | | | | | | | | |
| 1.460%, 12/01/2022 | | | | | | | | | | | | |
(Mandatory Tender Date 12/01/2021)(1) | | | 2,950,000 | | | | 2,978,762 | | | | | |
| Virginia Housing Development Authority: | | | | | | | | | | | | |
| 3.700%, 03/01/2023 (Callable 03/01/2021) | | | 75,000 | | | | 75,366 | | | | | |
| 3.450%, 04/01/2038 (Callable 10/01/2022) | | | 7,350,000 | | | | 7,581,819 | | | | | |
| Total Virginia | | | | | | | | | | | | |
| (Cost $12,409,064) | | | | | | | 12,591,252 | | | | 0.8 | % |
The accompanying notes are an integral part of these financial statements.
Baird Quality Intermediate Municipal Bond Fund
Schedule of Investments, December 31, 2020
Long-Term Investments (cont.)
| | | Principal | | | | | | % of | |
| | | Amount | | | Value | | | Net Assets | |
| Washington | | | | | | | | | |
| Central Puget Sound Regional Transit Authority, | | | | | | | | | |
| 5.000%, 11/01/2032 (Callable 11/01/2025) | | $ | 2,725,000 | | | $ | 3,286,132 | | | |
|
|
| County of King WA, | | | | | | | | | | | | |
| 5.000%, 07/01/2034 (Callable 01/01/2025) | | | 705,000 | | | | 826,168 | | | | | |
| Energy Northwest, | | | | | | | | | | | | |
| 5.000%, 07/01/2034 (Callable 07/01/2027) | | | 1,090,000 | | | | 1,367,939 | | | | | |
| King County Housing Authority: | | | | | | | | | | | | |
| 3.250%, 05/01/2033 (Callable 05/01/2028) | | | 1,500,000 | | | | 1,688,985 | | | | | |
| 4.000%, 11/01/2034 (Callable 11/01/2029) | | | 1,520,000 | | | | 1,845,128 | | | | | |
| 4.000%, 11/01/2036 (Callable 11/01/2029) | | | 2,740,000 | | | | 3,304,139 | | | | | |
| Pierce County School District No. 3, | | | | | | | | | | | | |
| 5.000%, 12/01/2033 | | | | | | | | | | | | |
| (Callable 06/01/2027) (Insured by SCH BD GTY) | | | 2,600,000 | | | | 3,269,162 | | | | | |
| Port of Seattle WA: | | | | | | | | | | | | |
| 5.000%, 01/01/2037 (Callable 01/01/2027) | | | 1,665,000 | | | | 2,061,353 | | | | | |
| 5.000%, 01/01/2038 (Callable 01/01/2027) | | | 1,000,000 | | | | 1,235,660 | | | | | |
| State of Washington: | | | | | | | | | | | | |
| 5.000%, 07/01/2032 (Callable 01/01/2025) | | | 1,005,000 | | | | 1,181,649 | | | | | |
| 5.000%, 07/01/2032 (Callable 01/01/2025) | | | 6,005,000 | | | | 7,060,499 | | | | | |
| 5.000%, 08/01/2034 (Callable 08/01/2023) | | | 2,755,000 | | | | 3,071,384 | | | | | |
| 5.000%, 02/01/2035 (Callable 02/01/2025) | | | 720,000 | | | | 845,618 | | | | | |
| 5.000%, 08/01/2038 (Callable 08/01/2026) | | | 1,225,000 | | | | 1,499,376 | | | | | |
| 5.000%, 07/01/2040 (Callable 07/01/2028) | | | 500,000 | | | | 632,670 | | | | | |
| Washington Health Care Facilities Authority: | | | | | | | | | | | | |
| 5.000%, 09/01/2030 | | | 300,000 | | | | 401,892 | | | | | |
| 5.000%, 09/01/2031 (Callable 09/01/2030) | | | 175,000 | | | | 233,060 | | | | | |
| 6.125%, 11/15/2031 (Pre-refunded to 05/15/2021) | | | 620,000 | | | | 633,504 | | | | | |
| 5.000%, 09/01/2032 (Callable 09/01/2030) | | | 185,000 | | | | 244,836 | | | | | |
| 5.000%, 09/01/2033 (Callable 09/01/2030) | | | 190,000 | | | | 250,194 | | | | | |
| 6.250%, 11/15/2041 (Pre-refunded to 05/15/2021) | | | 4,875,000 | | | | 4,983,371 | | | | | |
| Washington State Housing Finance Commission: | | | | | | | | | | | | |
| 2.550%, 07/01/2022 | | | | | | | | | | | | |
(Mandatory Tender Date 07/01/2021)(1) | | | 6,250,000 | | | | 6,317,750 | | | | | |
| 5.000%, 01/01/2023 (ETM) | | | 385,000 | | | | 402,036 | | | | | |
| 0.620%, 12/01/2048 | | | | | | | | | | | | |
| (SIFMA Municipal Swap Index + 0.550%) | | | | | | | | | | | | |
| (Callable 04/01/2023) | | | | | | | | | | | | |
(Mandatory Tender Date 10/01/2023)(2) | | | 4,465,000 | | | | 4,473,751 | | | | | |
| 4.000%, 06/01/2049 (Callable 06/01/2028) | | | 585,000 | | | | 647,958 | | | | | |
| 4.000%, 06/01/2050 | | | | | | | | | | | | |
| (Callable 06/01/2029) (Insured by GNMA) | | | 1,820,000 | | | | 2,065,464 | | | | | |
| Total Washington | | | | | | | | | | | | |
| (Cost $51,496,793) | | | | | | | 53,829,678 | | | | 3.6 | % |
The accompanying notes are an integral part of these financial statements.
Baird Quality Intermediate Municipal Bond Fund
Schedule of Investments, December 31, 2020
Long-Term Investments (cont.)
| | | Principal | | | | | | % of | |
| | | Amount | | | Value | | | Net Assets | |
| West Virginia | | | | | | | | | |
| West Virginia Economic Development Authority, | | | | | | | | | |
| 5.000%, 07/01/2033 (Callable 07/01/2027) | | $ | 875,000 | | | $ | 1,089,401 | | | | |
| West Virginia Parkways Authority, | | | | | | | | | | | |
| 5.000%, 06/01/2043 (Callable 06/01/2028) | | | 2,000,000 | | | | 2,503,120 | | | | |
| Total West Virginia | | | | | | | | | | | |
| (Cost $3,549,967) | | | | | | | 3,592,521 | | | | 0.2 | % |
| Wisconsin | | | | | | | | | | | | |
| Baraboo School District, | | | | | | | | | | | | |
| 4.000%, 04/01/2028 | | | | | | | | | | | | |
| (Callable 04/01/2026) (Insured by BAM) | | | 550,000 | | | | 639,331 | | | | | |
| City of Milwaukee WI, | | | | | | | | | | | | |
| 3.000%, 06/01/2033 (Callable 06/01/2026) | | | 2,500,000 | | | | 2,677,100 | | | | | |
| Mill City Mortgage Trust, | | | | | | | | | | | | |
| 3.000%, 09/01/2023 (Pre-refunded to 09/01/2021) | | | 310,000 | | | | 315,602 | | | | | |
| Public Finance Authority, | | | | | | | | | | | | |
| 5.000%, 03/01/2025 | | | 535,000 | | | | 623,954 | | | | | |
| Southeast Wisconsin Professional Baseball Park District: | | | | | | | | | | | | |
| 5.500%, 12/15/2026 (Insured by NATL) | | | 1,090,000 | | | | 1,336,329 | | | | | |
| 0.000%, 12/15/2027 (ETM) (Insured by NATL) | | | 300,000 | | | | 286,185 | | | | | |
| 0.000%, 12/15/2028 (ETM) (Insured by NATL) | | | 300,000 | | | | 280,452 | | | | | |
| 0.000%, 12/15/2029 (ETM) (Insured by NATL) | | | 345,000 | | | | 313,591 | | | | | |
| State of Wisconsin: | | | | | | | | | | | | |
| 5.000%, 05/01/2024 (Callable 05/01/2023) | | | 2,150,000 | | | | 2,387,919 | | | | | |
| 4.000%, 05/01/2031 (Pre-refunded to 05/01/2022) | | | 245,000 | | | | 257,453 | | | | | |
| 5.000%, 05/01/2033 (Callable 05/01/2025) | | | 500,000 | | | | 591,705 | | | | | |
| 5.000%, 05/01/2034 (Callable 05/01/2025) | | | 900,000 | | | | 1,064,223 | | | | | |
| 5.000%, 05/01/2037 (Callable 05/01/2028) | | | 2,470,000 | | | | 3,174,049 | | | | | |
| State of Wisconsin Clean Water | | | | | | | | | | | | |
| Fund Leveraged Loan Portfolio: | | | | | | | | | | | | |
| 5.000%, 06/01/2028 (Pre-refunded to 06/01/2024) | | | 5,430,000 | | | | 6,304,067 | | | | | |
| 5.000%, 06/01/2030 (Pre-refunded to 06/01/2024) | | | 10,515,000 | | | | 12,207,599 | | | | | |
| 5.000%, 06/01/2031 (Pre-refunded to 06/01/2024) | | | 7,975,000 | | | | 9,258,736 | | | | | |
| University of Wisconsin Hospitals & Clinics, | | | | | | | | | | | | |
| 5.000%, 04/01/2038 (Pre-refunded to 04/01/2023) | | | 2,655,000 | | | | 2,935,103 | | | | | |
| Village of Mount Pleasant WI: | | | | | | | | | | | | |
| 5.000%, 04/01/2036 (Callable 04/01/2028) | | | 275,000 | | | | 341,798 | | | | | |
| 4.000%, 04/01/2037 (Callable 04/01/2028) | | | 2,400,000 | | | | 2,771,544 | | | | | |
| 5.000%, 04/01/2048 (Callable 04/01/2028) | | | 1,500,000 | | | | 1,808,265 | | | | | |
| Wisconsin Center District: | | | | | | | | | | | | |
| 4.000%, 12/15/2029 (Callable 06/15/2026) | | | 1,480,000 | | | | 1,687,777 | | | | | |
| 5.000%, 12/15/2030 (Callable 06/15/2026) | | | 775,000 | | | | 947,647 | | | | | |
| 0.000%, 12/15/2034 (Callable 12/15/2030) | | | | | | | | | | | | |
| (Insured by AGM) | | | 1,205,000 | | | | 868,600 | | | | | |
| 0.000%, 12/15/2034 (Callable 12/15/2030) | | | 1,810,000 | | | | 1,303,689 | | | | | |
The accompanying notes are an integral part of these financial statements.
Baird Quality Intermediate Municipal Bond Fund
Schedule of Investments, December 31, 2020
Long-Term Investments (cont.)
| | | Principal | | | | | | % of | |
| | | Amount | | | Value | | | Net Assets | |
| Wisconsin Health & Educational Facilities Authority: | | | | | | | | | |
| 5.000%, 02/15/2028 (Pre-refunded to 08/15/2025) | | $ | 20,000 | | | $ | 24,199 | | | | |
| 4.000%, 02/15/2033 (Pre-refunded to 08/15/2025) | | | 100,000 | | | | 116,431 | | | | |
| 5.000%, 11/15/2036 (Callable 05/15/2026) | | | 205,000 | | | | 248,396 | | | | |
| 4.000%, 02/15/2038 (Pre-refunded to 08/15/2025) | | | 325,000 | | | | 378,401 | | | | |
| 5.000%, 07/01/2042 (Callable 07/01/2027) | | | 2,000,000 | | | | 2,391,840 | | | | |
| 4.000%, 11/15/2043 (Callable 11/15/2028) | | | 1,945,000 | | | | 2,273,744 | | | | |
| Wisconsin Housing & Economic Development Authority: | | | | | | | | | | | |
| 3.500%, 09/01/2046 | | | | | | | | | | | |
| (Callable 09/01/2025) (Insured by FNMA) | | | 1,090,000 | | | | 1,162,757 | | | | |
| 4.000%, 03/01/2048 | | | | | | | | | | | |
| (Callable 03/01/2027) (Insured by FNMA) | | | 1,380,000 | | | | 1,489,669 | | | | |
| 4.250%, 03/01/2049 (Callable 09/01/2028) | | | 2,030,000 | | | | 2,274,615 | | | | |
| Total Wisconsin | | | | | | | | | | | |
| (Cost $61,465,310) | | | | | | | 64,742,770 | | | | 4.3 | % |
| Wyoming | | | | | | | | | | | | |
| Wyoming Community Development Authority: | | | | | | | | | | | | |
| 4.000%, 12/01/2043 (Callable 06/01/2027) | | | 530,000 | | | | 563,374 | | | | | |
| 4.000%, 12/01/2048 (Callable 06/01/2028) | | | 2,825,000 | | | | 3,121,456 | | | | | |
| Total Wyoming | | | | | | | | | | | | |
| (Cost $3,534,792) | | | | | | | 3,684,830 | | | | 0.2 | % |
| Total Long-Term Investments | | | | | | | | | | | | |
| (Cost $1,405,915,885) | | | | | | | 1,483,855,342 | | | | 98.8 | % |
| Short-Term Investment | | | | | | | | | | | | |
| | | Shares | | | | | | | | | |
| Money Market Mutual Fund | | | | | | | | | | | | |
| Federated Hermes Institutional Tax-Free | | | | | | | | | | | | |
Cash Trust, Premier Shares, 0.01%(4) | | | 1,170,671 | | | | 1,170,671 | | | | | |
| Total Short-Term Investment | | | | | | | | | | | | |
| (Cost $1,170,671) | | | | | | | 1,170,671 | | | | 0.1 | % |
| Total Investments | | | | | | | | | | | | |
| (Cost $1,407,086,556) | | | | | | | 1,485,026,013 | | | | 98.9 | % |
| Other Assets in Excess of Liabilities | | | | | | | 16,596,667 | | | | 1.1 | % |
| TOTAL NET ASSETS | | | | | | $ | 1,501,622,680 | | | | 100.0 | % |
Notes to Schedule of Investments
AGC – Assured Guaranty Corp.
AGM – Assured Guaranty Municipal
AMBAC – Ambac Assurance Corp.
BAM – Build America Mutual Assurance Co.
BHAC – Berkshire Hathaway Assurance Corp.
FHA – Federal Housing Administration
The accompanying notes are an integral part of these financial statements.
Baird Quality Intermediate Municipal Bond Fund
Schedule of Investments, December 31, 2020
Notes to Schedule of Investments (cont.)FNMA – Federal National Mortgage Association
GNMA – Government National Mortgage Association
NATL – National Public Finance Guarantee Corp.
Q-SBLF – Qualified School Building Loan Fund
SCH BD GTY – School Board Guaranty
SD CRED PROG – State Credit Enhancement Program
ST AID – State Aid Intercept/Withholding
UT CSCE – Utah Charter School Credit Enhancement Program
ETM – Escrowed to Maturity
LIBOR – London Inter-bank Offered Rate
PSF – Permanent School Fund
SIFMA – Securities Industry and Financial Markets Association
| (1) | Variable rate security. The rate reported is the rate in effect as of December 31, 2020. |
| (2) | Variable rate security based on a reference index and spread. The rate reported is the rate in effect as of December 31, 2020. |
| (3) | Security issued under Rule 144A under the Securities Act of 1933 and classified as liquid under the Fund’s liquidity risk management program. Purchased in a private placement transaction; resale to the public may require registration or may extend only to qualified institutional buyers. At December 31, 2020, the value of these securities total $7,398,312, which represents 0.49% of total net assets. |
| (4) | Seven-day yield. |
| (5) | Step-up bond; the interest rate shown is the rate in effect as of December 31, 2020. |
Summary of Fair Value Exposure at December 31, 2020
The Fund has adopted authoritative fair valuation accounting standards which establish a definition of fair value and set out a hierarchy for measuring fair value. These standards require additional disclosures about the various inputs and valuation techniques used to develop the measurements of fair value and a discussion on changes in valuation techniques and related inputs during the period. These standards define fair value as the price that would be received to sell an asset or paid to transfer a liability in an orderly transaction between market participants at the measurement date.
The fair value hierarchy is organized into three levels based upon the assumptions (referred to as “inputs”) used in pricing the asset or liability. These standards state that “observable inputs” reflect the assumptions market participants would use in pricing the asset or liability based on market data obtained from independent sources and “unobservable inputs” reflect an entity’s own assumptions about the assumptions market participants would use in pricing the asset or liability. These inputs are summarized into three broad levels and described below:
| Level 1 – | Quoted prices (unadjusted) in active markets for identical assets or liabilities that the reporting entity can access at the measurement date. |
| Level 2 – | Inputs other than quoted prices included within Level 1 that are observable for the asset or liability, either directly or indirectly. |
| Level 3 – | Unobservable inputs for the asset or liability. |
The inputs or methodology used for valuing securities are not necessarily an indication of the risk associated with investing in those securities.
The accompanying notes are an integral part of these financial statements.
Baird Quality Intermediate Municipal Bond Fund
Summary of Fair Value Exposure at December 31, 2020 (cont.)
The following is a summary of the inputs used to value the Fund’s investments as of December 31, 2020:
| | | Level 1 | | | Level 2 | | | Level 3 | | | Total | |
| Long-Term Investments | | | | | | | | | | | | |
| Municipal Bonds | | $ | — | | | $ | 1,483,855,342 | | | $ | — | | | $ | 1,483,855,342 | |
| Total Long-Term Investments | | | — | | | | 1,483,855,342 | | | | — | | | | 1,483,855,342 | |
| Short-Term Investment | | | | | | | | | | | | | | | | |
| Money Market Mutual Fund | | | 1,170,671 | | | | — | | | | — | | | | 1,170,671 | |
| Total Short-Term Investment | | | 1,170,671 | | | | — | | | | — | | | | 1,170,671 | |
| Total Investments | | $ | 1,170,671 | | | $ | 1,483,855,342 | | | $ | — | | | $ | 1,485,026,013 | |
Changes in valuation techniques may result in transfers into or out of assigned levels within the fair value hierarchy. There were no transfers into or out of Level 3 during the reporting period, as compared to the security classifications from the prior year’s annual report. See the Fund’s Valuation Policy in Note 2a to the financial statements.
The accompanying notes are an integral part of these financial statements.
Baird Core Intermediate Municipal Bond Fund
December 31, 2020 (Unaudited)
The Baird Core Intermediate Municipal Bond Fund seeks a high level of current income that is exempt from federal income tax and is consistent with preservation of capital.
The coronavirus (COVID-19) challenges of 2020 were unexpected and unprecedented, but so was the speed and magnitude of the monetary and fiscal responses. The result was a year of significant volatility, yet a rewarding one for Fund investors who stayed the course. Over the full year, tax-exempt rates fell sharply across the curve with short rates falling 93bps and long yields declining 68bps, steepening the curve. As the year began, no one could have known the challenges that would soon be faced. Municipal funds were benefiting from a record streak of weekly inflows, state and local tax revenues were generally rising with the economy in its eleventh year of expansion and many municipalities were adding to an already healthy level of reserves. News broke in January of COVID-19 in the State of Washington; by the end of February, seven states had confirmed cases and it was spreading rapidly. Trading activity in the municipal market initially froze as the lockdowns began, then a torrent of selling was unleashed and a liquidity crisis quickly emerged. The selling and lack of dealer support for the market drove tax-exempt yields to record highs relative to comparable maturity Treasuries. Never had a U.S. economic shock been so swift, deep and broad, affecting so many municipalities. Investors were questioning the ability of municipalities to withstand this crisis and meet their obligations. On March 27th, President Trump signed the $2.2 trillion CARES Act which, along with other measures, offered substantial aid to nearly every sector of the municipal market. In addition, the establishment of the Municipal Liquidity Facility (MLF), which, for the first time ever, allowed the Fed to lend directly to states and other select municipalities, offered investors the psychological support they were looking for. As the policymakers acted, AAA-rated municipal yields peaked on March 20th and opportunistic investors began to emerge, looking to capitalize on the incredible undervaluation that had been created in the downdraft. From a credit perspective, the further in time we moved away from the initial economic shutdowns, the better the news became on tax revenues.
During 2020, the Fund’s Institutional Class Shares generated strong absolute and relative returns and outperformed its benchmark by 53 basis points net of fees.
The primary factors contributing to the Fund’s absolute and relative performance in 2020 include:
Contributors to Performance
| | • | Security selection – the largest contributor for the year |
| | • | Curve – meaningful benefit from curve allocation and roll |
| | • | Credit sector – added to lower-quality issues as valuations became more attractive |
Detractors from Performance
| | • | Sector weighting – especially Housing and Education |
| | • | Allocation to below investment grade issues |
Although the COVID-19 vaccinations have begun, we expect the economic impact of COVID-19 to linger well into 2021, particularly as it relates to travel and entertainment. Yet, with the massive fiscal stimulus that is already in the pipeline, and perhaps more coming now that the Democratic Party has full, albeit narrow, control of Washington, above-average economic growth is very likely this year. This should boost state and local tax revenues helping municipalities recover from the pandemic-induced decline. With short-term rates anchored by the Fed, a steeper yield curve is likely which provides the opportunity for investors to capture the roll-down benefit as bonds age along a relatively steep curve. We expect the roll-down return to be an important component of total return this year, along with the yield advantage the Fund enjoys above that of its benchmark. Municipal credit spreads have room to narrow further, suggesting a modest credit overweight is appropriate. Strategic positioning across market sectors and the yield curve, a continued focus on credit to identify improving trends, plus the always-important security selection process will all be important to navigate through the current environment.
We expect the Fund will maintain a neutral duration posture relative to the benchmark with an allocation that seeks to optimize the roll-down benefit of a steep, upwardly-sloping municipal curve and its sector weightings will favor an overweight to revenue-backed issues over general obligation debt. We believe a modestly overweight credit posture is appropriate for the Fund to benefit from further economic recovery. We also believe our continued focus on selecting investments with strong fundamental tax and revenue support remains critical.
Baird Core Intermediate Municipal Bond Fund
December 31, 2020 (Unaudited)
Portfolio Characteristics
Quality Distribution(1)(2)
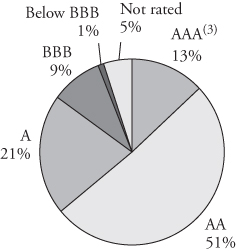
| | Net Assets | $864,451,189 | |
| | | | |
| | SEC 30-Day | | |
| | Yield(4) | | |
| | Institutional Class | 1.14% | |
| | Investor Class | 0.89% | |
| | | | |
| | Average | | |
| | Effective | | |
| | Duration | 4.18 years | |
| | | | |
| | Average | | |
| | Effective | | |
| | Maturity | 4.47 years | |
| | | | |
| | | Annualized | | |
Sector Weightings(1) | | Expense | | |
| | | Ratio(5) | | |
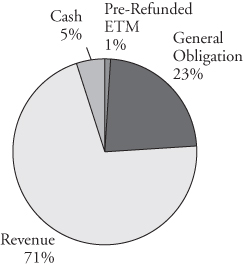
| | Institutional Class | 0.30% | |
| | Investor Class | 0.55% | (6) |
| | | | |
| | Portfolio | | |
| | Turnover Rate | 35% | |
| | | | |
| | Number of | | |
| | Holdings | 1,184 | |
| | | | |
| | | | |
| | | | |
| | | | |
| | | | |
| | | | |
| | | | |
| | | | |
| | | | | |
| (1) | Percentages shown are based on the Fund’s total investments. |
| (2) | The quality profile is calculated on a market value-weighted basis using the highest credit quality rating for each security held by the Fund given by S&P, Moody’s or Fitch, each of which is a Nationally Recognized Statistical Rating Organization (NRSRO). NRSROs rate the credit quality of securities using a scale that generally ranges from AAA (highest) to D (lowest). |
| (3) | Includes pre-refunded and escrowed-to-maturity (ETM) bonds. |
| (4) | SEC yields are based on SEC guidelines and are calculated for the 30 days ended December 31, 2020. |
| (5) | Reflects expense ratios as stated in the Fund’s current prospectus. |
| (6) | Includes 0.25% 12b-1 fee. |
Baird Core Intermediate Municipal Bond Fund
December 31, 2020 (Unaudited)
Institutional ClassValue of a $25,000 Investment
Growth of a hypothetical investment of $25,000 made on the Fund’s inception date (08/31/15), assuming reinvestment of all distributions.
Investor Class
Value of a $10,000 Investment
Growth of a hypothetical investment of $10,000 made on the Fund’s inception date (08/31/15), assuming reinvestment of all distributions.
Baird Core Intermediate Municipal Bond Fund
December 31, 2020 (Unaudited)
Total Returns
| | | Average Annual |
| | One | Three | Five | Since |
| For the Periods Ended December 31, 2020 | Year | Years | Years | Inception(1) |
| Institutional Class Shares | 5.26% | 4.41% | 3.92% | 4.05% |
| Investor Class Shares | 5.01% | 4.13% | 3.65% | 3.78% |
| Bloomberg Barclays Municipal | | | | |
Bond (1-15 Year) Index(2) | 4.73% | 4.23% | 3.39% | 3.53% |
| (1) | For the period from August 31, 2015 (inception date) through December 31, 2020. |
| (2) | The Bloomberg Barclays (1-15 Year) Municipal Bond Index is an unmanaged, market value weighted index of investment-grade, tax-exempt, and fixed-rate securities with maturities between 1 and 17 years. Securities must have an outstanding par value of at least $7 million and be issued as part of a transaction of at least $75 million. The bonds must be fixed rate, have a dated-date after December 31, 1990, and must be at least one year from their maturity date. This Index does not reflect any deduction for fees, expenses or taxes. A direct investment in an index is not possible. |
The line graphs on the previous page and the returns shown in the table above reflect reinvestment of dividends and/or capital gains distributions in additional shares. The returns in the graphs and table do not reflect the deduction of taxes that a shareholder would pay on Fund distributions or the redemption of Fund shares. The returns reflect the actual performance for each period and do not include the impact of trades executed on the last business day of the period that were recorded on the first business day of the next period.
The Fund’s gross expense ratio for each Class, as reflected in the Fund’s current prospectus, is set forth under “Portfolio Characteristics”.
The Fund may invest up to 10% of its net assets in non-investment grade debt securities (commonly referred to as “high yield” bonds). While these types of debt securities typically offer higher yields than investment grade securities, they also include greater risks including increased credit risk and the increased risk of default or bankruptcy. The Fund may invest up to 25% of its total assets in municipal obligations issued by persons in the same state. As a result, changes in economic, business or political conditions of a particular state may have a disproportionate impact on the Fund’s share price. Municipal securities investments are not appropriate for all investors, especially those taxed at lower rates. U.S. and international markets have experienced significant periods of volatility in recent years and months due to a number of economic, political and global macro factors including the impact of the coronavirus (COVID-19) as a global pandemic and related public health issues, growth concerns in the U.S. and overseas, uncertainties regarding interest rates, trade tensions and the threat of tariffs imposed by the U.S. and other countries. These and other geopolitical events may cause market disruptions and could have an adverse effect on the value of the Fund’s investments.
Past performance does not guarantee future results. Investment return and principal value will fluctuate so that an investor’s shares, when redeemed, may be worth more or less than their original cost.
For information about the performance of the Fund as of the most recent month-end, please call 1-866-44BAIRD or visit www.bairdfunds.com. Mutual fund performance changes over time and current performance may be lower or higher than that stated.
Baird Core Intermediate Municipal Bond Fund
Schedule of Investments, December 31, 2020
Long-Term Investments
| | | Principal | | | | | | % of | |
| | | Amount | | | Value | | | Net Assets | |
| Municipal Bonds | | | | | | | | | |
| Alabama | | | | | | | | | |
| Alabama Community College System: | | | | | | | | | |
| 3.500%, 11/01/2024 (Insured by BAM) | | $ | 1,010,000 | | | $ | 1,112,111 | | | |
|
|
| 3.500%, 11/01/2025 (Insured by BAM) | | | 1,100,000 | | | | 1,235,498 | | | | | |
| 5.000%, 10/01/2028 | | | | | | | | | | | | |
| (Callable 10/01/2026) (Insured by AGM) | | | 310,000 | | | | 378,095 | | | | | |
| Alabama Public School and College Authority, | | | | | | | | | | | | |
| 5.000%, 11/01/2029 | | | 2,000,000 | | | | 2,733,180 | | | | | |
| Birmingham Airport Authority: | | | | | | | | | | | | |
| 5.000%, 07/01/2027 (Insured by BAM) | | | 500,000 | | | | 624,820 | | | | | |
| 4.000%, 07/01/2036 | | | | | | | | | | | | |
| (Callable 07/01/2030) (Insured by BAM) | | | 335,000 | | | | 396,647 | | | | | |
| 4.000%, 07/01/2037 | | | | | | | | | | | | |
| (Callable 07/01/2030) (Insured by BAM) | | | 500,000 | | | | 590,045 | | | | | |
| Black Belt Energy Gas District: | | | | | | | | | | | | |
| 4.000%, 07/01/2046 (Callable 03/01/2021) | | | | | | | | | | | | |
(Mandatory Tender Date 06/01/2021)(1) | | | 130,000 | | | | 131,528 | | | | | |
| 4.000%, 08/01/2047 (Callable 04/01/2022) | | | | | | | | | | | | |
(Mandatory Tender Date 07/01/2022)(1) | | | 1,005,000 | | | | 1,055,461 | | | | | |
| City of Birmingham AL: | | | | | | | | | | | | |
5.000%, 03/01/2037 (Pre-refunded to 03/01/2023)(7) | | | 30,000 | | | | 33,116 | | | | | |
5.000%, 03/01/2040 (Callable 09/01/2025)(7) | | | 185,000 | | | | 217,728 | | | | | |
5.000%, 03/01/2043 (Pre-refunded to 03/01/2023)(7) | | | 1,935,000 | | | | 2,136,008 | | | | | |
5.000%, 03/01/2045 (Callable 09/01/2025)(7) | | | 1,205,000 | | | | 1,408,621 | | | | | |
| City of Pell City AL Special Care | | | | | | | | | | | | |
| Facilities Financing Authority, | | | | | | | | | | | | |
| 5.000%, 12/01/2031 (Callable 12/01/2021) | | | 1,000,000 | | | | 1,034,450 | | | | | |
| City of Troy AL, | | | | | | | | | | | | |
| 5.000%, 07/01/2031 | | | | | | | | | | | | |
| (Callable 07/01/2025) (Insured by BAM) | | | 555,000 | | | | 643,822 | | | | | |
| County of Jefferson AL: | | | | | | | | | | | | |
| 0.000%, 10/01/2025 | | | | | | | | | | | | |
| (Callable 10/01/2023) (Insured by AGM) | | | 1,000,000 | | | | 911,560 | | | | | |
| 5.000%, 09/15/2029 (Callable 03/15/2027) | | | 570,000 | | | | 710,345 | | | | | |
| 0.000%, 10/01/2033 | | | | | | | | | | | | |
| (Callable 10/01/2023) (Insured by AGM) | | | 110,000 | | | | 58,298 | | | | | |
| 0.000%, 10/01/2034 | | | | | | | | | | | | |
| (Callable 10/01/2023) (Insured by AGM) | | | 480,000 | | | | 235,344 | | | | | |
| Homewood Educational Building Authority: | | | | | | | | | | | | |
| 4.000%, 12/01/2033 (Callable 12/01/2029) | | | 785,000 | | | | 904,767 | | | | | |
| 4.000%, 12/01/2034 (Callable 12/01/2029) | | | 255,000 | | | | 293,398 | | | | | |
| Jasper Water Works & Sewer Board, Inc., | | | | | | | | | | | | |
| 5.000%, 06/01/2024 (Callable 06/01/2021) | | | 200,000 | | | | 203,930 | | | | | |
The accompanying notes are an integral part of these financial statements.
Baird Core Intermediate Municipal Bond Fund
Schedule of Investments, December 31, 2020
Long-Term Investments (cont.)
| | | Principal | | | | | | % of | |
| | | Amount | | | Value | | | Net Assets | |
| Lauderdale County Agriculture Center Authority, | | | | | | | | | |
| 4.000%, 07/01/2034 (Callable 07/01/2024) | | $ | 1,235,000 | | | $ | 1,311,150 | | | | |
| Leeds Public Educational Building Authority, | | | | | | | | | | | |
| 4.000%, 04/01/2034 | | | | | | | | | | | |
| (Callable 10/01/2025) (Insured by AGM) | | | 450,000 | | | | 508,518 | | | | |
| Madison Water & Wastewater Board: | | | | | | | | | | | |
| 4.000%, 12/01/2037 (Callable 12/01/2029) | | | 530,000 | | | | 642,996 | | | | |
| 4.000%, 12/01/2039 (Callable 12/01/2029) | | | 240,000 | | | | 288,658 | | | | |
| Mizuho Floater/Residual Trust, | | | | | | | | | | | |
| 0.470%, 12/01/2048 (Callable 02/01/2021) | | | | | | | | | | | |
(Optional Put Date 02/04/2021)(1)(3) | | | 5,700,000 | | | | 5,700,000 | | | | |
| Southeast Alabama Gas Supply District, | | | | | | | | | | | |
| 0.946%, 06/01/2049 (1 Month LIBOR USD + 0.850%) | | | | | | | | | | | |
| (Callable 03/01/2024) | | | | | | | | | | | |
(Mandatory Tender Date 06/01/2024)(2) | | | 750,000 | | | | 748,800 | | | | |
| Tallassee Board of Education: | | | | | | | | | | | |
| 4.000%, 08/01/2029 (Insured by AGM) | | | 420,000 | | | | 517,410 | | | | |
| 4.000%, 08/01/2030 (Insured by AGM) | | | 435,000 | | | | 543,541 | | | | |
| 4.000%, 08/01/2031 | | | | | | | | | | | |
| (Callable 08/01/2030) (Insured by AGM) | | | 455,000 | | | | 565,597 | | | | |
| 4.000%, 08/01/2032 | | | | | | | | | | | |
| (Callable 08/01/2030) (Insured by AGM) | | | 470,000 | | | | 580,596 | | | | |
| UAB Medicine Finance Authority, | | | | | | | | | | | |
| 4.000%, 09/01/2038 (Callable 09/01/2029) | | | 500,000 | | | | 595,400 | | | | |
| Total Alabama | | | | | | | | | | | |
| (Cost $28,173,907) | | | | | | | 29,051,438 | | | | 3.4 | % |
| Alaska | | | | | | | | | | | | |
| Alaska Housing Finance Corp.: | | | | | | | | | | | | |
| 5.000%, 12/01/2029 (Callable 06/01/2024) | | | 225,000 | | | | 255,510 | | | | | |
| 5.000%, 12/01/2031 (Callable 06/01/2028) | | | 500,000 | | | | 620,095 | | | | | |
| 3.450%, 12/01/2033 (Callable 06/01/2027) | | | 675,000 | | | | 692,941 | | | | | |
| 4.000%, 06/01/2036 (Callable 06/01/2025) | | | 1,750,000 | | | | 1,945,283 | | | | | |
| 3.750%, 12/01/2046 (Callable 02/01/2021) | | | 270,000 | | | | 270,710 | | | | | |
| Alaska Industrial Development & Export Authority, | | | | | | | | | | | | |
| 4.000%, 10/01/2034 (Callable 10/01/2029) | | | 1,585,000 | | | | 1,874,088 | | | | | |
| Alaska Municipal Bond Bank Authority, | | | | | | | | | | | | |
| 5.000%, 08/01/2027 (Callable 08/01/2023) | | | 500,000 | | | | 553,345 | | | | | |
| University of Alaska: | | | | | | | | | | | | |
| 4.000%, 10/01/2025 | | | 170,000 | | | | 187,617 | | | | | |
| 4.000%, 10/01/2026 (Callable 10/01/2023) | | | 650,000 | | | | 690,164 | | | | | |
| 5.000%, 10/01/2044 | | | | | | | | | | | | |
| (Callable 10/01/2026) (Insured by AGM) | | | 1,500,000 | | | | 1,696,740 | | | | | |
| Total Alaska | | | | | | | | | | | | |
| (Cost $8,450,061) | | | | | | | 8,786,493 | | | | 1.0 | % |
The accompanying notes are an integral part of these financial statements.
Baird Core Intermediate Municipal Bond Fund
Schedule of Investments, December 31, 2020
Long-Term Investments (cont.)
| | | Principal | | | | | | % of | |
| | | Amount | | | Value | | | Net Assets | |
| Arizona | | | | | | | | | |
| Arizona Health Facilities Authority, | | | | | | | | | |
| 5.250%, 03/01/2039 (Pre-refunded to 03/01/2021) | | $ | 270,000 | | | $ | 272,122 | | | | |
| Arizona Industrial Development Authority: | | | | | | | | | | | |
3.375%, 07/01/2021(3) | | | 190,000 | | | | 191,263 | | | | |
2.500%, 05/01/2022 (Insured by AGM)(3) | | | 3,379,020 | | | | 3,401,862 | | | | |
| 4.000%, 07/01/2023 (Insured by SD CRED PROG) | | | 115,000 | | | | 122,994 | | | | |
| 4.000%, 07/01/2023 (Insured by SD CRED PROG) | | | 100,000 | | | | 107,027 | | | | |
| 4.000%, 07/01/2024 (Insured by SD CRED PROG) | | | 200,000 | | | | 219,114 | | | | |
| 4.000%, 07/01/2025 (Insured by SD CRED PROG) | | | 100,000 | | | | 112,206 | | | | |
| 4.000%, 07/01/2026 (Insured by SD CRED PROG) | | | 100,000 | | | | 114,124 | | | | |
| 5.000%, 02/01/2028 | | | 200,000 | | | | 257,822 | | | | |
| 5.000%, 05/01/2028 | | | 270,000 | | | | 285,501 | | | | |
4.625%, 08/01/2028(3) | | | 1,160,000 | | | | 1,263,031 | | | | |
| 5.000%, 02/01/2030 | | | 340,000 | | | | 453,897 | | | | |
| Arizona State University, | | | | | | | | | | | |
| 5.000%, 07/01/2029 (Callable 07/01/2024) | | | 150,000 | | | | 172,627 | | | | |
| City of Tucson AZ, | | | | | | | | | | | |
| 5.000%, 07/01/2032 (Callable 07/01/2025) | | | 500,000 | | | | 596,095 | | | | |
| Kyrene Elementary School District No. 28, | | | | | | | | | | | |
| 4.000%, 07/01/2033 (Callable 07/01/2025) | | | 1,500,000 | | | | 1,692,135 | | | | |
| Maricopa County Industrial Development Authority: | | | | | | | | | | | |
| 2.625%, 07/01/2021 | | | 55,000 | | | | 55,038 | | | | |
| 5.000%, 07/01/2028 (Insured by SD CRED PROG) | | | 755,000 | | | | 933,641 | | | | |
| Town of Marana AZ: | | | | | | | | | | | |
| 4.000%, 07/01/2036 (Callable 07/01/2027) | | | 350,000 | | | | 404,282 | | | | |
| 4.000%, 07/01/2037 (Callable 07/01/2027) | | | 500,000 | | | | 576,165 | | | | |
| Total Arizona | | | | | | | | | | | |
| (Cost $10,825,542) | | | | | | | 11,230,946 | | | | 1.3 | % |
| Arkansas | | | | | | | | | | | | |
| Arkansas Development Finance Authority: | | | | | | | | | | | | |
| 4.000%, 12/01/2031 (Callable 12/01/2027) | | | 380,000 | | | | 443,893 | | | | | |
| 4.000%, 12/01/2032 (Callable 12/01/2027) | | | 400,000 | | | | 464,880 | | | | | |
| 4.000%, 12/01/2033 (Callable 12/01/2027) | | | 415,000 | | | | 480,703 | | | | | |
| 4.000%, 12/01/2034 (Callable 12/01/2027) | | | 430,000 | | | | 497,390 | | | | | |
| 4.000%, 12/01/2035 (Callable 12/01/2027) | | | 445,000 | | | | 513,383 | | | | | |
| 4.000%, 12/01/2038 (Callable 12/01/2027) | | | 250,000 | | | | 286,320 | | | | | |
| 4.000%, 06/01/2045 (Callable 12/01/2027) | | | 2,250,000 | | | | 2,589,907 | | | | | |
| Arkansas Technical University, | | | | | | | | | | | | |
| 4.000%, 06/01/2028 (Callable 06/01/2023) | | | 1,025,000 | | | | 1,086,746 | | | | | |
| Carroll-Boone Water District: | | | | | | | | | | | | |
| 3.000%, 12/01/2028 (Callable 12/01/2025) | | | 780,000 | | | | 841,932 | | | | | |
| 3.000%, 12/01/2029 (Callable 12/01/2025) | | | 505,000 | | | | 541,562 | | | | | |
| 3.000%, 12/01/2030 (Callable 12/01/2025) | | | 630,000 | | | | 672,393 | | | | | |
| 3.000%, 12/01/2032 (Callable 12/01/2025) | | | 1,060,000 | | | | 1,121,660 | | | | | |
The accompanying notes are an integral part of these financial statements.
Baird Core Intermediate Municipal Bond Fund
Schedule of Investments, December 31, 2020
Long-Term Investments (cont.)
| | | Principal | | | | | | % of | |
| | | Amount | | | Value | | | Net Assets | |
| City of Conway AR, | | | | | | | | | |
| 5.000%, 10/01/2035 (Callable 04/01/2024) | | $ | 185,000 | | | $ | 209,731 | | | |
|
|
| City of Fayetteville AR: | | | | | | | | | | | | |
| 1.750%, 11/01/2032 (Callable 11/01/2026) | | | 1,500,000 | | | | 1,527,705 | | | | | |
| 3.050%, 01/01/2047 (Callable 01/01/2027) | | | 905,000 | | | | 940,114 | | | | | |
| City of Heber Springs AR, | | | | | | | | | | | | |
| 3.000%, 11/01/2034 | | | | | | | | | | | | |
| (Callable 11/01/2024) (Insured by BAM) | | | 685,000 | | | | 719,305 | | | | | |
| City of Hot Springs AR, | | | | | | | | | | | | |
| 4.000%, 12/01/2030 | | | | | | | | | | | | |
| (Callable 12/01/2023) (Insured by BAM) | | | 540,000 | | | | 588,724 | | | | | |
| City of Little Rock AR: | | | | | | | | | | | | |
| 4.000%, 10/01/2031 (Callable 10/01/2025) | | | 105,000 | | | | 119,579 | | | | | |
| 4.000%, 10/01/2033 (Callable 10/01/2025) | | | 210,000 | | | | 235,944 | | | | | |
| City of Lonoke AR: | | | | | | | | | | | | |
| 5.000%, 06/01/2025 | | | 210,000 | | | | 250,442 | | | | | |
| 4.000%, 06/01/2028 (Callable 06/01/2025) | | | 50,000 | | | | 57,163 | | | | | |
| City of Magnolia AR, | | | | | | | | | | | | |
| 3.200%, 08/01/2033 | | | | | | | | | | | | |
| (Callable 08/01/2024) (Insured by BAM) | | | 1,085,000 | | | | 1,161,221 | | | | | |
| City of Marion AR, | | | | | | | | | | | | |
| 2.900%, 09/01/2047 (Callable 09/01/2027) | | | 225,000 | | | | 229,577 | | | | | |
| City of Maumelle AR: | | | | | | | | | | | | |
| 4.000%, 08/01/2026 (Callable 08/01/2025) | | | 25,000 | | | | 27,913 | | | | | |
| 4.000%, 08/01/2028 (Callable 08/01/2025) | | | 290,000 | | | | 320,847 | | | | | |
| 4.000%, 08/01/2029 (Callable 08/01/2025) | | | 700,000 | | | | 771,148 | | | | | |
| 4.000%, 08/01/2030 (Callable 08/01/2025) | | | 325,000 | | | | 356,860 | | | | | |
| City of North Little Rock AR: | | | | | | | | | | | | |
| 4.000%, 11/01/2028 (Callable 05/01/2027) | | | 645,000 | | | | 759,172 | | | | | |
| 4.000%, 11/01/2030 (Callable 05/01/2027) | | | 650,000 | | | | 754,715 | | | | | |
| City of Pine Bluff AR, | | | | | | | | | | | | |
| 3.000%, 02/01/2047 | | | | | | | | | | | | |
| (Callable 08/01/2027) (Insured by BAM) | | | 820,000 | | | | 877,990 | | | | | |
| City of Rogers AR, | | | | | | | | | | | | |
| 3.250%, 11/01/2043 (Callable 11/01/2026) | | | 1,485,000 | | | | 1,569,511 | | | | | |
| City of Russellville AR, | | | | | | | | | | | | |
| 4.000%, 07/01/2028 | | | | | | | | | | | | |
| (Callable 07/01/2025) (Insured by AGM) | | | 325,000 | | | | 373,389 | | | | | |
| City of Sherwood AR, | | | | | | | | | | | | |
| 3.050%, 12/01/2043 (Callable 12/01/2026) | | | 395,000 | | | | 413,565 | | | | | |
| City of Springdale AR, | | | | | | | | | | | | |
| 3.000%, 04/01/2043 | | | | | | | | | | | | |
| (Callable 04/01/2024) (Insured by BAM) | | | 890,000 | | | | 913,202 | | | | | |
| Conway Health Facilities Board, | | | | | | | | | | | | |
| 5.000%, 08/01/2029 (Callable 08/01/2026) | | | 360,000 | | | | 429,430 | | | | | |
The accompanying notes are an integral part of these financial statements.
Baird Core Intermediate Municipal Bond Fund
Schedule of Investments, December 31, 2020
Long-Term Investments (cont.)
| | | Principal | | | | | | % of | |
| | | Amount | | | Value | | | Net Assets | |
| Jackson County Special School District, | | | | | | | | | |
| 1.500%, 02/01/2024 | | | | | | | | | |
| (Callable 08/01/2022) (Insured by ST AID) | | $ | 60,000 | | | $ | 60,890 | | | | |
| Little Rock Metrocentere Improvement District No. 1, | | | | | | | | | | | |
0.030%, 12/01/2025 (Optional Put Date 01/04/2021)(1) | | | 1,000,000 | | | | 1,000,000 | | | | |
| National Park College District, | | | | | | | | | | | |
| 3.000%, 05/01/2025 (Callable 11/01/2024) | | | 235,000 | | | | 252,801 | | | | |
| Southern Arkansas University: | | | | | | | | | | | |
| 4.000%, 03/01/2025 (Insured by AGM) | | | 415,000 | | | | 473,133 | | | | |
| 4.000%, 03/01/2026 | | | | | | | | | | | |
| (Callable 03/01/2025) (Insured by AGM) | | | 520,000 | | | | 591,380 | | | | |
| 4.000%, 03/01/2026 | | | | | | | | | | | |
| (Callable 03/01/2025) (Insured by AGM) | | | 270,000 | | | | 306,113 | | | | |
| 4.000%, 03/01/2027 | | | | | | | | | | | |
| (Callable 03/01/2025) (Insured by AGM) | | | 545,000 | | | | 617,142 | | | | |
| 4.000%, 03/01/2027 | | | | | | | | | | | |
| (Callable 03/01/2025) (Insured by AGM) | | | 275,000 | | | | 310,560 | | | | |
| 4.000%, 03/01/2028 | | | | | | | | | | | |
| (Callable 03/01/2025) (Insured by AGM) | | | 165,000 | | | | 186,052 | | | | |
| 4.000%, 03/01/2028 | | | | | | | | | | | |
| (Callable 03/01/2025) (Insured by AGM) | | | 100,000 | | | | 112,323 | | | | |
| University of Central Arkansas: | | | | | | | | | | | |
| 4.000%, 11/01/2027 | | | | | | | | | | | |
| (Callable 11/01/2025) (Insured by BAM) | | | 340,000 | | | | 385,461 | | | | |
| 4.000%, 11/01/2028 | | | | | | | | | | | |
| (Callable 11/01/2025) (Insured by BAM) | | | 250,000 | | | | 282,143 | | | | |
| 4.000%, 11/01/2031 | | | | | | | | | | | |
| (Callable 11/01/2025) (Insured by BAM) | | | 885,000 | | | | 987,616 | | | | |
| Total Arkansas | | | | | | | | | | | |
| (Cost $27,678,695) | | | | | | | 28,713,630 | | | | 3.3 | % |
| California | | | | | | | | | | | | |
| Acalanes Union High School District: | | | | | | | | | | | | |
0.000%, 08/01/2028(7) | | | 105,000 | | | | 114,287 | | | | | |
0.000%, 08/01/2032(7) | | | 365,000 | | | | 452,640 | | | | | |
0.000%, 08/01/2035 (Callable 08/01/2029)(7) | | | 200,000 | | | | 232,976 | | | | | |
0.000%, 08/01/2039 (Callable 08/01/2029)(7) | | | 125,000 | | | | 144,418 | | | | | |
| American Valley Community Services District, | | | | | | | | | | | | |
1.500%, 11/01/2023 (Callable 11/01/2022)(3) | | | 4,000,000 | | | | 4,058,080 | | | | | |
| Bay Area Toll Authority, | | | | | | | | | | | | |
| 1.170%, 04/01/2045 | | | | | | | | | | | | |
| (SIFMA Municipal Swap Index + 1.100%) | | | | | | | | | | | | |
| (Callable 10/01/2023) | | | | | | | | | | | | |
(Mandatory Tender Date 04/01/2024)(2) | | | 650,000 | | | | 658,651 | | | | | |
The accompanying notes are an integral part of these financial statements.
Baird Core Intermediate Municipal Bond Fund
Schedule of Investments, December 31, 2020
Long-Term Investments (cont.)
| | | Principal | | | | | | % of | |
| | | Amount | | | Value | | | Net Assets | |
| Beaumont Unified School District, | | | | | | | | | |
| 0.000%, 08/01/2041 | | | | | | | | | |
(Pre-refunded to 08/01/2026) (Insured by AGM)(7) | | $ | 90,000 | | | $ | 119,220 | | | |
|
|
| Burbank Unified School District, | | | | | | | | | | | | |
0.000%, 02/01/2038 (Callable 08/01/2028)(7) | | | 210,000 | | | | 229,242 | | | | | |
| California Health Facilities Financing Authority: | | | | | | | | | | | | |
| 4.000%, 08/15/2035 (Callable 08/15/2026) | | | 3,000,000 | | | | 3,476,730 | | | | | |
| 5.250%, 03/01/2041 (Pre-refunded to 03/01/2021) | | | 135,000 | | | | 136,068 | | | | | |
| California Municipal Finance Authority: | | | | | | | | | | | | |
| 3.000%, 01/01/2021 | | | 230,000 | | | | 230,000 | | | | | |
| 5.000%, 08/01/2023 | | | 400,000 | | | | 417,028 | | | | | |
| 5.000%, 08/01/2024 | | | 400,000 | | | | 422,312 | | | | | |
| 5.000%, 10/01/2026 | | | 300,000 | | | | 362,634 | | | | | |
| 4.000%, 01/01/2048 (Pre-refunded to 01/01/2028) | | | 200,000 | | | | 247,864 | | | | | |
| California Public Finance Authority, | | | | | | | | | | | | |
| 5.000%, 10/15/2021 | | | 200,000 | | | | 205,894 | | | | | |
| Calipatria California Unified School District, | | | | | | | | | | | | |
| 0.000%, 08/01/2026 | | | 100,000 | | | | 93,743 | | | | | |
| Campbell Union School District, | | | | | | | | | | | | |
0.000%, 08/01/2035 (Callable 08/01/2026)(7) | | | 785,000 | | | | 958,838 | | | | | |
| Carlsbad Unified School District, | | | | | | | | | | | | |
0.000%, 08/01/2031(7) | | | 125,000 | | | | 173,350 | | | | | |
| Chawanakee Unified School District: | | | | | | | | | | | | |
4.000%, 08/01/2026 (Insured by BAM)(7) | | | 110,000 | | | | 130,977 | | | | | |
| 4.000%, 08/01/2027 | | | | | | | | | | | | |
(Callable 08/01/2026) (Insured by BAM)(7) | | | 100,000 | | | | 118,399 | | | | | |
| 4.000%, 08/01/2028 | | | | | | | | | | | | |
(Callable 08/01/2026) (Insured by BAM)(7) | | | 75,000 | | | | 88,237 | | | | | |
| 4.000%, 08/01/2029 | | | | | | | | | | | | |
(Callable 08/01/2026) (Insured by BAM)(7) | | | 80,000 | | | | 93,492 | | | | | |
| City & County of San Francisco CA, | | | | | | | | | | | | |
| 1.300%, 07/01/2023 | | | | | | | | | | | | |
(Mandatory Tender Date 01/01/2023)(1) | | | 400,000 | | | | 404,516 | | | | | |
| City of Redding CA, | | | | | | | | | | | | |
0.280%, 07/01/2022 (ETM) (Insured by NATL)(1)(5) | | | 55,000 | | | | 55,000 | | | | | |
| Colton Joint Unified School District, | | | | | | | | | | | | |
| 0.000%, 08/01/2035 | | | | | | | | | | | | |
(Pre-refunded to 08/01/2026) (Insured by AGM)(7) | | | 300,000 | | | | 378,579 | | | | | |
| Denair Unified School District, | | | | | | | | | | | | |
0.000%, 08/01/2031 (Insured by AGM)(7) | | | 130,000 | | | | 177,826 | | | | | |
| Desert Hot Springs Redevelopment | | | | | | | | | | | | |
| Agency Successor Agency, | | | | | | | | | | | | |
| 5.000%, 09/01/2029 | | | | | | | | | | | | |
| (Callable 09/01/2027) (Insured by BAM) | | | 300,000 | | | | 374,679 | | | | | |
The accompanying notes are an integral part of these financial statements.
Baird Core Intermediate Municipal Bond Fund
Schedule of Investments, December 31, 2020
Long-Term Investments (cont.)
| | | Principal | | | | | | % of | |
| | | Amount | | | Value | | | Net Assets | |
| El Rancho Unified School District, | | | | | | | | | |
| 0.000%, 08/01/2034 | | | | | | | | | |
(Callable 08/01/2028) (Insured by AGM)(7) | | $ | 475,000 | | | $ | 579,353 | | | |
|
|
| Encinitas Union School District, | | | | | | | | | | | | |
0.000%, 08/01/2031(7) | | | 205,000 | | | | 277,299 | | | | | |
| Enterprise Elementary School District, | | | | | | | | | | | | |
0.000%, 08/01/2035 (Callable 08/01/2031)(7) | | | 155,000 | | | | 222,568 | | | | | |
| Escondido Union High School District: | | | | | | | | | | | | |
| 0.000%, 08/01/2029 (Insured by AGC) | | | 500,000 | | | | 448,545 | | | | | |
6.875%, 08/01/2034 (Insured by AGC)(7) | | | 330,000 | | | | 557,806 | | | | | |
| Fontana Unified School District: | | | | | | | | | | | | |
| 3.000%, 08/01/2040 | | | | | | | | | | | | |
| (Callable 08/01/2028) (Insured by BAM) | | | 2,400,000 | | | | 2,637,456 | | | | | |
| 3.000%, 08/01/2041 | | | | | | | | | | | | |
| (Callable 08/01/2028) (Insured by BAM) | | | 1,750,000 | | | | 1,917,545 | | | | | |
| Fresno Joint Powers Financing Authority, | | | | | | | | | | | | |
| 5.000%, 04/01/2027 (Insured by AGM) | | | 305,000 | | | | 380,759 | | | | | |
| Grossmont Union High School District, | | | | | | | | | | | | |
| 0.000%, 08/01/2039 | | | | | | | | | | | | |
| (Callable 02/01/2025) (Insured by AGM) | | | 500,000 | | | | 227,905 | | | | | |
| Hueneme Elementary School District: | | | | | | | | | | | | |
| 4.000%, 08/01/2037 | | | | | | | | | | | | |
| (Callable 08/01/2028) (Insured by AGM) | | | 500,000 | | | | 591,575 | | | | | |
| 4.000%, 08/01/2038 | | | | | | | | | | | | |
| (Callable 08/01/2028) (Insured by AGM) | | | 1,050,000 | | | | 1,239,326 | | | | | |
| 4.000%, 08/01/2039 | | | | | | | | | | | | |
| (Callable 08/01/2028) (Insured by AGM) | | | 660,000 | | | | 777,440 | | | | | |
| Imperial Community College District, | | | | | | | | | | | | |
| 7.000%, 08/01/2040 | | | | | | | | | | | | |
(Pre-refunded to 08/01/2030) (Insured by AGM)(7) | | | 140,000 | | | | 216,825 | | | | | |
| Lake Elsinore Redevelopment Agency Successor Agency, | | | | | | | | | | | | |
| 5.000%, 09/01/2027 | | | | | | | | | | | | |
| (Callable 09/01/2025) (Insured by BAM) | | | 275,000 | | | | 329,161 | | | | | |
| Lemoore Union High School District, | | | | | | | | | | | | |
| 0.000%, 01/01/2021 (Insured by AMBAC) | | | 100,000 | | | | 100,000 | | | | | |
| Long Beach Bond Finance Authority: | | | | | | | | | | | | |
| 5.250%, 11/15/2023 | | | 90,000 | | | | 102,246 | | | | | |
| 5.000%, 11/15/2029 | | | 50,000 | | | | 64,851 | | | | | |
| Los Alamitos Unified School District, | | | | | | | | | | | | |
0.000%, 08/01/2041 (Callable 08/01/2031)(7) | | | 500,000 | | | | 545,040 | | | | | |
| Mayers Memorial Hospital District: | | | | | | | | | | | | |
| 0.000%, 08/01/2027 | | | 260,000 | | | | 222,932 | | | | | |
| 0.000%, 08/01/2028 | | | 290,000 | | | | 241,001 | | | | | |
The accompanying notes are an integral part of these financial statements.
Baird Core Intermediate Municipal Bond Fund
Schedule of Investments, December 31, 2020
Long-Term Investments (cont.)
| | | Principal | | | | | | % of | |
| | | Amount | | | Value | | | Net Assets | |
| Menifee Union School District: | | | | | | | | | |
| 3.000%, 08/01/2038 | | | | | | | | | |
| (Callable 08/01/2030) (Insured by AGM) | | $ | 330,000 | | | $ | 369,154 | | | |
|
|
| 3.000%, 08/01/2040 | | | | | | | | | | | | |
| (Callable 08/01/2030) (Insured by AGM) | | | 700,000 | | | | 776,356 | | | | | |
| 3.000%, 08/01/2045 | | | | | | | | | | | | |
| (Callable 08/01/2030) (Insured by AGM) | | | 1,000,000 | | | | 1,091,280 | | | | | |
| Mizuho Floater/Residual Trust, | | | | | | | | | | | | |
| 0.270%, 09/01/2046 (Callable 02/01/2021) | | | | | | | | | | | | |
(Optional Put Date 01/07/2021)(1)(3) | | | 4,000,000 | | | | 4,000,000 | | | | | |
| Mount Diablo Unified School District, | | | | | | | | | | | | |
| 0.000%, 08/01/2035 | | | | | | | | | | | | |
(Callable 08/01/2025) (Insured by AGM)(7) | | | 175,000 | | | | 193,748 | | | | | |
| Norwalk-La Mirada Unified School District, | | | | | | | | | | | | |
0.000%, 08/01/2029 (Insured by AGC)(7) | | | 235,000 | | | | 299,529 | | | | | |
| Oak Park Unified School District: | | | | | | | | | | | | |
0.000%, 08/01/2031(7) | | | 160,000 | | | | 226,037 | | | | | |
| 0.000%, 08/01/2038 | | | | | | | | | | | | |
(Callable 08/01/2031) (Insured by AGM)(7) | | | 110,000 | | | | 163,586 | | | | | |
| Ontario Montclair School District, | | | | | | | | | | | | |
| 0.000%, 08/01/2028 (Insured by NATL) | | | 1,450,000 | | | | 1,330,491 | | | | | |
| Pajaro Valley Unified School District: | | | | | | | | | | | | |
| 5.000%, 08/01/2032 | | | | | | | | | | | | |
| (Callable 01/21/2021) (Insured by BAM) | | | 120,000 | | | | 120,205 | | | | | |
| 5.000%, 08/01/2033 | | | | | | | | | | | | |
| (Callable 01/21/2021) (Insured by BAM) | | | 300,000 | | | | 300,504 | | | | | |
| Palomar Community College District, | | | | | | | | | | | | |
0.000%, 08/01/2039 (Callable 08/01/2035)(7) | | | 385,000 | | | | 504,173 | | | | | |
| Peralta Community College District, | | | | | | | | | | | | |
| 3.500%, 08/01/2033 (Callable 08/01/2025) | | | 1,325,000 | | | | 1,458,056 | | | | | |
| Reef-Sunset Unified School District, | | | | | | | | | | | | |
| 0.000%, 08/01/2033 | | | | | | | | | | | | |
(Callable 08/01/2026) (Insured by BAM)(7) | | | 200,000 | | | | 226,366 | | | | | |
| Rio Hondo Community College District: | | | | | | | | | | | | |
0.000%, 08/01/2042 (Callable 08/01/2034)(7) | | | 145,000 | | | | 195,779 | | | | | |
0.000%, 08/01/2042 (Callable 08/01/2034)(7) | | | 490,000 | | | | 671,026 | | | | | |
| Riverside County Redevelopment Successor Agency, | | | | | | | | | | | | |
| 0.000%, 10/01/2041 | | | | | | | | | | | | |
(Callable 10/01/2026) (Insured by BAM)(7) | | | 100,000 | | | | 113,142 | | | | | |
| Sacramento City Unified School District, | | | | | | | | | | | | |
| 5.000%, 07/01/2025 (Callable 07/01/2024) | | | 505,000 | | | | 575,043 | | | | | |
| San Diego Unified School District: | | | | | | | | | | | | |
| 4.000%, 07/01/2032 (Callable 07/01/2026) | | | 165,000 | | | | 193,090 | | | | | |
| 0.000%, 07/01/2034 (Callable 07/01/2025) | | | 1,650,000 | | | | 1,083,241 | | | | | |
The accompanying notes are an integral part of these financial statements.
Baird Core Intermediate Municipal Bond Fund
Schedule of Investments, December 31, 2020
Long-Term Investments (cont.)
| | | Principal | | | | | | % of | |
| | | Amount | | | Value | | | Net Assets | |
| San Jacinto Unified School District, | | | | | | | | | |
| 3.000%, 09/01/2028 (Insured by BAM) | | $ | 400,000 | | | $ | 424,820 | | | |
|
|
| San Mateo Foster City School District, | | | | | | | | | | | | |
0.000%, 08/01/2026(7) | | | 75,000 | | | | 85,268 | | | | | |
| Santa Barbara Unified School District, | | | | | | | | | | | | |
0.000%, 08/01/2036 (Callable 08/01/2033)(7) | | | 470,000 | | | | 677,670 | | | | | |
| Santa Paula Union High School District, | | | | | | | | | | | | |
0.000%, 08/01/2037 (Callable 08/01/2027)(7) | | | 160,000 | | | | 182,422 | | | | | |
| Savanna School District, | | | | | | | | | | | | |
| 0.000%, 08/01/2047 | | | | | | | | | | | | |
(Callable 08/01/2029) (Insured by AGM)(7) | | | 875,000 | | | | 955,413 | | | | | |
| School District of Belmont-Redwood Shores CA, | | | | | | | | | | | | |
0.000%, 08/01/2031 (Callable 08/01/2026)(7) | | | 100,000 | | | | 123,804 | | | | | |
| Sebastopol Union School District, | | | | | | | | | | | | |
| 0.000%, 08/01/2042 | | | | | | | | | | | | |
(Callable 08/01/2031) (Insured by AGM)(7) | | | 135,000 | | | | 135,859 | | | | | |
| Solano County Community College District: | | | | | | | | | | | | |
0.000%, 08/01/2027 (Callable 08/01/2025)(7) | | | 245,000 | | | | 263,931 | | | | | |
0.000%, 08/01/2028 (Callable 08/01/2025)(7) | | | 80,000 | | | | 85,776 | | | | | |
0.000%, 08/01/2030 (Callable 08/01/2025)(7) | | | 285,000 | | | | 302,442 | | | | | |
0.000%, 08/01/2041 (Callable 08/01/2028)(7) | | | 390,000 | | | | 443,715 | | | | | |
| South Placer Wastewater Authority, | | | | | | | | | | | | |
| 5.000%, 11/01/2034 | | | 500,000 | | | | 720,620 | | | | | |
| Summerville Union High School District, | | | | | | | | | | | | |
| 0.000%, 08/01/2033 | | | | | | | | | | | | |
(Callable 08/01/2028) (Insured by BAM)(7) | | | 25,000 | | | | 27,278 | | | | | |
| Temecula Valley Unified School District, | | | | | | | | | | | | |
| 4.500%, 08/01/2035 | | | | | | | | | | | | |
(Callable 08/01/2024) (Insured by BAM)(7) | | | 200,000 | | | | 222,326 | | | | | |
| Tender Option Bond Trust: | | | | | | | | | | | | |
| 0.270%, 07/01/2022 | | | | | | | | | | | | |
(Optional Put Date 01/07/2021)(1)(3) | | | 1,818,000 | | | | 1,818,000 | | | | | |
0.270%, 06/15/2055(1)(3) | | | 3,000,000 | | | | 3,000,000 | | | | | |
| University of California, | | | | | | | | | | | | |
| 5.000%, 05/15/2043 (Callable 05/15/2028) | | | 690,000 | | | | 874,237 | | | | | |
| West Hills Community College District, | | | | | | | | | | | | |
| 0.000%, 08/01/2035 | | | | | | | | | | | | |
(Callable 08/01/2027) (Insured by AGM)(7) | | | 50,000 | | | | 57,201 | | | | | |
| Westside Union School District, | | | | | | | | | | | | |
| 0.000%, 08/01/2028 | | | 160,000 | | | | 146,923 | | | | | |
| Wiseburn School District, | | | | | | | | | | | | |
| 0.000%, 08/01/2036 | | | | | | | | | | | | |
(Callable 08/01/2031) (Insured by AGM)(7) | | | 50,000 | | | | 57,505 | | | | | |
| Total California | | | | | | | | | | | | |
| (Cost $48,572,418) | | | | | | | 50,731,329 | | | | 5.9 | % |
The accompanying notes are an integral part of these financial statements.
Baird Core Intermediate Municipal Bond Fund
Schedule of Investments, December 31, 2020
Long-Term Investments (cont.)
| | | Principal | | | | | | % of | |
| | | Amount | | | Value | | | Net Assets | |
| Colorado | | | | | | | | | |
| Board of Governors of Colorado State University System, | | | | | | | | | |
| 5.000%, 03/01/2032 (Callable 03/01/2027) | | $ | 125,000 | | | $ | 152,991 | | | |
|
|
| Boulder Valley School District No. Re-2, | | | | | | | | | | | | |
| 5.000%, 12/01/2038 | | | | | | | | | | | | |
| (Callable 06/01/2025) (Insured by ST AID) | | | 2,000,000 | | | | 2,357,440 | | | | | |
| Bromley Park Metropolitan District No. 2, | | | | | | | | | | | | |
| 5.000%, 12/01/2023 (Insured by BAM) | | | 225,000 | | | | 253,415 | | | | | |
| Canterberry Crossing Metropolitan District II: | | | | | | | | | | | | |
| 5.000%, 12/01/2030 | | | | | | | | | | | | |
| (Callable 12/01/2028) (Insured by AGM) | | | 235,000 | | | | 304,431 | | | | | |
| 5.000%, 12/01/2031 | | | | | | | | | | | | |
| (Callable 12/01/2028) (Insured by AGM) | | | 250,000 | | | | 322,452 | | | | | |
| 5.000%, 12/01/2032 | | | | | | | | | | | | |
| (Callable 12/01/2028) (Insured by AGM) | | | 530,000 | | | | 679,757 | | | | | |
| City & County of Denver CO: | | | | | | | | | | | | |
| 0.000%, 08/01/2030 (Callable 08/01/2026) | | | 500,000 | | | | 406,635 | | | | | |
| 0.000%, 08/01/2031 (Callable 08/01/2026) | | | 150,000 | | | | 116,286 | | | | | |
| 0.000%, 08/01/2032 (Callable 08/01/2026) | | | 335,000 | | | | 248,295 | | | | | |
| City of Commerce City CO: | | | | | | | | | | | | |
| 5.000%, 12/15/2028 | | | | | | | | | | | | |
| (Callable 12/15/2027) (Insured by AGM) | | | 100,000 | | | | 127,719 | | | | | |
| 5.000%, 12/15/2029 | | | | | | | | | | | | |
| (Callable 12/15/2027) (Insured by AGM) | | | 310,000 | | | | 393,486 | | | | | |
| 5.000%, 12/15/2030 | | | | | | | | | | | | |
| (Callable 12/15/2027) (Insured by AGM) | | | 500,000 | | | | 632,255 | | | | | |
| City of Fort Lupton CO: | | | | | | | | | | | | |
| 5.000%, 12/01/2027 (Insured by AGM) | | | 75,000 | | | | 96,871 | | | | | |
| 5.000%, 12/01/2028 | | | | | | | | | | | | |
| (Callable 12/01/2027) (Insured by AGM) | | | 210,000 | | | | 270,396 | | | | | |
| 5.000%, 12/01/2029 | | | | | | | | | | | | |
| (Callable 12/01/2027) (Insured by AGM) | | | 250,000 | | | | 319,920 | | | | | |
| 5.000%, 12/01/2030 | | | | | | | | | | | | |
| (Callable 12/01/2027) (Insured by AGM) | | | 350,000 | | | | 447,507 | | | | | |
| City of Sheridan CO, | | | | | | | | | | | | |
| 5.000%, 12/01/2042 (Callable 12/01/2025) | | | 1,130,000 | | | | 1,349,650 | | | | | |
| Colorado Educational & Cultural Facilities Authority: | | | | | | | | | | | | |
| 4.000%, 11/15/2021 | | | 225,000 | | | | 231,835 | | | | | |
| 5.000%, 10/01/2022 | | | 1,300,000 | | | | 1,363,999 | | | | | |
| 4.000%, 11/15/2022 | | | 445,000 | | | | 468,452 | | | | | |
| 5.000%, 10/01/2023 | | | 700,000 | | | | 752,486 | | | | | |
| 4.000%, 12/15/2025 | | | 1,320,000 | | | | 1,402,025 | | | | | |
| 4.000%, 04/01/2028 | | | 540,000 | | | | 612,371 | | | | | |
| 5.000%, 06/01/2029 (Callable 06/01/2024) | | | 120,000 | | | | 134,342 | | | | | |
| 5.000%, 08/15/2030 (Callable 08/15/2024) | | | 500,000 | | | | 564,835 | | | | | |
The accompanying notes are an integral part of these financial statements.
Baird Core Intermediate Municipal Bond Fund
Schedule of Investments, December 31, 2020
Long-Term Investments (cont.)
| | | Principal | | | | | | % of | |
| | | Amount | | | Value | | | Net Assets | |
| Colorado Educational & Cultural | | | | | | | | | |
| Facilities Authority: (cont.) | | | | | | | | | |
| 2.000%, 09/01/2030 (Callable 09/01/2028) | | $ | 270,000 | | | $ | 276,102 | | | |
|
|
| 5.000%, 06/01/2031 (Callable 06/01/2024) | | | 40,000 | | | | 44,558 | | | | | |
| 5.000%, 08/15/2034 (Callable 08/15/2024) | | | 1,000,000 | | | | 1,120,010 | | | | | |
| Colorado Health Facilities Authority: | | | | | | | | | | | | |
| 5.000%, 12/01/2023 | | | 90,000 | | | | 100,839 | | | | | |
| 5.000%, 06/01/2027 (ETM) | | | 750,000 | | | | 963,585 | | | | | |
| 5.000%, 09/01/2027 | | | 205,000 | | | | 254,337 | | | | | |
| 5.000%, 12/01/2030 (Callable 06/01/2025) | | | 405,000 | | | | 461,323 | | | | | |
| 5.000%, 08/01/2036 (Callable 08/01/2029) | | | 150,000 | | | | 189,767 | | | | | |
| 4.000%, 10/01/2037 (Callable 10/01/2030) | | | 320,000 | | | | 376,544 | | | | | |
| 5.000%, 08/01/2049 (Callable 02/01/2026) | | | | | | | | | | | | |
(Mandatory Tender Date 08/01/2026)(1) | | | 3,130,000 | | | | 3,782,605 | | | | | |
| Colorado Housing & Finance Authority: | | | | | | | | | | | | |
| 4.000%, 05/01/2048 | | | | | | | | | | | | |
| (Callable 11/01/2026) (Insured by GNMA) | | | 320,000 | | | | 348,349 | | | | | |
| 4.250%, 11/01/2049 | | | | | | | | | | | | |
| (Callable 11/01/2028) (Insured by GNMA) | | | 2,320,000 | | | | 2,609,791 | | | | | |
| Colorado School of Mines, | | | | | | | | | | | | |
| 5.000%, 12/01/2029 | | | | | | | | | | | | |
| (Callable 12/01/2027) (Insured by ST AID) | | | 125,000 | | | | 158,999 | | | | | |
| County of Moffat CO, | | | | | | | | | | | | |
| 2.000%, 03/01/2036 | | | | | | | | | | | | |
(Mandatory Tender Date 10/03/2022)(1) | | | 50,000 | | | | 50,906 | | | | | |
| Crystal Valley Metropolitan District No. 2: | | | | | | | | | | | | |
| 4.000%, 12/01/2037 | | | | | | | | | | | | |
| (Callable 12/01/2030) (Insured by AGM) | | | 800,000 | | | | 971,920 | | | | | |
| 4.000%, 12/01/2038 | | | | | | | | | | | | |
| (Callable 12/01/2030) (Insured by AGM) | | | 1,000,000 | | | | 1,211,230 | | | | | |
| 4.000%, 12/01/2039 | | | | | | | | | | | | |
| (Callable 12/01/2030) (Insured by AGM) | | | 1,785,000 | | | | 2,157,190 | | | | | |
| Denver City & County School District No. 1: | | | | | | | | | | | | |
| 5.000%, 12/01/2030 (Callable 03/01/2021) | | | 395,000 | | | | 397,852 | | | | | |
| 5.000%, 12/01/2031 (Callable 03/01/2021) | | | 595,000 | | | | 599,284 | | | | | |
| Denver Health & Hospital Authority: | | | | | | | | | | | | |
| 5.000%, 12/01/2025 | | | 400,000 | | | | 470,604 | | | | | |
| 5.000%, 12/01/2027 | | | 340,000 | | | | 417,003 | | | | | |
| E-470 Public Highway Authority: | | | | | | | | | | | | |
| 0.000%, 09/01/2029 (Insured by NATL) | | | 2,550,000 | | | | 2,265,879 | | | | | |
| 1.138%, 09/01/2039 (1 Month LIBOR USD + 1.050%) | | | | | | | | | | | | |
| (Callable 03/01/2021) | | | | | | | | | | | | |
(Mandatory Tender Date 09/01/2021)(2) | | | 500,000 | | | | 500,365 | | | | | |
| Glen Metropolitan District No. 1, | | | | | | | | | | | | |
| 2.500%, 12/01/2025 (Insured by BAM) | | | 90,000 | | | | 94,112 | | | | | |
The accompanying notes are an integral part of these financial statements.
Baird Core Intermediate Municipal Bond Fund
Schedule of Investments, December 31, 2020
Long-Term Investments (cont.)
| | | Principal | | | | | | % of | |
| | | Amount | | | Value | | | Net Assets | |
| Glen Metropolitan District No. 2, | | | | | | | | | |
| 2.000%, 12/01/2030 (Insured by BAM) | | $ | 295,000 | | | $ | 295,322 | | | | |
| Grand River Hospital District: | | | | | | | | | | | |
| 5.250%, 12/01/2030 | | | | | | | | | | | |
| (Callable 12/01/2028) (Insured by AGM) | | | 350,000 | | | | 443,341 | | | | |
| 5.250%, 12/01/2031 | | | | | | | | | | | |
| (Callable 12/01/2028) (Insured by AGM) | | | 1,190,000 | | | | 1,495,866 | | | | |
| Prairie Center Metropolitan District No. 7, | | | | | | | | | | | |
| 4.125%, 12/15/2036 (Callable 12/15/2025) | | | 465,000 | | | | 483,526 | | | | |
| Regional Transportation District, | | | | | | | | | | | |
| 5.000%, 11/01/2033 (Callable 11/01/2027) | | | 500,000 | | | | 628,300 | | | | |
| Southlands Metropolitan District No. 1, | | | | | | | | | | | |
| 3.000%, 12/01/2022 | | | 80,000 | | | | 81,036 | | | | |
| Sterling Hills West Metropolitan District, | | | | | | | | | | | |
| 5.000%, 12/01/2027 | | | 230,000 | | | | 280,911 | | | | |
| Stetson Ridge Metropolitan District No. 3, | | | | | | | | | | | |
| 2.000%, 12/01/2030 (Insured by AGM) | | | 950,000 | | | | 957,733 | | | | |
| Vauxmont Metropolitan District: | | | | | | | | | | | |
| 5.000%, 12/15/2028 | | | | | | | | | | | |
| (Callable 12/15/2024) (Insured by AGM) | | | 125,000 | | | | 147,162 | | | | |
| 5.000%, 12/15/2029 | | | | | | | | | | | |
| (Callable 12/15/2024) (Insured by AGM) | | | 125,000 | | | | 146,612 | | | | |
| 5.000%, 12/15/2030 | | | | | | | | | | | |
| (Callable 12/15/2024) (Insured by AGM) | | | 125,000 | | | | 146,278 | | | | |
| 5.000%, 12/15/2031 | | | | | | | | | | | |
| (Callable 12/15/2024) (Insured by AGM) | | | 135,000 | | | | 157,607 | | | | |
| 3.250%, 12/15/2050 | | | | | | | | | | | |
| (Callable 12/15/2024) (Insured by AGM) | | | 2,675,000 | | | | 2,877,578 | | | | |
| Vista Ridge Metropolitan District: | | | | | | | | | | | |
| 5.000%, 12/01/2025 (Insured by BAM) | | | 600,000 | | | | 727,224 | | | | |
| 5.000%, 12/01/2026 (Insured by BAM) | | | 460,000 | | | | 573,928 | | | | |
| Total Colorado | | | | | | | | | | | |
| (Cost $40,672,352) | | | | | | | 43,275,429 | | | | 5.0 | % |
| Connecticut | | | | | | | | | | | | |
| City of Hartford CT, | | | | | | | | | | | | |
| 5.000%, 04/01/2027 | | | | | | | | | | | | |
| (Callable 04/01/2023) (Insured by BAM) | | | 550,000 | | | | 601,188 | | | | | |
| Connecticut Housing Finance Authority: | | | | | | | | | | | | |
| 4.000%, 11/15/2047 (Callable 11/15/2026) | | | 145,000 | | | | 156,984 | | | | | |
| 4.000%, 05/15/2049 (Callable 11/15/2028) | | | 1,420,000 | | | | 1,619,340 | | | | | |
| Connecticut State Health & | | | | | | | | | | | | |
| Educational Facilities Authority: | | | | | | | | | | | | |
| 5.000%, 11/01/2026 | | | 500,000 | | | | 621,130 | | | | | |
| 5.000%, 11/01/2026 (Callable 11/01/2022) | | | 135,000 | | | | 145,612 | | | | | |
The accompanying notes are an integral part of these financial statements.
Baird Core Intermediate Municipal Bond Fund
Schedule of Investments, December 31, 2020
Long-Term Investments (cont.)
| | | Principal | | | | | | % of | |
| | | Amount | | | Value | | | Net Assets | |
| Connecticut State Health & | | | | | | | | | |
| Educational Facilities Authority: (cont.) | | | | | | | | | |
| 5.000%, 07/01/2030 (Callable 07/01/2021) | | $ | 150,000 | | | $ | 152,589 | | | | |
| 4.250%, 07/01/2031 (Callable 07/01/2022) | | | 1,050,000 | | | | 1,083,128 | | | | |
| 5.000%, 07/01/2034 (Callable 07/01/2022) | | | 40,000 | | | | 41,820 | | | | |
| Connecticut State Higher | | | | | | | | | | | |
| Education Supplement Loan Authority: | | | | | | | | | | | |
| 5.000%, 11/15/2021 | | | 825,000 | | | | 856,713 | | | | |
| 5.000%, 11/15/2027 (Callable 11/15/2026) | | | 125,000 | | | | 152,147 | | | | |
| 3.000%, 11/15/2035 (Callable 11/15/2026) | | | 850,000 | | | | 887,409 | | | | |
| State of Connecticut: | | | | | | | | | | | |
| 5.000%, 04/15/2024 | | | 175,000 | | | | 201,477 | | | | |
| 5.000%, 10/01/2027 (Callable 10/01/2023) | | | 685,000 | | | | 767,652 | | | | |
| 5.000%, 07/15/2030 (Callable 07/15/2023) | | | 225,000 | | | | 248,504 | | | | |
| 5.000%, 10/15/2032 (Callable 10/15/2022) | | | 960,000 | | | | 1,028,784 | | | | |
| 5.000%, 09/01/2033 (Callable 09/01/2026) | | | 300,000 | | | | 362,838 | | | | |
| 5.000%, 05/01/2034 (Callable 05/01/2030) | | | 1,500,000 | | | | 1,993,125 | | | | |
| University of Connecticut: | | | | | | | | | | | |
| 5.000%, 01/15/2031 | | | | | | | | | | | |
| (Callable 01/15/2027) (Insured by AGM) | | | 1,000,000 | | | | 1,237,590 | | | | |
| 5.000%, 02/15/2031 (Callable 02/15/2021) | | | 100,000 | | | | 100,540 | | | | |
| 4.000%, 11/01/2037 | | | | | | | | | | | |
| (Callable 11/01/2028) (Insured by BAM) | | | 1,175,000 | | | | 1,378,957 | | | | |
| Total Connecticut | | | | | | | | | | | |
| (Cost $12,861,333) | | | | | | | 13,637,527 | | | | 1.6 | % |
| District of Columbia | | | | | | | | | | | | |
| District of Columbia Housing Finance Agency, | | | | | | | | | | | | |
| 3.500%, 06/15/2023 | | | 225,000 | | | | 233,241 | | | | | |
| District of Columbia Water & Sewer Authority, | | | | | | | | | | | | |
| 5.000%, 10/01/2037 (Callable 04/01/2026) | | | 275,000 | | | | 333,259 | | | | | |
| Metropolitan Washington Airports Authority: | | | | | | | | | | | | |
| 0.000%, 10/01/2029 (Insured by AGC) | | | 110,000 | | | | 96,802 | | | | | |
| 5.000%, 10/01/2033 (Callable 10/01/2025) | | | 250,000 | | | | 294,980 | | | | | |
| 0.000%, 10/01/2036 (Insured by AGC) | | | 1,355,000 | | | | 968,405 | | | | | |
| 6.500%, 10/01/2041 | | | | | | | | | | | | |
(Callable 10/01/2026) (Insured by AGC)(7) | | | 355,000 | | | | 445,099 | | | | | |
6.500%, 10/01/2044 (Callable 10/01/2028)(7) | | | 665,000 | | | | 877,454 | | | | | |
| 6.500%, 10/01/2044 | | | | | | | | | | | | |
(Callable 10/01/2028) (Insured by AGM)(7) | | | 960,000 | | | | 1,265,088 | | | | | |
| 5.000%, 10/01/2053 (Callable 04/01/2022) | | | 1,210,000 | | | | 1,260,663 | | | | | |
| Total District of Columbia | | | | | | | | | | | | |
| (Cost $5,383,327) | | | | | | | 5,774,991 | | | | 0.7 | % |
The accompanying notes are an integral part of these financial statements.
Baird Core Intermediate Municipal Bond Fund
Schedule of Investments, December 31, 2020
Long-Term Investments (cont.)
| | | Principal | | | | | | % of | |
| | | Amount | | | Value | | | Net Assets | |
| Florida | | | | | | | | | |
| Capital Trust Agency, Inc., | | | | | | | | | |
| 5.000%, 12/15/2029 (Callable 06/15/2026) | | $ | 400,000 | | | $ | 454,768 | | | |
|
|
| City of Fort Myers FL: | | | | | | | | | | | | |
| 5.000%, 12/01/2029 (Callable 12/01/2025) | | | 475,000 | | | | 575,206 | | | | | |
| 4.000%, 12/01/2037 (Callable 12/01/2025) | | | 1,000,000 | | | | 1,102,320 | | | | | |
| 4.000%, 12/01/2038 (Callable 12/01/2025) | | | 500,000 | | | | 550,270 | | | | | |
| City of Jacksonville FL: | | | | | | | | | | | | |
0.040%, 05/01/2029 (Optional Put Date 01/04/2021)(1) | | | 4,500,000 | | | | 4,500,000 | | | | | |
| 4.000%, 11/01/2032 (Callable 11/01/2029) | | | 375,000 | | | | 443,696 | | | | | |
| 4.000%, 10/01/2033 (Callable 10/01/2026) | | | 1,895,000 | | | | 2,196,040 | | | | | |
| City of Orlando FL: | | | | | | | | | | | | |
| 5.000%, 11/01/2025 (Insured by AGM) | | | 400,000 | | | | 480,892 | | | | | |
| 5.000%, 11/01/2034 | | | | | | | | | | | | |
| (Callable 11/01/2027) (Insured by AGM) | | | 775,000 | | | | 952,940 | | | | | |
| City of Tallahassee FL: | | | | | | | | | | | | |
| 5.000%, 12/01/2023 | | | 400,000 | | | | 444,264 | | | | | |
| 5.000%, 12/01/2024 | | | 300,000 | | | | 344,244 | | | | | |
| 5.000%, 12/01/2029 (Callable 12/01/2025) | | | 585,000 | | | | 679,226 | | | | | |
| 5.000%, 10/01/2033 (Callable 10/01/2025) | | | 1,250,000 | | | | 1,499,875 | | | | | |
| 5.000%, 10/01/2034 (Callable 10/01/2024) | | | 500,000 | | | | 580,860 | | | | | |
| County of Jackson FL, | | | | | | | | | | | | |
0.060%, 07/01/2022 (Optional Put Date 01/04/2021)(1) | | | 1,430,000 | | | | 1,430,000 | | | | | |
| County of Manatee FL, | | | | | | | | | | | | |
0.020%, 09/01/2024 (Optional Put Date 01/04/2021)(1) | | | 2,000,000 | | | | 2,000,000 | | | | | |
| County of Miami-Dade FL: | | | | | | | | | | | | |
| 5.000%, 04/01/2027 (Callable 04/01/2026) | | | 120,000 | | | | 147,358 | | | | | |
| 5.000%, 10/01/2032 (Callable 10/01/2026) | | | 135,000 | | | | 162,842 | | | | | |
| 6.875%, 10/01/2034 | | | | | | | | | | | | |
| (Callable 10/01/2029) (Insured by AGC)(7) | | | 255,000 | | | | 373,103 | | | | | |
| 7.000%, 10/01/2039 | | | | | | | | | | | | |
| (Callable 10/01/2029) (Insured by AGC)(7) | | | 390,000 | | | | 572,294 | | | | | |
| County of St. Lucie FL, | | | | | | | | | | | | |
0.030%, 09/01/2028 (Optional Put Date 01/04/2021)(1) | | | 5,000,000 | | | | 5,000,000 | | | | | |
| Florida Department of Management Services, | | | | | | | | | | | | |
| 5.000%, 11/01/2029 | | | 2,000,000 | | | | 2,684,600 | | | | | |
| Florida Development Finance Corp.: | | | | | | | | | | | | |
| 5.000%, 04/01/2028 | | | 400,000 | | | | 501,120 | | | | | |
| 5.000%, 04/01/2029 | | | 250,000 | | | | 318,753 | | | | | |
| Florida Higher Educational Facilities Financial Authority, | | | | | | | | | | | | |
| 5.000%, 10/01/2023 | | | 500,000 | | | | 538,380 | | | | | |
| Florida Housing Finance Corp.: | | | | | | | | | | | | |
| 4.200%, 01/01/2045 | | | | | | | | | | | | |
| (Callable 01/01/2028) (Insured by GNMA) | | | 1,625,000 | | | | 1,795,641 | | | | | |
| 4.350%, 01/01/2046 (Callable 01/01/2024) | | | 310,000 | | | | 321,991 | | | | | |
The accompanying notes are an integral part of these financial statements.
Baird Core Intermediate Municipal Bond Fund
Schedule of Investments, December 31, 2020
Long-Term Investments (cont.)
| | | Principal | | | | | | % of | |
| | | Amount | | | Value | | | Net Assets | |
| Florida Housing Finance Corp.: (cont.) | | | | | | | | | |
| 3.800%, 07/01/2047 | | | | | | | | | |
| (Callable 01/01/2027) (Insured by GNMA) | | $ | 555,000 | | | $ | 574,719 | | | |
|
|
| 4.000%, 07/01/2047 | | | | | | | | | | | | |
| (Callable 07/01/2025) (Insured by GNMA) | | | 200,000 | | | | 213,356 | | | | | |
| 4.000%, 07/01/2049 | | | | | | | | | | | | |
| (Callable 07/01/2027) (Insured by GNMA) | | | 185,000 | | | | 202,316 | | | | | |
| Florida Municipal Loan Council, | | | | | | | | | | | | |
| 5.000%, 10/01/2026 | | | 90,000 | | | | 112,470 | | | | | |
| Florida Municipal Power Agency, | | | | | | | | | | | | |
| 4.000%, 10/01/2030 (Callable 10/01/2027) | | | 500,000 | | | | 585,805 | | | | | |
| Highlands County Health Facilities Authority, | | | | | | | | | | | | |
| 0.070%, 11/15/2037 (Callable 01/04/2021) | | | | | | | | | | | | |
(Optional Put Date 01/07/2021)(1) | | | 6,500,000 | | | | 6,500,000 | | | | | |
| Hillsborough County Aviation Authority, | | | | | | | | | | | | |
| 5.000%, 10/01/2035 (Callable 10/01/2024) | | | 500,000 | | | | 567,930 | | | | | |
| JEA Water & Sewer System Revenue: | | | | | | | | | | | | |
| 5.000%, 10/01/2028 (Callable 10/01/2027) | | | 700,000 | | | | 900,655 | | | | | |
| 5.000%, 10/01/2032 (Callable 10/01/2027) | | | 700,000 | | | | 886,046 | | | | | |
| Miami Health Facilities Authority, | | | | | | | | | | | | |
| 5.000%, 07/01/2021 | | | 165,000 | | | | 164,786 | | | | | |
| Miami-Dade County Industrial Development Authority, | | | | | | | | | | | | |
| 5.000%, 01/15/2021 | | | 365,000 | | | | 365,332 | | | | | |
| Monroe County School District, | | | | | | | | | | | | |
| 5.000%, 10/01/2025 (Insured by AGM) | | | 200,000 | | | | 242,164 | | | | | |
| Orange County Convention Center: | | | | | | | | | | | | |
| 5.000%, 10/01/2032 (Callable 10/01/2026) | | | 1,000,000 | | | | 1,205,620 | | | | | |
| 4.000%, 10/01/2034 (Callable 10/01/2026) | | | 250,000 | | | | 284,820 | | | | | |
| 4.000%, 10/01/2036 (Callable 10/01/2026) | | | 300,000 | | | | 340,281 | | | | | |
| Orange County Health Facilities Authority: | | | | | | | | | | | | |
| 5.000%, 08/01/2028 (Callable 08/01/2024) | | | 2,500,000 | | | | 2,802,350 | | | | | |
| 5.000%, 10/01/2035 (Callable 10/01/2026) | | | 1,210,000 | | | | 1,454,577 | | | | | |
| Orange County School Board: | | | | | | | | | | | | |
| 5.000%, 08/01/2031 (Callable 08/01/2025) | | | 990,000 | | | | 1,182,684 | | | | | |
| 5.000%, 08/01/2033 (Callable 08/01/2026) | | | 150,000 | | | | 183,414 | | | | | |
| Palm Beach County Health Facilities Authority: | | | | | | | | | | | | |
| 5.000%, 05/15/2023 | | | 1,160,000 | | | | 1,238,729 | | | | | |
| 5.000%, 05/15/2024 | | | 300,000 | | | | 327,675 | | | | | |
| 4.000%, 05/15/2035 (Callable 05/15/2025) | | | 175,000 | | | | 180,075 | | | | | |
| Pinellas County School Board, | | | | | | | | | | | | |
| 5.000%, 07/01/2033 (Callable 07/01/2027) | | | 515,000 | | | | 637,549 | | | | | |
| Putnam County Development Authority, | | | | | | | | | | | | |
0.020%, 09/01/2024 (Optional Put Date 01/04/2021)(1) | | | 2,100,000 | | | | 2,100,000 | | | | | |
| Reedy Creek Improvement District, | | | | | | | | | | | | |
| 4.000%, 06/01/2035 (Callable 06/01/2027) | | | 1,000,000 | | | | 1,157,120 | | | | | |
The accompanying notes are an integral part of these financial statements.
Baird Core Intermediate Municipal Bond Fund
Schedule of Investments, December 31, 2020
Long-Term Investments (cont.)
| | | Principal | | | | | | % of | |
| | | Amount | | | Value | | | Net Assets | |
| School Board of Miami-Dade County, | | | | | | | | | |
| 5.000%, 11/01/2030 (Callable 11/01/2024) | | $ | 185,000 | | | $ | 214,733 | | | | |
| Tender Option Bond Trust, | | | | | | | | | | | |
| 0.270%, 01/01/2046 (Callable 01/01/2025) | | | | | | | | | | | |
(Optional Put Date 01/07/2021)(1)(3) | | | 2,230,000 | | | | 2,230,000 | | | | |
| University Park Recreation District: | | | | | | | | | | | |
| 2.750%, 05/01/2021 (Insured by BAM) | | | 260,000 | | | | 261,685 | | | | |
| 2.750%, 05/01/2022 (Insured by BAM) | | | 265,000 | | | | 271,959 | | | | |
| 2.750%, 05/01/2023 (Insured by BAM) | | | 270,000 | | | | 282,055 | | | | |
| Village Community Development District No. 13, | | | | | | | | | | | |
| 2.625%, 05/01/2024 | | | 500,000 | | | | 509,330 | | | | |
| Village Community Development District No. 7, | | | | | | | | | | | |
| 4.000%, 05/01/2021 | | | 215,000 | | | | 217,066 | | | | |
| Total Florida | | | | | | | | | | | |
| (Cost $56,848,264) | | | | | | | 59,047,984 | | | | 6.8 | % |
| Georgia | | | | | | | | | | | | |
| Auburn Urban Redevelopment Agency: | | | | | | | | | | | | |
| 4.000%, 10/01/2029 (Insured by BAM) | | | 210,000 | | | | 262,433 | | | | | |
| 4.000%, 10/01/2030 (Insured by BAM) | | | 275,000 | | | | 349,066 | | | | | |
| Barnesville-Lamar County | | | | | | | | | | | | |
| Industrial Development Authority, | | | | | | | | | | | | |
| 5.000%, 06/01/2028 | | | 175,000 | | | | 219,415 | | | | | |
| Burke County Development Authority: | | | | | | | | | | | | |
| 2.250%, 10/01/2032 | | | | | | | | | | | | |
(Mandatory Tender Date 05/25/2023)(1) | | | 500,000 | | | | 517,405 | | | | | |
0.050%, 11/01/2052 (Optional Put Date 01/04/2021)(1) | | | 6,505,000 | | | | 6,505,000 | | | | | |
| Carrollton Payroll Development Authority, | | | | | | | | | | | | |
| 5.000%, 07/01/2029 | | | 1,175,000 | | | | 1,491,745 | | | | | |
| City of Atlanta GA: | | | | | | | | | | | | |
| 5.000%, 01/01/2025 (Callable 02/01/2021) | | | 225,000 | | | | 225,785 | | | | | |
| 5.500%, 11/01/2027 (Insured by AGM) | | | 145,000 | | | | 180,073 | | | | | |
| 5.000%, 01/01/2028 (Callable 02/01/2021) | | | 1,000,000 | | | | 1,003,390 | | | | | |
| City of Dahlonega GA, | | | | | | | | | | | | |
| 4.000%, 09/01/2021 (Insured by AGM) | | | 150,000 | | | | 153,531 | | | | | |
| City of Monroe GA: | | | | | | | | | | | | |
| 4.000%, 12/01/2036 | | | | | | | | | | | | |
| (Callable 12/01/2030) (Insured by AGM) | | | 500,000 | | | | 617,070 | | | | | |
| 4.000%, 12/01/2037 | | | | | | | | | | | | |
| (Callable 12/01/2030) (Insured by AGM) | | | 750,000 | | | | 922,725 | | | | | |
| Clayton County Development Authority, | | | | | | | | | | | | |
| 4.000%, 07/01/2031 (Callable 07/01/2027) | | | 495,000 | | | | 563,142 | | | | | |
| Development Authority for Fulton County, | | | | | | | | | | | | |
| 5.000%, 10/01/2029 | | | 1,710,000 | | | | 2,154,087 | | | | | |
The accompanying notes are an integral part of these financial statements.
Baird Core Intermediate Municipal Bond Fund
Schedule of Investments, December 31, 2020
Long-Term Investments (cont.)
| | | Principal | | | | | | % of | |
| | | Amount | | | Value | | | Net Assets | |
| Development Authority of Bulloch County: | | | | | | | | | |
| 5.000%, 07/01/2030 | | $ | 405,000 | | | $ | 526,447 | | | | |
| 5.000%, 07/01/2031 (Callable 07/01/2030) | | | 420,000 | | | | 543,253 | | | | |
| 5.000%, 07/01/2032 (Callable 07/01/2030) | | | 445,000 | | | | 572,212 | | | | |
| 5.000%, 07/01/2033 (Callable 07/01/2030) | | | 465,000 | | | | 594,735 | | | | |
| 4.000%, 07/01/2039 (Callable 07/01/2030) | | | 295,000 | | | | 343,475 | | | | |
| Development Authority of Cobb County: | | | | | | | | | | | |
| 5.000%, 07/15/2028 (Callable 07/15/2027) | | | 305,000 | | | | 378,968 | | | | |
| 5.000%, 06/01/2035 (Callable 06/01/2027) | | | 645,000 | | | | 776,490 | | | | |
| Development Authority of Monroe County, | | | | | | | | | | | |
| 1.500%, 01/01/2039 | | | | | | | | | | | |
(Mandatory Tender Date 02/03/2025)(1) | | | 3,625,000 | | | | 3,701,379 | | | | |
| Gainesville & Hall County Hospital Authority: | | | | | | | | | | | |
| 5.000%, 02/15/2022 | | | 500,000 | | | | 524,095 | | | | |
| 5.000%, 02/15/2029 (Callable 02/15/2027) | | | 485,000 | | | | 598,936 | | | | |
| Georgia Housing & Finance Authority: | | | | | | | | | | | |
| 3.600%, 12/01/2033 (Callable 06/01/2027) | | | 450,000 | | | | 493,321 | | | | |
| 4.000%, 12/01/2039 (Callable 06/01/2026) | | | 380,000 | | | | 402,990 | | | | |
| Main Street Natural Gas, Inc.: | | | | | | | | | | | |
| 0.926%, 08/01/2048 (1 Month LIBOR USD + 0.830%) | | | | | | | | | | | |
| (Callable 09/01/2023) | | | | | | | | | | | |
(Mandatory Tender Date 12/01/2023)(2) | | | 2,000,000 | | | | 2,007,140 | | | | |
| 4.000%, 08/01/2049 (Callable 09/01/2024) | | | | | | | | | | | |
(Mandatory Tender Date 12/02/2024)(1) | | | 585,000 | | | | 663,197 | | | | |
| Total Georgia | | | | | | | | | | | |
| (Cost $26,743,435) | | | | | | | 27,291,505 | | | | 3.2 | % |
| Illinois | | | | | | | | | | | | |
| Adams & Hancock Counties | | | | | | | | | | | | |
| Community Unit School District No. 4: | | | | | | | | | | | | |
| 4.000%, 12/01/2027 | | | | | | | | | | | | |
| (Callable 12/01/2025) (Insured by BAM) | | | 290,000 | | | | 330,632 | | | | | |
| 4.000%, 12/01/2029 | | | | | | | | | | | | |
| (Callable 12/01/2025) (Insured by BAM) | | | 310,000 | | | | 349,730 | | | | | |
| 4.000%, 12/01/2030 | | | | | | | | | | | | |
| (Callable 12/01/2025) (Insured by BAM) | | | 325,000 | | | | 365,592 | | | | | |
| 4.000%, 12/01/2032 | | | | | | | | | | | | |
| (Callable 12/01/2025) (Insured by BAM) | | | 350,000 | | | | 391,108 | | | | | |
| Bourbonnais Township Park District: | | | | | | | | | | | | |
| 4.000%, 12/15/2023 (Insured by BAM) | | | 100,000 | | | | 108,230 | | | | | |
| 4.000%, 12/15/2024 (Insured by BAM) | | | 125,000 | | | | 138,650 | | | | | |
| 4.000%, 12/15/2025 (Insured by BAM) | | | 130,000 | | | | 147,576 | | | | | |
| Bureau County Township High School District No. 502, | | | | | | | | | | | | |
| 4.000%, 12/01/2031 | | | | | | | | | | | | |
| (Callable 12/01/2027) (Insured by BAM) | | | 1,330,000 | | | | 1,551,724 | | | | | |
The accompanying notes are an integral part of these financial statements.
Baird Core Intermediate Municipal Bond Fund
Schedule of Investments, December 31, 2020
Long-Term Investments (cont.)
| | | Principal | | | | | | % of | |
| | | Amount | | | Value | | | Net Assets | |
| Channahon Park District: | | | | | | | | | |
| 4.000%, 12/15/2031 | | | | | | | | | |
| (Callable 12/15/2029) (Insured by BAM) | | $ | 460,000 | | | $ | 562,102 | | | |
|
|
| 4.000%, 12/15/2034 | | | | | | | | | | | | |
| (Callable 12/15/2029) (Insured by BAM) | | | 510,000 | | | | 614,218 | | | | | |
| 4.000%, 12/15/2036 | | | | | | | | | | | | |
| (Callable 12/15/2029) (Insured by BAM) | | | 150,000 | | | | 178,716 | | | | | |
| 4.000%, 12/15/2038 | | | | | | | | | | | | |
| (Callable 12/15/2029) (Insured by BAM) | | | 595,000 | | | | 703,879 | | | | | |
| Chicago Board of Education, | | | | | | | | | | | | |
| 5.000%, 12/01/2023 (Insured by AGM) | | | 1,000,000 | | | | 1,111,570 | | | | | |
| Chicago Park District, | | | | | | | | | | | | |
| 5.000%, 01/01/2024 | | | 580,000 | | | | 642,889 | | | | | |
| City of Chicago IL: | | | | | | | | | | | | |
| 5.000%, 01/01/2024 | | | 250,000 | | | | 271,547 | | | | | |
| 5.000%, 01/01/2025 | | | | | | | | | | | | |
| (Callable 01/01/2024) (Insured by AGM) | | | 110,000 | | | | 123,548 | | | | | |
| 5.000%, 01/01/2026 (Callable 01/01/2024) | | | 250,000 | | | | 263,278 | | | | | |
| 0.000%, 01/01/2027 (Insured by NATL) | | | 195,000 | | | | 167,848 | | | | | |
| 0.000%, 01/01/2027 (Insured by NATL) | | | 330,000 | | | | 304,646 | | | | | |
| 5.000%, 11/01/2028 | | | | | | | | | | | | |
| (Callable 11/01/2027) (Insured by AGM) | | | 625,000 | | | | 785,969 | | | | | |
| 5.000%, 01/01/2030 | | | | | | | | | | | | |
| (Callable 01/01/2024) (Insured by AGM) | | | 445,000 | | | | 497,283 | | | | | |
| 5.625%, 01/01/2031 (Callable 01/01/2027) | | | 250,000 | | | | 291,492 | | | | | |
| 4.000%, 11/01/2032 | | | | | | | | | | | | |
| (Callable 11/01/2024) (Insured by BAM) | | | 200,000 | | | | 219,834 | | | | | |
| 5.000%, 11/01/2033 | | | | | | | | | | | | |
| (Callable 11/01/2027) (Insured by AGM) | | | 375,000 | | | | 457,163 | | | | | |
| 5.000%, 01/01/2035 | | | | | | | | | | | | |
| (Callable 01/01/2027) (Insured by AGM) | | | 250,000 | | | | 300,640 | | | | | |
| City of Decatur IL: | | | | | | | | | | | | |
| 4.250%, 03/01/2030 | | | | | | | | | | | | |
| (Callable 03/01/2024) (Insured by BAM) | | | 250,000 | | | | 276,050 | | | | | |
| 5.000%, 03/01/2034 | | | | | | | | | | | | |
| (Callable 03/01/2026) (Insured by BAM) | | | 855,000 | | | | 1,012,397 | | | | | |
| City of Rockford IL, | | | | | | | | | | | | |
| 3.000%, 12/15/2022 (Insured by AGM) | | | 150,000 | | | | 156,147 | | | | | |
| Cook & Will Counties School District No. 194: | | | | | | | | | | | | |
| 4.000%, 12/01/2025 | | | | | | | | | | | | |
| (Callable 12/01/2024) (Insured by BAM) | | | 160,000 | | | | 181,789 | | | | | |
| 4.000%, 12/01/2026 | | | | | | | | | | | | |
| (Callable 12/01/2024) (Insured by BAM) | | | 130,000 | | | | 147,359 | | | | | |
| Cook County Community | | | | | | | | | | | | |
| Consolidated School District No. 65, | | | | | | | | | | | | |
| 0.000%, 12/01/2023 | | | 200,000 | | | | 195,084 | | | | | |
The accompanying notes are an integral part of these financial statements.
Baird Core Intermediate Municipal Bond Fund
Schedule of Investments, December 31, 2020
Long-Term Investments (cont.)
| | | Principal | | | | | | % of | |
| | | Amount | | | Value | | | Net Assets | |
| Cook County School District No. 130: | | | | | | | | | |
| 5.000%, 12/01/2027 | | | | | | | | | |
| (Callable 12/01/2025) (Insured by AGM) | | $ | 1,195,000 | | | $ | 1,449,678 | | | |
|
|
| 5.000%, 12/01/2028 | | | | | | | | | | | | |
| (Callable 12/01/2025) (Insured by AGM) | | | 1,000,000 | | | | 1,210,960 | | | | | |
| Cook County School District No. 163: | | | | | | | | | | | | |
| 6.000%, 12/15/2025 (Insured by BAM) | | | 430,000 | | | | 534,236 | | | | | |
| 6.000%, 12/15/2027 (Insured by BAM) | | | 1,150,000 | | | | 1,515,332 | | | | | |
| Cook County School District No. 83, | | | | | | | | | | | | |
| 5.625%, 06/01/2033 | | | 775,000 | | | | 1,044,003 | | | | | |
| Darien Park District, | | | | | | | | | | | | |
| 4.150%, 12/15/2026 (Callable 02/01/2021) | | | 200,000 | | | | 200,500 | | | | | |
| DuPage County High School District No. 87, | | | | | | | | | | | | |
| 5.000%, 01/01/2029 (Callable 01/01/2025) | | | 315,000 | | | | 370,913 | | | | | |
| Exceptional Children Have Opportunities: | | | | | | | | | | | | |
| 4.000%, 12/01/2034 (Callable 12/01/2029) | | | 765,000 | | | | 897,123 | | | | | |
| 4.000%, 12/01/2035 (Callable 12/01/2029) | | | 645,000 | | | | 751,625 | | | | | |
| Ford, Champaign Counties Community | | | | | | | | | | | | |
| Unit School District No. 10, | | | | | | | | | | | | |
| 5.000%, 12/01/2027 | | | | | | | | | | | | |
| (Callable 12/01/2026) (Insured by AGM) | | | 600,000 | | | | 750,966 | | | | | |
| Hampshire Special Service Area No. 13: | | | | | | | | | | | | |
| 3.000%, 03/01/2027 (Insured by BAM) | | | 130,000 | | | | 141,521 | | | | | |
| 3.000%, 03/01/2028 | | | | | | | | | | | | |
| (Callable 03/01/2027) (Insured by BAM) | | | 140,000 | | | | 150,956 | | | | | |
| 3.000%, 03/01/2029 | | | | | | | | | | | | |
| (Callable 03/01/2027) (Insured by BAM) | | | 100,000 | | | | 106,731 | | | | | |
| 3.250%, 03/01/2032 | | | | | | | | | | | | |
| (Callable 03/01/2027) (Insured by BAM) | | | 165,000 | | | | 175,966 | | | | | |
| 3.300%, 03/01/2033 | | | | | | | | | | | | |
| (Callable 03/01/2027) (Insured by BAM) | | | 175,000 | | | | 186,203 | | | | | |
| 3.350%, 03/01/2034 | | | | | | | | | | | | |
| (Callable 03/01/2027) (Insured by BAM) | | | 185,000 | | | | 196,753 | | | | | |
| 3.400%, 03/01/2035 | | | | | | | | | | | | |
| (Callable 03/01/2027) (Insured by BAM) | | | 195,000 | | | | 207,665 | | | | | |
| 3.450%, 03/01/2036 | | | | | | | | | | | | |
| (Callable 03/01/2027) (Insured by BAM) | | | 205,000 | | | | 218,229 | | | | | |
| 3.500%, 03/01/2037 | | | | | | | | | | | | |
| (Callable 03/01/2027) (Insured by BAM) | | | 215,000 | | | | 229,048 | | | | | |
| Henry & Whiteside Counties Community | | | | | | | | | | | | |
| Unit School District No. 228, | | | | | | | | | | | | |
| 5.000%, 08/15/2031 | | | | | | | | | | | | |
| (Callable 08/15/2025) (Insured by AGM) | | | 270,000 | | | | 321,489 | | | | | |
| Huntley Area Public Library District, | | | | | | | | | | | | |
| 5.000%, 02/01/2037 (Callable 02/01/2029) | | | 500,000 | | | | 632,130 | | | | | |
The accompanying notes are an integral part of these financial statements.
Baird Core Intermediate Municipal Bond Fund
Schedule of Investments, December 31, 2020
Long-Term Investments (cont.)
| | | Principal | | | | | | % of | |
| | | Amount | | | Value | | | Net Assets | |
| Illinois Development Finance Authority, | | | | | | | | | |
| 2.450%, 11/15/2039 | | | | | | | | | |
(Mandatory Tender Date 03/03/2026)(1) | | $ | 1,000,000 | | | $ | 1,079,700 | | | |
|
|
| Illinois Educational Facilities Authority, | | | | | | | | | | | | |
| 4.000%, 11/01/2036 (Callable 11/01/2022) | | | 1,065,000 | | | | 1,138,219 | | | | | |
| Illinois Finance Authority: | | | | | | | | | | | | |
| 5.000%, 02/15/2021 | | | 100,000 | | | | 100,490 | | | | | |
| 5.000%, 10/01/2021 | | | 170,000 | | | | 172,985 | | | | | |
| 5.000%, 10/01/2023 | | | 105,000 | | | | 111,289 | | | | | |
| 5.000%, 11/01/2024 | | | 1,100,000 | | | | 1,248,687 | | | | | |
| 5.000%, 01/01/2029 (Callable 01/01/2027) | | | 475,000 | | | | 579,272 | | | | | |
| 5.000%, 02/15/2029 (Callable 02/15/2027) | | | 3,275,000 | | | | 4,110,551 | | | | | |
| 5.000%, 01/01/2030 (Callable 01/01/2027) | | | 90,000 | | | | 109,049 | | | | | |
| 5.000%, 10/01/2030 (Callable 10/01/2026) | | | 140,000 | | | | 167,108 | | | | | |
| 4.000%, 05/15/2034 (Callable 05/15/2026) | | | 300,000 | | | | 334,830 | | | | | |
| 1.451%, 05/01/2036 (1 Month LIBOR USD + 1.350%) | | | | | | | | | | | | |
| (Callable 02/01/2021) | | | | | | | | | | | | |
(Mandatory Tender Date 05/01/2021)(2) | | | 300,000 | | | | 300,036 | | | | | |
| 4.000%, 12/01/2040 (Callable 12/01/2027) | | | 270,000 | | | | 305,054 | | | | | |
| 4.000%, 12/01/2042 (Callable 12/01/2027) | | | 275,000 | | | | 308,897 | | | | | |
| 6.000%, 10/01/2048 (Callable 10/01/2022) | | | 1,000,000 | | | | 1,042,760 | | | | | |
| Illinois Housing Development Authority: | | | | | | | | | | | | |
| 3.500%, 08/01/2031 | | | | | | | | | | | | |
| (Callable 08/01/2027) (Insured by GNMA) | | | 355,000 | | | | 396,162 | | | | | |
| 3.100%, 02/01/2035 (Callable 02/01/2026) | | | 935,000 | | | | 995,083 | | | | | |
| 2.450%, 06/01/2043 | | | | | | | | | | | | |
| (Callable 01/01/2023) (Insured by GNMA) | | | 487,502 | | | | 498,978 | | | | | |
| 4.250%, 10/01/2049 (Callable 04/01/2028) | | | 1,820,000 | | | | 2,035,379 | | | | | |
| Illinois Sports Facilities Authority: | | | | | | | | | | | | |
| 5.000%, 06/15/2029 (Insured by BAM) | | | 2,500,000 | | | | 3,173,825 | | | | | |
| 5.000%, 06/15/2030 | | | | | | | | | | | | |
| (Callable 06/15/2029) (Insured by BAM) | | | 1,155,000 | | | | 1,457,645 | | | | | |
| Illinois State University, | | | | | | | | | | | | |
| 5.000%, 04/01/2031 | | | | | | | | | | | | |
| (Callable 04/01/2028) (Insured by AGM) | | | 500,000 | | | | 623,475 | | | | | |
| Joliet Park District: | | | | | | | | | | | | |
| 4.000%, 02/01/2030 | | | | | | | | | | | | |
| (Callable 02/01/2024) (Insured by BAM) | | | 250,000 | | | | 266,067 | | | | | |
| 4.000%, 02/01/2033 | | | | | | | | | | | | |
| (Callable 02/01/2023) (Insured by AGM) | | | 315,000 | | | | 327,408 | | | | | |
| Kankakee County School District No. 111, | | | | | | | | | | | | |
| 4.000%, 01/01/2025 (Insured by BAM) | | | 480,000 | | | | 535,574 | | | | | |
| Kendall & Kane Counties Community | | | | | | | | | | | | |
| Unit School District No. 115, | | | | | | | | | | | | |
| 0.000%, 01/01/2022 (Insured by NATL) | | | 1,090,000 | | | | 1,084,092 | | | | | |
The accompanying notes are an integral part of these financial statements.
Baird Core Intermediate Municipal Bond Fund
Schedule of Investments, December 31, 2020
Long-Term Investments (cont.)
| | | Principal | | | | | | % of | |
| | | Amount | | | Value | | | Net Assets | |
| Kendall Kane & Will Counties Community | | | | | | | | | |
| Unit School District No. 308: | | | | | | | | | |
| 4.000%, 02/01/2030 | | | | | | | | | |
| (Callable 02/01/2025) (Insured by BAM) | | $ | 2,550,000 | | | $ | 2,812,752 | | | |
|
|
| 4.750%, 10/01/2031 (Callable 10/01/2023) | | | 1,000,000 | | | | 1,092,150 | | | | | |
| Knox & Warren Counties Community | | | | | | | | | | | | |
| Unit School District No. 205: | | | | | | | | | | | | |
| 6.000%, 01/01/2030 (Callable 01/01/2021) | | | 285,000 | | | | 285,000 | | | | | |
| 2.250%, 12/01/2033 | | | | | | | | | | | | |
| (Callable 12/01/2027) (Insured by BAM) | | | 2,215,000 | | | | 2,243,153 | | | | | |
| 4.000%, 01/01/2034 | | | | | | | | | | | | |
| (Callable 01/01/2028) (Insured by BAM) | | | 855,000 | | | | 987,380 | | | | | |
| 4.000%, 01/01/2036 | | | | | | | | | | | | |
| (Callable 01/01/2028) (Insured by BAM) | | | 920,000 | | | | 1,058,165 | | | | | |
| 6.125%, 01/01/2036 (Callable 01/01/2021) | | | 1,400,000 | | | | 1,400,000 | | | | | |
| Lake County Community Unit School District No. 187, | | | | | | | | | | | | |
| 4.000%, 01/01/2035 | | | | | | | | | | | | |
| (Callable 01/01/2027) (Insured by BAM) | | | 1,190,000 | | | | 1,328,266 | | | | | |
| Macon County School District No. 61, | | | | | | | | | | | | |
| 4.000%, 01/01/2040 | | | | | | | | | | | | |
| (Callable 01/01/2027) (Insured by AGM) | | | 1,420,000 | | | | 1,608,193 | | | | | |
| Macoupin, Sangaman & Montgomery Government Bonds, | | | | | | | | | | | | |
| 4.250%, 12/01/2032 | | | | | | | | | | | | |
| (Callable 12/01/2023) (Insured by AGM) | | | 685,000 | | | | 742,903 | | | | | |
| Medinah Park District, | | | | | | | | | | | | |
| 4.250%, 01/01/2028 (Callable 01/01/2024) | | | 190,000 | | | | 206,961 | | | | | |
| Metropolitan Pier & Exposition Authority: | | | | | | | | | | | | |
| 5.500%, 12/15/2023 (ETM) (Insured by NATL) | | | 10,000 | | | | 10,231 | | | | | |
| 5.500%, 12/15/2023 (Insured by NATL) | | | 90,000 | | | | 97,311 | | | | | |
| 5.700%, 06/15/2025 | | | | | | | | | | | | |
(Callable 06/15/2022) (Insured by NATL)(7) | | | 50,000 | | | | 53,144 | | | | | |
| 0.000%, 06/15/2029 (Insured by NATL) | | | 1,700,000 | | | | 1,430,074 | | | | | |
| Metropolitan Water Reclamation | | | | | | | | | | | | |
| District of Greater Chicago: | | | | | | | | | | | | |
| 5.000%, 12/01/2031 (Callable 12/01/2021) | | | 1,010,000 | | | | 1,051,945 | | | | | |
| 5.000%, 12/01/2034 (Callable 12/01/2026) | | | 1,500,000 | | | | 1,841,280 | | | | | |
| Ogle & Winnebago Counties Community | | | | | | | | | | | | |
| Unit School District No. 223: | | | | | | | | | | | | |
| 5.000%, 12/01/2023 (Insured by BAM) | | | 415,000 | | | | 465,999 | | | | | |
| 5.000%, 12/01/2024 (Insured by BAM) | | | 100,000 | | | | 115,953 | | | | | |
| Peoria City School District No. 150, | | | | | | | | | | | | |
| 5.000%, 01/01/2026 (Insured by BAM) | | | 330,000 | | | | 400,752 | | | | | |
| Peoria County Community Unit School District No. 323, | | | | | | | | | | | | |
| 4.250%, 04/01/2032 (Callable 04/01/2022) | | | 415,000 | | | | 430,094 | | | | | |
The accompanying notes are an integral part of these financial statements.
Baird Core Intermediate Municipal Bond Fund
Schedule of Investments, December 31, 2020
Long-Term Investments (cont.)
| | | Principal | | | | | | % of | |
| | | Amount | | | Value | | | Net Assets | |
| Richland County Community Unit School District No. 1: | | | | | | | | | |
| 5.000%, 12/01/2030 | | | | | | | | | |
| (Callable 12/01/2024) (Insured by AGM) | | $ | 155,000 | | | $ | 180,378 | | | |
|
|
| 4.000%, 12/01/2033 | | | | | | | | | | | | |
| (Callable 12/01/2024) (Insured by AGM) | | | 1,750,000 | | | | 1,934,170 | | | | | |
| Shelby Christian Macon Counties | | | | | | | | | | | | |
| Community School District No. 21, | | | | | | | | | | | | |
| 4.000%, 12/01/2027 | | | | | | | | | | | | |
| (Callable 12/01/2023) (Insured by AGM) | | | 155,000 | | | | 168,603 | | | | | |
| St. Clair County Community Consolidated School District, | | | | | | | | | | | | |
| 0.000%, 12/01/2021 | | | 200,000 | | | | 198,578 | | | | | |
| St. Clair County Community Unit School District No. 187, | | | | | | | | | | | | |
| 4.000%, 01/01/2028 (Insured by AGM) | | | 175,000 | | | | 205,825 | | | | | |
| State of Illinois: | | | | | | | | | | | | |
| 4.875%, 05/01/2021 | | | 1,000,000 | | | | 1,012,480 | | | | | |
| 5.000%, 01/01/2022 (Callable 02/01/2021) | | | 220,000 | | | | 220,623 | | | | | |
| 6.000%, 06/15/2024 (Insured by NATL) | | | 100,000 | | | | 115,108 | | | | | |
| 5.000%, 06/15/2027 (Callable 06/15/2021) | | | 1,500,000 | | | | 1,522,305 | | | | | |
| 6.000%, 06/15/2027 (Insured by NATL) | | | 300,000 | | | | 374,976 | | | | | |
| 5.250%, 07/01/2028 (Callable 07/01/2023) | | | 175,000 | | | | 187,428 | | | | | |
| 5.500%, 07/01/2033 (Callable 07/01/2023) | | | 410,000 | | | | 438,097 | | | | | |
| 4.000%, 06/15/2038 | | | | | | | | | | | | |
| (Callable 06/15/2028) (Insured by BAM) | | | 2,500,000 | | | | 2,751,475 | | | | | |
| Tazewell County School District No. 51, | | | | | | | | | | | | |
| 9.000%, 12/01/2026 (Insured by NATL) | | | 1,060,000 | | | | 1,548,893 | | | | | |
| Tender Option Bond Trust, | | | | | | | | | | | | |
| 0.310%, 12/01/2050 | | | | | | | | | | | | |
(Optional Put Date 01/07/2021)(1)(3) | | | 3,255,000 | | | | 3,255,000 | | | | | |
| University of Illinois, | | | | | | | | | | | | |
| 5.000%, 10/01/2021 | | | 700,000 | | | | 721,980 | | | | | |
| Upper Illinois River Valley Development Authority: | | | | | | | | | | | | |
| 5.000%, 12/01/2023 | | | 600,000 | | | | 671,892 | | | | | |
| 5.000%, 12/01/2024 | | | 585,000 | | | | 677,103 | | | | | |
4.000%, 01/01/2031 (Callable 01/01/2027)(3) | | | 170,000 | | | | 175,205 | | | | | |
| Village of Crestwood IL: | | | | | | | | | | | | |
| 4.000%, 12/15/2021 (Insured by BAM) | | | 250,000 | | | | 257,993 | | | | | |
| 4.500%, 12/15/2026 | | | | | | | | | | | | |
| (Callable 12/15/2022) (Insured by BAM) | | | 200,000 | | | | 214,270 | | | | | |
| 4.000%, 12/15/2027 | | | | | | | | | | | | |
| (Callable 12/15/2025) (Insured by BAM) | | | 330,000 | | | | 372,101 | | | | | |
| Village of Franklin Park IL: | | | | | | | | | | | | |
| 5.000%, 04/01/2023 (Insured by BAM) | | | 460,000 | | | | 505,775 | | | | | |
| 4.000%, 07/01/2029 | | | | | | | | | | | | |
| (Callable 07/01/2025) (Insured by AGM) | | | 450,000 | | | | 508,644 | | | | | |
The accompanying notes are an integral part of these financial statements.
Baird Core Intermediate Municipal Bond Fund
Schedule of Investments, December 31, 2020
Long-Term Investments (cont.)
| | | Principal | | | | | | % of | |
| | | Amount | | | Value | | | Net Assets | |
| Village of River Grove IL: | | | | | | | | | |
| 4.000%, 12/15/2027 | | | | | | | | | |
| (Callable 12/15/2026) (Insured by BAM) | | $ | 135,000 | | | $ | 154,740 | | | |
|
|
| 4.000%, 12/15/2028 | | | | | | | | | | | | |
| (Callable 12/15/2026) (Insured by BAM) | | | 205,000 | | | | 233,704 | | | | | |
| Village of Stone Park IL: | | | | | | | | | | | | |
| 4.750%, 02/01/2029 | | | | | | | | | | | | |
| (Callable 02/01/2023) (Insured by BAM) | | | 230,000 | | | | 242,581 | | | | | |
| 4.750%, 02/01/2031 | | | | | | | | | | | | |
| (Callable 02/01/2023) (Insured by BAM) | | | 310,000 | | | | 325,925 | | | | | |
| 4.750%, 02/01/2032 | | | | | | | | | | | | |
| (Callable 02/01/2023) (Insured by BAM) | | | 275,000 | | | | 288,747 | | | | | |
| 4.750%, 02/01/2033 | | | | | | | | | | | | |
| (Callable 02/01/2023) (Insured by BAM) | | | 190,000 | | | | 199,173 | | | | | |
| 5.000%, 02/01/2035 | | | | | | | | | | | | |
| (Callable 02/01/2029) (Insured by BAM) | | | 300,000 | | | | 356,448 | | | | | |
| 5.000%, 02/01/2036 | | | | | | | | | | | | |
| (Callable 02/01/2029) (Insured by BAM) | | | 225,000 | | | | 266,519 | | | | | |
| 4.000%, 02/01/2037 | | | | | | | | | | | | |
| (Callable 02/01/2029) (Insured by BAM) | | | 185,000 | | | | 205,023 | | | | | |
| 4.000%, 02/01/2038 | | | | | | | | | | | | |
| (Callable 02/01/2029) (Insured by BAM) | | | 150,000 | | | | 165,816 | | | | | |
| Will County Community High School District No. 210: | | | | | | | | | | | | |
| 0.000%, 01/01/2023 (Insured by AGM) | | | 140,000 | | | | 136,905 | | | | | |
| 0.000%, 01/01/2026 (Insured by AGM) | | | 265,000 | | | | 247,942 | | | | | |
| 0.000%, 01/01/2027 (Insured by BAM) | | | 1,120,000 | | | | 1,024,150 | | | | | |
| 0.000%, 01/01/2027 (Insured by AGM) | | | 115,000 | | | | 105,158 | | | | | |
| 0.000%, 01/01/2028 (Insured by BAM) | | | 1,140,000 | | | | 1,015,580 | | | | | |
| 0.000%, 01/01/2028 (Insured by AGM) | | | 180,000 | | | | 160,355 | | | | | |
| 0.000%, 01/01/2028 | | | 40,000 | | | | 33,254 | | | | | |
| 0.000%, 01/01/2029 | | | 40,000 | | | | 31,979 | | | | | |
| 0.000%, 01/01/2033 (Insured by BAM) | | | 400,000 | | | | 305,384 | | | | | |
| 4.000%, 01/01/2034 | | | | | | | | | | | | |
| (Callable 01/01/2029) (Insured by AGM) | | | 400,000 | | | | 449,188 | | | | | |
| Will County Community Unit School District No. 201-U: | | | | | | | | | | | | |
| 4.000%, 01/01/2033 | | | | | | | | | | | | |
| (Callable 01/01/2028) (Insured by AGM) | | | 245,000 | | | | 280,179 | | | | | |
| 4.000%, 01/01/2034 | | | | | | | | | | | | |
| (Callable 01/01/2028) (Insured by AGM) | | | 785,000 | | | | 892,647 | | | | | |
| 4.000%, 01/01/2035 | | | | | | | | | | | | |
| (Callable 01/01/2028) (Insured by AGM) | | | 480,000 | | | | 544,810 | | | | | |
| Will County Township High School District No. 204: | | | | | | | | | | | | |
| 5.000%, 01/01/2025 | | | 125,000 | | | | 143,816 | | | | | |
| 6.250%, 01/01/2031 (Callable 01/01/2021) | | | 300,000 | | | | 300,000 | | | | | |
| Total Illinois | | | | | | | | | | | | |
| (Cost $86,991,777) | | | | | | | 92,633,963 | | | | 10.7 | % |
The accompanying notes are an integral part of these financial statements.
Baird Core Intermediate Municipal Bond Fund
Schedule of Investments, December 31, 2020
Long-Term Investments (cont.)
| | | Principal | | | | | | % of | |
| | | Amount | | | Value | | | Net Assets | |
| Indiana | | | | | | | | | |
| Bloomington Redevelopment District: | | | | | | | | | |
| 5.000%, 02/01/2025 | | $ | 325,000 | | | $ | 380,415 | | | |
|
|
| 5.000%, 08/01/2025 | | | 335,000 | | | | 398,868 | | | | | |
| 5.250%, 08/01/2036 (Callable 08/01/2029) | | | 1,450,000 | | | | 1,840,717 | | | | | |
| Carmel Redevelopment Authority, | | | | | | | | | | | | |
| 4.000%, 08/01/2033 (Pre-refunded to 08/01/2022) | | | 250,000 | | | | 264,905 | | | | | |
| City of Jeffersonville IN, | | | | | | | | | | | | |
| 5.000%, 01/01/2030 | | | | | | | | | | | | |
| (Callable 01/01/2028) (Insured by BAM) | | | 325,000 | | | | 416,244 | | | | | |
| City of Lawrence IN, | | | | | | | | | | | | |
| 5.000%, 01/01/2027 (Insured by BAM) | | | 385,000 | | | | 479,390 | | | | | |
| Evansville Park District: | | | | | | | | | | | | |
| 5.000%, 08/15/2035 | | | | | | | | | | | | |
| (Callable 02/15/2028) (Insured by BAM) | | | 150,000 | | | | 189,159 | | | | | |
| 5.000%, 08/15/2036 | | | | | | | | | | | | |
| (Callable 02/15/2028) (Insured by BAM) | | | 1,335,000 | | | | 1,676,693 | | | | | |
| Franklin Township-Marion County | | | | | | | | | | | | |
| Multiple School Building Corp., | | | | | | | | | | | | |
| 5.000%, 01/15/2035 | | | | | | | | | | | | |
| (Callable 01/15/2023) (Insured by ST AID) | | | 505,000 | | | | 544,304 | | | | | |
| Hammond Multi-School Building Corp., | | | | | | | | | | | | |
| 4.500%, 07/15/2026 | | | | | | | | | | | | |
| (Callable 01/15/2024) (Insured by ST AID) | | | 625,000 | | | | 695,069 | | | | | |
| Hammond Sanitary District: | | | | | | | | | | | | |
| 5.000%, 07/15/2026 (Insured by BAM) | | | 610,000 | | | | 751,300 | | | | | |
| 5.000%, 01/15/2028 | | | | | | | | | | | | |
| (Callable 07/15/2027) (Insured by BAM) | | | 295,000 | | | | 369,715 | | | | | |
| Indiana Bond Bank: | | | | | | | | | | | | |
| 0.730%, 10/15/2022 | | | | | | | | | | | | |
(SIFMA Municipal Swap Index + 0.660%)(2) | | | 125,000 | | | | 125,010 | | | | | |
| 1.129%, 10/15/2022 | | | | | | | | | | | | |
(3 Month LIBOR USD + 0.970%)(2) | | | 510,000 | | | | 510,076 | | | | | |
| Indiana Development Finance Authority, | | | | | | | | | | | | |
0.110%, 01/01/2027(1) | | | 2,160,000 | | | | 2,160,000 | | | | | |
| Indiana Finance Authority: | | | | | | | | | | | | |
| 5.000%, 10/01/2023 | | | 180,000 | | | | 195,197 | | | | | |
| 5.000%, 10/01/2032 (Callable 10/01/2023) | | | 3,520,000 | | | | 3,608,915 | | | | | |
| 4.000%, 05/01/2035 (Pre-refunded to 05/01/2023) | | | 290,000 | | | | 315,378 | | | | | |
| 3.750%, 10/01/2037 (Callable 10/01/2023) | | | 215,000 | | | | 195,459 | | | | | |
| 3.750%, 10/01/2042 (Callable 10/01/2023) | | | 140,000 | | | | 121,485 | | | | | |
| 5.500%, 08/15/2045 (Callable 02/01/2021) | | | 225,000 | | | | 225,448 | | | | | |
| Indiana Health & Educational | | | | | | | | | | | | |
| Facilities Financing Authority: | | | | | | | | | | | | |
1.750%, 11/15/2031 (Pre-refunded to 11/02/2021)(1) | | | 10,000 | | | | 10,120 | | | | | |
The accompanying notes are an integral part of these financial statements.
Baird Core Intermediate Municipal Bond Fund
Schedule of Investments, December 31, 2020
Long-Term Investments (cont.)
| | | Principal | | | | | | % of | |
| | | Amount | | | Value | | | Net Assets | |
| Indiana Health & Educational | | | | | | | | | |
| Facilities Financing Authority: (cont.) | | | | | | | | | |
| 1.750%, 11/15/2031 | | | | | | | | | |
(Mandatory Tender Date 11/02/2021)(1) | | $ | 715,000 | | | $ | 723,652 | | | |
|
|
| Indiana Municipal Power Agency, | | | | | | | | | | | | |
| 5.000%, 01/01/2032 (Callable 01/01/2025) | | | 1,000,000 | | | | 1,159,900 | | | | | |
| Indiana University, | | | | | | | | | | | | |
| 4.000%, 08/01/2035 (Callable 08/01/2027) | | | 80,000 | | | | 93,772 | | | | | |
| Indianapolis Local Public Improvement Bond Bank: | | | | | | | | | | | | |
| 1.400%, 06/01/2021 (Callable 03/01/2021) | | | 1,600,000 | | | | 1,600,032 | | | | | |
| 5.000%, 01/01/2033 (Pre-refunded to 01/01/2025) | | | 500,000 | | | | 594,645 | | | | | |
| IPS Multi-School Building Corp., | | | | | | | | | | | | |
| 5.000%, 07/15/2026 | | | | | | | | | | | | |
| (Callable 01/15/2025) (Insured by ST AID) | | | 925,000 | | | | 1,092,878 | | | | | |
| Kankakee Valley Middle School Building Corp., | | | | | | | | | | | | |
| 5.000%, 01/15/2029 (Insured by ST AID) | | | 1,000,000 | | | | 1,323,620 | | | | | |
| Loogootee School Building Corp., | | | | | | | | | | | | |
| 4.000%, 07/15/2026 (Insured by ST AID) | | | 135,000 | | | | 158,487 | | | | | |
| Munster School Building Corp.: | | | | | | | | | | | | |
| 5.000%, 07/15/2021 (Insured by ST AID) | | | 130,000 | | | | 133,072 | | | | | |
| 4.000%, 07/15/2024 (Insured by ST AID) | | | 170,000 | | | | 189,292 | | | | | |
| North Montgomery High School Building Corp., | | | | | | | | | | | | |
| 5.000%, 07/15/2033 | | | | | | | | | | | | |
| (Callable 07/15/2026) (Insured by ST AID) | | | 165,000 | | | | 199,893 | | | | | |
| Shelbyville Central Renovation School Building Corp., | | | | | | | | | | | | |
| 5.000%, 01/15/2029 | | | | | | | | | | | | |
| (Callable 07/15/2026) (Insured by ST AID) | | | 220,000 | | | | 271,269 | | | | | |
| Taylor Community School Building Corp., | | | | | | | | | | | | |
| 0.000%, 07/15/2029 | | | | | | | | | | | | |
| (Callable 07/15/2025) (Insured by ST AID) | | | 360,000 | | | | 293,875 | | | | | |
| Tipton County Jail Building Corp., | | | | | | | | | | | | |
| 5.000%, 01/15/2027 (Insured by ST AID) | | | 245,000 | | | | 305,373 | | | | | |
| Tri-Creek 2002 High School Building Corp., | | | | | | | | | | | | |
| 4.000%, 07/15/2039 | | | | | | | | | | | | |
| (Callable 07/15/2028) (Insured by ST AID) | | | 345,000 | | | | 399,165 | | | | | |
| Westfield High School Building Corp.: | | | | | | | | | | | | |
| 5.000%, 01/15/2029 | | | | | | | | | | | | |
| (Callable 01/15/2026) (Insured by ST AID) | | | 250,000 | | | | 302,942 | | | | | |
| 5.000%, 01/15/2030 | | | | | | | | | | | | |
| (Callable 01/15/2026) (Insured by ST AID) | | | 300,000 | | | | 362,040 | | | | | |
| 5.000%, 07/15/2031 | | | | | | | | | | | | |
| (Callable 01/15/2026) (Insured by ST AID) | | | 150,000 | | | | 180,581 | | | | | |
| Total Indiana | | | | | | | | | | | | |
| (Cost $23,803,687) | | | | | | | 24,858,355 | | | | 2.9 | % |
The accompanying notes are an integral part of these financial statements.
Baird Core Intermediate Municipal Bond Fund
Schedule of Investments, December 31, 2020
Long-Term Investments (cont.)
| | | Principal | | | | | | % of | |
| | | Amount | | | Value | | | Net Assets | |
| Iowa | | | | | | | | | |
| City of Cedar Rapids IA, | | | | | | | | | |
0.158%, 08/15/2029 (Insured by AMBAC)(1)(5) | | $ | 3,080,000 | | | $ | 2,964,500 | | | | |
| City of Coralville IA, | | | | | | | | | | | |
| 4.000%, 05/01/2022 | | | 100,000 | | | | 100,612 | | | | |
| City of Greenfield IA, | | | | | | | | | | | |
| 4.000%, 09/01/2036 | | | | | | | | | | | |
| (Callable 09/01/2026) (Insured by AGM) | | | 200,000 | | | | 233,248 | | | | |
| County of Carroll IA, | | | | | | | | | | | |
| 5.000%, 06/01/2035 (Callable 06/01/2027) | | | 645,000 | | | | 791,454 | | | | |
| Iowa Finance Authority: | | | | | | | | | | | |
| 4.000%, 07/01/2047 | | | | | | | | | | | |
| (Callable 07/01/2028) (Insured by GNMA) | | | 1,900,000 | | | | 2,171,320 | | | | |
| 2.875%, 05/15/2049 (Callable 01/21/2021) | | | 450,000 | | | | 454,351 | | | | |
| Iowa Higher Education Loan Authority, | | | | | | | | | | | |
| 3.750%, 05/19/2021 | | | 2,000,000 | | | | 2,010,860 | | | | |
| Southern Iowa Rural Water Association, | | | | | | | | | | | |
| 3.000%, 12/01/2032 | | | | | | | | | | | |
| (Callable 12/01/2028) (Insured by AGM) | | | 1,030,000 | | | | 1,156,453 | | | | |
| Total Iowa | | | | | | | | | | | |
| (Cost $9,659,072) | | | | | | | 9,882,798 | | | | 1.1 | % |
| Kansas | | | | | | | | | | | | |
| City of Derby KS, | | | | | | | | | | | | |
| 3.900%, 03/01/2037 (Callable 03/01/2025) | | | 525,000 | | | | 532,633 | | | | | |
| City of Hutchinson KS: | | | | | | | | | | | | |
| 4.000%, 12/01/2021 | | | 360,000 | | | | 365,969 | | | | | |
| 5.000%, 12/01/2022 | | | 140,000 | | | | 147,448 | | | | | |
| City of Wichita KS, | | | | | | | | | | | | |
| 3.000%, 09/01/2023 (Callable 09/01/2022) | | | 220,000 | | | | 224,640 | | | | | |
| Kansas Independent College Finance Authority, | | | | | | | | | | | | |
| 5.000%, 05/01/2021 | | | 1,600,000 | | | | 1,612,160 | | | | | |
| Total Kansas | | | | | | | | | | | | |
| (Cost $2,827,882) | | | | | | | 2,882,850 | | | | 0.3 | % |
| Kentucky | | | | | | | | | | | | |
| Kentucky Economic Development Finance Authority: | | | | | | | | | | | | |
| 0.000%, 10/01/2025 (Insured by NATL) | | | 420,000 | | | | 394,922 | | | | | |
| 0.000%, 10/01/2026 (Insured by NATL) | | | 475,000 | | | | 437,413 | | | | | |
| 0.000%, 10/01/2027 (Insured by NATL) | | | 455,000 | | | | 408,594 | | | | | |
| 0.000%, 10/01/2028 (Insured by NATL) | | | 615,000 | | | | 537,172 | | | | | |
| 5.250%, 08/15/2046 (Pre-refunded to 08/15/2021) | | | 790,000 | | | | 814,253 | | | | | |
| Kentucky Public Energy Authority: | | | | | | | | | | | | |
| 4.000%, 08/01/2027 | | | 250,000 | | | | 296,993 | | | | | |
| 4.000%, 01/01/2049 (Callable 10/01/2024) | | | | | | | | | | | | |
(Mandatory Tender Date 01/01/2025)(1) | | | 675,000 | | | | 758,754 | | | | | |
The accompanying notes are an integral part of these financial statements.
Baird Core Intermediate Municipal Bond Fund
Schedule of Investments, December 31, 2020
Long-Term Investments (cont.)
| | | Principal | | | | | | % of | |
| | | Amount | | | Value | | | Net Assets | |
| Kentucky Public Energy Authority: (cont.) | | | | | | | | | |
| 1.396%, 12/01/2049 (1 Month LIBOR USD + 1.300%) | | | | | | | | | |
| (Callable 03/01/2025) | | | | | | | | | |
(Mandatory Tender Date 06/01/2025)(2) | | $ | 2,000,000 | | | $ | 2,029,280 | | | | |
| 4.000%, 12/01/2049 (Callable 03/01/2025) | | | | | | | | | | | |
(Mandatory Tender Date 06/01/2025)(1) | | | 2,865,000 | | | | 3,263,808 | | | | |
| 4.000%, 12/01/2050 (Callable 03/01/2026) | | | | | | | | | | | |
(Mandatory Tender Date 06/01/2026)(1) | | | 490,000 | | | | 570,311 | | | | |
| Paducah Electric Plant Board, | | | | | | | | | | | |
| 5.000%, 10/01/2032 (Callable 10/01/2026) | | | | | | | | | | | |
| (Insured by AGM) | | | 1,000,000 | | | | 1,196,440 | | | | |
| Total Kentucky | | | | | | | | | | | |
| (Cost $9,828,094) | | | | | | | 10,707,940 | | | | 1.2 | % |
| Louisiana | | | | | | | | | | | | |
| City of Shreveport LA, | | | | | | | | | | | | |
| 5.000%, 08/01/2023 (Insured by BAM) | | | 350,000 | | | | 387,342 | | | | | |
| Louisiana Housing Corp., | | | | | | | | | | | | |
| 4.500%, 12/01/2047 (Callable 12/01/2027) | | | 170,000 | | | | 189,831 | | | | | |
| Louisiana Local Government Environmental | | | | | | | | | | | | |
| Facilities & Community Development Authority: | | | | | | | | | | | | |
| 5.000%, 10/01/2023 (Insured by BAM) | | | 200,000 | | | | 222,048 | | | | | |
| 5.000%, 10/01/2024 (Insured by BAM) | | | 100,000 | | | | 115,089 | | | | | |
| Louisiana Public Facilities Authority, | | | | | | | | | | | | |
| 0.000%, 10/01/2024 (7) | | | 125,000 | | | | 118,776 | | | | | |
| Louisiana Stadium & Exposition District, | | | | | | | | | | | | |
| 5.000%, 07/03/2023 (Callable 01/01/2023) | | | 1,000,000 | | | | 1,078,390 | | | | | |
| Louisiana State University & | | | | | | | | | | | | |
| Agricultural & Mechanical College: | | | | | | | | | | | | |
| 5.000%, 07/01/2030 | | | | | | | | | | | | |
| (Callable 07/01/2026) (Insured by BAM) | | | 380,000 | | | | 453,499 | | | | | |
| 4.000%, 07/01/2032 | | | | | | | | | | | | |
| (Callable 07/01/2026) (Insured by BAM) | | | 485,000 | | | | 545,344 | | | | | |
| St. Tammany Parish Wide School District No. 12: | | | | | | | | | | | | |
| 4.000%, 03/01/2035 (Callable 03/01/2027) | | | 100,000 | | | | 115,771 | | | | | |
| 4.000%, 03/01/2036 (Callable 03/01/2027) | | | 115,000 | | | | 132,804 | | | | | |
| Terrebonne Parish Consolidated Government, | | | | | | | | | | | | |
| 0.000%, 04/01/2034 (Insured by AGM) | | | 715,000 | | | | 550,786 | | | | | |
| Total Louisiana | | | | | | | | | | | | |
| (Cost $3,688,396) | | | | | | | 3,909,680 | | | | 0.4 | % |
| Maine | | | | | | | | | | | | |
| Maine Health & Higher Educational Facilities Authority, | | | | | | | | | | | | |
| 4.000%, 07/01/2037 (Callable 07/01/2029) | | | 230,000 | | | | 270,749 | | | | | |
| Maine State Housing Authority: | | | | | | | | | | | | |
| 3.500%, 11/15/2045 (Callable 05/15/2025) | | | 120,000 | | | | 126,073 | | | | | |
The accompanying notes are an integral part of these financial statements.
Baird Core Intermediate Municipal Bond Fund
Schedule of Investments, December 31, 2020
Long-Term Investments (cont.)
| | | Principal | | | | | | % of | |
| | | Amount | | | Value | | | Net Assets | |
| Maine State Housing Authority: (cont.) | | | | | | | | | |
| 4.000%, 11/15/2045 (Callable 11/15/2025) | | $ | 265,000 | | | $ | 280,579 | | | | |
| 3.500%, 11/15/2046 (Callable 11/15/2025) | | | 25,000 | | | | 26,116 | | | | |
| 3.500%, 11/15/2047 (Callable 11/15/2026) | | | 620,000 | | | | 664,125 | | | | |
| 4.000%, 11/15/2049 (Callable 05/15/2028) | | | 435,000 | | | | 480,358 | | | | |
| 4.000%, 11/15/2050 (Callable 05/15/2029) | | | 990,000 | | | | 1,121,987 | | | | |
| Total Maine | | | | | | | | | | | |
| (Cost $2,859,783) | | | | | | | 2,969,987 | | | | 0.3 | % |
| Maryland | | | | | | | | | | | | |
| County of Baltimore MD: | | | | | | | | | | | | |
| 3.000%, 09/01/2027 (Callable 09/01/2022) | | | 1,000,000 | | | | 1,039,580 | | | | | |
| 3.000%, 09/01/2029 (Callable 09/01/2022) | | | 1,125,000 | | | | 1,163,734 | | | | | |
| Maryland Community Development Administration: | | | | | | | | | | | | |
| 3.500%, 03/01/2050 (Callable 03/01/2029) | | | 745,000 | | | | 819,671 | | | | | |
| 3.250%, 09/01/2050 (Callable 09/01/2029) | | | 6,000,000 | | | | 6,648,120 | | | | | |
| Maryland Health & Higher Educational Facilities Authority: | | | | | | | | | | | | |
5.000%, 01/01/2028(6) | | | 300,000 | | | | 352,866 | | | | | |
| 4.000%, 01/01/2029 | | | 980,000 | | | | 1,147,609 | | | | | |
5.000%, 01/01/2029(6) | | | 290,000 | | | | 345,271 | | | | | |
5.000%, 01/01/2030 6) | | | 185,000 | | | | 222,829 | | | | | |
| Total Maryland | | | | | | | | | | | | |
| (Cost $11,643,570) | | | | | | | 11,739,680 | | | | 1.4 | % |
| Massachusetts | | | | | | | | | | | | |
| Massachusetts Development Finance Agency: | | | | | | | | | | | | |
| 5.000%, 07/01/2022 (Callable 07/01/2021) | | | 1,000,000 | | | | 1,020,500 | | | | | |
| 5.000%, 10/01/2025 (Insured by AGM) | | | 575,000 | | | | 690,242 | | | | | |
| Massachusetts Housing Finance Agency: | | | | | | | | | | | | |
| 4.000%, 12/01/2028 (Callable 06/01/2023) | | | 1,000,000 | | | | 1,064,400 | | | | | |
| 4.500%, 12/01/2048 (Callable 12/01/2027) | | | 1,780,000 | | | | 1,987,121 | | | | | |
| 4.000%, 06/01/2049 (Callable 12/01/2028) | | | 940,000 | | | | 1,043,757 | | | | | |
| Town of Ashburnham MA, | | | | | | | | | | | | |
| 4.250%, 07/01/2021 | | | | | | | | | | | | |
| (Callable 02/01/2021) (Insured by AGC) | | | 350,000 | | | | 350,966 | | | | | |
| University of Massachusetts Building Authority, | | | | | | | | | | | | |
| 5.000%, 11/01/2039 (Callable 11/01/2024) | | | 270,000 | | | | 311,075 | | | | | |
| Total Massachusetts | | | | | | | | | | | | |
| (Cost $6,250,854) | | | | | | | 6,468,061 | | | | 0.7 | % |
| Michigan | | | | | | | | | | | | |
| City of Detroit MI, | | | | | | | | | | | | |
| 5.250%, 07/01/2041 (Pre-refunded to 07/01/2021) | | | 50,000 | | | | 51,253 | | | | | |
| City of Monroe MI, | | | | | | | | | | | | |
| 4.000%, 05/01/2031 (Callable 05/01/2024) | | | 150,000 | | | | 164,895 | | | | | |
| City of Wyandotte MI, | | | | | | | | | | | | |
| 5.000%, 10/01/2023 (Insured by BAM) | | | 25,000 | | | | 27,893 | | | | | |
The accompanying notes are an integral part of these financial statements.
Baird Core Intermediate Municipal Bond Fund
Schedule of Investments, December 31, 2020
Long-Term Investments (cont.)
| | | Principal | | | | | | % of | |
| | | Amount | | | Value | | | Net Assets | |
| Detroit Michigan School District, | | | | | | | | | |
| 5.000%, 05/01/2033 | | | | | | | | | |
| (Callable 05/01/2022) (Insured by Q-SBLF) | | $ | 1,000,000 | | | $ | 1,058,270 | | | |
|
|
| Eastern Michigan University, | | | | | | | | | | | | |
| 4.000%, 03/01/2034 | | | | | | | | | | | | |
| (Callable 03/01/2027) (Insured by BAM) | | | 985,000 | | | | 1,129,943 | | | | | |
| Ferris State University, | | | | | | | | | | | | |
| 5.000%, 10/01/2026 | | | 865,000 | | | | 1,055,793 | | | | | |
| Flushing Community Schools, | | | | | | | | | | | | |
| 4.000%, 05/01/2029 | | | | | | | | | | | | |
| (Callable 05/01/2028) (Insured by Q-SBLF) | | | 220,000 | | | | 267,087 | | | | | |
| Michigan Finance Authority: | | | | | | | | | | | | |
| 5.000%, 12/01/2021 | | | 265,000 | | | | 275,192 | | | | | |
| 4.000%, 10/01/2024 | | | 650,000 | | | | 684,157 | | | | | |
| 5.000%, 09/01/2029 | | | 400,000 | | | | 499,636 | | | | | |
| 5.000%, 09/01/2030 (Callable 03/01/2030) | | | 440,000 | | | | 552,266 | | | | | |
| 5.000%, 07/01/2034 (Callable 07/01/2025) | | | 250,000 | | | | 293,563 | | | | | |
| 5.000%, 07/01/2036 | | | | | | | | | | | | |
| (Callable 07/01/2024) (Insured by NATL) | | | 500,000 | | | | 565,920 | | | | | |
| 5.000%, 07/01/2044 (Callable 07/01/2024) | | | 100,000 | | | | 107,681 | | | | | |
| Michigan State Building Authority, | | | | | | | | | | | | |
| 0.170%, 10/15/2042 (Callable 01/04/2021) | | | | | | | | | | | | |
(Optional Put Date 01/07/2021)(1) | | | 1,000,000 | | | | 1,000,000 | | | | | |
| Michigan State Hospital Finance Authority, | | | | | | | | | | | | |
| 4.000%, 11/15/2047 (Callable 11/15/2026) | | | 510,000 | | | | 578,034 | | | | | |
| Michigan State Housing Development Authority: | | | | | | | | | | | | |
| 4.250%, 12/01/2049 (Callable 06/01/2028) | | | 1,815,000 | | | | 2,034,688 | | | | | |
| 3.500%, 12/01/2050 (Callable 06/01/2029) | | | 1,985,000 | | | | 2,213,632 | | | | | |
| Pinckney Community Schools, | | | | | | | | | | | | |
| 5.000%, 05/01/2033 | | | | | | | | | | | | |
| (Callable 05/01/2026) (Insured by Q-SBLF) | | | 750,000 | | | | 907,042 | | | | | |
| Romeo Community School District, | | | | | | | | | | | | |
| 5.000%, 05/01/2029 | | | | | | | | | | | | |
| (Callable 05/01/2026) (Insured by Q-SBLF) | | | 1,000,000 | | | | 1,231,000 | | | | | |
| Roseville Community Schools, | | | | | | | | | | | | |
| 5.000%, 05/01/2026 (Insured by Q-SBLF) | | | 400,000 | | | | 495,244 | | | | | |
| Swartz Creek Community Schools, | | | | | | | | | | | | |
| 5.000%, 05/01/2039 | | | | | | | | | | | | |
| (Callable 05/01/2029) (Insured by Q-SBLF) | | | 815,000 | | | | 1,041,163 | | | | | |
| Trenton Public Schools School District: | | | | | | | | | | | | |
| 5.000%, 05/01/2029 | | | | | | | | | | | | |
| (Callable 05/01/2028) (Insured by Q-SBLF) | | | 135,000 | | | | 176,527 | | | | | |
| 5.000%, 05/01/2030 | | | | | | | | | | | | |
| (Callable 05/01/2028) (Insured by Q-SBLF) | | | 300,000 | | | | 390,582 | | | | | |
| Wayne County Airport Authority: | | | | | | | | | | | | |
| 5.000%, 12/01/2026 | | | 185,000 | | | | 228,286 | | | | | |
| 5.000%, 12/01/2031 (Callable 12/01/2027) | | | 375,000 | | | | 460,688 | | | | | |
The accompanying notes are an integral part of these financial statements.
Baird Core Intermediate Municipal Bond Fund
Schedule of Investments, December 31, 2020
Long-Term Investments (cont.)
| | | Principal | | | | | | % of | |
| | | Amount | | | Value | | | Net Assets | |
| Wayne-Westland Community Schools, | | | | | | | | | |
| 4.000%, 11/01/2038 | | | | | | | | | |
| (Callable 05/01/2029) (Insured by Q-SBLF) | | $ | 500,000 | | | $ | 590,005 | | | | |
| Western Michigan University, | | | | | | | | | | | |
| 5.000%, 11/15/2029 (Callable 05/15/2025) | | | 250,000 | | | | 295,778 | | | | |
| Total Michigan | | | | | | | | | | | |
| (Cost $17,428,157) | | | | | | | 18,376,218 | | | | 2.1 | % |
| Minnesota | | | | | | | | | | | | |
| City of Maple Grove MN: | | | | | | | | | | | | |
| 5.000%, 05/01/2027 | | | 200,000 | | | | 249,776 | | | | | |
| 5.000%, 05/01/2031 (Callable 05/01/2027) | | | 520,000 | | | | 627,775 | | | | | |
| City of Minneapolis MN, | | | | | | | | | | | | |
| 5.000%, 11/15/2034 (Callable 11/15/2025) | | | 680,000 | | | | 798,374 | | | | | |
| Housing & Redevelopment | | | | | | | | | | | | |
| Authority of The City of St. Paul: | | | | | | | | | | | | |
| 5.000%, 12/01/2029 | | | 1,175,000 | | | | 1,421,762 | | | | | |
| 5.000%, 12/01/2030 | | | 300,000 | | | | 364,854 | | | | | |
| 5.000%, 12/01/2036 (Callable 12/01/2030) | | | 1,600,000 | | | | 1,890,480 | | | | | |
| Maple River Independent School District No. 2135: | | | | | | | | | | | | |
| 4.000%, 02/01/2037 | | | | | | | | | | | | |
| (Callable 02/01/2030) (Insured by SD CRED PROG) | | | 970,000 | | | | 1,192,479 | | | | | |
| 4.000%, 02/01/2038 | | | | | | | | | | | | |
| (Callable 02/01/2030) (Insured by SD CRED PROG) | | | 700,000 | | | | 858,123 | | | | | |
| Minnesota Housing Finance Agency: | | | | | | | | | | | | |
| 4.375%, 07/01/2026 | | | | | | | | | | | | |
| (Callable 07/01/2021) (Insured by GNMA) | | | 115,000 | | | | 116,795 | | | | | |
| 3.600%, 07/01/2033 | | | | | | | | | | | | |
| (Callable 01/01/2023) (Insured by GNMA) | | | 620,000 | | | | 643,312 | | | | | |
| 4.000%, 01/01/2038 (Callable 01/01/2024) | | | 565,000 | | | | 604,601 | | | | | |
| 3.800%, 07/01/2038 | | | | | | | | | | | | |
| (Callable 01/01/2023) (Insured by GNMA) | | | 200,000 | | | | 207,536 | | | | | |
| 0.500%, 01/01/2045 | | | | | | | | | | | | |
| (SIFMA Municipal Swap Index + 0.430%) | | | | | | | | | | | | |
| (Callable 01/01/2023) | | | | | | | | | | | | |
| (Mandatory Tender Date 07/03/2023) | | | | | | | | | | | | |
(Insured by GNMA)(2) | | | 3,000,000 | | | | 2,997,180 | | | | | |
| 4.000%, 01/01/2047 | | | | | | | | | | | | |
| (Callable 01/01/2026) (Insured by GNMA) | | | 520,000 | | | | 557,794 | | | | | |
| Plymouth Intermediate District No. 287: | | | | | | | | | | | | |
| 4.000%, 02/01/2027 | | | 200,000 | | | | 238,794 | | | | | |
| 4.000%, 02/01/2028 (Callable 02/01/2027) | | | 350,000 | | | | 414,001 | | | | | |
| 4.000%, 02/01/2037 (Callable 02/01/2027) | | | 250,000 | | | | 284,428 | | | | | |
| Total Minnesota | | | | | | | | | | | | |
| (Cost $13,002,506) | | | | | | | 13,468,064 | | | | 1.6 | % |
The accompanying notes are an integral part of these financial statements.
Baird Core Intermediate Municipal Bond Fund
Schedule of Investments, December 31, 2020
Long-Term Investments (cont.)
| | | Principal | | | | | | % of | |
| | | Amount | | | Value | | | Net Assets | |
| Mississippi | | | | | | | | | |
| Biloxi Public School District, | | | | | | | | | |
| 5.000%, 04/01/2026 (Insured by BAM) | | $ | 500,000 | | | $ | 609,365 | | | | |
| City of Gulfport MS: | | | | | | | | | | | |
| 5.000%, 07/01/2024 | | | 485,000 | | | | 532,850 | | | | |
| 5.000%, 07/01/2027 (Callable 07/01/2026) | | | 500,000 | | | | 570,490 | | | | |
| City of Ridgeland MS: | | | | | | | | | | | |
| 3.000%, 10/01/2025 | | | 1,000,000 | | | | 1,057,370 | | | | |
| 3.000%, 10/01/2026 | | | 1,100,000 | | | | 1,169,080 | | | | |
| 3.000%, 10/01/2028 (Callable 10/01/2027) | | | 690,000 | | | | 729,441 | | | | |
| 3.000%, 10/01/2029 (Callable 10/01/2027) | | | 540,000 | | | | 566,287 | | | | |
| Copiah-Lincoln Community College District, | | | | | | | | | | | |
| 2.500%, 09/01/2021 (Insured by MAC) | | | 175,000 | | | | 177,368 | | | | |
| Medical Center Educational Building Corp., | | | | | | | | | | | |
| 5.000%, 06/01/2042 (Callable 06/01/2027) | | | 500,000 | | | | 605,290 | | | | |
| Mississippi Business Finance Corp., | | | | | | | | | | | |
| 3.200%, 09/01/2028 (Callable 03/13/2024) | | | 2,100,000 | | | | 2,227,092 | | | | |
| Mississippi Development Bank: | | | | | | | | | | | |
| 5.250%, 03/01/2034 (Callable 03/01/2028) | | | 490,000 | | | | 615,768 | | | | |
| 5.000%, 03/01/2048 | | | | | | | | | | | |
| (Callable 03/01/2029) (Insured by BAM) | | | 1,000,000 | | | | 1,233,070 | | | | |
| State of Mississippi: | | | | | | | | | | | |
| 5.000%, 10/15/2028 (Callable 10/15/2025) | | | 1,260,000 | | | | 1,468,253 | | | | |
| 5.000%, 10/01/2032 (Callable 10/01/2027) | | | 215,000 | | | | 272,143 | | | | |
| 5.000%, 10/15/2034 (Callable 10/15/2025) | | | 1,000,000 | | | | 1,145,270 | | | | |
| University of Southern Mississippi, | | | | | | | | | | | |
| 5.000%, 09/01/2035 (Callable 09/01/2026) | | | 385,000 | | | | 460,660 | | | | |
| West Rankin Utility Authority: | | | | | | | | | | | |
| 5.000%, 01/01/2028 | | | | | | | | | | | |
| (Callable 01/01/2025) (Insured by AGM) | | | 110,000 | | | | 128,430 | | | | |
| 5.000%, 01/01/2029 | | | | | | | | | | | |
| (Callable 01/01/2025) (Insured by AGM) | | | 275,000 | | | | 320,477 | | | | |
| 5.000%, 01/01/2030 | | | | | | | | | | | |
| (Callable 01/01/2025) (Insured by AGM) | | | 590,000 | | | | 684,990 | | | | |
| Total Mississippi | | | | | | | | | | | |
| (Cost $14,029,958) | | | | | | | 14,573,694 | | | | 1.7 | % |
| Missouri | | | | | | | | | | | | |
| Center School District No. 58: | | | | | | | | | | | | |
| 4.000%, 04/15/2030 (Callable 04/15/2027) | | | 210,000 | | | | 242,685 | | | | | |
| 4.000%, 04/15/2031 (Callable 04/15/2027) | | | 220,000 | | | | 253,354 | | | | | |
| Health & Educational Facilities | | | | | | | | | | | | |
| Authority of the State of Missouri: | | | | | | | | | | | | |
| 5.000%, 02/01/2025 (Callable 02/01/2024) | | | 45,000 | | | | 49,984 | | | | | |
| 5.000%, 09/01/2025 | | | 365,000 | | | | 423,447 | | | | | |
The accompanying notes are an integral part of these financial statements.
Baird Core Intermediate Municipal Bond Fund
Schedule of Investments, December 31, 2020
Long-Term Investments (cont.)
| | | Principal | | | | | | % of | |
| | | Amount | | | Value | | | Net Assets | |
| Health & Educational Facilities | | | | | | | | | |
| Authority of the State of Missouri: (cont.) | | | | | | | | | |
| 5.000%, 09/01/2026 | | $ | 410,000 | | | $ | 486,002 | | | |
|
|
| 5.000%, 09/01/2027 | | | 280,000 | | | | 338,820 | | | | | |
| 5.000%, 11/15/2027 (Callable 11/15/2025) | | | 480,000 | | | | 574,493 | | | | | |
| 5.000%, 06/01/2031 (Callable 06/01/2024) | | | 50,000 | | | | 56,479 | | | | | |
| 5.000%, 02/01/2035 (Callable 02/01/2024) | | | 295,000 | | | | 318,399 | | | | | |
| 5.250%, 10/01/2041 (Pre-refunded to 10/01/2021) | | | 100,000 | | | | 103,787 | | | | | |
| Hickman Mills C-1 School District: | | | | | | | | | | | | |
| 3.000%, 03/01/2039 | | | | | | | | | | | | |
| (Callable 03/01/2028) (Insured by ST AID) | | | 1,000,000 | | | | 1,103,990 | | | | | |
| 3.000%, 03/01/2040 | | | | | | | | | | | | |
| (Callable 03/01/2028) (Insured by ST AID) | | | 1,000,000 | | | | 1,099,140 | | | | | |
| Industrial Development Authority of the City of St. Louis, | | | | | | | | | | | | |
| 4.750%, 11/15/2047 (Callable 11/15/2026) | | | 500,000 | | | | 458,140 | | | | | |
| Jackson County Reorganized School District No. 7, | | | | | | | | | | | | |
| 4.000%, 03/01/2039 (Callable 03/01/2029) | | | 2,500,000 | | | | 3,026,300 | | | | | |
| Jackson County School District No. R-IV, | | | | | | | | | | | | |
| 6.000%, 03/01/2038 | | | | | | | | | | | | |
| (Callable 03/01/2029) (Insured by ST AID) | | | 1,005,000 | | | | 1,393,834 | | | | | |
| Missouri Housing Development Commission: | | | | | | | | | | | | |
| 3.700%, 11/01/2035 | | | | | | | | | | | | |
| (Callable 05/01/2025) (Insured by GNMA) | | | 80,000 | | | | 86,453 | | | | | |
| 3.950%, 11/01/2040 | | | | | | | | | | | | |
| (Callable 05/01/2025) (Insured by GNMA) | | | 475,000 | | | | 485,968 | | | | | |
| Missouri Southern State University: | | | | | | | | | | | | |
| 5.000%, 10/01/2028 (Insured by AGM) | | | 100,000 | | | | 122,888 | | | | | |
| 5.000%, 10/01/2029 (Insured by AGM) | | | 105,000 | | | | 130,920 | | | | | |
| 5.000%, 10/01/2030 | | | | | | | | | | | | |
| (Callable 10/01/2029) (Insured by AGM) | | | 135,000 | | | | 167,454 | | | | | |
| 5.000%, 10/01/2031 | | | | | | | | | | | | |
| (Callable 10/01/2029) (Insured by AGM) | | | 145,000 | | | | 179,022 | | | | | |
| 5.000%, 10/01/2032 | | | | | | | | | | | | |
| (Callable 10/01/2029) (Insured by AGM) | | | 155,000 | | | | 190,256 | | | | | |
| 4.000%, 10/01/2033 | | | | | | | | | | | | |
| (Callable 10/01/2029) (Insured by AGM) | | | 110,000 | | | | 125,258 | | | | | |
| 4.000%, 10/01/2034 | | | | | | | | | | | | |
| (Callable 10/01/2029) (Insured by AGM) | | | 115,000 | | | | 130,679 | | | | | |
| 4.000%, 10/01/2035 | | | | | | | | | | | | |
| (Callable 10/01/2029) (Insured by AGM) | | | 125,000 | | | | 141,630 | | | | | |
| 4.000%, 10/01/2036 | | | | | | | | | | | | |
| (Callable 10/01/2029) (Insured by AGM) | | | 150,000 | | | | 169,374 | | | | | |
| 4.000%, 10/01/2038 | | | | | | | | | | | | |
| (Callable 10/01/2029) (Insured by AGM) | | | 140,000 | | | | 157,202 | | | | | |
| 4.000%, 10/01/2039 | | | | | | | | | | | | |
| (Callable 10/01/2029) (Insured by AGM) | | | 110,000 | | | | 123,253 | | | | | |
The accompanying notes are an integral part of these financial statements.
Baird Core Intermediate Municipal Bond Fund
Schedule of Investments, December 31, 2020
Long-Term Investments (cont.)
| | | Principal | | | | | | % of | |
| | | Amount | | | Value | | | Net Assets | |
| Move Rolla Transportation Development District, | | | | | | | | | |
| 3.750%, 06/01/2029 (Callable 06/01/2026) | | $ | 260,000 | | | $ | 276,822 | | | | |
| Public Water Supply District No. 1, | | | | | | | | | | | |
| 4.000%, 07/01/2029 (Callable 07/01/2026) | | | 145,000 | | | | 167,068 | | | | |
| St. Charles County Francis Howell R-III School District, | | | | | | | | | | | |
| 4.000%, 03/01/2031 (Callable 03/01/2028) | | | 2,425,000 | | | | 2,928,915 | | | | |
| St. Louis Land Clearance for Redevelopment Authority, | | | | | | | | | | | |
| 3.875%, 10/01/2035 (Callable 10/01/2029) | | | 370,000 | | | | 349,846 | | | | |
| Total Missouri | | | | | | | | | | | |
| (Cost $15,383,454) | | | | | | | 15,861,862 | | | | 1.8 | % |
| Montana | | | | | | | | | | | | |
| Montana Board of Housing: | | | | | | | | | | | | |
| 3.600%, 12/01/2030 (Callable 06/01/2022) | | | 350,000 | | | | 359,972 | | | | | |
| 3.750%, 12/01/2038 | | | | | | | | | | | | |
| (Callable 12/01/2027) (Insured by FHA) | | | 465,000 | | | | 516,396 | | | | | |
| Montana Facility Finance Authority, | | | | | | | | | | | | |
| 4.000%, 07/01/2024 | | | 150,000 | | | | 162,780 | | | | | |
| Yellowstone County School District No. 8, | | | | | | | | | | | | |
| 5.000%, 07/01/2027 | | | 225,000 | | | | 286,681 | | | | | |
| Total Montana | | | | | | | | | | | | |
| (Cost $1,233,641) | | | | | | | 1,325,829 | | | | 0.2 | % |
| Nebraska | | | | | | | | | | | | |
| Central Plains Energy Project: | | | | | | | | | | | | |
| 5.000%, 09/01/2027 (Callable 09/01/2022) | | | 340,000 | | | | 363,844 | | | | | |
| 5.000%, 09/01/2042 (Callable 09/01/2022) | | | 585,000 | | | | 626,026 | | | | | |
| 5.000%, 03/01/2050 (Callable 10/01/2023) | | | | | | | | | | | | |
(Mandatory Tender Date 01/01/2024)(1) | | | 550,000 | | | | 618,162 | | | | | |
| Colfax County School District No. 123, | | | | | | | | | | | | |
| 4.000%, 12/15/2030 (Pre-refunded to 05/22/2024) | | | 225,000 | | | | 252,979 | | | | | |
| County of Douglas NE, | | | | | | | | | | | | |
| 5.000%, 07/01/2036 (Callable 07/01/2027) | | | 200,000 | | | | 236,956 | | | | | |
| Douglas County Hospital Authority No. 2, | | | | | | | | | | | | |
| 5.000%, 05/15/2030 (Callable 05/15/2026) | | | 90,000 | | | | 108,452 | | | | | |
| Nebraska Investment Finance Authority: | | | | | | | | | | | | |
| 3.500%, 09/01/2036 (Callable 03/01/2025) | | | 360,000 | | | | 381,103 | | | | | |
| 3.500%, 09/01/2046 (Callable 03/01/2025) | | | 100,000 | | | | 106,286 | | | | | |
| Village of Boys Town NE, | | | | | | | | | | | | |
| 3.000%, 09/01/2028 | | | 1,975,000 | | | | 2,265,779 | | | | | |
| Total Nebraska | | | | | | | | | | | | |
| (Cost $4,612,593) | | | | | | | 4,959,587 | | | | 0.6 | % |
| Nevada | | | | | | | | | | | | |
| City of Carson City NV, | | | | | | | | | | | | |
| 5.000%, 09/01/2033 (Callable 09/01/2027) | | | 250,000 | | | | 300,857 | | | | | |
The accompanying notes are an integral part of these financial statements.
Baird Core Intermediate Municipal Bond Fund
Schedule of Investments, December 31, 2020
Long-Term Investments (cont.)
| | | Principal | | | | | | % of | |
| | | Amount | | | Value | | | Net Assets | |
| City of Las Vegas NV Special | | | | | | | | | |
| Improvement District No. 815: | | | | | | | | | |
| 4.000%, 12/01/2021 | | $ | 100,000 | | | $ | 102,422 | | | | |
| 3.000%, 12/01/2022 | | | 100,000 | | | | 102,902 | | | | |
| City of Yerington NV, | | | | | | | | | | | |
| 1.625%, 11/01/2023 (Callable 11/01/2022) | | | 2,000,000 | | | | 2,026,640 | | | | |
| Clark County School District, | | | | | | | | | | | |
| 5.000%, 06/15/2032 | | | | | | | | | | | |
| (Callable 06/15/2027) (Insured by BAM) | | | 450,000 | | | | 555,799 | | | | |
| Nevada Housing Division: | | | | | | | | | | | |
| 4.000%, 04/01/2049 | | | | | | | | | | | |
| (Callable 10/01/2028) (Insured by GNMA) | | | 1,895,000 | | | | 2,110,158 | | | | |
| 4.000%, 10/01/2049 | | | | | | | | | | | |
| (Callable 10/01/2028) (Insured by GNMA) | | | 390,000 | | | | 435,225 | | | | |
| State of Nevada, | | | | | | | | | | | |
| 5.000%, 06/01/2033 (Callable 12/01/2023) | | | 300,000 | | | | 334,569 | | | | |
| Washoe County School District, | | | | | | | | | | | |
| 5.000%, 05/01/2030 (Callable 05/01/2027) | | | 525,000 | | | | 651,389 | | | | |
| Total Nevada | | | | | | | | | | | |
| (Cost $6,390,891) | | | | | | | 6,619,961 | | | | 0.8 | % |
| New Hampshire | | | | | | | | | | | | |
| New Hampshire Health and Education Facilities Authority, | | | | | | | | | | | | |
3.150%, 04/01/2022 (Callable 11/01/2021)(3) | | | 4,875,000 | | | | 4,905,274 | | | | | |
| Total New Hampshire | | | | | | | | | | | | |
| (Cost $4,905,768) | | | | | | | 4,905,274 | | | | 0.6 | % |
| New Jersey | | | | | | | | | | | | |
| Atlantic City Board of Education, | | | | | | | | | | | | |
3.400%, 08/15/2027(3) | | | 3,293,000 | | | | 3,658,227 | | | | | |
| City of Atlantic City NJ, | | | | | | | | | | | | |
| 5.000%, 03/01/2021 (Insured by BAM) | | | 100,000 | | | | 100,677 | | | | | |
| City of Newark NJ: | | | | | | | | | | | | |
| 5.000%, 10/01/2021 (Insured by ST AID) | | | 100,000 | | | | 103,087 | | | | | |
| 5.000%, 10/01/2021 | | | 200,000 | | | | 206,294 | | | | | |
| City of Trenton NJ, | | | | | | | | | | | | |
| 4.000%, 07/15/2023 (Insured by AGM) | | | 400,000 | | | | 435,232 | | | | | |
| City of Union City NJ, | | | | | | | | | | | | |
| 5.000%, 11/01/2023 (Insured by ST AID) | | | 440,000 | | | | 485,267 | | | | | |
| New Jersey Economic Development Authority: | | | | | | | | | | | | |
| 4.000%, 06/15/2022 | | | 775,000 | | | | 814,107 | | | | | |
| 5.000%, 06/15/2023 (Insured by BAM) | | | 295,000 | | | | 327,724 | | | | | |
| 5.000%, 03/01/2024 (Callable 03/01/2023) | | | 150,000 | | | | 163,187 | | | | | |
| 4.000%, 11/01/2027 | | | 1,100,000 | | | | 1,266,144 | | | | | |
| 3.125%, 07/01/2029 (Callable 07/01/2027) | | | 90,000 | | | | 90,898 | | | | | |
The accompanying notes are an integral part of these financial statements.
Baird Core Intermediate Municipal Bond Fund
Schedule of Investments, December 31, 2020
Long-Term Investments (cont.)
| | | Principal | | | | | | % of | |
| | | Amount | | | Value | | | Net Assets | |
| New Jersey Health Care Facilities Financing Authority: | | | | | | | | | |
| 5.000%, 07/01/2025 (Insured by AGM) | | $ | 150,000 | | | $ | 176,595 | | | | |
| 4.000%, 07/01/2026 (Callable 07/01/2022) | | | 1,000,000 | | | | 1,050,420 | | | | |
| 5.000%, 07/01/2026 | | | | | | | | | | | |
| (Callable 07/01/2025) (Insured by AGM) | | | 150,000 | | | | 176,092 | | | | |
| New Jersey Higher Education Student Assistance Authority, | | | | | | | | | | | |
| 2.375%, 12/01/2029 (Callable 06/01/2028) | | | 1,525,000 | | | | 1,584,993 | | | | |
| New Jersey Housing & Mortgage Finance Agency: | | | | | | | | | | | |
| 1.500%, 09/01/2022 | | | | | | | | | | | |
(Mandatory Tender Date 09/01/2021)(1) | | | 575,000 | | | | 579,059 | | | | |
| 4.500%, 10/01/2048 (Callable 10/01/2027) | | | 1,295,000 | | | | 1,460,164 | | | | |
| 4.750%, 10/01/2050 (Callable 04/01/2028) | | | 445,000 | | | | 506,664 | | | | |
| 3.500%, 04/01/2051 (Callable 04/01/2029) | | | 3,500,000 | | | | 3,914,260 | | | | |
| New Jersey Transportation Trust Fund Authority: | | | | | | | | | | | |
| 0.000%, 12/15/2024 (Insured by BHAC) | | | 605,000 | | | | 588,332 | | | | |
| 0.000%, 12/15/2028 (Insured by BHAC) | | | 240,000 | | | | 217,433 | | | | |
| 5.000%, 06/15/2029 (Callable 06/15/2026) | | | 775,000 | | | | 909,734 | | | | |
| 4.000%, 12/15/2037 | | | | | | | | | | | |
| (Callable 12/15/2028) (Insured by BAM) | | | 500,000 | | | | 573,255 | | | | |
| 5.000%, 06/15/2042 (Callable 06/15/2022) | | | 225,000 | | | | 235,487 | | | | |
| New Jersey Turnpike Authority: | | | | | | | | | | | |
| 5.000%, 01/01/2029 (Callable 01/01/2028) | | | 50,000 | | | | 64,085 | | | | |
| 0.851%, 01/01/2030 (1 Month LIBOR USD + 0.750%) | | | | | | | | | | | |
| (Callable 07/01/2022) | | | | | | | | | | | |
(Mandatory Tender Date 01/01/2023)(2) | | | 850,000 | | | | 850,603 | | | | |
| Newark Housing Authority, | | | | | | | | | | | |
| 5.000%, 01/01/2032 (Insured by NATL) | | | 495,000 | | | | 596,782 | | | | |
| Passaic Valley Sewerage Commission, | | | | | | | | | | | |
| 5.750%, 12/01/2022 | | | 550,000 | | | | 604,137 | | | | |
| South Jersey Transportation Authority, | | | | | | | | | | | |
| 5.000%, 11/01/2041 | | | | | | | | | | | |
| (Callable 11/01/2030) (Insured by BAM) | | | 1,350,000 | | | | 1,725,908 | | | | |
| State of New Jersey, | | | | | | | | | | | |
| 5.000%, 06/01/2025 | | | 4,000,000 | | | | 4,760,720 | | | | |
| Total New Jersey | | | | | | | | | | | |
| (Cost $27,226,932) | | | | | | | 28,225,567 | | | | 3.3 | % |
| New Mexico | | | | | | | | | | | | |
| New Mexico Hospital Equipment Loan Council, | | | | | | | | | | | | |
| 4.750%, 07/01/2022 | | | 270,000 | | | | 279,250 | | | | | |
| New Mexico Institute of Mining & Technology: | | | | | | | | | | | | |
| 4.000%, 12/01/2028 (Insured by AGM) | | | 300,000 | | | | 360,345 | | | | | |
| 4.000%, 12/01/2029 (Insured by AGM) | | | 335,000 | | | | 399,551 | | | | | |
| New Mexico Mortgage Finance Authority, | | | | | | | | | | | | |
| 3.500%, 09/01/2041 (Callable 03/01/2026) | | | 825,000 | | | | 878,906 | | | | | |
The accompanying notes are an integral part of these financial statements.
Baird Core Intermediate Municipal Bond Fund
Schedule of Investments, December 31, 2020
Long-Term Investments (cont.)
| | | Principal | | | | | | % of | |
| | | Amount | | | Value | | | Net Assets | |
| New Mexico State University, | | | | | | | | | |
| 4.000%, 04/01/2035 (Callable 04/01/2027) | | $ | 520,000 | | | $ | 591,588 | | | | |
| Village of Los Ranchos de Albuquerque NM: | | | | | | | | | | | |
| 4.000%, 09/01/2023 | | | 100,000 | | | | 107,370 | | | | |
| 4.000%, 09/01/2024 | | | 100,000 | | | | 110,034 | | | | |
| 4.000%, 09/01/2025 | | | 150,000 | | | | 168,946 | | | | |
| 5.000%, 09/01/2026 | | | 150,000 | | | | 180,325 | | | | |
| 5.000%, 09/01/2029 | | | 225,000 | | | | 286,612 | | | | |
| 5.000%, 09/01/2030 | | | 225,000 | | | | 291,461 | | | | |
| Total New Mexico | | | | | | | | | | | |
| (Cost $3,564,099) | | | | | | | 3,654,388 | | | | 0.4 | % |
| New York | | | | | | | | | | | | |
| Albany County Capital Resource Corp., | | | | | | | | | | | | |
| 3.100%, 07/01/2030 | | | 755,000 | | | | 708,620 | | | | | |
| Amherst Development Corp., | | | | | | | | | | | | |
| 5.000%, 10/01/2032 | | | | | | | | | | | | |
| (Callable 10/01/2027) (Insured by AGM) | | | 240,000 | | | | 292,392 | | | | | |
| BluePath TE Trust, | | | | | | | | | | | | |
2.750%, 09/01/2026 (Callable 08/27/2021)(3) | | | 796,228 | | | | 816,506 | | | | | |
| City of New York NY: | | | | | | | | | | | | |
| 5.250%, 07/01/2029 (Callable 07/01/2023) | | | 250,000 | | | | 277,500 | | | | | |
0.010%, 10/01/2040 (Optional Put Date 01/04/2021)(1) | | | 1,500,000 | | | | 1,500,000 | | | | | |
| County of Suffolk NY, | | | | | | | | | | | | |
| 5.000%, 05/01/2022 | | | 990,000 | | | | 1,043,351 | | | | | |
| Dutchess County Local Development Corp., | | | | | | | | | | | | |
| 5.000%, 07/01/2027 (Callable 07/01/2026) | | | 100,000 | | | | 119,804 | | | | | |
| Geneva Development Corp., | | | | | | | | | | | | |
| 5.000%, 09/01/2029 (Pre-refunded to 09/01/2023) | | | 185,000 | | | | 208,454 | | | | | |
| Metropolitan Transportation Authority: | | | | | | | | | | | | |
| 5.000%, 05/15/2021 | | | 150,000 | | | | 151,574 | | | | | |
| 5.000%, 09/01/2021 | | | 455,000 | | | | 463,622 | | | | | |
| 4.000%, 02/01/2022 | | | 800,000 | | | | 816,176 | | | | | |
| 5.000%, 05/15/2022 | | | 330,000 | | | | 343,048 | | | | | |
| 5.000%, 09/01/2022 | | | 1,750,000 | | | | 1,833,755 | | | | | |
| 0.646%, 11/01/2030 (1 Month LIBOR USD + 0.550%) | | | | | | | | | | | | |
(Mandatory Tender Date 11/01/2022)(2) | | | 980,000 | | | | 949,199 | | | | | |
| New York City Housing Development Corp., | | | | | | | | | | | | |
| 0.700%, 11/01/2060 (Callable 05/01/2023) | | | | | | | | | | | | |
(Mandatory Tender Date 05/01/2025)(1) | | | 2,500,000 | | | | 2,500,225 | | | | | |
| New York City Industrial Development Agency: | | | | | | | | | | | | |
| 5.000%, 03/01/2029 (Insured by AGM) | | | 250,000 | | | | 324,532 | | | | | |
| 5.000%, 03/01/2030 (Insured by AGM) | | | 250,000 | | | | 330,265 | | | | | |
| New York City Transitional Finance Authority: | | | | | | | | | | | | |
| 5.000%, 08/01/2031 (Callable 08/01/2028) | | | 50,000 | | | | 64,583 | | | | | |
The accompanying notes are an integral part of these financial statements.
Baird Core Intermediate Municipal Bond Fund
Schedule of Investments, December 31, 2020
Long-Term Investments (cont.)
| | | Principal | | | | | | % of | |
| | | Amount | | | Value | | | Net Assets | |
| New York City Transitional Finance Authority: (cont.) | | | | | | | | | |
| 5.000%, 08/01/2034 (Callable 08/01/2026) | | $ | 650,000 | | | $ | 785,746 | | | | |
| 5.000%, 08/01/2038 (Callable 08/01/2028) | | | 1,295,000 | | | | 1,631,532 | | | | |
| 5.000%, 08/01/2039 (Callable 08/01/2024) | | | 105,000 | | | | 120,476 | | | | |
| New York City Water & Sewer System: | | | | | | | | | | | |
| 5.000%, 06/15/2036 (Callable 06/15/2024) | | | 1,000,000 | | | | 1,148,860 | | | | |
| 5.000%, 06/15/2036 (Callable 06/15/2024) | | | 1,000,000 | | | | 1,148,860 | | | | |
0.020%, 06/15/2049 (Optional Put Date 01/04/2021)(1) | | | 600,000 | | | | 600,000 | | | | |
| New York Liberty Development Corp., | | | | | | | | | | | |
0.570%, 10/01/2035 (Optional Put Date 01/07/2021)(1)(3) | | | 1,000,000 | | | | 1,000,000 | | | | |
| New York State Dormitory Authority: | | | | | | | | | | | |
| 5.000%, 10/01/2038 (Callable 04/01/2028) | | | 1,500,000 | | | | 1,909,485 | | | | |
| 5.000%, 03/15/2044 (Callable 03/15/2024) | | | 2,800,000 | | | | 3,166,128 | | | | |
| New York State Housing Finance Agency, | | | | | | | | | | | |
| 1.600%, 11/01/2024 (Callable 12/01/2021) | | | 2,000,000 | | | | 2,021,700 | | | | |
| New York Transportation Development Corp., | | | | | | | | | | | |
| 5.000%, 12/01/2033 (Callable 12/01/2030) | | | 1,000,000 | | | | 1,288,970 | | | | |
| Onondaga Civic Development Corp.: | | | | | | | | | | | |
| 3.375%, 10/01/2026 (Callable 10/01/2025) | | | 50,000 | | | | 48,061 | | | | |
| 5.000%, 10/01/2040 (Callable 10/01/2025) | | | 95,000 | | | | 94,757 | | | | |
| Port Authority of New York & New Jersey, | | | | | | | | | | | |
| 5.000%, 09/01/2031 (Callable 09/01/2024) | | | 770,000 | | | | 886,070 | | | | |
| St. Lawrence County Industrial Development Agency, | | | | | | | | | | | |
| 5.000%, 07/01/2034 (Callable 07/01/2026) | | | 345,000 | | | | 404,902 | | | | |
| State of New York Mortgage Agency, | | | | | | | | | | | |
| 3.500%, 10/01/2043 (Callable 04/01/2023) | | | 175,000 | | | | 184,307 | | | | |
| Town of Oyster Bay NY, | | | | | | | | | | | |
| 3.000%, 02/01/2022 | | | 1,775,000 | | | | 1,821,186 | | | | |
| Utility Debt Securitization Authority, | | | | | | | | | | | |
| 5.000%, 12/15/2033 (Callable 12/15/2025) | | | 1,175,000 | | | | 1,431,808 | | | | |
| Total New York | | | | | | | | | | | |
| (Cost $31,473,947) | | | | | | | 32,436,454 | | | | 3.8 | % |
| North Carolina | | | | | | | | | | | | |
| North Carolina Capital Facilities Finance Agency, | | | | | | | | | | | | |
| 5.000%, 06/01/2022 (Insured by AGC) | | | 150,000 | | | | 157,704 | | | | | |
| North Carolina Housing Finance Agency, | | | | | | | | | | | | |
| 4.000%, 07/01/2047 (Callable 01/01/2027) | | | 530,000 | | | | 576,555 | | | | | |
| North Carolina Turnpike Authority: | | | | | | | | | | | | |
| 5.000%, 02/01/2024 | | | 3,000,000 | | | | 3,400,140 | | | | | |
| 5.000%, 01/01/2028 | | | 250,000 | | | | 314,833 | | | | | |
| 4.000%, 01/01/2041 | | | | | | | | | | | | |
| (Callable 01/01/2029) (Insured by AGM) | | | 1,000,000 | | | | 1,157,210 | | | | | |
| Total North Carolina | | | | | | | | | | | | |
| (Cost $5,377,193) | | | | | | | 5,606,442 | | | | 0.6 | % |
The accompanying notes are an integral part of these financial statements.
Baird Core Intermediate Municipal Bond Fund
Schedule of Investments, December 31, 2020
Long-Term Investments (cont.)
| | | Principal | | | | | | % of | |
| | | Amount | | | Value | | | Net Assets | |
| North Dakota | | | | | | | | | |
| City of Dickinson ND, | | | | | | | | | |
| 5.000%, 10/01/2025 (Callable 10/01/2021) | | $ | 825,000 | | | $ | 841,178 | | | | |
| City of Horace ND: | | | | | | | | | | | |
| 1.900%, 08/01/2022 (Callable 08/01/2021) | | | 1,000,000 | | | | 1,000,790 | | | | |
| 3.000%, 05/01/2037 (Callable 05/01/2026) | | | 2,495,000 | | | | 2,584,595 | | | | |
| City of Mandan ND, | | | | | | | | | | | |
| 2.750%, 09/01/2041 (Callable 02/01/2021) | | | 875,000 | | | | 875,411 | | | | |
| City of Williston ND: | | | | | | | | | | | |
| 4.250%, 07/15/2025 (Callable 07/15/2022) | | | 1,750,000 | | | | 1,836,853 | | | | |
| 5.000%, 05/01/2028 (Callable 05/01/2023) | | | 480,000 | | | | 524,366 | | | | |
| County of Burleigh ND: | | | | | | | | | | | |
| 4.000%, 11/01/2021 | | | 525,000 | | | | 538,472 | | | | |
| 2.750%, 02/01/2022 (Callable 01/21/2021) | | | 5,500,000 | | | | 5,500,935 | | | | |
| 4.000%, 11/01/2029 | | | | | | | | | | | |
| (Pre-refunded to 11/01/2022) (Insured by AGM) | | | 850,000 | | | | 908,556 | | | | |
| County of McKenzie ND: | | | | | | | | | | | |
| 5.000%, 08/01/2022 | | | 645,000 | | | | 683,681 | | | | |
| 5.000%, 08/01/2023 | | | 1,225,000 | | | | 1,343,837 | | | | |
| Jamestown Park District, | | | | | | | | | | | |
| 2.900%, 07/01/2035 (Callable 01/19/2021) | | | 1,300,000 | | | | 1,300,923 | | | | |
| North Dakota Housing Finance Agency: | | | | | | | | | | | |
| 3.350%, 07/01/2031 (Callable 01/01/2027) | | | 545,000 | | | | 601,664 | | | | |
| 3.000%, 07/01/2034 (Callable 07/01/2028) | | | 100,000 | | | | 109,062 | | | | |
| 3.500%, 07/01/2046 (Callable 01/01/2026) | | | 290,000 | | | | 312,063 | | | | |
| 4.000%, 01/01/2050 (Callable 07/01/2028) | | | 980,000 | | | | 1,120,816 | | | | |
| State Board of Higher Education | | | | | | | | | | | |
| of the State of North Dakota: | | | | | | | | | | | |
| 5.000%, 04/01/2027 (Insured by AGM) | | | 205,000 | | | | 259,188 | | | | |
| 5.000%, 04/01/2028 (Insured by AGM) | | | 100,000 | | | | 129,680 | | | | |
| Total North Dakota | | | | | | | | | | | |
| (Cost $20,063,623) | | | | | | | 20,472,070 | | | | 2.4 | % |
| Ohio | | | | | | | | | | | | |
| Akron Bath Copley Joint Township Hospital District: | | | | | | | | | | | | |
| 5.000%, 11/15/2032 (Callable 11/15/2030) | | | 700,000 | | | | 896,203 | | | | | |
| 4.000%, 11/15/2033 (Callable 11/15/2030) | | | 400,000 | | | | 467,780 | | | | | |
| City of Akron OH, | | | | | | | | | | | | |
| 4.000%, 12/01/2033 (Callable 12/01/2026) | | | 125,000 | | | | 143,424 | | | | | |
| City of Middleburg Heights OH, | | | | | | | | | | | | |
| 5.000%, 08/01/2033 (Callable 08/01/2031) | | | 645,000 | | | | 821,033 | | | | | |
| Columbus-Franklin County Finance Authority: | | | | | | | | | | | | |
| 3.820%, 11/15/2036 (Callable 11/15/2021) | | | 460,000 | | | | 466,702 | | | | | |
| 4.000%, 11/15/2038 (Callable 05/15/2022) | | | 335,000 | | | | 343,147 | | | | | |
The accompanying notes are an integral part of these financial statements.
Baird Core Intermediate Municipal Bond Fund
Schedule of Investments, December 31, 2020
Long-Term Investments (cont.)
| | | Principal | | | | | | % of | |
| | | Amount | | | Value | | | Net Assets | |
| County of Franklin OH, | | | | | | | | | |
| 0.500%, 05/15/2050 | | | | | | | | | |
| (SIFMA Municipal Swap Index + 0.430%) | | | | | | | | | |
| (Callable 05/15/2021) | | | | | | | | | |
(Mandatory Tender Date 11/15/2021)(2) | | $ | 1,000,000 | | | $ | 1,000,460 | | | |
|
|
| County of Licking OH, | | | | | | | | | | | | |
| 4.000%, 12/01/2028 (Pre-refunded to 12/01/2021) | | | 250,000 | | | | 258,612 | | | | | |
| County of Lorain OH: | | | | | | | | | | | | |
| 4.000%, 12/01/2028 (Callable 12/01/2023) | | | 180,000 | | | | 197,476 | | | | | |
| 5.000%, 12/01/2031 (Callable 12/01/2023) | | | 480,000 | | | | 534,725 | | | | | |
| 3.000%, 12/01/2036 (Callable 12/01/2025) | | | 400,000 | | | | 430,368 | | | | | |
| 4.000%, 12/01/2040 (Callable 12/01/2025) | | | 245,000 | | | | 277,095 | | | | | |
| Euclid City School District, | | | | | | | | | | | | |
| 4.000%, 12/01/2037 | | | | | | | | | | | | |
| (Callable 06/01/2027) (Insured by BAM) | | | 160,000 | | | | 188,184 | | | | | |
| Franklin County Convention Facilities Authority, | | | | | | | | | | | | |
| 5.000%, 12/01/2032 (Callable 12/01/2029) | | | 500,000 | | | | 629,370 | | | | | |
| Little Miami Local School District, | | | | | | | | | | | | |
| 5.000%, 11/01/2036 | | | | | | | | | | | | |
| (Callable 11/01/2025) (Insured by SD CRED PROG) | | | 1,845,000 | | | | 2,201,657 | | | | | |
| Ohio Air Quality Development Authority, | | | | | | | | | | | | |
| 2.400%, 12/01/2038 (Callable 10/01/2024) | | | | | | | | | | | | |
(Mandatory Tender Date 10/01/2029)(1) | | | 500,000 | | | | 529,855 | | | | | |
| Ohio Higher Educational Facility Commission: | | | | | | | | | | | | |
| 5.000%, 03/01/2025 | | | 690,000 | | | | 731,793 | | | | | |
| 5.000%, 05/01/2026 | | | 200,000 | | | | 243,154 | | | | | |
| 5.000%, 05/01/2027 (Callable 05/01/2026) | | | 610,000 | | | | 736,984 | | | | | |
| 5.000%, 05/01/2028 (Callable 05/01/2026) | | | 475,000 | | | | 569,031 | | | | | |
| Ohio Housing Finance Agency: | | | | | | | | | | | | |
| 3.200%, 09/01/2036 | | | | | | | | | | | | |
| (Callable 09/01/2025) (Insured by GNMA) | | | 875,000 | | | | 931,805 | | | | | |
| 4.000%, 03/01/2047 | | | | | | | | | | | | |
| (Callable 09/01/2025) (Insured by GNMA) | | | 215,000 | | | | 230,962 | | | | | |
| Ohio Turnpike & Infrastructure Commission: | | | | | | | | | | | | |
0.000%, 02/15/2034 (Callable 02/15/2031)(7) | | | 1,920,000 | | | | 2,394,528 | | | | | |
0.000%, 02/15/2036 (Callable 02/15/2031)(7) | | | 335,000 | | | | 417,681 | | | | | |
| Port of Greater Cincinnati Development Authority: | | | | | | | | | | | | |
| 5.000%, 04/01/2028 | | | 230,000 | | | | 283,323 | | | | | |
| 5.000%, 04/01/2030 | | | 230,000 | | | | 290,401 | | | | | |
| State of Ohio: | | | | | | | | | | | | |
| 5.000%, 11/15/2028 (Callable 05/15/2023) | | | 225,000 | | | | 248,646 | | | | | |
| 5.000%, 11/15/2035 (Callable 11/15/2030) | | | 605,000 | | | | 749,256 | | | | | |
| 4.000%, 11/15/2036 (Callable 11/15/2030) | | | 635,000 | | | | 718,877 | | | | | |
| Streetsboro City School District, | | | | | | | | | | | | |
| 4.500%, 12/01/2044 (Callable 12/01/2026) | | | 725,000 | | | | 870,319 | | | | | |
The accompanying notes are an integral part of these financial statements.
Baird Core Intermediate Municipal Bond Fund
Schedule of Investments, December 31, 2020
Long-Term Investments (cont.)
| | | Principal | | | | | | % of | |
| | | Amount | | | Value | | | Net Assets | |
| Warren City School District: | | | | | | | | | |
| 4.000%, 12/01/2030 | | | | | | | | | |
| (Callable 12/01/2026) (Insured by SD CRED PROG) | | $ | 1,215,000 | | | $ | 1,416,739 | | | | |
| 4.000%, 12/01/2031 | | | | | | | | | | | |
| (Callable 12/01/2026) (Insured by SD CRED PROG) | | | 695,000 | | | | 803,309 | | | | |
| 4.000%, 12/01/2036 | | | | | | | | | | | |
| (Callable 12/01/2026) (Insured by SD CRED PROG) | | | 460,000 | | | | 522,155 | | | | |
| Warrensville Heights City School District: | | | | | | | | | | | |
| 4.000%, 11/01/2035 | | | | | | | | | | | |
| (Callable 11/01/2024) (Insured by BAM) | | | 200,000 | | | | 218,086 | | | | |
| 4.000%, 11/01/2037 | | | | | | | | | | | |
| (Callable 11/01/2024) (Insured by BAM) | | | 500,000 | | | | 543,585 | | | | |
| Total Ohio | | | | | | | | | | | |
| (Cost $21,003,559) | | | | | | | 22,306,725 | | | | 2.6 | % |
| Oklahoma | | | | | | | | | | | | |
| Catoosa Industrial Authority, | | | | | | | | | | | | |
| 4.000%, 10/01/2028 (Callable 10/01/2026) | | | 250,000 | | | | 250,913 | | | | | |
| Oklahoma Development Finance Authority: | | | | | | | | | | | | |
| 2.600%, 03/01/2024 | | | 425,000 | | | | 424,354 | | | | | |
| 0.250%, 08/15/2031 (Callable 01/04/2021) | | | | | | | | | | | | |
(Optional Put Date 01/07/2021)(1) | | | 5,000,000 | | | | 5,000,000 | | | | | |
| Oklahoma Housing Finance Agency: | | | | | | | | | | | | |
| 3.300%, 03/01/2031 | | | | | | | | | | | | |
| (Callable 03/01/2022) (Insured by GNMA) | | | 25,000 | | | | 25,105 | | | | | |
| 3.000%, 09/01/2039 | | | | | | | | | | | | |
| (Callable 03/01/2028) (Insured by GNMA) | | | 250,000 | | | | 266,640 | | | | | |
| Total Oklahoma | | | | | | | | | | | | |
| (Cost $5,964,743) | | | | | | | 5,967,012 | | | | 0.7 | % |
| Oregon | | | | | | | | | | | | |
| Clackamas Community College District, | | | | | | | | | | | | |
5.000%, 06/15/2040 (Callable 06/15/2027)(7) | | | 475,000 | | | | 579,291 | | | | | |
| Clackamas County School District No. 12, | | | | | | | | | | | | |
| 5.000%, 06/15/2037 | | | | | | | | | | | | |
| (Callable 06/15/2027) (Insured by SCH BD GTY) | | | 25,000 | | | | 31,008 | | | | | |
| Clatsop County School District No. 1-C, | | | | | | | | | | | | |
| 0.000%, 06/15/2041 | | | | | | | | | | | | |
| (Callable 06/15/2029) (Insured by SCH BD GTY) | | | 785,000 | | | | 398,937 | | | | | |
| Clatsop County School District No. 30, | | | | | | | | | | | | |
| 0.000%, 06/15/2038 | | | | | | | | | | | | |
| (Callable 06/15/2029) (Insured by SCH BD GTY) | | | 425,000 | | | | 248,468 | | | | | |
| Multnomah & Clackamas Counties School District No. 10JT, | | | | | | | | | | | | |
| 0.000%, 06/15/2031 | | | | | | | | | | | | |
| (Callable 06/15/2029) (Insured by SCH BD GTY) | | | 100,000 | | | | 83,625 | | | | | |
The accompanying notes are an integral part of these financial statements.
Baird Core Intermediate Municipal Bond Fund
Schedule of Investments, December 31, 2020
Long-Term Investments (cont.)
| | | Principal | | | | | | % of | |
| | | Amount | | | Value | | | Net Assets | |
| Oregon State Facilities Authority: | | | | | | | | | |
| 5.000%, 10/01/2024 | | $ | 200,000 | | | $ | 231,138 | | | | |
| 5.000%, 10/01/2026 | | | 100,000 | | | | 123,060 | | | | |
| 5.000%, 10/01/2027 | | | 150,000 | | | | 188,753 | | | | |
| Salem Hospital Facility Authority: | | | | | | | | | | | |
| 5.000%, 05/15/2033 (Callable 05/15/2026) | | | 105,000 | | | | 116,893 | | | | |
| 5.000%, 05/15/2035 (Callable 05/15/2026) | | | 500,000 | | | | 597,135 | | | | |
| Umatilla County School District No. 6R: | | | | | | | | | | | |
| 0.000%, 06/15/2028 | | | | | | | | | | | |
(Callable 06/15/2027) (Insured by SCH BD GTY)(7) | | | 100,000 | | | | 113,022 | | | | |
| 0.000%, 06/15/2030 | | | | | | | | | | | |
(Callable 06/15/2027) (Insured by SCH BD GTY)(7) | | | 100,000 | | | | 111,753 | | | | |
| 0.000%, 06/15/2033 | | | | | | | | | | | |
(Callable 06/15/2027) (Insured by SCH BD GTY)(7) | | | 200,000 | | | | 220,706 | | | | |
| 0.000%, 06/15/2035 | | | | | | | | | | | |
(Callable 06/15/2027) (Insured by SCH BD GTY)(7) | | | 540,000 | | | | 591,602 | | | | |
| Washington Clackamas & Yamhill | | | | | | | | | | | |
| Counties School District No. 88J, | | | | | | | | | | | |
| 0.000%, 06/15/2046 | | | | | | | | | | | |
| (Callable 06/15/2028) (Insured by SCH BD GTY) | | | 500,000 | | | | 199,830 | | | | |
| Total Oregon | | | | | | | | | | | |
| (Cost $3,464,201) | | | | | | | 3,835,221 | | | | 0.4 | % |
| Pennsylvania | | | | | | | | | | | | |
| Berks County Municipal Authority: | | | | | | | | | | | | |
| 5.000%, 02/01/2026 | | | 1,000,000 | | | | 1,110,960 | | | | | |
| 5.000%, 02/01/2027 | | | 1,100,000 | | | | 1,236,950 | | | | | |
| Bloomsburg PA Area School District, | | | | | | | | | | | | |
| 4.000%, 09/01/2030 | | | | | | | | | | | | |
| (Callable 03/01/2024) (Insured by BAM) | | | 250,000 | | | | 272,877 | | | | | |
| City of Bradford PA: | | | | | | | | | | | | |
| 3.500%, 11/01/2032 | | | | | | | | | | | | |
| (Callable 11/01/2025) (Insured by AGM) | | | 1,180,000 | | | | 1,244,817 | | | | | |
| 3.500%, 11/01/2034 | | | | | | | | | | | | |
| (Callable 11/01/2025) (Insured by AGM) | | | 605,000 | | | | 634,766 | | | | | |
| Commonwealth Financing Authority: | | | | | | | | | | | | |
| 5.000%, 06/01/2022 | | | 750,000 | | | | 796,972 | | | | | |
| 4.000%, 06/01/2039 | | | | | | | | | | | | |
| (Callable 06/01/2028) (Insured by AGM) | | | 1,525,000 | | | | 1,757,715 | | | | | |
| Dauphin County General Authority, | | | | | | | | | | | | |
| 5.000%, 06/01/2029 (Callable 06/01/2026) | | | 690,000 | | | | 835,121 | | | | | |
| Delaware County Authority: | | | | | | | | | | | | |
| 4.000%, 10/01/2021 | | | 200,000 | | | | 203,004 | | | | | |
| 5.000%, 10/01/2023 | | | 240,000 | | | | 260,496 | | | | | |
The accompanying notes are an integral part of these financial statements.
Baird Core Intermediate Municipal Bond Fund
Schedule of Investments, December 31, 2020
Long-Term Investments (cont.)
| | | Principal | | | | | | % of | |
| | | Amount | | | Value | | | Net Assets | |
| Delaware Valley Regional Finance Authority: | | | | | | | | | |
| 0.976%, 09/01/2048 (1 Month LIBOR USD + 0.880%) | | | | | | | | | |
| (Callable 09/01/2024) | | | | | | | | | |
(Mandatory Tender Date 09/01/2025)(2) | | $ | 1,000,000 | | | $ | 1,001,800 | | | |
|
|
| 0.190%, 11/01/2055 (Callable 01/04/2021) | | | | | | | | | | | | |
(Optional Put Date 01/07/2021)(1) | | | 3,500,000 | | | | 3,500,000 | | | | | |
| East Hempfield Township | | | | | | | | | | | | |
| Industrial Development Authority, | | | | | | | | | | | | |
| 5.000%, 07/01/2030 (Callable 07/01/2023) | | | 700,000 | | | | 707,000 | | | | | |
| Lycoming County Authority, | | | | | | | | | | | | |
| 4.000%, 11/01/2043 | | | | | | | | | | | | |
(Mandatory Tender Date 05/01/2024)(1) | | | 500,000 | | | | 531,265 | | | | | |
| Mercer County Industrial Development Authority, | | | | | | | | | | | | |
6.125%, 10/01/2050 (Callable 10/01/2025)(3) | | | 3,500,000 | | | | 3,603,040 | | | | | |
| Mid Valley School District: | | | | | | | | | | | | |
| 4.000%, 03/15/2033 | | | | | | | | | | | | |
| (Callable 03/15/2025) (Insured by BAM) | | | 115,000 | | | | 127,859 | | | | | |
| 4.000%, 03/15/2034 | | | | | | | | | | | | |
| (Callable 03/15/2025) (Insured by BAM) | | | 650,000 | | | | 720,850 | | | | | |
| 4.000%, 03/15/2035 | | | | | | | | | | | | |
| (Callable 03/15/2025) (Insured by BAM) | | | 835,000 | | | | 924,738 | | | | | |
| Montgomery County Higher | | | | | | | | | | | | |
| Education & Health Authority: | | | | | | | | | | | | |
| 3.000%, 05/01/2036 | | | | | | | | | | | | |
(Mandatory Tender Date 05/01/2021)(1) | | | 245,000 | | | | 246,259 | | | | | |
| 4.000%, 05/01/2036 | | | | | | | | | | | | |
(Mandatory Tender Date 05/01/2022)(1) | | | 610,000 | | | | 621,651 | | | | | |
| Montgomery County Industrial Development Authority, | | | | | | | | | | | | |
| 5.000%, 11/15/2036 (Callable 11/15/2026) | | | 600,000 | | | | 697,002 | | | | | |
| Pennsylvania Economic Development Financing Authority, | | | | | | | | | | | | |
| 4.000%, 11/15/2034 (Callable 11/15/2027) | | | 1,000,000 | | | | 1,161,460 | | | | | |
| Pennsylvania Higher Educational Facilities Authority, | | | | | | | | | | | | |
| 5.000%, 07/01/2035 (Callable 07/01/2026) | | | 300,000 | | | | 301,137 | | | | | |
| Pennsylvania Housing Finance Agency: | | | | | | | | | | | | |
| 3.500%, 10/01/2046 (Callable 10/01/2025) | | | 305,000 | | | | 321,418 | | | | | |
| 4.000%, 10/01/2049 (Callable 10/01/2028) | | | 1,780,000 | | | | 1,935,003 | | | | | |
| Pennsylvania Turnpike Commission: | | | | | | | | | | | | |
| 5.000%, 06/01/2030 (Callable 12/01/2025) | | | 280,000 | | | | 333,651 | | | | | |
| 6.000%, 12/01/2030 | | | | | | | | | | | | |
(Callable 12/01/2027) (Insured by BAM)(7) | | | 205,000 | | | | 268,923 | | | | | |
| 0.000%, 12/01/2037 | | | | | | | | | | | | |
(Callable 12/01/2026) (Insured by AGM)(7) | | | 155,000 | | | | 174,809 | | | | | |
0.000%, 12/01/2037 (Callable 12/01/2026)(7) | | | 550,000 | | | | 615,807 | | | | | |
5.000%, 12/01/2038 (Callable 12/01/2028)(7) | | | 715,000 | | | | 883,683 | | | | | |
6.375%, 12/01/2038 (Callable 12/01/2027)(7) | | | 745,000 | | | | 983,161 | | | | | |
0.000%, 12/01/2040 (Callable 06/01/2029)(7) | | | 295,000 | | | | 310,594 | | | | | |
The accompanying notes are an integral part of these financial statements.
Baird Core Intermediate Municipal Bond Fund
Schedule of Investments, December 31, 2020
Long-Term Investments (cont.)
| | | Principal | | | | | | % of | |
| | | Amount | | | Value | | | Net Assets | |
| Pittsburgh Water & Sewer Authority, | | | | | | | | | |
| 0.720%, 09/01/2040 (1 Month LIBOR USD + 0.650%) | | | | | | | | | |
| (Callable 06/01/2023) | | | | | | | | | |
| (Mandatory Tender Date 12/01/2023) | | | | | | | | | |
(Insured by AGM)(2) | | $ | 4,000,000 | | | $ | 4,009,680 | | | | |
| Reading School District, | | | | | | | | | | | |
| 5.000%, 02/01/2023 (Insured by AGM) | | | 230,000 | | | | 250,762 | | | | |
| Ridley School District, | | | | | | | | | | | |
| 4.000%, 09/15/2031 | | | | | | | | | | | |
| (Callable 03/15/2025) (Insured by ST AID) | | | 830,000 | | | | 932,381 | | | | |
| School District of Philadelphia, | | | | | | | | | | | |
| 5.000%, 09/01/2023 (Insured by ST AID) | | | 55,000 | | | | 61,331 | | | | |
| Sports & Exhibition Authority of | | | | | | | | | | | |
| Pittsburgh and Allegheny County, | | | | | | | | | | | |
| 5.000%, 12/15/2028 | | | | | | | | | | | |
| (Callable 12/15/2027) (Insured by BAM) | | | 500,000 | | | | 630,910 | | | | |
| State Public School Building Authority, | | | | | | | | | | | |
| 0.000%, 05/15/2027 | | | 160,000 | | | | 146,682 | | | | |
| Upper Moreland Township School District, | | | | | | | | | | | |
| 5.000%, 10/01/2030 | | | | | | | | | | | |
| (Callable 04/01/2025) (Insured by ST AID) | | | 250,000 | | | | 296,610 | | | | |
| Westmoreland County Industrial Development Authority: | | | | | | | | | | | |
| 5.000%, 07/01/2029 | | | 725,000 | | | | 900,276 | | | | |
| 5.000%, 07/01/2030 | | | 550,000 | | | | 691,757 | | | | |
| York Suburban School District, | | | | | | | | | | | |
| 4.000%, 05/01/2030 | | | | | | | | | | | |
| (Callable 05/01/2024) (Insured by BAM) | | | 1,780,000 | | | | 1,959,353 | | | | |
| Total Pennsylvania | | | | | | | | | | | |
| (Cost $36,914,242) | | | | | | | 38,204,530 | | | | 4.4 | % |
| Rhode Island | | | | | | | | | | | | |
| Providence Public Buildings Authority, | | | | | | | | | | | | |
| 5.125%, 06/15/2021 (Insured by AGM) | | | 20,000 | | | | 20,403 | | | | | |
| Rhode Island Commerce Corp., | | | | | | | | | | | | |
| 5.000%, 07/01/2033 | | | | | | | | | | | | |
| (Callable 07/01/2028) (Insured by BAM) | | | 950,000 | | | | 1,145,111 | | | | | |
| Rhode Island Housing & Mortgage Finance Corp., | | | | | | | | | | | | |
| 3.500%, 10/01/2046 (Callable 04/01/2025) | | | 55,000 | | | | 56,793 | | | | | |
| Total Rhode Island | | | | | | | | | | | | |
| (Cost $1,105,056) | | | | | | | 1,222,307 | | | | 0.1 | % |
| South Carolina | | | | | | | | | | | | |
| City of Walhalla SC, | | | | | | | | | | | | |
| 5.000%, 06/01/2025 (Insured by BAM) | | | 185,000 | | | | 220,718 | | | | | |
| County of Florence SC, | | | | | | | | | | | | |
| 5.000%, 11/01/2033 (Callable 11/01/2024) | | | 250,000 | | | | 284,707 | | | | | |
The accompanying notes are an integral part of these financial statements.
Baird Core Intermediate Municipal Bond Fund
Schedule of Investments, December 31, 2020
Long-Term Investments (cont.)
| | | Principal | | | | | | % of | |
| | | Amount | | | Value | | | Net Assets | |
| Scago Educational Facilities Corp. | | | | | | | | | |
| for Union School District, | | | | | | | | | |
| 5.000%, 12/01/2023 (Insured by BAM) | | $ | 500,000 | | | $ | 562,370 | | | | |
| South Carolina Jobs-Economic Development Authority: | | | | | | | | | | | |
| 5.000%, 05/01/2029 (Callable 05/01/2028) | | | 1,055,000 | | | | 1,331,378 | | | | |
| 4.000%, 08/15/2030 (Callable 08/15/2026) | | | 270,000 | | | | 302,001 | | | | |
| 5.250%, 08/15/2033 (Callable 08/15/2026) | | | 2,500,000 | | | | 2,967,675 | | | | |
| 0.230%, 05/01/2048 (Callable 01/04/2021) | | | | | | | | | | | |
(Optional Put Date 01/07/2021)(1) | | | 5,075,000 | | | | 5,075,000 | | | | |
| South Carolina State Housing | | | | | | | | | | | |
| Finance & Development Authority: | | | | | | | | | | | |
| 3.800%, 07/01/2034 | | | | | | | | | | | |
| (Callable 07/01/2024) (Insured by GNMA) | | | 1,030,000 | | | | 1,063,877 | | | | |
| 3.800%, 01/01/2049 (Callable 07/01/2027) | | | 385,000 | | | | 417,540 | | | | |
| 4.000%, 07/01/2050 (Callable 07/01/2029) | | | 2,975,000 | | | | 3,398,878 | | | | |
| South Carolina Transportation Infrastructure Bank, | | | | | | | | | | | |
| 0.546%, 10/01/2031 (1 Month LIBOR USD + 0.450%) | | | | | | | | | | | |
| (Callable 10/01/2021) | | | | | | | | | | | |
(Mandatory Tender Date 10/01/2022)(2) | | | 3,980,000 | | | | 3,974,667 | | | | |
| Spartanburg Regional Health Services District: | | | | | | | | | | | |
| 4.000%, 04/15/2036 | | | | | | | | | | | |
| (Callable 04/15/2030) (Insured by AGM) | | | 445,000 | | | | 531,045 | | | | |
| 4.000%, 04/15/2037 | | | | | | | | | | | |
| (Callable 04/15/2030) (Insured by AGM) | | | 500,000 | | | | 594,635 | | | | |
| 4.000%, 04/15/2038 | | | | | | | | | | | |
| (Callable 04/15/2030) (Insured by AGM) | | | 500,000 | | | | 592,935 | | | | |
| Sumter Two School Facilities, Inc., | | | | | | | | | | | |
| 5.000%, 12/01/2023 (Insured by BAM) | | | 200,000 | | | | 224,516 | | | | |
| Total South Carolina | | | | | | | | | | | |
| (Cost $20,751,297) | | | | | | | 21,541,942 | | | | 2.5 | % |
| South Dakota | | | | | | | | | | | | |
| City of Rapid City SD, | | | | | | | | | | | | |
| 4.000%, 12/01/2035 (Callable 12/01/2029) | | | 3,260,000 | | | | 3,665,577 | | | | | |
| South Dakota Board of Regents | | | | | | | | | | | | |
| Housing & Auxiliary Facilities System, | | | | | | | | | | | | |
| 4.375%, 04/01/2036 | | | | | | | | | | | | |
| (Callable 04/01/2021) (Partially Pre-refunded) | | | 150,000 | | | | 151,516 | | | | | |
| South Dakota Health & Educational Facilities Authority, | | | | | | | | | | | | |
| 4.000%, 11/01/2040 (Callable 11/01/2025) | | | 140,000 | | | | 154,258 | | | | | |
| South Dakota Housing Development Authority: | | | | | | | | | | | | |
| 3.375%, 05/01/2033 (Callable 05/01/2022) | | | 350,000 | | | | 358,039 | | | | | |
| 4.000%, 05/01/2049 (Callable 05/01/2028) | | | 2,320,000 | | | | 2,566,570 | | | | | |
| Total South Dakota | | | | | | | | | | | | |
| (Cost $6,592,467) | | | | | | | 6,895,960 | | | | 0.8 | % |
The accompanying notes are an integral part of these financial statements.
Baird Core Intermediate Municipal Bond Fund
Schedule of Investments, December 31, 2020
Long-Term Investments (cont.)
| | | Principal | | | | | | % of | |
| | | Amount | | | Value | | | Net Assets | |
| Tennessee | | | | | | | | | |
| City of Clarksville TN, | | | | | | | | | |
| 5.000%, 02/01/2032 (Callable 02/01/2026) | | $ | 1,000,000 | | | $ | 1,206,900 | | | |
|
|
| City of Jackson TN: | | | | | | | | | | | | |
| 5.000%, 04/01/2029 (Callable 04/01/2025) | | | 555,000 | | | | 642,229 | | | | | |
| 5.000%, 04/01/2036 (Callable 04/01/2025) | | | 1,950,000 | | | | 2,216,117 | | | | | |
| City of Memphis TN: | | | | | | | | | | | | |
| 5.000%, 12/01/2032 (Pre-refunded to 12/01/2024) | | | 530,000 | | | | 627,329 | | | | | |
| 4.000%, 12/01/2033 (Callable 12/01/2026) | | | 1,300,000 | | | | 1,515,670 | | | | | |
| 4.000%, 12/01/2033 (Callable 12/01/2027) | | | 480,000 | | | | 572,616 | | | | | |
| 4.000%, 12/01/2034 (Callable 12/01/2026) | | | 1,310,000 | | | | 1,525,482 | | | | | |
| 4.000%, 12/01/2035 (Callable 12/01/2026) | | | 275,000 | | | | 319,501 | | | | | |
| County of Warren TN, | | | | | | | | | | | | |
| 4.000%, 06/01/2029 | | | | | | | | | | | | |
| (Callable 06/01/2026) (Insured by AGM) | | | 150,000 | | | | 174,705 | | | | | |
| Knox County Health Educational & Housing Facility Board: | | | | | | | | | | | | |
| 5.000%, 04/01/2022 | | | 200,000 | | | | 209,214 | | | | | |
| 5.000%, 01/01/2026 (Callable 01/01/2023) | | | 145,000 | | | | 157,570 | | | | | |
| Nashville & Davidson County Metropolitan Government, | | | | | | | | | | | | |
| 3.000%, 10/01/2024 | | | 275,000 | | | | 279,199 | | | | | |
| Shelby County Health Educational | | | | | | | | | | | | |
| & Housing Facilities Board, | | | | | | | | | | | | |
| 4.000%, 05/01/2037 (Callable 05/01/2027) | | | 250,000 | | | | 283,532 | | | | | |
| Tennessee Energy Acquisition Corp.: | | | | | | | | | | | | |
| 5.625%, 09/01/2026 | | | 75,000 | | | | 92,482 | | | | | |
| 5.000%, 02/01/2027 | | | 185,000 | | | | 224,616 | | | | | |
| 4.000%, 11/01/2049 (Callable 08/01/2025) | | | | | | | | | | | | |
(Mandatory Tender Date 11/01/2025)(1) | | | 785,000 | | | | 901,831 | | | | | |
| Tennessee Housing Development Agency: | | | | | | | | | | | | |
| 3.600%, 01/01/2031 (Callable 01/01/2023) | | | 1,590,000 | | | | 1,653,775 | | | | | |
| 3.550%, 07/01/2039 (Callable 07/01/2024) | | | 255,000 | | | | 269,204 | | | | | |
| 4.000%, 01/01/2042 (Callable 07/01/2026) | | | 195,000 | | | | 212,829 | | | | | |
| 3.800%, 07/01/2043 (Callable 01/01/2022) | | | 225,000 | | | | 227,997 | | | | | |
| 4.000%, 07/01/2043 (Callable 01/01/2023) | | | 155,000 | | | | 162,119 | | | | | |
| 4.000%, 07/01/2045 (Callable 01/01/2025) | | | 100,000 | | | | 106,806 | | | | | |
| 3.500%, 01/01/2047 (Callable 01/01/2026) | | | 70,000 | | | | 75,002 | | | | | |
| 4.500%, 07/01/2049 (Callable 01/01/2028) | | | 850,000 | | | | 956,684 | | | | | |
| 4.250%, 01/01/2050 (Callable 07/01/2028) | | | 905,000 | | | | 1,010,061 | | | | | |
| Total Tennessee | | | | | | | | | | | | |
| (Cost $15,226,655) | | | | | | | 15,623,470 | | | | 1.8 | % |
| Texas | | | | | | | | | | | | |
| Arlington Higher Education Finance Corp.: | | | | | | | | | | | | |
| 4.000%, 08/15/2028 | | | | | | | | | | | | |
| (Callable 08/15/2026) (PSF Guaranteed) | | | 250,000 | | | | 291,073 | | | | | |
The accompanying notes are an integral part of these financial statements.
Baird Core Intermediate Municipal Bond Fund
Schedule of Investments, December 31, 2020
Long-Term Investments (cont.)
| | | Principal | | | | | | % of | |
| | | Amount | | | Value | | | Net Assets | |
| Arlington Higher Education Finance Corp.: (cont.) | | | | | | | | | |
| 4.000%, 08/01/2033 | | | | | | | | | |
| (Callable 08/01/2028) (PSF Guaranteed) | | $ | 180,000 | | | $ | 214,022 | | | |
|
|
| 5.000%, 02/15/2038 | | | | | | | | | | | | |
| (Callable 02/15/2025) (PSF Guaranteed) | | | 295,000 | | | | 336,869 | | | | | |
| Austin-Bergstrom Landhost Enterprises, Inc., | | | | | | | | | | | | |
| 5.000%, 10/01/2035 (Callable 10/01/2027) | | | 1,250,000 | | | | 1,362,437 | | | | | |
| Bexar County Health Facilities Development Corp., | | | | | | | | | | | | |
| 5.000%, 07/15/2022 | | | 160,000 | | | | 166,374 | | | | | |
| Brazoria County Toll Road Authority, | | | | | | | | | | | | |
0.000%, 03/01/2043 (Callable 03/01/2030)(7) | | | 305,000 | | | | 304,393 | | | | | |
| City of Brownsville TX, | | | | | | | | | | | | |
| 4.000%, 09/01/2029 | | | | | | | | | | | | |
| (Callable 09/01/2026) (Insured by AGM) | | | 170,000 | | | | 197,239 | | | | | |
| City of Greenville TX: | | | | | | | | | | | | |
| 5.000%, 02/15/2034 (Callable 02/15/2024) | | | 200,000 | | | | 225,354 | | | | | |
| 5.000%, 02/15/2035 (Callable 02/15/2024) | | | 175,000 | | | | 196,896 | | | | | |
| City of Houston TX, | | | | | | | | | | | | |
| 5.500%, 12/01/2029 (ETM) (Insured by NATL) | | | 500,000 | | | | 649,690 | | | | | |
| City of Round Rock TX, | | | | | | | | | | | | |
| 4.000%, 12/01/2024 | | | 205,000 | | | | 231,617 | | | | | |
| City of San Antonio TX, | | | | | | | | | | | | |
| 2.750%, 02/01/2048 | | | | | | | | | | | | |
(Mandatory Tender Date 12/01/2022)(1) | | | 1,500,000 | | | | 1,571,535 | | | | | |
| City of Tyler TX, | | | | | | | | | | | | |
| 5.000%, 09/01/2029 (Callable 09/01/2025) | | | 150,000 | | | | 181,163 | | | | | |
| Clifton Higher Education Finance Corp.: | | | | | | | | | | | | |
| 4.000%, 08/15/2030 | | | | | | | | | | | | |
| (Callable 08/15/2026) (PSF Guaranteed) | | | 700,000 | | | | 813,582 | | | | | |
| 4.000%, 04/01/2034 | | | | | | | | | | | | |
| (Callable 04/01/2030) (PSF Guaranteed) | | | 325,000 | | | | 394,823 | | | | | |
| 5.000%, 08/15/2034 | | | | | | | | | | | | |
| (Callable 08/15/2026) (PSF Guaranteed) | | | 1,000,000 | | | | 1,229,540 | | | | | |
| 4.000%, 04/01/2035 | | | | | | | | | | | | |
| (Callable 04/01/2030) (PSF Guaranteed) | | | 250,000 | | | | 302,597 | | | | | |
| County of Harris TX, | | | | | | | | | | | | |
| 5.000%, 08/15/2029 (Callable 08/15/2022) | | | 150,000 | | | | 160,447 | | | | | |
| County of Williamson TX, | | | | | | | | | | | | |
| 5.000%, 02/15/2028 (Callable 02/15/2025) | | | 90,000 | | | | 106,935 | | | | | |
| Crane County Water District, | | | | | | | | | | | | |
| 5.000%, 02/15/2023 | | | 250,000 | | | | 273,870 | | | | | |
| Danbury Higher Education Authority, Inc.: | | | | | | | | | | | | |
| 4.000%, 02/15/2027 (PSF Guaranteed) | | | 200,000 | | | | 235,434 | | | | | |
| 4.000%, 02/15/2028 | | | | | | | | | | | | |
| (Callable 02/15/2027) (PSF Guaranteed) | | | 200,000 | | | | 238,184 | | | | | |
The accompanying notes are an integral part of these financial statements.
Baird Core Intermediate Municipal Bond Fund
Schedule of Investments, December 31, 2020
Long-Term Investments (cont.)
| | | Principal | | | | | | % of | |
| | | Amount | | | Value | | | Net Assets | |
| Danbury Higher Education Authority, Inc.: (cont.) | | | | | | | | | |
| 4.000%, 02/15/2030 | | | | | | | | | |
| (Callable 02/15/2027) (PSF Guaranteed) | | $ | 200,000 | | | $ | 234,300 | | | |
|
|
| 4.000%, 02/15/2031 | | | | | | | | | | | | |
| (Callable 02/15/2027) (PSF Guaranteed) | | | 200,000 | | | | 233,252 | | | | | |
| 5.000%, 02/15/2047 | | | | | | | | | | | | |
| (Callable 02/15/2022) (PSF Guaranteed) | | | 500,000 | | | | 523,160 | | | | | |
| Ferris Independent School District, | | | | | | | | | | | | |
| 5.000%, 08/15/2029 | | | | | | | | | | | | |
| (Callable 08/15/2026) (PSF Guaranteed) | | | 560,000 | | | | 693,050 | | | | | |
| Fort Bend County Municipal Utility District No. 155, | | | | | | | | | | | | |
| 4.000%, 09/01/2033 | | | | | | | | | | | | |
| (Callable 09/01/2023) (Insured by AGM) | | | 230,000 | | | | 242,576 | | | | | |
| Fort Bend County Municipal Utility District No. 30, | | | | | | | | | | | | |
| 4.000%, 09/01/2023 (Insured by BAM) | | | 295,000 | | | | 320,544 | | | | | |
| Fort Bend Independent School District, | | | | | | | | | | | | |
| 5.000%, 08/15/2030 | | | | | | | | | | | | |
| (Callable 08/15/2026) (PSF Guaranteed) | | | 100,000 | | | | 124,382 | | | | | |
| Grand Parkway Transportation Corp.: | | | | | | | | | | | | |
0.000%, 10/01/2034 (Callable 10/01/2028)(7) | | | 40,000 | | | | 47,108 | | | | | |
0.000%, 10/01/2036 (Callable 10/01/2028)(7) | | | 305,000 | | | | 357,722 | | | | | |
0.000%, 10/01/2046 (Callable 10/01/2028)(7) | | | 885,000 | | | | 1,024,370 | | | | | |
0.000%, 10/01/2047 (Callable 10/01/2028)(7) | | | 1,630,000 | | | | 1,888,111 | | | | | |
0.000%, 10/01/2048 (Callable 10/01/2028)(7) | | | 440,000 | | | | 509,018 | | | | | |
| Harris County Cultural Education Facilities Finance Corp., | | | | | | | | | | | | |
| 5.000%, 12/01/2026 (Callable 12/01/2024) | | | 100,000 | | | | 117,255 | | | | | |
| Harris County Municipal Utility District No. 371, | | | | | | | | | | | | |
| 4.000%, 09/01/2032 | | | | | | | | | | | | |
| (Callable 09/01/2023) (Insured by BAM) | | | 370,000 | | | | 394,427 | | | | | |
| Harris County Municipal Utility District No. 500, | | | | | | | | | | | | |
| 3.000%, 12/01/2022 (Insured by AGM) | | | 175,000 | | | | 183,628 | | | | | |
| Harris County Municipal Utility District No. 71, | | | | | | | | | | | | |
| 4.000%, 09/01/2028 | | | | | | | | | | | | |
| (Callable 09/01/2023) (Insured by BAM) | | | 250,000 | | | | 271,995 | | | | | |
| Harris County-Houston Sports Authority, | | | | | | | | | | | | |
| 5.000%, 11/15/2026 | | | | | | | | | | | | |
| (Callable 11/15/2024) (Insured by AGM) | | | 135,000 | | | | 155,093 | | | | | |
| Hunt Memorial Hospital District, | | | | | | | | | | | | |
| 5.000%, 02/15/2030 | | | 1,015,000 | | | | 1,279,874 | | | | | |
| Lake Travis Independent School District: | | | | | | | | | | | | |
| 2.625%, 02/15/2048 | | | | | | | | | | | | |
(Pre-refunded to 02/15/2022) (PSF Guaranteed)(1) | | | 25,000 | | | | 25,655 | | | | | |
| 2.625%, 02/15/2048 | | | | | | | | | | | | |
(Pre-refunded to 02/15/2022) (PSF Guaranteed)(1) | | | 35,000 | | | | 35,918 | | | | | |
The accompanying notes are an integral part of these financial statements.
Baird Core Intermediate Municipal Bond Fund
Schedule of Investments, December 31, 2020
Long-Term Investments (cont.)
| | | Principal | | | | | | % of | |
| | | Amount | | | Value | | | Net Assets | |
| Laredo Community College District, | | | | | | | | | |
| 5.000%, 08/01/2028 | | | | | | | | | |
| (Callable 08/01/2027) (Insured by BAM) | | $ | 350,000 | | | $ | 441,903 | | | |
|
|
| Leander Independent School District, | | | | | | | | | | | | |
| 0.000%, 08/15/2040 | | | | | | | | | | | | |
| (Callable 08/15/2024) (PSF Guaranteed) | | | 20,000 | | | | 8,859 | | | | | |
| Matagorda County Navigation District No. 1, | | | | | | | | | | | | |
| 4.400%, 05/01/2030 (Insured by AMBAC) | | | 925,000 | | | | 1,148,119 | | | | | |
| Montgomery County Municipal Utility District No. 119: | | | | | | | | | | | | |
| 4.000%, 04/01/2023 (Insured by BAM) | | | 200,000 | | | | 215,178 | | | | | |
| 4.000%, 04/01/2024 (Insured by BAM) | | | 200,000 | | | | 221,420 | | | | | |
| Navasota Independent School District, | | | | | | | | | | | | |
| 5.000%, 02/15/2048 | | | | | | | | | | | | |
| (Callable 02/15/2025) (PSF Guaranteed) | | | 2,100,000 | | | | 2,440,032 | | | | | |
| New Hope Cultural Education Facilities Finance Corp., | | | | | | | | | | | | |
3.625%, 08/15/2022 (Callable 08/15/2021)(3) | | | 135,000 | | | | 135,905 | | | | | |
| North Texas Tollway Authority: | | | | | | | | | | | | |
| 5.000%, 01/01/2024 | | | 100,000 | | | | 113,813 | | | | | |
| 5.000%, 01/01/2033 (Callable 01/01/2026) | | | 675,000 | | | | 804,843 | | | | | |
| 5.000%, 01/01/2034 (Callable 01/01/2025) | | | 95,000 | | | | 109,461 | | | | | |
0.000%, 09/01/2045 (Pre-refunded to 09/01/2031)(7) | | | 40,000 | | | | 60,282 | | | | | |
| Northeast Travis County Utility District: | | | | | | | | | | | | |
| 0.000%, 09/01/2023 (Insured by BAM) | | | 275,000 | | | | 268,502 | | | | | |
| 3.000%, 09/01/2027 (Insured by BAM) | | | 170,000 | | | | 191,214 | | | | | |
| Red River Education Finance Corp., | | | | | | | | | | | | |
| 5.000%, 06/01/2022 | | | 500,000 | | | | 521,390 | | | | | |
| Rio Vista Independent School District, | | | | | | | | | | | | |
| 4.000%, 08/15/2028 | | | | | | | | | | | | |
| (Callable 08/15/2025) (Insured by BAM) | | | 125,000 | | | | 143,371 | | | | | |
| Rosebud-Lott Independent School District: | | | | | | | | | | | | |
| 5.500%, 02/15/2030 | | | | | | | | | | | | |
| (Callable 02/15/2025) (PSF Guaranteed) | | | 100,000 | | | | 120,083 | | | | | |
| 5.500%, 02/15/2031 | | | | | | | | | | | | |
| (Callable 02/15/2025) (PSF Guaranteed) | | | 100,000 | | | | 119,813 | | | | | |
| SA Energy Acquisition Public Facility Corp., | | | | | | | | | | | | |
| 5.500%, 08/01/2022 | | | 160,000 | | | | 172,549 | | | | | |
| San Antonio Public Facilities Corp., | | | | | | | | | | | | |
| 4.000%, 09/15/2034 (Callable 09/15/2022) | | | 1,370,000 | | | | 1,426,376 | | | | | |
| Sedona Lakes Municipal Utility District No. 1, | | | | | | | | | | | | |
| 4.000%, 09/01/2026 | | | | | | | | | | | | |
| (Callable 09/01/2025) (Insured by BAM) | | | 85,000 | | | | 96,936 | | | | | |
| Southwest Houston Redevelopment Authority, | | | | | | | | | | | | |
| 5.000%, 09/01/2027 (Insured by AGM) | | | 250,000 | | | | 307,295 | | | | | |
The accompanying notes are an integral part of these financial statements.
Baird Core Intermediate Municipal Bond Fund
Schedule of Investments, December 31, 2020
Long-Term Investments (cont.)
| | | Principal | | | | | | % of | |
| | | Amount | | | Value | | | Net Assets | |
| Sterling Independent School District, | | | | | | | | | |
| 3.000%, 02/15/2028 | | | | | | | | | |
| (Callable 02/15/2024) (PSF Guaranteed) | | $ | 190,000 | | | $ | 203,405 | | | |
|
|
| Texas Department of Housing & Community Affairs, | | | | | | | | | | | | |
| 4.750%, 01/01/2049 (Callable 07/01/2028) | | | 4,140,000 | | | | 4,684,493 | | | | | |
| Texas Municipal Gas Acquisition & Supply Corp. I: | | | | | | | | | | | | |
| 1.595%, 12/15/2026 (3 Month LIBOR USD + 1.450%) | | | | | | | | | | | | |
(Callable 01/04/2021)(2) | | | 3,000,000 | | | | 2,952,510 | | | | | |
| 6.250%, 12/15/2026 | | | 1,355,000 | | | | 1,626,027 | | | | | |
| Texas Municipal Gas Acquisition & Supply Corp. III: | | | | | | | | | | | | |
| 5.000%, 12/15/2026 (Callable 12/15/2022) | | | 190,000 | | | | 205,386 | | | | | |
| 5.000%, 12/15/2028 (Callable 12/15/2022) | | | 575,000 | | | | 618,752 | | | | | |
| 5.000%, 12/15/2029 (Callable 12/15/2022) | | | 1,000,000 | | | | 1,073,630 | | | | | |
| Texas Municipal Power Agency, | | | | | | | | | | | | |
| 5.000%, 09/01/2047 (Callable 02/01/2021) | | | 500,000 | | | | 501,590 | | | | | |
| Tioga Independent School District Public Facility Corp.: | | | | | | | | | | | | |
| 3.250%, 08/15/2027 (Callable 08/15/2024) | | | 200,000 | | | | 199,996 | | | | | |
| 4.000%, 08/15/2041 (Callable 08/15/2024) | | | 825,000 | | | | 830,214 | | | | | |
| Town of Providence Village TX, | | | | | | | | | | | | |
| 4.000%, 03/01/2025 (Insured by BAM) | | | 105,000 | | | | 118,830 | | | | | |
| Travis County Municipal Utility District No. 4, | | | | | | | | | | | | |
| 4.000%, 09/01/2035 | | | | | | | | | | | | |
| (Callable 09/01/2022) (Insured by AGM) | | | 615,000 | | | | 645,129 | | | | | |
| Upper Trinity Regional Water District, | | | | | | | | | | | | |
| 5.000%, 08/01/2032 | | | | | | | | | | | | |
| (Callable 08/01/2028) (Insured by BAM) | | | 240,000 | | | | 307,649 | | | | | |
| Viridian Municipal Management District: | | | | | | | | | | | | |
| 4.000%, 12/01/2027 | | | | | | | | | | | | |
| (Callable 12/01/2023) (Insured by AGM) | | | 315,000 | | | | 343,715 | | | | | |
| 4.000%, 12/01/2028 | | | | | | | | | | | | |
| (Callable 12/01/2023) (Insured by AGM) | | | 470,000 | | | | 510,439 | | | | | |
| 6.000%, 12/01/2035 | | | | | | | | | | | | |
| (Callable 12/01/2024) (Insured by BAM) | | | 90,000 | | | | 108,465 | | | | | |
| Washington County Junior College District, | | | | | | | | | | | | |
| 5.000%, 10/01/2028 | | | | | | | | | | | | |
| (Callable 04/01/2026) (Insured by BAM) | | | 500,000 | | | | 607,640 | | | | | |
| Wimberley Independent School District, | | | | | | | | | | | | |
| 4.000%, 08/15/2031 | | | | | | | | | | | | |
| (Callable 08/15/2027) (PSF Guaranteed) | | | 330,000 | | | | 393,301 | | | | | |
| Total Texas | | | | | | | | | | | | |
| (Cost $41,103,766) | | | | | | | 43,344,027 | | | | 5.0 | % |
| Utah | | | | | | | | | | | | |
| Jordan Valley Water Conservancy District: | | | | | | | | | | | | |
| 5.000%, 10/01/2032 (Callable 10/01/2026) | | | 250,000 | | | | 309,227 | | | | | |
| 5.000%, 10/01/2033 (Callable 10/01/2026) | | | 350,000 | | | | 431,592 | | | | | |
The accompanying notes are an integral part of these financial statements.
Baird Core Intermediate Municipal Bond Fund
Schedule of Investments, December 31, 2020
Long-Term Investments (cont.)
| | | Principal | | | | | | % of | |
| | | Amount | | | Value | | | Net Assets | |
| Midvale Utah Redevelopment Agency, | | | | | | | | | |
| 5.000%, 05/01/2027 | | $ | 290,000 | | | $ | 369,944 | | | |
|
|
| Salt Lake City Corp.: | | | | | | | | | | | | |
| 5.000%, 07/01/2030 (Callable 07/01/2027) | | | 155,000 | | | | 192,936 | | | | | |
| 5.000%, 07/01/2042 (Callable 07/01/2027) | | | 2,725,000 | | | | 3,307,224 | | | | | |
| South Ogden Conservation District, | | | | | | | | | | | | |
| 4.000%, 02/01/2031 | | | | | | | | | | | | |
| (Callable 02/01/2022) (Insured by MAC) | | | 295,000 | | | | 304,222 | | | | | |
| Timpanogos Special Service District, | | | | | | | | | | | | |
| 4.000%, 06/01/2029 (Callable 06/01/2024) | | | 50,000 | | | | 55,056 | | | | | |
| Utah Charter School Finance Authority: | | | | | | | | | | | | |
| 5.000%, 04/15/2027 | | | | | | | | | | | | |
| (Callable 04/15/2026) (Insured by UT CSCE) | | | 365,000 | | | | 438,193 | | | | | |
| 4.000%, 04/15/2028 (Insured by UT CSCE) | | | 210,000 | | | | 249,091 | | | | | |
| 5.000%, 04/15/2028 | | | | | | | | | | | | |
| (Callable 04/15/2026) (Insured by UT CSCE) | | | 720,000 | | | | 860,299 | | | | | |
| 5.250%, 10/15/2028 | | | | | | | | | | | | |
| (Callable 10/15/2023) (Insured by UT CSCE) | | | 400,000 | | | | 447,792 | | | | | |
| 4.000%, 04/15/2029 (Insured by UT CSCE) | | | 225,000 | | | | 269,384 | | | | | |
| 5.000%, 10/15/2032 | | | | | | | | | | | | |
| (Callable 10/15/2027) (Insured by UT CSCE) | | | 285,000 | | | | 345,446 | | | | | |
| 5.000%, 10/15/2036 | | | | | | | | | | | | |
| (Callable 04/15/2023) (Insured by UT CSCE) | | | 700,000 | | | | 756,546 | | | | | |
| 5.000%, 04/15/2037 | | | | | | | | | | | | |
| (Callable 04/15/2026) (Insured by UT CSCE) | | | 520,000 | | | | 602,540 | | | | | |
| 5.000%, 10/15/2043 | | | | | | | | | | | | |
| (Callable 10/15/2023) (Insured by UT CSCE) | | | 2,250,000 | | | | 2,459,205 | | | | | |
| 5.000%, 10/15/2043 | | | | | | | | | | | | |
| (Callable 10/15/2027) (Insured by UT CSCE) | | | 1,000,000 | | | | 1,182,170 | | | | | |
| Utah Housing Corp., | | | | | | | | | | | | |
| 4.000%, 01/01/2045 | | | | | | | | | | | | |
| (Callable 01/01/2026) (Insured by FHA) | | | 245,000 | | | | 264,223 | | | | | |
| Utah Infrastructure Agency: | | | | | | | | | | | | |
| 5.000%, 10/15/2026 | | | 140,000 | | | | 171,837 | | | | | |
| 5.000%, 10/15/2027 | | | 125,000 | | | | 156,225 | | | | | |
| Utah Transit Authority, | | | | | | | | | | | | |
| 5.000%, 12/15/2029 (Callable 06/15/2028) | | | 75,000 | | | | 95,673 | | | | | |
| Total Utah | | | | | | | | | | | | |
| (Cost $12,698,687) | | | | | | | 13,268,825 | | | | 1.5 | % |
| Vermont | | | | | | | | | | | | |
| City of Burlington VT, | | | | | | | | | | | | |
| 5.000%, 07/01/2028 (Callable 07/01/2027) | | | 275,000 | | | | 346,093 | | | | | |
| Vermont Educational & Health Buildings Financing Agency, | | | | | | | | | | | | |
| 5.000%, 12/01/2035 (Callable 06/01/2026) | | | 710,000 | | | | 850,502 | | | | | |
The accompanying notes are an integral part of these financial statements.
Baird Core Intermediate Municipal Bond Fund
Schedule of Investments, December 31, 2020
Long-Term Investments (cont.)
| | | Principal | | | | | | % of | |
| | | Amount | | | Value | | | Net Assets | |
| Vermont Housing Finance Agency, | | | | | | | | | |
| 3.650%, 11/01/2032 (Callable 11/01/2024) | | $ | 120,000 | | | $ | 128,484 | | | | |
| Vermont Public Power Supply Authority: | | | | | | | | | | | |
| 5.000%, 07/01/2027 | | | 660,000 | | | | 821,951 | | | | |
| 5.000%, 07/01/2028 (Callable 07/01/2027) | | | 500,000 | | | | 618,945 | | | | |
| Winooski School District, | | | | | | | | | | | |
| 1.250%, 10/15/2021 | | | 3,500,000 | | | | 3,511,690 | | | | |
| Total Vermont | | | | | | | | | | | |
| (Cost $6,169,001) | | | | | | | 6,277,665 | | | | 0.7 | % |
| Virginia | | | | | | | | | | | | |
| City of Petersburg VA, | | | | | | | | | | | | |
| 4.000%, 11/01/2025 | | | | | | | | | | | | |
| (Callable 11/01/2022) (Insured by ST AID) | | | 290,000 | | | | 301,675 | | | | | |
| Salem Economic Development Authority, | | | | | | | | | | | | |
| 5.000%, 04/01/2021 | | | 250,000 | | | | 251,933 | | | | | |
| Virginia Housing Development Authority, | | | | | | | | | | | | |
| 3.450%, 04/01/2038 (Callable 10/01/2022) | | | 3,000,000 | | | | 3,094,620 | | | | | |
| Total Virginia | | | | | | | | | | | | |
| (Cost $3,584,982) | | | | | | | 3,648,228 | | | | 0.4 | % |
| Washington | | | | | | | | | | | | |
| Clark & Skamania Counties School District No. 112-6, | | | | | | | | | | | | |
| 5.000%, 12/01/2031 | | | | | | | | | | | | |
| (Callable 06/01/2025) (Insured by SCH BD GTY) | | | 160,000 | | | | 191,818 | | | | | |
| Energy Northwest, | | | | | | | | | | | | |
| 5.000%, 07/01/2030 (Callable 07/01/2028) | | | 600,000 | | | | 784,854 | | | | | |
| King County Housing Authority, | | | | | | | | | | | | |
| 5.000%, 12/01/2030 (Callable 12/01/2026) | | | 1,125,000 | | | | 1,347,480 | | | | | |
| King County Public Hospital District No. 1, | | | | | | | | | | | | |
| 5.000%, 12/01/2029 (Callable 12/01/2028) | | | 1,050,000 | | | | 1,290,030 | | | | | |
| Lewis County School District No. 302, | | | | | | | | | | | | |
| 5.000%, 12/01/2031 | | | | | | | | | | | | |
| (Callable 06/01/2025) (Insured by SCH BD GTY) | | | 235,000 | | | | 280,484 | | | | | |
| Pacific County School District No. 118, | | | | | | | | | | | | |
| 4.000%, 12/01/2025 (Insured by SCH BD GTY) | | | 215,000 | | | | 250,552 | | | | | |
| Pend Oreille County Public Utility District No. 1: | | | | | | | | | | | | |
| 5.000%, 01/01/2022 | | | 300,000 | | | | 309,666 | | | | | |
| 5.000%, 01/01/2038 (Callable 01/01/2029) | | | 2,500,000 | | | | 2,877,075 | | | | | |
| State of Washington: | | | | | | | | | | | | |
| 5.000%, 02/01/2038 (Callable 02/01/2024) | | | 645,000 | | | | 727,657 | | | | | |
| 5.000%, 07/01/2042 (Callable 07/01/2028) | | | 1,330,000 | | | | 1,673,738 | | | | | |
| 4.000%, 08/01/2042 (Callable 08/01/2022) | | | 345,000 | | | | 360,760 | | | | | |
| Washington Biomedical Research Properties 3.2, | | | | | | | | | | | | |
| 5.000%, 01/01/2037 (Callable 07/01/2025) | | | 100,000 | | | | 118,148 | | | | | |
The accompanying notes are an integral part of these financial statements.
Baird Core Intermediate Municipal Bond Fund
Schedule of Investments, December 31, 2020
Long-Term Investments (cont.)
| | | Principal | | | | | | % of | |
| | | Amount | | | Value | | | Net Assets | |
| Washington State Housing Finance Commission: | | | | | | | | | |
| 3.700%, 12/01/2033 (Callable 06/01/2024) | | $ | 85,000 | | | $ | 85,973 | | | | |
| 3.700%, 12/01/2034 (Callable 06/01/2025) | | | 45,000 | | | | 48,875 | | | | |
| 4.000%, 06/01/2049 (Callable 06/01/2028) | | | 460,000 | | | | 509,505 | | | | |
| Total Washington | | | | | | | | | | | |
| (Cost $10,143,663) | | | | | | | 10,856,615 | | | | 1.3 | % |
| Wisconsin | | | | | | | | | | | | |
| Appleton Redevelopment Authority, | | | | | | | | | | | | |
| 0.200%, 06/01/2036 (Callable 01/04/2021) | | | | | | | | | | | | |
(Optional Put Date 01/07/2021)(1) | | | 1,700,000 | | | | 1,700,000 | | | | | |
| Milwaukee Redevelopment Authority: | | | | | | | | | | | | |
| 5.000%, 11/15/2030 (Callable 11/15/2026) | | | 225,000 | | | | 276,460 | | | | | |
| 5.000%, 11/15/2032 (Callable 11/15/2026) | | | 175,000 | | | | 214,130 | | | | | |
| Public Finance Authority: | | | | | | | | | | | | |
| 4.000%, 01/01/2021 | | | 435,000 | | | | 435,000 | | | | | |
| 5.000%, 01/01/2021 | | | 150,000 | | | | 150,000 | | | | | |
| 5.000%, 01/01/2022 | | | 150,000 | | | | 156,375 | | | | | |
| 5.000%, 01/01/2023 | | | 190,000 | | | | 206,346 | | | | | |
5.000%, 10/01/2023(3) | | | 2,125,000 | | | | 2,257,749 | | | | | |
| 5.000%, 01/01/2024 | | | 230,000 | | | | 259,348 | | | | | |
5.000%, 10/01/2024(3) | | | 875,000 | | | | 947,056 | | | | | |
| 5.000%, 01/01/2025 | | | 260,000 | | | | 303,456 | | | | | |
3.000%, 04/01/2025(3) | | | 425,000 | | | | 433,649 | | | | | |
| 5.000%, 06/15/2025 | | | 220,000 | | | | 254,131 | | | | | |
3.000%, 03/01/2026 (Callable 03/01/2021)(3) | | | 1,250,000 | | | | 1,251,175 | | | | | |
| 0.000%, 09/01/2028 (Pre-refunded to 09/01/2026) | | | 100,000 | | | | 88,720 | | | | | |
| 5.000%, 03/01/2031 (Callable 03/01/2026) | | | 440,000 | | | | 517,911 | | | | | |
| 5.000%, 10/01/2044 (Callable 04/01/2029) | | | 1,750,000 | | | | 2,135,087 | | | | | |
| Southeast Wisconsin Professional Baseball Park District, | | | | | | | | | | | | |
| 0.000%, 12/15/2023 (ETM) (Insured by NATL) | | | 25,000 | | | | 24,657 | | | | | |
| Tender Option Bond Trust, | | | | | | | | | | | | |
| 0.320%, 05/01/2054 (Callable 02/01/2021) | | | | | | | | | | | | |
(Optional Put Date 01/07/2021)(1)(3) | | | 498,000 | | | | 498,000 | | | | | |
| University of Wisconsin Hospitals & Clinics, | | | | | | | | | | | | |
| 5.000%, 04/01/2038 (Pre-refunded to 04/01/2023) | | | 830,000 | | | | 917,565 | | | | | |
| Village of Mount Pleasant WI: | | | | | | | | | | | | |
| 5.000%, 04/01/2036 (Callable 04/01/2028) | | | 1,000,000 | | | | 1,242,900 | | | | | |
| 4.000%, 04/01/2037 (Callable 04/01/2028) | | | 1,000,000 | | | | 1,154,810 | | | | | |
| 5.000%, 04/01/2048 (Callable 04/01/2028) | | | 1,435,000 | | | | 1,729,907 | | | | | |
| Wisconsin Center District: | | | | | | | | | | | | |
| 5.250%, 12/15/2023 (ETM) (Insured by AGM) | | | 125,000 | | | | 135,814 | | | | | |
| 5.250%, 12/15/2023 (Insured by AGM) | | | 75,000 | | | | 83,674 | | | | | |
| 0.000%, 12/15/2027 | | | 525,000 | | | | 479,966 | | | | | |
| 0.000%, 12/15/2027 (Insured by NATL) | | | 220,000 | | | | 198,374 | | | | | |
The accompanying notes are an integral part of these financial statements.
Baird Core Intermediate Municipal Bond Fund
Schedule of Investments, December 31, 2020
Long-Term Investments (cont.)
| | | Principal | | | | | | % of | |
| | | Amount | | | Value | | | Net Assets | |
| Wisconsin Center District: (cont.) | | | | | | | | | |
| 5.000%, 12/15/2027 (Callable 06/15/2026) | | $ | 500,000 | | | $ | 614,680 | | | |
|
|
| 5.250%, 12/15/2027 (ETM) (Insured by AGM) | | | 70,000 | | | | 87,408 | | | | | |
| 5.250%, 12/15/2027 (Insured by AGM) | | | 195,000 | | | | 242,699 | | | | | |
| 0.000%, 12/15/2028 (Insured by AGM) | | | 1,025,000 | | | | 914,074 | | | | | |
| 0.000%, 12/15/2028 | | | 255,000 | | | | 227,404 | | | | | |
| 5.000%, 12/15/2028 (Callable 06/15/2026) | | | 345,000 | | | | 423,508 | | | | | |
| 0.000%, 12/15/2029 | | | 315,000 | | | | 273,177 | | | | | |
| 0.000%, 12/15/2030 | | | 460,000 | | | | 388,286 | | | | | |
| 0.000%, 12/15/2030 (Insured by AGM) | | | 645,000 | | | | 544,444 | | | | | |
| 5.000%, 12/15/2030 (Callable 12/15/2022) | | | 395,000 | | | | 418,953 | | | | | |
| 5.000%, 12/15/2030 (Callable 06/15/2026) | | | 500,000 | | | | 611,385 | | | | | |
| 5.000%, 12/15/2031 (Callable 06/15/2026) | | | 300,000 | | | | 366,294 | | | | | |
| 0.000%, 12/15/2037 | | | | | | | | | | | | |
| (Callable 06/15/2026) (Insured by BAM) | | | 1,980,000 | | | | 1,141,094 | | | | | |
| Wisconsin Health & Educational Facilities Authority: | | | | | | | | | | | | |
| 5.000%, 03/01/2021 | | | 150,000 | | | | 150,723 | | | | | |
| 5.000%, 03/01/2022 | | | 125,000 | | | | 129,551 | | | | | |
| 5.000%, 11/01/2022 | | | 120,000 | | | | 124,480 | | | | | |
| 5.000%, 07/01/2023 | | | 165,000 | | | | 183,130 | | | | | |
| 5.000%, 11/01/2023 | | | 125,000 | | | | 131,850 | | | | | |
| 5.000%, 07/01/2024 | | | 250,000 | | | | 287,780 | | | | | |
| 5.000%, 11/01/2024 | | | 155,000 | | | | 166,051 | | | | | |
| 4.000%, 09/15/2025 (Callable 09/15/2023) | | | 225,000 | | | | 236,077 | | | | | |
| 5.000%, 11/01/2025 | | | 245,000 | | | | 265,805 | | | | | |
| 5.000%, 07/01/2026 (Callable 07/01/2024) | | | 50,000 | | | | 57,447 | | | | | |
| 2.250%, 11/01/2026 (Callable 11/01/2021) | | | 750,000 | | | | 749,992 | | | | | |
| 5.000%, 08/15/2028 (Callable 08/15/2023) | | | 1,000,000 | | | | 1,103,010 | | | | | |
| 5.000%, 12/01/2028 (Callable 11/01/2026) | | | 45,000 | | | | 55,291 | | | | | |
| 5.000%, 08/15/2029 (Callable 08/15/2027) | | | 170,000 | | | | 214,326 | | | | | |
| 5.000%, 10/01/2029 | | | 515,000 | | | | 678,991 | | | | | |
| 5.000%, 12/15/2030 (Callable 12/15/2024) | | | 480,000 | | | | 553,637 | | | | | |
| 5.000%, 02/15/2032 (Callable 02/15/2022) | | | 670,000 | | | | 697,175 | | | | | |
| 5.000%, 04/01/2032 (Callable 10/01/2022) | | | 290,000 | | | | 311,092 | | | | | |
| 4.375%, 06/01/2039 (Callable 06/01/2022) | | | 175,000 | | | | 180,630 | | | | | |
| 5.000%, 08/15/2039 (Callable 08/15/2024) | | | 1,400,000 | | | | 1,581,300 | | | | | |
| 5.250%, 10/15/2039 (Callable 10/15/2021) | | | 460,000 | | | | 472,912 | | | | | |
| 4.000%, 11/15/2039 (Callable 05/15/2026) | | | 500,000 | | | | 568,785 | | | | | |
| 5.000%, 11/15/2044 (Callable 11/15/2022) | | | 330,000 | | | | 349,269 | | | | | |
| 5.000%, 12/15/2044 (Callable 12/15/2024) | | | 500,000 | | | | 562,725 | | | | | |
| 5.000%, 02/15/2051 (Callable 08/15/2026) | | | | | | | | | | | | |
(Mandatory Tender Date 02/15/2027)(1) | | | 700,000 | | | | 849,107 | | | | | |
| 5.000%, 02/15/2052 (Callable 08/15/2024) | | | | | | | | | | | | |
(Mandatory Tender Date 02/15/2025)(1) | | | 2,410,000 | | | | 2,772,705 | | | | | |
The accompanying notes are an integral part of these financial statements.
Baird Core Intermediate Municipal Bond Fund
Schedule of Investments, December 31, 2020
Long-Term Investments (cont.)
| | | Principal | | | | | | % of | |
| | | Amount | | | Value | | | Net Assets | |
| Wisconsin Housing & Economic Development Authority: | | | | | | | | | |
| 4.000%, 03/01/2048 | | | | | | | | | |
| (Callable 03/01/2027) (Insured by FNMA) | | $ | 1,445,000 | | | $ | 1,559,834 | | | | |
| 4.250%, 03/01/2049 (Callable 09/01/2028) | | | 1,820,000 | | | | 2,039,310 | | | | |
| Total Wisconsin | | | | | | | | | | | |
| (Cost $39,866,956) | | | | | | | 41,338,651 | | | | 4.8 | % |
| Wyoming | | | | | | | | | | | | |
| Wyoming Community Development Authority: | | | | | | | | | | | | |
| 3.000%, 12/01/2044 (Callable 06/01/2024) | | | 70,000 | | | | 72,636 | | | | | |
| 4.000%, 12/01/2048 (Callable 06/01/2028) | | | 1,785,000 | | | | 1,972,318 | | | | | |
| Total Wyoming | | | | | | | | | | | | |
| (Cost $1,957,112) | | | | | | | 2,044,954 | | | | 0.2 | % |
| Total Long-Term Investments | | | | | | | | | | | | |
| (Cost $815,001,598) | | | | | | | 850,456,128 | | | | 98.3 | % |
| Short-Term Investment | | | | | | | | | | | | |
| | | Shares | | | | | | | | | |
| Money Market Mutual Fund | | | | | | | | | | | | |
| Federated Hermes Institutional Tax-Free | | | | | | | | | | | | |
Cash Trust, Premier Shares, 0.01%(4) | | | 548,957 | | | | 548,957 | | | | | |
| Total Short-Term Investment | | | | | | | | | | | | |
| (Cost $548,957) | | | | | | | 548,957 | | | | 0.1 | % |
| Total Investments | | | | | | | | | | | | |
| (Cost $815,550,555) | | | | | | | 851,005,085 | | | | 98.4 | % |
| Other Assets in Excess of Liabilities | | | | | | | 13,446,104 | | | | 1.6 | % |
| TOTAL NET ASSETS | | | | | | $ | 864,451,189 | | | | 100.0 | % |
Notes to Schedule of Investments
AGC – Assured Guaranty Corp.
AGM – Assured Guaranty Municipal
AMBAC – Ambac Assurance Corp.
BAM – Build America Mutual Assurance Co.
BHAC – Berkshire Hathaway Assurance Corp.
FHA – Federal Housing Administration
FNMA – Federal National Mortgage Association
GNMA – Government National Mortgage Association
MAC – Municipal Assurance Corp.
NATL – National Public Finance Guarantee Corp.
Q-SBLF – Qualified School Building Loan Fund
SCH BD GTY – School Board Guaranty
SD CRED PROG – State Credit Enhancement Program
ST AID – State Aid Intercept/Withholding
UT CSCE – Utah Charter School Credit Enhancement Program
The accompanying notes are an integral part of these financial statements.
Baird Core Intermediate Municipal Bond Fund
Schedule of Investments, December 31, 2020
Notes to Schedule of Investments (cont.)ETM – Escrowed to Maturity
LIBOR – London Inter-bank Offered Rate
PSF – Permanent School Fund
SIFMA – Securities Industry and Financial Markets Association
| (1) | Variable rate security. The rate reported is the rate in effect as of December 31, 2020. |
| (2) | Variable rate security based on a reference index and spread. The rate reported is the rate in effect as of December 31, 2020. |
| (3) | Security issued under Rule 144A under the Securities Act of 1933 and classified as liquid under the Fund’s liquidity risk management program. Purchased in a private placement transaction; resale to the public may require registration or may extend only to qualified institutional buyers. At December 31, 2020, the value of these securities total $48,599,022, which represents 5.62% of total net assets. |
| (4) | Seven-day yield. |
| (5) | Auction rate security. An auction rate security is a debt instrument with a long nominal maturity for which the interest rate is regularly reset through a Dutch auction. The rate presented is either the rate set through the auction or the maximum interest rate provided for in the security issuance provision. |
| (6) | Security or a portion of the security purchased on a when-issued or delayed delivery basis. |
| (7) | Step-up bond; the interest rate shown is the rate in effect as of December 31, 2020. |
Summary of Fair Value Exposure at December 31, 2020
The Fund has adopted authoritative fair valuation accounting standards which establish a definition of fair value and set out a hierarchy for measuring fair value. These standards require additional disclosures about the various inputs and valuation techniques used to develop the measurements of fair value and a discussion on changes in valuation techniques and related inputs during the period. These standards define fair value as the price that would be received to sell an asset or paid to transfer a liability in an orderly transaction between market participants at the measurement date.
The fair value hierarchy is organized into three levels based upon the assumptions (referred to as “inputs”) used in pricing the asset or liability. These standards state that “observable inputs” reflect the assumptions market participants would use in pricing the asset or liability based on market data obtained from independent sources and “unobservable inputs” reflect an entity’s own assumptions about the assumptions market participants would use in pricing the asset or liability. These inputs are summarized into three broad levels and described below:
| Level 1 – | Quoted prices (unadjusted) in active markets for identical assets or liabilities that the reporting entity can access at the measurement date. |
| Level 2 – | Inputs other than quoted prices included within Level 1 that are observable for the asset or liability, either directly or indirectly. |
| Level 3 – | Unobservable inputs for the asset or liability. |
The inputs or methodology used for valuing securities are not necessarily an indication of the risk associated with investing in those securities.
The accompanying notes are an integral part of these financial statements.
Baird Core Intermediate Municipal Bond Fund
Summary of Fair Value Exposure at December 31, 2020 (cont.)
The following is a summary of the inputs used to value the Fund’s investments as of December 31, 2020:
| | | Level 1 | | | Level 2 | | | Level 3 | | | Total | |
| Long-Term Investments | | | | | | | | | | | | |
| Municipal Bonds | | $ | — | | | $ | 850,456,128 | | | $ | — | | | $ | 850,456,128 | |
| Total Long-Term Investments | | | — | | | | 850,456,128 | | | | — | | | | 850,456,128 | |
| Short-Term Investment | | | | | | | | | | | | | | | | |
| Money Market Mutual Fund | | | 548,957 | | | | — | | | | — | | | | 548,957 | |
| Total Short-Term Investment | | | 548,957 | | | | — | | | | — | | | | 548,957 | |
| Total Investments | | $ | 548,957 | | | $ | 850,456,128 | | | $ | — | | | $ | 851,005,085 | |
Changes in valuation techniques may result in transfers into or out of assigned levels within the fair value hierarchy. There were no transfers into or out of Level 3 during the reporting period, as compared to the security classifications from the prior year’s annual report. See the Fund’s Valuation Policy in Note 2a to the financial statements.
The accompanying notes are an integral part of these financial statements.
Baird Municipal Bond Fund
December 31, 2020 (Unaudited)
The Baird Municipal Bond Fund seeks a high level of current income that is exempt from federal income tax and is consistent with the preservation of capital.
The coronavirus (COVID-19) challenges of 2020 were unexpected and unprecedented, but so was the speed and magnitude of the monetary and fiscal responses. The result was a year of significant volatility, yet a rewarding one for Fund investors who stayed the course. Over the full year, tax-exempt rates fell sharply across the curve with short rates falling 93bps and long yields declining 68bps, steepening the curve. As the year began, no one could have known the challenges that would soon be faced. Municipal funds were benefiting from a record streak of weekly inflows, state and local tax revenues were generally rising with the economy in its eleventh year of expansion and many municipalities were adding to an already healthy level of reserves. News broke in January of COVID-19 in the State of Washington; by the end of February, seven states had confirmed cases and it was spreading rapidly. Trading activity in the municipal market initially froze as the lockdowns began, then a torrent of selling was unleashed and a liquidity crisis quickly emerged. The selling and lack of dealer support for the market drove tax-exempt yields to record highs relative to comparable maturity Treasuries. Never had a U.S. economic shock been so swift, deep and broad, affecting so many municipalities. Investors were questioning the ability of municipalities to withstand this crisis and meet their obligations. On March 27th, President Trump signed the $2.2 trillion CARES Act which, along with other measures, offered substantial aid to nearly every sector of the municipal market. In addition, the establishment of the Municipal Liquidity Facility (MLF), which, for the first time ever, allowed the Fed to lend directly to states and other select municipalities, offered investors the psychological support they were looking for. As the policymakers acted, AAA-rated municipal yields peaked on March 20th and opportunistic investors began to emerge, looking to capitalize on the incredible undervaluation that had been created in the downdraft. From a credit perspective, the further in time we moved away from the initial economic shutdowns, the better the news became on tax revenues.
During 2020, the Fund’s Institutional Class Shares generated strong absolute and relative returns and outperformed its benchmark by 474 basis points net of fees.
The primary factors contributing to the Fund’s absolute and relative performance in 2020 include:
Contributors to Performance
| | • | Security selection |
| | • | Credit sector – overweight to this sector and added to lower-quality issues as valuations became more attractive |
| | • | Curve – favorable structure relative to benchmark |
Detractors from Performance
| | • | The relative price differences between pricing services used by the Fund (ICE) and its benchmark (BVAL) |
| | • | Sector – weighting in Education and Housing |
Although the COVID-19 vaccinations have begun, we expect the economic impact of COVID-19 to linger well into 2021, particularly as it relates to travel and entertainment. Yet, with the massive fiscal stimulus that is already in the pipeline, and perhaps more coming now that the Democratic Party has full, albeit narrow, control of Washington, above-average economic growth is very likely this year. This should boost state and local tax revenues helping municipalities recover from the pandemic-induced decline. With short-term rates anchored by the Fed, a steeper yield curve is likely which provides the opportunity for investors to capture the roll-down benefit as bonds age along a relatively steep curve. We expect the roll-down return to be an important component of total return this year, along with the yield advantage the Fund enjoys above that of its benchmark. Municipal credit spreads have room to narrow further, suggesting a modest credit overweight is appropriate. Strategic positioning across market sectors and the yield curve, a continued focus on credit to identify improving trends, plus the always-important security selection process will all be important to navigate through the current environment.
Baird Municipal Bond Fund
December 31, 2020 (Unaudited)
We expect the Fund will target a neutral duration posture relative to the benchmark with an allocation that seeks to optimize the roll-down benefit of a steep, upwardly-sloping municipal curve and its sector weightings will favor an overweight to revenue-backed issues over general obligation debt. We believe an overweight credit posture is appropriate for the Fund to benefit from further economic recovery. We also believe our continued focus on selecting investments with strong fundamental tax and revenue support remains critical.
Baird Municipal Bond Fund
December 31, 2020 (Unaudited)
Portfolio Characteristics
Quality Distribution(1)(2)
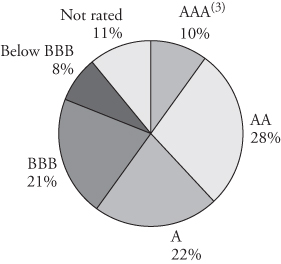
| | Net Assets | $21,901,820 | |
| | | | |
| | SEC 30-Day | | |
| | Yield(4) | | |
| | Institutional Class | 1.71% | |
| | Investor Class | 1.44% | |
| | | | |
| | Average | | |
| | Effective | | |
| | Duration | 5.04 years | |
| | | | |
| | Average | | |
| | Effective | | |
| | Maturity | 5.30 years | |
| | | | |
| | Annualized | | |
| | | Expense | | |
Sector Weightings(1) | | Ratio(5) | | |
| | | Institutional Class | 0.30% | |
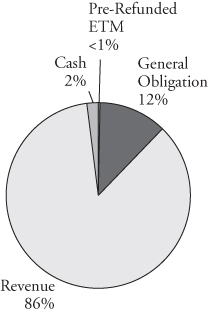 | | Investor Class | 0.55% | (6) |
| | | | |
| | Portfolio | | |
| | Turnover Rate | 124% | |
| | | | |
| | Number of | | |
| | Holdings | 182 | |
| | | | |
| | | | |
| | | | |
| | | | |
| | | | |
| | | | |
| | | | |
| | | | |
| | | | |
| | | | |
| | | | |
| | | | | |
| (1) | Percentages shown are based on the Fund’s total investments. |
| (2) | The quality profile is calculated on a market value-weighted basis using the highest credit quality rating for each security held by the Fund given by S&P, Moody’s or Fitch, each of which is a Nationally Recognized Statistical Rating Organization (NRSRO). NRSROs rate the credit quality of securities using a scale that generally ranges from AAA (highest) to D (lowest). |
| (3) | Includes pre-refunded and escrowed-to-maturity (ETM) bonds. |
| (4) | SEC yields are based on SEC guidelines and are calculated for the 30 days ended December 31, 2020. |
| (5) | Reflects expense ratios as stated in the Fund’s current prospectus. |
| (6) | Includes 0.25% 12b-1 fee. |
Baird Municipal Bond Fund
December 31, 2020 (Unaudited)
Institutional ClassValue of a $25,000 Investment
Growth of a hypothetical investment of $25,000 made on the Fund’s inception date (11/15/19), assuming reinvestment of all distributions.
Investor Class
Value of a $10,000 Investment
Growth of a hypothetical investment of $10,000 made on the Fund’s inception date (11/15/19), assuming reinvestment of all distributions.
Baird Municipal Bond Fund
December 31, 2020 (Unaudited)
Total Returns
| | | Average |
| | | Annual |
| | One | Since |
| For the Periods Ended December 31, 2020 | Year | Inception(1) |
| Institutional Class Shares | 9.95% | 9.94% |
| Investor Class Shares | 9.58% | 9.58% |
Bloomberg Barclays Municipal Bond Index(2) | 5.21% | 5.39% |
| (1) | For the period from November 15, 2019 (inception date) through December 31, 2020. |
| (2) | The Bloomberg Barclays Municipal Bond Index is considered representative of the broad market for investment grade, tax-exempt bonds with a maturity of at least one year. The index has four main sectors: state and local general obligation bonds, revenue bonds, insured bonds and prerefunded bonds. This Index does not reflect any deduction for fees, expenses or taxes. A direct investment in an index is not possible. |
The line graphs on the previous page and the returns shown in the table above reflect reinvestment of dividends and/or capital gains distributions in additional shares. The returns in the graphs and table do not reflect the deduction of taxes that a shareholder would pay on Fund distributions or the redemption of Fund shares. The returns reflect the actual performance for each period and do not include the impact of trades executed on the last business day of the period that were recorded on the first business day of the next period.
The Fund’s gross expense ratio for each Class, as reflected in the Fund’s current prospectus, is set forth under “Portfolio Characteristics”.
The Fund may invest up to 15% of its net assets in non-investment grade debt securities (commonly referred to as “high yield” bonds). While these types of debt securities typically offer higher yields than investment grade securities, they also include greater risks including increased credit risk and the increased risk of default or bankruptcy. The Fund may invest up to 25% of its total assets in municipal obligations issued by persons in the same state. As a result, changes in economic, business or political conditions of a particular state may have a disproportionate impact on the Fund’s share price. Municipal securities investments are not appropriate for all investors, especially those taxed at lower rates.
The Fund may invest up to 20% of its net assets in U.S. government and corporate bonds and other debt securities that are of the same quality as its investments in municipal bonds. These bonds produce income that is taxable for federal income tax purposes, unlike municipal bonds which generally provide income exempt from federal income tax. U.S. and international markets have experienced significant periods of volatility in recent years and months due to a number of economic, political and global macro factors including the impact of the coronavirus (COVID-19) as a global pandemic and related public health issues, growth concerns in the U.S. and overseas, uncertainties regarding interest rates, trade tensions and the threat of tariffs imposed by the U.S. and other countries. These and other geopolitical events may cause market disruptions and could have an adverse effect on the value of the Fund’s investments.
Past performance does not guarantee future results. Investment return and principal value will fluctuate so that an investor’s shares, when redeemed, may be worth more or less than their original cost.
For information about the performance of the Fund as of the most recent month-end, please call 1-866-44BAIRD or visit www.bairdfunds.com. Mutual fund performance changes over time and current performance may be lower or higher than that stated.
Baird Municipal Bond Fund
Schedule of Investments, December 31, 2020
Long-Term Investments
| | | Principal | | | | | | % of | |
| | | Amount | | | Value | | | Net Assets | |
| Municipal Bonds | | | | | | | | | |
| Alabama | | | | | | | | | |
| Alabama Community College System, | | | | | | | | | |
| 3.500%, 11/01/2025 (Insured by BAM) | | $ | 100,000 | | | $ | 112,318 | | | | |
| Alabama Special Care Facilities Financing Authority, | | | | | | | | | | | |
| 5.000%, 06/01/2026 (Callable 06/01/2025) | | | 110,000 | | | | 130,724 | | | | |
| Black Belt Energy Gas District, | | | | | | | | | | | |
| 4.000%, 12/01/2049 (Callable 09/01/2025) | | | | | | | | | | | |
(Mandatory Tender Date 12/01/2025)(1) | | | 45,000 | | | | 51,948 | | | | |
| Chilton County Health Care Authority, | | | | | | | | | | | |
| 3.000%, 11/01/2027 (Callable 11/01/2025) | | | 100,000 | | | | 108,742 | | | | |
| Eutaw Industrial Development Board, | | | | | | | | | | | |
0.060%, 06/01/2028 (Optional Put Date 01/04/2021)(1) | | | 200,000 | | | | 200,000 | | | | |
| Industrial Development Board of the City of Mobile AL, | | | | | | | | | | | |
0.050%, 06/01/2034 (Optional Put Date 01/04/2021)(1) | | | 200,000 | | | | 200,000 | | | | |
| Tallassee Board of Education, | | | | | | | | | | | |
| 4.000%, 08/01/2034 | | | | | | | | | | | |
| (Callable 08/01/2030) (Insured by AGM) | | | 100,000 | | | | 122,539 | | | | |
| University of West Alabama: | | | | | | | | | | | |
| 4.000%, 01/01/2040 | | | | | | | | | | | |
| (Callable 01/01/2030) (Insured by AGM) | | | 50,000 | | | | 58,299 | | | | |
| 4.000%, 01/01/2041 | | | | | | | | | | | |
| (Callable 01/01/2030) (Insured by AGM) | | | 100,000 | | | | 116,271 | | | | |
| Total Alabama | | | | | | | | | | | |
| (Cost $1,066,518) | | | | | | | 1,100,841 | | | | 5.0 | % |
| Alaska | | | | | | | | | | | | |
| CIVIC Ventures, | | | | | | | | | | | | |
| 5.000%, 09/01/2025 | | | 100,000 | | | | 109,987 | | | | | |
| Total Alaska | | | | | | | | | | | | |
| (Cost $108,188) | | | | | | | 109,987 | | | | 0.5 | % |
| Arizona | | | | | | | | | | | | |
| Arizona Industrial Development Authority: | | | | | | | | | | | | |
5.000%, 10/01/2030 (Callable 10/01/2026)(3) | | | 100,000 | | | | 103,197 | | | | | |
| 4.000%, 07/01/2032 (Callable 01/01/2028) | | | | | | | | | | | | |
| (Insured by SD CRED PROG) | | | 100,000 | | | | 113,322 | | | | | |
| Industrial Development Authority of the County of Pima, | | | | | | | | | | | | |
| 4.000%, 07/01/2029 | | | 25,000 | | | | 28,987 | | | | | |
| Total Arizona | | | | | | | | | | | | |
| (Cost $236,459) | | | | | | | 245,506 | | | | 1.1 | % |
| Arkansas | | | | | | | | | | | | |
| Batesville Public Facilities Board, | | | | | | | | | | | | |
| 5.000%, 06/01/2026 | | | 150,000 | | | | 168,166 | | | | | |
| Carroll-Boone Water District, | | | | | | | | | | | | |
| 3.000%, 12/01/2032 (Callable 12/01/2025) | | | 150,000 | | | | 158,726 | | | | | |
The accompanying notes are an integral part of these financial statements.
Baird Municipal Bond Fund
Schedule of Investments, December 31, 2020
Long-Term Investments (cont.)
| | | Principal | | | | | | % of | |
| | | Amount | | | Value | | | Net Assets | |
| Southern Arkansas University, | | | | | | | | | |
| 4.000%, 03/01/2028 | | | | | | | | | |
| (Callable 03/01/2025) (Insured by AGM) | | $ | 130,000 | | | $ | 146,587 | | | | |
| Total Arkansas | | | | | | | | | | | |
| (Cost $463,969) | | | | | | | 473,479 | | | | 2.2 | % |
| California | | | | | | | | | | | | |
| California Infrastructure & Economic Development Bank, | | | | | | | | | | | | |
| 0.478%, 08/01/2047 (1 Month LIBOR USD + 0.380%) | | | | | | | | | | | | |
| (Callable 02/01/2021) | | | | | | | | | | | | |
(Mandatory Tender Date 08/01/2021)(2) | | | 75,000 | | | | 74,992 | | | | | |
| California Municipal Finance Authority, | | | | | | | | | | | | |
| 5.000%, 10/01/2023 | | | 85,000 | | | | 94,151 | | | | | |
| California School Finance Authority, | | | | | | | | | | | | |
4.000%, 07/01/2021(3) | | | 100,000 | | | | 101,543 | | | | | |
| El Rancho Unified School District, | | | | | | | | | | | | |
| 0.000%, 08/01/2031 | | | | | | | | | | | | |
(Callable 08/01/2028) (Insured by AGM)(7) | | | 115,000 | | | | 141,367 | | | | | |
| Los Alamitos Unified School District, | | | | | | | | | | | | |
0.000%, 08/01/2042 (Callable 08/01/2029)(7) | | | 105,000 | | | | 118,873 | | | | | |
| Los Angeles Regional Airports Improvement Corp., | | | | | | | | | | | | |
| 4.500%, 01/01/2027 (Callable 01/01/2022) | | | 125,000 | | | | 128,918 | | | | | |
| Mayers Memorial Hospital District, | | | | | | | | | | | | |
| 0.000%, 08/01/2029 | | | 160,000 | | | | 128,643 | | | | | |
| Modesto Irrigation District, | | | | | | | | | | | | |
| 0.731%, 09/01/2027 (3 Month LIBOR USD + 0.580%) | | | | | | | | | | | | |
(Callable 02/01/2021) (Insured by NATL)(2) | | | 60,000 | | | | 59,257 | | | | | |
| Morongo Unified School District, | | | | | | | | | | | | |
0.000%, 08/01/2041 (Callable 08/01/2030)(7) | | | 25,000 | | | | 27,043 | | | | | |
| Newport Mesa Unified School District, | | | | | | | | | | | | |
0.000%, 08/01/2042 (Callable 08/01/2031)(7) | | | 35,000 | | | | 49,513 | | | | | |
| Oak Park Unified School District, | | | | | | | | | | | | |
| 0.000%, 08/01/2038 | | | | | | | | | | | | |
(Callable 08/01/2031) (Insured by AGM)(7) | | | 50,000 | | | | 74,358 | | | | | |
| Oxnard School District, | | | | | | | | | | | | |
| 2.000%, 08/01/2045 | | | | | | | | | | | | |
(Callable 08/01/2026) (Insured by BAM)(7) | | | 150,000 | | | | 166,686 | | | | | |
| Total California | | | | | | | | | | | | |
| (Cost $1,107,782) | | | | | | | 1,165,344 | | | | 5.3 | % |
| Colorado | | | | | | | | | | | | |
| City & County of Denver CO, | | | | | | | | | | | | |
| 5.000%, 08/01/2041 (Callable 08/01/2026) | | | 115,000 | | | | 137,096 | | | | | |
| Colorado Educational & Cultural Facilities Authority, | | | | | | | | | | | | |
| 2.000%, 09/01/2030 (Callable 09/01/2028) | | | 100,000 | | | | 100,823 | | | | | |
The accompanying notes are an integral part of these financial statements.
Baird Municipal Bond Fund
Schedule of Investments, December 31, 2020
Long-Term Investments (cont.)
| | | Principal | | | | | | % of | |
| | | Amount | | | Value | | | Net Assets | |
| Colorado Health Facilities Authority, | | | | | | | | | |
| 4.250%, 12/01/2023 (ETM) | | $ | 15,000 | | | $ | 16,676 | | | | |
| E-470 Public Highway Authority, | | | | | | | | | | | |
| 0.000%, 09/01/2029 (Insured by NATL) | | | 100,000 | | | | 88,858 | | | | |
| Vauxmont Metropolitan District: | | | | | | | | | | | |
| 5.000%, 12/15/2032 | | | | | | | | | | | |
| (Callable 12/15/2024) (Insured by AGM) | | | 25,000 | | | | 29,097 | | | | |
| 3.250%, 12/15/2050 | | | | | | | | | | | |
| (Callable 12/15/2024) (Insured by AGM) | | | 75,000 | | | | 80,680 | | | | |
| Total Colorado | | | | | | | | | | | |
| (Cost $428,123) | | | | | | | 453,230 | | | | 2.1 | % |
| Connecticut | | | | | | | | | | | | |
| Connecticut State Higher | | | | | | | | | | | | |
| Education Supplement Loan Authority, | | | | | | | | | | | | |
| 3.000%, 11/15/2035 (Callable 11/15/2026) | | | 150,000 | | | | 156,601 | | | | | |
| Total Connecticut | | | | | | | | | | | | |
| (Cost $146,754) | | | | | | | 156,601 | | | | 0.7 | % |
| District of Columbia | | | | | | | | | | | | |
| Metropolitan Washington Airports Authority, | | | | | | | | | | | | |
| 0.000%, 10/01/2036 (Insured by AGC) | | | 100,000 | | | | 71,469 | | | | | |
| Total District of Columbia | | | | | | | | | | | | |
| (Cost $64,372) | | | | | | | 71,469 | | | | 0.3 | % |
| Florida | | | | | | | | | | | | |
| Capital Trust Agency, Inc.: | | | | | | | | | | | | |
5.250%, 12/01/2024(3) | | | 100,000 | | | | 99,706 | | | | | |
5.250%, 12/01/2058 (Callable 12/01/2028)(3) | | | 150,000 | | | | 159,078 | | | | | |
| City of Tallahassee FL, | | | | | | | | | | | | |
| 4.000%, 12/01/2035 (Callable 06/01/2025) | | | 25,000 | | | | 26,601 | | | | | |
| County of St. Lucie FL, | | | | | | | | | | | | |
0.030%, 09/01/2028 (Optional Put Date 01/04/2021)(1) | | | 200,000 | | | | 200,000 | | | | | |
| Florida Housing Finance Corp., | | | | | | | | | | | | |
| 4.200%, 01/01/2045 | | | | | | | | | | | | |
| (Callable 01/01/2028) (Insured by GNMA) | | | 125,000 | | | | 138,126 | | | | | |
| JEA Water & Sewer System Revenue, | | | | | | | | | | | | |
| 0.080%, 10/01/2038 (Callable 01/04/2021) | | | | | | | | | | | | |
(Optional Put Date 01/07/2021)(1) | | | 300,000 | | | | 300,000 | | | | | |
| Miami Health Facilities Authority, | | | | | | | | | | | | |
| 5.000%, 07/01/2021 | | | 25,000 | | | | 24,967 | | | | | |
| Orange County Convention Center, | | | | | | | | | | | | |
| 4.000%, 10/01/2034 (Callable 10/01/2026) | | | 150,000 | | | | 170,892 | | | | | |
| Orange County Health Facilities Authority, | | | | | | | | | | | | |
| 5.000%, 08/01/2028 (Callable 08/01/2024) | | | 200,000 | | | | 224,188 | | | | | |
The accompanying notes are an integral part of these financial statements.
Baird Municipal Bond Fund
Schedule of Investments, December 31, 2020
Long-Term Investments (cont.)
| | | Principal | | | | | | % of | |
| | | Amount | | | Value | | | Net Assets | |
| Palm Beach County Health Facilities Authority, | | | | | | | | | |
| 5.000%, 05/15/2023 | | $ | 200,000 | | | $ | 213,574 | | | | |
| University of West Florida, | | | | | | | | | | | |
| 4.000%, 06/01/2034 (Callable 06/01/2026) | | | 50,000 | | | | 54,926 | | | | |
| Total Florida | | | | | | | | | | | |
| (Cost $1,572,618) | | | | | | | 1,612,058 | | | | 7.4 | % |
| Georgia | | | | | | | | | | | | |
| Burke County Development Authority, | | | | | | | | | | | | |
0.050%, 07/01/2049 (Optional Put Date 01/04/2021)(1) | | | 100,000 | | | | 100,000 | | | | | |
| Development Authority of Appling County, | | | | | | | | | | | | |
| 1.500%, 01/01/2038 | | | | | | | | | | | | |
(Mandatory Tender Date 02/03/2025)(1) | | | 100,000 | | | | 102,107 | | | | | |
| Total Georgia | | | | | | | | | | | | |
| (Cost $200,000) | | | | | | | 202,107 | | | | 0.9 | % |
| Illinois | | | | | | | | | | | | |
| Chicago Board of Education, | | | | | | | | | | | | |
| 5.500%, 12/01/2026 (Insured by NATL) | | | 60,000 | | | | 68,437 | | | | | |
| Chicago Park District, | | | | | | | | | | | | |
| 5.000%, 01/01/2022 | | | 85,000 | | | | 87,978 | | | | | |
| City of Chicago IL, | | | | | | | | | | | | |
| 0.000%, 01/01/2027 (Insured by NATL) | | | 100,000 | | | | 86,076 | | | | | |
| Cook County Community College District No. 508, | | | | | | | | | | | | |
| 5.250%, 12/01/2028 (Callable 12/01/2023) | | | 75,000 | | | | 80,251 | | | | | |
| Exceptional Children Have Opportunities, | | | | | | | | | | | | |
| 4.000%, 12/01/2035 (Callable 12/01/2029) | | | 150,000 | | | | 174,796 | | | | | |
| Illinois Finance Authority: | | | | | | | | | | | | |
| 5.125%, 05/15/2035 (Callable 02/01/2021) | | | 25,000 | | | | 25,065 | | | | | |
| 4.125%, 11/15/2037 (Callable 11/15/2025) | | | 30,000 | | | | 33,175 | | | | | |
| 6.000%, 10/01/2048 (Callable 10/01/2022) | | | 100,000 | | | | 104,276 | | | | | |
| Joliet Park District, | | | | | | | | | | | | |
| 4.000%, 02/01/2033 | | | | | | | | | | | | |
| (Callable 02/01/2023) (Insured by AGM) | | | 100,000 | | | | 103,939 | | | | | |
| Metropolitan Pier & Exposition Authority, | | | | | | | | | | | | |
| 0.000%, 06/15/2029 (Insured by NATL) | | | 100,000 | | | | 84,122 | | | | | |
| Southern Illinois University, | | | | | | | | | | | | |
| 5.000%, 04/01/2021 | | | 95,000 | | | | 95,580 | | | | | |
| Upper Illinois River Valley Development Authority, | | | | | | | | | | | | |
5.000%, 01/01/2045 (Callable 01/01/2027)(3) | | | 100,000 | | | | 104,304 | | | | | |
| Village of Crestwood IL, | | | | | | | | | | | | |
| 4.000%, 12/15/2027 | | | | | | | | | | | | |
| (Callable 12/15/2025) (Insured by BAM) | | | 100,000 | | | | 112,758 | | | | | |
The accompanying notes are an integral part of these financial statements.
Baird Municipal Bond Fund
Schedule of Investments, December 31, 2020
Long-Term Investments (cont.)
| | | Principal | | | | | | % of | |
| | | Amount | | | Value | | | Net Assets | |
| Will County Community High School District No. 210: | | | | | | | | | |
| 0.000%, 01/01/2027 | | $ | 30,000 | | | $ | 25,853 | | | | |
| 4.000%, 01/01/2034 | | | | | | | | | | | |
| (Callable 01/01/2029) (Insured by AGM) | | | 100,000 | | | | 112,297 | | | | |
| Total Illinois | | | | | | | | | | | |
| (Cost $1,249,461) | | | | | | | 1,298,907 | | | | 5.9 | % |
| Indiana | | | | | | | | | | | | |
| Indiana Finance Authority, | | | | | | | | | | | | |
| 5.000%, 10/01/2032 (Callable 10/01/2023) | | | 150,000 | | | | 153,789 | | | | | |
| Indiana Health & Educational Facilities Financing Authority, | | | | | | | | | | | | |
| 5.000%, 11/15/2046 (Callable 11/15/2026) | | | 100,000 | | | | 121,327 | | | | | |
| St. Joseph County Airport Authority, | | | | | | | | | | | | |
| 0.010%, 07/01/2028 | | | 155,000 | | | | 140,453 | | | | | |
| Total Indiana | | | | | | | | | | | | |
| (Cost $384,731) | | | | | | | 415,569 | | | | 1.9 | % |
| Iowa | | | | | | | | | | | | |
| City of Cedar Rapids IA, | | | | | | | | | | | | |
0.158%, 08/15/2029 (Insured by AMBAC)(1)(5) | | | 100,000 | | | | 96,250 | | | | | |
| City of Coralville IA, | | | | | | | | | | | | |
| 4.000%, 06/01/2025 (Callable 06/01/2024) | | | 100,000 | | | | 99,727 | | | | | |
| Total Iowa | | | | | | | | | | | | |
| (Cost $195,772) | | | | | | | 195,977 | | | | 0.9 | % |
| Kansas | | | | | | | | | | | | |
| City of Coffeyville KS, | | | | | | | | | | | | |
5.000%, 06/01/2025 (Insured by NATL)(3) | | | 100,000 | | | | 110,773 | | | | | |
| City of Derby KS, | | | | | | | | | | | | |
| 3.900%, 03/01/2037 (Callable 03/01/2025) | | | 25,000 | | | | 25,363 | | | | | |
| Total Kansas | | | | | | | | | | | | |
| (Cost $128,868) | | | | | | | 136,136 | | | | 0.6 | % |
| Kentucky | | | | | | | | | | | | |
| Kentucky Economic Development Finance Authority, | | | | | | | | | | | | |
| 0.000%, 10/01/2027 (Insured by NATL) | | | 90,000 | | | | 80,821 | | | | | |
| Kentucky Public Energy Authority, | | | | | | | | | | | | |
| 1.216%, 12/01/2049 (1 Month LIBOR USD + 1.120%) | | | | | | | | | | | | |
| (Callable 03/01/2025) | | | | | | | | | | | | |
(Mandatory Tender Date 06/01/2025)(2) | | | 50,000 | | | | 50,367 | | | | | |
| Total Kentucky | | | | | | | | | | | | |
| (Cost $123,105) | | | | | | | 131,188 | | | | 0.6 | % |
| Louisiana | | | | | | | | | | | | |
| Louisiana Stadium & Exposition District, | | | | | | | | | | | | |
| 5.000%, 07/01/2025 (Callable 07/01/2023) | | | 125,000 | | | | 137,102 | | | | | |
| Total Louisiana | | | | | | | | | | | | |
| (Cost $132,777) | | | | | | | 137,102 | | | | 0.6 | % |
The accompanying notes are an integral part of these financial statements.
Baird Municipal Bond Fund
Schedule of Investments, December 31, 2020
Long-Term Investments (cont.)
| | | Principal | | | | | | % of | |
| | | Amount | | | Value | | | Net Assets | |
| Maryland | | | | | | | | | |
| Maryland Health & Higher Educational Facilities Authority, | | | | | | | | | |
5.000%, 01/01/2030(6) | | $ | 100,000 | | | $ | 120,448 | | | | |
| Total Maryland | | | | | | | | | | | |
| (Cost $119,563) | | | | | | | 120,448 | | | | 0.6 | % |
| Massachusetts | | | | | | | | | | | | |
| Massachusetts Development Finance Agency: | | | | | | | | | | | | |
3.500%, 10/01/2022(3) | | | 60,000 | | | | 61,312 | | | | | |
5.000%, 07/15/2025(3) | | | 50,000 | | | | 57,562 | | | | | |
| Total Massachusetts | | | | | | | | | | | | |
| (Cost $114,645) | | | | | | | 118,874 | | | | 0.6 | % |
| Michigan | | | | | | | | | | | | |
| Flint Hospital Building Authority, | | | | | | | | | | | | |
| 5.000%, 07/01/2023 | | | 50,000 | | | | 52,624 | | | | | |
| Michigan Finance Authority, | | | | | | | | | | | | |
| 5.000%, 07/01/2044 (Callable 07/01/2024) | | | 300,000 | | | | 323,043 | | | | | |
| Total Michigan | | | | | | | | | | | | |
| (Cost $375,335) | | | | | | | 375,667 | | | | 1.7 | % |
| Minnesota | | | | | | | | | | | | |
| City of Maple Grove MN, | | | | | | | | | | | | |
| 4.000%, 05/01/2037 (Callable 05/01/2027) | | | 105,000 | | | | 114,031 | | | | | |
| Housing & Redevelopment Authority of The City of St. Paul, | | | | | | | | | | | | |
| 5.000%, 12/01/2036 (Callable 12/01/2030) | | | 150,000 | | | | 177,233 | | | | | |
| Total Minnesota | | | | | | | | | | | | |
| (Cost $285,229) | | | | | | | 291,264 | | | | 1.3 | % |
| Mississippi | | | | | | | | | | | | |
| City of Gulfport MS, | | | | | | | | | | | | |
| 5.000%, 07/01/2026 | | | 100,000 | | | | 114,772 | | | | | |
| State of Mississippi, | | | | | | | | | | | | |
| 5.000%, 10/15/2029 (Callable 10/15/2025) | | | 120,000 | | | | 139,219 | | | | | |
| Total Mississippi | | | | | | | | | | | | |
| (Cost $250,450) | | | | | | | 253,991 | | | | 1.2 | % |
| Missouri | | | | | | | | | | | | |
| Hickman Mills C-1 School District, | | | | | | | | | | | | |
| 3.000%, 03/01/2040 | | | | | | | | | | | | |
| (Callable 03/01/2028) (Insured by ST AID) | | | 200,000 | | | | 219,828 | | | | | |
| Industrial Development Authority of the City of St. Louis, | | | | | | | | | | | | |
| 3.875%, 11/15/2029 (Callable 11/15/2026) | | | 100,000 | | | | 93,657 | | | | | |
| Missouri Southern State University, | | | | | | | | | | | | |
| 4.000%, 10/01/2037 | | | | | | | | | | | | |
| (Callable 10/01/2029) (Insured by AGM) | | | 65,000 | | | | 73,184 | | | | | |
The accompanying notes are an integral part of these financial statements.
Baird Municipal Bond Fund
Schedule of Investments, December 31, 2020
Long-Term Investments (cont.)
| | | Principal | | | | | | % of | |
| | | Amount | | | Value | | | Net Assets | |
| St. Joseph Industrial Development Authority, | | | | | | | | | |
| 2.950%, 01/01/2022 | | $ | 100,000 | | | $ | 99,364 | | | | |
| St. Louis Land Clearance for Redevelopment Authority: | | | | | | | | | | | |
| 4.250%, 06/01/2026 | | | 125,000 | | | | 137,079 | | | | |
| 3.875%, 10/01/2035 (Callable 10/01/2029) | | | 165,000 | | | | 156,012 | | | | |
| Total Missouri | | | | | | | | | | | |
| (Cost $769,609) | | | | | | | 779,124 | | | | 3.6 | % |
| Nebraska | | | | | | | | | | | | |
| Village of Boys Town NE, | | | | | | | | | | | | |
| 3.000%, 09/01/2028 | | | 100,000 | | | | 114,723 | | | | | |
| Total Nebraska | | | | | | | | | | | | |
| (Cost $100,000) | | | | | | | 114,723 | | | | 0.5 | % |
| Nevada | | | | | | | | | | | | |
| City of Sparks NV, | | | | | | | | | | | | |
2.500%, 06/15/2024(3) | | | 50,000 | | | | 50,205 | | | | | |
| Total Nevada | | | | | | | | | | | | |
| (Cost $45,621) | | | | | | | 50,205 | | | | 0.2 | % |
| New Hampshire | | | | | | | | | | | | |
| New Hampshire Health and Education Facilities Authority: | | | | | | | | | | | | |
3.150%, 04/01/2022 (Callable 11/01/2021)(3) | | | 500,000 | | | | 503,105 | | | | | |
| 0.070%, 10/01/2030 (Callable 01/04/2021) | | | | | | | | | | | | |
(Optional Put Date 01/07/2021)(1) | | | 200,000 | | | | 200,000 | | | | | |
| Total New Hampshire | | | | | | | | | | | | |
| (Cost $703,156) | | | | | | | 703,105 | | | | 3.2 | % |
| New Jersey | | | | | | | | | | | | |
| Atlantic City Board of Education, | | | | | | | | | | | | |
3.400%, 08/15/2024(3) | | | 85,000 | | | | 91,288 | | | | | |
| Borough of Woodbury Heights NJ, | | | | | | | | | | | | |
| 4.000%, 12/01/2024 | | | | | | | | | | | | |
| (Callable 02/01/2021) (Insured by AGC) | | | 20,000 | | | | 20,053 | | | | | |
| Essex County Improvement Authority, | | | | | | | | | | | | |
| 5.000%, 11/01/2027 | | | 100,000 | | | | 125,774 | | | | | |
| New Jersey Economic Development Authority, | | | | | | | | | | | | |
| 5.000%, 03/01/2029 (Callable 03/01/2023) | | | 300,000 | | | | 321,906 | | | | | |
| New Jersey Transportation Trust Fund Authority: | | | | | | | | | | | | |
| 0.000%, 12/15/2026 (Insured by AMBAC) | | | 35,000 | | | | 32,054 | | | | | |
| 4.000%, 06/15/2045 (Callable 12/15/2030) | | | 200,000 | | | | 223,664 | | | | | |
| State of New Jersey, | | | | | | | | | | | | |
| 5.000%, 06/01/2029 | | | 200,000 | | | | 259,038 | | | | | |
| Total New Jersey | | | | | | | | | | | | |
| (Cost $1,043,954) | | | | | | | 1,073,777 | | | | 4.9 | % |
The accompanying notes are an integral part of these financial statements.
Baird Municipal Bond Fund
Schedule of Investments, December 31, 2020
Long-Term Investments (cont.)
| | | Principal | | | | | | % of | |
| | | Amount | | | Value | | | Net Assets | |
| New York | | | | | | | | | |
| Albany County Capital Resource Corp., | | | | | | | | | |
| 3.100%, 07/01/2030 | | $ | 100,000 | | | $ | 93,857 | | | | |
| Dutchess County Local Development Corp.: | | | | | | | | | | | |
| 3.000%, 07/01/2036 (Callable 07/01/2026) | | | 150,000 | | | | 157,250 | | | | |
5.000%, 07/01/2045 (Callable 07/01/2030)(3) | | | 150,000 | | | | 165,231 | | | | |
| Metropolitan Transportation Authority: | | | | | | | | | | | |
| 5.000%, 05/15/2022 | | | 25,000 | | | | 25,989 | | | | |
| 5.000%, 11/15/2023 | | | 50,000 | | | | 54,121 | | | | |
| 0.646%, 11/01/2030 (1 Month LIBOR USD + 0.550%) | | | | | | | | | | | |
(Mandatory Tender Date 11/01/2022)(2) | | | 25,000 | | | | 24,214 | | | | |
| Middletown City School District, | | | | | | | | | | | |
| 3.000%, 06/15/2034 | | | | | | | | | | | |
| (Callable 06/15/2024) (Insured by ST AID) | | | 110,000 | | | | 115,878 | | | | |
| New York City Industrial Development Agency, | | | | | | | | | | | |
2.052%, 03/01/2025(1) | | | 100,000 | | | | 102,482 | | | | |
| New York City Transitional Finance Authority, | | | | | | | | | | | |
| 4.000%, 07/15/2040 | | | | | | | | | | | |
| (Callable 07/15/2029) (Insured by ST AID) | | | 150,000 | | | | 176,559 | | | | |
| New York State Dormitory Authority, | | | | | | | | | | | |
| 5.000%, 03/15/2048 (Callable 09/15/2028) | | | 250,000 | | | | 312,085 | | | | |
| New York State Urban Development Corp., | | | | | | | | | | | |
| 5.000%, 03/15/2047 | | | 200,000 | | | | 257,224 | | | | |
| Onondaga Civic Development Corp., | | | | | | | | | | | |
| 5.000%, 10/01/2023 | | | 100,000 | | | | 102,983 | | | | |
| Town of Ramapo NY: | | | | | | | | | | | |
| 3.250%, 05/15/2023 | | | 100,000 | | | | 98,067 | | | | |
| 3.750%, 03/01/2030 (Callable 03/01/2023) | | | 50,000 | | | | 48,105 | | | | |
| Total New York | | | | | | | | | | | |
| (Cost $1,663,988) | | | | | | | 1,734,045 | | | | 7.9 | % |
| North Carolina | | | | | | | | | | | | |
| Winston-Salem State University, | | | | | | | | | | | | |
| 4.250%, 06/01/2032 (Callable 06/01/2024) | | | 50,000 | | | | 50,935 | | | | | |
| Total North Carolina | | | | | | | | | | | | |
| (Cost $54,039) | | | | | | | 50,935 | | | | 0.2 | % |
| North Dakota | | | | | | | | | | | | |
| City of Dickinson ND, | | | | | | | | | | | | |
| 5.000%, 10/01/2025 (Callable 10/01/2021) | | | 100,000 | | | | 101,961 | | | | | |
| County of Burleigh ND, | | | | | | | | | | | | |
| 2.750%, 02/01/2022 (Callable 01/21/2021) | | | 250,000 | | | | 250,043 | | | | | |
| County of McKenzie ND, | | | | | | | | | | | | |
| 5.000%, 08/01/2024 (Callable 08/01/2023) | | | 100,000 | | | | 109,674 | | | | | |
| Jamestown Park District, | | | | | | | | | | | | |
| 4.000%, 07/01/2031 (Callable 07/01/2024) | | | 100,000 | | | | 108,906 | | | | | |
The accompanying notes are an integral part of these financial statements.
Baird Municipal Bond Fund
Schedule of Investments, December 31, 2020
Long-Term Investments (cont.)
| | | Principal | | | | | | % of | |
| | | Amount | | | Value | | | Net Assets | |
| North Dakota Housing Finance Agency, | | | | | | | | | |
| 3.350%, 07/01/2031 (Callable 01/01/2027) | | $ | 90,000 | | | $ | 99,357 | | | | |
| Total North Dakota | | | | | | | | | | | |
| (Cost $662,368) | | | | | | | 669,941 | | | | 3.1 | % |
| Ohio | | | | | | | | | | | | |
| Cleveland-Cuyahoga County Port Authority, | | | | | | | | | | | | |
| 5.000%, 08/01/2025 (Callable 08/01/2024) | | | 160,000 | | | | 178,515 | | | | | |
| Ohio Higher Educational Facility Commission, | | | | | | | | | | | | |
2.659%, 12/01/2023(1) | | | 170,000 | | | | 175,370 | | | | | |
| Ohio Housing Finance Agency, | | | | | | | | | | | | |
| 3.750%, 09/01/2050 | | | | | | | | | | | | |
| (Callable 03/01/2029) (Insured by GNMA) | | | 65,000 | | | | 73,459 | | | | | |
| Ohio Turnpike & Infrastructure Commission, | | | | | | | | | | | | |
0.000%, 02/15/2034 (Callable 02/15/2031)(7) | | | 70,000 | | | | 87,301 | | | | | |
| Port of Greater Cincinnati Development Authority: | | | | | | | | | | | | |
| 3.000%, 05/01/2023 (Callable 05/01/2022) | | | 100,000 | | | | 100,068 | | | | | |
| 5.000%, 04/01/2030 | | | 125,000 | | | | 157,826 | | | | | |
| Total Ohio | | | | | | | | | | | | |
| (Cost $751,151) | | | | | | | 772,539 | | | | 3.5 | % |
| Oklahoma | | | | | | | | | | | | |
| Norman Regional Hospital Authority, | | | | | | | | | | | | |
| 5.000%, 09/01/2037 (Callable 09/01/2027) | | | 25,000 | | | | 29,478 | | | | | |
| Tulsa Industrial Authority: | | | | | | | | | | | | |
| 5.000%, 10/01/2022 | | | 100,000 | | | | 104,608 | | | | | |
| 5.000%, 10/01/2023 | | | 25,000 | | | | 26,746 | | | | | |
| Total Oklahoma | | | | | | | | | | | | |
| (Cost $160,221) | | | | | | | 160,832 | | | | 0.7 | % |
| Oregon | | | | | | | | | | | | |
| Clackamas Community College District, | | | | | | | | | | | | |
5.000%, 06/15/2038 (Callable 06/15/2027)(7) | | | 100,000 | | | | 122,385 | | | | | |
| Salem Hospital Facility Authority, | | | | | | | | | | | | |
| 5.000%, 05/15/2034 (Callable 05/15/2029) | | | 50,000 | | | | 64,277 | | | | | |
| Total Oregon | | | | | | | | | | | | |
| (Cost $168,721) | | | | | | | 186,662 | | | | 0.9 | % |
| Pennsylvania | | | | | | | | | | | | |
| Berks County Industrial Development Authority, | | | | | | | | | | | | |
| 5.000%, 11/01/2023 | | | 200,000 | | | | 212,938 | | | | | |
| Bucks County Industrial Development Authority, | | | | | | | | | | | | |
| 3.750%, 09/15/2043 (Callable 09/15/2023) | | | 130,000 | | | | 136,534 | | | | | |
| Dauphin County General Authority, | | | | | | | | | | | | |
6.250%, 10/15/2053 (Callable 10/15/2028)(3) | | | 400,000 | | | | 411,348 | | | | | |
| Delaware County Authority, | | | | | | | | | | | | |
| 4.000%, 10/01/2022 | | | 90,000 | | | | 92,934 | | | | | |
The accompanying notes are an integral part of these financial statements.
Baird Municipal Bond Fund
Schedule of Investments, December 31, 2020
Long-Term Investments (cont.)
| | | Principal | | | | | | % of | |
| | | Amount | | | Value | | | Net Assets | |
| Delaware Valley Regional Finance Authority: | | | | | | | | | |
| 0.600%, 09/01/2048 | | | | | | | | | |
| (SIFMA Municipal Swap Index + 0.530%) | | | | | | | | | |
| (Callable 09/01/2022) | | | | | | | | | |
(Mandatory Tender Date 09/01/2023)(2) | | $ | 150,000 | | | $ | 149,811 | | | | |
| 0.190%, 11/01/2055 | | | | | | | | | | | |
| (SIFMA Municipal Swap Index + 0.210%) | | | | | | | | | | | |
(Callable 01/04/2021) (Optional Put Date 01/07/2021)(1) | | | 100,000 | | | | 100,000 | | | | |
| East Hempfield Township Industrial Development Authority, | | | | | | | | | | | |
| 5.000%, 07/01/2025 | | | 150,000 | | | | 151,827 | | | | |
| Mercer County Industrial Development Authority, | | | | | | | | | | | |
6.125%, 10/01/2050 (Callable 10/01/2025)(3) | | | 300,000 | | | | 308,832 | | | | |
| Montgomery County Higher Education & Health Authority, | | | | | | | | | | | |
| 3.000%, 05/01/2036 | | | | | | | | | | | |
(Mandatory Tender Date 05/01/2021)(1) | | | 100,000 | | | | 100,514 | | | | |
| Montgomery County Industrial Development Authority, | | | | | | | | | | | |
| 5.000%, 11/15/2036 (Callable 11/15/2026) | | | 150,000 | | | | 174,250 | | | | |
| Pennsylvania Higher Educational Facilities Authority: | | | | | | | | | | | |
| 5.000%, 01/01/2025 (Callable 01/01/2022) | | | 90,000 | | | | 92,425 | | | | |
| 5.000%, 05/01/2031 (Callable 05/01/2026) | | | 25,000 | | | | 29,521 | | | | |
| 5.000%, 07/01/2035 (Callable 07/01/2026) | | | 100,000 | | | | 100,379 | | | | |
| Pennsylvania Turnpike Commission: | | | | | | | | | | | |
0.000%, 12/01/2040 (Callable 06/01/2029)(7) | | | 75,000 | | | | 78,965 | | | | |
| 5.000%, 12/01/2048 (Callable 12/01/2028) | | | 40,000 | | | | 50,112 | | | | |
| Philadelphia Authority for Industrial Development, | | | | | | | | | | | |
| 3.500%, 12/01/2036 (Callable 12/01/2028) | | | 100,000 | | | | 110,352 | | | | |
| Reading School District, | | | | | | | | | | | |
| 0.000%, 01/15/2029 (Insured by NATL) | | | 100,000 | | | | 86,152 | | | | |
| Sayre Health Care Facilities Authority, | | | | | | | | | | | |
| 0.981%, 12/01/2031 (3 Month LIBOR USD + 0.830%) | | | | | | | | | | | |
(Callable 02/01/2021)(2) | | | 75,000 | | | | 72,742 | | | | |
| Total Pennsylvania | | | | | | | | | | | |
| (Cost $2,412,089) | | | | | | | 2,459,636 | | | | 11.2 | % |
| Rhode Island | | | | | | | | | | | | |
| Rhode Island Turnpike & Bridge Authority, | | | | | | | | | | | | |
| 4.000%, 10/01/2036 (Callable 10/01/2029) | | | 125,000 | | | | 150,325 | | | | | |
| Total Rhode Island | | | | | | | | | | | | |
| (Cost $139,122) | | | | | | | 150,325 | | | | 0.7 | % |
| South Carolina | | | | | | | | | | | | |
| Florence-Darlington Commission for Technical Education, | | | | | | | | | | | | |
| 5.000%, 03/01/2024 (Callable 09/01/2023) | | | 100,000 | | | | 106,059 | | | | | |
| Patriots Energy Group Financing Agency, | | | | | | | | | | | | |
| 4.000%, 10/01/2048 (Callable 11/01/2023) | | | | | | | | | | | | |
(Mandatory Tender Date 02/01/2024)(1) | | | 65,000 | | | | 71,555 | | | | | |
The accompanying notes are an integral part of these financial statements.
Baird Municipal Bond Fund
Schedule of Investments, December 31, 2020
Long-Term Investments (cont.)
| | | Principal | | | | | | % of | |
| | | Amount | | | Value | | | Net Assets | |
| South Carolina Jobs-Economic Development Authority: | | | | | | | | | |
| 4.000%, 08/15/2030 (Callable 08/15/2026) | | $ | 100,000 | | | $ | 111,852 | | | | |
| 5.250%, 08/15/2033 (Callable 08/15/2026) | | | 150,000 | | | | 178,060 | | | | |
| South Carolina State Housing | | | | | | | | | | | |
| Finance & Development Authority, | | | | | | | | | | | |
| 3.800%, 07/01/2034 | | | | | | | | | | | |
| (Callable 07/01/2024) (Insured by GNMA) | | | 75,000 | | | | 77,467 | | | | |
| South Carolina Transportation Infrastructure Bank, | | | | | | | | | | | |
| 0.546%, 10/01/2031 (1 Month LIBOR USD + 0.450%) | | | | | | | | | | | |
| (Callable 10/01/2021) | | | | | | | | | | | |
(Mandatory Tender Date 10/01/2022)(2) | | | 150,000 | | | | 149,799 | | | | |
| Total South Carolina | | | | | | | | | | | |
| (Cost $672,472) | | | | | | | 694,792 | | | | 3.2 | % |
| South Dakota | | | | | | | | | | | | |
| City of Rapid City SD, | | | | | | | | | | | | |
| 4.000%, 12/01/2035 (Callable 12/01/2029) | | | 125,000 | | | | 140,551 | | | | | |
| Total South Dakota | | | | | | | | | | | | |
| (Cost $133,804) | | | | | | | 140,551 | | | | 0.6 | % |
| Tennessee | | | | | | | | | | | | |
| City of Memphis TN, | | | | | | | | | | | | |
| 4.000%, 12/01/2035 (Callable 12/01/2026) | | | 125,000 | | | | 145,227 | | | | | |
| Total Tennessee | | | | | | | | | | | | |
| (Cost $145,780) | | | | | | | 145,227 | | | | 0.7 | % |
| Texas | | | | | | | | | | | | |
| Arlington Higher Education Finance Corp., | | | | | | | | | | | | |
| 4.000%, 08/01/2033 | | | | | | | | | | | | |
| (Callable 08/01/2028) (PSF Guaranteed) | | | 125,000 | | | | 148,626 | | | | | |
| Austin-Bergstrom Landhost Enterprises, Inc., | | | | | | | | | | | | |
| 5.000%, 10/01/2035 (Callable 10/01/2027) | | | 100,000 | | | | 108,995 | | | | | |
| Brazoria County Toll Road Authority, | | | | | | | | | | | | |
0.000%, 03/01/2038 (Callable 03/01/2030)(7) | | | 55,000 | | | | 56,110 | | | | | |
| Brazos Higher Education Authority, Inc., | | | | | | | | | | | | |
| 2.350%, 04/01/2040 (Callable 04/01/2030) | | | 80,000 | | | | 78,923 | | | | | |
| Harris County Cultural Education Facilities Finance Corp., | | | | | | | | | | | | |
| 0.640%, 12/01/2049 | | | | | | | | | | | | |
| (SIFMA Municipal Swap Index + 0.570%) | | | | | | | | | | | | |
| (Callable 06/01/2024) | | | | | | | | | | | | |
(Mandatory Tender Date 12/04/2024)(2) | | | 40,000 | | | | 39,806 | | | | | |
| Lower Colorado River Authority, | | | | | | | | | | | | |
| 5.000%, 05/15/2040 (Callable 05/15/2025) | | | 75,000 | | | | 86,567 | | | | | |
| Tarrant County Cultural Education Facilities Finance Corp., | | | | | | | | | | | | |
| 2.250%, 11/15/2025 | | | 150,000 | | | | 154,572 | | | | | |
The accompanying notes are an integral part of these financial statements.
Baird Municipal Bond Fund
Schedule of Investments, December 31, 2020
Long-Term Investments (cont.)
| | | Principal | | | | | | % of | |
| | | Amount | | | Value | | | Net Assets | |
| Texas Municipal Gas Acquisition & Supply Corp. I, | | | | | | | | | |
| 6.250%, 12/15/2026 | | $ | 90,000 | | | $ | 108,002 | | | | |
| Total Texas | | | | | | | | | | | |
| (Cost $750,200) | | | | | | | 781,601 | | | | 3.6 | % |
| Utah | | | | | | | | | | | | |
| Weber Basin Water Conservancy District, | | | | | | | | | | | | |
| 5.000%, 10/01/2050 (Callable 10/01/2029) | | | 205,000 | | | | 260,865 | | | | | |
| Total Utah | | | | | | | | | | | | |
| (Cost $252,825) | | | | | | | 260,865 | | | | 1.2 | % |
| Washington | | | | | | | | | | | | |
| King County Housing Authority, | | | | | | | | | | | | |
| 4.000%, 11/01/2036 (Callable 11/01/2029) | | | 200,000 | | | | 241,178 | | | | | |
| Pend Oreille County Public Utility District No. 1, | | | | | | | | | | | | |
| 5.000%, 01/01/2038 (Callable 01/01/2029) | | | 150,000 | | | | 172,624 | | | | | |
| Washington Health Care Facilities Authority, | | | | | | | | | | | | |
| 1.470%, 01/01/2035 | | | | | | | | | | | | |
| (SIFMA Municipal Swap Index + 1.400%) | | | | | | | | | | | | |
| (Callable 07/01/2024) | | | | | | | | | | | | |
(Mandatory Tender Date 01/01/2025)(2) | | | 90,000 | | | | 89,212 | | | | | |
| Total Washington | | | | | | | | | | | | |
| (Cost $471,232) | | | | | | | 503,014 | | | | 2.3 | % |
| Wisconsin | | | | | | | | | | | | |
| Palmyra-Eagle Area School District, | | | | | | | | | | | | |
| 3.000%, 03/01/2025 (Callable 03/01/2023) | | | 75,000 | | | | 72,956 | | | | | |
| Public Finance Authority: | | | | | | | | | | | | |
| 5.000%, 07/01/2022 | | | 55,000 | | | | 57,087 | | | | | |
5.000%, 10/01/2023(3) | | | 75,000 | | | | 79,685 | | | | | |
| 5.000%, 10/01/2044 (Callable 04/01/2029) | | | 250,000 | | | | 305,012 | | | | | |
| Village of Mount Pleasant WI, | | | | | | | | | | | | |
| 5.000%, 04/01/2048 (Callable 04/01/2028) | | | 150,000 | | | | 180,827 | | | | | |
| Wisconsin Center District: | | | | | | | | | | | | |
| 0.000%, 12/15/2030 (Insured by AGM) | | | 450,000 | | | | 379,845 | | | | | |
| 0.000%, 12/15/2037 | | | | | | | | | | | | |
| (Callable 06/15/2026) (Insured by BAM) | | | 200,000 | | | | 115,262 | | | | | |
| Wisconsin Health & Educational Facilities Authority: | | | | | | | | | | | | |
| 4.000%, 05/01/2038 (Callable 05/01/2025) | | | 100,000 | | | | 87,336 | | | | | |
| 5.000%, 08/15/2039 (Callable 08/15/2024) | | | 100,000 | | | | 112,950 | | | | | |
| Wisconsin Housing & Economic Development Authority, | | | | | | | | | | | | |
3.500%, 07/01/2025(3) | | | 100,000 | | | | 101,782 | | | | | |
| Total Wisconsin | | | | | | | | | | | | |
| (Cost $1,429,360) | | | | | | | 1,492,742 | | | | 6.8 | % |
The accompanying notes are an integral part of these financial statements.
Baird Municipal Bond Fund
Schedule of Investments, December 31, 2020
Long-Term Investments (cont.)
| | | Principal | | | | | | % of | |
| | | Amount | | | Value | | | Net Assets | |
| Wyoming | | | | | | | | | |
| Carbon County Specific Purpose Tax Joint Powers Board, | | | | | | | | | |
| 5.000%, 06/15/2025 | | $ | 100,000 | | | $ | 113,379 | | | | |
| Total Wyoming | | | | | | | | | | | |
| (Cost $112,765) | | | | | | | 113,379 | | | | 0.5 | % |
| Total Long-Term Investments | | | | | | | | | | | | |
| (Cost $21,397,196) | | | | | | | 22,103,765 | | | | 100.9 | % |
| Short-Term Investment | | | | | | | | | | | | |
| | | Shares | | | | | | | | | |
| Money Market Mutual Fund | | | | | | | | | | | | |
| Federated Hermes Institutional Tax-Free | | | | | | | | | | | | |
Cash Trust, Premier Shares, 0.01%(4) | | | 102,702 | | | | 102,702 | | | | | |
| Total Short-Term Investment | | | | | | | | | | | | |
| (Cost $102,702) | | | | | | | 102,702 | | | | 0.5 | % |
| Total Investments | | | | | | | | | | | | |
| (Cost $21,499,898) | | | | | | | 22,206,467 | | | | 101.4 | % |
| Liabilities in Excess of Other Assets | | | | | | | (304,647 | ) | | | (1.4 | )% |
| TOTAL NET ASSETS | | | | | | $ | 21,901,820 | | | | 100.0 | % |
Notes to Schedule of Investments
AGC – Assured Guaranty Corp.
AGM – Assured Guaranty Municipal
AMBAC – Ambac Assurance Corp.
BAM – Build America Mutual Assurance Co.
GNMA – Government National Mortgage Association
NATL – National Public Finance Guarantee Corp.
SD CRED PROG – State Credit Enhancement Program
ST AID – State Aid Intercept/Withholding
ETM – Escrowed to Maturity
LIBOR – London Inter-bank Offered Rate
PSF – Permanent School Fund
SIFMA – Securities Industry and Financial Markets Association
| (1) | Variable rate security. The rate reported is the rate in effect as of December 31, 2020. |
| (2) | Variable rate security based on a reference index and spread. The rate reported is the rate in effect as of December 31, 2020. |
| (3) | Security issued under Rule 144A under the Securities Act of 1933 and classified as liquid under the Fund’s liquidity risk management program. Purchased in a private placement transaction; resale to the public may require registration or may extend only to qualified institutional buyers. At December 31, 2020, the value of these securities total $2,508,951, which represents 11.46% of total net assets. |
| (4) | Seven-day yield. |
| (5) | Auction rate security. An auction rate security is a debt instrument with a long nominal maturity for which the interest rate is regularly reset through a Dutch auction. The rate presented is either the rate set through the auction or the maximum interest rate provided for in the security issuance provision. |
The accompanying notes are an integral part of these financial statements.
Baird Municipal Bond Fund
Schedule of Investments, December 31, 2020
Notes to Schedule of Investments (cont.)| (6) | Security or a portion of the security purchased on a when-issued or delayed delivery basis. |
| (7) | Step-up bond; the interest rate shown is the rate in effect as of December 31, 2020. |
Summary of Fair Value Exposure at December 31, 2020
The Fund has adopted authoritative fair valuation accounting standards which establish a definition of fair value and set out a hierarchy for measuring fair value. These standards require additional disclosures about the various inputs and valuation techniques used to develop the measurements of fair value and a discussion on changes in valuation techniques and related inputs during the period. These standards define fair value as the price that would be received to sell an asset or paid to transfer a liability in an orderly transaction between market participants at the measurement date.
The fair value hierarchy is organized into three levels based upon the assumptions (referred to as “inputs”) used in pricing the asset or liability. These standards state that “observable inputs” reflect the assumptions market participants would use in pricing the asset or liability based on market data obtained from independent sources and “unobservable inputs” reflect an entity’s own assumptions about the assumptions market participants would use in pricing the asset or liability. These inputs are summarized into three broad levels and described below:
| Level 1 – | Quoted prices (unadjusted) in active markets for identical assets or liabilities that the reporting entity can access at the measurement date. |
| Level 2 – | Inputs other than quoted prices included within Level 1 that are observable for the asset or liability, either directly or indirectly. |
| Level 3 – | Unobservable inputs for the asset or liability. |
The inputs or methodology used for valuing securities are not necessarily an indication of the risk associated with investing in those securities.
The following is a summary of the inputs used to value the Fund’s investments as of December 31, 2020:
| | | Level 1 | | | Level 2 | | | Level 3 | | | Total | |
| Long-Term Investments | | | | | | | | | | | | |
| Municipal Bonds | | $ | — | | | $ | 22,103,765 | | | $ | — | | | $ | 22,103,765 | |
| Total Long-Term Investments | | | — | | | | 22,103,765 | | | | — | | | | 22,103,765 | |
| Short-Term Investment | | | | | | | | | | | | | | | | |
| Money Market Mutual Fund | | | 102,702 | | | | — | | | | — | | | | 102,702 | |
| Total Short-Term Investment | | | 102,702 | | | | — | | | | — | | | | 102,702 | |
| Total Investments | | $ | 102,702 | | | $ | 22,103,765 | | | $ | — | | | $ | 22,206,467 | |
Changes in valuation techniques may result in transfers into or out of assigned levels within the fair value hierarchy. There were no transfers into or out of Level 3 during the reporting period, as compared to the security classifications from the prior year’s annual report. See the Fund’s Valuation Policy in Note 2a to the financial statements.
The accompanying notes are an integral part of these financial statements.
Additional Information on Fund Expenses
December 31, 2020 (Unaudited)
As a shareholder of a mutual fund, you incur two types of costs: (1) transaction costs, which may include sales charges (loads) on purchase payments, reinvested dividends, or other distributions; redemption fees; and exchange fees; and (2) ongoing costs, such as management fees; distribution and/or service (12b-1) fees; and other fund expenses. Although the Funds do not charge any sales loads, redemption fees, or other transaction fees, you will be assessed fees for outgoing wire transfers, returned checks and stop payment orders at prevailing rates charged by U.S. Bancorp Fund Services, LLC, doing business as U.S. Bank Global Fund Services, the Funds’ transfer agent. If you request that a redemption be made by wire transfer, currently the Funds’ transfer agent charges a $15.00 fee.
This Example is intended to help you understand your ongoing costs (in dollars) of investing in each Fund and to compare these costs with the ongoing costs of investing in other mutual funds. The Example is based on an investment of $1,000 invested at the beginning of the period and held for the entire period (7/1/20 – 12/31/20).
Actual Expenses
The third and fourth columns of the following tables provide information about account values based on actual returns and actual expenses. You may use the information in these columns, together with the amount you invested, to estimate the expenses that you paid over the period. Simply divide your account value by $1,000 (for example, an $8,600 account value divided by $1,000 = 8.6), then multiply the result by the number in the fourth column entitled “Expenses Paid During Period’’ to estimate the expenses you paid on your account during this period.
Hypothetical Example for Comparison Purposes
The fifth and sixth columns of the following tables provide information about hypothetical account values and hypothetical expenses based on each Fund’s actual expense ratio and an assumed rate of return of 5% per year before expenses, which is not each Fund’s actual return. The hypothetical account values and expenses may not be used to estimate the actual ending account balance or expenses you paid for the period. You may use this information to compare the ongoing costs of investing in the Funds and other mutual funds. To do so, compare this 5% hypothetical example with the 5% hypothetical examples that appear in the shareholder reports of the other mutual funds. Please note that the expenses shown in the table are meant to highlight your ongoing costs only and do not reflect any transactional costs. Therefore, the sixth column of the tables (entitled “Expenses Paid During Period”) is useful in comparing ongoing costs only, and will not help you determine the relative total costs of owning different mutual funds. In addition, if these transactional costs were included, your costs could have been higher.
Additional Information on Fund Expenses
December 31, 2020 (Unaudited)
Actual vs. Hypothetical Returns
| | | | | | Hypothetical |
| | | | | | (5% return |
| | | | Actual | before expenses) |
| | Fund's | Beginning | Ending | Expenses | Ending | Expenses |
| | Annualized | Account | Account | Paid | Account | Paid |
| | Expense | Value | Value | During | Value | During |
| | Ratio(1) | 7/1/20 | 12/31/20 | Period(1) | 12/31/20 | Period(1) |
| Baird Ultra Short Bond Fund | | | | | | |
| Institutional Class | 0.15% | $1,000.00 | $1,004.70 | $0.76 | $1,024.38 | $0.76 |
| Investor Class | 0.40% | $1,000.00 | $1,002.40 | $2.01 | $1,023.13 | $2.03 |
| | | | | | | |
| Baird Short-Term Bond Fund | | | | | | |
| Institutional Class | 0.30% | $1,000.00 | $1,012.60 | $1.52 | $1,023.63 | $1.53 |
| Investor Class | 0.55% | $1,000.00 | $1,010.30 | $2.78 | $1,022.37 | $2.80 |
| | | | | | | |
| Baird Intermediate Bond Fund | | | | | | |
| Institutional Class | 0.30% | $1,000.00 | $1,017.60 | $1.52 | $1,023.63 | $1.53 |
| Investor Class | 0.55% | $1,000.00 | $1,016.30 | $2.79 | $1,022.37 | $2.80 |
| | | | | | | |
| Baird Aggregate Bond Fund | | | | | | |
| Institutional Class | 0.30% | $1,000.00 | $1,021.40 | $1.52 | $1,023.63 | $1.53 |
| Investor Class | 0.55% | $1,000.00 | $1,020.20 | $2.79 | $1,022.37 | $2.80 |
| | | | | | | |
| Baird Core Plus Bond Fund | | | | | | |
| Institutional Class | 0.30% | $1,000.00 | $1,028.40 | $1.53 | $1,023.63 | $1.53 |
| Investor Class | 0.55% | $1,000.00 | $1,027.50 | $2.80 | $1,022.37 | $2.80 |
| | | | | | | |
| Baird Short-Term | | | | | | |
| Municipal Bond Fund | | | | | | |
| Institutional Class | 0.30% | $1,000.00 | $1,016.20 | $1.52 | $1,023.63 | $1.53 |
| Investor Class | 0.55% | $1,000.00 | $1,013.80 | $2.78 | $1,022.37 | $2.80 |
| | | | | | | |
| Baird Strategic | | | | | | |
| Municipal Bond Fund | | | | | | |
| Institutional Class | 0.30% | $1,000.00 | $1,034.20 | $1.53 | $1,023.63 | $1.53 |
| Investor Class | 0.55% | $1,000.00 | $1,033.60 | $2.81 | $1,022.37 | $2.80 |
| | | | | | | |
| Baird Quality Intermediate | | | | | | |
| Municipal Bond Fund | | | | | | |
| Institutional Class | 0.30% | $1,000.00 | $1,016.40 | $1.52 | $1,023.63 | $1.53 |
| Investor Class | 0.55% | $1,000.00 | $1,015.40 | $2.79 | $1,022.37 | $2.80 |
| | | | | | | |
| Baird Core Intermediate | | | | | | |
| Municipal Bond Fund | | | | | | |
| Institutional Class | 0.30% | $1,000.00 | $1,028.70 | $1.53 | $1,023.63 | $1.53 |
| Investor Class | 0.55% | $1,000.00 | $1,026.40 | $2.80 | $1,022.37 | $2.80 |
| | | | | | | |
| Baird Municipal Bond Fund | | | | | | |
| Institutional Class | 0.30% | $1,000.00 | $1,047.30 | $1.54 | $1,023.63 | $1.53 |
| Investor Class | 0.55% | $1,000.00 | $1,044.90 | $2.83 | $1,022.37 | $2.80 |
| (1) | Expenses are equal to the Fund's annualized net expense ratio multiplied by the average account value over the period, 184 days and divided by 366 to reflect the one-half year period. |
Statements of Assets and Liabilities
December 31, 2020
| | | Baird | | | Baird | | | Baird | |
| | | Ultra Short | | | Short-Term | | | Intermediate | |
| | | Bond Fund | | | Bond Fund | | | Bond Fund | |
| ASSETS: | | | | | | | | | |
| Investments, at value (cost $4,609,222,598, | | | | | | | | | |
| $9,073,419,320 and | | | | | | | | | |
| $5,152,382,827, respectively) | | $ | 4,612,657,624 | | | $ | 9,211,305,372 | | | $ | 5,406,396,337 | |
| Interest receivable | | | 23,997,315 | | | | 47,068,953 | | | | 29,657,738 | |
| Receivable for Fund shares sold | | | 22,999,393 | | | | 40,402,764 | | | | 13,859,019 | |
| Uninvested cash | | | 238 | | | | — | | | | — | |
| Prepaid expenses and other assets | | | — | | | | 12,813 | | | | 128,364 | |
| Total assets | | | 4,659,654,570 | | | | 9,298,789,902 | | | | 5,450,041,458 | |
| LIABILITIES: | | | | | | | | | | | | |
| Payable for securities purchased | | | 72,425,509 | | | | 302,732,337 | | | | 127,231,723 | |
| Payable for Fund shares redeemed | | | 7,522,340 | | | | 10,495,453 | | | | 1,852,236 | |
| Due to custodian | | | — | | | | 54,751 | | | | — | |
| Payable to Advisor, net (Note 5) | | | 378,180 | | | | 1,863,382 | | | | 1,108,815 | |
| Accrued administration fees (Note 5) | | | 189,090 | | | | 372,676 | | | | 221,763 | |
| Accrued Rule 12b-1 fees (Note 7) | | | 19,223 | | | | 52,757 | | | | 22,070 | |
| Total liabilities | | | 80,534,342 | | | | 315,571,356 | | | | 130,436,607 | |
| NET ASSETS | | $ | 4,579,120,228 | | | $ | 8,983,218,546 | | | $ | 5,319,604,851 | |
| NET ASSETS CONSIST OF: | | | | | | | | | | | | |
| Paid-in capital | | $ | 4,575,388,395 | | | $ | 8,835,782,689 | | | $ | 5,063,592,345 | |
| Total distributable earnings | | | 3,731,833 | | | | 147,435,857 | | | | 256,012,506 | |
| NET ASSETS | | $ | 4,579,120,228 | | | $ | 8,983,218,546 | | | $ | 5,319,604,851 | |
| INSTITUTIONAL CLASS SHARES | | | | | | | | | | | | |
| Net Assets | | $ | 4,456,429,448 | | | $ | 8,790,481,561 | | | $ | 5,264,437,374 | |
| Shares outstanding ($0.01 par value, | | | | | | | | | | | | |
| unlimited shares authorized) | | | 442,176,747 | | | | 886,552,417 | | | | 450,339,541 | |
| Net asset value, offering and | | | | | | | | | | | | |
| redemption price per share | | $ | 10.08 | | | $ | 9.92 | | | $ | 11.69 | |
| INVESTOR CLASS SHARES | | | | | | | | | | | | |
| Net Assets | | $ | 122,690,780 | | | $ | 192,736,985 | | | $ | 55,167,477 | |
| Shares outstanding ($0.01 par value, | | | | | | | | | | | | |
| unlimited shares authorized) | | | 12,143,351 | | | | 19,442,760 | | | | 4,501,523 | |
| Net asset value, offering and | | | | | | | | | | | | |
| redemption price per share | | $ | 10.10 | | | $ | 9.91 | | | $ | 12.26 | |
The accompanying notes are an integral part of these financial statements.
Statements of Assets and Liabilities
December 31, 2020
| | | Baird | | | Baird | |
| | | Aggregate | | | Core Plus | |
| | | Bond Fund | | | Bond Fund | |
| ASSETS: | | | | | | |
| Investments, at value (cost $31,328,353,100 | | | | | | |
| and $27,646,158,290, respectively) | | $ | 33,218,348,819 | | | $ | 29,679,013,266 | |
| Interest receivable | | | 176,630,684 | | | | 182,788,992 | |
| Receivable for Fund shares sold | | | 100,250,102 | | | | 80,263,703 | |
| Uninvested cash | | | 307,972 | | | | — | |
| Prepaid expenses and other assets | | | 139,182 | | | | 6,652 | |
| Total assets | | | 33,495,676,759 | | | | 29,942,072,613 | |
| LIABILITIES: | | | | | | | | |
| Payable for securities purchased | | | 553,683,731 | | | | 424,530,684 | |
| Payable for Fund shares redeemed | | | 29,851,550 | | | | 19,562,821 | |
| Due to custodian | | | — | | | | 53 | |
| Payable to Advisor, net (Note 5) | | | 6,855,648 | | | | 6,133,619 | |
| Accrued administration fees (Note 5) | | | 1,371,130 | | | | 1,226,724 | |
| Accrued Rule 12b-1 fees (Note 7) | | | 364,308 | | | | 755,125 | |
| Total liabilities | | | 592,126,367 | | | | 452,209,026 | |
| NET ASSETS | | $ | 32,903,550,392 | | | $ | 29,489,863,587 | |
| NET ASSETS CONSIST OF: | | | | | | | | |
| Paid-in capital | | $ | 31,033,756,196 | | | $ | 27,470,035,399 | |
| Total distributable earnings | | | 1,869,794,196 | | | | 2,019,828,188 | |
| NET ASSETS | | $ | 32,903,550,392 | | | $ | 29,489,863,587 | |
| INSTITUTIONAL CLASS SHARES | | | | | | | | |
| Net Assets | | $ | 31,874,599,159 | | | $ | 26,805,544,109 | |
| Shares outstanding ($0.01 par value, | | | | | | | | |
| unlimited shares authorized) | | | 2,708,739,925 | | | | 2,208,185,115 | |
| Net asset value, offering and | | | | | | | | |
| redemption price per share | | $ | 11.77 | | | $ | 12.14 | |
| INVESTOR CLASS SHARES | | | | | | | | |
| Net Assets | | $ | 1,028,951,233 | | | $ | 2,684,319,478 | |
| Shares outstanding ($0.01 par value, | | | | | | | | |
| unlimited shares authorized) | | | 84,371,979 | | | | 211,692,826 | |
| Net asset value, offering and | | | | | | | | |
| redemption price per share | | $ | 12.20 | | | $ | 12.68 | |
The accompanying notes are an integral part of these financial statements.
Statements of Assets and Liabilities
December 31, 2020
| | | | | | | | | Baird | |
| | | Baird | | | Baird | | | Quality | |
| | | Short-Term | | | Strategic | | | Intermediate | |
| | | Municipal | | | Municipal | | | Municipal | |
| | | Bond Fund | | | Bond Fund | | | Bond Fund | |
| ASSETS: | | | | | | | | | |
| Investments, at value (cost $1,546,220,865, | | | | | | | | | |
| $169,039,130 and | | | | | | | | | |
| $1,407,086,556, respectively) | | $ | 1,573,785,675 | | | $ | 171,250,079 | | | $ | 1,485,026,013 | |
| Interest receivable | | | 12,047,208 | | | | 986,279 | | | | 12,981,379 | |
| Receivable for Fund shares sold | | | 34,835,429 | | | | 1,655,258 | | | | 4,372,439 | |
| Deposits with broker for future contracts | | | — | | | | 3,695 | | | | — | |
| Uninvested cash | | | 112,759 | | | | — | | | | — | |
| Prepaid expenses and other assets | | | — | | | | 4,889 | | | | 31 | |
| Total assets | | | 1,620,781,071 | | | | 173,900,200 | | | | 1,502,379,862 | |
| LIABILITIES: | | | | | | | | | | | | |
| Payable for securities purchased | | | 1,884,959 | | | | 2,525,227 | | | | — | |
| Payable for Fund shares redeemed | | | 6,261,233 | | | | 10,677 | | | | 312,393 | |
| Payable to Advisor, net (Note 5) | | | 330,372 | | | | 31,614 | | | | 316,351 | |
| Accrued administration fees (Note 5) | | | 66,131 | | | | 6,323 | | | | 63,310 | |
| Accrued Rule 12b-1 fees (Note 7) | | | 26,642 | | | | 3,810 | | | | 65,128 | |
| Total liabilities | | | 8,569,337 | | | | 2,577,651 | | | | 757,182 | |
| NET ASSETS | | $ | 1,612,211,734 | | | $ | 171,322,549 | | | $ | 1,501,622,680 | |
| NET ASSETS CONSIST OF: | | | | | | | | | | | | |
| Paid-in capital | | $ | 1,584,545,057 | | | $ | 168,667,157 | | | $ | 1,433,068,700 | |
| Total distributable earnings | | | 27,666,677 | | | | 2,655,392 | | | | 68,553,980 | |
| NET ASSETS | | $ | 1,612,211,734 | | | $ | 171,322,549 | | | $ | 1,501,622,680 | |
| INSTITUTIONAL CLASS SHARES | | | | | | | | | | | | |
| Net Assets | | $ | 1,519,978,919 | | | $ | 164,346,411 | | | $ | 1,449,233,436 | |
| Shares outstanding ($0.01 par value, | | | | | | | | | | | | |
| unlimited shares authorized) | | | 145,762,030 | | | | 15,401,260 | | | | 120,438,097 | |
| Net asset value, offering and | | | | | | | | | | | | |
| redemption price per share | | $ | 10.43 | | | $ | 10.67 | | | $ | 12.03 | |
| INVESTOR CLASS SHARES | | | | | | | | | | | | |
| Net Assets | | $ | 92,232,815 | | | $ | 6,976,138 | | | $ | 52,389,244 | |
| Shares outstanding ($0.01 par value, | | | | | | | | | | | | |
| unlimited shares authorized) | | | 8,859,780 | | | | 653,812 | | | | 4,245,852 | |
| Net asset value, offering and | | | | | | | | | | | | |
| redemption price per share | | $ | 10.41 | | | $ | 10.67 | | | $ | 12.34 | |
The accompanying notes are an integral part of these financial statements.
Statements of Assets and Liabilities
December 31, 2020
| | | Baird Core | | | | |
| | | Intermediate | | | Baird | |
| | | Municipal | | | Municipal | |
| | | Bond Fund | | | Bond Fund | |
| ASSETS: | | | | | | |
| Investments, at value (cost $815,550,555 | | | | | | |
| and $21,499,898, respectively) | | $ | 851,005,085 | | | $ | 22,206,467 | |
| Interest receivable | | | 6,869,247 | | | | 178,859 | |
| Receivable for Fund shares sold | | | 8,599,012 | | | | 5,001 | |
| Uninvested cash | | | 23,684 | | | | — | |
| Total assets | | | 866,497,028 | | | | 22,390,327 | |
| LIABILITIES: | | | | | | | | |
| Payable for securities purchased | | | 1,803,654 | | | | 382,183 | |
| Payable for Fund shares redeemed | | | 24,071 | | | | 100,556 | |
| Payable to Advisor, net (Note 5) | | | 177,793 | | | | 4,308 | |
| Accrued administration fees (Note 5) | | | 35,754 | | | | 862 | |
| Accrued Rule 12b-1 fees (Note 7) | | | 4,567 | | | | 598 | |
| Total liabilities | | | 2,045,839 | | | | 488,507 | |
| NET ASSETS | | $ | 864,451,189 | | | $ | 21,901,820 | |
| NET ASSETS CONSIST OF: | | | | | | | | |
| Paid-in capital | | $ | 828,453,637 | | | $ | 21,134,132 | |
| Total distributable earnings | | | 35,997,552 | | | | 767,688 | |
| NET ASSETS | | $ | 864,451,189 | | | $ | 21,901,820 | |
| INSTITUTIONAL CLASS SHARES | | | | | | | | |
| Net Assets | | $ | 842,156,606 | | | $ | 20,276,976 | |
| Shares outstanding ($0.01 par value, | | | | | | | | |
| unlimited shares authorized) | | | 76,863,183 | | | | 1,900,250 | |
| Net asset value, offering and | | | | | | | | |
| redemption price per share | | $ | 10.96 | | | $ | 10.67 | |
| INVESTOR CLASS SHARES | | | | | | | | |
| Net Assets | | $ | 22,294,583 | | | $ | 1,624,844 | |
| Shares outstanding ($0.01 par value, | | | | | | | | |
| unlimited shares authorized) | | | 2,035,919 | | | | 152,492 | |
| Net asset value, offering and | | | | | | | | |
| redemption price per share | | $ | 10.95 | | | $ | 10.66 | |
The accompanying notes are an integral part of these financial statements.
Statements of Operations
Year Ended December 31, 2020
| | | Baird | | | Baird | | | Baird | |
| | | Ultra Short | | | Short-Term | | | Intermediate | |
| | | Bond Fund | | | Bond Fund | | | Bond Fund | |
| INVESTMENT INCOME: | | | | | | | | | |
| Interest income, net of paydowns | | $ | 38,570,711 | | | $ | 165,683,639 | | | $ | 117,871,144 | |
| Other income | | | — | | | | 12,814 | | | | — | |
| Total investment income | | | 38,570,711 | | | | 165,696,453 | | | | 117,871,144 | |
| EXPENSES: | | | | | | | | | | | | |
| Investment advisory fees (Note 5) | | | 6,960,328 | | | | 19,129,986 | | | | 11,921,551 | |
| Administration fees (Note 5) | | | 1,392,066 | | | | 3,825,997 | | | | 2,384,310 | |
| Rule 12b-1 fees – Investor Class Shares (Note 7) | | | 188,910 | | | | 443,178 | | | | 131,043 | |
| Total expenses | | | 8,541,304 | | | | 23,399,161 | | | | 14,436,904 | |
| Fee waiver by Advisor (Note 5) | | | (4,176,197 | ) | | | — | | | | — | |
| Net expenses | | | 4,365,107 | | | | 23,399,161 | | | | 14,436,904 | |
| NET INVESTMENT INCOME | | | 34,205,604 | | | | 142,297,292 | | | | 103,434,240 | |
| | | | | | | | | | | | | |
| REALIZED AND UNREALIZED | | | | | | | | | | | | |
| GAIN ON INVESTMENTS: | | | | | | | | | | | | |
| Net realized gain on investments | | | 3,997,972 | | | | 94,099,405 | | | | 94,825,703 | |
| Net change in unrealized | | | | | | | | | | | | |
| appreciation on investments | | | 841,943 | | | | 63,720,034 | | | | 131,357,344 | |
| Net realized and unrealized gain on investments | | | 4,839,915 | | | | 157,819,439 | | | | 226,183,047 | |
| NET INCREASE IN NET ASSETS | | | | | | | | | | | | |
| RESULTING FROM OPERATIONS | | $ | 39,045,519 | | | $ | 300,116,731 | | | $ | 329,617,287 | |
The accompanying notes are an integral part of these financial statements.
Statements of Operations
Year Ended December 31, 2020
| | | Baird | | | Baird | |
| | | Aggregate | | | Core Plus | |
| | | Bond Fund | | | Bond Fund | |
| INVESTMENT INCOME: | | | | | | |
| Interest income, net of paydowns | | $ | 664,397,536 | | | $ | 736,144,462 | |
| Other income | | | — | | | | 68,186 | |
| Total investment income | | | 664,397,536 | | | | 736,212,648 | |
| EXPENSES: | | | | | | | | |
| Investment advisory fees (Note 5) | | | 68,333,750 | | | | 66,717,956 | |
| Administration fees (Note 5) | | | 13,666,750 | | | | 13,343,591 | |
| Rule 12b-1 fees – Investor Class Shares (Note 7) | | | 2,208,840 | | | | 6,372,462 | |
| Total expenses | | | 84,209,340 | | | | 86,434,009 | |
| NET INVESTMENT INCOME | | | 580,188,196 | | | | 649,778,639 | |
| | | | | | | | | |
| REALIZED AND UNREALIZED | | | | | | | | |
| GAIN ON INVESTMENTS: | | | | | | | | |
| Net realized gain on investments | | | 450,058,874 | | | | 377,481,315 | |
| Net change in unrealized | | | | | | | | |
| appreciation on investments | | | 1,082,021,852 | | | | 1,156,986,439 | |
| Net realized and unrealized gain on investments | | | 1,532,080,726 | | | | 1,534,467,754 | |
| NET INCREASE IN NET ASSETS | | | | | | | | |
| RESULTING FROM OPERATIONS | | $ | 2,112,268,922 | | | $ | 2,184,246,393 | |
The accompanying notes are an integral part of these financial statements.
Statements of Operations
Year Ended December 31, 2020
| | | | | | | | | Baird | |
| | | Baird | | | Baird | | | Quality | |
| | | Short-Term | | | Strategic | | | Intermediate | |
| | | Municipal | | | Municipal | | | Municipal | |
| | | Bond Fund | | | Bond Fund | | | Bond Fund | |
| INVESTMENT INCOME: | | | | | | | | | |
| Interest income | | $ | 22,943,539 | | | $ | 1,251,403 | | | $ | 32,573,105 | |
| Other income | | | — | | | | 4,998 | | | | — | |
| Total investment income | | | 22,943,539 | | | | 1,256,401 | | | | 32,573,105 | |
| EXPENSES: | | | | | | | | | | | | |
| Investment advisory fees (Note 5) | | | 3,003,976 | | | | 155,473 | | | | 3,489,076 | |
| Administration fees (Note 5) | | | 600,795 | | | | 31,095 | | | | 697,815 | |
| Interest expense (Note 6) | | | 243 | | | | 123 | | | | 4,976 | |
| Rule 12b-1 fees – Investor Class Shares (Note 7) | | | 179,628 | | | | 9,772 | | | | 182,100 | |
| Total expenses | | | 3,784,642 | | | | 196,463 | | | | 4,373,967 | |
| NET INVESTMENT INCOME | | | 19,158,897 | | | | 1,059,938 | | | | 28,199,138 | |
| | | | | | | | | | | | | |
| REALIZED AND UNREALIZED | | | | | | | | | | | | |
| GAIN (LOSS) ON INVESTMENTS: | | | | | | | | | | | | |
| Net realized gain (loss) on: | | | | | | | | | | | | |
| Investments | | | 15,898 | | | | 1,217,532 | | | | (78,247 | ) |
| Futures contracts | | | — | | | | 69,043 | | | | — | |
| Net change in unrealized | | | | | | | | | | | | |
| appreciation on investments | | | 17,888,577 | | | | 2,171,814 | | | | 29,683,436 | |
| Net realized and unrealized gain on investments | | | 17,904,475 | | | | 3,458,389 | | | | 29,605,189 | |
| NET INCREASE IN NET ASSETS | | | | | | | | | | | | |
| RESULTING FROM OPERATIONS | | $ | 37,063,372 | | | $ | 4,518,327 | | | $ | 57,804,327 | |
The accompanying notes are an integral part of these financial statements.
Statements of Operations
Year Ended December 31, 2020
| | | Baird Core | | | | |
| | | Intermediate | | | Baird | |
| | | Municipal | | | Municipal | |
| | | Bond Fund | | | Bond Fund | |
| INVESTMENT INCOME: | | | | | | |
| Interest income | | $ | 15,353,571 | | | $ | 342,779 | |
| Other income | | | — | | | | 59 | |
| Total investment income | | | 15,353,571 | | | | 342,838 | |
| EXPENSES: | | | | | | | | |
| Investment advisory fees (Note 5) | | | 1,608,719 | | | | 34,266 | |
| Administration fees (Note 5) | | | 321,744 | | | | 6,853 | |
| Rule 12b-1 fees – Investor Class Shares (Note 7) | | | 38,787 | | | | 707 | |
| Total expenses | | | 1,969,250 | | | | 41,826 | |
| NET INVESTMENT INCOME | | | 13,384,321 | | | | 301,012 | |
| | | | | | | | | |
| REALIZED AND UNREALIZED | | | | | | | | |
| GAIN ON INVESTMENTS: | | | | | | | | |
| Net realized gain on investments | | | 2,308,013 | | | | 421,211 | |
| Net change in unrealized | | | | | | | | |
| appreciation on investments | | | 17,146,048 | | | | 664,767 | |
| Net realized and unrealized gain on investments | | | 19,454,061 | | | | 1,085,978 | |
| NET INCREASE IN NET ASSETS | | | | | | | | |
| RESULTING FROM OPERATIONS | | $ | 32,838,382 | | | $ | 1,386,990 | |
The accompanying notes are an integral part of these financial statements.
Statements of Changes in Net Assets
Baird Ultra Short Bond Fund
| | | Year Ended | | | Year Ended | |
| | | December 31, 2020 | | | December 31, 2019 | |
| OPERATIONS: | | | | | | |
| Net investment income | | $ | 34,205,604 | | | $ | 37,739,622 | |
| Net realized gain on investments | | | 3,997,972 | | | | 1,283,731 | |
| Net change in unrealized appreciation on investments | | | 841,943 | | | | 4,766,335 | |
| Net increase in net assets resulting from operations | | | 39,045,519 | | | | 43,789,688 | |
| | | | | | | | | |
| CAPITAL SHARE TRANSACTIONS: | | | | | | | | |
| Proceeds from shares sold | | | 5,157,653,645 | | | | 1,576,519,226 | |
| Shares issued to holders in reinvestment of distributions | | | 36,864,816 | | | | 36,713,747 | |
| Cost of shares redeemed | | | (2,349,866,576 | ) | | | (932,349,988 | ) |
| Net increase in net assets resulting | | | | | | | | |
| from capital share transactions | | | 2,844,651,885 | | | | 680,882,985 | |
| | | | | | | | | |
| DISTRIBUTIONS TO SHAREHOLDERS: | | | | | | | | |
| Net distributions to shareholders: | | | | | | | | |
| Institutional Class | | | (37,083,722 | ) | | | (37,557,823 | ) |
| Investor Class | | | (1,027,965 | ) | | | (624,557 | ) |
| Total net distributions to shareholders | | | (38,111,687 | ) | | | (38,182,380 | ) |
| | | | | | | | | |
| TOTAL INCREASE IN NET ASSETS | | | 2,845,585,717 | | | | 686,490,293 | |
| | | | | | | | | |
| NET ASSETS: | | | | | | | | |
| Beginning of year | | | 1,733,534,511 | | | | 1,047,044,218 | |
| End of year | | $ | 4,579,120,228 | | | $ | 1,733,534,511 | |
The accompanying notes are an integral part of these financial statements.
Statements of Changes in Net Assets
Baird Short-Term Bond Fund
| | | Year Ended | | | Year Ended | |
| | | December 31, 2020 | | | December 31, 2019 | |
| OPERATIONS: | | | | | | |
| Net investment income | | $ | 142,297,292 | | | $ | 161,129,708 | |
| Net realized gain on investments | | | 94,099,405 | | | | 24,666,686 | |
| Net change in unrealized appreciation on investments | | | 63,720,034 | | | | 107,756,900 | |
| Net increase in net assets resulting from operations | | | 300,116,731 | | | | 293,553,294 | |
| | | | | | | | | |
| CAPITAL SHARE TRANSACTIONS: | | | | | | | | |
| Proceeds from shares sold | | | 4,721,546,127 | | | | 2,907,577,528 | |
| Shares issued to holders in reinvestment of distributions | | | 191,263,918 | | | | 149,691,548 | |
| Cost of shares redeemed | | | (2,673,470,942 | ) | | | (2,278,660,216 | ) |
| Net increase in net assets resulting | | | | | | | | |
| from capital share transactions | | | 2,239,339,103 | | | | 778,608,860 | |
| | | | | | | | | |
| DISTRIBUTIONS TO SHAREHOLDERS: | | | | | | | | |
| Net distributions to shareholders: | | | | | | | | |
| Institutional Class | | | (203,405,971 | ) | | | (158,021,583 | ) |
| Investor Class | | | (4,268,709 | ) | | | (3,939,938 | ) |
| Total net distributions to shareholders | | | (207,674,680 | ) | | | (161,961,521 | ) |
| | | | | | | | | |
| TOTAL INCREASE IN NET ASSETS | | | 2,331,781,154 | | | | 910,200,633 | |
| | | | | | | | | |
| NET ASSETS: | | | | | | | | |
| Beginning of year | | | 6,651,437,392 | | | | 5,741,236,759 | |
| End of year | | $ | 8,983,218,546 | | | $ | 6,651,437,392 | |
The accompanying notes are an integral part of these financial statements.
Statements of Changes in Net Assets
Baird Intermediate Bond Fund
| | | Year Ended | | | Year Ended | |
| | | December 31, 2020 | | | December 31, 2019 | |
| OPERATIONS: | | | | | | |
| Net investment income | | $ | 103,434,240 | | | $ | 103,522,908 | |
| Net realized gain on investments | | | 94,825,703 | | | | 8,857,119 | |
| Net change in unrealized appreciation on investments | | | 131,357,344 | | | | 157,961,371 | |
| Net increase in net assets resulting from operations | | | 329,617,287 | | | | 270,341,398 | |
| | | | | | | | | |
| CAPITAL SHARE TRANSACTIONS: | | | | | | | | |
| Proceeds from shares sold | | | 1,550,823,989 | | | | 1,396,378,184 | |
| Shares issued to holders in reinvestment of distributions | | | 150,464,993 | | | | 87,687,553 | |
| Cost of shares redeemed | | | (933,016,520 | ) | | | (568,729,114 | ) |
| Net increase in net assets resulting | | | | | | | | |
| from capital share transactions | | | 768,272,462 | | | | 915,336,623 | |
| | | | | | | | | |
| DISTRIBUTIONS TO SHAREHOLDERS: | | | | | | | | |
| Net distributions to shareholders: | | | | | | | | |
| Institutional Class | | | (170,877,181 | ) | | | (102,554,663 | ) |
| Investor Class | | | (1,643,514 | ) | | | (1,094,238 | ) |
| Total net distributions to shareholders | | | (172,520,695 | ) | | | (103,648,901 | ) |
| | | | | | | | | |
| TOTAL INCREASE IN NET ASSETS | | | 925,369,054 | | | | 1,082,029,120 | |
| | | | | | | | | |
| NET ASSETS: | | | | | | | | |
| Beginning of year | | | 4,394,235,797 | | | | 3,312,206,677 | |
| End of year | | $ | 5,319,604,851 | | | $ | 4,394,235,797 | |
The accompanying notes are an integral part of these financial statements.
Statements of Changes in Net Assets
Baird Aggregate Bond Fund
| | | Year Ended | | | Year Ended | |
| | | December 31, 2020 | | | December 31, 2019 | |
| OPERATIONS: | | | | | | |
| Net investment income | | $ | 580,188,196 | | | $ | 547,157,275 | |
| Net realized gain on investments | | | 450,058,874 | | | | 117,338,627 | |
| Net change in unrealized appreciation on investments | | | 1,082,021,852 | | | | 1,082,352,966 | |
| Net increase in net assets resulting from operations | | | 2,112,268,922 | | | | 1,746,848,868 | |
| | | | | | | | | |
| CAPITAL SHARE TRANSACTIONS: | | | | | | | | |
| Proceeds from shares sold | | | 14,671,793,407 | | | | 10,015,319,367 | |
| Shares issued to holders in reinvestment of distributions | | | 897,531,339 | | | | 512,385,172 | |
| Cost of shares redeemed | | | (6,436,143,568 | ) | | | (4,678,796,166 | ) |
| Net increase in net assets resulting | | | | | | | | |
| from capital share transactions | | | 9,133,181,178 | | | | 5,848,908,373 | |
| | | | | | | | | |
| DISTRIBUTIONS TO SHAREHOLDERS: | | | | | | | | |
| Net distributions to shareholders: | | | | | | | | |
| Institutional Class | | | (957,457,896 | ) | | | (549,645,021 | ) |
| Investor Class | | | (28,240,671 | ) | | | (17,995,718 | ) |
| Total net distributions to shareholders | | | (985,698,567 | ) | | | (567,640,739 | ) |
| | | | | | | | | |
| TOTAL INCREASE IN NET ASSETS | | | 10,259,751,533 | | | | 7,028,116,502 | |
| | | | | | | | | |
| NET ASSETS: | | | | | | | | |
| Beginning of year | | | 22,643,798,859 | | | | 15,615,682,357 | |
| End of year | | $ | 32,903,550,392 | | | $ | 22,643,798,859 | |
The accompanying notes are an integral part of these financial statements.
Statements of Changes in Net Assets
Baird Core Plus Bond Fund
| | | Year Ended | | | Year Ended | |
| | | December 31, 2020 | | | December 31, 2019 | |
| OPERATIONS: | | | | | | |
| Net investment income | | $ | 649,778,639 | | | $ | 609,321,044 | |
| Net realized gain on investments | | | 377,481,315 | | | | 87,582,941 | |
| Net change in unrealized appreciation on investments | | | 1,156,986,439 | | | | 1,227,759,163 | |
| Net increase in net assets resulting from operations | | | 2,184,246,393 | | | | 1,924,663,148 | |
| | | | | | | | | |
| CAPITAL SHARE TRANSACTIONS: | | | | | | | | |
| Proceeds from shares sold | | | 9,935,514,754 | | | | 8,006,235,991 | |
| Shares issued to holders in reinvestment of distributions | | | 893,836,372 | | | | 584,928,310 | |
| Cost of shares redeemed | | | (6,490,498,603 | ) | | | (3,769,814,425 | ) |
| Net increase in net assets resulting | | | | | | | | |
| from capital share transactions | | | 4,338,852,523 | | | | 4,821,349,876 | |
| | | | | | | | | |
| DISTRIBUTIONS TO SHAREHOLDERS: | | | | | | | | |
| Net distributions to shareholders: | | | | | | | | |
| Institutional Class | | | (877,183,905 | ) | | | (567,068,342 | ) |
| Investor Class | | | (80,861,249 | ) | | | (60,455,523 | ) |
| Total net distributions to shareholders | | | (958,045,154 | ) | | | (627,523,865 | ) |
| | | | | | | | | |
| TOTAL INCREASE IN NET ASSETS | | | 5,565,053,762 | | | | 6,118,489,159 | |
| | | | | | | | | |
| NET ASSETS: | | | | | | | | |
| Beginning of year | | | 23,924,809,825 | | | | 17,806,320,666 | |
| End of year | | $ | 29,489,863,587 | | | $ | 23,924,809,825 | |
The accompanying notes are an integral part of these financial statements.
Statements of Changes in Net Assets
Baird Short-Term Municipal Bond Fund
| | | Year Ended | | | Year Ended | |
| | | December 31, 2020 | | | December 31, 2019 | |
| OPERATIONS: | | | | | | |
| Net investment income | | $ | 19,158,897 | | | $ | 11,618,292 | |
| Net realized gain (loss) on investments | | | 15,898 | | | | (32,969 | ) |
| Net change in unrealized appreciation on investments | | | 17,888,577 | | | | 9,376,603 | |
| Net increase in net assets resulting from operations | | | 37,063,372 | | | | 20,961,926 | |
| | | | | | | | | |
| CAPITAL SHARE TRANSACTIONS: | | | | | | | | |
| Proceeds from shares sold | | | 1,268,274,181 | | | | 896,607,390 | |
| Shares issued to holders in reinvestment of distributions | | | 15,454,180 | | | | 9,383,424 | |
| Cost of shares redeemed | | | (705,651,336 | ) | | | (244,784,136 | ) |
| Net increase in net assets resulting | | | | | | | | |
| from capital share transactions | | | 578,077,025 | | | | 661,206,678 | |
| | | | | | | | | |
| DISTRIBUTIONS TO SHAREHOLDERS: | | | | | | | | |
| Net distributions to shareholders: | | | | | | | | |
| Institutional Class | | | (17,690,198 | ) | | | (10,340,865 | ) |
| Investor Class | | | (945,980 | ) | | | (1,298,626 | ) |
| Total net distributions to shareholders | | | (18,636,178 | ) | | | (11,639,491 | ) |
| | | | | | | | | |
| TOTAL INCREASE IN NET ASSETS | | | 596,504,219 | | | | 670,529,113 | |
| | | | | | | | | |
| NET ASSETS: | | | | | | | | |
| Beginning of year | | | 1,015,707,515 | | | | 345,178,402 | |
| End of year | | $ | 1,612,211,734 | | | $ | 1,015,707,515 | |
The accompanying notes are an integral part of these financial statements.
Statements of Changes in Net Assets
Baird Strategic Municipal Bond Fund
| | | | | | November 15, 2019^ | |
| | | Year Ended | | | through | |
| | | December 31, 2020 | | | December 31, 2019 | |
| OPERATIONS: | | | | | | |
| Net investment income | | $ | 1,059,938 | | | $ | 22,291 | |
| Net realized gain on: | | | | | | | | |
| Investments | | | 1,217,532 | | | | 40,936 | |
| Futures contracts | | | 69,043 | | | | — | |
| Net change in unrealized appreciation on investments | | | 2,171,814 | | | | 39,135 | |
| Net increase in net assets resulting from operations | | | 4,518,327 | | | | 102,362 | |
| | | | | | | | | |
| CAPITAL SHARE TRANSACTIONS: | | | | | | | | |
| Proceeds from shares sold | | | 175,516,418 | | | | 11,940,204 | |
| Shares issued to holders in reinvestment of distributions | | | 1,816,257 | | | | 19,842 | |
| Cost of shares redeemed | | | (20,666,990 | ) | | | — | |
| Net increase in net assets resulting | | | | | | | | |
| from capital share transactions | | | 156,665,685 | | | | 11,960,046 | |
| | | | | | | | | |
| DISTRIBUTIONS TO SHAREHOLDERS: | | | | | | | | |
| Net distributions to shareholders: | | | | | | | | |
| Institutional Class | | | (1,794,911 | ) | | | (21,632 | ) |
| Investor Class | | | (107,286 | ) | | | (42 | ) |
| Total net distributions to shareholders | | | (1,902,197 | ) | | | (21,674 | ) |
| | | | | | | | | |
| TOTAL INCREASE IN NET ASSETS | | | 159,281,815 | | | | 12,040,734 | |
| | | | | | | | | |
| NET ASSETS: | | | | | | | | |
| Beginning of period | | | 12,040,734 | | | | — | |
| End of period | | $ | 171,322,549 | | | $ | 12,040,734 | |
^ Inception was the close of business on November 15, 2019.
The accompanying notes are an integral part of these financial statements.
Statements of Changes in Net Assets
Baird Quality Intermediate Municipal Bond Fund
| | | Year Ended | | | Year Ended | |
| | | December 31, 2020 | | | December 31, 2019 | |
| OPERATIONS: | | | | | | |
| Net investment income | | $ | 28,199,138 | | | $ | 27,923,026 | |
| Net realized loss on investments | | | (78,247 | ) | | | (296,303 | ) |
| Net change in unrealized appreciation on investments | | | 29,683,436 | | | | 36,837,003 | |
| Net increase in net assets resulting from operations | | | 57,804,327 | | | | 64,463,726 | |
| | | | | | | | | |
| CAPITAL SHARE TRANSACTIONS: | | | | | | | | |
| Proceeds from shares sold | | | 489,982,241 | | | | 456,956,508 | |
| Shares issued to holders in reinvestment of distributions | | | 24,192,861 | | | | 24,635,306 | |
| Cost of shares redeemed | | | (385,275,248 | ) | | | (295,612,497 | ) |
| Net increase in net assets resulting | | | | | | | | |
| from capital share transactions | | | 128,899,854 | | | | 185,979,317 | |
| | | | | | | | | |
| DISTRIBUTIONS TO SHAREHOLDERS: | | | | | | | | |
| Net distributions to shareholders: | | | | | | | | |
| Institutional Class | | | (26,280,951 | ) | | | (26,299,068 | ) |
| Investor Class | | | (1,218,131 | ) | | | (1,731,578 | ) |
| Total net distributions to shareholders | | | (27,499,082 | ) | | | (28,030,646 | ) |
| | | | | | | | | |
| TOTAL INCREASE IN NET ASSETS | | | 159,205,099 | | | | 222,412,397 | |
| | | | | | | | | |
| NET ASSETS: | | | | | | | | |
| Beginning of year | | | 1,342,417,581 | | | | 1,120,005,184 | |
| End of year | | $ | 1,501,622,680 | | | $ | 1,342,417,581 | |
The accompanying notes are an integral part of these financial statements.
Statements of Changes in Net Assets
Baird Core Intermediate Municipal Bond Fund
| | | Year Ended | | | Year Ended | |
| | | December 31, 2020 | | | December 31, 2019 | |
| OPERATIONS: | | | | | | |
| Net investment income | | $ | 13,384,321 | | | $ | 10,624,164 | |
| Net realized gain on investments | | | 2,308,013 | | | | 1,173,329 | |
| Net change in unrealized appreciation on investments | | | 17,146,048 | | | | 16,527,720 | |
| Net increase in net assets resulting from operations | | | 32,838,382 | | | | 28,325,213 | |
| | | | | | | | | |
| CAPITAL SHARE TRANSACTIONS: | | | | | | | | |
| Proceeds from shares sold | | | 503,302,866 | | | | 206,715,430 | |
| Shares issued to holders in reinvestment of distributions | | | 11,616,466 | | | | 7,931,294 | |
| Cost of shares redeemed | | | (209,742,930 | ) | | | (70,580,422 | ) |
| Net increase in net assets resulting | | | | | | | | |
| from capital share transactions | | | 305,176,402 | | | | 144,066,302 | |
| | | | | | | | | |
| DISTRIBUTIONS TO SHAREHOLDERS: | | | | | | | | |
| Net distributions to shareholders: | | | | | | | | |
| Institutional Class | | | (14,625,581 | ) | | | (10,964,930 | ) |
| Investor Class | | | (331,006 | ) | | | (90,108 | ) |
| Total net distributions to shareholders | | | (14,956,587 | ) | | | (11,055,038 | ) |
| | | | | | | | | |
| TOTAL INCREASE IN NET ASSETS | | | 323,058,197 | | | | 161,336,477 | |
| | | | | | | | | |
| NET ASSETS: | | | | | | | | |
| Beginning of year | | | 541,392,992 | | | | 380,056,515 | |
| End of year | | $ | 864,451,189 | | | $ | 541,392,992 | |
The accompanying notes are an integral part of these financial statements.
Statements of Changes in Net Assets
Baird Municipal Bond Fund
| | | | | | November 15, 2019^ | |
| | | Year Ended | | | through | |
| | | December 31, 2020 | | | December 31, 2019 | |
| OPERATIONS: | | | | | | |
| Net investment income | | $ | 301,012 | | | $ | 14,645 | |
| Net realized gain on investments | | | 421,211 | | | | 31,173 | |
| Net change in unrealized appreciation on investments | | | 664,767 | | | | 41,802 | |
| Net increase in net assets resulting from operations | | | 1,386,990 | | | | 87,620 | |
| | | | | | | | | |
| CAPITAL SHARE TRANSACTIONS: | | | | | | | | |
| Proceeds from shares sold | | | 13,623,172 | | | | 7,329,812 | |
| Shares issued to holders in reinvestment of distributions | | | 613,016 | | | | 13,576 | |
| Cost of shares redeemed | | | (445,444 | ) | | | — | |
| Net increase in net assets resulting | | | | | | | | |
| from capital share transactions | | | 13,790,744 | | | | 7,343,388 | |
| | | | | | | | | |
| DISTRIBUTIONS TO SHAREHOLDERS: | | | | | | | | |
| Net distributions to shareholders: | | | | | | | | |
| Institutional Class | | | (655,522 | ) | | | (14,009 | ) |
| Investor Class | | | (37,344 | ) | | | (47 | ) |
| Total net distributions to shareholders | | | (692,866 | ) | | | (14,056 | ) |
| | | | | | | | | |
| TOTAL INCREASE IN NET ASSETS | | | 14,484,868 | | | | 7,416,952 | |
| | | | | | | | | |
| NET ASSETS: | | | | | | | | |
| Beginning of period | | | 7,416,952 | | | | — | |
| End of period | | $ | 21,901,820 | | | $ | 7,416,952 | |
^ Inception was the close of business on November 15, 2019.
The accompanying notes are an integral part of these financial statements.
Financial Highlights
Baird Ultra Short Bond Fund – Institutional Class
| | | Year Ended December 31, | |
| | | 2020 | | | 2019 | | | 2018 | | | 2017 | | | 2016 | |
| Per Share Data: | | | | | | | | | | | | | | | |
| Net asset value, beginning of year | | $ | 10.06 | | | $ | 10.01 | | | $ | 10.03 | | | $ | 10.03 | | | $ | 9.98 | |
| Income from investment operations: | | | | | | | | | | | | | | | | | | | | |
Net investment income(1) | | | 0.12 | | | | 0.26 | | | | 0.23 | | | | 0.13 | | | | 0.11 | |
| Net realized and unrealized | | | | | | | | | | | | | | | | | | | | |
| gains (losses) on investments | | | 0.05 | (3) | | | 0.05 | | | | (0.04 | ) | | | 0.00 | (2)(3) | | | 0.04 | |
| Total from investment operations | | | 0.17 | | | | 0.31 | | | | 0.19 | | | | 0.13 | | | | 0.15 | |
| Less distributions: | | | | | | | | | | | | | | | | | | | | |
| Distributions from | | | | | | | | | | | | | | | | | | | | |
| net investment income | | | (0.14 | ) | | | (0.26 | ) | | | (0.21 | ) | | | (0.13 | ) | | | (0.10 | ) |
| Distributions from net realized gains | | | (0.01 | ) | | | (0.00 | )(2) | | | — | | | | — | | | | — | |
| Total distributions | | | (0.15 | ) | | | (0.26 | ) | | | (0.21 | ) | | | (0.13 | ) | | | (0.10 | ) |
| Net asset value, end of year | | $ | 10.08 | | | $ | 10.06 | | | $ | 10.01 | | | $ | 10.03 | | | $ | 10.03 | |
| Total return | | | 1.66 | % | | | 3.11 | % | | | 1.95 | % | | | 1.30 | % | | | 1.56 | % |
| Supplemental data and ratios: | | | | | | | | | | | | | | | | | | | | |
| Net assets, end of year (millions) | | $ | 4,456.4 | | | $ | 1,701.0 | | | $ | 1,031.5 | | | $ | 532.0 | | | $ | 387.3 | |
| Ratio of expenses to average net assets | | | 0.15 | % | | | 0.15 | % | | | 0.15 | % | | | 0.15 | % | | | 0.15 | % |
| Ratio of expenses to average | | | | | | | | | | | | | | | | | | | | |
| net assets (before waivers) | | | 0.30 | % | | | 0.30 | % | | | 0.30 | % | | | 0.30 | % | | | 0.30 | % |
| Ratio of net investment income | | | | | | | | | | | | | | | | | | | | |
| to average net assets | | | 1.24 | % | | | 2.61 | % | | | 2.24 | % | | | 1.31 | % | | | 1.05 | % |
| Ratio of net investment income | | | | | | | | | | | | | | | | | | | | |
| to average net assets (before waivers) | | | 1.09 | % | | | 2.46 | % | | | 2.09 | % | | | 1.16 | % | | | 0.90 | % |
Portfolio turnover rate(4) | | | 92 | % | | | 70 | % | | | 66 | % | | | 83 | % | | | 97 | % |
| (1) | Calculated using average shares outstanding during the year. |
| (2) | Amount is less than $0.005. |
| (3) | Due to timing of capital share transactions, the per share amount of net realized and unrealized gain (loss) on investments varies from the amounts shown in the Statement of Operations. |
| (4) | Portfolio turnover is calculated on the basis of the Fund as a whole without distinguishing between the classes of shares issued and excludes in-kind transactions, where applicable. |
The accompanying notes are an integral part of these financial statements.
Financial Highlights
Baird Ultra Short Bond Fund – Investor Class
| | | Year Ended December 31, | |
| | | 2020 | | | 2019 | | | 2018 | | | 2017 | | | 2016 | |
| Per Share Data: | | | | | | | | | | | | | | | |
| Net asset value, beginning of year | | $ | 10.05 | | | $ | 10.00 | | | $ | 10.03 | | | $ | 10.03 | | | $ | 9.98 | |
| Income from investment operations: | | | | | | | | | | | | | | | | | | | | |
Net investment income(1) | | | 0.10 | | | | 0.24 | | | | 0.20 | | | | 0.11 | | | | 0.08 | |
| Net realized and unrealized | | | | | | | | | | | | | | | | | | | | |
| gains (losses) on investments | | | 0.07 | (2) | | | 0.04 | | | | (0.04 | ) | | | (0.01 | ) | | | 0.05 | |
| Total from investment operations | | | 0.17 | | | | 0.28 | | | | 0.16 | | | | 0.10 | | | | 0.13 | |
| Less distributions: | | | | | | | | | | | | | | | | | | | | |
| Distributions from | | | | | | | | | | | | | | | | | | | | |
| net investment income | | | (0.11 | ) | | | (0.23 | ) | | | (0.19 | ) | | | (0.10 | ) | | | (0.08 | ) |
| Distributions from net realized gains | | | (0.01 | ) | | | (0.00 | )(3) | | | — | | | | — | | | | — | |
| Total distributions | | | (0.12 | ) | | | (0.23 | ) | | | (0.19 | ) | | | (0.10 | ) | | | (0.08 | ) |
| Net asset value, end of year | | $ | 10.10 | | | $ | 10.05 | | | $ | 10.00 | | | $ | 10.03 | | | $ | 10.03 | |
| Total return | | | 1.66 | % | | | 2.87 | % | | | 1.60 | % | | | 1.05 | % | | | 1.32 | % |
| Supplemental data and ratios: | | | | | | | | | | | | | | | | | | | | |
| Net assets, end of year (millions) | | $ | 122.7 | | | $ | 32.5 | | | $ | 15.6 | | | $ | 7.6 | | | $ | 5.2 | |
| Ratio of expenses to average net assets | | | 0.40 | % | | | 0.40 | % | | | 0.40 | % | | | 0.40 | % | | | 0.40 | % |
| Ratio of expenses to average | | | | | | | | | | | | | | | | | | | | |
| net assets (before waivers) | | | 0.55 | % | | | 0.55 | % | | | 0.55 | % | | | 0.55 | % | | | 0.55 | % |
| Ratio of net investment income | | | | | | | | | | | | | | | | | | | | |
| to average net assets | | | 0.99 | % | | | 2.36 | % | | | 1.99 | % | | | 1.06 | % | | | 0.80 | % |
| Ratio of net investment income | | | | | | | | | | | | | | | | | | | | |
| to average net assets (before waivers) | | | 0.84 | % | | | 2.21 | % | | | 1.84 | % | | | 0.91 | % | | | 0.65 | % |
Portfolio turnover rate(4) | | | 92 | % | | | 70 | % | | | 66 | % | | | 83 | % | | | 97 | % |
| (1) | Calculated using average shares outstanding during the year. |
| (2) | Due to timing of capital share transactions, the per share amount of net realized and unrealized gain (loss) on investments varies from the amounts shown in the Statement of Operations. |
| (3) | Amount is less than $0.005. |
| (4) | Portfolio turnover is calculated on the basis of the Fund as a whole without distinguishing between the classes of shares issued and excludes in-kind transactions, where applicable. |
The accompanying notes are an integral part of these financial statements.
Financial Highlights
Baird Short-Term Bond Fund – Institutional Class
| | | Year Ended December 31, | |
| | | 2020 | | | 2019 | | | 2018 | | | 2017 | | | 2016 | |
| Per Share Data: | | | | | | | | | | | | | | | |
| Net asset value, beginning of year | | $ | 9.77 | | | $ | 9.57 | | | $ | 9.64 | | | $ | 9.66 | | | $ | 9.60 | |
| Income from investment operations: | | | | | | | | | | | | | | | | | | | | |
Net investment income(1) | | | 0.18 | | | | 0.24 | | | | 0.21 | | | | 0.17 | | | | 0.15 | |
| Net realized and unrealized | | | | | | | | | | | | | | | | | | | | |
| gains (losses) on investments | | | 0.23 | | | | 0.20 | | | | (0.07 | ) | | | (0.02 | ) | | | 0.06 | |
| Total from investment operations | | | 0.41 | | | | 0.44 | | | | 0.14 | | | | 0.15 | | | | 0.21 | |
| Less distributions: | | | | | | | | | | | | | | | | | | | | |
| Distributions from net investment income | | | (0.19 | ) | | | (0.24 | ) | | | (0.21 | ) | | | (0.17 | ) | | | (0.15 | ) |
| Distributions from net realized gains | | | (0.07 | ) | | | — | | | | — | | | | (0.00 | )(2) | | | (0.00 | )(2) |
| Total distributions | | | (0.26 | ) | | | (0.24 | ) | | | (0.21 | ) | | | (0.17 | ) | | | (0.15 | ) |
| Net asset value, end of year | | $ | 9.92 | | | $ | 9.77 | | | $ | 9.57 | | | $ | 9.64 | | | $ | 9.66 | |
| Total return | | | 4.23 | % | | | 4.68 | % | | | 1.49 | % | | | 1.53 | % | | | 2.25 | % |
| Supplemental data and ratios: | | | | | | | | | | | | | | | | | | | | |
| Net assets, end of year (millions) | | $ | 8,790.5 | | | $ | 6,469.1 | | | $ | 5,596.2 | | | $ | 5,399.7 | | | $ | 3,769.3 | |
| Ratio of expenses to average net assets | | | 0.30 | % | | | 0.30 | % | | | 0.30 | % | | | 0.30 | % | | | 0.30 | % |
| Ratio of net investment income | | | | | | | | | | | | | | | | | | | | |
| to average net assets | | | 1.87 | % | | | 2.50 | % | | | 2.21 | % | | | 1.73 | % | | | 1.57 | % |
Portfolio turnover rate(3) | | | 64 | % | | | 64 | % | | | 58 | % | | | 55 | % | | | 44 | % |
| (1) | Calculated using average shares outstanding during the year. |
| (2) | Amount is less than $0.005. |
| (3) | Portfolio turnover is calculated on the basis of the Fund as a whole without distinguishing between the classes of shares issued and excludes in-kind transactions, where applicable. |
The accompanying notes are an integral part of these financial statements.
Financial Highlights
Baird Short-Term Bond Fund – Investor Class
| | | Year Ended December 31, | |
| | | 2020 | | | 2019 | | | 2018 | | | 2017 | | | 2016 | |
| Per Share Data: | | | | | | | | | | | | | | | |
| Net asset value, beginning of year | | $ | 9.77 | | | $ | 9.57 | | | $ | 9.64 | | | $ | 9.66 | | | $ | 9.60 | |
| Income from investment operations: | | | | | | | | | | | | | | | | | | | | |
Net investment income(1) | | | 0.16 | | | | 0.22 | | | | 0.19 | | | | 0.14 | | | | 0.13 | |
| Net realized and unrealized | | | | | | | | | | | | | | | | | | | | |
| gains (losses) on investments | | | 0.21 | | | | 0.20 | | | | (0.07 | ) | | | (0.02 | ) | | | 0.06 | |
| Total from investment operations | | | 0.37 | | | | 0.42 | | | | 0.12 | | | | 0.12 | | | | 0.19 | |
| Less distributions: | | | | | | | | | | | | | | | | | | | | |
| Distributions from | | | | | | | | | | | | | | | | | | | | |
| net investment income | | | (0.16 | ) | | | (0.22 | ) | | | (0.19 | ) | | | (0.14 | ) | | | (0.13 | ) |
| Distributions from net realized gains | | | (0.07 | ) | | | — | | | | — | | | | (0.00 | )(2) | | | (0.00 | )(2) |
| Total distributions | | | (0.23 | ) | | | (0.22 | ) | | | (0.19 | ) | | | (0.14 | ) | | | (0.13 | ) |
| Net asset value, end of year | | $ | 9.91 | | | $ | 9.77 | | | $ | 9.57 | | | $ | 9.64 | | | $ | 9.66 | |
| Total return | | | 3.86 | % | | | 4.42 | % | | | 1.24 | % | | | 1.28 | % | | | 2.00 | % |
| Supplemental data and ratios: | | | | | | | | | | | | | | | | | | | | |
| Net assets, end of year (millions) | | $ | 192.7 | | | $ | 182.4 | | | $ | 145.0 | | | $ | 134.9 | | | $ | 104.9 | |
| Ratio of expenses to average net assets | | | 0.55 | % | | | 0.55 | % | | | 0.55 | % | | | 0.55 | % | | | 0.55 | % |
| Ratio of net investment income | | | | | | | | | | | | | | | | | | | | |
| to average net assets | | | 1.62 | % | | | 2.25 | % | | | 1.96 | % | | | 1.48 | % | | | 1.32 | % |
Portfolio turnover rate(3) | | | 64 | % | | | 64 | % | | | 58 | % | | | 55 | % | | | 44 | % |
| (1) | Calculated using average shares outstanding during the year. |
| (2) | Amount is less than $0.005. |
| (3) | Portfolio turnover is calculated on the basis of the Fund as a whole without distinguishing between the classes of shares issued and excludes in-kind transactions, where applicable. |
The accompanying notes are an integral part of these financial statements.
Financial Highlights
Baird Intermediate Bond Fund – Institutional Class
| | | Year Ended December 31, | |
| | | 2020 | | | 2019 | | | 2018 | | | 2017 | | | 2016 | |
| Per Share Data: | | | | | | | | | | | | | | | |
| Net asset value, beginning of year | | $ | 11.27 | | | $ | 10.80 | | | $ | 11.01 | | | $ | 10.97 | | | $ | 10.93 | |
| Income from investment operations: | | | | | | | | | | | | | | | | | | | | |
Net investment income(1) | | | 0.25 | | | | 0.29 | | | | 0.27 | | | | 0.26 | | | | 0.25 | |
| Net realized and unrealized | | | | | | | | | | | | | | | | | | | | |
| gains (losses) on investments | | | 0.58 | | | | 0.46 | | | | (0.21 | ) | | | 0.04 | | | | 0.06 | |
| Total from investment operations | | | 0.83 | | | | 0.75 | | | | 0.06 | | | | 0.30 | | | | 0.31 | |
| Less distributions: | | | | | | | | | | | | | | | | | | | | |
| Distributions from | | | | | | | | | | | | | | | | | | | | |
| net investment income | | | (0.25 | ) | | | (0.28 | ) | | | (0.27 | ) | | | (0.26 | ) | | | (0.25 | ) |
| Distributions from net realized gains | | | (0.16 | ) | | | — | | | | — | | | | (0.00 | )(2) | | | (0.02 | ) |
| Total distributions | | | (0.41 | ) | | | (0.28 | ) | | | (0.27 | ) | | | (0.26 | ) | | | (0.27 | ) |
| Net asset value, end of year | | $ | 11.69 | | | $ | 11.27 | | | $ | 10.80 | | | $ | 11.01 | | | $ | 10.97 | |
| Total return | | | 7.42 | % | | | 7.05 | % | | | 0.58 | % | | | 2.74 | % | | | 2.83 | % |
| Supplemental data and ratios: | | | | | | | | | | | | | | | | | | | | |
| Net assets, end of year (millions) | | $ | 5,264.4 | | | $ | 4,342.1 | | | $ | 3,264.9 | | | $ | 2,902.0 | | | $ | 2,209.1 | |
| Ratio of expenses to average net assets | | | 0.30 | % | | | 0.30 | % | | | 0.30 | % | | | 0.30 | % | | | 0.30 | % |
| Ratio of net investment income | | | | | | | | | | | | | | | | | | | | |
| to average net assets | | | 2.17 | % | | | 2.57 | % | | | 2.51 | % | | | 2.32 | % | | | 2.21 | % |
Portfolio turnover rate(3) | | | 37 | % | | | 26 | % | | | 32 | % | | | 31 | % | | | 30 | % |
| (1) | Calculated using average shares outstanding during the year. |
| (2) | Amount is less than $0.005. |
| (3) | Portfolio turnover is calculated on the basis of the Fund as a whole without distinguishing between the classes of shares issued and excludes in-kind transactions, where applicable. |
The accompanying notes are an integral part of these financial statements.
Financial Highlights
Baird Intermediate Bond Fund – Investor Class
| | | Year Ended December 31, | |
| | | 2020 | | | 2019 | | | 2018 | | | 2017 | | | 2016 | |
| Per Share Data: | | | | | | | | | | | | | | | |
| Net asset value, beginning of year | | $ | 11.80 | | | $ | 11.29 | | | $ | 11.50 | | | $ | 11.44 | | | $ | 11.39 | |
| Income from investment operations: | | | | | | | | | | | | | | | | | | | | |
Net investment income(1) | | | 0.23 | | | | 0.27 | | | | 0.25 | | | | 0.24 | | | | 0.23 | |
| Net realized and unrealized | | | | | | | | | | | | | | | | | | | | |
| gains (losses) on investments | | | 0.61 | | | | 0.50 | | | | (0.22 | ) | | | 0.04 | | | | 0.06 | |
| Total from investment operations | | | 0.84 | | | | 0.77 | | | | 0.03 | | | | 0.28 | | | | 0.29 | |
| Less distributions: | | | | | | | | | | | | | | | | | | | | |
| Distributions from | | | | | | | | | | | | | | | | | | | | |
| net investment income | | | (0.22 | ) | | | (0.26 | ) | | | (0.24 | ) | | | (0.22 | ) | | | (0.22 | ) |
| Distributions from net realized gains | | | (0.16 | ) | | | — | | | | — | | | | (0.00 | )(2) | | | (0.02 | ) |
| Total distributions | | | (0.38 | ) | | | (0.26 | ) | | | (0.24 | ) | | | (0.22 | ) | | | (0.24 | ) |
| Net asset value, end of year | | $ | 12.26 | | | $ | 11.80 | | | $ | 11.29 | | | $ | 11.50 | | | $ | 11.44 | |
| Total return | | | 7.16 | % | | | 6.83 | % | | | 0.30 | % | | | 2.53 | % | | | 2.55 | % |
| Supplemental data and ratios: | | | | | | | | | | | | | | | | | | | | |
| Net assets, end of year (millions) | | $ | 55.2 | | | $ | 52.2 | | | $ | 47.3 | | | $ | 53.9 | | | $ | 98.1 | |
| Ratio of expenses to average net assets | | | 0.55 | % | | | 0.55 | % | | | 0.55 | % | | | 0.55 | % | | | 0.55 | % |
| Ratio of net investment income | | | | | | | | | | | | | | | | | | | | |
| to average net assets | | | 1.92 | % | | | 2.32 | % | | | 2.26 | % | | | 2.07 | % | | | 1.96 | % |
Portfolio turnover rate(3) | | | 37 | % | | | 26 | % | | | 32 | % | | | 31 | % | | | 30 | % |
| (1) | Calculated using average shares outstanding during the year. |
| (2) | Amount is less than $0.005. |
| (3) | Portfolio turnover is calculated on the basis of the Fund as a whole without distinguishing between the classes of shares issued and excludes in-kind transactions, where applicable. |
The accompanying notes are an integral part of these financial statements.
Financial Highlights
Baird Aggregate Bond Fund – Institutional Class
| | | Year Ended December 31, | |
| | | 2020 | | | 2019 | | | 2018 | | | 2017 | | | 2016 | |
| Per Share Data: | | | | | | | | | | | | | | | |
| Net asset value, beginning of year | | $ | 11.21 | | | $ | 10.53 | | | $ | 10.87 | | | $ | 10.70 | | | $ | 10.61 | |
| Income from investment operations: | | | | | | | | | | | | | | | | | | | | |
Net investment income(1) | | | 0.25 | | | | 0.30 | | | | 0.29 | | | | 0.26 | | | | 0.25 | |
| Net realized and unrealized | | | | | | | | | | | | | | | | | | | | |
| gains (losses) on investments | | | 0.71 | | | | 0.69 | | | | (0.33 | ) | | | 0.19 | | | | 0.12 | |
| Total from investment operations | | | 0.96 | | | | 0.99 | | | | (0.04 | ) | | | 0.45 | | | | 0.37 | |
| Less distributions: | | | | | | | | | | | | | | | | | | | | |
| Distributions from | | | | | | | | | | | | | | | | | | | | |
| net investment income | | | (0.27 | ) | | | (0.31 | ) | | | (0.30 | ) | | | (0.28 | ) | | | (0.26 | ) |
| Distributions from net realized gains | | | (0.13 | ) | | | — | | | | — | | | | — | | | | (0.02 | ) |
| Total distributions | | | (0.40 | ) | | | (0.31 | ) | | | (0.30 | ) | | | (0.28 | ) | | | (0.28 | ) |
| Net asset value, end of year | | $ | 11.77 | | | $ | 11.21 | | | $ | 10.53 | | | $ | 10.87 | | | $ | 10.70 | |
| Total return | | | 8.63 | % | | | 9.48 | % | | | (0.30 | )% | | | 4.20 | % | | | 3.52 | % |
| Supplemental data and ratios: | | | | | | | | | | | | | | | | | | | | |
| Net assets, end of year (millions) | | $ | 31,874.6 | | | $ | 21,857.4 | | | $ | 14,897.5 | | | $ | 13,582.8 | | | $ | 9,769.9 | |
| Ratio of expenses to average net assets | | | 0.30 | % | | | 0.30 | % | | | 0.30 | % | | | 0.30 | % | | | 0.30 | % |
| Ratio of net investment income | | | | | | | | | | | | | | | | | | | | |
| to average net assets | | | 2.13 | % | | | 2.74 | % | | | 2.77 | % | | | 2.40 | % | | | 2.25 | % |
Portfolio turnover rate(2) | | | 35 | % | | | 31 | % | | | 24 | % | | | 28 | % | | | 36 | % |
| (1) | Calculated using average shares outstanding during the year. |
| (2) | Portfolio turnover is calculated on the basis of the Fund as a whole without distinguishing between the classes of shares issued and excludes in-kind transactions, where applicable. |
The accompanying notes are an integral part of these financial statements.
Financial Highlights
Baird Aggregate Bond Fund – Investor Class
| | | Year Ended December 31, | |
| | | 2020 | | | 2019 | | | 2018 | | | 2017 | | | 2016 | |
| Per Share Data: | | | | | | | | | | | | | | | |
| Net asset value, beginning of year | | $ | 11.60 | | | $ | 10.89 | | | $ | 11.23 | | | $ | 11.05 | | | $ | 10.94 | |
| Income from investment operations: | | | | | | | | | | | | | | | | | | | | |
Net investment income(1) | | | 0.23 | | | | 0.28 | | | | 0.27 | | | | 0.24 | | | | 0.23 | |
| Net realized and unrealized | | | | | | | | | | | | | | | | | | | | |
| gains (losses) on investments | | | 0.74 | | | | 0.71 | | | | (0.33 | ) | | | 0.19 | | | | 0.14 | |
| Total from investment operations | | | 0.97 | | | | 0.99 | | | | (0.06 | ) | | | 0.43 | | | | 0.37 | |
| Less distributions: | | | | | | | | | | | | | | | | | | | | |
| Distributions from | | | | | | | | | | | | | | | | | | | | |
| net investment income | | | (0.24 | ) | | | (0.28 | ) | | | (0.28 | ) | | | (0.25 | ) | | | (0.24 | ) |
| Distributions from net realized gains | | | (0.13 | ) | | | — | | | | — | | | | — | | | | (0.02 | ) |
| Total distributions | | | (0.37 | ) | | | (0.28 | ) | | | (0.28 | ) | | | (0.25 | ) | | | (0.26 | ) |
| Net asset value, end of year | | $ | 12.20 | | | $ | 11.60 | | | $ | 10.89 | | | $ | 11.23 | | | $ | 11.05 | |
| Total return | | | 8.42 | % | | | 9.17 | % | | | (0.54 | )% | | | 3.90 | % | | | 3.34 | % |
| Supplemental data and ratios: | | | | | | | | | | | | | | | | | | | | |
| Net assets, end of year (millions) | | $ | 1,029.0 | | | $ | 786.4 | | | $ | 718.2 | | | $ | 825.4 | | | $ | 809.1 | |
| Ratio of expenses to average net assets | | | 0.55 | % | | | 0.55 | % | | | 0.55 | % | | | 0.55 | % | | | 0.55 | % |
| Ratio of net investment income | | | | | | | | | | | | | | | | | | | | |
| to average net assets | | | 1.88 | % | | | 2.49 | % | | | 2.52 | % | | | 2.15 | % | | | 2.00 | % |
Portfolio turnover rate(2) | | | 35 | % | | | 31 | % | | | 24 | % | | | 28 | % | | | 36 | % |
| (1) | Calculated using average shares outstanding during the year. |
| (2) | Portfolio turnover is calculated on the basis of the Fund as a whole without distinguishing between the classes of shares issued and excludes in-kind transactions, where applicable. |
The accompanying notes are an integral part of these financial statements.
Financial Highlights
Baird Core Plus Bond Fund – Institutional Class
| | | Year Ended December 31, | |
| | | 2020 | | | 2019 | | | 2018 | | | 2017 | | | 2016 | |
| Per Share Data: | | | | | | | | | | | | | | | |
| Net asset value, beginning of year | | $ | 11.56 | | | $ | 10.82 | | | $ | 11.22 | | | $ | 11.03 | | | $ | 10.85 | |
| Income from investment operations: | | | | | | | | | | | | | | | | | | | | |
Net investment income(1) | | | 0.29 | | | | 0.33 | | | | 0.33 | | | | 0.30 | | | | 0.29 | |
| Net realized and unrealized | | | | | | | | | | | | | | | | | | | | |
| gains (losses) on investments | | | 0.72 | | | | 0.75 | | | | (0.39 | ) | | | 0.21 | | | | 0.22 | |
| Total from investment operations | | | 1.01 | | | | 1.08 | | | | (0.06 | ) | | | 0.51 | | | | 0.51 | |
| Less distributions: | | | | | | | | | | | | | | | | | | | | |
| Distributions from | | | | | | | | | | | | | | | | | | | | |
| net investment income | | | (0.31 | ) | | | (0.34 | ) | | | (0.34 | ) | | | (0.32 | ) | | | (0.31 | ) |
| Distributions from net realized gains | | | (0.12 | ) | | | — | | | | — | | | | — | | | | (0.02 | ) |
| Total distributions | | | (0.43 | ) | | | (0.34 | ) | | | (0.34 | ) | | | (0.32 | ) | | | (0.33 | ) |
| Net asset value, end of year | | $ | 12.14 | | | $ | 11.56 | | | $ | 10.82 | | | $ | 11.22 | | | $ | 11.03 | |
| Total return | | | 8.80 | % | | | 10.11 | % | | | (0.51 | )% | | | 4.65 | % | | | 4.73 | % |
| Supplemental data and ratios: | | | | | | | | | | | | | | | | | | | | |
| Net assets, end of year (millions) | | $ | 26,805.5 | | | $ | 21,424.9 | | | $ | 15,635.3 | | | $ | 13,920.2 | | | $ | 10,023.6 | |
| Ratio of expenses to average net assets | | | 0.30 | % | | | 0.30 | % | | | 0.30 | % | | | 0.30 | % | | | 0.30 | % |
| Ratio of net investment income | | | | | | | | | | | | | | | | | | | | |
| to average net assets | | | 2.46 | % | | | 2.95 | % | | | 3.01 | % | | | 2.68 | % | | | 2.61 | % |
Portfolio turnover rate(2) | | | 33 | % | | | 26 | % | | | 26 | % | | | 30 | % | | | 33 | % |
| (1) | Calculated using average shares outstanding during the year. |
| (2) | Portfolio turnover is calculated on the basis of the Fund as a whole without distinguishing between the classes of shares issued and excludes in-kind transactions, where applicable. |
The accompanying notes are an integral part of these financial statements.
Financial Highlights
Baird Core Plus Bond Fund – Investor Class
| | | Year Ended December 31, | |
| | | 2020 | | | 2019 | | | 2018 | | | 2017 | | | 2016 | |
| Per Share Data: | | | | | | | | | | | | | | | |
| Net asset value, beginning of year | | $ | 12.05 | | | $ | 11.28 | | | $ | 11.68 | | | $ | 11.46 | | | $ | 11.26 | |
| Income from investment operations: | | | | | | | | | | | | | | | | | | | | |
Net investment income(1) | | | 0.28 | | | | 0.32 | | | | 0.31 | | | | 0.28 | | | | 0.27 | |
| Net realized and unrealized | | | | | | | | | | | | | | | | | | | | |
| gains (losses) on investments | | | 0.74 | | | | 0.76 | | | | (0.40 | ) | | | 0.23 | | | | 0.23 | |
| Total from investment operations | | | 1.02 | | | | 1.08 | | | | (0.09 | ) | | | 0.51 | | | | 0.50 | |
| Less distributions: | | | | | | | | | | | | | | | | | | | | |
| Distributions from | | | | | | | | | | | | | | | | | | | | |
| net investment income | | | (0.28 | ) | | | (0.31 | ) | | | (0.31 | ) | | | (0.29 | ) | | | (0.28 | ) |
| Distributions from net realized gains | | | (0.11 | ) | | | — | | | | — | | | | — | | | | (0.02 | ) |
| Total distributions | | | (0.39 | ) | | | (0.31 | ) | | | (0.31 | ) | | | (0.29 | ) | | | (0.30 | ) |
| Net asset value, end of year | | $ | 12.68 | | | $ | 12.05 | | | $ | 11.28 | | | $ | 11.68 | | | $ | 11.46 | |
| Total return | | | 8.58 | % | | | 9.69 | % | | | (0.74 | )% | | | 4.47 | % | | | 4.47 | % |
| Supplemental data and ratios: | | | | | | | | | | | | | | | | | | | | |
| Net assets, end of year (millions) | | $ | 2,684.3 | | | $ | 2,500.0 | | | $ | 2,171.0 | | | $ | 2,431.0 | | | $ | 2,881.8 | |
| Ratio of expenses to average net assets | | | 0.55 | % | | | 0.55 | % | | | 0.55 | % | | | 0.55 | % | | | 0.55 | % |
| Ratio of net investment income | | | | | | | | | | | | | | | | | | | | |
| to average net assets | | | 2.21 | % | | | 2.70 | % | | | 2.76 | % | | | 2.43 | % | | | 2.36 | % |
Portfolio turnover rate(2) | | | 33 | % | | | 26 | % | | | 26 | % | | | 30 | % | | | 33 | % |
| (1) | Calculated using average shares outstanding during the year. |
| (2) | Portfolio turnover is calculated on the basis of the Fund as a whole without distinguishing between the classes of shares issued and excludes in-kind transactions, where applicable. |
The accompanying notes are an integral part of these financial statements.
Financial Highlights
Baird Short-Term Municipal Bond Fund – Institutional Class
| | | Year Ended December 31, | |
| | | 2020 | | | 2019 | | | 2018 | | | 2017 | | | 2016 | |
| Per Share Data: | | | | | | | | | | | | | | | |
| Net asset value, beginning of year | | $ | 10.26 | | | $ | 10.06 | | | $ | 10.08 | | | $ | 9.97 | | | $ | 10.04 | |
| Income from investment operations: | | | | | | | | | | | | | | | | | | | | |
Net investment income(1) | | | 0.17 | | | | 0.20 | | | | 0.20 | | | | 0.18 | | | | 0.15 | |
| Net realized and unrealized | | | | | | | | | | | | | | | | | | | | |
| gains (losses) on investments | | | 0.16 | | | | 0.20 | | | | (0.03 | ) | | | 0.10 | | | | (0.08 | ) |
| Total from investment operations | | | 0.33 | | | | 0.40 | | | | 0.17 | | | | 0.28 | | | | 0.07 | |
| Less distributions: | | | | | | | | | | | | | | | | | | | | |
| Distributions from | | | | | | | | | | | | | | | | | | | | |
| net investment income | | | (0.16 | ) | | | (0.20 | ) | | | (0.19 | ) | | | (0.17 | ) | | | (0.14 | ) |
| Distributions from net realized gains | | | — | | | | — | | | | (0.00 | )(2) | | | (0.00 | )(2) | | | (0.00 | )(2) |
| Total distributions | | | (0.16 | ) | | | (0.20 | ) | | | (0.19 | ) | | | (0.17 | ) | | | (0.14 | ) |
| Net asset value, end of year | | $ | 10.43 | | | $ | 10.26 | | | $ | 10.06 | | | $ | 10.08 | | | $ | 9.97 | |
| Total return | | | 3.25 | % | | | 3.96 | % | | | 1.75 | % | | | 2.84 | % | | | 0.71 | % |
| Supplemental data and ratios: | | | | | | | | | | | | | | | | | | | | |
| Net assets, end of year (millions) | | $ | 1,520.0 | | | $ | 926.1 | | | $ | 281.2 | | | $ | 120.9 | | | $ | 52.4 | |
| Ratio of expenses to average net assets | | | 0.30 | % | | | 0.30 | % | | | 0.30 | % | | | 0.30 | % | | | 0.30 | % |
| Ratio of net investment income | | | | | | | | | | | | | | | | | | | | |
| to average net assets | | | 1.61 | % | | | 1.96 | % | | | 2.03 | % | | | 1.74 | % | | | 1.44 | % |
Portfolio turnover rate(3) | | | 32 | % | | | 34 | % | | | 107 | % | | | 54 | % | | | 38 | % |
| (1) | Calculated using average shares outstanding during the year. |
| (2) | Amount is less than $0.005. |
| (3) | Portfolio turnover is calculated on the basis of the Fund as a whole without distinguishing between the classes of shares issued and excludes in-kind transactions, where applicable. |
The accompanying notes are an integral part of these financial statements.
Financial Highlights
Baird Short-Term Municipal Bond Fund – Investor Class
| | | Year Ended December 31, | |
| | | 2020 | | | 2019 | | | 2018 | | | 2017 | | | 2016 | |
| Per Share Data: | | | | | | | | | | | | | | | |
| Net asset value, beginning of year | | $ | 10.25 | | | $ | 10.04 | | | $ | 10.06 | | | $ | 9.96 | | | $ | 10.04 | |
| Income from investment operations: | | | | | | | | | | | | | | | | | | | | |
Net investment income(1) | | | 0.14 | | | | 0.17 | | | | 0.18 | | | | 0.15 | | | | 0.12 | |
| Net realized and unrealized | | | | | | | | | | | | | | | | | | | | |
| gains (losses) on investments | | | 0.15 | | | | 0.21 | | | | (0.03 | ) | | | 0.09 | | | | (0.08 | ) |
| Total from investment operations | | | 0.29 | | | | 0.38 | | | | 0.15 | | | | 0.24 | | | | 0.04 | |
| Less distributions: | | | | | | | | | | | | | | | | | | | | |
| Distributions from | | | | | | | | | | | | | | | | | | | | |
| net investment income | | | (0.13 | ) | | | (0.17 | ) | | | (0.17 | ) | | | (0.14 | ) | | | (0.12 | ) |
| Distributions from net realized gains | | | — | | | | — | | | | (0.00 | )(2) | | | (0.00 | )(2) | | | (0.00 | )(2) |
| Total distributions | | | (0.13 | ) | | | (0.17 | ) | | | (0.17 | ) | | | (0.14 | ) | | | (0.12 | ) |
| Net asset value, end of year | | $ | 10.41 | | | $ | 10.25 | | | $ | 10.04 | | | $ | 10.06 | | | $ | 9.96 | |
| Total return | | | 2.90 | % | | | 3.81 | % | | | 1.52 | % | | | 2.45 | % | | | 0.40 | % |
| Supplemental data and ratios: | | | | | | | | | | | | | | | | | | | | |
| Net assets, end of year (millions) | | $ | 92.2 | | | $ | 89.6 | | | $ | 64.0 | | | $ | 4.9 | | | $ | 6.3 | |
| Ratio of expenses to average net assets | | | 0.55 | % | | | 0.55 | % | | | 0.55 | % | | | 0.55 | % | | | 0.55 | % |
| Ratio of net investment income | | | | | | | | | | | | | | | | | | | | |
| to average net assets | | | 1.36 | % | | | 1.71 | % | | | 1.78 | % | | | 1.49 | % | | | 1.19 | % |
Portfolio turnover rate(3) | | | 32 | % | | | 34 | % | | | 107 | % | | | 54 | % | | | 38 | % |
| (1) | Calculated using average shares outstanding during the year. |
| (2) | Amount is less than $0.005. |
| (3) | Portfolio turnover is calculated on the basis of the Fund as a whole without distinguishing between the classes of shares issued and excludes in-kind transactions, where applicable. |
The accompanying notes are an integral part of these financial statements.
Financial Highlights
Baird Strategic Municipal Bond Fund – Institutional Class
| | | Year Ended | | | Period Ended | |
| | | December 31, 2020 | | | December 31, 2019(1) | |
| Per Share Data: | | | | | | |
| Net asset value, beginning of period | | $ | 10.07 | | | $ | 10.00 | |
| Income from investment operations: | | | | | | | | |
Net investment income(2) | | | 0.18 | | | | 0.02 | |
| Net realized and unrealized gain on investments | | | 0.66 | | | | 0.07 | |
| Total from investment operations | | | 0.84 | | | | 0.09 | |
| Less distributions: | | | | | | | | |
| Distributions from net investment income | | | (0.17 | ) | | | (0.02 | ) |
| Distributions from net realized gains | | | (0.07 | ) | | | — | |
| Total distributions | | | (0.24 | ) | | | (0.02 | ) |
| Net asset value, end of period | | $ | 10.67 | | | $ | 10.07 | |
| Total return | | | 8.39 | % | | | 0.88 | %(3) |
| Supplemental data and ratios: | | | | | | | | |
| Net assets, end of period (millions) | | $ | 164.3 | | | $ | 12.0 | |
| Ratio of expenses to average net assets | | | 0.30 | % | | | 0.30 | %(4) |
| Ratio of net investment income to average net assets | | | 1.72 | % | | | 1.60 | %(4) |
Portfolio turnover rate(5) | | | 119 | % | | | 47 | %(3) |
| (1) | Inception was close of business on November 15, 2019. |
| (2) | Calculated using average shares outstanding during the period. |
| (3) | Not annualized. |
| (4) | Annualized. |
| (5) | Portfolio turnover is calculated on the basis of the Fund as a whole without distinguishing between the classes of shares issued and excludes in-kind transactions, where applicable. |
The accompanying notes are an integral part of these financial statements.
Financial Highlights
Baird Strategic Municipal Bond Fund – Investor Class
| | | Year Ended | | | Period Ended | |
| | | December 31, 2020 | | | December 31, 2019(1) | |
| Per Share Data: | | | | | | |
| Net asset value, beginning of period | | $ | 10.07 | | | $ | 10.00 | |
| Income from investment operations: | | | | | | | | |
Net investment income(2) | | | 0.15 | | | | 0.02 | |
| Net realized and unrealized gain on investments | | | 0.67 | | | | 0.06 | |
| Total from investment operations | | | 0.82 | | | | 0.08 | |
| Less distributions: | | | | | | | | |
| Distributions from net investment income | | | (0.15 | ) | | | (0.01 | ) |
| Distributions from net realized gains | | | (0.07 | ) | | | — | |
| Total distributions | | | (0.22 | ) | | | (0.01 | ) |
| Net asset value, end of period | | $ | 10.67 | | | $ | 10.07 | |
| Total return | | | 8.13 | % | | | 0.85 | %(3) |
| Supplemental data and ratios: | | | | | | | | |
| Net assets, end of period (thousands) | | $ | 6,976.1 | | | $ | 27.4 | |
| Ratio of expenses to average net assets | | | 0.55 | % | | | 0.55 | %(4) |
| Ratio of net investment income to average net assets | | | 1.47 | % | | | 1.35 | %(4) |
Portfolio turnover rate(5) | | | 119 | % | | | 47 | %(3) |
| (1) | Inception was close of business on November 15, 2019. |
| (2) | Calculated using average shares outstanding during the period. |
| (3) | Not annualized. |
| (4) | Annualized. |
| (5) | Portfolio turnover is calculated on the basis of the Fund as a whole without distinguishing between the classes of shares issued and excludes in-kind transactions, where applicable. |
The accompanying notes are an integral part of these financial statements.
Financial Highlights
Baird Quality Intermediate Municipal Bond Fund – Institutional Class
| | | Year Ended December 31, | |
| | | 2020 | | | 2019 | | | 2018 | | | 2017 | | | 2016 | |
| Per Share Data: | | | | | | | | | | | | | | | |
| Net asset value, beginning of year | | $ | 11.75 | | | $ | 11.38 | | | $ | 11.52 | | | $ | 11.43 | | | $ | 11.74 | |
| Income from investment operations: | | | | | | | | | | | | | | | | | | | | |
Net investment income(1) | | | 0.24 | | | | 0.27 | | | | 0.27 | | | | 0.27 | | | | 0.26 | |
| Net realized and unrealized | | | | | | | | | | | | | | | | | | | | |
| gains (losses) on investments | | | 0.28 | | | | 0.37 | | | | (0.14 | ) | | | 0.09 | | | | (0.31 | ) |
| Total from investment operations | | | 0.52 | | | | 0.64 | | | | 0.13 | | | | 0.36 | | | | (0.05 | ) |
| Less distributions: | | | | | | | | | | | | | | | | | | | | |
| Distributions from | | | | | | | | | | | | | | | | | | | | |
| net investment income | | | (0.24 | ) | | | (0.27 | ) | | | (0.27 | ) | | | (0.27 | ) | | | (0.26 | ) |
| Distributions from return of capital | | | — | | | | — | | | | — | | | | (0.00 | )(2) | | | — | |
| Total distributions | | | (0.24 | ) | | | (0.27 | ) | | | (0.27 | ) | | | (0.27 | ) | | | (0.26 | ) |
| Net asset value, end of year | | $ | 12.03 | | | $ | 11.75 | | | $ | 11.38 | | | $ | 11.52 | | | $ | 11.43 | |
| Total return | | | 4.43 | % | | | 5.65 | % | | | 1.19 | % | | | 3.12 | % | | | (0.46 | )% |
| Supplemental data and ratios: | | | | | | | | | | | | | | | | | | | | |
| Net assets, end of year (millions) | | $ | 1,449.2 | | | $ | 1,257.4 | | | $ | 1,009.2 | | | $ | 1,044.1 | | | $ | 936.2 | |
| Ratio of expenses to average net assets | | | 0.30 | % | | | 0.30 | % | | | 0.30 | % | | | 0.30 | % | | | 0.30 | % |
| Ratio of net investment income | | | | | | | | | | | | | | | | | | | | |
| to average net assets | | | 2.03 | % | | | 2.30 | % | | | 2.39 | % | | | 2.29 | % | | | 2.19 | % |
Portfolio turnover rate(3) | | | 15 | % | | | 20 | % | | | 40 | % | | | 31 | % | | | 22 | % |
| (1) | Calculated using average shares outstanding during the year. |
| (2) | Amount is less than $0.005. |
| (3) | Portfolio turnover is calculated on the basis of the Fund as a whole without distinguishing between the classes of shares issued and excludes in-kind transactions, where applicable. |
The accompanying notes are an integral part of these financial statements.
Financial Highlights
Baird Quality Intermediate Municipal Bond Fund – Investor Class
| | | Year Ended December 31, | |
| | | 2020 | | | 2019 | | | 2018 | | | 2017 | | | 2016 | |
| Per Share Data: | | | | | | | | | | | | | | | |
| Net asset value, beginning of year | | $ | 12.04 | | | $ | 11.66 | | | $ | 11.80 | | | $ | 11.69 | | | $ | 12.00 | |
| Income from investment operations: | | | | | | | | | | | | | | | | | | | | |
Net investment income(1) | | | 0.22 | | | | 0.24 | | | | 0.25 | | | | 0.24 | | | | 0.23 | |
| Net realized and unrealized | | | | | | | | | | | | | | | | | | | | |
| gains (losses) on investments | | | 0.29 | | | | 0.38 | | | | (0.15 | ) | | | 0.11 | | | | (0.31 | ) |
| Total from investment operations | | | 0.51 | | | | 0.62 | | | | 0.10 | | | | 0.35 | | | | (0.08 | ) |
| Less distributions: | | | | | | | | | | | | | | | | | | | | |
| Distributions from | | | | | | | | | | | | | | | | | | | | |
| net investment income | | | (0.21 | ) | | | (0.24 | ) | | | (0.24 | ) | | | (0.24 | ) | | | (0.23 | ) |
| Distributions from return of capital | | | — | | | | — | | | | — | | | | (0.00 | )(2) | | | — | |
| Total distributions | | | (0.21 | ) | | | (0.24 | ) | | | (0.24 | ) | | | (0.24 | ) | | | (0.23 | ) |
| Net asset value, end of year | | $ | 12.34 | | | $ | 12.04 | | | $ | 11.66 | | | $ | 11.80 | | | $ | 11.69 | |
| Total return | | | 4.23 | % | | | 5.33 | % | | | 0.90 | % | | | 2.97 | % | | | (0.70 | )% |
| Supplemental data and ratios: | | | | | | | | | | | | | | | | | | | | |
| Net assets, end of year (millions) | | $ | 52.4 | | | $ | 85.1 | | | $ | 110.8 | | | $ | 107.3 | | | $ | 136.1 | |
| Ratio of expenses to average net assets | | | 0.55 | % | | | 0.55 | % | | | 0.55 | % | | | 0.55 | % | | | 0.55 | % |
| Ratio of net investment income | | | | | | | | | | | | | | | | | | | | |
| to average net assets | | | 1.78 | % | | | 2.05 | % | | | 2.14 | % | | | 2.00 | % | | | 1.94 | % |
Portfolio turnover rate(3) | | | 15 | % | | | 20 | % | | | 40 | % | | | 31 | % | | | 22 | % |
| (1) | Calculated using average shares outstanding during the year. |
| (2) | Amount is less than $0.005. |
| (3) | Portfolio turnover is calculated on the basis of the Fund as a whole without distinguishing between the classes of shares issued and excludes in-kind transactions, where applicable. |
The accompanying notes are an integral part of these financial statements.
Financial Highlights
Baird Core Intermediate Municipal Bond Fund – Institutional Class
| | | Year Ended December 31, | |
| | | 2020 | | | 2019 | | | 2018 | | | 2017 | | | 2016 | |
| Per Share Data: | | | | | | | | | | | | | | | |
| Net asset value, beginning of year | | $ | 10.65 | | | $ | 10.22 | | | $ | 10.32 | | | $ | 10.01 | | | $ | 10.13 | |
| Income from investment operations: | | | | | | | | | | | | | | | | | | | | |
Net investment income(1) | | | 0.23 | | | | 0.25 | | | | 0.23 | | | | 0.21 | | | | 0.18 | |
| Net realized and unrealized | | | | | | | | | | | | | | | | | | | | |
| gains (losses) on investments | | | 0.33 | | | | 0.43 | | | | (0.10 | ) | | | 0.30 | | | | (0.05 | ) |
| Total from investment operations | | | 0.56 | | | | 0.68 | | | | 0.13 | | | | 0.51 | | | | 0.13 | |
| Less distributions: | | | | | | | | | | | | | | | | | | | | |
| Distributions from | | | | | | | | | | | | | | | | | | | | |
| net investment income | | | (0.22 | ) | | | (0.24 | ) | | | (0.23 | ) | | | (0.20 | ) | | | (0.18 | ) |
| Distributions from net realized gains | | | (0.03 | ) | | | (0.01 | ) | | | — | | | | — | | | | (0.07 | ) |
| Total distributions | | | (0.25 | ) | | | (0.25 | ) | | | (0.23 | ) | | | (0.20 | ) | | | (0.25 | ) |
| Net asset value, end of year | | $ | 10.96 | | | $ | 10.65 | | | $ | 10.22 | | | $ | 10.32 | | | $ | 10.01 | |
| Total return | | | 5.26 | % | | | 6.75 | % | | | 1.30 | % | | | 5.15 | % | | | 1.14 | % |
| Supplemental data and ratios: | | | | | | | | | | | | | | | | | | | | |
| Net assets, end of year (millions) | | $ | 842.2 | | | $ | 535.5 | | | $ | 378.1 | | | $ | 234.8 | | | $ | 96.3 | |
| Ratio of expenses to average net assets | | | 0.30 | % | | | 0.30 | % | | | 0.30 | % | | | 0.30 | % | | | 0.30 | % |
| Ratio of net investment income | | | | | | | | | | | | | | | | | | | | |
| to average net assets | | | 2.09 | % | | | 2.36 | % | | | 2.30 | % | | | 2.04 | % | | | 1.79 | % |
Portfolio turnover rate(2) | | | 35 | % | | | 38 | % | | | 70 | % | | | 66 | % | | | 95 | % |
| (1) | Calculated using average shares outstanding during the year. |
| (2) | Portfolio turnover is calculated on the basis of the Fund as a whole without distinguishing between the classes of shares issued and excludes in-kind transactions, where applicable. |
The accompanying notes are an integral part of these financial statements.
Financial Highlights
Baird Core Intermediate Municipal Bond Fund – Investor Class
| | | Year Ended December 31, | |
| | | 2020 | | | 2019 | | | 2018 | | | 2017 | | | 2016 | |
| Per Share Data: | | | | | | | | | | | | | | | |
| Net asset value, beginning of year | | $ | 10.64 | | | $ | 10.22 | | | $ | 10.32 | | | $ | 10.00 | | | $ | 10.13 | |
| Income from investment operations: | | | | | | | | | | | | | | | | | | | | |
Net investment income(1) | | | 0.20 | | | | 0.22 | | | | 0.21 | | | | 0.18 | | | | 0.16 | |
| Net realized and unrealized | | | | | | | | | | | | | | | | | | | | |
| gains (losses) on investments | | | 0.33 | | | | 0.43 | | | | (0.11 | ) | | | 0.32 | | | | (0.06 | ) |
| Total from investment operations | | | 0.53 | | | | 0.65 | | | | 0.10 | | | | 0.50 | | | | 0.10 | |
| Less distributions: | | | | | | | | | | | | | | | | | | | | |
| Distributions from | | | | | | | | | | | | | | | | | | | | |
| net investment income | | | (0.19 | ) | | | (0.22 | ) | | | (0.20 | ) | | | (0.18 | ) | | | (0.16 | ) |
| Distributions from net realized gains | | | (0.03 | ) | | | (0.01 | ) | | | — | | | | — | | | | (0.07 | ) |
| Total distributions | | | (0.22 | ) | | | (0.23 | ) | | | (0.20 | ) | | | (0.18 | ) | | | (0.23 | ) |
| Net asset value, end of year | | $ | 10.95 | | | $ | 10.64 | | | $ | 10.22 | | | $ | 10.32 | | | $ | 10.00 | |
| Total return | | | 5.01 | % | | | 6.40 | % | | | 1.05 | % | | | 5.00 | % | | | 0.91 | % |
| Supplemental data and ratios: | | | | | | | | | | | | | | | | | | | | |
| Net assets, end of year (millions) | | $ | 22.3 | | | $ | 5.9 | | | $ | 2.0 | | | $ | 1.7 | | | $ | 1.4 | |
| Ratio of expenses to average net assets | | | 0.55 | % | | | 0.55 | % | | | 0.55 | % | | | 0.55 | % | | | 0.55 | % |
| Ratio of net investment income | | | | | | | | | | | | | | | | | | | | |
| to average net assets | | | 1.84 | % | | | 2.11 | % | | | 2.05 | % | | | 1.79 | % | | | 1.54 | % |
Portfolio turnover rate(2) | | | 35 | % | | | 38 | % | | | 70 | % | | | 66 | % | | | 95 | % |
| (1) | Calculated using average shares outstanding during the year. |
| (2) | Portfolio turnover is calculated on the basis of the Fund as a whole without distinguishing between the classes of shares issued and excludes in-kind transactions, where applicable. |
The accompanying notes are an integral part of these financial statements.
Financial Highlights
Baird Municipal Bond Fund – Institutional Class
| | | Year Ended | | | Period Ended | |
| | | December 31, 2020 | | | December 31, 2019(1) | |
| Per Share Data: | | | | | | |
| Net asset value, beginning of period | | $ | 10.10 | | | $ | 10.00 | |
| Income from investment operations: | | | | | | | | |
Net investment income(2) | | | 0.23 | | | | 0.02 | |
| Net realized and unrealized gain on investments | | | 0.76 | | | | 0.10 | |
| Total from investment operations | | | 0.99 | | | | 0.12 | |
| Less distributions: | | | | | | | | |
| Distributions from net investment income | | | (0.21 | ) | | | (0.02 | ) |
| Distributions from net realized gains | | | (0.21 | ) | | | — | |
| Total distributions | | | (0.42 | ) | | | (0.02 | ) |
| Net asset value, end of period | | $ | 10.67 | | | $ | 10.10 | |
| Total return | | | 9.95 | % | | | 1.19 | %(3) |
| Supplemental data and ratios: | | | | | | | | |
| Net assets, end of period (millions) | | $ | 20.3 | | | $ | 7.4 | |
| Ratio of expenses to average net assets | | | 0.30 | % | | | 0.30 | %(4) |
| Ratio of net investment income to average net assets | | | 2.20 | % | | | 1.69 | %(4) |
Portfolio turnover rate(5) | | | 124 | % | | | 46 | %(3) |
| (1) | Inception was close of business on November 15, 2019. |
| (2) | Calculated using average shares outstanding during the period. |
| (3) | Not annualized. |
| (4) | Annualized. |
| (5) | Portfolio turnover is calculated on the basis of the Fund as a whole without distinguishing between the classes of shares issued and excludes in-kind transactions, where applicable. |
The accompanying notes are an integral part of these financial statements.
Financial Highlights
Baird Municipal Bond Fund – Investor Class
| | | Year Ended | | | Period Ended | |
| | | December 31, 2020 | | | December 31, 2019(1) | |
| Per Share Data: | | | | | | |
| Net asset value, beginning of period | | $ | 10.10 | | | $ | 10.00 | |
| Income from investment operations: | | | | | | | | |
Net investment income(2) | | | 0.21 | | | | 0.02 | |
| Net realized and unrealized gain on investments | | | 0.75 | | | | 0.10 | |
| Total from investment operations | | | 0.96 | | | | 0.12 | |
| Less distributions: | | | | | | | | |
| Distributions from net investment income | | | (0.19 | ) | | | (0.02 | ) |
| Distributions from net realized gains | | | (0.21 | ) | | | — | |
| Total distributions | | | (0.40 | ) | | | (0.02 | ) |
| Net asset value, end of period | | $ | 10.66 | | | $ | 10.10 | |
| Total return | | | 9.58 | % | | | 1.16 | %(3) |
| Supplemental data and ratios: | | | | | | | | |
| Net assets, end of period (thousands) | | $ | 1,624.8 | | | $ | 29.1 | |
| Ratio of expenses to average net assets | | | 0.55 | % | | | 0.55 | %(4) |
| Ratio of net investment income to average net assets | | | 1.95 | % | | | 1.44 | %(4) |
Portfolio turnover rate(5) | | | 124 | % | | | 46 | %(3) |
| (1) | Inception was close of business on November 15, 2019. |
| (2) | Calculated using average shares outstanding during the period. |
| (3) | Not annualized. |
| (4) | Annualized. |
| (5) | Portfolio turnover is calculated on the basis of the Fund as a whole without distinguishing between the classes of shares issued and excludes in-kind transactions, where applicable. |
The accompanying notes are an integral part of these financial statements.
Notes to the Financial Statements
December 31, 2020
Baird Funds, Inc. (the “Corporation”) was incorporated on June 9, 2000, as a Wisconsin corporation and is registered as an open-end investment management company under the Investment Company Act of 1940, as amended (the “1940 Act”). The accompanying financial statements include the Baird Ultra Short Bond Fund, Baird Short-Term Bond Fund, Baird Intermediate Bond Fund, Baird Aggregate Bond Fund, Baird Core Plus Bond Fund, Baird Short-Term Municipal Bond Fund, Baird Strategic Municipal Bond Fund, Baird Quality Intermediate Municipal Bond Fund, Baird Core Intermediate Municipal Bond Fund and Baird Municipal Bond Fund (each, a “Fund” and collectively, the “Funds”), ten of the sixteen active funds in the series comprising the Corporation, each of which is diversified within the meaning of the 1940 Act. Robert W. Baird & Co. Incorporated (“Baird” or the “Advisor”) serves as investment advisor to the Funds. The Funds are investment companies and therefore follow the investment company accounting and reporting guidance of the Financial Accounting Standards Board (“FASB”) Accounting Standards Codification Topic 946, Financial Services – Investment Companies.
The following table presents the class-specific inception dates for each of the Funds:
| | Inception Date |
Fund | Institutional Class
| | Investor Class
|
| Baird Ultra Short Bond Fund | December 31, 2013 | | December 31, 2013 |
| Baird Short-Term Bond Fund | August 31, 2004 | | September 19, 2012 |
| Baird Intermediate Bond Fund | September 29, 2000 | | September 29, 2000 |
| Baird Aggregate Bond Fund | September 29, 2000 | | September 29, 2000 |
| Baird Core Plus Bond Fund | September 29, 2000 | | September 29, 2000 |
| Baird Short-Term Municipal Bond Fund | August 31, 2015 | | August 31, 2015 |
| Baird Strategic Municipal Bond Fund | November 15, 2019 | | November 15, 2019 |
| Baird Quality Intermediate Municipal Bond Fund | March 30, 2001 | | March 30, 2001 |
| Baird Core Intermediate Municipal Bond Fund | August 31, 2015 | | August 31, 2015 |
| Baird Municipal Bond Fund | November 15, 2019 | | November 15, 2019 |
Institutional Class shares are not subject to a distribution and service (12b-1) fee, while Investor Class shares are subject to a distribution and service (12b-1) fee of 0.25%. See Note 7.
The investment objective of the Baird Ultra Short Bond Fund is to seek current income consistent with preservation of capital. The Fund’s benchmark index, the Bloomberg Barclays U.S. Short-Term Government/Corporate Index, is an unmanaged, market value weighted index of investment grade, fixed-rate debt issues, including government and corporate securities, with maturities less than one year.
The investment objective of the Baird Short-Term Bond Fund is to seek an annual rate of total return, before Fund expenses, greater than the annual rate of total return of the Bloomberg Barclays 1-3 Year U.S. Government/Credit Bond Index. The Bloomberg Barclays 1-3 Year U.S. Government/Credit Bond Index is an unmanaged, market value weighted index of investment grade, fixed-rate debt issues, including government and corporate securities, with maturities between one and three years.
The investment objective of the Baird Intermediate Bond Fund is to seek an annual rate of total return, before Fund expenses, greater than the annual rate of total return of the Bloomberg Barclays Intermediate U.S. Government/Credit Bond Index. The Bloomberg Barclays Intermediate U.S. Government/Credit Bond Index is an unmanaged, market value weighted index of investment grade, fixed-rate debt issues, including government and corporate securities, with maturities between one and ten years.
The investment objective of the Baird Aggregate Bond Fund is to seek an annual rate of total return, before Fund expenses, greater than the annual rate of total return of the Bloomberg Barclays U.S. Aggregate Bond Index. The Bloomberg Barclays U.S. Aggregate Bond Index is an unmanaged, market value weighted index of investment grade, fixed-rate debt issues, including government, corporate, asset-backed and mortgage-backed securities, with maturities of at least one year.
Notes to the Financial Statements
December 31, 2020
The investment objective of the Baird Core Plus Bond Fund is to seek an annual rate of total return, before Fund expenses, greater than the annual rate of total return of the Bloomberg Barclays U.S. Universal Bond Index. The Bloomberg Barclays U.S. Universal Bond Index is an unmanaged, market value weighted index of fixed income securities issued in U.S. dollars, including U.S. government and investment grade debt, non-investment grade debt, asset-backed and mortgage-backed securities, Eurobonds, 144A securities and emerging market debt, with maturities of at least one year.
The investment objective of the Baird Short-Term Municipal Bond Fund is to seek current income that is exempt from federal income tax and is consistent with the preservation of capital.
The investment objective of the Baird Strategic Municipal Bond Fund is to seek a high level of current income that is exempt from federal income tax and is consistent with preservation of capital.
The primary investment objective of the Baird Quality Intermediate Municipal Bond Fund is to seek current income that is substantially exempt from federal income tax. A secondary objective is to seek total return with relatively low volatility of principal.
The investment objective of the Baird Core Intermediate Municipal Bond Fund is to seek a high level of current income that is exempt from federal income tax and is consistent with preservation of capital.
The investment objective of the Baird Municipal Bond Fund is to seek a high level of current income that is exempt from federal income tax and is consistent with preservation of capital.
The beneficial ownership, either directly or indirectly, of more than 25% of the voting securities of a fund creates a presumption of control of the fund, under Section 2(a)(9) of the 1940 Act. On December 31, 2020, entities affiliated with the Advisor held 25.4% of the Baird Municipal Bond Fund.
| 2. | Significant Accounting Policies |
The following is a summary of significant accounting policies consistently followed by the Funds in the preparation of their financial statements. These policies are in conformity with accounting principles generally accepted in the United States of America (“GAAP”).
| a) | Investment Valuation – Section 2(a)(41) of the 1940 Act, together with the rules and interpretations of the U.S. Securities and Exchange Commission (the “SEC”), require the Funds, in computing net asset value, to value their portfolio securities using market quotations when they are “readily available.” When market quotations are not readily available (e.g., because there is no regular market quotation for such securities, the market for such security is limited, the validity of quotations is questionable or the Funds’ independent pricing service does not provide a price), the Board of Directors (the “Board”) of the Corporation is responsible for ensuring the securities are valued at “fair value determined in good faith.” The Board has delegated such responsibility to the Advisor pursuant to pricing policies and procedures that the Board has adopted and regularly reviews. In general, the “fair value” of a security means the price that would be received to sell a security in an orderly transaction between market participants at the measurement date. |
| | |
| | The Funds determine the fair value of their investments and compute their net asset value per share as of the close of regular trading of the New York Stock Exchange (generally, 4:00 p.m. ET). |
| | |
| | Consistent with Section 2(a)(41) of the 1940 Act, the Funds price their securities as follows: debt securities are valued at their evaluated bid prices as provided by an independent pricing service using valuation methods that are designed to represent fair value, such as matrix pricing and other analytical pricing models, market transactions and dealer quotations. Debt securities purchased with maturities of 60 days or less are valued as described above unless an evaluated price is not available, in which case such security is valued at acquisition cost, plus or minus any amortized discount or premium (“amortized cost”), or, if the Advisor does not believe amortized cost is reflective of the fair value of the security, the security is priced at fair value as described below. Investments in mutual funds, including money market funds, are valued at their stated net asset value (“NAV”). Common stocks that are listed on a securities exchange (other than NASDAQ) are valued at the last quoted sales price. Securities traded on NASDAQ are valued at the NASDAQ Official Closing Price. Price information on listed stocks is taken |
Notes to the Financial Statements
December 31, 2020
| 2. | Significant Accounting Policies (cont.) |
| | |
| | from the exchange where the security is primarily traded. Securities that were not traded on the valuation date, as well as stocks that are not listed on an exchange, including NASDAQ, are valued at the average of the current bid and ask price. Other assets and securities for which market quotations are not readily available are valued at fair value as determined in good faith by the Advisor in accordance with procedures approved by the Corporation’s Board. In accordance with such procedures, the Advisor may, under certain circumstances, use alternative valuation methodologies, or it may use broker quotes or prices obtained from alternative independent pricing services or, if broker quotes or prices from alternative pricing services are unavailable or deemed to be unreliable, fair value will be determined by a valuation committee of the Advisor. In determining fair value, the valuation committee takes into account factors deemed relevant by the valuation committee and available information. Consequently, the price of the security used by a Fund to calculate its NAV may differ from quoted or published prices for the same security. Fair value pricing involves subjective judgments and there is no single standard for determining a security’s fair value. As a result, different mutual funds could reasonably arrive at a different fair value for the same security. It is possible that the fair value determined for a security is materially different from the value that could be realized upon the sale of that security or from the values that other mutual funds may determine. The prices determined for any individual security on any given day may vary significantly from the amount that can be obtained in an actual sale of that security, and the Funds’ NAVs may fluctuate significantly from day to day or from period to period. |
| | |
| b) | Securities Purchased on a When-Issued, Delayed Delivery or Forward Commitment Basis – Each Fund may purchase securities on a when-issued, delayed delivery or forward commitment basis. When-issued, delayed delivery and forward commitment transactions involve the risk that the price or yield obtained in a transaction may be more or less favorable than the price or yield available in the market when delivery takes place. At the time a Fund makes a commitment to purchase a security, the Fund records the transaction and reflects the value of the security in determining net asset value. Each Fund designates and maintains cash and/or marketable securities at least equal in value to commitments for when-issued, delayed delivery or forward commitment securities. |
| | |
| c) | Unregistered Securities – The Funds own certain investment securities which are unregistered. All of the unregistered securities held by the Funds as of December 31, 2020 consist of securities issued pursuant to Rule 144A under the Securities Act of 1933 and all have been classified as liquid under the Funds’ liquidity risk management program. |
| | |
| | The value of such securities for the Funds is as follows: |
| | Fund | | Value | | % of Net Assets |
| | Baird Ultra Short Bond Fund | | $ | 788,386,993 | | | | 17.22 | % | |
| | Baird Short-Term Bond Fund | | | 2,052,327,466 | | | | 22.85 | % | |
| | Baird Intermediate Bond Fund | | | 824,717,333 | | | | 15.50 | % | |
| | Baird Aggregate Bond Fund | | | 5,236,253,267 | | | | 15.91 | % | |
| | Baird Core Plus Bond Fund | | | 5,713,026,639 | | | | 19.37 | % | |
| | Baird Short-Term Municipal Bond Fund | | | 72,935,626 | | | | 4.52 | % | |
| | Baird Strategic Municipal Bond Fund | | | 22,740,569 | | | | 13.27 | % | |
| | Baird Quality Intermediate Municipal Bond Fund | | | 7,398,312 | | | | 0.49 | % | |
| | Baird Core Intermediate Municipal Bond Fund | | | 48,599,022 | | | | 5.62 | % | |
| | Baird Municipal Bond Fund | | | 2,508,951 | | | | 11.46 | % | |
| d) | Foreign Securities – For purposes of these financial statements, foreign securities are defined as securities of issuers that are organized outside the United States. The Funds may invest in U.S. dollar-denominated debt obligations of foreign companies and foreign governments. Investing in securities of foreign companies and foreign governments involves special risks and considerations not typically associated with investing in U.S. companies and the U.S. government. These risks include foreign currency fluctuations, political and economic instability and differences in financial reporting standards and less strict regulation of securities markets. Moreover, securities of many foreign companies and foreign governments and their markets may |
Notes to the Financial Statements
December 31, 2020
| 2. | Significant Accounting Policies (cont.) |
| | |
| | be less liquid and their prices more volatile than those of securities of comparable U.S. companies and the U.S. government. Occasionally, events that affect these values and exchange rates may occur after the close of the exchange on which such securities are traded. If such events materially affect the value of a Fund’s securities, these securities may be valued at their fair value pursuant to procedures adopted by the Board. |
| | |
| e) | Financial Derivative Instruments – Financial derivative instruments, such as futures contracts, derive their value from underlying asset prices, indices, reference rates and other inputs or a combination of these factors. These contracts are normally valued on the basis of broker-dealer quotations or a pricing service at the settlement price determined by the relevant exchange. Depending on the product and the terms of the transaction, the value of the derivative contracts can be estimated by a pricing service provider using a series of techniques, including simulation pricing models. The pricing models use inputs that are observed from actively quoted markets such as issuer details, indices, spreads, interest rates, curves, dividends and exchange rates. Futures contracts are carried at fair value using the primary exchange’s closing (settlement) price and are generally categorized in Level 1. |
| | |
| f) | Deposits with Broker – When trading derivative instruments, such as futures contracts, a Fund is only required to post initial or variation margin with the exchange or clearing broker. The use of margin in trading these instruments has the effect of creating leverage, which can expose the Fund to substantial gains or losses occurring from relatively small price changes in the value of the underlying instrument and can increase the volatility of the Fund’s returns. |
| | |
| | Upon entering into a futures contract, and to maintain the Fund’s open positions in futures contracts, the Fund is required to deposit with its custodian or futures broker in a segregated account in the name of the futures broker an amount of cash, U.S. government securities, suitable money market instruments, or other liquid securities, known as “initial margin.” The margin required for a particular futures contract is set by the exchange on which the contract is traded and may be significantly modified from time to time by the exchange during the term of the contract. Futures contracts are customarily purchased and sold on margins that may range upward from less than 5% of the value of the contract being traded. |
| | |
| | At December 31, 2020, the Baird Strategic Municipal Bond Fund had $3,695 in cash and cash equivalents on deposit with the broker for futures contracts which is presented on the Fund’s Statement of Assets and Liabilities. |
| | |
| | If the price of an open futures contract changes (by increase in underlying instrument or index in the case of a sale or by decrease in the case of a purchase) so that the loss on the futures contract reaches a point at which the margin on deposit does not satisfy margin requirements, the broker will require an increase in the margin. However, if the value of a position increases because of favorable price changes in the futures contract so that the margin deposit exceeds the required margin, the broker will pay the excess to the Fund. |
| | |
| | These subsequent payments, called “variation margin,” to and from the futures broker are made on a daily basis as the price of the underlying assets fluctuate making the long and short positions in the futures contract more or less valuable, a process known as “marking to the market.” At period end, the variation margin is shown as either a receivable or payable on the Fund’s Statement of Assets and Liabilities. The Fund expects to earn interest income on any margin deposits. At December 31, 2020, the Fund had no open positions in futures contracts and therefore there was no variation margin presented on the Fund's Statement of Assets and Liabilities. |
| | |
| g) | Income Tax Status – The Funds intend to continue to qualify as regulated investment companies as provided in Subchapter M of the Internal Revenue Code and to distribute substantially all of their taxable income to their shareholders in a manner which results in no tax expense to the Funds. Therefore, no federal income or excise tax provision is recorded. |
| | |
| | There is no tax liability resulting from unrecognized tax benefits relating to uncertain income tax positions taken or expected to be taken on the tax return for the fiscal year ended December 31, 2020, or for any other tax years which are open for exam. As of December 31, 2020, open tax years include the tax years ended December 31, 2017 through 2020. The Funds are not aware of any tax positions for which it is reasonably possible that the total amounts of unrecognized tax benefits will significantly |
Notes to the Financial Statements
December 31, 2020
| 2. | Significant Accounting Policies (cont.) |
| | |
| | change in the next 12 months. The Funds recognize interest and penalties, if any, related to unrecognized tax benefits as interest and other expense, respectively, in the Statement of Operations. During the period, the Funds did not incur any interest or penalties. |
| | |
| h) | Allocation of Income and Expenses – Each Fund is charged for those expenses directly attributable to it. Expenses directly attributable to a class of shares, such as Rule 12b-1 distribution fees, are charged to that class of shares. Income, expenses and realized and unrealized gains and losses are allocated to the classes based on their respective net assets. Expenses that are not directly attributable to a Fund are allocated among the Funds in the series in proportion to their assets or are divided equally amongst the Funds. |
| | |
| i) | Shareholder Transactions and Distributions – Shareholder transactions are recorded on the trade date. Dividends from net investment income are declared and paid monthly. Distributions of net realized capital gains, if any, are declared and paid at least annually. All distributions to shareholders are recorded on the ex-dividend date. The book basis character of distributions may differ from their ultimate characterization for Federal income tax purposes. GAAP requires that permanent financial reporting and tax differences be reclassified in the capital accounts. |
| | |
| j) | Use of Estimates – The preparation of financial statements in conformity with GAAP requires management to make estimates and assumptions that affect the reported amounts of assets and liabilities and disclosure of contingent assets and liabilities at the date of the financial statements and the reported amounts of income and expenses during the reporting period. Actual results could differ from those estimates. |
| | |
| k) | Securities Transactions and Investment Income – Investment transactions are recorded on the trade date. The Funds determine the gain or loss realized from investment transactions using the identified cost basis. Dividend income is recognized on the ex-dividend date and interest income is recognized on an accrual basis. Premiums and discounts on the purchase of securities are amortized/accreted using the effective interest method. Paydown gains and losses are recorded as interest income on the Statements of Operations for financial reporting purposes. |
| | |
| l) | Guarantees and Indemnifications – In the normal course of business, the Funds enter into contracts with service providers that contain general indemnification clauses. The Funds’ maximum exposure under these arrangements is unknown and would involve future claims against the Funds that have not yet occurred. Based on experience, the Funds would expect the risk of loss to be remote. |
| | |
| m) | New Accounting Pronouncements – In March 2020, FASB issued Accounting Standards Update 2020-04, Reference Rate Reform: Facilitation of the Effects of Reference Rate Reform on Financial Reporting (“ASU 2020-04”). The main objective of ASU 2020-04 is to provide relief to companies that will be impacted by the expected change in benchmark interest rates at the end of 2021, when participating banks will no longer be required to submit London Inter-bank Offered Rate (“LIBOR”) quotes by the UK Financial Conduct Authority. ASU 2020-04 allows companies to, provided the only change to existing contracts are a change to an approved benchmark interest rate, account for modifications as a continuance of the existing contract without additional analysis. In addition, derivative contracts that qualified for hedge accounting prior to modification, will be allowed to continue to receive such treatment, even if critical terms change due to a change in the benchmark interest rate. For new and existing contracts, the Funds may elect to apply the amendments as of March 12, 2020 through December 31, 2022. Management is currently assessing the impact of the adoption of ASU 2020-04 to the Funds’ financial statements and various filings. |
| | |
| n) | Other Matters – The global outbreak of COVID-19 (commonly referred to as “coronavirus”) has disrupted economic markets and the prolonged economic impact is uncertain. The ultimate economic fallout from the pandemic, and the long-term impact on economies, markets, industries and individual issuers, are not known. The operational and financial performance of the issuers of securities in which the Funds invest depends on future developments, including the duration and spread of the outbreak, and such uncertainty may in turn adversely affect the value and liquidity of the Funds’ investments, impair the Funds’ ability to satisfy redemption requests, and negatively impact the Funds’ performance. |
Notes to the Financial Statements
December 31, 2020
| 3. | Capital Share Transactions |
The following table summarizes the capital share transactions of each Fund for the past two fiscal periods:
Baird Ultra Short Bond Fund
| | | Year Ended | | | Year Ended | |
| | | December 31, 2020 | | | December 31, 2019 | |
| Institutional Class Shares | | Shares | | | Amount | | | Shares | | | Amount | |
| Shares sold | | | 462,621,401 | | | $ | 4,663,501,345 | | | | 152,736,068 | | | $ | 1,536,105,216 | |
| Shares issued to shareholders | | | | | | | | | | | | | | | | |
| in reinvestment of distributions | | | 3,564,569 | | | | 35,891,156 | | | | 3,599,353 | | | | 36,181,617 | |
| Shares redeemed | | | (193,156,605 | ) | | | (1,944,377,181 | ) | | | (90,279,310 | ) | | | (908,254,883 | ) |
| Net increase | | | 273,029,365 | | | $ | 2,755,015,320 | | | | 66,056,111 | | | $ | 664,031,950 | |
| Shares Outstanding: | | | | | | | | | | | | | | | | |
| Beginning of year | | | 169,147,382 | | | | | | | | 103,091,271 | | | | | |
| End of year | | | 442,176,747 | | | | | | | | 169,147,382 | | | | | |
| | | | | | | | | | | | | | | | | |
| | | Year Ended | | | Year Ended | |
| | | December 31, 2020 | | | December 31, 2019 | |
| Investor Class Shares | | Shares | | | Amount | | | Shares | | | Amount | |
| Shares sold | | | 49,156,046 | | | $ | 494,152,300 | | | | 4,021,429 | | | $ | 40,414,010 | |
| Shares issued to shareholders | | | | | | | | | | | | | | | | |
| in reinvestment of distributions | | | 96,822 | | | | 973,660 | | | | 52,962 | | | | 532,130 | |
| Shares redeemed | | | (40,343,759 | ) | | | (405,489,395 | ) | | | (2,397,279 | ) | | | (24,095,105 | ) |
| Net increase | | | 8,909,109 | | | $ | 89,636,565 | | | | 1,677,112 | | | $ | 16,851,035 | |
| Shares Outstanding: | | | | | | | | | | | | | | | | |
| Beginning of year | | | 3,234,242 | | | | | | | | 1,557,130 | | | | | |
| End of year | | | 12,143,351 | | | | | | | | 3,234,242 | | | | | |
| Total net increase | | | | | | $ | 2,844,651,885 | | | | | | | $ | 680,882,985 | |
| | | | | | | | | | | | | | | | | |
| Baird Short-Term Bond Fund | | | | | | | | | | | | | | | | |
| | | Year Ended | | | Year Ended | |
| | | December 31, 2020 | | | December 31, 2019 | |
| Institutional Class Shares | | Shares | | | Amount | | | Shares | | | Amount | |
| Shares sold | | | 463,915,266 | | | $ | 4,586,770,494 | | | | 289,867,873 | (1) | | $ | 2,810,969,343 | (1) |
| Shares issued to shareholders | | | | | | | | | | | | | | | | |
| in reinvestment of distributions | | | 18,915,873 | | | | 187,082,769 | | | | 15,016,743 | | | | 145,886,802 | |
| Shares redeemed | | | (258,354,649 | ) | | | (2,542,726,663 | ) | | | (227,421,040 | ) | | | (2,212,086,535 | ) |
| Net increase | | | 224,476,490 | | | $ | 2,231,126,600 | | | | 77,463,576 | | | $ | 744,769,610 | |
| Shares Outstanding: | | | | | | | | | | | | | | | | |
| Beginning of year | | | 662,075,927 | | | | | | | | 584,612,351 | | | | | |
| End of year | | | 886,552,417 | | | | | | | | 662,075,927 | | | | | |
Notes to the Financial Statements
December 31, 2020
3. Capital Share Transactions (cont.)
Baird Short-Term Bond Fund (cont.)
| | | Year Ended | | | Year Ended | |
| | | December 31, 2020 | | | December 31, 2019 | |
| Investor Class Shares | | Shares | | | Amount | | | Shares | | | Amount | |
| Shares sold | | | 13,605,960 | | | $ | 134,775,633 | | | | 9,981,756 | | | $ | 96,608,185 | |
| Shares issued to shareholders | | | | | | | | | | | | | | | | |
| in reinvestment of distributions | | | 422,979 | | | | 4,181,149 | | | | 391,693 | | | | 3,804,746 | |
| Shares redeemed | | | (13,255,473 | ) | | | (130,744,279 | ) | | | (6,853,659 | ) | | | (66,573,681 | ) |
| Net increase | | | 773,466 | | | $ | 8,212,503 | | | | 3,519,790 | | | $ | 33,839,250 | |
| Shares Outstanding: | | | | | | | | | | | | | | | | |
| Beginning of year | | | 18,669,294 | | | | | | | | 15,149,504 | | | | | |
| End of year | | | 19,442,760 | | | | | | | | 18,669,294 | | | | | |
| Total net increase | | | | | | $ | 2,239,339,103 | | | | | | | $ | 778,608,860 | |
(1) Includes purchase in-kind transactions. See additional information contained in this Note.
Baird Intermediate Bond Fund
| | | Year Ended | | | Year Ended | |
| | | December 31, 2020 | | | December 31, 2019 | |
| Institutional Class Shares | | Shares | | | Amount | | | Shares | | | Amount | |
| Shares sold | | | 131,066,832 | | | $ | 1,530,910,134 | | | | 124,549,008 | (1) | | $ | 1,378,094,146 | (1) |
| Shares issued to shareholders | | | | | | | | | | | | | | | | |
| in reinvestment of distributions | | | 12,766,632 | | | | 148,834,233 | | | | 7,767,687 | | | | 86,611,493 | |
| Shares redeemed | | | (78,696,908 | ) | | | (912,589,791 | ) | | | (49,521,814 | ) | | | (552,159,328 | ) |
| Net increase | | | 65,136,556 | | | $ | 767,154,576 | | | | 82,794,881 | | | $ | 912,546,311 | |
| Shares Outstanding: | | | | | | | | | | | | | | | | |
| Beginning of year | | | 385,202,985 | | | | | | | | 302,408,104 | | | | | |
| End of year | | | 450,339,541 | | | | | | | | 385,202,985 | | | | | |
| | | | | | | | | | | | | | | | | |
| | | Year Ended | | | Year Ended | |
| | | December 31, 2020 | | | December 31, 2019 | |
| Investor Class Shares | | Shares | | | Amount | | | Shares | | | Amount | |
| Shares sold | | | 1,633,425 | | | $ | 19,913,855 | | | | 1,564,836 | | | $ | 18,284,038 | |
| Shares issued to shareholders | | | | | | | | | | | | | | | | |
| in reinvestment of distributions | | | 133,565 | | | | 1,630,760 | | | | 92,309 | | | | 1,076,060 | |
| Shares redeemed | | | (1,686,067 | ) | | | (20,426,729 | ) | | | (1,425,125 | ) | | | (16,569,786 | ) |
| Net increase | | | 80,923 | | | $ | 1,117,886 | | | | 232,020 | | | $ | 2,790,312 | |
| Shares Outstanding: | | | | | | | | | | | | | | | | |
| Beginning of year | | | 4,420,600 | | | | | | | | 4,188,580 | | | | | |
| End of year | | | 4,501,523 | | | | | | | | 4,420,600 | | | | | |
| Total net increase | | | | | | $ | 768,272,462 | | | | | | | $ | 915,336,623 | |
(1) Includes purchase in-kind transactions. See additional information contained in this Note.
Notes to the Financial Statements
December 31, 2020
| 3. | Capital Share Transactions (cont.) |
Baird Aggregate Bond Fund
| | | Year Ended | | | Year Ended | |
| | | December 31, 2020 | | | December 31, 2019 | |
| Institutional Class Shares | | Shares | | | Amount | | | Shares | | | Amount | |
| Shares sold | | | 1,203,043,975 | | | $ | 14,069,540,913 | | | | 890,354,110 | (1) | | $ | 9,744,801,391 | |
| Shares issued to shareholders | | | | | | | | | | | | | | | | |
| in reinvestment of distributions | | | 74,311,480 | | | | 869,932,329 | | | | 44,958,567 | | | | 495,565,654 | |
| Shares redeemed | | | (518,886,091 | ) | | | (6,008,637,812 | ) | | | (400,015,560 | ) | | | (4,414,787,850 | ) |
| Net increase | | | 758,469,364 | | | $ | 8,930,835,430 | | | | 535,297,117 | | | $ | 5,825,579,195 | |
| Shares Outstanding: | | | | | | | | | | | | | | | | |
| Beginning of year | | | 1,950,270,561 | | | | | | | | 1,414,973,444 | | | | | |
| End of year | | | 2,708,739,925 | | | | | | | | 1,950,270,561 | | | | | |
| | | | | | | | | | | | | | | | | |
| | | Year Ended | | | Year Ended | |
| | | December 31, 2020 | | | December 31, 2019 | |
| Investor Class Shares | | Shares | | | Amount | | | Shares | | | Amount | |
| Shares sold | | | 49,811,927 | | | $ | 602,252,494 | | | | 23,678,620 | | | $ | 270,517,976 | |
| Shares issued to shareholders | | | | | | | | | | | | | | | | |
| in reinvestment of distributions | | | 2,276,758 | | | | 27,599,010 | | | | 1,477,136 | | | | 16,819,518 | |
| Shares redeemed | | | (35,497,571 | ) | | | (427,505,756 | ) | | | (23,327,468 | ) | | | (264,008,316 | ) |
| Net increase | | | 16,591,114 | | | $ | 202,345,748 | | | | 1,828,288 | | | $ | 23,329,178 | |
| Shares Outstanding: | | | | | | | | | | | | | | | | |
| Beginning of year | | | 67,780,865 | | | | | | | | 65,952,577 | | | | | |
| End of year | | | 84,371,979 | | | | | | | | 67,780,865 | | | | | |
| Total net increase | | | | | | $ | 9,133,181,178 | | | | | | | $ | 5,848,908,373 | |
(1) Includes purchase in-kind transactions. See additional information contained in this Note.
Baird Core Plus Bond Fund
| | | Year Ended | | | Year Ended | |
| | | December 31, 2020 | | | December 31, 2019 | |
| Institutional Class Shares | | Shares | | | Amount | | | Shares | | | Amount | |
| Shares sold | | | 748,369,472 | | | $ | 8,949,189,350 | | | | 631,387,566 | | | $ | 7,152,999,146 | |
| Shares issued to shareholders | | | | | | | | | | | | | | | | |
| in reinvestment of distributions | | | 67,703,177 | | | | 813,547,951 | | | | 46,248,366 | | | | 524,909,170 | |
| Shares redeemed | | | (461,624,165 | ) | | | (5,485,878,150 | ) | | | (268,458,877 | ) | | | (3,037,655,467 | ) |
| Net increase | | | 354,448,484 | | | $ | 4,276,859,151 | | | | 409,177,055 | | | $ | 4,640,252,849 | |
| Shares Outstanding: | | | | | | | | | | | | | | | | |
| Beginning of year | | | 1,853,736,631 | | | | | | | | 1,444,559,576 | | | | | |
| End of year | | | 2,208,185,115 | | | | | | | | 1,853,736,631 | | | | | |
Notes to the Financial Statements
December 31, 2020
| 3. | Capital Share Transactions (cont.) |
Baird Core Plus Bond Fund (cont.)
| | | Year Ended | | | Year Ended | |
| | | December 31, 2020 | | | December 31, 2019 | |
| Investor Class Shares | | Shares | | | Amount | | | Shares | | | Amount | |
| Shares sold | | | 78,958,693 | | | $ | 986,325,404 | | | | 71,909,873 | | | $ | 853,236,845 | |
| Shares issued to shareholders | | | | | | | | | | | | | | | | |
| in reinvestment of distributions | | | 6,401,361 | | | | 80,288,421 | | | | 5,080,103 | | | | 60,019,140 | |
| Shares redeemed | | | (81,049,037 | ) | | | (1,004,620,453 | ) | | | (62,144,601 | ) | | | (732,158,958 | ) |
| Net increase | | | 4,311,017 | | | $ | 61,993,372 | | | | 14,845,375 | | | $ | 181,097,027 | |
| Shares Outstanding: | | | | | | | | | | | | | | | | |
| Beginning of year | | | 207,381,809 | | | | | | | | 192,536,434 | | | | | |
| End of year | | | 211,692,826 | | | | | | | | 207,381,809 | | | | | |
| Total net increase | | | | | | $ | 4,338,852,523 | | | | | | | $ | 4,821,349,876 | |
| | | | | | | | | | | | | | | | | |
| Baird Short-Term Municipal Bond Fund | | | | | | | | | | | | | | | | |
| | | Year Ended | | | Year Ended | |
| | | December 31, 2020 | | | December 31, 2019 | |
| Institutional Class Shares | | Shares | | | Amount | | | Shares | | | Amount | |
| Shares sold | | | 111,010,726 | | | $ | 1,148,586,895 | | | | 83,569,164 | | | $ | 854,504,880 | |
| Shares issued to shareholders | | | | | | | | | | | | | | | | |
| in reinvestment of distributions | | | 1,408,880 | | | | 14,571,461 | | | | 791,896 | | | | 8,094,781 | |
| Shares redeemed | | | (56,886,182 | ) | | | (586,467,058 | ) | | | (22,094,002 | ) | | | (225,537,364 | ) |
| Net increase | | | 55,533,424 | | | $ | 576,691,298 | | | | 62,267,058 | | | $ | 637,062,297 | |
| Shares Outstanding: | | | | | | | | | | | | | | | | |
| Beginning of year | | | 90,228,606 | | | | | | | | 27,961,548 | | | | | |
| End of year | | | 145,762,030 | | | | | | | | 90,228,606 | | | | | |
| | | | | | | | | | | | | | | | | |
| | | Year Ended | | | Year Ended | |
| | | December 31, 2020 | | | December 31, 2019 | |
| Investor Class Shares | | Shares | | | Amount | | | Shares | | | Amount | |
| Shares sold | | | 11,551,814 | | | $ | 119,687,286 | | | | 4,140,204 | | | $ | 42,102,510 | |
| Shares issued to shareholders | | | | | | | | | | | | | | | | |
| in reinvestment of distributions | | | 85,715 | | | | 882,719 | | | | 126,459 | | | | 1,288,643 | |
| Shares redeemed | | | (11,522,304 | ) | | | (119,184,278 | ) | | | (1,894,173 | ) | | | (19,246,772 | ) |
| Net increase | | | 115,225 | | | $ | 1,385,727 | | | | 2,372,490 | | | $ | 24,144,381 | |
| Shares Outstanding: | | | | | | | | | | | | | | | | |
| Beginning of year | | | 8,744,555 | | | | | | | | 6,372,065 | | | | | |
| End of year | | | 8,859,780 | | | | | | | | 8,744,555 | | | | | |
| Total net increase | | | | | | $ | 578,077,025 | | | | | | | $ | 661,206,678 | |
Notes to the Financial Statements
December 31, 2020
| 3. | Capital Share Transactions (cont.) |
Baird Strategic Municipal Bond Fund
| | | Year Ended | | | Period Ended | |
| | | December 31, 2020 | | | December 31, 2019^ | |
| Institutional Class Shares | | Shares | | | Amount | | | Shares | | | Amount | |
| Shares sold | | | 15,288,645 | | | $ | 161,427,996 | | | | 1,191,211 | | | $ | 11,913,000 | |
| Shares issued to shareholders | | | | | | | | | | | | | | | | |
| in reinvestment of distributions | | | 162,489 | | | | 1,723,269 | | | | 1,971 | | | | 19,800 | |
| Shares redeemed | | | (1,243,056 | ) | | | (13,109,436 | ) | | | — | | | | — | |
| Net increase | | | 14,208,078 | | | $ | 150,041,829 | | | | 1,193,182 | | | $ | 11,932,800 | |
| Shares Outstanding: | | | | | | | | | | | | | | | | |
| Beginning of period | | | 1,193,182 | | | | | | | | — | | | | | |
| End of period | | | 15,401,260 | | | | | | | | 1,193,182 | | | | | |
| | | | | | | | | | | | | | | | | |
| | | Year Ended | | | Period Ended | |
| | | December 31, 2020 | | | December 31, 2019^ | |
| Investor Class Shares | | Shares | | | Amount | | | Shares | | | Amount | |
| Shares sold | | | 1,355,384 | | | $ | 14,088,422 | | | | 2,721 | | | $ | 27,204 | |
| Shares issued to shareholders | | | | | | | | | | | | | | | | |
| in reinvestment of distributions | | | 8,830 | | | | 92,988 | | | | 4 | | | | 42 | |
| Shares redeemed | | | (713,127 | ) | | | (7,557,554 | ) | | | — | | | | — | |
| Net increase | | | 651,087 | | | $ | 6,623,856 | | | | 2,725 | | | $ | 27,246 | |
| Shares Outstanding: | | | | | | | | | | | | | | | | |
| Beginning of period | | | 2,725 | | | | | | | | — | | | | | |
| End of period | | | 653,812 | | | | | | | | 2,725 | | | | | |
| Total net increase | | | | | | $ | 156,665,685 | | | | | | | $ | 11,960,046 | |
^ Inception was on close of business November 15, 2019.
Baird Quality Intermediate Municipal Bond Fund
| | | Year Ended | | | Year Ended | |
| | | December 31, 2020 | | | December 31, 2019 | |
| Institutional Class Shares | | Shares | | | Amount | | | Shares | | | Amount | |
| Shares sold | | | 39,063,817 | | | $ | 465,544,211 | | | | 37,429,313 | | | $ | 436,057,112 | |
| Shares issued to shareholders | | | | | | | | | | | | | | | | |
| in reinvestment of distributions | | | 1,929,063 | | | | 23,033,632 | | | | 1,967,518 | | | | 22,948,488 | |
| Shares redeemed | | | (27,597,516 | ) | | | (324,736,306 | ) | | | (21,039,444 | ) | | | (244,334,905 | ) |
| Net increase | | | 13,395,364 | | | $ | 163,841,537 | | | | 18,357,387 | | | $ | 214,670,695 | |
| Shares Outstanding: | | | | | | | | | | | | | | | | |
| Beginning of year | | | 107,042,733 | | | | | | | | 88,685,346 | | | | | |
| End of year | | | 120,438,097 | | | | | | | | 107,042,733 | | | | | |
Notes to the Financial Statements
December 31, 2020
| 3. | Capital Share Transactions (cont.) |
Baird Quality Intermediate Municipal Bond Fund (cont.)
| | | Year Ended | | | Year Ended | |
| | | December 31, 2020 | | | December 31, 2019 | |
| Investor Class Shares | | Shares | | | Amount | | | Shares | | | Amount | |
| Shares sold | | | 2,016,175 | | | $ | 24,438,030 | | | | 1,754,039 | | | $ | 20,899,396 | |
| Shares issued to shareholders | | | | | | | | | | | | | | | | |
| in reinvestment of distributions | | | 94,848 | | | | 1,159,229 | | | | 141,316 | | | | 1,686,818 | |
| Shares redeemed | | | (4,929,837 | ) | | | (60,538,942 | ) | | | (4,334,171 | ) | | | (51,277,592 | ) |
| Net decrease | | | (2,818,814 | ) | | $ | (34,941,683 | ) | | | (2,438,816 | ) | | $ | (28,691,378 | ) |
| Shares Outstanding: | | | | | | | | | | | | | | | | |
| Beginning of year | | | 7,064,666 | | | | | | | | 9,503,482 | | | | | |
| End of year | | | 4,245,852 | | | | | | | | 7,064,666 | | | | | |
| Total net increase | | | | | | $ | 128,899,854 | | | | | | | $ | 185,979,317 | |
| | | | | | | | | | | | | | | | | |
| Baird Core Intermediate Municipal Bond Fund | | | | | | | | | | | | | | | | |
| | | Year Ended | | | Year Ended | |
| | | December 31, 2020 | | | December 31, 2019 | |
| Institutional Class Shares | | Shares | | | Amount | | | Shares | | | Amount | |
| Shares sold | | | 43,702,531 | | | $ | 472,813,969 | | | | 19,236,314 | | | $ | 202,455,794 | |
| Shares issued to shareholders | | | | | | | | | | | | | | | | |
| in reinvestment of distributions | | | 1,042,918 | | | | 11,293,123 | | | | 744,428 | | | | 7,848,852 | |
| Shares redeemed | | | (18,165,745 | ) | | | (194,263,467 | ) | | | (6,689,681 | ) | | | (70,036,885 | ) |
| Net increase | | | 26,579,704 | | | $ | 289,843,625 | | | | 13,291,061 | | | $ | 140,267,761 | |
| Shares Outstanding: | | | | | | | | | | | | | | | | |
| Beginning of year | | | 50,283,479 | | | | | | | | 36,992,418 | | | | | |
| End of year | | | 76,863,183 | | | | | | | | 50,283,479 | | | | | |
| | | | | | | | | | | | | | | | | |
| | | Year Ended | | | Year Ended | |
| | | December 31, 2020 | | | December 31, 2019 | |
| Investor Class Shares | | Shares | | | Amount | | | Shares | | | Amount | |
| Shares sold | | | 2,881,342 | | | $ | 30,488,897 | | | | 405,371 | | | $ | 4,259,636 | |
| Shares issued to shareholders | | | | | | | | | | | | | | | | |
| in reinvestment of distributions | | | 29,884 | | | | 323,343 | | | | 7,809 | | | | 82,442 | |
| Shares redeemed | | | (1,430,773 | ) | | | (15,479,463 | ) | | | (51,823 | ) | | | (543,537 | ) |
| Net increase | | | 1,480,453 | | | $ | 15,332,777 | | | | 361,357 | | | $ | 3,798,541 | |
| Shares Outstanding: | | | | | | | | | | | | | | | | |
| Beginning of year | | | 555,466 | | | | | | | | 194,109 | | | | | |
| End of year | | | 2,035,919 | | | | | | | | 555,466 | | | | | |
| Total net increase | | | | | | $ | 305,176,402 | | | | | | | $ | 144,066,302 | |
Notes to the Financial Statements
December 31, 2020
| 3. | Capital Share Transactions (cont.) |
Baird Municipal Bond Fund
| | | Year Ended | | | Year Ended | |
| | | December 31, 2020 | | | December 31, 2019^ | |
| Institutional Class Shares | | Shares | | | Amount | | | Shares | | | Amount | |
| Shares sold | | | 1,148,322 | | | $ | 11,975,672 | | | | 730,100 | | | $ | 7,301,000 | |
| Shares issued to shareholders | | | | | | | | | | | | | | | | |
| in reinvestment of distributions | | | 54,692 | | | | 580,080 | | | | 1,342 | | | | 13,530 | |
| Shares redeemed | | | (34,206 | ) | | | (363,107 | ) | | | — | | | | — | |
| Net increase | | | 1,168,808 | | | $ | 12,192,645 | | | | 731,442 | | | $ | 7,314,530 | |
| Shares Outstanding: | | | | | | | | | | | | | | | | |
| Beginning of period | | | 731,442 | | | | | | | | — | | | | | |
| End of period | | | 1,900,250 | | | | | | | | 731,442 | | | | | |
| | | | | | | | | | | | | | | | | |
| | | Year Ended | | | Year Ended | |
| | | December 31, 2020 | | | December 31, 2019^ | |
| Investor Class Shares | | Shares | | | Amount | | | Shares | | | Amount | |
| Shares sold | | | 154,179 | | | $ | 1,647,500 | | | | 2,881 | | | $ | 28,812 | |
| Shares issued to shareholders | | | | | | | | | | | | | | | | |
| in reinvestment of distributions | | | 3,093 | | | | 32,936 | | | | 5 | | | | 46 | |
| Shares redeemed | | | (7,666 | ) | | | (82,337 | ) | | | — | | | | — | |
| Net increase | | | 149,606 | | | $ | 1,598,099 | | | | 2,886 | | | $ | 28,858 | |
| Shares Outstanding: | | | | | | | | | | | | | | | | |
| Beginning of period | | | 2,886 | | | | | | | | — | | | | | |
| End of period | | | 152,492 | | | | | | | | 2,886 | | | | | |
| Total net increase | | | | | | $ | 13,790,744 | | | | | | | $ | 7,343,388 | |
^ Inception was on close of business November 15, 2019.
During the year ended December 31, 2019, the Funds satisfied purchase in-kind requests made by large institutional shareholders by transferring cash and securities into the Funds. The transfers were effected in accordance with policies and procedures approved by the Board. Consideration received and shares sold were as follows:
Year Ended December 31, 2019
| | | | Value of Cash and | | | Shares | |
Fund | Effective Date | Securities Received | | Sold | |
| Baird Short-Term Bond Fund – Institutional Class | April 17, 2019 | | $ | 20,928,303 | | | 2,164,251 | |
| Baird Short-Term Bond Fund – Institutional Class | May 30, 2019 | | | 4,117,024 | | | 424,435 | |
| Baird Short-Term Bond Fund – Institutional Class | September 27, 2019 | | | 27,827,277 | | | 2,848,237 | |
| Total | | | $ | 52,872,604 | | | | |
| | | | | | | | | |
| Baird Intermediate Bond Fund – Institutional Class | February 27, 2019 | | $ | 31,286,219 | | | 2,878,217 | |
| Baird Intermediate Bond Fund – Institutional Class | April 24, 2019 | | | 5,132,174 | | | 465,715 | |
| Baird Intermediate Bond Fund – Institutional Class | April 24, 2019 | | | 730,646 | | | 66,302 | |
| Baird Intermediate Bond Fund – Institutional Class | May 30, 2019 | | | 7,067,068 | | | 637,822 | |
| Total | | | $ | 44,216,107 | | | | |
| | | | | | | | | |
| Baird Aggregate Bond Fund – Institutional Class | May 30, 2019 | | $ | 15,529,086 | | | 1,424,687 | |
| Total | | | $ | 15,529,086 | | | | |
Notes to the Financial Statements
December 31, 2020
| 4. | Investment Transactions and Income Tax Information |
During the year ended December 31, 2020, purchases and sales of investment securities (excluding short-term investments and any in-kind transactions) were as follows:
| | | U.S. Government Obligations | | | All Other | |
| | | Purchases | | | Sales | | | Purchases | | | Sales | |
| Baird Ultra Short Bond Fund | | $ | 311,450,638 | | | $ | 455,799,578 | | | $ | 2,687,409,356 | | | $ | 1,280,246,430 | |
| Baird Short-Term Bond Fund | | | 3,875,877,314 | | | | 3,166,349,524 | | | | 3,130,985,407 | | | | 1,635,108,534 | |
| Baird Intermediate Bond Fund | | | 1,440,582,096 | | | | 1,287,407,491 | | | | 998,530,615 | | | | 443,465,967 | |
| Baird Aggregate Bond Fund | | | 7,613,259,593 | | | | 6,049,081,269 | | | | 9,746,559,900 | | | | 3,268,488,284 | |
| Baird Core Plus Bond Fund | | | 5,296,754,393 | | | | 5,630,454,025 | | | | 6,987,273,789 | | | | 2,980,360,645 | |
| Baird Short-Term | | | | | | | | | | | | | | | | |
| Municipal Bond Fund | | | — | | | | — | | | | 836,685,411 | | | | 350,811,405 | |
| Baird Strategic Municipal Bond Fund | | | — | | | | — | | | | 182,220,624 | | | | 70,072,086 | |
| Baird Quality Intermediate | | | | | | | | | | | | | | | | |
| Municipal Bond Fund | | | — | | | | — | | | | 325,110,324 | | | | 200,556,550 | |
| Baird Core Intermediate | | | | | | | | | | | | | | | | |
| Municipal Bond Fund | | | — | | | | — | | | | 457,808,969 | | | | 212,943,082 | |
| Baird Municipal Bond Fund | | | — | | | | — | | | | 29,672,042 | | | | 16,488,892 | |
As of December 31, 2020, the components of distributable earnings (accumulated losses) for income tax purposes were as follows:
| | | Baird | | | Baird | | | Baird | |
| | | Ultra Short | | | Short-Term | | | Intermediate | |
| | | Bond Fund | | | Bond Fund | | | Bond Fund | |
| Cost of investments | | $ | 4,609,222,598 | | | $ | 9,073,462,528 | | | $ | 5,155,326,113 | |
| Gross unrealized appreciation | | $ | 5,024,523 | | | $ | 140,867,477 | | | $ | 260,161,913 | |
| Gross unrealized depreciation | | | (1,589,497 | ) | | | (3,024,633 | ) | | | (9,091,689 | ) |
| Net unrealized appreciation | | | 3,435,026 | | | | 137,842,844 | | | | 251,070,224 | |
| Undistributed ordinary income | | | 304,650 | | | | 4,590,708 | | | | 2,334,292 | |
| Undistributed long-term capital gains | | | — | | | | 5,002,305 | | | | 2,607,990 | |
| Distributable earnings | | | 304,650 | | | | 9,593,013 | | | | 4,942,282 | |
| Other accumulated losses | | | (7,843 | ) | | | — | | | | — | |
| Total distributable earnings | | $ | 3,731,833 | | | $ | 147,435,857 | | | $ | 256,012,506 | |
| | | | | | | | | | | | | |
| | | | | | | Baird | | | Baird | |
| | | | | | | Aggregate | | | Core Plus | |
| | | | | | | Bond Fund | | | Bond Fund | |
| Cost of investments | | | | | | $ | 31,348,903,035 | | | $ | 27,660,656,061 | |
| Gross unrealized appreciation | | | | | | $ | 1,954,418,458 | | | $ | 2,096,203,053 | |
| Gross unrealized depreciation | | | | | | | (84,972,674 | ) | | | (77,845,848 | ) |
| Net unrealized appreciation | | | | | | | 1,869,445,784 | | | | 2,018,357,205 | |
| Undistributed ordinary income | | | | | | | 2,065,275 | | | | 2,205,220 | |
| Distributable earnings | | | | | | | 2,065,275 | | | | 2,205,220 | |
| Other accumulated losses | | | | | | | (1,716,863 | ) | | | (734,237 | ) |
| Total distributable earnings | | | | | | $ | 1,869,794,196 | | | $ | 2,019,828,188 | |
Notes to the Financial Statements
December 31, 2020
| 4. | Investment Transactions and Income Tax Information (cont.) |
| | | Baird | | | Baird | | | Baird Quality | |
| | | Short-Term | | | Strategic | | | Intermediate | |
| | | Municipal | | | Municipal | | | Municipal | |
| | | Bond Fund | | | Bond Fund | | | Bond Fund | |
| Cost of investments | | $ | 1,546,271,044 | | | $ | 169,039,130 | | | $ | 1,407,129,876 | |
| Gross unrealized appreciation | | $ | 28,172,854 | | | $ | 2,341,541 | | | $ | 78,118,542 | |
| Gross unrealized depreciation | | | (658,223 | ) | | | (130,592 | ) | | | (222,405 | ) |
| Net unrealized appreciation | | | 27,514,631 | | | | 2,210,949 | | | | 77,896,137 | |
| Undistributed ordinary income | | | — | | | | 384,213 | | | | — | |
| Undistributed tax-exempt income | | | 524,675 | | | | 60,230 | | | | 700,056 | |
| Distributable earnings | | | 524,675 | | | | 444,443 | | | | 700,056 | |
| Other accumulated losses | | | (372,629 | ) | | | — | | | | (10,042,213 | ) |
| Total distributable earnings | | $ | 27,666,677 | | | $ | 2,655,392 | | | $ | 68,553,980 | |
| | | | | | | | | | | | | |
| | | | | | | Baird Core | | | | | |
| | | | | | | Intermediate | | | Baird | |
| | | | | | | Municipal | | | Municipal | |
| | | | | | | Bond Fund | | | Bond Fund | |
| Cost of investments | | | | | | $ | 815,556,772 | | | $ | 21,499,898 | |
| Gross unrealized appreciation | | | | | | $ | 35,815,148 | | | $ | 742,596 | |
| Gross unrealized depreciation | | | | | | | (366,835 | ) | | | (36,027 | ) |
| Net unrealized appreciation | | | | | | | 35,448,313 | | | | 706,569 | |
| Undistributed ordinary income | | | | | | | 221,028 | | | | 49,950 | |
| Undistributed tax-exempt income | | | | | | | 384,177 | | | | 11,169 | |
| Distributable earnings | | | | | | | 605,205 | | | | 61,119 | |
| Other accumulated losses | | | | | | | (55,966 | ) | | | — | |
| Total distributable earnings | | | | | | $ | 35,997,552 | | | $ | 767,688 | |
The difference between book-basis and tax-basis unrealized appreciation is attributable primarily to the tax deferral of losses on wash sales and mark-to-market on passive foreign investment companies.
Additionally, U.S. generally accepted accounting principles require that certain components of net assets relating to permanent differences be reclassified between financial and tax reporting. Permanent differences are due to equalization, over distributions, miscellaneous book adjustments and net operating losses. These reclassifications have no effect on net assets or net asset value per share. For the year ended December 31, 2020, the following table shows the reclassifications made:
| | | Total | | | | |
| | | Distributable | | | Paid-in | |
Fund | | Earnings | | | Capital | |
| Baird Ultra Short Bond Fund | | $ | (183,972 | ) | | $ | 183,972 | |
| Baird Short-Term Bond Fund | | | (11,327,491 | ) | | | 11,327,491 | |
| Baird Intermediate Bond Fund | | | (6,633,868 | ) | | | 6,633,868 | |
| Baird Aggregate Bond Fund | | | (45,015,380 | ) | | | 45,015,380 | |
| Baird Core Plus Bond Fund | | | (34,250,299 | ) | | | 34,250,299 | |
| Baird Strategic Municipal Bond Fund | | | (41,426 | ) | | | 41,426 | |
| Baird Core Intermediate Municipal Bond Fund | | | (337,647 | ) | | | 337,647 | |
Notes to the Financial Statements
December 31, 2020
| 4. | Investment Transactions and Income Tax Information (cont.) |
Distributions to Shareholders
Each Fund generally pays dividends from net investment income and distributes net realized capital gains, if any, at least annually. Income and capital gain distributions are determined in accordance with income tax regulations, which may differ from GAAP. Certain Funds also utilize earnings and profits distributed to shareholders on redemptions of shares as part of the dividends paid deduction. Distributions to shareholders are recorded on the ex-dividend date.
The tax components of distributions paid during the periods shown below were as follows:
| | | Year Ended December 31, 2020 | |
| | | Ordinary | | | Long-Term | | | Tax-Exempt | | | | |
Fund | | Income | | | Capital Gains | | | Income | | | Total | |
| Baird Ultra Short Bond Fund | | $ | 38,111,687 | | | $ | — | | | $ | — | | | $ | 38,111,687 | |
| Baird Short-Term Bond Fund | | | 185,540,551 | | | | 22,134,129 | | | | — | | | | 207,674,680 | |
| Baird Intermediate Bond Fund | | | 124,544,107 | | | | 47,976,588 | | | | — | | | | 172,520,695 | |
| Baird Aggregate Bond Fund | | | 785,940,815 | | | | 199,757,752 | | | | — | | | | 985,698,567 | |
| Baird Core Plus Bond Fund | | | 778,259,758 | | | | 179,785,396 | | | | — | | | | 958,045,154 | |
| Baird Short-Term Municipal Bond Fund | | | 105,949 | | | | — | | | | 18,530,229 | | | | 18,636,178 | |
| Baird Strategic Municipal Bond Fund | | | 986,026 | | | | — | | | | 916,171 | | | | 1,902,197 | |
| Baird Quality Intermediate | | | | | | | | | | | | | | | | |
| Municipal Bond Fund | | | — | | | | — | | | | 27,499,082 | | | | 27,499,082 | |
| Baird Core Intermediate | | | | | | | | | | | | | | | | |
| Municipal Bond Fund | | | 1,187,579 | | | | 810,416 | | | | 12,958,592 | | | | 14,956,587 | |
| Baird Municipal Bond Fund | | | 410,515 | | | | — | | | | 282,351 | | | | 692,866 | |
| | | | |
| | | Year Ended December 31, 2019 | |
| | | Ordinary | | | Long-Term | | | Tax-Exempt | | | | | |
Fund | | Income | | | Capital Gains | | | Income | | | Total | |
| Baird Ultra Short Bond Fund | | $ | 38,182,380 | | | $ | — | | | $ | — | | | $ | 38,132,380 | |
| Baird Short-Term Bond Fund | | | 161,961,521 | | | | — | | | | — | | | | 161,961,521 | |
| Baird Intermediate Bond Fund | | | 103,648,901 | | | | — | | | | — | | | | 103,648,901 | |
| Baird Aggregate Bond Fund | | | 567,640,739 | | | | — | | | | — | | | | 567,640,739 | |
| Baird Core Plus Bond Fund | | | 627,523,865 | | | | — | | | | — | | | | 627,523,865 | |
| Baird Short-Term Municipal Bond Fund | | | 28,242 | | | | — | | | | 11,611,249 | | | | 11,639,491 | |
| Baird Quality Intermediate | | | | | | | | | | | | | | | | |
| Municipal Bond Fund | | | 6,546 | | | | — | | | | 28,024,100 | | | | 28,030,646 | |
| Baird Core Intermediate | | | | | | | | | | | | | | | | |
| Municipal Bond Fund | | | 66,614 | | | | 398,341 | | | | 10,590,083 | | | | 11,055,038 | |
| | | Period Ended December 31, 2019(1) | |
| | | Ordinary | | | Tax-Exempt | | | | |
Fund | | Income | | | Income | | | Total | |
| Baird Strategic Municipal Bond Fund | | $ | 314 | | | $ | 21,360 | | | $ | 21,674 | |
| Baird Municipal Bond Fund | | | 166 | | | | 13,890 | | | | 14,056 | |
(1) | For the period from close of business on November 15,2019 (inception date) through December 31, 2019. |
The Funds in the table above designated as long-term capital gain dividends, pursuant to Internal Revenue Code Section 852(b)(3), the amount necessary to reduce the earnings and profits of the Funds related to net capital gain to zero for the tax year ended December 31, 2020. To the extent necessary to fully distribute such capital gains, the Funds also designate earnings and profits distributed to shareholders on the redemption of shares.
Notes to the Financial Statements
December 31, 2020
| 4. | Investment Transactions and Income Tax Information (cont.) |
At December 31, 2020, the following Funds deferred, on a tax basis, post-October losses of & specified losses:
Fund | | Loss Deferral | |
| Baird Ultra Short Bond Fund | | $ | 7,843 | |
| Baird Aggregate Bond Fund | | | 1,716,863 | |
| Baird Core Plus Bond Fund | | | 734,237 | |
| Baird Core Intermediate Municipal Bond Fund | | | 55,966 | |
At December 31, 2020, accumulated net realized capital loss carryovers, if any, and the year(s) in which the capital loss carryovers expire were:
| | | Capital Loss Carryover | | Year of Expiration | |
Fund | | Short-term | | | Long-term | | Short-term | | Long-term | |
| Baird Short-Term Municipal Bond Fund | | $ | 372,629 | | | $ | — | | Indefinitely | | N/A | |
| Baird Quality Intermediate Municipal Bond Fund | | | 5,426,515 | | | | 4,615,698 | | Indefinitely | | Indefinitely | |
During the year ended December 31, 2020, the Baird Short-Term Bond Fund, Baird Intermediate Bond Fund, Baird Core Plus Bond Fund, and Baird Short-Term Municipal Bond Fund utilized capital loss carryover of $7,371,164, $9,020,920, $34,267,426, and $18,963, respectively.
| 5. | Investment Advisory and Other Agreements |
The Funds have entered into an Investment Advisory Agreement with Baird for the provision of investment advisory services. Pursuant to the Investment Advisory Agreement, the Advisor is entitled to receive a fee, calculated daily and payable monthly, at the annual rate of 0.25% for the Funds as applied to the respective Fund’s average daily net assets. Certain officers and employees of the Advisor are also officers of the Funds.
For Baird Ultra Short Bond Fund, the Advisor has contractually agreed to waive management fees in an amount equal to an annual rate of 0.15% of average daily net assets for the Fund, at least through April 30, 2022. The agreement may only be terminated prior to the end of this term by or with the consent of the Board.
For the year ended December 31, 2020, the Advisor waived the following amount pursuant to the fee waiver agreement between the Advisor and the Corporation on behalf of the Baird Ultra Short Bond Fund:
Fund | Waived Amount | |
| Baird Ultra Short Bond Fund | $4,176,197 | |
These fees are not subject to recoupment by the Advisor.
The Funds have entered into an Administration Agreement with Baird. Under the Administration Agreement, the Advisor assumes and pays all expenses of the applicable Fund other than the investment advisory fees, fees under the 12b-1 plan, costs related to portfolio securities transactions and extraordinary or non-recurring expenses. Pursuant to the Administration Agreement, the Advisor is entitled to receive a fee, calculated daily and payable monthly, at the annual rate of 0.05% for the Funds as applied to the respective Fund’s average daily net assets.
U.S. Bancorp Fund Services, LLC, doing business as U.S. Bank Global Fund Services, serves as transfer agent, administrator, and accounting services agent for the Funds. U.S. Bank, N.A. (“U.S. Bank”) serves as custodian for the Funds.
Robert W. Baird & Co. Incorporated (the “Distributor”) is the sole distributor of the Funds pursuant to a distribution agreement.
No commissions were earned by the Distributor for services rendered as a registered broker-dealer in securities transactions for the year ended December 31, 2020 for the Funds.
Notes to the Financial Statements
December 31, 2020
| 5. | Investment Advisory and Other Agreements (cont.) |
The Funds may use related party broker-dealers. For the year ended December 31, 2020, there were no brokerage commissions paid to broker-dealers affiliated with the Advisor. The Advisor or its affiliates may have lending, banking, brokerage, underwriting, or other business relationships with the issuers of the securities in which the Funds invest.
The Funds may purchase securities from an underwriting syndicate in which the principal underwriter or members of the syndicate are affiliated with the Advisor. For the year ended December 31, 2020, the Funds purchased the following amounts of such securities:
Fund | | Purchases | |
| Baird Ultra Short Bond Fund | | $ | 17,050,000 | |
| Baird Short-Term Bond Fund | | | 12,000,000 | |
| Baird Intermediate Bond Fund | | | 2,800,000 | |
| Baird Aggregate Bond Fund | | | 14,100,000 | |
| Baird Short-Term Municipal Bond Fund | | | 28,850,000 | |
| Baird Strategic Municipal Bond Fund | | | 2,300,000 | |
| Baird Core Intermediate Municipal Bond Fund | | | 6,000,000 | |
| Baird Municipal Bond Fund | | | 200,000 | |
The Corporation maintains an uncommitted line of credit (“LOC”) with U.S. Bank to provide the sixteen Funds comprising the Corporation a temporary liquidity source to meet unanticipated redemptions. The LOC is unsecured at all times and is subject to certain restrictions and covenants. Under the terms of the LOC, borrowings for each Fund are limited to one third of the total eligible net assets (including the amount borrowed) of the respective Fund, or $600,000,000 of total borrowings for the Funds comprising the Corporation, whichever is less. U.S. Bank charges interest at the U.S. Prime Rate less 2%, but in no event less than a net rate of 1% per annum. As of December 31, 2020, the Prime Rate was 3.25%. The LOC matures on May 24, 2021, unless renewed. The Corporation has authorized U.S. Bank to charge any of the accounts of the borrowing Fund subject to the agreement for any missed payments.
During the year ended December 31, 2020, the Funds borrowed from the LOC as follows:
| | | Amount | | | Interest Charges | | | Borrowing | |
Fund | | Borrowed | | | Accrued | | | Rate | |
| Baird Quality Intermediate Municipal Bond Fund | | $ | 26,539,000 | | | $ | 4,976 | | | 2.25% | |
| Baird Short-Term Municipal Bond Fund | | | 2,043,000 | | | | 71 | | | 1.25% | |
| Baird Short-Term Municipal Bond Fund | | | 4,961,000 | | | | 172 | | | 1.25% | |
| Baird Strategic Municipal Bond Fund | | | 1,001,000 | | | | 104 | | | 1.25% | |
| Baird Strategic Municipal Bond Fund | | | 889,000 | | | | 31 | | | 1.25% | |
| Baird Strategic Municipal Bond Fund | | | 270,000 | | | | 9 | | | 1.25% | |
No other borrowings occurred during the year ended December 31, 2020 nor were any other borrowings outstanding under the LOC as of December 31, 2020.
Notes to the Financial Statements
December 31, 2020
| 7. | Distribution and Shareholder Service Plan |
The Funds have adopted a distribution and shareholder service plan (the “Plan”) pursuant to Rule 12b-1 under the 1940 Act. The Plan allows the Funds to compensate the Distributor for the costs incurred in distributing the Funds’ Investor Class Shares, including amounts paid to brokers or dealers, at an annual rate of 0.25% of the average daily net assets of the Funds’ Investor Class Shares.
For the year ended December 31, 2020, the Funds incurred fees pursuant to the Plan as follows:
Fund | | | |
| Baird Ultra Short Bond Fund | | $ | 188,910 | |
| Baird Short-Term Bond Fund | | | 443,178 | |
| Baird Intermediate Bond Fund | | | 131,043 | |
| Baird Aggregate Bond Fund | | | 2,208,840 | |
| Baird Core Plus Bond Fund | | | 6,372,462 | |
| Baird Short-Term Municipal Bond Fund | | | 179,628 | |
| Baird Strategic Municipal Bond Fund | | | 9,772 | |
| Baird Quality Intermediate Municipal Bond Fund | | | 182,100 | |
| Baird Core Intermediate Municipal Bond Fund | | | 38,787 | |
| Baird Municipal Bond Fund | | | 707 | |
| 8. | Other Derivative Information |
As a principal investment strategy, the Baird Strategic Municipal Bond Fund may invest in U.S. Treasury futures contracts for duration and yield curve management or to manage market and interest rate risk. The Fund’s market risk related to its derivatives trading is influenced by a wide variety of factors, including the level and volatility of interest rates, the fair value of futures contracts, the diversification effects among the Fund’s open positions and the liquidity of the markets in which it trades.
The Baird Strategic Municipal Bond Fund had no outstanding futures contracts at December 31, 2020.
Management has adopted authoritative standards regarding disclosure about derivatives and hedging activities and how they affect a Fund’s Statement of Assets and Liabilities and Statement of Operations. The derivative instruments are not designated as hedging instruments. Accordingly, all realized gains and losses, as well as any change in net unrealized gains or losses on open contracts from the preceding period, are recognized as part of realized and unrealized gain (loss) in the Statement of Operations.
The following table presents the results of the derivative trading and information related to volume for the year ended December 31, 2020 for the Baird Strategic Municipal Bond Fund. The below captions of “Net Realized” and “Net Change in Unrealized” correspond to the captions in the Fund's Statement of Operations.
| | | Gain (Loss) from Trading | |
| | | | | | Net Change | |
Fund and Type of Derivative Instrument | | Net Realized | | | in Unrealized | |
| Baird Strategic Municipal Bond Fund | | | | | | |
| U.S. Treasury futures contracts | | | | | | |
| Interest rate | | $ | 69,043 | | | $ | — | |
| Total U.S. Treasury futures contracts | | $ | 69,043 | | | $ | — | |
Notes to the Financial Statements
December 31, 2020
| 8. | Other Derivative Information (cont.) |
The average monthly notional amount is shown as an indicator of volume. The average monthly notional amounts during the year ended December 31, 2020 were:
| | | Average Notional Amount | |
| | | Long | | | Short | |
| | | Contracts | | | Contracts | |
| Baird Strategic Municipal Bond Fund | | | | | | |
| U.S. Treasury futures contracts | | $ | — | | | $ | 991,041 | |
Please refer to the Fund's prospectus for a full listing of risks associated with these investments.
In preparing these financial statements, management has evaluated events after December 31, 2020. There were no subsequent events since December 31, 2020, through the date the financial statements were issued that would warrant adjustment to or additional disclosure in these financial statements.
Report of Independent Registered Public
Accounting Firm
To the Shareholders and Board of Directors of Baird Funds, Inc.
Opinion on the Financial Statements
We have audited the accompanying statements of assets and liabilities, including the schedules of investments, of the funds listed below (the “Funds”), each a series of Baird Funds, Inc., as of December 31, 2020, the related statements of operations, the statements of changes in net assets, the related notes, and the financial highlights for each of the periods indicated below (collectively referred to as the “financial statements”). In our opinion, the financial statements present fairly, in all material respects, the financial position of each of the Funds as of December 31, 2020, the results of their operations, the changes in net assets, and the financial highlights for each of the periods indicated below in conformity with accounting principles generally accepted in the United States of America.
| | | Statements |
|
| | Statements of | of Changes | Financial |
| Fund Name | Operations | in Net Assets | Highlights |
| Baird Ultra Short Bond Fund, Baird Short-Term Bond | For the | For the | For the |
| Fund, Baird Intermediate Bond Fund, Baird Aggregate | year ended | years ended | years ended |
| Bond Fund, Baird Core Plus Bond Fund, Baird | December 31, | December 31, | December 31, |
| Short-Term Municipal Bond Fund, Baird Quality | 2020 | 2020 and 2019 | 2020, 2019, |
| Intermediate Municipal Bond Fund, Baird Core | | | 2018, and 2017 |
| Intermediate Municipal Bond Fund | | | |
| Baird Strategic Municipal Bond Fund, | For the | For the year ended December 31, |
| Baird Municipal Bond Fund | year ended | 2020 and for the period from |
| | December 31, | November 15, 2019 |
| | 2020 | (commencement of operations) |
| | | through December 31, 2019 |
The Funds’ financial highlights for the year ended December 31, 2016, were audited by other auditors whose report dated February 27, 2017, expressed an unqualified opinion on those financial highlights.
Basis for Opinion
These financial statements are the responsibility of the Funds’ management. Our responsibility is to express an opinion on the Funds’ financial statements based on our audits. We are a public accounting firm registered with the Public Company Accounting Oversight Board (United States) (“PCAOB”) and are required to be independent with respect to the Funds in accordance with the U.S. federal securities laws and the applicable rules and regulations of the Securities and Exchange Commission and the PCAOB.
We conducted our audits in accordance with the standards of the PCAOB. Those standards require that we plan and perform the audit to obtain reasonable assurance about whether the financial statements are free of material misstatement whether due to error or fraud.
Our audits included performing procedures to assess the risks of material misstatement of the financial statements, whether due to error or fraud, and performing procedures that respond to those risks. Such procedures included examining, on a test basis, evidence regarding the amounts and disclosures in the financial statements. Our procedures included confirmation of securities owned as of December 31, 2020, by correspondence with the custodian and brokers. Our audits also included evaluating the accounting principles used and significant estimates made by management, as well as evaluating the overall presentation of the financial statements. We believe that our audits provide a reasonable basis for our opinion.
We have served as the Funds’ auditor since 2017.
COHEN & COMPANY, LTD.
Milwaukee, Wisconsin
February 26, 2021
Directors & Officers
As of December 31, 2020 (Unaudited)
Independent Directors
John W. Feldt
Independent Director, Audit Committee Chair
Term of Office: Indefinite
Length of Time Served: Since September 2000
Age: 78
c/o Robert W. Baird & Co. Incorporated
777 East Wisconsin Avenue
Milwaukee, WI 53202
Principal Occupation(s) During the Past 5 Years: Retired.
Number of Active Portfolios in Complex Overseen by Director: 16
Other Directorships Held by Director: Director of Thompson IM Funds, Inc., a mutual fund complex (3 portfolios) (1987-2018).
Darren R. Jackson
Independent Director
Term of Office: Indefinite
Length of Time Served: Since November 2018
Age: 56
c/o Robert W. Baird & Co. Incorporated
777 East Wisconsin Avenue
Milwaukee, WI 53202
Principal Occupation(s) During the Past 5 Years: Retired; President, CEO and Director, Advance Auto Parts, Inc. (2008-2016).
Number of Active Portfolios in Complex Overseen by Director: 16
Other Directorships Held by Director: Director of Cree, Inc., a semiconductor company, since 2016; Director of Fastenal Company, a tool and supply distributor (2012-2020).
Frederick P. Stratton, Jr.
Independent Director, Nominating
Committee Chair
Term of Office: Indefinite
Length of Time Served: Since May 2004
Age: 81
c/o Robert W. Baird & Co. Incorporated
777 East Wisconsin Avenue
Milwaukee, WI 53202
Principal Occupation(s) During the Past 5 Years: Retired; Chairman Emeritus, Briggs & Stratton Corporation, a manufacturing company, (2003-2020).
Number of Active Portfolios in Complex Overseen by Director: 16
Other Directorships Held by Director: Director of Weyco Group, Inc., a men’s footwear distributor, since 1976.
Marlyn J. Spear, CFA
Independent Director, Chair of Board
Term of Office: Indefinite
Length of Time Served: Since January 2008
Age: 67
c/o Robert W. Baird & Co. Incorporated
777 East Wisconsin Avenue
Milwaukee, WI 53202
Principal Occupation(s) During the Past 5 Years: Retired; Chief Investment Officer, Building Trades United Pension Trust Fund (July 1989-February 2017).
Number of Active Portfolios in Complex Overseen by Director: 16
Other Directorships Held by Director: Management Trustee of AFL-CIO Housing Investment Trust, a mutual fund complex (1 portfolio) (1995-2018).
Directors & Officers
As of December 31, 2020 (Unaudited) (Continued)
Independent Director
Cory L. Nettles
Independent Director
Term of Office: Indefinite
Length of Time Served: Since January 2008
Age: 50
c/o Generation Growth Capital, Inc.
411 East Wisconsin Avenue, Suite 1710
Milwaukee, WI 53202
Principal Occupation(s) During the Past 5 Years: Managing Director, Generation Growth Capital, Inc., a private equity fund, since March 2007; Of Counsel, Quarles & Brady LLP, a law firm (January 2005-December 2016).
Number of Active Portfolios in Complex Overseen by Director: 16
Other Directorships Held by Director: Director of Weyco Group, Inc., a men’s footwear distributor, since 2007; Director of Associated Banc-Corp, since 2013.
Officers
Mary Ellen Stanek
President
Term of Office: Re-elected by Board annually
Length of Time Served: Since September 2000
Age: 64
777 East Wisconsin Avenue
Milwaukee, WI 53202
Principal Occupation(s) During the Past 5 Years: Managing Director, the Advisor, and Chief Investment Officer, Baird Advisors, a department of the Advisor, since March 2000.
Charles B. Groeschell
Vice President
Term of Office: Re-elected by Board annually
Length of Time Served: Since January 2010
Age: 67
777 East Wisconsin Avenue
Milwaukee, WI 53202
Principal Occupation(s) During the Past 5 Years: Managing Director, the Advisor, and Senior Portfolio Manager, Baird Advisors, a department of the Advisor, since February 2000.
Angela M. Palmer
Chief Compliance Officer and
AML Compliance Officer
Term of Office: Re-elected by Board annually
Length of Time Served: Since March 2014
Age: 48
777 East Wisconsin Ave
Milwaukee, WI 53202
Principal Occupation(s) During the Past 5 Years: Chief Compliance Officer, the Advisor, since March 2014; Anti-Money Laundering Compliance Officer since May 2015; Director, the Advisor, since July 2014.
Heidi L. Schneider
Treasurer
Term of Office: Re-elected by Board annually
Length of Time Served: Since August 2017
Age: 49
777 East Wisconsin Avenue
Milwaukee, WI 53202
Principal Occupation(s) During the Past 5 Years: Managing Director, the Advisor, since December 2013.
Charles M. Weber
Secretary
Term of Office: Re-elected by Board annually
Length of Time Served: Since September 2005
Age: 57
777 East Wisconsin Avenue
Milwaukee, WI 53202
Principal Occupation(s) During the Past 5 Years: Senior Associate General Counsel, the Advisor, since January 2013; Managing Director, the Advisor, since January 2009.
Directors & Officers
As of December 31, 2020 (Unaudited) (Continued)
Officers (Cont.)
Peter J. Hammond
Vice President
Term of Office: Re-elected by Board annually
Length of Time Served: Since August 2012
Age: 57
777 East Wisconsin Avenue
Milwaukee, WI 53202
Principal Occupation(s) During the Past 5 Years: Managing Director, the Advisor, since January 2016; Senior Vice President, the Advisor (March 2012-December 2015).
Dustin J. Hutter
Assistant Treasurer
Term of Office: Re-elected by Board annually
Length of Time Served: Since February 2011
Age: 44
777 East Wisconsin Avenue
Milwaukee, WI 53202
Principal Occupation(s) During the Past 5 Years: Senior Business Analyst, the Advisor, since September 2017; Director of Finance Services, the Advisor (August 2015-August 2017).
Andrew D. Ketter
Assistant Secretary
Term of Office: Re-elected by Board annually
Length of Time Served: Since February 2011
Age: 46
777 East Wisconsin Avenue
Milwaukee, WI 53202
Principal Occupation(s) During the Past 5 Years: Associate General Counsel, the Advisor, since September 2010; Director, the Advisor, since July 2014.
Additional information about the Funds’ Directors is available in the Statement of Additional Information which may be obtained without charge, upon request, by calling 1-866-44BAIRD, or at www.bairdfunds.com.
Baird Funds, Inc.
Disclosure Regarding the Board of Directors’ Approval of the Investment
Advisory Agreement for Baird Bond Funds (Unaudited)
The Board of Directors (the “Board”) of Baird Funds, Inc. (the “Corporation”), comprised of directors who are not “interested persons” of the Corporation within the meaning of the Investment Company Act of 1940 (the “Independent Directors”), met on August 17 and August 25, 2020 to consider the annual renewal of the investment advisory agreement between Robert W. Baird & Co. Incorporated (“Baird” or the “Advisor”) and the Corporation on behalf of the Baird Ultra Short Bond Fund, Baird Short-Term Bond Fund, Baird Intermediate Bond Fund, Baird Aggregate Bond Fund, Baird Core Plus Bond Fund, Baird Short-Term Municipal Bond Fund, Baird Quality Intermediate Municipal Bond Fund, and Baird Core Intermediate Municipal Bond Fund (the “Bond Funds” or the “Funds”). The Board did not consider the renewal of the investment advisory agreement between the Advisor and the Corporation on behalf of the Baird Municipal Bond Fund and Baird Strategic Municipal Bond Fund (the “New Municipal Bond Funds”) at those meetings because the investment advisory agreement for the New Municipal Bond Funds has an initial two-year term ending in 2021.
The Board, all of whom are Independent Directors, approved the continuation of the investment advisory agreement for the Bond Funds through a process that concluded at the August 25, 2020 meeting. In connection with its consideration of the investment advisory agreement, the Board reviewed and discussed various information that had been provided prior to the meeting, including a copy of the investment advisory agreement and related fee schedules, a memorandum provided by legal counsel summarizing the guidelines relevant to the Board’s consideration of the investment advisory agreement, a memorandum and other information provided in response to a request from the Board by the Advisor, including information about the operation of the Advisor and the Funds during the COVID-19 pandemic, a copy of the Advisor’s Form ADV Part 1A and Form ADV Part 2 brochures and brochure supplements, the annual report and audited consolidated financial statements for Baird Financial Group, Inc. (the Advisor’s parent company), a profitability analysis, comparative information about the Funds’ performance for the applicable periods ended June 30, 2020, comparative information about management fees and expense ratios, composite performance information for similar accounts managed by the Advisor, trading and brokerage commission information and other pertinent information.
The Board considered the Advisor’s 15(c) response and discussed various questions and information with representatives of the Advisor at the August 17, 2020 special meeting. At the August 25, 2020 meeting, the Board met in executive session with the Funds’ legal counsel to consider the investment advisory agreement. The Board also took into account information reviewed periodically throughout the year that was relevant to its consideration of the investment advisory agreement, including performance, management fee and other expense information, compliance matters, business initiatives of the Advisor, information about investments made by the Advisor in personnel, technology and services that benefit the Funds and discussions with the Funds’ portfolio managers.
Based on its evaluation of this information, the Board, including all of the Independent Directors, approved the continuation of the investment advisory agreement for the Bond Funds for an additional one-year period.
In considering the investment advisory agreement and reaching its conclusions, the Board reviewed and analyzed various factors that it determined were relevant, including the factors below. In deciding to approve the investment advisory agreement for each Fund, the Board did not identify any single factor as determinative but considered all factors together.
Nature, Extent and Quality of Services Provided to the Funds
The Board considered the nature, extent and quality of the services provided by the Advisor to the Funds. The Board noted the Advisor’s overall reputation and depth of the Advisor’s personnel, resources and commitment to the Funds and the experience of the portfolio management teams employed to manage the Funds’ investments. The Board considered the credentials and continuity of the portfolio management teams for the
Baird Funds, Inc.
Disclosure Regarding the Board of Directors’ Approval of the Investment
Advisory Agreement for Baird Bond Funds (Unaudited) (Continued)
Funds and noted that the Advisor continues to add resources in support of the Funds, including investments in personnel, technology, systems, trading and research capabilities, databases, work from home infrastructure and virtual meeting technology. The Board considered the information provided by the Advisor regarding the effective implementation of the Advisor’s business continuity plan and the performance and operation of the Funds during the COVID-19 pandemic.
The Board considered the Advisor’s disciplined investment decision making process used for the Funds. The Board also considered other services that the Advisor provides the Funds in its capacity as their investment advisor, such as making some of its key personnel available to serve as officers of the Funds, selecting broker-dealers for execution of portfolio transactions, ensuring adherence to the Funds’ investment policies and restrictions, proxy voting, compliance, risk management services, administering the Funds’ liquidity risk management program, administering the Funds’ cybersecurity program and business continuity plan, valuation support, providing support services to the Board and the committees of the Board and overseeing the Funds’ other service providers. The Board noted the growth in net assets in the Bond Funds, including during the challenging first six months of 2020, and Baird Advisors’ ability to effectively manage the Funds’ cash flows while maintaining strong performance. The Board also considered the strength of the Advisor’s compliance department, including the credentials of the Funds’ chief compliance officer, as well as the Advisor’s risk management system. The Board concluded that the nature, extent and quality of the services provided by the Advisor to the Funds were appropriate and that each Fund was likely to continue to benefit from services provided under the investment advisory agreement.
Investment Performance of the Advisor and the Funds
In considering the investment performance of each of the Funds, the Board reviewed information as of June 30, 2020 regarding the performance of each class of the Fund for applicable one-year, three-year, five-year, ten-year and since-inception periods in comparison to its benchmark index and its peer group as determined by Lipper. The Board also considered the Funds’ performance during the recent market downturn in the first six months of 2020 and noted that almost all of the Funds’ Institutional Class shares had seen positive relative performance against their benchmarks during this period. The Board also reviewed composite investment performance of Baird Advisors with respect to accounts managed by the Advisor that are comparable to the Funds but did not consider it to be a material factor in the 15(c) process.
The Board noted that the performance results of the Bond Funds have been extremely competitive and consistent on both an absolute and relative basis for all applicable periods, and that the performance for the Institutional Class shares of the Funds, other than the Quality Intermediate Municipal Bond Fund, has been in the top quartile of the respective Lipper peer group for the applicable one-year, three-year, five-year, ten-year and since-inception periods. With respect to the Quality Intermediate Municipal Bond Fund, the Board took note of the Advisor’s commentary regarding the Fund’s high-quality bias and emphasis on intermediate maturity holdings, which impacted the longer-term Lipper rankings for the Fund.
The Board noted that the returns of the Institutional Class of the Ultra Short Bond Fund, the Core Intermediate Municipal Bond Fund, the Aggregate Bond Fund, the Core Plus Bond Fund, the Short-Term Bond Fund and the Intermediate Bond Fund have exceeded the returns of the benchmark index and the Lipper peer group average over all applicable time periods. The Institutional Class of the Short-Term Municipal Bond Fund trailed the benchmark index but exceeded the Lipper peer group average for the one-year period and exceeded the benchmark index and the Lipper peer group average for the three-year and since-inception periods. The Institutional Class of the Quality Intermediate Municipal Bond Fund exceeded the benchmark index and Lipper peer group average for the one-year period, trailed the benchmark index and exceeded the Lipper peer group average for the three-year and since inception periods and trailed the benchmark index and Lipper peer group average for the five- and ten-year periods.
Baird Funds, Inc.
Disclosure Regarding the Board of Directors’ Approval of the Investment
Advisory Agreement for Baird Bond Funds (Unaudited) (Continued)
The Board also considered the Advisor’s quarterly portfolio commentaries and reviews explaining the Funds’ performance and the consistent investment strategies the Advisor employs for each Fund. The Board concluded that, although past performance is not a guarantee of future results, each Fund and its shareholders were likely to benefit from the continued management by the Advisor.
Advisory Fees and Expenses
The Board reviewed the fee and expense information for each of the Funds, including a comparison of each Fund’s advisory fee and total net expense ratio to industry data for other mutual funds in the same Morningstar peer group. The Board noted that each Fund’s advisory fee and net expense ratio for the Institutional Class shares are significantly lower than the average advisory fee and expense ratios for all mutual funds in the respective Morningstar category and the net expense ratio for Investor Class shares was lower than or competitive with the category averages. With respect to the Ultra Short Bond Fund, the Board considered the Advisor’s contractual agreement to waive management fees of 0.15% until April 30, 2021. In addition, the Board considered that under the Administration Agreement, each of the Bond Funds pays administrative fees to the Advisor at an annual rate of 0.05% of each Fund’s average daily net assets, and the Advisor is responsible for paying all third party service provider fees, director fees and most other expenses of each Fund, excluding management fees, Rule 12b-1 fees and specified excluded expenses, such as borrowing costs, transaction fees and extraordinary expenses, which has the effect of capping the Funds’ expense ratios at 0.55% and 0.30% for Investor and Institutional Class Shares, respectively.
The Board also reviewed and considered investment management fees charged by the Advisor to other investment advisory clients, including separately managed accounts and subadvisory arrangements with unaffiliated mutual funds and a collective investment trust, but did not consider these comparisons to be a material factor given the difference in services provided by the Advisor and the additional risks assumed by the Advisor as investment adviser to the Funds.
The Board noted the extent of the significant additional services provided to the Funds that the Advisor did not provide in other advisory and subadvisory relationships. Those services included operational support, valuation services, administration of the Funds’ liquidity risk management program, oversight of the Funds’ other service providers, director support, preparation of regulatory filings, implementation of the Funds’ compliance program including employment of the Funds’ Chief Compliance Officer and other compliance staff, the operation of the Funds’ business continuity plan and cybersecurity plan, and various other services. In addition, the Board noted that the provision of investment advisory services to the Funds requires more effort than it does for other accounts due to daily sales and redemption activity and additional regulatory and compliance requirements.
The Board concluded that the management fee and total expense ratio of each Fund were reasonable in light of the nature and quality of services provided and fees paid by comparable funds.
Costs and Profitability
The Board considered the fees realized, and the costs incurred, by the Advisor in providing investment management services and administration services to the Bond Funds and a profitability analysis with respect to each Fund. The Board considered that the Advisor’s profitability information does not reflect costs incurred for various support services to the Funds such as IT, compliance, risk, legal and finance. The Board reviewed the financial condition of the Advisor and its parent company and determined it to be sound. The Board concluded that the Advisor’s current level of profitability was reasonable.
Baird Funds, Inc.
Disclosure Regarding the Board of Directors’ Approval of the Investment
Advisory Agreement for Baird Bond Funds (Unaudited) (Continued)
Economies of Scale and Fee Levels Reflecting Those Economies
The Board reviewed asset levels for each Fund and considered whether there may be economies of scale in the management of each Fund at current levels and if its assets were to increase significantly.
The Board noted that the Funds’ advisory fee structure does not contain any breakpoint reductions as the Funds grow in size, but took into account management’s view that each Fund shares in economies of scale through the low advisory fee, which has been in place since the Funds were organized and is significantly lower than the advisory fee of peer Funds. In addition, the Board noted that the Advisor bears almost all of the Bond Funds’ expenses other than management, Rule 12b-1 and administration fees. The Directors concluded that the current fee structure of each Fund was reasonable.
Benefits Derived from the Relationship with the Funds
The Board considered other benefits to the Advisor from serving as advisor to the Funds (in addition to the advisory fee). Those benefits include fees received by the Advisor for administrative services to the Bond Funds and Rule 12b-1 fees received by the Distributor and its representatives. The Board noted that the Advisor’s asset management and other businesses may experience indirect benefits from the Advisor’s association with the Funds. The Board concluded that the other benefits realized by the Advisor from its relationship with the Funds were appropriate.
Based on its evaluation of the above factors, the Directors, all of whom are Independent Directors, concluded that the continuation of the investment advisory agreement was in the best interest of each Bond Fund and its shareholders.
Additional Information (Unaudited)
Proxy Voting
A description of the policies and procedures that the Funds use to determine how to vote proxies relating to portfolio securities is available without charge, upon request, by calling toll free, 1-866-44BAIRD, by accessing the Funds’ website at www.bairdfunds.com or by accessing the SEC’s website at www.sec.gov.
Each Fund’s proxy voting record for the most recent 12-month period ended June 30, if applicable, is available without charge, upon request, by calling toll free, 1-866-44BAIRD, by accessing the Funds’ website at www.bairdfunds.com or by accessing the SEC’s website at www.sec.gov. The Funds generally do not vote proxies because the securities held in their portfolios, consisting of bonds and other fixed-income securities, are not entitled to vote.
Portfolio Holdings Disclosure
The Funds file a complete schedule of portfolio holdings with the SEC for the first and third quarters of each fiscal year on Part F of Form N-PORT. The Funds’ filings on Part F of Form N-PORT are available on the SEC’s website at www.sec.gov. The Funds’ Form N-PORT reports may also be obtained by calling toll-free 1-866-44BAIRD.
Tax Information
The percentage of taxable ordinary income distributions that are designated as short-term capital gain distributions under Internal Revenue Section 871(k)(2)(C) for each Fund were as follows:
| Baird Ultra Short Bond Fund | 7.15% |
| Baird Short-Term Bond Fund | 22.73% |
| Baird Intermediate Bond Fund | 16.88% |
| Baird Aggregate Bond Fund | 19.99% |
| Baird Core Plus Bond Fund | 11.53% |
| Baird Strategic Municipal Bond Fund | 91.47% |
| Baird Core Intermediate Municipal Bond Fund | 96.50% |
| Baird Municipal Bond Fund | 98.03% |
Baird Funds, Inc. Privacy Policy
| | FACTS | | WHAT DOES BAIRD FUNDS DO WITH YOUR PERSONAL INFORMATION? | |
| | | | | |
| | Why? | | Financial companies choose how they share your personal information. Federal law gives consumers the right to limit some but not all sharing. Federal law also requires us to tell you how we collect, share, and protect your personal information. Please read this notice carefully to understand what we do. | |
| | | | | |
| | What? | | The types of personal information we collect and share depend on the product or service you have with us. This information can include: | |
| | | | • Social Security number | |
| | | | • Account balances, transaction history and assets | |
| | | | • Checking account information and wire transfer instructions | |
| | | | | |
| | How? | | All financial companies need to share customers’ personal information to run their everyday business. In the section below, we list the reasons financial companies can share their customers’ personal information; the reasons Baird Funds, Inc. chooses to share; and whether you can limit this sharing. | |
| | | Does Baird | Can you limit |
| | Reasons we can share your personal information | Funds, Inc. share? | this sharing? |
| | For our everyday business purposes— | Yes | No |
| | such as to process your transactions, maintain | | |
| | your account(s), respond to court orders and | | |
| | legal investigations, or report to credit bureaus | | |
| | For our marketing purposes— | Yes | No |
| | to offer our products and services to you | | |
| | For joint marketing with other financial companies | No | We do not share |
| | For our affiliates’ everyday business purposes— | Yes | No |
| | information about your transactions and experiences | | |
| | For our affiliates’ everyday business purposes— | No | We do not share |
| | information about your creditworthiness | | |
| | For our affiliates to market to you | No | We do not share |
| | For nonaffiliates to market to you | No | We do not share |
| | Questions? | | Call (toll free) 1-866-442-2473, Email prospectus@bairdfunds.com or go to www.bairdfunds.com | |
Baird Funds, Inc. Privacy Policy
| | Who we are | | | |
| | Who is providing | | Baird Funds, Inc. | |
| | this notice? | | | |
| | What we do | | | |
| | How does Baird | | To protect your personal information from unauthorized access and | |
| | Funds, Inc. protect my | | use, we use security measures that comply with federal law. These | |
| | personal information? | | measures include computer safeguards and secured files and buildings. | |
| | How does Baird | | We collect your personal information, for example, when you | |
| | Funds, Inc. collect | | • open an account or give us your contact information | |
| | my personal | | • make a wire transfer or provide account information | |
| | information? | | • make deposits or withdrawals from your account | |
| | | | We also collect your personal information from other companies. | |
| | Why can’t I limit | | Federal law gives you the right to limit only | |
| | all sharing? | | • sharing for affiliates’ everyday business purposes—information about your creditworthiness | |
| | | | • affiliates from using your information to market to you | |
| | | | • sharing for nonaffiliates to market to you | |
| | | | State laws and individual companies may give you additional rights to limit sharing. | |
| | Definitions | | | |
| | Affiliates | | Companies related by common ownership or control. They can be financial and nonfinancial companies. | |
| | |
| • | Robert W. Baird & Co Incorporated (the investment adviser and distributor to the Baird Funds) and its affiliates may share information among each other. | |
| | Nonaffiliates | | Companies not related by common ownership or control. They can be financial and nonfinancial companies. | |
| | | | • Baird Funds, Inc. does not share with nonaffiliates so they can market to you. | �� |
| | Joint marketing | | A formal agreement between nonaffiliated financial companies that together market financial products or services to you. We do not have any joint marketing partners. | |
| | | | • Baird Funds, Inc. does not have any joint marketing partners. | |
(This Page Intentionally Left Blank.)
c/o U.S. Bancorp Fund Services, LLC
P.O. Box 701
Milwaukee, WI 53201-0701
1-866-44BAIRD
Board of Directors
John W. Feldt
Darren R. Jackson
Cory L. Nettles
Marlyn J. Spear (Chair)
Frederick P. Stratton, Jr.
Investment Advisor and Distributor
Robert W. Baird & Co. Incorporated
777 East Wisconsin Avenue
Milwaukee, WI 53202
Administrator and Transfer Agent
U.S. Bancorp Fund Services, LLC
P.O. Box 701
615 East Michigan Street
Milwaukee, WI 53202
Custodian
U.S. Bank, N.A.
1555 N. RiverCenter Drive, Suite 302
Milwaukee, WI 53212
Legal Counsel
Godfrey & Kahn, S.C.
833 East Michigan Street, Suite 1800
Milwaukee, WI 53202
Independent Registered Public
Accounting Firm
Cohen & Company, Ltd.
342 North Water Street, Suite 830
Milwaukee, WI 53202
Annual Report –
Baird Funds
December 31, 2020
Baird MidCap Fund
Baird Small/Mid Cap Growth Fund
Baird Small/Mid Cap Value Fund
Baird SmallCap Value Fund
Chautauqua International Growth Fund
Chautauqua Global Growth Fund
Beginning on January 1, 2021, as permitted by regulations adopted by the U.S. Securities and Exchange Commission, paper copies of the Funds’ annual and semi-annual shareholder reports will no longer be sent by mail, unless you specifically request paper copies of the reports from the Funds or from your financial intermediary, such as a broker-dealer or bank. Instead, the reports will be made available on the Funds’ website (www.bairdassetmanagement.com/baird-funds/funds-and-performance#Literature) and you will be notified by mail each time a report is posted and provided with a website link to access the report.
If you already elected to receive shareholder reports electronically, you will not be affected by this change and you need not take any action. You may elect to receive shareholder reports and other communications from the Funds electronically anytime by contacting your financial intermediary or, if you are a direct investor, by calling 1-866-442-2473, or sending an e-mail request to prospectus@bairdfunds.com.
You may elect to receive all future reports in paper free of charge. If you invest through a financial intermediary, you can contact your financial intermediary to request that you continue to receive paper copies of your shareholder reports. If you invest directly with a Fund, you can call 1-866-442-2473 or send an e-mail request to prospectus@bairdfunds.com to let the Fund know you wish to continue receiving paper copies of your shareholder reports. Your election to receive reports in paper will apply to all Funds held in your account if you invest through your financial intermediary or all Funds held with the fund complex if you invest directly with the Funds.
| Go Green. | | Go Paperless. |
Sign up to receive your Baird Funds’ prospectuses and reports online.
Table of Contents
| Letter to Shareholders | | 1 |
| Baird MidCap Fund | | 2 |
| Baird Small/Mid Cap Growth Fund | | 11 |
| Baird Small/Mid Cap Value Fund | | 20 |
| Baird SmallCap Value Fund | | 29 |
| Chautauqua International Growth Fund | | 38 |
| Chautauqua Global Growth Fund | | 46 |
| Additional Information on Fund Expenses | | 55 |
| Statements of Assets and Liabilities | | 57 |
| Statements of Operations | | 60 |
| Statements of Changes in Net Assets | | 63 |
| Financial Highlights | | 69 |
| Notes to the Financial Statements | | 81 |
| Report of Independent Registered Public Accounting Firm | | 93 |
| Directors and Officers | | 94 |
| Disclosure Regarding the Board of Directors’ Approval of the Investment | | |
| Advisory Agreement for Baird Equity Funds | | 97 |
| Additional Information | | 101 |
| Privacy Notice | | A-1 |
This report has been prepared for shareholders and may be distributed to others only if preceded or accompanied by a current prospectus.
Cautionary Note on Analyses, Opinions and Outlooks: In this report we offer analyses and opinions on the performance of individual securities, companies, industries, sectors, markets, interest rates and governmental policies, including predictions, forecasts and outlooks regarding possible future events. These can generally be identified as such because the context of the statements may include such words as “believe,” “should,” “will,” “expects,” “anticipates,” “hopes” and words of similar effect. These statements reflect the portfolio managers’ good faith beliefs and judgments and involve risks and uncertainties, including the risk that the portfolio managers’ analyses, opinions and outlooks are or will prove to be inaccurate. It is inherently difficult to correctly assess and explain the performance of particular securities, sectors, markets, interest rate movements, governmental actions or general economic trends and conditions, and many unforeseen factors contribute to the performance of Baird Funds. Investors are, therefore, cautioned not to place undue reliance on subjective judgments contained in this report.
Baird Funds
1-866-442-2473
www.bairdfunds.com
February 26, 2021
Dear Shareholder,
After the challenges we have all endured over the past year, our Baird Equity Asset Management team hopes this letter finds you, your families and your loved ones healthy and safe. To say that 2020 was a challenging year for the financial markets and investors truly understates what we have all experienced. The impact of the coronavirus on our investors’ lives, families, businesses and communities felt at times overwhelming, but you all persevered and we are honored to have been your equity manager during this period.
For our Baird Equity Asset Management team, this year has reminded us of the importance of looking out for each other and remaining laser focused on delivering on your financial needs. We have spent many years building and refining our equity strategies and I am extremely proud of our team for navigating the unprecedented challenges in 2020. We not only delivered competitive returns, but also peace of mind that your equity portfolio was doing what it was supposed to do. Having talented, experienced teams with time-tested strategies remains a significant competitive advantage. That expertise and talent was a contributor to the Funds’ competitive performance in 2020.
Amidst this extremely volatile and challenged environment, the MidCap, Small/Mid Cap Growth, Chautauqua International Growth and Chautauqua Global Growth Funds delivered very strong absolute performance. Our Value Funds, while lagging in the growth environment, performed as they should have, particularly with superior downside protection during the March downdraft in the market. All of the Baird Equity Funds’ long-term track records remain competitive and the portfolios are positioned well as we enter 2021.
While much in the world has changed, our core commitment to our investors has not. We remain dedicated to generating competitive, risk-controlled returns over full market cycles, providing competitively-priced products, delivering outstanding service and continuing to invest in our long-tenured and seasoned investment team.
Through all of the challenges in 2020, we never lost sight of the fact that our long-term success rests on the trust you have placed in us to be effective stewards of your assets. We want to express our sincere appreciation for your confidence in our work and continued investment in the Baird Equity Funds. May 2021 bring you health, happiness and success.
Sincerely,
Mary Ellen Stanek, CFA
President
Baird Funds
Baird MidCap Fund
December 31, 2020 (Unaudited)
Portfolio Managers’ Commentary
For the year ended December 31, 2020, the Baird MidCap Fund Institutional Class posted a total return of 34.81% as compared to 35.59% for the Russell Midcap® Growth Index, the Fund’s benchmark index.
The ability of equity markets to perform so well in 2020 amid a global pandemic and a near full stop of the economy was rather remarkable, but scientific ingenuity applied to vaccine development and significant central bank and government stimulus helped offset the devastating impacts of the virus. The Fund’s positioning entering the year rested on an expectation for continued economic growth. Importantly, our underlying philosophy of investing in a mix of diversified, high-quality growth businesses helped the Fund navigate the significant market decline as the pandemic unfolded in March, as well as the sharp market rebound that followed. The Fund produced a second consecutive year of returns in excess of 30%, and we were pleased with the performance compared to the benchmark, particularly given favorable results in most benchmark sectors.
The Fund’s consumer discretionary holdings played a key role in driving relative outperformance. Despite the pandemic’s significant toll on employment, substantial monetary and fiscal stimulus created enough of a bridge to carry market expectations beyond the worst of the pandemic’s economic impact. The positive wealth effect from a strong equity market and rising home prices and increased levels of consumer savings helped support consumer confidence and spending. Typically, to achieve very strong relative performance in this sector, it takes good stock picking in several areas, and this was the case in 2020 as the Fund holdings we selected in diversified retail, home building, leisure, and the restaurant industries performed well. The Fund’s overweight positioning in the sector relative to the benchmark, based on the favorable fundamentals described above, also contributed to performance.
The Fund’s returns from investments in the producer durables and materials sectors exceeded benchmark performance. It is worth grouping these two sectors together given that the prospects of many companies in both tend to be heavily influenced by changes in the economic cycle. As a result, economic weakness in the first half of the year challenged the stock performance of many companies in these sectors but returns broadly improved in the second half. Fund holdings with exposure to areas experiencing increased activity and spending performed well and included, testing and measurement for the 5G network buildout, trucking, and power transmission equipment. The standout performer for the Fund in the materials sector was a company that produces composite decking primarily for residential homes. The overall housing market was strong in 2020 and Fund holdings in companies along the home spending chain, including repair and remodel, benefitted. The Fund also held several processing and services businesses and their generally more stable revenue streams held up well amid the market volatility during the year.
As a partial offset to the strength in preceding sectors, the Fund’s technology holdings meaningfully trailed benchmark performance. Returns were quite strong throughout the sector, particularly in the large software and services group, leaving little room for stock-selection error. In some respects, the performance headwind was a matter of style over substance. The technology sector includes an increasing number of high revenue growth, but unprofitable companies. We view sustainable revenue growth and the ability to generate a profit as important measures of quality. As a result, profitability is a fundamental characteristic that we require when selecting investments for the Fund. Unprofitable companies as a group produced stronger stock price returns in 2020 compared to profitable companies, and the performance differential between unprofitable and profitable business was particularly acute in the technology sector.
The financial services sector also detracted from relative performance. The payments and processing businesses held in the Fund did not keep pace. In addition, the Fund’s credit sensitive financial holdings struggled, suffering from the overhang of potential credit problems given economic weakness, and the headwind of low rates and a flat yield curve. Even a small weight in this area hurt relative performance. Exposure to a company providing a leading electronic bond trading platform, which performed well, helped moderate the sector’s underperformance.
Baird MidCap Fund
December 31, 2020 (Unaudited)
The healthcare sector positively contributed to Fund performance due to good stock picking. Notable performance from holdings in the healthcare services, medical and dental instruments, and equipment industries led to outperformance, highlighting the diversity of strength. Of note, two holdings providing technologies used in the emerging treatment systems for diabetes also continued to perform well.
The Fund’s investments in two sectors, energy, and consumer staples, each had a single holding during the year, owing to their small benchmark weights. Within energy, we sold a traditional oil and gas holding to reduce exposure to falling oil prices. While the sale proved helpful, not participating in the sector’s alternative energy industry, notably solar, hurt overall Fund performance. The consumer staples sector typically behaves in a more defensive manner; however, the Fund’s holding of a specialty potato producer underperformed both in the market decline and subsequent recovery as pandemic restrictions caused many restaurant closures, a key end market for the company.
While the Fund’s cash position is not used tactically, in such a strong market advance even the modest amount held by the Fund to accommodate additions to individual holdings or new investment ideas created a drag on relative performance.
Signs of an increased appetite for risk among market participants appeared later in the year evidenced by significant equity market strength and an uptick in mergers & acquisitions, not to mention sharp price appreciation in other corners of the market like Bitcoin and IPOs. The Fed continues to signal a desire for an accommodative monetary position to support the economy and lift inflation. We are encouraged by the prospects for the economy to recover further in 2021 but are on guard for excesses that might emerge from the significant push of money into the economic system.
The long-standing investment process underlying the Fund remains focused on identifying high-quality companies that deliver attractive returns and above average growth relative to peers. Seeking to control risk at the sector and position level is also a priority of our process, with the goal of providing lower volatility of returns for the Fund compared to its benchmark index.
Portfolio Managers:
Charles F. Severson, CFA
Kenneth M. Hemauer, CFA
Baird MidCap Fund
December 31, 2020 (Unaudited)
Portfolio Characteristics
A December 31, 2020 summary of the Fund’s top 10 holdings and equity sector analysis compared to the Russell Midcap® Growth Index is shown below.
Top 10 Holdings(1) | | | Equity Sector Analysis(2) |
| | | | |
| Monolithic Power Systems, Inc. | 3.1% | | 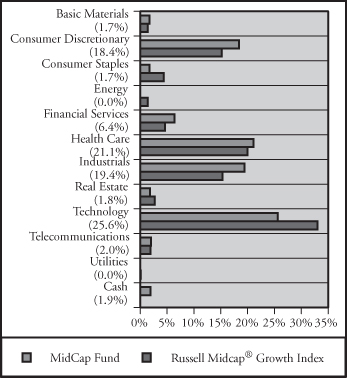
|
| Paycom Software, Inc. | 2.9% | |
| EPAM Systems, Inc. | 2.8% | |
| Five Below, Inc. | 2.6% | |
| Synopsys, Inc. | 2.6% | |
| Align Technology, Inc. | 2.6% | |
| Chipotle Mexican Grill, Inc. | 2.5% | |
| Pool Corp. | 2.4% | |
| Keysight Technologies, Inc. | 2.4% | |
| Microchip Technology, Inc. | 2.3% | |
| | | |
| Net Assets: | $2,265,825,678 | |
| Portfolio Turnover Rate: | 47% | |
| Number of Equity Holdings: | 60 | |
| | | |
Annualized Portfolio Expense Ratio(3): | | |
Gross | | |
| Institutional Class: | 0.82% | |
| Investor Class: | 1.07% | (4) |
| | | |
Net | | |
| Institutional Class: | 0.82% | |
| Investor Class: | 1.07% | (4) | |
| (1) | The Fund’s portfolio composition is subject to change and there is no assurance that the Fund will continue to hold any particular security. Percentages shown relate to the Fund’s total net assets as of December 31, 2020. |
| (2) | Percentages shown in parentheses relate to the Fund’s total value of investments as of December 31, 2020, and may not add up to 100% due to rounding. |
| (3) | Reflects expense ratios as stated in the Fund’s current prospectus. The Advisor has contractually agreed to limit the Fund’s total annual fund operating expenses to 0.85% of average daily net assets for the Institutional Class shares and 1.10% of average daily net assets for the Investor Class shares, at least through April 30, 2022. |
| (4) | Includes 0.25% 12b-1 fee. |
Baird MidCap Fund
December 31, 2020 (Unaudited)
Institutional ClassValue of a $25,000 Investment
Growth of a hypothetical investment of $25,000 made on 12/31/10, assuming reinvestment of all distributions.
Investor Class
Value of a $10,000 Investment
Growth of a hypothetical investment of $10,000 made on 12/31/10, assuming reinvestment of all distributions.
Baird MidCap Fund
December 31, 2020 (Unaudited)
Total Returns
| | | Average Annual |
| | | | | Since |
| For the Periods Ended December 31, 2020 | One Year | Five Years | Ten Years | Inception(1) |
| Institutional Class Shares | 34.81% | 19.31% | 14.81% | 9.41% |
| Investor Class Shares | 34.32% | 18.98% | 14.52% | 9.14% |
Russell Midcap® Growth Index(2) | 35.59% | 18.66% | 15.04% | 8.91% |
| (1) | For the period from December 29, 2000 (inception date) through December 31, 2020. |
| (2) | The Russell Midcap® Growth Index measures the performance of the mid-cap growth segment of the U.S. equity universe. It includes those Russell Midcap® Index companies with higher price-to-book ratios and higher forecasted growth values. This index does not reflect any deduction for fees, expenses or taxes. A direct investment in the index is not possible. |
The line graphs on the previous page and the returns shown in the table above reflect reinvestment of dividends and/or capital gains distributions in additional shares. The returns in the graphs and table do not reflect the deduction of taxes that a shareholder would pay on Fund distributions or the redemption of Fund shares. The returns reflect the actual performance for each period and do not include the impact of trades executed on the last business day of the period that were recorded on the first business day of the next period.
The gross expense ratio for each Class, as reflected in the Fund’s current prospectus, is set forth under “Portfolio Characteristics”.
The Fund focuses on growth-style stocks and therefore the performance of the Fund will typically be more volatile than the performance of funds that focus on types of stocks that have a broader investment style. The Fund may invest up to 15% of its total assets in U.S. dollar denominated foreign securities and ADRs. Foreign investments involve additional risks such as currency rate fluctuations, political and economic instability, and different and sometimes less strict financial reporting standards and regulation. The Fund invests a substantial portion of its assets in the stocks of mid-capitalization companies. Mid-capitalization companies often are more volatile and face greater risks than larger, more established companies. U.S. and international markets have experienced significant periods of volatility in recent years and months due to a number of economic, political and global macro factors including the impact of the coronavirus (COVID-19) as a global pandemic and related public health issues, growth concerns in the U.S. and overseas, uncertainties regarding interest rates, trade tensions and the threat of tariffs imposed by the U.S. and other countries. These and other geopolitical events may cause market disruptions and could have an adverse effect on the value of the Fund’s investments.
Past performance does not guarantee future results. Investment return and principal value will fluctuate so that an investor’s shares, when redeemed, may be worth more or less than their original cost.
For information about the performance of the Fund as of the most recent month-end, please call 1-866-44BAIRD or visit www.bairdfunds.com. Mutual fund performance changes over time and current performance may be lower or higher than that stated.
Baird MidCap Fund
Schedule of Investments, December 31, 2020
Common Stocks
| | | | | | | | | % of | |
| | | Shares | | | Value | | | Net Assets | |
| Aerospace & Defense | | | | | | | | | |
| HEICO Corp. | | | 231,150 | | | $ | 30,604,260 | | | | 1.3 | % |
Mercury Systems, Inc.(1) | | | 374,419 | | | | 32,971,337 | | | | 1.5 | % |
| | | | | | | | 63,575,597 | | | | 2.8 | % |
| Banks | | | | | | | | | | | | |
| Pinnacle Financial Partners, Inc. | | | 444,433 | | | | 28,621,485 | | | | 1.3 | % |
| Biotechnology | | | | | | | | | | | | |
BioMarin Pharmaceutical, Inc.(1) | | | 162,810 | | | | 14,276,809 | | | | 0.6 | % |
| Building Products | | | | | | | | | | | | |
Trex Co, Inc.(1) | | | 504,123 | | | | 42,205,178 | | | | 1.9 | % |
| Capital Markets | | | | | | | | | | | | |
| MarketAxess Holdings, Inc. | | | 50,955 | | | | 29,072,885 | | | | 1.3 | % |
| MSCI, Inc. | | | 63,750 | | | | 28,466,287 | | | | 1.2 | % |
| | | | | | | | 57,539,172 | | | | 2.5 | % |
| Commercial Services & Supplies | | | | | | | | | | | | |
Copart, Inc.(1) | | | 391,956 | | | | 49,876,401 | | | | 2.2 | % |
| Distributors | | | | | | | | | | | | |
| Pool Corp. | | | 145,453 | | | | 54,181,242 | | | | 2.4 | % |
| Electrical Equipment | | | | | | | | | | | | |
Generac Holdings, Inc.(1) | | | 216,525 | | | | 49,239,950 | | | | 2.2 | % |
| Rockwell Automation, Inc. | | | 106,164 | | | | 26,626,993 | | | | 1.2 | % |
| | | | | | | | 75,866,943 | | | | 3.4 | % |
| Electronic Equipment, Instruments & Components | | | | | | | | | | | | |
| CDW Corp. | | | 334,450 | | | | 44,077,166 | | | | 1.9 | % |
Keysight Technologies, Inc.(1) | | | 404,794 | | | | 53,469,239 | | | | 2.4 | % |
| | | | | | | | 97,546,405 | | | | 4.3 | % |
| Entertainment | | | | | | | | | | | | |
Take-Two Interactive Software, Inc.(1) | | | 206,268 | | | | 42,860,428 | | | | 1.9 | % |
| Food Products | | | | | | | | | | | | |
| Lamb Weston Holdings, Inc. | | | 490,689 | | | | 38,636,852 | | | | 1.7 | % |
| Health Care Equipment & Supplies | | | | | | | | | | | | |
Align Technology, Inc.(1) | | | 108,093 | | | | 57,762,738 | | | | 2.6 | % |
| Cooper Cos., Inc. | | | 110,116 | | | | 40,007,345 | | | | 1.8 | % |
DexCom, Inc.(1) | | | 88,675 | | | | 32,784,921 | | | | 1.5 | % |
IDEXX Laboratories, Inc.(1) | | | 96,113 | | | | 48,044,005 | | | | 2.1 | % |
Insulet Corp.(1) | | | 180,592 | | | | 46,164,733 | | | | 2.0 | % |
| ResMed, Inc. | | | 206,798 | | | | 43,956,983 | | | | 1.9 | % |
| | | | | | | | 268,720,725 | | | | 11.9 | % |
The accompanying notes are an integral part of these financial statements.
Baird MidCap Fund
Schedule of Investments, December 31, 2020
Common Stocks (cont.)
| | | | | | | | | % of | |
| | | Shares | | | Value | | | Net Assets | |
| Health Care Technology | | | | | | | | | |
Veeva Systems, Inc.(1) | | | 180,129 | | | $ | 49,040,120 | | | | 2.2 | % |
| Hotels, Restaurants & Leisure | | | | | | | | | | | | |
Chipotle Mexican Grill, Inc.(1) | | | 40,565 | | | | 56,251,891 | | | | 2.5 | % |
| Household Durables | | | | | | | | | | | | |
| DR Horton, Inc. | | | 260,929 | | | | 17,983,227 | | | | 0.8 | % |
| Insurance | | | | | | | | | | | | |
| Arthur J Gallagher & Co. | | | 312,943 | | | | 38,714,179 | | | | 1.7 | % |
| IT Services | | | | | | | | | | | | |
| Broadridge Financial Solutions, Inc. | | | 151,012 | | | | 23,135,038 | | | | 1.0 | % |
EPAM Systems, Inc.(1) | | | 175,894 | | | | 63,031,615 | | | | 2.8 | % |
Euronet Worldwide, Inc.(1) | | | 243,459 | | | | 35,282,078 | | | | 1.6 | % |
| Jack Henry & Associates, Inc. | | | 108,395 | | | | 17,558,906 | | | | 0.8 | % |
VeriSign, Inc.(1) | | | 131,424 | | | | 28,440,154 | | | | 1.2 | % |
| | | | | | | | 167,447,791 | | | | 7.4 | % |
| Life Sciences Tools & Services | | | | | | | | | | | | |
ICON PLC(1)(2) | | | 220,694 | | | | 43,030,916 | | | | 1.9 | % |
Repligen Corp.(1) | | | 194,092 | | | | 37,193,850 | | | | 1.6 | % |
| | | | | | | | 80,224,766 | | | | 3.5 | % |
| Machinery | | | | | | | | | | | | |
| Graco, Inc. | | | 517,159 | | | | 37,416,454 | | | | 1.7 | % |
| IDEX Corp. | | | 119,314 | | | | 23,767,349 | | | | 1.0 | % |
RBC Bearings, Inc.(1) | | | 62,232 | | | | 11,142,017 | | | | 0.5 | % |
| | | | | | | | 72,325,820 | | | | 3.2 | % |
| Media | | | | | | | | | | | | |
| Cable One, Inc. | | | 20,514 | | | | 45,699,448 | | | | 2.0 | % |
| Pharmaceuticals | | | | | | | | | | | | |
Catalent, Inc.(1) | | | 499,425 | | | | 51,975,160 | | | | 2.3 | % |
Jazz Pharmaceuticals PLC(1)(2) | | | 140,821 | | | | 23,242,506 | | | | 1.0 | % |
| | | | | | | | 75,217,666 | | | | 3.3 | % |
| Professional Services | | | | | | | | | | | | |
CoStar Group, Inc.(1) | | | 45,397 | | | | 41,959,539 | | | | 1.8 | % |
| TransUnion | | | 301,983 | | | | 29,962,753 | | | | 1.3 | % |
| Verisk Analytics, Inc. | | | 193,298 | | | | 40,126,732 | | | | 1.8 | % |
| | | | | | | | 112,049,024 | | | | 4.9 | % |
| Road & Rail | | | | | | | | | | | | |
| J.B. Hunt Transport Services, Inc. | | | 197,321 | | | | 26,963,915 | | | | 1.2 | % |
| Semiconductors & Semiconductor Equipment | | | | | | | | | | | | |
| Microchip Technology, Inc. | | | 377,199 | | | | 52,094,954 | | | | 2.3 | % |
| Monolithic Power Systems, Inc. | | | 189,063 | | | | 69,240,543 | | | | 3.1 | % |
| | | | | | | | 121,335,497 | | | | 5.4 | % |
The accompanying notes are an integral part of these financial statements.
Baird MidCap Fund
Schedule of Investments, December 31, 2020
Common Stocks (cont.)
| | | | | | | | | % of | |
| | | Shares | | | Value | | | Net Assets | |
| Software | | | | | | | | | |
Alteryx, Inc.(1) | | | 151,806 | | | $ | 18,488,453 | | | | 0.8 | % |
ANSYS, Inc.(1) | | | 94,829 | | | | 34,498,790 | | | | 1.5 | % |
Aspen Technology, Inc.(1) | | | 261,525 | | | | 34,063,631 | | | | 1.5 | % |
Paycom Software, Inc.(1) | | | 142,882 | | | | 64,618,384 | | | | 2.9 | % |
PTC, Inc.(1) | | | 277,343 | | | | 33,172,996 | | | | 1.5 | % |
Qualys, Inc.(1) | | | 195,018 | | | | 23,766,844 | | | | 1.0 | % |
Synopsys, Inc.(1) | | | 230,157 | | | | 59,665,901 | | | | 2.6 | % |
Tyler Technologies, Inc.(1) | | | 92,712 | | | | 40,470,642 | | | | 1.8 | % |
| | | | | | | | 308,745,641 | | | | 13.6 | % |
| Specialty Retail | | | | | | | | | | | | |
Burlington Stores, Inc.(1) | | | 197,599 | | | | 51,682,018 | | | | 2.3 | % |
Five Below, Inc.(1) | | | 344,111 | | | | 60,212,543 | | | | 2.6 | % |
Floor & Decor Holdings, Inc.(1) | | | 258,745 | | | | 24,024,473 | | | | 1.1 | % |
| Tractor Supply Co. | | | 309,353 | | | | 43,488,845 | | | | 1.9 | % |
| | | | | | | | 179,407,879 | | | | 7.9 | % |
| Technology Hardware, Storage & Peripherals | | | | | | | | | | | | |
NCR Corp.(1) | | | 667,093 | | | | 25,062,684 | | | | 1.1 | % |
| Textiles, Apparel & Luxury Goods | | | | | | | | | | | | |
Under Armour, Inc.(1) | | | 1,440,370 | | | | 24,731,153 | | | | 1.1 | % |
| Trading Companies & Distributors | | | | | | | | | | | | |
| Fastenal Co. | | | 552,696 | | | | 26,988,146 | | | | 1.2 | % |
| Total Common Stocks | | | | | | | | | | | | |
| (Cost $1,250,806,335) | | | | | | | 2,262,096,084 | | | | 99.9 | % |
| Short-Term Investment | | | | | | | | | | | | |
| Money Market Mutual Fund | | | | | | | | | | | | |
| First American Government | | | | | | | | | | | | |
Obligations Fund, Class U, 0.04%(3) | | | 9,864,530 | | | | 9,864,530 | | | | 0.4 | % |
| Total Short-Term Investment | | | | | | | | | | | | |
| (Cost $9,864,530) | | | | | | | 9,864,530 | | | | 0.4 | % |
| Total Investments | | | | | | | | | | | | |
| (Cost $1,260,670,865) | | | | | | | 2,271,960,614 | | | | 100.3 | % |
| Liabilities in Excess of Other Assets | | | | | | | (6,134,936 | ) | | | (0.3 | )% |
| TOTAL NET ASSETS | | | | | | $ | 2,265,825,678 | | | | 100.0 | % |
Notes to Schedule of Investments
| (1) | Non-Income Producing. |
| (2) | Foreign Security. |
| (3) | Seven-Day Yield. |
Industry classifications shown in the Schedule of Investments are based off of the Global Industry Classification Standard (GICS®). GICS® was developed by and/or is the exclusive property of MSCI, Inc. (“MSCI”) and Standard & Poor’s Financial Services LLC (“S&P”). GICS® is a service mark of MSCI and S&P and has been licensed for use by U.S. Bancorp Fund Services, LLC.
The accompanying notes are an integral part of these financial statements.
Baird MidCap Fund
Summary of Fair Value Exposure at December 31, 2020
The Fund has adopted authoritative fair valuation accounting standards which establish a definition of fair value and set out a hierarchy for measuring fair value. These standards require additional disclosures about the various inputs and valuation techniques used to develop the measurements of fair value and a discussion on changes in valuation techniques and related inputs during the period. These standards define fair value as the price that would be received to sell an asset or paid to transfer a liability in an orderly transaction between market participants at the measurement date.
The fair value hierarchy is organized into three levels based upon the assumptions (referred to as “inputs”) used in pricing the asset or liability. These standards state that “observable inputs” reflect the assumptions market participants would use in pricing the asset or liability based on market data obtained from independent sources and “unobservable inputs” reflect an entity’s own assumptions about the assumptions market participants would use in pricing the asset or liability. These inputs are summarized into three broad levels and described below:
| Level 1 – | Quoted prices (unadjusted) in active markets for identical assets or liabilities that the reporting entity can access at the measurement date. |
| Level 2 – | Inputs other than quoted prices included within Level 1 that are observable for the asset or liability, either directly or indirectly. |
| Level 3 – | Unobservable inputs for the asset or liability. |
The inputs or methodology used for valuing securities are not necessarily an indication of the risk associated with investing in those securities.
The following is a summary of the inputs used to value the Fund’s investments as of December 31, 2020:
| | | Level 1 | | | Level 2 | | | Level 3 | | | Total | |
| Equity | | | | | | | | | | | | |
| Common Stocks | | $ | 2,262,096,084 | | | $ | — | | | $ | — | | | $ | 2,262,096,084 | |
| Total Equity | | | 2,262,096,084 | | | | — | | | | — | | | | 2,262,096,084 | |
| Short-Term Investment | | | | | | | | | | | | | | | | |
| Money Market Mutual Fund | | | 9,864,530 | | | | — | | | | — | | | | 9,864,530 | |
| Total Short-Term Investment | | | 9,864,530 | | | | — | | | | — | | | | 9,864,530 | |
| Total Investments* | | $ | 2,271,960,614 | | | $ | — | | | $ | — | | | $ | 2,271,960,614 | |
| * | Additional information regarding the industry classifications of these investments is disclosed in the Schedule of Investments. |
Changes in valuation techniques may result in transfers into or out of assigned levels within the fair value hierarchy. There were no transfers into or out of Level 3 during the reporting period, as compared to the security classifications from the prior year’s annual report. See Fund’s Valuation Policy in Note 2a to the financial statements.
The accompanying notes are an integral part of these financial statements.
Baird Small/Mid Cap Growth Fund
December 31, 2020 (Unaudited)
Portfolio Manager's Commentary
For the year ended December 31, 2020, the Baird Small/Mid Growth Fund Institutional Class posted a total return of 44.57% as compared to 40.47% for the Russell 2500® Growth Index, the Fund’s benchmark index.
The ability of equity markets to perform so well in 2020 amid a global pandemic and a near full stop of the economy was rather remarkable, but scientific ingenuity applied to vaccine development and significant central bank and government stimulus helped offset the devastating impacts of the virus. The Fund’s positioning entering the year rested on an expectation for continued economic growth. Importantly, our underlying philosophy of investing in a mix of diversified, high-quality growth businesses helped the Fund navigate the significant market decline as the pandemic unfolded in March, as well as the sharp market rebound that followed. The Fund produced a second consecutive year of returns in excess of 35%, exceeding the benchmark return both years.
The Fund’s consumer discretionary holdings played a key role in driving relative outperformance. Despite the pandemic’s significant toll on employment, substantial monetary and fiscal stimulus created enough of a bridge to carry market expectations beyond the worst of the pandemic’s economic impact. The positive wealth effect from a strong equity market and rising home prices and increased levels of consumer savings helped support consumer confidence and spending. Typically, to achieve very strong relative performance in this sector, it takes good stock picking in several areas, and this was the case in 2020 as the Fund holdings we selected in diversified retail, e-commerce, home-related spending, and home building, industries performed well. The Fund’s overweight positioning in the sector relative to the benchmark, based on the favorable fundamentals described above, also contributed to performance.
The healthcare sector produced the second strongest relative returns for the Fund in calendar 2020. This was due to better than benchmark returns from businesses that either benefited from the coronavirus (COVID-19) crisis response, or were able to grow sales and earnings in spite of the crisis. Examples include medical technology companies with novel products, vaccine manufacturing or diagnostic testing companies, or companies that provide life-saving products to treat cancer or diabetes. Furthermore, a few select Fund holdings that were adversely affected due to COVID-19, did better than benchmark returns as the market seemed to assign increased valuations to them based on future years earnings from a more “normal” economic environment.
Based on new Russell benchmark industry definitions in 2020, the financial sector weight was reduced to less than 5%. The Fund’s relative returns were better than the benchmark due to two holdings in the portfolio, one focused on insurance sold to small businesses and the other an electronic trading platform for fixed income securities. The Fund’s lone regional bank holding was a negative contributor to annual relative performance.
Similar to financials, the Fund holds only two telecommunications stocks, including a re-classified consumer company the Fund has owned since inception. This small industry was also a positive contributor to relative performance for the year.
The Fund’s returns from investments in the producer durables and materials sectors exceeded benchmark performance. It is worth grouping these two sectors together given that the prospects of many companies in both tend to be heavily influenced by changes in the economic cycle. As a result, economic weakness in the first half of the year challenged the stock performance of many companies in these sectors but returns broadly improved in the second half. The standout performer for the Fund in the materials sector was a company that produces composite decking primarily for residential homes. The overall housing market was strong in 2020 and Fund holdings in companies along the home spending chain, including repair and remodel, benefitted. Other industrial companies that benefited the portfolio included auto suppliers, HVAC distributors, and a leading manufacturer of back-up generators and storage technologies for solar energy. The Fund also held a few services businesses and their generally more stable revenue streams held up well amid the market volatility during the year.
Baird Small/Mid Cap Growth Fund
December 31, 2020 (Unaudited)
As a partial offset to the strength in preceding sectors, the Fund’s technology holdings trailed benchmark performance. Returns were quite strong throughout the sector, particularly in the large software and services group, leaving little room for stock-selection error. In some respects, the performance headwind was a matter of style over substance. The technology sector includes an increasing number of high revenue growth, but unprofitable companies. We view sustainable revenue growth and the ability to generate a profit as important measures of quality. As a result, profitability is a fundamental characteristic that we generally require when selecting investments for the Fund, although a small amount of Fund assets can be invested in unprofitable businesses. Unprofitable companies as a group produced stronger stock price returns in 2020 compared to profitable companies, and the performance differential between unprofitable and profitable business was particularly acute in the technology sector. So, although the Fund benefited from a few unprofitable holdings, that was not enough to keep up with strong benchmark returns.
The Fund held only one stock in total between the energy and consumer staples sectors. The consumer staples sector typically behaves in a more defensive manner; however, the Fund’s holding of a specialty potato producer underperformed both in the market decline and subsequent recovery as pandemic restrictions caused many restaurant closures, a key end market for the company. The energy industry group in the Fund’s benchmark is majority-weighted to clean or alternative energy businesses, and having no holdings in this group was a detractor to the Fund’s relative performance for the year.
While the Fund’s cash position is not used tactically, in such a strong market advance even the modest amount held by the Fund to accommodate additions to individual holdings or new investment ideas created a drag on relative performance.
Signs of an increased appetite for risk among market participants appeared later in the year evidenced by significant equity market strength and an uptick in mergers & acquisitions, not to mention sharp price appreciation in other corners of the market like Bitcoin and IPOs. The Fed continues to signal a desire for an accommodative monetary position to support the economy and lift inflation. We are encouraged by the prospects for the economy to recover further in 2021 but are on guard for excesses that might emerge from the significant push of money into the economic system.
The long-standing investment process underlying the Fund remains focused on identifying high-quality companies that deliver attractive returns and above average growth relative to peers. Seeking to control risk at the sector and position level is also a priority of our process, with the goal of providing lower volatility of returns for the Fund compared to its benchmark index.
Portfolio Manager:
Jonathan Good
Baird Small/Mid Cap Growth Fund
December 31, 2020 (Unaudited)
Portfolio Characteristics
A December 31, 2020 summary of the Fund’s top 10 holdings and equity sector analysis compared to the Russell 2500® Growth Index is shown below.
Top 10 Holdings(1) | | | Equity Sector Analysis(2) |
| | | | |
| Five Below, Inc. | 3.1% | | 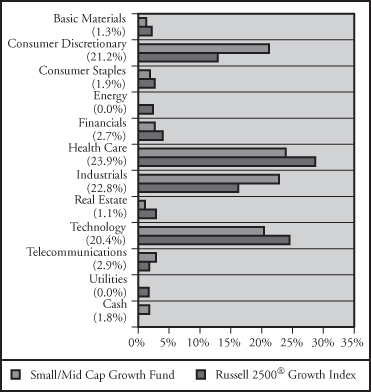 |
| Generac Holdings, Inc. | 2.7% | |
| SiteOne Landscape Supply, Inc. | 2.7% | |
| Pool Corp. | 2.6% | |
| Monolithic Power Systems, Inc. | 2.5% | |
| Burlington Stores, Inc. | 2.4% | |
| Euronet Worldwide, Inc. | 2.4% | |
| LHC Group, Inc. | 2.3% | |
| Insulet Corp. | 2.3% | |
| Repligen Corp. | 2.2% | |
| | | |
| Net Assets: | $51,814,671 | |
| Portfolio Turnover Rate: | 65% | |
| Number of Equity Holdings: | 60 | |
| | | |
Annualized Portfolio Expense Ratio(3): | | |
Gross | | |
| Institutional Class: | 2.10% | |
| Investor Class: | 2.35% | (4) |
| | | |
Net | | |
| Institutional Class: | 0.85% | |
| Investor Class: | 1.10% | (4) |
| | | | |
| (1) | The Fund’s portfolio composition is subject to change and there is no assurance that the Fund will continue to hold any particular security. Percentages shown relate to the Fund’s total net assets as of December 31, 2020. |
| (2) | Percentages shown in parentheses relate to the Fund’s total value of investments as of December 31, 2020, and may not add up to 100% due to rounding. |
| (3) | Reflects expense ratios as stated in the Fund’s current prospectus. The Advisor has contractually agreed to limit the Fund’s total annual fund operating expenses to 0.85% of average daily net assets for the Institutional Class shares and 1.10% of average daily net assets for the Investor Class shares, at least through April 30, 2022. |
| (4) | Includes 0.25% 12b-1 fee. |
Baird Small/Mid Cap Growth Fund
December 31, 2020 (Unaudited)
Institutional ClassValue of a $25,000 Investment
Growth of a hypothetical investment of $25,000 made on the Fund’s inception date (10/31/18), assuming reinvestment of all distributions.
Investor Class
Value of a $10,000 Investment
Growth of a hypothetical investment of $10,000 made on the Fund’s inception date (10/31/18), assuming reinvestment of all distributions.
Baird Small/Mid Cap Growth Fund
December 31, 2020 (Unaudited)
Total Returns
| | | Average |
| | | Annual |
| | One | Since |
| For the Periods Ended December 31, 2020 | Year | Inception(1) |
| Institutional Class Shares | 44.57% | 30.23% |
| Investor Class Shares | 43.89% | 29.75% |
Russell 2500® Growth Index(2) | 40.47% | 27.48% |
| (1) | For the period from October 31, 2018 (inception date) through December 31, 2020. |
| (2) | The Russell 2500® Growth Index measures the performance of the Small-to-Mid Cap Growth segment of the U.S. equity universe. It includes those Russell 2500® Index companies with higher price-to-book ratios and higher forecasted growth values. This index does not reflect any deduction for fees, expenses or taxes. A direct investment in the index is not possible. |
The line graphs on the previous page and the returns shown in the table above reflect reinvestment of dividends and/or capital gains distributions in additional shares. The returns in the graphs and table do not reflect the deduction of taxes that a shareholder would pay on Fund distributions or the redemption of Fund shares. The returns reflect the actual performance for each period and do not include the impact of trades executed on the last business day of the period that were recorded on the first business day of the next period.
The gross expense ratio for each Class, as reflected in the Fund’s current prospectus, is set forth under “Portfolio Characteristics”.
The Fund focuses on growth-style stocks and therefore the performance of the Fund will typically be more volatile than the performance of funds that focus on types of stocks that have a broader investment style. The Fund may invest up to 15% of its total assets in U.S. dollar denominated foreign securities and ADRs. Foreign investments involve additional risks such as currency rate fluctuations, political and economic instability, and different and sometimes less strict financial reporting standards and regulation. The Fund invests a substantial portion of its assets in the stocks of small- and mid-capitalization companies. Small- and mid-capitalization companies often are more volatile and face greater risks than larger, more established companies. U.S. and international markets have experienced significant periods of volatility in recent years and months due to a number of economic, political and global macro factors including the impact of the coronavirus (COVID-19) as a global pandemic and related public health issues, growth concerns in the U.S. and overseas, uncertainties regarding interest rates, trade tensions and the threat of tariffs imposed by the U.S. and other countries. These and other geopolitical events may cause market disruptions and could have an adverse effect on the value of the Fund’s investments.
Past performance does not guarantee future results. Investment return and principal value will fluctuate so that an investor’s shares, when redeemed, may be worth more or less than their original cost.
For information about the performance of the Fund as of the most recent month-end, please call 1-866-44BAIRD or visit www.bairdfunds.com. Mutual fund performance changes over time and current performance may be lower or higher than that stated.
Baird Small/Mid Cap Growth Fund
Schedule of Investments, December 31, 2020
Common Stocks
| | | | | | | | | % of | |
| | | Shares | | | Value | | | Net Assets | |
| Aerospace & Defense | | | | | | | | | |
| HEICO Corp. | | | 7,172 | | | $ | 949,573 | | | | 1.8 | % |
| Banks | | | | | | | | | | | | |
| Western Alliance Bancorp | | | 8,825 | | | | 529,059 | | | | 1.0 | % |
| Biotechnology | | | | | | | | | | | | |
Halozyme Therapeutics, Inc.(1) | | | 20,725 | | | | 885,165 | | | | 1.7 | % |
| Building Products | | | | | | | | | | | | |
| Lennox International, Inc. | | | 1,666 | | | | 456,434 | | | | 0.9 | % |
Trex Co, Inc.(1) | | | 10,696 | | | | 895,469 | | | | 1.7 | % |
| | | | | | | | 1,351,903 | | | | 2.6 | % |
| Commercial Services & Supplies | | | | | | | | | | | | |
IAA, Inc.(1) | | | 15,984 | | | | 1,038,640 | | | | 2.0 | % |
| Construction & Engineering | | | | | | | | | | | | |
MasTec, Inc.(1) | | | 16,452 | | | | 1,121,697 | | | | 2.2 | % |
WillScot Mobile Mini Holdings Corp.(1) | | | 22,255 | | | | 515,648 | | | | 1.0 | % |
| | | | | | | | 1,637,345 | | | | 3.2 | % |
| Containers & Packaging | | | | | | | | | | | | |
| AptarGroup, Inc. | | | 6,842 | | | | 936,601 | | | | 1.8 | % |
| Distributors | | | | | | | | | | | | |
| Pool Corp. | | | 3,675 | | | | 1,368,938 | | | | 2.6 | % |
| Diversified Telecommunication Services | | | | | | | | | | | | |
Bandwidth, Inc.(1) | | | 3,111 | | | | 478,067 | | | | 0.9 | % |
| Electrical Equipment | | | | | | | | | | | | |
Generac Holdings, Inc.(1) | | | 6,216 | | | | 1,413,581 | | | | 2.7 | % |
| Electronic Equipment, Instruments & Components | | | | | | | | | | | | |
| Littelfuse, Inc. | | | 3,521 | | | | 896,658 | | | | 1.7 | % |
| Equity Real Estate Investment Trusts (REITs) | | | | | | | | | | | | |
| National Storage Affiliates Trust | | | 15,554 | | | | 560,411 | | | | 1.1 | % |
| Food Products | | | | | | | | | | | | |
| Lamb Weston Holdings, Inc. | | | 12,783 | | | | 1,006,533 | | | | 1.9 | % |
| Health Care Equipment & Supplies | | | | | | | | | | | | |
Insulet Corp.(1) | | | 4,613 | | | | 1,179,220 | | | | 2.3 | % |
Masimo Corp.(1) | | | 3,000 | | | | 805,140 | | | | 1.6 | % |
Novocure Ltd.(1)(2) | | | 5,920 | | | | 1,024,396 | | | | 2.0 | % |
QUIDEL Corp.(1) | | | 2,938 | | | | 527,812 | | | | 1.0 | % |
Shockwave Medical, Inc.(1) | | | 6,193 | | | | 642,338 | | | | 1.2 | % |
STAAR Surgical Co.(1) | | | 8,225 | | | | 651,585 | | | | 1.3 | % |
| | | | | | | | 4,830,491 | | | | 9.4 | % |
| Health Care Providers & Services | | | | | | | | | | | | |
LHC Group, Inc.(1) | | | 5,575 | | | | 1,189,259 | | | | 2.3 | % |
The accompanying notes are an integral part of these financial statements.
Baird Small/Mid Cap Growth Fund
Schedule of Investments, December 31, 2020
Common Stocks (cont.)
| | | | | | | | | % of | |
| | | Shares | | | Value | | | Net Assets | |
| Health Care Technology | | | | | | | | | |
Inspire Medical Systems, Inc.(1) | | | 5,023 | | | $ | 944,777 | | | | 1.8 | % |
Phreesia, Inc.(1) | | | 13,521 | | | | 733,649 | | | | 1.4 | % |
Vocera Communications, Inc.(1) | | | 9,800 | | | | 406,994 | | | | 0.8 | % |
| | | | | | | | 2,085,420 | | | | 4.0 | % |
| Household Durables | | | | | | | | | | | | |
LGI Homes, Inc.(1) | | | 3,468 | | | | 367,088 | | | | 0.7 | % |
| Insurance | | | | | | | | | | | | |
| Kinsale Capital Group, Inc. | | | 4,207 | | | | 841,947 | | | | 1.6 | % |
| Internet & Direct Marketing Retail | | | | | | | | | | | | |
Etsy, Inc.(1) | | | 5,727 | | | | 1,018,891 | | | | 2.0 | % |
| IT Services | | | | | | | | | | | | |
Endava PLC – ADR(1)(2) | | | 6,895 | | | | 529,191 | | | | 1.0 | % |
Euronet Worldwide, Inc.(1) | | | 8,209 | | | | 1,189,648 | | | | 2.4 | % |
Globant SA(1)(2) | | | 3,334 | | | | 725,512 | | | | 1.4 | % |
| Jack Henry & Associates, Inc. | | | 4,430 | | | | 717,616 | | | | 1.4 | % |
| | | | | | | | 3,161,967 | | | | 6.2 | % |
| Life Sciences Tools & Services | | | | | | | | | | | | |
ICON PLC(1)(2) | | | 4,822 | | | | 940,194 | | | | 1.8 | % |
Repligen Corp.(1) | | | 5,950 | | | | 1,140,198 | | | | 2.2 | % |
| | | | | | | | 2,080,392 | | | | 4.0 | % |
| Machinery | | | | | | | | | | | | |
RBC Bearings, Inc.(1) | | | 3,652 | | | | 653,854 | | | | 1.3 | % |
| Toro Co. | | | 8,402 | | | | 796,846 | | | | 1.5 | % |
| | | | | | | | 1,450,700 | | | | 2.8 | % |
| Media | | | | | | | | | | | | |
| Cable One, Inc. | | | 496 | | | | 1,104,949 | | | | 2.1 | % |
| Multiline Retail | | | | | | | | | | | | |
Ollie’s Bargain Outlet Holdings, Inc.(1) | | | 4,793 | | | | 391,924 | | | | 0.8 | % |
| Pharmaceuticals | | | | | | | | | | | | |
Catalent, Inc.(1) | | | 9,518 | | | | 990,539 | | | | 1.9 | % |
Jazz Pharmaceuticals PLC(1)(2) | | | 4,168 | | | | 687,928 | | | | 1.3 | % |
| | | | | | | | 1,678,467 | | | | 3.2 | % |
| Road & Rail | | | | | | | | | | | | |
| Schneider National, Inc. | | | 19,228 | | | | 398,020 | | | | 0.8 | % |
| Semiconductors & Semiconductor Equipment | | | | | | | | | | | | |
| Monolithic Power Systems, Inc. | | | 3,499 | | | | 1,281,439 | | | | 2.5 | % |
| Software | | | | | | | | | | | | |
Aspen Technology, Inc.(1) | | | 7,337 | | | | 955,644 | | | | 1.8 | % |
Avalara, Inc.(1) | | | 5,023 | | | | 828,242 | | | | 1.6 | % |
Descartes Systems Group, Inc.(1)(2) | | | 10,495 | | | | 613,748 | | | | 1.2 | % |
Paylocity Holding Corp.(1) | | | 5,331 | | | | 1,097,707 | | | | 2.2 | % |
The accompanying notes are an integral part of these financial statements.
Baird Small/Mid Cap Growth Fund
Schedule of Investments, December 31, 2020
Common Stocks (cont.)
| | | | | | | | | % of | |
| | | Shares | | | Value | | | Net Assets | |
| Software (cont.) | | | | | | | | | |
PTC, Inc.(1) | | | 7,671 | | | $ | 917,528 | | | | 1.8 | % |
Q2 Holdings, Inc.(1) | | | 6,730 | | | | 851,547 | | | | 1.6 | % |
Qualys, Inc.(1) | | | 5,568 | | | | 678,572 | | | | 1.3 | % |
Tyler Technologies, Inc.(1) | | | 2,403 | | | | 1,048,958 | | | | 2.0 | % |
Upland Software, Inc.(1) | | | 15,393 | | | | 706,385 | | | | 1.4 | % |
Zendesk, Inc.(1) | | | 6,469 | | | | 925,843 | | | | 1.8 | % |
| | | | | | | | 8,624,174 | | | | 16.7 | % |
| Specialty Retail | | | | | | | | | | | | |
Burlington Stores, Inc.(1) | | | 4,726 | | | | 1,236,085 | | | | 2.4 | % |
Five Below, Inc.(1) | | | 9,143 | | | | 1,599,841 | | | | 3.1 | % |
Floor & Decor Holdings, Inc.(1) | | | 7,460 | | | | 692,661 | | | | 1.3 | % |
| | | | | | | | 3,528,587 | | | | 6.8 | % |
| Textiles, Apparel & Luxury Goods | | | | | | | | | | | | |
Crocs, Inc.(1) | | | 17,427 | | | | 1,091,976 | | | | 2.2 | % |
Under Armour, Inc.(1) | | | 43,740 | | | | 751,016 | | | | 1.4 | % |
| | | | | | | | 1,842,992 | | | | 3.6 | % |
| Trading Companies & Distributors | | | | | | | | | | | | |
SiteOne Landscape Supply, Inc.(1) | | | 8,788 | | | | 1,394,040 | | | | 2.7 | % |
| Watsco, Inc. | | | 1,853 | | | | 419,797 | | | | 0.8 | % |
| | | | | | | | 1,813,837 | | | | 3.5 | % |
| Total Common Stocks | | | | | | | | | | | | |
| (Cost $36,643,897) | | | | | | | 50,743,018 | | | | 98.0 | % |
| Short-Term Investment | | | | | | | | | | | | |
| Money Market Mutual Fund | | | | | | | | | | | | |
| First American Government | | | | | | | | | | | | |
Obligations Fund, Class U, 0.04%(3) | | | 2,197,659 | | | | 2,197,659 | | | | 4.2 | % |
| Total Short-Term Investment | | | | | | | | | | | | |
| (Cost $2,197,659) | | | | | | | 2,197,659 | | | | 4.2 | % |
| Total Investments | | | | | | | | | | | | |
| (Cost $38,841,556) | | | | | | | 52,940,677 | | | | 102.2 | % |
| Liabilities in Excess of Other Assets | | | | | | | (1,126,006 | ) | | | (2.2 | )% |
| TOTAL NET ASSETS | | | | | | $ | 51,814,671 | | | | 100.0 | % |
Notes to Schedule of Investments
| (1) | Non-Income Producing. |
| (2) | Foreign Security. |
| (3) | Seven-Day Yield. |
ADR – American Depository Receipt
Industry classifications shown in the Schedule of Investments are based off of the Global Industry Classification Standard (GICS®). GICS® was developed by and/or is the exclusive property of MSCI, Inc. (“MSCI”) and Standard & Poor’s Financial Services LLC (“S&P”). GICS® is a service mark of MSCI and S&P and has been licensed for use by U.S. Bancorp Fund Services, LLC.
The accompanying notes are an integral part of these financial statements.
Baird Small/Mid Cap Growth Fund
Summary of Fair Value Exposure at December 31, 2020
The Fund has adopted authoritative fair valuation accounting standards which establish a definition of fair value and set out a hierarchy for measuring fair value. These standards require additional disclosures about the various inputs and valuation techniques used to develop the measurements of fair value and a discussion on changes in valuation techniques and related inputs during the period. These standards define fair value as the price that would be received to sell an asset or paid to transfer a liability in an orderly transaction between market participants at the measurement date.
The fair value hierarchy is organized into three levels based upon the assumptions (referred to as “inputs”) used in pricing the asset or liability. These standards state that “observable inputs” reflect the assumptions market participants would use in pricing the asset or liability based on market data obtained from independent sources and “unobservable inputs” reflect an entity’s own assumptions about the assumptions market participants would use in pricing the asset or liability. These inputs are summarized into three broad levels and described below:
| Level 1 – | Quoted prices (unadjusted) in active markets for identical assets or liabilities that the reporting entity can access at the measurement date. |
| Level 2 – | Inputs other than quoted prices included within Level 1 that are observable for the asset or liability, either directly or indirectly. |
| Level 3 – | Unobservable inputs for the asset or liability. |
The inputs or methodology used for valuing securities are not necessarily an indication of the risk associated with investing in those securities.
The following is a summary of the inputs used to value the Fund’s investments as of December 31, 2020:
| | | Level 1 | | | Level 2 | | | Level 3 | | | Total | |
| Equity | | | | | | | | | | | | |
| Common Stocks | | $ | 50,743,018 | | | $ | — | | | $ | — | | | $ | 50,743,018 | |
| Total Equity | | | 50,743,018 | | | | — | | | | — | | | | 50,743,018 | |
| Short-Term Investment | | | | | | | | | | | | | | | | |
| Money Market Mutual Fund | | | 2,197,659 | | | | — | | | | — | | | | 2,197,659 | |
| Total Short-Term Investment | | | 2,197,659 | | | | — | | | | — | | | | 2,197,659 | |
| Total Investments* | | $ | 52,940,677 | | | $ | — | | | $ | — | | | $ | 52,940,677 | |
| * | Additional information regarding the industry classifications of these investments is disclosed in the Schedule of Investments. |
Changes in valuation techniques may result in transfers into or out of assigned levels within the fair value hierarchy. There were no transfers into or out of Level 3 during the reporting period, as compared to the security classifications from the prior year’s annual report. See Fund’s Valuation Policy in Note 2a to the financial statements.
The accompanying notes are an integral part of these financial statements.
Baird Small/Mid Cap Value Fund
December 31, 2020 (Unaudited)
Portfolio Manager’s Commentary
2020 equity returns were fueled primarily by investors’ expansion in price-to-earnings valuations as earnings for many companies collapsed under the weight of the global coronavirus (COVID-19) pandemic. As we look to 2021, it is likely those elevated price-to-earnings valuations will unwind as company earnings recover. Under such a scenario, we believe companies with strong profitability and earnings momentum will outperform the broader market.
Historically, deep value/low quality stocks fall the hardest during market declines and lead equities out of bear markets. Their outsized returns tend to be strong and swift, but their returns also tend to be quickly exhausted and yield to the returns of the broader market as the overall market recovery plays out. Therefore, we believe deep value stocks are unlikely to continue their recent winning ways as we have already been through a period of expanding price-to-earnings ratios along with low quality and beta outperformance during the most recent market downturn and subsequent recovery.
As we reflect upon performance for the calendar year 2020, we observe that the Fund performed consistent with our investment discipline. Our focus on high-quality businesses rewarded the Fund as expected during the first quarter of 2020, providing strong downside protection as markets plummeted and powering the Fund’s outperformance of its benchmark for the quarter. We lived off this alpha outperformance for much of the ricochet rebound during the next 8 months as deep value/low quality stocks led with the strongest returns out of the bear market. Similar to past market cycles, the recovery of high-quality stocks that provide strong protection on the downside, seem to be proceeding at a more measured pace. The next market phase, if we are correct, will likely favor the protracted outperformance of high-quality value stocks through the remainder of the economic cycle, which should benefit the Fund.
Portfolio Highlights
For the year ended December 31, 2020, the Baird Small/Mid Value Fund Institutional Class posted a total return of 0.48% as compared to 4.88% return for the Russell 2500® Value Index (“Russell 2500 Value”), the Fund’s benchmark.
Significant contributors to the Fund’s relative and absolute performance for the year include the following:
| • | The single largest detractor to the Fund’s relative underperformance versus the Russell 2500 Value was its position in Consumer Discretionary stocks. The Fund’s underweight to industries such as restaurants and retailers held back gains as many stocks in those areas performed ahead of our expectations despite a murky outlook for profitability as the COVID-19 pandemic worsened throughout the year. In addition, ZAGG declined on lower demand for its mobile phone power management products, and the Fund sold the stock. |
| | |
| • | Cerence, a provider of cognitive assistant solutions to the auto industry, skyrocketed 344% during the year as the company solidified its dominant market position with multiple contract wins throughout the year. |
| | |
| • | ARKO, a new position in the Fund, drifted lower after purchase and was a meaningful detractor for the year. Despite closing two attractive acquisitions in the convenience store space, the stock ended the year down 14%, likely due to a lack of Wall Street coverage. We took the opportunity to add to the Fund’s position. |
| | |
| • | The Fund’s Real Estate Investment Trust (REIT) exposure meaningfully outperformed the benchmark sector performance due to superior security selection. Standout gains were posted by CyrusOne, a data center operator, and a hotel REIT, RLJ Lodging Trust, which was purchased on the heels of positive efficacy news for COVID-19 vaccines. |
| | |
| • | The Fund’s Utility holdings gained more than 35% for the year, versus a decline for that sector in the Fund’s benchmark, the Russell 2500 Value. Our focus on renewable energy suppliers, Atlantica Yield and Algonquin Power, led to strong absolute and relative returns. |
| | |
| • | Despite gaining 22% for the year, the Fund’s Healthcare position trailed the corresponding benchmark sector performance largely due to underperformance of Hill-Rom Holdings as hospital capital spending suffered due to the pandemic. |
Baird Small/Mid Cap Value Fund
December 31, 2020 (Unaudited)
| • | The Fund’s intentional underweight to the Energy sector boosted performance as it was the worst performing sector in the Russell 2500 Value, down 40%. |
| | |
| • | Mixed performance among the Fund’s Industrial holdings held back absolute gains. E-Commerce logistics providers, Shyft Group and Air Transport Services were winners while FTI Consulting and Astronics were detractors. |
| | |
| • | The Fund’s overweight to Information Technology and superior security selection contributed positively to performance. The largest sector by weight in the Fund’s portfolio returned 34% during the year. Notable winners include Immersion Technology and SkyWorks Solutions. |
Portfolio Manager:
Michelle Stevens, CFA
Baird Small/Mid Cap Value Fund
December 31, 2020 (Unaudited)
Portfolio Characteristics
A December 31, 2020 summary of the Fund’s top 10 holdings and equity sector analysis compared to the Russell 2500® Value Index is shown below.
Top 10 Holdings(1) | | | Equity Sector Analysis(2) |
| | | | |
| Atlantica Yield PLC | 3.7% | | 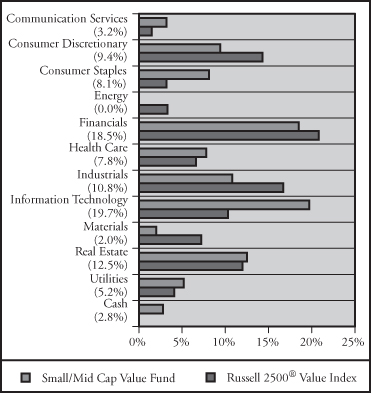
|
| Axos Financial, Inc. | 3.2% | |
| Arko Corp. | 3.2% | |
| Boingo Wireless, Inc. | 3.2% | |
| Laboratory Corp. of America Holdings | 3.1% | |
| DaVita, Inc. | 3.0% | |
| j2 Global, Inc. | 2.9% | |
| Urban Outfitters, Inc. | 2.7% | |
| Science Applications International Corp. | 2.7% | |
| Air Transport Services Group, Inc. | 2.6% | |
| | | |
| Net Assets: | $23,109,266 | |
| Portfolio Turnover Rate: | 84% | |
| Number of Equity Holdings: | 45 | |
| | | |
Annualized Portfolio Expense Ratio(3): | | |
Gross | | |
| Institutional Class: | 1.59% | |
| Investor Class: | 1.84% | (4) |
| | | |
Net | | |
| Institutional Class: | 0.85% | |
| Investor Class: | 1.10% | (4) |
| | | | |
| (1) | The Fund’s portfolio composition is subject to change and there is no assurance that the Fund will continue to hold any particular security. Percentages shown relate to the Fund’s total net assets as of December 31, 2020. |
| (2) | Percentages shown in parentheses relate to the Fund’s total value of investments as of December 31, 2020, and may not add up to 100% due to rounding. |
| (3) | Reflects expense ratios as stated in the Fund’s current prospectus. The Advisor has contractually agreed to limit the Fund’s total annual fund operating expenses to 0.85% of average daily net assets for the Institutional Class shares and 1.10% of average daily net assets for the Investor Class shares, at least through April 30, 2022. |
| (4) | Includes 0.25% 12b-1 fee. |
Baird Small/Mid Cap Value Fund
December 31, 2020 (Unaudited)
Institutional ClassValue of a $25,000 Investment
Growth of a hypothetical investment of $25,000 made on the Fund’s inception date (11/30/15), assuming reinvestment of all distributions.
Investor Class
Value of a $10,000 Investment
Growth of a hypothetical investment of $10,000 made on the Fund’s inception date (11/30/15), assuming reinvestment of all distributions.
Baird Small/Mid Cap Value Fund
December 31, 2020 (Unaudited)
Total Returns
| | | Average Annual |
| | | | | Since |
| For the Periods Ended December 31, 2020 | One Year | Three Years | Five Years | Inception(1) |
| Institutional Class Shares | 0.48% | 0.28% | 5.94% | 4.85% |
| Investor Class Shares | 0.15% | 0.01% | 5.64% | 4.56% |
Russell 2500® Value Index(2) | 4.88% | 4.34% | 9.43% | 8.26% |
| (1) | For the period from November 30, 2015 (inception date) through December 31, 2020. |
| (2) | The Russell 2500® Value Index measures the performance of the small cap value segment of the U.S. equity universe. It includes those Russell 2500® Index companies with lower price-to-book ratios and lower forecasted growth values. This index does not reflect any deduction for fees, expenses or taxes. A direct investment in the index is not possible. |
The line graphs on the previous page and the returns shown in the table above reflect reinvestment of dividends and/or capital gains distributions in additional shares. The returns in the graphs and table do not reflect the deduction of taxes that a shareholder would pay on Fund distributions or the redemption of Fund shares. The returns reflect the actual performance for each period and do not include the impact of trades executed on the last business day of the period that were recorded on the first business day of the next period.
The gross expense ratio for each Class, as reflected in the Fund’s current prospectus, is set forth under “Portfolio Characteristics”.
The Fund focuses on small to mid cap value style stocks and therefore the performance of the Fund may be more volatile than the performance of funds that focus on types of stocks that have a broader investment style. The Fund may invest up to 15% of its total assets in U.S. dollar denominated foreign securities and ADRs. Foreign investments involve additional risks such as currency rate fluctuations and the potential for political and economic instability, and different and sometimes less strict financial reporting standards and regulation. The Fund invests a substantial portion of its assets in the stocks of small- and mid-capitalization companies. Small- and mid-capitalization companies often are more volatile and face greater risks than larger, more established companies. U.S. and international markets have experienced significant periods of volatility in recent years and months due to a number of economic, political and global macro factors including the impact of the coronavirus (COVID-19) as a global pandemic and related public health issues, growth concerns in the U.S. and overseas, uncertainties regarding interest rates, trade tensions and the threat of tariffs imposed by the U.S. and other countries. These and other geopolitical events may cause market disruptions and could have an adverse effect on the value of the Fund’s investments.
Past performance does not guarantee future results. Investment return and principal value will fluctuate so that an investor’s shares, when redeemed, may be worth more or less than their original cost.
For information about the performance of the Fund as of the most recent month-end, please call 1-866-44BAIRD or visit www.bairdfunds.com. Mutual fund performance changes over time and current performance may be lower or higher than that stated.
Baird Small/Mid Cap Value Fund
Schedule of Investments, December 31, 2020
Common Stocks
| | | | | | | | | % of | |
| | | Shares | | | Value | | | Net Assets | |
| Air Freight & Logistics | | | | | | | | | |
Air Transport Services Group, Inc.(1) | | | 19,403 | | | $ | 608,090 | | | | 2.6 | % |
| Banks | | | | | | | | | | | | |
| TCF Financial Corp. | | | 9,190 | | | | 340,214 | | | | 1.5 | % |
| Chemicals | | | | | | | | | | | | |
| Avient Corp. | | | 11,235 | | | | 452,546 | | | | 2.0 | % |
| Commercial Services & Supplies | | | | | | | | | | | | |
| ACCO Brands Corp. | | | 51,679 | | | | 436,688 | | | | 1.9 | % |
| Communications Equipment | | | | | | | | | | | | |
Ciena Corp.(1) | | | 6,954 | | | | 367,519 | | | | 1.6 | % |
F5 Networks, Inc.(1) | | | 3,018 | | | | 530,987 | | | | 2.3 | % |
| | | | | | | | 898,506 | | | | 3.9 | % |
| Diversified Consumer Services | | | | | | | | | | | | |
OneSpaWorld Holdings Ltd.(2) | | | 44,122 | | | | 447,397 | | | | 1.9 | % |
| Electrical Equipment | | | | | | | | | | | | |
nVent Electric PLC(2) | | | 15,397 | | | | 358,596 | | | | 1.6 | % |
| Equity Real Estate Investment Trusts (REITs) | | | | | | | | | | | | |
| Agree Realty Corp. | | | 7,489 | | | | 498,618 | | | | 2.2 | % |
| CyrusOne, Inc. | | | 5,729 | | | | 419,076 | | | | 1.8 | % |
| EastGroup Properties, Inc. | | | 2,571 | | | | 354,952 | | | | 1.5 | % |
| Gaming and Leisure Properties, Inc. | | | 8,022 | | | | 340,124 | | | | 1.5 | % |
| Host Hotels & Resorts, Inc. | | | 33,502 | | | | 490,135 | | | | 2.1 | % |
| National Retail Properties, Inc. | | | 8,576 | | | | 350,930 | | | | 1.5 | % |
| RLJ Lodging Trust | | | 31,362 | | | | 443,772 | | | | 1.9 | % |
| | | | | | | | 2,897,607 | | | | 12.5 | % |
| Food Products | | | | | | | | | | | | |
Nomad Foods Ltd.(1)(2) | | | 21,426 | | | | 544,649 | | | | 2.4 | % |
Simply Good Foods Co.(1) | | | 18,513 | | | | 580,568 | | | | 2.5 | % |
| | | | | | | | 1,125,217 | | | | 4.9 | % |
| Health Care Equipment & Supplies | | | | | | | | | | | | |
ICU Medical, Inc.(1) | | | 1,851 | | | | 397,021 | | | | 1.7 | % |
| Health Care Providers & Services | | | | | | | | | | | | |
DaVita, Inc.(1) | | | 5,916 | | | | 694,538 | | | | 3.0 | % |
Laboratory Corp. of America Holdings(1) | | | 3,482 | | | | 708,761 | | | | 3.1 | % |
| | | | | | | | 1,403,299 | | | | 6.1 | % |
| Household Durables | | | | | | | | | | | | |
Helen of Troy Ltd.(1)(2) | | | 1,279 | | | | 284,181 | | | | 1.2 | % |
| Independent Power and Renewable Electricity Producers | | | | | | | | | | | | |
Atlantica Yield PLC(2) | | | 22,316 | | | | 847,562 | | | | 3.7 | % |
The accompanying notes are an integral part of these financial statements.
Baird Small/Mid Cap Value Fund
Schedule of Investments, December 31, 2020
Common Stocks (cont.)
| | | | | | | | | % of | |
| | | Shares | | | Value | | | Net Assets | |
| Insurance | | | | | | | | | |
| American Financial Group, Inc. | | | 6,619 | | | $ | 579,956 | | | | 2.5 | % |
| Fidelity National Financial, Inc. | | | 14,590 | | | | 570,323 | | | | 2.5 | % |
| Old Republic International Corp. | | | 27,543 | | | | 542,873 | | | | 2.3 | % |
| | | | | | | | 1,693,152 | | | | 7.3 | % |
| IT Services | | | | | | | | | | | | |
CACI International, Inc.(1) | | | 1,803 | | | | 449,542 | | | | 1.9 | % |
| Leidos Holdings, Inc. | | | 4,181 | | | | 439,507 | | | | 1.9 | % |
| Science Applications International Corp. | | | 6,519 | | | | 616,958 | | | | 2.7 | % |
| | | | | | | | 1,506,007 | | | | 6.5 | % |
| Machinery | | | | | | | | | | | | |
| Shyft Group, Inc. | | | 21,269 | | | | 603,614 | | | | 2.6 | % |
| Mortgage Real Estate Investment Trusts (REITs) | | | | | | | | | | | | |
| Blackstone Mortgage Trust, Inc. | | | 12,826 | | | | 353,100 | | | | 1.5 | % |
| Multi-Utilities | | | | | | | | | | | | |
Algonquin Power & Utilities Corp.(2) | | | 22,278 | | | | 366,696 | | | | 1.6 | % |
| Road & Rail | | | | | | | | | | | | |
| Knight-Swift Transportation Holdings, Inc. | | | 11,727 | | | | 490,423 | | | | 2.1 | % |
| Semiconductors & Semiconductor Equipment | | | | | | | | | | | | |
Silicon Motion Technology Corp. – ADR(2) | | | 10,520 | | | | 506,538 | | | | 2.2 | % |
| Software | | | | | | | | | | | | |
Cerence, Inc.(1) | | | 3,976 | | | | 399,508 | | | | 1.7 | % |
j2 Global, Inc.(1) | | | 6,730 | | | | 657,454 | | | | 2.9 | % |
| | | | | | | | 1,056,962 | | | | 4.6 | % |
| Specialty Retail | | | | | | | | | | | | |
Arko Corp.(1) | | | 81,987 | | | | 737,884 | | | | 3.3 | % |
| Tractor Supply Co. | | | 3,495 | | | | 491,327 | | | | 2.1 | % |
Urban Outfitters, Inc.(1) | | | 24,684 | | | | 631,910 | | | | 2.7 | % |
| Williams-Sonoma, Inc. | | | 3,005 | | | | 306,029 | | | | 1.3 | % |
| | | | | | | | 2,167,150 | | | | 9.4 | % |
| Technology Hardware, Storage & Peripherals | | | | | | | | | | | | |
Immersion Corp.(1) | | | 52,177 | | | | 589,078 | | | | 2.5 | % |
| Thrifts & Mortgage Finance | | | | | | | | | | | | |
Axos Financial, Inc.(1) | | | 19,695 | | | | 739,152 | | | | 3.2 | % |
Essent Group Ltd.(2) | | | 13,500 | | | | 583,200 | | | | 2.5 | % |
| Merchants Bancorp | | | 20,706 | | | | 572,107 | | | | 2.5 | % |
| | | | | | | | 1,894,459 | | | | 8.2 | % |
The accompanying notes are an integral part of these financial statements.
Baird Small/Mid Cap Value Fund
Schedule of Investments, December 31, 2020
Common Stocks (cont.)
| | | | | | | | | % of | |
| | | Shares | | | Value | | | Net Assets | |
| Wireless Telecommunication Services | | | | | | | | | |
Boingo Wireless, Inc.(1) | | | 57,812 | | | $ | 735,369 | | | | 3.2 | % |
| Total Common Stocks | | | | | | | | | | | | |
| (Cost $17,947,830) | | | | | | | 22,459,472 | | | | 97.2 | % |
| Short-Term Investment | | | | | | | | | | | | |
| Money Market Mutual Fund | | | | | | | | | | | | |
| First American Government | | | | | | | | | | | | |
Obligations Fund, Class U, 0.04%(3) | | | 955,999 | | | | 955,999 | | | | 4.1 | % |
| Total Short-Term Investment | | | | | | | | | | | | |
| (Cost $955,999) | | | | | | | 955,999 | | | | 4.1 | % |
| Total Investments | | | | | | | | | | | | |
| (Cost $18,903,829) | | | | | | | 23,415,471 | | | | 101.3 | % |
| Liabilities in Excess of Other Assets | | | | | | | (306,205 | ) | | | (1.3 | )% |
| TOTAL NET ASSETS | | | | | | $ | 23,109,266 | | | | 100.0 | % |
Notes to Schedule of Investments
| (1) | Non-Income Producing. |
| (2) | Foreign Security. |
| (3) | Seven-Day Yield. |
ADR – American Depository Receipt
Industry classifications shown in the Schedule of Investments are based off of the Global Industry Classification Standard (GICS®). GICS® was developed by and/or is the exclusive property of MSCI, Inc. (“MSCI”) and Standard & Poor’s Financial Services LLC (“S&P”). GICS® is a service mark of MSCI and S&P and has been licensed for use by U.S. Bancorp Fund Services, LLC.
The accompanying notes are an integral part of these financial statements.
Baird Small/Mid Cap Value Fund
Summary of Fair Value Exposure at December 31, 2020
The Fund has adopted authoritative fair valuation accounting standards which establish a definition of fair value and set out a hierarchy for measuring fair value. These standards require additional disclosures about the various inputs and valuation techniques used to develop the measurements of fair value and a discussion on changes in valuation techniques and related inputs during the period. These standards define fair value as the price that would be received to sell an asset or paid to transfer a liability in an orderly transaction between market participants at the measurement date.
The fair value hierarchy is organized into three levels based upon the assumptions (referred to as “inputs”) used in pricing the asset or liability. These standards state that “observable inputs” reflect the assumptions market participants would use in pricing the asset or liability based on market data obtained from independent sources and “unobservable inputs” reflect an entity’s own assumptions about the assumptions market participants would use in pricing the asset or liability. These inputs are summarized into three broad levels and described below:
| Level 1 – | Quoted prices (unadjusted) in active markets for identical assets or liabilities that the reporting entity can access at the measurement date. |
| Level 2 – | Inputs other than quoted prices included within Level 1 that are observable for the asset or liability, either directly or indirectly. |
| Level 3 – | Unobservable inputs for the asset or liability. |
The inputs or methodology used for valuing securities are not necessarily an indication of the risk associated with investing in those securities.
The following is a summary of the inputs used to value the Fund’s investments as of December 31, 2020:
| | | Level 1 | | | Level 2 | | | Level 3 | | | Total | |
| Equity | | | | | | | | | | | | |
| Common Stocks | | $ | 22,459,472 | | | $ | — | | | $ | — | | | $ | 22,459,472 | |
| Total Equity | | | 22,459,472 | | | | — | | | | — | | | | 22,459,472 | |
| Short-Term Investment | | | | | | | | | | | | | | | | |
| Money Market Mutual Fund | | | 955,999 | | | | — | | | | — | | | | 955,999 | |
| Total Short-Term Investment | | | 955,999 | | | | — | | | | — | | | | 955,999 | |
| Total Investments* | | $ | 23,415,471 | | | $ | — | | | $ | — | | | $ | 23,415,471 | |
| * | Additional information regarding the industry classifications of these investments is disclosed in the Schedule of Investments. |
Changes in valuation techniques may result in transfers into or out of assigned levels within the fair value hierarchy. There were no transfers into or out of Level 3 during the reporting period, as compared to the security classifications from the prior year’s annual report. See Fund’s Valuation Policy in Note 2a to the financial statements.
The accompanying notes are an integral part of these financial statements.
Baird SmallCap Value Fund
December 31, 2020 (Unaudited)
Portfolio Manager’s Commentary
2020 equity returns were fueled primarily by investors’ expansion in price-to-earnings valuations as earnings for many companies collapsed under the weight of the global coronavirus (COVID-19) pandemic. As we look to 2021, it is likely those elevated price-to-earnings valuations will unwind as company earnings recover. Under such a scenario, we believe companies with strong profitability and earnings momentum will outperform the broader market.
Historically, deep value/low quality stocks fall the hardest during market declines and lead equities out of bear markets. Their outsized returns tend to be strong and swift, but their returns also tend to be quickly exhausted and yield to the returns of the broader market as the overall market recovery plays out. Therefore, we believe deep value stocks are unlikely to continue their recent winning ways as we have already been through a period of expanding price-to-earnings ratios along with low quality and beta outperformance during the most recent market downturn and subsequent recovery.
As we reflect upon performance for the calendar year 2020, we observe that the Fund performed consistent with our investment discipline. Our focus on high-quality businesses rewarded the Fund as expected during the first quarter of 2020, providing strong downside protection as markets plummeted and powering the Fund’s outperformance of its benchmark for the quarter. We lived off this alpha outperformance for much of the ricochet rebound during the next 8 months as deep value/low quality stocks led with the strongest returns out of the bear market. Similar to past market cycles, the recovery of high-quality stocks that provide strong protection on the downside, seem to be proceeding at a more measured pace. The next market phase, if we are correct, will likely favor the protracted outperformance of high-quality value stocks through the remainder of the economic cycle, which should benefit the Fund.
Portfolio Highlights
For the year ended December 31, 2020, the Baird SmallCap Value Fund Institutional Class posted a total return of 2.85% as compared to 4.63% return for the Russell 2000® Value Index (“Russell 2000 Value”), the Fund’s benchmark.
Significant contributors to the Fund’s relative and absolute performance for the year include the following:
| • | The single largest detractor to the Fund’s relative underperformance versus the Russell 2000 Value was its position in Consumer Discretionary stocks. The Fund’s underweight to industries such as restaurants and retailers held back gains as many stocks in those areas performed ahead of our expectations despite a murky outlook for profitability as the COVID-19 pandemic worsened throughout the year. In addition, ZAGG declined on lower demand for its mobile phone power management products, and the Fund sold the stock. |
| | |
| • | The Fund’s Utility holdings gained more than 27% for the year, versus a decline for that sector in the Fund’s benchmark, the Russell 2000 Value. Our focus on renewable energy suppliers, Atlantica Yield and Algonquin Power led to strong absolute and relative returns and made it the most significant contributor to Fund performance for the year. |
| | |
| • | Cerence, a provider of cognitive assistant solutions to the auto industry, skyrocketed 344% during the year as the company solidified its dominant market position with multiple contract wins throughout the year. |
| | |
| • | The Fund’s intentional underweight to the Energy sector boosted performance as it was the worst performing sector in the Russell 2000 Value, down 38%. |
| | |
| • | ARKO, a new position in the Fund, drifted lower after purchase and was a meaningful detractor for the year. Despite closing two attractive acquisitions in the convenience store space, the stock ended the year down 14%, likely due to a lack of Wall Street coverage. We took the opportunity to add to the Fund’s position. |
Baird SmallCap Value Fund
December 31, 2020 (Unaudited)
| • | The Fund’s Real Estate Investment Trust (REIT) exposure meaningfully outperformed the benchmark sector performance due to superior security selection. Standout gains were posted by CyrusOne, a data center operator, and hotel REITs (Ryman Hospitality and RLJ Lodging Trust), which were purchased on the heels of positive efficacy news for COVID-19 vaccines. |
| | |
| • | Despite gaining 22% for the year, the Fund’s Healthcare position trailed the corresponding benchmark sector performance largely due to underperformance of Eagle Pharmaceutical and Hill-Rom as hospital capital spending suffered due to the pandemic. |
| | |
| • | Financials were another bright spot in the Fund both due to an underweight position and better security selection. Despite negative returns for the sector as a whole, many of the Fund’s long-time holdings such as Axos Financial, Merchants Bank, and Old Republic posted strong gains. |
| | |
| • | The Fund’s overweight to Information Technology and superior security selection contributed positively to performance. The largest sector by weight in the Fund’s portfolio returned 29% during the year. Notable winners include Immersion Technology, Knowles Group and F5 Networks. |
Portfolio Manager:
Michelle Stevens, CFA
Baird SmallCap Value Fund
December 31, 2020 (Unaudited)
Portfolio Characteristics
A December 31, 2020 summary of the Fund’s top 10 holdings and equity sector analysis compared to the Russell 2000® Value Index is shown below.
Top 10 Holdings(1) | | | Equity Sector Analysis(2) |
| | | | |
| Atlantica Yield PLC | 5.3% | | 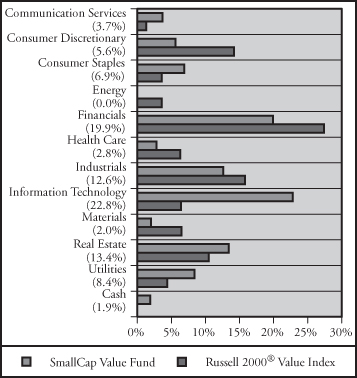
|
| Cerence, Inc. | 4.9% | |
| j2 Global, Inc. | 4.5% | |
| Axos Financial, Inc. | 4.1% | |
| Boingo Wireless, Inc. | 3.7% | |
| CACI International, Inc. | 3.4% | |
| Algonquin Power & Utilities Corp. | 3.1% | |
| Merchants Bancorp | 3.1% | |
| ICU Medical, Inc. | 2.8% | |
| Preferred Bank | 2.8% | |
| | | |
| Net Assets: | $30,724,055 | |
| Portfolio Turnover Rate: | 61% | |
| Number of Equity Holdings: | 43 | |
| | | |
Annualized Portfolio Expense Ratio(3): | | |
Gross | | |
| Institutional Class: | 1.44% | |
| Investor Class: | 1.69% | (4) |
| | | |
Net | | |
| Institutional Class: | 0.95% | |
| Investor Class: | 1.20% | (4) | |
(1) | The Fund’s portfolio composition is subject to change and there is no assurance that the Fund will continue to hold any particular security. Percentages shown relate to the Fund’s total net assets as of December 31, 2020. |
(2) | Percentages shown in parentheses relate to the Fund’s total value of investments as of December 31, 2020, and may not add up to 100% due to rounding. |
(3) | Reflects expense ratios as stated in the Fund’s current prospectus. The Advisor has contractually agreed to limit the Fund’s total annual fund operating expenses to 0.95% of average daily net assets for the Institutional Class shares and 1.20% of average daily net assets for the Investor Class shares, at least through April 30, 2022. |
(4) | Includes 0.25% 12b-1 fee. |
Baird SmallCap Value Fund
December 31, 2020 (Unaudited)
Institutional ClassValue of a $25,000 Investment
Growth of a hypothetical investment of $25,000 made on the Fund’s inception date (05/01/12), assuming reinvestment of all distributions.
Investor Class
Value of a $10,000 Investment
Growth of a hypothetical investment of $10,000 made on the Fund’s inception date (05/01/12), assuming reinvestment of all distributions.
Baird SmallCap Value Fund
December 31, 2020 (Unaudited)
Total Returns
| | | Average Annual |
| | | | | Since |
| For the Periods Ended December 31, 2020 | One Year | Three Years | Five Years | Inception(1) |
| Institutional Class Shares | 2.85% | 0.58% | 6.69% | 7.73% |
| Investor Class Shares | 2.54% | 0.31% | 6.43% | 7.46% |
Russell 2000® Value Index(2) | 4.63% | 3.72% | 9.65% | 9.56% |
| (1) | For the period from May 1, 2012 (inception date) through December 31, 2020. |
| (2) | The Russell 2000® Value Index measures the performance of the small-cap value segment of the U.S. equity universe. It includes those Russell 2000® Index companies with lower price-to-book ratios and lower forecasted growth values. This index does not reflect any deduction for fees, expenses or taxes. A direct investment in the index is not possible. |
The line graphs on the previous page and the returns shown in the table above reflect reinvestment of dividends and/or capital gains distributions in additional shares. The returns in the graphs and table do not reflect the deduction of taxes that a shareholder would pay on Fund distributions or the redemption of Fund shares. The returns reflect the actual performance for each period and do not include the impact of trades executed on the last business day of the period that were recorded on the first business day of the next period.
The gross expense ratio for each Class, as reflected in the Fund’s current prospectus, is set forth under “Portfolio Characteristics”.
The Fund focuses on small cap value style stocks and therefore the performance of the Fund may be more volatile than the performance of funds that focus on types of stocks that have a broader investment style. The Fund may invest up to 15% of its total assets in U.S. dollar denominated foreign securities and ADRs. Foreign investments involve additional risks such as currency rate fluctuations and the potential for political and economic instability, and different and sometimes less strict financial reporting standards and regulation. The Fund invests a substantial portion of its assets in the stocks of small-capitalization companies. Small-capitalization companies often are more volatile and face greater risks than larger, more established companies. U.S. and international markets have experienced significant periods of volatility in recent years and months due to a number of economic, political and global macro factors including the impact of the coronavirus (COVID-19) as a global pandemic and related public health issues, growth concerns in the U.S. and overseas, uncertainties regarding interest rates, trade tensions and the threat of tariffs imposed by the U.S. and other countries. These and other geopolitical events may cause market disruptions and could have an adverse effect on the value of the Fund’s investments.
Past performance does not guarantee future results. Investment return and principal value will fluctuate so that an investor’s shares, when redeemed, may be worth more or less than their original cost.
For information about the performance of the Fund as of the most recent month-end, please call 1-866-44BAIRD or visit www.bairdfunds.com. Mutual fund performance changes over time and current performance may be lower or higher than that stated.
Baird SmallCap Value Fund
Schedule of Investments, December 31, 2020
Common Stocks
| | | | | | | | | % of | |
| | | Shares | | | Value | | | Net Assets | |
| Air Freight & Logistics | | | | | | | | | |
Air Transport Services Group, Inc.(1) | | | 25,427 | | | $ | 796,882 | | | | 2.6 | % |
| Banks | | | | | | | | | | | | |
| Preferred Bank | | | 16,963 | | | | 856,123 | | | | 2.8 | % |
| Chemicals | | | | | | | | | | | | |
| Avient Corp. | | | 14,860 | | | | 598,561 | | | | 2.0 | % |
| Commercial Services & Supplies | | | | | | | | | | | | |
| ACCO Brands Corp. | | | 77,534 | | | | 655,162 | | | | 2.1 | % |
| Communications Equipment | | | | | | | | | | | | |
Ciena Corp.(1) | | | 8,751 | | | | 462,490 | | | | 1.5 | % |
F5 Networks, Inc.(1) | | | 2,805 | | | | 493,512 | | | | 1.6 | % |
| | | | | | | | 956,002 | | | | 3.1 | % |
| Diversified Consumer Services | | | | | | | | | | | | |
OneSpaWorld Holdings Ltd.(2) | | | 68,971 | | | | 699,366 | | | | 2.3 | % |
| Electrical Equipment | | | | | | | | | | | | |
nVent Electric PLC(2) | | | 30,710 | | | | 715,236 | | | | 2.3 | % |
| Electronic Equipment, Instruments & Components | | | | | | | | | | | | |
Knowles Corp.(1) | | | 16,380 | | | | 301,883 | | | | 1.0 | % |
| Equity Real Estate Investment Trusts (REITs) | | | | | | | | | | | | |
| Agree Realty Corp. | | | 9,092 | | | | 605,345 | | | | 2.0 | % |
| CyrusOne, Inc. | | | 10,384 | | | | 759,590 | | | | 2.5 | % |
| EastGroup Properties, Inc. | | | 3,006 | | | | 415,008 | | | | 1.4 | % |
| Gaming and Leisure Properties, Inc. | | | 13,042 | | | | 552,970 | | | | 1.8 | % |
| QTS Realty Trust, Inc. | | | 7,487 | | | | 463,296 | | | | 1.5 | % |
| RLJ Lodging Trust | | | 46,706 | | | | 660,890 | | | | 2.2 | % |
| Ryman Hospitality Properties, Inc. | | | 10,173 | | | | 689,322 | | | | 2.2 | % |
| | | | | | | | 4,146,421 | | | | 13.6 | % |
| Food Products | | | | | | | | | | | | |
Nomad Foods Ltd.(1)(2) | | | 24,976 | | | | 634,890 | | | | 2.1 | % |
Simply Good Foods Co.(1) | | | 20,628 | | | | 646,894 | | | | 2.1 | % |
| | | | | | | | 1,281,784 | | | | 4.2 | % |
| Health Care Equipment & Supplies | | | | | | | | | | | | |
ICU Medical, Inc.(1) | | | 4,072 | | | | 873,403 | | | | 2.8 | % |
| Household Durables | | | | | | | | | | | | |
Helen of Troy Ltd.(1)(2) | | | 1,844 | | | | 409,718 | | | | 1.3 | % |
| Independent Power and Renewable Electricity Producers | | | | | | | | | | | | |
Atlantica Yield PLC(1) | | | 42,949 | | | | 1,631,203 | | | | 5.3 | % |
The accompanying notes are an integral part of these financial statements.
Baird SmallCap Value Fund
Schedule of Investments, December 31, 2020
Common Stocks (cont.)
| | | | | | | | | % of | |
| | | Shares | | | Value | | | Net Assets | |
| Insurance | | | | | | | | | |
Everest Re Group Ltd.(2) | | | 1,723 | | | $ | 403,337 | | | | 1.3 | % |
| First American Financial Corp. | | | 8,237 | | | | 425,277 | | | | 1.4 | % |
| Old Republic International Corp. | | | 38,068 | | | | 750,320 | | | | 2.4 | % |
| | | | | | | | 1,578,934 | | | | 5.1 | % |
| IT Services | | | | | | | | | | | | |
CACI International, Inc.(1) | | | 4,213 | | | | 1,050,427 | | | | 3.4 | % |
| Science Applications International Corp. | | | 5,909 | | | | 559,228 | | | | 1.8 | % |
Verra Mobility Corp.(1) | | | 42,953 | | | | 576,429 | | | | 1.9 | % |
| | | | | | | | 2,186,084 | | | | 7.1 | % |
| Machinery | | | | | | | | | | | | |
| Shyft Group, Inc. | | | 19,543 | | | | 554,630 | | | | 1.8 | % |
| Mortgage Real Estate Investment Trusts (REITs) | | | | | | | | | | | | |
| Blackstone Mortgage Trust, Inc. | | | 17,560 | | | | 483,427 | | | | 1.6 | % |
| Multi-Utilities | | | | | | | | | | | | |
Algonquin Power & Utilities Corp.(2) | | | 57,940 | | | | 953,693 | | | | 3.1 | % |
| Road & Rail | | | | | | | | | | | | |
| Knight-Swift Transportation Holdings, Inc. | | | 14,383 | | | | 601,497 | | | | 2.0 | % |
| Semiconductors & Semiconductor Equipment | | | | | | | | | | | | |
Silicon Motion Technology Corp. – ADR(2) | | | 10,361 | | | | 498,882 | | | | 1.6 | % |
| Software | | | | | | | | | | | | |
Cerence, Inc.(1) | | | 15,005 | | | | 1,507,702 | | | | 4.9 | % |
j2 Global, Inc.(1) | | | 14,152 | | | | 1,382,509 | | | | 4.5 | % |
| | | | | | | | 2,890,211 | | | | 9.4 | % |
| Specialty Retail | | | | | | | | | | | | |
Arko Corp.(1) | | | 92,971 | | | | 836,739 | | | | 2.7 | % |
Urban Outfitters, Inc.(1) | | | 23,635 | | | | 605,056 | | | | 2.0 | % |
| | | | | | | | 1,441,795 | | | | 4.7 | % |
| Technology Hardware, Storage & Peripherals | | | | | | | | | | | | |
Immersion Corp.(1) | | | 70,347 | | | | 794,218 | | | | 2.6 | % |
| Thrifts & Mortgage Finance | | | | | | | | | | | | |
Axos Financial, Inc.(1) | | | 33,913 | | | | 1,272,755 | | | | 4.1 | % |
Essent Group Ltd.(2) | | | 13,787 | | | | 595,598 | | | | 1.9 | % |
| Merchants Bancorp | | | 34,061 | | | | 941,106 | | | | 3.1 | % |
| Meta Financial Group, Inc. | | | 11,666 | | | | 426,509 | | | | 1.4 | % |
| | | | | | | | 3,235,968 | | | | 10.5 | % |
| Wireless Telecommunication Services | | | | | | | | | | | | |
Boingo Wireless, Inc.(1) | | | 90,240 | | | | 1,147,853 | | | | 3.7 | % |
| Total Common Stocks | | | | | | | | | | | | |
| (Cost $21,388,865) | | | | | | | 30,288,936 | | | | 98.6 | % |
The accompanying notes are an integral part of these financial statements.
Baird SmallCap Value Fund
Schedule of Investments, December 31, 2020
Short-Term Investment
| | | | | | | | | % of | |
| | | Shares | | | Value | | | Net Assets | |
| Money Market Mutual Fund | | | | | | | | | |
| First American Government | | | | | | | | | |
Obligations Fund, Class U, 0.04%(3) | | | 365,926 | | | $ | 365,926 | | | | 1.2 | % |
| Total Short-Term Investment | | | | | | | | | | | | |
| (Cost $365,926) | | | | | | | 365,926 | | | | 1.2 | % |
| Total Investments | | | | | | | | | | | | |
| (Cost $21,754,791) | | | | | | | 30,654,862 | | | | 99.8 | % |
| Other Assets in Excess of Liabilities | | | | | | | 69,193 | | | | 0.2 | % |
| TOTAL NET ASSETS | | | | | | $ | 30,724,055 | | | | 100.0 | % |
Notes to Schedule of Investments
| (1) | Non-Income Producing. |
| (2) | Foreign Security. |
| (3) | Seven-Day Yield. |
ADR – American Depository Receipt
Industry classifications shown in the Schedule of Investments are based off of the Global Industry Classification Standard (GICS®). GICS® was developed by and/or is the exclusive property of MSCI, Inc (“MSCI”) and Standard & Poor’s Financial Services LLC (“S&P”). GICS® is a service mark of MSCI and S&P and has been licensed for use by U.S. Bancorp Fund Services, LLC.
The accompanying notes are an integral part of these financial statements.
Baird SmallCap Value Fund
Summary of Fair Value Exposure at December 31, 2020
The Fund has adopted authoritative fair valuation accounting standards which establish a definition of fair value and set out a hierarchy for measuring fair value. These standards require additional disclosures about the various inputs and valuation techniques used to develop the measurements of fair value and a discussion on changes in valuation techniques and related inputs during the period. These standards define fair value as the price that would be received to sell an asset or paid to transfer a liability in an orderly transaction between market participants at the measurement date.
The fair value hierarchy is organized into three levels based upon the assumptions (referred to as “inputs”) used in pricing the asset or liability. These standards state that “observable inputs” reflect the assumptions market participants would use in pricing the asset or liability based on market data obtained from independent sources and “unobservable inputs” reflect an entity’s own assumptions about the assumptions market participants would use in pricing the asset or liability. These inputs are summarized into three broad levels and described below:
| Level 1 – | Quoted prices (unadjusted) in active markets for identical assets or liabilities that the reporting entity can access at the measurement date. |
| Level 2 – | Inputs other than quoted prices included within Level 1 that are observable for the asset or liability, either directly or indirectly. |
| Level 3 – | Unobservable inputs for the asset or liability. |
The inputs or methodology used for valuing securities are not necessarily an indication of the risk associated with investing in those securities.
The following is a summary of the inputs used to value the Fund’s investments as of December 31, 2020:
| | | Level 1 | | | Level 2 | | | Level 3 | | | Total | |
| Equity | | | | | | | | | | | | |
| Common Stocks | | $ | 30,288,936 | | | $ | — | | | $ | — | | | $ | 30,288,936 | |
| Total Equity | | | 30,288,936 | | | | — | | | | — | | | | 30,288,936 | |
| Short-Term Investment | | | | | | | | | | | | | | | | |
| Money Market Mutual Fund | | | 365,926 | | | | — | | | | — | | | | 365,926 | |
| Total Short-Term Investment | | | 365,926 | | | | — | | | | — | | | | 365,926 | |
| Total Investments* | | $ | 30,654,862 | | | $ | — | | | $ | — | | | $ | 30,654,862 | |
| * | Additional information regarding the industry classifications of these investments is disclosed in the Schedule of Investments. |
Changes in valuation techniques may result in transfers into or out of assigned levels within the fair value hierarchy. There were no transfers into or out of Level 3 during the reporting period, as compared to the security classifications from the prior year’s annual report. See the Fund’s Valuation Policy in Note 2a to the financial statements.
The accompanying notes are an integral part of these financial statements.
Chautauqua International Growth Fund
December 31, 2020 (Unaudited)
Portfolio Manager’s Commentary
In 2020, the Chautauqua International Growth Fund Institutional Class returned 39.84%, significantly outperforming its benchmark, the MSCI ACWI ex U.S. Index®, which returned 10.65%.
The Fund typically holds a limited number of companies (25 to 35) invested primarily in equity securities of non-U.S. companies with medium to large market capitalizations. Stock selection accounted for the majority of the outperformance of the Chautauqua International Growth Fund, as compared to the MSCI ACWI ex U.S. Index®. Portfolio allocation was also a meaningful contributor to the outperformance, led by an overweight in the information technology sector and an underweight in the energy sector, which we exited in the first quarter. Investments in the information technology, health care, and consumer discretionary sectors drove the majority of the outperformance, and standouts such as Adyen, SolarEdge, ASML, Genmab, WuXi Biologics, TAL Education, and BYD were among the top contributors in the entire portfolio. On the other hand, investments in the financials sector were a modest detractor from performance, especially investments in Bank Rakyat, HDFC Bank, and DBS.
Heading into 2020, economic fundamentals were already weak and stock market performance had been overly reliant on monetary accommodation. We were cautious. In the fourth quarter of 2019, we had realigned the Fund towards portfolio companies we viewed as having more economically resilient business models and lower valuation multiples. At the time, this was an extra measure of care to insulate the Fund should the fragile global economy topple over.
Our cautious portfolio positioning at the start of the year proved to be prescient. The coronavirus (COVID-19) pandemic spread around the world in the first quarter. Financial assets were battered, and stock markets suffered a bear market decline. We were able to provide some downside protection in this environment because of the portfolio changes we made in the fourth quarter of 2019.
Central banks and governments around the world responded to the crisis with large waves of fiscal and monetary stimulus, amounting to many trillions of dollars worldwide. This served to prop up afflicted consumers and businesses, stabilize financial markets, and guarantee liquidity almost anywhere it was needed. We took advantage of market dislocations amidst the selloff to initiate positions in several companies that we had analyzed and were monitoring on our watchlist. We initiated positions in Adyen, SolarEdge, Prosus, Beigene, and WuXi Biologics. These investments proved to be among the most beneficial contributors to the Fund’s performance in 2020.
Markets rallied vigorously in the second quarter. The dramatic rise in stock prices was accompanied by extraordinary monetary accommodation, quantitative easing, and repeated signaling by central banks of a do-anything willingness to bolster economies. Not only did this amount to a lower discount rate, which inflates the value of financial assets, but it also provided a psychological backstop for investors. We were able to again outperform in the second quarter as result of the significant repositioning amidst the selloff in the first quarter.
Markets grinded higher again in the third quarter, and our outperformance continued. However, we grew concerned with the disconnect between stock prices and fundamentals. The economic recovery was stagnant or uneven, meanwhile we believed valuation multiples climbed to excessive levels relative to earnings, which had collapsed. We made changes in the Fund’s portfolio to reflect this caution, by taking profits from some high valuation “winners”, redeploying to lower valuation holdings, and initiating new positions in Brookfield Renewable and Fairfax Financial.
In the fourth quarter, positive developments of a COVID-19 vaccine improved market sentiment even further, forming the basis for a sustainable reopening scenario and sending stocks even higher. More so, this helped unleash a powerful “pro-cyclical” rotation, and value stocks substantially outperformed growth stocks. We were able to again outperform in this market environment, aided by the prior changes in the portfolio. Because the market continued to rally, we made additional changes to the portfolio to reflect our caution. We reduced positions in Adyen, Bank Rakyat, DBS Group, and SolarEdge. Proceeds were used to increase positions in Brookfield Renewable, BYD, Fairfax Financial, Novo Nordisk, Sinopharm, TAL Education, Tata Consultancy, Temenos, and WuXi Biologics.
Chautauqua International Growth Fund
December 31, 2020 (Unaudited)
Outlook
Due to the vaccine developments, the most likely economic scenario is one that improves in the next year. And we believe, we have averted a disaster scenario in which the pandemic continues to grow unchecked. As the vaccine is administered to larger swaths of the population, herd immunity is expected to increase, and the spread of the disease should decline. Vaccine manufacturers have announced expected availability in the billions of doses. The most uncertain aspects pertain to how much reach in the next year medical professionals will actually have administering the vaccines, and when emerging countries can obtain their share.
Central banks have become much more optimistic about the prospects for a rebound, albeit shallower and choppier than originally anticipated, in the next year. Many macroeconomic indicators have stabilized and are no longer deteriorating, with the exception of services and consumption data that are more sensitive to weakness in domestic economies. However, the recent resurgence of COVID-19 cases is expected to have follow-through effects on near-term economic growth. And while downside risks have been reduced in recent months, the most likely risks to economic recovery pertain to renewed containment measures. The availability of the vaccine is positive for the economic outlook and is further assisted by ongoing supportive measures by central banks and governments.
Monetary policy will continue to be an important component of the market narrative, but a depleted arsenal and general fatigue also play into worries that monetary policy is increasingly pushing on a string. Therefore, fiscal policy will play an even more critical role for supporting economies in these difficult times. Fortunately, recent important fiscal stimulus packages were passed and made it through political gridlock.
The rotation from growth outperformance to value outperformance was not terribly surprising. The interesting question is whether the rotation might be sustainable, especially as recent instances of growth to value rotations have tended to fizzle. The case that value stocks have more room to grow in price revolves around expectations for more positive vaccine developments and a rebound in corporate earnings. Furthermore, cyclical sectors should be a beneficiary of the economic reopening. Valuation differences between growth stocks and value stocks are still near their widest point over the last ten years. And overall, we believe market valuations have become expensive relative to current earnings power, and they are likely to stay elevated next year as central banks continue to ease into the recovery.
While valuations are high across the market, on a relative basis, they are still most attractive for international stocks. The pandemic has delivered a global growth shock, but in doing so, it has accelerated the timeline for several mega trends that the Fund has been actively investing in, such as productivity enhancement (robotics, automation, and software), e-commerce, electronic payments, and rapid drug development. Furthermore, many portfolio companies have been able to continue to deliver growth even in this recessionary environment, which is an exceptionally rare trait.
We have made adjustments to the Fund portfolio, including realizing profits from some high valuation “winners”, redeploying to lower valuation holdings, and raising cash levels so we hold some dry powder. On the margin, these changes should help mitigate some downside if markets become less hospitable, and we continue to contemplate further adjustments for a more conservative balance of growth, profitability, and valuation in the portfolio.
Respectfully Submitted,
Portfolio Managers:
Brian Beitner, CFA
Jesse A. Flores, CFA
Haicheng Li, CFA
Nathaniel R. Velarde
Chautauqua International Growth Fund
December 31, 2020 (Unaudited)
Portfolio Characteristics
A December 31, 2020 summary of the Fund’s top 10 holdings and equity sector analysis compared to the MSCI ACWI ex USA Index is shown below.
Top 10 Holdings(1) | | | | | |
| | | | | | |
| Wuxi Biologics Cayman, Inc. | 5.5% | | Net Assets: | $322,471,108 | |
| Genmab A/S | 4.9% | | Portfolio Turnover Rate: | 31% | |
| ASML Holding NV | 4.9% | | Number of Equity Holdings: | 30 | |
| Tata Consultancy Services Ltd. | 4.5% | | | | |
| Novo Nordisk A/S – ADR | 4.4% | | Annualized Portfolio Expense Ratio(3): | | |
| TAL Education Group – ADR | 4.2% | | Gross | | |
| Temenos Group AG | 4.2% | | Institutional Class: | 0.96% | |
| HDFC Bank Ltd. – ADR | 4.1% | | Investor Class: | 1.21% | (4) |
| Constellation Software, Inc. | 3.9% | | | | |
| Keyence Corp. | 3.9% | | Net | | |
| | | | Institutional Class: | 0.80% | |
| | | | Investor Class: | 1.05% | (4) |
| | | | | | |
Equity Sector Analysis(2) | | | Country Allocation(2) | | |
| | | | | | |
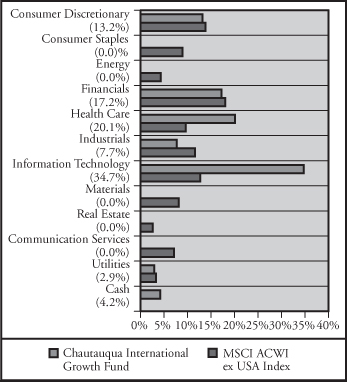 | | |  | | |
| (1) | The Fund’s portfolio composition is subject to change and there is no assurance that the Fund will continue to hold any particular security. Percentages shown relate to the Fund’s total net assets as of December 31, 2020. |
| (2) | Percentages shown in parentheses relate to the Fund’s total value of investments as of December 31, 2020, and may not add up to 100% due to rounding. |
| (3) | Reflects expense ratios as stated in the Fund’s current prospectus. The Advisor has contractually agreed to limit the Fund’s total annual fund operating expenses to 0.80% of average daily net assets for the Institutional Class shares and 1.05% of average daily net assets for the Investor Class shares, at least through April 30, 2022. |
| (4) | Includes 0.25% 12b-1 fee. |
Chautauqua International Growth Fund
December 31, 2020 (Unaudited)
Institutional ClassValue of a $25,000 Investment
Growth of a hypothetical investment of $25,000 made on the Fund’s inception date (04/15/16), assuming reinvestment of all distributions.
Investor Class
Value of a $10,000 Investment
Growth of a hypothetical investment of $10,000 made on the Fund’s inception date (04/15/16), assuming reinvestment of all distributions.
Chautauqua International Growth Fund
December 31, 2020 (Unaudited)
Total Returns
| | | Average Annual |
| | | | Since |
| For the Periods Ended December 31, 2020 | One Year | Three Years | Inception(1) |
| Institutional Class Shares | 39.84% | 13.75% | 14.81% |
| Investor Class Shares | 39.37% | 13.41% | 14.52% |
MSCI ACWI ex USA Index(2) | 10.65% | 4.88% | 9.16% |
| (1) | For the period from April 15, 2016 (inception date) through December 31, 2020. |
| (2) | The MSCI ACWI ex USA Index is a market-capitalization-weighted index maintained by MSCI, Inc. and designed to provide a broad measure of stock performance throughout the world, with the exception of U.S.-based companies. The MSCI ACWI ex USA Index includes both developed and emerging markets. This index does not reflect any deduction for fees, expenses or taxes. A direct investment in the index is not possible. |
The line graphs on the previous page and the returns shown in the table above reflect reinvestment of dividends and/or capital gains distributions in additional shares. The returns in the graphs and table do not reflect the deduction of taxes that a shareholder would pay on Fund distributions or the redemption of Fund shares. The returns reflect the actual performance for each period and do not include the impact of trades executed on the last business day of the period that were recorded on the first business day of the next period.
The gross expense ratio for each Class, as reflected in the Fund’s current prospectus, is set forth under “Portfolio Characteristics”.
The Fund focuses primarily on non-U.S. stocks with medium to large market capitalizations and therefore the performance of the Fund may be more volatile than the performance of funds that focus on types of stocks that have a broader investment style. Under normal market conditions, the Fund will invest at least 65% of its total assets in non-U.S. companies. Foreign investments involve additional risks such as currency rate fluctuations and the potential for political and economic instability, and different and sometimes less strict financial reporting standards and regulation. U.S. and international markets have experienced significant periods of volatility in recent years and months due to a number of economic, political and global macro factors including the impact of the coronavirus (COVID-19) as a global pandemic and related public health issues, growth concerns in the U.S. and overseas, uncertainties regarding interest rates, trade tensions and the threat of tariffs imposed by the U.S. and other countries. In addition, the United Kingdom withdrew from the European Union on January 31, 2020 following a June 2016 referendum referred to as “Brexit.” Although the EU and UK agreed to a trade deal in December 2020, there is significant market uncertainty regarding Brexit’s ramifications, and the range of possible political, regulatory, economic, and market outcomes are difficult to predict. These and other geopolitical events may cause market disruptions and could have an adverse effect on the value of the Fund’s investments.
Past performance does not guarantee future results. Investment return and principal value will fluctuate so that an investor’s shares, when redeemed, may be worth more or less than their original cost.
For information about the performance of the Fund as of the most recent month-end, please call 1-866-44BAIRD or visit www.bairdfunds.com. Mutual fund performance changes over time and current performance may be lower or higher than that stated.
Chautauqua International Growth Fund
Schedule of Investments, December 31, 2020
Common Stocks
| | | | | | | | | % of | |
| | | Shares | | | Value | | | Net Assets | |
| Application Software | | | | | | | | | |
Atlassian Corp. PLC (Australia)(1) | | | 35,843 | | | $ | 8,382,602 | | | | 2.6 | % |
Temenos Group AG (Switzerland)(2) | | | 96,483 | | | | 13,442,938 | | | | 4.2 | % |
| | | | | | | | 21,825,540 | | | | 6.8 | % |
| Asset Management & Custody Banks | | | | | | | | | | | | |
Julius Baer Group Ltd. (Switzerland)(2) | | | 117,522 | | | | 6,770,622 | | | | 2.1 | % |
| Automobile Manufacturers | | | | | | | | | | | | |
BYD Co. Ltd. (China)(2) | | | 272,341 | | | | 7,170,261 | | | | 2.2 | % |
| Biotechnology | | | | | | | | | | | | |
BeiGene Ltd. – ADR (China)(1) | | | 36,537 | | | | 9,440,795 | | | | 2.9 | % |
Genmab A/S (Denmark)(1)(2) | | | 39,151 | | | | 15,875,492 | | | | 4.9 | % |
| | | | | | | | 25,316,287 | | | | 7.8 | % |
| Diversified Banks | | | | | | | | | | | | |
Bank Rakyat Indonesia Persero Tbk PT (Indonesia)(2) | | | 41,679,076 | | | | 12,391,333 | | | | 3.9 | % |
DBS Group Holdings Ltd. (Singapore)(2) | | | 652,183 | | | | 12,359,345 | | | | 3.8 | % |
| | | | | | | | 24,750,678 | | | | 7.7 | % |
| Diversified Support Services | | | | | | | | | | | | |
Recruit Holdings Co. Ltd. (Japan)(2) | | | 81,879 | | | | 3,439,160 | | | | 1.1 | % |
| Education Services | | | | | | | | | | | | |
TAL Education Group – ADR (China)(1) | | | 188,114 | | | | 13,452,032 | | | | 4.2 | % |
| Electronic Equipment & Instruments | | | | | | | | | | | | |
Keyence Corp. (Japan)(2) | | | 22,259 | | | | 12,521,067 | | | | 3.9 | % |
| Environmental & Facilities Services | | | | | | | | | | | | |
| Waste Connections, Inc. (Canada) | | | 111,009 | | | | 11,386,194 | | | | 3.5 | % |
| Healthcare Distributors | | | | | | | | | | | | |
Sinopharm Group Co. Ltd. (China)(2) | | | 3,122,228 | | | | 7,573,980 | | | | 2.4 | % |
| Industrial Machinery | | | | | | | | | | | | |
FANUC Corp. (Japan)(2) | | | 40,641 | | | | 10,032,195 | | | | 3.1 | % |
| Information Technology | | | | | | | | | | | | |
| Constellation Software, Inc. (Canada) | | | 9,784 | | | | 12,704,981 | | | | 3.9 | % |
Topicus.com, Inc. (Canada)(1)(2) | | | 18,196 | | | | 64,110 | | | | 0.0 | % |
| | | | | | | | 12,769,091 | | | | 3.9 | % |
| Internet & Direct Marketing Retail | | | | | | | | | | | | |
Prosus NV (Netherlands)(2) | | | 101,988 | | | | 11,012,465 | | | | 3.4 | % |
| Internet Retail | | | | | | | | | | | | |
Alibaba Group Holding Ltd. – ADR (China)(1) | | | 46,702 | | | | 10,868,957 | | | | 3.4 | % |
| IT Services | | | | | | | | | | | | |
Adyen NV (Netherlands)(1)(2) | | | 5,176 | | | | 12,026,580 | | | | 3.7 | % |
Tata Consultancy Services Ltd. (India)(2) | | | 367,734 | | | | 14,439,124 | | | | 4.5 | % |
| | | | | | | | 26,465,704 | | | | 8.2 | % |
The accompanying notes are an integral part of these financial statements.
Chautauqua International Growth Fund
Schedule of Investments, December 31, 2020
Common Stocks (cont.)
| | | | | | | | | % of | |
| | | Shares | | | Value | | | Net Assets | |
| Life Sciences Tools & Services | | | | | | | | | |
Wuxi Biologics Cayman, Inc. (China)(1)(2) | | | 1,344,148 | | | $ | 17,825,209 | | | | 5.5 | % |
| Multi-Line Insurance | | | | | | | | | | | | |
| Fairfax Financial Holdings Ltd. (Canada) | | | 30,873 | | | | 10,522,626 | | | | 3.3 | % |
| Pharmaceuticals | | | | | | | | | | | | |
| Novo Nordisk A/S – ADR (Denmark) | | | 201,403 | | | | 14,068,000 | | | | 4.4 | % |
| Regional Banks | | | | | | | | | | | | |
HDFC Bank Ltd. – ADR (India)(1) | | | 183,764 | | | | 13,278,787 | | | | 4.1 | % |
| Renewable Electricity | | | | | | | | | | | | |
| Brookfield Renewable Corp. (Canada) | | | 159,367 | | | | 9,286,315 | | | | 2.9 | % |
| Semiconductor Equipment | | | | | | | | | | | | |
| ASML Holding NV (Netherlands) | | | 32,346 | | | | 15,775,790 | | | | 4.9 | % |
| Semiconductors | | | | | | | | | | | | |
AMS AG (Austria)(1)(2) | | | 163,044 | | | | 3,552,636 | | | | 1.1 | % |
| Taiwan Semiconductor | | | | | | | | | | | | |
| Manufacturing Co. Ltd. – ADR (Taiwan) | | | 113,626 | | | | 12,389,779 | | | | 3.8 | % |
| | | | | | | | 15,942,415 | | | | 4.9 | % |
| Semiconductors & Semiconductor Equipment | | | | | | | | | | | | |
SolarEdge Technologies, Inc. (Israel)(1) | | | 18,412 | | | | 5,875,637 | | | | 1.8 | % |
| Total Common Stocks | | | | | | | | | | | | |
| (Cost $200,853,630) | | | | | | | 307,929,012 | | | | 95.5 | % |
| Short-Term Investment | | | | | | | | | | | | |
| Money Market Mutual Fund | | | | | | | | | | | | |
| First American Government | | | | | | | | | | | | |
Obligations Fund, Class U, 0.04%(3) | | | 13,662,627 | | | | 13,662,627 | | | | 4.2 | % |
| Total Short-Term Investment | | | | | | | | | | | | |
| (Cost $13,662,627) | | | | | | | 13,662,627 | | | | 4.2 | % |
| Total Investments | | | | | | | | | | | | |
| (Cost $214,516,257) | | | | | | | 321,591,639 | | | | 99.7 | % |
| Other Assets in Excess of Liabilities | | | | | | | 879,469 | | | | 0.3 | % |
| TOTAL NET ASSETS | | | | | | $ | 322,471,108 | | | | 100.0 | % |
Notes to Schedule of Investments
| (1) | Non-Income Producing. |
| (2) | Level 2 security – See Note 2a to the financial statements. |
| (3) | Seven-Day Yield. |
ADR – American Depository Receipt
Industry classifications shown in the Schedule of Investments are based off of the Global Industry Classification Standard (GICS®). GICS® was developed by and/or is the exclusive property of MSCI, Inc. (“MSCI”) and Standard & Poor’s Financial Services LLC (“S&P”). GICS® is a service mark of MSCI and S&P and has been licensed for use by U.S. Bancorp Fund Services, LLC.
The accompanying notes are an integral part of these financial statements.
Chautauqua International Growth Fund
Summary of Fair Value Exposure at December 31, 2020
The Fund has adopted authoritative fair valuation accounting standards which establish a definition of fair value and set out a hierarchy for measuring fair value. These standards require additional disclosures about the various inputs and valuation techniques used to develop the measurements of fair value and a discussion on changes in valuation techniques and related inputs during the period. These standards define fair value as the price that would be received to sell an asset or paid to transfer a liability in an orderly transaction between market participants at the measurement date.
The fair value hierarchy is organized into three levels based upon the assumptions (referred to as “inputs”) used in pricing the asset or liability. These standards state that “observable inputs” reflect the assumptions market participants would use in pricing the asset or liability based on market data obtained from independent sources and “unobservable inputs” reflect an entity’s own assumptions about the assumptions market participants would use in pricing the asset or liability. These inputs are summarized into three broad levels and described below:
| Level 1 – | Quoted prices (unadjusted) in active markets for identical assets or liabilities that the reporting entity can access at the measurement date. |
| Level 2 – | Inputs other than quoted prices included within Level 1 that are observable for the asset or liability, either directly or indirectly. |
| Level 3 – | Unobservable inputs for the asset or liability. |
The inputs or methodology used for valuing securities are not necessarily an indication of the risk associated with investing in those securities.
The following is a summary of the inputs used to value the Fund’s investments as of December 31, 2020:
| | | Level 1 | | | Level 2 | | | Level 3 | | | Total | |
| Equity | | | | | | | | | | | | |
| Common Stocks | | $ | 147,432,495 | | | $ | 160,496,517 | | | $ | — | | | $ | 307,929,012 | |
| Total Equity | | | 147,432,495 | | | | 160,496,517 | | | | — | | | | 307,929,012 | |
| Short-Term Investment | | | | | | | | | | | | | | | | |
| Money Market Mutual Fund | | | 13,662,627 | | | | — | | | | — | | | | 13,662,627 | |
| Total Short-Term Investment | | | 13,662,627 | | | | — | | | | — | | | | 13,662,627 | |
| Total Investments* | | $ | 161,095,122 | | | $ | 160,496,517 | | | $ | — | | | $ | 321,591,639 | |
| * | Additional information regarding the industry classifications of these investments is disclosed in the Schedule of Investments. |
Changes in valuation techniques may result in transfers into or out of assigned levels within the fair value hierarchy. There were no transfers into or out of Level 3 during the reporting period, as compared to the security classifications from the prior year’s annual report. See the Fund’s Valuation Policy in Note 2a to the financial statements.
The accompanying notes are an integral part of these financial statements.
Chautauqua Global Growth Fund
December 31, 2020 (Unaudited)
Portfolio Manager’s Commentary
In 2020, the Chautauqua Global Growth Fund Institutional Class returned 37.97%, significantly outperforming its benchmark, the MSCI ACWI Index®, which returned 16.25%.
The Fund typically holds a limited number of companies (35 to 45) invested primarily in equity securities of both U.S. and non-U.S. companies with medium to large market capitalizations. Stock selection accounted for the majority of the outperformance of the Chautauqua Global Growth Fund, as compared to the MSCI ACWI Index®. Portfolio allocation was also a meaningful contributor to the outperformance, led by an overweight in the information technology sector and an underweight in the energy sector, which we exited in the first quarter. Investments in the information technology, health care, and consumer discretionary sectors drove the majority of the outperformance, and standouts such as Adyen, SolarEdge, Genmab, WuXi Biologics, TAL Education, and BYD were among the top contributors in the entire portfolio. While all regions positively contributed to the Fund overall, relative underweight exposure to the United States detracted from the allocation effect in North America.
Heading into 2020, economic fundamentals were already weak and stock market performance had been overly reliant on monetary accommodation. We were cautious. In the fourth quarter of 2019, we had realigned the Fund towards portfolio companies we viewed as having more economically resilient business models and lower valuation multiples. At the time, this was an extra measure of care to insulate the Fund should the fragile global economy topple over.
Our cautious portfolio positioning at the start of the year proved to be prescient. The coronavirus (COVID-19) pandemic spread around the world in the first quarter. Financial assets were battered, and stock markets suffered a bear market decline. We were able to provide some downside protection in this environment because of the portfolio changes we made in the fourth quarter of 2019.
Central banks and governments around the world responded to the crisis with large waves of fiscal and monetary stimulus, amounting to many trillions of dollars worldwide. This served to prop up afflicted consumers and businesses, stabilize financial markets, and guarantee liquidity almost anywhere it was needed. We took advantage of market dislocations amidst the selloff to initiate positions in several companies that we had analyzed and were monitoring on our watchlist. We initiated positions in Adyen, EPAM Systems, SolarEdge, Prosus, Beigene, and WuXi Biologics. These investments proved to be among the most beneficial contributors to the Fund’s performance in 2020.
Markets rallied vigorously in the second quarter. The dramatic rise in stock prices was accompanied by extraordinary monetary accommodation, quantitative easing, and repeated signaling by central banks of a do-anything willingness to bolster economies. Not only did this amount to a lower discount rate, which inflates the value of financial assets, but it also provided a psychological backstop for investors. We were able to again outperform in the second quarter as result of the significant repositioning amidst the selloff in the first quarter.
Markets grinded higher again in the third quarter, and our outperformance continued. However, we grew concerned with the disconnect between stock prices and fundamentals. The economic recovery was stagnant or uneven, meanwhile we believed valuation multiples climbed to excessive levels relative to earnings, which had collapsed. We made changes in the Fund’s portfolio to reflect this caution, by taking profits from some high valuation “winners”, redeploying to lower valuation holdings, and initiating new positions in Alteryx, Brookfield Renewable, and Fairfax Financial.
In the fourth quarter, positive developments of a COVID-19 vaccine improved market sentiment even further, forming the basis for a sustainable reopening scenario and sending stocks even higher. More so, this helped unleash a powerful “pro-cyclical” rotation, and value stocks substantially outperformed growth stocks. We were able to again outperform in this market environment, aided by the prior changes in the portfolio. Because the market continued to rally, we made additional changes to the portfolio to reflect our caution. We reduced positions in Adyen, Atlassian, BYD, and SolarEdge. Proceeds were used to initiate a new position in Alexandria Real Estate and increase positions in Bank Rakyat, Brookfield Renewable, DBS, Sinopharm, Tata Consultancy, and WuXi Biologics.
Chautauqua Global Growth Fund
December 31, 2020 (Unaudited)
Outlook
Due to the vaccine developments, the most likely economic scenario is one that improves in the next year. And we believe, we have averted a disaster scenario in which the pandemic continues to grow unchecked. As the vaccine is administered to larger swaths of the population, herd immunity is expected to increase, and the spread of the disease should decline. Vaccine manufacturers have announced expected availability in the billions of doses. The most uncertain aspects pertain to how much reach in the next year medical professionals will actually have administering the vaccines, and when emerging countries can obtain their share.
Central banks have become much more optimistic about the prospects for a rebound, albeit shallower and choppier than originally anticipated, in the next year. Many macroeconomic indicators have stabilized and are no longer deteriorating, with the exception of services and consumption data that are more sensitive to weakness in domestic economies. However, the recent resurgence of COVID-19 cases is expected to have follow-through effects on near-term economic growth. And while downside risks have been reduced in recent months, the most likely risks to economic recovery pertain to renewed containment measures. The availability of the vaccine is positive for the economic outlook and is further assisted by ongoing supportive measures by central banks and governments.
Monetary policy will continue to be an important component of the market narrative, but a depleted arsenal and general fatigue also play into worries that monetary policy is increasingly pushing on a string. Therefore, fiscal policy will play an even more critical role for supporting economies in these difficult times. Fortunately, recent important fiscal stimulus packages were passed and made it through political gridlock.
The rotation from growth outperformance to value outperformance was not terribly surprising. The interesting question is whether the rotation might be sustainable, especially as recent instances of growth to value rotations have tended to fizzle. The case that value stocks have more room to grow in price revolves around expectations for more positive vaccine developments and a rebound in corporate earnings. Furthermore, cyclical sectors should be a beneficiary of the economic reopening. Valuation differences between growth stocks and value stocks are still near their widest point over the last ten years. And overall, we believe market valuations have become expensive relative to current earnings power, and they are likely to stay elevated next year as central banks continue to ease into the recovery.
While valuations are high across the market, on a relative basis, they are still most attractive for international stocks. The pandemic has delivered a global growth shock, but in doing so, it has accelerated the timeline for several mega trends that the Fund has been actively investing in, such as productivity enhancement (robotics, automation, and software), e-commerce, electronic payments, and rapid drug development. Furthermore, many portfolio companies have been able to continue to deliver growth even in this recessionary environment, which is an exceptionally rare trait.
We have made adjustments to the Fund portfolio, including realizing profits from some high valuation “winners”, redeploying to lower valuation holdings, and raising cash levels so we hold some dry powder. On the margin, these changes should help mitigate some downside if markets become less hospitable, and we continue to contemplate further adjustments for a more conservative balance of growth, profitability, and valuation in the portfolio.
Respectfully Submitted,
Portfolio Managers:
Brian Beitner, CFA
Jesse A. Flores, CFA
Haicheng Li, CFA
Nathaniel R. Velarde
Chautauqua Global Growth Fund
December 31, 2020 (Unaudited)
Portfolio Characteristics
A December 31, 2020 summary of the Fund’s top 10 holdings and equity sector analysis compared to the MSCI ACWI Index is shown below.
Top 10 Holdings(1) | | | | | |
| | | | | | |
| SVB Financial Group | 4.6% | | Net Assets: | $139,018,950 | |
| Genmab A/S | 4.4% | | Portfolio Turnover Rate: | 24% | |
| TJX Cos, Inc. | 3.9% | | Number of Equity Holdings: | 46 | |
| Wuxi Biologics Cayman, Inc. | 3.8% | | | | |
| MasterCard, Inc. – Class A | 3.3% | | Annualized Portfolio Expense Ratio(3): | | |
| Tata Consultancy Services Ltd. | 3.3% | | Gross | | |
| HDFC Bank Ltd. – ADR | 3.1% | | Institutional Class: | 1.23% | |
| TAL Education Group – ADR | 3.0% | | Investor Class: | 1.48% | (4) |
| Bank Rakyat Indonesia Persero Tbk PT | 2.9% | | | | |
| Charles Schwab Corp. | 2.9% | | Net | | |
| | | | Institutional Class: | 0.80% | |
| | | | Investor Class: | 1.05% | (4) |
| | | | | | |
Equity Sector Analysis(2) | | | Country Allocation(2) | | |
| | | | | | |
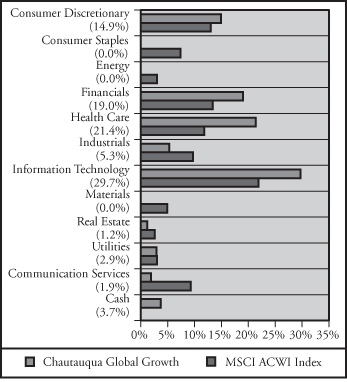 | | | 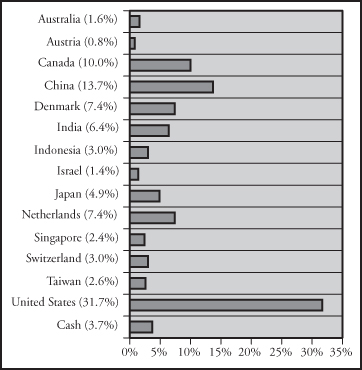 | | |
| (1) | The Fund’s portfolio composition is subject to change and there is no assurance that the Fund will continue to hold any particular security. Percentages shown relate to the Fund’s total net assets as of December 31, 2020. |
| (2) | Percentages shown in parentheses relate to the Fund’s total value of investments as of December 31, 2020, and may not add up to 100% due to rounding. |
| (3) | Reflects expense ratios as stated in the Fund’s current prospectus. The Advisor has contractually agreed to limit the Fund’s total annual fund operating expenses to 0.80% of average daily net assets for the Institutional Class shares and 1.05% of average daily net assets for the Investor Class shares, at least through April 30, 2022. |
| (4) | Includes 0.25% 12b-1 fee. |
Chautauqua Global Growth Fund
December 31, 2020 (Unaudited)
Institutional ClassValue of a $25,000 Investment
Growth of a hypothetical investment of $25,000 made on the Fund’s inception date (04/15/16), assuming reinvestment of all distributions.
Investor Class
Value of a $10,000 Investment
Growth of a hypothetical investment of $10,000 made on the Fund’s inception date (04/15/16), assuming reinvestment of all distributions.
Chautauqua Global Growth Fund
December 31, 2020 (Unaudited)
Total Returns
| | | Average Annual |
| | | | Since |
| For the Periods Ended December 31, 2020 | One Year | Three Years | Inception(1) |
| Institutional Class Shares | 37.97% | 15.27% | 17.39% |
| Investor Class Shares | 37.94% | 15.07% | 17.15% |
MSCI ACWI Index(2) | 16.25% | 10.06% | 12.65% |
| (1) | For the period from April 15, 2016 (inception date) through December 31, 2020. |
| (2) | The MSCI ACWI Index is a market-capitalization-weighted index maintained by MSCI, Inc. and designed to provide a broad measure of stock performance throughout the world. The MSCI ACWI Index includes both developed and emerging markets. This index does not reflect any deduction for fees, expenses or taxes. A direct investment in the index is not possible. |
The line graphs on the previous page and the returns shown in the table above reflect reinvestment of dividends and/or capital gains distributions in additional shares. The returns in the graphs and table do not reflect the deduction of taxes that a shareholder would pay on Fund distributions or the redemption of Fund shares. The returns reflect the actual performance for each period and do not include the impact of trades executed on the last business day of the period that were recorded on the first business day of the next period.
The gross expense ratio for each Class, as reflected in the Fund’s current prospectus, is set forth under “Portfolio Characteristics”.
The Fund focuses on both U.S. and non-U.S. stocks with medium to large market capitalizations and therefore the performance of the Fund may be more volatile than the performance of funds that focus on types of stocks that have a broader investment style. Under normal market conditions, the Fund will invest at least 40% of its total assets in non-U.S. companies. Foreign investments involve additional risks such as currency rate fluctuations and the potential for political and economic instability, and different and sometimes less strict financial reporting standards and regulation. U.S. and international markets have experienced significant periods of volatility in recent years and months due to a number of economic, political and global macro factors including the impact of the coronavirus (COVID-19) as a global pandemic and related public health issues, growth concerns in the U.S. and overseas, uncertainties regarding interest rates, trade tensions and the threat of tariffs imposed by the U.S. and other countries. In addition, the United Kingdom withdrew from the European Union on January 31, 2020 following a June 2016 referendum referred to as “Brexit.” Although the EU and UK agreed to a trade deal in December 2020, there is significant market uncertainty regarding Brexit’s ramifications, and the range of possible political, regulatory, economic, and market outcomes are difficult to predict. These and other geopolitical events may cause market disruptions and could have an adverse effect on the value of the Fund’s investments.
Past performance does not guarantee future results. Investment return and principal value will fluctuate so that an investor’s shares, when redeemed, may be worth more or less than their original cost.
For information about the performance of the Fund as of the most recent month-end, please call 1-866-44BAIRD or visit www.bairdfunds.com. Mutual fund performance changes over time and current performance may be lower or higher than that stated.
Chautauqua Global Growth Fund
Schedule of Investments, December 31, 2020
Common Stocks
| | | | | | | | | % of | |
| | | Shares | | | Value | | | Net Assets | |
| Apparel Retail | | | | | | | | | |
| TJX Cos, Inc. (United States) | | | 78,844 | | | $ | 5,384,256 | | | | 3.9 | % |
| Application Software | | | | | | | | | | | | |
Atlassian Corp. PLC (Australia)(1) | | | 9,271 | | | | 2,168,209 | | | | 1.6 | % |
Temenos Group AG (Switzerland)(2) | | | 20,935 | | | | 2,916,865 | | | | 2.1 | % |
| | | | | | | | 5,085,074 | | | | 3.7 | % |
| Asset Management & Custody Banks | | | | | | | | | | | | |
Julius Baer Group Ltd. (Switzerland)(2) | | | 21,550 | | | | 1,241,528 | | | | 0.9 | % |
| Automobile Manufacturers | | | | | | | | | | | | |
BYD Co. Ltd. (China)(2) | | | 76,170 | | | | 2,005,423 | | | | 1.4 | % |
| Biotechnology | | | | | | | | | | | | |
BeiGene Ltd. – ADR (China)(1) | | | 8,663 | | | | 2,238,433 | | | | 1.6 | % |
Genmab A/S (Denmark)(1)(2) | | | 15,233 | | | | 6,176,888 | | | | 4.4 | % |
Incyte Corp. (United States)(1) | | | 44,780 | | | | 3,894,964 | | | | 2.8 | % |
Regeneron Pharmaceuticals, Inc. (United States)(1) | | | 4,852 | | | | 2,344,050 | | | | 1.7 | % |
| | | | | | | | 14,654,335 | | | | 10.5 | % |
| Data Processing & Outsourced Services | | | | | | | | | | | | |
| MasterCard, Inc. – Class A (United States) | | | 13,020 | | | | 4,647,359 | | | | 3.3 | % |
| Diversified Banks | | | | | | | | | | | | |
Bank Rakyat Indonesia Persero Tbk PT (Indonesia)(2) | | | 13,791,440 | | | | 4,100,243 | | | | 2.9 | % |
DBS Group Holdings Ltd. (Singapore)(2) | | | 171,659 | | | | 3,253,064 | | | | 2.3 | % |
| | | | | | | | 7,353,307 | | | | 5.2 | % |
| Diversified Support Services | | | | | | | | | | | | |
Recruit Holdings Co. Ltd. (Japan)(2) | | | 31,512 | | | | 1,323,597 | | | �� | 1.0 | % |
| Education Services | | | | | | | | | | | | |
TAL Education Group – ADR (China)(1) | | | 58,449 | | | | 4,179,688 | | | | 3.0 | % |
| Electronic Equipment & Instruments | | | | | | | | | | | | |
Coherent, Inc. (United States)(1) | | | 5,770 | | | | 865,615 | | | | 0.6 | % |
Keyence Corp. (Japan)(2) | | | 4,685 | | | | 2,635,392 | | | | 1.9 | % |
| Universal Display Corp. (United States) | | | 10,547 | | | | 2,423,701 | | | | 1.7 | % |
| | | | | | | | 5,924,708 | | | | 4.2 | % |
| Environmental & Facilities Services | | | | | | | | | | | | |
| Waste Connections, Inc. (Canada) | | | 31,155 | | | | 3,195,568 | | | | 2.3 | % |
| Equity Real Estate Investment Trusts (REITs) | | | | | | | | | | | | |
| Alexandria Real Estate Equities, Inc. (United States) | | | 9,044 | | | | 1,611,822 | | | | 1.2 | % |
| Healthcare Distributors | | | | | | | | | | | | |
Sinopharm Group Co. Ltd. (China)(2) | | | 1,047,957 | | | | 2,542,161 | | | | 1.8 | % |
The accompanying notes are an integral part of these financial statements.
Chautauqua Global Growth Fund
Schedule of Investments, December 31, 2020
Common Stocks (cont.)
| | | | | | | | | % of | |
| | | Shares | | | Value | | | Net Assets | |
| Industrial Machinery | | | | | | | | | |
FANUC Corp. (Japan)(2) | | | 11,111 | | | $ | 2,742,741 | | | | 2.0 | % |
| Information Technology | | | | | | | | | | | | |
| Constellation Software, Inc. (Canada) | | | 2,866 | | | | 3,721,635 | | | | 2.7 | % |
Topicus.com, Inc. (Canada)(1)(2) | | | 5,330 | | | | 18,780 | | | | 0.0 | % |
| | | | | | | | 3,740,415 | | | | 2.7 | % |
| Interactive Media & Services | | | | | | | | | | | | |
Alphabet, Inc. – Class A (United States)(1) | | | 1,470 | | | | 2,576,381 | | | | 1.9 | % |
| Internet & Direct Marketing Retail | | | | | | | | | | | | |
Prosus NV (Netherlands)(2) | | | 36,755 | | | | 3,968,733 | | | | 2.9 | % |
| Internet Retail | | | | | | | | | | | | |
Alibaba Group Holding Ltd. – ADR (China)(1) | | | 11,671 | | | | 2,716,192 | | | | 2.0 | % |
Amazon.com, Inc. (United States)(1) | | | 691 | | | | 2,250,539 | | | | 1.6 | % |
| | | | | | | | 4,966,731 | | | | 3.6 | % |
| IT Services | | | | | | | | | | | | |
Adyen NV (Netherlands)(1)(2) | | | 1,445 | | | | 3,357,498 | | | | 2.4 | % |
EPAM Systems, Inc. (United States)(1) | | | 4,204 | | | | 1,506,503 | | | | 1.1 | % |
Tata Consultancy Services Ltd. (India)(2) | | | 115,110 | | | | 4,519,808 | | | | 3.3 | % |
| | | | | | | | 9,383,809 | | | | 6.8 | % |
| Life Sciences Tools & Services | | | | | | | | | | | | |
Illumina, Inc. (United States)(1) | | | 5,419 | | | | 2,005,030 | | | | 1.4 | % |
Wuxi Biologics Cayman, Inc. (China)(1)(2) | | | 394,209 | | | | 5,227,741 | | | | 3.8 | % |
| | | | | | | | 7,232,771 | | | | 5.2 | % |
| Multi-Line Insurance | | | | | | | | | | | | |
| Fairfax Financial Holdings Ltd. (Canada) | | | 8,115 | | | | 2,765,883 | | | | 2.0 | % |
| Other Diversified Financial Services | | | | | | | | | | | | |
| Charles Schwab Corp. (United States) | | | 77,112 | | | | 4,090,020 | | | | 2.9 | % |
| Pharmaceuticals | | | | | | | | | | | | |
| Bristol-Myers Squibb Company (United States) | | | 15,270 | | | | 947,198 | | | | 0.7 | % |
| Novo Nordisk A/S – ADR (Denmark) | | | 57,676 | | | | 4,028,669 | | | | 2.9 | % |
| | | | | | | | 4,975,867 | | | | 3.6 | % |
| Regional Banks | | | | | | | | | | | | |
HDFC Bank Ltd. – ADR (India)(1) | | | 60,085 | | | | 4,341,742 | | | | 3.1 | % |
SVB Financial Group (United States)(1) | | | 16,405 | | | | 6,362,352 | | | | 4.6 | % |
| | | | | | | | 10,704,094 | | | | 7.7 | % |
| Renewable Electricity | | | | | | | | | | | | |
| Brookfield Renewable Corp. (Canada) | | | 68,543 | | | | 3,993,971 | | | | 2.9 | % |
The accompanying notes are an integral part of these financial statements.
Chautauqua Global Growth Fund
Schedule of Investments, December 31, 2020
Common Stocks (cont.)
| | | | | | | | | % of | |
| | | Shares | | | Value | | | Net Assets | |
| Semiconductor Equipment | | | | | | | | | |
| ASML Holding NV (Netherlands) | | | 5,744 | | | $ | 2,801,464 | | | | 2.0 | % |
| Semiconductors | | | | | | | | | | | | |
AMS AG (Austria)(1)(2) | | | 47,955 | | | | 1,044,912 | | | | 0.8 | % |
| Nvidia Corp. (United States) | | | 2,992 | | | | 1,562,422 | | | | 1.1 | % |
| Taiwan Semiconductor | | | | | | | | | | | | |
| Manufacturing Co. Ltd. – ADR (Taiwan) | | | 33,529 | | | | 3,656,002 | | | | 2.6 | % |
| | | | | | | | 6,263,336 | | | | 4.5 | % |
| Semiconductors & Semiconductor Equipment | | | | | | | | | | | | |
SolarEdge Technologies, Inc. (Israel)(1) | | | 5,866 | | | | 1,871,958 | | | | 1.3 | % |
| Software | | | | | | | | | | | | |
Alteryx, Inc. (United States)(1) | | | 8,991 | | | | 1,095,014 | | | | 0.8 | % |
| Total Common Stocks | | | | | | | | | | | | |
| (Cost $90,815,667) | | | | | | | 132,322,014 | | | | 95.2 | % |
| Short-Term Investment | | | | | | | | | | | | |
| Money Market Mutual Fund | | | | | | | | | | | | |
| First American Government | | | | | | | | | | | | |
Obligations Fund, Class U, 0.04%(3) | | | 5,109,380 | | | | 5,109,380 | | | | 3.7 | % |
| Total Short-Term Investment | | | | | | | | | | | | |
| (Cost $5,109,380) | | | | | | | 5,109,380 | | | | 3.7 | % |
| Total Investments | | | | | | | | | | | | |
| (Cost $95,925,047) | | | | | | | 137,431,394 | | | | 98.9 | % |
| Other Assets in Excess of Liabilities | | | | | | | 1,587,556 | | | | 1.1 | % |
| TOTAL NET ASSETS | | | | | | $ | 139,018,950 | | | | 100.0 | % |
Notes to Schedule of Investments
| (1) | Non-Income Producing. |
| (2) | Level 2 security – See Note 2a to the financial statements. |
| (3) | Seven-Day Yield. |
ADR – American Depository Receipt
Industry classifications shown in the Schedule of Investments are based off of the Global Industry Classification Standard (GICS®). GICS® was developed by and/or is the exclusive property of MSCI, Inc. (“MSCI”) and Standard & Poor’s Financial Services LLC (“S&P”). GICS® is a service mark of MSCI and S&P and has been licensed for use by U.S. Bancorp Fund Services, LLC.
The accompanying notes are an integral part of these financial statements.
Chautauqua Global Growth Fund
Summary of Fair Value Exposure at December 31, 2020
The Fund has adopted authoritative fair valuation accounting standards which establish a definition of fair value and set out a hierarchy for measuring fair value. These standards require additional disclosures about the various inputs and valuation techniques used to develop the measurements of fair value and a discussion on changes in valuation techniques and related inputs during the period. These standards define fair value as the price that would be received to sell an asset or paid to transfer a liability in an orderly transaction between market participants at the measurement date.
The fair value hierarchy is organized into three levels based upon the assumptions (referred to as “inputs”) used in pricing the asset or liability. These standards state that “observable inputs” reflect the assumptions market participants would use in pricing the asset or liability based on market data obtained from independent sources and “unobservable inputs” reflect an entity’s own assumptions about the assumptions market participants would use in pricing the asset or liability. These inputs are summarized into three broad levels and described below:
| Level 1 – | Quoted prices (unadjusted) in active markets for identical assets or liabilities that the reporting entity can access at the measurement date. |
| Level 2 – | Inputs other than quoted prices included within Level 1 that are observable for the asset or liability, either directly or indirectly. |
| Level 3 – | Unobservable inputs for the asset or liability. |
The inputs or methodology used for valuing securities are not necessarily an indication of the risk associated with investing in those securities.
The following is a summary of the inputs used to value the Fund’s investments as of December 31, 2020:
| | | Level 1 | | | Level 2 | | | Level 3 | | | Total | |
| Equity | | | | | | | | | | | | |
| Common Stocks | | $ | 85,246,640 | | | $ | 47,075,374 | | | $ | — | | | $ | 132,322,014 | |
| Total Equity | | | 85,246,640 | | | | 47,075,374 | | | | — | | | | 132,322,014 | |
| Short-Term Investment | | | | | | | | | | | | | | | | |
| Money Market Mutual Fund | | | 5,109,380 | | | | — | | | | — | | | | 5,109,380 | |
| Total Short-Term Investment | | | 5,109,380 | | | | — | | | | — | | | | 5,109,380 | |
| Total Investments* | | $ | 90,356,020 | | | $ | 47,075,374 | | | $ | — | | | $ | 137,431,394 | |
| * | Additional information regarding the industry classifications of these investments is disclosed in the Schedule of Investments. |
Changes in valuation techniques may result in transfers into or out of assigned levels within the fair value hierarchy. There were no transfers into or out of Level 3 during the reporting period, as compared to the security classifications from the prior year’s annual report. See the Fund’s Valuation Policy in Note 2a to the financial statements.
The accompanying notes are an integral part of these financial statements.
Additional Information on Fund Expenses
December 31, 2020 (Unaudited)
Example
As a shareholder of a mutual fund, you incur two types of costs: (1) transaction costs, which may include sales charges (loads) on purchase payments, reinvested dividends, or other distributions; redemption fees; and exchange fees; and (2) ongoing costs, such as management fees; distribution and/or service (12b-1) fees; and other fund expenses. With the exception of the Chautauqua International Growth and Chautauqua Global Growth Funds, which charge redemption fees, the Funds do not charge any sales loads, redemption fees or other transaction fees; however, you will be assessed fees for outgoing wire transfers, returned checks and stop payment orders at prevailing rates charged by U.S. Bancorp Fund Services, LLC, doing business as U.S. Bank Global Fund Services, the Funds’ transfer agent. If you request that a redemption be made by wire transfer, currently the Funds’ transfer agent charges a $15.00 fee.
This Example is intended to help you understand your ongoing costs (in dollars) of investing in each Fund and to compare these costs with the ongoing costs of investing in other mutual funds. The Example is based on an investment of $1,000 invested at the beginning of the period and held for the entire period (7/1/20 – 12/31/20).
Actual Expenses
The third and fourth columns of the following table provide information about account values based on actual returns and actual expenses. You may use the information in these columns, together with the amount you invested, to estimate the expenses that you paid over the period. Simply divide your account value by $1,000 (for example, an $8,600 account value divided by $1,000 = 8.6), then multiply the result by the number in the fourth column entitled “Expenses Paid During Period” to estimate the expenses you paid on your account during this period.
Hypothetical Example for Comparison Purposes
The fifth and sixth columns of the following table provide information about hypothetical account values and hypothetical expenses based on the Funds’ actual expense ratios and an assumed rate of return of 5% per year before expenses, which is not the Funds’ actual return. The hypothetical account values and expenses may not be used to estimate the actual ending account balance or expenses you paid for the period. You may use this information to compare the ongoing costs of investing in the Funds and other mutual funds. To do so, compare this 5% hypothetical example with the 5% hypothetical examples that appear in the shareholder reports of the other mutual funds. Please note that the expenses shown in the table are meant to highlight your ongoing costs only and do not reflect any transactional costs. Therefore, the sixth column of the table (entitled “Expenses Paid During Period”) is useful in comparing ongoing costs only, and will not help you determine the relative total costs of owning different mutual funds. In addition, if these transactional costs were included, your costs could have been higher.
Additional Information on Fund Expenses
December 31, 2020 (Unaudited)
Actual vs. Hypothetical Returns
For the Six Months Ended December 31, 2020
| | | | | | Hypothetical |
| | | | | | (5% return |
| | | | Actual | before expenses) |
| | Fund’s | Beginning | Ending | Expenses | Ending | Expenses |
| | Annualized | Account | Account | Paid | Account | Paid |
| | Expense | Value | Value | During | Value | During |
| | Ratio(1) | 7/1/20 | 12/31/20 | Period(1) | 12/31/20 | Period(1) |
| Baird MidCap Fund | | | | | | |
| Institutional Class | 0.82% | $1,000.00 | $1,290.60 | $4.72 | $1,021.01 | $4.17 |
| Investor Class | 1.07% | $1,000.00 | $1,288.20 | $6.15 | $1,019.76 | $5.43 |
| | | | | | | |
| Baird Small/Mid Cap | | | | | | |
| Growth Fund | | | | | | |
| Institutional Class | 0.85% | $1,000.00 | $1,329.60 | $4.98 | $1,020.86 | $4.32 |
| Investor Class | 1.10% | $1,000.00 | $1,325.10 | $6.43 | $1,019.61 | $5.58 |
| | | | | | | |
| Baird Small/Mid Cap | | | | | | |
| Value Fund | | | | | | |
| Institutional Class | 0.85% | $1,000.00 | $1,231.80 | $4.77 | $1,020.86 | $4.32 |
| Investor Class | 1.10% | $1,000.00 | $1,228.80 | $6.16 | $1,019.61 | $5.58 |
| | | | | | | |
| Baird SmallCap | | | | | | |
| Value Fund | | | | | | |
| Institutional Class | 0.95% | $1,000.00 | $1,253.80 | $5.38 | $1,020.36 | $4.82 |
| Investor Class | 1.20% | $1,000.00 | $1,251.70 | $6.79 | $1,019.10 | $6.09 |
| | | | | | | |
| Chautauqua International | | | | | | |
| Growth Fund | | | | | | |
| Institutional Class | 0.80% | $1,000.00 | $1,335.90 | $4.70 | $1,021.11 | $4.06 |
| Investor Class | 1.05% | $1,000.00 | $1,333.40 | $6.16 | $1,019.86 | $5.33 |
| | | | | | | |
| Chautauqua Global | | | | | | |
| Growth Fund | | | | | | |
| Institutional Class | 0.80% | $1,000.00 | $1,297.30 | $4.62 | $1,021.11 | $4.06 |
| Investor Class | 1.05% | $1,000.00 | $1,294.70 | $6.06 | $1,019.86 | $5.33 |
| (1) | Expenses are equal to the Fund’s annualized net expense ratio multiplied by the average account value over the period, 184 days and divided by 366 to reflect the one-half year period. |
Statements of Assets and Liabilities
December 31, 2020
| | | | | | Baird | |
| | | Baird | | | Small/Mid | |
| | | MidCap | | | Cap Growth | |
| | | Fund | | | Fund | |
| ASSETS: | | | | | | |
| Investments, at value (cost $1,260,670,865 | | | | | | |
| and $38,841,556, respectively) | | $ | 2,271,960,614 | | | $ | 52,940,677 | |
| Dividends receivable | | | 184,363 | | | | 6,313 | |
| Interest receivable | | | 1,575 | | | | 74 | |
| Receivable for Fund shares sold | | | 2,497,815 | | | | 223,087 | |
| Prepaid expenses and other assets | | | 28,497 | | | | 13,199 | |
| Total assets | | | 2,274,672,864 | | | | 53,183,350 | |
| LIABILITIES: | | | | | | | | |
| Payable for securities purchased | | | 3,653,445 | | | | 1,319,828 | |
| Payable for Fund shares redeemed | | | 3,548,382 | | | | 1,952 | |
| Payable to Advisor, net (Note 5) | | | 1,398,348 | | | | 18,962 | |
| Payable to Directors | | | 13,310 | | | | 13,310 | |
| Accrued fund accounting and administration fees | | | 29,186 | | | | 5,117 | |
| Accrued shareholder servicing fees | | | 106,868 | | | | 2,766 | |
| Accrued professional fees | | | 1,929 | | | | 1,929 | |
| Accrued custody fees | | | 4,171 | | | | 2,445 | |
| Accrued Rule 12b-1 fees (Note 7) | | | 72,912 | | | | 171 | |
| Accrued expenses and other liabilities | | | 18,635 | | | | 2,199 | |
| Total liabilities | | | 8,847,186 | | | | 1,368,679 | |
| NET ASSETS | | $ | 2,265,825,678 | | | $ | 51,814,671 | |
| NET ASSETS CONSIST OF: | | | | | | | | |
| Paid-in capital | | $ | 1,208,438,450 | | | $ | 36,704,869 | |
| Total distributable earnings | | | 1,057,387,228 | | | | 15,109,802 | |
| NET ASSETS | | $ | 2,265,825,678 | | | $ | 51,814,671 | |
| INSTITUTIONAL CLASS SHARES | | | | | | | | |
| Net Assets | | $ | 2,065,521,329 | | | $ | 51,153,659 | |
| Shares outstanding ($0.01 par value, | | | | | | | | |
| unlimited shares authorized) | | | 73,335,285 | | | | 2,941,923 | |
| Net asset value, offering and redemption price per share | | $ | 28.17 | | | $ | 17.39 | |
| INVESTOR CLASS SHARES | | | | | | | | |
| Net Assets | | $ | 200,304,349 | | | $ | 661,012 | |
| Shares outstanding ($0.01 par value, | | | | | | | | |
| unlimited shares authorized) | | | 7,638,735 | | | | 38,317 | |
| Net asset value, offering and redemption price per share | | $ | 26.22 | | | $ | 17.25 | |
The accompanying notes are an integral part of these financial statements.
Statements of Assets and Liabilities
December 31, 2020
| | | Baird | | | | |
| | | Small/Mid | | | Baird | |
| | | Cap Value | | | SmallCap | |
| | | Fund | | | Value Fund | |
| ASSETS: | | | | | | |
| Investments, at value (cost $18,903,829 | | | | | | |
| and $21,754,791, respectively) | | $ | 23,415,471 | | | $ | 30,654,862 | |
| Dividends receivable | | | 18,146 | | | | 42,285 | |
| Interest receivable | | | 14 | | | | 13 | |
| Receivable for Fund shares sold | | | 35,457 | | | | 39,800 | |
| Receivable from Advisor, net (Note 5) | | | 400 | | | | — | |
| Prepaid expenses and other assets | | | 18,312 | | | | 21,754 | |
| Total assets | | | 23,487,800 | | | | 30,758,714 | |
| LIABILITIES: | | | | | | | | |
| Payable for securities purchased | | | 353,703 | | | | — | |
| Payable to Advisor, net (Note 5) | | | — | | | | 4,429 | |
| Payable to Directors | | | 13,310 | | | | 13,310 | |
| Accrued fund accounting and administration fees | | | 5,533 | | | | 6,141 | |
| Accrued shareholder servicing fees | | | 3,047 | | | | 7,485 | |
| Accrued professional fees | | | 1,929 | | | | 1,928 | |
| Accrued custody fees | | | 216 | | | | 58 | |
| Accrued Rule 12b-1 fees (Note 7) | | | 32 | | | | 515 | |
| Accrued expenses and other liabilities | | | 764 | | | | 793 | |
| Total liabilities | | | 378,534 | | | | 34,659 | |
| NET ASSETS | | $ | 23,109,266 | | | $ | 30,724,055 | |
| NET ASSETS CONSIST OF: | | | | | | | | |
| Paid-in capital | | $ | 19,893,873 | | | $ | 23,950,109 | |
| Total distributable earnings | | | 3,215,393 | | | | 6,773,946 | |
| NET ASSETS | | $ | 23,109,266 | | | $ | 30,724,055 | |
| INSTITUTIONAL CLASS SHARES | | | | | | | | |
| Net Assets | | $ | 23,030,200 | | | $ | 30,428,369 | |
| Shares outstanding ($0.01 par value, | | | | | | | | |
| unlimited shares authorized) | | | 1,873,425 | | | | 1,955,517 | |
| Net asset value, offering and redemption price per share | | $ | 12.29 | | | $ | 15.56 | |
| INVESTOR CLASS SHARES | | | | | | | | |
| Net Assets | | $ | 79,066 | | | $ | 295,686 | |
| Shares outstanding ($0.01 par value, | | | | | | | | |
| unlimited shares authorized) | | | 6,440 | | | | 19,047 | |
| Net asset value, offering and redemption price per share | | $ | 12.28 | | | $ | 15.52 | |
The accompanying notes are an integral part of these financial statements.
Statements of Assets and Liabilities
December 31, 2020
| | | Chautauqua | | | Chautauqua | |
| | | International | | | Global | |
| | | Growth Fund | | | Growth Fund | |
| ASSETS: | | | | | | |
| Investments, at value (cost $214,516,257 | | | | | | |
| and $95,925,047, respectively) | | $ | 321,591,639 | | | $ | 137,431,394 | |
| Foreign currency, at value (cost $780,597 | | | | | | | | |
| and $137,515, respectively) | | | 781,385 | | | | 139,014 | |
| Dividends receivable | | | 168,147 | | | | 56,285 | |
| Interest receivable | | | 594 | | | | 239 | |
| Receivable for Fund shares sold | | | 592,790 | | | | 1,622,655 | |
| Uninvested cash | | | 38,074 | | | | 15,758 | |
| Prepaid expenses and other assets | | | 22,542 | | | | 19,853 | |
| Total assets | | | 323,195,171 | | | | 139,285,198 | |
| LIABILITIES: | | | | | | | | |
| Payable for Fund shares redeemed | | | 4,592 | | | | 5,075 | |
| Payable to Advisor, net (Note 5) | | | 175,313 | | | | 64,910 | |
| Payable to directors | | | 13,310 | | | | 13,310 | |
| Accrued fund accounting and administration fees | | | 9,138 | | | | 7,794 | |
| Accrued shareholder servicing fees | | | 11,215 | | | | 6,573 | |
| Accrued professional fees | | | 1,290 | | | | 1,290 | |
| Accrued custody fees | | | 8,746 | | | | 3,951 | |
| Accrued Rule 12b-1 fees (Note 7) | | | 204 | | | | 451 | |
| Deferred tax | | | 490,722 | | | | 158,120 | |
| Accrued expenses and other liabilities | | | 9,533 | | | | 4,774 | |
| Total liabilities | | | 724,063 | | | | 266,248 | |
| NET ASSETS | | $ | 322,471,108 | | | $ | 139,018,950 | |
| NET ASSETS CONSIST OF: | | | | | | | | |
| Paid-in capital | | $ | 221,346,226 | | | $ | 99,256,074 | |
| Total distributable earnings | | | 101,124,882 | | | | 39,762,876 | |
| NET ASSETS | | $ | 322,471,108 | | | $ | 139,018,950 | |
| INSTITUTIONAL CLASS SHARES | | | | | | | | |
| Net Assets | | $ | 321,773,703 | | | $ | 137,342,222 | |
| Shares outstanding ($0.01 par value, | | | | | | | | |
| unlimited shares authorized) | | | 18,381,431 | | | | 6,920,329 | |
| Net asset value, offering and redemption price per share | | $ | 17.51 | | | $ | 19.85 | |
| INVESTOR CLASS SHARES | | | | | | | | |
| Net Assets | | $ | 697,405 | | | $ | 1,676,728 | |
| Shares outstanding ($0.01 par value, | | | | | | | | |
| unlimited shares authorized) | | | 39,895 | | | | 84,961 | |
| Net asset value, offering and redemption price per share | | $ | 17.48 | | | $ | 19.74 | |
The accompanying notes are an integral part of these financial statements.
Statements of Operations
Year Ended December 31, 2020
| | | | | | Baird | |
| | | Baird | | | Small/Mid | |
| | | MidCap | | | Cap Growth | |
| | | Fund | | | Fund | |
| INVESTMENT INCOME: | | | | | | |
| Dividends | | $ | 8,831,101 | | | $ | 129,639 | |
| Interest | | | 215,483 | | | | 3,935 | |
| Total investment income | | | 9,046,584 | | | | 133,574 | |
| | | | | | | | | |
| EXPENSES: | | | | | | | | |
| Investment advisory fees (Note 5) | | | 14,508,524 | | | | 225,664 | |
| Shareholder servicing fees | | | 803,153 | | | | 17,885 | |
| Fund accounting and administration fees | | | 168,328 | | | | 32,150 | |
| Federal and state registration fees | | | 71,764 | | | | 56,113 | |
| Directors fees | | | 59,571 | | | | 59,571 | |
| Reports to shareholders | | | 69,090 | | | | 1,472 | |
| Professional fees | | | 27,930 | | | | 28,625 | |
| Custody fees | | | 26,812 | | | | 8,361 | |
| Interest expense (Note 6) | | | 30,545 | | | | 2 | |
| Miscellaneous expenses | | | 2,049 | | | | 195 | |
| Rule 12b-1 fees – Investor Class Shares (Note 7) | | | 406,855 | | | | 750 | |
| Total expenses | | | 16,174,621 | | | | 430,788 | |
| Fee waiver by Advisor (Note 5) | | | — | | | | (174,285 | ) |
| Net expenses | | | 16,174,621 | | | | 256,503 | |
| NET INVESTMENT LOSS | | | (7,128,037 | ) | | | (122,929 | ) |
| | | | | | | | | |
| REALIZED AND UNREALIZED GAIN ON INVESTMENTS: | | | | | | | | |
| Net realized gain on investments | | | 291,556,478 | | | | 2,179,765 | |
| Net change in unrealized appreciation on investments | | | 318,460,636 | | | | 11,277,721 | |
| Net realized and unrealized gain on investments | | | 610,017,114 | | | | 13,457,486 | |
| NET INCREASE IN NET ASSETS | | | | | | | | |
| RESULTING FROM OPERATIONS | | $ | 602,889,077 | | | $ | 13,334,557 | |
The accompanying notes are an integral part of these financial statements.
Statements of Operations
Year Ended December 31, 2020
| | | Baird | | | | |
| | | Small/Mid | | | Baird | |
| | | Cap Value | | | SmallCap | |
| | | Fund | | | Value Fund | |
| INVESTMENT INCOME: | | | | | | |
| Dividends (net of issuance fees and/or foreign taxes | | | | | | |
| withheld of $2,518 and $5,647, respectively) | | $ | 340,801 | | | $ | 298,411 | |
| Interest | | | 4,522 | | | | 6,006 | |
| Other income | | | 701 | | | | 1,347 | |
| Total investment income | | | 346,024 | | | | 305,764 | |
| | | | | | | | | |
| EXPENSES: | | | | | | | | |
| Investment advisory fees (Note 5) | | | 158,831 | | | | 224,344 | |
| Directors fees | | | 59,571 | | | | 59,571 | |
| Federal and state registration fees | | | 47,291 | | | | 53,254 | |
| Fund accounting and administration fees | | | 34,567 | | | | 35,393 | |
| Professional fees | | | 27,946 | | | | 28,103 | |
| Shareholder servicing fees | | | 18,634 | | | | 28,417 | |
| Reports to shareholders | | | 1,541 | | | | 1,618 | |
| Custody fees | | | 1,256 | | | | 1,423 | |
| Miscellaneous expenses | | | 411 | | | | 883 | |
| Rule 12b-1 fees – Investor Class Shares (Note 7) | | | 828 | | | | 1,323 | |
| Total expenses | | | 350,876 | | | | 434,329 | |
| Fee waiver by Advisor (Note 5) | | | (170,040 | ) | | | (182,269 | ) |
| Net expenses | | | 180,836 | | | | 252,060 | |
| NET INVESTMENT INCOME | | | 165,188 | | | | 53,704 | |
| | | | | | | | | |
| REALIZED AND UNREALIZED | | | | | | | | |
| GAIN (LOSS) ON INVESTMENTS: | | | | | | | | |
| Net realized loss on investments | | | (860,611 | ) | | | (2,166,119 | ) |
| Net change in unrealized appreciation on investments | | | 878,323 | | | | 2,348,969 | |
| Net realized and unrealized gain on investments | | | 17,712 | | | | 182,850 | |
| NET INCREASE IN NET ASSETS | | | | | | | | |
| RESULTING FROM OPERATIONS | | $ | 182,900 | | | $ | 236,554 | |
The accompanying notes are an integral part of these financial statements.
Statements of Operations
Year Ended December 31, 2020
| | | Chautauqua | | | Chautauqua | |
| | | International | | | Global | |
| | | Growth Fund | | | Growth Fund | |
| INVESTMENT INCOME: | | | | | | |
| Dividends (net of issuance fees and/or foreign taxes | | | | | | |
| withheld of $253,944 and $60,466, respectively) | | $ | 1,850,132 | | | $ | 531,460 | |
| Interest | | | 46,571 | | | | 14,934 | |
| Other income | | | 4,362 | | | | 1,018 | |
| Total investment income | | | 1,901,065 | | | | 547,412 | |
| | | | | | | | | |
| EXPENSES: | | | | | | | | |
| Investment advisory fees (Note 5) | | | 1,631,915 | | | | 647,641 | |
| Federal and state registration fees | | | 60,973 | | | | 55,522 | |
| Directors fees | | | 59,571 | | | | 59,571 | |
| Fund accounting and administration fees | | | 54,329 | | | | 45,985 | |
| Shareholder servicing fees | | | 60,680 | | | | 32,327 | |
| Custody fees | | | 46,984 | | | | 24,801 | |
| Professional fees | | | 31,273 | | | | 31,153 | |
| Reports to shareholders | | | 6,367 | | | | 3,092 | |
| Miscellaneous expenses | | | 2,513 | | | | 655 | |
| Rule 12b-1 fees – Investor Class Shares (Note 7) | | | 2,571 | | | | 3,902 | |
| Total expenses | | | 1,957,176 | | | | 904,649 | |
| Fee waiver by Advisor (Note 5) | | | (213,896 | ) | | | (209,930 | ) |
| Net expenses | | | 1,743,280 | | | | 694,719 | |
| NET INVESTMENT INCOME (LOSS) | | | 157,785 | | | | (147,307 | ) |
| | | | | | | | | |
| REALIZED AND UNREALIZED | | | | | | | | |
| GAIN (LOSS) ON INVESTMENTS AND | | | | | | | | |
| FOREIGN CURRENCY TRANSLATION: | | | | | | | | |
| Net realized gain (loss) on investments | | | | | | | | |
| (net of foreign taxes withheld of $676 and $0, respectively) | | | 3,840,351 | | | | (666,978 | ) |
| Net realized gain on foreign currency translation | | | 1,689 | | | | 28,534 | |
| Net change in unrealized appreciation on investments | | | 81,505,309 | | | | 34,020,688 | |
| Net change in unrealized appreciation | | | | | | | | |
| (depreciation) on foreign currency translation | | | 5,661 | | | | (3,704 | ) |
| Net realized and unrealized gain on investments | | | 85,353,010 | | | | 33,378,540 | |
| NET INCREASE IN NET ASSETS | | | | | | | | |
| RESULTING FROM OPERATIONS | | $ | 85,510,795 | | | $ | 33,231,233 | |
The accompanying notes are an integral part of these financial statements.
Statements of Changes in Net Assets
Baird MidCap Fund
| | | Year Ended | | | Year Ended | |
| | | December 31, 2020 | | | December 31, 2019 | |
| OPERATIONS: | | | | | | |
| Net investment loss | | $ | (7,128,037 | ) | | $ | (1,758,440 | ) |
| Net realized gain on investments | | | 291,556,478 | | | | 113,591,259 | |
| Net change in unrealized appreciation on investments | | | 318,460,636 | | | | 445,197,148 | |
| Net increase in net assets resulting from operations | | | 602,889,077 | | | | 557,029,967 | |
| | | | | | | | | |
| CAPITAL SHARE TRANSACTIONS: | | | | | | | | |
| Proceeds from shares sold | | | 462,769,490 | | | | 658,933,497 | |
| Shares issued to holders in reinvestment of distributions | | | 163,266,379 | | | | 92,604,419 | |
| Cost of shares redeemed | | | (736,918,649 | ) | | | (650,544,300 | ) |
| Net increase (decrease) in net assets resulting | | | | | | | | |
| from capital share transactions | | | (110,882,780 | ) | | | 100,993,616 | |
| | | | | | | | | |
| DISTRIBUTIONS TO SHAREHOLDERS: | | | | | | | | |
| Net distributions to shareholders: | | | | | | | | |
| Institutional Class | | | (181,775,657 | ) | | | (109,134,740 | ) |
| Investor Class | | | (18,567,375 | ) | | | (7,559,012 | ) |
| Total net distributions to shareholders | | | (200,343,032 | ) | | | (116,693,752 | ) |
| | | | | | | | | |
| TOTAL INCREASE IN NET ASSETS | | | 291,663,265 | | | | 541,329,831 | |
| | | | | | | | | |
| NET ASSETS: | | | | | | | | |
| Beginning of year | | | 1,974,162,413 | | | | 1,432,832,582 | |
| End of year | | $ | 2,265,825,678 | | | $ | 1,974,162,413 | |
The accompanying notes are an integral part of these financial statements.
Statements of Changes in Net Assets
Baird Small/Mid Cap Growth Fund
| | | Year Ended | | | Year Ended | |
| | | December 31, 2020 | | | December 31, 2019 | |
| OPERATIONS: | | | | | | |
| Net investment loss | | $ | (122,929 | ) | | $ | (32,973 | ) |
| Net realized gain (loss) on investments | | | 2,179,765 | | | | (32,734 | ) |
| Net change in unrealized appreciation on investments | | | 11,277,721 | | | | 3,511,422 | |
| Net increase in net assets resulting from operations | | | 13,334,557 | | | | 3,445,715 | |
| | | | | | | | | |
| CAPITAL SHARE TRANSACTIONS: | | | | | | | | |
| Proceeds from shares sold | | | 24,212,271 | | | | 9,941,887 | |
| Shares issued to holders in reinvestment of distributions | | | 916,495 | | | | — | |
| Cost of shares redeemed | | | (4,275,076 | ) | | | (2,104,855 | ) |
| Net increase in net assets resulting | | | | | | | | |
| from capital share transactions | | | 20,853,690 | | | | 7,837,032 | |
| | | | | | | | | |
| DISTRIBUTIONS TO SHAREHOLDERS: | | | | | | | | |
| Net distributions to shareholders: | | | | | | | | |
| Institutional Class | | | (934,480 | ) | | | — | |
| Investor Class | | | (11,948 | ) | | | — | |
| Total net distributions to shareholders | | | (946,428 | ) | | | — | |
| | | | | | | | | |
| TOTAL INCREASE IN NET ASSETS | | | 33,241,819 | | | | 11,282,747 | |
| | | | | | | | | |
| NET ASSETS: | | | | | | | | |
| Beginning of year | | | 18,572,852 | | | | 7,290,105 | |
| End of year | | $ | 51,814,671 | | | $ | 18,572,852 | |
The accompanying notes are an integral part of these financial statements.
Statements of Changes in Net Assets
Baird Small/Mid Cap Value Fund
| | | Year Ended | | | Year Ended | |
| | | December 31, 2020 | | | December 31, 2019 | |
| OPERATIONS: | | | | | | |
| Net investment income | | $ | 165,188 | | | $ | 228,828 | |
| Net realized gain (loss) on investments | | | (860,611 | ) | | | 346,989 | |
| Net change in unrealized appreciation on investments | | | 878,323 | | | | 2,878,359 | |
| Net increase in net assets resulting from operations | | | 182,900 | | | | 3,454,176 | |
| | | | | | | | | |
| CAPITAL SHARE TRANSACTIONS: | | | | | | | | |
| Proceeds from shares sold | | | 7,507,607 | | | | 6,171,911 | |
| Shares issued to holders in reinvestment of distributions | | | 137,203 | | | | 167,707 | |
| Cost of shares redeemed | | | (9,442,201 | ) | | | (2,097,080 | ) |
| Net increase (decrease) in net assets resulting | | | | | | | | |
| from capital share transactions | | | (1,797,391 | ) | | | 4,242,538 | |
| | | | | | | | | |
| DISTRIBUTIONS TO SHAREHOLDERS: | | | | | | | | |
| Net distributions to shareholders: | | | | | | | | |
| Institutional Class | | | (163,070 | ) | | | (208,297 | ) |
| Investor Class | | | (50 | ) | | | (3,681 | ) |
| Total net distributions to shareholders | | | (163,120 | ) | | | (211,978 | ) |
| | | | | | | | | |
| TOTAL INCREASE (DECREASE) IN NET ASSETS | | | (1,777,611 | ) | | | 7,484,736 | |
| | | | | | | | | |
| NET ASSETS: | | | | | | | | |
| Beginning of year | | | 24,886,877 | | | | 17,402,141 | |
| End of year | | $ | 23,109,266 | | | $ | 24,886,877 | |
The accompanying notes are an integral part of these financial statements.
Statements of Changes in Net Assets
Baird SmallCap Value Fund
| | | Year Ended | | | Year Ended | |
| | | December 31, 2020 | | | December 31, 2019 | |
| OPERATIONS: | | | | | | |
| Net investment income | | $ | 53,704 | | | $ | 284,077 | |
| Net realized gain (loss) on investments | | | (2,166,119 | ) | | | 2,315,161 | |
| Net change in unrealized appreciation on investments | | | 2,348,969 | | | | 2,792,139 | |
| Net increase in net assets resulting from operations | | | 236,554 | | | | 5,391,377 | |
| | | | | | | | | |
| CAPITAL SHARE TRANSACTIONS: | | | | | | | | |
| Proceeds from shares sold | | | 4,992,494 | | | | 4,097,702 | |
| Shares issued to holders in reinvestment of distributions | | | 1,383,444 | | | | 184,267 | |
| Cost of shares redeemed | | | (8,125,553 | ) | | | (5,124,745 | ) |
| Net decrease in net assets resulting | | | | | | | | |
| from capital share transactions | | | (1,749,615 | ) | | | (842,776 | ) |
| | | | | | | | | |
| DISTRIBUTIONS TO SHAREHOLDERS: | | | | | | | | |
| Net distributions to shareholders: | | | | | | | | |
| Institutional Class | | | (1,581,926 | ) | | | (223,517 | ) |
| Investor Class | | | (14,822 | ) | | | (3,885 | ) |
| Total net distributions to shareholders | | | (1,596,748 | ) | | | (227,402 | ) |
| | | | | | | | | |
| TOTAL INCREASE (DECREASE) IN NET ASSETS | | | (3,109,809 | ) | | | 4,321,199 | |
| | | | | | | | | |
| NET ASSETS: | | | | | | | | |
| Beginning of year | | | 33,833,864 | | | | 29,512,665 | |
| End of year | | $ | 30,724,055 | | | $ | 33,833,864 | |
The accompanying notes are an integral part of these financial statements.
Statements of Changes in Net Assets
Chautauqua International Growth Fund
| | | Year Ended | | | Year Ended | |
| | | December 31, 2020 | | | December 31, 2019 | |
| OPERATIONS: | | | | | | |
| Net investment income | | $ | 157,785 | | | $ | 3,654,520 | |
| Net realized gain (loss) on investments | | | | | | | | |
| and foreign currency translation | | | 3,842,040 | | | | (6,741,312 | ) |
| Net change in unrealized appreciation | | | | | | | | |
| on investments and foreign currency translation | | | 81,510,970 | | | | 32,743,535 | |
| Net increase in net assets resulting from operations | | | 85,510,795 | | | | 29,656,743 | |
| | | | | | | | | |
| CAPITAL SHARE TRANSACTIONS: | | | | | | | | |
| Proceeds from shares sold | | | 91,388,589 | | | | 77,073,338 | |
| Shares issued to holders in reinvestment of distributions | | | 1,730,938 | | | | 2,901,751 | |
| Cost of shares redeemed | | | (28,256,851 | ) | | | (19,364,200 | ) |
| Redemption fees | | | 35,222 | | | | 32,973 | |
| Net increase in net assets resulting | | | | | | | | |
| from capital share transactions | | | 64,897,898 | | | | 60,643,862 | |
| | | | | | | | | |
| DISTRIBUTIONS TO SHAREHOLDERS: | | | | | | | | |
| Net distributions to shareholders: | | | | | | | | |
| Institutional Class | | | (2,104,798 | ) | | | (3,632,612 | ) |
| Investor Class | | | (1,953 | ) | | | (26,317 | ) |
| Total net distributions to shareholders | | | (2,106,751 | ) | | | (3,658,929 | ) |
| | | | | | | | | |
| TOTAL INCREASE IN NET ASSETS | | | 148,301,942 | | | | 86,641,676 | |
| | | | | | | | | |
| NET ASSETS: | | | | | | | | |
| Beginning of year | | | 174,169,166 | | | | 87,527,490 | |
| End of year | | $ | 322,471,108 | | | $ | 174,169,166 | |
The accompanying notes are an integral part of these financial statements.
Statements of Changes in Net Assets
Chautauqua Global Growth Fund
| | | Year Ended | | | Year Ended | |
| | | December 31, 2020 | | | December 31, 2019 | |
| OPERATIONS: | | | | | | |
| Net investment income (loss) | | $ | (147,307 | ) | | $ | 792,759 | |
| Net realized loss on investments | | | | | | | | |
| and foreign currency translation | | | (638,444 | ) | | | (157,584 | ) |
| Net change in unrealized appreciation | | | | | | | | |
| on investments and foreign currency translation | | | 34,016,984 | | | | 11,322,762 | |
| Net increase in net assets resulting from operations | | | 33,231,233 | | | | 11,957,937 | |
| | | | | | | | | |
| CAPITAL SHARE TRANSACTIONS: | | | | | | | | |
| Proceeds from shares sold | | | 62,986,909 | | | | 15,333,359 | |
| Shares issued to holders in reinvestment of distributions | | | 554,641 | | | | 688,936 | |
| Cost of shares redeemed | | | (14,586,110 | ) | | | (7,222,512 | ) |
| Redemption fees | | | 33,841 | | | | 3,722 | |
| Net increase in net assets resulting | | | | | | | | |
| from capital share transactions | | | 48,989,281 | | | | 8,803,505 | |
| | | | | | | | | |
| DISTRIBUTIONS TO SHAREHOLDERS: | | | | | | | | |
| Net distributions to shareholders: | | | | | | | | |
| Institutional Class | | | (635,729 | ) | | | (847,342 | ) |
| Investor Class | | | (4,036 | ) | | | (21,289 | ) |
| Total net distributions to shareholders | | | (639,765 | ) | | | (868,631 | ) |
| | | | | | | | | |
| TOTAL INCREASE IN NET ASSETS | | | 81,580,749 | | | | 19,892,811 | |
| | | | | | | | | |
| NET ASSETS: | | | | | | | | |
| Beginning of year | | | 57,438,201 | | | | 37,545,390 | |
| End of year | | $ | 139,018,950 | | | $ | 57,438,201 | |
The accompanying notes are an integral part of these financial statements.
Financial Highlights
Baird MidCap Fund – Institutional Class
| | | Year Ended December 31, | |
| | | 2020 | | | 2019 | | | 2018 | | | 2017 | | | 2016 | |
| Per Share Data: | | | | | | | | | | | | | | | |
| Net asset value, beginning of year | | $ | 22.90 | | | $ | 17.72 | | | $ | 19.16 | | | $ | 15.80 | | | $ | 14.99 | |
| Income from investment operations: | | | | | | | | | | | | | | | | | | | | |
Net investment loss(1) | | | (0.08 | ) | | | (0.02 | ) | | | (0.03 | ) | | | (0.03 | ) | | | (0.02 | ) |
| Net realized and unrealized | | | | | | | | | | | | | | | | | | | | |
| gains (losses) on investments | | | 7.99 | | | | 6.44 | | | | (0.30 | ) | | | 4.28 | | | | 0.83 | |
| Total from investment operations | | | 7.91 | | | | 6.42 | | | | (0.33 | ) | | | 4.25 | | | | 0.81 | |
| Less distributions: | | | | | | | | | | | | | | | | | | | | |
| Distributions from net realized gains | | | (2.64 | ) | | | (1.24 | ) | | | (1.11 | ) | | | (0.89 | ) | | | — | |
| Total distributions | | | (2.64 | ) | | | (1.24 | ) | | | (1.11 | ) | | | (0.89 | ) | | | — | |
| Net asset value, end of year | | $ | 28.17 | | | $ | 22.90 | | | $ | 17.72 | | | $ | 19.16 | | | $ | 15.80 | |
| Total return | | | 34.81 | % | | | 36.31 | % | | | (1.61 | )% | | | 26.88 | % | | | 5.40 | % |
| Supplemental data and ratios: | | | | | | | | | | | | | | | | | | | | |
| Net assets, end of year (millions) | | $ | 2,065.5 | | | $ | 1,825.8 | | | $ | 1,337.4 | | | $ | 1,279.6 | | | $ | 1,105.1 | |
| Ratio of expenses to average net assets | | | 0.82 | % | | | 0.82 | % | | | 0.81 | % | | | 0.83 | % | | | 0.82 | % |
| Ratio of net investment loss | | | | | | | | | | | | | | | | | | | | |
| to average net assets | | | (0.35 | )% | | | (0.07 | )% | | | (0.15 | )% | | | (0.17 | )% | | | (0.14 | )% |
Portfolio turnover rate(2) | | | 47 | % | | | 43 | % | | | 38 | % | | | 45 | % | | | 57 | % |
| (1) | Calculated using average shares outstanding during the year. |
| (2) | Portfolio turnover is calculated on the basis of the Fund as a whole without distinguishing between the classes of shares issued and excludes in-kind transactions, where applicable. |
The accompanying notes are an integral part of these financial statements.
Financial Highlights
Baird MidCap Fund – Investor Class
| | | Year Ended December 31, | |
| | | 2020 | | | 2019 | | | 2018 | | | 2017 | | | 2016 | |
| Per Share Data: | | | | | | | | | | | | | | | |
| Net asset value, beginning of year | | $ | 21.53 | | | $ | 16.76 | | | $ | 18.23 | | | $ | 15.10 | | | $ | 14.36 | |
| Income from investment operations: | | | | | | | | | | | | | | | | | | | | |
Net investment loss(1) | | | (0.14 | ) | | | (0.07 | ) | | | (0.08 | ) | | | (0.07 | ) | | | (0.06 | ) |
| Net realized and unrealized | | | | | | | | | | | | | | | | | | | | |
| gains (losses) on investments | | | 7.47 | | | | 6.08 | | | | (0.28 | ) | | | 4.09 | | | | 0.80 | |
| Total from investment operations | | | 7.33 | | | | 6.01 | | | | (0.36 | ) | | | 4.02 | | | | 0.74 | |
| Less distributions: | | | | | | | | | | | | | | | | | | | | |
| Distributions from net realized gains | | | (2.64 | ) | | | (1.24 | ) | | | (1.11 | ) | | | (0.89 | ) | | | — | |
| Total distributions | | | (2.64 | ) | | | (1.24 | ) | | | (1.11 | ) | | | (0.89 | ) | | | — | |
| Net asset value, end of year | | $ | 26.22 | | | $ | 21.53 | | | $ | 16.76 | | | $ | 18.23 | | | $ | 15.10 | |
| Total return | | | 34.32 | % | | | 35.94 | % | | | (1.86 | )% | | | 26.61 | % | | | 5.08 | % |
| Supplemental data and ratios: | | | | | | | | | | | | | | | | | | | | |
| Net assets, end of year (millions) | | $ | 200.3 | | | $ | 148.3 | | | $ | 95.5 | | | $ | 111.4 | | | $ | 137.2 | |
| Ratio of expenses to average net assets | | | 1.07 | % | | | 1.07 | % | | | 1.06 | % | | | 1.08 | % | | | 1.07 | % |
| Ratio of net investment loss | | | | | | | | | | | | | | | | | | | | |
| to average net assets | | | (0.60 | )% | | | (0.32 | )% | | | (0.40 | )% | | | (0.42 | )% | | | (0.39 | )% |
Portfolio turnover rate(2) | | | 47 | % | | | 43 | % | | | 38 | % | | | 45 | % | | | 57 | % |
| (1) | Calculated using average shares outstanding during the year. |
| (2) | Portfolio turnover is calculated on the basis of the Fund as a whole without distinguishing between the classes of shares issued and excludes in-kind transactions, where applicable. |
The accompanying notes are an integral part of these financial statements.
Financial Highlights
Baird Small/Mid Cap Growth Fund – Institutional Class
| | | | | | | | | Period Ended | |
| | | Year Ended December 31, | | | December 31, | |
| | | 2020 | | | 2019 | | | 2018(1) | |
| Per Share Data: | | | | | | | | | |
| Net asset value, beginning of period | | $ | 12.26 | | | $ | 8.95 | | | $ | 10.00 | |
| Income from investment operations: | | | | | | | | | | | | |
Net investment loss(2) | | | (0.06 | ) | | | (0.03 | ) | | | (0.00 | )(3) |
| Net realized and unrealized | | | | | | | | | | | | |
| gains (losses) on investments | | | 5.52 | | | | 3.34 | | | | (1.05 | ) |
| Total from investment operations | | | 5.46 | | | | 3.31 | | | | (1.05 | ) |
| Less distributions: | | | | | | | | | | | | |
| Distributions from net realized gains | | | (0.33 | ) | | | — | | | | — | |
| Total distributions | | | (0.33 | ) | | | — | | | | — | |
| Net asset value, end of period | | $ | 17.39 | | | $ | 12.26 | | | $ | 8.95 | |
| Total return | | | 44.57 | % | | | 36.98 | % | | | (10.50 | )%(4) |
| Supplemental data and ratios: | | | | | | | | | | | | |
| Net assets, end of period (millions) | | $ | 51.2 | | | $ | 18.3 | | | $ | 7.3 | |
| Ratio of expenses to average net assets | | | 0.85 | % | | | 0.85 | % | | | 0.85 | %(5) |
| Ratio of expenses to average | | | | | | | | | | | | |
| net assets (before waivers) | | | 1.43 | % | | | 2.10 | % | | | 3.88 | %(5) |
| Ratio of net investment loss | | | | | | | | | | | | |
| to average net assets | | | (0.41 | )% | | | (0.25 | )% | | | (0.03 | )%(5) |
| Ratio of net investment loss | | | | | | | | | | | | |
| to average net assets (before waivers) | | | (0.99 | )% | | | (1.50 | )% | | | (3.06 | )%(5) |
Portfolio turnover rate(6) | | | 65 | % | | | 60 | % | | | 9 | %(4) |
| (1) | Inception was close of business on October 31, 2018. |
| (2) | Calculated using average shares outstanding during the period. |
| (3) | Amount is less than $0.005. |
| (4) | Not annualized. |
| (5) | Annualized. |
| (6) | Portfolio turnover is calculated on the basis of the Fund as a whole without distinguishing between the classes of shares issued and excludes in-kind transactions, where applicable. |
The accompanying notes are an integral part of these financial statements.
Financial Highlights
Baird Small/Mid Cap Growth Fund – Investor Class
| | | | | | | | | Period Ended | |
| | | Year Ended December 31, | | | December 31, | |
| | | 2020 | | | 2019 | | | 2018(1) | |
| Per Share Data: | | | | | | | | | |
| Net asset value, beginning of period | | $ | 12.21 | | | $ | 8.94 | | | $ | 10.00 | |
| Income from investment operations: | | | | | | | | | | | | |
Net investment loss(2) | | | (0.09 | ) | | | (0.06 | ) | | | (0.00 | )(3) |
| Net realized and unrealized | | | | | | | | | | | | |
| gains (losses) on investments | | | 5.46 | | | | 3.33 | | | | (1.06 | ) |
| Total from investment operations | | | 5.37 | | | | 3.27 | | | | (1.06 | ) |
| Less distributions: | | | | | | | | | | | | |
| Distributions from net realized gains | | | (0.33 | ) | | | — | | | | — | |
| Total distributions | | | (0.33 | ) | | | — | | | | — | |
| Net asset value, end of period | | $ | 17.25 | | | $ | 12.21 | | | $ | 8.94 | |
| Total return | | | 43.89 | % | | | 36.69 | % | | | (10.60 | )%(4) |
| Supplemental data and ratios: | | | | | | | | | | | | |
| Net assets, end of period (thousands) | | $ | 661.0 | | | $ | 287.3 | | | $ | 8.9 | |
| Ratio of expenses to average net assets | | | 1.10 | % | | | 1.10 | % | | | 1.10 | %(5) |
| Ratio of expenses to average | | | | | | | | | | | | |
| net assets (before waivers) | | | 1.68 | % | | | 2.35 | % | | | 4.13 | %(5) |
| Ratio of net investment loss | | | | | | | | | | | | |
| to average net assets | | | (0.66 | )% | | | (0.50 | )% | | | (0.28 | )%(5) |
| Ratio of net investment loss | | | | | | | | | | | | |
| to average net assets (before waivers) | | | (1.24 | )% | | | (1.75 | )% | | | (3.31 | )%(5) |
Portfolio turnover rate(6) | | | 65 | % | | | 60 | % | | | 9 | %(4) |
| (1) | Inception was close of business on October 31, 2018. |
| (2) | Calculated using average shares outstanding during the period. |
| (3) | Amount is less than $0.005. |
| (4) | Not annualized. |
| (5) | Annualized. |
| (6) | Portfolio turnover is calculated on the basis of the Fund as a whole without distinguishing between the classes of shares issued and excludes in-kind transactions, where applicable. |
The accompanying notes are an integral part of these financial statements.
Financial Highlights
Baird Small/Mid Cap Value Fund – Institutional Class
| | | Year Ended December 31, | |
| | | 2020 | | | 2019 | | | 2018 | | | 2017 | | | 2016 | |
| Per Share Data: | | | | | | | | | | | | | | | |
| Net asset value, beginning of year | | $ | 12.32 | | | $ | 10.51 | | | $ | 12.43 | | | $ | 10.29 | | | $ | 9.52 | |
| Income from investment operations: | | | | | | | | | | | | | | | | | | | | |
Net investment income(1) | | | 0.08 | | | | 0.12 | | | | 0.04 | | | | 0.07 | | | | 0.13 | |
| Net realized and unrealized | | | | | | | | | | | | | | | | | | | | |
| gains (losses) on investments | | | (0.02 | )(5) | | | 1.80 | | | | (1.92 | ) | | | 2.14 | | | | 0.72 | |
| Total from investment operations | | | 0.06 | | | | 1.92 | | | | (1.88 | ) | | | 2.21 | | | | 0.85 | |
| Less distributions: | | | | | | | | | | | | | | | | | | | | |
| Distributions from net | | | | | | | | | | | | | | | | | | | | |
| investment income | | | (0.09 | ) | | | (0.11 | ) | | | (0.04 | ) | | | (0.07 | ) | | | (0.08 | ) |
| Distributions from net realized gains | | | — | | | | — | | | | (0.00 | )(2) | | | (0.00 | )(2) | | | — | |
| Total distributions | | | (0.09 | ) | | | (0.11 | ) | | | (0.04 | ) | | | (0.07 | ) | | | (0.08 | ) |
| Net asset value, end of year | | $ | 12.29 | | | $ | 12.32 | | | $ | 10.51 | | | $ | 12.43 | | | $ | 10.29 | |
| Total return | | | 0.48 | % | | | 18.23 | % | | | (15.11 | )% | | | 21.48 | % | | | 8.91 | % |
| Supplemental data and ratios: | | | | | | | | | | | | | | | | | | | | |
| Net assets, end of year (millions) | | $ | 23.0 | | | $ | 24.3 | | | $ | 17.1 | | | $ | 16.9 | | | $ | 11.9 | |
| Ratio of expenses to average net assets | | | 0.85 | % | | | 0.85 | % | | | 0.94 | %(3) | | | 0.95 | % | | | 0.95 | % |
| Ratio of expenses to average | | | | | | | | | | | | | | | | | | | | |
| net assets (before waivers) | | | 1.65 | % | | | 1.59 | % | | | 1.75 | % | | | 1.91 | % | | | 2.86 | % |
| Ratio of net investment income | | | | | | | | | | | | | | | | | | | | |
| to average net assets | | | 0.78 | % | | | 1.04 | % | | | 0.34 | % | | | 0.62 | % | | | 1.35 | % |
| Ratio of net investment income (loss) | | | | | | | | | | | | | | | | | | | | |
| to average net assets (before waivers) | | | (0.02 | )% | | | 0.30 | % | | | (0.47 | )% | | | (0.34 | )% | | | (0.56 | )% |
Portfolio turnover rate(4) | | | 84 | % | | | 37 | % | | | 34 | % | | | 60 | % | | | 38 | % |
| (1) | Calculated using average shares outstanding during the year. |
| (2) | Amount is less than $0.005. |
| (3) | Blended rate. Pursuant to the Expense Cap/Reimbursement Agreement effective December 1, 2018, the expense cap decreased to 0.85%. Prior to December 1, 2018, the expense cap was 0.95%. |
| (4) | Portfolio turnover is calculated on the basis of the Fund as a whole without distinguishing between the classes of shares issued and excludes in-kind transactions, where applicable. |
| (5) | Due to timing of capital share transactions, the per share amount of net realized and unrealized gain (loss) on investments varies from the amounts shown in the statement of operations. |
The accompanying notes are an integral part of these financial statements.
Financial Highlights
Baird Small/Mid Cap Value Fund – Investor Class
| | | Year Ended December 31, | |
| | | 2020 | | | 2019 | | | 2018 | | | 2017 | | | 2016 | |
| Per Share Data: | | | | | | | | | | | | | | | |
| Net asset value, beginning of year | | $ | 12.27 | | | $ | 10.48 | | | $ | 12.40 | | | $ | 10.28 | | | $ | 9.52 | |
| Income from investment operations: | | | | | | | | | | | | | | | | | | | | |
Net investment income(1) | | | 0.06 | | | | 0.09 | | | | 0.01 | | | | 0.04 | | | | 0.11 | |
| Net realized and unrealized | | | | | | | | | | | | | | | | | | | | |
| gains (losses) on investments | | | (0.04 | )(5) | | | 1.78 | | | | (1.90 | ) | | | 2.13 | | | | 0.71 | |
| Total from investment operations | | | 0.02 | | | | 1.87 | | | | (1.89 | ) | | | 2.17 | | | | 0.82 | |
| Less distributions: | | | | | | | | | | | | | | | | | | | | |
| Distributions from net | | | | | | | | | | | | | | | | | | | | |
| investment income | | | (0.01 | ) | | | (0.08 | ) | | | (0.03 | ) | | | (0.05 | ) | | | (0.06 | ) |
| Distributions from net realized gains | | | — | | | | — | | | | (0.00 | )(2) | | | (0.00 | )(2) | | | — | |
| Total distributions | | | (0.01 | ) | | | (0.08 | ) | | | (0.03 | ) | | | (0.05 | ) | | | (0.06 | ) |
| Net asset value, end of year | | $ | 12.28 | | | $ | 12.27 | | | $ | 10.48 | | | $ | 12.40 | | | $ | 10.28 | |
| Total return | | | 0.15 | % | | | 17.86 | % | | | (15.25 | )% | | | 21.08 | % | | | 8.64 | % |
| Supplemental data and ratios: | | | | | | | | | | | | | | | | | | | | |
| Net assets, end of year (thousands) | | $ | 79.1 | | | $ | 560.4 | | | $ | 341.5 | | | $ | 86.1 | | | $ | 53.2 | |
| Ratio of expenses to average net assets | | | 1.10 | % | | | 1.10 | % | | | 1.19 | %(3) | | | 1.20 | % | | | 1.20 | % |
| Ratio of expenses to average | | | | | | | | | | | | | | | | | | | | |
| net assets (before waivers) | | | 1.90 | % | | | 1.84 | % | | | 2.00 | % | | | 2.16 | % | | | 3.11 | % |
| Ratio of net investment income | | | | | | | | | | | | | | | | | | | | |
| to average net assets | | | 0.53 | % | | | 0.79 | % | | | 0.09 | % | | | 0.37 | % | | | 1.10 | % |
| Ratio of net investment income (loss) | | | | | | | | | | | | | | | | | | | | |
| to average net assets (before waivers) | | | (0.27 | )% | | | 0.05 | % | | | (0.72 | )% | | | (0.59 | )% | | | (0.81 | )% |
Portfolio turnover rate(4) | | | 84 | % | | | 37 | % | | | 34 | % | | | 60 | % | | | 38 | % |
| (1) | Calculated using average shares outstanding during the year. |
| (2) | Amount is less than $0.005. |
| (3) | Blended rate. Pursuant to the Expense Cap/Reimbursement Agreement effective December 1, 2018, the expense cap decreased to 1.10%. Prior to December 1, 2018, the expense cap was 1.20%. |
| (4) | Portfolio turnover is calculated on the basis of the Fund as a whole without distinguishing between the classes of shares issued and excludes in-kind transactions, where applicable. |
| (5) | Due to timing of capital share transactions, the per share amount of net realized and unrealized gain (loss) on investments varies from the amounts shown in the statement of operations. |
The accompanying notes are an integral part of these financial statements.
Financial Highlights
Baird SmallCap Value Fund – Institutional Class
| | | Year Ended December 31, | |
| | | 2020 | | | 2019 | | | 2018 | | | 2017 | | | 2016 | |
| Per Share Data: | | | | | | | | | | | | | | | |
| Net asset value, beginning of year | | $ | 15.96 | | | $ | 13.58 | | | $ | 16.99 | | | $ | 14.83 | | | $ | 13.03 | |
| Income from investment operations: | | | | | | | | | | | | | | | | | | | | |
Net investment income(1) | | | 0.03 | | | | 0.13 | | | | 0.05 | | | | 0.09 | | | | 0.21 | |
| Net realized and unrealized | | | | | | | | | | | | | | | | | | | | |
| gains (losses) on investments | | | 0.43 | (4) | | | 2.36 | | | | (2.85 | ) | | | 2.59 | | | | 1.76 | |
| Total from investment operations | | | 0.46 | | | | 2.49 | | | | (2.80 | ) | | | 2.68 | | | | 1.97 | |
| Less distributions: | | | | | | | | | | | | | | | | | | | | |
| Distributions from net | | | | | | | | | | | | | | | | | | | | |
| investment income | | | (0.03 | ) | | | (0.11 | ) | | | (0.06 | ) | | | (0.09 | ) | | | (0.17 | ) |
| Distributions from net realized gains | | | (0.83 | ) | | | — | | | | (0.55 | ) | | | (0.43 | ) | | | — | |
| Total distributions | | | (0.86 | ) | | | (0.11 | ) | | | (0.61 | ) | | | (0.52 | ) | | | (0.17 | ) |
| Net asset value, end of year | | $ | 15.56 | | | $ | 15.96 | | | $ | 13.58 | | | $ | 16.99 | | | $ | 14.83 | |
| Total return | | | 2.85 | % | | | 18.40 | % | | | (16.45 | )% | | | 18.05 | % | | | 15.11 | % |
| Supplemental data and ratios: | | | | | | | | | | | | | | | | | | | | |
| Net assets, end of year (millions) | | $ | 30.4 | | | $ | 33.0 | | | $ | 28.8 | | | $ | 33.6 | | | $ | 28.2 | |
| Ratio of expenses to average net assets | | | 0.95 | % | | | 0.95 | % | | | 1.00 | %(2) | | | 1.00 | % | | | 1.00 | % |
| Ratio of expenses to average | | | | | | | | | | | | | | | | | | | | |
| net assets (before waivers) | | | 1.64 | % | | | 1.44 | % | | | 1.38 | % | | | 1.35 | % | | | 1.43 | % |
| Ratio of net investment income | | | | | | | | | | | | | | | | | | | | |
| to average net assets | | | 0.21 | % | | | 0.87 | % | | | 0.29 | % | | | 0.61 | % | | | 1.58 | % |
| Ratio of net investment income (loss) | | | | | | | | | | | | | | | | | | | | |
| to average net assets (before waivers) | | | (0.48 | )% | | | 0.38 | % | | | (0.09 | )% | | | 0.26 | % | | | 1.15 | % |
Portfolio turnover rate(3) | | | 61 | % | | | 55 | % | | | 36 | % | | | 30 | % | | | 49 | % |
| (1) | Calculated using average shares outstanding during the year. |
| (2) | Blended rate. Pursuant to the Expense Cap/Reimbursement Agreement effective December 1, 2018, the expense cap decreased to 0.95%. Prior to December 1, 2018, the expense cap was 1.00%. |
| (3) | Portfolio turnover is calculated on the basis of the Fund as a whole without distinguishing between the classes of shares issued and excludes in-kind transactions, where applicable. |
| (4) | Due to timing of capital share transactions, the per share amount of net realized and unrealized gain (loss) on investments varies from the amounts shown in the statement of operations. |
The accompanying notes are an integral part of these financial statements.
Financial Highlights
Baird SmallCap Value Fund – Investor Class
| | | Year Ended December 31, | |
| | | 2020 | | | 2019 | | | 2018 | | | 2017 | | | 2016 | |
| Per Share Data: | | | | | | | | | | | | | | | |
| Net asset value, beginning of year | | $ | 15.97 | | | $ | 13.58 | | | $ | 16.97 | | | $ | 14.81 | | | $ | 12.99 | |
| Income from investment operations: | | | | | | | | | | | | | | | | | | | | |
Net investment income (loss)(1) | | | (0.01 | ) | | | 0.09 | | | | 0.01 | | | | 0.06 | | | | 0.18 | |
| Net realized and unrealized | | | | | | | | | | | | | | | | | | | | |
| gains (losses) on investments | | | 0.42 | (4) | | | 2.37 | | | | (2.85 | ) | | | 2.58 | | | | 1.75 | |
| Total from investment operations | | | 0.41 | | | | 2.46 | | | | (2.84 | ) | | | 2.64 | | | | 1.93 | |
| Less distributions: | | | | | | | | | | | | | | | | | | | | |
| Distributions from net | | | | | | | | | | | | | | | | | | | | |
| investment income | | | (0.03 | ) | | | (0.07 | ) | | | — | | | | (0.05 | ) | | | (0.11 | ) |
| Distributions from net realized gains | | | (0.83 | ) | | | — | | | | (0.55 | ) | | | (0.43 | ) | | | — | |
| Total distributions | | | (0.86 | ) | | | (0.07 | ) | | | (0.55 | ) | | | (0.48 | ) | | | (0.11 | ) |
| Net asset value, end of year | | $ | 15.52 | | | $ | 15.97 | | | $ | 13.58 | | | $ | 16.97 | | | $ | 14.81 | |
| Total return | | | 2.54 | % | | | 18.19 | % | | | (16.71 | )% | | | 17.78 | % | | | 14.84 | % |
| Supplemental data and ratios: | | | | | | | | | | | | | | | | | | | | |
| Net assets, end of year (millions) | | $ | 0.3 | | | $ | 0.9 | | | $ | 0.8 | | | $ | 2.6 | | | $ | 2.6 | |
| Ratio of expenses to average net assets | | | 1.20 | % | | | 1.20 | % | | | 1.25 | %(2) | | | 1.25 | % | | | 1.25 | % |
| Ratio of expenses to average | | | | | | | | | | | | | | | | | | | | |
| net assets (before waivers) | | | 1.89 | % | | | 1.69 | % | | | 1.63 | % | | | 1.60 | % | | | 1.68 | % |
| Ratio of net investment income (loss) | | | | | | | | | | | | | | | | | | | | |
| to average net assets | | | (0.04 | )% | | | 0.62 | % | | | 0.04 | % | | | 0.36 | % | | | 1.33 | % |
| Ratio of net investment income (loss) | | | | | | | | | | | | | | | | | | | | |
| to average net assets (before waivers) | | | (0.73 | )% | | | 0.13 | % | | | (0.34 | )% | | | 0.01 | % | | | 0.90 | % |
Portfolio turnover rate(3) | | | 61 | % | | | 55 | % | | | 36 | % | | | 30 | % | | | 49 | % |
| (1) | Calculated using average shares outstanding during the year. |
| (2) | Blended rate. Pursuant to the Expense Cap/Reimbursement Agreement effective December 1, 2018, the expense cap decreased to 1.20%. Prior to December 1, 2018, the expense cap was 1.25%. |
| (3) | Portfolio turnover is calculated on the basis of the Fund as a whole without distinguishing between the classes of shares issued and excludes in-kind transactions, where applicable. |
| (4) | Due to timing of capital share transactions, the per share amount of net realized and unrealized gain (loss) on investments varies from the amounts shown in the statement of operations. |
The accompanying notes are an integral part of these financial statements.
Financial Highlights
Chautauqua International Growth Fund – Institutional Class
| | | | | | | | | | | | | | | Period Ended | |
| | | Year Ended December 31, | | | December 31, | |
| | | 2020 | | | 2019 | | | 2018 | | | 2017 | | | 2016(1) | |
| Per Share Data: | | | | | | | | | | | | | | | |
| Net asset value, beginning of period | | $ | 12.62 | | | $ | 10.17 | | | $ | 12.59 | | | $ | 9.57 | | | $ | 10.00 | |
| Income from investment operations: | | | | | | | | | | | | | | | | | | | | |
Net investment income(2) | | | 0.01 | | | | 0.30 | | | | 0.06 | | | | 0.04 | | | | 0.00 | (3) |
| Net realized and unrealized | | | | | | | | | | | | | | | | | | | | |
| gains (losses) on investments | | | | | | | | | | | | | | | | | | | | |
| and foreign currency translation | | | 5.00 | | | | 2.42 | | | | (2.19 | ) | | | 3.41 | | | | (0.43 | ) |
| Total from investment operations | | | 5.01 | | | | 2.72 | | | | (2.13 | ) | | | 3.45 | | | | (0.43 | ) |
| Less distributions: | | | | | | | | | | | | | | | | | | | | |
| Distributions from net | | | | | | | | | | | | | | | | | | | | |
| investment income | | | (0.12 | ) | | | (0.27 | ) | | | (0.06 | ) | | | (0.02 | ) | | | — | |
| Distributions from net realized gains | | | — | | | | — | | | | (0.23 | ) | | | (0.41 | ) | | | — | |
| Total distributions | | | (0.12 | ) | | | (0.27 | ) | | | (0.29 | ) | | | (0.43 | ) | | | — | |
| Paid in capital from redemption fees | | | 0.00 | (3) | | | 0.00 | (3) | | | 0.00 | (3) | | | 0.00 | (3) | | | — | |
| Net asset value, end of period | | $ | 17.51 | | | $ | 12.62 | | | $ | 10.17 | | | $ | 12.59 | | | $ | 9.57 | |
| Total return | | | 39.84 | % | | | 26.72 | % | | | (16.94 | )% | | | 36.11 | % | | | (4.30 | )%(4) |
| Supplemental data and ratios: | | | | | | | | | | | | | | | | | | | | |
| Net assets, end of period (millions) | | $ | 321.8 | | | $ | 172.7 | | | $ | 85.4 | | | $ | 74.2 | | | $ | 14.8 | |
| Ratio of expenses to average net assets | | | 0.80 | % | | | 0.80 | % | | | 0.94 | %(5) | | | 0.95 | % | | | 0.95 | %(6) |
| Ratio of expenses to average | | | | | | | | | | | | | | | | | | | | |
| net assets (before waivers) | | | 0.90 | % | | | 0.96 | % | | | 1.07 | % | | | 1.20 | % | | | 2.32 | %(6) |
| Ratio of net investment income | | | | | | | | | | | | | | | | | | | | |
| to average net assets | | | 0.07 | % | | | 2.56 | % | | | 0.51 | % | | | 0.30 | % | | | 0.06 | %(6) |
| Ratio of net investment income (loss) | | | | | | | | | | | | | | | | | | | | |
| to average net assets (before waivers) | | | (0.03 | )% | | | 2.40 | % | | | 0.38 | % | | | 0.05 | % | | | (1.31 | )%(6) |
Portfolio turnover rate(7) | | | 31 | % | | | 31 | % | | | 42 | % | | | 71 | % | | | 73 | %(4) |
| (1) | Inception was close of business on April 15, 2016. |
| (2) | Calculated using average shares outstanding during the period. |
| (3) | Amount is less than $0.005. |
| (4) | Not annualized. |
| (5) | Blended rate. Pursuant to the Expense Cap/Reimbursement Agreement effective December 1, 2018, the expense cap decreased to 0.80%. Prior to December 1, 2018, the expense cap was 0.95%. |
| (6) | Annualized. |
| (7) | Portfolio turnover is calculated on the basis of the Fund as a whole without distinguishing between the classes of shares issued and excludes in-kind transactions, where applicable. |
The accompanying notes are an integral part of these financial statements.
Financial Highlights
Chautauqua International Growth Fund – Investor Class
| | | | | | | | | | | | | | | Period Ended | |
| | | Year Ended December 31, | | | December 31, | |
| | | 2020 | | | 2019 | | | 2018 | | | 2017 | | | 2016(1) | |
| Per Share Data: | | | | | | | | | | | | | | | |
| Net asset value, beginning of period | | $ | 12.60 | | | $ | 10.15 | | | $ | 12.57 | | | $ | 9.56 | | | $ | 10.00 | |
| Income from investment operations: | | | | | | | | | | | | | | | | | | | | |
Net investment income (loss)(2) | | | (0.02 | ) | | | 0.27 | | | | 0.03 | | | | 0.01 | | | | (0.01 | ) |
| Net realized and unrealized | | | | | | | | | | | | | | | | | | | | |
| gains (losses) on investments | | | | | | | | | | | | | | | | | | | | |
| and foreign currency translation | | | 4.95 | (8) | | | 2.41 | | | | (2.19 | ) | | | 3.41 | | | | (0.44 | ) |
| Total from investment operations | | | 4.93 | | | | 2.68 | | | | (2.16 | ) | | | 3.42 | | | | (0.45 | ) |
| Less distributions: | | | | | | | | | | | | | | | | | | | | |
| Distributions from net | | | | | | | | | | | | | | | | | | | | |
| investment income | | | (0.05 | ) | | | (0.23 | ) | | | (0.03 | ) | | | (0.00 | )(3) | | | — | |
| Distributions from net realized gains | | | — | | | | — | | | | (0.23 | ) | | | (0.41 | ) | | | — | |
| Total distributions | | | (0.05 | ) | | | (0.23 | ) | | | (0.26 | ) | | | (0.41 | ) | | | — | |
| Paid in capital from redemption fees | | | 0.00 | (3) | | | 0.00 | (3) | | | 0.00 | (3) | | | 0.00 | (3) | | | 0.01 | |
| Net asset value, end of period | | $ | 17.48 | | | $ | 12.60 | | | $ | 10.15 | | | $ | 12.57 | | | $ | 9.56 | |
| Total return | | | 39.37 | % | | | 26.42 | % | | | (17.21 | )% | | | 35.86 | % | | | (4.40 | )%(4) |
| Supplemental data and ratios: | | | | | | | | | | | | | | | | | | | | |
| Net assets, end of period (millions) | | $ | 0.7 | | | $ | 1.5 | | | $ | 2.1 | | | $ | 1.6 | | | $ | 0.3 | |
| Ratio of expenses to average net assets | | | 1.05 | % | | | 1.05 | % | | | 1.19 | %(5) | | | 1.20 | % | | | 1.20 | %(6) |
| Ratio of expenses to average | | | | | | | | | | | | | | | | | | | | |
| net assets (before waivers) | | | 1.15 | % | | | 1.21 | % | | | 1.32 | % | | | 1.45 | % | | | 2.58 | %(6) |
| Ratio of net investment income (loss) | | | | | | | | | | | | | | | | | | | | |
| to average net assets | | | (0.18 | )% | | | 2.31 | % | | | 0.26 | % | | | 0.05 | % | | | (0.19 | )%(6) |
| Ratio of net investment income (loss) | | | | | | | | | | | | | | | | | | | | |
| to average net assets (before waivers) | | | (0.28 | )% | | | 2.15 | % | | | 0.13 | % | | | (0.20 | )% | | | (1.57 | )%(6) |
Portfolio turnover rate(7) | | | 31 | % | | | 31 | % | | | 42 | % | | | 71 | % | | | 73 | %(4) |
| (1) | Inception was close of business on April 15, 2016. |
| (2) | Calculated using average shares outstanding during the period. |
| (3) | Amount is less than $0.005. |
| (4) | Not annualized. |
| (5) | Blended rate. Pursuant to the Expense Cap/Reimbursement Agreement effective December 1, 2018, the expense cap decreased to 1.05%. Prior to December 1, 2018, the expense cap was 1.20%. |
| (6) | Annualized. |
| (7) | Portfolio turnover is calculated on the basis of the Fund as a whole without distinguishing between the classes of shares issued and excludes in-kind transactions, where applicable. |
| (8) | Due to timing of capital share transactions, the per share amount of net realized and unrealized gain (loss) on investments varies from the amounts shown in the statement of operations. |
The accompanying notes are an integral part of these financial statements.
Financial Highlights
Chautauqua Global Growth Fund – Institutional Class
| | | | | | | | | | | | | | | Period Ended | |
| | | Year Ended December 31, | | | December 31, | |
| | | 2020 | | | 2019 | | | 2018 | | | 2017 | | | 2016(1) | |
| Per Share Data: | | | | | | | | | | | | | | | |
| Net asset value, beginning of period | | $ | 14.47 | | | $ | 11.29 | | | $ | 13.43 | | | $ | 10.09 | | | $ | 10.00 | |
| Income from investment operations: | | | | | | | | | | | | | | | | | | | | |
Net investment income (loss)(2) | | | (0.03 | ) | | | 0.22 | | | | 0.00 | (3) | | | (0.04 | ) | | | (0.01 | ) |
| Net realized and unrealized | | | | | | | | | | | | | | | | | | | | |
| gains (losses) on investments | | | | | | | | | | | | | | | | | | | | |
| and foreign currency translation | | | 5.49 | | | | 3.18 | | | | (1.98 | ) | | | 3.85 | | | | 0.10 | |
| Total from investment operations | | | 5.46 | | | | 3.40 | | | | (1.98 | ) | | | 3.81 | | | | 0.09 | |
| Less distributions: | | | | | | | | | | | | | | | | | | | | |
| Distributions from net | | | | | | | | | | | | | | | | | | | | |
| investment income | | | (0.09 | ) | | | (0.16 | ) | | | (0.00 | )(3) | | | — | | | | — | |
| Distributions from net realized gains | | | — | | | | (0.06 | ) | | | (0.16 | ) | | | (0.47 | ) | | | — | |
| Total distributions | | | (0.09 | ) | | | (0.22 | ) | | | (0.16 | ) | | | (0.47 | ) | | | — | |
| Paid in capital from redemption fees | | | 0.01 | | | | 0.00 | (3) | | | 0.00 | (3) | | | 0.00 | (3) | | | — | |
| Net asset value, end of period | | $ | 19.85 | | | $ | 14.47 | | | $ | 11.29 | | | $ | 13.43 | | | $ | 10.09 | |
| Total return | | | 37.97 | % | | | 30.14 | % | | | (14.70 | )% | | | 37.75 | % | | | 0.90 | %(4) |
| Supplemental data and ratios: | | | | | | | | | | | | | | | | | | | | |
| Net assets, end of period (millions) | | $ | 137.3 | | | $ | 55.8 | | | $ | 36.8 | | | $ | 23.2 | | | $ | 7.6 | |
| Ratio of expenses to average net assets | | | 0.80 | % | | | 0.80 | % | | | 0.94 | %(5) | | | 0.95 | % | | | 0.95 | %(6) |
| Ratio of expenses to average | | | | | | | | | | | | | | | | | | | | |
| net assets (before waivers) | | | 1.04 | % | | | 1.23 | % | | | 1.34 | % | | | 2.26 | % | | | 3.65 | %(6) |
| Ratio of net investment income (loss) | | | | | | | | | | | | | | | | | | | | |
| to average net assets | | | (0.17 | )% | | | 1.64 | % | | | 0.01 | % | | | (0.30 | )% | | | (0.16 | )%(6) |
| Ratio of net investment income (loss) | | | | | | | | | | | | | | | | | | | | |
| to average net assets (before waivers) | | | (0.41 | )% | | | 1.21 | % | | | (0.39 | )% | | | (1.61 | )% | | | (2.86 | )%(6) |
Portfolio turnover rate(7) | | | 24 | % | | | 26 | % | | | 38 | % | | | 61 | % | | | 69 | %(4) |
| (1) | Inception was close of business on April 15, 2016. |
| (2) | Calculated using average shares outstanding during the period. |
| (3) | Amount is less than $0.005. |
| (4) | Not annualized. |
| (5) | Blended rate. Pursuant to the Expense Cap/Reimbursement Agreement effective December 1, 2018, the expense cap decreased to 0.80%. Prior to December 1, 2018, the expense cap was 0.95%. |
| (6) | Annualized. |
| (7) | Portfolio turnover is calculated on the basis of the Fund as a whole without distinguishing between the classes of shares issued and excludes in-kind transactions, where applicable. |
The accompanying notes are an integral part of these financial statements.
Financial Highlights
Chautauqua Global Growth Fund – Investor Class
| | | | | | | | | | | | | | | Period Ended | |
| | | Year Ended December 31, | | | December 31, | |
| | | 2020 | | | 2019 | | | 2018 | | | 2017 | | | 2016(1) | |
| Per Share Data: | | | | | | | | | | | | | | | |
| Net asset value, beginning of period | | $ | 14.36 | | | $ | 11.22 | | | $ | 13.37 | | | $ | 10.08 | | | $ | 10.00 | |
| Income from investment operations: | | | | | | | | | | | | | | | | | | | | |
Net investment income (loss)(2) | | | (0.06 | ) | | | 0.19 | | | | (0.03 | ) | | | (0.07 | ) | | | (0.03 | ) |
| Net realized and unrealized | | | | | | | | | | | | | | | | | | | | |
| gains (losses) on investments | | | | | | | | | | | | | | | | | | | | |
| and foreign currency translation | | | 5.44 | | | | 3.15 | | | | (1.96 | ) | | | 3.83 | | | | 0.11 | |
| Total from investment operations | | | 5.38 | | | | 3.34 | | | | (1.99 | ) | | | 3.76 | | | | 0.08 | |
| Less distributions: | | | | | | | | | | | | | | | | | | | | |
| Distributions from net | | | | | | | | | | | | | | | | | | | | |
| investment income | | | (0.05 | ) | | | (0.14 | ) | | | — | | | | — | | | | — | |
| Distributions from net realized gains | | | — | | | | (0.06 | ) | | | (0.16 | ) | | | (0.47 | ) | | | — | |
| Total distributions | | | (0.05 | ) | | | (0.20 | ) | | | (0.16 | ) | | | (0.47 | ) | | | — | |
| Paid in capital from redemption fees | | | 0.05 | | | | 0.00 | (3) | | | 0.00 | (3) | | | 0.00 | (3) | | | 0.00 | (3) |
| Net asset value, end of period | | $ | 19.74 | | | $ | 14.36 | | | $ | 11.22 | | | $ | 13.37 | | | $ | 10.08 | |
| Total return | | | 37.94 | % | | | 29.73 | % | | | (14.86 | )% | | | 37.29 | % | | | 0.80 | %(4) |
| Supplemental data and ratios: | | | | | | | | | | | | | | | | | | | | |
| Net assets, end of period (millions) | | $ | 1.7 | | | $ | 1.6 | | | $ | 0.7 | | | $ | 0.7 | | | $ | 0.2 | |
| Ratio of expenses to average net assets | | | 1.05 | % | | | 1.05 | % | | | 1.19 | %(5) | | | 1.20 | % | | | 1.20 | %(6) |
| Ratio of expenses to average | | | | | | | | | | | | | | | | | | | | |
| net assets (before waivers) | | | 1.29 | % | | | 1.48 | % | | | 1.59 | % | | | 2.51 | % | | | 3.90 | %(6) |
| Ratio of net investment income (loss) | | | | | | | | | | | | | | | | | | | | |
| to average net assets | | | (0.42 | )% | | | 1.39 | % | | | (0.24 | )% | | | (0.55 | )% | | | (0.41 | )%(6) |
| Ratio of net investment income (loss) | | | | | | | | | | | | | | | | | | | | |
| to average net assets (before waivers) | | | (0.66 | )% | | | 0.96 | % | | | (0.64 | )% | | | (1.86 | )% | | | (3.11 | )%(6) |
Portfolio turnover rate(7) | | | 24 | % | | | 26 | % | | | 38 | % | | | 61 | % | | | 69 | %(4) |
| (1) | Inception was close of business on April 15, 2016. |
| (2) | Calculated using average shares outstanding during the period. |
| (3) | Amount is less than $0.005. |
| (4) | Not annualized. |
| (5) | Blended rate. Pursuant to the Expense Cap/Reimbursement Agreement effective December 1, 2018, the expense cap decreased to 1.05%. Prior to December 1, 2018, the expense cap was 1.20%. |
| (6) | Annualized. |
| (7) | Portfolio turnover is calculated on the basis of the Fund as a whole without distinguishing between the classes of shares issued and excludes in-kind transactions, where applicable. |
The accompanying notes are an integral part of these financial statements.
Notes to the Financial Statements
December 31, 2020
Baird Funds, Inc. (the “Corporation”) was incorporated on June 9, 2000, as a Wisconsin corporation and is registered as an open-end management investment company under the Investment Company Act of 1940, as amended (the “1940 Act”). The accompanying financial statements include the Baird MidCap Fund, the Baird Small/Mid Cap Growth Fund, the Baird Small/Mid Cap Value Fund, the Baird SmallCap Value Fund, the Chautauqua International Growth Fund and the Chautauqua Global Growth Fund (each a “Fund” and collectively the “Funds”), six of the sixteen active funds in the series comprising the Corporation. Pursuant to the 1940 Act, the Funds are “diversified” series of the Corporation. The investment advisor to the Funds is Robert W. Baird & Co. Incorporated (“Baird” or the “Advisor”). The Funds are investment companies and therefore follow the investment company accounting and reporting guidance of the Financial Accounting Standards Board (“FASB”) Accounting Standards Codification Topic 946, Financial Services – Investment Companies.
The following table presents the class-specific inception dates for each of the Funds:
| | Inception Date |
Fund | Institutional Class
| | Investor Class
|
| Baird MidCap Fund | December 29, 2000 | | December 29, 2000 |
| Baird Small/Mid Cap Growth Fund | October 31, 2018 | | October 31, 2018 |
| Baird Small/Mid Cap Value Fund | November 30, 2015 | | November 30, 2015 |
| Baird SmallCap Value Fund | May 1, 2012 | | May 1, 2012 |
| Chautauqua International Growth Fund | April 15, 2016 | | April 15, 2016 |
| Chautauqua Global Growth Fund | April 15, 2016 | | April 15, 2016 |
Institutional Class shares are not subject to a distribution and service (12b-1) fee, while Investor Class shares are subject to a distribution and service (12b-1) fee up to 0.25%. See Note 7.
The Baird MidCap Fund seeks long-term growth of capital through investments in equity securities of mid-capitalization companies.
The Baird Small/Mid Cap Growth Fund seeks long-term growth of capital through investments in equity securities of small- and mid-capitalization companies.
The Baird Small/Mid Cap Value Fund seeks long-term capital appreciation through investments in a diversified portfolio of common stocks of companies with small-to-medium market capitalizations.
The Baird SmallCap Value Fund seeks long-term capital appreciation through investments in a diversified portfolio of common stocks of companies with small market capitalizations.
The Chautauqua International Growth Fund seeks to provide long-term capital appreciation. The Fund invests primarily in equity securities of non-U.S. companies with medium to large market capitalizations.
The Chautauqua Global Growth Fund seeks to provide long-term capital appreciation. The Fund invests primarily in equity securities of both U.S. and non-U.S. companies with medium to large market capitalizations.
The beneficial ownership, either directly or indirectly, of more than 25% of the voting securities of a fund creates a presumption of control of the fund, under Section 2(a)(9) of the 1940 Act. On December 31, 2020, entities affiliated with the Advisor held 53% of the Baird Small/Mid Cap Growth Fund, 64% of the Baird Small/Mid Cap Value Fund, 61% of the Baird SmallCap Value Fund, and 31% of the Chautauqua Global Growth Fund. These shareholders included the Baird Foundation.
| 2. | Significant Accounting Policies |
The following is a summary of significant accounting policies consistently followed by the Funds in the preparation of their financial statements. These policies are in conformity with accounting principles generally accepted in the United States of America (“GAAP”).
Notes to the Financial Statements
December 31, 2020
| 2. | Significant Accounting Policies (cont.) |
| | |
| a) | Investment Valuation – Section 2(a)(41) of the 1940 Act, together with the rules and interpretations of the U.S. Securities and Exchange Commission (the “SEC”) require the Funds, in computing net asset value, to value their portfolio securities using market quotations when they are “readily available.” When market quotations are not readily available (e.g., because there is no regular market quotation for such securities, the market for such security is limited, the validity of quotations is questionable or, for debt securities, the Funds’ independent pricing service does not provide a price), the Board of Directors (the “Board”) of the Corporation is responsible for ensuring the securities are valued at “fair value determined in good faith.” The Board has delegated such responsibility to the Advisor pursuant to pricing policies and procedures that the Board has adopted and regularly reviews. In general, the “fair value” of a security means the price that would be received to sell a security in an orderly transaction between market participants at the measurement date. |
| | |
| | The Funds determine the fair value of their investments and compute their net asset value per share as of the close of regular trading of the New York Stock Exchange (4:00 p.m. ET). |
| | |
| | Consistent with Section 2(a)(41) of the 1940 Act, the Funds price their securities as follows: common stocks that are listed on a securities exchange (other than NASDAQ) are valued at the last quoted sale price. Securities traded on NASDAQ are valued at the NASDAQ Official Closing Price. Price information on listed stocks is taken from the exchange where the security is primarily traded. Securities that were not traded on the valuation date, as well as stocks that are not listed on an exchange, including NASDAQ, are valued at the average of the current bid and ask price. Debt securities are valued at their evaluated bid prices as provided by an independent pricing service using valuation methods that are designed to represent fair value, such as matrix pricing and other analytical pricing models, market transactions and dealer quotations. Debt securities purchased with maturities of 60 days or less are valued as described above unless an evaluated price is not available, in which case such security is valued at acquisition cost, plus or minus any amortized discount or premium (“amortized cost”), or, if the Advisor does not believe amortized cost is reflective of the fair value of the security, the security is priced at fair value as described below. Investments in mutual funds, including money market funds, are valued at their stated net asset value (“NAV”). Other assets and securities for which market quotations are not readily available are valued at fair value as determined in good faith by the Advisor in accordance with procedures approved by the Corporation’s Board. In accordance with such procedures, the Advisor may, under certain circumstances, use alternative valuation methodologies, or it may use broker quotes or prices obtained from alternative independent pricing services or, if broker quotes or prices from alternative pricing services are unavailable or deemed to be unreliable, fair value will be determined by a valuation committee of the Advisor. In determining fair value, the valuation committee takes into account factors deemed relevant by the valuation committee and available information. Consequently, the price of the security used by a Fund to calculate its NAV may differ from quoted or published prices for the same security. Fair value pricing involves subjective judgments and there is no single standard for determining a security’s fair value. As a result, different mutual funds could reasonably arrive at a different fair value for the same security. It is possible that the fair value determined for a security is materially different from the value that could be realized upon the sale of that security or from the values that other mutual funds may determine. The prices determined for any individual security on any given day may vary significantly from the amount that can be obtained in an actual sale of that security, and the Funds’ NAV may fluctuate significantly from day to day or from period to period. |
| | |
| | The Chautauqua International Growth and Chautauqua Global Growth Funds have retained an independent fair value pricing service to assist in valuing foreign securities in order to adjust for possible changes in value that may occur between the close of the foreign exchange and the time at which the Funds calculate their NAVs. The fair value pricing service uses statistical data based on historical performance of securities and markets, and other data in developing factors used to estimate fair value for that day. |
Notes to the Financial Statements
December 31, 2020
| 2. | Significant Accounting Policies (cont.) |
| | |
| b) | Foreign Securities – For purposes of these financial statements, foreign securities are defined as securities issued by companies that are organized outside the United States. Investing in securities of foreign companies and foreign governments involves special risks and considerations not typically associated with investing in U.S. companies and the U.S. government. These risks include foreign currency fluctuations and adverse political and economic developments. Moreover, securities of many foreign companies and foreign governments and their markets may be less liquid and their prices more volatile than those of securities of comparable U.S. companies and the U.S. government. Occasionally, events that affect these values and exchange rates may occur after the close of the exchange on which such securities are traded. If such events materially affect the value of a Fund’s securities, these securities may be valued at their fair value pursuant to procedures adopted by the Board. |
| | |
| c) | Foreign Currency Translation – Portfolio securities and other assets and liabilities denominated in foreign currencies are translated into U.S. dollar amounts at date of valuation. Purchases and sales of portfolio securities and income items denominated in foreign currencies are translated into U.S. dollar amounts on the respective dates of such transactions. When a Fund purchases or sells a foreign security, it will customarily enter into a foreign exchange contract to minimize foreign exchange risk from the trade date to the settlement date of such transaction. The Funds do not isolate the portion of the results of operations resulting from changes in foreign exchange rates on investments from the fluctuations arising from changes in market prices of securities held nor currency gains or losses realized between the trade and settlement dates on securities transactions. Such fluctuations are included with the net realized and unrealized gain or loss from investments. Net realized gain (loss) on foreign currency translations include those gains and losses arising from the sale of foreign currencies, currency gains or losses realized between the trade and settlement dates on foreign currency transactions, the differences between the amounts of dividends, and foreign withholding taxes recorded on a Fund’s books, and the U.S. dollar equivalent of the amounts actually received or paid. Net unrealized appreciation (depreciation) on investments includes changes in the value of investments resulting from exchange rates. |
| | |
| d) | Income Tax Status – The Funds intend to continue to qualify as regulated investment companies as provided in Subchapter M of the Internal Revenue Code and to distribute substantially all of their taxable income to their shareholders in a manner which results in no tax expense to the Funds. Therefore, no federal income or excise tax provision is recorded. |
| | |
| | There is no tax liability resulting from unrecognized tax benefits relating to uncertain income tax positions taken or expected to be taken on the tax return for the year ended December 31, 2020, or for any other tax years which are open for exam. As of December 31, 2020, open tax years include the tax years ended December 31, 2017 through 2020. The Funds are not aware of any tax positions for which it is reasonably possible that the total amounts of unrecognized tax benefits will significantly change in the next 12 months. The Funds recognize interest and penalties, if any, related to unrecognized tax benefits as interest expense and other expense, respectively, in the Statement of Operations. During the period, the Funds did not incur any interest or penalties. |
| | |
| e) | Shareholder Transactions and Distributions – Shareholder transactions are recorded on trade date. Dividends from net investment income, if any, are declared and paid annually. Distributions of net realized capital gains, if any, are declared and paid at least annually. All distributions to shareholders are recorded on the ex-dividend date. The book basis character of distributions may differ from their ultimate characterization for Federal income tax purposes. GAAP requires that permanent financial reporting and tax differences be reclassified in the capital accounts. |
| | |
| f) | Allocation of Income and Expenses – Each Fund is charged for those expenses directly attributable to it. Expenses directly attributable to a class of shares, such as Rule 12b-1 distribution fees, are charged to that class of shares. Income, expenses and realized and unrealized gains and losses are allocated to the classes based on their respective net assets. Expenses that are not directly attributable to a Fund are allocated among the Funds in the series in proportion to their respective assets or are divided equally amongst the Funds. |
Notes to the Financial Statements
December 31, 2020
| 2. | Significant Accounting Policies (cont.) |
| | |
| g) | Use of Estimates – The preparation of financial statements in conformity with GAAP requires management to make estimates and assumptions that affect the reported amounts of assets and liabilities and disclosure of contingent assets and liabilities at the date of the financial statements and the reported amounts of income and expenses during the reporting period. Actual results could differ from those estimates. |
| | |
| h) | Securities Transactions and Investment Income – Investment transactions are recorded on trade date. The Funds determine the gain or loss realized from investment transactions using the identified cost basis. For financial reporting purposes, investment transactions are recorded on the trade date. When a capital gain tax is determined to apply, the Fund may record an estimated deferred tax liability in an amount that would be payable if the securities were disposed of on the valuation date. Dividend income is recognized on the ex-dividend date net of withholding taxes, if any, and interest income is recognized on an accrual basis. Withholding taxes on foreign dividends have been accounted for in accordance with the Funds’ interpretation of applicable tax laws of the countries in which they invest. Distributions received from underlying investments in real estate investment trusts (“REITs”) may be classified as dividends, capital gains or return of capital. |
| | |
| i) | Guarantees and Indemnifications – In the normal course of business, the Funds enter into contracts with service providers that contain general indemnification clauses. The Funds’ maximum exposure under these arrangements is unknown and would involve future claims against the Funds that have not yet occurred. Based on experience, the Funds would expect the risk of loss to be remote. |
| | |
| j) | Other Matters – The global outbreak of COVID-19 (commonly referred to as “coronavirus”) has disrupted economic markets and the prolonged economic impact is uncertain. The ultimate economic fallout from the pandemic, and the long-term impact on economies, markets, industries and individual issuers, are not known. The operational and financial performance of the issuers of securities in which the Funds invest depends on future developments, including the duration and spread of the outbreak, and such uncertainty may in turn adversely affect the value and liquidity of the Funds’ investments, impair the Funds’ ability to satisfy redemption requests, and negatively impact the Funds’ performance. |
| | |
| 3. | Capital Share Transactions |
The following table summarizes the capital share transactions of each Fund for the past two fiscal years:
Baird MidCap Fund
| | | Year Ended | | | Year Ended | |
| | | December 31, 2020 | | | December 31, 2019 | |
| Institutional Class Shares | | Shares | | | Amount | | | Shares | | | Amount | |
| Shares sold | | | 17,318,781 | | | $ | 405,389,307 | | | | 28,582,666 | | | $ | 617,683,654 | |
| Shares issued to shareholders | | | | | | | | | | | | | | | | |
| in reinvestment of distributions | | | 5,260,655 | | | | 145,088,864 | | | | 3,751,830 | | | | 85,204,069 | |
| Shares redeemed | | | (28,981,798 | ) | | | (679,611,746 | ) | | | (28,056,428 | ) | | | (626,508,980 | ) |
| Net increase (decrease) | | | (6,402,362 | ) | | $ | (129,133,575 | ) | | | 4,278,068 | | | $ | 76,378,743 | |
| Shares Outstanding: | | | | | | | | | | | | | | | | |
| Beginning of year | | | 79,737,647 | | | | | | | | 75,459,579 | | | | | |
| End of year | | | 73,335,285 | | | | | | | | 79,737,647 | | | | | |
Notes to the Financial Statements
December 31, 2020
| 3. | Capital Share Transactions (cont.) |
Baird MidCap Fund (cont.)
| | | Year Ended | | | Year Ended | |
| | | December 31, 2020 | | | December 31, 2019 | |
| Investor Class Shares | | Shares | | | Amount | | | Shares | | | Amount | |
| Shares sold | | | 2,665,048 | | | $ | 57,380,183 | | | | 2,001,794 | | | $ | 41,249,843 | |
| Shares issued to shareholders | | | | | | | | | | | | | | | | |
| in reinvestment of distributions | | | 707,847 | | | | 18,177,515 | | | | 346,621 | | | | 7,400,350 | |
| Shares redeemed | | | (2,623,729 | ) | | | (57,306,903 | ) | | | (1,156,037 | ) | | | (24,035,320 | ) |
| Net increase | | | 749,166 | | | $ | 18,250,795 | | | | 1,192,378 | | | $ | 24,614,873 | |
| Shares Outstanding: | | | | | | | | | | | | | | | | |
| Beginning of year | | | 6,889,569 | | | | | | | | 5,697,191 | | | | | |
| End of year | | | 7,638,735 | | | | | | | | 6,889,569 | | | | | |
| Total net increase (decrease) | | | | | | $ | (110,882,780 | ) | | | | | | $ | 100,993,616 | |
| | | | | | | | | | | | | | | | | |
| Baird Small/Mid Cap Growth Fund | | | | | | | | | | | | | | | | |
| | | Year Ended | | | Year Ended | |
| | | December 31, 2020 | | | December 31, 2019 | |
| Institutional Class Shares | | Shares | | | Amount | | | Shares | | | Amount | |
| Shares sold | | | 1,684,734 | | | $ | 23,519,261 | | | | 857,808 | | | $ | 9,686,310 | |
| Shares issued to shareholders | | | | | | | | | | | | | | | | |
| in reinvestment of distributions | | | 52,529 | | | | 904,547 | | | | — | | | | — | |
| Shares redeemed | | | (287,296 | ) | | | (3,832,151 | ) | | | (179,809 | ) | | | (2,102,209 | ) |
| Net increase | | | 1,449,967 | | | $ | 20,591,657 | | | | 677,999 | | | $ | 7,584,101 | |
| Shares Outstanding: | | | | | | | | | | | | | | | | |
| Beginning of year | | | 1,491,956 | | | | | | | | 813,957 | | | | | |
| End of year | | | 2,941,923 | | | | | | | | 1,491,956 | | | | | |
| | | | | | | | | | | | | | | | | |
| | | Year Ended | | | Year Ended | |
| | | December 31, 2020 | | | December 31, 2019 | |
| Investor Class Shares | | Shares | | | Amount | | | Shares | | | Amount | |
| Shares sold | | | 45,645 | | | $ | 693,010 | | | | 22,746 | | | $ | 255,577 | |
| Shares issued to shareholders | | | | | | | | | | | | | | | | |
| in reinvestment of distributions | | | 699 | | | | 11,948 | | | | — | | | | — | |
| Shares redeemed | | | (31,548 | ) | | | (442,925 | ) | | | (225 | ) | | | (2,646 | ) |
| Net increase | | | 14,796 | | | $ | 262,033 | | | | 22,521 | | | $ | 252,931 | |
| Shares Outstanding: | | | | | | | | | | | | | | | | |
| Beginning of year | | | 23,521 | | | | | | | | 1,000 | | | | | |
| End of year | | | 38,317 | | | | | | | | 23,521 | | | | | |
| Total net increase | | | | | | $ | 20,853,690 | | | | | | | $ | 7,837,032 | |
Notes to the Financial Statements
December 31, 2020
| 3. | Capital Share Transactions (cont.) |
Baird Small/Mid Cap Value Fund
| | | Year Ended | | | Year Ended | |
| | | December 31, 2020 | | | December 31, 2019 | |
| Institutional Class Shares | | Shares | | | Amount | | | Shares | | | Amount | |
| Shares sold | | | 689,239 | | | $ | 7,452,148 | | | | 513,710 | | | $ | 6,004,940 | |
| Shares issued to shareholders | | | | | | | | | | | | | | | | |
| in reinvestment of distributions | | | 11,214 | | | | 137,153 | | | | 13,395 | | | | 164,491 | |
| Shares redeemed | | | (801,809 | ) | | | (8,974,059 | ) | | | (175,075 | ) | | | (2,077,538 | ) |
| Net increase (decrease) | | | (101,356 | ) | | $ | (1,384,758 | ) | | | 352,030 | | | $ | 4,091,893 | |
| Shares Outstanding: | | | | | | | | | | | | | | | | |
| Beginning of year | | | 1,974,781 | | | | | | | | 1,622,751 | | | | | |
| End of year | | | 1,873,425 | | | | | | | | 1,974,781 | | | | | |
| | | | | | | | | | | | | | | | | |
| | | Year Ended | | | Year Ended | |
| | | December 31, 2020 | | | December 31, 2019 | |
| Investor Class Shares | | Shares | | | Amount | | | Shares | | | Amount | |
| Shares sold | | | 5,288 | | | $ | 55,459 | | | | 14,425 | | | $ | 166,971 | |
| Shares issued to shareholders | | | | | | | | | | | | | | | | |
| in reinvestment of distributions | | | 4 | | | | 50 | | | | 263 | | | | 3,216 | |
| Shares redeemed | | | (44,509 | ) | | | (468,142 | ) | | | (1,618 | ) | | | (19,542 | ) |
| Net increase (decrease) | | | (39,217 | ) | | $ | (412,633 | ) | | | 13,070 | | | $ | 150,645 | |
| Shares Outstanding: | | | | | | | | | | | | | | | | |
| Beginning of year | | | 45,657 | | | | | | | | 32,587 | | | | | |
| End of year | | | 6,440 | | | | | | | | 45,657 | | | | | |
| Total net increase (decrease) | | | | | | $ | (1,797,391 | ) | | | | | | $ | 4,242,538 | |
| | | | | | | | | | | | | | | | | |
| Baird SmallCap Value Fund | | | | | | | | | | | | | | | | |
| | | Year Ended | | | Year Ended | |
| | | December 31, 2020 | | | December 31, 2019 | |
| Institutional Class Shares | | Shares | | | Amount | | | Shares | | | Amount | |
| Shares sold | | | 345,450 | | | $ | 4,859,915 | | | | 265,753 | | | $ | 4,013,663 | |
| Shares issued to shareholders | | | | | | | | | | | | | | | | |
| in reinvestment of distributions | | | 89,539 | | | | 1,374,807 | | | | 11,374 | | | | 181,421 | |
| Shares redeemed | | | (543,876 | ) | | | (7,510,893 | ) | | | (330,733 | ) | | | (5,030,908 | ) |
| Net decrease | | | (108,887 | ) | | $ | (1,276,171 | ) | | | (53,606 | ) | | $ | (835,824 | ) |
| Shares Outstanding: | | | | | | | | | | | | | | | | |
| Beginning of year | | | 2,064,404 | | | | | | | | 2,118,010 | | | | | |
| End of year | | | 1,955,517 | | | | | | | | 2,064,404 | | | | | |
Notes to the Financial Statements
December 31, 2020
| 3. | Capital Share Transactions (cont.) |
Baird SmallCap Value Fund (cont.)
| | | Year Ended | | | Year Ended | |
| | | December 31, 2020 | | | December 31, 2019 | |
| Investor Class Shares | | Shares | | | Amount | | | Shares | | | Amount | |
| Shares sold | | | 8,461 | | | $ | 132,579 | | | | 5,551 | | | $ | 84,039 | |
| Shares issued to shareholders | | | | | | | | | | | | | | | | |
| in reinvestment of distributions | | | 564 | | | | 8,637 | | | | 178 | | | | 2,846 | |
| Shares redeemed | | | (45,333 | ) | | | (614,660 | ) | | | (6,225 | ) | | | (93,837 | ) |
| Net decrease | | | (36,308 | ) | | $ | (473,444 | ) | | | (496 | ) | | $ | (6,952 | ) |
| Shares Outstanding: | | | | | | | | | | | | | | | | |
| Beginning of year | | | 55,355 | | | | | | | | 55,851 | | | | | |
| End of year | | | 19,047 | | | | | | | | 55,355 | | | | | |
| Total net decrease | | | | | | $ | (1,749,615 | ) | | | | | | $ | (842,776 | ) |
| | | | | | | | | | | | | | | | | |
| Chautauqua International Growth Fund | | | | | | | | | | | | | | | | |
| | | Year Ended | | | Year Ended | |
| | | December 31, 2020 | | | December 31, 2019 | |
| Institutional Class Shares | | Shares | | | Amount | | | Shares | | | Amount | |
| Shares sold | | | 6,655,236 | | | $ | 90,770,906 | | | | 6,564,998 | (1) | | $ | 76,704,816 | (1) |
| Shares issued to shareholders | | | | | | | | | | | | | | | | |
| in reinvestment of distributions | | | 100,236 | | | | 1,729,079 | | | | 227,632 | | | | 2,881,816 | |
| Shares redeemed | | | (2,058,055 | ) | | | (26,613,627 | ) | | | (1,503,822 | ) | | | (17,898,951 | ) |
| Redemption fees | | | — | | | | 34,899 | | | | — | | | | 32,968 | |
| Net increase | | | 4,697,417 | | | $ | 65,921,257 | | | | 5,288,808 | | | $ | 61,720,649 | |
| Shares Outstanding: | | | | | | | | | | | | | | | | |
| Beginning of year | | | 13,684,014 | | | | | | | | 8,395,206 | | | | | |
| End of year | | | 18,381,431 | | | | | | | | 13,684,014 | | | | | |
| | | | | | | | | | | | | | | | | |
| | | Year Ended | | | Year Ended | |
| | | December 31, 2020 | | | December 31, 2019 | |
| Investor Class Shares | | Shares | | | Amount | | | Shares | | | Amount | |
| Shares sold | | | 40,351 | | | $ | 617,683 | | | | 30,595 | | | $ | 368,522 | |
| Shares issued to shareholders | | | | | | | | | | | | | | | | |
| in reinvestment of distributions | | | 108 | | | | 1,859 | | | | 1,577 | | | | 19,935 | |
| Shares redeemed | | | (119,218 | ) | | | (1,643,224 | ) | | | (124,988 | ) | | | (1,465,249 | ) |
| Redemption fees | | | — | | | | 323 | | | | — | | | | 5 | |
| Net decrease | | | (78,759 | ) | | $ | (1,023,359 | ) | | | (92,816 | ) | | $ | (1,076,787 | ) |
| Shares Outstanding: | | | | | | | | | | | | | | | | |
| Beginning of year | | | 118,654 | | | | | | | | 211,470 | | | | | |
| End of year | | | 39,895 | | | | | | | | 118,654 | | | | | |
| Total net increase | | | | | | $ | 64,897,898 | | | | | | | $ | 60,643,862 | |
(1) Includes purchase in-kind transactions. See additional information contained in this Note.
Notes to the Financial Statements
December 31, 2020
| 3. | Capital Share Transactions (cont.) |
Chautauqua Global Growth Fund
| | | Year Ended | | | Year Ended | |
| | | December 31, 2020 | | | December 31, 2019 | |
| Institutional Class Shares | | Shares | | | Amount | | | Shares | | | Amount | |
| Shares sold | | | 3,815,907 | | | $ | 60,626,046 | | | | 1,067,813 | | | $ | 14,402,805 | |
| Shares issued to shareholders | | | | | | | | | | | | | | | | |
| in reinvestment of distributions | | | 28,094 | | | | 550,653 | | | | 45,894 | | | | 667,696 | |
| Shares redeemed | | | (782,203 | ) | | | (11,881,788 | ) | | | (516,819 | ) | | | (6,920,288 | ) |
| Redemption fees | | | — | | | | 28,770 | | | | — | | | | 3,644 | |
| Net increase | | | 3,061,798 | | | $ | 49,323,681 | | | | 596,888 | | | $ | 8,153,857 | |
| Shares Outstanding: | | | | | | | | | | | | | | | | |
| Beginning of year | | | 3,858,531 | | | | | | | | 3,261,643 | | | | | |
| End of year | | | 6,920,329 | | | | | | | | 3,858,531 | | | | | |
| | | | | | | | | | | | | | | | | |
| | | Year Ended | | | Year Ended | |
| | | December 31, 2020 | | | December 31, 2019 | |
| Investor Class Shares | | Shares | | | Amount | | | Shares | | | Amount | |
| Shares sold | | | 146,201 | | | $ | 2,360,863 | | | | 68,911 | | | $ | 930,554 | |
| Shares issued to shareholders | | | | | | | | | | | | | | | | |
| in reinvestment of distributions | | | 204 | | | | 3,988 | | | | 1,472 | | | | 21,240 | |
| Shares redeemed | | | (173,322 | ) | | | (2,704,322 | ) | | | (22,141 | ) | | | (302,224 | ) |
| Redemption fees | | | — | | | | 5,071 | | | | — | | | | 78 | |
| Net increase (decrease) | | | (26,917 | ) | | $ | (334,400 | ) | | | 48,242 | | | $ | 649,648 | |
| Shares Outstanding: | | | | | | | | | | | | | | | | |
| Beginning of year | | | 111,878 | | | | | | | | 63,636 | | | | | |
| End of year | | | 84,961 | | | | | | | | 111,878 | | | | | |
| Total net increase | | | | | | $ | 48,989,281 | | | | | | | $ | 8,803,505 | |
During the year ended December 31, 2019, Chautauqua International Growth Fund satisfied a purchase in-kind request made by a large institutional shareholder by transferring cash and securities into the Fund. The transfer was effected in accordance with policies and procedures approved by the Board. Consideration received and shares sold were as follows:
Year Ended December 31, 2019
| | | Value of Cash and | Shares |
Fund | Effective Date | Securities Received | Sold |
| Chautauqua International Growth | | | |
| Fund – Institutional Class | February 28, 2019 | $26,869,633 | 2,367,369 |
| Total | | $26,869,633 | |
| 4. | Investment Transactions and Income Tax Information |
During the year ended December 31, 2020, purchases and sales of investment securities (excluding short-term investments) were as follows:
| | | Baird | | | Baird | | | Baird | | | Baird | | | Chautauqua | | | Chautauqua | |
| | | MidCap | | | Small/Mid Cap | | | Small/Mid Cap | | | SmallCap | | | International | | | Global Growth | |
| | | Fund | | | Growth Fund | | | Value Fund | | | Value Fund | | | Growth Fund | | | Fund | |
| Purchases: | | $ | 886,343,012 | | | $ | 38,822,490 | | | $ | 16,851,517 | | | $ | 15,528,642 | | | $ | 128,436,401 | | | $ | 65,165,416 | |
| Sales: | | | 1,276,883,684 | | | | 19,183,099 | | | | 18,151,890 | | | | 17,888,086 | | | | 64,703,668 | | | | 19,759,276 | |
The Funds did not purchase or sell U.S. Government securities during the year ended December 31, 2020.
Notes to the Financial Statements
December 31, 2020
| 4. | Investment Transactions and Income Tax Information (cont.) |
As of December 31, 2020, the components of distributable earnings (accumulated losses) for income tax purposes were as follows:
| | | Baird | | | Baird | | | Baird | |
| | | MidCap | | | Small/Mid Cap | | | Small/Mid Cap | |
| | | Fund | | | Growth Fund | | | Value Fund | |
| Cost of investments | | $ | 1,265,427,882 | | | $ | 38,962,168 | | | $ | 18,977,800 | |
| Gross unrealized appreciation | | $ | 1,016,850,168 | | | $ | 14,315,009 | | | $ | 4,964,360 | |
| Gross unrealized depreciation | | | (10,317,436 | ) | | | (336,500 | ) | | | (526,689 | ) |
| Net unrealized appreciation | | | 1,006,532,732 | | | | 13,978,509 | | | | 4,437,671 | |
| Undistributed ordinary income | | | 5,402,485 | | | | 265,469 | | | | 2,986 | |
| Undistributed long-term capital gains | | | 45,452,011 | | | | 865,824 | | | | — | |
| Distributable earnings | | | 50,854,496 | | | | 1,131,293 | | | | 2,986 | |
| Other accumulated losses | | | — | | | | — | | | | (1,225,264 | ) |
| Total distributable earnings | | $ | 1,057,387,228 | | | $ | 15,109,802 | | | $ | 3,215,393 | |
| | | | | | | | | | | | | |
| | | Baird | | | Chautauqua | | | Chautauqua | |
| | | SmallCap | | | International | | | Global | |
| | | Value Fund | | | Growth Fund | | | Growth Fund | |
| Cost of investments | | $ | 21,803,136 | | | $ | 219,008,242 | | | $ | 97,665,668 | |
| Gross unrealized appreciation | | $ | 9,247,876 | | | $ | 112,064,762 | | | $ | 44,208,922 | |
| Gross unrealized depreciation | | | (396,150 | ) | | | (9,972,087 | ) | | | (4,601,316 | ) |
| Net unrealized appreciation | | | 8,851,726 | | | | 102,092,675 | | | | 39,607,606 | |
| Undistributed ordinary income | | | 35,329 | | | | 2,203,513 | | | | 1,103,536 | |
| Distributable earnings | | | 35,329 | | | | 2,203,513 | | | | 1,103,536 | |
| Other accumulated losses | | | (2,113,109 | ) | | | (3,171,306 | ) | | | (948,266 | ) |
| Total distributable earnings | | $ | 6,773,946 | | | $ | 101,124,882 | | | $ | 39,762,876 | |
The difference between book-basis and tax-basis unrealized appreciation is attributable primarily to the tax deferral of losses on wash sales and mark-to-market on passive foreign investment companies.
Additionally, U.S. generally accepted accounting principles require that certain components of net assets relating to permanent differences be reclassified between financial and tax reporting. These reclassifications are primarily due to differing treatments for equalization accounting for tax purposes. These reclassifications have no effect on net assets or net asset value per share. For the year ended December 31, 2020, the following table shows the reclassifications made:
| | | Total | | | | |
| | | Distributable | | | Paid In | |
Fund | | Earnings | | | Capital | |
| Baird MidCap Fund | | $ | (36,806,866 | ) | | $ | 36,806,866 | |
| Baird Small/MidCap Growth Fund | | | (36,264 | ) | | | 36,264 | |
| Chautauqua International Growth Fund | | | (26,000 | ) | | | 26,000 | |
| Chautauqua Global Growth Fund | | | (2,500 | ) | | | 2,500 | |
Distributions to Shareholders
Each Fund generally pays dividends from net investment income and distributes net realized capital gains, if any, at least annually. Income and capital gain distributions are determined in accordance with income tax regulations, which may differ from GAAP. Certain Funds also utilize earnings and profits distributed to shareholders on redemptions of shares as part of the dividends paid deduction.
Notes to the Financial Statements
December 31, 2020
| 4. | Investment Transactions and Income Tax Information (cont.) |
The tax components of distributions paid during the periods shown below are as follows:
| | | Year Ended December 31, 2020 | |
| | | Ordinary | | | Long-Term | | | | |
Fund | | Income | | | Capital Gains | | | Total | |
| Baird MidCap Fund | | $ | 33,330,403 | | | $ | 167,012,629 | | | $ | 200,343,032 | |
| Baird Small/Mid Cap Growth Fund | | | 503,155 | | | | 443,273 | | | | 946,428 | |
| Baird Small/Mid Cap Value Fund | | | 163,120 | | | | — | | | | 163,120 | |
| Baird SmallCap Value Fund | | | 49,386 | | | | 1,547,362 | | | | 1,596,748 | |
| Chautauqua International Growth Fund | | | 2,106,751 | | | | — | | | | 2,106,751 | |
| Chautauqua Global Growth Fund | | | 639,765 | | | | — | | | | 639,765 | |
| | | | | | | | | | | | | |
| | | Year Ended December 31, 2019 | |
| | | Ordinary | | | Long-Term | | | | | |
Fund | | Income | | | Capital Gains | | | Total | |
| Baird MidCap Fund | | $ | 4,716,248 | | | $ | 111,977,504 | | | $ | 116,693,752 | |
| Baird Small/Mid Cap Value Fund | | | 211,978 | | | | — | | | | 211,978 | |
| Baird SmallCap Value Fund | | | 227,402 | | | | — | | | | 227,402 | |
| Chautauqua International Growth Fund | | | 3,658,929 | | | | — | | | | 3,658,929 | |
| Chautauqua Global Growth Fund | | | 843,708 | | | | 24,923 | | | | 868,631 | |
The Funds in the table above designated as long-term capital gain dividend, pursuant to Internal Revenue Code Section 852(b)(3), the amount necessary to reduce the earnings and profits of the Funds related to net capital gain to zero for the tax years ended December 31, 2019 and 2020.
At December 31, 2020, accumulated net realized capital loss carryovers without expiration were:
| | | Capital Loss Carryover | | | Year of Expiration |
Fund | | Short-term | | | Long-term | | | Short-term | | Long-term |
| Baird Small/Mid Cap Value Fund | | $ | 1,112,826 | | | $ | 112,438 | | | Indefinitely | | Indefinitely |
| Baird SmallCap Value Fund | | | 1,713,951 | | | | 399,158 | | | Indefinitely | | Indefinitely |
| Chautauqua International Growth Fund | | | — | | | | 3,112,101 | | | N/A | | Indefinitely |
| Chautauqua Global Growth Fund | | | — | | | | 931,566 | | | N/A | | Indefinitely |
During the year ended December 31, 2020, the Chautauqua International Growth Fund utilized $3,529,037 of long-term capital loss carryover.
| 5. | Investment Advisory and Other Agreements |
The Funds have entered into an Investment Advisory Agreement with Baird for the provision of investment advisory services. Pursuant to the Investment Advisory Agreement, the Advisor is entitled to receive a fee, calculated daily and payable monthly, at the annual rates as follows:
Fund | Investment Advisory Fees |
| Baird MidCap Fund | 0.75% |
| Baird Small/Mid Cap Growth Fund | 0.75% |
| Baird Small/Mid Cap Value Fund | 0.75% |
| Baird SmallCap Value Fund | 0.85% |
| Chautauqua International Growth Fund | 0.75% |
| Chautauqua Global Growth Fund | 0.75% |
Notes to the Financial Statements
December 31, 2020
| 5. | Investment Advisory and Other Agreements (cont.) |
The Advisor has contractually agreed to waive its investment advisory fee and/or reimburse the Funds’ operating expenses, to the extent necessary to ensure that total operating expenses, including interest expense and the fees and expenses incurred by the Funds in connection with the Funds’ investments in other investment companies (to the extent, in the aggregate, such fees and expenses on an annual basis exceed 0.0049% of the Fund’s average daily net assets), but excluding taxes, brokerage commissions and extraordinary expenses, do not exceed the following annual percentages of the average daily net assets attributable to the Funds’ Institutional Class and Investor Class shares:
| | Institutional | Investor |
Fund | Class | Class |
| Baird MidCap Fund | 0.85% | 1.10% |
| Baird Small/Mid Cap Growth Fund | 0.85% | 1.10% |
| Baird Small/Mid Cap Value Fund | 0.85% | 1.10% |
| Baird SmallCap Value Fund | 0.95% | 1.20% |
| Chautauqua International Growth Fund | 0.80% | 1.05% |
| Chautauqua Global Growth Fund | 0.80% | 1.05% |
The Expense Cap/Reimbursement Agreement is in effect through at least April 30, 2022.
To the extent that the Advisor reimburses or absorbs fees and expenses, it may seek payment of such amounts for three years after the date in which expenses were reimbursed or absorbed. A Fund will make no such payment, however, if its total annual operating expenses exceed the expense limits in effect at the time the expenses were reimbursed or at the time these payments are proposed.
| | | Fiscal Year Ended December 31, | |
| | | 2020 | | | 2019 | | | 2018 | |
| Subject to recovery on or before fiscal year ending December 31, | | 2023 | | | 2022 | | | 2021 | |
Fund | | | | | | | | | |
| Baird Small/Mid Cap Growth Fund | | $ | 174,285 | | | $ | 160,643 | | | $ | 32,277 | (a) |
| Baird Small/Mid Cap Value Fund | | | 170,040 | | | | 164,099 | | | | 151,826 | |
| Baird SmallCap Value Fund | | | 182,269 | | | | 160,963 | | | | 135,562 | |
| Chautauqua International Growth Fund | | | 213,896 | | | | 230,596 | | | | 116,439 | |
| Chautauqua Global Growth Fund | | | 209,929 | | | | 206,779 | | | | 155,834 | |
(a) | For the period from close of business on October 31, 2018 (inception date) through December 31, 2018. |
U.S. Bancorp Fund Services, LLC, doing business as U.S. Bank Global Fund Services, serves as transfer agent, administrator, and accounting services agent for the Funds. U.S. Bank, N.A. (“U.S. Bank”) serves as custodian for the Funds.
Robert W. Baird & Co. Incorporated (the “Distributor”) is the sole distributor of the Funds pursuant to a distribution agreement.
No commissions were earned by the Distributor for services rendered as a registered broker-dealer in securities transactions for the year ended December 31, 2020 for the Funds.
Certain officers and employees of the Advisor are also officers of the Funds.
The Corporation maintains an uncommitted line of credit (“LOC”) with U.S. Bank to provide the sixteen Funds comprising the Corporation a temporary liquidity source to meet unanticipated redemptions. The LOC is unsecured at all times and is subject to certain restrictions and covenants. Under the terms of the LOC, borrowings for each Fund are limited to one third of the total eligible net assets (including the amount borrowed) of the respective Fund, or $600,000,000 of total borrowings for the Funds comprising the Corporation, whichever is less. U.S. Bank charges interest at the U.S. Prime Rate less 2%, but in no event less
Notes to the Financial Statements
December 31, 2020
than a net rate of 1% per annum. As of December 31, 2020, the Prime Rate was 3.25%. The LOC matures on May 24, 2021, unless renewed. The Corporation has authorized U.S. Bank to charge any of the accounts of the borrowing Fund subject to the agreement for any missed payments.
During the year ended December 31, 2020, the Funds borrowed from the LOC as follows:
| | | Amount | | | Interest Charges | | | Borrowing | |
Fund | | Borrowed | | | Accrued | | | Rate | |
| Baird MidCap Fund | | $ | 196,669,000 | | | $ | 30,545 | | | | 2.75 | % |
| Baird Small/Mid Cap Growth Fund | | | 23,000 | | | | 2 | | | | 2.75 | % |
No other borrowings occurred during the year ended December 31, 2020 nor were any other borrowings outstanding under the LOC as of December 31, 2020.
| 7. | Distribution and Shareholder Service Plan |
The Funds have adopted a distribution and shareholder service plan (the “Plan”) pursuant to Rule 12b-1 under the 1940 Act. The Plan allows the Funds to compensate the Distributor for the costs incurred in distributing the Funds’ Investor Class Shares, including amounts paid to brokers or dealers, at an annual rate of 0.25% of the average daily net assets of the Funds’ Investor Class Shares.
For the year ended December 31, 2020, the Funds incurred fees pursuant to the Plan as follows:
Fund | | |
| Baird MidCap Fund | $406,855 | |
| Baird Small/Mid Cap Growth Fund | 750 | |
| Baird Small/Mid Cap Value Fund | 828 | |
| Baird SmallCap Value Fund | 1,323 | |
| Chautauqua International Growth Fund | 2,571 | |
| Chautauqua Global Growth Fund | 3,902 | |
A redemption fee of 2.00% will be assessed on Institutional and Investor Class shares of the Chautauqua International Growth Fund and Chautauqua Global Growth Fund if redeemed (including in connection with an exchange) 90 days or less from their date of purchase, determined on a first-in, first-out (“FIFO”) basis. The redemption fee is paid directly to the Funds and is designed to offset brokerage commissions, market impact and other costs associated with fluctuations in Fund asset levels and cash flow caused by short-term shareholder trading.
For the year ended December 31, 2020, the Funds charged redemption fees as follows:
Fund | | |
| Chautauqua International Growth Fund | $35,222 | |
| Chautauqua Global Growth Fund | $33,841 | |
The Baird MidCap Fund, Baird Small/Mid Cap Growth Fund, Baird Small/Mid Cap Value Fund and Baird SmallCap Value Fund do not charge redemption fees.
In preparing these financial statements, management has evaluated events after December 31, 2020. There were no subsequent events since December 31, 2020, through the date the financial statements were issued that would warrant adjustment to or additional disclosure in these financial statements.
Report of Independent Registered Public
Accounting Firm
To the Shareholders and Board of Directors of Baird Funds, Inc.
Opinion on the Financial Statements
We have audited the accompanying statements of assets and liabilities, including the schedules of investments, of the funds listed below (the “Funds”), each a series of Baird Funds, Inc., as of December 31, 2020, the related statements of operations, the statements of changes in net assets, the related notes, and the financial highlights for each of the periods indicated below (collectively referred to as the “financial statements”). In our opinion, the financial statements present fairly, in all material respects, the financial position of each of the Funds as of December 31, 2020, the results of their operations, the changes in net assets, and the financial highlights for each of the periods indicated below in conformity with accounting principles generally accepted in the United States of America.
| | | Statements | |
| | Statements of | of Changes | Financial |
| Fund Name | Operations | in Net Assets | Highlights |
| Baird MidCap Fund, | For the | For the | For the years ended December 31, |
| Baird Small/Mid Cap Value Fund, | year ended | years ended | 2020, 2019, 2018, and 2017 |
| Baird SmallCap Value Fund, | December 31, | December 31, | |
| Chautauqua International Growth Fund, | 2020 | 2020 and | |
| Chautauqua Global Growth Fund | | 2019 | |
| Baird Small/Mid Cap Growth Fund | For the | For the | For the years ended December 31, |
| | year ended | years ended | 2020 and 2019 and for the |
| | December 31, | December 31, | period from October 31, 2018 |
| | 2020 | 2020 and | (commencement of operations) |
| | | 2019 | through December 31, 2018 |
The Funds’ financial highlights for the period ended December 31, 2016, were audited by other auditors whose report dated February 27, 2017, expressed an unqualified opinion on those financial highlights.
Basis for Opinion
These financial statements are the responsibility of the Funds’ management. Our responsibility is to express an opinion on the Funds’ financial statements based on our audits. We are a public accounting firm registered with the Public Company Accounting Oversight Board (United States) (“PCAOB”) and are required to be independent with respect to the Funds in accordance with the U.S. federal securities laws and the applicable rules and regulations of the Securities and Exchange Commission and the PCAOB.
We conducted our audits in accordance with the standards of the PCAOB. Those standards require that we plan and perform the audit to obtain reasonable assurance about whether the financial statements are free of material misstatement whether due to error or fraud.
Our audits included performing procedures to assess the risks of material misstatement of the financial statements, whether due to error or fraud, and performing procedures that respond to those risks. Such procedures included examining, on a test basis, evidence regarding the amounts and disclosures in the financial statements. Our procedures included confirmation of securities owned as of December 31, 2020, by correspondence with the custodian and brokers. Our audits also included evaluating the accounting principles used and significant estimates made by management, as well as evaluating the overall presentation of the financial statements. We believe that our audits provide a reasonable basis for our opinion.
We have served as the Funds’ auditor since 2017.
COHEN & COMPANY, LTD.
Milwaukee, Wisconsin
February 26, 2021
Directors & Officers
As of December 31, 2020 (Unaudited)
Independent Directors
John W. Feldt
Independent Director, Audit Committee Chair
Term of Office: Indefinite
Length of Time Served: Since September 2000
Age: 78
c/o Robert W. Baird & Co. Incorporated
777 East Wisconsin Avenue
Milwaukee, WI 53202
Principal Occupation(s) During the Past 5 Years: Retired.
Number of Active Portfolios in Complex Overseen by Director: 16
Other Directorships Held by Director: Director of Thompson IM Funds, Inc., a mutual fund complex (3 portfolios) (1987-2018).
Darren R. Jackson
Independent Director
Term of Office: Indefinite
Length of Time Served: Since November 2018
Age: 56
c/o Robert W. Baird & Co. Incorporated
777 East Wisconsin Avenue
Milwaukee, WI 53202
Principal Occupation(s) During the Past 5 Years: Retired; President, CEO and Director, Advance Auto Parts, Inc. (2008-2016).
Number of Active Portfolios in Complex Overseen by Director: 16
Other Directorships Held by Director: Director of Cree, Inc., a Semiconductor Company, since 2016; Director of Fastenal Company, a tool and supply distributor (2012-2020).
Frederick P. Stratton, Jr.
Independent Director, Nominating
Committee Chair
Term of Office: Indefinite
Length of Time Served: Since May 2004
Age: 81
c/o Robert W. Baird & Co. Incorporated
777 East Wisconsin Avenue
Milwaukee, WI 53202
Principal Occupation(s) During the Past 5 Years: Retired; Chairman Emeritus, Briggs & Stratton Corporation, a manufacturing company (2003-2020).
Number of Active Portfolios in Complex Overseen by Director: 16
Other Directorships Held by Director: Director of Weyco Group, Inc., a men’s footwear distributor, since 1976.
Marlyn J. Spear, CFA
Independent Director, Chair of Board
Term of Office: Indefinite
Length of Time Served: Since January 2008
Age: 67
c/o Robert W. Baird & Co. Incorporated
777 East Wisconsin Avenue
Milwaukee, WI 53202
Principal Occupation(s) During the Past 5 Years: Retired; Chief Investment Officer, Building Trades United Pension Trust Fund (July 1989-February 2017).
Number of Active Portfolios in Complex Overseen by Director: 16
Other Directorships Held by Director: Management Trustee of AFL-CIO Housing Investment Trust, a mutual fund complex (1 portfolio) (1995-2018).
Directors & Officers
As of December 31, 2020 (Unaudited) (Continued)
Independent Director
Cory L. Nettles
Independent Director
Term of Office: Indefinite
Length of Time Served: Since January 2008
Age: 50
c/o Generation Growth Capital, Inc.
411 East Wisconsin Avenue, Suite 1710
Milwaukee, WI 53202
Principal Occupation(s) During the Past 5 Years: Managing Director, Generation Growth Capital, Inc., a private equity fund, since March 2007; Of Counsel, Quarles & Brady LLP, a law firm (January 2005-December 2016).
Number of Active Portfolios in Complex Overseen by Director: 16
Other Directorships Held by Director: Director of Weyco Group, Inc., a men’s footwear distributor, since 2007; Director of Associated Banc-Corp, since 2013.
Officers
Mary Ellen Stanek
President
Term of Office: Re-elected by Board annually
Length of Time Served: Since September 2000
Age: 64
777 East Wisconsin Avenue
Milwaukee, WI 53202
Principal Occupation(s) During the Past 5 Years: Managing Director, the Advisor, and Chief Investment Officer, Baird Advisors, a department of the Advisor, since March 2000.
Charles B. Groeschell
Vice President
Term of Office: Re-elected by Board annually
Length of Time Served: Since January 2010
Age: 67
777 East Wisconsin Avenue
Milwaukee, WI 53202
Principal Occupation(s) During the Past 5 Years: Managing Director, the Advisor, and Senior Portfolio Manager, Baird Advisors, a department of the Advisor, since February 2000.
Angela M. Palmer
Chief Compliance Officer and
AML Compliance Officer
Term of Office: Re-elected by Board annually
Length of Time Served: Since March 2014
Age: 48
777 East Wisconsin Ave
Milwaukee, WI 53202
Chief Compliance Officer, the Advisor, since March 2014; Anti-Money Laundering Compliance Officer since May 2015; Director, the Advisor, since July 2014.
Heidi L. Schneider
Treasurer
Term of Office: Re-elected by Board annually
Length of Time Served: Since August 2017
Age: 49
777 East Wisconsin Avenue
Milwaukee, WI 53202
Principal Occupation(s) During the Past 5 Years: Managing Director, the Advisor, since December 2013.
Charles M. Weber
Secretary
Term of Office: Re-elected by Board annually
Length of Time Served: Since September 2005
Age: 57
777 East Wisconsin Avenue
Milwaukee, WI 53202
Principal Occupation(s) During the Past 5 Years: Senior Associate General Counsel, the Advisor, since January 2013; Managing Director, the Advisor, since January 2009.
Directors & Officers
As of December 31, 2020 (Unaudited) (Continued)
Officers (Continued)
Peter J. Hammond
Vice President
Term of Office: Re-elected by Board annually
Length of Time Served: Since August 2012
Age: 57
777 East Wisconsin Avenue
Milwaukee, WI 53202
Principal Occupation(s) During the Past 5 Years: Managing Director, the Advisor, since January 2016; Senior Vice President, the Advisor (March 2012-December 2015).
Dustin J. Hutter
Assistant Treasurer
Term of Office: Re-elected by Board annually
Length of Time Served: Since February 2011
Age: 44
777 East Wisconsin Avenue
Milwaukee, WI 53202
Principal Occupation(s) During the Past 5 Years: Senior Business Analyst, the Advisor, since September 2017; Director of Finance Services, the Advisor (August 2015-August 2017).
Andrew D. Ketter
Assistant Secretary
Term of Office: Re-elected by Board annually
Length of Time Served: Since February 2011
Age: 46
777 East Wisconsin Avenue
Milwaukee, WI 53202
Principal Occupation(s) During the Past 5 Years: Associate General Counsel, the Advisor, since September 2010; Director, the Advisor, since July 2014.
Additional information about the Funds’ Directors is available in the Statement of Additional Information which may be obtained without charge, upon request, by calling 1-866-44BAIRD, or at www.bairdfunds.com.
Baird Funds, Inc.
Disclosure Regarding the Board of Directors’ Approval of the Investment
Advisory Agreement for Baird Equity Funds (Unaudited)
The Board of Directors (the “Board”) of Baird Funds, Inc. (the “Corporation”), comprised of directors who are not “interested persons” of the Corporation within the meaning of the Investment Company Act of 1940 (the “Independent Directors”) met on August 17 and August 25, 2020 to consider the annual renewal of the investment advisory agreement between Robert W. Baird & Co. Incorporated (“Baird” or the “Advisor”) and the Corporation on behalf of the Baird MidCap Fund, Baird Small/Mid Cap Growth Fund, Baird Small/Mid Cap Value Fund, Baird SmallCap Value Fund, Chautauqua International Growth Fund and Chautauqua Global Growth Fund (the “Equity Funds” or the “Funds”).
The Board, all of whom are Independent Directors, approved the continuation of the investment advisory agreement for the Equity Funds through a process that concluded at the August 25, 2020 meeting. In connection with its consideration of the investment advisory agreement, the Board reviewed and discussed various information that had been provided prior to the meeting, including a copy of the investment advisory agreement and related fee schedules, a memorandum provided by legal counsel summarizing the guidelines relevant to the Board’s consideration of the investment advisory agreement, a memorandum and other information provided in response to a request from the Board by the Advisor, including information about the operation of the Advisor and the Funds during the COVID-19 pandemic, a copy of the Advisor’s Form ADV Part 1A and Form ADV Part 2 brochures and brochure supplements, the annual report and audited consolidated financial statements for Baird Financial Group, Inc. (the Advisor’s parent company), a profitability analysis, comparative information about the Funds’ performance for the applicable periods ended June 30, 2020, comparative information about management fees and expense ratios, composite performance information for similar accounts managed by the Advisor, trading and brokerage commission information and other pertinent information.
The Board considered the Advisor’s 15(c) response and discussed various questions and information with representatives of the Advisor at the August 17, 2020 special meeting. At the August 25, 2020 meeting, the Board met in executive session with the Funds’ legal counsel to consider the investment advisory agreement. The Board also took into account information reviewed periodically throughout the year that was relevant to its consideration of the investment advisory agreement, including performance, management fee and other expense information, compliance matters, business initiatives of the Advisor, information about investments made by the Advisor in personnel, technology and services that benefit the Funds and discussions with the Funds’ portfolio managers.
Based on its evaluation of this information, the Board, including all of the Independent Directors, approved the continuation of the investment advisory agreement for the Funds for an additional one-year period.
In considering the investment advisory agreement and reaching its conclusions, the Board reviewed and analyzed various factors that it determined were relevant, including the factors below. In deciding to approve the investment advisory agreement for each Fund, the Board did not identify any single factor as determinative but considered all factors together.
Nature, Extent and Quality of Services Provided to the Funds
The Board considered the nature, extent and quality of the services provided by the Advisor to the Funds. The Board noted the Advisor’s overall reputation and depth of the Advisor’s personnel, resources and commitment to the Funds and the experience of the portfolio management teams employed to manage the Funds’ investments. The Board considered the credentials and continuity of the portfolio management teams for the Funds and noted that the Advisor continues to add resources in support of the Funds, including investments in personnel, technology, systems, trading and research capabilities, databases, work from home infrastructure and virtual meeting technology. The Board considered the information provided by the Advisor regarding the effective implementation of the Advisor’s business continuity plan and the performance and operation of the Funds during the COVID-19 pandemic.
Baird Funds, Inc.
Disclosure Regarding the Board of Directors’ Approval of the Investment
Advisory Agreement for Baird Equity Funds (Unaudited) (Continued)
The Board considered the Advisor’s disciplined investment decision making process used for the Funds. The Board also considered other services that the Advisor provides the Funds in its capacity as their investment advisor, such as making some of its key personnel available to serve as officers of the Funds, selecting broker-dealers for execution of portfolio transactions, ensuring adherence to the Funds’ investment policies and restrictions, proxy voting, compliance, risk management services, administering the Funds’ liquidity risk management program, administering the Funds’ cybersecurity program and business continuity plan, valuation support, providing support services to the Board and the committees of the Board and overseeing the Funds’ other service providers. The Board noted the general stability of the assets managed by Baird Equity Asset Management despite outflows in certain Funds. The Board also considered the strength of the Advisor’s compliance department, including the credentials of the Funds’ chief compliance officer, as well as the Advisor’s risk management system. The Board concluded that the nature, extent and quality of the services provided by the Advisor to the Funds were appropriate and that each Fund was likely to continue to benefit from services provided under the investment advisory agreement.
Investment Performance of the Advisor and the Funds
In considering the investment performance of each of the Funds, the Board reviewed information as of June 30, 2020 regarding the performance of each class of the Fund for applicable one-year, three-year, five-year, ten-year and since-inception periods in comparison to its benchmark index and its peer group as determined by Lipper. The Board also considered the Funds’ performance during the recent market downturn in the first six months of 2020 and noted that almost all of the Funds’ Institutional Class had seen positive relative performance against their benchmarks during this period. The Board also reviewed composite investment performance of Baird Equity Asset Management with respect to accounts managed by the Advisor that are comparable to the Funds but did not consider it to be a material factor in the 15(c) process.
The Board noted that the performance of the Institutional Class of the MidCap Fund exceeded the benchmark index, but underperformed the Lipper peer group average for the one-year period, exceeded the benchmark index and Lipper peer group average for the three- and five-year periods, underperformed the benchmark index, but exceeded the Lipper peer group average for the ten-year period and exceeded the benchmark index and Lipper peer group average for the since-inception period. The Board took note of the outperformance of the Small/Mid Cap Growth Fund since inception on October 31, 2018 as compared to both the benchmark index and Lipper peer group. The Board noted that the SmallCap Value Fund and Small/Mid Cap Value Fund have outperformed the benchmark index over the one- and three-year periods, the Small Cap Value Fund has underperformed the benchmark index for the five-year period and both Funds underperformed the benchmark index for the since inception period. During the relevant periods, the Funds underperformed the Lipper peer group index. The Board noted that the Advisor considers the Funds to be appropriately classified as value funds whereas Lipper classifies the Funds as core funds and that underperformance versus the small-cap core peer group has been influenced by the growth tilt of many core managers as growth has continued to outperform value. The Board took note of the Advisor’s commentary regarding the Funds’ underperformance in certain time periods and the Advisor’s commitment to closely monitor the Value Funds’ performance going forward.
The Board noted that the Institutional Class of the Chautauqua International Growth Fund had outperformed the benchmark index and Lipper peer group for the one-, three- and since-inception periods and the Institutional Class of the Chautauqua Global Growth Fund had outperformed the benchmark index and Lipper peer group for the one-year and since-inception periods and had outperformed the benchmark, but underperformed the Lipper peer group, for the three-year period.
The Board also considered the Advisor’s quarterly portfolio commentaries and reviews explaining the Funds’ performance and the investment strategies the Advisor employs for each Fund. The Board concluded that, although past performance is not a guarantee of future results, each Fund and its shareholders were likely to benefit from the continued management by the Advisor.
Baird Funds, Inc.
Disclosure Regarding the Board of Directors’ Approval of the Investment
Advisory Agreement for Baird Equity Funds (Unaudited) (Continued)
Advisory Fees and Expenses
The Board reviewed the fee and expense information for each of the Funds, including a comparison of each Fund’s advisory fee and total net expense ratio to industry data for other mutual funds in the same Morningstar peer group. The Board noted that the advisory fee for the MidCap Fund and the Small/MidCap Growth Fund is slightly above the Morningstar category average; the advisory fee for the Small/Mid Cap Value Fund is below the Morningstar category average; and the advisory fee for the Small/Cap Value Fund, the Chautauqua International Growth Fund and the Chautauqua Global Growth Fund is above the category average. The Board also considered the total expense ratio of each Fund, after fee waivers and expense reimbursements by the Advisor, relative to all other mutual funds in its Morningstar category. The Board noted that the net expense ratios for each class of the Funds, after waivers, are below the Morningstar average except for the Investor Class of the SmallCap Value Fund, which has an expense ratio that is slightly above the peer group average. The Board considered the Advisor’s commentary regarding the competitiveness of the Equity Funds’ fees, as well as fee comparisons for the Institutional Class of each Fund with the institutional shares of similarly sized funds, noting that the expense ratio of the Institutional Class of each Fund fell below the category average.
The Board also reviewed and considered management fees charged by the Advisor to other investment advisory clients, including separately managed accounts, subadvisory arrangements with unaffiliated mutual funds, two private limited partnerships managed in strategies similar to the International Growth Fund and the Global Growth Fund and a collective investment trust, but did not consider these comparisons to be a material factor given the difference in services provided by the Advisor and the additional risks assumed by the Advisor as investment adviser to the Funds.
The Board noted the extent of the significant additional services provided to the Funds that the Advisor did not provide in other advisory and subadvisory relationships. Those services included operational support, valuation services, administration of the Funds’ liquidity risk management program, oversight of the Funds’ other service providers, director support, preparation of regulatory filings, implementation of the Funds’ compliance program including employment of the Funds’ Chief Compliance Officer and other compliance staff, the operation of the Funds’ business continuity plan and cybersecurity plan, and various other services. In addition, the Board noted that the provision of investment advisory services to the Funds requires more effort than it does for other accounts due to daily sales and redemption activity and additional regulatory and compliance requirements.
The Board concluded that the management fee and total expense ratio of each Fund were reasonable in light of the nature and quality of services provided and fees paid by comparable funds.
Costs and Profitability
The Board considered the fees realized, and the costs incurred, by the Advisor in providing investment management services to the Funds and a profitability analysis with respect to each Fund. The Board considered that the Advisor’s profitability information does not reflect costs incurred for various support services to the Funds such as IT, compliance, risk, legal and finance. The Board reviewed the financial condition of the Advisor and its parent company and determined it to be sound. The Board concluded that the Advisor’s current level of profitability was reasonable.
Economies of Scale and Fee Levels Reflecting Those Economies
The Board reviewed asset levels for each Fund and considered whether there may be economies of scale in the management of each Fund at current levels and if its assets were to increase significantly.
Baird Funds, Inc.
Disclosure Regarding the Board of Directors’ Approval of the InvestmentAdvisory Agreement for Baird Equity Funds (Unaudited) (Continued)
The Board recognized that the Advisor has waived fees and/or reimbursed expenses for each Fund pursuant to the fee waiver/expense reimbursement agreement. Other than the MidCap Fund, the Board did not consider economies of scale to be a material factor due to the current asset size of each Fund. The Board noted that the MidCap Fund’s management fee structure does not contain any breakpoint reductions as the Fund’s assets grow in size but considered the expenses incurred and management fees waived by the Advisor in the past. The Directors concluded that the current fee structure of each Fund was reasonable.
Benefits Derived from the Relationship with the Funds
The Board considered other benefits to the Advisor from serving as advisor to the Funds (in addition to the advisory fee). Those benefits include Rule 12b-1 fees received by the Distributor and its representatives. The Board noted that the Advisor derives ancillary benefits from its association with the Equity Funds in the form of research products and services received from unaffiliated broker-dealers who execute portfolio trades for the Funds. The Board noted that the Advisor’s asset management and other businesses may experience indirect benefits from the Advisor’s association with the Funds. The Board concluded that the other benefits realized by the Advisor from its relationship with the Funds were appropriate.
Based on its evaluation of the above factors, the Directors, all of whom are Independent Directors, concluded that the continuation of the investment advisory agreement was in the best interest of each Fund and its shareholders.
Additional Information (Unaudited)
Proxy Voting
A description of the policies and procedures that the Funds use to determine how to vote proxies relating to portfolio securities is available without charge, upon request, by calling toll free, 1-866-44BAIRD, by accessing the Funds’ website at www.bairdfunds.com or by accessing the SEC’s website at www.sec.gov.
Each Fund’s proxy voting record for the most recent 12-month period ended June 30 is available without charge, upon request, by calling toll free, 1-866-44BAIRD, by accessing the Funds’ website at www.bairdfunds.com or by accessing the SEC’s website at www.sec.gov.
Portfolio Holdings Disclosure
The Funds file a complete schedule of portfolio holdings with the SEC for the first and third quarters of each fiscal year on Part F of Form N-PORT. The Funds’ filings on Part F of Form N-PORT are available on the SEC’s website at www.sec.gov. The Funds’ Form N-PORT reports may also be obtained by calling toll-free 1-866-44BAIRD.
Qualified Dividend Income/Dividends Received Deduction
For the fiscal year ended December 31, 2020, certain dividends paid by the Funds may be subject to a maximum tax rate of 15%, as provided for by the Jobs and Growth Tax Relief Reconciliation Act of 2003. The percentage of dividends declared from ordinary income designated as qualified dividend income was as follows:
| Baird MidCap Fund | 100.00% | |
| Baird Small/Mid Cap Value Fund | 100.00% | |
| Baird SmallCap Value Fund | 100.00% | |
| Chautauqua International Growth Fund | 100.00% | |
| Chautauqua Global Growth Fund | 100.00% | |
For corporate shareholders, the percent of ordinary income distributions qualifying for the corporate dividends received deduction for the fiscal year ended December 31, 2020 was as follows:
| Baird MidCap Fund | 100.00% | |
| Baird Small/Mid Cap Value Fund | 91.99% | |
| Baird SmallCap Value Fund | 96.44% | |
| Chautauqua Global Growth Fund | 6.34% | |
The percentage of taxable ordinary income distributions that are designated as short-term capital gain distributions under Internal Revenue Section 871(k)(2)(C) for each Fund were as follows:
| Baird MidCap Fund | 100.00% | |
| Baird Small/Mid Cap Growth Fund | 100.00% | |
Baird Funds, Inc. Privacy Policy
| | FACTS | | WHAT DOES BAIRD FUNDS DO WITH YOUR PERSONAL INFORMATION? | |
| | | | | |
| | Why? | | Financial companies choose how they share your personal information. Federal law gives consumers the right to limit some but not all sharing. Federal law also requires us to tell you how we collect, share, and protect your personal information. Please read this notice carefully to understand what we do. | |
| | | | | |
| | What? | | The types of personal information we collect and share depend on the product or service you have with us. This information can include: | |
| | | | • Social Security number | |
| | | | • Account balances, transaction history and assets | |
| | | | • Checking account information and wire transfer instructions | |
| | | | | |
| | How? | | All financial companies need to share customers’ personal information to run their everyday business. In the section below, we list the reasons financial companies can share their customers’ personal information; the reasons Baird Funds, Inc. chooses to share; and whether you can limit this sharing. | |
| | | Does Baird | Can you limit |
| | Reasons we can share your personal information | Funds, Inc. share? | this sharing? |
| | For our everyday business purposes— | Yes | No |
| | such as to process your transactions, maintain | | |
| | your account(s), respond to court orders and | | |
| | legal investigations, or report to credit bureaus | | |
| | For our marketing purposes— | Yes | No |
| | to offer our products and services to you | | |
| | For joint marketing with other financial companies | No | We do not share |
| | For our affiliates’ everyday business purposes— | Yes | No |
| | information about your transactions and experiences | | |
| | For our affiliates’ everyday business purposes— | No | We do not share |
| | information about your creditworthiness | | |
| | For our affiliates to market to you | No | We do not share |
| | For nonaffiliates to market to you | No | We do not share |
| | Questions? | | Call (toll free) 1-866-442-2473, Email prospectus@bairdfunds.com or go to www.bairdfunds.com |
Baird Funds, Inc. Privacy Policy
| | Who we are | | | |
| | Who is providing | | Baird Funds, Inc. | |
| | this notice? | | | |
| | What we do | | | |
| | How does Baird | | To protect your personal information from unauthorized access and | |
| | Funds, Inc. protect my | | use, we use security measures that comply with federal law. These | |
| | personal information? | | measures include computer safeguards and secured files and buildings. | |
| | How does Baird | | We collect your personal information, for example, when you | |
| | Funds, Inc. collect | | • open an account or give us your contact information | |
| | my personal | | • make a wire transfer or provide account information | |
| | information? | | • make deposits or withdrawals from your account | |
| | | | We also collect your personal information from other companies. | |
| | Why can’t I limit | | Federal law gives you the right to limit only | |
| | all sharing? | | • sharing for affiliates’ everyday business purposes—information about your creditworthiness | |
| | | | • affiliates from using your information to market to you | |
| | | | • sharing for nonaffiliates to market to you | |
| | | | State laws and individual companies may give you additional rights to limit sharing. | |
| | Definitions | | | |
| | Affiliates | | Companies related by common ownership or control. They can be financial and nonfinancial companies. | |
| | | • | Robert W. Baird & Co Incorporated (the investment adviser and distributor to the Baird Funds) and its affiliates may share information among each other. | |
| | Nonaffiliates | | Companies not related by common ownership or control. They can be financial and nonfinancial companies. | |
| | | | • Baird Funds, Inc. does not share with nonaffiliates so they can market to you. | |
| | Joint marketing | | A formal agreement between nonaffiliated financial companies that together market financial products or services to you. We do not have any joint marketing partners. | |
| | | | • Baird Funds, Inc. does not have any joint marketing partners. | |
(This Page Intentionally Left Blank.)
Baird Funds, Inc.
c/o U.S. Bancorp Fund Services, LLC
P.O. Box 701
Milwaukee, WI 53201-0701
1-866-44BAIRD
Board of Directors
John W. Feldt
Darren R. Jackson
Cory L. Nettles
Marlyn J. Spear (Chair)
Frederick P. Stratton, Jr.
Investment Advisor and Distributor
Robert W. Baird & Co. Incorporated
777 East Wisconsin Avenue
Milwaukee, WI 53202
Administrator and Transfer Agent
U.S. Bancorp Fund Services, LLC
P.O. Box 701
615 East Michigan Street
Milwaukee, WI 53202
Custodian
U.S. Bank, N.A.
1555 N. RiverCenter Drive, Suite 302
Milwaukee, WI 53212
Legal Counsel
Godfrey & Kahn, S.C.
833 East Michigan Street, Suite 1800
Milwaukee, WI 53202
Independent Registered Public
Accounting Firm
Cohen & Company, Ltd.
342 North Water Street, Suite 830
Milwaukee, WI 53202
(b). Not applicable
Item 2. Code of Ethics.
As of the end of the period covered by this report, the Registrant has adopted a code of ethics that applies to the President, Treasurer and Assistant Treasurer of the Registrant. The Registrant has not made any substantive amendments to its code of ethics during the period covered by this report. The Registrant has not granted any waivers from any provisions of the code of ethics during the period covered by this report.
Item 3. Audit Committee Financial Expert.
The Registrant’s board of directors has determined that John W. Feldt, Frederick P. Stratton, Jr., Marlyn J. Spear, and Darren R. Jackson, members of the audit committee, each qualify as an “audit committee financial expert” as such term is defined in paragraph (b) of Item 3 of Form N-CSR. Mr. Feldt, Mr. Stratton, Ms. Spear, and Mr. Jackson are each “independent” as such term is defined in paragraph (a)(2) of Item 3 of Form N‑CSR.
Item 4. Principal Accountant Fees and Services.
Aggregate fees billed by Cohen & Company, Ltd. (“Cohen”), the Registrant’s principal accountant, during the last two fiscal years were as follows:
| | FYE 12/31/2020 | FYE 12/31/2019 | |
Audit Fees | $234,300
| $229,600
| |
Audit-Related Fees | $0
| $0
| |
Tax Fees | $72,000
| $72,000
| |
All Other Fees | $0
| $0
| |
In the above table, “audit fees” are fees billed for professional services for the audit of the Registrant’s annual financial statements or for services that are normally provided by the accountant in connection with statutory and regulatory filings or engagements. “Tax fees” are fees billed for professional services rendered for tax compliance, tax advice and tax planning, and specifically relate to Cohen’s review of the Registrant’s federal and state tax returns.
The audit committee has adopted pre-approval policies and procedures that require the audit committee to pre‑approve all audit and non‑audit services rendered to the Registrant, as well as all non-audit services provided to the Registrant’s investment adviser and any entity affiliated with the Registrant’s investment adviser with respect to any engagement that relates directly to the operations and financial reporting of the Registrant. In accordance with its policies and procedures, the audit committee pre-approved all audit and tax services provided by Cohen to the Registrant during fiscal 2020. During the past two fiscal years, the Registrant did not receive any non-audit services from Cohen pursuant to any waivers of the pre-approval requirement under paragraph (c)(7)(i)(C) of Rule 2-01 of Regulation S-X. Additionally, during the past two fiscal years, neither the Registrant’s investment adviser nor any entity controlling, controlled by, or under common control with the investment adviser that provides ongoing services to the Registrant received non-audit services from Cohen. All of Cohen’s hours spent on auditing the Registrant’s financial statements were attributed to work performed by full-time permanent employees of Cohen.
Item 5. Audit Committee of Listed Registrants.
Not applicable because the Registrant is not a “listed issuer” within the meaning of Rule 10A-3 under the Securities Exchange Act of 1934.
Item 6. Investments.
(a) | The complete Schedules of Investments in securities of unaffiliated issuers as of the close of the reporting period for the Baird MidCap Fund, Baird Small/Mid Cap Growth Fund, Baird Small/Mid Cap Value Fund, Baird SmallCap Value Fund, Chautauqua International Growth Fund, Chautauqua Global Growth Fund, Baird Ultra Short Bond Fund, Baird Short-Term Bond Fund, Baird Intermediate Bond Fund, Baird Aggregate Bond Fund, Baird Core Plus Bond Fund, Baird Short-Term Municipal Bond Fund, Baird Strategic Municipal Bond Fund, Baird Quality Intermediate Municipal Bond Fund, Baird Core Intermediate Municipal Bond Fund, and Baird Municipal Bond Fund are included as part of the report to shareholders filed under Item 1. |
(b) Not Applicable.
Item 7. Disclosure of Proxy Voting Policies and Procedures for Closed-End Management Investment Companies.
Not applicable because the Registrant is not a closed-end management investment company.
Item 8. Portfolio Managers of Closed-End Management Investment Companies.
Not applicable because the Registrant is not a closed-end management investment company.
Item 9. Purchases of Equity Securities by Closed-End Management Investment Company and Affiliated Purchasers.
Not applicable because the Registrant is not a closed-end management investment company.
Item 10. Submission of Matters to a Vote of Security Holders.
There have been no material changes to the procedures by which shareholders may recommend nominees to the Registrant’s board of directors.
Item 11. Controls and Procedures.
(a) | The Registrant’s management, with the participation of its principal executive and principal financial officers, has evaluated the effectiveness of the Registrant's disclosure controls and procedures (as defined in Rule 30a-3(c) under the Investment Company Act of 1940 (the “Act”)), as of a date within 90 days prior to the filing date of this Form N-CSR, as required by Rule 30a-3(b) under the Act and Rules 13a-15(b) or 15d-15(b) under the Securities Exchange Act of 1934. Based on such evaluation, the Registrant's principal executive and principal financial officers have concluded that the design and operation of the Registrant's disclosure controls and procedures are effective in providing reasonable assurance that the information required to be disclosed on Form N-CSR is recorded, processed, summarized and reported within the applicable time periods. |
(b) | There were no changes in the Registrant's internal control over financial reporting (as defined in Rule 30a-3(d) under the Act) that occurred during the period covered by this report that have materially affected, or are reasonably likely to materially affect, the Registrant's internal control over financial reporting. |
Item 12. Disclosure of Securities Lending Activities for Closed-End Management Investment Companies
Not applicable because the Registrant is not a closed-end management investment company.
Item 13. Exhibits.
(3) Any written solicitation to purchase securities under Rule 23c-1 under the Act sent or given during the period covered by the report by or on behalf of the Registrant to 10 or more persons. Not applicable because the Registrant is not a closed-end management investment company.
(4) Changes in the Registrant’s independent public accountant. There was no change in the Registrant’s independent public accountant for the period covered by the report.
SIGNATURES
Pursuant to the requirements of the Securities Exchange Act of 1934 and the Investment Company Act of 1940, the Registrant has duly caused this report to be signed on its behalf by the undersigned, thereunto duly authorized.
(Registrant) BAIRD FUNDS, INC.
By (Signature and Title) /s/ Mary Ellen Stanek
Mary Ellen Stanek, President (Principal Executive Officer)
Date March 5, 2021
Pursuant to the requirements of the Securities Exchange Act of 1934 and the Investment Company Act of 1940, this report has been signed below by the following persons on behalf of the Registrant and in the capacities and on the dates indicated.
By (Signature and Title) /s/ Mary Ellen Stanek
Mary Ellen Stanek, President (Principal Executive Officer)
Date March 5, 2021
By (Signature and Title) /s/ Heidi Schneider
Heidi Schneider, Treasurer (Principal Financial Officer)
Date March 5, 2021